simbe_darby_ar-2015-16.pdf - Sime Darby Berhad
399
-
Upload
khangminh22 -
Category
Documents
-
view
2 -
download
0
Transcript of simbe_darby_ar-2015-16.pdf - Sime Darby Berhad


. 2 Sime Darby BerhadAnnual Report 2016Innovating for the Future
COVER RATIONALE
This year, the design for our Annual Report cover is influenced by topography, symbolising Sime Darby’s reach and expertise. The modern and clean feel represents our clarity in vision and strategy. At Sime Darby, we believe in our people’s ability to innovate and maximise our operational and strategic potential. Even in the toughest of times, our value driven culture, inherent synergies and strong focus on sustainability and innovation continue to enable us to remain resilient and maintain our leadership position in our operating domains.
ABOUT THIS REPORT
As part of our on-going efforts to improve corporate reporting, the Group has focused on developing transparency and effectiveness in its third year of Integrated Reporting. In line with our adoption of best practices and our commitment to sustainability, this Report is our sincere acknowledgement of the symbiotic relationship that exists between the need to protect and preserve the environment, the impetus for economic development and the need to balance the rights of humankind.
This Report therefore, aims to disclose where we want to be and how we plan to achieve our targets. We have provided an insight into how our core values drive our strategic objectives and in turn, how this translates into value creation - both for us and our stakeholders.

Sime Darby Berhad 1Annual Report 2016 Innovating for the Future
Sime Darby is a diversified multinational and a key player in the Malaysian economy, with businesses in key growth sectors, namely, plantation, industrial equipment, motors, property and logistics, with operations in 26 countries and 4 territories.
Committed to developing a sustainable future, Sime Darby strives to maintain an equitable balance between increasing value for shareholders and responsible development that brings value to society and safeguards the environment. Sime Darby is one of the largest companies listed on Bursa Malaysia and has a market capitalisation of RM48.02 billion (USD11.74 billion) as at 30 June 2016.
OUR VISION
To be a leading multinational corporation delivering sustainable value to all stakeholders.
OUR MISSION
We are committed to developing a winning portfolio of sustainable businesses.
We subscribe to good corporate governance and high ethical values.
We continuously strive to deliver superior financial returns through operational excellence and high performance standards.
We provide an environment for our people to realise their full potential.
OUR VALUES
At Sime Darby, the core values that we uphold throughout our operations and businesses worldwide are Integrity, Respect & Responsibility, Excellence and Enterprise.
Integrity Uphold high levels of personal and professional values in all our business interactions and decisions.
Respect & Responsibility Respect for the individuals we interact with and the environment that we operate in (internally and externally) and committing to being responsible in all our actions.
Excellence Stretch the horizons of growth for ourselves and our business through our unwavering ambition to achieve outstanding personal and business results.
Enterprise Seek and seize opportunities with speed and agility, challenging set boundaries.
ABOUT SIME DARBY

Sime Darby BerhadAnnual Report 2016Innovating for the Future2
CONTENTS
04 Group Highlights06 Group Overview08 Chairman’s Message11 President & Group Chief Executive’s Review 16 Global Trends and Market Outlook18 Managing Our Material Issues20 Group Business Model22 Strategy Blueprint24 Innovation in Action31 Group Performance Review i. Introduction ii. Strategy Performance Review iii. Financial Performance Review63 Divisional Operations Review112 Statement on Corporate Governance 116 Directors’ Profiles121 Executive Leadership145 Governance & Audit Committee Report 152 Nomination & Remuneration Committee Report160 Sustainability Committee Report165 Risk Management Committee Report167 Statement on Risk Management and Internal Controls175 Statement of Directors’ Responsibilities 178 Directors’ Report183 Statement by Directors183 Statutory Declaration184 Independent Auditors’ Report186 Statements of Profit or Loss187 Statements of Comprehensive Income 188 Statements of Financial Position190 Statements of Changes in Equity193 Statements of Cash Flows196 Notes to the Financial Statements 349 Supplementary Information350 Notice of Annual General Meeting355 Analysis of Shareholdings358 Additional Compliance Information359 Share Price Movement & Financial Calendar 360 Properties of the Group379 Notice to Shareholders Under the Personal Data Protection Act 2010381 Compliance with the Principles and
Recommendation of the Malaysian Code on Corporate Governance 2012
383 United Nations Global Compact (UNGC) Communication on Progress
384 Global Reporting Initiative (GRI)386 Slavery and Human Trafficking Statement 389 Independent Assurance Report Form of Proxy
http://www.simedarby.com/ investor-relations/annual-reports/annual-report
GROWING INNOVATION page 24
IMPROVING CUSTOMER INTRICITY THROUGH DIGITAL PLATFORM page 26
NEW BUSINESS MODEL page 28

Sime Darby Berhad 3Annual Report 2016 Innovating for the Future
CORPORATE INFORMATION
BOARD OF DIRECTORS
Tan Sri Dato’ Abdul Ghani Othman Independent Non-Executive Chairman
Tan Sri Dato’ Sri Dr Wan Abdul Aziz Wan Abdullah Non-Independent Non-Executive Deputy Chairman
Tan Sri Samsudin Osman Non-Independent Non-Executive Director
Tan Sri Datuk Dr Yusof Basiran Non-Independent Non-Executive Director
Bapak Muhammad Lutfi Non-Independent Non-Executive Director
Datuk Zaiton Mohd Hassan Senior Independent Non-Executive Director
Datuk Wan Selamah Wan Sulaiman Independent Non-Executive Director
Datuk Dr Mohd Daud Bakar Non-Independent Non-Executive Director
Dato Sri Lim Haw Kuang Independent Non-Executive Director
Dato’ Rohana Tan Sri Mahmood Independent Non-Executive Director
Ir Dr Muhamad Fuad Abdullah Independent Non-Executive Director (To retire upon conclusion of the 10th AGM on 2 November 2016)
REGISTERED OFFICE
19th Floor, Wisma Sime Darby Jalan Raja Laut 50350 Kuala Lumpur, Malaysia
Telephone : +(603) 2691 4122 Facsimile : +(603) 2719 0044 Email : [email protected] Website : www.simedarby.com
SHARE REGISTRAR
Tricor Investor & Issuing House Services Sdn Bhd (Company No. 11324-H) Office: Unit 32-01, Level 32, Tower AVertical Business Suite Avenue 3, Bangsar South No. 8, Jalan Kerinchi 59200 Kuala Lumpur, Malaysia
Telephone : +(603) 2783 9299 Facsimile : +(603) 2783 9222 Email : [email protected]
Customer Service Centre:Unit G-3, Ground Floor, Vertical PodiumAvenue 3, Bangsar SouthNo. 8, Jalan Kerinchi59200 Kuala Lumpur, Malaysia
AUDITORS
Pricewaterhouse Coopers (AF-1146) Chartered Accountants Level 10, 1 Sentral, Jalan Rakyat Kuala Lumpur Sentral 50706 Kuala Lumpur, Malaysia
Telephone : +(603) 2173 1188 Facsimile : +(603) 2173 1288
FORM OF LEGAL ENTITY
Incorporated on 7 November 2006 as a private company limited by shares under the Companies Act, 1965 and converted into a public company limited by shares on 5 April 2007
STOCK EXCHANGE LISTING
Listed on the Main Market of Bursa Malaysia Securities Berhad since 30 November 2007
Stock Code : 4197 Stock Name : SIME
PLACE OF INCORPORATION AND DOMICILE
Malaysia
AS AT 31 AUGUST 2016
Encik Zainal Abidin Jamal Non-Independent Non-Executive Director
Tan Sri Dato’ Seri Mohd Bakke Salleh Executive Director
PRESIDENT & GROUP CHIEF EXECUTIVE
Tan Sri Dato’ Seri Mohd Bakke Salleh
SECRETARY
Puan Norzilah Megawati Abdul Rahman (LS 0009247)

4 Sime Darby BerhadAnnual Report 2016Innovating for the Future
REVENUE (RMbn)
2016
2015
2014
2013
2012 4.3
3.8
3.5
2.4
2.4
0 1.0 2.0 3.0 4.0 5.0
2.4
NET EARNINGS (RMbn)
2015
2014
2013
2012
2011 29.81
34.66
32.61
27.81
40.83
0 10 20 30 40 50
40.83
TOTAL ENERGY CONSUMPTION* (M GJ)
2016
2015
2014
2013
2012 13.25
10.58
7.76
8.49
18.75
0 4 8 12 16 20
18.75
LOST TIME INJURY FREQUENCY RATE (INCIDENTS PER MILLION MAN-HOURS WORKED)
2016
2015
2014
2013
2012 5.8
4.8
4.4
3.4
3.1
0 1.0 2.0 3.0 4.0 5.0 6.0
PROFIT BEFORE INTEREST AND TAX (PBIT) (RMbn)
3.1
2015
2014
2013
2012
2011 2.72
3.14
2.54
2.60
3.15
0 0.5 1.0 1.5 2.0 2.5 3.0
3.15
CARBON EMISSIONS* (M TONNES CO2-E)
2016
2015
2014
2013
2012
44.046.6
46.1
43.9
43.7
44.0
0 12.0 24.0 36.0 48.0 60.0
GROUP HIGHLIGHTS
Our results reflect a year of resilient performance amidst challenging economic conditions.
* Based on calendar year

5Strategic ReportSime Darby Berhad Annual Report 2016
OPERATIONAL HIGHLIGHTS
Our value-driven culture, strong focus on research and innovation and shared synergies within our businesses has enabled us to retain our market leading positions. In our pursuit of operational excellence, we have achieved a sustainable business performance which positions us for growth in the long-term.
For more on our divisional performance, see pages 63 to 111.
PLANTATION MOTORS
FFB production (million MT)
9.69.6 in
FY2015
Units sold
83,06091,278 in
FY2015
CPO extraction rate (%)
21.821.7in
FY2015
Gross Sales Value (RMm)
1,7452,134 in FY2015
Port throughput (million MT)
34.736.3 in
FY2015
FFB yield (MT/ha)
18.820.4 in
FY2015
Units sold
1,8941,659 in FY2015
Order book (RMbn)
1.21.9 in
FY2015
PROPERTY LOGISTICS*
Note:
* E&U Division (China Operations) is now known as the Logistics Division to reflect the growing ports and logistics business in China.
INDUSTRIAL

6 Sime Darby BerhadAnnual Report 2016Innovating for the Future
GROUP OVERVIEW
We are a global business with operations in 26 countries and four territories with over 120,000 employees. We have established market positions in key growth sectors namely plantation, industrial equipment, motors, property and logistics.
UNITED KINGDOMTHE NETHERLANDS
GERMANY
SOUTH AFRICA
UNITED STATES OF AMERICA
LIBERIA
INDIA
CHINAJAPAN
HONG KONG TAIWAN
SOUTH KOREA
MACAU
MALAYSIASRI LANKA
THAILAND
MALDIVESPHILIPPINES
BRUNEI
AUSTRALIA
NEW CALEDONIA
NEW ZEALAND
SOLOMON ISLANDSPAPUA NEW GUINEA
INDONESIA
VIETNAM
SINGAPORE
CHRISTMAS ISLAND
123,410employees across
26countries
4territories
PROFIT BEFORE INTEREST AND TAX BY GEOGRAPHICAL SEGMENT
BRAZIL
MYANMAR

7Strategic ReportSime Darby Berhad Annual Report 2016
DIVISION REVENUE CONTRIBUTION
PROFIT CONTRIBUTION
PLANTATION
Fully integrated player in the oil palm value chain. The world’s largest producer of Certified Sustainable Palm Oil.
Page 64
A premier community developer involved in property development, property investment and asset management. Malaysia’s largest property developer in terms of land bank and active developments.
PROPERTY
Page 96
Involved in the assembly, import, distribution and retail businesses. A major player in the Asia Pacific automotive industry with presence in 10 countries and territories.
MOTORS
Page 88
Involved in Ports & Logistics and Water Management in Shandong, Eastern China, with operations in Weifang and Jining.
LOGISTICS
Page 105
Among the world’s largest Caterpillar dealers. Offers a comprehensive variety of equipment and services, from sales of new machines, engines and used equipment for rental across 10 countries throughout the Asia Pacific region.
INDUSTRIAL
Page 80

8 Sime Darby BerhadAnnual Report 2016Innovating for the Future
CHAIRMAN’S MESSAGE
“A company’s strength is tested during tough times. The stronger the core, the stronger the company. Business diversity, financial flexibility and its talent capacity remain the essence of Sime Darby. Armed with a century of experience, a hunger for innovation and a dedicated workforce, this Company is certainly poised for continued growth amidst a challenging business landscape.”
Tan Sri Dato’ Abdul Ghani OthmanChairman
DEAR SHAREHOLDERS,
On behalf of the Board of Directors, it gives me great pleasure to present to you the Sime Darby Annual Report for the financial year ended 30th June 2016 (FY2016). This will be the third instalment of our Integrated Reporting journey as we continue to embark on enhancing reporting connectivity while providing stakeholders with a more holistic view of how the Company creates and sustains value.
In times of economic turbulence, Sime Darby’s core strength has come to the fore in the form of disciplined management of capital expenditure and working capital as well as strategic cost containment measures. The Group’s presence in both industrial and consumer based sectors has cushioned the adverse impact of market volatility. This, coupled with our innovative endeavours, will continue to help the Group to manoeuvre challenging market conditions and capitalise on future value creation opportunities. This has been the inspiration behind this year’s annual report theme, “Innovating for the Future”.
OUR PERFORMANCE
The Group registered a revenue of RM44.0 billion and Net Earnings of RM2.4 billion for the full Financial Year 2015/2016. This represents an improvement of 0.5 percent and a decline of 0.9 percent respectively, compared with the previous financial year. Despite a number of headwinds, the Group has managed to exceed its Net Earnings FY2016 Key Performance Indicator (KPI) target of RM2.0 billion by 20 percent while the Return on Average Shareholders’ Equity (ROE) KPI target of 6.3 percent was surpassed by 1.3 percentage points at 7.6 percent.
A detailed discussion of the Group’s financial performance can be found in the Group Financial Review on page 55.
DIVIDEND
The Board recommends the payment of a final dividend of 21.0 sen per share for FY2016. Combined with the earlier interim dividend of 6.0 sen per share, the full year dividend amounts to 27.0 sen per share. This brings the total payout for the period under review to RM1.7 billion, or a net dividend payout ratio of 71%.

9Strategic ReportSime Darby Berhad Annual Report 2016
DELIVERING SUSTAINABLE VALUE
The Financial Year 2015/2016 proved to be a challenging year for the Group. During this time, the Group was exposed to volatile commodity prices, unpredictable weather conditions, softening consumer sentiments, the slowing down of major economies and a marked depreciation of the Ringgit. Sime Darby, nevertheless, remained strong by capitalising on its well positioned and diversified portfolio of businesses in order to contend with the difficult business environment.
With its strong governance, sound approach to risk management, holistic stakeholder engagements as well as continued investment in human capital, the Board believes this Company will make great strides in achieving notable milestones and increasing returns.
CORPORATE GOVERNANCE
Sime Darby’s commitment to strengthening its corporate governance remains key in providing the framework within which the Company can implement its strategy and create further value for our shareholders. We have continued to enhance our governance towards a greater emphasis on raising the standards of good practice in relation to Board leadership and effectiveness.
This is evident in our pursuit to achieve a high-performing Board by improving its diversity to reflect the varied nature of the Company’s operations and to continuously strive towards enhancing its composition in line with the evolving circumstances and needs of the Group. The recent appointments of four new board members are part of these on-going efforts.
We are also making significant headway in our endeavour to achieve a minimum of 30% women representatives.
Read more about the Group’s approach to governance in the Corporate Governance section on page 112.
RISK MANAGEMENT AND INTERNAL CONTROLS
The Board places great importance on identifying and dealing with wide-ranging risk potentials as this is crucial in safeguarding and enhancing shareholder value. The Group’s Risk Management Framework and Internal Control System, that is further described in the Statement on Risk Management and Internal Control, specifically addresses some of Sime Darby’s most significant risk areas. Our appetite for risk in these areas is a key consideration in our decision making, as
defined risk appetite parameters guide the Group’s risk tolerance when pursuing its strategic objectives.
In March 2016, the Group Compliance Office (GCO) took a step forward in enhancing its internal controls with the launch of the Sime Darby Integrity Programme (SDIP), which was designed to support the Corporate Integrity Pledge signed in 2011. The SDIP’s main objective is to ring-fence and enhance the Group’s ethics practices and parameters, in its bid to provide ease and confidence to our stakeholders. A review of the Group’s Code of Business Conduct (COBC) is underway as part of the SDIP programme.
Any enhancement to the COBC or development of additional Group Policies and Principles will be derived from the results of the SDIP programme. STAKEHOLDER ENGAGEMENT
Sime Darby’s ability to consistently deliver value even in trying times lies in its capacity to align the Group’s focus to the concerns of its stakeholders, such as investors, governments, communities and non-governmental organisations, among others.
Throughout the year, the Company has engaged our wide range of stakeholders through various methods and channels to communicate developments within the Group and its strategies. Towards this end, an independent external stakeholder engagement exercise was conducted by Group Sustainability & Quality Management (GSQM) and Forum for the Future.
In line with the Group’s commitment towards transparency to build trust with its respective stakeholders, this exercise has been instrumental in helping to highlight material sustainability issues. We will continue to engage and value the priorities and concerns of our stakeholders in our pursuit to inculcate a customer centric culture within the Group. The feedback and input received from the engagement process have been taken into consideration in the formulation of the Company’s strategies. In Liberia for instance, we are going to pilot findings of the high carbon stock study to guide its on-ground implementation following engagements and studies that took more than a year.
For more details on our key focus areas, please refer to the Stakeholder Engagement section on page 143.

1 0 Sime Darby BerhadAnnual Report 2016Innovating for the Future
CHAIRMAN’S MESSAGE
OUR PEOPLE AND VALUES
Here in Sime Darby, we continuously invest in our people as we strongly believe that they are the catalyst in propelling Sime Darby to greater heights. Development interventions pave the way to leadership for internal talent via a balanced mix of on-the job experience, informal learning exposure and formal learning.
In this tough market where businesses are forced to adapt, we are lucky that our people have the hunger and compelling desire to challenge ourselves and each other. It is this innovative spirit and positive mindset that drive the Group’s approach towards value creation while shaping the business and improving its prospects for future success. Underlined by its core values of integrity, respect & responsibility, excellence and enterprise, Sime Darby will leverage on its strong home-grown innovative capabilities as a competitive advantage amongst its peers.
Read more about our Performance Driven Transformation on page 51. STRATEGY
Over the last five years, the operating environment and landscape have changed on a global scale. While we are focused on delivering sustainable value to our stakeholders today, we understand that in a changing world, we choose to stand still at our own peril. As such, the group has re-emphasised the need for a long term approach to strategy and business development. We are constantly assessing our operating landscape to take advantage of opportunities in our core areas to set the Group on a firmer footing for future growth. Meanwhile, we remain focused on strengthening and growing our businesses, identifying opportunities that create value in the longer term and improving our performance through innovation.
OUR FUTURE
The Group continues to face many headwinds amidst a challenging business landscape. Besides the global economic slowdown that has extended into the new financial year, volatile commodity prices, subdued consumer sentiments as well as tighter fiscal measures and regulations remain major factors that need to be addressed. As part of our efforts in mitigating these challenges, the Company will continue to strengthen its capacity through cost reduction and improving cash flow generation. Sime Darby also aims to capitalise on its various business models and our innovation culture to deliver value to the stakeholders.
We are confident that our strategies will enable the Company to be better positioned for future growth while delivering sustainable value to our shareholders, employees and the respective markets in which the Group operates.
ACKNOWLEDGEMENT
On behalf of the Board, I would like to take this opportunity to record my appreciation to all our valued stakeholders for their continued trust and loyalty and for growing the Group with us. I would also like to thank my colleagues on the Main Board and Flagship Subsidiary Boards for their substantial achievements this year and for positioning the business to succeed for years to come. On behalf of my fellow directors, I would like to take this opportunity to congratulate and welcome Datuk Dr Mohd Daud Bakar, Encik Zainal Abidin Jamal, Datuk Wan Selamah Wan Sulaiman and Bapak Muhammad Lutfi to the Main Board. This wise combination of experience and skillsets will undoubtedly be beneficial to our shareholders.
We have announced the resignation of Dato’ Azmi Mohd Ali on 1 March 2016 due to the change of nominee director by a major shareholder, Permodalan Nasional Berhad. He is succeeded by Encik Zainal Abidin Jamal. I would like to thank Dato’ Azmi for his dedicated service and commitment during his tenure of service as Non-Executive Director. Ir Dr Muhamad Fuad Abdullah has expressed his intention to retire as an Independent Non-Executive Director and would therefore not seek re-election at the Annual General Meeting on 2 November 2016. I would like to thank them for the value that they have brought to the Board and for their dedication and commitment. Datuk Zaiton Mohd Hassan was appointed as the Senior Independent Director to succeed Dato’ Henry Sackville Barlow who retired at the conclusion of the Ninth Annual General Meeting of Sime Darby held on 23 November 2015.
My heartfelt gratitude also goes out to the management team and everyone in Sime Darby around the world for their outstanding commitment and performance, particularly during this challenging period. Sime Darby is well positioned to continuously grow and improve its performance with your unwavering support.
Tan Sri Dato’ Abdul Ghani Othman, Chairman

1 1Strategic ReportSime Darby Berhad Annual Report 2016
PRESIDENT & GROUP CHIEF EXECUTIVE’S REVIEW
“With a changing business landscape, there is an opportunity for us to continue taking the Company to new heights. ”
DEAR SHAREHOLDERS,
In the year under review, we witnessed volatility in almost all major commodities including crude oil, base metals and agricultural products.
Economically, the global scenario was subdued in FY2016 with the slowing down of major economies such as China and the European Union. The tail end of the financial year saw even more uncertainty in the market when the United Kingdom voted to leave the European Union causing immediate reactions in the property and financial markets.
Tan Sri Dato’ Seri Mohd Bakke SallehPresident and Group Chief Executive
Furthermore, fiscal consolidations and changes to government policies impacted demand across the Group’s businesses and operating geographies. The depreciation of the Malaysian Ringgit coupled with market volatility weighed on business sentiment throughout the year, affecting domestic demand.
Uncertainty has become the new normal and how we respond to this challenge will determine our ability to deliver value to our stakeholders.

1 2 Sime Darby BerhadAnnual Report 2016Innovating for the Future
In view of the volatile business environment, how did Sime Darby address its challenges?
Challenges will always be present. We should not allow ourselves to be distracted by it. Every challenge provides room to not just adapt and build resilience but to also find new business opportunities. Sime Darby has not allowed challenges to thwart our future potential but has instead been focusing on productivity and efficiency enhancements while gaining competitive advantage by turning risks into opportunities. Our Plantation Division for example, focused on operational improvements and acceleration of innovation through research & development and agronomic practices, as well as enhancing value through sustainability. The Division initiated its first commercial planting of its Genome Select seeds, capable of delivering at least a 15% increase in oil yield over current highest yielding planting materials. The Division has also been steadfast in its pursuit of cost management initiatives through efficiency in its supply chains as well as improved processes.
The Industrial Division undertook strategic rightsizing, continued cost-cutting measures, sustained a disciplined approach towards working capital management and worked towards identifying new businesses such as the Mine Energy Solutions partnership. The Motors Division focused on resource optimisation, as well as venturing into new markets, securing new marques and increasing footprint strategically. Our Property business looked into further enhancing the value of its landbank and strengthening the position of its brand, while the Logistics Division expedited the expansion of its ports with strategic partners.
We have always believed that the fundamentals of all our businesses remain strong despite the challenging landscape.
What were some of the milestones that Sime Darby achieved whilst carrying out its Five-Year Strategy Blueprint?
The Group’s main focus was to strengthen its core businesses and this was done through the execution of a number of acquisitions, disposals and partnerships. We acquired the Bucyrus dealership from Caterpillar in 2011 to increase our foothold in the Australian mining equipment market. In the same year, we disposed of our Oil & Gas business to focus resources on sectors where we have leadership. In 2012, we ventured into the international property market via our 40% stake in the Battersea Power Station project in the United Kingdom, and in 2013, we entered into a 50:50 joint venture with Ramsay Healthcare to further develop our Healthcare business.
In 2014, we disposed of our Malaysian and Thai Power businesses to consolidate and focus our attention on our existing core businesses. Towards this end, the Group penetrated new markets and territories. We made our foray in the automotive business in Taiwan, Vietnam and also Brisbane, Australia through existing and new marques. This included BMW, Mini and Kia. In 2015, we acquired New Britain Palm Oil Ltd (NBPOL) to expand our plantation landbank and to leverage on NBPOL’s strong operational best practices. This was essentially a period of strategic positioning, setting the stage for the Group to move to its next phase of growth to realise value.
Refer to the Divisional Operations Review on pages 63 to 111 of this Annual Report for details of our performance in each Division.
PRESIDENT & GROUP CHIEF EXECUTIVE’S REVIEW
PGCE INSIGHTS

1 3Strategic ReportSime Darby Berhad Annual Report 2016
OUR STRATEGY
With a changing business landscape, there are opportunities for us to take the company to new heights. The Group will continue to drive operational efficiencies, seek out investment opportunities while maintaining capital discipline to maximise long term shareholder returns. Uncertain market conditions, increasing sustainability awareness, technological disruptions and the rising population of millennials are key trends that will impact how we operate in future. This forms the basis of our new strategy moving forward, one that focuses on Results, Innovation, Sustainability and Energy, the people.
Details of the Global Trends and Market Outlook, are outlined on pages 16 and 179 of this Report respectively. 1. Driving Results
Our first strategic area of focus is to drive the Company’s performance through improved productivity, adopting more cost effective practices and disciplined capital management.
In FY2016, the Group continued with its cost saving activities through its Operational Excellence programme which includes the deployment of Lean Six Sigma (LSS) initiatives. Through LSS, we have saved a total of RM586 million since its establishment in FY2013 and we are on track to meet our RM775 million target by FY2017.
In December 2015, we launched a “War on Waste” campaign with the objective of eliminating all forms of wastage across the Group. The success of the Campaign was realised by achieving RM163 million in projected savings and 1.3 million hours identified from 1,816 projects at 156 operating units globally. This was achieved through our 100 days Kaizen Waste Elimination Challenge.
Refer to the Driving Results section on page 33 of this Annual Report for further information.
2. Innovation Growth and Resource Allocation
The next area of focus under our strategy blueprint is to ensure a flow of innovation projects and the capacity to match this growing need.
As part of the Group’s efforts to promote innovation, we have introduced a Stage Gate process to execute these ideas and established Divisional Innovation Committees to deliberate on new projects. The Group’s focus now is to execute projects that are currently in the pipeline while exploring technologies and related business areas that could add value to existing businesses.
Refer to the Innovation Growth and Resource Allocation section on page 37 of this Annual Report for further information.
3. Leading Sustainability
Sustainability is integral to Sime Darby. It plays a pivotal role in the Group’s ongoing success and our ability to create long term value for our wide range of stakeholders. With the launch of the Sustainable Development Goals (SDGs) in 2015, we have ensured that we are aligned to the SDGs, with the underlying aim of contributing to a better society, minimising environmental harm and delivering sustainable development.
The High Carbon Stock (HCS) Study has been completed and we are currently involved in the convergence process of the two HCS methodologies (the HCS Approach and the HCS Study). We will be implementing the pilot findings of the study in Liberia, where we hope to gain better understanding through practical implementation on-ground.

1 4 Sime Darby BerhadAnnual Report 2016Innovating for the Future
PRESIDENT & GROUP CHIEF EXECUTIVE’S REVIEW
Environment, Safety and Health (ESH)
We are truly saddened to report a total of 13 fatalities in the last financial year. This is unacceptable for a company that takes pride in its sustainability efforts. Reinforcing and realigning our safety culture through concerned reporting on near miss incidences will be critical to the performance and wellbeing of our employees. This will also empower our employees to take charge of their safety and health.
In the new financial year, we aim to drive our sustainability strategy further, focusing on key areas of value creation through sustainability, improving health and safety performance, achieving optimum efficiency, addressing impacts to climate change and advancing sustainability practices.
Refer to the Leading Sustainability section on page 41 of this Annual Report for further information.
4. Performance Driven Transformation
In Sime Darby, our people are our greatest asset. We recognise that in order to meet our goals, it is imperative that we foster a positive and conducive environment for our employees. To do this, we continue to develop capable and engaged leaders, drive operational excellence with Human Resource (HR) processes and focus on aligning our talent with organisational goals.
We continued the Accelerated Leaders’ Programme for our middle level talent to prepare them for senior leadership roles. We have also embarked on Executive Leadership Coaching for key Senior Executives to improve their personal performance through coaching and peer learning. As part of the effort to strengthen our coaching culture, the Supervisory Coaching Programme was also launched in the last financial year.
Refer to the Performance Driven Transformation section on page 51 of this Annual Report for further information.
OUTLOOK
FY2016 was undoubtedly tough amidst an array of headwinds faced by the global economy, including slower growth in China and a number of large developing economies, a fresh recession in Japan and a weak economy in Europe.
As easy monetary policies in major countries have not yielded the desired results, the global economy is likely to remain sluggish this year. Against this backdrop, investors’ nerves are being tested like never before; recent jitters have called into question the safe haven status of investments like treasuries and gold. Making matters worse, global security issues and geopolitical challenges are impacting sentiment and creating greater instability.
The rising prices of commodities, however, offer some optimism that business conditions may be recovering. Crude Palm Oil (CPO) prices, for example, have trended higher from the lows in mid-2015, averaging RM2,307/MT for the year under review. Palm oil stocks are expected to face a severe reduction, keeping world export supplies tight in the foreseeable future. The decline in exports due to easing demand in several key export markets as well as the increase in consumption of palm oil for biodiesel production may impact palm oil supplies, providing a potential upside for CPO prices. Notwithstanding the macro factors, the Plantation division continues to focus on improving productivity, particularly in Genome select planting, agro-management practices and mechanisation across all its operations. These on-going efforts are expected to increase oil yields and lower operating costs in the future.
The Industrial Division remains impacted by the consolidation of the mining sector in Australia. However, the continuing increase in coal production activity in Queensland is expected to lead to an upsurge in demand for our product support services. The parts & service segment contributes almost 60% of the Division’s earnings. In Singapore, continued low oil prices have significantly affected demand for engines in the oil and gas and marine sectors. Infrastructure projects in Malaysia such as the Pan-Borneo Highway and the West Coast Highway are expected to boost demand for construction machinery and contribute to our pipeline of projects for the coming years. Besides streamlining its cost base to increase efficiency in the challenging environment, the Division will also focus on new growth sectors such as Energy Solutions to diversify its portfolio of businesses.

1 5Strategic ReportSime Darby Berhad Annual Report 2016
The Motors business, particularly in Malaysia, has been impacted by competitive market conditions and weak domestic demand, stringent bank lending policies on vehicle financing and the depreciation of the Ringgit which has resulted in shrinking margins. Notwithstanding the market challenges, the Motors Division is pursuing growth in new markets and continues to launch new products. With the easing of vehicle lending restrictions and increased supply of Certificate of Entitlements, demand for new vehicles in Singapore is expected to be strong in the coming year. Our operations in Vietnam and Thailand remain robust and will help to counter weaker demand in China and Australia.
The Malaysian residential property market remains soft due to cautious consumer sentiment and tight lending conditions. The impact of the Overnight Policy Rate cut to loan applications is expected to be marginal in the coming months without any other stimulus measures. However, the Group’s sizeable land bank in strategic locations augurs well for its future growth. In the United Kingdom, the property market has been affected by the uncertainty from the Brexit vote. The impact on the Group’s Battersea Development Project is being closely monitored. Nevertheless, construction is progressing well and the Group is on track to recognise its maiden profit from this project in the Financial Year ending June 2017.
Our Port operations in Weifang, China, continue to be affected by the economic slowdown in the region and strong competition from neighbouring ports. Low petrol prices which translate into cheaper cost for land transportation will continue to reduce Weifang Port’s geographic advantage which is its proximity. Despite this, the Logistics Division remains on-track in its plans to increase the port’s capacity and to diversify its range of facilities.
We are cognisant of the fact that risks will be elevated and what remains crucial is to follow a disciplined long-term strategy that balances the Group’s diverse businesses, generating attractive returns while avoiding excessive risk.
ACKNOWLEDGEMENT
On behalf of the Management team, I would like to express our sincere appreciation to the Board members and our shareholders for your confidence and support. I would also like to thank all the employees for their hard work and dedication throughout the year. In a difficult environment, they have indeed gone the extra mile! I am confident that the Group is well positioned to deliver growth, solid returns and value to all our stakeholders.
Tan Sri Dato’ Seri Mohd Bakke SallehPresident & Group Chief Executive

1 6 Sime Darby BerhadAnnual Report 2016Innovating for the Future
GLOBAL TRENDS AND MARKET OUTLOOK UNDERSTANDING OUR OPERATING CHALLENGES
INCREASED UNCERTAINTYOF MARKET CONDITIONS
INCREASING SUSTAINABILITY AWARENESS
TREND DESCRIPTION TREND DESCRIPTION
• Economicgrowthrateshavebecomelesspredictable,with increasing volatility in commodity prices and currencies as markets become more interconnected.
• Businessescannolongerexpectrevenuegrowthtobedriven primarily by the organic expansion of its existing operating markets.
•Scrutinyofsustainabilitycommitmentsandbusiness practices is increasing and attracting the interest of a wide range of stakeholders.
•Extremeweatherconditionshaveaffectedtheenvironment and ecosystems and thus the way we do our business.
•Businessesarefacingstrongerdemandtomeettheneeds and concerns of their employees, local communities and the societies where they operate.
VOLATILITY OF COMMODITY PRICES SUSTAINABILITY AWARENESS IN EMERGING MARKET
GROUP-LEVEL MEGATRENDS
Source: Bloomberg, August 2016 Source: RobecoSAM
Source: Bloomberg, RSPO
DEVELOPMENTS DEVELOPMENTS
•ElNinoweatherphenomenonresultedinadverseweather which impacted the palm oil industry to causing reduction in production.
•CPOpricewasvolatileinFY2016,achievingalowofRM1,806 /MT in Aug’15 and a high of RM2,716 /MT in Apr’16.
•RinggitfluctuatedsignificantlyinFY2016,rangingfrom RM3.75 to RM4.46 per USD.
•Geopoliticaluncertaintieshasledtoincreasedvolatility in the financial markets (eg: Brexit, increase in acts of terrorism and the US election).
•In2015,morethan150worldleadersadoptedtheSustainable Development Goals (SDGs) under the 2030 Agenda for Sustainable Development.
•RSPOstatedthatthecertifiedsustainablepalmoilsupply in 2015 was 12.9m MT which is 8.2% higher than 2014.
•Fastmovingconsumergoodscompaniescontinuetofocus on improving sustainability practices within their supply chain.

1 7Strategic ReportSime Darby Berhad Annual Report 2016
DISRUPTIVE TECHNOLOGIES AND BUSINESS MODELS
CHANGING DEMOGRAPHICS OF CONSUMERS AND EMPLOYEES
TREND DESCRIPTION TREND DESCRIPTION
•Businessesareleveragingontechnologyadvancements to enhance products, services and customer engagement.
•Availabilityoffundsviaangelinvestorsandventurecapital is enabling startups to commercialise ideas.
•Digitalisationhasloweredthebarrierofentry,making it easier for new entrants to disrupt incumbents.
•Increasingnumberofworkingmillennialsmeansthatbusinesses need to segmentise their offerings to suit generations of consumers with different preferences.
•Customerengagementmodelsneedtoevolveandleverage on different social media platforms.
•HumanResourcestrategyneedstobeadaptedtoaccount for the diversity of the workforce and to attract top talent.
CUMULATIVE COUNT OF “UNICORNS”- STARTUPS VALUED > USD 1 BILLION
GLOBAL AGE DISTRIBUTION
Megatrends are large, transformative global forces that have a profound impact on business, the economy, society, culture and the future. We proactively adapt our strategies to harness the opportunities and mitigate the threats that arise from these drivers of future change.
GROUP-LEVEL MEGATRENDS
Source: United Nations, Department of Economic and Social Affairs, Population Division (2015)Source: TechCrunch, August 2016
Source: Pew Research, Facebook, PwC
DEVELOPMENTS DEVELOPMENTS
•Carmanufacturersareactivelyinvestingincar-sharing and ride-sharing apps.
•Caterpillar’sinvesteecompany,UptakenamedHottest Startup of 2015 by Forbes.
•ConsumersintheUScannowpurchasealgaeoilviaselected market channels.
•Companiesaresettingupventurecapitalarmstoinvest in promising startups.
•Theglobalmedianforsmartphoneownershipisat43%.
•Facebookhas1.71bnmonthlyactiveusers(23%ofglobal population).
•Millennialswillform50%oftheglobalworkforceby2020.

1 8 Sime Darby BerhadAnnual Report 2016Innovating for the Future
MANAGING OURMATERIAL ISSUES
The material issues outlined in this report have been identified from both internal and external sources. The Group’s revised Strategy Blueprint has been developed to address these material issues.
MATERIAL ISSUES DESCRIPTION KEY AREA OF FOCUS
REFERENCE
PRODUCTIVITY AND EFFICIENCY IMPROVEMENTS
The challenging and uncertain business environment means that the Group needs to focus on improving productivity and efficiency to sustain value creation.
Driving results via Productivity and Cost Reduction Measures
Efforts to improve the productivity and efficiency of the Group’s businesses are found in the Driving Results from pages 33 to 54.
CAPITAL STRUCTURE – REDUCING LEVERAGE
The Group’s gearing increased to 57% as at June 2015 after the acquisition of New Britain Palm Oil Limited. With challenging conditions faced by the Group’s businesses, lower gearing would strengthen the Group’s financial flexibility.
The actions undertaken to reduce the Group’s gearing is discussed in Group Financial Review section from pages 55 to 61.
INNOVATION GROWTH
To meet the Group’s long term profit targets, it has to ensure that there are sufficient projects in the pipeline. Given the limited resources, it is imperative that high impact projects are prioritised.
Innovation Growth and Resource Allocation
The discussion on innovation growth and the key innovation projects are found in the Innovation Growth and Resource Allocation section from pages 37 to 40.
SAFETY AND HEALTH
Safeguarding the safety and health of the Group’s people, contractors as well as local community members wherever it operates in is of utmost importance. The Group is working towards its overall goal of Zero Harm.
Leading Sustainability
Discussion on the Group’s safety & health performance can be found in the Leading Sustainability section from pages 41 to 50.
ENVIRONMENTAL IMPACT
Stakeholders are increasingly demanding that organisations operate in a manner that minimises environmental impact. Sime Darby believes that the protection and enhancement of the environment goes hand in hand with the long term of sustainability of the business.
Discussion on the Group’s performance in minimising environmental harm can be found in the Leading Sustainability section from pages 41 to 50.
SOCIAL PERFORMANCE
Human Rights is an increasing area of concern from a wide range of stakeholders. Sime Darby believes it has a duty to respect the rights of all individuals, including but not limited to, our employees and communities wherever it operates.
Discussion on the Group’s efforts around Human Rights can be found in the Leading Sustainability section from pages 41 to 50.
LEADERSHIP DEVELOPMENT
It is essential for leaders to be influential, motivated and inspiring in order to continuously push the boundaries of success and growth.
Performance Driven Transformation
Discussion on the Group’s initiatives to develop its leaders can be found in the Performance Driven Transformation section from pages 51 to 54.
MATERIAL ISSUES AND STAKEHOLDER ENGAGEMENT

1 9Strategic ReportSime Darby Berhad Annual Report 2016
We define stakeholders as individuals or groups who impact or are impacted by our businesses. This includes our investors, customers, suppliers, business partners, employees, society and communities, the government, authorities and regulators, the media, non-governmental organisations, international bodies and many others.
Engagement sessions with our stakeholders are centred on the material issues identified. The table below sets out the types of engagements done for each stakeholder group.
STAKEHOLDER HOW WE ENGAGE
Investors • Roadshowsandregionalinvestorconferences• Groupandone-on-onemeetings• Annualgeneralmeeting,quarterlyresultsbriefingsessions
Customers • Tradeshows&exhibitions• Productlaunches• Directengagementsandsurveys• Directvisitstosites&factoriesoperatedbytheGroup
Suppliers / Business Partners • Relationshipbuilding/networkingsessions• VendorDevelopmentProgramme
Employees (current and potential) • Townhalls,eventsandactivities• Focusgroupdiscussionsontargetedissuesand engagement surveys
Communities • Communityengagementandoutreach• Communitydevelopmentprogrammes• Strategicpartnerships
Governments / Authorities /Regulators
• Regularengagement,communicationanddialogue• Consultationonregulatorymatters
Civil Society / NGO’s • Industryroundtables• Strategicpartnerships• Directengagements
Others (Media, Academics, Industry Association)
• Stakeholderengagementsurveys• Periodicupdatesoncorporatedevelopments,keyeventsand
press release issuance• Groupandone-on-oneQ&Asessions
OUR STAKEHOLDERS
Information on our Stakeholder Engagement policy can be found on page 143 of this Annual Report.

2 0 Sime Darby BerhadAnnual Report 2016Innovating for the Future
OUR CONGLOMERATE ADVANTAGE
Robust Capital Management
Stable and healthy financial position
Innovation FocusSystems to drive innovation
across the enterprise
Trusted and CredibleStrong brand, leadership
and governance track record
Market LeadersLeading in our key markets and sustainable practices
DiversityDiverse portfolio of
talent, experience and regional exposure
Strong Stakeholder Engagement
Long history of understanding and balancing the needs of
our diverse stakeholders
OUR KEY RESOURCES
WHAT WE DO TO ENABLE OUR BUSINESSES
Access to capital
Managing capital and optimising portfolio performance
Disciplined approach to capital allocation based on new growth | Industry leadership | Returns and
industry outlook.
Established brand and industry specific
knowledge
Driving the quality and competencies of our businesses,
reinforcing the value of our reputation and shared resources
Strong brand developed from more than100 years of heritage | Deep industry knowledge that enables
businesses to be market leaders.
Focus on sustainability, strong governance and
risk management
Proactively managing sustainability, risk and
governance frameworks and driving it through our businesses
Two-tier board structure | Established Board Sustainability Committee | Sustainable Palm Oil
Manifesto and High Carbon Stock Study.
Experienced leaders and high-performing
employees
Developing our employees and leaders through training and
emphasising on safety & health of our employees
HR’s five-year strategy and roadmap | Establish Sime Darby Leadership Centre.
Strong stakeholder relationships
Solidifying our stakeholder relationships through regular engagement
Stakeholder Engagement Policy | Participation in Global Thought Leadership Platforms.
GROUP BUSINESS MODELCREATING SUSTAINABLE VALUE THROUGH OUR BUSINESS MODEL
Underpinned by Integrity, Respect & Responsibility, Excellence and Enterprise

2 1Strategic ReportSime Darby Berhad Annual Report 2016
Underpinned by Integrity, Respect & Responsibility, Excellence and Enterprise
HOW WE CREATE VALUE
CREATEOptimal capital structure and allocation that provides lower cost of financing and resilient returns.
RM
Raised via Perpetual Sukuk Wakalah in
FY 2016
Return on Average Shareholders’ Equity
bn2.2 7.6%
ESTABLISHProcesses for our businesses to leverage on our brand and shared resources to deliver commercially viable, margin accretive innovations.
Our Property Division awarded the Putra Brand
Award for FY2016
R&D centres in our Plantation Division
8LEVERAGEInternal controls and processes that protect the value creation process of our businesses.
Sustainability Awards
in FY2016
4Corporate governance, business conduct and
corporate responsibility awards in FY2016
3
NURTURESafe and conducive working environment for our employees, enabling Sime Darby to attract and retain talent.
awards for our CEO, CFO and senior
management team in FY2016
105HR awards received
in FY2016
BUILDStrong reputation and trust which connects our businesses to opportunities.
Asiamoney’s Best Managed Company
( Large Cap) in Malaysia 2015
Membership and partnership in
leading industry organisations
HOW WE SHARE THE VALUE WE CREATE
INVESTORSWe continue to be a trusted and stable investment proposition for capital providers that is driven by consistent performance and protected by our strong sustainability, governance and risk focus. Our track record and disciplined investment strategy provide greater access to growth opportunities, translating to sustainable shareholder returns.
CUSTOMERSWe offer added value from differentiated and innovative products and services from a highly regarded brand that they can rely on.
ENVIRONMENTWe aim to minimise the impact of our businesses on the environment.
EMPLOYEESSafe and conducive working environment led by our cohesive and effective management team, enabling our people to achieve their career aspirations which makes the Group an Employer of Choice.
GOVERNMENTS & COMMUNITIESSime Darby is an exemplary corporate citizen which operates responsibly, to deliver growth and long term value to the economy and society.
SUPPLIERS & BUSINESS PARTNERSWe believe in developing long-term relationships with our principals, suppliers and business partners, in order to create greater value from the sharing of our capabilities and resources to achieve a common goal.

2 2 Sime Darby BerhadAnnual Report 2016Innovating for the Future
STRATEGY BLUEPRINT
KEY AREA OF FOCUS OBJECTIVES MARKET TRENDS
Driving Results via Capital Discipline,
Productivity and Cost Reduction Measures
Innovation Growth and Resource Allocation
Leading Sustainability
Performance Driven Transformation
See pages 33 to 36 for more details
See pages 37 to 40 for more details
See pages 41 to 50 for more details
See pages 51 to 54 for more details
Achieve operational excellence to remain resilient in all business environments
Continuously enhance capital management
Execute strategic measures to create value
Position the Group for future growth via a pipeline of innovation projects
Build winning partnerships in core, adjacent and new segments
Judicious resource allocation to prioritised projects
Internalise innovation capabilities within the Group
Contribute to a better society
Minimise environmental harm
Deliver sustainable development
Develop capable and engaged leaders
Inculcate an innovation and sustainability culture
Drive operational excellence with HR processes
Focus on aligning talent and organisation to achieve common goals
Increase in uncertainty of market conditions
Disruptive technologies and business models
Increase in uncertainty of market conditions
Disruptive technologies and business models
Changing demographics of consumers and employees
Increasing sustainability awareness
Changing demographics of consumers and employees
Increasing sustainability awareness
Changing demographics of consumers and employees

2 3Strategic ReportSime Darby Berhad Annual Report 2016
PROGRESS HIGHLIGHTS PRIORITIES FOR FY2017
• RM243.3m benefits harvested from the Group’s Lean Six Sigma Business management Management Strategy in FY2016, exceeding the RM200m target set.
• Identified potential savings of RM163.5m through our 100 days Kaizen Waste Elimination Challenge.
• Plantation continued the integration of NBPOL and have realised cost synergies of RM24m in FY2016.
• Disposal of two Singapore commercial properties for RM601m.
• Sime Darby’s Terberg Tractors secured contracts from Westports Malaysia and PSA Singapore Terminals worth RM88m and RM90m respectively.
• Integration of E&U Non-China into Industrial to extract synergies and streamline processes.
• Increase productivity and streamline staff costs.
• Stringent management of capital and operating expenditure.
• Explore strategic corporate exercises that could unlock value for investors.
• Rollout of the Stage Gate idea-to-commercialisation process and set up Division Innovation Committees.
• Launched Ideas Portal, Ideas Lab and ran internal hackathons as ideation platforms in FY2016.
• Commenced first large scale planting of Genome Select high yielding oil palms.
• Industrial Division to supply natural gas solutions to mining companies via Mine Energy Solutions (Joint Venture).
• Launch of Sime Darby Property Mobile App.
• Logistics in Joint Venture with Dragon Crown Group to develop liquid terminal.
• Focus on executing projects that are already in the pipeline. Successful innovations will be scaled up and replicated.
• Continuously explore technologies and related activities that could add value to existing businesses (eg: precision agriculture, integrated milling, water management, sustainable homes).
• Completion of the High Carbon Stock (HCS) Science Study. Convergence of the different methodologies around HCS underway and being piloted in Liberia.
• Launched ‘Open Palm’ – an online dashboard that provides traceability information of the Plantation Division’s entire palm oil supply chain.
• Launched a hotspot monitoring dashboard in the interest of transparency around the issue of fire and haze within South East Asia.
• Started to assist small oil palm producers to be part of the Group’s sustainable palm oil value chains.
• The Group Human Rights Task Force established.
• Continue to protect employees by developing a safe working culture with the ultimate goal of zero harm.
• Minimise the impacts of operations on the environment and climate change.
• Proactive participation in strategic sustainability platforms to develop thought leadership.
• Continue to operationalise the respect for Human Rights across the entire Group.
• Optimisation of workforce and rigorous workforce planning.
• Implementation of transformation programmes and enhanced key leadership programmes to drive talent readiness.
• Improve quality and quantity of critical positions coverage. 85% of critical positions have successors identified in FY2016 compared to 79% in FY2015.
• Won the Gold award for the Excellence in Innovative use of HR technology category in the Human Resources Magazine’s HR Excellence Awards 2015.
• Drive accountability and diversity of talent within the Group.
• Incorporate innovation in leadership programmes.
• Enhance the productivity measurement metrics through analytics.
• Ensure alignment of talent capabilities to business needs.

2 4 Sime Darby BerhadAnnual Report 2016Innovating for the Future
Innovation has become a necessity in today’s economic climate of commodity price volatility and growing environmental challenges.
The Plantation of the Future focuses on driving continuous innovation to find new ways to stay ahead of the challenges while meeting the world’s growing nutritional needs and protecting the environment.
Moving towards a fully connected, integrated and automated estate
GROWING INNOVATION
PLANTATION OF THE FUTURE

2 5Strategic ReportSime Darby Berhad Annual Report 2016
GENOME SELECT Commenced the first commercial scale planting of its new Genome Select (GS) planting material in April 2016.
Potential Benefits:• Upto15%increaseinyieldovercurrent
highest yielding materials.• By2023,enoughmaterialtoconduct
entire annual replanting exercise.
Highlights:• Establishedafullyfunctionalhigh
throughput genome lab.• PlantedGSparentalpalms.
SIME DARBY PLANTATION ESTATE, MILL, & UPSTREAM APPLICATION (SEMUA 2.0)
SIME DARBY DIGITAL SUPERVISION (SDDS)
A web based system that allows structured and transparent field supervision of worker’s performance via their handheld Global Positioning System (GPS) enabled devices.
Potential Benefits:• Immediatecorrectiveactionstoresolve
operational issues from real time data.• Abletoremotelymanageharvesting
operations in an efficient manner.
Highlights:• Successfullyimplementedinallestatesin
Malaysia and 70% in Indonesia.
SIME DARBY DRONE MONITORING
Improving efficiency of mapping and monitoring of oil palm plantations through deployment of unmanned aerial vehicles.
Potential Benefits:• Improvecropsurveillanceresultingin
improved yield mapping, effective analysis of poor performing fields, estate infrastructure planning, reduced dependency on ground census methods improved water management & flood mitigation plan.
Highlights:• Embarkedintofullimagingworks of estates.
SEMUA 2.0 is the second generation of an integrated centralised platform linking all upstream operations (from estate office to field, from mill office to factory floor) in Malaysia, Liberia and Indonesia. The updated platform has allowed new technology such as several mobile solutions (FFB Count, Genome Breading, Geotagging, FFB grading, etc) to be brought in to further support the upstream business unit.
Potential Benefits:• FacilitateclosermonitoringofUpstream
operations by leveraging on mobile and Near Field Communication (NFC) technologies to enhance collaboration.
Highlights:• Firstintheindustrytodigitallyconnect
upstream operations down to estate’s fields.
• Connectsestates,mills,marketingandhead office activities.

2 6 Sime Darby BerhadAnnual Report 2016Innovating for the Future
In Sime Darby, we acknowledge the importance of technology in improving the way we engage and communicate with our customers, from providing a platform to improve their experience of our brand to addressing their sustainability concerns of our operations.
Living in a world with instant access to everything forces corporations to innovate their customer engagement approach.
IMPROVING CUSTOMER CENTRICITY THROUGH DIGITAL PLATFORMS
THE CONNECTED EXPERIENCE

2 7Strategic ReportSime Darby Berhad Annual Report 2016
SIME DARBY PROPERTY APP & PRIME
#SJ40 BY SIME DARBY PROPERTY
A one-stop app for Motors customers in Malaysia to stay in touch with each of the principal brands.
Potential Benefits:• ToelevateMotorsservicequality
aftersales.• Toprovideadditionalreservation
platform for car rental business.
Highlights:• LaunchedinJuly2016.• Morethan5,000downloads.• Featureslatestcampaigns,offersand
upcoming events, booking function for test drives and service appointments, one click SOS call, location map and much more.
TRACEABILITY DASHBOARD
SIME DARBY MOTORS BRAND CONNECT
The Sime Darby Property app uses interactive online technology to improve sales and grow the Sime Darby Property brand.
Potential Benefits:• ToachieveCustomer First goal by
increasing customer retention and loyalty. • Toallowcustomerstoexperiencetheir
future homes before making a purchase.• Toimprovesalesthroughexpansionofthe
sales referral programme. Highlights: • LaunchedinJanuary2016.• Morethan19,000downloadsoftheapp.• Featuresincludefriendlyinterfaceand
virtual tours of selected properties.
An integrated campaign that drives brand relevance, awareness and lead-generation through social media and digital platforms.
Potential Benefits:• Tohighlightourcommitmentto
enhancing Subang Jaya.• Tostimulatepublicinterestand
showcase the future of Subang Jaya.
Highlights:• LaunchedinFebruary2016.• World’s1st crowd-sourced 360o music
video by a property developer.• 1st property developer to partner with
Spotify on interactive advertisements, events and crowd-sourced playlist.
• 15millionreachedviaoursocialmediaplatforms (as at 19 August 2016).
Open Palm is Sime Darby Plantation’s (SDP) online platform that discloses the company’s sustainability supply chain to customers. Customers have access to key data on the origin of all palm products that go through SDP refineries.
Potential Benefits: • Buildtrustandincreasetransparency
with our customers by allowing them to virtually trace the source of the products purchased from SDP.
Highlights:• LaunchedinNovember2015.

2 8 Sime Darby BerhadAnnual Report 2016Innovating for the Future
We welcome and are constantly on the look out for new business opportunities to grow, move forward, execute innovation and deliver value to our shareholders.
With the advancement of technology, we need to be agile and explore new business models within our Divisions. One way is to engage with new start-ups and industry movers and shakers who can potentially revamp the industry with new business models.
INNOVATING BUSINESS OFFERINGS THROUGH PARTNERSHIPS
Accelerating our innovation journey via partners, allies and collaborators who complement our strengths to create a win-win situation.
NEW BUSINESS MODELS

2 9Strategic ReportSime Darby Berhad Annual Report 2016
SIME DARBY RENEWABLES Unlock potential value-added benefits along the oil palm value chain through co-investing with reputable strategic partners.
Potential Benefits:• Ensuresuccessfulcommercialisation
of strategic palm-related technologies.
• Createnewrevenuestreamswithniche margins and execute non-traditional cost savings within the Plantation division.
Highlights:• Portfolioofthreecompanies-
Biosynthetic Technologies, MYBiomass and Verdezyne.
MINE ENERGY SOLUTIONS (MES)
MES is a 50:50 JV between Sime Darby Industrial and IntelliGas. IntelliGas is a gas technology specialist which developed and patented high-density compressed natural gas (HDCNG™) supply solutions for mobile mining equipment.
PRIVATE REAL ESTATE FUND IN SIME DARBY PROPERTY
Established a Private Real Estate fund to enable future asset monetisation activities with a long term goal of generating recurring income.
Potential Benefits:• Aplatformtomonetiseandacquirereal
estate to generate strong cash flow and recurring income.
• AnopportunitytonurtureREITmanagement skills through knowledge transfer.
Highlights:• Unlockedthevalueoftwoassets
through a private real estate trust in Singapore.
Potential Benefits:• Potentiallysubstituteasignificantamountof
diesel with gas and deliver cost savings while reducing GHG emissions.
Highlights:• CollaborationbetweenHastingsDeeringand
MES to fit a CAT 789 mine truck with dual fuel HDCNG™ engine with refueling facility commissioning in final stages.

3 0 Sime Darby BerhadAnnual Report 2016Innovating for the Future
GroupGroupPerformance Review32 Introduction
33 Strategy Performance Review
55 Group Financial Review

3 1Strategic ReportSime Darby Berhad Annual Report 2016
GroupGroupPerformance Review32 Introduction
33 Strategy Performance Review
55 Group Financial Review

3 2 Sime Darby BerhadAnnual Report 2016Innovating for the Future
In FY2016, the Group updated its Strategy Blueprint with a focus on ensuring that the Group is able to achieve its long term objectives amidst the challenging macroeconomic environment. To enable the Group to remain resilient and position itself for growth, it has identified four Key Areas of Focus:
• DrivingResultsviaCapitalDiscipline,Productivity and Cost Reduction Measures
• InnovationGrowthandResourceAllocation• LeadingSustainability• PerformanceDrivenTransformation.
The purpose of the Group Performance Review is to provide comprehensive insights into how the Group has delivered against its strategies as well as its performance in FY2016.
INTRODUCTION
Value Distribution
The value that Sime Darby creates for its stakeholders can either be in the form of financial returns or in non financial or intangible forms.
The Statement of Value Added illustrates how Sime Darby’s performance supports the Group’s ability to deliver financial value to its stakeholders.
The financial value in the statement is based on the Profit before Finance Costs, Corporate Social Responsibility (CSR) expenses, Tax, Depreciation & Amortisation and Staff Cost.
This year, the Group has revised its approach on reporting its performance. The first part of the performance review focuses on reporting the Group’s performance against the four Key Areas of Focus within its Strategy Blueprint (i.e. the Strategy Review). This change was made in order to present stakeholders with a more meaningful and integrated insights into how the Group has performed during the year and to capture its progress towards achieving its long-term goals.
The Strategy Review is followed by the Group Financial Review to provide an insight into the progress of the Group’s strategies and the financial performance of the Group in FY2016.
VALUE DISTRIBUTED (RMm) FY2016 FY2015
Employees 5,363.9 4,893.0
Government & Society1 314.9 689.0
Providers of Capital
Dividends 695.0 877.3
Non-controlling interests 157.7 118.9
Perpetual Sukuk 33.7 -
Finance costs2 738.0 581.6
Reinvestment and future growth 3,497.8 3,010.7
Total 10,801.0 10,170.5 Notes:1 Tax and CSR expenses2 Gross Finance Costs

3 3Strategic ReportSime Darby Berhad Annual Report 2016
DRIVING RESULTS VIA CAPITAL DISCIPLINE, PRODUCTIVITY AND COST REDUCTION MEASURES
STRATEGY PERFORMANCE REVIEW
1
With global economic growth facing challenges from multiple fronts, coupled with stiff competition and industry consolidation in multiple sectors, the Group needs to drive results via capital discipline, productivity and cost reduction measures.
The Sime Darby Group is fully aware that businesses can no longer expect profit growth to be driven unilaterally by the steady expansion of its existing operating markets. It has made significant inroads into disciplined capital management, driving productivity improvements and implementing tough cost reduction measures.
OPERATIONAL EXCELLENCE
Lean Six Sigma
The Group drives Operational Excellence via Lean Six Sigma, a data-based approach to problem solving, value creation and waste elimination. Lean Six Sigma is a continuous improvement approach that is applicable to processes in production, services, and administration for both simple and complex problems.
Building Lean Six Sigma Capacity
The competency and skill of our employees are the main enablers of our Operational Excellence journey. Each year, we build our capacity through internal trainings and provide our employees with the opportunity for external certification by the American Society of Quality (ASQ). Our capacity building approach involves all levels of the organisation from leadership to operations.
In FY2016, a total of 69 executives and middle management employees were trained as Green Belt and Black Belt practitioners. Two of our internally trained Black Belt practitioners obtained the Certificate of Six Sigma Black Belt (CSSBB) by the ASQ.
Note: [ ] Indicates role of each belters
War on Waste
In December 2015, the Group launched the War on Waste programme. This is an extension of the Lean Six Sigma (LSS) business management strategy that has already been implemented. This programme was aimed at waste elimination using Kaizen (simple continuous improvement) that focused on the eight (8) common types of wastes, namely Defects, Overproduction, Waiting, Non-Utilised Talent, Transportation, Inventory, Motion and Extra-Processing. In this programme, 156 operating units initiated over 1,800 improvement projects that amounted to potential savings of RM 165 million and 1.3 million hours within 12 months. The benefits of this projects are currently being realised in FY2017 with the target of increasing the participation of more operating units and identifying further improvements across the Group.
Black Belts [Drive Change] Trainees
Black Belts [Drive Change] Trained
Black Belts [Drive Change]certified by ASQ
Master Black Belt [Strategic] Trainees
Champion [Leadership]
Green Belts [LSS Project lead] Trained
White Belts [Kaizen Project lead] Trained
LSS PRACTITIONERS ACROSS THE GROUP
13
39
11
419
460
70
5
0 100 200 300 400 500

3 4 Sime Darby BerhadAnnual Report 2016Innovating for the Future
Performance
This financial year, our operations have harvested RM 243 million* in Lean Six Sigma benefits across the Group, exceeding the set target of RM200 million. Since the introduction of our Lean Six Sigma Business Management Strategy in 2012, we have achieved a total of RM 604 million (cumulative over four years) in benefits from continuous improvement initiatives. We are now on track to achieve the RM775 million target (cumulative over five years) in FY2017.
The Group recognises that there is significant potential for cost reduction and cost avoidance in Procurement throughout our operations as reflected in the benefits we have recorded from procurement-related improvements. In FY2016 alone, Procurement-related improvements made savings of RM 142 million, which is 58% of Group’s total LSS benefits. Procurement-related improvements have consistently delivered more than 50% of the Group’s LSS benefits across the last three (3) years beginning in FY2012. Examples of these improvements include unifying purchases of common items such as fertilisers for estates and cement for construction sites. Other examples include cost reduction from multiple sourcing of goods and services and project management prior to final accounts closure of projects. These procurement-related improvements are identified and verified upfront before being recognised as part of the Group’s total LSS benefits. Our plan includes further scaling up improvements in procurement across the Group.
Please refer to the Divisional Operation Review on pages 63 to 111 of this Annual Report for details of LSS Performance at Division level.
National and International Recognition
In November 2015, Sime Darby won the PNB Innovation & Quality Award for the fifth year in a row with the LSS improvement project at Sime Darby Austral that successfully enhanced the degumming process. Using new specifications for phosphoric acid and an optimum dosing pattern, this project successfully increased the quality of refined oil and lowered the refinery’s operating cost due to lesser bleaching earth requirement. The Sime Darby team then went on to represent Malaysia at the 2016 World Conference on Quality and Improvement International Team Excellence Award held in Wisconsin, USA and was recognised for the Best Project in Organisational Impact.
Sime Darby’s Head of Operational Excellence, Mr Azman Shah Mohamed Noor, also participated as an advisor throughout the National Productivity Blueprint engagement programme across five states in Malaysia. Azman was also named a Productivity Champion by Dato’ Sri Mustapa Mohamed, Minister of International Trade and Industry (MITI) in recognition of his contribution and the key role he will play to implement the productivity initiatives outlined in the soon-to-be unveiled National Productivity Blueprint. He will assist in the formulation of industry-specific productivity roadmaps.
STRATEGY PERFORMANCE REVIEW
*Sime Darby’s LSS data has been independently audited. Read the Independent Assurance Report on page 389.
Others include E&U Non China & Group Head Office

3 5Strategic ReportSime Darby Berhad Annual Report 2016
FY2017 Priorities
FY2017 will be the fifth and final year of Sime Darby’s first Lean Six Sigma Business Management Strategy with a target of RM775 million in accumulated benefits over five years. To achieve this ambitious target, Sime Darby’s Operational Excellence functions will focus on the following key areas:
• IntroductionoftheOperationalExcellencefive (5) year Blueprint for FY2018 – FY2022.
• ExtendingthefootprintofLSSpracticeinSime Darby, with specific focus on Plantation Upstream in both Malaysia and Indonesia.
• Replicationofsuccessfulhighimpactimprovements across the Group.
• ContinuationoftheWaronWaste.• Furthercapacitydevelopmentacrossall
divisions. With the Group’s internally developed capacity of Master Black belts, Black Belts, and Green Belts, more training sessions and projects will be conducted in more areas of operations.
• EmploymentofLSStoaddresssafetyandhealth issues across the Group.
CREATING VALUE FOR INVESTORS
The Group continuously monitors developments in the market and evaluates strategic opportunities that could potentially enhance shareholder value. Strategic measures are implemented to ensure that the Group remains resilient in all business environments and is well positioned for future growth.
Asset Monetisation
We embarked on an asset monetisation strategy with the following objectives:
• Unlockvalueofexistingassets• Reallocatecapitalintobusinesseswithhigh
growth potential
In March 2016, the Property Division disposed two Singapore subsidiaries (which owns two Singapore properties) to a private property fund which is 25% owned by the Group for RM601 million and realised a gain of RM447 million.
The Group also initiated the reverse take-over of Saizen REIT, a Singapore-listed real estate investment trust. On 12 August 2016, the Group entered into a framework agreement for the sale and lease-back of certain industrial properties in Australia to Saizen REIT.
Completion of this Saizen REIT exercise will provide a platform foe recurring income generation. Furthermore, it provides the Industrial Division with an opportunity to unlock value in its commercial properties, against the backdrop of weak sentiments in the coal markets. This exercise is expected to be completed in FY 2017.

3 6 Sime Darby BerhadAnnual Report 2016Innovating for the Future
NEW BRITAIN PALM OIL LIMITED (NBPOL)
Since the acquisition of NBPOL in March 2015, Sime Darby has focused on synergies between NBPOL and existing operations to capture the full value of the strategic transaction.
Within Upstream operations, cost synergies were achieved by centralising fertiliser sourcing and shipping tenders, refinancing of NBPOL’s loans, as well as research & development (R&D) facility sharing and insourcing. These cost synergies amounted to RM24 million in FY2016. Best practices of both companies in the areas of sustainable oil palm development, smallholder management and irrigation are expected to increase operational efficiencies and reduce cost of production over time.
Within Downstream operations, NBPOL’s refinery in Liverpool was able to expand bakery sales due to the additional segregated stearin supply from Sime Darby’s other operations. Cost was also reduced by sourcing inter-esterification products from Unimills instead of the external market.
Looking forward, additional value will be created by leveraging on the R&D capabilities and impeccable sustainability credentials of both companies. NBPOL’s Dami seeds will be used for replanting in Indonesia while the trial application of Sime Darby Plantation’s planting materials will begin in Papua New Guinea.
Kumbango Oil Refinery & Mill at Kimbe, West New Britain, Papua New Guinea

3 7Strategic ReportSime Darby Berhad Annual Report 2016
INNOVATION GROWTH AND RESOURCE ALLOCATION
STRATEGY PERFORMANCE REVIEW
2
“Execution is the key for innovation - we’ll focus on ensuring our innovative ideas are executed with success.”
The Sime Darby Group has a heritage built on innovation. The Company’s foundation is its plantation business, where it pioneered the zero-burning replanting technique in the 1980s and in the 1990’s developed natural ways to deal with pests and diseases.
Today, innovation at Sime Darby primarily focuses on capability building, inspiring our people to innovate and execute innovation. In Sime Darby, we are in the best position to innovate due to the diversity of our businesses, our footprint in multiple geographical areas and a melting pot of people we have.
FY2016 REVIEW
Innovation at Sime Darby is defined as creating something new or doing something differently that creates value. Value can be created by changing what we offer our customers, or how we offer it to them. These changes can be as small as making incremental changes to our current products and services, or as big as offering entirely new products and services to new markets. We call these different types of innovations ‘Core’, ‘Adjacent’, and ‘New’ innovations.
Through the course of the year, the Group focused on capability building and putting internal ecosystems in place to support Innovation in Sime Darby. These include, but are not limited to, areas such as innovation growth blueprints, innovation production systems, innovation governance and controls, and innovation leadership, talent and culture.
Within each category of capability, we have determined clear desired end results, and in FY2016 have made considerable progress in these three key areas: progressing the Resource Allocation Systems, developing Innovation Talent, and putting in place an Ideas Supply Chain system.
Within the Resource Allocation Systems, we have made considerable progress in putting in place a Group wide portfolio management system for innovation projects which guides the resource allocation process. In Innovation Talent, we have made headway in hiring talent to incubate and manage innovation initiatives within each Division. The launch of the Sime Darby Ideas Portal represents significant progress in putting in place a robust and centralised Ideas Supply Chain system.
Having a robust ecosystem and strong internal capabilities to manage Innovation will better position the Group to capitalise and execute Innovation opportunities that come our way.
PIPELINE OF INNOVATION PRODUCTS
Innovating within the Sime Darby Group enables us to meet long term profit targets by ensuring business growth beyond business as usual levels and allows us to counter the volatile external market conditions of our core businesses. While innovating allows for the creation of new profit pools, more importantly, it promotes sustainable profit growth. This is done by positioning the Group for long term development or profitability, which in turn ensures sustained and increased value creation for our shareholders.
Stage Gate
All innovation projects across the Group are governed by our internal stage gate process, where ideas are transformed to commercialisation projects by conceptualising, developing and commercialising new products and services. The ultimate purpose of the stage gate process is to progressively reduce risks inherent to an innovation project, as resource commitments are increased towards commercialisation. This is done by ensuring that risks which could derail projects are identified on and addressed before further resources are allocated to the project.
HARI NAIR Group Chief Strategy and Innovation Officer

3 8 Sime Darby BerhadAnnual Report 2016Innovating for the Future
The iterative nature of Stage Gate allows for ideas to be tested and refined as it progresses towards commercialisation. Additionally, three different modes of Stage Gate is utilised for different type of projects, allowing flexibility in the way projects are managed. The Stage Gate process also incorporates a Post Implementation Review after the final Commercialisation stage, in order to assess key learnings for application in future projects of a similar nature.
In FY2016, Sime Darby has rolled out theStage Gate process in the Plantation and Property divisions, with a total of 18 projects identified to pilot Stage Gate in the two Divisions. These projects are in various stages of the ideas-to-commercialisation process, with the progression towards commercialisation managed by each Divisions’ respective Innovation Committees.
FY2017 Priorities
The Group recognises that innovation projects play a pivotal role towards helping the Group achieve its long term financial targets. The Group also recognises that Innovation initiatives have the potential to be future game changers in the industries that the Group operate in. As such, the Group is targeting Group wide adoption of the Stage Gate process for all its innovation projects in FY2017, to link its Group wide long term profit targets to innovation initiatives within the Group.
RESOURCE ALLOCATION
The development of a healthy pipeline of innovation projects is imperative for Sime Darby to meet its innovation targets. However, once innovation projects have been identified, and are managed towards commercialisation via the Stage Gate process, the prioritisation of projects is important to ensure that resources are allocated judiciously, and projects embarked upon is given the support it needs to commercialise successfully.
STRATEGY PERFORMANCE REVIEW

3 9Strategic ReportSime Darby Berhad Annual Report 2016
Portfolio Management
Innovation projects are managed at the portfolio level to ensure a healthy mix of Core, Adjacent and New type of Innovations are being pursued at the Group and Division levels.
Along with continuous monitoring of the portfolio mix, portfolio management also allows for prioritisation of projects and the corresponding allocation of resources by using multiple portfolio lenses. Pre-identified key investment metrics such as Net Present Value (NPV), Resource Requirements (Full Time Equivalent and capital expenditure), and Profit Before Interest and Tax (PBIT) values are used to evaluate overall portfolio health and used as metrics to prioritise projects.
In FY2016, we achieved progress in identifying and categorising innovation projects across the Group, which has enabled a preliminary diagnostic of where the Group is in terms of its remaining gap to profit targets. More than 200 projects were assessed as part of a portfolio prioritisation exercise. Of the 200, the top 20 projects are estimated to contribute approximately 90% to Sime Darby’s total portfolio Net Present Value. In terms of NPV value, 87% of projects were identified as Core, 12% as Adjacent, and 1% as New.
FY2017 Priorities
Sime Darby plans to prioritise and focus its innovation capabilities towards helping the top projects to be commercialised. Resource allocation systems such as portfolio management will be important to identify these priority projects, allowing for critical input when making decisions on resource allocation. Ideas Portal
The Sime Darby Ideas Portal, is a web based tool that collects all possible insights, views, opinions, data, trends and knowledge from within the Group. These ideas are funnelled and filtered through to extract the best ideas to be surfaced and realised. The aim of the Ideas Portal is to cultivate openness, collaboration, inclusiveness and crowdsourcing.
To ensure transparency and proper recognition are in place, employees are encouraged to not only openly share their ideas on the Portal, but also provide constructive feedback and support on the ideas posted by others. The ratings given are based on the following criteria; desirable, doable, defensible and profitable. The system then maps and ranks ideas based on the cumulative scores given from the Ideas Portal community.
As at August 2016, more than 1,200 employees are registered on the Portal with 168 solutions shared. Moving forward, Sime Darby aims to engage with 1000 active users on the Ideas Portal to generate ideas to be executed following the Stage Gate process. There is an ongoing activation campaign within Sime Darby to ensure traction and continuity as we conduct Innovation workshops to develop internal capabilities to drive innovation within the organisation.
Hackathons
Hackathons are events where cross functional groups of Sime Darby employees meet to engage in collaborative brainstorming sessions to solve problems.
In November 2015, we executed the Ideas Lab project; the first hackathon-style workshop held for 30 young talents from various business units in Sime Darby to solve challenge statements relevant to the Sime Darby business model. The six challenge statements consisted of cross-divisional business opportunities, product innovation, operational efficiency, lean/cost reduction, brand/commercial innovation and customer experience. Guided by six different mentors from key management roles, participants had to undergo brainstorming sessions and submit their ideas through Ideas Portal. A total of 62 individual ideas and solutions transpired the initial phase of the hackathon. At the hackathon finale, teams pitched their ideas to the panellists and top ideas were selected to be incubated.
The Group also collaborated with external parties such as Asia School of Business and Axiata to source for objective ideas on challenges faced in the business.

4 0 Sime Darby BerhadAnnual Report 2016Innovating for the Future
Innovation Committees
As part of the Innovation Management process, Sime Darby established Division Innovation Committees as the main governing bodies for driving innovation across the Divisions.
The Division Innovation Committees have mandates to drive innovation projects and ideas within the Division, evaluate portfolio health towards achieving the desired portfolio mix, approve and decide on capital and resource allocation along the Stage Gate process.
FY2017 Priorities
With the right Winning Mindsets and the necessary foundation, including the process and governance in place, Sime Darby is ready to achieve and continuously deliver sustainable innovation to our shareholders. With that, the innovation capability focus from Ideas Portal, Hackathons and innovation execution would be on rapid prototyping and iteration user testing and on-ground market validation with our customers.
SIME DARBY YOUNG INNOVATORS CHALLENGE (SDYIC)
Sime Darby Young Innovators Challenge (SDYIC) is an initiative to encourage youths from ages 13 to 16 residing in Malaysia to collaborate and discover innovative, creative and actionable solutions by exploring and encouraging design thinking, innovation, leadership and entrepreneurial skills. This programme acts as an ideation pipeline as participants were given challenge statements to solve using creative confidence, undergo a change maker journey, presentation confidence and rapid prototyping. It is also a way to develop internal capabilities by bringing ideas generated in this programme to execution.
A total of 168 participants across the country were selected to join the Regional Workshop held in March 2016 at four different locations namely, Malacca, Negeri Sembilan, Penang and Sabah. The regional champions then proceeded to the National Workshop which was held in June 2016. The National competition which coincided with Sime Darby’s inaugural Innovation Day was attended by the Prime Minister of Malaysia Dato’ Seri Mohd Najib Tun Abdul Razak on 2 June 2016.
Robin Food inaugural champion of SDYIC 2016. The team of four 16 year-olds proposed an app to reduce food wastage by connecting Hypermarkets and Hotels to Food Banks to be distributed to charities and NGOs in Malaysia.
To ensure the momentum of innovation, the winning idea is being brought to life by Sime Darby in December 2016.
Sime Darby and Yayasan Sime Darby (which funds the SDYIC project) are currently working closely with Food Aid Foundation, a leading food bank in Malaysia and TESCO in developing the app.
The Robin Food app is an example of an innovation idea, linking the external and internal ideation engines to the innovation governance process, and finally, execution towards commercialisation.
STRATEGY PERFORMANCE REVIEW

4 1Strategic ReportSime Darby Berhad Annual Report 2016
LEADING SUSTAINABILITYSTRATEGY PERFORMANCE REVIEW
3“We operate in a different environment today, where we would need to balance the expectations of a wide range of stakeholders while we continue building a sustainable and resilient business. We have made good progress this year in pursuing sustainability in a way that creates value to the organisation, but we still have many challenges ahead in our journey moving forward.”
DR SIMON LORD Group Chief Sustainability Officer
The launch of the United Nations Global Goals in 2015, which charts ambitious global sustainable development targets up to 2030, strengthens the Group’s belief that businesses must operate in a sustainable manner. This reinforces Sime Darby’s sustainability purpose that delivering value to the Group’s wide range of stakeholders can be achieved by balancing commitments to contribute to a better society, minimising environmental harm and delivering sustainable development. This is underpinned by the Group’s sustainability beliefs of Disclose, Engage, Empower, Protect, Enhance and Respect.
CONTRIBUTING TO A BETTER SOCIETY
The scale of Sime Darby’s global operations enables the Group to create a positive impact on its employees and society. The Group believes that it is responsible to protect and respect the rights of its people and the communities impacted by its business. It also strives to empower and enhance livelihoods through its business presence. Material issues that have been identified as being relevant to this section are Safety and Health, Human Rights, and Social Investment.
Safety and Health
Safeguarding the safety and health of the Group’s people, contractors as well as local community wherever it operates globally is of utmost importance and the Group is working towards its overall goal of Zero Harm. This year the Group faced a bigger challenge with the integration of newly acquired business units, which has expanded the boundaries of the Group’s safety and health programme.
FY2016 Review
The Group reported 13 occupational fatalities this financial year. These incidents were primarily contributed by work place risks such as falls from heights, being hit by vehicles and falling objects. These losses are unacceptable and the Group is determined to mitigate these risks with corrective actions to prevent recurrence of similar incidents.
For the year under review, the Group recorded a Lost Time Injury Frequency Rate (LTIFR) of 18.75. This indicator reflects the number of incidents occurring for every 1 million working hours. This high rate is due to integration of newly acquired operating units in New Britain Palm Oil Limited (NBPOL) which contributed to 4,037 additional Lost Time Injury (LTI) cases this year. The LTIFR for the Group without the inclusion of NBPOL was 7.18* which would have been a reduction of 15.43% from the previous year.
* These safety and health data have been independently audited. Read the Independent Assurance Report on page 389.

4 2 Sime Darby BerhadAnnual Report 2016Innovating for the Future
Analysis of the LTI data showed that 98.7% of the entire Group’s LTIs originated from the Plantation Division in FY2016 and 68.3% (4,037 cases) of Plantation LTI originated from NBPOL. Based on an analysis on NBPOL data, 66.4% of the LTI from NBPOL originated from one strategic operating unit, West New Britain (WNB), which contributed 44.7% (2,679 cases) of the entire Group’s LTI.
8 12 12 7 13
Sime Darby Group Safety and Health Severity Rate (Without NBPOL)
Number of lost days per 1,000,000 hours worked
FY2012 FY2013 FY2014 FY2015 FY2016
226.98 311.44 316.63 193.13 284.00*
The Group has also analysed Lost Work Days (LWD) and Lost Work Days Rate (LWDR). LWD indicates number of days lost due to injuries which exclude fatalities and LWDR indicator indicates the severity of the injuries. Analysis of these indicators showed that the severity of the incidents which originated in NBPOL were minor (2.3 lost days per incident) in nature compared to the severity of incidents across the Group as a whole. These incidents in NBPOL were mainly from thorn pricks, cuts and sharp hand tools related injuries.
Note: Others include incidents occurred in Thailand and The Netherlands operations.
STRATEGY PERFORMANCE REVIEW
*These Sime Darby safety and health data have been independently audited. Read the Independent Assurance Report on page 389

4 3Strategic ReportSime Darby Berhad Annual Report 2016
FY2017 Priorities
In FY2017, the Group’s occupational safety and health will emphasise on:
• FurtherrolloutoftheNBPOLSafetyIntervention package to other business units to further reduce the LTI within NBPOL.
• Implementationofsitespecificinterventionprogrammes to mitigate significant risks associated with major incidents which are falls from heights, falling objects from harvesting, and vehicle related incidents from internal transportation.
• Implementationofasafetycampaigntobuild trust and encourage active participation and a caring mindset among the workforce. This would include site roadshows on raise awareness specific risks and associated mitigation actions.
• Aleadershipdevelopmentprogrammeforall levels of management to empower them to give visible safety leadership behaviour.
• EnhancementoftheGroupinternalauditfunction to implement a more robust and comprehensive approach to Environmental Safety and Health audit programme across the Group.
HUMAN RIGHTS
The Group believes that businesses have a responsibility to respect, support and uphold fundamental human rights as expressed in the Universal Declaration for Human Rights and the United Nations Guiding Principles on Business and Human Rights (UNGP). As a signatory to the United Nations Global Compact (UNGC) the Group is committed to conduct its business in alignment with the ten UNGC principles, in the areas of human rights, labour, environment and anti-corruption. The Group’s human rights commitment is extended to everyone within its sphere of influence, which includes employees, business counterparts and communities. The Group complies with all local legislations and industry regulations relevant to its businesses.
The Group piloted a NBPOL Safety Intervention Package at West New Britain in April 2016 which focused on addressing the site specific risks which were identified. Key improvements introduced were:
• Equippingworkersinthefieldwithpersonalprotective equipment such as safety boots and gloves to mitigate sharp thorn pricks and tools cuts.
• Providingsupervisorswithfirstaidequipment and training to enable them to render immediate first aid treatment to prevent further complications from injuries.
• Implementingarehabilitationandreturntowork programme policy to provide opportunities for employees to return to work quickly via alternative work options.
• Tostartimplementingannualinternalaudits, validation and reviews of health delivery processes within West New Britain to ensure compliance of occupational safety and health policies and procedures.
With the implementation of the pilot NBPOL Safety Intervention Package in West New Britain, the business unit recorded encouraging improvement in the subsequent two months. The Group plans to further expand the rollout of the NBPOL Safety Intervention Package to other business units within NBPOL.
Reduction of NBPOL Lost Time Injury after the Safety Intervention Package
No of LTI Cases

4 4 Sime Darby BerhadAnnual Report 2016Innovating for the Future
FY2016 Review
Business and Human Rights continues to be an emerging area of attention for the Group, and greater focus has been given to this area this financial year. The greatest challenge in the Group’s human rights journey is to identify and understand the human rights impact on our diversified workforce within a multifaceted business environment spanning over 20 countries.
In the year under review, a cross-functional Group Human Rights Task Force was established with the objective of operationalising respect for human rights and the development of a robust methodology to monitor, report and verify various aspects of human rights across the Group.
The focus this year involves conducting impact assessments on salient issues across the Group’s business; identification and implementation of improvement plans; and verification and monitoring of the effectiveness of the implementation. Following on assessment, there are several areas that have been identified as salient to the Group, which will be the focus moving forward. Some of these areas include:
• Exploitation and Modern Day Slavery
Material to the business is the commitment to ensure no forms of forced or bonded labour, slavery, human trafficking and sexual exploitation exists in the Group’s operations. The priority for FY2016 was to assess risks surrounding migrant labour in the Plantation and Property operations in Malaysia where progressive improvement plans will subsequently be developed and key indicators will be used to monitor the effectiveness. The Group also acknowledges that the oversight of its supply chain will be a continuous challenge and will be conducted in stages. Further report of the Group’s progress can be seen in the UK Modern Slavery Act Statement on page 387.
• Freedom of Association
Employees in the Group have the freedom to join and form organisations of their own choice and to bargain collectively. In FY2016, 98,963 employees were covered by Collective Bargaining Agreements throughout the Group. Employees are currently represented by 48 collective bargaining agreements in 11 countries.
The Group has started to roll out various awareness and capacity development programmes around Human Rights, which are customised to meet the requirements of the target audience. This programme is currently targeted towards senior management and practitioners at this point in time, but is planned to be rolled out to other stakeholders moving forward. The Group has also engaged with a wide range of external stakeholders which include the International Labour Organisation (ILO) and the United Nations Children’s Fund (UNICEF) to explore opportunities to collaborate and solve some of the complex issues being faced by the Group.
FY2017 Priorities
In FY2017, we will build on existing efforts and increase the momentum in embedding respect for Human Rights across the Group. Key areas of focus include:
• Furtheridentificationandimplementationof action plans to mitigate key risk areas around salient human rights issues impacting the Group, with an immediate focus on risks around migrant labour.
• Enhancementoftheawarenessandcapability development programme across the Group, which would include increased engagements with senior management, practitioners and rights holders.
• Enhancementofthegovernancearoundbusiness and human rights to include requirements within governance structures, such as the Code for Business Conduct.
• Increasedengagementwithexternalstakeholders such as NGOs, Civil Society Organisations and local communities surrounding the Group’s operations, with an objective of working together to solve complex issues around Human Rights.
Please refer to the Group’s sustainability microsite at www.simedarby.com/sustainability for more information around other salient Human Rights issues facing the organisation.
STRATEGY PERFORMANCE REVIEW
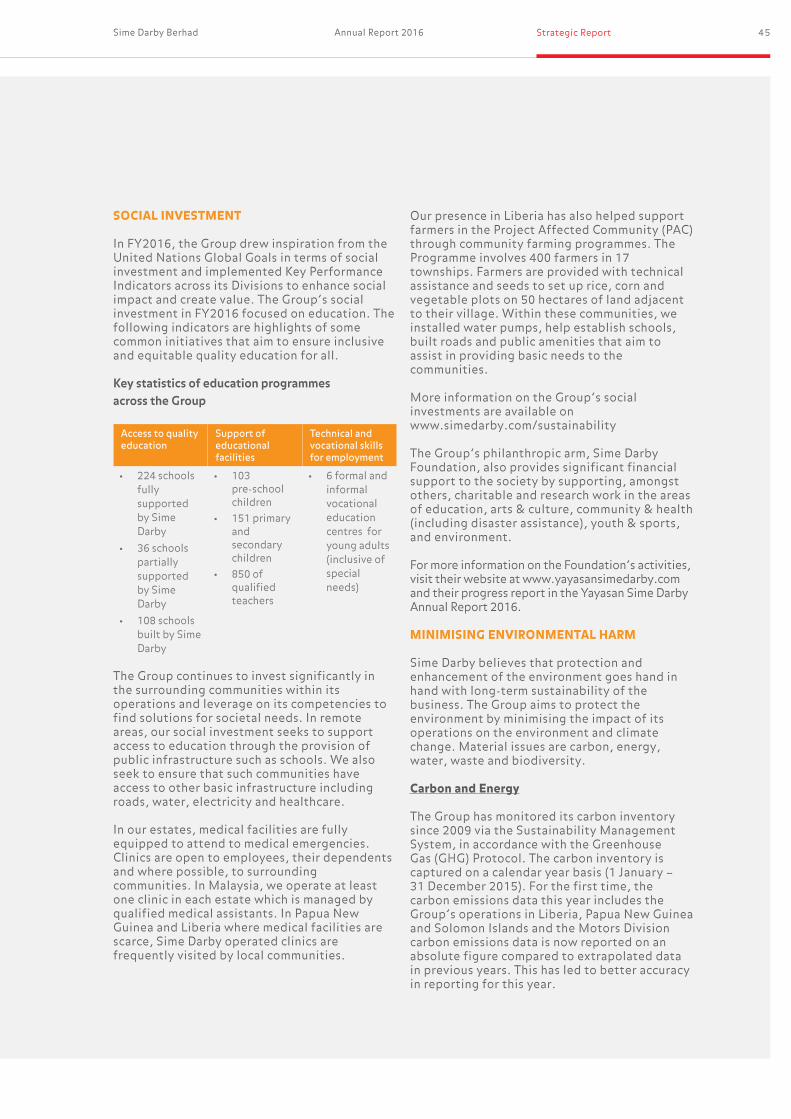
4 5Strategic ReportSime Darby Berhad Annual Report 2016
SOCIAL INVESTMENT
In FY2016, the Group drew inspiration from the United Nations Global Goals in terms of social investment and implemented Key Performance Indicators across its Divisions to enhance social impact and create value. The Group’s social investment in FY2016 focused on education. The following indicators are highlights of some common initiatives that aim to ensure inclusive and equitable quality education for all.
Key statistics of education programmes across the Group
Access to quality education
Support of educational facilities
Technical and vocational skills for employment
• 224schoolsfully supported by Sime Darby
• 36schoolspartially supported by Sime Darby
• 108schoolsbuilt by Sime Darby
• 103pre-school children
• 151primaryand secondary children
• 850ofqualified teachers
• 6formalandinformal vocational education centres for young adults (inclusive of special needs)
The Group continues to invest significantly in the surrounding communities within its operations and leverage on its competencies to find solutions for societal needs. In remote areas, our social investment seeks to support access to education through the provision of public infrastructure such as schools. We also seek to ensure that such communities have access to other basic infrastructure including roads, water, electricity and healthcare.
In our estates, medical facilities are fully equipped to attend to medical emergencies. Clinics are open to employees, their dependents and where possible, to surrounding communities. In Malaysia, we operate at least one clinic in each estate which is managed by qualified medical assistants. In Papua New Guinea and Liberia where medical facilities are scarce, Sime Darby operated clinics are frequently visited by local communities.
Our presence in Liberia has also helped support farmers in the Project Affected Community (PAC) through community farming programmes. The Programme involves 400 farmers in 17 townships. Farmers are provided with technical assistance and seeds to set up rice, corn and vegetable plots on 50 hectares of land adjacent to their village. Within these communities, we installed water pumps, help establish schools, built roads and public amenities that aim to assist in providing basic needs to the communities.
More information on the Group’s social investments are available on www.simedarby.com/sustainability
The Group’s philanthropic arm, Sime Darby Foundation, also provides significant financial support to the society by supporting, amongst others, charitable and research work in the areas of education, arts & culture, community & health (including disaster assistance), youth & sports, and environment.
For more information on the Foundation’s activities, visit their website at www.yayasansimedarby.com and their progress report in the Yayasan Sime Darby Annual Report 2016.
MINIMISING ENVIRONMENTAL HARM Sime Darby believes that protection and enhancement of the environment goes hand in hand with long-term sustainability of the business. The Group aims to protect the environment by minimising the impact of its operations on the environment and climate change. Material issues are carbon, energy, water, waste and biodiversity.
Carbon and Energy
The Group has monitored its carbon inventory since 2009 via the Sustainability Management System, in accordance with the Greenhouse Gas (GHG) Protocol. The carbon inventory is captured on a calendar year basis (1 January – 31 December 2015). For the first time, the carbon emissions data this year includes the Group’s operations in Liberia, Papua New Guinea and Solomon Islands and the Motors Division carbon emissions data is now reported on an absolute figure compared to extrapolated data in previous years. This has led to better accuracy in reporting for this year.

4 6 Sime Darby BerhadAnnual Report 2016Innovating for the Future
The carbon emissions data however, currently does not include emissions from land use conversion and carbon sequestration yet as the methodology around this is still being studied. However, once included, the total emissions of the Group may differ substantially and a re-statement on the Group’s carbon baseline is required. The Group plans to adopt the methodology into the calculations once it has been finalised.
2015 Performance
In calendar year 2015, the Group emitted a total of 3.15 million tonnes of carbon dioxide equivalent (tCO2-e). However, the carbon emissions for the Group without the inclusion of New Britain Palm Oil Limited (NBPOL) was 2.58 million* tCO2-e. The absolute carbon emissions
Plantation Other Divisions
Million GJ
SIME DARBY GROUP ENERGY CONSUMPTION
2009
26.50 26.70
29.81
34.66 32.61
27.81
40.83
2010 2011 2012 2013 2014 2015
30.00
40.00
20.00
10.00
0.00
*These Sime Darby carbon emissions data have been independently audited. Read the Independent Assurance Report on page 389
STRATEGY PERFORMANCE REVIEW
increased by 21% from last year, mainly due to the inclusion of operating units in Liberia, Papua New Guinea and Solomon Islands. Excluding these operations, the absolute emissions recorded a slight decrease of 1.1%. The majority (94.8%) of the Group’s carbon emissions is still emitted by the Plantation Division and Palm oil mill effluent (POME) treatment remains the highest contributor of total Group carbon emissions (68.4%) followed by boilers (11.8%) and purchased electricity (7.1%).
The total Group energy consumption in 2015 was 40.83 million GJ, an increase of 46.8% compared to the previous year, mainly due to the increase in the energy usage for boilers from the additional operating units. Excluding these operating units, the energy consumption recorded a slight decrease of 0.8%. However,

4 7Strategic ReportSime Darby Berhad Annual Report 2016
Note:* These Sime Darby carbon emissions data have
been independently audited. Read the Independent Assurance Report on page 390
1. No Change2. Industrial Division measures their performance in
absolute figures
FY2016 Review
Initiatives have been implemented across the Group to reduce carbon emissions and energy consumption within operations. Considering the significance of POME treatment emissions (69% of the total Group emissions), methane capture and avoidance initiatives are key to achieving the reduction targets for the Plantation Division by 2020.The Division is currently reviewing the methane reduction programme including biogas projects at the oil palm mills due to operational and economic challenges.
The Plantation Division estates have utilised organic fertilisers produced through composting plants across Malaysia, mainly from POME and empty fruit bunch (EFB). To date, the Group has a total of 22 composting plants. Last year alone, 167,178 tonnes of CO2-e was prevented from being released to atmosphere as a result of these initiatives.
the majority of the energy use from boilers is still sourced from renewable sources such as biomass (palm kernel shell and fibre) which contribute to 86.7% of the Group’s total energy consumption. In 2015, it is estimated that an additional 1.79 million tonnes of tCO2-e would have been emitted if diesel was used instead of biomass.
Sime Darby Group Carbon Emissions Intensities
Units Baseline Year
Revised Baseline
Revised Target
Revised target (%) Target Year 2015
Performance
Plantation Upstream
tCO2-e/ mt CPO
produced2009 1.061 0.641 -40%1 2020
1.02 (1.0* excluding NBPOL)
Property tCO2-e/ 100 m2 built up
areaAverage 5
year (2011-2015)
1.64 1.56 -5% 2020 1.64*
tCO2-e/ RM revenue 23.04 21.89 -5% 2020 23.04
Industrial tCO2-e 2014 45,3182 44,8652 -1% 2017 41,3892
Motors Assembly
tCO2-e/ vehicles
assembled2015 0.65 0.61 -5% 2020 0.65
Motors Sales
tCO2-e/ 10 vehicles serviced
(throughput)
2015 0.324 0.308 -5% 2020 0.324
Logistics tCO2-e/ 1000 port
throughput2014 0.72 0.65 -10% 2020 0.71
In the Industrial Division, its Hastings Deering operations in Australia is the first company in Australia to take delivery of a fully Tier 4 emissions compliant machine namely Cat F-Series Excavator in the middle of 2016. The excavator has a cutting edge technology, which is operated with green and lean operational benefits, leading to reduced fuel costs and near zero emissions.
FY2017 Priorities
In FY2017, the Group will continue efforts to reduce energy consumption and carbon emissions across all divisions. Key areas of focus include:
• Furtherrefinementofcarbonreductionstrategies for each division to meet the respective restated carbon emissions reduction targets, with an emphasis on the Plantation Division.
• Furtherdisclosureofcarbonemissionsacross the Group will include disclosures around Land Use, Land Use Change and Forestry (LULUCF) in the carbon inventory.

4 8 Sime Darby BerhadAnnual Report 2016Innovating for the Future
Water, Waste and Biodiversity
With future global megatrends impacting the organisation, the Group recognises that water, waste and biodiversity will be of increasing significance to the Group’s operations moving forward. This is aligned with the Group’s aim of respecting and protecting the environment by promoting sustainable consumption and production.
FY2016 Review
The Group has developed waste and water management procedures outlining leading practices for waste measurement and monitoring. This has been successfully embedded into the Group’s Environment, Safety and Health management system which will be reviewed on a yearly basis. The Group is also in the midst of setting water consumption baseline and reduction targets for each Division. The Divisions have also been tasked to develop waste inventories across all operations. Once the exercise is completed, monitoring and measurement processes will be put into place.
The Group also engaged with local authorities and organisations to tackle water issues in Malaysia. Sime Darby is part of the ‘Water for Growth’ coalition, consisting of governmental bodies, water regulators and other corporations interested in advancing the water agenda in Malaysia. The Group is also involved in the Integrated Urban Water Management (IUWM) task force group initiated by the Academy of Science of Malaysia (ASM) under the Ministry of Science, Technology and Innovation, which provides opportunities to better understand policy issues at a state level and to keep abreast on latest jurisdictions. On the biodiversity front, Sime Darby is working closely with stakeholders to form a strategic coalition between Non-governmental organisations (NGO) and corporations on tiger conservation. Currently at the planning stage, identifying the right partners to work with, the intended focus areas will be, but not limited to, awareness creation, anti-poaching operations, monitoring of the tiger population and fund raising for these activities.
FY2017 Priorities
Key focus in FY2017 for the water and waste areas would include implementation of monitoring and reporting mechanisms across the Group, developing baselines, and setting individual targets for each Division. The Group will continue to engage with internal and external stakeholders around water, waste and biodiversity to raise awareness and collaborate on areas of mutual interest.
DELIVERING SUSTAINABLE DEVELOPMENT
Sustainable development refers to development that meets the needs of the present without compromising on the ability of future generations to meet their own needs. Sime Darby aims to lead by demonstrating how it is delivering sustainable development. Material issues around this area include Sime Darby’s role in the development of sustainable thought leadership and delivery of sustainable businesses.
Sustainable Thought Leadership
Sime Darby has been involved in many thought leadership platforms which aim to shape the debate in how businesses will need to operate to ensure a sustainable future. This includes participation in industry groups such as the Roundtable on Sustainable Palm Oil, global forums such as the Innovation Forum and Global Child Forum and platforms which serve to take businesses forward on issues which are material to the Group such as the Global Business Initiative on Human Rights.
FY2016 Review
Some of the key platforms and forums in which Sime Darby participated in FY2016 include:
• High Carbon Stock
In December 2015, the High Carbon Stock (HCS) Study which started in 2014 came to an end with the publishing of the final report of the Study. Following that, Sime Darby is also involved in efforts to converge the various approaches surrounding HCS in the industry. The HCS Convergence Working Group was established with multiple stakeholders being involved with the objective to develop a single, coherent set of rules for implementation of companies’ commitments to “no deforestation” in their palm oil operations and supply chains. Sime Darby will continue
STRATEGY PERFORMANCE REVIEW

4 9Strategic ReportSime Darby Berhad Annual Report 2016
to engage in the HCS Convergence efforts to ensure alignment with the various stakeholders around this critical issue which will define how the industry operates in the future. Sime Darby is currently piloting both methodologies on the ground in Liberia.
• Global Child Forum
In May 2016, Sime Darby was recognised for its practices around Children’s Rights in a benchmark study on the Corporate Sector in South East Asia. This study was initiated by the Global Child Forum and the Boston Consulting Group. The findings were presented in the first South East Asia Global Child Forum. In the high level plenary of the Forum, Sime Darby highlighted that human rights is at the core of the Group’s sustainability work and the Group recognises that children and young workers are particularly vulnerable.
• Sabah Roundtable on Sustainable Palm Oil (RSPO) Jurisdictional Certification
Sime Darby sits on the Sabah Jurisdictional Certification Steering Committee which supports the stakeholders in Sabah, especially the Sabah Government, on the implementation of the vision of achieving 100% Certified Sustainable Palm Oil following RSPO Standards in Sabah by 2025. This vision was announced at the International Heart of Borneo Conference, Kota Kinabalu in November 2015.
More details of other key sustainable thought leadership platforms in which the Group participates in can be found on the sustainability microsite at www.simedarby.com/sustainability.
FY2017 Priorities
The Group will continue to engage and collaborate with a wide range of stakeholders, and participate in global platforms to create positive impact and to shape the debate on how businesses would need to operate in the future.
Socioeconomic Development
The Group believes that community engagement is fundamental to achieve mutual growth in the countries we operate in. Sime Darby provides local job opportunities and is involved in local sourcing initiatives to support micro-small entrepreneurs. Sime Darby Plantation introduced the ‘Smallholders Outgrowers Scheme’ in its Indonesian, Papua New Guinea (PNG) and Solomon Islands operations. The scheme provides local growers with direct support from Sime Darby Plantation. The smallholders receive technical assistance to improve their agricultural production, financial management and improved returns. In Liberia, the Outgrowers scheme will work with smallholders to develop 44,000 hectares under the concession area.
Certification of Smallholders
Operations Approx. Area (hectares)
Involved stakeholders
Certification status as at June 2016
Indonesia 45,000 25,000 families
24,820 hectares with a total production capacity of 477,317 metric tonnes of fresh fruit bunch
PNG & Solomon Islands
42,077 17,600 families
100% certified with a total production capacity of 531,212 metric tonnes of fresh fruit bunch
Sustainable Led Business
As the Group continues its journey to embed sustainability in its operations globally, sustainability is also seen as a means to develop new products and solutions to customers, and also to differentiate the Group amongst competitors. Therefore, the Group acknowledges the value that can be derived from sustainability led businesses, such as being the largest producer globally of certified sustainable palm oil, developer of sustainable townships in Malaysia and also providing energy efficient solution in the mining industry. Please refer to the individual Divisional Highlights on pages 63 to 111 for more details of sustainable led businesses across the entire Group.

5 0 Sime Darby BerhadAnnual Report 2016Innovating for the Future
TRANSPARENCY VIA ONLINE HOTSPOT DASHBOARD
Sime Darby Plantation pioneered the zero burning replanting technique in 1985 and it is now recognised as an industry standard. This led to the company winning an award from the United Nations in 1992 for its environmental achievements.
In October 2015, Sime Darby Plantation launched a hotspot monitoring dashboard in the interest of transparency and to provide insights that could lead to long-term solutions to the recurring haze situation. The dashboard is based on the Group’s real-time monitoring system, which is managed in Kuala Lumpur and Jakarta. Alerts are immediately communicated to estates which will then conduct on the ground verification if there is indeed a fire. If a fire is detected, the estate will put it out immediately. The system complements the response measures on the ground such as observation towers and regular patrols
The dashboard can be accessed athttp://www.simedarby.com/hotspot-alerts/
The Group has also been engaging communities in partnership with local authorities and academic institutions to better understand the drivers of traditional farming methods, which typically involves slashing and burning, and to raise the awareness of sustainable farming practices. An existing project with the University of Riau found that while villagers are aware of the dangers and implications of fire, burning land for clearing has been practised and considered by communities to be the most efficient way to clear land. Based on these insights, SDP’s operating company PT Bhumireksa Nusa Sejati and the university have been training the local communities in sustainable farming practices and educating them on the benefits of zero burning. As a result, the number of hotspots in the community area has fallen to just three from 40 previously.
STRATEGY PERFORMANCE REVIEW

5 1Strategic ReportSime Darby Berhad Annual Report 2016
PERFORMANCE DRIVENTRANSFORMATION
STRATEGY PERFORMANCE REVIEW
4
“In creating a performance driven culture, our people need to be aligned towards a common goal and adopt a shared mindset of accountability and sustainability. The journey towards a greater Sime Darby is one that must be participated by management and employees alike.”
ZULKIFLI ZAINAL ABIDINGroup Chief Human Resources Officer
We need to cultivate a strong culture driven by performance that will unlock the optimal value of our talent pool. From the Human Resources perspectives, we prioritise the development of leadership capabilities to enable a results-centric work environment, a culture that promotes innovation and sustainability, operational excellence and efficiency by adopting leading practices. The journey began in November 2015, when we introduced the transformation programme, termed as “RISE”, a Group-wide initiative that aims to accelerate Sime Darby’s performance in delivering results. RISE embodies the four elements critical to driving a change of mindsets that will drive results and higher performance, through Results, Innovation, Sustainability and Energy. These elements will shape our priorities towards delivering value to stakeholders.
The collective change of mindsets anchored on delivering results is vital to this culture change. The Six Winning Mindsets focuses on fostering results-driven behaviour, a desire to continuously improve the way of doing things and customer centricity. They also stress on the importance of recognising and empowering talent, as well as building trust with the team and other stakeholders.
DEVELOPING CAPABLE AND ENGAGED LEADERS
Today’s highly volatile business environment requires leaders with different attributes compared to the past. The current business scenario requires competencies that respond well to changing customer needs, capabilities to convince and the ability to execute with exceptional speed.
The correlation between revenue growth and outstanding leadership has been established in many studies. Developing leadership capabilities is one of the key focus areas for Sime Darby.
The Sime Darby Leadership Centre (SDLC) is the centralised leadership platform where leaders are developed. It continues to deliver leadership development programmes which addresses the needs of the businesses. The curriculum is also continuously reviewed to ensure relevance and alignment to organisational strategy.
Training Programmes
Sime Darby continues to provide skills and leadership training to its employees through deploying various methods. Experiential learning has been recognised as the most effective learning method. Structured on-the-job experience (OJE) such as job rotations, short-term assignments and special projects enable our talent to build their competency and gain exposure in multiple disciplines. Sime Darby has also introduced the Talent Exchange Programme (TEP) for its people to gain knowledge, skills and experience by working with top consulting firms.
Customised flagship programmes are provided for our talent to identify their development gaps and accelerate growth. Since 2012, the Group partnered with one of the world’s best executive programme providers to run the Accelerated Leaders Programme (ALP) for Sime Darby’s Top Talent at the Senior Management level. Based on the success of ALP 3, ALP 2 was formed in 2016 as an extension of the programme to suit the development needs of our top talent at the Middle Management level. A total of 86 middle management talent went through the ALP programmes.
In the past years, the focus has also been to embed coaching values in the organisation to elevate managers’ effectiveness in managing their teams. Various coaching programmes have been extended to our employees at various levels.

5 2 Sime Darby BerhadAnnual Report 2016Innovating for the Future
Succession Management
Sime Darby has placed succession management as one of its priorities at Group and Divisional levels. Over the past five (5) years, our succession bench strength has gradually grown.The succession management for C-1 (direct reports to President & Group Chief Executive) and C-2 (positions reporting to C-1) were further strengthened in FY2016. 85% of C-1 and C-2 critical positions have at least 1 successor identified as compared to 79% in FY2015.
FY2017 Priorities
Our focus in FY2017 is to increase the effectiveness of succession management.Talent reviews, which were only conducted at Divisional level, will be extended to functional level to ensure holistic coverage of succession management. More effective development interventions have also been planned to increase talent readiness.
Top leadership involvement in succession management is crucial to obtain their commitment and accountability in identifying, assessing and developing talent. The President & Group Chief Executive and his direct reports continue to be actively involved in talent discussions. Moving forward, the next line of leaders will be included in the exercise to cultivate talent throughout the organisation.
INCULCATING A CULTURE OF INNOVATION AND SUSTAINABILITY
Innovation is central to our strategy and performance in our HR value chain.
Innovation Training
In February 2016, the Group introduced a mobile app for RISE, aimed at promoting ongoing recognition and feedback within Sime Darby. The RISE app allows employees to provide instant recognition and feedback to one another, promotes accountability, encourages valuing talent and also fosters continuous improvement. Since its launch, the RISE App has been downloaded by 3,560 users with close to 4,000 recognition and feedback cards given. We are planning to hold awareness campaigns across all our operations to further promote the app.
As a way of promoting the integration of innovation within the business, we infused innovation methodology and tools into our ALP, allowing ALP to bring direct impact to real business issues and strategic imperatives for the Group. The pipeline projects from ALP will be implemented by
FY2020. The Ideas Lab was also launched as a platform for our young talent to contribute innovative solutions to business challenges put forward by our leaders. Diversity and Inclusion
Sime Darby champions an inclusive culture and an environment that fosters harmonious and sustainable relationships. We understand that diversity is key to a sustainable future. We strive to build an inclusive work environment for all our employees. Various initiatives were planned and implemented throughout FY2016 to instil Diversity and Inclusion (D&I) within our operations. The programmes include forums, talks, provision of amenities and multi-cultural celebrations. Sime Darby has also commenced work to develop a D&I policy.
The Group is also committed to protecting and addressing gender discrimination within our workforce. The Policy on the Prevention of Sexual Harassment at the Workplace, aimed at preventing and eradicating sexual harassment at the work place, as well as provide a mechanism to effectively address complaints of such nature, has been implemented since 1 May 2013.
FY2017 Priorities
In order to drive a high performance-cultured organisation, Sime Darby has started its journey by cultivating high level performance, goal alignment and engagement. The “Six Winning Mindsets” became the behaviours that we will embed in our work culture.
DRIVING OPERATIONAL EXCELLENCE WITH HR PROCESSES
Organisations are looking for sources of growth amid today’s challenges. Some of the key avenues for internal resource optimisation include process redesign, workforce planning, role clarification and organisation delayering.
Workforce Analytics
The availability of accurate and reliable workforce analytics gives an added advantage to understanding the dynamics of our workforce and the impact of our people initiatives to the businesses. Various d ivisions in the Group have been using industry specific systems and analytics to deepen our understanding of the business landscape.
We implemented the HR Analytics Dashboard system in FY2016 to track the metrics of crucial and
STRATEGY PERFORMANCE REVIEW

5 3Strategic ReportSime Darby Berhad Annual Report 2016
high-impact talents across the Group. The dashboard has proven to be a frontier for Sime Darby when the Group was awarded with the HR Excellence Award’s Gold award by the Human Resources Magazine under the “Excellence in Innovative Use of HR Technology” category.
Workforce Planning & Organisation De-layering
Workforce optimisation is key to create an organisation where the right talent is recruited at the right time, cost and place. Selected work portfolios were strategically outsourced to maximise capabilities and ensure high resource utilisation. Interactive technologies were deployed to drive service delivery and reduce cost.
Grievances & Whistleblowing
Sime Darby values feedback, both positive and constructive, from our employees. It is against this background that Sime Darby introduced the Grievance Policy in 2010. Our objective is to encourage employees to air their grievances to gather feedback and identify amicable solutions. We remain committed in ensuring that our employees are treated fairly and with respect, by taking appropriate action to address the issues raised by employees.
Sime Darby has also put in place a whistleblowing channel for the reporting of issues deemed sensitive.This is made available internally to Sime Darby employees, Directors, counterparts and business partners as well as to other external parties via the Sime Darby corporate website. The primary aim of the Whistleblowing mechanism is to enable individuals to raise genuine concerns without fear of retaliation. The Whistleblowing Policy has been embedded in the Group Policies and Authorities to ensure compliance.
FY2017 Priorities
We are looking towards extending the productivity measures beyond the current metrics. In FY2017, we will continue to conduct analytics-based workforce planning and organisation structure review practices based on the strategic direction of our key businesses. To further improve our analytics discipline, system review and data integration will be our priority to synthesise critical business and people information for greater insights.
In our effort to increase productivity and maximise organisational effectiveness, we are looking into automating and adopting mechanisation for targeted processes. Outsourcing of non-critical
transactional processes will be an area of opportunity that the Group will explore in depth to maximise resource and process effectiveness.
ORGANISATIONAL & INDIVIDUAL ALIGNMENT
Sime Darby’s successes to date are mainly due to the collective alignment of our people towards supporting the business, operational and financial objectives of the organisation. With the changing economic scenario, organisations can no longer afford to have a misaligned workforce. Employees need to be clear of business objectives and their roles in driving business results. A group-wide cultural and performance transformation has been put in place for the next fiscal year.
Performance Management
Sime Darby has continuously over the years reviewed our existing Performance Management System and benchmarked against leading practices by renowned world leading consulting firms. The key performance measurement is reviewed and improved year on year for robustness to weather the volatile economic environment and to drive high performance and growth of the organisation and individual.
Reward and Remuneration
Against the backdrop of economic volatility, Sime Darby recognises the need to remain competitive in attracting, retaining and motivating high performing talent. Remuneration remains as one of the key competitive advantage for organisations to win the war for talent. Sime Darby was among the first few companies in Malaysia that implemented Flexible Benefits (FlexBen) to cater to its diverse and multi-generational workforce. Since its introduction in 2008, the FlexBen scheme has undergone continuous refinement based on the take up rate of FlexBen options and employees’ selection trends over the past years. In FY2016, employees may opt to utilise their Flexible credits for reimbursements of their eligible dependents’ healthcare, well-being, education and travelling expenses.
As at 30 June 2016, 88% of our employees have flexed at least one of their FlexBen items compared to 33% when it was first introduced. The increased utilisation reflects the attractiveness of our benefits package in addressing employees’ needs.

5 4 Sime Darby BerhadAnnual Report 2016Innovating for the Future
Employee Engagement
The alignment between employees and the organisation relies upon the workforce’s engagement level. An engaged workforce would be more productive and demonstrate discretionary efforts to achieve the desired level of performance. For the sixth year running, Sime Darby partnered with AON Hewitt to conduct the Global Employee Engagement Survey (GEES) 2016. The objective of this exercise is to gauge the level of engagement of Sime Darby’s employees across the globe. We received an encouraging response rate of 99% which demonstrated our employees’ commitment towards making Sime Darby an engaging workplace.
The economic downturn imposed uncertainties that is expected to directly impact employees’ sense of security. Significant efforts are being undertaken to ensure engagement results are not impacted during this period. Employees’ feedback are reviewed and prioritised in line with key engagement drivers identified for further action.
GEES provides valuable insights into key areas that will make a positive impact on employee engagement. Our GEES ambassadors i.e. management of the various Divisions, are working towards translating the key drivers into actionable strategic initiatives that will help drive employee engagement. This will include one-on-one coaching for senior leaders to align and create the experiences that would foster the Six Winning Mindsets.
FY2017 Priorities
Sime Darby is embedding the Six Winning Mindsets into the Performance Management System, Leadership and Talent interventions, and GEES to enable organisational and individual alignment to the transformation initiative. Descriptors will be developed for the Six Winning Mindsets to establish consistency of behavioural expectations across the Group. The Performance Management System will also be subject to further review to ensure its relevance against leading market practices.
SIME DARBY INNOVATION DAY (SDID) 2016
The main objective of SDID 2016 is to promote and showcase innovation within the organisation through content sharing by divisions, group, partners and speakers. Through this Event, we actively engaged with the innovation cluster to promote collaborations/partnering within the organisation besides showcasing ideas and innovations via panel sharing and story-telling sessions and display exhibits. The SDID will be the stepping stone towards motivating and inspiring Sime Darby employees to move into a more innovative and sustainable work culture.
We also kicked-off the Sime Darby Innovation Award, an annual competition honouring excellence in innovation and service development. It was successfully introduced to recognise commendable commitment to deliver desirable, innovative and unique solutions to enhance Sime Darby’s competitive footprint from a financial or Customer First perspective. The Awards culminated with the Chairman’s Award which symbolises the persistence and excellence in game-changing innovation that brings a tangible and sustainable impact to Sime Darby.
AWARDS AND ACCOLADES
STRATEGY PERFORMANCE REVIEW

5 5Strategic ReportSime Darby Berhad Annual Report 2016
GROUP FINANCIAL REVIEW
KEY ISSUES:
• Globalmarketandeconomicenvironment.• Challengingbusinessconditions–low
commodity prices, weak consumer sentiment.• Volatileforeignexchangeratesand
weaker Malaysian Ringgit.• Improvingfinancialflexibility.
PERPETUAL SUKUK
In March 2016, the Group issued RM2.2 billion of Perpetual Sukuk under its RM3 billion Perpetual Sukuk programme. The Perpetual Sukuk has a non-call tenure of 10 years and a 5.65% profit rate per annum. The Perpetual Sukuk is accorded a 100% equity credit for accounting treatment whilst for credit rating purposes, subject to meeting certain criteria, it is accorded 50% equity credit. The proceeds were principally used to repay bank borrowings.
ASSET MONETISATION
The asset monetisation exercise serves the objective of unlocking value and realising cash from low yielding or under-performing assets or assets which have achieved its value potential. It also accelerates the establishment of a recurring income platform for the Property Division. One of the key strategic thrusts of the Property Division is to build a portfolio of yield accretive assets and to develop its Real Estate Investment Trust (REIT) management skills to enhance the profit from steady income sources.
In March 2016, the Property Division disposed two Singapore subsidiaries which owns two Singapore properties, namely the Sime Darby Centre at Dunearn Road and the Sime Darby Enterprise Centre at Jalan Kilang, to a private property fund which is 75% owned by Blackstone Real Estate Partners Asia Ltd and 25% owned by Sime Darby Property Singapore Ltd, an indirect wholly-owned subsidiary of the Group, for SGD206.3 million (equivalent to RM600.8 million), resulting in a gain on disposal of RM447.1 million.
During the year, the Group disposed of the following low performing assets:
• TheGroup’s55%interestinSyarikatMalacca Straits Inn for RM55.4 million;
• TheGroup’s90.4%equityinterestinEastWest Insurance Company Limited for RM10.5 million; and
• Developmentlandtotalling238acresinSemenyih, Selangor for RM254.4 million.
INTRODUCTION
In FY2016, our focus was on achieving cash flow generation and strengthening our financial flexibility to support future growth.
In March 2015, as part of the Group’s growth strategy to expand the plantation land bank and to consolidate the Group’s position as the world’s largest producer of Crude Palm Oil (CPO) and Certified Sustainable Palm Oil (CSPO), the Group acquired New Britain Palm Oil Ltd (NBPOL) to add over 80,000 hectares of planted oil palm to the Group’s total oil palm planted area.
To fund the acquisition, the Group borrowed about RM6 billion, comprising of RM2 billion short term borrowings and USD830 million term loans and assumed borrowings of NBPOL of about RM0.9 billion. The USD borrowings were raised principally as a natural hedge as NBPOL’s cash flows are primarily in USD and its functional currency is USD.
As a result, the Group’s gross debt increased from RM11.2 billion as at 30 June 2014 to RM18.1 billion as at 30 June 2015 and correspondingly the Debt/Equity ratio increased from 38% to 57%.
The impact of the borrowings was compounded by the challenging market conditions which continued into FY2016. Low CPO prices, the prolonged slump in coal prices, the weak consumer sentiment and the weaker Ringgit which put pressure on margins, affected the performance of the Group’s businesses.
During the year, the Group embarked on various deleveraging initiatives to strengthen its financial flexibility. At the close of the financial year, the Group’s gross debt and Debt/Equity ratio were reduced to RM15.8 billion and 44% respectively.

5 6 Sime Darby BerhadAnnual Report 2016Innovating for the Future
In addition to those disposals, the Group has also announced the following:
• Theproposedsaleandlease-backofcertainof the Group’s Industrial assets in Australia to Saizen Real Estate Investment Trust (Saizen REIT) for which the proceeds will be partly in cash and from issuance of new units in Saizen REIT to an entity of the Group.
• Theproposeddisposalof125,978,324ordinary stock units and all convertible warrants held by the Group in Eastern & Oriental Berhad for RM323.3 million. The disposal was completed on 29 September 2016.
• Theproposedplacementofupto5%oftheexisting issued and paid-up share capital of the Company. The proposed placement was approved by shareholders at the Extraordinary General Meeting (EGM) held on 30 September 2016. About 50% of the proceeds would be used to repay bank borrowings, 40% for capital expenditure and the balance for working capital and to defray issuance expenses.
DEBT AND FUNDING STRATEGY
In FY2016, due to the high borrowings and weaker operating performance, the Company’s credit rating was downgraded by Standard & Poor’s Ratings Services from A- to BBB+, Moody’s Investors Services Limited from A3 to Baa1 and Fitch Ratings from A to BBB+. The Group maintained its MARC-1ID/AAAID rating by the Malaysian Rating Corporation Berhad.
RM million FY2016 FY2015 FY2014
Total Borrowings 15,833.6 18,063.0 11,174.8
Cash (including cash under Housing Development Accounts)
3,520.9 4,201.0 4,896.0
Equity 35,707.0 31,571.5 29,312.6
Borrowings / Equity 44.3% 57.2% 38.1%
Islamic and Conventional Financing
The Group continues to support Islamic financing and as at 30 June 2016, approximately RM6.4 billion or 40% of the Group’s total borrowings were issued in accordance with Islamic principles. Conventional debt as a percentage of Total Assets of the Group was about 15%, which is well below the threshold of 33% set by the Securities Commission to meet the criteria of a Shariah compliant counter on Bursa Malaysia.
Fixed and Floating Interest Rate Loans
The Group manages its interest rate risk by targeting an optimal mix of its fixed rate (including those swapped to fixed rates) and floating rate loans, taking into consideration market conditions. Interest rate swaps are used to hedge against increase in interest cost. As at 30 June 2016, approximately 65% of the Group’s long term borrowings are at fixed rates or covered by interest rate hedges.
GROUP FINANCIAL REVIEW

5 7Strategic ReportSime Darby Berhad Annual Report 2016
Loan Currency and Net Investment Currency Exposure
The Group’s investments in various countries and currencies exposes the Group to foreign currency risk. Borrowings in the functional currency of the foreign operations mitigates this risk by acting as a hedge against the Group’s foreign investments. In addition, the borrowings in the functional currency also mitigates the impact of foreign currency translation of these borrowings on the Group’s profit or loss.
FY2016 FY2015
0
5
20
15
10
25
30
35
0-1 year 1-2 years 2-5 years > 5 years
%
27.926.2
18.6
27.3
35.0
10.3
34.1
20.6
Debt Profile
During the year, we also focused on improving the Group’s debt profile.
Approximately 69% or RM10.9 billion of the Group’s borrowings are in the respective borrowers’ functional currency. Most of the remaining RM4.9 billion (USD1.2 billion) are swapped to the functional currency of the borrower or hedged against the net investment.
The borrowings due within 12 months has reduced from RM6.3 billion (35.0% of total borrowings) to RM4.4 billion (27.9% of total borrowings) while borrowings due after 5 years increased from RM3.7 billion (20.6%) to RM4.3 billion (27.3%).
RM million Short Term <1 year 1-2 years 2-5 years 5-10 years >10 Years
FY2016 2,552.3 1,867.2 4,152.7 2,946.1 3,226.3 1,089.0
% 16.1 11.8 26.2 18.6 20.4 6.9
FY2015 5,156.6 1,161.0 1,867.5 6,160.2 3,160.6 557.1
% 28.6 6.4 10.3 34.1 17.5 3.1

5 8 Sime Darby BerhadAnnual Report 2016Innovating for the Future
The Group’s EBITDA margin declined from 11.4% to 11.0% primarily due to the challenging business conditions experienced by all Divisions. However, our cash flow generation from operations this financial year has improved by RM211 million compared to the previous year, largely driven by diligent cash management, cost rationalisation measures and tight management of working capital. Free cash flow turned from negative to a positive RM835 million due to the acquisition of NBPOL for RM6 billion in the previous year and higher proceeds from asset disposals in the current financial year.
GROUP FINANCIAL REVIEW
CASH FLOW AND LIQUIDITY MANAGEMENT
FY2016
RM million Plantation Industrial Motors Property Group
Revenue 11,876.5 9,617.5 18,924.4 2,864.9 43,962.8
EBITDA* 2,183.2 552.5 742.2 1,102.4 4,815.0
Operating cash flow 1,625.4 807.9 1,336.2 (98.7) 3,741.2
Capital expenditure and investments (1,361.4) (255.6) (699.0) (707.6) (3,331.2)
Proceeds from disposals 297.6 38.9 35.2 823.2 1,142.2
Finance costs paid (542.5) (144.1) (129.8) (225.4) (717.0)
Free cash flow 19.1 447.1 542.6 (208.5) 835.2
FY2015
RM million Plantation Industrial Motors Property Group
Revenue 10,268.6 10,558.2 18,646.3 3,455.0 43,728.7
EBITDA* 2,110.7 784.0 697.8 991.1 4,975.3
Operating cash flow 1,732.3 1,295.2 739.8 (489.0) 3,530.1
Capital expenditure and investments (1,222.2) (283.2) (432.6) (413.5) (2,618.4)
NBPOL acquisition (5,998.4) - - - (5,998.4)
Proceeds from disposals 333.6 47.4 16.1 502.8 839.4
Finance costs paid (352.0) (154.5) (144.4) (180.7) (585.8)
Free cash flow (5,506.7) 904.9 178.9 (580.4) (4,833.1)
Note:* Earnings before Interest, Tax, Depreciation and Amortisation
Capital expenditure for the year comprised largely of replacement capital expenditure, planting expenditure of RM0.8 billion and the enhancement and expansion of facilities for the Motors Division.

5 9Strategic ReportSime Darby Berhad Annual Report 2016
OVERVIEW OF FINANCIAL PERFORMANCE
Group revenue at RM44.0 billion increased marginally by 0.5%.
The increase was mainly due to higher revenue for Plantation following the full year consolidation of NBPOL’s revenue of RM1.7 billion as compared to RM723 million for 4 months in FY2015.
Revenue for Industrial Division declined 8.9% to RM9.6 billion due to lower equipment delivery and product support sales while Property’s revenue declined by 17.1% to RM2.9 billion due to lower property sales.
Profit Before Interest and Tax (PBIT)
Group PBIT declined by 8.9% to RM3.1 billion, due to the lower profit from all Divisions except for Property.
Plantation Division - profit declined by 18.5% to RM1.1 billion mainly due to higher operating costs and lower Fresh Fruit Bunch (FFB) production. CPO price realised was slightly higher at RM2,242/MT against RM2,193/MT in FY2015.
Industrial Division - profit declined by 37.4% to RM326 million largely due to lower equipment sales to the mining sector in Australia and also the economic slowdown which has affected the construction, power and marine sectors.
Motors Division - registered a higher profit by 6.1% to RM503 million. This is mainly due to higher profit in Singapore as a result of improved results from the BMW operations and increase in the number of certificate of entitlements issued.
Property Division - profit increased by 19.7% to RM1.1 billion mainly attributable to gains from disposals totaling RM816 million. The disposal gains include two Singapore subsidiaries of RM447 million, Syarikat Malacca Straits Inn of RM39 million, compulsory land acquisitions of RM145 million and Semenyih land sales of RM185 million compared to RM512 million in FY2015. Excluding these gains, profit declined by 34.3% due to lower property development revenue.
Further explanation of each of the Divisions’ financial performance are provided in the Divisional Operations Review from pages 63 to 111.
Finance Costs
Finance costs decreased by RM17 million to RM454 million mainly attributable to higher interest capitalised of RM284 million (FY2015 : RM111 million). Gross finance costs increased to RM738 million from RM582 million due to higher average borrowings in FY2016.
The Group’s average borrowing cost for the year was lower at 3.4% from 3.6% in FY2015. This was primarily due to the refinancing of higher interest rate loans and the repayment of AUD200 million loans of the Industrial Division which carried an interest rate of 4.5% per annum.

6 0 Sime Darby BerhadAnnual Report 2016Innovating for the Future
FY2017 PRIORITIES
Our focus areas for FY2017:
• ImprovingthecapitalstructureoftheDivisions and the Group.
• Completingandstabilisingthenewlyimplemented key information systems such as the Business Transformation Project in the Industrial Division and the Group Consolidation reporting system, and to reap benefits realisation from these new or upgraded systems.
• Continuetheconsolidationoftransactionprocessing in the shared services unit of the Group to drive efficiency, productivity and cost reduction.
GROUP FINANCIAL REVIEW
Net Earnings of the Group declined by 0.9% as the drop in Net Earnings was mitigated by the lower tax expense.
Consequential of the lower Net Earnings and higher Average Shareholders’ Equity of RM31.5 billion in FY2016 against RM29.5 billion in FY2015, the ROE declined from 8.2% to 7.6%.
Taxation
The Group’s effective tax rate was low at 7.8%. This was primarily due to the non-taxable gain on disposal of subsidiaries of RM513 million and the net tax benefit of RM349 million from the change in tax base following a tax revaluation. Excluding both these items, the effective tax rate of the Group is 25%.
The Group took the opportunity to realise the tax benefit following a new legislation on fixed assets revaluation (under Peraturan Menteri Keuangan No. 191/PMK.010/2015) (PMK 191) issued by the Ministry of Finance in Indonesia.
Under the special tax regulations, certain Indonesian subsidiaries of the Group submitted their application for the special tax incentive by performing a tax revaluation on certain assets and paid a final tax amount, equivalent to RM66.4 million, for the revaluation surplus in May 2016. Under this incentive, the companies would enjoy lower tax expense in the future as a result of the higher tax depreciation on the revalued assets.

6 1Strategic ReportSime Darby Berhad Annual Report 2016
Notes:
The comparatives have been restated following the change in accounting policy for bearer plants
*The financial results have been restated to exclude discontinued operations
5 - YEAR FINANCIAL HIGHLIGHTS
FINANCIAL YEAR ENDED 30 JUNE (RM MILLION) 2012 2013 2014 2015 2016
FINANCIAL RESULTSRevenue* 46,630.5 46,109.0 43,908.0 43,728.7 43,962.8
Earnings before interest, tax, depreciation and amortisation (EBITDA)* 7,013.7 5,996.9 5,602.6 4,975.3 4,815.0
Profit before interest and tax* 5,821.3 4,818.3 4,421.5 3,419.7 3,115.5
Profit before tax* 5,612.9 4,497.8 4,167.3 3,145.4 2,815.8
Profit after tax 4,468.0 3,970.5 3,672.1 2,548.9 2,600.2
Profit attributable to owners of the Company 4,272.1 3,839.0 3,502.5 2,430.0 2,408.8
FINANCIAL POSITIONShare capital 3,004.7 3,004.7 3,032.1 3,105.6 3,163.5
Reserves 22,587.5 23,806.1 25,420.8 27,462.5 29,349.2
Shareholders’ equity 25,592.2 26,810.8 28,452.9 30,568.1 32,512.7
Perpetual Sukuk - - - - 2,230.1
Non-controlling interests 854.5 866.0 859.7 1,003.4 964.2
Total equity 26,446.7 27,676.8 29,312.6 31,571.5 35,707.0
Borrowings 9,832.6 10,139.9 11,174.8 18,063.0 15,833.6
Other liabilities 11,773.1 10,726.4 10,736.5 12,603.9 12,668.7
Total Equity and Liabilities 48,052.4 48,543.1 51,223.9 62,238.4 64,209.3
Non-current assets 22,997.5 25,342.3 26,438.9 36,307.3 39,517.5
Other assets excluding Cash and Housing Development Accounts (HDA) 19,949.3 18,547.0 19,889.0 21,730.1 21,170.9
Cash (including HDA) 5,105.6 4,653.8 4,896.0 4,201.0 3,520.9
Total Assets 48,052.4 48,543.1 51,223.9 62,238.4 64,209.3
FINANCIAL RATIOSOperating margin (%) 12.5 10.1 9.8 8.1 7.0
Return on average shareholders’ equity (%) 17.4 14.7 12.7 8.2 7.6
Debt/Equity (%) 37.2 36.6 38.1 57.2 44.3
Debt/EBITDA (times) 1.4 1.7 2.0 3.6 3.3
SHARE STATISTICS
Basic earnings per share (sen)71.0 63.8 58.0 39.6 38.4
Net dividend per share (sen) 35.0 34.0 36.0 25.0 27.0
Net assets per share attributable to owners of the Company (RM) 4.3 4.5 4.7 4.9 5.1

6 2 Sime Darby BerhadAnnual Report 2016Innovating for the Future

6 3Strategic ReportSime Darby Berhad Annual Report 2016

6 4 Sime Darby BerhadAnnual Report 2016Innovating for the Future
OUR KEY HIGHLIGHTS
PLANTATIONDIVISIONAL OPERATIONS REVIEW

6 5Strategic ReportSime Darby Berhad Annual Report 2016
101,818 employees2015: 108,630 employees
“These are difficult times for our business, dictated by low commodity prices and extreme weather conditions. Our teamwork, winning mindsets and focused innovative solutions to overcome current challenges will be crucial to ensure we deliver operational excellence and strong financial results in the coming years.”
DATUK FRANKI ANTHONY DASSManaging Director, Plantation Division
OUR VISION
To be a leading integrated global plantation company.
OUR KEY MARKETS
Malaysia, India, Thailand, Indonesia, United Kingdom, South Africa, Germany, China, The Netherlands, Vietnam.
OUR KEY FOCUS
During the year under review, the core focus of the Division was to sustain operational excellence as a low cost producer and navigate a profitable path through the current challenging market environment.
WHO WE ARE
Sime Darby Plantation is an integrated global plantation company with a business that spans the entire palm oil value chain. The Division manages approximately 629,000 ha of planted areas and grazing pastures in Malaysia, Indonesia, Liberia, Papua New Guinea (PNG) and the Solomon Islands. Its downstream operations are spread across 17 countries, producing oils and fats products, oleochemicals, biodiesel and other palm oil derivatives and renewables. The Plantation Division’s midstream segment is involved in trading, marketing and logistics services. The Division is also a pioneer and the leader of many sustainable practices for the palm oil industry and is the world’s largest producer of Certified Sustainable Palm Oil (CSPO).

6 6 Sime Darby BerhadAnnual Report 2016Innovating for the Future
MARKET & INDUSTRY OVERVIEW
Palm Oil Industry
Crude Palm Oil (CPO) prices continued its downward spiral from RM2,294/MT in January 2015 to a low of RM1,970/MT by August 2015, before recovering slowly from September 2015 onwards. The extreme prolonged dry weather due to the Super El Nino phenomenon that occurred in FY2016 is expected to affect crop production over the next one to two years while the immediate impact of tree stress is likely to persist until October 2016. Most parts of Peninsular Malaysia, Sabah and Papua New Guinea experienced prolonged droughts of almost three to four months, while South Kalimantan was the worst hit, experiencing almost seven months of dryness. Crop production was down around 6% across the industry, with the last quarter being worst hit by more than 20% in some areas. Weak production, coupled with low inventory, provided support to CPO prices, which rose to a high of RM2,647/MT in April 2016. Nonetheless, the upside was capped by high soybean supplies in the United States and South America, as well as low crude oil prices. The average Malaysian CPO price for FY2016 was RM2,304/MT.
There have also been changes within the industry landscape, including:
• IncreaseinforeignworkerlevyinMalaysia,which came into effect on 18 March 2016. The levy for the Plantation & Agriculture sector was increased by RM50/worker to RM640/worker, which will see an annual
cost increase of approximately RM1 million to hire new workers or renew contracts for existing foreign workers.
• IncreaseinminimumwageinMalaysia,which came into effect on 1 July 2016. The minimum wage in Peninsular Malaysia increased to RM1,000/month from RM900/month, while in East Malaysia, the minimum wage was increased to RM920/month from RM800/month.
• IncreaseinbiodieselmandatesinMalaysia(from 7% to 10% - implementation is currently on hold) and in Thailand (from 7% to 10% by 2018)
• EstablishmentoftheCouncilofPalmOilProducing Countries (CPOPC) by Malaysia and Indonesia, to address common challenges faced in the palm oil industry, remove undercutting tactics and ensure the long term sustainability of CPO prices.
• Indonesiaimposedanewmoratoriumeffective 1 May 2016 on new oil palm plantation and mining permits to protect the environment. This could potentially restrict further growth in greenfield development.
• ThesigningoftheTrans-PacificPartnershipAgreement (TPPA), completed on 4 February 2016, which will provide for the gradual abolition of import tariffs on palm oil and rubber to member countries from 2018.
(Sources: MIDF Research, Bangkok Post, The New Straits Times, The Star, The Sun Daily, HCS Study Website, Sime Darby Press Release (website), Jakarta Post)
An aerial shot of the Kumbango Refinery and Mill shows a magnificent view of the integrated operations at New Britain Palm Oil, a new member of the Division’s big family.
DIVISIONAL OPERATIONS REVIEW

6 7Strategic ReportSime Darby Berhad Annual Report 2016
BUSINESS MODEL
Flexibility in the Division’s business model allows for it to be agile and to better withstand the ever-changing business landscape, whilst maximising returns.

6 8 Sime Darby BerhadAnnual Report 2016Innovating for the Future
OUR STRATEGY
The Division’s five-year strategy is geared towards doubling profitability and transforming performance through innovative solutions.
DIVISIONAL OPERATIONS REVIEW

6 9Strategic ReportSime Darby Berhad Annual Report 2016
REVIEW OF PERFORMANCE
Overall Financial Performance
The Plantation Division registered a profit of RM1,052.4 million despite lower FFB production, partially mitigated by the higher average CPO price realised in the second half of FY2016, better profits from Downstream operation and cost optimisation initiatives.
Overall Group FFB production was lower by 0.2% attributable to lower FFB production in Malaysia and Indonesia by 11.5% and 10.0% respectively. The operation in New Britain Palm Oil Limited (NBPOL) recorded FFB production of 1.62 million MT in its first full year of contribution post acquisition. The decline in production especially in the second half of the financial year could also be seen industry-wide in Malaysia and Indonesia, largely due to the lag effect of the Super El-Nino phenomenon especially in Sabah, parts of Peninsular Malaysia and Kalimantan. Increased accelerated replanting also contributed to the lower crop production in Malaysia and Indonesia. Nevertheless, OER increased from 21.7% in the previous year to 21.9%.
The average CPO price realised for the year of RM2,242 per MT was 2.2% higher than that achieved in the previous year of RM2,193 per MT. CPO prices realised in Malaysia, Indonesia and NBPOL were RM2,321, RM2,019 and RM2,410 per MT, respectively.
Midstream and downstream operations recorded an improved performance with a profit of RM241.6 million compared to RM77.7 million in the previous year. The commendable results were due to the continued efforts by the Division to strengthen its supply chain and distribution network, leading to higher sales of differentiated products, better refinery utilisation and increased RSPO premiums from sales of stearin and CPO. The PBIT also included a share of the gain on disposal of the Dusseldorf oleo-chemical plant by Emery group of RM21 million.
The various cost savings and cost optimisation initiatives implemented by the Division helped to further cushion the impact of lower crop production on the company’s profits.
*PNG & Solomon Islands operations’ FFB for FY2015 is used as comparison against its performance in FY2016. FFB Yield MT/ha for the post acquisition period (March – June 2015) was 8.83 MT/ha

7 0 Sime Darby BerhadAnnual Report 2016Innovating for the Future
Upstream Operations
The severe impact of the prolonged dry weather on the Division’s overall performance can be seen from the reduction of total FFB yield per mature hectare across all the Division’s operations from 20.39 MT in FY2015 to 18.82MT in FY2016.
The increase in OER for the Division in FY2016 was mostly from improvements in operational efficiencies and crop quality despite lower moisture content in the fruits as a result of dry weather.
OER for Indonesia upstream decreased marginally compared to FY2015 due to a high number of malformed bunches developed as a result of prolonged droughts in Kalimantan.
For FY2017, the focus on yield and OER improvements will always remain paramount, in line with the Division’s short term target of achieving FFB yield of 23 MT/ha and OER of 23% by FY2018 (Mission 23:23), and its long term target of 25 MT/ha FFB yield and 25% OER by the year 2025 (Mision 25:25). Utmost attention is being given to good estate and mill management, with greater emphasis on timely fertiliser application, water conservation, field irrigation, integrated pest & disease management, as well as continuous improvement on crop quality and milling efficiencies.
Malaysia
The Malaysian operations continue to raise the standards of replanting, manuring and nursery management. Accelerated replanting of old and low yielding fields for FY2016 was 13,000ha. Over the next five years, a total of 82,500 ha will be replanted in Malaysia. More focus will be placed on creating large water bodies to irrigate the palms during dry seasons, improving soil fertility and enhancing other agro-management practices such as the planting of Nephrolepis, application of Empty Fruit Bunches (EFB) and compost. For Inland estates, the target is for 30% of the estates to have water sources that can last for up to 3 months during the dry weather. A dedicated unit has been set-up to implement palm watering projects at selected sites throughout Malaysia.
Malaysia continues to capitalise on the low Free Fatty Acid (FFA) CPO or Premium Quality (PQ)/ Superior Quality (SQ) oil as a catalyst to increase sales of specialty products to global food manufacturers. An alternative mill process for production of crude palm oil with low FFA was successfully commercialised. This process will be expanded to five more mills in FY2017. In FY2016, PQ oil production was 39,500MT, while SQ oil production was 19,500MT. The target is to produce 70,000MT of PQ/SQ oil annually.
Malaysia has also initiated additional intensive cost saving measures without impacting productivity such as the Kaizen Waste Elimination Challenge, which has been successful. In addition, mechanisation initiatives and innovative use of digital technology which was introduced in FY2015, continued to be enhanced and implemented in FY2016 to further strengthen operations efficiency and field supervision.
Indonesia
In Indonesia, the Division embarked on a transformation project targeted to improve yield and OER. This long term initiative will focus on the following:-
• LongRangeReplantingProgramme(LRRP)• Constructionofhugewaterbodiesandfield
irrigation• Millimprovement/upgrading• ImprovementonfieldaccessibilityforFFB
evacuation in peat areas for PT BNS.• TalentManagementthroughrestructuring
of regional operations
DIVISIONAL OPERATIONS REVIEW
*PNG & Solomon Islands operations’ OER for FY2015 is used as comparison against its performance in FY2016. OER for the post acquisition period (March – June 2015) was 21.8%

7 1Strategic ReportSime Darby Berhad Annual Report 2016
Operations will be further strengthened and cost reduction measures will be given priority.Accelerated replanting with a target rate of 7% of total planted hectarege annually will continue, as part of our efforts to rectify the current older age profile. At present, 41% of the Division’s total planted area (or 84,419 ha of oil palms) is aged above 19 years old. 49% of the area is situated in South Kalimantan and Sulawesi region, while 22% and 29% are in Sumatera as well as Central Kalimantan regions respectively. A Replanting Unit was set-up in September 2015 to provide estates with support for excellent replanting standards to ensure best yielding fields with a target first year yield of 15 - 20 MT/ha or above. The site specific focus and monitoring to improve soil fertility implemented in all fields will also help to improve overall yields.
Papua New Guinea and Solomon Islands
Work continues on the integration of the PNG and Solomon Islands upstream operations into the Division’s existing operations following the acquisition of NBPOL in March 2015. A number of operational synergies and cost saving initiatives were implemented in FY2016: • Feedstocksupplychainalignmentbetween
business units such as SD Unimills and New Britain Oils Ltd., supply of segregated SG CPKO to SD Unimills from NBPOL;
• Savingsthroughscalepurchasesoffertilisers;
• HRTalentexchangeefforts;• JointR&Deffortsinplantingmaterialand
other scientific aspects;• Coordinationandalignmentonshipping
contracts;• IntegrationofITframeworkinvolving
infrastructure enhancements and the harmonisation of local business systems with those utilised across the Division.
Liberia
As at the end of FY2016, total planted area for the Division’s Liberian operations was 10,518 ha, comprising 10,411 ha of oil palm and 107 ha of rubber. Although Liberia had been declared Ebola-free on 9 June 2016, all new land development activities were put on hold following a voluntary moratorium beginning October 2014. The moratorium was in compliance with undertakings given as part of the SPOM. Another SPOM undertaking was the HCS Science Study which was completed in December 2015. Following the release of the study’s findings, the Division is
currently conducting the HCS+ and HCS Approach trials, resulting in further delay on the Division’s new land development in Liberia and deferring the Division’s plan to plant an additional 6,000 ha of oil palm and 4,000 ha of rubber in FY2016 to FY2017.
The 30/60 MT/hour palm oil mill is targeted for completion in December 2016. The new completion date was fixed following the delay in the arrival of the mill’s equipment and machineries due to the Ebola crisis. The 8 MT/hour mini mill was commissioned since January 2016 to process the operations’ FFB.
The Division’s matured oil palm area in Liberia for FY2015 is 1,567 ha. A total of 2,665 MT FFB had been processed to produce 570 MT of CPO with OER of 21.39%.
Rubber
The Division’s rubber yield decreased slightly to 1,961 kg per ha in FY2016 compared to 2,025 kg per ha achieved the previous year mainly due to new areas coming into maturity.
The average rubber selling price was slightly higher at RM6.5 per kg of dry rubber against RM6.3 per kg last year. The profit before replanting increased to RM12.6 million from RM8.0 million realised last year due to various cost savings measures undertaken by the Group which resulted in the profit per mature hectare before replanting being higher at RM2,954 per mature hectare compared to RM1,802 per mature hectare last year.
The conversion of marginal oil palm areas to rubber in Malaysia is advancing well with 3,100 ha of oil palm converted to-date and another 1,500 ha will be converted to rubber in FY2017. In Indonesia, 650 ha of rubber has been planted.
Downstream Operations
In FY2016, the Division’s Downstream operations delivered a new record PBIT despite the difficult and volatile environment. Overall global plant utilisation increased by 6%, attributable to higher sales volumes on high margin differentiated products and driven by higher demand for RSPO certified products, especially from Europe. The sales growth in FY2016 was 30%, contributed mainly from Indonesia due to better refining margins, as well as an increase in customer base and synergy value created in Europe, subsequent to the acquisition of NBPOL.

7 2 Sime Darby BerhadAnnual Report 2016Innovating for the Future
As part of the War on Waste (WOW) campaign launched by the Group in FY2016, the Division also participated in the Kaizen Waste Elimination Challenge.
Total Projects
Completed
Potential RMm Saved within
12 months
Potential Hours Saved within 12
months
KWEC 2016
1,279 RM 35.5 0.97 million hours
(Read more about the Division’s initiatives and achievements in LSS in the Sime Darby Plantation Sustainability Report 2016)
As an ongoing strategic initiative to ensure physical deliveries of segregated and traceable products to our customer, the traceability dashboard (known as ‘Open Palm’) was introduced to allow customers access to key data on the origin of palm products purchased from the Division’s refineries. In FY2016, the Division’s Downstream operations recorded higher sales of differentiated and RSPO certified products by 13% as compared to the last financial year.
The Division won the PNB Group Innovation & Quality Award 2015 and the “Best Project in Organizational Impact” award at the International Team Excellence Awards at the American Society for Quality’s 2016 World Conference on Quality and Improvement (WCQI) for the “Reduction of Phosphoric Acid Dosage in Degumming Process” project, which can provide potential revenue of almost RM 60 mil in addition to lowering processing cost by RM2.3mil annually.
Moving forward, sales of differentiated products is expected to increase further through market expansion initiatives, as well as new product offerings and process improvements through collaboration between the Division’s downstream operations, R&D as well as Innovation Centres. In addition, the Division is also currently looking into “Waste to Wealth” initiatives, in which the co-products of its refineries such as Palm Fatty Acid Distillate (PFAD) and Palm Kernel Expeller (PKE), can be fully utilised and converted into high value products.
Lean Six Sigma Initiatives
DIVISIONAL OPERATIONS REVIEW
Leading in Sustainability
Sustainable Palm Oil Certification
Following the integration of NBPOL in FY2015, the Division further strengthened its position as the leader in plantation sustainability. Sime Darby Plantation is the world’s largest producer of CSPO. As at the end of FY2016, the Division produced 2.2 million MT of CSPO and 0.5 million MT of CSPKO. The Division also maintained RSPO certification status for all its Upstream operations in Malaysia (100%), Indonesia (96%), Papua New Guinea (100%) and Solomon Islands (100%).
The Division remains committed to achieving 100% RSPO certification for its upstream operations despite the challenges at PT Mitra Austral Sejahtera (PT MAS) in West Kalimantan, Indonesia which has not been certified due to legacy claims from the Project Affected Communities which remains unresolved. The claims, which involve ownership of nucleus plantations after the expiry of land tenures, and allocation of Plasma plots within the original village/customary area, require involvement of several stakeholders, including the Indonesian government, in order to be concluded.
Benefits achieved in FY2016 reflects the commitment of all business units in Sime Darby Plantation to produce real results that reduce non-value adding activities and increase organisational capability. FY2016 marks the highest benefits from Upstream Malaysia with RM2.9 million contribution from 17 mills and 1 estate.

7 3Strategic ReportSime Darby Berhad Annual Report 2016
For FY2017, the Division will continue to collaborate closely with all relevant stakeholders to find the best solutions to the remaining claims.
• Indonesian Sustainable Palm Oil (ISPO) Certification
As at FY2016, 48% of our Strategic Operating Units (SOU) in Indonesia have been certified. The rest of the SOUs have completed the audit process and are awaiting certifications.
• Malaysian Sustainable Palm Oil (MSPO) Development
Labu SOU has obtained MSPO certification.
Additionally, all of the Division’s downstream business units in Malaysia and Indonesia have also received the RSPO Supply Chain Certification.
Sustainability-Oriented Development
As a founding member of the RSPO and the world’s leading producer of CSPO, the Division continued its strict adherence to sustainable plantation practices, as well as its commitment to promoting sustainability in areas surrounding its operations.
In FY2016, the Division further intensified its effort and commitment to prevent forest fires and haze with the following:
(i) Launch of Hotspots Alerts Dashboard in October 2015 on Sime Darby’s website to provide the public with information on the number of hotspots recorded in and around the Division’s operations, and actions taken.
(ii) Adopted a commitment made by Sime Darby’s President & Group Chief Executive to monitor and put out fire outbreaks occurring within a 5 km radius of its operations in November 2015;
(iii) Completed the `Fire Prevention through Sustainable Farming Practices’ programme in four villages surrounding PT Bhumireksa Nusa Sejati in Riau in January 2016. The programme was implemented in collaboration with University of Riau (UNRI) and was successful in achieving zero hotspots in targeted areas.
(iv) The Group embarked on a similar fire prevention programme in April 2016. The programme, also in collaboration with UNRI, involved four other villages in Riau. A new collaboration with University of Lambung Mangkurat (UNLAM) in seven villages in South Kalimantan was also initiated, targeted to be completed in November 2016.
To further improve its sustainability and agricultural credentials, the Division plans to launch the Responsible Agriculture Charter (RAC) at the end of 2016. The Charter will outline the Division’s aspirations and commitments to continuous improvement and to address the continuing challenges around No-deforestation, No-peat and No-exploitation. With focused commitments in three key areas namely human rights and social development, the environment and corporate integrity, the Charter will be applicable to the Division’s entire oil palm operations, with a phased roll-out to the Division’s third party oil palm suppliers and all other agricultural supply chains by 2020.
Plasma and smallholders plantation development remains an important aspect of the Division’s focus on developing surrounding communities as the initiative accounts for approximately 100,000 ha of the Division’s development while providing livelihood to local communities. For its operations in PNG and Solomon Islands, more than 45,000 ha has been developed for the Division’s outgrowers’ scheme comprising total matured areas of more than 42,000 ha, which are 100% RSPO certified. The scheme supports the livelihood of approximately 325,000 people, which is 4.5% of the total population. In FY2016, the Division also continued to provide local communities in Indonesia with the means to make a living and improve their quality of life through its KKPA*/Plasma schemes which impact more than 25,000 families. Out of approximately 45,000 ha of land developed for this purpose, approximately 25,000 ha has been RSPO certified (from 19,000 ha in FY2015) with a production capacity of over 695,000 MT of FFB. The Division aims to support the RSPO certification for all estates under its outgrower schemes in Indonesia by 2019.
In June 2016, the Division also partnered with Wild Asia (WA) to assist small oil palm producers in the Lower Kinabatangan area in Sabah, Malaysia to achieve RSPO certification and secure the supply of certified FFB from small producers under the Wild Asia Group Scheme (WAGS). The Division’s mills currently receive about 11,000 MT of FFB from 24 independent smallholders throughout Malaysia and the partnership with WA will significantly increase the participation of smallholders in SDP’s sustainable supply chain.
* Kredit Koperasi Primer Anggota (Members’ Primary Credit Co-operative)

7 4 Sime Darby BerhadAnnual Report 2016Innovating for the Future
Sustainable Palm Oil Manifesto (SPOM)
Following the launch of SPOM in September 2014, the Division further enhanced its commitment under SPOM by halting all new oil palm development, while an independent High Carbon Stock (HCS) Science Study was conducted to develop guidance on the methods to identify HCS areas. The study was envisaged to result in a new integrated approach to sustainable land-use planning, which the Division is committed to test.
Subsequent to the completion of the study’ in December 2015, HCS+ was proposed as a guide for oil palm growers to develop plantations that are carbon neutral, conflict-free, transparent and equitable to all stakeholders. The HCS+ plus trial is currently ongoing in the Division’s Liberian operations, in addition to a trial on the HCS Approach, which is an alternative methodology that proposes a forest stratification model to identify and conserve high carbon stock forests. The trials will allow the comparison of both methodologies in terms of conservation and developmental outcomes, as well as practicality of implementation.
Tree Planting
Sime Darby’s “Plant-A-Tree” Programme, initiated in 2008, aims to increase the biodiversity value in its plantations with a target of planting one million trees by the year 2020. To date, a total of 330,000 trees comprising 276 species have been planted in the Division’s estates. Currently, the Division is focused on reforesting a 160 ha Conservation Set-A-Side in Jentar Estate, Pahang with endangered, rare and threatened (ERT) tree species. A nursery with a capacity of 50,000 seedlings was established in September 2013 for this project. By the end of FY2016, a total of 93,161 trees comprising 96 species have been planted, 64 of which are ERT species. In FY2016, the Division also signed a Memorandum of Collaboration with Forest Research Institute of Malaysia (FRIM) to inject further technical and research expertise into the project. Additionally, approximately 694,000 trees have also been planted in collaboration with Yayasan Sime Darby, through the Ulu Segama Rehabilitation and RiLeaf programmes in Sabah, and North Selangor Peat Swamp Rehabilitation Programme. (Read more about the Division’s Tree Planting Project in the Sime Darby Plantation Sustainability Report 2016)
2016
2015
2014
2013
2012 17.1
13.4
9.8
10.8
9.3
0 4 8 15 20 25
9.3
LOST TIME INJURY FREQUENCY RATE (INCIDENTS PER MILLION MAN-HOURS WORKED)
excluding NBPOL including NBPOL
23.7
DIVISIONAL OPERATIONS REVIEW
* Based on calendar year
Carbon Reduction Strategy
Capturing methane-rich biogas from anaerobic treatment ponds within mill operations remains a key element in the Division’s carbon reduction strategy. The Division has earmarked several biogas projects for implementation and once operational these projects will contribute significantly to the Division’s target of reducing 40% of carbon emissions from its ops. This year, a 6.5% reduction of carbon emissions was reported in methane avoidance projects at its 22 composting plants.
(Read more about the Division’s leadership, initiatives and achievements in sustainability in the Sime Darby Plantation Sustainability Report 2016)

7 5Strategic ReportSime Darby Berhad Annual Report 2016
Safety and Health
(i) The Division recorded a Fatal Accident Rate (FAR) of 2.0 for every 100 million hours worked – 31% lower compared with the same period in the last FY. The Division also saw a 32% reduction in fatal cases in Upstream Malaysia and a 28% reduction in Upstream Indonesia.
(ii) Lost Time Injury Frequency Rate (LTIFR) (excluding NBPOL) recorded 9.3 cases per million hours worked - a 13% reduction compared with the previous financial year.The total reduction is 43% over the last 5 years.
In FY2016, a number of key initiatives were implemented to promote the culture of harm- prevention, self-regulation and accountability among employees to further strengthen the Division’s commitment and performance in ESH.
(Read more about the Division’s key Safety & Health initiatives in the Sime Darby Plantation Sustainability Report 2016)
R&D and Innovation
In FY2016, the Division continued its focus on three key strategies of yield/productivity improvements, increasing revenue streams and developing sustainable practices, whilst pursuing transformational innovative strategies. This is not only to improve overall operational efficiency, but also to create sustainable value for its stakeholders and position the Division as the leading integrated global plantation company.
The following were some of the key initiatives, carried out in FY2016:
(i) First large scale planting of Genome Select High Yielding Materials.
In 2009, Sime Darby Plantation was first in the world to successfully sequence, assemble and annotate the complex sequence of 1.8 billion chemical units that make up the genetic code of the oil palm. In FY2016, the Division commenced its first large scale planting of Genome Select high yielding oil palms, a major milestone that will allow the production of more oil with existing land.
The new materials can deliver 15% higher yield than Sime Darby’s current best commercial planting material Calix 600. Seed production has also commenced and new planted ’Genome Select’ parent palms will ensure the increased availability of ‘Genome Select’ commercial materials from 500 ha in FY2017-18 to full replant capacity from 2023 onwards.
Additionally, the high-throughput genetic testing facility established in 2015 at the Division’s R&D unit is also now fully operational. It will be utilised to conduct field test on palms with traits that can improve harvesting efficiency by 2019, while also selecting palms for maximum yield and climate resilience thereafter.
(ii) Water Management
Innovative water management is key to overcome extreme weather conditions such as the recent Super El Nino. The Division is currently embarking on various water conservation measures to provide its estates and mills adequate and consistent water supply during prolonged dry months.
The Division’s first large scale planting of Genome Select high yielding in FY2016 is yet another major milestone in its R&D initiative, after Sime Darby became the first company in the world to successfully sequence, assemble and annotate the oil palm genome in 2009.

7 6 Sime Darby BerhadAnnual Report 2016Innovating for the Future
In Indonesia, good water management practices have been intensified since early FY2016; where more than 1,200 water bodies of various sizes were established. The number of water bodies will increase gradually once more fields are replanted. With priority given to estates in South Kalimantan and Sulawesi, which have experienced the worst impact of the Super El-Nino phenomenon.
(iii) Precision Agriculture
By pushing traditional boundaries, certain day-to-day upstream activities in the Division are now being revolutionised and performed by smart tools, systems or machines to increase efficiency and productivity and reduce dependency on workers.
- Mechanisation The Division continued to expand the use of
Mechanically Assisted Infield Collection (MAIC) system to cover another 2,400 ha in FY2016. A total of 181,400 ha in Malaysia is using MAIC compared with 179,000 ha in FY2015. Moving forward, the following will be the Division’s areas of focus:
i) Redesigned machine for FFB evacuation in terraces to further eliminate manual loading will be implemented in FY2018;
ii) For mechanised spraying, the usage of single operator/tractor mounted auto sprayer (sensor based sprayer for mature palm circles) for flat and undulating estates is being tested and expected to be implemented in 2017/2018;
iii) Further expansion of mechanised fertiliser application will be further targeted for the areas currently under manual application; and
iv) Mechanised fertiliser application on terraces is also being explored with target implementation in FY2018.
- Sime Darby Digital Supervision (SDDS)
To enhance harvesting supervision and reduce paperwork, employees on the field are provided with SDDS which enable real time and online reporting from the estates. This technology has allowed for improved transparency of field harvesting supervision and ease of reporting by the estate managers, assistants as well as supervisors. Information is quickly captured to provide timely data availability for precise analysis of estate performances and mitigation of any issues.
- Unmanned Aircraft System @ Drones
The Division is in the process of developing data imaging of its estate operations through the deployment of drones. This would allow the Division to carry out site specific decision making based on the data in the future. Besides imaging, heat sensors could also assist the Division to address pest and diseases outbreaks, as well as water management at a faster and more accurate manner.
- Improving Mill efficiencies
The Division is also currently working on a number of process technologies to improve mills efficiencies including increasing its OER rate.
Going from strength to strength, the Division’s downstream operations expect to climb to greater heights with further market expansion, new product offerings and operational improvements.
DIVISIONAL OPERATIONS REVIEW

7 7Strategic ReportSime Darby Berhad Annual Report 2016
(iv) Process Improvements at Refineries
In FY2016, the Division’s R&D team introduced the double bleaching process to its refineries combining both acid activated bleaching earth and natural bleaching earth, resulting in significant cost savings and reduced process contaminants. Further improvement in refining processes to produce more sustainable and higher quality products was also implemented, such as the optimisation of processing conditions to produce very low 3-MCPD palm oil meant for the infant formula segment. In FY2017, the Division will be working towards lowering the 3-MCPD level for other applications for all its refineries in Asia Pacific.
(v) Sime Darby Renewables
The Division also aspires to diversify its earning streams and invest in high margin businesses by developing niche applications for downstream non-edible products, and build strategic and tactical capabilities. Sime Darby Renewables has been set up as an innovation driven unit within the Division to look into utilising feedstock within the palm oil value chain, as well as areas of Green Technology, such as biogas and composting. This is currently being carried out via co-investment with reputable strategic partners which include, among others:
1. MyBiomass – Utilising palm biomass waste to produce high value green chemicals.
2. Verdezyne – Leveraging on biology to produce chemicals from renewable non-food sources.
3. Biosynthetic Technologies – Producing a new class of bio-based synthetic molecules that are made from organic fatty acids found in plant oils.
OUTLOOK & FUTURE FOCUS
Outlook
The Global palm oil supply is expected to reach more than 70 mil MT by 2020 from the current 61 mil MT, driven by robust long term fundamentals. Population growth remains key in driving palm oil demand in the long run, especially in Africa and the Asia Pacific. Malaysia is anticipated to remain a major supplier with production expected to reach more than 22 mil MT by 2020. Other positive drivers to the local industry include the establishment of the Council of Palm Oil Producing
Countries in collaboration with Indonesia, a possible increase in biodiesel mandates, potential wider market participation through the Trans-Pacific Partnership Agreement (TPPA), as well as the continuous support from Government and industry bodies.
However, major events such as the recent announcement of the United Kingdom’s exit from the European Union (Brexit) and the upcoming elections in the United States could provide some degree of uncertainty to the growth of the global economy and commodity markets. A lower appetite for risk coupled with cautious spending and volatility in foreign markets might pose a threat to CPO demand and prices, as it could result in weaker demand growth for vegetable oil usage in food, oleochemicals and biodiesel.
Additionally, extreme weather conditions are becoming a major challenge and are forcing plantation companies to deal with weather changes innovatively in order to mitigate adverse impacts on operational and financial outcomes.
Sources: The Star, The Sun Daily, LMC Oilseeds & Oils Report 2015, United Nations
Future Focus
The Plantation Division’s robust business model as an integrated plantation company with presence across the value chain allows it to better withstand challenges currently faced by the industry. With a sizable landbank, the Division enjoys economies of scale and will further continue to grow as the largest CSPO producer in the world. Going forward, the Division will be driven by strategies which are geared towards transforming performance through innovative solutions. It continues to focus on investing in transformational innovative solutions to increase productivity and enhance production through yield enhancement via genome technology, superior agro management and milling technologies, and mechanisation. In addition, the Division will also be emphasising initiatives to ensure higher margins for its de-commoditised and differentiated CSPO products.

7 8 Sime Darby BerhadAnnual Report 2016Innovating for the Future
FY 2013/ 2014 FY 2014/ 2015
MALAYSIA INDONESIA LIBERIA TOTAL MALAYSIA INDONESIA LIBERIAPNG AND SOLOMON ISLANDS
TOTAL
OIL PALMCrop Production - FFB (in MT) 5,994,240 3,424,080 - 9,418,320 5,936,613 3,050,823 - 650,113 9,637,549
FFB Processed - FFB (in MT)- Own- Outside- Total
5,992,338 385,497
6,377,835
3,384,166 761,534
4,145,700
- - -
9,376,504 1,147,031 10,523,535
5,929,814 284,856
6,214,670
3,050,236 714,470
3,764,706
- - -
650,113 222,881 872,994
9,630,163 1,222,207
10,852,370
Hectarage (in Hectares)Mature hectaresImmature hectaresTotal planted hectares
270,148 40,641
310,789
185,408 19,058
204,466
- 10,035 10,035
455,556 69,734 525,290
264,325 43,982
308,307
177,316 27,096
204,412
- 10,259 10,259
73,318 8,750
82,068
514,959 90,087
605,046
FFB Yield per mature hectare (MT) 22.00 18.23 - 20.44 22.28 16.82 - 8.83 20.39
Mill production (in MT)- Palm Oil (CPO)- Palm Kernel (PK)
1,373,007 328,563
927,803 193,567
- -
2,300,810 522,130
1,319,370 317,902
845,957 178,303
- -
190,320 50,800
2,355,647 547,005
CPO Extraction Rate (%)PK Extraction Rate (%)
21.53 5.15
22.38 4.67
- -
21.86 4.96
21.23 5.12
22.47 4.74
0.00 0.00
21.80 5.82
21.71 5.04
RUBBERPlanted Area (hectares)Rubber production (‘000kg)Yield per mature hectare (kg)Average selling price (RM per kg)
8,642 9,764 2,036
8.20
- - - -
107 - - -
8,749 9,764 2,036 8.20
9,405 9,113 2,025
6.28
91 - - -
107 - - -
- - - -
9,603 9,113 2,025
6.28
DIVISIONAL OPERATIONS REVIEW

7 9Strategic ReportSime Darby Berhad Annual Report 2016
FY 2013/ 2014 FY 2014/ 2015
MALAYSIA INDONESIA LIBERIA TOTAL MALAYSIA INDONESIA LIBERIAPNG AND SOLOMON ISLANDS
TOTAL
OIL PALMCrop Production - FFB (in MT) 5,994,240 3,424,080 - 9,418,320 5,936,613 3,050,823 - 650,113 9,637,549
FFB Processed - FFB (in MT)- Own- Outside- Total
5,992,338 385,497
6,377,835
3,384,166 761,534
4,145,700
- - -
9,376,504 1,147,031 10,523,535
5,929,814 284,856
6,214,670
3,050,236 714,470
3,764,706
- - -
650,113 222,881 872,994
9,630,163 1,222,207
10,852,370
Hectarage (in Hectares)Mature hectaresImmature hectaresTotal planted hectares
270,148 40,641
310,789
185,408 19,058
204,466
- 10,035 10,035
455,556 69,734 525,290
264,325 43,982
308,307
177,316 27,096
204,412
- 10,259 10,259
73,318 8,750
82,068
514,959 90,087
605,046
FFB Yield per mature hectare (MT) 22.00 18.23 - 20.44 22.28 16.82 - 8.83 20.39
Mill production (in MT)- Palm Oil (CPO)- Palm Kernel (PK)
1,373,007 328,563
927,803 193,567
- -
2,300,810 522,130
1,319,370 317,902
845,957 178,303
- -
190,320 50,800
2,355,647 547,005
CPO Extraction Rate (%)PK Extraction Rate (%)
21.53 5.15
22.38 4.67
- -
21.86 4.96
21.23 5.12
22.47 4.74
0.00 0.00
21.80 5.82
21.71 5.04
RUBBERPlanted Area (hectares)Rubber production (‘000kg)Yield per mature hectare (kg)Average selling price (RM per kg)
8,642 9,764 2,036
8.20
- - - -
107 - - -
8,749 9,764 2,036 8.20
9,405 9,113 2,025
6.28
91 - - -
107 - - -
- - - -
9,603 9,113 2,025
6.28
FY 2015/ 2016
MALAYSIA INDONESIA LIBERIAPNG AND SOLOMON ISLANDS
TOTAL
5,256,834 2,745,212 2,665 1,615,795 9,620,506
5,255,597 316,528
5,572,125
2,733,739 699,972
3,433,711
2,665 -
2,665
1,615,795 531,212
2,147,007
9,607,796 1,547,712
11,155,508
255,638 49,749
305,387
170,733 32,742
203,475
1,567 8,844
10,411
74,113 9,868
83,981
502,051 101,203 603,254
20.26 15.50 1.70 21.85 18.82
1,183,881 279,574
771,272 161,952
570 -
486,695 126,704
2,442,418 568,230
21.25 5.02
22.46 4.72
21.39 0.00
22.67 5.90
21.89 5.09
10,462 8,393 1,961
6.49
605 - - -
107 - - -
- - - -
11,174 8,393 1,961 6.49

8 0 Sime Darby BerhadAnnual Report 2016Innovating for the Future
OUR KEY HIGHLIGHTS
INDUSTRIALDIVISIONAL OPERATIONS REVIEW

8 1Strategic ReportSime Darby Berhad Annual Report 2016
7,291 employees2015: 7,714 employees
“Sime Darby Industrial Division managed the business cycle and succeeded in maintaining leadership positions in its markets. The Division is poised to adapt and seize new opportunities in order to achieve meaningfulimprovement and ensure continuing success.”
SCOTT CAMERONManaging Director, Industrial Division
OUR VISION
To be a high performance distributor of Caterpillar products and related solutions that deliver sustainable shareholder value through enterprise and initiative.
OUR KEY MARKETS
Australia (Queensland and Northern Territory), Brunei, China (Xinjiang, Fujian, Guangdong, Guangxi, Hainan, Hunan, Jiangxi, Hong Kong and Macau), Christmas Island (Indian Ocean), Malaysia, New Caledonia, Papua New Guinea, Singapore, Solomon Islands, Vietnam.
WHO WE ARE
Sime Darby Industrial is a market leader in the heavy equipment business, selling and renting both new and used Caterpillar (CAT) equipment and provides after-sales services. The Division represents CAT and a range of Allied brands, enabling it to offer a complete value chain of heavy equipment products and services. It strives to bring value added integration to its stakeholders through proactive engagements with its customers and the community.
OUR KEY FOCUS
Sime Darby Industrial aims to maintain leadership for current products in all its markets while exploring opportunities in the Asia Pacific. It also intends to develop Energy Solutions as a second core business line; focusing on the sale of cost effective energy and the distribution of products and services in line with its strategy to diversify away from the economic cycles of fossil fuels. Emphasis will also be given to the integration of Energy and Utilities (Non China) as the Division leverages on core competencies and finds synergies between the recently merged businesses. In order to accomplish its objectives, the Division will be supported by the execution of Caterpillar’s worldwide distribution strategies, productivity improvements on the back of Lean Six Sigma (LSS), Caterpillar Production System (CPS) and Business Transformation Project (BTP), with the six Winning Mindsets embedded in all tasks as part of the Division’s adoption of RISE initiatives.

8 2 Sime Darby BerhadAnnual Report 2016Innovating for the Future
MARKET & INDUSTRY OVERVIEW
Profitable opportunities despite economic contraction
Australia & Pacific Islands
The Australian mining sector continued to contract during the first half of FY2016 with prime equipment sales at their lowest levels since 2008. The second half of FY2016 has seen a stabilisation in this market as thermal and coking coal prices recovered by almost 15% (Source: AME Group).
Coal export volumes for the second half of the fiscal year continued to rise as the mining sector strived to achieve higher productivity levels. Year-on-year coal volumes increased by over 20% with record quantities exported from Queensland ports. An increase in coal commodity prices by up to 150% during the second half benefitted the Queensland-based mining sector. The General Construction sector remains flat year-on-year with no significant growth in Government Infrastructure spending during the fiscal year (Source: BIS Shrapnel, Australian Bureau of Statistics).
China
China’s economy experienced contractions with the Purchasing Managers’ Index (PMI) contracting between August 2015 and March 2016. This contraction was mainly due to subdued commodity prices and policy restructuring based on directives issued by the Chinese government in the new Five-year Plan for the Economy. China’s economy resumed its grind toward slower growth in April 2016, weighed down by overcapacity in industries such as steel and coal. Policymakers decided to shift away from debt-and stimulus-fuelled growth, and instead, focused on stressing the need for deleveraging, upgrading industrial capabilities, and cutting excess capacity.
The heavy mining sector experienced consolidation based on the government’s directive to reduce the number of players and drive productivity and efficiency.
Malaysia
The Malaysian economy expanded by 4.0% in the second quarter of 2016 in comparison to 4.9% in the second quarter of 2015. The slight moderation in growth mainly reflected external shocks to the economy and cautious spending by the private sector. The agricultural sector contracted, as adverse weather conditions led the production of palm oil. The growth in construction remained solid, driven mainly by the civil engineering
sub-sector. The mining sector turned around to record a positive growth of 6.3% in June 2016 over the same month in the previous year.
(Source: Department of Statistics Malaysia)
Singapore
Singapore’s total construction demand of S$27 billion in 2015 was 300% lower than the previous year, and was largely held up by public sector projects. The construction industry continued to face higher cost conditions and manpower shortage.
The offshore rig and vessel new-build sector has been subdued as oil prices remained volatile. Oil prices were less than half of its peak price in mid-2014, resulting in oil and gas companies reducing investments for exploration and production activities.
On the back of a weak offshore rig sector, corresponding demand for offshore support vessels (OSVs) was anaemic. The OSV market saw lower utilisation and charter rates, indicating excess supply and led to few new vessel orders, and consequently less demand for power systems solutions.
CAT excavators are top models of performance, versatility and fuel efficiency.
DIVISIONAL OPERATIONS REVIEW

8 3Strategic ReportSime Darby Berhad Annual Report 2016
BUSINESS MODEL
Sime Darby Industrial aims to deliver high quality world class heavy equipment and related solutions to the Asia Pacific region using knowledge and experience acquired through more than 85 years in the industry. It leverages on its relationship with international principals in delivering value to its stakeholders. The positive brand image as a result of increased customer confidence will lead to further growth and translate into financial gains.
Access to capital
Business platform and operating systems
Experience and knowledge in heavy equipment
World class training centres
Safe work environment
Continuous engagement with stakeholders
OUR KEY RESOURCES
Conglomerate Advantage
Low cost of capital from parent company
Innovative Capabilities
•Line production capabilities
•Comprehensive enterprise resource
planning
Proactive Customer Solutions
Tailored innovations to fit customers’
requirements planning
Market wide network in the Asia Pacific region
Industry recognition
Certified by CAT
CREATESuperior financial returns through operational excellence and high performance standards.
QUALITYHigh quality manufactured equipment.
EFFICIENTCommon division wide operating system.
SKILLEDHighly skilled workforce operating in a zero-harm environment.
SYNERGISEAchieve further synergy with principals while delivering customer satisfaction.
Underpinned by Integrity, Respect & Responsibility, Excellence and Enterprise
CUSTOMERS• Deliver reliable products
and services that meet stringent quality standards of our principals to customers.
VENDORS• Increase brand value
resulting in potential growth partnerships.
• Increase partners’ confidence.
• Attract additional associates.
GOVERNMENTS & SOCIETY• Strengthen relationships
with customers, principals and vendors that ensure interests of all stakeholders are considered.
INVESTORS• Develop a winning
portfolio of sustainable businesses.
• Growth through expanding further down the value chain.
• Strengthen corporate structure leading to ease of business.
HOW WE SHARE THE VALUE WE CREATE
EMPLOYEES• Develop competencies
and skills that increases job efficiency and effectiveness resulting in higher productivity.
HOW WE CREATE VALUE
OUR COMPETITIVE ADVANTAGE

8 4 Sime Darby BerhadAnnual Report 2016Innovating for the Future
OUR STRATEGY
Sime Darby Industrial remains consistent with its strategy to achieve its vision while making periodical assessments in order to ensure that its goals are still relevant in this dynamic economy. The Division is committed to ensuring the Winning Mindsets are implanted in every action taken by its people in order to ensure the success of the businesses in line with the RISE initiative.
DIVISIONAL OPERATIONS REVIEW

8 5Strategic ReportSime Darby Berhad Annual Report 2016
REVIEW OF PERFORMANCE
Overall Financial Performance
Sime Darby Industrial has been realigning its business processes to mitigate the impacts of challenging market environments in all territories. The Division also maintains a close relationship with all its stakeholders, predominantly with its principals to ensure that it receives updated information on all products available in the markets it operates in. Despite continuous operational improvements focused on cost saving initiatives, the Division faced numerous challenges in ensuring a commendable financial performance given the weak market sentiment. The Division continued to maintain its leadership position in all regions and has won numerous awards for excellence in operations of the business, interaction with customers and employee empowerment-demonstrating its commitment to achieving its vision. The Industrial Division registered a sharp decline in profit by 37.4% from RM521.2 million to RM326.3 million, mainly due to lower equipment deliveries and margin pressures in the product support business in Australia as mining companies continue to curtail spending amidst depressed coal prices .
As at June 2016, the Business Transformation Project (BTP) is at 90% completion with Hastings Deering going through the final stages of implementation with expected completion in the first quarter of FY2017. Following delivery and stabilisation of BTP, key initiatives will be established and target savings will be validated by businesses.
The RISE initiatives were introduced in the second half of FY2016 and the Division RISE Working Committee was tasked to formulate the RISE Implementation Plan for FY2017. Despite the recent commencement of this programme, the Division has always strived for excellence and the implementation of this initiative will serve as an umbrella to all other programmes currently underway in the Division such as Lean Six Sigma (LSS) and the Business Transformation Project.
Australia & Pacific Islands
The Australia and Pacific Islands businesses have continued to focus on cost mitigation and targeted market-share improvement strategies in order to maximise current profitability and an increased market position prior to an anticipated improvement in product support revenues. The Australian operation has successfully reduced its total cost base by over 40% from its peak in 2013.
Increases in market shares for prime equipment sales have been recorded in all sectors. General Construction has increased from 25% to over 38% in the last year alone. Parts market shares is now at an all-time high and customer net loyalty score has increased to 53% in FY2016 in comparison to 38% in FY2015.
CAT Production System (CPS) continues to be the mainstay of the Division’s Australian operations’ investment in LSS. Over a 25% reduction in labour time associated with component rebuild has resulted in increased market share (88% win rate for component rebuild quotes to date).
The Australian & Pacific Islands business was again recognized by CAT and awarded the CAT Presidents Customer Experience Award (CPS / LSS) and two awards for excellence in technology and innovation deployment (Hastings Deering is the only dealer in the world to achieve Master Performance Level – Equipment Care Advisor).
China
China’s financial performance was below expectations on lower equipment deliveries and product support sales due to the softening of the mining and construction sectors. This was despite a pleasing 4.3% increase in machine sales market share from 10.3% in FY2015 to 14.5% in FY2016 and increased contribution of parts and services to the overall company. Profitability was further impacted by slowdowns in the coal mining industry together with related restructuring costs and provisioning for potential losses on repossession of equipment.
Malaysia
The results of the Malaysian operations were largely affected by lower equipment deliveries and product support sales. The contraction of the machine industry coupled with reduction in margins due to the depreciation of the Ringgit has impacted the equipment profitability in Malaysia. Pleasingly, market share within this contracting market remained strong.
Terberg Tractors Malaysia continued its strong performance by winning contracts worth more than RM90 million to supply 290 terminal tractors to PSA Singapore Terminals. The Division’s Malaysian operations won the CAT Service Training Excellence Award. Miri branch represented the Malaysian operations in the inter-dealer Going the Extra Mile (GEM) Competition and won second position amongst 17 dealers in Asia Pacific.

8 6 Sime Darby BerhadAnnual Report 2016Innovating for the Future
Singapore
The Singapore operations’ performance was affected by falling oil prices and the consequent slowdown in the marine and oil & gas sectors. Equipment sales saw notable milestones, such as the delivery of more than 110 machines for the Changi Airport Terminal 5 project, which includes the first sale of the Cat RM500B soil compactor in Singapore. The Power Systems division successfully delivered Cat engines and gensets for 24 vessels in the year under review.
The strengthening of the USD also affected Caterpillar machines’ price competitiveness against Japanese and European sourced competitors. Despite these factors, Cat machines managed to secure market leadership in Singapore.
INNOVATION
Mine Energy Solution (MES), a collaboration between the Division and IntelliGas, a gas technology specialist which developed and patented high-density compressed natural gas (HDCNG™) remains on track towards commercialisation.
Durability trials of the first “dual-fuel” HDCNG™ mining truck are set to begin in August 2017 with preliminary commercialisation negotiations currently occurring in Queensland, Western Australia and the USA. This investment will afford the Division the opportunity to broaden its global footprint and range of allied products.
The Power Systems Division in Malaysia embarked on a collaboration project with Sime Darby Plantation in the construction and operation of biogas power plants. The Project is conditional
upon securing Biogas Feed-in Quota from relevant authorities and is expected to commence in the coming financial year. This Project will be the first of other collaborative sustainability projects which will focus on inter-division synergies.
SAFETY & HEALTH
The Division continued the focus on implementing and sustaining a culture of safety to realise the goal of a zero-harm workplace. A key component of this has been the deployment of a Felt Leadership Programme in targeted areas across the Division’s region in FY2016. The Programme has educated the Division’s employees to be accountable for their own safety, as well as that of their colleagues and others.
An increased emphasis on reporting of incidents has seen Lost Time Injury Frequency Rate (LTIFR) increase to 3.4 in FY2016 from 2.7 at the end of last financial year. The Total Recordable Injury Frequency Rate (TRIFR) rate has decreased to 6.4 in FY2016 from 6.7 in FY2015. A fatality in the China operations in June 2016 has reemphasised the importance of ensuring that the Division has effective processes in place to manage critical hazards across the business.
As part of the Division’s goal of realising Zero Harm, the top 10 critical hazards have been identified as “isolation”, “work at height”, “suspended loads”, “safety devices”, “load restraint”, “safe systems of work”, “people, plant and vehicle interaction”, “fit for work”, operating plant and equipment” and “confined space”. Lifesaving commitments relating to each of these critical hazards will be deployed in FY2017 with training on processes to support implementation.
DIVISIONAL OPERATIONS REVIEW
Terberg Terminal Tractors continuously responds to customers’ needs delivering vehicles of the highest quality.

8 7Strategic ReportSime Darby Berhad Annual Report 2016
OUTLOOK & FUTURE FOCUS
The challenging economy will drive productivity and technological improvements
Australia & Pacific Islands
Commodity markets appear to have stabilised and are beginning to show signs of modest improvement. The large volumes of new equipment placed into the market over the last five years have reached their rebuild stage. The business is lean and ready to take advantage of the product support opportunities that are beginning to appear. Increasing use of technology to lower customer costs and improve penetration is a key strategy.
China
There is an increasing trend of adoption in technology-based solutions for traditional heavy equipment. Infrastructure, rail and road building and maintenance are moving at a good pace which will be ideal segments for potential business expansion. The heavy mining sector is slow due to consolidation of industry players via mergers and acquisitions as the Chinese government focuses on reducing the number of players to increase productivity and efficiency.
Malaysia
Opportunities for sale and rental of smaller CAT & Allied equipment are present due to the urban transportation infrastructure development across the nation especially in the Klang Valley, namely the upgrading of five major highways, the East Coast railway line, the Penang Transport Master Plan, upgrading of rural roads nationwide and public transportation systems in the Klang Valley as well as the continued investment in the Pan Borneo Highway.
Continued investment in nation building projects provide potential growth for the heavy equipment industry via major projects including the Pengerang Integrated Petroleum Complex, construction of five new hospitals in various states, Flood Mitigation Projects nationwide, the Malaysia Vision Valley (MVV) project in Negeri Sembilan and eight new theme parks in Iskandar Malaysia.
Singapore
Demand for heavy equipment is expected to remain steady with continued public investment in infrastructure projects such as the remaining contracts for the Mass Rapid Transit (MRT) line, Changi Airport Terminal 5, Tuas Mega Port and road expansion works.
Recovery in the oil and gas and marine segments is not expected to be imminent. Although the rig and OSV market is likely to remain soft, there is still opportunity for the construction and conversions of other vessels, as well as expanded opportunities with new products such as Cat Propulsion, and Pyroban for Zone 2 hazardous environments.
Our employees’ energy delivers results in each of our business.

8 8 Sime Darby BerhadAnnual Report 2016Innovating for the Future
OUR KEY HIGHLIGHTS
MOTORSDIVISIONAL OPERATIONS REVIEW

8 9Strategic ReportSime Darby Berhad Annual Report 2016
9,676 employees2015: 10,310 employees
“We have made encouraging progress to improve our position in FY2016 despite an unprecedented turbulent year. We are confident that with improved efforts and delivery, the Division will outperform in the new financial year”.
DATO’ LAWRENCE LEE CHEOW HOCK,Managing Director, Motors Division
OUR VISION
To be a leading automotive player in the Asia Pacific region.
OUR KEY MARKETS
Australia, China, Hong Kong, Macau, Malaysia, New Zealand, Singapore, Taiwan, Thailand and Vietnam.
OUR KEY FOCUS
The Division focuses on enhancing operational efficiency and maximising opportunities for growth along the value chain. The Division strives to deliver its objectives of achieving strategic growth and improved performance in the coming years.
WHO WE ARE
Sime Darby Motors is an automotive group in the Asia Pacific region. Sime Darby Motors represents several automotive manufacturers, from luxury brands such as BMW, Jaguar Land Rover and Porsche, to broad-appeal market brands including Ford and Hyundai. We are active in all facets of the automotive value chain, from assembly and distribution, to retail and rental.
MARKET & INDUSTRY OVERVIEW
The automotive industry was affected by various factors, including regulatory changes and economic uncertainties during the year.
Malaysia
Weak consumer sentiment and moderation in private consumption of big-ticket items led to softer vehicle sales this year. The subdued automotive industry was also affected by the slower economic growth, weaker Ringgit and stringent approvals for hire purchase loans. Passenger vehicle sales was down by 14.5% year-on-year in the first half of 2016.
Singapore
Increased certificate of entitlements (COEs) following de-registration of vehicles nearing their 10-year validity period bolstered vehicle sales. In 2015, 100,859 vehicles were de-registered, up 74.7% year-on-year. Vehicles de-registered in the first six months of 2016 grew by 35.7% to 62,416 units, up from 45,995 units the previous year.

9 0 Sime Darby BerhadAnnual Report 2016Innovating for the Future
China
Luxury marques in China continue to face tough market conditions arising from intense price competition and government intervention imposing curbs on luxury spending. This notwithstanding, vehicle sales increased by 8.3% year-on-year in 1H2016.
Hong Kong
The deteriorating economic climate due to the slowing Chinese economy, the negative impact of the decline in property prices and weak consumer spending had adversely affected luxury vehicle sales. Vehicle sales were down 19.3% year-on-year in the first half of 2016.
Australia
New vehicle sales continued to increase, fuelled largely by the growth of the SUV market. Vehicle sales increased by 3.4% year-on-year in 1H2016. The mining sector struggled under the weight of declining external demand for Australia’s raw materials which undermined demand for the rental of commercial vehicles.
All figures are inclusive of Passenger Vehicles (PV) and Commercial Vehicles (CV) and represent unit sales.
Sources1 Malaysian Automotive Association2 Singapore Land Transport Authority 3 Thai Automotive Industry Association4 Vietnam Automobile Manufacturers Association 5 China Association of Automobiles Manufacturers
6 Hong Kong Department of Transport7 DSEC Macau 8 Taiwan Transportation Vehicle Manufacturers Association9 Australia Federal Chamber of Automative Industries10 New Zealand Motor Industry Association
The all-new BMW 7 series. The future of luxury is here.
DIVISIONAL OPERATIONS REVIEW

9 1Strategic ReportSime Darby Berhad Annual Report 2016
BUSINESS MODEL
The Motors Division’s business model includes importation, assembly, distribution, retail of new and used cars, after-sales service and rental. The Division’s diversified portfolio of 30 brands targets middle-to-high income groups. The Division’s wide retail network is complemented by its customer-focused after-sales service and used-car segments. The Division’s assembly capabilities have enabled it to competitively price its Complete Knocked Down (CKD) products in the retail market.
Access to capital
Assembly capacity and expertise
Intellectual capital: Business processes, brands, dealership, outlet approvals and designs, licenses
Talents: Experienced management team with in depth industry knowledge
Conducive work environment
Continuous engagement with stakeholders
OUR KEY RESOURCES
Conglomerate Advantage
Access to capital
Strong PresenceDiversified portfolio of
leading brands in strategic locations across
major Asia Pacific markets
Strong NetworkLong standing and
proven relationships with key world class
automotive manufacturers
Value Chain ControlVertically integrated across its value chain
which includes importation, assembly,
distribution, retail of new and used cars,
after-sales service and rental
CREATERespectable financial returns through operational excellence and high performance standards.
DIVERSIFYWide range of brand coverage: 30 marques ranging from mass market brands to luxury brands.
SYNERGISEStrong relationships with car manufacturers enhances growth potential.
CULTIVATEDevelop capabilities in assembly expertise and comprehensive after-sales services.
Underpinned by Integrity, Respect & Responsibility, Excellence and Enterprise
BUSINESS PARTNERS• Increase brand value and
enhance brand loyalty resulting in potential growth.
• Increased confidence in partnerships.
CUSTOMERS• Easily accessible outlets
and comprehensive after-sales service provide customers with convenience and reliability.
GOVERNMENTS & SOCIETY• Develop positive
relationships with authorities.
INVESTORS• Develop a winning
portfolio of sustainable businesses.
• Growth through geographical expansion.
HOW WE SHARE THE VALUE WE CREATE
EMPLOYEES• Develop competencies
and skills which increase job efficiency and effectiveness resulting in improved quality and a safe workplace.
HOW WE CREATE VALUE
OUR COMPETITIVE ADVANTAGE

9 2 Sime Darby BerhadAnnual Report 2016Innovating for the Future
OUR STRATEGY
Sime Darby Motors aspires to be a leading automotive player in the Asia Pacific Region. A key strategic theme is to tap into the growing demand for automobiles in the Asia Pacific region through both organic and inorganic growth. To ensure sustainability of the operations, the Division aims to expand its assembly capacity to serve export markets, and continues to focus on after-sales and the used car business. The Motors Division is also pursuing innovative projects to stimulate long-term growth.
REVIEW OF PERFORMANCE
Overall Financial Performance
The Motors Division reported an improved PBIT of RM502.5 million for FY2016, 6.1% higher than the previous financial year, attributable to the impressive results from China, Singapore, Thailand and Vietnam. However, headwinds encountered in FY2015 continued into FY2016, especially in Malaysia, where the weaker Ringgit and tighter lending conditions resulted in a decline in profit; Hong Kong/Macau posted reduced earnings due to intense competition in the luxury segment while New Zealand recorded lower contribution from the Truck Operations.
The improved year-on-year performance for the Division was commendable, considering the challenging conditions prevailing in most markets.
Malaysia
The Malaysian operations continued to struggle in the face of subdued growth for Passenger Vehicles (PV) that stemmed from tighter lending conditions and the impact of the Goods and Services Tax (GST). Sales volume declined by 27% in FY2016.In early 2016, BMW Malaysia announced that it has received customised Energy Efficient Vehicles
(EEV) status incentives for a number of its models, which allows the vehicles to be priced more competitively. At the same time, this scheme has supported Inokom to further expand its portfolio of CKD products as the EEV policy aims to attract foreign investments in the local automobile industry.
Construction work for the “Automotive Complex” in Ara Damansara, Malaysia is ongoing, with completion expected by early FY2018. The facility will be built in accordance with the “Green Building Index” standards. Once ready, this one-stop facility will house a number of luxury and premium brands while offering after-sales service for all marques represented under one roof. This will further strengthen Motors’ brand presence in Malaysia, elevate customer experience and reduce operational costs.
Singapore
Singapore delivered a stellar performance with all operating units positively contributing to this success which was underpinned by an increased COE quota. The BMW operation benefitted from the introduction of Category A COE models (smaller cars below 1600cc), a segment that represents 40% of the market, previously denied to BMW. The unavailability of key Ford models were offset by Peugeot’s improved year-on-year sales
DIVISIONAL OPERATIONS REVIEW

9 3Strategic ReportSime Darby Berhad Annual Report 2016
performance. The used car business exceeded expectations despite sourcing issues for second-hand cars – a continued function of the prohibitive loan curbs, with cars being kept for longer periods in favour of retaining existing cars. Conversely, the Hertz rental business benefitted from the finance restrictions, as the car leasing option is becoming a more viable alternative to ownership.
Thailand
The Thailand operations have turned around and performed well during the year on a more stable political environment. Improvements to boost operational efficiency across all facets of the business has paid off despite the fragile economy. Units sold increased by 29% during the year.
Vietnam
The Vietnam operation reported another record profit on the back of a buoyant economy. The introduction of Special Consumption Tax (SCT) in January 2016 provided the impetus for increased registrations to avoid the increased levy. To meet the potential of this rising economy, particularly with AFTA opportunities from 2018, continued nationwide network expansion remains a key focus. The addition of a Body and Paint facility in Ho Chi Minh City immediately contributed to the healthier bottom line.
China
The China operations have recovered strongly to more than double its PBIT despite the continued intense competition and economic slowdown, on the back of improved margins, cost control and increased contribution from the after-sales business. The operations will continue to focus on maximising value across the value chain, particularly the after-sales, finance and insurance income streams to further enhance profit contribution.
Hong Kong/Macau
The luxury car business in both Hong Kong and Macau were adversely affected by the deteriorating economic conditions, underpinned by a slowing Chinese economy, weak property market and sharp decline in gambling revenue for Macau. Efforts to realise synergies from the consolidation of the operations in Hong Kong and Macau operations are ongoing. Further improvements are being made to consolidate the operations and improve productivity.
Taiwan
In the second year of its start-up phase in Taiwan, the Kia business focused on growing its brand equity in the market to maximise volume. Sales volume grew 88% over the previous year, whilst revenue increased by 102%. The locally assembled Kia Carens won the prestigious MPV of the Year Award for the second year running, and proved to be a mainstay of the expanding sales volume. The year culminated with the successful launch of the all-new Kia Sportage in June 2016, and a further expansion of the Motor Division’s dealer network with the addition of one 3S and two 2S facilities in Eastern Taiwan.
Australia
The BMW operation in Brisbane continues to contribute strong results, helping to offset losses from the Corefleet operations, whose rental business continues to struggle in the midst of the Australian mining sector downturn. The Peugeot Citroen business faced aggressive competition in the mass market segment.
In line with the retail growth strategy, a new Ferrari dealership was set up in Brisbane during the financial year, while the new enlarged Porsche Sydney Dealership is expected to commence operations in FY2017.
New Zealand
The New Zealand operations reported lower profits, affected by the troubled dairy industry, leading to demand for commercial vehicles dropping by half. At the same time, heavy trucks also experienced lower demand against a slowdown in the construction sector. The motor retail business has turned around and delivered an impressive performance, reflecting the result of a successful restructuring exercise.

9 4 Sime Darby BerhadAnnual Report 2016Innovating for the Future
OPERATIONAL IMPROVEMENTS SAFETY & HEALTH
Safety is crucial to the Division. Processes have been put in place which have resulted in reduced Lost Time Injury Frequency Rate (LTIFR) from 1.6 in FY2015 to 0.4 in FY2016, better than the target of 1.5. Initiatives such as the introduction of the Environment, Safety & Health Manual and Procedures, continuous safety awareness and capacity building programmes also helped to reduce lost time due to injury.
Motors has exceeded the targeted benefits derived from Lean Six Sigma initiatives of RM6.0 million by achieving approximately RM13.7 million in savings. This amount is mainly contributed by savings in procurement and assembly operations.
Additionally, Motors also launched a division-wide War on Waste campaign as part of the Group’s continuous improvement (Kaizen) challenge.
INNOVATION
The Division launched a Mobile Application (Mobile App) in Malaysia for various brands under its belt. Features of the Mobile App include the convenience to book a car for a test drive or for rent, locate the nearest dealer, request for roadside assistance and to stay updated on attractive deals and promotions. The main drive for the implementation of this Mobile App is placing customers first by providing convenience and attending to problems with immediate solutions. In addition, the launch of the Mobile App is a sign of having continuous improvement with effort to provide enhanced services.
The Porsche 911 GT3 RS. Naturally aspirated. Nurburgring Honed.
DIVISIONAL OPERATIONS REVIEW

9 5Strategic ReportSime Darby Berhad Annual Report 2016
The Ford Mustang. Engineered for adrenaline pumping performance.
OUTLOOK & FUTURE FOCUS
The Motors Division expects a mixed performance from its businesses in the near future. The Malaysian operations are expected to face continued weak market sentiment, stringent hire purchase financing and a weak Ringgit. However, this would be mitigated by upcoming product launches.
The easing of loan tenure and amount by the Monetary Authority of Singapore coupled with the increasing COE supply is expected to drive demand for new cars in Singapore. The operations in Thailand are expected to improve with the recovery of the economy post the general elections expected in mid-2017. However, the operations in Vietnam could be impacted by the higher SCT impact.
The China car industry is bracing itself for a “new normal” of slower growth as the economy slows and markets in coastal cities become more saturated. Restrictions on car sales and driving prohibitions remain a threat.
The positive near-term impact of the recently announced interest rates and tax cuts will outweigh what remains a fairly lacklustre economic backdrop in Australia. New Zealand car sales may decline from 2015 levels as the NZD weakens and households look to reduce debt levels.
The Motors Division remains focused on enhancing operational efficiency. With organic growth initiatives such as turning around of underperforming businesses, management of cost and working capital, improving after-sales operations as well as the execution of strategic projects in the pipeline, the Division is well positioned to continue delivering sustainable profits in the coming years.
The Jaguar XE. The most advanced, efficient and refined sports saloon the Jaguar has ever produced.
Hyundai Tucson. Change the way you drive.

9 6 Sime Darby BerhadAnnual Report 2016Innovating for the Future
OUR KEY HIGHLIGHTS
PROPERTY DIVISIONAL OPERATIONS REVIEW
0 200 400 600 800 1000 1200
2016
2015
2014
2013
2012
PROFIT BEFORE INTEREST AND TAX (PBIT) (RMm)
1,064.7
889.4
599.7
571.5
467.2

9 7Strategic ReportSime Darby Berhad Annual Report 2016
1,763employees2015: 1,789 employees
“We aspire to establish Sime Darby Property as the number one sustainable property developer in Malaysia and beyond, that dynamically realises the needs and dreams of our customers and communities. We aim to deliver the best performance and products to remain at the forefront of the industry.”
DATO’ IR. JAUHARI HAMIDIManaging Director, Property Division
OUR VISION
To be the No.1 sustainable property developer in Malaysia and beyond.
OUR KEY MARKETS
Malaysia, Australia, Singapore, Vietnam and United Kingdom.
OUR KEY FOCUS
Sime Darby Property is committed to transforming spaces into sustainable communities. We deliver economic, social and environmental value to all our communities and stakeholders. Innovation and sustainability are mindsets that we actively cultivate to deliver on these promises.
WHO WE ARE
Sime Darby Property is a multiple award winning integrated developer based in Malaysia. We are involved in property development, property investment & asset management, with assets in Australia, Singapore, Vietnam and the United Kingdom. Sime Darby Property has over 40 years of experience in developing sustainable communities, with 23 active townships/developments and has approximately 28,000 acres of landbank infour main corridors spanning from Selangor to Johor, which includes 10,800 acres earmarked for future development. Sime Darby Property
spearheads various projects including themed townships, integrated and niche developments, transit oriented developments, industrial parks, business centres and retail malls. In addition to property development, the Division also operates several commercial and hospitality & leisure assets in Malaysia and Singapore, including TPC Kuala Lumpur (formerly known as the Kuala Lumpur Golf and Country Club).
MARKET & INDUSTRY OVERVIEW
Malaysia’s real GDP growth for 2015 moderated at 5.1% as domestic demand remained the key driver of growth (2014: 5.9%) (Bank Negara Malaysia, BNM). 2016 GDP growth is estimated to maintain circa 4.2% (Malaysian Institute of Economic Research, MIER).
Headline inflation, as measured by the annual percentage change in the Consumer Price Index (CPI), declined to 2.1% in 2015 (2014: 3.2%). The lower headline inflation was largely contributed by the impact of the lower global energy and commodity prices, which more than offset the effects from a weaker Ringgit, the implementation of GST, and several upward adjustments in administered prices made towards the end of the year.
Notwithstanding weaker external demand, MIER’s latest survey results are slightly upbeat for consumers. Consumer sentiment has inched upwards to 78.5 points in CY2Q16 (CY2Q2015: 71.7 points) but still remains below the optimism threshold.

9 8 Sime Darby BerhadAnnual Report 2016Innovating for the Future
The move by BNM to lower the Overnight Policy Rate (OPR) to 3% is encouraging and this is expected to generally help spur the Malaysian economy and subsequently deliver positive impact to the property industry.
The Malaysian House Price Index (MHPI) sustained its moderating trend. As at Q42015, the MHPI stood at 227.5 points (at base year 2000), up by 5.8% on an annual basis. The annual rate of increase for MHPI has been decelerating since Q42013, due to the various cooling measures to curb excessive increase of house prices (National Property Information Centre, NAPIC).
In 2015, 362,105 transactions worth RM149.9 billion was recorded, down by a marginal 5.7% in volume and 8.0% in value against 2014. The residential sub-sector continued to lead the overall market, with 65.2% contribution in volume and 49.0% in value.
The retail sub-sector recorded a slight improvement in occupancy from 81.8% in 2014 to 82.4% in 2015. Selangor dominated the existing retail space whilst Kuala Lumpur dominated the incoming and planned supply. As for the office sub-sector, a slight downturn was seen in the overall occupancy rate which was 83.7%, down from 84.9% in 2014.
In the UK, annual growth in prime central residential London was 0.8% in March 2016, a rate that is unlikely to change significantly in the short-term as the market digests a series of tax changes, including an additional 3% stamp duty for buy-to-let properties and second homes introduced in April 2016. While there remains a high level of speculation over the impact of Brexit on the prime London property market, it remains too early to discern its likely long term impact (Knight Frank UK).
Spanning over 7.12 acres in Ara Damansara, Malaysia the Cantara Residences is a freehold condominium with four tower blocks connected by a Sky Bridge and located close to the Lembah Subang LRT station.
DIVISIONAL OPERATIONS REVIEW

9 9Strategic ReportSime Darby Berhad Annual Report 2016
BUSINESS MODEL
The Division continues to build its brand through themed-township developments, integrated and niche developments, managed industrial/business parks and commercial developments. It is now working towards establishing Real Estate Investment Trust (REIT) platforms as part of its aspirations to become an integrated property developer with a respectable amount of recurring income.
OUR STRATEGY
The Property Division’s strategy is centred on improving its core execution, preparing for new growth areas and establishing REIT platforms. It is determined to meet the constantly evolving needs of the market through delivering the right products at the right price, and driving operational efficiency from product design to product handover.
As for the development of new growth areas, Malaysia Vision Valley (MVV) represents a key priority for the Property Division.

1 0 0 Sime Darby BerhadAnnual Report 2016Innovating for the Future
DIVISIONAL OPERATIONS REVIEW

1 0 1Strategic ReportSime Darby Berhad Annual Report 2016
REVIEW OF PERFORMANCE
Overall Financial Performance
The Property Division’s Profit Before Interest and Tax (PBIT) jumped 20% from RM889.4 million in FY2015 to RM1,065 million in FY2016, surpassing the RM1 billion mark for the first time. This was mainly attributable to monetisation of our assets, from the disposal of two subsidiaries in Singapore of RM447.1 million, gain on disposal of Syarikat Malacca Straits Inn Sdn Bhd of RM39.4 million, gain on compulsory land acquisitions totaling RM145.4 million and gain on disposal of land in Semenyih of RM184.5 million. The one-off gains from the disposal of the two Singapore subsidiaries for SGD206.3 million (RM600.8 million) are part of the Group’s initiatives to unlock the value of its commercial properties and establish REIT platforms.
The Malaysian residential market continued to pose challenges in FY2016. The Property Development segment recorded a Gross Sales Value (GSV) of RM1.74 billion on the back of 1,894 units sold, compared with GSV of RM2.1 billion and 1,659 units sold in FY2015. The lower GSV in FY2016 despite higher units sold was mainly due to the stronger demand for mid-range products.
Property Development - Malaysia
In FY2016, the Property Division continued to launch new townships and mixed developments despite challenging market conditions. These include Elmina West, Serenia City and Bandar Universiti Pagoh (BUP). Two of these new townships are set to derive value from the presence of higher education facilities, namely Xiamen University within Serenia City, which enrolled its first batch of 600 students in February 2016, and the Pagoh Education Hub in BUP, expecting to enrol its first batch of students by May 2017.
The Division launched Quarza Residences within the integrated development of KL East, which is adjacent to a forest park and surrounded by lush green landscapes.
The Division entered into a collaboration with the KYS Education Group with a long-term land lease arrangement for the setting up of the KYS International School in KL East. The development of KYS International School in KL East will be undertaken independently by the KYS Education Group. The launch of residential units in Elmina Valley in FY2016 is an indication that despite challenging market conditions, market demand remains strong for the right products at the right price. This is reflected by the Elmina Valley first and second phases achieving take-up rates between 85% and 95%.
Other highlights for FY2016 include the launch of the Bandar Ainsdale interchange in July 2015 and the Nilai Impian interchange in October 2015. These interchanges provide easy access to the townships, while ensuring the Property Division’s support for the development of vital infrastructure in Negeri Sembilan.
One of the most significant partnerships the Division will undertake in 2017 will be Malaysia Vision Valley (MVV), a strategic regional development initiative promoted by the Negeri Sembilan State Government, with the support of the Federal Government. MVV is a Public-Private-Partnership project covering an area of up to 378,000 acres over 30 years. It aims to be an extension of the Greater KL area and a sustainable driver of economic development in Malaysia.The Property Division will continue to offer new products in the future such as Managed Industrial/ Business Parks (MIBPs) in Bandar Bukit Raja and BUP. Other MIBPs currently in the pipeline include Kulai, Lagong and Kota Elmina.
From its vantage point on the River Thames, the 42 acres Battersea Power Station masterplan occupies one of the most accessible locations in London, creates a series of villages with each intended to have its own distinct character.

1 0 2 Sime Darby BerhadAnnual Report 2016Innovating for the Future
Property Development - United Kingdom
The Property Division owns a 40% stake in the iconic Battersea Power Station project. The commercial space at Circus West, where 867 new homes will be located, is the bedrock of a vibrant new neighbourhood which not only delivers a community-focused environment, but also helps to create an attractive visitor destination when it opens to the public in early 2017. The residential component of Circus West is 99% taken up (including reserved units) and the first home-owners are expected to move in at the end of 2016.
Phase 2, which is 91% taken up (including reserved units), will see 255 apartments created above and within the Power Station, with designs and materials reflecting the spirit of the grand building. It will also accommodate 470,000 sq ft of offices, over 80 shops, 15 cafes and restaurants, 39,000 sq ft street food market, leisure and recreation facilities as well as a 2,000 seat event venue.
Phase 3 will be the main gateway to the entire development. It will feature a pedestrianised high street, ‘Electric Boulevard, with 45 new shops, 12 cafes and restaurants. A total of 1,318 new homes will be developed, along with hospitality and health facilities. For Phase 3A, 60% of the residential units have been taken up (including reserved units). Prospect Place will be the location of ‘Prospect Park’, housing a children’s play area in the northern end and a community hub building in the southern area. Prospect Place forms part of the new High Street at Battersea Power Station.
Lifestyle hotel operator Art’otel has signed an agreement to manage a new hotel at the Battersea Power Station redevelopment. The 160-plus bedroom hotel will be developed and managed by PPHE Hotel Group, owner of the Art’otel brand.
Once completed, the Battersea Power Station project will see the creation of a vibrant, mixed-use development and a new town centre for London, serviced by an extension to the Northern Line.
Battersea Power Station has been the recipient of 14 awards in three years since development began, including being named Developer of the Year in the 2015 International Emirates Glass LEAF awards, for demonstrating buildings that are setting the benchmark for the international architectural and design community. It was also the recipient of The Estates Gazette London Award, in honour of the development’s impact on the capital.
Property Investment and Asset Management
Melawati Mall, a collaboration between Sime Darby Property and CapitaLand Mall Asia, is set to bring about a facelift to the township of Melawati. The first major shopping mall in the established and affluent residential district of Taman Melawati, it is targeting middle and upper-middle income families, working professionals, residents in the vicinity and students from nearby schools.
The 13-storey mall has about 620,000 sq ft of net lettable area, with more than 250 retail shops spread over eight levels of retail space. It is set to open in the second quarter of 2017.
Sime Darby Property also partnered Blackstone Real Estate Partners Asia Ltd. to set up a private real estate investment trust for two assets in Singapore.
The Division intends to establish a listed REIT platform, which is expected to facilitate future asset monetisation activities through its access to the capital markets.
Set within the 5,000 acres City of Elmina, Elmina Valley Phase 1 & 2 are strategically situated within green surrounds, fostering wellness and liveability.
DIVISIONAL OPERATIONS REVIEW

1 0 3Strategic ReportSime Darby Berhad Annual Report 2016
INNOVATION
The Property Division aspires to be an innovative company with innovative products and services, in order to remain dynamic in a competitive market environment and to differentiate itself from its competitors.
In FY2016, the Division embarked on key innovation projects which included launching a mobile app, utilising virtual reality technology, digitising the Hand Over of Vacant Possession (HOVP) process and enhancing our marketing efforts through an all-inclusive digital and social media campaign.
The mobile app enables the expansion of our customer base within the country and beyond. The app has a user-friendly interface and virtual tours of selected properties for prospective customers, while existing homeowners (PRIME members) are able to manage their property portfolios, view billings, statement of accounts and report any issues they may have with their property.
To further provide customers with an immersive experience of their potential future homes, the Division utilised virtual reality technology that renders a 3-dimensional walk-through of the property.
The automated HOVP process, simplifies and improves the submission of defect rectification process via a web based customer portal or the mobile app. This increases customer centricity through improved customer experience and ensure quality excellence through an efficient inspection process.
On the digital campaign front, the Division pioneered its first social media and digital brand campaign for the 40th anniversary of its first township, Subang Jaya across Facebook, Instagram, Youtube, and digital ad networks. Its official Facebook page hit an all time high with a total of 2.47 million impressions, exceeding the target of planned views by over 300% for a total of 483,735 views. Through the campaign, the Property Division maximised its creative use of crowdsourcing techniques to reinforce the strength of its brand and stimulate interest and sales leads for future developments within the township.
SUSTAINABILITY
Sustainability remains at the core of the Property Division’s business practices and strategy, as well as a key component of its design and management approach. It recognises that its main business of developing large-scale townships has a long lasting impact and should be as positive as possible, by minimising adverse externalities such as environmental degradation and social marginalisation through the creation of socially and economically vibrant communities.
The Property Division ensures that its business assets, townships and developments adhere to strict environmental standards by embarking on the tracking and management of carbon emissions, waste and water. It has set area and revenue based carbon and water intensity reduction targets for the year 2020. For waste, the Division has set an area and per capita based intensity reduction target.
The Property Division’s approach includes stakeholder engagement to support its vision of developing sustainable communities, instil awareness and understanding of the need to lead a sustainable lifestyle and promote a long term balanced outcome. Community-based initiatives include the T.R.E.E. (Together in Restoring the Earth’s Environment) programme where 980 endangered, rare and threatened (ERT) trees from 22 species have been planted so far and the Young Sustainability Ambassadors (YSA) programme, with more than 630 members enrolled to date.
TPC Kuala Lumpur (formerly known as KLGCC), a prominent world class amenity nestled within Sime Darby Property’s new pride and joy, ALYA Kuala Lumpur (formerly known as KLGCC Resort).

1 0 4 Sime Darby BerhadAnnual Report 2016Innovating for the Future
The Property Division embarked on a five-year Environmental Safety and Health (ESH) Transformation Plan that underlines initiatives to strengthen its fundamentals and subsequently, maintain an excellent ESH performance record. The Property Division recorded a total of 1,189 concern reports for FY2016. This signifies enhanced awareness on safety among the Division’s stakeholders, through the reporting of unsafe practices and conditions, near misses and other actions detrimental to safety.
Two key initiatives were also implemented, namely ESH Risk Management and ESH Legal Compliance programmes. These programmes shall drive the Division towards a risk based ESH management approach in ensuring a safe and healthy workplace.
OUTLOOK & FUTURE FOCUS
According to NAPIC, the residential sub-sector is expected to experience further softening in 2016, in view of the various internal and external uncertainties foreseeable in the coming year. Affordably priced residential products will continue to be the driver of 2016 property market growth in Malaysia.
The division will focus on delivering the right product mix to ensure we remain at the forefront of the industry as well as achieving project progress as planned.
The Division will also continue to focus on increasing recurring income streams through asset monetisation, acquisition of yield accretive properties and yield income. Additionally, it will focus its efforts on new growth areas like MVV, managed industrial/business parks, commercial developments.
DIVISIONAL OPERATIONS REVIEW
Chemara Hills, Seremban is a thoughtfully planned township nestled on elevated land, providing communities the space, privacy and security it needs.

1 0 5Strategic ReportSime Darby Berhad Annual Report 2016
OUR KEY HIGHLIGHTS
LOGISTICSDIVISIONAL OPERATIONS REVIEW

1 0 6 Sime Darby BerhadAnnual Report 2016Innovating for the Future
“The Logistics Division’s performance remains resilient despite the weak economic backdrop. The Division is focused on completing its expansion projects, working with major customers and industry partners to capture throughput and improve its logistics offerings.”
TIMOTHY LEE CHI TIMManaging Director, Logistics Division
OUR VISION
To be a leading comprehensive ports & logistics and water business operator in Shandong province, China.
OUR KEY MARKET
Bohai Bay, Shandong province, China.
OUR KEY FOCUS
The Division’s focus is on delivering exceptional port handling service and other logistics-related service to its customers in China.
WHO WE ARE
The Logistics Division (renamed from E&U Division (China Operations) to reflect the growing ports and logistics business in China) is the primary operator of Weifang Port, of which operations cover dry bulk, break bulk, liquid bulk, general cargo and container handling services. Weifang Port is expected to complete the construction of 6 x 30,000 deadweight tonnage (DWT) and 2 x 50,000 DWT berths capable of handling bigger ships that carry dry bulk, wood chips, pulp, liquid and petrochemical cargos by the end of FY2017. The Division also operates three river ports located in Jining, Shandong Province. The Jining Ports provide basic port related services such as stevedoring and storage services primarily for coal and coal-related products. The two water treatment plants operated by the Division are located in the Binhai Economic-Technological Development Area (BEDA) adjacent to Weifang Port and supplies clean water to residential, commercial and industrial users in BEDA.
977 employees2015: 1,041 employees

1 0 7Strategic ReportSime Darby Berhad Annual Report 2016
MARKET & INDUSTRY OVERVIEW
Pockets of opportunities available amidst challenging operating environment
The FY2016 results reflected the challenging economic conditions in China as the country’s 2015’s GDP growth slowed to a 25-year low of 6.9%. The slowdown was expected as China is shifting away from a manufacturing-dependent economy to one driven by consumer demand whilst its government is determined to shed the excess of strong credit and investment growth. Demand for crude oil, steel, coal and other raw materials that once fueled China’s economic expansion, generally declined across most parts of the country. Both Weifang and Jining Port clusters handled lower volume for certain types of commodities compared to the year before.
Despite the slowdown, Shandong’s hinterland will continue to provide pockets of growth in certain industries such as petroleum and paper-making. For instance, China is beefing up its energy policy by diversifying its import source - as a result of geopolitical uncertainties. In early 2015, the National Development and Reform Commission (NDRC) of China announced the deregulation of crude oil importation, allowing local refineries of
Weifang Sime Darby Port’s 3 x 20,000 DWT container berths.
smaller capacity to use crude oil as feedstock (which is cheaper compared to fuel oil previously used by the refinery). Non-state owned refineries in the Shandong hinterland stood to benefit from such liberalisation which came earlier than expected. As at of the end of 2015, a total of 10 refineries (approximately half of the refineries in Shandong or 25% of the refineries in China) were awarded the permit to import about 40 million MT of crude oil per annum. This translates into more stevedoring and storage business for Weifang Port when the new liquid terminal is operational in 2017 as some of the recipients are the port’s existing customers. Separately, sizeable committed investments by paper makers, paper pulp makers and furniture makers in the immediate hinterland of Weifang promise potential additional volume of woodchips and wood cargo for the port.

1 0 8 Sime Darby BerhadAnnual Report 2016Innovating for the Future
BUSINESS MODEL
The Logistics Division operates businesses in port and related services in Weifang and Jining, Shandong Province. Its port unit handles a diverse range of dry bulk, break bulk, liquid and container cargos. Additionally, the Division owns and
Access to capital
Multi-purpose port with 15 berths/terminals in Weifang Port
Bulk/coal ports with 14 berths/terminals in Jining
Water treatment facilities 51.1 million cubic metres per annum
Talents: Employees with relevant industry experience exceeding an average of 10 years
Business processes, licenses and government approvals
OUR KEY RESOURCES
Conglomerate Advantage
Access to capital
Strategic LocationClose proximity to
immediate and regional
hinterland with increased demand
Strong NetworkLong-standing
relationship developed with business partners,
suppliers, local authorities and
regulators
CREATEStable returns on investment.
ENHANCECatalyst to spur local economy.
GROWLargest integrated port network in Jining.
DEVELOPCreate employment for local community.
NETWORKLong-term partnership with different stakeholders.
Underpinned by Integrity, Respect & Responsibility, Excellence and Enterprise
CUSTOMERS• Provide customers with
reliable service, backed by proven track record in efficiency and productivity.
• One of the most efficient river port networks in Shandong province.
EMPLOYEES• Develop a pool of talent
for the local industry.
GOVERNMENTS & SOCIETY• Develop positives
relationship with authorities.
INVESTORS• Improving Return on
Average Invested Capital.
• Targeting double digit returns over the long-term.
HOW WE SHARE THE VALUE WE CREATE
HOW WE CREATE VALUE
OUR COMPETITIVE ADVANTAGE
operates two water treatment plants and distribution pipe network in Weifang’s BEDA, a marine economic area 20 kilometres away from Weifang Port.
DIVISIONAL OPERATIONS REVIEW

1 0 9Strategic ReportSime Darby Berhad Annual Report 2016
OUR STRATEGY
The Division aims to enhance Weifang Port’s status from a feeder port to a major regional port and improve its domestic and international cargo mix by completing its planned expansion programme. The Jining Port Cluster strives to preserve its leading position as a major coal and coal related products
REVIEW OF PERFORMANCE
Overall Financial Performance
The Logistics Division’s overall financial performance remained resilient during FY2016 despite the challenging environment. The revenue of RM293.5 million for FY2016 remained virtually unchanged on a year-on-year basis, on the back of improved water volume and water average tariff, which mitigated the overall reduction in port throughput. The general cargo throughput in Weifang and Jining ports were lower than last year due to the slowdown in economic activities and stiff competition from alternative modes of transportation. On the other hand, PBIT increased 27% from RM76.8 million to RM97.6 million. The increase was mainly attributable to the gain on disposal of the 50% equity interest in Weifang Sime Darby Liquid Terminal Co. Ltd, of RM18.3 million for the purpose of forming a 50:50 joint venture with Dragon Crown Group Holdings (DC), a Hong Kong listed integrated liquid terminal company, to jointly develop the two liquid berths and approximately 500,000 cubic metre tank facilities in Weifang Port, as part of the Logistics Division’s strategy to grow its port businesses. The joint venture would allow the Division to penetrate the lucrative chemical market by leveraging on DC’s strong local and international client network.
Weifang Port would also benefit from the technical know-how and industry experience in handling highly sophisticated chemical products gained from the JV.
Ports & Logistics
Weifang Port recorded a slight (1.6%) decrease in general cargo throughput this year as the drop in such traditional bulk products as raw salt, coal, and fuel oil were offset by the improvement in transhipment throughput for products like bauxite and iron ore fines and newly developed products such as de-sulphureted gypsum, timber, and drop-and-pull trucker. Weifang Port’s resilient performance is attributed to its timely response to the highly competitive market and its initiative in developing new products for its cargo handling services. Despite lower throughput, Weifang Port improved its productivity (measured by tonne per hour) by 3% for general cargo and the truck turnover time improved by 8.4% in FY2016.
Jining Ports’ 12.1% decline in throughput is primarily attributable to the weak market demand for construction materials (sand and steel) amidst the slowing property market, as well as the lower coal throughput in light of the tightening environmental policy in China.
STRATEGIC OBJECTIVES
FY2016 HIGHLIGHTS PRIORITIES FOR FY2017
• Close to 95% completion of six new terminals (3 x 30,000 DWT multipurpose terminal and 3 x 30,000 DWT dry bulk terminal).
• Approximately 85% completion of 2 x 50,000 DWT liquid terminal.
• Laid additional distributional pipes of approximately 14km to new areas and users. Total length of water pipes reached 203.5 km in FY2016, covering two-thirds of BEDA area of 616 km2.
• Nil
Expand and diversify the capacity and capability of Weifang Port to maximise its full potential.
Full completion of six new multipur-pose and dry bulk terminals in 2nd half of 2016 and two new liquid terminals in 1st half of 2017.
Commence construction of Jining Sime Darby Longgong Port (phase 2).
Continue expanding shipping routes and develop other value-added services.
Diversify cargo and develop logistics support at Jining Port.
Strengthen market share by expanding in tandem with demand and/ or the Government’s development plans.
handling port in the Grand Canal waterway, while also diversifying its cargo mix as coal demand slackens. Weifang Water will continue to support the development of Weifang Port as well as BEDA’s development plans to capture new demand and expand its market share and customer base.

1 1 0 Sime Darby BerhadAnnual Report 2016Innovating for the Future
During the year under review, container operations handled 215,745 twenty-foot equivalent unit (TEU) of containers, an 11.6% growth. The growth is the result of the Division’s strategy to capture the increasing demand in the immediate and surrounding hinterland. The container operations marked a significant milestone in FY2016 with the successful establishment of its first international direct shipping route to Busan, South Korea. As of today, the container operations of Weifang Port has successfully established six container shipping routes in total (five domestic route and one international direct route), covering key destinations in China and extending its network to worldwide destinations via its Weifang – Dalian transhipment route.
The Division continued its cost savings and business improvement initiatives during the year under review. The results have been encouraging as the realised benefits of RMB0.9 million (RM0.6 million) exceeded the target of RMB0.3 million (RM0.2 million). Benefits were mainly derived from electricity savings through streamlining processes, waste recycling and wear and tear reduction.
The main channel of Weifang Port has been dredged up to 10.2 m (capable of accommodating 20,000 DWT class vessels) by the Weifang Port Services Co. Ltd, a 37% Sime Darby owned joint venture company responsible for developing, managing and maintaining major infrastructures in Weifang Port. In FY2016, the joint venture company proceeded to upgrade the main channel to accommodate 35,000 DWT class vessels, which is expected to be completed in the second half of 2016.
Water Management
Despite the slower economic growth, the water operation registered an increase of 5.9% in water sales volume from 33.9 million cubic metres to 35.9 million cubic metres due to higher water usage from several key customers. As a result, capacity utilisation improved from 66.3% to 74.8% in FY2016.
Safety & Health
In 2016, the Logistics Division recorded two major incidents with one fatality and one serious injury within its operation site in Weifang Port and Jining Port.
Occupational safety and health practices have been the top priority of the Division with repeated training and safety awareness campaigns held to educate its workforce, clients and visitors entering the premises of the ports and water plants during the year. Environmental, Safety and Health updates are discussed during monthly operations meetings to improve the safety level of its operations.
DIVISIONAL OPERATIONS REVIEW

1 1 1Strategic ReportSime Darby Berhad Annual Report 2016
OUTLOOK & FUTURE FOCUS
Focused on Enhancing Competitive Advantage and Capturing Opportunities
The Division expects slower economic growth in China over the next few years and cargo growth will generally remain flattish. Competition among the ports and other transportation modes may lead to declining and volatile tariff rates while collaboration among logistics players will likely intensify to mitigate the risk.
Despite the prevailing challenging outlook for the port industry, the Division’s commitment towards the completion of eight large terminals as well as improvement of its customer value proposition along the modern logistic chain remains its primary focus going forward. In its quest to become a leading logistics provider in Bohai Bay, the Division will strive to integrate it strategic plan with various initiatives under the China economic transition (eg. One Belt, One Road), seize new available business opportunities and enhance cooperation with relevant key parties including anchor customers, shipping
E&U China’s Jining Ports is one of the most efficient river port networks in Shandong province.
companies and forwarding agencies to strengthen its control over its immediate and regional hinterland markets, while expanding its connectivity within Shandong and outside Shandong.
The Shandong hinterland continues to provide growth opportunities in certain industries such as petroleum and paper-making. The liberalisation on the importation of crude oil and large investments committed by oil refiners and paper-making companies in the immediate hinterland, augur well for Weifang Port’s new terminals.
In addition, the Division will continue to streamline its operations and improve operational and cost efficiency. With the above initiatives, the Division will be able to continue to deliver sustainable returns.

1 1 2 Sime Darby BerhadAnnual Report 2016Innovating for the Future

1 1 3Sime Darby Berhad Annual Report 2016 Corporate Governance
STATEMENT ONCORPORATE GOVERNANCE
“Our governance processes, culture of integrity and openness, and a diversity of perspective continue to support the Board in delivering a sustainable and successful Sime Darby Group.”
TAN SRI DATO’ ABDUL GHANI OTHMANChairman
CHAIRMAN’S OVERVIEW
The Board attaches the highest priority to corporate governance and as a Board, we provide strong leadership in setting standards and values for our company. As Chairman, I passionately believe in creating and delivering long term sustainable value to our stakeholders. Our governance processes, culture of integrity and openness, and a diversity of perspective continue to support the Board in delivering a sustainable and successful Sime Darby Group. Our Board Committees continue to play a vital role in supporting the Board. Our governance structure is shown on page 122. Each Board Committee chair has provided a report on the Committee’s key focus areas and action plans during the year. You can read about this in the ensuing pages of this statement.
I am pleased to report that we are fully compliant with the Malaysian Code on Corporate Governance 2012.
Strategy
The Board remains focused on the key priorities of the Company in light of the challenging operating environment. As a Board, we are cognisant of our critical role in governing and setting the strategic direction of the Company, while excercising oversight on the targets set by management.
Together with Management, we explored and debated the strategic priorities of the Company, leveraging on our Board members’ different experiences, skills and expertise to provide insights and refinements to the strategic process, always with a focus as to ‘where the Company wants to be and how to get there.’
Board Effectiveness
I continue to keep the membership of our Board under review, looking for exceptional candidates to join us and ensuring that we have the right mix of skills, experience and background. Our overriding priority in any new appointment is to select the best candidate with a view to achieving a high-performing Board, in line with the evolving circumstances and needs of the Group. The Directors of the Board are selected on the criteria of proven skill and ability in their particular field of endeavour, and a diversity of outlook and experience which directly benefits the operation of the Board as the custodian of the business.
I am personally committed to ensuring that our Board is strong, committed, effective and able to respond to the opportunities and challenges we face in a changing world, and under the prevailing ‘business unusual’ circumstances. As Chairman, it is my responsibility to encourage an environment of open, robust and effective debate during discussions at the Board. The Board certainly did not shy away from difficult conversations and decisions during the financial year, always with a focus on what was needed to drive forward the execution of the strategy to generate sustainable value for Sime Darby and its stakeholders. This is the Board culture we foster at Sime Darby and we shall continue to live this culture and promote it within our businesses. We have carried out the annual board evaluation through an external facilitator. The feedback from the evaluation provided insightful areas and recommendations for the Board and these will form part of our key focus areas for FY2017. The resulting development themes that arose from the evaluation are discussed from pages 141 to 143.

1 1 4 Sime Darby BerhadAnnual Report 2016Innovating for the Future
Composition, Diversity and Inclusiveness
The Board and I are committed to work towards greater diversity in the boardroom. In addition to gender, we will look to achieve diversity in age, nationalities and balance of skills, experience, knowledge and independence, so as to bring relevant perspectives to Board discussions. I am pleased that we have made demonstrable progress to increase the number of women Directors on our Board. Most recently, Datuk Wan Selamah Wan Sulaiman, the former Accountant-General, joined the Board as an Independent Non-Executive Director with effect from 15 January 2016. Currently, 23% of our Board members are women and the Board aspires to meet the Government’s call of having 30% women representation on Board.
The new appointments ensure that the Board remains effective and cohesive with optimum balance of skills, experience, knowledge, independence and personal attributes. The recruitment process was led by me as Chairman of the Nomination & Remuneration Committee (NRC)with the full involvement and support of the members of the NRC and is explained in more detail in the NRC Report.
Dialogues with Stakeholders
The Board recognises that regular communication results in engaged stakeholders. During the year, we have continued our work in promoting greater and more effective engagement with our institutional investors and analysts. The President & Group Chief Executive and I, along with our Group Chief Financial Officer have met with our major institutional investors on several occasions to discuss, among others, the strengthening of our market position and the Group’s key investments. I have also met with our major shareholder both in my capacity as Chairman of Sime Darby and as Chairman of the NRC on the composition of the Board. We will continue to engage with our shareholders over the course of the coming financial year.
Governance Debate and Consultation Exercises
We continue to engage in the wider governance debate and consultation exercises that have taken place during the year. Among others, we have responded to the public consultation paper on the Proposed Draft of the Malaysian Code on Corporate Governance 2016 issued by the Securities Commission Malaysia, and the Proposed Review of the Main Market Listing Requirements relating to Disclosure and Corporate Governance Requirements, Stakeholders Feedback to Improve on the Standard of Disclosure by Listed Issuers and the consultation paper on Sustainability issued by Bursa Malaysia Securities Berhad. You will find that some of the proposed governance practices outlined in the public consultation paper on the Malaysian Code on Corporate Governance 2016 have been integrated into this Statement. I am pleased to share that the Company has adopted many of these recommendations even prior to the issuance of the public consultation paper. The Board believes in the Company taking leadership position and becoming the agent of change in continuously raising the bar on governance standards and best practices.
STATEMENT ON CORPORATE GOVERNANCE
1 1 5Sime Darby Berhad Annual Report 2016 Corporate Governance
Culture and Values
In Sime Darby, it is the people that makes the Company great. As a Board, we set the ‘tone at the top’ in terms of the Company’s culture and values. The Board recognises the importance of adhering to Sime Darby’s founding values during any transformational change. In everything we do, in the decisions that we make, we uphold a culture of doing the ‘right thing’ in the way we operate, locally and globally. We are governed by our Code of Business Conduct to ensure that we do the right things in the right way. The Board and I recently endorsed the Sime Darby Group Slavery and Human Trafficking Statement for the financial year 2015/2016 which is a governance framework on human rights, slavery and human trafficking under the UK Modern Slavery Act 2015. You can read the Statement on page 386. Although the Group is not required to publish the Statement as the Group’s current operations do not meet the revenue threshold requirements, Sime Darby has decided to take the leadership role in publishing the Statement in our continuous Human Rights journey.
Reporting
This annual report marks the third year in our Integrated Reporting journey and I am pleased with the progress we are making to keep our annual report interesting and engaging and ensuring that key messages are clear, concise and easy to locate. I would like to thank the Chairmen and members of the Board Committees for their commitment and devoting their time to our reporting. In this corporate governance statement, we aim to provide an insight into the workings of the Board and its Committees over the last financial year and the Corporate Governance Framework. The Board is satisfied that all committees are working effectively to deliver strong oversight and governance over their respective areas of responsibility, and are reporting appropriately to the Board. I would like to thank my fellow Board members, the Chairmen and members of the Board Committees for their exceptional support and commitment during the course of FY2016.
The year 2016 has not been without its challenges and I thank Management and our employees for their relentless efforts and innovative ideas to counter the challenges in the competitive operating environment. We must strive to maintain our leadership position to take forward the execution of our strategy, deliver our priorities and generate the long-term sustainable value that will benefit the stakeholders and society at large. The Annual General Meeting is a platform for meaningful engagement with our shareholders. The Board and I look forward to seeing you at the 2016 Annual General Meeting for an open and constructive discussion.
TAN SRI DATO’ ABDUL GHANI OTHMANChairman

1 1 6 Sime Darby BerhadAnnual Report 2016Innovating for the Future
BOARD OF DIRECTORS
Tan Sri Dato’ Abdul Ghani Othman Chairman, Independent Non-Executive Director
Malaysian, age 69
Date of Appointment: 1 July 2013Areas of Expertise:Public Administration and Economics.Relevant Experience:Began his career with the Faculty of Economics, University of Malaya and has held various positions in the Malaysian Government including Deputy Minister of Energy, Telecommunications and Post, Deputy Minister of Finance, Minister of Youth and Sports and Chief Minister of Johor. Former Chairman of Johor Corporation. Current member of the Board of Trustees of the World Islamic Economic Forum (WIEF) Foundation and an Advisor of City University College of Science & Technology. Directorship of other Listed Issuers/Public Companies:Listed Issuers: None.Public Companies: Sime Darby Property Berhad.
Tan Sri Dato’ Sri Dr Wan Abdul Aziz Wan Abdullah Deputy Chairman, Non-Independent Non-Executive DirectorMalaysian, age 64
Date of Appointment: 10 December 2012Areas of Expertise:Public Administration and Economics. Relevant Experience:Held various senior positions in Government, notably, the Secretary General of Treasury in the Ministry of Finance. Former Alternate Executive Director of World Bank Group, representing the South East Asia Group and former Executive Director of the Islamic Development Bank and Islamic Trade Finance Corporation. Presently a Director of the Sabah Economic Development and Investment Authority (SEDIA).Directorship of other Listed Issuers/Public Companies:Listed Issuers: Malaysia Airports Holdings Berhad.Public Companies: Bank Pembangunan Malaysia Berhad, Permodalan Nasional Berhad and RAM Holdings Berhad.
Tan Sri Samsudin Osman Non-Independent Non-Executive Director
Malaysian, age 69
Date of Appointment: 19 December 2008Areas of Expertise:Public Administration and Fund Management.Relevant Experience:Held various senior positions in the Malaysian Government including Secretary General, Ministry of Home Affairs and Ministry of Domestic Trade and Consumer Affairs, and Chief Secretary to the Government of Malaysia. Former President of Perbadanan Putrajaya. Current Chairman of the Employees Provident Fund Board, Universiti Utara Malaysia and National Unity Consultative Council. Directorship of other Listed Issuers/Public Companies:Listed Issuers: BIMB Holdings Berhad.Public Companies: None.
NRCNRC RMC
M M M

1 1 7Sime Darby Berhad Annual Report 2016 Corporate Governance
Muhammad Lutfi Non-Independent Non-Executive Director
Indonesian, age 47
Date of Appointment: 24 November 2015Areas of Expertise:Trading, Oil & Gas and Power Utilities.Relevant Experience:Former National Chairman of the Indonesia Young Entrepreneurs Association (HIPMI) and Chairman of the Indonesia Coordinating Board of Investment. Former Ambassador Extraordinary and Plenipotentiary to Japan and the Federated States of Micronesia and Minister of Trade of the Republic of Indonesia. Current President Commissioner of PT Medco Energi International Tbk.Directorship of other Listed Issuers/Public Companies:None.
Tan Sri Datuk Dr Yusof Basiran Non-Independent Non-Executive Director
Malaysian, age 68
Date of Appointment: 16 November 2010Areas of Expertise:Plantation and Research & Development.Relevant Experience:Former Director-General of the Malaysian Palm Oil Board and Palm Oil Research Institute of Malaysia. Past President of the Academy of Sciences Malaysia. Current Chief Executive Officer of the Malaysian Palm Oil Council and Director of Bank Negara Malaysia. Senior Fellow of the Academy of Sciences Malaysia and Fellow of the Malaysian Oil Scientists’ and Technologists’ Association and the Incorporated Society of Planters.Directorship of other Listed issuers/Public Companies:Listed Issuers: CB Industrial Product Holding Berhad.Public Companies: None.
Datuk Zaiton Mohd Hassan Senior Independent Non-Executive Director
Malaysian, age 60
Date of Appointment: 16 November 2010(Appointed as Senior Independent Non-Executive Director of Sime Darby Berhad on 23 November 2015)Areas of Expertise:Banking and Finance.Relevant Experience:Has working experience in PricewaterhouseCoopers, Bank Pembangunan (M) Bhd and Bapema Corporation Sdn Bhd. Has served 12 years with Maybank in various senior positions including that of General Manager, Group Strategic Planning. Former President/Executive Director of Malaysian Rating Corporation Berhad. Current Chairman of the Private Pension Administrator Malaysia, Vice President of the Malaysian Institute of Accountants and Chief Executive Officer of Malaysia Professional Accountancy Centre (MyPAC). Fellow and Council Member of the Association of Chartered Certified Accountants, UK and member of the International Federation of Accountants (IFAC) Professional Accountants in Business (PAIB) Committee.Directorship of other Listed Issuers/Public Companies:Listed Issuers: BIMB Holdings Berhad and Dolphin International Berhad.Public Companies: Bank Islam Malaysia Berhad.
NRCGACSC SC
M M F
Nomination & Remuneration Committee
Male
Risk Management Committee
Chairman Member
Sustainability Committee
Governance & Audit CommitteeNRC GAC
SCRMC
Committee membership
GenderM
F Female

1 1 8 Sime Darby BerhadAnnual Report 2016Innovating for the Future
Datuk Wan Selamah Wan Sulaiman Independent Non-Executive Director
Malaysian, age 61
Date of Appointment: 15 January 2016Areas of Expertise:Accounting & Finance.Relevant Experience:Has served the Ministry of Education and the Ministry of Defence. Has held various senior positions in the Accountant-General’s Department, Ministry of Finance, including Director of the Information Technology Services Division and Director of the Central Operations and Agency Services Division. Former Accountant-General of Malaysia. Directorship of other Listed Issuers/ Public Companies:Listed Issuers: None.Public Companies: Prasarana Malaysia Berhad.
Dato Sri Lim Haw Kuang Independent Non-Executive Director
Malaysian, age 62
Date of Appointment: 26 August 2010
Areas of Expertise:Oil & Gas and Power & Water Utilities.
Relevant Experience:Served 34 years with Shell in various senior positions including Executive Chairman of Shell Companies in China, Chairman of Shell Companies in Malaysia and Managing Director of Shell Malaysia Exploration & Production. Former President of the Business Council for Sustainable Development Malaysia and Director of BG Group Plc as well as ENN Energy Holdings Limited. Currently, Director of Bank Negara Malaysia and ENN Group Co Limited as well as International Council Member of the China Council for International Cooperation on Environment and Development.Directorship of other Listed Issuers/ Public Companies:Listed Issuers:None.Public Companies: Ranhill Holdings Berhad.
Datuk Dr Mohd Daud Bakar Non-Independent Non-Executive Director
Malaysian, age 52
Date of Appointment: 1 June 2016Areas of Expertise:Shariah Advisory in Islamic Finance and Islamic Capital Market.
Relevant Experience:Founder and Chairman of Amanie Group, Chairman of the Shariah Advisory Councils of Bank Negara Malaysia, the Securities Commission and the Labuan Financial Services Authority. Chairman of the Shari’ah Committee of the International Islamic Liquidity Management Corporation. Currently a Shariah Board member of numerous international financial institutions and banks.Directorship of other Listed Issuers/ Public Companies:None.
GAC NRCRMC
MF M
BOARD OF DIRECTORS

1 1 9Sime Darby Berhad Annual Report 2016 Corporate Governance
Dato’ Rohana Tan Sri Mahmood Independent Non-Executive Director
Malaysian, age 62
Date of Appointment: 24 June 2014
Areas of Expertise:Economics and Fund Management.
Relevant Experience:Former Assistant Secretary of the Planning Division of the Ministry of Foreign Affairs Malaysia. Presently, Chairman and Founder of RM Capital Partners & Associates Sdn Bhd and Chairman of the Advisory Council and Founding Member of the Kuala Lumpur Business Club. Member of the APEC Business Advisory Council, Global Council of the Asia Society, New York, Advisory Board of Chubb Limited, New York and the Malaysian Committee of the Council for Security Cooperation in the Asia Pacific as well as a Board Member of the Pacific Basin Economic Council Limited, Hong Kong. Distinguished Fellow and Board member of the Institute of Strategic and International Studies Malaysia.Directorship of other Listed Issuers/ Public Companies:Listed Issuers: AMMB Holdings Berhad and Paramount Corporation Berhad.Public Companies: AmInvestment Bank Berhad and Sime Darby Property Berhad.
Ir Dr Muhamad Fuad Abdullah Independent Non-Executive Director
Malaysian, age 63
Date of Appointment: 4 February 2013
Areas of Expertise:Engineering, Project Management and Shariah Advisory in Islamic Finance and Islamic Capital Market.
Relevant Experience:Former Chief Executive Officer of Kausar Corporation Sdn Bhd and Managing Director of Five-H Associates Sdn Bhd. Presently, Chairman of the Shariah Committee for the Malaysian Industrial Development Finance Berhad Group of Companies, member of the Shariah Advisory Committee for BIMB Securities Sdn Bhd and member of the Group Shariah Committee of MNRB Holdings Berhad.Directorship of other Listed Issuers/ Public Companies:Listed Issuers: Mesiniaga Berhad.Public Companies: Institut Kefahaman Islam Malaysia and MIDF Property Berhad.
Zainal Abidin Jamal Non-Independent Non-Executive Director
Malaysian, age 62
Date of Appointment: 1 March 2016
Areas of Expertise:Legal, Business and Regulatory Affairs.
Relevant Experience:Enrolled as an Advocate and Solicitor of the Supreme Court of Singapore and the High Court of Malaya. Served as a First Class Magistrate in Brunei Darussalam and Company Secretary of Harrisons Malaysian Plantations Berhad. Founder and Senior Partner of Zainal Abidin & Co. Directorship of other Listed Issuers/ Public Companies:Listed Issuers: None.Public Companies: Maybank Islamic Berhad, Maybank Trustees Berhad, Etiqa Takaful Berhad, Lam Soon (M) Berhad and Sime Darby Property Berhad.
GACNRC SCSC RMC
M MF
Nomination & Remuneration Committee
Male
Risk Management Committee
Chairman Member
Sustainability Committee
Governance & Audit CommitteeNRC GAC
SCRMC
Committee membership
GenderM
F Female

1 2 0 Sime Darby BerhadAnnual Report 2016Innovating for the Future
Additional Information
1. Save as disclosed below, none of the Directors has any family relationship with and is not related to any director and/or major shareholder of Sime Darby Berhad, nor has any personal interest in any business arrangement involving the Company:
i. Tan Sri Samsudin Osman is a nominee Director of the Employees Provident Fund Board.
ii. The nominee Directors of Permodalan Nasional Berhad are as follows:
• Tan Sri Dato’ Sri Dr Wan Abdul Aziz Wan Abdullah;
• Tan Sri Datuk Dr Yusof Basiran;
• Muhammad Lutfi;• Datuk Dr Mohd Daud
Bakar; and• Zainal Abidin Jamal.
2. None of the Directors has any conflict of interest with Sime Darby Berhad or been convicted for offences within the past five years other than traffic offences, if any.
3. The details of Directors’ attendance at Board Meetings held in the financial year ended 30 June 2016 are set out in the Statement on Corporate Governance from pages 132 to 133 of this Annual Report.
4. The full profiles of the Directors are available online in the Board of Directors section at www.simedarby.com.
Tan Sri Dato’ Seri Mohd Bakke Salleh President & Group Chief Executive (Malaysian, age 62)
Date of Appointment: 16 November 2010
Areas of Expertise:Economics, Finance and Management.
Relevant Experience:Former Group President & Chief Executive Officer of Felda Global Ventures Holdings Berhad, Group Managing Director of Felda Holdings Berhad and Group Managing Director and Chief Executive Officer of Lembaga Tabung Haji. Former Director, Property Division of Pengurusan Danaharta Nasional Berhad and has held various senior positions within the Permodalan Nasional Berhad Group including the Managing Director of Federal Power Sdn Bhd, Managing Director of Syarikat Perumahan Pegawai Kerajaan Sdn Bhd and Group General Manager of Island & Peninsular Group. Presently, Director of Malaysian Industry-Government Group for High Technology, an organisation under the Prime Minister’s Department and Council Member for the Northern Corridor Implementation Authority and Global Science & Innovation Advisory Council. Fellow of the Institute of Chartered Accountants in England and Wales. Directorship of other Listed Issuers/ Public Companies:Listed Issuers: Eastern & Oriental Berhad.Public Companies: Sime Darby Property Berhad and Yayasan Sime Darby.
Norzilah Megawati Abdul Rahman
Group Secretary(Malaysian, age 56)
Date of Appointment: 29 September 2007
Relevant Experience:Held various senior positions in Kumpulan Guthrie Berhad including Manager, Group Chief Executive’s Office, Controller, Corporate Business Development and Monitoring, Director of Corporate Business Development and Human Resource and Head, Group Legal & Compliance. Has working experience in many areas, among others, investment analysis, money market trading, corporate secretarial and legal as well as a Manager in the Group Chief Executive’s Office in Permodalan Nasional Berhad. Qualifications:• DegreeinLawfromthe
University of Malaya• AdmittedtotheMalaysianBar• LicensedCompanySecretary
Note: The full profile of the Group Secretary is available online in the Executive Leadership section at www.simedarby.com.
M

1 2 1Sime Darby Berhad Annual Report 2016 Corporate Governance
The Executive Leadership Team is the executive platform on which the Group’s senior leaders come together to communicate, review and deliberate on issues and actions of Group-wide significance, and support the President & Group Chief Executive in the performance of his duties.
Datuk Tong Poh KeowGroup Chief Financial Officer
Jeffri Salim DavidsonDeputy Group Chief Financial Officer
Hari NairGroup Chief Strategy & Innovation Officer
Zukifli Zainal AbidinGroup Chief Human Resources Officer
Philip KunjappyGroup Chief Trading & Procurement Officer
Dr Simon LordGroup Chief Sustainability Officer
Datuk Franki Anthony DassManaging Director, Plantation Division
Dato’ Ir Jauhari HamidiManaging Director, Property Division
Dato’ Lawrence Lee Cheow HockManaging Director, Motors Division
Scott William CameronManaging Director, Industrial Division
Timothy Lee Chi TimManaging Director, Logistics Division
Norzilah Megawati Abdul RahmanGroup Secretary
Glenn Charles DalyGroup Head, Risk Management
John Edward Arkosi, OBEGroup Head, Compliance &Corporate Assurance
Choo Suit MaeGroup General Counsel
Leela BarrockGroup Head, Communications
Note: The profiles of the Executive Leadership Team are available online in the Executive Leadership section at www.simedarby.com.
EXECUTIVELEADERSHIP

1 2 2 Sime Darby BerhadAnnual Report 2016Innovating for the Future
CORPORATE GOVERNANCE FRAMEWORK
The Corporate Governance Framework of the Sime Darby Group has been designed with the following key aims:
• Promotionoftransparency,accountabilityand a responsive attitude.
• Provisionofoperatingautonomytothevarious core business Divisions and Sime Darby Group companies towards the achievement of business objectives while maintaining adequate checks and balance.
• Cultivationofethicalbusinessconductanddesired behaviours based on the Group’s core values and business principles, which are also set out in the Code of Business Conduct (COBC).
The Framework is the means by which the Board of SDB delegates functions and powers to the Flagship Subsidiary Boards (FSB) of the respective Divisions and facilitates the delegation of day-to-day management to operating personnel.
Two-Tier Board Structure
The hallmark of Sime Darby’s Corporate Governance Framework is the two-tier board structure, headed by the Sime Darby Board, also known as the Main Board and supported by Divisional FSBs. Each Divisional FSB is charged with operational oversight of its Division but remains subject to the direction and counsel of the Main Board, particularly on matters of strategy and policy. In addition, the Main Board has delegated certain responsibilities to Board Committees to assist in carrying out its functions and to ensure independent oversight of internal control and risk management.
The structure is modular and Divisional FSBs can be added or removed as and when businesses are acquired or disposed of. Following the integration of the operations in the Energy & Utilities (E&U) Division Non-China Operations into the Industrial Division, the E&U Division Non-China Operations ceased to become a Flagship Subsidiary. E&U Division China Operations is now known as the Logistics Division to reflect the growing ports and logistics business in China. Terms of Reference (TOR) have been established to ensure the Divisional FSBs remain focused on all aspects of Divisional operations. This allows the Main Board to take a broader perspective, looking at enterprise issues such as strategy, risk management and governance.
Notes: 1 As of 1 July 2016, upon the completion of the integration of the operating entities of E&U Division
Non-China Operations into Industrial Division, the latter assumes oversight of the former. 2 As of 1 July 2016, E&U Division China Operations has been renamed Logistics Division.
STATEMENT ON CORPORATE GOVERNANCE

1 2 3Sime Darby Berhad Annual Report 2016 Corporate Governance
Assurance, Compliance and Risk
The three (3) key gatekeepers of good corporate governance in the Sime Darby Group are the Assurance, Compliance and Risk Management functions. Direct reporting lines to the Governance & Audit Committee and the Risk Management Committee enable these functions to operate with a high degree of impartiality and independence from the rest of the organisation, emphasising the Group’s commitment for high standards of governance. The Group Secretary serves as a key advisor to the Board on matters of corporate governance.
Additional information on the Group’s risk management and internal control systems can be found in the Statement on Risk Management and Internal Control on page 167.
Note:Group Head, Corporate Assurance, Group Head, Compliance and Group Head, Risk Management have administrative reporting lines to the President & Group Chief Executive.

1 2 4 Sime Darby BerhadAnnual Report 2016Innovating for the Future
BOARD STRUCTURE AND ROLES
Board Charter
The Board Charter sets out the Board’s strategic intent and outlines the roles and powers that the Board specifically reserves for itself and those which it delegates to Management and in so doing, also sets the tone of the various Board Committees and FSBs.
The Board Charter serves as a constitution for the Board and assists the Board in the assessment of its own performance. The Charter addresses the following pertinent matters:
• Thepurpose,reviewprocessandcontinuouseducation of the Board.
• ThestructureandcompositionoftheBoard.• AuthorityoftheBoard,includingtheright
to obtain advice, to have access to personnel of the Group and to convene meetings as required.
• TherolesandresponsibilitiesoftheBoardincluding the Board’s oversight role and succession planning.
• TheconductofBoardmeetings.
The Board Charter is reviewed periodically with its latest update being made in February 2015 to strengthen the Group’s commitment towards environment, safety and health.
The Board Charter is available online in the Corporate Governance section at www.simedarby.com
Roles and Responsibilities of the Board
The Main Board recognises its duty and privilege as the apex governing body of the Group. The Board is cognisant of the need to promote and protect the interests of shareholders and stakeholders of the Group. The Main Board also shoulders the ultimate responsibility of determining the direction of the Group, assisting in the fine-tuning of corporate strategies and ensuring effective execution of these strategies.
The key objectives of the Main Board are to:
• OverseetheconductoftheGroup’sbusiness including the formulation of strategy and performance objectives, control and accountability systems, corporate governance framework, risk management practices and human capital management.
• Approveandmonitortheprogressofmajorcapital expenditure, fund-raising, acquisitions and divestitures.
• Fulfilstatutoryandfiduciaryresponsibilities by monitoring the operational, financial and risk management processes of the Group.
• Ensurecompliancewithenvironment,safetyand health legislation by understanding the operations being carried out by the employees as well as the hazards and risks associated with the Group’s operations.
• ReviewtheefficiencyandqualityoftheGroup’s financial reporting process and systems of accounting and internal controls.
• Ascertaintheindependenceoftheexternalauditor and Group Corporate Assurance (GCA) function.
• Monitorcompliancewithestablishedpolicies and procedures.
• EvaluatetheperformanceoftheMainBoard, FSBs and the various Board Committees.
The Main Board not only sets the strategic direction but also oversees and ensures that the conduct of the businesses of the Group is in compliance with laws and ethical values.
STATEMENT ON CORPORATE GOVERNANCE

1 2 5Sime Darby Berhad Annual Report 2016 Corporate Governance
Overview of the Roles on the Board
Role Key Responsibilities
Chairman The Chairman of the Board’s primary role is to preside over meetings of Directors and ensure the smooth functioning of the Board in the interest of good corporate governance.
President & Group Chief Executive (PGCE)
The PGCE assumes overall responsibilities for the execution of the Group’s strategies in line with the Board’s direction, oversees the operations of the Flagship Subsidiary Companies and drives the Group’s businesses and performance towards achieving its vision and goals.
Senior Independent Non-Executive Director
The Senior Independent Non-Executive Director acts as a point of contact for shareholders and other stakeholders with concerns which have not been resolved or those deemed inappropriate to be communicated through the normal channels.
Non-Executive Director
Non-Executive Directors (both Independent and Non-Independent) monitor and supervise Management’s conduct in running the business while bringing their external perspective and wisdom to bear on the decision making process.
Further descriptions of the duties/roles are in the Board Charter available in the Corporate Governance section at www.simedarby.com
Relationship between the Chairman and PGCE
The Board supports the principle that separate individuals for the Chairman and Chief Executive Officer positions is beneficial to the effective functioning of the Board and facilitates a powerful check and balance mechanism.
There is a separation of roles and responsibilities of the Chairman and the PGCE as set out in the Board Charter. The Chairman leads the Board in setting the Group’s key policies and direction, ensures effective operation of the Board and is the spokesperson for the Board. He principally ensures that the Board fulfils its obligations under the Board Charter and as required under the relevant legislations. The PGCE ensures effective implementation of the Board’s policies, achieves strategic vision and performance targets, exercises high level of business judgement and manages the relationship with stakeholders and the interface with the public.
Board Committees
Four (4) Board Committees are established to assist the Main Board in the discharge of its statutory and fiduciary responsibilities. The Board Committees and their roles are as follows:
Board Committee Role
Governance & Audit Committee (GAC)
Chairman:Datuk Zaiton Mohd Hassan
Oversees the Company’s financial reporting process and practices, reviews the Group’s business process and system of internal controls, ensures implementation of an effective ethics programme across the Group, monitors compliance with established policies and procedures and ascertains the independence of both external auditors and internal audit function.
Refer to report on page 145 for more details on key activities.
Nomination & Remuneration Committee (NRC)
Chairman:Tan Sri Dato’ Abdul Ghani Othman
Manages the nomination and remuneration process of the Board, Board Committees, FSBs and pivotal management positions within the Sime Darby Group. Administers the Long Term Incentive Plan including any incentive plan (whether by way of a cash scheme or a share scheme) implemented or to be implemented by the Sime Darby Group.
Refer to report on page 152 for more details on key activities.
Sustainability Committee (SC)
Chairman:Dato’ Rohana Tan Sri Mahmood
Assists and supports the Board’s responsibility in overseeing the Group’s objectives, policies and practices pertaining to sustainability, more particularly the “People, Planet and Prosperity” elements covering environment, community relations and safety & health.
Refer to report on page 160 for more details on key activities.
Risk Management Committee (RMC)
Chairman:Dato Sri Lim Haw Kuang
Oversees the risk management activities of the Sime Darby Group. The Committee supports the Board in fulfilling its responsibility in identifying significant risks and ensuring the implementation of appropriate systems to manage the overall risk exposure of the Group.
Refer to report on page 165 for more details on key activities.

1 2 6 Sime Darby BerhadAnnual Report 2016Innovating for the Future
Flagship Subsidiary Boards
In view of the size of the Sime Darby Group, FSBs were established to exercise oversight over each core division within the Group. Each FSB is structured to ensure a balanced composition, with members drawn from the Main Board, Senior Management and external industry experts. All nominations to Divisional FSBs are reviewed by the NRC.
Each FSB has at least three (3) representatives from the Main Board to facilitate a clear and unambiguous line of oversight from the Board to the Divisions. There are also three (3) representatives from Management and at least three (3) external parties. The external Directors who are subject matter experts form a valuable resource for strategic planning providing insight into trends and forecasts, creating a more conducive environment for informed decision making.
The role of the FSB is to oversee the operations of the respective Divisions, subject always to the counsel of the Main Board and in compliance with any policy and delegated authority limits set by the Main Board. Broadly, the FSB’s key roles are to:
• overseetheoperationsoftherespectiveDivisions, which include but are not limited to overseeing their business strategy and performance, human capital management, corporate governance and risk management practices.
• fulfilitsstatutoryandfiduciaryresponsibilities of monitoring management and financial risk processes and accounting and financial reporting practices of the Division.
• reviewtheDivision’sbusinessefficiencyand the quality of the Division’s accounting function, financial reporting processes and system of internal controls.
• enhancetheindependenceofboththeexternal and internal audit functions by providing direction to and exercising oversight of, these functions.
• ensuretheimplementationofaneffectiveethics programme across the Division and monitor compliance with established policies and procedures.
The TOR of the FSBs have been enhanced to include provisions on safety & health oversight responsibilities consistent with the amendments made to the Board Charter.
Each FSB has the discretion to establish its own Board Committee(s) to facilitate the discharge of its duties and responsibilities. The GAC of the FSBs of the Plantation and Property Divisions were established on 11 February 2011 and 29 February 2016 respectively. The GACs of the FSBs have oversight of the financial risk processes and accounting and financial reporting practices of their respective Division, considers the reports and recommendations by the internal and external auditors, and reviews the overall results of the companies within the Divisions. The TORs of the GACs of the FSBs are aligned with the TOR of the GAC of the Main Board, where relevant.
The composition of each FSB is available at the respective websites of the Divisions. The salient TOR of the FSB are available online in the Corporate Governance section at www.simedarby.com
AUTHORITY AND DELEGATION
Authority of the Board
Every year the Board has a forward schedule and agenda of key items to consider. The Board reserves full decision making powers on the following matters:
• GroupandDivisionalstrategy,corporateplans and annual budget.
• Acquisitions,disposalsandtransactionsexceeding the authority limits of the FSBs.
• ChangestoHeadsoftheDivision/ManagingDirectors of Flagship Subsidiary Companies and Senior Management at Group Head Office.
• Changesinthekeypolicies,proceduresanddelegated authority limits of the Group.
STATEMENT ON CORPORATE GOVERNANCE

1 2 7Sime Darby Berhad Annual Report 2016 Corporate Governance
The Board, together with the FSBs, perform the following roles as set out by the Malaysian Code on Corporate Governance 2012:
• ReviewandadoptastrategicplanfortheCompany.
• OverseetheconductoftheCompany’sbusiness to ensure that the business is managed properly.
• Identifyprincipalrisksandensuretheimplementation of appropriate internal controls and mitigation measures to manage these risks.
• Managethesuccessionplanningprocess,including appointing, training, determining compensation of and where appropriate, replacing Senior Management.
• Overseethedevelopmentandimplementation of a shareholders’ communication policy for the Company.
• Reviewtheadequacyandtheintegrityofthe Company’s internal control systems and management information systems, including systems for compliance with applicable laws, regulations, rules, directives and guidelines.
The Board has been practising some of the roles recommended under the Proposed Malaysian Code on Corporate Governance 2016, as follows:
• ReviewandadoptastrategicplanfortheCompany which includes strategies on environmental, social and governance underpinning sustainability.
• OverseeManagement’simplementationofthe Company’s strategic objectives and its performance.
• Ensurethatanappropriateriskmanagementframework is in place and set the risk appetite within which the Board expects Management to operate.
• Overseethedevelopmentandimplementation of a shareholders’ communication policy for the Company.

1 2 8 Sime Darby BerhadAnnual Report 2016Innovating for the Future
Delegated Executive Authority
As the Board does not manage every aspect of the Group, the Executive Leadership team is given certain powers to execute transactions as defined and formalised in the Group Policies and Authorities, specifically the limits of authority. The Board, however, is aware that delegation does not absolve responsibility as the Directors remain responsible for the exercise of power by the delegatee as if such power had been exercised by the Directors themselves.
In terms of day-to-day management, the Company has established a number of high level committees as follows:
Management Committee Role
Group Management Committee (GMC)
Chairman:President & Group Chief Executive
Has overall responsibility for management policies, day-to-day operations of the Group, the deployment and implementation of Board resolutions and oversees the achievement of objectives and results.
The GMC has no executive powers. Proposals by Management are discussed at the meeting where views are sought from members. The respective Managing Directors approve the proposals in accordance with the authority limits in the Group Policies and Authorities.
The current members include the Group Chief Financial Officer, Managing Directors of the Divisions and Group Chiefs of Group Head Office. The Group Head, Compliance & Corporate Assurance, Group Head, Risk Management, Group General Counsel and Group Head, Communications attend the meetings of the GMC as regular invitees. The Group Secretary acts as the Secretary to the GMC.
The GMC meets on a bi-monthly basis and when deemed necessary. The Committee met 8 times in the financial year.
Management Sustainability Committee
Chairman:Group Chief Operating Officer
Oversees sustainability operations within the Group including recommending Group sustainability policies and standards & procedures, reviewing and monitoring business sustainability practices and targets, tracking global sustainability trends and incorporating new developments into the Group sustainability management framework and addressing sustainability risks, communications and stakeholder management.
Group Investment Committee
Chairman:Group Chief Financial Officer
Reviews and recommends for approval major investment decisions to the PGCE and the relevant FSBs and/or the Main Board.
The Committee met 13 times in the financial year.
Group Tender Committee
Chairman:President & Group Chief Executive orGroup Chief Operating Officer
Review tenders valued at RM100 million and above before deliberation by the relevant FSB or the Main Board. The Committee has no mandate to approve the tenders that it reviews.
The Committee met 7 times in the financial year.
STATEMENT ON CORPORATE GOVERNANCE

1 2 9Sime Darby Berhad Annual Report 2016 Corporate Governance
Role of the Group Secretary
The Group Secretary is responsible for advising the Board on regulatory compliance matters and providing good information flow and comprehensive practical support to Directors, both as individuals and collectively, with particular emphasis on supporting the Non-Executive Directors in maintaining the highest standards of probity and corporate governance. All Directors have unrestricted access to the advice and services of the Group Secretary to facilitate the discharge of their duties.
The Group Secretary’s position is subject to a fixed tenure. The renewal of the contract, together with the performance of the Group Secretary is tabled to the NRC and the Main Board for recommendation and approval respectively.
The profile of the Group Secretary, Puan Norzilah Megawati Abdul Rahman, can be found on page 120. The detailed roles of the Group Secretary is available online in the Executive Leadership section at www.simedarby.com
Code of Business Conduct and Compliance
Established in 2011, the Group’s COBC serves as a central moral compass to guide the Group towards achieving the highest standards of behaviour in our business dealings. For related compliance activities, please refer to page 151. Details in relation to the whistleblowing channels available to external parties and stakeholders are available online in the Governance section at www.simedarby.com/about-us/governance/whitsleblowing Contact details of the Senior Independent Director are available on page 174.
Structure of High-Level Committees

1 3 0 Sime Darby BerhadAnnual Report 2016Innovating for the Future
BOARD ACTIVITIES AND MEETINGS
Board Activities
Topic Areas of focusFY2016
Matters considered Outcome Priorities for FY2017
Strategy Growth and innovation strategy
To remain resilient and position the Group for future growth through an emphasis on innovation.
Unlocked value of non-core assets and endorsed Innovation Growth KPIs for PGCE to drive the execution and identification of innovation projects.
To enhance capital discipline, explore strategic corporate exercises that could unlock value for investors, and support innovation growth to achieve the Group’s long term targets.
Continue to review/refine our risk appetite statements across our business as parameters to guide the Group’s risk tolerance when pursuing its strategic objectives.
Risk Appetite Statement
Parameters to guide the Group’s risk tolerance when pursuing its strategic objectives.
Enhance the Risk Management Framework.
Integration of the operations of the E&U Non-China Operations Division and Industrial Division
Integration of the operations of Flagship Subsidiaries to provide an integrated solution for clients and create a coherent market approach for biogas that allow for a single point of contact for biogas opportunities.
Allow further synergies in resource management, procurement and a mutual customer base and create a stronger platform for organic growth opportunities.
Group Corporate Disclosure Guidelines
Stakeholders engagements.
Provide meaningful communication to the investing public and proper disseminating of material information to stakeholders for transparency and good governance.
Leadership Succession planning Board Effectiveness Assessment 2016.
The outcome of the Board Effectiveness Assessment 2016 is on page 142.
Continue to review/refine the succession planning process.
Conduct a forward-looking talent/executive succession review to enhance understanding of what is being done to develop talent.
Board Composition Policy on Board Composition.
Diversity and inclusiveness
STATEMENT ON CORPORATE GOVERNANCE

1 3 1Sime Darby Berhad Annual Report 2016 Corporate Governance
In FY2016, the Board primarily focused on strategic growth and financial & business performance, in line with Sime Darby’s strategies and the challenging business landscape. Significant time was also spent assessing and deliberating new appointments to the Board. Time spent on various broad agenda topics at Board meetings is as follows:
In June of each year, the Board meets to set the tone for the Group’s long-term corporate strategy blueprint and to discuss and challenge the Group’s business strategy and plan, Group Budget and the Group Human Resources Blueprint. The meeting is attended by members of both the Board and GMC to facilitate effective and detailed discussions.
Board and Management Retreats are held annually to discuss, among others, the strategic direction of the Company and Group. The retreat also provides an opportunity for the Board to interact with members of Senior Management from the Group Head Office and Divisions in an informal setting.
An off-site retreat was held in March 2016 in Penang, Malaysia. The key focus was on strategic determining factors which would enable the Group to remain resilient and position itself for future growth. The Board and Management also engaged with several guest speakers who shared the macroeconomic outlook and sectoral megatrends. The topics of discussion can be found on page 138. The opportunity for meaningful discussion between the Board and Management at the retreat solidified the strategic themes and direction for the Group, preparing the Group to navigate the uncertain economic and business landscape.
Board and Management RetreatGroup photo session of the Board and Management during the Penang retreat.

1 3 2 Sime Darby BerhadAnnual Report 2016Innovating for the Future
BOARD MEETINGS AND ATTENDANCE
In FY2016, the Main Board had seven (7) Board meetings. No unscheduled Board meeting was called at short notice.
All Directors attended at least 50% of the Board Meetings held during the financial year, with the majority having full attendance, and have complied with the Main Market Listing Requirements of Bursa Malaysia Securities Berhad (Listing
Requirements) in terms of attendance. This reflects Board members’ commitment and dedication in fulfilling their duties and responsibilities. Directors who were unable to attend a meeting were encouraged to give the Chairman their views and comments on matters to be discussed in advance.
The breakdown of Board, Board Committees and General Meetings held and Directors’ attendance are set out below:
Board, Board Committee and General Meetings held in FY2016
GAC GAC GAC GAC GAC
NRC GAC AGM NRC NRC NRC
SC NRC BOD SC SC NRC SC
BOD RMC BOD RMC BOD RMC BOD RMC BOD RMC BOD NRC
Jul ‘15 Aug ‘15 Sep ‘15 Oct ‘15 Nov ‘15 Dec’15 Jan ‘16 Feb ‘16 Mar ‘16 Apr ‘16 May ‘16 Jun ‘16
Meetings: Board Committee Meetings:BOD Board GAC Governance & Audit Committee SC Sustainability Committee
AGM Annual General Meeting NRC Nomination & Remuneration Committee
RMC Risk Management Committee
Denotes unscheduled meeting
Details of the key activities of each Board Committee are set out within the relevant Committee reports from pages 145 to 166.
Directors’ attendance at Board meetings and the Annual General Meeting
Current Directors Designation/Independence
Scheduled meetings
Attendance % AGM
Tan Sri Dato’ Abdul Ghani Othman Chairman, Independent 7/7 100 1/1
Tan Sri Dato’ Sri Dr Wan Abdul Aziz Wan Abdullah
Deputy Chairman, Non-Independent
7/7 100 1/1
Tan Sri Samsudin Osman Non-Independent 6/7 86 1/1
Tan Sri Datuk Dr Yusof Basiran Non-Independent 7/7 100 1/1
Tan Sri Dato’ Seri Mohd Bakke Salleh Executive Director 7/7 100 1/1
Bapak Muhammad Lutfi Non-Independent 2/4 50 N/A
Datuk Zaiton Mohd Hassan Senior Independent 6/7 86 1/1
Datuk Wan Selamah Wan Sulaiman Independent 3/3 100 N/A
Datuk Dr Mohd Daud Bakar Non-Independent 1/1 100 N/A
Dato Sri Lim Haw Kuang Independent 7/7 100 1/1
Dato’ Rohana Tan Sri Mahmood Independent 6/7 86 1/1
Ir Dr Muhamad Fuad Abdullah Independent 7/7 100 1/1
Zainal Abidin Jamal Non-Independent 2/2 100 N/A
STATEMENT ON CORPORATE GOVERNANCE

1 3 3Sime Darby Berhad Annual Report 2016 Corporate Governance
BOARD EFFECTIVENESS
Balance and diversity
A Balanced Board
The Company continues to have a strong Board with qualified individuals and a good mix of technical and commercial experience with industry specific knowledge. The Directors collectively bring considerable knowledge, judgement and experience to the Board. The Non-Executive Directors come from broad industry and professional backgrounds, with varied experience and expertise aligned to the needs of the Group’s businesses. The areas of expertise of each Director is provided in pages 116 to 120.
The Chairman of the Main Board is an Independent Non-Executive Director. A strong and able non-executive element is a key feature of the Board and all Board members, with the exception of the PGCE, are Non-Executive Directors.
The Board actively seeks to maintain a strong independent element on the Board. Six (6) of the Directors are independent, exceeding the minimum one-third (1/3) requirement as set out in the Listing Requirements. None of the Independent Directors have served on the Board for more than nine (9) years. Details of the independence and objectivity assessments undertaken are provided on pages 136 and 158.
Five (5) of the Non-Independent Non-Executive Directors are Nominee Directors of Permodalan Nasional Berhad (PNB). Another Non-Independent Non-Executive Director, the Chairman of the Employees Provident Fund Board (EPF), represents EPF on the Main Board. Amanah Saham Nasional Berhad is the management company of Amanah Saham Bumiputera and is a wholly-owned subsidiary of PNB. AmanahRaya Trustees Berhad - Amanah Saham Bumiputera and EPF are major shareholders of the Company.
The Board is of the view that its size and composition is appropriate and commensurate with the complexity and scale of the Group’s operations. The Board constantly identifies and assesses potential candidates who meet the priority expertise and diversity requirements for appointment to the Board. New appointments as Directors of Sime Darby and the Group are made based on clear selection criteria.
Biographies of the Directors, their independence status and details of the relevant skills and experience they each bring to the Board are set out from pages 116 to 120. The selection criteria and recruitment process for Director appointments, and the Board’s reasons for supporting the appointments and re-appointments of Directors are set out in the NRC Report from pages 152 to 159. An explanation of the main roles of the Board is set out on page 125.
Designation/Independence
Scheduled meetings
Former Directors Attendance % AGM
Tan Sri Dato’ Sri Hamad Kama Piah Che Othman*
Deputy Chairman, Non-Independent
N/A N/A N/A
Tan Sri Dato’ Dr Wan Mohd Zahid Mohd Noordin
Non-Independent 2/3 67 0/1
Tan Sri Datuk Amar (Dr) Tommy Bugo @ Hamid Bugo
Independent 3/3 100 1/1
Dato’ Henry Sackville Barlow Senior Independent 3/3 100 1/1
Dato’ Azmi Mohd Ali Non-Independent 5/5 100 1/1
Designation
Scheduled meetings
Secretary Attendance % AGM
Norzilah Megawati Abdul Rahman Group Secretary 7/7 100 1/1
*Note: Tan Sri Dato’ Sri Hamad Kama Piah Che Othman resigned from the Board on 31 July 2015. No Board Meeting was held during Tan Sri Hamad Kama Piah’s tenure in FY2016.
Details of Board Committee attendance are set out within the relevant Committee reports from pages 145 to 166. The attendance of the members at the respective FSB meetings is available online in the Corporate Governance section at www.simedarby.com.

1 3 4 Sime Darby BerhadAnnual Report 2016Innovating for the Future
Overview of Board Diversity and Inclusivenessas at 30 June 2016
Balance of independent and non-independent directors
6
15
1
Independent DirectorsInclusive of Chairman
Nominee DirectorEmployees Provident Fund Board
Nominee DirectorsPermodalan Nasional Berhad
Executive Director
Promoting diversity and inclusiveness
The Board continuously enhances its composition in line with evolving circumstances and the needs of the Group given its size, business diversity and geography. The Board Composition Policy, approved in August 2015, aims to maintain at least two (2) women Directors on the Board with the Board actively working towards the minimum of 30% women as members of the Board by the end of 2016. The Board also embraces age diversity to encourage diversity in perspectives and balance the Board’s insight, experience and approach to decision making. The Board targets to have a composition where at least 50% of its Directors are less than 60 years of age by 2017.
The Policy and progress towards achieving the diversity targets have been reviewed in May 2016. The Board remains committed to meeting the targets set in the Policy. Additional details on Sime Darby’s diversity progress are provided in the NRC Report from pages 152 to 159. The salient features of the Board Composition Policy is available online in the Corporate Governance section at www.simedarby.com.
STATEMENT ON CORPORATE GOVERNANCE

1 3 5Sime Darby Berhad Annual Report 2016 Corporate Governance
BOARD EXPERIENCE
Note: Individual Directors may fall into one or more categories.
Length of service of non-executive directors
Fostering commitment
Board meeting and agenda schedules for discussion at the next calendar year are made available in the first quarter of each financial year to allow for adequate preparation before meetings. The schedules include meetings of Board Committees and general meetings of shareholders and maps out the flow of key items of business to ensure that sufficient time is set aside for strategic discussions.
To ensure that there is sufficient time for the Board to discuss substantive matters, key agenda items requiring the Board’s consideration are usually discussed at the beginning of Board meetings to allow for adequate time for thorough discussion.
In view of the size, complexity and operations of the Sime Darby Group spanning across 26 countries and 4 territories, Non-Executive Directors tend to devote a substantial amount of time to the Group.
Each Non-Executive Director is expected to commit approximately 45 days a year of his/her time to the Group. Time spent by Directors include not only formal Board meetings but also commitments of the Board Committees and FSBs, off site programmes, discussions with Management, professional development and education and Company functions. This time commitment means that Board nomination goes through a rigorous selection process, through the NRC, to ensure Directors are able to commit their time as members of the Board, Board Committees and FSBs. In their acceptance letters as a Director on the Main Board, the Directors undertake to devote sufficient time to carry out their responsibilities as a Director of the Company.
In addition, the Board had, in November 2014, approved the protocol for members of the Main Board accepting directorships on the Boards of companies outside of the Sime Darby Group. The

1 3 6 Sime Darby BerhadAnnual Report 2016Innovating for the Future
protocol require members of the Sime Darby Board to discuss with the Chairman prior to their acceptance of any directorship on companies outside of the Sime Darby Group to ensure that the appointment is not in conflict with the Sime Darby Group’s business and does not materially interfere with his/her performance as a Director on the Sime Darby Board.
Directors are required to declare their directorships and/or interests in other public and private companies upon appointment and on an annual basis. The Directors also notify the Company of any subsequent change in their directorships and/or interests in public and private companies. The Company will subsequently notify the other Directors upon receiving notice of such changes.
None of the Directors of the Company hold more than five (5) directorships in public listed companies, in compliance with the Listing Requirements. Non-Executive Directors may be expected to relinquish other appointments to ensure that they can meet the time commitment required of their role.
Independence, objectivity and conflicts of interest
The Board is aware that tenure is not the absolute indicator of a Director’s independence and objectivity. The test is whether the Director is able to exercise independent and objective judgement and act in the best interests of the Company. In this regard, the Board undertook the following during FY2016:
• ConductedindependenceassessmentsofallIndependent Directors following the criteria guided by the definition of “independent director” as prescribed by the Listing Requirements. The assessment is performed annually and when a new interest or relationship develops
• IndependentDirectorsarerequiredtosubmit a declaration of independence prior to appointment
• IninstanceswhereanIndependentNon-Executive Director is to be retained beyond nine (9) years, the NRC shall conduct an assessment of the Independent Non-Executive Director(s) and recommend to the Board whether they shall remain Independent or be re-designated as a Non- Independent Non-Executive Director.
All Directors of the Company and its subsidiaries must avoid any situation which might give rise to a conflict between their personal interests and those of the Group. Prior to appointment, potential conflicts of interest are disclosed and assessed to ensure that there are no matters which would prevent that person from taking on the role.
Directors are responsible for notifying the Chairman and/or the Group Secretary as soon as they become aware of actual or potential conflict situations.
If any potential conflict arises, the Board will consider each conflict situation separately on its particular facts and record the declarations made by the Director in the Board minutes and as to the authorisations granted by the Board, if any. Directors are not allowed to participate in discussions nor vote in respect of contracts that they are interested in, or be counted as part of the quorum at a meeting when considering a motion concerning any such contract. In the event a corporate proposal is required to be approved by shareholders, interested Directors will further undertake to ensure that persons connected to them similarly abstain from voting on the resolutions. This will be recorded in the minutes of the meetings.
During FY2016, Encik Zainal Abidin Jamal declared his pecuniary interest in respect of the following legal work undertaken by his firm whereby the firm acts as solicitors for the following subsidiaries of Sime Darby:
(i) Sime Darby Property Selatan Satu Sdn Bhd in respect of the Pagoh Education Hub Project
(ii) Sime Darby Serenia Development Sdn Bhd in respect of the Sale and Purchase Agreement of a parcel of freehold land measuring approximately 150 acres at Ampar Tenang Estate.
The above matters are handled by another partner of the firm and not Encik Zainal Abidin Jamal.
STATEMENT ON CORPORATE GOVERNANCE

1 3 7Sime Darby Berhad Annual Report 2016 Corporate Governance
Information and professional development
Information
Board materials and information (agenda, Board papers, minutes etc.) are, to the extent feasible, provided/made available five (5) working days prior to each Board meeting so that Directors have sufficient time to read and understand the information and obtain further information, clarification or explanation, where necessary.
Except for sensitive/confidential papers, Board materials are disseminated electronically using a Board Meeting Management Solution which provides Directors with secured access to meeting papers globally. The solution is an initiative towards having paperless Board meetings and has made conference calls with Directors who are travelling more effective.
Board papers deemed urgent may be submitted to the Group Secretary for tabling at Board meetings, subject to the approval of both the Chairman and the PGCE. Meeting agendas are also sequenced in such a way taking into consideration the complexity of the proposals and whether they are items for approval or noting by the Board in order for Board meetings to be more effective and to enable in-depth deliberation of matters. Issues raised, deliberations and decisions including dissenting views made at Board meetings are recorded in the minutes.
Managing Directors and/or Senior Management personnel may be required to make presentations on proposal papers and brief/update the Board on operational issues to further facilitate the Board’s decision-making process.
All the Directors have direct access to the advice and services of the Group Secretary whether as the full Board or in their individual capacity, in the furtherance of their duties.
From time to time and where necessary, the Board may seek independent professional advice at the Company’s/relevant subsidiary’s expense. The services of independent professional advisors or experts are typically sought to confirm or dispel concerns raised by the Directors. The Board nevertheless affirms that reliance on an independent advisor or expert does not abrogate the Board’s individual or collective responsibility for the final decision.
The protocol for the Board and Directors to seek independent professional advice is set out in the Directors’ Manual.
Induction
On appointment, each new Director of the Main Board and FSBs will undergo an on-boarding exercise. This will expedite the familiarisation process for new Directors with the environment that the Group operates in, the business operations of the various Divisions including their range of products or services, the Group organisation structure and Management’s roles and responsibilities. Management will also arrange for site visits to key operating units for new Directors. This is to give each new Director a visual perspective of the Group’s operations. The site visits will include briefings from the Management of operational units to provide further depth and appreciation of the key drivers behind the Group’s core businesses.
Three (3) on-boarding sessions were arranged in FY2016 to provide Bapak Muhammad Lutfi, Datuk Wan Selamah, Datuk Dr Mohd Daud and Encik Zainal Abidin with an overview of the business operations, strategies and financial performance of the Group and its Divisions. The briefings were conducted by the Group Chief Strategy & Innovation Officer, the Group Chief Financial Officer, Group Chief Human Resources Officer, and the Managing Directors of the respective Divisions.
Professional Development
The Board is aware of the importance of continuing professional development for its Directors to ensure that they are equipped with the necessary skills and knowledge to meet the challenges of the Board. All the Directors have successfully completed the Mandatory Accreditation Programme (MAP).
Life-long learning, training programmes, conferences and seminars which are relevant to the Group’s businesses to sustain active participation in Board deliberations are identified on an on-going basis and the Company allocates a dedicated training budget to support the continuous development of the Directors. In addition, each Director identifies the areas of training that he or she may require for further personal development as a Director or Board Committee member. The Group Secretary arranges for the Directors’ attendance at these training programmes.
The Company also organises in-house education programmes by inviting experts to speak on specific topics of interest either during Board meetings, retreats or at separate sessions.

1 3 8 Sime Darby BerhadAnnual Report 2016Innovating for the Future
All Directors attended training programmes, conferences, seminars, courses and/or workshops during the financial year. A summary of selected in-house education programmes and external trainings attended by Directors during FY2016 is set out below.
Period Topics
July - September 2015 Board Chairman Series Part 2: “Leadership Excellence from the Chair”
Corporate Governance Breakfast Series with Directors: “The Board’s Response in Light of Rising Shareholder Engagements”
FIDE Forum: “Board Leading Change - Organisational Transformation Strategy as Key to Sustainable Growth in Challenging Times”
Corporate Directors Advanced Programme (CDAP): Strategy & Risks - Managing Uncertainty
The Interplay Between Corporate Governance, Non-Financial Information and Investment Decision - What Boards of Listed Companies Need to Know
October - December 2015
Khazanah Megatrends Forum
Global Islamic Economy Summit (GIES) 2015
OIC - Asia Trade and Economic Forum 2015
Employee Provident Fund (EPF) Global Private Equity Summit 2015
Asia-Pacific Economic Cooperation (APEC) CEO Summit 2015
Foreign Exchange Administration (FEA) Rules
January - March 2016 Audit Oversight Board New Auditor’s Report - Sharing the UK Experience
Sime Darby Corporate Governance Workshop
Ring the Bell for Gender Equality
8th Annual Corporate Governance Summit 2016
Driving Performance Through Human Governance
Sime Darby Board and Management Retreat• TheEconomistCorporateNetwork• TheInnovationImperative• AViewfromthePeriphery• Motors&Industrials-LivinginaVUCAWorld
April - June 2016 Thought Leadership Session Programme: Nurturing Strategic, Innovative & Global Minds
Creating A Better World: The Role of Corporate ASEAN in Driving the Sustainable Development Goals
Islamic Infrastructure Investment Forum
Institute of Strategic and International Studies (ISIS) 20th Asia Pacific Roundtable
Sustainability Engagement Series for Directors/Chief Executives Officers
Note:The list of trainings are attended on individual basis. More detailed information on the Directors’ Training and Continuous Education Programme is available online in the Board of Directors section at www.simedarby.com
Corporate Governance WorkshopParticipants during the Sime Darby Corporate Governance Workshop. The workshop approached the issues of governance from a business strategy, reputation, culture and sustainability perspective.
STATEMENT ON CORPORATE GOVERNANCE

1 3 9Sime Darby Berhad Annual Report 2016 Corporate Governance
Directors’ remuneration
The objective of the Company’s policy on Directors’ remuneration is to attract and retain Directors of the calibre needed to direct the Group successfully.
The Directors’ remuneration policy is reviewed regularly to ensure that the compensation of the Chairman and Directors of the Main Board and FSBs are aligned to at least around the 75th percentile and the 50th percentile of appropriate peer groups respectively. The remuneration of the Non-Executive Directors are reviewed once every three years. There has been no change to the remuneration framework for the Non-Executive Directors and members of the Board Committees since February 2014.
The following are salient elements of the Directors’ remuneration policy:
Non-Executive Directors Executive Director
Paid fixed annual Director fees as members of the Board and Board Committees.
The NRC considers and recommends to the Board for approval the framework for the Executive Director’s remuneration and the final remuneration package.
Level of remuneration reflects the level of responsibilities undertaken by the Non-Executive Director concerned. The Company also reimburses reasonable expenses incurred by these Directors in the course of their duties.
Components of the remuneration are structured to link rewards to corporate and individual performance. Performance is measured against profits and other targets set in accordance with the Company’s annual budget and plans.
The remuneration package comprises fees, benefits-in-kind and other emoluments.
Remuneration for the Non-Executive Directors of the Board and as members of the Board Committees in the form of fees is as follows:
Board/Board Committee Chairman (RM/Year)
Deputy Chairman (RM/Year)
Member (RM/Year)
Board 600,000 250,000 180,000 1 360,000 2
Governance & Audit Committee 40,000
Not Applicable
30,000
Nomination & Remuneration Committee 40,000 30,000
Sustainability Committee 40,000 30,000
Risk Management Committee 40,000 30,000
Notes:1 Fee for Resident Director2 Fee for Non-Resident Director

1 4 0 Sime Darby BerhadAnnual Report 2016Innovating for the Future
Details of Directors’ remuneration (including benefits-in-kind) and the aggregate remuneration of Directors in respective bands of RM50,000 for FY2016 are as follows:
Salary & Other Remuneration2
(RM’000)
Directors’ Fees& Other Remuneration
(RM’000)Benefits-in-
kind3
(RM’000)
PBESS4
(RM’000)Total
(RM’000)
Range of Remuneration
(RM’000)5By SDB By the Subsidiaries
Executive Director
Tan Sri Dato’ Seri Mohd Bakke Salleh
7,312 - - 32 (376)6 6,968 6,950-7,000
Non-Executive Directors
Tan Sri Dato’ Abdul Ghani Othman
N/A1
640 268 32
N/A1
940 900 - 950
Dato Sri Lim Haw Kuang 414 300 60 774 750 - 800
Datuk Zaiton Mohd Hassan 246 242 23 511 500 - 550
Tan Sri Datuk Dr Yusof Basiran
210 270 25 505
Dato’ Rohana Tan Sri Mahmood
234 205 25 464 450 - 500
Tan Sri Dato’ Sri Dr Wan Abdul Aziz Wan Abdullah
302 130 25 457
Dato’ Henry Sackville Barlow
116 307 10 433 400 - 450
Ir Dr Muhamad Fuad Abdullah
240 167 25 432
Tan Sri Samsudin Osman 180 150 25 355 350 - 400
Muhammad Lutfi 234 83 1 318 300 - 350
Dato’ Azmi Mohd Ali 161 134 17 312
Tan Sri Dato’ Dr Wan Mohd Zahid Mohd Noordin
127 60 10 197 150 - 200
Datuk Wan Selamah Wan Sulaiman
93 89 9 191
Tan Sri Datuk Amar (Dr) Tommy Bugo @ Hamid Bugo
124 40 10 174
Zainal Abidin Jamal 70 67 5 142 100 - 150
Tan Sri Dato Sri Hamad Kama Piah Che Othman
23 13 2 38 50 and below
Datuk Dr Mohd Daud Bakar 15 0 1 16
Notes:1 N/A - Not Applicable2 Paid by the Sime Darby Group3 Comprises Company Car and Driver, where relevant4 Performance-Based Employee Share Scheme5 The following successive range of remuneration bands of RM50,000 is not applicable: RM50,001 to RM100,000 RM200,001 to RM300,000 RM550,001 to RM750,000 RM800,001 to RM900,000 RM950,001 to RM6,950,0006 Reversal of provision made in respect of the second grant of PBESS
STATEMENT ON CORPORATE GOVERNANCE

1 4 1Sime Darby Berhad Annual Report 2016 Corporate Governance
A summary of the Executive Director’s remuneration package comprises the following:
Board Evaluation
Board Evaluations are conducted annually to provide opportunities for increasing efficiency, maximising strengths and highlighting areas for improvement. Professional consultants are engaged to conduct the evaluations in alternate years.
In 2014, the Board Effectiveness Assessment (BEA) was conducted by professional external facilitators who returned in 2016 to conduct a follow up review on the agreed action items and look into succession planning in greater depth. The BEA 2015 was conducted internally and focused on action plans to address the areas highlighted during the Board Working Session in October 2014.
The BEA, Board Committee Assessments and Individual Directors’ Evaluation 2016 were performed through a series of structured one-to-one interview sessions between Directors and facilitators guided by Interview Protocols developed by the Sponsorship Group comprising Tan Sri Abdul Ghani, Chairman of the Sime Darby Board and NRC, and Tan Sri Mohd Bakke, PGCE.
Interviews were also performed with selected individuals from Management to obtain feedback from a Management perspective. The areas covered were as follows:
Evaluation Assessment Criteria
Board of Directors Board composition, information, agendas and meetings, leadership, dynamics, Board-Management relationship and processes such as succession planning, risk oversight and strategy oversight
Board Committees Board Committees’ strengths, effectiveness, support, composition and communication
Individual Directors Individual Director’s strengths, contributions and areas of focus and improvement
The BEA 2016 concluded with a Board Working Session in August 2016. The Board was clear that there were several key areas that would enable the Board to be more effective, challenge business performance, and drive strategic debate. Action plans highlighting key findings and priority areas were agreed upon, to be used as a roadmap by the Board over the succeeding year in its journey to drive a high performing Board. One-to-one feedback sessions were also held with each Director to review his/her individual performance. The individual feedbacks form part of the Director’s development plan for continued optimum contribution to Sime Darby.

1 4 2 Sime Darby BerhadAnnual Report 2016Innovating for the Future
The outcome of the BEA 2016 and progress against the 2015 actions items are as follows:
2014 Focus Areas 2015 Actions Items 2016 Outcomes 2017 Priorities
Board succession planning
The Board approved the BoardComposition Policy in August 2015 which sets out the approach with regard to the composition of the Board.
The Board and the NRC identified and assessed the suitability of potential candidates to be appointed to the Board.
Priorities on expertise/ diversity for Director recruitment have been identified.
Four Directors have been appointed to the Board. Their areas of expertise, skills and experience are provided from pages 116 to 120.
Potential candidates to be appointed to the Board are being actively identified and assessed.
The Board acknowledges that succession planning is a continuous and ongoing process.
The Board and the NRC will conduct a forward-looking talent/executive succession review to enhance understanding of what is being done to develop talent.
Succession planning will be one of the Board’s main priorities.PGCE succession
planningThe Board worked towards identifying potential successors for the PGCE position and developing clear selection criteria for the successor to the position of the PGCE.
A working draft of the PGCE Succession Planning Roadmap and the criteria for the successor to the PGCE have been developed.
Refining the Board and Board Committee papers
Refinement of the executive summary as preface to proposals by Management has been made.
The PGCE briefed and discussed methods to improve delivery, balance and conciseness of information provided in Board papers during the GMC meeting.
The Terms of Reference of each Board Committee were updated with improvements to the circulation period for meeting agenda and relevant documents and information
Board papers were made available electronically through secured means to Board members for timely and ease of access, especially when travelling.
Management was credited with significantly improving the Board papers and the use of an electronic Board Meeting Management Solution.
No new matter was raised during the 2016 evaluation.
No action is proposed for 2017.
Management will continue to identify opportunities to further improve Directors’ experience in board paper management.
Refocusing the Board agenda
Proposals by Management were discussed at the beginning of meetings.
The focus of reporting by the Chairman of each Board Committee to the Main Board has shifted from “minute driven” to “here’s what we decided to do and why”.
To continue optimising the Board agenda to shift focus towards “big picture issues”.
Each Board meeting will have a session devoted to a “big picture issue” impacting Sime Darby.
To spend more time on talent/executive succession review.
Improving the delivery of the on-boarding exercise for newly appointed Directors
On-boarding sessions have been staged over the course of the Director’s first year of service. Opportunities were also provided for newly appointed Directors to participate in orientations of FSBs on which they do not serve.
On-boarding sessions received very positive feedback from new Directors. Details of the on-boarding sessions are provided in page 137.
On-boarding sessions will be regularly reviewed and improved to provide an effective induction experience for new Directors.
STATEMENT ON CORPORATE GOVERNANCE

1 4 3Sime Darby Berhad Annual Report 2016 Corporate Governance
The Chairman monitors the level of attendance and contribution by Directors at Board meetings. For the BEA 2016, the Chairman was provided with a performance summary of individual Directors so that he can meet with each Director on an individual basis and engage in dialogues with the Director on his/her contribution to the Board debate.
STAKEHOLDER ENGAGEMENT
Timely and Quality Disclosure
The Board is committed to ensuring that communications to the investing public regarding the business, operations and financial performance of the Group are accurate, timely, factual, informative, consistent, broadly disseminated and where necessary, filed with regulators in accordance with applicable legal and regulatory requirements.
The Board has developed and adopted, in the Group Policies and Authorities, a policy on Stakeholder Engagement stipulating the authorised channels and personnel through which/whom certain information of the Group shall be approved and disclosed to internal and external stakeholders.
The Policy regulates the review and release of information to regulatory authorities, facilitating timely and accurate disclosure of the Company’s affairs and includes internal and external corporate communications and investor relations activities.
To further enhance the level and quality of disclosure, the Board adopted the Group Corporate Disclosure Guidelines in August 2015. The Guidelines provide specific guidance on the disclosure of material information, maintenance of the confidentiality of information, dissemination of information and communications including that which is transmitted electronically.
Technology has also been utilised to increase the effectiveness and timeliness of information dissemination. The Company’s website is a key communication channel for the Company to reach its shareholders, the Investment Community and the general public. Up-to-date information on Group activities, financial results and major strategic developments are provided on the website. The Company website further outlines the Company’s business principles, Corporate Governance Framework, COBC, whistleblowing guidelines and various corporate governance initiatives.
The financial results, annual reports, announcements to Bursa Malaysia Securities Berhad, corporate presentations, sustainability initiatives and other information on the Company is available online at www.simedarby.com.
Engaging Shareholders
Annual General Meeting
The AGM is an opportunity for further shareholder engagement and for the Chairman to explain the Company’s progress and, along with other members of the Board, to answer any question. All Directors attend, unless unforeseen circumstances or pressing commitments prevent them. Attendance of the Directors at the AGM 2015 is provided on pages 132 and 133 and details of the AGM 2016 are set out on pages 350 to 354.
The Company’s AGM, scheduled in November of each year, is the primary platform for communication with the widest range of shareholders. Some of the measures to encourage greater shareholder attendance and participation include the following:
• Shareholderswhoareunabletoattendareallowed to appoint a proxy/ies to attend and vote on their behalf. The proxy need not be a shareholder.
• ThevenueoftheAGMisatacentralandeasilyaccessible location.
• TheSimeDarbywebsite(www.simedarby.com) contains a number of references to and notices about the AGM.
• MembersoftheBoard,SeniorManagementaswell as the external auditors of the Company are present at the AGM to address any question or concern that shareholders may have.
• ThePGCEpresentsthehighlightsoftheSimeDarby Group’s performance at AGMs and shareholders queries are answered and their views obtained.
From 1 July 2016, all resolutions set out in the notices of general meetings will be voted by poll. Polling processes will be explained during the general meetings and will be conducted through electronic voting. Poll results are verified by appointed Scrutineers.

1 4 4 Sime Darby BerhadAnnual Report 2016Innovating for the Future
shareholding structure, including any change to the holdings of substantial shareholders, of the Company.
The timely release of financial results on a quarterly basis provides the Investment Community with an up-to-date view of the Group’s performance and operations. A press conference and an analysts’ briefing are held concurrently with the release of the quarterly financial results to Bursa Malaysia Securities Berhad. To widen the reach to stakeholders, summaries of the financial results are advertised in selected daily newspapers while copies of the full announcement can be supplied to shareholders and members of the public upon request.
The Investor Relations Unit also constantly engages the Investment Community on environmental, social and governance (ESG) matters while providing updates on the Group’s sustainability strategies.
Shareholders are welcome to raise queries by contacting the Company at any time throughout the year and need not wait for the AGM for such an opportunity. The contact information is available on page 174 and at the Company’s website at www.simedarby.com.
Details of the Group’s engagement with other stakeholders can be found on page 19.
Annual General Meeting 2015Tan Sri Dato’ Seri Mohd Bakke Salleh presenting Sime Darby’s response to the matters raised by Minority Shareholder Watchdog Group to shareholders at the Annual General Meeting 2015.
Investor Relations
The Board recognises the importance of an effective communication channel between the Company, its shareholders and the general public. Pertinent matters that may affect stakeholders include strategic developments, financial results and material business matters affecting the Company and Group.
The Company has an Investor Relations Unit that facilitates communication between the Company and the Investment Community. Senior Management of the Company actively engages with the Investment Community and the Board is periodically briefed on these interactions and feedback from the Investment Community.
The Investor Relations Unit has an extensive programme that involves the holding of regular meetings, conference calls and site visits, all intended to keep the Investment Community abreast of the Company’s strategic developments and financial performance. In addition, investment road shows and conferences are held to engage with shareholders and potential investors across the globe.
Every quarter, the Investor Relations Unit provides reports to the Board on shareholding details, investor relations activities, recommendation by analysts, comments from the Investment Community as well as commentary on share price information and company valuation. The Board also receives a report at each quarterly meeting on the
STATEMENT ON CORPORATE GOVERNANCE

1 4 5Sime Darby Berhad Annual Report 2016 Corporate Governance
GOVERNANCE & AUDITCOMMITTEE REPORT
“The GAC plays an imperative role in cascading a culture of compliance, by making sure that an effective ethics programme is implemented across the Group, and that established policies and procedures are complied with”
DATUK ZAITON MOHD HASSANChairman of the Governance & Audit Committee
INTRODUCTION
The Audit Committee was established on 29 September 2007. With effect from 25 November 2010, the Committee was re-named the Governance & Audit Committee (GAC), in order to accurately reflect the powers of oversight over governance matters delegated to the Committee.
CHAIRMAN’S OVERVIEW
The GAC primarily endeavours to assist the Board in fulfilling its statutory and fiduciary responsibilities by monitoring the Group’s management of financial risk processes along with its accounting and financial reporting practices, reviewing the Group’s business processes, ensuring the efficacy of the Group’s system of internal controls, and in maintaining oversight of both external and internal audit functions on behalf of the Board.
As Chairman of the GAC, my role includes acting as the key contact between Committee members and Board members, as well as Senior Management, Group Corporate Assurance Department (GCAD) and Group Compliance Office (GCO), and the external auditors. I meet the Group Head, Compliance & Corporate Assurance on a regular basis in order to deliberate on matters arising from internal audit and investigations, to decide on the most effective way in enhancing Sime Darby Berhad’s (Sime Darby or Company) governance structure and practices.
Effective corporate governance demands a shift from platitudes to that of pragmatism. The GAC plays an imperative role in cascading a culture of compliance, by making sure that an effective ethics programme is implemented across the Group, and that established policies and procedures are complied with.
In an environment where corporate integrity is under heightened scrutiny, Sime Darby’s Code of Business Conduct (COBC) forms the bedrock of our ethical commitment. Established in 2011, the Group’s COBC serves as a central moral compass to guide the Group towards achieving the highest standards of behaviour in our business dealings. The COBC has been approved by the Main Board and provides guidance on various activities, and is in tandem with the Group’s Core Values and Business Principles. Compliance with the provisions in the COBC is mandatory for all Directors and employees of the Group and where applicable, counterparts and business partners. Business counterparts, especially vendors, are made aware of the expected behaviours during the vendor registration stage through the Vendor’s Letter of Declaration.
We acknowledge that whistleblowing is an essential safety valve in our internal control environment, and the Group has in place a Whistleblowing Policy which forms part of our Group Policies and Authorities. This policy is premised on a no retaliation principle, and protection is afforded to whistleblowers for reports that are made in good faith. The Whistleblowing Policy also provides in detail the escalation processes and various reporting channels that are available to employees internally.
Additionally, in my capacity as Senior Independent Director, I oversee investigations of all whistleblowing cases, from receipt to closure. In an effort to bridge disconnect between governance and the ground, I am directly accessible to whistleblowers via Sime Darby’s whistleblowing channels. The Whistleblowing Policy is reviewed every two years, in order to ensure continued relevance.
DATUK ZAITON MOHD HASSANChairman of the Governance & Audit Committee

1 4 6 Sime Darby BerhadAnnual Report 2016Innovating for the Future
GOVERNANCE & AUDIT COMMITTEE REPORT
COMMITTEE EFFECTIVENESS
Composition and Attendance
Members* Membership Appointment Attendance#
Datuk Zaiton Mohd Hassan^ Chairman/Senior Independent Non-Executive Director
16 November 2010 5/6 83.33%
Datuk Wan Selamah Wan Sulaiman
Member/Independent Non-Executive Director
1 March 2016 1/1 100%
Ir Dr Muhamad Fuad Abdullah Member/Independent Non-Executive Director
4 February 2013 6/6 100%
Former Members* Membership Retirement/ Resignation Attendance#
Dato’ Henry Sackville Barlow Chairman/Senior Independent Non-Executive Director
23 November 2015 4/4 100%
Tan Sri Datuk Amar (Dr) Hamid Bugo
Member/Independent Non-Executive Director
23 November 2015 2/4 50%
Dato’ Azmi Mohd Ali Member/Non-Independent Non-Executive Director
1 March 2016 1/1 100%
Notes:* For the Members’ profiles see from pages 116 to 120.^ Datuk Zaiton Mohd Hassan was redesignated as the Senior Independent Director and appointed as Chairman of the GAC on 23 November 2015.# Reflects the number of meetings held during the time the Directors held office.
The Chairman of the GAC, Datuk Zaiton Mohd Hassan is a Fellow and Council Member of the Association of Chartered Certified Accountants (ACCA), a Member of the Professional Accountants In Business (PAIB) Committee of the International Federation of Accountants (IFAC), the Vice President of the Malaysian Institute of Accountants (MIA) and a member of the Malaysian Institute of Certified Public Accountants (MICPA). Datuk Wan Selamah Wan Sulaiman who was appointed as a member of GAC on 1 March 2016 is a Fellow of the ACCA and a Member of the MIA. The GAC, therefore, meets the requirements of paragraph 15.09(1)(c) of the Main Market Listing Requirements of Bursa Malaysia Securities Berhad (Listing Requirements) which stipulate that at least one (1) member of the GAC must be a qualified accountant.
The President & Group Chief Executive (PGCE), Group Chief Financial Officer, Group Head, Compliance & Corporate Assurance and Group Head, Risk Management attend the GAC meetings to brief and provide clarification to the Committee on their areas of responsibility. Other members of Senior Management are also invited for specific agenda items to support detailed discussions during the Committee’s meetings.
The external auditors also attend and brief the Committee on matters relating to external audit at five (5) GAC meetings during the financial year and provide a high level review of the financial position of the Group at the meetings. Time was also set aside for the external auditors to have private discussions with the Committee in the absence of Management, except for the Group Secretary. During the financial year, four (4) private sessions were held between the GAC and the external auditors.
Similarly, the Group Head, Compliance & Corporate Assurance also met privately with the Committee at all quarterly meetings of the GAC.
Annual Performance Assessment
The Board reviewed the term of office and assessed the performance of the GAC with the recommendation by the Nomination & Remuneration Committee. The term of office and performance of the GAC are reviewed annually pursuant to the Listing Requirements.
The Board also performed an annual assessment to assess the Committee’s effectiveness in carrying its duties set out in the Terms of Reference. The Board

1 4 7Sime Darby Berhad Annual Report 2016 Corporate Governance
is satisfied that the Committee has effectively discharged its duties in accordance with the Terms of Reference.
The Board Effectiveness Assessment 2016 further affirms the strength of the Committee lead by a capable and experienced Chairman. The composition of the Committee would be further augmented with members having appropriate level of skills and knowledge to contribute to the effective functioning of the GAC.
Roles of the Committee
The GAC is responsible for:
• AssistingtheBoardinfulfillingitsstatutoryand fiduciary responsibilities of monitoring the Sime Darby Group of companies’ management of financial risk processes and accounting and financial reporting practices.
• ReviewingtheSimeDarbyGroup’sbusinessprocess, the quality of the Group accounting function, financial reporting and the system of internal controls.
• Enhancingtheindependenceofboththeexternal and internal audit functions by providing direction to and oversight of these functions on behalf of the Board.
• AssistingtheBoardinensuringthataneffective ethics programme is implemented across the Group, and monitors compliance with established policies and procedures.
Detailed Terms of Reference for the GAC is available online in the Corporate Governance section at www.simedarby.com.
OUR FOCUS AND ACTION PLAN
The Committee receive updates on the key governance and audit initiatives and issues across the Group at each Committee meeting. Some of the Committee’s focus include:
Significant initiative/issues
Matters Considered
Outcome
Ensured financial statements comply with applicable financial reporting standard
Change of Accounting Policy for Biological Assets.
Change in the accounting policy was effected in the financial statements for the third quarter ended 31 March 2016.
Significant initiative/issues
Matters Considered
Outcome
Recommended establishment of the GAC of Sime Property Berhad
The Board of Sime Darby Property Berhad established its GAC on 29 February 2016. The GAC of Sime Darby Property Berhad has oversight on the financial risk processes, accounting and financial reporting practices, considering the reports and recommendations by the internal and external auditors and reviewing the overall results of the companies within the Division, among others.
Group Information Technology (IT) Roadmap and Initiative
Key IT projects includes, among others, IT programmes embarked upon by the Industrial Division to deliver an end-to-end system across the countries in which it operates to fulfill the requirements of its dealer networks business and its customer base. Other IT programmes/solutions focused on providing the best support to the Group’s business and operations such as ‘customer centricity’ mindset and monitoring of estates and mills.
The various enhancements and initiatives done by Group IT have contributed significantly towards business process improvements across the Group.
Summary of work of the GAC during the financial year:
1. Financial Reporting
(a) Review the unaudited quarterly financial results and the related press statement, among others, any change in accounting policies, significant matters highlighted, the going concern assumption, and compliance with accounting standards and regulatory requirements for recommendation to the Board for approval before release to the Bursa Malaysia Securities Berhad (Bursa Securities).

1 4 8 Sime Darby BerhadAnnual Report 2016Innovating for the Future
GOVERNANCE & AUDIT COMMITTEE REPORT
(b) Review the consolidated audited financial statements of the Company and the Group and ensuring that the statements comply with the Financial Reporting Standards for recommendation to the Board for approval.
(c) Review the significant matters highlighted by the auditors in the financial statements and significant judgements made by Management.
(d) Review the Group Financial and Foreign Currency Exposures.
(e) Review the status and performance of the Group’s major ongoing and completed investments and key ongoing property development projects.
(f) Review the change of Accounting Policy and Revaluation of Biological Assets of the Group for recommendation to the Board for approval.
(g) Review the Report on the Group’s Cash and Borrowings Position and Cash Flow Projections.
(h) Review the issuance of the Letter of Financial Support for financial year ended 30 June 2016 in respect of the Sime Darby Group companies for recommendation to the Board for approval.
2. Internal and External Audit
(a) Review GCAD’s scope of work and audit plan which includes conducting regular risk based systematic audits at the Group and Division levels.
(b) Review the external auditors’ Audit Plan, which summarises the responsibilities and the scope of work for the financial year ended
30 June 2016. (c) Review the adequacy of GCAD’s resources and
financial budget to meet planned audit activities across the Group.
(d) Consider major findings and key significant external/internal audit matters raised by the external auditors and GCAD and Management’s response and follow-up actions thereto.
(e) Consider together with Management the global audit fees of the external auditors for recommendation to the Board for approval.
(f) Review reports on violations of COBC and whistleblowing issues to ensure all reported violations are properly investigated and actions are taken in response to all concerns raised.
(g) Meet quarterly with the external auditors/Group Head, Compliance & Corporate Assurance without the presence of Management except for the Group Secretary.
(h) Review the minutes of meetings of Board Meetings of selected joint venture companies and the minutes of meetings of GAC of the Flagship Subsidiary Boards (FSB) and subsidiary companies of the Group.
(i) Oversee the internal controls framework and reviewing as well as recommending enhancements to the Group’s governance and audit processes.
(j) Review progress updates on major projects and acquisitions.
(k) Review the External Validation Report on the quality assurance review of GCAD to comply with the International Standards for the Professional Practice of Internal Auditing.
(l) Note the paper on enhancing Audit Committee transparency – Focus on Oversight Role over External Auditors.
3. Related Party Transactions
(a) Review significant related party transactions entered into/to be entered into by the Company and the Group and the disclosure of such transactions in the Annual Report.
(b) Review the Circular to Shareholders with regards to the proposed renewal of shareholders’ mandate for existing recurrent related party transactions and proposed new shareholders’ mandate for additional recurrent related party transactions of a revenue or trading nature for recommendation to the Board for approval.
(c) Review the processes and procedures on related party transactions/recurrent related party transactions in the Group Policies and Authorities (GPA) to ensure that related parties are appropriately identified and that related party transactions are declared, approved and reported appropriately.
(d) Review the compliance of related party disclosures to the Malaysian Financial Reporting Standard 124, Companies Act, 1965, Listing Requirements and internal guidelines on a quarterly basis.

1 4 9Sime Darby Berhad Annual Report 2016 Corporate Governance
4. Governance
(a) The GAC Chairman updated the Board on principal matters deliberated at GAC meetings and the activities undertaken by the GAC at each quarterly Board meeting. Minutes of the GAC meeting were tabled for confirmation at the following GAC meeting and circulated to the Board for noting at the next most practicable Board meeting.
(b) Review the Statement on Corporate Governance, GAC Report and Statement on Risk Management and Internal Control prior to their inclusion in the Company’s Annual Report 2015 for recommendation to the Board for approval.
(c) Perform a self-assessment to assess its effectiveness in carrying out the duties as set out in the GAC’s Terms of Reference.
(d) Note the analysis of Corporate Governance Disclosure in the Annual Reports 2012-2013 issued by Bursa Securities and reviewing the Corporate Governance Disclosure score of Sime Darby evaluated by Bursa Securities.
(e) Review the Company’s feedback on the Consultation Paper No. 2/2015 by Bursa Securities on the proposed review of the Listing Requirements relating to Disclosure and Corporate Governance Requirements, and Post-Listing Disclosure Obligations for Mineral, Oil and Gas listed issuers.
(f) Review the Revised Competition Law Compliance Manual to comply with the Competition Act by incorporating feedback from operational teams impacted by the Competition Act and ensure it is both practical for operations and business friendly.
5. Other activities
(a) Consider and review the interim and proposed final dividends for recommendation to the Board for consideration. The Dividend Reinvestment Plan (DRP) was applied to the entire final single tier dividend and Shareholders have been given the option to reinvest their final dividend in the new Sime Darby shares to be issued pursuant to the DRP.
(b) Review the report on the activities carried out by GCO during the financial year. The functions and activities of the GCO can be found on page 151.
(c) Review and recommend revisions to the GPA following amendments to laws and regulations, changes in the Management Structure and enhancement of procedures and processes for the Board’s approval.
(d) Review the appointment of financial advisors for non-audit assignments.
(e) Review the Group IT Roadmap which comprises the IT Strategy, Risk and Security and/or key IT initiatives.
(f) Review the Group’s Global Trading & Marketing position on outstanding trades performed on Bursa Malaysia Derivatives Berhad, forward sales of crude palm oil, and crude palm oil and palm kernel expeller sales contracted.
(g) Review the Company’s Financial Year (FY) 2015/16 Headline Key Performance Indicators for recommendation to the Board for approval.
(h) Review the provisional Purchase Price Allocation on the Acquisition following the completion of the acquisition of 100% equity interest in New Britain Palm Oil Limited.
(i) Review the deleveraging actions for Sime Darby, among others, Proposed Placement and recommendation to the Board for approval.
(j) Perform the annual assessment of the performance of the Group Head, Compliance & Corporate Assurance.
(k) Conduct special review on specific areas of operations.
INTERNAL AUDIT
Overview
The Group has an in-house internal audit function which is carried out by GCAD and is headed by Mr John Edward Arkosi, OBE, Fellow member of Certified Practising Accountants (FCPA). Mr Arkosi holds an accounting degree from Curtin University, Perth, Australia and is a FCPA Australia and a member of the Institute of Internal Auditors, Malaysia. Mr Arkosi has accumulated over 33 years’ experience in a wide range of industries and government linked entities including over 12 years in Papua New Guinea – initially with PricewaterhouseCoopers before moving into commerce and industry assuming various senior and general management positions, audit and consultancy roles.

1 5 0 Sime Darby BerhadAnnual Report 2016Innovating for the Future
GOVERNANCE & AUDIT COMMITTEE REPORT
GCAD is organised as a centralised department with divisional Corporate Assurance Departments with direct control and supervision for audit services across the Group. There are a total of 190 internal auditors, excluding Management Trainees and Interns, across the Group headed by Mr Arkosi and supported by Divisional Heads in Malaysia and regional offices in Australia, China and Indonesia.
GCAD is guided by its Group Corporate Assurance Charter which specifies that GCAD reports functionally to the GAC and administratively to the PGCE to allow an appropriate degree of independence from the operations of the Group. GCAD’s principal responsibility is to undertake regular and systematic reviews of the internal control systems so as to provide reasonable assurance that such systems continue to operate satisfactorily and effectively in the Company and the Group.
The GAC reviews, challenges and approves the GCAD audit plan (including its financial budget) annually with periodic reviews to ensure business alignment, risk assessment and audit methodology and ensure robustness in the audit planning process. The GAC also approves the appointment or termination of the Group Head, Corporate Assurance; Heads of GCAD Divisional Teams; and senior members of GCAD.
The Group Head of Corporate Assurance attends the meetings of the FSBs on a quarterly basis to brief the FSBs on audit results and significant matters raised in the detailed GCA reports undertaken in the respective divisions.
All internal audit functions during the financial year were conducted by GCAD. Nevertheless, where required, GCAD has engaged and co-sourced with external audit firms to complement audit coverage and/or subject matter experts in specific technical areas including forensic and legal advisory.
During the financial year ended 30 June 2016, the total cost incurred for the internal audit function was RM44.2 million (2015: RM44.1 million) including RM494,000 external consultancy costs.
Activities
The attainment of the above objectives involves key activities undertaken by GCAD. The key activities undertaken as part of the assurance process includes, but are not limited to:
• Evaluatingriskexposurerelatingtoachievement of the Group’s strategic objectives based on the approved Strategy Blueprint and mapping this against the Divisional Enterprise Risk Management Risk Register to ensure key risks are considered and deliberated with Divisional Management, external auditors and Group Risk Management on a periodic basis.
• Reviewingandappraisingthesoundness,adequacy and application of accounting, financial and other controls and promoting effective control across the Group at a reasonable cost.
• Evaluatingthesystemsestablishedtoensurecompliance with those laws, regulations, policies, plans and procedures which could have a significant impact on the Group and Divisions.
• Carryingoutauditsonareassuchasinformation technology and environmental, safety and health as part of routine audit scope of work on the Group.
• Carryingoutanalysistodeterminetheefficiency of businesses carried out by the Group.
• Drivingdataanalyticsandcontinuousauditing/monitoring, thereby expanding GCAD’s audit coverage which supports greater operational efficiency/cost reduction.

1 5 1Sime Darby Berhad Annual Report 2016 Corporate Governance
GROUP COMPLIANCE OFFICE
The GCO was established as an independent function with the objective to assist the Board, GAC and Management in coordinating compliance risk management activities, and to provide reasonable assurance to the Board and Management, that the Group’s operations and activities are conducted in line with all applicable legal and regulatory requirements, internal policies and procedures, COBC and standards of good practice applicable to the Group’s operations. GCO’s function, including its activities are guided by its Charter and the GPA. GCO’s role is executed via provision of oversight, coordination, consultation and validation of the Group’s state of compliance.
Key Activities for financial year ended 30 June 2016:
• Intheyear2011,theGroupsetitselfapartfrom its peers and pioneered the voluntary unilateral declaration by way of signing the Corporate Integrity Pledge. The Group expressed its undivided commitment to work towards a principled and ethical work environment. Within the same year, the Main Board approved for application the Group’s first COBC. Arising from the implementation of the COBC Group wide, it has been the pride of the Group that the standards of ethical behaviour expected of its employees, directors and business partners, are well established.
• Thisfinancialyearalsoseestheimplementation and introduction of the new whistleblowing committee. Chaired by the Group Head, GCO & GCA, this committee aims in facilitating quicker decision making in relation to whistleblowing cases and matters, without compromising on the soundness of the decision making process.
EXTERNAL AUDITORS
Audit Partner Rotation
The MIA had regulated that there should be a mandatory rotation of the key audit partner for the audit of listed companies after a period of not more than five years. The audit partner rotating after such period should not resume audit engagement partner role for the audit client until two years have elapsed.
Currently, the external auditor rotates the audit partner responsible for the engagement every five years as the GAC was of the view that the main objective of audit partner rotation was to enhance actual and perceived auditor independence. The current lead partner started his term of office in relation to the FY2012. As the audit partner enters the fifth year of engagement with the Company, the GAC has agreed that a new audit partner be invited to attend the meetings of the GAC from the first quarter of the FY2017. The new audit partner was formally introduced to the GAC at its meeting in August 2016. The current audit partner will rotate after the closure of FY2016 statutory audit. During FY2017, the outgoing partner may also attend the future GAC meetings e.g. during the Quarterly Updates, not as the engagement partner but to give the necessary hand over and support to ensure a smooth and orderly transition.
Suitability and Independence of External Auditors
In recommending the suitability of the external auditors for re-appointment at the forthcoming Annual General Meeting of the Company, the GAC considered their suitability and independence, by assessing, among others, the adequacy of their experience and resources, their audit engagements, the number and experience of their engagement partners, the supervisory and professional staff assigned to the Sime Darby Group given the size and complexity of the Group.
During the financial year, the external auditors and Management have engaged in healthy debates on audit issues and assumptions to ensure check and balance in financial reporting.
This report is made in accordance with a resolution of the Board of Directors dated 27 September 2016.

1 5 2 Sime Darby BerhadAnnual Report 2016Innovating for the Future
NOMINATION & REMUNERATION COMMITTEE REPORT
“The Committee’s purpose, among others, is to ensure that the succession planning process and any appointment made brings a balance of skills, knowledge, experience and diversity to the Board”
TAN SRI DATO’ ABDUL GHANI OTHMANChairman of the Nomination & Remuneration Committee
INTRODUCTION
The Nomination Committee and the Remuneration Committee were established on 29 September 2007. Subsequently, on 16 November 2010, the Nomination and Remuneration Committees were merged to become the Nomination & Remuneration Committee (NRC). On 28 August 2014, the NRC assumed the functions of the Long Term Incentive Plan Committee so as to ensure a holistic remuneration framework for employees of the Group.
I am pleased to present the report of the NRC for the financial year ended 30 June 2016 (FY2016). During FY2016, the NRC has undertaken a number of activities as discussed in this report.
CHAIRMAN’S OVERVIEW
Reviewing Board Composition and Succession Plans
The NRC has continued with its work of reviewing the composition of the Board and overseeing the succession plans for senior executive management. Our Committee has worked to ensure that the right balance of skills, knowledge, breadth of experience and diversity is reflected on our Board. The President & Group Chief Executive (PGCE) and the Group Chief Human Resources Officer report to the NRC on the progress made on the succession plans for the Group. The NRC’s focus is to ensure that the Group has appropriate and adequate plans in place in order to effectively respond to the changing needs of the businesses of the Group. The Committee’s purpose, among others, is to ensure that the succession planning process and any appointment made brings a balance of skills, knowledge, experience and diversity to the Board.
Recruitment Priorities
The process of identifying and appointing new directors is rigorous and transparent. Candidates are identified based on the required skills, experience and competencies for the role, as well as being a good fit for the Board. The aim is to secure a boardroom which achieves the right balance between challenge and teamwork, with fresh input and thinking, while maintaining a cohesive Board. The NRC will regularly review membership of the Board and Board Committees to ensure that the members continue to have the requisite skills and experience to meet the challenges ahead.
Diversity and Inclusiveness
The Board fully recognises and embraces the benefits of diversity at the Board level as it brings a broader and more rounded perspective to decision making.
The Board continues to have the goal of increasing female representation on the Board. The NRC acknowledges that the Board is currently just below the policy on female representation on the Board. The NRC is committed to improving this position as soon as reasonably possible. Diversity, however, includes but is not limited to gender. There are a variety of different aspects, including professional and industry experience, understanding of different geographical regions and ethnic background, as well as different perspectives and skills that embody diversity. The Board will have regard to gender but will remain focused on recruiting, on merit, the best candidate as a member of the Board.

1 5 3Sime Darby Berhad Annual Report 2016 Corporate Governance
Augmenting Board Effectiveness
The effectiveness of the Board is vital to the success of the Company and the Group. An effective Board leads the Company, both now and for the future. The Board undertakes a rigorous evaluation process each year in order to assess how well the Board, its Committees and each Individual Director are performing. The aim is to continually enhance the Board’s effectiveness and the Group’s overall performance.
External evaluations were held in both 2014 and 2016. For the evaluation in 2016, the Company engaged the external facilitator used in 2014. The external facilitator has not been engaged for any other work for the Group.
As Chairman of the Board and the NRC, I am part of the Sponsorship Group for the Board Effectiveness Assessment’s (BEA) for 2014 and 2016 so as to provide input on areas requiring attention and focus. I am able to discuss with each Director their individual evaluation reports to ensure that they continue to devote sufficient time and energy, and make positive contributions to the Board.
Remuneration of the Non-Executive Directors
The Company’s remuneration principles for Directors are tailored to provide the remuneration framework needed to recruit, retain and motivate the right behaviour on the part of Directors and also to adequately compensate Directors for their time and effort required to manage the business of the Company.
In line with the Main Market Listing Requirements of Bursa Malaysia Securities Berhad (Listing Requirements), the total remuneration of the Non-Executive Directors (NED) of Sime Darby comprising the amount received from the Company and the amount received from the Sime Darby Group are disclosed in the Annual Report 2016 of the Company under the Statement on Corporate Governance.
The Board has not proposed any change to the fee structure of the Board and Board Committees of Sime Darby as approved by the Board at its meeting held in May 2016.
TAN SRI DATO’ ABDUL GHANI OTHMANChairman of the Nomination & Remuneration Committee
COMPOSITION OF THE COMMITTEE
Members1 Membership Appointment Attendance
Tan Sri Dato’ Abdul Ghani Othman Chairman/Independent Non-Executive Director
1 July 2013 7/7
Datuk Zaiton Mohd Hassan Member/Senior Independent Non-Executive Director
12 September 2014 6/7 2
Tan Sri Dato’ Sri Dr Wan Abdul Aziz Wan Abdullah
Member/Non-Independent Non-Executive Director
31 July 2015 7/7
Dato Sri Lim Haw Kuang Member/Independent Non-Executive Director
23 November 2015 4/4 3
Dato’ Rohana Tan Sri Mahmood Member/Independent Non-Executive Director
23 November 2015 4/4 3
Former Members Membership Retirement Attendance
Tan Sri Datuk Amar (Dr) Tommy Bugo @ Hamid Bugo
Member/Independent Non-Executive Director
23 November 2015 3/3 4
Dato’ Henry Sackville Barlow Member/Senior Independent Non-Executive Director
23 November 2015 3/3 4
Notes:1 For the Members’ profiles see pages from 116 to 120.2 Datuk Zaiton Mohd Hassan was re-designated as the Senior Independent Non-Executive Director (Senior INED) of Sime Darby Berhad (SDB) in place of Dato’ Henry Sackville Barlow who retired at the conclusion of the last Annual General Meeting (AGM) of the Company held on 23 November 2015.3 Reflect the number of meetings held during the period Dato Sri Lim Haw Kuang and Dato’ Rohana Tan Sri Mahmood held office.4 Resigned as a Member of the NRC with effect from 23 November 2015.

1 5 4 Sime Darby BerhadAnnual Report 2016Innovating for the Future
NOMINATION & REMUNERATION COMMITTEE REPORT
The NRC comprises NEDs with the majority being Independent Directors. The Committee is chaired by the Chairman of the Board and includes the Senior INED as its member. The composition of the NRC complies with the requirements of both the Listing Requirements and the Malaysian Code on Corporate Governance 2012 (MCCG 2012). The NRC has strong membership where the Directors as a group, provide an appropriate balance and diversity of skills, experience, gender and knowledge to the Company. The Chair of the Governance & Audit Committee, Datuk Zaiton Mohd Hassan, the Chair of the Risk Management Committee, Dato Sri Lim Haw Kuang and the Chair of the Sustainability Committee, Dato’ Rohana Tan Sri Mahmood, are all members of the NRC. The make-up of the NRC is sound, with members bringing good knowledge of nomination and remuneration issues and all members making informed contributions to ensure that the right issues are considered in a timely manner and with robust discussion. Meetings of the NRC are attended by the PGCE. Other members of Senior Management are invited to meetings of the NRC, when necessary, to support detailed discussions.
ROLES OF THE COMMITTEE
The Committee is established by the Board with the following primary objectives:
• ToassisttheBoardinreviewingtheappropriate size and balance of the Board and reviewing the required mix of skills, experience and knowledge of the Directors. The NRC also ensures that there is sufficient succession planning and human capital development focus in the Sime Darby Group.
• TorecommendtotheBoardtheremuneration framework for the NEDs, Executive Directors, the PGCE, key pivotal positions and employees of the Group.
• ToadministerthePerformance-BasedEmployees Share Scheme (PBESS) of the Company in accordance with the By-Laws as approved by the shareholders.
The detailed Terms of Reference (TOR) of the NRC is available online in the Corporate Governance section at www.simedarby.com.
KEY ACTIVITIES
Activities during the financial year
During FY2016, the Committee’s key activities included:
Nomination Function
In relation to the Board of Sime Darby and, where relevant, the Flagship Subsidiary Boards (FSB):
• RecommendingandreviewingthePolicyonBoard Composition
• ReviewingcomplianceofBoardCommitteeswith their respective TORs
• RecommendingrevisionstotheTORsoftheBoard Committees
• Recommendingthere-electionofDirectorsretiring at the 2015 and 2016 AGMs
• RecommendingthedisclosureoftheReporton the NRC for the 2015 Annual Report
• Evaluatingandrecommendingsuitablecandidates for appointment to the Boards/Board Committees of Sime Darby, Flagship Subsidiary Companies and major subsidiaries of Sime Darby
• ReviewingtheTORoftheFSBs• Recommendingthedisbandmentofthe
Nomination Committee and Remuneration Committee and Revision to the composition of the Audit Committee of New Britain Palm Oil Limited
• MonitoringtheconductoftheBEA2015• Recommendingtheengagementofthe
Malaysian Directors Academy to conduct the BEA 2016
In relation to Management:
• MonitoringtheBumiputeraEmpowermentAgenda Key Performance Indicators (KPI) 2015 achievement
• RecommendingtheBumiputeraEmpowerment Agenda 2016 targets
Remuneration Function
In relation to the Boards of the Group:
• Recommendingappropriatelevelsofremuneration for NEDs of the Sime Darby Group of Companies for FY2016

1 5 5Sime Darby Berhad Annual Report 2016 Corporate Governance
In relation to employees of the Group:
• RecommendingthebonuspayoutforFY2014/2015
• Recommendingthebonusandsalaryincrement proposals for Direct Reports of the PGCE for FY2014/2015 and for FY2015/2016, respectively
• Recommendingthebonusandsalaryincrement proposals of the PGCE for FY2014/2015 and FY2015/2016, respectively
• Reviewingandrecommendingtherenewalof the fixed term contract of the PGCE
NOMINATION AND RECRUITMENT PROCESS
One of the NRC’s key roles is to drive the recruitment process for new Directors. In considering candidates as potential Directors, the NRC takes into account the following criteria:
• Skills,knowledge,expertiseandexperience• Timecommitment,character,professionalism
and integrity• Perceivedabilitytoworkcohesivelywithother
members of the Board• Specialistknowledgeortechnicalskillsinline
with the Group’s strategy• Diversityinage,genderandexperience/
background• Numberofdirectorshipsincompaniesoutside
the Group.
• Reviewingandrecommendingtherenewalof fixed term contracts of some members of Senior Management
• Recommendingthesuccessionplanfortheposition of the PGCE
• Recommendingthesalaryincrementproposal for employees of the Sime Darby Group for FY2016/2017
Long Term Incentive Plan Function
• Recommendingthedefermentofthe3rd
Long Term Incentive Plan (LTIP) Grant Offer• Reviewingthereversaloftheprovisionfor
the 2nd Grant of the LTIPSome of the Committee’s focus during FY2016 include:
Significant Initiatives/
IssuesMatters Considered Outcome
Recommendations for new NEDs
The Committee considered the appointments of new NEDs of Sime Darby and the Group based on the recommendations and/or requirements of applicable governance regulations and best practices i.e. Listing Requirements and MCCG 2012 as well as the composition requirement based on the TORs of the respective Board Committees.
Datuk Zaiton Mohd Hassan was re-designated as the Senior INED on 23 November 2015.
The Board approved the appointments of four (4) new NEDs on the Board of Sime Darby during FY2016.
Board Diversity The Committee reviewed the Board Composition Policy (Policy) adopted by the Board of Sime Darby in August 2015.
The Board agreed that the Policy on Board Composition should be maintained.
The Board will continuously take into consideration the Policy on diversity in terms of skills, background, knowledge, international and industry experience, culture, independence, age and gender of a new Director to the Board so as to bring relevant perspectives to Board discussions.
A pre-screening of candidates is also undertaken. The Chairman of the NRC will report the findings of the pre-screening at the meeting of the NRC, prior to recommendation of the individual to the Board.
In line with the Company’s protocol on Directors accepting new directorships of companies outside the Sime Darby Group, a Board member of Sime Darby is requested to discuss with the Chairman of Sime Darby the proposed appointment prior to his/her acceptance of such directorship. The Director shall then inform the Group Secretary in writing upon such appointment for the Group Secretary to notify other members of the Board and the relevant regulatory authorities.

1 5 6 Sime Darby BerhadAnnual Report 2016Innovating for the Future
NOMINATION & REMUNERATION COMMITTEE REPORT
Directors are made aware of the time commitment expected from each of them in carrying out their roles as Director and/or Member of Board Committees including attendance at the Board, Board Committees and other types of meetings, if required. Directors are required to confirm that they are able to devote sufficient time to their roles at the Company and at the Group levels taking into consideration the number of their listed company board representations and other principal commitments. In accordance with the provisions of the Listing Requirements, none of the Directors hold more than five (5) directorships in listed issuers.
In FY2016, the Board approved the appointments of the following NEDs on the Board of Sime Darby upon the recommendations of the NRC:
• BapakMuhammadLutfion24 November 2015.
• DatukWanSelamahWanSulaimanon 15 January 2016.• EncikZainalAbidinJamalon1March2016• DatukDrMohdDaudBakaron1June2016.
Pursuant to Article 104 of the Articles of Association (AA) of the Company, the abovenamed Directors will be seeking re-election at the forthcoming AGM of the Company as set out in the Notice of the AGM.
Given Bapak Muhammad Lutfi’s extensive experience and network, the NRC is of the opinion that Bapak Muhamad Lutfi has the relevant expertise, skills and experience to add value to the Board. As the former Minister of Trade of Indonesia, Bapak Lutfi possesses deep understanding of the culture and practices in Indonesia, especially in the trading sector. Bapak Lutfi’s extensive experience and network in the Asia region is invaluable to opening up business opportunities for the Company, particularly for the Group’s operations in Indonesia.
As the former Accountant General of Malaysia, Datuk Wan Selamah Wan Sulaiman is highly regarded in the accounting fraternity for her expertise and experience in accounting systems development. With the appointment of Datuk Wan Selamah, the number of women Directors on the Board of Sime Darby increased to three (3).
As a prominent corporate and commercial lawyer, Encik Zainal Abidin Jamal possesses immense knowledge, skills and experience in the legal, compliance and regulatory space. He brings valuable legal perspectives to the Group’s investment proposals and corporate activities.
Datuk Dr Mohd Daud Bakar is a world renowned expert in Islamic finance with nine (9) offices worldwide. His global experience and skills particularly in relation to Islamic financial instruments will provide the Board with valuable input on Shariah investment funds and Sukuk.
In FY2016, the Board approved the appointments of the Chairmen and/or Members of the following Board Committees:
Board Committee Director Designation
Governance & Audit Committee (GAC) •DatukZaitonMohdHassan•DatukWanSelamahWanSulaiman
Chairman Member
Sustainability Committee •Dato’RohanaTanSriMahmood•BapakMuhammadLutfi
Chairman Member
Risk Management Committee •DatoSriLimHawKuang•EncikZainalAbidinJamal
Chairman Member
In FY2016, the Board also approved the appointments of the Chairmen and/or Members of the following FSBs:
FSB Director Designation
Sime Darby Plantation Sdn Bhd(SD Plantation)
•BapakMuhammadLutfi Member
Sime Darby Property Berhad(SD Property)
•TanSriDato’AbdulGhaniOthman•Dato’RohanaTanSriMahmood•EncikZainalAbidinJamal
ChairmanMemberMember

1 5 7Sime Darby Berhad Annual Report 2016 Corporate Governance
FSB Director Designation
Sime Darby Motors Sdn Bhd •TanSriDato’SriDrWanAbdul Aziz Wan Abdullah•DatukWanSelamahWanSulaiman
Chairman
Member
Sime Darby Industrial Holdings Sdn Bhd •EncikZainalAbidinJamal Member
Sime Darby Energy Sdn Bhd •IrDrMuhamadFuadAbdullah•DatukWanSelamahWanSulaiman
MemberMember
Sime Darby Utilities Sdn Bhd •IrDrMuhamadFuadAbdullah Member
Following the recommendations of the NRC, the following Directors were appointed to the Board Committees of the following FSBs in FY2016:
FSB Board Committee of FSB Director Designation
SD Plantation GAC •DatukZaitonMohdHassan Chairman
SD Property GAC •Dato’RohanaTanSriMahmood Member
The Group Secretary ensures that all appointments are properly made, that all necessary information is obtained from the Directors, both for the Company’s own records and for the purposes of meeting statutory obligations, as well as obligations arising from the Listing Requirements or other regulatory requirements.
The recruitment process concludes with an on-boarding exercise and related training programmes to train and equip the Director with the required knowledge and understanding of the Group’s businesses and operations. Additional details on the structure of the on-boarding exercise and the Directors’ professional development are set out on page 137.
RE-ELECTION OF DIRECTORS
The NRC ensures that the Directors retire and are re-elected in accordance with the relevant laws and regulations and the AA.
Pursuant to Article 99 of the Company’s AA, at least one-third (1/3) of the remaining Directors (excluding Directors who are above the age of 70 years and seeking re-appointment under Section 129 of the Companies Act, 1965 and Directors seeking re-election pursuant to Article 104 of the Company’s AA) are required to retire by rotation at each AGM and all Directors shall retire from office at least once every three (3) years. A retiring Director is eligible for re-election.
The Board recommends the re-election of the following Directors who will be retiring pursuant to Article 99 of the Company’s AA at the forthcoming AGM:
• TanSriDato’AbdulGhaniOthman,theChairman of Sime Darby and also the Chairman of the NRC, has exhibited positive leadership in chairing the Board of Sime Darby, and has ensured effective discussions at both the individual and the Board levels. As Chairman of SD Plantation and SD Property, he has led both Divisions to continue to be the two largest profit contributors of the Sime Darby Group.
• TanSriDato’SriDrWanAbdulAzizWanAbdullah, Deputy Chairman of Sime Darby, has extensive experience in policy development and the implementation of Government policies, and excellent network in both the public and private sectors. This has supported the Board as a whole, and in particular, the Chairman, in high level decision-making. As the Chairman of SD Motors, Tan Sri Dato’ Sri Dr Wan Abdul Aziz has led the Motors Division in achieving commendable performance amidst dynamic and challenging market conditions.
• IrDrMuhamadFuadAbdullahhasnotifiedtheCompany in writing of his intention not to seek re-election at the forthcoming AGM of the Company. Ir Dr Muhamad Fuad will retain office until the conclusion of this AGM in accordance with Article 99 of the AA of the Company.

1 5 8 Sime Darby BerhadAnnual Report 2016Innovating for the Future
NOMINATION & REMUNERATION COMMITTEE REPORT
The above Directors have met the Board’s expectations of high performance. The Board is of the view that these Directors have brought independent and objective judgment in Board deliberations and decisions.
TENURE AND ANNUAL ASSESSMENT OF THE INDEPENDENT DIRECTORS
In FY2016, the Board had conducted the annual independence assessment on the following six (6) Independent Directors:
• TanSriDato’AbdulGhaniOthman• DatukZaitonMohdHassan• DatukWanSelamahWanSulaiman• DatoSriLimHawKuang• Dato’RohanaTanSriMahmood• IrDrMuhamadFuadAbdullah
None of the six (6) Independent Directors has served on the Board for more than nine (9) years.
Tan Sri Dato’ Abdul Ghani Othman and Datuk Wan Selamah Wan Sulaiman being Independent Directors who are seeking re-election at the Tenth AGM of the Company, have undergone the independence assessment. Based on the criteria applied by the Company, the Board is satisfied that Tan Sri Dato’ Abdul Ghani and Datuk Wan Selamah have maintained their independence during FY2016.
The Board is also satisfied that the other Independent Directors have maintained their independence in FY2016, in compliance with the requirements and recommendation of both the Listing Requirements and the MCCG 2012 and other criteria for assessing independence set by the Company.
BOARD COMPOSITION AND DIVERSITY
The Board Composition Policy (Policy) was adopted by the Board of Sime Darby in August 2015. The NRC assisted the Board to review the Policy in FY2016 to ensure that the Policy is in line with the requirements of Sime Darby as well as to monitor progress towards the Board’s achievement of the following targets set out in the Policy:
Gender Diversity
Currently, the Board has three (3) women Directors or 23% women representation on the Board. In order to achieve the target of 30% women representation on the Board, the NRC will continue with its search for capable candidates to increase the number of women directors on the Board.
Age Diversity
Currently, 17% of the Directors of Sime Darby are below the age of 60 years. The Board targets to have a composition of at least 50% of its Directors below the age of 60 years by 2017.
Ethnic Diversity
The Board will work towards diversifying the ethnic composition of the Board as and when vacancies arise and suitable candidates are identified. With the appointment of Bapak Muhammad Lutfi, a former Minister of Trade of the Republic of Indonesia to the Board of Sime Darby and its FSB, the Board has broadened its diversity in terms of dynamics, international experience, background, culture and knowledge.
Independence of Directors
Currently, six (6) Directors of Sime Darby are Independent Directors. Thus far, the Board has exceeded the requirement of having at least 1/3 of its members (or four (4) Directors) being Independent Directors.
The Board after reviewing the Policy agreed that the Policy on Board Composition should be maintained. The NRC is responsible for the implementation of this policy and for monitoring progress towards the achievement of the Board’s objectives.
The salient features of the Policy are available online in the Corporate Governance section at www.simedarby.com.

1 5 9Sime Darby Berhad Annual Report 2016 Corporate Governance
BOARD EFFECTIVENESS ASSESSMENT
The Board Effectiveness Assessment (BEA) 2015 was conducted through an internal survey. The focus areas for the BEA 2015 were the areas for enhancement highlighted during the Board Working Session in 2014.
For 2016, an external third party was engaged to facilitate the BEA 2016. The BEA was conducted through a series of structured interviews with members of the Board to assess the performance of the Board, Board Committees and Individual Directors, and to produce a roadmap to enhance the Board’s effectiveness.
Detailed information on the BEA can be found on pages 141 to 143.
LONG TERM INCENTIVE PLAN
The First LTIP Grant (1st Grant) was made to eligible employees on 7 October 2013 consisting of PBESS for executive employees and Long Term Bonus (LTB) for non-executive employees subject to the performance criteria being met. The 1st PBESS Grant has a three-year vesting period while the 1st
LTB Grant has a two-year vesting period (Grants).
The LTIP serves to attract, retain, motivate and reward eligible employees whose contributions are vital to the operations, continued growth and profitability of the Group. The Grants will be vested after fulfilment of certain performance conditions as determined by the NRC in its sole and absolute discretion.
Given that the Group has not achieved the performance targets set in respect of the 1st Grant, the NRC had decided that there will be no vesting of the 1st Grant offers.
As at 31 August 2016, there are 12.5 million outstanding ordinary shares of RM0.50 each in Sime Darby relating to the Second LTIP Grant (2nd Grant) made on 20 October 2014. The NRC has, at its meeting held in February 2016, also reviewed the probability of achieving the 2nd Grant targets.
None of the NEDs has participated in the PBESS.

1 6 0 Sime Darby BerhadAnnual Report 2016Innovating for the Future
SUSTAINABILITY COMMITTEE REPORT
“The world we operate in is changing, and organisations like Sime Darby would need to adapt to ensure it continues to be sustainable and resilient. The Sustainability Committee is committed to ensure the Group operates in a way that balances the economic, environmental and social expectations of the company.”
DATO’ ROHANA TAN SRI MAHMOODChairman of the Sustainability Committee
INTRODUCTION
The Sustainability Committee was established on 28 August 2012 and has oversight responsibilities in relation to the Sime Darby Group’s objectives, policies and practices pertaining to sustainability, more particularly around contributing to a better society, minimising environmental harm and delivering sustainable development.
CHAIRMAN’S OVERVIEW
The Sustainability Committee and I strive to ensure that the Group delivers on its commitment of sustainable futures by operating in an economically, socially and environmentally sustainable manner.
Occupational Safety and Health performance of the Group remains the top priority for discussion during each Sustainability Committee meeting as it is imperative for us to ensure that we respect our employees’ basic right to a safe working environment. Unfortunately, 13 occupational fatalities involving employees and contractors were recorded this financial year. These incidents are unacceptable and we commit to work relentlessly with the Group’s management to achieve the ultimate goal of Zero Harm so that our employees are able to return from work safely every day to their loved ones.
The sustainable practices within our Plantation Division continues to be a main topic of debate, especially on the risks surrounding the areas of no deforestation, traceability of supply chain, and exploitation and modern day slavery. Plantation Division has developed an Open Palm Dashboard to provide our customers with access to key data on the origin of all palm products. The Dashboard allows customers to determine the location of the
oil palm mills from which the palm products are produced. The Group has also developed a Responsible Agriculture Charter which covers the Group’s commitments on these areas, and more, for all crops within the Group’s operations. The Charter will be launched in the next financial year.
Our Operational Excellence programme has continued to gain traction and empowered our employees to achieve an outstanding result with an accumulation of RM590 million of harvested benefits since FY2013, exceeding annual targets. We are on track to achieve a total of RM775 million of accumulated benefits by FY2017. Sime Darby’s Operational Excellence programme has once again been recognised internationally in the American Society of Quality (ASQ) World Conference as the Best Project in Organisational Impact and locally, the Group has emerged as champions for the 5th consecutive year for the PNB Quality Award.
Sime Darby fully supports Bursa Malaysia Securities Berhad’s efforts on improving sustainability disclosures following the recent amendments to the Main Market Listing Requirements. Sime Darby prepares its Integrated Report in accordance with the Global Reporting Initiatives (GRI) Guideline 4.0 and has fully disclosed all required elements throughout the Report. The GRI content index can be found on page 384.
On behalf of the Sustainability Committee, I would like to thank everyone who has contributed to the sustainability agenda within Sime Darby and look forward to our journey ahead together.
DATO’ ROHANA TAN SRI MAHMOODChairman of the Sustainability Committee

1 6 1Sime Darby Berhad Annual Report 2016 Corporate Governance
COMMITTEE EFFECTIVENESS
Composition and Attendance
Members1 Membership Appointment Attendance
Dato’ Rohana Tan Sri Mahmood Chairman/Independent Non-Executive Director
28 August 2014 4/4 100% 2
Tan Sri Datuk Dr Yusof Basiran Member/Non-Independent Non-Executive Director
28 August 2012 4/4 100%
Muhammad Lutfi Member/Non-Independent Non-Executive Director
24 November 2015 1/2 50% 3
Ir Dr Muhamad Fuad Abdullah Member/Independent Non-Executive Director
4 February 2013 4/4 100%
Ex Officio Member Membership Appointment Attendance
Sir Jonathon Espie Porritt Sustainability Advisor 10 May 2012 3/4 75%
Former Member Membership Retirement Attendance
Dato’ Henry Sackville Barlow Chairman/Senior Independent Non-Executive Director
23 November 2015 2/2 100% 3
Notes:1 For the Members’ profiles see pages 116 and 120.2 Dato’ Rohana Tan Sri Mahmood was appointed as Chairman of the Sustainability Committee on 23 November 2015.3 Reflects the number of meetings held during the time Dato’ Henry Sackville Barlow and Bapak Muhammad Lutfi held office.
The Sustainability Committee comprises Non-Executive Directors and is chaired by an Independent Non-Executive Director. The Committee is supported by Sir Jonathon Porritt, Sustainability Advisor. Sir Jonathon assists the Committee by identifying emerging sustainability trends and their implications to Sime Darby, reviewing and updating the Group Sustainability Principles and plans, assessing Sime Darby’s progress towards achieving sustainable outcomes as defined by the Principles and providing advice on sustainability reporting, including assurance methods.
On 23 November 2015, Dato’ Rohana Tan Sri Mahmood was appointed as Chairman of the Sustainability Committee succeeding Dato’ Henry Sackville Barlow who retired from the Sime Darby Board at the conclusion of the Sime Darby Annual General Meeting 2015.
Bapak Muhammad Lutfi was appointed as a member of the Committee on 24 November 2015 and brings with him experience in the trading sector and networking in the Asia Region particularly in Indonesia.
Meetings of the Committee are attended by the President & Group Chief Executive, Group Chief Sustainability Officer, together with other members of senior management.
The Committee’s Terms of Reference was revised on 24 May 2016 to invite the Group Head, Compliance & Corporate Assurance, and Group Head, Risk Management to attend meetings of the Committee commencing FY2017 so as to better integrate sustainability into the operations of the Sime Darby Group.
Annual Performance Assessment
The Board performs an annual assessment to assess the Committee’s effectiveness in carrying its duties set out in the Terms of Reference. The Board is satisfied that the Committee has effectively discharged its duties in accordance with its Terms of Reference.
The Board Effectiveness Assessment 2016 further credited the Chairman of the Committee for her excellent leadership in chairing the Committee.

1 6 2 Sime Darby BerhadAnnual Report 2016Innovating for the Future
ROLES OF THE COMMITTEE
The Committee is responsible for:
• ReviewingtheeffectivenessoftheSimeDarbyGroup’s strategies, policies, principles and practices relating to sustainability and operational excellence on a world-wide basis, including whether these strategies, policies, procedures and processes promote the Group’s sustainability agenda. In doing so, the Committee also supervises the Management Sustainability Committee.
• AdvisingontheGroup’sSustainabilityReporting and providing oversight on independent audits and assurance reports.
• Steeringthestakeholderdialogueprocesswithregard to the strategic sustainability goals. This include key concerns/allegations that are raised by stakeholders, evolving public sentiments and government regulations.
Detailed Terms of Reference for the Committee is available online in the Corporate Governance section at www.simedarby.com.
OUR FOCUS AND ACTION PLAN
Activities during the financial year
The Committee receives updates on key sustainability initiatives and issues across the Group at each Committee meeting. Some of the Committee’s focus include:
Significant initiatives/issues Matters Considered OutcomeImproving the Occupational Health and Safety (OHS) performance of the organisation
The OHS performance of the Group is an area of key concern with the alarming number of fatalities and major accidents across the Group. The OHS performance and key initiatives are debated extensively during each Sustainability Committee meeting.
OHS performance continues to be an area of focus for the entire Group to ensure the safety performance improves moving forward.
Managing risks and opportunities involving sustainability within the Plantation Division
The Committee deliberated on the material issues and actions being taken in our Plantation Division which include areas such as High Carbon Stock, Supply Chain Traceability, Certified Sustainable Palm Oil and Community Rights.
The Group continues to ensure risks surrounding material sustainability issues are mitigated effectively and opportunities that arise are capitalised on.
Ensuring the adoption of responsible agricultural practices
The Committee debated on the proposed Responsible Agriculture Charter for adoption which reaffirms Sime Darby’s commitments of responsible agricultural practices. These commitments cover the current and emerging environmental, social and governance expectations of a wide range of stakeholders.
Sime Darby has committed to adopt the Charter for all crops within the Group, and will be launched in FY2017.
Implementing respect for Human Rights within the organisation
The Committee debated operationalising the respect for Human Rights within the Group, which includes the Statement for the UK Modern Slavery Act. The Statement communicates the efforts of Sime Darby to oppose slavery, servitude and forced or compulsory labour and human trafficking within the Group.
Human Rights is an area of increased attention within the Group. The Group’s UK Modern Slavery Act statement was approved for release and can be found on page 386.
SUSTAINABILITY COMMITTEE REPORT

1 6 3Sime Darby Berhad Annual Report 2016 Corporate Governance
The other work of the Committee in 2016 principally fell into the following areas:
1. Group Sustainability Initiatives
(a) Reviewing the Group Sustainability Key Initiatives which track the progress of initiatives that contribute towards achieving Sime Darby’s sustainability goals.
(b) Assisting the development of a Group Travel Risk Management Standard by providing feedback on guidelines on health, safety and security matters.
2. Occupational Safety and Health Performance
(a) Reviewing and deliberating the overall Group Safety and Health Performance, the overall Improvement Plan and status of key critical action plans around Safety and Health across the Group.
3. Continuous Improvement
(a) Reviewing the report on the War on Waste Campaign.
4. Climate Change
(a) Reviewing and deliberating on the report on the High Carbon Stock Study.
(b) Reviewing the report on the Group Carbon Emissions for 2014. The report covered five Divisions across ten countries of operations.
5. Plantation Sustainability
(a) Reviewing the Open Palm (Traceability Dashboard) created to furnish customers with essential traceability information of the palm oil supplied by Sime Darby.
(b) Reviewing the report on the Certified Sustainable Palm Oil marketing efforts which include updates on the sales of certified sustainable oils/products, global oil tender of key customers and engagements and meetings with key customers.
(c) Reviewing highlights/key issues from Plantation Division including the traceability of the Plantation palm oil supply chain, social issues in Indonesia and Liberia, management of the Ebola outbreak in Liberia, Biogas Projects, Composting Plants and the Roundtable on Sustainable Palm Oil Compensation Plan.
6. Sustainability Advisory Work Programme
(a) Reviewing and deliberating the Sustainability Advisory Work Programme which cover projects around the areas of stakeholder engagement and climate risk at the Plantation Division, future townships, sustainability consumer research and sustainability ratings at the Property Division.
7. Assurance and Governance Around Sustainability
(a) Reviewing and deliberating the independent third party limited assurance report on the annual verification of key sustainability indicators around Safety & Health, Lean Six Sigma benefits and Carbon Emissions to ensure the robustness of the data being reported around those areas.
(b) Reviewing Management’s proposed responses to the Consultation Paper No. 1/2015 by Bursa Malaysia Securities Berhad on the proposed amendments to the Main Market Listing Requirements relating to Sustainability Statement in Annual Reports and the Sustainability Reporting Guide. The proposed amendments aim to enhance sustainability practices and disclosures for listed companies.
GOVERNANCE IN ACTION
Sustainability Statement
In addition to providing financial information, the Board and Sustainability Committee acknowledge that reporting non-financial information, particularly on Sime Darby’s management of environmental, social and the economic issues, is equally important for stakeholders to have a better understanding of Sime Darby’s overall performance.
Sime Darby has been preparing its Integrated Reports in accordance with GRI Sustainability Reporting Guidelines. In doing so, we have also met the requirements laid down by Bursa Malaysia Securities Berhad on the preparation of a Sustainability Statement.

1 6 4 Sime Darby BerhadAnnual Report 2016Innovating for the Future
(c) Reviewing the proposed changes in the Governance Structure Section of the Group Policies & Authorities. The proposed changes will improve the level of control and interface with Division Sustainability & Quality Management and will maintain the Group Chief Sustainability Officer’s accountability to drive the sustainability agenda within the Division and the Flagship Subsidiary Boards.
(d) Reviewing the Report on the Sustainability Committee and other Sustainability Sections prior to their inclusion in the Company’s Annual Report 2016 for recommendation to the Board for approval.
(e) Reviewing the report on compliance by the Committee with its Terms of Reference.
(f) Endorsing the revised Terms of Reference of the Committee to streamline with the Sustainability Framework of Sime Darby.
8. Participation on Global Sustainability Platforms
(a) Deliberating on the participation of Sime Darby in the Palm Oil Innovation Group (POIG). POIG supports the Roundtable on Sustainable Palm Oil (RSPO) by building on RSPO standards and commitments; and focuses on three thematic areas of environmental responsibility, partnerships with communities, as well as corporate product and integrity.
STRATEGY IN SUSTAINABILITY
The Board recognises that the Sime Darby Group’s strategies must promote sustainability. Across the Group, we are united in our focus on the Group’s sustainability purpose that drives our activities across the Group, namely Contributing to a Better Society, Minimising Environmental Harm and Delivering Sustainable Development.
The Committee and the Board had, in May and June 2015 respectively, approved the sustainability strategy for the Group. The sustainability strategy covers the structures that must be in place to deliver sustainability performance at a higher level with the purpose of ensuring that the Group pursues sustainability in a way that creates value to the organisation. Having approved the sustainability strategy, progress on sustainability have been linked to the Senior Management’s key performance indicators effective FY2016.
Priorities for FY2017
Looking ahead, the Committee will remain focused in ensuring that the Group pursues sustainability in a way that creates value to the organisation. Key areas of focus in the next financial year will include improving the OHS Performance of the Group, expansion of the Operational Excellence programme to further increase benefits to the organisation, ensuring respect for Human Rights is operationalised, further implementation of sustainable practices, such as the rollout of the Responsible Agriculture Charter, further engagement with strategic external stakeholders and the Group’s participation at strategic platforms which would benefit the Group as a whole.
SUSTAINABILITY COMMITTEE REPORT

1 6 5Sime Darby Berhad Annual Report 2016 Corporate Governance
RISK MANAGEMENT COMMITTEE REPORT
“The Committee is focused on ensuring strategic risks are identified and providing oversight over the risk management framework of the Group.”
DATO SRI LIM HAW KUANGChairman of the Risk Management Committee
ROLES OF THE COMMITTEE
The primary objective of the Committee is to assist the Board in the discharge of its statutory and fiduciary responsibilities by identifying significant risks and ensuring that the Group Risk Management Framework (RMF) includes the necessary policies and mechanisms to manage the overall risk exposures of the Group.
Specific duties of the Committee are as follows:
• Reviewtheadequacyofthescope,functions, authority, competency and resources of Group Risk Management (GRM).
• Provideoversight,directionandcounseltothe risk management process, specifically to:
(i) ensure that appropriate risk management policies, guidelines and processes are implemented;
(ii) consider whether response strategies (and contingency plans) to manage or mitigate material risks are appropriate and effective given the nature of the identifiable risks; and
(iii) evaluate the risk profile and risk tolerance of the Group.
• Reviewinvestmentproposalsthataresignificant from a risk perspective and monitor the execution of risk mitigation strategies for such proposals. Follow up on post-investment risk mitigation strategies to ensure that the strategies are implemented subsequent to the Board’s approval.
INTRODUCTION
The Risk Management Committee (RMC) was established on 29 September 2007 and is responsible for ensuring the implementation of appropriate systems to manage the overall risk exposures of the Sime Darby Group.
CHAIRMAN’S OVERVIEW The RMC supports the Main Board in identification and assessment of key enterprise risks, emerging mega trends and potential business discontinuities, and deliberation of risk mitigation strategy and measures. On a regular basis the RMC meets and focuses on:
• ReviewingandadvisingtheMainBoardonnew major investment proposals and new market entries.
• MonitoringofGroupcashflowandgearing.• JointreviewswiththeManagingDirectorof
each business assessing market specific and division specific risks, mitigation plans and major project implementation status.
In conjunction with the Main Board’s effort to enhance the Flagship Subsidiary Boards (FSBs) composition, the RMC is developing recommendations to empower the FSBs further so that the Main Board can focus more on strategic matters. DATO SRI LIM HAW KUANGChairman of the Risk Management Committee

1 6 6 Sime Darby BerhadAnnual Report 2016Innovating for the Future
RISK MANAGEMENT COMMITTEE REPORT
Detailed Terms of Reference for the Committee is available online at the Corporate Governance section www.simedarby.com
COMMITTEE EFFECTIVENESSComposition and Attendance
Members1 Membership Appointment Attendance
Dato Sri Lim Haw Kuang Chairman/Independent Non-Executive Director
16 November 2010 3/5 60% 2
Tan Sri Dato’ Sri Dr Wan Abdul Aziz Wan Abdullah
Member/Non-Independent Non-Executive Director
8 November 2012 5/5 100%
Zainal Abidin Jamal Member/Non-Independent Non-Executive Director
1 March 2016 1/1 100% 3
Former Members Membership Retirement / Resignation
Attendance
Tan Sri Datuk Amar (Dr) Tommy Bugo @ Hamid Bugo
Chairman/Independent Non-Executive Director
23 November 2015 3/3 100% 3
Dato’ Azmi Mohd Ali Member/Non-Independent Non-Executive Director
1 March 2016 4/4 100% 3
Notes:1 For the Members’ profiles see pages from 116 to 120. 2 Dato Sri Lim Haw Kuang was appointed as Chairman of the Risk Management Committee on 23 November 2015.3 Reflects the number of meetings held during the time Tan Sri Datuk Amar (Dr) Tommy Bugo @ Hamid Bugo, Dato’ Azmi Mohd Ali and Encik Zainal Abidin Jamal held office.
The RMC comprises Non-Executive Directors and is supported by GRM in discharging its responsibilities. The RMC Chairman reports to the Board on key matters deliberated at the RMC meetings.
On 23 November 2015, Dato Sri Lim Haw Kuang was appointed as Chairman of the RMC succeeding Tan Sri Datuk Amar (Dr) Tommy Bugo @ Hamid Bugo who retired from the Board of Sime Darby at the conclusion of the Sime Darby Annual General Meeting 2015.
Encik Zainal Abidin Jamal was appointed as a member of the Committee on 1 March 2016 in place of Dato’ Azmi Mohd Ali who resigned from the Board of Sime Darby on 1 March 2016.
Meetings of the Committee are attended by the President & Group Chief Executive, Group Chief Financial Officer, Group Head – Risk Management, Group Head – Group Compliance & Group Corporate Assurance. In addition, other members of senior management are also invited to attend meetings as and when necessary to support detailed discussions.
Annual Performance Assessment
The Board through the Nomination & Remuneration Committee performs an annual assessment to assess the Committee’s effectiveness in carrying its duties set out in the Terms of Reference. The Board is satisfied that the Committee has effectively discharged its duties in accordance with its Terms of Reference.
The Board Effectiveness Assessment 2016 further commended the Committee’s focus towards “bigger picture” risk issues facing the Sime Darby Group.

1 6 7Sime Darby Berhad Annual Report 2016 Corporate Governance
STATEMENT ON RISK MANAGEMENTAND INTERNAL CONTROLINTRODUCTION
The Board is pleased to provide this statement on Risk Management and Internal Control which outlines the nature of risk management and internal control within the Sime Darby Group for the financial year under review.
Risk management and internal control are integrated into management processes and embedded in all day to day business activities of the Group.
RESPONSIBILITIES AND ACCOUNTABILITIES
a) The Main Board
The Group adopts a two-tier board structure, led by the Sime Darby Board (also known as the Main Board) and supported by the Divisional Flagship Subsidiary Boards (FSBs). Each Divisional FSB is charged with operational oversight of its Division but remains subject to the direction and counsel of the Main Board.
The Main Board has delegated the Risk and Governance responsibilities to Board Committees which ensure independent oversight of internal control and risk management. Notwithstanding the delegated responsibilities, the Main Board acknowledges its overall responsibility in the establishment and oversight of the Group’s risk management framework and internal control systems for the Group. The Main Board is cognisant of the fact that its role in providing risk oversight sets the tone and culture towards managing key risks that may impede the achievement of the Group’s business objectives within an acceptable risk profile. The Main Board also recognises the fact that the internal control systems are designed to manage and minimise, rather than eliminate, occurrences of material misstatements or unforeseeable circumstances, fraud or losses.
• RiskManagementCommittee
The Risk Management Committee (RMC) assists the Main Board in ensuring the implementation of appropriate systems to manage the overall risk exposure of the Group, which include identifying significant risks and ensuring that the Group Risk Management Framework includes all the necessary policies and mechanism to manage the overall risk exposure of the Group. The RMC is also tasked to review
the effectiveness of the Group Risk Management Framework, the results of risk assessments and recommend any policies and/or framework for the Main Board’s approval.
The responsibilities of the RMC are detailed on pages 165 and 166 of this Annual Report. The RMC is chaired by an Independent Non-Executive Director.
In discharging its responsibilities, the RMC is assisted by the Group Risk Management Department.
• GovernanceandAuditCommittee
The main responsibility of the Governance and Audit Committee (GAC) is to assist the Main Board in fulfilling its statutory and fiduciary responsibilities of monitoring the Group’s management of financial risk processes, accounting and financial reporting practices. The GAC is also tasked to review the process, quality of the Group accounting function, financial reporting and the systems of internal controls, which include ensuring that an effective ethics programme is implemented across the Group. The GAC also monitors compliance of established policies and procedures. The Terms of Reference and GAC’s activities in assessing the adequacy and effectiveness of internal control systems and their implementation within the Group are detailed on pages 149 to 150 of this Annual Report. The GAC is chaired by an Independent Non-Executive Director.
In discharging its duties, GAC is supported and assisted by two functional units within the Group, i.e. the Group Compliance Office (GCO) and the Group Corporate Assurance Department (GCAD).
b) The Management
Management is responsible for implementing Board-approved frameworks, policies and procedures on risk management and internal control. Management acknowledges their responsibility to identify and evaluate the risks faced, and also acknowledges their responsibility to monitor the achievement of business goals and objectives within the risk appetite parameters approved by the Board.

1 6 8 Sime Darby BerhadAnnual Report 2016Innovating for the Future
Management’s responsibility includes but is not limited to:
• Settingtherightexample(behaviourandactions), encourage, reinforce the importance of good business behaviours and apply the required rules and regulations.
• RecommendingGroupPoliciesforMainBoard’s approval and implementing and monitoring the effectiveness of approved policies and procedures to manage risk.
• Ensuringappropriateandtimelycorrectiveactions are undertaken to strengthen internal controls and minimise occurrence of non-compliance incidences.
• KeepingtheMainBoardappraisedofneworemerging risk and/or controls issues on a timely basis and seeks guidance when required.
Management is expected to provide assurance to the Main Board (and the respective FSBs) that the Group’s risk management and internal control systems are operating adequately and effectively based on the risk management framework adopted by the Group.
c) Group Compliance Office
GCO’s main role is to assist the Main Board, GAC and Management in coordinating compliance risk management activities (i.e. programmes or activities to identify, mitigate and educate employees about the risks of non-compliance). This role is executed via oversight, coordination, consultation and validation of the Group’s state of compliance. In recognising the diverse nature and the challenges faced by the Group, GCO’s programmes and activities are tailored to meet the specific needs and requirements of each of the Divisions and/or business units, focusing on emerging areas of compliance not addressed or covered by other assurance functions to minimise duplication of work yet remain within the scope and mandate provided by the GAC. The Group adopts good practices recommended by the Australian Standards 3806 -2006 “Compliance Programme” and International Standard 19600 “Compliance Management” in the design of its Compliance programmes.
GAC monitors the strategy and delivery of the compliance programmes via periodic progress reports submitted and reported by the Group Head, GCO. GAC also provides the necessary feedback to GCO through the annual GAC survey conducted by GCO as part of its improvement efforts.
GCO’s mandate and activities are detailed on page 151 of this Annual Report.
d) Group Corporate Assurance Department
GCAD which is an integral part of the Group’s internal control systems, reports directly to the GAC. GCAD’s primary role is to provide independent, reasonable and objective assurance in addition to consulting services designed to add value and improve efficiency of the operations within the Group. It assists the Group to achieve its objectives by bringing a systematic and disciplined approach to evaluate and improve the effectiveness of risk management, control and governance processes.
The annual audit plan, established on a risk-based approach, is reviewed and approved by the GAC annually. The audit plan is aligned with the Group’s objectives and strategies as articulated in the Strategy Blueprint. GCAD conducts internal audit engagements accordingly. GCAD’s audit practices conforms to the International Professional Practices Framework (IPPF) published by the Institute of Internal Auditors Inc. in United States of America.
GCAD conducts periodic assessment of business emerging risks and actively monitors and responds to adverse indicators and key risks. Adjustments are made to the audit coverage as required, including scope extension and/or undertaking special reviews with amendments to the Audit Plan reported to the appropriate FSB’s and GAC periodically.
GCAD’s mandate and activities are detailed on page 150 of this Annual Report.
e) Group Risk Management Department
GRM Department assists the Board and RMC in discharging their risk management responsibilities. GRM is structured to ensure that sufficient support is provided at both the Group Head Office and Divisional levels. This structure reflects the types of key risks identified at the Group and Divisional levels in that some risks are Divisional specific and some are common across the Group requiring a coordinated approach.
STATEMENT ON RISK MANAGEMENT AND INTERNAL CONTROL

1 6 9Sime Darby Berhad Annual Report 2016 Corporate Governance
RISK MANAGEMENT AND INTERNAL CONTROL FRAMEWORK
The Group has a risk management framework that is integrated into and where appropriate embedded into the day to day business activities and management decision making framework of the Group. The Group does not adopt any one risk management standard or guideline believing it is better to tailor the risk management framework to the specific circumstances of the Group. The Group practices are generally aligned with the principles of ISO 31000. It should be noted that these principles in themselves are broad and to be utilised only where considered appropriate.
Supporting this broader risk management framework is an internal control system that facilitates internal control design and operating effectiveness to manage key risks.
Key aspects of the Group’s overall risk management and internal control framework are selectively outlined below, where they provide assurance the framework is adequate and effective for the purposes of this Statement.
Mandate and Commitment
The Main Board has approved via the RMC, the Group Risk Management Framework (RMF) which encapsulates the governance arrangements as well as assigns responsibility to relevant levels of management and operations. The implementation of the RMF is ultimately the responsibility of the President & Group Chief Executive (PGCE) and members of the Sime Darby Group Management Committee (GMC). An overview of the Group’s overall risk management framework is provided in the diagramme below:

1 7 0 Sime Darby BerhadAnnual Report 2016Innovating for the Future
STATEMENT ON RISK MANAGEMENT AND INTERNAL CONTROL
Integration of Risk Management and Internal Control
Integration of the formal risk management framework into the wider management framework occurs wherever practicable. The Group has embedded a number of risk assessment updating activities which are enabled by a risk management process outlined in ISO 31000 (refer to the tables below).
CONTEXT TIMING MANAGEMENT INVOLVEMENT
Strategies/Objectives
Annual Review Top Down (as part of the Annual Strategic Updating process)
Business Unit/ Operating Unit/Project
Quarterly Update
Bottom Up (as part of the periodic monthly management review process)
Major Projects (CAPEX/Improvements/Customer)
Monthly Review/ Adhoc Update
Project Team (as part of the routine project management review process)
Major Proposals (Investment/Improvements/Bids)
As Required Proposal Team (as part of the project evaluation process)
As can be seen, a top-down review of enterprise level risks is conducted as part of the annual strategic planning update to ensure that the risk implications of any changes in strategy are identified, assessed and documented. This is supplemented by quarterly risk updates and regular reviews of projects along with assessments of investment proposals where required. The outcome of these reviews is the identification of some new risks and the reassessment of some others. It may also lead to the development of specific action plans. Where conditions significantly change during the year, this may necessitate changes to strategy and also the risk implications. Such activities clearly demonstrate that the Main Board and Senior Management perceive risk management as integral to strategic planning and managing the business.
In relation to internal controls, the Group has been implementing progressively across the Group’s operations Control Self-Assessment (CSA), which allows Management to conduct self-assessments on the adequacy and effectiveness of internal control systems in place. The results of the CSA will allow identification of high risk areas and identification of such areas enables GCAD to reduce audit resources on routine compliance work and focus it on high risk areas and business advisory reviews.
During the financial year, the respective Divisions in the Group continue to identify new business functional areas to roll out CSA that uses a questionnaire approach. The roll out of CSA is coordinated and monitored by GCAD and supported by GCO. The results of the CSA process will be validated during GCAD audits and exceptions will be reported to the GAC.
Risk Management Process Risk Assessment Updating

1 7 1Sime Darby Berhad Annual Report 2016 Corporate Governance
Control Environment
The Main Board has put in place Group Policies and Authorities (GPAs) which act as a key pillar of the Group’s governance framework as it is a tool by which the Main Board formally delegates functions and powers to the FSBs and Management with specific oversight and supervisory functions. This enables the Main Board to facilitate a robust control environment encircling clear lines of responsibilities, accountability and authority limits that are aligned with the Group’s business operations.
As the GPAs cover a wide range of areas, they also act as an ethical roadmap for the Group’s diverse businesses to navigate the intricacies of global business practices and cultures. The GPAs are reviewed annually whereby any new GPAs and/or enhancement to the current GPAs shall be approved by the Main Board prior to implementation. The Divisions are expected to develop further delegated authorities with supporting policies and procedures based on the mandate and guidance provided by the GPAs. Among the key supporting policies and procedures developed are as listed below:
• Core Values, Business Principles and Code of Business Conduct
The Group has clearly set out expected behaviors of Directors and employees of the Group in the Group’s Core Values, Business Principles and Code of Business Conduct (COBC). An attestation programme is in place with the aim to confirm that each Director and employee has read and agreed to comply with the provisions of the COBC. The COBC is available in nine languages in recognition of the large geographical spread that the Group operates from, ensuring that it reaches far and wide to Group personnel where major local languages are represented to minimise translation error.
• Integrity and Anti-Corruption Sime Darby Group’s COBC articulates
expected behaviors of all employees in terms of dealing with internal and external stakeholders. Strict adherence is expected without compromise. It upholds the Group’s Core Values, the first of which states INTEGRITY. Sime Darby Group was the first Government-Linked Company (GLC) to have signed the Corporate Integrity Pledge in 2011. The Group launched the Sime Darby Integrity Programme in 2015/2016 to strengthen the ring-fencing of the Group’s ethics parameters.
• Whistleblowing Policy The Group has put in place a Whistleblowing
Policy that provides clarity of oversight and responsibilities of the whistleblowing process, the reporting process, protection to whistleblowers and confidentiality afforded to the whistleblower. The primary aim of the Whistleblowing Policy and its supporting mechanism is to enable individuals to raise genuine concerns without fear of retaliation.
The Policy on whistleblowing as set out in the GPAs is available in the Sime Darby Enterprise Portal. An overview of the Whistleblowing Policy is available in the Group’s website.
• Group Procurement Policies and Authorities The Group Procurement Policies and
Authorities (GPPA) covers all type of purchases (capital expenditure/operating expenditure/trade) made by all businesses in the countries in which the Group operates. The GPPAs mainly states the key principles and procedures required in the procurement of goods and services within the Group. These key principles and procedures shall also serve as guidelines in establishing the detailed procurement procedures (Standard Operating Procedures - SOP) at all divisions and operating units.
• Vendor Letter Of Declaration Vendor Letter of Declaration (VLOD) was
introduced as one of the initiatives to align the Group’s expectation of the behaviors of our suppliers with the principles contained in the COBC. Amongst others, the VLOD is a document which captures vendor’s formal affirmation to comply with the principles of the COBC, to not be involved with any offence of bribery, corruption or fraud; and to not be engaged in bribery, corruption or fraud with the Sime Darby Group.
• Risk Management Policy The Group has a formal risk management
policy that describes the risk management framework and supporting processes that have been approved by the RMC. It also has supporting policies, standards and/or guidelines to guide decision making.

1 7 2 Sime Darby BerhadAnnual Report 2016Innovating for the Future
• Business Continuity Management To support the Group in being able to
respond and recover from significant unexpected events, work continued on Business Continuity Management (BCM) to facilitate robust plans being available to protect the interests of all stakeholders.
• Financial Budgets The Group’s Divisions/operating units
prepare budgets on an annual basis. The budgets are reviewed by Management prior to submission to the respective FSBs and Main Board for approval. The Sime Darby GMC reviews the financial performance (actual against budget) and forecast for the financial year of the Divisions/operating units on a regular basis. In addition, the financial performance is reported to the Board on a quarterly basis.
Communication and Reporting
• Reporting to Shareholders/StakeholdersExternal stakeholder relations and communication is given a high priority in view of the types of risks faced by the Group. Specifically, sustainability issues require careful management of Non-Governmental Organisations and other interested parties. The Group being a large GLC in Malaysia, necessitates an effective external communications strategy to ensure the reputation of the Group is protected.
The Group has established processes and procedures to ensure Quarterly and Annual Accounts, which covers the Company’s performance, are submitted to Bursa Malaysia Securities Berhad (Bursa Securities) for release to shareholders and stakeholders, on a timely basis. All Quarterly Results are reviewed and approved by the Main Board prior to announcement.
The Annual Reports of the Company that include the annual audited financial statements together with the auditors’ and directors’ reports are issued to the shareholders within the stipulated time prescribed under the Main Market Listing Requirement (MMLR) of Bursa Securities.
• Whistleblowing Mechanism/ChannelsThe whistleblowing mechanism/channels are managed to provide independence from Management. This is articulated in the Whistleblowing Policy (as stated in the GPAs), where GCO can be contacted for reporting either through emails, letters, calls or fax.
The GAC reviews the results of the completed investigation, with the Chairman of the GAC having oversight responsibilities of all whistleblowing cases, from the receipt of the cases via the online system or otherwise, through to the closure of each investigation.
On a quarterly basis, the GAC reviews the results of completed investigations. A summary of trending and analysis report is presented to the Board for notation.
STATEMENT ON RISK MANAGEMENT AND INTERNAL CONTROL

1 7 3Sime Darby Berhad Annual Report 2016 Corporate Governance
MATERIAL JOINT VENTURES AND ASSOCIATES
The disclosures in this Statement do not include the risk management and internal control practices of the Group’s material Joint Ventures and Associates. The Group’s interests in these entities are safeguarded through the appointment of members of the Group’s Senior Management team to the Board of Directors and, in certain cases, the management or operational committees of these entities.
The Group’s interest is protected and served through the review of key financial and management accounts and other appropriate information on the performance of these entities. The monitoring, review and reporting arrangements in place provide reasonable assurance that the system of internal control are appropriate to the Group’s operations and that risks are at an acceptable level throughout the Group’s businesses.
REVIEW OF THE STATEMENT BY THE EXTERNAL AUDITORS
As required by Paragraph 15.23 of the MMLR of Bursa Securities, the external auditors have reviewed this Statement on Risk Management and Internal Control. Their limited assurance review was performed in accordance with Recommended Practice Guide (RPG) 5 (Revised) issued by the Malaysian Institute of Accountants. RPG 5 (Revised) does not require the external auditors to form an opinion on the adequacy and effectiveness of the risk management and internal control systems of the Group.
CONCLUSION
For the financial year under review and up to the date of approval of this statement, the Board is satisfied with the adequacy and effectiveness of the Group’s system of risk management and internal control to safeguard shareholders’ investments and Group’s assets.
The Board has received reasonable assurance from the PGCE and Group Chief Financial Officer that the Group’s risk management and internal control systems, in all material aspects, are operating adequately and effectively.
This Statement is prepared in accordance with the Statement on Risk Management and Internal Control – Guidelines for Directors of Listed Issuers (Guidelines) issued on 31 December 2012, which is in line with the requirements of Paragraph 15.26 (b) of the MMLR of Bursa Securities and Principle 6 of the Malaysian Code on Corporate Governance 2012 issued by Securities Commission Malaysia.
This Statement is made in accordance with a resolution of the Board dated 27 September 2016.

1 7 4 Sime Darby BerhadAnnual Report 2016Innovating for the Future
Other Disclosures and Compliance
Any query regarding the Sime Darby Group may be conveyed to the following persons:
NORZILAH MEGAWATI ABDUL RAHMANGroup Secretary
Telephone : +(6 03) 2691 4122 extension 2370Facsimile : +(6 03) 2719 0044Email : [email protected]
LEELA BARROCKGroup Head, Communications
Telephone : +(6 03) 2691 4122 extension 2341Facsimile : +(6 03) 2698 0645Email : [email protected]
The Senior Independent Director of the Board to whom concerns relating to the Sime Darby Group may be conveyed by Directors, shareholders and other stakeholders, may be contacted at:
DATUK ZAITON MOHD HASSANSenior Independent Non-Executive Director
Telephone : +(6 03) 2691 0948Telephone (toll free) : 1 800 88 8880 (Local) 800 8008 8000 (International)Facsimile : (+6 03) 2698 6629Email : zaiton.mohd.hassan@ simedarby.com
The Company’s website is www.simedarby.com
Statement of Compliance
Pursuant to Paragraph 15.25 of the Listing Requirements, the Board is satisfied that the Company has applied the Principles of the Malaysian Code on Corporate Governance 2012 during the financial year under review, with due regard to the Recommendations supporting the Principles.
A checklist highlighting the compliance of this statement with the Principles and Recommendations of the Malaysian Code on Corporate Governance 2012 is set out on page 381.
This Statement is made in accordance with a resolution of the Board of Directors dated 27 September 2016.

Sime Darby Berhad 1 7 5Annual Report 2016 Financial Reports
The Directors are responsible for the preparation,integrity and fair presentation of the annual financialstatements of the Sime Darby Berhad Group. Asrequired by the Companies Act, 1965 (Act) and theMain Market Listing Requirements of Bursa MalaysiaSecurities Berhad, the financial statements for thefinancial year ended 30 June 2016, as presented onpages 186 to 348, have been prepared in accordancewith the Financial Reporting Standards issued bythe Malaysian Accounting Standards Board and theprovisions of the Act.
The Directors consider that in preparing the financialstatements, the Group and the Company have used the appropriate accounting policies, consistently appliedand supported by reasonable and prudent judgmentsand estimates. The Directors are satisfied that theinformation contained in the financial statements givea true and fair view of the state of affairs of the Groupand the Company at the end of the financial year andthe results and the cash flows of the Group and theCompany for the financial year.
The Directors have responsibility for ensuring thatproper accounting records are kept. The accountingrecords should disclose with reasonable accuracythe financial position of the Group and the Companyto enable the Directors to ensure that the financialstatements comply with the Act. The Directors havethe general responsibility for taking such steps asare reasonably open to them to safeguard the assetsof the Group to prevent and detect fraud and otherirregularities.
This statement is made in accordance with a resolutionof the Board of Directors dated 27 September 2016.
Board Approval of Financial Statements
The annual financial statements for the financial yearended 30 June 2016 are set out on pages 186 to 348.The preparation thereof was supervised by the GroupChief Financial Officer and approved by the Board ofDirectors on 27 September 2016.
STATEMENT OF RESPONSIBILITY BY THE BOARD OF DIRECTORS

Sime Darby BerhadAnnual Report 2016Innovating for the Future1 7 6
For the financial year ended 30 June 2016
Reports and Financial Statements 178 Directors’ Report
183 Statement by Directors
183 Statutory Declaration
184 Independent Auditors’ Report
Financial Statements
186 Statements of Profit or Loss
187 Statements of Comprehensive Income
188 Statements of Financial Position
190 Statements of Changes in Equity
193 Statements of Cash Flows
196 Notes to the Financial Statements
349 Supplementary Information

Sime Darby Berhad 1 7 7Annual Report 2016 Financial Reports
For the financial year ended 30 June 2016
Reports and Financial Statements 178 Directors’ Report
183 Statement by Directors
183 Statutory Declaration
184 Independent Auditors’ Report
Financial Statements
186 Statements of Profit or Loss
187 Statements of Comprehensive Income
188 Statements of Financial Position
190 Statements of Changes in Equity
193 Statements of Cash Flows
196 Notes to the Financial Statements
349 Supplementary Information

Sime Darby BerhadAnnual Report 2016Innovating for the Future1 7 8
The Directors have pleasure in presenting their report together with the audited financial statements of the Group and of the Company for the financial year ended 30 June 2016.
Principal Activities
The Company is principally an investment holding company. The principal activities of the subsidiaries, joint ventures and associates are set out in Note 60 to the financial statements.
During the financial year, the principal activities of the Group were divided into five segments namely, Plantation, Industrial, Motors, Property and Energy & Utilities. There has been no significant change in the principal activities of the Group and of the Company during the financial year.
Financial Results
The results of the Group and of the Company for the financial year ended 30 June 2016 were as follows:
Group CompanyRM million RM million
Profit before tax 2,815.8 1,288.2Taxation (215.6) (0.6)Profit for the financial year 2,600.2 1,287.6
Profit attributable to owners of:- the Company 2,408.8 1,253.9- perpetual sukuk 33.7 33.7- non-controlling interests 157.7 –Profit for the financial year 2,600.2 1,287.6
In the opinion of the Directors, the results of the operations of the Group and of the Company during the financial year were not substantially affected by any item, transaction or event of a material and unusual nature, except for the change in accounting policy for bearer plants as disclosed in Note 2(a) to the financial statements.
Dividends
Since the end of the previous financial year, the Company had paid the following dividends:
RM million
a. In respect of the financial year ended 30 June 2015, a final single tier dividend of 19.0 sen per share was paid on 6 January 2016; and 1,180.1
b. In respect of the financial year ended 30 June 2016, an interim single tier dividend of 6.0 sen per share was paid on 6 May 2016 379.6
1,559.7
The final dividend for the financial year ended 30 June 2015 amounting to RM1,180.1 million was paid partly by way of the issuance of 115,914,252 new ordinary shares of RM0.50 each in the Company (new Sime Darby Shares) at the issue price of RM7.46 per share, amounting to RM864.7 million following the election made by shareholders of the Company under the Dividend Reinvestment Plan (DRP) and the balance of RM315.4 million by way of cash.
At the forthcoming Annual General Meeting (AGM), a final single tier dividend of 21.0 sen per ordinary share of RM0.50 each amounting to RM1,328.7 million (Final Dividend) in respect of the financial year ended 30 June 2016, will be proposed for shareholders’ approval. Subject to the relevant regulatory approvals being obtained and shareholders’ approval at the forthcoming AGM for the renewal of the authority to allot and issue new Sime Darby Shares for the purpose of the implementation of the DRP, shareholders of the Company will be given an option pursuant to the DRP to reinvest up to their entire Final Dividend into new Sime Darby Shares at an issue price to be determined and announced at a later date.
DIRECTORS’ REPORTFor the financial year ended 30 June 2016

Sime Darby Berhad 1 7 9Annual Report 2016 Financial Reports
Reserves and Provisions
All material transfers to or from reserves and provisions during the financial year are shown in the financial statements.
Share Capital, Perpetual Sukuk and Debentures
During the financial year, the Company increased its issued and paid-up ordinary share capital from RM3,105,579,143 to RM3,163,536,269 by way of issuance of 115,914,252 new ordinary shares of RM0.50 each at an issue price of RM7.46 per share. The new ordinary shares were issued pursuant to the DRP of the Company and ranked pari passu in all respects with the existing ordinary shares of the Company.
On 24 March 2016, the Company made its first issuance of RM2.2 billion Sukuk Wakalah (perpetual sukuk) under the Perpetual Subordinated Sukuk Programme of up to RM3.0 billion. The proceeds from the issuance of the perpetual sukuk was utilised by the Company to repay its borrowings. Details of the perpetual sukuk are disclosed in Note 41 to the financial statements.
There were no issuances of debentures during the financial year.
Performance-Based Employee Share Scheme
The Company’s Performance-Based Employee Share Scheme (PBESS) is governed by the by-laws approved by the shareholders at the Extraordinary General Meeting held on 8 November 2012 and was effected on 15 January 2013. Under the PBESS, ordinary shares of RM0.50 each in the Company are granted to eligible employees and executive directors of the Group. The PBESS is in force for a maximum period of ten (10) years from the effective date and is administered by the Nomination & Remuneration Committee (NRC).
The PBESS is based on 3-year cliff vesting and is subject to achievement of certain performance metrics. The salient features of the PBESS and the vesting conditions are disclosed in Note 39 to the financial statements.
The grants under the PBESS comprise the Group Performance Share (GPS), the Division Performance Share (DPS) and the General Employee Share (GES). The number of shares granted under the PBESS and the number of shares outstanding at the end of the financial year are as follows:
GPS DPS GES‘000 ‘000 ‘000
At 1 July 2015 First grant – 7 October 2013 3,549 4,768 4,662
Second grant – 20 October 2014 3,702 4,984 5,2127,251 9,752 9,874
Movement during the financial year Forfeited (558) (749) (753)
At 30 June 2016 6,693 9,003 9,121
The Group is reviewing the salient features of the Long Term Incentive Plan (LTIP). Accordingly, the third grant of PBESS to be made in the financial year has been deferred until such time the review is approved by the NRC.
The first grant awarded on 7 October 2013, based on 3-year cliff vesting, has reached the end of the performance period on 30 June 2016. In August 2016, the NRC has approved the non-vesting of the first grant as the vesting conditions which include performance targets were not met.
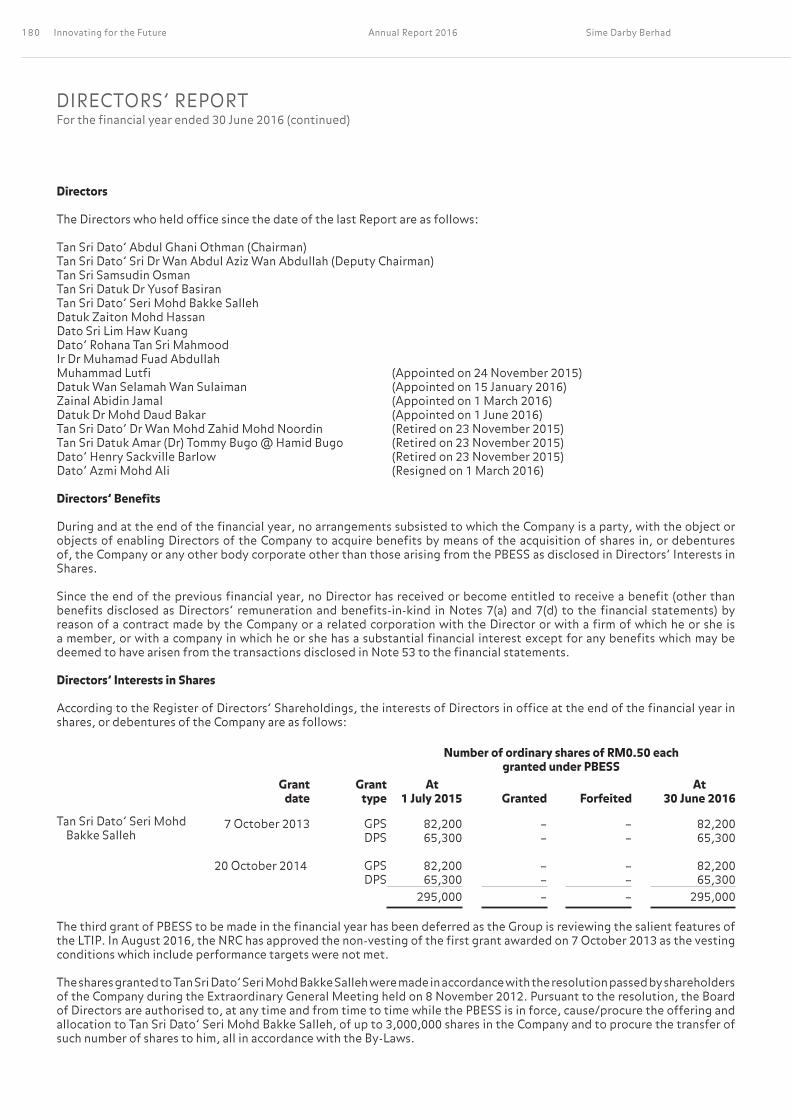
Sime Darby BerhadAnnual Report 2016Innovating for the Future1 8 0
Directors
The Directors who held office since the date of the last Report are as follows:
Tan Sri Dato’ Abdul Ghani Othman (Chairman)Tan Sri Dato’ Sri Dr Wan Abdul Aziz Wan Abdullah (Deputy Chairman)Tan Sri Samsudin OsmanTan Sri Datuk Dr Yusof BasiranTan Sri Dato’ Seri Mohd Bakke SallehDatuk Zaiton Mohd HassanDato Sri Lim Haw KuangDato’ Rohana Tan Sri MahmoodIr Dr Muhamad Fuad AbdullahMuhammad Lutfi (Appointed on 24 November 2015)Datuk Wan Selamah Wan Sulaiman (Appointed on 15 January 2016)Zainal Abidin Jamal (Appointed on 1 March 2016)Datuk Dr Mohd Daud Bakar (Appointed on 1 June 2016)Tan Sri Dato’ Dr Wan Mohd Zahid Mohd Noordin (Retired on 23 November 2015)Tan Sri Datuk Amar (Dr) Tommy Bugo @ Hamid Bugo (Retired on 23 November 2015)Dato’ Henry Sackville Barlow (Retired on 23 November 2015)Dato’ Azmi Mohd Ali (Resigned on 1 March 2016)
Directors’ Benefits
During and at the end of the financial year, no arrangements subsisted to which the Company is a party, with the object or objects of enabling Directors of the Company to acquire benefits by means of the acquisition of shares in, or debentures of, the Company or any other body corporate other than those arising from the PBESS as disclosed in Directors’ Interests in Shares.
Since the end of the previous financial year, no Director has received or become entitled to receive a benefit (other than benefits disclosed as Directors’ remuneration and benefits-in-kind in Notes 7(a) and 7(d) to the financial statements) by reason of a contract made by the Company or a related corporation with the Director or with a firm of which he or she is a member, or with a company in which he or she has a substantial financial interest except for any benefits which may be deemed to have arisen from the transactions disclosed in Note 53 to the financial statements.
Directors’ Interests in Shares
According to the Register of Directors’ Shareholdings, the interests of Directors in office at the end of the financial year in shares, or debentures of the Company are as follows:
Number of ordinary shares of RM0.50 each granted under PBESS
Grant date
Grant type
At1 July 2015 Granted Forfeited
At 30 June 2016
Tan Sri Dato’ Seri Mohd Bakke Salleh
7 October 2013 GPS 82,200 – – 82,200DPS 65,300 – – 65,300
20 October 2014 GPS 82,200 – – 82,200DPS 65,300 – – 65,300
295,000 – – 295,000
The third grant of PBESS to be made in the financial year has been deferred as the Group is reviewing the salient features of the LTIP. In August 2016, the NRC has approved the non-vesting of the first grant awarded on 7 October 2013 as the vesting conditions which include performance targets were not met.
The shares granted to Tan Sri Dato’ Seri Mohd Bakke Salleh were made in accordance with the resolution passed by shareholders of the Company during the Extraordinary General Meeting held on 8 November 2012. Pursuant to the resolution, the Board of Directors are authorised to, at any time and from time to time while the PBESS is in force, cause/procure the offering and allocation to Tan Sri Dato’ Seri Mohd Bakke Salleh, of up to 3,000,000 shares in the Company and to procure the transfer of such number of shares to him, all in accordance with the By-Laws.
DIRECTORS’ REPORTFor the financial year ended 30 June 2016 (continued)

Sime Darby Berhad 1 8 1Annual Report 2016 Financial Reports
Directors’ Interests in Shares (continued)
The GPS and DPS will be vested only upon fulfillment of vesting conditions which include achievement of service period and performance targets. Depending on the level of achievement of the performance targets as determined by the NRC, the total number of shares which will be vested may be lower or higher than the total number of shares granted and is subject to a limit of up to 3,000,000 shares over the duration of the PBESS. The details of the shares granted under the PBESS and its vesting conditions are disclosed in Note 39 to the financial statements.
Statutory Information on the Financial Statements
a. Before the statements of profit or loss, comprehensive income and financial position of the Group and of the Company were made out, the Directors took reasonable steps:
i. to ascertain that proper action had been taken in relation to the writing off of bad debts and the impairment for doubtful debts, and satisfied themselves that all known bad debts had been written off and adequate impairment had been made for doubtful debts; and
ii. to ensure that any current assets, which were unlikely to realise in the ordinary course of business, their values as shown in the accounting records of the Group and of the Company, have been written down to amounts which they might be expected to realise.
b. At the date of this Report, the Directors are not aware of any circumstances:
i. which would render the amount written off for bad debts or the amount of impairment for doubtful debts in the financial statements of the Group and of the Company inadequate to any substantial extent; or
ii. which would render the values attributed to current assets in the financial statements of the Group and of the Company misleading; or
iii. which have arisen which render adherence to the existing method of valuation of assets or liabilities of the Group and of the Company misleading or inappropriate.
c. As at the date of this Report:
i. there are no charges on the assets of the Group and of the Company which have arisen since the end of the financial year to secure the liability of any other person; and
ii. there are no contingent liabilities in the Group and in the Company which have arisen since the end of the financial year other than those arising in the ordinary course of business.
d. At the date of this Report, the Directors are not aware of any circumstances not otherwise dealt with in the Report or financial statements which would render any amount stated in the financial statements misleading.
e. In the opinion of the Directors:
i. no contingent or other liability has become enforceable or is likely to become enforceable within the period of twelve months after the end of the financial year which will or may substantially affect the ability of the Group and of the Company to meet their obligations as and when they fall due; and
ii. no item, transaction or event of a material and unusual nature has arisen in the interval between the end of the financial year and the date of this Report which is likely to affect substantially the results of the operations of the Group and of the Company for the financial year in which this Report is made except as disclosed in Note 61 to the financial statements.

Sime Darby BerhadAnnual Report 2016Innovating for the Future1 8 2
Immediate and Ultimate Holding Companies
The Directors regard Permodalan Nasional Berhad as its immediate holding company and Yayasan Pelaburan Bumiputra as its ultimate holding company. Both companies are incorporated in Malaysia.
Auditors
The auditors, PricewaterhouseCoopers, have expressed their willingness to continue in office.
Signed in accordance with a resolution of the Board of Directors dated 27 September 2016.
Tan Sri Dato’ Abdul Ghani Othman Tan Sri Dato’ Seri Mohd Bakke SallehChairman President & Group Chief Executive/ Executive DirectorKuala Lumpur27 September 2016
DIRECTORS’ REPORTFor the financial year ended 30 June 2016 (continued)

Sime Darby Berhad 1 8 3Annual Report 2016 Financial Reports
I, Datuk Tong Poh Keow, the officer primarily responsible for the financial management of Sime Darby Berhad, do solemnly and sincerely declare that the financial statements set out on pages 186 to 348 are, to the best of my knowledge and belief, correct, and I make this solemn declaration conscientiously believing the same to be true, and by virtue of the provisions of the Statutory Declarations Act, 1960.
Datuk Tong Poh Keow (MIA 4625)Group Chief Financial Officer
SUBSCRIBED AND SOLEMNLY DECLARED by the abovenamed Datuk Tong Poh Keow, at Kuala Lumpur, Malaysia on 27 September 2016.
Before me,
Tan Kim ChooiCommissioner for Oaths (No. W661) Kuala Lumpur
We, Tan Sri Dato’ Abdul Ghani Othman and Tan Sri Dato’ Seri Mohd Bakke Salleh, two of the Directors of Sime Darby Berhad, do hereby state that, in the opinion of the Directors, the financial statements set out on pages 186 to 348 are drawn up so as to give a true and fair view of the state of affairs of the Group and of the Company as at 30 June 2016 and of the results and the cash flows of the Group and of the Company for the financial year ended on that date, in accordance with the Financial Reporting Standards issued by the Malaysian Accounting Standards Board and the provisions of the Companies Act, 1965.
The supplementary information set out in Note 63 to the financial statements on page 349 has been prepared in accordance with the Guidance on Special Matter No. 1, Determination of Realised and Unrealised Profits or Losses in the Context of Disclosure Pursuant to Bursa Malaysia Securities Berhad Listing Requirements, as issued by the Malaysian Institute of Accountants.
Signed in accordance with a resolution of the Board of Directors dated 27 September 2016.
Tan Sri Dato’ Abdul Ghani Othman Tan Sri Dato’ Seri Mohd Bakke Salleh Chairman President & Group Chief Executive/ Executive DirectorKuala Lumpur27 September 2016
STATEMENT BY DIRECTORS PURSUANT TO SECTION 169 (15) OF THE COMPANIES ACT, 1965
STATUTORY DECLARATION PURSUANT TO SECTION 169 (16) OF THE COMPANIES ACT, 1965

Sime Darby BerhadAnnual Report 2016Innovating for the Future1 8 4
REPORT ON THE FINANCIAL STATEMENTS
We have audited the financial statements of Sime Darby Berhad on pages 186 to 348, which comprise the statements of financial position as at 30 June 2016 of the Group and of the Company, and the statements of profit or loss, comprehensive income, changes in equity and cash flows of the Group and of the Company for the financial year then ended, and a summary of significant accounting policies and other explanatory notes, as set out on Notes 1 to 62.
Directors’ Responsibility for the Financial Statements
The Directors of the Company are responsible for the preparation of financial statements so as to give a true and fair view in accordance with Financial Reporting Standards and the requirements of the Companies Act, 1965 in Malaysia. The Directors are also responsible for such internal control as the Directors determine is necessary to enable the preparation of financial statements that are free from material misstatement, whether due to fraud or error.
Auditors’ Responsibility
Our responsibility is to express an opinion on these financial statements based on our audit. We conducted our audit in accordance with approved standards on auditing in Malaysia. Those standards require that we comply with ethical requirements and plan and perform the audit to obtain reasonable assurance about whether the financial statements are free from material misstatement.
An audit involves performing procedures to obtain audit evidence about the amounts and disclosures in the financial statements. The procedures selected depend on our judgement, including the assessment of risks of material misstatement of the financial statements, whether due to fraud or error. In making those risk assessments, we consider internal control relevant to the entity’s preparation of the financial statements that give a true and fair view in order to design audit procedures that are appropriate in the circumstances, but not for the purpose of expressing an opinion on the effectiveness of the entity’s internal control. An audit also includes evaluating the appropriateness of accounting policies used and the reasonableness of accounting estimates made by the Directors, as well as evaluating the overall presentation of the financial statements.
We believe that the audit evidence we have obtained is sufficient and appropriate to provide a basis for our audit opinion.
Opinion
In our opinion, the financial statements give a true and fair view of the financial position of the Group and of the Company as of 30 June 2016 and of their financial performance and cash flows for the financial year then ended in accordance with Financial Reporting Standards and the requirements of the Companies Act, 1965 in Malaysia.
INDEPENDENT AUDITORS’ REPORT TO THE MEMBERS OF SIME DARBY BERHAD(Incorporated in Malaysia)(Company No.752404 U)

Sime Darby Berhad 1 8 5Annual Report 2016 Financial Reports
INDEPENDENT AUDITORS’ REPORT TO THE MEMBERS OF SIME DARBY BERHAD (CONTINUED)(Incorporated in Malaysia)(Company No.752404 U)
REPORT ON OTHER LEGAL AND REGULATORY REQUIREMENTS
In accordance with the requirements of the Companies Act, 1965 (the Act) in Malaysia, we also report the following:
(a) In our opinion, the accounting and other records and the registers required by the Act to be kept by the Company and its subsidiaries of which we have acted as auditors have been properly kept in accordance with the provisions of the Act.
(b) We have considered the financial statements and the auditors’ reports of all the subsidiaries of which we have not acted as auditors, which are indicated in Note 60 to the financial statements.
(c) We are satisfied that the financial statements of the subsidiaries that have been consolidated with the Company’s financial statements are in form and content appropriate and proper for the purposes of the preparation of the financial statements of the Group and we have received satisfactory information and explanations required by us for those purposes.
(d) The audit reports on the financial statements of the subsidiaries did not contain any qualification or any adverse comment made under Section 174(3) of the Act.
OTHER REPORTING RESPONSIBILITIES
The supplementary information set out in Note 63 on page 349 is disclosed to meet the requirement of Bursa Malaysia Securities Berhad (Bursa Malaysia) and is not part of the financial statements. The Directors are responsible for the preparation of the supplementary information in accordance with Guidance on Special Matter No. 1, Determination of Realised and Unrealised Profits or Losses in the Context of Disclosure Pursuant to Bursa Malaysia Listing Requirements, as issued by the Malaysian Institute of Accountants (MIA Guidance) and the directive of Bursa Malaysia. In our opinion, the supplementary information is prepared, in all material respects, in accordance with the MIA Guidance and the directive of Bursa Malaysia.
OTHER MATTERS
This report is made solely to the members of the Company, as a body, in accordance with Section 174 of the Companies Act, 1965 in Malaysia and for no other purpose. We do not assume responsibility to any other person for the content of this report.
PRICEWATERHOUSECOOPERS DATO’ MOHAMMAD FAIZ BIN MOHAMMAD AZMI(No. AF: 1146) (No. 2025/03/18 (J))Chartered Accountants Chartered Accountant
Kuala Lumpur27 September 2016

Sime Darby BerhadAnnual Report 2016Innovating for the Future1 8 6
Group CompanyNote 2016 2015
Restated2016 2015
Revenue 6 43,962.8 43,728.7 1,270.0 1,254.0
Operating expenses 7 (42,399.8) (41,464.7) (26.3) (17.2)Other operating income 8 1,409.2 988.3 5.8 22.5Other gains and losses 9 94.9 289.4 (1.0) 2.5Operating profit 3,067.1 3,541.7 1,248.5 1,261.8Share of results of joint ventures 10 22.9 (100.6) – –Share of results of associates 11 25.5 (21.4) – –Profit before interest and tax 3,115.5 3,419.7 1,248.5 1,261.8Finance income 12 154.2 196.3 215.6 187.9Finance costs 13 (453.9) (470.6) (175.9) (169.0)Profit before tax 2,815.8 3,145.4 1,288.2 1,280.7Taxation 14 (215.6) (596.5) (0.6) 0.5Profit for the financial year 2,600.2 2,548.9 1,287.6 1,281.2
Profit for the financial year attributable to owners of:- the Company 2,408.8 2,430.0 1,253.9 1,281.2- perpetual sukuk 33.7 – 33.7 –- non-controlling interests 157.7 118.9 – –
2,600.2 2,548.9 1,287.6 1,281.2
Sen SenEarnings per share attributable to owners of the
Company: 15- Basic 38.4 39.6- Diluted 38.4 39.6
The comparatives have been restated as given in Note 56, following the change in accounting policy as described in Note 2(a). The notes on pages 196 to 348 form an integral part of these financial statements.
STATEMENTS OF PROFIT OR LOSSFor the financial year ended 30 June 2016Amounts in RM million unless otherwise stated

Sime Darby Berhad 1 8 7Annual Report 2016 Financial Reports
Group CompanyNote 2016 2015 2016 2015
Restated
Profit for the financial year 2,600.2 2,548.9 1,287.6 1,281.2
Other comprehensive income/(loss)
Items that will be reclassified subsequently to profit or loss
Currency translation differences 534.9 751.5 – –Net change in fair value of:- investments 25 5.6 (22.1) – –- cash flow hedges 83.9 194.4 – –Share of other comprehensive (loss)/income of: - joint ventures (123.6) 113.7 – –- associates 11.4 18.2 – –Taxation (19.8) (66.7) – –
492.4 989.0 – –Reclassified to profit or loss:- currency translation differences on:
- repayment of net investments (85.0) (151.5) – –- disposal of a subsidiary (3.8) 0.5 – –
- changes in fair value of cash flow hedges as adjustment to revenue and other gains and losses (52.3) (250.5) – –
Reclassified changes in fair value of cash flow hedges to inventories 7.5 (20.9) – –
Taxation 11.6 83.6 – –370.4 650.2 – –
Items that will not be reclassified subsequently to profit or loss
Actuarial gains/(losses) on defined benefit pension plans 47 0.3 (6.6) – –
Share of other comprehensive income/(loss) of a joint venture 3.2 (20.9) – –
Taxation 0.1 1.7 – –3.6 (25.8) – –
Total other comprehensive income 17 374.0 624.4 – –
Total comprehensive income for the financial year 2,974.2 3,173.3 1,287.6 1,281.2
Total comprehensive income for the financial year attributable to owners of:
- the Company 2,743.7 2,998.0 1,253.9 1,281.2- perpetual sukuk 33.7 – 33.7 –- non-controlling interests 196.8 175.3 – –
2,974.2 3,173.3 1,287.6 1,281.2
The comparatives have been restated as given in Note 56, following the change in accounting policy as described in Note 2(a). The notes on pages 196 to 348 form an integral part of these financial statements.
STATEMENTS OF COMPREHENSIVE INCOMEFor the financial year ended 30 June 2016Amounts in RM million unless otherwise stated

Sime Darby BerhadAnnual Report 2016Innovating for the Future1 8 8
Group CompanyNote 2016 2015 20141 2016 2015
Restated Restated
NON-CURRENT ASSETSProperty, plant and equipment 18 24,456.5 23,026.8 17,168.5 – –Prepaid lease rentals 19 947.3 923.8 868.8 – –Investment properties 20 394.8 571.8 656.2 – –Biological assets 21 45.0 8.8 – – –Land held for property development 22 695.1 810.4 927.7 – –Subsidiaries 23 – – – 8,078.0 7,514.5Amount due from a subsidiary 24 – – – 6,111.8 1,700.0Joint ventures 10 2,889.4 2,237.7 1,590.3 – –Associates 11 1,324.3 1,582.2 1,521.0 – –Investments 25 157.8 140.1 171.6 – –Intangible assets 26 4,336.6 3,994.0 1,233.5 – –Deferred tax assets 27 1,598.2 1,139.2 988.6 – –Tax recoverable 28 544.8 478.6 396.5 – –Derivative assets 29 139.2 214.8 68.2 – –Receivables 30 548.6 527.9 587.6 – –Amounts due from customers on construction
contracts 31 1,439.9 651.2 260.4 – –39,517.5 36,307.3 26,438.9 14,189.8 9,214.5
CURRENT ASSETSInventories 32 9,396.8 9,660.7 9,510.9 – –Biological assets 21 16.8 41.5 – – –Property development costs 33 3,179.7 2,604.6 1,917.2 – –Receivables 30 6,523.1 7,273.3 6,526.0 6.8 0.2Amounts due from subsidiaries 24 – – – 7,007.3 9,244.6Accrued billings and others 34 1,383.1 1,630.7 1,284.3 – –Tax recoverable 28 239.3 310.7 215.4 0.5 1.1Derivative assets 29 125.1 79.9 43.0 – –Cash held under Housing Development
Accounts 35 610.0 556.1 514.2 – –Bank balances, deposits and cash 36 2,910.9 3,644.9 4,381.8 200.0 204.8
24,384.8 25,802.4 24,392.8 7,214.6 9,450.7
Non-current assets held for sale 37 307.0 128.7 392.2 – –
TOTAL ASSETS 64,209.3 62,238.4 51,223.9 21,404.4 18,665.2
1 as at 1 July 2014
STATEMENTS OF FINANCIAL POSITIONAs at 30 June 2016 Amounts in RM million unless otherwise stated

Sime Darby Berhad 1 8 9Annual Report 2016 Financial Reports
Group CompanyNote 2016 2015 20141 2016 2015
Restated Restated
EQUITYShare capital 38 3,163.5 3,105.6 3,032.1 3,163.5 3,105.6Share premium 2,601.9 1,795.6 555.0 2,601.9 1,795.6Reserves 40 7,876.2 7,636.0 7,053.1 5,725.1 5,762.1Retained profits 18,871.1 18,030.9 17,812.7 2,712.8 3,018.6ATTRIBUTABLE TO OWNERS OF THE
COMPANY 32,512.7 30,568.1 28,452.9 14,203.3 13,681.9Perpetual sukuk 41 2,230.1 – – 2,230.1 –Non-controlling interests 42 964.2 1,003.4 859.7 – –TOTAL EQUITY 35,707.0 31,571.5 29,312.6 16,433.4 13,681.9
NON-CURRENT LIABILITIESBorrowings 43 11,414.1 11,745.4 8,109.2 700.0 1,700.0Finance lease obligation 44 126.9 139.2 145.9 – –Amount due to a subsidiary 24 – – – 3,211.8 –Provisions 46 267.0 17.2 49.3 – –Retirement benefits 47 215.9 167.4 141.5 – –Deferred income 48 420.9 407.5 375.7 – –Deferred tax liabilities 27 2,658.4 2,586.4 933.8 1.5 2.1Derivative liabilities 29 28.7 19.0 2.4 – –
15,131.9 15,082.1 9,757.8 3,913.3 1,702.1
CURRENT LIABILITIESPayables 45 8,017.8 8,324.3 8,105.2 14.0 21.1Amounts due to subsidiaries 24 – – – 36.3 3,052.4Progress billings and others 49 206.6 194.9 208.7 – –Borrowings 43 4,419.5 6,317.6 3,065.6 1,007.4 207.7Finance lease obligation 44 8.4 6.8 6.6 – –Provisions 46 203.6 215.4 283.4 – –Deferred income 48 210.8 158.8 102.2 – –Tax payable 245.5 222.5 267.9 – –Derivative liabilities 29 58.2 61.1 29.7 – –
13,370.4 15,501.4 12,069.3 1,057.7 3,281.2
Liabilities associated with assets held for sale 37 – 83.4 84.2 – –
TOTAL LIABILITIES 28,502.3 30,666.9 21,911.3 4,971.0 4,983.3
TOTAL EQUITY AND LIABILITIES 64,209.3 62,238.4 51,223.9 21,404.4 18,665.2
1 as at 1 July 2014
The comparatives have been restated as given in Note 56, following the change in accounting policy as described in Note 2(a). The notes on pages 196 to 348 form an integral part of these financial statements.

Sime Darby BerhadAnnual Report 2016Innovating for the Future1 9 0
Group2016 Note
Sharecapital
Share premium Reserves
Retained profits
Attributable to owners
of the Company
Perpetualsukuk
Non- controlling
interests Total
equity
At 1 July 2015, as previously stated 3,105.6 1,795.6 7,636.0 18,049.4 30,586.6 – 1,024.4 31,611.0
Effects of change in accounting policy
2(a), 56 – – – (18.5) (18.5) – (21.0) (39.5)
At 1 July 2015, as restated 3,105.6 1,795.6 7,636.0 18,030.9 30,568.1 – 1,003.4 31,571.5
Profit for the financial year – – – 2,408.8 2,408.8 33.7 157.7 2,600.2
Other comprehensive income for the financial year 17 – – 331.3 3.6 334.9 – 39.1 374.0
Total comprehensive income for the financial year – – 331.3 2,412.4 2,743.7 33.7 196.8 2,974.2
Performance-based employee share scheme 39 – – (37.0) – (37.0) – – (37.0)
Share of capital reserve of associates 11 – – 2.3 – 2.3 – – 2.3
Transfer between reserves – – 1.7 (1.7) – – – –Transactions with owners:- acquisition of non-
controlling interest 50(c) – – – (10.8) (10.8) – (2.2) (13.0)- disposal of
subsidiaries 51(b) – – – – – – (11.7) (11.7)- put options adjustment 45 – – (58.1) – (58.1) – – (58.1)- issuance of perpetual
sukuk (net of expenses) 41 – – – – – 2,196.4 – 2,196.4- dividends paid by way
of: 16- issuance of shares
pursuant to the Dividend Reinvestment Plan 57.9 806.8 – (864.7) – – – –
- cash – – – (695.0) (695.0) – (222.1) (917.1)Share issue expenses – (0.5) – – (0.5) – – (0.5)At 30 June 2016 3,163.5 2,601.9 7,876.2 18,871.1 32,512.7 2,230.1 964.2 35,707.0
STATEMENTS OF CHANGES IN EQUITYFor the financial year ended 30 June 2016Amounts in RM million unless otherwise stated

Sime Darby Berhad 1 9 1Annual Report 2016 Financial Reports
Group2015
NoteShare
capitalShare
premium ReservesRetained
profits
Attributable to owners
of the Company
Non- controlling
interests Total
equity
At 1 July 2014, as previously stated 3,032.1 555.0 7,053.1 17,948.4 28,588.6 876.7 29,465.3
Effects of change in accounting policy
2(a), 56 – – – (135.7) (135.7) (17.0) (152.7)
At 1 July 2014, as restated 3,032.1 555.0 7,053.1 17,812.7 28,452.9 859.7 29,312.6
Profit for the financial year – – – 2,430.0 2,430.0 118.9 2,548.9Other comprehensive income/
(loss) for the financial year 17 – – 593.5 (25.5) 568.0 56.4 624.4Total comprehensive income
for the financial year – – 593.5 2,404.5 2,998.0 175.3 3,173.3Performance-based employee
share scheme 39 – – (2.1) – (2.1) – (2.1)Share of capital reserve of
associates 11 – – (2.9) – (2.9) – (2.9)Transfer between reserves – – (5.6) 5.6 – – –Transactions with owners:- acquisition of non-wholly
owned subsidiaries – – – – – 72.2 72.2- issue of shares in a subsidiary – – – – – 0.1 0.1- capital repayment by a
subsidiary – – – – – (7.3) (7.3)- dividends paid by way of: 16
- issuance of shares pursuant to the Dividend Reinvestment Plan 73.5 1,241.1 – (1,314.6) – – –
- cash – – – (877.3) (877.3) (96.6) (973.9)Share issue expenses – (0.5) – – (0.5) – (0.5)At 30 June 2015 3,105.6 1,795.6 7,636.0 18,030.9 30,568.1 1,003.4 31,571.5

Sime Darby BerhadAnnual Report 2016Innovating for the Future1 9 2
Company2016 Note
Sharecapital
Share premium Reserves
Retained profits
Attributable to owners
of the Company
Perpetual sukuk
Totalequity
At 1 July 2015 3,105.6 1,795.6 5,762.1 3,018.6 13,681.9 – 13,681.9Profit for the financial year – – – 1,253.9 1,253.9 33.7 1,287.6Performance-based employee
share scheme 39 – – (37.0) – (37.0) – (37.0)Transactions with owners:- issuance of perpetual sukuk (net
of expenses) 41 – – – – – 2,196.4 2,196.4- dividends paid by way of: 16
- issuance of shares pursuant to the Dividend Reinvestment Plan 57.9 806.8 – (864.7) – – –
- cash – – – (695.0) (695.0) – (695.0)Share issue expenses – (0.5) – – (0.5) – (0.5)At 30 June 2016 3,163.5 2,601.9 5,725.1 2,712.8 14,203.3 2,230.1 16,433.4
2015
At 1 July 2014 3,032.1 555.0 5,764.2 3,929.3 13,280.6 – 13,280.6Profit for the financial year – – – 1,281.2 1,281.2 – 1,281.2Performance-based employee
share scheme 39 – – (2.1) – (2.1) – (2.1)Transactions with owners:- dividends paid by way of: 16
- issuance of shares pursuant to the Dividend Reinvestment Plan 73.5 1,241.1 – (1,314.6) – – –
- cash – – – (877.3) (877.3) – (877.3)Share issue expenses – (0.5) – – (0.5) – (0.5)At 30 June 2015 3,105.6 1,795.6 5,762.1 3,018.6 13,681.9 – 13,681.9
An analysis of the movements in each category within reserves is set out in Note 40. The notes on pages 196 to 348 form an integral part of these financial statements.
STATEMENTS OF CHANGES IN EQUITY
For the financial year ended 30 June 2016 (continued)Amounts in RM million unless otherwise stated

Sime Darby Berhad 1 9 3Annual Report 2016 Financial Reports
Group CompanyNote 2016 2015 2016 2015
Restated
Cash flow from operating activitiesProfit for the financial year 2,600.2 2,548.9 1,287.6 1,281.2Adjustments for:- dividends from subsidiaries – – (1,270.0) (1,254.0)- income from investments (91.9) (66.1) – –- amortisation of prepaid lease rentals 48.4 43.7 – –- depreciation and amortisation 1,699.5 1,389.9 – –- share of results of joint ventures and associates (48.4) 122.0 – –- finance income (154.2) (196.3) (215.6) (187.9)- finance costs 453.9 470.6 175.9 169.0- taxation 215.6 596.5 0.6 (0.5)- other non-cash items [note (a)] (416.0) (395.5) 4.3 (8.1)
4,307.1 4,513.7 (17.2) (0.3)Changes in working capital:- inventories and rental assets 794.1 966.5 – –- property development costs (968.2) (575.2) – –- land held for property development (9.6) (6.9) – –- receivables and others 196.3 (474.2) (43.6) 12.2- payables and others (176.7) (214.7) 0.2 (37.8)Cash generated from/(used in) operations 4,143.0 4,209.2 (60.6) (25.9)Tax (paid)/refunded (617.7) (957.6) 0.5 (1.1)Dividends received from:- subsidiaries – – 1,270.0 1,254.0- associates 42.2 30.9 – –Income received from investments 91.9 66.1 – –Net cash from operating activities 3,659.4 3,348.6 1,209.9 1,227.0
Cash flow from investing activitiesFinance income received 81.8 160.1 168.1 166.1Proceeds from sale of: - property, plant and equipment 176.4 305.0 – –- prepaid lease rental – 1.0 – –- investment properties 3.0 154.3 – –- a joint venture 30 161.3 15.7 – –- associate – 318.4 – –- investments – 77.1 – –- intangible assets 0.7 – – –Net cash inflow from disposal of subsidiaries 51(b) 800.8 41.1 – –Purchase of:- property, plant and equipment 18 (2,268.1) (1,908.9) – –- investment properties (2.6) (2.3) – –- investments – (58.7) – –- intangible assets (181.5) (214.5) – –Payment for prepaid lease rentals (43.2) (49.9) – –Acquisition of subsidiaries – (6,022.9) – –Acquisition and subscription of shares in joint
ventures (670.4) (350.8) – –Acquisition and subscription of shares in associates (57.2) (64.5) – –Advances to subsidiaries – – (2,512.2) (801.8)Repayment from subsidiaries – – – 1,000.9Others (95.2) 3.9 – –Net cash (used in)/from investing activities (2,094.2) (7,595.9) (2,344.1) 365.2
STATEMENTS OF CASH FLOWSFor the financial year ended 30 June 2016Amounts in RM million unless otherwise stated

Sime Darby BerhadAnnual Report 2016Innovating for the Future1 9 4
STATEMENTS OF CASH FLOWS
For the financial year ended 30 June 2016 (continued)Amounts in RM million unless otherwise stated
Group CompanyNote 2016 2015 2016 2015
Restated
Cash flow from financing activitiesProceeds from shares issued to an owner of non-
controlling interest – 0.1 – –Proceeds from issuance of perpetual sukuk 41 2,200.0 – 2,200.0 –Perpetual sukuk issuance expenses 41 (4.7) – (4.7) –Capital repayment by a subsidiary to owners of
non-controlling interests – (7.3) – –Purchase of additional interest in subsidiaries 50(c) (13.0) – – –Advances from a subsidiary – – – 10.7Share issuance expenses (0.5) (0.5) (0.5) (0.5)Finance costs paid (717.0) (585.8) (170.4) (160.3)Long-term borrowings raised 1,903.0 3,799.1 – –Repayment of long-term borrowings (2,058.5) (1,829.7) – (700.0)Revolving credits, trade facilities and other
short-term borrowings (net) (2,707.8) 2,942.6 (200.0) –Dividends paid (917.1) (973.9) (695.0) (877.3)Net cash (used in)/from financing activities (2,315.6) 3,344.6 1,129.4 (1,727.4)
Net decrease in cash and cash equivalents (750.4) (902.7) (4.8) (135.2)Foreign exchange differences 91.4 255.1 – –Cash and cash equivalents at beginning of the
financial year 4,154.6 4,802.2 204.8 340.0Cash and cash equivalents at end of the financial year
[note (b)] 3,495.6 4,154.6 200.0 204.8

Sime Darby Berhad 1 9 5Annual Report 2016 Financial Reports
Group CompanyNote 2016 2015 2016 2015
Restated
a. Other non-cash items:
(Gain)/loss on disposal of: - property, plant and equipment (60.0) (83.0) – –- investment properties (2.6) (68.1) – –- subsidiaries 51 (513.0) 3.7 – –- a joint venture – (157.2) – –- associates – (55.5) – –Surplus from liquidation of a subsidiary – – – (5.6)Write offs of property, plant and equipment 30.7 45.8 – –Write-down of inventories (net) 207.2 119.9 – –Impairment/(reversal of impairment) of:- property, plant and equipment 24.3 15.0 – –- prepaid lease rentals (0.5) (1.4) – –- investment properties 1.3 4.5 – –- a subsidiary – – 3.3 –- investments 1.6 – – –- intangible assets (3.5) (1.3) – –- receivables 60.0 0.7 – –Changes in fair value of derivatives and
warrants (110.8) (282.0) – –Unrealised foreign currencies exchange loss/
(gain) 75.6 167.2 1.0 (2.5)Realised foreign currencies exchange gain
transferred from equity (85.0) (151.5) – –Performance-based employee share scheme
and other expenses (41.3) 47.7 – –(416.0) (395.5) 4.3 (8.1)
b. Cash and cash equivalents at end of the financial year:
Cash held under Housing Development Accounts 35 610.0 556.1 – –
Bank balances, deposits and cash 36 2,910.9 3,644.9 200.0 204.8Bank overdrafts 43 (25.3) (46.4) – –
3,495.6 4,154.6 200.0 204.8
The comparatives have been restated as given in Note 56, following the change in accounting policy as described in Note 2(a). The notes on pages 196 to 348 form an integral part of these financial statements.

Sime Darby BerhadAnnual Report 2016Innovating for the Future1 9 6
NOTES TO THE FINANCIAL STATEMENTSFor the financial year ended 30 June 2016Amounts in RM million unless otherwise stated
1 General Information
The Company is principally an investment holding company. The principal activities of the subsidiaries, joint ventures and associates are set out in Note 60.
During the financial year, the principal activities of the Group were divided into five segments namely, Plantation, Industrial, Motors, Property and Energy & Utilities. There has been no significant change in the principal activities of the Group and of the Company during the financial year.
2 Basis of Preparation
The financial statements of the Group and of the Company are prepared in accordance with the provisions of the Companies Act, 1965 and comply with the Financial Reporting Standards (FRS) issued by the Malaysian Accounting Standards Board (MASB). The financial statements have been prepared under the historical cost convention except as disclosed in the summary of principal accounting policies in Note 3.
The preparation of financial statements in conformity with FRS, requires the use of certain critical accounting estimates and assumptions that affect the reported amounts of assets and liabilities and the disclosure of contingent assets and liabilities at the date of the financial statements, and the reported amounts of the revenue and expenses during the reported period. The areas involving a higher degree of judgment or complexity, or areas where assumptions and estimates are significant to the Group’s and to the Company’s financial statements are disclosed in Note 4.
During the financial year, the Group has changed an accounting policy and considered the new accounting pronouncements in the preparation of the financial statements.
a. Change in accounting policyDuring the financial year, the Group changed its accounting policy for bearer plants to be in line with the accounting requirements of FRS 116 – Property, Plant and Equipment. A bearer plant is a living plant that is used in the production or supply of agricultural produce, is expected to bear produce for more than one period and has a remote likelihood of being sold as agricultural produce, except for incidental scrap sales. The bearer plants of the Group are oil palm trees, rubber trees and growing cane.
Prior to the change in the accounting policy, the Group adopted the capital maintenance model on its bearer plants (previously termed as biological assets) whereby the expenditure on new planting was capitalised as biological assets at cost and was not amortised. Replanting of same crops expenditure was charged to the profit or loss in the financial year in which the expenditure was incurred.
Under the revised accounting policy, bearer plants (both new planting and replanting) are accounted for in the same way as self-constructed items of property, plant and equipment. Expenditure on new planting and replanting of bearer plants are capitalised at cost and depreciated on a straight-line basis over the economic useful lives of 22 years for oil palm trees, 24 years for rubber trees and 5 years for growing cane from date of maturity or, the remaining period of the land lease, whichever is shorter. Bearer plants are classified as property, plant and equipment. The bearer plants are assessed for indicator of impairment, and if indication exists, an impairment test is performed in accordance with FRS 136 – Impairment of Assets.
Livestock which do not meet the definition of bearer plants continue to be presented as biological asset (see Note 3(d)).
The revised accounting policy will result in the financial statements reflecting more fairly the Group’s financial position and financial performance. The carrying amount of bearer plants will be more reflective of the cost incurred whilst the depreciation of the bearer plants over their useful lives will reflect the consumption of the bearer plants’ future economic benefits.
The new accounting policy is also more aligned with the underlying principle in the revised standard, Agriculture: Bearer Plants (Amendments to MFRS 116 – Property, Plant and Equipment and MFRS 141 - Agriculture) issued under the Malaysian Financial Reporting Standards Framework (MFRS Framework) (see Note 2(c)).
The change in the accounting policy has been applied retrospectively and the impact on the current year and the comparative figures are disclosed in Note 56.

Sime Darby Berhad 1 9 7Annual Report 2016 Financial Reports
2 Basis of Preparation (continued)
b. Accounting pronouncements that are not yet effective and have not been early adopted in preparing these financial statements
i. All of the following new standard and amendments are effective on or after 1 July 2016. The adoption is not expected to result in any significant changes to the Group’s and Company’s results or financial position.
• FRS14–RegulatoryDeferralAccounts• AccountingforAcquisitionsofInterestsinJointOperations(AmendmentstoFRS11)• ClarificationofAcceptableMethodsofDepreciationandAmortisation(AmendmentstoFRS116andFRS
138)• AnnualImprovementstoFRSs2012–2014Cycle• EquityMethodinSeparateFinancialStatements(AmendmentstoFRS127)• InvestmentEntities:ApplyingtheConsolidationException(AmendmentstoFRS10,FRS12andFRS128)• DisclosureInitiative(AmendmentstoFRS101andFRS107)• RecognitionofDeferredTaxAssetsforUnrealisedLosses(AmendmentstoFRS112)• ClassificationandMeasurementofShare-basedPaymentTransactions(AmendmentstoFRS2)
ii. The effective date for the following amendments has been deferred to a date to be determined by MASB.
• SaleorContributionofAssetsbetweenanInvestoranditsAssociateorJointVenture(AmendmentstoFRS10 and FRS 128).
iii. The Group is currently assessing and has yet to quantify the potential impact of the following new standard that will be effective on 1 July 2018.
• FRS9–FinancialInstruments(InternationalFinancialReportingStandard9–FinancialInstrumentsasissuedby International Accounting Standards Board in July 2014).
FRS 9 replaces FRS 139 – Financial Instruments: Recognition and Measurement. The standard introduces new requirements for classification and measurement, impairment and hedge accounting.
c. Malaysian Financial Reporting Standards FrameworkIn November 2011, the MASB issued the MFRS Framework to replace the FRS Framework. MFRS Framework is a fully International Financial Reporting Standards (IFRS)-compliant framework which is applicable for all non-private entities for annual periods beginning on or after 1 January 2012, other than the Transitioning Entities (TEs), which may defer adoption pending the amendment to MFRS 141 – Agriculture and the issuance of a new standard on revenue recognition which will subsume IC Interpretation 15 – Agreements for the Construction of Real Estate. TEs are entities within the scope of MFRS 141 and IC Interpretation 15, including their parent, significant investor and venturer.
Subsequent to the amendment to MFRS 141 and the issuance of MFRS 15 – Revenue from Contracts with Customers, on 28 October 2015, MASB announced that TEs shall apply the MFRS Framework with effect from annual period beginning on or after 1 January 2018.
The Group and the Company, being TEs, will continue to comply with FRS until the MFRS Framework is adopted, no later than from the financial period beginning on 1 July 2018.
The accounting pronouncements under the MFRS Framework where there is no equivalent standard or revision to the standard in the FRS Framework are set out below:
i. Effective upon the adoption of the MFRS Framework:
• MFRS141–AgricultureMFRS 141 prescribes the accounting treatment, financial statement presentation and disclosures related to agricultural activity. It requires measurement of fair value less costs to sell, from initial recognition of biological assets up to the point of harvest.

Sime Darby BerhadAnnual Report 2016Innovating for the Future1 9 8
NOTES TO THE FINANCIAL STATEMENTS
For the financial year ended 30 June 2016 (continued)Amounts in RM million unless otherwise stated
2 Basis of Preparation (continued)
c. Malaysian Financial Reporting Standards Framework (continued)The accounting pronouncements under the MFRS Framework where there is no equivalent standard or revision to the standard in the FRS Framework are set out below: (continued)
i. Effective upon the adoption of the MFRS Framework: (continued)
• MFRS141–Agriculture(continued)The amendment to MFRS 141 on 2 September 2014 introduces a new category for biological asset, i.e. the bearer plants. A bearer plant is accounted for in the same way as self-constructed items of property, plant and equipment. Bearer plants are measured either at cost or revalued amounts, less accumulated depreciation and impairment losses in accordance with MFRS 116 – Property, Plant and Equipment. Agricultural produce growing on bearer plants continue to be measured at fair value less costs to sell in accordance with MFRS 141, with fair value changes recognised in profit or loss as the produce grows.
ii. Effective for annual periods beginning on or after 1 January 2018:
• MFRS15–RevenuefromContractswithCustomersThe core principle in MFRS 15 is that an entity recognises revenue to depict the transfer of promised goods and services to customers in an amount that reflects the consideration to which the entity expects to be entitled in exchange for those goods or services. Revenue is recognised when a customer obtains control of goods or services, i.e. when the customer has the ability to direct the use of and obtain the benefits from the goods or services.
iii. Effective for annual periods beginning on or after 1 January 2019:
• MFRS16–LeasesMFRS 16 sets out the principles for the recognition, measurement, presentation and disclosure of leases. It introduces a single lessee accounting model and requires a lessee to recognise assets and liabilities for all leases with a term of more than 12 months, unless the underlying asset is of low value. A lessee is required to recognise a right-of-use asset representing its right to use the underlying leased asset and a lease liability representing its obligation to make lease payments.
The Group is in the process of assessing the full impact of the new standards, revisions and amendments to published standards and, in particular, MFRS 141, MFRS 15 and MFRS 16, on the financial statements of the Group and of the Company in the year of initial application.
3 Summary of Principal Accounting Policies
The following principal accounting policies have been applied consistently in dealing with items that are considered material in relation to the financial statements, and to all the financial years presented, unless otherwise stated.
a. Basis of consolidationThe consolidated financial statements comprise the financial statements of the Company and all its subsidiaries made up to the end of the financial year and are prepared using uniform accounting policies for like transactions and other events in similar circumstances.
i. SubsidiariesSubsidiaries are entities over which the Group has control. The Group controls an entity when the Group has power over the entity, has exposure to or rights to variable returns from its involvement with the entity and has the ability to affect those returns through its power over the entity.
Subsidiaries are consolidated using the acquisition method except for those subsidiaries acquired under common control. Under the acquisition method, subsidiaries are consolidated from the date on which control is transferred to the Group and de-consolidated from the date when control ceases. The consideration is measured at the fair value of the assets given, equity instruments issued and liabilities incurred at the date of exchange.
Contingent consideration is recorded at fair value as component of the purchase consideration with subsequent adjustment resulting from events after the acquisition date taken to profit or loss. Acquisition related costs are recognised as expenses when incurred.

Sime Darby Berhad 1 9 9Annual Report 2016 Financial Reports
3 Summary of Principal Accounting Policies (continued)
a. Basis of consolidation (continued)
i. Subsidiaries (continued)Existing equity interests in the acquiree are re-measured to fair value at the date of business combination with any resulting gain or loss taken to the profit or loss.
Identifiable assets, liabilities and contingent liabilities assumed in a business combination are measured at their fair values, at the date of acquisition. The excess of the consideration and the fair value of previously held equity interests over the Group’s share of the fair value of the identifiable net assets acquired at the date of acquisition is reflected as goodwill. Any gain from bargain purchase is recognised directly in the profit or loss.
Intercompany transactions and balances are eliminated on consolidation, but unrealised losses arising therefrom are eliminated only to the extent of the cost of the asset that can be recovered, and the balance is recognised in the profit or loss as reduction in net realisable value or as impairment loss.
Non-controlling interests in the results and net assets of non-wholly owned subsidiaries are presented separately in the financial statements. Transactions with owners of non-controlling interests without a change in control are treated as equity transactions in the statement of changes in equity.
When control ceases, the disposal proceeds and the fair value of any retained investment are compared to the Group’s share of the net assets disposed. The difference together with the carrying amount of allocated goodwill and the exchange reserve that relate to the subsidiary is recognised as gain or loss on disposal.
ii. Business combinations under common controlBusiness combinations under common control are accounted using the predecessor method of merger accounting where the profit or loss and other comprehensive income include the results of each of the combining entities from the earliest date presented or from the date when these entities came under the control of the common controlling party (if later).
The assets and liabilities of the combining entities are accounted for based on the carrying amounts from the perspective of the common controlling party, or the combining entities if the common controlling party does not prepare consolidated financial statements.
The difference in cost of acquisition over the aggregate carrying amount of the assets and liabilities of the combining entities as of the date of the combination is taken to equity. Transaction cost for the combination is recognised in the profit or loss.
Similar treatment applies in the Company’s separate financial statements when assets and liabilities representing the underlying businesses under common control are directly acquired by the Company. In accounting for business combinations in the Company’s separate financial statements, the excess of the cost of acquisition over the aggregate carrying amounts of assets and liabilities as of the date of the combination is taken to equity.
iii. Joint venturesJoint ventures are separate vehicles in which the Group has rights to its net assets and where it’s strategic, financial and operating decisions require unanimous consent of the Group and one or more parties sharing the control.
Joint ventures are accounted using the equity method. Equity method is a method of accounting whereby the investment is recorded at cost inclusive of goodwill and adjusted thereafter for the Group’s share of the post-acquisition results and other changes in the net assets of the joint ventures based on their latest audited financial statements or management accounts. Where necessary, adjustments are made to the financial statements of joint ventures used by the Group in applying the equity method to ensure consistency of accounting policies with those of the Group.
After application of the equity method, the carrying amount of the joint ventures will be assessed for impairment. Equity method is discontinued when the carrying amount of joint venture reaches zero, or reaches the limit of the obligations in the case when the Group has committed legal or constructive obligations in respect of the joint venture.

Sime Darby BerhadAnnual Report 2016Innovating for the Future2 0 0
NOTES TO THE FINANCIAL STATEMENTS
For the financial year ended 30 June 2016 (continued)Amounts in RM million unless otherwise stated
3 Summary of Principal Accounting Policies (continued)
a. Basis of consolidation (continued)
iii. Joint ventures (continued)Unrealised gains on transactions between the Group and its joint ventures are eliminated to the extent of the Group’s interest in the joint ventures. Unrealised losses are also eliminated on the same basis but only to the extent of the costs that can be recovered, and the balance that provides evidence of reduction in net realisable value or an impairment of the assets transferred are recognised in the profit or loss.
When joint control ceases, the disposal proceeds and the fair value of any retained investment are compared to the carrying amount of the joint venture. The difference together with the cumulative exchange reserve that relate to the joint venture is recognised as gain or loss on disposal. In the case of partial disposal without losing joint control, the difference between the proceeds and the carrying amount disposed, and the proportionate exchange reserve is recognised as gain or loss on disposal.
iv. Associates Associates are entities in which the Group is in a position to exercise significant influence. Significant influence is the power to participate in the financial and operating policy decisions, but not control over those policies.
Investments in associates are accounted for using the equity method, similar to Note 3(a)(iii) above.
b. Foreign currencies
i. Presentation and functional currencies Ringgit Malaysia is the presentation currency of the Group and of the Company. Ringgit Malaysia is also the
functional currency of the Company. The functional currency is the currency of the primary economic environment in which the Company operates. The Group’s foreign operations have different functional currencies.
ii. Transactions and balances Foreign currency transactions and monetary items are translated into the functional currency using the exchange
rates prevailing at the transaction dates and at the end of the reporting period, respectively. Foreign exchange differences arising therefrom and on settlement are recognised in the profit or loss.
iii. Translation of foreign currency financial statementsFor consolidation purposes, foreign operations’ results are translated into the Group’s presentation currency at average exchange rates for the financial year whilst the assets and liabilities, including goodwill and fair value adjustments arising on consolidation, are translated at exchange rates ruling at the end of the reporting period. The resulting translation differences are recognised in other comprehensive income and accumulated in exchange reserve.
Intercompany loans where settlement is neither planned nor likely to occur in the foreseeable future, are treated as part of the parent’s net investment. Translation differences arising therefrom are recognised in other comprehensive income and reclassified from equity to profit or loss upon repayment or disposal of the relevant entity.
Exchange reserve in respect of a foreign operation is recognised to profit or loss when control, joint control or significant influence over the foreign operation is lost. On partial disposal without losing control, a proportion of the exchange reserve in respect of the subsidiary is re-attributed to the non-controlling interest. The proportionate share of the cumulative translation differences is reclassified to profit or loss in respect of all other partial disposals.

Sime Darby Berhad 2 0 1Annual Report 2016 Financial Reports
3 Summary of Principal Accounting Policies (continued)
b. Foreign currencies (continued)
iv. Principal exchange rates Year end rates Average rates
2016 2015 2016 2015 RM RM RM RM
Australian dollar (AUD) 3.00 2.90 3.01 2.88British pound (GBP) 5.40 5.95 6.13 5.42Chinese renminbi (RMB) 0.61 0.61 0.64 0.56European Union euro (EUR) 4.46 4.23 4.59 4.14Hong Kong dollar 0.52 0.49 0.53 0.44Indonesian rupiah (IDR1,000) 0.31 0.28 0.30 0.28New Zealand dollar 2.86 2.58 2.76 2.68Singapore dollar (SGD) 2.98 2.81 2.97 2.63Thailand baht 0.11 0.11 0.12 0.11United States dollar (USD) 4.01 3.78 4.11 3.45
c. Property, plant and equipment Property, plant and equipment are stated at cost less accumulated depreciation and accumulated impairment losses. Cost includes expenditure that is directly attributable to the acquisition of an asset. The carrying amount of the replaced part is derecognised and all repairs and maintenance costs are charged to the profit or loss during the financial year in which they are incurred.
Valuation adjustments on certain Malaysian plantation land and buildings were incorporated into the financial statements. In 1998, the Group applied the transitional provision in MASB Approved Accounting Standard IAS 16 – Property, Plant and Equipment, which allows the Group to continue carrying those land and buildings in the financial statements on the basis of their previous revaluation. Surpluses arising on previous revaluation are credited to revaluation reserve. On disposal, amounts in revaluation reserve relating to those assets are transferred to retained profits. Other than depreciation and impairment adjustments, there has been no subsequent valuation recorded on those land and buildings.
Freehold land is not depreciated as it has indefinite life. The cost of plantation expenditures on new planting and replanting of bearer plants and assets in the course of construction are shown as capital work in progress. Depreciation commences when the bearer plants mature or when the assets are ready for use. Other property, plant and equipment are depreciated on a straight-line basis to write down the cost or valuation of each asset to their residual values over their estimated useful lives.
The principal annual depreciation rates are:
Leasehold land over the lease period ranging from 30 to 999 yearsBuildings 2% to 25%, or over the lease term if shorterBearer plants- Oil palm 22 years, or the lease term if shorter- Rubber 24 years, or the lease term if shorter- Growing cane 5 years, or the lease term if shorterPlant and machinery 2% to 33.3%Rental assets 10% to 33.3%Vehicles, equipment and fixtures 5% to 33.3%
The assets’ residual values and useful lives are reviewed, and adjusted if appropriate, annually.
Rental assets will be transferred to inventories at their carrying amounts when they cease to be rented and become held for sale.

Sime Darby BerhadAnnual Report 2016Innovating for the Future2 0 2
NOTES TO THE FINANCIAL STATEMENTS
For the financial year ended 30 June 2016 (continued)Amounts in RM million unless otherwise stated
3 Summary of Principal Accounting Policies (continued)
d. Biological assetsBiological assets comprised cattle livestock stated at historical cost based on the value at the beginning of the period plus purchase and rearing costs incurred during the period. The carrying amount is derecognised when the livestock is sold. No amount is recognised in the financial statements upon the birth of new born calves.
e. Prepaid lease rentalsPrepaid lease rentals represent payment for rights to use land over a predetermined period that is accounted for as an operating lease and is stated at cost less amount amortised and accumulated impairment losses.
The prepaid lease rentals are amortised on a straight-line basis over the lease period ranging from 9 to 71 years.
f. Investment propertiesInvestment properties are land and buildings held for rental income and/or capital appreciation which are not substantially occupied or intended to be occupied for use by, or in the operations of the Group.
Investment properties are stated at cost less accumulated depreciation and accumulated impairment losses. Freehold land and buildings under construction are not depreciated. Other investment properties are depreciated on a straight-line basis to write down the cost of each asset to their residual values over their estimated useful lives.
The principal annual depreciation rates are:
Leasehold land over the lease period ranging from 50 to 99 yearsBuildings 2% to 5%, or over the lease term if shorter
The residual values and useful lives are reviewed, and adjusted if appropriate, annually.
g. Land held for property development Land held for property development consists of cost of land on which no significant development work has been undertaken or where development activities are not expected to be completed within the normal operating cycle. Land held for property development is classified as non-current asset and carried at cost less accumulated impairment losses, if any.
Cost associated with the acquisition of land includes the purchase price of the land, professional fees, stamp duties, commissions, conversion fees and other relevant levies.
Land held for property development is transferred to property development costs under current assets when development activities have commenced and are expected to be completed within the normal operating cycle.
h. Investments in subsidiariesInvestments in subsidiaries and contribution to subsidiaries are recorded at costs less accumulated impairment losses, if any, in the Company’s financial statements.
Contributions to subsidiaries are amounts which the Company does not expect repayment in the foreseeable future and are considered as part of the Company’s investment in the subsidiaries.
i. Intangible assets
i. GoodwillGoodwill represents the excess of the consideration and the fair value of previously held interests over the Group’s share of the fair value of identifiable assets, liabilities and contingent liabilities of the acquiree at the date of acquisition.
Goodwill is stated at cost less accumulated impairment losses. Goodwill is allocated to cash generating units for the purpose of impairment testing.
Goodwill on acquisition of joint ventures and associates is included as part of the cost of investments in joint ventures and associates. Such goodwill is tested for impairment as part of the overall net investment in each joint venture and associate.

Sime Darby Berhad 2 0 3Annual Report 2016 Financial Reports
3 Summary of Principal Accounting Policies (continued)
i. Intangible assets (continued)
ii. Research and development costsResearch costs are charged to the profit or loss in the financial year in which the expenditure is incurred.
Development costs which fulfill commercial and technical feasibility criteria are capitalised at cost less accumulated impairment losses. The development costs are amortised from the commencement of commercial production of the product to which they relate on a straight-line basis over the period of the expected benefit, not exceeding a period of 5 years. The useful life will be reviewed and adjusted if appropriate, annually. Impairment testing is performed annually on development activities which have not entered commercial production. Development activity is also tested for impairment whenever indication of impairment exists.
iii. Smallholder relationshipSmallholder relationship assets arose on the acquisition of subsidiaries. These assets are shown at fair value on acquisition of subsidiaries and subsequently subject to amortisation over the remaining life of the underlying assets. The smallholder relationship assets are tested for impairment whenever indication of impairment exists.
iv. Computer softwareExpenditure on computer software that is not an integral part of the related hardware is treated as an intangible asset and is carried at cost less accumulated amortisation and accumulated impairment losses. Amortisation is calculated using the straight-line basis over their estimated useful lives. The annual amortisation rates ranges from 10% to 33.3%. Projects in progress are not amortised as these computer software are not yet available for use.
v. Distribution and dealership rightsDistribution and dealership rights with no predetermined service period are stated at cost less accumulated impairment losses, if any, and are not amortised.
vi. Trademarks and other intangible assetsTrademarks and other intangible assets are stated at cost less accumulated amortisation and accumulated impairment losses. They are amortised on a straight-line basis over their contractual periods or estimated useful lives once they are available for use. The principal annual amortisation rates ranges from 5% to 20%.
j. Non-current assets held for sale Non-current assets or groups of assets are classified as “held for sale” if their carrying amounts will be recovered principally through a sale transaction rather than through continuing use.
Depreciation ceases when an asset is classified as a non-current asset held for sale. Non-current assets held for sale are stated at the lower of carrying amount and fair value less cost to sell.
k. Inventories Inventories are stated at the lower of cost and net realisable value. The cost of inventories is determined on a weighted average basis except for the following:
Heavy equipment, motor vehicles and completed development units Specific identification basisReplacement parts First in first out basis
The cost of raw materials, consumable stores, replacement parts and trading inventories represents cost of purchase plus incidental costs, and in the case of other inventories, includes design costs, cost of materials, direct labour, other direct costs and related production overheads based on normal operating capacity.
Net realisable value is the estimated selling price in the ordinary course of business, less cost to completion and selling expenses.

Sime Darby BerhadAnnual Report 2016Innovating for the Future2 0 4
NOTES TO THE FINANCIAL STATEMENTS
For the financial year ended 30 June 2016 (continued)Amounts in RM million unless otherwise stated
3 Summary of Principal Accounting Policies (continued)
l. Property development costs Property development costs carried in the statement of financial position includes the cost of land, related development costs common to whole projects and direct building costs less cumulative amounts recognised as expense in profit or loss for property under development. Revenue and expense recognised in profit or loss are determined by reference to the stage of completion of the development activity in respect of the development units sold. Any expected loss on development projects, is recognised as an expense immediately.
At end of each reporting period, the cumulative revenue recognised and progress billings made for each development unit sold are compared. Where the revenue recognised exceeds the billings to the purchaser, the net amount is shown as accrued billings. Where the billings to the purchaser exceeds revenue recognised, the net amount is shown as progress billings.
m. Construction contractsConstruction costs include the costs attributable to a contract for the period from the date of securing the contract to the final completion of the contract.
When the outcome of the contract can be estimated reliably, the percentage of completion method is used to determine the appropriate amount of revenue and costs to be recognised in a given period. The percentage of completion is determined by referring to either the proportion of costs incurred to-date to the total estimated costs or the completion of a physical proportion of contract work to-date. When the outcome of a construction contract cannot be estimated reliably, contract revenue is recognised only to the extent of contract costs incurred that is probably recoverable. When it is probable that contract costs will exceed total contract revenue, the expected loss is recognised as an expense immediately.
At end of each reporting period, the cumulative costs incurred, profits or losses recognised and progress billings made for each contract work are compared. Where costs incurred and profits or losses recognised exceeds progress billings, the net amount is shown as amount due from customers on construction contracts. Where progress billings exceeds costs incurred and profits or losses recognised, the net amount is shown as amount due to customers on construction contracts.
n. Financial assetsThe Group’s financial assets are classified into four categories as set out in Note 54(a). The accounting policies for each of these categories, other than derivatives used for hedging as set out in Note 3(o), are as follows:
i. Financial assets at fair value through profit or lossFinancial assets are classified as fair value through profit or loss if they are held for trading. Derivatives are categorised as held for trading unless they are designated and are effective hedging instrument.
These financial assets are measured at fair value and transaction costs are expensed in profit or loss. Any gain or loss arising from changes in fair value are recognised in profit or loss.
ii. Loans and receivablesFinancial assets with fixed or determinable payments that are not quoted in an active market are classified as loans and receivables. These financial assets are recorded at fair value plus transaction costs and thereafter, they are measured at amortised cost using the effective interest method less accumulated impairment losses.
iii. Available-for-sale financial assetsAvailable-for-sale financial assets are financial assets that are designated as available for sale or are not classified in any of the two preceding categories. These financial assets are recorded initially at fair value plus transaction costs and thereafter, they are measured at fair value. Except for impairment, foreign exchange differences on translation of monetary available-for-sale financial assets such as debt instruments, interest calculated using the effective interest method and dividends which are recognised in profit or loss, any gain or loss arising from changes in fair value are recognised in other comprehensive income. On derecognition, the cumulative gain or loss is reclassified from available-for-sale reserve to profit or loss.

Sime Darby Berhad 2 0 5Annual Report 2016 Financial Reports
3 Summary of Principal Accounting Policies (continued)
n. Financial assets (continued)Financial assets are classified as current assets for those having maturity dates of not more than 12 months after the end of the reporting period, and the balance is classified as non-current. For available-for-sale financial assets, the classification is based on expected date of realisation of the assets.
Regular way purchase or sale of a financial asset is recognised on the settlement date i.e. the date that an asset is delivered to or by the Group. A contract that requires or permits net settlement of the change in the value of the contract is not a regular way contract. Such contract is accounted for as a derivative in the period between the trade date and the settlement date.
o. Derivatives and hedging activities Derivatives are measured at fair value. A derivative that is neither designated nor an effective hedging instrument is categorised under fair value through profit or loss and changes in its fair value are recognised in profit or loss. In the case of a derivative that qualifies for cash flow hedge, the effective portion of changes in its fair value is recognised in other comprehensive income.
The gain or loss is removed from equity and included in profit or loss in the same period or periods during which the hedged item affects profit or loss. In the case of a hedge of a forecast transaction which results in the recognition of a non-financial asset or a non-financial liability, the gain or loss is removed from equity and included in the carrying amount of the asset or liability. The gain or loss is also removed from equity and included in profit or loss when a derivative expires, no longer meets the criteria for hedge accounting, or the forecasted transaction is no longer expected to occur.
Derivatives are carried as assets when the fair value is positive and as liabilities when the fair value is negative. Derivatives are classified as current asset or current liability for those having maturity dates of no more than 12 months after the end of the reporting period, and the balance is classified as non-current.
p. ImpairmentGoodwill and other intangible assets that have an indefinite useful life or are not yet available for use are tested for impairment. Other non-financial assets are assessed for indication of impairment. If an indication exists, an impairment test is performed. In the case of financial assets, investment in subsidiaries and interest in joint ventures and associates, they are assessed for objective evidence of impairment.
This exercise is performed annually and whenever events or circumstances occur indicating that impairment may exist. The recognition and measurement of impairment are as follows:
i. Non-financial assetsAn impairment loss is recognised for the amount by which the carrying amount of the non-financial asset exceeds its recoverable amount. The recoverable amount is the higher of an asset’s fair value less costs to sell and value-in-use.
Impairment loss on a revalued asset is treated as a revaluation decrease to the extent that the impairment loss does not exceed the amount in the revaluation surplus for the same asset. Impairment loss on non-financial assets stated at historical costs is charged to profit or loss.
Except for goodwill, assets that were previously impaired are reviewed for possible reversal of the impairment at the end of each reporting period. Any subsequent increase in recoverable amount is recognised in the profit or loss unless it reverses an impairment loss on a revalued asset in which case it is taken to revaluation reserve. Reversal of impairment loss is restricted by the carrying amount that would have been determined had no impairment loss been recognised for the asset in prior years.
An impairment loss recognised for goodwill is not reversed.

Sime Darby BerhadAnnual Report 2016Innovating for the Future2 0 6
NOTES TO THE FINANCIAL STATEMENTS
For the financial year ended 30 June 2016 (continued)Amounts in RM million unless otherwise stated
3. Summary of Principal Accounting Policies (continued)
p. Impairment (continued)The recognition and measurement of impairment are as follows: (continued)
ii. Subsidiaries, joint ventures and associatesAn impairment loss is recognised for the amount by which the carrying amount of the subsidiary, joint venture or associate exceeds its recoverable amount. The recoverable amount is the higher of an asset’s fair value less costs to sell and present value of the estimated future cash flows expected to be derived from the investment including the proceeds from its disposal. Any subsequent increase in recoverable amount is recognised in profit or loss.
iii. Loans and receivablesLoans and receivables are assessed individually and thereafter collectively for objective evidence of impairment. If evidence exists, the amount of impairment loss is measured as the difference between the asset’s carrying amount and the present value of estimated future cash flows discounted at the asset’s original effective interest rate. The impairment loss is recognised in profit or loss. Reversal of impairment loss to profit or loss, if any, is restricted to not exceeding what the amortised cost would have been had the impairment not been recognised previously.
iv. Available-for-sale financial assetsA significant or prolonged decline in the fair value of the available-for-sale financial assets below its cost indicates that the assets are impaired. If such evidence exists, the decline in fair value together with the cumulative loss recognised in other comprehensive income, if any, is taken to profit or loss. An impairment loss recognised for equity instrument is not reversed through profit or loss. Reversal of impairment losses through profit or loss is made only if the financial asset is a debt instrument and the increase in fair value can be objectively related to an event occurring after the impairment loss was recognised in profit or loss.
q. Share capital, perpetual sukuk and put option
i. Share capitalProceeds from ordinary shares issued are accounted for as equity, with the nominal value of the shares being separately disclosed as share capital. Cost directly attributable to the issuance of new shares are shown in equity as a deduction from the proceeds.
Dividends to owners of the Company and non-controlling interests are recognised in the statement of changes in equity in the period in which they are declared.
ii. Perpetual sukukPerpetual sukuk is classified as equity instruments as there is no contractual obligation to redeem the instrument. Cost directly attributable to the issuance of the instrument, net of tax, are treated as a deduction from the proceeds.
Perpetual sukuk holders’ entitlement is accounted for as an appropriation in the profit or loss and distribution is recognised in the statement of changes in equity in the period in which it is declared.
iii. Put option over non-controlling interestPut option over non-controlling interest is accounted for as financial liability and is initially recognised at fair value within payables with a corresponding charge directly to equity. The cost of writing such put option, determined as the excess of the fair value of the option over any consideration received, is recognised as a financing cost. Subsequently, the liability is measured at amortised cost, using the effective interest rate method. The charge arising is recorded as a financing cost. In the event that the option expires unexercised, the liability is derecognised with a corresponding adjustment to equity.
r. ProvisionsProvisions are recognised when the Group has a legal or constructive obligation, where the outflow of resources is probable and can be reliably estimated. Provisions are measured at the present value of the obligation. The increase in the provision due to the passage of time is recognised as interest expense.
The present obligation to develop affordable housing is recognised as a provision and form part of the property development costs on other housing.

Sime Darby Berhad 2 0 7Annual Report 2016 Financial Reports
3 Summary of Principal Accounting Policies (continued)
s. Deferred incomeDeferred income comprises the following:
i. Maintenance income Maintenance income is deferred and recognised by reference to the percentage of the estimated total costs for each of the machinery maintenance contracts and for vehicle service contracts, it is on a straight-line basis over the contractual period.
ii. Advance annualised licence feesAdvance annualised licence fees are deferred and recognised on a fixed annualised amount on a straight-line basis over the term of the golf club memberships.
iii. Government grantsGovernment grants are recognised at fair value when there is reasonable assurance that the Group will comply with the conditions attached to them and the grants will be received. Grants are treated as deferred income and allocated to profit or loss over the useful lives of the related assets or the period of operating expenditure to which the grants are intended to compensate.
t. Employee costs
i. Short-term employee benefitsWages, salaries, paid annual leave and sick leave, bonuses and non-monetary benefits are accrued in the period in which the services are rendered by employees.
ii. Defined contribution pension plansA defined contribution pension plan is a pension plan under which the Group pays fixed contributions into a separate entity. The Group has no legal or constructive obligations to pay further contributions if the fund does not hold sufficient assets to pay all employees the benefits relating to employee service in the current and prior periods.
The Group has various defined contribution pension plans in accordance with local conditions and practices in the countries in which it operates. The Group’s contributions to defined contribution pension plans are charged to profit or loss in the financial year in which they relate.
iii. Defined benefit pension plansA defined benefit pension plan is a pension plan that is not a defined contribution pension plan. Typically defined benefit pension plans define an amount of pension benefit that an employee will receive on retirement, usually dependent on one or more factors such as age, years of service and compensation.
The Group has various defined benefit pension plans, some of which are funded by payments from the relevant Group companies in various countries. The Group’s defined benefit pension plans are determined based on a periodic actuarial valuation by external consultants where the amount of the benefits that eligible employees have earned in return for their services in the current and prior years are estimated.
The liabilities in respect of the defined benefit pension plans are the present values of the defined benefit obligations at the end of the reporting period, adjusted for actuarial gains and losses and past service costs, and reduced by the fair value of the plan assets. The defined benefit obligations, calculated using the Projected Unit Credit Method, are determined by independent actuaries, considering the estimated future cash outflows.
Actuarial gains or losses arising from market adjustments and changes in actuarial assumptions are recognised in other comprehensive income.
iv. Termination benefitsTermination benefits are payable whenever an employee’s employment is terminated in exchange for these benefits. The Group recognises termination benefits when it is demonstrably committed to either terminate the employment of current employees according to a detailed formal plan without possibility of withdrawal or to provide termination benefits as a result of a proposal to encourage voluntary redundancy.

Sime Darby BerhadAnnual Report 2016Innovating for the Future2 0 8
NOTES TO THE FINANCIAL STATEMENTS
For the financial year ended 30 June 2016 (continued)Amounts in RM million unless otherwise stated
3 Summary of Principal Accounting Policies (continued)
t. Employee costs (continued)
v. Share-based compensationThe Company operates an equity-settled, share-based compensation plan for the Group’s employees. Employee services received in exchange for the grant of the Company’s shares are recognised as an expense in the profit or loss over the vesting period of the grant, with a corresponding increase in equity.
The total amount to be expensed over the vesting period is determined by reference to the fair value of the shares granted.
Non-market vesting conditions are included in the assumptions to arrive at the number of shares that are expected to vest. At the end of the reporting period, the Group and the Company revise its estimates of the number of shares that are expected to vest. The impact of the revision of original estimates, if any, is recognised in the profit or loss, with a corresponding adjustment to equity.
The fair value of shares granted to employees of subsidiaries are recharged by the Company to the subsidiaries.
u. Financial liabilitiesThe Group’s financial liabilities are classified into four categories as set out in Note 54(a). The accounting policies for each of these categories, other than derivatives used for hedging as set out in Note 3(o), are as follows:
i. Financial liabilities at fair value through profit or lossFinancial liabilities are classified as fair value through profit or loss if they are held for trading. Derivatives are categorised as held for trading unless they are designated and are effective hedging instruments. The Group does not have any financial liabilities designated as fair value through profit or loss upon initial recognition.
ii. Financial guarantee contractsA financial guarantee contract is a contract that requires the issuer to make specified payments to reimburse the holder for a loss it incurs because a specified debtor fails to make payment when due. Financial guarantee contracts are recognised initially at fair value plus transaction costs and thereafter, at the higher of the best estimate of the expenditure required to settle the present obligation at the end of the reporting period and the amounts initially recognised less cumulative amortisation recognised.
iii. Other financial liabilitiesAll other financial liabilities are recognised initially at fair value plus transaction costs and thereafter, at amortised cost using the effective interest method. Amortisation is charged to profit or loss.
Financial liabilities are classified as current liabilities for those having maturity dates of not more than 12 months after the end of the reporting period, and the balance is classified as non-current.
v. Cash and cash equivalentsFor the purpose of the statements of cash flows, cash and cash equivalents include cash in hand, deposits held at call with banks and cash held under Housing Development Accounts, net of bank overdrafts.
w. Revenue recognitionRevenue from sale of goods and performance of services are recognised at the fair value of the consideration received or receivable upon delivery of goods or performance of services, net of discounts, allowances, indirect taxes and liquidated ascertained damages.
Revenue from property development is recognised when it is probable that future economic benefits will flow to the Group, and by reference to the stage of completion of the development activity in respect of development units sold. The stage of completion is measured by the completion of a physical proportion of contract work to-date. Revenue from construction contracts is recognised on the percentage of completion method by reference to either the proportion of costs incurred to-date to the total estimated costs or the completion of a physical proportion of contract work to-date.

Sime Darby Berhad 2 0 9Annual Report 2016 Financial Reports
3 Summary of Principal Accounting Policies (continued)
w. Revenue recognition (continued)Other revenue is recognised on the following basis:
i. Interest income – recognised on an accrual basis, using the effective interest method
ii. Dividend income – recognised when the right to receive payment is established
iii. Rental income – recognised on a straight-line basis over the lease term
x. Operating leasesLeases where substantially all the rewards and risks of ownership of assets remain with the lessor are accounted for as operating leases. Rentals on operating leases are charged to the profit or loss on a straight-line basis over the lease term.
y. Finance leases Leases of property, plant and equipment where the Group has substantially all the risks and rewards of ownership are classified as finance leases. The assets are capitalised at the lower of the fair value of the leased assets and the present value of the minimum lease payments at the inception of the respective leases. The corresponding liabilities are classified as finance lease obligation.
Lease payments are allocated between the finance charges and finance lease obligation. The finance cost is charged to profit or loss over the lease period so as to produce a constant periodic rate of interest on the remaining finance lease obligation.
Property, plant and equipment acquired under finance leases is depreciated over the shorter of the useful life of the asset and the lease term.
z. Borrowing costsBorrowing costs directly attributable to the acquisition, construction or production of qualifying assets are capitalised to the cost of those assets until the assets are substantially ready for their intended use or sale.
aa. TaxationTaxation comprises current and deferred tax. Tax is recognised in the profit or loss, except to the extent that it relates to items recognised directly in other comprehensive income. In this case, the tax is recognised in other comprehensive income.
The current income tax charge is the expected income taxes payable in respect of the taxable profit for the financial year and is measured using the tax rates that have been enacted at the end of the reporting period.
Management periodically evaluates positions taken in tax returns with respect to situations in which applicable tax regulation is subject to interpretation. Provisions are established where appropriate on the basis of amounts expected to be paid to the tax authorities.
Deferred tax is recognised on temporary difference arising between the tax bases of assets and liabilities and their carrying amounts in the financial statements. However, deferred tax is not accounted for if it arises from initial recognition of an asset or liability in a transaction other than a business combination that at the time of the transaction affects neither accounting nor taxable profit or loss.
Deferred tax assets are recognised to the extent that it is probable that future taxable profit will be available against which the temporary differences can be utilised. Deferred tax is recognised on temporary differences arising on investments in subsidiaries, joint ventures and associates except where the timing of the reversal of the temporary difference can be controlled and it is probable that the temporary difference will not reverse in the foreseeable future.
Deferred tax is measured at the tax rates (and laws) that have been enacted or substantively enacted at the end of the reporting period and are expected to apply when the related deferred income tax asset is realised or the deferred income tax liability is settled.

Sime Darby BerhadAnnual Report 2016Innovating for the Future2 1 0
NOTES TO THE FINANCIAL STATEMENTS
For the financial year ended 30 June 2016 (continued)Amounts in RM million unless otherwise stated
3 Summary of Principal Accounting Policies (continued)
ab. Commodity future and forward contracts Commodity contracts are entered into to manage exposure to adverse movements in vegetable oil prices. Certain
contracts are entered into and continue to be held for the purpose of the receipt or delivery of the physical commodity in accordance with the Group’s expected purchase, sale or usage requirements. Accordingly, such contracts are deemed not to be financial instruments. Gains or losses arising from these contracts are deferred and included in the measurement of the purchase or sale transactions only upon the recognition of the anticipated transactions.
Contracts entered other than for the purpose of the receipt or delivery of physical commodity are treated as derivatives.
ac. Contingent liabilities
The Group does not recognise contingent liabilities but discloses their existence in the notes to the financial statements. A contingent liability is a possible obligation that arises from past events whose crystallisation will be confirmed by the occurrence or non-occurrence of one or more uncertain future events beyond the control of the Group or a present obligation that is not recognised because it is not probable that an outflow of resources will be required to settle the obligation. A contingent liability also arises in the extremely rare circumstances where there is a liability that is not recognised because it cannot be measured reliably.
ad. Segment reporting Segment information is presented in a manner that is consistent with the internal reporting provided to management for the allocation of resources and assessment of its performance. The Group’s operating businesses are organised and managed separately according to the nature of the products and services provided, with each segment representing a strategic business unit that offers different products and serves different markets.
Segment revenue, expense, assets and liabilities are those amounts resulting from operating activities of a segment that are directly attributable to the segment and the relevant portion that can be allocated on a reasonable basis to the segment. Segment revenue, expense, assets and liabilities are determined before intragroup balances and intragroup transactions are eliminated as part of the consolidation process, except to the extent that such intragroup balances and transactions are between Group companies within a single segment. Intragroup transactions which in substance represent reallocation of non-current assets from a segment to another segment are also eliminated. Inter-segment pricing is based on similar terms as those available to external parties.
ae. Fair value estimation Fair values shown in the financial statements are categorised into three different levels to increase consistency and comparability in fair value measurements. The levels of hierarchy are based on the input used to measure the fair value of an asset or a liability. The hierarchy based on highest to the lowest priority is as follows:
Level 1 – quoted prices in active markets for identical assets or liabilitiesLevel 2 – valuation inputs (other than Level 1 input) that are observable for the asset or liability, either
directly or indirectlyLevel 3 – valuation inputs that are not based on observable market data
4 Critical Accounting Estimates and Judgment in Applying Accounting Policies
The preparation of financial statements in conforming with FRS requires the use of certain critical accounting estimates that involve complex and subjective judgments and the use of assumptions, some of which may be for matters that are inherently uncertain and susceptible to change. The Directors exercise their judgment in the process of applying the Group’s accounting policies. Estimates and assumptions are based on the Directors’ best knowledge of current events. Such estimates and judgment could change from period to period and have a material impact on the results, financial position, cash flows and other disclosures.

Sime Darby Berhad 2 1 1Annual Report 2016 Financial Reports
4 Critical Accounting Estimates and Judgment in Applying Accounting Policies (continued)
The estimates and assumptions that have a significant risk of causing a material adjustment to the carrying amounts of assets and liabilities within the next financial year are outlined below.
a. Impairment of non-financial assetsThe Group assesses whether there is any indication that non-financial assets are impaired at the end of each reporting period. Impairment is measured by comparing the carrying amount of an asset with its recoverable amount. The recoverable amount is measured at the higher of the fair value less cost to sell for that asset and its value-in-use. The value-in-use is the net present value of the projected future cash flow derived from that asset discounted at an appropriate discount rate. Projected future cash flows are calculated based on historical sector and industry trends, general market and economic conditions, changes in technology and other available information. Changes to any of these assumptions would affect the amount of impairment.
The impairment assessment on property, plant and equipment and intangible assets are disclosed in Notes 18 and 26 respectively.
b. Construction contracts and property development projects The Group recognises contract and property development revenue based on percentage of completion method. Significant judgment is required in determining:
• thecompletenessandaccuracyofthebidsand/orbudgets;• theextentofthecostsincurred;• theestimationofthevariationworksthatarerecoverablefromcustomers;• theadditionaloverheadsduetomeetingcustomers’request,weatherandotherdelays;• thesubcontractorsperformanceissues;and• thechangesinavailabilityandproximityofequipmentandmaterial.
The foregoing factors as well as the stage of completion of contracts in progress and the mix of contracts at different margins may cause fluctuations in gross profit between periods. Substantial changes in cost estimates, particularly in complex projects have had, and can in future periods have, a significant effect on the Group’s profitability. In making the above judgment, the Group relies on past experience and work of specialists.
c. Taxation The Group has recognised certain tax recoverable for which the Group believes that there is a reasonable basis for recognition. Where the final tax outcome of this matter is different from the amount that was initially recorded, such difference may cause a material adjustment to the carrying amount of the tax recoverable balance recorded in the period in which such determination is made.
Deferred tax assets are recognised to the extent that it is probable that future taxable profit will be available against which temporary differences or unutilised tax losses and tax credits can be utilised. This involves judgment regarding future taxable profits of a particular entity in which the deferred tax asset has been recognised.
d. Contingent liabilitiesRecognition and measurement for contingent liabilities is based on management’s view of the expected outcome of the contingencies after consulting legal counsel for litigation cases and experts, internal and external to the Group, for matters in the ordinary course of business. The Group’s contingent liabilities and material litigation are shown in Notes 57 and 58 respectively.
5 Financial Risk and Capital Management Policies
a. Financial Risk ManagementThe Group’s operations expose it to a variety of financial risks, including foreign exchange risk, price risk, interest rate risk, credit risk and liquidity and cash flow risk. The Group’s overall financial risk management policies seek to manage and minimise the potential adverse effects of these risks on the financial performance of the Group.
The Group’s exposure to these financial risks are managed through risk reviews, internal control systems, insurance/takaful programs and adherence to Group Policies and Authorities which are implemented on a group-wide basis. The Board regularly reviews these risks and approves the policies covering the management of these risks.

Sime Darby BerhadAnnual Report 2016Innovating for the Future2 1 2
NOTES TO THE FINANCIAL STATEMENTS
For the financial year ended 30 June 2016 (continued)Amounts in RM million unless otherwise stated
5 Financial Risk and Capital Management Policies (continued)
a. Financial Risk Management (continued)The Group uses derivative financial instruments, principally interest rate swaps, cross currency swaps, forward foreign exchange contracts, commodity futures contracts and foreign currency options as appropriate to hedge the Group’s exposure to financial risk. Derivative financial instruments are not held for speculative purposes.
Whilst all derivatives entered into provide economic hedges to the Group, certain derivatives do not qualify for the application of hedge accounting under the specific rules in FRS 139. Where there are open positions, these are managed in accordance with Group policies. The notional amounts and fair values of derivative financial instruments as at 30 June are disclosed in Note 29.
i. Foreign exchange riskThe Group’s foreign exchange risk refers to adverse exchange rate movements on foreign currency positions originating from trade receivables and payables, deposits and borrowings denominated in foreign currencies and from retained profits in overseas subsidiaries where the functional currencies are not in Ringgit Malaysia.
The Group operates internationally and is exposed to foreign exchange risk arising from various currency exposures, primarily with respect to United States dollar, British pound, European Union euro, Australian dollar and Indonesian rupiah. Foreign exchange risk arises from future commercial transactions, recognised assets and liabilities, and investments in foreign operations.
The Group applies natural hedging, to the extent possible, by selling and purchasing in the same currency. Net exposure on foreign currency receivables and payables are hedged via forward foreign exchange contracts including hedging on cash flows generated from anticipated transactions denominated in foreign currencies.
The Group funds its investments in the currency of its investments to the extent possible, so as to provide a natural hedge against the foreign exchange translation risk relating to the net investment in foreign operations.
The Group’s Centralised Treasury function monitors the Group’s exposure to foreign currency risk and aims to maximise foreign currency netting within the Group whilst managing the cost of hedging effectively.
Details of the Group’s foreign currency exposure and the currency profile of monetary financial assets and financial liabilities are described in Note 55(a).
ii. Price riskThe Group is directly exposed to commodity price risk due to fluctuations in crude palm oil futures prices. Indirectly, the Group is also exposed to mineral price risk such as coal, as fluctuation or downturn in mineral prices would affect the demand for mining equipment and parts and services offered by the Industrial division.
The Group enters into commodity futures contracts to minimise exposure to adverse movements in crude palm oil prices. Certain contracts are entered into and continue to be held for the purpose of the receipt or delivery of the physical commodity in accordance with the Group’s expected purchase, sale or usage requirements.
Contracts that are not held for the purpose of physical delivery are accounted for as derivatives and are disclosed in Note 29(d).
iii. Interest rate riskThe Group’s interest rate risk arises from its borrowings and deposits placed with financial institutions. The Group manages its interest rate risks on deposits by placement on varying maturities. The Group manages its interest rate risk on its long-term borrowings by targeting a mix of fixed and floating rate debt by using derivatives such as interest rate swaps.
As at 30 June 2016, the percentage of fixed rate borrowings, both before and after taking into account the interest rate swap contracts, to the total borrowings are 40.3% (2015: 29.4%) and 54.6% (2015: 44.7%) respectively. Details of the percentages of fixed rate borrowings over total borrowings are disclosed in Note 55(b).

Sime Darby Berhad 2 1 3Annual Report 2016 Financial Reports
5 Financial Risk and Capital Management Policies (continued)
a. Financial Risk Management (continued)
iv. Credit riskFinancial assets that are primarily exposed to credit risks are receivables, cash and bank balances, marketable securities and financial instruments used in hedging activities.
Credit risk arises on sales made on credit terms, derivatives with positive fair value, deposits with banks, guarantees and performance guarantees given on behalf of others and risk sharing arrangement.
The Group seeks to control credit risk by dealing with counterparties with appropriate credit histories and deposit with banks and financial institutions with good credit ratings. Third party agencies’ ratings are considered, if available. In addition, customers’ most recent financial statements, payment history and other relevant information are considered in the determination of credit risk.
Counterparties are assessed at least annually and more frequently when information on significant changes in their financial position becomes known.
Credit terms and limits are set based on these assessments. Where appropriate, guarantees or securities are obtained to limit credit risk. Sales to trade customers are usually suspended when earlier amounts are overdue exceeding 180 days.
The risk sharing arrangement is with a third party leasing company which is a member of our principal vendor, in connection with the sale of its equipment. Details of the arrangement and the total outstanding risk sharing amount are disclosed in Notes 46 and 57(a). An amount of RM17.0 million (2015: RM22.1 million) has been provided for based on a percentage of risk sharing ratio over the total outstanding lease portfolio.
Details of the credit risk of the Group’s trade receivables are disclosed in Note 55(c). The highest percentage of concentration of net trade receivables as at 30 June 2016 was 14.5% (2015: 17.5%) in the Property segment in Malaysia.
v. Liquidity and cash flow riskLiquidity risk refers to the risk that the Group or the Company will encounter difficulty in meeting financial obligations when it falls due.
The Group maintains a prudent borrowing policy which is aimed towards maintaining sufficient cash for all cash flow requirements, managing debt and investment portfolio within the relevant time buckets to maturity, obtaining a diverse range of funding sources, and keeping an adequate amount of credit facilities to provide ample liquidity cushion.
The Group companies performed quarterly twelve month rolling cash flow projections to ensure that requirements are identified as early as possible and the Group has sufficient cash to meet operational needs. Such projections take into consideration the Group’s financing plans and is also used for monitoring of covenant compliance and credit metrics. The Group’s Centralised Treasury function manages all strategic funding requirements and invests surplus cash in highly liquid investment instruments such as interest bearing current account, time deposits, money market deposits and unit trust investment under money market funds.
The Group assesses various funding options when there is a need for financing, including monitoring funding options available in the capital markets. The Group has an existing RM4.5 billion Islamic Medium Term Notes and Islamic Commercial Papers Programme, the USD1.5 billion Multi-Currency Sukuk Programme and a RM3.0 billion Perpetual Subordinated Sukuk Programme which it can tap upon at the appropriate time.
As at 30 June 2016, the Group has total cash and cash equivalents of RM3,495.6 million (2015: RM4,154.6 million) which include cash in hand, deposits held at call with banks and cash held under Housing Development Accounts, net of bank overdrafts.
The Group believes that its contractual obligations, including those shown in commitments and contingencies in Notes 55(d) and 57 can be met from existing cash and investments, operating cash flows, credit lines available and other financing that the Group reasonably expect to be able to secure should the need arises.

Sime Darby BerhadAnnual Report 2016Innovating for the Future2 1 4
NOTES TO THE FINANCIAL STATEMENTS
For the financial year ended 30 June 2016 (continued)Amounts in RM million unless otherwise stated
5 Financial Risk and Capital Management Policies (continued)
b. Capital ManagementThe Group’s capital management objectives are to ensure the Group’s ability to continue as a going concern and maximise shareholders’ value. The Group is committed towards optimising its capital structure and ensuring competitive cost of capital. Implementation of optimal capital structure includes balancing between debt and equity by putting in place appropriate dividend and financing policies which influence the level of debt and equity.
The key considerations in this regard are to maintain ready access to capital markets and to preserve the Group’s ability to repay and service debt obligations over time.
i. Rating by External Rating AgenciesThe Company and its capital market programmes are rated by both local and international rating agencies:
Rating Agency Company/Programme Rating
Fitch Ratings Company and the USD1.5 billion Multi-Currency Sukuk Programme
BBB+
Moody’s Investors Service Company and the USD1.5 billion Multi-Currency Sukuk Programme
Baa1
Malaysian Rating Corporation Berhad
Company and the RM4.5 billion Islamic Medium Term Note Programme (IMTN)
MARC-1ID/ AAAID
RM3.0 billion Perpetual Subordinated Sukuk Programme (Perpetual Sukuk)
AAIS**
**the two notch rating differential between the IMTN and Perpetual Sukuk is in line with MARC’s notching principles on hybrid securities
ii. Gearing ratiosThe Group uses the gearing ratio to assess the appropriateness of its debt level, hence determining its capital structure. The ratio is calculated as Total Debt divided by Total Equity. The Group’s gearing ratio as at 30 June is as follows:
2016 2015
Borrowings 15,768.0 18,018.4Interest payable 65.6 44.6Total Debt 15,833.6 18,063.0
Debt/Equity ratio 0.44 0.57
The debt/equity ratio of the Group has decreased from 0.57 as at 30 June 2015 to 0.44 as at 30 June 2016 mainly due to the repayment of borrowings from the RM2.2 billion proceeds from the Perpetual Sukuk issued during the financial year.
iii. Externally imposed financial covenants and capital structureThe Group maintains a debt to equity ratio that complies with debt covenants and regulatory requirements in countries where the Group operates. This includes minimum capital requirements and the requirement to maintain legal reserves which are non-distributable.

Sime Darby Berhad 2 1 5Annual Report 2016 Financial Reports
6 Revenue
Revenue for the Group represents sale of goods, performance of services, income from property development activities, construction contracts and rental income earned outside the Group, net of discounts, allowances and liquidated ascertained damages.
Revenue for the Company represents dividend income from investment in subsidiaries (unquoted).
Group Company2016 2015 2016 2015
Sale of goods 37,952.7 37,096.8 – –Performance of services 3,139.8 3,103.9 – –Property development 1,846.4 2,838.8 – –Construction contracts 951.3 620.9 – –Rental income 72.6 68.3 – –Dividend income – – 1,270.0 1,254.0
43,962.8 43,728.7 1,270.0 1,254.0
7 Operating Expenses
Group Company2016 2015 2016 2015
Restated
Changes in inventories of finished goods and work in progress 1,799.9 1,514.5 – –
Finished goods, work in progress and other direct overheads 23,141.3 24,712.7 – –
Raw materials and consumables 7,479.6 5,635.6 – –Employee costs (including Executive Director’s
emoluments) [note (a)] 5,290.8 4,822.4 0.6 0.6Amortisation of prepaid lease rentals 48.4 43.7 – –Amortisation of intangible assets 52.6 35.4 – –Depreciation:- property, plant and equipment [note (b)] 1,631.3 1,336.4 – –- investment properties 15.6 18.1 – –Property development costs 1,058.8 1,766.7 – –Construction contract costs 673.5 480.7 – –Research expenditure [note (a)] 143.7 118.7 – –Provision of warranties and guarantees 60.4 47.1 – –

Sime Darby BerhadAnnual Report 2016Innovating for the Future2 1 6
NOTES TO THE FINANCIAL STATEMENTS
For the financial year ended 30 June 2016 (continued)Amounts in RM million unless otherwise stated
7 Operating Expenses (continued)
Group Company2016 2015 2016 2015
Restated
Auditors’ remuneration:Fees for statutory audits- PricewaterhouseCoopers Malaysia 7.0 6.7 0.7 0.7- member firms of PricewaterhouseCoopers International Limited 20.5 19.6 – –- others 0.5 0.3 – –Fees for non-audit services [note (c)]
- PricewaterhouseCoopers Malaysia 1.5 9.7 0.3 0.6- member firms of PricewaterhouseCoopers International Limited 2.6 3.8 – –- others 1.2 3.1 – –Non-Executive Directors’ fees [note (d)] 5.8 5.9 3.4 3.6Hire of plant and machinery and rental of vehicles
from: - a subsidiary – – 2.5 2.7- others 348.9 116.7 – –Operating lease payments for land and buildings - a subsidiary – – 0.1 0.1- others 259.9 264.6 – –Management fee charged by a subsidiary – – 8.9 5.1Loss on disposal of: - property, plant and equipment 18.8 42.4 – –- a subsidiary – 3.7 – –Write offs of property, plant and equipment 30.7 45.8 – –Impairment of: - property, plant and equipment 24.5 16.2 – –- investment properties 1.3 4.5 – –- a subsidiary – – 3.3 –- investment 1.6 – – –- intangible assets – 0.3 – –- receivables 100.9 60.8 – –Other costs 178.2 328.6 6.5 3.8
42,399.8 41,464.7 26.3 17.2

Sime Darby Berhad 2 1 7Annual Report 2016 Financial Reports
7 Operating Expenses (continued)
Group Company2016 2015 2016 2015
a. Employee costs
Staff:- salaries, allowances, overtime and bonus 4,894.6 4,501.7 0.6 0.6- defined benefit pension plans [Note 47] 48.4 21.8 – –- defined contribution pension plans 290.1 260.9 – –- performance-based employee share scheme (36.6) (2.1) – –- termination benefits 87.4 33.4 – –
5,283.9 4,815.7 0.6 0.6
Executive Director of the Company:- salaries, allowances and bonus 6.4 5.9 – –- defined contribution pension plans 0.9 0.8 – –- performance-based employee share scheme (0.4) – – –
6.9 6.7 – –
Employee costs included in profit or loss 5,290.8 4,822.4 0.6 0.6Employee costs included in research expenditure 69.7 64.3 – –Employee costs included in construction contracts
[Note 31] 3.4 6.3 – –5,363.9 4,893.0 0.6 0.6
During the financial year, the Group and the Company reversed the cost of the second grant of the PBESS awarded on 20 October 2014 (2015: reversed the first grant of PBESS awarded on 7 October 2013). The reversals were made following the review of the probability of achievement of the targets, in particular, the performance targets. If the first grant of shares were to vest, the cost of PBESS would amount to RM100.6 million as at 30 June 2016.
Details of the shares granted under the PBESS and its vesting conditions are disclosed in Note 39.
Estimated monetary value of benefits of the Executive Director amounted to RM32,200 (2015: RM32,200) for the Group.
Group Company2016 2015 2016 2015
b. Depreciation on property, plant and equipment
Depreciation included in profit or loss 1,631.3 1,336.4 – – Depreciation included in property, plant and
equipment [Note 18(c)] 36.1 24.4 – –1,667.4 1,360.8 – –
c. Fees for non-audit services provided by the Company’s auditor and its member firms
Quarterly review and other assurance services 0.9 1.0 0.2 0.2 Financial advisory services 0.2 8.2 0.1 0.4 Tax related services 3.0 4.3 – –
4.1 13.5 0.3 0.6

Sime Darby BerhadAnnual Report 2016Innovating for the Future2 1 8
NOTES TO THE FINANCIAL STATEMENTS
For the financial year ended 30 June 2016 (continued)Amounts in RM million unless otherwise stated
7 Operating Expenses (continued)
c. Fees for non-audit services provided by the Company’s auditor and its member firms (continued)The percentage of non-audit fees to total fees paid and payable to PricewaterhouseCoopers Malaysia and its member firms for the current financial year is 13.0% (2015: 33.9%). The lower fees paid and payable for the current financial year were largely due to the provision of financial advisory services in relation to the post-acquisition integration and harmonisation of New Britain Palm Oil Limited and the corporate exercise for the Motors Division in the financial year ended 30 June 2015.
The Governance & Audit Committee reviews on a quarterly basis, the engagement of the external auditors for non-audit services. Non-audit services can be offered by the external auditors if there are efficiency and value added benefits to the Group, without compromising auditor independence.
d. Non-Executive Directors’ feesEstimated monetary value of benefits of Non-executive Directors amounted to RM0.3 million (2015: RM0.4 million) for the Group and the Company.
8 Other Operating Income
Group Company2016 2015 2016 2015
Commission, handling fees and incentives 350.4 235.0 – –Income from investments (gross):- quoted shares in Malaysia 0.3 2.5 – –- unquoted shares 91.4 62.5 – –- unquoted debentures 0.2 0.1 – –- unit trust – 1.0 – –Hire of plant and machinery 1.1 5.2 – –Rental income from land and buildings 25.5 28.4 – –Gain on disposal of: - property, plant and equipment 78.8 125.4 – –- investment properties 2.6 68.1 – –- subsidiaries [Note 51] 513.0 – – –- a joint venture – 157.2 – –- equity interest in an associate – 55.5 – –Surplus from liquidation of a subsidiary – – – 5.6Reversal of impairment losses of:- property, plant and equipment 0.2 1.2 – –- prepaid lease rental 0.5 1.4 – –- intangible assets 3.5 1.6 – –- receivables 40.9 60.1 – –Bad debts recovered 1.1 3.9 – –Sale of scrap 10.7 16.6 – –Directors’ fees and other income from subsidiaries – – 5.8 –Forfeitures, recoveries and other miscellaneous income 289.0 162.6 – 16.9
1,409.2 988.3 5.8 22.5

Sime Darby Berhad 2 1 9Annual Report 2016 Financial Reports
9 Other Gains and Losses Group Company2016 2015 2016 2015
Foreign currency exchange gain:- realised 392.0 437.9 5.0 4.7- unrealised 199.6 172.2 189.4 464.3Foreign currency exchange loss:- realised (332.3) (263.3) (5.0) (4.7)- unrealised (275.2) (339.4) (190.4) (461.8)Fair value (loss)/gain:- foreign currency exchange contracts (4.3) 4.1 – –- commodity future contracts 6.2 3.8 – –- cross currency swap 46.7 257.2 – –- quoted warrants [Note 25] (3.0) 12.0 – –Gain on ineffective portion of cash flow hedges for
foreign currency exchange contracts 65.2 4.9 – –94.9 289.4 (1.0) 2.5
10 Joint Ventures
The Group’s interest in joint ventures as at 30 June, their respective principal activities and countries of incorporation are set out in Note 60.
The Group’s interest in joint ventures are as follows:
Group2016
Material joint
ventures Others Total
Share of results 22.1 0.8 22.9Share of other comprehensive loss (112.3) (8.1) (120.4)Share of total comprehensive loss (90.2) (7.3) (97.5)
Unquoted shares, at costs 2,282.7 446.2 2,728.9Share of post-acquisition reserves 146.7 49.8 196.5Loan to a joint venture – 28.8 28.8Unrealised profit on transactions with joint ventures – (56.3) (56.3)Impairment losses – (8.5) (8.5)
2,429.4 460.0 2,889.4
2015
Share of results (71.2) (29.4) (100.6)Share of other comprehensive income 66.2 26.6 92.8Share of total comprehensive loss (5.0) (2.8) (7.8)
Unquoted shares, at costs 1,887.4 358.5 2,245.9Share of post-acquisition reserves 57.8 (8.5) 49.3Loan to a joint venture – 5.8 5.8Unrealised profit on transactions with joint ventures – (56.7) (56.7)Impairment losses – (6.6) (6.6)
1,945.2 292.5 2,237.7

Sime Darby BerhadAnnual Report 2016Innovating for the Future2 2 0
NOTES TO THE FINANCIAL STATEMENTS
For the financial year ended 30 June 2016 (continued)Amounts in RM million unless otherwise stated
10 Joint Ventures (continued)
a. Material joint venturesIn the opinion of the Directors, the joint ventures which are material to the Group are as follows:
Name of joint venture Description
Emery Oleochemicals (M) Sdn Bhd group (Emery)
Emery is a joint venture between PTT Global Chemical and Sime Darby Plantation Sdn Bhd. Emery is principally engaged in the production and trading of oleochemicals and derivatives. It has its headquarter in Shah Alam, Malaysia with manufacturing facilities and sales and marketing offices located in Asia Pacific, Europe and North America. The joint venture allows cross leveraging of opportunities for upstream and downstream integration.
Ramsay Sime Darby Health Care Sdn Bhd group (RSDH)
RSDH was formed following the merger of Sime Darby Healthcare Sdn Bhd and Affinity Health Care Holdings Pty Ltd, a subsidiary of Ramsay Health Care Ltd, to build a quality portfolio of hospitals throughout Asia. The principle activities of RSDH are management of hospitals and provision of related healthcare services.
Battersea Project Holding Company Limited group (Battersea)
Battersea is a joint venture between Setia International Limited, a subsidiary of S P Setia Berhad, Kwasa Global (Jersey) Limited and Sime Darby Property (Hong Kong) Limited, a subsidiary of Sime Darby Property Berhad. Battersea was formed to acquire and develop the Battersea Power Station site in London, United Kingdom and for the Group to expand its footprint into a key international market for property development and investment.
Summarised financial informationThe summarised statements of comprehensive income of the material joint ventures are as follows:
Group2016 Emery RSDH Battersea Total
Revenue 2,627.5 800.7 – 3,428.2
Depreciation and amortisation (87.6) (53.0) (1.2) (141.8)Interest income 8.9 1.1 0.1 10.1Interest expense (36.9) (11.0) (0.2) (48.1)
Profit/(loss) before tax 80.2 66.5 (47.4) 99.3Taxation (46.7) (10.1) (3.7) (60.5)Profit/(loss) for the financial year 33.5 56.4 (51.1) 38.8Non-controlling interests (2.7) (1.9) – (4.6)Profit/(loss) attributable to joint venturers 30.8 54.5 (51.1) 34.2Other comprehensive income/(loss) 74.8 – (374.3) (299.5)Total comprehensive income/(loss) 105.6 54.5 (425.4) (265.3)
Share of results 15.4 27.2 (20.5) 22.1Share of other comprehensive income/(loss) 37.4 – (149.7) (112.3)Share of total comprehensive income/(loss) 52.8 27.2 (170.2) (90.2)

Sime Darby Berhad 2 2 1Annual Report 2016 Financial Reports
10 Joint Ventures (continued)
a. Material joint ventures (continued)
Summarised financial information (continued)The summarised statements of comprehensive income of the material joint ventures are as follows: (continued)
Group2015 Emery RSDH Battersea Total
Revenue 2,670.7 705.9 – 3,376.6
Depreciation and amortisation (86.0) (48.6) (25.7) (160.3)Interest income 6.6 1.2 0.1 7.9Interest expense (30.7) (11.7) – (42.4)
(Loss)/profit before tax (15.2) 47.5 (166.8) (134.5)Taxation (16.4) (15.7) (6.3) (38.4)(Loss)/profit for the financial year (31.6) 31.8 (173.1) (172.9)Non-controlling interests (2.7) (1.4) – (4.1)(Loss)/profit attributable to joint venturers (34.3) 30.4 (173.1) (177.0)Other comprehensive (loss)/income (31.2) 1.1 203.2 173.1
Total comprehensive (loss)/income (65.5) 31.5 30.1 (3.9)
Share of results (17.2) 15.2 (69.2) (71.2)Share of other comprehensive (loss)/income (15.6) 0.5 81.3 66.2
Share of total comprehensive (loss)/income (32.8) 15.7 12.1 (5.0)

Sime Darby BerhadAnnual Report 2016Innovating for the Future2 2 2
NOTES TO THE FINANCIAL STATEMENTS
For the financial year ended 30 June 2016 (continued)Amounts in RM million unless otherwise stated
10 Joint Ventures (continued)
a. Material joint ventures (continued)
Summarised financial information (continued)The summarised statements of financial position of the material joint ventures are as follows:
Group 2016 Emery RSDH Battersea Total
Non-current assets 1,114.8 1,183.8 2,032.2 4,330.8
Current assetsCash and cash equivalents 226.8 37.0 878.7 1,142.5Other current assets 1,003.2 110.8 5,946.8 7,060.8
1,230.0 147.8 6,825.5 8,203.3
Non-current liabilitiesFinancial liabilities (9.9) (113.1) (3,747.8) (3,870.8)Other non-current liabilities – (48.6) – (48.6)
(9.9) (161.7) (3,747.8) (3,919.4)
Current liabilitiesFinancial liabilities (842.2) – (2.0) (844.2)Other current liabilities (482.9) (143.2) (1,824.6) (2,450.7)
(1,325.1) (143.2) (1,826.6) (3,294.9)
Non-controlling interests (57.3) (10.3) – (67.6)
Net assets 952.5 1,016.4 3,283.3 5,252.2
2015
Non-current assets 1,138.2 1,156.8 1,395.3 3,690.3 Current assetsCash and cash equivalents 126.0 41.0 862.8 1,029.8Other current assets 1,075.8 128.0 4,059.2 5,263.0
1,201.8 169.0 4,922.0 6,292.8
Non-current liabilitiesFinancial liabilities (10.1) (145.8) (2,611.8) (2,767.7)Other non-current liabilities – (47.0) – (47.0)
(10.1) (192.8) (2,611.8) (2,814.7)
Current liabilitiesFinancial liabilities (880.9) (0.1) (1.4) (882.4)Other current liabilities (545.2) (162.8) (1,431.4) (2,139.4)
(1,426.1) (162.9) (1,432.8) (3,021.8)
Non-controlling interests (56.9) (8.2) – (65.1)
Net assets 846.9 961.9 2,272.7 4,081.5

Sime Darby Berhad 2 2 3Annual Report 2016 Financial Reports
10 Joint Ventures (continued)
a. Material joint ventures (continued)
Summarised financial information (continued)The projected Gross Development Value (GDV) for the Battersea development project is GBP9,160 million (equivalent to RM49,433 million). The development commenced on 10 January 2013 with the launch of Phase 1. As at the end of the financial year, a total of three phases with total GDV of GBP5,585 million (equivalent to RM30,140 million) have been launched. The revenue and profit from the development will be recognised only upon fulfillment of the revenue recognition criteria based on the terms of the sale contract. Accordingly, the revenue and profit will only be recognised upon hand-over of each development.
The total development cost incurred as at 30 June 2016 of RM7,498.8 million (2015: RM5,237.0 million) is recognised as an asset and is measured at the lower of cost and net realisable value. Development cost includes interest expense capitalised during the financial year of RM60.3 million (2015: RM140.9 million).
The summarised statements of financial position reflects the amounts presented in the financial statements of the joint ventures adjusted for differences in accounting policies between the Group and the joint ventures as well as post-acquisition changes to the fair value adjustment at acquisition date.
The most recent available financial statements of the joint ventures are used in applying equity method of accounting with appropriate adjustments made for significant transactions occurring between that date and 30 June.
ReconciliationReconciliation of the summarised financial information presented to the carrying amount of the Group’s interest in the material joint ventures are as follows:
Group2016 Emery RSDH Battersea Total
Net assetsAt 1 July 2015 846.9 961.9 2,272.7 4,081.5Total comprehensive income/(loss) 105.6 54.5 (425.4) (265.3)Capital injection – – 1,436.0 1,436.0At 30 June 2016 952.5 1,016.4 3,283.3 5,252.2
Group’s interest in the joint ventures (%) 50.0 50.0 40.0
Interest in joint ventures 476.3 508.2 1,313.3 2,297.8Goodwill – 131.6 – 131.6Carrying amount at end of the financial year 476.3 639.8 1,313.3 2,429.4
2015
Net assetsAt 1 July 2014 875.9 930.4 1,493.1 3,299.4Total comprehensive (loss)/income (65.5) 31.5 30.1 (3.9)Capital injection 36.5 – 749.5 786.0At 30 June 2015 846.9 961.9 2,272.7 4,081.5
Group’s interest in the joint ventures (%) 50.0 50.0 40.0
Interest in joint ventures 423.5 481.0 909.1 1,813.6Goodwill – 131.6 – 131.6Carrying amount at end of the financial year 423.5 612.6 909.1 1,945.2

Sime Darby BerhadAnnual Report 2016Innovating for the Future2 2 4
NOTES TO THE FINANCIAL STATEMENTS
For the financial year ended 30 June 2016 (continued)Amounts in RM million unless otherwise stated
10 Joint Ventures (continued)
b. Commitments and contingent liabilitiesOther than the following, there is no commitment nor contingent liability relating to the Group’s interest in the joint ventures.
Pursuant to the Subscription and Shareholders’ Agreement, which is reiterated through Letters of Undertaking issued by the shareholders of Battersea Project Holding Company Limited (Battersea) to Battersea, the shareholders are committed to subscribe for shares in Battersea in proportion to their respective shareholdings when a capital call is made for the purpose of ensuring Battersea and its subsidiaries are able to meet their respective funding obligations. The Group’s portion of the commitment as at 30 June 2016 is up to GBP359.5 million (equivalent to RM1,940.1 million) (2015: GBP453.5 million, equivalent to RM2,699.9 million).
11 Associates
The Group’s interest in the associates as at 30 June, their respective principal activities and countries of incorporation are set out in Note 60.
The Group’s interest in associates are as follows:
Group2016
Material associates Others Total
Share of results 21.0 4.5 25.5Share of other comprehensive income 0.5 10.9 11.4Share of total comprehensive income 21.5 15.4 36.9
Share of capital reserve 2.3 – 2.3
Quoted shares in Malaysia, at costs 292.3 – 292.3Unquoted shares, at costs 561.8 318.5 880.3Share of post-acquisition reserves 150.4 142.3 292.7Loan to an associate – 8.1 8.1Unrealised profit on transactions with associates (129.6) (1.7) (131.3)Impairment losses – (17.8) (17.8)
874.9 449.4 1,324.3
2015
Share of results (38.1) 16.7 (21.4)Share of other comprehensive (loss)/income (3.9) 22.1 18.2Share of total comprehensive (loss)/income (42.0) 38.8 (3.2)
Share of capital reserve (2.9) – (2.9)
Quoted shares in Malaysia, at costs 554.2 – 554.2Unquoted shares, at costs 561.8 295.7 857.5Share of post-acquisition reserves 150.0 163.8 313.8Loan to an associate – 7.7 7.7Unrealised profit on transactions with associates (142.6) (1.7) (144.3)Impairment losses – (6.7) (6.7)
1,123.4 458.8 1,582.2
The loan to an associate is unsecured and bears interest at 7.85% (2015: 7.85%) per annum.

Sime Darby Berhad 2 2 5Annual Report 2016 Financial Reports
11 Associates (continued)
a. Material associatesIn the opinion of the Directors, the associates which are material to the Group are as follows:
Name of associate Description
Eastern & Oriental Berhad group (E&O)
E&O is a company listed on the Main Market of Bursa Malaysia Securities Berhad. The stake in E&O enables the Group to extend its presence in the property development and hospitality sectors, beyond the Greater Kuala Lumpur, specifically in Penang and Johor.
Tesco Stores (Malaysia) Sdn Bhd (Tesco)
Tesco was established on 29 November 2001 as a result of a strategic alliance between Tesco PLC and the Group. Tesco owns and operates over fifty (50) hypermarkets in Malaysia. The investment enables the Group to establish its footprint into the consumer retail business in Malaysia.
Seriemas Development Sdn Bhd group (Seriemas)
The Group’s interest in Seriemas was following the merger with Golden Hope Plantations Bhd (GHPB) in November 2007. The equity interest of 40.0% arose from a rationalisation exercise by GHPB in November 2004 which involves the acquisition of plantation assets by GHPB and the dilution of GHPB’s 100.0% interest in property development companies. Seriemas currently owns landbanks in Malaysia and is involved in property development and investment.
Shaw Brothers (M) Sdn Bhd (Shaw Brothers)
The Group’s interest in Shaw Brothers was acquired by United Estate Projects Berhad (now known as Sime UEP Properties Berhad) from Shaw and Shaw Pte Ltd in 1984. Sime UEP Properties Berhad became a subsidiary of the Group in 1985. Shaw Brothers’ principal activities are investment holding and property investment.
Summarised financial informationThe summarised statements of comprehensive income of and dividends received from the material associates are as follows:
Group 2016 E&O Tesco Seriemas
Shaw Brothers Total
Revenue 422.2 4,493.5 125.4 22.1 5,063.2
Depreciation and amortisation (20.3) (202.7) (0.6) (0.4) (224.0)Interest income 10.8 0.3 2.0 2.4 15.5Interest expense (50.4) (178.9) (0.2) – (229.5)
Profit/(loss) before tax 5.9 (275.3) 105.9 28.4 (135.1)Taxation (4.4) 37.3 (27.9) (2.1) 2.9Profit/(loss) for the financial year 1.5 (238.0) 78.0 26.3 (132.2)Non-controlling interests (1.6) – (0.1) – (1.7)(Loss)/profit attributable to owners of
associates (0.1) (238.0) 77.9 26.3 (133.9)Other comprehensive (loss)/income (0.2) – 0.2 1.4 1.4Total comprehensive (loss)/income (0.3) (238.0) 78.1 27.7 (132.5)
Share of results – (19.7) 31.2 9.5 21.0Share of other comprehensive (loss)/income (0.1) – 0.1 0.5 0.5Share of total comprehensive (loss)/income (0.1) (19.7) 31.3 10.0 21.5
Share of capital reserve 0.5 1.8 – – 2.3Dividends received 8.61 – – 1.8 10.4
1 Distribution of treasury stocks

Sime Darby BerhadAnnual Report 2016Innovating for the Future2 2 6
NOTES TO THE FINANCIAL STATEMENTS
For the financial year ended 30 June 2016 (continued)Amounts in RM million unless otherwise stated
11 Associates (continued)
a. Material associates (continued)
Summarised financial information (continued)The summarised statements of comprehensive income of and dividends received from the material associates are as follows: (continued)
Group 2015 E&O Tesco Seriemas
Shaw Brothers Total
Revenue 449.5 4,596.6 108.2 22.8 5,177.1
Depreciation and amortisation (20.8) (205.1) (0.5) (0.3) (226.7)Interest income 6.2 0.3 4.0 2.5 13.0Interest expense (35.4) (174.5) (0.2) – (210.1)
Profit/(loss) before tax 153.6 (274.1) 26.6 19.2 (74.7)Taxation (45.5) 28.6 (5.9) (2.7) (25.5)Profit/(loss) for the financial year 108.1 (245.5) 20.7 16.5 (100.2)Non-controlling interests (4.6) – 0.1 – (4.5)Profit/(loss) attributable to owners of
associates 103.5 (245.5) 20.8 16.5 (104.7)Other comprehensive loss (0.5) – (0.2) (9.9) (10.6)Total comprehensive income/(loss) 103.0 (245.5) 20.6 6.6 (115.3)
Share of results 21.4 (73.7) 8.3 5.9 (38.1)Share of other comprehensive loss (0.2) – (0.1) (3.6) (3.9)Share of total comprehensive income/(loss) 21.2 (73.7) 8.2 2.3 (42.0)
Share of capital reserve – (2.9) – – (2.9)Dividends received 7.3 – 7.2 1.8 16.3

Sime Darby Berhad 2 2 7Annual Report 2016 Financial Reports
11 Associates (continued)
a. Material associates (continued)
Summarised financial information (continued)The summarised statements of financial position of the material associates are as follows:
Group2016 E&O Tesco Seriemas
Shaw Brothers Total
Non-current assets 3,171.5 3,464.3 496.7 305.7 7,438.2
Current assetsCash and cash equivalents 247.3 75.6 108.2 55.4 486.5Other current assets 1,438.4 545.6 498.3 1.8 2,484.1
1,685.7 621.2 606.5 57.2 2,970.6
Non-current liabilitiesFinancial liabilities (1,340.3) (3,031.1) (3.5) – (4,374.9)Other non-current liabilities (397.5) (103.0) – – (500.5)
(1,737.8) (3,134.1) (3.5) – (4,875.4)
Current liabilitiesFinancial liabilities (178.0) (158.8) (0.6) – (337.4)Other current liabilities (155.7) (965.1) (73.0) (11.8) (1,205.6)
(333.7) (1,123.9) (73.6) (11.8) (1,543.0)
Non-controlling interests (48.8) – 2.2 – (46.6)
Net assets 2,736.9 (172.5) 1,028.3 351.1 3,943.8
2015
Non-current assets 2,481.0 3,663.9 452.6 270.6 6,868.1
Current assetsCash and cash equivalents 199.6 59.2 92.0 67.5 418.3Other current assets 1,520.3 646.0 470.1 1.1 2,637.5
1,719.9 705.2 562.1 68.6 3,055.8
Non-current liabilitiesFinancial liabilities (709.6) (2,836.3) (4.1) – (3,550.0)Other non-current liabilities (82.8) (277.3) – (0.1) (360.2)
(792.4) (3,113.6) (4.1) (0.1) (3,910.2)
Current liabilitiesFinancial liabilities (453.0) (226.0) (0.6) – (679.6)Other current liabilities (173.7) (969.9) (61.5) (10.7) (1,215.8)
(626.7) (1,195.9) (62.1) (10.7) (1,895.4)
Non-controlling interests (47.1) – 1.7 – (45.4)
Net assets 2,734.7 59.6 950.2 328.4 4,072.9

Sime Darby BerhadAnnual Report 2016Innovating for the Future2 2 8
NOTES TO THE FINANCIAL STATEMENTS
For the financial year ended 30 June 2016 (continued)Amounts in RM million unless otherwise stated
11 Associates (continued)
a. Material associates (continued)
Summarised financial information (continued)The summarised statements of financial position reflects the amounts presented in the financial statements of the associates adjusted for differences in accounting policies between the Group and the associates as well as post-acquisition changes to the fair value adjustment at acquisition date.
The most recent available financial statements of the associates are used in applying equity method of accounting with appropriate adjustments made for significant transactions occurring between that date and 30 June.
ReconciliationReconciliation of the summarised financial information presented to the carrying amount of the Group’s interest in the material associates are as follows:
Group2016 E&O Tesco Seriemas
Shaw Brothers Total
Net assetsAt 1 July 2015 2,734.7 59.6 950.2 328.4 4,072.9Total comprehensive (loss)/income (0.3) (238.0) 78.1 27.7 (132.5)Dividend paid – – – (5.0) (5.0)Reserves movement 2.5 5.9 – – 8.4At 30 June 2016 2,736.9 (172.5) 1,028.3 351.1 3,943.8
Group’s interest in the associates (%) 12.22 30.0 40.0 36.0
Interest in associates 334.1 (51.8) 411.4 126.4 820.1Goodwill 3.0 – – – 3.0Unrecognised share of losses – 51.8 – – 51.8Carrying amount at end of the financial year 337.1 – 411.4 126.4 874.9
Market value at end of the financial year 253.6 – – –
2015
Net assetsAt 1 July 2014 2,665.0 315.0 947.6 326.8 4,254.4Total comprehensive income/(loss) 103.0 (245.5) 20.6 6.6 (115.3)Dividends paid (33.3) – (18.0) (5.0) (56.3)Reserves movement – (9.9) – – (9.9)At 30 June 2015 2,734.7 59.6 950.2 328.4 4,072.9
Group’s interest in the associates (%) 22.0 30.0 40.0 36.0
Interest in associates 601.8 17.9 380.1 118.2 1,118.0Goodwill 5.4 – – – 5.4Carrying amount at end of the financial year 607.2 17.9 380.1 118.2 1,123.4
Market value at end of the financial year 456.2 – – –

Sime Darby Berhad 2 2 9Annual Report 2016 Financial Reports
11 Associates (continued)
a. Material associates (continued)
Reconciliation (continued)Reconciliation of the summarised financial information presented to the carrying amount of the Group’s interest in the material associates are as follows: (continued)
2 As at 30 June 2016, the Group’s equity interest in E&O is 22.2% (excluding treasury stocks) following the acquisition of additional stocks during the financial year for RM7.5 million. On 3 June 2016, the Group had entered into a Share Sale Agreement (SSA) with Paramount Spring Sdn Bhd to dispose of inter alia 125,978,324 ordinary stock units of RM1.00 each, representing approximately 10% equity interest in E&O at RM2.60 per stock unit. On 27 September 2016, by way of a supplementary agreement, the price per ordinary stock unit was revised to RM2.45. As at 30 June 2016, the SSA is pending completion and hence, the 10% equity interest in E&O is classified under non-current assets held for sale (see Note 37).
The market value of the Group’s interest in E&O as at 30 June 2016 was RM462.7 million. Excluding the 10% equity interest in E&O which is pending completion of the SSA, the market value of the Group’s remaining interest in E&O as at 30 June 2016 is RM253.6 million, which is approximately RM83.5 million below its carrying amount. The recoverable amount is higher than the carrying amount based on the value-in-use calculation undertaken by management.
b. Commitments and contingent liabilities There are no commitment nor contingent liabilities relating to the Group’s interest in the associates.
12 Finance Income
Group Company2016 2015 2016 2015
Interest income from:- subsidiaries – – 203.6 167.0- banks and other financial institutions 64.8 106.5 0.2 0.3- financial guarantees in respect of credit facilities granted to:
- certain subsidiaries – – 11.8 20.6- others 0.3 0.3 – –
- other interest income 19.9 38.6 – –85.0 145.4 215.6 187.9
Accretion of discount on: - receivables [Note 30(a)] 30.5 35.6 – –- gross amount due from customers 38.7 15.3 – –
154.2 196.3 215.6 187.9

Sime Darby BerhadAnnual Report 2016Innovating for the Future2 3 0
NOTES TO THE FINANCIAL STATEMENTS
For the financial year ended 30 June 2016 (continued)Amounts in RM million unless otherwise stated
13 Finance Costs
Group Company2016 2015 2016 2015
Interest expense paid to:- banks and other financial institutions 397.9 308.0 3.3 8.3- finance lease obligation 5.1 5.3 – –- a subsidiary – – 89.0 72.5Net change in fair value of interest rate swap contracts (13.1) (13.8) – –Cross currency swap interest 73.5 70.3 – –Financial guarantees in respect of credit facilities
granted to a subsidiary – – 3.5 –463.4 369.8 95.8 80.8
Islamic financing distribution payment:- Sukuk 90.0 71.6 – –- Medium Term Notes 80.1 88.2 80.1 88.2- other facilities 104.5 52.0 – –
274.6 211.8 80.1 88.2
Total finance costs 738.0 581.6 175.9 169.0
Interest capitalised in: - property, plant and equipment [Note 18(c)] (93.1) (29.9) – –- intangible assets [Note 26(a)] (14.7) (9.7) – –- construction contracts cost [Note 31] (40.4) (16.6) – –- property development costs [Note 33] (135.9) (54.8) – –Net finance costs 453.9 470.6 175.9 169.0

Sime Darby Berhad 2 3 1Annual Report 2016 Financial Reports
14 Taxation
Group Company2016 2015 2016 2015
RestatedIncome tax:In respect of current year- Malaysian income tax 233.1 321.3 1.2 –- foreign income tax 406.1 412.1 – –In respect of prior years- Malaysian income tax 15.3 (28.0) – – - foreign income tax 4.6 (1.6) – –Total income tax 659.1 703.8 1.2 –
Deferred tax:- origination and reversal of temporary differences (8.3) 93.3 (0.6) (0.5)- effects of recognition of previously unrecognised
tax losses, unabsorbed capital allowances and temporary differences (36.2) (95.6)
– –
- effects of change in tax base applicable to unrealised profit following changes to the land use (50.5) (105.0) – –
- effects of change in tax base following a tax revaluation (348.5) – – –
Total deferred tax (443.5) (107.3) (0.6) (0.5)
Total tax expense/(credit) 215.6 596.5 0.6 (0.5)
The effects of change in tax base following a tax revaluation amounting to RM348.5 million arose from a new legislation on fixed assets revaluation (under Peraturan Menteri Keuangan No. 191/PMK.010/2015)(“PMK 191”) issued by the Ministry of Finance in Indonesia, effective from 20 October 2015. Under the special tax regulations, certain Indonesian entities of the Group elected and submitted their application for the special tax incentive by performing a tax revaluation on certain assets and paid a final tax amount of IDR218.8 billion (equivalent to RM66.4 million) for the revaluation surplus in May 2016.
Subsequent to the fixed assets revaluation, these entities will enjoy lower income tax expense over the future tax depreciation period as a result of higher depreciation expense. Consequent to the election and submission, the Group has recognised deferred tax assets amounting to IDR1,367.7 billion (equivalent to RM414.9 million) in June 2016, hence the net tax benefit of IDR1,148.9 billion (equivalent to RM348.5 million).

Sime Darby BerhadAnnual Report 2016Innovating for the Future2 3 2
NOTES TO THE FINANCIAL STATEMENTS
For the financial year ended 30 June 2016 (continued)Amounts in RM million unless otherwise stated
14 Taxation (continued)
Tax reconciliationReconciliation from tax at applicable tax rate to tax expense/(credit) is as follows:
Group Company2016 2015 2016 2015
Restated
Profit before tax 2,815.8 3,145.4 1,288.2 1,280.7Less: Share of results of joint ventures (22.9) 100.6 – – Share of results of associates (25.5) 21.4 – –
2,767.4 3,267.4 1,288.2 1,280.7
Applicable tax 585.2 794.3 309.2 320.2Withholding tax on foreign income 29.9 53.8 – –Effects of tax incentives and non-taxable income:- single tier dividends (22.0) (16.4) (304.8) (313.5)- foreign currency exchange gain (22.2) (77.4) (45.5) (116.1)- gains on disposal of subsidiaries (87.4) – – –- gains on disposal of a joint venture and equity interest
in an associate – (53.2) – –- tax incentives and other income (60.0) (117.6) (2.8) (10.8)Effects of non-deductible expenses:- foreign currency exchange loss 47.4 41.8 45.7 115.4- depreciation and amortisation on non-qualifying assets
and other expenses 158.6 142.9 8.0 4.3Perpetual sukuk distribution and expenses (9.2) – (9.2) –Deferred tax assets not recognised in respect of current
year’s tax losses 10.6 58.5 – –Under/(over) provision in prior years 19.9 (29.6) – –Effects of recognition of previously unrecognised tax
losses, unabsorbed capital allowances and temporary differences (36.2) (95.6) – –
Effects of change in tax base applicable to unrealised profit following changes to the land use (50.5) (105.0) – –
Effects of change in tax base following the tax revaluation (348.5) – – –
Tax expense/(credit) for the financial year 215.6 596.5 0.6 (0.5)
Applicable tax rate (%) 21.1 24.3 24.0 25.0
Effective tax rate (%) 7.8 18.3 0.0 0.0
The Group’s applicable tax rate reduced from 24.3% to 21.1% due to changes in the proportion of income contributed by subsidiaries which are subjected to different statutory income tax rate.

Sime Darby Berhad 2 3 3Annual Report 2016 Financial Reports
15 Earnings Per Share
Basic and diluted earnings per share attributable to owners of the Company are computed as follows:
Group2016 2015
Restated
BasicProfit for the financial year 2,408.8 2,430.0
Weighted average number of ordinary shares in issue (million) 6,268.7 6,138.4
Earnings per share (sen) 38.4 39.6
DilutedProfit for the financial year1 2,408.7 2,429.6
Weighted average number of ordinary shares in issue (million) 6,268.7 6,138.4
Diluted earnings per share (sen) 38.4 39.6
1 adjusted for the dilutive effect of long-term stock incentive plan of an associate of RM0.1 million (2015: RM0.4 million).
16 Dividends
Group/Company2016 2015
Final single tier dividend of 19.0 sen per share (2015: 30.0 sen per share) for the financial year ended 30 June 2015 paid on 6 January 2016 1,180.1 1,819.2
Interim single tier dividend of 6.0 sen per share (2015: 6.0 sen per share) for the financial year ended 30 June 2016 paid on 6 May 2016 379.6 372.7
1,559.7 2,191.9
Dividends paid by way of: - issuance of shares pursuant to the Dividend Reinvestment Plan 864.7 1,314.6- cash 695.0 877.3
1,559.7 2,191.9
In respect of the final dividend for the financial year ended 30 June 2015, of the total final dividend paid of RM1,180.1 million, RM864.7 million was satisfied by the issuance of 115,914,252 new Sime Darby Shares pursuant to the Dividend Reinvestment Plan (DRP) while the balance of RM315.4 million was paid in cash (see Note 38).
At the forthcoming Annual General Meeting (AGM), a final single tier dividend of 21.0 sen per ordinary share of RM0.50 each amounting to RM1,328.7 million (Final Dividend) in respect of the financial year ended 30 June 2016, will be proposed for shareholders’ approval. Subject to the relevant regulatory approvals being obtained and shareholders’ approval at the forthcoming AGM for the renewal of the authority to allot and issue new Sime Darby Shares for the purpose of the implementation of the DRP, shareholders of the Company will be given an option pursuant to the DRP to reinvest their entire Final Dividend or a portion thereof into new Sime Darby Shares at an issue price to be determined and announced at a later date.

Sime Darby BerhadAnnual Report 2016Innovating for the Future2 3 4
NOTES TO THE FINANCIAL STATEMENTS
For the financial year ended 30 June 2016 (continued)Amounts in RM million unless otherwise stated
17 Other Comprehensive Income/(Loss)
Other comprehensive income/(loss) and the tax effects are analysed as follows:
Group2016
Hedging reserve
Available-for-sale reserve
Exchange reserve
Retained profits
Non-controlling interests Total
Taxeffects
Net of tax
Currency translation differences – – 495.6 – 39.3 534.9 – 534.9Net change in fair value of:- investments – 5.6 – – – 5.6 – 5.6- cash flow hedges 83.9 – – – – 83.9 (19.8) 64.1Actuarial gains on defined benefit pension plans – – – 0.3 – 0.3 0.1 0.4Reclassified to profit or loss:- currency translation differences:
- on repayment of net investments – – (85.0) – – (85.0) – (85.0)- on disposal of subsidiaries – – (3.8) – – (3.8) – (3.8)
- changes in fair value of cash flow hedges as adjustment to:- revenue (4.3) – – – – (4.3) – (4.3)- other gains and losses (48.2) – – – 0.2 (48.0) 13.9 (34.1)
Reclassified changes in fair value of cash flow hedges to inventories 7.5 – – – – 7.5 (2.3) 5.2
Share of other comprehensive income/(loss) of:- joint ventures 0.7 – (124.3) 3.2 – (120.4) – (120.4)- associates – 0.6 10.8 – – 11.4 – 11.4Other comprehensive income before tax 39.6 6.2 293.3 3.5 39.5 382.1 (8.1) 374.0Taxation (7.8) – – 0.1 (0.4) (8.1)
Other comprehensive income after tax 31.8 6.2 293.3 3.6 39.1 374.0
2015
Currency translation differences – – 694.7 – 56.8 751.5 – 751.5Net change in fair value of:- investments – (22.1) – – – (22.1) – (22.1)- cash flow hedges 194.4 – – – – 194.4 (66.7) 127.7Actuarial losses on defined benefit pension plans – – – (6.1) (0.5) (6.6) 1.7 (4.9)Reclassified to profit or loss:- currency translation differences:
- on repayment of net investments – – (151.5) – – (151.5) – (151.5)- on disposal of a subsidiary – – 0.5 – – 0.5 – 0.5
- changes in fair value of cash flow hedges as adjustment to: - revenue 4.1 – – – – 4.1 – 4.1- other gains and losses (254.5) – – – (0.1) (254.6) 77.2 (177.4)
Reclassified changes in fair value of cash flow hedges to inventories (20.9) – – – – (20.9) 6.4 (14.5)
Share of other comprehensive (loss)/income of:- joint ventures (0.4) – 114.1 (20.9) – 92.8 – 92.8- associates – (3.6) 21.8 – – 18.2 – 18.2Other comprehensive (loss)/income before tax (77.3) (25.7) 679.6 (27.0) 56.2 605.8 18.6 624.4Taxation 16.9 – – 1.5 0.2 18.6
Other comprehensive (loss)/income after tax (60.4) (25.7) 679.6 (25.5) 56.4 624.4

Sime Darby Berhad 2 3 5Annual Report 2016 Financial Reports
17 Other Comprehensive Income/(Loss)
Other comprehensive income/(loss) and the tax effects are analysed as follows:
Group2016
Hedging reserve
Available-for-sale reserve
Exchange reserve
Retained profits
Non-controlling interests Total
Taxeffects
Net of tax
Currency translation differences – – 495.6 – 39.3 534.9 – 534.9Net change in fair value of:- investments – 5.6 – – – 5.6 – 5.6- cash flow hedges 83.9 – – – – 83.9 (19.8) 64.1Actuarial gains on defined benefit pension plans – – – 0.3 – 0.3 0.1 0.4Reclassified to profit or loss:- currency translation differences:
- on repayment of net investments – – (85.0) – – (85.0) – (85.0)- on disposal of subsidiaries – – (3.8) – – (3.8) – (3.8)
- changes in fair value of cash flow hedges as adjustment to:- revenue (4.3) – – – – (4.3) – (4.3)- other gains and losses (48.2) – – – 0.2 (48.0) 13.9 (34.1)
Reclassified changes in fair value of cash flow hedges to inventories 7.5 – – – – 7.5 (2.3) 5.2
Share of other comprehensive income/(loss) of:- joint ventures 0.7 – (124.3) 3.2 – (120.4) – (120.4)- associates – 0.6 10.8 – – 11.4 – 11.4Other comprehensive income before tax 39.6 6.2 293.3 3.5 39.5 382.1 (8.1) 374.0Taxation (7.8) – – 0.1 (0.4) (8.1)
Other comprehensive income after tax 31.8 6.2 293.3 3.6 39.1 374.0
2015
Currency translation differences – – 694.7 – 56.8 751.5 – 751.5Net change in fair value of:- investments – (22.1) – – – (22.1) – (22.1)- cash flow hedges 194.4 – – – – 194.4 (66.7) 127.7Actuarial losses on defined benefit pension plans – – – (6.1) (0.5) (6.6) 1.7 (4.9)Reclassified to profit or loss:- currency translation differences:
- on repayment of net investments – – (151.5) – – (151.5) – (151.5)- on disposal of a subsidiary – – 0.5 – – 0.5 – 0.5
- changes in fair value of cash flow hedges as adjustment to: - revenue 4.1 – – – – 4.1 – 4.1- other gains and losses (254.5) – – – (0.1) (254.6) 77.2 (177.4)
Reclassified changes in fair value of cash flow hedges to inventories (20.9) – – – – (20.9) 6.4 (14.5)
Share of other comprehensive (loss)/income of:- joint ventures (0.4) – 114.1 (20.9) – 92.8 – 92.8- associates – (3.6) 21.8 – – 18.2 – 18.2Other comprehensive (loss)/income before tax (77.3) (25.7) 679.6 (27.0) 56.2 605.8 18.6 624.4Taxation 16.9 – – 1.5 0.2 18.6
Other comprehensive (loss)/income after tax (60.4) (25.7) 679.6 (25.5) 56.4 624.4

Sime Darby BerhadAnnual Report 2016Innovating for the Future2 3 6
NOTES TO THE FINANCIAL STATEMENTS
For the financial year ended 30 June 2016 (continued)Amounts in RM million unless otherwise stated
18 Property, Plant and Equipment
Group2016
Freehold land
Leasehold land Buildings
Bearer plants
Plant and machinery
Rental assets
Vehicles, equipment
and fixtures
Capitalwork in
progress Total
At 1 July 2015, as previously stated 2,847.0 1,826.0 6,136.1 – 2,853.6 750.2 1,152.3 999.3 16,564.5Effects of change in accounting policy [Note 2(a)] – – – 4,661.4 – – – 1,800.9 6,462.3At 1 July 2015, as restated 2,847.0 1,826.0 6,136.1 4,661.4 2,853.6 750.2 1,152.3 2,800.2 23,026.8Disposal of subsidiaries [Note 51(b)] – – – – – – – (200.1) (200.1)Additions 0.6 94.0 201.3 – 227.6 568.1 127.6 1,739.1 2,958.3Disposals (0.8) – (5.4) (13.2) (25.4) – (23.8) (11.0) (79.6)Write offs – – (2.0) (23.9) (0.6) (1.3) (2.9) – (30.7)Impairment losses – (8.7) (9.4) – (0.1) (4.9) (1.4) – (24.5)Reversal of impairment losses – – – – 0.2 – – – 0.2Transfer from/(to):- investment properties [Note 20] – – (0.1) – – – – (2.7) (2.8)- land held for property development [Note 22] (4.3) – – – – – – – (4.3)- inventories – – – – – (278.9) 2.2 – (276.7)- non-current assets held for sale [Note 37] 10.2 (0.5) 4.1 – – – 2.1 – 15.9Reclassification – – 285.0 415.6 236.3 0.1 44.8 (981.8) –Depreciation – (65.0) (397.6) (382.7) (335.0) (188.9) (298.2) – (1,667.4)Exchange differences 14.7 57.3 140.0 275.2 76.4 8.0 51.0 118.8 741.4At 30 June 2016 2,867.4 1,903.1 6,352.0 4,932.4 3,033.0 852.4 1,053.7 3,462.5 24,456.5
Cost/valuation 2,869.0 2,374.5 8,660.4 6,778.6 5,665.3 1,291.1 3,144.7 3,473.9 34,257.5Accumulated depreciation – (440.3) (2,257.2) (1,843.4) (2,597.5) (428.4) (2,083.0) – (9,649.8)Accumulated impairment losses (1.6) (31.1) (51.2) (2.8) (34.8) (10.3) (8.0) (11.4) (151.2)Carrying amount at end of the financial year 2,867.4 1,903.1 6,352.0 4,932.4 3,033.0 852.4 1,053.7 3,462.5 24,456.5
2015
At 1 July 2014, as previously stated 2,770.6 1,239.6 5,335.0 – 1,862.9 1,229.3 986.4 922.9 14,346.7Effects of change in accounting policy [Note 2(a)] – – – 1,722.4 – – – 1,099.4 2,821.8At 1 July 2014, as restated 2,770.6 1,239.6 5,335.0 1,722.4 1,862.9 1,229.3 986.4 2,022.3 17,168.5Acquisition of subsidiaries 88.5 524.0 597.7 2,728.1 801.4 – 167.3 306.5 5,213.5Disposal of subsidiaries – – (35.0) – (25.6) – (0.4) – (61.0)Additions 0.9 1.0 99.7 – 106.2 325.5 220.3 1,459.3 2,212.9Disposals (13.3) (0.1) (268.5) – (69.0) – (62.6) (8.5) (422.0)Write offs (0.6) – (14.9) (20.7) (6.2) (0.7) (0.8) (1.9) (45.8)Impairment losses – – (14.5) – – (1.7) – – (16.2)Reversal of impairment losses – – 0.4 – 0.4 – – 0.4 1.2Transfer from/(to):- investment properties [Note 20] 14.4 (5.8) (1.0) – – – – – 7.6- land held for property development [Note 22] (17.4) – – – – – – – (17.4)- inventories – – – – – (573.5) (3.8) – (577.3)- property development cost [Note 33] – – 5.1 – – – – – 5.1- non-current assets held for sale [Note 37] (0.1) (0.6) (3.4) – (2.1) – 0.5 (0.1) (5.8)Reclassification – 27.0 490.1 203.0 298.3 (0.2) 82.8 (1,101.0) –Depreciation – (34.4) (261.3) (225.9) (325.0) (238.6) (275.6) – (1,360.8)Exchange differences 4.0 75.3 206.7 254.5 212.3 10.1 38.2 123.2 924.3At 30 June 2015 2,847.0 1,826.0 6,136.1 4,661.4 2,853.6 750.2 1,152.3 2,800.2 23,026.8
Cost/valuation 2,847.6 2,269.8 8,110.2 6,119.1 5,244.5 1,187.8 3,013.1 2,810.9 31,603.0Accumulated depreciation – (421.1) (1,911.8) (1,454.9) (2,278.4) (429.9) (1,854.1) – (8,350.2)Accumulated impairment losses (0.6) (22.7) (62.3) (2.8) (112.5) (7.7) (6.7) (10.7) (226.0)Carrying amount at end of the financial year 2,847.0 1,826.0 6,136.1 4,661.4 2,853.6 750.2 1,152.3 2,800.2 23,026.8

Sime Darby Berhad 2 3 7Annual Report 2016 Financial Reports
18 Property, Plant and Equipment
Group2016
Freehold land
Leasehold land Buildings
Bearer plants
Plant and machinery
Rental assets
Vehicles, equipment
and fixtures
Capitalwork in
progress Total
At 1 July 2015, as previously stated 2,847.0 1,826.0 6,136.1 – 2,853.6 750.2 1,152.3 999.3 16,564.5Effects of change in accounting policy [Note 2(a)] – – – 4,661.4 – – – 1,800.9 6,462.3At 1 July 2015, as restated 2,847.0 1,826.0 6,136.1 4,661.4 2,853.6 750.2 1,152.3 2,800.2 23,026.8Disposal of subsidiaries [Note 51(b)] – – – – – – – (200.1) (200.1)Additions 0.6 94.0 201.3 – 227.6 568.1 127.6 1,739.1 2,958.3Disposals (0.8) – (5.4) (13.2) (25.4) – (23.8) (11.0) (79.6)Write offs – – (2.0) (23.9) (0.6) (1.3) (2.9) – (30.7)Impairment losses – (8.7) (9.4) – (0.1) (4.9) (1.4) – (24.5)Reversal of impairment losses – – – – 0.2 – – – 0.2Transfer from/(to):- investment properties [Note 20] – – (0.1) – – – – (2.7) (2.8)- land held for property development [Note 22] (4.3) – – – – – – – (4.3)- inventories – – – – – (278.9) 2.2 – (276.7)- non-current assets held for sale [Note 37] 10.2 (0.5) 4.1 – – – 2.1 – 15.9Reclassification – – 285.0 415.6 236.3 0.1 44.8 (981.8) –Depreciation – (65.0) (397.6) (382.7) (335.0) (188.9) (298.2) – (1,667.4)Exchange differences 14.7 57.3 140.0 275.2 76.4 8.0 51.0 118.8 741.4At 30 June 2016 2,867.4 1,903.1 6,352.0 4,932.4 3,033.0 852.4 1,053.7 3,462.5 24,456.5
Cost/valuation 2,869.0 2,374.5 8,660.4 6,778.6 5,665.3 1,291.1 3,144.7 3,473.9 34,257.5Accumulated depreciation – (440.3) (2,257.2) (1,843.4) (2,597.5) (428.4) (2,083.0) – (9,649.8)Accumulated impairment losses (1.6) (31.1) (51.2) (2.8) (34.8) (10.3) (8.0) (11.4) (151.2)Carrying amount at end of the financial year 2,867.4 1,903.1 6,352.0 4,932.4 3,033.0 852.4 1,053.7 3,462.5 24,456.5
2015
At 1 July 2014, as previously stated 2,770.6 1,239.6 5,335.0 – 1,862.9 1,229.3 986.4 922.9 14,346.7Effects of change in accounting policy [Note 2(a)] – – – 1,722.4 – – – 1,099.4 2,821.8At 1 July 2014, as restated 2,770.6 1,239.6 5,335.0 1,722.4 1,862.9 1,229.3 986.4 2,022.3 17,168.5Acquisition of subsidiaries 88.5 524.0 597.7 2,728.1 801.4 – 167.3 306.5 5,213.5Disposal of subsidiaries – – (35.0) – (25.6) – (0.4) – (61.0)Additions 0.9 1.0 99.7 – 106.2 325.5 220.3 1,459.3 2,212.9Disposals (13.3) (0.1) (268.5) – (69.0) – (62.6) (8.5) (422.0)Write offs (0.6) – (14.9) (20.7) (6.2) (0.7) (0.8) (1.9) (45.8)Impairment losses – – (14.5) – – (1.7) – – (16.2)Reversal of impairment losses – – 0.4 – 0.4 – – 0.4 1.2Transfer from/(to):- investment properties [Note 20] 14.4 (5.8) (1.0) – – – – – 7.6- land held for property development [Note 22] (17.4) – – – – – – – (17.4)- inventories – – – – – (573.5) (3.8) – (577.3)- property development cost [Note 33] – – 5.1 – – – – – 5.1- non-current assets held for sale [Note 37] (0.1) (0.6) (3.4) – (2.1) – 0.5 (0.1) (5.8)Reclassification – 27.0 490.1 203.0 298.3 (0.2) 82.8 (1,101.0) –Depreciation – (34.4) (261.3) (225.9) (325.0) (238.6) (275.6) – (1,360.8)Exchange differences 4.0 75.3 206.7 254.5 212.3 10.1 38.2 123.2 924.3At 30 June 2015 2,847.0 1,826.0 6,136.1 4,661.4 2,853.6 750.2 1,152.3 2,800.2 23,026.8
Cost/valuation 2,847.6 2,269.8 8,110.2 6,119.1 5,244.5 1,187.8 3,013.1 2,810.9 31,603.0Accumulated depreciation – (421.1) (1,911.8) (1,454.9) (2,278.4) (429.9) (1,854.1) – (8,350.2)Accumulated impairment losses (0.6) (22.7) (62.3) (2.8) (112.5) (7.7) (6.7) (10.7) (226.0)Carrying amount at end of the financial year 2,847.0 1,826.0 6,136.1 4,661.4 2,853.6 750.2 1,152.3 2,800.2 23,026.8

Sime Darby BerhadAnnual Report 2016Innovating for the Future2 3 8
NOTES TO THE FINANCIAL STATEMENTS
For the financial year ended 30 June 2016 (continued)Amounts in RM million unless otherwise stated
18 Property, Plant and Equipment (continued)
The restated carrying amount of the property, plant and equipment of the Group as at 1 July 2014 is analysed as follows:
Freehold
landLeasehold
land BuildingsBearer plants
Plant and machinery
Rental assets
Vehicles, equipment
and fixtures
Capitalwork in
progress Total
Cost/valuation 2,777.2 1,628.3 7,007.6 2,934.0 3,942.6 1,847.8 2,689.0 2,031.4 24,857.9Accumulated depreciation – (371.3) (1,625.7) (1,208.8) (1,960.2) (611.1) (1,697.3) – (7,474.4)Accumulated impairment losses (6.6) (17.4) (46.9) (2.8) (119.5) (7.4) (5.3) (9.1) (215.0)Carrying amount at end of the financial year 2,770.6 1,239.6 5,335.0 1,722.4 1,862.9 1,229.3 986.4 2,022.3 17,168.5
a. Bearer plants Bearer plants comprised oil palm, rubber trees and growing cane. Immature bearer plants are capitalised in capital
work in progress.
Mature Immature
Total bearer plants
Group2016
Oilpalm
Rubber trees
Growing cane Total
Oilpalm
Rubber trees Total
At 1 July 2015, as previously stated – – – – – – – –Effects of change in accounting policy [Note 2(a)] 4,555.0 13.5 92.9 4,661.4 1,720.5 80.4 1,800.9 6,462.3At 1 July 2015, as restated 4,555.0 13.5 92.9 4,661.4 1,720.5 80.4 1,800.9 6,462.3Additions – – – – 820.7 38.8 859.5 859.5Disposals (13.2) – – (13.2) – – – (13.2)Write offs (23.8) (0.1) – (23.9) – – – (23.9)Reclassification 392.1 23.5 – 415.6 (392.1) (23.5) (415.6) –Depreciation (353.8) (5.1) (23.8) (382.7) – – – (382.7)Exchange differences 266.3 1.2 7.7 275.2 25.7 0.1 25.8 301.0At 30 June 2016 4,822.6 33.0 76.8 4,932.4 2,174.8 95.8 2,270.6 7,203.0
Cost/valuation 6,625.6 45.0 108.0 6,778.6 2,174.8 95.8 2,270.6 9.049.2Accumulated depreciation (1,800.2) (12.0) (31.2) (1,843.4) – – – (1,843.4)Accumulated impairment losses (2.8) – – (2.8) – – – (2.8)Carrying amount at end of the financial year 4,822.6 33.0 76.8 4,932.4 2,174.8 95.8 2,270.6 7,203.0
2015
At 1 July 2014, as previously stated – – – – – – – –Effects of change in accounting policy [Note 2(a)] 1,708.0 14.4 – 1,722.4 1,045.4 54.0 1,099.4 2,821.8At 1 July 2014, as restated 1,708.0 14.4 – 1,722.4 1,045.4 54.0 1,099.4 2,821.8Acquisition of subsidiaries 2,635.6 – 92.5 2,728.1 225.3 – 225.3 2,953.4Additions – – – – 574.3 26.8 601.1 601.1Write offs (20.3) (0.4) – (20.7) – – – (20.7)Reclassification 202.5 0.5 – 203.0 (202.5) (0.5) (203.0) –Depreciation (217.3) (1.0) (7.6) (225.9) – – – (225.9)Exchange differences 246.5 – 8.0 254.5 78.0 0.1 78.1 332.6At 30 June 2015 4,555.0 13.5 92.9 4,661.4 1,720.5 80.4 1,800.9 6,462.3
Cost/valuation 5,996.3 22.4 100.4 6,119.1 1,720.5 80.4 1,800.9 7,920.0Accumulated depreciation (1,438.5) (8.9) (7.5) (1,454.9) – – – (1,454.9)Accumulated impairment losses (2.8) – – (2.8) – – – (2.8)Carrying amount at end of the financial year 4,555.0 13.5 92.9 4,661.4 1,720.5 80.4 1,800.9 6,462.3

Sime Darby Berhad 2 3 9Annual Report 2016 Financial Reports
18 Property, Plant and Equipment (continued)
The restated carrying amount of the property, plant and equipment of the Group as at 1 July 2014 is analysed as follows:
Freehold
landLeasehold
land BuildingsBearer plants
Plant and machinery
Rental assets
Vehicles, equipment
and fixtures
Capitalwork in
progress Total
Cost/valuation 2,777.2 1,628.3 7,007.6 2,934.0 3,942.6 1,847.8 2,689.0 2,031.4 24,857.9Accumulated depreciation – (371.3) (1,625.7) (1,208.8) (1,960.2) (611.1) (1,697.3) – (7,474.4)Accumulated impairment losses (6.6) (17.4) (46.9) (2.8) (119.5) (7.4) (5.3) (9.1) (215.0)Carrying amount at end of the financial year 2,770.6 1,239.6 5,335.0 1,722.4 1,862.9 1,229.3 986.4 2,022.3 17,168.5
a. Bearer plants Bearer plants comprised oil palm, rubber trees and growing cane. Immature bearer plants are capitalised in capital
work in progress.
Mature Immature
Total bearer plants
Group2016
Oilpalm
Rubber trees
Growing cane Total
Oilpalm
Rubber trees Total
At 1 July 2015, as previously stated – – – – – – – –Effects of change in accounting policy [Note 2(a)] 4,555.0 13.5 92.9 4,661.4 1,720.5 80.4 1,800.9 6,462.3At 1 July 2015, as restated 4,555.0 13.5 92.9 4,661.4 1,720.5 80.4 1,800.9 6,462.3Additions – – – – 820.7 38.8 859.5 859.5Disposals (13.2) – – (13.2) – – – (13.2)Write offs (23.8) (0.1) – (23.9) – – – (23.9)Reclassification 392.1 23.5 – 415.6 (392.1) (23.5) (415.6) –Depreciation (353.8) (5.1) (23.8) (382.7) – – – (382.7)Exchange differences 266.3 1.2 7.7 275.2 25.7 0.1 25.8 301.0At 30 June 2016 4,822.6 33.0 76.8 4,932.4 2,174.8 95.8 2,270.6 7,203.0
Cost/valuation 6,625.6 45.0 108.0 6,778.6 2,174.8 95.8 2,270.6 9.049.2Accumulated depreciation (1,800.2) (12.0) (31.2) (1,843.4) – – – (1,843.4)Accumulated impairment losses (2.8) – – (2.8) – – – (2.8)Carrying amount at end of the financial year 4,822.6 33.0 76.8 4,932.4 2,174.8 95.8 2,270.6 7,203.0
2015
At 1 July 2014, as previously stated – – – – – – – –Effects of change in accounting policy [Note 2(a)] 1,708.0 14.4 – 1,722.4 1,045.4 54.0 1,099.4 2,821.8At 1 July 2014, as restated 1,708.0 14.4 – 1,722.4 1,045.4 54.0 1,099.4 2,821.8Acquisition of subsidiaries 2,635.6 – 92.5 2,728.1 225.3 – 225.3 2,953.4Additions – – – – 574.3 26.8 601.1 601.1Write offs (20.3) (0.4) – (20.7) – – – (20.7)Reclassification 202.5 0.5 – 203.0 (202.5) (0.5) (203.0) –Depreciation (217.3) (1.0) (7.6) (225.9) – – – (225.9)Exchange differences 246.5 – 8.0 254.5 78.0 0.1 78.1 332.6At 30 June 2015 4,555.0 13.5 92.9 4,661.4 1,720.5 80.4 1,800.9 6,462.3
Cost/valuation 5,996.3 22.4 100.4 6,119.1 1,720.5 80.4 1,800.9 7,920.0Accumulated depreciation (1,438.5) (8.9) (7.5) (1,454.9) – – – (1,454.9)Accumulated impairment losses (2.8) – – (2.8) – – – (2.8)Carrying amount at end of the financial year 4,555.0 13.5 92.9 4,661.4 1,720.5 80.4 1,800.9 6,462.3

Sime Darby BerhadAnnual Report 2016Innovating for the Future2 4 0
NOTES TO THE FINANCIAL STATEMENTS
For the financial year ended 30 June 2016 (continued)Amounts in RM million unless otherwise stated
18 Property, Plant and Equipment (continued)
a. Bearer plants (continued)The restated carrying amount of the bearer plants of the Group as at 1 July 2014 is analysed as follows:
Mature Immature Total
bearer plants
Oilpalm
Rubber trees
Growing cane Total
Oilpalm
Rubber trees Total
Cost/valuation 2,910.8 23.2 – 2,934.0 1,045.4 54.0 1,099.4 4,033.4Accumulated
depreciation (1,200.0) (8.8) – (1,208.8) – – – (1,208.8)Accumulated
impairment losses (2.8) – – (2.8) – – – (2.8)Carrying amount at
end of the financial year 1,708.0 14.4 – 1,722.4 1,045.4 54.0 1,099.4 2,821.8
b. Leasehold land The carrying amount of long leasehold land and short leasehold land as at 30 June 2016 are RM1,309.0 million (2015:
RM1,438.9 million) and RM594.1 million (2015: RM387.1 million), respectively.
c. Capital work in progress Included in additions to the capital work in progress are depreciation and interest expense capitalised of RM36.1
million (2015: RM24.4 million) and RM93.1 million (2015: RM29.9 million), respectively.
d. Underlying assets for Islamic financing Certain plantation land and bearer plants of the Group are used as underlying assets (Sukuk Assets) for the perpetual
sukuk issued in March 2016 and Sukuk issued in January 2013 which are based on the Shariah Principle of Ijarah (see Notes 41 and 43(d)). The structure does not represent collaterisation and there was no transfer of registered title of the Sukuk Assets. The carrying amount of the Sukuk Assets as at 30 June 2016 amounted to RM1,026.1 million (2015: RM816.8 million).
e. Assets pledged as security Property, plant and equipment with a total carrying amount of RM289.0 million (2015: RM3,872.2 million) were
pledged as security for borrowings (see Note 43). Included in plant and machinery is an amount of RM119.8 million (2015: RM137.3 million) acquired under finance leases (see Note 44).
f. Impairment losses During the financial year, the Group carried out a review of the recoverable amount of its property, plant and
equipment. The review led to the recognition of a net impairment of RM24.3 million, which includes RM19.1 million due to the impairment of the property, plant and equipment in the Property segment to its fair value less costs to sell.

Sime Darby Berhad 2 4 1Annual Report 2016 Financial Reports
18 Property, Plant and Equipment (continued)
g. Reconciliation of the additions to the cash flow Reconciliation of the additions to the cash flow for purchase of property, plant and equipment is as follows:
Group2016 2015
Restated
Additions for the financial year 2,958.3 2,212.9Add:Payment made for previous year’s additions 113.4 139.6Less: Additions to rental assets, included as changes in working capital in the
statements of cash flows (568.1) (325.5)Interest expense capitalised in capital work in progress (93.1) (29.9)Depreciation capitalised (36.1) (24.4)Amounts not yet due for payment (106.3) (63.8)Total cash payments during the financial year 2,268.1 1,908.9
19 Prepaid Lease Rentals
The prepaid lease rentals are payments for rights in respect of the following:
Group2016
Long leasehold
land
Short leasehold
land Total
At 1 July 2015 2.4 967.0 969.4Disposal of subsidiaries [Note 51(b)] – (17.1) (17.1)Additions – 43.2 43.2Reversal of impairment losses – 0.5 0.5Amortisation (0.1) (48.3) (48.4)Exchange differences – 44.6 44.6At 30 June 2016 2.3 989.9 992.2
2015
At 1 July 2014 2.5 903.0 905.5Disposal of subsidiaries – (26.9) (26.9)Additions – 48.9 48.9Disposals – (1.0) (1.0)Reversal of impairment losses – 1.4 1.4Amortisation (0.5) (43.2) (43.7)Exchange differences 0.4 84.8 85.2At 30 June 2015 2.4 967.0 969.4
The prepaid lease rentals are subject to the following maturity periods: Group2016 2015
Non-currentDue later than one year 947.3 923.8
CurrentDue no later than one year, included in accrued billings and others under
current assets [Note 34] 44.9 45.6992.2 969.4

Sime Darby BerhadAnnual Report 2016Innovating for the Future2 4 2
NOTES TO THE FINANCIAL STATEMENTS
For the financial year ended 30 June 2016 (continued)Amounts in RM million unless otherwise stated
20 Investment Properties
Group2016
Freehold land
Long leasehold
land
Short leasehold
land Buildings Total
At 1 July 2015 89.3 52.9 31.1 398.5 571.8Disposal of subsidiaries [Note 51(b)] (68.2) (13.9) (3.5) (79.9) (165.5)Additions – – – 1.1 1.1Impairment losses – – – (1.3) (1.3)Transfer from/(to):- property, plant and equipment [Note 18] – – – 2.8 2.8- property development costs [Note 33] 8.0 – – – 8.0- non-current asset held for sale [Note 37] – – (6.5) (6.8) (13.3)Depreciation – (0.8) (0.9) (13.9) (15.6)Exchange differences 3.5 0.6 1.8 0.9 6.8At 30 June 2016 32.6 38.8 22.0 301.4 394.8
Cost 32.6 53.0 36.3 430.0 551.9Accumulated depreciation – (10.8) (14.3) (102.8) (127.9)Accumulated impairment losses – (3.4) – (25.8) (29.2)Carrying amount at end of the financial year 32.6 38.8 22.0 301.4 394.8
2015
At 1 July 2014 114.3 56.0 22.6 463.3 656.2Additions – – – 1.3 1.3Disposals (17.2) – – (66.4) (83.6)Impairment losses – (3.4) – (1.1) (4.5)Transfer from/(to):- property, plant and equipment [Note 18] (14.4) – 5.8 1.0 (7.6)- non-current asset held for sale [Note 37] – – – (0.3) (0.3)Depreciation – (0.8) (0.9) (16.4) (18.1)Exchange differences 6.6 1.1 3.6 17.1 28.4At 30 June 2015 89.3 52.9 31.1 398.5 571.8
Cost 89.3 66.5 49.6 624.5 829.9Accumulated depreciation – (10.2) (18.5) (200.4) (229.1)Accumulated impairment losses – (3.4) – (25.6) (29.0)Carrying amount at end of the financial year 89.3 52.9 31.1 398.5 571.8
The fair value of investment properties as at 30 June 2016 was RM862.7 million (2015: RM1,485.5 million). The fair value was arrived at after taking into consideration the valuation performed by external professional firms of surveyors and valuers. The fair value is categorised as Level 2 in the fair value hierarchy as the valuation, which was performed using comparable and investment basis, was based on observable valuation inputs.
Investment properties with a total carrying amount of RM156.5 million (2015: RM151.9 million) were pledged as security for borrowings (see Note 43).

Sime Darby Berhad 2 4 3Annual Report 2016 Financial Reports
20 Investment Properties (continued)
Rental income generated from and direct operating expenses incurred on income generating investment properties are as follows:
Group2016 2015
Rental income 64.5 68.3Direct operating expenses (19.3) (15.3)
21 Biological Assets
Group2016
Oil palm
Rubbertrees
Growing cane Livestock Total
At 1 July 2015, as previously stated 5,884.2 47.2 100.5 50.3 6,082.2Effects of change in accounting policy [Note 2(a)] (5,884.2) (47.2) (100.5) – (6,031.9)At 1 July 2015, as restated – – – 50.3 50.3Additions – – – 22.5 22.5Disposals – – – (19.3) (19.3)Exchange differences – – – 8.3 8.3At 30 June 2016 – – – 61.8 61.8
2015
At 1 July 2014, as previously stated 2,498.8 35.3 – – 2,534.1Effects of change in accounting policy [Note 2(a)] (2,498.8) (35.3) – – (2,534.1)At 1 July 2014, as restated – – – – –Acquisition of subsidiaries – – – 44.8 44.8Exchange differences – – – 5.5 5.5At 30 June 2015 – – – 50.3 50.3
The biological assets are subject to the following maturity period:
Group2016 2015
Non-currentDue later than one year 45.0 8.8
CurrentDue no later than one year 16.8 41.5
61.8 50.3

Sime Darby BerhadAnnual Report 2016Innovating for the Future2 4 4
NOTES TO THE FINANCIAL STATEMENTS
For the financial year ended 30 June 2016 (continued)Amounts in RM million unless otherwise stated
22 Land Held for Property Development
Group2016 2015
At 1 July 810.4 927.7Transfer from/(to):- property, plant and equipment [Note 18] 4.3 17.4- property development costs [Note 33] (129.2) (141.6)Incidental costs incurred 9.6 6.9At 30 June 695.1 810.4 Land held for property development of a subsidiary with carrying amount of RM21.7 million (2015: RM21.7 million) was pledged as security for borrowings (see Note 43).
23 Subsidiaries
The Company’s equity interest in the subsidiaries, their respective principal activities and countries of incorporation are set out in Note 60.
Company2016 2015
Unquoted shares at cost 5,694.8 5,128.0Accumulated impairment (3.3) –Contributions to subsidiaries 2,386.5 2,386.5
8,078.0 7,514.5
During the financial year, the Company increased its investment in Sime Darby Property Berhad (SDPB) by subscribing to new preference shares of SDPB for a total consideration of RM566.8 million.
Contributions to subsidiaries are amounts which the Company does not expect repayment in the foreseeable future and are considered as part of the Company’s investment in the subsidiaries.
24 Amounts Due From/(To) Subsidiaries
Company2016 2015
Amounts due from subsidiaries
Non-current - interest bearing 6,111.8 1,700.0
Current- interest bearing 1,000.0 3,227.0- non-interest bearing 6,007.3 6,017.6
7,007.3 9,244.6
13,119.1 10,944.6

Sime Darby Berhad 2 4 5Annual Report 2016 Financial Reports
24 Amounts Due From/(To) Subsidiaries (continued)
Company2016 2015
Amounts due to subsidiaries
Non-current- interest bearing 3,211.8 –
Current- interest bearing – 3,027.0- non-interest bearing 36.3 25.4
3,248.1 3,052.4
% %Interest rates per annum on interest bearing amounts:
Amounts due from subsidiaries- non-current 2.05 - 5.65 4.19 - 4.75- current 4.75 2.05 - 3.77
Amounts due to subsidiaries- non-current 2.05 - 3.29 –- current – 2.05 - 3.29
The amounts due from/(to) subsidiaries are unsecured.
The amounts due from subsidiaries classified under non-current are not expected to be recalled within the next twelve months whilst the amounts due to subsidiaries are not due to be settled within the next twelve months. The amounts classified under current are repayable on demand.
25 Investments
Group2016
Quoted shares
Quoted warrants
Unquoted shares
Unquoted debenture
Unit trust and others Total
At 1 July 2015 30.8 12.0 93.0 4.1 0.2 140.1Additions – – – – 24.7 24.7Impairment losses – – – – (1.6) (1.6)Net change in fair value (charged)/
credited to:- profit or loss [Note 9] – (3.0) – – – (3.0)- other comprehensive income [Note 17] (3.9) – 9.5 – – 5.6Transfer to non-current assets held for
sale [Note 37] – (9.0) – – – (9.0)Exchange differences – – 1.1 – (0.1) 1.0At 30 June 2016 26.9 – 103.6 4.1 23.2 157.8
2015
At 1 July 2014 42.6 – 83.6 4.1 41.3 171.6Additions – – 22.7 – 36.0 58.7Disposals – – – – (77.1) (77.1)Net change in fair value (charged)/
credited to:- profit or loss [Note 9] – 12.0 – – – 12.0- other comprehensive income [Note 17] (11.8) – (10.3) – – (22.1)Exchange differences – – (3.0) – – (3.0)At 30 June 2015 30.8 12.0 93.0 4.1 0.2 140.1
The unquoted debenture carries a coupon rate of 3.75% per annum and matures on 30 June 2020 at its nominal value of RM4.2 million.

Sime Darby BerhadAnnual Report 2016Innovating for the Future2 4 6
NOTES TO THE FINANCIAL STATEMENTS
For the financial year ended 30 June 2016 (continued)Amounts in RM million unless otherwise stated
26 Intangible Assets
Acquired Internally generated
Group2016 Goodwill
Distribution/dealership rights
Smallholder relationship
Computer software
Trademarks and others Total
Computer software
Development costs
Total intangible assets
At 1 July 2015 2,069.4 845.2 568.4 61.3 84.5 3,628.8 311.5 53.7 3,994.0Disposal of subsidiaries [Note 51(b)] – – – (0.1) – (0.1) – – (0.1)Additions – – – 9.7 4.9 14.6 149.4 32.3 196.3Disposals – – – (0.7) – (0.7) – – (0.7)Reversal of impairment losses [Note 8] – – – – 3.5 3.5 – – 3.5Amortisation – – (16.8) (23.4) (10.2) (50.4) – (2.2) (52.6)Exchange differences 119.2 24.8 38.6 1.4 1.6 185.6 8.9 1.7 196.2At 30 June 2016 2,188.6 870.0 590.2 48.2 84.3 3,781.3 469.8 85.5 4,336.6
Cost 2,189.7 870.0 606.8 227.9 155.7 4,050.1 470.4 104.9 4,625.4Accumulated amortisation – – (16.6) (170.9) (66.1) (253.6) (0.6) (13.4) (267.6)Accumulated impairment losses (1.1) – – (8.8) (5.3) (15.2) – (6.0) (21.2)Carrying amount at end of the financial year 2,188.6 870.0 590.2 48.2 84.3 3,781.3 469.8 85.5 4,336.6
2015
At 1 July 2014 102.3 870.1 – 57.3 13.7 1,043.4 161.9 28.2 1,233.5Acquisition of subsidiaries 1,879.8 – 535.6 – 54.0 2,469.4 – – 2,469.4Adjustment to purchase price allocation 0.6 – – – – 0.6 – 2.6 3.2Additions – – – 31.3 18.0 49.3 149.9 25.1 224.3Disposals – – – (0.2) – (0.2) – – (0.2)Impairment losses [Note 7] (0.1) – – – (0.2) (0.3) – – (0.3)Reversal of impairment losses [Note 8] – – – – 1.6 1.6 – – 1.6Amortisation – – – (27.0) (5.4) (32.4) (0.2) (2.8) (35.4)Exchange differences 86.8 (24.9) 32.8 (0.1) 2.8 97.4 (0.1) 0.6 97.9At 30 June 2015 2,069.4 845.2 568.4 61.3 84.5 3,628.8 311.5 53.7 3,994.0
Cost 2,070.4 845.2 568.4 218.3 145.4 3,847.7 312.3 73.6 4,233.6Accumulated amortisation – – – (148.3) (52.7) (201.0) (0.8) (13.9) (215.7)Accumulated impairment losses (1.0) – – (8.7) (8.2) (17.9) – (6.0) (23.9)Carrying amount at end of the financial year 2,069.4 845.2 568.4 61.3 84.5 3,628.8 311.5 53.7 3,994.0
a. Intangible assets under development Included in additions to intangible assets is interest expense capitalised of RM14.7 million (2015: RM9.7 million).
b. Material intangible assetsIn the opinion of the Directors, intangible assets which are material to the Group are as follows:
Segment Investment Intangible asset Carrying amount
2016 2015
Plantation New Britain Palm Oil Limited (NBPOL) group Goodwill 2,073.7 1,958.7
Plantation NBPOL group Smallholder relationship
590.2 568.4
Industrial Bucyrus distribution rights Distribution rights 719.6 700.8
Industrial Business Transformation Process system Computer software 467.2 310.3
Motors Vehicle distribution/ dealership rights Distribution/ dealership rights
150.4 144.4

Sime Darby Berhad 2 4 7Annual Report 2016 Financial Reports
26 Intangible Assets
Acquired Internally generated
Group2016 Goodwill
Distribution/dealership rights
Smallholder relationship
Computer software
Trademarks and others Total
Computer software
Development costs
Total intangible assets
At 1 July 2015 2,069.4 845.2 568.4 61.3 84.5 3,628.8 311.5 53.7 3,994.0Disposal of subsidiaries [Note 51(b)] – – – (0.1) – (0.1) – – (0.1)Additions – – – 9.7 4.9 14.6 149.4 32.3 196.3Disposals – – – (0.7) – (0.7) – – (0.7)Reversal of impairment losses [Note 8] – – – – 3.5 3.5 – – 3.5Amortisation – – (16.8) (23.4) (10.2) (50.4) – (2.2) (52.6)Exchange differences 119.2 24.8 38.6 1.4 1.6 185.6 8.9 1.7 196.2At 30 June 2016 2,188.6 870.0 590.2 48.2 84.3 3,781.3 469.8 85.5 4,336.6
Cost 2,189.7 870.0 606.8 227.9 155.7 4,050.1 470.4 104.9 4,625.4Accumulated amortisation – – (16.6) (170.9) (66.1) (253.6) (0.6) (13.4) (267.6)Accumulated impairment losses (1.1) – – (8.8) (5.3) (15.2) – (6.0) (21.2)Carrying amount at end of the financial year 2,188.6 870.0 590.2 48.2 84.3 3,781.3 469.8 85.5 4,336.6
2015
At 1 July 2014 102.3 870.1 – 57.3 13.7 1,043.4 161.9 28.2 1,233.5Acquisition of subsidiaries 1,879.8 – 535.6 – 54.0 2,469.4 – – 2,469.4Adjustment to purchase price allocation 0.6 – – – – 0.6 – 2.6 3.2Additions – – – 31.3 18.0 49.3 149.9 25.1 224.3Disposals – – – (0.2) – (0.2) – – (0.2)Impairment losses [Note 7] (0.1) – – – (0.2) (0.3) – – (0.3)Reversal of impairment losses [Note 8] – – – – 1.6 1.6 – – 1.6Amortisation – – – (27.0) (5.4) (32.4) (0.2) (2.8) (35.4)Exchange differences 86.8 (24.9) 32.8 (0.1) 2.8 97.4 (0.1) 0.6 97.9At 30 June 2015 2,069.4 845.2 568.4 61.3 84.5 3,628.8 311.5 53.7 3,994.0
Cost 2,070.4 845.2 568.4 218.3 145.4 3,847.7 312.3 73.6 4,233.6Accumulated amortisation – – – (148.3) (52.7) (201.0) (0.8) (13.9) (215.7)Accumulated impairment losses (1.0) – – (8.7) (8.2) (17.9) – (6.0) (23.9)Carrying amount at end of the financial year 2,069.4 845.2 568.4 61.3 84.5 3,628.8 311.5 53.7 3,994.0
a. Intangible assets under development Included in additions to intangible assets is interest expense capitalised of RM14.7 million (2015: RM9.7 million).
b. Material intangible assetsIn the opinion of the Directors, intangible assets which are material to the Group are as follows:
Segment Investment Intangible asset Carrying amount
2016 2015
Plantation New Britain Palm Oil Limited (NBPOL) group Goodwill 2,073.7 1,958.7
Plantation NBPOL group Smallholder relationship
590.2 568.4
Industrial Bucyrus distribution rights Distribution rights 719.6 700.8
Industrial Business Transformation Process system Computer software 467.2 310.3
Motors Vehicle distribution/ dealership rights Distribution/ dealership rights
150.4 144.4

Sime Darby BerhadAnnual Report 2016Innovating for the Future2 4 8
NOTES TO THE FINANCIAL STATEMENTS
For the financial year ended 30 June 2016 (continued)Amounts in RM million unless otherwise stated
26 Intangible Assets (continued)
b. Material intangible assets (continued)GoodwillThe goodwill arose from the acquisition of NBPOL group in March 2015 largely represents the excess of the purchase consideration over the fair value of identifiable assets, liabilities and contingent liabilities. The amount of goodwill recognised is dependent upon the allocation of the purchase price to the fair value of the identifiable assets acquired and the liabilities assumed.
Smallholder relationshipThe smallholder relationship asset is attributable to the purchase of controlling interests in NBPOL group. This asset reflects the relationship between the Group and the smallholders who cultivate and harvest fresh fruit bunches on land owned by the smallholders for sale to the Group. It is recognised initially at fair value and thereafter amortised over the remaining life of the underlying assets.
Distribution/dealership rightsThe distribution rights for the Industrial segment was acquired by the Group in December 2011 to distribute Bucyrus products in the Northern Territory and Queensland in Australia, Papua New Guinea and New Caledonia (Australasia).
The distribution/dealership rights for the Motors segment are in respect of the following:
i. BMW and MINI distribution rights in Vietnam; andii. BMW, MINI and Lamborghini dealership rights in Brisbane, Australia
Computer softwareThe internally generated computer software is in relation to the Business Transformation Process system which is being progressively rolled out to the different regions. Once it is fully implemented, it will replace the existing Enterprise Resource Planning system of the Industrial division.
c. Intangible assets with indefinite useful livesGoodwill and distribution and dealership rights are intangible assets with indefinite useful lives. These assets are not amortised as they are not confined to a predetermined service period and they are expected to contribute to net cash inflows indefinitely.
The recoverable amounts of the cash-generating units (CGUs) are based on their value-in-use calculations using cash flow projections from financial budgets.
NBPOL goodwillFor purpose of impairment testing, the goodwill was allocated to CGU within the Group which will benefit from the synergies arising from the acquisition of NBPOL, namely NBPOL CGU of USD367 million (equivalent to RM1,472.3 million) and Minamas CGU of USD150 million (equivalent to RM601.4 million). The key assumptions used are as follows:
NBPOL CGU Minamas CGUMethodology A 40-year cash flow, based on the
average remaining lease periodA 48-year cash flow, based on the
maximum lease period granted
Fresh fruit bunch (FFB) yields 32 metric tonne (MT) per hectare (ha) based on average 128 palms per ha
33 MT per ha based on average 148 palms per ha
Crude palm oil (CPO) selling price
USD660 – USD845 per MT, adjusted for 3.8% duty advantage and USD15
per MT sustainability premium
USD704 – USD800 per MT
Discount rate 9.7% per annum 10% per annum

Sime Darby Berhad 2 4 9Annual Report 2016 Financial Reports
26 Intangible Assets (continued)
c. Intangible assets with indefinite useful lives (continued)The recoverable amount of NBPOL CGU calculated based on value-in-use exceeded carrying amount by RM1,788 million. Impact arising from changes to key assumptions are as follows:
Key assumptions Sensitivity Value-in-use is lower byFFB yields Lower by 1 MT per ha 301.1CPO selling price Lower by USD100 per MT 1,332.9Discount rate Higher by 100 basis points 1,003.7
Bucyrus distribution rightsFor purpose of impairment testing, the Bucyrus distribution rights was allocated to CGU within the Group which will benefit from the acquisition, namely the Industrial operations in Australasia. The key assumptions used are as follows:
Group2016 2015
Discount rates (%) per annum 9.0–13.3 8.8–13.3Forecast growth rates (%):- year 1 to 4 0–>100.0 0–>100.0- terminal 0.3–4.5 0.3–4.5
The recoverable amount of Bucyrus distribution rights calculated based on value-in-use exceeded carrying amount by RM804.9 million. Impact arising from changes in key assumptions are as follows:
Key assumptions Sensitivity Value-in-use is lower byDiscount rate Higher by 100 basis points 747.15 years budgeted profit Lower by 50% 639.0Long term growth rate Lower by 10% 455.5
Based on management assessment, no impairment charge is required on both the NBPOL goodwill and Bucyrus distribution rights. Management believes that there are no reasonably possible changes in any of the key assumptions used that would cause the carrying amounts of the CGUs to materially exceed the recoverable amounts.
d. Intangible assets with finite useful livesIntangible assets with finite useful lives are amortised over their useful lives. The amortisation charge for the financial year of RM52.6 million (2015: RM35.4 million) was recorded in profit or loss (see Note 7).
27 Deferred Tax
Deferred tax assets and liabilities are offset when there is a legally enforceable right to set off current tax assets against current tax liabilities and when the deferred taxes relate to the same tax authority. The following amounts, determined after appropriate offsetting, are shown in the statements of financial position:
Group Company2016 2015
Restated20141
Restated2016 2015
Deferred tax assets 1,598.2 1,139.2 988.6 – –Deferred tax liabilities (2,658.4) (2,586.4) (933.8) (1.5) (2.1)
(1,060.2) (1,447.2) 54.8 (1.5) (2.1)
Tax losses for which the tax effects have not been recognised in the financial statements 1,024.1 1,052.3 1,056.6 – –
1 as at 1 July 2014

Sime Darby BerhadAnnual Report 2016Innovating for the Future2 5 0
NOTES TO THE FINANCIAL STATEMENTS
For the financial year ended 30 June 2016 (continued)Amounts in RM million unless otherwise stated
27 Deferred Tax (continued)
The components and movements of the Group’s deferred tax assets and liabilities during the financial year are as follows:
Group2016
Property, plant and equipment and intangible
assets
Prepaidlease
rentalsProperty
developmentImpairment and
provisions
Tax losses and unabsorbed
capital allowances Others Total
At 1 July 2015, as previously stated (1,881.2) (156.7) 319.4 374.9 241.8 124.5 (977.3)Effects of change in accounting policy [Note 2(a)] (469.9) – – – – – (469.9)At 1 July 2015, as restated (2,351.1) (156.7) 319.4 374.9 241.8 124.5 (1,447.2)Disposal of subsidiaries [Note 51(b)] – – – – – 3.3 3.3Credited/(charged) to profit or loss [Note 14]- origination and reversal of temporary differences 2.3 0.1 (20.5) (39.6) 133.1 (67.1) 8.3- effects of recognition of previously unrecognised tax losses, unabsorbed
capital allowances and temporary differences 0.7 8.9 (0.3) 82.8 7.2 (63.1) 36.2- effects of change in tax base applicable to unrealised profit following
changes to the land use – – 50.5 – – – 50.5- effects of change in tax base following changes to the tax revaluation 348.5 – – – – – 348.5Charged to other comprehensive income [Note 17] – – – (0.1) – (8.0) (8.1)Exchange differences (37.9) (10.2) – (0.5) (1.9) (1.2) (51.7)At 30 June 2016 (2,037.5) (157.9) 349.1 417.5 380.2 (11.6) (1,060.2)
2015
At 1 July 2014, as previously stated (183.6) (197.9) 324.0 369.1 106.8 76.8 495.2Effects of change in accounting policy [Note 2(a)] (440.4) – – – – – (440.4)At 1 July 2014, as restated (624.0) (197.9) 324.0 369.1 106.8 76.8 54.8Acquisition of subsidiaries (1,534.9) – – 23.8 9.5 (35.7) (1,537.3)Disposal of subsidiaries – – – – – (0.2) (0.2)Credited/(charged) to profit or loss [Note 14]- origination and reversal of temporary differences (84.2) – (59.6) (12.4) 40.2 22.7 (93.3)- effects of recognition of previously unrecognised tax losses, unabsorbed
capital allowances and temporary differences 13.4 – (50.0) (20.6) 90.9 61.9 95.6- effects of change in tax base applicable to unrealised profit following
changes to the land use – – 105.0 – – – 105.0Charged to other comprehensive income [Note 17] – – – 1.7 – 16.9 18.6Transfer to non-current assets held for sale [Note 37] (3.0) – – 6.5 (5.7) – (2.2)Exchange differences (118.4) 41.2 – 6.8 0.1 (17.9) (88.2)At 30 June 2015 (2,351.1) (156.7) 319.4 374.9 241.8 124.5 (1,447.2)
Deferred tax is not recognised on the unremitted earnings of overseas subsidiaries and joint ventures where the Group is able to control the timing of the remittance and it is probable that there will be no remittance in the foreseeable future. If these earnings were remitted, tax of RM639.8 million (2015: RM504.0 million) would be payable.

Sime Darby Berhad 2 5 1Annual Report 2016 Financial Reports
27 Deferred Tax (continued)
The components and movements of the Group’s deferred tax assets and liabilities during the financial year are as follows:
Group2016
Property, plant and equipment and intangible
assets
Prepaidlease
rentalsProperty
developmentImpairment and
provisions
Tax losses and unabsorbed
capital allowances Others Total
At 1 July 2015, as previously stated (1,881.2) (156.7) 319.4 374.9 241.8 124.5 (977.3)Effects of change in accounting policy [Note 2(a)] (469.9) – – – – – (469.9)At 1 July 2015, as restated (2,351.1) (156.7) 319.4 374.9 241.8 124.5 (1,447.2)Disposal of subsidiaries [Note 51(b)] – – – – – 3.3 3.3Credited/(charged) to profit or loss [Note 14]- origination and reversal of temporary differences 2.3 0.1 (20.5) (39.6) 133.1 (67.1) 8.3- effects of recognition of previously unrecognised tax losses, unabsorbed
capital allowances and temporary differences 0.7 8.9 (0.3) 82.8 7.2 (63.1) 36.2- effects of change in tax base applicable to unrealised profit following
changes to the land use – – 50.5 – – – 50.5- effects of change in tax base following changes to the tax revaluation 348.5 – – – – – 348.5Charged to other comprehensive income [Note 17] – – – (0.1) – (8.0) (8.1)Exchange differences (37.9) (10.2) – (0.5) (1.9) (1.2) (51.7)At 30 June 2016 (2,037.5) (157.9) 349.1 417.5 380.2 (11.6) (1,060.2)
2015
At 1 July 2014, as previously stated (183.6) (197.9) 324.0 369.1 106.8 76.8 495.2Effects of change in accounting policy [Note 2(a)] (440.4) – – – – – (440.4)At 1 July 2014, as restated (624.0) (197.9) 324.0 369.1 106.8 76.8 54.8Acquisition of subsidiaries (1,534.9) – – 23.8 9.5 (35.7) (1,537.3)Disposal of subsidiaries – – – – – (0.2) (0.2)Credited/(charged) to profit or loss [Note 14]- origination and reversal of temporary differences (84.2) – (59.6) (12.4) 40.2 22.7 (93.3)- effects of recognition of previously unrecognised tax losses, unabsorbed
capital allowances and temporary differences 13.4 – (50.0) (20.6) 90.9 61.9 95.6- effects of change in tax base applicable to unrealised profit following
changes to the land use – – 105.0 – – – 105.0Charged to other comprehensive income [Note 17] – – – 1.7 – 16.9 18.6Transfer to non-current assets held for sale [Note 37] (3.0) – – 6.5 (5.7) – (2.2)Exchange differences (118.4) 41.2 – 6.8 0.1 (17.9) (88.2)At 30 June 2015 (2,351.1) (156.7) 319.4 374.9 241.8 124.5 (1,447.2)
Deferred tax is not recognised on the unremitted earnings of overseas subsidiaries and joint ventures where the Group is able to control the timing of the remittance and it is probable that there will be no remittance in the foreseeable future. If these earnings were remitted, tax of RM639.8 million (2015: RM504.0 million) would be payable.

Sime Darby BerhadAnnual Report 2016Innovating for the Future2 5 2
NOTES TO THE FINANCIAL STATEMENTS
For the financial year ended 30 June 2016 (continued)Amounts in RM million unless otherwise stated
27 Deferred Tax (continued)
The movements of the Company’s deferred tax liabilities during the financial year are as follows: Company
2016 2015
At 1 July (2.1) (2.6)Credited to profit or loss- origination and reversal of temporary differences 0.6 0.5At 30 June (1.5) (2.1) The deferred tax arose from temporary differences on payables.
28 Tax Recoverable
Group Company2016 2015 2016 2015
Non-current 544.8 478.6 – –Current 239.3 310.7 0.5 1.1
784.1 789.3 0.5 1.1
The non-current tax recoverable includes additional tax assessments paid and withholding taxes, which would normally take more than a year to resolve with the relevant tax authorities. These taxes are recognised as recoverable as the Group has reasonable grounds to believe that the additional tax assessments were wrongly issued and the withholding taxes will be refunded once the Group complies with the claim procedure and documentation requirements.
29 Derivative Assets/Liabilities
The Group’s derivative assets and liabilities are as follows:
Group2016
Derivative assets
Derivative liabilities Net
Non-currentNon-hedging derivatives:- forward foreign exchange contracts [note (a)] 4.6 – 4.6Cash flow hedges:- forward foreign exchange contracts [note (a)] – (1.3) (1.3)- interest rate swap contracts [note (b)] 0.9 (27.4) (26.5)- cross currency swap contract [note (c)] 133.7 – 133.7
139.2 (28.7) 110.5
CurrentNon-hedging derivatives:- forward foreign exchange contracts [note (a)] – (7.7) (7.7)- commodity futures contracts [note (d)] 16.4 (6.1) 10.3Cash flow hedges:- forward foreign exchange contracts [note (a)] 32.7 (30.9) 1.8- interest rate swap contracts [note (b)] 0.6 (13.5) (12.9)- cross currency swap contract [note (c)] 75.4 – 75.4
125.1 (58.2) 66.9
Total 264.3 (86.9) 177.4

Sime Darby Berhad 2 5 3Annual Report 2016 Financial Reports
29 Derivative Assets/Liabilities (continued)
Group 2015
Derivative assets
Derivative liabilities Net
Non-currentNon-hedging derivatives:- forward foreign exchange contracts [note (a)] 15.1 (2.7) 12.4Cash flow hedges:- forward foreign exchange contracts [note (a)] 0.9 (3.5) (2.6)- interest rate swap contracts [note (b)] 14.2 (12.8) 1.4- cross currency swap contract [note (c)] 184.6 – 184.6
214.8 (19.0) 195.8
CurrentNon-hedging derivatives:- forward foreign exchange contracts [note (a)] 3.4 (27.7) (24.3)- commodity futures contracts [note (d)] 12.7 (8.6) 4.1Cash flow hedges:- forward foreign exchange contracts [note (a)] 7.6 (7.6) –- interest rate swap contracts [note (b)] – (17.2) (17.2)- cross currency swap contract [note (c)] 56.2 – 56.2
79.9 (61.1) 18.8
Total 294.7 (80.1) 214.6
These derivatives are entered into to hedge foreign currency, interest rate and price risks as described in Note 5. Whilst all derivatives entered provide economic hedges to the Group, non-hedging derivatives are instruments that do not qualify for the application of hedge accounting under the specific rules in FRS 139.

Sime Darby BerhadAnnual Report 2016Innovating for the Future2 5 4
NOTES TO THE FINANCIAL STATEMENTS
For the financial year ended 30 June 2016 (continued)Amounts in RM million unless otherwise stated
29 Derivative Assets/Liabilities (continued)
a. Forward foreign exchange contractsAs at 30 June, forward foreign exchange contracts have been entered into with the following notional amounts and maturities:
MaturitiesGroup2016
Less than 1 year
1 year to 3 years Total
Forward contracts used to hedge anticipated sales denominated in:- United States dollar 64.5 – 64.5- Japanese yen 25.7 – 25.7- Singapore dollar 3.5 – 3.5
93.7 – 93.7
Forward contracts used to hedge receivables denominated in:- United States dollar 158.1 10.2 168.3- European Union euro 89.21 – 89.2- Australian dollar 177.21 – 177.2- British pound 0.1 – 0.1- Japanese yen 5.9 – 5.9
430.5 10.2 440.7
Forward contracts used to hedge anticipated purchases denominated in:- United States dollar 250.9 – 250.9- European Union euro 613.4 46.8 660.2- Japanese yen 27.8 – 27.8- Australian dollar 56.0 – 56.0- British pound 81.9 – 81.9- Singapore dollar 2.4 – 2.4
1,032.4 46.8 1,079.2
Forward contracts used to hedge payables denominated in:- United States dollar 144.0 – 144.0- European Union euro 66.5 – 66.5- Japanese yen 10.4 – 10.4- British pound 3.4 – 3.4- Singapore dollar 0.3 – 0.3- other currencies 0.5 – 0.5
225.1 – 225.1
Total notional amount 1,781.7 57.0 1,838.7
Net fair value (liabilities)/assets (5.9) 3.3 (2.6)

Sime Darby Berhad 2 5 5Annual Report 2016 Financial Reports
29 Derivative Assets/Liabilities (continued)
a. Forward foreign exchange contracts (continued)As at 30 June, forward foreign exchange contracts have been entered into with the following notional amounts and maturities: (continued)
MaturitiesGroup2015
Less than 1 year
1 year to 3 years Total
Forward contracts used to hedge anticipated sales denominated in:- United States dollar 250.5 27.7 278.2- European Union euro 47.7 – 47.7- Japanese yen 25.5 – 25.5
323.7 27.7 351.4
Forward contracts used to hedge receivables denominated in:- United States dollar 483.6 – 483.6- European Union euro 40.9 – 40.9- Japanese yen 0.1 – 0.1- Australian dollar 171.81 – 171.8
696.4 – 696.4
Forward contracts used to hedge anticipated purchases denominated in:- United States dollar 343.8 8.3 352.1- European Union euro 645.3 588.6 1,233.9- Japanese yen 62.6 – 62.6- Australian dollar 43.0 2.2 45.2- British pound 3.2 – 3.2- Singapore dollar 2.5 – 2.5
1,100.4 599.1 1,699.5
Forward contracts used to hedge payables denominated in:- United States dollar 162.5 – 162.5- European Union euro 24.8 – 24.8- Japanese yen 12.0 – 12.0- Australian dollar 0.1 – 0.1- British pound 2.1 – 2.1- Swiss franc 0.2 – 0.2
201.7 – 201.7
Total notional amount 2,322.2 626.8 2,949.0
Net fair value (liabilities)/assets (24.3) 9.8 (14.5)
1 included are contracts totaling RM63.3 million (2015: Nil) and RM177.2 million (2015: RM171.6 million) denominated in European Union euro and Australian dollar respectively, used to hedge against short term inter-company receivables.

Sime Darby BerhadAnnual Report 2016Innovating for the Future2 5 6
NOTES TO THE FINANCIAL STATEMENTS
For the financial year ended 30 June 2016 (continued)Amounts in RM million unless otherwise stated
29 Derivative Assets/Liabilities (continued)
b. Interest rate swap contractsThe Group has entered into interest rate swap contracts for certain long-term borrowings to reduce the Group’s exposure from volatility in interest rates. The interest rate swap contracts, all plain vanilla, as at 30 June are as follows:
Effectiveperiod
Range of weighted average rate per annum
Notional amount in original currencyOriginal
currency 2016 2015
12 December 2012 to 12 December 2018 1.822% to 1.885% USD 166.5 233.325 September 2014 to 25 March 2019 4.353% to 4.603% AUD – 200.011 June 2015 to 4 February 2022 2.85% to 2.99% USD 350.0 275.030 June 2015 to 17 December 2018 3.938% RM 192.0 252.0
The notional amount, fair value and maturity periods of the interest rate swap contracts are as follows:
Notional amount Fair value assets/
(liabilities)2016 2015 2016 2015
Maturity periods:- due no later than one year 340.0 312.6 (12.9) (17.2)- due later than one year and no later than three years 989.4 1,017.7 (20.7) (13.2)- due later than three years and no later than seven
years 936.2 1,425.6 (5.8) 14.62,265.6 2,755.9 (39.4) (15.8)
c. Cross currency swap contractThe Group has entered into a cross currency swap contract to exchange the principal payments of a USD222.0 million (2015: USD311.0 million) loan into AUD, the functional currency of the subsidiary, to reduce the Group’s exposure from adverse fluctuations in foreign currency.
Notional amount Fair value assets/
(liabilities)2016 2015 2016 2015
Maturity periods:- due no later than one year 357.3 336.8 75.4 56.2- due later than one year and no later than three years 534.0 673.5 133.7 144.8- due later than three years and no later than five years – 166.5 – 39.8
891.3 1,176.8 209.1 240.8

Sime Darby Berhad 2 5 7Annual Report 2016 Financial Reports
29 Derivative Assets/Liabilities (continued)
d. Commodity futures contracts The outstanding commodity futures contracts that are not held for the purpose of physical delivery, all maturing in
less than 1 year, are as follows:
Group 2016
Quantity (metric tonne)
Notional amount
Fair value assets/
(liabilities)
Purchase contracts denominated in:- Ringgit Malaysia 57,300 141.6 (3.7)- United States dollar 11,918 33.1 (1.6)
69,218 174.7 (5.3)
Sales contracts denominated in:- Ringgit Malaysia 62,000 163.1 14.0- United States dollar 5,569 16.4 1.6- European Union euro 172 0.5 –
67,741 180.0 15.6
2015
Purchase contracts denominated in:- Ringgit Malaysia 34,150 75.2 2.6- United States dollar 107,888 264.7 (5.6)
142,038 339.9 (3.0)
Sales contracts denominated in:- Ringgit Malaysia 22,120 83.2 –- United States dollar 94,631 237.5 7.1
116,751 320.7 7.1

Sime Darby BerhadAnnual Report 2016Innovating for the Future2 5 8
NOTES TO THE FINANCIAL STATEMENTS
For the financial year ended 30 June 2016 (continued)Amounts in RM million unless otherwise stated
30 Receivables
Group Company2016 2015 2016 2015
Non-current
Trade receivables [note (a)] 39.8 70.0 – –Amount due from a joint venture [note (a)] 60.8 – – –Advances for plasma plantation projects [note (b)] 110.6 84.0 – –Redeemable loan stocks [note (a)] 304.3 284.4 – –Other receivables [note (a)] 52.9 105.6 – –
568.4 544.0 – –Accumulated impairment losses:- advances for plasma plantation projects (19.8) (16.1) – –
548.6 527.9 – –
Current
Trade receivables [note (a)] 4,472.9 5,481.3 – –Amounts due from joint ventures 184.9 59.4 – –Amounts due from associates 40.3 22.2 – –Other receivables- on deferred payment terms [note (a)] 105.6 87.8 – –- indirect taxes recoverable 504.5 380.2 0.1 0.1- rebates from principals 387.7 326.4 – –- proceeds from disposal of a subsidiary – 46.5 – –- proceeds from disposal of a joint venture – 161.3 – –- proceeds from disposal of property, plant and equipment 51.8 83.7 – –- warranty claims, advances and others 737.0 642.4 6.7 0.1Deposits 298.0 194.3 – –
6,782.7 7,485.5 6.8 0.2Accumulated impairment losses:- trade receivables (143.3) (105.3) – –- amounts due from associates (0.1) (0.1) – –- other receivables (116.2) (106.8) – –
6,523.1 7,273.3 6.8 0.2
Total receivables 7,071.7 7,801.2 6.8 0.2

Sime Darby Berhad 2 5 9Annual Report 2016 Financial Reports
30 Receivables (continued)
a. Receivables on deferred payment termsAnalysis of receivables on deferred payment terms are as follows:
Group 2016
Trade receivables
Redeemable loan stocks
Amount due from a joint
ventureOther
receivables Total
Nominal valueAt 1 July 2015 133.5 500.0 – 199.2 832.7Arising from disposal of a subsidiary
[Note 51(b)] – – 62.8 – 62.8Addition 18.4 – – 51.9 70.3Received (57.2) – – (88.1) (145.3)Exchange differences 0.8 – (2.0) (0.8) (2.0)At 30 June 2016 95.5 500.0 60.8 162.2 818.5
Discount At 1 July 2015 (6.6) (215.6) – (5.8) (228.0)Addition (1.2) – – (3.8) (5.0)Accretion credited to profit or loss
[Note 12] 4.8 19.9 – 5.8 30.5Exchange differences (0.1) – – 0.1 –At 30 June 2016 (3.1) (195.7) – (3.7) (202.5)
Carrying amount at end of the financial year 92.4 304.3 60.8 158.5 616.0
The receivables on deferred payment terms are subject to the following maturity periods:
Trade receivables
Redeemable loan stocks
Amount due from a joint
ventureOther
receivables Total
Non-currentDue later than one year 39.8 304.3 60.8 52.9 457.8
CurrentDue no later than one year 52.6 – – 105.6 158.2
92.4 304.3 60.8 158.5 616.0

Sime Darby BerhadAnnual Report 2016Innovating for the Future2 6 0
NOTES TO THE FINANCIAL STATEMENTS
For the financial year ended 30 June 2016 (continued)Amounts in RM million unless otherwise stated
30 Receivables (continued)
a. Receivables on deferred payment terms (continued)Analysis of receivables on deferred payment terms are as follows: (continued)
Group 2015
Trade receivables
Redeemable loan stocks
Other receivables Total
Nominal valueAt 1 July 2014 92.0 500.0 244.2 836.2Additions 75.4 – – 75.4Received (37.1) – (51.8) (88.9)Exchange differences 3.2 – 6.8 10.0At 30 June 2015 133.5 500.0 199.2 832.7
Discount At 1 July 2014 (6.9) (234.2) (15.5) (256.6)Addition (6.8) – – (6.8)Accretion credited to profit or loss [Note 12] 7.3 18.6 9.7 35.6Exchange differences (0.2) – – (0.2)At 30 June 2015 (6.6) (215.6) (5.8) (228.0)
Carrying amount at end of the financial year 126.9 284.4 193.4 604.7
The receivables on deferred payment terms are subject to the following maturity periods:
Trade receivables
Redeemable loan stocks
Other receivables Total
Non-currentDue later than one year 70.0 284.4 105.6 460.0
CurrentDue no later than one year 56.9 – 87.8 144.7
126.9 284.4 193.4 604.7
i. Trade receivablesNon-current trade receivables represents the outstanding net present value of land sold to a joint venture and equipment sold to Industrial division’s customers under deferred payment terms. The discount rates used were 5.0% (2015: 5.0%) and ranging from 8.3% to 11.6% (2015: 8.5% to 13.0%) per annum respectively.

Sime Darby Berhad 2 6 1Annual Report 2016 Financial Reports
30 Receivables (continued)
a. Receivables on deferred payment terms (continued)
ii. Redeemable loan stocks (unsecured)The redeemable loan stocks arose from the disposal of Guthrie Corridor Expressway Sdn Bhd (now known as Prolintas Expressway Sdn Bhd) (GCESB) in 2007 to a subsidiary of Permodalan Nasional Berhad. In accordance with the Sale and Purchase of Shares Agreement, the settlement of the intercompany balance due from GCESB would be partially by cash and the balance through issuance of RM500.0 million non-transferable zero coupon Redeemable Loan Stocks (RLS) of GCESB.
On inception, the RLS was discounted to take into account the time value of money based on the discounted cash flow projections method. The discount rate used was 7.0% per annum which represents GCESB’s effective cost of borrowings then.
Unless redeemed early, either wholly or partially, at the fair value to be agreed by the Group and GCESB, the RLS shall be redeemed at 100% of its nominal value in cash as follows:
Redemption date
Nominal value
1st tranche 1 July 2022 256.02nd tranche 1 July 2023 50.03rd tranche 1 July 2024 50.04th tranche 1 July 2025 50.05th tranche 1 July 2026 50.06th tranche 1 July 2027 44.0
500.0
iii. Amount due from a joint ventureThe amount due from a joint venture, Weifang Sime Darby Liquid Terminal Co Ltd is unsecured. The amount comprises a RMB60.0 million (equivalent to RM36.5 million) loan, which bears interest at 6.4% per annum and repayable on 10 February 2019 and a RMB40.0 million (equivalent to RM24.3 million) loan, which bears interest at 6.0% per annum and repayable over two equal instalments on 11 December 2019 and 19 July 2020.
iv. Other receivablesOther receivables include the following:
a. an amount due from a local authority in China under a construction agreement of RMB36.0 million (equivalent to RM21.9 million) (2015: RMB68.0 million, equivalent to RM41.5 million), of which RMB11.9 million (equivalent to RM7.2 million) (2015: RMB33.1 million, equivalent to RM20.2 million) is expected to be repaid within the next 12 months. The amount bears interest at 2.4% (2015: 3.3%) per annum.
b. the present value of the deferred payment consideration arose from the disposal of Sime Darby Healthcare Sdn Bhd in June 2013 amounting to RM90.1 million (2015: RM151.9 million). The discount rate used was 6.9% (2015: 6.9%) per annum. The instalment received during the financial year amounted to RM67.6 million (2015: RM45.0 million) (see Note 51(b)).
c. convertible notes receivable of RM17.4 million (2015: Nil) in an associate. The amount bears interest at 8% (2015: Nil) per annum and is expected to be repaid by January 2018.

Sime Darby BerhadAnnual Report 2016Innovating for the Future2 6 2
NOTES TO THE FINANCIAL STATEMENTS
For the financial year ended 30 June 2016 (continued)Amounts in RM million unless otherwise stated
30 Receivables (continued)
b. Advances for plasma plantation projects
Group2016 2015
At 1 July 84.0 91.3Additions 23.4 20.8Recovered on handover (3.3) (32.5)Exchange differences 6.5 4.4At 30 June 110.6 84.0
In Indonesia, oil palm plantation owners/operators are required to participate in selected programmes to develop plantations for smallholders (herein referred to as plasma farmers). The Group is involved in “Perusahaan Inti Rakyat Transmigrasi” and “Kredit Koperasi Primer untuk Anggotanya” which require the Group to serve as a contractor for developing the plantations, train and develop the skills of the plasma farmers, and purchase the fresh fruit bunches harvested by the plasma farmers at prices determined by the Indonesian Government.
The advances made by the Group in the form of plasma plantation development costs are recoverable from the plasma farmers upon the completion and handover of the plasma plantation projects to plasma farmers. These advances are to be recovered either directly from plasma farmers or through bank loans obtained by plasma farmers. Impairment losses are made when the estimated amount recoverable is less than the outstanding advances.
c. Receivables pledged as securityReceivables with a total carrying amount of RM173.0 million (2015: Nil) were pledged as security for borrowings.
d. Ageing analysis of receivablesAgeing analysis of receivables categorised into impaired and not impaired are as follows:
Group Company2016 2015 2016 2015
Not impaired: - not past due 4,593.7 5,566.7 6.8 0.2- past due by
1 to 30 days 1,192.3 1,174.6 – – 31 to 60 days 332.1 307.6 – – 61 to 90 days 184.2 186.1 – – 91 to 180 days 192.2 146.7 – – more than 181 days 417.2 312.8 – –
Impaired 439.4 335.0 – –Gross receivables 7,351.1 8,029.5 6.8 0.2
The receivables that are neither past due nor individually impaired are creditworthy debtors with good payment records with the Group. More than 62.5% (2015: 69.3%) of the Group’s gross receivables are from this group of customers. Receivables that are past due but not individually impaired relate to a number of independent customers for whom there is no recent history of default.
The receivables that are individually determined to be impaired at the reporting date relate to debtors that are in financial difficulties, have defaulted on payments and/or have disputes on the billings. Of the total amount due from these debtors, an impairment of RM192.7 million (2015: RM166.4 million) has been made while the balance is expected to be recovered through the debt recovery process.

Sime Darby Berhad 2 6 3Annual Report 2016 Financial Reports
30 Receivables (continued)
d. Ageing analysis of receivables (continued)Movements of impairment loss accounts are as follows:
Group2016 2015
At 1 July 228.3 264.0Write offs (11.7) (40.5)Impairment losses 100.9 60.8Reversal of impairment losses (40.9) (60.1)Exchange differences 2.8 4.1At 30 June 279.4 228.3
Impairment arising from: - individual assessment 192.7 166.4- collective assessment 86.7 61.9Carrying amount at end of the financial year 279.4 228.3 The Group’s credit risk management objectives, policy and the exposure are described in Note 5.
31 Construction Contracts
Group2016 2015
Aggregate costs incurred 3,701.2 3,207.2Recognised profits less losses to-date (278.5) (494.1)
3,422.7 2,713.1Progress billings (2,154.9) (2,190.7)Accumulated accretion credited to profit or loss 54.0 15.3
1,321.8 537.7
Represented by:
Non-CurrentAmounts due from customers 1,439.9 651.2
CurrentAmounts due from customers [Note 34] 64.2 53.4Amounts due to customers [Note 49] (182.3) (166.9)
1,321.8 537.7
Retention sums 11.4 12.0

Sime Darby BerhadAnnual Report 2016Innovating for the Future2 6 4
NOTES TO THE FINANCIAL STATEMENTS
For the financial year ended 30 June 2016 (continued)Amounts in RM million unless otherwise stated
31 Construction Contracts (continued)
Included in construction contract costs incurred during the financial year are employee costs and interest expense of RM3.4 million (2015: RM6.3 million) and RM40.4 million (2015: RM16.6 million) respectively.
The non-current amounts due from customers represents the development costs incurred to design and construct the Pagoh Education Hub (the Project). The Project is undertaken on concession basis under the concept of “Build-Lease-Maintain-Transfer”.
Under the Concession Agreements entered on 7 November 2012, the Group will undertake the construction works for Government of Malaysia (GoM), Universiti Tun Hussein Onn Malaysia (UTHM), International Islamic University Malaysia (IIUM) and Universiti Teknologi Malaysia (UTM) over a period of three years, together with the supply of teaching equipment. Upon completion of the construction works, the campuses will be leased to GoM, UTHM, IIUM and UTM for a period of twenty (20) years. During the lease period, the Group will maintain the facilities and infrastructures of the campuses.
In consideration for the construction works and the maintenance of the facilities, the Group will receive Availability Charges and Asset Management Services Charges over the lease period. Cost of teaching equipment will be received over the first five years of the lease period. The consideration is allocated by reference to the relative fair values of the construction works, asset management services and costs of teaching equipment, taking into account the deferred payment arrangement.
The non-current amounts due from customers are pledged as security for borrowings (see Note 43).
32 Inventories
Group2016 2015
Produce stocks- palm oil products 355.3 362.0- rubber 5.2 5.5- sugar 24.1 33.2Raw material and consumable stores 842.5 754.8Work in progress 376.5 373.5Finished goods 78.2 72.9Completed development units 873.5 315.1Trading inventories- heavy equipment 1,706.5 2,252.0- motor vehicles 3,459.8 3,816.4- spare parts 1,618.9 1,643.6- commodities and others 56.3 31.7
9,396.8 9,660.7
Inventories where the net realisable value is expected to be below the carrying amount were written down. During the financial year, the Group wrote down an amount of RM222.2 million (2015: RM123.9 million) and reversed RM15.0 million (2015: RM4.0 million) previously written down. The carrying amount of trading inventories stated at net realisable value was RM2,486.9 million (2015: RM1,442.8 million).

Sime Darby Berhad 2 6 5Annual Report 2016 Financial Reports
33 Property Development Costs
Group2016 2015
Land and development costs
At 1 July 7,026.2 5,825.5Development costs incurred during the financial year 2,162.8 2,396.7Transfer from/(to):
– (5.1)- property, plant and equipment [Note 18]- investment properties [Note 20] (8.0) –- land held for property development [Note 22] 129.2 141.6Completed development units transferred to inventories (653.0) (75.6)Completed development units and land sold (2,136.9) (1,252.3)Exchange differences 3.7 (4.6)At 30 June 6,524.0 7,026.2
Less: Costs recognised in profit or loss
At 1 July (4,421.6) (3,908.3)Recognised during the financial year (1,058.8) (1,766.7)Completed development units and land sold 2,136.9 1,252.3Exchange differences (0.8) 1.1At 30 June (3,344.3) (4,421.6)
Total property development costs 3,179.7 2,604.6
Property development costs are analysed as follows:
Land at cost 334.9 319.7Development costs 6,189.1 6,706.5Costs recognised in profit or loss (3,344.3) (4,421.6)
3,179.7 2,604.6
Included in development costs incurred during the financial year is interest expense of RM135.9 million (2015: RM54.8 million).
Property development projects with a total carrying amount of RM182.0 million (2015: RM22.1 million) were pledged as security for borrowings.
34 Accrued Billings and Others Group
2016 2015
Accrued billings 454.6 843.4Amounts due from customers on construction contracts [Note 31] 64.2 53.4Prepaid to suppliers 564.4 480.9Prepaid lease rentals [Note 19] 44.9 45.6Other prepayments 255.0 207.4
1,383.1 1,630.7

Sime Darby BerhadAnnual Report 2016Innovating for the Future2 6 6
NOTES TO THE FINANCIAL STATEMENTS
For the financial year ended 30 June 2016 (continued)Amounts in RM million unless otherwise stated
35 Cash Held under Housing Development Accounts
The Group’s cash held under the Housing Development Accounts represents receipts from purchasers of residential properties less payments or withdrawals provided under Section 7A of the Housing Developers (Control and Licensing) Amendment Act 2002. The amount is held at call with banks and is available only to the subsidiaries involved in the property development activities.
The weighted average effective interest rate of cash held under Housing Development Accounts was 2.0% (2015: 2.0%) per annum.
36 Bank Balances, Deposits and Cash
Group Company2016 2015 2016 2015
Deposits with licensed banks- Islamic 187.4 209.2 115.0 99.4- conventional 544.9 1,125.8 – –Deposits with licensed financial institutions- Islamic 221.0 154.4 85.0 105.4- conventional 200.7 94.1 – –
1,154.0 1,583.5 200.0 204.8Cash at bank and in hand 1,756.9 2,061.4 – –Total bank balances, deposits and cash 2,910.9 3,644.9 200.0 204.8
% % % %Effective profit/interest rates per annum on deposits
with licensed banks/financial institutions- Islamic 3.39 3.25 3.55 3.35- conventional 2.33 3.90 – –
Included in bank balances, deposits and cash are funds of Yayasan Sime Darby of RM1.9 million (2015: RM25.9 million). These funds are set aside for educational, environmental conservation and sustainability projects and related activities for the benefit of the community.
Deposits with licensed banks of certain subsidiaries with carrying amount of RM82.4 million (2015: RM99.6 million) were pledged as security for borrowings.
37 Non-Current Assets Held for Sale and Liabilities Associated with Assets Held for Sale
Group2016 2015
Non-current assets held for sale- property, plant and equipment 7.0 8.2- investment property 13.0 0.2- associate [note (a)] 278.0 –- investment [note (a)] 9.0 –- disposal group [note (b)] – 120.3
307.0 128.7
Liabilities associated with assets held for sale- disposal group [note (b)] – (83.4)Net assets held for sale 307.0 45.3

Sime Darby Berhad 2 6 7Annual Report 2016 Financial Reports
37 Non-Current Assets Held for Sale and Liabilities Associated with Assets Held for Sale (continued)
Movements in the net assets held for sale are as follows:
Group2016 2015
At 1 July 45.3 308.0Disposals- associates – (262.9)- property, plant and equipment (4.7) (0.1)- investment properties (0.4) (2.6)- disposal group
- property, plant and equipment (84.8) –- deferred tax assets (9.2) –- other net liabilities 71.9 –
Transfer from/to: - associates 278.0 –- property, plant and equipment [Note 18] (15.9) 5.8- investment properties [Note 20] 13.3 0.3- investment [Note 25] 9.0 –- deferred tax assets [Note 27] – 2.2- other assets and liabilities 3.7 (4.9)Exchange differences 0.8 (0.5)At 30 June 307.0 45.3 a. Associate and investment The associate and investment held for sale are the Group’s interest in quoted shares and quoted warrants respectively
in Eastern & Oriental Berhad (E&O).
On 3 June 2016, the Group entered into a Share Sale Agreement (SSA) with Paramount Spring Sdn Bhd (PSSB) to dispose off 125,978,324 ordinary stock units of RM1.00 each and all 48,795,600 convertible warrants 2015/2019 in E&O for a total cash consideration of RM342.2 million or approximately RM2.60 per stock unit and RM0.30 for each convertible warrant. On 27 September 2016, the Group and PSSB have mutually agreed to revise the consideration to RM323.3 million, representing RM2.45 per stock unit and RM0.30 for each convertible warrant. The disposal is expected to be completed within 4 months from the date of the SSA.
b. Disposal group The disposal group classified under non-current assets held for sale and liabilities associated with assets held for sale
as at 30 June 2015, were in respect of Syarikat Malacca Straits Inn Sdn Bhd (SMSI) and Sime Darby Australia Limited group (SDAL). The sale of SMSI was completed on 21 June 2016 for a total consideration of RM55.4 million. SDAL ceased to be classified as assets held for sale as the Group does not expect the sale to be concluded within the next twelve months.

Sime Darby BerhadAnnual Report 2016Innovating for the Future2 6 8
NOTES TO THE FINANCIAL STATEMENTS
For the financial year ended 30 June 2016 (continued)Amounts in RM million unless otherwise stated
38 Share Capital
Group/CompanyNumber of shares
(million) Nominal value2016 2015 2016 2015
Authorised:At 1 July and 30 JuneOrdinary shares of RM0.50 each 8,000.0 8,000.0 4,000.0 4,000.0
Series A redeemable convertible preference shares of RM0.01 each 7,000.0 7,000.0 70.0 70.0
Series B redeemable convertible preference shares of RM0.10 each 25.0 25.0 2.5 2.5
4,072.5 4,072.5
Issued and fully paid up:Ordinary shares of RM0.50 each At 1 July 6,211.1 6,064.1 3,105.6 3,032.1Issued during the financial year 115.9 147.0 57.9 73.5At 30 June 6,327.0 6,211.1 3,163.5 3,105.6
During the financial year, the Company increased its issued and paid-up ordinary share capital from RM3,105,579,143 to RM3,163,536,269 by way of issuance of 115,914,252 new ordinary shares of RM0.50 each at an issue price of RM7.46 per share amounting to RM864.7 million, pursuant to the Dividend Reinvestment Plan of the Company (see Note 16). The new ordinary shares issued during the financial year ranked pari passu in all respects with the existing ordinary shares of the Company.
The premium arising from the issuance of new ordinary shares of RM806.8 million had been credited to the share premium reserve. Cost directly attributable to the issuance of the new shares during the financial year amounting to RM0.5 million was offset against share premium.
39 Performance-Based Employee Share Scheme
The Company’s Performance-Based Employee Share Scheme (PBESS) is governed by the by-laws approved by the shareholders at the Extraordinary General Meeting held on 8 November 2012 and was effected on 15 January 2013. Under the PBESS, ordinary shares of RM0.50 each in the Company (Sime Darby Shares) are granted to eligible employees and executive directors of the Group.
The grants under the PBESS comprise the Group Performance Share (GPS), the Division Performance Share (DPS) and the General Employee Share (GES).
The salient features of the PBESS are as follows:
a. Eligible employees are those executives (including executive directors) of the Group (other than subsidiaries which are dormant) who have attained the age of 18 years; entered into a full-time or fixed-term contract of employment with and is on the payroll of a company within the Group; have not served notice of resignation or received notice of termination on the date of the offer; whose service/employment have been confirmed in writing; and have fulfilled other eligibility criteria which has been determined by the Nomination & Remuneration Committee (NRC) at its sole and absolute discretion from time to time.
b. The total number of Sime Darby Shares to be allocated to an employee shall not be more than 10% of the Sime Darby Shares made available under the PBESS if the employee either singly or collectively through persons connected with the said employee, holds 20% or more of the Company’s issued and paid up share capital.

Sime Darby Berhad 2 6 9Annual Report 2016 Financial Reports
39 Performance-Based Employee Share Scheme (continued)
The salient features of the PBESS are as follows: (continued)
c. The maximum number of Sime Darby Shares to be allotted and issued under the PBESS shall not be more than in aggregate 10% of the issued and paid-up ordinary share capital of the Company at any point in time during the duration of the PBESS.
d. The PBESS shall be in force for a period of 10 years commencing from the effective date of implementation.
e. The new Sime Darby Shares to be allotted and issued pursuant to the PBESS shall, upon allotment and issuance, rank pari passu in all respects with the then existing issued Sime Darby Shares and shall be entitled to any rights, dividends, allotments and/or distributions attached thereto and/or which may be declared, made or paid to the Company’s shareholders, provided that the relevant allotment date of such new shares is before the record date (as defined in the PBESS By-Laws) for any right, allotment or distribution.
f. If the NRC so decides (but not otherwise), in the event of any alteration in the capital structure of the Company during the duration of the PBESS, such corresponding alterations (if any) may be made in the number of unvested Sime Darby Shares and/or the method and/or manner in the vesting of the Sime Darby Shares comprised in a grant.
The shares granted will be vested only upon fulfilment of vesting conditions which include achievement of service period and performance targets as follows:
Vesting conditionsType of grant
GPS DPS GESPerformance metrics Group Long Term Incentive
Plan (LTIP) scorecard (financial targets) and absolute and relative total shareholders’ return of Sime Darby Berhad
Division/Group LTIP scorecard (financial and strategic targets)
Division/Group LTIP scorecard (financial and strategic targets)
Vesting period First grant- over a 3-year period from the commencement date of 1 July 2013, with retest till
30 June 2018 only for GPS
Second grant- over a 3-year period from the commencement date of 1 July 2014, with retest till
30 June 2019 only for GPS
Depending on the level of achievement of the performance targets as determined by the NRC, the total number of shares which will vest may be lower or higher than the total number of shares granted.
The movements in the number of Sime Darby Shares granted under the PBESS to the Group’s and the Company’s eligible employees are as follows:
Fair value at grant date
Number of ordinary shares of RM0.50 each
GroupAt
1 July 2015 Granted ForfeitedAt
30 June 2016(RM) ‘000 ‘000 ‘000 ‘000
First grantGPS 7.74 3,549 – (249) 3,300DPS 8.58 4,768 – (337) 4,431GES 8.58 4,662 – (352) 4,310
Second grantGPS 7.24 3,702 – (309) 3,393DPS 8.18 4,984 – (412) 4,572GES 8.18 5,212 – (401) 4,811

Sime Darby BerhadAnnual Report 2016Innovating for the Future2 7 0
NOTES TO THE FINANCIAL STATEMENTS
For the financial year ended 30 June 2016 (continued)Amounts in RM million unless otherwise stated
39 Performance-Based Employee Share Scheme (continued)
The movements in the number of Sime Darby Shares granted under the PBESS to the Group’s and the Company’s eligible employees are as follows: (continued)
Fair value at grant date
Number of ordinary shares of RM0.50 each
Company At
1 July 2015 Granted ForfeitedAt
30 June 2016 (RM) ‘000 ‘000 ‘000 ‘000
First grantGES 8.58 2 – – 2
Second grantGES 8.18 2 – – 2
The Group is reviewing the salient features of the LTIP. Accordingly, the third grant of PBESS to be awarded during the financial year has been deferred until such time the review is approved by the NRC.
The first grant awarded on 7 October 2013 has reached the end of the performance period on 30 June 2016. In August 2016, the NRC has approved the non-vesting of the first grant as the performance conditions were not met.
The fair value of the Sime Darby Shares granted is determined using Monte Carlo Simulation model, taking into account the terms and conditions under which the shares were granted.
The significant inputs in the model are as follows:
GPS DPS GES
First grantClosing market price at grant date (RM) 9.54 9.54 9.54Expected volatility (%) 12.94 12.94 12.94Expected dividend yield (%) 3.47 3.47 3.47Risk free rate (%) 3.21 - 3.53 3.28 3.28
Second grantClosing market price at grant date (RM) 9.16 9.16 9.16Expected volatility (%) 11.60 11.60 11.60Expected dividend yield (%) 3.79 3.79 3.79Risk free rate (%) 3.51 - 3.64 3.51 3.51
The expected dividend yield used was based on historical data and future estimates, which may not necessarily be the actual outcome. Volatility is measured over a 3-year period on a daily basis to increase the credibility of assumptions.

Sime Darby Berhad 2 7 1Annual Report 2016 Financial Reports
40 Reserves
The nature of each of the Group’s reserves is as follows:
Nature Description
Share grant reserve Arising from the Performance-Based Employee Share Scheme of the Company, as disclosed in Note 39
Revaluation reserve Surplus from revaluation of certain Malaysian plantation land and buildings
Capital reserve Arising from business combinations under common control totaling RM6,231.2 million (2015: RM6,231.2 million) and other credits
Legal reserve Arising from statutory requirements of countries where the Group operates
Hedging reserve Arising from changes in fair value of derivatives under cash flow hedge
Available-for-sale reserve Arising from changes in fair value of available-for-sale investments
Exchange reserve Arising from exchange differences on retranslation of the net investments in foreign operations
Group2016
Share grant
reserveRevaluation
reserveCapitalreserve
Legal reserve
HedgingReserve
Available- for-salereserve
Exchangereserve Total
At 1 July 2015 37.0 67.0 6,881.9 68.0 (99.9) 47.6 634.4 7,636.0Other comprehensive income
[Note 17] – – – – 31.8 6.2 293.3 331.3Performance-based employee
share scheme (37.0) – – – – – – (37.0)Share of capital reserve of
associates – – 2.3 – – – – 2.3Transfer from retained profits – – – 1.7 – – – 1.7Transactions with owners:- put options adjustment
[Note 45] – – (58.1) – – – – (58.1)At 30 June 2016 – 67.0 6,826.1 69.7 (68.1) 53.8 927.7 7,876.2
2015
At 1 July 2014 39.1 67.0 6,888.3 70.1 (39.5) 73.3 (45.2) 7,053.1Other comprehensive (loss)/
income [Note 17] – – – – (60.4) (25.7) 679.6 593.5Performance-based employee
share scheme (2.1) – – – – – – (2.1)Share of capital reserve of
associates – – (2.9) – – – – (2.9)Transfer to retained profits – – (3.5) (2.1) – – – (5.6)At 30 June 2015 37.0 67.0 6,881.9 68.0 (99.9) 47.6 634.4 7,636.0

Sime Darby BerhadAnnual Report 2016Innovating for the Future2 7 2
NOTES TO THE FINANCIAL STATEMENTS
For the financial year ended 30 June 2016 (continued)Amounts in RM million unless otherwise stated
40 Reserves (continued)
Company2016
Share grant reserve
Capital reserve Total
At 1 July 2015 37.0 5,725.1 5,762.1Performance-based employee share scheme (37.0) – (37.0)At 30 June 2016 – 5,725.1 5,725.1
2015
At 1 July 2014 39.1 5,725.1 5,764.2Performance-based employee share scheme (2.1) – (2.1)At 30 June 2015 37.0 5,725.1 5,762.1
The Company’s capital reserve arose from business combinations under common control.
41 Perpetual Sukuk
Group/Company2016 2015
Nominal value 2,200.0 –Transaction costs, net of tax (3.6) –
2,196.4 –Profit attributable to perpetual sukuk holders 33.7 –
2,230.1 –
On 24 March 2016, the Company made its first issuance of RM2.2 billion nominal value of Perpetual Subordinated Sukuk (perpetual sukuk) pursuant to the newly established RM3.0 billion Perpetual Subordinated Sukuk Programme. The Programme is rated AAIS by the Malaysian Rating Corporation Berhad.
The perpetual sukuk is accounted as equity as there is no contractual obligation to redeem the instrument.
The salient features of the perpetual sukuk are as follows:
a. Unsecured and is issued under the Islamic principle of Wakalah Bi Al-Istithmar (“Sukuk Wakalah”) where the Company is to manage a Wakalah portfolio on behalf of the perpetual sukuk holders. The Wakalah portfolio comprises certain assets of the Group (see Note 18) and investments in commodities in accordance with the Shariah Principle of Ijarah and Murabahah.
b. Carries an initial fixed periodic distribution rate of 5.65% per annum payable on a semi-annual basis in arrears. The periodic distribution rate will be reset on 24 March 2026 to the then prevailing 10–year Malaysian Government Securities (MGS) benchmark rate plus 1.75% (Initial Spread) and 1.00% (Step-Up Margin) and at every 10 year thereafter.
c. No fixed redemption date but the Company has the option to redeem at the end of the tenth year from the date of issue and on each subsequent semi-annual periodic distribution date.
d. The expected periodic distribution amount may be deferred by the Company to perpetuity as long as no discretionary dividend distribution or other payment has been declared by the Company in respect of any of the Company’s ordinary shares.

Sime Darby Berhad 2 7 3Annual Report 2016 Financial Reports
41 Perpetual Sukuk (continued)
The salient features of the perpetual sukuk are as follows: (continued)
e. The Company also has the option to redeem the perpetual sukuk under the following circumstances:
i. Accounting Event – if the perpetual sukuk is or will no longer be recorded as equity as a result of changes to accounting standards;
ii. Tax Event – if the Company is or will become obliged to pay additional amount due to changes in tax laws or regulations;
iii. Tax Deductibility Event – if distribution made would not be fully deductible for income tax purposes as a result of changes in tax laws or regulations or changes to official interpretation or pronouncement that provides for a position with respect to such laws or regulations; and
iv. Rating Event – if the equity credit is lower than initially assigned to the perpetual sukuk as a result of changes in equity credit criteria, guidelines or methodology of rating agency.
f. The perpetual sukuk holders do not have any voting rights in the Company and rank in priority to holders of ordinary shares, but subordinated to the claims of present and future creditors of the Company.
42 Non-Controlling Interests
In the opinion of the Directors, the subsidiaries of the Group that have non-controlling interests which are material to the Group as at 30 June 2016 are as follows:
Name of subsidiary Place of business
PT Indotruba Tengah (Indotruba) IndonesiaPT Kartika Inti Perkasa group (KIP) IndonesiaSime Darby Property Selatan Sdn Bhd group (SDPS) MalaysiaSime Darby Brunsfield Holding Sdn Bhd group (SDBH) MalaysiaWangsa Mujur Sdn Bhd group (Wangsa) Malaysia
The profit, comprehensive income and net assets attributable to owners of non-controlling interests are as follows:
Group2016
Material non-controlling
interests Others Total
Profit for the financial year 127.7 30.0 157.7Other comprehensive income 23.5 15.6 39.1Total comprehensive income 151.2 45.6 196.8
Net assets 434.0 530.2 964.2
2015 (Restated)
Profit for the financial year 102.7 16.2 118.9Other comprehensive income 13.5 42.9 56.4Total comprehensive income 116.2 59.1 175.3
Net assets 454.9 548.5 1,003.4

Sime Darby BerhadAnnual Report 2016Innovating for the Future2 7 4
NOTES TO THE FINANCIAL STATEMENTS
For the financial year ended 30 June 2016 (continued)Amounts in RM million unless otherwise stated
42 Non-Controlling Interests (continued)
Summarised financial informationThe summarised statements of comprehensive income of and dividends paid by each subsidiary that has non-controlling interests that are material to the Group are as follows:
Group2016 Indotruba KIP SDPS SDBH Wangsa Total
Revenue 14.9 217.7 780.4 245.2 84.6 1,342.8
Profit for the financial year 34.6 53.2 201.9 8.0 15.8 313.5Other comprehensive income 30.8 17.6 – 2.7 – 51.1
Total comprehensive income 65.4 70.8 201.9 10.7 15.8 364.6
Attributable to owners of non-controlling interests:
- profit for the financial year 17.3 21.3 80.7 3.2 5.21 127.7- other comprehensive income 15.4 7.0 – 1.1 – 23.5
- total comprehensive income 32.7 28.3 80.7 4.3 5.2 151.2
Dividends paid to owners of non-controlling interests 162.8 8.6 – – 0.7 172.1
2015 (Restated)
Revenue 52.5 246.2 370.3 359.4 83.2 1,111.6
Profit for the financial year 52.8 56.3 98.3 35.8 8.7 251.9Other comprehensive income/(loss) 20.9 11.3 – (3.7) – 28.5
Total comprehensive income 73.7 67.6 98.3 32.1 8.7 280.4
Attributable to owners of non-controlling interests:
- profit for the financial year 26.4 22.5 39.3 14.2 0.31 102.7- other comprehensive income/(loss) 10.5 4.5 – (1.5) – 13.5
- total comprehensive income 36.9 27.0 39.3 12.7 0.3 116.2
Dividends paid to owners of non-controlling interests – 57.0 – – 0.8 57.8

Sime Darby Berhad 2 7 5Annual Report 2016 Financial Reports
42 Non-Controlling Interests (continued)
Summarised financial information (continued)The summarised statements of financial position of each subsidiary that has non-controlling interests that are material to the Group are as follows:
Group2016 Indotruba KIP SDPS SDBH Wangsa Total
Non-current assets 104.0 153.4 1,503.1 311.5 210.4 2,282.4Current assets 84.5 268.6 221.0 811.8 99.6 1,485.5Non-current liabilities (5.6) (8.3) (972.9) (435.8) (26.5) (1,449.1)Current liabilities (6.4) (150.6) (346.9) (717.8) (12.5) (1,234.2)Net assets/(liabilities) 176.5 263.1 404.3 (30.3) 271.0 1,084.6
Proportion of equity held by owners of non-controlling interests (%) 50.0 40.0 40.0 40.0 27.5
Non-controlling interests 88.3 105.2 161.7 (3.6) 82.41 434.0
2015 (Restated)
Non-current assets 65.7 89.8 664.4 312.1 201.6 1,333.6Current assets 383.7 301.4 151.2 589.6 92.1 1,518.0Non-current liabilities (3.9) (6.7) (516.8) (787.2) (24.1) (1,338.7)Current liabilities (8.8) (170.7) (96.4) (155.5) (14.0) (445.4)Net assets/(liabilities) 436.7 213.8 202.4 (41.0) 255.6 1,067.5
Proportion of equity held by owners of non-controlling interests (%) 50.0 40.0 40.0 40.0 27.5
Non-controlling interests 218.4 85.5 81.0 (7.9) 77.91 454.9
1 including the non-controlling interests in Chartquest Sdn Bhd, a 84.3% owned subsidiary of Wangsa Mujur Sdn Bhd
There are no significant restrictions on the ability of these subsidiaries to distribute cash dividends to the Group.
The amounts presented in the summarised financial statements are before inter-company eliminations.

Sime Darby BerhadAnnual Report 2016Innovating for the Future2 7 6
NOTES TO THE FINANCIAL STATEMENTS
For the financial year ended 30 June 2016 (continued)Amounts in RM million unless otherwise stated
42 Non-Controlling Interests (continued)
Summarised financial information (continued)The summarised statements of cash flows of each subsidiary that has non-controlling interests that are material to the Group are as follows:
Group2016 Indotruba KIP SDPS SDBH Wangsa Total
Cash generated from/(used in) operations 13.6 32.4 (300.9) 18.5 75.8 (160.6)Tax (paid)/refund (13.8) 2.6 (3.7) (10.3) (1.5) (26.7)Net cash (used in)/from operating activities (0.2) 35.0 (304.6) 8.2 74.3 (187.3)
Net cash (used in)/from investing activities (2.9) (11.1) 3.7 (3.8) (16.7) (30.8)
Net cash (used in)/from financing activities (325.6) (63.1) 352.9 10.5 (1.7) (27.0)
Net change in cash and cash equivalents (328.7) (39.2) 52.0 14.9 55.9 (245.1)Cash and cash equivalents at beginning of
the financial year 352.6 43.0 122.6 39.0 38.9 596.1
Foreign exchange differences 24.4 2.8 – – – 27.2
Cash and cash equivalents at end of the financial year 48.3 6.6 174.6 53.9 94.8 378.2
2015 (Restated)
Cash generated from/(used in) operations 23.3 57.2 (226.0) (11.1) (22.7) (179.3)Tax (paid)/refund (20.1) (15.3) (8.2) (17.1) 0.7 (60.0)Net cash from/(used in) operating activities 3.2 41.9 (234.2) (28.2) (22.0) (239.3)
Net cash from/(used in) investing activities 12.2 (23.2) 2.3 114.1 (23.0) 82.4
Net cash (used in)/from financing activities – (33.2) 269.4 (118.8) (1.2) 116.2
Net change in cash and cash equivalents 15.4 (14.5) 37.5 (32.9) (46.2) (40.7)Cash and cash equivalents at beginning of
the financial year 319.6 54.9 85.2 71.8 85.1 616.6
Foreign exchange differences 17.6 2.6 – – – 20.2
Cash and cash equivalents at end of the financial year 352.6 43.0 122.7 38.9 38.9 596.1

Sime Darby Berhad 2 7 7Annual Report 2016 Financial Reports
43 Borrowings
Group Company2016 2015 2016 2015
Non-current
SecuredTerm loans [note (a)] 434.8 592.3 – –Syndicated Islamic financing [note (b)] 847.1 470.5 – –Islamic financing 177.3 78.7 – –
UnsecuredTerm loans [note (a)] 4,368.0 4,520.0 – –Islamic Medium Term Notes [note (c)] 700.0 1,700.0 700.0 1,700.0Sukuk [note (d)] 3,205.2 3,018.4 – –Islamic financing 300.0 123.5 – –Revolving credit and others [note (e)] 1,381.7 1,242.0 – –
11,414.1 11,745.4 700.0 1,700.0Current
SecuredTerm loans [note (a)] 43.0 585.2 – –Syndicated Islamic financing [note (b)] 22.4 – – –Revolving credits and others 290.9 192.7 – –
UnsecuredBank overdrafts 25.3 46.4 – –Term loans [note (a)] 814.9 595.1 – –Islamic Medium Term Notes [note (c)] 1,007.4 7.4 1,007.4 7.4Sukuk [note (d)] 36.2 25.8 – –Islamic financing 72.0 1,900.0 – –Revolving credits, trade facilities and others 2,107.4 2,965.0 – 200.3
4,419.5 6,317.6 1,007.4 207.7
Total borrowings 15,833.6 18,063.0 1,707.4 1,907.7
The breakdown of borrowings between the principal and interest portion are as follows:
Group Company2016 2015 2016 2015
Borrowings- principal 15,768.0 18,018.4 1,700.0 1,900.0- interest 65.6 44.6 7.4 7.7Total borrowings 15,833.6 18,063.0 1,707.4 1,907.7

Sime Darby BerhadAnnual Report 2016Innovating for the Future2 7 8
NOTES TO THE FINANCIAL STATEMENTS
For the financial year ended 30 June 2016 (continued)Amounts in RM million unless otherwise stated
43 Borrowings (continued)
a. Term loansThe term loans include the following:
Group2016 2015
Secured Security Repayment TermsRinggit loans Certain property, plant
and equipment, an investment property and property under development
Ranging from 7 – 10 years from respective first drawdown dates, fully repayable by August 2023
416.9 438.7
Nil (2015: USD145.5 million)
Certain property, plant and equipment and biological assets
Fully repaid in February 2016 – 550.5
Nil (2015: PGK87.5 million)
Certain property, plant and equipment and biological assets
Fully repaid in February 2016 – 120.7
Unsecured Repayment TermsRinggit loans Over nine semi-annual instalments commencing 36 months
from their respective first drawdown dates, fully repayable by January 2020
1,178.7 1,407.5
USD495.5 million (2015: USD495.1 million)
Over nine semi-annual instalments commencing 36 months from the drawdown date of 17 February 2015
1,989.4 1,873.2
USD222.0 million (2015: USD311.0 million)
Over nine semi-annual instalments commencing 36 months from the drawdown date of 12 December 2011
891.3 1,176.7
USD153.2 million (2015: Nil)
Over 20 equal instalments commencing 3 months from the drawdown date of 29 February 2016
615.2 –
EUR100.0 million (2015: Nil)
Bullet repayment in August 2030 457.8 –
Nil (2015: AUD200.0 million)
Fully repaid in June 2016 – 580.8
b. Syndicated Islamic financing - securedThe syndicated Islamic financing consist of four facilities with facility limit of RM896.0 million. The facilities are repayable over 24 semi-annual instalments commencing no later than 36 months from their respective first drawdown dates. During the financial year, the Group had drawndown additional RM399.0 million (2015: RM283.7 million) from the facilities.
The syndicated Islamic financing are secured by fixed and floating charges over all present and future assets of certain subsidiaries, including the legal assignments of the rights, titles, interest and benefits in the Pagoh Education Hub project.

Sime Darby Berhad 2 7 9Annual Report 2016 Financial Reports
43 Borrowings (continued)
c. Islamic Medium Term Notes and Islamic Commercial PapersOn 24 September 2009, the Company had established an Islamic Medium Term Note (IMTN) Programme of RM4,500.0 million and an Islamic Commercial Paper (ICP)/IMTN Programme of RM500.0 million with a combined limit of RM4,500.0 million. The IMTN Programme and ICP/IMTN Programme are for tenures of 20 years and 7 years, respectively. The IMTN Programme and the ICP/IMTN Programme are structured under the Shariah Principle of Musyarakah.
Details of the IMTNs outstanding as at 30 June 2016 are as follows:
Date of issuance Tenure(months)
Nominalvalue
Periodic distribution rate
(per annum)Maturity date
16 November 2009 84 1,000.0 4.75% 16 November 201611 December 2012 120 300.0 3.98% 9 December 202211 December 2012 180 400.0 4.35% 10 December 2027
1,700.0
The IMTNs are rated AAAID by Malaysian Rating Corporation Berhad and are listed on the Main Market of Bursa Malaysia Securities Berhad under an Exempt Regime.
Standard & Poor’s Ratings Services had previously assigned its ASEAN regional scale rating of axA+ on the Company and its IMTN Programme. The ASEAN regional scale rating, which provides an independent opinion on the creditworthiness of the issuer relative to other ASEAN issuers, has since been withdrawn at the Company’s request in April 2016.
d. Sukuk On 11 January 2013, the Group had established a Multi-Currency Sukuk Programme (Sukuk Programme) with a programme limit of USD1,500.0 million (or its equivalent in other currencies).
The Sukuk Programme is structured under the Shariah Principle of Ijarah, which is a sale and leaseback arrangement. Sime Darby Global Berhad, a wholly owned subsidiary of the Company, is the issuer of this programme.
Details of the sukuk outstanding as at 30 June 2016 are as follows:
Date of issuance Tenure(months)
Nominal value
(USD million)
Periodic distribution rate
(per annum)Maturity date
29 January 2013 60 400.0 2.053% 29 January 201829 January 2013 120 400.0 3.290% 29 January 2023
800.0
The Sukuk Programme has been accorded ratings of BBB+ and Baa1 by Fitch Ratings and Moody’s Investors Service respectively. In April 2016, the rating by Standard & Poor’s Ratings Services was withdrawn at the Company’s request.
The sukuk issued is listed on the Singapore Exchange Securities Trading Limited and on Bursa Malaysia Securities Berhad pursuant to Bursa Malaysia’s Exempt Regime on 30 January 2013.
e. Revolving credit and othersThe revolving credit facility of USD330.0 million (equivalent to RM1,324.9 million) for a tenure of 3 years, is repayable in February 2018.

Sime Darby BerhadAnnual Report 2016Innovating for the Future2 8 0
NOTES TO THE FINANCIAL STATEMENTS
For the financial year ended 30 June 2016 (continued)Amounts in RM million unless otherwise stated
43 Borrowings (continued)
f. Other information on borrowings
i. Islamic financing The average effective distribution rates per annum are as follows:
Group Company2016 2015 2016 2015
% % % %
Islamic Medium Term Notes 4.52 4.52 4.52 4.52Sukuk 2.75 2.75 – –Syndicated Islamic financing 7.00 7.00 – –Islamic financing 4.24 3.84 – –
ii. Conventional financingThe average effective interest rates per annum are as follows:
Group Company2016 2015 2016 2015
% % % %
Term loans:- before interest rate swaps 3.00 3.04 – –- after interest rate swaps 3.07 3.22 – –Bank overdrafts 3.76 4.73 – –Other borrowings 3.31 3.40 – 3.77
The Group’s term loans that are subject to contractual interest rates repricing within 1 year amounted to RM5,165.9 million (2015: RM6,191.1 million).
iii. Secured financingBorrowings amounting to RM1,815.5 million (2015: RM1,919.4 million) are secured by fixed and floating charges over the assets of the Group. The carrying amounts of assets that the Group has pledged as collateral for the borrowings are as follows:
Group2016 2015
Property, plant and equipment [Note 18] 289.0 3,872.2Investment properties [Note 20] 156.5 151.9Land held for property development [Note 22] 21.7 21.7Amounts due from customers on construction contracts [Note 31] 1,439.9 651.2Other assets 437.4 121.7
2,344.5 4,818.7

Sime Darby Berhad 2 8 1Annual Report 2016 Financial Reports
43 Borrowings (continued)
f. Other information on borrowings (continued)
iv. Currencies and maturity profile The currencies and maturity profile of the Group’s borrowings are as follows:
Maturities
Group 2016
Within 1year
Between1 and 2
years
Between 2 and 5
yearsAbove 5
years Total
Term loans:- Ringgit Malaysia 347.2 396.3 684.8 167.1 1,595.4- European Union euro 11.5 – – 446.3 457.8- United States dollar 488.1 707.5 1,763.0 538.5 3,497.1- other currencies 11.1 20.6 34.5 44.2 110.4Islamic Medium Term Notes:- Ringgit Malaysia 1,007.4 – – 700.0 1,707.4Sukuk:- United States dollar 36.2 1,599.3 – 1,605.9 3,241.4Syndicated Islamic financing:- Ringgit Malaysia 22.4 49.3 210.4 587.4 869.5Islamic financing:- Ringgit Malaysia 72.0 – 251.4 225.9 549.3Bank overdraft:- Chinese renminbi 3.1 – – – 3.1- New Zealand dollar 22.2 – – – 22.2Revolving credits, trade facilities and other
borrowings:- Ringgit Malaysia 352.7 59.0 2.0 – 413.7- Chinese renminbi 425.2 – – – 425.2- European Union euro 173.1 – – – 173.1- Indonesian rupiah 341.7 – – – 341.7- United States dollar 810.7 1,320.7 – – 2,131.4- other currencies 294.9 – – – 294.9
4,419.5 4,152.7 2,946.1 4,315.3 15,833.6
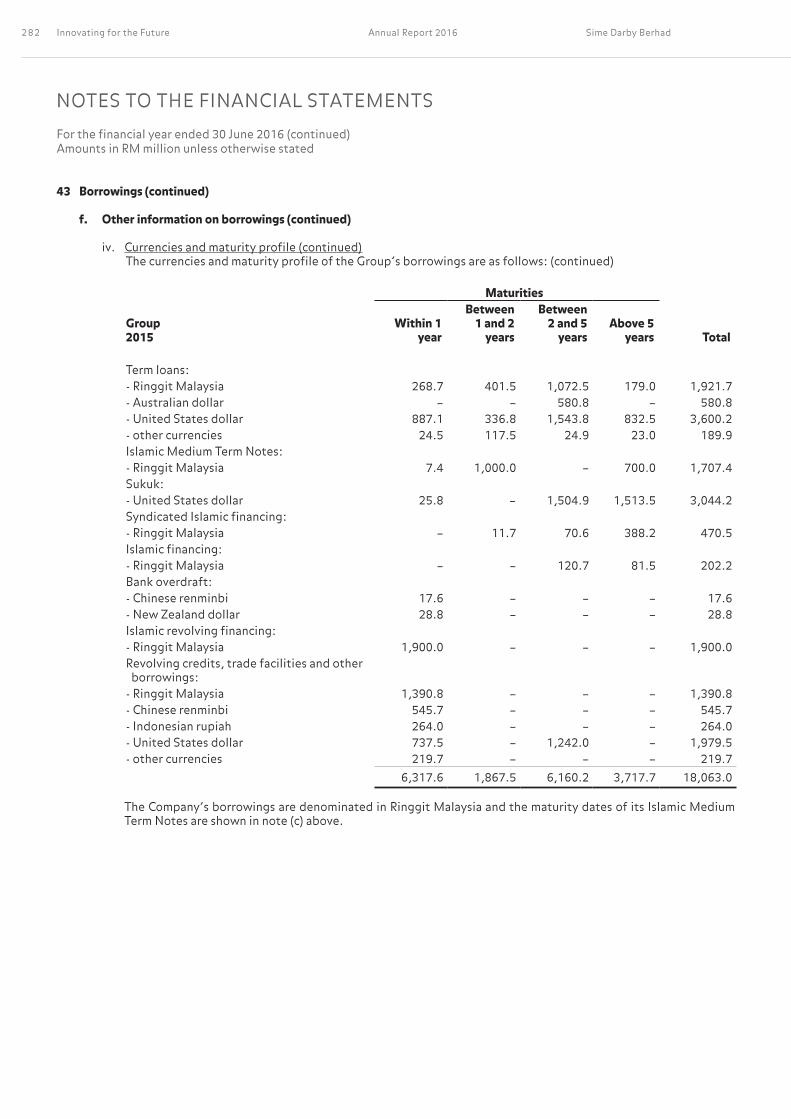
Sime Darby BerhadAnnual Report 2016Innovating for the Future2 8 2
NOTES TO THE FINANCIAL STATEMENTS
For the financial year ended 30 June 2016 (continued)Amounts in RM million unless otherwise stated
43 Borrowings (continued)
f. Other information on borrowings (continued)
iv. Currencies and maturity profile (continued) The currencies and maturity profile of the Group’s borrowings are as follows: (continued)
Maturities
Group 2015
Within 1year
Between1 and 2
years
Between 2 and 5
yearsAbove 5
years Total
Term loans:- Ringgit Malaysia 268.7 401.5 1,072.5 179.0 1,921.7- Australian dollar – – 580.8 – 580.8- United States dollar 887.1 336.8 1,543.8 832.5 3,600.2- other currencies 24.5 117.5 24.9 23.0 189.9Islamic Medium Term Notes:- Ringgit Malaysia 7.4 1,000.0 – 700.0 1,707.4Sukuk:- United States dollar 25.8 – 1,504.9 1,513.5 3,044.2Syndicated Islamic financing:- Ringgit Malaysia – 11.7 70.6 388.2 470.5Islamic financing:- Ringgit Malaysia – – 120.7 81.5 202.2Bank overdraft:- Chinese renminbi 17.6 – – – 17.6- New Zealand dollar 28.8 – – – 28.8Islamic revolving financing:- Ringgit Malaysia 1,900.0 – – – 1,900.0Revolving credits, trade facilities and other
borrowings:- Ringgit Malaysia 1,390.8 – – – 1,390.8- Chinese renminbi 545.7 – – – 545.7- Indonesian rupiah 264.0 – – – 264.0- United States dollar 737.5 – 1,242.0 – 1,979.5- other currencies 219.7 – – – 219.7
6,317.6 1,867.5 6,160.2 3,717.7 18,063.0
The Company’s borrowings are denominated in Ringgit Malaysia and the maturity dates of its Islamic Medium Term Notes are shown in note (c) above.

Sime Darby Berhad 2 8 3Annual Report 2016 Financial Reports
44 Finance Lease Obligation
The Group leased composting plants under finance lease arrangements. The average lease term is 20 years (2015: 20 years). The Group has options to purchase the plants for nominal amount at the end of the lease term.
Group2016 2015
Gross finance lease liabilities – minimum lease payments- due no later than one year 12.9 11.8- due later than one year and no later than five years 48.7 47.3- due later than five years 110.6 131.7
172.2 190.8Future finance charges (36.9) (44.8)Present value of finance lease liabilities 135.3 146.0
The present value of finance lease liabilities is analysed as follows:
Non-currentDue later than one year and no later than five years 32.5 29.6Due later than five years 94.4 109.6
126.9 139.2CurrentDue no later than one year 8.4 6.8
135.3 146.0
The finance lease obligations, denominated in Ringgit Malaysia, are subject to fixed interest rates of 3.7% to 4.5% (2015: 3.7% to 4.5%) per annum and are secured on plant and machinery with a total net book value of RM119.8 million (2015: RM137.3 million) (see Note 18).
45 Payables
Group Company2016 2015 2016 2015
Trade payables 4,678.1 4,587.1 – –Accruals- indirect taxes payable 157.8 327.6 – –- others [note (a)] 2,208.9 2,324.8 5.2 5.0Customers’ and other deposits [note (b)] 875.4 1,044.0 – –Amounts due to joint ventures 38.6 40.4 – –Amounts due to associates 0.3 0.1 – –Put options over non-controlling interests [note (c)] 58.1 – – –Financial guarantees [note (d)] 0.6 0.3 8.8 16.1
8,017.8 8,324.3 14.0 21.1
a. Accruals Included in accruals are amounts payable for the purchase of property, plant and equipment of RM140.1 million
(2015: RM101.1 million). In 2015, accruals also included amount payable for the acquisition of additional interest in an associate of RM34.1 million.
b. Customers’ and other deposits Included in customers’ and other deposits is an amount of RM34.3 million (2015: Nil), being the deposit received for
the proposed disposal of stock units and convertible warrants in Eastern & Oriental Berhad.

Sime Darby BerhadAnnual Report 2016Innovating for the Future2 8 4
NOTES TO THE FINANCIAL STATEMENTS
For the financial year ended 30 June 2016 (continued)Amounts in RM million unless otherwise stated
45 Payables (continued)
c. Put options over non-controlling interests The put options represent the present value of put options granted to owners of non-controlling interests as provided
in the Shareholders’ Agreements on the acquisitions of the Motors distribution/dealership rights in Australia and Vietnam.
d. Financial guaranteesThe fair value of financial guarantees is determined as the estimated amount that would be payable to a third party for assuming the obligations based on current market rate available for similar instruments. The financial guarantees are in respect of the following contracts:
Group Company2016 2015 2016 2015
Guarantees in respect of credit facilities granted to:- certain subsidiaries – – 1,083.3 3,028.7- joint ventures 28.1 6.6 – –- certain associates 62.3 62.9 – –- plasma stakeholders 61.6 79.2 – –
152.0 148.7 1,083.3 3,028.7
46 Provisions
Group2016 Warranties
Risk sharing
Development cost Total
At 1 July 2015 210.5 22.1 – 232.6
Additions 83.4 20.4 – 103.8Amounts unutilised (32.0) (11.4) – (43.4)Charged to profit or loss [Note 7] 51.4 9.0 – 60.4Recognised in property development costs – – 253.6 253.6Utilised (68.1) (14.3) – (82.4)Exchange differences 6.2 0.2 – 6.4At 30 June 2016 200.0 17.0 253.6 470.6
2015
At 1 July 2014 301.9 30.8 – 332.7
Additions 99.5 18.1 – 117.6Amounts unutilised (53.9) (16.6) – (70.5)Charged to profit or loss [Note 7] 45.6 1.5 – 47.1Utilised (143.8) (14.5) – (158.3)Exchange differences 6.8 4.3 – 11.1At 30 June 2015 210.5 22.1 – 232.6
The provisions are subject to the following maturity periods: Group2016 2015
Non-currentDue later than one year 267.0 17.2
CurrentDue no later than one year 203.6 215.4
470.6 232.6

Sime Darby Berhad 2 8 5Annual Report 2016 Financial Reports
46 Provisions (continued)
a. WarrantiesProvision is recognised on warranties provided for the sales of machinery, vehicles and other products that are not covered by manufacturers’ warranties. The provision was estimated based on historical claims experience, as well as recent trends which are indicative of future claims.
b. Risk sharing Provision is recognised for possible future losses arising from customer defaults pursuant to the risk sharing
arrangements entered into by the Group with Caterpillar (China) Financial Leasing Co Ltd.
c. Development costProvision is recognised for the estimated shortfall between the cost and the gross development value for the construction of affordable housing. The corresponding asset is recognised as common cost in property development costs and the cost of constructing the other components of the development. Affordable housing is a prerequisite to the approval by the authorities to develop associated housing units comprised within the master and building plan.
47 Retirement Benefits
Group2016 2015
At 1 July 167.4 141.5Acquisition of subsidiaries – 0.3Charge for the financial year [Note 7(a)] 48.4 21.8Contributions paid (1.3) (1.2)Benefits paid – unfunded obligations (7.0) (6.4)Actuarial losses (0.3) 6.6Exchange differences 8.7 4.8At 30 June 215.9 167.4
The amounts are determined as follows:
Present value of funded obligations [note (a)] 540.9 484.1Fair value of plan assets [note (b)] (380.6) (367.9)
160.3 116.2Present value of unfunded obligations [note (a)] 55.6 51.2Net liabilities 215.9 167.4
The amounts recognised in the profit or loss are as follows:
Current service cost 21.8 17.0Past service cost 15.1 0.2Interest cost 12.0 12.8Expected return on plan assets (0.5) (8.2)
48.4 21.8
Total return on plan assets are as follows:
Expected return on plan assets 0.5 8.2Actuarial gains on plan assets (1.8) 59.8
(1.3) 68.0

Sime Darby BerhadAnnual Report 2016Innovating for the Future2 8 6
NOTES TO THE FINANCIAL STATEMENTS
For the financial year ended 30 June 2016 (continued)Amounts in RM million unless otherwise stated
47 Retirement Benefits (continued)
Group
2016
2015a. Changes in the present value of defined benefit obligations
Wholly or partly funded obligations 540.9 484.1Unfunded obligations 55.6 51.2
596.5 535.3
Movements in the present value of defined benefit obligations are as follows:
At 1 July 535.3 446.1Acquisition of subsidiaries – 0.3Current service cost 21.8 17.0Past service cost 15.1 0.2Interest cost 12.0 12.8Benefits paid – funded obligations (7.5) (7.0)Benefits paid – unfunded obligations (7.0) (6.4)Actuarial losses (2.1) 66.4Exchange differences 28.9 5.9At 30 June 596.5 535.3
b. Changes in the fair value of plan assets
At 1 July 367.9 304.6 Expected return on plan assets 0.5 8.2 Contributions by employers 1.3 1.2 Benefits paid (7.5) (7.0) Actuarial (losses)/gains (1.8) 59.8 Exchange differences 20.2 1.1 At 30 June 380.6 367.9
c. Principal actuarial assumptionsPrincipal actuarial assumptions used at 30 June are as follows:
% %
Discount rate 1.05 – 8.3 1.3 – 8.3Expected return on plan assets 2.5 – 8.0 2.5 – 8.0Expected rate of salary increases 1.5 – 8.2 1.5 – 8.2
48 Deferred Income
Group
2016
2015
Maintenance income 299.1 215.5Advance annualised licence fees 146.1 148.0Government grant 186.5 202.8
631.7 566.3

Sime Darby Berhad 2 8 7Annual Report 2016 Financial Reports
48 Deferred Income (continued)
The deferred income are subject to the following maturity periods:
Group
2016
2015
Non-currentDue later than one year 420.9 407.5
CurrentDue no later than one year 210.8 158.8
631.7 566.3
The government grants are received in relation to the purchase of property, plant and equipment and prepaid lease rentals of certain subsidiaries.
49 Progress Billings and Others
Group 2016 2015
Amounts due to customers on construction contracts [Note 31] 182.3 166.9Progress billings 4.1 5.4Others 20.2 22.6
206.6 194.9
50 Acquisitions
a. Acquisition of a subsidiary On 28 October 2015, Sime Darby Brunsfield Holding Sdn Bhd acquired 2 ordinary shares of RM1.00 each representing the entire issued and paid up share capital of Superglade Sdn Bhd for a total cash consideration of RM2. The intended principal activity of Superglade is general trading and real property investment holding.
b. Acquisition and establishment of joint ventures Joint ventures acquired by the Group during the financial year ended 30 June 2016 are as follows:
Name of joint venturePurchase
consideration
Group’s effective
interest acquired
Effective acquisition date
%IndustrialMine Energy Solutions Pty Ltd AUD2 50.0 18 May 2016
Energy & UtilitiesSime Darby Gas Malaysia BioCNG Sdn Bhd RM510,000 51.0 6 June 2016
In addition, on 24 March 2016, Sime Darby Property Singapore Limited established Sime Darby Real Estate Investment Trust 1 (the Trust) which was constituted by a Deed of Trust entered by Sime Darby Real Estate Management Pte Ltd (as Manager of the Trust) with Perpetual (Asia) Limited (as Trustee of the Trust). The Group has a 25% equity interest in the Trust.

Sime Darby BerhadAnnual Report 2016Innovating for the Future2 8 8
NOTES TO THE FINANCIAL STATEMENTS
For the financial year ended 30 June 2016 (continued)Amounts in RM million unless otherwise stated
50 Acquisitions (continued)
c. Acquisition of non-controlling interests
i. On 17 September 2015, Malaysia Land Development Company Berhad (MLDC) completed the Selective Capital Reduction and Repayment Exercise (SCR) for a total cash consideration of RM2.5 million. Following the SCR, the Group’s interest in MLDC has increased from 50.7% to 100%.
ii. On 4 May 2016, Haynes Mechanical Pty Ltd increased its equity interest in TFP Engineering Pty Ltd from 70% to 95% for a total cash consideration of AUD3.5 million (equivalent to RM10.5 million).
Details of net cash outflow on acquisition of non-controlling interest by the Group during the financial year ended 30 June 2016 are as follows:
Non-controlling interest acquired 2.2Premium on acquisition 10.8Net cash outflow on acquisition of non-controlling interest 13.0
51 Disposal of subsidiaries
a. Subsidiaries disposed by the Group during the financial year ended 30 June 2016 are as follows:
Name of subsidiaryDisposal
consideration
Group’s effective
interest disposed
Effective disposal date
%PropertySime Darby Property (Dunearn) Pte Ltd (formerly
known as Sime Darby Property (Dunearn) Limited) (SDPD)
SGD184.0 million (equivalent to
RM535.7 million)
100.01 31 March 2016
Sime Darby Property (Kilang) Pte Ltd (formerly known as Sime Darby Property (Kilang) Limited) (SDPK)
SGD22.3 million (equivalent to
RM65.1 million)
100.01 31 March 2016
Syarikat Malacca Straits Inn Sdn Bhd (SMSI) RM55.4 million 55.02 21 June 2016
Energy & UtilitiesWeifang Sime Darby Liquid Terminal Co Ltd (WSDLT) RMB60.85 million
(equivalent to RM39.2 million)
50.03 23 May 2016
OthersEast West Insurance Company Limited GBP1.7 million
(equivalent to RM10.5 million)
90.4 10 August 2015
1 SDPD and SDPK were disposed to Aster Investment Holding Pte Ltd, a company wholly-held by Perpetual (Asia) Limited, as Trustee for Sime Darby Real Estate Investment Trust 1 (see Note 50(b)).
2 The disposal comprises 55% equity interest and 78.6% interest in redeemable preference shares in SMSI.
3 Following the completion of the disposal, the Group’s interest in WSDLT is accounted for as a joint venture and is recognised initially at fair value.

Sime Darby Berhad 2 8 9Annual Report 2016 Financial Reports
51 Disposal of subsidiaries (continued)
b. Details of the assets, liabilities and net cash inflow arising from the disposal of subsidiaries by the Group during the financial year ended 30 June 2016 are as follows:
Property, plant and equipment [Notes 18 and 37] 284.9Prepaid lease rentals [Note 19] 17.1Investment properties [Note 20] 165.5Intangible assets [Note 26] 0.1Amounts due to the Group [Note 30(a)(iii)] (62.8)Borrowings (133.1)Net current liabilities (43.9)Deferred tax assets [Notes 27 and 37] 5.9Non-controlling interest (11.7)Net assets disposed 222.0Gain on disposal of subsidiaries 513.0Less: Net exchange gain included in the gain on disposal (3.8)Less: Fair value of retained portion of investment (39.2)Proceeds from disposal, net of transaction costs 692.0Less: Cash and cash equivalent in subsidiaries disposed (5.3)Net cash inflow from disposal of subsidiaries during the financial year 686.7
Net cash inflow from disposal of subsidiaries during the financial year 686.7Proceeds from disposal of subsidiaries in previous years [Notes 30 and 30(a)(iv)] 114.1Net cash inflow on disposal of subsidiaries 800.8
52 Segment Information - Group The Group has five key reportable segments, which are the Group’s strategic business units. The strategic business
units offer different products and services, and are each headed by a Managing Director. The President and Group Chief Executive reviews the internal management reports on a monthly basis and conducts performance dialogues with the business units on a regular basis.
Segments comprise:
Plantation Production of crude palm oil, palm kernel, rubber, sugar cane, cattle and beef products and refining of palm oil related products
Industrial Sales, rental and servicing of heavy equipment
Motors Assembly and distribution of vehicles and the provision of after-sale services
Property Development of residential, commercial and industrial properties and management and pro-vision of golf and other recreational facilities and services
Energy & Utilities Engineering, management of port facilities and treatment and distribution of treated water
Others Healthcare, insurance broking and other general investments
Transactions between segments are carried out on agreed terms between both parties. The effects of such inter-segment transactions are eliminated on consolidation. The measurement basis and classification are consistent with those adopted in the previous financial year.

Sime Darby BerhadAnnual Report 2016Innovating for the Future2 9 0
NOTES TO THE FINANCIAL STATEMENTS
For the financial year ended 30 June 2016 (continued)Amounts in RM million unless otherwise stated
52 Segment Information – Group (continued)
a. Segment results
2016 Plantation Industrial Motors PropertyEnergy &
Utilities OthersCorporate and
elimination Total
Segment revenue:External 11,876.5 9,617.5 18,924.4 2,864.9 629.2 50.3 – 43,962.8Inter-segment 0.3 53.2 27.1 208.6 20.2 7.3 (316.7) –
11,876.8 9,670.7 18,951.5 3,073.5 649.4 57.6 (316.7) 43,962.8
Segment results:Operating profit 1,060.9 326.3 492.8 1,040.9 90.6 14.9 40.7 3,067.1Share of results of joint ventures and associates (8.5) – 9.7 23.8 15.1 8.3 – 48.4Profit before interest and tax 1,052.4 326.3 502.5 1,064.7 105.7 23.2 40.7 3,115.5
Included in the share of results of joint ventures and associates is the impairment of an associate – (10.7) – – – – – (10.7)
Included in operating profit/(loss) are:
Amortisation of prepaid lease rentals (37.7) (0.5) (2.9) (0.1) (7.2) – – (48.4)Depreciation and amortisation (1,084.6) (225.7) (246.5) (61.4) (68.1) (0.6) (12.6) (1,699.5)Impairment losses:- property, plant and equipment (0.1) (4.9) (0.3) (19.1) (0.1) – – (24.5)- receivables (10.3) (52.1) (7.2) (17.0) (6.3) (1.6) (6.4) (100.9)- others – (1.6) – (1.3) – – – (2.9)Reversal of impairment losses:- property, plant and equipment – – 0.2 – – – – 0.2- receivables – 37.7 0.3 2.4 0.4 – 0.1 40.9- others – – 0.5 – – 3.5 – 4.0Gain on disposal of subsidiaries – – – 486.6 18.3 – 8.1 513.0Other non-cash items 75.9 (78.3) (103.9) 9.6 (15.0) 0.4 97.5 (13.8)

Sime Darby Berhad 2 9 1Annual Report 2016 Financial Reports
52 Segment Information – Group (continued)
a. Segment results
2016 Plantation Industrial Motors PropertyEnergy &
Utilities OthersCorporate and
elimination Total
Segment revenue:External 11,876.5 9,617.5 18,924.4 2,864.9 629.2 50.3 – 43,962.8Inter-segment 0.3 53.2 27.1 208.6 20.2 7.3 (316.7) –
11,876.8 9,670.7 18,951.5 3,073.5 649.4 57.6 (316.7) 43,962.8
Segment results:Operating profit 1,060.9 326.3 492.8 1,040.9 90.6 14.9 40.7 3,067.1Share of results of joint ventures and associates (8.5) – 9.7 23.8 15.1 8.3 – 48.4Profit before interest and tax 1,052.4 326.3 502.5 1,064.7 105.7 23.2 40.7 3,115.5
Included in the share of results of joint ventures and associates is the impairment of an associate – (10.7) – – – – – (10.7)
Included in operating profit/(loss) are:
Amortisation of prepaid lease rentals (37.7) (0.5) (2.9) (0.1) (7.2) – – (48.4)Depreciation and amortisation (1,084.6) (225.7) (246.5) (61.4) (68.1) (0.6) (12.6) (1,699.5)Impairment losses:- property, plant and equipment (0.1) (4.9) (0.3) (19.1) (0.1) – – (24.5)- receivables (10.3) (52.1) (7.2) (17.0) (6.3) (1.6) (6.4) (100.9)- others – (1.6) – (1.3) – – – (2.9)Reversal of impairment losses:- property, plant and equipment – – 0.2 – – – – 0.2- receivables – 37.7 0.3 2.4 0.4 – 0.1 40.9- others – – 0.5 – – 3.5 – 4.0Gain on disposal of subsidiaries – – – 486.6 18.3 – 8.1 513.0Other non-cash items 75.9 (78.3) (103.9) 9.6 (15.0) 0.4 97.5 (13.8)

Sime Darby BerhadAnnual Report 2016Innovating for the Future2 9 2
NOTES TO THE FINANCIAL STATEMENTS
For the financial year ended 30 June 2016 (continued)Amounts in RM million unless otherwise stated
52 Segment Information – Group (continued)
a. Segment results (continued)
2015 (Restated) Plantation Industrial Motors PropertyEnergy &
Utilities OthersCorporate and
elimination Total
Segment revenue:External 10,268.6 10,558.2 18,646.3 3,455.0 729.7 70.9 – 43,728.7Inter-segment 0.3 63.4 33.9 175.7 49.2 9.6 (332.1) –
10,268.9 10,621.6 18,680.2 3,630.7 778.9 80.5 (332.1) 43,728.7
Segment results:Operating profit 1,323.2 512.4 466.6 928.6 134.0 22.2 154.7 3,541.7Share of results of joint ventures and associates (32.4) 8.8 7.0 (39.2) (8.2) (58.0) – (122.0)Profit/(loss) before interest and tax 1,290.8 521.2 473.6 889.4 125.8 (35.8) 154.7 3,419.7
Included in operating profit/(loss) are:
Amortisation of prepaid lease rentals (34.8) (0.4) (2.6) (0.4) (5.5) – – (43.7)Depreciation and amortisation (752.7) (271.2) (228.6) (62.1) (62.7) (0.7) (11.9) (1,389.9)Impairment losses:- property, plant and equipment (14.5) (1.7) – – – – – (16.2)- receivables (1.4) (51.0) (2.6) (1.2) (4.6) – – (60.8)- others (0.2) – (0.1) (4.5) – – – (4.8)Reversal of impairment losses:- property, plant and equipment 0.8 – 0.4 – – – – 1.2- receivables – 43.2 3.2 13.3 0.4 – – 60.1- others – – 1.4 – – 1.6 – 3.0(Loss)/gain on disposal of:- subsidiaries (3.7) – – – – – – (3.7)- a joint venture – – – 157.2 – – – 157.2- an associate – – – 55.5 – – – 55.5Other non-cash items 104.8 (92.2) (33.2) 26.8 (12.4) 0.3 276.0 270.1

Sime Darby Berhad 2 9 3Annual Report 2016 Financial Reports
52 Segment Information – Group (continued)
a. Segment results (continued)
2015 (Restated) Plantation Industrial Motors PropertyEnergy &
Utilities OthersCorporate and
elimination Total
Segment revenue:External 10,268.6 10,558.2 18,646.3 3,455.0 729.7 70.9 – 43,728.7Inter-segment 0.3 63.4 33.9 175.7 49.2 9.6 (332.1) –
10,268.9 10,621.6 18,680.2 3,630.7 778.9 80.5 (332.1) 43,728.7
Segment results:Operating profit 1,323.2 512.4 466.6 928.6 134.0 22.2 154.7 3,541.7Share of results of joint ventures and associates (32.4) 8.8 7.0 (39.2) (8.2) (58.0) – (122.0)Profit/(loss) before interest and tax 1,290.8 521.2 473.6 889.4 125.8 (35.8) 154.7 3,419.7
Included in operating profit/(loss) are:
Amortisation of prepaid lease rentals (34.8) (0.4) (2.6) (0.4) (5.5) – – (43.7)Depreciation and amortisation (752.7) (271.2) (228.6) (62.1) (62.7) (0.7) (11.9) (1,389.9)Impairment losses:- property, plant and equipment (14.5) (1.7) – – – – – (16.2)- receivables (1.4) (51.0) (2.6) (1.2) (4.6) – – (60.8)- others (0.2) – (0.1) (4.5) – – – (4.8)Reversal of impairment losses:- property, plant and equipment 0.8 – 0.4 – – – – 1.2- receivables – 43.2 3.2 13.3 0.4 – – 60.1- others – – 1.4 – – 1.6 – 3.0(Loss)/gain on disposal of:- subsidiaries (3.7) – – – – – – (3.7)- a joint venture – – – 157.2 – – – 157.2- an associate – – – 55.5 – – – 55.5Other non-cash items 104.8 (92.2) (33.2) 26.8 (12.4) 0.3 276.0 270.1

Sime Darby BerhadAnnual Report 2016Innovating for the Future2 9 4
NOTES TO THE FINANCIAL STATEMENTS
For the financial year ended 30 June 2016 (continued)Amounts in RM million unless otherwise stated
52 Segment Information – Group (continued)
b. Segment assets and liabilities and additions to non-current assets
2016 Plantation Industrial Motors PropertyEnergy &
Utilities OthersCorporate and
elimination Total
Segment assetsOperating assets 25,987.7 9,086.1 8,746.5 9,673.2 2,553.9 86.9 1,172.0 57,306.3Joint ventures and associates 684.4 206.5 89.9 2,267.9 321.0 644.0 – 4,213.7Non-current assets held for sale 3.8 3.2 13.0 287.0 – – – 307.0
26,675.9 9,295.8 8,849.4 12,228.1 2,874.9 730.9 1,172.0 61,827.0
Segment liabilitiesLiabilities 1,689.0 1,875.6 3,094.1 2,035.6 817.0 68.8 49.4 9,629.5
Additions to non-current assets, other than financial instruments and deferred tax assets, are as follows:
Capital expenditure 1,487.2 651.8 654.6 62.2 363.3 0.1 11.8 3,231.0Additions to interest in joint ventures and associates 8.5 20.2 – 648.0 25.2 – – 701.9
1,495.7 672.0 654.6 710.2 388.5 0.1 11.8 3,932.9
2015 (Restated)
Segment assetsOperating assets 25,394.9 9,437.9 9,207.8 8,709.7 2,477.1 127.8 1,006.1 56,361.3Joint ventures and associates 653.6 196.0 90.7 2,013.0 233.2 633.4 – 3,819.9Non-current assets held for sale 4.6 3.5 – 120.5 0.1 – – 128.7
26,053.1 9,637.4 9,298.5 10,843.2 2,710.4 761.2 1,006.1 60,309.9
Segment liabilitiesLiabilities 1,860.7 2,141.4 2,868.1 1,572.1 885.7 100.1 137.5 9,565.6Liabilities associated with assets held for sale – – – 83.4 – – – 83.4
1,860.7 2,141.4 2,868.1 1,655.5 885.7 100.1 137.5 9,649.0
Additions to non-current assets, other than financial instruments and deferred tax assets, are as follows:
Capital expenditure 1,202.8 455.1 560.8 81.2 183.8 0.3 10.3 2,494.3Additions to interest in joint ventures and associates 129.8 23.5 – 313.3 144.5 – – 611.1
1,332.6 478.6 560.8 394.5 328.3 0.3 10.3 3,105.4

Sime Darby Berhad 2 9 5Annual Report 2016 Financial Reports
52 Segment Information – Group (continued)
b. Segment assets and liabilities and additions to non-current assets
2016 Plantation Industrial Motors PropertyEnergy &
Utilities OthersCorporate and
elimination Total
Segment assetsOperating assets 25,987.7 9,086.1 8,746.5 9,673.2 2,553.9 86.9 1,172.0 57,306.3Joint ventures and associates 684.4 206.5 89.9 2,267.9 321.0 644.0 – 4,213.7Non-current assets held for sale 3.8 3.2 13.0 287.0 – – – 307.0
26,675.9 9,295.8 8,849.4 12,228.1 2,874.9 730.9 1,172.0 61,827.0
Segment liabilitiesLiabilities 1,689.0 1,875.6 3,094.1 2,035.6 817.0 68.8 49.4 9,629.5
Additions to non-current assets, other than financial instruments and deferred tax assets, are as follows:
Capital expenditure 1,487.2 651.8 654.6 62.2 363.3 0.1 11.8 3,231.0Additions to interest in joint ventures and associates 8.5 20.2 – 648.0 25.2 – – 701.9
1,495.7 672.0 654.6 710.2 388.5 0.1 11.8 3,932.9
2015 (Restated)
Segment assetsOperating assets 25,394.9 9,437.9 9,207.8 8,709.7 2,477.1 127.8 1,006.1 56,361.3Joint ventures and associates 653.6 196.0 90.7 2,013.0 233.2 633.4 – 3,819.9Non-current assets held for sale 4.6 3.5 – 120.5 0.1 – – 128.7
26,053.1 9,637.4 9,298.5 10,843.2 2,710.4 761.2 1,006.1 60,309.9
Segment liabilitiesLiabilities 1,860.7 2,141.4 2,868.1 1,572.1 885.7 100.1 137.5 9,565.6Liabilities associated with assets held for sale – – – 83.4 – – – 83.4
1,860.7 2,141.4 2,868.1 1,655.5 885.7 100.1 137.5 9,649.0
Additions to non-current assets, other than financial instruments and deferred tax assets, are as follows:
Capital expenditure 1,202.8 455.1 560.8 81.2 183.8 0.3 10.3 2,494.3Additions to interest in joint ventures and associates 129.8 23.5 – 313.3 144.5 – – 611.1
1,332.6 478.6 560.8 394.5 328.3 0.3 10.3 3,105.4

Sime Darby BerhadAnnual Report 2016Innovating for the Future2 9 6
NOTES TO THE FINANCIAL STATEMENTS
For the financial year ended 30 June 2016 (continued)Amounts in RM million unless otherwise stated
52 Segment Information – Group (continued)
b. Segment assets and liabilities and additions to non-current assets (continued) Capital expenditure consists of the following:
2016 2015Restated
Property, plant and equipment 2,958.3 2,212.9Prepaid lease rentals 43.2 48.9Investment properties 1.1 1.3Biological assets 22.5 –Land held for property development 9.6 6.9Intangible assets other than goodwill 196.3 224.3
3,231.0 2,494.3
Reconciliation of segment assets and liabilities to total assets and total liabilities are as follows:
Assets Liabilities2016 2015 2016 2015
Restated Restated
Segment total 61,827.0 60,309.9 9,629.5 9,649.0Tax assets/liabilities 2,382.3 1,928.5 2,903.9 2,808.9Borrowings – – 15,833.6 18,063.0Finance lease obligation – – 135.3 146.0
64,209.3 62,238.4 28,502.3 30,666.9
c. Segment by geographyRevenue by location of customers are analysed as follows:
2016 2015
Malaysia 9,883.6 11,668.7Indonesia 888.2 1,241.5Singapore 4,242.9 3,728.2Other countries in South East Asia 2,883.5 2,383.4China 11,194.6 10,759.3Australasia 1 8,899.0 9,486.4Europe 3,095.2 1,953.2Other countries 2,875.8 2,508.0
43,962.8 43,728.7

Sime Darby Berhad 2 9 7Annual Report 2016 Financial Reports
52 Segment Information – Group (continued)
c. Segment by geography (continued)Revenue, profit/(loss) before interest and tax and non-current assets, other than financial instruments and tax assets, by location of the Group’s operations are analysed as follows:
RevenueProfit/(loss) before
interest and taxNon-current
assets2016 2015 2016 2015 2016 2015
Restated Restated
Malaysia 12,956.0 14,057.5 1,743.7 2,278.1 16,807.2 15,747.0Indonesia 966.1 1,265.7 170.8 442.6 3,209.6 2,825.9Singapore 4,015.9 3,635.6 679.1 102.7 843.4 959.0Other countries in South East Asia 2,804.5 2,282.2 84.5 59.6 506.9 487.2China 10,746.5 10,474.0 327.1 308.6 3,244.8 2,748.9Australasia 1 10,117.8 9,999.8 75.3 320.5 9,623.2 9,081.5Europe 1,774.0 1,402.4 30.6 (88.8) 1,649.5 1,420.3Other countries 582.0 611.5 4.4 (3.6) 644.3 536.9
43,962.8 43,728.7 3,115.5 3,419.7 36,528.9 33,806.7
1 Australasia consists of Australia, New Caledonia, New Zealand, Papua New Guinea, and Solomon Islands
Reconciliation of non-current assets, other than financial instruments and tax assets to the total non-current assets are as follows:
2016 2015Restated
Non-current assets other than financial instruments and tax assets 36,528.9 33,806.7Investments 157.8 140.1Deferred tax assets 1,598.2 1,139.2Tax recoverable 544.8 478.6Derivative assets 139.2 214.8Receivables 548.6 527.9
39,517.5 36,307.3
The Group’s operations are diverse in terms of the range of products and services it offers and the geographical coverage. There is no single customer that contributed 10% or more to the Group’s revenue.
The comparatives have been restated as given in Note 56, following the change in accounting policy as described in Note 2(a).

Sime Darby BerhadAnnual Report 2016Innovating for the Future2 9 8
NOTES TO THE FINANCIAL STATEMENTS
For the financial year ended 30 June 2016 (continued)Amounts in RM million unless otherwise stated
53 Related Parties
Significant related party transactions and balances other than as disclosed in Notes 6, 7, 8, 12, 13, 23, 24, 30 and 45 are as follows:
Group
2016 2015a. Transactions with joint ventures
Tolling fees and sales to Emery Oleochemicals (M) Sdn Bhd group 51.3 48.8
Disposal of property, plant and equipment to Weifang Port Services Co Ltd – 315.0
Disposal of subsidiaries, Sime Darby Property (Dunearn) Pte Ltd (formerly known as Sime Darby Property (Dunearn) Limited) and Sime Darby Property (Kilang) Pte Ltd (formerly known as Sime Darby Property (Kilang) Limited) to Aster Investment Holding Pte Ltd, a subsidiary of Sime Darby Real Estate Investment Trust 1 600.8 –
Sale of land to Sime Darby Sunsuria Development Sdn Bhd – 241.8
b. Transactions with associatesSales and services for parts to Energy Power Systems (Australia) Pty Ltd 9.3 11.0Sale of land to Eastern & Oriental Berhad group – 239.8Sale of products and services to Tesco Stores (Malaysia) Sdn Bhd 13.1 18.7
c. Transactions between subsidiaries and their significant owners of non-controlling interests
Transactions between companies in which Tan Sri Dato’ Ir Gan Thian Leong and Encik Mohamad Hassan Zakaria are substantial shareholders:
- turnkey works rendered by Brunsfield Engineering Sdn Bhd to Sime Darby Brunsfield Holding Sdn Bhd (SDBH) group 378.4 296.1
- sale of an investment property by SDBH group to Subang Mall Property Sdn Bhd – 139.5
- sale of properties by SDBH group to Brunsfield OASIS Square Sdn Bhd – 34.7Purchase of agricultural tractors, engines and parts by Sime Kubota Sdn
Bhd from Kubota Corporation 37.3 29.2Sale of vehicles and parts by Jaguar Land Rover (M) Sdn Bhd to Sisma Auto
Sdn Bhd 91.9 109.6Royalty payment to and procurement of cars and ancillary services by
Inokom Corporation Sdn Bhd (ICSB) from Hyundai Motor Company and its related companies 41.4 226.4
Contract assembly service provided by ICSB to Berjaya Corporation Berhad group 47.3 85.7
Project management services rendered to Sime Darby Property Selatan Sdn Bhd (SDPS) by Tunas Selatan Construction Sdn Bhd, the holding company of Tunas Selatan Pagoh Sdn Bhd 9.3 11.5

Sime Darby Berhad 2 9 9Annual Report 2016 Financial Reports
53 Related Parties (continued)
Significant related party transactions and balances other than as disclosed in Notes 6, 7, 8, 12, 13, 23, 24, 30 and 45 are as follows: (continued)
Group2016 2015
d. Transactions with firms in which a Director of the Company is a partnerProvision of legal services by Azmi & Associates, a firm in which Dato’ Azmi Mohd Ali
is a partner (Dato’ Azmi Mohd Ali has since retired from the Board of Directors on 1 March 2016) 0.1 0.1
e. Transactions with Directors and their close family members Sales of properties and cars – 3.7
f. Transactions with key management personnel and their close family membersSales of properties and cars 9.0 2.1Sales of properties by Battersea Project Phase 3 Residential Company Limited,
a joint venture – 17.4
Group Company2016 2015 2016 2015
g. Remuneration of Directors and key management personnel
Salaries, fees and other emoluments 48.6 38.2 3.4 3.6Defined contribution pension plan 3.2 3.3 – –Performance-based employee share scheme (PBESS) (2.0) (0.1) – –
Estimated monetary value of benefits by way of usage of the Group’s and Company’s assets 0.6 0.7 0.3 0.4
The movement in the number of ordinary shares of RM0.50 each of the Company granted under the PBESS to the Executive Director and key management personnel of the Group is as follows:
Fair value at grant date
Number of ordinary shares of RM0.50 eachAt
1 July 2015 Granted ForfeitedAt
30 June 2016(RM) ‘000 ‘000 ‘000 ‘000
First grantGPS 7.74 428 – (10) 418DPS 8.58 391 – (8) 383
Second grantGPS 7.24 428 – (29) 399DPS 8.18 392 – (23) 369

Sime Darby BerhadAnnual Report 2016Innovating for the Future3 0 0
NOTES TO THE FINANCIAL STATEMENTS
For the financial year ended 30 June 2016 (continued)Amounts in RM million unless otherwise stated
53 Related Parties (continued)
Significant related party transactions and balances other than as disclosed in Notes 6, 7, 8, 12, 13, 23, 24, 30 and 45 are as follows: (continued)
h. Transaction with shareholders and GovernmentAs at 30 June 2016, Permodalan Nasional Berhad (PNB) and the funds managed by its subsidiary, Amanah Saham Nasional Berhad (ASNB), together owns 54.4% (2015: 53.4%) of the issued share capital of the Company. PNB is an entity controlled by the Malaysian Government through Yayasan Pelaburan Bumiputra (YPB). The Group regards YPB as the ultimate holding company. As a result, the Malaysian Government and Malaysian Government’s controlled bodies (collectively referred to as government-related entities) are related parties of the Group and of the Company.
Transactions entered into during the financial year with government-related entities include the sales and purchases of goods and services. These related party transactions were entered into in the ordinary course of business and do not require the approval of shareholders except for the purchase of chemicals and fertilisers from Chemical Company of Malaysia Berhad group, in which YPB has substantial indirect interest, amounting to RM121.6 million (2015: RM87.3 million). Shareholders’ mandate was obtained for this recurrent related party transaction during the last annual general meeting.
In addition, the Group entered into the following transactions with government related entities during the financial year:
i. On 24 March 2016, funds managed by ASNB subscribed for RM560.0 million of the Sukuk Wakalah issued by the Company (see Note 41); and
ii. On 21 June 2016, PNB acquired the Group’s interest in Syarikat Malacca Straits Inn Sdn Bhd for a total consideration of RM55.4 million (see Note 51(a)).
i. Outstanding balances with related partiesThe significant outstanding balances between the Group and related parties as at 30 June are as follows:
Group2016 2015
i. Amounts due from/(to) joint ventures and associatesEastern & Oriental Berhad group – 175.9Guangzhou Keylink Chemicals Co Ltd 28.5 23.0Malaysia - China Hydro Joint Venture (23.1) (33.7)Seriemas Development Sdn Bhd 21.8 21.8Sime Darby CapitaLand (Melawati Mall) Sdn Bhd (formerly known as
Sime Darby Capitamalls Asia (Melawati Mall) Sdn Bhd) 38.3 33.3Sime Darby Sunrise Development Sdn Bhd 69.8 74.7Weifang Sime Darby Liquid Terminal Co Ltd 148.6 –
ii. Amounts due to owner of non-controlling interests of Sime Darby Brunsfield Holding Sdn Bhd
Brunsfield Metropolitan Sdn Bhd 149.3 147.1Brunsfield Engineering Sdn Bhd 90.5 61.5
iii. Amount (nominal value) due from YPB groupProlintas Expressway Sdn Bhd [Note 30(a)(ii)] 500.0 500.0
All outstanding balances are unsecured and repayable in accordance with agreed terms.
Other than as disclosed above, there were no material contracts subsisting as at 30 June 2016 or if not then subsisting, entered into since the end of the previous financial year by the Company or its subsidiaries which involved the interests of Directors or substantial shareholders.

Sime Darby Berhad 3 0 1Annual Report 2016 Financial Reports
54 Financial Instruments
a. Financial instruments by categoryFinancial assets and financial liabilities are categorised as follows:
Derivatives used for hedging
Fair value through profit
or loss – held for trading
Loans and receivables
Available-for-sale
financial assets Total
Group2016
Non-current assetsInvestments – – – 157.8 157.8Derivative assets 134.6 4.6 – – 139.2Receivables – – 548.6 – 548.6
Current assetsReceivables – – 6,523.1 – 6,523.1Derivative assets 108.7 16.4 – – 125.1Cash held under Housing Development
Accounts – – 610.0 – 610.0Bank balances, deposits and cash – – 2,910.9 – 2,910.9Total financial assets 243.3 21.0 10,592.6 157.8 11,014.7
Derivatives used for hedging
Fair value through profit
or loss – held for trading
Financial guarantee contracts
Financial liabilities at
amortised cost Total
Non-current liabilitiesBorrowings – – – 11,414.1 11,414.1Finance lease obligation – – – 126.9 126.9Derivative liabilities 28.7 – – – 28.7
Current liabilitiesPayables – – 0.6 8,017.2 8,017.8Borrowings – – – 4,419.5 4,419.5Finance lease obligation – – – 8.4 8.4Derivative liabilities 44.4 13.8 – – 58.2Total financial liabilities 73.1 13.8 0.6 23,986.1 24,073.6

Sime Darby BerhadAnnual Report 2016Innovating for the Future3 0 2
NOTES TO THE FINANCIAL STATEMENTS
For the financial year ended 30 June 2016 (continued)Amounts in RM million unless otherwise stated
54 Financial Instruments (continued)
a. Financial instruments by category (continued)Financial assets and financial liabilities are categorised as follows: (continued)
Derivatives used for hedging
Fair value through profit
or loss – held for trading
Loans and receivables
Available-for-sale
financial assets Total
Group2015
Non-current assetsInvestments – 12.0 – 128.1 140.1Derivative assets 199.7 15.1 – – 214.8Receivables – – 527.9 – 527.9
Current assetsReceivables – – 7,273.3 – 7,273.3Derivative assets 63.8 16.1 – – 79.9Cash held under Housing Development
Accounts – – 556.1 – 556.1Bank balances, deposits and cash – – 3,644.9 – 3,644.9Total financial assets 263.5 43.2 12,002.2 128.1 12,437.0
Derivatives used for hedging
Fair value through profit
or loss – held for trading
Financial guarantee contracts
Financial liabilities at
amortised cost Total
Non-current liabilitiesBorrowings – – – 11,745.4 11,745.4Finance lease obligation – – – 139.2 139.2Derivative liabilities 16.3 2.7 – – 19.0
Current liabilitiesPayables – – 0.3 8,324.0 8,324.3Borrowings – – – 6,317.6 6,317.6Finance lease obligation – – – 6.8 6.8Derivative liabilities 24.8 36.3 – – 61.1Total financial liabilities 41.1 39.0 0.3 26,533.0 26,613.4

Sime Darby Berhad 3 0 3Annual Report 2016 Financial Reports
54 Financial Instruments (continued)
a. Financial instruments by category (continued)In respect of the Company, amounts due from subsidiaries, receivables and bank balances, deposits and cash totaling RM13,325.9 million (2015: RM11,149.6 million) are categorised under loans and receivables.
Borrowings, amounts due to a subsidiaries and payables of the Company of RM1,707.4 million (2015: RM1,907.7 million), RM3,248.1 million (2015: RM3,052.4 million) and RM5.2 million (2015: RM5.0 million), respectively, are categorised as financial liabilities at amortised cost whilst the financial guarantees included in payables of RM8.8 million (2015: RM16.1 million) is categorised under financial guarantee contracts.
The recognition and measurement basis are described in Notes 3(n) and 3(u).
b. Measurement of financial instruments
i. Financial instruments measured at fair value The measurement and categorisation of the financial instruments carried at fair value are as follows:
Investments Quoted market prices in active markets are considered Level 1. If such quoted market prices are not available, fair
value are determined using market prices for similar assets or present value techniques, applying an appropriate risk-free interest rate adjusted for non-performance risk. The inputs used in present value techniques are observable and fall into the Level 2 category. It is classified into the Level 3 category if significant unobservable inputs are used.
Derivatives The fair values of derivative are determined using quoted price of identical instruments from an active market,
if available (Level 1). If quoted prices are not available, price quoted for similar instruments, appropriately adjusted, or present value techniques, based on available market observable inputs are used, including foreign exchange spot and forward rates, interest rate curves and prices of the underlying commodities. The fair values obtained using price quotes for similar instruments or valuation techniques represent a Level 2 input unless significant unobservable inputs are used, which would result in Level 3 valuation methods.

Sime Darby BerhadAnnual Report 2016Innovating for the Future3 0 4
NOTES TO THE FINANCIAL STATEMENTS
For the financial year ended 30 June 2016 (continued)Amounts in RM million unless otherwise stated
54 Financial Instruments (continued)
b. Measurement of financial instruments (continued)
i. Financial instruments measured at fair value (continued) The following table presents the Group’s financial assets and liabilities that are measured at fair value as at 30 June into three different levels as defined above:
Group2016 Level 1 Level 2 Level 3 Total
Financial assetsInvestments 26.9 25.5 105.4 157.8Derivative assets- forward foreign exchange contracts – 37.3 – 37.3- interest rate swap contracts – 1.5 – 1.5- cross currency swap contract – 209.1 – 209.1- commodity futures contracts – 16.4 – 16.4
26.9 289.8 105.4 422.1
Financial liabilitiesDerivative liabilities- forward foreign exchange contracts – 39.9 – 39.9- interest rate swap contracts – 40.9 – 40.9- commodity futures contracts – 6.1 – 6.1
– 86.9 – 86.9
2015
Financial assetsInvestments 42.8 24.4 72.9 140.1Derivative assets- forward foreign exchange contracts – 27.0 – 27.0- interest rate swap contracts – 14.2 – 14.2- cross currency swap contract – 240.8 – 240.8- commodity futures contracts – 12.7 – 12.7
42.8 319.1 72.9 434.8
Financial liabilitiesDerivative liabilities- forward foreign exchange contracts – 41.5 – 41.5- interest rate swap contracts – 30.0 – 30.0- commodity futures contracts – 8.6 – 8.6
– 80.1 – 80.1
The investments categorised as Level 3 in the fair value hierarchy are non-traded equity investments which are valued at their recoverable amounts. The movement during the financial year was mainly due to the fair value loss of an investment which was recognised in other comprehensive income. There is no transfer between levels of the fair value hierarchy during the financial year.
The Company does not have any financial assets and liabilities measured at fair value as at 30 June 2016 (2015: Nil).

Sime Darby Berhad 3 0 5Annual Report 2016 Financial Reports
54 Financial Instruments (continued)
b. Measurement of financial instruments (continued)
ii. Financial instruments measured at amortised costThe carrying amounts and fair values of long-term financial assets and liabilities measured at amortised cost as at 30 June are as follows:
Group Company
2016Carrying amount
Fairvalue
Carryingamount
Fair value
Financial assetsAmounts due from a subsidiary – – 6,111.8 6,111.8Receivables- trade and other receivables 250.9 250.9 – –- amount due from a joint venture 60.8 60.8 – –- advances for plasma plantation projects 90.8 90.8 – –- redeemable loan stocks 304.3 281.7 – –
Financial liabilitiesAmounts due to a subsidiary – – 3,211.8 3,211.8Borrowings- Islamic Medium Term Notes 1,707.4 1,686.7 1,707.4 1,686.7- Sukuk 3,241.4 3,221.6 – –- term loans and others 8,389.2 8,389.2 – –
2015
Financial assetsAmounts due from a subsidiary – – 1,700.0 1,700.0Receivables- trade and other receivables 320.3 320.3 – –- advances for plasma plantation projects 67.9 67.9 – –- redeemable loan stocks 284.4 221.3 – –
Financial liabilitiesBorrowings- Islamic Medium Term Notes 1,707.4 1,700.2 1,707.4 1,700.2- Sukuk 3,044.2 3,000.2 – –- term loans and others 8,207.3 8,207.3 – –
The fair values of the Group’s long-term financial instruments are categorised as Level 2 in the fair value hierarchy as they are estimated by discounting the future contractual cash flows at the current market rate available for similar instruments.

Sime Darby BerhadAnnual Report 2016Innovating for the Future3 0 6
NOTES TO THE FINANCIAL STATEMENTS
For the financial year ended 30 June 2016 (continued)Amounts in RM million unless otherwise stated
55 Financial Risk Management
The Group’s activities expose it to a variety of financial risks, including foreign exchange risk, price risk, interest rate risk, credit risk, liquidity risk and cash flow risk. The policy on financial risk management is described in Note 5.
Details of each financial risk are as follows:
a. Foreign exchange risk During the financial year, the Group’s revenue was transacted in the following currencies:
2016 2015
Functional currency
Other than functional
currencyTotal
revenueFunctional
currency
Other than functional
currencyTotal
revenue
Transacted currencyRinggit Malaysia 9,119.3 17.4 9,136.7 11,970.9 – 11,970.9United States dollar 1,114.1 4,305.9 5,420.0 566.1 2,797.9 3,364.0Indonesian rupiah 885.7 – 885.7 1,236.8 – 1,236.8Singapore dollar 3,817.0 – 3,817.0 3,210.8 31.5 3,242.3Chinese renminbi 7,503.5 326.0 7,829.5 7,397.7 – 7,397.7Hong Kong dollar 2,817.5 – 2,817.5 3,013.3 – 3,013.3Australian dollar 6,248.6 2.0 6,250.6 6,598.2 6.2 6,604.4Other currencies 7,737.9 67.9 7,805.8 6,426.1 473.2 6,899.3
39,243.6 4,719.2 43,962.8 40,419.9 3,308.8 43,728.7
Currency profile of monetary financial assets and financial liabilities and long term borrowings are as follows:
Denominated in other than functional currencies
Group2016
United States dollar
Australian dollar
Chinese renminbi
European Union
euroSingapore
dollar Others
Denomi-nated in
functional currencies Total
Investment (debt instrument) – – – – – – 4.1 4.1
Receivables (net) 592.9 1.0 82.9 23.9 6.8 272.2 6,092.0 7,071.7Cash held
under Housing Development Accounts – – – – – – 610.0 610.0
Bank balances, deposits and cash 621.8 7.0 16.3 18.4 49.7 74.3 2,123.4 2,910.9
Borrowings (4,917.1) – (41.9) – – – (10,874.6) (15,833.6)Finance lease
obligation – – – – – – (135.3) (135.3)Payables (406.7) (2.7) (1.6) (68.5) (5.9) (308.1) (7,224.3) (8,017.8)
(4,109.1) 5.3 55.7 (26.2) 50.6 38.4 (9,404.7) (13,390.0)

Sime Darby Berhad 3 0 7Annual Report 2016 Financial Reports
55 Financial Risk Management (continued)
Details of each financial risk are as follows: (continued)
a. Foreign exchange risk (continued)Currency profile of monetary financial assets and financial liabilities are as follows: (continued)
Denominated in other than functional currencies
Group2015
United States dollar
Australian dollar
Chinese renminbi
European Union
euroSingapore
dollar Others
Denomi-nated in
functional currencies Total
Investment (debt instrument) – – – – – – 4.1 4.1
Receivables (net) 958.5 3.5 23.1 44.8 9.9 260.4 6,501.0 7,801.2Cash held
under Housing Development Accounts – – – – – – 556.1 556.1
Bank balances, deposits and cash 447.5 15.4 12.6 50.1 6.3 149.5 2,963.5 3,644.9
Borrowings (4,868.4) – – – – (120.7) (13,073.9) (18,063.0)Finance lease
obligation – – – – – – (146.0) (146.0)Payables (466.6) (7.2) (2.3) (27.5) (10.5) (104.9) (7,705.3) (8,324.3)
(3,929.0) 11.7 33.4 67.4 5.7 184.3 (10,900.5) (14,527.0)

Sime Darby BerhadAnnual Report 2016Innovating for the Future3 0 8
NOTES TO THE FINANCIAL STATEMENTS
For the financial year ended 30 June 2016 (continued)Amounts in RM million unless otherwise stated
55 Financial Risk Management (continued)
Details of each financial risk are as follows: (continued)
a. Foreign exchange risk (continued)Currency profile of monetary financial assets and financial liabilities are as follows: (continued)
Company2016
Denominated in United States
dollar
Denominated in functional
currency Total
Amounts due from subsidiaries 3,248.1 9,871.0 13,119.1Receivables (net) – 6.8 6.8Bank balances, deposits and cash – 200.0 200.0Borrowings – (1,707.4) (1,707.4)Amounts due to subsidiaries (3,248.1) – (3,248.1)Payables (7.7) (6.3) (14.0)
(7.7) 8,364.1 8,356.4
2015
Amounts due from subsidiaries 3,061.1 7,883.5 10,944.6Receivables (net) – 0.2 0.2Bank balances, deposits and cash – 204.8 204.8Borrowings – (1,907.7) (1,907.7)Amounts due to subsidiaries (3,052.4) – (3,052.4)Payables (22.5) 1.4 (21.1)
(13.8) 6,182.2 6,168.4
The percentages of receivables and payables denominated in currency other than functional currency covered by forward foreign exchange contracts as at 30 June are as follows:
Group Company2016 2015 2016 2015
Monetary items denominated in currency other than functional currency
- amounts due from a subsidiary – – 3,248.1 3,061.1- receivables 979.7 1,300.2 – –- amounts due to subsidiaries – – 3,248.1 3,052.4- payables 793.5 619.0 7.7 22.5
Forward foreign exchange contracts- receivables 200.2 524.8 – –- payables 225.1 201.7 – –
Percentage covered (%)- receivables 20.4 40.4 – –- payables 28.4 32.6 – –
The Company’s receivables and payables above are denominated in USD. There is minimal foreign currency risk due to the natural hedge between the receivables and payables, therefore no forward foreign exchange contract has been entered into.

Sime Darby Berhad 3 0 9Annual Report 2016 Financial Reports
55 Financial Risk Management (continued)
Details of each financial risk are as follows: (continued)
a. Foreign exchange risk (continued) As at 30 June 2016, the unhedged exposure to the Group from holding financial assets and liabilities other than in the functional currency amounted to RM263.1 million (2015: RM342.3 million).
The following table illustrates the effect of changes in exchange rate on the translation of foreign currency monetary items against the functional currency at 30 June, both before and after taking into account the hedge instruments. The Group has considered recent volatility in exchange rates and has concluded that a 10% (2015: 10%) movement in rates is a reasonably possible assumption. If the major currencies strengthened by that percentage at 30 June, the Group’s profit before tax will improve/(decline) by:
Impact on profit before tax
Group2016
Strength-ened by
Net monetary
items HedgedOpen
positionBefore hedge
After hedge
Major currencyUnited States dollar 10% (4,109.1) 4,199.2 90.1 (410.9) 9.0Chinese renminbi 10% 55.7 – 55.7 5.6 5.6European Union euro 10% (26.2) 40.6 14.4 (2.6) 1.4
2015
Major currencyUnited States dollar 10% (3,929.0) 3,970.8 41.8 (392.9) 4.2Chinese renminbi 10% 33.4 – 33.4 3.3 3.3European Union euro 10% 67.4 (16.1) 51.3 6.7 5.1
Included in the net monetary items are foreign currency denominated bank balances, deposits and cash and borrowings. The Group does not hedge these items except for term loans amounting to USD222.0 million (2015: USD311.0 million) (see Note 29(c)). In addition, term loan and revolving credit amounting to USD830.0 million (equivalent to RM3,332.2 million) (2015: USD830.0 million, equivalent to RM3,115.1 million) are used to hedge a net investment in foreign operation. Effect of changes in exchange rate will be adjusted to other comprehensive income.
b. Interest rate riskThe percentages of fixed rate borrowings, both before and after taking into account the interest rate swap (IRS) contracts, to the total borrowings as at 30 June are as follows:
Group Company
2016 2015 2016 2015
Total borrowings 15,833.6 18,063.0 1,707.4 1,907.7
Fixed rate borrowings 6,373.1 5,319.4 1,707.4 1,707.4Floating rate borrowings (swapped to fixed) 2,265.6 2,755.9 – –Total fixed rate borrowings after swap 8,638.7 8,075.3 1,707.4 1,707.4
Percentage of fixed rate borrowings over total borrowings:
- before swap (%) 40.3 29.4 100.0 89.5- after swap (%) 54.6 44.7 100.0 89.5

Sime Darby BerhadAnnual Report 2016Innovating for the Future3 1 0
NOTES TO THE FINANCIAL STATEMENTS
For the financial year ended 30 June 2016 (continued)Amounts in RM million unless otherwise stated
55 Financial Risk Management (continued)
Details of each financial risk are as follows: (continued)
b. Interest rate risk (continued)As at 30 June 2016, the Group’s and the Company’s floating rate borrowings stood at RM9,460.5 million (2015: RM12,743.6 million) and Nil (2015: RM200.3 million) respectively. The following table demonstrates the effect of changes in interest rate of floating rate borrowings, both before and after taking into account the IRS contracts mentioned in the preceding paragraph. If the interest rate increased by 1% in the following currencies of borrowings, the Group’s and Company’s profit before tax and other comprehensive income will be higher/(lower) by:
Group Company2016 Before IRS After IRS Before IRS After IRS
Profit before tax- Ringgit Malaysia (25.1) (22.5) – –- Australian dollar (0.3) 5.5 – –- United States dollar (56.3) (37.0) – –
Other comprehensive income- Ringgit Malaysia – 2.9 – –- United States dollar – 66.1 – –
2015
Profit before tax- Ringgit Malaysia (53.6) (51.0) (2.0) (2.0)- Australian dollar (5.8) – – –- United States dollar (55.8) (36.6) – –
Other comprehensive income- Ringgit Malaysia – 0.5 – –- Australian dollar – 0.5 – –- United States dollar – 6.1 – –
A 1% decrease in interest rate would have an equal but opposite effect.

Sime Darby Berhad 3 1 1Annual Report 2016 Financial Reports
55 Financial Risk Management (continued)
Details of each financial risk are as follows: (continued)
c. Credit riskThe maximum exposure and collateral and credit enhancements as at 30 June are as follows:
Group Company
2016Maximum exposure
Collateral and credit
enhance-ment
Maximum exposure
Collateral and credit
enhance-ment
Amounts due from subsidiaries – – 13,119.1 –Receivables 7,351.1 755.7 6.8 –Derivative assets 264.3 – – –Cash held under Housing Development Accounts 610.0 – – –Bank balances, deposits and cash 2,910.9 – 200.0 –Guarantees in respect of credit facilities granted to:- certain subsidiaries – – 1,083.3 –- a joint venture, associates and others 152.0 – – –Risk sharing arrangement 258.1 – – –
11,546.4 755.7 14,409.2 –
2015
Amounts due from subsidiaries – – 10,944.6 –Receivables 8,029.5 1,711.8 0.2 –Derivative assets 294.7 – – –Cash held under Housing Development Accounts 556.1 – – –Bank balances, deposits and cash 3,644.9 – 204.8 –Guarantees in respect of credit facilities granted to:- certain subsidiaries – – 3,028.7 –- a joint venture, associates and others 148.7 – – –Risk sharing arrangement 208.0 – – –
12,881.9 1,711.8 14,178.3 –

Sime Darby BerhadAnnual Report 2016Innovating for the Future3 1 2
NOTES TO THE FINANCIAL STATEMENTS
For the financial year ended 30 June 2016 (continued)Amounts in RM million unless otherwise stated
55 Financial Risk Management (continued)
Details of each financial risk are as follows: (continued)
c. Credit risk (continued)The credit risks concentration profile of the Group’s net trade receivables analysed by country where the Group operates and by reportable segment as at 30 June are as follows:
Group2016 Plantation Industrial Motors Property
Energy & Utilities Others Total
Malaysia 528.8 199.9 345.8 633.9 60.2 33.0 1,801.6Indonesia 15.1 – – – – – 15.1Singapore 15.1 163.4 71.4 0.6 33.0 3.1 286.6Other countries in
South East Asia 117.7 6.7 46.2 0.1 9.0 – 179.7China – 378.4 110.5 – 44.7 0.4 534.0Australasia 193.4 626.3 199.6 0.1 – – 1,019.4Europe 406.2 – – 0.3 – – 406.5Other countries 126.5 – – – – – 126.5
1,402.8 1,374.7 773.5 635.0 146.9 36.5 4,369.4In percentageMalaysia 12.1 4.6 7.9 14.5 1.4 0.7 41.2Indonesia 0.3 – – – – – 0.3Singapore 0.4 3.7 1.6 – 0.8 0.1 6.6Other countries in
South East Asia 2.7 0.1 1.1 – 0.2 – 4.1China – 8.7 2.5 – 1.0 – 12.2Australasia 4.4 14.4 4.6 – – – 23.4Europe 9.3 – – – – – 9.3Other countries 2.9 – – – – – 2.9
32.1 31.5 17.7 14.5 3.4 0.8 100.0
2015
Malaysia 884.7 178.3 677.4 955.2 71.5 29.9 2,797.0Indonesia 7.6 – – – – – 7.6Singapore 17.8 260.1 68.4 0.8 37.8 3.5 388.4Other countries in
South East Asia 126.7 3.8 26.7 0.2 15.1 – 172.5China – 321.7 119.9 – 53.5 15.2 510.3Australasia 373.2 619.9 211.8 – – – 1,204.9Europe 247.1 – – 0.4 – – 247.5Other countries 117.8 – – – – – 117.8
1,774.9 1,383.8 1,104.2 956.6 177.9 48.6 5,446.0In percentageMalaysia 16.2 3.3 12.4 17.5 1.3 0.5 51.2Indonesia 0.1 – – – – – 0.1Singapore 0.3 4.8 1.3 – 0.7 0.1 7.2Other countries in
South East Asia 2.3 0.1 0.5 – 0.3 – 3.2China – 5.9 2.2 – 1.0 0.3 9.4Australasia 6.9 11.4 3.9 – – – 22.2Europe 4.5 – – – – – 4.5Other countries 2.2 – – – – – 2.2
32.5 25.5 20.3 17.5 3.3 0.9 100.0

Sime Darby Berhad 3 1 3Annual Report 2016 Financial Reports
55 Financial Risk Management (continued)
Details of each financial risk are as follows: (continued)
c. Credit risk (continued)The Company has no significant concentration of credit risks except for loans to its subsidiaries where risk of default has been assessed to be low.
d. Liquidity and cash flow riskThe undiscounted contractual cash flows of the Group’s and of the Company’s financial liabilities as at 30 June are as follows:
Group2016
On demand or within 1
year
Between1 and 2
years
Between2 and 5
yearsAbove
5 years
Total contractual
cash flows
Total carrying amount
Borrowings- principal 4,353.9 4,152.7 2,946.1 4,315.3 15,768.0 15,768.0- interest 459.7 319.4 613.1 574.7 1,966.9 65.6Finance lease obligation 12.9 12.6 36.1 110.6 172.2 135.3Payables 8,017.2 – – – 8,017.2 8,017.2Financial guarantee contracts 61.7 33.2 44.0 13.1 152.0 0.6Derivative liabilities- interest rate swap contracts 13.6 13.0 16.7 0.6 43.9 39.4
12,919.0 4,530.9 3,656.0 5,014.3 26,120.2 24,026.1
2015
Borrowings- principal 6,273.0 1,867.5 6,160.2 3,717.7 18,018.4 18,018.4- interest 498.9 358.6 605.1 367.8 1,830.4 44.6Finance lease obligation 11.8 11.8 35.5 131.7 190.8 146.0Payables 8,324.0 – – – 8,324.0 8,324.0Financial guarantee contracts 55.3 25.1 55.0 13.3 148.7 0.3Derivative liabilities- interest rate swap contracts 11.0 11.0 2.4 (3.7) 20.7 15.8
15,174.0 2,274.0 6,858.2 4,226.8 28,533.0 26,549.1

Sime Darby BerhadAnnual Report 2016Innovating for the Future3 1 4
NOTES TO THE FINANCIAL STATEMENTS
For the financial year ended 30 June 2016 (continued)Amounts in RM million unless otherwise stated
55 Financial Risk Management (continued)
Details of each financial risk are as follows: (continued)
d. Liquidity and cash flow risk (continued)The undiscounted contractual cash flows of the Group’s and of the Company’s financial liabilities as at 30 June are as follows: (continued)
Company2016
On demand or within 1
year
Between1 and 2
years
Between2 and 5
yearsAbove
5 years
Total contractual
cash flows
Total carrying amount
Borrowings- principal 1,000.0 – – 700.0 1,700.0 1,700.0- interest 53.0 29.3 88.0 130.8 301.1 7.4Amounts due to subsidiaries- principal 0.1 1,605.9 – 1,605.9 3,211.9 3,211.9- interest 85.8 72.0 158.5 83.5 399.8 36.2Payables 5.2 – – – 5.2 5.2Financial guarantee contracts 429.3 435.3 218.7 – 1,083.3 8.8
1,573.4 2,142.5 465.2 2,520.2 6,701.3 4,969.5
2015
Borrowings- principal 200.0 1,000.0 – 700.0 1,900.0 1,900.0- interest 77.4 53.0 88.1 160.3 378.8 7.7Amounts due to subsidiaries 3,052.4 – – – 3,052.4 3,052.4Payables 5.0 – – – 5.0 5.0Financial guarantee contracts 1,996.7 408.8 623.2 – 3,028.7 16.1
5,331.5 1,461.8 711.3 860.3 8,364.9 4,981.2
56 Restatement on Change in Accounting Policy
During the financial year, the Group changed its accounting policy for bearer plants to be in line with the accounting requirements of FRS 116 – Property, Plant and Equipment (see Note 2(a)). The change in accounting policy has been applied retrospectively and has resulted in:
a. the reclassification of bearer plants from biological assets to property, plant and equipment; and
b. the capitalisation and subsequent depreciation of bearer plants and the tax effect.

Sime Darby Berhad 3 1 5Annual Report 2016 Financial Reports
56 Restatement on Change in Accounting Policy (continued)
a. Impact of change in accounting policy on Consolidated Statement of Profit or Loss
Financial year ended 30 June 2016
Financial year ended 30 June 2015
Previous policy
Adjust-ments
As presented
Previously stated
Adjust-ments As restated
Operating expenses (42,422.4) 22.6 (42,399.8) (41,607.4) 142.7 (41,464.7)
Included in operating expenses:- replanting expenditure (335.2) 335.2 – (279.6) 279.6 –- other expenses – – – (47.8) 47.8 –- depreciation of property,
plant and equipment (1,330.3) (301.0) (1,631.3) (1,162.5) (173.9) (1,336.4)- write offs of property, plant
and equipment (19.1) (11.6) (30.7) (35.0) (10.8) (45.8)
Operating profit 3,044.5 22.6 3,067.1 3,399.0 142.7 3,541.7
Profit before tax 2,793.2 22.6 2,815.8 3,002.7 142.7 3,145.4Tax expense (223.8) 8.2 (215.6) (567.0) (29.5) (596.5)Profit for the financial year 2,569.4 30.8 2,600.2 2,435.7 113.2 2,548.9
Attributable to owners of:- the Company 2,378.0 30.8 2,408.8 2,312.8 117.2 2,430.0- perpetual sukuk 33.7 – 33.7 – – –- non-controlling interests 157.7 – 157.7 122.9 (4.0) 118.9
2,569.4 30.8 2,600.2 2,435.7 113.2 2,548.9
Sen Sen Sen Sen Sen SenEarnings per share:- Basic 37.9 0.5 38.4 37.7 1.9 39.6- Diluted 37.9 0.5 38.4 37.7 1.9 39.6

Sime Darby BerhadAnnual Report 2016Innovating for the Future3 1 6
NOTES TO THE FINANCIAL STATEMENTS
For the financial year ended 30 June 2016 (continued)Amounts in RM million unless otherwise stated
56 Restatement on Change in Accounting Policy (continued)
b. Impact of change in accounting policy on Consolidated Statement of Financial Position
As at 30 June 2016 As at 30 June 2015 As at 1 July 2014
Previous policy
Adjust-ments
As presented
Previously stated
Adjust-ments
As restated
Previously stated
Adjust-ments
As restated
Non-current assets
Property, plant and equipment 17,253.5 7,203.0 24,456.5 16,564.5 6,462.3 23,026.8 14,346.7 2,821.8 17,168.5
Biological assets 6,688.4 (6,643.4) 45.0 5,940.2 (5,931.4) 8.8 2,534.1 (2,534.1) –
Current assetsBiological assets 123.4 (106.6) 16.8 142.0 (100.5) 41.5 – – –
EquityRetained profit 18,858.8 12.3 18,871.1 18,049.4 (18.5) 18,030.9 17,948.4 (135.7) 17,812.7Non-controlling
interest 985.2 (21.0) 964.2 1,024.4 (21.0) 1,003.4 876.7 (17.0) 859.7
Non-current liabilities
Deferred tax liabilities 2,196.7 461.7 2,658.4 2,116.5 469.9 2,586.4 493.4 440.4 933.8
c. Impact of change in accounting policy on Consolidated Statement of Cash Flows
Financial year ended 30 June 2016
Financial year ended 30 June 2015
Previous policy
Adjust-ments
As presented
Previously stated
Adjust-ments As restated
Profit for the financial year 2,569.4 30.8 2,600.2 2,435.7 113.2 2,548.9Depreciation and amortisation 1,398.5 301.0 1,699.5 1,216.0 173.9 1,389.9Write offs of property, plant and
equipment 19.1 11.6 30.7 35.0 10.8 45.8Tax expense 223.8 (8.2) 215.6 567.0 29.5 596.5Net cash from operations 3,324.2 335.2 3,659.4 3,021.2 327.4 3,348.6
Investing activitiesPurchase of property, plant and
equipment (1,932.9) (335.2) (2,268.1) (1,581.5) (327.4) (1,908.9)Net cash used in investing
activities (1,759.0) (335.2) (2,094.2) (7,268.5) (327.4) (7,595.9)
Net change in cash and cash equivalents (750.4) – (750.4) (902.7) – (902.7)

Sime Darby Berhad 3 1 7Annual Report 2016 Financial Reports
57 Contingent Liabilities and Commitments
Contingent liabilities and commitments are as follows: a. Guarantees
In the ordinary course of business, the Group may obtain surety bonds and letters of credit, which the Group provides to customers to secure advance payment, performance under contracts or in lieu of retention being withheld on contracts. A liability would only arise in the event the Group fails to fulfill its contractual obligations.
The Company has also provided performance guarantees to customers of certain subsidiaries to secure performance under contracts or in lieu of retention withheld on contracts.
The outstanding guarantees as at 30 June are as follows:
Group Company2016 2015 2016 2015
Performance and advance payment guarantees to customers of:- subsidiaries – – 1,581.8 1,581.8- the Group 2,233.9 2,250.6 – –
2,233.9 2,250.6 1,581.8 1,581.8
In addition, the Group guarantees the payment from its customers under a risk sharing arrangement with a third party leasing company in connection with the sale of its equipment up to a pre-determined amount. As at 30 June 2016, the total outstanding risk sharing amount on which the Group has an obligation to pay the leasing company should the customers default, amounted to RM258.1 million (2015: RM208.0 million) (see Note 55 (c)).
b. ClaimsAs at 30 June 2016, claims against the Group not taken up in the statements of financial position amounted to RM11.1 million (2015: RM8.4 million). These claims include disputed amounts for the supply of goods and services.
There were no claims against the Company as at 30 June 2016 (2015: Nil). c. Capital commitments
Group2016 2015
Authorised capital expenditure not provided for in the financial statements:Property, plant and equipment- contracted 504.7 700.2- not contracted 2,295.8 3,092.8
2,800.5 3,793.0Other capital expenditure- contracted 85.9 185.6- not contracted 128.0 15.6
3,014.4 3,994.2
Capital commitments by segment:Plantation 1,678.8 1,557.3Industrial 159.1 159.9Motors 680.2 1,169.4Property 69.9 98.4Energy & Utilities 424.0 1,009.2Others 2.4 –
3,014.4 3,994.2
The Company does not have any capital commitment as at 30 June 2016 (2015: Nil).

Sime Darby BerhadAnnual Report 2016Innovating for the Future3 1 8
NOTES TO THE FINANCIAL STATEMENTS
For the financial year ended 30 June 2016 (continued)Amounts in RM million unless otherwise stated
57 Contingent Liabilities and Commitments (continued)
Contingent liabilities and commitments are as follows: (continued)
d. Leases
Group2016 2015
The future minimum lease payments under non-cancellable operating leases are as follows:
- due no later than one year 314.2 347.5- due later than one year but not later than five years 634.2 922.3- due later than five years 535.4 376.3
1,483.8 1,646.1 The Company does not have any non-cancellable operating lease as at 30 June 2016 (2015: Nil).
e. Plasma PlantationThe Group is committed to develop a total of 56,099 (2015: 55,560) hectares of oil palm plantation for plasma farmers in Indonesia. A total of 45,801 (2015: 43,843) hectares have been developed of which about 36,408 (2015: 35,712) hectares have been handed over to plasma farmers.
58 Material Litigation
The material litigations outstanding are as follows:
a. Qatar Petroleum Project (QP Project), Maersk Oil Qatar Project (MOQ Project) and the Marine Project Civil Suits (O&G Suit)On 23 December 2010, Sime Darby Berhad, (SDE), Sime Darby Energy Sdn Bhd, Sime Darby Marine Sdn Bhd and Sime Darby Marine (Hong Kong) Pte Ltd (collectively, the Plaintiffs) filed a civil suit in the High Court against Dato’ Seri Ahmad Zubair @ Ahmad Zubir Hj Murshid, Dato’ Mohamad Shukri Baharom, Abdul Rahim Ismail, Abdul Kadir Alias and Mohd Zaki Othman (collectively, the Defendants) claiming, inter alia, damages arising from the Defendants’ negligence and breaches of duty in relation to the QP Project, the MOQ Project and the project relating to the construction of a derrick lay barge known as the Marine Project. The aggregate amount claimed was RM93.3 million and USD78.8 million (equivalent to RM316.4 million) together with general and aggravated damages to be assessed and other relief.
On 13 June 2014, all the Defendants consented to judgment being recorded on the Defendants’ liability (Consent Judgment) with damages to be assessed.
The Plaintiffs shall be permitted to enforce judgment against any of the Defendants upon the Plaintiffs recovering all claims from the respective employers for the QP Project and the MOQ Project and the proceeds of sale of the derrick lay barge, or after the expiry of 3 years from the date of final judgment, whichever is earlier.
The amount of damages will be assessed by the Court. The Plaintiffs have filed a Notice of Application for directions to assess damages and the matter has been fixed for hearing on 17 November 2016.
b. Bakun Hydroelectric Project (Bakun Project) and the Indemnity Agreement Civil Suits (Bakun Suit)On 24 December 2010, Sime Darby Berhad, Sime Engineering Sdn Bhd, Sime Darby Holdings Berhad and Sime Darby Energy Sdn Bhd (collectively, the Plaintiffs) filed a civil suit in the High Court against Dato’ Seri Ahmad Zubair @ Ahmad Zubir Hj Murshid, Dato’ Mohamad Shukri Baharom (DMS) and Abdul Rahim Ismail (collectively, the Defendants) claiming, inter alia, damages in connection with the Defendants’ negligence and breaches of duty in relation to the Package CW2-Main Civil Works for the Bakun Project and in respect of the Receipt, Discharge and Indemnity Agreement dated 12 January 2010 (Indemnity Agreement) given to DMS. The aggregate amount claimed was RM91.4 million together with general and aggravated damages to be assessed and other relief.

Sime Darby Berhad 3 1 9Annual Report 2016 Financial Reports
58 Material Litigation (continued)
The material litigations outstanding are as follows: (continued)
b. Bakun Hydroelectric Project (Bakun Project) and the Indemnity Agreement Civil Suits (Bakun Suit) (continued)On 13 June 2014, all the Defendants consented to judgment being recorded on the Defendants’ liability (Consent Judgment) with damages to be assessed.
The Plaintiffs shall be permitted to enforce judgment against any of the Defendants upon the Malaysia-China Hydro Joint Venture receiving full settlement from Sarawak Hidro Sdn Bhd or the Ministry of Finance and/or an assignee or successor in title thereof in relation to the Bakun Project, or after the expiry of 3 years from the date of final judgment, whichever is earlier.
The amount of damages will be assessed by the Court. The Plaintiffs have filed a Notice of Application for directions to assess damages and the matter has been fixed for hearing on 17 November 2016.
c. Emirates International Energy Services (EMAS)EMAS had on 13 January 2011, filed a civil suit in the Plenary Commercial Court in Abu Dhabi against Sime Darby Engineering Sdn Bhd (SDE) (First Suit) claiming payment of USD178.2 million comprising (a) a payment of USD128.2 million for commissions; and (b) a payment of USD50.0 million as “morale compensation”.
SDE filed its Statement of Defence and Counter Claim for the sum of AED100 million (equivalent to RM109.3 million) on 14 August 2011. SDE’s Statement of Defence contained a request for the matter to be referred to arbitration and on 22 August 2011, the Court dismissed the First Suit. EMAS did not appeal against the Court’s decision.
i. Proceedings at the Judicial Department of Abu DhabiOn 31 March 2012, EMAS filed the Second Suit against SDE at the Judicial Department of Abu Dhabi. The claim of USD178.2 million by EMAS was based on the same facts and grounds as the First Suit.
On 11 June 2013, the Court appointed a court expert specialising in commercial agencies. On 30 July 2013, the court expert released his report recommending SDE to pay EMAS compensation of approximately USD11.2 million. On 18 May 2014, despite the objection of the parties, the Court issued judgment for the sum of AED41.0 million (equivalent to RM44.8 million) against SDE.
The parties appealed to the Court of Appeal against the Court’s decision. On 2 July 2014, the Court of Appeal reversed the finding of the Court (“Court of Appeal’s Decision”).
On 1 September 2014, EMAS filed an appeal to the Supreme Court against the Court of Appeal’s Decision. On 25 December 2014, the Supreme Court dismissed EMAS’s appeal against the Court of Appeal’s Decision. By virtue of the Supreme Court’s decision, EMAS has effectively exhausted all its avenues in the Abu Dhabi courts in pursuing its claim against SDE.
ii. Proceedings at Dubai Chamber of Commerce and Industry (DIAC)On 24 January 2016, EMAS submitted a Request for Arbitration against SDE to DIAC. The amount claimed by EMAS as stated in the Request is AED41.0 million (equivalent to RM 44.8 million).
On 20 March 2016, SDE submitted its response to the Request. DIAC confirmed the appointment of the arbitrators and the tribunal chairman on 6 June 2016 and 26 June 2016, respectively.
During the preliminary meeting, the tribunal set the proceeding schedule and fixed the matter for hearing from 11 September 2017 to 15 September 2017.
d. Qatar Petroleum (QP) Statement of Claim On 15 August 2012, Sime Darby Engineering Sdn Bhd (SDE) filed a Statement of Claim at the Qatar Court against QP for the sum of QAR1.0 billion (equivalent to RM1.1 billion). The claim seeks the repayment of a liquidated performance bond, payment of outstanding invoices, compensation and additional costs incurred in relation to an offshore engineering project in Qatar undertaken by SDE pursuant to a contract dated 27 September 2006.
On 15 May 2014, a panel of 3 experts were appointed to assist the Court. On 1 April 2015, the experts submitted their report and recommended that SDE be compensated in the sum of QAR13.5 million (equivalent to RM14.9 million) (Expert Report). At the hearing on 14 April 2015, the parties submitted their objections to the Expert Report.

Sime Darby BerhadAnnual Report 2016Innovating for the Future3 2 0
NOTES TO THE FINANCIAL STATEMENTS
For the financial year ended 30 June 2016 (continued)Amounts in RM million unless otherwise stated
58 Material Litigation (continued)
The material litigations outstanding are as follows: (continued)
d. Qatar Petroleum (QP) Statement of Claim (continued)On 8 June 2016, the experts submitted their 2nd report and recommended that SDE be compensated the sum of QAR12.9 million (Expert 2nd Report). At the hearing on 23 June 2016, the parties submitted their objections to the Expert 2nd Report. On 21 July 2016, the Court delivered its judgment and ordered QP to pay the sum of QAR12.9 million (equivalent to RM14.2 million) to SDE (Judgment). On 24 August 2016, SDE filed enforcement proceedings against QP to enforce the Judgment. The matter is fixed for hearing on 18 October 2016. On 25 September 2016, SDE filed an appeal to the Court of Appeal against the Judgment sum and the appeal has been fixed for hearing on 25 October 2016.
e. Oil and Natural Gas Corporation Ltd (ONGC) (O5WHP Project) Sime Darby Engineering Sdn Bhd (SDE) and Swiber Offshore Construction Pte Ltd (SOC) entered into a Consortium Agreement dated 23 February 2010 (CA) to govern their relationship as a Consortium in relation to the execution and performance of the 05 Well Head Platform Project (05WHP Project) awarded by ONGC. A contract dated 26 February 2010 (Contract) was executed for a total contract price of USD188.9 million.
Disputes and differences relating to the 05WHP Project have arisen between the Consortium and ONGC and the Consortium has invoked the referral of the dispute to arbitration pursuant to the Contract. SDE’s portion of the Consortium’s claim is circa USD32.5 million. The Consortium and ONGC agreed to refer the dispute to an Outside Expert Committee (OEC).
On 2 December 2014, the OEC issued its report, recommending USD12 million in full and final settlement in favour of the Consortium, of which USD6.7 million (equivalent to RM27.0 million) was apportioned to SDE and USD5.3 million (equivalent to RM21.2 million) to SOC. On 20 March 2015, the Consortium informed ONGC of its objection to the OEC’s recommendation. On 19 April 2015, ONGC rejected the Consortium’s request.
On 21 December 2015, the Consortium issued a notice to ONGC of its intention to proceed with arbitration. During the preliminary meeting held on 13 July 2016 in Mumbai, the tribunal set the proceedings schedule and the next procedural meeting has been fixed on 17 December 2016.
f. Oil and Natural Gas Corporation Ltd (ONGC) (B-193 Process Platform) Sime Darby Engineering Sdn Bhd (SDE) and Swiber Offshore Construction Pte Ltd (SOC) entered into a Consortium Agreement dated 3 July 2010 (CA) to govern their relationship as a Consortium to undertake works relating to the B-193 Process Platform Project (PP Project) awarded by ONGC. A contract dated 3 July 2010 (Contract) was executed for a total contract price of USD618.4 million.
On 1 June 2016, the Consortium initiated arbitration proceedings against ONGC and nominated its arbitrator. SDE’s portion of the Consortium’s claim is circa USD76 million. ONGC has failed to submit its response to the Consortium’s notice of arbitration.
g. Malaysia Marine and Heavy Engineering Sdn Bhd (MMHE) Notice of ArbitrationMMHE and Sime Darby Engineering Sdn Bhd (SDE) entered into a Sale and Purchase Agreement dated 25 August 2011 (SPA) for the disposal of SDE’s oil and gas business to MMHE for a consideration of RM393.5 million and subsequently entered into a Supplemental Agreement dated 30 March 2012 (SSPA) to vary certain terms and conditions of the SPA.
The SSPA provides, inter alia, that the fabrication of KBB Topsides Contract No. KPOC/COC/2009/015 for the Kebabangan Northern Hub Development (KPOC Project) between Kebabangan Petroleum Operating Company Sdn Bhd and SDE dated 20 September 2011 shall be novated by SDE to MMHE with effect from 31 March 2012 for a consideration of RM20.0 million.
On 17 March 2015, SDE received a Notice of Arbitration dated 16 March 2015 (Notice) from MMHE to refer the disputes to arbitration before the Regional Centre for Arbitration Kuala Lumpur (KLRCA) in accordance with the Rules of Arbitration of the KLRCA. The claim from MMHE as stated in the Notice is RM56.9 million.
KLRCA has fixed the matter for hearing from 7 November 2016 to 18 November 2016.

Sime Darby Berhad 3 2 1Annual Report 2016 Financial Reports
58 Material Litigation (continued)
The material litigations outstanding are as follows: (continued)
h. Claim against PT Anzawara SatriaOn 11 May 2006, PT Sajang Heulang (PT SHE), a subsidiary of Sime Darby Plantation Sdn Bhd filed legal action in the District Court of Kotabaru against PT Anzawara Satria (PT AS) claiming for the surrender of approximately 60 hectares of land forming part of Hak Guna Usaha (HGU) 35 belonging to PT SHE on which PT AS had allegedly carried out illegal coal mining activities.
On 5 March 2006, the District Court of Kotabaru ruled in favour of PT AS and declared that HGU 35 was defective and had no force of law and that PT AS had the right to conduct mining activities on the said land (District Court Kotabaru Decision). PT SHE appealed to the High Court of Kalimantan Selatan at Banjarmasin against the District Court Kotabaru Decision. On 4 December 2007, the High Court of Kalimantan Selatan at Banjarmasin upheld the District Court Kotabaru Decision (1st High Court Decision). On 12 February 2008, PT SHE appealed to the Supreme Court of Indonesia against the 1st High Court Decision. On 10 March 2011, the Supreme Court ruled in favour of PT AS and ordered PT SHE to surrender 2,000 hectares of land in Desa Bunati to PT AS (1st Judicial Review Decision).
Meanwhile, on 24 May 2006, PT AS claimed in the State Administration Court Banjarmasin for an order that the mining rights held by PT AS superseded the HGU 35 held by PT SHE and that the said HGU 35 measuring approximately 2,128 hectares was improperly issued to PT SHE. On 26 September 2006, the State Administration Court Banjarmasin ruled in favour of PT SHE and dismissed PT AS’s claim (State Administration Court Banjarmasin Decision). PT AS appealed to the High Court of State Administration at Jakarta against the State Administration Court Banjarmasin Decision. On 19 February 2007, the High Court of State Administration at Jakarta ruled in favour of PT AS and nullified PT SHE’s HGU 35 (2nd High Court Decision). On 9 December 2009, PT SHE appealed to the Supreme Court against the 2nd High Court Decision. On 26 October 2010, the Supreme Court declared PT SHE as the lawful owner of HGU 35 (2nd Judicial Review Decision).
On 7 November 2011, PT SHE filed judicial review proceedings (3rd Judicial Review) before the Supreme Court seeking a decision on the conflicting decisions comprised by the 1st and the 2nd Judicial Review Decisions. On 28 December 2012, the Supreme Court dismissed the 3rd Judicial Review on the ground that the application could not be determined by another judicial review decision.
On 27 March 2013, PT AS commenced execution of the 1st Judicial Review Decision and in carrying out the execution proceedings, felled oil palm trees and destroyed buildings and infrastructure, resulting in damage to approximately 1,500 hectares of land.
On 23 April 2014, PT SHE filed a claim at the District Court of Batu Licin against PT AS for the sum of IDR672.8 billion (approximately RM205.4 million) for loss and/or damage caused by PT AS in executing the 1st Judicial Review Decision.
On 20 January 2015, the District Court of Batu Licin decided in favour of PT SHE and awarded damages in the sum of IDR69.9 billion (approximately RM21.4 million) and on 13 February 2015 issued a written decision (District Court Batu Licin Decision). On 29 January 2015, PT AS filed an appeal to the High Court of Kalimantan Selatan, Banjarmasin against the District Court Batu Licin Decision.
On 10 February 2016, the High Court of Kalimantan Selatan, Banjarmasin ruled in favour of PT AS on the ground that the same subject matter (claim for execution/compensation) and the same object matter (being 60 hectares of land in Desa Bunati) had been deliberated and decided by the High Courts and Supreme Courts. Thus, PT SHE is not entitled to bring the same action before the District Court of Batu Licin (3rd High Court Decision).
On 22 February 2016, PT SHE filed an appeal to the Supreme Court against the 3rd High Court Decision. On 28 March 2016, PT AS filed its reply to PT SHE’s appeal.

Sime Darby BerhadAnnual Report 2016Innovating for the Future3 2 2
NOTES TO THE FINANCIAL STATEMENTS
For the financial year ended 30 June 2016 (continued)Amounts in RM million unless otherwise stated
58 Material Litigation (continued)
The material litigations outstanding are as follows: (continued)
i. New Britain Palm Oil Limited (“NBPOL”) v. Masile Incorporated Land Group (“Masile”), NBPOL v. Rikau Incorporated Land Group (“Rikau”) & NBPOL v. Meloks Incorporated Land Group (“Meloks”) On 30 August 2011 (prior to the acquisition of NBPOL by Sime Darby Plantation Sdn Bhd on 2 March 2015), NBPOL initiated three separate legal actions against Masile, Rikau and Meloks (collectively, Defendants) in the National Court of Justice at Waigani, Papua New Guinea (Court). All three actions relate to the same cause of action in that the Defendants had defaulted in their obligations to surrender the Special Agricultural Business Leases (SABLs) to NBPOL for registration of the sub-leases despite having received benefits under the sub-lease agreements (SLAs), which include, rent paid by NBPOL for the customary land of 3,720 hectares (Land), royalties for the fresh fruit bunches harvested from the Land and 31,250 ordinary shares in NBPOL issued to each of the Defendants. NBPOL sought orders for specific performance requiring the Defendants forthwith deliver to NBPOL the SABLs to enable the sub-leases to be registered in accordance with the Land Registration Act.
By an Amended Statement of Claim dated 3 November 2014, in addition to NBPOL’s claim for specific performance for the Defendants to surrender their SABLs, in the alternative, NBPOL claimed compensation for costs incurred by NBPOL in developing the Land into an oil palm estate amounting to PGK30.7 million (equivalent to RM38.9 million), compensation for appreciation of the value of the Land due to the development by NBPOL and compensation for 31,250 ordinary shares in NBPOL issued to each of the Defendants pursuant to the SLAs.
The Defendants in turn via their Defence and Cross-Claim filed on 23 April 2012, Amended Defence and Cross-Claim filed on 9 September 2012 and Further Amended Defence and Cross-Claim filed on 11 December 2014, cross-claimed amongst others, that the SLAs were unfair and inequitable agreements, and should be declared invalid, void and of no effect as well as damages for environmental damage and trespass to property by NBPOL.
Trial relating to the Meloks claim commenced from 18 July 2016 to 22 July 2016 and was adjourned to 1 November 2016 to 7 November 2016.
59 Holding Companies
The Directors regard Permodalan Nasional Berhad as its immediate holding company and Yayasan Pelaburan Bumiputra as its ultimate holding company. Both companies are incorporated in Malaysia.
60 List of Subsidiaries, Joint Ventures and Associates
Subsidiaries, joint ventures and associates which are active as at 30 June 2016 are as follows:
Name of companyCountry of incorporation
Group’seffective
interest (%) Auditors Principal activities2016 2015
Plantation – SubsidiariesChartquest Sdn Bhd Malaysia 61.1 61.1 1 Cultivation of oil palmChermang Development (Malaya) Sdn
Bhd Malaysia 83.9 83.9 1 )
)Investment holdingConsolidated Plantations Berhad Malaysia 100.0 100.0 1 )
Eminent Platform Sdn Bhd Malaysia 100.0 100.0 1 )Golden Hope Overseas Sdn Bhd Malaysia 100.0 100.0 1 )Guthrie Industries Malaysia Sendirian
BerhadMalaysia 100.0 100.0 1 Cultivation of oil palm and
processing of palm oil and palm kernel

Sime Darby Berhad 3 2 3Annual Report 2016 Financial Reports
60 List of Subsidiaries, Joint Ventures and Associates (continued)
Subsidiaries, joint ventures and associates which are active as at 30 June 2016 are as follows: (continued)
Name of companyCountry of incorporation
Group’seffective
interest (%) Auditors Principal activities2016 2015
Plantation – Subsidiaries (continued)Guthrie International Investments (L)
LimitedMalaysia 100.0 100.0 1 )
)Investment holdingKumpulan Jelei Sendirian Berhad Malaysia 100.0 100.0 1 )
Mostyn Palm Processing Sdn Bhd Malaysia 100.0 100.0 1 )Sanguine (Malaysia) Sdn Bhd Malaysia 100.0 100.0 1 Cultivation of oil palmSime Darby Agri-Bio Sdn Bhd Malaysia 100.0 100.0 1 Manufacturing of rat baits
and trading of agricultural related products
Sime Darby Austral Holdings Berhad Malaysia 100.0 100.0 1 Investment holdingSime Darby Austral Sdn Bhd Malaysia 60.0 60.0 1 Processing of palm oil and
palm kernelSime Darby Beverages Sdn Bhd Malaysia 100.0 100.0 1 Fruit cultivation, processing
of pink guava puree and juices
Sime Darby Biodiesel Sdn Bhd Malaysia 100.0 100.0 1 Production of biodiesel and related products
Sime Darby Biotech Laboratories Sdn Bhd
Malaysia 100.0 100.0 1 Provision of oil palm tissue culture services
Sime Darby Consulting Sdn Bhd Malaysia 100.0 100.0 1 Investment holding Sime Darby Foods & Beverages
Marketing Sdn Bhd Malaysia 100.0 100.0 1 Distribution and marketing of
cooking oil, tocotrienols, guava juices and palm related products
Sime Darby Futures Trading Sdn Bhd Malaysia 100.0 100.0 1 Trading of crude palm oil and palm oil products and sub-marketing agent of refined products
Sime Darby Jomalina Sdn Bhd Malaysia 100.0 100.0 1 Operation of palm oil refineries and kernel crushing plant
Sime Darby Kempas Sdn Bhd Malaysia 100.0 100.0 1 Processing and marketing of edible oil and related products
Sime Darby Latex Sdn Bhd Malaysia 100.0 100.0 1 Processing of latex and other rubber related products
Sime Darby Plantation (Sabah) Sdn Bhd
Malaysia 100.0 100.0 1 )) Cultivation of oil palm and
processing of palm oil and palm kernelSime Darby Plantation (Sarawak)
Sdn Bhd Malaysia 100.0 100.0 1 )
)Sime Darby Plantation Childcare
Centre Sdn Bhd Malaysia 100.0 100.0 1 Provision of childcare services
to employeesSime Darby Plantation Intellectual
Property Sdn Bhd (formerly known as Sime Darby Plantation Investment (Cameroon) Sdn Bhd)
Malaysia 100.0 100.0 1 Registered holder of commercial patents, trademarks, copyrights, trade security, IP rights

Sime Darby BerhadAnnual Report 2016Innovating for the Future3 2 4
60 List of Subsidiaries, Joint Ventures and Associates (continued)
Subsidiaries, joint ventures and associates which are active as at 30 June 2016 are as follows: (continued)
NOTES TO THE FINANCIAL STATEMENTS
For the financial year ended 30 June 2016 (continued)Amounts in RM million unless otherwise stated
Name of companyCountry of incorporation
Group’seffective
interest (%) Auditors Principal activities2016 2015
Plantation – Subsidiaries (continued)Sime Darby Plantation Sdn Bhd Malaysia 100.0 100.0 1 Production and processing
of palm oil, palm kernel, rubber and other palm oil and rubber related products and investment holding
Sime Darby Plantation Thailand Sdn Bhd
Malaysia 100.0 100.0 1 Investment holding
Sime Darby Research Sdn Bhd Malaysia 100.0 100.0 1 Research and development services on tropical agriculture to group companies
Sime Darby Seeds & Agricultural Services Sdn Bhd
Malaysia 100.0 100.0 1 Agricultural research and advisory services and production of oil palm seeds and seedlings
Sime Darby Technology Centre Sdn Bhd Malaysia 100.0 100.0 1 Provision of research and development services in biotechnology and agriculture
The China Engineers (Malaysia) Sdn Bhd Malaysia 100.0 100.0 1 Cultivation of oil palm and processing of palm oil and palm kernel
Vertical Drive Sdn Bhd Malaysia 100.0 100.0 1 Investment holdingWangsa Mujur Sdn Bhd Malaysia 72.5 72.5 1 ) Cultivation of oil palm and
processing of palm oil and palm kernel
PT Aneka Intipersada
Indonesia 100.0 100.0 2 ))
PT Aneka Sawit Lestari Indonesia 100.0 100.0 2 Production of oil palm planting materials
PT Anugerah Sumbermakmur Indonesia 100.0 100.0 2 )Investment holding
PT Asricipta Indah Indonesia 90.0 90.0 2 )
PT Bahari Gembira Ria Indonesia 99.0 99.0 2 ) Cultivation of oil palm and processing of palm oil and palm kernel
PT Bersama Sejahtera Sakti Indonesia 91.1 91.1 2 )PT Bhumireksa Nusasejati Indonesia 100.0 100.0 2 )PT Bina Sains Cemerlang Indonesia 100.0 100.0 2 )PT Budidaya Agro Lestari Indonesia 100.0 100.0 2 Cultivation of oil palmPT Golden Hope Nusantara Indonesia 100.0 100.0 2 Processing of palm oil
productsPT Guthrie Pecconina Indonesia Indonesia 100.0 100.0 2 Cultivation of oil palm and
processing of palm oil and palm kernel
PT Indo Sukses Lestari Makmur Indonesia 95.0 95.0 2 Cultivation of rubber PT Indotruba Tengah Indonesia 50.0 50.0 2 Cultivation of oil palm and
processing of palm oil and palm kernel
PT Kartika Inti Perkasa Indonesia 60.0 60.0 2 Investment holding

Sime Darby Berhad 3 2 5Annual Report 2016 Financial Reports
60 List of Subsidiaries, Joint Ventures and Associates (continued)
Subsidiaries, joint ventures and associates which are active as at 30 June 2016 are as follows: (continued)
Name of companyCountry of incorporation
Group’seffective
interest (%) Auditors Principal activities2016 2015
Plantation – Subsidiaries (continued)PT Kridatama Lancar Indonesia 100.0 100.0 2 )
Cultivation of oil palm and processing of palm oil and palm kernel
PT Ladangrumpun Suburabadi Indonesia 100.0 100.0 2 )PT Laguna Mandiri Indonesia 88.6 88.6 2 )PT Lahan Tani Sakti Indonesia 100.0 100.0 2 )PT Langgeng Muaramakmur Indonesia 100.0 100.0 2 )PT Minamas Gemilang Indonesia 100.0 100.0 2 Investment holdingPT Mitra Austral Sejahtera Indonesia 65.0 65.0 2 Cultivation of oil palm and
processing of palm oil and palm kernel
PT Muda Perkasa Sakti Indonesia 100.0 100.0 2 Investment holdingPT Padang Palma Permai Indonesia 100.0 100.0 2 ) Cultivation of oil palm and
processing of palm oil and palm kernel
PT Paripurna Swakarsa Indonesia 100.0 100.0 2 ))
PT Perkasa Subur Sakti Indonesia 100.0 100.0 2 Processing of palm oil and palm kernel
PT Perusahaan Perkebunan Industri dan Niaga Sri Kuala
Indonesia 100.0 100.0 2 Cultivation of oil palm
PT Sajang Heulang Indonesia 100.0 100.0 2 ) Cultivation of oil palm and processing of palm oil and palm kernel
PT Sandika Natapalma
Indonesia 100.0 100.0 2 ))
PT Sime Agri Bio Indonesia 100.0 100.0 2 Trading of agricultural related products
PT Sime Indo Agro Indonesia 100.0 100.0 2 Cultivation of oil palm and processing of palm oil and palm kernel
PT Sritijaya Abaditama Indonesia 60.0 60.0 2 Investment holdingPT Swadaya Andika Indonesia 100.0 100.0 2 ) Cultivation of oil palm and
processing of palm oil and palm kernel
PT Tamaco Graha Krida Indonesia 90.0 90.0 2 )PT Teguh Sempurna Indonesia 100.0 100.0 2 )PT Timbang Deli Indonesia Indonesia 48.9 48.9 2 Production of oil palm seeds
and cultivation of rubberPT Tunggal Mitra Plantations Indonesia 60.0 60.0 2 Cultivation of oil palm and
processing of palm oil and palm kernel
New Britain Plantation Services Pte Ltd Singapore 100.0 100.0 2 Investment and management of oil palm plantations and seed production
Sime Darby Edible Products Limited Singapore 100.0 100.0 2 Marketing of edible oils and related products
Sime Darby Plantation Europe Ltd Singapore 100.0 100.0 2 )
Investment holdingSime Darby Plantation Investment (Liberia) Private Limited
Singapore 100.0 100.0 2 ))
Ultra Oleum Pte Ltd Singapore 100.0 100.0 2 )Verdant Bioscience Pte Ltd Singapore 52.0 52.0 2 Agriculture science and
research

Sime Darby BerhadAnnual Report 2016Innovating for the Future3 2 6
60 List of Subsidiaries, Joint Ventures and Associates (continued)
Subsidiaries, joint ventures and associates which are active as at 30 June 2016 are as follows: (continued)
NOTES TO THE FINANCIAL STATEMENTS
For the financial year ended 30 June 2016 (continued)Amounts in RM million unless otherwise stated
Name of companyCountry of incorporation
Group’seffective
interest (%) Auditors Principal activities2016 2015
Plantation – Subsidiaries (continued)Sime Darby China Oils & Fats Company
Limited Hong Kong 100.0 100.0 2 )
)
Investment holding
Sime Darby Hong Kong Nominees Limited
Hong Kong 100.0 100.0 2 ))
Sime Darby International Investments Limited
Cayman Islands 100.0 100.0 4 ))
Sime Darby Plantation Holdings (Asia Pacific)
Cayman Islands 100.0 100.0 4 ))
Sime Darby Plantation Holdings (Cayman Islands)
Cayman Islands 100.0 100.0 4 ))
Sime Darby Edible Products India Private Limited
India 100.0 100.0 2 Provision of market support services
Sime Darby Plantation (Liberia) Inc Liberia 100.0 100.0 3 Cultivation of oil palm and rubber
Golden Hope Overseas Capital Mauritius 100.0 100.0 2 )Investment holdingMulligan International BV Netherlands 100.0 100.0 2 )
Sime Darby Netherlands BV Netherlands 100.0 100.0 2 )Sime Darby Unimills BV Netherlands 100.0 100.0 2 Processing of edible oil and
related productsKula Palm Oil Limited Papua New
Guinea100.0 100.0 2 Cultivation of oil palm and
processing of palm oil and palm kernel
New Britain Palm Oil Limited Papua New Guinea
100.0 100.0 2 Investment holding, cultivation of oil palm and processing of palm oil and palm kernel
Poliamba Limited Papua New Guinea
100.0 100.0 2 Cultivation of oil palm and processing of palm oil and palm kernel
Ramu Agri-Industries Limited Papua New Guinea
100.0 100.0 2 Cultivation of oil palm and sugar cane, processing of palm oil, palm kernel, sugar and ethanol, cattle rearing and processing of beef
Guadalcanal Plains Palm Oil Limited Solomon Island 80.0 80.0 3 Cultivation of oil palm and processing of palm oil and palm kernel
Sime Darby Hudson And Knight (Proprietary) Limited
South Africa 100.0 100.0 3 Processing of edible oil and related products
Industrial Enterprises Co Ltd Thailand 99.9 99.9 2 Processing of soya bean oil and related products
Morakot Industries Public Company Limited
Thailand 99.9 99.9 2 Processing of edible oil and related products
Sime-Morakot Holdings (Thailand) Limited
Thailand 100.0 100.0 2 ))
Investment holdingThe China Engineers (Thailand)
Limited Thailand 99.9 99.9 2 )
)

Sime Darby Berhad 3 2 7Annual Report 2016 Financial Reports
60 List of Subsidiaries, Joint Ventures and Associates (continued)
Subsidiaries, joint ventures and associates which are active as at 30 June 2016 are as follows: (continued)
Name of companyCountry of incorporation
Group’seffective
interest (%) Auditors Principal activities2016 2015
Plantation – Subsidiaries (continued)New Britain Oils Ltd United
Kingdom100.0 100.0 2 )
) Processing of edible oil and related productsGolden Hope-Nha Be Edible Oils Co
LtdVietnam 51.0 51.0 2 )
)
Plantation – Joint VenturesEmery Oleochemicals (M) Sdn Bhd
groupMalaysia 50.0 50.0 3 Production of oleochemicals
and derivativesEmery Specialty Chemicals Sdn Bhd
groupMalaysia 50.0 50.0 3 Production of chemical
productsMybiomass Sdn Bhd Malaysia 30.0 30.0 3 Develop and pioneer high
value green chemicals biorefinery
Sime Darby TNBES Renewable Energy Sdn Bhd
Malaysia 51.0+ 51.0+ 1 Production of renewable energy using palm oil effluents
Guangzhou Keylink Chemicals Co Ltd China 43.5 43.5 3 Manufacturing of surface active agents
Rizhao Sime Darby Oils & Fats Co Ltd China 45.0 45.0 2 Storage of palm oil related products
Plantation – AssociatesBarlow Bulking Sdn Bhd Malaysia 32.0 32.0 3 Provision of bulking and
marketing facilities for edible oil producers and millers
Nescaya Maluri Sdn Bhd Malaysia 40.0 40.0 3 Investment holding and quarry licensing
Muang Mai Guthrie Public Co Ltd Thailand 49.0 49.0 3 Processing of rubberThai Eastern Trat Co Ltd Thailand 40.0 40.0 2 Operation of palm oil mill Verdezyne Inc United States
of America36.4 36.5 3 Production of drop-in
alternatives to petroleum-derived chemicals from palm-based products and by-products
Industrial – SubsidiariesShandong Equipment Malaysia Sdn
Bhd Malaysia 100.0 100.0 1 Sales and service support for
Shandong Engineering machinery
Sime Darby Electropack Sdn Bhd Malaysia 100.0 100.0 1 Manufacturing and assembly of generators, agricultural and industrial machinery
Sime Darby Industrial Academy Sdn Bhd
Malaysia 100.0 100.0 1 Training services
Sime Darby Industrial Holdings Sdn Bhd
Malaysia 100.0 100.0 1 Investment holding
Sime Darby Industrial Power Sdn Bhd Malaysia 91.2 91.2 1 Sale of generators, agricultural and industrial
machinery

Sime Darby BerhadAnnual Report 2016Innovating for the Future3 2 8
60 List of Subsidiaries, Joint Ventures and Associates (continued)
Subsidiaries, joint ventures and associates which are active as at 30 June 2016 are as follows: (continued)
NOTES TO THE FINANCIAL STATEMENTS
For the financial year ended 30 June 2016 (continued)Amounts in RM million unless otherwise stated
Name of companyCountry of incorporation
Group’seffective
interest (%) Auditors Principal activities2016 2015
Industrial – Subsidiaries (continued)Sime Darby Industrial Power Systems
Sdn Bhd Malaysia 100.0 100.0 1 Assembly and packaging of
generatorsSime Darby Industrial Sdn Bhd Malaysia 100.0 100.0 1 Sale, rental and assembly of
Caterpillar equipment and spare parts and service support
Sime Darby TMR Sdn Bhd Malaysia 100.0 100.0 1 Reconditioning of used equipment and machinery
Sime Kubota Sdn Bhd Malaysia 90.0 90.0 1 Assembly and distribution of Kubota agricultural machinery and other machinery and equipment
Site Technology Asia Pacific Sdn Bhd Malaysia 100.0 100.0 1 Supplying Global Positioning System (GPS)/digital work site positioning and machine control for heavy and highway construction applications under SITECH brand
Tractors Material Handling Sdn Bhd Malaysia 100.0 100.0 1 Sale of lift trucks and spare parts, and the rental and servicing of other material handling equipment
Tractors Petroleum Services Sdn Bhd Malaysia 100.0 100.0 1 Supply, repair and maintenance of Caterpillar engines and other equipment for the oil and gas industry, refurbishment of gas turbines and the sale and installation of pressure vessels
Sime Darby Eastern Investments Private Limited
Singapore 100.0 100.0 2 ))
Investment holdingSime Darby Eastern Limited Singapore 100.0 100.0 2 )Sime Darby Industrial Singapore Pte
LtdSingapore 100.0 100.0 2 )
)Tractors Singapore Limited Singapore 100.0 100.0 2 Sale, rental and assembly of
Caterpillar equipment and spare parts and service support
Foshan Sime Darby Elco Power Equipment Ltd
China 100.0 100.0 2 Wholesale of diesel generators and spare parts
Guangzhou Sime Darby SITECH Dealers Co Ltd
China 100.0 100.0 3 Sale, hire and servicing of survey equipment
Sime Darby CEL Machinery (Guangdong) Co Ltd
China 100.0 100.0 2 Sale of Caterpillar equipment and spare parts and service support

Sime Darby Berhad 3 2 9Annual Report 2016 Financial Reports
60 List of Subsidiaries, Joint Ventures and Associates (continued)
Subsidiaries, joint ventures and associates which are active as at 30 June 2016 are as follows: (continued)
Name of companyCountry of incorporation
Group’seffective
interest (%) Auditors Principal activities2016 2015
Industrial – Subsidiaries (continued)Sime Darby CEL Machinery (Guangxi)
Co LtdChina 100.0 100.0 2 Technical development
and consultation on machinery engineering and international business consultation
Sime Darby CEL Machinery (Hunan) Co Ltd
China 100.0 100.0 2 ))
Sale of Caterpillar equipment and spare parts and service support
Sime Darby CEL Machinery (Jiangxi) Co Ltd
China 100.0 100.0 2 ))
Sime Darby CEL Machinery (Xinjiang) Co Ltd
China 100.0 100.0 2 ))
Xiamen Sime Darby CEL Machinery Co Ltd
China 100.0 100.0 2 ))
Sime Darby CEL (South China) Limited Hong Kong 100.0 100.0 2 Investment holdingSime Darby Elco Power Systems
LimitedHong Kong 100.0 100.0 2 Distribution of Perkins engine
products and spare parts and provision of after-sales services
The China Engineers Limited Hong Kong 100.0 100.0 2 Sale of and after sales support for Caterpillar equipment
AC Haynes Investments Pty Ltd Australia 100.0 100.0 2 Crane hire Austchrome Pty Ltd Australia 100.0 100.0 2 Chroming and hydraulic
repairsDG Nominees Pty Ltd Australia 100.0 100.0 2 Auto glass supplier/installerHastings Deering (Australia) Limited Australia 100.0 100.0 2 Sale, rental and servicing
for Caterpillar products, hardchroming and hydraulic repair
Hastings Deering Property Services Pty Ltd
Australia 100.0 – 2 Leasing of properties
Haynes Mechanical Pty Ltd Australia 100.0 100.0 2 Labour hire/contracting, sale of mining machinery parts, service and repair and crane hire
Sime Darby Industrial Australia Pty Ltd Australia 100.0 100.0 2 Investment holdingTFP Engineering Pty Ltd Australia 95.0 70.0 2 Sale of mining machinery,
service and labour hireSime Darby Industrial (B) Sdn Bhd Brunei 70.0 70.0 3 Assembly, marketing and
distribution of agricultural and industrial equipment
CICA Limited Channel Islands
100.0 100.0 3 Supply of industrial equipment and after-sales services
Caltrac SAS New Caledonia 100.0 100.0 2 Sale of Caterpillar equipment and spare parts and service support

Sime Darby BerhadAnnual Report 2016Innovating for the Future3 3 0
60 List of Subsidiaries, Joint Ventures and Associates (continued)
Subsidiaries, joint ventures and associates which are active as at 30 June 2016 are as follows: (continued)
NOTES TO THE FINANCIAL STATEMENTS
For the financial year ended 30 June 2016 (continued)Amounts in RM million unless otherwise stated
Name of companyCountry of incorporation
Group’seffective
interest (%) Auditors Principal activities2016 2015
Industrial – Subsidiaries (continued)SCI Sime Darby Invest NC New Caledonia 100.0 100.0 2 Property investmentHastings Deering (PNG) Limited Papua New
Guinea100.0 100.0 2 )
) Sale of Caterpillar equipment and spare parts and service supportHastings Deering (Solomon Islands)
Limited Solomon
Islands100.0 100.0 3 )
)CICA Vietnam Company Limited Vietnam 100.0 100.0 2 Provision of consultancy and
services for installation, operation, repair and maintenance of industrial machines, equipment and vehicles
Industrial – Joint venturesTerberg Tractors Malaysia Sdn Bhd
groupMalaysia 50.0 50.0 1 Marketing, distributing
and servicing of Terberg terminal tractors
Wilpena Pty Ltd Australia 50.0 50.0 4 Sale of Caterpillar equipment and spare parts and service support
Mine Energy Solutions Pty Ltd Australia 50.0 – 2 Service provider for end-to-end energy solution to the mobile mining industry
Industrial – Associates APac Energy Rental Pte Ltd Singapore 30.0 30.0 3 Rental of generator setsFG Wilson Asia Pte Ltd Singapore 50.0 50.0 2 Sale and servicing of diesel
generator setsEnergy Power Systems Australia Pty
LtdAustralia 20.0 20.0 2 Distribution and rental of
Caterpillar engine and associated products
Nova Power Pty Ltd Australia 38.9 38.9 2 Provision of low emission power to support electricity distribution networks
Sitech Construction Systems Pty Ltd Australia 30.6 30.6 2 Sale and servicing of Trimble Technology construction products
Ultimate Positioning Group Pty Ltd Australia 29.4 29.4 2 Sale, hire and servicing of Trimble surveying equipment
Motors – SubsidiariesAuto Bavaria Sdn Bhd Malaysia 100.0 100.0 1 )
Investment holding Ford Malaysia Sdn Bhd Malaysia 51.0 51.0 1 )Hyundai-Sime Darby Berhad Malaysia 99.9 99.9 1 )Hyundai-Sime Darby Motors Sdn Bhd Malaysia 100.0 100.0 1 Sales and distribution of
passenger and light commercial vehicles and spare parts

Sime Darby Berhad 3 3 1Annual Report 2016 Financial Reports
60 List of Subsidiaries, Joint Ventures and Associates (continued)
Subsidiaries, joint ventures and associates which are active as at 30 June 2016 are as follows: (continued)
Name of companyCountry of incorporation
Group’seffective
interest (%) Auditors Principal activities2016 2015
Motors – Subsidiaries (continued)Inokom Corporation Sdn Bhd Malaysia 53.5 53.5 1 Manufacture and assembly
of light commercial and passenger vehicles, and contract assembly of motor vehicles
Jaguar Land Rover (Malaysia) Sdn Bhd Malaysia 60.0 60.0 1 Importation and distribution of motor vehicles and spare parts
Sime Darby Auto Bavaria Sdn Bhd Malaysia 100.0 100.0 1 Provision of management services and retail of motor vehicles, spare parts, accessories and provision of after-sales services and assembler of motor vehicles
Sime Darby Auto Britannia Sdn Bhd Malaysia 75.0 75.0 1 Motor vehicles dealershipSime Darby Auto ConneXion Sdn Bhd Malaysia 100.0 100.0 1 Distribution and retail of
motor vehicles and spare parts and provision of after-sales services
Sime Darby Auto Hyundai Sdn Bhd Malaysia 51.0 51.0 1 Sale of motor vehicles, spare parts and provision of after-sales services
Sime Darby Auto Imports Sdn Bhd Malaysia 100.0 100.0 1 Importation of motor vehicles and spare parts
Sime Darby Auto Performance Sdn Bhd Malaysia 70.0 70.0 1 Distribution and retail of motor vehicles, spare parts, accessories and provision of after-sales services
Sime Darby Auto Selection Sdn Bhd Malaysia 100.0 100.0 1 Sales of used motor vehicles and spare parts
Sime Darby Hyundai Integrated Sdn Bhd
Malaysia 51.0 51.0 1 Distribution of motor vehicles
Sime Darby Hyundai Sdn Bhd Malaysia 51.0 51.0 1 Investment holding and importation of motor vehicles
Sime Darby Motor Group (Taiwan) Sdn Bhd
Malaysia 100.0 100.0 1 )) Investment holding
Sime Darby Motors Sdn Bhd Malaysia 100.0 100.0 1 )Sime Darby Rent-A-Car Sdn Bhd Malaysia 100.0 100.0 1 Vehicle rentalEurope Automobiles Corporation
Holdings Pte Ltd Singapore 89.2 89.2 2 Investment holding
Performance Motors Limited Singapore 100.0 100.0 2 Motor vehicles dealership Performance Premium Selection
Limited Singapore 60.0 60.0 2 Retailer, wholesaler and
exporter of used carsSime Darby Motor Holdings Limited Singapore 100.0 100.0 2 Investment holding and
provision of management and auxiliary services

Sime Darby BerhadAnnual Report 2016Innovating for the Future3 3 2
60 List of Subsidiaries, Joint Ventures and Associates (continued)
Subsidiaries, joint ventures and associates which are active as at 30 June 2016 are as follows: (continued)
NOTES TO THE FINANCIAL STATEMENTS
For the financial year ended 30 June 2016 (continued)Amounts in RM million unless otherwise stated
Name of companyCountry of incorporation
Group’seffective
interest (%) Auditors Principal activities2016 2015
Motors – Subsidiaries (continued)Sime Darby Services Private Limited Singapore 100.0 100.0 2 Vehicle rental Sime Darby Singapore Limited Singapore 100.0 100.0 2 )
Investment holdingSime Singapore Limited Singapore 100.0 100.0 2 )Vantage Automotive Limited Singapore 100.0 100.0 2 Motor vehicles dealership Changsha Bow Yue Vehicle Services Co
LtdChina 100.0 100.0 2 Retail of motor vehicles and
spare parts and provision of after-sales services
Chengdu Bow Yue Used Cars Centre Co Ltd
China 100.0 100.0 2 Retail of used cars and provision of related services
Chengdu Bow Yue Vehicle Co Ltd China 100.0 100.0 2 Retail of motor vehicles and spare parts, provision of after-sales services and investment holding
Chongqing Bow Chuang Motor Sales & Services Co Ltd
China 100.0 100.0 2 Retail of motor vehicles and spare parts and provision of after-sales services
Guangdong Deda Bow Ma Motor Service Co Ltd
China 65.0 65.0 2 Retail of spare parts and provision of after-sales services for motor vehicles
Guangzhou Bow Yue Vehicle Trading Co Ltd
China 100.0 100.0 2 Retail of motor vehicles and spare parts
Hainan Bow Yue Vehicles Trading and Services Ltd
China 100.0 100.0 3 ))
Retail of motor vehicles and spare parts and provision of after-sales services
Hangzhou Sime Darby Motors Sales and Services Co Ltd
60.0 60.0 2 ))
Hangzhou Sime Darby Trading Co Ltd China 60.0 60.0 2 )Nanjing Sime Darby Motors Sales &
Services Co LtdChina 60.0 60.0 2 )
)Shanghai Sime Darby Motor Commerce
Co LtdChina 60.0 60.0 2 Retail of motor vehicles and
investment holdingShanghai Sime Darby Motor Sales and
Services Co LtdChina 60.0 60.0 2 Retail of motor vehicles and
spare parts and provision of after-sales services
Shantou Bow Yue Dehong Motors Services Co Ltd (formerly known as Shantou Dehong Bow Ma Motors Co Ltd)
China 60.0 60.0 2 Provision of after-sales services for motor vehicles and retail of spare parts
Shantou Bow Yue Vehicle Trading Co Ltd
China 100.0 100.0 2 )) Retail of motor vehicles and
spare partsShenzhen Bow Chuang Vehicle Trading Co Ltd
China 100.0 100.0 2 ))

Sime Darby Berhad 3 3 3Annual Report 2016 Financial Reports
60 List of Subsidiaries, Joint Ventures and Associates (continued)
Subsidiaries, joint ventures and associates which are active as at 30 June 2016 are as follows: (continued)
Name of companyCountry of incorporation
Group’seffective
interest (%) Auditors Principal activities2016 2015
Motors – Subsidiaries (continued)Shenzhen Sime Darby Motor
Enterprises Co LtdChina 100.0 100.0 2 Retail of spare parts and
provision of after-sales services for motor vehicles
Yunnan Bow Yue Vehicle Trading Co Ltd
China 65.0 65.0 2 )) Retail of motor vehicles and
spare parts and provision of after-sales services Yunnan Dekai Bow Ma Motors
Technology & Service Co Ltd China 65.0 65.0 3 )
)BMW Concessionaires (HK) Limited Hong Kong 100.0 100.0 2 Distribution and retail of
motor vehicles, provision of after-sales services and investment holding
Bow Ma Motors (South China) Limited Hong Kong 100.0 100.0 2 Investment holdingGoodwood Motors Limited Hong Kong 100.0 100.0 2 ) Distribution and retail of
motor vehiclesIsland Motors Limited Hong Kong 100.0 100.0 2 )Marksworth Limited Hong Kong 100.0 100.0 2 Investment holding Sime Darby Hongkong Finance Limited Hong Kong 100.0 100.0 2 Provision of intra-group
financial services Sime Darby Management Services
LimitedHong Kong 100.0 100.0 2 Property investment
Sime Darby Managing Agency (Hong Kong) Limited
Hong Kong 100.0 100.0 2 Insurance agency
Sime Darby Motor Group (HK) Limited Hong Kong 100.0 100.0 2 )Investment holding
Sime Darby Motor Group (PRC) Limited Hong Kong 100.0 100.0 2 )Sime Darby Motor Services Limited Hong Kong 100.0 100.0 2 Distribution and retail
of motor vehicles and spare parts, provision of after-sales services and management services
Sime Winner Holdings Limited Hong Kong 60.0 60.0 2 Investment holdingUniversal Automobile Company
Limited (formerly known as AutoFrance Hong Kong Limited)
Hong Kong 100.0 100.0 2 )))
Distribution and retail of motor vehicles
Universal Cars Limited Hong Kong 100.0 100.0 2 )Wallace Harper Motors Company
Limited Hong Kong 100.0 100.0 2 Retail of used motor vehicles,
provision of after-sales services and car leasing
BMW Concessionaires (Macau) Limited Macau 100.0 100.0 2 ) Retail of motor vehicles and provision of after-sales services
Harper Engineering (Macau) Limited Macau 100.0 100.0 2 ))
Brisbane BMW Bodyshop Pty Ltd Australia 70.0 70.0 2 Retail of spare parts, panels and accessories

Sime Darby BerhadAnnual Report 2016Innovating for the Future3 3 4
60 List of Subsidiaries, Joint Ventures and Associates (continued)
Subsidiaries, joint ventures and associates which are active as at 30 June 2016 are as follows: (continued)
NOTES TO THE FINANCIAL STATEMENTS
For the financial year ended 30 June 2016 (continued)Amounts in RM million unless otherwise stated
Name of companyCountry of incorporation
Group’seffective
interest (%) Auditors Principal activities2016 2015
Motors – Subsidiaries (continued)Brisbane BMW Unit Trust Australia 70.0 70.0 2 )
Motor vehicle dealershipsLMM Holdings Pty Ltd Australia 70.0 70.0 2 )Sime Darby Automobiles Pty Ltd Australia 100.0 100.0 2 Distribution of motor vehiclesSime Darby Fleet Services Pty Ltd Australia 100.0 100.0 2 Vehicle rental and related
mechanical servicesSime Darby Motors Group (Australia)
Pty LimitedAustralia 100.0 100.0 2 Provision of management
services and investment holding
Sime Darby Motors Retail Australia Pty Limited
Australia 100.0 100.0 2 Retail of motor vehicles and provision of after-sales services
Sime Darby Motors Wholesale Australia Pty Limited
Australia 100.0 100.0 2 Distribution of motor vehicles
Continental Car Services Limited New Zealand 100.0 100.0 2 Retail of new and used passenger cars and light commercial vehicles, spare parts and accessories and the provision of related services
Hino Distributors NZ Limited New Zealand 100.0 100.0 2 Distribution and retail of trucks
Infinity Automotive Limited New Zealand 100.0 100.0 2 Retail of new and used passenger cars and light commercial vehicles, spare parts and accessories and the provision of related services
Motor Truck Distributors (NZ) Limited New Zealand 100.0 100.0 2 Distribution and retail of trucks and buses
North Shore Motor Holdings Limited New Zealand 100.0 100.0 2 Retail of new and used passenger cars, spare parts and accessories and the provision of related services
Sime Darby Automobiles NZ Limited New Zealand 100.0 100.0 2 Distribution of motor vehicles and spare parts
Sime Darby Commercial (NZ) Limited New Zealand 100.0 100.0 2 )Investment holding
Sime Darby Motor Group (NZ) Limited New Zealand 100.0 100.0 2 )Truck Stops (NZ) Limited New Zealand 100.0 100.0 2 Provision of spare parts and
services for trucksUD Truck Distributors (NZ) Limited New Zealand 100.0 100.0 2 Distribution and retail of
trucks, spare parts and accessories and the provision of related services
Performance Motors (Thailand) Limited Thailand 100.0 100.0 2 Motor vehicles dealership

Sime Darby Berhad 3 3 5Annual Report 2016 Financial Reports
60 List of Subsidiaries, Joint Ventures and Associates (continued)
Subsidiaries, joint ventures and associates which are active as at 30 June 2016 are as follows: (continued)
Name of companyCountry of incorporation
Group’seffective
interest (%) Auditors Principal activities2016 2015
Motors – Subsidiaries (continued)Sime Darby (Thailand) Limited Thailand 100.0 100.0 2 Investment holding and
provision of management and auxiliary services
Sime Darby Mazda (Thailand) Limited Thailand 100.0 100.0 2 )Motor vehicles dealership
Sime Darby Vantage (Thailand) Limited Thailand 100.0 100.0 2 )Viking Motors Limited Thailand 100.0 100.0 2 Leasing of propertiesSime Darby Auto Kia Co Ltd Taiwan 100.0 100.0 2 Wholesale and retail of
vehicles, spare parts and accessories and provision of after-sales services
Sime Darby Kia Taiwan Co Ltd Taiwan 100.0 100.0 2 Manufacture and sales of vehicles, spare parts and accessories and repairs and maintenance of vehicles and other automotive services
Europe Automobiles Corporation Vietnam 90.0 90.0 2 Distribution and retail of vehicles
Performance Motors Vietnam Joint Stock Company
Vietnam 90.0 – 2 Retail of vehicles and spare parts
Motors – AssociatesBMW Malaysia Sdn Bhd Malaysia 49.0* 49.0* 3 Sale and distribution of motor
vehicles and motorcycles Sime Kansai Paints Sdn Bhd Malaysia 40.0 40.0 3 Manufacturing, selling and
marketing of automotive and industrial paints
Munich Automobiles Pte Ltd Singapore 40.0 40.0 3 Sale and distribution of motor vehicles and after-sales services
BMW Financial Services Hong Kong Limited
Hong Kong 49.0 49.0 3 Provision of financing and hire purchase facilities
Property – SubsidiariesGenting View Resort Development Sdn
Bhd Malaysia 60.0 30.4 1 Property development and
provision of management services
Golfhome Development Sdn Bhd Malaysia 100.0 100.0 1 ) Property investment and property developmentGolftek Development Sdn Bhd Malaysia 100.0 100.0 1 )
Harvard Golf Resort (Jerai) Berhad Malaysia 99.0 99.0 1 Provision of golfing and sporting services

Sime Darby BerhadAnnual Report 2016Innovating for the Future3 3 6
60 List of Subsidiaries, Joint Ventures and Associates (continued)
Subsidiaries, joint ventures and associates which are active as at 30 June 2016 are as follows: (continued)
NOTES TO THE FINANCIAL STATEMENTS
For the financial year ended 30 June 2016 (continued)Amounts in RM million unless otherwise stated
Name of companyCountry of incorporation
Group’seffective
interest (%) Auditors Principal activities2016 2015
Property – Subsidiaries (continued)Harvard Hotel (Jerai) Sdn Bhd Malaysia 100.0 100.0 1 Operation of a hotelImpian Golf Resort Berhad Malaysia 100.0 100.0 1 Provision of golfing and
sporting servicesIronwood Development Sdn Bhd Malaysia 100.0 100.0 1 Property investment and
property developmentKuala Lumpur Golf & Country Club
BerhadMalaysia 100.0 100.0 1 Provision of golfing and
sporting services and property development
Malaysia Land Development Company Berhad
Malaysia 100.0 50.7 1 Property investment, management and investment holding
Sime Darby Ainsdale Development Sdn Bhd
Malaysia 100.0 100.0 1 Property development
Sime Darby Ampar Tenang Sdn Bhd Malaysia 100.0 100.0 1 Property investmentSime Darby Ara Damansara
Development Sdn Bhd Malaysia 100.0 100.0 1 Property investment and
property developmentSime Darby Augsburg (M) Sdn Bhd Malaysia 100.0 100.0 1 Property developmentSime Darby Brunsfield Damansara
Sdn Bhd Malaysia 60.0 60.0 1 Property investment and
property development and construction
Sime Darby Brunsfield Holding Sdn Bhd
Malaysia 60.0 60.0 1 Property development and investment holding
Sime Darby Brunsfield Kenny Hills Sdn Bhd
Malaysia 60.0 60.0 1 Property development
Sime Darby Brunsfield Motorworld Sdn Bhd
Malaysia 60.0 60.0 1 Investment holding
Sime Darby Brunsfield Properties Holding Sdn Bhd
Malaysia 60.0 60.0 1 Property investment
Sime Darby Brunsfield Resort Sdn Bhd Malaysia 60.0 60.0 1 Property developmentSime Darby Builders Sdn Bhd Malaysia 100.0 100.0 1 Property development and
constructionSime Darby Building Management
Services Sdn Bhd Malaysia 100.0 100.0 1 Property management
Sime Darby Chemara Sdn Berhad Malaysia 100.0 100.0 1 )Property developmentSime Darby Constant Skyline Sdn
Bhd Malaysia 100.0 100.0 1 )
)Sime Darby Elmina Development Sdn
Bhd Malaysia 100.0 100.0 1 Property investment and
property developmentSime Darby GVR Management Sdn Bhd Malaysia 100.0 50.7 1 Resort managementSime Darby Johor Development Sdn
BhdMalaysia 100.0 100.0 1 )
)Property development
Sime Darby KLGCC Development Sdn Bhd
Malaysia 100.0 100.0 1 ))

Sime Darby Berhad 3 3 7Annual Report 2016 Financial Reports
60 List of Subsidiaries, Joint Ventures and Associates (continued)
Subsidiaries, joint ventures and associates which are active as at 30 June 2016 are as follows: (continued)
Name of companyCountry of incorporation
Group’seffective
interest (%) Auditors Principal activities2016 2015
Property – Subsidiaries (continued)Sime Darby Kulai Development Sdn
Bhd (formerly known as Sime Darby Homes Sdn Bhd)
Malaysia 100.0 100.0 1 ))) Property investment and
property developmentSime Darby Landscaping Sdn Bhd Malaysia 100.0 100.0 1 )Sime Darby Lukut Development Sdn
Bhd Malaysia 100.0 100.0 1 )
)Sime Darby Melawati Development
Sdn Bhd Malaysia 100.0 100.0 1 Property investment,
property development and property management
Sime Darby Nilai Utama Sdn Bhd Malaysia 70.0 70.0 1 Property developmentSime Darby Nominees Sendirian
BerhadMalaysia 100.0 100.0 1 Investment holding
Sime Darby Pagoh Development Sdn Bhd
Malaysia 100.0 100.0 1 Property investment and property development
Sime Darby Paralimni Sdn Bhd Malaysia 100.0 100.0 1 Property developmentSime Darby Properties (Sabah) Sdn Bhd Malaysia 100.0 100.0 1 Property development and
investment holdingSime Darby Properties (Selangor) Sdn
Bhd Malaysia 100.0 100.0 1 Property development
Sime Darby Properties Builders Sdn Bhd
Malaysia 100.0 100.0 1 Construction
Sime Darby Properties Realty Sdn Bhd Malaysia 100.0 100.0 1 Property development and management
Sime Darby Property (Bukit Selarong) Sdn Bhd
Malaysia 100.0 100.0 1 ))
Property developmentSime Darby Property (Bukit Tunku) Sdn Bhd
Malaysia 100.0 100.0 1 ))
Sime Darby Property (Klang) Sdn Bhd Malaysia 100.0 100.0 1 )Sime Darby Property (Lembah Acob)
Sdn Bhd Malaysia 100.0 100.0 1 Property investment and
property development Sime Darby Property (Nilai) Sdn Bhd Malaysia 100.0 100.0 1 Property investment,
property development and property management
Sime Darby Property (Subang) Sdn Bhd Malaysia 100.0 100.0 1 Property investment and property development
Sime Darby Property (Sungai Kapar) Sdn Bhd
Malaysia 100.0 100.0 1 Investment holding, property investment and property development
Sime Darby Property (Utara) Sdn Bhd Malaysia 100.0 100.0 1 Property investment and property development
Sime Darby Property Berhad Malaysia 100.0 100.0 1 Investment holding, property development and provision of management services
Sime Darby Property Holdings Sdn Bhd Malaysia 100.0 100.0 1 )Property investment and
property managementSime Darby Property Management Sdn Bhd
Malaysia 100.0 100.0 1 ))

Sime Darby BerhadAnnual Report 2016Innovating for the Future3 3 8
60 List of Subsidiaries, Joint Ventures and Associates (continued)
Subsidiaries, joint ventures and associates which are active as at 30 June 2016 are as follows: (continued)
NOTES TO THE FINANCIAL STATEMENTS
For the financial year ended 30 June 2016 (continued)Amounts in RM million unless otherwise stated
Name of companyCountry of incorporation
Group’seffective
interest (%) Auditors Principal activities2016 2015
Property – Subsidiaries (continued)Sime Darby Property Selatan Dua Sdn
Bhd Malaysia 60.0 60.0 1 )
) Construction and asset management services under concession arrangement
Sime Darby Property Selatan Empat Sdn Bhd
Malaysia 60.0 60.0 1 ))
Sime Darby Property Selatan Satu Sdn Bhd
Malaysia 60.0 60.0 1 ))
Sime Darby Property Selatan Sdn Bhd Malaysia 60.0 60.0 1 Investment holding and construction
Sime Darby Property Selatan Tiga Sdn Bhd
Malaysia 60.0 60.0 1 Construction and asset management services under concession arrangement
Sime Darby Serenia Development Sdn Bhd
Malaysia 100.0 100.0 1 Property investment and property development
Sime Darby Sungai Kantan Development Sdn Bhd
Malaysia 100.0 100.0 1 Property development and management
Sime Darby Urus Harta Sdn Bhd Malaysia 100.0 100.0 1 Property management Sime Darby USJ Development Sdn Bhd Malaysia 100.0 100.0 1 Property investment and
property developmentSime Healthcare Sdn Bhd Malaysia 100.0 100.0 1 Property investmentSime Wood Industries Sdn Bhd Malaysia 100.0 100.0 1 Property investment and
property managementStableford Development Sdn Bhd Malaysia 100.0 100.0 1 Property investment,
property development and operation of a convention centre
Superglade Sdn Bhd Malaysia 60.0 – 1 Property investment, property development and management
Syarikat Malacca Straits Inn Sdn Bhd Malaysia – 55.0 1 Operation of a hotel Syarikat Perumahan Guthrie Sdn Bhd Malaysia 100.0 100.0 1 Property developmentThe Glengowrie Rubber Company Sdn
BerhadMalaysia 93.4 93.4 1 Property investment and
property developmentWisma Sime Darby Sdn Berhad Malaysia 100.0 100.0 1 Property investment,
property management and related services
Darby Park (Management) Pte Ltd Singapore 100.0 100.0 2 Property investment, management of service apartments and investment holding
Darby Park (Singapore) Pte Ltd
Singapore 100.0 100.0 2 Property investment and management of service residences

Sime Darby Berhad 3 3 9Annual Report 2016 Financial Reports
60 List of Subsidiaries, Joint Ventures and Associates (continued)
Subsidiaries, joint ventures and associates which are active as at 30 June 2016 are as follows: (continued)
Name of companyCountry of incorporation
Group’seffective
interest (%) Auditors Principal activities2016 2015
Property – Subsidiaries (continued)Sime Darby Property (Alexandra) Pte
Ltd (formerly known as Sime Darby Property (Alexandra) Limited)
Singapore 100.0 100.0 2 )))
Property investment and property management
Sime Darby Property (Dunearn) Pte Ltd (formerly known as Sime Darby Property (Dunearn) Limited)
Singapore – 100.0 2 )))
Sime Darby Property (Kilang) Pte Ltd (formerly known as Sime Darby Property (Kilang) Limited)
Singapore – 100.0 2 )))
Sime Darby Property (Vietnam) Pte Ltd
Singapore 100.0 100.0 2 Investment holding and management of service residences
Sime Darby Property Singapore Limited
Singapore 100.0 100.0 2 Investment holding and property management
Sime Darby Real Estate Management Pte Ltd
Singapore 100.0 – 2 Property management and fund management
Sime Darby Property (Hong Kong) Limited
Hong Kong 100.0 100.0 2 Investment holding
OCI Management Pty Ltd Australia 60.0 60.0 2 Security and landcare servicesSime Darby Australia Limited Australia 100.0 100.0 2 Investment holding and
management of service apartments
Sime Darby Hotels Pty Ltd Australia 100.0 100.0 2 Operation of service apartments
Sime Darby Investments Pty Limited Australia 100.0 100.0 2 Investment holdingSime Darby Resorts Pty Ltd Australia 100.0 100.0 2 Management of a resort Sime Darby Serenity Cove Pty Ltd Australia 60.0 60.0 2 Property developmentKey Access Holdings Limited British Virgin
Islands100.0 100.0 4 )
)Investment holdingSime Darby Brunsfield Australia Pte
Ltd British Virgin
Islands60.0 60.0 4 )
)
Vibernum Limited Guernsey 100.0 100.0 2 )Property investmentSime Darby London Limited United
Kingdom100.0 100.0 2 )
)Darby Park (Vietnam) Limited Vietnam 65.0 65.0 2 Operation of service
residences

Sime Darby BerhadAnnual Report 2016Innovating for the Future3 4 0
60 List of Subsidiaries, Joint Ventures and Associates (continued)
Subsidiaries, joint ventures and associates which are active as at 30 June 2016 are as follows: (continued)
NOTES TO THE FINANCIAL STATEMENTS
For the financial year ended 30 June 2016 (continued)Amounts in RM million unless otherwise stated
Name of companyCountry of incorporation
Group’seffective
interest (%) Auditors Principal activities2016 2015
Property – Joint ventures PJ Midtown Development Sdn Bhd Malaysia 30.0 30.0 1 Property developmentSime Darby CapitaLand (Melawati Mall)
Sdn Bhd (formerly known as Sime Darby Capitamalls Asia (Melawati Mall) Sdn Bhd)
Malaysia 50.0 50.0 3 Property investment
Sime Darby Sunrise Development Sdn Bhd
Malaysia 50.0 50.0 1 Property development
Sime Darby Real Estate Investment Trust 1
Singapore 25.0 – 2 Real estate investment
Sime Darby Brunsfield Properties Australia Pty Ltd
Australia 50.0 50.0 3 ))
Investment holdingSime Darby Brunsfield International
LimitedBritish Virgin
Islands50.0 50.0 4 )
)Battersea Project Holding Company
Limited groupJersey 40.0 40.0 2 Property investment and
property developmentBattersea Power Station Development
Company LimitedUnited
Kingdom40.0 40.0 2 Property development and
management servicesBattersea Power Station Estates
LimitedUnited
Kingdom40.0 40.0 2 Property sales services
Property – AssociatesEastern & Oriental Berhad group
Malaysia 22.2 22.0 3 Investment holding, hotel ownership and management, property investment and development and café and restaurant operations
Kuantan Pahang Holding Sdn Bhd group
Malaysia 30.0 30.0 1 Investment holding and property development
Mostyn Development Sdn Bhd Malaysia 30.0 30.0 3 Property developmentSeriemas Development Sdn Bhd group Malaysia 40.0 40.0 3 Property development
and provision of related consultancy services
Shaw Brothers (M) Sdn Bhd Malaysia 36.0 36.0 3 Investment holding, property investment and provision of management services
Energy & Utilities – SubsidiariesChubb Malaysia Sendirian Berhad Malaysia 100.0 100.0 1 Marketing, installation, rental
and servicing of security products
Mecomb Malaysia Sdn Berhad Malaysia 100.0 100.0 1 System integration, marketing and installation of advanced electronic and electro-mechanical equipment, instruments and systems

Sime Darby Berhad 3 4 1Annual Report 2016 Financial Reports
60 List of Subsidiaries, Joint Ventures and Associates (continued)
Subsidiaries, joint ventures and associates which are active as at 30 June 2016 are as follows: (continued)
Name of companyCountry of incorporation
Group’seffective
interest (%) Auditors Principal activities2016 2015
Energy & Utilities – Subsidiaries (continued)Sime Darby Energy Sdn Bhd Malaysia 100.0 100.0 1 Investment holding Sime Darby Engineering Sdn Bhd Malaysia 100.0 100.0 1 Engineering, procurement,
construction, installation, hook-up and commissioning services relating to oil and gas industry
Sime Darby Joy Industries Sdn Bhd Malaysia 55.0 55.0 1 Designing and manufacturing of heat exchangers, radiators, process equipment modules, filters and separators
Sime Darby Offshore Engineering Sdn Bhd
Malaysia 100.0 100.0 1 Systems integration and marketing of products and service provider primarily for oil & gas/ petrochemical industry and biogas value chain
Sime Darby Utilities Sdn Bhd Malaysia 100.0 100.0 1 )Investment holdingSime Darby Water Resources Sdn
BhdMalaysia 100.0 100.0 1 )
)Sime Surveillance Sdn Bhd Malaysia 100.0 100.0 1 Provision of security services Mecomb Singapore Limited Singapore 100.0 100.0 2 Manufacture and installation
of industrial equipment and the import and sale of technical, nautical and scientific instruments and mechanical, electrical and electronic equipment
Sime Darby Energy Pte Ltd Singapore 100.0 100.0 2 Investment holdingJining Sime Darby Longgong Port Co
LtdChina 70.0 70.0 2 )
) Operation of portJining Sime Darby Port Co Ltd China 70.0 70.0 2 )Jining Sime Darby Taiping Port Co Ltd China 70.0 70.0 2 Operation of port and
warehousingSime Darby Joy (Shanghai) Co Ltd China 55.0 55.0 2 Supply of process equipment
and heat exchangersWeifang Sime Darby General Terminal
Co LtdChina 99.9 99.9 2 )
) Operation of portWeifang Sime Darby Port Co Ltd China 99.0 99.0 2 )Weifang Sime Darby Water
Management Co Ltd China 100.0 100.0 2 Treatment and supply of
water Weifang Sime Darby West Port Co Ltd China 99.9 99.9 2 Operation of port

Sime Darby BerhadAnnual Report 2016Innovating for the Future3 4 2
60 List of Subsidiaries, Joint Ventures and Associates (continued)
Subsidiaries, joint ventures and associates which are active as at 30 June 2016 are as follows: (continued)
NOTES TO THE FINANCIAL STATEMENTS
For the financial year ended 30 June 2016 (continued)Amounts in RM million unless otherwise stated
Name of companyCountry of incorporation
Group’seffective
interest (%) Auditors Principal activities2016 2015
Energy & Utilities – Subsidiaries (continued)Weifang Wei Gang Tugboat Services
Co Ltd China 99.5 99.5 3 Provision of tugboat pilot
services and related services
Sime Darby Overseas (HK) Limited Hong Kong 100.0 100.0 2 Investment holdingMecomb (Thailand) Limited Thailand 100.0 100.0 2 Sale of electrical and
mechanical equipment components and instruments
Energy & Utilities – Joint venturesMalaysia–China Hydro Joint Venture Malaysia 48.9 48.9 1 Engineering, procurement and
construction workWeifang Port Services Co Ltd group China 36.6 36.6 3 Construction, management
and maintenance of sea channel, anchorage and other port infrastructure
Weifang Senda Container Service Provider Co Ltd
China 50.0 – 3 Operation of container services
Weifang Sime Darby Liquid Terminal Co Ltd
China 50.0 99.9 2 Operation of liquid terminal and storage services
Energy & Utilities – AssociatesChubb Singapore Private Limited
groupSingapore 30.0 30.0 2 Marketing of security and fire
protection products and services
Weifang Ocean Shipping Tally Co Ltd China 39.6 39.6 3 Provision of shipping tally services for cargoes and containers
Others – Subsidiaries Sime Darby Allied Products Berhad Malaysia 100.0 100.0 1 Investment holding Sime Darby Global Berhad Malaysia 100.0 100.0 1 Special purpose vehicle
for the issue of multi-currency Islamic securities programme
Sime Darby Global Services Centre Sdn Bhd
Malaysia 100.0 100.0 1 Provision of support services to group companies
Sime Darby Holdings Berhad Malaysia 100.0 100.0 1 Investment holding, marketing of and agents for commodities and provision of management services to group companies
Sime Darby Holiday Homes Sdn Bhd Malaysia 100.0 100.0 1 Property management services and provision of childcare services to employees

Sime Darby Berhad 3 4 3Annual Report 2016 Financial Reports
60 List of Subsidiaries, Joint Ventures and Associates (continued)
Subsidiaries, joint ventures and associates which are active as at 30 June 2016 are as follows: (continued)
Name of companyCountry of incorporation
Group’seffective
interest (%) Auditors Principal activities2016 2015
Others – Subsidiaries (continued)Sime Darby Insurance Pte Ltd Malaysia 100.0 100.0 1 Onshore and offshore captive
insurerSime Darby Lockton Insurance Brokers
Sdn BhdMalaysia 60.0 60.0 1 Insurance and reinsurance
brokers, insurance advisory and consultancy services
Sime Darby Malaysia Berhad Malaysia 100.0 100.0 1 Holding of trademarksSime Darby Technologies Holdings Pte
Ltd Malaysia 100.0 100.0 1 )
) Investment holding Sime Darby Ventures Sdn Bhd Malaysia 100.0 100.0 1 )Yayasan Sime Darby Malaysia @ @ 1 Administration of
scholarship awards and loans for educational purposes, undertake sports, environmental conservation and sustainability projects; and other related activities for the benefit of the community
Sime Darby Eastern International Limited
Singapore 100.0 100.0 2 Investment holding
Sime Darby Insurance Brokers (Singapore) Pte Ltd
Singapore 100.0 100.0 2 Insurance brokers
Sime Darby Far East (1991) Limited Hong Kong 100.0 100.0 2 )Investment holding
Sime Darby Hong Kong Limited Hong Kong 100.0 100.0 2 )Sime Darby Insurance Brokers (Hong
Kong) Limited Hong Kong 100.0 100.0 2 Insurance brokers
Sime Darby Investments (BVI) Limited British Virgin Islands
100.0 100.0 4 Investment holding and holding of trademarks
Others – Joint ventureRamsay Sime Darby Health Care Sdn
Bhd groupMalaysia 50.0 50.0 1 Operation of healthcare
facilities and provision of related healthcare services
Others – AssociatesTesco Stores (Malaysia) Sdn Bhd Malaysia 30.0 30.0 3 Operation of hypermarkets Union Sime Darby (Thailand) Ltd Thailand 49.0 49.0 2 Insurance brokers

Sime Darby BerhadAnnual Report 2016Innovating for the Future3 4 4
NOTES TO THE FINANCIAL STATEMENTS
For the financial year ended 30 June 2016 (continued)Amounts in RM million unless otherwise stated
60 List of Subsidiaries, Joint Ventures and Associates (continued)
Subsidiaries, joint ventures and associate which are dormant/inactive as at 30 June 2016 are as follows:
Name of companyCountry of incorporation
Group’seffective
interest (%) Auditors2016 2015
Plantation – Subsidiaries Derawan Sdn Bhd Malaysia 100.0 100.0 1Kumpulan Jerai Sendirian Berhad Malaysia 100.0 100.0 1Kumpulan Linggi Sendirian Berhad Malaysia 100.0 100.0 1Kumpulan Sua Betong Sendirian Berhad Malaysia 100.0 100.0 1Kumpulan Tebong Sendirian Berhad Malaysia 100.0 100.0 1Kumpulan Temiang Sendirian Berhad Malaysia 100.0 100.0 1Nature Ambience Sdn Bhd Malaysia 100.0 100.0 1Sahua Enterprise Sdn Bhd Malaysia 100.0 100.0 1Sime Darby Bioganic Sdn Bhd Malaysia 100.0 100.0 1Sime Darby Bukit Talang Sdn Bhd Malaysia 100.0 100.0 1Sime Darby Julau Plantation Sdn Bhd Malaysia 100.0 100.0 1Sime Darby Oils & Fats Sdn Bhd Malaysia 100.0 100.0 1Sime Darby Plantation (Peninsular) Sdn Bhd Malaysia 100.0 100.0 1PT Guthrie Abdinusa Industri Indonesia 70.0 70.0 2PT Sime Darby Commodities Trading Indonesia 100.0 100.0 2Kwang Joo Seng (Malaysia) Private Limited Singapore 100.0 100.0 2Dongguan Sime Darby Sinograin Oils and Fats Co Ltd China 65.0 65.0 2Dami Australia Pty Ltd Australia 100.0 100.0 2Golden Hope–Nhabe (Cambodia) Import & Export Co Ltd Cambodia 51.0 51.0 4Sime Darby CleanerG BV Netherlands 100.0 100.0 2Sime Darby Commodities Europe BV Netherlands 100.0 100.0 2New Britain Nominees Ltd Papua New Guinea 100.0 100.0 2New Britain Tankers Limited Papua New Guinea 100.0 100.0 2Plantation Contracting Services Ltd Papua New Guinea 100.0 100.0 2Vitroplant Orangerie Bay Ltd Papua New Guinea 100.0 100.0 2Trolak Estates Limited Scotland 100.0 100.0 3Sime Darby Edible Products Tanzania Limited Tanzania 100.0 100.0 4Dusun Durian Plantations Limited United Kingdom 100.0 100.0 3Kinta Kellas Rubber Estates Plc United Kingdom 100.0 100.0 3Malaysian Estates Plc United Kingdom 100.0 100.0 3The Kuala Selangor Rubber Plc United Kingdom 100.0 100.0 3The London Asiatic Rubber and Produce Company Limited United Kingdom 100.0 100.0 3The Pataling Rubber Estates Limited United Kingdom 100.0 100.0 3The Straits Plantations Limited United Kingdom 100.0 100.0 3The Sungei Bahru Rubber Estates Plc United Kingdom 100.0 100.0 3
Industrial – Subsidiaries Associated Tractors Sendirian Berhad Malaysia 100.0 100.0 1Tractors Machinery International Pte Ltd Singapore 100.0 100.0 2Sime Darby SEM Dealer (Fujian) Ltd China 100.0 100.0 2Sime Darby Yangon Limited Myanmar 100.0 100.0 3

Sime Darby Berhad 3 4 5Annual Report 2016 Financial Reports
Name of companyCountry of incorporation
Group’seffective
interest (%) Auditors2016 2015
Motors – Subsidiaries Associated Motor Industries Malaysia Sdn Bhd Malaysia 51.0 51.0 1Sime Darby System Integrators Sdn Bhd Malaysia 99.9 99.9 1Hainan Bow Yue Vehicle Trading Co Ltd China 100.0 100.0 3Tianjin Sime Winner Motors Trading Co Ltd China 60.0 60.0 3AutoFrance China Limited Hong Kong 100.0 100.0 2Sime Darby Motor Service Centre Limited Hong Kong 100.0 100.0 2Sime Darby Prestige Motors Company Limited Hong Kong 100.0 100.0 2SimeWinner Nissan Autocrafts Limited Hong Kong 60.0 60.0 2Universal Cars (Importers) Limited Hong Kong 100.0 100.0 2Wallace Harper & Company Limited Hong Kong 100.0 100.0 2Warwick Motors Limited Hong Kong 100.0 100.0 2Sime Darby Hong Kong Group Company Limited Bermuda 100.0 100.0 3Continental Cars Limited New Zealand 100.0 100.0 2ERF Man and Western Star (NZ) Limited New Zealand 100.0 100.0 2Palmerston North Motors Wholesale Limited New Zealand 100.0 100.0 2Sime Darby Auto Services Limited Thailand 100.0 100.0 2
Property – Subsidiaries Sime Darby Brunsfield Property Sdn Bhd Malaysia 70.0 70.0 1Sime Darby Properties Harta Sdn Bhd Malaysia 100.0 100.0 1Sime Darby Property (USJ) Sdn Bhd Malaysia 100.0 100.0 1Sime Darby Putra Heights Development Sdn Bhd Malaysia 100.0 100.0 1Sime Darby Property (Amston) Pte Ltd Singapore 100.0 100.0 2
Energy & Utilities – SubsidiariesSime Darby Marine Sdn Bhd Malaysia 100.0 100.0 1Sime Darby Water Resources (Perak) Sdn Bhd Malaysia 75.0 75.0 1Sime Engineering Sdn Bhd Malaysia 100.0 100.0 1Jining Sime Darby Guozhuang Port Co Ltd China 70.0 70.0 2Weifang Wei Gang Dredging Project Co Ltd China 99.5 99.5 3Sime Darby Marine (Hong Kong) Private Limited Hong Kong 100.0 100.0 2
Energy & Utilities – Joint venturesSime Darby Gas Malaysia BioCNG Sdn Bhd Malaysia 51.0 – 1Sime Engineering Sdn Bhd – Edwards & Sons Joint Venture Malaysia – 51.0 1
Energy & Utilities – AssociateSime Darby Almana WLL Qatar 49.0 49.0 4
60 List of Subsidiaries, Joint Ventures and Associates (continued)
Subsidiaries, joint ventures and associate which are dormant/inactive as at 30 June 2016 are as follows: (continued)

Sime Darby BerhadAnnual Report 2016Innovating for the Future3 4 6
NOTES TO THE FINANCIAL STATEMENTS
For the financial year ended 30 June 2016 (continued)Amounts in RM million unless otherwise stated
Name of companyCountry of incorporation
Group’seffective
interest (%) Auditors2016 2015
Others – SubsidiariesGolden Hope Plantations Berhad Malaysia 100.0 100.0 1Highlands & Lowlands Berhad Malaysia 100.0 100.0 1Kumpulan Guthrie Berhad Malaysia 100.0 100.0 1Kumpulan Sime Darby Berhad Malaysia 100.0 100.0 1Sime UEP Properties Berhad Malaysia 100.0 100.0 1Sime Darby (China) Enterprise Management Co Ltd China 100.0 100.0 2East West Insurance Company Limited United Kingdom – 90.4 3Robt Bradford & Co Ltd United Kingdom 100.0 100.0 2Robt Bradford Hobbs Savill Ltd United Kingdom 98.6 98.6 2
Subsidiaries, joint venture and associate placed under members’ voluntary liquidation/deregistered during the financial year are as follows:
Plantation – SubsidiariesSime Darby Genomics Sdn Bhd Malaysia – 100.0 1Sime Darby Plantation Indonesia Sdn Bhd Malaysia – 100.0 1Sincere Outlook Sdn Bhd Malaysia – 100.0 1Sime Darby Plantation Cameroon Ltd Cameroon – 100.0 4
Motors – SubsidiariesAuto Technology Engineering Company Limited Hong Kong – 100.0 2Vermont International Limited Hong Kong – 60.0 2Sodor Properties Limited New Zealand – 100.0 2
Property – SubsidiariesSime Darby Property (Bestari Jaya) Sdn Bhd Malaysia – 100.0 1Sime Darby SJCC Development Sdn Bhd Malaysia – 100.0 1Xinjiang Sime Darby Property Co Ltd China – 100.0 2Green East Prime Ventures Inc Philippines – 63.2 3Sime Darby Management Services Limited United Kingdom – 100.0 2
Property - AssociateBitaria Sdn Bhd Malaysia – 24.0 3
Energy & Utilities – SubsidiariesBalui Hydro Sdn Bhd Malaysia – 100.0 1Malaysian Oriental Holdings Berhad Malaysia – 100.0 1Sime Darby T&I Sdn Bhd Malaysia – 51.0 1Weifang Binhai Haiwei Dredging Project Co Ltd China – 50.8 3
Energy & Utilities – Joint ventureWeifang Wei Gang Shipyard Co Ltd China – 48.5 3
60 List of Subsidiaries, Joint Ventures and Associates (continued)
Subsidiaries, joint ventures and associate which are dormant/inactive as at 30 June 2016 are as follows: (continued)

Sime Darby Berhad 3 4 7Annual Report 2016 Financial Reports
Name of companyCountry of incorporation
Group’seffective
interest (%) Auditors2016 2015
Others – SubsidiariesGuthrie Ropel Berhad Malaysia – 100.0 1Sime Darby Management Services (Singapore) Pte Ltd Singapore – 100.0 2Xinjiang Sime Darby Heavy Equipment Co Ltd China – 100.0 2Sime Travel Holdings Limited Hong Kong – 100.0 2
Notes: 1 - audited by PricewaterhouseCoopers, Malaysia 2 - audited by member firms of PricewaterhouseCoopers International Limited, which are separate and
independent legal entities from PricewaterhouseCoopers, Malaysia 3 - audited by firms other than member firms of PricewaterhouseCoopers International Limited 4 - no legal requirement to appoint auditors + - notwithstanding the Group holds more than 50% equity interest in Sime Darby TNBES Renewable Energy
Sdn Bhd, the investment is classified as joint venture (and not subsidiary) as significant decisions require unanimous consent from all its shareholders
* - notwithstanding the Group holds more than 20% equity interest in BMW Malaysia Sdn Bhd, the investment is classified as available-for-sale investment (and not associate) due to the Group’s restricted influence pursuant to the shareholders’ agreement
@ - Yayasan Sime Darby is a company without share capital, limited by guarantee
60 List of Subsidiaries, Joint Ventures and Associates (continued)
Subsidiaries, joint venture and associate placed under members’ voluntary liquidation/deregistered during the financial year are as follows: (continued)

Sime Darby BerhadAnnual Report 2016Innovating for the Future3 4 8
NOTES TO THE FINANCIAL STATEMENTS
For the financial year ended 30 June 2016 (continued)Amounts in RM million unless otherwise stated
61 Material Events After the Reporting Period
Material events after the reporting period are as follows:
a. Reorganisation of reporting segmentsWith effect from 1 July 2016, the Group has reorganised its Energy & Utilities segment. The trading and engineering services have been merged into the Industrial division and the Group’s port and water management operations in China have been renamed “Logistics”.
Following from the above, the principal activities of the Group are divided into five segments namely, Plantation, Industrial, Motors, Property and Logistics.
b. Proposed disposal of properties, subscription of new units in Saizen Real Estate Investment Trust and acquisition of Japan Residential Assets Manager Limitedi. On 15 August 2016, Sime Darby Property Singapore Limited (SDPSL) and Hastings Deering (Australia) Limited
(HDAL) entered into a Framework Agreement with Saizen Real Estate Investment Trust (Saizen REIT) (through Japan Residential Asset Manager Limited (JRAM), manager of Saizen REIT) for the proposed disposal of certain of HDAL’s industrial properties in Australia to Saizen REIT. Saizen REIT is listed in Singapore Exchange.
Pursuant to the Framework Agreement, the consideration for the properties shall be satisfied in cash and from receivables from the issuance of new units in Saizen REIT to SDPSL or its nominees. The consideration for the sale of the properties shall be negotiated and be based on independent valuations of the properties. Saizen REIT will lease the properties to HDAL.
The completion of the transaction is subject to and conditional upon the conditions precedent as may be agreed by the parties in a Definitive Agreement which will be entered into by the relevant parties by 30 September 2016.
ii. On the same date, SDPSL entered into a conditional Share Purchase Agreement with Japan Regional Assets Manager Limited (JRegional) for the acquisition of 80% of the issued shares of JRAM. The consideration for the acquisition of JRAM shall be the aggregate of 80% of the net assets of JRAM and USD1 million (equivalent to RM4.01 million). SDPSL shall be entitled to a call option to acquire the remaining 20% equity interest held by JRegional at any time after 24 months from the completion of the acquisition at an amount to be determined and mutually agreed before 30 September 2016.
The completion of the transactions (i) and (ii) above are inter-conditional.
c. Proposed placement of Sime Darby Shares
On 23 August 2016, the Company announced a proposed placement involving the issuance of new Sime Darby Berhad shares of up to 5% of the existing issued and paid-up share capital of the Company to investors to be identified via book-building. The proceeds will be used to repay borrowings, fund capital expenditure and working capital.
On 7 September 2016, Bursa Malaysia Securities Berhad approved the listing application of the placement shares, subject to compliance with the Listing Requirements. The proposed placement is subject to shareholders’ approval at the extraordinary general meeting to be held on 30 September 2016.
62 Approval of Financial Statements
The financial statements have been approved for issue in accordance with a resolution of the Board of Directors on 27 September 2016.

Sime Darby Berhad 3 4 9Annual Report 2016 Financial Reports
63 Supplementary information
The breakdowns of realised and unrealised retained profits of the Group and of the Company as at 30 June 2016 as set out below have been prepared pursuant to the directive issued by Bursa Malaysia Securities Berhad and have been prepared in accordance with the Guidance on Special Matter No. 1 (GSM1), Determination of Realised and Unrealised Profits or Losses in the Context of Disclosure Pursuant to Bursa Malaysia Securities Berhad Listing Requirements, as issued by the Malaysian Institute of Accountants.
Group Company2016 2015 2016 2015
Restated
Total retained profits of the Company and its subsidiaries
- realised 26,254.6 25,921.6 2,709.4 3,036.4- unrealised 5,188.1 5,135.8 3.4 (17.8)
31,442.7 31,057.4 2,712.8 3,018.6
Total share of retained profits from joint ventures- realised (74.1) (104.1) – –- unrealised 27.9 35.0 – –
(46.2) (69.1) – –
Total share of retained profits from associates- realised 266.3 308.2 – –- unrealised (29.9) (46.5) – –
236.4 261.7 – –
Less: consolidation adjustments (12,761.8) (13,219.1) – –
Total retained profits 18,871.1 18,030.9 2,712.8 3,018.6
Total retained profits, as previously stated 18,871.1 18,049.4Effects of change in accounting policy (see Notes 2(a)
and 56) – (18.5)Total retained profits, as restated 18,871.1 18,030.9
In arriving at the unrealised profits, the following which are deemed in the GSM1 as unrealised, are included:
a. credits or charges relating to the recognition of deferred tax;b. cumulative net gains (but not net losses) from the remeasurement of assets or liabilities at fair value through profit
or loss;c. provision of liabilities in respect of present obligations where resources are only consumed upon settlement of the
obligation; andd. translation gains or losses of monetary items denominated in a currency other than the functional currency.
SUPPLEMENTARY INFORMATION


Sime Darby BerhadAnnual Report 2016Innovating for the Future3 5 0
NOTICE IS HEREBY GIVEN that the Tenth Annual General Meeting of Sime Darby Berhad (Sime Darby or Company) will be held at the Grand Ballroom, First Floor, Sime Darby Convention Centre, 1A, Jalan Bukit Kiara 1, 60000 Kuala Lumpur, Malaysia on Wednesday, 2 November 2016 at 10.00 a.m. for the following businesses:
AS ORDINARY BUSINESS
1. To receive the Audited Financial Statements for the financial year ended 30 June 2016 together with the Reports of the Directors and the Auditors thereon.
2. To declare a final single tier dividend of 21 sen per ordinary share for the financial year ended 30 June 2016.
3. To approve the payment of Directors’ remuneration as disclosed in the Audited Financial Statements for the financial year ended 30 June 2016.
4. To re-elect the following Directors who retire pursuant to Article 104 of the Articles of Association of the Company and who have offered themselves for re-election:
(i) Bapak Muhammad Lutfi(ii) Datuk Wan Selamah Wan Sulaiman(iii) Encik Zainal Abidin Jamal(iv) Datuk Dr Mohd Daud Bakar
5. To re-elect the following Directors who retire pursuant to Article 99 of the Articles of Association of the Company and who have offered themselves for re-election:
(i) Tan Sri Dato’ Abdul Ghani Othman(ii) Tan Sri Dato’ Sri Dr Wan Abdul Aziz Wan Abdullah
6. To re-appoint Messrs PricewaterhouseCoopers as Auditors of the Company for the financial year ending 30 June 2017, and to authorise the Directors to fix their remuneration.
AS SPECIAL BUSINESS
7. To consider and, if thought fit, pass the following Ordinary Resolutions:
(i) Proposed Renewal of Shareholders’ Mandate for Existing Recurrent Related Party Transactions and Proposed New Shareholders’ Mandate for Additional Recurrent Related Party Transactions of a Revenue or Trading Nature
“THAT, subject always to the Companies Act, 1965 (Act), the Articles of Association of the Company, other applicable laws, guidelines, rules and regulations, and the approvals of the relevant governmental/regulatory authorities, approval be and is hereby given to the Company and/or its subsidiary companies to enter into all arrangements and/or transactions involving the interests of the Related Parties as specified in Section 2.4 of the Circular to Shareholders dated 11 October 2016, provided that such arrangements and/or transactions are:
(a) recurrent transactions of a revenue or trading nature;(b) necessary for the day-to-day operations;(c) carried out in the ordinary course of business on normal commercial terms which
are not more favourable to the Related Parties than those generally available to the public; and
(d) not detrimental to the minority shareholders of the Company
(the Mandate);
(Resolution 1)
(Resolution 2)
(Resolution 3)(Resolution 4)(Resolution 5)(Resolution 6)
(Resolution 7)(Resolution 8)
(Resolution 9)
NOTICE OF ANNUAL GENERAL MEETING

Sime Darby Berhad 3 5 1Annual Report 2016 Innovating for the Future
(Resolution 10)
AND THAT the Mandate shall continue in force until:
(a) the conclusion of the next Annual General Meeting (AGM) of the Company following this AGM, at which time the Mandate will lapse, unless by an ordinary resolution passed at that meeting, the Mandate is renewed; or
(b) the expiration of the period within which the next AGM is required to be held pursuant to Section 143(1) of the Act, (but shall not extend to such extensions as may be allowed pursuant to Section 143(2) of the Act); or
(c) the Mandate is revoked or varied by ordinary resolution passed by the shareholders of the Company in general meeting,
whichever is the earliest;
AND THAT the Directors of the Company be and are hereby authorised to complete and do all such acts and things (including executing all such documents as may be required) as they may consider expedient or necessary to give effect to the Mandate.”
(ii) Proposed Renewal of Authority for Directors to Allot and Issue New Ordinary Shares of RM0.50 Each in the Company (SDB Shares) in relation to the Dividend Reinvestment Plan that Provides Shareholders of the Company with an Option to Reinvest Their Cash Dividend in New SDB Shares (Dividend Reinvestment Plan)
“THAT pursuant to the Dividend Reinvestment Plan (DRP) as approved by the Shareholders at the Extraordinary General Meeting held on 21 November 2013, approval be and is hereby given to the Directors to allot and issue such number of new SDB Shares from time to time as may be required to be allotted and issued pursuant to the DRP until the conclusion of the next Annual General Meeting, upon such terms and conditions and to such persons as the Directors may, in their sole and absolute discretion, deem fit and in the best interest of the Company PROVIDED THAT the issue price of the said new SDB Shares shall be fixed by the Directors at not more than ten percent (10%) discount to the adjusted five (5)-day volume weighted average market price (VWAMP) of SDB Shares immediately prior to the price-fixing date, of which the VWAMP shall be adjusted ex-dividend before applying the aforementioned discount in fixing the issue price and not less than the par value of SDB Shares at the material time;
AND THAT the Directors and the Secretary of the Company be and are hereby authorised to do all such acts and enter into all such transactions, arrangements and agreements and to execute, sign and deliver for and on behalf of the Company, all such documents and impose such terms and conditions or delegate all or any part of its powers as may be necessary or expedient in order to give full effect to the DRP, with full powers to assent to any conditions, modifications, variations and/or amendments (if any) including amendments, modifications, suspension and termination of the DRP as the Directors may, in their absolute discretion, deem fit and in the best interest of the Company and/or as may be imposed or agreed to by any relevant authorities.”
8. To transact any other business for which due notice shall have been given in accordance with the Articles of Association of the Company and the Companies Act, 1965.
By Order of the Board
Norzilah Megawati Abdul Rahman (LS 0009247) Mazlina Mohd Zain (LS 0008287) Company Secretaries
Kuala Lumpur, Malaysia 11 October 2016
(Resolution 11)

Sime Darby BerhadAnnual Report 2016Innovating for the Future3 5 2
Notes:
1. A Member entitled to attend and vote at the Meeting is entitled to appoint not more than two (2) proxies to attend and vote on his/her behalf. Where a Member appoints more than one (1) proxy, the appointment shall be invalid unless he/she specifies the proportion of his/her shareholdings to be represented by each proxy. A proxy may, but need not, be a Member. A Member may appoint any person to be his/her proxy without any restriction as to the qualification of such person and the provisions of Sections 149(1)(a) and 149(1)(b) of the Companies Act, 1965 (Act) shall not apply to the Company.
2. Where a Member of the Company is an Authorised Nominee as defined under the Securities Industry (Central Depositories) Act 1991 (SICDA), he/she may appoint not more than two (2) proxies in respect of each Securities Account he/she holds with ordinary shares of the Company standing to the credit of the said Securities Account.
3. Where a Member of the Company is an Exempt Authorised Nominee as defined under SICDA which holds ordinary shares in the Company for multiple beneficial owners in one (1) Securities Account (Omnibus Account), there is no limit to the number of proxies which the Exempt Authorised Nominee may appoint in respect of each Omnibus Account it holds PROVIDED THAT each beneficial owner of ordinary shares, or where the ordinary shares are held on behalf of joint beneficial owners, such joint beneficial owners, shall only be entitled to instruct the Exempt Authorised Nominee to appoint not more than two (2) proxies to attend and vote at a general meeting of the Company instead of the beneficial owner or joint beneficial owners.
4. The instrument appointing a proxy shall be in writing signed by the appointor or his/her attorney duly authorised in writing or, if the appointor is a corporation, either under its common seal or signed by an officer or attorney so authorised.
5. The Form of Proxy and the Power of Attorney or other authority, if any, under which it is signed or a notarially certified copy of that power or authority, must be deposited at the office of the Share Registrar of the Company, Tricor Investor & Issuing House Services Sdn Bhd at Unit 32-01, Level 32, Tower A, Vertical Business Suite, Avenue 3, Bangsar South, No. 8, Jalan Kerinchi, 59200 Kuala Lumpur, Malaysia before 12.00 p.m. on 1 November 2016 or not less than 24 hours before the time appointed for the taking of the poll at the Annual General Meeting (AGM), whichever is the later.
6. Only Members registered in the Record of Depositors as at 21 October 2016 shall be eligible to attend, speak and vote at the AGM or appoint proxy(ies) to attend, speak and/or vote on their behalf.
7. Pursuant to Paragraph 8.29A(1) of the Main Market Listing Requirements of Bursa Malaysia Securities Berhad (MMLR), all the resolutions set out in the Notice of AGM will be put to vote by poll.
EXPLANATORY NOTES ON ORDINARY BUSINESSES
1. Audited Financial Statements for the Financial Year Ended 30 June 2016
This Agenda item is meant for discussion only as Section 169(1) of the Act does not require the Audited Financial Statements to be formally approved by the shareholders. As such, this item is not put forward for voting.
2. Resolution 1 - Declaration of a Final Single Tier Dividend
In accordance with Article 126 of the Company’s Articles of Association (AA), the Board is recommending that the shareholders approve the payment of the final single tier dividend.
Pursuant to Paragraph 8.26 of the MMLR, the final single tier dividend, if approved, will be paid no later than three (3) months from the date of shareholders’ approval.
3. Resolution 2 - Payment of Directors’ Remuneration for Non-Executive Directors for the Financial Year Ended 30 June 2016
Article 79(1) of the Company’s AA provides that the remuneration for Non-Executive Directors (NED) shall be determined by the Company by an ordinary resolution at a general meeting.
Please refer to pages 216 to 218 of the Notes to the Financial Statements for the amount of Directors’ Remuneration received from Sime Darby, to be approved at this AGM comprising Fees and Benefits amounting to RM3.7 million. The remuneration of each Director is set out in the Statement on Corporate Governance on page 140 of the Company’s Annual Report.
NOTICE OF ANNUAL GENERAL MEETING

Sime Darby Berhad 3 5 3Annual Report 2016 Innovating for the Future
4. Resolutions 3 to 8 - Re-election of Directors Pursuant to Articles 104 and 99 of the Articles of Association
(i) Article 104 of the AA stipulates that a Director appointed by the Board shall hold office until the conclusion of the next AGM of the Company and shall be eligible for re-election.
Bapak Muhammad Lutfi, Datuk Wan Selamah Wan Sulaiman, Encik Zainal Abidin Jamal and Datuk Dr Mohd Daud Bakar appointed during the financial year, being eligible, have offered themselves for re-election at the Tenth (10th) AGM pursuant to Article 104 of the AA.
Bapak Muhammad Lutfi, Datuk Wan Selamah Wan Sulaiman, Encik Zainal Abidin Jamal and Datuk Dr Mohd Daud Bakar have successfully completed their Mandatory Accreditation Programmes pursuant to the provision of the MMLR.
(ii) Article 99 of the AA expressly states that at every AGM, at least one-third (1/3) of the Directors for the time being shall retire from office. In addition, Article 100 of the AA states that all Directors shall retire from office at least once every three (3) years. A retiring Director shall be eligible for re-election.
Tan Sri Dato’ Abdul Ghani Othman and Tan Sri Dato’ Sri Dr Wan Abdul Aziz Wan Abdullah being eligible, have offered themselves for re-election at the 10th AGM pursuant to Article 99 of the AA.
The Board recommends the re-election of the Directors who standing for re-election. Key contributions of the Directors seeking re-election are provided in the Nomination & Remuneration Committee (NRC) Report on pages 152 to 159 of the Company’s Annual Report. All Directors standing for re-election have abstained from deliberations and decisions on their own eligibility to stand for re-election at the relevant NRC and Board meetings, and will continue to abstain from deliberations and decisions on their own eligibility to stand for re-election at this AGM.
Ir Dr Muhamad Fuad Abdullah has informed the Board in writing of his intention to retire as an Independent Non-Executive Director (INED) and therefore would not be seeking re-election at the AGM under Article 99 of the AA. Hence, he will retain office until the conclusion of this AGM in accordance with Article 99 of the AA.
The Board has conducted an assessment of the independence of the INEDs seeking re-election at this AGM, namely Tan Sri Dato’ Abdul Ghani Othman and Datuk Wan Selamah Wan Sulaiman based on the criteria set by the Company and guided by the definition of “Independent Director” as prescribed by the MMLR and the Malaysian Code on Corporate Governance 2012. The Board also satistied that the other Independent Directors have maintained their independence in the financial year ended 30 June 2016.
5. Resolution 9 - Re-appointment of Auditors
Pursuant to Sections 172(2) and 172(16) of the Act, shareholders are required to approve the re-appointment of Auditors who shall hold office until the conclusion of the next AGM and to authorise the Directors to determine their remuneration thereof. The present Auditors, Messrs PricewaterhouseCoopers (PwC), have indicated their willingness to continue their services for another year. The re-appointment of PwC as Auditors of the Company has been considered against the relevant criteria prescribed by Paragraph 15.21 of the MMLR.
EXPLANATORY NOTES ON SPECIAL BUSINESS
1. Resolution 10 - Proposed Renewal of Shareholders’ Mandate for Existing Recurrent Related Party Transactions and Proposed New Shareholders’ Mandate for Additional Recurrent Related Party Transactions of a Revenue or Trading Nature
The proposed Resolution 10, if passed, will enable the Company and/or its subsidiary companies to enter into recurrent transactions involving the interests of the Related Parties, which are of a revenue or trading nature and necessary for the Group’s day-to-day operations, subject to the transactions being carried out in the ordinary course of business on terms not more favourable than those generally available to the public and are not detrimental to the minority shareholders of the Company.
Detailed information on the Proposed Renewal of Shareholders’ Mandate and Proposed New Shareholders’ Mandate is set out in Section 2.4 of the Circular to Shareholders relating to the matter dispatched together with the Company’s Annual Report.

Sime Darby BerhadAnnual Report 2016Innovating for the Future3 5 4
2. Resolution 11 - Proposed Renewal of Authority for Directors to Allot and Issue New Ordinary Shares of RM0.50 Each in the Company (SDB Shares) in relation to the Dividend Reinvestment Plan that Provides Shareholders of the Company with an Option to Reinvest Their Cash Dividend in New SDB Shares
The shareholders had, at the Ninth AGM held on 23 November 2015, approved the renewal of the authority for the Directors to allot and issue new SDB Shares pursuant to the Dividend Reinvestment Plan (DRP) and such authority will expire at the conclusion of this AGM. Sime Darby had on 23 August 2016 announced to Bursa Malaysia Securities Berhad on the decision of the Board for the shareholders to be given an option to elect to reinvest their entire Final Dividend of 21 sen per ordinary share for the financial year ended 30 June 2016 into new SDB Shares at an issue price to be determined and announced at a later date in accordance with the DRP.
This proposed Resolution 11, if passed, will renew the Directors’ authority to allot and issue new SDB Shares in respect of the above Final Dividend under the DRP, until the conclusion of the next AGM.
STATEMENT ACCOMPANYING NOTICE OF ANNUAL GENERAL MEETING(Pursuant to Paragraph 8.27(2) of the MMLR)
The profile of the Directors who are standing for re-election (as per Resolutions 3 to 8 as stated above) at the 10th AGM of Sime Darby are set out in the “Profile of Directors” section from pages 116 to 120 of the Company’s Annual Report.
The details of any interest in securities held by the said Directors are set out in the “Directors’ Report” section on pages 178 to 182 of the Company’s Annual Report.
NOTICE OF ANNUAL GENERAL MEETING

Sime Darby Berhad 3 5 5Annual Report 2016 Other Information
ANALYSIS OF SHAREHOLDINGS
Authorised Share Capital : RM4,072,500,000.00 divided into 8,000,000,000 ordinary shares of RM0.50 each, 7,000,000,000 Series A redeemable convertible preference shares of RM0.01 each and 25,000,000 Series B redeemable convertible preference shares of RM0.10 each
Issued and Paid-up Share Capital : RM3,163,536,269.00 comprising 6,327,072,538 ordinary shares of RM0.50 each
Class of Shares : Ordinary shares of RM0.50 each
Voting Rights : One vote per ordinary share in the case of a poll and one vote per person on a show of hand
Size of ShareholdingsNo. of
Shareholders % of ShareholdersNo. of
Shares Held% of
Issued CapitalLess than 100 2,422 8.94 67,804 0.00
100 to 1,000 6,344 23.41 3,954,301 0.06
1,001 to 10,000 13,469 49.70 44,464,747 0.70
10,001 to 100,000 3,837 14.16 106,683,526 1.69
100,001 to less than 5% of issued capital
1,026 3.78 2,402,613,122 37.97
5% and above of issued capital 3 0.01 3,769,289,038 59.58
Total 27,101 100.00 6,327,072,538 100.00
Classification of ShareholdersNo. of
Shareholders % of ShareholdersNo. of
Shares Held% of
Issued CapitalIndividuals 21,633 79.82 140,022,874 2.21
Banks/Finance Companies 113 0.42 4,021,647,506 63.56
Investment Trusts/Foundations/Charities
15 0.05 509,233 0.01
Industrial and Commercial Companies
651 2.40 94,234,931 1.49
Government Agencies/Institutions 7 0.03 16,787,686 0.27
Nominees 4,680 17.27 2,053,765,033 32.46
Others 2 0.01 105,275 0.00
Total 27,101 100.00 6,327,072,538 100.00
Directors’ Direct and Indirect Interests in the Company and its Related Corporations Save as disclosed in the Directors’ Report of the Financial Statements as set out on page 180, none of the Directors of the Company has any interest, direct or indirect, in shares in the Company or in shares, debentures or participatory interest made available by a related corporation.
As at 30 August 2016

Sime Darby BerhadAnnual Report 2016Innovating for the Future3 5 6
30 LARGEST SHAREHOLDERS AS PER THE RECORD OF DEPOSITORS
No. Name of Shareholder No. of Shares Held
% of Issued Capital
1. AmanahRaya Trustees Berhad Qualifier: Amanah Saham Bumiputera
2,692,308,522 42.55
2. Citigroup Nominees (Tempatan) Sdn BhdQualifier: Employees Provident Fund Board
682,245,194 10.78
3. Permodalan Nasional Berhad 394,735,322 6.24
4. Kumpulan Wang Persaraan (DIPERBADANKAN) 229,596,661 3.63
5. Lembaga Tabung Haji 164,755,100 2.60
6. AmanahRaya Trustees BerhadQualifier: Amanah Saham Wawasan 2020
112,502,843 1.78
7. AmanahRaya Trustees BerhadQualifier: Amanah Saham Malaysia
103,813,473 1.64
8. Cartaban Nominees (Asing) Sdn BhdQualifier: Exempt AN for State Street Bank & Trust Company (West CLT OD67)
65,728,295 1.04
9. AmanahRaya Trustees BerhadQualifier: AS 1Malaysia
62,903,937 0.99
10. Cartaban Nominees (Tempatan) Sdn BhdQualifier: Exempt AN for Eastspring Investments Berhad
50,940,055 0.80
11. HSBC Nominees (Asing) Sdn BhdQualifier: BBH and Co Boston for Vanguard Emerging MarketsStock Index Fund
50,519,213 0.80
12. Maybank Securities Nominees (Tempatan) Sdn BhdQualifier: Malayan Banking Berhad for Lembaga Kemajuan Tanah Persekutuan (FELDA)
47,000,000 0.74
13. HSBC Nominees (Asing) Sdn BhdQualifier: Exempt AN for JPMorgan Chase Bank, National Association (U.S.A.)
42,859,706 0.68
14. Cartaban Nominees (Asing) Sdn BhdQualifier: GIC Private Limited for Government of Singapore (C)
42,274,955 0.67
15. Malaysia Nominees (Tempatan) Sendirian BerhadQualifier: Great Eastern Life Assurance (Malaysia) Berhad (Par 1)
40,809,630 0.64
16. AmanahRaya Trustees BerhadQualifier: Amanah Saham Didik
40,120,558 0.63
17. Maybank Nominees (Tempatan) Sdn BhdQualifier: Maybank Trustees Berhad for Public Ittikal Fund (N14011970240)
39,034,718 0.62
18. AMSEC Nominees (Tempatan) Sdn BhdQualifier: MTrustee Berhad for CIMB Islamic Dali Equity Growth Fund (UT-CIMB-DALI)
37,723,203 0.60
19. Maybank Nominees (Tempatan) Sdn BhdQualifier: Maybank Trustees Berhad for Public Regular Savings Fund (N14011940100)
32,443,806 0.51
20. AmanahRaya Trustees BerhadQualifier: Public Islamic Dividend Fund
31,000,434 0.49
ANALYSIS OF SHAREHOLDINGSAs at 30 August 2016

Sime Darby Berhad 3 5 7Annual Report 2016 Other Information
No. Name of Shareholder No. of Shares Held
% of Issued Capital
21. CIMB Group Nominees (Tempatan) Sdn BhdQualifier: Yayasan Hasanah (AUR-VCAM)
27,464,000 0.43
22. Citigroup Nominees (Tempatan) Sdn BhdQualifier: Exempt AN for AIA Bhd
26,380,837 0.42
23. Maybank Securities Nominees (Tempatan) Sdn BhdQualifier: Malayan Banking Berhad for Lembaga Kemajuan Tanah Persekutuan (FELDA 2)
25,000,000 0.40
24. AmanahRaya Trustees BerhadQualifier: Public Islamic Select Enterprises Fund
24,427,465 0.39
25. AmanahRaya Trustees BerhadQualifier: Amanah Saham Bumiputera 2
21,229,223 0.34
26. AmanahRaya Trustees BerhadQualifier: Public Islamic Sector Select Fund
19,973,355 0.32
27. Citigroup Nominees (Tempatan) Sdn BhdQualifier: Employees Provident Fund Board (NOMURA)
15,330,239 0.24
28. Citigroup Nominees (Asing) Sdn BhdQualifier: Legal & General Assurance (Pensions Management) Limited (A/C 1125250001)
15,035,740 0.24
29. HSBC Nominees (Asing) Sdn BhdQualifier: Exempt AN for the Bank of New York Mellon (Mellon ACCT)
14,551,865 0.23
30. UOB Kay Hian Nominees (Asing) Sdn BhdQualifier: Exempt AN for UOB Kay Hian Pte Ltd (A/C Clients)
13,721,892 0.22
Total 5,166,430,241 81.66
Substantial Shareholders as per the Register of Substantial Shareholders
No. Name of Substantial Shareholder No. of Shares Held (Direct Interest)
% of Issued Capital
No. of Shares Held(Indirect/Deemed
Interest)
% of Issued Capital
1.
2.3.4.
AmanahRaya Trustees Berhad - Amanah Saham Bumiputera Employees Provident Fund BoardPermodalan Nasional BerhadYayasan Pelaburan Bumiputra1
2,692,308,522675,435,194394,735,322
-
42.5510.68
6.24-
-52,926,815
- 394,735,322
-0.84
-6.24
1 Deemed interest by virtue of its interest in Permodalan Nasional Berhad pursuant to Section 6A of the Companies Act, 1965

Sime Darby BerhadAnnual Report 2016Innovating for the Future3 5 8
ADDITIONAL COMPLIANCE INFORMATIONIn compliance with the Main Market Listing Requirements of Bursa Malaysia Securities Berhad, the following information is provided:
UTILISATION OF PROCEEDS RAISED FROM CORPORATE PROPOSAL
On 24 March 2016, Sime Darby Berhad (Sime Darby or Company) launched its issuance of RM2.2 billion Perpetual Subordinated Islamic Medium Term Notes based on the Shariah Principle of Wakalah Bi Al-Istithmar (Sukuk Wakalah) pursuant to a Perpetual Subordinated Sukuk Programme of up to RM3.0 billion in nominal value. The Sukuk Wakalah has been issued with a tenure of perpetual non-call 10 years at a profit rate of 5.65% per annum.
The net proceeds arising from the issuance of the Sukuk Wakalah has been utilised for the Sime Darby Group’s working capital requirements and general corporate exercises, and/or to finance future investments and/or capital expenditure and/or to refinance debt obligations (whether in whole or part) of the Sime Darby Group.
AUDIT AND NON-AUDIT FEES
(i) The amount of audit fees paid or payable to the external auditors, Messrs PricewaterhouseCoopers (PwC), for services rendered to the Group and the Company for the financial year ended 30 June 2016 amounted to RM27.5 million and RM0.8 million respectively.
(ii) The amount of non-audit fees paid or payable to the external auditors, PwC, and their affiliated companies for services rendered to the Group and the Company for the financial year ended 30 June 2016 amounted to RM4.1 million and RM0.3 million respectively.
Notes:
1 Tan Sri Dato’ Dr Ir Gan Thian Leong is a Director and an indirect Major Shareholder of SDBH, holding an effective interest of 19.2% in SDBH by virtue of his effective interest of 48% shareholding in Brunsfield Metropolitan Sdn Bhd (BMSB), a Major Shareholder of SDBH pursuant to Section 6A of the Companies Act, 1965 (Act). He also holds an effective interest of 43.2% in BESB.
2 Encik Mohamad Hassan Zakaria is a Director and an indirect Major Shareholder of SDBH, holding an effective interest of 20.8% in SDBH by virtue of his effective interest of 52% shareholding in BMSB, a Major Shareholder of SDBH pursuant to Section 6A of the Act. He also holds an effective interest of 41.6% in BESB.
Company Transacting Party Nature of Transaction Related Party Value of Transaction RM’ million
Sime Darby Brunsfield Damansara Sdn Bhd and Sime Darby Brunsfield Resort Sdn Bhd
(Subsidiaries of Sime Darby Brunsfield Holding Sdn Bhd (SDBH))
Brunsfield Engineering Sdn Bhd (BESB)
Building contract for the design and build as well as certain service provider components of SDBH’s property development projects(Oasis Corporate Park, Oasis Autocity, Oasis Rio, Kuala Lumpur Golf & Country Club (KLGCC) Senada (Parcel G2), Oasis Central, KLGCC – Parcel A & B, Oasis Ky’la, and Oasis Tower)
Interested Directors and Major Shareholders
Tan Sri Dato’ Dr Ir Gan Thian Leong1
Encik Mohamad Hassan Zakaria2
378.4
MATERIAL CONTRACTS INVOLVING INTERESTS OF DIRECTORS AND MAJOR SHAREHOLDERS
There were no material contracts entered into by the Company and its subsidiaries involving interests of Directors and Major Shareholders since the end of the previous financial year.
CONTRACTS RELATING TO LOANS
There were no contracts relating to loans by the Company involving interests of Directors and Major Shareholders during the financial year ended 30 June 2016.
RECURRENT RELATED PARTY TRANSACTIONS OF A REVENUE OR TRADING NATURE
At the Ninth Annual General Meeting (AGM) held on 23 November 2015, Sime Darby obtained a general mandate from its shareholders for recurrent related party transactions of a revenue or trading nature, to be entered into by its subsidiaries (RRPT Mandate).
The RRPT Mandate is valid until the conclusion of the forthcoming Tenth AGM of the Company to be held on 2 November 2016.
The Company proposes to seek a renewal of the existing RRPT Mandate and a new mandate for additional recurrent related party transactions of a revenue or trading nature at its forthcoming Tenth AGM. The renewal of the existing RRPT Mandate and the new mandate, if approved by the shareholders, will be valid until the conclusion of the Company’s next AGM. Details of the RRPT Mandate and the new mandate being sought are provided in the Circular to Shareholders dated 11 October 2016 sent together with the Annual Report. Pursuant to Paragraph 10.09(2)(b) and Paragraph 3.1.5 of Practice Note 12 of the Main Market Listing Requirements of Bursa Malaysia Securities Berhad, details of the recurrent related party transactions of a revenue or trading nature entered into during the financial year ended 30 June 2016 by the subsidiaries of Sime Darby were as follows:

Sime Darby Berhad 3 5 9Annual Report 2016 Other Information
10.00 200.00
PRICE (RM) VOLUME (MILLION)(RHS)
8.00150.00
6.00100.00
4.00
2.0050.00
0 0
JUL AUG SEP OCT 2015 2015 2015 2015
NOV 2015
DEC2015
JAN 2016
FEB 2016
MAR2016
APR 2016
MAY2016
JUN2016
Highest (RM) 8.72 8.79 8.08 8.80 8.43 7.97 8.07 8.00 8.00 7.99 7.71 7.66
Lowest (RM) 8.42 7.02 7.17 8.05 7.91 7.23 7.07 7.40 7.70 7.70 7.26 7.45
Volume (Million)(RHS)
62.24 85.28 83.49 118.04 82.74 93.01 79.61 62.93 82.17 49.52 153.69 62.79
Highest (RM)
Lowest(RM)
Volume(Million)
SHARE PRICE MOVEMENT &FINANCIAL CALENDAR
FINANCIAL RESULTS
Announcement of Unaudited Consolidated Results
First Quarter : 26 November 2015Second Quarter : 24 February 2016Third Quarter : 25 May 2016Fourth Quarter : 23 August 2016
ANNUAL GENERAL MEETING
Notice Date : 11 October 2016Meeting Date : 2 November 2016
DIVIDENDS
Interim Single Tier Dividend of 6.0 sen Per Ordinary Share
Announcement of the notice of entitlement and payment : 24 February 2016
Date of Entitlement : 21 April 2016Date of Payment : 6 May 2016
Final Single Tier Dividend of 21.0 sen Per Ordinary Share
The entitlement and payment dates for the Final Dividend will be announced later. The proposed Final Dividend is subject to the approval of shareholders of the Company at the forthcoming Annual General Meeting.
The shareholders of the Company will be given the option pursuant to the Dividend Reinvestment Plan to reinvest up to their entire Final Dividend into new ordinary shares of RM0.50 each in the Company at an issue price to be determined and announced at a later date.
For the financial year ended 30 June 2016

Sime Darby BerhadAnnual Report 2016Innovating for the Future3 6 0
PROPERTIES OF THE GROUP
Location Tenure
Land area
(Hectares)Year of
acquisition
Age of building (Years)+ Description
Net book value
(RM million)
PLANTATION PROPERTIESUPSTREAM
Malaysia
Kedah Darul AmanAnak Kulim, Bukit Hijau,
Bukit Selarong, Jentayu, Padang Buluh, Somme, Sungai Dingin
Freehold 18,893 1978-2006 12 Oil palm and rubber estates and a palm oil mill
374.0
Bukit Hijau Leasehold expiring 2068
9 2006 – Rubber estate 0.1
Perak Darul RidzuanBagan Datoh, Bikam,
Chersoneese, Cluny, Elphil, Flemington, Holyrood, Kalumpong, Kamuning, Kinta Kellas, Sabrang, Selaba, Seri Intan, Sogomana, Sungei Samak, Sungei Wangi, Tali Ayer
Freehold 37,407 1978-2001 8-24 Oil palm and rubber estates and 5 palm oil mills
850.6
Bagan Datoh, Chersonese, Cluny, Kalumpong, Kamuning, Kinta Kellas, Sogomana, Sungai Samak, Sungei Wangi, Tali Ayer
Leasehold expiring 2035 -2897
5,446 1978-1987 – Oil palm estates and a pink guava farm
38.6
Pahang Darul MakmurChenor, Jabor, Kerdau,
Mentakab, Sungai MaiFreehold 9,340 1985-2006 21 Oil palm estates and
a palm oil mill181.1
Bukit Puteri, Chenor, Jentar, Kerdau, Sungai Mai
Leasehold expiring 2057 -2086
10,621 1985-1992 11-21 Oil palm estates and 2 palm oil mills
168.5
Selangor Darul EhsanBanting, Bukit Cheraka,
Bukit Kerayong, Bukit Lagong, Bukit Rajah, Bukit Rotan, Bukit Talang, Dusun Durian, East Carey Island, Elmina, Sabak Bernam, Sepang, Sungai Buloh, Teluk Panglima Garang, Tennamaram, West Carey Island
Freehold 36,333 1978-2013 3-26 Oil palm estates, 4 palm oil mills, biodiesel and kernel, crushing plants, rat bait factory, laboratories, research centres, warehouse and a training centre
966.0
East Carey Island, Port Klang, Sungai Buloh, Tennamaram
Leasehold expiring 2018-2109
299 1978-2010 41 Oil palm estates and a bulking plant
4.2
As at 30 June 2016

Sime Darby Berhad 3 6 1Annual Report 2016 Other Information
Location Tenure
Land area
(Hectares)Year of
acquisition
Age of building (Years)+ Description
Net book value
(RM million)
PLANTATION PROPERTIES (continued)UPSTREAM (continued)
Malaysia (continued)
Negeri Sembilan Darul Khusus
Ampar Tenang, Bradwall, Bukit Pelandok, Bukit Pilah, Kok Foh, Labu, New Labu, P.D. Lukut, Pertang, Rantau, Salak, Sengkang, Siliau, Sungai Gemas, Sungai Sabaling, St Helier, Sua Betong, Sungai Bharu, Tampin Linggi, Tanah Merah
Freehold 40,308 1978-2009 4-23 Oil palm and rubber estates, 4 palm oil mills and a research laboratory
749.3
Kok Foh, Sungai Bharu Leasehold expiring 2034-2072
149 1982-1997 – Oil palm estates 1.2
MelakaBukit Asahan, Diamond
Jubilee, Kempas, Kemuning, Serkam
Freehold 14,997 1978-2011 10-18 Oil palm estates and 2 palm oil mills
250.5
Bukit Asahan, Diamond Jubilee, Kempas, Kemuning, Serkam
Leasehold expiring 2025-2071
470 1982-1992 – Oil palm estates 3.7
Johor Darul TakzimBatu Anam, Bukit Badak,
Bukit Benut, Bukit Paloh, Cenas, CEP Nyior, CEP Renggam, Cha’ah, Gunung Mas, Hadapan, Kempas Klebang, Kulai, Lambak, Lanadron, Layang, New Pagoh, Nordanal, North Labis, Pagoh, Pekan, Pengkalan Bukit, Sembrong, Seri Pulai, Sungai Senarut, Sungai Simpang Kiri, Tangkah, Tun Dr. Ismail, Ulu Remis, Welch, Yong Peng
Freehold 53,680 1978-2011 5-21 Oil palm and rubber estates, 4 palm oil mills, a research centre and 2 rubber factories
1,137.0
Cenas, CEP Nyior, Cha’ah, Lanadron, Layang, Muar River, Pekan, Sembrong, Sungai Senarut, Sungai Simpang Kiri, Ulu Remis
Leasehold expiring 2020-2918
18,616 1978-2012 20-25 Oil palm estates and 2 palm oil mills
176.4
SabahBinuang, Giram, Imam,
Jeleta Bumi, Kunak, Melalap, Merotai, Mostyn, Sandakan Bay, Sapong, Segaliud, Sentosa, Sungang, Table, Tiger, Tigowis, Tingkayu, Tun Tan Siew Sin, Tunku
Leasehold expiring 2019-2940
53,798 1978-1983 10-31 Oil palm estates, 6 palm oil mills, a bulking plant and a research centre
1,199.3

Sime Darby BerhadAnnual Report 2016Innovating for the Future3 6 2
Location Tenure
Land area
(Hectares)Year of
acquisition
Age of building (Years)+ Description
Net book value
(RM million)
PLANTATION PROPERTIES (continued)UPSTREAM (continued)
Malaysia (continued)
SarawakBayu, Belian, Chartquest,
Damai, Derawan, Dulang, Kelida, Lavang, Paroh, Pekaka, Rajawali, Rasan, Ruai, Sahua, Samudera, Semarak, Takau
Leasehold expiring 2048-2082
47,294 1990-2004 14-22 Oil palm estates and 4 palm oil mills
550.7
Plantation Properties - Upstream Malaysia
347,660
6,651.2
Indonesia
Kalimantan - WestAwatan, Beturus, East,
Kelampai, Lembiru, Pelanjau, Mas 1 – 4, Sei Mawang, Sungai Putih, West
Leasehold expiring 2030
59,599 2001-2013 6-15 Oil palm estates, 3 palm oil mills and a bulking plant
234.2
Kalimantan - CentralBaras Danum, Batang
Garing,Hatan Tiring, Kawan Batu, Kuala Kuayan, Pemantang, Sapiri, Sekunyir, Seruyan, Sukamandang
Leasehold expiring 2033-2034
39,116 2001-2008 3-20 Oil palm estates, 3 palm oil mills and a bulking plant
319.4
Kalimantan - SouthAngsana, Bakau, Bebunga,
Betung, Binturung, Gunung Aru, Gunung Kemasan, Gunung Sari, Lanting, Laut Timur, Matalok, Mustika, Pantai Bonati, Pantai Timur, Pondok Labu, Rampa, Randi, Rantau, Sangkoh, Sekayu, Selabak, Sesulung, Sungai Cengal
Leasehold expiring 2032-2039
86,636 2001-2012 4-21 Oil palm estates, 8 palm oil mills, 2 bulking plants and a kernel crushing plant
869.4
Sulawesi - CentralUngkaya Leasehold
expiring 2024
4,145 2001-2011 5-22 Oil palm estate, a palm oil mill and a bulking plant
51.7
Sumatera - JambiPanjang Leasehold
expiring 2038
3,018 2001-2007 9 Oil palm estate and a palm oil mill
28.2
PROPERTIES OF THE GROUPAs at 30 June 2016

Sime Darby Berhad 3 6 3Annual Report 2016 Other Information
Location Tenure
Land area
(Hectares)Year of
acquisition
Age of building (Years)+ Description
Net book value
(RM million)
PLANTATION PROPERTIES (continued)UPSTREAM (continued)
Indonesia (continued)
Sumatera - SouthBumi Ayu, Bukit Pinang,
Karang Ringin, Mangun Jaya, Napal, Rantau Panjang, Sungai Jernih, Sungai Pinang
Leasehold expiring 2033-2034
21,114 2001-2002 14-16 Oil palm estates and 2 palm oil mills
238.8
Bangka Belitung Leasehold expiring 2072
10,000 2012 – Rubber estates 16.8
Sumatera - East AcehBatang Ara, Blang Simpo 1 &
2, TamiangLeasehold expiring 2022-2037
8,896 2001-2008 19-34 Oil palm estates and 2 palm oil mills
109.5
Sumatera - RiauAlur Damai, Aneka Persada,
Mandah, Menggala 1 – 3, Nusa Lestari, Nusa Persada, Pinang Sebatang, Rotan Semelur, Teluk Bakau, Teluk Siak
Leasehold expiring 2031-2036
54,888 2001-2015 3-21 Oil palm estates, 5 palm oil mills and a research centre
645.7
Sumatera – NorthDeli Serdang Leasehold
expiring 2023
972 2015 – Rubber estate, oil palm nursery and office building
9.6
Plantation Properties - Upstream Indonesia 288,384
2,523.3
LiberiaBomi, Bong 1 & 2, Grand
Cape Mount, Gbarpolu, Lofa
Leasehold expiring 2072
220,000 2009 3-6 Oil palm and rubber estates
518.3
Papua New GuineaWest New Britain, Morobe,
Oro, Milne Bay, New Ireland
Leasehold expiring 2018-2093
128,327 2015 2-49 Oil palm estates, a sugar cane plantation, grazing pastures, a refinery, 2 biogas plants, a sugar factory, 11 palm oil mills, 5 kernel crushing plants and 2 abattoirs
4,078.5
Solomon IslandsGuadalcanal Leasehold
expiring 2043-2062
8,304 2015 2-11 Oil palm estates, a palm oil mill and a kernel crushing plant
272.9
Plantation Properties - Upstream
992,675
14,044.2

Sime Darby BerhadAnnual Report 2016Innovating for the Future3 6 4
Location Tenure
Land area
(Hectares)Year of
acquisition
Age of building (Years)+ Description
Net book value
(RM million)
PLANTATION PROPERTIES (continued)DOWNSTREAM AND OTHERS
Malaysia
Selangor Darul EhsanTeluk Panglima Garang,
North Port Edible Oil Refinery Complex
Freehold 2 2012 – Vacant land 23.8
Leasehold expiring 2076-2105
17 2006-2009 6-8 Refineries 244.2
Johor Darul TakzimPasir Gudang Leasehold
expiring 2035-2043
6 1974-1985 41 Refinery 9.9
SarawakKawasan Perindustrian
Kidurong, BintuluLeasehold expiring 2072
14 2004 3-9 Refinery and a kernel crushing plant
28.6
Plantation Properties - Downstream and Others Malaysia
39
306.5
Overseas
IndonesiaDesa Sei Taib, Kecamatan
Pulau Laut, KalimantanLeasehold expiring 2044
32 2014 2-3 Refinery 99.2
SingaporeBoon Lay Road Leasehold
expiring 2029
3 1970 44 Warehouse and office building
0.1
ThailandSukhumvit Road, Bangkok Freehold – 1986-2011 9-28 Office building,
refinery and vacant land
5.8
Poochaosamingprai Road, Samut Prakan
Freehold 5 1986 9-28 Refinery 43.3
Yok Krabat-Laksi Road, Samut Sakhon
Freehold 6 1986 – Vacant land 7.0
Tiwanon Road, Nonthaburi Freehold 13 2014 31-36 Crushing and refining plant and office building
80.4
VietnamHo Chi Minh City Freehold 3 1992 24 Refinery 1.9
The NetherlandsLindtsedijk, Zwijndrecht Freehold 6 2002 3-85 Refinery, biodiesel
plant and a research centre
149.7
*Less than one hectare
PROPERTIES OF THE GROUPAs at 30 June 2016

Sime Darby Berhad 3 6 5Annual Report 2016 Other Information
Location Tenure
Land area
(Hectares)Year of
acquisition
Age of building (Years)+ Description
Net book value
(RM million)
PLANTATION PROPERTIES (continued)DOWNSTREAM AND OTHERS (continued)
Overseas (continued)
South AfricaBoksburg Leasehold
expiring 2017
1 2004 5 Refinery 0.2
United KingdomLiverpool Leasehold
expiring 2034
3 2015 2-7 Refinery and office building
44.9
Plantation Properties - Downstream and Others Overseas
72 432.5
Plantation Properties - Downstream and Others 111 739.0
GENERAL
Malaysia
Selangor Darul EhsanPlantation Tower, Oasis,
Ara DamansaraFreehold 2 2012 4 Office complex 238.8
IndonesiaThe Plaza OfficeTower Lt 36,
JakartaLeasehold expiring 2033
– 2004-2008 4-11 3 floors of a 45-storey office building
10.7
Plantation Properties - General 2 249.5
Total Plantation Properties 992,788 15,032.7
+ the age of building is in respect of the office building, mill and plant

Sime Darby BerhadAnnual Report 2016Innovating for the Future3 6 6
Location Tenure
Land area
(Hectares)Year of
acquisition
Age of building
(Years) Description
Net book value
(RM million)
INDUSTRIAL PROPERTIES
Malaysia
Perak Darul RidzuanJalan Lahat, Bukit Merah,
IpohLeasehold expiring 2036-2056
3 1982-1996 36 Single storey office building, factory, workshop and warehouse
1.3
Pahang Darul MakmurSemambu Industrial Estate,
KuantanLeasehold expiring 2041
3 1982 36 2 blocks of single-storey office building with detached factory, workshop and warehouse
2.9
Selangor Darul EhsanKompleks Kejuruteraan,
Jalan Puchong, Taman Perindustrian Puchong Utama, Puchong
Freehold 14 1993 18 Land and 5-storey commercial office, training centre, workshop and warehouse
59.4
Johor Darul TakzimJalan Skudai, Johor Bahru Leasehold
expiring 2024
* 2014 3 2-storey office building, warehouse and workshop
0.4
SabahJalan Apas, Tawau, Jalan
Labuk, Sandakan, Tuaran Road, Kota Kinabalu
Leasehold expiring 2025-2888
3 1982 36 2-storey office building, training centres, workshop and warehouse
1.5
SarawakJalan Piasau, Miri, Kidurong
Light Industrial Estate, Bintulu, Lorong Then Kung Suk, Sibu
Leasehold expiring 2028-2060
4 1982-1986 16-36 Office buildings detached with factory, workshop and warehouse
6.6
Industrial Properties – Malaysia 27 72.1
Overseas
SingaporeBenoi Sector Leasehold
expiring 2032
7 2004 45 3-storey office building, warehouse and workshop
21.6
BruneiBeribi Industrial Estate,
Bandar Seri BegawanLeasehold expiring 2019
* 2003 13 Office, service centre and warehouse
0.1
PROPERTIES OF THE GROUP
* less than one hectare
As at 30 June 2016

Sime Darby Berhad 3 6 7Annual Report 2016 Other Information
Location Tenure
Land area
(Hectares)Year of
acquisition
Age of building
(Years) Description
Net book value
(RM million)
INDUSTRIAL PROPERTIES (continued)
Overseas (continued)
ChinaChangsha Economic
Technological Development Area, Changsha, Hunan
Leasehold expiring 2063
2 2013 – Industrial land 8.2
Ji Mei District, Xiamen, Fujian
Leasehold expiring 2062
1 2012-2015 2 Land and 3-storey office buildings, warehouse and workshop
16.8
Nanchang, Jiang Xi Leasehold expiring 2059
1 2009-2011 5 3-storey office building, warehouse and workshop
7.2
Nanning, Guangxi Leasehold expiring 2064
3 2014 – Industrial land 7.5
Shunde, Foshan, Guangdong
Leasehold expiring 2045
2 1996-2011 5-19 Land and 2 blocks of 4-storey and 2-storey buildings, warehouse and workshops
12.1
Yifu Garden, Dongguan, Guangdong
Leasehold expiring 2072
– 2014 3 Staff quarters 0.5
Urumqi, Xinjiang Leasehold expiring 2060
4 2010-2012 4 Land held for office building, warehouse and workshop
29.9
Hong KongYuen Long Industrial Estate,
Yuen Long DistrictLeasehold expiring 2047
2 1993-1995 21 2-storey office building, warehouse and workshop
7.7
Australia
Northern TerritoryAlice Springs Facility and
Darwin FacilityFreehold 8 1992-2011 12-49 Single-storey
office buildings, warehouse and workshops
26.2
Gove Facility, Traeger Close Leasehold expiring 2053
6 2006 10 Single-storey commercial offices, workshop and warehouse
0.4
QueenslandArcherfield Facility, Kerry
Road, Archerfield, Bellrick Street, Beaudesert Road, Acacia Ridge, Brisbane
Freehold 22 1992-2012 1-70 Single-storey and 2-storey commercial offices, warehouses and workshops
234.2

Sime Darby BerhadAnnual Report 2016Innovating for the Future3 6 8
Location Tenure
Land area
(Hectares)Year of
acquisition
Age of building
(Years) Description
Net book value
(RM million)
INDUSTRIAL PROPERTIES (continued)
Overseas (continued)
Australia (continued)
Queensland (continued)Boundary Road, Richlands,
BrisbaneFreehold 1 2010 6 2 blocks of 2-storey
and single-storey office buildings, warehouse and workshop
17.6
Bowhill Road, Willawong, Brisbane
Freehold 21 2012-2014 – Industrial land 117.2
Cairns Facility, Kenny Street, Comport St, Portsmith, Cairns
Freehold
Perpetual lease
1
*
1992-2008 36 Single-storey commercial office, workshop and warehouse
16.3
Emerald Facility, Archer Drive, Alstonia Drive, Buckland Street
Freehold 13 1992-2013 2-42 Single-storey commercial offices, workshops and staff hotels
10.9
Mackay Facility,Farrellys Lane, Connors Road, Broadsound Road, Commercial Avenue, Mackay
Perpetual lease
Freehold
Leasehold expiring 2016-2018
3
43
1
1992-2013 1-34 2-storey commercial offices, training facilities, workshops and warehouses
385.1
Mt Isa Facility, Kolongo Crescent Kalkadoon, Mt Isa
Freehold 5 1992-2011 38 Single-storey commercial office, workshop and warehouse
25.7
RockhamptonFacility, Port Curtis Road, Richardson Road, Rockhampton
Freehold
Leasehold expiring 2016-2017
35
2
1992 2-42 13 blocks of single-storey commercial office, workshop, warehouse and training facility
121.4
Toowoomba Facility, Carrington Road, Torrington
Freehold 5 1992-2012 1-44 Single-storey commercial offices, workshop and warehouse
52.9
Townsville Facility, Corner Woolcock Street and Blakey Street, Garbutt, Townsville
Freehold 2 1992 42 2-storey commercial offices, workshop and warehouse
26.7
PROPERTIES OF THE GROUP
* less than one hectare
As at 30 June 2016

Sime Darby Berhad 3 6 9Annual Report 2016 Other Information
Location Tenure
Land area
(Hectares)Year of
acquisition
Age of building
(Years) Description
Net book value
(RM million)
INDUSTRIAL PROPERTIES (continued)
Overseas (continued)
New CaledoniaCanala, Kouaoua Freehold 2 2000-2004 22 Commercial office,
workshop and warehouse and residential dwelling
0.1
Lot 1 & 2 Lotissement ZICO II, Paita
Freehold 2 2010 – Office building, workshop, warehouse and operational bay under construction
78.4
Paagoumene, Koumac Freehold * 2012 5 Workshop and warehouse
0.2
Rue Gervolino, Nepoui Leasehold expiring 2015-2017
* 2005-2007 9-11 Commercial office, workshop and warehouse
0.2
Papua New GuineaPort Moresby Facility,
Spring Garden Road, Moresby, Lae Facility, Corner Milford Street & Malaita Street, Lae, Tabubil Facility, Batch Street
Perpetual lease
Leasehold expiring 2016-2094
*
18
1992-2013 20-64 2-storey and single-storey office buildings, sales service and parts facility, and staff hostels
30.2
Solomon IslandsHoniara Facility,
Guadalcanal Island, Panatina Village, Honiara
Leasehold expiring 2091
3 1992 32 Office, industrial building, warehouse and 2-storey staff hostels
0.1
Industrial Properties Overseas 215 1,255.4
Total Industrial Properties 242 1,327.5
* less than one hectare

Sime Darby BerhadAnnual Report 2016Innovating for the Future3 7 0
Location Tenure
Land area
(Hectares)Year of
acquisition
Age of building
(Years) Description
Net book value
(RM million)
MOTORS PROPERTIES
Malaysia
Kedah Darul Aman
Padang Meha, Kulim Freehold 78 2004 19 Assembly plant 86.5
Selangor Darul Ehsan
Autocity, Ara Damansara Freehold 9 2014-2015 – Office building and showroom under construction
395.3
Temasya Industrial Park, Shah Alam
Freehold * 2004-2006 13-15 3-storey office building and showroom, 3-storey semi detached light industrial office building and showroom
14.7
Kuala Lumpur
193 – 195, Jalan Klang Lama Leasehold expiring 2026
* 2015 2 2-storey office building, showroom and workshop
7.7
362, Jalan Tun Razak Freehold * 2010 9 4-storey 4S service centre and workshop
49.1
Sabah
Sedco Industrial Estate, Jalan Limau Manis, Off Jalan Lintas, Kota Kinabalu
Leasehold expiring 2034
2 2003 13 Single-storey showroom and service centre
3.7
Motors Properties - Malaysia 89 557.0
Overseas
Singapore 303 & 305 Alexandra Road Leasehold
expiring 2047-2057
9 2002-2005 8-10 6-storey 4S showroom, service centre and workshop
236.4
Benoi Sector Leasehold expiring 2032
1 1983 32 Pre-delivery inspection centre, workshop and office
–
Kampung Arang Road Leasehold expiring 2034
* 1982 47 2-storey service centre and workshop
11.9
PROPERTIES OF THE GROUP
* less than one hectare
As at 30 June 2016

Sime Darby Berhad 3 7 1Annual Report 2016 Other Information
Location Tenure
Land area
(Hectares)Year of
acquisition
Age of building
(Years) Description
Net book value
(RM million)
MOTORS PROPERTIES (continued)
Overseas (continued)
Singapore (continued)Ubi Road 4 Leasehold
expiring 2020
* 1997 24 4-storey 3S showrooms, offices, pre-delivery inspection centre, workshop and rent to external tenants
11.2
ThailandAnusawaree, Charan
Sanit Wong Road, Charoen Nakhon Road, Ladkrabang Road Minburi, Paknam, Paradise Road, Phetkasem Road, Saphansoong, Srinakarin Road, Suksawat Road
Freehold
Leasehold expiring 2017-2034
*
9
2002-2014 2-16 3S showroom, workshops and offices
57.0
ChinaJinkai Avenue, Beibu New
DistrictLeasehold expiring 2031
2 2016 1 5-storey 5S center 46.3
Yingbin Road, Panyu, Daguang Nan Road, Tianhe, Guangzhou
Leasehold expiring 2020-2032
3 1999-2015 1-18 2-storey, single-storey and 4-storey 4S centre
24.6
Hai Yu Zhong Xian Road, Nanhai Road, Haikou District, Hainan
Leasehold expiring 2059-2070
2 2000 - 2004 10-21 2-storey 4S centre 12.7
Tianshan Road, Shantou, Guangdong
Leasehold expiring 2022
* 2002 12 2-storey 4S centre 3.3
Shen Nan Road, Yue Liang Wan Road, Nanshan District, Shenzhen
Leasehold expiring 2042
1 1994-2004 12-21 2-storey and 8-storey 4S centre
14.0
Hongqiao land, East 3rd Ring, Yunnan
Leasehold expiring 2027
2 2010 6 3-storey 4S centre 15.4
Jinke Nan Road, Jin Niu District, Chengdu, Sichuan
Leasehold expiring 2052
1 2008-2011 5-8 7-storey 4S showrooms, service centres and workshops
79.7
West of Houzishi Bridge, Yue Lu District, Changsha
Leasehold expiring 2028
1 2011 5 2-storey 4S centre 14.6
* less than one hectare

Sime Darby BerhadAnnual Report 2016Innovating for the Future3 7 2
Location Tenure
Land area
(Hectares)Year of
acquisition
Age of building
(Years) Description
Net book value
(RM million)
MOTORS PROPERTIES (continued)
Overseas (continued)
Hong Kong and Macau 2 - 4 Floor, Kailey Industrial
Centre, Fung Yip Street, Chai Wan
Leasehold expiring 2047
– 1989 25 3-floors of a 20-storey office building and service centre
8.1
Matauwei Road, Tokwawan, Kowloon
Leasehold expiring 2035
* 1978 53 11-storey service centre, showroom and petrol filling station
19.7
Oriental Centre 67 – 71 Chatnam Road, Kowloon
Leasehold expiring 2038
– 1993 40 2-floors of an 18-storey building with showroom and service centre
13.0
Castle Peak Road, Tsuen Wan, New Territories
Leasehold expiring 2047
* 1972 44 6-storey 4S service centre
6.9
No. 51 North, Fanling, New Territories
Leasehold expiring 2047
* 2015 – Development of single-storey 3S service centre
217.1
3 & 4 Floor, Topsail Plaza, 11 On Sum Street, Shatin
Leasehold expiring 2047
– 1992 21 2-floors of a 16-storey office building and service centre
58.0
3719D, 3719E, 3719F6, 3719I & 3723F, Yuen Long District
Leasehold expiring 2047
4 1984 110 4 separate plots of land for pre-delivery inspection/ commercial repair/storage
1.4
120-158 Rua dos Pescadores, Macau
Leasehold expiring 2016
* 1977 40 5-storey building with showroom and service centre
–
AustraliaChurch Street, Granville,
New South WalesFreehold * 2015 17 Single storey office,
showroom and workshop
45.8
Littlefield St, Fortitude Valley, Monier Road, Queensland
Freehold Leasehold expiring 2016
2*
2008 - 2014 8-36 Single-storey and two-storey offices, showrooms and workshops
183.1
Orkney Road, Karratha, Western Australia
Freehold * 2007 32 Single-storey office and workshop
1.5
PROPERTIES OF THE GROUP
* less than one hectare
As at 30 June 2016

Sime Darby Berhad 3 7 3Annual Report 2016 Other Information
Location Tenure
Land area
(Hectares)Year of
acquisition
Age of building
(Years) Description
Net book value
(RM million)
MOTORS PROPERTIES (continued)
Overseas (continued)
New ZealandGreat South Road, Maranui Avenue,
Silverfield Street, Auckland
Freehold Leasehold expiring 2017-2026
313
1998-2014 4-55 Workshop, central parts warehouse and warranty processing centre
23.8
Malden Street, Palmerston North
Freehold 3 2005 13-47 Workshop, office and central parts warehouse
17.8
Wairau Road, Wairau Valley Freehold 1 2014 – Land held for development of single-storey 3S service centre
25.7
VietnamTan Phu Ward, Duc Giang
WardLeasehold expiring 2021-2027
* 2013 3-8 3-storey offices, showroom, workshop and warehouse
23.9
Motors Properties Overseas 57 1,172.9
Total Motors Properties 146 1,729.9
*Less than one hectare

Sime Darby BerhadAnnual Report 2016Innovating for the Future3 7 4
Location Tenure
Remaining Land area
(Hectares)Year of
acquisition
Net book value
(RM million)
LAND HELD FOR PROPERTY DEVELOPMENT
Malaysia
Kedah Darul AmanJerai, Bukit Selarong, Taman Sg. Dingin Freehold 444 2007 38.9
Selangor Darul EhsanBandar Bukit Raja, Kapar, Klang Freehold 1,035 2008 50.3
Bukit Lagong and Lagong Mas, Rawang Freehold 629 2008 37.2
Bukit Subang 1, Shah Alam Freehold * 2008 13.5
Elmina Estate, Sungai Buloh Freehold 1,192 1985 17.5
Glengowrie, Jalan Acob, New Lunderston and Semenyih Estate
Freehold 217 1995 18.4
Melawati Development, Hulu Kelang Freehold 17 1978 23.3
Putra Heights, Subang Jaya Freehold 10 1992 16.6
Sungai Kapar Indah, Klang Freehold 4 1985 2.5
Subang Jaya City Centre, Subang Jaya Freehold 10 1964-2013 47.9
Serenia City, Sepang Freehold 297 2008 2.1
Taman Subang Ria Leaseholdexpiring 2087
29 2007 –
USJ Heights, Subang Jaya Freehold 9 1995 6.4
Kuala LumpurKLGCC, Bukit Kiara Leasehold
expiring 2111
51 1991 358.2
Negeri Sembilan Darul KhususHamilton, New Labu, and Sungai Sekah, Nilai Freehold 224 1995 19.7
Labu, Rasah, Sua Betong, Taman Sengkang Freehold 226 1995-2012 15.5
Nilai Impian / Utama, Nilai Freehold 99 1992-1996 7.3
Rasah, Seremban Leaseholdexpiring 2066
3 1995 0.3
PROPERTIES OF THE GROUPAs at 30 June 2016

Sime Darby Berhad 3 7 5Annual Report 2016 Other Information
Location Tenure
Remaining Land area
(Hectares)Year of
acquisition
Net book value
(RM million)
LAND HELD FOR PROPERTY DEVELOPMENT (continued)
Malaysia (continued)
Johor Darul TakzimLanadron Estate, Muar Leasehold
expiring 2111
929 1994-2015 19.2
SabahImam and Mostyn Estate, Tawau Leasehold
expiring 2050-2058
16 2006 0.3
Total Development Properties 5,441 695.1
Location Tenure
Land area
(Hectares)Year of
acquisition
Age of building
(Years) Description
Net book value
(RM million)
INVESTMENT AND HOSPITALITY PROPERTIES
Malaysia
Kedah Darul AmanHarvard Golf & Country Club
and Hotel, BedongFreehold 1,583 1984-2012 18-20 Golf course, club
house and hotel7. 0
Pulau PinangPenang House Freehold 1 2007 95 Holiday bungalows 1.6
Reef Apartment, Batu Ferringhi
Freehold – 1989 27 2 units of apartment 0.9
Pahang Darul MakmurGenting View Resort,
Genting HighlandsFreehold 22 1999 21-25 Hotel resort and
apartments17.3
Frasers’ Hill / Cameron Highlands
Leasehold expiring 2026-2082
2 1982 30-87 Holiday bungalows 1.1
Selangor Darul EhsanBlock F and G, Oasis, Ara
Damansara, Petaling JayaFreehold 1 2012 5 2 blocks of 10-storey
office building and 2-storey carpark
236.5
Bayuemas Oval and Akademi Tunku Jaafar, Kota Bayuemas
Freehold 17 2007 9-12 Cricket club and lawn bowl
40.0
Elmina East, Sungai Buloh Freehold 3 2015 2 Sales gallery 13.7
Impian Golf & Country Club, Kajang
Freehold 60 2007-2009 21 18-hole golf course and resort
56.3

Sime Darby BerhadAnnual Report 2016Innovating for the Future3 7 6
Location Tenure
Land area
(Hectares)Year of
acquisition
Age of building
(Years) Description
Net book value
(RM million)
INVESTMENT AND HOSPITALITY PROPERTIES (continued)
Malaysia (continued)
Selangor Darul Ehsan (continued)Jalan Astaka, Shah Alam Freehold * 2005 11 3 units of shoplot 0.7
Oasis Gallery, Ara Damansara
Freehold 2 2007 9 Sales gallery 8.0
Sime Darby Pavillion, Shah Alam
Freehold * 1998 8 3-storey office building
14.7
Saujana Impian, Kajang Freehold * 2015 2 Sales office and sales gallery
0.1
Tropika Paradise, Subang Jaya
Freehold – 2012 16 Apartments 0.4
Wisma Zuellig, Jalan Bersatu, Petaling Jaya
Leasehold expiring 2059
1 2000 23 Office building 14.8
Wisma LJT, Pusat Bandar Melawati
Freehold
Leasehold expiring 2016
*
–
2007 9 Carpark and township site office
6.0
Kuala LumpurKuala Lumpur Golf &
Country Club, Bukit KiaraLeasehold expiring 2111
114 1991-2009 4-23 Two 18-hole golf courses and clubhouse
262.3
KL East, Melawati Freehold * 2015 2 Sales gallery 12.8
Serini, Taman Melawati Leasehold expiring 2018
* 2015 2 Sales gallery 1.5
Sime Darby Convention Centre, Bukit Kiara
Leasehold expiring 2090-2111
4 2006 11 Convention centre 94.0
Wisma Guthrie, Jalan Gelenggang Damansara Heights
Freehold * 1973 43 4-storey office building
12.8
Negeri Sembilan Darul KhususPlanters’ Haven Clubhouse Freehold * 2008 9 Club house 11.5
Port Dickson Freehold 3 2007 22-58 Holiday bungalows 2.0Leasehold expiring 2072
*
*Less than one hectare
PROPERTIES OF THE GROUPAs at 30 June 2016

Sime Darby Berhad 3 7 7Annual Report 2016 Other Information
Location Tenure
Land area
(Hectares)Year of
acquisition
Age of building
(Years) Description
Net book value
(RM million)
INVESTMENT AND HOSPITALITY PROPERTIES (continued)
Malaysia (continued)
JohorTaman Pasir Putih Sales
GalleryFreehold * 2014 4 Sales gallery 1.8
SabahMarina Court, Kota Kinabalu Freehold – 2006 10 Apartment 0.7
Investment and Hospitality Properties – Malaysia 1,813 818.5
Overseas
SingaporeDarby Park Executive Suites,
Orange Grove RoadLeasehold expiring 2092
* 1992-1993 23 75-units of luxury apartment
78.2
Orion, Orange Grove Road Freehold – 2008 8 2 units of apartment 10.3
Sime Darby Business Centre, Alexandra Road
Leasehold expiring 2055
* 1991 23 5-storey light industrial building
60.3
VietnamRangdong Orange Court, Le
Quy Don, Vung TauLeasehold expiring 2030
* 1995 19 69 units of luxury serviced apartment
8.5
United KingdomDundee Street, Edinburgh Freehold – 2010 21 4-storey office
building41.4
St Johns Wood Court, Wynnstay Gardens
Leasehold expiring 2109-2966
– 1996-2009 97-108 2 units of apartment 3.7
AustraliaDarby Park Serviced
Residences, Margaret River, Western Australia
Freehold 1 2003 12 8 units service apartment
3.0
Darby Park Serviced Residences, Subiaco, Western Australia
Freehold * 2001 22 Service apartments 0.5
Karri Valley Resort, Vasse Highway, Pemberton, Western Australia
Freehold 116 2000 29 Chalet and lakeside residential units
10.2

Sime Darby BerhadAnnual Report 2016Innovating for the Future3 7 8
Location Tenure
Land area
(Hectares)Year of
acquisition
Age of building
(Years) Description
Net book value
(RM million)
INVESTMENT AND HOSPITALITY PROPERTIES (continued)
Overseas (continued)
Australia (continued)Serenity Shores,
QueenslandFreehold * 2009 6 Residential
properties1.7
Investment and Hospitality Properties - Overseas 117 217.8
Total Investment and Hospitality Properties 1,930 1,036.3
ENERGY & UTILITIES PROPERTIES
Malaysia
Selangor Darul EhsanJalan 225, Petaling Jaya Leasehold
expiring 2074
* 1983 34 ))) Industrial land
and building
1.5
Jalan Tandang, Petaling Jaya Leasehold expiring 2065-2066
15 1985-1994 23-53 )))
54.1
Energy & Utilities Properties - Malaysia 15 55.6
Overseas
SingaporeJurong Pier Leasehold
expiring 2025
2 1978 8 Workshop and office 2.8
ChinaJining City, Shandong Leasehold
expiring 2019-2064
83 2009-2015 1-7 Jining Ports wharf, warehouse and office
291.0
1 Binhai Economic Development Zone, Shandong
Leasehold expiring 2035-2065
189 2005-2011 1-14 Reservoir, water treatment plant and office building
101.6
Weifang City, Shandong Leasehold expiring 2055
– 2005-2008 12 6 units of apartment 1.7
Yanzi Town, Weifang Port, Shandong
Leasehold expiring 2055
407 2005-2015 1-11 Port, warehouse and office
734.9
Energy & Utilities Properties - Overseas 681 1,132.0
Total Energy & Utilities Properties 696 1,187.6
TOTAL GROUP PROPERTIES 1,001,243 21,009.1
PROPERTIES OF THE GROUP
*Less than one hectare
As at 30 June 2016

Sime Darby Berhad 3 7 9Annual Report 2016 Other Information
Sime Darby Berhad (“SDB” or “we” or “us” or “our”) strives to protect your personal data in accordance with the Personal Data Protection Act 2010 (“the Act”). The Act was enacted to regulate the processing of personal data. To comply with the Act, we are required to manage the personal data that we collect from you relating to your shareholding in SDB.
The purposes for which your personal data may be used are, but not limited to:
• Internal recordkeeping includingbutnot limited to theregistration and management of your shareholding in SDB
• Toprovideservicestoyou• TocommunicatewithyouasashareholderofSDB• Tobetterunderstandyourneedsasourshareholder• Forsecurityandfraudpreventionpurposes• Forthepurposesofstatisticalanalysisofdata• Formarketingactivities• Forthepurposesofourcorporategovernance• Tosendyoueventinvitationsbasedonselectedevents• To comply with any legal, statutory and/or regulatory
requirements• Forthepurposesofinclusioninmediaengagementsand/
or any relevant or related events• For the purposes of us preparing guest invitations,
registration and/or sign-ups for our events• Forthepurposesofprintedandon-linepublications
(collectively, “the Purposes”).
Your personal data is or will be collected from information provided by you, including but not limited to, postal, facsimile, telephone, and email communications with or from you, and information provided by third parties, including but not limited to, Bursa Malaysia Berhad and any other stock exchange, and your stockbrokers and remisiers.
You may be required to supply us with your name, correspondence address, telephone number, facsimile number, and email address.
If you fail to supply us with such personal data, we may not be able to process and/or disclose your personal data for any of the Purposes.
Please be informed that your personal data may be disclosed, disseminated and/or transferred to companies within the Sime Darby Group (including the holding company, subsidiaries, related and affiliated companies, both local and international), whether present or future (collectively, “the Group”) or to any third party organisations or persons for the purpose of fulfilling our obligations to you in respect of the Purposes and all such other purposes that are related to the Purposes and also in providing integrated services, maintaining and storing records including but not limited to the share registrar(s) appointed by us to manage the registration of shareholders.
The processing, disclosure, dissemination and/or transfer of your personal data by us and/or the Group and/or third party organisations or persons may result in your personal data being transferred outside of Malaysia.
To this end, we are committed to ensuring the confidentiality, protection, security and accuracy of your personal data made available to us. It is your obligation to ensure that all personal data submitted to us and retained by us are accurate, not misleading, updated and complete in all aspects. For
the avoidance of doubt, we and/or the Group and/or our or their employees or authorised officers or agents will not be responsible for any personal data submitted by you to us that is inaccurate, misleading, not up to date and incomplete.
Further, we may request your assistance to procure the consent of third parties whose personal data is made available by you to us and you hereby agree to use your best endeavours to do so.
You may at any time after the submission of your personal data to us, request for information relating to your personal data by contacting our share registrar Tricor Investor & Issuing House Services Sdn Bhd if you wish to enquire about any aspects of share registration matters:
Tricor Investor & Issuing House Services Sdn BhdUnit 32-01, Level 32, Tower A, Vertical Business SuiteAvenue 3, Bangsar SouthNo. 8, Jalan Kerinchi59200 Kuala Lumpur.
Attention : Ms Lim Lay Kiow, Senior Manager Tel : 03-2783 9299email : [email protected]
In addition, you may request for access to your personal data by contacting your broker or alternatively Tricor Investor & Issuing House Services Sdn Bhd as shown above if:
• yourequireaccesstoand/orwishtomakecorrectionstoyour personal data subject to compliance of such request for access or correction not being refused under the provisions of the Act and/or existing laws; or
• youwishtoenquireaboutyourpersonaldata.
Any personal data retained by us shall be destroyed and/or deleted from our records and system in accordance with our retention policy in the event such data is no longer required for the said Purposes.
In the event of any inconsistency between the English version and the Bahasa Malaysia version of this Notice, the English version shall prevail over the Bahasa Malaysia version.
We trust that you will consent to the processing of your personal data and that you declare that you have read, understood and accepted the statements and terms herein.
NOTICE TO SHAREHOLDERS UNDER THE PERSONAL DATA PROTECTION ACT 2010

Sime Darby BerhadAnnual Report 2016Innovating for the Future3 8 0
Sime Darby Berhad (“SDB” atau “kami”) bermatlamat untuk melindungi data peribadi anda selaras dengan Akta Perlindungan Data Peribadi 2010 (“Akta”). Akta tersebut diperbuat untuk mengawal selia pemprosesan data peribadi. Bagi mematuhi Akta tersebut, kami dikehendaki untuk menguruskan data peribadi yang kami kumpulkan daripada anda berkenaan dengan pegangan saham anda di SDB.
Tujuan penggunaan data peribadi anda adalah untuk, tetapi tidak terhad kepada:
• Penyimpananrekoddalamantermasuktetapitidakterhadkepada pendaftaran dan pengurusan pegangan saham anda di SDB
• Untukmemberikanperkhidmatankepadaanda• Untuk berkomunikasi dengan anda sebagai pemegang
saham SDB• Untuklebihmemahamikeperluanandasebagaipemegang
saham kami• Bagi maksud-maksud keselamatan dan pencegahan
penipuan• Bagimaksudanalisisstatistikdata• Untukaktivitipemasaran• Bagimaksudtadbiruruskorporatkami• Untuk menghantar jemputan acara berdasarkan acara-
acara terpilih• Untukmematuhiapa-apakehendakdisisiundang-undang,
statut, dan peraturan• Bagi maksud penyertaan dalam penglibatanmedia dan/
atau apa-apa acara relevan atau berkaitan• Bagi maksud kami menyediakan jemputan tetamu,
pendaftaran dan/atau kemasukan untuk acara-acara kami• Bagimaksud penerbitan bercetak dan penerbitan dalam
talian kami
(secara kolektif, “Tujuan-Tujuan tersebut”).
Data peribadi anda sedang atau akan dikumpul daripada maklumat yang diberikan oleh anda, termasuk tetapi tidak terhad kepada, komunikasi-komunikasi pos, faksimili, telefon, dan emel dengan atau daripada anda, dan maklumat yang diberikan oleh pihak ketiga, termasuk tetapi tidak terhad kepada, Bursa Malaysia Berhad dan apa-apa bursa saham lain, dan broker saham dan remisier anda.
Anda mungkin diperlukan untuk memberikan kepada kami nama, alamat surat-menyurat, nombor telefon, nombor faksimili, dan alamat emel anda.
Jika anda gagal untuk memberikan kami data peribadi tersebut, kami mungkin tidak dapat memproses dan/atau menzahirkan data peribadi anda bagi mana-mana Tujuan-Tujuan tersebut.
Sila maklum bahawa data peribadi anda boleh dizahirkan, disebarkan dan/atau dipindahkan kepada syarikat-syarikat di dalam Kumpulan Sime Darby (termasuk syarikat induk, anak-anak syarikat, syarikat-syarikat berkaitan dan bersekutu tempatan dan antarabangsa), samada pada masa kini atau masa hadapan (secara kolektif, “Kumpulan”), atau kepada mana-mana organisasi atau individu pihak ketiga bagi maksud memenuhi tanggungjawab kami kepada anda berkenaan dengan Tujuan-Tujuan tersebut dan bagi semua maksud lain yang berkaitan dengan Tujuan-Tujuan tersebut dan juga untuk memberikan perkhidmatan-perkhidmatan bersepadu, menyelenggara dan menyimpan rekod-rekod termasuk tetapi tidak terhad kepada pendaftar saham atau pendaftar-pendaftar saham yang dilantik oleh kami untuk menguruskan pendaftaran pemegang saham.
Pemprosesan, penzahiran, penyebaran dan/atau pemindahan data peribadi anda oleh kami dan/atau Kumpulan dan/atau organisasi atau individu pihak ketiga mungkin mengakibatkan data peribadi anda dipindah ke luar Malaysia.
Untuk tujuan ini, kami komited dalam memastikan penyulitan, perlindungan, keselamatan dan ketepatan data peribadi anda yang diberikan kepada kami. Adalah tanggungjawab anda untuk memastikan bahawa semua data peribadi yang diberikan kepada kami dan disimpan oleh kami adalah tepat, tidak mengelirukan, terkini dan lengkap dalam semua aspek. Bagi mengelakkan keraguan, kami dan/atau Kumpulan dan/atau pekerja atau pegawai yang diberi kuasa atau ejen kami tidak akan bertanggungjawab untuk apa-apa data peribadi yang diberikan oleh anda kepada kami yang tidak tepat, mengelirukan, bukan terkini dan tidak lengkap.
Selanjutnya, kami boleh meminta bantuan anda untuk memperolehi persetujuan pihak ketiga yang data peribadinya telah diberikan oleh anda kepada kami dan anda dengan ini bersetuju untuk menggunakan usaha terbaik anda untuk berbuat demikian.
Anda boleh pada bila-bila masa selepas penyerahan data peribadi anda kepada kami, meminta untuk mengakses data peribadi anda dengan menghubungi pendaftar saham kami Tricor Investor & Issuing House Services Sdn Bhd jika anda ingin membuat sebarang pertanyaan berkenaan dengan aspek-aspek pendaftaran saham:
Tricor Investor & Issuing House Services Sdn BhdUnit 32-01, Level 32, Tower A, Vertical Business SuiteAvenue 3, Bangsar SouthNo. 8, Jalan Kerinchi59200 Kuala Lumpur.
Untuk perhatian : Cik Lim Lay Kiow, Pengurus Kanan No.Tel : 03-2783 9299emel : [email protected]
Anda juga boleh membuat permintaan untuk mengakses data peribadi anda dengan menghubungi broker anda atau secara alternatif Tricor Investor & Issuing House Services Sdn Bhd seperti yang tersebut di atas jika:
• andamemerlukanakseskepadadan/atau inginmembuatpembetulan kepada data peribadi anda, tertakluk kepada pematuhan permintaan untuk akses atau pembetulan itu tidak ditolak di bawah peruntukan Akta tersebut dan/atau undang-undang yang sedia ada; atau
• anda inginmembuatpertanyaanmengenaidataperibadianda;
Apa-apa data peribadi yang dikekalkan oleh kami akan dimusnahkan dan/atau dipadamkan daripada rekod dan sistem kami megikut polisi penyimpanan kami sekiranya data tersebut tidak lagi diperlukan bagi Tujuan-Tujuan tersebut.
Sekiranya terdapat apa-apa konflik antara versi Bahasa Inggeris and versi Bahasa Malaysia dalam Notis ini, versi Bahasa Inggeris akan mengatasi versi Bahasa Malaysia.
Kami percaya bahawa anda akan bersetuju kepada pemprosesan data peribadi anda dan anda mengakui bahawa anda telah membaca, memahami dan menerima pernyataan-pernyataan dan terma-terma di sini.
NOTIS KEPADA PEMEGANG SAHAM DI BAWAH AKTA PERLINDUNGAN DATA PERIBADI 2010

Sime Darby Berhad 3 8 1Annual Report 2016 Other Information
Principle/Recommendation Status of Compliance Remarks Page
Principle 1 - Establish Clear Roles and Responsibilities
1.1 The Board should establish clear functions reserved for the Board and those delegated to management Complied 126-129
1.2 The Board should establish clear roles and responsibilities in discharging its fiduciary and leadership functions
Complied 124-126
1.3 The Board should formalise ethical standards through a code of conduct and ensure its compliance Complied 129
1.4 The Board should ensure that the Company’s strategies promote sustainability Complied 22-23,
160-164
1.5 The Board should have procedures to allow its members access to information and advice Complied 137
1.6 The Board should ensure it is supported by a suitably qualified and competent company secretary Complied 129
1.7 The Board should formalise, periodically review and make public its Board Charter Complied 124
Principle 2 - Strengthen Composition
2.1 The Board should establish a Nominating Committee which should comprise exclusively of non-executive directors, a majority of whom must be independent
Complied 125, 153
2.2 The Nominating Committee should develop, maintain and review the criteria to be used in the recruitment process and annual assessment of Directors
Complied133-135,141-143,152-159
2.3 The Board should establish formal and transparent remuneration policies and procedures to attract and retain Directors
Complied 139-141
Principle 3 - Reinforce Independence
3.1 The Board should undertake an assessment of its Independent Directors annually Complied 136, 158
3.2 The tenure of an Independent Director should not exceed a cumulative term of 9 years. Upon completion of the 9 years, an Independent Director may continue to serve on the Board subject to the Director’s re-designation as a Non- Independent Director
Complied 133-136, 158
3.3 The Board must justify and seek shareholders’ approval in the event it retains as an Independent Director, a person who has served in that capacity for more than 9 years
Not applicableNone of the Independent Directors have served on the Board for more than nine (9) years. 133-136
3.4 The positions of Chairman and Chief Executive Officer should be held by different individuals, and the Chairman must be a Non-Executive member of the Board
Complied 116, 120, 125
3.5 The Board must comprise a majority of Independent Directors where the Chairman of the Board is not an Independent Director
Not applicableThe Chairman of the Board is an Independent Director. 116
Principle 4 - Foster Commitment
4.1 The Board should set out expectations on time commitment for its members and protocols for accepting new directorships
Complied 135-136
4.2 The Board should ensure its members have access to appropriate continuing education programmes Complied 137-138
COMPLIANCE WITH THE PRINCIPLES AND RECOMMENDATIONS OF THE MALAYSIAN CODE ON CORPORATE GOVERNANCE 2012The table below sets out the compliance of Sime Darby Berhad with the Malaysian Code on Corporate Governance 2012 in respect of FY2016.

Sime Darby BerhadAnnual Report 2016Innovating for the Future3 8 2
COMPLIANCE WITH THE PRINCIPLES AND RECOMMENDATIONS OF THE MALAYSIAN CODE ON CORPORATE GOVERNANCE 2012
Principle/Recommendation Status of Compliance Remarks Page
Principle 5 - Uphold Integrity in Financial Reporting
5.1 The Audit Committee should ensure financial statements comply with applicable financial reporting standards
Complied 147-148
5.2 The Audit Committee should have policies and procedures to assess the suitability and independence of External Auditors
Complied 151
Principle 6 - Recognise and Manage Risks
6.1 The Board should establish a sound framework to manage risks Complied 123,
165-173
6.2 The Board should establish an internal audit functions which reports directly to the Audit Committee Complied 123,
149-150
Principle 7 - Ensure Timely and High Quality Disclosure
7.1 The Board should ensure the Company has appropriate corporate disclosure policies and procedures Complied 143
7.2 The Board should encourage the Company to leverage on information technology for effective dissemination of information
Complied 143
Principle 8 - Strengthen Relationship between Company and Shareholders
8.1 The Board should take reasonable steps to encourage shareholder participation at general meetings Complied 143
8.2 The Board should encourage poll voting
Complied
The voting at general meeting is conducted on a poll. Poll Administrator and Independent Scrutineers are appointed to conduct the polling process and verify the results of the poll respectively.
143
8.3 The Board should promote effective communication and proactive engagements with shareholders Complied 143-144

Sime Darby Berhad 3 8 3Annual Report 2016 Other Information
Sime Darby Annual Report 2016 describes the Group’s performance against the UNGC’s Ten Principles for this financial year (1 July 2015 – 30 June 2016). The following table details the relevant report sections to support each Principle.
Core Value Principle Relevant SectionsPage References
Human Rights Principle 1: Businesses should respect the protection of internationally proclaimed human rights; and
Principle 2: Make sure that they are not complicit in human rights abuses.
• ManagingourMaterialIssues• HumanRights• SimeDarbySlaveryandHuman
Trafficking Statement
1843386
Labour Principle 3: Businesses should uphold the freedom of association and the effective recognition of the right to collective bargaining;
Principle 4: the elimination of all forms of forced and compulsory labour;
Principle 5: the effective abolition of child labour; and
Principle 6: the elimination of discrimination in respect of employment and occupation.
• ManagingourMaterialIssues• HumanRights• SimeDarbySlaveryandHuman
Trafficking Statement
1843386
Environment Principle 7: Businesses should support a precautionary approach to environmental challenges;
Principle 8: undertake initiatives to promote greater environmental responsibility; and
Principle 9: encourage the development and diffusion of environmentally friendly technologies.
• ManagingourMaterialIssues• MinimisingEnvironmentalHarm• DivisionalOperationalReview
184563
Anti-corruption
Principle 10: Businesses should work against corruption in all its forms, including extortion and bribery.
• ManagingourMaterialIssues• CorporateGovernance• CodeofBusinessConductand
Compliance• StatementonRiskManagementand
Internal Control
18112129
167
UNITED NATIONS GLOBAL COMPACT(UNGC) COMMUNICATION ON PROGRESS

Sime Darby BerhadAnnual Report 2016Innovating for the Future3 8 4
GLOBAL REPORTING INITIATIVE(GRI) CONTENT INDEX
Sime Darby Berhad Annual Report has been prepared in accordance with the GRI Sustainability Reporting Guidelines (Version 4) at Core level. The following summary table details the location of specific disclosures throughout the report. It also includes additional supporting commentary and reasons for the omission of data, where relevant. For further details, please visit www.simedarby.com.
GeneralStandard Disclosure Location of Disclosure (page number)
External Assurance
Strategy and Analysis
G4-1, G4-2 – Chairman’s Message (8)– President and Group Chief Executive’s Review (11)– Global Trends and Market Outlook (16)– Group Business Model (20)– Strategy Blueprint (22)
Organisational Profile
G4-3, 5, 6, 7, 8, 9 – Corporate Information (3)– Group Highlights (4)– Group Overview (6)– Group Business Model (20)– Division Operational Reviews (64, 80, 88, 96, 105)
G4-10, G4-11 – Corporate Information (3)– Leading Sustainability - Human Rights (43)– Division Operational Reviews (64, 80, 88, 96, 105)
G4-12 – Division Operational Reviews (64, 80, 88, 96, 105)
G4-13 – E&U Division (China Operations) is now known as the Logistics Division to reflect the growing ports and logistics business in China.
G4-14 – Global Trends and Market Outlook (16)– Managing our Material Issues (18)– Statement of Risk Management and Internal Control (167)– Sustainable Thought Leadership (48)
G4-15, G4-16 – Sustainable Thought Leadership (48)– Plantation Divisional Review (68)– Sustainability Committee Report (160)– United Nations Global Compact Communication on Progress (383)
Identified Material Aspects and Boundaries
G4-17 – Group Financial Review (55)– Financial Statements (178)
Yes
G4-18, 19, 20, 21 – Managing our Material Issues (18)
G4-23 – Group Overview (6)
Stakeholder Engagement
G4-24, 25, 26, 27 – Managing our Material Issues (18)
Report Profile
G4-28 – Fiscal year (1 July 2015 – 30 June 2016), unless stated otherwise
G4-29 – Sime Darby Group’s most recent report on sustainability performance was its Sime Darby Annual Report 2015, launched November 2014.
– Sime Darby Plantation launched its inaugural 2014 Sustainability Report in November 2014 and Sime Darby Property launched its inaugural 2014 Sustainability Report in July 2015
G4-30 – Annual
G4-31 – Corporate Information (3)
G4-32 – Sime Darby has reported in accordance to GRI G4 at a Core Level. The “In Accordance” rating is demonstrated by this GRI Content Index
G4-33 – Independent Auditor’s Report and Independent Assurance Report

Sime Darby Berhad 3 8 5Annual Report 2016 Other Information
GeneralStandard Disclosure Location of Disclosure (page number)
External Assurance
Governance
G4-34, 35, 36, 37, 38, 39, 40, 41, 42, 43, 44, 45, 46, 47, 48, 49, 50, 51, 52, 53, 54, 55Structure & Composition, and roles in – Strategy Setting, – Performance Evaluation, – Risk Management, – Sustainability Reporting, – Evaluation of Economic,
Social and Environmental Performance,
– Remuneration and Incentives
– Statement on Corporate Governance (113)– Report on the Governance and Audit Committee (145)– Report on the Nomination and Remuneration Committee (152)– Report on the Sustainability Committee (160)– Report on the Risk Management Committee (165)– Statement on Risk Management and Internal Control (167)
Ethics and Integrity
G4-56, 57, 58The organisations values, policies and mechanisms in place around ethics and integrity
– Statement on Corporate Governance (113)– Code of Business Conduct and Compliance (129)
Economic
Economic Performance and Market Presence (G4-DMA, G4-EC1, G4-EC3)
– Group Financial Review (55)– Financial Statements
Yes
Environmental
Energy (G4-DMA, G4 EN3)
– Carbon and Energy (45)
Biodiversity (G4-DMA, G4- EN11, G4-EN12, EN13)
– Water, Waste and Biodiversity (48)
Emissions (G4-DMA, G4-EN15, G4-EN16, G4-EN18, G4-EN19)
– Carbon and Energy (45) Yes
Labour Practices and Decent Work
Occupational Health and Safety (G4-DMA, G4-LA6, G4-LA7)
– Safety & Health (41) Yes
Human Rights
Freedom of Association and Collective Bargaining, Child Labor, Forced Labor and Indigenous Rights (G4-DMA, G4-HR4, G4-HR5, G4-HR6)
– Human Rights (43)– Sime Darby Slavery and Human Trafficking Statement (386)
Society
Local Communities (G4-DMA, G4-SO1, SO2)
– Social Investment (45) Note: All of Sime Darby Plantation estates have community plans in place. The Property Division provides ongoing engagement at its existing townships and developments

Sime Darby BerhadAnnual Report 2016Innovating for the Future3 8 6
PREAMBLE
At Sime Darby, we believe that businesses have the responsibility to respect, support and uphold fundamental human rights, as expressed in the Universal Declaration for Human Rights and the United Nations Guiding Principles on Business and Human Rights. This includes the right to not be held in slavery or servitude. We recognise that slavery can take various forms and affects anyone regardless of nationality, gender, religion, disability or age. Therefore, we are committed to ensuring that slavery and human trafficking have no place in our business and supply chains.
The overarching building blocks of our approach to embed human rights are as follows:
Respect - Ensuring that our operations do not impede on the rights of people and their cultural values.
Protect - Adopting a precautionary approach and safeguarding vulnerable populations and ecosystems.
Enhance - Going beyond risk minimisation and impact mitigation to create a net positive footprint.
Empower - Supporting stakeholders in making their voices heard and build their own sustainable future.
Engage - Listening to our stakeholders and maintain dialogue and consultation on our performance.
Disclose - Sharing our journey and be transparent about our performance and objectives.
Our implementation process which is being undertaken consists of identification, prevention and mitigation of human rights impacts, including modern slavery.
This statement is made pursuant to Section 54 of the Modern Slavery Act 2015 and provides disclosure regarding our efforts to address slavery and human trafficking issues in our supply chains for the current financial year.
ABOUT US
Sime Darby is a Malaysia-based diversified multinational with five core businesses namely, Plantation, Industrial Equipment, Motors, Property and Logistics under the holding company, Sime Darby Berhad, which is listed on Bursa Malaysia. We have a total workforce of more than 120,000 employees across 26 countries and 4 territories.
COUNTRIES / TERRITORIES WITH SIME DARBY OPERATIONS
- United States of America - United Kingdom- The Netherlands - Germany- Liberia - Brazil- South Africa - China- South Korea - Japan- Taiwan - Hong Kong- India - Myanmar- Macau - Thailand- Maldives - Sri Lanka- Vietnam - Philippines- Malaysia - Brunei- Singapore - Indonesia- Papua New Guinea - Christmas Island- Solomon Islands - Australia- New Caledonia - New Zealand
PLANTATION
Fully integrated player in the oil palm value chain. The world’s largest producer of Certified Sustainable Palm Oil.
INDUSTRIAL
Offers a comprehensive range of heavy equipment and services, from the sales of new machines, engines and used equipment for rental through its chain of Cat Rental.
MOTORS
Involved in the assembly, import, distribution and retail businesses. A major player in the Asia Pacific automotive industry with presence in ten countries and territories.
PROPERTY
Leading property developer, its core businesses are property development and property investment. Currently Malaysia’s largest property developer in terms of landbank and active developments.
LOGISTICS
Involved in Ports & Logistics and Water Management in Shandong, Eastern China, with operations in Weifang and Jining.
SIME DARBY SLAVERY AND HUMAN TRAFFICKING STATEMENT

Sime Darby Berhad 3 8 7Annual Report 2016 Other Information
As a diversified multinational, we acknowledge that each of our Divisions is unique and its supply chains consist of multiple levels of suppliers. These sourcing activities range from sourcing of fresh fruit bunches (FFB) of the oil palm fruit from local smallholders in Indonesia to sourcing of products and machineries from established principals and business counterparts in other parts of Asia, Europe and the United States of America.
We have started conducting preliminary assessments on all of our Divisions and have identified some areas requiring further analysis in the Plantation and Property Divisions due to risks posed by the use of migrant labour. We are investigating these areas and will implement appropriate action plans depending on the results of our investigations.
OUR APPROACH
The oversight of human rights, including the prevention of modern slavery in all its forms at Sime Darby is led by the Main Board of Sime Darby Berhad through board committees such as the Sustainability Committee, supported by the Risk Management Committee, the Governance and Audit Committee, and Flagship Boards (FSB) of each Division.
Sime DarbyBerhad Board
Risk Management
Committee
SustainabilityCommittee
Governance & Audit Committee
Group Sustainability& Quality Management
Group Human Resources
Group ComplianceGroup Legal
Group Risk Management Group Procurement
Group Communications
President & Group
Chief Executive
Group Human Rights Taskforce
PlantationFSB
IndustrialFSB
MotorsFSB
PropertyFSB
LogisticsFSB
Our commitment to respect fundamental human rights is articulated in our business core values, Code of Business Conduct (COBC), and the Group Policies and Authorities (GPA). These policies are applicable to all persons within our sphere of influence, such as our employees and business counterparts and extends to communities surrounding our operations. We are cognisant of all laws and regulations in the countries and territories in which we operate. We are also committed to working with our suppliers and business counterparts to encourage compliance. When faced with conflicts between local legislations and international standards or any other conflicting requirements, we seek ways to uphold internationally recognised human rights principles.
The Group’s overall risk management framework assists with identifying human rights related risks. It does this whenever a new investment is evaluated, particularly when it involves entering a new country or industry, a holistic business risk assessment is undertaken which includes understanding and identifying the socio-political, regulatory, industry, partnership and other related business risks. The assessments assist in determining whether there are any potential human rights aspects to be considered. Aligned with the Group’s overall risk management framework and cognisant of the UN Guiding Principles on Business and Human Rights, we intend to develop a more specific risk management framework focused on human rights. This will further assist with the identification, assessment, reporting and monitoring of human rights risks.
Human rights are also considered when the Group formally updates its business risks on a quarterly basis, with existing or emerging key risk areas reported to respective Divisional Flagship Boards and the Group’s Risk Management Committee.
Within the Sime Darby Group, there are firmly established grievance procedures and whistle blowing channels which all of our employees and external parties are encouraged to use to report potential ethics, human rights, legal or regulatory violations, including improper or unethical business practices. We commit to investigate all reported incidents and take appropriate actions where violations have been proven. Reports received via the whistleblowing channels and results of the investigation are shared with the Chairman of Governance and Audit Committee, who is also the Senior Independent Director of the Board via an online system. The Governance and Audit Committee reviews the results of completed investigations on a quarterly basis.
HUMAN RIGHTS TASK FORCE
In 2015, we further strengthened our resolve with the creation of a cross-functional Group Human Rights Taskforce. The objectives of the Group Human Rights Task Force are to review and consolidate human rights related policies, identify material human rights issues within our operations, and facilitate co-operation between relevant parties and stakeholders in encouraging compliance through an inclusive approach.
Note: Representatives from Sime Darby Foundation and other relevant functions also attend Group and Divisional human rights task force meetings.

Sime Darby BerhadAnnual Report 2016Innovating for the Future3 8 8
The Group Human Rights Task Force has identified 8 key areas of focus for the Group. These are: equal opportunity and non-discrimination; freedom of association; exploitation through modern slavery and forced labour; working and living conditions; safety and health; child protection; land and community rights; and sexual harassment and violence.
A review of these areas is currently being undertaken in the Plantation Division. This has resulted in the issue of the Responsible Agriculture Charter, which provides a robust guideline on how Sime Darby Plantation conducts business and includes a section on human rights.
OUR BUSINESS AND SUPPLIER DUE DILIGENCE
Our current business due diligence strategy comprises of commercial risk and impact assessments across our business, development and implementation of action plans, and monitoring of effectiveness. We will endeavour to include human rights as part of our due diligence strategy.
Our procurement processes, which are governed by our internal Group Procurement Policies and Authorities and Code of Business Conduct require all potential business counterparts and suppliers to undergo a pre-qualification process. As part of the registration process, our potential suppliers sign a Vendor Letter of Declaration which affirms that they will abide by all applicable laws and regulations relating to anti-bribery and corruption matters and shall not engage in any form of bribery, corruption or fraud during the course of their engagement and business relationship with the Group.
We also conduct formal monitoring and assessment of our key suppliers and contractors against performance indicators, which includes reviewing non-conformance report raised, tracking of suppliers’ delivery records, obtaining feedback from internal users and clients, and verifying that the certifications received by key suppliers are valid and current. We reserve the right to terminate our relationships with suppliers if issues of non-compliance with our policies are discovered and/or non-compliance is not addressed in a timely or appropriate manner.
We recognise that the declaration and assessment procedures will need to be reviewed from time to time to reflect key human rights focus areas in our supply chains.
In addition, we are currently reviewing our Code of Business Conduct to further strengthen our commitment to respecting human rights and guard against modern slavery in our business, and our wider supply chains. This will also include our procurement processes which will implement specific measures to include our obligations to respecting human rights through our supply chains.
REVIEW AND ENGAGEMENT
We support our commitment by periodic review and assessment of both positive and negative impacts and integrate outcomes into our internal control systems.
Where we may find any human rights abuses or misconduct within our supply chains, we will work with our stakeholders to address adverse human rights impacts.
Ongoing awareness and capacity programmes are being rolled-out to engage and educate various levels of the workforce. Training programmes have been tailored to specifically meet requirements of different target audiences. At the management level, engagement sessions have been rolled out to enable decision-makers to understand the risks and impacts of human rights on our business. For relevant functions and departments who are responsible for the implementation of policies, mitigation plans and reporting structures, a more focused training approach is being developed. This focused training will emphasise on the implementation and operationalisation of human rights within the company.
As part of our capacity building programme, learning tools are being developed to equip a wider audience within Sime Darby with knowledge and awareness of human rights, including those relating to modern slavery.
Proactive engagements with relevant external stakeholders are also carried out through strategic partnerships, co-creation of multi-stakeholder projects and knowledge sharing platforms. This includes our partnership and alliance with the United Nation Global Compact (UNGC), participation in the Global Business Initiative on Human Rights (GBIHR), World Business Council for Sustainable Development (WBCSD) and the Roundtable on Sustainable Palm Oil (RSPO). We have also engaged with the United Nations Children’s Fund to address the rights of children as a specific stakeholder.
We conduct internal audits of our business operations and investigations on allegations made through our grievance procedures and whistle blowing channels against human rights infringements and abuses. We will continue to monitor these procedures with a view to continuous improvement.
The Board of Directors of each of Sime Darby Berhad and New Britain Oils Limited have endorsed this statement of commitment at their board meetings.
Tan Sri Dato’ Seri Mohd Bakke Salleh, President & Group Chief Executive, Sime Darby BerhadNon-Executive Director, New Britain Palm Oils Limited
David Mather, Chief Executive Officer, New Britain Palm Oils LimitedDirector, New Britain Oils Limited
SIME DARBY SLAVERY AND HUMAN TRAFFICKING STATEMENT

Sime Darby Berhad 3 8 9Annual Report 2016 Other Information
INDEPENDENTASSURANCE REPORT
To Management of Sime Darby Berhad
We have been engaged by Sime Darby Holdings Berhad to perform an independent limited assurance engagement on selected Sustainability Information (hereon after referred to in the Subject Matter as “Selected Information”) as reported by Sime Darby Berhad (“Sime Darby”) in its Annual Report for financial year 2015/16 (“Sime Darby Annual Report 2016”).
Management’s Responsibility
Management of Sime Darby is responsible for the preparation of the Selected Information included in the Sime Darby Annual Report 2016 in accordance with Sime Darby’s internal sustainability reporting guidelines and procedures.
This responsibility includes the selection and application of appropriate methods to prepare the Selected Information reported in the Sime Darby Annual Report 2016 as well as the design, implementation and maintenance of processes relevant for the preparation. Furthermore, the responsibility includes the use of assumptions and estimates for disclosures made by Sime Darby which are reasonable in the circumstances.
Our Responsibility
Our responsibility is to provide a conclusion on the Subject Matter based on our limited assurance engagement performed in accordance with the approved standard for assurance engagements in Malaysia, International Standard on Assurance Engagements (ISAE) 3000 “Assurance Engagements Other Than Audits or Reviews of Historical Financial Information”. This standard requires that we comply with ethical requirements, and plan and perform the assurance engagement under consideration of materiality to express our conclusion with limited assurance.
The accuracy of the Selected Information is subject to inherent limitations given their nature and methods for determining, calculating and estimating such data.
Our assurance report should therefore be read in connection with Sime Darby’s sustainability reporting guideliness and procedures on the reporting of its sustainability performance.
In a limited assurance engagement, the evidence-gathering procedures are more limited than for a reasonable assurance engagement, and therefore less assurance is obtained than in a reasonable assurance engagement.
Subject Matter
The following information collectively known as Selected Information on which we provide limited assurance consists of:
• Themanagementandreportingprocesseswithrespectto the preparation of the following five (5) Selected Information reported and marked in Sime Darby Annual Report 2016, which excludes the sustainability data for New Britain Palm Oil Limited’s Selected Information: - Carbon & Energy – Total Carbon Emissions
in tonnes of carbon dioxide (CO2) equivalent (tCO2-e) for the calendar year 2015;
- Carbon & Energy – Carbon Emissions Intensities for the calendar year 2015;
- Total Monetary Savings in respect of projects identified for Lean Six Sigma for the financial year ended 30 June 2016;
- Health & Safety – Lost Time Injury Frequency Rate (LTIFR) for the financial year ended 30 June 2016; and
- Health & Safety – Severity Rate (SR) for the financial year ended 30 June 2016.
Criteria
• SimeDarby’s internal sustainability reportingguidelinesand procedures by which the Selected Information is gathered, collated and aggregated internally.
Main Assurance Procedures
Our work, which involved no independent examination of any of the underlying financial information, included the following procedures:• Inquiries of personnel responsible for the Selected
Information reported in Sime Darby Annual Report 2016 regarding the processes to prepare the said report and the underlying controls over those processes;
• Inquiries of personnel responsible for data collection atthe corporate, division and operation unit level for the Selected Information;
• Inspection on a sample basis of internal documents,contracts, reports, data capture forms and invoices to support the Selected Information for accuracy including observation of management’s controls over the processes;
• Inquiries of personnel on the collation and reporting ofthe Selected Information at the corporate, division and operation unit level; and
• Checking the formulas, proxies and default values usedin the computation of the Carbon Emissions against Sime Darby’s sustainability reporting guidelines and procedures.
Conclusion
Based on our limited assurance engagement, in all material aspects, nothing has come to our attention that causes us to believe that the Selected Information in the Subject Matter has not been fairly stated in accordance with Sime Darby’s internal sustainability reporting guidelines.
Other matters
This report is addressed to Sime Darby Holdings Berhad in connection with the performance of an independent limited assurance on the Selected Information in the Subject Matter as reported by Sime Darby Berhad in its Annual Report for financial year 2015/16, and should not be used or relied upon for any other purposes. Our report is not to be disseminated to any third party in whole or in part. Accordingly, we will not accept any liability or responsibility to any other party to whom our report is shown or into whose hands it may come.
PRICEWATERHOUSECOOPERS(No. AF: 1146)Chartered AccountantsKuala Lumpur28 September 2016

No. Agenda
1. To receive the Audited Financial Statements for the financial year ended 30 June 2016 together with the Reports of the Directors and the Auditors thereon
Ordinary Business Resolution For Against
2. To declare a final single tier dividend for the financial year ended 30 June 2016 1
3. To approve the payment of Directors’ remuneration for the financial year ended 30 June 2016 2
4(i) To re-elect Bapak Muhammad Lutfi who retires in accordance with Article 104 of the Articles of Association of the Company
3
4(ii) To re-elect Datuk Wan Selamah Wan Sulaiman who retires in accordance with Article 104 of the Articles of Association of the Company
4
4(iii) To re-elect Encik Zainal Abidin Jamal who retires in accordance with Article 104 of the Articles of Association of the Company
5
4(iv) To re-elect Datuk Dr Mohd Daud Bakar who retires in accordance with Article 104 of the Articles of Association of the Company
6
5(i) To re-elect Tan Sri Dato’ Abdul Ghani Othman who retires in accordance with Article 99 of the Articles of Association of the Company
7
5(ii) To re-elect Tan Sri Dato’ Sri Dr Wan Abdul Aziz Wan Abdullah who retires in accordance with Article 99 of the Articles of Association of the Company
8
6. To re-appoint PricewaterhouseCoopers as Auditors of the Company and to authorise the Directors to fix their remuneration
9
Special Business
7(i) To approve the Renewal of Shareholders’ Mandate for Existing Recurrent Related Party Transactions and the New Shareholders’ Mandate for Additional Recurrent Related Party Transactions of a Revenue or Trading Nature
10
7(ii) To approve the Renewal of Authority for Directors to Allot and Issue New Ordinary Shares of RM0.50 Each in the Company (SDB Shares) in relation to the Dividend Reinvestment Plan that Provides Shareholders of the Company with an Option to Reinvest Their Cash Dividend in New SDB Shares
11
- -
Number of ordinary shares held CDS Account No.
**or failing him/her, the Chairman of the Meeting, as my/our proxy/proxies to attend and vote for me/us and on my/our behalf at the Tenth Annual General Meeting of Sime Darby Berhad (Sime Darby or Company) to be held at the Grand Ballroom, First Floor, Sime Darby Convention Centre, 1A, Jalan Bukit Kiara 1, 60000 Kuala Lumpur, Malaysia, on Wednesday, 2 November 2016 at 10.00 a.m. and at any adjournment thereof.
(FULL NAME OF SHAREHOLDER AS PER NRIC/PASSPORT/CERTIFICATE OF INCORPORATION IN CAPITAL LETTERS)
(FULL NAME OF PROXY AS PER NRIC/PASSPORT IN CAPITAL LETTERS)
(FULL NAME OF PROXY AS PER NRIC/PASSPORT IN CAPITAL LETTERS)

Percentage (%)
First proxy
Second proxy
For appointment of two (2) proxies, percentage of shareholdings to be represented by the proxies must be indicated below:
Dated this day of 2016
Signature/Common Seal of Member(s)
1. A Member entitled to attend and vote at the Meeting is entitled to appoint not more than two (2) proxies to attend and vote on his/her behalf. Where a Member appoints more than one (1) proxy, the appointment shall be invalid unless he/she specifies the proportion of his/her shareholdings to be represented by each proxy. A proxy may, but need not, be a Member. A Member may appoint any person to be his/her proxy without any restriction as to the qualification of such person and the provisions of Sections 149(1)(a) and 149(1)(b) of the Companies Act, 1965 shall not apply to the Company.
2. Where a Member of the Company is an Authorised Nominee as defined under the Securities Industry (Central Depositories) Act 1991 (SICDA), he/she may appoint not more than two (2) proxies in respect of each Securities Account he/she holds with ordinary shares of the Company standing to the credit of the said Securities Account.
3. Where a Member of the Company is an Exempt Authorised Nominee as defined under SICDA which holds ordinary shares in the Company for multiple beneficial owners in one (1) Securities Account (Omnibus Account), there is no limit to the number of proxies which the Exempt Authorised Nominee may appoint in respect of each Omnibus Account it holds PROVIDED THAT each beneficial owner of ordinary shares, or where the ordinary shares are held on behalf of joint beneficial owners, such joint beneficial owners, shall only be entitled to instruct the Exempt Authorised Nominee to appoint not more than two (2) proxies to attend and vote at a general meeting of the Company instead of the beneficial owner or joint beneficial owners.
4. The instrument appointing a proxy shall be in writing signed by the appointor or his/her attorney duly authorised in writing or, if the appointor is a corporation, either under its common seal or signed by an officer or attorney so authorised.
5. The Form of Proxy and the Power of Attorney or other authority, if any, under which it is signed or a notarially certified copy of that power or authority, must be deposited at the office of the Share Registrar of the Company, Tricor Investor & Issuing House Services Sdn Bhd at Unit 32-01, Level 32, Tower A, Vertical Business Suite, Avenue 3, Bangsar South, No. 8, Jalan Kerinchi, 59200 Kuala Lumpur, Malaysia before 12.00 p.m. on 1 November 2016 or not less than 24 hours before the time appointed for the taking of the poll at the Annual General Meeting (AGM), whichever is the later.
6. Only Members registered in the Record of Depositors as at 21 October 2016 shall be eligible to attend, speak and vote at the AGM or appoint proxy(ies) to attend, speak and/or vote on their behalf.
7. Pursuant to Paragraph 8.29A(1) of the Main Market Listing Requirements of Bursa Malaysia Securities Berhad, all the resolutions set out in the Notice of AGM will be put to vote by poll.
* Please delete as applicable.** If you do not wish to appoint the Chairman of the Meeting as your proxy/one of your proxies, please strike out words “or failing him/her, the Chairman
of the Meeting” and insert the name(s) of the proxy(ies) you wish to appoint in the blank space(s) provided.

THE SHARE REGISTRAR
SIME DARBY BERHAD (752404-U)
c/o Tricor Investor & Issuing House Services Sdn Bhd (11324-H)
Unit 32-01, Level 32, Tower AVertical Business Suite
Avenue 3, Bangsar SouthNo. 8, Jalan Kerinchi59200 Kuala Lumpur
Malaysia
Fold Here----------------------------------------------------------------------------------------------------------------------------------------------------
----------------------------------------------------------------------------------------------------------------------------------------------------Fold Here

NOTICE TO PROXIES UNDER THE PERSONAL DATA PROTECTION ACT 2010
Sime Darby Berhad (“SDB” or “we” or “us” or “our”) strives to protect your personal data in accordance with the Personal Data Protection Act 2010 (“the Act”). The Act was enacted to regulate the processing of personal data. To comply with the Act, we are required to manage the personal data that we collect from you relating to your acting as a proxy for a shareholder in SDB.
The purposes for which your personal data may be used are, but not limited to:
• Internal recordkeeping includingbutnot limited to theregistration of attendance at the general meeting(s)
• TocommunicatewithyouasaproxyforashareholderofSDB
• Forsecurityandfraudpreventionpurposes• Forthepurposesofstatisticalanalysisofdata• Forthepurposesofourcorporategovernance• To comply with any legal, statutory and/or regulatory
requirements
(collectively, “the Purposes”).
Your personal data is or will be collected from information provided by you, including but not limited to, postal, facsimile, telephone, and email communications with or from you, and information provided by third parties, including but not limited to, Bursa Malaysia Berhad and any other stock exchange, and your stockbrokers and remisiers.
You may be required to supply us with your name, NRIC No. and correspondence address.
If you fail to supply us with such personal data, we may not be able to process and/or disclose your personal data for any of the Purposes.
Please be informed that your personal data may be disclosed, disseminated and/or transferred to companies within the Sime Darby Group (including the holding company, subsidiaries, related and affiliated companies, both local and international), whether present or future (collectively, “the Group”) or to any third party organisations or persons for the purpose of fulfilling our obligations to you in respect of the Purposes and all such other purposes that are related to the Purposes and also in providing integrated services, maintaining and storing records including but not limited to the share registrar(s) appointed by us to manage the registration of shareholders.
The processing, disclosure, dissemination and/or transfer of your personal data by us and/or the Group and/or third party organisations or persons may result in your personal data being transferred outside of Malaysia.
To this end, we are committed to ensuring the confidentiality, protection, security and accuracy of your personal data made available to us. It is your obligation to ensure that all personal data submitted to us and retained by us are accurate, not misleading, updated and complete in all aspects. For the avoidance of doubt, we and/or the Group and/or our or their employees or authorised officers or agents will not be responsible for any personal data submitted by you to us that is inaccurate, misleading, not up to date and incomplete.
Further, we may request your assistance to procure the consent of third parties whose personal data is made available by you to us and you hereby agree to use your best endeavours to do so.
You may at any time after the submission of your personal data to us, request for access to your personal data from Tricor Investor & Issuing House Services Sdn Bhd if:
• you require access to and/orwish tomake corrections toyour personal data subject to compliance of such request for access or correction not being refused under the provisions of the Act and/or existing laws; or
• youwishtoenquireaboutyourpersonaldata.
Tricor Investor & Issuing House Services Sdn BhdUnit 32-01, Level 32, Tower A, Vertical Business SuiteAvenue 3, Bangsar SouthNo. 8, Jalan Kerinchi59200 Kuala Lumpur.
Attention : Ms Lim Lay Kiow, Senior Manager Tel : 03-2783 9299email : [email protected]
Any personal data retained by us shall be destroyed and/ or deleted from our records and system in accordance with our retention policy in the event such data is no longer required for the said Purposes.
In the event of any inconsistency between the English version and the Bahasa Malaysia version of this Notice, the English version shall prevail over the Bahasa Malaysia version.
We trust that you will consent to the processing of your personal data and that you declare that you have read, understood and accepted the statements and terms herein.

Notis kepada proksi di bawah akta perliNduNgaN data peribadi 2010
sime darby berhad (“sdb” atau “kami”) bermatlamat untuk melindungi data peribadi anda selaras dengan akta perlindungan data peribadi 2010 (“akta”). akta tersebut diperbuat untuk mengawal selia pemprosesan data peribadi. bagi mematuhi akta tersebut, kami dikehendaki untuk menguruskan data peribadi yang kami kumpulkan daripada anda berkenaan dengan perwakilan anda sebagai proksi untuk pemegang saham di sdb.
tujuan penggunaan data peribadi anda adalah untuk, tetapi tidak terhad kepada:
• Penyimpanan rekoddalaman termasuk tetapi tidak terhadkepada pendaftaran kehadiran di mesyuarat (-mesyuarat) agung
• Untuk berkomunikasi dengan anda sebagai proksi untukpemegang saham sdb
• Bagi maksud-maksud keselamatan dan pencegahanpenipuan
• Bagimaksudanalisisstatistikdata• Bagimaksudtadbiruruskorporatkami• Untuk mematuhi apa-apa kehendak-kehendak di sisi
undang-undang, statut, dan/atau peraturan
(secarakolektif,“Tujuan-Tujuantersebut”).
data peribadi anda sedang atau akan dikumpul daripada maklumat yang diberikan oleh anda, termasuk tetapi tidak terhad kepada, komunikasi-komunikasi pos, faksimili, telefon, dan emel dengan atau daripada anda, dan maklumat yang diberikan oleh pihak ketiga, termasuk tetapi tidak terhad kepada, bursa Malaysia berhad dan apa-apa bursa saham lain, dan broker saham dan remisier anda.
anda mungkin diperlukan untuk memberikan kepada kami nama, No. kp baru dan alamat surat-menyurat.
Jika anda gagal untuk memberikan kami data peribadi tersebut, kami mungkin tidak dapat memproses dan/atau menzahirkan data peribadi anda bagi mana-mana tujuan-tujuan tersebut.
sila maklum bahawa data peribadi anda boleh dizahirkan, disebarkan dan/atau dipindahkan kepada syarikat-syarikat di dalam kumpulan sime darby (termasuk syarikat induk, anak-anak syarikat, syarikat-syarikat berkaitan dan bersekutu tempatan dan antarabangsa),samadapadamasakiniataumasahadapan(secarakolektif, “kumpulan”), atau kepada mana-mana organisasi atau individu pihak ketiga bagi maksud memenuhi tanggungjawab kami kepada anda berkenaan dengan tujuan-tujuan tersebut dan bagi semua maksud lain yang berkaitan dengan tujuan-tujuan tersebut dan juga untuk memberikan perkhidmatan-perkhidmatan bersepadu, menyelenggara dan menyimpan rekod-rekod termasuk tetapi tidak terhad kepada pendaftar saham atau pendaftar-pendaftar saham yang dilantik oleh kami untuk menguruskan pendaftaran pemegang saham.
pemprosesan, penzahiran, penyebaran dan/atau pemindahan data peribadi anda oleh kami dan/atau kumpulan dan/atau organisasi atau individu pihak ketiga mungkin mengakibatkan data peribadi anda dipindah ke luar Malaysia.
untuk tujuan ini, kami komited dalam memastikan penyulitan, perlindungan, keselamatan dan ketepatan data peribadi anda yang diberikan kepada kami. adalah tanggungjawab anda untuk memastikan bahawa semua data peribadi yang diberikan kepada kami dan disimpan oleh kami adalah tepat, tidak mengelirukan, terkini dan lengkap dalam semua aspek. bagi mengelakkan keraguan, kami dan/atau kumpulan dan/atau pekerja atau pegawai yang diberi kuasa atau ejen kami tidak akan bertanggungjawab
untuk apa-apa data peribadi yang diberikan oleh anda kepada kami yang tidak tepat, mengelirukan, bukan terkini dan tidak lengkap.
selanjutnya, kami boleh meminta bantuan anda untuk memperolehi persetujuan pihak ketiga yang data peribadinya telah diberikan oleh anda kepada kami dan anda dengan ini bersetuju untuk menggunakan usaha terbaik anda untuk berbuat demikian.
anda boleh pada bila-bila masa selepas penyerahan data peribadi anda kepada kami, meminta untuk mengakses dataperibadiandadaripadaTricor Investor& IssuingHouseServicesSdnBhdjika:
• andamemerlukanakseskepadadan/atauinginmembuatpembetulan kepada data peribadi anda, tertakluk kepada pematuhan permintaan untuk akses atau pembetulan itu tidak ditolak di bawah peruntukan akta tersebut dan/atau undang-undang yang sedia ada; atau
• andainginmembuatpertanyaanmengenaidataperibadianda.
TricorInvestor&IssuingHouseServicesSdnBhdunit 32-01, level 32, tower a, VerticalBusinessSuiteavenue 3, bangsar southNo.8,JalanKerinchi59200 kuala lumpur.
untuk perhatian : Cik lim lay kiow, pengurus kananNo.tel : 03-2783 9299emel : [email protected]
apa-apa data peribadi yang dikekalkan oleh kami akan dimusnahkan dan/atau dipadamkan daripada rekod dan sistem kami mengikut polisi penyimpanan kami sekiranya data tersebut tidak lagi diperlukan bagi tujuan-tujuan tersebut.
sekiranya terdapat apa-apa konflik antara versi bahasa inggeris and versi bahasa Malaysia dalam Notis ini, versi bahasa inggeris akan mengatasi versi bahasa Malaysia.
Kami percaya bahawa anda akan bersetuju kepadapemprosesan data peribadi anda dan anda mengakui bahawa anda telahmembaca,memahamidanmenerimapernyataan-pernyataan dan terma-terma di sini.