siem industries inc. 200 annual report 5
56
SIEM INDUSTRIES SIEM INDUSTRIES INC. 200 ANNUAL REPORT 5
-
Upload
khangminh22 -
Category
Documents
-
view
0 -
download
0
Transcript of siem industries inc. 200 annual report 5

SIEM INDUSTRIES
S I E M I N D U S T R I E S I N C .2 0 0
A N N U A L R E P O R T5

THE COMPANY
Siem Industries Inc. is a diversified industrial holding company that operates through autonomous affiliates. We currently hold interests in several industrial areas including the oil and gas services industry, ocean transport of refrigerated cargoes, ocean transport of automobiles, Swedish industrial holdings in land-based industries and salt mining.
CONTENTS
DESCRIPTION OF BUSINESS 1
SHAREHOLDER MATTERS 6
SELECTED FINANCIAL DATA 8
MANAGEMENT'S DISCUSSION AND ANALYSIS
OF FINANCIAL CONDITION AND
RESULTS OF OPERATIONS 8
DIRECTORS AND OFFICERS 12
COMPENSATION OF DIRECTORS AND OFFICERS 13
OPTIONS TO PURCHASE SECURITIES FROM COMPANY 13
INTEREST OF MANAGEMENT IN CERTAIN TRANSACTIONS 14
AUDITOR’S REPORT 15
CONSOLIDATED FINANCIAL STATEMENTS 16
NOTES TO CONSOLIDATED FINANCIAL STATEMENTS 20
TRANSITION FROM US GAAP TO IFRS 48

TO OUR SHAREHOLDERS :
Last June, I wrote to you about our expectations for high activity levels in the industries in which we operate.
The markets exceeded expectations for many of our activities during the past year. The high energy prices
have brought the oil and gas service industry to record levels. We expect the market conditions to remain
favourable for some time. The Group’s capital expenditures on newbuildings of vessels for the offshore
industry and purchases of vessels for Star Reefer amount to $885 million. Our organization worldwide has
grown to 6,000 people. We continue to emphasize safety and strive to deliver “best in class” products and
services and earn the position as a preferred supplier with our customers. We build for the long term.
Net income for 2005 was $26.8 million. The Company continued to experience strong growth in
shareholders’ equity as the book value increased to $29.96 per share from $24.60 per share, an increase of
22%.
Subsea 7 is one of the world’s leading subsea engineering and construction contractors with revenues of
$1.3 billion for 2005 and a backlog of $1.4 billion at the end of 2005. Subsea 7 has prepared for the
increasing requirements of the offshore market to operate in deepwater by entering into contracts for the
construction of two pipelay and construction vessels at a cost of approximately $200 million each. The Seven
Oceans will lay rigid pipe and is scheduled for delivery in the second quarter of 2007 and the Seven Seas will
lay flexible pipe and J-lay rigid pipe and is scheduled for delivery in the second quarter of 2008. In addition
to the newbuilds, Subsea 7 has made significant upgrades to two other vessels in the existing fleet, completed
the construction of a pipeline fabrication spoolbase in Angola and commenced the construction of five
heavy-duty workclass ROV systems with the first two systems delivered in March 2006. In May 2006, an
agreement for joint operation in the Far East was signed with Technip.
Siem Offshore placed orders to build eight offshore platform supply vessels (“PSVs”) and two multi-function
construction support vessels. Two of the PSVs have been delivered and are performing as expected. Further,
Siem Offshore acquired Rovde Shipping AS (now, Siem Rovde AS), signed an agreement to acquire a
controlling interest in a 2004-built PSV and shipbuilding contracts for two additional offshore service vessels
and acquired a controlling interest in a company that has developed a process for riserless subsea well
interventions. Siem Offshore’s total investment in vessels and newbuilds exceeds NOK2 billion ($300
million).
STAR Reefers is one of the world’s leading reefer owners and operators with 37 owned and operated vessels
with a total capacity of 19.3 million cubic feet. During the third quarter of 2005, STAR Reefers secured
access to quality tonnage with the acquisition of seven vessels, which included six Polar–class vessels. These
acquisitions follow STAR Reefers’ previous commitment to ensure a supply of quality tonnage by entering
into 10-year charters for four specialized reefer newbuilds, each with a capacity of 585,000 cubic feet. STAR
First, the first of these four newbuilds, was delivered in March 2006.

Competition from container vessels will continue as supply of new container vessels increases with new yard
deliveries. The current spot market rates for reefer vessels is very low and gives no contribution to older
vessels with high fuel consumption. Scrapping of reefer vessels is therefore expected to resume this year.
Siem Car Carriers remains profitable and its three car carrier vessels continue to perform well. Two of the
vessels have charters into mid-2010 and the third vessel has a charter to mid-2008.
Siem Industrikapital (“SIAB”) in Sweden has three remaining industries: EFG, Boule and Emotron.
Proceeds generated by the sale of an investment enabled SIAB to repay its debt and pay $18.6 million of
dividends to the Company in 2005.
Siem Investments’ two remaining investments of significance are Deusa International GmbH and
Transocean Inc. Deusa continues efforts to improve its potash mining operations. During 2005, Deusa
entered into contracts for the construction of a thermolysis plant with operations expected to commence at
the end of 2006 and full operations during the first quarter of 2007. Waste suppliers will pay Deusa to take
wastes which will be incinerated at very high temperatures. The incineration releases gases which can be used
by Deusa to provide power, a major cost component in the potash mining operations, at a consistent level
and determinable price and can be used by the power plant to generate electricity. Transocean benefits from
high activity in the oil and gas industry and enjoys record day-rates on long-term contracts. Our shareholding
in Transocean has a market value in excess of $100 million.
The outlook for our industries continues to be positive, particularly in the oil and gas sector where the
backlog of contracted revenue continues to rise. In this environment, management of people and execution
of operations is the main focus.
The Company bought back 1,714,500 of its own shares from Storebrand in October 2005. Mr. Rune Holen,
who represented Storebrand on our Board, resigned at that time. I thank Rune for his contributions to the
Company.
Kristian Siem, Chairman
9 June 2006

1
DESCRIPTION OF BUSINESS
INTRODUCTION TO BUSINESS
The Company operates as a diversified industrial holding company with its major holdings in the oil and gas service industry through its holdings in Subsea 7 Inc. and Siem Offshore Inc., in the shipping industry through its holdings in STAR Reefers Inc. and Siem Car Carriers Inc. and in the financial investment area through its holdings in Siem Investments Inc. (formerly, Siem Acquisition and Reorganisation Fund, Inc.) and Siem Capital AB. Through its investment in Siem Capital, the Company owns a number of smaller, strategic investments and investments in listed and unlisted senior secured notes and other notes receivables.
Press releases and quarterly financial reports issued by the Company may be obtained from the Company’s website at www.siemindustries.com.
DESCRIPTION OF MAJOR INDUSTRIAL HOLDINGS
At their respective Annual General Meetings conducted in July 2005, Subsea 7 Inc. changed its name to “Subsea 7 Holding Inc.”, Siem Offshore Inc. changed its name to “Subsea 7 Inc.” to reflect the nature of its primary business activities, and Siem Supply Inc. changed its name to “Siem Offshore Inc.” All references to companies in the following discussion will use the new names.
SUBSEA 7 INC.
In October 2005, the Company used NOK85,000,000 of the Subsea 7 8% Convertible Bond Loans (“8% Convertible Bonds”) and $17,000,000 cash to purchase and retire 1,714,500 Company Common Shares.
At 31 December 2005, the Company owned 58,349,653 shares of Subsea 7 Inc. (OSE Symbol: SUB), or approximately 41.8% of its issued and outstanding shares, and NOK140,130,000 face amount of 8% Convertible Bond. The Company reports the investment in Subsea 7 using the equity method of accounting.
In January 2006, the Company received 7,340,492 shares of Subsea 7 following the conversion of its NOK140,130,000 8% Convertible Bonds at the conversion rate of NOK19.09 per share. The Company further increased its shareholding in March 2006 when it purchased 704,000 shares of Subsea 7 in the market at an average price of NOK81.3226 per share.
Fiscal 2005 Discussion and Subsequent Events — In late-2004, Subsea 7 conducted private placements to issue a total of 49,300,000 new shares. The proceeds from these placements were used to improve working capital and to raise the funds necessary to purchase Halliburton Company’s 50%-interest in Subsea 7 Holding. Subsea 7 completed the purchase in early-January 2005 at a price of approximately $203,000,000. In connection with the private placements, Subsea 7 conducted an offering for the purpose of providing shareholders who were not invited to participate in the private placement with the opportunity to maintain their relative shareholding in Subsea 7. The offering was completed in January 2005 and a total of 2,458,549 new shares issued.
In June 2005, Subsea 7 made the decision to segregate its subsea assets and activities from the other assets and activities. Accordingly, the non-Subsea 7 assets and activities were transferred into Siem Offshore, a wholly-owned subsidiary of Subsea 7. At an Extraordinary General Meeting held in August 2005, Subsea 7’s shareholders approved its plan to spin-off Siem Offshore. The spin-off, considered effective at the end of 30 June 2005, was treated as the payment of a dividend in specie whereby Subsea 7 distributed all of the shares in Siem Offshore to its shareholders by the issuance of one share of Siem Offshore for each outstanding share of Subsea 7.
At 31 May 2006, the Company owned 66,394,145 shares of Subsea 7 with a market value of approximately $1,010,300,000 using a closing market price of NOK92.50 and an exchange rate of NOK6.0790/$1.00.

2
The following financial highlights for Subsea 7 show the results and amounts for 2005 as compared to the proforma results and amounts for 2004. The proforma amounts include the results for Subsea 7 Holding as if it had been 100%-owned for all of 2004 rather than only 50%-owned and exclude the results for Siem Offshore.
As of and for the Year Ended 31 December Subsea 7 Financial Highlights (in thousands): 2005 Proforma 2004
Financial Performance: Revenues $ 1,287,028 $ 812,808 EBITDA $ 166,093 $ 63,377 Net income $ 45,204 $ (31,051)
Financial Position: Assets $ 880,930 $ 741,702 Liabilities $ 592,252 $ 525,340
Other notable: Capital expenditures $ 102,628 $ 6,410 Backlog $ 1,355,000 $ 1,206,000
At the end of 2005, Subsea 7 employed in excess of 3,700 employees, including 550 engineers and/or project managers, controlled a fleet of 14 vessels, utilized more than 100 remotely-operated vehicles (ROVs) and operated five pipeline construction yards. Subsea 7 operates in all of the major offshore oil and gas areas worldwide.
Subsea 7 has undertaken significant capital expenditures to meet the requirements of the growing offshore business. In June 2005, Subsea 7 entered into contracts to build a rigid-pipe pipelay and construction vessel for delivery in the second quarter of 2007 at a cost of approximately $200 million. In February 2006, Subsea 7 entered into contracts to build a flexible-pipe pipelay and construction vessel with the ability to J-lay rigid pipe. Delivery is expected in the second quarter of 2008 at a cost of approximately $200 million. In addition to the newbuildings, upgrades were made to two of Subsea 7’s existing vessels.
Other capital expenditures included the construction of a pipeline fabrication spoolbase in Angola which commenced operations in August 2005 and the construction of five latest-generation heavy-construction workclass ROV systems with the first two systems delivered in March 2006.
In May 2006, Subsea 7 conducted a private placement for $300 million of Convertible Notes due 2011 (the “2011 Convertible Notes”). The 2011 Convertible Notes bear interest at 2.80% p.a. and are convertible into new shares of Subsea 7 at a rate of $26.33 per share.
The underwriter, Lehman Brothers International (Europe), requested that the Company support the placement by entering into a securities lending agreement. The Company agreed to the request. Terms of the securities lending agreement provide that the Company will lend up to 9,000,000 shares of its Subsea 7 shareholdings to the underwriter for the duration of the 2011 Convertible Notes. The agreement provides that the Subsea 7 shares or their equivalent will be returned to the Company at the conclusion of the convertible note facility and also permits the Company to recall the shares in certain circumstances where the Company desires to vote these shares. The Company will receive a fee, payable monthly in arrears, that is equal to of 0.50% p.a. of the average daily market value of the shares.
For more information regarding Subsea 7, please visit Subsea 7’s website at www.subsea7.com.
SIEM OFFSHORE INC.
At the time of Subsea 7’s spin-off of Siem Offshore, the new shares of Siem Offshore were allocated a value of NOK4.14 per share representing a transfer of shareholders’ equity from Subsea 7 shares to Siem Offshore shares. Following the spin-off, the Company received 58,349,653 shares of Siem Offshore. Subsequent to the completion of the spin-off, the shares of Siem Offshore were listed on the Oslo Stock Exchange.
At 31 December 2005, the Company owned 58,349,653 shares of Siem Offshore Inc. (OSE Symbol: SIOFF), or approximately 44.8% of its issued and outstanding shares. The Company reports the investment in Siem Offshore using the equity method of accounting.

3
In March 2006 the Company purchased 4,410,750 shares of Siem Offshore in the market at an average price of NOK4.20 per share.
At 31 May 2006, the Company owned 62,760,403 shares of Siem Offshore with a market value of approximately $53,100,000 using a closing market price of NOK5.15 and an exchange rate of NOK6.0790/$1.00.
Fiscal 2005 Discussion and Subsequent Events — The following shows the actual results and amounts for Siem Offshore for the 6 month period from the effective date of its spin-off by Subsea to the end of 2005 and the unaudited proforma results and amounts for Siem Offshore for 2005 and 2004 as prepared by Siem Offshore and included in its annual report to illustrate the effect of the spin-off. The proforma results and amounts are for information purposes only and the underlying assumptions are discussed therein.
Actual and Proforma Results and Amounts for Siem Offshore Actual As of and for the Year Ended 31 December (in thousands) 1 July to 31 December 2005 Proforma 2005 Proforma 2004
Financial Performance: Revenues $ 16,476 $ 30,500 $ 30,861 EBITDA $ 3,859 $ 7,999 $ 11,208 Net income (loss) $ (2,057) $ (5,091) $ 2,548
Financial Position: Assets $ 92,951 $ 92,951 $ 90,759 Liabilities $ 38,471 $ 38,471 $ 19,923
Following the spin-off, Siem Offshore owned 6 platform supply vessels (PSVs) of a VS 470 Mk II design that were under construction plus options for the construction of two more vessels of the same design, a 50%-interest in Overseas Drilling Limited (“ODL”) which is owner of the JOIDES Resolution, a 41%-interest in KS Big Orange XVIII which is owner of the Big Orange XVIII, a subsidiary that owns and operates 10 supply/crew vessels in Brazil and other activities related to software development projects in Brazil.
In September 2005, Siem Offshore entered into an agreement to acquire Rovde Shipping AS. Rovde Shipping owned 4 small PSV/AHTS (anchor-handling, towing and supply) vessels with standby and oil-recovery capabilities, two partly-owned modern large PSVs and a vessel management operation. The conditions for the acquisition were completed in February 2006 and 35,019,678 new shares of Siem Offshore paid to Rovde Shipping shareholders. The company was renamed Siem Rovde AS.
The first of the newbuild PSVs was delivered to Siem Offshore in October 2005 and commenced a 6-month charter with 6 additional monthly options shortly thereafter.
In December 2005, ODL entered into a contract for the use of the JOIDES Resolution as a scientific ocean-drilling for the Integrated Ocean Drilling Program’s Phase II. The operational phase of the contract commences in 2007 and continues through the fourth quarter 2013 with 10 additional yearly options. The estimated contract value for the operational phase through 2013 is approximately $140 million but can be terminated at any time with a $3 million termination fee. Prior to the commencement of the operational phase, the JOIDES Resolution will undergo a major conversion which will be paid by the charterer. Day rates will apply during the conversion.
During 2005, Siem Offshore purchased 4,642,000 of its own shares in the market at an average cost of NOK4.01 per share.
In February 2006, Siem Offshore declared the final option for 2 PSVs of VS 470 Mk II design for approximately NOK285 million and entered into an contract to sell one of the other newbuild PSVs scheduled for delivery at the end of 2006 for approximately NOK163 million.
In February and April 2006, Siem Offshore entered into separate contracts for the construction of 2 multi-functional field and ROV support vessels of a MT 6016 L design for a total of NOK680 million with the first delivery scheduled in June 2007 and the second delivery in March 2008.
In May 2006, Siem Offshore entered into an agreement to acquire up to 60% of Well Intervention Solutions AS (“WIS”), a wholly-owned subsidiary of Wellis AS. WIS has developed a process to enable safer and more efficient riserless subsea intervention, drilling and maintenance services from vessels.

4
In May 2006, Siem Offshore purchased 1,662,000 of its own shares in the market at an average cost of NOK5.00 per share.
For more information regarding Siem Offshore, please visit its website at www.siemoffshore.com.
STAR REEFERS INC.
At 31 December 2005, the Company owned 6,272,534 shares of STAR Reefers Inc. (OSE Symbol: SRI), or approximately 72.3% of its issued and outstanding shares.
The Company acquired 20,000 newly-issued STAR shares in March 2005 when it paid $6.60 per share, or an aggregate $132,000, to exercise share options that had been assigned to the Company by its Chairman, Mr. Kristian. Siem. The 20,000 share options were part of a total 174,000 share options that were exercised. At the time of the exercise, the market value of the 20,000 shares was in excess of $450,000.
At 31 May 2006, the Company owned 6,272,534 shares of STAR with a market value of approximately $123,800,000 using a closing market price of NOK120.00 and an exchange rate of NOK6.0790/$1.00.
Fiscal 2005 Discussion and Subsequent Events — STAR Reefers Inc. (“STAR Reefers” or “STAR”) is one of the world’s leading reefer owners and operators. At the end of 2005, STAR Reefers controlled a modern fleet of 36 owned and chartered vessels with a total capacity of 18.7 million cubic feet (“cbft”). The operations include the refrigerated marine transportation of perishable commodities such as fruits and vegetables.
The financial statements of STAR are included in the Company’s consolidated financial statements. The following financial highlights for STAR show the standalone comparative results and amounts for 2005 and 2004.
As of and for the Year Ended 31 December STAR Reefers Financial Highlights (in thousands) 2005 2004
Financial Performance: Operating revenues $ 154,007 $ 134,726 EBITDA $ 45,851 $ 26,260 Net income (loss) $ 31,242 $ 16,166
Financial Position: Assets $ 311,556 $ 204,421 Liabilities $ 191,235 $ 116,929
STAR announced in March 2005 that it had agreed to time-charter two newbuild, specialized reefer vessels. These vessels are in addition to the two vessel newbuildings announced in November 2004. Each of the four vessels will have a capacity of 585,000 cbft and be chartered for a period of 10 years commencing upon delivery. The first vessel, STAR First, was delivered in March 2006 and the fourth vessel will be delivered in the second quarter of 2007.
STAR concluded the acquisition of six Polar-class vessels in third quarter of 2005. The 1992- and 1993-built vessels, were previously on time charter to STAR. These time charters were terminated on delivery. The $117,300,000 purchase price was paid using the proceeds of increased bank debt of approximately $83,000,000 and the proceeds of a $21,100,000 short-term loan provided by the Company. The balance of the purchase price was paid using internally-generated cash. The amount outstanding under the short-term loan provided by the Company was reduced to $6,224,000 at the end of December 2005 and fully repaid in January 2006.
At the end of September 2005, STAR completed the acquisition of a 1991-built specialized reefer vessel for $14,200,000 using the proceeds of a $12,800,000 short-term credit facility provided by the Company and internally-generated cash. Only $12,000,000 was drawn under the short-term credit facility and all outstanding amounts were repaid in October 2005.
In December 2005, STAR sold a wholly-owned subsidiary, which was itself owner of a single vessel. Following the sale, the vessel was bareboat-chartered back to STAR.
For more information regarding STAR Reefers, please visit its website at www.star-reefers.com.

5
SIEM CAR CARRIERS INC. (“Car Carriers”)
At December 31 2005, the Company owned approximately 88% of Siem Car Carriers Inc. Car Carriers is the owner of three 2000-built sister ships engaged in the ocean-transportion of vehicles, each with a carrying capacity of 4,300 cars and 400 high and heavy units.
Car Carriers used proceeds from a $90,000,000 bank loan to finance the 2002 acquisition of the three vessels. In July 2004, Car Carriers refinanced the outstanding $68,750,000 principal amount with a new $75,000,000 facility. Car Carriers used the excess funds generated by the new facility and available cash to pay a cash distribution of $9,250,000 to its shareholders. The Company’s share of the distribution was $8,150,000.
Since the the loan refinancing in July 2004, Car Carriers has made payments and prepayment to reduce the loan balance to $60,000,000 at the end of December 2005 and to $58,000,000 at the end of May 2006.
Two of the vessels are under 5-year time charters, one of which is scheduled to expire on or about May 2010 and the second on or about August 2010. The third vessel had its term extended to May 2008 following the exercise of an option under the existing charter.
Car Carriers is included in the Company’s consolidated financial statements. On a standalone basis, Car Carriers recorded net income of $6,670,000 and $7,480,000 in 2005 and 2004, respectively. The aggregate market value of the vessels has appreciated since the 2002 acquisition.
INVESTMENTS AND OTHER ACTIVITIES
TRANSOCEAN INC. — Transocean, a publicly-traded company (NYSE Symbol: RIG), is the world’s premier offshore contractor with the largest and most technologically-advanced fleet of offshore drilling units operating worldwide.
At 31 December 2005, the Company owned 1,423,720 shares of Transocean. The ownership remained unchanged at 31 May 2006 and the Transocean common stock had a market value of approximately $115,800,000. For more information on Transocean, please visit Transocean’s website at www.deepwater.com.
SIEM INVESTMENTS INC. — Siem Investments (formerly, Siem Acquisition and Reorganisation Fund, Inc.), was established to originate and/or participate in the acquisition, reorganization or restructuring of investment opportunities in particular businesses experiencing distress situations.
Since the commencement of its activities, Siem Investments has accumulated a number of investments which concluded successfully. Due to the increasing attention paid to the Company’s other larger investments, the activity has diminished and investments liquidated. The only remaining investment of significance is a 49%-interest in Deusa International GmbH. Deusa, a German company involved in potash mining, emerged from bankruptcy around year 2000 when the creditors requested that the Siem Investments assist in the reclamation of Deusa’s operations. Siem Investments has been involved in an advisory capacity for several years and acquired a 49%-interest in 2004 which is reported using the equity method.
During 2005, Deusa entered into contracts for the construction of a thermolysis plant which will become operational at the end of 2006 with full operation planned during the first quarter of 2006. The thermolysis plant will receive municipal wastes of a specified content and grade and incinerate these wastes at very high temperatures. The thermolysis process will cause the release of gases which can be used in the potash mining operations and in a power plant for the generation of electricity. The thermolysis plant will provide power, a major cost component in the potash mining operations, to Deusa at a consistent level and determinable price, thus reducing Deusa’s exposure to volatile energy prices. Furthermore, the suppliers of the municipal wastes pay Deusa for the disposal of such wastes.
The cost of the thermolysis plant is approximately EUR20,000,000. Siem Investments provides project-financing to Deusa until the operational risks associated with this plant have been reduced and improved terms of a bank financing can be obtained. At 31 December 2005, the amount of project-financing provided to Deusa for the thermolysis plant construction was EUR3,300,000. During 2006, an additional EUR7,593,000 has been provided as project financing.

6
SIEM CAPITAL AB — In February 1998, the Company entered into an agreement to acquire a 64% interest in share capital and a 50% voting interest in Siem Capital AB, a Swedish company, with the remaining 36% share capital and 50% voting interest held by the previous managers of Siem Capital. Siem Capital holds interests in several industrial companies including EFG European Furniture Group AB, a leading designer and manufacturer of business office furniture in Europe, and Boule Diagnostics International AB, the holding company for three separate biotechnology/medical technology businesses, Boule Medical AB, Boule Diagnostics AB and Labdesign Boule Nordic AB.
In May 2004, Siem Industrikapital (SIAB), a wholly-owned subsidiary of Siem Capital AB, sold a major shareholding. SIAB used the proceeds to reduce its debt from SEK203 million to SEK30 million and set aside approximately SEK180 million for distribution to its shareholders. Siem Capital made distributions to the Company of SEK123,500,000 in April 2005 and SEK10,000,000 in December 2005.
PRIVATBANKEN ASA — The Company acquired 4,999,999 shares of Privatbanken ASA in October 2000 at a price of NOK10.50 per share, or $1.11 per share based on exchange rates at the time, or an aggregate investment of $5,557,000
In mid-2004, Privatbanken listed its shares on the Oslo Stock Exchange. In early 2005, SEBanken AB announced a voluntary offer to purchase all shares, warrants and convertible debt issued by Privatbanken. The purchase offer was NOK17.00 per share, or approximately $2.71, on the day of the offer. In May 2005, the Company purchased an additional 1,301,250 Privatbanken shares at NOK16.70 per share, or an aggregate $3,470,000.
Shortly thereafter, SEBanken AB acquired greater than 90% of the shares which gave it the right to require Privatbanken shareholders to accept the offer. The Company accepted the offer and received $16,872,000 in September 2005 plus interest from the date that the offer became final. SHAREHOLDER MATTERS
NATURE OF TRADING MARKET
Quotes for the Company’s common shares, U.S. $0.25 par value per share (“Common Shares”), which is the Company’s only issued and outstanding form of equity securities, are available from Pink Sheets LLC, a centralized quotation service that collects and publishes market maker quotes for OTC securities, under the symbol “SEMUF” at www.pinksheets.com. Previously, the Company's Common Shares were publicly-traded on the American Stock Exchange commencing in 1987 and on the Oslo Stock Exchange commencing in 1997. The Company voluntarily delisted from the American Stock Exchange effective October 1998. The Company was delisted by the Oslo Stock Exchange in November 1999 when it failed to satisfy a requirement for a minimum number of shareholders to be registered on the VPS in Norway. The Company is not registered with the Securities and Exchange Commission.
There are approximately 85 holders of record and it is estimated that there are less than 1,000,000 Common Shares available for active trading, or approximately 6.6% of the outstanding shares. Daily trading, if any, of Common Shares on the Pink Sheets is often numbered in hundreds of shares. The low liquidity of the Company’s Common Shares has made the trading susceptible to volatile pricing.
In January 2005, the Company announced a tender offer to purchase up to 1,000,000 Common Shares. The purpose of the tender offer was to provide an opportunity to interested shareholders to liquidate some or all of their holdings without a potential disruption in price because of the number of shares tendered and without having to incur the usual transaction costs associated with open-market sales. At closing of the tender offer in March 2005 following a couple of extensions of the expiration date, the Company purchased and retired 26,752 Common Shares at $17.50 per share.
On 12 January 2005, the last full trading day on the Pink Sheets LLC prior to the Company’s announcement of the tender offer, the best bid and best ask prices per Common Share was $14.75 for 200 shares and $16.25 for 200 shares. Since the tender offer, the market prices of the Company’s largest investments which operate in the oil and gas industry have moved steadily upward. Accordingly, the price for Common Shares have also moved upward.

7
At the end of the day on 31 May 2006, the best bid and ask prices were $50.25 and $54.50, respectively, with the most recent sale at $51.50 per Common Share.
DIVIDEND POLICY
The Company's policy is to reinvest available funds into the business; consequently, the Company does not pay dividends on a regular basis. The Board of Directors declared and paid extraordinary cash dividends of $0.07 per Common Share to shareholders on each of 25 January 2006 and 27 January 2005.
CONTROL
The following table sets forth certain information, as of 9 June 2006 with respect to the only persons known to the Company who owned beneficially more than 10% of the Company's Common Shares and the number of Common Shares owned by officers and directors of the Company, as a group:
Name of Beneficial Owners or Identity of Group
Shares Percentage of Beneficially Owned Common Shares
Sero Trust (1) Officers and Directors as a Group (2)
8,852,688 58.8% 1,379,092 9.2%
(1) The Sero Trust, whose potential beneficiaries include the mother and certain of the brothers of Mr. Kristian Siem, Chairman of the Company, is the beneficial owner of the Common Shares through its wholly-owned subsidiary, Elderberry Holdings Limited, which is the direct owner of the Common Shares. The trustee for the Sero Trust holds voting and dispositive power over its shareholding.
(2) Mr. Siem owns 1,378,992 Common Shares, or approximately 9.2% of the Common Shares. The Ores Trust is the beneficial owner of 1,352,432 Common Shares, or approximately 9.0% of the Common Shares, through its wholly-owned subsidiary, Siem Holding Inc., which is the direct owner of the Common Shares. Mr. Siem and his wife and children are potential beneficiaries of the Ores Trust. Each of Mr. Siem and the trustee for the Ores Trust hold separate voting and dispositive powers over their respective shareholdings.
EXCHANGE CONTROLS AND OTHER LIMITATIONS AFFECTING SHAREHOLDERS
The Company may not carry on business in the Cayman Islands except in furtherance of its business outside the Cayman Islands and is prohibited from inviting the public of the Cayman Islands to subscribe for any of its common shares.
Neither the Company's Memorandum or Articles of Association nor Cayman Islands law impose any limitations on the right of nonresident or foreign owners to hold or vote their common shares except in the event of insanity of a holder. The laws of the Cayman Islands freely permit the import and export of capital including, but not limited to, the payment of dividends to persons who do not reside in the Cayman Islands.

8
SELECTED FINANCIAL DATA
The following selected financial data has been derived from the consolidated financial statements of the Company for the fiscal years ended 31 December 2005 and 2004 and should be read in conjunction with the consolidated financial statements of the Company (including the related notes) and “Management's Discussion and Analysis of Financial Condition and Results of Operations” included elsewhere herein.
(in thousands, except per share amounts)
Years Ended 31 December 2005 2004
FINANCIAL PERFORMANCE: Total revenues (1) Total expenses and other
$ 205,522 $ 218,925 (169,034) (178,117)
Income before income tax expense Income tax expense
36,488 40,808 332 134
Net income Minority interests
36,156 40,674 9,319 3,161
Net income attributed to Common Shares
$ 26,837 $ 37,513
Net income, basic and diluted, per Common Share
$ 1.64 $ 2.23
FINANCIAL POSITION: Working capital Total assets Long-term interest-bearing debt Shareholders' equity
$ 42,104 $ 49,992 $ 778,809 $ 659,101 $ 230,586 $ 179,060 $ 451,042 $ 413,210
Wtd. avg. no. shares outstanding Ending no. of shares outstanding
16,407 16,794 15,053 16,794
(1) Includes equity in the income of unconsolidated affiliates of $13,217 and $12,077 for each of the years ended 31 December 2005 and 2004, respectively.
MANAGEMENT'S DISCUSSION AND ANALYSIS OF FINANCIAL CONDITION AND RESULTS OF OPERATIONS
OVERVIEW
In early January 2005, Subsea 7 completed the acquisition of the 50%-interest in Subsea 7 Holding Inc. from Halliburton Company at a price of $203,000,000 using the proceeds of a December 2004 private placement of approximately $160,000,000, the excess funds arising from the restructuring of its loan facility which generated approximately $33,000,000 and available cash.
The Company did not participate in the December private placement and its ownership interest was reduced to 44.8%. Following the dilution of its interest and the subsequent loss of control, the Company deconsolidated the Subsea 7 financial statements from the consolidated financial statements and commenced to report the investment in Subsea 7 under the equity method of accounting effective 31 December 2004. However, since the loss of control was not deemed to occur until the end of 2004, the Company included Subsea 7’s income and expenses in its consolidated income statement for the full year.
At completion of the Company’s tender offer for its Common Shares in March 2005, the Company paid an aggregate $468,160 to purchase and retire 26,752 Common Shares.
In March 2005, STAR completed the repayment of a $7,000,000 provided by the Company at the end of December 2004, STAR to assist in financing the purchase of a 1993-built specialized-reefer vessel with a capacity of approximately 526,000 cbft.
In April 2005, Siem Capital made a dividend distribution of SEK123,500,000, or approximately $17,320,000, to the Company. The Company recorded the distribution as a reduction of its investment in Siem Capital.

9
In August 2005, Subsea 7 completed the spin-off Siem Offshore. The spin-off was treated as the payment of a dividend in specie whereby Subsea 7 distributed all of the shares in Siem Offshore to its shareholders by the issuance of one share of Siem Offshore for each share of Subsea 7. The new shares of Siem Offshore were allocated a value of NOK4.14 per share representing a transfer of shareholders’ equity from the Subsea 7 shares to the Siem Offshore shares. The Company received 58,349,653 of the newly-issued shares of Siem Offshore.
In the third quarter of 2005, STAR used the proceeds of a $21,100,000 loan provided by the Company and $83,000,000 of increased bank debt to finance the purchase of six Polar-class vessels for $117,300,000. STAR reduced the outstanding balance under the short-term loan to $6,224,000 by the end of December 2005 and all paid the remaining amounts in January 2006.
At the end of September 2005, STAR used the proceeds of a short-term credit facility provided by the Company to complete the acquisition of a specialized reefer vessel for $14,200,000. The $12,000,000 loan was repaid in October 2005.
In October 2005, the Company accepted an offer to pay $17,000,000 cash and deliver NOK85,000,000 face amount of Subsea 7 8% Convertible Bonds held by the Company in exchange for 1,714,500 Common Shares. Upon completion of the exchange, the Company retired the Common Shares.
In December 2005, Siem Capital made a second dividend distribution of approximately SEK10,000,000. The Company recorded the distribution as a reduction of its investment in Siem Capital.
At the end of December 2005, the Company’s Board of Directors declared a dividend of $0.07 per share payable in cash to shareholders of record on December 30, 2005.
RESULTS OF OPERATIONS
FISCAL YEARS ENDED 31 DECEMBER 2005 AND 2004
Operating revenues recorded during fiscal years 2005 and 2004 were $173,344,000 and $176,036,000, respectively. The net decrease is attributed to the deconsolidation of Subsea 7’s financial statements at the end of 2004. Subsea 7’s operating revenues, as recorded in the consolidated income statements, were $-0- and $21,554,000 for 2005 and 2004, respectively. The absence of Subsea 7 operating revenues was offset by the continued growth of STAR’s operations and improvement in freight rates.
Interest income recorded during fiscal years 2005 and 2004 was approximately $5,743,000 and $3,806,000, respectively. In general, interest income increased from 2004 because of the increasing rate environment for its interest-bearing assets.
Net gains (losses) for fiscal years 2005 and 2004 were approximately $10,508,000 and $24,705,000, respectively. The level of trading and other securities was significantly diminished in 2005 when compared to 2004 as management devoted increasing attention to longer-term investments. Major components of the net gains recorded during 2005 included approximately $5,298,000 net gains related to the sales and mark-to-market of trading securities owned by the Company, $2,045,000 related to the sale of a vessel by STAR and $2,286,000 related to the recovery from an investment previously written-off. Major components of the net gains recorded during 2004 included approximately $12,147,000 related to Siem Investments’ investments in notes issued by the companies involved in the oil and gas industry, $9,855,000 net gains related to the sales and mark-to-market of trading equities held by the Company and $5,057,000 related to the sale of two vessels by STAR.
Equity in the income (losses) of unconsolidated affiliates recorded during fiscal years 2005 and 2004 was approximately $13,217,000 and $12,077,000, respectively. The major components of net equity income for 2005 included equity income of $16,910,000 in aggregate for the operations of Subsea 7, Siem Offshore and their affiliates and an equity loss of $(2,437,000) for the investment in Siem Capital. The major components of net equity income for 2004 included equity income of $3,010,000 in aggregate for the operations of Subsea 7, Siem Offshore and their affiliates and equity income of $8,205,000 for the investment in Siem Capital.
Other revenues recorded during fiscal years 2005 and 2004 were approximately $2,710,000 and $2,301,000, respectively. Significant other income items include dividend income and fees.

10
Operating expenses recorded during the fiscal years 2005 and 2004 were $106,197,000 and $126,959,000, respectively. As noted in the discussion for operating revenues, the net decrease is attributed to the deconsolidation of Subsea 7. Subsea 7’s operating expenses, as reported in the consolidated income statements, were $-0- and $17,057,000 for 2005 and 2004, respectively.
Depreciation and amortization expense for fiscal years 2005 and 2004 were $13,262,000 and $15,274,000, respectively. Subsea 7’s depreciation and amortization expenses, as reported in the consolidated income statements, were $-0- and $2,051,000 for 2005 and 2004, respectively.
Impairment of goodwill during 2004 was approximately $6,154,000. This impairment was related to Subsea 7’s assessment of the goodwill related to its non-subsea activities in Brazil. Following the assessment, it was determined that the goodwill should be written-off it in its entirety.
Interest expense for fiscal years 2005 and 2004 were approximately $8,212,000 and $10,892,000, respectively. Subsea 7’s depreciation and amortization expenses, as reported in the consolidated income statements, were $-0- and $3,646,000 for 2005 and 2004, respectively. This reduction was offset by the increasing interest rate environment.
General and administrative expenses for fiscal years 2005 and 2004 were approximately $30,772,000 and $21,334,000, respectively. General and administrative expenses during 2005 included $9,295,000, $-0- and $142,000 related to STAR, Subsea 7 and Car Carriers, respectively. Other major components include a provision to establish a reserve for the settlement of a probable probable claim and related legal fees, $13,180,000 related to the performance unit plan and $1,842,000 for management fee expense. General and administrative expenses during 2004 included $8,669,000, $2,899,000 and $250,000 related to STAR, Subsea 7 and Car Carriers, respectively. Other major components include $4,619,000 related to the performance unit plan and $2,209,000 for management fee expense. The performance unit plan is a long-term compensation incentive plan that provides benefits based on the difference between the market value of the individual performance unit compared to the value of the unit on the date that the unit was granted. The management fee expense is based on the level of net income and is determined in accordance with provisions of a management service agreement.
Currency exchange gains (losses) for fiscal years 2005 and 2004 were $(10,332,000) and $3,407,000, respectively. The net currency exchange losses for 2005 reflect the depreciation of the Company’s non-USD-denominated investments.
Income tax expense (benefit) for fiscal years 2005 and 2004 were $332,000 and $134,000, respectively. Included within the income tax expense are withholding taxes ranging from 20-30% on dividends received from the Company’s various equity investments and Norwegian tax expense (benefit) incurred with respect to the Company’s activities in Norway. Subsea 7 and Siem Offshore are the largest taxpayers in the consolidated entity; however, equity income from unconsolidated affiliates reflects only after-tax results for such investments.
FINANCIAL CONDITION AND LIQUIDITY
The current ratios were 1.69 and 2.29 at 31 December 2005 and 2004, respectively. The interest-bearing debt-to-total assets ratio were 0.30 and 0.27 at 31 December 2005 and 2004, respectively.
At the end of 2005, the Company had $80,000,000 in available drawing capacity under its various revolvers.
SUBSEQUENT EVENTS
In January 2006, the Company received 7,340,492 shares of Subsea 7 following conversion of the NOK140,130,000 Subsea 7 8% Convertible Bonds to increase its shareholding to 65,690,145 shares of Subsea 7.
At the end of January 2006, the Company paid approximately $1,054,000 cash to Company shareholders with respect to the dividends declared at the end of 2005 at the rate of $0.07 per Common Share.

11
In March 2006, the Company purchased 4,410,750 shares of Siem Offshore in the market at an average price of NOK4.20 per share which increased its shareholding to 62,760,403 shares of Siem Offshore.
Also in March 2006, the Company purchased 704,000 shares of Subsea 7 in the market at an average price of NOK81.3226 per share which increased its shareholding to 66,394,145 shares of Subsea 7.
In May 2006, Subsea 7 conducted a private placement for $300 million of Convertible Notes due 2011 (the “2011 Convertible Notes”). The 2011 Convertible Notes bear interest at 2.80% p.a. and are convertible into new shares of Subsea 7 at a rate of $26.33 per share.
The Company agreed to support the placement of the 2011 Convertible Notes by entering into a securities lending agreement with the underwriter, Lehman Brothers International (Europe). Terms of the agreement provide that the Company will lend up to 9,000,000 shares of its Subsea 7 shareholdings to the underwriter for the duration of the 2011 Convertible Notes, that the Subsea 7 shares or their equivalent will be returned to the Company at the conclusion of the convertible note facility and that the Company is permitted, in certain circumstances where the Company desires to vote these shares, to request redelivery of the shares. The Company will receive a fee, payable monthly in arrears, that is equal to of 0.50% p.a. of the average daily market value of the securities borrowed under this agreement.
At the end of May 2006, the Company concluded a settlement and release agreement, involving an action originating in 1990, by the payment of $3,500,000.
By the end of May 2006, the Company’s subsidiary, Siem Investments, had loaned an additional EUR7,593,000 to Deusa for the project financing of the thermolysis plant. MARKET RISKS DISCLOSURES
The Company’s balance sheet includes a substantial amount of assets whose fair values are subject to market risks. Due to the Company's significant level of investments in equity securities, fluctuations in equity prices represent the largest market risk factor affecting the Company's financial position. The following sections address the significant market risks associated with the Company's business activities.
EQUITY PRICE RISK
Strategically, the Company strives to invest at reasonable prices in businesses possessing good economics and competent management. The Company prefers to invest a meaningful amount in each investee and, as a result, the Company's equity investments are concentrated in relatively few investees.
The Company's primary investment strategy is to invest in businesses in which it possesses experience on a long-term basis. Thus, short-term price volatility with respect to its investments is understood and accepted by the Company provided that the underlying business, economic and management qualities of the investees remain favorable.
The carrying values of investments subject to equity price risks accounted for under the equity method of accounting are based on costs adjusted for the Company’s proportionate share of investee earnings. The carrying values of investments which the Company has classified as available-for-sale securities are adjusted to reflect market prices at the end of the period with the appreciation or depreciation in the investments reflected as a component of comprehensive income. The carrying values of investments which the Company has classified as trading securities are adjusted to reflect market prices at the end of the period with the adjustment reflected as a gain or loss. Market prices are subject to fluctuation and, consequently, the amount realized in the subsequent sale of an investment may significantly differ from the reported market value. Fluctuation in the market price of a security may result from perceived changes in the underlying economic characteristics of the investee, the relative price of alternative investments and general market conditions. Furthermore, amounts realized in the sale of a particular security may be affected by the relative quantity of the security being sold.
INVESTMENT CONCENTRATION RISK
The Company believes that it may have investment concentration risks with respect to its investments in the oil and gas services industry. However, it believes that such risks are somewhat moderated because the oil

12
and gas service companies in which the Company has investments are positioned at different stages of the oil and gas exploration and drilling cycle. FORWARD-LOOKING STATEMENTS
Investors are cautioned that certain statements contained in this document, as well as some statements made by the Company in periodic press releases and some oral statements made by its management during presentations about the Company, are "forward-looking" statements within the meaning of the United States’ Private Securities Litigation Reform Act of 1995 (the "Act"). Forward-looking statements include statements which are predictive in nature, which depend upon or refer to future events or conditions, which include words such as "expects", "anticipates", "intends", "plans", "believes", "estimates", or similar expressions. In addition, any statements concerning future financial performance (including future revenues, earnings or growth rates), ongoing business strategies or prospects, and possible future Company actions, which may be provided by management, are also forward-looking statements as defined by the Act. Forward-looking statements are based on current expectations and projections about future events and are subject to risks, uncertainties, and assumptions about the Company, economic and market factors and the industries in which the Company conducts business, among other things. These statements are not guarantees of future performance and the Company has no specific intention to update these statements.
Actual events and results may differ materially from those expressed or forecasted in forward-looking statements due to a number of factors. The principal important risk factors that could cause the Company's actual performance and future events and actions to differ materially from such forward-looking statements, include, but are not limited to, changes in market prices of the Company's significant equity investees, changes in income tax laws, and changes in general economic and market factors that affect the prices of securities or the industries in which the Company and its affiliates conduct business. DIRECTORS AND OFFICERS
The following persons are currently directors and executive officers of the Company:
DIRECTORS
Director Present Name Position Since Term Expires
M.D. Moross Director (1,2) 1995 2006 Kristian Siem Director and Chairman 1982 2007 Barry W. Ridings Director (1,2) 1993 2007 Michael Delouche Director 2003 2008
(1) Member of Audit Committee. (2) Member of Compensation Committee.
Directors are normally elected for terms of three years at the Annual General Meeting of Shareholders. Executive officers are appointed by and serve at the pleasure of the Board. Officer appointments are normally confirmed at the Board meeting which promptly follows the Annual General Meeting of Shareholders.
Mr. Rune Holen, a Director since 2000 and whose term was scheduled to expire in 2006, resigned as a Director following the Company’s acquisition and retirement of 1,714,500 Common Shares from Storebrand Livforsikring AS. Mr. Holen is a partner in a Storebrand-related company.
EXECUTIVE OFFICERS
Officer Name Office Since
Michael Delouche President and Secretary 1991
Kristian Siem is Chairman of Subsea 7 Inc., STAR Reefers Inc., Siem Offshore Inc. and Siem Capital AB and a director on the Boards of Transocean Inc. and North Atlantic Small Companies Investment Trust plc.
M.D. Moross is a private investor and the father-in-law of Kristian Siem.

13
Barry W. Ridings is a Managing Director of Lazard Frères & Co. and a director on the Board of New Valley Corporation.
Michael Delouche was an audit manager with KPMG Peat Marwick LLP prior to joining the Company. He was appointed Controller in 1991, Secretary in 1994, Vice-President in 2002 and President in 2003 and is a director on the Boards of Subsea 7 Inc., STAR Reefers Inc. and Siem Offshore Inc.
COMPENSATION OF DIRECTORS AND OFFICERS
The Company recorded aggregate fees for the services of its directors and officers for fiscal years 2005 and 2004 were approximately $2,154,000 and $2,487,000, respectively. Directors are entitled to a director’s fee of $18,000 per annum and reimbursements of expenses incurred on behalf of the Company. Specific agreements for the services of certain other directors and officers are as follows:
Management Services Agreement, Years 2000-2004 — A 5-year management services agreement (the “MSA”) between the Company and Mr. Siem commenced January 1, 2000. The MSA provided that Mr. Siem must devote a minimum 50% of his professional time, skill and labor to perform his duties for and promote the interests of Siem Industries. The annual compensation consists of a base compensation in the amount of $300,000 plus additional compensation equal to 5% of the audited net income in excess of $2,000,000. The fee payable under this MSA for fiscal 2004 was $2,209,000.
Management Services Agreement, Years 2005-2009 — Following the expiration of the former MSA at the end of 2004, a new 5-year MSA was agreed between the Company and Mr. Siem effective January 1, 2005. Many of the terms are similar to the former MSA. Mr. Siem must devote a minimum 50% of his professional time, skill and labor to perform his duties for and promote the interests of the Company. The annual compensation consists of a base compensation in the amount of $700,000 plus additional compensation equal to 5% of the audited net income in excess of $4,000,000. The fee payable under this MSA for fiscal 2005 was $1,842,000.
Management Services Agreement — Mr. Delouche is seconded to the Company under a separate management services agreement which provides for reimbursement for certain expenses incurred by him. The reimbursements for fiscal years 2005 and 2004 were approximately $206,000 and $204,000, respectively.
OPTIONS TO PURCHASE SECURITIES FROM COMPANY
Performance units have been awarded pursuant to provisions of the Company's 1987 Performance Unit Plan (the “1987 Plan”) and 2005 Performance Unit Plan (the “2005 Plan”), as amended, by the Compensation Committee of the Board of Directors.
The 1987 Plan provides that performance units shall be granted at a value no less than 110% of the average closing market price of the Company's Common Shares for the 20 trading days preceding the date of the award. The performance unit value of the grant, which is determined by multiplying the number of performance units by the value per performance unit, is credited to the individual's performance unit account on the date of the award. Grants of awards vest over a five-year award periods at 20% per year; however, all rights to the performance unit account are forfeited if the individual's employment ceases before the end of the award period with certain reasonable exceptions including the death, total disability or retirement after age 60 of the individual.
Under the 1987 Plan, the amount of payment to the individual after the end of the award period is equal to the number of vested performance units multiplied by the difference between the average closing market price of the Common Shares and the value of the performance units awarded. The Company has the option to make the payment in either cash or Common Shares.
The 1987 Plan will expire on the earlier of the vesting of an aggregate 1,600,000 performance units by the participants or January 2007.
In October 2004, the Board of Directors commenced a review of the 1987 Plan to determine whether the termination date should be extended, whether a new plan of s similar type should be implemented or whether a new long-term incentive program should be devised. The primary concerns with respect to the

14
1987 Plan include the absence of a listing on a stock exchange and the low liquidity of the shares. In February 2005, the 2005 Plan was completed with many provisions similar to that in the 1987 Plan. The 2005 Plan provides that performance units shall be granted at a value no less than 110% of the net asset value per Common Share based on the balance sheets prepared by the Company on a quarterly basis in accordance with applicable law and prevailing generally accepted accounting principles. Net asset value for purposes of the 2005 Plan means the amount that is determined after adjustments have been made to the balance sheet to reflect the market values for the Company’s investments in securities issued by publicly-traded companies for which market prices are readily available. This approach was used because it corresponds to methods used in similar situations where low liquidity or illiquid shares exist. The performance unit value of the grant, which is determined by multiplying the number of performance units by the value per performance unit, is credited to the individual's performance unit account on the date of the award. Grants of awards vest over a five-year award periods at 20% per year; however, all rights to the performance unit account are forfeited if the individual's employment ceases before the end of the award period with certain reasonable exceptions including the death, total disability or retirement after age 60 of the individual. The Company may elect to make payments in either cash or Common Shares. If the Company makes payment in Common Shares and there is no liquid market for such shares, then the Company is obligated either to provide a market for the Common Shares within 9 months of the new share issue or to redeem or purchase the Common Shares for the cash amount that would have been paid had the original payment been made in cash.
The 2005 Plan expires on the earlier of the vesting of an aggregate 1,000,000 performance units by the participants or 31 December 2014, which is the end of a 10-year period from the effective date of agreement.
At the end of June 2005, the Compensation Committee granted 196,000 Performance Units at $48.21 per unit.
A summary of the performance unit awards which have been granted and are currently outstanding is presented below:
Name
No. of Performance Units Awarded and Outstanding Granted May 1995 Granted May 1996 Granted June 2005 at $3.00 per Unit at $5.50 per Unit at $48.21 per Unit
Kristian Siem M.D. Moross Barry W. Ridings Michael Delouche Others
400,000 60,000 115,000 — 28,000 7,000 28,000 — 7,000 40,000 20,000 10,000 — — 50,000
An aggregate 274,200 performance units granted under the 1987 Plan have been forfeited and 7,000 performance units granted under the 2005 Plan have been forfeited. INTEREST OF MANAGEMENT IN CERTAIN TRANSACTIONS
Mr. Siem holds an option to purchase the property which houses the offices of Siem Kapital in Oslo, Norway. The option provides for a one-year period, commencing on the date that he is no longer an officer or director with the Company or any of its subsidiaries, during which time he can purchase the property at the price paid by Siem Kapital. This option is subject to review by the Compensation Committee.

To the Annual Shareholders’ Meeting of Siem Industries Inc
PricewaterhouseCoopers AS Postboks 447 N-4664 Kristiansand Telefon 02316 Telefaks 23 16 10 00
Kontorer: Arendal Bergen Drammen Fredrikstad Førde Hamar Kristiansand Mo i Rana Molde Måløy Narvik Oslo Stavanger Stryn Tromsø Trondheim Tønsberg Ålesund
PricewaterhouseCoopers navnet refererer til individuelle medlemsfirmaer tilknyttet den verdensomspennende PricewaterhouseCoopers organisasjonen
Medlemmer av Den norske Revisorforening | Foretaksregisteret: NO 987 009 713
www.pwc.no
Auditor’s Report for 2005 We have audited the consolidated financial statements of Siem Industries Inc. and its subsidiaries (the “Company”) at and for the year ended 31 December 2005 that shows a consolidated net income attributable to Common Shares of USD26,837,000. We have also audited the information in the Directors' Report concerning the financial statements and the going-concern assumption. The Company’s consolidated financial statements include the balance sheet, the income statement, the statements of cash flow and changes in equity and the accompanying notes as set out on pages 16 to 50. International Financial Reporting Standards (“IFRS”) based on the revised standards and interpretations that are mandatory for accounting periods commencing 1 January 2005 have been applied in the preparation of the consolidated financial statements. These consolidated financial statements are the responsibility of the Company’s Board of Directors and Officers. Our responsibility is to express an opinion on these financial statements and on other information according to the requirements of the Norwegian Act on Auditing and Auditors. We conducted our audit in accordance with laws, regulations and auditing standards and practices generally accepted in Norway, including standards on auditing adopted by The Norwegian Institute of Public Accountants. These auditing standards require that we plan and perform the audit to obtain reasonable assurance as to whether the financial statements are free of material misstatement. An audit includes examining, on a test basis, evidence supporting the amounts and disclosures in the financial statements. An audit also includes assessing the accounting principles used and significant estimates made by management, as well as evaluating the overall financial statement presentation. To the extent required by law and auditing standards, an audit also comprises a review of the management of the Company's financial affairs and its accounting and internal control systems. We believe that our audit provides a reasonable basis for our opinion. In our opinion: • the consolidated financial statements of the Company have been prepared in accordance with the laws and
regulations and give a true and fair view of the consolidated financial position at 31 December 2005 and the results of its operations and its cash flows and the changes in equity for the year then ended, in accordance with IFRS based on the revised standards and interpretations that are mandatory for accounting periods commencing 1 January 2005;
• the information in the Directors' Report concerning the consolidated financial statements and the going-concern assumption are consistent with the financial statements and comply with the law and regulations.
Kristiansand, 9 June 2006 PricewaterhouseCoopers AS Torstein S. Robstad State Authorised Public Accountant (Norway) Note: This translation from Norwegian has been prepared for information purposes only

16
For Years Ended 31 December(Dollars in thousands, except per share amounts) Notes 2005 2004 2004
REVENUES:Operating revenues 11 $ 173,344 $ 176,036 $ 171,299Interest income 5,743 3,806 3,806Gains (losses), net 13 10,508 24,705 24,877Equity in income (loss) of unconsolidated affiliates 5 13,217 12,077 16,089Other income 2,710 2,301 2,427 Total revenues and other income 205,522 218,925 218,498
OTHER EXPENSES (INCOME):Operating expenses 11,12 106,197 126,959 130,825Depreciation and amortization 14 13,262 15,274 15,931Impairment of goodwill 8 — 6,154 6,744Interest expense 8,212 10,892 8,665General and administrative expenses 15,16,17,20 30,772 21,334 14,391Currency exchange losses (gains), net 18,19 10,332 (3,407) (3,319)Other 259 911 968
Total other expenses (income) 169,034 178,117 174,205Income before income tax expense 36,488 40,808 44,293Income tax expense 10 332 134 134
Net income 36,156 40,674 44,159Minority interest expense 9,319 3,161 3,980
Net income attributed to Common Shares $ 26,837 $ 37,513 $ 40,179
Earnings per Common Share:Basic $ 1.64 $ 2.23 $ 2.39Diluted $ 1.64 $ 2.23 $ 2.39
Weighted avg. no. of Common Shares outstanding for period
See accompanying Notes which are an integral part of these Consolidated Financial Statements.
US GAAPI F R S
SIEM INDUSTRIES INC. AND SUBSIDIARIESCONSOLIDATED INCOME STATEMENTS
16,793,86016,793,86016,406,469
17
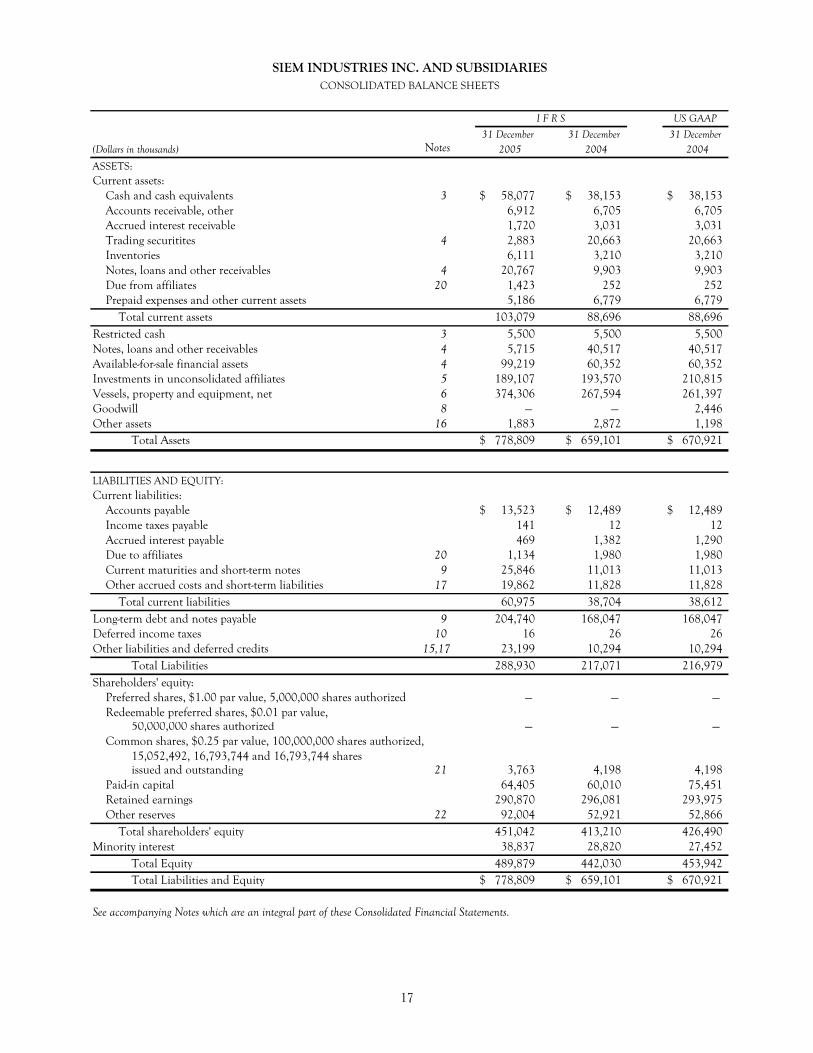
(Dollars in thousands) Notes 2005 2004 2004
ASSETS:Current assets:
Cash and cash equivalents 3 $ 58,077 $ 38,153 $ 38,153Accounts receivable, other 6,912 6,705 6,705Accrued interest receivable 1,720 3,031 3,031Trading securitites 4 2,883 20,663 20,663Inventories 6,111 3,210 3,210Notes, loans and other receivables 4 20,767 9,903 9,903Due from affiliates 20 1,423 252 252Prepaid expenses and other current assets 5,186 6,779 6,779
Total current assets 103,079 88,696 88,696Restricted cash 3 5,500 5,500 5,500Notes, loans and other receivables 4 5,715 40,517 40,517Available-for-sale financial assets 4 99,219 60,352 60,352Investments in unconsolidated affiliates 5 189,107 193,570 210,815Vessels, property and equipment, net 6 374,306 267,594 261,397Goodwill 8 — — 2,446Other assets 16 1,883 2,872 1,198
Total Assets $ 778,809 $ 659,101 $ 670,921
LIABILITIES AND EQUITY:Current liabilities:
Accounts payable $ 13,523 $ 12,489 $ 12,489Income taxes payable 141 12 12Accrued interest payable 469 1,382 1,290Due to affiliates 20 1,134 1,980 1,980Current maturities and short-term notes 9 25,846 11,013 11,013Other accrued costs and short-term liabilities 17 19,862 11,828 11,828
Total current liabilities 60,975 38,704 38,612Long-term debt and notes payable 9 204,740 168,047 168,047Deferred income taxes 10 16 26 26Other liabilities and deferred credits 15,17 23,199 10,294 10,294
Total Liabilities 288,930 217,071 216,979Shareholders' equity:
Preferred shares, $1.00 par value, 5,000,000 shares authorized — — — Redeemable preferred shares, $0.01 par value,
50,000,000 shares authorized — — — Common shares, $0.25 par value, 100,000,000 shares authorized,
15,052,492, 16,793,744 and 16,793,744 sharesissued and outstanding 21 3,763 4,198 4,198
Paid-in capital 64,405 60,010 75,451Retained earnings 290,870 296,081 293,975Other reserves 22 92,004 52,921 52,866
Total shareholders' equity 451,042 413,210 426,490Minority interest 38,837 28,820 27,452
Total Equity 489,879 442,030 453,942Total Liabilities and Equity $ 778,809 $ 659,101 $ 670,921
See accompanying Notes which are an integral part of these Consolidated Financial Statements.
I F R S US GAAP
SIEM INDUSTRIES INC. AND SUBSIDIARIESCONSOLIDATED BALANCE SHEETS
31 December 31 December 31 December

18
Paid-in Retained Other Minority(in thousands, except number of shares) Number Share Capital Capital Earnings Reserves Interest
Balances at 1 January 2004 16,794,144 $ 4,198 $ 12,578 $ 259,748 $ 36,098 $ 40,304Reacquisition and
retirement of stock (400) — — (4) — — Cash dividends ($0.07 per share) — — — (1,176) — — Net income — — — 37,513 — 3,161Subsidiary pays cash dividend to minority interests — — — — — (1,100)Adjustments for issuance of shares
by subsidiary to minority interests at prices greater than book value — — 47,432 — — —
Subsidiary issues shares to minority interests — — — — — 8,105Purchase shares from minority interests — — — — — (6,535)Unrealized appreciation
on available-for-sale securities — — — — 26,168 — Currency translation adjustments — — — — (9,399) — Share-based compensation — — — — 54 — Deconsolidation of Subsea 7, net — — — — — (15,115)
Balances at 31 December 2004 16,793,744 4,198 60,010 296,081 52,921 28,820Reacquisition and
retirement of stock (1,741,252) (435) — (30,995) — — Cash dividends ($0.07 per share) — — — (1,053) — — Net income — — — 26,837 — 9,319Adjustments for issuance of shares
by subsidiary to minority interests at prices greater than book value — — 4,395 — — —
Subsidiary issues shares to minority interests — — — — — 883Purchase shares from minority interests — — — — — (185)Unrealized appreciation
on available-for-sale securities — — — — 38,867 — Currency translation adjustments — — — — 142 — Share-based compensation — — — — 74 —
Balances at 31 December 2005 15,052,492 $ 3,763 $ 64,405 $ 290,870 $ 92,004 $ 38,837
See accompanying Notes which are an integral part of these Consolidated Financial Statements.
SIEM INDUSTRIES INC. AND SUBSIDIARIESCONSOLIDATED STATEMENTS OF CHANGES IN EQUITY
Common Shares
Attributable to Common Shareholders

19
For Years Ended 31 December(Dollars in thousands) 2005 2004 2004
CASH FLOWS FROM OPERATING ACTIVITIES:Net income attributed to Common Shares $ 26,837 $ 37,513 $ 40,179
Adjustments to reconcile net income (loss)to net cash provided by (used in) operating activities:
Depreciation and amortization 16,937 18,448 15,931Undistributed equity in loss (income) of unconsolidated affiliates (13,217) (12,077) (16,089)Net losses (gains) on investments (10,508) (24,705) (24,877)Impairment of goodwill — 6,154 6,744Minority interests in net income 9,319 3,161 3,980Provisions for losses on time charters — (201) (201)Share-based compensation 74 — — Deferred compensation for performance unit plan 13,180 4,619 4,619Deferred income taxes (10) (10) (10)Currency exchange losses (gains) 10,332 (3,407) (3,319)
Changes in assets and liabilities net of effect of acquired companies:(Increase) decrease in:
Accounts receivable, other (207) (3,677) (3,469)Accrued interest receivable 1,311 2,854 2,854Trading securities 22,024 6,831 6,830Inventories (2,901) 757 757Due from affiliates (1,171) 1,523 1,523Prepaid expenses and other current assets 1,593 1,390 1,390
Increase (decrease) in:Accounts payable 1,157 962 (1,418)Income taxes payable 129 (56) (56)Accrued interest payable (913) (3,693) (3,785)Due to affiliates (846) 1,651 1,651Other accrued costs and short-term liabilities 8,034 2,222 2,222
Net cash provided by (used in) operating activities 81,154 40,259 35,456CASH FLOWS FROM INVESTING ACTIVITIES:
Additions to notes receivable and other investments (8,176) (17,228) (15,348)Proceeds from repayment of notes receivable and other investments 31,811 52,299 52,591Distributions from (investments in) unconsolidated affiliates 18,329 (14,029) (14,029)Purchases of vessels, shipping related assets and other (140,817) (23,246) (18,319)Disposal of vessels, shipping related assets and other 19,598 25,794 26,667Cash not included following deconsolidation of Siem Offshore — (8,305) (8,305)(Increase) decrease in restricted cash — 8,212 8,212Other 258 7,624 4,070
Net cash provided by (used in) investing activities (78,997) 31,121 35,539CASH FLOWS FROM FINANCING ACTIVITIES:
Cash dividends paid to Company shareholders (1,176) (1,008) (1,008)Cash dividends paid to minority shareholders — (1,100) (1,100)Proceeds from long-term debt and notes payable 83,000 39,533 39,533Repayment of long-term debt and notes payable (29,418) (121,564) (121,564)Repurchase of common stock (31,430) (4) (4)Contribution from minority interests of consolidated subsidiaries — 9,626 9,626Other (704) (1,504) (1,119)
Net cash provided by (used in) financing activities 20,272 (76,021) (75,636)Effect of exchange rate changes on cash (2,505) 378 378Net increase (decrease) in cash and cash equivalents 19,924 (4,263) (4,263)Cash and cash equivalents, beginning of period 38,153 42,416 42,416Cash and cash equivalents, end of period $ 58,077 $ 38,153 $ 38,153
SUPPLEMENTAL DISCLOSURE OF CASH FLOW INFORMATION:Cash paid during the period for:
Interest $ 9,125 $ 12,704 $ 12,450Income taxes $ 212 $ 200 $ 218
See accompanying Notes which are an integral part of these Consolidated Financial Statements.
SIEM INDUSTRIES INC. AND SUBSIDIARIESCONSOLIDATED STATEMENTS OF CASH FLOWS
I F R S US GAAP

NOTES TO CONSOLIDATED FINANCIAL STATEMENTS
20
(1) GENERAL INFORMATION
Siem Industries Inc. was incorporated in October 1980 under the laws of the Cayman Islands as Bahama Cruise Line, Inc. The name was changed to Bermuda Star Line, Inc. in 1986, to Norex America, Inc. in 1989, to Norex Industries Inc. in 1996 and to Siem Industries Inc. in 1998. The “Company” or “Siem Industries”, as used herein, refers to Siem Industries Inc. and its subsidiaries and affiliates unless the context indicates otherwise.
The Company’s registered office address is P.O. Box 309GT, South Church Street, George Town, Grand Cayman, Cayman Islands, BWI.
Quotes for the Company’s Common Shares are available from Pink Sheets LLC, a centralized quotation service that collects and publishes quotes for over-the-counter securities by market makers, under the symbol “SEMUF” at www.pinksheets.com .
The currency symbols “$” (or “USD”), “NOK” and “GBP” refer to United States dollars, Norwegian kroner and British pounds representing the lawful currencies of the United States, Norway, and Great Britain, respectively, and “EUR” refers to Euros.
At 31 December 2005, the Company owned the following major investments: 58,349,653 shares, or 41.8%, of Subsea 7 Inc. (“Subsea 7”; OSE Symbol: “SUB”), a publicly-traded Cayman Islands company and one of the world’s leading subsea engineering and construction contractors, 58,349,653 shares, or 44.8%, of Siem Offshore Inc. (“Siem Offshore”; OSE Symbol: “SIOFF”), a publicly-traded Cayman Islands company that was spun-off from Subsea 7 with effect 1 July 2005 by the issuance of one new share of Siem Offshore for each share of Subsea 7 held by its shareholders, the purpose of such transaction being to de-merge the non-subsea assets and activities from Subsea 7 and to provide Siem Offshore with the opportunity to focus on other shipping services for the oil and gas industry; 6,252,534 shares, or 73.0%, of STAR Reefers Inc. (“STAR”; OSE Symbol: “SRI”), a publicly-traded Cayman Islands company and one of the major owners and operators of refrigerated vessels transporting fruits, vegetables, meats and other consumables; an 88% interest in Siem Car Carriers, Inc. (“Car Carriers”), a Cayman Islands company and owner of three car carrier vessels; and 1,423,720 shares of Transocean Inc., a publicly-traded Cayman Islands company and the world’s predominant premium deepwater drilling contractor. The Company also owned a 64% interest in Siem Capital AB, the parent company of Siem Industrikapital AB (“Siem Industrikapital”), both Swedish companies, and a 49%-interest in Deusa International GmbH (“Deusa”), a German company. Siem Industrikapital holds interests in several industrial companies including EFG European Furniture Group AB, a leading designer and manufacturer of business-to-business office furniture in Europe, and Boule Diagnostics International AB, the holding company for three separate biotechnology/medical technology businesses, Boule Medical AB, Boule Diagnostics AB and Labdesign Boule Nordic AB. Deusa’s operations include the mining of potash which is used for fertilizer production, bischofite for the construction industry, magnesium chloride for de-icing and other materials.
At 31 December 2005, Elderberry Holdings Limited (“Elderberry”) owned 8,852,688 shares, or approximately 58.8% of the issued and outstanding shares of the Company’s Common Stock. Elderberry is owned by a trust, whose potential beneficiaries include the mother and certain of the brothers of Mr. Kristian Siem, the Company’s Chairman. The Ores Trust beneficially owned 1,352,432 shares, or approximately 9.0% of the Common Stock. Potential beneficiaries of the Ores Trust include members of Mr. Siem’s immediate family. Mr. Siem personally owned 1,378,992 shares, or approximately 9.2% of the Common Stock. Mr. Siem and the trustees for the trusts hold separate voting and dispositive powers over their respective holdings.
Subsea 7, Siem Offshore, STAR and Car Carriers represent significant subsidiaries of the Company.
(2) SUMMARY OF SIGNIFICANT ACCOUNTING POLICIES
BASIS OF PREPARATION
The Company’s consolidated financial statements have been prepared in accordance with International Financial Reporting Standards (“IFRS”) under the assumption that the Company is a going-concern and are presented in United States dollars. The consolidated financial statements are based on historical costs, as

NOTES TO CONSOLIDATED FINANCIAL STATEMENTS
21
modified by the revaluation of available-for-sale financial assets and by adjustments of financial assets and liabilities to fair value through profit or loss.
The preparation of financial statements requires the use of certain critical estimates and assumptions that affect the reported amounts of assets and liabilities at the end of the fiscal year and the reported amounts of income and expenses during the fiscal year. Estimates and assumptions made by management include selecting useful lives of property and equipment, estimating provisions for uncollectible receivables, determining the carrying value and possible impairment of long-lived assets, goodwill and intangible assets, estimating income tax provision and performing other similar evaluations.
For fiscal years prior to and including 2004, the Company prepared its consolidated financial statements in accordance with generally accepted accounting principles in the United States (“USGAAP”). When it became necessary for the Company’s subsidiaries listed on the Oslo Stock Exchange to prepare their respective financial statements in accordance with IFRS, the Company determined that it would also adopt IFRS to maintain consistency in reporting. The transition from USGAAP to IFRS involved the restatement of retained earnings at 1 January 2004 and the restatement of the financial statements for 2004 to provide comparative amounts for 2005.
INTERPRETATIONS AND AMENDMENTS TO PUBLISHED IFRS EFFECTIVE IN 2005
The accounting policies adopted are consistent with those of the previous financial year except that the Group has adopted those new/revised standards mandatory for financial years beginning on or after 1 January 2005. The significant changes made as a result of the adoption of IFRS are detailed below:
IFRS 2 “Share-Based Payment”. The revised accounting policy for share-based payment transactions is detailed in the accounting policies presented below. The main impact of IFRS 2 is the recognition of an expense and a corresponding entry to equity for employee share options based on the fair value of the equity instruments granted at the grant date.
IFRS 3 “Business Combinations”, IAS 36 “Impairment of Assets” and IAS 38 “Intangible Assets”. IFRS 3 has been applied for business combinations dated on or after 31 March 2004. Adoption of IFRS 3 and IAS 36 (revised) has resulted in the company being required, where goodwill is recognized on an acquisition, to test for impairment at the cash generating unit level annually (unless an event occurs during the year which requires goodwill to be tested more frequently) from 1 January 2005. These requirements have been applied to the acquisition of Subsea 7 Holding Inc. on 31 December 2004.
Additionally, under IFRS 3, the identification of assets and liabilities in a business acquisition will include intangible assets not previously recognized under NGAAP. The principal intangible assets that will be recognized separately from goodwill on an acquisition will be customer contracts and relationships. These intangible assets will be valued at the date of acquisition and amortized over their estimated economic lives. In accordance with IAS 38, the useful lives of intangible assets are now assessed at the individual asset level as having either a finite or indefinite life assessed on the basis of all the relevant factors. The revised accounting policy for intangible assets is detailed in the accounting policies presented below.
IAS 32 “Financial Instruments: Disclosure and Presentation” and IAS 39 “Financial Instruments: Recognition and Measurement”. The Group has adopted IFRS 32 and IFRS 39 from 1 January 2005 and the comparative figures for 2004 have been restated to record the fair values of financial instruments and the respective movements in the fair values during the year.
STANDARDS, INTERPRETATIONS AND AMENDMENTS TO PUBLISHED IFRS NOT YET EFFECTIVE
IFRS 7 “Financial Instruments: Disclosures”. This standard consolidates IAS 30 and the disclosure requirements of IAS 32 relating to financial instruments. It is anticipated that this standard will not have a material impact on the Company’s consolidated financial statements.
IFRIC 4 “Determining Whether an Arrangement Contains a Lease”. This interpretation contains guidance for determining whether arrangements that do not take the legal form of a lease should nonetheless be accounted as such in accordance with IAS 17 “Leases”. It is anticipated that this standard will not have a material impact on the Company’s consolidated financial statements.

NOTES TO CONSOLIDATED FINANCIAL STATMENTS
22
CONSOLIDATION OF SUBSIDIARIES AND ACCOUNTING FOR INVESTMENTS IN UNCONSOLIDATED AFFILIATES
Subsidiaries — Subsidiaries are entities over which the parent company generally controls more than 50% of the entity’s issued and outstanding voting shares and has the ability to control its the operating and financial policies. Details of the subsidiary’s financial statements are included within the consolidated financial statements from the date that control is established. The subsidiary’s financial statements are deconsolidated from the date that control is ended.
The purchase method is used to account for the acquisition of subsidiaries. The cost of an acquisition is measured as the fair value of the assets given, equity instruments issued, liabilities incurred or assumed as of the date of the purchase and costs incurred that are attributed to such acquisition. The identifiable assets acquired and liabilities and contingent liabilities assumed are measured at the respective fair values at the date of acquisition. Any excess of the cost of the acquisition over the share of the fair value of identifiable net assets acquired is recorded as goodwill. If the cost of the acquisition is less than the fair value of identifiable net assets acquired, then the amount is recognized currently in the income statement.
Intercompany transactions and balances between consolidated companies are eliminated.
Noncontrolling, or minority, interests represent third party shareholders who may have influence but not control over a company’s activities. The share of a company’s net assets at the end of a fiscal period and the net income during a period that are attributed to third parties are recorded as minority interests payable and minority interests expense, respectively. Disposals of shares to minority interests may result in gains or losses that are recorded currently in the income statement and purchases of shares may result in goodwill.
Affiliates — Affiliates are entities over which the parent company generally controls between 20% to 50% of the voting rights in the entity and has significant influence with, but not the ability to control, the entity’s operating and financial policies. Investments in affiliates are accounted for under the equity method of accounting and are initially recorded at cost. An investment in an affiliate may include goodwill arising from the acquisition.
The parent company records its share of the affiliates post-acquisition net income or losses as equity in the income or losses of the affiliate in the income statement and its share of post-acquisition movements in the affiliate’s shareholder equity are recognized in the parent company’s equity reserves. Cumulative post-acquisition movements are adjusted against the parent’s carrying amount of the investment. Unrealized gains or losses between the parent and its affiliate are eliminated to the extent of the parent’s interest in the affiliate.
FOREIGN CURRENCY TRANSLATION
Functional and Presentation Currency — The Company uses the USD as the functional and presentation currency in the financial statements since the USD is the primary currency in the environment in which the Company and its subsidiaries and affiliates operate.
Transactions and Balances — Foreign currency transactions are translated into the functional currency using the exchange rates prevailing on the date of the transactions. Currency exchange gains and losses resulting from the settlement of such transactions and from the translation of monetary assets and liabilities using the currency rates prevailing on the last day of the fiscal period are recorded in the income statement.
Changes in the fair value of a monetary security that is classified as available-for-sale and is denominated in a foreign currency are analyzed between changes arising from translation differences in the amortized cost of the security and other changes in the carrying amount of such security. Translation differences are recognized as currency exchange gains or losses in the income statement and other changes are recognized in equity.
Translation differences on non-monetary financial assets and liabilities are included as part of the fair value gain or loss. Translation differences on non-monetary financial assets and liabilities such as equities held at fair value through profit or loss are recognized as part of the fair value gain or loss and are recorded as exchange gains or losses in the income statement. Translation differences on non-monetary financial assets classified as available-for-sale are included in the fair value reserve in equity.

NOTES TO CONSOLIDATED FINANCIAL STATEMENTS
23
Subsidiaries — The Company translates the results and balances of its consolidated subsidiaries that have a functional currency different from the USD as follows:
• Assets and liabilities for each fiscal period are translated at the closing exchange rate on the date of the balance sheet.
• Income and expenses for each fiscal period are translated at the average exchange rate for the period.
• Resulting exchange differences are recognized as a separate component of equity.
Goodwill and fair value adjustments that are identified on the date of acquisition of a foreign entity are treated as assets and liabilities of the foreign entity and translated at the closing rate on the reporting date.
ACCOUNTING ESTIMATES AND JUDGMENTS
The preparation of consolidated financial statements requires management to make good faith estimates and assumptions that affect the reported amount of assets, liabilities, revenues, expenses and disclosure of contingent assets and liabilities. The Company continually evaluates its estimates, including those related to investments, materials and supplies obsolescence, property and equipment and other long-lived assets, intangible assets and goodwill, bad debts, income taxes, financing operations and contingent liabilities as of the date of the financial statements and the period then ended. The Company’s estimates are based on historical experience and various assumptions, including expectations of future events, that are believed reasonable under the circumstances, the results of which form the basis for making judgments about the carrying values of assets and liabilities that are not readily apparent from other sources. Actual results may differ from the estimates and assumptions used in the preparation of the consolidated financial statements.
CASH AND CASH EQUIVALENTS
Cash and cash equivalents include cash, certificates of deposit and all highly liquid investments purchased with original maturities of three months or less. Cash equivalents are stated at cost plus accrued interest, which approximates fair value.
The Company is required to maintain minimum cash balances or to pledge securities and/or cash deposits as security for drawdowns under its revolving credit facilities. Pledged cash deposits and minimum cash balances required by loan facilities are reported as restricted cash in the consolidated balance sheet. The restricted cash amounts were $5,500,000 at both 31 December 2005 and 2004.
ACCOUNTS AND OTHER RECEIVABLES
Accounts and other receivables include trade receivables which are recognized initially at fair value and, subsequently, at amortized cost using the effective interest method less any provision for impairment. A provision for impairment of trade receivables is recorded when objective evidence indicates that the Company may not be able to collect all amounts that are due in accordance with the originals terms of the transaction. Such objective evidence includes default or delinquency of payments, significant financial difficulties of the debtor and probability that the debtor may enter bankruptcy or financial reorganization. The amount of the provision is the difference between the asset’s carrying amount and the present value of the estimated future cash flows as discounted at the effective rate of interest. The provision is recorded in the income statement as a general and administrative expense.
INVENTORIES
The major components of inventory include bunkers and lubrication oil. These inventories are recorded at the lower of cost or net realizable value. Cost is determined using the first-in, first-out (“FIFO”) method. Net realizable value is the estimated selling price in the ordinary course of business less applicable selling expenses.

NOTES TO CONSOLIDATED FINANCIAL STATMENTS
24
FINANCIAL ASSETS
The Company determines the classification of its financials assets at initial recognition and re-evaluates the designation at each reporting date. The classifications are discussed below.
Financial Assets at Fair Value through Profit or Loss — Assets in this category are considered to be current assets because they are held for trading purposes, such as listed equity securities, or are expected to be realized within 12 months after the reporting date.
Notes, Loans and Other Receivables — These financial assets are non-derivative financial assets with fixed or determinable payments that are not quoted in an active market. Notes, loans and other receivables having maturities of less than 12 months after the reporting date are recorded as current assets in the balance sheet and assets having maturities greater than 12 months after the reporting date are recorded as noncurrent assets.
Available-for-Sale Financial Assets — These financial assets are non-derivative financial assets that either are designated for this category or are not designated in the other categories. Available-for-sale financial assets are recorded as noncurrent assets in the balance sheet unless the Company intends to dispose of the investment within 12 months after the reporting date.
Held-to-Maturity Financial Assets — These financial assets are non-derivative financial assets with fixed or determinable payments and maturities that the Company has the positive intent and ability to hold to maturity. Held-to-maturity financial assets are recorded as noncurrent assets in the balance sheet if the assets have maturities greater than 12 months from the reporting date and as current assets if the assets have maturities less than 12 months from the reporting date.
Purchases and sales of financial assets are recognized on the trade date which is the date on which the Company has committed to purchase or sale the asset. Investments in financial assets carried at fair value through profit or loss are initially recognized at fair value and transaction costs are expensed in the income statement. Other investments in financial assets are initially recognized at fair value plus transaction costs. In subsequent periods, financial assets at fair value through profit or loss and available-for-sale financial assets are carried at fair value. Notes, loans and other receivables and held-to-maturity investments are carried at amortized cost using the effective interest method.
Changes in the fair value of the financial assets at fair value through profit or loss are recorded in the income statement as gains or losses. Changes in the fair value of monetary securities that are denominated in currencies other than the functional currency and classified as available-for-sale are analyzed between translation differences resulting from changes in the amortized cost of the security and other changes in the carrying amount of the security. The translation differences are recognized as currency exchange gains or losses in the income statement and the other changes in the carrying amount are recognized in a separate component of equity.
Fair values are based on current bid prices in the market for listed investments. Fair values for unlisted investments or investments in which the market is not active are determined using valuations techniques including recent arm’s length transactions, reference to other instruments that are similar in nature and discounted cash flow analysis.
The Company assesses at each reporting date whether objective evidence exists that indicates a possible impairment. Such evidence would include a significant or prolonged decline in the fair value of the security below its cost or the security no longer pays in accordance with the terms of the underlying agreement. If such evidence exists, then the cumulative loss which is measured as the difference between the carrying value and the current fair value is recorded as an impairment loss in the income statement.
PROPERTY AND EQUIPMENT AND RELATED IMPAIRMENT
Property and equipment consist primarily of vessels designed for the ocean-transport of refrigerated goods (“reefer vessels” or “vessels”) and the ocean-transport of cars and high and heavy units (“car carriers”). Vessels are related shipping assets are stated at historical cost, which includes costs directly attributable to the acquisition, less accumulated depreciation. The carrying value of vessels and related shipping assets are based on estimates, assumptions and judgments relative to capitalized costs, useful lives and residual values

NOTES TO CONSOLIDATED FINANCIAL STATEMENTS
25
reflecting both historical experience and expectations of future industry conditions and operations. Depreciation for vessels is provided on a straight-line basis over the estimated useful life of 15-30 years after allowing for residual values. Equipment and other fixed asset costs less residual values are depreciated on a straight-line basis over the estimated useful life of 3-5 years.
Buildings are depreciated over a useful life of 20 years. Remaining long-lived assets include furniture, fixtures and cars that are carried at cost and depreciated on a straight-line basis over the estimated useful life of 3-5 years.
Subsequent costs that may be included in the asset’s carrying value may include expenditures for renewals, major modifications or betterments. These costs are capitalized as separate assets when it is probable that future economic benefits associated with these assets will result and the costs can be measured reliably. These costs of these assets may be amortized over the adjusted remaining useful life of the related asset.
Following the disposal or retirement of property and equipment, the costs and related accumulated depreciation are removed from the respective accounts and any resulting gains or losses are recorded in the statements of operations.
The assets’ residual, or scrap, values and useful lives are reviewed periodically and adjusted if appropriate. The carrying values of assets are reviewed periodically for potential impairment whenever events or changes in circumstances indicate that the carrying amount of such assets may not be recoverable. This determination of recoverability for property and equipment held for use is based on the estimated discounted future net cash flows of the underlying asset and the difference is recorded as an impairment loss in the income statement.
The Company classifies property and equipment as held-for-sale when it has established a plan for the disposal of certain assets. Assets held-for-sale are recorded as current assets at the lower of book value or net realizable value.
Maintenance, major repairs and costs incurred to maintain the certification of assets and comply with current regulations are charged to operating expense as incurred.
DEFERRED DRYDOCKING COSTS
Drydocking costs are costs incurred pursuant to a program of vessel classification and scheduled, periodic drydockings of the vessels. The costs are accumulated and capitalized as a separate component of the vessels’ carrying values because such costs have a different pattern of benefits that require different rates of amortization from the related vessel.
LOANS AND NOTES PAYABLE AND DEFERRED FINANCING COSTS
Loans and notes payable are recognized initially at fair value net of financing costs incurred to obtain the financing. Financing costs, including debt arrangement fees, are deferred and amortized using the effective interest method of amortization over the term of the underlying facility agreement. Loans and notes payable are recorded as noncurrent liabilities for payments that extend more than 12 months from the reporting date. Payments on loans and notes payable due less than 12 months from the reporting date are recorded as current liabilities. The unamortized balance of deferred financing costs are recorded as a reduction of noncurrent loans and notes payable. The amortization of deferred financing costs is recorded in the income statement as interest expense.
INTANGIBLE ASSETS
Goodwill represents the excess of the purchase price over the fair value of assets acquired in business acquisitions under the purchase method of accounting on the date of acquisition. Goodwill on acquisitions of affiliates is included in the investments in affiliates. The Company evaluates goodwill for impairment at the reporting unit level on an annual basis unless circumstances require an interim evaluation. The evaluation compares the fair value of a reporting subsidiary against the carrying value of the reporting unit. If the fair value of the reporting unit is less than the carrying value, then additional analyses would be undertaken to determine the amount of the impairment. Goodwill is carried at cost less accumulated impairment losses. Impairment losses that are recorded in the income statement are not reversed. Gains and losses on the disposal of a entity include the carrying amount of goodwill related to the entity sold.

NOTES TO CONSOLIDATED FINANCIAL STATMENTS
26
REVENUE RECOGNITION
Voyage revenues and expenses are recognized on the accrual basis. Revenues are generated from freight billings, time charter and bareboat charter hires. The operating results of voyages in progress are estimated and recorded pro-rata on a per day basis in the consolidated statements of operations. Probable losses on voyages are provided for in full at the time such losses can be estimated. Time charter and bareboat charter revenues are recorded over the term of the charter as service is provided. Operating costs and costs in connection with freight-seeking activities are expensed as incurred.
Revenues generated by vessels in the Star Reefers Pool are booked on a gross basis. Voyage expenses such as fuel costs, port costs and other voyage-related expenses are deducted from gross revenue to reflect net charter earnings. Revenue from vessels deployed in third party pools are recorded on a net time charter basis because such vessels are operating either under a straight time charter or on pool-terms where STAR does not have access to gross revenues or voyage expense data.
Interest and dividend income are recognized on the accrual method as earned.
LEASES
Leases in which a significant portion of the risks and rewards of ownership are retained by the lessor are classified as operating leases. Payments made under operating leases are charged to the income statement on a straight-line basis over the term of the lease. All time charter contracts are considered to be operating leases and, accordingly, charter hire is expensed as incurred.
The Company controls several vessels under bareboat charters and sale-leaseback agreements. All such bareboat charters and sale-leaseback transactions are evaluated individually to determine whether the arrangement should be classified as a capital lease. A vessel under capital lease is depreciated on either a straight-line basis over the vessel’s remaining economic useful life or on a straight-line basis over the term of the lease. The method to be applied is determined by the criteria according to which the lease has been assessed to be a capital lease. Depreciation of vessels under capital leases is recorded in depreciation and amortization expense in the income statement.
All bareboat charters and sale-leaseback agreements were classified as operating leases at 31 December 2005. Furthermore, all other significant leases are operating leases.
EMPLOYEE BENEFITS
Share-Based Compensation
According to IFRS 2, all share-based payment transactions must be recognized in the financial statements using a fair value measurement basis.
Performance Unit Plan — The parent company has maintained a Performance Unit Plan for its officers, directors and others who contribute to the success of the Company since 1987. Compensation expense is measured at the end of each period as the amount by which the fair value of the Company’s Common Stock covering a grant of performance units exceeds the value specified under the plan and is charged to expense over the periods that the recipient of the grant performs the related services. The Company has the option to satisfy the redemption of the performance units in either cash or Common Shares.
Stock Option Plans — STAR Reefers established a stock option plan in 2001. Since its inception, a total of 380,000 options have been granted to its employees and directors. IFRS 2 only applies to those options granted after November 2002 and not yet vested at 1 January 2005. Consequently, the fair value of 130,000 options granted in July 2004 that were not yet vested at 1 January 2005 was determined using the Black-Scholes option pricing model. The option value represents the value of the services rendered in exchange for the grant of the options. The option value is recorded as an expense in the income statement on a straight-line basis over the vesting period of the underlying options and is credited to other reserves which is a separate component of equity. Upon exercise of the options, the related accumulated compensation is reclassified from other reserves and recorded as paid-in capital.

NOTES TO CONSOLIDATED FINANCIAL STATEMENTS
27
Pension Obligations
STAR Reefers maintains a defined benefit plan for its employees in Norway. The net present value of the future obligations of the pension plan is determined using insurance accounting principles. Net pension expenses are recorded as salary-related expenses in the income statement. The estimated net funds are recorded as noncurrent assets in the balance sheet. The effect of changes in the estimates and differences between estimated and actual return are recognized only when the accumulated effect exceeds 10% of the larger of the pension fund assets and the pension fund obligation. The excess amount is amortized over the remaining service life of the employees.
STAR Reefers maintains two defined contribution plans for its employees in the U.K. Yearly contributions for the two plans are expensed as incurred.
DERIVATIVE FINANCIAL INSTRUMENTS AND HEDGING ACTIVITIES
The Company enters into certain derivative financial instruments to manage its exposure to fluctuations in foreign exchange rates, interest rates and fuel bunker prices. Accordingly, the Company recognizes all currency exchange contracts, interest rate swap contracts and bunker contracts in the financial statements and measures such contracts at fair value regardless of the purpose or intent for holding them. None of the derivative financial instruments qualify as hedging. Accordingly, all changes in the fair market value of derivative financial instruments are recorded in net income for the current period.
The Company uses forward currency exchange contracts to reduce the exchange rate risk for specific non-U.S. currency transactions. These contracts require the exchange of USD for non-U.S. currency at a fixed rate with maturities that are generally less than 6 months. The carrying amounts of these contracts are adjusted to their market values at each reporting date and recorded to income. The Company has entered into forward contracts to sell USD and buy NOK to provide for administrative expenses in Oslo and to sell USD and buy GBP to provide for administrative expenses in London. These contracts have been accounted for as cash flow hedges.
Interest rate swaps are used to manage exposure to changes in interest rates by adjusting the proportion of total debt that is subject to variable and fixed interest rates. The interest rate terms under the outstanding bank loans provide for a variable, or floating, rate of interest based on LIBOR. Consequently, the Company has entered into interest rate swap contracts and agreed to pay an amount equal to a specified fixed rate of interest multiplied by the notional principal amount and to receive in return an amount equal to a specified variable rate of interest multiplied by the same notional principal amount.
INCOME TAXES
The Company is incorporated in the Cayman Islands and is exempt from income taxes in that jurisdiction. For the two years ended 31 December 2005, there was no Cayman Islands income or profits tax, withholding tax, capital gains tax, capital transfer tax, estate duty or inheritance tax payable by a Cayman Islands company or its shareholders. The Company has received assurance from the Cayman Islands government under the Tax Concessions Law (1995 Revision) that, in the event that any legislation is enacted in the Cayman Islands imposing tax computed on profits or income, or computed on any capital assets, gain or appreciation, or any tax in the nature of estate duty or inheritance tax, such tax shall not be applicable to the Company or to any of its operations or to the shares, debentures or other obligations of the Company. Therefore, there will be no Cayman Islands tax consequences affecting distributions under present law.
Income taxes have been provided based upon the tax laws and rates in the countries in which the operations are conducted and income is earned. The income tax rates imposed by these taxing authorities may vary substantially. Income for tax purposes may differ from income before taxes for financial accounting purposes, particularly in those tax regimes that are revenue-based. There is no expected relationship between the provision for income taxes and income before income taxes because the countries have different tax regimes which vary not only with respect to the nominal rate, but also in terms of the availability of deductions, credits and other benefits. Variations may also arise because income earned and taxed in any particular country or countries may fluctuate from period to period. Deferred tax assets and liabilities are recognized for the anticipated future tax effects of temporary differences between the financial statement basis and the tax basis of the Company’s assets and liabilities and the operating losses carried forward using the

NOTES TO CONSOLIDATED FINANCIAL STATMENTS
28
applicable tax rates in effect at year-end. A valuation allowance for deferred tax assets is recorded when it is more likely than not that some or all of the benefit from the deferred tax asset will not be realized.
NET EARNINGS, OR NET INCOME, PER COMMON SHARE
The Company reports both basic earnings per common share and diluted earnings per common share. Basic earnings per common share is determined by dividing net income (loss) available to common shareholders by the weighted average number of common shares outstanding during the period. Diluted earnings per common share is determined by using the average market price per common share when applying the treasury stock method to determine the number of common share equivalents which should be added to the weighted average number of shares outstanding. For the Company, diluted earnings per common share is the same as basic earnings per common share since there are no common share equivalents because the Performance Units, which are potentially common share equivalents, are expected to be settled in cash.
RECLASSIFICATIONS
The Company has reclassified certain amounts in the prior period financial statements in order to conform to the current year presentation. Such reclassification had no effect on the Company’s net income (loss), financial position, total shareholders’ equity or cash flows. (3) CASH AND CASH EQUIVALENTS
At 31 December 2005 and 2004, the following securities are recorded at fair value through profit and loss and are classified as trading securities:
(in thousands) 2005 2004
Total cash and cash equivalents $ 63,577 $ 43,653 Less: Restricted cash - noncurrent assets 5,500 5,500 Cash - current assets $ 58,077 $ 38,153
Terms in certain of the Company’s loan and revolving credit facilities require minimum cash balances or the pledge of cash deposits. Minimum cash balances and pledged cash deposits represent a form of security for long-term liabilities and are not available for unrestricted use. Accordingly, these balances are recorded as noncurrent assets. (4) FINANCIAL ASSETS
Financial Assets at Fair Value through Profit or Loss
At 31 December 2005 and 2004, the following securities are recorded at fair value through profit and loss and are classified as trading securities:
(in thousands) 2005 2004
Trading securities: Listed equity securities $ 2,883 $ 20,663 Trading securities, net fair value $ 2,883 $ 20,663
The activity in trading securities during the fiscal years ended 31 December is presented below:
(in thousands) 2005 2004
Trading securities: Balance, 1 January $ 20,663 $ 16,082 Purchases 6,206 3,231 Proceeds from sales (28,230) (10,062) Gains (losses) 5,298 9,855 Currency exchange gains (losses) (1,054) 1,557 Trading securities, 31 December $ 2,883 $ 20,663

NOTES TO CONSOLIDATED FINANCIAL STATEMENTS
29
Available-for-Sale Financial Assets
At 31 December 2005 and 2004, the following securities are recorded at fair value with changes recorded as a separate component of equity and are classified as available-for-sale financial assets:
No. of Shares (in thousands, except for no. of shares) 2005 2005 2004
Available-for-sale securities: Listed equity security - Transocean 1,423,720 $ 9,247 $ 9,247 Net cost of available-for-sale securities 9,247 9,247 Net unrealized appreciation on available-for-sale securities 89,972 51,105 Available-for-sale securities, net fair value $ 99,219 $ 60,352
Transocean — The Company’s investment in Transocean Inc. (NYSE Symbol: RIG) originated in 1994 as an investment in an offshore rig owner and operator that, through a series of mergers, has evolved into a shareholding in present-day Transocean.
The fair value of listed securities is estimated using quoted market prices of these or similar investments when available.
Notes, Loans and Other Receivables
At 31 December 2005 and 2004, the following notes, loans and other receivables are recorded:
(in thousands) 2005 2004
Available-for-sale securities: Listed security, non-performing senior notes, 8.875% fixed interest rate $ — $ 5,022 Held-to-maturity securities: Listed security – Subsea 7 8% Convertible Bond Loan 20,767 37,193 Unlisted securities: Notes receivable, interest rates ranging from 6.75% p.a. to 12.0% p.a. 5,715 8,205 Available-for-sale and held-to-maturity securities $ 26,482 $ 50,420
Notes, Loans and Other Receivables: Current $ 20,767 $ 9,903 Noncurrent $ 5,715 $ 40,517
The activity in notes, loans and other receivables during the fiscal years ended 31 December is presented below:
(in thousands) 2005 2004
Notes, loans and other receivables: Balance, 1 January $ 50,420 $ 35,235 Additions 8,176 18,314 Deconsolidation of Subsea 7 and presentation of convertible bond loan — 37,193 Proceeds from maturities, repayments and sales (31,811) (52,299) Gains (losses), net 3,165 15,598 Impairments — (4,166) Currency exchange gains (losses) (3,468) 545 Notes, loans and other receivables, 31 December $ 26,482 $ 50,420
Subsea 7 (formerly, DSND) 8% Convertible Bond Loan (or, “Subsea 7 Bonds”) — In late October 2002, Subsea 7 announced a financial restructuring plan to refinance its short-term obligations. One component of the plan was the issuance of bonds in the amount of NOK300,000,000 with the bonds bearing interest at 8% p.a., maturity in three years and conversion into new shares at the rate of NOK20 per share. The Company acquired NOK219,610,000 of Subsea 7 Bonds at closing of the issue in January 2003 and an additional NOK5,520,000 in December 2003.

NOTES TO CONSOLIDATED FINANCIAL STATMENTS
30
Prior to the deconsolidation of Subsea 7, the Company’s holdings of Subsea 7 Bonds were eliminated, or offset, against Subsea 7’s obligations under the Subsea 7 Bonds. Following the deconsolidation at the end of 2004, the Company’s investment in Subsea 7 Bonds was presented without elimination.
Subsequent to the spin-off of Siem Offshore by Subsea 7 in August 2005, the conversion rate for the Subsea 7 Bonds was adjusted from NOK20 per share to NOK19.09 per share.
In October 2005, the Company used NOK85,000,000 of Subsea 7 Bonds and $17,000,000 cash to acquire 1,714,500 shares of Company Common Shares which were subsequently retired.
Siem Investments Portfolio —Siem Investments has invested in debt securities, both listed and unlisted securities, that are issued by companies engaged in the shipping, energy services and financial services industries. During periodic evaluations of the portfolio prior to 2004, Siem Investments had identified one of its investments, an investment in senior note obligations issued by a company engaged in the oil and gas industry, as troubled and had recorded impairments of $12,071,000 in aggregate. In June 2004, these senior notes went into default and a joint provisional liquidator was appointed by a committee of note holders. The improving oil and gas industry increased the value of the note issuer’s assets and the market responded by bidding the value of the notes higher. Siem Investments reduced its exposure to this investment by selling some of the notes in June 2004 and completed the exit from this investment by early-November 2004. Proceeds from the sales were greater than the original cost resulting in a complete recovery of the impairments previously recorded and the recognition of additional gains.
In July 2004, Siem Investments acquired notes issued by a company involved in the offshore supply vessel industry. The notes became non-performing and the issuer began to prepare a pre-packaged bankruptcy which provided for the conversion of the notes into newly-issued common shares. The market value of the notes increased as the restructuring of the company progressed. Siem Investments completed the sale of the notes at the end of January 2005 and recorded a gain on this investment.
The net recorded value of the notes, loans and other similar receivables approximates the fair value of such notes at 31 December 2005. (5) INVESTMENTS IN UNCONSOLIDATED AFFILIATES
A summary of the equity in net income (losses) of and the investments in unconsolidated affiliates as of and for the years ended 31 December is presented below:
Summary of Unconsolidated Affiliates (in thousands) Percentage Equity in Year Ended Affiliate Ownership Net Income (Loss) Investments in
31 December 2005 Subsea 7 41.8% $ 17,829 $ 160,135 Siem Offshore (3) 44.8% (919) 22,266 Siem Capital 64.0% (2,437) 1,213 Deusa 49.0% (1,256) 5,493 $ 13,217 $ 189,107
31 December 2004 Subsea 7 (1) 44.8% $ — $ 160,598 Subsea 7 Holding (2) 50.0% (4,606) — Overseas Drilling Ltd. 50.0% 7,616 — Siem Capital 64.0% 8,205 26,223 Deusa 49.0% 512 6,749 Other 350 —
$ 12,077 $ 193,570
(1) Subsea 7 Inc. was Siem Offshore Inc. prior to its name change in July 2005. (2) Subsea 7 Holding Inc. was Subsea 7 Inc. prior to its name change in July 2005 and is currently a wholly-owned
subsidiary of Subsea 7 Inc.

NOTES TO CONSOLIDATED FINANCIAL STATEMENTS
31
(3) Subsea 7 Inc. transferred all of its non-subsea assets and activities into Siem Supply Inc., a wholly-owned subsidiary, which was renamed Siem Offshore Inc. in July 2005. The new Siem Offshore was spun-off as a separate company by Subsea 7 in August 2005.
Siem Offshore and Subsea 7 — All references to companies in the following discussion will use the new names adopted at the respective annual general meetings held for the respective companies in July 2005.
In November and December 2004, Subsea 7 conducted two private placements and sold a total of 49,300,000 newly-issued shares, primarily for the purpose of financing the acquisition of Halliburton Co.’s 50%-interest in Subsea 7 Holding. The Company did not participate in the offerings and its interest was reduced to 44.8%. Following the loss of control, the Company retained the ability to exercise significant influence. Accordingly, the Company determined that the facts and circumstances related to the loss of control no longer required the Company to include Subsea 7’s financial statements within its consolidated financial statements and that the investment in Subsea 7 be reflected under the equity method of accounting. Since the loss of control was not deemed to occur until the end of 2004, Subsea 7’s results of operations for the full year have been recorded in the Company’s consolidated operations, including the equity income (loss) recorded by Subsea 7 on its investments accounted for under the equity method of accounting.
In early-January 2005, Subsea 7 formally completed the acquisition of the 50%-interest in Subsea 7 Holding that was held by Halliburton Company at a price of $203,000,000 using the proceeds from the December 2004 private placement of approximately $160,000,000, the excess funds arising from the restructuring of its loan facility which generated approximately $33,000,000 and available cash. In mid-January 2005, Subsea 7 issued 2,458,549 new shares in connection with an offering that was conducted to provide Subsea 7 shareholders, who were shareholders of record as of 17 November 2004 and who were not invited to participate in the December 2005 placement, to maintain their former shareholder interest relative to other shareholders at such date.
The new shares issued by Subsea 7 pursuant to the private placements and offerings were sold to unaffiliated third parties at prices higher than book value. As a result, the Company’s share of the book value in Subsea 7 increased even though the number of Subsea 7 shares owned by the Company remained constant. The Company accounted for its share of the increase in book value of Subsea 7 shares as an increase in additional paid-in capital.
Following the Company’s deconsolidation of Subsea 7 at the end of 2004, the investments accounted for under the equity method of accounting by Subsea 7 were no longer separately presented but the results from such investment are included in the equity in the income from Subsea 7. The most significant of these investments were Subsea 7 Holding and Overseas Drilling.
In June 2005, Subsea 7 determined that it would segregate its subsea assets and activities from its non-subsea assets and activities. The non-subsea assets and activities were transferred to Siem Supply Inc., a wholly-owned subsidiary of Subsea 7.
At an Extraordinary General Meeting of Subsea 7 held in August 2005, the shareholders approved the spin-off of Siem Offshore. This spin-off, considered effective 30 June 2005 for accounting purposes, was carried out as the payment of a dividend in specie when Subsea 7 distributed all of the shares of Siem Offshore to its shareholders by the issuance of one share of Siem Offshore for each share of Subsea 7 held by the shareholders. Following the distribution, the shares of Siem Offshore were listed on the Oslo Stock Exchange. As a result of the distribution, the Company owned 58,349,653 shares of Siem Offshore, or 43.3%. During the period from the time that it became a separate-listed company to the end of fiscal 2005, Siem Offshore purchased and retired 4,642,000 of its own shares and the Company’s ownership interest increased to 44.8%.
The investment in Subsea 7 includes goodwill of approximately $32,126,000. This goodwill was recorded in November 2002 following the conclusion of the Company’s mandatory offer to Subsea 7 shareholders to purchase their holdings in Subsea 7 shares. The Company’s ownership interest significantly increased at the time and the Subsea 7 financial statements were consolidated within the Company’s consolidated financial statements. As a result of the deconsolidation, the goodwill is no longer separately reported but is included in investments in affiliates. There has been no impairment of the goodwill.

NOTES TO CONSOLIDATED FINANCIAL STATMENTS
32
Overseas Drilling Ltd. — Overseas Drilling is a single-purpose joint venture that owns the vessel, Joides Resolution. The vessel was contracted to the Ocean Drilling Program through January 2006.
Siem Capital — The Company acquired a 50% voting interest and a 64% interest in share capital in Siem Capital in February 1998. The remaining 50% voting interest and 36% share capital interest is held by the other, nonaffiliated owner of Siem Capital. Terms of the agreement provide that the Company will receive the initial proceeds from the sale of Siem Capital’s investments for the purpose of reducing its investment in share capital until such time that both parties hold a 50% interest; thereafter, the proceeds from additional sales will be split evenly.
In April 2005, Siem Capital made a dividend distribution of SEK123,500,000, or approximately $17,320,000, to the Company. In December 2005, Siem Capital made a second dividend distribution of approximately SEK10,000,000. The Company recorded the distributions as a reduction of the investment in Siem Capital.
Siem Capital’s ownership interests in its various investee companies range between 12% and 40% with only two exceptions that are considered to be immaterial. (6) VESSELS, PROPERTY AND EQUIPMENT
Summaries of the vessels and related shipping assets and property, equipment and other at 31 December are presented below:
2005 2004 Vessels and Property, Equipment Vessels and Property, Equipment (in thousands) Related Assets and Other Related Assets and Other
Cost: Balance, 1 January $ 293,459 $ 7,369 $ 304,514 $ 8,382 Additions 131,035 30 19,379 68 Disposals (17,350) (101) (30,434) (921) Translation adjustment — (718) — — Cost, 31 December 407,144 6,580 293,459 7,529
Less: Accumulated depreciation: Balance, 1 January $ 38,713 $ 72 $ 38,154 $ 696 Depreciation, see Note 14 12,657 220 10,603 307 Disposals (616) — (10,044) (771) Accum. depreciation, 31 December 50,754 292 38,713 232 Net book value, 31 December $ 356,390 $ 6,288 $ 254,746 $ 7,297Property, equipment and other, net 6,288 7,297 Deferred drydocking costs, see Note 7 11,628 5,551 Vessels, property and equipment, net $ 374,306 $ 267,594
STAR — STAR increased the number of owned vessels from 17 at the end of 2004 to 23 at the end of 2005. During 2005, STAR purchased 7 vessels, including 6 Polar-class vessels purchased en bloc, and sold 1 vessel as part of the sale of a wholly-owned subsidiary. During 2004, STAR purchased 1 vessel and sold 2 vessels. Appraisals from two shipbrokers were averaged and indicated that the fair value for the fleet exceeded its book value at the end of 2005 and no impairment is necessary.
Six of the vessels purchased during mid-2005 were on time charter to STAR at the time of the acquisition. Following the purchase, the charters were cancelled. The vessel that was sold in 2005 was taken back by STAR under a bareboat charter that is accounted for as an operating lease.
The increase in the number of owned vessels and reduction of vessels under charter increased the depreciation expense and reduced the charter expense during 2005.

NOTES TO CONSOLIDATED FINANCIAL STATEMENTS
33
(7) DEFERRED DRYDOCKING COSTS
A summary of the drydocking activity for the years ended 31 December is presented below:
Year Ended 31 December (in thousands) 2005 2004
Deferred drydocking costs: Balance, 1 January $ 5,551 $ 5,066 Additions 9,752 3,799 Disposals — (140) Amortization (3,675) (3,174) Deferred drydocking costs, 31 December $ 11,628 $ 5,551
The amortization of deferred drydocking costs is recorded as an operating expense. (8) GOODWILL
The goodwill balance and changes in the carrying amount of goodwill at and for the periods ended 31 December are presented below:
(in thousands) 2005 2004
Goodwill: Balance, 1 January $ — $ 38,665 Impairment of goodwill — (6,154) Other: Deconsolidation of Subsea 7, see Note 5 — (32,126) Other (primarily, translation adjustments) — (385) Goodwill, 31 December $ — $ —
At the end of November 2002, the Company recorded goodwill when it acquired additional shares in Subsea 7 and gained a controlling interest. The Company accounted for the acquisition using the purchase method and included Subsea 7’s financial statements in the consolidated financial statements. The fair value analysis was based on reporting unit cash flows, industry segment ratios and other relevant assumptions. Although the Company believes that its analysis is reasonable, changes in industry conditions, geographic exploration, drilling and production demands and other variables possibly affecting estimated cash flows of the reporting units, comparable financial ratios and anticipated future performance can materially impact future impairment analyses.
During 2004, Subsea 7 performed its periodic review of goodwill and recorded an impairment.
At the end of 2004, the Company deconsolidated the financial statements of Subsea 7 and goodwill is recorded in the investments in affiliates.

NOTES TO CONSOLIDATED FINANCIAL STATMENTS
34
(9) LONG-TERM DEBT
A summary of long-term debt and notes payable, net of unamortized discounts and premiums, at 31 December is presented below:
Interest (in thousands) Rate 2005 2004
$53mm Revolver LIBOR plus 1.25% $ — $ — $30mm Revolver LIBOR plus 0.25% — — $50mm Revolver LIBOR plus 1.125% — — Fortis Bank Facility LIBOR plus range of 1.375% to 1.625% 161,155 92,422 NOK36.5mm Loan 7.45% 4,220 4,855 $75mm Syndicate LIBOR plus range of 0.95% to 1.10% 60,000 75,000 EUR5mm Loan EURIBOR plus 1.15% 5,920 6,783 Other 116 519 231,411 179,579 Unamortized financing fees (825) (519) Long-term debt and notes payable $ 230,586 $ 179,060
Long-term debt and notes payable: Current $ 25,846 $ 11,013 Noncurrent $204,740 $168,047
The scheduled maturities of the face values of the Company’s debt and notes payable for each of the years ended 31 December are presented below:
Years Ended Maturities 31 December (in thousands)
2006 $ 25,846 2007 30,716 2008 39,572 2009 29,774 2010 70,455 2011 and thereafter 34,223 Total $ 230,586
Revolving Credit Facilities — A $53,000,000 revolving credit facility (the “$53mm Revolver”) was made available by DnB NOR Bank ASA from April 1997 until the time that it was terminated in January 2005.
A new $50,000,000 revolving credit facility (the “$50mm Revolver”) was made available to the Company by HSH Nordbank AG. Terms of the $50mm Revolver provide for interest at a rate of LIBOR plus 1.125%, a commitment fee of 0.20% payable quarterly on any undrawn portion of the facility, term period of five years and security in the form of a pledge of listed equity securities. There were no drawdowns under this facility in 2005.
The Company has been the beneficiary of a $30,000,000 revolving credit facility (the “$30mm Revolver”) as made available by Nordea Bank S.A. since August 1998. Terms of the $30mm Revolver provide for interest at LIBOR plus 0.25%, maturity in October 2006 and security in the form of a pledge of listed equity securities. The weighted average interest rates for this revolver were 1.72% for 2004. During 2004, the Company repaid $13,000,000. There were no drawdowns under this facility in 2005 or 2004.
STAR Credit Agreements — In February 2004, STAR refinanced its existing facilities using the proceeds of a new syndicated secured term loan facility led by Fortis Bank for the amount of $127,600,000 (the “Fortis Bank Facility”). Terms of this facility provided for interest rates at LIBOR plus a margin ranging between 1.375% and 1.625%, depending on the leverage. STAR renegotiated the Fortis Bank Facility in December 2004 and secured lower margins on the outstanding amounts. In addition, Fortis Bank agreed to take over the outstanding participations of other banks in the syndicate.

NOTES TO CONSOLIDATED FINANCIAL STATEMENTS
35
In order to finance the acquisition of the 6 Polar-class vessels, the Fortis Bank Facility was increased by $83,000,000 to $161,200,000 and Deutsche Bank joined with Fortis Bank on a 50:50 basis in the lending syndicate. The Fortis Bank Facility is secured by the mortgages on 22 vessels, the assignments of earnings and insurances and the pledging of shares in STAR’s wholly-owned shipowning subsidiary and cash accounts in favor of the lenders. The facility agreement contains restrictive covenants which limit dividend payments and capital expenditures and financial covenants concerning the market value of vessels, minimum liquidity and working capital. STAR was in compliance with all covenants at the end of 2005.
The weighted average interest rates for the STAR credit facilities were 4.3% and 4.1% for 2005 and 2004, respectively. During 2005, STAR incurred additional debt of approximately $83,001,000 and repaid approximately $14,268,000.
Car Carriers Agreement — Car Carriers refinanced its bank obligations in July 2004 using the proceeds of a $75,000,000 term facility provided by Schiffshypothekenbank zu Lubeck AG and Deutsche Bank AG (the “$75mm Syndicate”). Terms provide for interest rates of LIBOR plus a margin ranging between 0.95% to 1.10%, semiannual payments of principal and interest and a balloon payment at maturity in 2011. Security for the $75mm Syndicate is in the form of first mortgages on the three vessels and assignments of earnings and insurances. The underlying agreement contains restrictive covenants which limit the payment of dividends and capital expenditures and financial covenants on the market value of vessels, minimum liquidity and working capital. Car Carriers expects to be in compliance with such covenants throughout 2005.
The weighted average interest rates for the Car Carriers’ credit facilities were approximately 4.37% and 3.87% for 2005 and 2004, respectively. During 2005, STAR prepaid $15,000,000 of debt.
At the time of the refinancing in July 2004, the outstanding balance under the $90mm Syndicate had been reduced to $69,750,000. Car Carriers used the excess funds generated by the refinancing plus available cash on hand to pay a $9,250,000 dividend to its shareholders.
Other Term Loan Agreements — In April 2001, DSND Bygg AS, a Norwegian company established for the express purpose of constructing and owning an office building in Grimstad, Norway, entered into an agreement for a NOK36,500,000 term loan to finance the cost of the building (the “NOK36.5mm Loan”). The terms provide for a 20-year loan period and a fixed rate of interest of 7.45% p.a. with interest and principal payable semiannually. Security for the loan is in the form of a first mortgage on the building and assignments of earnings and insurance.
In September 2004, Siem Investments used a EUR5,000,000- loan (the “EUR5mm Loan”) provided by DVB Bank AG to acquire a 49%-interest in Deusa International GmbH. Terms of the loan agreement provide for interest rates of EURIBOR plus a margin of 1.15%, payments of interest at the end of selected interest periods ranging from 1 to 6 months, and a balloon payment at maturity in September 2008. Security for the EUR5mm Loan is a pledge of the shares held in Deusa.
Taking into consideration the variable rate structure of the Company’s long-term debt, the fair value of long-term debt approximates its carrying value.

NOTES TO CONSOLIDATED FINANCIAL STATMENTS
36
(10) INCOME TAXES
The Company is incorporated in the Cayman Islands and, as such, is not subject to income taxes in that jurisdiction. Income taxes have been provided based upon the tax laws and rates in the countries in which operations are conducted and income is earned. There is no expected relationship between the provision for or benefit from income taxes and income or loss before income taxes because the countries have taxation regimes that vary not only with respect to nominal rate, but also in terms of the availability of deductions, credits and other benefits. Variations also arise because income earned and taxed in any particular country or countries may fluctuate from year to year.
Income Tax Expense (Benefit), in thousands 2005 2004
Current $ 340 $ 142 Deferred (8) (8) Income tax expense (benefit) $ 332 $ 134
The Company records equity in the income (losses) of unconsolidated affiliates net of the income tax expense incurred by the affiliate. In their respective income statements for 2005, Subsea 7 recorded income before income taxes of $89,891,000 and related income tax expense of $44,687,000 and Siem Offshore recorded losses before income taxes of $(1,160,000) and related income tax expense of $898,000.
Deferred Tax Liabilities (Assets), in thousands 2005 2004
Deferred tax liabilities: Fixed assets $ — $ 596 Deferred capital gains 123 406 Drydock and other assets 276 157 Deferred tax liabilities 399 1,159
Deferred tax assets: Provisions and accruals $ (48) $ (58) Fixed assets (240) — Net operating loss carryforwards (25,777) (37,347) Deferred tax assets (26,065) (37,405) Net deferred tax liabilities (assets) (25,666) (36,246)Valuation allowance 25,682 36,272 Net deferred tax liabilities (assets) $ 16 $ 26
Deferred taxes are recorded to recognize temporary differences existing between the tax bases of assets or liabilities and their reported amounts in the financial statements using the applicable tax rates in effect at year-end. The tax effect of temporary differences are recorded as deferred tax assets or deferred tax liabilities. Deferred tax assets generally represent items that can be used as a tax deduction or credit in future years. Deferred tax liabilities generally represent items that have been taken as a tax deduction but have not yet been recorded in the statement of operations. Valuation allowances have been provided to offset deferred tax assets on net operating losses incurred during the year in certain jurisdictions where, in the opinion of management, it is more likely than not that the financial statement benefits will not be realized.
A significant portion of the income tax detail presented in the tables above are attributed to STAR. With respect to STAR, tax losses in Norway can be carried forward indefinitely.
As indicated above, the Company is not subject to income taxes in the Cayman Islands. Further, for the 3 years ended 31 December 2005, there was no Cayman Islands income or profits taxes, withholding taxes, capital gains taxes, capital transfer taxes, estate duties or inheritance taxes payable by a Cayman Islands company or its shareholders. The Company has received assurances from the Cayman Islands government that, in the event that any legislation is enacted in the Cayman Islands imposing taxes on profit or income, taxes on capital assets, either gain or appreciation, or any taxes in the nature of estate duties or inheritance taxes, such tax shall not be applicable to the Company or to any of its operations or to the shares or other obligations of the Company. Consequently, under present law, there will be no Cayman Islands tax consequences affecting distributions.

NOTES TO CONSOLIDATED FINANCIAL STATEMENTS
37
(11) OPERATING REVENUES AND EXPENSES
Operating revenues consist of freight revenues on a time charter basis from voyage charters, time and bareboat charters, pool arrangements and property rentals are presented below for the years ended 31 December:
Year Ended 31 December (in thousands) 2005 2004
Operating revenues: Net time charter revenues $ 172,804 $ 175,369 Other 540 667 Operating revenues $ 173,344 $ 176,036
Ship operating expenses are a component of operating expenses and include crew payroll, spares parts, maintenance and repair, lube oil and consumables, and other related expenses. Operating expenses for the years ended 31 December are presented below:
Year Ended 31 December (in thousands) 2005 2004
Operating expenses: Ship operating expenses $ 42,795 $ 38,906 Insurance 3,809 3,782 Time charter expenses 46,197 54,767 Bareboat charter expenses 9,721 9,274 Drydock amortization, see Note 7 3,675 3,174 Subsea 7’s operating expenses (1) — 17,056 Operating expenses $ 106,197 $ 126,959
(1) Subsea 7’s operating expenses for fiscal year 2004 were included in the consolidated financial statements prior to its deconsolidation at the end of 2004. Details are not available and the amount is therefore shown as a single line item.
The net time charter revenues earned and operating expenses incurred by Subsea 7 for fiscal 2004 have been included in the consolidated financial statements up to the time of its deconsolidation at the end of 2004. (12) OPERATING LEASES
Charter-hire payments to third parties for certain contracted-in vessels are accounted for as operating leases. The future minimum rental payments under the Company’s non-cancelable operating leases are presented below:
Years Ended Minimum Lease Payments 31 December (in thousands)
2006 $ 40,885 2007 37,195 2008 41,520 2009 38,796 20010 34,505 2011 and thereafter 138,676 Total $ 331,577
The net present value of the minimum lease payments is $248,602,000 using a 6% discount rate.

NOTES TO CONSOLIDATED FINANCIAL STATMENTS
38
(13) GAINS (LOSSES) FROM INVESTMENTS AND SALES OF PROPERTY AND EQUIPMENT
A summary of the net gains (losses) related to the Company’s investments and the sales of property and equipment for the years ended 31 December is presented below:
Year Ended 31 December (in thousands) 2005 2004
Gains (losses), net: Financial assets at fair value through profit or loss, see Note 4 $ 5,298 $ 9,855 Available-for-Sale - Notes, loans and other receivables, see Note 4 879 15,598 Impairments/write-offs, see Note 4 — (4,166) Recovery of previous write-off 2,286 — Write-off accrued interest income on nonperforming loan — (1,696) Property, plant and equipment 2,045 5,057 Other — 57 Gains (losses), net $ 10,508 $ 24,705
(14) DEPRECIATION AND AMORTIZATION
A summary of the depreciation and amortization for the years ended 31 December is presented below:
Year Ended 31 December (in thousands) 2005 2004
Depreciation and amortization: Depreciation, see Note 6 $ 12,877 $ 10,910 Depreciation, Subsea 7 — 2,051 Amortization, other 385 2,313 Depreciation and amortization $ 13,262 $ 15,274
The depreciation expense incurred by Subsea 7 prior to the time of its deconsolidation is reflected in the amounts for 2004. (15) PERFORMANCE UNIT PLAN AND STOCK OPTION PLANS
A summary of the performance unit awards which have been granted and are currently outstanding is presented below:
Name
No. of Performance Units Awarded and Outstanding Granted May 1995 Granted May 1996 Granted June 2005 at $3.00 per Unit at $5.50 per Unit at $48.21 per Unit
Kristian Siem M.D. Moross Barry W. Ridings Michael Delouche Others
400,000 60,000 115,000 — 28,000 7,000 28,000 — 7,000 40,000 20,000 10,000 — — 50,000
Performance units have been awarded pursuant to provisions of the Company's 1987 Performance Unit Plan (the “1987 Plan”) and 2005 Performance Unit Plan (the “2005 Plan”), as amended, by the Compensation Committee of the Board of Directors.
The 1987 Plan provides that performance units shall be granted at a value no less than 110% of the average closing market price of the Company's Common Shares for the 20 trading days preceding the date of the award. The performance unit value of the grant, which is determined by multiplying the number of performance units by the value per performance unit, is credited to the individual's performance unit account on the date of the award. Grants of awards vest over a five-year award periods at 20% per year; however, all rights to the performance unit account are forfeited if the individual's employment ceases before the end of the award period with certain reasonable exceptions including the death, total disability or retirement after age 60 of the individual.

NOTES TO CONSOLIDATED FINANCIAL STATEMENTS
39
Under the 1987 Plan, the amount of payment to the individual after the end of the award period is equal to the number of vested performance units multiplied by the difference between the average closing market price of the Common Shares and the value of the performance units awarded. The Company has the option to make the payment in either cash or Common Shares; however, it is the Company’s intention to make cash payments.
The 1987 Plan will expire on the earlier of the vesting of an aggregate 1,600,000 performance units by the participants or January 2007.
In October 2004, the Board of Directors commenced a review of the 1987 Plan to determine whether the termination date should be extended, whether a new plan of s similar type should be implemented or whether a new long-term incentive program should be devised. The primary concerns with respect to the 1987 Plan include the absence of a listing on a stock exchange and the low liquidity of the shares. In February 2005, the 2005 Plan was completed with many provisions similar to that in the 1987 Plan. The 2005 Plan provides that performance units shall be granted at a value no less than 110% of the net asset value per Common Share based on the balance sheets prepared by the Company on a quarterly basis in accordance with applicable law and prevailing generally accepted accounting principles. Net asset value for purposes of the 2005 Plan means the amount that is determined after adjustments have been made to the balance sheet to reflect the market values for the Company’s investments in securities issued by publicly-traded companies for which market prices are readily available. This approach was used because it corresponds to methods used in similar situations where low liquidity or illiquid shares exist. The performance unit value of the grant, which is determined by multiplying the number of performance units by the value per performance unit, is credited to the individual's performance unit account on the date of the award. Grants of awards vest over a five-year award periods at 20% per year; however, all rights to the performance unit account are forfeited if the individual's employment ceases before the end of the award period with certain reasonable exceptions including the death, total disability or retirement after age 60 of the individual. The Company may elect to make payments in either cash or Common Shares. If the Company makes payment in Common Shares and there is no liquid market for such shares, then the Company is obligated either to provide a market for the Common Shares within 9 months of the new share issue or to redeem or purchase the Common Shares for the cash amount that would have been paid had the original payment been made in cash.
The 2005 Plan will expire on the earlier of the vesting of an aggregate 1,000,000 performance units by the participants or 31 December 2014, which is the end of a 10-year period from the effective date of agreement.
At the end of June 2005, the Compensation Committee granted 196,000 Performance Units at $48.21 per unit.
The Company records compensation expense with respect to the Plan. This expense is determined using the number of units which have vested and the closing market price of Common Shares at the end of the reporting period. The Company recorded compensation expense, a component of general and administrative expenses, in the amounts of $13,180,000 and $4,619,000 for fiscal years 2005 and 2004, respectively. The obligation is recorded in other liabilities and deferred credits.
An aggregate 274,200 units granted under the 1987 Plan have been forfeited since being awarded in 1995 and 1996 and 7,000 units granted under the 2005 Plan have been forfeited.

NOTES TO CONSOLIDATED FINANCIAL STATMENTS
40
STAR Option Program — In 2001, STAR launched a stock option program as part of its long-term incentive plan. Options granted in 2001 vested 50% in February 2003 and 50% in February 2005. Options granted in 2004 vested 50% after release of preliminary results for 2004 and 50% after release of preliminary results for 2005. Vested options expire in November 2006.
Option Share Program Granted May 2001 Granted November 2001 Granted July 2004 at $6.60 Strike Price at $7.20 Strike Price at NOK84 Strike Price
Balance, 1 January 2004 New options granted Options exercised Options cancelled
150,000 100,000 — — — 130,000 (32,000) (67,000) — (21,500) — —
Balance, 31 December 2004 Options exercised Options cancelled
106,500 33,000 130,000 (106,500) (33,000) (39,500) — — (12,500)
Balance, 31 December 2005 — — 78,000
The fair value of the separate options at date of grant has been calculated using the Black-Scholes option-pricing model and the option value expensed over the vesting period of the options.
STAR’s share price at 31 December 2005 was NOK149. (16) PENSION PLANS
STAR maintains a defined benefit pension plan that covers employees in its Norwegian office. The individuals covered by this plan included 9 employees and 6 retirees at the end of 2004 and 12 employees and 6 retirees at the end of 2003. Siem Offshore also maintains a defined benefit plan for its Norwegian office. Details of Siem Offshore’s plan are excluded from the 2004 presentation since the investment in Siem Offshore is accounted for under the equity method of accounting rather than included in consolidation effective at the end of 2004; however, Siem Offshore’s plan covered 8 employees and 10 retirees at the end of 2003. Benefits under the defined benefit pension plan are based primarily upon the participant’s years of service and compensation at time of retirement (in thousands):
Weighted Average Assumptions 2005 2004
Discount rate 5.00% 5.00% Expected return on funds 6.00% 6.00% Expected increase in salaries 3.00% 3.00% Expected pension regulation 2.50% 2.50% Expected G-regulation/inflation 3.00% 3.00% Social security tax 14.10% 14.10%
Components of Periodic Benefit Cost 2005 2004
Service cost $ 74 $ 85 Interest cost 53 55 Return on plan assets (83) (88) Social security tax — — Recognized actuarial gains (losses) — — Net periodic benefit cost $ 44 $ 52
Status of Plan Funding 2005 2004
Expected value of pension funds $ 1,403 $ 1,503 Estimated pension benefit obligation (1,065) (1,197) Pension funds (obligations) $ 338 $ 306 Unrecognized actuarial gains (losses) (109) 3 Social security tax — — Net pension funds (obligations) $ 229 $ 309

NOTES TO CONSOLIDATED FINANCIAL STATEMENTS
41
In prior years, STAR prepaid pension premiums for tax purposes. The overfunding is recorded in other assets because the excess amounts can be released to cover future premiums.
STAR Reefers UK maintains a defined contribution plan for its employees. Under this plan, STAR London contributes a fixed percentage of the employee’s base salary. The percentage is dependent on the number of years employed and the level of position within the company. Contributions are recorded as general and administrative expenses when incurred and were approximately $261,000 and $240,000 for 2005 and 2004, respectively.
Certain information concerning pension assets and benefit obligations related to foreign subsidiaries has not been presented since the information is not readily available and is immaterial. (17) COMMITMENTS AND CONTINGENCIES
The Company or any of its subsidiaries or affiliates may become involved in various legal proceedings during the ordinary course of business. It is the Company’s policy to accrue for amounts related to these legal matters if it is probable that a liability has been incurred and an amount can be reasonably estimated. The Company is not aware of any litigation which, in the opinion of management, is likely to have a material adverse effect on the Company's financial position, results of operations or cashflows other than as discussed.
Deusa received a grant in the amount of EUR4,823,000 from the local government entity, Thüringer Aufbaubank (“TAB”), with the proceeds to be used for the development and expansion of Deusa’s operations. Under certain conditions such as the termination of Deusa’s operations, the grant becomes revocable and must be repaid by Deusa. Siem Investments has agreed to guarantee repayment of this obligation in the event that the grant is revoked and Deusa is unable to pay its liability. The amount of the grant that is subject to repayment declines over the course of a 5-year period.
During 2005, Deusa entered into contracts for the construction of a thermolysis plant which will become operational at the end of 2006 with full operation planned during the first quarter of 2006. The thermolysis plant will receive municipal wastes of a specified content and grade and incinerate these wastes at very high temperatures. The thermolysis process will cause the release of gases which can be used in the potash mining operations and in a power plant for the generation of electricity. The thermolysis plant will provide power, a major cost component in the potash mining operations, to Deusa at a consistent level and determinable price, thus reducing Deusa’s exposure to volatile energy prices. Furthermore, the suppliers of the municipal waste streams pay Deusa for the disposal of wastes.
The cost of the thermolysis plant is approximately EUR20,000,000-. After preliminary discussions with banks concerning the financing of the plant construction, the Company’s subsidiary, Siem Investments, offered to provide project-financing to Deusa until the operational risks associated with this plant have been reduced and improved terms of a bank financing can be obtained. At 31 December 2005, the amount of project-financing provided to Deusa for the thermolysis plant construction was EUR3,300,000. The loans to Deusa are recorded as held-to-maturity securities in notes, loans and other receivables.
Following the sale of its interest in Albion Reefers Ltd. to STAR in July 2001, the seller retained an obligation arising from its guarantees of certain charter rates to the owner of four vessels that were chartered to Albion Reefers. The guarantee is a secondary guarantee that may be called upon if STAR is unable to make the charter payments. In November 2002, the Company agreed to assume the secondary guarantee in exchange for a payment of $3,850,000. In connection with this assumption, STAR and the Company negotiated an extension of the charter terms at lower rates. The guarantees extended through 2009 for two of the vessels and through 2010 for the other two vessels. At the time of the assumption by the Company, the maximum amount of the guarantee was $27,000,000 with quarterly reductions in the guarantees made at $187,500 per vessel. The $3,850,000 amount paid to the Company for the assumption was recorded as a deferred credit with the intent that no portion will be recognized as income until it becomes probable that no losses will be sustained in connection with the guarantee. Two of the vessels subject to this guarantee have been purchased by STAR and the underlying charters cancelled. As a result of the elimination of exposure on 2 of the 4 vessels, the Company recorded $1,925,000 of the deferred credit as income in 2003. The remaining $1,925,000 deferred credit is recorded in other liabilities and deferred credits.

NOTES TO CONSOLIDATED FINANCIAL STATMENTS
42
In 1990, insurance underwriters paid $3,000,000 to an affiliate of the Company pursuant to a claim submitted by the Company following the termination of a memorandum of agreement for the sale of a vessel. Subsequent to their payment, the underwriters began to dispute the validity of the claim. The Company’s defense and contention was that there was no basis for a dispute since all parties, including the underwriters who had their own surveyors aboard the vessel, the shipmanagement company and two law firms who advised on the actions, were aware or should have been aware of the facts and circumstances prior to the acceptance and payment of the claim. After a period of several years during which time there was little activity, the issue was revived by attorneys for the insurance underwriters and claims were pursued against the Company and directors for the affiliate. After two judgments were delivered in favor of the Company, the underwriters’ claim against the Company was dismissed by the Norwegian Supreme Court in 2004. The claim against the directors, for which the Company had provided an indemnity, continued and, in December 2005, the Oslo District Court ruled in favor of the underwriters. The court concluded that the directors had permitted the affiliate to reduce its capital without setting aside a reserve for claims and found the directors liable for $4,200,000 plus interests and court costs. The judgment was appealed on the basis that the reduction of capital was made because the directors for the affiliate did not believe there were any claims existing at the time of the reduction that could be successfully asserted against the affiliate and thus require a reserve.
In March 2006, a preliminary agreement was reached for the payment of $3,500,000 inclusive of interests and costs for the settlement and release of any and all claims by all parties to this action.
Following the December 2005 ruling, the Company recorded a provision of $4,700,000 at the end of 2005. Total reserves for settlement, litigation and other proceedings at 31 December 2005 was $5,700,000, which included a $1,000,000 provision established at the end of 2004. The reserve is recorded in other accrued costs and short-term liabilities and the related provisions are recorded as general and administrative expenses. (18) CURRENCY EXCHANGE GAINS (LOSSES)
A summary of the components of currency exchange gains (losses) for the years ended 31 December is presented below:
Year Ended 31 December (in thousands) 2005 2004
Currency exchange gains (losses): Financial assets at fair value through profit and loss, see Note 4 $ (1,054) $ 1,557 Notes, loans and other receivables, see Note 4 (3,468) 545 Cash and cash equivalents, adjusted using period-ending exchange rates (2,505) 378 Forward currency contracts not deemed to be hedges 1,127 (2,036) Intercompany notes and other receivables (4,232) 2,728 EUR5mm Loan 868 (547) STAR, breakdown not provided (810) (59) Subsea 7, breakdown not provided — 696 Other (258) 145 Currency exchange gains (losses) $ (10,332) $ 3,407
(19) DERIVATIVE INSTRUMENTS AND HEDGING ACTIVITIES
Foreign Exchange Risk — The nature of the operations conducted by the Company exposes the Company to foreign exchange risk. This risk is primarily associated with compensation costs and purchases from suppliers that are denominated in currencies other than the USD. Gains and losses on foreign exchange derivative instruments which qualify as hedges for accounting purposes are deferred and recorded as other comprehensive income and recognized when the underlying foreign exchange exposure is realized. Gains and losses on foreign exchange derivative instruments which do not qualify as hedges for accounting purposes are recognized based on the change in the market value of the derivative instruments.
The Company has on occasion purchased foreign exchange contracts with contracts terms less than six months to protect against the adverse effects of exchange rate fluctuations. These derivatives did not meet the

NOTES TO CONSOLIDATED FINANCIAL STATEMENTS
43
strict guidelines to qualify for hedge accounting and the gains and losses on both the derivatives and the existing foreign currency-denominated assets and liabilities were recorded as currency gains or losses in the statements of operations. With respect to foreign exchange contracts outstanding in 2005 and 2004, the Company recorded aggregate currency gains (losses) of $1,127,000 and $(2,036,000), respectively.
STAR operates in an industry in which a majority of its transactions are denominated in USD, whether such activity involves revenues or operating expenses or assets or liabilities. STAR’s overhead expenses, however, are denominated in either NOK or GBP. During 2005 and 2004, STAR hedged its exchange rate exposure by entering into forward contracts on behalf of its Oslo and London offices.
STAR holds options to purchase vessels that are currently on time charter with the purchase option price subject to adjustment according to the Japanese yen/USD rate of exchange. Management monitors these risks and enters into hedge contracts from time to time to manage the exposure. During 2005, STAR entered into forward contracts to hedge currency fluctuation exposures. The increase (decrease) in the market values of the forward currency contracts outstanding at 31 December is as follows:
(in thousands) Amount 2005 2004
Market value increase (decrease): Sell USD / Buy NOK $ 500 $ (21) $ — Sell USD / Buy Japanese yen $ 10,000 $ (369) $ —
Interest Rate Risk — The Company’s use of debt exposes the Company to interest rate risk. Floating rate debt, in which the interest rate can change from one interest period to the next in periods as short as one month, exposes the Company to short-term changes in market interest rates. Fixed rate debt, in which the interest rate is fixed over the life of the facility, exposes the Company to changes in market interest rates if the Company should decide to refinance maturing debt with new debt.
The Company may, from time to time, use interest rate swap agreements to manage the effect of interest rate changes on future income. These derivatives are used as a hedge of underlying future interest payments and are not used for speculative or trading purposes. The agreements involve the exchange of amounts based on variable interest rates and amounts based on a fixed interest rate over the life of the agreement without an exchange of the notional amount upon which the payments are based. The interest rate differential to be paid or to be received on the swaps is recognized over the lives of the swaps as an adjustment to interest expense.
The major risks in using interest rate derivatives include changes in interest rates that affect the value of such instruments, potential increases in the interest expense of the Company due to market increases in floating interest rates in the case of derivatives which exchange fixed interest rates for floating interest rates and the creditworthiness of the counterparties in such transactions.
STAR’s loans are based on floating interest rates and STAR has therefore entered into swap agreements for a portion of the mortgage debt in order to reduce its exposure to interest rate fluctuations. The increase (decrease) in market values for the swap agreements outstanding at 31 December is as follows:
Principal Amount Expiry (in thousands) Swap Rate Date 2005 2004
$25,000 4.911% July 2006 $ (73) $ (775)
STAR pays the fixed interest rate and receives the floating interest rates based on 3-month LIBOR for the $25,000,000 amount.
STAR wrote two interest rate caps in April 2002 of which one remains outstanding at the end of 2005. The premium received for writing the cap was applied to reduce the fixed interest rate paid under the swaps. The increase (decrease) in market values for the cap agreements outstanding at 31 December is as follows:
Cap Amount Expiry (in thousands) Cap Rate Date 2005 2004
$25,000 6.0% July 2006 $ (6) $ (6)
STAR is obligated under the contracts for all interest over 6% based on 3-month LIBOR.

NOTES TO CONSOLIDATED FINANCIAL STATMENTS
44
The requirements necessary to classify the interest rate swaps and interest rate caps as hedges were not satisfied; consequently, the gains (losses) were recorded in the consolidated statements of operations to reflect the changes in fair, or market, values. Such fair values are determined by estimating the cost of interest rate swaps to offset the outstanding swaps or the cost of reversing the caps.
Bunker Hedging — STAR’s management has been authorized by its board of directors to enter into bunker hedge contracts. There were no such contracts outstanding at the end of 2005 or 2004.
(20) RELATED PARTY TRANSACTIONS
Subsea 7 — Subsea 7 completed its financial restructuring in January 2003 following the issuance of the NOK300,000,000 of Subsea 7 8% Convertible Bond Loan. The Company acquired NOK219,610,000 of the Subsea 7 Bonds at closing and subsequently increased its holdings to NOK225,130,000 after it acquired an additional NOK5,520,000 at par in December 2003. The Company used NOK85,000,000 of the Subsea 7 Bonds and $17,000,000 to purchase and retire 1,714,500 Common Shares from corporate shareholder of the Company. At 31 December 2005, the Company held NOK140,130,000 of Subsea 7 Bonds.
The Company provided a short-term loan of $5,300,000 to Subsea 7 in January 2004 for working capital purposes. Terms of the loan provided for interest at 3% p.a., maturity at end of six months from drawdown and an arrangement fee of 0.5%. The maturity date was extended and the loan was fully repaid at the end of July 2004.
The Company provided a second short-term loan of $3,000,000 to Subsea 7 in October 2004. Terms of the loan provided for interest at 1-month LIBOR plus 2.50% and maturity at the end of December 2004. The loan was repaid in mid-December 2004.
Subsea 7 refinanced its $200,000,000 syndicated loan facility, which had been reduced to $117,000,000, with a new loan of $150,000,000 and a bonding/guarantee facility of $80,000,000. As part of the refinancing, the lender requested that the Company provide a $10,000,000 Letter of Comfort. The Company complied with the request and issued the letter which expired at the end of December 2005. Subsea 7 paid the Company a $25,000 fee as consideration for the letter.
Subsea 7 makes payments to the Company in relation to chairman and director fees and reimbursements for advice on financings and corporate development and expenses for office, travel and communication.
Siem Offshore — Following its spin-off and establishment as a separate, publicly-traded company in August 2005, Siem Offshore commenced payments to the Company in relation to chairman and director fees and reimbursements for advice on financings and corporate development and expenses for office, travel and communication.
STAR — In late December 2003, STAR exercised its option to purchase 100% of the shares of Caribbean Shipping Ltd. owned by the Company. STAR used a combination of cash and a $2,500,000 seller’s credit to satisfy the option price. Terms of the seller’s credit provided for maturity in April 2004, interest rates of 8% p.a. for the period from issuance through January 31, 2004, 10% for the period February 1 to February 29, 2004 and 12% from March 31, 2004 until maturity.
In December 2004, STAR purchased the Regal Star, a 1993-built specialized reefer vessel, for approximately $17,600,000. The Company provided a short-term loan of $7,000,000 to STAR to finance the acquisition. Terms of the loan provided for interest at LIBOR plus 1.375% from drawdown, maturity at the end of March 2005 and an arrangement fee of $15,000. The loan was repaid in early March 2005.
In August 2005, the Company provided a $21,100,000 loan to STAR with the proceeds used to partially finance the acquisition of the 6 Polar-class reefer vessels. Terms of the loan included an interest rate based on 1-month LIBOR plus a 0.85% margin and an arrangement fee of 0.20%. Payments reduced the balance to $6,224,000 at 31 December 2005. The remaining balance was repaid in January 2006.
In September 2005, the Company provided a $12,800,000 short-term credit facility to STAR. Terms of the facility included an interest rate based on 1-month LIBOR plus a 0.75% margin and an arrangement fee of $5,000. Total drawdowns of $12,000,000 were provided under the facility in September 2006 and the outstanding loan was fully repaid in October 2006.

NOTES TO CONSOLIDATED FINANCIAL STATEMENTS
45
STAR makes payments to the Company in relation to chairman and director fees and reimbursements for advice on financings and corporate development and expenses for office, travel and communication.
Car Carriers — In January 2004, the Company provided a short-term loan of $6,800,000 to Car Carriers. The proceeds of the loan were used to make prepayments to eliminate the guarantee provided by the Company. Terms of the loan provided for interest at a rate of 3% p.a. and maturity in July 2005. The loan was repaid in July 2004.
In July 2004, Car Carriers completed the refinancing of the $69,750,000 amount outstanding with a new $75,000,000 facility. Car Carriers combined the excess funds generated by the new facility with available cash to distribute a dividend of $9,250,000 to its shareholders. The Company’s share of the dividend was $8,150,000.
In August 2004, Car Carriers made payments of $15,000 to each of Kristian Siem and the other shareholder in Car Carriers for their roles in the creation of the company in 2002. Kristian Siem assigned his payment to the Company.
Car Carriers reimburses the Company with respect to its advice on then refinancing completed in July 2004 and to its efforts to extend and or secure new charters at the expiration of the current charters. The reimbursement amount for 2004 was approximately $100,000.
Other — A 5-year management service agreement between Kristian Siem and the Company became effective 1 January 2000 (the “2000 MSA”). Terms of the agreement provided that Mr. Siem serve and devote a minimum of 50% of his professional time to the furtherance of the Company’s interests. Under the 2000 MSA, Mr. Siem is paid two levels of compensation: base compensation and additional compensation. The base compensation is $300,000 for each of the first three years and such greater amounts as may thereafter be agreed by Mr. Siem and the Company. The additional compensation is equal to 5% of the net income greater than $2,000,000 during each year of the agreement.
In May 2005, the Compensation Committee approved a new 5-year management service agreement between Kristian Siem and the Company (the “2005 MSA”) to replace the 2000 MSA that expired at the end of 2004. The 2005 MSA became effective 1 January 2005. The terms of the 2005 MSA are similar to the previous agreement with the exception of compensation. The base compensation is now $700,000 and the additional compensation is equal to 5% of the net income greater than $4,000,000 during each year of the agreement.
Total fees incurred by the Company under the management service agreements were $1,842,000 and $2,209,000 for 2005 and 2004, respectively, and are recorded in general and administrative expenses.
The Company’s Chairman holds an option to purchase the property which houses the offices of Siem Kapital AS, a wholly-owned subsidiary, located in Oslo, Norway. The option provides for a one-year option period, which commences on the date that he is no longer an officer or director with the Company or any of its subsidiaries, during which time he can purchase the property at the price paid by Siem Kapital. This option is subject to review by the Compensation Committee.
A summary of receivables and payables with affiliates at 31 December is presented below:
(in thousands) 2005 2004
Due from affiliates: Subsea 7 $ 800 $ — Siem Offshore 100 — Other 523 252 Total due from affiliates $ 1,423 $ 252
Due to affiliates: Kristian Siem $ 1,134 $ 1,980 Total due to affiliates $ 1,134 $ 1,980

NOTES TO CONSOLIDATED FINANCIAL STATMENTS
46
(21) CAPITALIZATION AND CAPITAL ACCOUNTS
The Company purchases Common Shares from time to time from its shareholders who have offered to sell such shares to the Company. In 2004, the Company purchased and retired 400 Common Shares at an average cost of $11.25.
In early January 2005, the Company announced a tender offer to buyback up to 1,000,000 Common Shares. The final expiration date, after a couple of extensions, was 21 March 2005. Upon conclusion of the tender offer, the Company purchased and retired 26,752 Common Shares at a price of $17.50 per Common Share.
In October 2005, a corporate shareholder with a representative on the Company’s Board of Directors offered to exchange its 1,714,500 Common Shares for $17,000,000 and NOK85,000,000 face amount of Subsea 7 8% Convertible Bonds held by the Company. The Company agreed to the exchange and obtained a fair value opinion as required under corporate statues. At closing, the Company received and retired the 1,714,500 Common Shares and received and accepted the tender of resignation from the former corporate shareholder’s representative serving on the Board of Directors.
In December 2005, the Board of Directors declared an extraordinary dividend of $0.07 per Common Share payable on 25 January 2006 to shareholders of record as of 30 December 2005. In December 2004, the Board of Directors declared an extraordinary dividend of $0.07 per Common Share payable on 27 January 2005 to shareholders of record as of 31 December 2004. (22) OTHER RESERVES
The composition of other reserves is provided below:
Other Reserves Currency Available-for-Sale Translation Share-based (in thousands) Securities Adjustment Compensation Total
Balances, 1 January 2004 $ 24,937 $ 11,161 $ — $ 36,098 Unrealized appreciation on available-for-sale securities 26,168 — — 26,168 Currency translation differences — (9,399) — (9,399) Share-based compensation — — 54 54 Balances, 31 December 2004 51,105 1,762 54 52,921 Unrealized appreciation on available-for-sale securities 38,867 — — 38,867 Currency translation differences — 142 — 142 Share-based compensation — — 74 74 Balances, 31 December 2005 $ 89,972 $ 1,904 $ 128 $ 92,004
(23) SUBSEQUENT EVENTS
In January 2006, the Company received 7,340,492 shares of Subsea 7 following conversion of the NOK140,130,000 Subsea 7 Convertible Bond to increase its shareholding to 65,690,145 shares of Subsea 7.
At the end of January 2006, the Company paid approximately $1,054,000 cash to Company shareholders with respect to the dividends declared at the end of 2005 at the rate of $0.07 per Common Share.
In March 2006, the Company purchased 4,410,750 shares of Siem Offshore in the market at an average price of NOK4.20 per share which increased its shareholding to 62,760,403 shares of Siem Offshore.
Also in March 2006, the Company purchased 704,000 shares of Subsea 7 in the market at an average price of NOK81.3226 per share which increased its shareholding to 66,394,145 shares of Subsea 7.

NOTES TO CONSOLIDATED FINANCIAL STATEMENTS
47
In May 2006, Subsea 7 conducted a private placement for $300 million of Convertible Notes due 2011 (the “2011 Convertible Notes”). The 2011 Convertible Notes bear interest at 2.80% p.a. and are convertible into new shares of Subsea 7 at a rate of $26.33 per share.
The Company agreed to support the placement by entering into a securities lending agreement with the underwriter, Lehman Brothers International (Europe). Terms of the agreement provide that the Company will lend up to 9,000,000 shares of its Subsea 7 shareholdings to the underwriter for the duration of the 2011 Convertible Notes, that the Subsea 7 shares or their equivalent will be returned to the Company at the conclusion of the convertible note facility and that the Company is permitted, in certain circumstances where the Company desires to vote these shares, to request redelivery of the shares. The Company will receive a fee, payable monthly in arrears, that is equal to of 0.50% p.a. of the average daily market value of the securities.
At the end of May 2006, the Company concluded a settlement and release agreement, involving an action originating in 1990, by the payment of $3,500,000.
Through the end of May 2006, the Company’s subsidiary, Siem Investments, had loaned an additional EUR7,593,000 to Deusa for the project financing of the thermolysis plant.

TRANSITION FROM US GAAP TO IFRS Reconciliation of Consolidated Income Statement and Balance Sheets from US GAAP to IFRS
48
Effect of Transition (Dollars in thousands) Notes to IFRS Reclassifications
REVENUES:Operating revenues 1 $ 171,299 4,737 $ 176,036Interest income 3,806 3,806Gains (losses), net 4 24,877 (172) 24,705Equity in income (loss) of unconsolidated affiliates 2 16,089 (4,012) 12,077Other income 2,427 (126) 2,301 Total revenues and other income 218,498 (4,184) 4,611 218,925
OTHER EXPENSES:Operating expenses 1,3 (130,825) 1,673 2,193 (126,959)Depreciation and amortization 4 (15,931) 657 (15,274)Impairment of goodwill 5 (6,744) 590 (6,154)Interest expense 6 (8,665) (2,227) (10,892)General and administrative expenses 1 (14,391) (46) (6,897) (21,334)Currency exchange gains (losses), net 3,319 (5) 93 3,407Other (968) 57 (911)
Total other expenses (174,205) 699 (4,611) (178,117)
Income before income tax expense 44,293 (3,485) 0 40,808Income tax expense (134) (134)
Net income 44,159 (3,485) 0 40,674Minority interest expense 7 (3,980) 819 (3,161)
Net income attributed to Common Shares $ 40,179 (2,666) 0 $ 37,513
ASSETS:Cash and cash equivalents $ 38,153 $ 38,153Accounts receivable, other 6,705 6,705Accrued interest receivable 3,031 3,031Trading securitites 20,663 20,663Inventories 3,210 3,210Notes, loans and other receivables 9,903 9,903Due from affiliates 252 252Prepaid expenses and other current assets 6,779 6,779
Total current assets 88,696 0 0 88,696Restricted cash 5,500 5,500Notes, loans and other receivables 40,517 40,517Available-for-sale financial assets 60,352 60,352Investments in unconsolidated affiliates 8 210,815 (17,245) 193,570Vessels, property and equipment, net 3,4 261,397 6,197 267,594Goodwill 9 2,446 (524) (1,922) 0Other assets 9 1,198 (248) 1,922 2,872
Total Assets $ 670,921 (11,820) 0 $ 659,101
LIABILITIES AND EQUITY:Accounts payable $ 12,489 $ 12,489Income taxes payable 12 12Accrued interest payable 12 1,290 92 1,382Due to affiliates 1,980 1,980Current maturities and short-term notes 11,013 11,013Other accrued costs and short-term liabilities 11,828 11,828
Total current liabilities 38,612 92 0 38,704Long-term debt and notes payable 168,047 168,047Deferred income taxes 26 26Other liabilities and deferred credits 10,294 10,294
216,979 92 0 217,071Shareholders' equity:
Common shares 4,198 4,198Paid-in capital 8 75,451 (15,441) 60,010Retained earnings 293,975 2,106 0 296,081Other reserves 52,866 55 52,921
Total shareholders' equity 426,490 (13,280) 0 413,210Minority interest 7 27,452 1,368 28,820
Total Equity 453,942 (11,912) 0 442,030Total Liabilities and Equity $ 670,921 (11,820) 0 $ 659,101
For Year Ended 31 December 2004
US GAAP IFRS

TRANSITION FROM US GAAP TO IFRS Reconciliation of 31 December 2003/1 January 2004 Shareholders’ Equity from US GAAP to IFRS
49
Available- CurrencyShare Paid-in Retained for-Sale Translation Share-Based
(in thousands, except number of shares) Notes Capital Capital Earnings Securities Adjustment Compensation
Balances at 31 December 2003, US GAAP $ 4,198 $ 12,578 $ 254,976 $ 24,937 $ 11,161 $ — Deferral of previously expensed drydocking costs 3 6,324Decompose drydocking from vessel costs
and revise salvage value 3 (1,414)Share-based compensation 10 (46)Pension obligation and funds 11 (471)Financial statements marked-to-market 5Remeasurement of convertible bond liability 6 (2,127)Remeasurement of capitalized borrowing costs 12 62Reversal of NGAAP to USGAAP reconciliation 2 4,126Minority interests 7 (1,687)
Balances at 1 January 2004, IFRS 4,198 12,578 259,748 24,937 11,161 — Share-based compensation 54Reacquisition and
retirement of stock (4)Cash dividends ($0.07 per share) (1,176)Net income attributed to Common Shares 37,513Adjustments for issuance of shares
by subsidiary to minority interests at prices greater than book value 47,432
Unrealized appreciation on available-for-sale securities 26,168
Currency translation adjustments (9,399)Balances at 31 December 2004, IFRS $ 4,198 $ 60,010 $ 296,081 $ 51,105 $ 1,762 $ 54
RECONCILIATION OF THE INCOME STATEMENT AND BALANCE SHEET FROM US GAAP TO IFRS
GENERAL
The consolidated financial statements for the Company for fiscal years up to and including 2004 were prepared in accordance with accounting principles generally accepted in the United States (US GAAP). Commencing in 2005, the consolidated financial statements have been prepared in accordance with International Financial Reporting Standards (IFRS). Several of the Company’s major investments are companies listed on exchanges in the European Union and were required to adopt IFRS with effect 1 January 2005. After consideration, it was determined that the Company should adopt IFRS to establish consistency and standardize the accounting principles and practices used across Group companies and to alleviate the problems associated with the consolidation of the Company’s subsidiaries where the individual subsidiaries used their own countries’ accounting principles in the preparation of their respective financial statements.
Following the transition to IFRS, it is necessary for the Company to present the reconciliation of the consolidated income statement and balance sheet from US GAAP to IFRS for the year ended 31 December 2004 and to present the reconciliation of the opening balances of shareholders’ equity from US GAAP to IFRS at 1 January 2004.
The presentation of the reconciliation from US GAAP to IFRS includes the reversals of prior years’ adjustments that were made to a subsidiary’s financial statements to reconcile those financial statements from non-US GAAP to US GAAP and the recording of adjustments necessary to reconcile the financial statements from their original GAAP to IFRS.
NOTES
1. STAR reclassed overhead expenses relating to its ship pool operations from voyage expenses, which are netted against vessel revenues, to general and administrative expenses. In addition, STAR reclassed external management fees from ship operating expenses to general and administrative expenses.
2. One of Subsea 7’s subsidiaries recorded an impairment for fiscal 2003 after Subsea 7 had already released its annual report. This created a timing difference because the Company recorded Subsea 7’s 50%-portion of the $9.9 million impairment in fiscal 2003 and reversed Subsea 7’s entry which it recorded in fiscal 2004.

TRANSITION FROM US GAAP TO IFRS
50
3. In prior years, all major repairs and drydocking costs were expensed when incurred. Under IAS 16, major repairs
and drydocking costs which meet specific criteria for recognition as an asset are deferred and recorded in vessels, property and equipment. Such costs are amortized over the period until the next drydocking.
4. Previously, vessel depreciation expense was based on the cost of the vessel less an estimated scrap value. In accordance with IFRS, the depreciation expense is adjusted for changes in estimated scrap values on the reporting date. The residual values were revised on 1 January 2004 and 31 December 2004. In both cases, the scrap values were higher than those previously used and this resulted in a lower depreciable base and, consequently, lower depreciation expense. The reduction in accumulated depreciated has reduced the gains recorded on the sales of vessels.
5. In prior years, the Company would record reconciling entries to reverse amortization of goodwill recorded by the subsidiaries in accordance with their non-US GAAP. IFRS does not provide for the amortization of goodwill but does require that goodwill be tested for impairment on a periodic basis.
6. Under IFRS, Subsea 7 is required to account for the cost of the conversion option embedded in its 8% Convertible Bonds due in January 2006. The adjustment resulted in an increase in interest expense and a corresponding increase in the convertible bond liability.
7. Adjustments to their respective income statements by the Company’s subsidiaries resulted in a change in minority interest expense and related interest payable.
8. When the Company’s subsidiaries issue shares to third party shareholders at prices in excess of the subsidiaries’ book value, the Company makes adjustments to record the increase in the value of the Company’s investment even though the Company was not actively engaged in a transaction. The increase is value is recorded as a separate component of equity and as an increase in the investment of the appropriate subsidiary. The deconsolidation of Subsea 7 at the end of 2004 and the re-measurement under IFRS reduced the increase in value.
9. STAR previously purchased two vessels and recorded the excess of the price over appraised values as goodwill. Under IFRS, the excess amount is deferred and expensed over a fixed length of time.
10. IFRS requires that all share-based payments, such as shaer options, be recorded in the financial statements using a fair value measurement basis. The expense is based on the fair value of the options on the date of the grant and the vesting period of the underlying options.
11. Upon adoption of IFRS, STAR recorded all cumulative non-expensed actuarial changes in estimates for pension liabilities to equity.
12. Previously, borrowing costs were capitalized and amortized based on nominal interest accrual. IFRS requires that the capitalized borrowing costs be accounted for using the effective interest method and be aggregated with the underlying loan liability.

SIEM INDUSTRIES
SUBSIDIARIES AND AFFILIATES Subsea 7 Inc. Subsea 7 Holding Inc. Siem Offshore Inc. STAR Reefers Inc. STAR Reefers Pool Inc. Siem Car Carriers Inc. Siem Investments Inc. Deusa International GmbH Siem Capital AB Siem Kapital AS Siem Capital UK Ltd. DSND Bygg AS DIRECTORS Kristian Siem, Chairman M.D. Moross Barry W. Ridings Michael Delouche
REGISTERED OFFICE EXECUTIVE OFFICE OFFICE Siem Industries Inc. Siem Industries Inc. Siem Kapital AS c/o Maples and Calder P.O. Box 10718 APO Jerpefaret 12, Voksenlia South Church Street Harbour Place – 5th Floor N-0788 Oslo, Norway George Town, Grand Cayman 103 South Church Street Cayman Islands, BWI George Town, Grand Cayman Cayman Islands, BWI Telephone: +1.345.949.1030 Telefax: +1.345.946.3342 SIEM INDUSTRIES INC. HOME PAGE www.siemindustries.com
Annual Report: Shareholders may obtain additional copies without charge. Please refer to the Company’s Home Page for contact information.