SIALKOT CITY - Population and Housing Census
78
City Report SIALKOT CITY Population and Housing Census 1998 -- - -- - - . s ·; .• Government of Pakistan Statistics Division Population Censμs Organization www. census.gov.pk
-
Upload
khangminh22 -
Category
Documents
-
view
0 -
download
0
Transcript of SIALKOT CITY - Population and Housing Census

City Report
SIALKOT CITY Population and Housing Census
1998
- --- -- - -
(!)~
. s · ; .•
Government of Pakistan Statistics Division
Population Censµs Organization www. census.gov.pk

iii
PREFACE
The process of urban ization and continuous expansion of the cities 10 term of
population size have resulted in ever increasing civic problems. This, naturally , necessitates
the availability of data pertaining to urban centres for planned development of the area and to
solve other rele vant issues .
Although , the regul ar census publications of 1998 Census i.e . , District/ Provincial
and National Reports carry data by rural/ urban areas in all the tables whi le two tables pertain
to urba_n localities in the district/ province but that does not replace the demand for exclusive
tabulation of data for urban centres , especially the big cities . Therefore , it seemed appropriate
to publi sh separate City Reports , initially for big cities, hav ing population of 3 lac and above.
The City Report consists of five parts viz (I) Write up which carries general
description of the city, (II) Broad analysis of population data, (III) !lroad analysis of ho~sing
data, Part -IV comprises statistical tables whik part-V provides additional information in the
form of annexures .
I hope thi s report wil l be a valuable addition to the stock of census publications
and will serve its purpose.
Islamabad, October, 2004 NAJAM HASAN
Chief Census Comm issioner

v
CONTENTS
PART-I Page No.
l. GENERAL DESCRIPTION OF THE C ITY
I. I INTRODUCTION 1'
I l.2 HISTORY I 1.3 CLIMATE 3 , 1.4 LOCAL GOVERNMENT SYSTEM 4
1.5 JUDICIAL SYSTEM 4
1.6 POLICE SET-UP 4
1. 7 EDUCATIONAL FACILITIES 5
1.8 HEAL TH FACILITIES 5
1.9 INDUSTRY 6
1. 10 COMM UN ICATION 6
I. I I PLACES OF INTEREST 6
I. I I . I Sialkot Fort 6
I. I 1.2 Raja Teja Singh Temple 6
1.11. 3 Temple of Guru Baba Nanak 6
l.11.4 Darbar Baoli Sahib 7
I. I l.5 Shrine Hazrat Imam Ali-ul-Haq 7
l.l l.6 Shrine Maulvi Abdul Hakeem 7
l.11.7 Iqbal Manzi! 7
I .11. 8 Clock Tower 7

VI
PART-II
2 . BROAD ANALYSIS OF POP ULATION DATA
2.1 POP ULATIO N SIZE, GROWTH AND DISTRIBUTION 11
2. I. l Populatio n Size and G rowth 11
2. l.2 Household Size 14
2. l. 3 Religious Composition 14
2. l.4 Lingui stic Dist ribution ) ~
2. l.5 Disabl ed Po pulation 15
2.2 SEX, AGE AND MARITAL STATUS I 8
2.2 .1 Sex Ratio 18
2.2.2 Ag e Structure 19
2.2.3 Marita l Status 19
2.3 LITERACY AND EDUCATION 21
2.3 . l Lite racy Ra ti o 21
2.3.2 Educational Attain ment 23
2.3 .3 En ro lment Ratio 23
2.3 .4 Leve l o f Ed ucati o n 25
2.4 MIGRATIO N 27
2.4 . l Life Time Migrants 27
2.4 .2 Duration of Continuous Residence 29
2.4.3 Reason of Migrati on 29
2.5 ECONOMIC CHARACTERISTICS/ LABOUR FORCE 31
2.5. l Economically Acti ve Popu lation 31
2.5 .2 Un-Employment 33
2.5 .3 Employed Popul ati on by Occup ati on 33
2.5.4 Employed Populati on by Indust ry 35
2.5 .5 Employed Popu lation by Emplo yment Statu s 35
2.6 IMMUNIZATION 37
2.7 NATIONAL IDENTITY CARD 39

vii
PART-Ill
3 BROAD ANALYSIS OF HOUSING DATA
3. 1
3.1. I
3.1.2
3 . I .3
3 . 1 .4
3. 1 .5
TYPE- OF HOUSING STOCK Leve l o f Congestion
Nature of T enure
Period of Construction
Constructi on Material of Outer Wa ll s
Co nstructi on Material of Roofs
3.2
3.2 . 1
3.2 .2
3.2 .3 3. 2 .4
3.2 .5
HOUSING FACILITIES
Source of Drinking Water
Source of Ligh ting
Cook ing Fuel Used
Availability of Kitc hen .Bathroom and Latr ine
Source of In formatio n
PART- IV
STATISTICAL TABLES
Table- I
Table-2
Table-3
T a ble-4
Tabk-5
Tablc-6
Table- 7
Table-8
T able-9
Table-1 0
Table-I I
Table-1 2
Table-1 3
Tab le-1 4
Table- 15
Population by sex. sex rati o. household size and a nnual growth rate
(Not Inc luded)
(No t Incl uded )
Populatio n by s ingle year age and se x
Population by selected age group an d sex
Pop u lati o n ( 15 years and above) by sex, age group and marital status
Pop ulation by relation ship to the head of househo ld by age group and sex
Popu latio n by re lig ion and sex
Population (5 years and above) by rel igio n and ability to read the Holy Quran or respective Ho ly Book
Pop ulati o n by m othe r tong ue and sex
Popu lati on ( 10 years and above) by literacy, sex and age group
Lite rate popu lat ion ( I 0 yea rs and above) by leve l of e ducati onal atta inment, sex and age gro up
Lit erate population (I 0 years a nd a bove) by fie ld o f educat ion , sex and age gro up
Populati on (5 years and above ) by educational ins titution att endance, sex and age group
Student popu lati on (5 years and a bove) b y educati onal attainment, sex and age group
43
43 43
45
45
47
47
49
49 ·
49
51
53
55
59
60
69
70
73
78
79
80
8 1
84
87
88
89

Table-16
Table-17
Table-18
Table-19
Table-20
Table-2 l
Table-22
Table-23
Table-24
Table-25
Table-26
Table-27
Table-28
Table-29
Table-30
Table-31
Table-32
Table-33
Table-34
Table-35
Table-36
Table-37
Table-38
Table-39
Table-40
Table-41
viii
Student population (5 years and above) by field of education , sex and age group
Population by place of enumeration, place of birth and sex
Population by duration of continuous residence . sex and age group
Migrant population by_ place of previotts residence and duration of continuous residence
Migrant population (I 0 years and above) by place of previous residence , literacy and educational attainment
Migrant population by place of previous residence , reason for migration and sex
Population ( 10 years and above) by activity, sex and age group
Emp loyed population (I 0 years and above) by occupation. employment status , sex and broad age group
Emp loyed population (I 0 years and above) by industry . employment status, sex and broad age group
Employed population (I 0 years and above) by industry, occupation, sex and broad age group
Employed population ( 10 years and above) by occupation. educational attainment and sex
Un-employed population (I 0 years and above) by educational attainment, sex and age group
Un-employed population (I 0 years and abo ve ) by reason of unemployment. sex and age group
Ever married womt:n ( 15 - 49 yt:ars) by age group and number of children born alive ·
Ever married women ( 15 - 49 years) by age group and number of childn::n still living
Ever married working women ( 15 - 49 years) by age group and number of children born alive
Ever married women ( 15 - 49 years) by age group. literacy , educational attainment and number of children born alive
Ever married women ( 15 - 49 years) by age group. number of children born alive during last 12 months and stil I living
Disabled population by nature of di sab ility. sex and age group
Disabl ed population ( l 0 years and above) by nature of disabi Ii ty . sex , educational attainment and activ ity
Population (less than l 0 years) by immuniza tion and sex
Population (I 8 years and above) holding National Identity Card by age group and sex
Homeless population by age group, sex, marital s tatus . religion and literacy
(Not included)
Selected populat ion and housing statistics of the city
Household by size
90
91
92
94
95
96
97
.98
100
102
I 05
106
(()7
108
I OlJ
I JO
111
113
114
11 6
117
118
11 9
122
126

Table-42
Table-43
Table-44
Table-45
Table-46
Table-4 7
Table-48
Table-49
Table-50
Table-51
Table-52
ix
Housing units by household size and number of rooms
Housing units by number of rooms and tenure
Owned housing units by period of construction and number of rooms
Housing units by tenure, material used in outer \valls and roofs
Owned housing units by pe riod of construction, mate rial used in outer walls and roofs
Hous ing units by tenure, source of drinking water, lighting and cooking fuel us ed
Owned housing units by period of construction, source of drinking water. lighting and cooking fuel usi::d
Hous ing units by tenure , kitche n_ bath room and latrine facilities
Owned housing units by period of construction, kitchen, bath room and latrine facilities
Owned housing uni ts by period of construction , material used in outer walls and mate rial used in roofs
Num bcr of households by source of information
PART-V
ANNEXURES
Anncxure-A Pakistan Standard Classification of Occupations fo r the 1998 Population Census
Annexure-B Pakistan Standard Classific3tion of Industries for the 1998 Population Census
Anncxure-C Dcsci rption of Census Circles
Anncxu rc-D City Map
127
128
129
130
131
132
135
138
139
140
143
II(
v VII
I: . I l
' l I
"
! i

::
PART- I GENERAL DESCRIPTION.

I - GENERAL DESCRIPTION OF THE CITY
1. t INTRODUCTION
Sialkot city is one of the most anci ent c ity of Punjab . It is said to have been founded
by Raja Sul or Sala of Pando dynasty hence called Sulkot. which subsequently changed to
Sialkot. It was about the time of Vikrama Ditya that Raja Sahvan built a fort and established
the principality of Sialkot. Sialkot is located about 120 kilomete rs north cas t of Lahore and
about 53 kilom eters east of Gujran\';·ala .
1.2 HISTORY
The popular belief is that Sialkot was founded in th e n: ig n of Vikrama Di tya of
Ujjain by Raja Sal ivahan or Salban, \\"ho built the fort and c ity and gave th e place its present
name . Legend has it that Sali vahan had two so ns. one Po ran who was killed by the
instrum entality of a wicked s tep-mother and thro\\"n into a well. still the resort of pi lg rim s near
Sialkot, the other Raja Ras al u the great mythical he ro of Punjab folk talc s, who is said to have
reigned at Sialkot. It has recently bee n suggested that Sialkot is th e site of the anc ient town of
Sakal a.
Sakala which has recently been idcnt i fied \Yi th Sialkot c ity was the cap ital of
Madras in th e lat e Vadic period . It \\as a lso the capital of the Greek k ings of the house of
Euthydemus and th e place of reside nce of Me nadc r . Aftt:r th e invasion by Huns in the las t
quarte r of 5th century A. D . . it became the capi tal of Tormana. In th e earli est days, the country
was a waste la nd and studded with thick forests and inhabited by a pastoral race cal led Yahars
or Yi rs. who li ved c hi e fl y along th e banks o f th e river. Sometimes afte r the in vas ion of
Alexander, peop le from remote parts of Indi a settled in thi s area. a mongst \\"horn were Sh un .
Hun and Dall. sons of Raja Rachar Rao of Rajputana.
In the time of Vik ram a Ditya th t: Shun and Dall we re recorded as the most po\Ye rfu l
tribes in th e Punj ab. After the flood. the popular be li e f is that the whole country rema ined
uninhabited for a tho usand years . The firs t account of its restoration dates from the t ime \vhen
Sialkot formed a part of Kashm ir, under Raja Sum Da tt. It was about th e time of Vikrama
Ditya king of Ujjain that Raja Salwan built a fort and es tabli shed the principality of Sialkot.
He was of the Sia caste and th e name of Sialkot is attributed by one account to this orig in .
Raja Rasalu succeeded hi s father Raja Sal wan \Yho took a dis tingu ished part in the
events of hi s tim e. About 360 A .D, one Raja Hu di believed to be chief of t he Ghakkar t ribe ,
est ab li s hed himsel f in the co unt ry to th e \vest of Jhe lum and contracted an a lliance with Rasalu
whom he induced to g ive his daughter in marriage. Rasalu failed to fulfil the promi se and Raja
I ~ -·•. ~

2
Hudi brought a large force to Sialkot. He was hom;va. una ble to conquer the fort in "hich
Raja Rasalu shut him se lf up and contented h imself in plunderi ng th e coun try and sub.i ugating
the Shuns, Dali s a nd fats . Later. ho weve r. Raja Rasalu ·s daughter eloped with Ra.ia Hu di .
After the death of Raja Rasalu in abo ut A. D. -WO. the co un try is sai d to h ~n e fo l kn under the
c urse of hi s brothe r. Poran . From that tim e on\\·ard for about 300 years the country remained
totall y devastated from famine and incessant plunder. In th e year 790 A .D .. the fort a nd city of
Sialkot was demolished by a large army under Ra.ia Niraut s uppo rted by th e tribesmen o f
Yusafzai country . No me nti o n is found o f Si a lko t for a longer pi.: riod after that e:-;cept it
remaine d a portion of th e te rritories of Raj a Braham Deo of Jam m u .
In 11 84 Shahab-ud-Din Ghauri invaded · th e Punjab wh ich was then in the hands of
the las t of th e Ghazan vide king . Shahab-ud-Din Ghau ri was unable to capture Lahore and
the refore retu rned to Sialkot where he left a garriso n. After hi s n;tu rn to Ghazni Sultan Khusro
Mal ik of Laho re in alliance \\·ith th e Ghakkars besieged Sialkot city but were unable to
capture it.
In 1394 on return from Delhi . Taimur marched al ong th e foot of h ill s a nd cap tured
Jam mu \vhere he compell e d Ra.ia to em brace Is lam . In 1 52~ Babar advanced to Ind ia by'' ay of
Sialkot which capitulated and Khusro Kokaltash was appointed gove rn or of Sialkot. Baba r·s
last successful invasion of Punjab was affected by an ad,·a nce in the Indus in 1525. Hi s troops
fro m Lahore joine d him and he ad vanced to Pasru r and thence on to Kalan aur. At the tim e of
Akbar. the present a rea w ith th e e:-;cepti o n of Bajwat Trans -Chenab formed part of the Rachna
Bar Sarkar o f the Lahore prov ince .
Und e r Shah Jchan . Ali Mardan Khan he ld charge of Sialkot . In hi s time also a
Mughal prince Murad Bakhsh marched by" ay of Sialko t to Pathankot . At the en d of reign of
Muhammad Shah when Mughal powe r at Dehli \\as on the dcclint: the outlying dis tri cts \\ere
left to them selves . Sialkot had been ap p ropriated by a powe rfu l fami ly of Path~m s and the
sub-m ountainous tracts were in th e hands of Raja Ranjit Deo. Zafa rwal. Pasrur and Daska.
though s ubord inate to Lahore. were spli t up into Tappas aftern ards called Talukas. In 1748
Ahmed Shah Durrani dt!te rmined to subdue Mi r Man nu for pn.:\'cn tin g hi s conq uest o f Sirhand.
But Mir Mannu entered the negotiations and the fo ur districts of Gujrat. Sialkot. Pasr ur and
Aurangabad \Yere g ive n to Ahmed Shah . In 1751 Ahmed Shah marched on the fou r di strict s
\Yhi ch had defaulted in payment of revenu e a nd also conq uered Laho re, establishing h is po\\ er
in th e Punjab and Sirhand. He however left his son Tai mur to rule at Laho re!. About th at time.
Raja Ranjit Deo the rul e r of the four d istricts exte nded his dominatio n over country. but the
Talukas and the city of Sialko t were not inc luded in it. They ,,·e re he ld by a powerful Path:rn
famil y t ill the time of the Sikhs. When th e Durrani power declined and the Sikhs formed
themselves into the well-kno\vn associations called the 12 Mis ls. Sialkot was \Hested from the
Pathans by two Sikh leade rs , Jhanda Sing h and Ganda Singh confederates of the famous
famil y of Guiab Singh Mariwala w h o represented the Bhangi Misl and the area came unde r
Bhangi rule . About that time Sia lkot suffered from famine and starvation w hich continued for

3
three ~cars resu lting large scale migration to Kashmir. Maha Singh father of Ranj it Singh,
marched upon Jammu and plundered the area.
From that tim e onwards. the Bhangi Sardars carried out in cessant raids on Ranjit
'!,'
--- Deo·s principality and thc_area_ultimatdy _wa_s\lp.prpp_riated_b\" them . Bct~y~en 1_7~7 to _ l ~_!_Q__ ;f Ranjit Sing h s ucceeded in wresting the whole of th e area by conquest or confiscation. Ranjit
Singh succeeded in smashing the Sikh confederacy and establ is hing h is sovereignty over a
large area. which inc luded Sialkot. On the death of Ranjit Singh u nder a regency established at
Lahore guided by Briti s h influence. Briti sh officers \\"ert: employed to restore order. In 1848
with the annexation of the Punjab , Sia lkot a lso p laced under British rul e .
1.3 CLIMATE
Sialkot city has a hot summer and cold "·inter. The summer season starts from
Apri l and continues ti ll Octobe r. While the duration of the winter season is from November to
March. Jun e is the hott est m o nth and January the co ldest month. The mean maxim um and
minimum temperature during the month o f June is about 40 and 25 d t:gree centigrade and in
January about 19 and 5 deg ree centigrade res pectively . The avt:rage rain fall is about 980
millimeter. The highest rainfall is from July to September.
The max imum and min imum mean temperature durin g various months of summ er,
\\ intt:r and s pring seasons and average rainfall is indicated below:
Tempe rature (''C)
Month Maximum
Jan uar\" 18 .5
Februan· 2 1.0
March 25.7
April 32 .8
May 3 8 . ()
J une 3 9 _ lJ
Jul y 34 .9
August 33 .6
September 33.6
October 3 1. 7
Nove mbe r 26 . 1
Decembe r 20 . 1
Annual 29.5
Sou rce: Pakistan Me teorological Department .
•
Minimum
4.8
7 .2
11.9
17 .5
2 1. 9
7 - .., _). _,
25 .2
24 .8
22 .5
16.4
9.7
5.3
16 . 1
Precipitation (m m)
39.4
43.9
55 .5
30. 7
27.9
70. 3
292 .9
259 . 1
I 03 .6
15 .0
9.0
3 1.4
978.7
~ l
I I

4
1.4 LOCAL GOVERNMENT SYSTEM
With the int roducti on of ne\Y local body sy s tem in 2001. city· s administrati on is
being headed by Di s trict Nazim . He is a ss is te d by Tehsil Naz i m s \\ ho also supcn·ise
Municipal Corporation . The re are 17 Union Co unc i ls in Mun ic ipal a rea of th..: city an d ckctcd
rep resen tative p f each uni on counci l is th t: m embe r of Municipal Co rpo ration.
1.5 JUDICIARY
The judicial setup in the city is headed by Dist ri c t & Session Judge. \\ ho is ass is ted
by addi ti onal Di strict & Sess io n s Judges. After the abolitio n ofexccuti\e magi st racy . spec ial
Judi cial Magi strates have been appo inted . The number of judges \\·o rki ng in \·arious capacities
is as under :
I . Di s tri ct & Session s Judge 0 I
2 . Additional Di stri ct & Sess io n Judges 05
3 . Senior Civi l Judges 0 I
4 . Ci v il judges 08
5. Special Jud ic ial Magistrates 02
1.6 POLICE SET UP
Mainte nance o f Law and Order is the mai n function of the City Administratio n
wi th th e he lp of Ju diciary a nd Po li ce. The C ity Po l ice is under the administrati o n of
the Distri c t Po lice Officer. The re arc s ix police s tations in the c itY . The de ta il of po lice
officials is g iH:n bdo\Y :
I . De puty Superinte ndent of Pol ice 01
2 . Po lice Inspectors 06
3. Sub Ins pectors 18
4 . A ss istant Sub Ins pectors 48
5. Head Constab les 19
6. Constables 182
l

5
1. 7 EDUCATIONAL FACILITIES
The city has adequate educational faci lities . The famous Murray College is situated
in Sial~ot_ ~!r_~r~m where Allam a Iqbal , the great poet and philosopher of the east obtained
his in termediate and bachelor' s- degree .
A number of schools and co lleges in government as well as private sector are
contributing towards the spread of education in the city, detai l of which a re given in the
following tab les :
Insti t utions Government Private
Total Male Female Total Male Female
Universities
Deg ree Colleges 6 3 3
Intermediate Colleges
Higher Secondary School 7 2 5
Secondary High School 19 9 10 59 44 15
Middle Schools 2.0 7 13 9 * * Primary Schools 28 10 18
Madressa School 10 10 10 10
* refers to co-education
1.8 HEAL TH FACILITIES
Good medical facilities are available in Sialkot city . Well reputed hospitals like
Allarna Iqbal Memorial Hospital , Civil Hospital for women , Mission Hospital , Police
Hospital , Dis trict Jail Hospital and Combined Military Hospital in Sialkot Cantonment are
providing med ical facilities to the pwblic . Bes ides many private hospitals/clinics then: are
number of other hospitals & medical centers in government sectors are working in the city
which are as fo ll ows :
Facilities Total Govt. Private
Dispensaries/Hospitals f 47 5 42 ' Unani Dispensaries 18 2 16
Maternity Care Centers 57 15 42
First Aid Centers 46 4 42
Vaccination/ EPI Centers 13 10 3
I

6
1.9 INDUSTRY
Sialkot citv ts reno \rned for major three industries. i .e . sports goods. surgica l
instruments and musical instruments. These goods are exported to Europe. America. Africa
and many other overseas markets .
The principal sports industry compri ses manufacturing of tennis . badminton and
squash rackets : cricket bats and balls , hockey st icks and balls. carum boards and other indoor
games; polo sticks and heads. footbal ls , volley balls . rugby balls. shuttl ecocks. etc.
Beside the above the most popular small sca~e industry in the city is manufacturing
of elect ric goods which prov ide livelihood and financial supports to a large segment of the
population of the city .
1.10 COMMUNICATION
Sialkot city 1s well connected with other part of the country through roads
and railways.
1.11 PLACES OF INTEREST
1.11.1 Sialkot Fort
The fort prov ided she lter to the European inhabitants of the cantonment during the
war of 1857 . It stands on a circular eminence. and is said to have been bui lt by Raia Salwan . It
was part ly dismantled in 1866. At the foot of th e mound is a small ce metery containing the
graves of those. who fe ll in the first war of independence ( 1857) . The s lope of the fort has been
converted into flower beds.
l. l 1.2 Raja Teja Singh Temple
There is a temple said to have bee n raised by Raja Teja Singh \\·hich has a
conspicuous sp ire v isible from all s ides of the to\vn. attached to the temple is a rest house for
travelers, endowed by the Raja.
1.11.3 Temple of Guru Baba Nanak
The temple of the first Guru i .e . Baba Nanak. knO\\·n as Ber Baba Nanak is held in
great veneration by the Sikhs. and used to be the scene of a large fair. which was held by the
Sikhs, up to the time of independence. The Sikhs still come here from India to pay homage at
this temple which contains a handsome cupola.

7
1.11.4 Darbar Baoli Sahib
Darbar Baoli Sahib. a covered well erected in the memory of Guru Nanak, who
visi ted the place on his return from Afghanistan, is also a place of sanctity for the Sikhs.
1.11.5 Shrine of Hazrat Imam Ali-ul Haq
The mosque and sh rine of Hazrat Imam Ali-ul-Haq, known as the Imam Sahib, is of
ancit;nt construction. It occupies a conspicuous position in the ci ty and is well designed and
handsomely built edifice , said to have been erected by Shah Daul ah. Being one of the oldest
strong ho lds of th e Muslim religion. it is held in great reve rence throughout the former Punjab.
During th e mon th of Muharram a large fare is he ld here and a large numbe r of worshipers
come from far off places to pay homage at the shrine .
1.11.6 Shrine Maulvi Abdul Hakeem
The sh rin e of Maulvi Abdul Hakeem is situated in Mianapura Mohallah , Sialkot.
The Maulvi was a distinguished schola r of the times of Aurangzeb , and acquired great repute
as a teacher.
1.ll.7 Iqbal Manzi!
Iqbal Manzi! is a great hi storical place situated o n Iqba l road \Vhe re Sir Allama
Dr. Muhammad Iqba l ,,·as born on November 9, 1877. This build ing has now bee n taken o ver
by the A rchaeology Department and is being mainta ined as a museum and a lib rary .
l. l l.8 Clock Tower
C lock Tower is in th e Sadar Bazar of Sialkot cantonme nt . It is said that it was
constructed by Lala Ramgi Das a local bus iness man during 192 1-2 2.

PART- II BROAD ANALYSIS OF
POPULATION DATA

11
2 - BROAD ANALYSIS OF POPULATION DATA
2.1 POPULATION SIZE, GROWTH AND DISTRIBUTI O N
2.1.1 Population Size and Grow.th
Sialkot city , comprising Municipal Corporation and Cantonment, ranked
12th amongst the big cities of Pakistan with a population of 42 1,502 in 1998 Census. The
population of the city grew at an average annual growth rate of 1.98 percent during the intercensal
period 1981-98(17 year) and registered an increase of 39'.57 percent over 198 l when its
population was 302,009.
The population of Sialkot city grew at a faster rate i .e ., 4.77 percent during the
intercensal period 1972-81 , registering 48.3 0 percent increase when substantial influx of
migration took place due to attraction of small industrial environment of working population
from other parts of the province/country and extension in boundaries of the city during
intercensal period 1972-8 1. The average annual growth rate of population, however decl ined
to 1.98 percent during 1981-98 as compared to 1972-81. The over a ll increase in population
of the city has been about three times during the last 47 years i .e., 1951 -98. If the population
of the city continue t o grow at its present growth rate i .e., 1.98 , it wi ll be double in the next 35
years. The fo llowing tab le shows the population, intercensal increase and annual growth rate
of the city since 1951 .
,
TABLE 2. t : POPULATION , INTERCENSAL INCREASE AND
GROWTH RATES S I NCE 1951
Description 1951 1961 1972 1981 1998
Population 156,378 167,294 203,650 302,009 421 ,502
Intercensal Increase 6.98 21. 73 48. 30 39.57
(per cent)
Average Annual Growth 0.68 1.70 4 .77 l. 98
Rate (per cent)
The population of Sialkot Cantonment has incteased from 43 ,862 in 1981 to
63,126 in 1998 registe ring intercensal grow_!h rate of 2.16 percent as compared to
Sialkot Municipal Corporation where population increased from 258, 147 to 358,376 at the
average annual growth rate of I .96 percent.

450000
400000
350000
300000
z 0 i== s 250000 :::> a. 0 ~
200000
156,378
150000
100000
50000
0 1951
12
Fig : 2.1
SIALKOT CITY POPULATION SINCE 1951
203,650
167,294
1961 1972
CENSUS YEARS
421 .502
302,009
1981 1998

6 .00
5.00
4 .00
t=' z w u ffi;3.oo ~
2.00
1.00
0 .00 1951-61
13
Fig : 2.2
SIALKOT CITY AVERAGE ANNUAL GROWTH RATE I
\
!
i 1
1.98
1961-72 1972-81 1981-98
(INTERCENSAL PERIOD)

14
2. 1.2 Household Size
The average househ o ld size of S ialko t city according to 1998 Cens u s is 6. 9
pe rsons_ which has decreased from 7 .3 in 198 1 indicating some impro vement in standard of
l iving during_ intercensal pe riod 198 1-98 .
2. 1 .3 Religious Composition
The population of Sialkot city is predominantly Muslim whic h consti tutes about
95 percent o f th e total po pulation . Among th t.: minori t ies , the Christians a rc in majo rity .
being 4 .63 pe rcent while the percentages of Ahmadi. Hindu. Scheduled Casts etc .. are
neg ligible i .e., less than 0.5 percent. The follo\ving table gives the percentage distribution of
populati on of the city by rel igion in 1998 .
TABLE 2.2: PERCENTAGE DISTRIBUTION OF POPULATION
BY RELIGION, 1998
Religion C ity M .Corp Cantt.
Mus lim 94 .94 95.55 91. 48
Chri stian 4 .63 3.98 8.3 1
Hindu (Jati) 0 . 19 0.22 0 .02
Ahm adi 0 .23 0.24 0. 18
Scheduled Castes * * *
Others 0 .0 1 0 .0 1 0 .0 I
* Refers to a ve ry small percentage.
2.1.4 Linguistic Distribution
The language used fo r com munication between parents an d their children is
referred to as the " mother tongue" and this in fo rma ti on was co llected for all the members of a
household . T he 1998 Cen su s reveals that Punjabi -is the most common lang uage s poken by
93 .54 percent population of the c ity. Urdu and Pushto are spoken by 3. 75 and I. 74 percent
respective ly, followed by Siraiki , Sindhi , Balochi etc ., having neglig ible sh are . Table 2 .3
shows pe rcentage distribution of population by mothe r tongue .

15
TABLE 2.3: PERCE NTAGE DISTRIBUTION OF POPULATION BY
MOTHER TONGUE, 1998
Arl!a Urdu Punjabi Si ndhi Pus hto Balochi Siraiki Others
City 3 . 75 93.54 0 . 18 I. 74 * 0.25 0.50
M .Corp . 2 .50 96.49 * 0.71 * * 0. 18
Cantt. 10 . 8 1 76 .80 I. 14 7 .59 0 . 12 1.22 2.32
* ~efcr to a very small percentage .
2.1.5 Disabled Population
The disabled or special population is a delicate segment of the socie ty and needs to
be identified bY their number and nature of disability for better planning for its
re habilitation and s upport at public and pri vate level.
According to 1998 Cen s us. di sabled p e rso ns 1n th e city arc 3.274
who constitute 0.78 pe rcent of the total popu lation . Among them 69.70 pe rcl!nt arc males and
30.30 pe rcent females . Of th e disab led pe rsons. 26 .26 pe rcent arc reported to be crippled
fo ll o\\·c d by 13 .87 percent ml!ntally retarded and 8 .83 percent insane . Blind arc
7. 12 percent and d eaf/ mute 5.35 percent. However. a hi g h percen tage of di sabled is catcgorisl!d
as · others· constitutin g 32.53 percent of the total disabled populatio n. The fol lowing table
co ntain s the detail of di sabled pop ulation by di sab ility and sex.
TABLE 2.4: PERCENTAGE OF DISABLED PERSONS BY DISABILITY
AND SEX, 1998
Di sabi lity Bo th Sexes Male Female
Total 3.274 2,28 l 993
Blind 7. 12 6 . 71 8 .06
Deaf/ Mute 5 .35 3 .59 9 .37
Crippled 26 .29 26 .26 26.38
Insane 8 .83 9 .56 7 . 15
Mentally Retarded 13 .87 13.76 14 . 10
Multipl e disability 6.02 6 .05 5 .94
Othe rs 32.53 34.06 29 .00
~
r t
' I :• l, i
J ~ I

16
Fig: 2.3
SIALKOT CITY POPULATION BY MOTHER TONGUE
Sindhi 0.18%
Siratki
0.25% Others
Pushto 1.74%
Punjabi 93.58%
0.50%
Urdu 3.75%
D Urdu
I!! Punjabi
D Sindhi
D Pushto
• Siraiki
O Others

17
Fig : 2.4
SIALKOT CITY DISABLED POPULATION BY DISABILITY
Others 32.53%
Multiple Disability 6.02%
Mentally Retarded 13.87%
Blind 7.12%
Deaf/Mute 5.35%
Insane 8.83%
Crippled 26.29%
~ ~!1

18
2.2 SEX, AGE AND MARITAL STATUS
2.2. l Sex Ratio
The sex ratio (number of males per hundred fomaks) 1s an impo rtant
demographic variable . It is primaril y affected bY ratio at birth and later b\' sex
differentials in mo rtality, migration and enumeration biases . The sex ratio in turn affrcts
fertility , mo rtality, mig ration a nd labour force composition .
The sex compos ition of the populati.on of Sialkot c ity in 1998 Census s hows that
th ere arc 117 males against every 100 females. The high sex ratio is a g eneral trend observed
in most of th e urban ccntn:s which is due to sex selective migration in search of better j o bs.
higher education and other social norms.
The sex ratio widely differs at various age groups. It is the highest. 1.59 for age
grou p 30-34 and the lowes t for age group 15-19, ,,·hi ch do not fo rm a uniform patte rn . The
sex ratio in cantonment a rea is con s iderab ly high especially in the ages bctm.:cn 20 to 44
because of higher number of s ing le population in the Cantonment area . The fo llowing table
shows the sex ratio in different age groups.
TABLE 2.5: SEX RATIO BY AGE GROUP
Age Group Sc:..: Ratio
( In years ) Cit\' M.Co rp . Cantt _
All Ages 117 .2 I 05 .4 22 I. 7
00 - 04 104 .5 10-Ll I 07 .6
05 - 09 107 .0 106 .6 110. 2
l 0 - 14 107 .8 107 .7 I 04 .0
15 - 19 100 . 1 99 .8 102 .4
20 - 24 11 0.8 97 .2 229 .2
25 - 29 142 .3 102 .7 429 .0
30 - 34 15 9.4 102 .9 570 .6
35 - 39 139.3 104.2 432 .2
40 - 44 122.8 11 0 .5 243 .7
45 - 49 117 .0 11 0 .0 187 .6
50 - 54 116 .5 11 3.9 146 .0
55 - 59 l 16. l 11 4 .2 140 .0
60 - 64 11 3.9 11 3 . 1 124 .0
65 - 69 118 . 7 11 8.2 125 .0
70 -74 124 . l 124 .6 11 8 .0
75 & Over 123 .5 123 . I 129 .5

19
2.2.2 Age Structure
Every popu lation forms a unique age structure based o n its hi s torical population
phe nomena i.e . . inti.:raction of birth s, death s and migration \vhich has a cons iderable impact
on its de mog raphic behaviour and emerg ing socio-economic characterist ics .
In the 1998 Cen s us_ di s tribution of population by selective age g roups shows that
proportion of children und e r te n years of age was 23.10 percent a nd that o f under five years
11 .03 percent incl udin g 2.00 pe rcent infants . The po pulation unde r fifteen years was 35 .3 1
percent. o f th e total population . The propo rti on o f popul at.ion in work in g age groups i .e .,
15-6-f years was 61 .09 percent wh il e senior citizen , 65 years and above. comp ri sed 3 .59
percent. Thus th e age d ependency ratio (the rat io of persons in d e pendent ages i .e .. under 15
and abo\·e 64 years to tho se in eco no mically producti ve ages i .e ... 15 -64 years) comes to be
63 .69 percent fo r the c ity. ''hich was 69.52 percent in Muni cipal Co rp o ration and o nly 36 .97
pe rce nt in th e Canto nment .
The adult popu lation of 18 years and a bove \Yhi c h is al so e li g ible to vo te in local,
provincial and national a ssembl y e lections co n s titutes 58 .45 percent. Tab le 2.6 shows
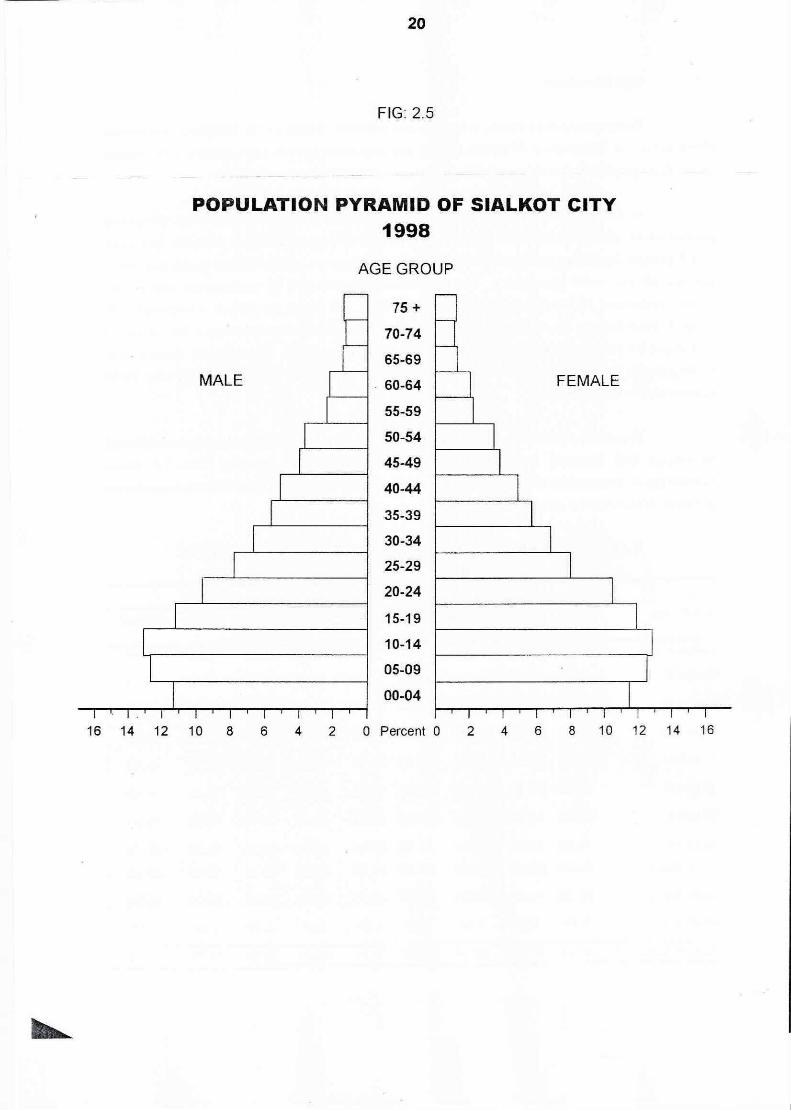
pe rce ntage of population in various age groups and sex. while fi gure 2:5 d epicts population .
pyramid of the c ity by sex and age groups .
Age Group
Under-I
Under-5
U nder- 1 ll
Under-15
S lo 2-l
15 to -l9
15 10 6-l
18 1060
18 & above
2 1 & above
65 & 0\'Cr
TABLE 2.6: PERCENTAGE OF POPULATION BY SELECTIVE
AGE GROUPS AND SEX, 1998
Cit y
Bo th Mal e Fema le
Sexes
2.00 1. 89 2. 13
1. I. 0 3 I 0 . -Vi I I. 7 I
23. Io 22 .01
35.J I 33 .75
-l S. 2-l -l 3 .22
53 . 57 55 . 10
(> l.09 62.57
53 . 92 55 . 96
58 . -l5 60. 58
5 l. 38 5-l .OO
3.59 3.66
24 .36
37. ))
-l7.6 l
51 .77
59 .35
5 1. 53
55.96
-l8. 33
3. 52
M . Crop.
Both Male
Sexes
2. 11 2. 08
1 I .-l3 11 .36
2-l .09 2-l .09
37.09 37 .23
-l 7.28 -t6 . 79
50. 91 50. 19
59 .00 58.58
5 1.32 51. 1-l
56.22 56.39
-l8 .70 -l9 . 09
3.92 -l .20
Cant!
Female Bolh Ma le
Sexes
2. 1-l 1. -l () 1.08
11. 50 8. 78 6.6 1
2-l .08 17 .-l6 t:l . 2 1
36. 9-l 25. 19 19.06
-l 7. 80 :n.67 28. 15
5 1. 66 G8. 70 75.86
59 .-l J 71.00 79. 50
51 .50 68 . 70 76 .33
56 . 0-l 7 1. l I 78.32
H .29 66.65 7-l. 75
3.63 I. 79 l.H
Age Dependency Rat io 63 .69 59 . 80 68 .50 69 .52 70. 7 1 68 .29 36.97 25.79
Fe ma le
2. IO
13.61
26 .90
38. 80
-l5 .92
52 .82
5!Ud
51. 76
55 . 16
-l8. 70
2.59
70 . 55
.
I ~
20
FIG: 2.5
POPULATION PYRAMID OF SIALKOT CITY 1998
AGE GROUP
75 +
70-74
65-69
MALE . 60-64 FEMALE
55-59
50-54
45-49
40-44
35-39
30-34
25-29
20-24
15-19
10-14
05-09
00-04
16 14 12 10 8 6 4 2 O Percent O 2 4 6 8 10 12 14 16

21
2.2.3 Marital Status
To determine th e marital s tatu s . the population of fift een years and above is
classified into nen; r marri ed , married. wid O\Yed and di v orce d . According to 1998 Ce ns us, the
proportion of ne ver married in the city was 36.46 percent while that o f cu rrently married 58 .46
percent. Of th e remaining , -l .78 percent were widowed and 0.29 percent divorced . The
pe rcentage of fema les in a ll catego ri es except never married is relati vely higher than that o f
males . The percentage di s tributi on of population by marita l statu s and sex is g iven in the
fo llowi ng table .
TABLE 2. 7 : DISTRIB UT ION OF POP U LATION ( 15 YEARS & ABOVE)
BY MARITAL STATUS AND SEX, 1998
Ne,·cr Married Married Widowed Divorced
Arca Both Male Fema le Both Ma le Female Both Mal e Fema le Both Male Female
Sexes Sexes Sexes Sexes
City 36.-l6 39 .25 3 3. 0 2 58.-l6 57 . 91 59 . 1-l -l . 78 2Ji6 7 .39 0 .29 0 . 17 ll.-l -l
M.Corp. 38 .8-l -l-l .O I 3 3 . -l 2 55.50 52.6 1 58 . 53 5.33 3 . 16 7 .60 0 .3 2 0 .20 ll.-l5
Ca ntl . 25 . 11 23 . 6 -l 29 .-l2 72.6 1 75 .26 6-l . 8 1 2. 1-l 1.00 5.-l8 (). 1-l 0. 10 0 .30
Age s peci fie di str ib uti o n of pop ul a ti o n by marital s tatus shows a higher
perc<: ntage of ma rri ed fe ma les as compared to males be lo\\ -lO years of age . It ri ses from 6 .0-l
percent a t age 15-19 years and r<:aches the maximum at 91 .94 percent in the age group 35-39
\\·hich hom;ver. declines at bter ages. Similarly. percentages of \v ido wed and d ivo rced
females is h igher in a ll ag e groups up to 50 years & above . Howeve r. percentag<: of never
married mal es is higher in a lmost a ll age g roups . The fol lo,,·ing table con tains distribu t ion of
popubtion in s pec ific age groups by marital s tatu s and sex .
TABLE 2 .8 : PERCE NTAGE OF POPULATION (15 YEARS & ABOVE)
BY MARITAL STATUS, SEX AN D AGE GROUPS, 1998
Age Grou p Never Marri ed Married Widowed Di vorced
Male Fe mal e Male Female Male Female Ma le Female
15-19 98.01 93. 75 1. 8 J 6.04 0.17 0. 18 * 0. {)3
20-24 82 .82 60. 13 16.94 39.39 0.22 0.32 0 .02 0 .17
25-29 46.40 22 .89 53.04 75 .99 0.42 0.67 0 . 14 0.44
30-34 18.30 8 .6 J 80.86 89. 70 0 .59 1.45 0.24 0.68
35-39 9 . 16 4 .40 89.52 9 1.94 1.04 2.88 0 .28 0.78
40-44 6.89 3.52 9 1.4 1 89.78 1.33 5 .87 0 .36 0.83
45-49 4.59 2.97 92. 74 86.43 2.38 9.93 0.28 0.67
50 + 4 .22 4.49 82 .97 62.4 1 12.55 32 .57 0 .25 0.53
" Refe r to a very sma ll pe rcentage .
~~-~

70
60
50
I- 40 z w (.) 0:: w a.
30
20
10
0 .
22
Fig: 2.6
SIALKOT CITY POPULATION 15 YEARS AND ABOVE BY MARITAL
STATUS
58.46 57.91 59.14 .
39 .25
Never Married Married
7.39
~~n LJILJ Widowed
D Both Sexes
8Male
DFemale
029 0 .17 0.44
Divorced

23
2.3 LITERACY AND EDUCATION
2.3 . l Literacy Ratio
A perso n who could read a ne\\·spaper and w rite a simp le le tter in any language
\\as cons idered as literate in 1998 Census . Literacy ratio is the percentage of literate persons
amongst the population o f I 0 years a nd above . Accordi ngly. the literacy ratio in Sialkot ci ty
com es to be 76.03 perce nt in 1998 Cen s us as compared to 56 .2 pe rcent in 1981. It is high e r for
males at 78.45 pe rce nt as compare d to 73 . 11 pe rce nt for females. The literacy ratio in
Cantonment area is s li g htl y hi gh~r at 82.6 1 percent as compared to that of Mu ni cipal
Co rpo ration at 7-L 77 percent. The follo \\·ing table s hows th e lite racy ratio in 198 I & 1998
Censuses .
TABLE 2.9 : LITERACY RA TIO BY SEX, 198 1 & 1998
Arca 1998
l 98 I Both Sexes Male Female
Ci ty 56.2 76.03 78.45 73.1 1
M.Corp 49 .0 74 .77 76 .07 73.40
Cantt 63.-t 82 .6 1 87 .26 70.3 8
2 .3.2 Educational Attainment
Education meets the s hortage of train ed and quali fied manpO\\er which is an
impo rtant fact o r for in c reas ing productivity and accele rating economic growth . Data o n
ed ucational attainment is therefore. essential forde\e lop nit:nt p lan ning. o ne source of which is
th e Population Cens us .
T he pe rcentage of ed ucated popubtio n ( 10 years a nd above) in the c ity is 75 .67
which is h igher in Cantonment , 82 . 16 percent than that of Municipal Corporation at 74.43
pe rce nt . The sex differential regardi ng forma ll y educated persons. by and large, is s imilar to
that obsem.;d in literacy ratios . The fo llowing tab le s hows the percentage of ed ucated
populatio n in respect of Sialkot c ity. Municipal Co rp o rati on and Cantonment by sex.
TABLE 2. 10: PERCENTAGE OF EDUCATED PERSONS (10 YEARS &ABOVE)
BY SEX, 1998
A rca Both Sexes Male Female
C ity 75.67 78 . 13 72.70
M .Corp. 74.43 75.77 73 .0 l
Cantt. 82. 16 86 .84 69.84
------------- - - ------------- - - - -
~

24
Fig: 2.7
SIALKOT CITY OBoth Sexes
LITERACY RATIO BY SEX •Male
OFemale
100.00
~0.00 87.26
80.00 78.45
70.00
I- 60.00 z w (..) a:: w
50.00 Cl.
40.00
30.00
20.00
10.00
0.00
City M.Corp. Gantt

29
2.4 .2 Duration of Continuous Residence
The status of mi g rant population by durati on of continuous res idence shows tha t
52 .2 1 percent in-migrants a rc res iding in Sial kot c ity for mo re than ten years i .e .. before 1988.
and o.00 percent fora period of5 to 10 years i .e . . bi;twecn March 1988 to March 1993. \\hilc
41 .8 pe rcen t in-migr:rnts ha,·e mo,·i;d in less than 5 yi;ars back i .c . after March 1993.
Thc mi g rant po pulatio n and its di stribution by duration of conti nu ous res idence is g i\·en in the
fol lowing tabk:
TABLE 2. 14 J\llGRANT POPULAT I ON BY DURATION OF CONTI NUOUS
RES I DENCE AND SE\'., 1998
Sex T o ta l Mig rants by Duraci on of Conunuous Residence (percentage)
!\ I igrant s lc ss chan 5 Ycars but less I 0 Y ca rs
5 Y cars than IO Ycars and above
Boeh Sexes 5 I . 646 4 I . 80 6.00 52 .21
Malc _,2_ 86 1 5 () . 4 7 4 .49 45 .03
Fcmalc 18 . 7X5 26 .61 8.63 64. 76
2.4 .J Rea so n of Migration
The <lata o n n.:aso n of mi g rati on to\\·ards Sialko t c ity e labo rates that 38 .80
percent of th e migran ts h ~\\ e 111 0 \ ed in because o f th ei r emp loyment/ trans fe r inc ludin g 60.36
pcrccn t malcs and onl~ 1.06 pcrcent fc maks . ..\nothcr 22.4 I percent migrated \\ ith head of
the famil~· :itH.l 1-L-! 3 percent due to marriage \\ hi lc 2 .9 percent h:ivc mo,·ed for bus iness. The
fol lo" ing t:iblc sho\\ s the pcrcentagc of mi g r:int s by reason of migrati on .
TABLE 2. 15: MIGRANT POPULATION BY REASON OF M I GRATI ON
ANO SEX, 1998
Migranc Popula ti on by reaso n of Migrat ion (Percentage)
Sex Study Marriage Mo,·cd wi I h Business Emplo~ ment Returning Hea lth Others
Head Transfer Home
Both Sexes 0.99 l -L43 22.4 1 2.87 38. 79 1.29 0 .24 18.98
Male 1.24 0 .58 15.27 4 .07 60.36 1. 20 0. 16 17 . II
Female (). 55 38.65 34. 90 0 .78 1.06 J.44 0 .37 22.25
~ i• •· i
t

30
Fig: 2.10
SIALKOT CITY MIGRANT POPULATION BY REASON OF MIGRATION
45
40 38.79
35
~ 30 I-z w u ffi 25 a.. 22.41
20 18.98
15 14.43
10
5 2.87
0.99 D 1.29
[:=J 0.24
0 c=i Study Marriage Moved with Business Employment Returning Health Others
Head T ransfer Home

31
2.5 ECONOMIC CHARACTERISTICS
2 .5. l Economically Active Population
Economically acli\t! population (labour force) comprises perso ns of either sex who
arc e ngaged in some work for pay o r profit including un-paid fami ly helpers. persons not
,,·orking but looking for ,,·ork as well as those l::tid off during the reference period i .e . .
preceding year from cens us date .
According to 1998 Cens us. the economical ly ac ti ve popubtion in Sialkot city is
2-L X5 pem.:nt of the tota l population . It is -l4 .98 percen t for males and on ly 1.28 percent for
fcmaks . The remaining 75 . 15 percent of total population which inc lude children under 10.
s tudL:nts . domesti c workers. landl o rd / prope rty ow ne rs . retired and disabled persons. is treated
as the popu lation not eco nomically act ive . The popu lation of c hildren under ten years is
2 3 . I () percent and srndcnts. I 0 .27 perce nt. The s hare of domestic \\ orke rs is 34 .66 percent.
co mprising as h igh as 74 02 percent females and on ly 1.06 pL:rccnt mal t!s . ThL: fo llowi ng tabl e
giYes percentage of population by economic categories and scx .
TABLE 2.16: PERCENTAGE OF POP ULATION BY ECONOM IC CATEGORIES,
UN-EMPLOYMENT RATE, LABOUR FORCE
PARTICIPAT ION RATE AND SEX, 1998
Eco nom ic Cateoor\" "' -Both SL:xL:s
Economical ly Acti\"C 24 .85
No t Economically Actin; 75 . 15
Chi ldrc n Under 10 23 . I 0
Student I 0. 27
Do mestic Workers 34 .66
Others 7. I I
Unemployment Rate 14 .96
Labour Force Participation 32 .32
Rate (Refined)
Mak
44.98
55 . 0 I
22 .01
18 .8 1
1.06
13 . 14
15 .30
5 7 .6 7
Fe mal e
l .2 8
98 .72
24 .37
0.27
7 4. 02
0 .06
0 .89
1.69
The percentage of economica lly active populat ion (labour force) to the total
population i .e ., 24 .85 is t e rmed as crude acti v ity or participation rate \"vhile the percentage
am o ng population aged 10 years a nd above is called refine d act iv ity rate or labo ur force
participation rate which is 32.32 pe rcent for the city. There is a wide variation in the labour
force participation rates for males and females \\hi ch is 57.67 percent for males as compared
to on ly 1.69 percent females . Figure 2 . 11 s how s pe rcentage di stribution of population age d I 0
years and above by activity .
l I

32
Fig: 2.11
SIALKOT CITY POPULATION BY ACTIVITY
Disabled 0.47%
Retired 1.24%
Landlord/Property Owner 0.78%
Domestic Work 45.08%
Others 6.77%
Working 27.23%
Students 13.35%
Looking for Work 3.36%
Laid Off 1.47%
Unpaid Family Helper 0.25%

33
2.5.2 Un-Employment
The ·un-employment rate· is the percentage of unemplo>ed persons (looking for
"ork and l::iid oft) of the economically active population ::iges I 0 years and above . The
un-emp lo>ment rate in the city is 14 .96 perce nt "hich is fairly high and may be attributed to
influ x o f p o pulation from surruun<l ing areas in search and h o pe of ge tting jobs . The
un-employmcnt rat e for male is higher at 15.30 percent compared to o n ly 0 .89 percent for
female s ''ho an.: m o~ t l y engaged in dorm:st ic \\·ork as indicated in tab le 2 . 16.
2.5 .3 Employed Popu lation by Occupation
The e mployed population includes the persons \Yho arc w orki ng for pay o r profit
including un -paid family helper. The emp loye d popu lati on is further categorised bY
occupational g roups . The maximum concen tration of cmploycd perso ns has b ec n obscn cd
in th e .. Ekmcntary O ccu p a ti o ns ... i .c .. salcs and sen ices. agricu ltural and rclatcd labourers
a nd la bo ucrs in cons tru ction. manufacturing & tran s port. "hi ch is 2-L 12 percent. Anotlwr
16 .% pe rcent o f employed pers ons arc ··craft and Related Trades Work e rs·- follO\Yed by 13 03
percent ··Sen·ice W orkers and Shop and Market Sales Work c rs-- and 8 .22 pc rc..: nt
-- profess iona ls-- . The proportion o f employed persons i n occupational group s like
--T echnicians anti Associate Profess io nal s -- . ··Skilled Agricultun: and Fi s he ry ,,·orkcrs -- _ :rnd
"" Plant and Machine Operato rs/ Asscmbkrs"" \arics between 1.71 and clerks 2.65 pcrccnt \\h ilc
the lo\\ es t. i .e . . 0. 18 pe rcent is for ··Legislators. Senior officia ls and Managers·· . Thc fol lo,,·_
ing 1ab lc s hO\\S th e detail of e mpl oyed populati o n by occupati on .
TABLE 2.17 PERCENTAGE DI STRI BUTI ON OF EMPLOYED POPULATION l3Y
OCC U PATION, 1998
f\:I aj or O ccup ation Emp lo) c t! Po pulatio n
Group umber Pc rccntag.c
All Occu pati o ns 89.086 (100)
Leg is lators. Senior Officials and Managers 160 0 . 1 x
2 Profoss ional 7 .3 I lJ 8 .22
3 Technicians and Associate Professional s 2. 77fi 3. 12
-t C le rk s 2.362 2 .65
) Sen ice Workers and Shop and Markel Sales Workers I 1.fi07 13. 01
6 Sk ilkd Agricultural and Fishery W o rkers 2.482 2.79
7 C raft ::ind Related Trades Workers 15.1 10 16 .%
8 Plant and Machine Operators and Assemble rs 1.5 I 0 I . 71
9 Elementary Occup::iti o ns 21.490 2-L 12
0 Others 24. 254 27 .23

34
Fig 2.12
SIALKOT CITY EMPLOYED POPULATION BY OCCUPATION
30
25
20 fz w u a:: ~ 5
10
5
0
8.22
3 12
0.18 D , .. ~" ~" ~ o<' ~~<::' <>'" "' ~"' ,., ..
'"'" " ,.,o <1'0
"" ,_., ~,'lf
'!$' #'Ii 0 ·,p' "of? c;"'<:'
{>' - ~~" ,_a ~a , ..
~q'b ~ ,... ..
""' ,,,,., ~o~
,_.,<!' cji
27.23
24.12
16.96
13.03
2.65 2.79
D D 1.71
D 1/' ,.,
'" '" '" r>" '" c.,'<" ,...., ,... .. ,... .. ~ .. "'o IS"'
~o' ~o' ~rf .f o><f 0
~ .. .,~ 1:f' ., ..
o" 1:;'l' oc; '<§' ;,,,<• "'<:' .,:]><:'. ,..., ""
.,o o<' e,<:' ~~ ~<'Ii i' ~ «>"f " ~
o<f' .§>q §' "'<' ,::.<i
c; 'l"q; c.,<~ ~<;of> .,p"'o ,.c;
"~ '?' ~ «''Ii

35
2.5 .4 Employed Popula ti o n by Ind us try
The distributi o n of e m ployed popu la ti o n by indus t ry ind icates th e h ighest
pe rcen tage in ··communitY. Social and Perso na l Sen ices .. i .e . . -H> .94 p e rcent followed by
··l\fon ufacturi ng··. at I 8A7 percent. An other 13 .60 percent arc t: mp loyt:d in ··wholcsak &
Rt:tai l Tradc and Rcstaurant s & H otels ... and l 3 .2 l percent in ··construction .. w hil e 4.75
perce nt arc engage d in .. Financing. Insurance. Rea l Es tate and Business Scn·ices··. The
in,·oln:ment o f c mploycd populati o n in othe r indus t ries is less then 3 pcrcen t as given in
the fo l lo,,·i ng tab le.
TABLE 2.18: PERCENTAGE DI STRIBUTION OF EMPLOYED POP ULATION BY
I NDUSTRY, 1998
Major
Di,·is io n
All Indu s tri es
Indust ry
Ag ricultu rc. Forcstry . Hunting a nd Fi shing
2 Mining and Quarrying
3 Manufactu ring
~ Elcctrici tY. Gas and Wat e r
5 Construction
6 Wh olesale and Retail Trade and Restaurant s and Ho tel s
7 Trans po rt. Storage and Com muni cat ion
X Financ ing. Insurance. Real Estate and Bus111ess Serviccs
9 Com mu nit\·. S ocia l and Perso nal Services
0 Act i\ iti cs not Adequately De fined
2 .5 .5 Emp loyed P opu lation by Employment St a tus
Employed Pop ulat ion
Numbe r Percentage
89.086 (I 00)
2. 725 3.06
1.302 l .46
1 6. ~ 55 18.4 7
303 () .34
l l. 765 13 .2 1
12.108 13.60
2. 4 94 2.80
4 .232 4 . 75
36 .469 40 .94
1.233 1. 3 8
The compos iti o n of e mployed population by employment stat us shO\\"S that a
significant propo rti o n comprisi ng 36 .37 percent is ' Se lf Employed· follo\\ed by the
.. Employees ·'. (Govt.) and (Pri vate) at 36 .20 and 24.60 percen t respective ly whi le
emp loyees in a utonom o us bodies arc o nl y 1.13 percent. Emp loyers and Un-paid fam il y
he lpers arc onl~ 0.56 percent and 1. 16 respect ive ly as d e tailed in th e fo li o \\ ing table .

36
Fig : 2.13
SIALKOT CITY EMPLOYED POPULATION BY INDUSTRY
45.00
40.94
40.00
35.00
30_00
I-z 25.00 w u 0:: w 0. 20.00 18-47
15.00 13.21 13_60
1000
4-75 5.00 3_06 2.80 D D 1.46
D CJ 0 34
0.00
1.38
CJ
- ~°' -~°' - ~°' Q)- ff' q;.<> ~o<:- "'., 0°' l> ,,_~ ~ __,~ ~~ O' ~,o !:"'() ~<:'
q} (;' .§ o~ &Qi '>"' 'It ~ <:>"' 0"' 'b- o" ,S'li '1>.,
~., 'Ii<:' ~.;s ., .. ~ tt;.->i
~<:-°' <:-0 ~'1><:' 0 c,O ~ cP~ ~<::-e o"' ~ ·s-°''1>' .J-.... <'Ii ,., & ~.;s 67Jv 'b- <o" q"' o"'
r}<;\' ~<:' Jf ~~·- ,'lief 'It "'b- ,,_'?' ~ '-"' J~ _<:-<::!
'<.o'"' o"' e:,'-0 ,._'Ii ,,_,'Ii <v°' "' ~"'"?
";}.vt..0 · ~- ~ ?·
_,,, ~ <:-°'<:f ~e; <)>
i;' ~" '?' i,vv 'b-'<'
,._,'Ii 0 · ,,,_c; 00~ '?-°' ~"'
, 'Ii .,_, a-"'" '"" ~-~"<;' o"'
.~ ... </'

37
TABLE 2.19: PERCENTAGE DISTRIBUTI ON OF EMPLOYED POPULATI ON BY
EMPLOYMENT STATUS, 1998
Employment Status Both Sexes Male Female
Tot:tl 100 I 00 100
Self Employed 36 .37 36. 70 24 .90
Empl oyees (Go' t) 36.20 36. 13 3X.45
Emplo~cc s (Auto Body) I . 13 I . 12 I. 30
Employees (Private) 24 .60 2-L50 27. 77
Employers () . 5 5 0.5X
Un-p:tid Famil ~· Helpers 1. 16 0. lJX 7. 59
2.6 I MMUN I Z.-\T I ON
The population of chi ldre n under 10 ~ca rs arc , ·accinated to immu ni ze agairrst
six basic t.lisc:tses (tube rculoses. diphtheria. tetanus. po li o. :tnd meas les ) . The question about
immunization\\ :is included in thl! 1998 Cen s us to c\·alu:itc the \·accinatio n programme launc hl!d
by the GoH:rnm ent. It is e ncouraging to no te th::i t o ut of total popu lation of children under
10 ~e::irs in the city. 72. 85 pcrc ..: nt ha,·e been reported \accinated . Those not , ·acci nated \\ere
o nl ~ 1.04 percent "hilc the rcmG inin g 26. 11 percent ,,·e re reported as · not kno\\n'. The
percenwg..: of , ·accin::iti o n am ong mal e :ind f..:m:ilc c hild re n w:is 73 .21 pl!rcent ::i1H.l 72.4 7
percent r..: s pccti\ cl~ . The fo l lo\\ ing t::ibk s ho\\ s pe rcentag..: of popularion under I 0 years by
i 111111 uni zatio n and sex.
Sex
TABLE 2.20 : PERCENT ACE OF POPULATI ON UNDER 10 YEARS BY
IMMUNIZATI ON ANO SEX, 1998
To tal Vacc i- Not
Population natcd Vacci nated Known
Both Scx..:s 3 18.096 75 .6X 6.45 17 . 87
Male 163.294 74 .% 6.60 18.44
Fe m;.ik 154.802 76.45 6 .29 17.26

40.00
35.00
30.00
25.00
..... z w 20.00 u a:: w Q_
15.00
10.00
5.00
0.00
3B
Fig: 2.14
SIALKOT CITY EMPLOYED POPULATION BY EMPLOYMENT STATUS
36.37 36.20
Self Employed Employees (Govt.)
1.13
c=i Employees (Auto Body)
24.60
Employees (Private)
0.55 c:==:i
1.16
c=J Employers Un-paid Family
Helpers

39
2.7 NAT IO NA L IDE NT IT Y CARD
The Nationa l Registration scheme for Paki s toni nati onals was introd uc1.:d in 1973
and the informotion obout obtaining National Identity Cards has been collected for the firs t
time in 1998 Census . A ccord ing to th e re sponse to the que stion 7-L85 percent of the
popu lati on aged IX years and abo\e ha\·e ob tained Nat ional Identity Cards . It \\·as 83.42
percent male s ~rnd 6J .9l) percent female s 72 .9X percent in C orpo ration and 83.27 pc rcent in
Cantonn11.: nt area. as dl:tai le d in th1.: fol IO\\·ing table .
TABLE 2.2 1 : PERCENTAGE OF POPULATION (18 YEA RS AND ABOVE)
HOLDING NAT IONAL IDENTITY C.-\ RD BY SEX, 1998
Both Sexes Mak Female
Arca . I. Card N. I. Card N. l.Card N . l.Card N .I. Card N . I. Card
Obtain cd Not Obtained Not Obtained No t
Obtained Obtain1.:d Obta ined
( i tY 74 .85 25 . 15 XJ .4 2 16 .58 63 .99 36 .0 I
1\1. Corp . 73 .98 2 7.02 82. 14 17 .86 63 .26 36 . 74
(' :111 Ct. 83 .27 16. 73 87 .3 2 12 .68 70 .5 2 29. 4l)

'I I
PART- III BROAD ANALYSIS OF
HOUSING DAT A

43
3 - BROAD ANALYSIS OF HOUSI NG DATA
3.1 TYPE OF HO US I NG STOCK
Housing is one of the basic necess iti es of li fe . It provide she lter and amenities for
mai ntenance of pri vacy. famil y health and dcsi rabk Ii' ing conditions. Therefore. data on housing and facilitil:s therein arc essential for planed development of the soc iety . Moreove r. sustained
migration from rural to urban areas in search of better jobs and li ving conditions requires updated data on urban ho using ''h ich helps to understand quali tati ve and quantitative
as pects of Ii\ ing conditions of the peop le.
Accordi ng to 1998 the Census. there \Ve re 57.4_.7 housing units in Sialkot City. as
against 35.5 -11 enunh.:ratcd in 1980 Census showing an increase of 6 1.6 percent during the intercensal pl:riod 1980-98 . Out of the total housing units 88. 33 pe rcent in Mu nicipal and 11 .67 percent in Cantonment areas .
3. 1. I Level of Congestion
Le\ c l of congestion 111 term of persons/rooms pe r housing unit reflects the hous ing conditions as wel l as the li ving standard of a soc iety. Their changing trend helps in determ ining the ove rall requirement of housing unit s and ultimatel y provides a base for po l icy formation and future planni ng at macro and micro level in the city. During 1998
Census. there ,,·e re 6 .9 persons per housing unit in Sialkot city. while 2 .4 persons \Vere living
in one roo m. The ave rage numbe r of rooms pe r housing unit ,,·as 2.9.
The percentage of single room housing units has reduced from 29.53 in 1980 to 19 . 9 I in 1998 in Municipal Corporation . Similarly the percentage of housi ng un it w ith two rooms has s lightly decreased from 30.06 in 1980 to 27.0-1 in 1998. On the other hand . the
percentage of three and mo re rooms housing unit has increased from 40.4 in 1980 to 53 .03 in I 9lJX. shO\\ ing an impro\ emcnt in Ii\ ing condit ions during intercensal pe ri od. The
follO\\ ing tabk gi,·cs the indices of congestion in 1980 & 1998.
TABLE 3.1: IND ICES OF CONGEST ION , 1980 & 1998
lnd i..:x 1980 1998
City M. Corp . Cantt. Cit,· M Corp . Can tt
Persons pi..:r housing unit 7 .... 6 t) 7.0 6 .0
Pi..: rsons per room 2 .7 2 .-1 2.4 2.1
Rooms per hous ing unit 2 .7 2 .9 2.9 2 .8
Hou sing unit with one room (%) 29 .53 20.0 7 19 .92 2 I. 3-1
Hou sing unit \\ ith two room s ('Yi,) 30.06 27 .94 27 .04 34.81
Hou si ng unit with 3-4 ('Yo) 28 .57 34 .90 36 . 12 25 .82
Hou sing unit \\ ith 5 or 11 .83 17 .09 16 .9 1 18.02
more rooms (%)
Fig ure fo r city and cantonm ent arc not se parately ava ilable in 1980.

44
Fig 3.1
SIALKOT CITY HOUSING UNITS BY NUMBER OF ROOMS
Five or more Rooms 17.09%
...... . . . . . . . . . . . . . . . . . . . . . . . . . . . . . . . . . . . . . . . . . . . . . . . . . . . . . . . . . . . . . . . . . . . . . . . . . . . . . . . . . . . . . . . . . . . . . . . . . . . . . . . . . . . . . . . . . . . . . . . . . . . . . . . . . . . . . . . . . . . . . . . . . . . . . . . . . . . . . . . . . . . . . . . . . . . . . . . . . . . . . . . . . . . . . . . . . . . . . . . . . . . .
Two Rooms 27.94%

45
3 . ) .2 Nature of T enure
According to the l9lJX Census. there were 57..l47 hou sing unit in Sialkot city.
11.67 percen t in C:111tonment and 88 .33 pe rcent in Municipal area . If \\e compare tenure
fi g ures oYer time. the O \ \ ned ca tegory has increased while that of rented has decreased from
1480 to 1998 . The n.: nt free has al so s lightly increased in Muni cipal Corporation . The
pcrccntagt: of rented housing units in Cantonment area ,,·as much higher than that in
Municipal Corporation . Similarly the percentage of rent free houses in Cantonment was highe r
at 1-t .3-t percent as com pared to 6 . 10 percent in Municipal area. These facts indicate a natural
tre nd of habitatio n culture of defence forces and ci\ ilian population . The fo ll owing table pro
\·ides the d:ita by natu ·re of tenure in the city .
TABLE 3.2: PERCENTAGE OF HO US ING UNIT BY NATURE OF TENURE,
1980 & 1998
Nat ure of Tenure 1980 1998 ~~~~~~~~~~~~~~~~~~~~~~~~
Cit\" 1\1 . Co rp . C :111 tt . Ci ty M. Corp. Cantt.
Owned 77.7-t 75 . 13 X0 .32 35 .85
Rented 16.-tl 17.81 13.58 49 .81
7 06 6 . 1 () 14 . 3-t
Figure for city and c:in tonment no t separat1.:l y a\ailablc in I 980.
3.1.3 Peri od of Construction
Out of the tota l owned housing uni ts . onl y I. 15 pe rcent \\·ere found under
construction '' he rcas more than 71 .XO percent of housing units in c ity w1.:re con structed I 0
years ca rli1.:r to the 1998 Census. Th e remaining 16. 1-t percent hou sing units \\·e re co nstru cted
between March. 1988 and 1998. of '' hi ch 10.9 1 percent were built afte r March. 1993. The
fo llowing tab le g i' cs furth er dctai Is.
TABLE 3.3: PERCENTAGE OF OWNE D HOUSING UN ITS BY PERIOD OF
CONSTRUCTION , 1980 & 1998
Pe ri od of Constru cti on 1980 1998
c it \" M. Corp . Cantt. C itv M. Co rp . Cantt.
Under Construct ion I. 15 1.17 0.92
Less than 5 years 17.96 10.9 1 10.76 13.40
5-10 years 15 .77 16. 14 16. 14 16. 10
More than I 0 years 66 .27 71.80 7 1.93 69.58
Figure fo r city and cantonment are not se parately availab le in 1980.

46
Fig : 3.2
SIALKOT CITY HOUSING UNITS BY PERIOD OF CONSTRUCTION
80.00
71.80
70.00
60.00
50.00
I-z w (.)
40.00 a: w a..
30.00
20.00 16.14
10.91
10.00
D 1.15
0.00
Under Construction Less than 5 Years 5-10 Years More than 10 Years
( PERIOD OF CONSTRUCTION )

41
3.1.4 Construction Materia l of Outer Walls
Quality of ho us ing units is dt.:termine d by constructi on material u sed in outer \\alls
:rnd roofs of the houses . Ac co rding to 1998-Cc ns us. 95 .20 percent housing u nits had standard
categ ory o f \\alls made of baked bri c ks /bl ocks/s tone s \\ith cement bo unding whil e 3 .9 8
percent h;ld " ·al ls of un baked brick/mud bounded in the city . Remaining categorie s of houses
made o f wood / bamboo o r falling under·· o the rs .. ,,·e re 0 .45 and 0 .37 pe rcent rcspec ti\-1.!ly .
C o ns tru c ti o n pattern o f o uter \\all s in C:rnto nm l.!n t :ind Municip:il areas sho wed
s ignificant diffcn:nce. The fo ll o,,ing tabk 3 .4 gi,·e s detail o f co ns truc t ion m aterial of \\ a lls .
TABLE 3.-t : CONST RUCTION MATERIAL USE D I N OUTER WALLS,
1980 & 1998
Wall fate rial 1980 199 8
City 1\1. Corp . Cantt. C i tY rvl. Corp. Cantt.
Baked Bricks/ Blocks/Stones 96. 4 3 95 . 20 lJ .5 .27 94. 67
Unbaked Bricks/ Mud 2 .45 3. 98 3.90 4 .66
W ood/ Bamboo 0. 16 0. 45 0 .48 0 . 22
Others 0 .97 0 .3 7 0 .35 (). 4 5
Fi g ure for ci ty a nd c an to nment arc no t separat.: I ~ a,·a ilabk 198 0.
3.1.5 Construction Materia l of Roofs
Thi.! pro portio n of housing units ha,·ing s tandard catcgo r~· o f roo fs construc ted" ith
RCC / RBC (reinforce d concrete/ bricks \\ith ce me nt bo unding) is 65 .62 pe rce nt. w h ik thl.!
pcrcl.'. n tagcs of ce rn l.! nt/ iron sheet :rnd " ·ood/ bamboo used in thi.: co ns truc ti on of roo fs ore I 1.6 1
a nd 2 1.20 rl.'.spcct i\ c l: ·. Ho\\i.:\·cr comparis o n of Mu n ic ipal :lrea fig u n.:s of 1998 C ens us" ich
th:lt of I 980 C e ns u s portra yed a pict ure o f impro n.:: me nt in Ii' in g s tru c tu res . The fo lio'' ing
tabk g i\ cs further d1.:tails .
TABLE 3.5: CONSTRUCTION MATERI AL USED I N ROO FS,
1980 & 1998
Roo f Makria l 1980 1998 ~~~~~~~~~~~~~~~~~~~~~~~~
Ci tY M . Corp . Cantt. CitY M . Corp . C:intt.
RCC/ RBC 3 1 A 6 65 .60 65 . 62 65.4 7
Ce m ent/ Iron s heet 67.47* 11 .6 1 I 0 .85 I 7.3 7
W ood/ Bamboo 2 1. 20 21.89 15. 98
Othe rs 1.07 1.59 1.64 I . 18
* Inc lude s percent:ige s hare of \\Ood/ bamboo .
Figu re for c ity :ind cantonment arc not se parat e ly a\·a il ablc in 1980 .

Fig : 3.3
SIALKOT CITY HOUSING UNITS BY MATERIAL USED IN
OUTER WALLS AND ROOFS
Wood/Bamboo 0.45%
Un-Baked Bricks/Mud 3.98%
Wood/Bamboo 21 .20%
Cement/Iron Sheet
11 .6 1%
Other 0.37%
Baked
( OUTER WALLS )
Bricks/Blocks/Stones
Other 1 59%
95.20%
(ROOFS)
·,

49
3.2 HO US ING FACILITIES
3 .2. 1 Source of Drinking Water
Easy access to potable/ safe drinking wate r is one of the bas ic hu man needs . As pe r
informat ion co llected in the 1998 Census. in Si alkot city. the facil ity of drin king water in side
the house was a\ai labk to 96 .68 percent of the hous ing units which was relati ve ly hi ghe r in
the l\.lunicipal aro;i · ~ s compar-c d to the Cantonment area. The comparison o f fi g ures of 1980
and I 99 X Ccn s u sc~ · in Mlln icipal area showed si·gn of impro,··emcnt as pipe water ·is avail ab1c . .
to hig her percehtagc· o f housing unit s 1n l 9n. T~blc 3 .6 g i,·cs detail of source of drinking
TABLE 3.6 : PERCENTAGE OF HO US I NG UN ITS BY SOURCE OF
DRINKI NG WATER, 1980 & 1998
Source o f Drinking Water 1980 199 8
Cit \' M. Corp. Cantt . Cit\' M. Corp . Cantt .
INS IDE 84.9 3 96. 68 9 7. 36 91 .48
Pipe (Nul) 45 . 99 82.3 7 8 1. 2 7 90.42
Hand Pump 3 8.6 2 13 . 99 15 . 74 0 . 73
We ll 0 .3 2 0 .32 0 .3 5 0 . 03
OUTSIDE 15. 07 3. 32 2 .64 8 .52
Pipe (l\' u l) I o. -I'> 2 . 7 1 2. 0 8 7.49
Hand P11111 p 4 .2 8 0. 34 0. 3 1 0 .55
\Ve ll 0 . 28 0. 02 0 .03
Po nd 0 .02 0 . 0 I ( I (I I
Othe rs 0.2·-I o. ~ 1 o . .+x
Fig ure fo r c ity and ca111011nH.: nt arc not sc paratdy avai labk fo r 1980.
3.2.2 Source of Lightin g
Elect ri c ity is the most comm on source of lighting !n the city whic h i.> :n ail able to
lJ X.5 7 pe rcent of the hous ing units . Thc pt: rc cntagc of housing units us ing ke rosene o il of
light is only 1. 0 8 pe rcent. There is no signifi cant d ifference in the sourcf: of lig hti ng in
Mun ici pal Corporati on and Cantonme nt area. Comparison of info rmati on i il Munic ipal a n;a
presented a good im pro\'cment ove r 19 80. Table 3 .7 pro,·idcs pcrce ntag~ of hous ing units by
source of light.

50
Fig: 3.4
SIALKOT CITY HOUSING UNITS BY SOURCE OF DRINKING WATER
Hand Pump 14.33%
Well 0 .34%
Pond 0.01 %
Other 0.24%
Pipe (Nul) 85.08%

51
TABLE 3.7: PERCENTAGE OF HOUSI NG UN ITS BY SOURCE OF LIGHTING,
1980 & 1998
Source of Lighting 19 80 1998
cit\ M . Co rp . Cantt . City M. Corp. Cantt.
Elcc tricitY 89 .96 98.5 7 98 .5 5 98. 72
Kerosene Oil 9 .04 I. 08 1.09 1.06
Others 1.0 I 0.35 0.36 0.22
3.2.3 Cooking Fuel Used
The most pronounced so urce o f cook ing fuel in the c ity is gas wh ich is used in
79. (>7 pe rcent o f the total hous ing units . Wood ;:ind ke ro se ne oi l were u sed in 10.55 and 8 .39
pe rce nt ho us ing uni ts respect ive ly. Pe rcentage of housi ng units usi ng gas in Municipal area is
h ig her then that o f Cantonment.
During I <JXO Census in Muni c ipal area. " ood ,~· as fo und to be prond un ci..:d cooking
fuel at '!>9 .7 7 p-.: rce nt . fo ll o\\l!d b \ gas ;1 t n.1 1 percen t. S ubs tan ti\·e red uct io n in the
pe rcentage of housi ng units us ing ,,·ood and ke rosene oi l in 1998 ;:ind th ree a nd ha lf fo ld
increase in th e percentage o f hous in g units using gas indi cate a trend of im proveme nt 111
l\ lun icip;1I a rea of Sia lkot. The fo l lo\\ ing table 3 X pro' ides percentage of housi ng un its by
so u rce of cooki ng fu e l used .
TABLE 3.8: PERCENTAGE OF HOUSI NG UNITS BY COOKI N G F UEL US ED,
1980 & 1998
Sou rec o f L i g h t i n g 1980 l 99 X
C ity M. Corp . Can tt. Cit,· 1\1 Corp . Can tr .
W ood 39. 77 I 0.55 10. 12 l 3 j' ;,
Kerose ne O il 20.92 8 .39 7 .90 12. If
Gas 23 . 11 79.66 XO . 61 72.49
Oth e rs 16 .20 1.40 1. J 6 1. 64
' ·

52
Fig: 3.5
SIALKOT CITY HOUSING UNITS BY SOURCE OF LIGHTING &
COOKING FUEL USED
Kerosene Oil 1.08%
Gas 79.66%
Other 0 35%
Other 1.40%
(LIGHTING)
Electricity 98.57%
Wood 10.55%
(COOKING FUEL)
Kerosene Oil 8.39%

3.2A Availability o f Kitchen, Bathro om , Latrine
Accordin g to the I lJlJX Censu s 55.1 (1 percen t of the housi ng units h:ld scpar:ltl.:
ki1ch..: n in Sialk u t cit:. relati\ c l: hi gher in Cantonment as comp.11ccl to i\lunicipal area .
The pcrccntag<.: o f ho using units \\ ith shareJ kitch..:n ''as 2 1.<10 percen t "hilc 2 3. I X percent
housing unirs h:l\ c 1w kitchen foci lit: . Cantonment and i\ lun icip:il :Hea shO\\ similar
' :1 ri:lli on
Proportion of housing units h:1\ ing scpar:ltL' and shared bath nwm facili ri es in thL·
c ir' \\as L>bsenL·<l ro bL· :l t. 5<J.20 an<l J-1 .:'J jJl' rce nl re :; pel.'ti\c l:. The hous ing uni.rs ha\ ing no
barh room focil ir:· \\<.:re tJ.27 perccn t. The corrl'Sponding faci lir ies 111 C111ton111e nt and
\1 11nicipal area sho \\cd \\ i<le \ariatio n.
SeparatL' latrine facil it: \\as a\ ailablc to 5:0UHi percent hous ing uni rs of the cit: in
l l)lJX C.:n sus . The pe rcentage or housing units \\ith s har..:d lat rine \\aS 3<J.2:> \\hilc 5 . 71
pace nr ha\..: nL> l:it rin ..: foci lit' Faci liti..:s of s..:parati.; lat rin e and sha n:J latrine in ho using
units of CantonmL·nt :1 rea ''ere ob sen ed to be at 71 1-1 and 2 1 . ..!6 percent respect i' cl: against
) (1 .~3 and J X. 19 percent in i\ lunicipa l area . The percentage di s tributi o n o f ho using units l)\·
kitchen . hat h room anJ l:1trine facilities arc shO\\ll in th c foll o\\ ing table.
T AB LE 3.9 P ER CEN TAGE OF HOl'SI N <; l lNITS BY KITC HE N, B.-\THROO~l
.\ N D L.-\TR I N E F:\CILITI ES, 1998
Housing F:iciliti cs Cit'
Kitchen
Shared 21 .no
None 23 IX
Bath room
Se pa race 56 .20
Shared
1 one lJ . 2 7
Latrine
Separate 58 .06
Shared 36 .23
Nont.: 5. 71
1\1. Co rp .
22 . ..!3
n .x7
:'..! .-1-1
36.61
56 .33
38. 19
5. 4Y
Canlt .
15 .82
17 .%
69 .-llJ
18 . 79
11. 73
7 I . 1-1
2 I . -16
7. 20
. {~

1-z w u a:: w
70.00
60.00
50.00
40.00
Cl. 30.00
20.00
10.00
0.00
Fig: 3.6
SIALKOT CITY HOUSING UNITS BY KITCHEN,
BATHROOM AND LATRINE FACILITIES
58.06
55.1 6 56.20
KITCHEN BATHROOM LAT RINE
D Separate
• Shared
IZ! None

55
3.2.S Source of Information
Th 1.: q u1.:s ti on o n suu rc1.: of in for mation has b1.:en asked for the firs t t ime in 1998
C...: nsus to ass1.:ss the medi a co\e rJgc . Three main sourc1.:s \ iz : \\ J tchin g TV. li s ten ing radi o
!ind reading newspaper were co\e red in tho..: qu...: s tionnai re . Ove r 92 pc rcent o f the
houschulds in tho..: c ity h~n...: access to T.Y . fol lo\\o..:d by 56 .32 perc...:n t reading 110..:\\·spap...:r \\·hil c
35 . XX p...: rc ...:nt ha\ 1.: access to radio . Thc proport io ns of popu la t ion ha,·ing access to
Cantonm...:nt areas is higher as compared to 1\.1.C as shown in the fol lowi ng tablt: .
TABLE 3. 10 : PERCEN TAGE OF HOUSE HOLDS BY SOU RCE OF
I NFORMATION, 1998
Arca To tal Ho us..:: ho lds T. Y. Radio N<.::\\ spap...: rs
Cit\· 47 .342 92 .62 35 . 88 56.32
!VI. Corp 41. 334 92 .72 32 . 16 54.36
Cantt 6.008 9 1.% 61.53 69. 77

57
PART- IV STATISTICAL TABLES OF 1998
PO PU LA TION AND HOUSING CENSUS
' l' ~
I ' I
' 1

59
TABLE l - POPULATION BY SEX , SEX RATIO. HOUSEHOLD SIZE ANO ANNUAL GROllT H RATE
CITY / URBAN
LOCAL! TY
S I AU.OT CI TY
S IALl,OT CAN TT.
S IAU.OT I-I. CORPORATION
BOTH
SEXES
2
MALE
3
POPULATION 1996
FEMALE
4
SEX
RATIO
5
I 1981 - 1998
______ I POPULATION IAVG. ANNUAL
AVERAGE 1981 jGROIJTH RATE
HOUSEHOLD ( % AGE )
S IZE
6 8
-- ----- -- ------ --------------·-----
SIALKOT CITY
421. 502 227.398 194, 104 117.2 6 . 9 302 , 009 1.98
63.126 43.504 19,622 221 . 7 6.0 43 , 862 2. 16
358.376 183.894 174,482 105.4 7.0 258 . 147 1.95

60
TABLE 4 - POPULATI ON SY Sl~GLE YE AR AGE ANO SEX
-- ---POPULATI ON 1998
AGE
( IN YEARS) BOTH SEXES MALE F EMALE
-·----- -----~- -- ·-2
···--- - - - - --·- --
SIALKOT CIT Y
ALL AGE$ 421. 502 7?7 . 398 194 .104
00 -- 04 46,510 23. 771 22. 7 39
BELOW 8.446 4.304 4. 142
01 7.967 Jl. l 12 J.855
02 9,933 5.070 •.853
03 10.115 5.114 !'>.001
04 10,049 5 , 171 4.878
05 09 50,839 26,280 24.559
05 10 . 332 5,37 5 4,957
06 10,363 5,395 4,968
07 10.633 5,4'12 5.191
08 10.981 5,671 5. 310
09 8,530 4,397 4. 133
10 14 SI. 488 26.709 24 . 779
JO l !. 801 6. !62 5.539
l l 8.870 4.676 a. 190
12 11.597 !; . 133 5.464
13 9,252 ~.7 38 4,514
14 9.966 5.000 4,968
15 19 45,023 22. 719 22. 704
15 8.997 4.492 4,505
16 9,000 4.390 4.610
17 8,264 3.987 4 . 297
18 ll,289 5.837 5.452
19 7 ,853 4,013 3,840
20 24 42,951 22. 577 20.374
20 10,646 5, 134 5.512
21 6 , 805 J, 630 3.175
22 10,219 5.262 •.957
23 7 ,305 4.102 3.203
24 7,976 4 • .J.49 3.527
25 29 38, 56• 22.647 15.9li
25 10 0413 5 .287 4. 7~!
26 7,525 4,410 3. l 15
27 7 . 023 4,372 2,051
28 a. 1as 5.1 .04 J.641
29 5 , 183 J.434 l. 749

61
TABLE 4 - POPULATION BY S INGLE YEAR AGE ANO SEX
- -- - -- - - - - --- - ----· -- ------ . --POPULATION 1998
AGE
( IN YEARS ) BOTH SEX ES MALE FEMALE
4
S l ALKOT CI TY
30 J4 35. 328 21. 708 13 ,620
30 I I . 721 6.336 5 , 365
3 1 4 ,525 3 , 177 1 , 348
32 7 .696 • .856 3,040
3 3 6.026 3. 6 92 2 , 136
34 5 . 156 3. 447 I. 7 11
35 39 26 .6 15 15.494 I!. 121
35 9 . 980 5 . 487 -l.493
36 4, 994 3.109 1 , 665
3 7 3,760 2. 3 39 I. 42 1
~8 5 , 226 2. 690 2. 336
3 9 2 .653 1.669 984
40 4 4 21,052 1 1.604 9 , 446
40 6 , 405 4 , 337 4 , 068
41 2.364 1. • 00 964
42 • .358 Z, 445 I. 9 13
43 3. 019 1. 778 1 . 24 1
•• 2 . ?0b 1.644 1 .262
45 49 15 . 666 8 . 556 7 , 31 2
45 6. 374 J , 254 3 .120
46 2 ,464 1. 447 1 . 01 7
4 7 2 .255 1.285 970
48 3. 06 1 l . 620 1.441
49 I, 7 1•1 950 76 4
50 54 14 , 2 36 7 .659 6 ,577
50 6 , 61 0 3. 372 3 , 236
5 1 1 .627 946 679
52 2 , 490 1 , 358 I. 132
53 1 , 78 4 967 797
54 l . 725 994 7 31
55 59 9,C40 4 ,856 4, 164
5 5 J, 763 I ,870 I ,693
56 I ,38! 797 584
57 I , I Ill 62 5 48'i
56 1. 786 I .020 766
59 1,0 00 544 456

TABLE 4 - POPULATION BY SINGLE YEAR AGE AND SEX
AGE
(IN YEARS)
60 6 4
60
61
62
63
64
65 69
65
66
67
68
69
70 74
70
7 J
72
73
74
75 &. ABOVE
·-- - ------ --
POPULATION 1998
BOTH SEXES MALE
2 3
SlALKOT CITY
8,421 4 ,485
4,480 2,302
666 407
l,227 678
1 ,059 577
989 521
5.448 2.957
2,770 1,388
631 400
597 369
893 488
557 312
4,616 2 ,556
2.808 1.457
323 199
588 355
413 268
484 277
5 , 103 2,820
FEMALE
3,936
2, 178
259
549
482
468
2.491
I. 382
2 3 1
228
405
245
2.060
1 . 35 1
124
233
145
207
2,283

63

64
TABLE 4 - POPULATION ev SI NGLE YEAR AGE ANO SEX
POPULATION 1998
AGE
(IN YEARS) BOTH SEXES MALE FEMALE
--- - - - -- ---- - -2 3 4
---- - ---- --
S IALKOT CANTT
30 34 II. 038 9,J92 1, 6 46
JO 2 .935 2 ,Jl2 623
JI 1.837 1.638 199
32 2.376 2 ,04 1 335
33 2. 059 1,783 2 76
34 1 .831 1,618 213
35 39 6 .338 5 . 1a 7 I. 191
35 2.226 I.Bil 415
36 1 . 436 l .203 233
37 l ,008 830 178
38 I ,032 798 234
39 636 505 131
40 44 3 ,007 2 . 132 875
40 I ,013 706 307
4 1 424 32J J OI
42 6 44 434 210
43 465 343 122
4 4 461 326 135
45 49 l , 88 1 1.227 654
45 57 4 J66 208
46 359 2 45 114
4 7 329 226 103
48 393 244 149
49 226 146 80
50 54 1. JOI 772 529
50 495 287 206
51 194 134 ~o
52 2 4 1 141 100
53 194 104 9(J
54 177 106 71
55 59 7 39 431 308
55 221 127 9 4
56 119 70 49
S7 11 0 61 49
58 173 104 69
59 J 16 69 4 7


67 i
TABLE 4 - POPULATION BY S INGLE YEAR AGE AND SE X I ~ ------- -- ---------~ I POPULATION 1998
AGE I ___ 4 ( IN YEARS) BOTH SEXES MALE FEMALE >
.l --------- ---- ------- - --- -- -- ~
2 3 4 ·'
--------
' SI ALKOT M.CORPORATI ON ~
I JO J4 24, 290 12, 316 11 , 974
30 0. 786 4,024 4 ,762
3 1 2 . 688 1 , 539 1,149
32 5 ,520 2 .815 2, 705
33 3,969 2, 109 1,860
3 4 3,327 1,829 1, 4 98
35 39 20 ,277 10, 347 9,930
35 7. 754 3,676 4,078
36 3,558 1 , 906 1 ,652
37 2. 752 1,509 1 ,243
38 4, 196 2,092 2.104
39 2,017 1,164 853
40 44 18 , 045 9 , 472 8,573
40 7,392 3, 631 3, 76 1
41 1.940 1,077 863
42 3. 7 14 2 . Oil 1,703
43 2 , 554 1 . 435 I, 119
44 2 , 445 1.318 1.127
45 4 9 13,987 7.329 6,658
45 5.800 2.888 2,912
4 6 2, 105 1 ,202 903
47 1,926 1,059 867
48 2,668 1. 376 1,292
49 1.488 804 684
50 54 12.935 6.887 6,04i:l
so 6, 115 3,085 3,030
51 1,433 814 619
52 2,249 1 ,217 1,032
53 1.590 883 701
54 1 ,548 888 660
55 59 8,301 4,425 J,876
55 J , 542 1.74 3 l. 799
56 1,262 727 535
57 1.000 56• 436
58 1.613 916 637
59 884 47 5 4(J9

AGE
( IN YEARS)
60 64
60
61
62
63
64
65 69
65
66
67
68
69
70 74
7 0
7 1
72
7 3
74
75 &. .;aovE
68
TABLE 4 - POPULATION BY SINGLE YEAR AGE ANO SEX
- --------------------· --·---- - - ·-· I POPULATION 1998
'----- -----BOTH SEXES MALE FEMA LE
3 4
SIALKOT M. CORPORATION
7,7 40 4, 108 3.632
4,200 2, 162 2.038
603 367 236
1 . 097 593 504
949 513 436
891 47 3 418
5,025 2,722 2 . 303
2,609 I, 312 1.297
573 362 211
545 337 2 08
810 436 37 4
488 2 75 2 13
4,289 2,379 1 ,910
2 ,640 1,38 1 1. 259
30 5 18 9 11 6
5 30 317 2 13
376 242 134
438 250 188
4, 722 2 ,605 2, 11 7
·---- ---·- ·-- - - --- --- --- - ·-

69
TABLE 5 - POPULATION BY SELECTED AGE GROUP ANO SEX
AGE
GROUP
(IN YEARS )
UtlOER
UNDER 5
UNDER JO
UNDER 15
05 24
15 49
15 6 4
18 60
18 & ABOVE
21 &. ABOVE
65 & ABOVE
UNDER
UNDER s UNOER 10
UNDER 15
OS 24
JS 49
JS 64
18 60
:a & ABOVE
21 & ABOVE
65 & ABOVE
UNDER
UNDER 5
UllOER 10
UNDER J5
05 2 4
15 49
15 64
18 60
18 &. ABOVE
21 .!. ABOVE
65 t. ABOVE
POPULATI ON 1998
BOTH SEXES 1·1ALE
2
S!ALKOT C!TY
6,446 4,J04
46,510 2J. 771
97,349 50.051
J48,637 76. 760
190,701 98,265
225.601 125,J05
257.498 142.305
~27.276 127 .253
246.384 137.769
216.596 122. 785
15 . 167 0. 333
S !ALKOT CANTT
884 47 l
5,546 2.875
11. 022 5. 746
15,906 8,293
2 1. 255 12, 2 4 5
43,368 33.004
46,089 34.584
43,367 33.210
44 , 899 34 ,074
42.075 32,519
l, 131 627
SIAL,OT M.CORPORATION
7,562 3.833
40. 964 2 0 .696
86.327 44. 305
132,93 1 66,467
169,446 86,040
182, 433 92' 301
211 , 409 107 '72 J
183,909 94.04 3
201 '485 103,695
174,521 90.266
J4 ' 036 7,706
FEMALE
4
4, 142
22' 7 39
47,298
72 ,077
92,416
100,496
115.193
100 .023
108,615
93.611
6,834
4))
2 , 671
5,276
7 ,613
9 , 010
10.364
1 1. 505
10, 157
10 ,825
9,556
504
3. 729
20.068
42,022
64 , 464
83,406
90 , 132
103 , 588
89 ,866
9 7,790
84 . 255
6,330

70
TABLE 6 - POPULATION (15 YEARS AND ASOVE:) BY SEX, AGE GROUP AND MARITAL STATUS
SEX I AGE
GROUP
(IN YEARS )
BOTH SE XES
JS AND ABOVE
15
20
25
30
35
40
45
50
55
60
65
70
19
24
29
34
39
44
49
54
59
64
69
74
75 AND ASOVE
MALE
JS AND ABOVE
15 19
20 24
25
30
35
40
45
50
55
60
65
70
29
34
39
44
49
54
59
64
69
74
75 AND ABOVE
FEMALE
15 AND ABOVE
15
20
25
30
35
40
45
50
55
60
65
70
19
24
29
34
39
44
49
54
59
64
69
74
75 AND ABOVE
TOTAL I _ _ _ _
POPULATION INEVER MARR IED!
2
272,665
45,423
42,951
38 ,S64
35,328
26,615
21 ,052
15 . 868
14,236
9,040
8,421
S,448
4,616
5, 103
150,638
22.719
22 . 577
22,647
21 . 708
15,494
11. 604
8 , 556
7,659
4,856
4,485
2,957
2.556
2 ,820
122.027
22,704
20,374
15,917
13,620
11 , 121
9,448
7,312
6.S77
4' 184
3,936
2.491
2.060
2.283
3
SIALKOT CI TY
99,426
43 ,554
30,9~9
14' 1S2
5,084
1,908
1, 133
610
569
272
388
176
223
408
59. 129
22,268
18.b99
10 ,508
3.972
I, 419
800
393
340
153
221
82
93
181
40,297
21,286
12 ,250
3,644
1 ,112
489
333
217
. 229
119
167
94
130
227
MARITA L STATUS
MARRIED
4
159,409
1 . 783
I I ,849
24, 108
29' 771
2 4 ,096
19,089
14.255
12,112
7,404
6 ' 162
3 , 755
2 , 682
2, 343
87,235
412
J,8Z4
12 . 012
17,554
13 ,871
10. 607
7 , 935
6 ,937
4 , 347
3. 733
2,408
1,879
1,7 16
72, 1 74
l ' 371
8.025
12,096
12.217
10, 225
8 ,482
6 , 320
5, 175
3.057
2,429
1, 347
803
627
WIDOWED
5
13,034
78
11 4
203
327
481
710
930
l ,496
1,325
1 ,841
l, 4 96
1,698
2 ,335
4,011
38
49
96
129
16 1
155
204
363
337
521
462
579
917
9 . 023
40
65
107
198
320
555
7 26
l, 133
988
1,320
l,034
l.119
l ,418
DIVORCED
6
796
8
39
101
146
130
120
73
59
39
30
21
13
17
263
5
31
53
43
42
24
19
19
10
5
6
533
34
70
93
87
78
49
40
20
20
16 I
8
11

11
TABLE 6 - POPU LATION (1 5 YEARS ANO ABOVE) BY SEX, AGE GROUP ANO MARIT~L STATUS
SEX / AGE
GROUP
(IN YEARS)
BOTH SEXES
15 AND ABOVE
15 19
20 24
25
30
35
40
~ 5
50
55
60
65
70
29
34
39
44
49
54
59
64
69
74
75 AND ABOVE
MALE
!5 At<O ABOVE
15 !9
20
25
30
35
40
45
50
55
60
65
70
2 4
29
34
39
44
49
54
59
64
69
74
75 ANO ABOVE
FEMALE
15 ANO ABOVE
IS 19
20 24
25 29
30
35
40
45
50
55
60
65
70
34
39
44
49
54
59
64
69
74
75 ANU ABOVE
TOTAL
POPULATION I NEVER t·tARRI EDI
2
47,220
3,986
6,909
10,209
1 l .038
6.338
3.007
1.88 1
1.301
735J
68 1
423
327
381
35.211
2.017
4 . 810
8.279
9. 392
5. 147
2. 132
1.227
772
431
377
235
177
2 15
12.009
1,969
2,099
1.930
1 ,646
1.191
875
654
529
308
304
188
150
166
3
S I AL~OT CAN TT
11 . 857
3. 717
3,950
2 ,512
921
297
137
78
58
33
49
23
25
57
8.324
1.922
2 . 923
2, 153
792
2•2
105
49
35
20
30
13
11
29
3 ,533
1.795
1 , 027
359
129
55
32
29
23
13
19
10
14
28
MARITAL STATUS
MARRIED
4
34.286
257
2 ,947
7,649
10 ,046
5,9B4
2,808
I, 7 37
I. 110
607
504
266
191
180
26 ,503
89
I .882
6.090
8 ,545
•.873
2,007
I . 160
707
382
319
181
131
l 37
7. 783
168
l,065
1.559
J,501
I, 111
801
577
403
225
185
8 5
60
43
\./IDOWED
5
l ,010
12
10
34
45
51
55
64
129
99
126
132
110
143
352
6
5
25
41
29
18
16
30
29
28
41
35
49
6 58
6
5
9
4
22
37
48
99
70
98
91
75
94
DIVORCED
6
67
2
14
26
6
2
2
32
11
14
3
2
35
2
12
5
4
2
2

, ..
TABLE 6 - POPULATION (15 YEARS ANO ABOVE) BY SEX, AGE GROUP ANO MARITAL STATUS
SEX / AGE
GROUP
(I N YEARS )
TOTAL
POPULATION jNEVER MARRIED !
2
-----~- - --- - -------------- ----·
MARITAL STATUS
MARR JED WIDOWED
4 5
SIALKOT M. CORPORATION
BOTH SEXES
15 ANO ABOVE
15
20
25
30
35
40
45
50
55
60
65
70
19
24
29
34
39
44
49
54
59
64
69
74
75 ANO ABOVE
MALE
15 ANO ABOVE
15
20
25
30
35
40
45
50
55
60
65
70
19
24
29
34
39
44
49
54
59
64
69
74
75 AND ABOVE
FEMALE
15 AND l\BOVE
15
20
25
. 30
35
40
45
50
55
60
65
70
19
24
29
34
39
44
49
54
59
64
69
74
75 ANO ABOVE
225,445
41, 437
36,042
28.355
24,290
20 .277
18,045
13.987
12, 935
8.301
7.740
5.025
4 ,289
4.722
115 , 427
20. 702
17.767
14,368
12 , 316
10,347
9.472
7. 329
6 , 887
4,425
4 , 108
2.722
2 , 379
2.605
110.018
20,735
18,275
13.987
11. 9 7 4
9.930
8.57 3
6.658
6.048
3,876
3 , 632
2,303
1,910
2,117
87,569
39.837
26.999
11.640
4 .163
I, 611
996
532
511
239
339
153
198
351
50 . 805
20.346
15,776
8.355
3.180
1 . 177
595
344
305
133
191
69
82
152
36,764
19 ,491
1 1,223
3.285
983
434
JOJ
188
206
106
148
84
116
199
125,123
1 .526
8,902
16. 459
19,725
18, 112
16.281
12.518
11. 002
6. 797
5,658
3 ,489
2. 491
2. 163
6 0. 7 32
323
1, 942
5.922
9.009
8.998
8.600
6. 775
6 . 230
3. 965
3 ,414
2 . 227
1,748
1, 579
64,391
1.203
6 , 960
10.537
10 . 716
9, 1 14
7,681
5.743
4, 772
2,832
2 , 244
1 ,262
743
584
12,024
66
104
169
282
430
655
866
I. 367
J,226
1 . 715
1. 364
1.588
2.192
3.659
32
44
7 1
88
132
1 37
188
333
308
493
421
544
868
8 , 365
34
60
98
19 4
298
518
678
1 , 034
918
1 , 222
943
1 . 044
I, 324
DIVORCED
6
7 29
8
37
87
120
124
113
71
55
39
28
19
12
16
231
5
20
39
40
40
22
19
19
10
5
5
6
498
32
6 7
8 1
84
7 3
49
36
20
18
14
10

73
TABLE 7 - POPULATION BY RELATI ONSHIP TO THE HEAD OF HOUSEHOLD BY AGE GROUP ANO SEX
SEX / AGE RELATIONSHIP TO THE HEAD Of HOUSEHOLD
GROUP
(IN YEARS)
BOTH SEXES
ALL AGES
00
05
10
15
20
25
30
35
40
45
50
55
60
65
70
0 4
09
14
19
2 4
2 9
34
39
44
49
54
59
6 4
69
74
75 ANO ABOVE
MALE
ALL AGES
00
05
10
15
20
25
30
35
40
45
50
55
6 0
65
70
04
09
14
19
24
29
34
39
44
49
54
59
64
69
74
75 AND ABOVE
TOTAL
POPULATION
2
421,502
46 ,510
50,839
51,488
45,423
42,951
38. 564
35 ,328
26,615
21.052
15,868
14,236
9,040
8 ,42 1
5,448
4 , 616
5, 103
227,398
23,771
26 , 280
26. 709
22.7 19
22 , 5 77
22,6 47
21. 708
15, 494
11,604
8,556
7 ,659
4,856
4 ,485
2. 957
2,556
2 ,820
HEAD SPOUSE
SIALKOT C I TY
57. 734
67
101
57
187
915
2,940
5,737
7, 158
8,080
7,237
7, 361
5,030
4,665
3, 125
2.623
2,451
49, 763
39
49
38
156
806
2,627
5, 130
6 ,261
7,055
6,283
6 , 298
4 .299
3,902
2,619
2 , 147
2,054
45,685
89
435
2 ,852
5 . 521
7, 106
7 ,013
6 ,525
5 ,224
4,390
2,596
2,021
1,051
5 45
3 17
558
24
52
63
69
65
83
83
51
25
12
15
6
SON/
DAUGHTER
5
195,567
26 . 197
35,548
40,469
36,719
25 ,927
13 ,852
7 ,825
4,321
2,314
l,092
621
170
162
6 1
93
196
111,405
13,466
18,452
21 . 011
18,673
15,3 40
10,528
6.572
3, 689
1,942
925
448
JIB
97
26
41
77
OTHER
RELATIVE
6
95, 143
20 , 068
14,970
10.277
7,308
9,571
9,200
6,592
4 , 086
2,705
1.638
l,543
I, 127
1,486
1. 176
1. 31 6
2,080
39,614
JO , 168
7,663
5,254
3,343
2.868
2,504
1,901
I. 474
1,147
641
589
329
409
280
342
642
NON
RELATI VE
27,373
178
220
596
774
3 , 686
7 ,051
8,068
4 ,037
J , 428
677
321
117
87
35
39
59
26,058
98
116
382
4<15
3 ,500
6,919
7 , 980
3. 9~7
1 . 377
6 ~6
299
98
62
26
23
40

74
TABLE 7 - POPULATION BY RELATIONSHIP TO THE HEAD OF HOUSEHOLD BY AGE GROUP ANO SEX
SEX / AGE
GROUP
(IN YEARS)
FEMALE
ALL AGES
00
05
10
15
20
25
30
35
40
45
50
55
60
0 4
09
14
19
24
2 9
34
39
44
49
54
59
64
65 69
70 74
75 AND ABO\IE
BOTH SEXES
ALL AGES
00
OS
lEl
15
20
25
JO
35
40
45
50
55
60
65
04
09
14
19
24
29
34
39
44
49
54
59
64
69
70 74
75 AND ABOVE
TOTAL
POPULATION
2
194,104
22 . 739
24 ,559
24 ,779
22. 704
20 ,37 4
15,917
13 , 620
11 .• 121
9 , 44B
7,312
6,577
4,184
3 ,936
2,491
2,060
2,283
63 . 126
5.546
5,476
4,884
3.986
6,909
10,209
11,038
6 , 338
3,007
1,881
1,301
739
681
423
327
381
RELATIONSHIP TO THE HEAD OF HOUSEHOLD
HEAD SPOUSE
3 4
SI ALKOT CITY
7 ,971
2B
52
19
Jl
109
313
607
897
1 . 025
954
1 .063
731
7 63
506
476
397
45 .127
65
383
2 , 789
5,452
7,041
6,930
6,442
5, 173
4,365
2 ,584
2,006
l ,045
542
3 10
SIALKOT CANTT
6,949
8
18
147
693
1 ,295
l, 152
909
766
642
393
358
230
167
160
5,848
15
110
757
1,128
l ,086
860
638
474
332
192
142
65
28
21
SON/
DAUGHTER
5
84, 162
12. 7 3 1
17 ,096
19,458
18,04 6
10 , 587
3,324
I, 253
632
372
167
17 3
52
65
35
52
119
20,090
4,256
4,438
3.909
2 , 979
l,980
1 , 1 1 1
584
329
249
11 3
55
20
14
7
18
28
OTHER
RELATIVE
6
55 ,529
9,900
7,307
5, 02 3
3 , 965
6 . 703
6,696
4,631
2,6 12
1 , 558
997
954
798
1,077
896
974
1 , 438
7 , 712
1,268
l , 010
845
601
734
826
704
455
306
197
169
102
136
110
103
146
NON
RELATl VE
1 ,315
80
104
214
279
186
132
88
50
51
21
22
19
25
9
16
19
22.527
18
21
107
278
3,291
6 ,45 1
7,369
3,542
905
331
103
32
31
11
ll
26

75
TABLE 7 - POPULATION BY RELATIONSHIP TO THE HEAD Of HOUSEHOLD BY AGE GROUP AND SEX
SEX / AGE
GROUP
(IN YEARS)
MALE
ALL AGES
00
05
10
15
20
25
30
35
4 0
45
50
55
60
65
70
04
09
14
19
24
29
34
39
44
49
54
59
64
69
74
75 AND ABOVE
FEMALE
ALL AGES
00
05
10
15
20
25
30
35
40
45
50
55
04
09
14
19
24
29
34
39
44
49
54
59
60 64
65 69
70 74
75 ANO ABOVE
TOTAL
POPULATION
2
43 ,504
2,875
2,871
2,547
2,017
4 ,810
8,279
9 . 392
5. 147
2.132
1 . 227
772
431
377
235
177
215
19,622
2,671
2,605
2.337
l .969
2.099
1 ,930
l.646
l .191
875
654
529
308
304
188
150
166
RELATIONSH IP TO THE HEAD Of HOUSEHOLD
HEAD SPOUSE
3 4
SIALKOT CANTT
6,400
4
IB
135
684
1.268
1 .088
853
704
552
345
289
190
135
125
549
12
9
27
64
56
62
90
48
69
40
32
JS
43
3
3
3
5
4
8
5
2
5.805
12
107
754
1,123
1 ,082
853
630
469
331
190
141
65
28
20
SON/
DAUGHTER
5
11,005
2' 189
2,335
2,045
l , 474
1 ,092
767
443
273
207
96
40
13
10
6
12
9.085
2,067
2' 103
1 , 864
J ,505
888
344
141
56
42
15
4
12
16
OTHER
RELATIVE
6
3,759
669
521
432
291
318
406
322
247
169
94
82
43
52
32
:>A
53
3,953
599
489
413
J IO
416
420
182
208
137
103
87
5~
8(
78
75
93
NON
RELATIVE
22,297
13
12
60
231
3,262
6,417
7,355
3,532
895
.;20
97
28
25
10
8
24
230
5
9
47
47
29
34
14
6
2

TABLE 7 - POPULATION BY RELATIONSHIP TO THE HEAO OF HOUSEHOLO BY AGE GROUP ANO SEX
SEX f AGE
GROUP
(IN YEARS)
BOTH SEXES
ALL AGES
00
05
10
15
20
25
30
35
40
45
50
55
60
65
04
09
14
19
24
29
34
39
44
49
54
59
64
69
70 74
75 AND ABOVE
MALE
ALL AGES
00
05
10
15
20
25
30
35
40
45
so 55
60
65
70
04
09
14
19
24
29
34
39
44
49
54
59
64
69
74
75 AND ABOVE
I RELATIONSHIP TO THE HEAD OF HOUSEHOLD
TOTAL
POPULATION
! _ ______________ _
2
358,376
40 ,964
45,363
46,604
41,437
36,042
28,355
24,290
20,277
18,045
13,987
12,935
8,301
7,7 40
5,025
4,289
4 , 722
183,894
20 . 896
23 . 409
24, 162
20,702
17,767
14. 368
l~.316
10,347
9,472
7. 329
6 , 887
4,425
4 , 108
2 . 722
HEAD SPOUSE
3 4
SON/
DAUGHTER
5
OTHER
RELATIVE
6
NON
RE LATIVE
- - - - - - ----------------
S IALKOT M. CORPORATION
50. 785
63
94
49
169
768
2 , 247
4,442
6,006
7 . 171
6. 47 l
6,719
4 ,637
4 , 307
2,895
2,456
2,291
43,363
35
46
J l
138
671
l ,943
3, 862
5. 17 3
6,202
s . 579
~ .746
3,954
3 , 613
2 , 429
2,012
l , 929
39 , 837
74
325
2,095
4,393
6.C~O
6 .153
5 ,887
4,750
4,038
2,404
l , 879
986
517
29 6
515
21
49
60
1'>4
!'!
76
75
46
24
10
14
6
6
175,477
2 1 ,941
31,110
36,560
33,740
23,947
12, 741
7 ,24 1
3,992
2,065
979
566
150
148
54
75
168
100.400
11, 277
16. JJ7
18,966
17, 199
14,248
9 ' 761
6. 129
3,416
1 , 735
829
408
105
87
23
35
65
87,431
18 ,800
13 , 960
9 . 432
6,7 0 7
8,837
8,374
5,888
3,631
2,399
1. 44 1
l , 374
1 .025
1 .350
1 ,066
1 .213
1. 934
35 ,855
9 , 499
7, 142
4,822
3,052
2. 550
2,098
1,639
I, 227
978
547
507
286
357
248
31 4
589
4 , 846
160
199
489
496
395
600
699
495
523
346
218
8 5
56
24
28
33
3,761
85
104
322
264
238
502
. 625
455
482
328
202
70
37
16
15
16

·77
TABLE 7 - POPULATION BY RELATI ONSHIP TO THE HEAD OF HOUSEHOLD BY AGE GROUP ANO SEX
SU / AGE RELATIONSHIP TO THE HEAD OF HOUSEHOLD
GROUP TOTAL
(I N YEARS) POPULATION SON/ OTHER NON -
HEAD SPOUSE DAUGHTER RELATIVE RELATIVE
- - --- -------2 3 5 6
- - - ---·- ·-----
SIALKOT M.CORPORATION
FEMALE
ALL AGES 174,482 7 , 422 39,322 7 5. 077 51 ,576 l ,085
00 04 20 , 068 28 10,664 9,301 75
05 09 21 , 954 46 14,993 6, 818 95
JO l 4 22 ,442 lB 53 17, 594 4,610 167
15 19 20. 7 35 31 276 16,541 3,655 232
20 2 4 18, 2 75 97 2,035 9,699 6.287 157
25 29 13,987 304 4, 329 2,980 6 ,276 98
J O 34 11, 974 580 5 . 959 1 ,112 4 , 249 74
35 39 9,930 833 6,077 576 2, 404 40
40 44 8,573 969 5,812 330 1,421 41
45 49 6,658 892 4,704 150 894 18
50 54 6,048 973 4,03 4 158 867 16
55 59 3,876 683 2,394 45 739 15
60 64 J,632 694 1 ,865 61 993 19
65 69 2,303 466 980 31 818 8
70 74 1,910 4 44 514 40 899 13
75 ANO ABOVE 2, 117 362 290 ]03 1. 34 5 17

SEX
BOTH SEXES
MALE
FEMALE
BOTH SEXES
MALE
FEMALE
BOTH SEXES
MALE
FEMALE
TOTAL
2
421 ,502
227' 398
194' 104
63 , 126
43,504
19,622
358,376
183 ,894
174,482
78
TABLE 8 - POPULATION BY RE LI GION ANO SEX
HINDU
MUSLIM CHRISTIAN (JATI)
5
--- ---
SIALKOT CITY
400' 165 19, 51 5
2 16,370 10,088
183,795 9,427
SIALKOT CANTT
57, 745 5,244
40,580 2,848
17, 165 2. 396
SlALKOT M.CORPORATION
342,420
175 , 79 0
166, 630
14,271
7,240
7,031
806
430
376
18
9
9
788
421
367
OAOIAN I
(AHMAD!)
6
967
486
481
111
63
48
856
423
433
SCHEDULED
CASTES
4
4
OTHERS
8
44
23
2 1
4
3
37
19
18

RELIGION
ALL RELIGIONS
MUSLIM
CHRISTIAN
HI NDU (JATI)
QAD IANI (AHMADI)
SCHEDULED CAST ES
OTHERS
79
TABLE 9 - POPULATION (5 YEARS AND ABOVE ) BY RELIGION, AB I LITY TO READ THE YOLY OURAN OR
RESPECTIVE HOLY BOOK
TOTAL CAN READ I CANNOT READ
I_
I BOTH MALE FEMALE BOTH
SEXES SEXES
-----2 3 4
---------. ---
SIALkOT CITY
37 4 ,992 203,627 171,365 301, 4 33
36 1 . 904 197,006 164 ,898 295,205
11 , 81 l 5,973 5,838 5,573
611 327 284 10
553 269 284 532
II 11 11
102 52 50 102
MALE
6
157,7 49
154,537
2,912
248
52
I_
FEMALE I BOTH
SEXES
7 6
143,684 7 3 ,559
140,666 66 , 6 99
2,661 6,238
10 601
284 2 1
11
50
MA LE
9
45 , 8 78
42 , 469
3,061
327
21
FEMALE
10
27,681
24,230
3,177
274
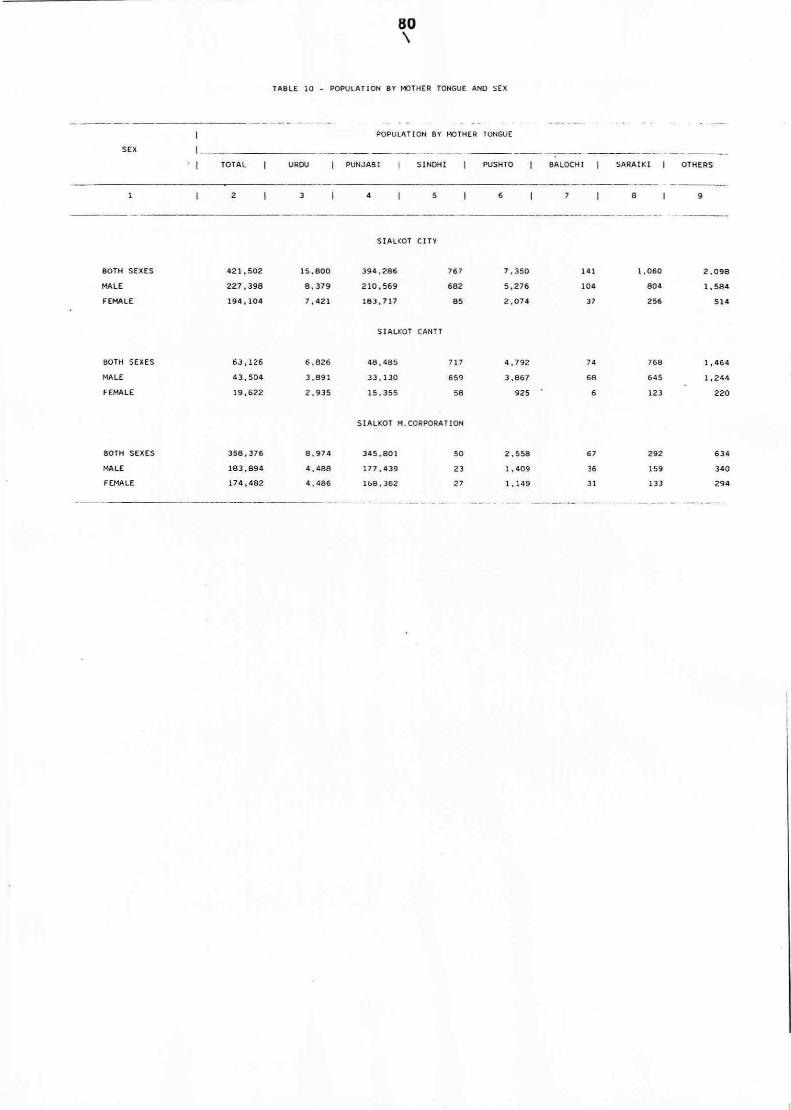
SEX
BOTH SEXES
MALE
FEMALE
BOTH SEXES
MALE
FEMALE
BOTH SEXES
MALE
FEMALE
I I_
TOTAL
2
421,502
227,398
194, 104
63, 126
43,504
19,622
358 , 376
183,894
174,482
80 \
TABLE 10 - POPULATION BY MOTHER TONGUE ANO SEX
POPULATION BY MOTHER TONGUE
URDU PUNJABI S INDHI PUSH TO
3 4 5 6
BALOCHI SARAI Kl
8
---------------------------------~-----·
15 , 800
8,379
7,421
6,826
3,891
2,935
8,974
4 , 4 88
4 , 486
S I ALKOT CITY
394 ,286 767
210,569 682
183,717 85
S IALKOT CANTT
48,485 717
33.130 659
15,355 58
SIALKOT H.CORPORATION
345,801
177 , 439
168 .362
50
23
27
7 , 350
5,276
2,074
4. 792
3,867
925
2,558
I . 409
1, 149
141
104
37
74
68
6
6 7
36
JI
1,060
804
256
768
645
123
292
159
133
OTHERS
9
2 . 098
1 , 584
514
I, 464
1,244
220
634
340
294