Provisional Population Totals - Directorate of Census Operations
122
Provisional Population Totals Paper 1 of 2011 CENSUS OF INDIA 2011 Karnataka T.K. ANIL KUMAR of the Indian Administrative Service Director of Census Operations Karnataka Series 30
-
Upload
khangminh22 -
Category
Documents
-
view
4 -
download
0
Transcript of Provisional Population Totals - Directorate of Census Operations

Provisional Population TotalsPaper 1 of 2011
CENSUS OF INDIA 2011
Karnataka
T.K. ANIL KUMAR of the Indian Administrative ServiceDirector of Census OperationsKarnataka
Series 30

(C) Government of India Copyright 2011
DesignNational Institute of Design, Ahmedabad
Printed at Government Central PressDirectorate of Printing, Stationery & PublicationsGovernment of Karnataka
Published byDirectorate of Census Operations, KarnatakaBangalore
Data Product No. : 29-001-2011-Cen-Book (E)
Price: (Inland): ` 235/- (Foreign) £ 3.17 $ 5.31
Census websitewww.censuskarnataka.gov.inemail: [email protected]

GRATEFULLY DEDICATED TO THE PERSON ENUMERATED AND THE ENUMERATOR

PROVISIONAL POPULATION TOTALS 5
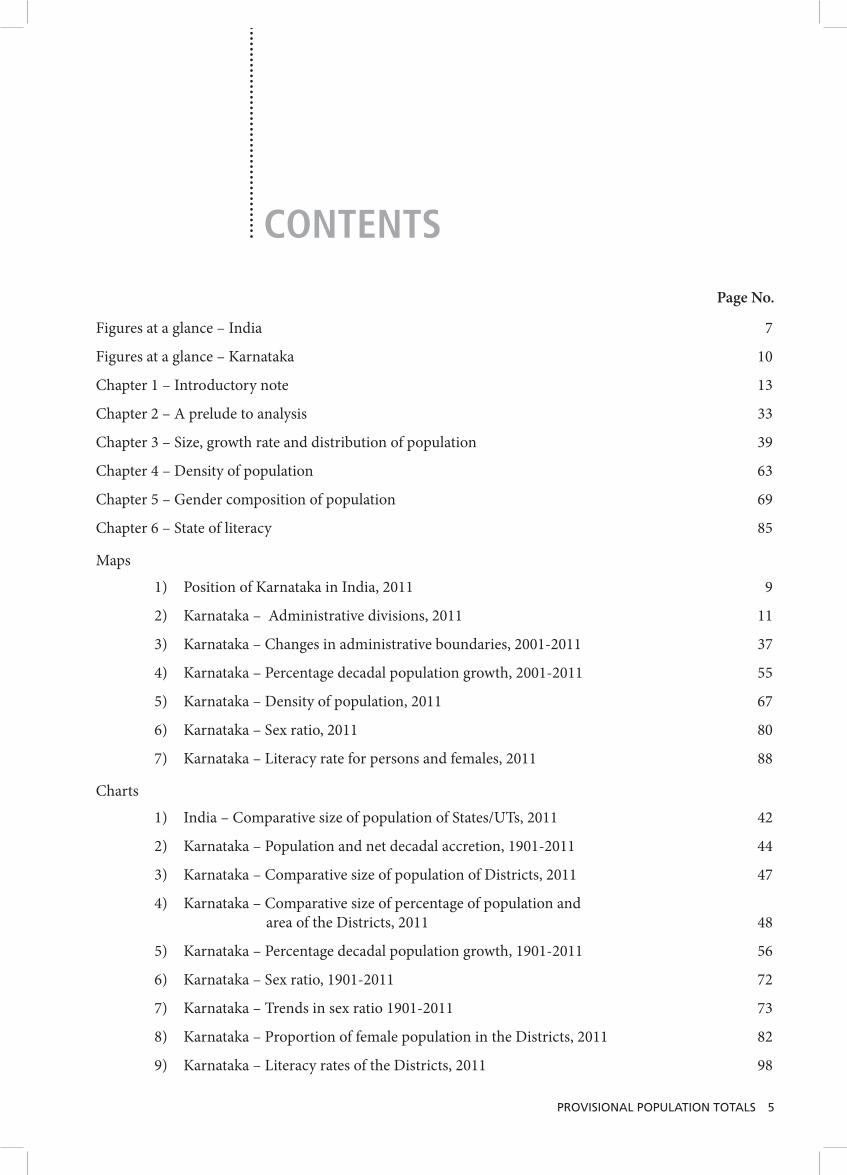
CONTENTS
Page No.
Figures at a glance – India 7
Figures at a glance – Karnataka 10
Chapter 1 – Introductory note 13
Chapter 2 – A prelude to analysis 33
Chapter 3 – Size, growth rate and distribution of population 39
Chapter 4 – Density of population 63
Chapter 5 – Gender composition of population 69
Chapter 6 – State of literacy 85
Maps 1) Position of Karnataka in India, 2011 9
2) Karnataka – Administrative divisions, 2011 11
3) Karnataka – Changes in administrative boundaries, 2001-2011 37
4) Karnataka – Percentage decadal population growth, 2001-2011 55
5) Karnataka – Density of population, 2011 67
6) Karnataka – Sex ratio, 2011 80
7) Karnataka – Literacy rate for persons and females, 2011 88
Charts 1) India – Comparative size of population of States/UTs, 2011 42
2) Karnataka – Population and net decadal accretion, 1901-2011 44
3) Karnataka – Comparative size of population of Districts, 2011 47
4) Karnataka – Comparative size of percentage of population and area of the Districts, 2011 48
5) Karnataka – Percentage decadal population growth, 1901-2011 56
6) Karnataka – Sex ratio, 1901-2011 72
7) Karnataka – Trends in sex ratio 1901-2011 73
8) Karnataka – Proportion of female population in the Districts, 2011 82
9) Karnataka – Literacy rates of the Districts, 2011 98

6
Annexures Table 1 – Distribution of population, decadal growth rate, sex ratio and population density for State and Districts: 2011 100
Table 2 – Percentage decadal variation in population for State and Districts: 1901-2011 102
Table 3 – Sex ratio for State and Districts: 1901-2011 104
Table 4 – Population in the age-group 0-6, number of literates and literacy rate by sex for State and Districts: 2011 106
Table 5 – Literacy rates by sex for State and District: 2001 and 2011 108
Table 6 – Proportion of child population in the age-group by sex 0-6: 2001 and 2011 109
Census in pictures 111
GIS enumeration block map 117
GIS ward map 118
Specimen of Houselisting and Housing Census Schedule 119
Specimen of Household Schedule 121

POPULATION 1 Persons 1,21,01,93,422Males 62,37,24,248Females 58,64,69,174
DECADAL POPULATION GROWTH 2001-2011 Absolute Percentage
Persons 18,14,55,986 17.64Males 9,15,01,158 17.19Females 8,99,54,828 18.12
DENSITY OF POPULATION 2 (per sq. km.)
382
SEX RATIO (females per 1000 males)
940
POPULATION IN THE AGE GROUP 0-6 1
Absolute Percentage to total
populationPersons 15,87,89,287 13.12Males 8,29,52,135 13.30Females 7,58,37,152 12.93
LITERATES 1 Absolute Literacy rate
Persons 77,84,54,120 74.04Males 44,42,03,762 82.14Females 33,42,50,358 65.46
Notes: please see notes overleaf.
Provisional Population Totals
CENSUS OF INDIA 2011
FIGURES AT A GLANCE INDIA

8
General Notes
1. Th e fi gures for India and Manipur, include by sex, the estimated population, 0-6 population and literates of Paomata, Mao Maram and Purul sub-divisions of Senapati district of Manipur for Census 2001 and 2011.
2. For working out density of India and the State of Jammu & Kashmir, the entire area and population of those portions of Jammu & Kashmir which are under illegal occupation of Pakistan and China have not been taken into account.
3. For Census 2011, the population of “Others” has been clubbed with the “Males” for working out population, 0-6 population, literates and related rates and ratios.
4. In working out ‘decadal variation’ and ‘percentage decadal variation’ for 1941-1951 & 1951-1961 of India and Nagaland State, the population of Tuensang District for 1951 (7,025) & the population of Tuensang (83,501) & Mon (50,774) districts for 1961 Census have not been taken into account as the area was censused for the fi rst time in 1951 and the same are not comparable.
5. Th e 1981 Census could not be held owing to disturbed conditions prevailing in Assam. Hence the population fi gures for 1981 of Assam have been worked out by ‘Interpolation’.
6. Th e 1991 Census was not held in Jammu & Kashmir. Hence the population fi gures for 1991 of Jammu & Kashmir have been worked out by ‘Interpolation’.
7. Th e distribution of population of Pondicherry (Puducherry) by sex for 1901 (246,354), and 1931 (258,628) and 1941 (285,011) is not avaiable. Th e fi gures of India for these years are, therefore, exclusive of these population fi gures so far as distribution by sex is concerned.
8. Arunachal Pradesh was censused for the fi rst time in 1961.
9. In 1951, Tuensang was censused for the fi rst time for 129.5 sq.kms. of areas only. In 1961 censused areas of Tuensang District of Nagaland was increased to 5356.1 sq. kms.
10. Due to non-availability of census data the fi gures for the decades, from 1901 to 1951 have been estimated for the districts of Kohima, Phek, Wokha, Zunheboto, and Mokokchung of Nagaland. Estimation however could not be done for Tuensang and Mon as they were not fully censused prior to 1961.
11. As the sex break-up for the districts Sheopur, Morena, Bhind, Gwalior, Datia, Shivpuri, Guna, Ratlam, Ujjain, Shajapur, Dewas, Jhabua, Dhar, Indore, West Nimar (Khargone), Barwani, Rajgarh, Bhopal, Sehore and Raisen is not available for the year 1901. Figures for males and females have been estimated for the year 1901 for Madhya Pradesh.
12. One village Ramtapur (code No. 217 and 101 in 1951 and 1961 respectively) of Jukkal circle of Degulur taluka which was transferred under the state Reorganisation Act, 1956 from Maharashtra to Andhra Pradesh, still continues in Nanded district of Maharashtra. Th e population of this village has, however, been adjusted in Nizamabad district for the year 1901 - 1951.
13. Th e names of Uttaranchal and Pondicherry have changed to Uttarakhand and Puducherry respectively aft er Census 2001.
Note of caution:Th e fi gures in this report being of a provisional nature, only the important footnotes have been given above. Th e detailed footnotes would be given when the fi nal population tables are released.
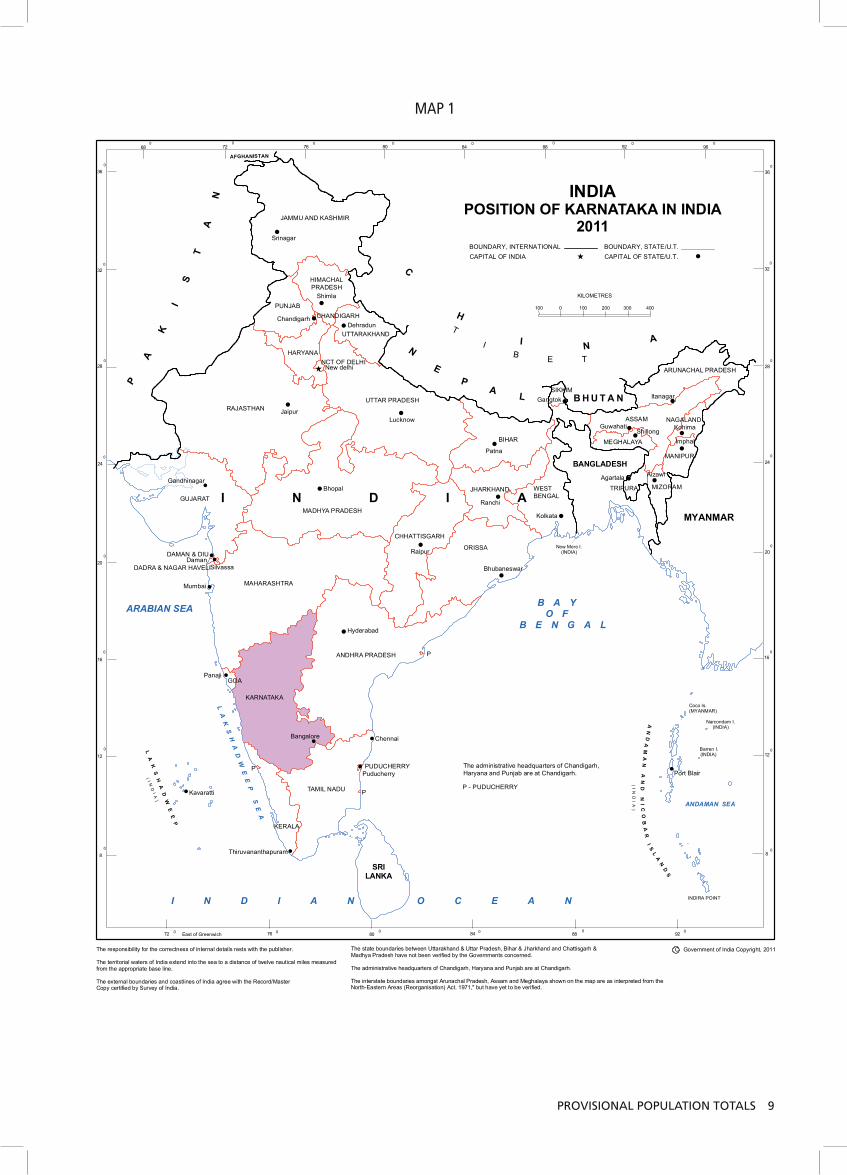
PROVISIONAL POPULATION TOTALS 9
MAP 1
!!
!
! ! ! !! ! !
! !
!
!!
!!
!!
!!
!
!
!!
!
!
!!
!
!!
!
!
!
!!
!!
!!
!!
!
!! !
!
!
!!
!!
!
!
!!
!
!
!!
!!
!!
!
!! ! ! !
!
!!!
!!
!
!
!
!
!
!
!
!
! !
! !
!
!
!
!
!
!!
!!
!
!!
! ! !
!!
!
!
!
!
!!
!
!
!
!
!!!
!
!
!!!!
!
!!
!!
!!
!
!
!
!
!
!
!
!
!!
!
!
!
!!
!
!!!
!
!
!
!
!
!
! !
!
!
!!
!
!
!
!
!
!
!!
!
!
!
!
!
!!
!
!
!
!
!
!
!
!!
!
!
!!
!!
!!
!
!
!
!
!!
!
!
!!
!
!
!
!
!
!
!
!
!
! !
!
!
!
!
!!
!!
!
!
!
!
!
! !
!
! !! !
!
!
!
!!
! !
!
!
!
!
!
!
!
!
!
!
!
!
!
!
!
!
!
!
!
!
!
!
!
!
!
!
!
!
!
! !
!
!
!
!
! !
!! !
!!
!
!
!
!!
!
!!
!
!!
!!!
!!
!
!
!
!
!
!
!!
!!!
!
! !
!
!! !
!
!
!
!!
! !
!
!
!
!
!!
!!
!
!
!
!
!!
!
!
!
!! !
!
!
!
!
! ! !
!
!
! !!
!!
!! !!
!!
!!
!
!!
!
!
!
!
!
!
!
!
!
! ! ! ! ! ! !
!!
! !
!
!
!
!
!!
! !
!!
!!
!
!!
!
! !!
!
!!
!
! ! !!
!
!
!!
! !
! ! ! ! !
!!
!
!
!
!
! !
!
!! !
!
!! !
!
!
!!
!
!
!
!
!!
!
!
!
!
!
!
!!
!!
!
!!
!
!!
!!
!
!!
! ! ! ! !!
!
!!
! ! ! !!
! !
!
!
!!
!
!
!
!
!! !
!
! !
!! !
!!
!!
!
!
!
!!
!
!
!!
!! ! !
!
!
!!
!!
!
!! !
!!
!!
!
!
!
!
!
!
!! !
! !!
!!
!
!!
!! !
!!
!!
!
!
!! !
!!
!
!
!!!
!!
!
!
!
!
!
! !
!
!
!!
!!
!
!!
!! ! !
!
!!
!
!
!
!!
!
!
!
!!
!
!!
!!
!!
!!
! !
!
!!
!
!
!!
!!
!
!!
!
!!
!!
!
!
!
!
!!
!
PA
KI
ST
AN
B H U T A N
BANGLADESH
ARABIAN SEA
N
EP
A L
B A Y O F
B E N G A L
LA
KS
HA
DW
EE
P
AN
DA
MA
N
AN
D
NI
CO
BA
R
IS
LA
ND
S
ANDAMAN SEA
(I
ND
IA
)
(I N
DI
A)
MYANMAR
POSITION OF KARNATAKA IN INDIA2011
INDIA
BOUNDARY, INTERNATIONAL BOUNDARY, STATE/U.T.
New More I.(INDIA)
P - PUDUCHERRY
AFGHANISTAN! !
!
!
!
!
!
!
!
!
JHARKHAND
!
!
Srinagar
Shimla
Chandigarh!
!
^
!
!
!
Dehradun
Jaipur
Bhopal
Lucknow
New delhi
!Gandhinagar
!!Daman
Silvassa
!Mumbai
!Panaji
!Bangalore
!Thiruvananthapuram
! Kavaratti
!
Puducherry
! Hyderabad
!Port Blair
!
Raipur
!Ranchi
!Kolkata
!
Patna
!Gangtok
!Shillong!Guwahati
!Itanagar
!Kohima
!
Imphal
!Aizawl
!Agartala
Coco Is.(MYANMAR)
Narcondam I.(INDIA)
Barren I.(INDIA)
INDIRA POINT
SRILANKA
P
P
P
I N D I A
!
Bhubaneswar
! Chennai
CAPITAL OF INDIA CAPITAL OF STATE/U.T. !^
The administrative headquarters of Chandigarh,Haryana and Punjab are at Chandigarh.
80
120
16
20
240
280
320
360
0
0
72 0 76 0 800 84 0 88
092 0
East of Greenwich
- - - - - -- -
360
320
280
240
- -
200
160
120
80
800
840
880
920
960
680
720
760
LA
KS
HA
DW
EE
P
SE
A
I N D I A N O C E A N
KILOMETRES
100 0 100 200 300 400
UTTARAKHAND
C
H
I NA
T
IB E T
RAJASTHAN
ORISSA
MAHARASHTRA
MADHYA PRADESH
KARNATAKA
GUJARAT
BIHAR
ANDHRA PRADESH
UTTAR PRADESH
ASSAM
TAMIL NADU
CHHATTISGARH
JAMMU AND KASHMIR
PUNJAB
WESTBENGAL
KERALA
HARYANA
ARUNACHAL PRADESH
HIMACHALPRADESH
MANIPUR
MIZORAM
MEGHALAYA
NAGALAND
TRIPURA
SIKKIM
GOA
NCT OF DELHI
DADRA & NAGAR HAVELI
DAMAN & DIU
PUDUCHERRY
CHANDIGARH
C Government of India Copyright, 2011The responsibility for the correctness of internal details rests with the publisher.
The territorial waters of India extend into the sea to a distance of twelve nautical miles measuredfrom the appropriate base line.
The external boundaries and coastlines of India agree with the Record/MasterCopy certified by Survey of India.
The state boundaries between Uttarakhand & Uttar Pradesh, Bihar & Jharkhand and Chattisgarh & Madhya Pradesh have not been verified by the Governments concerned.
The administrative headquarters of Chandigarh, Haryana and Punjab are at Chandigarh.
The interstate boundaries amongst Arunachal Pradesh, Assam and Meghalaya shown on the map are as interpreted from the North-Eastern Areas (Reorganisation) Act. 1971," but have yet to be verified.

POPULATION Persons 6,11,30,704Males 3,10,57,742Females 3,00,72,962
DECADAL POPULATION GROWTH 2001-2011 Absolute Percentage
Persons 82,80,142 15.67Males 41,58,824 15.46Females 41,21,318 15.88
DENSITY OF POPULATION(per sq. km.)
319
SEX RATIO (females per 1000 males)
968
POPULATION IN THE AGE GROUP 0-6
Absolute Percentage to total
populationPersons 68,55,801 11.21Males 35,27,844 11.36Females 33,27,957 11.07
LITERATES Absolute Literacy rate
Persons 4,10,29,323 75.60Males 2,28,08,468 82.85Females 1,82,20,855 68.13
FIGURES AT A GLANCE KARNATAKA
Provisional Population Totals
CENSUS OF INDIA 2011

PROVISIONAL POPULATION TOTALS 11
MAP 2


1INTRODUCTORY NOTE


PROVISIONAL POPULATION TOTALS 15
1Introductory note
The Indian Census has a rich tradition and enjoys the reputation of being one of the best and largest administrative exercises in the world. Continuing this tradition, the Census of India 2011 was conducted in the country from 9th February to 28th February 2011. Th e Census of India 2011, would bring out valuable data on the state of human resources that inhabit our country, their demography, culture and economic structure at this crucial juncture of the country’s history that would be vital to guide and shape the future course of the Nation.
Th e decadal Census is normally seen as a gigantic head count of population. In reality it is much more than just that. Th e Census gives us a snapshot of not only the demographic but also the economic, social and cultural profi le of the country at a particular point in time. It is the only available and reliable source of primary data at the level of the village and town (ward) covering not only the settled population but also the houseless and the nomadic groups. It provides valuable information for planning and formulation of policies by the Government and is also used widely by National and International agencies, scholars, business persons, industrialists, etc. In addition, the Census provides a basic framework for conduct of other surveys in the country. Any informed decision making that is based on empirical data is dependent on the Census. Democratic processes like the delimitation of electoral constituencies and affi rmative action like reservation are also based on the basic data sets provided by the Census.
WHAT IS A POPULATION CENSUS?
Th e word ‘Census’ originated from the Latin word ‘Censere’ which means to assess or to estimate. Th e Census concept has been well defi ned by the United Nations. It states that “a Census is the total process of collecting, compiling, evaluating, analysing and publishing or otherwise disseminating demographic, economic and social data pertaining, at a specifi ed time, to all persons in a country or in a well delimited part of a country”.
HISTORY
Th e descriptions in earliest literature ‘Rig Veda’ reveal that some kind of population count was carried out during 800-600 BC in India. Further references of Census-taking in India can be traced back to the Mauryan period in Kautilaya’s ‘Arthashastra’ (321-296 BC) which prescribed collection of population statistics as a measure of state policy for the purpose of taxation. Later, during the Mughal period, in the writings of Abul Fazl (1595-96) in the ‘Ain-e-Akbari’ laid emphasis on the importance of Census as a tool for decision
Enumeration of His Excellency the Governor of Karnataka

16
making. A systematic and modern population Census, in its present scientifi c form was conducted non-synchronously between 1865 and 1872 in diff erent parts of the country. Th is eff ort, culminating in 1872, has been popularly labelled as the fi rst population Census of India. However, the fi rst synchronous Census in India was conducted in 1881. Since then, Census is being conducted once in ten years. In this unbroken series, Census 2011 is the fi ft eenth since 1872 and seventh aft er Independence.
METHODOLOGY
Th e Census operations are carried out in two phases, the Houselisting and Housing Census and the Population Enumeration. During the fi rst phase, all the structures whether pucca or katcha, houses and households are identifi ed and systematically listed to form a base for the second phase, the Population Enumeration. Th e fi rst phase of the 2011 Census operations was carried out in the State from 15th April to 1st June, 2010 for 45 days. Besides listing of structures and houses, it also collected
useful data on assets and amenities available to a household which provide a comprehensive database on the housing stock in the State, its quality and living conditions.
Th e Census operations in India are conducted following an extended de facto canvasser method. Under this approach, data is collected for every individual by visiting the household and canvassing the same questionnaire all over the country, over a period of three weeks. Th e count is then updated to the reference date and time by conducting a revision round. In the revision round, any changes in the entries that arise on account of births,
deaths and migration between the time of the enumerator’s visit and the reference date/time is noted down and the record updated.
Th e second and the most important phase of the 2011 Census known as the Population Enumeration was undertaken from 9th February 2011 to 28th February 2011 with a revision round from 1st to 5th of March 2011. Th e count was updated to the Reference Moment of 00:00 hours on the 1st of March 2011. Th e houseless were enumerated on the night of 28th February 2011.
ORGANISATIONAL STRUCTURE
In India, the population Census is a Union Subject (Article 246) and is listed at serial number 69 of the Seventh Schedule of the Constitution. Th e Census Act, 1948 forms the legal basis for the conduct of Censuses in independent India. Although the Census Act is an instrument of Central Legislation, in the scheme of its execution the State Governments provide the administrative support for the actual conduct of the Census.
Hon’ble Chief Minister signing the fi lled-in Household Schedule
Enumeration of Sri. Shivakumara Swamiji of Siddaganga Mutt, Tumkur

Introductory note
PROVISIONAL POPULATION TOTALS 17
Th e Offi ce of the Registrar General and Census Commissioner, India, is an attached offi ce under the Ministry of Home Aff airs of the Government of India. Its main responsibility is to conceive, plan and implement Census taking in the country. Th e organization is headed by the Registrar General and Census Commissioner, India, at the centre. Th e fi eld offi ces in the States/UTs, headed by the Directors of Census Operations are responsible for the conduct of Census in their respective States/UTs.
Th e Directorate of Census Operations, Karnataka, is one among the 33 Directorates of Census Operations in the country. Th e Deputy Commissioners / Commissioners of Corporations are designated as Principal Census Offi cers under the Census Act, 1948 and are primarily responsible for taking up Census in their jurisdictions. Th e Enumerators and Supervisors are critical in the execution arm of the entire structure. Th ey are appointed at the Charge (Taluk / Ward) level and are the ones who collect information from the individual households across the State.
At the State level, the Revenue Department, Government of Karnataka was designated as the Nodal Department for Census 2011. Th e Secretary, Revenue (Disaster Management) Department was nominated as Nodal Offi cer / State Co-ordinator for 2011 Census operations.
HIERARCHY OF CENSUS FUNCTIONARIES
State Co-ordinators
Registrar General & Census Commissioner, India
Directors of Census Operations, State/UT
District Magistrates/Collectors/Commissioners of Municipal Corporations
Tehsildars / Mamlatdars
Enumerators/Supervisors
Prinicipal Census Offi cers
Charge Offi cers
PLANNING FOR 2011 CENSUS FREEZING OF ADMINISTRATIVE BOUNDARIES
Th e fi rst step towards Census taking relates to preparation of a complete and unduplicated list of all geographical entities in the State, which includes districts, taluks, towns and revenue villages, including their hamlets, at a particular point of time. All administrative units across the State were frozen as on 31st December 2009. Th is exercise also involved obtaining the latest maps of districts, taluks, towns, etc. A Directory of Administrative units with unique identifi cation codes was prepared for each unit to ensure that every administrative unit is covered without omission or duplication. A unique feature of the coding system in Census 2011 is that it identifi es Villages, Statutory Towns and Census Towns as separate series.
Th e fi nalisation of the Rural-Urban frame, demarcation of Out Growths of Towns and Urban Agglomeration was taken up as part of pre-census activity. Th ere are 3,893 Census Towns, 999 Out Growths and 476 Urban Agglomerations that have been demarcated in the country in Census 2011. Th e number of administrative units in the State as on the cut-off date is given in the box.

18
Number of Administrative Units in Census 2011
Districts 30
Taluks 176
Statutory Towns 220
Non Statutory Towns (Census Towns) 127
Urban Agglomerations 22
Out Growths 54
Villages 29,340
PERMANENT LOCATION CODE
One of the important inputs in Census-taking is assigning of the location code numbers at various administrative levels. Th e Location Code Number is a simple device by which every compact geographical area in any administrative unit can be uniquely identifi ed. Each such administrative unit starting from State right down to the village/ward can be referred to by a combination of such unique numbers. Until the 1991 Census, a hierarchical coding system was followed, whereby each administrative unit was coded within the next higher administrative unit serially and systematically, following a geographical order.In the past, the frequent changes in district and sub-district administrative units during the inter-census period had posed several problems to the study of changes in growth and distribution of population and their characteristics from one Census to another. For the Census of India, 2001, a system of Permanent Location Code Numbers (PLCN) had been adopted by assigning to each village, within the State/UT, a continuous series of numbers. Each village had been assigned an eight digit code. Th e fi rst six digits represent the code of the village as existing at the present Census. Th e last two digits are kept ‘00’ for accommodating future changes in case of split of an existing village or creation of new villages, etc. Since, Permanent Location Codes have been assigned to each village, theoretically, tracing the precise location of villages on account of future jurisdictional changes in the boundaries of various administrative areas within the State should not pose a problem. While the basic schema of Census 2001 have been retained, some improvements have been made in 2011 Census. Firstly, short codes were introduced for fi eld work in order to reduce the scriptory work of enumerators – Two digits each for the State and districts, Th ree digits in the case of sub-districts within the district, and Four digits in the case of Villages and Towns within a sub-district. Secondly, revenue villages have been given a range between 0001 and 6999. Th irdly, statutory towns have been given codes within the range of 7001-7999 and Census towns are covered in the range of 8001-8999. Th is makes it easy to distinguish each type of administrative unit clearly. Th is is, however, only for the purpose of fi eld work. In the detailed presentations of data, the full codes will be given.
PRE-TEST AND FINALISATION OF QUESTIONS
Th e Census questionnaire was pre-tested in the fi eld in the State and across the country from 28th June 2009 to 17th August 2009. A notifi cation to this eff ect was published in the Gazette of India on 8th April 2009 and republished in the State Gazette. Th e pre-test was conducted as a full scale exercise, a virtual rehearsal of the Census. Th e questionnaire was pre-tested in 20 urban blocks in Bruhat Bangalore Mahanagara Palike and 19 blocks in rural areas. Indi taluk in Bijapur and Kadur taluk in Chikmagalur districts were selected as rural charges for the pre-test. Th e results and fi eld experiences of the pre-test were sent to the Offi ce of the Registrar General and Census Commissioner. Based on the feed back received from all the States, the Offi ce of the Registrar General fi nalised the draft questionnaire which was put up before the Technical Advisory Committee for approval. Th e fi nal questionnaire was then put up for the consideration of the Government of India which gave its assent to canvass two sets of questionnaires. In all 35 questions were canvassed in the Houselisting Operations and 29 questions in Population Enumeration.

Introductory note
PROVISIONAL POPULATION TOTALS 19
NOTIFICATIONS REGARDING CONDUCT OF CENSUS OF INDIA 2011
Th e Census of India is conducted under the provisions of the Census Act, 1948 and the Census Rules, 1990. Th e statute requires the notifi cation of various processes under provisions of the above Act and Rules. Accordingly, various processes have been duly notifi ed in the Gazette of India and were republished in the State Gazette aft er following the processes laid down. Th e following important notifi cations were issued:
Republishing Gazette of India notifi cation - notifi cation of dates and period of conduct of the Census • of the population of India.
Republishing Gazette of India notifi cation - dates for conduct of Pre-test of Census of India 2011.•
Notifi cation of dates and period of conduct of Houselisting and Housing Census and preparation of • National Population Register (NPR) in the State.
Notifi cation on the questions proposed to be canvassed during the Houselisting and Housing Census.•
Republishing Gazette of India notifi cation - notifi cation of dates and period of conduct of Population • Enumeration.
APPOINTMENT OF CENSUS FUNCTIONARIES
Consequent on the publication of the notifi cation on Census-taking, the process of appointment of all the Deputy Commissioners as Principal Census Offi cers and other offi cers were undertaken which paved the way for formally launching the Census operations in the State. Subsequently the process of constitution of Charges, appointment of Charge Offi cers, Master Trainers, Supervisors and Enumerators were completed. For the Houselisting operations 95,742 Enumerators, 15,935 Supervisors and 1,933 Master Trainers were appointed. For the second phase, i.e., Population Enumeration, 1,03,079 Enumerators, 16,939 Supervisors and 2,278 Master Trainers were appointed.
CARTOGRAPHY
A pre-requisite for Census-taking is the availability of maps of all the administrative divisions. During the Census, the Map Division of the Directorate took up the task of fi nalising the maps for the 29,340 villages, 176 taluks, 220 towns and 30 districts of the State. Th e Map Division of the Census Organisation is now the largest producer of thematic maps in the country.
Maps of all newly formed administrative units that have come up since 2001 have been obtained and have been updated. Th e added feature in Census 2011 is that printouts of maps showing the boundary of every village/town were provided to the Charge Offi cers to mark the position of enumeration blocks on these. Th is was aimed at reducing the chances of omission or duplication of areas. Further, digital maps have been prepared for all the 176 taluks and 220 towns of the State.
Th e Offi ce of the Registrar General and Census Commissioner, India, New Delhi initiated a massive project to create digital maps for 33 capital cities in the country. Bangalore was one among the capital cities selected under the project. Th is work was initiated in February 2009 and involved physical verifi cation and creation of digital maps of all the wards of Bruhat Bangalore Mahanagara Palike. Due to the concerted eff orts of the Map division of the Directorate, it was possible to cover 134 wards under the project by April 2010, when the Houselisting operations began. Th is meant that 134 wards were provided with maps upto the enumeration block level, with street, building and other major landmarks during the Houselisting operations.
Th is Directorate was able to issue enumeration block maps to all the wards of Bruhat Bangalore Mahanagara Palike (BBMP) in the second phase of the operation, i.e., Population Enumeration 2011. Th is was not an easy task as it involved series of consultations with Ward Offi cers, fi eld visits, editing and printing of 15,974 enumeration block maps.
A copy of enumeration block map and ward map are given in page nos. 117 and 118.

20
PRINTING AND LOGISTICS
A feature that makes the Indian Census particularly complex is that the Schedules are canvassed in 16 languages and the Instruction Manuals are developed in 18 languages. In Census 2011, the Offi ce of the Registrar General ensured that the schedules used were of high quality. Th e Census 2011 schedules were printed on special grade paper in consultation with experts in scanning technology and paper technologists. Th e services of the National Institute of Design were utilized to upgrade the quality and aesthetics of the schedule. Unique features that distinguish it are bar codes in each schedule, unique form numbers, pre-printing of State and district codes, uniform quality of printing and colour drop-out facility. In order to maintain the quality and high production volumes, high end presses were involved for the fi rst time to print the Houselisting and Population Enumeration schedules. Th e result was that the Indian Census schedules are now comparable with the best in the world.
Th e distribution of these printed materials in time, according to the requirement of the fi eld operations, and reverse collection of fi lled in schedules is a complex task for the Census Organization. A pioneering initiative of using the India Post for handling the logistics was undertaken. A special ‘Logistics Post’ arrangement was put in place by India Post for Census 2011. Th e precision with which the entire logistics operation was accomplished within a very short period of time, was remarkable.
TRAINING
The need for comprehensive training of all functionaries, especially the Enumerators and Supervisors can hardly be underscored. Improved training pedagogy, training aids were developed in collaboration with UN agencies. For the first time, NGOs – the Master Trainers Alliance (MTA), who are specialised in training and capacity building in undertaking various health and demographic surveys in different parts of the State, participated in the training programme organised at different levels.
CENSUS OF INDIA 2011
::
:
::
:
::: :
:
:
:
::
:
:
:
:
:
::
: ::
G
G
G G
G
G
GG G
G
G
G
G
G
G
GG
G
G
GG
G
GManipalHospital
Dr. VenkataraoMemorialHospital
BangloreEducationPrimary School
TeluguSchool
CorporationBoy's HighSchool
B M P Primary School
Hostel &KND School
SchoolSchool
Urdu HigherPrimaryBoy's School
CorporationBoy's & Girl'sHigh School
Karnataka SecondaryEducationExamination Board
MudhurvaniSchool
B P IndianPublicSchool
S V M ES School
Govt. GirlsP U College
ChildSchool
KishoreSchool
ArunaChetanSchool
M E S CollegeOf Arts &
Commerce
SaraswathiVidhya Niketan
HarshaVidhyaKendra
Cluny ConventHigh School
VenugopalKrishnaTemple
NandiTemple
ShriRam
Temple
KodandaramaTemple
GaneshaTemple
RagavendraTemple
Temple
Sri Gangammadevi Temple
NarasihmaSwamyTemple
Sri SaiTemple
ShriramTemple
KadumalleswaraTemple
T T D
Temple
Temple
SriMahaganapathi
Temple
Sri AyyappaTemple
ShriRaghavendraTemple
Jambu MahaGanapati
Temple
ShriParameshwari Temple
Veeranjanayatemple
Shri RamaTemple
SriRadhakrishnaTemple
KancheTemple
Z52 4th Main Road
Z57 4th Main Road
15th Cross Sampege Road
Road
14th A Cross 10th Main Road
7th
Mai
n R
oad
6th
Mai
n R
oad
8th
Mai
n R
oad
14th A Cross Road
Roa d
14th A Cross Road
Road
14th Cross 9th Main Road
Z41 6th Main Road
Z38 4th Main Road
Road
Z44 11th
Ma in
Road
15th Cross Sampege Road 15th Cross Sampege Road
R oad
14th Cross 10th Main Road
5th
Mai
n R
oad
Malleshwaram
4th Cross Road
15th Cross Sampege Road
16th Cross Sampege Road
Road
Z51 3rd Main Road
7th Tem
ple
Roa
d
1st Cross 3rd Main Road
3rd
Cro
ss 10
th M
ain
Roa
d
Z30 11th Main Road
17th Cross Road
2nd C
ross 10t h
Main
Road
14th Cross 10th Main Road
Road
Z11 11th Main Road
Z56 4th Main Road
1st Cr o ss
1 0 th M
a in R
o a d
Couser ve
Roa d
3r d A
Ma in
Roa d
Road
7th M
ai n R
oad M
a lle sh wa ra m
5th
Tem
ple
Roa
d
4 th M
ain R
oa d M
al le shwa ra m
4
th C
ross
5th
Mai
n R
oad
Road
Z58 4th Main Road
4th A
Ma in
Roa d
Sir T.Chowdaiah Road5t
h M
ain
Roa
d
6th
Tem
ple
Roa
d
Sam
pege
Roa
d4t h
Main
Road
Malleshw
ar am
11th A Cross 4th Main Road
3rd Cross Road
9th
Ma i
n R
oad
Mal
lesh
war
amZ49 11th Main Road
6th
Tem
ple
Roa
d
16th Cross Sampege Road
11th M
ain Road
Malleshwaram
16th Cross Sampege Road
Road
2nd
Cr o
ss R
oad
6th
Mai
n R
oad
Cou
serv
e R
oad
Road
17th Cross Road
Z54 1 1t h
Mai n
Ro a d
1st M
ain
Ro a
d
Co us er ve
Roa d
2 nd
Ma i
n R
oad
G P
L ay o
u t
West P
ark R
o ad
1st Main Road
13th Cross 6th Main Road
4th Tem
p le R
o ad
3r d A
Mai n
Ro a d
5t h M
a in R
o ad M
a ll es h war am
8 th A
Mai n
Ro ad
8th
Tem
p le
Roa
d
7th
Tem
ple
Roa
d
14th B Cross 10th Main Road
5th M
a in R
oa d M
a lle sh war am
6th
Tem
ple
Roa
d
Road
Subhaiah Road
Sam
p ege R
o ad
Wes
t Par
k R
oad
3rd
Mai
n R
oad
11th B Cross 10th Main Road
8th M
ai n R
oad M
al leshwa ram
12th Cross 9th Main Road
12th C Cross Road
East
Park
Roa
d
12th C Cross Road
5th
Tem
ple
Roa
d
8 t h M
ain R
oad M
alleshwaram
3rd
Mai
n R
oad
Mal
lesh
war
am
13th B Cross Road
13th A Cross Road
13th Cross 9th Main Road
9th
Mai
n R
oad
6th Cross Road
16th Cross Sampege Road
Eas
t Par
k R
oad
14th A Cross Road
15th Cross Sampege Road
15th A Cross Road
4th Cross Road
10th A Cross West Park Road
3rd Cross Road
5th Cross Road
12th
B Cross Road
5th Main Road
13th Cross 9th Main Road
13th Cross 11th Main Road
Z12 11t h
Main
Road
3rd
Mai
n R
oad
5th Cross Road
3rd A Cross Road
14th B Cross 10th Main Road
6th
Tem
ple
Roa
d
12th Cross 8th Main Road
5th Cross Road
4th Cross Road
3rd Cross Road
2nd
Ma i
n R
oad
15th Cross Sampege Road
2nd Cross RoadTemple
Road
Road
1st Cross Road
4th Cross Road
1st Main
Road
12th Cross 11th Main Road
Road
Roa
d
1st M
ain
Ro a
d
15th Cross Sampege Road
6th Cross 11th Main Road
4th
Mai
n R
o ad
15th Cross 10th Main Road
5th
Mai
n R
oad
2nd M
ain Road
13th Cross Temple Road
6th A
Main
Ro ad
10th M
ai n R
oad M
a l le shwa ra m
15th Cross 10th Main Road
3rd M
ain Road
5t h A
Ma in
Ro ad
6th Cross 11th Main Road
7t h A
Ma in
Ro ad
17th Cross Road
7th Cross Road
11th Cross 11th Main Road Malleshwaram
11th Cross 11th Main Road Malleshwaram
East Pa rk
Roa d
5th Main Road (M K K Road)
West P
a r k R
oa d
7th Cross 8th Main Road Malleshwaram
Sir T.Chowdaiah Road
8th Cross 2nd Main Road Malleshwaram
13th Cross 11th Main Road
6th M
ai n R
oad M
a lleshwaram
3r d M
ain R
o ad M
a lle sh wa ra m
11th M
ain Road
Malleshwaram
Roa
d
2nd
Tem
ple
Roa
d
5th
Mai
n R
oad
3rd
Ma i
n R
oad
4th
Mai
n R
oad
3 rd T em
p le R
o ad
Roa
d
10 th M
ain R
o ad M
a lle sh war am
4 th T em
p le R
oa d
Road
5th M
a in R
oa d M
a lle sh wa ra m
2nd Main Road
10th Main Road
4th Main Road
Morgosa
Road
Road
2nd Cross Road
Temple Road
Road
9th Cross Road
Road
Roa
d
Roadc
Roa
d
Ro a
d
Road
Road
Road
Ro a
d
Road
Road
5th
Mai
n R
oad
Road
Road
Road
Road
Roa
d
Road
Road
Road
Road
Road
Z6 R N P Main Road
Road
Roa
d
Road
Subhaiah Road
Roa
d
Roa
d
Road
Roa
d
Road
Roa
d
Roa
d
Road
Road
Road
Road
Road
Road
Road
Roa
dR
oad
Road
18th
Cros
s R
oad
Road
Roa
d
Roa
d
Road
Roa
d
Roa
d
Road
Road
Roa
d
Roa
d
Road
Roa
d
Road
Road
Road
Road
RoadRoad
Road
Road
Road
Road
Road
Road
Road
Road
Road
Road
Road
Road
Road
Road
Roa
d
Roa
d
Road
Road
15th Cross Sampege Road
Road
Road
Roa
d
Road
Road
15th Cross Sampege Road
Road
Road
Road
Z40 3rd Main Road
Z46 3rd Main Road
Roa
d
Roa
d
Road
Z47
4th
Mai
n Ro
ad
Road
Road
Road
Road
Road
Road
Roa
d
RoadRoad
Road
Road
Road
Road
Road
Road
Road
Roa d
13th
Cro s
s 9t
h M
ain
Roa
d
Road
14th A Cross Road
Roa
dRoad
Road
Road
Gay a trina
gar R
oad
4th Temple Road
16th Cross Sampege Road
Road
Roa
d
Road
Road
Road
Road
15th Cross Sampege Road
Road
Road
Road
Roadc
Road
Road
Road
Road
12th
B C
ross
Roa
d
Road
Road
Road
Road
4t h M
ain R
oad M
a lles hwa ram
Roadc
Road
Z32 10 th
Ma in
Road
Roa
d
Road
Road
Road
Road
Road
Road
Road
9th
Mai
n R
oad
Subhaiah Road
17th Cross Road
13th A Cross Road
13th
B C
ros s
Ro a
d
12th Cross 5th Main Road
Road
6th
Mai
n R
oad
9th
Mai
n R
oad
Road
4th M
a in R oa d
Mall es hw a ra m
9th Cross 11th Main Road
2nd Cross Road
Roa
d
Road
S P
Aven
ue Ro
ad
3rd
A M
ain
Roa
d
Road
Z39 6th Main Road
16th Cross Sampege Road
Road
10th Cross 3rd Main Road
Road
S P Avenue Road
Road
Road
5th
Mai
n R
oad
3rd
Mai
n R
oad
Road
Roa d
10th Cross 3rd Main Road
14th Cross Sampege Road
Z55
11th
Mai
n R
oad
Road
Roa
d
6th
Mai
n R
oad
S P Avenue
Road14th Cross 8th Main Road
12th Cross 5th Main Road
S P
Avenu
e Road
Road
3rd
Mai
n R
oad
12th
A C
ross
Roa
d
10th Cross 3rd Main Road
8th A Cross 2nd Main Road
9th Cross 11th Main Road
17th Cross Road
3rd
Cro
ss 11
th M
ain
Road
Road
6th
Mai
n R
oad
Road
1st M
a in
Roa
d
14th Cross Sampege Road
9th
Ma i
n R
o ad
2nd Cro ss
11t h M
ai n R
oa d
1st C
ross
11th
Mai
n R
oad
Z43 3rd Main Road
3rd M
a in R
oa d1st M
a in
Roa
d
Z50 3rd Main Road
Roa
d
6th
Mai
n R
o ad
1st M
a in
Ro a
d
Road
Z14 11 t h
Mai n
Roa d 13th B Cro
ss R
oad
5th Cross Road5th Cross Road
Road
Road
Ro a
d
Roadc
Road
Road
Road
Temple Road
Malleshw
aram
14th Cross Sampege Road
17th Cross Road
Road
Z45 3rd Main Road
Z28 8th Main Road
4th M
a in R
oa d M
a lle sh war am
Templ e
Roa d
14th Cross 8th Main Road
10th
Mai
n R
o ad
Road
Road
13th Main Road
17th Cross Road
5th Cross Road
Road
2nd
Mai
n R
oad
G P
L ayo
u t
Roa
d
Road
3rd
Ma i
n R
oad
G P
Lay o
ut
1st M
ain
Roa
d
Roa
d
15th Cross 10th Main Road
13th Cross 6th Main Road
Roa
dz
Roa
d
Roa
d
Roa
d
Roa
d
Road
16th Cross Sampege Road
Roa
d
13th A Cross Road
Z13 11th Main Road
2nd
Mai
n R
oad
4th M
ai n R
o ad M
a ll es h wa ra m
15th A Cross Road
Z48 11 th
Mai n
Ro ad
4th
Mai
n R
oad
Ma l
lesh
war
am
Road
14th Cross 9th Main Road
Temple
Temple
Temple
B M P Samudaya Bhavana
Temple
Shri BhauraoDeshpande
Smarak Bhavan
Temple
State Bank Of Mysore
Temple
SaraswathividhyaNiketanHarsha Vidhya kendra
BangaloreElectricity
Supply Company
KishoreSchool
Shri vidyaMandir Education
Society
ChildSchool
M E S CollegeOf Arts &
Commerce
Aruna Chetan School
ClunyConvent High
School
AsthikaSamaja
B S N LSri Radhakrishna Temple
CorporationBoy's & Girl'sHigh School
ManipalHospital
SouthWestenRailway
Veeranjanayatemple
Dr. VenkataraoMemorialHospital
Jambu MahaGanapatiTemple
Chaitanya Co-Op Bank
Complex
KarnatakaSecondary EducationExamination Board
Urdu HigherPrimary
Boy's School
Central BankThe
MelleshwramCo-Op Bank
Vasavi Kala MandirShri Parameshwari Temple
ShriRaghavendra
Temple
BangloreEducation
Primary School
Sharahada Co-Op Bank
KancheTemple
B P IndianPublicSchool
Govt. Girls P U College
Bnk ofIndia
S V M ES School
Shri RamaTemple
VenugopalKrishnaTemple
CorporationMarket
Temple
Temple
Temple
TempleTemple
Temple
VydikaDharma
Sahaya Sabha
B M P TaxOffice
TempleC P I OfficeTemple
Temple
Temple
Temple
Temple
Temple
Temple
Temple
Temple
Temple
Temple
Temple
RamarajuNilayam
C V Raman Panchavati
The Canara Union
Sharada Vidya Niketan
Pragati Mansion
Vacant Land
M L AMelleshwaram Ladies
Association
Seva Sadana
SuddamaKalyanaMantapa
ChowdiahMemorial
Hall
Rajeva Hotel
Indian Automobil
Raj Aparment
Temple View Apartment
Sarva Priya Apartment
Vacant Land
Gokul Complex
KrishnaApartment
Sai Kraupa Apartment
ChindrikaApartment
RajeshwarApartment
PanchavathiApartment
Shri RamanujaShanskritiBhavan
MelleshwarmAssociation
Office
Malleshwarm(Corporation)Play Ground
Play Ground
Vyalikaval Slum
(3
(10
(7
(8 (9
(1
(2
(5
(4
(6
61
60
59 58
34
63
62
4
56
2
1
7
8
9
12
13
11
14
15
16
3319
35
32
18
20
21
31
29
3022
28
23
24
3
17
25
2627
10
41
38
39
36
37
40
42
4345
46
47
4452
51
53
54
55
49
48
50
57
56
77°34'30"E
77°34'30"E
77°34'0"E
77°34'0"E
13°0
'30"
N 13°0
'30"
N
13°0
'0"N
13°0
'0"N
WARD - 35 Aramane Nagara
WARD - 45 Malleswaram
WAR
D -
66 S
ubra
man
ya N
agar
WARD - 76 Gayithri Nagar
WARD - 95 Subhash Nagar
WA
RD
- 77
Dat
tatre
ya T
empl
e
WARD - 64 Rajamahal Guttahalli
0 100 200 300 40050Meters "
CENSUS OF INDIA 2011
EB NUMBERSUPERVISORY NUMBER
5
(3
RAILWAYSPARK
EB BOUNDARYSUPERVISORY BOUNDARY
HOUSE
HOSPITALPOLICESTATIONSCHOOLTEMPLECHURCHMOSQUE
RIVER
POST OFFICEWATER TANK
WARD BOUNDARYLegend
G
\
G:+1*(
© Government of India, Copyright
1063100
Total No. of Supervisor CircleTotal No. of EBsTotal No. of SlumTotal No. of SRS BlockTotal No. of Special Charge
=====
WARD - 65Kadu Malleshwara
BBMPCharge No. 49
Digitised ward map

Introductory note
PROVISIONAL POPULATION TOTALS 21
A three tier cascade of training was devised for this purpose. At the top of the pyramid were a group of National Trainers, who were rigorously trained for 3 days at a residential training camp. Th e National Trainers, trained Master Trainer Facilitators (MTFs) at the State level. Th e MTFs in turn, trained Master Trainers (MTs) at the district level. Th e MTs ultimately trained the Enumerators and Supervisors at the charge level. Special eff orts were taken to improve the Instruction Manuals by including more illustrations and examples. Training Guides were also prepared.
In order to impart comprehensive and consistent training to the
Enumerators and Supervisors throughout the State, a theme based Digital Video Discs (DVDs) of the various training modules was prepared in a Power Point Presentation format. Th ese were specifi cally designed and developed with voice over facility explaining the concepts and methodology of canvassing the questions and recording the responses/codes on the schedules covering all the 29 questions.
A gender sensitive and innovative ‘e-learning’ module was also prepared by Offi ce of the Registrar General, India to simplify diffi cult questions and responses by way of role plays in the typical fi eld situation through animation. Th is was dubbed in Kannada and included in the training DVDs prepared by this Directorate.
Th is module had all gender sensitive themes such as inclusion, head of the household, age, mother tongue, work, migration and fertility. Th ese DVDs were supplied to all the Charge Offi cers and Master Trainers for imparting uniform training to the Enumerators and Supervisors throughout the State. Th e 2011 Census training strategy carefully planned special focus on gender responsive questions. Th ere was a separate training module developed to address this issue in the gender critical districts during the training programmes. Experts in this fi eld from partner NGOs known as Gender Master Trainer Facilitators (GMTFs) were invited to give focused training on this critical component at the enumerator level.
PUBLICITYIn view of the fact that many feel hesitant to part with personal information as sought for in a Census, adequate publicity measures are a pre-requisite for its success. It is needless to say that for organising such a huge administrative exercise, full support and co-operation of the general public is a must. With
Training of Charge Offi cers for Population Enumeration, Hassan district
Training of Enumerators & Supervisors - Population Enumeration Hosadurga Taluk, Chitradurga District
NationalTrainers
(NTs)3+2
Master Trainer Facilitators(MTFs)17.31
Master Trainers (MTs)2278
Enumerators and Supervisors1,31,984

22
this objective of enlisting the co-operation of all sections of society as well as to gain confi dence among the general public that information provided will be kept confi dential as required under the law, a strategy was planned and executed with the electronic and print media.
Census 2011 witnessed the use of a Mascot – a lady enumerator. Th is was done in order to encourage and acknowledge the services of the real protagonists of the Census, namely the enumerators.
During Houselisting operations, held between April and May 2010, the pitch of the publicity campaign was kept at a moderate level. For the Population Enumeration phase held from 9th to 28th February 2011 the publicity campaign was on a massive scale and aimed to enhance awareness about this gigantic exercise of national importance seeking co-operation of the people for its success. Special eff orts were made to
sensitize target groups such as women, children, workers and the disabled. Apart from this, attention was also focused on accurately capturing female work participation which is very oft en subject to omission. In addition to the publicity measures undertaken at the central level, this Directorate also made all signifi cant eff orts to reach all sections of the society in the State by utilising the local mass media. TV channels, All India Radio, FM radio channels, cable networks, news papers, public transport vehicles, auto rickshaws, rail and bus stations, hoardings in public places, public announcements, etc., were
extensively used to propagate Census messages. TV and Radio spots, advertisement in the news papers, messages from the dignitaries and celebrities, panel discussions in TV channels and All India Radio were launched. Th e State government Public Sector Undertakings were also roped in to sponsor some of the publicity activities undertaken by this Directorate. Th e State government departments issued circulars which ensured that the publicity materials were displayed prominently at all Panchayt Raj
Publicity Poster in Kannada for Population Enumeration
Population Enumeration Publicity hoarding on a Bus Shelter in BBMP
His Excellency the Governor of Karnataka and Hon’ble Chief Minister of Karnataka launching the publicity campaign for Population Enumeration by releasing Census
balloon during the Republic Day Parade on 26.01.2011

Introductory note
PROVISIONAL POPULATION TOTALS 23
Institutions, Anganwadi centres, Public Distribution Shops (PDS) and prominent public offi ces. Greater focus was given to bigger Corporations in general and Bruhat Bangalore Mahanagara Palike in particular. Besides, traditional methods of publicity such as hoardings, stickers, posters, pamphlets were also used. Th e district revenue administration also supplemented the publicity measures in their respective jurisdictions.
CENSUS HELPLINE Help desks and help lines had been introduced in the last Census. Th e same was continued in this Census as well. Th e help desks were established at the charge level and were manned by Assistant Charge Offi cers, Master Trainers and Census Clerks to provide timely assistance to enumerators during the course of fi eld work and subsequently used for the public to register their complaints, in case of non-enumeration. In rural areas, at least one Help Centre was opened at the Taluk headquarters and in large cities/towns several such centres were in operation. Th ese centres were equipped with Instruction Manuals and other directions/clarifi cations issued by the Directorate of Census Operations, on important aspects relating to Population Enumeration. Most of the complaints lodged during the last days of the fi eld work in the Help Centres by the public were mainly regarding non-enumeration. For the convenience of the general public to register their enumeration related complaints and queries, a toll free telephone line was installed at the national level and dedicated telephone lines for receiving complaints were also established in the Census Directorate. Th is provided a channel for the public to register their grievances. Sincere and honest eff orts were made to follow up each of the individual complaints, which led to an improved coverage of the population.
INITIATIVES Some initiatives made in Census 2011 are listed below:
State Level Census Co-ordination Committee: Head-ed by the Chief Secretary to Government of Karnataka, the State Level Census Co-ordination Committee was constituted with Director of Census Operations as Convenor to oversee the preparations. Th e committee met three times over the period of the operations and was very useful in solving ticklish administrative issues. Meeting of State Level Census Co-ordination Committee chaired by
Chief Secretary to Government of Karnataka
Population Enumeration posters and stickers in front of Jog Kargal Town Panchayat Offi ce, Shimoga District
A Population Enumeration Hoarding in a Public Place

24
District/Taluk Level Census Co-ordination Committee: Headed by the Deputy Commissioners of concerned districts and Tahsildars of the concerned taluks respectively, the District/Taluk Level Census Co-ordination Committees were constituted to monitor the Census operations in their districts/taluks.
Conference of Principal Census Offi cers: Th e fi rst State level conference was held on 6th February 2010 for Principal Census Offi cers. Hon`ble Minister for Home, Government of Karnataka, Dr V.S.Acharya inaugurated the conference and Sri.G.Karunakara Reddy, Hon’ble Minister for Revenue,
Government of Karnataka, presided over the conference. Th e key note address was delivered by Dr.C.Chandramouli, Registrar General and Census Commissioner, India. Director of Census Operations, Karnataka, imparted training to the Principal and Additional Principal Census Offi cers. Th is conference kicked off the fi led operations of the Census 2011 in the State.
Video Conferencing: Th e Karnataka State Wide Area Network (KSWAN) was put to good use during the Census operations in the State. Monthly meetings chaired by the State Nodal Offi cer were conducted which helped
in monitoring the fi eld operations. Trainings were also conducted using this medium to Charge offi cers. Th e Village and Town Directory Training was done using the EDUSAT network which helped in ensuring uniform training to the Taluk level offi cials across the State.
Conference of District Census Offi cers and Additional District Census Offi cers: Two training programmes were organised for District Census Offi cers and Additional District Census Offi cers in Bangalore.
Inauguration of First State Level Conference of Principle Census Offi cers – Lighting of Lamp by Hon’ble Minister for Revenue, Govt. of Karnataka
Dr. C. Chandramouli, Registrar General and Census Commissioner, India, fl anked by Sri K.S.Prabhakara, State Nodal Offi cer and Sri T.K. Anil Kumar, Director of Census
Operations, Karnataka monitoring the Population Enumeration work in Karnataka through Video Conference of Principal Census Offi cers
Training Conference of District and Additional District Census Offi cers in Bangalore

Introductory note
PROVISIONAL POPULATION TOTALS 25
Messages by VIPs/ Important Personalities: His Excellency the Governer of Karnataka and Hon’ble Chief Minister sought co-operation of the general public for the success of gigantic excercise. Messages were conveyed over the visual media across the State. Eminent personalities of the State also conveyed the messages through the visual media on the need to participate in the Census 2011.Support of PSU: State Public Sector under-takings viz., Mysore Minerals Ltd., Hutti Gold Mines Ltd., Karnataka Soaps and Detergents Ltd., Karnataka Power Corporation Ltd. (KPCL), and Karnataka Power Transmission Corporation Ltd. (KPTCL) sponsored publicity materials such as hoardings, posters, school kits etc., on Population Enumeration and helped in reaching out to the people. Bangalore Electricity Supply Company (BESCOM) printed Census messages on electricity bills and KPCL published census messages in their regular tender advertisements.Short Service Messages on Mobile phones: Th e Mobile telephone service providers were requested to send SMS to their customers to participate in the Population Enumeration from 9th to 28th February 2011. BSNL, Airtel and other private mobile service providers sent SMS to their customers free of cost. Web Site: A new Census website was created for the Directorate (www.censuskarnataka.gov.in) which hosted Instruction Manuals, Circulars, Frequently Asked Questions and other important instructions/notifi cations. Th is source was also accessed by the Enumerators as well as the public at large. Th e site was visited 9500 times during the fi eld operations.Audio Visual Media: Innovative training CDs were prepared by the Directorate and distributed to the fi eld functionaries to ensure uniform instructions were issued to all Master Trainers. Partnership with Non Governmental Organisations: Disability, Gender and Homeless, having been identifi ed as areas requiring special focus, eff orts were made by the Directorate to identify and work with credible Non Governmental Organisations. Th e participation ranged from awareness building to extensive involvement in training and even actual participation in the conduct of fi eld operations. Th e results have been quite encouraging. Narendra Foundation, an NGO working in the fi eld of disability, were the Master Trainer Alliance partners for Karnataka. Two National Trainers and 17 Master Trainer Facilitators of the NGO provided assistance in imparting training to Master Trainers and also supervised the training of Enumerators and Supervisors at the Charge level. Th eir experience in the fi eld of disability immensely helped in sensitizing the Enumerators and Supervisors in collection of data on disability.An NGO working in the fi eld of re-habilitation of Houseless Households was utilised for enumeration of Houseless Households in Bruhat Bangalore Mahanagara Palike. Th e Civil Defence Organisation also provided assistance during the Population Enumeration exercise in Bangalore City.
Census in Schools: A message on census was circulated to all the high schools all over the state. Th is was to reach out to the next generation on the importance and magnitude of the Indian Census.
CONDUCT OF CENSUS 2011
Houselisting and Housing Census
Th e Census Operations in India are carried out in two phases- the Houselisting and Housing Census followed by the Population Enumeration. Th e objective of the Houselisting and Housing Census is to systematically list out all the structures, houses and households Census in School : A student reading out a message on Census in the School Assembly
26
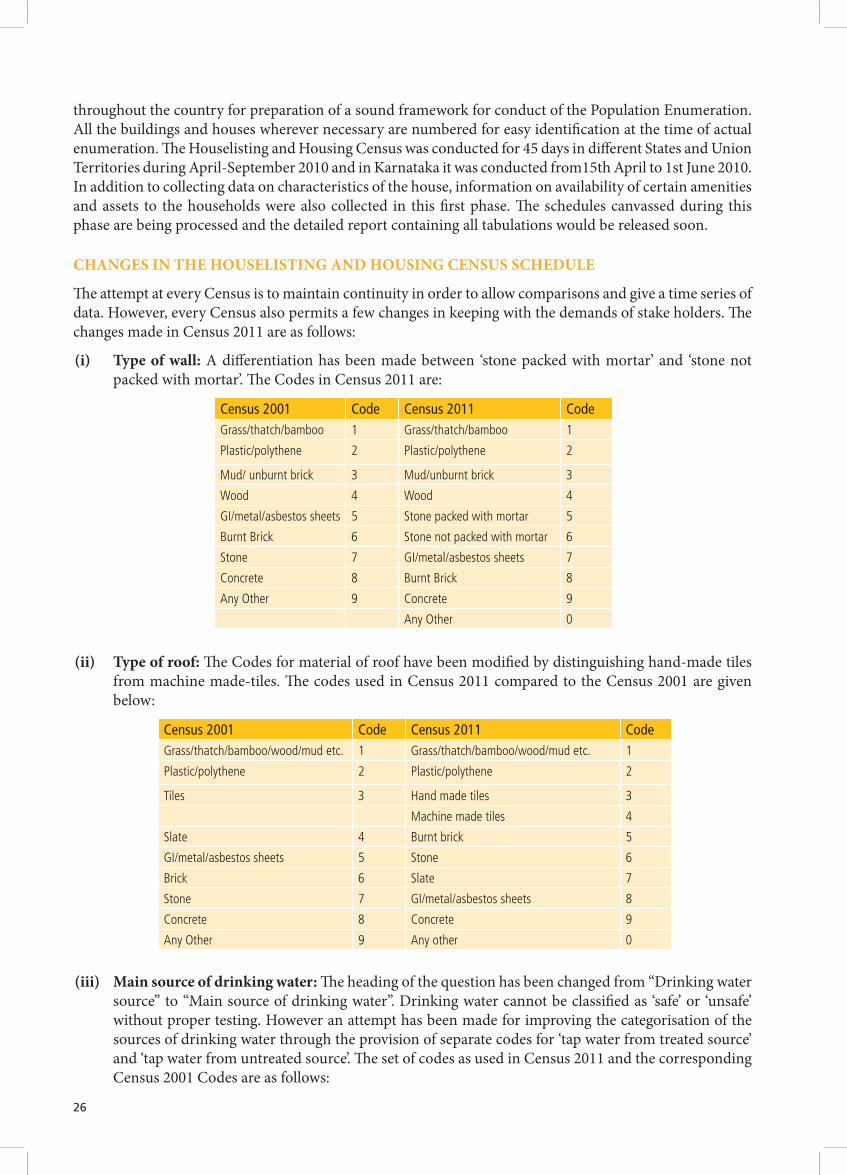
throughout the country for preparation of a sound framework for conduct of the Population Enumeration. All the buildings and houses wherever necessary are numbered for easy identifi cation at the time of actual enumeration. Th e Houselisting and Housing Census was conducted for 45 days in diff erent States and Union Territories during April-September 2010 and in Karnataka it was conducted from15th April to 1st June 2010. In addition to collecting data on characteristics of the house, information on availability of certain amenities and assets to the households were also collected in this fi rst phase. Th e schedules canvassed during this phase are being processed and the detailed report containing all tabulations would be released soon.
CHANGES IN THE HOUSELISTING AND HOUSING CENSUS SCHEDULE
Th e attempt at every Census is to maintain continuity in order to allow comparisons and give a time series of data. However, every Census also permits a few changes in keeping with the demands of stake holders. Th e changes made in Census 2011 are as follows:
(i) Type of wall: A diff erentiation has been made between ‘stone packed with mortar’ and ‘stone not packed with mortar’. Th e Codes in Census 2011 are:
Census 2001 Code Census 2011 CodeGrass/thatch/bamboo 1 Grass/thatch/bamboo 1
Plastic/polythene 2 Plastic/polythene 2
Mud/ unburnt brick 3 Mud/unburnt brick 3
Wood 4 Wood 4
GI/metal/asbestos sheets 5 Stone packed with mortar 5
Burnt Brick 6 Stone not packed with mortar 6
Stone 7 GI/metal/asbestos sheets 7
Concrete 8 Burnt Brick 8
Any Other 9 Concrete 9
Any Other 0
(ii) Type of roof: Th e Codes for material of roof have been modifi ed by distinguishing hand-made tiles from machine made-tiles. Th e codes used in Census 2011 compared to the Census 2001 are given below:
Census 2001 Code Census 2011 CodeGrass/thatch/bamboo/wood/mud etc. 1 Grass/thatch/bamboo/wood/mud etc. 1
Plastic/polythene 2 Plastic/polythene 2
Tiles 3 Hand made tiles 3
Machine made tiles 4
Slate 4 Burnt brick 5
GI/metal/asbestos sheets 5 Stone 6
Brick 6 Slate 7
Stone 7 GI/metal/asbestos sheets 8
Concrete 8 Concrete 9
Any Other 9 Any other 0
(iii) Main source of drinking water: Th e heading of the question has been changed from “Drinking water source” to “Main source of drinking water”. Drinking water cannot be classifi ed as ‘safe’ or ‘unsafe’ without proper testing. However an attempt has been made for improving the categorisation of the sources of drinking water through the provision of separate codes for ‘tap water from treated source’ and ‘tap water from untreated source’. Th e set of codes as used in Census 2011 and the corresponding Census 2001 Codes are as follows:

Introductory note
PROVISIONAL POPULATION TOTALS 27
Census 2001 Code Census 2011 CodeDrinking Water Source Main Source of Drinking Water
Tap 1 Tap water from treated source 1
Handpump 2 Tap water from untreated source 2
Tubewell 3 Covered well 3
Well 4 Un-covered well 4
Tank/pond/lake 5 Hand pump 5
River/canal 6 Tube well/borehole 6
Spring 7 Spring 7
Any Other 8 River/canal 8
Tank/pond/lake 9
Other Sources 0
(iv) Source of Lighting: Th e heading has been modifi ed as ‘Main Source of Lighting’(v) Bathing facility within premises: Realising that bathroom within the house was a predominantly
urban phenomenon, the heading has been changed as bathing facility within the premises. Moreover, the categories have been expanded to include ‘Enclosure without roof ’. Th e code list for the Census 2011 along with codes as were in Census 2001 are given below:
Census 2001 Code Census 2011 Code
Bathroom within the house Bathing facility available within premises
Yes 1 Bathroom 1
No 2 Enclosure without roof
2
No 3
(vi) Latrine: In Census 2001, information was sought on the availability of latrine ‘within the house’; in Census 2011 it has been modifi ed as available ‘Within the premises”. Attempt has also been made to include other types of latrines. Th ese categories are more in keeping with the WHO/UNICEF categories. Th e set of codes as used in Census 2011 and the corresponding Census 2001 Codes are as follows:
Census 2001 Code Census 2011 Code
No Latrine 0 Flush/pour fl ush latrine connected to
Service Latrine 1 Piped sewer system 1
Pit Latrine 2 Septic system 2
Water Closet 3 Other system 3
Pit Latrine
With slab/Ventilated Improved Pit 4
Without slab/open pit 5
Night soil disposed into open drain 6
Service Latrine
Night soil removed by human 7
Night soil serviced by animals 8
No latrine within premises
Public Latrine 9
Open 0
28
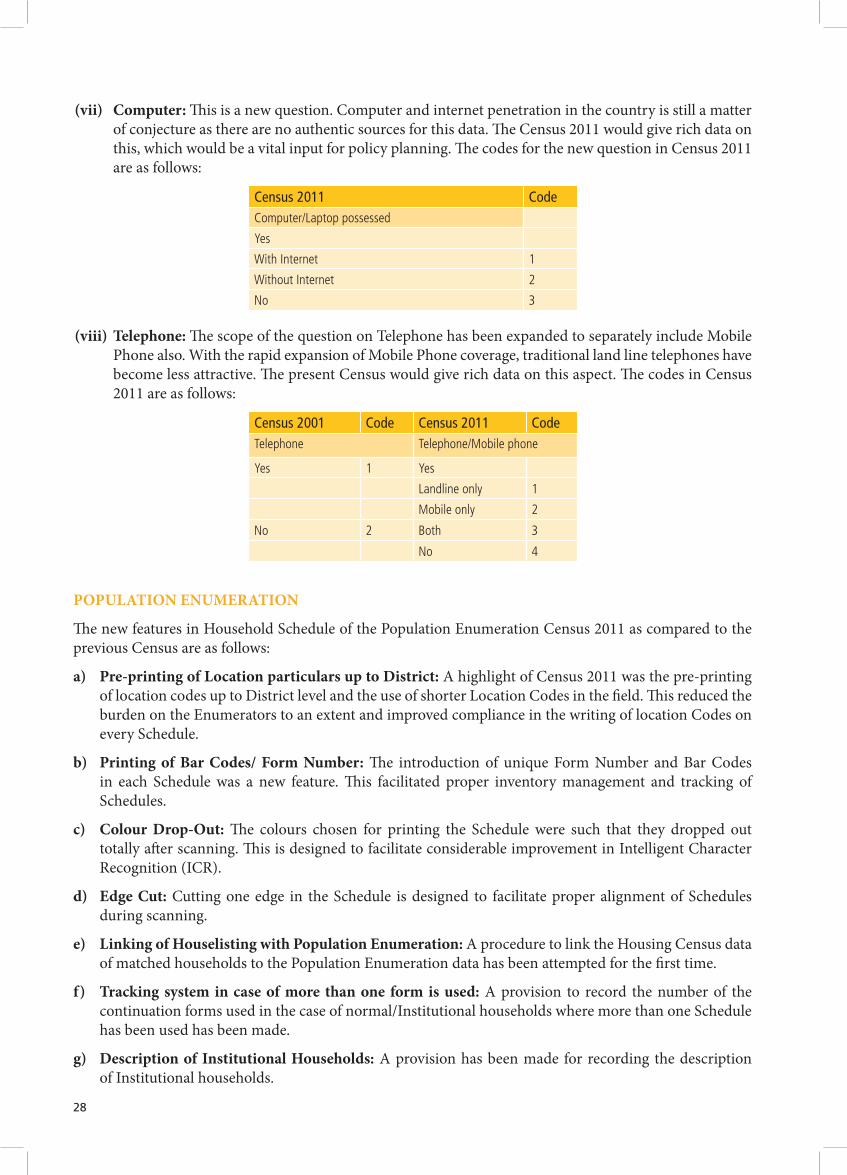
(vii) Computer: Th is is a new question. Computer and internet penetration in the country is still a matter of conjecture as there are no authentic sources for this data. Th e Census 2011 would give rich data on this, which would be a vital input for policy planning. Th e codes for the new question in Census 2011 are as follows:
Census 2011 CodeComputer/Laptop possessed
Yes
With Internet 1
Without Internet 2
No 3
(viii) Telephone: Th e scope of the question on Telephone has been expanded to separately include Mobile Phone also. With the rapid expansion of Mobile Phone coverage, traditional land line telephones have become less attractive. Th e present Census would give rich data on this aspect. Th e codes in Census 2011 are as follows:
Census 2001 Code Census 2011 CodeTelephone Telephone/Mobile phone
Yes 1 Yes
Landline only 1
Mobile only 2
No 2 Both 3
No 4
POPULATION ENUMERATION
Th e new features in Household Schedule of the Population Enumeration Census 2011 as compared to the previous Census are as follows:
a) Pre-printing of Location particulars up to District: A highlight of Census 2011 was the pre-printing of location codes up to District level and the use of shorter Location Codes in the fi eld. Th is reduced the burden on the Enumerators to an extent and improved compliance in the writing of location Codes on every Schedule.
b) Printing of Bar Codes/ Form Number: Th e introduction of unique Form Number and Bar Codes in each Schedule was a new feature. Th is facilitated proper inventory management and tracking of Schedules.
c) Colour Drop-Out: Th e colours chosen for printing the Schedule were such that they dropped out totally aft er scanning. Th is is designed to facilitate considerable improvement in Intelligent Character Recognition (ICR).
d) Edge Cut: Cutting one edge in the Schedule is designed to facilitate proper alignment of Schedules during scanning.
e) Linking of Houselisting with Population Enumeration: A procedure to link the Housing Census data of matched households to the Population Enumeration data has been attempted for the fi rst time.
f) Tracking system in case of more than one form is used: A provision to record the number of the continuation forms used in the case of normal/Institutional households where more than one Schedule has been used has been made.
g) Description of Institutional Households: A provision has been made for recording the description of Institutional households.

Introductory note
PROVISIONAL POPULATION TOTALS 29
h) Gender: In a radical departure from the past, a provision has been made for the respondent to return a gender other than male or female. Th is is an option to be exercised by the respondent and not determined by the Enumerator.
i) Date of birth: A provision has been made to record age in completed years as well as date of birth. Th is is expected to improve reporting of age at least among a section of the population.
j) Current marital status: Separate codes have been assigned for ‘Divorced’ and ‘Separated’.
k) Disability: Th e question on disability has been enlarged in Census 2011. In comparison to the 5 codes in Census 2001, 8 codes have been provided in the present Census. Th e new codes are: Mental Retardation, Mental Illness, Any Other and Multiple Disability. Th e questions and the instructions have been fi nalised aft er extensive deliberations with civil society organisations and the Ministry of Social Justice and Empowerment. Respondents with multiple disability would now be able to report up to 3 disabilities for the fi rst time.
l) Status of current attendance in educational institution: Separate codes have been given for persons who have never attended any educational institution and persons who have attended earlier. An additional code for recording persons attending special institution for the disabled has also been added.
m) Worked any time during last year: Th e question on Work Status has been modifi ed as below:
Main Worker If worked for 6 months or more
Marginal Worker If worked for 3 months or more but less than 6 months If worked for less than 3 months
Non Worker If not worked at all
Such a classifi cation would not only retain the older categorization of Main, Marginal and Non Worker but would also off er richer data on the period of work.
n) Non-economic activity: A category of ‘Others’ has been included to account for commercial sex workers and persons involved in illegal activities. A new code for ‘rentier’ has also been introduced.
o) Migration: While processing of the Census 2001 data, it was found that the non-response with respect to providing the district names was relatively more both in the question on place of birth and place of last residence. It was felt that as the names of the districts might have undergone a change, the respondent was unable to provide the correct names. Th us, in Census 2011, an added item, namely, the name of village/ town has been added in both these questions.
p) Number of children born alive during last one year: Mention of the specifi c period ‘1st March 2010 to 28th February 2011’ on the body of the Schedule has been done.
QUESTION DROPPED
a) Household engaged in cultivation/plantation: Th e following question was canvassed in Census2001: ‘Total net area of land under cultivation/ plantation’; ‘Net area of irrigated land’ and ‘Tenure status of land under cultivation/ plantation’. Th e question was canvassed but could not be tabulated on account of widespread non-response. Th ere were also other technical problems like, variation in the units of measurement, comparability with other sources of data, namely, the Agricultural Census, land holding survey of the NSS, etc. Hence it was decided to drop this question in Census 2011.
b) A comparison of the questions proposed in Census 2011 with the questions canvassed in Census 2001 is presented below.

30
Sr. No Census 2001 Census 2011 Remarks1) Name of person Name of the person No Change
2) Relationship to head Relationship to head No Change
3) Sex Sex Provision for returning a gender other than male or female
4) Age in completed years Date of Birth Date of Birth in addition to age
5) Current marital status Current marital status Seperate code for ‘Divorced’ and ‘Seperated’
6) Age at marriage Age at marriage No Change
7) Religion Religion No Change
8) Mother tongue Mother tongue No Change
9) Other languages known Other languages known No Change
10) Literacy status Literacy status No Change
11) Highest educational level attained Highest educational level attained No Change
12) Status of attendance in educational institution
Status of attendance in educational institution
Seperate Code for persons who have never attended and who have attended before
13) Disability Disability Question modifi ed. Three questions instead of one.
14) Did the person work any time last year Worked any time during last year Additional code for two types of marginal workers (3-6 months, less than 3 months)
For main or marginal worker
15) Category of economic activity Work category No Change
16) Occupation of the person Occupation No Change
17) Describe in detail the nature of indus-try, trade or service
Nature of industry, trade or service No Change
18) Class of worker Class of worker No Change
For marginal workers or non-workers
19) Record Code of non-economic activity Non-economic activity Adding a seperate code for rentiers
20) Is the person seeking/available for work
Seeking/available for work No Change
For other workers
21) Journey to place to work
22) Distance from residence to place of work in kilometers
One way distance from usual residence to place of work in kilometers
No Change
23) Mode of travel to place of work (Code) Mode of travel to place of work (Code) No Change
24) Birth place Birth place Name of village/town is also added
25) Place of last residence Place of last residence Name of village/town is also added
26) At the time of migration, was the place of last residence Rural/Urban
At the time of migration, was the place of last residence Rural/Urban
No Change
27) Reason for migration of this person Reason for migration of this person No Change
28) Duration of stay in this village or town since migration
Duration of stay in this village or town since migration
No Change
For ever married woman
29) Number of children surviving at present
Number of children surviving at present
No Change
30) Total no. of children ever born alive Total no. of children ever born alive No Change
For currently married woman

Introductory note
PROVISIONAL POPULATION TOTALS 31
Sr. No Census 2001 Census 2011 Remarks31) Number of children born alive during
last one yearNumber of children born alive during last one year
No Change
For household engaged in cultivation/plantation
32) Total net area of land under cultiva-tion/plantation
Dropped
33) Net area of irrigated land Dropped
34) Tenure status of land under cultivation/plantation
Dropped
POST ENUMERATION SURVEY
Post Enumeration Survey(PES), earlier referred to as Post Enumeration Check(PEC), for evaluating the results of the Population Census has become an integral part of the Census operation since Independence. No precise estimate of the extent of error in the census count was ever made prior to Independence. PES was conducted for Population Enumeration till the 1991 Census. However, since Census 2001 this practice was extended to cover Houselisting operations also. Th e objective of the PES is to quantify the extent of omission and duplication in Census enumeration. Th is is done by measuring both coverage and content errors. Th e results would help in identifying areas that require attention such as concepts and defi nitions employed, procedures of enumeration and related instructions to the fi eld staff , as well as in improving the conduct of future censuses. No attempts, however, are made to adjust the census results based on the PES results.
Th e PES of the fi rst phase, that is, Houselisting Operations, has been completed in the State in 2010 aft er the completion of houselisting operation. It is proposed to start the PES of the second phase of Census of India 2011, that is, Population Enumeration, in April/May, 2011 in the State. A total of 197 Enumeration Blocks of Population Enumeration have been selected for the purpose of estimating coverage error. For measuring content error, a 20 percent sub-sample of the selected enumeration blocks has been identifi ed. Th e Government of Karnataka have agreed to provide their Staff for the fi eld work and supervision. Intensive training will be imparted to them before the fi eld operation. Th e fi eld work is proposed to be conducted from May to June, 2011.
ACKNOWLEDGEMENTS
Th e Directorate of Census Operations, Karnataka is indebted to all those who were instrumental in the successful conduct of the 2011 Census Operations in Karnataka. Credit goes to the people of Karnataka, who responded overwhelmingly in providing the required information. Th eir willing co-operation and active participation has been the driving force behind the successful conduct of the Census of India 2011.
We would like to thank Shri. H.R. Bhardwaj, His Excellency the Governor of Karnataka and Shri. B.S.Yeddyurappa, Hon’ble Chief Minister of Karnataka for propogating a message on the Census, calling upon the people of Karnataka to extend full co-operation and actively participate in the Census Operations by providing correct and complete information.
We would also like to acknowledge the hard work done by each and every enumerator and supervisor in the 2011 Census. In addition to their normal offi cial duties, they have toiled all day for more than three weeks to complete the arduous task within the given time. Th e task is by no means an easy one and requires a lot of preservance and patience. As has always been the case, this devoted army of fi eld workers have accomplished it with characteristic aplomb and sincerity. Training was one of the high points in the Census of India 2011. Th e Master Trainer Alliance from NGO’s and the Master Trainers, who were specifi cally engaged for training the enumerators and supervisors have accomplished the given task to our satisfaction, deserve accolades for their contribution.

32
Th e successful conduct of a Census largely depends on the co-operation from the State Government. Th e State Government was always quick in issuing necessary orders, instructions and circulars whenever they were approached by the Census Directorate. We would like to record our appreciation and sincere thanks to Sri S.V. Ranganath, Chief Secretary to Government of Karnataka, Sri K.S.Prabhakara, Secretary to Government of Karnataka, Revenue Department and State Nodal Offi cer for 2011 Census and all other senior offi cials in the State Government, who were gracious enough to extend their helping hand whenever approached.
Our sincere thanks are also due to the State Election Commission for completing the election process before the commencement of the fi eld work.
It goes without saying that the support of the District administration is vital to the successful conduct of census in the district. We would like to place on record our sincere thanks to all the Deputy Commissioners and Commissioners of Municipal Corporations and all other senior offi cials assisting them, who spared no eff orts to ensure that the Census operations in their jurisdiction was completed smoothly and within the given time schedule.
Our special thanks are also due to all the Charge Offi cers and Special Charge Offi cers and their offi cials particularly the Census Clerks, who shouldered a major responsibility in the smooth conduct of census in the Charge.
Th e electronic and print media gave unprecedented and massive publicity for the Census Operations. We would like to express our gratitude to each and every media agency for their constant support and making census a big news story.
We received full co-operation from the Government of India Text Books Press, Mysore, the Directorate of Printing, Stationery & Publications, Government of Karnataka and M/s. Manipal Press who did a commendable job in printing and supplying various forms and schedules required, well in time.
We would like to put on record our gratitude and sincere thanks to Dr.C.Chandramouli, Registrar General and Census Commissioner, India, New Delhi who stood by us at all times. His constant support and guidance have always been a source of inspiration.
We would also record our deep appreciation and sincere thanks to Sri R.C.Sethi, Additional Registrar General and senior offi cers in the offi ce of the Registrar General, Government of India, New Delhi who have always been a source of strength and extended timely help and co-operation.
Finally, we would like to thank each and every member of the Census family who have toiled day and night for the last twenty months without a break and completed this demanding task smoothly and successfully. In the fi nal analysis, the indomitable team spirit has enabled us to deliver the fi rst fruits of this mammoth exercise in the form of this volume.
T.K. ANIL KUMARDirector of Census Operations, Karnataka
6th April, 2011Bangalore

2A PRELUDE TO ANALYSIS


PROVISIONAL POPULATION TOTALS 35
2A prelude to analysis
Th e Indian Census has a long tradition of releasing the population data on a provisional basis within a short time aft er the completion of the Population Enumeration. Th e Provisional Population Totals are compiled by each enumerator directly from the page totals of a few data items of each page of the Household Schedule, which are then consolidated at the enumerator’s block level. Th e totals of various administrative levels at the taluk, town, the district and the State are consolidated through a process of successive aggregation. Th e entire exercise of aggregation right from the enumerator’s block level to the State level is completed within a short span.
Th e data items on which the provisional totals are collected and compiled for each sex are Population, Child Population in the age group 0-6, and Literate Population. Th e actual processing and fi nal tabulation of this volume of data takes time, therefore, provisional data relating to some key aspects of the population becomes extremely useful to the data users. In the present publication, the fi rst in the series of publications of Census of India 2011, the following tables are included:-
Table Contents
Provisional Population Total Table 1
Distribution of Population, Decadal Growth Rate, Sex Ratio and Population Density for State and Districts: 2011
Provisional Population Total Table 2
Percentage Decadal Variation in Popula-tion for State and Districts: 1901-2011
Provisional Population Total Table 3
Sex Ratio for State and Districts: 1901-2011
Provisional Population Total Table 4
Population in the Age-group 0-6, Number of Literates and Literacy Rate by Sex for State and Districts: 2011
Provisional Population Total Table 5
Literacy Rates by Sex for State and District : 2001 and 2011
Provisional Population Total Table 6
Proportion of Child Population in the Age-group by Sex 0-6: 2001 and 2011
Th e data presented in these tables have been briefl y analyzed. Th e analysis is supported by maps/diagrams, which highlight certain basic features of the population statistics presented in the tables.

36
Th e districtwise tables and statements presented in this publication are arranged in ascending order of the Location Code Numbers given to diff erent districts at the Census of India, 2011. Statement showing list of districts arranged as per their present Location Code Numbers is given below:
Name of the District Location Code NumberBelgaum 01Bagalkot 02Bijapur 03Bidar 04Raichur 05Koppal 06Gadag 07Dharwad 08Uttara Kannada 09Haveri 10Bellary 11Chitradurga 12Davanagere 13Shimoga 14Udupi 15Chikmagalur 16Tumkur 17Bangalore 18Mandya 19Hassan 20Dakshina Kannada 21Kodagu 22Mysore 23Chamarajanagar 24Gulbarga 25Yadgir 26Kolar 27Chikkaballapura 28Bangalore Rural 29Ramanagara 30
Th ere have been a few jurisdictional changes in the boundaries of the districts aft er 2001 Census due to the creation of three new districts. Th e boundaries of the following three districts and change in the number of taluks in these districts are given below:-
Sl. No. District Number of Taluks Reasons for the difference
2001 20111 Bangalore Rural 8 4 Four taluks transferred to newly created Ramanagara district
2 Kolar 11 5 Six taluks transferred to newly created Chikkaballapura district
3 Gulbarga 10 7 Three taluks transferred to newly created Yadgir District
It will be important for the data users to bear in mind that the fi rst fl ush of Census results, ‘Th e Provisional Population Totals’, is rather raw data and not subjected to the intensive checks and cross checks as in the case of usual Census data. Further, the numbers given are somewhat tentative and the fi nal fi gures are bound to be diff erent. Th erefore, some caution is necessary while interpreting the results. Th e intelligent data user will have these limitations at the back of his mind but, still use the data to pick up some early demographic trends.
Note: For Census 2011, the population of “Others” has been clubbed with the “Males” for working out population, 0-6 population, literates and related rates and ratios.

A prelude to analysis
PROVISIONAL POPULATION TOTALS 37
MAP 3


3SIZE, GROWTH RATE ANDDISTRIBUTION OF POPULATION


PROVISIONAL POPULATION TOTALS 41
3Size, growth rate anddistribution of populationAs per the provisional results compiled for the Census of India 2011, the population of India at 00.00 hours of 1st March 2011 stood at 1,21,01,93,422 comprising of 62,37,24,248 males and 58,64,69,174 females. Statement - 1 given below shows the distribution of population among the States and Union Territories and their percentage share of population. Th e distribution of population is graphically presented in Chart - 1.
STATEMENT - 1POPULATION OF STATES/UTs BY SEX AND PERCENTAGE SHARE OF POPULATION IN TOTAL POPULATIONState/ UT Code
India/State/Union Territory #
Total population Percentage share in total populationPersons Males Females
- INDIA 1,21,01,93,422 62,37,24,248 58,64,69,174 100
01 Jammu & Kashmir 1,25,48,926 66,65,561 58,83,365 1.04
02 Himachal Pradesh 68,56,509 34,73,892 33,82,617 0.57
03 Punjab 2,77,04,236 1,46,34,819 1,30,69,417 2.29
04 Chandigarh # 10,54,686 5,80,282 4,74,404 0.09
05 Uttarakhand 1,01,16,752 51,54,178 49,62,574 0.8406 Haryana 2,53,53,081 1,35,05,130 1,18,47,951 2.0907 NCT of Delhi # 1,67,53,235 89,76,410 77,76,825 1.3808 Rajasthan 6,86,21,012 3,56,20,086 3,30,00,926 5.6709 Uttar Pradesh 19,95,81,477 10,45,96,415 9,49,85,062 16.4910 Bihar 10,38,04,637 5,41,85,347 4,96,19,290 8.5811 Sikkim 6,07,688 3,21,661 2,86,027 0.0512 Arunachal Pradesh 13,82,611 7,20,232 6,62,379 0.1113 Nagaland 19,80,602 10,25,707 9,54,895 0.1614 Manipur 27,21,756 13,69,764 13,51,992 0.2215 Mizoram 10,91,014 5,52,339 5,38,675 0.0916 Tripura 36,71,032 18,71,867 17,99,165 0.3017 Meghalaya 29,64,007 14,92,668 14,71,339 0.2418 Assam 3,11,69,272 1,59,54,927 1,52,14,345 2.5819 West Bengal 9,13,47,736 4,69,27,389 4,44,20,347 7.5520 Jharkhand 3,29,66,238 1,69,31,688 1,60,34,550 2.7221 Orissa 4,19,47,358 2,12,01,678 2,07,45,680 3.4722 Chhattisgarh 2,55,40,196 1,28,27,915 1,27,12,281 2.1123 Madhya Pradesh 7,25,97,565 3,76,12,920 3,49,84,645 6.0024 Gujarat 6,03,83,628 3,14,82,282 2,89,01,346 4.9925 Daman & Diu # 2,42,911 1,50,100 92,811 0.0226 Dadra & Nagar Haveli # 3,42,853 1,93,178 1,49,675 0.0327 Maharashtra 11,23,72,972 5,83,61,397 5,40,11,575 9.2928 Andhra Pradesh 8,46,65,533 4,25,09,881 4,21,55,652 7.0029 Karnataka 6,11,30,704 3,10,57,742 3,00,72,962 5.0530 Goa 14,57,723 7,40,711 7,17,012 0.1231 Lakshadweep # 64,429 33,106 31,323 0.0132 Kerala 3,33,87,677 1,60,21,290 1,73,66,387 2.7633 Tamil Nadu 7,21,38,958 3,61,58,871 3,59,80,087 5.9634 Puducherry # 12,44,464 6,10,485 6,33,979 0.1035 Andaman
& Nicobar Islands #379,944 2,02,330 1,77,614 0.03

42
Utta
r Pra
desh
Maharashtra
Bihar
West Bengal
AndhraPradesh
Tam
il Nad
u
Mad
hya
Prad
esh
RajasthanKarnataka
Gujarat
Orissa
Kerala
Jharkhand
AssamPunjab
Chhatisgarh 2 55 40 196 2.11 %
Haryana 2 53 53 081 2.09%
* NCT of Delhi 1 67 53 235 1.38 %
Jammu & Kashmir 1 25 48 926 1.04 %
Others 3 61 78 981 2.98 %
INDIA 1 21 01 93 422
INDIA COMPARATIVE SIZE OF POPULATION
OF STATES/ UTS* 2011
Others Uttarakhand Himachal Pradesh Tripura Meghalaya Manipur Nagaland Goa Arunachal Pradesh * Puducherry * Chandigarh Mizoram Sikkim * Dadra & Nagar Haveli * Andaman & Nicobar Islands * Daman & Diu * Lakshadweep
3 61 78 981 1 01 16 752
68 56 509 36 71 032 29 64 007 27 21 756 19 80 602 14 57 723 13 82 611 12 44 464 10 54 686 10 91 014 6 07 688 3 42 853 3 79 944 2 42 911
64 429
2.98 % 0.84 % 0.57 % 0.30 % 0.24 % 0.22 % 0.16 % 0.12 % 0.11 % 0.10 % 0.09 % 0.09 % 0.05 % 0.03 % 0.03 % 0.02 % 0.01 %
9 13 4
7 736
7.5
5 %
11 23 72 972
9.29 %
10 38 04 637 8.58 %
19 95 81 477 16.49 %
8 46 65 533
7.00 % 7 25 97 565 6.00 %
7 21 38 958 5.96 %
6 86 21 012
5.67 %
6 11 30 704
5.05 %
6 03 83 628
4.99 %
4 19 47 358 3.47 %
3 33 87 677 2.76 %
3 29 66 238 2.72 %
3 11 69 272 2.58 %
2 77 04 236
2.29 %
UTS * - Union Territories
CHART 1

Size, growth rate and distribution of population
PROVISIONAL POPULATION TOTALS 43
As seen from the above statement, among the States and Union Territories in the country, Uttar Pradesh has the largest share of 16.49 percent population and it is followed by Maharastra 9.29 percent, Bihar 8.58 percent, West Bengal 7.55 percent, Andhra Pradesh 7.00 percent and Madhya Pradesh 6.00 percent. Th ese six States together constitute more than 54 percent of India’s total population. Th e least share of population of 0.01 percent is recorded in the Union Territory of Lakshadweep, preceded by the Union Territories of Daman & Diu (0.02 percent), Dadra & Nagar Haveli and Andaman & Nicobar Islands (0.03 percent). It is interesting to note that excluding NCT of Delhi, the remaining 6 Union Territories together contribute a mere 0.28 percent of population to the total population of the Country. Among the States, Sikkim has the lowest share of just 0.05 percent population. Karnataka State with a share of 5.05 percent population is the 9th biggest State in the Country and retains its 2001 Census position.
Th e decadal growth of population of Karnataka over the decades from 1901-2011 is given in Statement 2. Th e provisional results for the Census of India 2011, reveals that population of Karnataka at the reference point of time is 6,11,30,704 with 3,10,57,742 males and 3,00,72,962 females. In absolute terms, the population of Karnataka has increased by 82,80,142 persons during the decade 2001-2011 and in terms of percentage it has registered a decadal growth rate of 15.67 percent, which is below the national average of 17.64.
STATEMENT - 2POPULATION AND ITS GROWTH, KARNATAKA: 1901 - 2011
Census years
Population Decadal Growth Average annual exponential growth
rate (percent)
Progresssive growth rate over 1901
(percent)
Absolute Percentage
1901 1,30,54,754 - - - -
1911 1,35,25,251 4,70,497 3.60 0.35 3.60
1921 1,33,77,599 -1,47,652 -1.09 -0.11 2.47
1931 1,46,32,992 12,55,393 9.38 0.90 12.09
1941 1,62,55,368 16,22,376 11.09 1.05 24.52
1951 1,94,01,956 31,46,588 19.36 1.77 48.62
1961 2,35,86,772 41,84,816 21.57 1.95 80.68
1971 2,92,99,014 57,12,242 24.22 2.17 124.43
1981 3,71,35,714 78,36,700 26.75 2.37 184.46
1991 44,97,7201 78,41,487 21.12 1.92 244.53
2001 5,28,50,562 78,73,361 17.51 1.61 304.84
2011 6,11,30,704 82,80,142 15.67 1.46 368.26
Th e net addition in population over the decades has consistently increased from 1901 to 2011, except in the decade 1911 - 1921. However, from 1981-1991 onwards the decadal growth rates have shown a declining trend, which implies that even though the population of the State is steadily growing, the pace of its growth is on the decline. Th e total progressive growth rate of the State population since 1901 to 2011 is 368.26 percent. In absolute terms, the population of the State which stood at 1,30,54,754 in 1901 has increased to 6,11,30,704 over the last 110 years with a net increase of 4,80,75,950. Th e net decadal accretion of population is depicted in Chart - 2.

44
CHART 2K
ARN
ATA
KA
POPU
LATI
ON
AN
D N
ET D
ECA
DA
L A
CCRE
TIO
N 1
901-
2011
IN CRORES
FIG
URE
S O
N TO
P O
F TH
E BA
RS R
EPRE
SEN
TS
TOTA
L PO
PULA
TIO
N F
OR
EACH
CEN
SUS
YEAR
.
7 6 5 4 3 2 1 0 -1
CEN
SUS
YEA
RS
1 30
54
754
6 11
30
704
5 28
50
562
4 49
77
201
3 71
35
714
2 92
99
014
2 35
86
772
1 35
25
251 1
33 7
7 59
91 46
32
9921
62 5
5 36
81 94
01
956
1901
1911
1931
1941
1951
1961
1971
1981
1991
2001
2011
1921
1911
1921
1931
1941
1951
1961
1971
1981
1991
2001
2011
4 70
497
-1 4
7 65
212
55
393
16 2
2 37
631
46
588
41 8
4 81
657
12
242
78 3
6 70
078
41
487
78 7
3 36
182
80
142
NET
ACC
RETI
ON
NET
DED
UCT
ION

Size, growth rate and distribution of population
PROVISIONAL POPULATION TOTALS 45
Statement - 3 shows the population of the districts and their percentage share in the population of the State. Th e percentage share of population among the districts is graphically depicted in Chart - 3.
STATEMENT - 3POPULATION OF DISTRICTS BY SEX AND PERCENTAGE SHARE OF POPULATION IN TOTAL POPULATION
District Code
State / District Total population Percentage share in total populationPersons Males Females
- Karnataka 6,11,30,704 3,10,57,742 3,00,72,962 100
01 Belgaum 47,78,439 24,27,104 23,51,335 7.82
02 Bagalkot 18,90,826 9,52,902 9,37,924 3.09
03 Bijapur 21,75,102 11,12,953 10,62,149 3.56
04 Bidar 17,00,018 8,70,850 8,29,168 2.78
05 Raichur 19,24,773 9,66,493 9,58,280 3.15
06 Koppal 13,91,292 7,01,479 6,89,813 2.28
07 Gadag 10,65,235 5,38,477 5,26,758 1.74
08 Dharwad 18,46,993 9,39,127 9,07,866 3.02
09 Uttara Kannada 14,36,847 7,27,424 7,09,423 2.35
10 Haveri 15,98,506 8,19,295 7,79,211 2.61
11 Bellary 25,32,383 12,80,402 12,51,981 4.14
12 Chitradurga 16,60,378 8,43,411 8,16,967 2.72
13 Davanagere 19,46,905 9,89,602 9,57,303 3.18
14 Shimoga 17,55,512 8,79,817 8,75,695 2.87
15 Udupi 11,77,908 5,62,896 6,15,012 1.93
16 Chikmagalur 11,37,753 5,67,483 5,70,270 1.86
17 Tumkur 26,81,449 13,54,770 13,26,679 4.39
18 Bangalore 95,88,910 50,25,498 45,63,412 15.69
19 Mandya 18,08,680 9,09,441 8,99,239 2.96
20 Hassan 17,76,221 8,85,807 8,90,414 2.91
21 Dakshina Kannada 20,83,625 10,32,577 10,51,048 3.41
22 Kodagu 5,54,762 2,74,725 2,80,037 0.91
23 Mysore 29,94,744 15,11,206 14,83,538 4.90
24 Chamarajanagar 10,20,962 5,13,359 5,07,603 1.67
25 Gulbarga 25,64,892 13,07,061 12,57,831 4.20
26 Yadgir 11,72,985 5,91,104 5,81,881 1.92
27 Kolar 15,40,231 7,79,401 7,60,830 2.52
28 Chikkaballapura 12,54,377 6,37,504 6,16,873 2.05
29 Bangalore Rural 9,87,257 5,07,514 4,79,743 1.61
30 Ramanagara 10,82,739 5,48,060 5,34,679 1.77
It can be seen from Statement-3 that Bangalore district, home to the State head-quarters, with its share of 15.69 percent population is the most populous district in the State. In other words, for every 6 person in the State one belongs to Bangalore district. Belgaum with a share of 7.82 percent occupies the second

46
place, followed by Mysore (4.90), Tumkur (4.39), Gulbarga (4.20) and Bellary (4.14) districts. All these 5 districts have more than 2.5 million population each and together contribute one fourth to the State’s total population. Among these fi ve districts, 4 districts have Municipal Corporations within their jurisdiction, which is a factor for them to have more population. Kodagu with a population of just 0.55 million is the least populous district in the State, preceded by Banglore Rural district with 0.98 million. Except for these two districts in the State, all other districts have more than 1 million population. Th e comparative size of population and area of the districts, 2011in terms of percentage is depicted in Chart-4.
In terms of ranking, Bangalore district with a share of 15.69 percent ranks fi rst, followed by Belgaum district (7.82 percent), Kodagu district with 0.91 percent share occupies the last rank preceded by Bangalore Rural district (1.61 percent). In the statement - 4 given below, it can be seen that 14 districts have retained the same ranks as in 2001 Census. It is interesting to note that inspite of increase in the total population of Bangalore Rural district during the decade 2001-11, the percentage share of its population to the total population of the State remains identical at 1.61 percent for both the decades.
Census publicity hoarding at IOCL petrol bunk, Bangalore.
Enumeration of Hon’ble Chief Justice, High Court of Karnataka

Size, growth rate and distribution of population
PROVISIONAL POPULATION TOTALS 47
CHART 3
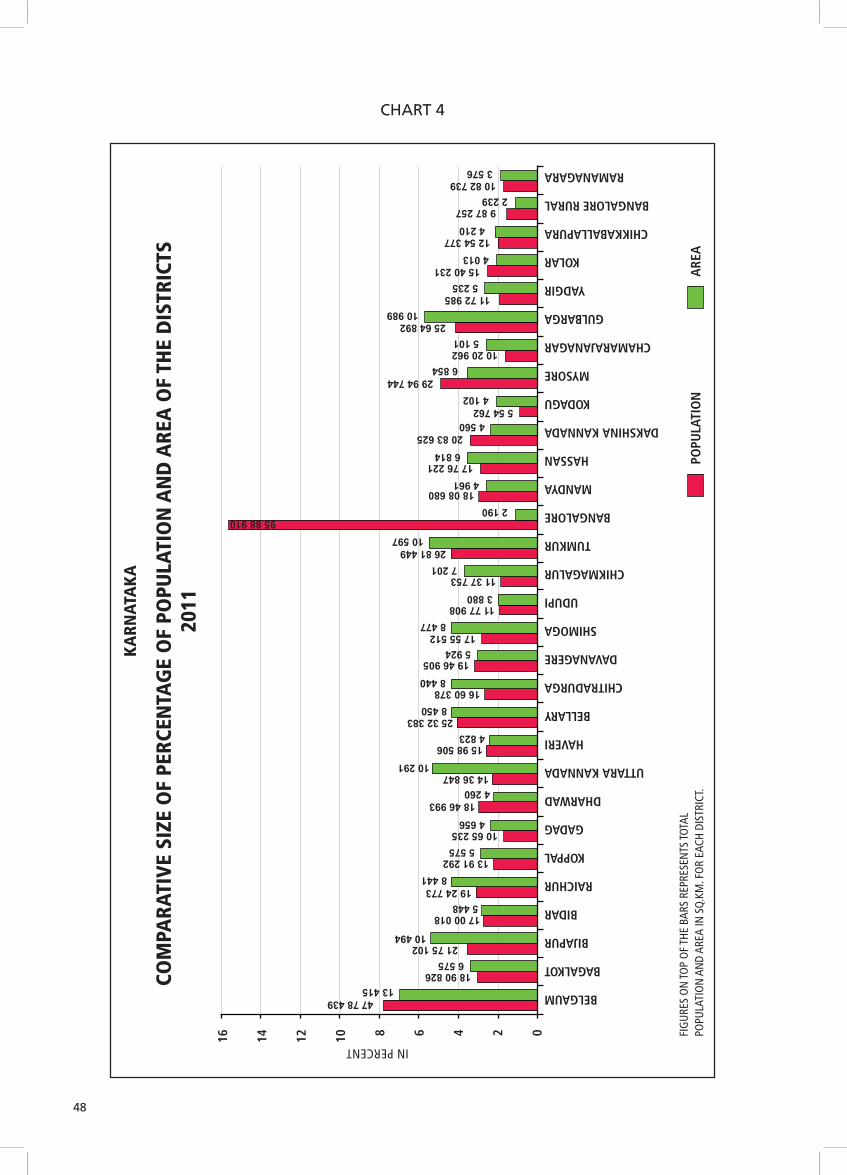
48
CHART 4K
ARN
ATA
KA
COM
PARA
TIV
E SI
ZE O
F PE
RCEN
TAG
E O
F PO
PULA
TIO
N A
ND
ARE
A O
F TH
E D
ISTR
ICTS
20
11
IN PERCENT
FIG
URE
S O
N TO
P O
F TH
E BA
RS R
EPRE
SEN
TS TO
TAL
POPU
LATI
ON
AN
D AR
EA IN
SQ.
KM. F
OR
EACH
DIS
TRIC
T.
47 78 43913 415
18 90 8266 575
21 75 10210 494
17 00 0185 448
19 24 7738 441
14 36 84710 291
18 46 9934 260
15 98 5064 823
8 45016 60 378
8 440
11 37 753
17 55 5128 477
13 91 2925 575
4 656
19 46 9055 924
11 77 9083 880
26 81 44910 597
10 65 235
25 32 383
7 201
2 190
5 54 7624 102
20 83 6254 560
17 76 2216 814
29 94 7446 854
10 20 9625 101
18 08 6804 961
25 64 89210 989
11 72 9855 23515 40 231
4 013
4 210
10 82 7393 576
9 87 2572 239
12 54 377
95 88 910
BELGAUM
BAGALKOT
BIJAPUR
BIDAR
RAICHUR
KOPPAL
GADAG
DHARWAD
UTTARA KANNADA
HAVERI
BELLARY
CHITRADURGA
DAVANAGERE
SHIMOGA
UDUPI
CHIKMAGALUR
TUMKUR
BANGALORE
MANDYA
HASSAN
DAKSHINA KANNADA
KODAGU
MYSORE
CHAMARAJANAGAR
GULBARGA
YADGIR
KOLAR
CHIKKABALLAPURA
BANGALORE RURAL
RAMANAGARA
16 14 12 10 8 6 4 2 0
POPU
LATI
ON
ARE
A

Size, growth rate and distribution of population
PROVISIONAL POPULATION TOTALS 49
STATEMENT - 4 RANKING OF DISTRICTS BY POPULATION SIZE : 2001 AND 2011
Rank In 2011 State/ Districts Population 2011 Percent to total Population of District
Rank in 2001
2011 2001
- Karnataka 6,11,30,704 100.00 100.00 -1 Bangalore 95,88,910 15.69 12.37 1
2 Belgaum 47,78,439 7.82 7.97 2
3 Mysore 29,94,744 4.90 5.00 3
4 Tumkur 26,81,449 4.39 4.89 4
5 Gulbarga 25,64,892 4.20 4.11 5
6 Bellary 25,32,383 4.14 3.84 6
7 Bijapur 21,75,102 3.56 3.42 8
8 Dakshina Kannada 20,83,625 3.41 3.59 7
9 Davanagere 19,46,905 3.18 3.39 9
10 Raichur 19,24,773 3.15 3.16 12
11 Bagalkot 18,90,826 3.09 3.13 13
12 Dharwad 18,46,993 3.02 3.04 15
13 Mandya 18,08,680 2.96 3.34 10
14 Hassan 17,76,221 2.91 3.26 11
15 Shimoga 17,55,512 2.87 3.11 14
16 Bidar 17,00,018 2.78 2.84 17
17 Chitradurga 16,60,378 2.72 2.87 16
18 Haveri 15,98,506 2.61 2.72 18
19 Kolar 15,40,231 2.52 2.62 19
20 Uttara Kannada 14,36,847 2.35 2.56 20
21 Koppal 13,91,292 2.28 2.26 21
22 Chikkaballapura 12,54,377 2.05 2.17 22
23 Udupi 11,77,908 1.93 2.10 24
24 Yadgir 11,72,985 1.92 1.81 28
25 Chikmagalur 11,37,753 1.86 2.16 23
26 Ramanagara 10,82,739 1.77 1.95 25
27 Gadag 10,65,235 1.74 1.84 26
28 Chamarajanagar 10,20,962 1.67 1.83 27
29 Bangalore Rural 9,87,257 1.61 1.61 29
30 Kodagu 5,54,762 0.91 1.04 30
Table - 2 given in the Annexure shows the percentage decadal growth rate of each district since 1901. Th e decadal growth rates, 2001 - 2011 for the districts are depicted in Map - 4.
Statement - 5 shows the selected indicators of population growth in diff erent districts of the State. Th e percentage decadal growth of population in districts 1901-2011 is depicted in Chart - 5. Th e percentage decadal growth of population in the inter-censal period 2001 -2011 varied from a negative rate of -0.28 percent in Chikmagalur district to the highest of 46.68 percent in Bangalore district. Th e average decadal growth rate for the State stands at 15.67. Th ere are seven districts including Bangalore, which have registered growth rate above the State average, whereas in the remaining 23 districts the decadal population growth rate is below the State average of 15.67. Among these 23 districts, apart from Chikmagalur district which has a negative decadal growth, 14 districts have registered below 10 percent decadal growth, with Kodagu recording the least of 1.13 percent.

50
Th e change in percentage decadal growth rates between the decades 1991 - 2001 and 2001 - 2011 presented in the statement establishes the declining trends in the decadal growth rates over the previous decade. As can be seen the decadal growth rate for the State has declined by 1.84 percentage points. Relative fi gures for the districts indicate that except for Bangalore, Bijapur, Yadgir and Bellary, which have registered higher growth rates than the previous decade, the remaining 26 districts have recorded growth rates less than that registered in 1991-2001. Th e change in percentage decadal growth rate in respect of these districts varies from -12.43 percent in Chikmagalur district to -1.24 percent in Udupi district.
STATEMENT - 5 POPULATION, PERCENTAGE DECADAL GROWTH AND AVERAGE ANNUAL EXPONENTIAL GROWTH RATES 1991-2001 AND 2001-2011
Dis-trict Code
State/ District Total Population Percentage decadal growth
Change in Per-centage de-cadal rowth
Average annual exponential growth
rate
2001 2011 1991-2001 2001-2011 1991-2001 2001-2011
- Karnataka 5,28,50,562 6,11,30,704 17.51 15.67 -1.84 1.61 1.47
01 Belgaum 42,14,505 47,78,439 17.61 13.38 -4.23 1.62 1.26
02 Bagalkot 16,51,892 18,90,826 18.82 14.46 -4.36 1.72 1.36
03 Bijapur 18,06,918 21,75,102 17.51 20.38 2.87 1.61 1.87
04 Bidar 15,02,373 17,00,018 19.63 13.16 -6.47 1.79 1.24
05 Raichur 16,69,762 19,24,773 23.52 15.27 -8.25 2.11 1.43
06 Koppal 11,96,089 13,91,292 24.84 16.32 -8.52 2.22 1.52
07 Gadag 9,71,835 10,65,235 13.13 9.61 -3.52 1.23 0.92
08 Dharwad 16,04,253 18,46,993 16.68 15.13 -1.55 1.54 1.42
09 Uttara Kannada 13,53,644 14,36,847 10.93 6.15 -4.78 1.04 0.60
10 Haveri 14,39,116 15,98,506 13.39 11.08 -2.31 1.26 1.06
11 Bellary 20,27,140 25,32,383 22.41 24.92 2.51 2.02 2.25
12 Chitradurga 15,17,896 16,60,378 15.63 9.39 -6.24 1.45 0.90
13 Davanagere 17,90,952 19,46,905 14.86 8.71 -6.15 1.39 0.84
14 Shimoga 16,42,545 17,55,512 13.10 6.88 -6.22 1.23 0.67
15 Udupi 11,12,243 11,77,908 7.14 5.90 -1.24 0.69 0.58
16 Chikmagalur 11,40,905 11,37,753 12.15 -0.28 -12.43 1.15 -0.03
17 Tumkur 25,84,711 26,81,449 12.10 3.74 -8.36 1.14 0.37
18 Bangalore 65,37,124 95,88,910 35.09 46.68 11.59 3.01 3.91
19 Mandya 17,63,705 18,08,680 7.26 2.55 -4.71 0.70 0.25
20 Hassan 17,21,669 17,76,221 9.68 3.17 -6.51 0.92 0.31
21 Dakshina Kannada 18,97,730 20,83,625 14.59 9.80 -4.79 1.36 0.94
22 Kodagu 5,48,561 5,54,762 12.31 1.13 -11.18 1.16 0.11
23 Mysore 26,41,027 29,94,744 15.75 13.39 -2.36 1.46 1.26
24 Chamarajanagar 9,65,462 10,20,962 9.29 5.75 -3.54 0.89 0.56
25 Gulbarga 21,74,742 25,64,892 21.76 17.94 -3.82 1.97 1.66
26 Yadgir 9,56,180 11,72,985 20.12 22.67 2.55 1.83 2.06
27 Kolar 13,87,062 15,40,231 14.46 11.04 -3.42 1.35 1.05
28 Chikkaballapura 11,49,007 12,54,377 14.33 9.17 -5.16 1.34 0.88
29 Bangalore Rural 8,50,968 9,87,257 18.60 16.02 -2.58 1.71 1.50
30 Ramanagara 10,30,546 10,82,739 7.84 5.06 -2.78 0.75 0.50

Size, growth rate and distribution of population
PROVISIONAL POPULATION TOTALS 51
Statement - 6 presents the distribution of the districts by ranges of percentage decadal growth and percentage of population of these districts. It clearly brings out the major shift in distribution of districts by ranges of growth rates between 1991-2001 and 2001-2011.
STATEMENT - 6 DISTRIBUTION OF DISTRICTS BY RANGE OF PERCENTAGE DECADAL GROWTH: 1991-2001 AND 2001-2011
Percent-age
decadal growth
Number of Districts
1991-2001
Percentage of population to total popula-
tion 2001
Number of Districts
2001-2011
Percentage of population to total popula-
tion 2011
<12 6 15.04 17 41.85
12-15 10 27.54 4 18.59
15-18 5 22.30 5 14.26
18-21 4 9.39 1 3.56
21-24 3 11.11 1 1.92
24-27 1 2.26 1 4.14
27-30 - - - -
30+ 1 12.37 1 15.69
Th e number of districts in the range below 12 percent has increased from 6 districts in 2001 Census to 17 districts in 2011 Census. Th e percentage of population to total population in this range has gone up from 15.04 percent in 2001 to 41.85 percent in 2011. In the next range i.e., 12-15 percent, the number of districts decreased from 10 in 2001 to 4 in 2011 constituting 18.59 percent of population.
STATEMENT - 7 DISTRIBUTION OF DISTRICTS BY RANGE OF AVERAGE ANNUAL EXPONENTIAL GROWTH : 1991-2001 AND 2001-2011
Average annual exponential growth rate
Number of Districts
1991-2001
Percentage of population to
total population
Number of Districts
2001-2011
Percentage of population to
total population
<1.0 5 12.48 15 36.71
1.0-1.4 11 30.10 8 29.89
1.5-1.9 9 31.69 4 11.64
2.0-2.4 4 13.37 2 6.06
2.5-2.9 0 0 0 0
3.0+ 1 12.37 1 15.69
A similar inference could be drawn from Statement - 7 in which the districts have been classifi ed by ranges of average annual exponential growth rates for these decades. Th e proportion of population of the districts in each of these categories to the total population has also been shown. During the period 1991-2001, 16 districts, with a share of about 42.58 percent of the State’s population, registered an average annual exponential growth rate of less than 1.5 percent. During 2001-2011, as many as 23 districts with a share of about 66.60 percent fall in this category.

52
STATEMENT - 8 DECADAL GROWTH OF POPULATION AND PERCENTCONTRIBUTION TO TOTAL GROWTH OF STATE 1991-2001 AND 2001-2011
District Code
States / Distrticts Decadal growth of population (Absolute)
Percentage contribution to total growth of the state
1991-2001 2001-2011 1991-2001 2001-2011
- Karnataka 78,73,361 82,80,142 100 100
01 Belgaum 6,30,899 5,63,934 8.01 6.81
02 Bagalkot 2,61,633 2,38,934 3.32 2.89
03 Bijapur 2,69,187 3,68,184 3.42 4.45
04 Bidar 2,46,574 1,97,645 3.13 2.39
05 Raichur 3,17,953 2,55,011 4.04 3.08
06 Koppal 2,38,011 1,95,203 3.02 2.36
07 Gadag 1,12,793 93,400 1.43 1.13
08 Dharwad 2,29,358 2,42,740 2.91 2.93
09 Uttara Kannada 1,33,384 83,203 1.69 1.00
10 Haveri 1,69,903 1,59,390 2.16 1.92
11 Bellary 3,71,140 5,05,243 4.71 6.10
12 Chitradurga 2,05,179 1,42,482 2.61 1.72
13 Davanagere 2,31,730 1,55,953 2.94 1.88
14 Shimoga 1,90,286 1,12,967 2.42 1.36
15 Udupi 74,144 65,665 0.94 0.79
16 Chikmagalur 1,23,622 -3,152 1.57 -0.04
17 Tumkur 2,78,892 96,738 3.54 1.17
18 Bangalore 16,97,962 30,51,786 21.57 36.86
19 Mandya 1,19,331 44,975 1.52 0.54
20 Hassan 1,51,985 54,552 1.93 0.66
21 Dakshina Kannada 2,41,565 1,85,895 3.07 2.25
22 Kodagu 60,106 6,201 0.76 0.07
23 Mysore 3,59,374 3,53,717 4.56 4.27
24 Chamarajanagar 82,097 55,500 1.04 0.67
25 Gulbarga 3,88,604 3,90,150 4.94 4.71
26 Yadgir 1,60,149 2,16,805 2.03 2.62
27 Kolar 1,75,204 1,53,169 2.23 1.85
28 Chikkaballapura 1,43,976 1,05,370 1.83 1.27
29 Bangalore Rural 1,33,443 1,36,289 1.69 1.65
30 Ramanagara 74,877 52,193 0.95 0.63
Statement - 8 presents the absolute increase in population of the districts of the State during the Census decade 1991-2001 and 2001-2011. Th e percentage contributions of each of the districts to the total growth of the State for the decades 1991-2001 and 2001-2011 have also been shown in Statement - 8. Although, in the State as a whole there has been an increase in net accretion in the population during 2001-2011 as compared to 1991-2001, as many as 23 districts have shown a reverse trend in this respect. Th e district of Bangalore has contributed 36.86 percent to the total growth of the State in the decade 2001-2011.

Size, growth rate and distribution of population
PROVISIONAL POPULATION TOTALS 53
STATEMENT - 9POPULATION AND PROPORTION OF CHILD POPULATION IN THE AGE GROUP 0-6 BY SEX : 2001-2011
District Code
States/ Districts Child Population in the age group 0-6
Proportion of child population in the age group 0-6 to total population
2011 2001 2011
Persons Males Females P M F P M F
- Karnataka 68,55,801 35,27,844 33,27,957 13.59 13.72 13.45 11.21 11.36 11.07
01 Belgaum 6,05,524 3,13,599 2,91,925 14.81 15.11 14.49 12.67 12.92 12.42
02 Bagalkot 2,63,781 1,36,780 1,27,001 16.03 16.37 15.69 13.95 14.35 13.54
03 Bijapur 3,03,480 1,57,212 1,46,268 15.87 16.06 15.68 13.95 14.13 13.77
04 Bidar 2,16,885 1,12,103 1,04,782 16.08 16.13 16.01 12.76 12.87 12.64
05 Raichur 2,72,703 1,39,917 1,32,786 16.95 17.12 16.79 14.17 14.48 13.86
06 Koppal 1,94,199 99,460 94,739 17.39 17.65 17.12 13.96 14.18 13.73
07 Gadag 1,27,259 65,464 61,795 14.18 14.31 14.05 11.95 12.16 11.73
08 Dharwad 2,10,194 1,08,231 1,01,963 13.61 13.65 13.56 11.38 11.52 11.23
09 Uttara Kannada 1,46,457 75,225 71,232 12.82 12.98 12.65 10.19 10.34 10.04
10 Haveri 1,87,754 96,518 91,236 14.16 14.06 14.26 11.75 11.78 11.71
11 Bellary 3,41,804 1,74,946 1,66,858 15.74 15.92 15.56 13.50 13.66 13.33
12 Chitradurga 1,77,786 91,973 85,813 13.15 13.21 13.08 10.71 10.90 10.50
13 Davanagere 2,06,935 1,07,181 99,754 13.42 13.46 13.37 10.63 10.83 10.42
14 Shimoga 1,76,904 90,271 86,633 12.67 12.81 12.53 10.08 10.26 9.89
15 Udupi 1,00,579 51,448 49,131 10.30 11.20 9.50 8.54 9.14 7.99
16 Chikmagalur 1,00,791 51,347 49,444 12.15 12.31 11.99 8.86 9.05 8.67
17 Tumkur 2,52,307 1,29,253 1,23,054 11.92 12.03 11.81 9.41 9.54 9.28
18 Bangalore 9,88,482 5,09,268 4,79,214 11.82 11.60 12.05 10.31 10.13 10.50
19 Mandya 1,62,147 83,846 78,301 11.63 11.94 11.32 8.96 9.22 8.71
20 Hassan 1,55,579 79,197 76,382 11.60 11.87 11.33 8.76 8.94 8.58
21 Dakshina Kannada 2,02,670 1,04,169 98,501 12.02 12.45 11.59 9.73 10.09 9.37
22 Kodagu 52,697 26,661 26,036 12.68 12.80 12.56 9.50 9.70 9.30
23 Mysore 2,85,956 1,46,192 1,39,764 12.25 12.27 12.24 9.55 9.67 9.42
24 Chamarajanagar 94,859 48,854 46,005 11.90 11.94 11.87 9.29 9.52 9.06
25 Gulbarga 3,52,162 1,81,955 1,70,207 16.50 16.74 16.25 13.73 13.92 13.53
26 Yadgir 1,85,727 95,620 90,107 18.58 18.87 18.29 15.83 16.18 15.49
27 Kolar 1,61,877 82,814 79,063 13.41 13.49 13.32 10.51 10.63 10.39
28 Chikkaballapura 1,24,719 64,129 60,590 13.10 13.19 13.01 9.94 10.06 9.82
29 Bangalore Rural 1,02,019 52,400 49,619 12.61 12.65 12.57 10.33 10.32 10.34
30 Ramanagara 1,01,565 51,811 49,754 11.48 11.60 11.36 9.38 9.45 9.31
Th e quick collection and compilation of data on child population in the age group 0-6 although primarily intended for calculating the literacy rates, allows us to broadly analyse its possible linkages with growth of population. Statement - 9 gives the child population for 2011 and also its proportion to the total population for 2001 and 2011 by sex. In Karnataka, the proportion of children in the age group 0-6 decreased from 13.59 percent in 2001 to 11.21 percent in 2011. In case of males, the percentage dropped by 2.36 percentage points and for the females

54
by 2.38 percentage points. Among the disticts the highest proportion of child population (0-6) is found in Yadgir district (15.83 percent) which incidentally had the highest proportion of child population (0-6) in 2001 also. Th e least proportion of child population (0-6) is recorded in Udupi district (8.54 percent) which also had the lowest proportion in 2001 Census. Th e proportion of child population (0-6) is above the State average of 11.21 percent in only 12 districts of the State.
STATEMENT - 10 DISTRIBUTION OF DISTRICTS BY THEIR RANGES OF THE PROPORTIONOF CHILD POPULATION IN THE AGE GROUP 0-6 FOR 2001 AND 2011
Range of pro-portion of child population in the age group 0-6
Number of Districts 2001
Percentage of population to total population 2001 (all ages)
Number of Districts 2011
Percentage of Population to total population 2011 (all ages)
Less than 9.00 0 0 4 9.65
9.00-11.99 7 29.74 17 57.42
12.00-13.99 12 33.16 7 27.86
14.00-15.99 5 19.79 2 5.07
16.00-17.99 5 15.51 0 0
18.00 and above 1 1.81 0 0
Th e distribution of districts by their ranges of the proportion of child population in the age group 0-6 for the 2001 and 2011 Censuses is given in Statement - 10. It would be of interest to note that in 2001 only 7 districts had percentage of child population in the age group 0-6 less than 12 percent with a share of 29.74 percent of the State’s population. Th is number of districts has swelled to 21 in 2011 and now has a share of 67.07 per cent. Th e number of districts having child population less than 16 per cent has increased from 24 with a share of about 82.69 percent of the State’s population in 2001 to 30 with a share of 100 percent in 2011. Th ese results perhaps broadly indicate a drop in fertility across the State.
Meeting with Special Charge Offi cers
Census Publicity hoarding at KPCL offi ce premises, Bangalore.

Size, growth rate and distribution of population
PROVISIONAL POPULATION TOTALS 55
MAP -4
KARNATAKAM
A
H A R A S H T R
A
P
R
A
D
E
S
H
T A M I L
N
A
D
U
K
E
R
A L
A
A
N
D
H
R
A
PERCENTAGE DECADALPOPULATION GROWTH
2001 - 2011
ARABIAN SEA
L A K S H
A D
W E E P
S E
A
GO
A
020 20 40 60 80 100
KILOMETRES
STATE
DISTRICT
BOUNDARIES :-
O OO O OO74 75 76 77 78 79
O
O
O
O
O
O
O
16
17
18
12
13
14
15
OOOOOO74 75 76 77 78 79EAST OF GREENWICH
18
17
16
O
O
O
15
14
O
O
13
12
O
O
PERCENTAGE DECADAL POPULATIONGROWTH 2001 - 2011
The responsibility for the correctness of internal details rests with the publisher. The territorial waters of India extend into the sea to a distance of twelve nautical miles measured from the appropriate base line.The external boundaries and coastlines of India agree with the Record/Master Copy certified by Survey of India.
15.01 - 20.00( State Average 15.67 )
... ... ... ... ...
5.00 & BELOW
10.01 - 15.00
20.01 & ABOVE
0.00 & BELOW
GAIN
LOSS
© Government of India Copyright, 2011.
5.01 - 10.00
T = TumkurT
BELGAUM13.38
BIJAPUR20.38
TUMKUR3.74
GULBARGA17.94
RAICHUR15.27
BELLARY24.92
SHIMOGA6.88
BIDAR13.16
HASSAN3.17
MYSORE13.39
YADGIR22.67
KOPPAL16.32
BAGALKOT14.46
GADAG9.61
HAVERI11.08
UTTARA KANNADA6.15
UDUPI5.90
KOLAR11.04
MANDYA2.55
CHITRADURGA9.39
CHIKMAGALUR-0.28
KODAGU1.13
DHARWAD15.13
DAKSHINA KANNADA9.80
DAVANAGERE8.71
CHAMARAJANAGAR5.75
RAMANAGARA5.06
CHIKKABALLAPURA9.17
BANGALORE46.68
BANGALORE RURAL16.02

56
CHART 5
BELGAUM BAGALKOT
BIJAPUR BIDAR
-10
0
10
20
30
-10
0
10
20
30
-10
0
10
20
30
-10
0
10
20
30
RAICHUR
KARNATAKA PERCENTAGE DECADAL POPULATION GROWTH 1901-2011
A
-10
0
10
20
30
40
PE
RC
EN
TA
GE
D
EC
AD
AL
V
AR
IA
TI
ON
1901
-11
1911
-21
1921
-31
1931
-41
1941
-51
1951
-61
1961
-71
1971
-81
1981
-91
1991
-01
2001
-11
-10
0
10
20
30
40
KOPPAL
CENSUS YEARS CENSUS YEARS
1901
-11
1911
-21
1921
-31
1931
-41
1941
-51
1951
-61
1961
-71
1971
-81
1981
-91
1991
-01
2001
-11

Size, growth rate and distribution of population
PROVISIONAL POPULATION TOTALS 57
CHART 5
GADAG
-10
0
10
20
30
DHARWAD
UTTARA KANNADA HAVERI
BELLARY
-10
0
10
20
30
-20-10
010203040
PE
RC
EN
TA
GE
D
EC
AD
AL
V
AR
IA
TI
ON
B
0
10
20
30
CHITRADURGA
1901
-11
1911
-21
1921
-31
1931
-41
1941
-51
1951
-61
1961
-71
1971
-81
1981
-91
1991
-01
2001
-11
1901
-11
1911
-21
1921
-31
1931
-41
1941
-51
1951
-61
1961
-71
1971
-81
1981
-91
1991
-01
2001
-11
-10
0
10
20
30
40
-10
0
10
20
30
40

58
CHART 5
-100
10203040
DAVANAGERE
-100
10203040506070
SHIMOGA
UDUPI
0
10
20
30
-100
1020304050
CHIKMAGALUR
TUMKUR
0
10
20
30
PE
RC
EN
TA
GE
D
EC
AD
AL
V
AR
IA
TI
ON
C
BANGALORE
1901
-11
1911
-21
1921
-31
1931
-41
1941
-51
1951
-61
1961
-71
1971
-81
1981
-91
1991
-01
2001
-11
1901
-11
1911
-21
1921
-31
1931
-41
1941
-51
1951
-61
1961
-71
1971
-81
1981
-91
1991
-01
2001
-11
01020304050607080

Size, growth rate and distribution of population
PROVISIONAL POPULATION TOTALS 59
CHART 5
MANDYA
0
10
20
30
HASSAN
DAKSHINA KANNADA KODAGU
MYSORE
0
10
20
30
0
10
20
30
-100
1020304050
0
10
20
30PE
RC
EN
TA
GE
D
EC
AD
AL
V
AR
IA
TI
ON
D
-10
0
10
20
30
CHAMARAJANAGAR
1901
-11
1911
-21
1921
-31
1931
-41
1941
-51
1951
-61
1961
-71
1971
-81
1981
-91
1991
-01
2001
-11
1901
-11
1911
-21
1921
-31
1931
-41
1941
-51
1951
-61
1961
-71
1971
-81
1981
-91
1991
-01
2001
-11

60
CHART 5
GULBARGA
-10
0
10
20
30
YADGIR
KOLAR
-10
0
10
20
30
0
10
20
30
CHIKKABALLAPURA
BANGALORE RURAL
0
10
20
30
0
10
20
30
PE
RC
EN
TA
GE
D
EC
AD
AL
V
AR
IA
TI
ON
E
0
10
20
30
RAMANAGARA
1901
-11
1911
-21
1921
-31
1931
-41
1941
-51
1951
-61
1961
-71
1971
-81
1981
-91
1991
-01
2001
-11
1901
-11
1911
-21
1921
-31
1931
-41
1941
-51
1951
-61
1961
-71
1971
-81
1981
-91
1991
-01
2001
-11

Size, growth rate and distribution of population
PROVISIONAL POPULATION TOTALS 61
CHART 5
PE
RC
EN
TAG
E D
EC
ADA
L V
AR
IATI
ON
F
KARNATAKA
-10
0
10
20
30
CENSUS YEARS
1901
-11
1911
-21
1921
-31
1931
-41
1941
-51
1951
-61
1961
-71
1971
-81
1981
-91
1991
-01
2001
-11


4DENSITY OF POPULATION


PROVISIONAL POPULATION TOTALS 65
4Density of population
One of the important indices of population concentration is the density of population. It is defi ned as the number of persons per square kilometre. Th e population density of Karnataka in 2011 was 319 persons per square kilometre an increase from 276 in 2001. It means that, on an average 43 more people inhabit every square kilometre area in the State than the numbers that lived a decade ago.
Th e population density of Karnataka from 1901 to 2011 is shown in statement-11. At the beginning of the twentieth century, the density of Karnataka was as low as 68 and this has steadily increased from one decade to another to reach 319 in 2011. While in terms of absolute value it has increased, the percentage of increase over 2001 indicates a downward trend. Th e percentage increase in 2011 is 15.58 percent compared to 17.45 percent in 2001.
STATEMENT - 11DENSITY OF POPULATION, KARNATAKA: 1901-2011
Census year Density (per sq. km)
Absolute increase
Percentage increase
1901 68 - -
1911 71 3 4.41
1921 70 -1 -1.41
1931 76 6 8.57
1941 85 9 11.84
1951 101 16 18.82
1961 123 22 21.78
1971 153 30 24.39
1981 193 40 26.14
1991 235 42 21.76
2001 276 41 17.45
2011 319 43 15.58
In Statement - 12 the districts in the State are ranked in descending order according to the density of population. Bangalore district with 4378 persons per square kilometre is the most densely populated and ranks fi rst in the State. Bangalore district which includes the Bruhat Bangalore Mahanagara Palike limits in its jurisdiction has increased its habitants by 1393 per square kilometre during the decade. Kodagu is the least populated district in the State with the density of 135 persons per square kilometre. Kodagu which ranked at the 29th place in 2001 Census has slipped to the last position. Th e density of Chikmagalur district remained constant over the last decade at 158 persons per square kilometre. Th e districtwise density of population of Karnataka as in 2011 Census is given in Map - 5.

66
STATEMENT - 12RANKING OF DISTRICTS BY DENSITY : 2001 AND 2011
Rank in 2011 States/Districts Density (per sq.km) Rank in 2001
2011 2001- Karnataka 319 276 -
1 Bangalore 4,378 2,985 1
2 Dakshina Kannada 457 416 2
3 Bangalore Rural 441 380 4
4 Mysore 437 385 3
5 Dharwad 434 377 5
6 Kolar 384 346 7
7 Mandya 365 356 6
8 Belgaum 356 314 8
9 Haveri 331 298 10
10 Davanagere 329 302 9
11 Bidar 312 276 13
12 Udupi 304 287 12
13 Ramanagara 303 288 11
14 Bellary 300 240 18
15 Chikkaballapura 298 273 14
16 Bagalkot 288 251 16
17 Hassan 261 253 15
18 Tumkur 253 244 17
19 Koppal 250 215 19
20 Gulbarga 233 198 21
21 Gadag 229 209 20
22 Raichur 228 198 22
23 Yadgir 224 183 25
24 Bijapur 207 172 27
25 Shimoga 207 194 23
26 Chamarajanagar 200 189 24
27 Chitradurga 197 180 26
28 Chikmagalur 158 158 28
29 Uttara Kannada 140 132 30
30 Kodagu 135 134 29
STATEMENT - 13RANKING OF NEIGHBOURING STATES AS PER DENSITY:2001 AND 2011
Rank in 2011 India/ States Density ( per sq. km.) Rank in 2001
2011 2001- India 382 325 -
8 Kerala 859 819 8
12 Tamilnadu 555 480 11
16 Goa 394 364 14
17 Maharashtra 365 315 17
19 Karnataka 319 276 20
20 Andhra Pradesh 308 277 19
A comparison with the neighbouring States of Karnataka is given in Statement - 13. Kerala is the most densely populated State in the Southern Region, which ranks at 8th place. From the statement it can be seen that Karnataka which ranked 20th in 2001 has moved up to 19th rank in 2011 Census.

Density of population
PROVISIONAL POPULATION TOTALS 67
MAP 5
KARNATAKAM
A
H A R A S H T R
A
P
R
A
D
E
S
H
T A M I L
N
A
D
U
K
E
R
A
L A
A
N
D
H
R
A
DENSITY OF POPULATION 2011
ARABIAN SEA
L A K S H A D
W E E
P S E A
GO
A
020 20 40 60 80 100
KILOMETRES
STATEDISTRICT
BOUNDARIES :-
O OO O OO74 75 76 77 78 79
O
O
O
O
O
O
O
16
17
18
12
13
14
15
OOOOOO74 75 76 77 78 79EAST OF GREENWICH
18
17
16
O
O
O
15
14
O
O
13
12
O
O
PERSONS PER Sq. Km
© Government of India Copyright, 2011.
351 - 425
T
( State Average 319 )
... ... ... ... ...
200 & BELOW
276 - 350
426 & ABOVE
The responsibility for the correctness of internal details rests with the publisher. The territorial waters of India extend into the sea to a distance of twelve nautical miles measured from the appropriate base line.
The external boundaries and coastlines of India agree with the Record/Master Copy certified by Survey of India.
201 - 275
T = Tumkur
BELGAUM356
BIJAPUR207
TUMKUR253
GULBARGA233
RAICHUR228
BELLARY300
SHIMOGA207
BIDAR312
HASSAN261
MYSORE437
YADGIR224
KOPPAL250
BAGALKOT288
GADAG229
HAVERI331
UTTARAKANNADA
140
UDUPI304
KOLAR384
MANDYA365
CHITRADURGA197
CHIKMAGALUR158
KODAGU135
DAVANA-GERE
329
DHARWAD434
DAKSHINAKANNADA
457
CHIKKABALLAPURA298
CHAMARAJANAGAR200
RAMANAGARA303
BANGALORE4378
BANGALORE RURAL441


5GENDER COMPOSITION OF POPULATION


PROVISIONAL POPULATION TOTALS 71
5Gender composition of population
Th e composition of population by gender is one of the basic demographic characteristics, which is vital for any demographic analysis. Demographic events are generally diff erentiated by sex. Th e data on sex is crucial for planning purposes especially in health services, estimating fertility rates, mortality rates, etc. Th erefore, it is important to consider the eff ect of variation in the gender composition of population for any meaningful demographic analysis.
A simple measure to calculate the gender composition is the sex ratio. It is defi ned as the number of females per 1000 males. Th e Indian Census has the tradition of bringing out dis-aggregated information by sex on various aspects of population. Th e data on sex of an individual was collected under ‘column number 3’ in Census 2011 schedule. Th e information collected and compiled are presented in number of statements in this chapter.
STATEMENT - 14SEX RATIO FOR SOUTHERN STATES : 2001 AND 2011
Census year
India Kerala Tamil Nadu Andhra Pradesh
Goa Karnataka Maharashtra
2011 940 1084 995 992 968 968 925
2001 933 1058 987 978 961 965 922
As per the provisional fi gures of Census of India 2011, the sex ratio for the country as a whole is 940 as against 933 in 2001. On the other hand, the sex ratio for Karnataka has witnessed a marginal increase of 3 points during the decade. Th e sex ratio for the State as per provisional fi gures of Census 2011 is 968 compared to 965 in 2001 Census. Th e State fi gures are however more than the national average. Among the Southern States, Karnataka and Goa’s sex ratio are identical and are the second lowest next to Maharashtra which has recorded 925 females per 1000 males.
STATEMENT - 15SEX RATIO FOR KARNATAKA : 1901 - 2011
Census Year
1901 1911 1921 1931 1941 1951 1961 1971 1981 1991 2001 2011
Sex ratio (Females per 1000 males)
983 981 969 965 960 966 959 957 963 960 965 968
Statement - 15 and Chart - 6 presents the sex ratio in Karnataka State since 1901. A quick perusal of Statement - 15 shows that the sex ratio fi gures during the past decades are not consistent. In 1901, the State was better placed with 983 females per 1000 males which is the highest ratio ever recorded. Even aft er completion of more than ten decades, the State has not touched this level.
Th e district wise fi gures for trends in sex ratio for the past hundred years are given in Table 3 under Annexures. Th e trends are shown separately in Chart - 7. Mandya, Mysore and Chamarajanagar districts which

72
KA
RNAT
AK
A
SEX
RAT
IO 1
901-
2011
FIG
URE
S O
N TO
P O
F TH
E BA
RS R
EPRE
SEN
TS
SEX
RATI
O F
OR
EACH
CEN
SUS
YEAR
.
985
980
975
970
965
960
955
950
983
966
960
959
957
963
960
965
968
965
969
981
FEMALES PER 1000 MALES
1901
1911
1921
1931
1941
1951
1961
1971
1981
1991
2001
2011
CEN
SUS
YEA
RS
CHART 6

Gender composition of population
PROVISIONAL POPULATION TOTALS 73
CHART 7
BELGAUM BAGALKOT
BIJAPUR BIDAR
RAICHUR KOPPAL
���
���
���
���
���
����
���
���
���
���
���
����
����
���
���
���
���
���
����
KARNATAKA TRENDS IN SEX RATIO 1901-2011
FE
MA
LE
S
PE
R
1
00
0
MA
LE
S
1901
19
11
1921
19
31
1941
19
51
1961
19
71
1981
19
91
2001
20
11
CENSUS YEARS CENSUS YEARS
A
1901
19
11
1921
19
31
1941
19
51
1961
19
71
1981
19
91
2001
20
11
���
���
���
���
���
����
���
���
���
���
���
����
����
���
���
���
���
���
����
����

74
CHART 7
GADAG DHARWAD
UTTARA KANNADA HAVERI
BELLARY CHITRADURGA
���
���
���
���
���
����
���
���
���
���
���
����
���
���
���
���
���
����
���
���
���
���
���
����
���
���
���
���
���
����FE
MA
LE
S
PE
R
1
00
0
MA
LE
S
B
1901
19
11
1921
19
31
1941
19
51
1961
19
71
1981
19
91
2001
20
11
1901
19
11
1921
19
31
1941
19
51
1961
19
71
1981
19
91
2001
20
11
���
���
���
���
���
����
����
CENSUS YEARS CENSUS YEARS

Gender composition of population
PROVISIONAL POPULATION TOTALS 75
CHART 7
DAVANAGERE SHIMOGA
UDUPI CHIKMAGALUR
TUMKUR BANGALORE
���
���
���
���
���
����
���
���
���
���
���
����
����
����
����
����
���
���
���
���
���
����
����
���
���
���
���
���
����
CENSUS YEARS CENSUS YEARS
FE
MA
LE
S
PE
R
1
00
0
MA
LE
S C
1901
19
11
1921
19
31
1941
19
51
1961
19
71
1981
19
91
2001
20
11
1901
19
11
1921
19
31
1941
19
51
1961
19
71
1981
19
91
2001
20
11
���
���
���
���
���
����
���
���
���
���
���
����

76
CHART 7
MANDYA HASSAN
DAKSHINA KANNADA KODAGU
MYSORE CHAMARAJANAGAR
���
���
���
���
���
����
����
���
���
���
���
���
����
����
���
���
���
���
���
����
����
���
���
���
���
���
����
����
���
���
���
���
���
����
����
CENSUS YEARS CENSUS YEARS
FE
MA
LE
S
PE
R
1
00
0
MA
LE
S
D
1901
19
11
1921
19
31
1941
19
51
1961
19
71
1981
19
91
2001
20
11
1901
19
11
1921
19
31
1941
19
51
1961
19
71
1981
19
91
2001
20
11
���
���
���
���
���
����
����
����
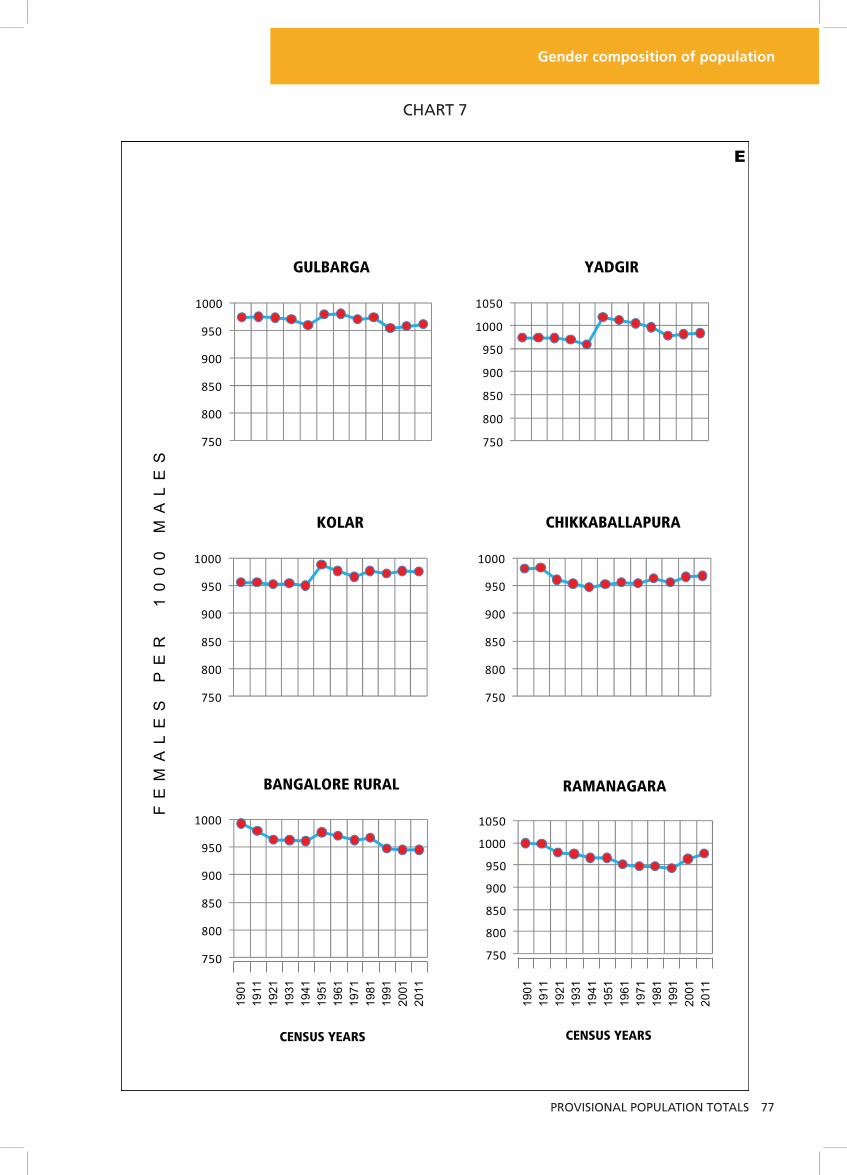
Gender composition of population
PROVISIONAL POPULATION TOTALS 77
CHART 7
GULBARGA YADGIR
KOLAR CHIKKABALLAPURA
BANGALORE RURAL RAMANAGARA
���
���
���
���
���
����
����
���
���
���
���
���
����
���
���
���
���
���
����
���
���
���
���
���
����
CENSUS YEARS CENSUS YEARS
FE
MA
LE
S
PE
R
1
00
0
MA
LE
S E
1901
19
11
1921
19
31
1941
19
51
1961
19
71
1981
19
91
2001
20
11
1901
19
11
1921
19
31
1941
19
51
1961
19
71
1981
19
91
2001
20
11
���
���
���
���
���
����
���
���
���
���
���
����
����

78
CHART 7
KARNATAKA 19
01
1911
1921
1931
1941
1951
1961
1971
1981
1991
2001
2011
CENSUS YEARS
FEM
ALE
S P
ER
100
0 M
ALE
S
F
���
���
���
���
���
����

Gender composition of population
PROVISIONAL POPULATION TOTALS 79
began the 20th Century with favourable sex ratio of females out numbering males, recorded unfavourable ratios in 2011. Further it can be seen from the table that Udupi and Dakshina Kannada have maintained their sex ratio favourabe to women throughout the period of analysis with some fl uctuations in the ratios. It is interesting to note that in 2011 Udupi district has registered the lowest sex ratio in the last 10 decades.
STATEMENT - 16SEX RATIO OF TOTAL POPULATION AND CHILDPOPULATION IN THE AGE GROUP 0-6 : 2001 AND 2011
District Code
States / Districts Sex ratio (females per1,000 males)
Total Population Child Population in the age group 0-6
Population aged 7 and above
2001 2011 2001 2011 2001 2011- Karnataka 965 968 946 943 968 971
1 Belgaum 960 969 921 931 967 974
2 Bagalkot 980 984 940 929 988 994
3 Bijapur 950 954 928 930 955 958
4 Bidar 949 952 941 935 950 955
5 Raichur 983 992 964 949 987 999
6 Koppal 983 983 953 953 989 988
7 Gadag 969 978 952 944 972 983
8 Dharwad 949 967 943 942 950 970
9 Uttara Kannada 971 975 946 947 974 979
10 Haveri 944 951 957 945 941 952
11 Bellary 969 978 947 954 973 982
12 Chitradurga 955 969 946 933 957 973
13 Davanagere 952 967 946 931 952 972
14 Shimoga 978 995 956 960 981 999
15 Udupi 1,130 1,093 958 955 1,151 1,106
16 Chikmagalur 984 1,005 959 963 988 1009
17 Tumkur 967 979 949 952 970 982
18 Bangalore 908 908 943 941 903 904
19 Mandya 986 989 934 934 993 994
20 Hassan 1,004 1,005 958 964 1,010 1,009
21 Dakshina Kannada 1,022 1,018 952 946 1,032 1,026
22 Kodagu 996 1,019 977 977 999 1,024
23 Mysore 964 982 962 956 964 984
24 Chamarajanagar 971 989 964 942 971 994
25 Gulbarga 958 962 931 935 964 967
26 Yadgir 982 984 952 942 989 993
27 Kolar 977 976 965 955 979 979
28 Chikkaballapura 966 968 952 945 968 970
29 Bangalore Rural 945 945 939 947 946 945
30 Ramanagara 964 976 945 960 967 977
Statement - 16 gives the sex ratio of the total population, sex ratio in the age group 0–6 and sex ratio of population aged 7 and above for 2001 and 2011 for all the districts of Karnataka State. Th e sex ratio of the districts as per the Provisional Population Totals, 2011 is depicted in Map - 6.

80
KARNATAKA
MA
H
AR
AS
HT
R
A
PR
AD
ES
H
T A M IL
NA
DU
KE
R
AL
A
AN
DH
RA
SE X RAT I O20 11
ARABIANSEA
LA
KS
HA
DW
EE
PS
EA
GO
A
020 20 40 60 80 100
KILOMETRES
STATEDISTRICT
BOUNDARIES :-
O OO O OO74 75 76 77 78 79
O
O
O
O
O
O
O
16
17
18
12
13
14
15
OOOOOO74 75 76 77 78 79EAST OF GREENWICH
18
17
16
O
O
O
15
14
O
O
13
12
O
O
FEMALES PER 1000 MALES
© Government of India Copyright, 2011.
986 - 1000
T
( State Average 968 )
... ... ...
... ...
955 & BELOW
971 - 985
1001 & ABOVE
The responsibility for the correctness of internal details rests with the publisher.The territorial waters of India extend into the sea to a distance of twelve nautical miles measured from the appropriate base line.The external boundaries and coastlines of India agree with the Record/Master Copy certified by Survey of India.
956 - 970
T = Tumkur
BELGAUM969
BIJAPUR954
TUMKUR979
RAICHUR992
GULBARGA962
BELLARY978
SHIMOGA995
BIDAR952
HASSAN1005
MYSORE982
YADGIR984
KOPPAL983
GADAG978
HAVERI951
BAGALKOT984
UDUPI1093
UTTARA KANNADA975
MANDYA989
KOLAR976
CHITRADURGA969
CHIKMAGALUR1005
KODAGU1019
DAVANAGERE967
DHARWAD967
DAKSHINA KANNADA1018
CHAMARAJANAGAR989
RAMANAGARA976
CHIKKABALLAPURA968
BANGALORE908
BANGALORE RURAL945
MAP 6

Gender composition of population
PROVISIONAL POPULATION TOTALS 81
Th e sex ratio in the State ranges from 1093 in Udupi district to 908 in Bangalore district. Th ough Udupi district has registered the highest sex ratio of 1093, the ratio in fact has declined from 1130 in 2001. A similiar trend is observed in Dakshina Kannada district. Bangalore district has recorded the lowest sex ratio in the state and has witnessed no improvement in the gender composition during the decade. While Chikmagalur and Kodagu districts have shown favourable sex ratios, the ratios in respect of Koppal and Bangalore Rural districts have remained the same. Th e proportion of Female population in the district of the State is depicted in Chart-8.
Th e gender composition of the children in the age group 0-6 is a cause of great concern for the Government and the Demographers. At the national level the sex ratio (0-6) has decreased from 927 in 2001 to 914 in 2011. On the other hand the sex ratio (0-6) for the State is 943 in 2011 as against 946 in 2001. Th ere is marginal decline in the sex ratio (0-6) for the State during the last decade. Among the neighbouring States, Karnataka and Andhra Pradesh have identical sex ratio (0-6) of 943 and are ahead of Maharashtra which has reported a ratio of 883. Th e fi gures for the State are however a little lower than Kerala (959) and Tamilnadu (946).
Among the districts in the State, 11 districts have shown upward trend while the 0-6 sex ratio have declined in 16 districts. Th e ratios for Koppal, Mandya and Kodagu have remained the same over the decade. Th e details can be seen in Statement - 16.
STATEMENT - 17DISTRIBUTION OF DISTRICTS BY RANGE OF SEX RATIO OF THE STATE: 2001 AND 2011
Sex ratio 2001 Percentage of population to total population, 2001
(All age)
2011 Percentage of population tototal population, 2011
(All age)
880 & below 0 0 0 0
881-915 1 12.37 1 15.69
916-950 5 13.63 1 1.61
951-985 19 60.67 19 61.03
986 & above 5 13.33 9 21.66
Statement - 17 gives the distribution of districts by diff erent ranges of sex ratio and their share in the total population of the State in these ranges. A comparison between 2001 and 2011 data reveals that there has been a decrease in the number of districts reporting in the range 916-950 which has obviously resulted in lower percentage share of population in 2011. Contrary to this, the number of districts in the range 986 and above has gone up to 9 in 2011 from 5 in 2001. In both the Censuses one district (Bangalore) has the sex ratio ranging between 881 to 915. However its percentage of share to the total population has gone up from 12.37 in 2001 to 15.69 in 2011.
STATEMENT - 18DISTRIBUTION OF DISTRICTS BY SEX RATIOBELOW STATE LEVEL AND ABOVE STATE LEVEL : 2001 AND 2011
Sex ratio Number of Districts
Percentage of Population to total population 2001
(All age)
Number of Districts
Percentage of population to total population 2011
(All age)
Below state average 12 51.30 9 38.71
Above state average 18 48.70 21 61.29
Statement - 18 classifi es the districts in two classes, namely below and above the State sex ratio. It is interesting to note the increase in the number of districts above the State average in 2011 which has added three more districts to this class resulting in increased percentage share of population during the decade.

82
KA
RNAT
AK
A
PRO
PORT
ION
OF
FEM
ALE
PO
PULA
TIO
N IN
DIS
TRIC
TS 2
011
53 52 51 50 49 48 47 46 45
IN PERCENT
BELGAUM
BAGALKOT
BIJAPUR
BIDAR
RAICHUR
KOPPAL
GADAG
DHARWAD
UTTARA KANNADA
HAVERI
BELLARY
CHITRADURGA
DAVANAGERE
SHIMOGA
UDUPI
CHIKMAGALUR
TUMKUR
BANGALORE
MANDYA
HASSAN
DAKSHINA KANNADA
KODAGU
MYSORE
CHAMARAJANAGAR
GULBARGA
YADGIR
KOLAR
CHIKKABALLAPURA
BANGALORE RURAL
RAMANAGARA
KARNATAKA
49.2
149.6
0
49.1
749
.20
49.4
4
48.7
5
49.3
749
.15
49.4
549
.58
49.7
9
48.7
748
.83
49.8
850
.12 49
.48
47.5
949.7
250.1
350.4
450
.48 49
.5449
.72 49
.0449
.61
49.1
949
.38
48.5
9
49.1
849
.40
52.2
1
FIG
URE
S O
N TO
P O
F TH
E BA
RS R
EPRE
SEN
TS P
ERCE
NTA
GE
OF
FEM
ALE
POPU
LATI
ON
TO TO
TAL
POPU
LATI
ON.
CHART 8

Gender composition of population
PROVISIONAL POPULATION TOTALS 83
STATEMENT - 19SEX RATIO OF TOTAL POPULATION ANDCHILD POPULATION IN THE AGE GROUP 0-6: 1961-2011
Census years Sex ratio in the age group 0-6 years Overall sex ratio1961 987 959
1971 978 957
1981 974 963
1991 960 960
2001 946 965
2011 943 968
Statement - 19 gives the sex ratio of the total population and child population in the age group 0-6 from 1961 to 2011. It is clear that the sex ratio in the age group 0-6 has decreased at a much faster pace than the overall sex ratio of the State aft er 1981. While the 0-6 sex ratio has declined by 3 points between 2001 and 2011 the overall sex ratio has increased by 3 points.
STATEMENT - 20DISTRIBUTION OF DISTRICTS BY RANGE OFSEX RATIO OF CHILD POPULATION IN THE AGE-GOUP 0-6 : 2001 AND 2011
Sex ratio Number of Districts
Percentage of Population to total population 2001
(0-6 age)
Number of Districts
Percentage of population to total population 2011
(0-6 age)880 & below 0 0 0 0
881-915 0 0 0 0
916-950 15 61.79 19 71.91
951-985 15 38.21 11 28.09
986 & above 0 0 0 0
Statement - 20 gives the distribution of the districts by ranges of sex ratio of child population in the age group 0-6 and their relative share in these ranges in terms of percentage of population to the total population of the State in 2001 and 2011. None of the districts in the State has the child sex ratio below 915 and above 986. Th e trend that was observed in 2001 Census is witnessed in this Census also. However it is worrying to note that number of districts with sex ratio 951-985 had reduced to 11 in 2011 resulting in over 10 percent decrease in the share of population in this range during the decade.
STATEMENT - 21DISTRIBUTION OF DISTRICTS BY RANGE OFSEX RATIO OF POPULATION AGED 7+ : 2001 AND 2011
Sex ratio Number of Districts
Percentage of Population tototal population 2001
(7+ age)
Number of Districts
Percentage of population to total population 2011
(7+ age)880 & below 0 0 0 0
881-915 1 12.62 1 15.86
916-950 4 10.13 1 1.63
951-985 15 51.48 16 53.52
986 & above 10 25.77 12 28.98
Statement - 21 provides the distribution of the districts by ranges of sex ratio of population in the age group of seven and above for the years 2001 and 2011. It also gives the percentage of population to the total population of the districts in each of the categories. It is seen from the table that for the range of 916-950 the percentage to total population has drastically reduced to 1.63 per cent in 2011 from 10.13 percent in 2001.


6STATE OF LITERACY


PROVISIONAL POPULATION TOTALS 87
6State of literacy
Literacy and Education are reasonably good indicators of development in a society. Spread and diff usion of Literacy is generally associated with essential traits of today’s civilization such as modernization, urbanization, industrialization, communication and commerce. It forms an important input in the overall development of individuals enabling them to comprehend their social, political and cultural environment better and respond to it appropriately. Higher levels of literacy and education lead to greater awareness and also contribute in improvement of economic condition. It acts as a catalyst of social uplift ment enhancing the returns on investments made in almost every aspect of development eff ort, be it population control, health, hygiene, environmental degradation control, empowerment of women and weaker sections of the society. Improved levels of literacy also are pre-requisites for acquiring various skills.Literacy is one of the important social characteristics on which information is obtained of every individual in the Census. For the purpose of Census a person aged seven and above, who can both read and write with understanding in any language, is treated as literate. A person, who can only read but cannot write, is not a literate. In the Census prior to 1991, children below fi ve years of age were necessarily treated as illiterates. It is not mandatory that to be treated as literate, a person should have received any formal education or acquired any minimum educational standard. Literacy status can be acquired through adult literacy classes or by attending any non-formal educational system. Persons who are blind and can read in Braille are also treated as literates.In Census up to 1981, it was customary to work out the literacy rate taking into account the total population. Since literacy rate is more meaningful if the sub-population in the age group 0-6 is excluded from the total population, it was decided in 1991 to use the term literacy rate for the population relating to seven years and above. Since then same concept is being continued.Table 4 given under Annexure presents the total population, child population in the age group 0-6, literates and literacy rates for the State of Karnataka as reported in the Provisional Population Totals, Census of India, 2011.As per Census 2011 Provisional Population Totals, the literacy rate of the State stands at 75.60 percent, the male literacy rate at 82.85 percent and the female literacy rate at 68.13 percent. Th e map of the State depicting the literacy rate for persons and females, 2011 is shown in Map - 7.
STATEMENT - 22NUMBER OF LITERATES AND ILLITERATES AMONGPOPULATION AGED 7 YEARS AND ABOVE AND THEIR CHANGE : 2001 AND 2011
Literates/ Illiterates Persons Males Females
Literates2001 3,04,34,962 1,76,61,211 1,27,73,751
2011 4,10,29,323 2,28,08,468 1,82,20,855
Increase in 2011 over 2001 1,05,94,361 51,47,257 54,47,104
Illiterates2001 1,52,33,500 55,46,749 96,86,751
2011 1,32,45,580 47,21,430 85,24,150
Increase in 2011 over 2001 -19,87,920 -8,25,319 -11,62,601

88
KARNATAKA
MA
H
AR
AS
HT
R
A
PR
AD
ES
H
T A M IL
NA
DU
KE
R
AL
A
AN
DH
RA
LITERACY RATE FORPERSONS AND FEMALES
2011
ARABIANSEA
LA
KS
HA
DW
EE
PS
EA
GO
A
020 20 40 60 80 100
KILOMETRES
STATEDISTRICT
BOUNDARIES :-
O OO O OO74 75 76 77 78 79
O
O
O
O
O
O
O
16
17
18
12
13
14
15
OOOOOO74 75 76 77 78 79EAST OF GREENWICH
18
17
16
O
O
O
15
14
O
O
13
12
O
O
62.01 - 71.00
80.01 & ABOVE
PERCENTAGE OF LITERATES TOTOTAL POPULATION EXCLUDING0 - 6 AGE - GROUP
© Government of India Copyright, 2011.
71.01 - 80.00
T
( State Average 75.60 )
... ... ...... ...
53.00 & BELOW
62.01 - 71.00
80.01 & ABOVE
The responsibility for the correctness of internal details rests with the publisher.The territorial waters of India extend into the sea to a distance of twelve nautical miles measured from the appropriate base line.The external boundaries and coastlines of India agree with the Record/Master Copy certified by Survey of India.
53.01 - 62.00
T = Tumkur
71.01 - 80.00
53.00 & BELOW
53.01 - 62.00
( State Average 68.13)
THE FIGURES WITHIN THE DISTRICTSREPRESENTS FEMALE LITERACY RATE
PERCENTAGE OF FEMALE LITERATES TOTOTAL FEMALE POPULATION EXCLUDING0 - 6 AGE - GROUP
BELGAUM64.74
BIJAPUR56.54
TUMKUR66.45
RAICHUR49.56
BELLARY58.28
SHIMOGA74.89
BIDAR61.66
HASSAN68.30
MYSORE66.59
YADGIR41.31
KOPPAL56.22
GADAG65.29
HAVERI70.65
UTTARAKANNADA
78.21
UDUPI81.41
KOLAR66.56
MANDYA62.10
KODAGU77.91
DAVANA-GERE69.39
GULBARGA55.87
BAGALKOT58.55
CHITRADURGA66.05
CHIKMAGALUR72.88
DHARWAD73.57
CHAMARAJANAGAR54.32
DAKSHINAKANNADA
84.04
RAMANAGARA61.30
CHIKKA-BALLAPURA
61.55
BANGALORE84.80
BANGALORE RURAL70.73
MAP 7

State of literacy
PROVISIONAL POPULATION TOTALS 89
Statement - 22 gives the absolute number of literates and illiterates among the population aged seven year and above in the State for the 2001 and 2011 Censuses. Th e Statement points out to a substantial increase in number of literates during the decade. Quite interestingly, females outnumber males in terms of absolute increase. Out of the 10,594,361 added to the literate population during 2001-2011 Census, 5,147,257 were males and 5,447,104 were females. Further, during this period the contribution of the total decrease of 1,987,920 among illiterates is dominated by females (1,162,601) as compared to males (825,319).
STATEMENT - 23POPULATION AGED 7 AND ABOVE, LITERATES IN 2001 AND THEIRDECADAL DIFFERENCE AND PERCENTAGE DECADAL DIFFERENCE DURING 2001-2011
District Code
States/Districts Population aged 7
and above 2001
Decadal differ-ence in Popula-
tion aged 7 and above2001-2011
Percentage decadal
difference2001-2011
Number of literates
2001
Decadal difference in
number of literates2001-2011
Percentage decadal
difference2001-2011
Karnataka 4,56,68,462 86,06,441 18.85 3,04,34,962 1,05,94,361 34.81
01 Belgaum 35,90,474 5,82,441 16.22 23,05,279 7,80,013 33.84
02 Bagalkot 13,87,020 2,40,025 17.31 7,94,785 3,34,187 42.05
03 Bijapur 15,20,087 3,51,535 23.13 8,66,561 3,91,181 45.14
04 Bidar 12,60,856 2,22,277 17.63 7,68,358 2,84,823 37.07
05 Raichur 13,86,694 2,65,376 19.14 6,76,799 3,22,100 47.59
06 Koppal 9,88,085 2,09,008 21.15 5,34,547 2,70,880 50.67
07 Gadag 8,34,000 1,03,976 12.47 5,51,362 1,53,774 27.89
08 Dharwad 13,85,991 2,50,808 18.10 9,92,550 3,21,803 32.42
09 Uttara Kannada 11,80,141 1,10,249 9.34 9,04,024 1,80,253 19.94
10 Haveri 12,35,404 1,75,348 14.19 8,37,509 2,57,296 30.72
11 Bellary 17,08,054 4,82,525 28.25 9,80,483 5,05,747 51.58
12 Chitradurga 13,18,361 1,64,231 12.46 8,49,690 2,44,713 28.80
13 Davanagere 15,50,677 1,89,293 12.21 10,45,620 2,81,994 26.97
14 Shimoga 14,34,382 1,44,226 10.05 10,68,934 2,01,911 18.89
15 Udupi 9,97,662 79,667 7.99 8,10,584 1,19,039 14.69
16 Chikmagalur 10,02,261 34,701 3.46 7,23,610 98,060 13.55
17 Tumkur 22,76,549 1,52,593 6.70 15,25,485 2,79,876 18.35
18 Bangalore 57,64,584 28,35,844 49.19 47,82,565 28,27,397 59.12
19 Mandya 15,58,558 87,975 5.64 9,51,460 2,03,492 21.39
20 Hassan 15,22,004 98,638 6.48 10,44,584 1,85,357 17.74
21 Dakshina Kannada 16,69,670 2,11,285 12.65 13,91,738 2,75,096 19.77
22 Kodagu 4,78,987 23,078 4.82 3,73,541 40,764 10.91
23 Mysore 23,17,472 3,91,316 16.89 14,71,155 4,94,337 33.60
24 Chamarajanagar 8,50,525 75,578 8.89 4,32,700 1,33,376 30.82
25 Gulbarga 18,15,959 3,96,771 21.85 9,86,857 4,65,836 47.20
26 Yadgir 7,78,509 2,08,749 26.81 3,10,588 2,06,352 66.44
27 Kolar 12,01,108 1,77,246 14.76 7,90,771 2,33,784 29.56
28 Chikkaballapura 9,98,492 1,31,166 13.14 5,91,496 2,00,196 33.85
29 Bangalore Rural 7,43,667 1,41,571 19.04 5,17,550 1,75,518 33.91
30 Ramanagara 9,12,229 68,945 7.56 5,53,777 1,25,206 22.61

90
Statement - 23 shows the population aged seven and above and the absolute number of literates in 2001, their percentage and decadal diff erence during 2001 and 2011. Th e percentage decadal increase in population aged seven years and above during 2001 and 2011 is 18.85 percent while the corresponding increase in the number of literates in the age group is 34.81 percent. Th e districts which have shown decadal percentage increase of more than 50 per cent are Yadgir (66.44), Bangalore (59.12), Bellary (51.58) and Koppal (50.67). Th ough Yadgir is the only district in the State to record less than 60 per cent literacy rate in 2011, in terms of percentage increase in number of literates during the decade it ranks fi rst in the State with 66.44 per cent.
STATEMENT - 24NUMBER OF ILLITERATES, DECADAL DECREASEIN ILLITERATES AND PERCENTAGE CONTRIBUTION IN DECREASE : 2001 - 2011
District Code
States/Districts Number of illiterates Decadal decrease in number of illiterates
(4-3)
Percentage contribution in decrease
2001 2011Karnataka 1,52,33,500 1,32,45,580 -1987920 100
01 Belgaum 12,85,195 10,87,623 -1,97,572 9.94
02 Bagalkot 5,92,235 4,98,073 -94,162 4.74
03 Bijapur 6,53,526 6,13,880 -39,646 1.99
04 Bidar 4,92,498 4,29,952 -62,546 3.15
05 Raichur 7,09,895 6,53,171 -56,724 2.85
06 Koppal 4,53,538 3,91,666 -61,872 3.11
07 Gadag 2,82,638 2,32,840 -49,798 2.51
08 Dharwad 3,93,441 3,22,446 -70,995 3.57
09 Uttara Kannada 2,76,117 2,06,113 -70,004 3.52
10 Haveri 3,97,895 3,15,947 -81,948 4.12
11 Bellary 7,27,571 7,04,349 -23,222 1.17
12 Chitradurga 4,68,671 3,88,189 -80,482 4.05
13 Davanagere 5,05,057 4,12,356 -92,701 4.66
14 Shimoga 3,65,448 3,07,763 -57,685 2.90
15 Udupi 1,87,078 1,47,706 -39,372 1.98
16 Chikmagalur 2,78,651 2,15,292 -63,359 3.19
17 Tumkur 7,51,064 6,23,781 -1,27,283 6.40
18 Bangalore 9,82,019 9,90,466 8,447 -0.42
19 Mandya 6,07,098 4,91,581 -1,15,517 5.81
20 Hassan 4,77,420 3,90,701 -86,719 4.36
21 Dakshina Kannada 2,77,932 2,14,121 -63,811 3.21
22 Kodagu 1,05,446 87,760 -17,686 0.89
23 Mysore 8,46,317 7,43,296 -1,03,021 5.18
24 Chamarajanagar 4,17,825 3,60,027 -57,798 2.91
25 Gulbarga 8,29,102 7,60,037 -69,065 3.47
26 Yadgir 4,67,921 4,70,318 2,397 -0.12
27 Kolar 4,10,337 3,53,799 -56,538 2.84
28 Chikkaballapura 4,06,996 3,37,966 -69,030 3.47
29 Bangalore Rural 2,26,117 1,92,170 -33,947 1.71
30 Ramanagara 3,58,452 3,02,191 -56,261 2.83

State of literacy
PROVISIONAL POPULATION TOTALS 91
Statement - 24 presents the number of illiterates, decadal decrease in illiterates and the percentage contribution in its decrease during 2001-2011 at the district level. Th e absolute number of illiterates in the state as a whole declined in this decade by 1,987,920. Th e maximum contribution in this decline came from Belgaum district, where the number of illiterates decreased by 197,572 accounting for 9.94 per cent of the total decrease in illiterates during 2001-2011. Bangalore and Yadgir on the other hand increased its number of illiterates, contributing negatively to the decrease in illiterates in the State by -0.42 and -0.12 per cent respectively.
STATEMENT - 25 NUMBER OF MALE ILLITERATES, DECADAL DECREASE IN MALEILLITERATES AND PERCENTAGE CONTRIBUTION IN DECREASE : 2001-2011
District Code States/Districts Number of male illiterates Decadal decrease in number of
male illiterates
Percentage contribution in decrease2001 2011
- Karnataka 55,46,749 47,21,430 -8,25,319 100
01 Belgaum 4,43,526 3,61,443 -82,083 9.95
02 Bagalkot 2,03,139 1,61,916 -41,223 4.99
03 Bijapur 2,33,805 2,15,868 -17,937 2.17
04 Bidar 1,78,050 1,52,223 -25,827 3.13
05 Raichur 2,68,466 2,36,830 -31,636 3.83
06 Koppal 1,56,869 1,31,163 -25,706 3.11
07 Gadag 87,464 71,453 -16,011 1.94
08 Dharwad 1,36,347 1,09,456 -26,891 3.26
09 Uttara Kannada 92,457 67,072 -25,385 3.08
10 Haveri 1,42,494 1,14,050 -28,444 3.45
11 Bellary 2,66,685 2,51,622 -15,063 1.83
12 Chitradurga 1,70,696 1,39,976 -30,720 3.72
13 Davanagere 1,87,657 1,49,839 -37,818 4.58
14 Shimoga 1,30,246 1,09,651 -20,595 2.50
15 Udupi 54,587 42,515 -12,072 1.46
16 Chikmagalur 99,389 74,026 -25,363 3.07
17 Tumkur 2,68,381 2,19,947 -48,434 5.87
18 Bangalore 3,65,896 3,69,521 3,625 -0.44
19 Mandya 2,30,705 1,80,462 -50,243 6.09
20 Hassan 1,63,786 1,32,688 -31,098 3.77
21 Dakshina Kannada 84,618 62,077 -22,541 2.73
22 Kodagu 39,051 31,651 -7,400 0.90
23 Mysore 3,43,541 2,94,365 -49,176 5.96
24 Chamarajanagar 1,76,757 1,49,184 -27,573 3.34
25 Gulbarga 3,12,686 2,80,047 -32,639 3.95
26 Yadgir 1,90,400 1,81,687 -8,713 1.06
27 Kolar 1,45,740 1,25,788 -19,952 2.42
28 Chikkaballapura 1,53,266 1,24,084 -29,182 3.54
29 Bangalore Rural 80,310 66,281 -14,029 1.70
30 Ramanagara 1,39,735 1,14,545 -25,190 3.05
Statement - 25 presents the district level fi gures of male illiterates in 2001 and 2011 Censuses, the decadal decrease in male illiterates and the percentage contribution in decrease. In case of male illiterates, their absolute number in the state has gone down by 825,319 during the decade 2001-2011. Belgaum district has contributed the maximum of 9.95 per cent of the total decrease of the State. On the other hand Bangalore district has added 3,625 male illiterates to the State in the decade 2001-2011.

92
STATEMENT - 26NUMBER OF FEMALE ILLITERATES, DECADAL DECREASE IN FEMALEILLITERATES AND PERCENTAGE CONTRIBUTION IN DECREASE : 2001 -2011
District Code
State/ Districts Number of female illiterates
Decadal decrease in number of
female illiterates
Percentage contribution in
decrease2001 2011
Karnataka 96,86,751 85,24,150 -11,62,601 100
01 Belgaum 8,41,669 7,26,180 -1,15,489 9.93
02 Bagalkot 3,89,096 3,36,157 -52,939 4.55
03 Bijapur 4,19,721 3,98,012 -21,709 1.87
04 Bidar 3,14,448 2,77,729 -36,719 3.16
05 Raichur 4,41,429 4,16,341 -25,088 2.16
06 Koppal 2,96,669 2,60,503 -36,166 3.11
07 Gadag 1,95,174 1,61,387 -33,787 2.91
08 Dharwad 2,57,094 2,12,990 -44,104 3.79
09 Uttara Kannada 1,83,660 1,39,041 -44,619 3.84
10 Haveri 2,55,401 2,01,897 -53,504 4.60
11 Bellary 4,60,886 4,52,727 -8,159 0.70
12 Chitradurga 2,97,975 2,48,213 -49,762 4.28
13 Davanagere 3,17,400 2,62,517 -54,883 4.72
14 Shimoga 2,35,202 1,98,112 -37,090 3.19
15 Udupi 1,32,491 1,05,191 -27,300 2.35
16 Chikmagalur 1,79,262 1,41,266 -37,996 3.27
17 Tumkur 4,82,683 4,03,834 -78,849 6.78
18 Bangalore 6,16,123 6,20,945 4,822 -0.41
19 Mandya 3,76,393 3,11,119 -65,274 5.61
20 Hassan 3,13,634 2,58,013 -55,621 4.78
21 Dakshina Kannada 1,93,314 1,52,044 -41,270 3.55
22 Kodagu 66,395 56,109 -10,286 0.88
23 Mysore 5,02,776 44,8931 -53,845 4.63
24 Chamarajanagar 2,41,068 2,10,843 -30,225 2.60
25 Gulbarga 5,16,416 4,79,990 -36,426 3.13
26 Yadgir 2,77,521 2,88,631 11,110 -0.96
27 Kolar 2,64,597 2,28,011 -36,586 3.15
28 Chikkaballapura 2,53,730 2,13,882 -39,848 3.43
29 Bangalore Rural 1,45,807 1,25,889 -19,918 1.71
30 Ramanagara 2,18,717 1,87,646 -31,071 2.67
Statement - 26 presents the district level fi gures of female illiterates in the 2001 and 2011 Censuses, the decadal decrease in female illiterates and the percentage contribution in the decrease. Th e number of female illiterates in the State decreased from 96,86,751 in 2001 to 85,24,150 in 2011 Census. Th e maximum number of female illiterates decreased in Belgaum district, a decrease of 1,15,489 (contributing to 9.93 per cent of the decrease in the State). It is pertinent to note that the number of female illiterates have increased in Yadgir and Bangalore districts in the decade 2001-2011.

State of literacy
PROVISIONAL POPULATION TOTALS 93
STATEMENT - 27RANKING OF DISTRICTS BY LITERACY RATE AND SEX : 2011
Rank Persons Males Females
States/Districts Literacy rate States/Districts Literacy rate States/Districts Literacy rate
Karnataka 75.61 Karnataka 82.84 Karnataka 68.15
1 Dakshina Kannada 88.62 Dakshina Kannada 93.31 Bangalore 84.80
2 Bangalore 88.48 Bangalore 91.82 Dakshina Kannada 84.04
3 Udupi 86.29 Udupi 91.69 Udupi 81.41
4 Uttara Kannada 84.03 Uttara Kannada 89.72 Uttara Kannada 78.21
5 Kodagu 82.52 Kodagu 87.24 Kodagu 77.91
6 Shimoga 80.50 Dharwad 86.83 Shimoga 74.89
7 Dharwad 80.30 Shimoga 86.11 Dharwad 73.57
8 Chikmagalur 79.24 Chikmagalur 85.66 Chikmagalur 72.88
9 Bangalore Rural 78.29 Bangalore Rural 85.44 Bangalore Rural 70.73
10 Haveri 77.60 Gadag 84.89 Haveri 70.65
11 Davanagere 76.30 Haveri 84.22 Davanagere 69.39
12 Hassan 75.89 Hassan 83.55 Hassan 68.30
13 Gadag 75.18 Davanagere 83.02 Mysore 66.59
14 Kolar 74.33 Belgaum 82.90 Kolar 66.56
15 Tumkur 74.32 Tumkur 82.05 Tumkur 66.45
16 Belgaum 73.94 Kolar 81.94 Chitradurga 66.05
17 Chitradurga 73.82 Chitradurga 81.37 Gadag 65.29
18 Mysore 72.56 Bagalkot 80.16 Belgaum 64.74
19 Bidar 71.01 Bidar 79.94 Mandya 62.10
20 Mandya 70.14 Mysore 78.44 Bidar 61.66
21 Chikkaballapura 70.08 Chikkaballapura 78.36 Chikkaballapura 61.55
22 Bagalkot 69.39 Koppal 78.21 Ramanagara 61.30
23 Ramanagara 69.20 Mandya 78.14 Bagalkot 58.55
24 Bellary 67.85 Bijapur 77.41 Bellary 58.28
25 Koppal 67.28 Bellary 77.24 Bijapur 56.54
26 Bijapur 67.20 Ramanagara 76.92 Koppal 56.22
27 Gulbarga 65.65 Gulbarga 75.11 Gulbarga 55.87
28 Chamarajanagar 61.12 Raichur 71.35 Chamarajanagar 54.32
29 Raichur 60.46 Chamarajanagar 67.88 Raichur 49.56
30 Yadgir 52.36 Yadgir 63.33 Yadgir 41.31
Statement - 27 presents districts arranged in descending order according to 2011 literacy rates. Dakshina Kannada tops the rank list in respect of overall literacy and male literacy rate followed by Bangalore district. In respect of female literates, Bangalore ranks fi rst followed by Dakshina Kannada. Yadgir which has returned less than 60 per cent literacy ranks last among the districts in the State. Ten districts have the same rank for both the sexes. Noticeable gender gap in literacy is observed in Mysore and Gadag districts. Mysore ranks at 13th place in female literacy and 20th in male literacy rate. In Gadag district the female literacy is at 17th place where as the male literacy is ranked at 10th place. Th e literacy rate for persons, males and females as per Provisional Population Totals, 2011 are depicted in Chart - 9 for the districts.

94
STATEMENT - 28RANKING OF DISTRICTS BY LITERACY RATE : 2001 AND 2011
District Code
States/Districts Literacy rate Rank Decadal difference in literacy rate2001 2011 2001 2011
- Karnataka 66.64 75.60 - - 8.97
1 Belgaum 64.21 73.94 17 16 9.73
2 Bagalkot 57.30 69.39 24 22 12.09
3 Bijapur 57.01 67.20 25 26 10.19
4 Bidar 60.94 71.01 20 19 10.07
5 Raichur 48.81 60.46 29 29 11.65
6 Koppal 54.10 67.28 27 25 13.18
7 Gadag 66.11 75.18 14 13 9.07
8 Dharwad 71.61 80.30 8 7 8.69
9 Uttara Kannada 76.60 84.03 5 4 7.43
10 Haveri 67.79 77.60 11 10 9.81
11 Bellary 57.40 67.85 23 24 10.43
12 Chitradurga 64.45 73.82 16 17 9.37
13 Davanagere 67.43 76.30 12 11 8.87
14 Shimoga 74.52 80.50 6 6 5.98
15 Udupi 81.25 86.29 3 3 5.04
16 Chikmagalur 72.20 79.24 7 8 7.04
17 Tumkur 67.01 74.32 13 15 7.31
18 Bangalore 82.96 88.48 2 2 5.57
19 Mandya 61.05 70.14 19 20 9.09
20 Hassan 68.63 75.89 10 12 7.26
21 Dakshina Kannada 83.35 88.62 1 1 5.27
22 Kodagu 77.99 82.52 4 5 4.53
23 Mysore 63.48 72.56 18 18 9.08
24 Chamarajanagar 50.87 61.12 28 28 10.25
25 Gulbarga 54.34 65.65 26 27 11.31
26 Yadgir 39.90 52.36 30 30 12.46
27 Kolar 65.84 74.33 15 14 8.49
28 Chikkaballapura 59.24 70.08 22 21 10.84
29 Bangalore Rural 69.59 78.29 9 9 8.70
30 Ramanagara 60.71 69.20 21 23 8.49
Statement - 28 gives ranking of the districts by literacy rates of 2001 and 2011 along with decadal diff erence. In terms of overall literacy rate by order of ranking, the ranking in 2001 and 2011 Censuses show a similar trend. Th e decadal diff erence in literacy rate for the State is 8.97 per cent. Out of 30 districts in Karnataka, 16 districts have decadal diff erence above the State average and 14 districts below the State average. Koppal has the highest decadal diff erence of 13.18 per cent followed by 12.46 per cent in Yadgir district.

State of literacy
PROVISIONAL POPULATION TOTALS 95
STATEMENT - 29LITERACY RATES AND DECADAL DIFFERENCE IN LITERACY RATES BY SEX : 2001-2011
District Code
States/Districts 2001 Gap in literacy
rate
2011 Gap in literacy
rate
Decadal difference in literacy rates
Males Females Males Females Males Females
- Karnataka 76.10 56.87 19.23 82.85 68.13 14.72 6.75 11.26
01 Belgaum 75.70 52.32 23.38 82.90 64.74 18.16 7.20 12.42
02 Bagalkot 70.88 43.56 27.32 80.16 58.55 21.61 9.28 14.99
03 Bijapur 69.94 43.47 26.47 77.41 56.54 20.87 7.47 13.07
04 Bidar 72.46 48.81 23.65 79.94 61.66 18.28 7.48 12.85
05 Raichur 61.52 35.93 25.59 71.35 49.56 21.79 9.83 13.63
06 Koppal 68.42 39.61 28.81 78.21 56.22 21.99 9.79 16.61
07 Gadag 79.32 52.52 26.80 84.89 65.29 19.60 5.57 12.77
08 Dharwad 80.82 61.92 18.90 86.83 73.57 13.26 6.01 11.65
09 Uttara Kannada 84.53 68.47 16.06 89.72 78.21 11.51 5.19 9.74
10 Haveri 77.61 57.37 20.24 84.22 70.65 13.57 6.61 13.28
11 Bellary 69.20 45.28 23.92 77.24 58.28 18.96 8.04 13.00
12 Chitradurga 74.66 53.78 20.88 81.37 66.05 15.32 6.71 12.27
13 Davanagere 76.37 58.04 18.33 83.02 69.39 13.63 6.65 11.35
14 Shimoga 82.01 66.88 15.13 86.11 74.89 11.22 4.10 8.01
15 Udupi 88.23 75.19 13.04 91.69 81.41 10.28 3.46 6.22
16 Chikmagalur 80.29 64.01 16.28 85.66 72.88 12.78 5.37 8.87
17 Tumkur 76.78 56.94 19.84 82.05 66.45 15.60 5.27 9.51
18 Bangalore 87.92 77.48 10.44 91.82 84.80 7.02 3.90 7.32
19 Mandya 70.50 51.53 18.97 78.14 62.10 16.04 7.64 10.57
20 Hassan 78.37 59.00 19.37 83.55 68.30 15.25 5.18 9.30
21 Dakshina Kannada 89.70 77.21 12.49 93.31 84.04 9.27 3.61 6.83
22 Kodagu 83.70 72.26 11.44 87.24 77.91 9.33 3.54 5.65
23 Mysore 70.88 55.81 15.07 78.44 66.59 11.85 7.56 10.78
24 Chamarajanagar 59.03 42.48 16.55 67.88 54.32 13.56 8.85 11.84
25 Gulbarga 66.18 42.06 24.12 75.11 55.87 19.24 8.93 13.81
26 Yadgir 51.35 28.32 23.03 63.33 41.31 22.02 11.98 12.99
27 Kolar 75.99 55.46 20.53 81.94 66.56 15.38 5.95 11.10
28 Chikkaballapura 69.80 48.33 21.47 78.36 61.55 16.81 8.56 13.22
29 Bangalore Rural 78.99 59.67 19.32 85.44 70.73 14.71 6.45 11.06
30 Ramanagara 69.88 51.22 18.66 76.92 61.30 15.62 7.04 10.08
Statement - 29 presents literacy rates and decadal diff erence in literacy rates by sex for 2001-2011. It is quite evident from the statement that the gender gap in literacy rate between 2001 and 2011 Censuses had narrowed down over the period of ten years in all the districts. As it was already pointed out that females outnumber males in terms of increase in absolute number of literates, the percentage decadal diff erence in literacy rate also depicts the same trend. It may be observed from the statement that this decadal diff erence is high among females in all the districts.

96
Th e statistics presented in Table 4 have been summarized in Statement - 30. Th e comparable fi gures of the 2001 and 2011 Censuses have been presented in this statement. As per the provisional fi gures of 2011 Census, number of districts falling under diff erent ranges as given in the statement have remarkably changed during the decade. None of the districts in the State have below 50 per cent literacy rate. Yadgir is the only
STATEMENT
DISTRIBUTION OF POPULATION AND
SHARE OF
Range of Literacy rate
No. of Districts
2001
Population Literates
Absolute Percentage Absolute Percentage
Total 30 5,28,50,562 100.00 3,04,34,962 100.00
0-39.99 1 9,56,180 1.81 3,10,588 1.02
40-49.99 1 16,69,762 3.16 6,76,799 2.22
50-59.99 7 1,09,71,250 20.76 51,87,429 17.04
60-69.99 13 2,34,16,365 44.31 1,32,12,600 43.41
70-79.99 5 62,89,908 11.90 40,62,659 13.35
80+ 3 95,47,097 18.06 69,84,887 22.95
Total 30 26,898,918 100.00 1,76,61,211 100.00
0-39.99 0 0 0 0 0
40-49.99 0 0 0 0 0
50-59.99 2 9,72,287 3.61 4,55,622 2.58
60-69.99 7 56,20,942 20.90 32,02,412 18.13
70-79.99 13 1,22,28,044 45.46 79,15,012 44.82
80+ 8 80,77,645 30.03 60,88,165 34.47
Total 30 2,59,51,644 100.00 1,27,73,751 100.00
0-39.99 3 18,94,532 7.30 5,51,763 4.32
40-49.99 7 55,31,229 21.31 20,94,382 16.40
50-59.99 12 1,07,66,523 41.49 51,68,225 40.46
60-69.99 4 28,25,797 10.89 16,10,693 12.61
70-79.99 4 49,33,563 19.01 33,48,688 26.22
80+ 0 - 0 - 0

State of literacy
PROVISIONAL POPULATION TOTALS 97
-30
LITERATES BY LITERACY RATES : 2001-2011
DISTRICT’S
2011 Range of Literacy rateNo. of
DistrictsPopulation Literates
Absolute Percentage Absolute Percentage
30 6,11,30,704 100.00 4,10,29,323 100.00 Total
0 - 0 - 0 0-39.99
0 - 0 - 0 40-49.99
1 11,72,985 1.92 5,16,940 1.26 50-59.99
8 1,45,82,969 23.86 83,75,022 20.41 60-69.99
14 2,69,30,193 44.05 1,78,47,162 43.50 70-79.99
7 1,84,44,557 30.17 1,42,90,199 34.83 80+
30 3,10,57,742 100.00 2,28,08,468 100.00 Total
0 0 0 0 0 0-39.99
0 0 0 0 0 40-49.99
0 - 0 - 0 50-59.99
2 11,04,463 3.56 6,29,118 2.76 60-69.99
10 98,45,449 31.70 66,52,669 29.17 70-79.99
18 2,01,07,830 64.74 1,55,26,681 68.07 80+
30 3,00,72,962 100.00 1,82,20,855 100.00 Total
0 - 0 - 0 0-39.99
2 15,40,161 5.12 6,12,296 3.36 40-49.99
6 57,07,301 18.98 28,17,991 15.47 50-59.99
12 1,19,93,783 39.88 70,15,344 38.50 60-69.99
7 46,02,245 15.30 30,50,778 16.74 70-79.99
3 62,29,472 20.71 47,24,446 25.93 80+
district that falls in the range 50.00 – 59.99 rate. Twenty one districts in the State have literacy rate above 70 percent. With regard to males, 28 districts can be proud of having more than 70 percent literates. However, the scenario is not so remarkable in case of females. Th ere are 20 districts which have less than 70 percent female literacy.

98
CHART 9
67.8577.24
58.2873.82
81.3766.05
80.5086.11
74.8986.29
91.6981.41
79.2485.66
72.8874.32
82.0566.45
88.4891.82
84.8070.14
78.1462.10
75.8983.55
68.3088.62
93.3184.04
82.5287.24
77.9172.56
78.4466.59
61.1267.88
54.3265.65
75.1155.87
52.3663.33
41.3174.33
81.9466.56
75.6082.85
68.13
69.2076.92
61.30
78.2985.44
70.73
70.0878.36
61.55
KA
RNAT
AK
A
LITE
RACY
RAT
E O
F TH
E D
ISTR
ICTS
201
1
100 90 80 70 60 50 40 30
IN PERCENT
BELGAUM
BAGALKOT
BIJAPUR
BIDAR
RAICHUR
KOPPAL
GADAG
DHARWAD
UTTARA KANNADA
HAVERI
BELLARY
CHITRADURGA
DAVANAGERE
SHIMOGA
UDUPI
CHIKMAGALUR
TUMKUR
BANGALORE
MANDYA
HASSAN
DAKSHINA KANNADA
KODAGU
MYSORE
CHAMARAJANAGAR
GULBARGA
YADGIR
KOLAR
CHIKKABALLAPURA
BANGALORE RURAL
RAMANAGARA
KARNATAKA
73.9482.90
64.7469.39
80.1658.55
67.2077.41
56.5471.01
79.9461.66
60.4671.35
49.5667.28
78.2156.22
75.1884.89
65.2980.30
86.8373.57
84.0389.72
78.2177.60
84.2270.65
76.3083.02
69.39
PERS
ON
SM
ALE
SFE
MA
LES
FIG
URE
S O
N TO
P O
F TH
E BA
RS R
EPRE
SEN
TS
PERC
ENTA
GE
OF
LITE
RACY
IN E
ACH
DIST
RICT
.

ANNEXURES
PROVISIONAL POPULATION TOTALS - TABLES

100
Table 1 : Distribution of Population, Decadal growth rate,
District Code
State/District Population 2011 Percentage decadal growth rate of population
Persons Males Females 1991-01 2001-11
- KARNATAKA 6,11,30,704 3,10,57,742 3,00,72,962 17.51 15.67
01 BELGAUM 47,78,439 24,27,104 23,51,335 17.61 13.38
02 BAGALKOT 18,90,826 9,52,902 9,37,924 18.82 14.46
03 BIJAPUR 21,75,102 11,12,953 1,06,21,49 17.51 20.38
04 BIDAR 17,00,018 8,70,850 8,29,168 19.63 13.16
05 RAICHUR 19,24,773 9,66,493 9,58,280 23.52 15.27
06 KOPPAL 13,91,292 7,01,479 6,89,813 24.84 16.32
07 GADAG 10,65,235 5,38,477 5,26,758 13.13 9.61
08 DHARWAD 18,46,993 9,39,127 9,07,866 16.68 15.13
09 UTTARA KANNADA 14,36,847 7,27,424 7,09,423 10.93 6.15
10 HAVERI 15,98,506 8,19,295 7,79,211 13.39 11.08
11 BELLARY 25,32,383 12,80,402 12,51,981 22.41 24.92
12 CHITRADURGA 16,60,378 8,43,411 8,16,967 15.63 9.39
13 DAVANAGERE 19,46,905 9,89,602 9,57,303 14.86 8.71
14 SHIMOGA 17,55,512 8,79,817 8,75,695 13.10 6.88
15 UDUPI 11,77,908 5,62,896 6,15,012 7.14 5.90
16 CHIKMAGALUR 11,37,753 5,67,483 5,70,270 12.15 -0.28
17 TUMKUR 26,81,449 13,54,770 13,26,679 12.10 3.74
18 BANGALORE 95,88,910 50,25,498 45,63,412 35.09 46.68
19 MANDYA 18,08,680 9,09,441 8,99,239 7.26 2.55
20 HASSAN 17,76,221 8,85,807 8,90,414 9.68 3.17
21 DAKSHINA KANNADA 20,83,625 10,32,577 10,51,048 14.59 9.80
22 KODAGU 5,54,762 2,74,725 2,80,037 12.31 1.13
23 MYSORE 29,94,744 15,11,206 14,83,538 15.75 13.39
24 CHAMARAJANAGAR 10,20,962 5,13,359 5,07,603 9.29 5.75
25 GULBARGA 25,64,892 13,07,061 12,57,831 21.76 17.94
26 YADGIR 11,72,985 5,91,104 5,81,881 20.12 22.67
27 KOLAR 15,40,231 7,79,401 7,60,830 14.46 11.04
28 CHIKKABALLAPURA 12,54,377 6,37,504 6,16,873 14.33 9.17
29 BANGALORE RURAL 9,87,257 5,07,514 4,79,743 18.60 16.02
30 RAMANAGARA 10,82,739 5,48,060 5,34,679 7.84 5.06

ANNEXURES
PROVISIONAL POPULATION TOTALS 101
Sex ratio and Population density for State and Districts 2011
Sex ratio (females per 1000 males)
Population density (per sq.km.)
State/District District Code
2001 2011 2001 2011
965 968 276 319 KARNATAKA -
960 969 314 356 BELGAUM 01
980 984 251 288 BAGALKOT 02
950 954 172 207 BIJAPUR 03
949 952 276 312 BIDAR 04
983 992 198 228 RAICHUR 05
983 983 215 250 KOPPAL 06
969 978 209 229 GADAG 07
949 967 377 434 DHARWAD 08
971 975 132 140 UTTARA KANNADA 09
944 951 298 331 HAVERI 10
969 978 240 300 BELLARY 11
955 969 180 197 CHITRADURGA 12
952 967 302 329 DAVANAGERE 13
978 995 194 207 SHIMOGA 14
1,130 1,093 287 304 UDUPI 15
984 1005 158 158 CHIKMAGALUR 16
967 979 244 253 TUMKUR 17
908 908 2,985 4,378 BANGALORE 18
986 989 356 365 MANDYA 19
1,004 1,005 253 261 HASSAN 20
1,022 1,018 416 457 DAKSHINA KANNADA 21
996 1,019 134 135 KODAGU 22
964 982 385 437 MYSORE 23
971 989 189 200 CHAMARAJANAGAR 24
958 962 198 233 GULBARGA 25
982 984 183 224 YADGIR 26
977 976 346 384 KOLAR 27
966 968 273 298 CHIKKABALLAPURA 28
945 945 380 441 BANGALORE RURAL 29
964 976 288 303 RAMANAGARA 30

102
Table 2 : Percentage decadal variation in Population
District Code State/District Percentage
1901-11 1911-21 1921-31 1931-41 1941-51 1951-61
- KARNATAKA 3.60 -1.09 9.38 11.09 19.36 21.57
01 BELGAUM -4.19 0.46 13.64 13.97 16.71 20.53
02 BAGALKOT 5.25 -4.81 7.60 13.53 15.97 16.62
03 BIJAPUR 22.65 -8.33 10.83 11.18 21.45 20.89
04 BIDAR 18.95 -5.81 9.51 16.90 7.45 20.35
05 RAICHUR 7.38 -9.59 4.72 10.34 6.16 19.29
06 KOPPAL 7.38 -4.94 9.37 12.16 18.32 10.57
07 GADAG -5.98 5.72 0.17 12.19 10.97 20.43
08 DHARWAD -7.91 2.48 8.21 8.28 18.29 25.24
09 UTTARA KANNADA -5.27 -6.69 4.01 5.58 17.37 33.16
10 HAVERI -7.74 -5.17 10.46 7.45 19.67 24.95
11 BELLARY -0.94 -13.22 12.04 10.21 20.58 19.89
12 CHITRADURGA 11.19 3.71 13.31 9.20 16.40 25.97
13 DAVANAGERE 4.16 -6.86 15.74 10.15 17.62 25.84
14 SHIMOGA -4.10 -3.59 3.05 4.43 24.91 60.31
15 UDUPI 2.63 2.89 6.59 8.69 13.50 12.67
16 CHIKMAGALUR -5.79 -1.45 4.25 3.04 16.54 43.05
17 TUMKUR 9.97 5.15 11.12 10.73 20.46 18.76
18 BANGALORE 8.47 12.25 22.79 25.11 69.77 19.61
19 MANDYA 4.47 7.59 7.27 9.09 12.90 25.49
20 HASSAN 1.61 0.63 2.61 5.16 13.93 25.27
21 DAKSHINA KANNADA 6.04 5.83 9.20 11.71 13.34 21.18
22 KODAGU -3.12 -6.37 -0.31 3.31 35.96 40.72
23 MYSORE 3.22 2.62 8.61 16.20 23.65 16.66
24 CHAMARAJANAGAR 2.91 -4.62 7.30 10.74 15.14 18.76
25 GULBARGA 9.22 -7.94 11.56 6.99 14.52 19.50
26 YADGIR 9.22 -7.94 11.56 6.99 14.52 7.03
27 KOLAR 9.31 1.60 7.74 18.25 17.15 10.91
28 CHIKKABALLAPURA 6.02 1.53 6.46 9.57 14.78 18.63
29 BANGALORE RURAL 5.28 0.21 10.09 12.37 21.23 13.61
30 RAMANAGARA 9.65 8.23 17.81 12.98 24.13 16.08

ANNEXURES
PROVISIONAL POPULATION TOTALS 103
for State and Districts : 1901-2011
decadal variation State/District District Code
1961-71 1971-81 1981-91 1991-01 2001-11
24.22 26.75 21.12 17.51 15.67 KARNATAKA -
22.16 22.94 20.30 17.61 13.38 BELGAUM 01
20.74 23.54 20.79 18.82 14.46 BAGALKOT 02
18.61 18.68 22.94 17.51 20.38 BIJAPUR 03
24.26 20.83 26.12 19.63 13.16 BIDAR 04
26.76 28.84 30.53 23.52 15.27 RAICHUR 05
31.44 22.27 28.05 24.84 16.32 KOPPAL 06
18.35 19.37 15.56 13.13 9.61 GADAG 07
26.76 31.26 19.64 16.68 15.13 DHARWAD 08
23.13 26.38 13.66 10.93 6.15 UTTARA KANNADA 09
14.87 24.76 20.53 13.39 11.08 HAVERI 10
24.21 33.64 26.84 22.41 24.92 BELLARY 11
21.30 21.13 20.51 15.63 9.39 CHITRADURGA 12
29.99 32.44 23.07 14.86 8.71 DAVANAGERE 13
29.57 27.59 15.11 13.10 6.88 SHIMOGA 14
19.55 22.31 9.42 7.14 5.90 UDUPI 15
23.33 23.77 11.57 12.15 -0.28 CHIKMAGALUR 16
19.04 21.51 16.58 12.10 3.74 TUMKUR 17
46.55 59.08 38.44 35.09 46.68 BANGALORE 18
28.38 22.85 15.96 7.26 2.55 MANDYA 19
23.05 23.10 15.67 9.68 3.17 HASSAN 20
27.17 22.72 15.98 14.59 9.80 DAKSHINA KANNADA 21
17.18 22.10 5.75 12.31 1.13 KODAGU 22
28.40 25.12 24.84 15.75 13.39 MYSORE 23
15.50 24.61 14.99 9.29 5.75 CHAMARAJANAGAR 24
25.36 19.39 23.84 21.76 17.94 GULBARGA 25
21.88 20.17 24.69 20.12 22.67 YADGIR 26
14.51 26.35 16.03 14.46 11.04 KOLAR 27
21.42 24.78 16.72 14.33 9.17 CHIKKABALLAPURA 28
19.20 25.48 17.91 18.60 16.02 BANGALORE RURAL 29
14.19 23.46 13.30 7.84 5.06 RAMANAGARA 30

104
Table 3 : Sex ratio for
District Code State/District Sex ratio since
1901 1911 1921 1931 1941 1951
- KARNATAKA 983 981 969 965 960 966
01 BELGAUM 980 967 957 952 947 956
02 BAGALKOT 999 995 974 984 977 997
03 BIJAPUR 996 986 957 962 951 963
04 BIDAR 990 979 968 959 949 980
05 RAICHUR 992 978 973 981 969 1,004
06 KOPPAL 992 978 973 981 969 968
07 GADAG 995 976 993 981 973 987
08 DHARWAD 983 970 956 939 936 958
09 UTTARA KANNADA 925 956 968 952 965 967
10 HAVERI 973 973 942 945 944 938
11 BELLARY 968 975 967 970 970 956
12 CHITRADURGA 967 968 947 952 937 942
13 DAVANAGERE 971 977 957 949 952 956
14 SHIMOGA 894 897 892 860 869 878
15 UDUPI 1,107 1,112 1,099 1,120 1,123 1,150
16 CHIKMAGALUR 907 911 910 886 892 896
17 TUMKUR 985 977 958 962 951 958
18 BANGALORE 982 958 931 928 922 895
19 MANDYA 1,032 1,028 999 995 982 990
20 HASSAN 1,010 1,019 998 985 977 970
21 DAKSHINA KANNADA 1,029 1,041 1,030 1,042 1,049 1,048
22 KODAGU 801 799 831 803 827 830
23 MYSORE 1,009 1,007 989 976 961 966
24 CHAMARAJANAGAR 1,024 1,015 1,007 998 975 978
25 GULBARGA 974 975 973 970 960 979
26 YADGIR 974 975 973 970 960 1,019
27 KOLAR 957 956 953 955 950 988
28 CHIKKABALLAPURA 981 983 961 954 948 953
29 BANGALORE RURAL 993 980 964 963 961 977
30 RAMANAGARA 999 998 978 975 966 966

ANNEXURES
PROVISIONAL POPULATION TOTALS 105
State and Districts : 1901-2011
(females per 1000 males) State/District District Code
1961 1971 1981 1991 2001 2011
959 957 963 960 965 968 KARNATAKA -
952 947 957 954 960 969 BELGAUM 01
987 987 997 982 980 984 BAGALKOT 02
967 963 970 948 950 954 BIJAPUR 03
971 963 968 952 949 952 BIDAR 04
994 982 988 978 983 992 RAICHUR 05
973 979 989 981 983 983 KOPPAL 06
981 983 981 969 969 978 GADAG 07
941 928 938 935 949 967 DHARWAD 08
946 957 958 966 971 975 UTTARA KANNADA 09
939 938 937 936 944 951 HAVERI 10
960 966 975 966 969 978 BELLARY 11
942 946 952 951 955 969 CHITRADURGA 12
948 947 944 942 952 967 DAVANAGERE 13
879 919 944 964 978 995 SHIMOGA 14
1,165 1,140 1,130 1,134 1,130 1,093 UDUPI 15
903 937 953 977 984 1,005 CHIKMAGALUR 16
956 957 961 959 967 979 TUMKUR 17
890 886 900 903 908 908 BANGALORE 18
967 960 960 963 986 989 MANDYA 19
969 974 987 999 1,004 1,005 HASSAN 20
1,027 1,006 1,015 1,020 1,022 1,018 DAKSHINA KANNADA 21
862 910 933 979 996 1,019 KODAGU 22
942 936 948 953 964 982 MYSORE 23
968 955 956 953 971 989 CHAMARAJANAGAR 24
980 970 974 954 958 962 GULBARGA 25
1,012 1,005 997 979 982 984 YADGIR 26
977 966 977 972 977 976 KOLAR 27
957 955 964 956 966 968 CHIKKABALLAPURA 28
971 963 967 948 945 945 BANGALORE RURAL 29
952 948 947 943 964 976 RAMANAGARA 30

106
Table 4 : Population in the age-group 0-6, Number of literates and
District Code
State / District Population 2011 Population in age group 0-6
P M F P M F
- KARNATAKA 6,11,30,704 3,10,57,742 3,00,72,962 68,55,801 35,27,844 33,27,957
01 BELGAUM 47,78,439 24,27,104 23,51,335 6,05,524 3,13,599 2,91,925
02 BAGALKOT 18,90,826 9,52,902 9,37,924 2,63,781 1,36,780 1,27,001
03 BIJAPUR 21,75,102 11,12,953 1,06,21,49 3,03,480 1,57,212 1,46,268
04 BIDAR 17,00,018 8,70,850 8,29,168 2,16,885 1,12,103 1,04,782
05 RAICHUR 19,24,773 9,66,493 9,58,280 2,72,703 1,39,917 1,32,786
06 KOPPAL 13,91,292 7,01,479 6,89,813 1,94,199 99,460 94,739
07 GADAG 10,65,235 5,38,477 5,26,758 1,27,259 65,464 61,795
08 DHARWAD 18,46,993 9,39,127 9,07,866 2,10,194 1,08,231 1,01,963
09 UTTARA KANNADA 14,36,847 7,27,424 7,09,423 1,46,457 75,225 71,232
10 HAVERI 15,98,506 8,19,295 7,79,211 1,87,754 96,518 91,236
11 BELLARY 25,32,383 12,80,402 12,51,981 3,41,804 1,74,946 1,66,858
12 CHITRADURGA 16,60,378 8,43,411 8,16,967 1,77,786 91,973 85,813
13 DAVANAGERE 19,46,905 9,89,602 9,57,303 2,06,935 1,07,181 99,754
14 SHIMOGA 17,55,512 8,79,817 8,75,695 1,76,904 90,271 86,633
15 UDUPI 11,77,908 5,62,896 6,15,012 1,00,579 51,448 49,131
16 CHIKMAGALUR 11,37,753 5,67,483 5,70,270 1,00,791 51,347 49,444
17 TUMKUR 26,81,449 13,54,770 13,26,679 2,52,307 1,29,253 1,23,054
18 BANGALORE 95,88,910 50,25,498 45,63,412 9,88,482 5,09,268 4,79,214
19 MANDYA 18,08,680 9,09,441 8,99,239 1,62,147 83,846 78,301
20 HASSAN 17,76,221 8,85,807 8,90,414 1,55,579 79,197 76,382
21 DAKSHINA KANNADA 20,83,625 10,32,577 10,51,048 2,02,670 1,04,169 98,501
22 KODAGU 5,54,762 2,74,725 2,80,037 52,697 26,661 26,036
23 MYSORE 29,94,744 15,11,206 14,83,538 2,85,956 1,46,192 1,39,764
24 CHAMARAJANAGAR 10,20,962 5,13,359 5,07,603 94,859 48,854 46,005
25 GULBARGA 25,64,892 13,07,061 12,57,831 3,52,162 1,81,955 1,70,207
26 YADGIR 11,72,985 5,91,104 5,81,881 1,85,727 95,620 90,107
27 KOLAR 15,40,231 7,79,401 7,60,830 1,61,877 82,814 79,063
28 CHIKKABALLAPURA 12,54,377 6,37,504 6,16,873 1,24,719 64,129 60,590
29 BANGALORE RURAL 9,87,257 5,07,514 4,79,743 1,02,019 52,400 49,619
30 RAMANAGARA 10,82,739 5,48,060 5,34,679 1,01,565 51,811 49,754
Note : Literacy rate is the percentage of literates to population aged 7 years and above.

ANNEXURES
PROVISIONAL POPULATION TOTALS 107
Literacy rate by sex for State and Districts : 2011
Number of Literates Literacy rate State/District District CodeP M F P M F
4,10,29,323 2,28,08,468 1,82,20,855 75.60 82.85 68.13 KARNATAKA -
30,85,292 17,52,062 13,33,230 73.94 82.90 64.74 BELGAUM 01
11,28,972 6,54,206 4,74,766 69.39 80.16 58.55 BAGALKOT 02
12,57,742 7,39,873 5,17,869 67.20 77.41 56.54 BIJAPUR 03
10,53,181 6,06,524 4,46,657 71.01 79.94 61.66 BIDAR 04
9,98,899 5,89,746 4,09,153 60.46 71.35 49.56 RAICHUR 05
8,05,427 4,70,856 3,34,571 67.28 78.21 56.22 KOPPAL 06
7,05,136 4,01,560 3,03,576 75.18 84.89 65.29 GADAG 07
13,14,353 7,21,440 5,92,913 80.30 86.83 73.57 DHARWAD 08
10,84,277 5,85,127 4,99,150 84.03 89.72 78.21 UTTARA KANNADA 09
10,94,805 6,08,727 4,86,078 77.60 84.22 70.65 HAVERI 10
14,86,230 8,53,834 6,32,396 67.85 77.24 58.28 BELLARY 11
10,94,403 6,11,462 4,82,941 73.82 81.37 66.05 CHITRADURGA 12
13,27,614 7,32,582 5,95,032 76.30 83.02 69.39 DAVANAGERE 13
12,70,845 6,79,895 5,90,950 80.50 86.11 74.89 SHIMOGA 14
9,29,623 4,68,933 4,60,690 86.29 91.69 81.41 UDUPI 15
8,21,670 4,42,110 3,79,560 79.24 85.66 72.88 CHIKMAGALUR 16
18,05,361 10,05,570 7,99,791 74.32 82.05 66.45 TUMKUR 17
76,09,962 41,46,709 34,63,253 88.48 91.82 84.80 BANGALORE 18
11,54,952 6,45,133 5,09,819 70.14 78.14 62.10 MANDYA 19
12,29,941 6,73,922 5,56,019 75.89 83.55 68.30 HASSAN 20
16,66,834 8,66,331 8,00,503 88.62 93.31 84.04 DAKSHINA KANNADA 21
4,14,305 2,16,413 1,97,892 82.52 87.24 77.91 KODAGU 22
19,65,492 10,70,649 8,94,843 72.56 78.44 66.59 MYSORE 23
5,66,076 3,15,321 2,50,755 61.12 67.88 54.32 CHAMARAJANAGAR 24
14,52,693 8,45,059 6,07,634 65.65 75.11 55.87 GULBARGA 25
5,16,940 3,13,797 2,03,143 52.36 63.33 41.31 YADGIR 26
10,24,555 5,70,799 4,53,756 74.33 81.94 66.56 KOLAR 27
7,91,692 4,49,291 3,42,401 70.08 78.36 61.55 CHIKKABALLAPURA 28
6,93,068 3,88,833 3,04,235 78.29 85.44 70.73 BANGALORE RURAL 29
6,78,983 3,81,704 2,97,279 69.20 76.92 61.30 RAMANAGARA 30

108
Table 5 : Literacy rates by sex for State and Districts : 2001 and 2011
District Code
State / District Literacy rate
Persons Males Females
2001 2011 2001 2011 2001 2011
- KARNATAKA 66.64 75.60 76.10 82.85 56.87 68.13
01 BELGAUM 64.21 73.94 75.70 82.90 52.32 64.74
02 BAGALKOT 57.30 69.39 70.88 80.16 43.56 58.55
03 BIJAPUR 57.01 67.20 69.94 77.41 43.47 56.54
04 BIDAR 60.94 71.01 72.46 79.94 48.81 61.66
05 RAICHUR 48.81 60.46 61.52 71.35 35.93 49.56
06 KOPPAL 54.10 67.28 68.42 78.21 39.61 56.22
07 GADAG 66.11 75.18 79.32 84.89 52.52 65.29
08 DHARWAD 71.61 80.30 80.82 86.83 61.92 73.57
09 UTTARA KANNADA 76.60 84.03 84.53 89.72 68.47 78.21
10 HAVERI 67.79 77.60 77.61 84.22 57.37 70.65
11 BELLARY 57.40 67.85 69.20 77.24 45.28 58.28
12 CHITRADURGA 64.45 73.82 74.66 81.37 53.78 66.05
13 DAVANAGERE 67.43 76.30 76.37 83.02 58.04 69.39
14 SHIMOGA 74.52 80.50 82.01 86.11 66.88 74.89
15 UDUPI 81.25 86.29 88.23 91.69 75.19 81.41
16 CHIKMAGALUR 72.20 79.24 80.29 85.66 64.01 72.88
17 TUMKUR 67.01 74.32 76.78 82.05 56.94 66.45
18 BANGALORE 82.96 88.48 87.92 91.82 77.48 84.80
19 MANDYA 61.05 70.14 70.50 78.14 51.53 62.10
20 HASSAN 68.63 75.89 78.37 83.55 59.00 68.30
21 DAKSHINA KANNADA 83.35 88.62 89.70 93.31 77.21 84.04
22 KODAGU 77.99 82.52 83.70 87.24 72.26 77.91
23 MYSORE 63.48 72.56 70.88 78.44 55.81 66.59
24 CHAMARAJANAGAR 50.87 61.12 59.03 67.88 42.48 54.32
25 GULBARGA 54.34 65.65 66.18 75.11 42.06 55.87
26 YADGIR 39.90 52.36 51.35 63.33 28.32 41.31
27 KOLAR 65.84 74.33 75.99 81.94 55.46 66.56
28 CHIKKABALLAPURA 59.24 70.08 69.80 78.36 48.33 61.55
29 BANGALORE RURAL 69.59 78.29 78.99 85.44 59.67 70.73
30 RAMANAGARA 60.71 69.20 69.88 76.92 51.22 61.30
Note : Literacy rate is the percentage of literates to population aged 7 years and above.

ANNEXURES
PROVISIONAL POPULATION TOTALS 109
Table 6 : Proportion of child population in the age group 0-6 by sex : 2001 and 2011
District Code
State/District Proportion of Child Population in the age group 0-6
2001 2011
P M F P M F
- KARNATAKA 13.59 13.72 13.45 11.21 11.36 11.07
01 BELGAUM 14.81 15.11 14.49 12.67 12.92 12.42
02 BAGALKOT 16.03 16.37 15.69 13.95 14.35 13.54
03 BIJAPUR 15.87 16.06 15.68 13.95 14.13 13.77
04 BIDAR 16.08 16.13 16.01 12.76 12.87 12.64
05 RAICHUR 16.95 17.12 16.79 14.17 14.48 13.86
06 KOPPAL 17.39 17.65 17.12 13.96 14.18 13.73
07 GADAG 14.18 14.31 14.05 11.95 12.16 11.73
08 DHARWAD 13.61 13.65 13.56 11.38 11.52 11.23
09 UTTARA KANNADA 12.82 12.98 12.65 10.19 10.34 10.04
10 HAVERI 14.16 14.06 14.26 11.75 11.78 11.71
11 BELLARY 15.74 15.92 15.56 13.50 13.66 13.33
12 CHITRADURGA 13.15 13.21 13.08 10.71 10.90 10.50
13 DAVANAGERE 13.42 13.46 13.37 10.63 10.83 10.42
14 SHIMOGA 12.67 12.81 12.53 10.08 10.26 9.89
15 UDUPI 10.30 11.20 9.50 8.54 9.14 7.99
16 CHIKMAGALUR 12.15 12.31 11.99 8.86 9.05 8.67
17 TUMKUR 11.92 12.03 11.81 9.41 9.54 9.28
18 BANGALORE 11.82 11.60 12.05 10.31 10.13 10.50
19 MANDYA 11.63 11.94 11.32 8.96 9.22 8.71
20 HASSAN 11.60 11.87 11.33 8.76 8.94 8.58
21 DAKSHINA KANNADA 12.02 12.45 11.59 9.73 10.09 9.37
22 KODAGU 12.68 12.80 12.56 9.50 9.70 9.30
23 MYSORE 12.25 12.27 12.24 9.55 9.67 9.42
24 CHAMARAJANAGAR 11.90 11.94 11.87 9.29 9.52 9.06
25 GULBARGA 16.50 16.74 16.25 13.73 13.92 13.53
26 YADGIR 18.58 18.87 18.29 15.83 16.18 15.49
27 KOLAR 13.41 13.49 13.32 10.51 10.63 10.39
28 CHIKKABALLAPURA 13.10 13.19 13.01 9.94 10.06 9.82
29 BANGALORE RURAL 12.61 12.65 12.57 10.33 10.32 10.34
30 RAMANAGARA 11.48 11.60 11.36 9.38 9.45 9.31


CENSUS IN PICTURES


CENSUS IN PICTURES
PROVISIONAL POPULATION TOTALS 113
Second State Level Census Co-ordination Committee meeting.
Registrar General & Census Commissioner, India lighting the lamp during the inauguration of the First State Level Conference of Principal and Additional Principal Census Offi cers, held on 6.02.2010.
A view of the Video Conference with Principal Census Offi cers
A view of the Principal Census Offi cers during the State level conference

114
State Nodal Offi cer for Census 2011 inaugurating the District Census Offi cers and Additional District Census Offi cers Conference.
Director of Census Operations addressing the District/Additional District Census Offi cers.
Press Conference held on 7.2.2011 for launching of the Population Enumeration.
Unveiling of Census Mascot.
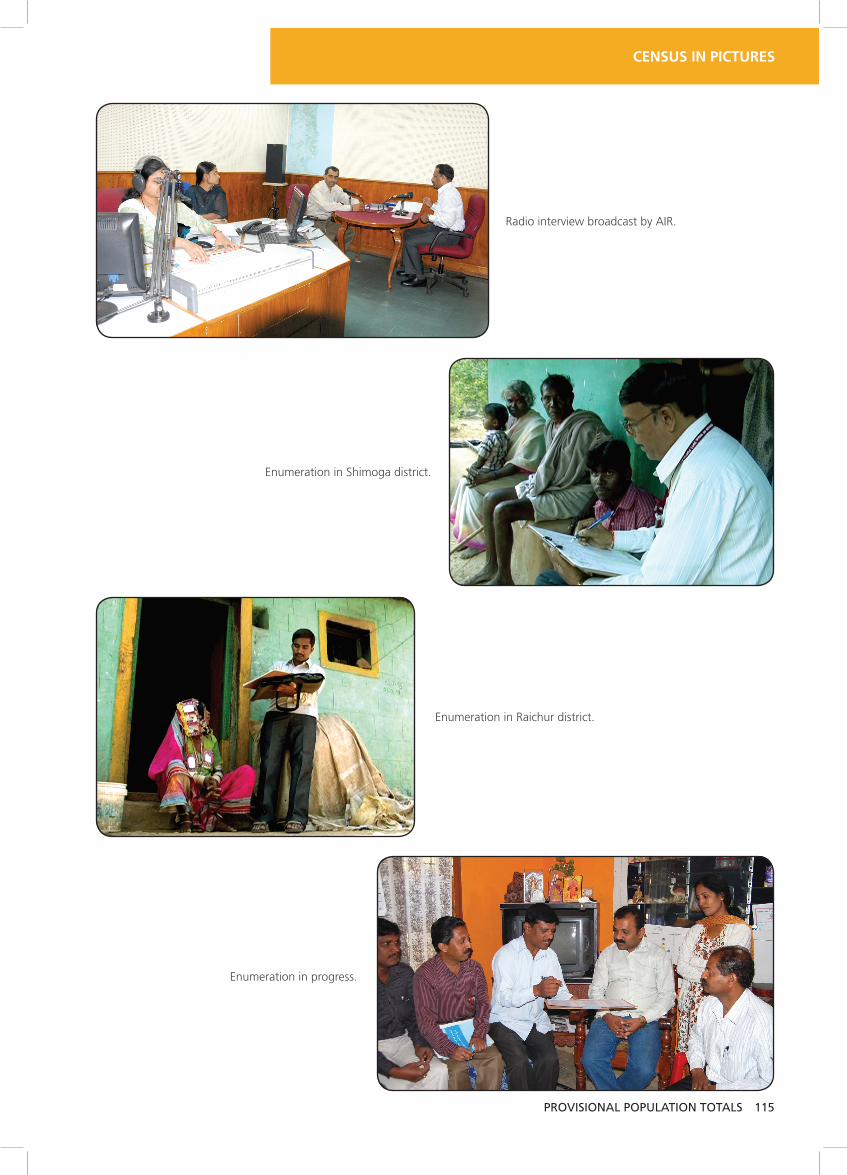
CENSUS IN PICTURES
PROVISIONAL POPULATION TOTALS 115
Radio interview broadcast by AIR.
Enumeration in Shimoga district.
Enumeration in Raichur district.
Enumeration in progress.

116
Enumeration in a shop-cum-residence in BBMP.
Enumeration of Houseless households in Belgaum Cantonment.
Enumeration of Houseless households in BBMP.
Enumeration of boat population in Mangalore.

PROVISIONAL POPULATION TOTALS 117
GIS enumeration block map
G
G
G
G
Chi ldSchool
ArunaChetanSchool
M E S Col legeOf Arts &
Commerce
14th B Cross 10th Main Road
15th Cross 10th Main Road
Roa
d
Road
10th M
ain Roa d
Malles hw
ar am
14th Cross 10th Main Road14th Cross 10th Main Road
Ro ad
14th A Cross 10th Main Road
Roa d
10t h M
ain R
oa d M
a lleshwara m
Road
15th Cross 10th Main Road
14th B Cross 10th Main Road
13th Cross 11th Main Road
11 th M
ain R oad
Mal le shwa ra m
koushik
softwareservicepvt.ltd.
councellingcentre
facinationbatiqu
anandashram
eye specialist ramya punith r.r reddy
renoisome mangal frazercompanykamal kunjmanasa
aptments.
kalpananilaya
anandashram
Suprabath
vijayabank guest
house
trinity
suryaaptments.
tejaswini
mes college
c.v.raman
kishore school
athma aptments
ganesh aptments
saraswathiaptments
anandashram
anandashram
anandashram
infotecbrowsing
centre
usha kiranshanthinilaya
child school kids
r.k.beautyparlour
women's welfare centresubramanyeshwara
nilaya
sri saikrupa
manipal home finance
akshayaaptments
cluny convent
anantsree
mango hose
Child School
M E S CollegeOf Arts &
Commerce
ClunyConvent High
School
ArunaChetanSchool
KishoreSchool
C V Raman Panchavati
24
17
25
26
Census of India 2011For official use only ´
WARD NO.65 - KADUMALLESHWARA25
ENUMERATOR BLOCK BOUNDARYROADS
OTHER BUILDINGIMPORTANT BUILDING
LEGEND
PARK
LAKE
HOUSE
RIVER
RAILWAY LINE
TEMPLE
MOSQUE
CHURCH
POLICE STATION
POST OFFICE
SCHOOL
HOSPITAL
WATER TANK
:
1+\
*
GG
(
")WELL
Note: The Enumerator should scrupulously follow the detailedinstructions issued separately for updating the GIS Map. Theenumerator shall update the GIS Map as per the actual groundsituation at the time of Population Enumeration and indicate thebuilding/census house numbers on the GIS Map as per theupdated AHL. After updating, the enumerator will replicate this GISMap as it is on the blank Layout Map frame issued for PopulationEnumeration. After completion of the Population Enumeration, this GIS Map duly signed is to be handed over to the Supervisor.
Signature of the Enumerator
PEB No.
Charge No. 49

118
CENS
US O
F IN
DIA
2011
::
:
::
:
::
::
:
:
:
::
:
:
::
:
::
::
:
G
G
GG
G
G
GG
G
G
G
G
G
G
G
GG
G
G
GG
G
GM
anip
alH
ospi
tal
Dr.
Venk
atar
aoM
emor
ial
Hos
pita
l
Bang
lore
Educ
atio
nPr
imar
y S
choo
l
Telu
guSc
hool
Cor
pora
tion
Boy'
s H
igh
Scho
ol
B M
P P
rimar
y S
choo
l
Hos
tel &
KND
Sch
ool
Scho
olSc
hool
Urd
u H
ighe
rPr
imar
yBo
y's
Sch
ool
Cor
pora
tion
Boy'
s &
Girl
'sH
igh
Scho
ol
Karn
atak
a Se
cond
ary
Educ
atio
nEx
amin
atio
n B
oard
Mud
hurv
ani
Scho
ol
B P
Indi
anPu
blic
Scho
ol
S V
M E
S S
choo
l
Gov
t. G
irls
P U
Col
lege
Chi
ldSc
hool
Kish
ore
Scho
ol
Arun
aC
heta
nSc
hool
M E
S C
olle
geO
f Arts
&C
omm
erce
Sara
swat
hiVi
dhya
Nik
etan
Har
sha
Vidh
yaKe
ndra
Clu
ny C
onve
ntH
igh
Scho
ol
Venu
gopa
lKr
ishn
aTe
mpl
e
Nan
diTe
mpl
e
Shri
Ram
Tem
ple
Koda
ndar
ama
Tem
ple
Gan
esha
Tem
ple
Rag
aven
dra
Tem
ple
Tem
ple
Sri G
anga
mm
adev
i Tem
ple
Nar
asih
ma
Swam
yTe
mpl
e
Sri S
aiTe
mpl
e
Shrir
amTe
mpl
e
Kadu
mal
lesw
ara
Tem
ple
T T
D
Tem
ple
Tem
ple
Sri
Mah
agan
apat
hiTe
mpl
e
Sri A
yyap
paTe
mpl
e
Shri
Rag
have
ndra
Tem
ple
Jam
bu M
aha
Gan
apat
iTe
mpl
e
Shri
Para
mes
hwar
i Tem
ple
Veer
anja
naya
tem
ple
Shri
Ram
aTe
mpl
e
Sri
Rad
hakr
ishn
aTe
mpl
e
Kanc
heTe
mpl
e
Z 52
4th
Mai
n R
oad
Z57
4th
Ma i
n R
o ad
15th
Cro
ss S
a mpe
ge R
oad
Roa
d
14th
A C
ross
10th
Mai
n R
oad
7th Main Road
6th Main Road
8th Main Road
14th
A C
ross
Roa
d
Road
14th
A C
ross
Roa
d
Roa
d
14th
Cro
ss 9t
h M
ain
Roa
d
Z41
6th
Mai
n R
oad
Z38
4th
Mai
n R
oad
Roa
d
Z44 11th Main Road
15th
Cro
ss S
ampe
ge R
oad
15th
Cro
ss Sa
mpe
ge R
oad
Roa
d
14th
Cro
ss 10
th M
ain
Roa
d
5th Main Road Mallesh
war
am
4th
Cro
ss R
oad
15th
Cro
ss Sa
mpe
ge R
oad
1 6th
Cr o
ss S
a mpe
ge R
oad
Roa
d
Z 51
3rd
Mai
n R
oad
7th Temple Road
1st C
ross
3rd
Mai
n R
oad
3rd Cross 10th Main Road
Z30
11th
Mai
n R
oad
17th
Cro
ss R
oad
2nd Cross 10th Main Road
14th
Cro
ss 10
th M
ain
Roa
d
Roa
d
Z11
11th
Mai
n R
oad
Z 56
4th
Mai
n R
oad
1st Cross 10th Main Road
Couserve Road
3rd A Main Road
Roa
d
7th Main Road Malleshwaram
5th Temple Road
4th Main Road Malleshwaram
4
th Cross 5th Main Road
Roa
d
Z58
4th
Mai
n R
oad
4th A Main Road
Sir T.C
howda
iah Ro
ad
5th Main Road
6th Temple Road
Sampege Road
4th Main Road Malleshwaram
11th
A C
ross
4th
Mai
n R
oad
3rd
Cro
ss R
o ad
9th Main Road Malleshwaram
Z49
11th
Mai
n R
oad
6th Temple Road
16th
Cro
ss S
ampe
ge R
oad
11th Main Road Malleshwaram
16th
Cr o
ss S
ampe
ge R
o ad
Roa
d
2nd Cross Road
6th Main Road
Couserve Road
Roa
d
17th
Cro
ss R
oad
Z54 11th Main Road
1st Main Road
Couserve Road
2nd Main Road G P Layout
West Park Road
1st M
a in
Roa
d
13th
Cro
ss 6t
h M
ain
Roa
d
4th Temple Road
3rd A Main Road
5th Main Road Malleshwaram
8th A Main Road8th Temple Road
7th Temple Road
14th
B C
ros s
10th
Mai
n R
oad
5th Main Road Malleshwaram
6th Temple Road
Roa
d
Sub
haia
h R
oad
Sampege Road
West Park Road
3rd Main Road
11th
B C
ross
10th
Mai
n R
oad
8th Main Road Malleshwaram
12th
Cro
ss 9t
h M
a in
Roa
d
12th
C C
ross
Roa
d
East Park Road
12th
C C
ross
Roa
d
5th Temple Road
8th Main Road Malleshwaram
3rd Main Road Malleshwaram
13th
B C
ross
Roa
d
13th
A C
ross
Roa
d
13th
Cr o
ss 9t
h M
ain
Roa
d
9th Main Road
6th
Cro
ss R
oad
16th
Cro
ss Sa
mpe
ge R
oad
East Park Road
14th
A C
ross
Roa
d
15th
Cro
ss Sa
mpe
ge R
oad
15th
A C
r oss
Roa
d
4th
Cro
ss R
oad
10th
A C
ross
Wes
t Par
k R
oad
3rd
Cr o
ss R
oad
5th
Cro
ss R
oad
12th B Cro
ss R
oad
5 th
Mai
n R
oad
13th
Cro
ss 9t
h M
ain
Ro
ad
13th
Cro
ss 11
th M
ain
Roa
d
Z12 11th Main Road
3rd Main Road
5th Cross Road
3rd
A C
ross
Roa
d
14th
B C
ross
10th
Mai
n R
oad
6th Temple Road
12th
Cro
ss 8t
h M
ain
Roa
d
5 th
Cr o
s s R
oad
4th
Cro
ss R
oad
3rd
Cro
ss R
oad
2nd Main Road
15t h
Cro
ss Sa
mpe
ge R
oad
2nd
Cro
ss R
oad
Temple
Road
Roa
d
1st C
ros s
Ro a
d
4th
Cro
ss R
o ad
1st Main Road
12th
Cro
ss 1 1
th M
ain
Roa
d
Road
Road
1st Main Road
15th
Cro
ss Sa
mpe
ge R
oad
6th
Cro
ss 11
th M
ain
Roa
d
4th Main Road
15th
Cro
ss 1 0
th M
ain
Roa
d
5th Main Road
2nd Main Road
13th
Cro
s s Te
mp l
e R
oad
6th A Main Road
10th Main Road Malleshwaram
15th
Cro
ss 10
th M
ain
Ro a
d
3rd Main Road
5th A Main Road
6th
Cro
ss 11
th M
ain
Roa
d
7th A Main Road
17th
Cro
ss R
oad
7 th
Cro
ss R
oad
11th
Cro
ss 1 1
th M
ain
Roa
d M
alle
shw
ara m
11th
Cro
ss 11
th M
ain
Roa
d M
alle
shw
aram
East Park Road
5th
Mai
n R
oad
(M K
K R
oad)
West Park Road
7th
Cro
ss 8t
h M
ain
Roa
d M
alle
shw
aram
Sir T
.Cho
wd a
iah
Roa
d
8th
Cro
ss 2n
d M
ain
Roa
d M
alle
shw
aram
13th
Cro
ss 11
th M
ain
Roa
d
6th Main Road Malleshwaram
3rd Main Road Malleshwaram
11th Main Road Malleshwaram
Road
2nd Temple Road
5th Main Road
3rd Main Road
4th Main Road
3rd Temple Road
Road
10th Main Road Malleshwaram
4th Temple Road
Roa
d
5th Main Road Malleshwaram
2nd
Mai
n R
o ad
1 0th
Ma i
n R
o ad
4 th
Ma i
n R
o ad
Morgosa Road
Roa
d
2nd
Cro
ss R
oad
Temple Road
Road
9th
Cros
s Road
Road
Road
Roa
dc
Road
Road
Roa
d
Roa
d
Roa
d
Road
Roa
d
Roa
d
5th Main Road
Road
Roa
d
Roa
d
Ro a
d
Road
Roa
d
Roa
d
Roa
d
Roa
d
Road
Z6 R
N P
Mai
n R
oad
Ro a
d
Road
Roa
d
Sub
haia
h R
oad
Road
Road
Roa
d
Road
Road
Road
Road
Roa
d
Roa
d
Roa
d
Roa
d
Roa
d
Roa
d
Road
RoadRoad
Roa
d
18th Cross Road
Roa
d
Road
Road
Roa
d
Road
Road
Road Roa
d
Road
Road
Roa
d
Road
Roa
d
Roa
d
Roa
d
Roa
d
Roa
dR
oad
Roa
d
Roa
d
Roa
d
Roa
d
Road
Road Roa
d
Road
Roa
d
Roa
d
Road
Roa
d
Roa
d
Roa
d
Road
Road
Roa
d
Roa
d
15t h
Cros
s Sa
mpe
ge R
oad
Roa
d
Roa
d
Road
Roa
d
Roa
d
15th
Cro
ss S
ampe
ge R
oad
Roa
d
Roa
d
Roa
d
Z40
3rd
Mai
n Ro
ad
Z 46
3 rd
Mai
n Ro
ad
Road
Road
Road
Z47 4th Main Road
Roa
d
Roa
d
Road
Roa
d
Roa
d
Roa
d
Road
Roa
dR
o ad
Roa
d
Roa
d
Roa
d
Roa
d
Roa
d
Roa
d
Roa
d
Road
13th Cross 9th Main Road
Roa
d
14th
A C
r oss
Roa
d
Road
Roa
d
Road
Road
Gay
atrinagar Road
4th Te
mple
Road
16th
Cro
ss S
a mpe
ge R
oad
Road
Road
Road
Roa
d
Roa
d
Roa
d
15th
Cro
ss S
ampe
ge R
oad
Roa
d
Roa
d
Road
Roa
dc
Road
Roa
d
Roa
d
Road
12th B Cross Road
Roa
d
Roa
d
Roa
d
Roa
d
4th Main Road Malleshwaram
Roa
dc
Road
Z32 10th Main Road
Road
Roa
d
Roa
d
Roa
d
Roa
d
Roa
d
Road
Roa
d
9th Main Road
Subh
aiah
Roa
d
17th
Cr o
ss R
oad
13th
A C
ross
Roa
d
13th B Cross Road
12t h
Cro s
s 5 t
h M
a in
Ro a
d
Roa
d
6th Main Road
9th Main Road
Roa
d
4th Main Road Malleshwaram
9th
Cro
ss 11
th M
ain
Roa
d
2nd
Cro
ss R
oad
Road
Roa
d
S P Avenue Road
3rd A Main Road
Roa
d
Z39
6th
Mai
n R
oad
16th
Cro
ss Sa
mpe
ge R
o ad
Road
10th
Cro
ss 3r
d M
ain
Roa
d
Roa
d
S P
Aven
ue Ro
ad
Roa
d
Ro a
d
5th Main Road
3rd Main Road
Roa
d
Roa
d
10th
Cros
s 3r
d M
ain
Road
14th
Cro
ss S
ampe
ge R
oad
Z55 11th Main Road
Roa
d
Road
6th Main Road
S P
Aven
ue Roa
d
14th
Cros
s 8t
h M
ain
Roa
d
12th
Cro
ss 5t
h M
a in
Roa
d
S P Ave
nue Roa
d
Roa
d
3rd Main Road
12th A Cross Road
10th
Cro
ss 3r
d M
ain
Roa
d
8th
A Cr
oss
2nd
Mai
n Ro
ad
9th
Cro
ss 11
th M
ain
Roa
d
17th
Cro
ss R
oad
3rd Cross 11th Main Road
Roa
d
6th Main Road
Roa
d
1st Main Road
14th
C ros
s Sa
mpe
ge R o
ad
9th Main Road
2nd Cross 11th Main Road
1st Cross 11th Main Road
Z43
3rd
Ma i
n R
o ad
3rd Main Road
1st Main Road
Z50
3rd
Ma i
n R
oad
Road
6th Main Road
1st Main Road
Roa
d
Z14 11th Main Road
13th
B Cr
oss Road
5th
Cro
ss R
oad
5th
Cr o
ss R
oad
Roa
d
Roa
d
Road
Roa
dc
Roa
d
Road
Roa
d
Temple
Roa
d Malleshwaram
14t h
Cro
s s S
ampe
g e R
o ad
17th
Cro
ss R
oad
Roa
d
Z 45
3 rd
Mai
n R
oad
Z28
8th
Mai
n R
oad
4th Main Road Malleshwaram
Temple Road
14th
Cro
ss 8t
h M
ain
Roa
d
10th Main Road
Roa
d
Road
13th
Ma i
n R
oad
17th
Cr o
ss R
oad
5th
Cro
ss R
oad
Roa
d
2nd Main Road G P Layout
Road
Roa
d
3rd Main Road G P Layout
1st Main Road
Road
15th
Cro
ss 1 0
th M
ain
Roa
d
13th
Cro
ss 6t
h M
ain
Roa
d
Roadz
Road
Road
Road
Road
Roa
d
16th
Cro
s s S
ampe
ge R
oad
Road
13th
A C
r oss
Roa
d
Z13
11th
Mai
n R
oad
2nd Main Road
4th Main Road Malleshwaram
15t h
A C
ros s
Ro a
d
Z48 11th Main Road
4th Main Road Malleshwaram
Roa
d
14th
Cro
ss 9t
h M
ain
Roa
d
Tem
ple
Tem
ple
Tem
ple
B M
P S
amud
aya
Bhav
ana Tem
ple
Shri
Bha
urao
Des
hpan
deSm
arak
Bha
van
Tem
ple
Stat
e B
ank
Of M
ysor
e
Tem
ple
Sara
swat
hivi
dhya
Nik
etan
Har
sha
Vidh
ya k
endr
a
Bang
alor
eEl
ectri
city
Supp
ly C
ompa
ny
Kish
ore
Scho
ol
Shri
vidy
aM
andi
r Edu
catio
nSo
ciet
y
Chi
ldSc
hool
M E
S C
olle
geO
f Arts
&C
omm
erce
Arun
a C
heta
n S
choo
l
Clu
nyC
onve
nt H
igh
Scho
ol
Asth
ika
Sam
aja
B S
N L
Sri R
adha
kris
hna
Tem
ple
Cor
pora
tion
Boy'
s &
Girl
'sH
igh
Sch
ool
Man
ipal
Hos
pita
l
Sout
hW
este
nR
ailw
ay
Veer
anja
naya
tem
ple
Dr.
Venk
atar
aoM
emor
ial
Hos
pita
l
Jam
bu M
aha
Gan
apat
iTe
mpl
e
Cha
itany
a C
o-O
p Ba
nk
Com
plex
Karn
atak
aSe
cond
ary
Edu
catio
nEx
amin
atio
n B
oard
Urd
u H
ighe
rPr
imar
yBo
y's
Sch
ool
Cen
tral B
ank
The
Mel
lesh
wra
mC
o-O
p B
ank
Vasa
vi K
ala
Man
dir
Shri
Par
ames
hwar
i Tem
ple
Shri
Rag
have
ndra
Tem
ple
Bang
lore
Educ
atio
nPr
imar
y Sc
hoolSh
arah
ada
Co-
Op
Ban
k
Kanc
heTe
mpl
e
B P
Indi
anPu
blic
Scho
ol
Gov
t. G
irls
P U
Col
lege
Bnk
ofIn
dia
S V
M E
S S
choo
l
Shri
Ram
aTe
mpl
e
Venu
gopa
lKr
ishn
aTe
mpl
e
Cor
pora
tion
Mar
ket
Tem
ple
Tem
ple
Tem
ple
Tem
ple
Tem
ple
Tem
ple
Vydi
kaD
harm
aSa
haya
Sab
ha
B M
P T
axO
ffice
Tem
ple
C P
I O
ffice
Tem
ple
Tem
ple
Tem
ple
Tem
ple
Tem
ple
Tem
ple
Tem
ple
Tem
ple Te
mpl
e
Tem
ple
Tem
ple
Tem
ple
Ram
araj
uN
ilaya
m
C V
Ram
an P
anch
avat
i
The
Can
ara
Uni
on
Shar
ada
Vidy
a N
iket
an
Prag
ati M
ansi
on
Vaca
nt L
and
M L
AM
elle
shw
aram
Lad
ies
Asso
ciat
ion
Seva
Sad
ana
Sudd
ama
Kaly
ana
Man
tapa
Cho
wdi
ahM
emor
ial
Hal
l
Raj
eva
Hot
el
Indi
an A
utom
obil
Raj
Apa
rmen
t
Tem
ple
View
Apa
rtmen
t
Sarv
a Pr
iya
Apa
rtmen
t
Vaca
nt L
and
Gok
ul C
ompl
ex
Kris
hna
Apar
tmen
t
Sai K
raup
a A
partm
ent
Chi
ndrik
aAp
artm
ent
Raj
eshw
arAp
artm
ent
Panc
hava
thi
Apar
tmen
t
Shri
Ram
anuj
aSh
ansk
riti
Bhav
an
Mel
lesh
war
mAs
soci
atio
nO
ffice
Mal
lesh
war
m(C
orpo
ratio
n)Pl
ay G
roun
d
Play
Gro
und
Vyal
ikav
al S
lum
(3
(10
(7
(8(9
(1
(2
(5
(4
(6
61
60
5958
34
63
62
456 2
1
7
8
9
12
13
11
14
1516
3319
35
32
18
20
21
31
29
3022
28
23
24 3
1725
2627
10
41
38
39
3637
40
42
4345
46 47
4452
51
5354
55
49
48
50
57
56
77°3
4'30
"E
77°3
4'30
"E
77°3
4'0"
E
77°3
4'0"
E
13°0'30"N
13°0'30"N
13°0'0"N
13°0'0"N
WAR
D -
35 A
ram
ane
Nag
ara
WA
RD
- 45
Mal
lesw
aram
WARD - 66 Subramanya Nagar
WAR
D -
76 G
ayith
ri N
agar
WA
RD
- 95
Sub
hash
Nag
arWARD - 77 Dattatreya Temple
WA
RD
- 64
Raj
amah
al G
utta
halli
010
020
030
040
050
Met
ers
"
CE
NS
US
OF
IND
IA 2
011
EB N
UM
BER
SUPE
RV
ISO
RY
NU
MB
ER
5 (3
RA
ILW
AYS
PAR
K
EB B
OU
ND
ARY
SUPE
RV
ISO
RY
BO
UN
DAR
Y
HO
USE
HO
SPI
TAL
POLI
CES
TATI
ON
SCH
OO
LTE
MP
LEC
HU
RC
HM
OS
QU
E
RIV
ER
POST
OFF
ICE
WAT
ER
TAN
K
WAR
D B
OU
ND
ARY
Lege
nd
G \ G : + 1 * (
© G
over
nmen
t of I
ndia
, Cop
yrig
ht
10 63 1 0 0
Tota
l No.
of S
uper
viso
r Circ
leTo
tal N
o. o
f EB
sTo
tal N
o. o
f Slu
mTo
tal N
o. o
f SR
S B
lock
Tota
l No.
of S
peci
al C
harg
e
= = = = =
WA
RD
- 65
Kad
u M
alle
shw
ara
BBM
PC
harg
e N
o. 4
9

PROVISIONAL POPULATION TOTALS 119
Specimen of houselisting and housing census schedule
Sign
atur
e of
the
Supe
rvis
or w
ith D
ate
Sign
atur
e of
the
Enum
erat
or w
ith D
ate
Use
onl
y ar
abic
num
bers
as
indi
cate
d he
re
Build
ing
num
ber
Line
nu
mbe
rCe
nsus
ho
use
num
ber
Wal
lFl
oor
Roof
Asc
erta
in u
se o
f Ce
nsus
hou
se
(Mun
icip
al
or lo
cal
auth
ority
or
cen
sus
num
ber)
Pred
omin
ant
mat
eria
l of
floo
r, w
all
and
roof
of
the
cens
us
hous
e
(Giv
e co
de n
umbe
r fro
m th
e re
spec
tive
lists
bel
ow)
Gra
ss/ t
hatc
h/ b
ambo
o et
c. ..
. 1
Plas
tic/ p
olyt
hene
......
......
......
. 2
Mud
/ unb
urnt
bric
k....
......
......
3
Woo
d ...
......
......
......
......
......
.....
4St
one
not p
acke
d w
ith m
orta
r.. 5
Ston
e pa
cked
with
mor
tar..
......
6G
.I./m
etal
/ asb
esto
s sh
eets
.....
7Bu
rnt b
rick.
......
......
......
......
.....
8Co
ncre
te...
......
......
......
......
......
9
Any
othe
r.....
......
......
......
......
...
0
Gras
s/ th
atch
/ bam
boo/
woo
d/ m
ud e
tc...
1Pl
astic
/ pol
ythe
ne...
......
......
......
......
....
2Ha
nd m
ade
tiles
......
......
......
......
......
...
3M
achi
ne m
ade
tiles
......
......
......
......
.....
4Bu
rnt b
rick.
......
......
......
......
......
......
.....
5St
one.
......
......
......
......
......
......
......
......
. 6
Slat
e....
......
......
......
......
......
......
......
.....
7G
.I./m
etal
/ asb
esto
s sh
eets
......
......
....
8Co
ncre
te...
......
......
......
......
......
......
......
9An
y ot
her..
......
......
......
......
......
......
......
0
Resi
denc
e ....
......
......
......
......
......
... 1
Resi
denc
e-cu
m-o
ther
use
......
......
. 2Sh
op/ o
ffice
......
......
......
......
......
.... 3
Scho
ol/ c
olle
ge e
tc. .
......
......
......
... 4
Hote
l/ lo
dge/
gue
st h
ouse
etc
. ....
. 5Ho
spita
l/ di
spen
sary
etc
. ....
......
.... 6
Fact
ory/
wor
ksho
p/ w
orks
hed
etc.
7Pl
ace
of w
orsh
ip ..
......
......
......
......
8O
ther
non
-res
iden
tial u
se ...
......
.... 9
Vaca
nt ...
......
......
......
......
......
......
... 0
Tap
wat
er fr
om tr
eate
d so
urce
1
Tap
wat
er fr
om u
n-tre
ated
sour
ce
2 Co
vere
d w
ell..
......
......
......
......
. 3
Un-
cove
red
wel
l.....
......
......
.....
4Ha
nd P
ump.
......
......
......
......
....
5Tu
bew
ell/b
oreh
ole.
......
......
.....
6Sp
ring.
......
......
......
......
......
......
7
Rive
r/can
al...
......
......
......
......
...
8Ta
nk/p
ond/
lake
......
......
......
.....
9O
ther
sou
rces
......
......
......
......
.. 0
Fire
woo
d....
......
......
.....
1 Cr
op re
sidu
e....
......
......
2
Cow
dung
cak
e....
......
.. 3
Coal
/lign
ite/c
harc
oal..
4
Kero
sene
......
......
......
...
5LP
G/P
NG
......
......
......
...
6El
ectr
icity
......
......
......
.. 7
Bio-
gas.
......
......
......
.....
8An
y ot
her..
......
......
......
9
No
cook
ing.
......
......
.....
0
*
for c
ol. 1
5
Sche
duled
Cas
te ca
n be
only
from
Hin
dus,
Sikhs
and
Bu
ddhi
sts a
nd n
ot fr
om a
ny
othe
r reli
gion
. Sch
edul
ed T
ribe
can
be fr
om a
ny re
ligio
n.#
for c
ol. 1
7 Do
not
inclu
de
kitch
en, b
athr
oom
, latri
ne,
store
room
, pas
sage
way
and
ve
rand
ah. I
nclu
de liv
ing
room
, be
droo
m, d
inin
g ro
om, d
raw
-in
g ro
om, s
tudy
room
, ser
vant
’s ro
om a
nd o
ther
sim
ilar r
oom
s.
Fuel
use
d fo
r co
okin
gFl
oor
4
Not
e:
Wal
l5
Roof
6U
se o
f ce
nsus
hou
se7
Tota
l27
Mai
n so
urce
of
drin
king
wat
er19
Ava
ilabi
lity
of k
itch
en26 Co
okin
g in
side
ho
use:
Has
kitc
hen
.....
1
Does
not
hav
e
ki
tche
n ...
......
.. 2
Cook
ing
outs
ide
hous
e:
Has
kitc
hen
.....
3
Does
not
hav
e
ki
tche
n ...
......
.. 4
No
cook
ing
......
. 5
Type
of l
atri
ne fa
cilit
y23 Flus
h/po
ur fl
ush
latr
ine
conn
ecte
d to
Pi
ped
sew
er s
yste
m...
......
......
.. 1
Se
ptic
tank
.....
......
......
......
......
2
O
ther
sys
tem
.....
......
......
......
...
3Pi
t la
trin
e
With
sla
b/ve
ntila
ted
impr
oved
pit.
4
With
out s
lab/
open
pit
......
......
.. 5
Nig
ht so
il di
spos
ed in
to o
pen
drai
n.. 6
Serv
ice
latr
ine
N
ight
soi
l rem
oved
by
hum
an..
7
Nig
ht s
oil s
ervi
ced
by a
nim
als.
. 8
No
latr
ine
wit
hin
prem
ises
Pu
blic
latr
ine.
......
......
......
......
.. 9
O
pen
......
......
......
......
......
......
.. 0
Nam
e of
the
he
ad o
f th
e ho
useh
old
If Code ‘1’ or ‘2’ in column 7, condition of this census house: Good-1/Livable- 2/Dilapidated-3
Sex: Male-1/ Female-2
If SC* or ST* or Other: SC -1/ ST - 2 / Other - 3
Ownership status of this house:Owned-1/ Rented-2/ Any other-3
Number of dwelling rooms # exclusively in possession of this household (Record 0,1,2,3..)
Number of married couple(s) living in this household (Record 0,1,2,3....)
Main source of drinking water: (Give Code number from the list below)
Availability of drinking water source:Within the premises-1/ Near the premises-2/ Away-3
Main source of lighting: Electricity-1, Kerosene-2, Solar-3, Other oil-4, Any other-5, No lighting-6
Latrine within the premises: Yes-1/ No-2
Waste water outlet connected to:Closed drainage-1/Open drainage-2/ No drainage-3
Bathing facility available within the premises: Yes: Bathroom-1, Enclosure without roof-2/No-3
Availability of kitchen: (Give Code number from the list below)
Fuel used for cooking:(Give Code number from the list below)
Radio/ Transistor: Yes-1/ No-2
Television: Yes-1/ No-2
Computer/Laptop:Yes: With Internet-1, Without Internet-2/ No-3
Telephone/Mobile phone:Yes: Landline only-1, Mobile only-2, Both-3/No-4
Bicycle:Yes-1/ No-2
Scooter/ Motor Cycle/ Moped:Yes-1/ No-2
Car/ Jeep/ Van:Yes-1/ No-2
Availing Banking Services Yes-1/ No-2
Hous
ehol
d nu
mbe
r
Persons
Males
Females
Star
t H
ere
Loca
tion
Pa
rtic
ular
sSt
ate/
UT
Dist
rict
Tahs
il/Ta
luk/
P.S.
/Dev
. Blo
ck
Circ
le/M
anda
l
Tow
n/Vi
llage
War
d Co
de N
o.
(onl
y fo
r Tow
n)Ho
usel
istin
g Bl
ock
No.
23
45
67
811
910
1213
1415
1617
1819
2021
2223
2425
2627
2829
3031
3233
3435
1
(Writ
e th
e ac
tual
use
and
then
ch
oose
the
appr
opria
te c
ode
from
th
e lis
t bel
ow a
nd re
cord
the
sam
e in
the
box
at th
e le
ft ha
nd
side
of t
he c
olum
n)
(Give
sepa
rate
seria
l num
ber
to e
ach
hous
ehol
dan
d w
rite
‘999
’fo
r eve
ryin
stitu
tiona
lho
useh
old)
Code
N
o.A
ctua
l use
Mud
.....
......
......
....
1W
ood/
bam
boo
....
2Bu
rnt b
rick
......
.....
3St
one .
......
......
......
. 4
Cem
ent .
......
......
... 5
Mos
aic/
floo
r tile
s. .
6An
y ot
her .
......
......
7
Cens
us o
f In
dia
2011
Hou
selis
ting
and
Hous
ing
Cens
us S
ched
ule
Tota
l num
ber
of p
erso
ns
norm
ally
re
sidi
ng in
thi
s ho
useh
old
Do n
ot fi
ll co
l-um
ns 1
4 an
d 15
fo
r ins
titut
iona
l ho
useh
olds
Fill
if t
he c
ensu
s ho
use
is u
sed
who
lly o
r pa
rtly
as
a re
side
nce
Fill
colu
mns
16
to 3
5 fo
r no
rmal
hou
seho
lds.
Put
das
h (-
) in
case
of
inst
itut
iona
l hou
seho
lds
and
non-
resi
dent
ial c
ensu
s ho
uses
Am
enit
ies
avai
labl
e to
the
hou
seho
ldA
sset
s po
sses
sed
by t
he h
ouse
hold
Page
No.
Info
rmat
ion
rela
ting
to
the
head
of
the
hous
ehol
d
ASI
DE-
Coun
t th
e nu
mbe
r of
ent
ries
and
giv
e to
tal
Conf
iden
tial
w
hen
fille
d
Form
Num
ber
2802 3739
ENGLISH
If ‘1’ in col. 22, give Code from 1 to 8;if ‘2’ in col. 22, give Code 9 or 0 from the list below
Form
Num
ber
2802 3739

120
Sign
atur
e of
the
Enum
erat
or w
ith D
ate
Sign
atur
e of
the
Supe
rvis
or w
ith D
ate
Cont
inue
d to
an
othe
r sh
eet
Writ
e ‘C
’ if
cont
inue
d to
ano
ther
sh
eet
Writ
e la
st th
ree
digi
ts o
f th
e fo
rm n
umbe
r of t
he
cont
inue
d sh
eet
Use
onl
y ar
abic
num
bers
as
indi
cate
d he
re
Cens
us o
f In
dia
2011
Hou
selis
ting
and
Hous
ing
Cens
us S
ched
ule
Page
No.
BSI
DE-
Conf
iden
tial
w
hen
fille
d
Build
ing
num
ber
Line
nu
mbe
rCe
nsus
ho
use
num
ber
Wal
lFl
oor
Roof
Asc
erta
in u
se o
f Ce
nsus
hou
se
(Mun
icip
al
or lo
cal
auth
ority
or
cen
sus
num
ber)
Pred
omin
ant
mat
eria
l of
floo
r, w
all
and
roof
of
the
cens
us
hous
e
(Giv
e co
de n
umbe
r fro
m th
e re
spec
tive
lists
bel
ow)
Gra
ss/ t
hatc
h/ b
ambo
o et
c. ..
. 1
Plas
tic/ p
olyt
hene
......
......
......
. 2
Mud
/ unb
urnt
bric
k....
......
......
3
Woo
d ...
......
......
......
......
......
.....
4St
one
not p
acke
d w
ith m
orta
r.. 5
Ston
e pa
cked
with
mor
tar..
......
6G
.I./m
etal
/ asb
esto
s sh
eets
.....
7Bu
rnt b
rick.
......
......
......
......
.....
8Co
ncre
te...
......
......
......
......
......
9
Any
othe
r.....
......
......
......
......
...
0
Gras
s/ th
atch
/ bam
boo/
woo
d/ m
ud e
tc...
1Pl
astic
/ pol
ythe
ne...
......
......
......
......
....
2Ha
nd m
ade
tiles
......
......
......
......
......
...
3M
achi
ne m
ade
tiles
......
......
......
......
.....
4Bu
rnt b
rick.
......
......
......
......
......
......
.....
5St
one.
......
......
......
......
......
......
......
......
. 6
Slat
e....
......
......
......
......
......
......
......
.....
7G
.I./m
etal
/ asb
esto
s sh
eets
......
......
....
8Co
ncre
te...
......
......
......
......
......
......
......
9An
y ot
her..
......
......
......
......
......
......
......
0
Resi
denc
e ....
......
......
......
......
......
... 1
Resi
denc
e-cu
m-o
ther
use
......
......
. 2Sh
op/ o
ffice
......
......
......
......
......
.... 3
Scho
ol/ c
olle
ge e
tc. .
......
......
......
... 4
Hote
l/ lo
dge/
gue
st h
ouse
etc
. ....
. 5Ho
spita
l/ di
spen
sary
etc
. ....
......
.... 6
Fact
ory/
wor
ksho
p/ w
orks
hed
etc.
7Pl
ace
of w
orsh
ip ..
......
......
......
......
8O
ther
non
-res
iden
tial u
se ...
......
.... 9
Vaca
nt ...
......
......
......
......
......
......
... 0
Tap
wat
er fr
om tr
eate
d so
urce
1
Tap
wat
er fr
om u
n-tre
ated
sour
ce
2 Co
vere
d w
ell..
......
......
......
......
. 3
Un-
cove
red
wel
l.....
......
......
.....
4Ha
nd P
ump.
......
......
......
......
....
5Tu
bew
ell/b
oreh
ole.
......
......
.....
6Sp
ring.
......
......
......
......
......
......
7
Rive
r/can
al...
......
......
......
......
...
8Ta
nk/p
ond/
lake
......
......
......
.....
9O
ther
sou
rces
......
......
......
......
.. 0
Fire
woo
d....
......
......
.....
1 Cr
op re
sidu
e....
......
......
2
Cow
dung
cak
e....
......
.. 3
Coal
/lign
ite/c
harc
oal..
4
Kero
sene
......
......
......
...
5LP
G/P
NG
......
......
......
...
6El
ectr
icity
......
......
......
.. 7
Bio-
gas.
......
......
......
.....
8An
y ot
her..
......
......
......
9
No
cook
ing.
......
......
.....
0
*
for c
ol. 1
5
Sche
duled
Cas
te ca
n be
only
from
Hin
dus,
Sikhs
and
Bu
ddhi
sts a
nd n
ot fr
om a
ny
othe
r reli
gion
. Sch
edul
ed T
ribe
can
be fr
om a
ny re
ligio
n.#
for c
ol. 1
7 Do
not
inclu
de
kitch
en, b
athr
oom
, latri
ne,
store
room
, pas
sage
way
and
ve
rand
ah. I
nclu
de liv
ing
room
, be
droo
m, d
inin
g ro
om, d
raw
-in
g ro
om, s
tudy
room
, ser
vant
’s ro
om a
nd o
ther
sim
ilar r
oom
s.
Fuel
use
d fo
r co
okin
gFl
oor
4
Not
e:
Wal
l5
Roof
6U
se o
f ce
nsus
hou
se7
Tota
l27
Mai
n so
urce
of
drin
king
wat
er19
Ava
ilabi
lity
of k
itch
en26 Co
okin
g in
side
ho
use:
Has
kitc
hen
.....
1
Does
not
hav
e
ki
tche
n ...
......
.. 2
Cook
ing
outs
ide
hous
e:
Has
kitc
hen
.....
3
Does
not
hav
e
ki
tche
n ...
......
.. 4
No
cook
ing
......
. 5
Type
of l
atri
ne fa
cilit
y23 Flus
h/po
ur fl
ush
latr
ine
conn
ecte
d to
Pi
ped
sew
er s
yste
m...
......
......
.. 1
Se
ptic
tank
.....
......
......
......
......
2
O
ther
sys
tem
.....
......
......
......
...
3Pi
t la
trin
e
With
sla
b/ve
ntila
ted
impr
oved
pit.
4
With
out s
lab/
open
pit
......
......
.. 5
Nig
ht so
il di
spos
ed in
to o
pen
drai
n.. 6
Serv
ice
latr
ine
N
ight
soi
l rem
oved
by
hum
an..
7
Nig
ht s
oil s
ervi
ced
by a
nim
als.
. 8
No
latr
ine
wit
hin
prem
ises
Pu
blic
latr
ine.
......
......
......
......
.. 9
O
pen
......
......
......
......
......
......
.. 0
Nam
e of
the
he
ad o
f th
e ho
useh
old
If Code ‘1’ or ‘2’ in column 7, condition of this census house: Good-1/Livable- 2/Dilapidated-3
Sex: Male-1/ Female-2
If SC* or ST* or Other: SC -1/ ST - 2 / Other - 3
Ownership status of this house:Owned-1/ Rented-2/ Any other-3
Number of dwelling rooms # exclusively in possession of this household (Record 0,1,2,3..)
Number of married couple(s) living in this household (Record 0,1,2,3....)
Main source of drinking water: (Give Code number from the list below)
Availability of drinking water source:Within the premises-1/ Near the premises-2/ Away-3
Main source of lighting: Electricity-1, Kerosene-2, Solar-3, Other oil-4, Any other-5, No lighting-6
Latrine within the premises: Yes-1/ No-2
Waste water outlet connected to:Closed drainage-1/Open drainage-2/ No drainage-3
Bathing facility available within the premises: Yes: Bathroom-1, Enclosure without roof-2/No-3
Availability of kitchen: (Give Code number from the list below)
Fuel used for cooking:(Give Code number from the list below)
Radio/ Transistor: Yes-1/ No-2
Television: Yes-1/ No-2
Computer/Laptop:Yes: With Internet-1, Without Internet-2/ No-3
Telephone/Mobile phone:Yes: Landline only-1, Mobile only-2, Both-3/No-4
Bicycle:Yes-1/ No-2
Scooter/ Motor Cycle/ Moped:Yes-1/ No-2
Car/ Jeep/ Van:Yes-1/ No-2
Availing Banking Services Yes-1/ No-2
Hous
ehol
d nu
mbe
r
Persons
Males
Females
23
45
67
811
910
1213
1415
1617
1819
2021
2223
2425
2627
2829
3031
3233
3435
1
(Writ
e th
e ac
tual
use
and
then
ch
oose
the
appr
opria
te c
ode
from
th
e lis
t bel
ow a
nd re
cord
the
sam
e in
the
box
at th
e le
ft ha
nd
side
of t
he c
olum
n)
(Give
sepa
rate
seria
l num
ber
to e
ach
hous
ehol
dan
d w
rite
‘999
’fo
r eve
ryin
stitu
tiona
lho
useh
old)
Code
N
o.A
ctua
l use
Mud
.....
......
......
....
1W
ood/
bam
boo
....
2Bu
rnt b
rick
......
.....
3St
one .
......
......
......
. 4
Cem
ent .
......
......
... 5
Mos
aic/
floo
r tile
s. .
6An
y ot
her .
......
......
7
Tota
l num
ber
of p
erso
ns
norm
ally
re
sidi
ng in
thi
s ho
useh
old
Do n
ot fi
ll co
l-um
ns 1
4 an
d 15
fo
r ins
titut
iona
l ho
useh
olds
Fill
if t
he c
ensu
s ho
use
is u
sed
who
lly o
r pa
rtly
as
a re
side
nce
Fill
colu
mns
16
to 3
5 fo
r no
rmal
hou
seho
lds.
Put
das
h (-
) in
case
of
inst
itut
iona
l hou
seho
lds
and
non-
resi
dent
ial c
ensu
s ho
uses
Am
enit
ies
avai
labl
e to
the
hou
seho
ldA
sset
s po
sses
sed
by t
he h
ouse
hold
Info
rmat
ion
rela
ting
to
the
head
of
the
hous
ehol
d
Coun
t th
e nu
mbe
r of
ent
ries
and
giv
e to
tal
ENGLISH
If ‘1’ in col. 22, give Code from 1 to 8;if ‘2’ in col. 22, give Code 9 or 0 from the list below

PROVISIONAL POPULATION TOTALS 121
Specimen of household schedule
ENGLISH

122