Provisional Population Totals, Series-23, West Bengal
42
CENSUS OF INDIA SERIES-23 WEST BENGAL Paper I of 1981 PROVISIONAL POPULATION TOTALS S. N. GHOSH of the Indian Administrative Service DIRECTOR OF CENSUS OPERATIONS WEST BENGAL
-
Upload
khangminh22 -
Category
Documents
-
view
4 -
download
0
Transcript of Provisional Population Totals, Series-23, West Bengal

CENSUS OF INDIA SERIES-23
WEST BENGAL
Paper I of 1981
PROVISIONAL POPULATION TOTALS
S. N. GHOSH
of the Indian Administrative Service
DIRECTOR OF CENSUS OPERATIONS
WEST BENGAL


CONTENTS
PAGE
FIGURES AT A GLANCE: (v)
Acknowledgement (vii)
Statement showing a comparative picture of the population 1
MAPS AND CHARTS: 3-9
Chart showing the comparative population size of the Districts 1981 5
Map-I: Decennial population growth rates 1971-81 (Dilnrw~ 6
Map-2 : Density of population, 1981 (Districts) 7
Map-3 : Sex Ratio, 1981 (Districts) 8
Map-4 : Percentage of Literates to total population (Districts) 9
BACKGROUND NOTE : 11-16
ApPENDIX I-List of Officers of the Directorate: 17-18
A - Names of Principal Census Officers and District Census Officers 17
B - Names of Deputy and Assistant Directors at the Headquarters 17
C - Names of Regional Deputy Directors 18
D - Names of Deputy and Assistant Directors, Regional Census Officers Ilnd Zonal Census Officers, Calcutta City Census Operations 18
E - Names of Deputy and Assistant Directors and Zonal Census Officers, Haora City Census Operations 18
ApPENDIX II-Officials who worked in the "Provisional Population Totals-1981 Census Project" 19
ANALYSIS OF REsULTS: 21-26
PROVISIONAL POPULATION TABLES: 27-34
I - Distribution of population, Sex Ratio, Growth Rate and density of population by districts 28
II - Decadal variation in population since 1901 29
III - Literacy (including population in age-group 0-4) 30-31
IV - Cities with a population of 100,000 and above 32-33
V - Provisional Population Total-India and States 34


FIGURES AT A GLANCE
Census of India 1981 • Provisional Population Totals
A. POPULATION OF WEST BENGAL
B. DECENNIAL POPULATION GROWTH 1971-81 (1) Absolute
(2) Percentage
C. DENSITY OF POPULATION
D. SEX RATIO
E. LITERACY RATE
v
Total 54,485,560
Males 28,505,151
Females 25,980,409
10,173,549
+ 22'96 per cent
614 per Sq. Km.
911 Females per 1,000 males
Total 40'88 per cent
Males 50'49 per cent
Females 30'33 per cent


ACKNOWLEDGEMENT
On successful completion of the Census Operation in the State and with the publishing of the present paper, we most gratefully acknowledge the invaluable services rendered by the Enumerators and Circle Supervisors and then, of course, by the respondents who co-operated with the former ungrudgingly. The Enumerators and Circle Supervisors, bulle of whom were not government employees or even employees of any organisation at all-maintained the best tradition of Indian Census and rendered honorary service with a rare sense of duty. Moving from door to door, they had to canvass the census questionnaire braving inclement weather, some rude refusals and some uncharitable remarks and of course the usual problems that go with such a task. We are indeed indebted to each one of them overwhelmingly.
It is often said that it takes two to undertake a census-one is the enumerator and the other is the respondent. lfthe enumerator has done his duty in the very best possible manner, the same homage is to bc paid to the respondent also, majority of whom answered the Enumerators' barrage of questions patiently. The handful of them who at first refused to answer the questions of the Enumerators, did finally answer them after being pursuaded to do so, and we are thankful to them also.
I am personally grateful to two persons: Sri P. Padmanahha, Registrar General, and the Census Commissioner of India and Sri A. K. Sen, Chief Secretary to the Government of West Bengal, who not only guided me whenever necessary, but personally solved many of my apparently insurmountable problems without which we just could not finish thc job of Ccnsus. My senior colleagues in the State Secretariat also helped me whenever I approached them with any problem concerning Census. Particularly, Sri R. N. Sen Gupta, Secretary to the Government of West Bengal, Department of Home, Sri A. K. Baneljee, Special Secretary to the Government of West Bengal, Department of Home and Sri D. Sanyal, Deputy Secretary to the Government of West Bengal, Department of Home (C & E), were the ones who put up with hundred of my requests and demands and helped me in every possible way in our endeavour. I am indeed thankful to them for all that they did.
Finally, my friends and colleagucs in the Districts and my colleagues in the Directorate Office, not only worked hard, but often inspired me by their skill, ingenuity, zeal and devotion to duty. I gratefully acknowledge their contribution to the successful completion of Census in West Bengal in 1981.
Calcutta 23 March 1981
vii
S. N. Ghosh Director of Census Operations
West Bengal


STATEMENT SHOWING A COMPARATIVE PICTURE OF THE POPULATION
1981 Census (provisional Figures)
Total Population Decennial growth rates Density of
Population Population (percentage) population in 1971 in 1981 1981
State/District (and rank) (and rank) 1961-71 1971-81 (per km2)
1 2 3 4 5 6
WEST BENGAL 44,312,Oll 54,485,560 +26.87 +22.96 '14
1. Koch Bihar 1,414,183 1,771,562 +38.67 +25.27 523 (15) (15)
2. Jalpaiguri 1,750,159 2,207,087 +28.76 +26.11 353 (12) (ll)
3. Darjiling 781,777 1,006,434 +25.16 +28.74 327 (16) (16)
4. West Dinajpur 1,859,887 2,402,763 +40.50 +29.19 462 (10) (9)
5. Maldah 1,612,657 2,035,009 +31.98 +26.19 548 (13) (13)
6. Murshidabad 2,946,563 3,702,869 +28.57 +25.94 693 (5) (4)
7. Nadia 2,223,911 2,977,013 +29.91 +33.48 758 (8) (7)
8. Twentyfour Parganas 8,449,482 10,726,751 +34.53 +26.95 759 (1) (I)
9. Calcutta 3,148,746 3,291,655 + 7.57 + 4.54 31,651 (4) (6)
10. Haora 2,417,286 2,957,464 -t 18.58 +22.35 2,006 (7) (8)
11. HugIi 2,872,116 3,549,817 +28.72 +23.60 1,129 (6) (5)
12. Medinipur 5,509,247 6,723,860 +26.89 +22.05 478 (2) (2)
13. Bankura 2,031,039 2,374,205 +22.02 +16.90 345 (9) (10)
14. Puruliya 1,602,875 1,855,429 +17.86 +15.76 296 (14) (14)
15. Barddhaman 3,916.174 4,808,886 +27.04 +22.80 684 (3) (3)
16. Birbhum 1,775,909 2,094,756 +22.80 +17.95 460 (11) (12)

MAPS
AND
CHARTS


CHART SHOWING THE COMPARATIVE POPULATION
SIZE OF THE DISTRICTS 1981
MEDfNIPUA

WEST BENGAL
DECENNIAL POPULATION
GROWT H RATES
1971-81
(DISTRICTS)
80U~DA'UE;:
IN Tl'RNATIONAl.
SU.T'"I!. ~$TiUCT ., .•
LEGENDS
BELOW 18
~srATE AVERAGE; 22.'96 -= _ '" 22,97- 26
~ ••• ABOVE 28
' .. us 0 15 10
\
OISTRICl HEADOUARTERS •. 0
T'" i.pl' itgrl ... ",,0'.'" 01 11'iI'tIQ •• '.nd Iflto) ft., ,.;, .. to) 0. d"tanc;:a of twsl ... ., noufIC91I11a •• maOJi\lHtD frQln t.ft. oppr"prl.f;l". £oJ." ,I"e-_
.,.
Q
...
z

WEST BENGAL
DENSITY OF POPULATION. 1981
(DISTRICTS)
INDEX
P£II:SON5 PU( SQ. Kill.
_ AeOVE '.000
~ 601_1,000
~STATf AVEAAG£
301_ 500
lOO -300
16 U 32 ••
~Fi9 Nf'" IS 0 10 30
\
o .,TIIIINATIONAL ._._._*p STATI. •• •• _._._._
::~~:A~;T~~, ._._._._ OISTRICT HEAOQV:':RT"EAS·,'. ~
14 10 tc ••
¥ ••
MAP 2
.,.
o
z
NOTE:·
WHERE DISTRICT tH~E DIFFERS FROM ITS Hf.:,It,DQUA,",TER5 rnWN
NAME:,THE FORMER. HAS, BEEN' WRI rUN IN eRA(;;I(E. T

u'
...
2.'
".
.. ' .T I
WEST BENGAL
SEX RATIO, 1981 (DISTRiCTS)
INDEX
FfMALES f'ER ,OOQ foIALES
~ • •• 951 AND ADovt
~ 901-95Q
-"'-. STAlE A'JARAGE - 911
§ .. ~ 8~ 900
o .. , 150 AND saow
aOUNDidt,IS: INTE!=tNATIONAL _._. __ _ S"TAT£ ••• I.' ... _._._-_ DISTRICT ••• , '" _._._._
~;r:;:C~A~~~~QUARiERS::-' . ., ~ les 0 to 32 ., 14 10 .to,
rdi H I 1::1-;;;;%;---4 115 0 ,$ 30 .. ,
,
MAP J .. ' 00'
,.
../
o
•• -1,------...,
z •
22 .. ' •
• NOTE:. WHERt DlSTPtCT NAU£ DfF"'"S ~AoM 17S HEADQUARTE~$ TO¥tN NAhAE THE FOAMER HAS BEEN WRITTEN IN "RACKET
.,' 80ud u •• '" Sll,_'~)'-o~la ,,!C!!, .11" tn'll P.!"~ Ot--";;-Sl4I"¥."." (ii!'flHot 0' '''_''1.
T .... , .. r1lorlol ... oler. 0' , .. cu ... h"d ;1'1'Il10 thi' fH to 0 d:".nc. Of ''''-'''11 Ito"tlc,f".:'" m,ol'H.f;j frollll the opproprl.t. 00" Ii,., ••
II'
. tlF t
10'

WEST BENGAL LITERACY, 1981
(DISTRICTS)
INDEX ----~
PERCENT,o.Gt- QFll't.RAfES TO TOTAL POPUl.ATiON INCLUDING A.GE 0-4
4S'OI AND ABOVE
35'01_45'00
STATE AVERAGE 40'6&
25'01- JS'OO
25'00 AND BELOW
BOUNDARY;'NTERNA'tIONAL __ • __ _ " STATE ......... _._._.-" DISTHICT, •• ' ••• _. __ ._ ~
STAT£ CAPITAL •• ". ,.. '" 'Q. DISTRICT HEADQUARTERS ... ", 0
"'pon $1011'''.,
T,. "rltc.",., .,h'r. ,,( In"o .~"no iM~ H,~ tH to Q .i"OMl1.f h...ely!, lIoulle_, ",ilM _., ••• loIrttt 'ro .. fila "p~r~prtCiI. bo.tiI 1111 ••
o
z WHERE QISTRICT ru.ME DIFFERS FROM ITS HEADQUARTERS TO'#"J NAME, THE FoRMER, HAS BEEN WRITTEN IN BRACKEr
<

CENSUS 1981
BACKGROUND NOTE

WHAT PRECEDED THE 1981 CENSUS
J .
The present volume is the very' first of the published documents on the results orI981 Census. This volume supplies only the Provisional Totals in terms of crude results which have been chain-relayed from the lowest level of Census hierarchy and therefore, does not boast of either finality or compre: hensive dealing with all that Census can generate.' However, with the prospect of a good harvest in terms of tabulated results in due course of time! we"may, for the moment look back to an that preceded the Census Operations of 1981.
Population Census by door to door canvassing'method is both costly and difficult. But this is the method that we have followed in India for more lhan~a: century and with good results too. f'-10st important of all, it is an administrative exercise of gigantic magnitude-perhaps thc biggest civil administrative exercise in this Country-and barring China, probably in the' World. Census Operations suffer in comparison to other administrative yxercises insofar as it has no ghi,mour at all and further the organisation which is builf up for the conduct-of the Op~rations consists of sucll persons over whom the Census Authorities have little direct control. By the very nature of the System evolved through the ages, the Census Authorities simply have to depend upon the devotion to duty of a huge body of masses who form the vital part of Census hierarchy. Still, the Operations have been staged successfully every 10 years, '1981 being no exception. .
II
The preparation for each Census Operation has to start quite early-in fact, the preparation for 1981 Census started as long back as early part of 1978 when the First Date..Users Conference was held in New Delhi in mid-February in that year. In this Conference, the principal users of Census Data coming from the Ministries of th~ Government of India, of the State Governments, the Universities, the Research Organisations, the Institutions dealing with applied side of Ecbnomics, Statistics and Anthropology, .including such bodies as the Election Commission, the -Plallliing Commission, the Reserve Bank of India etc. congregated to discuss the kind of data that were being asked for by the users and how the requirements of the different users can be met without overburdening the Enumerators who would, in the final analysis, be responsible for collection of Census data from th.c
Jfield. The Confer~~ce' also discus'sed'all the related aspects of Censu; like forms-and methods of Tabulation, ancillary studies ~elating to Census'apart from general strategy of 1981 Census. The ........ ~ .. 1'" ~ ~ oJ. .... _ ._..._
ideas thrown up ~y this :C.onference was, thereafter, taken up 1?y an Expert Body to form the Census questi~nnaires for,1981.( On_ the basis of that, a Pilot Study wfts take!} up in West.Bengal-alongwith the res~,of India-~n 31 B~~c~s d1!~ing the 'p.eriod fr~m 12._?Y8 to 2!.~.78. T~~ Pilot Study was, in many, ways, an eye-opener for it revealed quite a few operational problems and defencts in the original quest\onnaire w~ich were, therefore, subject~d to further 'scrutiny by tlie' Registrar General and Census Commissioner, India.
Then followed the Pre-tests on the basis of the modified questionnaire.s. Two sets of Pre-tests were undertaken in West Bengal alongwith the rest of India. The First Pre:-Jest was held within the period from 19.9.78 to 5.10.78 in 30 Blocks. This Pre-test, however, coincided with the great Lower Bengal flood of 1978, as a tesult'of which it virtually had to be abandoned. The Second Pre-test on these questionnaires was taken up between 1.6.79 and '21.6.79 in 10 Blocks in different places in West Bengal. it was the last Pre-test which gave us some good idea about the workability of the questionnaires. '·n wasuthe questionnaire which was finally adopted for canvassing in 1981 Cenus with "Some' very minor-changes:·
i3

III
The vastness of the organisation in the conduct of Census was apparent as soon as we started the work of finding out the exact jurisdiction of various administrative units in West Bengal. As everyone knows, the Land Re~ords would normally be in a state of continuous Jiux. With new Police Stations coming up, the administrative jurisdiction of municipalities and such urban bodies changing over time, and with division and merger of Mauzas in the rural areas, the work of finding out the exact jurisdiction of these administrative units itself poses a challenge. Added to this would be the problem of verification of boundary lines of districts and -- what is more important--of International boundary lines. Getting hold of the details of these jurisdictional limits took us quite a lot 66 time; but thanks to the kindness of the State Government we could finally get hold of all the details of jurisdictional changes that had taken place between 1971 and 1979. Further, by dint of an order from the Chief Secretary, Government of West Bengal, all further contemplated jurisdiction changes of these administrative units was brought to a halt till the Census Operations would be over in J 981. Since in rural areas Mauza would constitute the basic unit of Census taking we also had to get searches started in the District Collectorates as well as in the office of the Director of Land Rec(lrd~ and Surveys of the State Government for locating Mauza maps.
IV
Simultaneously we had to identIfy the urban areas in this State. Since the census figures maintained traditionally the difference between Urban and Rural population, it was necessary to find out the Urban areas before census started. In this task, the norms of the previous Census are retained. All muniCipalities, and those areas which had been declared to be of equivalent status by the Government automatically came under this category. In addition the non-municipal towns all over the State were to be identified. In order to qualify as non-municipal towns, these areas were required to pass three tests namely:
(i) A population of 5,000 or above; (ii) A density of 400 per sq. km. or above; and
(iii) The requirement that at this 75% of the male working force to be engaged in nonagricultural pursuits.
Apart from these, there were Project Towns which had sprung up due to establishment of some industries or which had become a town because some government activity (for example: tourist report). Further, the 1971 concept of Urban Agglomeration was to be kept in tact and was to be applied this time also. Besides, a concept related to Urban Agglomeration, namely Urban Outgrowth was introduced. While the Urban Agglomerations were meant to take care of growths with urban characteristics which are associated with already determined towns of various kinds (such as municipalities), the concept of Urban out growth was meant to cover such non-Urban Areas are adjacent to a mother town and grown have actually Urban characteristics but have failed to satisfy the tests passing which would have qualified them to be non-municipal towns by their own right.
v The essence of Census Organisation boils down to division of the entire State into artificially-created small census-jurisdictions, census-taking in which would be possible by the basic field level worker called Enumerator. Since some of the divisions and sub-divisions of the entire State are already available in terms of Districts, Police Stations, and Mauzas (in respect of rural areas) and Districts, Municipalities Or Towns etc. (for Urban areas), we could accept these administrative jurisdictions
14

as already given and then go for further sub-divisions of the smallest units in these administrative jurisdictions. In Rural areas the Mauza was considered to be lowest administrative unit which if required, would further to be sub-divided for the purpose of Census into a number of enumeration blocks. In Rural Areas, the ideal population in an enumeration block would be 750. Therefore, if a Mauza consisted of 750 or less population, that Mamas itself wouid become one enumeration block. On the other hand, if the popUlation of the Mauza exceeded 750, then it might have been sub-divided into a number of enumeration blocks. In urban areas, the T"lunicipalitie~, which form the biggest bulk of Urban areas in this State, we could work upon the concept of ward i;l each Municipality. The ideal population in an enumeration block in Urban areas was to be 600. Thus, a Ward in a Municipality was to be sub-divided into suitable number of enumeration block~ depending upon the Ward population and our requirement of 600 persons per enumeration block. In other kinds of Urban areas, (like towns, cantonments, project towns, non-municipal towns etc.) the same concepts were to be applied if they had divisions equivalent to Wards in a Municipality. If not, we were to go back to somewhat artificial Census concept of Circle.
As we go on creating Enumeration Blocks, creation of Census Circle" would pose no problem because the simple rule to be followed was that there would be Census Circle, on an average, for every fiy<; Enumeration Blocks. fo this manner the entire State had b';:en divided into 98,063 Enumeration Blocks and 15,990 Circles in the initial stage. These Blocks and Circles could undergo modification at latcr stagl~s before the final enumeration started. They in fact did undergo further I:hanges and at the time of enumeration, the number of Enumeration Blocks (excepting those ill Military Special Census Charges) went up the 99,913 and the number of Census Circles went up the 17,121.
VI
The lowest level Census worker is known as the Enumerator. The requirement of nearly a lakh Enumerators was met mostly by the Primary School Teachers in rural areas. In urban areas, young persons of respec;tive localitjes, who were kind enough to shoulder the great burden for -[; Scant)nri5nohil~lUn1'oI1ly, filled" up tliesezaps:-- "The sa,~ne category of persons aiso worked, by and large, as Circle Supervisors in these urban areas. In rural areas, however officials in the Community Development Block offices, were available to take up the challenge. The Block Development Officers became, what is known as Census Charge Officers for their respective Block jurisdictions (excluding the urban areas, naturally). And for Municipalities, Towns etc., the Chairman i
Presidents/Executive Officers/Administrators were appointed as the Municipal or Town Census Officers. All of them worked under the leadership of the District Magistrates/Deputy Commissioners of the respective Districts. The latter were designated as the Prillcipal Census Officer. He was assisted mainly by one Officer, who had been designated as the District Census Officer and was headquartered at the District B.O. Further in each Sub-division, the Sub-divisional Officer acted as the Sub-divisional Census Officer. Thus the entire State (excepting Calcutta and Haora cities) was to be censused through the existing State Govt. administrative machinery. In Calcutta and Haora cities, we set up two offices with our own Deputy Directors to head those offices, for undertaking Census. Calcutta city had for quite a few past Censuses been the direct responsibility of the Directorate; to this, Haora city was added this time. Besides manning these two city offices directly, we also set up a number of small Regional Offices of Deputy Directors throughout the State to help the District authorities in the conduct of Census. Thus, the 1981 Census maintained the commendable traditions of the past and once again became one of the finest examples of CentreState collaboration in-achieving a common goal. The Government of India in the Ministry of Home Affairs and the Registrar General of India on behalf of the latter extended all possible help to this Directorate as well as to the State Government to make the Census programme a success.
15

VII
The work of houselisting started in the State from 10.8.80. It was thought prudent to give a longish period of time for houselisting as this was a time when agricultural operations would be in fuB swing and there was apprehension of periodic floods, too. As a matter of fact, serious flood did take place in portions of Maldah and Murshidabad District and in these places the houselisting operation was disrupted because of floods. The houselisting work was finally over in the middle of November throughout the State, though the work was actually over before the Pujas in the rest of the State excepting the flood affected areas of Maldah and :f\,1urshidabad. In hOllselistillg, which is a stage preliminary to actual census-taking, the Enumcrators are expected to prepare a list of houses for their respective Enumeration Blocks and collect certain other basic information relating to these house and also prepare a sketch map for each Enumeration Block showing the location of the houses and the important land-marks. With houselisting, was tagged the work of preparation of Enterprise Lists, locating the Enterprise as would be found in each Enumeration Block and finding out the number of the blind, crippled and dumb in each household. This short description of the work has been given injust a few work however was indeed huge. Before any such operation, it was absolutely essential that the great number of Enumerators and Circle Superviso!·s be traincd thoroughly in the concepts of houselisting and their application in the field. \Vith four days of training planned for each Enumerator and Circle Supervisor, we had to tackle more than a lakh of Census workers who were assembled from various walks of life and who constituted a motley crowd. It took us more than two months' of time to discuss the concepts of hOLlselisting again and again with the Enumerators and Circle Supervisors and trained them thoroughly.
VIII
As soon as houselisting was finally over in the State, we started the preliminaries for final enumeration which was to take place between the 9th of February and the 28th February 1981 simultaneously all over India. Now that the houselisting was over, it was possible to organise the Enumeration Blocks and Circles on a more realistic basis and the Census Charge Ofllcers were asked to re-organise them immediately. While the work of re-organisation of the enumeration blocks etc., were still continuing; we started the training programme for final enumeration. Once again, the training took us more than two months of time. This time however, the training had to be imparted and undergone in much more details than earlier, and we imparted, in all, full five days of training to all the Enumerators and Circle Supervisors. There were in addition requests for repeat training course, which had to be accommodated. Actually with all these repeat courses and basic courses taken together, we spent about two and a half months of time acting as Trainers for almost each and every single day. We could complete all training programmes just in the nick of time when the 9th of February, which was the date of starting of enumeration, arrived.
IX
In a work of such colossal dimensions, a few errors are always pOSSible. In fact, the commissions and omissions are of great importance to Census authorities themselves. To determine the extent of error, Post Enumeration Checks are being carried out. r,e point that deserves specific mention is that while our aim was to count every single person, the possible inadverteut omission of a few out of a total of nearly 5.45 millions in West Bengal does not invalidate the Census. We are confident that as and when the results of the Post T:nullleratiol) Checks would be available, this firm belief of ours would be reaffirmed.
16
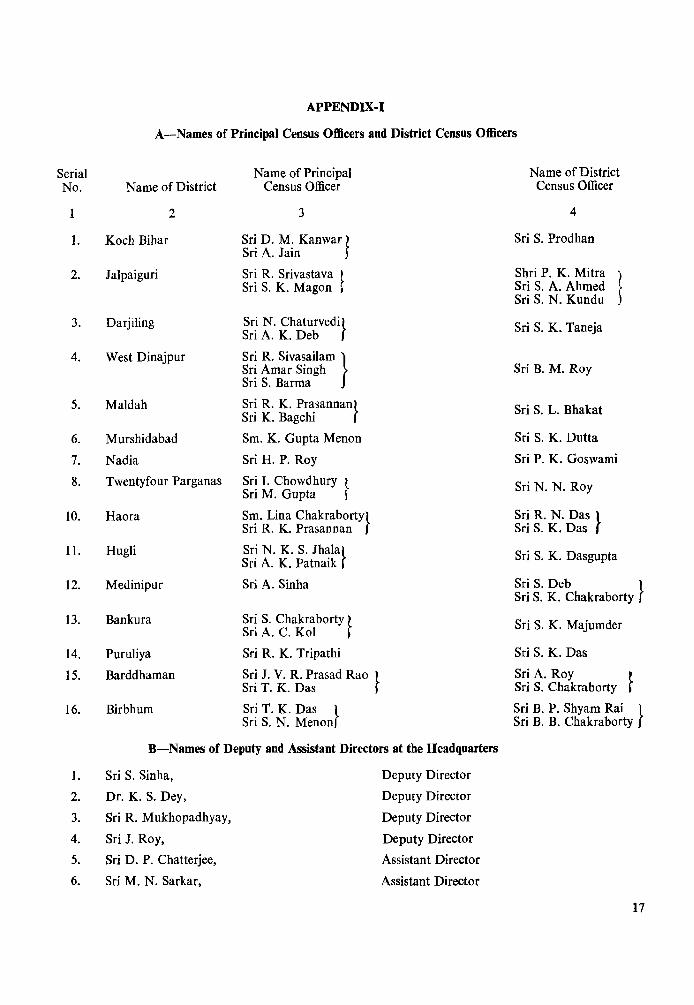
APPENDIX-I
A-Names of Principal Census Officers and District Census Officers
Serial Name of Principal Name of District No. Name of District Census Officer Census Officer
1 2 3 4
1. Koch Bihar Sri D. M. Kanwar J Sri S. Prodhan Sri A. Jain
2. Jalpaiguri Sri R. Srivastava ~ Shri P. K. Mitra
1 Sri S. K. Magon , Sri S. A. Ahmed Sri S. N. Kundu
3. Darjiling Sri N. Chaturvedi} Sri A. K. Deb
Sri S. K. Taneja
4. West Dinajpur Sri R. Sivasailam } Sri Amar Singh Sri B. M. Roy Sri S. Barma
5. Maldah Sri R. K. prasannan} Sri S. L. Bhakat Sri K. Bagchi
6. Murshidabad Sm. K. Gupta Menon Sri S. K. Dutta
7. Nadia Sri H. P. Roy Sri P. K. Goswami
8. Twentyfour Parganas Sri I. Chowdhury } Sri N. N. Roy Sri M. Gupta
10. Haora Sm. Lina Chakraborty} Sri R. N. Das } Sri R. K. Prasannan Sri S. K. Das
11. HugH Sri N. K. S. Jhala} Sri S. K. Dasgupta Sri A. K. Patnaik
12. Medinipur Sri A. Sinha Sri S. Deb } Sri S. K. Chakraborty
13. Bankura Sri S. Chakraborty} Sri S. K. Majumder Sri A. C. Kol
14. Puruliya Sri R. K. Tripathi Sri S. K. Das
15. Barddhaman Sri J. V. R. Prasad Rao } Sri A. Roy } Sri T. K. Das Sri S. Chakraborty
16. Birbhum Sri T. K. Das } Sri B. P. Shyam Rai } Sri S. N. Menon Sri B. B. Chakraborty
B-Names of Deputy and Assistant Directors at the Headquarters
1. Sri S. Sinha, Deputy Director
2. Dr. K. S. Dey, Deputy Director
3. Sri R. Mukhopadhyay, Deputy Director
4. Sri J. Roy, Deputy Director
5. Sri D. P. Chatterjee, Assistant Director
6. Sri M. N. Sarkar, Assistant Director
17

12
1.
2. 3. 4. 5. 6.
I. 2. 3. 4. 5. 6.
7. 8. 9.
10. II. 12. 13. 14. 15. 16.
APPENDIX-I-contd.
C-Names of Regional Deputy Directors
Sri A. K. Das
Sri K. L. Biswas Sri S. Sarkar Sri S. Ghosh Sri B. N. Chakraborty Sri P. Dasgupta
Darjiling-Jalpaiguri-Koch Bihar-West DinajpurMaldah Murshidabad-Nadia Twentyfour Parganas Haora-Hugli Barddhaman-Birbhum Medinipur-Puruliya-Bankura
D-Names of Deputy and Assistant Directors, Regional Census Officers and Zonal Census Officers, Calcutta City Census Operations
Sri A. K. Mukhopadhyay Deputy Director
Sri A. Sengupta Deputy Director
Sri S. K. Majumder Assistant Director
Sri L. N. Chatterjee Assistant Director
Sri A. K. Ghosh Investigator
Sri T. K. Ghosal Regional Census Officer Sri S. Raye Sri D. K. Sen Regional Census Officer
Sri P. R. Halder Regional Census Officer Smt. Lakshmi Saha Zonal Census Officer, Zone No. I
Sri Nirmal Mitra Zonal Census Officer, Zone No. II Sri M. L. Chandra Zonal Census Officer, Zone No. III Sri Debdas Paul Zonal Census Officer, Zone No. IV
Smt. Parul Barman Zonal Census Officer, Zone No. V Sri Samir Chandra Zonal Census Officer, Zone No. VI Sri Sitangshu Bhattacharya Zonal Census Officer, Zone No. VII Smt. Kiran Biswas Zonal Census Officer, Zone No. VIn
E-Names of Deputy and Assistant Directors and Zonal Census Officers, Haora City Census Operations
The Regional Deputy Director, Haora-Hugli headed the office of Census Operations in Haora City 1. 2. 3. 4. 5. 6. 7. 8. 9.
10. 11. 12. 13. 14.
Sri N. C. Sarkar Assistant Director Sri A. K. Roy Tabulation Officer Sri T. K. Ghosal Tabulation Officer Sri Afzaluddin Ahmed Computor Sri Kamalesh Dhani Sri Somenath Roy Sri Ajit Kumar Mandai
Sri Dwijendra Lal Nandi Sri Bimal Kumar Majumder Sri Mihir Kumar Sengupta Sri Gouri Sankar Das Sri Joy Kumar Paul Sri Manas Kumar Mitra
Comput~r
Computor Computor Computor Computor
Computor Computor Comput~r
Computor

APPENDIX-ll
Officials who worked in the "Provisional Population Totals-1981 Census Project"
GENERAL SUPERVISION :
COMPILATION:
MAPPING:
PRINTING:
Dr. K. S. Dey, Deputy Director
(1) Sri M. N. Sarkar, Assistant Director
(2) Sri S. K. Guha, Investigator
(1) Sri Bimalesh Das, Sr. Draftsman
(2) Sri J. B. Dasgupta, Artist
(3) Sri H. R. Banerjee, Draftsman
(4) Sri B. Majumdar, Draftsman
(5) Sri S. Chatterjee, Draftsman
(J) Sri Dipankar Sen, Investigator
(2) Sri Himangshu Saha Chowdhury, Proof Reader
(3) Sri Nikhil Bagchi, Computor
19


ANAL YSIS
OF
RESULTS


A SHORT DEMOGRAPHIC PROFILE
The provisional total population of West Bengal, as on the sunrise of the 1st March, 1981, stood at 54,485,560, comprising of 28,505,151 males and 25,980,409 females. In absolute terms, the population of West Bengal went up by 1,01,73,549 over the period 1971-81, thereby registering a decennial growth rate of 22.96%. There has thus been a perceptible fall in growth rate, though the fall is not as markedly high as it was during the period 1961-71. To go back a little into the past, this State registered a very high rate of 32.80% during 1951-61, which, when compared to the decennial growth rate of 13.22% for the period 1941-51, would clearly indicate that there was something more than purely indigenous population growth. As a matter of fact, large scale shift of papulation into West Bengal from beyond did take place in that decade. The 1961-71 growth indicated an incremental rate of 26.87%, which was still higher than the all-India growth rate of 24.80%. Although the available data are still too scanty to form any definitive opinion, it is perhaps possible to advance it as tentative findings that the 1971-81 decadal growth rate of 22.96% represents a normal indigenous growth. The provisional all-India growth rate in 1971-81 is 24.75~;;; as compared to the 1961-71 growth rate of 24.80/~.
GROWTH RATE:
West Bengal has ranked quite high in the immediate past in the all-India arena in the matter of sheer bulk of population. In 1971, this State ranked 4th in India, with Uttar Pradesh, Bihar and Maharastra taking the first three places. Population of West Bengal formed 8.08~;;; of the entire population of India. This time, West Bengal continues to hold the same position, accounting for 7.97% of the total population of our country. Ahead of West Bengal are the same States this time also, namely, Uttar Pradesh, Bihar and Maharastra. It is of interest to note that the growth rate of population-as per provisional figures-has fallen everywhere in 1981 except in 8 States (i.e., Andhra Pradesh, Bihar, Karnataka, Nagaland, Punjab, Rajasthan, Sikkim and Uttar Pradesh) and 2 Union Territories (i.e., Dadra and Nagar Haveli and Pondicherry). In simple comparative terms, the first few States/Union Territories registering high growth rate, are : Chandigarh (74.95%), Andaman & Nicobar Islands (63.51 %), Delhi (52.41 %), Sikkim (50.44%), Nagaland (49.73%) and Dadra & Nagar Haveli (39.78%) .. On the other hand, the first few States/U.Ts registering low growth rate are: Tamil Nadu (17.23%), Kerala (19.00%), Orissa (19.72~~), Himachal Pradesh (22.46%), Andhra Pradesh (22.76%) and West Bengal (22.96%).
A look at the 1981 population figures of the constituent districts of West Bengal will show that the rate of growth of population has fallen everywhere except in the districts of Darjiling, Nadia and Haora. These districts have respectively registered growth rates of 28.74%, 33.48% and 22.35/~ during 1971-81, against their earlier respective rates of 25.16%,29.91% and 18.58% during 1961-71. Looked at from a slightly different angle, the districts which have a growth rate higher than the State average of 22.96% are: Koch Bihar (25.27%), Jalpaiguri (26.11%), Darjiling (28.74%), West Dinajpur (29.19%), Maldah (26.19%), Murshidabad (25.94%), Nadia 05.48/~), Twentyfour Parganas (26.95%) and Hugli (23.60%). Of them, Jalpaiguri and Darjiling districts are somewhat different-they are not predominantly agriculture-based riverine plains, as the rest of the members of this group are. So, if we leave them out of this group it would appear that riverine areas which are agriculturally relatively prosperous have also a relatively high growth rate. But, of course, it would not be quite proper to treat the districts of Twentyfour Parganas and Hugli as predominantly agricultural, since large tracts of both these districts form parts of Calcutta Urban Agglomeration. And further, the district of Barddhaman is a somewhat extra-ordinary case, too, for it has a very
23

important and sizeable industrial base simultaneously being very advanced agriculturally also. This district has registered a growth rate of 22.80/~ which is just marginally lower than the State average.
The tentative suggestion outlined above finds an indirect support from the relatively low growth rate of those districts which are agriculturally relatively backward. These are the districts of Medinipur, Birbhum, Bankura and Puruliya, all of which are usually taken as an extension of the Chhota Nagpur plateau. Of them, Medinipur's growth rate of 22.05% is quite near the State average. This is perhaps explained by the fact that a sizeable part of this district consisting of Sadar (South), Ghatal, Tamluk and a big chunk of Contai Sub-divisions are agriculturally quite flourishing and do not really form a part of the relatively barren plateau. But, quite obviously, Birbhum (17.95%), Bankura (16.90%), and Puruliya (15.76%) indicate presence of those demographic and economic factors which do not favour a flourishing popUlation.
The district of Calcutta has always been a special case. Calcutta, with parts of the districts of Twentyfour Parganas, Haora and Hugli (and a small area of Nadia) from the Calcutta Urban Agglomeration. The growth rate of Calcutta City for the decade 1971-81, is 4.54% only. Thus, from 1951-61 onwards, this city has been experiencing a clearly discernible decreasing rate of growth. From 8.48% in 1951-61, it fell to 7.57% in 1961-71 and has now marked a further fall which is relatively sharp in nature. From this trend, it may be held out tentatively that the popular belief that Calcutta City is demographically drawing closer and closer to a saturation point, is perhaps correct. On the other hand, the growth rate of the Urban Agglomeration of Calcutta tends to lend credence to another popular belief that the Urban Agglomeration is very much alive and still a drawer of crowds. How much of the growth of the Urban Agglomeration however is due to outmigration from the Calcutta City and inmigration from beyond the Urban Agglomeration itself is difficult to judge in the absence of migration tables.
The Urban Agglomeration of Calcutta has 144 Units within it. 107 of them are towns by their own rights, (31 municipalities, 70 non-municipal towns, 1 Cantonment, 3 municipal corporation and 2 Notified Areas) while 37 are Urban Out Growths. In 1971, this Urban Agglomeration had 74 units, which were at that time divided into Municipal and Non-Municipal categories only (the concept of Out Growth coming up only in 1981 in West Bengal). Thus, the Urban Agglomeration of Calcutta of 1971 and that of 1981 are not the same area geographically, the latter being larger than the former. This time, the Urban Agglomeration of Calcutta covers, apart from Calcutta Municipal Corporation itself (which is coterminus with Calcutta district), 3 units in Nadia, 76 units in Twentyfour Parganas, 38 units in Haora and 26 units in Hugli district. The provisional total population of this Urban Agglomeration in 1981 has come to 9,165,650, against the 1971 figure of 7.031,382 thus registering a 30.35% increase. Calcutta Urban Agglomeration's corresponding growth rate during 1961-71 was 22.57%.
Though it is usually the district of Calcutta and the Urban Agglomeration of Calcutta that evince great interest, it will perhaps be of equal interest to know that the extent of urbanization in West Bengal has increased significantly over the decade 1971-81. Taking all classes of urban areas together, there have been found 32 Urban Agglomerations in West Bengal in 1981, involving, in all, 272 constituent units. This presents a somewhat sharp increase over 1971, when there were 11 Urban Agglomerations in all, involving a total of 97 constituent units.
DENSITY:
In the decade under consideration, density of popUlation-another important demographic consideration-has also gone up considerably. In 1971, densiW.of population per sq. km. was 499;
24

the same in 1981 stands at 614. Once again, the district of Calcutta, as usual, heads the list, with 31,651 persons per sq.km. In 1971, this figure for Calcutta read 30,276. Haora district retains its second position within West Bengal with 2,006 persons per sq. km. against the 1971 figure of 1,640. Similarly, the third place is retained by Hugli district with 1,129 persons per sq.km., its 1971 density of population being 913. It will be noted that density of population has increased in every district from 1971. The pattern has followed the rate of increase of population, i.e., in the agriculturally backward areas of western region comprising of part of Medinipur, Bankura, Puruliya and Birbhum districts, density of population is relatively low compared to the riverine districts where agriculture usually flourishes, i.e., Koch Bihar, West Dinajpur, Maldah, Murshidabad, Nadia, part of Twentyfour Parganas and part of Hugli. Same is true of that part of Barddhaman district which is agriculturally advanced.
SEX RATIO:
In respect of sex-ratio (number of females per 1,000 males), the all-India figure is 935 as against the 1971 figure of 930. The increase in number of females per 1,000 males seems to be a noteworthy fact in 1981 all over India. Only in 9 States/U.Ts., the sex-ratio is on the decline. They are : Alldhra Pradesh (975 in 1981 and 977 in 1971), Bihar (947 in 1981 and 954 in 1971), Manipur (972 in 1981 and 980 in 1971), Nagaland (867 in 1981 and 871 in 1971), Orissa (982 in 1981 and 988 in 1971), Dadra and Nagar Haveli (974 in 1981 and 1,007 in 1971), Goa, Daman and Diu (981 in 1981 and 989 in 1971), Lakshadweep (876 in 1981 and 978 in 1971) and Pondicherry (985 in 1981 and 989 in 1971). In the States of Tamil Nadu (978) and Madhya Pradesh (941) the figures have remained constant. The general trend of gain in sex ratio is a significant item which will be of great interest to demographers. Against this background, in West Bengal also, the sex-ratio has marked an increase to 911 in 1981 as compared to 891 in 1971. When the individual disticts are considered, we find a rising trend everywhere except in Nadia where the ratio has remained stationery, at 948, Birbhum where it has further declined to 963 from 968 in 1971, and Puruliya where again the ratio has declined to 957 from the 1971 mark of 963. It would appear that the sizeable gains in sex-ratio noted in the districts of Koch Bihar, Jalpaiguri, Darjiling and West Dinajpur have suddently dwindled in the districts of MaIda and Murshidabad where the gains are only marginal and then coming to Nadia, the ratio has not changed at all. In another region, while the gains in Calcutta district has been quite high, Haora district has also registred a slightly lower but still considerable increase in the number of females, and a still lower but sizeable increase has been registered in the districts of Twentyfour Parganas, Barddhaman and Hugli. In the Western region, while Medinipur and Bankura have marked some increase, Puruliya and Birbhum continue to suffer further drops in the sex ratio.
LITERACY:
When we consider literacy, we find that the percentage of literates to total population has gone up in West Bengal from 33.20% in 1971 to 40.88% in 1981 thereby registering an increase of 7.68%. In the previous decade, it rose from 29.28~~ in 1961 to 33.20% in 1971. The percentage of literate males to total population and that of literate females to total population have gone up almost in a parallel. These percentages in West Bengal are now respectively"'150.49% and 30.33%. This means that male literacy has increased by 7.68% while female literacy has gone up in this State by 7.91 %. Looking at the districts, we find that Twentyfour Parganas district has maintained its lead registering 12.46~~ increase in literacy, followed by Haora (10.87%), Bankura (10.20%), Hugli (9.98%), Medinipur (9.97%) and Darjiling (9.45%). It would be~obvious from a look at Table-III that all the districts have registered increases. the lowest being in West Dinajpur (4.80,%). What is
25

of further interest is that female literacy has been going up steadily over the last decade in West Bengal. The percentage increase in female literacy among different districts have been of the following order: Haora (12.17%), Hugli (10.58%), Medinipur (10.31%), Darjiling (9.15%), Barddhaman (9.05%), Calcutta (8.67/~), Bankura (8.64%), Twentyfour Parganas (8.27%), Koch Bihar (7.37%), Birbhum (6.81/~), Nadia (5.79%), Jalpaiguri (5.40%), Puruliya (5.09~~), Murshidabad (5.02%), Maldah (4.87%) and West Dinajpur (4.71).
The overall literacy picture, when put against the all-India background will not compare too unfavourably, since percentage of literates to total population in West Bengal is 40.88% against the all-India figure of 36.17%. But it should provoke some thought also, for in the meantime, other States have gone further ahead. While with 33.20~~ of literacy to total population West Bengal ranked 13th in 1971 among all States and Union Territories taken together, (as per final figures inclusive of Mizoram which came into existence after 1971) this State had to concede further places to others and as per provisional figures of 1981, now stands 15th only. Ahead of West Bengal are : Kerala (69.17%), Chandigarh (64.68°,~), Delhi (61.06~/o), Mizoram (59.50/~), Goa, Daman and Diu (55.86/~), Lakshadweep (54.72~/~), Pondicherry (54.23~ ~), Andaman & Nichobar Islansd (51.27%), Maharashtra (47.37~1u), Tamil Nadu (45.78~~), Gujarat (43.75~~), Manipur and Nagaland (both 41.99%, Himachal Pradesh (41.94";;,) and Tripura (41.58°';;;).
[ In the computation of provisional literacy figures of 1981, Assam and Jammu & Kashmir have not been considered. ]
CONCLUSION:
At this moment, the available facts and figures are too scanty to allow any valid conclusion of the demographic front. Neither perhaps we should attempt one, as the figures given in this paper are all provisional figures only which may very well undergo some changes in the final shape. Yet, one or two trends are vaguely discernible. For one thing, while the overall population growth rate for the country as a v,. hole has shown a tendency to fall-albeit marginally-some of the States including West Bengal are-showing perceptibly dwindling growth rate-which one hopes will be borne out after the final figures are arrived at. Another point is that, the number of females per 1,000 males is likely to register an increase-in India as well as in West Bengal. And finally the literacy rate has gone up-both in India and West Bengal, which becomes a more welcome fact when considered in conjunction with the encouraging upward trend in female literacy. From these three sets of basic premises, one can perhaps conclude that the overall demographic trends are encouraging than ever before and if the trends are- confirmed by the final figures of 1981 Census an'd the trend continues, we as a Nation shall be better off in future.
26

PROVISIONAL
POPULATION TABLES

TABLE-I
DISTRIBUTION OF POPULATION, SEX RATIO, GROWTH RATE AND DENSITY OF POPULATION
BY DISTRICTS
1981 Census (provisional Figures)
Sex Ratio Density of Decennial Females per Population Growth rate of
Population 1981 1000 males per Sq. Km2• Population ~
State/District Persons Males Females 1971 1981 1971 1981 1961-71 1971-81
2 3 4 5 6 7 8 9 10
WEST BENGAL 54,485,560 28,505,151 25,980,409 891 911 499 614 +26.87. +22.96
Koch Bihar 1,771,562 915,401 856,161 916 '1 935 . 418 523 +38.67 +25.27
Jalpaiguri 2,207,087 1,154,611 1,052,476 887 I,; 912 280 353 +28.76 +26.11
Darjiling 1,006,434 531,655 474,779 882 it 893 254 327 +25.16 +28.74
West Dinajpur 2,402,763 1,240,353 1,162,410 921 i, 937 . 357 462 +40.50 +29.(9
Maldah 2,035,009 1,043,634 991,375 948 '< 950 434 548 +31.98 +26.19
M urshidabad 3,702,869 1,889,785 1,813,084 956 L1 959 552 693 +28.57 +25.94
Nadia 2,977,013 1,528,626 1,448,387 948 (, 948 566 758 +29.91 +33.48
Twentyfour Parganas 10,726,751 5,634,777 5,091,974 882\'1) 904 598 759 +34.53 -1-26.95
Calcutta 3,291,655 1,922,632 1,369,023 636 I';. 7121 )30,276 31,651 + 7.57 + 4.54
Haora 2,957,464 1,578,964 1,378,500 833 \ 873 1,640 2,006 +18.58 +22.35
Hugli 3,549,817 1,859,790 1,690,027 896 ":" 909 913 1,129 +28.72 +23.60
Medinipur 6,723,860 3,444,561 3,279,299 945 1 952 . 391 478 +26.89 +22.05
Bankura 2,374,205 1,208,424 1,165,781 958 .- 965 ! 295 345 +22.02 +16.90
Puruliya 1,855,429 948.211 907,218 963 -: 957 .' 256 296 +17.86 +15.76
Barddhaman 4,808,886 2,536,405 2,272,481 886 ',: 896 557 634 +27.04 +22.80
Birbhum 2,094,756 1,067,322 1,027,434 968 963 390 460 +22.80 +17.95
28

tA8tE-U
DECADAL VARIATION IN POPULATION SINCE 1901
1981 Census (Provisional Figures)
Percentage Decadal variation in Population
State/District 1901-11 1911-21 1921-31 1931-41 1941-51 1951-61 1961-71 1971-81
2 3 4 5 6 7 8 9
WEST BENGAL t 6.25 -- 2.91 + 8.14 +22.93 +13.22 +32.80 +26.87 +22.96
I. Koch Bihar + 4.58 - 0.07 - 0,26 + 8.43 + 4.74 +52.45 +38.67 +25,27
2. Jalpaiguri +21.30 + 4.93 + 6,47 +14.42 +- 8.13 + 48.27 +28.76 +26.11
3. Darjiling + 5,31 + 5.12 +12.85 +17.72 + 17.58 +35.90 +25.16 +28.74
4. West Dinajpur + 6.78 -12.13 + 7.23 + 11.92 + 17.03 +35.51 + 40.50 +29.19
5. Maldah +\5.72 - 1.77 + 4.99 +17.19 + 11.05 +30.33 +31.98 +26.19
6. Murshidabad + 1.71 - 8.99 + 11.96 +19.69 + 4.61 +33.46 +28.57 +25.94
7. Nadia + 0.36 - 8.26 + 1.48 + 16.42 +36.15 +49.81 +29.91 +33.48
8. Twentyfour Parganas +14.78 + 6.31 + 9.53 +26.07 +23.50 +40.84 +34.53 +26.95
9. Calcutta + 8.86 + 3.63 +10.63 +86.00 +24.50 + 8,48 + 7.57 + 4.54
10. Haora +10.93 + 5.71 +10.17 +35.62 + 8.12 +26.51 +18.58 +22.35
11. Hugli + 3.67 - 0.90 + 3.22 +24.04 +13.35 +39.02 +28.72 +23.60
12. Medinipur + US - 5.48 + 4.97 +13.99 + 5.28 +29.26 +26.89 +22.05
13. Bankura + 1.99 -10,43 + 9.00 +16.00 + 2.30 +26.17 +22.02 + 16.90
14. Puruliya +13.70 - 5.98 + 16.91 +11.95 + 7.43 +16.33 +17.86 +15.76
15. Barddhaman + 0.37 - 6.46 + 9.82 +19.99 +15.92 +40.65 +27.04 +22.80
16. Birbhum + 3.67 - 9.41 +11.25 +10.63 + 1.77 +35.55 +22.80 +17.95

TABLE
UTERACY (INCLUDING
Total Population 1981 Literate Population 1981 r-
State/District Persons Males Females Persons Males Females
2 3 4 5 6 7
WEST BENGAL 54,485,560 28,505,151 25,980,409 22,271,867 14,391,808 7,880,059
1. Koch Bihar 1,771,562 915,401 856,161 531,326 366,055 165,271
2. Jalpaiguri 2,207,087 1,154,611 1.052,476 659,461 444,301 215,160
3. Darjiling 1,006,434 531,655 474,779 427.962 274,244 153,718
4. West Dinajpur 2,402,763 1,240,353 1,162,410 646,772 448,191 198,581
5. Maldah 2,035,009 1,043,634 991,375 469,211 328.310 140,901
6. Murshidabad 3,702,869 1,889,785 1,813,084 924.686 611,325 313,361
7. Nadia 2,977,013 1,528,626 1,448,387 1,094,546 668,670 425,876
8. Twentyfour Parganas 10,726,751 5,634,777 5,091,974 4,924,567 3,122,117 1,802,450
9. Calcutta 3.291,655 1,922,632 1.369,023 2,270,880 1,407,470 863,410
10. Haora 2,957,464 1,578,964 1,378,500 1,521,992 958,922 S63,070
11. HugJi 3,549,817 1,859,790 1,690,027 1,732,194 1,076,715 655,479
12. Medinipur 6,723,860 3,444,561 3,279,299 2,880,558 1,905,470 975,088
13. Bankura 2,374,205 1,208,424 1,165,781 866,494 597,107 269,387
14. Puruliya 1,855,429 948,211 907,218 553,243 432,207 121,036
15. Barddhaman 4,808,886 2,536,405 2,272,481 2,059,995 1,291,426 768,569
16. Birbhum 2,094,756 1,067,322 1,027,434 707,980 459,278 248,702

-Ill 1981 Census
(Provisional Figures) POPULATION IN AGE-GROUP 0-4)
Percentage of Literates to total population ,-
1971 1981 r- ---, Persons Males Females Persons Males Females State/District
8 9 10 11 12 13
33.20 42.8J 22.42 40.88 50.49 30.33 WEST BENGAL
21.92 31.08 11.93 29.99 39.99 19.30 1. Koch Bihar
24.01 ' 31.96 15.04 29.88 38.48 20.44 2. Jalpaiguri
33.07 41.75 23.23 42.52 51.58 32.38 3. Darjiling
22.12 31.09 12.37 26.92 36.13 17.08 4. West Dinajpur
17.61 25.45 9.34 23.06 31.46 14.21 5. Maldah
19.66 26.73 12.26 24.97 32.35 17.28 6. Murshidabad
31.31 38.61 23.61 36.77 43.74 29.40 7. Nadia
33.45 48.44 27.13 45.91 55.41 35.40 8. Twentyfour Parganas
60.3~ 64.08 54.40 68.99 73.21 63.07 9. Calcutta
40.59 50.51 28.68 51.46 60.73 40.85 10. Haora
38.82 48.33 28.21 48.80 57.89 38.79 11. Hugli
32.87 45.59 19.42 42.84 55.32 29.73 12. Medinipur
26.30 37.63 14.47 36.50 49.41 23.11 13. Bankura
21.50 34.27 8.25 29.82 45.58 13.34 14. Puruliya
34.36 42.87 24.75 42.84 50.92 33.80 15. Barddhaman
26.57 35.45 17.40 33.80 43.03 24.21 16. Birbhum
31

TABI,E-IV-CITIES WITH A POPULATION OF
SI Provisional Population 1981
,--- ---.. No. Name of City Persons Males Females Sex Ratio
2 3 4 5 6
I. ·Calcutta (M.C.) 3,291,655 1,922,632 1,369,023 712 2. *Haora (M.C.) 742,298 420,517 321,781 765 3. *South Suburban (M) 394,594 208,882 185,712 889 4. Durgapur (N.A.) 305,838 167,814 138,024 822 5. *Bhatpara (M) 269,158 152,823 116,335 761 6. *Jadabpur (M) 249,424 132,210 117,214 887 7. *Kamarhati (M) 240,418 135,925 104,493 769 8. *South Dum Dum (M) 227,578 119,829 107,749 899 9. ·Panihati (M) 205,546 109,133 96,413 883
10. *Garden Reach (M) 191,389 106,918 84,471 790 11. Asansol (M) 187,039 103,875 83,164 801 12. *Baranagar (M) 167,848 89,883 77,965 867 13. Barddhaman (M) 167,589 88,885 78,704 885 14. Siliguri (M) 153,825 85,779 68,046 793 15. Kharagpur (M) 152,964 81,527 71,437 876 16. *Bally (M) 137,723 80,929 56,794 702 17. *Hugli-Chinsurah (M) 129,338 67,106 62,232 927 18. *Serampur (M) 126,918 70,317 56,601 805 19. Nabadwip (M) 118,820 60,110 58,710 977 20. *Naihati (M) 114,165 64,056 50.109 782 21. Balurghat (M) 112,531 59,288 53,243 898 22. *Barrackporc (M) 109,149 58,344 50,805 871 23. *Titagarh (M) 104,439 64,269 40,170 625 24. *Chandannagar (M.C.) 101,568 53,375 48,193 903
Name of Urban Agglomeration
1. Calcutta U.A. 9,165,650 5,140,019 4,025,631 783 2. Asansol U.A. 365,371 204,410 160,961 787 3. Kharagpur U.A. 234,931 124,753 110,178 883 4. Nabadwip U.A. 129,647 65,642 64,005 975 5. Habra U.A. 127,855 65,220 62,635 960 6. Raniganj U.A. 119,322 69,381 49,941 720 7. Balurghat U.A. 112,531 59,288 53,243 898 8. Ondal U.A. 108,647 62,995 45,652 725 9. Baharampur U.A. 100,150 51,019 49,131 963
Notes: (1) Asterisk (*) marked cities are included in Calcutta Urban Agglomeration (2) Balurghat City includes its 2 out growths and with these two out growths Balurghat Urban Agglo-
meration has also been formed. U.A.-Urban Agglomeration, M.C.-Municipal Corporation, N.A.-Notified Area
M-·Municipality,
32

100,000 AND ABOVE 1981 Census (Provisional Figures)
Total Literates Literacy Rates ----'---------.. SI.
Persons Males Females Persons Males Females Remarks No. Name of City
7 8 9 10 11 12 13 1. 2
2,270,880 1,407,470 863,410 68.99 73.21 63.07 1. *Calcutta (M.C.)
483,428 297,689 185,739 65.13 70.79 57.72 2. *Haora (M.C.)
280,561 160,506 120,055 71.10 76.84 64.65 3. *South Suburban (M)
203,369 120,639 82,730 66.50 71.89 59.94 4. Durgapur (N.A.)
130,984 87,126 43,858 48.66 57.01 37.70 5. *Bhatpara (M)
169,223 96,282 72,941 67.85 72.83 6213 6. *Jadabpur (M)
161,860 96,594 65,266 67.32 71.06 62.46 7. *Kamarhati (M)
165,546 92,800 72,746 72.74 77.44 67.51 8. *South Dum Dum (M)
147,635 82,492 65,143 71.83 75.59 67.57 9. *Panihati (M)
90,857 60,198 30,659 47.47 56.30 36.30 10. *Garden Reach (M)
116,730 69,394 47,336 62.41 66.81 56.92 11. Asansol (M)
127,367 72,261 55,106 75.88 80.39 70.68 12. *Baranagar (M)
105,726 62,474 43,252 63.09 70.2() 54.96 13. Barddhaman (M)
96,275 57,344 38,931 62.59 66.85 57.21 14. Siliguri (M)
88,126 53,081 35,045 57.61 65.11 49.06 15. Kharagpur (M)
88,434 55,595 32,839 64.21 68.70 57.82 16. *BallyeM)
94,200 52,522 41,678 72.83 78.27 66.97 17 *Hugli-Chinsurah (M)
82,597 48,952 - 33,645 65.08 69.62 59.44 18. *Serampur (M)
72,497 41,522 30,975 61.01 69.08 52.76 19. Nabadwip (M)
62,422 38,655 23,767 54.68 60.35 47.43 20. *Naihati (M)
74,733 42,848 31,885 66.41 72.27 59.89 21. Balurghat (M)
75,087 43,295 31,792 68.79 74.21 62.58 22. *Barrackpore eM)
48,441 34,943 13,498 46.38 54.37 33.60 23. *Titagarh eM)
70,624 40,060 30,564 69.53 75.05 63.42 24. *Chandannagar(M.C.)
Name of Urban Agglomeration
5,979,495 3,632,222 2,347,273 65.24 70.67 58.31 l. Calcutta U.A. 209,038 129,538 79,500 57.21 63.37 49.39 2. Asansol U.A. 140,370 84,331 56,039 59.75 67.60 50.86 3. Kharagpur U.A. 76,525 44,130 32,395 59.03 67.23 50.61 4. Nabadwip U.A. 90,105 49,614 40,491 70.47 76.07 64.65 5. Habra U.A. 51,197 34,649 16,548 42.91 49.94 33.14 6. Raniganj U.A. 74,733 42,848 31,885 66.41 72.27 59.89 7. Balurghat U.A. 43,216 30,374 12,842 39.78 48.22 28.13 8. Ondal U.A. 65,282 36,144 29,138 65.18 70.84 59.31 9. Baharampur U. A.
33

TABLE-V-PROVISIONAL POPULATION TOTALS
(1981 CENSUS)
India/State/Union Total Population 1981 Total Literates 1981
J_ _____ ---, ,-
Territories Persons Males Females Persons Males Females
2 3 4 5 6 7
INDIA 683,810,051 353,347,249 330,462,802 37,991,932 158,837,215 79,154,717
STATES
1. Andhra Pradesh 53,403,619 27,035,531 26,368,088 15,989,266 10,578,388 5,410,878 2. Assam* 19,902.826 10,472,712 9,430,114 3. Bihar 69,823,154 35,865,467 33,957,687 18,163,410 13,551,736 4,611,674 4. Gujarat 33,960,905 17,484,540 16,476,365 14,858,075 9,534,470 5,323,605 5. Haryana 12,850,902 6,846,153 6,004,749 4,605,649 3,271,047 1,334,602 6. Himachal Pradesh 4,237,569 2,131,312 2,106,257 1,777,201 1,1l5,973 661,228 7. Jammu & Kashmir* 5,981,600 3,062,200 2,919,400 8. Kamataka 37,043,451 18,869,494 18,173,957 14,228,947 9,171,677 5,057,270 9. Kerala 25,403,217 12,487,961 12,915,256 17,571,819 9,244,609 8,327,210
10. Madhya Pradesh 52,131,717 26,856,752 25,274,965 14,502,063 10,574,919 3,927,144 11. M aharashtra 62,693,898 32,341,115 30,352,783 29,695,721 19,046,963 10,648,758 12. Manipur 1,433,691 727,108 706,583 601,943 385,123 216,820 13. Meghalaya 1,327,874 678,883 648,991 441,077 251,056 190,021 14. Nagaland 773,281 414,231 359,050 324,700 203,643 121,057 15. Orissa 26,272,054 13,253,523 I3,018,531 8,964,625 6,216,037 2,748,588 16. Punjab 16,669,755 8,840,234 7,829,521 6,791,547 4,118,415 2,673,132 17. Rajasthan 34,102,912 17,749,282 16,353,630 8,201,615 6,350,945 1,850,670 18. Sikkim 315,682 171,959 143,723 106,780 75,066 31,714
19. Tamil Nadu 48,297,456 24,420,228 23,877,228 22,111,593 13,965,132 8,146,461 20. Tripura 2,060,189 1,057,714 1,002,475 856,688 539,932 316,756 21. Uttar Pradesh 110,858,019 58,780,640 52,077,379 30,358,013 22,845,887 7,512,126 22. West Bengal 54,485,560 28,505,151 25,980,409 22,271,867 14,391,808 7,880,059
Union Territories
1. A & N Islands 188,254 106,889 81,365 96,520 62,470 34,050 2. Arunachal Pradesh 628,050 335,941 292,109 126,185 94,002 32,183 3. Chandigarh 450,061 254,208 195,853 291,091 174,953 116,138 4. D & N. Have1i 103,677 52,514 51,163 27,578 19,007 8,571 5. Delhi 6,196,414 3,422,550 2,773,864 3,783,611 2,325,804 1,457,807 6. Goa, Daman & Diu 1,082,117 546,260 535,857 604,489 353,832 250,657
7. Lakshadweep 40,237 20,367 19,870 22,018 13,233 8,785
8. Mizoram 487,774 251,988 235,786 290,241 166,296 123,945 9. Pondicherry 604,136 304,342 299,794 327,600 194,792 132,808
*Projected figures
34