Engaging with student writing & providing meaningful feedback
Upload
khangminh22Category
view
1download
0
The Benefits of Knowledge: Short-term Effects of
Providing Information About Mortality Risks to Mature
Adults in Malawi
Hans-Peter Kohler Alberto Ciancio Iliana V. Kohler Adeline Delavande
September 29, 2017
Abstract
Survival and disease perceptions (SDPs) are an understudied but potentially important andmodifiable determinant of mental health, health behaviors and other life-cycle decisions in sub-Saharan Africa (SSA). This project is the first study, for both high-income and low-income con-texts, to provide RCT-based evidence about the updating of SDPs after a health-informationintervention targeted towards reducing misperceptions about mortality risks, including dif-ferences in updating by cognitive skills. Preliminary findings, to be expanded in our finalanalyses, indicate that respondents revised upward their own survival probability, particularlyover the long term (10 year); but they did not revise their expectations to match the presentedprobabilities that reflect objective population-level mortality risks. Respondents also reviseupward the survival probabilities of healthy individuals in their context and individuals usingART, while they revise downward the survival probability of those sick with AIDS, reflectinga strong awareness of the efficacy of the ART treatment.
*** Extended Abstract for 2018 PAA Submission—Do Not Circulate Without Permission ***
1 Introduction
Recent improvements in adult life expectancies in high HIV-prevalence sub-Saharan African (SSA)
low-income countries (LICs) have reversed previous adverse trends in adult survival during the
1990s and early 2000s when the HIV/AIDS epidemic considerably reduced life expectancies (Fig-
ure 1A).1–15 Despite these improvements, there is widespread evidence that currently many indi-
viduals have distorted survival and disease perceptions (SDPs) and are overly pessimistic about
their own survival and disease environment.16–21 For example, mature adults in the Malawi Lon-
gitudinal Study of Families and Health (MLSFH) report subjective probabilities of surviving for
the next 5 years of about 46–58%, compared to 83–87% suggested by current life-tables.22 This im-
plies that rural Malawians underestimate their chances to survive five years by 33–45% (Figure 1B),
which is consistent with considerable overestimation of local HIV prevalence and morbidity.16,21
Yet, there is evidence—in part based on research from members of this research team—that sur-
vival expectations affect mental health19,23 and influence a wide range of behaviors, including sex-
ual behavior,18 labor supply and output,19 human capital investment,20,24,25 retirement, bequests
and preparations for old-age,26–31 and fertility.32 However, to date there is only limited informa-
tion about whether more accurate SDPs, and better knowledge about recent gains in health and
1

(A) 10-year survival probability (males, Malawi) (B) MLSFH Subjective 5-year survival probabilities
1970 1980 1990 2000 2010 2020
0.75
0.80
0.85
0.90
10 y
ear
surv
ival
from
age
35,
45
and
55 From age 35
From age 45
From age 55
0.0
0.2
0.4
0.6
0.8
1.0
5−ye
ar p
roba
bilit
y of
dyi
ng
2006 2008 2010 2012 2013 2017
0.0
0.2
0.4
0.6
0.8
1.0
0.0
0.2
0.4
0.6
0.8
1.0
0.0
0.2
0.4
0.6
0.8
1.0
0.0
0.2
0.4
0.6
0.8
1.0
0.0
0.2
0.4
0.6
0.8
1.0
0.0
0.2
0.4
0.6
0.8
1.0
Life−table 5−year survival probability
MLSFH mature adults subjective5−year survival probs
Figure 1: 10-year survival probabilities 1970–2020 (Malawi), and subjective prob. of surviving
5 years for MLSFH mature adultsNotes: Panel A: Based on 2012 UN Word Population Prospects. 22,37 Panel B: For MLSFH mature adults (aged 45+ in 2012) who partic-ipated in the 2012/13 MLSFH rounds. The boxplot-like graph displays the mean (dot) and median (center line) of the corresponding5-year survival expectations, as well as the 10th (lower whisker), 25th (bottom of box), 75th (top of box), and 90th (upper whisker)percentiles of the distribution. 16,38 Life-table survival probabilities are merged by age and gender from the UN Malawi 2005–15 lifeta-bles. 22
survival, have the potential to improve individuals’ decision-making, health and economic out-
comes in SSA. Recent MLSFH and other publications on the effects of subjective survival probabil-
ities on sexual risk taking, mental health and labor supply clearly suggest this possibility,17–20,33–36
and for example, our policy simulations suggest that interventions that provide information about
mortality risks are not only effective for reducing HIV incidence, but are more effective than inter-
ventions informing about HIV transmission risks.18
This paper provides evidence from a recent population-based randomized controlled trial
(RCT) that provided mature adults (= persons aged 45+) with information about population-level
mortality through an interactive information session. Our analyses focus on pre-intervention per-
ceptions of mortality risk, and short-term updating of mortality reception in response to new age-
and gender-specific (accurate) information about mortality risk. We report results from our ex-
ploratory research on how to effectively convey evidence-based information about recent mortal-
ity levels and trends to mature adults to increase the accuracy of survival and disease perceptions
(SDPs), and we investigate the extent to which updating of mortality receptions depends on cogni-
tive abilities and health condition. We particularly explore if individuals’ information about their
health, such as knowledge about specific health problems, diseases and/or HIV status, affects
pre-intervention mortality perceptions as well as the updating of mortality risk after information
about population-level mortality risk has been provided.
2 Background
2.1 Distorted survival and disease perceptions (SDPs)
Recent mortality change in high HIV-prevalence SSA LICs has been dramatic. In Malawi, adult
life expectancy (LE at age 20) was a “roller-coaster” due to the AIDS epidemic: after increasing to
2

Table 1: Association of distorted SDPs with depression and anxiety in MLSFH
OLS Regressions Depression AnxietyScore (’12) Score (’12)
M1: Survival misperception (2012) 2.03∗∗ 1.15∗∗
(4.45) (3.88)
M2: Survival misperception (2010) 1.34∗∗ 0.69∗
(2.86) (2.18)
M3: Survival misperception (2012) 2.63∗∗ 1.44∗∗
(5.55) (4.67)Surv. mispercept. × low cognit. ability -2.48∗ -1.28∗
(-2.47) (-2.01)
Regression of 2012 PHQ-9 depression and GAD-7 anxiety scores amongMLSFH mature adults on survival misperceptions (measured in 2012 or 2010),age, age2, female. M3 additionally includes an interaction between survivalmisperceptions and a dummy for low cognitive ability. ∗ p < 0.05, ∗∗ p < 0.01.Survival misperception is a respondent’s underestimation of his/her 5-yearsurvival probability, measured in either 2010 or 2012 (see Fig. 1B). Low cog-nitive ability indicates that a respondent is in the bottom quartile of the overallMLSFH cognitive score distribution.43 Key findings: Misperceptions of survival(= underestimation of survival chances) by respondents are associated withhigher 2012 depression and anxiety levels; association persists even if survivalmisperceptions are measured 2 years prior to the outcomes. And while a lowoverall cognitive score is associated with a about 3 percentage point highersurvival misperception (coef not shown), a low cognitive ability reduces theassociation between survival misperception and depression/anxiety. This isconsistent with an interpretation that individuals with low cognitive functionhave more distorted SDPs, possibly due to limitations in social learning, butat the same time, are less affected in terms of depression or anxiety by suchdistorted SDPs. Similar associations exists in the U.S. HRS data.44
44.1 years in 1986, it declined to 36.9 in 2002 (-7.2 years or -16%), and increased to 42.6 in 2010.22
10-year survival probabilities for adults changed immensely (Figure 1A): 35-year old males at-
tained a 10-year survival probability of 91% in 1986, which dropped below 77% in 2002, having
recovered to 85% by 2010. This trend is shared with other SSA LICs with high HIV prevalence.22
And while reductions in multiple diseases have contributed to declining infant mortality and in-
creasing adult life expectancy,6,39 it is the widespread roll-out of ART that is widely credited with
reversing the decline of adult survival rates during the last decade.2,3,13,40–42 For example, stud-
ies from the Karonga HDSS (near one of the MLSFH study sites) have shown 42% declines in
adult mortality rates (ages 15–59) subsequent to the introduction of ART, including 52% declines
at ages 30–44 and 34% declines for mature adults aged 45–59.3,40,41 Post-ART mortality declines
of similar magnitudes have also occurred among the household and family members of MLSFH
respondents,42 along with significant post-ART improvements in health among MLSFH respon-
dents (independent of HIV status) and their household/family members.19,42
Despite these gains in survival, however, there is widespread evidence that Malawians (and
adults in other SSA LICs) have distorted SDPs that are associated with depression and anxiety
(Table 1), causally affect mental health (Section 2.2), and importantly influence HIV risk-taking
and life-cycle decision-making (Section 2.2). Rural Malawians have been shown to overestimate
their own probability of being HIV+, the HIV prevalence in their local communities, and they
3

Figure 2: Antiretroviral treatment (ART), SDPs and life-cycle behaviors: Total savings (USD) in
the general population, 2006–2010, by distance to ART
05
01
00
15
0To
tal sa
vin
gs (
US
D)
2006 2008 2010ART begins
Year
Near (< 6km)
Far (> 12km)
Middle
2008: ART arrives in MLSFH study
regions
ART became available in MLSFH regions in 2008. Respondents closer to ART clinicsand thus improved access to ART—including HIV– individuals who do not directlybenefit from the treatment—have been shown to update (= revise downward) theirperceptions about adult mortality. Reductions in subjective mortality risks wereassociated with consistent changes in life-cycle behaviors, including increased la-bor supplies, higher savings (shown in figure above), and increased investments inhuman capital.19,20
are inadequately aware about recent declines in HIV prevalence and incidence.45,46 They also
substantially underestimate survival probabilities (Figure 1B), an aspect that can be particularly
well-documented with our MLSFH longitudinal information on probabilistic expectations (i.e.,
expectations that can be interpreted as probabilities).16–20,33–35 E.g., while the life-table 5-year sur-
vival probability declined slightly during 2006–13 from .87 to .83 (-4.5%) due to the respondents
getting older, the subjective median 5-year survival probability reported by MLSFH mature adults
declined markedly from 58% (2006) to 46% in 2013 (-21%). In a period when adult survival was
improving significantly (Figure 1A), MLSFH mature adults therefore became increasingly more
pessimistic about their survival (Figure 1B), much more than is justified due to the respondents’
own aging. As a result, the underestimation of survival probabilities increased from 33% in 2006 to
45% in 2013.
There is evidence based on the MLSFH and related studies that respondents’ SDPs change
in response to new health information or changes in the local disease environment (e.g., access to
ART).16–19,47,48 For example, MLSFH respondents who received improved access to ART in 2008—
including HIV– individuals who do not directly benefit from the treatment—have been shown
to update (= revise downward) their perceptions about adult mortality.19,20 Exploiting random
variation in MLSFH HIV testing procedures, we have also shown that providing information
to individuals about their HIV status results in corresponding updates of subjective mortality
risks and related SDPs,17,18,35 and preliminary analyses of small-scale variation in infant mortal-
ity indicate that subjective survival expectations and related SDPs are updated in response to
local mortality events and mortality conditions.49 Overall, however, the updating of SDPs among
4

MLSFH respondents was not sufficient during the rapidly changing mortality and disease context
of Malawi in recent years. There is consistent evidence that that adult rural Malawians—as well
as adults in other SSA countries—have significantly distorted SDPs: they substantially underesti-
mate their survival chances (Figure 1B),16,19 overestimate local HIV prevalence,21 and their SDPs do
not adequately reflect the recent significant gains in adult survival (Figure 1B). This persistence of
distorted SDPs is not surprising. Mortality change has been rapid and non-monotonic, and indi-
viduals don’t have access to reliable information about local health and mortality trends.21,48,50–54
Individuals generally rely on social learning and heuristics, which are often biased by giving too
much weight to the events in the numerator (deaths) and underestimating the population at risk
(exposure) (salience bias), and SDPs often reflect averages of current and past realities.55–59 In
addition, HIV/AIDS prevention programs have often emphasized the dire consequences of HIV
infection and promoted “fears” about HIV, thereby contributing to distorted SDPs.21,60–67 In the
2017 MLSFH mature adults survey, we finally observe an increase in survival expectations (Fig-
ure 1B). It is possible that, with some delay, respondents have come to realize the benefits of ART
and the advances in health services in Malawi. However, there is still a considerable gap with the
actual survival probabilities. It is yet to be seen, if we are going to see convergence in the next
years.
2.2 SDPs, health and life-cycle behaviors
Understanding individuals’ perceptions about their disease environment is critical because dis-
torted SDPs are an important, and potentially modifiable, determinant of mental health, health behaviors
and other life-cycle decisions in SSA LICs. For example: our analyses in Kohler et al. 68 show that
depression and anxiety among mature MLSFH respondents are significantly associated with pes-
simistic subjective survival probabilities and HIV-related SDPs, as well as socioeconomic shocks
(e.g., household-level morbidity/mortality) on which such SDPs are based. Delavande & Kohler 18
document that survival expectations play an important causal role in health behaviors, and sub-
jective expectations about mortality risk, but not the risk of living with HIV, are found to be an
important determinant of the decision to have multiple sexual partners. Baranov et al. 19 and Bara-
nov & Kohler 20 find that the widespread ART roll-out had profound influences on the HIV– pop-
ulation by reducing perceived mortality risks and uncertainty, and that as a consequence of these
changed perceptions, ART seems to have affected mental health and important life-cycle behav-
iors in the general population: Respondents closer to ART clinics and improved access to ART—
including HIV– individuals who do not directly benefit from the treatment—have been shown to
update (= revise downward) their perceptions about adult mortality. These reductions in subjec-
tive mortality risks have causally and significantly contributed to improvements in mental health:
for respondents residing within 3km of an ART clinic, ART availability after 2008 increased their
SF12 mental health score by 0.32 standard deviations or 69% of the pre-ART difference between
HIV– and HIV+ respondents. Moreover, besides affecting mental health, reductions in subjec-
tive mortality risks were associated with consistent changes in life-cycle behaviors, including in-
creased labor supplies, higher savings (shown in Figure 2), and increased investments in human
capital.19,20
5

Delavande & Kohler 18 also simulate the impact of a health-information intervention provid-
ing information on the mortality risk of someone healthy and of someone infected with HIV, that
is, an intervention similar to the type of information campaign we propose in this project. Our
analyses show that such a campaign reduces the probabilities of risky sex and decreases the aver-
age probability of having multiple partners. This evidence for Malawi is consistent with related
findings from contexts without generalized HIV epidemics. For instance, several studies from
high-income contexts have shown that survival expectations directly influence retirement behav-
ior, consumption and bequest of older adults.26–31 In both high- and middle/low-income contexts,
studies have also documented that reductions in, or better knowledge of, mortality risks affects
human capital investments and fertility.24,25,32
2.3 Eliciting subjective expectations in developing countries
Central to this research is our ability to measure subjective mortality risks and related SDPs in a
SSA LIC. Delavande and Kohler have been among the pioneers of developing adequate survey
instruments for this purpose,16 inspired by research from high-income contexts,69 and there has
been a growing recent literature on this topic (reviewed by Delavande36,70). The dominant con-
clusion of this literature is that respondents are willing to provide expectations in probabilistic
formats (often with visual aids, such as those developed for the MLSFH16), that response rates
are typically very high, that the vast majority of respondents respect basic properties of proba-
bilities, that expectations vary with characteristics in the same way, at least qualitatively, as ac-
tual outcomes vary with those characteristics, that past outcomes experienced by individuals are
correlated with expectations about future outcomes, and that the elicited expectations influence
behavior in various domains including health, education, agricultural production and migration.
2.4 Information interventions, health and life-cycle behaviors
Information interventions have been successfully implemented in various contexts to provide
decision-relevant information to individuals who may either lack respective knowledge and/or
have biased perceptions about decision-relevant facts. Recent studies show that providing infor-
mation to students on the returns to education and financial aid has positive effects on effort,
schooling outcomes, and applications to university.71–77 The Poverty Action Lab (JPAL) lists in-
terventions providing information about the returns to schooling among the most cost-effective
ways to increase human capital in LICs.78 Large effects of information interventions have also
been documented with respect to health inputs and outcomes. Studies have shown that provid-
ing information on the relative risk of HIV infection by partner’s age leads to decreases in teen
pregnancy (an proxy for the incidence of unprotected sex),79 that information about HIV status
influences subsequent sexual behavior and marriage transitions,17,33–35,80 and that circumcision
uptake is affected by information about the reductions in HIV risk resulting from male circumci-
sion.81,82 More generally, information-based public health campaigns have successfully influenced
health behaviors in many important domains (e.g., smoking, blood pressure control, cholesterol
consumption, condom use), but not all.83
6

2.5 Mature adults—an important population for studying SDPs
Besides the ability to leverage recently-funded data collection for MLSFH mature adults, our focus
on mature adults (= individuals aged 45+) is substantively justified. First, mature adults are an
essential subpopulation in SSA LICs because of their growing demographic relevance,37,84 their
almost universal labor force participation with virtually no “retirement”,85 their important contri-
butions to intergenerational transfers,86,87 and their pivotal caretaking roles in families affected
by HIV/AIDS.88,89 Second, among mature adults, the (actual) mortality risks in contexts such
as Malawi continue to be relatively high,90 and as a result, SDPs are arguably more important
for life-course decision-making and well-being than at younger ages. Third, the SDPs of mature
adults have been importantly formed by the rise and more recent ebbing of the AIDS epidemic
and AIDS mortality,91 while AIDS-mortality constitutes only a small fraction of the overall mortal-
ity risk among mature adults given the (still) fairly low HIV prevalence among mature adults.38,90
Fourth, Kohler et al. 68 have also shown that depression and anxiety are fairly widespread among
MLSFH mature adults, that both are related to pessimistic SDPs, and that both are associated with
adverse outcomes such as less nutritional intakes and reduced work efforts.
3 Malawi Longitudinal Study of Families and Health (MLSFH)
Our analyses are based on the Malawi Longitudinal Study of Families and Health (MLSFH). The
MLSFH is one of very few long-standing publicly-available cohort studies in a SSA LICs context
with currently nine data collection rounds during 1998–2017 for up to 4,000 individuals. It has been
the basis of more then 230 publications and working papers,92 and it provides a unique resource
for research on SDPs. The MLSFH cohorts were selected in 1998 (with important additions in 2004
and 2008) to represent the rural population. A Cohort Profile, providing information on sampling
procedures, analyses of attrition, survey methods and instruments has been published in the Int.
J. of Epidemiology.38 HIV/AIDS is widespread in Malawi,45 and access to ART—reaching 67% cov-
erage in 2010—is expanding.19 Yet, despite the magnitude of the epidemic, the vast majority of
the population—more than 85% of adults aged 15–49, and higher among adults aged 50+90,93—is
HIV negative. Life expectancy at birth was 51 for men and 55 for women in 2010, and healthy
life expectancy was 7–8 years less.12 Mortality levels among MLSFH respondents, including their
recent reversal, correspond to those of the overall population.42,90,94–96 Prospective longitudinal
data in the MLSFH 1998–2013 include household structure and family change, human capital,
social capital, sexual behaviors, subjective expectations and well-being, and household produc-
tion and consumption. The study has included probabilistic expectations—i.e., expectations that
can be interpreted as probabilities—and related SDPs for HIV and health-related outcomes since
2006 (Table 2). Data also include spouse linkages (updated at each round), parent-children link-
ages, and longitudinal linkages of children listed on the family/household roster. HIV testing and
counseling has been done repeatedly since 2004.
7

Table 2: Selected measures on SDPs, health and life-cycle behaviors available for MLSFH ma-
ture adults
Construct Definition Measurement/Scales/Items Source
(1) Survival and Dis-ease Perceptions(SDPs)
Subjective probabilistic expectations (since2006), using an elicitation method developedfor the MLSFH, 16–18 including about mor-tality/survival, own HIV infection, local HIVprevalence, and local AIDS-related morbidity
(2) Mental heath, de-pression and anxiety
Depression and anxiety modules of the PHQ(since 2012); 38 SF12 mental health score 97 andsubjective well-being 98 (since 2006)
(3) Health behaviorsand other life-cyclebehaviors(all MLSFH waves)
Sexual behaviors, work efforts and otherincome-generating activities, health expendi-tures, savings, human capital investments (in-cluding for children), financial and non-financialtransfers, alcohol and tobacco consumption
(4) Cognitive function Spatial/temporal orientation; 99 visual & con-structional tests; 100 memory, recall and executivefunctioning 43 (all since 2012)
(5) Physical health(since 2006, and de-tailed, since 2012)
Activities of daily living and functional limita-tions; 101 grip strength; 102 height, weight andBMI; 103 blood pressure; 104 HIV status 105
(6) Other Extensive information on household composi-tion, socioeconomic context and shocks, socialand human capital using the respective MLSFHmodules (see Cohort Profile, 38 Table 4).
3.1 Study population: MLSFH mature adults with 2012–13 and 2017 surveys
Our study population consists of all MLSFH mature adults, that is, all MLSFH respondents aged
45 and older. Most of these respondents participated in the 2012 (N = 1, 266) and 2013 (N = 1, 257)
MLSFH mature adult surveys, and MLSFH respondents who reached age 45 by 2017 were addi-
tionally enrolled (N ≈ 500). In total, N2017 = 1, 820. Extensive longitudinal data are available for
these mature adults: E.g., 65% of 2012 respondents participated in four or more pre-2012 MLSFH
rounds, and 40% in all six pre-2012 rounds.38 Most important for this project, the 2012 and 2013
MLSFH (i) continued the collection of detailed data on subjective mortality expectations and re-
lated SDPs, (ii) developed, validated and collected scales providing an extensive assessments of
mental health and cognitive function (with more limited data available in the MLSFH since 2006),
and (iii) continued to collect a rich set of MLSFH measures on health outcomes, health inputs and
other life-cycle behaviors (Table 2). An additional 2017 mature adult survey using the measures
in Table 2 has been collected as part of a recently-awarded project on non-communicable diseases,
including (i) an expansion of the mature adult sample to all respondents reaching age 45 by 2017
and (ii) a migration follow-up—using established MLSFH procedures—of all mature adults who
have migrated since the 2008 survey.106–108
3.2 Benefits-of-Knowledge Health-information Intervention
To investigate questions about the causal impacts of health information on (i) SDPs, (ii) men-
tal health and health behaviors, and (iii) labor supply, savings, intergenerational transfers and
other life-cycle behaviors, the MLSFH implemented in 2017 a Benefits-of-Knowledge (BenKnow)
Health-information Intervention. The BenKnow health-information intervention has random-
ized 50% of the study population (900+ individuals in 65+ villages) in a treatment group that
8

received detailed information about recent mortality trends, current survival probabilities and life
expectancy/modal age at death. Randomization was at the village-level for logistical reasons and
to avoid spill-over effects. The health-information intervention was implemented in 2017 subse-
quent to the MLSFH survey (Section 3.1). A well-trained survey team returned to MLSFH mature
adults surveyed in 2017 and residing in treatment villages. The survey team had the 2017-elicited
mortality perceptions and other SDPs for each respondent. Respondents in treatment villages
then received information about recent health and mortality trends and their individual-specific
5-year and 10-year survival probabilities.
Specifically, after reviewing a respondent’s answer in the MLSFH mature adults survey about
SDPs, interviewers asked whether respondents noticed that people live longer and how they
noticed. Interviewers then provided information on mortality trends and survival probabilities.
First, respondents were shown three videos where local people talk about how they noticed that
people are more healthy and live longer nowadays in rural Malawi. The actors are mature adults
chosen from villages similar to those of the respondents. The first video depicts a carpenter in his
workshop, the second a woman with a sewing machine and the third an old man sitting in front
of his house. After the videos, interviewers presented an information sheet with information on
5-year and 10-year survival probabilities for individuals the same age and gender of the respon-
dent based on recent estimates for Malawi (Figure 3); health-information sheet for all age groups
is included in the Appendix). Given the low level of education of the respondents, an innova-
tive technique was used to translate the mathematical survival probabilities in understandable
figures. The sheet first shows 10 men-like figures colored in blue that represent 10 persons, the
same age and sex of the respondents that are alive today. The second figure has again 10 men but
now some are colored in red. The probability of dying in 5-years from now is represented by how
many men-like figures are colored blue out of 10 and the survival probability is represented by
how many men-like figures are colored blue out of 10. The third figure represented the 10-year
survival probabilities with the same technique.
In the last section of the questionnaire, we asked several questions to verify whether respon-
dents understood the information we provided and to see if they updated their expectations. In
particular, we asked again their 5 and 10 years subjective survival probabilities and the reason
why they decided to change or not change their answer with respect to their answer in the mature
adults survey. Finally, we asked the 5-year survival probabilities for individuals their same age
and sex with and without HIV, with and without AIDS and with ART treatment. These expecta-
tions can be then compared to the expectations elicited in the mature adults surveys which asked
the same question.
Tablets with Redcap software was used to administer the survey and to show the videos. The
appendix provides the heath-information sheets provided to respondents (figure 3), the video
scripts as well as the questionnaire guide that was used by interviewers.
In the MLSFH mature adults survey, 1,572 respondents completed the survey of whom 787
were in the treatment group and were therefore eligible to be interviewed by the intervention
team. The response rate for the intervention was more than 98% with 778 respondents that com-
pleted the intervention survey.
To have a better understanding of whether the information we provided was comprehensible
9

Figure 3: Benefits-of-Knowledge Health-information Intervention: Health information sheet
providing life-table-based information about 5-year and 10-year mortality probabilities for a
woman aged 60-64 years old (see Appendix for all ages)
10 persons your age and sex alive today
Approximately 1 person will have DIED
Pafupifupi munthu mmodzi adzakhala ATAMWALIRAApproximately 9 persons will still be ALIVE
Pafupifupi anthu 9 adzakhala akadali MOYO
Between 2 to 3 persons will have DIED
Pakati pa anthu awiri kapena atatu adzakhala ATAMWALIRA
About 7 to 8 persons will still be ALIVE
Pakati pa anthu 7 kapena 8 adzakhala akadali MOYO
Today/Lero
Woman Aged 60 to 64 Years Old
5 Years from today/Zaka 5 kuchokera lero
10 Years from today/Zaka 10 kuchokera lero
Anthu 10 aakazi ndipo a zaka ngati inu amene alimoyo lero
Mkazi wa zaka zapakati pa 60 ndi 64 zakubadwa
and credible, we conducted a separate cognitive survey where we interview 35 people outside of
our MLSFH sample but with similar characteristics in terms of age and rural context. With a more
extensive survey, we tried to understand how people form their expectations and how they think
about increase in life expectancy and what does it mean to live longer. The interview included as
well the expectations questions and the mortality information intervention.
10

Figure 4: 5-year and 10-year survival probabilities prior to health-information intervention:
Treatment vs. control group
Pre-Intervention 5-year Survival Probabilities
0.0
0.2
0.4
0.6
0.8
1.0
5−ye
ar s
urvi
val p
roba
bilit
y
Treatment vs Control
treatment control
0.0
0.2
0.4
0.6
0.8
1.0
0.0
0.2
0.4
0.6
0.8
1.0
Pre-Intervention 10-year Survival Probabilities
0.0
0.2
0.4
0.6
0.8
1.0
10−
year
sur
viva
l pro
babi
lity
treatment control
0.0
0.2
0.4
0.6
0.8
1.0
0.0
0.2
0.4
0.6
0.8
1.0
Notes: This boxplot-like graph displays the mean and median of thereported expectations, as well as the 10th, 25th, 75th, and 90th percentilesof the distribution (see also Appendix Figure A.1).
4 Results
4.1 Pre-intervention mortality risks
The MLSFH adults survey collected data on expectations about own survival and survival of dif-
ferent categories of persons. Findings from previous rounds of the MLSFH surveys showed that
individuals underestimate their survival probabilities. Figure 4 shows the results for treatment
and control group in the 2017 MLSFH adults survey. As expected, the distribution in survival
probabilities between treatment and control group are very similar and suggest the randomiza-
tion was properly implemented. This boxplot-like graph displays the mean and median of the
reported expectations, as well as the 10th, 25th, 75th, and 90th percentiles of the distribution (see
also Appendix Figure A.1). The median and percentiles of the distribution of subjective probabil-
ities are calculated assuming a uniform distribution of the underlying subjective probabilities Pi
within each 10 percentage point interval centered around the number of peanuts divided by 10.
11

The mid-point of each interval is used in calculations of the average (implied) subjective probabil-
ity.1.
The median survival probability in 5 years is 70% which is greater than in previous surveys
but well below the life-table 5-year survival probability. The improvement with respect to the pre-
vious years reflects that respondents are realizing that people live longer but they are still very far
from the average survival probability. The median survival probability in 10 years is 40% which
is also substantially lower than the life-table 10-year survival probability. In line with these find-
ings, 45% of the respondents noticed people living longer with most of them observing that AIDS
treatment has become available nearby and health services have improved. When asked about in-
dividuals with different characteristics, respondents ranked their survival probability in the way
we expected. The median 5-year survival probability for healthy individuals is 70% which goes
down to 60% for HIV positive individuals and 50% for individuals sick with AIDS and bounce
back to 60% for those treated with ART (results for treatment group in Figure 5a).
4.2 Exploratory results from cognitive interviews
Results from the cognitive interviews showed that respondents report back that the information
is credible and useful and that they understand it. Respondents reported that they talk with
relatives, friends and people in the same village about how people tend to live longer nowadays.
They also realize the progress in fighting HIV in the country. Quoting one of the respondents:
people "can live long once they get tested and start taking ART and taking care of themselves by
not having sex carelessly". In general, there is a strong trust in the ability of ART to limit the effects
of AIDS and actually even an overestimation of the power of the treatment as if ART was sort of
miraculous. Respondents tend to relate to the videos and acknowledge the benefits of ART, the
progress in kids immunization, the improvements in food security and health services but they
also sometimes note that the situation in their village is worst than the one presented in the videos.
When thinking about what does it mean to live longer, respondents mention savings, sex behavior
and food habits. These findings are very promising for the investigation of updates in beliefs and
for future surveys, when we will measure the effects of the intervention on individual behaviors.
4.3 Updating of mortality perceptions after BenKnow health-information interven-
tion
The results show that 56% of respondents revised at least one belief about their own survival
probability upward while 21% of respondents revised at least one belief downward. 40% updated
in the right direction, while 20% updated in the wrong direction. Looking at the 5-year and 10-
year separately, we note that the change toward more optimistic beliefs is mostly focused on the
10-year probabilities (Figure 6).
In the survey, we asked why respondents decided to update or not update their beliefs. Re-
spondents that did not revise beliefs explained that they understood the information but they
1This midpoint of the interval is equal to the number of peanutes, X, divided by 10, except for 0 beans, where themidpoint is .025, and 10 beans, where the midpoint is .0975
12

0.0 0.2 0.4 0.6 0.8 1.0
10−year survival probability5−year S
urvival Probability P
re−Intervention
healthyhiv
aidsart
0.0 0.2 0.4 0.6 0.8 1.00.0 0.2 0.4 0.6 0.8 1.00.0 0.2 0.4 0.6 0.8 1.00.0 0.2 0.4 0.6 0.8 1.0
(a)
Pre
Inte
rve
ntio
n
0.0 0.2 0.4 0.6 0.8 1.0
10−year survival probability
5−year Survival P
robability Post−Intervention
healthyhiv
aidsart
0.0 0.2 0.4 0.6 0.8 1.00.0 0.2 0.4 0.6 0.8 1.00.0 0.2 0.4 0.6 0.8 1.00.0 0.2 0.4 0.6 0.8 1.0
(b)
Po
stIn
terv
en
tion
Fig
ure
5:
Su
rviv
al
Pro
bab
ilities
of
Ind
ivid
uals
with
Diffe
ren
tH
ealth
Sta
tus
13

Figure 6: Update in survival probabilities in response to BenKnow health-information inter-
vention
0.0
0.2
0.4
0.6
0.8
1.0
5−ye
ar s
urvi
val p
roba
bilit
y
Update in survival probability
5y pre 5y post 10y pre 10y post
0.0
0.2
0.4
0.6
0.8
1.0
0.0
0.2
0.4
0.6
0.8
1.0
0.0
0.2
0.4
0.6
0.8
1.0
0.0
0.2
0.4
0.6
0.8
1.0
think nobody can predict their own mortality. Respondents who revised their beliefs said that
they believed the information and that it was very convincing.
The beliefs distribution about 5-year survival probability for healthy individuals shifted up-
ward after the intervention (Figure 5b). The beliefs distribution for individuals affected with HIV
did not significantly change after the intervention, while, interestingly, the beliefs distribution for
individuals sick with AIDS shifted downward. Therefore, respondents are more pessimistic about
the survival chances of an individual sick with AIDS. However, respondents are more optimistic
than in the past regarding individuals sick with AIDS treated with antiretroviral treatments (ART).
5 Additional analyses forthcoming by 2018 PAA
For the PAA 2018 Annual Meeting, we plan to extend our analysis in the following directions:
• Investigate whether health events such as deaths of relatives and friends affected the revi-
sions of mortality perceptions by determining a different reaction to the information pro-
vided. It is possible that individuals exposed to several deaths among friends and family
members were less likely to relate to the information provided.
• Using data on cognitive skills, try to separately identify the effects of the intervention on
mortality perceptions from the effects on the ability to elicit the expectations through the
beans method.
• Compare revision on own mortality and other individuals mortality to see if individuals that
do not revise their own mortality perceptions they understand the information but they do
not update because of private health information.
• Analyze how revisions of beliefs depends on local trends in health and mortality.
• Analyze how revisions of beliefs spatially correlate.
14

• Investigate how cognitive skills affect revisions of mortality perceptions. Cognitive skills
play an important role in forming expectations. Individuals with high cognitive skills may
be better able to process information from the changing environment to which they are ex-
posed and form their expectations more in line with facts At the same time, cognitive ability
may help to understand the information provided by the intervention. Finally, respondents
with higher cognitive skills may have a better understanding of what is an expectation and
a probability and their answers could be more representative of their own expectations and
have less measurement error.
• Investigate how physical and mental health affect revisions of mortality perceptions. Health
status has a clear impact on the probability of surviving. Respondents with particular bad
health conditions will correctly state a lower probability of surviving than the average. Be-
sides physical health, mental health also affects the survival expectations. We can then in-
corporate observable health characteristics in the analysis and see if they help explain the
heterogeneity in beliefs. Additionally, it is worth to explore the interaction between beliefs
updating and health characteristics.
6 Concluding Discussions
The 2017 Mature Adults survey and the 2017 BenKnow health-information intervention allow us
to investigate for the first time how individuals in a Sub-Saharian country form their expectations
on survival, and on how they update their beliefs once provided with information on mortality
trends in their context.
Individuals in Malawi seem to start recognizing that life expectancy rose in the past years even
though they are still overly pessimistic. The information intervention administered to a random-
ized sample of the Mature Adults survey was effective in updating the beliefs of the respondents
at least in the short term. Respondents revised upward their own survival probability particularly
over the long term (10 year). There was no anchoring to the information provided in the sense
that, even though they updated on average toward the survival probabilities presented by the
interviewers, they did not fully revise their expectations to match the presented probabilities that
reflect objective population-level mortality risks. Respondents also revise upward the survival
probabilities of healthy individuals in their context and individuals using ART. Interestingly, they
revise downward the survival probability of those sick with AIDS determining a strong difference
in the survival probability with respect to individuals using ART perhaps because they are fully
aware of the efficacy of the treatment and the negative effects of not using ART.
Future analysis will allow to determine the factors that lead to revising expectations by fully
exploiting the heterogeneity in individual characteristics and in the response to the intervention.
The results of this RCT will help us to understand whether and when a mortality information
campaign in sub-Saharian Africa could be an effective tool in changing mortality perceptions.
15
References
[1] Bongaarts JP, Pelletier F, Gerland P. Global trends in AIDS mortality. In International Hand-
books of Population, editors Rogers RG, Crimmins EM, New York: Springer, vol. 2, pp. 171–
183. 2011.
[2] Bor J, Herbst AJ, Newell ML, Bärnighausen T. Increases in adult life expectancy in rural
South Africa: Valuing the scale-up of HIV treatment. Science 2013; 339(6122):961–965.
[3] Floyd S, Marston M, Baisley K, Wringe A, Herbst K, Chihana M, et al. The effect of an-
tiretroviral therapy provision on all-cause, aids and non-aids mortality at the population
level—a comparative analysis of data from four settings in Southern and East Africa. Tropi-
cal Medicine & International Health 2012; 17(8):e84–e93.
[4] Jamison D, Jha P, Laxminarayan R, Ord T. Copenhagen consensus challenge pa-
per on “Infectious Disease”, 2012. Copenhagen Consensus Project 2012. http://www.
copenhagenconsensus.com.
[5] Jha P, Nugent R, Verguet S, Bloom D. Copenhagen consensus challenge paper on “Chronic
Disease”, 2012. Copenhagen Consensus Project 2012. http://www.copenhagenconsensus.
com.
[6] Lozano R, Naghavi M, Foreman K, Lim S, Shibuya K, Aboyans V, et al. Global and regional
mortality from 235 causes of death for 20 age groups in 1990 and 2010: a systematic analysis
for the global burden of disease study 2010. Lancet 2012; 380(9859):2095–2128.
[7] Msyamboza KP, Ngwira B, Dzowela T, Mvula C, Kathyola D, Harries AD, et al. The burden
of selected chronic non-communicable diseases and their risk factors in Malawi: Nationwide
STEPS survey. PLoS ONE 2011; 6(5):e20316–.
[8] Mwagomba B, Zachariah R, Massaquoi M, Misindi D, Manzi M, Mandere BC, et al. Mortal-
ity reduction associated with HIV/AIDS care and antiretroviral treatment in rural Malawi:
Evidence from registers, coffin sales and funerals. PLoS ONE 2010; 5(5):e10452.
[9] Ntsekhe M, Damasceno A. Recent advances in the epidemiology, outcome, and prevention
of myocardial infarction and stroke in sub-Saharan Africa. Heart 2013; .
[10] Ortblad KF, Lozano R, Murray CJ. The burden of hiv: insights from the global burden of
disease study 2010. [editorial]. AIDS 2013; 27(13):2003–2017.
[11] Reniers G, Masquelier B, Gerland P. Adult mortality in Africa. In International Handbooks of
Population, editors Rogers RG, Crimmins EM, New York: Springer Netherlands, vol. 2, pp.
151–170. 2011.
[12] Salomon JA, Wang H, Freeman MK, Vos T, Flaxman AD, Lopez AD, et al. Healthy life ex-
pectancy for 187 countries, 1990–2010: A systematic analysis for the Global Burden Disease
Study 2010. Lancet 2012; 380(9859):2144–2162.
16

[13] UNAIDS. Global Report: UNAIDS Report on the Global AIDS Epidemic. New York: World
Health Organization and UNAIDS, 2012. http://www.unaids.org/globalreport/.
[14] Wang H, Dwyer-Lindgren L, Lofgren KT, Rajaratnam JK, Marcus JR, Levin-Rector A, et al.
Age-specific and sex-specific mortality in 187 countries, 1970-2010: a systematic analysis for
the global burden of disease study 2010. Lancet 2012; 380(9859):2071–2094.
[15] World Bank. Malawi at a glance, 2013. World Bank Country Profile. http://devdata.
worldbank.org/AAG/mwi_aag.pdf.
[16] Delavande A, Kohler HP. Subjective expectations in the context of HIV/AIDS in Malawi.
Demographic Research 2009; 20(31):817–874.
[17] Delavande A, Kohler HP. The impact of HIV testing on subjective expectations and risky
behavior in Malawi. Demography 2012; 49(3):1011–1036.
[18] Delavande A, Kohler HP. HIV/AIDS-related expectations and risky behavior in Malawi.
Review of Economic Studies 2016; 83(1):118–164.
[19] Baranov V, Bennett D, Kohler HP. The indirect impact of antiretroviral therapy: Mortality
risk, mental health, and HIV-negative labor supply. Journal of Health Economics 2015; 44:195–
211.
[20] Baranov V, Kohler HP. The impact of AIDS treatment on savings and human capital invest-
ment in Malawi. American Economic Journal: Applied Economics forthcoming; Working paper
version available at http://repository.upenn.edu/psc_working_papers/55.
[21] Anglewicz P, Kohler HP. Overestimating HIV infection: The construction and accuracy
of subjective probabilities of HIV infection in rural Malawi. Demographic Research 2009;
20(6):65–96.
[22] UN Population Division. World Population Prospects, the 2012 revision: Standard (median)
forecasts, 2012. United Nations, Department of Economic and Social Affairs, Population
Division. http://esa.un.org/unpd/wpp/.
[23] Kohler IV, Payne CF, Bandawe C, Kohler HP. The demography of mental health among ma-
ture adults in a low-income high HIV-prevalence context, 2015. Popuation Studies Center,
Univeristy of Pennsylvania, PSC Working Paper Series, WPS 15-1. Revise and resubmit at
Demography. http://repository.upenn.edu/psc_working_papers/59/.
[24] Oster E, Shoulson I, Dorsey ER. Limited life expectancy, human capital and health invest-
ments. American Economic Review 2013; 103(5):1977–2002.
[25] Jayachandran S, Lleras-Muney A. Life expectancy and human capital investments: Evidence
from maternal mortality declines. Quarterly Journal of Economics 2009; 124(1):349–397.
[26] Hurd MD, Smith J, Zissimopoulos J. The effects of subjective survival on retirement and
social security claiming. Journal of Applied Econometrics 2004; 19:761–775.
17

[27] Delavande A, Perry M, Willis R. Probabilistic thinking and early social security claiming,
2006. Michigan Retirement Research Center Working Paper UM06-09.
[28] Khan M, Rutledge MS, Wu AY. How do subjective longevity expectations influence retire-
ment plans?, 2014. Center for Retirement REsearch at Boston College Working Paper CRR
WP 2014-1. http://www.ssrn.com/abstract=2376923.
[29] Gan L, Gong G, Hurd M, McFadden D. Subjective mortality risk and bequests. Journal of
Econometrics 2015; 188(2):514–525.
[30] Bloom DE, Canning D, Moore M, Song Y. The effect of subjective survival probabilities on
retirement and wealth in the United States. In Population Aging, Intergenerational Transfers
and the Macroeconomy, editors Clark R, Ogawa N, Mason A, Cheltenham, UK: Edward Elgar
Publishing, pp. 67–100. 2007. NBER Working Paper #12688.
[31] Salm M. Subjective mortality expectations and consumption and saving behaviours among
the elderly. Canadian Journal of Economics 2010; 43(3):1040–1057.
[32] Canning D, Günther I, Linnemayr S, Bloom D. Fertility choice, mortality expectations, and
interdependent preferences—an empirical analysis. European Economic Review 2013; 63:273–
289.
[33] Fedor TM, Kohler HP, Behrman JR. The impact of learning HIV status on marital stability
and sexual behavior within marriage in Malawi. Demography 2015; 52(1):259–280.
[34] De Paula A, Shapira G, Todd P. How beliefs about HIV status affect risky behaviors: Evi-
dence from Malawi. Journal of Applied Econometrics 2014; 29(6):944–964.
[35] Thornton RL. HIV testing, subjective beliefs and economic behavior. Journal of Development
Economics 2012; 99(2):300–313.
[36] Delavande A. Probabilistic expectations in developing countries. Annual Review of Economics
2014; 6(1):1–20.
[37] Kohler I, Kohler HP. Unpublished analyses of the lifetables and age specific mortality rates
for malawi in the 2012 un world population prospects, 2015. Available from authors upon
request. Based on Arriaga’s formula for the demposition of differences in life expectancies.
Data Source: UN Population Division, World Population Prospects, the 2012 Revision: Stan-
dard (Median) Forecasts. United Nations, Department of Economic and Social Affairs, Pop-
ulation Division. http://esa.un.org/unpd/wpp.
[38] Kohler HP, Watkins SC, Behrman JR, Anglewicz P, Kohler IV, Thornton RL, et al. Co-
hort profile: The Malawi Longitudinal Study of Families and Health (MLSFH). Inter-
national Journal of Epidemiology 2015; 44(2):394–404. Working paper version available at
http://repository.upenn.edu/psc_working_papers/46.
[39] Murray CJL, Vos T, Lozano R, Naghavi M, Flaxman AD, Michaud C, et al. Disability-
adjusted life years (dalys) for 291 diseases and injuries in 21 regions, 1990-2010: A systematic
analysis for the Global Burden of Disease Study 2010. Lancet 2012; 380(9859):2197–2223.
18

[40] Floyd S, Molesworth A, Dube A, Banda E, Jahn A, Mwafulirwa C, et al. Population-level
reduction in adult mortality after extension of free anti-retroviral therapy provision into
rural areas in northern Malawi. PLoS ONE 2010; 5(10):e13499. http://dx.doi.org/10.1371%
2Fjournal.pone.0013499.
[41] Jahn A, Floyd S, Crampin AC, Mwaungulu F, Mvula H, Munthali F, et al. Population-level
effect of HIV on adult mortality and early evidence of reversal after introduction of an-
tiretroviral therapy in Malawi. Lancet 2008; 371(9624):1603–1611.
[42] Payne CF, Kohler HP. The population-level impact of ART rollout on adult health and mor-
tality in rural Malawi, 2015. Unpublished manuscript, under review at PLoS Medicine.
[43] Kohler I, Payne C, Kohler HP. The link between functional limitations and mental health
among mature and elderly adults in rural Malawi, 2013. Paper presented at the Annual
Meeting of the Population Association of America, New Orleans, LA, April 11–13, 2013.
http://paa2013.princeton.edu/abstracts/131894.
[44] Kohler I, Kohler HP. Unpublished analyses of U.S. HRS data for 2008, 2015. Available from
authors upon request.
[45] Malawi DHS. Malawi Demographic and Health Survey 2010 (Final Report). Zomba, Malawi,
and Calverton, Maryland, USA: National Statistical Office (NSO) and ICF Macro, 2011. http:
//www.measuredhs.com.
[46] UNAIDS. Epidemiological fact sheet for Malawi, 2013. Geneva, Switzerland: UNAIDS.
Accessed 5 November 2013. http://www.unaids.org/en/regionscountries/countries/
malawi/.
[47] Godlonton S, Thornton RL. Learning from others’ HIV testing: Updating beliefs and re-
sponding to risk. American Economic Review 2013; 103(3):439–44.
[48] Payne JW, Sagara N, Shu SB, Appelt KC, Johnson EJ. Life expectancy as a constructed belief:
Evidence of a live-to or die-by framing effect. Journal of Risk and Uncertainty 2013; 46(1):27–
50.
[49] Kohler HP, Behrman JR, Kohler IV, Romero J. Survival expectations, work efforts, sav-
ings and intergenerational transfers among mature adults in Malawi, 2015. Unpublished
Manuscript, Population Studies Center, Universtiy of Pennsylvania, Philadelpia, PA.
[50] Kohler HP. Social interaction and fertility: An economic approach, 1997. Dissertation, De-
partment of Economics, University of California at Berkeley.
[51] Montgomery MR. Perceiving mortality decline. Population and Development Review 2000;
26(4):795–819.
[52] Montgomery MR. Learning and lags in mortality perceptions. In From Death to Birth: Mor-
tality Decline and Reproductive Change, editors Montgomery MR, Cohen B, Washington, DC:
National Academy Press, pp. 112–137. 1998.
19

[53] Sandberg J. Infant mortality, social networks, and subsequent fertility. American Sociological
Review 2006; 71(2):288–309.
[54] Sandberg J, Rytina S, Delaunay V, Marra A. Social learning about levels of perinatal and
infant mortality in niakhar, Senegal. Social Networks 2012; 34(2):264–274.
[55] Fiske ST, Taylor SE. Social Cognition. New York: SAGE Publications, 2nd edn., 2013.
[56] Tversky A, Kahneman D. Judgment under uncertainty: Heuristics and biases. Science 1974;
185(4157):1124–1131.
[57] Kahneman D. Thinking, fast and slow. New York: MFarrar, Straus and Giroux, 2011.
[58] Kohler HP, Behrman JR, Watkins SC. Social networks and HIV/AIDS risk perceptions. De-
mography 2007; 44(1):1–33.
[59] Elder TE. The predictive validity of subjective mortality expectations: Evidence from the
health and retirement study. Demography 2013; 50(2):569–589.
[60] Trinitapoli J, Yeatman S. Uncertainty and fertility in a generalized AIDS epidemic. American
Sociological Review 2011; 76(6):935–954.
[61] Ashforth A, Watkins SC. Narratives of death in the time of AIDS in rural Malawi. Africa
2015; 85(2):145–268.
[62] Watkins SC. Navigating the AIDS epidemic in rural Malawi. Population and Development
Review 2004; 30(4):673–705.
[63] Ashforth A. An epidemic of witchcraft? the implications of aids for the post-apartheid state.
African Studies 2002; 61(1):121–143.
[64] Farmer P. AIDS and Accusation: Haiti and the Geography of Blame. Los Angeles: University of
California Press, 2006. First published 1992.
[65] Conroy A, Yeatman S, Dovel K. The social construction of aids during a time of evolving
access to antiretroviral therapy in rural Malawi. Culture, Health & Sexuality 2013; 15(8):924–
937.
[66] Green EC, Witte K. Can fear arousal in public health campaigns contribute to the de-
cline of HIV prevalence? Journal of Health Communication 2006; 11(3):245–259. http://www.
tandfonline.com/doi/abs/10.1080/10810730600613807.
[67] Green EC, Kajubi P, Ruark A, Kamya S, D’Errico N, Hearst N. The need to reemphasize be-
havior change for HIV prevention in Uganda: A qualitative study. Studies in Family Planning
2013; 44(1):25–43.
[68] Kohler IV, Payne CF, Bandawe C, Kohler HP. The demography of mental health among
mature adults in a low-income high HIV-prevalence context. Demography 2017; 54(4):1529–
1558. Published Online: 27 July 2017.
20

[69] Manski CF. Measuring expectations. Econometrica 2004; 72(5):1329–1376.
[70] Delavande A, Gine X, McKenzie D. Measuring subjective expectations in developing coun-
tries: A critical review and new evidence. Journal of Development Economics 2011; 94:151–163.
[71] Bettinger EP, Long BT, Oreopoulos P, Sanbonmatsu L. The role of application assistance and
information in college decisions: Results from the H&R Block Fafsa Experiment. Quarterly
Journal of Economics 2012; 127(3):1205–1242.
[72] Dinkelman T, Martínez A C. Investing in schooling in Chile: The role of information about
financial aid for higher education. Review of Economics and Statistics 2013; 96(2):244–257.
[73] Fryer RG. Information and student achievement: Evidence from a cellular phone experi-
ment, 2013. NBER Working Paper #19113.
[74] Hoxby C, Turner S. Expanding college opportunities for high-achieving, low income stu-
dents, 2012. Stanford Institute For Economic Policy Research SIEPR Discussion Paper No.
12-014. http://www-siepr.stanford.edu/repec/sip/12-014.pdf.
[75] Jensen R. The (perceived) returns to education and the demand for schooling. Quarterly
Journal of Economics 2010; 125(2):515–548.
[76] Nguyen T. Information, role models and perceived returns to education: Experimental
evidence from Madagascar, 2008. Working Paper, Poverty Action Lab (JPAL) and Mas-
sachusetts Institute of Technology. http://www.povertyactionlab.org/sites/default/files/
documents/Nguyen%202008.pdf.
[77] Wiswall M, Zafar B. Determinants of college major choice: Identification using an informa-
tion experiment. Review of Economic Studies 2015; 82(2):791–824.
[78] Poverty Action Lab (JPAl) Website. Cost effectiveness: Additional years of student par-
ticipation per $100, 2015. Accessed 8 October 2015. http://www.povertyactionlab.org/
policy-lessons/education/student-participation.
[79] Dupas P. Do teenagers respond to HIV risk information? Evidence from a field experiment
in Kenya. American Economic Journal: Applied Economics 2011; 3(34):1–34.
[80] Thornton RL. The demand for learning HIV status and the impact on sexual behavior:
Evidence from a field experiment. American Economic Review 2008; 98(5):1829–1863.
[81] Godlonton S, Munthali A, Thornton R. Circumcision, information, and HIV prevention.
Review of Economics and Statistics Forthcoming; .
[82] Chinkhumba J, Godlonton S, Thornton R. The demand for medical male circumcision. Amer-
ican Economic Journal: Applied Economics 2014; 6(2):152–77.
[83] Hornik R. Public health communication: Evidence for behavior change. Routledge, 2012.
21

[84] UN Population Division. World Population Prospects, the 2015 revision: Key findings, 2015.
United Nations, Department of Economic and Social Affairs, Population Division. http://
esa.un.org/unpd/wpp/.
[85] Malawi National Statistical Office. Welfare Monitoring Survey (WMS) 2009, 2010.
National Statistical Office of Malawi. http://www.nsomalawi.mw/publications/
welfare-monitoring-surveys-wms/welfare-monitoring-surveys-wms-2009.html.
[86] Kohler IV, Kohler HP, Anglewicz P, Behrman JR. Intergenerational transfers in the era of
HIV/AIDS: Evidence from rural Malawi. Demographic Research 2012; 27(27):775–834.
[87] Lee RD, Mason A. Generational economics in a changing world. Population and Development
Review 2011; 37:115–142.
[88] Merli GM, Palloni A. The HIV/AIDS epidemic, kin relations, living arrangements and the
elderly in South Africa. In Aging in Sub-Saharan Africa: Recommendations for Furthering Re-
search, editors Cohen B, Menken J, Washington, D.C.: National Academy Press, pp. 117–165.
2006.
[89] Zimmer Z. Household composition among elders in Sub-Saharan Africa in the context of
HIV/AIDS. Journal of Marriage and the Family 2009; 71(4):1086–1099.
[90] Payne C, Mkandawire J, Kohler HP. Disability transitions and health expectancies among
adults 45 years and older mature in Malawi: A cohort modeling approach. PLOS Medicine
2013; 10(5):e1001435.
[91] Kohler HP, Watkins SC, Anglewicz P, Behrman JR, Kohler IV, Payne CF, et al. Surviving the
epidemic: Families and well-being, malawi 1998–2013, 2015. Mansuscript submitted for the
2016 Annual Meeting of the Population Association of America.
[92] MLSFH. Project Website: Malawi Longitudinal Study of Families and Health (MLSFH),
2015. http://www.malawi.pop.upenn.edu.
[93] Freeman E, Anglewicz P. HIV prevalence and sexual behavior at older ages in rural Malawi.
International Journal of STD & AIDS 2012; 23(7):490–496.
[94] Doctor HV. Adult mortality in rural Malawi. Southern African Journal of Demography 2004;
9(1):49–66.
[95] Chin B. Essays on health, mortality, and intergenerational transfers in rural Malawi, 2011.
Ph.D. Dissertation, Graduate Group in Demography, University of Pennsylvania, Philadel-
phia, PA.
[96] Gerland P, Kaphuka J, Mandere G, Misiri H, Fleming P. Adult mortality estimations from co-
hort and census/survey data: A comparison of direct and indirect methods in rural Malawi,
2007. http://uaps2007.princeton.edu/abstracts/70706.
[97] Ware JE, Kosinksi M, Keller SD. SF-12: How to Score the SF12 Physical & Mental Health Sum-
mary Scales, Third Edition. Lincoln, RI: QualityMetric, 2001.
22

[98] Layard R. Measuring subjective well-being. Science 2010; 327(5965):534–535.
[99] DeRenzi E, Vignolo L. The Token Test: A sensitive test to detect receptive disturbances in
aphasics. Brain 1962; 85:665–678.
[100] Warrington E, James M. The Visual Object and Space Perception Battery. Bury St. Edmunds,
Suffolk, Tngland: Thames Valley Test Company., 1991.
[101] National Research Council. Preparing for an Aging World: The Case for Cross-National Research.
Washington, D.C.: National Academy Press, 2001.
[102] Sanderson WC, Scherbov S. Measuring the speed of aging across population subgroups.
PLoS ONE 2014; 9(5):e96289. http://dx.doi.org/10.1371%2Fjournal.pone.0096289.
[103] Molini V, Nubé M, van den Boom B. Adult BMI as a health and nutritional inequality
measure: Applications at macro and micro levels. World Development 2010; 38(7):1012–1023.
[104] Lloyd-Sherlock P, Beard J, Minicuci N, Ebrahim S, Chatterji S. Hypertension among older
adults in low- and middle-income countries: prevalence, awareness and control. Interna-
tional Journal of Epidemiology 2014; 43(1):116–128.
[105] Obare F. Nonresponse in repeat population-based voluntary counseling and testing for HIV
in rural Malawi. Demography 2010; 47(3):651–665.
[106] Anglewicz PA, Kohler HP, VanLandingham M, Manda-Taylor L. Health selection, internal
migration, and HIV infection in Malawi, 2017. Earlier version was presented at the Annual
Meeting of the Population Association of America, San Diego, CA, April 30–May 2, 2015.
http://paa2015.princeton.edu/abstracts/153278.
[107] Anglewicz P, VanLandingham M, Manda-Taylor L, Kohler HP. Cohort profile: Internal mi-
gration in Sub-Saharan Africa: The Migration and Health in Malawi (MHM) Study. BMJ
Open 2017; 7:e014799. Working paper version available at http://repository.upenn.edu/
psc_working_papers/62/.
[108] Anglewicz P. Migration, marital dissolution, and HIV infection in Malawi. Demography
2012; 49(1):239–265.
23

0.0
0.1
0.2
0.3
0.4
0.5
0.6
0.0
0.1
0.2
0.3
0.4
0.5
0.6
10th percentile
25th percentile
Median
75th percentile
90th percentile
Mean with 95% CI
Figure A.1: Standardized boxplot-like graph to display distribution of subjective probabilities
24

Benefits of Knowledge Respondent ID [___________________]
Page 1
The Benefits of Knowledge: Mortality risk, Mental health and Life-cycle behavior
Protocol and Questionnaire for Health Information Intervention
Section 1---Background Information Pre-Intervention
Apo bakafufuku bakiza kunyumba kwinu zuba linyake, bakamufumbani mafumbo yakukhwaskana na mwabi kuti
banthu banyakhe panji imwe mungafwa pakuluta kwa nyengo pakugwiriska ntchito skawa zakukwana 10 (khumi).
When the survey team came to your house the other day, they asked you some questions about the chances that some people or you
might die as time goes by using 10 peanuts.
BK0kasi mukuyakumbukira mafumbo ghala?
Do you remember those questions?
enya Yes……………….1
yayi No…………………2
sono tiyeni tiwonere lumoza mazgolo ghinu. Let’s look at your answers together.
INTERVIEWER: Verify the number of peanuts that respondent put when previously interviewed. Put the corresponding
number of peanuts in the cup for 5 years probabilities and the corresponding number of peanuts in the cup for 10 years
probabilities. Show the respondent the cup with [M9_X7A] peanuts for the 5 years probabilities and the cup with [M9_X7B]
peanuts for the 10 years probabilities.mungauskangamo yayi skawa mu mbale, kweni muzileke pa nthazi pa uyo
wakuzgola pa nyengo yose yakuchezga uku.Do not remove the peanuts from the cups and keep them in front of the
respondent during the whole time of the interview!
mukabika skawa[____], kung’anamula kuti pali mwabi wakukwana [___] pa maulendo wose 10 wakuti mungafwa
mu vyaka 5 (vinkhonde) ivyo vikwiza.[Interviewer lay out M9_X7A peanuts for 5-year mortality risk on flat surface]
You allocated [M9_X7A] peanuts, meaning [M9_X7A] chances out of 10, when asked about the chances that you might die
in the next 5 years. [Interviewer: lay out M9_X7A peanuts for 5-year mortality risk on flat surface]
mukabika skawa [____], kung’anamula kuti pali mwabi wakukwana [___] pa maulendo wose 10 wakuti mungafwa
mu vyaka 10(khumi) ivyo vikwiza.
[Interviewer lay out M9_X7B peanuts for 10-year mortality risk on flat surface, below the M9_X7A peanuts]
You allocated [M9_X7B] peanuts, meaning [M9_X7B] chances out of 10, when asked about the chances that you might die in the next 10
years. [Interviewer lay out M9_X7B peanuts for 10-year mortality risk on flat surface, below the M9_X7A peanuts]
BK1Kasi mukumanya kuti banthu muno mu Malawi awo
bakukhala mu vikaya nge muno bakukhala nyengo
zitali kujumpha umo bakakhaliranga mu vyaka 5
(vinkhonde) panji 10 (khumi) ivyo vyajumpha?
Have you noticed lately that people in Malawi living in
villages like yours tend to live longer than they used to 5 or
10 years ago?
enya Yes .................................. 1
yayi No ........................... 2→ continue with videos
following the exact sequence below; start with Video 1
(Story 1)
BK2 kasi mukamanyawuli kuti banthu bakukhala
nyengo zitali kujumpha umo vikabira mu vyaka
5 (vinkhonde) panji 10 (khumi) ivyo
vyajumpha?
Howdid you notice that people tend to live longer than
they used to 5 or 10 years ago?
[ check all answers that apply]
Interviewer: probe if the respondent does not provide
nkhuluta ku nyifwa zakubazgika wakaI go to fewer
funerals..............................................................................1
nkhawona kuti banyane na bachibale awo bakafwanga
bakaba bakuchepa I noticed that fewer of my friends and
relatives are dying .............................................................2
nkhuwona kuti banthu bakutayika pala bachekulaI notice
that people are dying when they are older
……………..……….3

Benefits of Knowledge Respondent ID [___________________]
Page 2
initially a response. wovwiri wa AIDS ukusangika pafupi
AIDS treatment has become available
nearby.............................4
ntchito za umoyo zaluta pa nthazi ndipo zikovwira
banthuHealth services have improved, and this helps
individuals...........................................................5
zinyakhe
Other [________________________________]........6
Section 2---Videos
[CONTINUE WITH VIDEOS:]
Sono nkhukumba nimuwonwsyani ma kanema agho gha kuwoneska kuti banthu mu malwi muno bakukhala na moyo nyengo yitali
mazuba yano kujumpha vyaka vinkhonde (5) panji khumi(10) ivyo vyajumpha. Makanema agha yajambulika na banthu ba vyamasebero
ndipo uthega ubo uli mumakanema agha ghakukoleranako na vya umoyo na umo banthu bakufwira muno mumalawi panyengo yasono. I
would like to show you a video showing that people in Malawi are living longer nowadays than 5 or 10 years ago. These videos have been
recorded by actors and the information in these videos is consistent with recent health and mortality trends in Malawi.
Video 1 (Story 1---Davie the carpenter):
A middle-aged man, working it his carpenter’s shop, talks: Hi, my name is Davie and I have a bit of land where I grow maize. I also know how to work with wood. I am lucky because both my parents are still alive. They are both in their 70ies
and are doing well. They are taking care of themselves: they have enough food, they are in good health and they don’t need to go often to the hospital and they actively participate in village activities. They also teach important things about life to me and my children. They knew that they could live longer than their parents and with the little they were earning they bought some livestock to support themselves in their old days. My brothers and I also help them sometimes. My aunties and uncle also died very old. They were more than 65. And I see a lot of other families in our village with old family members that are still alive. My grand-parents were not so lucky and they were dead when they were my age. Yes, I really notice that people are living longer nowadays. And it is a good thing for everyone.
A middle-aged man, working in his carpenter’s shop, talks: monile zina lane ndine Davie ndipo nili na malo yakulima
pachoko apo nkhulimapo ngoma kweniso nili na luso lakupala mathabwa. nili na mwabi kuti bapapi bane bali na umoyo.
bose bali mu vyaka vya muma 70, ndipo bali na umoyo uweme. bakujipwerera bekha: bali na chakurya chakukwana, bali
na umoyo uwemi, ndipo kuti bakukhumbikwa kuluta ku chipatala kabirikabirindipo bakutola lwande mu vyakuchitika vya mu
muzi. kweniso bakusambizga vinthu vyakwenerera vyakukhwafyana na umoyo kwa ine na bana bane. bakamanya kuti
bakhalenge nyengo zitale kujumpha bapapi bawo ndipo pa tuchoko uto bakasanganga bakagulako vibeto vyakuwovwira ku
uchekulu wawo. bakulu bane na ine tikuwovwira nyengo zinyakhe. bazinkhazi bane na basibweni bane bakafwa nawo
bakafwa bakati bachekula chomene. bakaba na vyaka vyakujumpha 65. ndipo nkhuwona ma banja ghanandi ghanyakhe
mu muzi mwithu ayo yali na banthubachekulu awo bali na um,oyo. basekulu na ba buya bakabavya mwabi chifukwa
bakafwa apo bakaba na msinkhu nge wane. nadi nkhuwona kuti banthu bakukhala nyengo zitali mazuba ghano. ndipo
ntchinthu chiwemi kwa waliyose..
Interviewer: continue with Video 2 --Rose
Video 2 (Story 2 -- Rose):
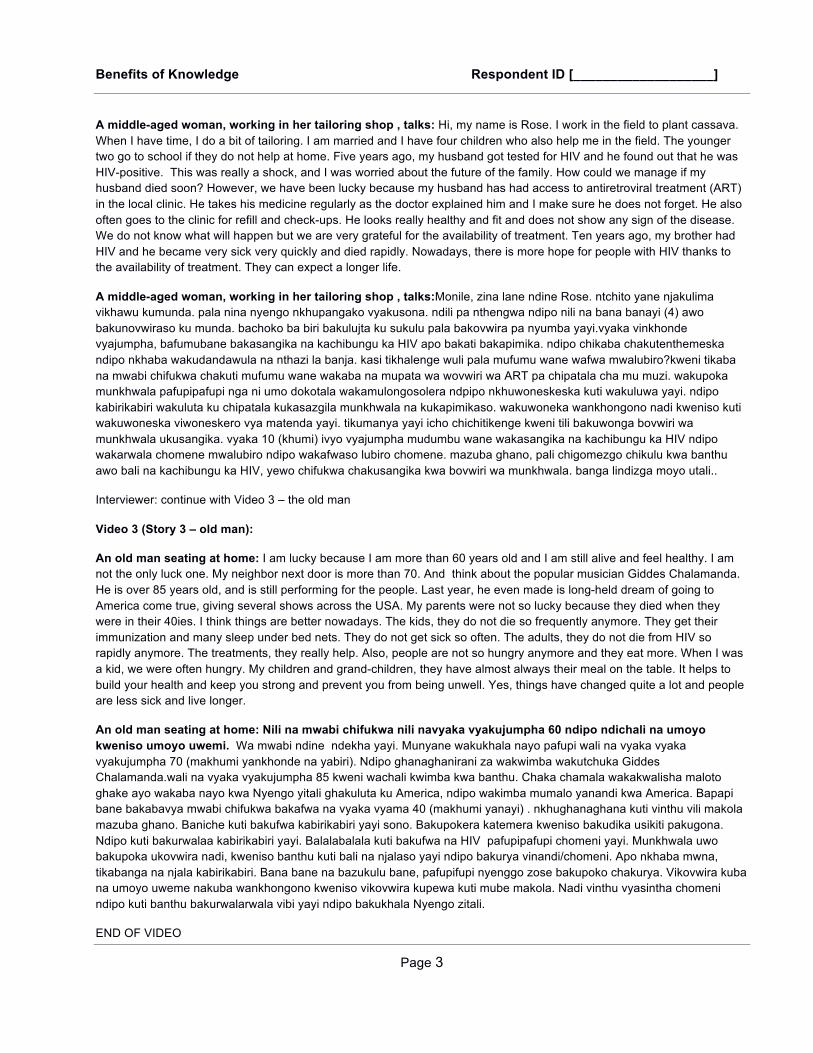
Benefits of Knowledge Respondent ID [___________________]
Page 3
A middle-aged woman, working in her tailoring shop , talks: Hi, my name is Rose. I work in the field to plant cassava.
When I have time, I do a bit of tailoring. I am married and I have four children who also help me in the field. The younger
two go to school if they do not help at home. Five years ago, my husband got tested for HIV and he found out that he was
HIV-positive. This was really a shock, and I was worried about the future of the family. How could we manage if my
husband died soon? However, we have been lucky because my husband has had access to antiretroviral treatment (ART)
in the local clinic. He takes his medicine regularly as the doctor explained him and I make sure he does not forget. He also
often goes to the clinic for refill and check-ups. He looks really healthy and fit and does not show any sign of the disease.
We do not know what will happen but we are very grateful for the availability of treatment. Ten years ago, my brother had
HIV and he became very sick very quickly and died rapidly. Nowadays, there is more hope for people with HIV thanks to
the availability of treatment. They can expect a longer life.
A middle-aged woman, working in her tailoring shop , talks:Monile, zina lane ndine Rose. ntchito yane njakulima
vikhawu kumunda. pala nina nyengo nkhupangako vyakusona. ndili pa nthengwa ndipo nili na bana banayi (4) awo
bakunovwiraso ku munda. bachoko ba biri bakulujta ku sukulu pala bakovwira pa nyumba yayi.vyaka vinkhonde
vyajumpha, bafumubane bakasangika na kachibungu ka HIV apo bakati bakapimika. ndipo chikaba chakutenthemeska
ndipo nkhaba wakudandawula na nthazi la banja. kasi tikhalenge wuli pala mufumu wane wafwa mwalubiro?kweni tikaba
na mwabi chifukwa chakuti mufumu wane wakaba na mupata wa wovwiri wa ART pa chipatala cha mu muzi. wakupoka
munkhwala pafupipafupi nga ni umo dokotala wakamulongosolera ndpipo nkhuwoneskeska kuti wakuluwa yayi. ndipo
kabirikabiri wakuluta ku chipatala kukasazgila munkhwala na kukapimikaso. wakuwoneka wankhongono nadi kweniso kuti
wakuwoneska viwoneskero vya matenda yayi. tikumanya yayi icho chichitikenge kweni tili bakuwonga bovwiri wa
munkhwala ukusangika. vyaka 10 (khumi) ivyo vyajumpha mudumbu wane wakasangika na kachibungu ka HIV ndipo
wakarwala chomene mwalubiro ndipo wakafwaso lubiro chomene. mazuba ghano, pali chigomezgo chikulu kwa banthu
awo bali na kachibungu ka HIV, yewo chifukwa chakusangika kwa bovwiri wa munkhwala. banga lindizga moyo utali..
Interviewer: continue with Video 3 – the old man
Video 3 (Story 3 – old man):
An old man seating at home: I am lucky because I am more than 60 years old and I am still alive and feel healthy. I am
not the only luck one. My neighbor next door is more than 70. And think about the popular musician Giddes Chalamanda.
He is over 85 years old, and is still performing for the people. Last year, he even made is long-held dream of going to
America come true, giving several shows across the USA. My parents were not so lucky because they died when they
were in their 40ies. I think things are better nowadays. The kids, they do not die so frequently anymore. They get their
immunization and many sleep under bed nets. They do not get sick so often. The adults, they do not die from HIV so
rapidly anymore. The treatments, they really help. Also, people are not so hungry anymore and they eat more. When I was
a kid, we were often hungry. My children and grand-children, they have almost always their meal on the table. It helps to
build your health and keep you strong and prevent you from being unwell. Yes, things have changed quite a lot and people
are less sick and live longer.
An old man seating at home: Nili na mwabi chifukwa nili navyaka vyakujumpha 60 ndipo ndichali na umoyo
kweniso umoyo uwemi. Wa mwabi ndine ndekha yayi. Munyane wakukhala nayo pafupi wali na vyaka vyaka
vyakujumpha 70 (makhumi yankhonde na yabiri). Ndipo ghanaghanirani za wakwimba wakutchuka Giddes
Chalamanda.wali na vyaka vyakujumpha 85 kweni wachali kwimba kwa banthu. Chaka chamala wakakwalisha maloto
ghake ayo wakaba nayo kwa Nyengo yitali ghakuluta ku America, ndipo wakimba mumalo yanandi kwa America. Bapapi
bane bakabavya mwabi chifukwa bakafwa na vyaka vyama 40 (makhumi yanayi) . nkhughanaghana kuti vinthu vili makola
mazuba ghano. Baniche kuti bakufwa kabirikabiri yayi sono. Bakupokera katemera kweniso bakudika usikiti pakugona.
Ndipo kuti bakurwalaa kabirikabiri yayi. Balalabalala kuti bakufwa na HIV pafupipafupi chomeni yayi. Munkhwala uwo
bakupoka ukovwira nadi, kweniso banthu kuti bali na njalaso yayi ndipo bakurya vinandi/chomeni. Apo nkhaba mwna,
tikabanga na njala kabirikabiri. Bana bane na bazukulu bane, pafupifupi nyenggo zose bakupoko chakurya. Vikovwira kuba
na umoyo uweme nakuba wankhongono kweniso vikovwira kupewa kuti mube makola. Nadi vinthu vyasintha chomeni
ndipo kuti banthu bakurwalarwala vibi yayi ndipo bakukhala Nyengo zitali.
END OF VIDEO

Benefits of Knowledge Respondent ID [___________________]
Page 4
Section 3--- Provision of Updated Mortality Information
[INTERVIEWER: SELECT THE MORTALITY INFORMATION SHEET CORRESPONDING TO THE RESPONDENT’S
AGE AND SEX. USE THE INFORMATION ON THIS SHEET WHEN WE REFER TO ‘MORTALITY INFO SHEET’
BELOW]
Bupu withu wakafukufuku wawona vya kulondezya vya kafukufuku uyo wakupangika sonosono kukhwaskana na umo banthu wakufwira
muno mumalawi, kweniso banthu ba vyaka nga imwe, banalume/bakanakazi wakwenera kukhalira na moyo. Kufumira mu kafukufuku uyu,
ntchamachitiko kuti mungamanya kuyeskezgera umo munthu wa vyaka nga ndimwe kweniso mwanakazi/mwanalume wangafwira mu
vyaka vinkhonde panji khumi kufumira mwahuno.. Our research team has looked at some recent data showing how many individuals in
Malawi are dying, and how long individuals your age and sex are likely to live. From these findings, it is possible to estimate how likely a
person of your age and sex will die within five or ten years.
Tikhumba timuoneskani ivi pakugwiriska ntchito vithunzi. Pa vithunzi ivi, vithuzi vya blue vikulongola banthu awo
wachali na umoyo, ndipo viswesi vikulongola banthu awo wali kutayika.We would like to illustrate this to you with some
pictures. In these pictures, blue persons indicate people who are alive, and red persons indicate people who have died.
Tiyambenge na banthu khumi (10) analume/wanakazi wavyaka nga imwe. Banthu awa wachali naumoyo ndipo
wakukhala mu Mmalawi mwenemuno wakuchita vinthu nga imwe. Mukuwawona banthu khumi (10) wose awo bali
mu blue panji wamoyo. INTERVIEWER: SHOW FIRST GRAPH ON THE MORTALITY INFO SHEET].
We begin with 10 hypothetical persons who are about your age and are of the same sex. These 10 persons are alive today, and they live
in Malawi in a similar context as you do. You can see these 10 persons in this figure that shows 10 blue, or alive, persons
[INTERVIEWER: SHOW FIRST GRAPH ON THE MORTALITY INFO SHEET].
Sono tiyeni tiwone mu vyaka vinkhonde munthazi, ndipo tifumbe kuti ni banthu balinga pa chithuzithuzi
chakwamba awwo bazamukuba bachali na umoyo mu vyaka 5 kwamba muhanyauno. Naumo mukuwonera pa
chithuzithuzi ichi [SHOW THE SECOND GRAPH “5 YEARS FROM TODAY” ON THE MORTALITY INFO SHEET],
banthu banyakhe bazamuba kuti bafwa ndipo bakuwoneka mu viswesi kweni banyakhe bazamuba na umoyo
ndipo bakuwoneka mu blue, vyaka 5 kwamba muhanyauno. Banthu awo bali mu viswesi mu chithuzithuzi ichi
chikulongosola mpata kufuma pa 10 kuti banthu ba msinku winu banakazi/banalume bazamufwa mukatikati mwa
vyaka 5 ivyo vikwiza: pala banthu banandi bakuwoneka mu viswesi (panji uswesi unandi munthu wali), pali wofi
ukulu wakufwa.
We can now look five years into the future, and ask how many of the persons in the first figure will still be alive 5 years from today. As
you see on this picture [SHOW SECOND GRAPH “5 YEARS FROM TODAY” ON THE MORTALITY INFO SHEET], some of the persons
will have died, and are shown in red, and others will still be alive, and are shown in blue, five years from today. How many persons are in
red in this graph tells the chance out of 10 that a person your age and sex will die within the next five years: the more people we show in
red (or the more red a person is), the higher is the risk of dying.
Kutolera naumo tikumanyira, tikughanaghana kuti [READ RED LINE IN 5-YEARS FROM TODAY SECTION]
mukatikati mwa vyaka vinkhonde (5) kwambira mwahuno, kweni [READ BLUE LINE IN 5-YEARS FROM TODAY
SECTION]mukatikati mwa vyaka vinkhonde (5) kwambira mwahuno.
Based on our knowledge today, we predict that [READ RED LINE IN 5-YEARS FROM TODAY SECTION] within 5 years from today, while
[READ BLUE LINE IN 5-YEARS FROM TODAY SECTION] within 5 years from today.
Sono tiyeni tiwone mu vyaka khumi munthazi, ndipo tifumbe kuti ni banthu balinga pa chithuzithuzi chakwamba
awo bazamukuba bachali na umoyo mu vyaka10 kwamba muhanyauno. Naumo mukuwonera pa chithuzithuzi ichi
[SHOW THE SECOND GRAPH “10 YEARS FROM TODAY” ON THE MORTALITY INFO SHEET], banthu banyakhe
bazamube kuti bafwa ndipo bakuwoneka mu viswesi kweni banyakhe bazamuba na umoyo ndipo bakuwoneka mu
blue, vyaka 10 kwamba muhanyauno. Banthu awo bali mu viswesi mu chithuzithuzi ichi chikulongosola mpata
kufuma pa 10 kuti banthu ba msinku winu banakazi/banalume bazamufwa mukatikati mwa vyaka 10 ivyo vikwiza:
pala banthu banandi bakuwoneka mu viswesi (panji uswesi unandi munthu wali), pali wofi ukulu wakufwa.We can
also look ten years into the future, starting today, and how many of the persons in the first figure will still be alive 10 years from today. As
you see on this picture [SHOW THIRD GRAPH “10 YEARS FROM TODAY” ON THE MORTALITY INFO SHEET], some of the persons
will have died, and are shown in red, and others will still be alive, and are shown in blue, ten years from today. How many persons are in

Benefits of Knowledge Respondent ID [___________________]
Page 5
red in this graph tells you is the chance out of 10 that a person your age and sex will die within the next ten years. The more people we
show in red (or the more red a person is), the higher is the risk of dying.
Kutolera naumo tikumanyira, tikughanaghana kuti [READ RED LINE IN “10-YEARS FROM TODAY” SECTION]
mukatikati mwa vyaka khumi (10) kwambira mwahuno, kweni [READ BLUE LINE IN “10-YEARS FROM TODAY”
SECTION] mukatikati mwa vyaka khumi (10) kwambira mwahuno.
Based on our knowledge today, we predict that [READ RED LINE IN “10-YEARS FROM TODAY” SECTION] within 10 years from today,
while [READ BLUE LINE IN “10-YEARS FROM TODAY” SECTION] within 10 years from today.
Ntheula, palije munthu uyo wangamanya kuyowoya vyakuchitika munthazi vya munthu, kweni uthenga
ungapataula kwakuyana na ivo vingachitika pala tingati tione pa chiulu cha banthu banalume/banakazi) bavyaka
vinu. Ndipo uthenga uwu ngwakovwira kuti imwe mughanaghane kuti pali mupata wuli kuti mungafwa mukatikati
mwa vyaka 5 panji 10. Ntheula mwakuchepeska nkhani iyi tiyowoye kuti banalume/banakazi wakukwana 10
wavyaka nga imwe wa:Of course, nobody can predict what will happen to a specific individual, but this information can tell you about
what is likely to happen if we look at a large group of people of your age and sex. And this information is helpful for you to think how likely
you might die within the next 5 or 10 years. So, let’s summarize this information: if we look at 10 persons your age and sex:
• [READ RED LINE IN “5-YEARS FROM TODAY” SECTION] muvya vinkhonde vikwiza ivi kwambira mwahuuno,
apo[READ BLUE LINE IN “5-YEARS FROM TODAY” SECTION] muvya vinkhonde vikwiza ivi kwambira
mwahuuno, apo
• [READ RED LINE IN “5-YEARS FROM TODAY” SECTION] within 5 years from today, while [READ BLUE LINE IN “5-YEARS FROM
TODAY” SECTION] within 5 years from today; and
• [READ RED LINE IN “10-YEARS FROM TODAY” SECTION] muvya khumi vikwiza ivi kwambira mwahuuno,
apo [READ BLUE LINE IN “10-YEARS FROM TODAY” SECTION] muvya vinkhonde vikwiza ivi kwambira
mwahuuno, apo [READ RED LINE IN “10-YEARS FROM TODAY” SECTION] within 10 years from today, while
[READ BLUE LINE IN “10-YEARS FROM TODAY” SECTION] within 10 years from today
Ntheula pakulondezga uthenga uwu, usange ningatola zinyakhe mwa skawa izi, izo zilongolenge kuti
ntchamachitiko wuli kuti mwanalume/mwanakazi wa vyaka nga imwe watayikenge mukatikati mwa vyaka
vinkhonde(5), [INTERVIEWER: PICK THE NUMBER OF BEANS THAT CORRESPONDS TO THE NUMBER OF RED
PEOPLE ON THE FIGURE WITH 5-YEARS MORTALITY INFO] m'balemu.
So based on this information, if I were to pick the number of peanuts that reflects how likely it is that a person your age and
sex would die within 5 years, I would put ningawika skawa [____]mumbale umu[INTERVIEWER: PICK THE NUMBER OF
BEANS THAT CORRESPONDS TO THE NUMBER OF RED PEOPLE ON THE FIGURE WITH “5-YEARS FROM
TODAY” MORTALITY INFO] peanuts on the plate.
Interviewer: Put the number of beans infront of the cup with the 5-years chances of dying. Do not remove the peanuts but
leave on the ground.So the respondent can see original answer in the cup, and new information on the ground until the end
of the interview.
Ntheula pakulondezga uthenga uwu, usange ningatola zinyakhe mwa skawa izi, izo zilongolenge kuti ntchamachitiko wuli kuti mwanalume/mwanakazi wa vyaka nga imwe watayikenge mukatikati mwa vyaka khumi (10), [INTERVIEWER: PICK THE NUMBER OF BEANS THAT CORRESPONDS TO THE NUMBER OF RED PEOPLE
ON THE FIGURE WITH 10-YEARS MORTALITY INFO] So based on this information, if I were to pick the number of peanuts that reflects how likely it is that a person your age and
sex would die within 10 years, I would put ningawika skawa [____] mumbale umu[INTERVIEWER: PICK THE NUMBER
OF BEANS THAT CORRESPONDS TO THE NUMBER OF RED PEOPLE ON THE FIGURE WITH “10-YEARS FROM
TODAY” MORTALITY INFO] peanuts on the plate.
Interviewer: Put the number of beans infront of the cup with the 5-years chances of dying. Do not remove the peanuts but
leave on the ground.So the respondent can see original answer in the cup, and new information on the ground until the end
of the interview.

Benefits of Knowledge Respondent ID [___________________]
Page 6
[Interviewer: The following is an example how to use ½ peanuts and whole peanuts if the figures are partially
colored in red. 1) If the instructions on the mortality info sheet say “less than 1 person will have died” put ½ a
peanut; 2) If the instructions on the mortality info sheet say “Between 2 and 3 persons will have died” or “About
2 and 3 persons will have died” then put 2½ peanut. In all other cases put a whole peanut (for example, if
instructions say “almost [#] persons will have died”, “about 1 person will have died”, “approximately[ #] persons
will have died”, “almost [#] persons will have died”, “slightly more [#] persons will have died”.
BK3: Kasi uthenga uwu mukuupulikiska? Do you understand this information?
Enya Yes ........1 → SKIP BK3a
Yayi No.............2 → go back to beginning of
Section 3 above, and explain
again to respondent and ask
BK3a;
BK3a. Kasi uthenga uwu mukuupulikiska?Do you
understand this information?
Enya Yes .......................1
Yayi No........................2
BK3b. Kasi mukughanaghana kuti uthenga uwu
ukulongola unenesko wa ivo vikuchitika kwa banthu
wavyaka nga imwe awo bakutayika muchigawa chino
mazuwa ghano?Do you think this information reflects
correctly what happens to people of your age and sex dying
in your community nowadays?
Enya, vikulongola uneneskoYes, reflects correctly...............................................................................1 Enya,vikulongola unenesko uchokoYes, reflects somewhat............................................................................2 Yayi, vikulongola unenesko charaNo, does not reflect
correctly...............................................................................3 Nkhumanya yayi Dont' Know..................................................4
Ntheula kwakuyana na umoyo winu na umo banja linu nakasangilo ka chuma, mungawa namupata wukulu panji uchoko wakuti
mungafwa kujumpha munthu waliyose wamusinkhu winu mwanalume/mwanakazi pa banthu wanande. Of course, depending on your
health and depending on your own family and economic context, you might be more or less likely to die than the average person your age
and sex in a large group.
Sono nimufumbaningiso naumo mukughanaghanira kuti pali mpata wuli wakuti mungafwa muvyaka 5 panji 10. Lawiskani skawa
izo mukawika pakwamba kwakuyana na mwawi wakuti mungafwa mukatikati mwa vyaka 5 na 10. Kufuma pa ivyo namuphalirani,
kweniso kwakuyana na umo mukumanyira umoyo, banja na chuma chonde munizgoleso mafumbo ayo nimufumbaninge.
Mukumbukire kuti mungaswa skawa pakati ndipo muwike skawa ya hafu mwakusazgirapo skawa zambula kuswa usange
mwakhumba kutola pakati pa skawa ziwiri zambula kuswa.Now, I would like to ask you again about what you think about the chances
that you might die in the next five or ten years. Look at the peanuts that you had put earlier for the chances that you will die within 5 years
and 10 years. Based on what I have told you, and based on what you know about your own health, family and economic context please
answer again the following questions below. Remember that you can break a peanut in ½ and put ½ peanut in addition to the whole
peanuts if you want to pick a value between two whole peanuts.
Interviewer:Provide respondent with the empty 3rd
cup in front of him/her. Give respondent 10 peanuts. Remind respondent that he/she can put ½ bean if respondent wants to pick value between two whole peanuts (e.g., respondent thinks 1 and 1/2 peanuts (1.5) is the best answer). If respondent is not able to break the peanut in ½, help
him/her with this. If respondent used ½ peanut, do not substitute with a whole peanut.

Benefits of Knowledge Respondent ID [___________________]
Page 7
Tolani skawa izo zilongolenge naumo imw mukughanaghanira kuti Pick the number of peanuts that reflects how likely you think it is that you
# OF PEANUTS in plate
BK_X7a: Mutayikenge muvyaka vinkhonde (5) vikwiza ivi kwambira mwahuno
will die within a five-year period beginning today
(LEAVE PEANUTS ON PLATE)
[_____]
if 10 ask BK_X8a, or BK_X8b,
or BK_X8c, or BK_X8d and if the answer is yes and the respondent
does not revise his/her answer
then continue to BK4.
BK_X8a: If BK_X7a>M9_X7A: Mazgolo yinu kwasono yakuoneska kuti mupata wakuti mungataika muvyaka vinkhonde (5) vikwiza ivi ngukulu kupambana nauwo
mukayowoya pakwambilira pala apo nanguwa nindamuoneskani uthenga uwo mukayowoya. Ivi ndivo vanguba mumaghanoghano ghinu? Your answers show that you now think that the chance of dying within the next 5 years are larger than what you said before I gave you the information. Is that what you had in mind?
Yes 1 No 2
If No, go to BK_X7a2
If Yes, go to BK_X7b
BK_X8b: If BK_X7a<M9_X7A: Mazgolo yinu kwasono yakuoneska kuti mupata wakuti mungataika muvyaka vinkhonde (5) vikwiza ivi nguchoko kupambana nauwo mukayowoya pakwambilira
pala apo nanguwa nindamuoneskani uthenga uwo mukayowoya. Ivi ndivo vanguba mumaghanoghano ghinu? Your answers show that you now think that the chance of dying within the next 5 years are smaller than what you said before I gave you the information. Is that what you had in mind?
Yes No
If No, go to BK_X7a2
If Yes, go to BK_X7b
BK_X8c: If BK_X7a=M9_X7A: Mazgolo yinu kwasono yakuoneska kuti mupata wakuti mungataika muvyaka vinkhonde (5) vikwiza ivi ukuyana waka nauwo mukayowoya pakwambilira pala apo nanguwa nindamuoneskani uthenga uwo mukayowoya. Ivi ndivo vanguba
mumaghanoghano ghinu? Your answers show that you now think that the chance of dying within the next 5 years are equal to what you said before I gave you the information. Is that what you had in mind?
Yes No
If No, go to
BK_X7a2 If Yes, go to
BK_X7b
Tolani skawa izo zilongolenge naumo mukughanaghanira kuti pali mupata wuli wakuti Pick the number of peanuts that reflects how likely you think it is that you
# OF PEANUTS
in plate
BK_X7a2: Mutayikenge muvya vinkhonde (5) vikwiza ivi kwambira mwahuno will die within a five-year period beginning today
(LEAVE PEANUTS ON PLATE)
[_____] if 10 go to
BK4 or BK5 depending if
they changed their answer compared to
the initial
number of peanuts in the main
questionnaire

Benefits of Knowledge Respondent ID [___________________]
Page 8
Add the number of peanuts that reflects how likely you think it is that you:
BK_X7b. Shazgilanimo skawa mumbale umu izo zilongolenge naumo mukughanaghanira kuti pali mupata wuli wakuti mutaikenge muvyaka khumi (10)vikwiza ivi kwambira mwahuno
will die within a ten-year period beginning today
(IT IS POSSIBLE TO ADD ZERO ADDITIONAL PEANUTS)
[_____]
BK_X8d: If BK_X7b>M9_X7B: Mazgolo yinu kwasono yakuoneska kuti mupata wakuti mungataika muvyaka 10 vikwiza ivi ngukulu kupambana nauwo mukayowoya
pakwambilira pala apo nanguwa nindamuoneskani uthenga uwo mukayowoya. Ivi ndivo vanguba mumaghanoghano ghinu? Your answers show that you now think that the chance of dying within the next 10 years are larger than what you said before I gave you the information. Is that what you had in mind?
Yes No
If No, go to BK_X7b2
If Yes, go to BK4
BK_X8e: If BK_X7b<M9_X7B: Mazgolo yinu kwasono yakuoneska kuti mupata wakuti mungataika muvyaka 10 vikwiza ivi nguchoko kuyerezgera nauwo mukayowoya pakwambilira pala apo nanguwa nindamuoneskani uthenga uwo mukayowoya. Ivi ndivo vanguba mumaghanoghano
ghinu? Your answers show that you now think that the chance of dying within the next 10 years are smaller than what you said before I gave you the information. Is that what you had in mind?
Yes No
If No, go to
BK_X7b2 If Yes, go to BK4
BK_X8f: If BK_X7b=M9_X7B: Mazgolo yinu kwasono yakuoneska kuti mupata wakuti mungataika muvyaka 10 vikwiza ivi ukuyana waka nauwo mukayowoya pakwambilira pala apo nanguwa nindamuoneskani uthenga uwo mukayowoya. Ivi ndivo vanguba mumaghanoghano ghinu? Your answers show that you now think that the chance of dying within the next 10 years are equal to
what you said before I gave you the information. Is that what you had in mind?
Yes No
If No, go to BK_X7b2
If Yes, go to BK4
Tolani skawa izo zilongolenge naumo mukuganizira kuti pali mupatata wuli wakuti Pick the number of peanuts that reflects how likely you think it is that you
# OF PEANUTS
in plate
BK_X7b2: Mutayikenge muvyaka khumi (10) vikwiza ivi kwambira mwahuno will die within a ten-year period beginning today
(LEAVE PEANUTS ON PLATE)
[_____]
go to BK4 or BK5
depending if
they changed their answer compared to
the initial number of peanuts in the main
questionnaire
Interviewer: Confirm if the respondent has changes the number of beans on the plate compared to his/her initial answer. If the respondent
did NOT change his/her answer, continue with question BK4. If the respondent did change his/her answer, continue with question BK5.
BK4 Chifukwa wuli mundakhumbe
yayi kusintha zgolo linu?
Why did you not want change your
answer: (select all that apply)
Nkhumanya kale kuti banthu wakukhala nyengo yitalimwakuti palije
chachilendo chilichose icho nasambilapo I already
knew that people live longer so I did not learn anything new …………1
Nkhugomezga yayi uthenga uwo mwanipa I do not believe
the information you gave me ............................................................... 2

Benefits of Knowledge Respondent ID [___________________]
Page 9
The
information you provided was not very clear ..................................... 3
Palije uyo wangapenekera za kufwa kwake. Nobody can predict their
mortality .............................................................................................. 4
Vinyakhe Other
[_________________________________]...................... 5
BK5.
Kasi ntchifukwa wuli icho mwasintila zgolo
linu?Why did you change your
answer? (select all that appy)
Nkhamanyanga yayi kuti banthu wakukhala nyengo yitali I did not know
that
people live longer …………………………………….………….……. 1
Naugomezga uthenga uwo mwanipasa I believe the
information you gave me …………………………….…………………….2
Uthenga uwo mwanipasa ngwakukhumbikira chomeneThe
information you provided to me was very convincing ……………………3
Vinyakhe Other
…………………………………………………………………..4
Paumaliro, ghanaghanirani vyakuti pali mupata wuli wakuti munthu munyakhe watayikenge apo nyengo yikuluta.
Nimufumbaninge vya munthu wakumughanaghanira waka uyo wakuchita vinthu nga imwe ndipo
nimulongosolenge kwa imwe.
Finally, I would like you to consider the likelihood that somebody else dies as time goes by. I am going to ask you about an
imaginary person living in the same context like you, and I am going to describe him/her to you.
INTERVIEWER: Empty the 3rd
cup infront of the respondent. For each of questions X8a to X8d start with an empty plate
and 10 peanuts. Do not leave peanuts on plate. If the respondent used ½ peanut, replace it after asking the question with
one whole peanut and make sure that the respondent starts with 10 whole peanuts.
Tolani skawa izo zilongolenge kuti pali mupata wuli wakuti yumoza mwa banthu awa watayikenge mukatikati mwa vyaka vinkhonde kwambira mwahuno:
Pick the number of peanuts that reflects how likely you think it is that one of the following persons will die within a five-year period beginning today:
# of peanuts in plate
BK_X8a For men:
Mwanalume wa vyaka nga imwe wankhongono uyo walije HIV? A man your age who is healthy and does not have HIV?
For women: Mwanakazi wa vyaka nga imwe wankhongono uyo walije HIV?
A woman your age who is healthy and does not have HIV?
[_____]
BK_X8b For men:
Mwanalume wavyaka nga imwe uyo wali na HIV ndipo wandayambe kulwala?
A man your age who is infected with HIV?
For women: Mwanakazi wavyaka nga imwe uyo wali na HIV ndipo wandayambe kulwala? A woman your age who is infected with HIV?
[_____]

Benefits of Knowledge Respondent ID [___________________]
Page 10
BK_X8c For men:
Mwanalume wa vyaka nga imwe uyo wakuluwala Edzi?
A man your age who sick with AIDS?
For women: Mwanakazi wa vyaka nga imwe uyo wakuluwala Edzi? A woman your age who sick with AIDS?
[_____]
BK_X8d
For men: Mwanalume wa vyaka ngati imwe uyo wakulwala Edzi kweni wakupokera wovwiri wa ART? A man your age who sick with AIDS and who is treated with antiretroviral treatments (ART)?
For women:
Mwanakazi wa vyaka ngati imwe uyo wakulwala Edzi kweni wakupokera wovwiri wa ART?A
woman your age who sick with AIDS and who is treated with antiretroviral treatments (ART)?
[_____]

10 persons your age and sex alive today
Less than 1 person will have DIED
Anthu ochepera mmodzi adzakhala ATAMWALIRAMore than 9 persons will still be ALIVE
Anthu opitilira 9 adzakhala akadali MOYO
About 1 person will have DIED
Pafupifupi munthu mmodzi adzakhala ATAMWALIRA
About 9 persons will still be ALIVE
Anthu 9 adzakhala akadali MOYO
Today/Lero
Woman Aged < 45 Years Old
5 Years from today/Zaka 5 kuchokera lero
10 Years from today/Zaka 10 kuchokera lero
Anthu 10 aakazi ndipo a zaka ngati inu amene alimoyo lero
Mkazi wa zaka zapakati pa zochepera 45 zakubadwa

10 persons your age and sex alive today
Less than 1 person will have DIED
Anthu ochepera mmodzi adzakhala ATAMWALIRAMore than 9 persons will still be ALIVE
Anthu opitilira 9 adzakhala akadali MOYO
About 1 person will have DIED
Pafupifupi munthu mmodzi adzakhala ATAMWALIRA
About 9 persons will still be ALIVE
Anthu 9 adzakhala akadali MOYO
Today/Lero
Woman Aged 45 to 49 Years Old
5 Years from today/Zaka 5 kuchokera lero
10 Years from today/Zaka 10 kuchokera lero
Anthu 10 aakazi ndipo a zaka ngati inu amene alimoyo lero
Mkazi wa zaka zapakati pa 45 ndi 49 zakubadwa

10 persons your age and sex alive today
Less than 1 person will have DIED
Anthu ochepera mmodzi adzakhala ATAMWALIRAMore than 9 persons will still be ALIVE
Anthu opitilira 9 adzakhala akadali MOYO
Slightly more than 1 person will have DIED
Anthu opesera pang’ono mmodzi adzakhala ATAMWALIRA
Almost 9 persons will still be ALIVE
Pafupifupi anthu 9 adzakhala akadali MOYO
Today/Lero
Woman Aged 50 to 54 Years Old
5 Years from today/Zaka 5 kuchokera lero
10 Years from today/Zaka 10 kuchokera lero
Anthu 10 aakazi ndipo a zaka ngati inu amene alimoyo lero
Mkazi wa zaka zapakati pa 50 ndi 54 zakubadwa

10 persons your age and sex alive today
Less than 1 person will have DIED
Anthu ochepera mmodzi adzakhala ATAMWALIRAMore than 9 persons will still be ALIVE
Anthu opitilira 9 adzakhala akadali MOYO
Between 1 to 2 persons will have DIED
Pakati pa munthu mmodzi ndi awiri adzakhala ATAMWALIRA
About 8 to 9 persons will still be ALIVE
Pakati pa anthu 8 kapena 9 adzakhala akadali MOYO
Today/Lero
Woman Aged 55 to 59 Years Old
5 Years from today/Zaka 5 kuchokera lero
10 Years from today/Zaka 10 kuchokera lero
Anthu 10 aakazi ndipo a zaka ngati inu amene alimoyo lero
Mkazi wa zaka zapakati pa 55 ndi 59 zakubadwa

10 persons your age and sex alive today
Approximately 1 person will have DIED
Pafupifupi munthu mmodzi adzakhala ATAMWALIRAApproximately 9 persons will still be ALIVE
Pafupifupi anthu 9 adzakhala akadali MOYO
Between 2 to 3 persons will have DIED
Pakati pa anthu awiri kapena atatu adzakhala ATAMWALIRA
About 7 to 8 persons will still be ALIVE
Pakati pa anthu 7 kapena 8 adzakhala akadali MOYO
Today/Lero
Woman Aged 60 to 64 Years Old
5 Years from today/Zaka 5 kuchokera lero
10 Years from today/Zaka 10 kuchokera lero
Anthu 10 aakazi ndipo a zaka ngati inu amene alimoyo lero
Mkazi wa zaka zapakati pa 60 ndi 64 zakubadwa

10 persons your age and sex alive today
Between 1 to 2 persons will have DIED
Pakati pa munthu mmodzi ndi awiri adzakhala ATAMWALIRAAbout 8 to 9 persons will still be ALIVE
Pakati pa anthu 8 kapena 9 adzakhala akadali MOYO
Between 3 to 4 persons will have DIED
Pakati pa anthu atatu ndi anayi adzakhala ATAMWALIRA
About 6 to 7 persons will still be ALIVE
Pafupifupi anthu 6 kapena 7 adzakhala akadali MOYO
Today/Lero
Woman Aged 65 to 69 Years Old
5 Years from today/Zaka 5 kuchokera lero
10 Years from today/Zaka 10 kuchokera lero
Anthu 10 aakazi ndipo a zaka ngati inu amene alimoyo lero
Mkazi wa zaka zapakati pa 65 ndi 69 zakubadwa

10 persons your age and sex alive today
Between 2 to 3 persons will have DIED
Pakati pa anthu awiri kapena atatu adzakhala ATAMWALIRAAbout 7 to 8 persons will still be ALIVE
Pafupifupi anthu 7 kapena 8 adzakhala akadali MOYO
Around 5 persons will have DIED
Pafupifupi anthu 5 adzakhala ATAMWALIRA
About 4 to 5 persons will still be ALIVE
Pafupifupi anthu 4 kapena 5 adzakhala akadali MOYO
Today/Lero
Woman Aged 70 to 74 Years Old
5 Years from today/Zaka 5 kuchokera lero
10 Years from today/Zaka 10 kuchokera lero
Anthu 10 aakazi ndipo a zaka ngati inu amene alimoyo lero
Mkazi wa zaka zapakati pa 70 ndi 74 zakubadwa

10 persons your age and sex alive today
Between 3 to 4 persons will have DIED
Pakati pa anthu atatu kapena anayi adzakhala ATAMWALIRAAbout 6 to 7 persons will still be ALIVE
Pakati pa anthu 6 kapena 7 adzakhala akadali MOYO
Almost 7 persons will have DIED
Pafupifupi anthu 7 adzakhala ATAMWALIRA
About 3 persons will still be ALIVE
Pafupifupi anthu atatu adzakhala akadali MOYO
Today/Lero
Woman Aged 75 to 79 Years Old
5 Years from today/Zaka 5 kuchokera lero
10 Years from today/Zaka 10 kuchokera lero
Anthu 10 aakazi ndipo a zaka ngati inu amene alimoyo lero
Mkazi wa zaka zapakati pa 75 ndi 79 zakubadwa

10 persons your age and sex alive today
Almost 5 persons will have DIED
Pafupifupi anthu 5 adzakhala ATAMWALIRAAbout 5 persons will still be ALIVE
Pafupifupi anthu 5 adzakhala akadali MOYO
About 7 to 8 persons will have DIED
Pakati pa anthu 7 kapena 8 adzakhala ATAMWALIRA
About 2 to 3 persons will still be ALIVE
Pakati pa anthu awiri kapena atatu adzakhala akadali MOYO
Today/Lero
Woman Aged 80 plus Years Old
5 Years from today/Zaka 5 kuchokera lero
10 Years from today/Zaka 10 kuchokera lero
Anthu 10 aakazi ndipo a zaka ngati inu amene alimoyo lero
Mkazi wa zaka zapakati pa 80 kapena kupyolera apo zakubadwa
Copyright © 2022 FDOKUMEN