PROviding Computing solutions for ExaScale ChallengeS
163
This project has received funding from the European Union’s Horizon 2020 research and innovation programme under grant agreement No 777533. PROviding Computing solutions for ExaScale ChallengeS D4.1 Initial state of the art and requirement analysis, initial PROCESS architecture Project : PROCESS H2020 – 777533 Start / Duration: 01 November 2017 36 Months Dissemination 1 : PU Nature 2 : R Due Date: Month 6 Work Package: WP 4 Filename 3 D4.1_Initial_ state_of_the_art_and_requirement_analysis_ initial_PROCESS_architecture_v1.docx ABSTRACT The PROCESS project brings together heterogeneous use cases with unique challenges that the current solutions are unable to meet. This deliverable provides requirement and innovation potential analysis of the use cases together with their detailed description. On the basis of the analysis, the common conceptual model and initial PROCESS architecture have been developed. According to the technological state of the art, we have identified technologies that will help solve the use case challenges, which will be revised during the lifetime of PROCESS, taking into account the involved technologies for both computing resource management and data management deployed and used across existing European Research Infrastructures (RI). This version is a draft of D4.1 and is under review. 1 PU = Public; CO = Confidential, only for members of the Consortium (including the EC services). 2 R = Report; R+O = Report plus Other. Note: all “O” deliverables must be accompanied by a deliverable report. 3 eg DX.Y_name to the deliverable_v0xx. v1 corresponds to the final release submitted to the EC.
-
Upload
khangminh22 -
Category
Documents
-
view
2 -
download
0
Transcript of PROviding Computing solutions for ExaScale ChallengeS

This project has received funding from the European
Union’s Horizon 2020 research and innovation programme under grant agreement No 777533.
PROviding Computing solutions for ExaScale ChallengeS
D4.1 Initial state of the art and requirement analysis, initial PROCESS architecture
Project : PROCESS H2020 – 777533 Start /
Duration: 01 November 2017 36 Months
Dissemination1: PU Nature2: R
Due Date: Month 6 Work Package: WP 4
Filename3 D4.1_Initial_ state_of_the_art_and_requirement_analysis_ initial_PROCESS_architecture_v1.docx
ABSTRACT
The PROCESS project brings together heterogeneous use cases with unique challenges that the current solutions are unable to meet. This deliverable provides requirement and innovation potential analysis of the use cases together with their detailed description. On the basis of the analysis, the common conceptual model and initial PROCESS architecture have been developed. According to the technological state of the art, we have identified technologies that will help solve the use case challenges, which will be revised during the lifetime of PROCESS, taking into account the involved technologies for both computing resource management and data management deployed and used across existing European Research Infrastructures (RI).
This version is a draft of D4.1 and is under review.
1 PU = Public; CO = Confidential, only for members of the Consortium (including the EC services).
2 R = Report; R+O = Report plus Other. Note: all “O” deliverables must be accompanied by a deliverable report.
3 eg DX.Y_name to the deliverable_v0xx. v1 corresponds to the final release submitted to the EC.

This version is a draft of D4.1 and is under review. 2
Deliverable Contributors:
Name Organization Role / Title
Deliverable Leader4
Hluchý, L. UISAV Deliverable coordinator
Contributing Authors5
Bobák, M., Dlugolinský, Š., Habala, O., Nguyen, G., Šeleng, M., Tran, V.
UISAV Writers
Pancake-Steeg, J., Spahr, S.
LSY Writers
gentschen Felde, N., Heikkurinen, M., Höb, M., Schmidt, J.
LMU Writers
Graziani, M., Müller, H. HES-SO Writers
Maassen, J., Spreeuw, H. NLESC Writers
Belloum, A., Cushing, R., Rahmanian, A.
UvA Writers
Bubak, M., Meizner, J., Nowakowski, P., Rycerz, K., Wilk, B.
AGH / AGH-UST
Writers
Reviewer(s)6
Cushing, Reginald UvA Reviewer
Graziani, Mara HES-SO Reviewer
Habala, Ondrej UISAV Reviewer
Höb, Maximilian LMU Reviewer
Maassen, Jason NLESC Reviewer
Meizner, Jan AGH / AGH-UST
Reviewer
Nowakowski, Piotr AGH / AGH-UST
Reviewer
Spahr, Stefan LSY Reviewer
Final review and approval
gentschen Felde, Nils LMU Project coordinator
Document History
Release Date Reasons for Change Status7 Distribution
0.1 2018-01-18 Initial version Draft 2018-01-18
0.2 2018-02-09 Final version of the document structure
Draft 2018-02-09
0.3 2018-03-09 1st improvement of the draft version
Draft 2018-03-09
0.4 2018-04-10 2nd improvement of the draft version
Draft 2018-04-10
4 Person from the lead beneficiary that is responsible for the deliverable.
5 Person(s) from contributing partners for the deliverable.
6 Typically person(s) with appropriate expertise to assess the deliverable quality.
7 Status = “Draft”; “In Review”; “Released”.

This version is a draft of D4.1 and is under review. 3
0.5 2018-04-17 Preparation of the prefinal version
In Review 2018-04-17
0.6 2018-04-23 Reviewing In Review 2018-04-23
0.7 2018-04-25 1st language correction In Review 2018-04-25
0.8 2018-04-28 2nd language correction In Review 2018-04-28
1.0 2018-04-30 Final version Released 2018-04-30

This version is a draft of D4.1 and is under review. 4
Table of Contents
Executive Summary ................................................................................................................... 8
List of Figures ............................................................................................................................. 9
List of Tables ............................................................................................................................ 11
Introduction ............................................................................................................................... 12
1 Use case analysis ............................................................................................................. 12
1.1 UC#1: Exascale learning on medical image data ..................................................... 12
1.1.1 Use Case Domain .............................................................................................. 12
1.1.2 Use Case Motivation .......................................................................................... 12
1.1.3 Use Case Goal ................................................................................................... 12
1.1.4 Use Case Description......................................................................................... 13
1.1.5 ‘Data Upload’ workflow ....................................................................................... 14
1.1.6 ‘Model Training’ workflow ................................................................................... 15
1.1.7 ‘Model Testing’ workflow .................................................................................... 18
1.1.8 Software layers ................................................................................................... 18
1.1.9 Methods and tools .............................................................................................. 19
1.1.10 Datasets’ description .......................................................................................... 19
1.1.11 Requirement analysis ......................................................................................... 20
1.1.12 Innovation potential ............................................................................................ 21
1.2 UC#2: Square Kilometre Array/LOFAR..................................................................... 23
1.2.1 Use Case Domain .............................................................................................. 23
1.2.2 Use case Motivation ........................................................................................... 23
1.2.3 Use Case Goal ................................................................................................... 23
1.2.4 Use Case Description......................................................................................... 23
1.2.5 Use Case Scenario ............................................................................................ 25
1.2.6 Methods and tools .............................................................................................. 27
1.2.7 Dataset description............................................................................................. 28
1.2.8 Requirement analysis ......................................................................................... 28
1.2.9 Innovation potential ............................................................................................ 29
1.3 UC#3: Supporting innovation based on global disaster risk data ............................. 30
1.3.1 Use Case Domain .............................................................................................. 30
1.3.2 Use Case Motivation .......................................................................................... 30
1.3.3 Use Case Goal ................................................................................................... 30
1.3.4 Use Case Description......................................................................................... 30
1.3.5 Software layers ................................................................................................... 31
1.3.6 Workflow ............................................................................................................. 32
1.3.7 Methods and tools .............................................................................................. 33

This version is a draft of D4.1 and is under review. 5
1.3.8 Datasets’ description .......................................................................................... 33
1.3.9 Requirement analysis ......................................................................................... 34
1.3.10 Innovation potential ............................................................................................ 34
1.4 UC#4: Ancillary pricing for airline revenue management ......................................... 35
1.4.1 Use Case Domain .............................................................................................. 35
1.4.2 Use Case Motivation .......................................................................................... 35
1.4.3 Use Case Goal ................................................................................................... 35
1.4.4 Use Case Description......................................................................................... 36
1.4.5 Software layers ................................................................................................... 37
1.4.6 Scenario ............................................................................................................. 37
1.4.7 Methods and tools .............................................................................................. 38
1.4.8 Datasets’ description .......................................................................................... 38
1.4.9 Requirement analysis ......................................................................................... 39
1.4.10 Innovation potential ............................................................................................ 41
1.5 UC#5: Agricultural analysis based on Copernicus data ........................................... 42
1.5.1 Use Case Domain .............................................................................................. 42
1.5.2 Use Case Motivation .......................................................................................... 42
1.5.3 Use Case Goal ................................................................................................... 42
1.5.4 Use Case Description......................................................................................... 42
1.5.5 Software layers ................................................................................................... 43
1.5.6 Workflow ............................................................................................................. 43
1.5.7 Methods and tools .............................................................................................. 44
1.5.8 Dataset description............................................................................................. 44
1.5.9 Requirement analysis ......................................................................................... 44
1.5.10 Innovation potential ............................................................................................ 45
2 Common conceptual model .............................................................................................. 46
2.1 Requirements Analysis .............................................................................................. 46
2.1.1 Use Case 1: Exascale learning on medical image data .................................... 46
2.1.2 Use Case 2: Square Kilometre Array/LOFAR ................................................... 47
2.1.3 Use Case 3: Supporting innovation based on global disaster risk data ............ 48
2.1.4 Use Case 4: Ancillary pricing for airline revenue management ........................ 49
2.1.5 Use Case 5: Agricultural analysis based on Copernicus data .......................... 49
2.2 General Requirements .............................................................................................. 50
2.3 Summary .................................................................................................................... 51
3 Architecture ....................................................................................................................... 53
3.1 Architecture components ........................................................................................... 53
3.2 The initial technology-based architecture ................................................................. 56
4 State of the art of services ................................................................................................ 58

This version is a draft of D4.1 and is under review. 6
4.1 State of the art of extreme large data services ......................................................... 58
4.1.1 Challenges facing Exascale data management ................................................ 58
4.1.2 Exascale data management projects ................................................................. 61
4.1.3 Distributed file systems: a current overview and future outlook ........................ 61
4.2 Data Delivery service for extreme data application .................................................. 68
4.2.1 State of the art .................................................................................................... 68
4.2.2 LOBCDER .......................................................................................................... 71
4.3 Federated Metadata storage service for extreme data application .......................... 74
4.3.1 State of the art .................................................................................................... 74
4.3.2 DataNet............................................................................................................... 80
4.4 Secure and trusted storage and data access ........................................................... 82
4.4.1 State of the art .................................................................................................... 82
4.5 Integration of data management with service orchestration ..................................... 87
4.6 State of the art of extreme large computing services ............................................... 88
4.6.1 Challenges facing exascale computing ............................................................. 88
4.6.2 Exascale computing projects ............................................................................. 89
4.7 Interactive execution environment ............................................................................ 89
4.7.1 State of the art .................................................................................................... 89
4.7.2 EurValve Model Execution Environment ......................................................... 100
4.7.3 Rimrock execution environment ....................................................................... 101
4.7.4 Atmosphere cloud platform .............................................................................. 102
4.8 Benchmarking and monitoring services .................................................................. 104
4.8.1 State of the art .................................................................................................. 104
4.8.2 Conclusions and the chosen solution .............................................................. 106
4.9 Programming of multi-core architecture .................................................................. 108
4.9.1 State of the art .................................................................................................. 108
4.9.2 PUMPKIN ......................................................................................................... 110
4.10 Services for Big Data processing and manipulation ............................................... 112
4.10.1 State of the art of Big Data processing frameworks ........................................ 112
4.10.2 State of the art of Big Data manipulations based on software requirements of
use cases ........................................................................................................................ 113
4.11 State of the art of orchestration services ................................................................ 116
4.11.1 Challenges facing exascale orchestartion ....................................................... 116
4.11.2 Exascale orchestration projects ....................................................................... 116
4.12 Service deployment and orchestration .................................................................... 117
4.12.1 State of the art .................................................................................................. 117
4.12.2 TOSCA ............................................................................................................. 118
4.12.3 Cloudify ............................................................................................................. 120

This version is a draft of D4.1 and is under review. 7
4.13 Services for data access and integration ................................................................ 122
4.13.1 State of the art .................................................................................................. 122
4.14 Application-oriented scientific gateway ................................................................... 127
4.14.1 State of the art .................................................................................................. 127
Conclusion .............................................................................................................................. 129
List of Abbreviations ............................................................................................................... 129
References ............................................................................................................................. 132
5 Appendix ......................................................................................................................... 144
5.1 Performance analysis of the main technological tools ............................................ 144
5.1.1 LOBCDER ........................................................................................................ 144
5.1.2 DataNet............................................................................................................. 147
5.1.3 EurValve Model Execution Environment ......................................................... 153
5.1.4 Rimrock execution environment ....................................................................... 154
5.1.5 Atmosphere cloud platform .............................................................................. 155
5.1.6 Zabbix ............................................................................................................... 155
5.1.7 PUMPKIN ......................................................................................................... 157
5.1.8 TOSCA ............................................................................................................. 162
5.1.9 Cloudify ............................................................................................................. 162
5.1.10 DISPEL ............................................................................................................. 163

D4.1 Executive Summary
This version is a draft of D4.1 and is under review. 8
Executive Summary This deliverable represents the first attempt at integrating the requirements of the five use
cases with the known state of the art in extreme data solutions. Due to the nature of this
challenge, it was necessary to bring all this information into a single document, despite the
difficulty of managing such a large deliverable. Splitting the text into distinct deliverables would
have run the risk of missing areas where the use case requirements - that are often orthogonal
with respect to each other, at least at first glance - can nevertheless be fulfilled with common
solutions and approaches.
The integration of the requirements and the state fo the art is centred on a description of a
high-level architectural approach that will be used as a starting point in all of the future activities
of the project. As such, the role of the deliverable is to provide a comprehensive historical
"snapshot" of the original foundations of the development. Due to the ambitious nature of the
project use cases, it is likely that many of the details described in this document will change
during the project lifetime. In fact, we assume that this evolution (that will be documented in
the deliverables D4.2, D4.3, D4.4 and D4.5) and the reasoning behind the changes may be of
equal interest and value in terms of exploitable knowledge.
To make this evolution of the structure of PROCESS solutions more intuitive to follow, we have
used the information contained in this document as a basis for an online solution that allows
comparing this first version of the architecture, subsequent architecture and state-of-the art
versions as well as the latest "live" version of the document with each other. This resource can
be accessed at https://confluence.lrz.de/pages/viewpage.action?pageId=87393327.
The aim of this document is to provide the requirements analysis of the use cases, an initial
state of the art, and a description of the initial architecture of the PROCESS project. The
document starts with the analysis of the requirements and innovation potential of our use cases
as the main influencer of the project. This analysis is followed by a common conceptual model
and the description of the initial architecture. Those two models represent a (conceptual, and
technological) design of a platform that addresses the requirements of the use cases.
Subsequently, the technological state of the art is described, and the best technical solutions
selected to meet the technological requirements of the initial architecture as well as functional
requirements arising from the use cases.
The document has the following structure:
• Section 1 presents requirements that are vital for the use cases in terms of functionality,
software components, and hardware infrastructure. It also includes a detailed
description of the use cases and analysis of their innovation potential.
• Section 2 describes the common conceptual model providing an abstraction for the
architecture design.
• Section 3 describes the initial architecture, with a high-level structure of the project
platform.
• Section 4 describes the state of the art with regard to technologies that are necessary
to fulfil all of the requirements. It includes a detailed technical description of the tools
selected to be used as the project’s software components.
The document represents a specification for the project platform which will be implemented
during later stages.
The design of the platform will be updated according to new requirements that will come from
other work packages (WP2, WP3, WP5, WP6, WP7).

D4.1 List of Figures
This version is a draft of D4.1 and is under review. 9
List of Figures Figure 1: WSIs preprocessing pipeline .................................................................................................................... 13 Figure 2: Data Upload workflow. ............................................................................................................................ 15 Figure 3: Network Training workflow. .................................................................................................................... 17 Figure 4: Workflow Phases and Application Scenarios........................................................................................... 18 Figure 5: The Low-Frequency Array or LOFAR ........................................................................................................ 24 Figure 6: The calibration and imaging pipeline for a single observation. .............................................................. 26 Figure 7: Output images produced after Direction Independent Calibration (left) and additional Direction
Dependent Calibration (right). ................................................................................................................................ 27 Figure 8: The pre-2017 GAR workflow. ................................................................................................................... 32 Figure 9: The post-2017 GAR workflow. ................................................................................................................. 32 Figure 10: Workflow scenario. ................................................................................................................................ 37 Figure 11: Booking-Flight-Ancillary Relations......................................................................................................... 39 Figure 12: Workflow of use case 5. ......................................................................................................................... 43 Figure 13: Conceptual model of use case 1. ........................................................................................................... 47 Figure 14: Conceptual model of Use Case 2. .......................................................................................................... 48 Figure 15: Conceptual model of Use Case 3. .......................................................................................................... 48 Figure 16: Conceptual model of Use Case 4. .......................................................................................................... 49 Figure 17: Conceptual model of use case 5. ........................................................................................................... 50 Figure 18: Common conceptual model. .................................................................................................................. 51 Figure 19: The initial functional design of the PROCESS architecture. ................................................................... 55 Figure 20: The technology components of PROCESS’ architecture ........................................................................ 57 Figure 21: Conceptual design of LOBCDER ............................................................................................................. 72 Figure 22: Interaction of the main SDN components. ............................................................................................ 73 Figure 23: Conceptual design of DataNet ............................................................................................................... 81 Figure 24: Conceptual design of Metadata repository. .......................................................................................... 82 Figure 25: The method of integration of the DISPEL process enactment into LOBCDER........................................ 88 Figure 26: Flow of the R Notebook execution. ........................................................................................................ 90 Figure 27: Architecture of DataBricks using AWS Cloud. ....................................................................................... 92 Figure 28: Architecture of Beaker notebook. .......................................................................................................... 93 Figure 29: Jupyter architecture. .............................................................................................................................. 94 Figure 30: Cloud Datalab running in Google Cloud Platform. ............................................................................... 96 Figure 31: Architecture of Zeppelin. ....................................................................................................................... 97 Figure 32: EurValve Model Execution Environment (MEE) architecture. ............................................................. 100 Figure 33: Rimrock architecture. .......................................................................................................................... 102 Figure 34: The architecture of Atmosphere. ......................................................................................................... 103 Figure 35: Benchmarking and monitoring services. ............................................................................................. 104 Figure 36: Monitoring architecture. ..................................................................................................................... 107 Figure 37: Anatomy of a Pumpkin node ............................................................................................................... 111 Figure 38: Spark Streaming ecosystem ................................................................................................................. 113 Figure 39: TOSCA topology template structure .................................................................................................... 118 Figure 40: Example of relationships between components in the Tosca template .............................................. 120 Figure 41: Cloudify manager architecture ............................................................................................................ 121 Figure 42: Centralized approach to data ............................................................................................................. 122 Figure 43: A decentralized approach to data processing ..................................................................................... 123 Figure 44: The distributed architecture of the Admire system. ............................................................................ 124 Figure 45: Integration of the DISPEL Gate into the data processing system of PROCESS. ................................... 126 Figure 46: Slice-view of application-oriented scientific gateway. ........................................................................ 128 Figure 47: Transitions among monitoring states visualised in the gateway ........................................................ 128 Figure 48: Average Session time for various concurrent users requests (128 to 1024) on different configurations
of LOBCDER (number of workers varies from 1 to 16). [Koulouzis1 2016]. .......................................................... 145 Figure 49: LOBCDER reacts to drop of performance due to third party data transfer on the worker host worker.
LOCDER switch to another worker to avoid slow connection [Koulouzis1 2016]. ............................................... 146

D4.1 List of Figures
This version is a draft of D4.1 and is under review. 10
Figure 50: Simulating network congestion ........................................................................................................... 147 Figure 51: Results of the test case 1 (execution time). ......................................................................................... 148 Figure 52: Results of the test case 2 (execution time). ......................................................................................... 149 Figure 53: Results of the test case 2 (TPS). ........................................................................................................... 149 Figure 54: Results of the test case 3 (execution time). ......................................................................................... 150 Figure 55: Results of the test case 3 (TPS). ........................................................................................................... 151 Figure 56: Results of the test case 4 (execution time). ......................................................................................... 152 Figure 57: Results of the test case 4 (TPS). ........................................................................................................... 152 Figure 58: Packet coalescing processing efficiency .............................................................................................. 158 Figure 59: Packet coalescing processing efficiency .............................................................................................. 158 Figure 60: Packet coalescing processing efficiency .............................................................................................. 159 Figure 61: Packet coalescing processing efficiency .............................................................................................. 159 Figure 62: Aggregate and mean of predicted compute backlog on network over time ...................................... 160 Figure 63: Predicted compute backlog calculated using Lyapunov quadratic function, and the Lyapunov ........ 161

D4.1 List of Tables
This version is a draft of D4.1 and is under review. 11
List of Tables Table 1: Current technologies and local existing infrastructure. ............................................................................ 16 Table 2: Datasets description. ................................................................................................................................ 19 Table 3: Dataset metadata description. ................................................................................................................. 20 Table 4: PROCESS common concepts required per use case. ................................................................................. 52 Table 5: Overview of exascale data management projects.................................................................................... 61 Table 6: Categorisation of metadata. ..................................................................................................................... 75 Table 7: Interactive execution environment comparison. ...................................................................................... 97 Table 8: Overview of test case 1. .......................................................................................................................... 148 Table 9: Overview of test case 2. .......................................................................................................................... 149 Table 10: Overview of test case 3. ........................................................................................................................ 151 Table 11: Overview of test case 4. ........................................................................................................................ 153

D4.1 Introduction
This version is a draft of D4.1 and is under review. 12
1 Introduction The aim of the PROCESS project is to create prototypes that will be able to handle exascale
services. This goal will be achieved by creating tools and services that will support
heterogenous exascale use cases driven by both the scientific research community and the
industry. Both communities require extreme processing power as well as extreme storage
resources. Work package 4 is responsible for design of a novel architecture, capable of
handling exascale applications. However, the scope of the document is broader and therefore
the document itself is the result of joint work of multiple work packages.
Accoring to the description of the deliverable, the main objectives are to provide (within the
responsible work package):
• initial per-use case requirement analysis (WP2)
• initial per-use case innovation potential analysis (WP2)
• common conceptual model (WP3)
• initial PROCESS architecture (WP4)
• state of the art for systems, platforms and services for extreme data applications (WP5)
• state of the art for systems, platforms and services for extreme computing
applications (WP6)
• state of the art for service orchestration and user interfaces (WP7)
2 Use case analysis
2.1 UC#1: Exascale learning on medical image data
2.1.1 Use Case Domain Healthcare, digital histopathology.
2.1.2 Use Case Motivation The use case motivation is to improve the performance of automated cancer diagnostics and
treatment planning. We plan to develop more powerful tools for cancer detection, localisation
and stage classification, which could support the decisions of physicians during the diagnostic
process. Cancer diagnostics are generally time-consuming and suffer from high disagreement
rates between pathologists, since tumour stages do not have defined boundaries [Jimenez-
del-Toro, 2018]. Through visualisation and interpretation of the network decisions, the level of
objectivity in the diagnostics can be increased, consequently reducing the analysis time and
disagreement rates.
The resources brought by the connection between High Performance Computing (HPC) and
medical imaging research would permit analysis of large-scale challenge datasets for medical
imaging. The training of multiple deep learning models could be distributed among different
computational centres and more complex models could be trained with shorter time
constraints.
2.1.3 Use Case Goal The final goal is to improve the performance of the current state-of-the-art algorithms for cancer
detection through the accomplishment of three main objectives. The first objective is the
development of image analysis algorithms for supervised and weakly supervised learning.
Supervised learning attempts to learn a mapping f(.) between each datapoint x (e.g. the
histopathology image) and its label y (e.g. presence of cancer, cancer stage, cancer locations)
such that y = f(x). The introduction of weak labeling will enable the use of scarcely annotated
data to improve model performance and generalisation. To further build upon these
advantages, unsupervised learning algorithms can be used to model unannotated data, thus
removing the need of manual annotation before training. The trained networks are used on

D4.1 Use case analysis
This version is a draft of D4.1 and is under review. 13
testing data to identify tumorous regions and to suggest pathologists possible tumorous
regions in the histopathology image. Visualisation methods can be used to gather
instantaneous feedback and explanations for the network decisions, thus increasing the
reliability of the models and improving trust in the developed tools [Montavon, 2017]. The
second objective is the distribution of training across multiple computational centres. Neural
networks can be independently trained at different computational centres, obtaining a speed
up in time proportional to their number. The models could then be assembled into a single
model with improved generalisation abilities. The third objective consists of investigating the
trade-off between performance and computational resources by increasing the size of the
datasets and the computational complexity of the models. For example, an enormous amount
of computations is required if slight perturbations are introduced in the data and multiple
models are trained to investigate model robustness. Overall, the presented objectives will
contribute to the analysis of huge collections of medical data, and therefore to the development
of improved algorithms for the automatic suggestion of patient cancer stage and correlated
patient cases.
2.1.4 Use Case Description Digital histopathology is the automatic analysis of a biopsy or surgical tissue specimens, which
are captured by a high resolution scanner and stored as Whole Slide Images (WSIs). WSIs
are usually stored in a multi-resolution pyramid structure, where each layer contains down-
sampled versions of the original image. The amount of information in WSIs is huge, since it
includes tissue that is not relevant for cancer diagnosis (e.g. background, stroma, healthy
tissue etc.) For this reason machine learning and deep learning models are built to detect
Region of Interest (ROI) within WSIs. ROIs are portions in the WSIs where the cancer is
spreading and therefore contain relevant information to train the network.
Figure 1 shows an example of the data preprocessing pipeline. As a first step the raw WSIs
are analysed at a very low resolution level, and tissue is filtered from the background. Based
on doctor’s annotations, tumor regions are isolated. These regions represent ROIs which are
used to perform network training. From the normal tissue and from tumor ROIs, patches are
extracted at a higher level of magnification. Higher resolution highlights qualitative features of
the nuclei which are essential for cancer detection. For instance, recent research has shown
that performance of classifiers improves with higher resolution patches [Liu, 2017].
Figure 1: WSIs preprocessing pipeline: Normal tissue and tumor tissue masks are extracted and high-resolution patches are sampled from the selected regions.

D4.1 Use case analysis
This version is a draft of D4.1 and is under review. 14
Exascale learning on medical image data aims at improving the performance of decision
support in the process of cancer detection, localisation and staging/grading to optimize and
personalize treatment planning. The automated tools deliver decision support for physicians,
speed up visual inspection of tissue specimens and reduce subjectivity in the grading/staging
process.
The use case tackles cancer detection and tissue classification using histopathology images,
such as CAMELYON and TUPAC. The PROCESS infrastructure allows us to develop more
complex models and to use increasingly larger amounts of data at a finer scale.
Access to exascale computing will consistently decrease the turn-around time of the
experiments, pushing the boundaries of computation and consequently allowing researchers
to develop models that are otherwise computationally unfeasible.
The main focus of the use case and technologies will be on the application of content-based
tasks on WSIs, which are gigapixel images. As an example, three main tasks will be
addressed:
• Search - e.g. "Are there patients with comparable scan results? Are there
corresponding study cases?"
• Detection - e.g. "Where can cancerous tissue be detected? Are there cancerous
changes visible in this scan?"
• Classification - e.g. "Which stage does this cancer belong to?"
A typical use case scenario can be defined as follows: “The researcher wants to train a deep
neural model from a large corpus of WSIs (>>1TB). The training procedure requires intense
prototyping for the customisation of the neural network architecture, learning criteria and
dataset preprocessing. In addition, handling WSI datasets requires efficient storage of large
datasets.”
To make an example, approximatively 1000 WSI are included in the CAMELYON17 dataset,
500 of which contain annotations and metadata (such as a description of the patient case,
image width and height, the number of resolution levels and a text report with the main findings
in the image). Tumors as small as 100x100 pixels should be detected in 200,000x100,000
gigapixel microscopy images. A brute-force approach would perform pixel-by-pixel analysis,
requiring the classification of more than 109 elements. If the state-of-the-art model for image
classification is used, e.g. ResNet [He, Kaiming 2016], the number of operations needed for
training is on the order of 1017, with at least 3.6 GFLOPS required per each full scan of the
training data (i.e. epoch), which may increase to 11.6 GFLOPS if the depth of the network is
increased. Hence, with 50 training epochs, the computations required scale up to the order of
exaflops and several days on a single dedicated GPU. Moreover, such a large dataset (each
resolution level occupies, on average, 50 to 60 GB) calls for a dedicated infrastructure to
handle the storage requirements and data processing [Szegedy 2015]. Hence the
requirements for intensive computations and massive storage.
The exascale infrastructure provided will be used by three main workflows of the use case:
data upload, model training and model testing and deployment, which are presented below.
2.1.5 ‘Data Upload’ workflow The collected datasets need to be uploaded to the HPC infrastructure and distributed on
parallel storage. Different approaches could be used. As the first stage, local copies will be
made on each centre. However, a streaming server which could handle file locations and data
transfer is needed. Correct handling of the data and its distribution to both CPU and GPU
clusters in the PROCESS architecture should be ensured and eventual bottlenecks during I/O
operations and data decoding should be correctly handled.

D4.1 Use case analysis
This version is a draft of D4.1 and is under review. 15
Figure 2 summarises the workflow. The datasets need to be available on the server where the
network training will be performed. Hence the need for a user-friendly data infrastructure, which
should guarantee data management and delivery. For instance, the main modules required
would concern: data transfer, data management and data access. Moreover, the Hadoop
ecosystem with Apache Spark should be preferred, as both are frequently used and easy to
apply.
Figure 2: Data Upload workflow. The full dot represents the starting point in the workflow and the dot sorrounded by a circle represents the ending point. The raw WSIs are transfered to the PROCESS infrastructure, which needs to handle and distribute the dataset within the different computational centres.
Current software and hardware infrastructure used
The current system implementation works on datasets that can be manually downloaded from
the websites of public challenges (e.g. Camelyon, TUPAC). Data is saved on a local NAS that
can be accessed by different users. Raw WSIs are saved as BIGTIFF files with annotations
saved in separate files (i.e. XML, CSV, binary, etc.).
2.1.6 ‘Model Training’ workflow Different Deep Neural Networks (referred to as "networks" in this section) need to be trained
and monitored. For this workflow, we identify three main phases and three different application
scenarios. The three phases consist of:
• Phase 1: Patch Extraction - thousands of high resolution patches are extracted from
raw WSIs
• Phase 2: Local and Distributed Training - supervised and unsupervised training is
performed on the extracted dataset of patches in both local and distributed fashion, and
training statistics are monitored
• Phase 3: Performance Boosting - multiple training runs are relaunched with data
perturbations to address model robustness
The three different scenarios for the workflow can be pictured as follows:
• Scenario n.1: Moving the models to hospitals. Different models are trained
independently at each data centre and finally ensambled and made available to
hospitals for local testing.
• Scenario n.2: Distributing training to the data location. Training is distributed across
centres on different portions of data and computations are dynamically handled. This
scenario simulates the distribution of training to where the data resides, especially in
cases of private data that cannot leave the hospital environment.
• Scenario n.3: Dataset sizes and model complexities are jointly increased over multiple
training runs and pareto frontiers are investigated.

D4.1 Use case analysis
This version is a draft of D4.1 and is under review. 16
Figure 3 summarises the DNN training workflow. Network development is currently performed
locally on less powerful infrastructures, using a series of tools for data processing and
manipulation (reported in Table 1). The libraries that are generally involved in network training
set the requirements for a user-friendly infrastructure where it is possible to create virtual
environments that can replicate the development environment. Docker containers can be used
to create separable, self-contained virtual environments in which to develop software and run
programs. The 'image' of a Docker module can contain standalone and ready-to-be-executed
packages of software, tools, libraries and settings. The flexibility of these containers allows
porting complex software development environments required by Machine Learning and Deep
learning.
Moreover, network training calls for a service-oriented infrastructure that is easily scalable to
large computations. The setup of a Hadoop ecosystem will scale up to larger datasets within
the HPC and Cloud computing infrastructures.
Table 1: Current technologies and local existing infrastructure.
Currently used
technologies:
Python 2.7, Tensorflow 1.4.0, Caffe, Theano, Lasagne, DIGITS,
mxnet, Keras 2.1.2, TFLearn, Numpy, SciPy, Pandas, Scikit-learn,
OpenCV, Openslide, Matplotlib, Seaborn, Skimage, h5py, PyTorch,
OpenBLAS, cuDNN, FFmpeg, NLTK, Gensim, R, Weka.
Data Storage: NAS
Data Processing H5DS, Apache Spark, Hadoop
Existing
computing
infrastructure:
8 GPUs
Data preprocessing is the second step in the workflow and belongs to the Patch Extraction
phase. In this phase many of the technologies mentioned in Table 1 are used to process the
information in the WSI. The intermediate results of image preprocessing (ex. patch extraction,
data augmentation output, image metadata) need to be stored so that they could be used for
multiple training runs. Data preprocessing is intrinsically parallel and should be scaled to
multiple CPU cores.
The third step in the workflow is network training, which requires as input a configuration file
containing a list of model settings and the WSI data (both metadata and images). The network
training process itself is generally highly parallelizable. The parallelization might be performed
at different levels and could involve both CPUs and GPUs. For instance, the simplest training
configuration settings should enable parallel training on a single node with multiple GPU cores.
More sophisticated parallelization methods would scale the computations on different nodes.
Parallelization could then be performed at different scales, namely at the data level and at the
model level. On the one hand, parallelization at the data level involves the use of different
nodes to run the same portion of code on different batches of data. In this context data storage
may represent a huge bottleneck in the organization of the clusters, and therefore the
PROCESS Data Manager should be able to identify and tackle possible issues. On the other
hand, the parallelization could be performed at the model level, involving the development of
more sophisticated models that distribute the tasks among different workers. However, this
method is generally discouraged since the communication latency between cluster nodes

D4.1 Use case analysis
This version is a draft of D4.1 and is under review. 17
might be a limiting factor. Therefore, the development of models that could efficiently use the
computational power of the PROCESS infrastructure stands as a perfect use case for the
project, involving a series of challenges in the development that still need to be tackled. The
training will also be distributed across the multiple centres. As a first scenario (Scenario n.1),
different models will be trained independently on each data centre and the final results will then
be ensambled in one single model with higher generalisation. This scenario is close to the
hospital reality where the hospitals could download the trained models and deploy them locally
without the need to share the data. In Scenario n.2, training is distributed across the centres
and the computations are dynamically handled. This scenario will highlight the challenges of
distributing computations on physically distant centres. Dedicated handling of job queuing and
data routing is needed to organise the computations among nodes. The final scenario,
(Scenario n.3) addresses the task of constantly increasing model complexities and dataset
sizes. For instance, the number of extracted patches will increase and data augmentation will
be used to test model performances for increasing dataset sizes. Moreover, the different
resolution layers will be used to create more complex models and performances will be
recorded for a growing number of model parameters.
In all the scenarios, network training will be monitored in real time, therefore a service to
visualise statistics and collect feedback is needed.
The final output of training consists of the trained network model (e.g. weights, checkpoints,
training statistics), which should be stored in the system for testing. The trained model should
be made available for download for local testing.
The convention for the model saving format generally includes a series of HDF5 files on the
order of several MB per file, often scaling up to GB when larger models are trained. The use
case should not exclude the possibility to train several different models and store the results
in a dedicated file system.
Figure 3: Network Training workflow. The solid dot represents the starting point in the workflow and the dot sorrounded by a circle represents the ending point.

D4.1 Use case analysis
This version is a draft of D4.1 and is under review. 18
The different stages in the pipeline and the three application scenarios are summarized in
Figure 4.
Figure 4: Workflow Phases and Application Scenarios.
Current software and hardware infrastructure used
Currently state-of-the-art models are trained locally on a GPU server with 4 Tesla K80 cores.
The hyperparameter setting phase takes place in a local machine and data processing is then
adjusted accordingly. The raw data on the NAS data storage is accessed and local copies of
the data, following preprocessing, are made on the server. Training is performed on one single
GPU node, and, eventually, multiple models are trained on distinct GPUs. The training
statistics are accessible in real time and the trained model is stored on the server and can be
downloaded for local testing.
2.1.7 ‘Model Testing’ workflow A user-friendly infrastructure for model testing is required. The dataset and the test model need
to be specified as input. The testing output and statistics should be returned as output. The
testing could be performed in parallel by multiple CPU cores for processing large amounts of
testing data. The trained models need to be available for external download, so that local
testing could be possible.
Model Testing will assess the performance of the developed models and will simulate their
distribution across hospitals. For instance, the models trained at different centres and their
ensambles will be made accessible to the research community for download and local testing
on private data.
Current software and hardware infrastructure used
Two different modalities are available for testing. In the first case the testing data is loaded to
NAS storage and the trained models are tested on the server. In the second case the trained
models are downloaded from the server and tested locally on the user machine.
2.1.8 Software layers The key software layers for this use case are focused on pattern recognition, statistical
modelling and deep learning. However, the approach could be relevant in modelling problems
where the amount of data to be analysed is the key challenge. Extremely large datasets might
be difficult to download, and hospitals might require a high level of confidentiality. As a
generalised solution, the “Evaluation as a Service” (EaaS) could be seen as a “Clean slate”
approach to dealing with very large datasets, especially ones that require sophisticated access
control e.g. due to privacy issues. In EaaS the data remains in a central infrastructure and does
not need to be moved. For example, data might remain internal at hospitals, or be made

D4.1 Use case analysis
This version is a draft of D4.1 and is under review. 19
available in a closed cloud environment. The VISCERAL project [ref] represents an example
where the data is kept in a central space and the algorithms are moved to the data.
2.1.9 Methods and tools Content-based search relies on the theoretical and practical results of two decades of research
into content-based information retrieval. The consortium members are directly involved in
capturing and evaluating the state of the art in content-based image search e.g. through their
involvement in organising the annual [ImageCLEF] events.
The “Evaluation as a Service” approach relies on the results of several projects, e.g.
[VISCERAL]. The main benefits involve the possibility of working with the data on situ and
therefore allowing hospitals not to reveal sensible data. Moreover, the use of the computational
resources is reserved to the training of the models, which has the highest computational
demands.
2.1.10 Datasets’ description The datasets, which we describe in Table 2, consist of digitalized pathology images from
human tissues which will not be changed once transferred. The image characteristics and
analytics depend on the disease types, as well as the data structure, which changes across
datasets. The ground-truth annotations of the data are contained in files which may vary in
format and size.
The preprocessing of the data should be able to generate an intermediate dataset of image
patches, which need to be stored and visualised for validation and training.
Table 2: Datasets description.
Dataset Name Estimated size Description Format Annotations
Camelyon17 >3TB 1000 WSI, 100
patients BIGTIFF XML file
Camelyon16 >1TB 400 WSI BIGTIFF XML file +Binary
Mask
TUPAC16 >3TB WSI BIGTIFF CSV file
TCGA >3TB WSI BIGTIFF TXT file
PubMed
Central
~ 5 million
images Low resolution
Multiple
formats
NLP of image
captions
SKIPOGH >30TB WSI BIGTIFF
Datasets’ metadata
Histopathology scans contain both annotations and clinical metadata, so that physicians can
easily access a complete picture of the case. Metadata generally include overall information
about the file, such as image shape, number of resolution layers, layer sizes, patient data and
scanner information. A brief clinical description of the case may also be included. Table 3
presents a short summary of the metadata fields and types.

D4.1 Use case analysis
This version is a draft of D4.1 and is under review. 20
Table 3: Dataset metadata description.
metadata field field type
image width string
image height string
number of resolution layers int
layers shape list of integer pairs (width, height)
subsampling levels list of integers
patient's information set of string data
clinical description textual information
scanner type string
2.1.11 Requirement analysis The main requirements derive from the challenging nature of the tasks:
1. The possibility to use Docker containers would provide openness to different
programming languages tools and frameworks, together with their constant update.
Moreover, Docker containers are perfectly suited to the EaaS framework, since they
can be independently distributed among hospitals without the need to connect to the
main infrastructure.
2. A PROCESS Environments Manager that could guarantee a flexible building,
deployment and management of multiple running applications. Training monitoring is
one of the essential requirements for exascale training. The distribution of the training
across the different computing resources needs to be monitored constantly.
3. An efficient data storage system that takes into account the different image formats and
resolutions across the datasets and ensures flexibility and adaptation to a variety of
datatypes. For instance, WSIs are generally saved as BIGTIFF files, and paired with
annotation files that might be either XMLs or CSVs of even TXTs. Moreover, datasets
such as PubMed central require the possibility to handle and process JPEG, MPEG
and more common image compression formats with the same degree of elasticity. As
exascale requirements, we need the distribution of the datasets across the different
computational centres, ensuring fast connectivity between the local storage and the
computational resources to reduce internal latency.
4. The possibility of performing dense linear algebra on distributed-memory HPC
systems. Multiple GPU computation libraries should be used to merge multiple CUDA
kernels. Furthermore, top-level development of the deep models should be performed
using the most common machine learning and deep learning frameworks (e.g.
Tensorflow 1.4.0, Keras 2.1.2, TFLearn, Caffe, Microsoft CNTK, Nvidia DIGITS,
Theano, etc.).

D4.1 Use case analysis
This version is a draft of D4.1 and is under review. 21
5. The distribution of training runs across different centres requires automated detection
of the optimal model parameters and efficient scheduling of processes to the available
resources.
6. A user-friendly environment for locating the data, launching training runs, monitoring
the results and downloading outputs.
Software requirements
1. The set of common tools for machine learning and deep learning reported in Table 1
e.g. Tensorflow, Keras, Theano, PyTorch), together with the necessary GPU drives
(e.g. CUDA, Nvidia CuDNN).
2. The possibility to update, upgrade and switch between tools with a high level of
flexibility.
3. Support for standard tools for Medical Imaging, such as OpenSlide, ASAP and DICOM.
4. An environment for Python development, possibly with support of Jupyter notebooks.
5. The Spark and Hadoop frameworks to efficiently handle distributed data storage, and
the compatibility with more common local development formats such as HDF5.
Hardware requirements
1. Access to GPUs for network training
2. Access to CPU clusters for data preprocessing, data postprocessing, network testing
3. High RAM capacity
4. High internal caching to reduce the number of I/O operations
5. Accessibility of the data from both CPUs and GPUs with low latency in the
communication between nodes
Security and privacy requirements
The project will mainly use public datasets that are available online and have no security and
privacy constraints. Data collection will not be performed within the context of the project,
although previously acquired data may be used in conjunction with hospitals. In such cases
the data will be pseudonymised, thus retaining a level of detail in the replaced data that should
allow tracking back of the data to its original state. In this way the ethical constraints related to
the usage of patient data will also be addressed. However, the use of sensible data sets the
need for specific security requirements:
1. Access control. Access to the data should be restricted to a subset of authorised users.
2. Traceability. It should be possible to trace back access history to the user, place and
date/time when the access was performed.
3. The Evaluation-as-a-Service approach will address the privacy constraints concerning
the use of patient data in research. Algorithms used to detect ROIs and visual
similarities in the data can be designed by using large training datasets from a variety
of sources, such as cohort studies. In such a scenario, pattern detection and
classification are performed in a closed environment, namely virtual machines or
Docker containers. This approach supports an open development of models and
algorithms, and avoids data protection issues by processing information that should not
leave the hospitals "in situ".
2.1.12 Innovation potential
Current state
Deep learning frameworks and their large-data requirements have finally reached a point that
necessitates collaboration with major data centres. Training time complexity and computing
requirements have become a strong limitation in the development of successful applications
of deep learning to the medical imaging field. Researchers are frequently forced to find
alternative solutions to avoid the complexity of their models to reach the boundaries of the
D4.1 Use case analysis
This version is a draft of D4.1 and is under review. 22
computing power they have available, and this may affect the performance of these algorithms.
Similarly, the size of the datasets makes data exchange prohibitive and development on
multiple infrastructures is often discouraged in favour of an 'in situ' approach. To ease the
development process and thus develop more powerful solutions for medical imaging the limits
of computing power and data storage need to be pushed far beyond current boundaries.
Solutions from PROCESS
PROCESS will contribute to bring to researchers an infrastructure where it will be possible to
develop novel patter recognition and machine learning algorithms for the medical domain with
improved flexibility, speed performances and more powerful systems. PROCESS will allow
researchers in the medical imaging community who are not experts in the field of HPC to
access exascale infrastructures. This would promote the development of exascale deep
learning models for analysis of large histopathology datasets. Highly complex models could be
trained within the HPC infrastructure on massive datasets and made available for the digital
histopathology community. Many different architectures will be tested to extend learning to
weakly annotated data. Intermediate results of computations, which might be several orders
of magnitude larger than the original data, will be efficiently stored with PROCESS. Moreover,
PROCESS will provide an EaaS of the algorithms developed, which will be run in a sandboxed
environment on the data that is not allowed to be shared.
As a result, we expect a decrease of the turn-around time of the experiments and of the
development of the models for digital image analysis, thus allowing the development of
applications otherwise computationally infeasible.
Refinement and Innovations
Access to HPC will lead to better detection and classification of cancer stages, thus improving
the treatment of medical conditions and consequently improving the quality of life of patients.
The research community will benefit from insights on the project via Open Access scientific
publications.
As a result, we expect a decrease of the turn-around time of the experiments and of the
development of the models for digital image analysis, thus allowing the development of
applications otherwise computationally infeasible.
The Evaluation-as-a-Service paradigm in the PROCESS project will provide additional interest
for researchers by giving them the opportunity to run/evaluate their algorithms on the
PROCESS HPC infrastructure on large data sets and subsets thereof in order to train their
machine learning models, which can potentially improve the learning curve for scientific
communities examining new techniques/services. At the same time, this approach also avoids
the need for large data downloads and eliminates possible privacy constraints that often come
with medical data, as the data itself does not leave the hosting site's boundaries at any given
time and can thus not be matched with other data, which can lead to security breaches. Beyond
that, shipping the algorithm to the data where it is run on a specialized HPC architecture, can
absorb the needs of research communities that require access to data to validate tools.
Key performance indicators
The key performance indicators will be measured in terms of an increase in the data volume
available to train the tools, and in the consequent increase in performance. Algorithm
performance will be evaluated on the basis of overall training time and data storage
requirements, the accuracy of models developed and cumulative errors in the evaluation of
medical data.

D4.1 Use case analysis
This version is a draft of D4.1 and is under review. 23
2.2 UC#2: Square Kilometre Array/LOFAR
2.2.1 Use Case Domain Radio Astronomy.
2.2.2 Use case Motivation LOFAR is a state-of-the art radio telescope capable of wide field imaging at low frequencies.
It has been ingesting data into a long-term archive (the LOFAR LTA) since 2012 and its volume
is now expanding at a rate of approximately 5-7PB/year. The LOFAR LTA consists of tapes at
locations in Amsterdam (The Netherlands), Jülich (Germany) and Poznan (Poland). Its current
volume is about 28 PB. This consists mostly of "Measurement Sets", i.e. visibilities - correlated
signals from LOFAR stations. LOFAR is one of the testbeds for the Square Kilometer Array
(SKA) and is similar to the part of SKA that will be built in Australia.
Initially, the data produced by LOFAR is reduced and analysed by the astronomers who
requested the observations. Subsequently, the data is ingested in the LTA. Since LOFAR is a
wide field radio telescope, the LTA should contain a wealth of serendipitous discoveries, like
transient radio sources. Such sources can only be discovered by massive analysis of data from
these observations.
The first step in the analysis is often the creation of images from the data which the astronomer
can inspect. Unfortunately, significant processing and expert knowledge is needed to produce
these image cubes from observations stored in the archive. As a result of these difficulties, the
LOFAR LTA is largely unexplored by astronomical research. We want to unlock the LOFAR
LTA and increase its scientific output.
2.2.3 Use Case Goal The goal of this use case is to simplify the processing of archived data. Astronomers should
be able to select a dataset on a portal, select a workflow, and then launch the processing
pipeline from there. For this we need an easy to use, flexible, efficient and scalable workflow
infrastructure for processing of extremely large volumes of astronomical observation data.
PROCESS will provide a mechanism to run containerized workflows, thereby improving the
portability and easy of use. A suitable portal is needed to select datasets and workflows.
Through this portal, the astronomer must be able to browse through the available datasets and
available workflows, and launch processing directly from there to the hardware infrastructure
available in the project. Data should then be transferred from the LTA to the processing
infrastructure, processed, and the results made available in the portal.
Currently, the processing of a dataset typically takes much longer than the observation time
used to acquire the dataset. For example, to process a single 8-hour observation using the
calibration and imaging workflow described below currently takes about 4 days (due to the lack
of parallelisation of part of the workflow). To keep up with the speed at which data is generated,
it is essential to increase the processing performance. Running the same workflow in parallel
on different dataset provides the horizontal scalability required for processing the LOFAR
archive, and (in the future) the SKA archive as well. Vertical scalability will be achieved by
applying multi- and many-core techniques.
2.2.4 Use Case Description Analysing the massive volumes of data stored in the archive is an acute problem. For example,
even with the LOFAR data volumes (currently 28 PB), a significant percentage of the archived
data is never used, mostly because only expert users are capable of accessing and processing
such data.

D4.1 Use case analysis
This version is a draft of D4.1 and is under review. 24
Figure 5: The Low-Frequency Array or LOFAR, is a large radio telescope consisting of an array of approximately 8000 omnidirectional antennas concentrated in 51 stations distributed throughout Europe. The central station is shown in the top right image, and a close up of the antenna’s is shown top left. The bottom images show the distribution of stations in Europe. Images courtesy of ASTRON (http://www.lofar.org/)
The LOFAR radio telescope consists of around 8000 antennas in 51 stations. These antennas
produce approximately 25 GB/s, which needs to be processed in real time to combine their
signals into a single view of the sky. This data is stored in the LOFAR Long term archive (LTA),
which is distributed over Amsterdam, Juelich and Groningen. Data is typically stored on tape
and can be accessed via a web portal or SRM client. The data remains private to its originating
project for a year following acquisition, but is made public afterwards.
Individual observations produce up to 100TB of data. These are typically reduced to 16 TB
before being stored in the archive. Each observation is stored in a well-defined directory
structure, containing multiple files with both the metadata and the measurements themselves.
A major hurdle is that the archive stores partially processed observations (also referred to as
visibilities), not the images or sky maps that astronomers typically use as a starting point for
their research. Once unknown sources are detected in the sky maps, the astronomers often

D4.1 Use case analysis
This version is a draft of D4.1 and is under review. 25
need to run more detailed analysis on the visibilities directly. For this reason, the visibilities are
stored in the archive, not the sky maps.
The initial conversion of the observations into sky maps requires several processing steps,
such as retrieving the data from tape, performing RFI (Radio Frequency Interference) removal,
calibration, and imaging. Unfortunately, due to the large data volumes (tens to hundreds of
TBs), and complexity of the tools, each of these processing steps take a significant amount
time and effort by the astronomer. Further automating this part will significantly simplify the use
of the stored observations, and allow the astronomer to focus on the science instead of the
preprocessing of the data.
2.2.5 Use Case Scenario In a typical use case an event is detected in the sky, for example a satellite detects a flash of
gamma radiation at a certain position. Subsequently, astronomers want to observe this same
patch of the sky with other instruments, such as optical and radio telescopes. Additionally, the
astronomers want to check past observations to determine if any objects had previously been
detected at the given position. To do so, data must be retrieved from the archive that covers
this position on the sky, and be converted into sky maps.
Besides inspecting single observations, astronomers also perform surveys where a large
number of observations are combined to analyse certain features or detect certain events in
large portions of the sky. For such surveys, a large number of observations must be processed
by the same workflow, for example to create larger sky maps.
The workflow
The current pipeline is developed by Leiden University and SURFsara in the Netherlands. It is
based on the following software:
• uberftp client
[http://www.lofar.org/wiki/doku.php?id=public:grid_srm_software_installation]
• globus-url-copy client
[http://www.lofar.org/wiki/doku.php?id=public:grid_srm_software_installation]
• voms-client (only on the login node)
[http://www.lofar.org/wiki/doku.php?id=public:grid_srm_software_installation]
• CVMFS [https://cernvm.cern.ch/portal/filesystem]
• PiCaS
[http://docs.surfsaralabs.nl/projects/grid/en/latest/Pages/Practices/picas/picas_overvie
w.html]
• python 2.7 or higher
• pre-FACTOR [https://github.com/lofar-astron/prefactor]
• DDF [https://github.com/mhardcastle/ddf-pipeline]
A gridFTP enabled client is required for the interaction with the Grid storage (dCache). Voms
tools should be installed and configured to support the LOFAR VO to allow users (or 'robot
users') to create proxies with LOFAR attributes. Installing and configuring CVMFS with
Softdrive mount point enables access to the LOFAR software tree from any compute node.
A single server runs the PiCaS system which uses the CouchDB database for storing the
descriptions of jobs. Python is required to execute the staging scripts and interact with the
CouchDB API via a python-based client. The processing clients require outbound internet
connectivity to retrieve job descriptions from PiCaS.

D4.1 Use case analysis
This version is a draft of D4.1 and is under review. 26
Figure 6: The calibration and imaging pipeline for a single observation. The astronomer triggers the staging of a 16 TB observation from the archive to temporary storage. This data is then first processed by the Direction Independent Pipeline which may run in parallel on up to 244 nodes (taking approx. 4 hours). Next, the Direction Dependent Pipeline is run on a single node (taking approx 4 days) and produces up to output 244 images of 25K x 25K resolution for inspection by the astronomer.
As a first step in the processing pipeline (shown above), the observation data needs to be
downloaded from the archive. This may require retrieving the data from tape and storing it on
temporary storage (dCache). From there, the data is accessible via GridFTP.
The workflow consists of 2 pipelines, the Direction Independent Pipeline (DI), and the Direction
Dependent Pipeline (DD). Both pipelines perform calibration, which is essential to detect the
weakest possible signals. Calibration is needed to remove interference from the instrument
and the ionosphere, thereby increasing the sensitivity of the telescope significantly.
Calibration starts by converting a sky-map of well known radio sources into visibilities, using a
Fourier transform to convert to (u, v, w) space, and interpolating from a regular grid to the
irregular grid measured by LOFAR. This gives the "ground truth" visibilities. Next, the observed
visibilities of the well-known sources need to be mapped to match this ground truth. The
mapping matrix is derived through a least-squares fitting algorithm (such as Levenberg-
Marquardt).
The DI pipeline creates a single mapping matrix which is applied to the entire observation. This
calibration serves as a starting point for the DD pipeline, which performs a similar calibration
for dozens to hundreds of directions within the LOFAR array beam.
The outputs of both pipelines are shown in Figure 7 below. Although images may be produced
after DI, they are limited in resolution and contain residual errors caused by disturbances in
the ionosphere which vary over the field of view. This is shown the left image in Figure 7. The
DD takes the output of the DI as input and further reduces the errors to produce high resolution,
low error images, as shown in the right image of Figure 7.

D4.1 Use case analysis
This version is a draft of D4.1 and is under review. 27
Figure 7: Output images produced after Direction Independent Calibration (left) and additional Direction Dependent Calibration (right). The image left clearly contains artifacts caused by the ionosphere. These are subsequently removed by the direction dependent calibration, shown on the right. Image courtesy of (Shimwel et al.: The LOFAR two meter sky survey).
DI uses the pre-FACTOR package to perform the initial calibration. Internally it consists of
several steps, some of which can be run in parallel. As shown in Figure 6, it splits the input
data into 244 subbands which can be processed independently. Each subband becomes a
separate calibration job. Each job requires a relatively small input of 1.2 GB, which is reduced
to an output of around 3 MB. When all jobs are finished, a second calibration job combines the
results into a single table approximately 100 MB in size.
This table is then applied to the observation target, which again is split into 244 jobs, one for
each subband. Each job requires around 60GB of input, and produces around 1.2 GB of output.
The output of these jobs is then again combined into the final DI calibrated datasets, which
consist of around 300 GB of data. The entire DI takes around 4 hours for a single dataset when
running on 244 nodes.
Following the crude direction independent (DI) calibration, direction dependent calibration (DD)
is performed. This is an iterative procedure on the target field, which is called self calibration.
It is currently implemented using the DDF package on a single node (using all the cores of one
high-end CPU). This takes about four days uses the initial calibration output (300GB) to reduce
the 16 TB of observation data to 0.5 TB. This data is then converted to a collection of (up to)
244 images at 25k x 25k resolution (1.2 GB each).
Currently, the processing is performed on the Gina cluster of SURFsara, which is located in
Amsterdam. Where the jobs of the DI pipeline can be run on relatively simple compute nodes
with 8 GB of RAM and 100 GB of scratch space, the DD pipeline requires a single high-end
machine with at least 256GB of RAM and 3 TB of scratch.
To process a single observation, approximately 27K core hours are required to run the pipeline.
To process the complete archive an estimated 47M core hours is currently needed. An
additional 8 to 12M core hours is needed each year to keep up with the 5-7 PB of data produced
yearly. Note that these estimates are for running a single pipeline on all data, using a single
configuration. However, for different science cases different configurations or pipelines are
used. Therefore, this estimate is a lower bound for the processing time that is required.
2.2.6 Methods and tools Currently, the data is retrieved from the LTA using gridftp. The production of image cubes from
this measurement data relies on a number of standalone applications (pre-FACTOR and DDF)
D4.1 Use case analysis
This version is a draft of D4.1 and is under review. 28
which need to be run in sequence. An EOSCpilot project in which the Netherlands eScience
Center is involved is currently automating this workflow using the Common Workflow
Language (CWL) and Docker / Singularity. These codes can be reused in PROCESS.
2.2.7 Dataset description LOFAR uses the aperture synthesis technique for collecting data for imaging. Consequently,
a LOFAR imaging run results in a large number of "visibilities" - signals correlated between
different stations with a time delay determined by the direction on the sky of the target of the
observation.
A typical LOFAR observation takes 8-12 hours and results in a data set with a size of about
16TB, after every eight consecutive frequency channels have been averaged into one channel,
which always happens before ingestion into the LOFAR Long Term Archive. Currently, this
archive contains 28 PB, and is growing at 5-7 PB each year.
Each observation is stored in a so called “MeasurementSet” as defined in the Common
Astronomy Software Applications package (CASA). CASA is developed by an international
consortium of scientists under the guidance of the National Radio Astronomical Observatory
(NRAO).
For the LTA each MeasurementSet contains a number of directories (typically 244 of 488), one
for each subband of measured frequencies. Each of these directories contains several “tables”
(binary files), one for the measured data, and several for the metadata.
The metadata includes the timespan of the observation, the time sampling, the frequency
range and frequency channel width. It also includes the pointing of the observation, i.e. the
right ascension and declination of the target (i.e., the sky coordinates independent of earth
rotation) and the positions of the LOFAR stations in earth coordinates.
The actual data consist of "visibilities", i.e. correlations between the antenna signals as they
are combined per LOFAR station. These are single precision complex numbers in large binary
files (typically 64 GB each). Although these binary files can be easily read, each complex
visibility has to be paired with a point (u, v, w) in Fourier space, which requires correct
interpretation of the metadata of the observation and calls for dedicated software. A number
of software packages for interpreting radio interferometric data - a.k.a. "aperture synthesis" -
are available.
2.2.8 Requirement analysis The main requirements for this use case are:
1. A user-friendly environment for selecting the data and workflows, launching the
workflows, monitoring the results and downloading outputs.
2. The possibility to use Docker or Singularity containers as workflow steps to allow each
step to use different analysis tools and dependencies.
3. A mechanism to run the workflows on suitable processing hardware. While some parts
of the workflow may run in parallel on relatively simple compute nodes (24 cores, 8 GB
memory, 100GB scratch storage), other parts currently run sequentially on a fat node
with significant memory (256 GB or more, 3 TB scratch storage).
4. An efficient data management system that is capable of efficiently transporting the
MeasurementSets from the archive locations in Amsterdam, Juelich and Poznan to the
processing locations.
5. The capability to horizontally scale to a significant number of compute resources to in
order to run a large number of (independent) workflows at the same time. Since
processing the entire archive for a single science case already requires a significant

D4.1 Use case analysis
This version is a draft of D4.1 and is under review. 29
amount of core hours O(47M), handling multiple science cases simultaneously will
require up to exascale resources.
Software requirements
1. Python virtual environment
2. Support for Docker or Singularity containers
3. gridftp for downloading measurement data
4. Voms-client to manage gridftp access
5. CVMFS client to distribute singularity containers
6. PiCaS installation to distribute work
Hardware requirements
1. Access to a sufficiently fast network to download the measurement dataset to
processes. At least 1 Gbit/s or faster, although 10 Gbit/s or higher is preferred.
2. Access to the PiCaS installation from the compute nodes.
3. Access to sufficient storage to temporarily store the measurement dataset, temporary
data, and output image cube. O(20TB) in total.
4. Access to CPU clusters for data preprocessing with fast access to the data.
5. (In the future) access to GPU clusters for data preprocessing with fast access to the
data.
Security and privacy requirements
The project will use public datasets that are already available online in the LOFAR archive and
have no security and privacy constraints. Data collection will not be performed within the
context of the project. The processed results (image cubes) produced within the project may
also be distributed freely without any security of privacy constraints.
2.2.9 Innovation potential
Current state
The current implementation of the LOFAR processing pipeline requires 4 days of processing
for a single 8-hour observation. This excludes the extraction of the data from the archive to the
processing location. In addition, and more importantly, significant expertise and effort is
needed to reduce the visibility data from the observation to image pixels.
Solutions from the PROCESS
PROCESS will provide the astronomers with a user-friendly portal on which they can select
the datasets and workflows they wish to use for processing. They can then launch the
workflows from this portal, after which the PROCESS infrastructure will be used to select a
suitable compute infrastructure and move the data from the archive to the location where it will
be processed. Once available, the output images will be made available through the portal.
This simple and easy access to exascale infrastructure will further open up the LTA to the
astronomy community, increase the scientific output of LOFAR, and serve as a stepping stone
for SKA, which will produce even more data.
Refinement and Innovations
Easy access to processing infrastructure from the LOFAR archive will increase the scientific
output. Presently, the LOFAR archive is hardly used and its scientific output is very low.
Key performance indicators
The key performance indicator is how easy it is for astronomers to process the data in the
archive, both for single observations and surveys (processing multiple observations).
Therefore, this should reduce the effort required.
D4.1 Use case analysis
This version is a draft of D4.1 and is under review. 30
Moreover, instead of a waiting for about a week (including staging the data from tape to disk)
to retrieve an image of the sky, it would be advantageous if this timespan could be reduced
significantly.
2.3 UC#3: Supporting innovation based on global disaster risk data
2.3.1 Use Case Domain Probabilistic modelling of natural hazards, risk assessment and provision of open data
products based on this modelling effort.
2.3.2 Use Case Motivation The initial motivation for the use case was providing a simple and efficient way to publish the
datasets that were used to produce the 2015 and 2017 UNISDR Global Assessment Reports
(GAR 2015 and the 2017 Risk Atlas). The datasets had previously been shared with
researchers (both in academia and e.g. at insurance companies) on request, however due to
resource constraints of the UN infrastructure available at the time, direct access to data
required hosting the data by the MNM-Team at LMU and building a simple download portal to
provide more seamless access to data.
Initially the secondary motivation was to collect data of the third-party use of the data and
identify PROCESS components and approaches that would allow the emerging community to
develop more fine-grained data curation and sharing practices. However, with the changes in
the UNISDR approach to future assessment report, this community support became a more
active topic of interest. As the 2019 GAR report is going to be based on a more open expert
consultation approach, addressing data management support in a more proactive way through
a high-level showcase (UNISDR/CIMA collaboration) has become necessary.
2.3.3 Use Case Goal The use case goals are a) to increase the efficiency of data generation and curation (simulated
data related to natural hazards) for probabilistic analysis purposes by the parties affiliated with
the UNISDR Global Assessment process and b) to encourage and facilitate third-party use of
these datasets.
2.3.4 Use Case Description N.B. There is, at the moment, considerable uncertainty related to mechanisms the GAR-like
data is produced and consumed as part of the global risk assessment process. The amount of
data is conceptually based on the following formula:
"Relevant surface area of area under analysis" X "resolution" X "number of scenarios needed
for probabilistic analysis" X "size of an individual scenario data"
The number of scenarios and the necessary resolution of the scenario data depends on the
type of hazard. For example, in case of analysing the earthquake risk it is not necessary to
pinpoint the exact position of the epicentre, as differences of the order of few kilometres do not
influence the possible outcomes in case of a major earthquake. However, impact of a flash
flood scenario may be dramatically different depending on small variations of location of the
maximum rainfall, surface structure and e.g. slight variations in the elevation of building and
infrastructure will have a major impact on the outcomes. Thus a global flood model will always
unavoidably be a compromise (some of these compromises are discussed in detail by Rudari
et al 2015 and Dottori et al 2016). The GAR 2015 dataset size (~1.5TB) should be seen as the
minimum, with the follow-up activities likely increasing the storage requirements by at least an
order of magnitude during the duration of the PROCESS project.

D4.1 Use case analysis
This version is a draft of D4.1 and is under review. 31
The PROCESS project supports the distribution of the GAR 2015 datasets using a simple web
portal. However, the plans for GAR 2019 will present additional challenges in addition to the
likely increase of resolution of analysis:
• Loss calculation process will become a community-based effort aiming at scientific
consensus (along the lines of the IPCC approach). Thus, there will be several datasets,
produced through different methodologies and, at least initially, residing in different
repositories (instead of a centrally managed system curated by UNISDR)
• Interaction between different research groups will almost certainly lead to the need for
supporting versioning of the datasets as the process of cross-correlation and analysis
uncovers opportunities for refinements and improvements in the accuracy of the
models. However, for traceability reasons all versions of the data would need to be
Findable, Accessible, Interoperable and Reusable (so-called FAIR principle, promoted
by the RDA).
Thus, the key to the success of UC#3 is to showcase lifecycle support for disaster risk
management data. This showcase would be aimed at convincing the data producers to apply
solutions that are interoperable with the PROCESS approach (or, in an ideal case, adapt the
PROCESS solution or PROCESS service). The initial key focus area of UC#3 will be in
supporting the risk modelling community with analysis of external reuse, based on the data
published using PROCESS tools becoming more active towards the end of the project.
The UNISDR collaboration aims at solving two interrelated problems: how to support
community uptake and broad range of innovation activities based on the new natural disaster
risk related open data products, and how to enable more efficient data management of the
disaster risk data in the face of increased amounts of data that will be produced in a more
dynamic fashion by a distributed, heterogeneous collaboration.
The work builds on the collaboration between UNISDR, LMU and LRZ that has supported the
refinements of the Global Assessment Report (GAR) production process and has produced
the first versions of the download portal that can be used to publish the GAR data as an open
data resource. The datasets can be used to perform probabilistic risk assessment on a global
scale and contain scenarios (typically thousands or tens of thousands tropical storms,
earthquakes, floods etc.) and vulnerability and exposure information that can be used to
assess the impact of particular hazard scenarios. Making GAR data publicly available will have
a multitude of uses in education (from civil engineering to sociology of risk perception), policy
formation (more accurate risk assessment in public investments and zoning) and industry
(common dataset that can be used to increase resilience in the complex supply chain
networks).
At the moment the dataset is relatively small (on the order of several terabytes), but increased
availability of more accurate GIS information and lifting of the current limitations related to
computational, data transfer and storage capacities are likely to increase this by orders of
magnitude – even without taking into account derived products and downscaled models that
the innovation ecosystem supported by the GAR data will produce. UC#3 and UC#5 are strong
candidates for cross-pollination and service reuse, as the diverse community brought together
by UC#3 will allow testing the broader relevance and usability of the solutions developed in the
context of UC#5 in a more multifaceted manner than the “pure” expert use by UC#5 users
could.
2.3.5 Software layers At the moment the focus is on providing a high-level framework that links the different hazard
scenarios, exposure and vulnerability information together using the so-called AME format
which is the consensus approach for the risk modelling community involved in GAR. The

D4.1 Use case analysis
This version is a draft of D4.1 and is under review. 32
different modelling components will produce their outputs in an AME compliant format, which
allows calculating the estimated disaster losses (taking into account risk reduction policies,
building codes, changes in population etc.) The overall focus of the use case is on modelling
and simulation.
2.3.6 Workflow The pre-2017 workflow of the overall GAR process is presented below:
Figure 8: The pre-2017 GAR workflow.
PROCESS support focuses on interaction and data sharing between the distributed hazard
modelling teams and the risk computation team at UNISDR. Once the GAR process has been
finalised, the hazard, exposure and vulnerability data would be turned into open data products.
The post-2017 GAR workflow differs considerably from this model:
Figure 9: The post-2017 GAR workflow.
D4.1 Use case analysis
This version is a draft of D4.1 and is under review. 33
The consensus process will encompass numerous teams performing analysis on a wide
variety of datasets (many-to-many relationship between datasets, teams and analyses). The
UNISDR/CIMA process represents just one of these combinations, albeit due to its scale and
nature as a recognised UNISDR project, it is a more far-reaching effort than most of the
contributions to the 2019 version of GAR. From the PROCESS point of view successful
completion of the data generation is important mainly as a way to establish relevance of the
project in the broader GAR community and to build foundations for deeper collaboration.
Current software and hardware infrastructure used
The current software infrastructure consists of running flood models with 90m resolution based
on the following software components:
• Matlab-based software components used for the generation of the input data of
Continuum (starting from the CORDEX dataset), for the hydrological calibration
procedure and for the probabilistic generation of a large number of flood scenarios,
based on previously computed water depth hazard maps and on the results of the
hydrological simulations.
• Hydrological model (Continuum, written in Fortran)
• Python-based loss computation solution for each scenario
The data generation is performed on the LRZ cluster.
2.3.7 Methods and tools While the basic structure of the data is grid-like, due to limitations of the resolution it is important
to take into account a group of adjacent grid points. Thus the risk modelling is not a trivially
parallel problem, and the ways to deal with this issue with the higher resolution datasets will
need to be reviewed.
Quality aspects of the prototype: the GAR data is, in principle, open and the key software
framework (CAPRA-GIS) is a mature open source solution used by a global community
involved in probabilistic risk modelling. The AME file format is a commonly accepted standard
that will be more formally documented as part of this project.
The developments can be tested both against earlier versions of the CAPRA software and by
re-calculating the results of the earlier GAR publications (issued in 2009, 2011, 2013 and
2015).
In terms of data management, the developments envisage moving from a model where the
bulk data transfer is sometimes performed by shipping physical hard drives to Geneva to a
model that is producing simulation results directly into a shared repository. This means that
the data services need to be integrated with workflows that are based on a very heterogeneous
set of software solutions (different in-house developments either as stand-alone programs or
running on top of a framework such as Matlab).
2.3.8 Datasets’ description The exposure, vulnerability and scenario datasets are used to generate high-level global
disaster risk assessment reports (e.g. the latest GAR15). There is an ongoing effort to provide
more in-depth analysis of the flood risk by performing probabilistic modelling of flood scenarios
with a resolution of less than 100m. The pilot is ongoing as a collaboration between the project
and the CIMA research foundation in the context of the "UNISDR Sub-Saharan Africa
Programme".
While the end result of the analysis is a relatively compact dataset, the intermediary data
structures are challenging (12-14 million individual files). Computational demands are
estimated at 200 000 core hours.
D4.1 Use case analysis
This version is a draft of D4.1 and is under review. 34
2.3.9 Requirement analysis An easy to use and extensible interface to disaster risk data is required. The interface should
support data discovery by non-experts as well as integration with applications - including
disaster risk assessment tools used in the Global Assessment Process - through an open API.
For future engagement with the broader UNISDR community, the ability to efficiently support
several indexing/curation approaches on top of the same datasets could be of interest. The
versioning of data will also become a critical issue.
While the final datasets of the UNISDR/CIMA pilot will be relatively modest in size, PROCESS
will investigate (together with CIMA) the potential value of the intermediary results (a subset of
the 12-14 million files) for third parties.
Software requirements
Matlab, Python, and Fortran.
Hardware requirements
High-end server multi-core nodes are sufficient.
Security and privacy requirements
The simulated dataset does not have any security or privacy issues associated with it. All
datasets are available for free for non-commercial purposes to governments, international
organisations, universities, non-governmental organisations, the private sector and the civil
society (more details are available via http://unisdr.mnm-team.org/)
2.3.10 Innovation potential PROCESS will build on ongoing collaboration between UNISDR, LMU and LRZ that has
developed initial prototypes and a development roadmap to serve the disaster risk assessment
community. The use case will be used to test the relevance and usability of PROCESS services
with a community that has very diverse goals and technical capabilities.
The use case directly supports the work of UNISDR and the 29 collaborating UN agencies
(including e.g. WHO, WMO and UNEP). Through the UNISDR Science and Technology
partnership the results of the project can be disseminated to a large group of NGOs, SMEs as
well as research organisations in all the UN member states. This outreach activity does not
need to be limited to strict UNISDR collaboration scope, but can include all the project results
of potential interest for disaster management and risk reduction.
The case may approach exascale resource requirements in the research mode (e.g. modelling
losses on the building level in a large, populous country), while at the same time encouraging
adoption of exascale-capable data services by a very large and diverse group of stakeholders
(first responders, SMEs providing modelling services etc.).
Current state
The UNISDR/CIMA pilot is running on the LRZ infrastructure with completion expected in the
first half of 2018.
Solutions from PROCESS
Access to computing capacity and temporary file storage.
Refinement and Innovations
Adoption of tools and approaches for workflow automatization.
Key performance indicators
1. Active users of the UNISDR data
2. Successful completion of the UNISDR/CIMA pilot

D4.1 Use case analysis
This version is a draft of D4.1 and is under review. 35
3. Adoption of PROCESS tools to be developed by the broader UNISR/GAR community
Novel approaches to HPC and data management
The preliminary performance testing of the risk calculation seem to indicate that performance
tuning depends on a multitude of factors, and partitioning the datasets in was to allow “in
memory” processing will be investigated.
The large number of intermediate files has, in the past, revealed limitations of common file
systems. As such, the UNISDR pilot may serve as a stress testing tool for the PROCESS
solutions.
2.4 UC#4: Ancillary pricing for airline revenue management
2.4.1 Use Case Domain Industrial / Airline domain
2.4.2 Use Case Motivation In traditional indirect distribution, airlines publish some of their data via third party systems,
alongside their own internal source of availability. It is then up to other third parties, Global
Distribution Systems (GDSs), to use these sources of data to create itineraries and to correctly
apply fares to them. It is only at the point that the customer makes a booking that the airline
has visibility on that customer and their request. At this stage the customer decisions have
been made based on the airline’s static data it published in advance and aggregated without
the influence of the Airline. The data is static with respect to content (combination of services
offered as a bundle) and price (pre-determined in advance and not at the time when the
shopping request is processed).
For this reason airline revenue management (RM) has been mainly around following aspect
for more than 40 years: determining how much of seat inventory shall be sold for each of the
previously determined static price-points. During the last decade - and mainly driven by on one
hand the growth and success of so-called low-cost airlines, and on the other hand the
increasing volume of flights booked on the airline's own website (were the airline has more or
less full control about content and look and feel) - the focus has shifted from controlling how
much of flight inventory to sell at pre-determined price-points to:
• merchandising any service item that might be related to a passengers journey, (e.g.
rental car, valet parking, taxi from/to airport, lounge access, travel insurances etc.),
• unbundling of services, i.e. offering more choice options to the traveler by offering a
large number of "à la carte" options (some of them could even be sold without the need
to book a flight),
• controlling the entire offer that is made to a shopper, i.e. content (services and
conditions), form and price points (in case it is not a single price but multiple prices
because of e.g. "à la carte" options and ancillaries).
This means that selling ancillaries around the flight has become more and more important. For
many airlines selling ancillaries has already become the main contributor to their contribution
margin.
2.4.3 Use Case Goal The first goal of the use case is an analysis of current ancillary sales and hidden sales pattern.
Therefore two approaches will be pursuit: first we evaluate the option to generate artificial sales
data based on internal airline knowledge and secondly we try to evaluate real sales data from
partner airlines.

D4.1 Use case analysis
This version is a draft of D4.1 and is under review. 36
The second goal is deriving a promising machine learning algorithm for pricing of offered
ancillaries. Therefore we will train common machine learning algorithms (e.g. random forest
and neural networks) and evaluate their performance.
Lastly, a simulation should indicate the quality and chances of the pricing algorithms. Ultimately
good quality pricing algorithms promise airlines significantly higher revenues from their
ancillary sales.
All of these business goals should be achieved while providing a platform that is capable of
storing the incoming ancillary data in a way that allows easy exploitation for airlines. On the
one hand, the platform should provide libraries for machine learning and quick processing for
the model learning, while on the other hand storing the models in an efficient way such that
several hundred million ancillary pricing requests a day can be answered.
2.4.4 Use Case Description Ancillaries is a broad term for any services that goes beyond simple transportation from A to
B. Ancillary in this sense can be anything from being able to check-in an additional bag to
booking an “Uber” that transports the customer from the airport to his hotel. Although ancillaries
have caught the attention of basically every airline, traditional RM software does not cover this
topic at all, yet.
The challenges we face are manifold. We need to store and analyse huge data volumes that
major airlines already have today (e.g. Deutsche Lufthansa has more than 100 million
passengers per year). Due to the advanced digitization we expect an exponential increase of
the data volume. Beside the more dynamic or volatile booking data (we call this a passenger
name record PNR) the solution needs a wide access to more data like airport basic data,
vacation period in different countries, events like fairs, huge sport events etc. Also data like
weather forecasts (e.g. snow conditions in the Alps) can be of interest. Also input from highly
volatile social media streams like Twitter can be an interesting source to be analysed. And last
but not least web-scraping can provide information about the airline's competitors and their
offerings.
Airlines are not operating alone. Major airlines cooperate with other, bigger and smaller,
airlines in joint ventures, networks and strategic alliances (e.g. the Star Alliance, One World
etc.). Therefore, the data created in and by such networks needs to be included in the analysis
and dynamic pricing solution.
To achieve this, we need an infrastructure that is capable of collecting, processing and
analysing huge amounts of data. This needs to be done in a very dynamic way, because the
result of the analysis (i.e. the calculated price of an ancillary) must be feed back into the
shopping / booking process. Due to the growth of on-line retailers and an increasing number
of on-line travel platforms, airlines expect a yearly increase in the quantity of requests by about
20%. The infrastructure must be capable of responding to more than 100 million requests per
day and within 500 ms per request.
Within the dynamic pricing engine we must make use of new prediction methods that offer
ancillaries to a customer at an optimal price depending on his/her shopping history and
individual preferences, and by also considering attributes of the requested itineraries, e.g.
• free golf bag for famous golfing destinations,
• or, free skiing bag if the passenger travels to e.g. Innsbruck and there is snow in the
Alps.
We need to develop new algorithms and forecasting models to optimally price the provided
ancillaries. This will include leading-edge methods and technologies from the domains of
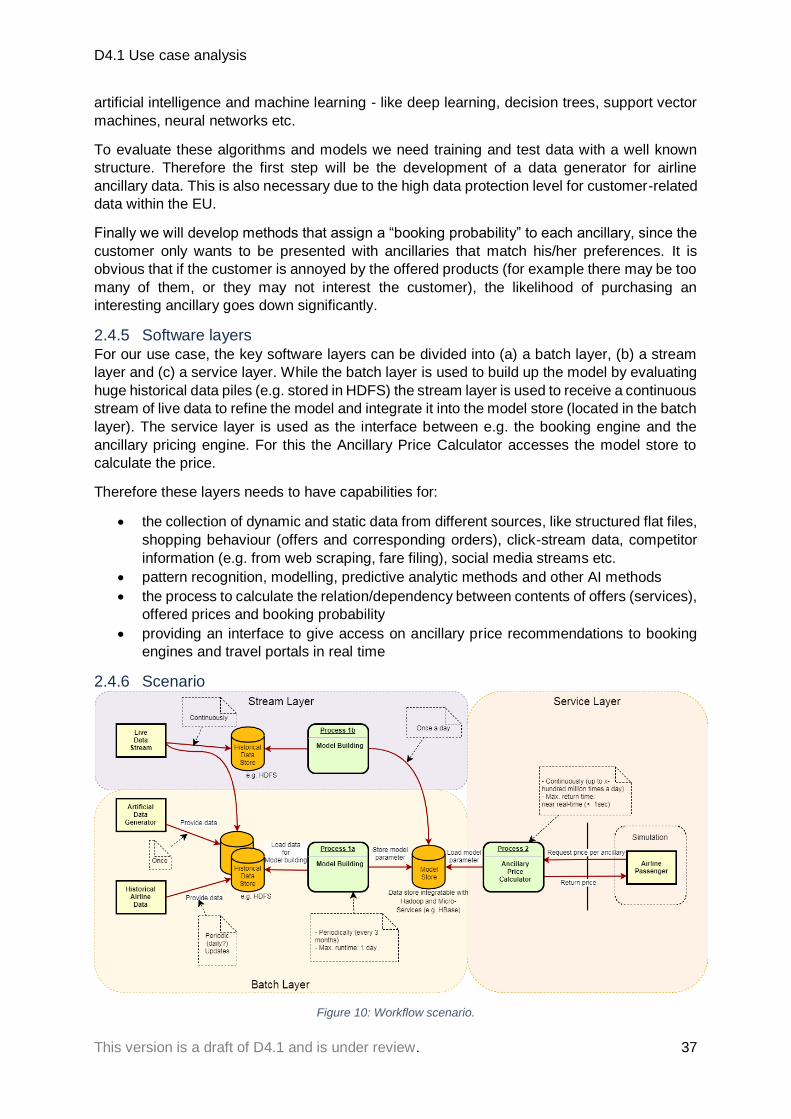
D4.1 Use case analysis
This version is a draft of D4.1 and is under review. 37
artificial intelligence and machine learning - like deep learning, decision trees, support vector
machines, neural networks etc.
To evaluate these algorithms and models we need training and test data with a well known
structure. Therefore the first step will be the development of a data generator for airline
ancillary data. This is also necessary due to the high data protection level for customer-related
data within the EU.
Finally we will develop methods that assign a “booking probability” to each ancillary, since the
customer only wants to be presented with ancillaries that match his/her preferences. It is
obvious that if the customer is annoyed by the offered products (for example there may be too
many of them, or they may not interest the customer), the likelihood of purchasing an
interesting ancillary goes down significantly.
2.4.5 Software layers For our use case, the key software layers can be divided into (a) a batch layer, (b) a stream
layer and (c) a service layer. While the batch layer is used to build up the model by evaluating
huge historical data piles (e.g. stored in HDFS) the stream layer is used to receive a continuous
stream of live data to refine the model and integrate it into the model store (located in the batch
layer). The service layer is used as the interface between e.g. the booking engine and the
ancillary pricing engine. For this the Ancillary Price Calculator accesses the model store to
calculate the price.
Therefore these layers needs to have capabilities for:
• the collection of dynamic and static data from different sources, like structured flat files,
shopping behaviour (offers and corresponding orders), click-stream data, competitor
information (e.g. from web scraping, fare filing), social media streams etc.
• pattern recognition, modelling, predictive analytic methods and other AI methods
• the process to calculate the relation/dependency between contents of offers (services),
offered prices and booking probability
• providing an interface to give access on ancillary price recommendations to booking
engines and travel portals in real time
2.4.6 Scenario
Figure 10: Workflow scenario.

D4.1 Use case analysis
This version is a draft of D4.1 and is under review. 38
Current software and hardware infrastructure used
Most software and hardware infrastructures at airlines' revenue management departments are
still based on concepts which emerged in the 90s and early 2000s. Usually, there is a big
monolithic piece of software that is really hard to maintain and difficult to extend. Furthermore
data storage is organized in big Oracle instances which guarantee data consistency and
transaction safety, but at the drawback of poor scalability. The rapid growth of passenger
numbers and the opening of new business fields has led to the following requirements for new
software and hardware which traditional solutions cannot answer:
• Support for quick changes in the software: the market changes quickly and the internet
allows the customer to easily compare offers. Hence, airlines have to react quickly to
the market.
• Elastic scaling of hardware: growing hardware costs are no longer expected, since the
machines are often left unused (e.g. few bookings with European airlines during night
hours in Europe).
• Vertical scaling of data stores: the growing data volumes are approaching the limits of
horizontal scaling of Oracle systems. Hence the need for vertical scaling.
The service layer (right-hand side of the workflow diagram) uses state-of-the-art microservice
software stacks such as Spring boot, Kubernetes etc. and provides RESTful services. The
service registry uses the Netflix Eureka framework and is replicated to avoid a single point of
failure. Eureka also facilitates dynamic load balancing. The services are accessed through an
application gateway, for this Netflix Zuul is used which also integrates security services.
The streaming and batch-layer is currently under development and therefore not yet fixed. It
will likely rely on Hadoop/HDFS infrastructure and we plan to use HBase as an interface
between the big data side and the microservice side. For the streaming layer, Apache Spark
streaming looks promising. For the model building part, frameworks such as Tensorflow and
H2o.ai will be evaluated.
2.4.7 Methods and tools The goal within this project is to develop methods for ancillary pricing. Therefore we look at the
historical data for common patterns:
• When (with respect to the departure of the flight) was the ancillary purchased?
• Does the length of the flight correspond to the volume of a certain ancillary's sale?
• Can we isolate customer groups that are more prone to purchasing a certain ancillary
(e.g. how to identify business travelers that might be more willing to pay for internet on
the plane?)
After looking at this historical data we try to identify the willingness-to-pay of the customers for
an ancillary, i.e. when (with respect to the departure) to offer the ancillary at which price.
Current research implies that this historical training is best done with AI methods of machine
learning and deep learning, accompanied by regression and classification models, like e.g.
decision trees, neural networks or support vector machines will be applied. The proper
methods are to be evaluated in-depth during the first project phase.
These requirements demands for a tool stack that offers state-of-the-art support for the
aforementioned algorithms.
2.4.8 Datasets’ description As an initial step we will start to generate sample data sets.

D4.1 Use case analysis
This version is a draft of D4.1 and is under review. 39
The data generated will be an approximation of the data coming from a booking process of
major airline network carriers. Those carriers handle more hundreds of millions passengers
each year and a substantial amount of passengers purchase multiple ancillaries along a flight.
Common examples are advanced seat reservation (reserve your seat on the plane way ahead
of the departure), an extra checked-in bag or lounge access at the airport.
So, for each (simulated) passenger we have:
• the flight product itself, which is a pre-packaged offer that the airline makes to all
passengers. It includes the class of service (Economy, Premium Economy, Business,
First) and a number of included services (flight, carry-on bag, checked-in bag, right to
cancel, right for refund).
• additional purchased services as 'ancillaries a la carte'. Examples are WLAN, an extra
checked-in bag, etc.
In the airline world, the central document is the "passenger name record" (PNR). Whenever a
flight is ordered by a passenger, a PNR is created. Along with the PNR there may exist EMDs
("electronic miscellaneous document"). These EMDs contain the sold ancillaries. For our data
sets we will probably simplify this setting:
Figure 11: Booking-Flight-Ancillary Relations
Naturally this data comes with some sort of metadata that is usually stored with the data itself.
As metadata we usually have information about the booking (date, time, sales channel) and
the customer (frequent traveller number).
For huge airline network carriers we expect about 1 billion ancillaries in our historical data set,
since we have
• about 100 million passengers with
• in average 5 purchased ancillaries over
• two years.
We are in contact with airline partners who might provide real data sets at a later stage.
A typical PNR contains roughly 1 to 2 KB of data. With the aforementioned figures and some
extensions due to additional input channels, an average size of several TBs is expected.
2.4.9 Requirement analysis 1. The system needs to be capable to deal with the large passenger data sets that airlines
generate.
2. Scalable architecture which has the potential to:
a. handle large amount of data
b. handle data from different sources
c. handle high volume of requests per day
d. provide quick response times

D4.1 Use case analysis
This version is a draft of D4.1 and is under review. 40
e. be extensible in terms of continuously increasing data as well as increase in
parallel requests being sent.
3. This data does not only need to be stored, but has to provide efficient algorithmic
usage.
4. Tool-stack supporting Lambda Architecture principles especially for historical data
processing.
5. Establishing a consolidated data structure on which further statistical processing can
be performed
6. Processing of ongoing data streams to keep the consolidated data structure up-to-date
(i.e. learning new data behavior into reference data).
7. Distributed computing fundamentals based on the Hadoop ecosystem.
8. Applying mathematical and statistical algorithms on consolidated data structure to
identify an optimal reference model
9. Applying variables of incoming requests on the optimal reference model to compute
probability, estimates and forecast
10. Efficient algorithmic usage means on the one hand the update of the model parameters
within a reasonable timeframe (e.g. within a nightly time slot). On the other hand, this
implies real-time responses with revenue-optimal prices upon customer request.
The requirements for the ancillary use case can be split into several groups:
Non-functional requirements
• Provide data storage for at least two years’ worth of historical data.
• Provide data storage for derived model parameters.
• Process two years’ worth of historical data with machine learning algorithms (e.g. random forest, neural networks) in reasonable time (max. one day).
• Respond to pricing requests for ancillaries in real time (< 500ms).
• Provide scalability to respond to hundreds of million pricing requests per day.
Software requirements
Hadoop, HBase, Spark, Tensorflow etc.
For the business side, common machine learning libraries have to be available. Furthermore
we need access to the Hadoop file system as well as to the HBase data store such that we
can look at the stored data.
Software will be written in Java (at least Java 8). Additionally, an installation of the statistical
software "R" is required for rapid prototyping of new algorithmic ideas.
Hardware requirements
For the first steps for our use case we need the ability to store data in the range of less than
100 TB. The necessary compute power depends on the model building algorithms and tools
we will use. This needs to be evaluated during implementation. We are, however, confident
that the resources provided by the project partners are sufficient.
Security and Privacy requirements
Ancillary data is personal data. However, it does not carry the strictest privacy requirements,
since the data does not contain names, addresses or credit card data. However it may contain
data that directly connects to a person such as frequent traveller information. If using real data
this will be considered as confidential information provided by the involved airlines.
This results in the following requirements:

D4.1 Use case analysis
This version is a draft of D4.1 and is under review. 41
• The software is supposed to be run at airlines in the European Union. Therefore it has
to comply with the "EU General Data Protection Regulation", if applicable.
• The software needs to be deployable on sight at the customer's cloud service, for
example Microsoft Azure.
2.4.10 Innovation potential
Current state
When looking at the current state, we have to distinguish between the business side and the
technical side.
On the business side, if you ask any airline today for the most promising future revenue
channel, the answer is always: ancillaries. Successful airlines like Ryanair and easyJet are
prominent examples for airlines that make revenues far beyond the simple transportation from
A to B.
Although all airlines believe their revenue future lies in the ancillaries, their methods for
generating ancillary offers are quite elementary: usually pricing is done by estimation and all
customers are presented with all ancillary options. This leads to a poor look-to-book ratio and
therefore poor revenues. The poor look-to-book ratio is mainly caused by the following
reasons:
• The available ancillary offers do not attract the given customer.
• Pricing options do not suit the customer.
While some airlines already apply rule-based pricing, completely automated pricing is not yet
in use.
On the technical side, airlines usually operate with old monoliths that rely on traditional Oracle
databases. These databases tend to hit the limit of their capabilities when airlines grow.
Therefore, expensive and badly performing software is use. Furthermore machine learning is
currently not widely used, since traditional software usually does not contain efficient
implementations of machine learning algorithms.
Solutions from the PROCESS
PROCESS will provide an architecture supported by a tool-stack ecosystem which will support
our process of transformation of historical data by evaluating distributed and scalable
computing algorithms based on LAMBDA architecture principles, processing of incoming data
streams applying statistical and mathematical models as well as AI methods like machine
learning and deep learning to compute probability, estimates, forecast and apply them on near
real-time customer requests.
This will help airlines solve the issues with their current data sets, opening new possibilities
with the availability of machine learning algorithms.
Refinement and Innovations
With our use case prototype application we are planning to tackle the aforementioned
obstacles for an increased ancillary sale.
We will implement a tool that allows airlines to comb their databases with recent ancillary sales
for matching offers for the current customer. We also intend to develop methods to generate
revenue-optimal prices for these ancillaries, taking the current customer’s history into effect.
Increased ancillary sales translate into huge revenue improvements, keeping in mind that
major airlines serve up to 100 million passengers per year.

D4.1 Use case analysis
This version is a draft of D4.1 and is under review. 42
Key performance indicators
The PROCESS project is a success to airlines if we can demonstrate that we have
implemented a system that can efficiently maintain the airlines data, while at the same time
using this data to generate dynamic prices for offered ancillaries.
The final performance indicator will be the increase of revenue in the ancillary pricing when the
system will be in use. Another, more technical, KPI can be the maximum request rate for
querying the model.
2.5 UC#5: Agricultural analysis based on Copernicus data
2.5.1 Use Case Domain Agricultural Observation and Prediction.
2.5.2 Use Case Motivation Global Change, which subsumes the accelerating influence of humans on the natural
environment, can be experienced in manifold ways. The most prominent are climate change,
land use change including changing land management intensities, changing demand for
biomass resources, increasing inputs of nutrients, changing mass balances of glaciers and
changing global cycles of important elements like carbon and nitrogen. These changes
influence the availability, quality and allocation of water resources, the productivity of the
biosphere, the intensity of land cultivation and land use on all scales from local to global and
will force to adapt to changing future boundary conditions.
With increasing area the characteristic land surface processes and features, like snow
dominated mountain processes, intensive agriculture and irrigation, land use patterns and
geological settings simultaneously influence the overall reaction of an area or watershed. It is
therefore necessary to treat this large variety of land surface processes and human
interventions in a consistent manner within one model.
Therefore this use case analysis earth observation data as a spearhead activity for piloting and
stress-testing advanced data analysis techniques that can be used to select and preprocess
specific (e.g. spatially limited) time-series from the Copernicus datasets, that are rapidly
approaching exascale level.
2.5.3 Use Case Goal The aim of the use case is to realistically simulate natural processes and impacts of human
interventions based on a few rigorous principles, which ensure maximum predictive power.
Among them is a strict conservation of mass and energy and no calibration using measured
streamflow records. The used software has been developed for the last 25 years with the aim
to provide an integrated, stable and versatile tool to simulate land surface processes and to
consider the dynamic interactions between the different land surface compartments an the
human influences in the processes.
The main focus is on Multi-Model Simulations which are seamlessly linked with observational
data (including also sources like social media and local sensor networks to complement
satellite observations) to improve accuracy, relevance and efficiency beyond what would be
possible to achieve using either simulation or observational data on their own.
2.5.4 Use Case Description The fundamental scientific problem is the sustainability of food production on the global scale,
which is a multi-disciplinary problem requiring integrating simulation models from cell-level
phenomena all the way to macroscale developments (such as climate change or soil erosion).
The key inputs for the analysis are the Copernicus datasets, consisting of data from several
satellites (Sentinel family) that produce radar and visible light data with up to 10m resolution.

D4.1 Use case analysis
This version is a draft of D4.1 and is under review. 43
The radar data covers the whole globe every 2 days, with a monthly data rate of about 3PB.
The visible light data covers the globe every 2-5 days, with a monthly data rate of about 4.5BP.
The availability of such fine-grained, global time series makes it possible to correlate and
validate different Earth System Models that simulate the combined impact of several
mechanisms with complex interaction patterns. The use case will use one such modelling
system - the PROMET software - as a validation tool for services that provide efficient and
semantically rich interface to Copernicus data sets.
2.5.5 Software layers The use case is based on a tightly coupled modelling framework PROMET (Processes of Mass
and Energy Transfer) that combines modelling the macroscale carbon cycle, water and energy
inputs with the behaviour of water and key nutrients in the soil with analysis of plant metabolism
and even human decision-making. This use case combines tools for
• Modelling a wide variety of global, local and cellular phenomena
• Simulation of the system-level combined impact of these processes
• Basic pattern recognition tools, e.g. adaptive and Bayesian methods for social media
analysis and for data mining from the Copernicus datasets. Deep learning to identify
human structures and their changes over time being considered
• Verification approach that allows adjusting simulation parameters based on the actual,
observed development in the earth observation data during the simulation process.
• Dimension reduction approaches to manage Copernicus datasets (multi-sensor, multi-
temporal data-cube) more efficiently
The closed source code is written in FORTRAN 77 and 95. Any communication with
PROCESS components will be processed over an interface provided by the PROMET
programmers.
2.5.6 Workflow
Figure 12: Workflow of use case 5.
The Use Case initially starts by accessing data sets from the Copernicus observations. These
data are fetched via an adapter, which needs to be implemented during the project. The
fetched data sets will be stored in the PROCESS storage facilities. It includes raw and
metadata.
With a newly developed preprocessor, some of the data will preprocessed on the PROCESS
computing resources. This will maximize the parallelization degree and enlarge the possible
processed amount of data within a given time frame compared to the actual processing. The
processed data is again stored within the PROCESS storage resources.
The closed-source PROMET will fetch this data via a new so-called PROMET-Adapter, which
can grant access to the data storage and also grant access for the PROMET software to be
executed on the PROCESS computing resources.

D4.1 Use case analysis
This version is a draft of D4.1 and is under review. 44
Current software and hardware infrastructure used
PROMET is a proprietary model written in Fortran with Intel-specific instructions. It is
parellelized with OpenMP and scales up to 16 cores. Current data processing of the
Copernicus data sets is also proprietary and therefore closed-source.
2.5.7 Methods and tools The PROMET framework combines the finding from over 700 peer-reviewed scientific papers
that are used to create a combined system capable of modelling complex phenomena based
on simulating the “first principle” behaviour of each of the interconnected subsystems. The
scalability of the system is based on effective use of OpenMP library.
2.5.8 Dataset description PROMET uses the Copernicus data sets in own, proprietary data formats. The processed
Copernicus datasets consisting of data from several satellites (Sentinel family) are defined by:
• XML files
• RGB images
• over all 7.5 Petabyte raw data each month
This data is available from the Copernicus Open Access Hub. The Data Hub exposes two
dedicated APIs for browsing and accessing the data stored in the rolling archive. The APIs are:
• Open Data Protocol (OData)
• Open Search (Solr)
The OData interface is a data access protocol built on top of core protocols like HTTP and
commonly accepted methodologies like REST that can be handled by a large set of client tools
as simple as common web browsers, download-managers or computer programs such as
cURL or Wget.
OpenSearch is a set of technologies that allow publishing of search results in a standard and
accessible format. OpenSearch is RESTful technology and complementary to the OData. In
fact, OpenSearch can be used to complementary serve as the query aspect of OData, which
provides a way to access identified or located results and download them.
The metadata consists of the configuration of the preprocessing, which will include the
description of the Copernicus data sets and the manipulation formula applied on each value
field with the corresponding calculation value (weight). For example, to the measured amount
of rainfall a certain error value needs to be added or subtracted. metadata in this could be tuple
of (rainfall, addition, 0.012%).
2.5.9 Requirement analysis
• The use case requires linking and comparing modelling and simulation results with the
actual observational data, supporting formation of hypotheses and quality assessment
of the simulation tools. Providing this functionality requires:
• Extraction of relevant time series from the Sentinel data (up to 7.5PB per month)
• Storing the simulated data and associated metadata in a way that it can be linked with
the Sentinel time series
• Providing generic API for using Copernicus data with any modelling framework
Software Requirements
To enable PROMET processing more data sets from the Copernicus data, three main
connectors between the PROCESS and the PROMET infrastructure are needed:

D4.1 Use case analysis
This version is a draft of D4.1 and is under review. 45
PROCESS-Copernicus-Adapter: To collect the data sets from the Copernicus database and
to store it in the PROCESS storage, an adapter needs to be implemented realizing an efficient
transport between these two storage units.
PROCESS-PROMET-PrePROCESSor: To speed up the computation of the preprocessing of
the Copernicus data sets a new preprocessor needs to be implemented. The aim is to execute
the preprocessing massively parallel and completely on PROCESS computing resources. This
pre-processor will be written in Python to be executable on HPC resources.
PROCESS-PROMET-Adapter: This final adapter will provide a seamless transport between
the PROCESS storage with the preprocessed Copernicus data sets and PROMET itself.
Hardware requirements
• Store raw Copernicus data sets
• Computational resources for preprocessing
Security and privacy requirements
All used input data is open accessible and has therefore no special security and privacy
requirements. The used software is a closed source project. Any provided source code needs
to be processed confidentially.
2.5.10 Innovation potential PROCESS will provide a generic API and web-based interface to Copernicus data that allows
tight coupling of the modelling applications, observational data, and simulation results and
associated metadata.
The use case uses the tightly coupled modelling framework PROMET as a demonstrator of
using the massive Copernicus datasets as a solution for challenging modelling problems.
PROMET combines modelling the macroscale carbon cycle, water and energy inputs with the
behaviour of water and key nutrients in the soil with analysis of plant metabolism and even
human decision-making.
The generalizable components of the use case are related to the identifying and staging of the
relevant input data from the massive Copernicus datasets for use in the modelling solutions,
and to the mechanisms that allow correlation of the simulation results and the observation time
series using (near-) exascale data resources.
Current state
The current state of the use case uses none of the before described adapters. The necessary
data sets are imported into the framework almost manually and any preprocessing is
sequential.
Solutions from the PROCESS
PROCESS tools will make it possible to perform these multi-model simulations in a way that is
seamlessly linked with observational data (including also sources like social media and local
sensor networks to complement satellite observations) to improve accuracy, relevance and
efficiency beyond what would be possible to achieve using either simulation or observational
data on their own.
The open, generic APIs developed will make it possible to use Copernicus data to refine, steer
and validate the behaviour of any Earth System modelling system in much more flexible way
than today.
Refinement and Innovations
PROCESS will provide a generic API and web-based interface to Copernicus data, which might
be adapted to other open source databases.
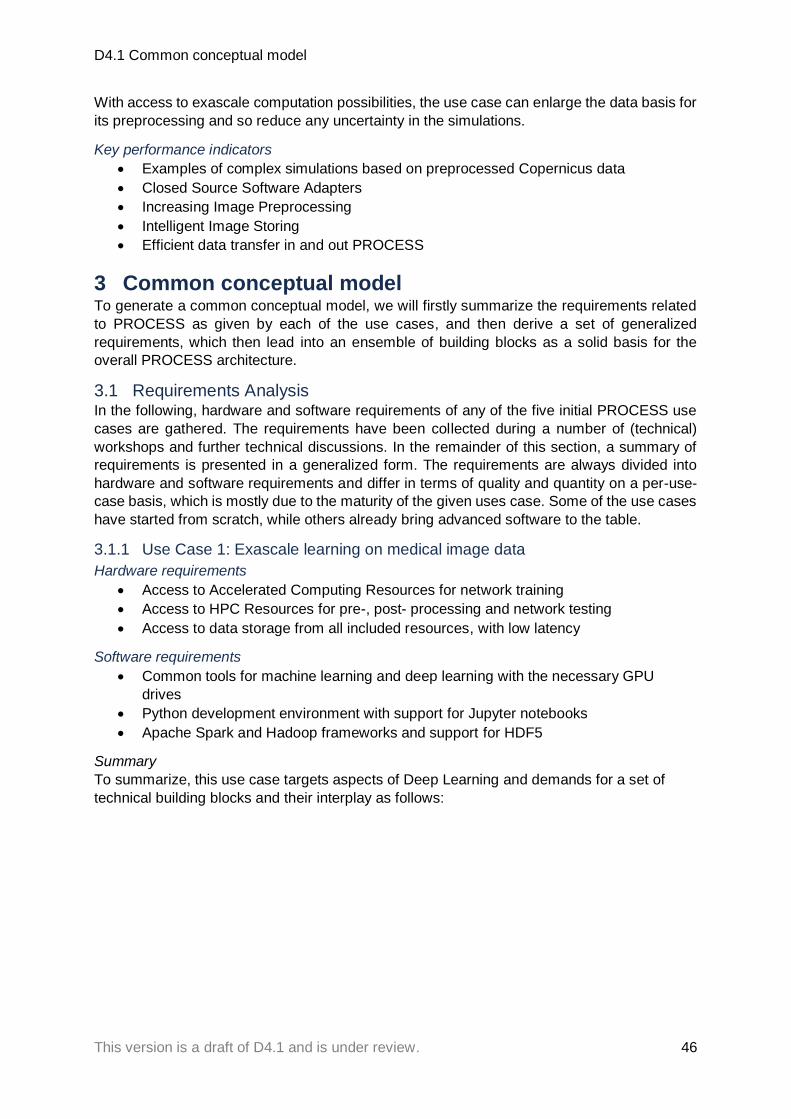
D4.1 Common conceptual model
This version is a draft of D4.1 and is under review. 46
With access to exascale computation possibilities, the use case can enlarge the data basis for
its preprocessing and so reduce any uncertainty in the simulations.
Key performance indicators
• Examples of complex simulations based on preprocessed Copernicus data
• Closed Source Software Adapters
• Increasing Image Preprocessing
• Intelligent Image Storing
• Efficient data transfer in and out PROCESS
3 Common conceptual model To generate a common conceptual model, we will firstly summarize the requirements related
to PROCESS as given by each of the use cases, and then derive a set of generalized
requirements, which then lead into an ensemble of building blocks as a solid basis for the
overall PROCESS architecture.
3.1 Requirements Analysis In the following, hardware and software requirements of any of the five initial PROCESS use
cases are gathered. The requirements have been collected during a number of (technical)
workshops and further technical discussions. In the remainder of this section, a summary of
requirements is presented in a generalized form. The requirements are always divided into
hardware and software requirements and differ in terms of quality and quantity on a per-use-
case basis, which is mostly due to the maturity of the given uses case. Some of the use cases
have started from scratch, while others already bring advanced software to the table.
3.1.1 Use Case 1: Exascale learning on medical image data
Hardware requirements
• Access to Accelerated Computing Resources for network training
• Access to HPC Resources for pre-, post- processing and network testing
• Access to data storage from all included resources, with low latency
Software requirements
• Common tools for machine learning and deep learning with the necessary GPU
drives
• Python development environment with support for Jupyter notebooks
• Apache Spark and Hadoop frameworks and support for HDF5
Summary
To summarize, this use case targets aspects of Deep Learning and demands for a set of
technical building blocks and their interplay as follows:

D4.1 Common conceptual model
This version is a draft of D4.1 and is under review. 47
Figure 13: Conceptual model of use case 1.
3.1.2 Use Case 2: Square Kilometre Array/LOFAR
Hardware requirements
• Fast connected resources (10 Gbit/s or higher)
• Access to external PiCaS installation from the computing resources
• Access to data storage of at least 20TB
• Access to CPU clusters for pre-processing
• In the future, access to GPU clusters for pre-processing
Software requirements
• Python development environment
• Support for docker or singularity (CVMFS) containers
• Support for gridftp
• Workload manager (PiCaS token pool server)
Summary
To summarize, this use case targets aspects of Exascale Management and Calibration and
demands for a set of technical building blocks and their interplay as follows:

D4.1 Common conceptual model
This version is a draft of D4.1 and is under review. 48
Figure 14: Conceptual model of Use Case 2.
3.1.3 Use Case 3: Supporting innovation based on global disaster risk data
Hardware requirements
• Access to HPC Resources
• Access to data storage
Software requirements
• Matlab
• Python development environment
• Probabilistic risk calculations
• Large-Scale, mathematical modelling
Summary
To summarize, this use case targets aspects of Probabilistic Analysis and demands for a set
of technical building blocks and their interplay as follows:
Figure 15: Conceptual model of Use Case 3.

D4.1 Common conceptual model
This version is a draft of D4.1 and is under review. 49
3.1.4 Use Case 4: Ancillary pricing for airline revenue management
Hardware requirements
• Data storage on the order of several TB
• Access to computing power (HTC or Docker)
• Access to data storage
Software requirements
• Apache Hadoop, HBase and Spark
• Java 8+ development environment
• Machine learning capabilities (not specified at time of writing)
Summary
To summarize, this use case targets aspects of Deep Learning and demands for a set of
technical building blocks and their interplay as follows:
Figure 16: Conceptual model of Use Case 4.
3.1.5 Use Case 5: Agricultural analysis based on Copernicus data
Hardware requirements
• Access to HPC resources
• Access to data storage
Software requirements
• Transfer Copernicus data sets to data storage
• Python development environment
Summary
To summarize, this use case targets aspects of Exascale Data Extraction and demands for a
set of technical building blocks and their interplay as follows:

D4.1 Common conceptual model
This version is a draft of D4.1 and is under review. 50
Figure 17: Conceptual model of use case 5.
3.2 General Requirements To summarize, the following superset of requirements is derived from the use cases:
Hardware requirements
• Access to HPC resources
• Access to Cloud resources
• Access to accelerated computing resources
• Access to external infrastructure from computing resources
• Access to data storage on the order of 1PB (distributed)
Software requirements
• Common tools for machine learning and deep learning
• Python development environment with support for Jupyter notebooks
• Java environment
• Apache Spark, Hadoop and HBase frameworks
• Support for containers such as Docker and Singularity
• Secure access to and extraction from external data resources
• Grid support
• Matlab environment
• Data extraction tools
• Large-scale modelling
• Predictive analytic methods
• Probabilistic risk calculation
All these requirements lead to different Execution Models, namely:
• Deep Learning
• Exascale Data Management
• Exascale Data Extraction
• Probabilistic Analysis
• Calibration
• Pre- and Post-Processing

D4.1 Common conceptual model
This version is a draft of D4.1 and is under review. 51
Looking at the use cases reveals a good portion of requirements and building blocks that can
be found in many or nearly every use case. In addition to the commonly used services, a few
extraordinary requirements (e.g. access to specialized hardware, such as machine learning
clusters or GPGPUs) arise. Putting everything together we arrive at a common conceptual
model that is able to cover any of the requirements presented by the five initial PROCESS use
cases:
Figure 18: Common conceptual model.
The common conceptual model is enriched by certain (technical) necessities, namely:
• Secure access: As PROCESS is thought to serve several communities and use cases
concurrently, a user and security management component is mandatory.
• Data Management: While a multitude of different data sources in different locations are
accessed, a data management component is needed.
o Access credentials to physical data stores must be passed on to the de-facto
service provider and a potential translation must take place.
o Potentially arising meta-data must be managed.
• Computing management: Similar to data management, access to a variety of physical
compute resources, including credentials delegation, must be made available. Within
this component a service multiplex and potential credential translation will be
implemented and ensured.
3.3 Summary In order to fulfil the requirements, one can derive the following building blocks as the starting
point for the PROCESS architecture:
• Secure User Access to Management Platform
• Execution management Framework
• Distributed Data Management
o Raw Data
o Metadata
• Physical Data Storage and Archives
o Storage
o Archives
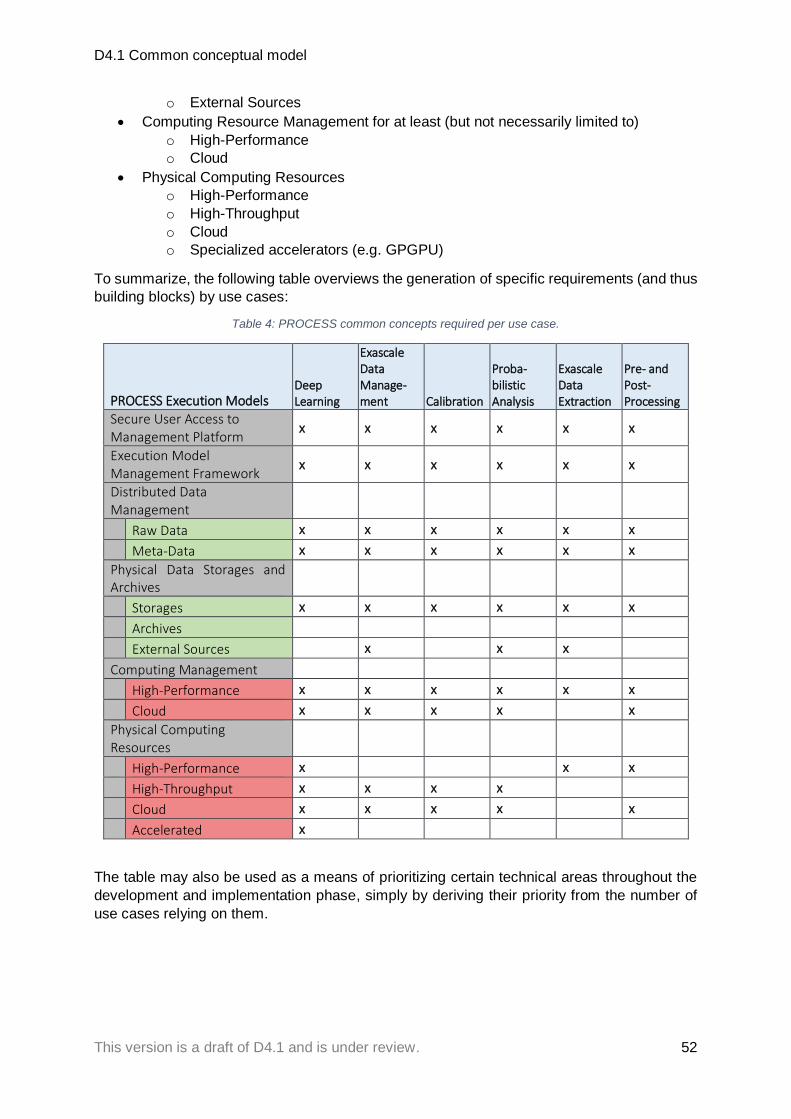
D4.1 Common conceptual model
This version is a draft of D4.1 and is under review. 52
o External Sources
• Computing Resource Management for at least (but not necessarily limited to)
o High-Performance
o Cloud
• Physical Computing Resources
o High-Performance
o High-Throughput
o Cloud
o Specialized accelerators (e.g. GPGPU)
To summarize, the following table overviews the generation of specific requirements (and thus
building blocks) by use cases:
Table 4: PROCESS common concepts required per use case.
PROCESS Execution Models Deep Learning
Exascale Data Manage-ment Calibration
Proba-bilistic Analysis
Exascale Data Extraction
Pre- and Post-Processing
Secure User Access to Management Platform
x x x x x x
Execution Model Management Framework
x x x x x x
Distributed Data Management
Raw Data x x x x x x
Meta-Data x x x x x x
Physical Data Storages and Archives
Storages x x x x x x
Archives
External Sources x x x
Computing Management
High-Performance x x x x x x
Cloud x x x x x
Physical Computing Resources
High-Performance x x x
High-Throughput x x x x
Cloud x x x x x
Accelerated x
The table may also be used as a means of prioritizing certain technical areas throughout the
development and implementation phase, simply by deriving their priority from the number of
use cases relying on them.

D4.1 Architecture
This version is a draft of D4.1 and is under review. 53
4 Architecture
4.1 Architecture components The project bases its developments on the architectural framework model presented in Figure
19. This is a functional model, helping to align developments in each of the following “service
component clusters”:
• Computing and storage infrastructure, responsible for optimising the performance of
the underlying infrastructure while providing consistent interfaces to physical computing
and data resources to the higher-level services
• SOA/Cloud solutions, supporting mapping of the “business processes” to mature, well-
documented and supported software and service components
• Visualisation layer, supporting discovery and investigation of the input datasets, data
pipeline design, scripting, as well as visualisation and further processing of the results
of the analysis.
The main challenges in processing of exascale data which we want to tackle in PROCESS are
as follows: extreme data sizes and data structure complexity. The former often prevents
migration of data to a remote computation location, while the latter requires extensive domain
knowledge in order to be able to use data effectively [USDOE, 2010]. This forces users of
exascale data to perform computations in situ, and only the largest research institutions and
the best funded projects can afford to acquire access to an infrastructure able to house both
the data and the extreme computational resources that can process it. Additionally, the expert
domain knowledge required to be able to make sense of the data is often hard to find. These
requirements make exascale processing prohibitively expensive for smaller players.
Designing an architecture which alleviates some of these problems and brings exascale data
closer to smaller research organizations, and even to individual researchers is a crucial step
in fulfilling the objectives of PROCESS. The architecture must be able to decouple access to
the data from their use in computation, and to provide simplified access to individual
components of the data.
In PROCESS, we will also design a reference architecture (in JRA1) that not only addresses
exascale data management challenges related to infrastructure owned by the consortium but
also deals with data management challenges across existing Research Infrastructures (RI).
RIs play an increasingly important role in the advancement of knowledge and technology in
Europe. They are a key instrument in bringing together stakeholders with different
backgrounds to look for solutions to many of the problems which the exascale data society is
facing today.
Research infrastructures (RIs) offer unique research services to users from different countries,
attracting young people to science, and helping shape scientific communities. RIs are hosted
at research institutes, use a combination of high-performance computing (HPC), grids and
clouds, and are often interconnected with high-capacity networks. RIs are accessed by the
scientific community through a layer of high-level services that efficiently and transparently
manage the execution of complex distributed CPU and data-intensive applications. Often these
applications, modeled as workflows, are composed by loosely coupled tasks or jobs which
communicate through file exchange systems [Agarwal 2012], [Wang 2013]. Such file exchange
is facilitated by Distributed File Access Services (DFASs) which offer a single point of entry to
discover and manage files and replication to improve file availability. Despite the effort to move
computation to the data, there are cases where this is simply not possible. Technical
constraints such as privacy and security issues, lack of computing power or the need for
specialized hardware prevent computation from reaching the data [Vairavanathan 2013],
[Tudoran 2016].

D4.1 Architecture
This version is a draft of D4.1 and is under review. 54
Typically, scientific workflows need access to datasets which are processed to generate new
datasets, which have to be further processed by subsequent tasks to achieve a defined goal
[Simonet 2015]. Therefore any DFAS which supports such an execution model needs to
maintain strict consistency throughout its file access points. To enable use of off-the-shelf
software and to hide the complexity of the network from the application developers and end
users some DFASs offer standardized protocols [Sim 2007], [Mandrichenko 2005], [SNIA
2010] which decouple the development of client software from the DFAS, enabling
implementation of clients that can present the DFAS as a POSIX file system through network
transparency. Network transparency hides the way protocols transmit and receive data over
the network; thus any operation that can be performed on a local file can also be performed
on a remote file. To scale with increasing request load, Distributed File Access Services
(DFASs) often employ redundant pools of servers. Despite the availability of RIs, DFASs do
not always take advantage of their capabilities. It is rarely the case when DFASs interact with
network devices (switches, routers, etc.) to optimize data transfers and maintain quality of
service (QoS). The main hurdle for interacting with network devices to optimize data transfers
is the configuration of these devices, each of which relies on different protocols and interfaces.
This makes large data transfers between RIs difficult to facilitate and slows down the life cycle
of scientific applications [Chen 2013], [Kluge 2013], [Kreutz 2015].
From the point of view of computations, the focus of the project will be to facilitate simulation,
modelling and development of mathematical method and tools for exascale data processing.
This, in particular will include:
• services that enable execution of simulations models as interactive workflows using
heterogeneous software, including modern languages for scientific computing
• services that facilitate access to HPC and cloud resources by using well-defined
standards
• services that facilitate programming for multicore architectures
• benchmark and monitoring services
According to the requirements analysis, the main demands placed on the architecture are: an
exascale data-capable, service-oriented, and cloud-based architecture allowing exascale
computational research even for organizations which do not possess extreme resources.
Considering the demands, a modular open-source architecture is proposed (Figure 19). It is
divided into three main modules: (1) exascale data module led by work package 5 (green
boxes), (2) exascale computing module led by work package 6 (red boxes), and (3) service
orchestration module led by work package 7 (blue boxes, it includes a user interface).

D4.1 Architecture
This version is a draft of D4.1 and is under review. 55
Figure 19: The initial functional design of the PROCESS architecture.
Users access the architecture through an application-oriented scientific gateway which
provides secure access in the form of an interactive environment. The environment is
represented as a script application programming interface (API), command-line interface (CLI),
and graphical user interface (GUI). Authentication and authorisation of the user is performed
by a dedicated service.
In order to alleviate the problems with processing exascale data, each of use case scenarios
will be expressed as a set of containers or virtual machines. Commonly, workflow/scenario
steps consist of applications that have enormous dependencies. This approach will unlock the
full potential of the infrastructure, and also provide a secure and isolated environment.
However, it implies virtualization/containerisation of an application environment as well as its
execution environment. The architecture will provide a containerized application repository,
which will offer a container or virtual machine per workflow/scenario step.
The core of the platform services is the virtualization layer. This component will be responsible
for deployment of application services. Once the services are deployed, they will be
orchestrated by high-level descriptions automatically. This element will be responsible for
resource allocation, configuration of all services and management of their lifecycle.
To reach an exascale-capable infrastructure, interoperability across multiple computing
centres is essential. The whole infrastructure is divided into two parts: (1) an extreme large
data service-oriented infrastructure, and (2) an extreme large computing service-oriented
infrastructure. The first part is modelled as a distributed virtual file system (DVFS), an
abstraction layer on top of a more concrete file system. It allows applications to access different
types of file systems (within a data storage federation) in a uniform way. It also supports access
to files from multiple hosts via a computer network. The main requirements are to fit the

D4.1 Architecture
This version is a draft of D4.1 and is under review. 56
federated architecture principles and to avoid forcing users to rely on any specific client. DVFS
also includes a manager for metadata and supporting data services (such as monitoring).
The second part is responsible for management of computing resources. It is modelled as an
interactive computing environment, allowing to access different computing resources in a
uniform manner. It supports extreme large computations that require heterogeneous
infrastructures. It offers HPC computations, HTC computations as well as cloud computations,
and supports accelerators.
4.2 The initial technology-based architecture A preliminary list of required technologies has been identified during the first PROCESS
technical meeting in Amsterdam, (February 2018), which focused on the initial analysis of the
use case requirements. The objective is to establish, as soon as possible, a testbed for the
application owners within PROCESS to try and play arround with various solutions they are
currently experimenting with. It will also help create synergy between the application and
technology developers in the PROCESS project.
Integration as a whole is depicted by Figure 20. Users will interact with the architecture through
a Model Execution Environment (MEE). The whole architecture is driven by a SOA approach,
and so RESTful interfaces are dominant. MEE will provide authentication and authorisation
services. It will be integrated with Jupyter and offer browsing of files through LOBCDER. MEE
will be connected to a TOSCA template repository through SSL, and Cloudify through a REST
API. Following successful authentication and authorisation, users will be able to specify a
workflow. Cloudify will obtain its description in a TOSCA template and deploy dedicated
Docker/Singularity images on corresponding infrastructure elements. In order to achieve this
functionality, Cloudify will include three plugins: (1) the LOBCDER plugin, (2) the Rimrock
plugin, and (3) the Atmosphere plugin, exploiting the underlying REST API (and WebDAV,
within LOBCDER plugin). HPC resources will be managed by Rimrock through the GSI-SSH
protocol, and cloud infrastructures will be governed by Atmosphere. The distributed virtual file
system will be provided by LOBCDER. It will provide direct access to data sources through a
dedicated virtual file system driver. However, if the service is complicated (for example data
filtering, data integration etc.), then it will go through the DISPEL Gate. LOBCDER is also
integrated with DataNet which will be responsible for management of metadata. More details
about the technologies are provided in the next section, which focuses on the current state of
the art and a description of the relevant tools.
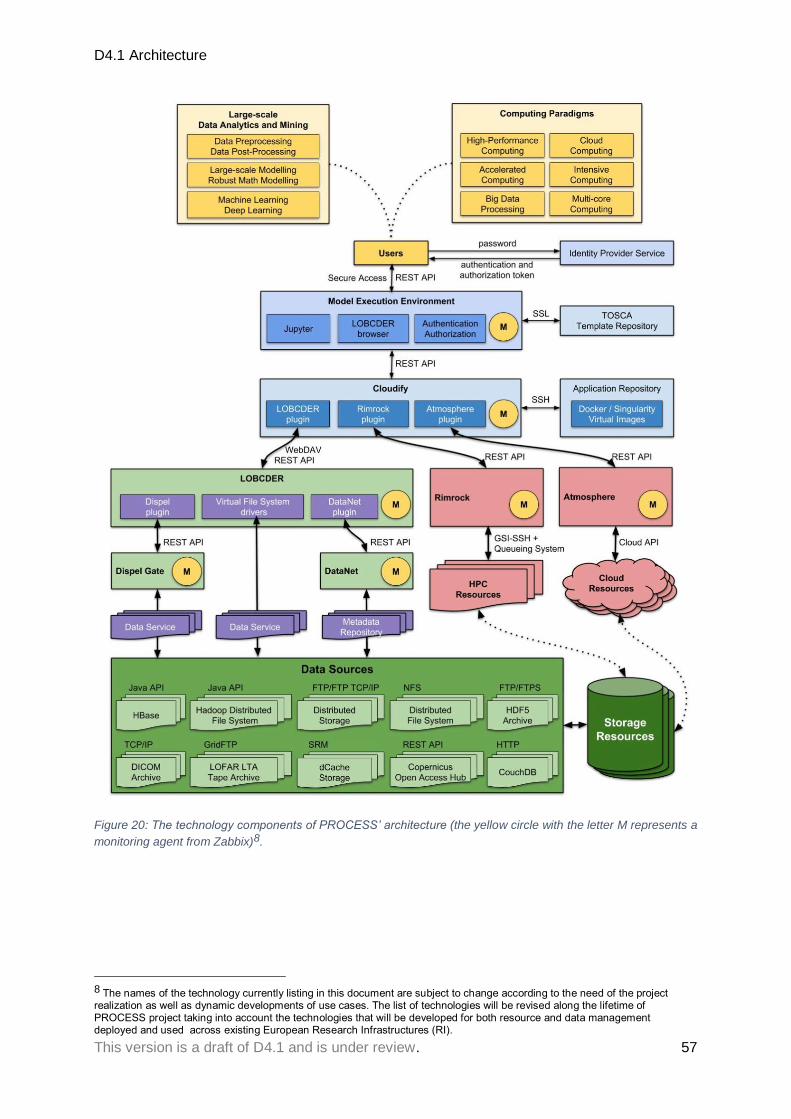
D4.1 Architecture
This version is a draft of D4.1 and is under review. 57
Figure 20: The technology components of PROCESS’ architecture (the yellow circle with the letter M represents a
monitoring agent from Zabbix)8.
8 The names of the technology currently listing in this document are subject to change according to the need of the project realization as well as dynamic developments of use cases. The list of technologies will be revised along the lifetime of PROCESS project taking into account the technologies that will be developed for both resource and data management deployed and used across existing European Research Infrastructures (RI).

D4.1 State of the art of services
This version is a draft of D4.1 and is under review. 58
5 State of the art of services
5.1 State of the art of extreme large data services
5.1.1 Challenges facing Exascale data management In 2009, at the supercomputing conference in Portland, Oregon, Computer world projected
exascale implementation by 2018. They define exascale computer as a system which is
capable of at least one exaFLOPS, or a billion calculations per second. Comparing to the
capacity of petascale computer that exascale capacity is a thousand fold higher. The
american DoE (Department of Energy) listed in the description of the Advanced Scientific
computing Research eight challenges facing exacale computing, ranging from processor
architecture to programming model and reliability. Data management has been mentioned at
two levels: (1) memory bandwidth capacity, (2) data movement and I/O systems. The other
major challenge is related to cost and energy. The estimated system power for an exa-scale
computing is 200 MW. This is impossible to achieve if the target is between 20-40 MW. In this
case all factors that can lead to more power consumption cannot be considered.
One way to achieve exa-scale is to use mulitple peta-scale computers, or even use a large
number of less performing computers. This is not a new idea and this is what grid, cloud, big
data platform were aiming at and could not achieve. The overhead of such systems can cause
high latency, which prevent to reach the goals for exa-scale computing. Petabytes and
exabytes of data and metadata are generated and processed by the exascale applications.
These amount of data has to be transferred back and forth between different components and
processing units. This makes communication overhead a big issue for such systems.
Granularity of data transfer determines the amount of communication overhead. There should
some evolution in software and hardware to reduce the transfer cost between storage and
processing units. The next generation of extreme-scale systems will be fully distributed, hence,
both software and hardware needs to be loosely coupled and work as a unique unit
asynchronously. This challenges makes time of execution as another significant overhead in
exascale systems.
In the following paragraphs we summarize the major challenges facing exascale computing:
Power and energy: This is known as the most important challenge to reach 1000x faster
computational power. Reaching exascale computing with a combination of current
technologies and devices needs hundreds of megawatts of power [Reed 2015]. Hence, it may
have some technologies, software, and hardware devices that are not efficient for exascale
systems. To handle this problem, there are some techniques such as thinking of redesigning
power-care cooling and processing circuits [Reed 2015]. However, improvement in hardware
and architecture level such as decrease in latency and increase in bandwidth onely would not
be able to reach energy efficiency. Redesign of network and processing devices can make it
easy to provide more efficient solutions in software level. For example, a manageable
hardware device can be easily controlled by software in case of need. Further, redesign of
circuits may need to have another type of software with new features (i.e. locality-aware). Thus,
all aspects of an exascale system affect the amount of energy need to be consumed.
Memory and storage: Having 1000x faster computing systems needs similar higher memory
and storage capability in terms of capacity and speed. Without such memory and storage
capability, we cannot envision having an efficient exascale computing system. The
computation of the next-generation processors will be noticeable, however, similar scaling of
memories regarding speed and capacity has not fully addressed yet. If enough memory
bandwidth as same as the computation power does not feed the system, the computational
level of an exascale system does not work well. A heterogeneous architecture will get both
hardware and software levels to unlock heterogeneous exascale system [Schulte 2015].

D4.1 State of the art of services
This version is a draft of D4.1 and is under review. 59
According to the envision of memory requirements for an exascale system, none of the current
memory solutions are able to reach the exascale targets [LLNL 2014]. Another challenge in
reaching memory targets for exascale systems is the conflicting objectives of bandwidth and
capacity. A solution to support exascale systems is to provide a heterogeneous memory
architecture besides considering energy consumption while memory can be a major
responsibility for a large fraction of power consumption of the whole system [Schulte 2015].
Hardware architecture: Development of hardware components and communication devices
may solve other challenges or ease the way we can tackle current challenges. This effort may
include design of a more energy efficient CPU core, model a new circuit with more controlling
features, propose a new communication link/device, increase in the capacity and/or
transmitting speed of memory & storage devices etc. This development can be done based on
the exascale architecture and the major needs to have a plausible exascale computing system.
To do so, there would be applied system and/or application options to enable resiliency. In this
review, we do not want to focus on pure hardware approaches. However, we will discuss
hardware aspects in cases they help, provide or ease system and software solutions.
Programming approaches: As the computing power (clock rate) becomes flat in a single
core, parallel computing of applications on several CPU cores seems to be more logical to
reach more computational power. In exascale systems, we need to consider parallelism of
applications on billions of processing cores, which would need a big change in all aspects of
the previously provided software and systems.
Existing programming approaches and technologies do not provide efficient performance for
extreme-scale HPC systems. Lightweight parallelism will be required to make such systems.
Hence, an evolution of programming models will be required. There are two different ways for
the evolution of programming languages [Bergman 2008]:
1. Innovation provides a new paradigm to the programming conceptual model.
2. Standardization improves existing standards by combining current concepts of related
programming models and technologies.
It seems a combination of both can be the best choice to serve all features that we expect from
a programming paradigm for applications in exascale systems.
There is a need to accelerate communication while the next generation of extreme-scale
computing will be distributed. Lack of these abilities will result in dramatic decrease in
parallelism performance due to the complex nature of the system. Another problem of current
programming models is the lack of prevention of applications from using much of a specific
resource, which causes failures [Snir 2014]. Some of the most important issues in current
programming techniques that need to be enhanced for exascale applications are provided
below [Norman 2017], [Bergman 2008]:
1. Developing portable programming models. This is specifically beneficial for data-
intensive applications.
2. Making a trade-off between portability and performance.
3. Algorithmic and programming techniques to handle poor locality
4. Debugging capabilities for distributed systems. This is now very hard to debug a code
that run on millions of processing units.
5. Nontraditional software stack
6. Programming abstraction for resilent exascale applications
7. Loosely-coupled programming models
8. Automatic parallelism at extreme scale programming algorithms
D4.1 State of the art of services
This version is a draft of D4.1 and is under review. 60
Resiliency: According to the prediction based on the current large scale systems and
technology advancement, this is expected to exhibit a widespread increase in the rate of faults
in the next generation of exascale systems. As a result, many errors and thus malfunctions will
be propagated from simple components of the extreme computing system, which would have
dramatically corrupt the final results of the whole processing units. The resiliency issue is not
the same as the fault issue, however, fault and error management is a must to reach resiliency.
Numerous computing devices are going to bind together to reach the exascale computational
power. The probability of facing failures in a single component is quiet low. In contrast, the
more the number of components work together in the same system, the higher is the risk of
facing a failure in one of the components and the more effect does the faults would have on
the overall performance of the system.
Resiliency at exascale systems can be provided with different solutions. The major solution is
to prevent the system from any faults and errors. To do so, the first step would be avoiding the
system from error occurrence. In the next step, error detection would be a vital necessity for
such systems if any error has been occurred. After detecting these errors, the first urgency
operation would be decreasing the negative effects of the occurred error. Recovery from the
last point before the time in which the error occurred is the next step. Diagnosis is another
solution that not only does it detect the root causes of the occurred fault but it does also take
some decisions in order not to face such failures in future [Snir 2014].
Scalability: Existing design of software for centralized architecture of HPC systems has limited
scalability, which is a serious bottleneck for extreme-scale computing systems [Wang1 2016].
This concern motivates alternative solutions to expose intra-node parallelism such as
distributed architectures to support scalability [Wang1 2016]. To achieve extreme scalability,
some problems should be addressed that are provided below [Wang1 2016], [Chakroun 2015],
[Wang2 2016]:
1. Lightweight, asynchronous, and loosely coupled software systems
2. Fully distributed load-balanced and locality-aware management algorithms
3. Locality-aware encoding
4. Auto-tuning compilers
5. Distributed and n-dimensional data structures for metadata
6. Shared memory threading techniques
7. Inter-node distribution techniques
Fault tolerance: Once we think of having an extreme-scale computing system, we should be
aware of higher error rate of such systems because of the complexity of the system in hardware
and application levels [Snir 2014]. Thus, the nominal computation power of the system in reality
would be marginal because of this obstacle.
Faults and errors are directly effect on the resiliency. Fault tolerance and error prevention is a
must to reach resiliency. A failure in general can either cause incorrect results or make some
problems to run an application (i.e. increase in execution time). A fault itself is not necessarily
the cause of an error (i.e. an active fault will cause an error while a dormant fault will not),
however, it shows that the system is vulnerable and it is not fully immune from deficiencies.
There are six different sources of failures: hardware, software, network, environment, human,
and unknown [Bergman 2008]. Most of these failures comes from hardware and software
sources respectively, including both intermittent and hard failures [Bergman 2008].
In this section, we specifically discuss software related faults. These software related fault
sources are grouped into three domains: (a) software itself is the reason of faults; (b) software
cannot overcome hardware problems results in faults; (c) incorrect firmware in software is the

D4.1 State of the art of services
This version is a draft of D4.1 and is under review. 61
responsible for hardware faults. Same as the fact that each fault does not necessarily causes
an error, all software errors are not equally bad. Hence, some approaches such as prevention,
prediction, tolerance, detection, containment, and recovery can be applied according to the
severity of the faults [Snir 2014].
5.1.2 Exascale data management projects Since 2011 a number of projects tackling various issues in exascale computing have been
initiated worldwide. Some of these projects have already produced useful outcome in terms of
methods, techniques, and tools. Table 5 lists a couple of large exascale projects in EU and
US. While we are collecting applications requirements in PROCESS and assessing our own
suite of tools, we are also studying the methods and tools developed in these projects. At this
point in time our investigation are at a very early stage, in terms of software selection
considering maturity of the code and whether it is still active and has some developers and
users communities to support. Unfortunately for software developed in short lifetime projects
(3 to 4 years) these two requirements are often not satisfied. Nevertheless, the methodologies
and ideas developed in these projects will the PROCESS project to avoid pitfalls and speed
up the PROCESS development process.
Table 5: Overview of exascale data management projects.
Project Name Description
1. CRESTA The CRESTA software collection contains a collection of software
designed and enhanced to exploit future exascale platforms and to
support applications on exascale platforms [CRESTA].
2. Mont-Blanc
Provides software tools that help programmers and sowtware
architects to observe and understand the behaviour of applications
running on an ARM-based system, locate and fix errors in the code,
and explain observed performance inefficiencies [Mont-Blanc]
3. MaX
projects
MaX addresses the challenges of porting, scaling, and optimising
material science application codes for the peta- and exascale
platforms in order to deliver best code performance and improve
users´ productivity on the upcoming architectures [MaX_projects].
4. Exascale
project
Developed a comprehensive and coherent software stack that will
enable application developers to productively write highly parallel
applications that can portably target diverse exascale architectures
[Exascale_project]
5.1.3 Distributed file systems: a current overview and future outlook Many applications require access to data sets that do not fit on a single server. Additionally,
such application might have varying degrees of performance, availability and fault-tolerance
requirements. One way to address these issues is by making use of a distributed file system
(DFS). In the following sections we give an overview of several established DFS solutions
(GFS, HDFS, GlusterFS, Ceph, Lustre and cloud-based object storage), while also taking a
look at future challenges we expect to be relevant for the advancement of DFS design. For the
established solutions, we highlight differences in their design and outline characterizing
aspects. For the future challenges, we discuss novel research projects and how these attempt

D4.1 State of the art of services
This version is a draft of D4.1 and is under review. 62
to tackle the challenges. Besides focussing on fault tolerance and scalability characteristics,
we briefly consider the solutions in the context of exascale computing to see whether they
would be appropriate.
The capacity of storage devices has been ever growing since the inception of the first hard
disk drives (HDD's) more than 60 years ago. State-of-the-art technology currently limits HDD
storage capacity for a single device at around 10TB, with technology to support ~100TB HDD's
expected by 2025 [hgst14][astc]. However, many modern applications deal with data sets sized
beyond what fits on a single machine or server. Moreover, these applications potentially require
varying degrees of performance, availability and fault-tolerance. To facilitate this, one has to
make use of a distributed file system (DFS). DFSs are not a new technology, traditional
solutions like the Network File System (NFS) have been around since the 1980s
[Sandberg85designand]. Although these traditional technologies are still being used, it are the
developments in high-performance computing (HPC) and the advent of big data and cloud-
based applications that have lead to the development of many novel DFS designs and
architectures. Moreover, since we are slowly but steadily heading towards the era of exa-scale
computing, it will be interesting to see how DFS designs are developing in this regard. With
this work, we provide an overview of several established state-of-the-art DFS solutions while
also highlighting novel research projects and regarding them in an exa-scale computing
context.
In the case of a DFS, the file system manages access to storage devices attached to multiple
machines or servers. In order for the file system to actually manage data stored on multiple
servers, these servers will have to communicate with each other over a network. Thus in the
case of a DFS, another layer is placed on top of the traditional file system in the form of a
network protocol to facilitate the communication between servers. This additional layer of
abstraction should allow for a DFS to mount storage devices physically attached to different
servers on multiple client machines.
From a design perspective, there are three properties that are desirable for a DFS, namely:
transparency, fault tolerance and scalability [levy1990distributed].Transparency means that
ideally the complexity of the distributed file system should be completely abstracted away and
thus be hidden. Interaction with the DFS should mimic that of interacting with a local file
system, the user or client should not be concerned with the intricacies of where and how the
data is distributed and/or replicated. Fault tolerance means that in the event of a transient
server failure (e.g. a failing HDD) or partial network failure (i.e. network partition) the system
should continue to function, ideally without any compromising of data integrity. Lastly,
scalability means that the system be able to withstand high load and allow for new resources
(such as servers) to be integrated into the system with relative ease. In essence, a DFS will
always comprise of a set of servers. There are however many ways in which these can be
arranged architecturally to realize distributed storage.
Since data in a DFS will be distributed among several servers and will likely have to be
replicated in places to ensure availability in case of a server failure, the notion of state becomes
blurry. In 2000, Brewer proposed the CAP theorem, which essentially suggests that it is
impossible for a distributed system (and thus a DFS) to provide Consistency (C), Availability
(A) and Partition tolerance (P) guarantees all at the same time [brewer2000towards]. The
theorem was formalized and proved correct in 2002 by Gilbert and Brewer and states that at
most two out of the three guarantees can be provided simultaneously [gilbert2002brewer]. The
probability of server failure increases with the number of servers used, some form of replication
is thus required to provide fault-tolerance. However, since data is replicated, failures in such a
concurrent system can lead to state inconsistencies. Consistency in this context refers to the
notion that replicated copies are identical. More formally, the strict consistency guarantee

D4.1 State of the art of services
This version is a draft of D4.1 and is under review. 63
states that there must be a single total order on all concurrent data operations such that to an
outside observer, they appear as a single operation, essentially behaving as though the
operation was performed on a single machine. While occasional server failures are inevitable,
it is desirable for a distributed system to be continuously available. Availability thus refers to
the guarantee of a distributed system to always provide a response to a request eventually (i.e
it should not fail or give an error). Communication among servers happens via a network.
Similar to how server failures are inevitable, it is likely that there will be errors and failures in
the network (e.g. loss of network messages or corruption). Partition tolerance refers to the
ability of a system to cope with partitioning within a network, a situation that can occur when a
certain set of servers is unable to deliver network messages to other servers in the network.
In accordance with this guarantee, only complete network failure should allow the system
respond incorrectly. In any other case, the system should behave as expected.
Given the seemingly hard limitations presented by the CAP theorem, the choice for a DFS will
almost always come down to a CP or AP design, as a we would like our DFS to continue
functioning in the case of network errors (i.e. we cannot give up P). However, regarding the
`two out of three' formulation as a hard limitation on distributed system design is an
oversimplification. In a 2012 article reflecting on his initial proposed idea, Brewer argues that
the traditional notion of CAP has served its purpose (which was to ‘open the minds of designers
to a wider range of systems and tradeoffs') and that system designers should be freed of these
perceived limitations [brewer2012cap]. In it he states that while networks can behave
unreliably and partitions can occur, such events are relatively rare. Why should a system
therefore have to choose between C or A when the system is not partitioned? Systems can be
designed to deal with partitions explicitly and perform recovery afterwards. The choice between
the three guarantees should not be thought of as a hard choice (e.g. choosing P means losing
either C or A), but in terms of probabilities (e.g. the probability of P is deemed lower than other
failures). When a distributed system is able to detect partitions, it can explicitly account for
them in a three stage process: partition detection, partition mode, recovery mode. In the first
stage, the network partition must be detected and the system should enter partition mode.
While in partition mode, the system should either impose limits on certain operations (reducing
A) or record extra information regarding operations by storing the intent of an operation so it
can be executed after partition recovery (hiding the reduction of A). In the last stage, the system
will have to reimpose C by essentially re-computing the state. Note that the last stage can lead
to merge conflicts which can either required to be resolved manually or automatically (by
imposing a deterministic choice on what option to choose). Ultimately the key insight here is
that when there is a network partition, there need not be a hard choice between either C or A:
a choice between C and A can be made on sub system level granularity
In the realm of HPC, supercomputers comprising of thousands of interconnected servers are
being used to solve the world's most complex problems. We see application of HPC in both
the scientific domain and industry: ranging from modelling global climate phenomenon to
designing more efficient drugs. Currently, the state of the art in HPC is at the peta-scale (in the
order of 1015 FLOPS), first achieved in 2008 [firstpetascale]. However, we now see an
enormous increase in the size of commercial and scientific datasets. Consequently, it is likely
that the current peta-scale technologies will not be able to handle this and that we will require
new solutions to prepare ourselves for the next milestone: exa-scale computing 1018 FLOPS).
Exa-scale systems are expected to be realized by 2023 and will likely comprise of ~100,000
interconnected servers; simply scaling up peta-scale solutions will likely not suffice
[vijayaraghavany2017design]. Evidently, this raises many challenges in how the required
hardware but also how to design applications that can make use of that many computing
nodes. However, what is relevant for this paper is how the large volumes of data involved will
be stored. Exa-scale systems will need novel DFSs, sufficiently scalable to accommodate for
D4.1 State of the art of services
This version is a draft of D4.1 and is under review. 64
the increase in memory capacity requirements. While not the solely focus of this paper, we will
attempt to take this into account when discussing DFSs and recent research projects to see
how well they might be suited for an exa-scale computing context.
Established DFS solutions
Before the advent of big data and cloud computing there were three main prevalent storage
architectures: direct-attached storage (DAS), storage area networks (SANs) and network-
attached storage (NAS) [mesnier2003object].In the case of both DAS and SAN, the file system
running on a client node will see the storage device as being attached locally since all the
administrative complexity is manifested in the lower level protocols and hardware. The
advantages of SAN compared to NAS are thus performance and scalability, however these
come at the cost of tight coupling between servers in the form of expensive dedicated
supporting hardware and specialized network layer switches [vacca2006optical].With the
advent of cloud computing and open-source big data toolkits there is a trend of solving
scalability issues using commodity hardware at the application level of abstraction. The need
for specialized hardware and infrastructure and lack of application level configurability of SAN
therefore largely rules it out as a solution for current day large scale data storage needs. Ideally
what we want is solution that was designed from the ground up with modern scalability needs
in mind running on commodity hardware like the Google File System
(GFS)[ghemawat2003google], Hadoop Distributed File System (HDFS)
[shvachko2010hadoop], GlusterFS [glusterfs], Ceph [weil2006ceph], and Lustre [lustre].
Cloud-based object storage
Although arguably not a DFS at the same level of abstraction as those previously discussed,
we deemed it necessary to discuss the object storage services provided by practically all major
cloud providers. These services essentially provide a complete virtualization of storage, not
burdening application developers with the intricacies of cluster management or the cost of
running and maintaining a private cluster. Additionally, these services are comparably trivial to
set up and provide easy to use interfaces. Here we will briefly discuss the advantages and
disadvantages of these services and discuss the consistency models offered by the three
major cloud providers: Amazon, Microsoft and Google. There are many advantages to cloud-
based object storage. For system designers and application developers, an object interface
that abstracts away nearly all of the administrative complexities that come with distributed data
storage is a major selling point. The relative ease of use and pricing of cloud services make it
so that large scale data storage is available to small companies or even individuals, and not
just in the reach of large enterprises or universities. Since the major cloud providers have data
centers all around the globe, data can be replicated over these data centers and can thus lead
to better performance when accessed from varying locations. With respect to the interfaces
provided for these services, in addition to the availability of language bindings for practically
all popular programming languages in the form of official or third-party libraries, they all provide
very similar RESTful API's for interfacing with them over HTTP/HTTPS. Since the interfaces
are web-based it means that cross platform data sharing is trivial. It must be noted however
that while the interfaces are similar, they are not identical. Thus there is the risk of vendor lock-
in. Fortunately, efforts are being made by the SNIA to standardize the interface for clients in
the form of the Cloud Data Management Interface (CDMI) [cdmi].
In terms of CAP, usually cloud-based object storage solutions used to fall in the AP category,
providing high availability (through replication) and partition tolerance while offering only
eventual consistency [mahmood2016achieving]. Informally put, eventual consistency only
guarantees that given the absence of future updates, eventually all read operations on a
particular data item will yield the latest version. It should be noted that preservation of the
ordering of operations is not at all guaranteed. One of the most obvious use cases for eventual
consistency is the hosting of large sets of unstructured data that are not subjected to frequent

D4.1 State of the art of services
This version is a draft of D4.1 and is under review. 65
change such as static images or videos. Where it evidently falls short is when stale reads can
compromise the business logic of an application. In an effort to allow for stronger consistency
guarantees for replicated cloud storage, Mahmood et al. propose a system enabling causal
consistency for cloud storage services [mahmood2016achieving]. With causal consistency,
preservation of the causal relationships between operations is guaranteed. More specifically it
guarantees that write operations that are potentially causally related must always be observed
in the same order, while concurrent writes may be seen in a different order
[tanenbaum2007distributed].Today, the major cloud providers offer different consistency
guarantees for their object storage services. Since major cloud providers have immense
backing infrastructures, they are able to offer virtually unlimited storage capacity. This means
that at least in terms of memory capacity, cloud-based object storage is scalable to petabytes
and even exabytes. They offer it at a level of abstraction that is easy to interface with from a
system designer or application developer point of view. They major downside however will be
the relatively high latency of the web based interfaces, making it unsuitable for latency sensitive
(HPC) workloads. With regard to consistency, the major cloud providers initially only offered
eventual consistency for their object storage services, ruling out their use in applications which
rely on stronger consistency restraints. However, we are seeing efforts being made in both
academia and industry to improve these services by providing stronger consistency models in
the presence of high availability and partition tolerance. Although at a higher level of
abstraction than the previously discussed DFSs, cloud-based object storage can be an
appropriate solution when extremely low latency is not required.
Challenges
The existing open-source solutions mentioned in the previous section are production ready
and can be used today. However, there is also an active research community with respect to
improving DFS design, both in academia and in open-source communities. For this section,
we have chosen three challenges that we expect to be relevant for the advancement of DFS
design. We will briefly describe them and novel research projects attempting to address these
challenges.
Scalability of metadata management
To ensure future use of current DFS designs means that they not only have to be scalable in
terms of actual storage capacity, but also in metadata management. In a comparison of typical
file system workloads, it was found that nearly half of all operations are metadata operations
[roselli2000comparison]. It is for this reason that there is a continuous effort being made to
make metadata management more scalable. Here we will briefly go over the metadata
scalability characteristics of the discussed DFSs and take a look at two recent research
projects. From the discussed DFSs we have observed the inherent lack of metadata scalability
of GFS and HDFS, since they both feature a design with only a single metadata server. Lustre
allows for multiple metadata servers, but relies on explicitly storing the locations of files.
GlusterFS somewhat improves on this aspect by not explicitly storing metadata regarding file
locations but instead it opting for algorithmic placement. It must be noted however that even
with this in place, all the other metadata operations still happen on the data storage servers.
The design of Ceph is probably the most scalable with respect to metadata management, since
it allows for a cluster of metadata servers and also features algorithmic file placement and
dynamic metadata workload distribution. A notable recent development in relational databases
is NewSQL, a class of databases seeking to combine the scalability characteristics of NoSQL
databases with the transactional characteristics of traditional relational databases. In a 2017
paper Niazi et al, present HopFS, a DFS built on top of HDFS, replacing the single metadata
server with a cluster of NewSQL databases storing the metadata [niazi2017hopsfs]. They
attempt to address the issue of metadata management scalability by storing all HDFS
metadata in a Network Database (NDB), a NewSQL engine for MySQL Cluster. They tested
D4.1 State of the art of services
This version is a draft of D4.1 and is under review. 66
their solution on a Spotify workload (a Hadoop cluster of 1600+ servers storing 60 petabytes
of data) for which they observed a throughput increase of 16-37x compared to regular HDFS.
What makes this solution noteworthy is that it is a drop-in replacement for HDFS, allowing it to
be used in existing Hadoop environments, allowing them to scale beyond the limits imposed
by the single metadata server approach. Using a similar approach, Takatsu et al. present
PPFS (Post-Petascale File System), a DFS optimized for high file creation workloads. In their
paper they argue that modern DFSs are not optimized for high file creation workloads, and that
for exa-scale computing this can turn out to be a serious performance bottleneck
[takatsu2017ppfs]. They have evaluated their system against IndexFS (2014), a middleware
for file systems such as HDFS and Lustre aiming to improve metadata performance [rennie].
With respect to file creation performance, they observed a 2.6x increase in performance. They
achieved this by employing a distributed metadata cluster design using key-value metadata
storage and non-blocking distributed transactions to simultaneously update multiple entries.
Although only tested on relatively small clusters comprising of tens of servers, it good to see
that an effort is being made to improve upon aspects such as file creation performance, which
might turn out to be a bottleneck in an exa-scale context.
Small file performance
There is a discrepancy in performance between DFSs with respect workloads involving many
small files as opposed to workloads with fewer, but larger files. In a comparative analysis of
various DFSs, it was established that the design of GFS, HDFS and Lustre make them not well
suited towards workloads involving many small files, while Ceph and GlusterFS seemed to
perform reasonably well for both types of workloads[depardon2013analysis]. That being said,
there is room left for improvement with regard to small file workload performance. Here we will
briefly highlight two recent research projects attempting to address this issue. In their paper,
Zhang et al. present HybridFS, a DFS framework that runs on top of multiple DFSs and
dynamically chooses which DFS to use for file placement [hybridfs]. HybridFS is a DFS
framework that runs on top of multiple DFSs and features an additional metadata management
server that is in charge of file placement on the underlying DFSs, features a partial metadata
store for small files and can perform dynamic file migration to balance storage usage on the
DFSs. They have evaluated their solution on an 8 node cluster running Ceph, HDFS and
GlusterFS. They observed a best-case performance increase of 30% in read/write operations
when compared to single DFS. HybridFS is definitely a step in the right direction with regard
to providing a workload agnostic DFS framework. With respect to exa-scale computing, the
relatively small cluster size on which it was tested and the fact that the additional metadata
management server introduces an additional single point of failure limit its scalability and
thereby suitability for exa-scale computing. A different approach is taken by Fu et al., who
present iFlatLFS (Flat Lightweight File System), an OS level file system designed as a
replacement for file systems such as Ext4, ReiserFS or XFS when deployed on storage servers
in a DFS [fu2015performance]. The file system was explicitly designed to address the issue of
poor small file performance. In iFlatFS, data can be directly addressed from disk instead of
through a hierarchical file tree as is the case for the conventional file systems. They achieve
this by using a much simpler metadata scheme that occupies much less space, which allows
it to be entirely cached in memory. This in turn means that all metadata requests can be server
from memory, instead of having to go through disk. They have tested their solution using the
Taobao File System (TFS, developed by Alibaba) in which they observed an almost twofold
increase in 1KB-64KB file performance when compared to Ext4.
Decentralization
In the solutions discussed so far we have seen various approaches to positively influence the
scalability characteristics of a DFS. A recurring concept is that of decentralization, distributing
responsibility of certain aspects of the system to multiple non-authoritative servers instead of

D4.1 State of the art of services
This version is a draft of D4.1 and is under review. 67
relying on a single or multiple dedicated centralised servers. Removing a single point of failure
by distributing the workload should help to increase fault tolerance and scalability. We see
such an approach in GlusterFS and Ceph, which both feature a decentralized approach
towards file placement. Here we will briefly discuss a recent project that seeks to go even
further, a completely decentralized peer-to-peer DFS. Currently an open-source project with
active development from a community of developers, the InterPlanetary File System (IPFS) is
a DFS protocol designed to allow all connected peers to access the same set of files
[benet2014ipfs]. The author describes it as being similar to the Web in a single BitTorrent
swarm exchanging objects within a Git repository. It makes use of distributed hash tables,
incentivized block exchange and a self certifying namespace to create content addressable
peer-to-peer network of files. Any type of data can be stored as an object in IPFS, with integrity
validation and automatic deduplication as built-in features. Removing all single points of failure
by taking a completely distributed peer-to-peer approach is very interesting, since it in theory
provides infinite scalability. However, having to rely on servers beyond your control likely rules
it out for latency sensitive or mission critical applications. That being said, leveraging a globally
distributed network of interconnected machines as a DFS is very relevant to at least capacity
requirements. One can envision that given a large peer count, storing exabytes of data
becomes almost trivial. Generally, we expect that the concept of decentralization will play a
significant role in the development of future DFSs to cope with ever increasing scalability
demands.
Summary
The goal of this state of the art study is to have an overview of the state-of-the-art of DFSs.
We have evaluated the design of several well established DFS solutions while also taking a
look novel research attempting to solve the challenges of future DFSs. With respect to the
established solutions, we have seen drastically varying designs. From single metadata server
architectures such as GFS/HDFS, to clusters of metadata servers in the case of Ceph and
Lustre. GlusterFS and Ceph both employ algorithmic file placement, which mean that there is
no need to explicitly store file location metadata. Purely based on high-level design
comparison, Ceph seems to cater the most to modern scalability requirements and will
therefore be a likely candidate to be used in an exa-scale computing context. Lastly we
discussed cloud-based object storage, which with its immense backing infrastructure is be able
to store exabyte sized data sets. However, for latency sensitive applications like HPC it is
unlikely to be a good fit. We have taken a look at recent research and presented them in the
context of three challenges that we deemed relevant for future DFS designs. Firstly, we
discussed the issue of scaling metadata management. We found that with respect to metadata
clusters, we are seeing efforts being made to incorporate techniques from the database world
such as distributed transactions and NewSQL databases to speed up metadata performance.
Secondly, we discussed the issue of performance in small file workloads. We regarded two
research projects attempting to tackle this issue. The first of which by running multiple DFSs,
each optimized for certain file sizes, and having an additional layer on top of it dynamically
choosing an appropriate underlying DFS based on the type of workload. The second
introduced an entirely new HDD level file system to be run on the storage servers in a DFS,
increasing performance by reducing the size of stored metadata, allowing it to be stored
entirely in main memory. Lastly we discussed the concept of decentralization with respect to
DFSs. We regarded IPFS, a completely decentralized peer-to-peer DFS allowing for all peers
to access the same set of files.
This state of the art is far from exhaustive and that there are a lot of current DFS solutions and
research projects that we have not covered. There is a lot of ongoing research into developing
new techniques and designing refined architectures for future DFSs preparation for building
exa-scale system. We will extend the state of the art in course of the project lifetime.

D4.1 State of the art of services
This version is a draft of D4.1 and is under review. 68
5.2 Data Delivery service for extreme data application
5.2.1 State of the art Many proposals attempt to realize storage federation and unify data access. These proposals
are often tightly coupled with a storage infrastructure or technology which minimizes flexibility
and makes it difficult to adapt to hardware and software changes. Existing solutions often
implement “ad-hoc” interfaces to provide access to users and applications. These designs
reduce interoperability and in most cases are specific for grid or cloud environments. Globus
Online [Foster2011] is a data transport service that federates GridFTP [Bresnahan2007]
resources for moving large quantities of data across geographically distributed storage
systems. Although Globus online is able to transfer huge amounts of data, it is limited to
coordinating transfers between GridFTP servers.
The approach described in [Abu-Libdeh2010] implements redundant storage techniques on
cloud systems to allow customers to avoid vendor lock-in, reduce the cost of switching
providers and to tolerate provider outages or failures.
This approach is limited to the Amazon S3 storage. PhysiomeSpace is a solution developed
with the VPH community in mind [Testi2010]. PhysiomeSpace puts emphasis on sharing and
managing medical images and supports almost any type of biomedical data. However, it uses
a custom developed client to make the data available to users making it less flexible and
requiring more effort to maintain compatibility of the custom client with the service. Additionally,
the proposed solution is limited to use Storage Resource Broker (SRB) [Rajasekar2006].
VeilFS is a system that attempts to unify access to files stored at heterogeneous data storage
systems that belong to geographically distributed organizations [Dutka2014].This approach is
designed to only use local storage. VeilFS also uses custom access protocols forcing users to
adopt a dedicated client implemented only for VeilFS. Unlike existing proposals, our approach
takes advantage of all available technologies to offer a large scale collaborative storage
environment to the VPH community. Our architecture is able to federate multiple,
heterogeneous and independent storage resources and present them as a unified storage
space.
Hadoop Distributed File System
The Hadoop Distributed File System (HDFS) was developed as part of the popular open-
source big data framework Hadoop and officially released in 2011 [Shvachko2011]. The design
of HDFS was heavily inspired by that of GFS, one might even go as far as stating that is an
open-source implementation of GFS. However, in contrast to GFS, Hadoop (and thereby
HDFS) is an Apache project and is thus available under the Apache opensource license. This
has lead to widespread use of HDFS, in the context of Hadoop but also as a separate entity
[hadoop2018]. In GFS, the locations of chunks are not persistently stored on the master (they
are determined by the HeartBeat messages) while in HDFS the NameNode does maintain
persistent location information. Although GFS is optimized for append-only operations, it does
allow for random writes within files. In HDFS random writes are not possible, only append write
operations are allowed. Lastly concurrent writes in GFS can lead to consistent but undefined
state. HDFS on the other hand employs a single-writer, multiple-reader model meaning that
files will always be consistent and defined. The limitations of HDFS are identical to those of
GFS. While scalable to thousands of servers and capable of storing tens of petabytes of data,
the single server metadata management severely limits its further scalability.
GlusterFS
GlusterFS is an open-source networked file system designed for running on commodity
hardware [Gluster2018]. It is marketed as being a scale-out NAS system, relying on a more
traditional client server design rather than employing a metadata server based architecture like
GFS or HDFS. GlusterFS is fully POSIX compliant, runs on commodity Ethernet networks but

D4.1 State of the art of services
This version is a draft of D4.1 and is under review. 69
also on Infiniband RDMA (an alternative networking standard often used in the context of
HPC). While it is a user-space file system like GFS and HDFS, it can be mounted as native
storage on Linux via File system in User space (FUSE) or NFS. In GlusterFS, data is stored
on sets of servers called volumes. Each volume is a collection of bricks, where each brick is a
directory exported from a server. Data is subsequently distributed and potentially replicated on
servers within a volume. The level of redundancy within a volume is customisable. Distributed
volumes: files are simply distributed without replication, limiting the placement of a file to at
most one brick. Replicated volumes: for better availability and reliability, files can be replicated
across bricks within a volume. Distributed replicated volumes: files are distributed across
replicated sets of bricks in the volume, potentially providing improved read performance.
Dispersed volumes: based on erasure codes, stores encoded fragments of a file on multiple
bricks in such a way that the original file can be recovered with only a subset of the encoded
fragments. Distributed dispersed volumes: similar to replicated vs. distributed replicated
volumes, providing higher reliability. Besides the customisable replication within GlusterFS,
what makes its design stand out is the fact that it does not maintain a separate metadata index
of file locations. Instead, the file location is determined algorithmically using its elastic hashing
algorithm (EHA). Given a path and file name, the hashing algorithm will determine where this
file will be placed. Not having to explicitly store a metadata record is huge advantage in terms
of scalability. However, a possible disadvantage of such a placement strategy is that while file
placement might be uniform, uniformity of the actual distribution of data need not be, since not
all files are equal in size.
With respect to CAP, GlusterFS favors consistency and availability by default. However, with
replication enabled, GlusterFS allows you to set up a server quorum which effectively allows
you to trade in availability for partition tolerance. In the event of a network partition, i.e. when
different sets of servers are concurrently handling different writes, we can end up with
inconsistent state for the same files. When no quorum is set up, clients are always allowed to
perform write operations, regardless of any network partition (high availability). As a
consequence, any file that is left in an inconsistent state will be marked as such, and will require
manual intervention to resolve the merge conflict. When a quorum is set up, only a single set
of servers is allowed to perform write operations.
This means that availability is sacrificed for the servers not in this set, write operations will
simply. However, this does mean that the system is able to handle network partitions.
Ceph
Ceph is an open-source storage system providing object, block and file storage. It was initially
presented in 2006 by Weil et al. as a research project [Weil2006]. In 2011, Weil founded
Inktank Storage to lead the development of Ceph, which was subsequently acquired by Red
Hat in 2014, now making them the lead development contributor. As with the previously
discussed DFSs, Ceph is designed to be run on commodity hardware. It is POSIX compliant
and natively mountable in Linux. Like with GFS and HDFS, there is a decoupling of data and
metadata. Data transfer occurs between client and data storage servers directly, while
metadata operations are handled by metadata servers. However, unlike GFS and HDFS which
employ a single metadata server, in Ceph, metadata is managed by an actual cluster of
metadata servers (MDSs). It there by attempts to tackle the problem of metadata management
scalability, allowing for up to tens or hundreds of MDSs to form a metadata cluster [Maltzahn].
Within this cluster, the metadata workload is attempted to be evenly distributed by the use of
dynamic subtree partitioning, delegating the workload for parts of the file hierarchy to certain
MDSs taking into account metadata popularity. Additionally, it allows MDSs to serve in standby
mode, ready to take over in the event of an MDS failure, thereby increasing fault tolerance.
Similarly to GlusterFS’s EHA, Ceph uses its Controlled Replication Under Scalable Hashing
(CRUSH) to algorithmically determine where objects are to be placed. In Ceph, data is stored

D4.1 State of the art of services
This version is a draft of D4.1 and is under review. 70
in a distinct cluster referred to as the Reliable Autonomic Distributed Object Storage (RADOS),
exposing a single autonomous object store to clients and the metadata cluster. Within this
cluster, objects are stored in conceptual object storage devices (OSDs) which are stored on
the local file system of a server. Since 2017, besides allowing OSDs to be run on top of
conventional Linux file systems, Ceph now offers its own file system called BlueStore which is
optimized for the OSD design (thereby removing the translation overhead due between OSD
semantics and traditional file system semantics) [Ceph2018]. Within the data cluster, data
replication is available and customizable. Similar to GlusterFS’s dispersed volume, Ceph too
uses erasure codes in replication. Ceph offers a lot of customizability with respect to
consistency and availability. Not only does it support MDS/OSD clusters ranging from a handful
to hundreds of servers, allowing for high availability, it also offers a choice between strict or
relaxed consistency models within these clusters. With regard to partition tolerance, Ceph
supports a cluster of monitors which maintain a map of the storage cluster, keeping track of
the state of the storage servers allowing for action to be taken when necessary. In agreement
with the revised take on the CAP theorem and given the amount of customizability Ceph offers,
it is not appropriate to label it as either a CA, CP or AP system, thus we will refrain from doing
so.
Lustre
Lustre is an open-source DFS tailored to HPC environments, scaling up to thousands of
servers and storing petabytes of data [Lustre2018]. It is fully POSIX compliant, natively
mountable on Linux and can be run over standard Ethernet or HPC oriented interconnects
such as Infiniband. In Lustre, storage and transfer of data and metadata are performed by
different servers. Similar to the design of Ceph, metadata is stored on a cluster of metadata
targets (MDTs).The metadata is distributed over these servers via the Lustre Distributed
Namespace (DNE), an approach along the same lines as Ceph’s dynamic subtree partitioning.
However, unlike Ceph, clients do not access MDTs directly. Instead the client endpoint for
metadata operations are the metadata servers (MDSs). The same goes for data storage; files
are stored in objects on object storage targets (OSTs) while the client request for the objects
are handled by object storage servers (OSSs), which delegate the requests to the ODTs. Thus
we see a clear separation of the actual storage of data/metadata and the handling of their
respective client requests. This should help in distributing the workload, at the cost of requiring
more servers. Lustre was originally designed for use in HPC, whereby it was assumed that the
storage devices provide internal redundancy and fault tolerance. Therefore Lustre does not
provide any file system level replication. However, a high level design is provided by the Lustre
team for file level replication [Lustre2018].In terms of consistency, Lustre is able to provide
strong consistency via a locking mechanism. Lustre aims to achieve high availability by
providing fail over mechanism, essentially allowing redundant servers to take over in the event
of server failures.
The exascale application viewpoint
The advantages to the design of GlusterFS. First of all, it offers POSIX file semantics, which
means that it is mountable like any other traditional file system and adheres to strict
consistency requirements. Secondly, its replication via erasure codes is a more space efficient
way of replicating data than naively storing multiple copies. But the main advantage however
is the fact the design does not feature a server explicitly storing file location metadata. With
respect to scalability, not requiring a metadata server that can potentially be a performance
bottleneck is a significant benefit. For certain workloads, a disadvantage of the design of
GlusterFS is that it works on file granularity (as opposed to aggregated data blocks or chunks).
Such a design can introduce more internal administrative overhead when for example
replicating huge numbers of small files. However, we deem it likely that its approach of having
a decentralized Namespace will manifest itself in exa-scale DFS solutions of the future.

D4.1 State of the art of services
This version is a draft of D4.1 and is under review. 71
The design of Ceph, allowing for clusters of not only data, but also metadata and monitor
servers provides it with excellent scalability characteristics. Currently, it is currently already
being used by Yahoo to store petabytes of data and is chosen as the technology to prepare
their infrastructure for storing exabytes of data [Yahoo2018]. This in combination with the level
of customizability makes Ceph a good candidate for an exa-scale computing DFS.
There are several clear advantages to Lustre’s design. The first of which is that it allows for
clusters of data and metadata, like Ceph. Secondly, the handling of client requests and actual
storage of data and metadata occurs on different machines. In terms of scalability this is a
clear advantage since it allows for explicit control over how many server to dedicate to the
handling of client requests and actual storage. Similarly, availability can be customized by
introducing redundant backup servers to a cluster. The number of files that are stored in a
single object is customizable as well, which means that Lustre is not necessarily tied to single
type of workload with respect to file size. However, the lack of replication at the software level
makes it a poor fit for failure sensitive commodity hardware, especially when the cluster size
grows. That being said, its metadata and data cluster architecture, given hardware providing
built-in redundancy and fault tolerance, make it a good candidate for an exa-scale computing
DFS.
5.2.2 LOBCDER
Technology Readiness Level
TRL 6: Have been used in VPH-share (FP7 project) production environment for more than two
years. We note here that for the PROCESS project we will have to reconsider certain
components of the LOBCDER in the light of more recent state of the art technologies.
TRL 7-8: According to the EC definition9 TRL 8 is defined as “system complete and qualified”.
For LOBCDER to reach this level, LOBCDER will be subject to a series of tests and evaluations
which will aim to prove that LOBCDER in its final form is able to meet its operational
requirements under the range of conditions in which LOBCDER will be expected to operate.
To achieve this goal, we are now investigating several existing assessment tools, the so called
Technology readiness calculators10,11,12. In the short term, we will update the LOBCDER code
by replacing two components of the LOBCDER systems namely the virtual file system library
(potential library is Apache Commons Virtual File System) and the Java Webdav Server Library
(io.milton)
Main features of the service in the PROCESS project
Distributed Virtual File System.
Architecture
LOBCDER is a data storage federation which can be used to persistently store binary data
(files), ensuring consistent, safe and convenient access from various entry points, including
the Master Interface, Atomic Service Instances and custom clients. Externally, LOBCDER
mimics a WebDAV server and can therefore be accessed by any DAV-compliant software.
9 https://ec.europa.eu/research/participants/data/ref/h2020/wp/2014_2015/annexes/h2020-wp1415-annex-g-trl_en.pdf
10 Nolte, William L.; et al. (20 October 2003). "Technology Readiness Level Calculator, Air Force Research Laboratory, presented at the NDIA Systems Engineering Conference".
11 Technology Readiness Assessment Guide, DOE G 413.3-4A Approved 9-15-2011, https://www.directives.doe.gov/directives-
documents/400-series/0413.3-EGuide-04-admchg1/@@images/file
12 From NASA to EU: the evolution of the TRL scale in Public Sector Innovation https://www.innovation.cc/discussion-papers/22_2_3_heder_nasa-to-eu-trl-scale.pdf

D4.1 State of the art of services
This version is a draft of D4.1 and is under review. 72
Data delivery service for an extreme data application will be based on the Large OBject Cloud
Data storagE fedeRation (LOBCDER) technology [LOBCDER1, LOBCDER2], which is
agnostic from the back-end storage available technologies to offer a large-scale collaborative
storage environment. It does not assume any central control of the back end storage and thus
by design it fit the federated architecture principles, and it does not require to use a specific
client, any client which use WebDav protocol or REST interface can be used on top on the
LOBCDER backend. LOBCDER is a Virtual File System which scales, is technology agnostic
and operates over federated heterogeneous distributed systems (no central control). LOCDER
is able to federate multiple, heterogeneous and independent storage resources and present
them as a unified storage space. Some of the basic features provided by LOBCDER like the
access transparency, file management policy, actual file transfers and the location
transparency can be found across multiple services like EUDAT set of services B2ACCESS,
B2DROP, B2SAFE, B2STAGE, and B2FIND, or the EGI online storage and data transfer
services. The module architecture of LOBCDER simplify the use the integration of like the
EUDAT and EGI technology which are widely used across European e-Infrastructure. On top
on these basic services LOBCDER offer more advanced services like Replicas management,
Migration management and support in case of concurrent access to files coherency and
partitioning [Koulouzis1 2016]. The LOBCDER system has also network services extension
that be interesting to consider during the project which allow in case of programmable
networks (SDN) to optimize the speed of large data transfers, by either selecting the best
replica or rerouting the traffic in case of network congestion [Koulouzis2 2016] (see Figure 22).
These advanced services can be easily ported to the EUDAT service eco-systems as the
LOBCDER has a flexible Plug-In Architecture which allows to substitute any of the basic
services.
Figure 21: Conceptual design of LOBCDER [Koulouzis3 2016].

D4.1 State of the art of services
This version is a draft of D4.1 and is under review. 73
The core of LOBCDER technology is the resource layer which creates a logical representation
of the physical storage space and manages physical files. It contains the WebDAV resources,
the resource catalogue and the task component. This layer provides a WebDAV representation
of logical resources which are stored and queried in the persistence layer. Logical resources
hold metadata such as the modification date and length. The persistence layer also provides
information on how to access physical data, which includes endpoint credentials. The backend
provides the necessary abstraction to uniformly access physical storage resources. This is a
virtual resource system (VRS) API used by a grid resource browser. A virtual file system (VFS)
Client performs operations on physical data, which are translated to specific storage resources
by VFS Drivers. Different driver implementations allow transparent access to storage
resources, whether these are cloud, grid or other resources. The persistence layer is a
relational database which holds the logical file system that is made up of Logical Resources
(Each logical file has N Physical Data Resource Identifier (PDRI)s which are associated with
Storage Site.) and provides Atomicity, Consistency, Isolation and Durability (ACID) [Koulouzis3
2016]. Its performance analysis is described separately with more details in Section 6.1.1.
Figure 22: Interaction of the main SDN components. When an HTTP consumer requests data LOBCDER provides the data transfer from heterogeneous storage backends, while the the NEWQoSPlanner aggregates information collected from the network, reserves paths and controls the flows via SDN controllers [Koulouzis1 2016].
Plans for integration with other systems (from PROCESS)
In process LOBCDER can be used as a Distributed Virtual File System (DVFS). LOBCDER
has its own metadata storage system, which has to be synchronized or adapted to the meta-
data federated storage to be developed in Task JRA2.3. On the front-end side LOBCDER has
a WebDAV interface and thus any WebDAV client application can seamlessly use LOBCDER
as DVFS, while on the back-end LOBCDER is able to use a wide range of storage systems
like local file system, SFTP, WebDAV, GridFTP, SRM, LFC iRODS, OpenStack-Swift, vCloud,
AWS S3.
LOBCDER presents a webdav interface in the front, which mean means it supports the
standard webdav method (COPY, LOCK, MKCOL, MOVE, PROPFIND, PROPPATCH,
UNLOCK). LOBCDER expose a set of REST Resources, which have been defined in the VPH-
share and need to be replaced or adapted for the PROCESS project
• Archive: Generates archives given a folder path. Each file and folder is added at
runtime from the backend to the archive

D4.1 State of the art of services
This version is a draft of D4.1 and is under review. 74
• DRIDataResource: Used by the DRI service to supervise resources for corrupted files.
• DRItemsResource: Used by the DRI service to supervise resources for corrupted files
etc.
• Item: Gets resource properties like length owner physical location etc.
• Items: Gets resource properties like length owner physical location etc.
• PermissionsResource: Sets and gets permissions for a resource
• SetBulkPermissionsResource: Sets permissions for folder and subtree
• Translator: This service translates long authentication tokens to short so they can be
used by WebDAV clients
• TTL: Sets an expiring temporary directory to store data. This is to stop having unused
directories lying in LOBCDER. When using this after TTL time has elapsed since the
last access, the directory is automatically removed by the system.
5.3 Federated Metadata storage service for extreme data application
5.3.1 State of the art
Characteristics of metadata in scientific research
Research nowadays still did not manage to produce a metadata standard which can be
recognized and applied through various branches of science. Despite constantly growing in
capacity and complexity datasets that a single project can produce, common interdisciplinarity
in current research, there is no unified approach for scientific metadata management. One can
vary between not even scientific domains only but sometimes even between individual
applications. However, it seems that the scientific world becomes more aware of the
importance of systematic and enhanced metadata management. The potential it brings in
automatization of scientific analysis, the possibility of logical data independence in scientific
applications asks for adequate technological support: metadata scientific management tools
which will be able to properly manage the variety of metadata and noticeably improve scientific
discovery.
From applicability point of view in conventional approach metadata can be perceived in 3 main
categories, which reflect the aim and nature of the metadata:
• descriptive metadata - integrated within datasets, adjusted to simplify the navigation
and read data variables, produced by researchers
• ad-hoc text annotations - most informative but very time consuming to produce,
frequently overlooked in metadata management due to high cost, produced by
researchers
• provenance data - generated automatically, holds information about the data
generating process, data transformations, the historical analyses and their associated
data movement, produced by applications/workflows
Another useful categorisation of metadata can be outlined relying on two attributes relevant to
data-centric research:
• source of the metadata
• metadata storage type

D4.1 State of the art of services
This version is a draft of D4.1 and is under review. 75
Table 6: Categorisation of metadata.
In Table 6 a distinction was made based on those attributes. The common metadata acquisition
sources are scientists or application developers (labelled as ‘Human-generated’) and software
libraries and tools (‘Automatically acquired’). Metadata is often stored within the data files
(labelled as ‘Integrated’) or in separate files or database systems (‘Segregated’) [BLANAS
2015]. We briefly discuss these categories in the following paragraphs.
• User-defined metadata prior to data generation: Starting from the top right corner in
Table 6, some metadata are provided explicitly by a scientist at the moment of data
production. Examples include data type and endianness information, or the
dimensionality and chunking strategy of an array for defining the layout of data on a
disk. Under this paradigm, a particular file format, such as HDF5, or data encoding
defines the collected metadata in advance and stores the metadata within the dataset.
• Ad-hoc metadata that annotate a dataset: Another way to acquire metadata is to
explicitly request it by the domain expert. Many times, however, important information
that describes specific features or properties of the data cannot be shoehorned into this
rigid format. Scientists describe these properties in plain text that accompanies the
dataset. As shown in the top left corner in Table 6, such metadata can be logically
thought as an annotation to an existing dataset which is stored separately from the
data. Common techniques that use this metadata management paradigm include
publishing readme.txt files at the same website or file system folder as the dataset, as
well as electronic or face-to-face communication. In certain instances this form of
metadata is captured in the logbooks of scientists and can only be acquired through
direct communication.
• Workflow-based metadata: Several scientific workflow systems are in use to automate
task coordination and management in complex workflows. Workflow systems collect
information that is mainly related to the provenance of the data and is used to quickly
identify (or repeat) the process that generated a specific fragment of a dataset. Each
workflow system stores and manages provenance metadata differently, and no
standardized interface to access lineage information from applications currently exists.
Should a scientist desire to access the provenance metadata, they first need to learn
the data model and the query interface of the workflow system.
Every piece of any of mentioned metadata type is independently generated and collected
throughout the usual cycle of data-driven scientific discovery:
• data creation
• processing
• analysis
• archival
D4.1 State of the art of services
This version is a draft of D4.1 and is under review. 76
• sharing
Project specific dataset collected in this cycle can become an input for the next cycle, in an
effort to produce yet another metadata. Due to the distinct metadata schema sometimes
datasets cannot be compared nor reused. Such situation is often due to lack of integrated
metadata management framework that enriches scientific data with information that is:
1. well-structured, holding crucial to data discovery information
2. stored within each dataset and can be accessed via established data access and
querying interfaces,
3. acquired, propagated, and managed automatically
[BLANAS 2015] In the extreme-scale data era that many scientific domains are entering, it
becomes necessary to collect information-rich metadata that go beyond provenance. Rich
metadata may include multi-resolution snapshots of data, summarizations, and semantic
relationships among datasets. To support this, new types of metadata emerge:
• Identity information includes the dataset name or any other unique identifier, the
application pro- ducing the dataset, and reproducibility information such as the task and
its parameters that were used to produce the result.
• Dataset descriptions include summary statistics, derived variables, the resolution of the
dataset, and the location of low-resolution snapshots of data for quick visualizations.
• Performance and profiling information are historical access patterns, the presence of
augmented datasets (such as indexes, partial replicas, or materialized views), and the
locations of physically re- organized layouts of the data for faster access. This category
also includes prior response time and energy consumption measurements that can be
used for optimization decisions. This information can be readily leveraged for
exploratory scientific data analysis.
• Relationships among various datasets or tasks, such as derived variables of a dataset,
or possible computations to derive such a variable upon request. This includes
information on different views of the same dataset, such as a sorted replica or a bitmap
index. Relationship metadata captures how analysis results are computed and where
the results are stored.
• User-defined metadata. Users and applications will be able to specify additional
metadata to extend the semantic information conveyed as metadata.
Challenges for metadata in exascale applications
Exascale science requires richer metadata that is embedded within scientific datasets. An
information-rich metadata management framework should allow scientists to understand a
dataset through multi-resolution summaries that have been retained from prior analyses and
are embedded in the data. Metadata-aware analysis tools can leverage multi-resolution
summaries and accelerate exploratory data analysis. The summaries of the datasets from prior
analyses can be visualized instantly. This substantially increases the scientific re-use value of
the dataset, but introduces complexity that need to be addressed [BLANAS 2015].
With the emergence of large-scale storage architectures that separate metadata management
from file read/write operations, metadata management has become a research problem on its
own. Partitioning of the metadata among the servers is of critical importance for maintaining
efficient MDS operation and a desirable load distribution across the cluster. What is more
although the size of metadata are relatively small compared to the overall size of the data
storage system, metadata operations may make up over 50% of all file system operations. In
petabyte/exabyte-scale distributed file systems that decouple read and write from metadata

D4.1 State of the art of services
This version is a draft of D4.1 and is under review. 77
operations, behaviour of the metadata server cluster will be critical to overall system
performance and scalability [WEIL 2004].
Technology overview
In order to select a database solution for the aforementioned application we need to introduce
some basic concepts that are crucial to designing database architecture and as a consequence
strongly connected with their applicability as an answer to the stated problem. As described in
the previous sections metadata storage in exascale applications require scalability in order to
grant required efficiency regardless the use case characteristics. Metadata intensive use cases
in exascale workflows require efficient processing of metadata operations despite significant
read/write operations load imposed on the metadata management system. Constantly growing
metadata database footprint requires storage infrastructure to grow together with grow
together with the increase of that footprint. This means that in order to handle both trivial (less
metadata intensive) and heavy loads, as well as and adapt to the constantly growing data
quantity scalability is priority feature of the database solution for metadata storage. Current
database solutions provide scalability on different levels. In order to understand differences
between them there is a need to introduce concepts of ACID, BASE and CAP theorem.
CAP Theorem
Brewer first presented the CAP Theorem in the context of a web service [GILBERT 2012]. A
web service is implemented by a set of servers, perhaps distributed over a set of
geographically distant data centers. Clients make requests of the service. When a server
receives a request from the service, it sends a response. The CAP Theorem was introduced
as a trade-off between consistency, availability, and partition tolerance. We now discuss each
of these terms.
Consistency
Consistency, informally, simply means that each server returns the right response to each
request, i.e., a response that is correct according to the desired service specification. (There
may, of course, be multiple possible correct responses.) The meaning of consistency depends
on the service.
Trivial services: Some services are trivial in the sense that they do not require any coordination
among the servers. For example, if the service is supposed to return the value of the constant
π to 100 decimal places, then a correct response is exactly that. Since no coordination among
the servers is required, trivial services do not fall within the scope of the CAP Theorem.
Weakly consistent services: In response to the inherent trade-offs implied by the CAP
Theorem, there has been much work attempting to develop weaker consistency requirements
that still provide useful services and yet avoid sacrificing availability. A distributed web cache
is an example of one such system.
Simple services: For the purposes of discussing the CAP Theorem, we focus on simple
services that have straightforward correctness requirements: the semantics of the service are
specified by a sequential specification, and operations are atomic. A sequential specification
defines a service in terms of its execution on a single, centralized server: the centralized server
maintains some state, and each request is processed in order, updating the state and
generating a response. A web service is atomic if, for every operation, there is a single instant
in between the request and the response at which the operation appears to occur.
(Alternatively, this is equivalent to saying that, from the perspective of the clients, it is as if all
the operations were executed by a single centralized server.) While there are several weaker
consistency conditions used in practice (e.g., sequential consistency, causal consistency, etc.),
we focus on atomicity due to its simplicity.

D4.1 State of the art of services
This version is a draft of D4.1 and is under review. 78
Complicated services: Many real services have more complicated semantics. Some services
cannot be specified by sequential specifications. Others simply require more complicated
coordination, transactional semantics, etc. The same CAP trade-offs typically apply, but for
simplicity we do not focus on these cases.
Availability
The second requirement of the CAP Theorem is that the service guarantee availability.
Availability simply means that each request eventually receive a response. Obviously, a fast
response is better than a slow response, but for the purpose of CAP, it turns out that even
requiring an eventual response is sufficient to create problems. (In most real systems, of
course, a response that is sufficiently late is just as bad as a response that never occurs.)
Partition-tolerance
The third requirement of the CAP theorem is that the service be partition tolerant. Unlike the
other two requirements, this property can be seen as a statement regarding the underlying
system: communication among the servers is not reliable, and the servers may be partitioned
into multiple groups that cannot communicate with each other. For our purposes, we simply
treat communication as faulty: messages may be delayed and, sometimes, lost forever. (Again,
it is worth pointing out that a message that is delayed for sufficiently long may as well be
considered lost, at least in the context of practical systems.)
ACID
ACID is a set of properties of database transactions intended to guarantee validity even in the
event of errors, power failures, etc. In the context of databases, a sequence of database
operations that satisfies the ACID properties, and thus can be perceived as a single logical
operation on the data, is called a transaction. Database transactions greatly simplify the job of
the application developer. As signied by the acronym, ACID transactions provide the following
guarantees [PRITCHETT 2008]:
Atomicity
All of the operations in the transaction will complete, or none will.
Consistency
The database will be in a consistent state when the transaction begins and ends.
Isolation
The transaction will behave as if it is the only operation being performed upon the database.
Durability
Upon completion of the transaction, the operation will not be reversed.
BASE
Scaling database systems to dramatic transaction rates requires a new way of thinking about
managing resources [PRITCHETT 2008]. The traditional transactional models are problematic
when loads need to be spread across a large number of components. Decoupling the
operations and performing them in turn provides for improved availability and scale at the cost
of consistency. BASE provides a model for thinking about this decoupling. As ACID provides
the consistency choice for partitioned databases, then how do you achieve availability instead?
One answer is BASE (basically available, soft state, eventually consistent). BASE is
diametrically opposed to ACID. Where ACID is pessimistic and forces consistency at the end
of every operation, BASE is optimistic and accepts that the database consistency will be in a
state of flux. Although this sounds impossible to cope with, in reality it is quite manageable and
leads to levels of scalability that cannot be obtained with ACID. The availability of BASE is
achieved through supporting partial failures without total system failure. Here is a simple

D4.1 State of the art of services
This version is a draft of D4.1 and is under review. 79
example: if users are partitioned across five database servers, BASE design encourages
crafting operations in such a way that a user database failure impacts only the 20 percent of
the users on that particular host. This lead to higher perceived availability of the system.
Storage solutions
In order to choose appropriate storage solution for the application we need to take into
consideration both standard ACID compliant databases, as well as other solutions that are
implemented in the style of BASE. Up to now a plethora of database solutions have been
implemented in order to respond to particular needs and applications. In particular many
NoSQL (not only SQL) databases provide features that support various usage scenarios
defined by CAP theorem. In order to grant scalability of the metadata database solution we
aim for Partition Tolerance. As stated by Brewer by enforcing Partition Tolerance,
compromising other qualities of database system such as Consistency or Availability is
inevitable.
RDBMSs
RDBMS falls into the consistent and available category. The integrity model is ACID [BOICEA
2012]. RDBMS can be scaled by sharding or full replication, but these strategies come with
complexities and limits, the major one being that you will always need to have redundancy per
shard which means operational complexity increases as well as having to make the application
tier aware of the sharding scheme. [MongoDB1]. This implies significant cost for the application
tier that makes these solutions practically useless for general purpose metadata storage that
requires scalability. The complexity caused by the data model evolution performed just to allow
for scalability cannot be justified for the users praising clarity and understandability of data
model - which is a key to effectively manage metadata store.
MongoDB
NoSQL is a class of database management system different from the traditional relational
databases in that data is not stored using fixed table schemas. Its main purpose is to serve as
a database system for huge web-scale applications where they outperform traditional relational
databases [BOICEA 2012]. MongoDB stores data in flexible, JSON-like documents, meaning
fields can vary from document to document and data structure can be changed over time
[MongoDB1]. MongoDB offers consistency, durability and conditional atomicity. RDBMSs
offers integrity features that MongoDB doesn't offer like: isolation, transactions, referential
integrity and revision control. MongoDB uses BASE integrity model instead [BOICEA 2012].
MongoDB 4.0 will add support for multi-document transactions, making it the only database to
combine the speed, flexibility, and power of the document model with ACID data integrity
guarantees. Through snapshot isolation, transactions provide a globally consistent view of
data, and enforce all-or-nothing execution to maintain data integrity [MongoDB2].
CouchDB
Unlike traditional relational databases, where each action performed is necessarily subject to
database-wide consistency checks, CouchDB makes it really simple to build applications that
sacrifice immediate consistency for the huge performance improvements that come with
simple distribution [CouchDB1]. CouchDB, never use locks. This makes every part of the
system always available to handle requests. In exchange, try to afford the cluster a moment to
bring itself up to date after any change. Alternatively, store relevant state locally, such as by
using PouchDB, which will keep itself up to date with your cluster automatically [CouchDB2].
CouchDB is ACID compliant. Within a CouchDB server, for a single document update,
CouchDB has the properties of atomicity, consistency, isolation, and durability (ACID).
Transactions across document boundaries nor transactions across multiple servers are
available [CouchDB3].

D4.1 State of the art of services
This version is a draft of D4.1 and is under review. 80
Conclusions
Discussion presented in the State of the Art research description leads to the following
conclusions regarding proposed solution:
1. Scalability - MongoDB for its’ capability of sharing
2. Failover - MongoDB for its’ replication feature
3. Access protocol - REST over HTTP for ease of access, straight-forward client
adaptation
4. Metadata representation format - JSON documents, HAL for linking and discoverability
5.3.2 DataNet DataNet is a complex web-based platform for metadata storage, access and manipulation
provided in a convenient Software as a Service delivery model. It allows for management of
metadata repositories for scientific applications. The use of commonly adopted REST interface
makes it easily adaptable for various e-Science applications. Thanks to the growing popularity
of a REST architectural style and ubiquitous use of HTTP, the implemented solution is widely
supported in vast majority of programming languages, hence the straightforward integration
for many workflow applications. DataNet federated deployment model supports scalability
which makes it suitable for extreme data applications and exascale computing. Its performance
analysis is described separately with more details in Section 6.1.2.
Technology Readiness Level
The DataNet has been deployed in the PLGrid Polish National Infrastructure where it was used
in semi-production environments. Due to this fact we're considering current DataNet to be TRL
6. Our research up-to date have shown that for the needs of the PROCESS project we would
need to perform significant refactoring of this tool to enable required flexibility and scalability.
While reaching this goal we're going to integrate well established solutions such as MongoDB
as the backend, or Docker solution for manageable deployment and availability. After the
refactoring and reconfirmation that the modified prototype is functioning properly (is still at TRL
6), we are planning to provide fully production deployment on limited scale (e.g. in single site).
At this phase after running series of tests we would be able to consider DataNet to be at TRL
7. Later in the project we are going to provide additional mechanisms allowing scalability of the
solution beyond single site. When we would confirm that our platform is scaling well and that
metadata are stored in optimal way in the cloud of DataNet services we would be able to assign
this tool the TRL 8.
Main features of DataNet application in the PROCESS project
1. metadata repository management via web-based platform
2. REST access to metadata resources
3. JSON serialization format for metadata
4. support for schema-less and schematic metadata
5. authorization and authentication integrated with the project ecosystem
6. isolated metadata repositories for different applications/scientific user groups
7. metadata repository monitoring

D4.1 State of the art of services
This version is a draft of D4.1 and is under review. 81
DataNet architecture
Figure 23: Conceptual design of DataNet
Platform components
1. web-based portal
2. metadata repositories
3. monitoring system
DataNet implements a SaaS delivery model. A user accesses the platform using a web-based
user interface. The web-based portal allows for deployment and management of metadata
repositories using a web browser and it will support the PROCESS project security solution by
implementing an appropriate authentication/authorization mechanisms.

D4.1 State of the art of services
This version is a draft of D4.1 and is under review. 82
Figure 24: Conceptual design of Metadata repository.
Metadata repository is an application built on top of a database (document based noSQL
database solution such as MongoDB) and provides accompanying a REST interface which
allows to access and manipulate metadata. The REST interface provides authentication and
authorization mechanisms in order to control metadata access. Metadata repository is
wrapped into a Docker container and deployed in a Docker Swarm cluster. User can define
and deploy several metadata repositories for different purposes. As repositories are deployed
in a virtualized computing environment, performance of a single repository is not directly
affected by the load handled by other repositories. Different repositories can be deployed in
different infrastructures - different Docker Swarm clusters. Therefore, as the metadata
management system can be distributed on both repository and infrastructural level, system is
scalable and ready to be used by a multi-user/multi-application community generating high
load.
Metadata repositories are constantly monitored by a centralized monitoring system. System
allows a user to verify state and performance of their repositories.
Plans for integration with other systems
1. PROCESS project security solution - authentication/authorization (Identity Provider) for
web-portal, token exchange for API usage
2. data management system (LOBCDER) - possible integration for handling data-
metadata coupling
5.4 Secure and trusted storage and data access
5.4.1 State of the art
Secure data access
The recent advances in the general ICT and cloud computing technologies facilitate global
data availability and access over the network for cooperative group of researchers, including
wide public access to scientific data. To enable such a global availability the whole data
lifecycle should be supported including the benefits of the data storage/ preservation,
aggregation, and provenance on a large scale and during long/unlimited periods of time. During
different stages of data processing, data can be processed and stored on different systems
that may be in the different administrative and security domains. It is important that the

D4.1 State of the art of services
This version is a draft of D4.1 and is under review. 83
supporting infrastructure ensures data security (integrity, confidentiality, availability, and
accountability), and data ownership protection. With current needs to process large datasets
that require powerful computation, there should be a possibility to enforce data/dataset policies
to ensure that they are processed only on trusted systems and complying with other data
protection requirements, in general enabling a data-centric security model. Researchers must
trust such Secure Data Centric Infrastructure (SDCI) infrastructure to process their data and
be ensured that their stored data are protected from unauthorized access or tampering. Privacy
issues also arise from the distributed character of the considered infrastructure that can span
multiple countries with different national policies. This makes the access control and
accounting infrastructure an important elements.
Data-centric security models
The recent advances in the general ICT and cloud computing technologies facilitate global
data availability and access over the network for cooperative group of researchers, including
wide public access to scientific data. To enable such a global availability the whole data
lifecycle should be supported including the benefits of the data storage/ preservation,
aggregation, and provenance on a large scale and during long/unlimited periods of time. During
different stages of data processing, data can be processed and stored on different systems
that may be in the different administrative and security domains. It is important that the
supporting infrastructure ensures data security (integrity, confidentiality, availability, and
accountability), and data ownership protection. With current needs to process large datasets
that require powerful computation, there should be a possibility to enforce data/dataset policies
to ensure that they are processed only on trusted systems and complying with other data
protection requirements, in general enabling a data-centric security model. Researchers must
trust such Secure Data Centric Infrastructure (SDCI) infrastructure to process their data and
be ensured that their stored data are protected from unauthorized access or tampering. Privacy
issues also arise from the distributed character of the considered infrastructure that can span
multiple countries with different national policies. This makes the access control and
accounting infrastructure an important elements.
The future data infrastructure requires different data centric operational models and protocols,
which is especially important in situations when the object or event related data will go through
a number of transformations and become even more distributed, between traditional security
domains. The same relates to the current federated access control model, which is based on
the cross administrative and security domains identities and policy management. When
moving to generically distributed data-centric models, additional research is needed to address
the following issues:
• maintaining semantic and referral integrity, i.e., linkage between data at the different
stages of their transformation
• data location, search, access
• data integrity and identifiability, referral integrity
• data security and data centric access control
• data ownership, personally identifiable data, privacy, opacity of data operations
• trusted virtualization platform, data centric trust bootstrapping
Existing cloud providers such as AWS and Microsoft Azure offer configurable services for
identity and access management. A cloud developer can make use of these services to build
a security infrastructure for managing authentication and authorization in their applications.
However, these services are limited or not usable in scientific contexts in various ways:

D4.1 State of the art of services
This version is a draft of D4.1 and is under review. 84
• They do not provide a complete lifecycle management for security services or allow the
management of context in dynamic settings where the necessary computing
infrastructure is created on-demand.
• They do not support rich authorization models such as attribute-based access control
model. For instance, AWS employs an identity-based authorization model for
user/tenant account but this is not defined for the deployed services [IAM].
• Cloud developers are charged for the security-related services and pertinent network
traffic. For instance, Azure charges developers based on the number of access control
transactions and the quantity of data transferred from/to Azure data centers [AAD].
There are two fundamental problems related to security to be addressed for distributed SDCI.
The first problem is associated with the dynamic provisioning of a security infrastructure for
identity and access management. Considering the fact that research data is both
geographically and logically distributed, collaboration between researchers imposes that
certain security services are in place during the time of collaboration. The second problem,
also called as dynamic trust bootstrapping, refers to establishment of trust between partners
in on-demand cloud provisioning [MembreyP] [DemchGriSec]. With dynamic trust
bootstrapping, researchers from different organizations can establish a chain of trust when
sharing data, results, and VM instances for reproducing experiments.
Dynamic Access Control Infrastructure (DACI)
The extended Dynamic Access Control Infrastructure (DACI) [Ngo 2012] has been developed
in the EU funded CYCLONE project that allows deployment of the configurable access control
infrastructure as a part of depoyed on-demand cloud based application or service. DACI
presents a virtual infrastructure to provide access control services to an on-demand cloud
formation. The following basic security services are provided with DACI:
• Authentication and identity management service: provides authentication service,
issues, and verifies attribute statements binding to authenticated subjects using the
Security Assertions Markup Language (SAML) specification [SAML].
• Authorization service: provides the authorization service compliant with the XACML-
SAML profile [SANLXACML 2005].
• Authorization service: provides the authorization service compliant with the XACML-
SAML profile [SANLXACML 2005].
These services provide a basic infrastructure for managing access control in dynamic
environments. Since certain use cases involve sensitive data, DACI services were extended
with three additional services pertinent to security: encryption service that provides protection
of data at rest (or on the move), key management service for storing/exchanging keys, and
distributed logging. Moreover, helper tools for assisting the specification and verification of
policies are made available [Turkmen 2013, Turkmen 2015].
Trust Bootstrapping of the on-demand provisioned security infrastructure
The initialization and deployment of a security infrastructure in on-demand cloud provisioning
over multiple cloud providers imply that there is a dynamic mechanism to establish trust
between involved parties and to populate necessary information for the proper function of the
infrastructure. This process, also known as trust bootstrapping, may involve the collection of
keys/certificates from all partners, retrieval of list of identity providers (in a federated setting),
and so on. Some of this contextual information needs to be provided in a preconfigured manner
while other information can be retrieved automatically. For instance, bioinformatics
researchers are often affiliated with an organization that is part of a larger network, such as
eduGAIN [eduGAIN], where the retrieval of certain information with respect to identity of users
can be automated.

D4.1 State of the art of services
This version is a draft of D4.1 and is under review. 85
The Dynamic Infrastructure Trusted Bootstrapping Protocol (DITBP) [MembreyP 2012]
leverages the Trusted Platform Module (TPM) and can be effectively implemented using
available technologies and tools. TPM is typically available on all CPU boards and supported
by majority of cloud platforms.
The DITTBP subset has been implemented and tested with the software TPM in the CYCLONE
project testbed. It has been implemented using keylime [keylime] for bootstrapping trust within
cloud nodes and the services running on them. It can be considered as an instance of DITBP
that employs a cloud verifier to periodically check the integrity of the node. There are three
steps involved during the deployment of a VM node with keylime:
1. Key generation in which the tenant creates a fresh symmetric key Kt for each new node
it requests and shares the key with the node and the verifier using secret sharing
2. Node initiation that refers to the instantiation of the node with the respective tenant
configuration through cloud-init
3. Key derivation in which the secrets are installed to cloud nodes according to a secure
key derivation protocol.
Additional research in this direction are needed, in particular in the PROCESS project to enable
data centric data infrastructure capable of processing distributed large/exascale
heterogeneous datasets on distributed exascale computing infrastructure. There are not many
research in the area of the Trusted Computing Platform Architecture (TCPA) [tcpa 2007] due
to complexity of this security domain but demand and interest is growing.
In the condition that majority of modern computer motherbords are equipped with TPM, recent
researches are revisiting the TCPA and TPM functionality to enable secure bootstrapping of
the VM running application code with hardware based root of trust realisedby TPM which
contains hardware based private key and can be used for deriving the Attestation Identity Key
(AIK) that can be used for VM identification [TCPAIK 2016]. The problem with the TPM initial
binding to the CPU and environment and protection against the Cuckoo attack is addressed in
the research by [Parno 2008, Parno 2010].
Federated access control and Single Sign On (SSO)
Federated access control is a common practice currently with web based applications. It
provides a basis for the Single Sign On (SSO). Federated access is based on using federated
identity service that maps multiple user credentials to one selected identity or credentials,
typically provided by user home organisation. A typical example of using federated access
control is a site that allows users to login with their Google or Facebook account. For
universities and research organisations, the federated access control allows using user identity
from their home organisation to access resources and services at all federation member
universities. EGI Federated AAI is the federated access control and federated identity
management service provide by EGI community. GEANT community is operating eduGAIN
service to interconnect national identify federations.
The OpenID standard [openid] provides a framework for the communication that must take
place between the identity provider and the OpenID acceptor "relying party". The OpenID
protocol does not rely on a central authority to authenticate a user's identity. An extension to
the standard (the OpenID Attribute Exchange) facilitates the transfer of user attributes, such
as name and gender, from the OpenID identity provider to the relying party. The basic
technology is provided by the SAML and OAuth2 protocols discussed above. These protocols
allow a relying party to delegate the login to the identity provider. The identity provider performs
the login and confirms to the relying party that this user is known. The identity provider provides
the relying party with an access token, identity and optionally attributes such as the user’s
email and name.
D4.1 State of the art of services
This version is a draft of D4.1 and is under review. 86
Federated identity management is widely used by European research and academic
community. It allows researchers to deploy their own scientific applications and platform over
one or more cloud infrastructures using federated access control infrastructure and other
services federated nationally or internationally among cooperating organizations. Such
deployments can be done with the dynamic allocation of network resources for the isolation of
the VMs inside a dedicated private cloud, including virtual network and replicated user data.
The widely use among European research community the eduGAIN framework provides
access to research infrastructures and other resources. The initiative faces a number of both
technical and organizations challenges. Below we describe the two protocols used in
eduGAIN.
The SAML and OAuth2 protocols are designed for logging in to web sites. In this scenario the
identity of the user is established and a session cookie is used to maintain the authenticated
state of the user. Research environments, however, often use different authentication
protocols such as X.509 certificate based protocols (e.g., ssh) and proprietary protocols used
by databases. Initiatives such as COmanage [comanage] provide an infrastructure to associate
an X.509 public key with a federated identity. This, however, is not yet an established
technology.
The SAML and oauth2 protocols require the relying party (see above) to be registered with the
identity provider. This is needed to guarantee the security of the protocol. At the same time
this can be used as a statement of trust that the identity provider considers the relying party
trustworthy. Note that this is not required. For example, anyone can create a Google account
and use this to register any website for ‘login with Google’. Google does not verify that the
website is trustworthy. On the other hand, the Dutch DigiD [digid] that can be used to login with
government agencies and some private organizations such as insurance companies has a
very strict procedure for accepting new relying parties. This may be compared to TLS
certificates that may be obtained from Let’s Encrypt15 that only verifies the DNS really belongs
to the site and the requester of the certificate can indeed control the contents of the site or one
of the traditional certificate providers that also validate that the requesting organization exists
and is trustworthy.
These protocols allow providing attributes of the user known to the identity provider to the
relying party. Normally the relying party requests a profile about the user. On the first login the
identity provider confirms with the user that, for example, his or her email address is requested
and whether or not this is acceptable. While attributes such as name, email, scientific role and
detailed affiliation are in general required for an RI to grant access, such attributes are rarely
available from the identity provider for privacy reasons. In practice, academic and research
institute’s identity services have strict rules to accept relying parties for their services and are
much more reluctant than e.g., social login services such as Google and Facebook in providing
attributes that reveal the true identity of the identified person.
In practice granting access to research infrastructure (RI) to new users may be tricky. A proper
federated identity management for European research infrastructures. Such initiatives are
starting at the national level where trying to establish a truested identity manager whic acts as
a SAML/oauth2 proxy, relying on the research institutes and providing the required attribute
management and support for e.g., X.509 certificates, like the Science Collaboration Zone
(SCZ) [SCZ] is an attempt to create such an entity for the Netherlands and the Clariah [Clariah]
project providing a research infrastructure to humanity scholars, this proved impossible from
an organizational perspective.

D4.1 State of the art of services
This version is a draft of D4.1 and is under review. 87
Exascale application viewpoint
Authentication and authorisation will be an important element and should be carefully consider
when it comes to exascale computing as no data center or single computing center will be able
to deliver exascale needed resources by its own. Computing across multiple data centers is
thus a must, and therefore solutions which will claim to achieve or target exascale have to use
common and well established authentication and authorisation frameworks that are been
developed in European initiatives like PRACE, EGI or GeANT. At this moment there are a
number of initiatives for federating identity across and beyond europe to make access to
resource more easy like EGI Check-in service [EGI-Check-in], eduGAIN [eduGAIN].
5.5 Integration of data management with service orchestration The idea of integrating the results of service orchestration directly into the data management
suite of a distributed, cloud-based storage and data sharing system originates with the need
to provide access to on-demand produced data. When accessing and processing very large
datasets – in the domain of Big Data – it is often not possible to use the standard extract –
transform – load paradigm. The cost of the extract step may be too high. We need to be able
to provide a way to do the transformation in-situ, where the dataset is stored. Details on how
this can be achieved in a generalized and safe way will be described in WP7. Here in WP5 we
need to deal with the problem of accessing on-demand generated data through the data
management infrastructure envisaged for PROCESS.
The basic tool for data management in PROCESS is the LOBCDER – a distributed data
federation and management system. LOBCDER provides unified interface to access all
federated data via a WebDAV frontend. Behind this frontend, it manages a 2-level (logical and
physical) catalogue of resources, which it accesses through a virtual file system (VFS) stack
composed of a client and a driver. Our goal is to provide a VFS capable of running on-demand
transformations of data, which is then made available via the WebDAV frontend.
WebDAV allows access to a file system represented in the classical directory-file hierarchical
structure. The service orchestration tools of WP7, on the other hand, represent their results by
their properties. The VFS driver which we need to design and develop must thus be capable
not only of executing a service-based data transformation process; it must also be able to
transform property-based descriptions of data sets into a hierarchical structure

D4.1 State of the art of services
This version is a draft of D4.1 and is under review. 88
Figure 25: The method of integration of the DISPEL process enactment into LOBCDER.
The method of integration of DISPEL-driven access to data into the LOBCDER's virtual file
system is shown in Figure 25. The DISPEL VFS driver will provide access to one or more file
hierarchy trees with pre-configured DISPEL process descriptions. Upon user's request through
the LOBCDER's WebDAV interface, requesting to retrieve a file from a subtree belonging into
the DISPEL VFS driver space, the appropriate DISPEL process will be parametrized according
to the properties of the requested file and executed on a configured DISPEL Gate. The output
data from this data process will be streamed back through the LOBCDER's WebDAV interface
to the requestor.
5.6 State of the art of extreme large computing services
5.6.1 Challenges facing exascale computing Despite continuous increase in the compute power of the HPC systems still even the biggest
system on the latest edition of the TOP500 list13 provide only fraction (about 1/10) of the
ExaFLOP. In turn it seems clear that at least initially reaching exascale computing capabilities
would require combination of the multiple HPC systems. Running tasks in such combined
system is related with multiple challenges. The basic one is related to the heterogeneity of
such systems, as they are operated by multiple entities. This heterogeneity may involve both
access mechanisms (protocols, credential types), software installed on those clusters (such
as OS type and version, queuing system). Additionally each cluster usually run its workloads
in internal private LANs which do not allow inbound connections from the Internet (due to
13 https://www.top500.org/list/2017/11/

D4.1 State of the art of services
This version is a draft of D4.1 and is under review. 89
mechanisms such as NAT). This in turn introduces additional restrictions for the designed
infrastructure, such as the lack of ability for direct p2p communication between jobs running
on different clusters. One of the important goals of the project would be to provide mechanism
allowing such communication with minimal overhead required for the exascale system.
5.6.2 Exascale computing projects Exascale project14 - the US project focusing on the acceleration of the process of the exascale
systems delivery including those providing exascale compute services
ECOSCALE15 - the EU project focusing on paving the way toward the energy-efficient exascale
systems
5.7 Interactive execution environment
5.7.1 State of the art Several solutions already exist to support interactive execution of large-scale computations on
hybrid underlying infrastructures. This section provides a basic description of the available
mechanisms and tools which support creation and sharing of executable documents for data
analysis. In this section we also provide a brief introduction to scripting notebooks, in particular
their integration with HPC infrastructures in order to support building extreme large computing
services as well as their extensions mechanisms needed to add support specific to the
PROCESS project. We also present the results of comparison of their functionality. Part of this
work has been submitted to KUKDM 2018 conference [KUKDM2018].
RNotebooks
The purpose of R Notebooks [Rstudio] is to provide user-friendly interface for working with
RMarkdown documents (i.e. a document format designed for creation of code notebooks
initially for R language but now extended with a few more alternative ones.) R Markdown
syntax utilizes well-know markdown format (.md file) and integrates it with code chunks, in
order to create one comprehensive document. R Notebooks enables programmers to use R
Markdown notebooks interactively (execute particular chunks of code separately), with
standard programming IDE features, like syntax highlighting, coding suggestions and some
other features
Architecture
The R Notebooks are connection of R Markdown with RStudio (which is IDE for R). The
following layers of the R Notebooks stack might be distinguished:
1. RStudio or RStudio Server
2. R Markdown editor, that is embedded in the RStudio IDE
3. Knitr package, that manages chunks execution and rendering of the final document
4. Engines for running the code chunks
5. R Markdown renderer
14 https://www.exascaleproject.org/
15 http://www.ecoscale.eu/

D4.1 State of the art of services
This version is a draft of D4.1 and is under review. 90
Figure 26: Flow of the R Notebook execution.
Figure 26. provides the visual representation of the process of code execution and preparing
the notebook for further rendering. There are following steps of the code execution process:
1. Knitr package discovers languages needed for chunks and invokes specific engines,
for example Python or Bash.
2. Chunks are executed in the separate processes for languages different than R, which
is executed in the same R session process as notebook.
3. The standard output (and errors), as well as any return value from code chunks (ex.
pictures) is returned to Notebook HTML document.
After executing code chunks the markdown document with code output is rendererd by the
pandoc, universal document converter. Pandoc is integrated in RStudio, but can also be used
as a standalone application and as such it can be installed on Windows, Mac OS or Linux
platform.As a terminal based application it is widely used in many systems for converting
documents, supporting over 30 document formats. In the R Notebooks it is used for rendering
variety of formats, most commonly html pages, pdf document or slides.
Functionality
R Notebooks is mainly designed for use with the R language. However, apart from that the
knitr library works also with a few other languages. As for now R Notebooks can operate with
some of these, namely Python, SQL, Bash, Rcpp and Stan. There are also some ways to
manually integrate some other languages in your R Notebooks. Chunks of different types can
be placed in a single document, but the communication between non-R chunks is limited to
the file system or environmental variables usage (with some exceptions like Rcpp which allows
to compile C++ code to the R version). The user is responsible for providing an engine for each
language they want to use.
RStudio natively supports scalability only in the sense of multiple R users. It handles team of
R programmers allowing for project sharing, collaborative editing, session management, and
IT administration tools like authentication, audit logs, and server performance metrics. These
features are only available in the RStudio Server Pro version of the project (in some limited
sense also in basic RStudio Server).
To effectively utilize the cluster resources RStudio Server Pro provides a load balancing
feature, which ensures that a new R session will go to machine with the most availability, and
that features like the admin dashboard and project sharing will scale new RStudio nodes are
added. This requires having RStudio Server Pro installed on every node of the cluster.

D4.1 State of the art of services
This version is a draft of D4.1 and is under review. 91
Integration with HPC infrastructures
Integration of R Notebooks with HPC cluster can be achieved indirectly by utilization of some
packages that are available for the R environment. One example of such a package is rslurm.
It provides a simple api for executing jobs on the SLURM workload manager. It is designated
for solving embarrassingly parallel problems, in which there is no communication between
individual tasks. This way requires running the notebook on the machine that has access to
the SLURM system of the HPC cluster. It can be achieved by installing on this edge node the
RStudio Server, accessing it remotely via web browser and deploying the SLURM job.
Internally, R Notebooks provides also integration with Spark via R Spark libraries that can be
obtained from CRAN. The integration is done simply by utilizing the package in the R code
chunk. An example is the sparklyr package. There is also a direct access to SparkUI to observe
jobs triggered from R Notebook.
Extensibility
As far as RNotebooks are concerned, there is not much that an ordinary user can do, as this
is an inherent part of the RStudio, which does not allow for any substantial extensibility. Apart
from some minor features that enhance the code production like RStudio Snippets (simple text
macros that can be created by user to enable quickly insertion of commonly used code
snippets) or similar RStudio Addins (which provide a mechanism for executing R functions
interactively from within the RStudio IDE), the only feature that deserves attention, in the
context of notebooks is the opportunity to define custom templates for R Markdown documents.
Regarding R Markdown itself, it is possible to quite effortlessly write your own engine for
executing unsupported languages - as an example, a tiny engine that allows to incorporate GO
language chunks in the R Markdown notebooks. Of course, such engine is quite impaired, as
it does not allow for communication between chunks and does not handle visual outputs.
Nevertheless, the knitr library seems to be a very powerful tool, so more comprehensive
solutions should be possible.
DataBricks
The Databricks [Databricks] platform can be used in various fields of computer science. It is
used by scientific teams, engineering teams and in enterprise. In the industry, it has been
applied in such areas as advertising and marketing technology, energy modeling, enterprise
technology software, financial service, healthcare and life sciences, Internet of Things,
manufacturing and industrial, media and entertainment, public sector, retail and consumer
packaged goods and telecom. Its use cases include, among others just-in-time data
warehousing, machine learning, graph processing and cybersecurity analytics. The Databricks
platform has been successful in projects belonging to some of the largest companies in the
world:
1. Viacom - the company has built a real-time analytics platform based on Apache
Spark and Databricks, which constantly monitors the quality of video feeds and
reallocates resources in real-time when needed.
2. Shell - Databricks provides Shell with a cloud-native unified analytics platform that
helps with improved inventory and supply chain management.
3. HP - Databricks provides HP Inc. with a scalable, affordable, unified analytics platform
that allows them to predict product issues and uncover new customer Services.
Architecture
DataBricks can only be run by using two possible cloud platforms: Amazon Web Services
(AWS) and MicroSoft Azure. The architecture of Databricks using AWS platform is shown in
Figure 27. It consists of Databricks UI web application deployed on its own private cloud and
Databricks runtime running on AWS. Such setting requires proper configuration of AWS from
its user. After proper setup, Databricks is capable of submitting Spark’s jobs on AWS.

D4.1 State of the art of services
This version is a draft of D4.1 and is under review. 92
Figure 27: Architecture of DataBricks using AWS Cloud.
Running Databricks on Azure platform is simpler as, in comparison to the AWS setup, the
Databricks web application is build-in the Azure platform. As a result the application which
submits a Spark’s job and the jobs themselves are run on the same cloud platform. In
Databricks, two different types of resources can be created (in both AWS and Azure):
1. Standard Clusters: Databricks’ standard clusters have a lot of configuration options to
customize and fine tune your Spark jobs.
2. Serverless Pools (BETA): With serverless pools, Databricks auto-manages all the
resources and you just need to provide the range of instances required for the pool.
Serverless pools support only Python and SQL. Serverless pools also auto-configure
the resources with right Spark configuration.
Functionality
The Databricks platform is not just an interactive notebook. It is the technological ecosystem.
It includes elements, such as infrastructure management software, interactive notebook and
backend software based on Apache Spark (Databricks Runtime). All components are supplied
by the manufacturer as a whole. The functionality provided by Databricks is a superset of the
Apache Spark functionality.The Databricks platform can thus be used wherever Apache Spark
is currently used. It is worth mentioning that the Databricks Runtime engine is fully compatible
with the free version of Apache Spark. Therefore, the vendor lock-in does not occur here. Due
to the fact that Databricks provide the entire technical ecosystem and significantly simplifies
the usage of a complicated tool such as Spark, it may bring attention of new users. The big
advantage of using Databricks is also the ability to significantly optimize the company's
expenses, through use “serverless” pool feature. On the other hand the use of services
provided by Databricks, has some limitations. Actually the users of Databricks ecosystem are
not allowed to use their own infrastructure. They are obliged to use the services of cloud
providers as Microsoft Azure or AWS.
Databricks Notebook allows to create blocks of code in the following languages: Scala, Python,
R, SQL and Markdown. Different programming languages can be used in one block of code.
What is more, if SparkContext and SQLContext objects are shared by the same Spark cluster
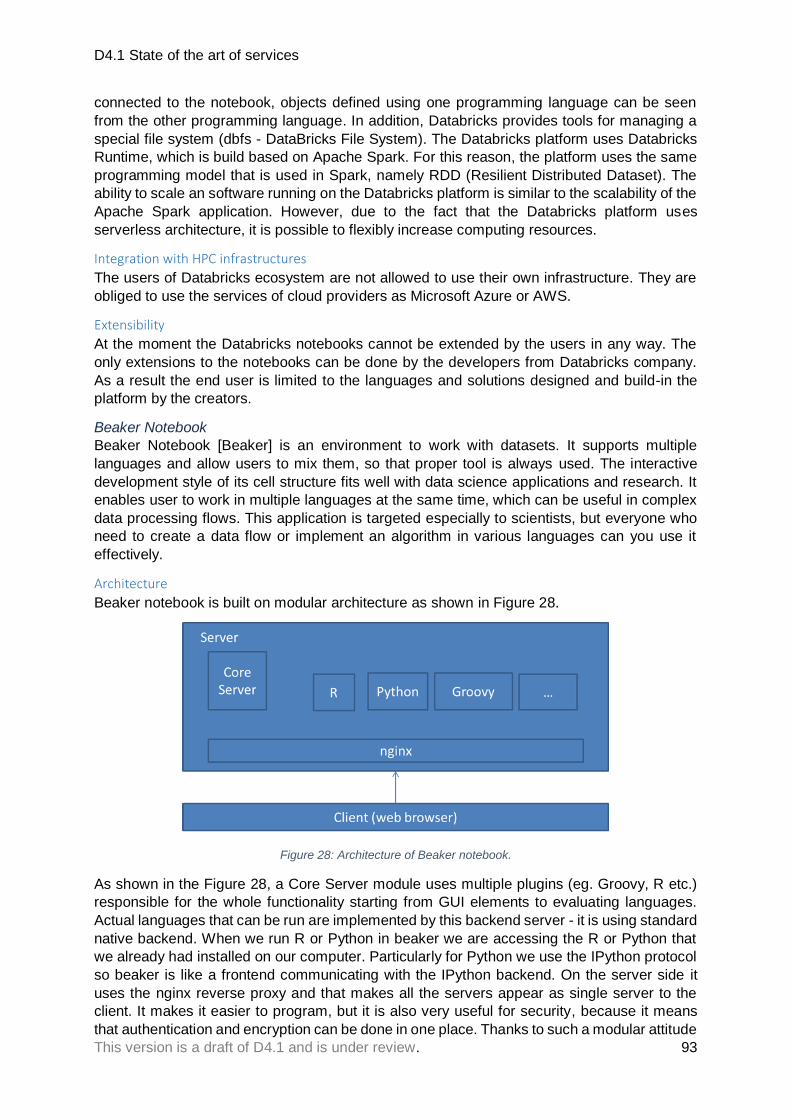
D4.1 State of the art of services
This version is a draft of D4.1 and is under review. 93
connected to the notebook, objects defined using one programming language can be seen
from the other programming language. In addition, Databricks provides tools for managing a
special file system (dbfs - DataBricks File System). The Databricks platform uses Databricks
Runtime, which is build based on Apache Spark. For this reason, the platform uses the same
programming model that is used in Spark, namely RDD (Resilient Distributed Dataset). The
ability to scale an software running on the Databricks platform is similar to the scalability of the
Apache Spark application. However, due to the fact that the Databricks platform uses
serverless architecture, it is possible to flexibly increase computing resources.
Integration with HPC infrastructures
The users of Databricks ecosystem are not allowed to use their own infrastructure. They are
obliged to use the services of cloud providers as Microsoft Azure or AWS.
Extensibility
At the moment the Databricks notebooks cannot be extended by the users in any way. The
only extensions to the notebooks can be done by the developers from Databricks company.
As a result the end user is limited to the languages and solutions designed and build-in the
platform by the creators.
Beaker Notebook
Beaker Notebook [Beaker] is an environment to work with datasets. It supports multiple
languages and allow users to mix them, so that proper tool is always used. The interactive
development style of its cell structure fits well with data science applications and research. It
enables user to work in multiple languages at the same time, which can be useful in complex
data processing flows. This application is targeted especially to scientists, but everyone who
need to create a data flow or implement an algorithm in various languages can you use it
effectively.
Architecture
Beaker notebook is built on modular architecture as shown in Figure 28.
Figure 28: Architecture of Beaker notebook.
As shown in the Figure 28, a Core Server module uses multiple plugins (eg. Groovy, R etc.)
responsible for the whole functionality starting from GUI elements to evaluating languages.
Actual languages that can be run are implemented by this backend server - it is using standard
native backend. When we run R or Python in beaker we are accessing the R or Python that
we already had installed on our computer. Particularly for Python we use the IPython protocol
so beaker is like a frontend communicating with the IPython backend. On the server side it
uses the nginx reverse proxy and that makes all the servers appear as single server to the
client. It makes it easier to program, but it is also very useful for security, because it means
that authentication and encryption can be done in one place. Thanks to such a modular attitude
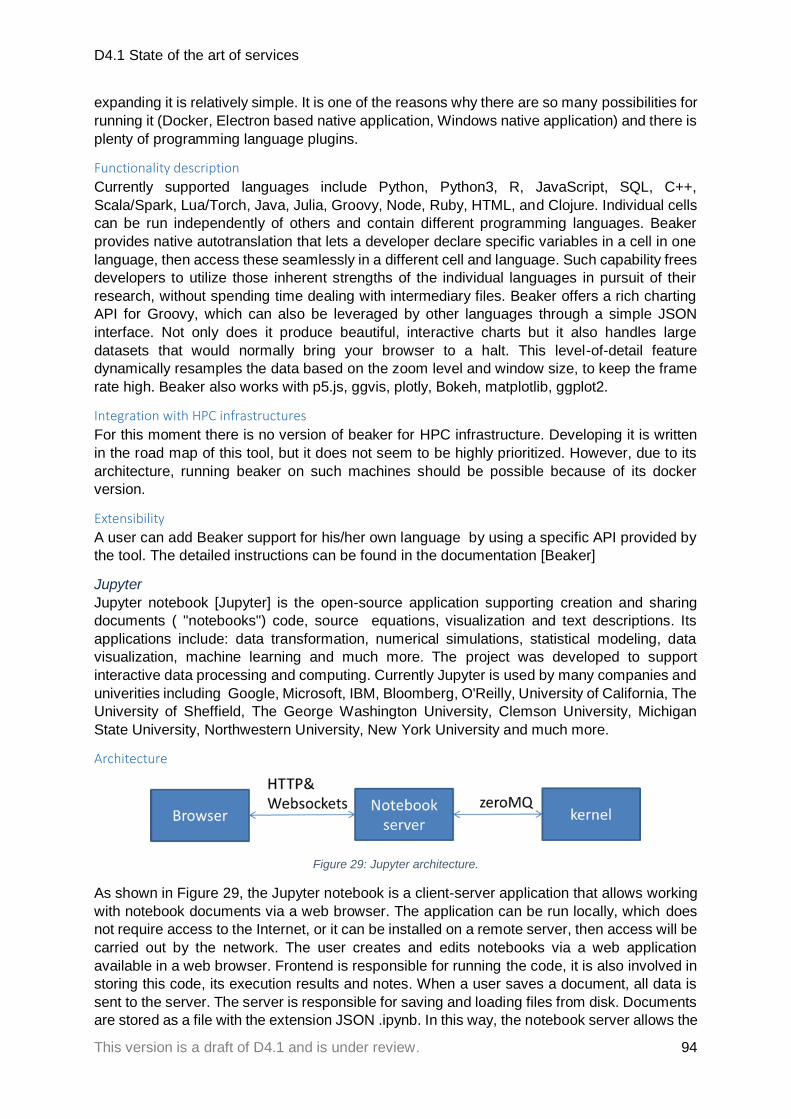
D4.1 State of the art of services
This version is a draft of D4.1 and is under review. 94
expanding it is relatively simple. It is one of the reasons why there are so many possibilities for
running it (Docker, Electron based native application, Windows native application) and there is
plenty of programming language plugins.
Functionality description
Currently supported languages include Python, Python3, R, JavaScript, SQL, C++,
Scala/Spark, Lua/Torch, Java, Julia, Groovy, Node, Ruby, HTML, and Clojure. Individual cells
can be run independently of others and contain different programming languages. Beaker
provides native autotranslation that lets a developer declare specific variables in a cell in one
language, then access these seamlessly in a different cell and language. Such capability frees
developers to utilize those inherent strengths of the individual languages in pursuit of their
research, without spending time dealing with intermediary files. Beaker offers a rich charting
API for Groovy, which can also be leveraged by other languages through a simple JSON
interface. Not only does it produce beautiful, interactive charts but it also handles large
datasets that would normally bring your browser to a halt. This level-of-detail feature
dynamically resamples the data based on the zoom level and window size, to keep the frame
rate high. Beaker also works with p5.js, ggvis, plotly, Bokeh, matplotlib, ggplot2.
Integration with HPC infrastructures
For this moment there is no version of beaker for HPC infrastructure. Developing it is written
in the road map of this tool, but it does not seem to be highly prioritized. However, due to its
architecture, running beaker on such machines should be possible because of its docker
version.
Extensibility
A user can add Beaker support for his/her own language by using a specific API provided by
the tool. The detailed instructions can be found in the documentation [Beaker]
Jupyter
Jupyter notebook [Jupyter] is the open-source application supporting creation and sharing
documents ( "notebooks") code, source equations, visualization and text descriptions. Its
applications include: data transformation, numerical simulations, statistical modeling, data
visualization, machine learning and much more. The project was developed to support
interactive data processing and computing. Currently Jupyter is used by many companies and
univerities including Google, Microsoft, IBM, Bloomberg, O'Reilly, University of California, The
University of Sheffield, The George Washington University, Clemson University, Michigan
State University, Northwestern University, New York University and much more.
Architecture
Figure 29: Jupyter architecture.
As shown in Figure 29, the Jupyter notebook is a client-server application that allows working
with notebook documents via a web browser. The application can be run locally, which does
not require access to the Internet, or it can be installed on a remote server, then access will be
carried out by the network. The user creates and edits notebooks via a web application
available in a web browser. Frontend is responsible for running the code, it is also involved in
storing this code, its execution results and notes. When a user saves a document, all data is
sent to the server. The server is responsible for saving and loading files from disk. Documents
are stored as a file with the extension JSON .ipynb. In this way, the notebook server allows the

D4.1 State of the art of services
This version is a draft of D4.1 and is under review. 95
user to perform editing, even without a kernel for a particular programming language. The
notebook console uses the IPython kernel which is a separate process that is responsible both
for running user code. The frontend communicates with the IPython kernel via JSON messages
sent by zeroMQ sockets.
Functionality
Jupyter has support for many programming languages and this a list is constantly growing,
thanks to the fact that the project is an open-source project. After selecting an existing
notebook or creating a new one, we can write the code and perform its fragments. The result
of the code is displayed under the appropriate cell immediately after the calculation. Jupyter
can display text and images as well as very complex, interactive visualizations.
Integration with HPC infrastructures
Jupyter developers do not provide any mechanisms for integration with HPC infrastructures.
The solutions that could be found on the web are only partially efficient. One of the simplest
ways is to run the server as a batch job on a HPC cluster and forwarding the appropriate ports.
Several libraries also enable submitting jobs directly from the server running Jupyter to HPC
queuing systems, but up to our best knowledge none of them seems to be mature enough and
actually provides a working solution. There is also the possibility to run Jupyter in a docker
container.
Extensibility
The kernel process can connect simultaneously to several frontend applications. In this case,
the various frontends will have access to the same variables. This design facilitates the
construction of a wide variety of frontends based on the same kernel, but also opens up the
possibility of support for new programming languages on the same frontends by writing kernels
in these languages. Currently, there are two ways to create a kernel for a different languages.
Wrapper kernels reuse communication mechanism and only implement that part which is
responsible for the execution. Native kernels implement the two parts in the target
programming language.
Cloud Datalab
Google Datalab [CloudDatalab] is freeware interactive notebook delivered by Google. It’s
primary goal is to provide data exploration, analysis and visualisation and machine learning
models building on Google Cloud Platform. Therefore Datalab is mostly aimed for Google
Cloud Platform users. Datalab has been used for data querying and basic machine learning to
calibrate temperature forecasts [Arvalez 2016]. It is also used as tool for educational machine
learning environment at Howard University.
Architecture
Cloud Datalab runs interactive Jupyter notebooks. Cloud Datalab is packaged as a container
and run in a virtual machine (VM) instance. This VM is provided by Google Compute Engine -
Google service responsible for running instances on Google Cloud hardware resources. Cloud
Datalab notebooks can be stored in a Google Cloud Source Repository. Figure 30 presents
typical Google Cloud Cluster. Such a cluster is composed of a head node and a set of compute
nodes. Users interact with the head node that then coordinates work out to the compute nodes.
Datalab Notebook runs on one of cluster VM instances.

D4.1 State of the art of services
This version is a draft of D4.1 and is under review. 96
Figure 30: Cloud Datalab running in Google Cloud Platform.
Functionality
Cloud Datalab is a powerful interactive tool created to explore, analyze, transform and visualize
data and build machine learning models on the Google Cloud Platform. It runs on Google
Compute Engine and connects to multiple cloud services (like Google BigQuery, Cloud
Machine Learning Engine, Google Compute Engine and Google Cloud Storage) easily so user
can focus on one’s data science tasks. It enables analysis of data using couple of programming
languages (currently supported ones are: Python, SQL, and JavaScript (for BigQuery user-
defined functions)). It is easily scalable, allows for running local analysis on sampled data and
running training jobs on terabytes of data seamlessly.
Integration with HPC infrastructures
It is possible to install datalab on the Google Cloud Dataproc (Spark/Hadoop - based service,
allowing for Google Cloud Platform - integrated clusters creation). Up to our best knowledge,
there is no possibility of using Datalab with external Clusters.
Extensibility
Google provides users with a way to extend datalab notebook, by using an ‘%extension’
command. However currently only MathJax (JavaScript display engine for mathematics) is
supported. It is also possible to add your own features implementations to the Datalab itself
since it is an open source project. Thus you can create your code, commit it and then create
a pull request in order for the Datalab team to review your implementation before incorporating
one into the project.
Apache Zeppelin
Zeppelin [Zeppelin] is an interactive notebook designed for the processing, analysis and
visualization of large data sets. It provides native support for Apache Spark distributed
computing. Zeppelin allows to extend their functionality through various interpreters (eg. Spark,
Scala, Python, shell, etc.). Examples of projects and institutions using Zeppelin, are:
1. Helium - instead of writing a code and running it, a user runs packaged code and get
result on the notebook
2. Hortonworks - an organization dedicated to creating, distributing and supporting
platforms that are ready data management solutions for companies. One of the
services offered by the use of the Apache Spark with Zeppelin.

D4.1 State of the art of services
This version is a draft of D4.1 and is under review. 97
Architecture
Figure 31: Architecture of Zeppelin.
Figure 31 shows the architecture of Zeppelin. A client communicates with a server using
REST API or WebSocket. The server sends the processed jobs to the interpreters - engine
processing tasks. Interpreters can be combined into groups, so they can operate
simultaneously on the same Notebook.
Functionality
It is possible to use multiple languages in a single document created in Zeppelin. The user can
take advantage of available interpreters by grouping them in groups of interpreters and decide
which of the groups to use, which gives him access to all the languages of the collection.
Zeppelin provides built in native support for the Apache Spark platform. For data visualisation,
Zeppelin provides some basic chart types. It also offers the ability to display automatically
aggregated data using built-in functions in a graph. The notebook can be shared between
contributors and modified simultaneously.
Integration with infrastructure HPC
It is possible to run Zeppelin on HPC using a connection to a YARN cluster.
Possible extension
A user can easily create own interpreters, it is also possible to extend backend and frontend
of Zeppelin by using provided API
Comparison and conclusion
Table 7: Interactive execution environment comparison.
Name of the
tool/
environment
Large data
sets
support
Infrastructure
(HPC/Cloud)
Extension
possibilities
for fulfilling
PROCESS
specific
requirements
Ability
of
mixing
langua
ges
in one
docum
ent
Additional
note

D4.1 State of the art of services
This version is a draft of D4.1 and is under review. 98
R Notebook
using
additional c
ustom
libraries
(e.g. for
Apache
SPARK)
using custom
libraries
communicating
with HPC
queuing
systems (e.g.
SLURM)
possiblity to
add own
engine
for executing
unsupported
languages
Yes
some of the
features
(e.g. project
sharing,
collaborative
editing,
session
management,
server
performance
metrics, using
cluster, load
balancing etc.)
available only
with the
commencial R
studio Pro
DataBricks
the whole
platform is
based
on Apache
SPARK
Available only
on Amazon
Web Services
or MicroSoft
Azure
almost none Yes
Beaker
using
additional
custom
libraries
no specyfic
support for
HPC; docker
version
available
A user
can add
Beaker
support for
unsupported
language by
using a
specific API
provided by
that tool.
Yes
Currently, a
new version –
BeakerX is
available
which actually
is a collection
of kernels and
extensions to
the Jupyter
interactive
computing
environment.
Jupyter
using
additional
custom
libraries
no mature
solution for
HPC; docker
version
available
Possibility to
add
unsupported
language by
writing
a new
Jupyter
kernel
No

D4.1 State of the art of services
This version is a draft of D4.1 and is under review. 99
Cloud Datalab
support for
Google data
services
(e.g.
BigQuery,
Cloud
Machine
Learning
Engine etc)
only Google
Cloud Platform limited Yes using Jupyter
Zeppelin
native
support for
Apache
Spark
possible to run
on HPC using
connection to
YARN cluster
possibility to
add own
unsupported
laguages
Yes
Although there exists many Interactive execution environments that could be considered to be
extended for PROCESS requirements, many of them have some drawbacks. DataBricks and
Cloud Datalab require to be run on specific cloud resources. Zeppelin and DataBricks are
based on Apache SPARK solution which potentially limits their usage to that platform.
RNotebooks seems to be promising, however some important features are only available with
a commercial version of Rstudio. BeakerX (the sucessor of Beaker) and Cloud Data are
actually based on Jupyter solution that seem to be most popular base for building such
environments.
The goal of the Interactive Execution Environment is to bridge the gap between users of
computational services (who are not expected to be familiar with the complexity of developing
and executing extreme large scale computational tasks with the use of modern HPC
infrastructures) and the underlying hardware resources. Accordingly, the IEE is envisioned as
an interface layer where applications can be accessed and their results browsed in a coherent
manner by domain scientists taking part in the PROCESS project and beyond.
The following properties are regarded as particularly desirable:
• A means of implementing the “focus on services and forget about infrastructures”
concept
• Provides two ways of accessing the underlying computational resources: through a
user-friendly GUI and programmatically, via a dedicated RESTful API
• Can be embedded in any external environment (such as Jupyter) via API integration
• Interfaces computational clouds and traditional HPC (batch job submission) using
Rimrock and public cloud access libraries, as appropriate.
The features which need to be provided by the environment are as follows:
• Registration and administrative management of computational resources
• Deployment of computational tasks on the available resources
• Infrastructure monitoring services
• User-friendly access to PROCESS datasets
• Security management (users, groups, roles)
• Administrative services (billing and logging)
• Integration with external tools via standardized APIs

D4.1 State of the art of services
This version is a draft of D4.1 and is under review. 100
Following preliminary discussions with use case developers and the project's architecture
team, the following tools have been identified as usable in the context of the PROCESS project
- in addition to the previously discussed notebook solutions, which can function as an
embedded feature in a comprehensive GUI.
5.7.2 EurValve Model Execution Environment The EurValve Model Execution Environment is an execution environment for data processing
pipelines. Originally conceived in the context of the EurValve project, the goal was to develop
a decision support system for procedures related to heart valve abnormalities, enabling
clinicians to decide upon the optimal course of action for any specific patient (i.e. choose
between medication/surgery and advise on the possible strategies and outcomes of the latter).
While the aforementioned DSS does not, by itself, involve large-scale processing, it is based
on a knowledge base whose production is one of the principal goals of EurValve. Assembling
this knowledge base calls for processing a vast array of patient data (for both prospective and
retrospective patients) through the use of dedicated pipelines, consisting of multiple services
and making use of various types of supercomputing infrastructures (both traditional batch HPC
and cloud models). Its performance analysis is described separately with more details in
Section 6.1.3.
Figure 32: EurValve Model Execution Environment (MEE) architecture.
MEE allows additional visualization interfaces to be plugged in; therefore it could be used to
embed a selection of computational notebooks (such as the ones presented above),
exposing their functionality in a secure and accessible manner. It can also provide a top-level
interface to any underlying data storage solution, thus integrating the PROCESS toolkit into a

D4.1 State of the art of services
This version is a draft of D4.1 and is under review. 101
coherent whole. Further details concerning the MEE can be found at
http://www.cyfronet.krakow.pl/cgw17/presentations/S7_2-EurValve-MEE-Oct-2017-v02.pdf.
Technology Readiness Level
The platform is regarded as having reached TRL 6 given that a prototype is in operation in the
EurValve project – see https://valve.cyfronet.pl. Deploying MEE in support of PROCESS use
cases would advance this to a production infrastructure, consistent with the requirements of
TRL 8.
Main features of the service in the PROCESS project
The service can be extended to account for the requirements of PROCESS. More specifically,
the following extensions are contemplated:
1. Creation of a new type of pipeline step in MEE which would be implemented as a
Jupyter notebook, with the user able to adapt/modify code prior to execution. This
would be achieved by embedding the Jupyter environment in MEE itself. When a
pipeline is to be executed (note that a pipeline will correspond to a PROCESS
application run), the GUI would display a Jupyter widget enabling users to interact with
the script which encapsulates the base application logic. This script would then be sent
for execution by a Jupyter engine residing on the available hardware infrastructure
(HPC or cloud resources).
2. Enabling MEE to interact with Docker containers deployed in the cloud or on specially
prepared cluster nodes (via the Singularity engine available on Prometheus and MUC
clusters)
3. Implementing a REST endpoint for MEE itself to enable its functionality to be invoked
remotely.
PROCESS platform components
The components which would be beneficial for PROCESS are outlined above. In general, MEE
itself is envisoned as a standalone component which may be used to invoke PROCESS
application runs on the underlying resources.
Plans for integration with other systems (from PROCESS)
MEE integrates with Atmosphere and Rimrock directly. It is capable of requesting Atmosphere
to launch VMs in the cloud, and of scheduling HPC jobs with Rimrock. External usage of MEE
is currently possible via its web-based GUI, however a RESTful interface may be added as
needed.
5.7.3 Rimrock execution environment Rimrock stands for Robust Remote Process Controller Controller [RIMROCK1], [RIMROCK2]
is a service that simplifies interaction with remote HPC servers. It can execute applications in
batch mode or start an interactive application, where output can be fetched online and new
input sent using a simple REST interface. What is more, by using a dedicated REST interface
users are able to submit new jobs to the infrastructure. This solution would support efficient
creation and sharing of executable documents for analysis of heterogeneous research
datasets. Its performance analysis is described separately with more details in Section 6.1.4.
Technology Readiness Level
RIMROCK is currently actively used in production in the Polish national-wide HPC
infrastructure PLGrid (https://submit.plgrid.pl/) in our opinion it already surpassed original TRL
6 and should be now considered at TRL 7. The work planned in the PROCESS project
including further testing and integration with other EU e-Infrustructures (such as the clusters
provided by the LMU/LRZ, UvA or UISAV) would certainly pave the way towards the TRL 8.

D4.1 State of the art of services
This version is a draft of D4.1 and is under review. 102
Main features of the service in the PROCESS project
The RIMROCK may be used as component of the whole PROCESS workflow (or directly via
external tools used by the PROCESS use-cases if needed) by:
1. providing unified gateway to the multiple HPC clusters (such as Prometheus, LRZ
Linux-Cluster and SuperMUC , UvA and UISAV clusters),
2. taking care of the unified JOB identification so upstream clients would not need to keep
records where the job has been scheduled,
3. hiding underling complex HPC access protocols by exposing simple RESTful API
4. allowing scheduling, monitoring and terminating HPC jobs
5. supporting common resource access methods (such as gsissh and grid middlewares)
6. controlling common job queuing systems (currently PBS and SLURM with plans for
extensions)
7. allowing running simple task on the UI node (without submitting on the cluster)
Architecture
Figure 33: Rimrock architecture.
Rimrock is a service which simplifies the management of processes and tasks executed in the
high performance computing infrastructure. The service stands out by unifying access to
computing and storage resources with the popular REST interface communication
paradigm and by utilizing user rights delegation making it possible to chain multiple,
intermediary services within a single user session [Pajak 2015]. It supports file stage-in/stage-
out using GridFTP and it is compatible with PBS, SLURM, GLite and QCG.
Plans for integration with other systems (from PROCESS)
As RIMROCK is acting as gateway for the HPC infrastructures exposing the REST API it is
going to be integrated with the MEE which would use it as backend to those infrastructures.
5.7.4 Atmosphere cloud platform Atmosphere [Atmosphere1], [Atmosphere2] is a hybrid cloud environment facilitating the
development and sharing of computational services wrapped as cloud virtual machines, with
access to external data sources (such as LOBCDER, mentioned above). Atmosphere supports
the entire cloud service development lifecycle and provides a set of pluggable interfaces which
can be included in portals and web applications. It is compatible with a wide range cloud
middlewares of open-source and commercial vendors, and provides interfaces to both public
and private cloud resources in the form of a technology-agnostic UI and RESTful APIs. Its
performance analysis is described separately with more details in Section 6.1.5.

D4.1 State of the art of services
This version is a draft of D4.1 and is under review. 103
Technology Readiness Level
As Atmosphere is currently running in production mode in the PL-Grid environment, where it
provides access to cloud resources which are made available to the PL-Grid consortium
(https://cloud.plgrid.pl), and also supports all the operational use cases of the VPH-Share
infrastructure (https://vph.cyfronet.pl), it should be regarded as having attained TRL 7.
Deploying the platform in PROCESS, with its attendant use cases, would provide qualified
testing and demonstration necessary for achieving TRL 8.
Main features of the service in the PROCESS project
In the Process project Atmosphere can be used to spawn Virtual Machines hosting system
components in selected cloud setups (such as the OpenStack cloud in place at ACC Cyfronet
AGH). To be able to perform this function, the Atmosphere host must be able to talk to the
cloud head node. Atmosphere can also manage VMs deployed in commercial clouds, such as
Amazon EC2 and Google Cloud Platform.
Architecture
The architecture of Atmosphere is briefly outlined in the following image.
Figure 34: The architecture of Atmosphere.
Atmosphere itself provides a RESTful API (see https://github.com/dice-
cyfronet/atmosphere for a descrtiption thereof), which can be used to implement higher-level
UIs, such as the VPH-Share Cloud UI.
PROCESS platform components
Atmosphere can process incoming requests by way of a RESTful API and can therefore
integrate with external services and GUIs. Note that Atmosphere is directly integrated with the
Model Execution Environment (MEE) described above. MEE can direct Atmosphere to spawn
virtual machines upon which individual pipeline steps can be computed, then clean up unused
resources once the computations have concluded.
Plans for integration with other systems (from PROCESS)
The API provided by Atmosphere can be interfaced by any component capable of
communicating with a RESTful web service. Ideally, the entity issuing calls to Atmosphere
should be the one responsible for orchestration of services in the PROCESS framework, i.e.
the service or component which decides where to deploy specific computational tasks.
Atmosphere handles the actual communication with the underlying cloud platform, deploys
VMs and returns access details which the service orchestrator requires to actually
communicate with the VMs in question.
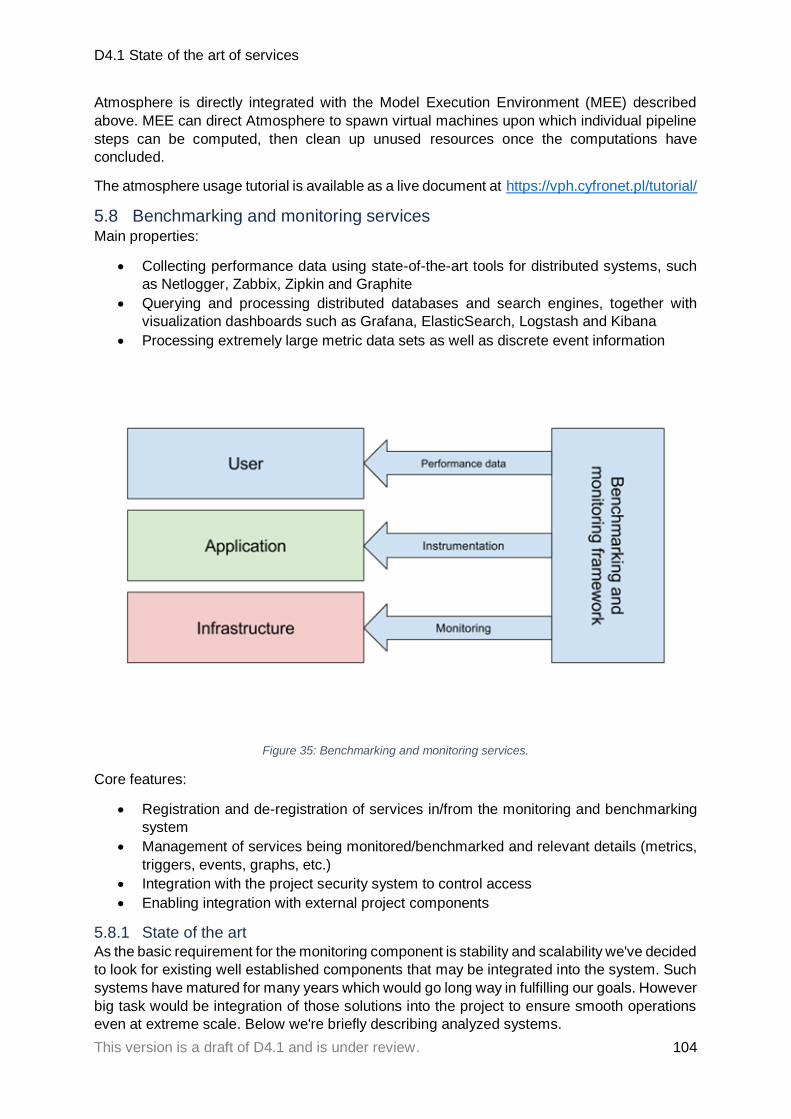
D4.1 State of the art of services
This version is a draft of D4.1 and is under review. 104
Atmosphere is directly integrated with the Model Execution Environment (MEE) described
above. MEE can direct Atmosphere to spawn virtual machines upon which individual pipeline
steps can be computed, then clean up unused resources once the computations have
concluded.
The atmosphere usage tutorial is available as a live document at https://vph.cyfronet.pl/tutorial/
5.8 Benchmarking and monitoring services Main properties:
• Collecting performance data using state-of-the-art tools for distributed systems, such
as Netlogger, Zabbix, Zipkin and Graphite
• Querying and processing distributed databases and search engines, together with
visualization dashboards such as Grafana, ElasticSearch, Logstash and Kibana
• Processing extremely large metric data sets as well as discrete event information
Figure 35: Benchmarking and monitoring services.
Core features:
• Registration and de-registration of services in/from the monitoring and benchmarking
system
• Management of services being monitored/benchmarked and relevant details (metrics,
triggers, events, graphs, etc.)
• Integration with the project security system to control access
• Enabling integration with external project components
5.8.1 State of the art As the basic requirement for the monitoring component is stability and scalability we've decided
to look for existing well established components that may be integrated into the system. Such
systems have matured for many years which would go long way in fulfilling our goals. However
big task would be integration of those solutions into the project to ensure smooth operations
even at extreme scale. Below we're briefly describing analyzed systems.

D4.1 State of the art of services
This version is a draft of D4.1 and is under review. 105
Nagios
As one of the most well known and widely used monitoring system with history dating to 1996
(with initial Open Source release under NetSaint name in 1999 and following release as Nagios
in 2002) [NAG-HIST] is a natural candidate for our system. At present it offers both free and
Open Source version known as Nagios Core as well as commercial version (Nagios XI). The
solution is focusing on providing alerting services both for external checks (like ping, HTTP) as
well as internal checks (like disk/memory/CPU usage). It is easily extendable and offers a
standardized plugin mechanism. Plugins may be developed in any technology providing they
return appropriate output. They may be called either locally or remotely e.g. via NRPE solution
or SSH. Nagios Core configuration is stored in hierarchical set of flat configuration files (in plain
text) which might be not as easy to manage as the solution based on a database but on the
other hand offers great speed and reliability.
Zabbix
Zabbix is another well established solution with initial stable release in 2004 (with earlier beta
and internal releases dating 1998) which is comparable to Nagios. It offers similar alerting
features as Nagios with additional out of the box continues load monitoring and visualization
(through tables and graphs). In contrary to Nagios, Zabbix requires installation of agents on
monitored nodes to allow internal checks, which allows more consistent platform but at the
same time may be more complex especially in heterogeneous systems. Zabbix offers large set
of predefined monitoring templates for various types of services. It keeps it configuration in the
database and allows very straight-forward management via the GUI or Web API.
Icinga
Icinga has been originally created as a fork of Nagios in 2009. It's goal was to allow better
scalability for large deployments. Later the Icinga2 has been compliantly redesigned and
rewritten to allow modern UI and wide range of RDBMS backend, yet still providing backward
compatibility with the Icinga1 / Nagios plugins.
Munin
Munin is a tool writtedn in Perl, which allows monitoring system resource usage. It is also
capable of graphing collected resource data (using the RRDtool). This system may be used in
combination with an alerting system (such as Nagios) to check for bottlenecks.
Cacti
Cacti is antother resource monitoring tool using RRDtool to graph collected usage data. It is
composed of a PHP frontend and a scalable C backend (Spine). It is especially well suited to
graph network usage based on data collected from network switches or routers via the Simple
Network Management Protocol (SNMP).
Ganglia
Ganglia is yet another load monitoring tool especially well suited for large tightly-coupled
systems like Clusters. To reach this goal a set of optimisations were implemented such as the
ability to use Multicast instead of Unicast to reduce the trafic overhead related to the monitoring
platform.
Collectd
Collectd as the name suggests may be used to collect data from numerous sources both
directly from nodes as well as indirectly e.g. via the SNMP. Collected data may be then written
to disk or sent to other services via the network which makes this tool perfect as a building
block for larger and more complex systems.
Elastic Stack
Elastic Stack is a name for a set of tools composed of:

D4.1 State of the art of services
This version is a draft of D4.1 and is under review. 106
1. Data Collectors:
1. Beats - responsible for collecting metrics data from nodes including both
generic data (such as memory/cpu usage) as well as application specific data
(e.g. from Nginx) or even container based platforms (Docker, Kubernetes),
2. Logstash - responsible for acquiring and preprocessing data from multiple
sources (including logs, NetFlow, collecting engines such as Collectd etc.)
2. Search and analytics engine called Elasticsearch
3. Presentation / graphing platform called Kibana which allows showing the results in
modern Web Based UI
Grafana
Grafana is another visualization toool capable of agregation of data from multiple sources
(such as InfluxDB, but also already mentioned Elasticsearch). In this aspects is similar to
Kibana but focuses more on metrics (time series) then log analytics.
NFDUMP with NfSen
This set of tools is specific to analysis of network traffic from NetFlow compatible sources (such
as routers). NFDUMP is used to collect data form the source and NfSen act as a frontend
capable of graphing and providing GUI for users. NetFlow based analysis allows to track
connections based parameters such as protocol or source/destination port.
ntopng
The ntopng is based on a legacy Open Source tool called ntop. It allows processing and
graphing of NetFlow data similar to the previously mentioned NfSen, but it comes with a
modern UI. The basic version of ntopng (Community) is free and open source, however the
vendor offer also non-free commercial versions (Professional, Enterprise) as well as other
commercial parts of the system such as:
1. nProbe - for collecting data from NetFlow sources or directly from the network
2. n2disk - for traffic recording
3. PF_RING - for high-speed packet capture (PF_RING standard is distributed under
GPL/LGPL mixed license, and high-speed PF_RING ZC driver is proprietary)
5.8.2 Conclusions and the chosen solution Based on the above SotA analysis we have initially chosen 3 best candidates for this task -
Zabbix, Nagios and Icinga, as they are ale mature complete solutions well suited for the task.
The rest of the solutions are also fine, but would address only a subset of the tasks. In result,
usage of other mentioned solutions would require integration of multiple distinct components
which may not provide in our opinion sufficient stability for the PROCESS project. Upon further
analysis we have finally chosen Zabbix as the best solution. We made this decision as Icinga
2 (current version of Icinga) is not so mature and well established as Zabbix and Nagios. On
the other hand Nagios Core offer great alerting capabilities, however it is not offering the same
level of support for online resources monitoring, as well as its configuration is based on text
files might require more complex integration. Zabbix's configuration is based on a RDBMS (like
MariaDB/MySQL) and could be modified via the API. With over 19 years of history and constant
development/testing, as well as wide range of users including big corporations from wide are
of domains such as Banking/Finances, Health, IT and Telecommunication Zabbix is a fully
mature solution and in our opinion may be rated as TRL 9. Its performance analysis is
described separately with more details in Section 6.1.6.
Main features of the service in the PROCESS project
Zabbix in the PROCESS project would be responsible for collecting monitoring data required
to allow:

D4.1 State of the art of services
This version is a draft of D4.1 and is under review. 107
• Alerting when the infrastructure is inaccessible
• Prevent inaccessibility by alerting when infrastructure factors (such as available
resource) are out of specified range,
• Allow browsing and visualization (as charts) of the collected measurements.
Architecture
Figure 36: Monitoring architecture.
PROCESS platform components
The Zabbix platform would be able to gather (both actively as well as passively) data from the
PROCESS infrastructure. Collected data may be exposed via the Web UI and may be used to
trigger notification mechanism through media such as E-Mails or Jabber.
Plans for integration with other systems (from PROCESS)
The monitoring system is planned to be integrated with all services deployed in PROCESS as
its main role is to check whether those services are up and running within the specified
parameters. This integration would be done by installation of Zabbix Agents on each host
running the services. Additionally the front-end might be integrated with the security platform,
as well as may be configured from other components via the REST API (e.g. to register new
cloud instance).

D4.1 State of the art of services
This version is a draft of D4.1 and is under review. 108
Exascale application viewpoint
Monitoring system in itself does not require exascale however our goal is to provide a solution
capable of monitoring of such systems. The usage of the Zabbix platform would allow sharing
the load of this task among agents dispersed on the whole infrastructure, aggregated by the
proxies. If the use of a single Zabbix server would not be sufficient for such a scale we are
planning to deploy a cluster of multiple monitoring servers to process required amount of
monitoring data.
5.9 Programming of multi-core architecture
5.9.1 State of the art Many-core devices offer enormous potential in compute- power and can increase the
performance of supercomputer and data-center applications significantly. However, many-core
devices are difficult to program. There are a variety of problems that needs to be solved to
obtain high-performance from multi-core devices. Because of the variety of type of many-core
devices execution times in heterogeneous many-core clusters requires, some form of load
balancing. Load balancing is particularly challenging in heterogeneous many-core clusters,
because it involves communication between nodes over relatively slow networks which results
in a skewed computation/communication ratio. Often to obtain high-performance from multi-
core devices, the identified computational kernels have to be optimized each type of hardware
and the run-time system should know the type and number of available many-core devices in
each node and map the right kernels to the devices. Often many-core devices expose a
complicated interface to the programmer with many levels of parallelism and a complicated
memory hierarchy, all meant to reach high performance. They do not have a standardized
instruction set, there are many different kinds of many-core processors, and the hardware
evolves quickly. Because of the many levels of parallelism that closely interact with the memory
subsystem, the performance of a program can improve drastically if it accounts for the
limitations of the processor and makes proper use of the available hardware.
Many-cores expose all kinds of architectural intricacies to achieve high performance and the
performance differences can be quite large when a program is well-balanced in how the
hardware is used. Existing approaches often focus on achieving high performance from
homogeneous many-core clusters. Often, the overall solution is a directly derived from an MPI
program with a programming language for many-core devices, such as OpenCL [Gohara 2010]
or CUDA [Nickolls 2008]. In a heterogeneous environment the execution times vary across
types of many-core hardware a solution based on only on Message passing with rigid
communication patterns is not the ideal solution.
Several frameworks targeting many-core clusters are analysed in [Hijma 2015], some of these
frameworks targeted aimed to enable the MapReduce programming model to take of the many-
core devices like the GPMR a Map-Reduce framework for GPU clusters [Stuart 2011], the
HadoopCL which extends Hadoop with OpenCL to make the computational power of many-
cores available to Hadoop jobs, or the Glasswing [El-Helw 2014] is a MapReduce framework
fully written in OpenCL and C++ and has a significant performance benefit over the previous
two frameworks. Other frameworks tried to optimize the use of many-core architecture in
general, we briefly list here the systems covered in [Hijma 2015]:
1. The OmpSs [Bueno 2012] combines OpenMP pragmas with StarSs pragmas to
program clusters of GPUs. It offers a sequential programming model in which
programmers can annotate parallel regions with directives to indicate the data-
dependencies with in, out, and inout statements between tasks and on what kind of
device a task should run.
2. Planas et al. [Planas 2013] provides an adaptive scheduler that can choose multiple
versions of compute- kernels and learns to choose the better performing version.

D4.1 State of the art of services
This version is a draft of D4.1 and is under review. 109
3. StarPU [Augonnet 2011] and PaRSEC [Bosilca 2013] provide an execution model
based on tasks. Programmers have to manually annotate data-flow dependencies
between the tasks. The run-time system handles data-dependencies, scheduling of
tasks, and load balancing.
4. SkePU [Majeed 2013] is built on top of StarPU and provides a skeleton framework that
allows programmers to express a program in terms of frequently used patterns encoded
in the program construct. The program remains sequential while the implementation of
the patterns is parallel.
Exascale application viewpoint
The question that is asked when considering exascale computing is whether or not the current
programming models are able to achieve exascale? Can the evolution/extension of current
approaches provide adequate support for exascale systems? William Gropp discussed in
[Gropp 2013] the potential possible extension of existing programing models to achieve
exascale computing. Because an exascale system is likely to have distributed memory
hardware, Gropp considers the solution based on one well-established model, hybrid models
and recent programming models. He starts with the most natural programming model MPI,
having MPI everywhere faces several challenges which may require significant effort both in
building a scalable MPI implementation and a different approach from the programmer point
of view to achieve exascale using MPI model. Gropp discards the option that extension of
OpenMP can lead to exascale computing, according to Gropp evidence is lacking that OpenMP
will scale to hundreds of cores. The scaling of OpenMP to hundreds of cores will require
changes both in programming style and in the language itself. Certain constructs in OpenMP
like locks, atomic sections, sequential sections encourage fine-grained synchronization and
thus limit scaling. It is not easy to achieve an exascale program by extending a single
programming model, the obvious option that can be considered for exascale are hybrid models.
The biggest problem when mixing programming systems is that they will compete for
resources, and memory bandwidth. In the past Hybrid systems did not show good scalability,
but it is hard to separate the intrinsic problems of such systems from performance problems
due to the use of inappropriate programming patterns [capello 2000], [Drosinos, 2004], or
inefficient implementations. More promising in Gropp’s analysis are the one-sided
communication programing models because they make use of modern communication
hardware features such as Remote DMA or RDMA which can reduce the amount of copying
that may occur during communication and reduce communication software overheads.
The report of the 2011 workshop on “exascale programming challenges” defines four criteria
to assess the suitability of a programming model for exascale computing [exascale, 2011].
Among these criteria is ability of “the programming model to permit users with different skill
sets to guide the lowering of abstraction levels from the algorithm level all the way down to the
executable level. This suggest an approach that support multi-level of abstractions such as the
Cashmire programing model which has been proposed for programming high-performance
applications for clusters with many-core accelerators and forms a tight integration of two
existing programming systems: Satin [Nieuwpoort , 2010] and MCL [Hijma, 2015-1]. The
programming system is designed such that programmers can choose their own abstraction-
level for their program to trade-off performance, portability and ease of programming [Hijma
2015]. MCL offers abstraction levels by providing a library of hardware descriptions that are
organized in a hierarchy. At the highest level the targeted programming model is likely to be a
domain-specific language, this can help to exploit domain properties that can be used to
optimize programs. The programming notation used by the application programmer should
provide constructs that can help exploiting these domain specific properties.
Even if exascale computing clearly requires disruptive changes at all levels of the computing
stack, driven by needs for massive concurrency, the appearance of completely new paradigm

D4.1 State of the art of services
This version is a draft of D4.1 and is under review. 110
for exascle computing is not likely to happen in the coming years, a more realistic approach is
to adapt existing programing model, languages and environment [Heroux 2016].
5.9.2 PUMPKIN Distributed computing paradigms vary considerably and target specific application scenarios;
process oriented such as Actor model [Haller2009] and KPNs (Kahn Process Networks)
[Kahn1974], large scale data oriented such as MapReduce and dataflows. MapReduce
[Ghemawat2008] is based on a map(), reduce() functions. These functions are common
procedures in many data analyses problems. Many frameworks have evolved around this
central concept which aims at ameliorating certain aspects such as programmability and
communication.
Another bread of post-Hadoop distributed frameworks addresses different application
scenarios where the batch oriented.
Hadoop [White2009] is not ideal. Frameworks such as Storm [storm] and Spark [Zaharia2010]
aim at streaming data while others such as Pregel [Malewicz2010] are for large scale graph
processing. The aim of such systems is to achieve high-processing throughput on dedicated
clusters whereby the software stack is tuned for the specific resources. A lower level of
distributed computing paradigm deals with fine grained control and communication of
concurrent functions. Such a paradigm is the actor model whereby functions known as actors
communicate asynchronously using messages [Haller2009]. Actors perform a certain task in
response to a message, actors are autonomous and are able to create new actors creating a
hierarchy of actors. Scientific Workflow Management Systems (SWMS) come in many shapes
and sizes and vary in the computational model, types of processes used, and types of
resources used. Many base their model on process flow [Missier2010] and also include a form
of control flow [Altintas2004], others implement data flow models [Cushing2013] or
communication models as used in coordination languages [Arbab2006, Cortes2000] and some
propose eccentric models such as based on chemical reactions [Fernandez2011].
A common denominator in most workflow systems is that the unit of reason is the process i.e.
the abstract workflow describes a topology of tasks configured in a certain way. Coordination
languages are another form of coordinating multiple tasks
Automata are widely used in filtering-based processing such as event stream processing
whereby automata are used to model queries in a distributed environment that queries streams
of events such as stock events. The model used is an extension of the traditional NFA where
instead of a finite input alphabet they read relational streams whereby state transitions are
controlled by predicates. Automata are also extensively used in high performance XML-filtering
for modeling queries. The bases of queries are that searching can be done using regular
expressions and FSMs are suited to recognize such languages. Our application of automata
is to describe data transformations whereby the input symbols are functions/tasks which are
modifying the state and the content of the data.
Main features of the service in the PROCESS project
Provides application as a set of networked functions ideal for edge-to-cloud computing with in-
network data processing/filtering/transcoding.
Technology Readiness Level
The tool has been demonstrated in several demos including SC13, SC14 and COMMIT-
DEMO. To reach TRL 7 we will partner with at least one use case (SKA) in PROCESS and
develop a streamlined version taking into account scaling to the exascale. Building on this
version, we reach TRL 8 by developing a production ready version for the use case.

D4.1 State of the art of services
This version is a draft of D4.1 and is under review. 111
Architecture
Pumpkin is a framework that helps to process data by simply describing which process(es)
should be applied to transform the data from one state to another. For example a HelloWorld
application in Pumpkin would typically include 3 tasks a task that inputs or injects the data in
this case the string "Hello world", a second task that processes the data, it greets world with a
hello and the final task for extracting or output the data helloworld.
Proposed multi-core architecture will be based on Exploratory Data Processing (PUMPKIN)
technology [PUMPKIN1], [PUMPKIN2] which is a decentralized data centric tool to
coordinating the execution of complex applications over federated distributed systems. It is a
framework for distributed Data Transformation Network (DTN) builded on an automata-based
data processing model where a data packet is a self contained processing unit which
incorporates data, state, code and routing information. Automata is used to model the packet
state transformation from one node to the next. A decentralized distributed system takes care
of routing data packets too [PUMPKIN1].
Automata data model describes the abstract data processing model. The same model is used
to build a distributed processing infrastructure around the data processing schema. The
schema represents the knowledge of how data can be processed which at a network and
resource level this represents a data routing table [PUMPKIN1].
Globally distributed resources are combined together in the PUMPKIN framework through a
data processing protocol. Data is partitioned into packets. A packet is an atomic unit of data
processing. Each data packet can encapsulate the automata as part of the header. The
automaton header makes the packet self aware of where it has to go for processing. The data
packet can also contain the code for processing the packet [PUMPKIN1].
The processing granularity is at the data packet level. This allows for various controllability
such as scaling at packet level. A packet source will load balance data packets to multiple
replicated, identical data processing functions. Replication is also at the packet level. Data
packets can be replicated to multiple functions requesting the same data state [PUMPKIN1].
Data processing functions are hosted in nodes. Functions can be statically deployed or
deployed through the data packet since the packet can also carry code. The task for each node
is two fold: nodes process data and also route data [PUMPKIN1].
Figure 37: Anatomy of a Pumpkin node [PUMPKIN1].

D4.1 State of the art of services
This version is a draft of D4.1 and is under review. 112
Each node in PUMPKIN discovers routes to other nodes. A routing table allows nodes to send
data packets to the next node in a P2P fashion. In SDNs the routing table can be used to
reconfigure the network [PUMPKIN1]. Its performance analysis is described separately with
more details in Section 6.1.7.
PROCESS platform components
Pumpkin provides a runtime to be deployed on PROCESS VMs or containers. The runtime
enables functional parallelism across VMs. User or program interaction is through SSH and
VM configuration scripts such as Ansible or Docker
Plans for integration with other systems (from PROCESS)
Pumpkin runtime needs to be running on every node. Starting the runtime can be done through
SSH or through booting scripts of the VM/container. Each node can be assigned different
Pumpkin functions which are just python class files in a specified directory. User access to
Pumpkin is done through one of the nodes using SSH where the user copies a Pumpkin start
function which kicks off execution of the workflow. Retrieving output is also done through a
stop function which receives input at the end of the workflow. Users can also start execution
by copying a data packet to one of the nodes through SCP or otherwise. This scenario is
intended for stream-like processing where data files initiate processing without user interaction.
Communication between nodes is with TCP (UDT under investigation) and communication on
single node is through IPC. Pumpkin can integrate with LOBCDER for data management
especially input/output data. One way we envision is to initiate computation directly through
the data store by dropping input files in monitored folders.
PUMPKIN has been already tested on Atmosphere cloud platform. A potential integration
within PROCESS will be with EurValve Model execution environment or any similar client
application that is that can help capture the application workflow requirements build an abstract
automaton that formally describe data processing independent from underlying processes
while also providing routing information to route data based on its current state in a P2P fashion
around networks of distributed processing nodes.
5.10 Services for Big Data processing and manipulation
5.10.1 State of the art of Big Data processing frameworks
• Apache Spark™ ecosystem [SSE] (Figure 38) is a fast and general engine for large-
scale data processing; it is originally developed at the University of California,
Berkeley's AMPLab. The Spark codebase was later donated to the Apache Software
Foundation. Apache Spark provides an interface for programming entire clusters with
implicit data parallelism and fault tolerance. It runs on Hadoop, Mesos, standalone, or
in the cloud. It can access diverse data sources including HDFS, Cassandra, HBase,
and S3. Apache Spark™ (and its extensions) can be used for hyper-parameter turning
where applicable.
• H2O, Sparkling Water and Deep Water combines the fast, scalable machine learning
algorithms of H2O with the capabilities of Apache Spark. Drive computation from
Scala/R/Python and utilize the H2O Flow UI. Deep learning, ensembles, GBM, GLM
and DRF for accuracy. In memory processing and distributed for speed. R, Python,
Flow, Tableau and Excel interfaces.

D4.1 State of the art of services
This version is a draft of D4.1 and is under review. 113
Figure 38: Spark Streaming ecosystem [SSE].
5.10.2 State of the art of Big Data manipulations based on software requirements of
use cases Machine Learning and Deep Learning frameworks:
• Apache Spark MLlib and ML - open source ML libraries built on top of Spark, which
contain ML algorithms such as classification, regression, clustering or collaborative
filtering; featurization tools for feature extraction, transformation, dimensionality
reduction and selection; pipeline tools for constructing, evaluating and tuning ML
pipelines; and persistence utilities for saving and loading algorithms, models and
pipelines. They also contain tools for linear algebra, statistics and data handling. Except
the distributed data parallel model, MLlib can be easily used together with stream data
as well. For this purpose, MLlib offers few basic ML algorithms for stream data such as
streaming linear regression or streaming k-means. For a larger class of ML algorithms,
one have to let model to learn offline and then apply the model on streaming data online
[MLlib].
• H2O.ai - a set of Hadoop compatible frameworks for DL over Big Data as well as for
Big Data predictive analytics; i.e., H2O, Sparkling Water and Deep Water. H2O's
algorithms are implemented on top of distributed Map/Reduce framework and utilize
the Java Fork/Join framework for multi-threading. DL in H2O is based on FFNNs trained
with stochastic gradient descent (SGD) using back-propagation. Sparkling Water
contains the same features and functionality as H2O but provides a way to use H2O
with Spark. Deep Water is H2O DL with native implementation of DL models for GPU-
optimised backends such as TensorFlow, MXNet, and Caffe. These backends are
accessible from Deep Water through connectors.
• Scikit-Learn - widely known as a well-maintained, open source and popular Python ML
tool, which contains comprehensive algorithm library for incremental learning [Scikit]. It
extends the functionality of NumPy and SciPy packages with numerous DM algorithms.
It also uses the Matplotlib package for plotting charts. Scikit-Learn does not support
scalability out of the box, but there are few packages, which integrates the library with
Big Data processing tools such as Spark or Hadoop; e.g., DataBricks' spark-sklearn.

D4.1 State of the art of services
This version is a draft of D4.1 and is under review. 114
• Weka - is a collection of a general-purpose and very popular wide set of ML algorithms
implemented in Java and engineered specifically for DM [Weka]. Weka has a package
system to extend its functionality, with both official and unofficial packages available,
which increases the number of implemented DM methods. Weka does not support
scalability out of the box. There is already a package of generic configuration classes
and distributed map/reduce type tasks for Weka (distributedWekaBase) used as a base
for wrapper implementation for Apache Hadoop (distributedWekaHadoop,
distributedWekaHadoop2, distributedWekaHadoop2Libs) and Apache Spark
(distributedWekaBase). These wrappers provide Weka to run within a distributed
environment with some known limitations; e.g., only CSV files are supported on input,
one Spark context per one JVM.
• Caffe - a Deep Learning framework suitable for neural networks and excellent
implementation of Convolutional Neural Networks for image processing. It is the fastest
out-of-the-box DL library on CPU, GPU training.
• TensorFlow - an open source software library for numerical computation using data
flow graphs [TensorFlow]. It is designed for large-scale distributed training and
inference. It can run on single CPU systems, GPUs, mobile devices and large scale
distributed systems of hundreds of nodes.
• Theano - an open source pioneering DL tool (development started in 2007) supporting
GPU computation. At its heart, Theano is a compiler for mathematical expressions in
Python to transform structures into very efficient code using NumPy and efficient native
libraries like BLAS and native code to run as fast as possible on CPUs or GPUs.
Theano supports extensions for multi-GPU data parallelism and has a distributed
framework for training models.
• MXNet - an open source DL framework designed for both efficiency and flexibility
[MXNet]. It allows automatic parallel mixing of symbolic and imperative programming
to maximize efficiency and productivity. MXNet is portable and lightweight, scaling
effectively to multiple GPUs and multiple machines.
• PyTorch - a Python library for GPU-accelerated DL [PyTorch]. The library is a Python
interface of the same optimized C libraries that Torch uses. PyTorch is written in
Python, C, and CUDA. The library integrates acceleration libraries such as Intel MKL
and NVIDIA (CuDNN, NCCL). At the core, it uses CPU and GPU Tensor and NN
backends (TH, THC, THNN, THCUNN) written as independent libraries on a C99 API.
PyTorch supports tensor computation with strong GPU acceleration (it provides
Tensors that can run either on the CPU or the GPU, highly accelerating compute), and
DNNs built on a tape-based autograd system [PyTorch].
Deep Learning wrapper libraries:
• Keras - the most famous wrapper (at the moment) for TensorFlow, Theano, Mircosoft
CNTK, DeepLearning4J (DL4J), and MXNet [Keras]
• Lasagne - a lightweight wrapper library to build and train neural networks in Theano. It
is implemented in Python and still under heavy development. The documentation is
limited at the moment [Lasagne].
• TFLearn - a modular and transparent deep learning wrapper library designed to provide
a higher-level API to TensorFlow in order to facilitate and speed-up experimentations
[TFLearn].
• NVIDIA Digits - a web application for training DNNs for image classification,
segmentation and object detection tasks using DL backends such as Caffe, Torch and
TensorFlow with a wide variety of image formats and sources with DIGITS plugins.
DIGITS simplifies common DL tasks such as managing data, designing and training
NNs on multi-GPU systems, monitoring performance in real time with advanced

D4.1 State of the art of services
This version is a draft of D4.1 and is under review. 115
visualisations, and selecting the best performing model from the results browser for
deployment. DIGITS is mainly interactive (GUI) [NVIDIA Digits].
Accelerated libraries for intensive computing:
• NVIDIA CUDA - The NVIDIA CUDA (Compute Unified Device Architecture) [Cuda] is a
parallel computing platform and programming model developed by NVIDIA for general
computing on GPUs. GPU-accelerated CUDA libraries enable drop-in acceleration
across multiple domains such as linear algebra, image and video processing, DL and
graph analytics. The NVIDIA CUDA Toolkit [CudaToolkit] provides a development
environment for creating high performance GPU-accelerated applications.
• NVIDIA cuDNN - The NVIDIA CUDA Deep Neural Network library (cuDNN) [cuDNN],
which is a GPU-accelerated library of DNN's primitives. The cuDNN provides highly
tuned implementations for standard routines such as forward and backward
convolution, pooling, normalization, and activation layers. It allows DL users to focus
on training NNs and developing software applications rather than spending time on low-
level GPU performance tuning.
• OpenCL - OpenCL (Open Computing Language) developed by Khronos provides
compatibility across heterogeneous hardware from any vendor [OpenCL].
• OpenBLAS - an open-source optimized BLAS (Basic Linear Algebra Subprograms)
library providing standard interfaces for linear algebra, vector-vector operations, matrix-
vector operations, and matrix-matrix operations [OpenBLAS].
Data analytic and data processing:
• R is a free software environment for statistical computing and graphics including linear
and nonlinear modeling, classical statistical tests, time-series analysis, classification,
clustering. It compiles and runs on a wide variety of UNIX platforms, Windows and
MacOS. R is ease of use and extensible via more than 10 thousands packages.
• Python is general purpose programming language for research, development and
production, at small and large scales. Python features a dynamic type system and
automatic memory management, with large and comprehensive libraries for scientific
computation and data analysis. It contains many scientific packages such as NumPy,
SciPy, and Pandas.
• Hadoop and Spark for large-scale data processing is Apache open source projects and
a wide range of commercial tools and solutions that fundamentally change the way of
Big Data storage, processing and analysis.
• Other libraries and frameworks belong in this category are for image processing
libraries (e.g. FFmpeg, OpenCV, Openslide, Skimage), text processing libraries (e.g.
Gensim, NLTK), visualisation libraries (e.g. Matplotlib, Seaborn).
Machine
Learning
libraries
Accelerated
libraries for
intensive
computing
Deep
Learning
frameworks
and libraries
Deep
Learning
wrapper
libraries
Big Data
processing
and analytics
frameworks
Data
Analytics
libraries
Scikit-
Learn*,
Weka*,
H2O.ai
CUDA, cuDNN,
OpenCL,
OpenBLAS,
NCCL2,
TensorFlow
Caffe,
TensorFlow,
Theano,
MXNet,
PyTorch,
H2O.ai
Keras,
TFLearn,
Lasagne,
NVIDIA
Digits,
Apache
Hadoop,
Apache Spark
NumPy,
SciPy,
Pandas,
Python, R

D4.1 State of the art of services
This version is a draft of D4.1 and is under review. 116
* scalability supported by additional wrapper or package
Hardware requirements (storage, CPU, GPU, network etc.)
• Big Data processing frameworks: multi-core computing architecture, low-latency
interconnection networks, Big Data storage
• Accelerated libraries for intensive computing: GPU, low-latency interconnection
networks
• Machine Learning and Deep Learning frameworks and libraries: GPU, low-latency
interconnection networks, underlying accelerated libraries/drivers
• Data analytic tools: in general, without special requirements, but they may depend on
the underlying computing infrastructure
PROCESS platform components
• Big Data processing frameworks: Hadoop Distributed File system, virtual images with
preinstalled frameworks (Apache Spark, Apache Hadoop, H20)
• Accelerated libraries for intensive computing (see for Deep Learning frameworks and
libraries
• Machine Learning and Deep Learning frameworks and libraries: virtual
images/container/VM with preinstalled frameworks
• Data analytic tools: virtual images/container/VM with preinstalled frameworks
Plans for integration with other systems (from PROCESS)
• Big Data processing frameworks: Hadoop Distributed system integrated with DISPEL
(creating a connector in DISPEL to the HDFS), virtual images with preinstalled
frameworks will be deployed as Docker images and can be deployed on any underlying
architecture
• Accelerated libraries for intensive computing: virtual images/container/VM with
preinstalled frameworks
• Machine Learning and Deep Learning frameworks and libraries: virtual
images/container/VM with preinstalled frameworks
• Data analytic tools: virtual images/container/VM with preinstalled frameworks
5.11 State of the art of orchestration services
5.11.1 Challenges facing exascale orchestartion As mentioned in the sections above, applications and services in exascale are very complex.
The most important challenges from the view of orchestrations are as follows:
1. Extreme hardware requirements, access to special hardware like GPU
2. Very complex software components and dependencies among components of services
and applications
3. Heterogeneity and multi-tenancy of infrastructure
4. Complex infrastructure services for managing data and computation resources
5.11.2 Exascale orchestration projects SeaClouds (Seamless Adaptive Multi-cloud Management of Service-based applications)
http://www.seaclouds-project.eu/ EU FP7 funded project whose mission is to provide
seamless adaptive multi-cloud management of service-based applications. It actively
participated in the standardization of TOSCA and CAMP.
DICE (DevOps for Big Data) http://www.dice-h2020.eu/ EU H2020 funded project intended
to develop a model-driven DevOps toolchain to develop Big data applications. It offers an
Eclipse-based IDE implementing the DICE DevOps methodology, UML for application design
and supports OASIS TOSCA-compliant deployment and orchestration.

D4.1 State of the art of services
This version is a draft of D4.1 and is under review. 117
COLA (Cloud Orchestration at the Level of Application) EU H2020 funded project which have
objectives to provide a reference implementation of a generic and pluggable framework that
supports the optimal and secure deployment and run-time orchestration of cloud applications.
The project use Occopus, a cloud orchestrator framework developed at MTA SZTAKI
(Hungary) with its own language for software and hardware descriptions.
5.12 Service deployment and orchestration
5.12.1 State of the art Orchestration is often understood as automating the process of deployment, workflow
execution, dynamic scaling, service healing and other management activities of services and
applications in cloud. As cloud applications became more and more complex with different
software and hardware components, the importance of orchestration become more and more
important. Generally, the service orchestration can be described as following:
• Composition of different tools, services and processes, defining relationships among
these building blocks, linking them together as an integrated system
• Description of hardware requirements for deployment and execution of the system,
connecting the hardware and software components properly for delivering services
• Automating the execution of different workflows of the services including deployment,
initialization, start/stop, scaling, healing of the services
There are efforts for standardization and interoperability. One of the most important
standardization body in the area of service orchestration and cloud computing is the
Organization for the Advancement of Structured Information Standards (OASIS), which is a
global nonprofit consortium that works on the development, convergence, and adoption of
standards for security, Internet of Things, energy, content technologies, emergency
management, and other areas. Many standards related to services orchestration have been
created under OASIS technical committees, e.g. UDDI (Universal Description Discovery and
Integration), WSDM (Web Services Distributed Management), WS-BPEL (Web Services
Business Process Execution Language), SPML (Service Provisioning Markup Language).
From the view of cloud applications, the following standards are relevant. For service
orchestration, OASIS defines TOSCA — Topology and Orchestration Specification for Cloud
Applications, as standard for describing cloud services, the relationships between parts of the
service, and the operational behavior of the services. More details of TOSCA standard is
provided in the Section 5.12.2.
As the moment, there are several orchestration frameworks based on TOSCA. The most
important frameworks are described in follows:
• Cloudify is open source TOSCA-based orchestration framework based on YAML. As
Cloudify is the orchestrator that will be used in the PROCESS project, it will be
described separately with more details in Section 5.12.3.
• Alien4Cloud: Alien4cloud is open source TOSCA based designer and Cloud
Application Lifecycle Management Platform. The focus of Alien4Cloud is in design and
description of the topology, not in execution/deployment. It relies on other orchestration
platforms like Kubernetes, Mesos or Cloudify for realization of the deployment and
workflow execution. Alien4Cloud is written in Java with web-based GUI for editing
TOSCA templates
• Openstack Heat is orchestration tool specific for Openstack cloud middleware.
Although it has its own description language, it can provide support for TOSCA via
TOSCA Parser and Heat-Translator
• INDIGO-DataCloud Orchestrator is an orchestration framework developed in INDIGO-
DataCloud project. It depends on several other services developed in the project like

D4.1 State of the art of services
This version is a draft of D4.1 and is under review. 118
IAM (Identity and Access Management Service), SLAM (SLA Manager) for its full
functionalities.
5.12.2 TOSCA
Main features of the service in the PROCESS project
In the PROCESS, new custom types will be defined for different services and applications
developed in the project.
Architecture
TOSCA (Topology and Orchestration Specification for Cloud Applications, is an OASIS
(Organization for the Advancement of Structured Information Standards) standard language
to describe a topology of cloud based web services, their components, relationships, and the
processes that manage them [Tosca]. Its performance analysis is described separately with
more details in Section 6.1.8.
The TOSCA metamodel uses the concept of service templates to describe cloud workloads as
a topology template, which is a graph of node templates modeling the components a workload
is made up of and as relationship templates modeling the relations between those components.
TOSCA further provides a type system of node types to describe the possible building blocks
for constructing a service template, as well as relationship type to describe possible kinds of
relations. Both node and relationship types may define lifecycle operations to implement the
behavior an orchestration engine can invoke when instantiating a service template. For
example, a node type for some software product might provide a ‘create’ operation to handle
the creation of an instance of a component at runtime, or a ‘start’ or ‘stop’ operation to handle
a start or stop event triggered by an orchestration engine. Those lifecycle operations are
backed by implementation artifacts such as scripts or Chef recipes that implement the actual
behavior. The structure of TOSCA topology template is shown in the Figure 39 bellows:
Figure 39: TOSCA topology template structure [ToscaTemplate].
An orchestration engine processing a TOSCA service template uses the mentioned lifecycle
operations to instantiate single components at runtime, and it uses the relationship between
components to derive the order of component instantiation. For example, during the
instantiation of a two-tier application that includes a web application that depends on a

D4.1 State of the art of services
This version is a draft of D4.1 and is under review. 119
database, an orchestration engine would first invoke the ‘create’ operation on the database
component to install and configure the database, and it would then invoke the ‘create’ operation
of the web application to install and configure the application (which includes configuration of
the database connection).
Topology templates can be specified in YAML, a human friendly data serialisation standard for
all programming languages. Like XML, YAML is designed to be portable between programming
languages, however, it is much easier to read and edit than XML. A simple example for
deploying MySQL server would look in TOSCA YAML as follows:
tosca_definitions_version: tosca_simple_yaml_1_0
description: Template for deploying a single server
with MySQL software on top.
topology_template:
inputs:
.....
node_templates:
mysql:
type: tosca.nodes.DBMS.MySQL
properties:
root_password: { get_input: my_mysql_rootpw
}
port: { get_input: my_mysql_port }
requirements:
- host: db_server
db_server:
type: tosca.nodes.Compute
capabilities:
......
The relationships between components in the template above can be described as an example
(Figure 40) in the following scheme:
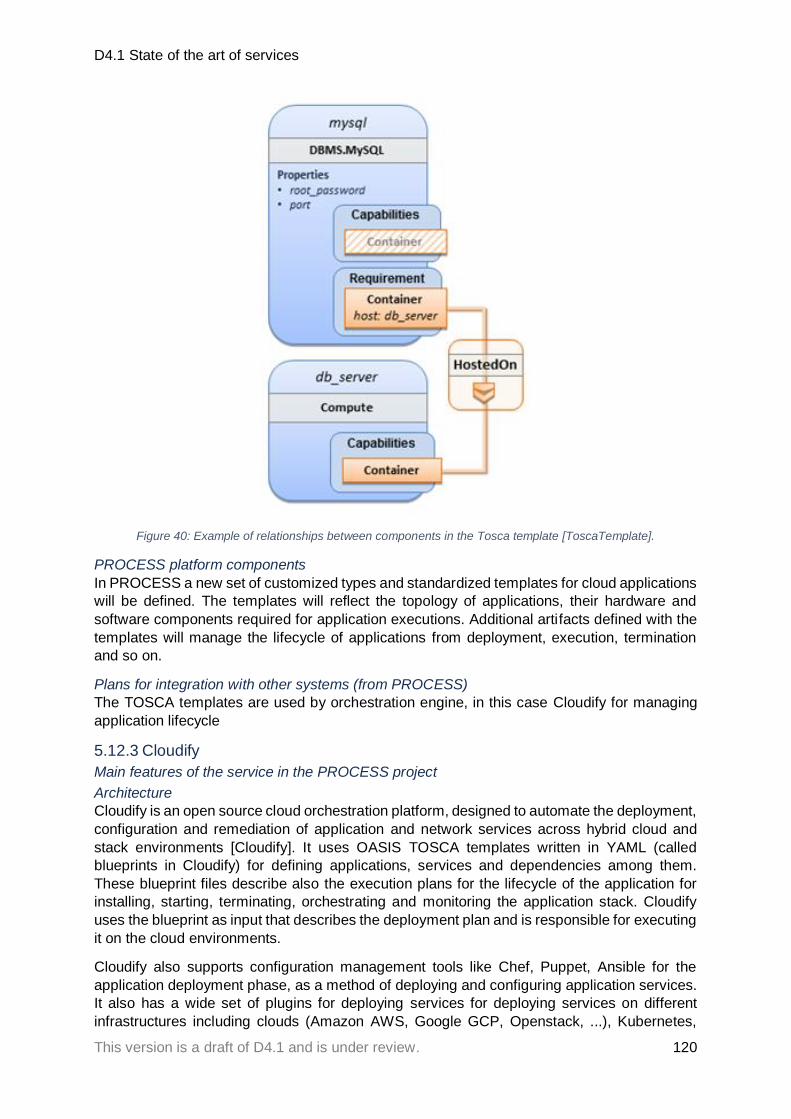
D4.1 State of the art of services
This version is a draft of D4.1 and is under review. 120
Figure 40: Example of relationships between components in the Tosca template [ToscaTemplate].
PROCESS platform components
In PROCESS a new set of customized types and standardized templates for cloud applications
will be defined. The templates will reflect the topology of applications, their hardware and
software components required for application executions. Additional artifacts defined with the
templates will manage the lifecycle of applications from deployment, execution, termination
and so on.
Plans for integration with other systems (from PROCESS)
The TOSCA templates are used by orchestration engine, in this case Cloudify for managing
application lifecycle
5.12.3 Cloudify
Main features of the service in the PROCESS project
Architecture
Cloudify is an open source cloud orchestration platform, designed to automate the deployment,
configuration and remediation of application and network services across hybrid cloud and
stack environments [Cloudify]. It uses OASIS TOSCA templates written in YAML (called
blueprints in Cloudify) for defining applications, services and dependencies among them.
These blueprint files describe also the execution plans for the lifecycle of the application for
installing, starting, terminating, orchestrating and monitoring the application stack. Cloudify
uses the blueprint as input that describes the deployment plan and is responsible for executing
it on the cloud environments.
Cloudify also supports configuration management tools like Chef, Puppet, Ansible for the
application deployment phase, as a method of deploying and configuring application services.
It also has a wide set of plugins for deploying services for deploying services on different
infrastructures including clouds (Amazon AWS, Google GCP, Openstack, ...), Kubernetes,

D4.1 State of the art of services
This version is a draft of D4.1 and is under review. 121
Fabric (via SSH), Docker and customized scripts. Its performance analysis is described
separately with more details in Section 6.1.9.
The architecture of Cloudify manager, the core part of the orchestration is described at bellows
in the Figure 41.
Figure 41: Cloudify manager architecture [CloudifyMA].
PROCESS platform components
In PROCESS, Cloudify composes from following components:
1. TOSCA template repository
2. Cloudify CLI
3. Cloudify plugins for deployments on relevant infrastructures (RIMROCK, Atmosphere)
Plans for integration with other systems (from PROCESS)
Cloudify will integrate with RIMROCK and Atmosphere for deploying applications to the
relevant computing platforms (HPC, Cloud). It will use the API provided by the technologies
for manipulating with computing resources and applications.
Actual Technology Readiness Level and future implementation
Cloudify has been used in industry by, AT&T, VMware, Deutsche Telekom, Orange, and other
(TRL9). At the moment of writing (10.4.2018), the community version has version number
18.2.28. In the PROCESS project, new TOSCA custom types and plugins will be developed
for integration with technologies developed in WP5 and WP6 and use cases in WP2.

D4.1 State of the art of services
This version is a draft of D4.1 and is under review. 122
5.13 Services for data access and integration
5.13.1 State of the art Service-oriented architectures (SOA) represent a fundamental shift from centrist, silo-based
paradigm of application development towards a more open, decentralized and distributed
paradigm. This shift has largely been caused by the gradual adoption of internet technologies
into the IT facilities of enterprises and the continuing globalization of all levels of economic
activities.
The shift towards the distributed SOA paradigm brings new challenges also in the area of data
access and data integration. By removing the central data silos from IT infrastructure and
distributing the data sources and/or storage over several network-connected systems, data
access and data integration become much more demanding. Indeed, we now see data as a
service [DAAS1]. In the recent 8 years, significant research into the challenges of data access
and data integration in SOA-based environments has been conducted
[SOADI1],[SOADI2],[SOADI3], but the actual idea of using web services for data integration
came much earlier [HANSEN2003]. Currently, SOA and the relevant data access and data
integration technologies are well established in the enterprise sphere as well
[ORACLEDI][INFORM].
Exascale application viewpoint
In the context of PROCESS, we define an Exascale Application as one where:
1. the amount of data processed is measured in hundreds of terabytes to petabytes to
exabytes
2. the application components are distributed and connected via the internet
3. the data processing consists of data access/acquisition (from permanent storage or
from streams produced by sensors), filtering, repair, preprocessing and finally the
processing which produces the application’s results.
Figure 42: Centralized approach to data - large data sets are moved to a central place and there they are processed.
In this context, a centralized approach (Figure 42) is untenable. It would require a concentration
of data storage and computation resources on a scale that only specialized data processing
centers can provide. In PROCESS, our goal is to provide tools, services and methodology for
a distributed and scalable approach to exascale data processing. Therefore, the main
principles of data access and data integration in PROCESS are (illustrated in Figure 43):
1. data processing goes to data instead of data going to data processing
2. data processing, being often a complicated process involving multiple data access
points and potentially many data filtering and data integration points, is defined in a
formal, persistent and reusable way

D4.1 State of the art of services
This version is a draft of D4.1 and is under review. 123
3. data access and data integration processes, being as complicated as they are in a
distributed exascale environment, should be abstract enough so that a division of
responsibilities among data experts, domain experts and users is possible.
Figure 43: A decentralized approach to data processing - processing elements are deployed near data sources, process the data and send only the results over the network.
These requirements are fulfilled best by the Admire (FP7 project: Advanced Data Mining and
Integration Research for Europe) [Admire] technological stack. It contains a network of
interlinked DISPEL gates which control data processes consisting of REST-enabled web
services and a dedicated, high level and abstract data process definition language called
DISPEL [DISPEL]. In connection with the dynamic deployment of services into containers to
be done in task JRA4.1 (Service deployment and orchestration), the Admire stack can also
ensure the ability to deploy computation to data, instead of it being necessary to transfer large
data sets to the place of computation. A performance analysis of DISPEL is described
separately with more details in Section 6.1.10.
Main features of the service in the PROCESS project
In the context of PROCESS, the data access and data integration services provided by Admire
technology will:
1. provide access to large data sets by deploying data accesss/filtering/integration
services near the data storage, on demand
2. provide data integration services, including integrating data from streams (i.e. from
sensors)
3. allow to define data access and data integration processes in a persistent manner and
with a sufficient level of abstraction for them to be reusable
4. allow for separation of data access/data integration concerns between data experts,
application domain experts and data process users
5. integrate with the higher-level data access service – LOBCDER – via a custom-made
VFS driver

D4.1 State of the art of services
This version is a draft of D4.1 and is under review. 124
Architecture
Figure 44: The distributed architecture of the Admire system.
Figure 44 shows the basic concept of Admire and also a general application of the architecture
to our scenarios. We have connected several local data providers, provided a Data Mining and
Integration (DMI) process description which streams data from them, cleans it, filters and
repairs it, and performs data mining on the resulting stream. The results are then provided in
an accessible manner to the domain experts who have defined the scenario's goals. Project
Admire's framework delivers an integrated approach to enable fluent exploration and
exploitation of data. That integration encompasses the full path of actions from accessing the
source data to delivering derived results. That path includes gaining permission to access data,
extracting selected subsets of data, cleaning and transforming data, performing analyses and
preparing results in the form required by their destination. As the multiple sources of data
encode and organize information in different ways a significant element is data integration,
which includes conversions at both syntactic and semantic levels in order to enable data
composition. Admire uses the DMI term to refer to all aspects of this full path of exploration
and exploitation.
The computational steps in a DMI process are accomplished by PE. Each PE corresponds to
code that the enactment may activate via some mechanism, such as a web-service invocation
or an object's method invocation. A single enactment may contain multiple instances of a
particular PE. Apart from the DISPEL Gate, the toolkit contains also a comfortable GUI-based
tool for DISPEL document construction, using UML as the graphical modelling language. The
model can be exported to DISPEL and subsequently used for data processing process
instantiation. The whole Admire framework is intended to operate on large data sets, streaming
them through PEs acting as filters. The PEs instantiated in a process are called activities.
Some of the PEs are generic (e.g. an SQL reader), and some must be developed specifically
for the application process where they figure, or the data resource which they expose.
The DISPEL language provides a notation of all DMI requests to a DISPEL Gate. The
description of a DMI process is a composition of existing PEs that actually perform task like

D4.1 State of the art of services
This version is a draft of D4.1 and is under review. 125
querying a data source, transforming tuples in a sequence, merging streams, classifying data
and so on. Example of a section of DISPEL DISPEL is below:
//import components
use uk.org.ogsadai.SQLQuery;
use uk.org.ogsadai.TupleToWebRowSetCharArrays;
use eu.Admire.Results;
use eu.Admire.LinearTrendFilter;
//create an instance of PE SQLQuery
SQLQuery query = new SQLQuery;
//define inputs of instance
String expression = "SELECT .....";
|- expression -| => query.expression;
|- "DbSvpResource" -| => query.resource;
//create an instance of another PE
LinearTrendFilter filter = new LinearTrendFilter();
//connect output from query to input of filter
query.data => filter.data;
//transforming data
TupleToWebRowSetCharArrays toWRS = new TupleToWebRowSetCharArrays;
filter.result => toWRS.data;
//delivery result
Results result = new Results;
|- "results" -| => result.name;
toWRS.result => result.input;
The inputs of each processing element may be literal (strings, numbers, variables or
expressions of the previous types), or stream outputs from other processing elements. In the
example above, we have a SQLQuery activity with two input parameters: SQL command
stored in expression variable and a constant string DbSvpResource for data resource. The
output from SQL query will be streamed to a filter LinearTrendFilter which replaces missing
values. The data then are transformed to a human-readable form and delivered to the result.
It is important to know that data integration and mining is iterative process, the users can try
to use some data sets and mining methods, examine the results, and then change the data
sets and/or mining methods to get better results. With DISPEL language, the users can change
the data integration and mining process easily, since the logic of the process is separated from
the physical resources. During execution, the DISPEL Gate can try and do several optimization
techniques to improve performance, e.g. placing processing elements close to data sources.
All data are transported between processing elements as streams, i.e. the second processing
element can start immediately when the first one produces first data item.
PROCESS platform components
1. DISPEL Gate – a component able to process DISPEL data process descriptions and
instantiate, orchestrate and control the described data processes; multiple gates may
cooperate in one data process
2. LOBCDER virtual file system driver – an integration component which will enable
LOBCDER to provide access to data processed by the Admire stack

D4.1 State of the art of services
This version is a draft of D4.1 and is under review. 126
3. Data access and data integration services – a set of services custom-built to provide
the data access, data integration and data processing (mainly filtering/pre-processing)
capabilities required by the pilot applications of the project.
Plans for integration with other systems (from PROCESS) and interfaces
The Admire stack is a subsystem of the data access and data integration stack of PROCESS.
The main entry point for data access is the LOBCDER service, this the Admire stack will be
integrated with LOBCDER via a custom virtual file system driver (an integration point supported
by LOBCDER).
The Admire stack's DISPEL Gate will interface with LOBCDER via a VFS driver, which will
connect to other LOBCDER's subsystems via their API. The DISPEL Gate itself, as well as the
services it utilises, are accessible via their REST interfaces over the HTTP protocol - see
Figure 45. Input to DISPEL Gate is always a DISPEL document describing a data process,
output are arbitrary data streamed back to LOBCDER and via it to the WebDAV client asking
for the data.
Figure 45: Integration of the DISPEL Gate into the data processing system of PROCESS.
Technology Readiness Level
The Admire system has been deployed as a prototype and tested in a relevant environment
(not necessarily an actual operational environment). Thus it conforms to TRL 6 [EUTRL]. In
order to bring it to TRL 8, the components relevant to PROCESS will be deployed and tested
in the context of PROCESS pilot applications' operation environments. Then they will be

D4.1 State of the art of services
This version is a draft of D4.1 and is under review. 127
packaged and documented to create a product. Currently expected changes to DISPEL Gate
are:
1. addition of currently not implemented processing elements
2. complete removal of OGSA-DAI iterfaces and move to REST/HTTP (partially done in
Admire)
3. desing, development and deployment of custom, application-specific processing
elements
5.14 Application-oriented scientific gateway
5.14.1 State of the art The most common way the user could access the HPC resources is by establishing a secure
SSH connection and running the jobs manually, polling the state of the jobs and waiting for the
results of the execution. This traditional way is safe, however, not very comfortable for non-IT
scientists who want to concentrate mainly on their research fields. In many cases, this fact is
the reason for the fluctuation from IT complicated situations and resignation to run experiments
in super powerful environments. A number of gateway approaches were done with the purpose
to enable easier access to high performance computational resources. They vary in
implementation levels, most of them are very complex, which requires hard developer work to
customize for fit user application needs.
• gUSE [gUse] (Grid and cloud user support environment) is very popular open source
science workflow system developed by Laboratory of Parallel and Distributed Systems
(SZ- TAKI, Hungary). It provides a generic purpose, workflow-oriented graphical user
interface to create and run workflows on various distributed computing infrastructures.
The framework may help small user communities who cannot afford to develop their
own customized science gateway. The core of the framework is the Directed Acyclic
Graphs design, which can define also complicated simulations. gUSE is quite
sophisticated for every high-performance application types.
• Gilda [Gilda] (Grid INFN Laboratory for Dissemination Activities) is a virtual laboratory
to demonstrate and disseminate the strong capabilities of Grid computing. It includes
the Grid demonstrator i.e. a customized version of the full Genius web portal, from
which everybody can submit a pre-defined set of applications to the Gilda testbed.
Currently, Gilda has been re-engineered to improve its services for training and
dissemination.
• Ganga [Ganga] is a tool that allows easy interaction with heterogeneous computational
environments, configuration of the applications and coherent organization of jobs.
Ganga functionality may be accessed by a user through any of several interfaces: a
text-based command line in Python reference, a file-based scripting interface and a
graphical user interface (GUI). This reflects the different working styles in different user
communities, and addresses various usage scenarios such as GUI for training new
users, the command line to exploit advanced use-cases, and scripting for automation
of repetitive tasks. For Ganga sessions, the usage fractions are 55%, 40% and 5%
respectively for interactive prompt, scripts and GUI.
• Web4grid [web4grid] interface is intended to be a user-friendly web where Grid users
can submit their jobs and recover the results on an automatic way. Besides the
interface it provides the capability to monitor the existing jobs and to check the Grid
state. It does not intent to make the unique access to both HPC and Grid.
• Cloudify Manager [CM] is a dedicated environment comprising an open-source stack,
that provides a secure environment for managing production-level applications. It
enable viewing application’s topology and perform different tasks such as utilize
plugins, keep and deployment of blueprints, run multi workflows using the Cloudify Web
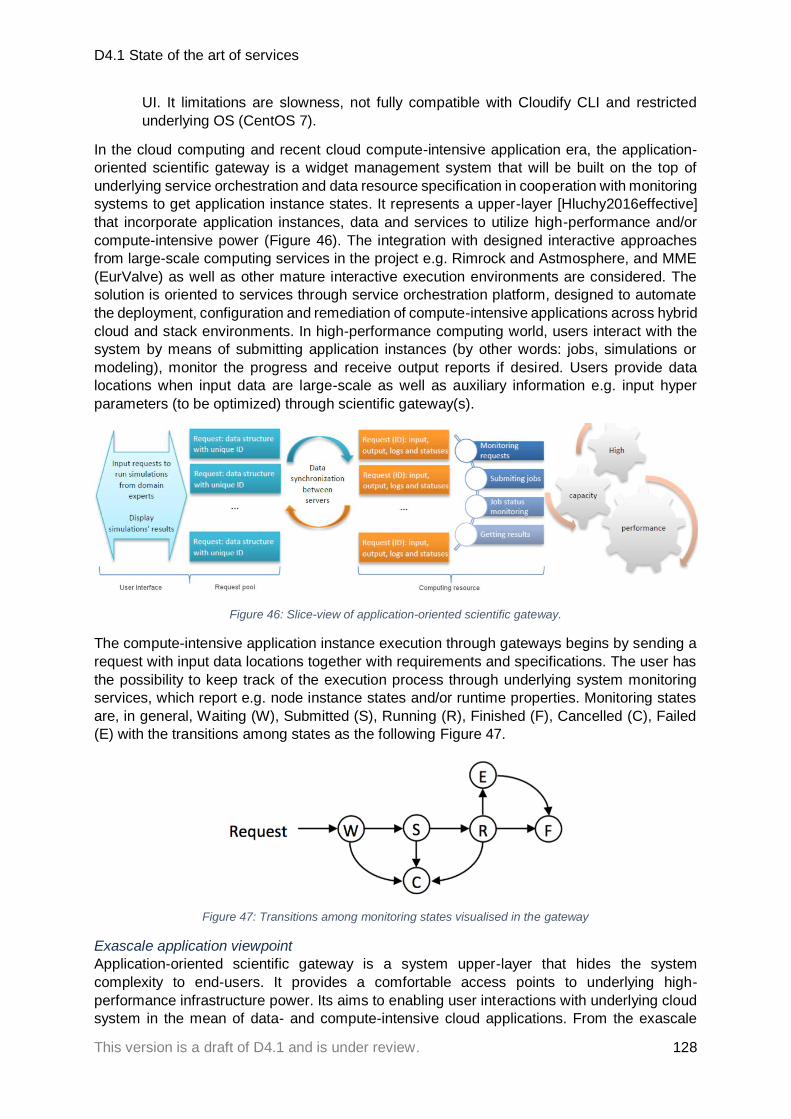
D4.1 State of the art of services
This version is a draft of D4.1 and is under review. 128
UI. It limitations are slowness, not fully compatible with Cloudify CLI and restricted
underlying OS (CentOS 7).
In the cloud computing and recent cloud compute-intensive application era, the application-
oriented scientific gateway is a widget management system that will be built on the top of
underlying service orchestration and data resource specification in cooperation with monitoring
systems to get application instance states. It represents a upper-layer [Hluchy2016effective]
that incorporate application instances, data and services to utilize high-performance and/or
compute-intensive power (Figure 46). The integration with designed interactive approaches
from large-scale computing services in the project e.g. Rimrock and Astmosphere, and MME
(EurValve) as well as other mature interactive execution environments are considered. The
solution is oriented to services through service orchestration platform, designed to automate
the deployment, configuration and remediation of compute-intensive applications across hybrid
cloud and stack environments. In high-performance computing world, users interact with the
system by means of submitting application instances (by other words: jobs, simulations or
modeling), monitor the progress and receive output reports if desired. Users provide data
locations when input data are large-scale as well as auxiliary information e.g. input hyper
parameters (to be optimized) through scientific gateway(s).
Figure 46: Slice-view of application-oriented scientific gateway.
The compute-intensive application instance execution through gateways begins by sending a
request with input data locations together with requirements and specifications. The user has
the possibility to keep track of the execution process through underlying system monitoring
services, which report e.g. node instance states and/or runtime properties. Monitoring states
are, in general, Waiting (W), Submitted (S), Running (R), Finished (F), Cancelled (C), Failed
(E) with the transitions among states as the following Figure 47.
Figure 47: Transitions among monitoring states visualised in the gateway
Exascale application viewpoint
Application-oriented scientific gateway is a system upper-layer that hides the system
complexity to end-users. It provides a comfortable access points to underlying high-
performance infrastructure power. Its aims to enabling user interactions with underlying cloud
system in the mean of data- and compute-intensive cloud applications. From the exascale

D4.1 Conclusion
This version is a draft of D4.1 and is under review. 129
viewpoint, here is an assumption that large-scale data resource (input, output) are from
distributed large-scale data repositories (e.g. extracted portions of data in data repositories) to
be processed within application instances. However, scientific gateways can provide certain
upload/download function for small datasets i.e. for the functionality testing or verification
purpose according to user needs.
Conclusion The deliverable provides the initial state of the art and requirement analysis together with the
initial PROCESS architecture. According to the description of the deliverable, it should contain
(with a corresponding section from the document):
• initial per-use case requirements analysis (Section 0)
• initial per-use case innovation potential analysis (Section 0)
• common conceptual model (Section 3)
• initial PROCESS architecture (Section 4)
• state of the art for systems, platforms and services for extreme data
applications (Section 5)
• state of the art for systems, platforms and services for extreme computing
applications (Section 5)
• state of the art for service orchestration and user interfaces (Section 5)
The analysis of the use cases is divided into three parts: (1) detailed description, (2)
requirements analysis, and (3) analysis of innovation potential. The PROCESS project has five
use cases with the following main requirements:
• UC#1: exascale computational processing methods that are able to exploit accelerated
computing
• UC#2: scalable workflows that are able to cooperate with exascale datastets
• UC#3: support for the exascale community
• UC#4: responding to a large number of requests within miliseconds per request
• UC#5: methods suitable for exascale data extraction
The challenges identified by the analysis are addressed within the common conceptual model
and initial PROCESS architecture. Both of these translate the challenges into technical
terms/requirements that drive the design of the initial PROCESS architecture. According to the
requirements, the architecture is based on containerization and virtual machines supported by
an exascale capable distributed virtual file system, and computing manager. This approach
will utilize the available infrastructure with minimal overhead, and provide a platform capable
of satisfying the requirements of the use case communities.
According to the technological state of the art, we have proposed a preliminary technology-
based architecture depicting the main technological components16. However, we expect that
this architecture will evolve and change over time. Thus the design of the platform will be
updated according to new requirements coming from other work packages (WP2, WP3, WP5,
WP6, and WP7).
List of Abbreviations ACID Atomicity, Consistency, Isolation, Durability
16 The names of the technology currently listing in this document are subject to change according to the need of the project realization as well as dynamic developments of use cases. The list of technologies will be revised along the lifetime of PROCESS project taking into account the technologies that will be developed for both resource and data management deployed and used across existing European Research Infrastructures (RI).

D4.1 List of Abbreviations
This version is a draft of D4.1 and is under review. 130
AIK Attestation Identity Key
API Application Programming Interface
BASE Basically Available, Soft state, Eventually consistent
CAP Consistency (C), Availability (A) and Partition tolerance (P)
CDMI Cloud Data Management Interface
CIMA Centro Internazionale in Monitoraggio Ambientale (International Centre
on Environmental Monitoring in the fields of Civil Protection, Disaster Risk Reduction and
Biodiversity)
CPU Central Processing Unit
CVMFS CernVM File System
CWL Common Workflow Language
DACI Dynamic Access Control Infrastructure
DAS Direct-Attached Storage
DFAS Distributed File Access Services
DFS Distributed File Systems
DNN Deep Neural Networks
DD Direction Dependent
DDP Direction Dependent Pipeline
DI Direction Independent
DIP Direction Independent Pipeline
DITBP Dynamic Infrastructure Trusted Bootstrapping Protocol
DL Deep Learning
DNS Domain Name System
EMD Electronic Miscellaneous Document
EMS Earth System Models
FAIR Findable, Accessible, Interoperable and Reusable
FS File System
GDPR General Data Protection Regulation
GFS Google File System
GAR Global Assessment Reports
GDS Global Distribution Systems
HDFS Hadoop Distributed File System
HPC High Performance Computing

D4.1 List of Abbreviations
This version is a draft of D4.1 and is under review. 131
HTTP Hypertext Transfer Protocol
HTTPS HTTP Secure
iFlatLFS Flat Lightweight File System
IPFS InterPlanetary File System
LTA Long Term Archive
NAS Network-Attached Storage
NDB Network Database
NFS Network File System
NoSQL not only SQL
ML Machine Learning
MMS Multi-Model Simulations
OASIS Organization for the Advancement of Structured Information Standards
OData Open Data Protocol
ORCA Open Resource Control Architecture
RDA Research Data Alliance
ROI Region of Interest
RI Research Infrastructure
PNR Passenger Name Record
PROMET Processes of Mass and Energy Transfer
PPFS Post-Petascale File System
SAML Security Assertions Markup Language
SAN Storage Area Networks
SCZ Science Collaboration Zone
SDCI Secure Data Centric Infrastructure
SDN Software Defined Networks
SSO Single Sign On
TCPA Trusted Computing Platform Architecture
TFS Taobao File System
TOSCA Topology and Orchestration Specification for Cloud Applications
TPM Trusted Platform Module
UNISDR United Nations Office for Disaster Risk Reduction
VM Virtual Machine
VO Virtual Organization

D4.1 References
This version is a draft of D4.1 and is under review. 132
WSIs Whole Slide Images
References [AAD] Microsoft Azure Active Directory (AAD) [onine] https://azure.microsoft.com/en-
us/services/active-directory/
[Abu-Libdeh2010] H. Abu-Libdeh, L. Princehouse, and H. Weatherspoon, “Racs: a case for
cloud storage diversity,” in Proceedings of the 1st ACM symposium on Cloud computing, ser.
SoCC ’10. New York, NY, USA: ACM, 2010, pp. 229–240. [Online]. Available:
http://doi.acm.org/10.1145/1807128.1807165
[Admire] [EU FP7 ICT project: Advanced Data Mining and Integration Research for Europe
(Admire), 2008-2011. Grant agreement no. 215024. http://www.Admire-project.eu]
[Agarwal 2012] Agarwal, R., Juve, G. and Deelman, E., 2012, November. Peer-to-peer data
sharing for scientific workflows on amazon ec2. In High Performance Computing,
Networking, Storage and Analysis (SCC), 2012 SC Companion: (pp. 82-89). IEEE.
[Altintas2004] I. Altintas, C. Berkley, E. Jaeger, M. Jones, B. Ludascher, S. Mock, Kepler: an
extensible system for design and execution of scientific workflows, in: Scientific and
Statistical Database Management, 2004. Proceedings. 16th International Conference on,
2004, pp. 423–424, http://dx.doi.org/10.1109/SSDM.2004.1311241 .
[Arbab2006] F. Arbab, Composition of interacting computations, in: D. Goldin, S. Smolka, P.
Wegner (Eds.), Interactive Computation, Springer, Berlin, Heidelberg, 2006, pp. 277–321.
http://dx.doi.org/10.1007/3-540-34874-3_12 .
[Arvalez 2016] F.M. Alvarez Calibrating Temperature Forecasts with Machine Learning,
Google BigQuery, and Reforecasts https://medium.com/google-cloud/fun-with-ghcn-data-on-
googles-bigquery-79275af13e07
[Atmosphere1] Atmosphere webpage http://dice.cyfronet.pl/products/atmosphere
[Atmosphere2] Atmosphere on GitHub https://github.com/dice-cyfronet/atmosphere
[astc] Astc technology roadmap. http://idema.org/?page id=5868. Accessed: 03-12- 2017.
[Augonnet 2011] C. Augonnet, S. Thibault, R. Namyst, and P.-A. Wacrenier, “StarPU: a
unified platform for task scheduling on heteroge- neous multicore architectures,”
Concurrency and Computa- tion: Practice and Experience, vol. 23, no. 2, pp. 187–198, 2011.
[BeakerNotebook] Beaker Notebook webpage http://beakernotebook.com/features
[Bergman 2008] Bergman, K., Borkar, S., Campbell, D., Carlson, W., Dally, W., Denneau, M.,
others. (2008). Exascale computing study: Technology challenges in achieving exascale
systems. Defense Advanced Research Projects Agency Information Processing Techniques
Office (DARPA IPTO), Tech. Rep, 15.
[benet2014ipfs] Juan Benet. Ipfs-content addressed, versioned, p2p file system. arXiv
preprint arXiv:1407.3561 , 2014.
[BLANAS 2015] BLANAS, Spyros; BYNA, Surendra. Towards Exascale Scientific Metadata
Management. arXiv preprint arXiv:1503.08482, 2015.
[BOICEA 2012] BOICEA, Alexandru; RADULESCU, Florin; AGAPIN, Laura Ioana. MongoDB
vs Oracle--database comparison. In: Emerging Intelligent Data and Web Technologies
(EIDWT), 2012 Third International Conference on. IEEE, 2012. p. 330-335.

D4.1 References
This version is a draft of D4.1 and is under review. 133
[Bosilca 2013] G. Bosilca, A. Bouteiller, A. Danalis, M. Faverge, T. Her- ault, and J.
Dongarra, “PaRSEC: Exploiting Heterogeneity to Enhance Scalability,” Computing in Science
Engineering, vol. 15, no. 6, pp. 36–45, Nov 2013.
[Bresnahan2007] J. Bresnahan, M. Link, G. Khanna, Z. Imani, R. Kettimuthu, and I. Foster,
“Globus GridFTP: what’s new in 2007,” in GridNets ’07, 2007.
[brewer2012cap] Eric Brewer. Cap twelve years later: How the” rules” have changed.
Computer , 45(2):23–29, 2012.
[brewer2000towards] Eric A Brewer. Towards robust distributed systems. In PODC , volume
7, 2000
[Broekema 2015] Broekema, P.C., van Nieuwpoort, R.V. and Bal, H.E., 2015. The Square
Kilometre Array science data processor. Preliminary compute platform design. Journal of
Instrumentation, 10(07), p.C07004.
[Bueno 2012] J. Bueno, J. Planas, A. Duran, R. M. Badia, X. Martorell, E. Ayguade, and J.
Labarta, “Productive Programming of GPU Clusters with OmpSs,” in Int. Par. and Dist. Proc.
Sym. (IPDPS). Los Alamitos, CA, USA: IEEE Comp. Society, 2012, pp. 557–568.
[Caffe] Caffe: Deep learning framework by Berkeley Artificial Intelligence Research (BAIR),
accessed January 2018, http://caffe.berkeleyvision.org/
[CAMELYON17] The CAMELYON17 challenge, accessed January 2018,
https://camelyon17.grand-challenge.org/
[Cappello 2000] F. Cappello and D. Etiemble, “MPI versus MPI+OpenMP on IBM SP for the
NAS benchmarks,” in Proceedings of the 2000 ACM/IEEE Conference on High Performance
Networking and Computing (SC2000), 2000.
[cdmi] Storage Networking Industry Association. Cloud data management interface (cdmi)
version 1.1.1. 2015.
[Ceph2018] Ceph v12.2.0 luminous released - ceph. http://ceph.com/releases/v12-2-0-
luminous-released/. Accessed: 06-01-2018
[Chakroun 2015] Chakroun, I., Vander Aa, T., De Fraine, B., Haber, T., Wuyts, R., &
Demeuter, W. (2015). ExaShark: A scalable hybrid array kit for exascale simulation. In
Proceedings of the Symposium on High Performance Computing (pp. 41–48).
[Chen 2013] Chen, J., Choudhary, A., Feldman, S., Hendrickson, B., Johnson, C.R., Mount,
R., Sarkar, V., White, V. and Williams, D., 2013. Synergistic Challenges in Data-Intensive
Science and Exascale Computing: DOE ASCAC Data Subcommittee Report.
[Ciepiela 2013] Ciepiela, E., Harężlak, D., Kasztelnik, M., Meizner, J., Dyk, G., Nowakowski,
P. and Bubak, M., 2013. The collage authoring environment: From proof-of-concept
prototype to pilot service. Procedia Computer Science, 18, pp.769-778.
[clariah] https://www.clariah.nl/
[Cloudify] Cloudify: Cloud & NFV Orchestration Based on TOSCA, accessed February
2018, https://cloudify.co/
[Cloudify-requirements] Prerequisites for Installing a
Cloudify. http://docs.getcloudify.org/4.3.0/installation/prerequisites/. Accessed March 2018
[CloudifyMA] Cloudify manager architecture, accessed February
2018, https://cloudify.co/guide/3.0/overview-architecture.html

D4.1 References
This version is a draft of D4.1 and is under review. 134
[CM] Cloudify Manager, accessed April 2018, http://docs.getcloudify.org/4.2.0/intro/cloudify-
manager/
[Collage] Collage webpage http://collage.cyfronet.pl
[comanage] COmanage: Collaborative Organization
Management https://www.internet2.edu/products-services/trust-identity/comanage/
[Cortes2000] M. Cortes, A coordination language for building collaborative applications,
Comput. Support. Coop. Work (CSCW) 9 (1) (2000) 5–31. http:
//dx.doi.org/10.1023/A:1008798208890, http://dx.doi.org/10.1023/A%3A1008798208890 .
[CouchDB1] CouchDB, accessed Feb 2018, http://guide.couchdb.org/draft/consistency.html
[CouchDB2] Coding eventual consistency, accessed Feb 2018,
https://developer.ibm.com/dwblog/2014/coding-eventual-consistency/
[CouchDB3] Addressing the NoSQL criticism, accessed Feb 2018, http://bradley-
holt.com/2011/07/addressing-the-nosql-criticism/
[Cuda] CUDA Zone | NVIDIA Development, accessed Feb 2018,
https://developer.nvidia.com/cuda-zone
[CudaToolkit] NVIDIA CUDA Toolkit, accessed Feb 2018, https://developer.nvidia.com/cuda-
toolkit
[cuDNN] NVIDIA cuDNN | GPU Accelerated Deep Learning, accessed Feb
2018, https://developer.nvidia.com/cudnn
[Cushing2013] R. Cushing, S. Koulouzis, A. Belloum, M. Bubak, Applying workflow as a
service paradigm to application farming, Concurr. Comput.:Pract. Exper. (2013) http:
//dx.doi.org/10.1002/cpe.3073. n/a–n/a, http://dx.doi.org/10.1002/cpe.3073 .
[DAAS1] Machan, Dyan. "DaaS:The New Information Goldmine". Wall Street Journal, August
19, 2009.[DASH] DASH webpage www.dash-project.org
[Databricks] Databricks webpage https://databricks.com/product/databricks
[Datalab] Datalab webpage https://cloud.google.com/datalab/
[DataNet] DataNet webpage https://datanet.plgrid.pl/?locale=en
[depardon2013analysis] Benjamin Depardon, Ga¨el Le Mahec, and Cyril S´eguin. Analysis of
six distributed file systems. 2013.
[DemchGriSec 2008] Demchenko, Y., C. de Laat, O. Koeroo, D. Groep, Re-thinking Grid
Security Architecture. Proceedings of IEEE Fourth eScience 2008 Conference, December
7–12, 2008, Indianapolis, USA. Pp. 79-86. IEEE Computer Society Publishing. ISBN 978-0-
7695-3535-7
[Digits] NVidia Digits: The NVIDIA Deep Learning GPU Training System, accessed January
2018, https://developer.nvidia.com/digits
[Digid] https://www.digid.nl/
[DISPEL] Atkinson, M., Brezany, P., Krause, A., van Hemert, J., Janciak, I., Yaikhom, G.:
DISPEL: Grammar and Concrete Syntax, version 1.0.The Admire Project, February 2010.
Accessed March 2011. http://www.Admire-project.eu/docs/Admire-D1.7-research-
prototypes.pdf

D4.1 References
This version is a draft of D4.1 and is under review. 135
[Drosinos 2004] N. Drosinos and N. Koziris, “Performance comparison of pure MPI vs. hybrid
MPI-OpenMP parallelization models on SMP clusters,” in Pro- ceedings of the 18th
International Parallel and Distributed Processing Symposium (IPDPS 2004, 2004
[Dutka2014] Ł. Dutka, R. Słota, M. Wrzeszcz, D. Król, and J. Kitowski, “Uniform and efficient
access to data in organizationally distributed environments,” in eScience on Distributed
Computing Infrastructure.Springer, 2014, pp. 178–194.
[ECD] https://ec.europa.eu/research/participants/data/ref/h2020/wp/2014_2015/annexes/h20
20-wp1415-annex-g-trl_en.pdf
[eduGAIN] EDUGAIN, http://services.geant.net/edugain/Pages/Home.aspx.
[EGI-Check-in] EGI-check-in service, https://www.egi.eu/services/check-in/
[El-Helw 2014] I. El-Helw, R. Hofman, and H. E. Bal, “Scaling MapReduce Vertically and
Horizontally,” in SC ’14: Proc. of the 2014 ACM/IEEE conf. on Supercomputing. ACM, 2014
[EUTRL] HORIZON 2020 - WORK PROGRAMME 2014-2015 - Annex G: Technology
Readiness Levels (TRL).
https://ec.europa.eu/research/participants/data/ref/h2020/wp/2014_2015/annexes/h2020-
wp1415-annex-g-trl_en.pdf
[exascale, 2011] Report of the 2011 Workshop on Exascale Programming Challenges
Marina del Rey, July 27-29, 2011
https://www.nersc.gov/assets/pubs_presos/ProgrammingChallengesWorkshopReport.pdf
[Fernandez2011] H. Fernandez, C. Tedeschi, T. Priol, A chemistry-inspired workflow
management system for scientific applications in clouds, in: eScience, IEEE Computer
Society, 2011, pp. 39–46. URL:
http://dblp.unitrier.de/db/conf/eScience/eScience2011.html#FernandezTP11 .
[firstpetascale] June 2008 — top500 supercomputer sites.
https://www.top500.org/lists/2008/06/. Accessed: 04-01-2018.
[Foster2011] I. Foster, “Globus online: Accelerating and democratizing science through
cloud-based services,” Internet Computing, IEEE, vol. 15, no. 3, pp. 70–73, May 2011.
[fu2015performance] Songling Fu, Ligang He, Chenlin Huang, Xiangke Liao, and Kenli Li.
Performance optimization for managing massive numbers of small files in distributed file
systems. IEEE Transactions on Parallel and Distributed Systems , 26(12):3433–3448, 2015.
[Ganga] J. T. Mo ́scicki, et al. Ganga: a tool for computational-task management and easy
access to Grid resources. Computer Physics Communications 180.11 (2009): 2303-2316.
[GDPR 2016] General Data Protection Regulation, Regulation 2016/679, 27 April 2016
[online] http://eur-lex.europa.eu/legal-
content/EN/TXT/PDF/?uri=CELEX:32016R0679&from=E
[ghemawat2003google] Sanjay Ghemawat, Howard Gobioff, and Shun-Tak Leung. The
google file system. In ACM SIGOPS operating systems review , volume 37, pages 29–43.
ACM, 2003.
[Ghemawat2008] J. Dean, S. Ghemawat, Mapreduce: Simplified data processing on large
clusters, Commun. ACM 51 (1) (2008) 107–113. http://dx.doi.org/10.1145/1327452.
1327492. URL: http://doi.acm.org/10.1145/1327452.1327492.

D4.1 References
This version is a draft of D4.1 and is under review. 136
[gilbert2002brewer] Seth Gilbert and Nancy Lynch. Brewer’s conjecture and the feasibility of
consistent, available, partition-tolerantweb services. Acm Sigact News , 33(2):51–59, 2002.
[GILBERT 2012] GILBERT, Seth; LYNCH, Nancy. Perspectives on the CAP
Theorem. Computer, 2012, 45.2: 30-36.
[Gilda] GILDA - Grid Infn Laboratory for Dissemination Activities. Accessed: 12-12-
2017. https://gilda.ct.infn.it/
[glusterfs] Gluster docs. http://docs.gluster.org/en/latest/. Accessed: 05-01-2018.
[Gluster2018] Gluster docs. http://docs.gluster.org/en/latest/. Accessed: 05-01-2018.
[Gohara 2010] Stone, D. Gohara, and G. Shi, “OpenCL: A Parallel Pro- gramming Standard
for Heterogeneous Computing Systems,” Comp. in Science & Eng., vol. 12, no. 3, pp. 66–73,
2010.
[Greenspan 2016] Greenspan, H., van Ginneken, B. and Summers, R.M., 2016. Guest
editorial deep learning in medical imaging: Overview and future promise of an exciting new
technique. IEEE Transactions on Medical Imaging, 35(5), pp.1153-1159.
[Gropp 2013] W. Gropp and M. Snir, "Programming for Exascale Computers," in Computing
in Science & Engineering, vol. 15, no. 6, pp. 27-35, Nov.-Dec. 2013. doi:
10.1109/MCSE.2013.96
[gUse 2012] P. Kacsuk, Z. Farkas, M. Kozlovszky, G. Hermann, A. Balasko, K. Karoczkai
and I. Marton. WS-PGRADE/gUSE generic DCI gateway framework for a large variety of
user communities. Journal of Grid Computing, 10(4), 601-630, 2012.
[hadoop2018] Poweredby - hadoop wiki. https://wiki.apache.org/hadoop/PoweredBy.
Accessed: 05-01-2018.
[HANSEN2003] Hansen M., Madnick S., Siegel M. Data Integration Using Web Services. In:
Bressan S., Lee M.L., Chaudhri A.B., Yu J.X., Lacroix Z. (eds) Efficiency and Effectiveness
of XML Tools and Techniques and Data Integration over the Web. Lecture Notes in
Computer Science, vol 2590. Springer, Berlin, Heidelberg, 2003.
[Harężlak 2014] Harężlak, D., Kasztelnik, M., Pawlik, M., Wilk, B. and Bubak, M., 2014. A
lightweight method of metadata and data management with DataNet. In eScience on
Distributed Computing Infrastructure (pp. 164-177). Springer International Publishing.
[Haller2009] P. Haller, M. Odersky, Scala actors: Unifying thread-based and eventbased
programming, Theoret. Comput. Sci. 410 (2–3) (2009) 202–220. Distributed Computing
Techniques. http://dx.doi.org/10.1016/j.tcs.2008.09.019. URL:
http://www.sciencedirect.com/science/article/pii/S0304397508006695 .
[Heroux 2016]Michael A. Heroux, “Exascale Programming: Adapting What We Have Can
(and Must) Work” hpcwire, https://www.hpcwire.com/2016/01/14/24151/
[hgst14] Hgst ultrastar hs14. http://www.hgst.com/products/harddrives/ ultrastar-hs14.
Accessed: 03-12-2017.
[Hijma 2015] Hijma, P.; Jacobs, C. J.; van Nieuwpoort, R. V. & Bal, H. E. Cashmere:
Heterogeneous Many-Core Computing 29th IEEE International Parallel & Distributed
Processing Symposium (IPDPS 2015), 25-29 May 2015, Hyderabad, India., 2015. DOI
10.1109/IPDPS.2015.38

D4.1 References
This version is a draft of D4.1 and is under review. 137
[Hijma, 2015-1] P. Hijma, R. V. van Nieuwpoort, C. J. Jacobs, and H. E. Bal, “Stepwise-
refinement for performance: a methodology for many-core programming,” Concurrency and
Computation: Practice and Experience, 2015. [Online]. Available: http:
//dx.doi.org/10.1002/cpe.3416
[Hluchy2016effective] L. Hluchý, G. Nguyen, J. Astaloš, V. Tran, V. Šipková, B.M. Nguyen:
Effective computation resilience in high performance and distributed environments.
Computing and Informatics, 2016, vol. 35, no. 6, pp. 1386-1415, ISSN 1335-9150. Open
Access.
[hybridfs] L. Zhang, Y. Wu, R. Xue, T. C. Hsu, H. Yang, and Y. C. Chung. Hybridfs - a high
performance and balanced filesystem framework with multiple distributed file systems. In
2017 IEEE 41st Annual Computer Software and ApplicationsConference (COMPSAC) ,
volume 1, pages 796– 805, July 2017. doi: 10.1109/COMPSAC.2017.140.
[IAM] AWS Identity and Access Management (IAM) [online] https://aws.amazon.com/iam/
[ImageCLEF] ImageCLEF - The CLEF Cross Language Image Retrieval Track., accessed
January 2018, http://www.imageclef.org/
[INFORM] Data Integration Tools and Software Solutions. Informatica UK
https://www.informatica.com/gb/products/data-integration.html#fbid=lmvA-SmcuiW
[Jupyter] Julpiter webpage http://jupyter.org/
[Kahn1974] G. Kahn, The semantics of a simple language for parallel programming,in: J.L.
Rosenfeld (Ed.), Information Processing, North Holland, Amsterdam, Stockholm, Sweden,
1974, pp. 471–475.
[Keras] Keras documentation, accessed Apr 2018, https://keras.io
[keylime 2016] N. Schear et al., “Bootstrapping and maintaining trust in the cloud,” in
Proceedings of the 32nd Conf. on computer security applications, ACSAC 2016, Los
Angeles, USA, Dec. 5-9, 2016, 2016, pp. 65–77.
[Kluge 2013] Kluge, M., Simms, S., William, T., Henschel, R., Georgi, A., Meyer, C., Mueller,
M.S., Stewart, C.A., Wünsch, W. and Nagel, W.E., 2013. Performance and quality of service
of data and video movement over a 100 Gbps testbed. Future Generation Computer
Systems, 29(1), pp.230-240.
[Koulouzis1 2016] Koulouzis, S., Belloum, A.S., Bubak, M.T., Zhao, Z., Živković, M. and de
Laat, C.T., 2016. SDN-aware federation of distributed data. Future Generation Computer
Systems, 56, pp.64-76.
[Koulouzis2 2016] Koulouzis, S., Belloum, A., Bubak, M., Lamata, P., Nolte, D., Vasyunin, D.
and de Laat, C., 2016. Distributed Data Management Service for VPH Applications. IEEE
Internet Computing, 20(2), pp.34-41.
[Koulouzis3 2016] Koulouzis, S., 2016. Methods for federating and transferring data to
eScience applications. Universiteit van Amsterdam [PhD thesis].
[Kreutz 2015] Kreutz, D., Ramos, F.M., Verissimo, P.E., Rothenberg, C.E., Azodolmolky, S.
and Uhlig, S., 2015. Software-defined networking: A comprehensive survey. Proceedings of
the IEEE, 103(1), pp.14-76.
[KUKDM2018] Rycerz, K., Nowakowski, P., Meizner, J., Wilk, B., Bujas, J., Jarmocik, Ł,
Krok, M., Kurc, P., Lewicki, S., Majcher, M., Ociepka, P., Petka, L., Podsiadło, K.,Skalski, P.,
Zagrajczuk, W., Zygmunt M., Bubak M.,A Survey of Interactive Execution Environments for

D4.1 References
This version is a draft of D4.1 and is under review. 138
Extreme Large-Scale Computations, submitted to KUKDM 2018 Conference , Zakopane, 7-
9.03.2018
[Lasagne] Lasagne Documentation, accessed Apr
2018, http://lasagne.readthedocs.io/en/latest/index.html
[levy1990distributed] Eliezer Levy and Abraham Silberschatz. Distributed file systems:
Concepts and examples. ACM ComputingSurveys (CSUR) , 22(4):321–374, 1990.
[LLNL 2014] LLNL-PROP-652542, L., & Lab, L. N. (2014). FastForward 2 R&D Draft
Statement of Work.
[LOBCDER1] LOBCDER on GitHub, accessed January 2018,
https://github.com/skoulouzis/lobcder
[LOBCDER2] LOBCDER webpage, accessed January 2018,
https://ivi.fnwi.uva.nl/sne/wsvlam2/?page_id=14
[Lustre2018] Lustre - file level replication high level design. http://wiki.lustre.org/File Level
Replication High Level Design. Accessed: 06-01-2018.
[lustre] Lustre. http://lustre.org/, Accessed: 06-01-2018.
[mahmood2016achieving] Tariq Mahmood, Shankaranarayanan Puzhavakath Narayanan,
Sanjay Rao, TN Vijaykumar,and Mithuna Thottethodi. Achieving causal consistency under
partial replication for geo-distributed cloudstorage. 2016.
[Malewicz2010] G. Malewicz, M.H. Austern, A.J. Bik, J.C. Dehnert, I. Horn, N. Leiser, G.
Czajkowski, Pregel: A system for large-scale graph processing, in: Proceedings of the 2010
ACM SIGMOD International Conference on Management of Data, SIGMOD ’10, ACM, New
York, NY, USA, 2010, pp. 135–146. http://dx.doi.org/10.1145/1807167.1807184. URL:
http://doi.acm.org/10.1145/1807167.1807184.
[Maltzahn] Carlos Maltzahn, Esteban Molina-Estolano, AmandeepKhurana, Alex J Nelson,
Scott A Brandt, and Sage Weil. Ceph as a scalable alternative to the hadoop distributed file
system. login: The USENIX Magazine , 35:38–49
[Mandrichenko 2005] Mandrichenko, I., Allcock, W. and Perelmutov, T., 2005. GridFTP v2
protocol description. GGF Document Series GFD, 47.
[Majeed 2013] M. Majeed, U. Dastgeer, and C. Kessler, “Cluster-SkePU: A Multi-Backend
Skeleton Programming Library for GPU Clusters,” in Proc. of the Int. Conf. on Par. and Dist.
Proc. Techn. and Appl. (PDPTA), Las Vegas, USA, July 2013.
[MDSN] Microsoft Developer Network (MDSN), https://msdn.microsoft.com/en-
us/library/hh446535.aspx.
[MembreyP 2012] MembreyP,ChanKCC,NgoC,DemchenkoY,deLaatC.Trusted virtual
infrastructure bootstrapping for on demand services. In: The 7th international conference on
availability, reliability and security (AReS 2012), 20-24 August 2012, Prague; 2012.
[mesnier2003object] Mike Mesnier, Gregory R Ganger, and Erik Riedel. Object-based
storage. IEEE Communications Magazine, 41(8):84–90, 2003.
[Missier2010] Missier, P., Soiland-Reyes, S., Owen, S., Tan, W., Nenadic, A., Dunlop, I.,
Williams, A., Oinn, T. and Goble, C., 2010, June. Taverna, reloaded. In International
conference on scientific and statistical database management (pp. 471-481). Springer,
Berlin, Heidelberg.

D4.1 References
This version is a draft of D4.1 and is under review. 139
[MLlib] Spark MLlib documentation, accessed Apr 2018, https://spark.apache.org/docs/latest/
[MongoDB1] What is MongoDB, accessed Feb 2018, https://www.mongodb.com/what-is-
mongodb
[MongoDB2] Multi-document transactions in MongoDB, accessed Feb 2018,
https://www.mongodb.com/blog/post/multi-document-transactions-in-
mongodb?jmp=homepage
[MXNet] Apache MXNet - A flexible and efficient library for deep learning, accessed Feb
2018, https://mxnet.apache.org/
[NAG-HIST] History of Nagios, accessed January
2018, https://www.nagios.org/about/history/
[NASA-EU] From NASA to EU: the evolution of the TRL scale in Public Sector
Innovation https://www.innovation.cc/discussion-papers/22_2_3_heder_nasa-to-eu-trl-
scale.pdf
[Ngo 2012] Ngo C, Membrey P, Demchenko Y, de Laat C. Policy and context management
in dynamically provisioned access control service for virtualised cloud infrastructures. In: The
7th international conference on availability, reliability and security (AReS 2012), 20-24
August 2012, Prague, Czech Republic; 2012, ISBN 978-0- 7695-4775-6.
[Nolte2003] Nolte, William L.; et al. (20 October 2003). "Technology Readiness Level
Calculator, Air Force Research Laboratory, presented at the NDIA Systems Engineering
Conference".
[Norman 2017] Norman, M. R., Mametjanov, A., & Taylor, M. (2017). Exascale Programming
Approaches for the Accelerated Model for Climate and Energy.
[niazi2017hopsfs] Salman Niazi, Mahmoud Ismail, Seif Haridi, Jim Dowling, Steffen
Grohsschmiedt, and Mikael Ronstr¨om.Hopsfs: Scaling hierarchical file system metadata
using newsql databases. In FAST , pages 89–104, 2017.
[Nickolls 2008] J. Nickolls, I. Buck, M. Garland, and K. Skadron, “Scalable Parallel
Programming with CUDA,” Queue, vol. 6, no. 2, pp. 40–53, 2008.
[Nieuwpoort , 2010] R. V. van Nieuwpoort, G. Wrzesin ́ska, C. J. H. Jacobs, and H. E. Bal,
“Satin: A High-Level and Efficient Grid Programming Model,” ACM Trans. Program. Lang.
Syst., vol. 32, no. 3, pp. 1–39, 2010.
[Nieuwpoort 2016] van Nieuwpoort, R.V., 2016, October. Towards exascale real-time RFI
mitigation. In Radio Frequency Interference (RFI) (pp. 69-74). IEEE.
[NVIDIA Digits] The NVIDIA Deep Learning GPU Training System, accessed Feb
2018, https://developer.nvidia.com/digits
[Oinn2010] T. Oinn, C. Goble, Taverna, reloaded, in: M. Gertz, T. Hey, B. Ludaescher,
SSDBM 2010, Heidelberg, Germany, 2010. URL: http://www.taverna.org.uk/pages/wp-
content/uploads/2010/04/T2Architecture.pdf
[OpenBLAS] What is BLAS? Why is it important?, accessed Apr
2018, https://github.com/xianyi/OpenBLAS/wiki/faq#whatblas
[OpenCL] OpenCL | Open Computing Language - The Khronos Group Inc.,
2018, https://www.khronos.org/opencl/; https://developer.nvidia.com/opencl

D4.1 References
This version is a draft of D4.1 and is under review. 140
[openid] OpenID Authentication 2.0 - Final [online] http://openid.net/specs/openid-
authentication-2_0.html
[ORACLEDI] Oracle Cloud - Data Integration Platform Cloud Service. Oracle Corporation.
https://cloud.oracle.com/en_US/data-integration-platform
[Pajak 2015] Pajak, R., 2015. RESTful (r)evolution for science gateways using HPC
resources. http://dice.cyfronet.pl/blog/RESTful-revolution-for-science-gateways-using-HPC-
resources
[parno 2010] Bryan Parno, Jonathan M. McCune, Adrian Perrig, Bootstrapping Trust in
Commodity Computers, Proceeding SP'10 Proceedings of the 2010 IEEE Symposium on
Security and Privacy, May 16 - 19, 2010
[parno 2008] Bryan Parno, Bootstrapping trust in a "trusted" platform, Proceeding
HOTSEC'08 Proceedings of the 3rd conference on Hot topics in security
[Pawlik 2014] Pawlik, M., 2014 Taming [meta]data with DataNet, a PaaS case study.
http://dice.cyfronet.pl/blog/taming-meta-data-with-datanet
[PRITCHETT 2008] PRITCHETT, Dan. Base: An acid alternative. Queue, 2008, 6.3: 48-55.
[Planas 2013] J. Planas, R. M. Badia, E. Ayguadé, and J. Labarta, “Self- Adaptive OmpSs
Tasks in Heterogeneous Environments,” in Int. Par and Dist. Proc. Sym. (IPDPS).
Washington, DC, USA: IEEE Computer Society, 2013, pp. 138–149.
[PUMPKIN1] PUMPKIN webpage https://ivi.fnwi.uva.nl/sne/wsvlam2/?page_id=36
[PUMPKIN2] PUMPKIN on GitHub https://github.com/recap/pumpkin
[PyTorch] PyTorch | Deep learning framework that puts Python first, accessed Feb
2018, http://pytorch.org/
[Rajasekar2006] A. Rajasekar, M. Wan, R. Moore, and W. Schroeder, “A prototype rule-
based distributed data management system,” in HPDC workshop on Next Generation
Distributed Data Management, 2006.
[Reed 2015] Reed, D. A., & Dongarra, J. (2015). Exascale computing and big data.
Communications of the ACM, 58(7), 56–68.
[rennie] Kai Ren, Qing Zheng, Swapnil Patil, and Garth Gibson. Indexfs: Scaling file system
metadata performance with stateless caching and bulk insertion. In Proceedings of the
International Conference for High Performance Computing,Networking, Storage and Analysis
, SC ’14, pages 237–248, Piscataway, NJ, USA, 2014. IEEE Press. ISBN978-1-4799-5500-8.
doi: 10.1109/SC.2014.25. URL https://doi.org/10.1109/SC.2014.25 .
[RIMROCK1] RIMROCK webpage https://submit.plgrid.pl
[RIMROCK2] RIMROCK on GitLab https://gitlab.dev.cyfronet.pl/plgrid-core-4-1/rimrock
[Rstudio] Rstudio webpage https://www.rstudio.com
[SAML] Assertions and protocols for the OASIS security assertion markuplanguage(SAML)
V2.0.OASISStandard, 15 March 2005. Available from: http://docs.oasis-
open.org/security/saml/v2.0/saml-core-2.0-os.pdf
[SAML 2.0] SAML 2.0 profile of XACML 2.0, version 2.0. OASIS Standard, 1 February 2005.
Available from: http:// docs.oasis-open.org/xacml/2.0/access_control-xacml-2.0-saml-profile-
spec-os.pdf.

D4.1 References
This version is a draft of D4.1 and is under review. 141
[Sandberg85designand] Russel Sandberg, David Goldberg, Steve Kleiman, Dan Walsh, and
Bob Lyon. Design and implementation or thesun network filesystem, 1985.
[Schulte 2015] Schulte, M. J., Ignatowski, M., Loh, G. H., Beckmann, B. M., Brantley, W. C.,
Gurumurthi, S., … Rodgers, G. (2015). Achieving exascale capabilities through
heterogeneous computing. IEEE Micro, 35(4), 26–36.
[Scikit] Scikit-Learn Machine Learning in Python, accessed Feb 2018, http://scikit-
learn.org/stable/
[SCZ] Science collaboration zone home, https://wiki.surfnet.nl/display/SCZ
[Shvachko2010] Konstantin Shvachko, HairongKuang, Sanjay Radia, and Robert Chansler.
The hadoop distributed file system.In Mass storage systems and technologies (MSST), 2010
IEEE 26th symposium on, pages 1–10. IEEE, 2010.
[shvachko2010hadoop] Konstantin Shvachko, Hairong Kuang, Sanjay Radia, and Robert
Chansler. The hadoop distributed file system. In Mass storage systems and technologies
(MSST), 2010 IEEE 26th symposium on , pages 1–10. IEEE, 2010.
[Sim 2007] Sim, A. and Shoshani, A., 2007. The storage resource manager interface
specification, Version 2.2. In CERN, FNAL, JLAB, LBNL and RAL.
[Simonet 2015] Simonet, A., Fedak, G. and Ripeanu, M., 2015. Active Data: A programming
model to manage data life cycle across heterogeneous systems and infrastructures. Future
Generation Computer Systems, 53, pp.25-42.
[SKA1] Square Kilometre Array, accessed January 2018, https://skatelescope.org
[SKA2] European Commission identifies SKA as a landmark project, accessed January
2018, https://skatelescope.org/news/ec-identifies-ska-as-landmark-project
[SlipStream ] SlipStream cloud automation, http://sixsq.com/products/slipstream/. Accessed
June 2016.
[SNIA 2010] Storage Networking Industry Association, 2010. Cloud data management
interface (CDMI).
[Snir 2014] Snir, M., Wisniewski, R. W., Abraham, J. A., Adve, S. V, Bagchi, S., Balaji, P., …
others. (2014). Addressing failures in exascale computing. The International Journal of High
Performance Computing Applications, 28(2), 129–173.
[SOADI1] P. Spiess et al., "SOA-Based Integration of the Internet of Things in Enterprise
Services," 2009 IEEE International Conference on Web Services, Los Angeles, CA, 2009,
pp. 968-975. doi: 10.1109/ICWS.2009.98
[SOADI2] Mamou, Jean-Cloude et al. Data integration through a services oriented
architecture. US Patent appl. no. US20050223109A1.
https://patentimages.storage.googleapis.com/0d/bb/ae/fab285591cf290/US20050223109A1.
[SOADI3] J. Wang, A. Yu, X. Zhang and L. Qu, "A dynamic data integration model based on
SOA," 2009 ISECS International Colloquium on Computing, Communication, Control, and
Management, Sanya, 2009, pp. 196-199.
doi: 10.1109/CCCM.2009.5267945
[SSE] Spark Streaming ecosystem, accessed Feb
2018, https://www.datanami.com/2015/11/30/spark-streaming-what-is-it-and-whos-using-it/

D4.1 References
This version is a draft of D4.1 and is under review. 142
[storm] Apache Storm, URL: http://hortonworks.com/hadoop/storm/
[Stuart 2011] J. A. Stuart and J. D. Owens, “Multi-GPU MapReduce on GPU Clusters,” in Int.
Par. and Dist. Proc. Sym. (IPDPS). Los Alamitos, CA, USA: IEEE Comp. Society, 2011, pp.
1068–1079
[Szegedy 2015] Szegedy, C., Liu, W., Jia, Y., Sermanet, P., Reed, S., Anguelov, D., Erhan,
D., Vanhoucke, V. and Rabinovich, A., 2015. Going deeper with convolutions. In
Proceedings of the IEEE conference on computer vision and pattern recognition (pp. 1-9).
[takatsu2017ppfs] Fuyumasa Takatsu, Kohei Hiraga, and Osamu Tatebe. Ppfs: A scale-out
distributed file system for postpetascalesystems. Journal of Information Processing , 25:438–
447, 2017.
[tanenbaum2007distributed] Andrew S Tanenbaum and Maarten Van Steen. Distributed
systems: principles and paradigms . 2016.
[tcpa 2007] Trusted Computing Platform Architecture, Specification Revision 1.4, 2 August
2007 https://trustedcomputinggroup.org/
[tcpaik 2016] Qiang Huang, Dehua Zhang, Le Chang, Jinhua Zhao, Building Root of Trust for
Report with Virtual AIK and Virtual PCR Usage for Cloud, International Conference on
Security, Privacy and Anonymity in Computation, Communication and Storage, SpaCCS
2016
[TensorFlow] TensorFlow | An open-source software library for Machine Intelligence,
accessed Feb 2018, https://www.tensorflow.org/
[Testi2010] D. Testi, P. Quadrani, and M. Viceconti, “PhysiomeSpace: digital library service
for biomedical data,” Physical and Engineering Sciences, vol. 368, no. 1921, pp. 2853–2861,
Jun. 2010. [Online]. Available: http://dx.doi.org/10.1098/rsta.2010.0023
[TFLearn] TFLearn, accessed Apr 2018, http://tflearn.org
[Toro 2017] Jimenez–del–Toro, O., Atzoria, M., Otálora, S., Andersson, M., Eurén, K.,
Hedlund, M., Rönnquist, P. and Müller, H., 2017. Convolutional neural networks for an
automatic classification of prostate tissue slides with high–grade Gleason score. In Proc. of
SPIE Vol (Vol. 10140, pp. 101400O-1).
[Tosca] OASIS Topology and Orchestration Specification for Cloud Applications (TOSCA),
accessed February 2018, https://www.oasis-
open.org/committees/tc_home.php?wg_abbrev=tosca
[ToscaTemplate] TOSCA topology template structure, accessed February
2018, http://docs.oasis-open.org/tosca/TOSCA/v1.0/csd04/TOSCA-v1.0-csd04.html)
[TRAG2011] Technology Readiness Assessment Guide, DOE G 413.3-4A Approved 9-15-
2011, https://www.directives.doe.gov/directives-documents/400-series/0413.3-EGuide-04-
admchg1/@@images/file
[Tudoran 2016] Tudoran, R., Costan, A., Nano, O., Santos, I., Soncu, H. and Antoniu, G.,
2016. JetStream: Enabling high throughput live event streaming on multi-site clouds. Future
Generation Computer Systems, 54, pp.274-291.
[Turkmen 2013] Turkmen F, Foley SN, O’Sullivan B, Fitzgerald WM, Hadzic T, Basagiannis
S, et al. Explanations and relaxations for policy conflicts in physical access control. ICTAI
_=9913 Proceedings of the 2013 IEEE 25th International Conference on Tools with Artificial
Intelligence, IEEE Computer Society, November 4–6, 2013, Washington, DC; 2013.

D4.1 References
This version is a draft of D4.1 and is under review. 143
[Turkmen 2015] Turkmen F, den Hartog J, Ranise S, Zannone, N. Analysis of XACML
policies with SMT, In: Principles of Security and Trust. POST 2015. Lecture Notes in
Computer Science, vol 9036. Springer, Berlin, Heidelberg.
[USDOE, 2010] U.S. Department of Energy: The Opportunities and Challenges of Exascale
Computing. 2010.
https://science.energy.gov/~/media/ascr/ascac/pdf/reports/Exascale_subcommittee_report.p
df
[vacca2006optical] John R Vacca. Optical Networking Best Practices Handbook. John Wiley
& Sons, 2006.
[Vairavanathan 2013] Vairavanathan, M.E., Al-Kiswany, S., Barros, A., Costa, L.B., Yang, H.,
Fedak, G., Zhang, Z., Katz, D.S. and Wilde, M., 2013. A case for Workflow-Aware Storage:
An Opportunity Study using MosaStore,‖. Submitted to FGCS Journal.
[vijayaraghavany2017design] Thiruvengadam Vijayaraghavany, Yasuko Eckert, Gabriel H
Loh, Michael J Schulte, Mike Ignatowski,Bradford M Beckmann, William C Brantley, Joseph
L Greathouse, Wei Huang, Arun Karunanithi, et al. Designand analysis of an apu for
exascale computing. In High Performance Computer Architecture (HPCA), 2017IEEE
International Symposium on , pages 85–96. IEEE, 2017.
[VISCERAL] VISCERAL is an abbreviation for Visual Concept Extraction Challenge in
Radiology., accessed January 2018, http://www.visceral.eu/
[Wang 2013] Wang, L., Tao, J., Ranjan, R., Marten, H., Streit, A., Chen, J. and Chen, D.,
2013. G-Hadoop: MapReduce across distributed data centers for data-intensive computing.
Future Generation Computer Systems, 29(3), pp.739-750.
[Wang1 2016] Wang, K., Kulkarni, A., Lang, M., Arnold, D., & Raicu, I. (2016). Exploring the
design tradeoffs for extreme-scale high-performance computing system software. IEEE
Transactions on Parallel and Distributed Systems, 27(4), 1070–1084.
[Wang2 2016] Wang, K., Qiao, K., Sadooghi, I., Zhou, X., Li, T., Lang, M., & Raicu, I. (2016).
Load-balanced and locality-aware scheduling for data-intensive workloads at extreme scales.
Concurrency and Computation: Practice and Experience, 28(1), 70–94.
[web4grid] M. A. Tugores and P. Colet. Web interface for generic grid jobs, Web4Grid.
Computing and Informatics, 31(1), 173-187, 2012.
[WEIL 2004] WEIL, Sage A., et al. Dynamic metadata management for petabyte-scale file
systems. In: Supercomputing, 2004. Proceedings of the ACM/IEEE SC2004 Conference.
IEEE, 2004. p. 4-4.
[Weil2006] Sage A Weil, Scott A Brandt, Ethan L Miller, Darrell DE Long, and Carlos
Maltzahn. Ceph: A scalable, high performance distributed file system. In Proceedings of the
7th symposium on Operating systems design andimplementation, pages 307–320. USENIX
Association, 2006.
[weil2006ceph] Sage A Weil, Scott A Brandt, Ethan L Miller, Darrell DE Long, and Carlos
Maltzahn. Ceph: A scalable, highperformancedistributed file system. In Proceedings of the
7th symposium on Operating systems design and implementation , pages 307–320. USENIX
Association, 2006.
[Weka] Weka3: Data Mining Software in Java, accessed Feb
2018, http://www.cs.waikato.ac.nz/ml/weka/

D4.1 Appendix
This version is a draft of D4.1 and is under review. 144
[White2009] T. White, Hadoop: The Definitive Guide, first ed., O’Reilly Media, Inc., 2009.
[Yahoo2018] Yahoo cloud object storage.
https://yahooeng.tumblr.com/post/116391291701/yahoocloud-object-store-object-storage-at.
Accessed: 06-01- 2018.
[Zaharia2010] M. Zaharia, M. Chowdhury, M.J. Franklin, S. Shenker, I. Stoica, Spark: Cluster
computing with working sets, in: Proceedings of the 2nd USENIX Conference on Hot Topics
in Cloud Computing, Hot-Cloud’10, USENIX Association, Berkeley, CA, USA, 2010, 10–10,
URL: http://dl.acm.org/citation.cfm?id=1863103.1863113 .
[Zeppelin] Zeppelin web page https://zeppelin.apache.org/
6 Appendix
6.1 Performance analysis of the main technological tools
6.1.1 LOBCDER
Software requirements
Java 7 or higher git, maven 2, root access on MySQL 5.5 or higher, Tomcat 6 or 7 (will not
work with 8).
Hardware requirements
Commodity hardware.
Performance characteristics
LOBCDER is designed to scale out with the number of requests. One LOBCDER master is
able to serve more than 38,000 requests per second. In case of increase of the load, multiple
R masters can be instantiated allowing to load-balance the incoming traffic across all the
masters. To evaluate the scalability of LOBCDER in terms of file availability for concurrent
requests, a set of benchmark tests were conducted. The Benchmark was conducted on the
DAS-3 supercomputer17, One LOBCDER master was deployed on a computer at the University
of Amsterdam with an Intel Xeon E5450 CPU at 3.00GHz and 8 GB of memory and 16
LOBCDER workers on 16 nodes of the DAS-3 supercomputer18. Each node has a 2.4 GHz
AMD Opteron CPU and 4 GB of memory. The storage is located on three nodes hosted on the
DAS-4 supercomputer2 and accessible through secure file transfer protocol (SFTP). All files
were replicated on all available storage and to reduce the load on the storage backend, caches
were used on each LOBCDER worker. For producing concurrent requests, we used the Tsung
benchmark tool19 which is able to simulate a large amount of users. Tests are composed of
four separate experiments using 128, 256, 512 and 1024 users requesting the same file
simultaneously. On each test 1, 2, 4, 8 and 16 workers were used respectively.
17 http://www.cs.vu.nl/das3/
18 http://www.cs.vu.nl/das4/
19 http://tsung.erlang-projects.org

D4.1 Appendix
This version is a draft of D4.1 and is under review. 145
Figure 48: Average Session time for various concurrent users requests (128 to 1024) on different configurations of LOBCDER (number of workers varies from 1 to 16). [Koulouzis1 2016].
The Figure 48 shows the average session time of all users. One session is the time between
a user sends a request to download a file and the time it takes LOBCDER to complete the
transfer. As the number of users increases their average wait time also increases for a fixed
number of workers. As LOBCDER creates more threads to serve incoming requests it uses
CPU and IO resources slowing down the response. When adding more workers the average
waiting time of each user is drastically decreased. Adding more workers increases the rate at
which users finish their download. We have measured that with 1 worker, LOBCDER serves
approximately 55 users/sec and with 16 workers it serves 90 users/sec.
System configuration
Deploying LOBCDER is simple because it is implemented as a web application, allowing
deployment on a variety of application servers. For an intuitive data access for users and
applications LOBCDER uses a WebDAV interface. This way LOBCDER is able to provide a
file system abstraction with strict consistency and, with the use of workers, offer improved
availability. Both the master and workers can access any type of data source, whether this is
grid or cloud storage, due to the use of a virtual file system (VFS) API. The VFS API offers
unified access to a large number of storage resources such as Local File System, SFTP,
WebDAV, GridFTP, SRM, LFC, iRODS, OpenStack- Swift, vCloud, AWS S3. LOBCDER
workers are simple stateless servlets, which allows them to be deployed on grid, cloud, or
cluster servers. The number of LOBCDER workers can be increased or decreased following
the number of incoming data transfer requests and therefore they elastically scale depending
on the load.
LOBCDER has extensions which enable to interface with Software defined networks (SDN) to
further optimize the data transfers. LOBCDER support an SDN-aware file transfer mode to
improving the performance and reliability of large data transfers on research infrastructure
equipped with programmable network switches. In case of multiple data sources, LOBCDER
SDN extensions, enable to identify the data sources, to react to a sudden drop a transfer rate
either because of third party transfer on the data source or a network congestion. To assess
the performance of the architecture we used a controlled test environment. This environment
allows evaluation of the performance and functionality of the architecture against several

D4.1 Appendix
This version is a draft of D4.1 and is under review. 146
scenarios. Using real live networks these scenarios might be particularly difficult to test. We
may control characteristics of the links specifying bandwidth and latency as well as introduce
traffic in any part of the network. To conduct our experiments we used ExoGeni a multi-domain
infrastructure-as-a-service (NIaaS) federated testbed that provides a virtual laboratory for
networking and distributed systems. ORCA (Open Resource Control Architecture), the
ExoGENI control framework software, allows easy deployment of virtual topologies, composed
by virtual machines, networking connections, and other elements
Figure 49: LOBCDER reacts to drop of performance due to third party data transfer on the worker host worker. LOCDER switch to another worker to avoid slow connection [Koulouzis1 2016].
Results for the second scenario. We measured speed from the consumer’s perspective while
downloading a 5 GB file. After approximately 200 s the performance drops dramatically
because the node hosting the LOBCDER worker is performing some other I/O operation. In
the static case the LOBCDER worker is not reacting while in the dynamic it drops the
connection at approximately 220 s and the consumer resumes the transfer at approximately
250 s from an alternative LOBCDER worker.

D4.1 Appendix
This version is a draft of D4.1 and is under review. 147
Figure 50: Simulating network congestion, the worker request from NEWQoSPlanner a different route to establish provious performance .[Koulouzis1 2016].
Results for the third scenario. Measuring speed from the consumer’s perspective while
downloading a 1 GB file. After 55 s the performance of the transfer is reduced due to injected
traffic on the chosen link. In the static routing case the transfer continues on the problematic
link completing the transfer after 940 s. In the dynamic case, the LOBCDER worker sends an
optimization request to the NEWQoSPlanner which reroutes the traffic from an alternative link
complementing the transfer after 545 s.
6.1.2 DataNet
Software requirements
Software requirements vary in regard to components:
1. Web-based portal
a. Ruby on Rails execution environment
b. MySQL database
2. Metadata repository
a. Docker CE (Swarm mode enabled)
Hardware requirements
Hardware requirements vary in regard to components:
1. Web-based portal
a. Small VM is required - 1 CPU core and 2 GB of RAM should be enough for
standard installation. HDD space is a non-factor - 10 GB should be more than
enough providing logs are handled / rotated properly.
2. Metadata repository
a. For a single metadata repository (not federated) use case a cluster of VMs is
required - minimum 3 for sharding metadata, minimum 9 for sharding with
replication.
b. Network: VMs must be mutually accessible via IPv4 communication protocol
c. Storage: depending of the use case. Minimum 25 GB disk per VM node is
required for initial deployment

D4.1 Appendix
This version is a draft of D4.1 and is under review. 148
Performance characteristics
Initial estimates of DataNet performance are based on the characteristics of a single repository
installation being MongoDB database covered with raw RESTheart service instance
representing API of DataNet single repository. The results presented below show the
relationship between REST interface performance and native MongoDB interface
performance. Multi-node instance of DataNet repository will be subject of further benchmarks.
All the tests were run on an machine with MongoDB and RESTHeart running on Sunfire X2200
M2 with 2 CPU (2,2GHz AMD Opteron) with 16 Gbyte of RAM. Test cases run by MacBook
Pro client with 2,66 GHz Intel Core i7 and 8 GB 1067 MHz DDR3. The client and the server on
the same local network linked by a 10/100 Ethernet switch.
Test case 1
Measure the execution time to create 1 million documents with random data, using 200 test
threads.
Figure 51: Results of the test case 1 (execution time).
In this scenario, RESTHeart introduces just a 2,41% overhead over the total execution time:
Table 8: Overview of test case 1.
Execution Time TPS
RESTHeart 250s 3990 tps
Direct 244s 4086 tps
Test case 2
Measure the execution time to query a collection 100.000 times, getting 5 documents each
time (limit 5) and skipping just 25 documents, under different concurrency levels.

D4.1 Appendix
This version is a draft of D4.1 and is under review. 149
Figure 52: Results of the test case 2 (execution time).
Figure 53: Results of the test case 2 (TPS).
RESTHeart delivers better performances under any concurrency level over direct access via
MongoDB driver:
Table 9: Overview of test case 2.
Threads 50 100 200 250 400 500

D4.1 Appendix
This version is a draft of D4.1 and is under review. 150
RESTHeart 78s 82s 78s 76s 76s 76s
Direct 97s 95s 96s 96s 109s 112s
Test case 3
Measure the execution time to query a collection 2.000 times, getting 5 documents each time
(limit 5) and skipping just 250.000 documents, under different concurrency levels.
Figure 54: Results of the test case 3 (execution time).

D4.1 Appendix
This version is a draft of D4.1 and is under review. 151
Figure 55: Results of the test case 3 (TPS).
Thanks to the eager pre-allocation DBCursor engine, queries with significant skip parameter
executes much faster (50 times in this case) with RESTHeart:
Table 10: Overview of test case 3.
Threads 1 2 4 5 8 10 20 40 50 80 100 200 400 500
RESTH
eart
16,2
8s
6,2
2s
5,0
5s
2,5
3s
3,7
6s
3,6
s
2,9
8s
5,6
5s
9,0
4s
10,7
4s
6,7
6s
9,2
4s
6,7
6s
12,7
1s
Direct 1091
s
627
s
324
s
328
s
329
s
32
5s
324
s
321
s
321
s 304s
302
s
305
s
327
s 327s
Test case 4
Measure the execution time to query a collection 500 times, getting 5 documents each time
(limit 5) skipping more and more documents each time, with a concurrency level of 4.
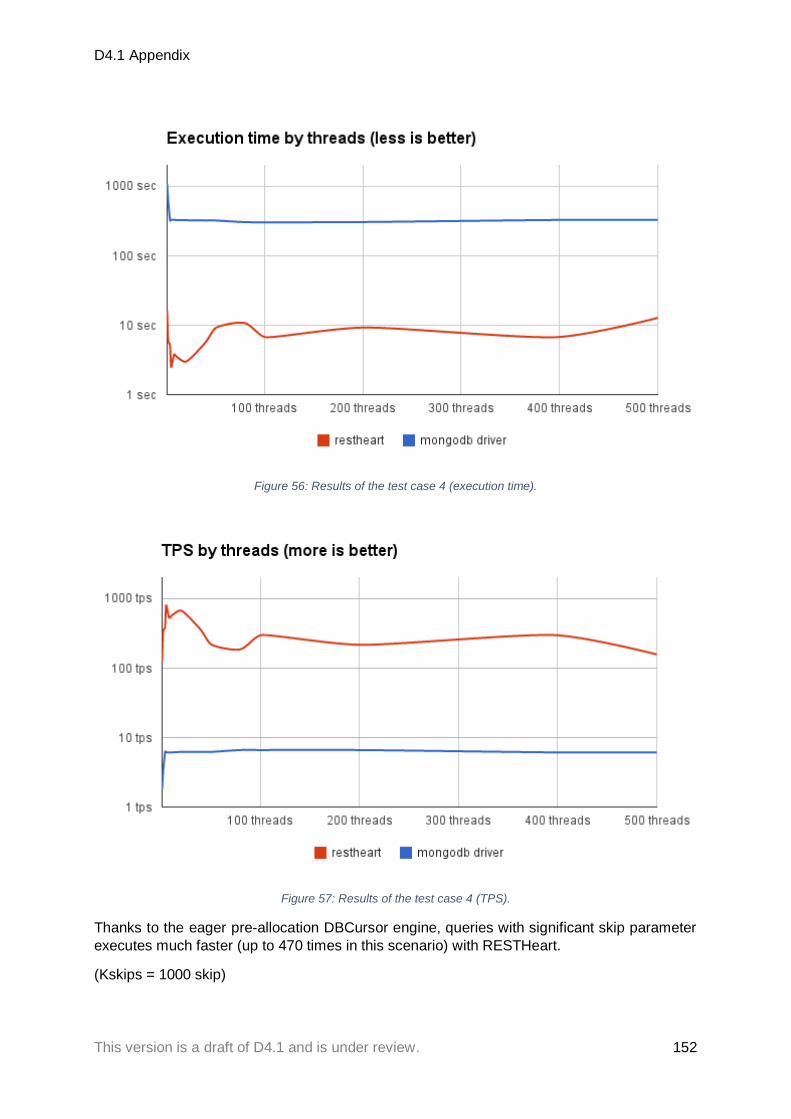
D4.1 Appendix
This version is a draft of D4.1 and is under review. 152
Figure 56: Results of the test case 4 (execution time).
Figure 57: Results of the test case 4 (TPS).
Thanks to the eager pre-allocation DBCursor engine, queries with significant skip parameter
executes much faster (up to 470 times in this scenario) with RESTHeart.
(Kskips = 1000 skip)

D4.1 Appendix
This version is a draft of D4.1 and is under review. 153
Table 11: Overview of test case 4.
Kskips 250 500 750 1.000 1.250 1.500 1.750 2.000 2.250
RESTHeart 2,6s 1,91s 1,9s 1,88s 1,58s 2,05s 1,51s 1,52s 1,51s
Direct 79s 156s 242s 317s 375s 453s 558s 601s 713s
6.1.3 EurValve Model Execution Environment
Software requirements
The Model Execution Environment is implemented as a Web application: it consists of a
backend which should run on a dedicated host (preferably under Linux) and communicates
with lower-tier services using public APIs while providing a UI for the end user. The
environment is hosted on GitLab at https://gitlab.com/eurvalve/vapor. It comes with the
following software dependencies (all of which are freely available under open-source licenses):
1. MRI 2.3.x
2. PostgreSQL
3. PostgreSQL citext extension (sudo apt-get install postgresql-contrib)
4. Redis (sudo apt-get install redis-server)
5. PostgreSQL libpq-dev (sudo apt-get install libpq-dev)
6. NodeJS (sudo apt-get install nodejs)
Hardware requirements
A dedicated host is required with an up-to-date version of Linux (the system has heretofore
been deployed under the Ubuntu distribution). While the service itself does not consume a
large quantity of resources, at least 4 GB RAM and 20 GB free HDD space is recommended.
The host must also expose at least one public IP address.
Performance characteristics
As a service orchestrator/UI MEE is not regarded as a performance bottleneck in the context
of exascale computing. Performance of the system has been tested in the EurValve project,
and has been found to depend on the number of concurrent UI requests (i.e. the number of
users accessing simulation runs). Given the nature of PROCESS application tasks, this is not
viewed as a significant issue; however, if needed, MEE can be scaled by deploying additional
instances of the service on separate hosts.
System configuration
While the configuration of the underlying host is briefly outlined above and meticulously
described in the deployment section of the project documentation on Gitlab, the system itself
requires no additional configuration after being launched in production mode - except for
routine maintenance tasks, e.g. creation of user accounts.
Response time
Real-time usage characteristics are supported by the UI with request/response cycles on the
order of 2-3 seconds, subject to network link quality and host load. Response time may
degrade under heavy load conditions or when a large quantity of data needs to be presented
(e.g. for simulations consisting of hundreds of steps - which, however, is not likely to occur in
the context of PROCESS).

D4.1 Appendix
This version is a draft of D4.1 and is under review. 154
Resource utilization
MEE, by itself, is not a high-performance computing service and relies on the resources
provided by a single host, where it expects to be the sole tenant. Please see above for a
description of the required hardware resources.
Scalability
Since MEE is not expected to constitute a bottleneck in the operation of the PROCESS
exascale computing platform, no additional considerations have been given to its scalability.
In the case of a large number of users interacting with the GUI simultaneously (i.e. when the
service host needs to process a large number of concurrent requests), the application may be
scaled by being deployed to additional access hosts (e.g. one individual host per PROCESS
use case).
6.1.4 Rimrock execution environment
Software requirements
Rimrock is a web-based application developed in Java. It uses Spring Boot solution which
provides mechanism which bundles all required classes and application server into single JAR.
So only Java (8+), PostgreSQL and optionally Nginx as a reverse proxy is needed. The system
has been tested on Ubuntu 14.04 upwards. The newest LTS version is strongly recommended.
Hardware requirements
Small VM is required - 1 CPU core and 2 GB of RAM should be enough for standard
installation. HDD space is a non-factor - 10 GB should be more than enough providing logs
are handled / rotated properly.
Performance characteristics
As RIMROCK only proxies HPC job related actions to the relevant queuing systems such as
SLURM (responsible for queuing jobs) which is then run on the Cluster (performing the heavy
workload) it's a lightweight component and should not induce any bottlenecks. The
performance is not related to the size of the single job (as it's not running it) and might be
degraded only if very large number of (even small) jobs would be submitted at the same time.
However this risk may be easily mitigated by using more resources for the RIMROCK node
(bigger VM or bare metal node) or by scaling as described latter in this document.
System configuration
RIMROCK require rather standard configuration as described in its documentation such as
installation of Java, PostgreSQL, creation of the database and storing it's configuration.
Response time
In normal condition RIMROCK should respond in less then 3 second even for slowest
operations (such as scheduling new JOB). This may degrade due to the network performence
(anywhere on the path from the client, through RIMROCK to backend Cluster UI Node),
extremly high load on RIMROCK or slow responding Cluster (e.g. queuing system).
Throughput
In normal condition due to small amount of data used to schedule the job (just script + headers,
as real data is passed directly between the cluster and the data repository) throughhput of the
service should not be a significant factor.
Resource utilization
In normal condition due to small amount of data used to schedule the job (just script + headers,
as real data is passed directly between the cluster and the data repository) throughhput of the
service should not be a significant factor.

D4.1 Appendix
This version is a draft of D4.1 and is under review. 155
Scalability
As mentioned already running RIMROCK on a single node should be sufficient (performance
wise) at normal conditions. If number of jobs (not its size) would be extreemly high RIMROCK
may be scalled by deploying additional instances (e.g. one instance per site). In this case only
extre requirement would be for Client (such as MEE) to record on which site job was deployed
(and use it to query proper instance of the RIMROCK).
6.1.5 Atmosphere cloud platform
Software requirements
The platform works as a standalone service running on a dedicated host and implemented in
Ruby on Rails - a popular technology stack for client/server solutions. It comes with its own
dependency management system (bundler) and all of its code is open-source, and can be
downloaded from GitHub. See https://github.com/dice-cyfronet/atmosphere for details.
The following software requirements need to be taken into account:
1. Linux distribution (Ubuntu LTS preferred)
2. Ruby v2.1+ and Ruby on Rails v4+.
3. Any relational database compatible with Ruby on Rails (PostgreSQL suggested,
although other DBMS' should work as well)
Hardware requirements
A host running the Linux operating system is required (we recommend Ubuntu, although other
distributions should support Atmosphere as well). The host must be connected to the Internet
and possess at least one public IP address. 100 GB of HDD storage space is required (chiefly
for proper maintenance of system logs).
Performance characteristics
Atmosphere has been tested in the framework of several projects, including VPH-Share, PL-
Grid and ISMOP, managing several hundred concurrent VMs. The performance capabilities of
Atmosphere are restricted by the actual availability of hardware resources in the underlying
cloud platforms (i.e. by the number of physical hosts, CPUs, memory and disk storage
available to PROCESS).
System configuration
The aforementioned GitHub repository contains the information necessary to set up and
configure Atmosphere. Further details can be obtained by contacting its developers at ACC
Cyfronet AGH (using the contact details provided).
Scalability
Multiple instances of Atmosphere can be set up, although each one will then need to be
interacted with directly.
6.1.6 Zabbix
Software requirements
As Zabbix is composed of multiple componentes - Frontend, Server and (optional) Proxy its
software requirements varies based on which component(s) is/are deployed on the node.
Basic requirement is the RDBMs system - usually MySQL (>= 5.0.3 for Zabbix 3.4) or
equivalent MariaDB version are considered best fit, however Zabbix also support other
engines: Oracle (>= 10g), PostgreSQL (>= 8.1), IBM DB2 (>= 9.7). SQLite may also be used
but only for the Proxy component.

D4.1 Appendix
This version is a draft of D4.1 and is under review. 156
Front-end
The front-end is required to configure the system and to visualize the gathered data. As a
standard PHP based web application it basically requires Apache (>= 1.3.12) and PHP (>=
5.4). Also the following set of PHP extensions is always required: gd, bcmath, ctype, libXML,
xmlreader, xmlwriter, session, sockets, mbstring and gettext. Additionally a proper extension
for the used RDBMS is required (like mysqli, oci8, pgsql, ibm_db2). Optionally an LDAP
extension may also be required if LDAP authentication should be used.
Server and Proxy
The server is backend needed to coordinate the data collection from the Agents (and Proxies).
Proxies are optional components that may aggregate data from many Agents and pass them
to the Server to distribute the load (increase scalability of the system). Both components are
written in the C language and may be compiled from source or installed as packages. Only two
libraries are required - libpcre as well as libevent (which is required for Server, but optional for
Proxy).
Additionally some optional libraries may be used to extend monitoring capabilities - namly:
OpenIPMI, libssh2, fping, libcurl (Web monitoring), libiksemel (Jabber), libxml2, net-snmp.
Java Gateway
This is an entirely optional component which may be used for monitoring of JMX enabled
applications. As the name suggests this component is written in Java, and as such requires
the Java Runtime Environment to be installed on the node. All libraries (JARs) are bundled
with the package - including: logback-core-0.9.27, logback-classic-0.9.27, slf4j-api-1.6.1 and
android-json-4.3_r3.1. They may also be replaced with stand-alone installations if desired.
Client side requirements
To access the Zabbix Front-end user needs to have any modern Web Browser with JavaScript
and Cookies enabled.
Hardware requirements
Basic installation of Zabbix have very low hardware requirements. In such case both server
and front-end may be installed on a single VM with 1 vCPU and 1 GB of RAM. Even for quite
big deployments (monitoring over 10 000 hosts) a relatively small system should be sufficient
(8 CPU cores, 16 GB of RAM and fast I/O like SSD in RAID10). However, in case of a bigger
deployment further dispersion of the infrastructure (like RDBMS cluster + separate machines
for Front-end, Server and multiple Proxies) is advisable. In addition to above resources it’s
required to deploy Zabbix Agents on monitored nodes which would also consume some
hardware resources however due to lightweight nature of the Agent those usage should not
be significant.
Performance characteristics
Due to the nature of the system it focuses on minimizing the load of monitored services, as
such it uses very light agents written in C. This is critical as monitoring system should not have
adverse effect on the system being monitored. Also due to the need to process large numbers
of events the server is written in C to provide maximum performance. The load on the front-
end is usually much smaller (especially in system such as process where amount of monitored
resources greatly exceeds number of potential operators watching the UI). Due to this fact
even usage of PHP language would provide close to real-time performance required for
smooth user experience.
D4.1 Appendix
This version is a draft of D4.1 and is under review. 157
System configuration
Each components may be installed from OS packages or from the Source Code. Only the
database needs to be configured and it’s schema loaded. All further configuration may be done
via the Web UI.
Response time
Alerting functionality should usually respond below 1 second unless the system is under high
load. Alert should be sent in a matter of minutes. UI needs to respond in real time (below 1
second) to be usable.
Throughput
System is designed to handle ten of thousands of nodes each reporting hundreds of events.
Resource utilization
Resource utilization of the Agents should be minimal due to lightweight character of this
component. Utilization of rest of the infrastructure would be highly dependant on the scale of
the infrastructure but should be within the bound described earlier in Hardware Requirements.
Scalability
Due to the architecture of the system collection mechanism is naturally scalable using Agents
deployed on each service and Proxies capable of data aggregation. Server and UI should work
well for large deployments even on single node but if needed may be clustered and. Also
RDBMS may be clustered for large deployments.
6.1.7 PUMPKIN
Hardware requirements
Pumpkin is a Python framework and therefore runs on commodity hardware. It has been
written primarily for Linux therefore we suggest Linux as a execution platform. When run in a
distributed fashion, Pumpkin nodes need to discover each other and communicate with each
other thus participating nodes should be on a virtual IPv4 network with IP broadcast enabled.
Depending on the application, memory usage can be quite high due to buffers; we suggest a
minimum of 2GB of RAM and 20GB of free HDD space for each node.
Software requirements
Pumpkin depends on Python 2.7 and a list of Python packages: numpy, ujson, pyinotify, tftpy,
networkx,zmq, pika, pystun, netaddr, pyftpdlib.
Performance characteristics
To test PUMPKIN we have selected two applications workflow with different characteristics to
create different scenarios. The Twitter workflow has fine grained data atomicity thus creating
scenarios for pronounced overhead while blood flow simulation workflow and sensitivity
analyses workflow is a computational intensive workflow with intricate data transition stages.
The Pumpkin testbed used for these applications scenario is intended to demonstrate the
applicability to globally distributed resources on controlled and uncontrolled resources. The
node network which included 3 nodes on EC21 (Ireland), 1 node on EC2 (Oregon), 1 node on
VPH computing platform2, 2 nodes on private cloud (Amsterdam), Docker4 node
(Amsterdam), 1 PC (Amsterdam). Although EC2 nodes have public facing IP addresses the
other nodes are all behind NATs and thus direct communication was not possible. In this case
the nodes automatically use the RabbitMQ callback. The controller-less, dispersed and diverse
resources are set up as a state machine using the automaton. The code is deployed
dynamically through the packet system described in [Cushing, 2016] using the laptop node as
the bootstrapping node. Following 4 figures illustrates how the control flow is able to adapt to
the traffic traversing the node network. As is expected, the faster and more stable connections,
the higher packet efficiency can be achieved at lower coalescing factor. Figure 61 shows in-

D4.1 Appendix
This version is a draft of D4.1 and is under review. 158
memory communication between Docker3 VM and host where high efficiency is achieved with
low coalescing. The trade-off between parallel efficiency and coalesce efficiency produces a
Pareto fronts. From Figure 58 between 60 and 100 data packets are enough to obtain
adequate efficiency. On the other hand, Figure 59 shows that the range 60 to 100 provides an
abysmal coalesce efficiency, which means a higher coalescing number is needed.
Figure 58: Packet coalescing processing efficiency, ceff (), between EC2 (Ireland) and private cloud (Amsterdam) vs. parallel packet efficiency, peff (), assuming data window of 1000 data packets and 20 nodes. The numbers next to the data points are the actual number of packets in the grouping [PUMPKIN1 2016]
Figure 59: Packet coalescing processing efficiency, ceff (), between EC2 (Ireland) and EC2 (Oregon) vs. parallel packet efficiency, peff (), assuming data window of 1000 data packets and 20 nodes. The numbers next to the data points are the actual number of packets in the grouping.[PUMPKIN1].

D4.1 Appendix
This version is a draft of D4.1 and is under review. 159
Figure 60: Packet coalescing processing efficiency, ceff (), between VPH-Share cloud (Cracow) and private cloud (Amsterdam) over RabbitMQ vs. parallel packet efficiency [PUMPKIN1 2016].
Figure 61: Packet coalescing processing efficiency, ceff (), between Docker VM and Docker host vs. parallel packet efficiency, peff (), assuming data window of 1000 [PUMPKIN1 2016].
In following 2 figures we demonstrate how we manage to control backlogs in the network.
Figure 62 shows both the aggregate predicted compute backlog over time, which never goes
over 40 s, which without flow control, backlog would spiral out of control. The stark difference
between the aggregate and mean boils down to the EC2 (Oregon) VM, which had a slow, low
bandwidth connection, which resulted in more pronounced flow controller fluctuations. The
Lyapunov drift in Figure 63 shows the effort of the flow controller maintaining a 0 drift
progressively correcting spikes in predicted backlog. Twitter feed data7 is also injected from
the same node. The PC node in the network acts as an interface to the network and also as

D4.1 Appendix
This version is a draft of D4.1 and is under review. 160
an optional compute node. The filters were given an additional synthetic load. This load aims
at creating a backlog scenario where each successive processing node is slower than the
previous. The loads for tweet inject(), filter english(), filterisa(), filterhasa() are 0, 0.1, 0.2, 0.3
respectively where the load signifies sleep time on every packet. In this scenario every Tweet
is packaged as a data packet and given the initial state of RAW. These packets are injected
into the network and traverse the appropriate nodes to end in a final state. Each state transition
acts as a filter thus tagging the data along the way with a state tag. The first filter filterenglish()
will tag the tweets with state ENGLISH or state NON ENGLISH. The ENGLISH tagged data
packets will move forward into the network while theother packets are dumped since a final
state was reached. The last final state, is an extraction state to which relevant datatransitions
too. The node network achieves 3 levels of parallelism; through pipelining processing and
communication overlaps each other, d-op filterisa() and filterhasa() are intrinsically
independent which means they run in parallel and the third level of parallelism is derived from
data partitioning where multiple instances of d-opfilterenglish(), filterisa() and filterhasa() split
the streams between themselves.
Figure 62: Aggregate and mean of predicted compute backlog on network over time [PUMPKIN1 2016].
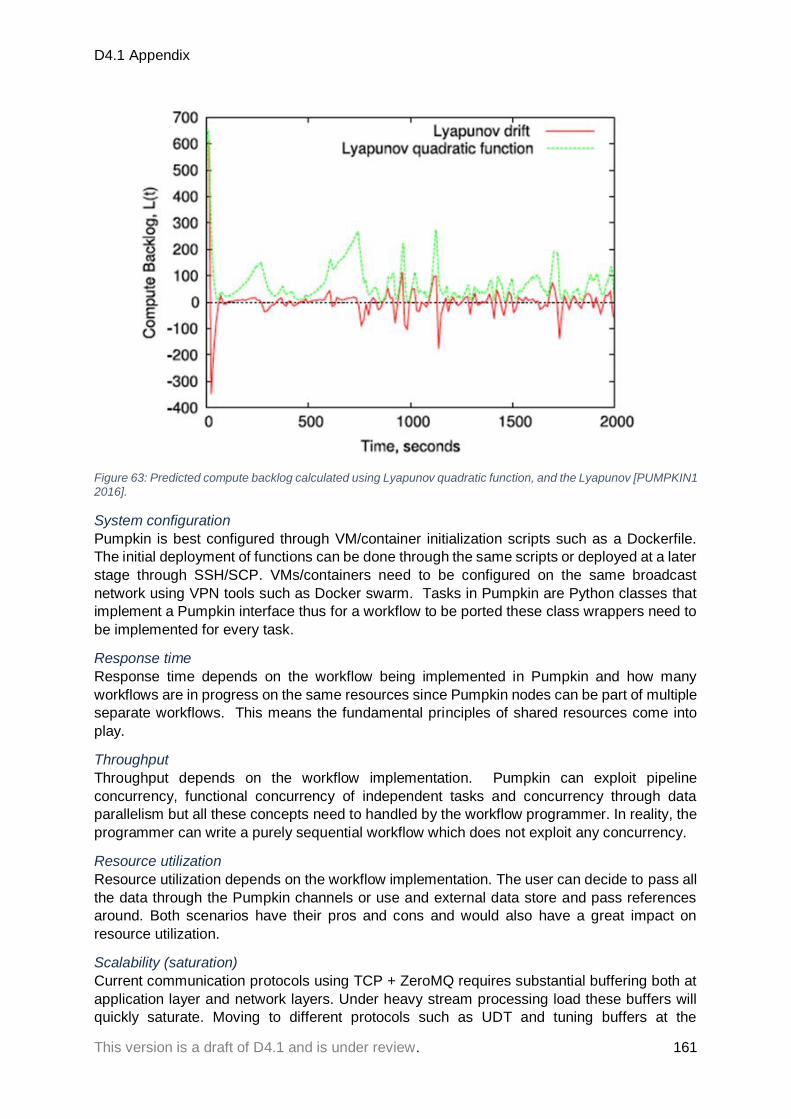
D4.1 Appendix
This version is a draft of D4.1 and is under review. 161
Figure 63: Predicted compute backlog calculated using Lyapunov quadratic function, and the Lyapunov [PUMPKIN1 2016].
System configuration
Pumpkin is best configured through VM/container initialization scripts such as a Dockerfile.
The initial deployment of functions can be done through the same scripts or deployed at a later
stage through SSH/SCP. VMs/containers need to be configured on the same broadcast
network using VPN tools such as Docker swarm. Tasks in Pumpkin are Python classes that
implement a Pumpkin interface thus for a workflow to be ported these class wrappers need to
be implemented for every task.
Response time
Response time depends on the workflow being implemented in Pumpkin and how many
workflows are in progress on the same resources since Pumpkin nodes can be part of multiple
separate workflows. This means the fundamental principles of shared resources come into
play.
Throughput
Throughput depends on the workflow implementation. Pumpkin can exploit pipeline
concurrency, functional concurrency of independent tasks and concurrency through data
parallelism but all these concepts need to handled by the workflow programmer. In reality, the
programmer can write a purely sequential workflow which does not exploit any concurrency.
Resource utilization
Resource utilization depends on the workflow implementation. The user can decide to pass all
the data through the Pumpkin channels or use and external data store and pass references
around. Both scenarios have their pros and cons and would also have a great impact on
resource utilization.
Scalability (saturation)
Current communication protocols using TCP + ZeroMQ requires substantial buffering both at
application layer and network layers. Under heavy stream processing load these buffers will
quickly saturate. Moving to different protocols such as UDT and tuning buffers at the

D4.1 Appendix
This version is a draft of D4.1 and is under review. 162
application layer will minimize buffer problems. Within Pumpkin data can be duplicated in
memory which will increase memory usage especially under heavy load. This can be
minimized by limiting what can be copied in memory.
6.1.8 TOSCA
Software requirements
TOSCA is a description language for application topology. Once the application is described,
an orchestrator will be used for automation of application lifecycle according to the topology
described in the TOSCA template. There are different implementations of orchestrators:
Openstack Heat translator, Cloudify, Alien4Cloud, OpenTOSCA.
Hardware requirements
TOSCA is description language for application topology so it does not have hardware
requirements. The orchestration of the TOSCA template is realized by the chosen orchestrator,
in this project Cloudify.
Performance characteristics
Not applicable. TOSCA is description language, not software components
System configuration
TOSCA templates will be defined according to OASIS standards. Each template will include
the basic types according to the standards and types supported by orchestration engines, then
custom types if needed. All files, including templates, artifacts and data usually placed in a
single directory with the template in the main directory and others in subdirectory.
6.1.9 Cloudify
Software requirements
Cloudify use many different software technologies see [Cloudify-requirements]. However, it is
distributed in a standard software package format (RPM, DEB) that can be installed on
standard LInux machine with Ubuntu, Centos and compatible flavors via standard installation
mechanisms (rpm, dpkg commands).
Hardware requirements
Cloudify can be deployed on standard cloud m1.medium flavor (2 CPU cores, 4GB RAM, 40GB
harddisk). The exact requirements of Cloudify are available at [Cloudify-requirements].
Performance characteristics
Cloudify itself does not have high demand on hardware resources. At mentioned above, it can
run on m1.medium flavor. The response time (and performance) depend on the services via
which Cloudify deploy and manage applications (e.g. Openstack, Amazon EC2).
System configuration
Cloudify can be installed in standard Linux installation methods (rpm, dpkg). Once installed,
Cloudify run as command-line client that receives input from users (or user interface) and
perform relevant actions on the specified TOSCA templates.
Response time
The response time depend on the response time of underlying services via which Cloudify will
deploy and manage application (e.g. Openstack, Amazon EC2) and the time needed for
application software installation. Cloudify itself does not have high demand on hardware
resources, typical response times, excluded time needed for hardware acquisition and
application software installation, are in seconds.

D4.1 Appendix
This version is a draft of D4.1 and is under review. 163
Throughput
The throughtput (and performance) depend on the services via which Cloudify deploy and
manage applications (e.g. Openstack, Amazon EC2)
Resource utilization
The resource utilization (and performance) depend on the services via which Cloudify deploy
and manage applications (e.g. Openstack, Amazon EC2)
Scalability (saturation)
Scalability of Cloudify depens on the services via which Cloudify deploy and manage
applications (e.g. Openstack, Amazon EC2). Single Cloudify execution can deploy as many
application instances as the the underlying service allows.
6.1.10 DISPEL
Software requirements
The Admire stack requires Java 7 or newer.
Hardware requirements
The Admire stack hardware requirements are:
1. internet connection
2. a system capable of effectively executing Java 7 code
Specialized services may have additional hardware requirements, for example a deep learning
service may require GPGPU access, but these are not required for the basic Admire data
integration stack.
Performance characteristics
Not applicable – performance of data access and data integration is specific to the services
which will perform it.
System configuration
The configuration consists of several steps:
1. Deployment and configuration of the DISPEL Gate (at multiple points if necessary)
2. Configuration of available service endpoints in the DISPEL Gate
3. Configuration of LOBCDER so it is able to use the VFS access to the data provided by
the Admire stack
Response time
Response time depends on the capabilities of the data storage which is accessed and of the
data integration/access services engaged in the particular data process.
Throughput
Throughput is defined by the capabilities of the data access/data integration services engaged
in the data process.
Resource utilization
The functional component of the Admire stack, the DISPEL Gate, is a Java process which
typically requires 256MB – 2GB of memory, depending on its utilization. Permanent storage
requirements are negligible, consisting only of the need to store the program and its
configuration.
Scalability (saturation)
A single Gate may be saturated by multiple data processes executed at the same time. This
bottleneck can be overcome by utilizing several distributed Gate instances. The number of
deployed Gates is not limited.