Short- and Long-term Survival after Stroke in Hospitalized Patients in Chile: A Nationwide 5-Year...
7
Short- and Long-term Survival after Stroke in Hospitalized Patients in Chile: A Nationwide 5-Year Study Lorena Hoffmeister, MPH,* Pablo M. Lavados, MD, MPH,† Cristiane Murta-Nascimento, MD, PhD,‡x Miguel Araujo, MD, MSc,* Ver onica V. Olavarr ıa, MD, MSc,† and Xavier Castells, MD, PhD‡x Background: Short- and long-term stroke survival is a key indicator of hospital perfor- mance in stroke care. Our aim was to estimate short- and long-term survival rates in discharged patients diagnosed with ischemic stroke in Chile in a 5-year period and identify associated variables. Materials and Methods: We included all discharged pa- tients from all hospitals in Chile with main diagnosis of ischemic stroke from 2003 to 2007, which were identified through the National Hospital Discharge Registry. To establish survival, discharges were linked to deaths in the Deaths Registry. Kaplan– Meier survival curves were used to estimate the cumulative 7-day, 30-day, 1-year, and 3-year survival rates. Independent predictors of death (sex, age, geographical re- gions, and status insurance) were assessed by Cox proportional hazard regression model. Results: A total of 51,130 with first-ever ischemic stroke patients were identi- fied. Overall survival rate decreased from 88.9% (95% confidence interval [CI] 88.6- 89.2) 7 days after hospital admission to 81.9% (95% CI 81.6-82.3), 69.9% (95% CI 69.5-70.3), and 61.2% (95% CI 60.7-61.6) after 30-day, 1-year, and 3-year, respectively. The multivariable model showed that the elderly patients (.80 years; hazard ratio [HR] 4.07; 95% CI 3.89-4.26) and hospital admission in the North (HR 1.14; 95% CI 1.09-1.20) and South area (HR 1.06; 95% CI 1.03-1.110) were associated with lower sur- vival after stroke. Patients with private health insurance have a higher probability of survival than patients with public insurance (private insurance, HR .53; 95% CI .49- .56). Conclusions: Short- and long-term survival after ischemic stroke was heteroge- neous by geographic regions and type of health insurance, regardless age and sex were the strongest predictors. This suggests an impact of socioeconomic factors and access to acute management of strokes on survival. Key Words: Stroke—brain ischemia—survival—fatal outcome—epidemiology—Chile. Ó 2013 by National Stroke Association Introduction Strokes are the third cause of disability-adjusted life years worldwide. 1 Rates of stroke mortality and bur- den vary greatly among countries, being low- and medium-income countries more affected. 2 In Chile, these events account for 65% of all strokes with an adjusted an- nual incidence of 97.4 per 100,000 inhabitants, 3 causing 9% of the total number of deaths in the country. 3,4 From the *School of Public Health, Faculty of Medicine, Universi- dad Mayor, Santiago, Chile; †Neurology Service—Clinica Alemana, Universidad del Desarrollo, Santiago, Chile; ‡Department of Epide- miology and Evaluation, Institut Municipal d’Investigaci oM edica- Parc de Salut Mar, Mar Teaching Hospital, Barcelona, Spain; and xRed de Investigaci on en Servicios de Salud en Enfermedades Cr oni- cas (REDISSEC), Barcelona, Spain. Received March 20, 2013; revision received April 30, 2013; accepted May 6, 2013. This project was partially funded by the National Health Research Fund (FONIS) from the National Commission of Scientific and Tech- nological Research in Chile (CONICYT) by the Ministry of Health of Chile and by the University Mayor. Address correspondence to Lorena Hoffmeister, MPH, School of Public Health, Faculty of Medicine, Universidad Mayor, Jos e Toribio Medina 38, Santiago, CP 8340587, Chile. E-mail: lorena.hoffmeister@ umayor.cl. 1052-3057/$ - see front matter Ó 2013 by National Stroke Association http://dx.doi.org/10.1016/j.jstrokecerebrovasdis.2013.05.005 Journal of Stroke and Cerebrovascular Diseases, Vol. 22, No. 8 (November), 2013: pp e463-e469 e463
-
Upload
independent -
Category
Documents
-
view
4 -
download
0
Transcript of Short- and Long-term Survival after Stroke in Hospitalized Patients in Chile: A Nationwide 5-Year...
Short- and Long-term Surviv
al after Stroke in HospitalizedPatients in Chile: A Nationwide 5-Year StudyLorena Hoffmeister, MPH,* Pablo M. Lavados, MD, MPH,†
Cristiane Murta-Nascimento, MD, PhD,‡x Miguel Araujo, MD, MSc,*
Ver�onica V. Olavarr�ıa, MD, MSc,† and Xavier Castells, MD, PhD‡x
From the *School of Pu
dad Mayor, Santiago, Ch
Universidad del Desarro
miology and Evaluation
Parc de Salut Mar, Mar
xRed de Investigaci�on en
cas (REDISSEC), Barcelo
ReceivedMarch 20, 201
May 6, 2013.
This project was partia
Fund (FONIS) from the N
Journal of Stroke and C
Background: Short- and long-term stroke survival is a key indicator of hospital perfor-
mance in stroke care. Our aim was to estimate short- and long-term survival rates in
discharged patients diagnosed with ischemic stroke in Chile in a 5-year period and
identify associated variables.Materials and Methods: We included all discharged pa-
tients from all hospitals in Chile with main diagnosis of ischemic stroke from 2003
to 2007, which were identified through the National Hospital Discharge Registry. To
establish survival, discharges were linked to deaths in the Deaths Registry. Kaplan–
Meier survival curves were used to estimate the cumulative 7-day, 30-day, 1-year,
and 3-year survival rates. Independent predictors of death (sex, age, geographical re-
gions, and status insurance) were assessed by Cox proportional hazard regression
model. Results: A total of 51,130 with first-ever ischemic stroke patients were identi-
fied. Overall survival rate decreased from 88.9% (95% confidence interval [CI] 88.6-
89.2) 7 days after hospital admission to 81.9% (95% CI 81.6-82.3), 69.9% (95% CI
69.5-70.3), and 61.2% (95% CI 60.7-61.6) after 30-day, 1-year, and 3-year, respectively.
The multivariable model showed that the elderly patients (.80 years; hazard ratio
[HR] 4.07; 95% CI 3.89-4.26) and hospital admission in the North (HR 1.14; 95% CI
1.09-1.20) and South area (HR 1.06; 95% CI 1.03-1.110) were associatedwith lower sur-
vival after stroke. Patients with private health insurance have a higher probability of
survival than patients with public insurance (private insurance, HR .53; 95% CI .49-
.56). Conclusions: Short- and long-term survival after ischemic stroke was heteroge-
neous by geographic regions and type of health insurance, regardless age and sex
were the strongest predictors. This suggests an impact of socioeconomic factors and
access to acute management of strokes on survival. Key Words: Stroke—brain
ischemia—survival—fatal outcome—epidemiology—Chile.
� 2013 by National Stroke Association
Introduction
Strokes are the third cause of disability-adjusted
life years worldwide.1 Rates of stroke mortality and bur-
den vary greatly among countries, being low- and
blic Health, Faculty of Medicine, Universi-
ile; †Neurology Service—Clinica Alemana,
llo, Santiago, Chile; ‡Department of Epide-
, Institut Municipal d’Investigaci�o M�edica-
Teaching Hospital, Barcelona, Spain; and
Servicios de Salud en Enfermedades Cr�oni-
na, Spain.
3; revision received April 30, 2013; accepted
lly funded by the National Health Research
ational Commission of Scientific and Tech-
erebrovascular Diseases, Vol. 22, No. 8 (Novem
medium-income countries more affected.2 In Chile, these
events account for 65% of all strokes with an adjusted an-
nual incidence of 97.4 per 100,000 inhabitants,3 causing
9% of the total number of deaths in the country.3,4
nological Research in Chile (CONICYT) by the Ministry of Health of
Chile and by the University Mayor.
Address correspondence to Lorena Hoffmeister, MPH, School of
Public Health, Faculty of Medicine, Universidad Mayor, Jos�e Toribio
Medina 38, Santiago, CP 8340587, Chile. E-mail: lorena.hoffmeister@
umayor.cl.
1052-3057/$ - see front matter
� 2013 by National Stroke Association
http://dx.doi.org/10.1016/j.jstrokecerebrovasdis.2013.05.005
ber), 2013: pp e463-e469 e463
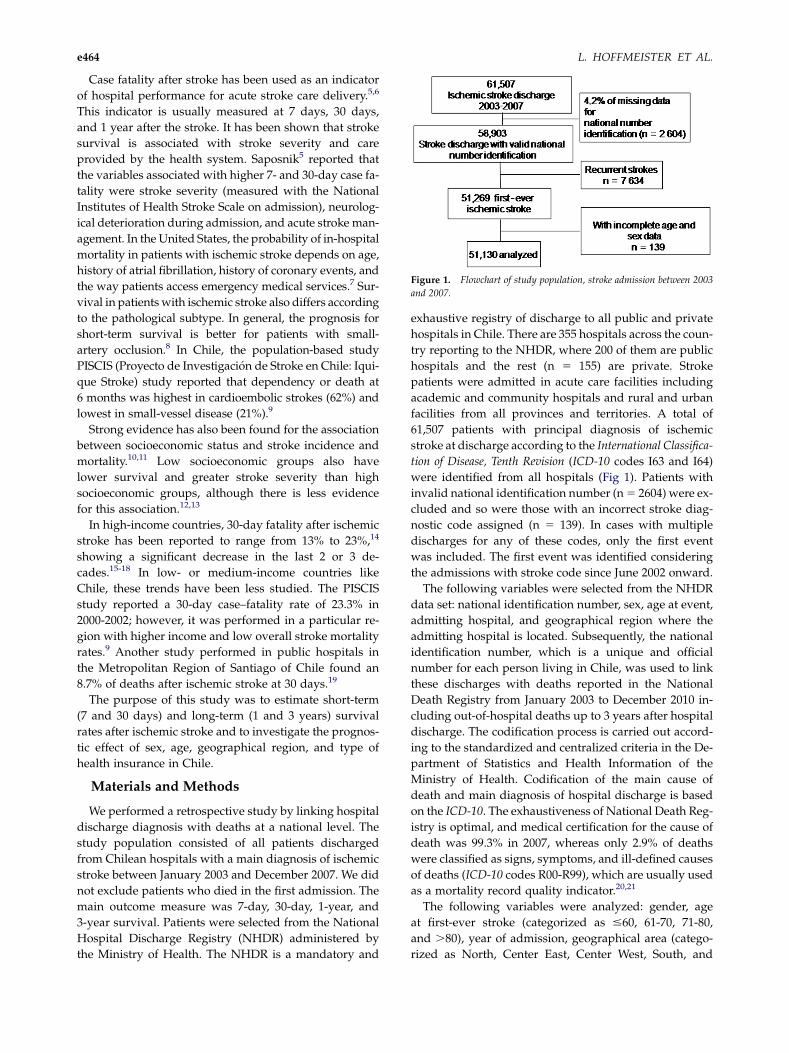
Figure 1. Flowchart of study population, stroke admission between 2003
and 2007.
L. HOFFMEISTER ET AL.e464
Case fatality after stroke has been used as an indicator
of hospital performance for acute stroke care delivery.5,6
This indicator is usually measured at 7 days, 30 days,
and 1 year after the stroke. It has been shown that stroke
survival is associated with stroke severity and care
provided by the health system. Saposnik5 reported that
the variables associated with higher 7- and 30-day case fa-
tality were stroke severity (measured with the National
Institutes of Health Stroke Scale on admission), neurolog-
ical deterioration during admission, and acute stroke man-
agement. In the United States, the probability of in-hospital
mortality in patients with ischemic stroke depends on age,
history of atrial fibrillation, history of coronary events, and
the way patients access emergency medical services.7 Sur-
vival in patientswith ischemic stroke also differs according
to the pathological subtype. In general, the prognosis for
short-term survival is better for patients with small-
artery occlusion.8 In Chile, the population-based study
PISCIS (Proyecto de Investigaci�on de Stroke en Chile: Iqui-
que Stroke) study reported that dependency or death at
6 months was highest in cardioembolic strokes (62%) and
lowest in small-vessel disease (21%).9
Strong evidence has also been found for the association
between socioeconomic status and stroke incidence and
mortality.10,11 Low socioeconomic groups also have
lower survival and greater stroke severity than high
socioeconomic groups, although there is less evidence
for this association.12,13
In high-income countries, 30-day fatality after ischemic
stroke has been reported to range from 13% to 23%,14
showing a significant decrease in the last 2 or 3 de-
cades.15-18 In low- or medium-income countries like
Chile, these trends have been less studied. The PISCIS
study reported a 30-day case–fatality rate of 23.3% in
2000-2002; however, it was performed in a particular re-
gion with higher income and low overall stroke mortality
rates.9 Another study performed in public hospitals in
the Metropolitan Region of Santiago of Chile found an
8.7% of deaths after ischemic stroke at 30 days.19
The purpose of this study was to estimate short-term
(7 and 30 days) and long-term (1 and 3 years) survival
rates after ischemic stroke and to investigate the prognos-
tic effect of sex, age, geographical region, and type of
health insurance in Chile.
Materials and Methods
We performed a retrospective study by linking hospital
discharge diagnosis with deaths at a national level. The
study population consisted of all patients discharged
from Chilean hospitals with a main diagnosis of ischemic
stroke between January 2003 and December 2007. We did
not exclude patients who died in the first admission. The
main outcome measure was 7-day, 30-day, 1-year, and
3-year survival. Patients were selected from the National
Hospital Discharge Registry (NHDR) administered by
the Ministry of Health. The NHDR is a mandatory and
exhaustive registry of discharge to all public and private
hospitals in Chile. There are 355 hospitals across the coun-
try reporting to the NHDR, where 200 of them are public
hospitals and the rest (n 5 155) are private. Stroke
patients were admitted in acute care facilities including
academic and community hospitals and rural and urban
facilities from all provinces and territories. A total of
61,507 patients with principal diagnosis of ischemic
stroke at discharge according to the International Classifica-
tion of Disease, Tenth Revision (ICD-10 codes I63 and I64)
were identified from all hospitals (Fig 1). Patients with
invalid national identification number (n5 2604) were ex-
cluded and so were those with an incorrect stroke diag-
nostic code assigned (n 5 139). In cases with multiple
discharges for any of these codes, only the first event
was included. The first event was identified considering
the admissions with stroke code since June 2002 onward.
The following variables were selected from the NHDR
data set: national identification number, sex, age at event,
admitting hospital, and geographical region where the
admitting hospital is located. Subsequently, the national
identification number, which is a unique and official
number for each person living in Chile, was used to link
these discharges with deaths reported in the National
Death Registry from January 2003 to December 2010 in-
cluding out-of-hospital deaths up to 3 years after hospital
discharge. The codification process is carried out accord-
ing to the standardized and centralized criteria in the De-
partment of Statistics and Health Information of the
Ministry of Health. Codification of the main cause of
death and main diagnosis of hospital discharge is based
on the ICD-10. The exhaustiveness of National Death Reg-
istry is optimal, and medical certification for the cause of
death was 99.3% in 2007, whereas only 2.9% of deaths
were classified as signs, symptoms, and ill-defined causes
of deaths (ICD-10 codes R00-R99), which are usually used
as a mortality record quality indicator.20,21
The following variables were analyzed: gender, age
at first-ever stroke (categorized as #60, 61-70, 71-80,
and .80), year of admission, geographical area (catego-
rized as North, Center East, Center West, South, and
SURVIVAL AFTER STROKE IN CHILE e465
Extreme South), and type of health insurance. There are
significant differences between the private health insur-
ance systems (institutions called Private health insurance
companies, PHIC) and the public system managed by the
National Health Fund (NHF), for example, while NHF
covers 70.4% of the Chilean population, PHICs only cover
16.6%. The members of PHICs, in addition to the compul-
sory contribution, increase their payments to access
higher coverage with an annual average contribution of
6.2 times the NHF contributors.22 NHF has 4 income
based groups: A (indigent), people who do not contribute
with their wages and that can only use public health pro-
viders; B (low income), those who earn less than a mini-
mum wage; C (middle income), those earning between
1 and 1.5 times the minimum wage; and D (middle-high
income), those earning more than 1.5 times the minimum
wages. To summarize the profile of income and access to
health care in these 2 systems, we arranged the type of
health insurance into 3 categories: public health insurance
(low income), which includes groups A and B; public
health insurance (middle-high income), which includes
groups C and D; and private health insurance (high in-
come) including the enrollees of PHICs.
Survival time was calculated from the date of hospital
admission for stroke to date of death by any cause. Pa-
tients with no record of death were censored at December
31, 2010. Survival curves were generated using the Ka-
plan–Meier method and were compared by the log-rank
test. Cox proportional hazard regression analyses were
carried out to evaluate survival differences between sex,
age, year of event, geographical area, and type of health
insurance. Adjusted and unadjusted hazard ratios and
95% confidence interval (CI) were computed. Possible in-
teraction between age and sex was investigated by con-
structing interaction terms in the Cox proportional
model. All calculations were carried out using the STATA
statistical software (version 8.0). All P values were 2
sided, and values less than .05 were considered statisti-
cally significant.
This study protocol was approved by the Ethics Com-
mittee of the Universidad Mayor of Santiago, Chile.
Results
We analyzed 51,130 patients with first-ever ischemic
stroke admitted to 272 hospitals across Chile from Janu-
ary 1, 2003, to December 31, 2007 (Fig 1). Of these,
52.1% of the patients weremen. Themean age at the event
was 69.0 years (SD 12.5) for men and 72.0 years (SD 13.7)
for women. A total of 8842 events were registered in 2003
and 12,545 in 2007. For all the years studied, the mean
length of hospital stay was 9.8 days (SD 14.2), and 10%
of the patients were discharged after 20 or more days.
During follow-up, we identified 23,626 (46.2% of pa-
tients) deaths. The median follow-up was 3.3
years (range ,1 day to 8.0 years). Causes of death were
cerebrovascular disease (37.1%), other cardiovascular dis-
ease (30.5%), cancer (7.2%), diabetes (5.9%), and other
causes (19.3%). The 7-day, 30-day, 1-year, and 3-year sur-
vival rates were 88.9% (95% CI 88.6%-89.2%), 81.9% (95%
CI 81.6%-82.3%), 69.9% (95% CI 69.5%-70.3%), and 61.2%
(95% CI 60.7%-61.6%), respectively. When we compared
patients admitted in each consecutive period from 2003
to 2007, we found that survival gradually improved in
all follow-up periods (Table 1). The univariate analysis
showed that survival rates were higher in men than
women in all follow-ups. Survival rate decreased at ad-
vanced ages. Patients discharged from hospitals in the
geographic regions of North and South had lower sur-
vival rates than those subjects discharged in other geo-
graphic regions. The 7-day, 30-day, 1-year, and 3-year
survival rates were lower in patients having public health
insurance (low income) compared with public health in-
surance (middle-high income) and private health insur-
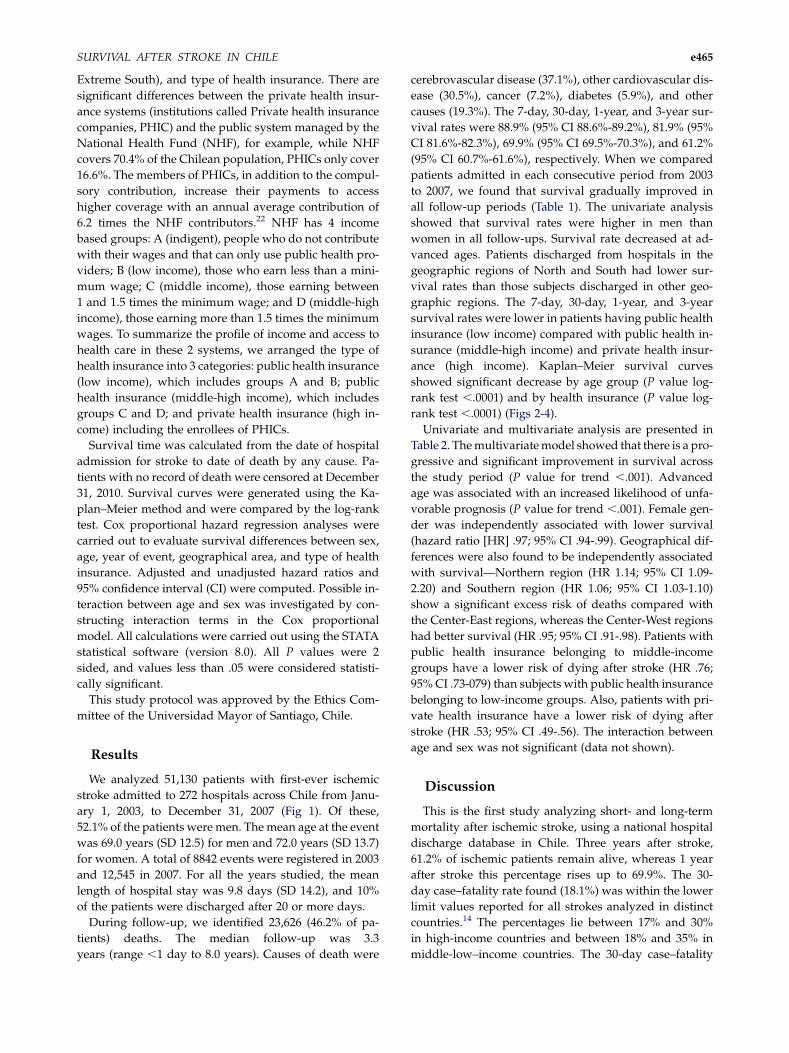
ance (high income). Kaplan–Meier survival curves
showed significant decrease by age group (P value log-
rank test ,.0001) and by health insurance (P value log-
rank test ,.0001) (Figs 2-4).
Univariate and multivariate analysis are presented in
Table 2. Themultivariatemodel showed that there is a pro-
gressive and significant improvement in survival across
the study period (P value for trend ,.001). Advanced
age was associated with an increased likelihood of unfa-
vorable prognosis (P value for trend ,.001). Female gen-
der was independently associated with lower survival
(hazard ratio [HR] .97; 95% CI .94-.99). Geographical dif-
ferences were also found to be independently associated
with survival—Northern region (HR 1.14; 95% CI 1.09-
2.20) and Southern region (HR 1.06; 95% CI 1.03-1.10)
show a significant excess risk of deaths compared with
the Center-East regions, whereas the Center-West regions
had better survival (HR .95; 95% CI .91-.98). Patients with
public health insurance belonging to middle-income
groups have a lower risk of dying after stroke (HR .76;
95% CI .73-079) than subjects with public health insurance
belonging to low-income groups. Also, patients with pri-
vate health insurance have a lower risk of dying after
stroke (HR .53; 95% CI .49-.56). The interaction between
age and sex was not significant (data not shown).
Discussion
This is the first study analyzing short- and long-term
mortality after ischemic stroke, using a national hospital
discharge database in Chile. Three years after stroke,
61.2% of ischemic patients remain alive, whereas 1 year
after stroke this percentage rises up to 69.9%. The 30-
day case–fatality rate found (18.1%) was within the lower
limit values reported for all strokes analyzed in distinct
countries.14 The percentages lie between 17% and 30%
in high-income countries and between 18% and 35% in
middle-low–income countries. The 30-day case–fatality
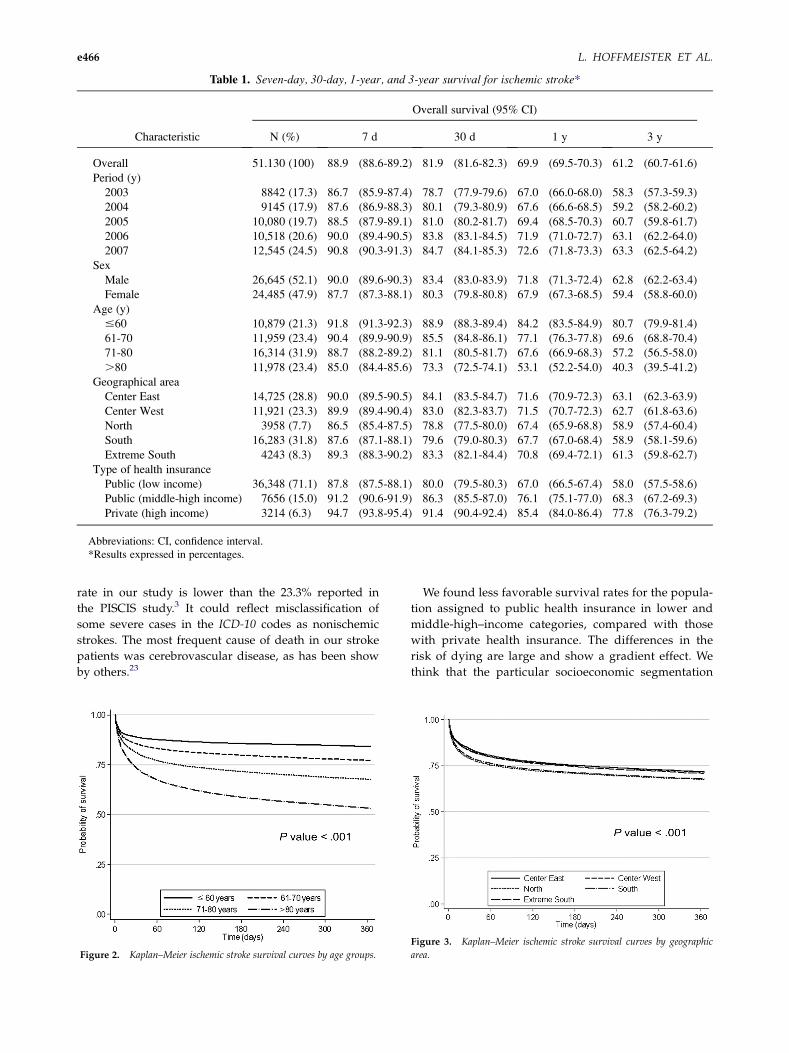
Table 1. Seven-day, 30-day, 1-year, and 3-year survival for ischemic stroke*
Characteristic
Overall survival (95% CI)
N (%) 7 d 30 d 1 y 3 y
Overall 51.130 (100) 88.9 (88.6-89.2) 81.9 (81.6-82.3) 69.9 (69.5-70.3) 61.2 (60.7-61.6)
Period (y)
2003 8842 (17.3) 86.7 (85.9-87.4) 78.7 (77.9-79.6) 67.0 (66.0-68.0) 58.3 (57.3-59.3)
2004 9145 (17.9) 87.6 (86.9-88.3) 80.1 (79.3-80.9) 67.6 (66.6-68.5) 59.2 (58.2-60.2)
2005 10,080 (19.7) 88.5 (87.9-89.1) 81.0 (80.2-81.7) 69.4 (68.5-70.3) 60.7 (59.8-61.7)
2006 10,518 (20.6) 90.0 (89.4-90.5) 83.8 (83.1-84.5) 71.9 (71.0-72.7) 63.1 (62.2-64.0)
2007 12,545 (24.5) 90.8 (90.3-91.3) 84.7 (84.1-85.3) 72.6 (71.8-73.3) 63.3 (62.5-64.2)
Sex
Male 26,645 (52.1) 90.0 (89.6-90.3) 83.4 (83.0-83.9) 71.8 (71.3-72.4) 62.8 (62.2-63.4)
Female 24,485 (47.9) 87.7 (87.3-88.1) 80.3 (79.8-80.8) 67.9 (67.3-68.5) 59.4 (58.8-60.0)
Age (y)
#60 10,879 (21.3) 91.8 (91.3-92.3) 88.9 (88.3-89.4) 84.2 (83.5-84.9) 80.7 (79.9-81.4)
61-70 11,959 (23.4) 90.4 (89.9-90.9) 85.5 (84.8-86.1) 77.1 (76.3-77.8) 69.6 (68.8-70.4)
71-80 16,314 (31.9) 88.7 (88.2-89.2) 81.1 (80.5-81.7) 67.6 (66.9-68.3) 57.2 (56.5-58.0)
.80 11,978 (23.4) 85.0 (84.4-85.6) 73.3 (72.5-74.1) 53.1 (52.2-54.0) 40.3 (39.5-41.2)
Geographical area
Center East 14,725 (28.8) 90.0 (89.5-90.5) 84.1 (83.5-84.7) 71.6 (70.9-72.3) 63.1 (62.3-63.9)
Center West 11,921 (23.3) 89.9 (89.4-90.4) 83.0 (82.3-83.7) 71.5 (70.7-72.3) 62.7 (61.8-63.6)
North 3958 (7.7) 86.5 (85.4-87.5) 78.8 (77.5-80.0) 67.4 (65.9-68.8) 58.9 (57.4-60.4)
South 16,283 (31.8) 87.6 (87.1-88.1) 79.6 (79.0-80.3) 67.7 (67.0-68.4) 58.9 (58.1-59.6)
Extreme South 4243 (8.3) 89.3 (88.3-90.2) 83.3 (82.1-84.4) 70.8 (69.4-72.1) 61.3 (59.8-62.7)
Type of health insurance
Public (low income) 36,348 (71.1) 87.8 (87.5-88.1) 80.0 (79.5-80.3) 67.0 (66.5-67.4) 58.0 (57.5-58.6)
Public (middle-high income) 7656 (15.0) 91.2 (90.6-91.9) 86.3 (85.5-87.0) 76.1 (75.1-77.0) 68.3 (67.2-69.3)
Private (high income) 3214 (6.3) 94.7 (93.8-95.4) 91.4 (90.4-92.4) 85.4 (84.0-86.4) 77.8 (76.3-79.2)
Abbreviations: CI, confidence interval.
*Results expressed in percentages.
L. HOFFMEISTER ET AL.e466
rate in our study is lower than the 23.3% reported in
the PISCIS study.3 It could reflect misclassification of
some severe cases in the ICD-10 codes as nonischemic
strokes. The most frequent cause of death in our stroke
patients was cerebrovascular disease, as has been show
by others.23
Figure 2. Kaplan–Meier ischemic stroke survival curves by age groups.
We found less favorable survival rates for the popula-
tion assigned to public health insurance in lower and
middle-high–income categories, compared with those
with private health insurance. The differences in the
risk of dying are large and show a gradient effect. We
think that the particular socioeconomic segmentation
Figure 3. Kaplan–Meier ischemic stroke survival curves by geographic
area.
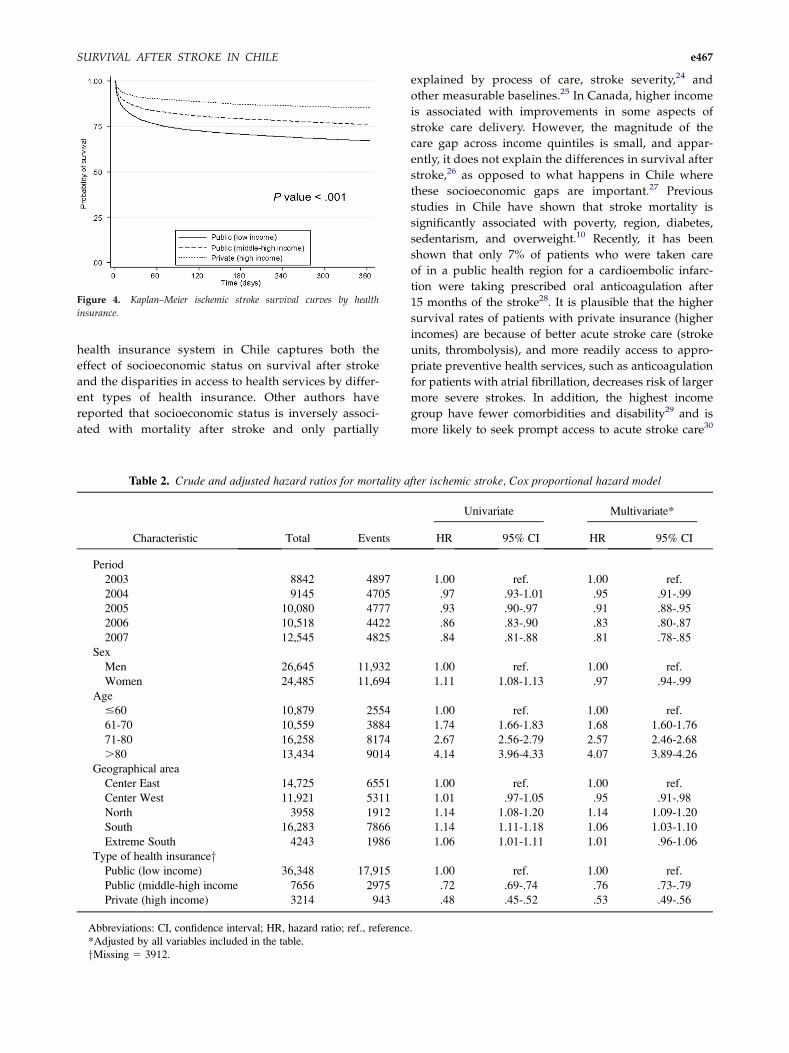
Figure 4. Kaplan–Meier ischemic stroke survival curves by health
insurance.
SURVIVAL AFTER STROKE IN CHILE e467
health insurance system in Chile captures both the
effect of socioeconomic status on survival after stroke
and the disparities in access to health services by differ-
ent types of health insurance. Other authors have
reported that socioeconomic status is inversely associ-
ated with mortality after stroke and only partially
Table 2. Crude and adjusted hazard ratios for mortality a
Characteristic Total Events
Period
2003 8842 4897
2004 9145 4705
2005 10,080 4777
2006 10,518 4422
2007 12,545 4825
Sex
Men 26,645 11,932
Women 24,485 11,694
Age
#60 10,879 2554
61-70 10,559 3884
71-80 16,258 8174
.80 13,434 9014
Geographical area
Center East 14,725 6551
Center West 11,921 5311
North 3958 1912
South 16,283 7866
Extreme South 4243 1986
Type of health insuranceyPublic (low income) 36,348 17,915
Public (middle-high income 7656 2975
Private (high income) 3214 943
Abbreviations: CI, confidence interval; HR, hazard ratio; ref., reference
*Adjusted by all variables included in the table.
yMissing 5 3912.
explained by process of care, stroke severity,24 and
other measurable baselines.25 In Canada, higher income
is associated with improvements in some aspects of
stroke care delivery. However, the magnitude of the
care gap across income quintiles is small, and appar-
ently, it does not explain the differences in survival after
stroke,26 as opposed to what happens in Chile where
these socioeconomic gaps are important.27 Previous
studies in Chile have shown that stroke mortality is
significantly associated with poverty, region, diabetes,
sedentarism, and overweight.10 Recently, it has been
shown that only 7% of patients who were taken care
of in a public health region for a cardioembolic infarc-
tion were taking prescribed oral anticoagulation after
15 months of the stroke28. It is plausible that the higher
survival rates of patients with private insurance (higher
incomes) are because of better acute stroke care (stroke
units, thrombolysis), and more readily access to appro-
priate preventive health services, such as anticoagulation
for patients with atrial fibrillation, decreases risk of larger
more severe strokes. In addition, the highest income
group have fewer comorbidities and disability29 and is
more likely to seek prompt access to acute stroke care30
fter ischemic stroke, Cox proportional hazard model
Univariate Multivariate*
HR 95% CI HR 95% CI
1.00 ref. 1.00 ref.
.97 .93-1.01 .95 .91-.99
.93 .90-.97 .91 .88-.95
.86 .83-.90 .83 .80-.87
.84 .81-.88 .81 .78-.85
1.00 ref. 1.00 ref.
1.11 1.08-1.13 .97 .94-.99
1.00 ref. 1.00 ref.
1.74 1.66-1.83 1.68 1.60-1.76
2.67 2.56-2.79 2.57 2.46-2.68
4.14 3.96-4.33 4.07 3.89-4.26
1.00 ref. 1.00 ref.
1.01 .97-1.05 .95 .91-.98
1.14 1.08-1.20 1.14 1.09-1.20
1.14 1.11-1.18 1.06 1.03-1.10
1.06 1.01-1.11 1.01 .96-1.06
1.00 ref. 1.00 ref.
.72 .69-.74 .76 .73-.79
.48 .45-.52 .53 .49-.56
.
L. HOFFMEISTER ET AL.e468
that would improve survival compared with disadvan-
taged groups.
Our analysis shows geographical differences in sur-
vival after stroke in Chile, independent of sex and age
distribution. These results may be explained by the num-
ber of hospitals with more resources available for the
acute management of stroke at each region and by the dif-
ferent degrees of isolation affecting access to these medi-
cal services. For instance, Center-West and Center-East
regions are located mainly in urban zones with high pop-
ulation density and more hospitals facilities, presenting
a higher survival after stroke. Meanwhile, the South
area shows higher levels of poverty, lower population
density, and less hospital facilities, all of which may con-
tribute to higher stroke mortality rate and risk factors of
cerebrovascular diseases.10 The North area is a desert
mining and fishing region with relatively isolated small
urban centers and few large cities, showing increased
case–fatality rates, which could also be attributed to the
effect of environmental toxins such as high arsenic expo-
sure in drinking water as has been found in the city of
Antofagasta31,32 located in these region.
Our findings reveal a decreasing trend of the mortality
after stroke. A systematic review of epidemiological stud-
ies of case fatality between 1980 and 2005 found a trend
toward decreasing rates in high-income countries, with
an annual percentage variation of 1.1%, and a lower de-
creasing trend in middle-low–income countries but
with an annual variation of .6%.14 A population-based
study in Brazil showed that the case–fatality rate
decreased from 26.6% in 1995 to 19.1% in 2005-2006.33 Ac-
cording to some authors, the variables associated with
this decrease were a lower incidence of severe cases34
and also a cohort effect35 as life expectancy in the general
population was also improving. Other authors indicate
that the decline in case fatality is because of improve-
ments in the acute management of stroke, such as stroke
units.36 However, in Chile, only recently have stroke units
begun to be implemented and very few patients are taken
care of in these units. Since 2005, through the Regimen
of Explicit Guarantees in Health, improved access to hos-
pital admission, CT scanning, access to neurological con-
sultation, and rehabilitation are guaranteed to all the
population,37 and this may be contributing to improve
survival.
The analysis showed that survival was lower among
women. However, this difference is not observed in the
multivariate analysis. Some studies have reported gender
differences in mortality after stroke.38-40 The increased
case–fatality rate in women is not associated with the
level of care as it is with advanced age, unconsciousness
at presentation (severity), depression, and deep vein
thrombosis.41 We have no data on severity, but these dif-
ferences could be partly explained by the distribution of
pathologic subtypes of ischemic strokes between men
and women. The PISCIS study reported an increased
risk of cardioembolic stroke in women, a pathologic sub-
type that has a higher case fatality than other subtypes.9
As far as we know, this is the largest study evaluating
survival in patients with ischemic stroke in Chile. We
used an exhaustive national register that covers hospital
discharges for ischemic stroke in different facility centers
from both networks of public and private health care.
One of the limitations of this study was the inability to
ascertain stroke severity, which has been shown to be one
of the most important short- and long-term prognostic
variables in stroke.5 Another limitation of this study
was that variables reflecting the characteristics of the hos-
pitals or the organization of health services for ischemic
stroke care could not be included. However, the geo-
graphical dimension allowed us to capture the entire geo-
graphical area of Chile and differences in the served
population.
In conclusion, we found that geographical area and
type of health insurance affect survival of stroke patients
in Chile, independently of age, sex, and period. This sug-
gests a major impact of socioeconomic factors and access
to acute management of stroke and mortality.
References
1. Murray CJ, Vos T, Lozano R, et al. Disability-adjusted lifeyears (DALYs) for 291 diseases and injuries in 21 regions,1990-2010: a systematic analysis for the Global Burden ofDisease Study 2010. Lancet 2012;380:2197-2223.
2. Johnston SC, Mendis S, Mathers CD. Global variation instroke burden and mortality: estimates from monitoring,surveillance, and modelling. Lancet Neurol 2009;8:345-354.
3. Lavados PM, Sacks C, Prina L, et al. Incidence, 30-daycase-fatality rate, and prognosis of stroke in Iquique,Chile: a 2-year community-based prospective study(PISCIS project). Lancet 2005;365:2206-2215.
4. Department of Statistics and Health Information. HealthIndicators 2010. Santiago, Chile: Ministry of Health, 2011.
5. Saposnik G, Hill MD, O’Donnell M, et al. Variables asso-ciated with 7-day, 30-day, and 1-year fatality after ische-mic stroke. Stroke 2008;39:2318-2324.
6. Saposnik G, Webster F, O’Callaghan C, et al. Optimizingdischarge planning: clinical predictors of longer stay afterrecombinant tissue plasminogen activator for acutestroke. Stroke 2005;36:147-150.
7. Fonarow GC, Reeves MJ, Smith EE, et al. Characteristics,performance measures, and in-hospital outcomes of thefirst one million stroke and transient ischemic attack ad-missions in get with the guidelines-stroke. Circ Cardio-vasc Qual Outcomes 2010;3:291-302.
8. Kolominsky-Rabas PL, Weber M, Gefeller O, et al. Epide-miology of ischemic stroke subtypes according to TOASTcriteria: incidence, recurrence, and long-term survival inischemic stroke subtypes: a population-based study.Stroke 2001;32:2735-2740.
9. Lavados PM, Sacks C, Prina L, et al. Incidence, case-fatality rate, and prognosis of ischaemic stroke subtypesin a predominantly Hispanic-Mestizo population in Iqui-que, Chile (PISCIS project): a community-based incidencestudy. Lancet Neurol 2007;6:140-148.
SURVIVAL AFTER STROKE IN CHILE e469
10. Lavados PM, Diaz V, Jadue L, et al. Socioeconomic andcardiovascular variables explaining regional variationsin stroke mortality in Chile: an ecological study. Neuroe-pidemiology 2011;37:45-51.
11. Addo J, Ayerbe L, Mohan KM, et al. Socioeconomicstatus and stroke: an updated review. Stroke 2012;43:1186-1191.
12. Rey V, Faouzi M, Huchmand-Zadeh M, et al. Stroke ini-tial severity and outcome relative to insurance statusin a universal health care system in Switzerland. Eur JNeurol 2011;18:1094-1097.
13. Cox AM, McKevitt C, Rudd AG, et al. Socioeconomicstatus and stroke. Lancet Neurol 2006;5:181-188.
14. Feigin VL, Lawes CM, Bennett DA, et al. Worldwidestroke incidence and early case fatality reported in 56population-based studies: a systematic review. LancetNeurol 2009;8:355-369.
15. Mayo NE, Nadeau L, Daskalopoulou SS, et al. Theevolution of stroke in Quebec: a 15-year perspective.Neurology 2007;68:1122-1127.
16. Sturgeon JD, Folsom AR. Trends in hospitalization rate,hospital case fatality, and mortality rate of stroke bysubtype in Minneapolis-St. Paul, 1980-2002. Neuroepi-demiology 2007;28:39-45.
17. Stegmayr B, Asplund K. Improved survival after strokebut unchanged risk of incidence. Lakartidningen 2003;100:3492-3498.
18. Tu JV, Nardi L, Fang J, et al. National trends in rates ofdeath and hospital admissions related to acute myocar-dial infarction, heart failure and stroke, 1994-2004.CMAJ 2009;180:E118-E125.
19. Hoffmeister L, Lavados PM, ComasM, et al. Performancemeasures for in-hospital care of acute ischemic stroke inpublic hospitals in Chile. BMC Neurol 2013;13:23.
20. National Institute of Statistics. Mortality trends in Chileof death causes and age, 1990-2007. Santiago, Chile: Na-tional Institute of Statistics, 2010.
21. Mathers CD, Fat DM, Inoue M, et al. Counting the deadand what they died from: an assessment of the global sta-tus of cause of death data. Bull World Health Organ 2005;83:171-177.
22. Urriola R. Chile: social protection in health. Rev PanamSalud Publica 2006;20:273-286.
23. Boysen G, Marott JL, Gronbaek M, et al. Long-termsurvival after stroke: 30 years of follow-up in a cohort,the Copenhagen City Heart Study. Neuroepidemiology2009;33:254-260.
24. Kerr GD, Higgins P, Walters M, et al. Socioeconomicstatus and transient ischaemic attack/stroke: a pros-pective observational study. Cerebrovasc Dis 2011;31:130-137.
25. KapralMK,Fang J,ChanC, et al.Neighborhood incomeandstroke care and outcomes. Neurology 2012;79:1200-1207.
26. Huang K, Khan N, Kwan A, et al. Socioeconomic statusand care after stroke: results from the Registry of the Ca-nadian Stroke Network. Stroke 2013;44:477-482.
27. OECD. Divided We Stand: Why Inequality KeepsRising. http://dx.doi.org/10.1787/9789264119536-en:OECD Publishing; 2011
28. Munoz-Venturelli P, Sacks C, Madrid E, Lavados PM.Long-term Adherence to National Guidelines for Second-ary Prevention of Ischemic Stroke: A Prospective CohortStudy in a Public Hospital in Chile. J Stroke CerebrovascDis 2013 [Epub ahead of print].
29. Fuentes-Garcia A, Sanchez H, Lera L, et al. Socioeco-nomic inequalities in the onset and progression of dis-ability in a cohort of older people in Santiago (Chile).Gac Sanit 2013;27(3):226-232.
30. Abilleira S, Lucente G, Ribera A, et al. Patient-related fea-tures associated with a delay in seeking care after stroke.Eur J Neurol 2011;18(6):850-856.
31. Lisabeth LD, Ahn HJ, Chen JJ, et al. Arsenic in drinkingwater and stroke hospitalizations in Michigan. Stroke2010;41:2499-2504.
32. Moon K, Guallar E, Navas-Acien A. Arsenic exposureand cardiovascular disease: an updated systematic re-view. Curr Atheroscler Rep 2012;14:542-555.
33. Cabral NL, Goncalves AR, Longo AL, et al. Trends instroke incidence, mortality and case fatality rates in Join-ville, Brazil: 1995-2006. J Neurol Neurosurg Psychiatry2009;80:749-754.
34. Rothwell PM, Coull AJ, Giles MF, et al. Change in strokeincidence, mortality, case-fatality, severity, and risk fac-tors in Oxfordshire, UK from 1981 to 2004 (Oxford Vascu-lar Study). Lancet 2004;363:1925-1933.
35. Benatru I, Rouaud O, Durier J, et al. Stable stroke inci-dence rates but improved case-fatality in Dijon, France,from 1985 to 2004. Stroke 2006;37:1674-1679.
36. Cadilhac DA, Pearce DC, Levi CR, et al. Improvements inthe quality of care and health outcomes with new strokecare units following implementation of a clinician-led,health system redesign programme in New South Wales,Australia. Qual Saf Health Care 2008;17:329-333.
37. Lavados PM, Salinas R, Maturana R. Government pro-grams for treating stroke in Chile. Int J Stroke 2007;2:51-52.
38. Appelros P, Stegmayr B, Terent A. Sex differences instroke epidemiology: a systematic review. Stroke 2009;40:1082-1090.
39. Lewsey JD, Gillies M, Jhund PS, et al. Sex differences inincidence, mortality, and survival in individuals withstroke in Scotland, 1986 to 2005. Stroke 2009;40:1038-1043.
40. Eriksson M, Glader EL, Norrving B, et al. Sex differencesin stroke care and outcome in the Swedish national qual-ity register for stroke care. Stroke 2009;40:909-914.
41. Saposnik G, Kapral MK. Understanding stroke in women:similar care, worse outcomes? Stroke 2009;40:674-675.