SHENZHEN PROPERTIES & RESOURCES DEVELOPMENT ...
23
SHENZHEN PROPERTIES & RESOURCES DEVELOPMENT (GROUP) LTD. THE THIRD QUARTERLY REPORT 2012 I. Important Notes The Board of Directors, the Supervisory Committee as well as directors, supervisors and senior executives of Shenzhen Properties & Resources Development (Group) Ltd. (hereinafter referred to as the Company) guarantee that this report carries no false information, misleading statements or major omissions, and accept, individually and collectively, the responsibility for the factuality, accuracy and completeness of the information set forth herein. All directors attended the board session for reviewing this report. Chen Yugang (principal of the Company), Wang Hangjun (the person in charge of the accounting work) and Shen Xueying (the person in charge of the accounting organ/the principal of accounting) hereby confirm that the financial statements enclosed in the quarterly report are factual and complete. II. Company Profile (I)Major accounting data and financial indexes Any retrospective adjustment in previous financial statements? √ Yes □No □ Inapplicable 31 Dec. 2011 Increase/decrease (%) 30 Sept. 2012 Before adjustment After adjustment After adjustment Total assets (RMB Yuan) 4,081,206,075.30 3,499,608,314.21 3,526,566,922.95 15.73% Owners’ equity attributable to shareholders of the Company (RMB Yuan) 1,302,003,177.35 1,130,243,873.92 1,141,461,317.97 14.06% Share capital (Share) 595,979,092.00 595,979,092 595,979,092.00 0% Net assets per share attributable to shareholders of the Company (RMB Yuan/share) 2.1846 1.8964 1.9153 14.06% Jul.-Sept. 2012 YoY increase/decrease (%) Jan.-Sept. 2012 YoY increase/decrease (%) Gross operating revenues (RMB Yuan) 418,381,326.42 179.51% 1,041,304,227.34 -20.24% Net profit attributable to shareholders of the Company (RMB Yuan) 76,322,473.56 863.87% 174,644,758.87 -43.55% Net cash flow from operating activities (RMB Yuan) -- -- 587,922,305.81 -239.93% Net cash flow per share from operating activities (RMB Yuan/share) -- -- 0.9865 -239.93% Basic EPS (RMB Yuan/share) 0.1281 863.87% 0.293 -43.55% Diluted EPS (RMB Yuan/share) 0.1281 863.87% 0.293 -43.55% 1
-
Upload
khangminh22 -
Category
Documents
-
view
0 -
download
0
Transcript of SHENZHEN PROPERTIES & RESOURCES DEVELOPMENT ...

SHENZHEN PROPERTIES & RESOURCES DEVELOPMENT (GROUP) LTD.
THE THIRD QUARTERLY REPORT 2012
I. Important Notes
The Board of Directors, the Supervisory Committee as well as directors, supervisors and senior executives of Shenzhen Properties & Resources Development (Group) Ltd. (hereinafter referred to as the Company) guarantee that this report carries no false information, misleading statements or major omissions, and accept, individually and collectively, the responsibility for the factuality, accuracy and completeness of the information set forth herein. All directors attended the board session for reviewing this report. Chen Yugang (principal of the Company), Wang Hangjun (the person in charge of the accounting work) and Shen Xueying (the person in charge of the accounting organ/the principal of accounting) hereby confirm that the financial statements enclosed in the quarterly report are factual and complete.
II. Company Profile
(I)Major accounting data and financial indexes
Any retrospective adjustment in previous financial statements? √ Yes □No □ Inapplicable
31 Dec. 2011 Increase/decrease (%) 30 Sept. 2012
Before adjustment After adjustment After adjustment
Total assets (RMB Yuan) 4,081,206,075.30 3,499,608,314.21 3,526,566,922.95 15.73%
Owners’ equity attributable to shareholders of the Company (RMB Yuan)
1,302,003,177.35 1,130,243,873.92 1,141,461,317.97 14.06%
Share capital (Share) 595,979,092.00 595,979,092 595,979,092.00 0%
Net assets per share attributable to shareholders of the Company (RMB Yuan/share)
2.1846 1.8964 1.9153 14.06%
Jul.-Sept. 2012 YoY increase/decrease (%) Jan.-Sept. 2012 YoY increase/decrease
(%) Gross operating revenues (RMB Yuan) 418,381,326.42 179.51% 1,041,304,227.34 -20.24%
Net profit attributable to shareholders of the Company (RMB Yuan)
76,322,473.56 863.87% 174,644,758.87 -43.55%
Net cash flow from operating activities (RMB Yuan) -- -- 587,922,305.81 -239.93%
Net cash flow per share from operating activities (RMB Yuan/share)
-- -- 0.9865 -239.93%
Basic EPS (RMB Yuan/share) 0.1281 863.87% 0.293 -43.55%
Diluted EPS (RMB Yuan/share) 0.1281 863.87% 0.293 -43.55%
1

Weighted average ROE (%) 6.25% 5.48% 14.29% -15.54%
Weighted average ROE after deducting non-recurring gains and losses (%)
6.19% 5.41% 13.63% -15.99%
Items of non-recurring gains and losses √Applicable □Inapplicable
Item Amount during
Jan.-Sept. 2012 (RMB Yuan)
Notes
Gains and losses on disposal of non-current assets 9,524,761.46
“Gains and losses on disposal of non-current assets” referred to gains and losses on disposal of fixed assets and investing properties.
Tax rebate, reduction or exemption due to un-authorized approval or the lack of formal approval documents
Government grants recognized in the current year, except for those acquired in the ordinary course of business or granted at certain quotas or amounts according to the country’s unified standards
Capital occupation fees received from non-financial enterprises that are included in current gains and losses
Gains generated when the investment costs of the Company’s acquiring subsidiaries, associates and joint ventures are less than the fair value of identifiable net assets in the investees attributable to the Company in the acquisition of the investments
Exchange gains and losses of non-monetary assets -2,348,164.39
“Exchange gains and losses of non-monetary assets” referred to the transfer taxes and fares arising from the asset exchanges carried out between the Company and its controlling shareholder due to the share reform commitment.
Gains and losses through entrusting others to invest or manage assets
Various asset impairment provisions due to acts of God such as natural disasters
Gains and losses on debt restructuring
Enterprise reorganization expenses, such as expenses on employee settlement and integration
Gains and losses on the parts exceeding the fair value when prices of transactions become unfair
Net current gains and losses from the period-begin to the combination date of subsidiaries due to business combinations under the same control
1,912,516.93
“Net current gains and losses from the period-begin to the combination date of subsidiaries due to business combinationsunder the same control” mainly referred to net gains and losses (including reversed interest on internal entrustment loans) for Jan.-May 2012 of the 100% equity interests of Shenzhen Shenxin Taxi Co., Ltd. obtained by the Company under the same control. For details, see Note (IV) to the Financial Statements.
Gains and losses on contingent matters which are irrelevant to the normal operation of the Company
Gains and losses on fair value changes of transactional financial assets and liabilities, and investment gains on disposal of transactional financial assets and liabilities and available-for-sale financial assets, except for the effective hedging business related to the Company’s normal operation
2
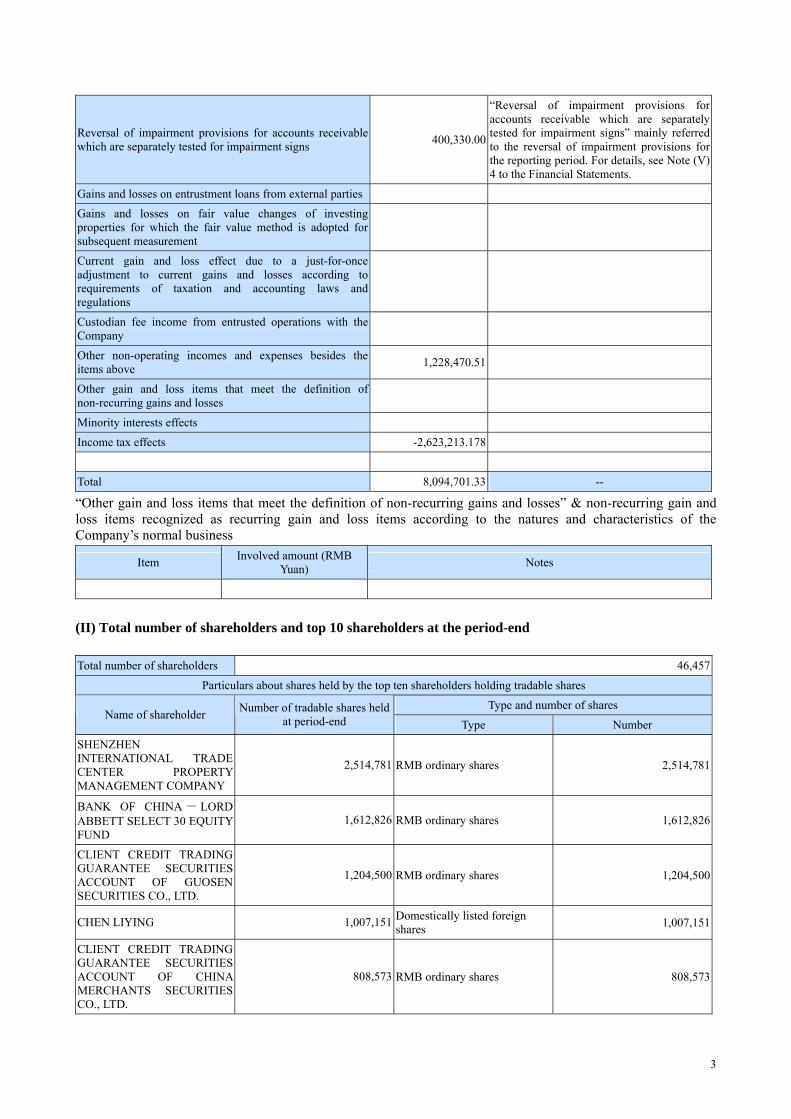
Reversal of impairment provisions for accounts receivable which are separately tested for impairment signs 400,330.00
“Reversal of impairment provisions for accounts receivable which are separately tested for impairment signs” mainly referred to the reversal of impairment provisions for the reporting period. For details, see Note (V) 4 to the Financial Statements.
Gains and losses on entrustment loans from external parties Gains and losses on fair value changes of investing properties for which the fair value method is adopted for subsequent measurement
Current gain and loss effect due to a just-for-once adjustment to current gains and losses according to requirements of taxation and accounting laws and regulations
Custodian fee income from entrusted operations with the Company
Other non-operating incomes and expenses besides the items above 1,228,470.51
Other gain and loss items that meet the definition of non-recurring gains and losses
Minority interests effects
Income tax effects -2,623,213.178
Total 8,094,701.33 --
“Other gain and loss items that meet the definition of non-recurring gains and losses” & non-recurring gain and loss items recognized as recurring gain and loss items according to the natures and characteristics of the Company’s normal business
Item Involved amount (RMB Yuan) Notes
(II) Total number of shareholders and top 10 shareholders at the period-end
Total number of shareholders 46,457
Particulars about shares held by the top ten shareholders holding tradable shares
Type and number of shares Name of shareholder Number of tradable shares held
at period-end Type Number SHENZHEN INTERNATIONAL TRADE CENTER PROPERTY MANAGEMENT COMPANY
2,514,781 RMB ordinary shares 2,514,781
BANK OF CHINA - LORD ABBETT SELECT 30 EQUITY FUND
1,612,826 RMB ordinary shares 1,612,826
CLIENT CREDIT TRADING GUARANTEE SECURITIES ACCOUNT OF GUOSEN SECURITIES CO., LTD.
1,204,500 RMB ordinary shares 1,204,500
CHEN LIYING 1,007,151 Domestically listed foreign shares 1,007,151
CLIENT CREDIT TRADING GUARANTEE SECURITIES ACCOUNT OF CHINA MERCHANTS SECURITIES CO., LTD.
808,573 RMB ordinary shares 808,573
3
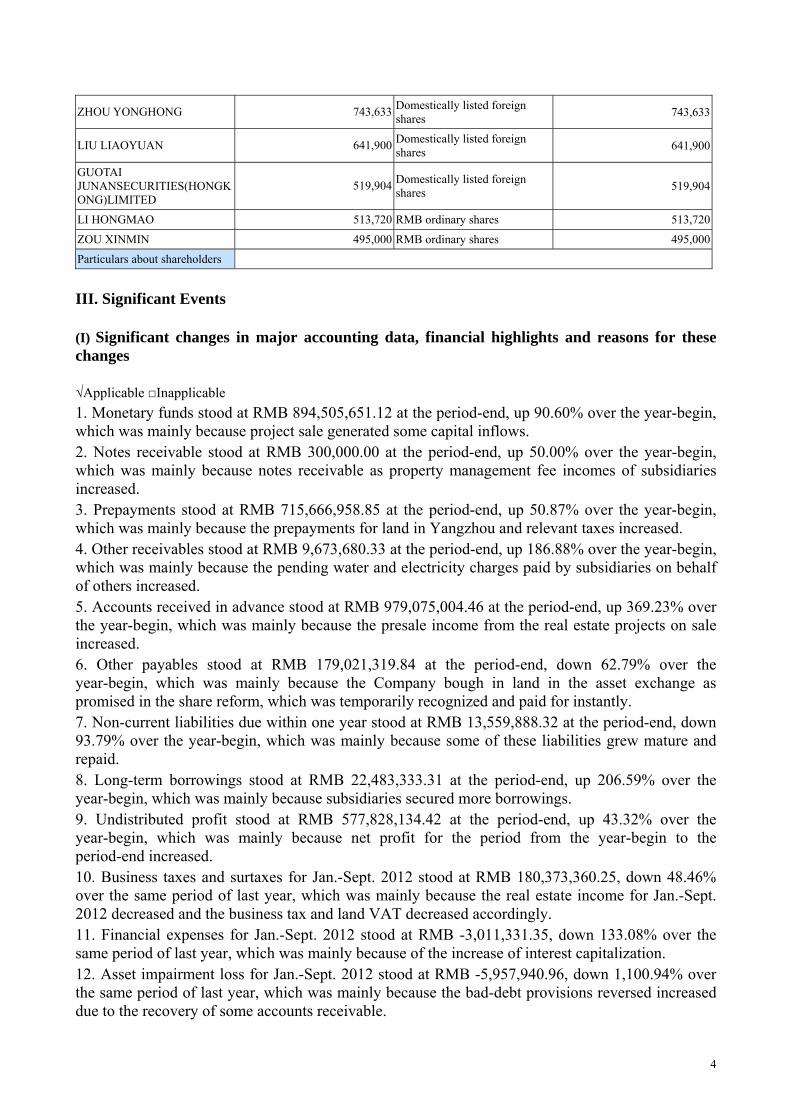
ZHOU YONGHONG 743,633 Domestically listed foreign shares 743,633
LIU LIAOYUAN 641,900 Domestically listed foreign shares 641,900
GUOTAI JUNANSECURITIES(HONGKONG)LIMITED
519,904 Domestically listed foreign shares 519,904
LI HONGMAO 513,720 RMB ordinary shares 513,720
ZOU XINMIN 495,000 RMB ordinary shares 495,000
Particulars about shareholders
III. Significant Events
(I) Significant changes in major accounting data, financial highlights and reasons for these changes
√Applicable □Inapplicable
1. Monetary funds stood at RMB 894,505,651.12 at the period-end, up 90.60% over the year-begin, which was mainly because project sale generated some capital inflows. 2. Notes receivable stood at RMB 300,000.00 at the period-end, up 50.00% over the year-begin, which was mainly because notes receivable as property management fee incomes of subsidiaries increased. 3. Prepayments stood at RMB 715,666,958.85 at the period-end, up 50.87% over the year-begin, which was mainly because the prepayments for land in Yangzhou and relevant taxes increased. 4. Other receivables stood at RMB 9,673,680.33 at the period-end, up 186.88% over the year-begin, which was mainly because the pending water and electricity charges paid by subsidiaries on behalf of others increased. 5. Accounts received in advance stood at RMB 979,075,004.46 at the period-end, up 369.23% over the year-begin, which was mainly because the presale income from the real estate projects on sale increased. 6. Other payables stood at RMB 179,021,319.84 at the period-end, down 62.79% over the year-begin, which was mainly because the Company bough in land in the asset exchange as promised in the share reform, which was temporarily recognized and paid for instantly. 7. Non-current liabilities due within one year stood at RMB 13,559,888.32 at the period-end, down 93.79% over the year-begin, which was mainly because some of these liabilities grew mature and repaid. 8. Long-term borrowings stood at RMB 22,483,333.31 at the period-end, up 206.59% over the year-begin, which was mainly because subsidiaries secured more borrowings. 9. Undistributed profit stood at RMB 577,828,134.42 at the period-end, up 43.32% over the year-begin, which was mainly because net profit for the period from the year-begin to the period-end increased. 10. Business taxes and surtaxes for Jan.-Sept. 2012 stood at RMB 180,373,360.25, down 48.46% over the same period of last year, which was mainly because the real estate income for Jan.-Sept. 2012 decreased and the business tax and land VAT decreased accordingly. 11. Financial expenses for Jan.-Sept. 2012 stood at RMB -3,011,331.35, down 133.08% over the same period of last year, which was mainly because of the increase of interest capitalization. 12. Asset impairment loss for Jan.-Sept. 2012 stood at RMB -5,957,940.96, down 1,100.94% over the same period of last year, which was mainly because the bad-debt provisions reversed increased due to the recovery of some accounts receivable.
4

13. Investment income for Jan.-Sept. 2012 stood at RMB 2,053,061.42, up 47.89% over the same period of last year, which was mainly because the associates generated more gains. 14. Investment income from associates and joint ventures for Jan.-Sept. 2012 stood at RMB 2,053,061.42, up 79.34% over the same period of last year, which was mainly because the associate Shenzhen Guomao Tian’an Properties Co., Ltd. generated more profit. 15. Net non-operating amount for Jan.-Sept. 2012 stood at RMB 339,392.58, up 122.11% over the same period of last year, which was mainly because subsidiaries renewed vehicles and disposed old ones, which generated more income. 16. Income tax expenses for Jan.-Sept. 2012 stood at RMB 51,992,849.23, down 46.35% over the same period of last year, which was mainly because the profit contributed by the subsidiary Shenzhen Huangcheng Real Estate Co., Ltd. decreased considerably. 17. Operating profit, total profit and net profit for Jan.-Sept. 2012 stood at RMB 226,298,215.52, 226,637,608.10 and 174,644,758.87 respectively, down 44.51%, 44.21% and 43.55% respectively over the same period of last year, which was mainly because the carried over income from real estate for Jan.-Sept. 2012 decreased. 18. Net cash flows from operating activities for Jan.-Sept. 2012 stood at RMB 587,922,305.81, up 239.93% over the same period of last year, which was mainly because of more capital inflows from sale of properties. 19. Net cash flows from investing activities for Jan.-Sept. 2012 stood at RMB 8,021,682.48, up 206.97% over the same period of last year, which was mainly because the cash received as investment income increased. 20. Net cash flows from financing activities for Jan.-Sept. 2012 stood at RMB -170,791,033.25, down 149.88% over the same period of last year, which was mainly because the Company secure fewer borrowings and repaid more due borrowings. 21. Net increase in cash and cash equivalents for Jan.-Sept. 2012 stood at RMB 425,191,909.55, up 597.69% over the same period of last year, which was mainly because the Company received more income from house selling for Jan.-Sept. 2012.
(II) Progress of significant events and its influence, as well as the analysis and explanation on solutions
1. About non-standard audit opinion
□Applicable √Inapplicable
2. The Company offers capital to the controlling shareholder or its related parties or provides external guarantees in violation of the prescribed procedures.
□Applicable √Inapplicable
3. Signing and execution of significant contracts concerning routine operation
□Applicable √Inapplicable
4. Others
□Applicable √Inapplicable
5

(III) Commitments of the Company or shareholders with an over 5% shareholding made in or carried down into the reporting period
√Applicable □Inapplicable
Commitment Commitment maker Contents Commitment
time Commitment
period Fulfillment
Commitments made in a share reform
Shenzhen Investment Holdings Co., Ltd.
1. The Company’s non-tradable share holders Construction Holdings and Investment Management Company made a common commitment to abide by laws, regulations and rules and perform prescribed commitment duties. And they also made special commitments as follows: Non-tradable shares held by Construction Holdings and Investment Management Company would not be traded or transferred within 36 months since they acquired right of trade. After expiration of the aforesaid commitment, originally non-tradable shares sold through the listing and trading system on the Shenzhen Stock Exchange should not exceed 5 percents of total shares of the Company within 12 months, as well as not exceed 10 percents within 24 months. In case these companies acted against the
21 Oct. 2009 20 Oct. 2012
1. Up to the date of public notice, Construction Holdings and Investment Holdings never sold shares of the Company. 2. (1) Up to the date of public notice, Investment Holdings never sold shares of the Company actually controlled. (2) In order to implement the commitment, the Company prepared to start the relevant affairs together with Investment Holdings, and disclosed the Public Notice on Implementation of Commitment of Share Merger Reform on Assets Replacement and Significant Related Transaction, which was reviewed and approved at the First Special Shareholders’ General Meeting for 2010, for details, please refer to Public Notice on Resolutions of the First Special Shareholders’ General Meeting for 2010; Investment Holdings has applied to
6
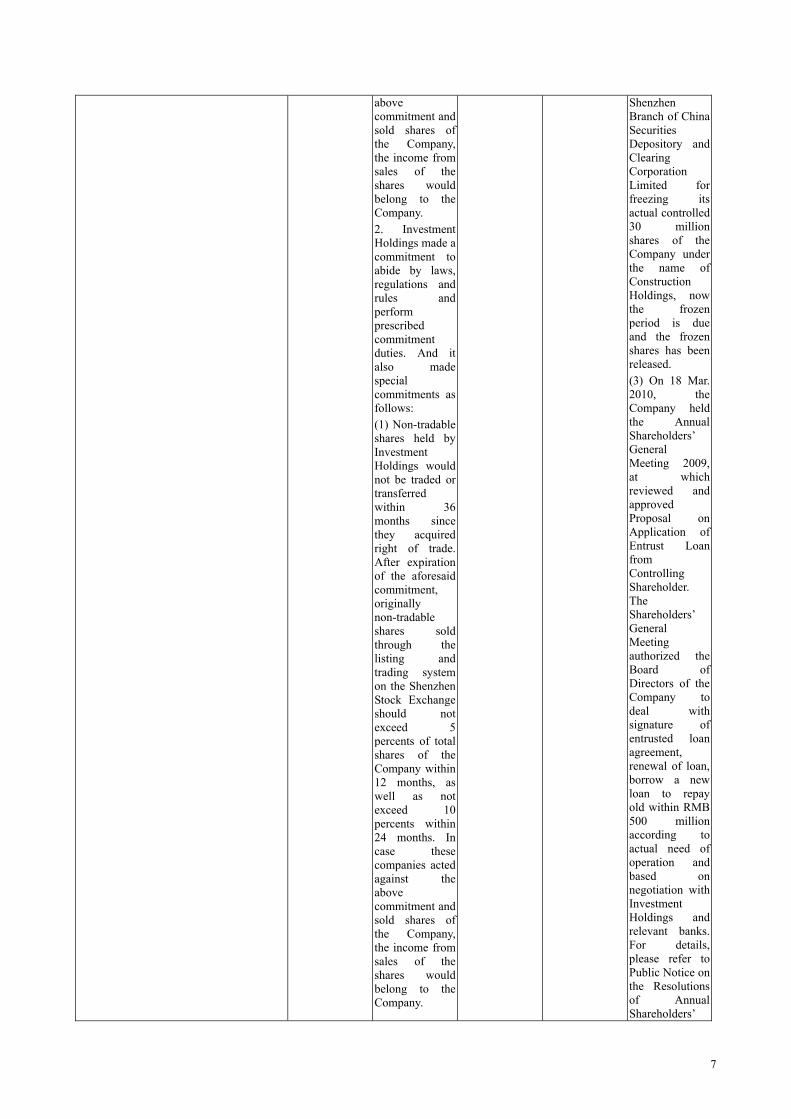
above commitment and sold shares of the Company, the income from sales of the shares would belong to the Company. 2. Investment Holdings made a commitment to abide by laws, regulations and rules and perform prescribed commitment duties. And it also made special commitments as follows: (1) Non-tradable shares held by Investment Holdings would not be traded or transferred within 36 months since they acquired right of trade. After expiration of the aforesaid commitment, originally non-tradable shares sold through the listing and trading system on the Shenzhen Stock Exchange should not exceed 5 percents of total shares of the Company within 12 months, as well as not exceed 10 percents within 24 months. In case these companies acted against the above commitment and sold shares of the Company, the income from sales of the shares would belong to the Company.
Shenzhen Branch of China Securities Depository and Clearing Corporation Limited for freezing its actual controlled 30 millionshares of the Company under the name of Construction Holdings, now the frozen period is due and the frozen shares has been released. (3) On 18 Mar. 2010, the Company held the Annual Shareholders’ General Meeting 2009, at which reviewed and approved Proposal on Application of Entrust Loan from Controlling Shareholder. The Shareholders’ General Meeting authorized the Board of Directors of the Company to deal with signature of entrusted loan agreement, renewal of loan, borrow a new loan to repay old within RMB 500 million according to actual need of operation and based on negotiation with Investment Holdings and relevant banks. For details, please refer to Public Notice on the Resolutions of Annual Shareholders’
7

(2) Within one year since the non-tradable shares held by Construction Holdings and Investment Management Company controlled by Investment Holdings acquired the right of trading, Shenzhen Investment Holdings Co., Ltd will start up capital injection to the Company, that is, Shenzhen Investment Holdings Co., Ltd will inject legitimate capital no less than RMB 500 million including land resource in lump sum or in batches by replace or other legitimate way, will increase land reserves of the Company and enhance profitability in the future. In case the aforesaid capital failed to start completely within one year, Shenzhen Investment Holdings Co., Ltd will compensate 20% of reorganization capital failing to start to the Company within 30 days when expiration of 1 year, and continued to implement the capital injection which had been started. As for the capital injection failing to start,
General Meeting on 19 Mar. 2010. On 28 Dec. 2010, Investment Holdings entrusted Shenzhen Jingtian Sub-branch of China Everbright Bank to provide entrust loan of RMB 10 million for the Company’s subsidiary Shenzhen ITC Vehicle Industry Co., Ltd.; from the end of report period to the date of the public notice, Investment Holdings has provided entrust loan of RMB 490 million for the Company. (4) Whether the commitment will be implemented is according to net profit of 2012.
8
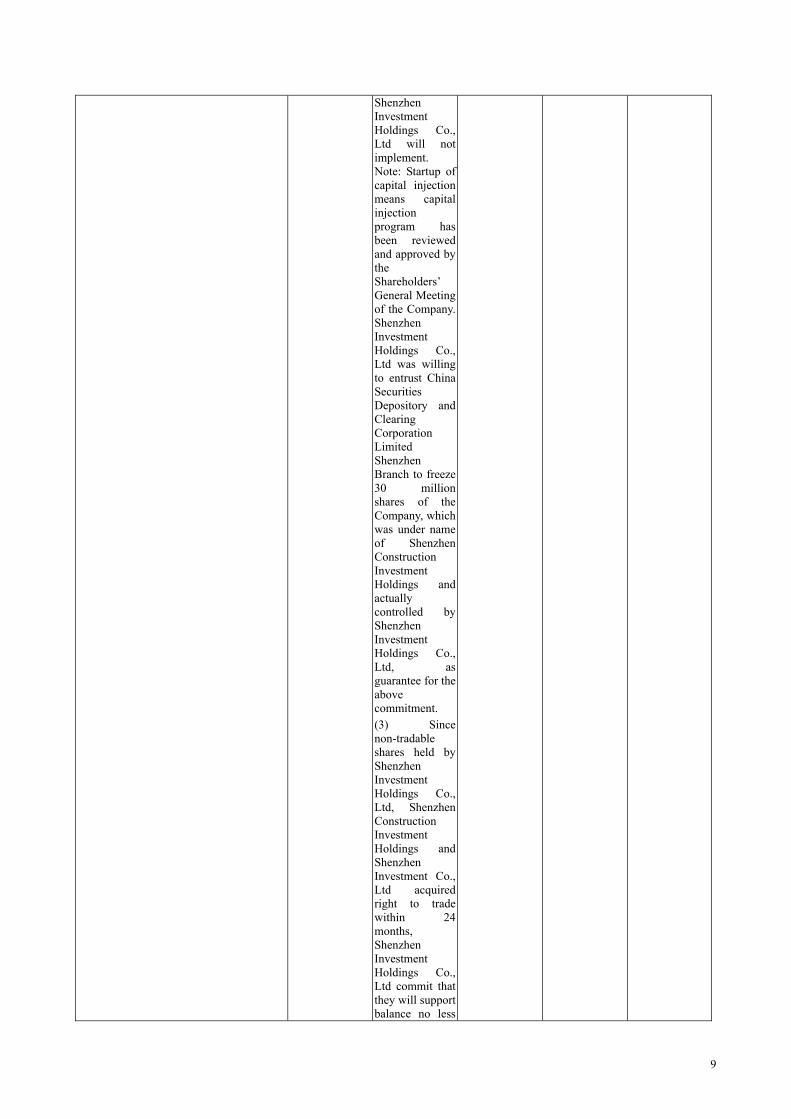
Shenzhen Investment Holdings Co., Ltd will not implement. Note: Startup of capital injection means capital injection program has been reviewed and approved by the Shareholders’ General Meeting of the Company. Shenzhen Investment Holdings Co., Ltd was willing to entrust China Securities Depository and Clearing Corporation Limited Shenzhen Branch to freeze 30 million shares of the Company, which was under name of Shenzhen Construction Investment Holdings and actually controlled by Shenzhen Investment Holdings Co., Ltd, as guarantee for the above commitment. (3) Since non-tradable shares held by Shenzhen Investment Holdings Co., Ltd, Shenzhen Construction Investment Holdings and Shenzhen Investment Co., Ltd acquired right to trade within 24 months, Shenzhen Investment Holdings Co., Ltd commit that they will support balance no less
9

than RMB 500 million with method of entrust loan in line with relevant provisions of laws and administrative statutes to release nervous capital of the Company. The aforesaid balance means accumulative incurred amount within 24 months since the date when non-tradable shares held by Shenzhen Investment Holdings Co., Ltd, Shenzhen Construction Investment Holdings and Shenzhen Investment Co., Ltd acquired right to trade, and each entrust loan for support will not be less than 12 months; the above cash support of RMB 500 million excluded entrust loan offered before the date when non-tradable shares held by Shenzhen Investment Holdings Co., Ltd, Shenzhen Construction Investment Holdings and Shenzhen Investment Co., Ltd acquired right to trade. (4) In case that net profit of the Company in any year of 2010, 2011 and 2012 was less than 2009, Shenzhen Investment Holdings Co., Ltd. will make
10
up balance of net profit between the year and 2009 with cash.
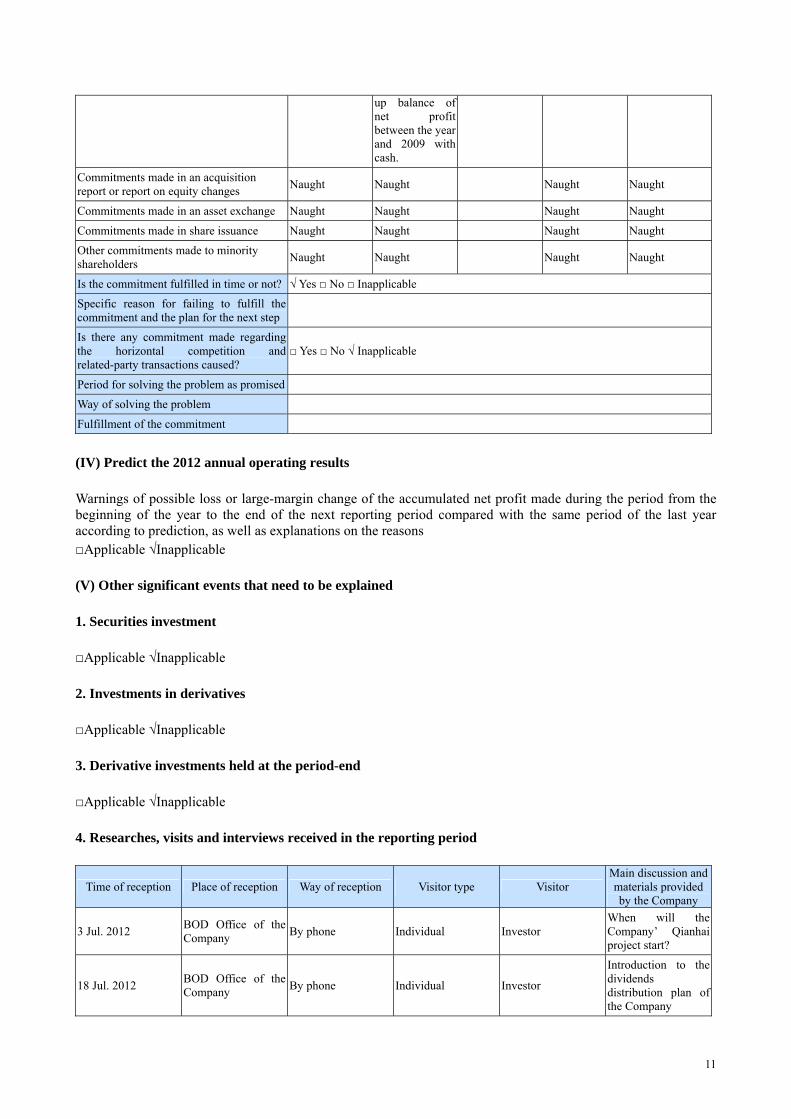
Commitments made in an acquisition report or report on equity changes Naught Naught Naught Naught
Commitments made in an asset exchange Naught Naught Naught Naught
Commitments made in share issuance Naught Naught Naught Naught
Other commitments made to minority shareholders Naught Naught Naught Naught
Is the commitment fulfilled in time or not? √ Yes □ No □ Inapplicable
Specific reason for failing to fulfill the commitment and the plan for the next step
Is there any commitment made regarding the horizontal competition and related-party transactions caused?
□ Yes □ No √ Inapplicable
Period for solving the problem as promised
Way of solving the problem
Fulfillment of the commitment
(IV) Predict the 2012 annual operating results
Warnings of possible loss or large-margin change of the accumulated net profit made during the period from the beginning of the year to the end of the next reporting period compared with the same period of the last year according to prediction, as well as explanations on the reasons □Applicable √Inapplicable
(V) Other significant events that need to be explained
1. Securities investment
□Applicable √Inapplicable
2. Investments in derivatives
□Applicable √Inapplicable
3. Derivative investments held at the period-end
□Applicable √Inapplicable
4. Researches, visits and interviews received in the reporting period
Time of reception Place of reception Way of reception Visitor type Visitor Main discussion and materials provided by the Company
3 Jul. 2012 BOD Office of the Company By phone Individual Investor
When will the Company’ Qianhai project start?
18 Jul. 2012 BOD Office of the Company By phone Individual Investor
Introduction to the dividends distribution plan of the Company
11

9 Aug. 2012 BOD Office of the Company By phone Individual Investor
Progress of the Company’s projects outside Shenzhen
11 Sept. 2012 BOD Office of the Company By phone Individual Investor
Situation on the Company’s Yangzhou project
20 Sept. 2012 BOD Office of the Company By phone Individual Investor
Situation on fulfillment of commitments made by major shareholders in the share splitting reform
5. Corporate bonds issued
Any corporate bonds issued? □ Yes √ No
IV. Appendix
(I) Financial statements
Consolidated statements or not? √ Yes □ No □ Inapplicable The currency unit for data of the financial statements below is RMB Yuan unless otherwise specified.
1. Consolidated balance sheet
Prepared by Shenzhen Properties & Resources Development (Group) Ltd. Unit: RMB Yuan
Item Balance as at 30 Sept. 2012 Balance as at 30 Jun. 2012
Current Assets:
Monetary funds 894,505,651.12 469,313,741.57
Settlement reserves
Intra-group lendings
Transactional financial assets
Notes receivable 300,000.00 200,000.00
Accounts receivable 81,724,927.45 70,557,693.71
Accounts paid in advance 715,666,958.85 474,354,748.39
Premiums receivable
Reinsurance premiums receivable
Receivable reinsurance contract reserves
Interest receivable
Dividend receivable
Other accounts receivable 9,673,680.33 3,372,036.99
Financial assets purchased under agreements to resell
Inventories 1,702,689,661.53 1,814,992,629.34
Non-current assets due within 1 year
12

Other current assets
Total current assets 3,404,560,879.28 2,832,790,850.00
Non-current assets:
Loans by mandate and advances granted
Available-for-sale financial assets
Held-to-maturity investments
Long-term accounts receivable
Long-term equity investment 83,156,601.39 81,103,539.95
Investing property 257,462,881.08 291,159,907.85
Fixed assets 67,868,265.32 74,166,940.06
Construction in progress
Engineering materials
Disposal of fixed assets
Production biological assets
Oil-gas assets
Intangible assets 115,887,178.87 121,254,256.15
R&D expense
Goodwill
Long-term deferred expenses 1,859,494.32 1,989,226.53
Deferred income tax assets 150,410,775.04 124,102,202.41
Other non-current assets
Total of non-current assets 676,645,196.02 693,776,072.95
Total assets 4,081,206,075.30 3,526,566,922.95
Current liabilities:
Short-term borrowings 660,000,000.00 601,495,212.00
Borrowings from Central Bank
Customer bank deposits and due to banks and other financial institutions
Intra-group borrowings
Transactional financial liabilities
Notes payable
Accounts payable 172,015,698.95 187,093,587.42
Accounts received in advance 979,075,004.46 208,655,909.41
Financial assets sold for repurchase
Handling charges and commissions payable
Employee’s compensation payable 43,366,848.95 46,354,982.87
Tax payable 584,240,976.90 499,805,593.28
Interest payable
Dividend payable
Other accounts payable 179,021,319.84 481,167,880.34
Reinsurance premiums payable
Insurance contract reserves
Payables for acting trading of securities
Payables for acting underwriting of securities
Non-current liabilities due within 1 year 13,559,888.32 218,359,888.32
13

Other current liabilities
Total current liabilities 2,631,279,737.42 2,242,933,053.64
Non-current liabilities:
Long-term borrowings 22,483,333.31 7,333,333.32
Bonds payable
Long-term payables
Specific payables
Estimated liabilities
Deferred income tax liabilities
Other non-current liabilities 124,577,740.16 133,977,130.96
Total non-current liabilities 147,061,073.47 141,310,464.28
Total liabilities 2,778,340,810.89 2,384,243,517.92
Owners’ equity (or shareholders’ equity)
Paid-up capital (or share capital) 595,979,092.00 595,979,092.00
Capital reserves 63,783,019.03 77,820,275.72
Less: Treasury stock
Specific reserves
Surplus reserves 70,368,860.95 70,368,860.95
Provisions for general risks
Retained profits 577,828,134.42 403,183,375.55
Foreign exchange difference -5,955,929.05 -5,890,286.25
Total equity attributable to owners of the Company 1,302,003,177.35 1,141,461,317.97
Minority interests 862,087.06 862,087.06
Total owners’ (or shareholders’) equity 1,302,865,264.41 1,142,323,405.03Total liabilities and owners’ (or shareholders’) equity 4,081,206,075.30 3,526,566,922.95
Legal representative: Che Yugang Person-in-charge of the accounting work: Wang Hanjun Chief of the accounting division: Shen Xueying
2. Balance sheet of the Company
Prepared by Shenzhen Properties & Resources Development (Group) Ltd. Unit: RMB Yuan
Item Balance as at 30 Sept. 2012 Balance as at 30 Jun. 2012
Current Assets:
Monetary funds 291,047,661.26 83,846,009.34
Transactional financial assets
Notes receivable
Accounts receivable 56,825,594.28 57,610,601.35
Accounts paid in advance 618,523,100.60 435,617,463.60
Interest receivable
Dividend receivable
Other accounts receivable 85,389,686.05 66,901,359.57
Inventories 323,543,264.42 323,385,959.42
Non-current assets due within 1 year 475,000,000.00
Other current assets
14

Total current assets 1,850,329,306.61 967,361,393.28
Non-current assets:
Available-for-sale financial assets
Held-to-maturity investments
Long-term accounts receivable
Long-term equity investment 315,444,362.35 300,514,039.95
Investing property 194,548,698.98 196,918,915.36
Fixed assets 22,097,857.52 29,002,844.78
Construction in progress
Engineering materials
Disposal of fixed assets
Production biological assets
Oil-gas assets
Intangible assets
R&D expense
Goodwill
Long-term deferred expenses 1,859,494.32 1,989,226.53
Deferred income tax assets
Other non-current assets 280,000,000.00 475,000,000.00
Total of non-current assets 533,950,413.17 1,003,425,026.62
Total assets 2,384,279,719.78 1,970,786,419.90
Current liabilities:
Short-term borrowings
Transactional financial liabilities
Notes payable
Accounts payable 33,613,669.85 33,981,501.43
Accounts received in advance 351,401.50
Employee’s compensation payable 9,042,625.42 7,550,348.37
Tax payable 1,968,018.65 1,829,406.16
Interest payable
Dividend payable
Other accounts payable 1,663,690,307.82 1,268,548,668.33
Non-current liabilities due within 1 year
Other current liabilities
Total current liabilities 1,708,314,621.74 1,312,261,325.79
Non-current liabilities:
Long-term borrowings
Bonds payable
Long-term payables
Specific payables
Estimated liabilities
Deferred income tax liabilities
Other non-current liabilities 1,851,595.90 4,161,870.46
Total non-current liabilities 1,851,595.90 4,161,870.46
Total liabilities 1,710,166,217.64 1,316,423,196.25
Owners’ equity (or shareholders’ equity)
15

Paid-up capital (or share capital) 595,979,092.00 595,979,092.00
Capital reserves 37,754,232.28 38,914,227.99
Less: Treasury stock
Specific reserves
Surplus reserves 69,712,050.51 69,712,050.51
Provisions for general risks
Retained profits -29,331,872.65 -50,242,146.85
Foreign exchange difference
Total owners’ (or shareholders’) equity 674,113,502.14 654,363,223.65
Total liabilities and owners’ (or shareholders’) equity 2,384,279,719.78 1,970,786,419.90
Legal representative: Che Yugang Person-in-charge of the accounting work: Wang Hanjun Chief of the accounting division: Shen Xueying
3. Consolidated income statement for the reporting period
Prepared by Shenzhen Properties & Resources Development (Group) Ltd. Unit: RMB Yuan
Item Jul.-Sept. 2012 Jul.-Sept. 2011
I. Total operating revenues 418,381,326.42 149,684,436.70
Including: Sales income 418,381,326.42 149,684,436.70
Interest income
Premium income
Handling charge and commission income
II. Total operating cost 319,192,530.02 140,659,365.01
Including: Cost of sales 164,081,318.90 88,277,116.63
Interest expenses Handling charge and commission expenses
Surrenders
Net claims paid Net amount withdrawn for the insurance contract reserve
Expenditure on policy dividends
Reinsurance premium
Taxes and associate charges 122,085,226.17 15,236,488.21
Selling and distribution expenses 10,536,332.44 8,244,545.62
Administrative expenses 24,179,447.59 24,996,117.18
Financial expenses -1,689,795.08 3,900,097.37
Asset impairment loss 5,000.00
Add: Gain/(loss) from change in fair value (“-” means loss) -3,364.50
Gain/(loss) from investment (“-” means loss) 551,552.30 708,904.17
Including: share of profits in associates and joint ventures 551,552.30 465,464.86
Foreign exchange gains (“-” means loss)
16

III. Business profit (“-” means loss) 99,740,348.70 9,730,611.36
Add: non-operating income 948,915.94 216,351.70
Less: non-operating expense 115,750.74 1,862,043.62
Including: loss from non-current asset disposal 28,458.15 2,793.00
IV. Total profit (“-” means loss) 100,573,513.90 8,084,919.44
Less: Income tax expense 24,251,040.34 166,605.56
V. Net profit (“-” means loss) 76,322,473.56 7,918,313.88
Including: Net profit achieved by combined parties before the combinations 1,280,913.16
Attributable to owners of the Company 76,322,473.56 7,918,313.88
Minority shareholders’ income
VI. Earnings per share -- --
(I) Basic earnings per share 0.1281 0.0133
(II) Diluted earnings per share 0.1281 0.0133
VII. Other comprehensive incomes -220,538.72 1,365,300.15
VIII. Total comprehensive incomes 76,101,934.84 9,283,614.03
Attributable to owners of the Company 76,101,934.84 9,283,614.03
Attributable to minority shareholders
Where business mergers under the same control occurred in this reporting period, the net profit achieved by the merged parties before the business mergers was RMB 0.
Legal representative: Che Yugang Person-in-charge of the accounting work: Wang Hanjun Chief of the accounting division: Shen Xueying
4. Income statement of the Company for the reporting period
Prepared by Shenzhen Properties & Resources Development (Group) Ltd. Unit: RMB Yuan
Item Jul.-Sept. 2012 Jul.-Sept. 2011
I. Total sales 11,984,996.41 18,088,202.33
Less: cost of sales 4,733,631.14 9,138,030.94
Business taxes and surcharges 2,006,295.65 1,741,847.05
Distribution expenses
Administrative expenses 9,973,393.45 9,345,936.07
Financial costs -255,381.09 -388,384.89
Impairment loss 342,038.98 5,000.00
Add: gain/(loss) from change in fair value (“-” means loss) -3,364.50
Gain/(loss) from investment (“-” means loss) 9,748,302.30 5,933,532.84
Including: income form investment on associates and joint ventures 551,552.30 465,464.86
II. Business profit (“-” means loss) 4,933,320.58 4,175,941.50
Add: non-business income 54,040.00 44,681.26
Less: non-business expense 31,452.19 1,684,900.09
Including: loss from non-current asset disposal 1,359.60 2,793.00
17
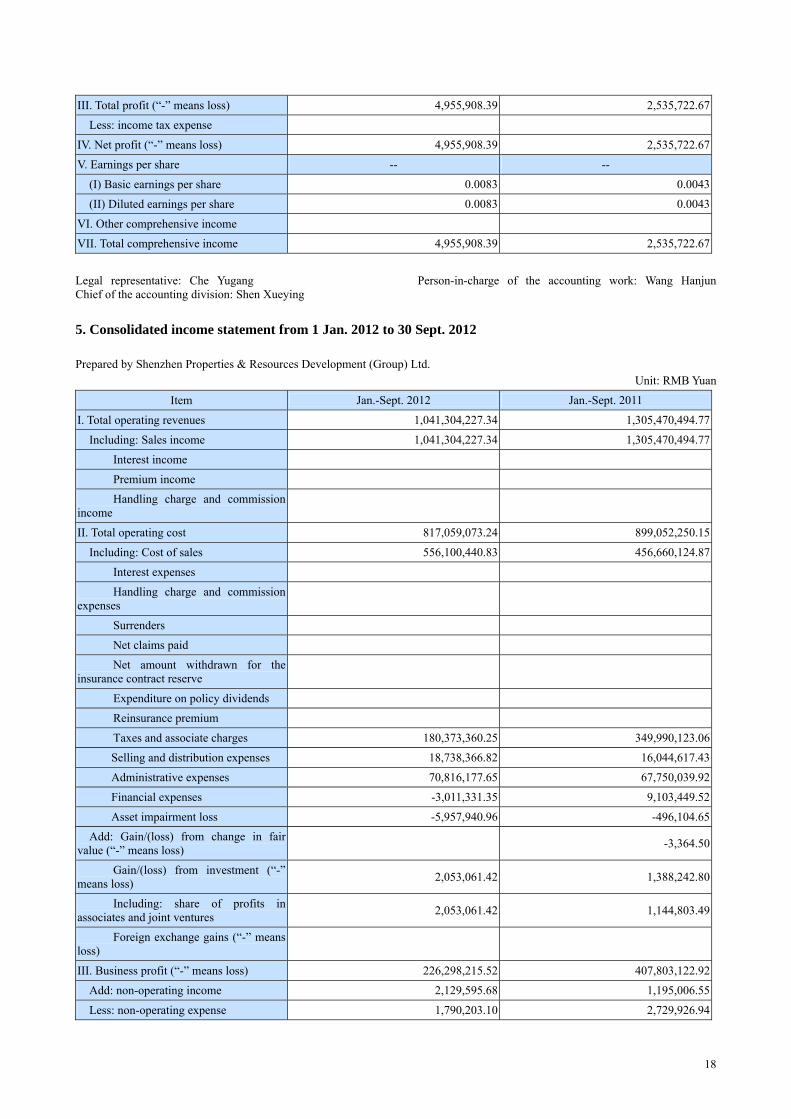
III. Total profit (“-” means loss) 4,955,908.39 2,535,722.67
Less: income tax expense
IV. Net profit (“-” means loss) 4,955,908.39 2,535,722.67
V. Earnings per share -- --
(I) Basic earnings per share 0.0083 0.0043
(II) Diluted earnings per share 0.0083 0.0043
VI. Other comprehensive income
VII. Total comprehensive income 4,955,908.39 2,535,722.67
Legal representative: Che Yugang Person-in-charge of the accounting work: Wang Hanjun Chief of the accounting division: Shen Xueying
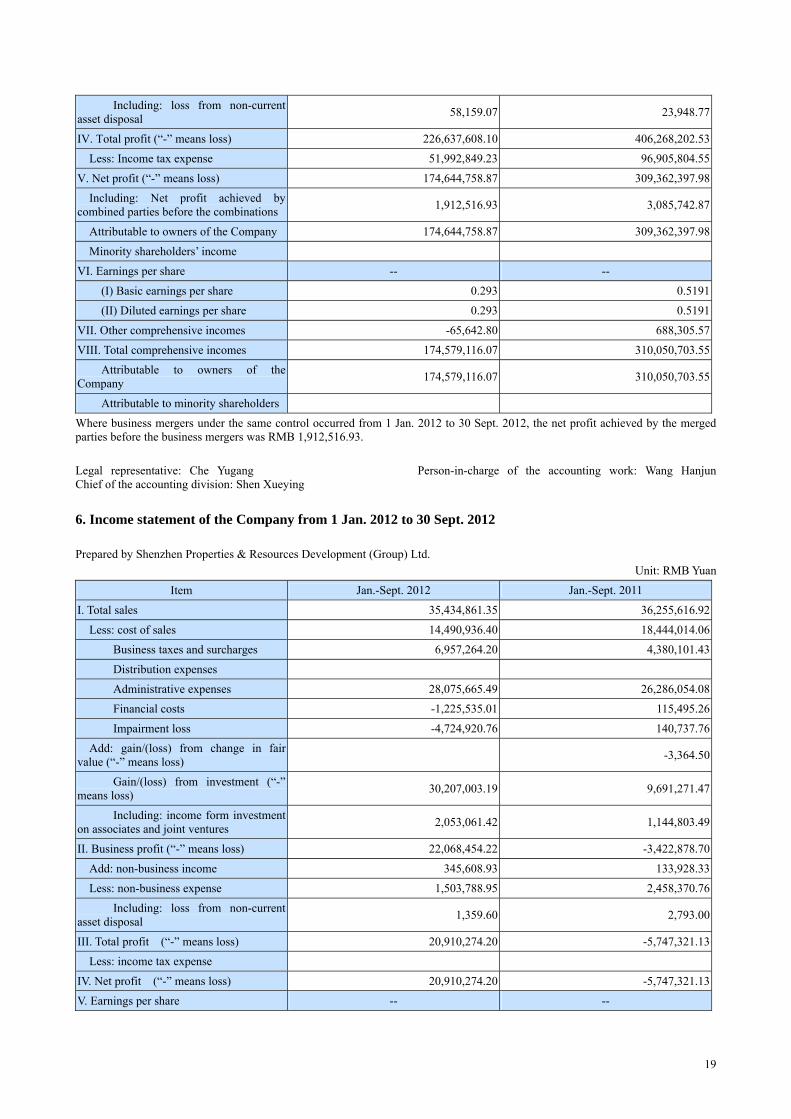
5. Consolidated income statement from 1 Jan. 2012 to 30 Sept. 2012
Prepared by Shenzhen Properties & Resources Development (Group) Ltd. Unit: RMB Yuan
Item Jan.-Sept. 2012 Jan.-Sept. 2011
I. Total operating revenues 1,041,304,227.34 1,305,470,494.77
Including: Sales income 1,041,304,227.34 1,305,470,494.77
Interest income
Premium income
Handling charge and commission income
II. Total operating cost 817,059,073.24 899,052,250.15
Including: Cost of sales 556,100,440.83 456,660,124.87
Interest expenses
Handling charge and commission expenses
Surrenders
Net claims paid
Net amount withdrawn for the insurance contract reserve
Expenditure on policy dividends
Reinsurance premium
Taxes and associate charges 180,373,360.25 349,990,123.06
Selling and distribution expenses 18,738,366.82 16,044,617.43
Administrative expenses 70,816,177.65 67,750,039.92
Financial expenses -3,011,331.35 9,103,449.52
Asset impairment loss -5,957,940.96 -496,104.65
Add: Gain/(loss) from change in fair value (“-” means loss) -3,364.50
Gain/(loss) from investment (“-” means loss) 2,053,061.42 1,388,242.80
Including: share of profits in associates and joint ventures 2,053,061.42 1,144,803.49
Foreign exchange gains (“-” means loss)
III. Business profit (“-” means loss) 226,298,215.52 407,803,122.92
Add: non-operating income 2,129,595.68 1,195,006.55
Less: non-operating expense 1,790,203.10 2,729,926.94
18
Including: loss from non-current asset disposal 58,159.07 23,948.77
IV. Total profit (“-” means loss) 226,637,608.10 406,268,202.53
Less: Income tax expense 51,992,849.23 96,905,804.55
V. Net profit (“-” means loss) 174,644,758.87 309,362,397.98
Including: Net profit achieved by combined parties before the combinations 1,912,516.93 3,085,742.87
Attributable to owners of the Company 174,644,758.87 309,362,397.98
Minority shareholders’ income
VI. Earnings per share -- --
(I) Basic earnings per share 0.293 0.5191
(II) Diluted earnings per share 0.293 0.5191
VII. Other comprehensive incomes -65,642.80 688,305.57
VIII. Total comprehensive incomes 174,579,116.07 310,050,703.55
Attributable to owners of the Company 174,579,116.07 310,050,703.55
Attributable to minority shareholders
Where business mergers under the same control occurred from 1 Jan. 2012 to 30 Sept. 2012, the net profit achieved by the merged parties before the business mergers was RMB 1,912,516.93.
Legal representative: Che Yugang Person-in-charge of the accounting work: Wang Hanjun Chief of the accounting division: Shen Xueying
6. Income statement of the Company from 1 Jan. 2012 to 30 Sept. 2012
Prepared by Shenzhen Properties & Resources Development (Group) Ltd. Unit: RMB Yuan
Item Jan.-Sept. 2012 Jan.-Sept. 2011
I. Total sales 35,434,861.35 36,255,616.92
Less: cost of sales 14,490,936.40 18,444,014.06
Business taxes and surcharges 6,957,264.20 4,380,101.43
Distribution expenses
Administrative expenses 28,075,665.49 26,286,054.08
Financial costs -1,225,535.01 115,495.26
Impairment loss -4,724,920.76 140,737.76
Add: gain/(loss) from change in fair value (“-” means loss) -3,364.50
Gain/(loss) from investment (“-” means loss) 30,207,003.19 9,691,271.47
Including: income form investment on associates and joint ventures 2,053,061.42 1,144,803.49
II. Business profit (“-” means loss) 22,068,454.22 -3,422,878.70
Add: non-business income 345,608.93 133,928.33
Less: non-business expense 1,503,788.95 2,458,370.76
Including: loss from non-current asset disposal 1,359.60 2,793.00
III. Total profit (“-” means loss) 20,910,274.20 -5,747,321.13
Less: income tax expense
IV. Net profit (“-” means loss) 20,910,274.20 -5,747,321.13
V. Earnings per share -- --
19

(I) Basic earnings per share 0.0351 -0.0096
(II) Diluted earnings per share 0.0351 -0.0096
VI. Other comprehensive income
VII. Total comprehensive income 20,910,274.20 -5,747,321.13
Legal representative: Che Yugang Person-in-charge of the accounting work: Wang Hanjun Chief of the accounting division: Shen Xueying
7. Consolidated cash flow statement from 1 Jan. 2012 to 30 Sept. 2012
Prepared by Shenzhen Properties & Resources Development (Group) Ltd. Unit: RMB Yuan
Item Jan.-Sept. 2012 Jan.-Sept. 2011
I. Cash flows from operating activities:
Cash received from sale of commodities and rendering of service 1,585,210,179.74 500,307,414.98
Net increase of deposits from customers and dues from banks
Net increase of loans from the central bank
Net increase of funds borrowed from other financial institutions
Cash received from premium of original insurance contracts
Net cash received from reinsurance business
Net increase of deposits of policy holders and investment fund
Net increase of disposal of tradable financial assets
Cash received from interest, handling charges and commissions
Net increase of intra-group borrowings Net increase of funds in repurchase business
Tax refunds received
Other cash received relating to operating activities 18,018,232.63 60,270,787.47
Subtotal of cash inflows from operating activities 1,603,228,412.37 560,578,202.45
Cash paid for goods and services 496,469,948.90 632,575,741.85 Net increase of customer lendings and advances
Net increase of funds deposited in the central bank and amount due from banks
Cash for paying claims of the original insurance contracts
Cash for paying interest, handling charges and commissions
Cash for paying policy dividends
Cash paid to and for employees 177,842,182.24 164,011,492.87
Various taxes paid 248,831,302.47 122,362,379.15
20
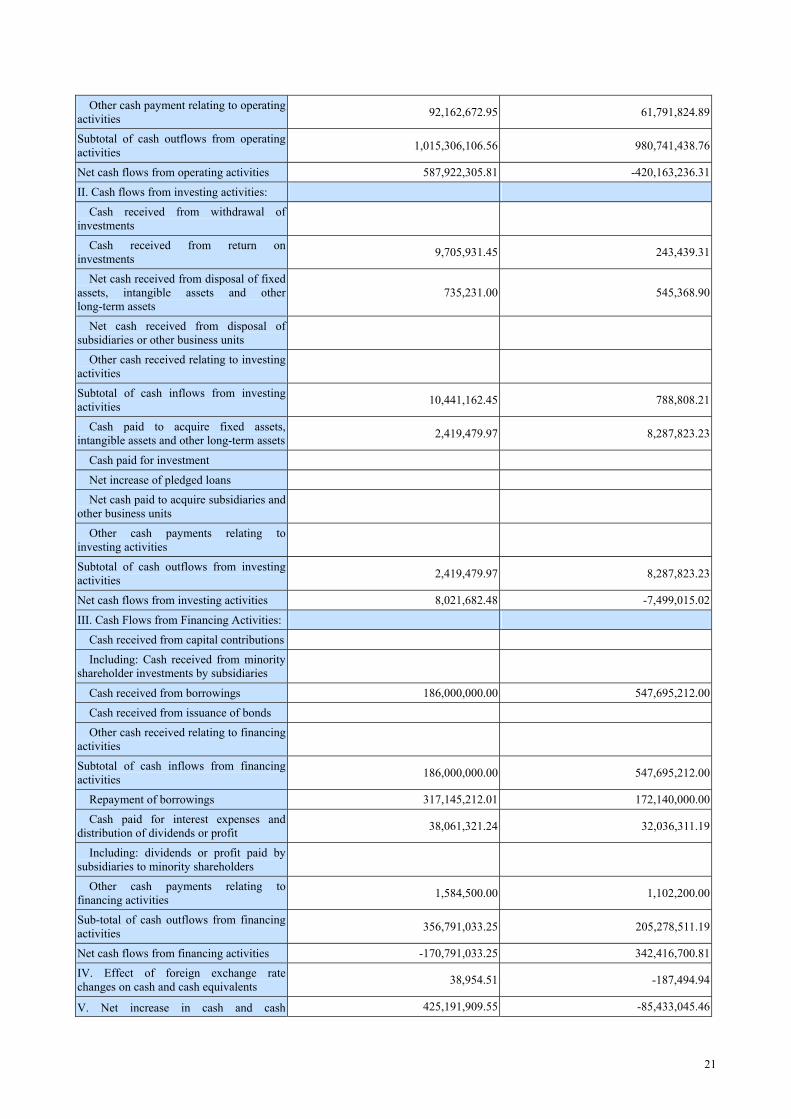
Other cash payment relating to operating activities 92,162,672.95 61,791,824.89
Subtotal of cash outflows from operating activities 1,015,306,106.56 980,741,438.76
Net cash flows from operating activities 587,922,305.81 -420,163,236.31
II. Cash flows from investing activities:
Cash received from withdrawal of investments
Cash received from return on investments 9,705,931.45 243,439.31
Net cash received from disposal of fixed assets, intangible assets and other long-term assets
735,231.00 545,368.90
Net cash received from disposal of subsidiaries or other business units
Other cash received relating to investing activities
Subtotal of cash inflows from investing activities 10,441,162.45 788,808.21
Cash paid to acquire fixed assets, intangible assets and other long-term assets 2,419,479.97 8,287,823.23
Cash paid for investment
Net increase of pledged loans
Net cash paid to acquire subsidiaries and other business units
Other cash payments relating to investing activities
Subtotal of cash outflows from investing activities 2,419,479.97 8,287,823.23
Net cash flows from investing activities 8,021,682.48 -7,499,015.02
III. Cash Flows from Financing Activities:
Cash received from capital contributions
Including: Cash received from minority shareholder investments by subsidiaries
Cash received from borrowings 186,000,000.00 547,695,212.00
Cash received from issuance of bonds
Other cash received relating to financing activities
Subtotal of cash inflows from financing activities 186,000,000.00 547,695,212.00
Repayment of borrowings 317,145,212.01 172,140,000.00
Cash paid for interest expenses and distribution of dividends or profit 38,061,321.24 32,036,311.19
Including: dividends or profit paid by subsidiaries to minority shareholders
Other cash payments relating to financing activities 1,584,500.00 1,102,200.00
Sub-total of cash outflows from financing activities 356,791,033.25 205,278,511.19
Net cash flows from financing activities -170,791,033.25 342,416,700.81
IV. Effect of foreign exchange rate changes on cash and cash equivalents 38,954.51 -187,494.94
V. Net increase in cash and cash 425,191,909.55 -85,433,045.46
21

equivalents
Add: Opening balance of cash and cash equivalents 469,313,741.57 545,466,594.53
VI. Closing balance of cash and cash equivalents 894,505,651.12 460,033,549.07
Legal representative: Che Yugang Person-in-charge of the accounting work: Wang Hanjun Chief of the accounting division: Shen Xueying
8. Cash flow statement of the Company from 1 Jan. 2012 to 30 Sept. 2012
Prepared by Shenzhen Properties & Resources Development (Group) Ltd. Unit: RMB Yuan
Item Jan.-Sept. 2012 Jan.-Sept. 2011
I. Cash flows from operating activities:
Cash received from sale of commodities and rendering of service 35,264,786.16 35,309,320.83
Tax refunds received
Other cash received relating to operating activities 727,979,585.98 1,358,354,510.20
Subtotal of cash inflows from operating activities 763,244,372.14 1,393,663,831.03
Cash paid for goods and services 5,097,690.13 392,843,556.61
Cash paid to and for employees 13,377,954.00 14,208,550.00
Various taxes paid 10,068,456.28 6,202,692.36
Other cash payment relating to operating activities 555,738,828.65 312,614,581.41
Subtotal of cash outflows from operating activities 584,282,929.06 725,869,380.38
Net cash flows from operating activities 178,961,443.08 667,794,450.65
II. Cash flows from investing activities:
Cash received from retraction of investments 268,735.50
Cash received from return on investments 37,859,931.45 8,546,467.98
Net cash received from disposal of fixed assets, intangible assets and other long-term assets
Net cash received from disposal of subsidiaries or other business units
Other cash received relating to investing activities
Subtotal of cash inflows from investing activities 37,859,931.45 8,815,203.48
Cash paid to acquire fixed assets, intangible assets and other long-term assets 9,619,722.61 2,366,005.00
Cash paid for investment 525,000,000.00
Net cash paid to acquire subsidiaries and other business units
Other cash payments relating to investing activities
Subtotal of cash outflows from investing activities 9,619,722.61 527,366,005.00
22

Net cash flows from investing activities 28,240,208.84 -518,550,801.52
III. Cash flows from financing activities:
Cash received from capital contributions
Cash received from borrowings
Cash received from issuance of bonds
Other cash received relating to financing activities
Subtotal of cash inflows from financing activities 0.00 0.00
Repayment of borrowings
Cash paid for interest expenses and distribution of dividends or profit
Other cash payments relating to financing activities
Sub-total of cash outflows from financing activities 0.00 0.00
Net cash flows from financing activities 0.00 0.00
IV. Effect of foreign exchange rate changes on cash and cash equivalents -125.07
V. Net increase in cash and cash equivalents 207,201,651.92 149,243,524.06
Add: Opening balance of cash and cash equivalents 83,846,009.34 78,920,447.75
VI. Closing balance of cash and cash equivalents 291,047,661.26 228,163,971.81
Legal representative: Che Yugang Person-in-charge of the accounting work: Wang Hanjun Chief of the accounting division: Shen Xueying
(II) Audit report
Un-audited.
23