Sharing Experiments Using Open Source Software
27
SOFTWARE—PRACTICE AND EXPERIENCE Softw. Pract. Exper. 2010; 00:1–7 Prepared using speauth.cls [Version: 2002/09/23 v2.2] Sharing Experiments Using Open Source Software Adam Nelson, Tim Menzies, Gregory Gay ∗, ∗ Lane Department of Computer Science and Electrical Engineering, West Virginia University, Morgantown, WV, USA key words: open source, data mining SUMMARY When researchers want to repeat, improve or refute prior conclusions, it is useful to have a complete and operational description of prior experiments. If those descriptions are overly long or complex, then sharing their details may not be informative. OURMINE is a scripting environment for the development and deployment of data mining experiments. Using OURMINE, data mining novices can specify and execute intricate experiments, while researchers can publish their complete experimental rig alongside their conclusions. This is achievable because of OURMINE’s succinctness. For example, this paper presents two experiments documented in the OURMINE syntax. Thus, the brevity and simplicity of OURMINE recommends it as a better tool for documenting, executing, and sharing data mining experiments. 1. Introduction Since 2004, the authors have been involved in an open source data mining experiment. Researchers submitting to the PROMISE conference on predictive models in software engineering are encouraged to offer not just conclusions, but also the data they used to generate those conclusions. The result is nearly 100 data sets, all on-line, freely available for download † . The premise of this paper is that after data sharing comes experiment sharing; i.e. the PROMISE repository should grow to include not just data, but the code required to run experiments over that data. This simplifies the goal of letting other researchers repeat, or even extend, data mining experiments of others. Repeating experiments is not only ∗ Correspondence to: Lane Department of Computer Science and Electrical Engineering, West Virginia Unviersity, Morgantown, WV, USA ∗ E-mail: [email protected], [email protected], [email protected] Contract/grant sponsor: Publishing Arts Research Council; contract/grant number: 98–1846389 † http://promisedata.org/data Received 1 October 2009 Copyright c ⃝ 2010 John Wiley & Sons, Ltd. Revised ?? December 2009
-
Upload
khangminh22 -
Category
Documents
-
view
3 -
download
0
Transcript of Sharing Experiments Using Open Source Software
SOFTWARE—PRACTICE AND EXPERIENCESoftw. Pract. Exper. 2010; 00:1–7 Prepared using speauth.cls [Version: 2002/09/23 v2.2]
Sharing Experiments UsingOpen Source Software
Adam Nelson, Tim Menzies, Gregory Gay∗,∗
Lane Department of Computer Science and Electrical Engineering, West Virginia University,Morgantown, WV, USA
key words: open source, data mining
SUMMARY
When researchers want to repeat, improve or refute prior conclusions, it is useful tohave a complete and operational description of prior experiments. If those descriptionsare overly long or complex, then sharing their details may not be informative.
OURMINE is a scripting environment for the development and deployment of datamining experiments. Using OURMINE, data mining novices can specify and executeintricate experiments, while researchers can publish their complete experimental rigalongside their conclusions. This is achievable because of OURMINE’s succinctness. Forexample, this paper presents two experiments documented in the OURMINE syntax.Thus, the brevity and simplicity of OURMINE recommends it as a better tool fordocumenting, executing, and sharing data mining experiments.
1. Introduction
Since 2004, the authors have been involved in an open source data mining experiment.Researchers submitting to the PROMISE conference on predictive models in softwareengineering are encouraged to offer not just conclusions, but also the data they used to generatethose conclusions. The result is nearly 100 data sets, all on-line, freely available for download †.
The premise of this paper is that after data sharing comes experiment sharing; i.e. thePROMISE repository should grow to include not just data, but the code required to runexperiments over that data. This simplifies the goal of letting other researchers repeat,or even extend, data mining experiments of others. Repeating experiments is not only
∗Correspondence to: Lane Department of Computer Science and Electrical Engineering, West VirginiaUnviersity, Morgantown, WV, USA∗E-mail: [email protected], [email protected], [email protected]/grant sponsor: Publishing Arts Research Council; contract/grant number: 98–1846389†http://promisedata.org/data
Received 1 October 2009Copyright c⃝ 2010 John Wiley & Sons, Ltd. Revised ?? December 2009
2 A. NELSON ET AL.
Figure 1. The WEKA toolit running the J48 decision tree learner.
essential in confirming previous results, but also in providing an inciteful understanding ofthe fundamentals involving those experiments. Thus, it is important to have a prepared setof clearly defined and operational experiments that can be utilized in order to achieve similarprior results.
Consequently, we have been assessing data mining toolkits such as the WEKA‡ tool ofFigure 1, “R”§, the ORANGE¶ tool of Figure 2, RAPID-I∥, MLC++ ∗∗, and MATLAB††. Wefind that they are are not suitable for publishing experiments. Our complaint with these toolsis same as that offered by Ritthoff et al. [19]:
• Proprietary tools such as MATLAB are not freely available.
‡http://www.cs.waikato.ac.nz/ml/weka/§http://www.r-project.org/¶http://magix.fri.uni-lj.si/orange/∥http://rapid-i.com/∗∗http://www.sgi.com/tech/mlc/††http://www.mathworks.com
Copyright c⃝ 2010 John Wiley & Sons, Ltd. Softw. Pract. Exper. 2010; 00:1–7Prepared using speauth.cls
SHARING EXPERIMENTS USING OPEN SOURCE SOFTWARE 3
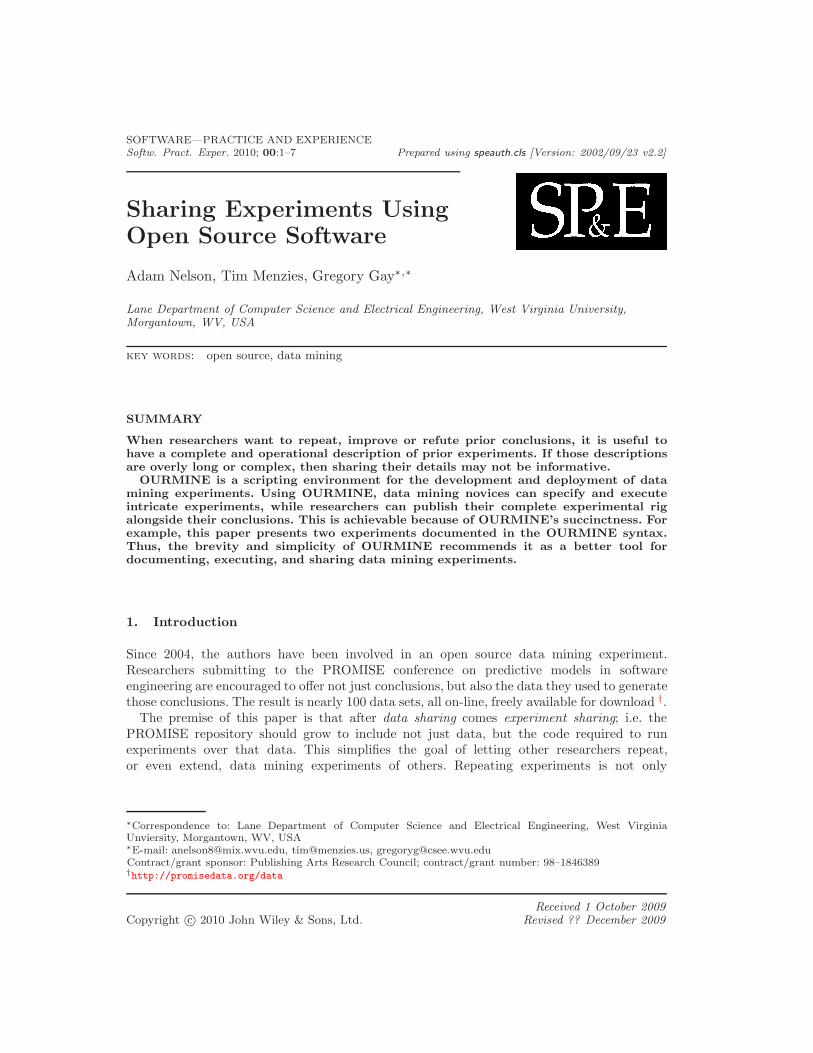
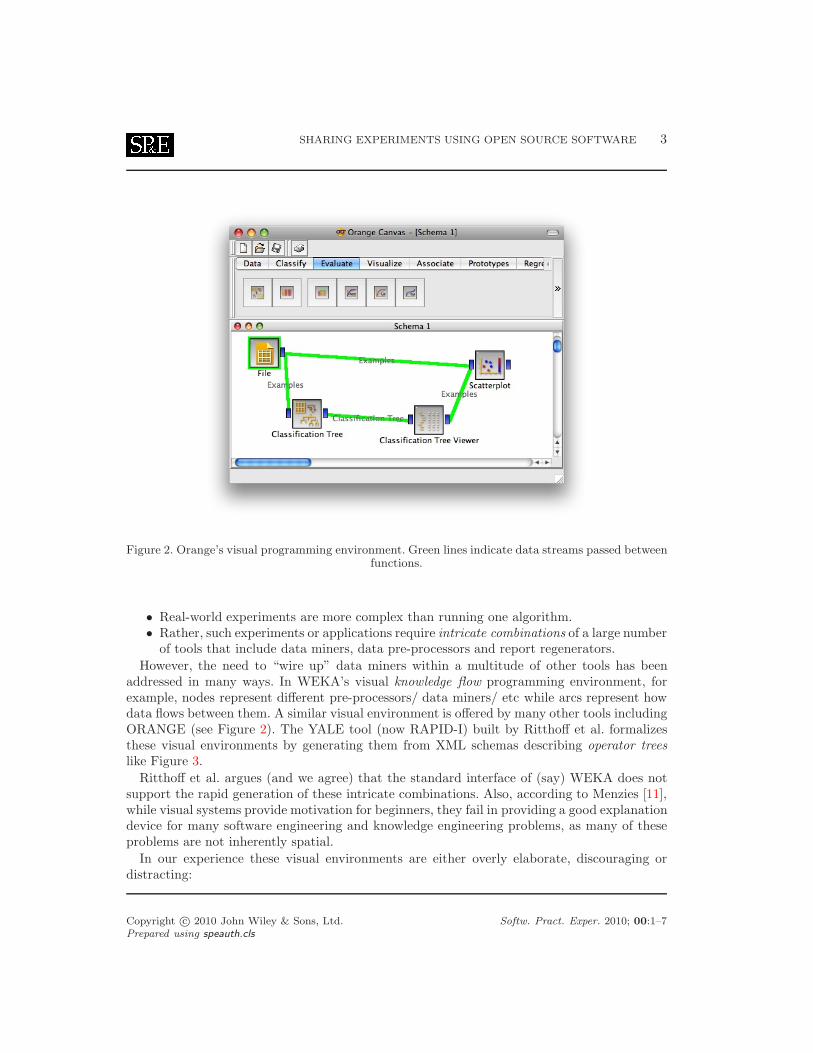
Figure 2. Orange’s visual programming environment. Green lines indicate data streams passed betweenfunctions.
• Real-world experiments are more complex than running one algorithm.• Rather, such experiments or applications require intricate combinations of a large number
of tools that include data miners, data pre-processors and report regenerators.However, the need to “wire up” data miners within a multitude of other tools has been
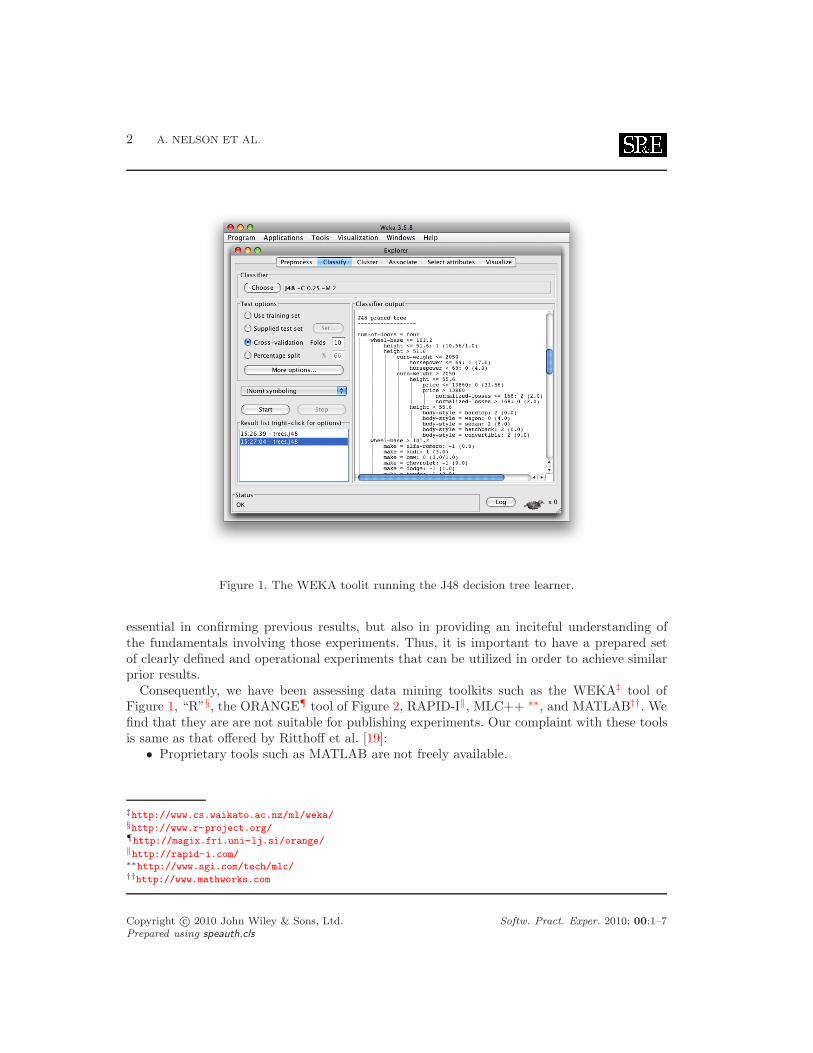
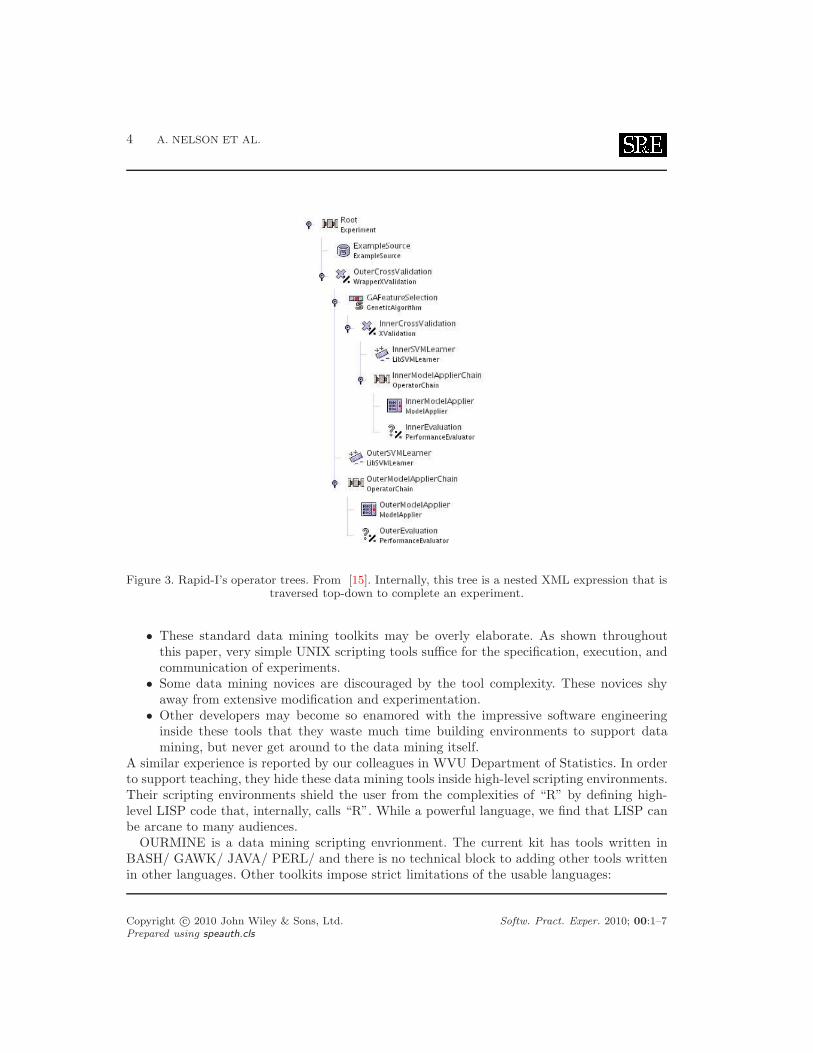
addressed in many ways. In WEKA’s visual knowledge flow programming environment, forexample, nodes represent different pre-processors/ data miners/ etc while arcs represent howdata flows between them. A similar visual environment is offered by many other tools includingORANGE (see Figure 2). The YALE tool (now RAPID-I) built by Ritthoff et al. formalizesthese visual environments by generating them from XML schemas describing operator treeslike Figure 3.
Ritthoff et al. argues (and we agree) that the standard interface of (say) WEKA does notsupport the rapid generation of these intricate combinations. Also, according to Menzies [11],while visual systems provide motivation for beginners, they fail in providing a good explanationdevice for many software engineering and knowledge engineering problems, as many of theseproblems are not inherently spatial.
In our experience these visual environments are either overly elaborate, discouraging ordistracting:
Copyright c⃝ 2010 John Wiley & Sons, Ltd. Softw. Pract. Exper. 2010; 00:1–7Prepared using speauth.cls
4 A. NELSON ET AL.
Figure 3. Rapid-I’s operator trees. From [15]. Internally, this tree is a nested XML expression that istraversed top-down to complete an experiment.
• These standard data mining toolkits may be overly elaborate. As shown throughoutthis paper, very simple UNIX scripting tools suffice for the specification, execution, andcommunication of experiments.
• Some data mining novices are discouraged by the tool complexity. These novices shyaway from extensive modification and experimentation.
• Other developers may become so enamored with the impressive software engineeringinside these tools that they waste much time building environments to support datamining, but never get around to the data mining itself.
A similar experience is reported by our colleagues in WVU Department of Statistics. In orderto support teaching, they hide these data mining tools inside high-level scripting environments.Their scripting environments shield the user from the complexities of “R” by defining high-level LISP code that, internally, calls “R”. While a powerful language, we find that LISP canbe arcane to many audiences.
OURMINE is a data mining scripting envrionment. The current kit has tools written inBASH/ GAWK/ JAVA/ PERL/ and there is no technical block to adding other tools writtenin other languages. Other toolkits impose strict limitations of the usable languages:
Copyright c⃝ 2010 John Wiley & Sons, Ltd. Softw. Pract. Exper. 2010; 00:1–7Prepared using speauth.cls
SHARING EXPERIMENTS USING OPEN SOURCE SOFTWARE 5
• MLC++ requires C++• Extensions to WEKA must be written in JAVA.
Our preference for BASH [17]/GAWK [1] over, say, LISP is partially a matter of taste butwe defend that selection as follows. Once a student learns, for example, RAPID-I’s XMLconfiguration tricks, then those learned skills are highly specific to that toolkit. On the otherhand, once a student learns BASH/GAWK methods for data pre-processing and reporting,they can apply those scripting tricks to any number of future UNIX-based applications.
This paper introduces OURMINE as follows:• First, we describe the base tool and offer some samples of coding in OURMINE;• Next, we demonstrate OURMINE’s ability to succinctly document even complex
experiments.This paper is an extension of a prior publication [4]:• This paper details functionality added since that last paper was published;• This paper adds a new experiment to the description of OURMINE (see §3.2).
2. OURMINE
OURMINE was developed to help graduate students at West Virginia University documentand execute their data mining experiments. The toolkit uses UNIX shell scripting. As a result,any tool that can be executed from a command prompt can be seemlessly combined with othertools.
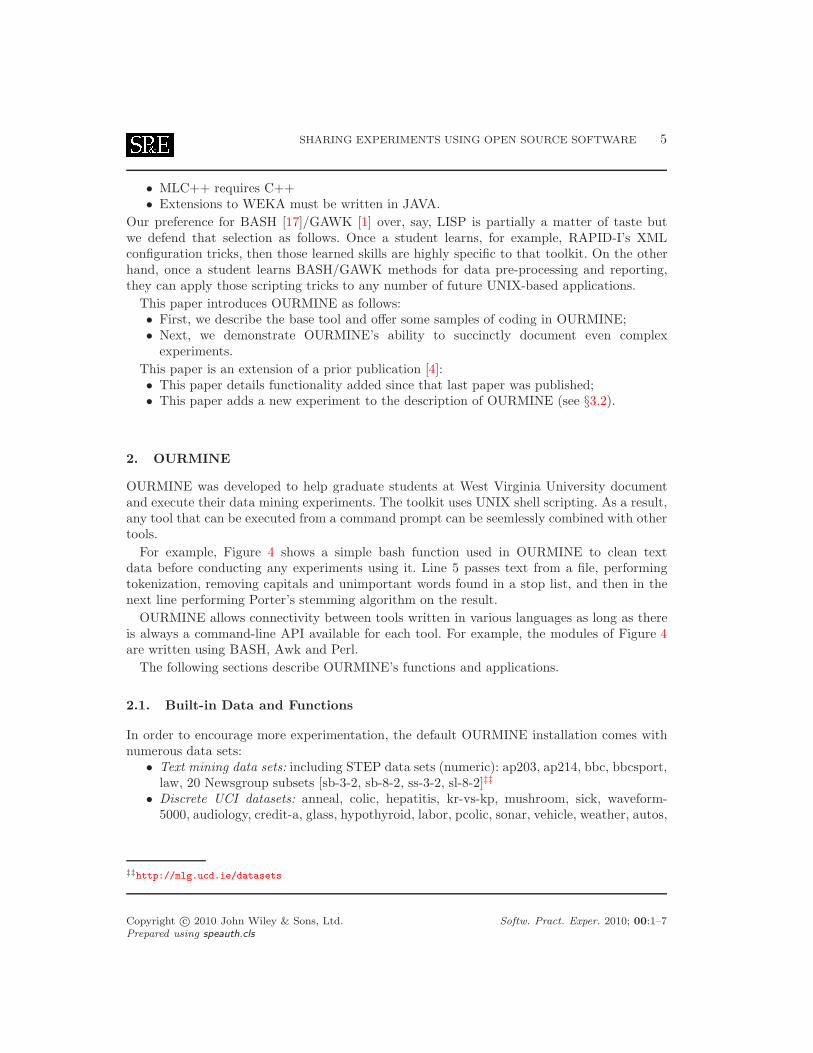
For example, Figure 4 shows a simple bash function used in OURMINE to clean textdata before conducting any experiments using it. Line 5 passes text from a file, performingtokenization, removing capitals and unimportant words found in a stop list, and then in thenext line performing Porter’s stemming algorithm on the result.
OURMINE allows connectivity between tools written in various languages as long as thereis always a command-line API available for each tool. For example, the modules of Figure 4are written using BASH, Awk and Perl.
The following sections describe OURMINE’s functions and applications.
2.1. Built-in Data and Functions
In order to encourage more experimentation, the default OURMINE installation comes withnumerous data sets:
• Text mining data sets: including STEP data sets (numeric): ap203, ap214, bbc, bbcsport,law, 20 Newsgroup subsets [sb-3-2, sb-8-2, ss-3-2, sl-8-2]‡‡
• Discrete UCI datasets: anneal, colic, hepatitis, kr-vs-kp, mushroom, sick, waveform-5000, audiology, credit-a, glass, hypothyroid, labor, pcolic, sonar, vehicle, weather, autos,
‡‡http://mlg.ucd.ie/datasets
Copyright c⃝ 2010 John Wiley & Sons, Ltd. Softw. Pract. Exper. 2010; 00:1–7Prepared using speauth.cls
6 A. NELSON ET AL.
1 clean(){2 local docdir=$13 local out=$2
4 for file in $docdir/*; do5 cat $file | tokes | caps | stops $Lists/stops.txt > tmp6 stems tmp >> $out7 rm tmp8 done9 }
Figure 4. An OURMINE function to clean text documents and collect the results. Tokes is a tokenizer;caps sends all words to lower case; stops removes the stop workds listed in ”$Lists/stops.txt”; and
stems performs Porter’s stemming algorithm (removes confusing suffixes).
credit-g, heart-c, ionosphere, letter, primary-tumor, soybean, vote,weather.nominal, breast-cancer, diabetes, heart-h, iris, lymph, segment, splice, vowel;
• Numeric UCI datasets: auto93, baskball, cholesterol, detroit, fruitfly, longley, pbc, quake,sleep, autoHorse, bodyfat, cleveland, echoMonths, gascons, lowbwt, pharynx, schlvote,strike, autoMpg, bolts, cloud, elusage, housing, mbagrade, pollution, sensory, veteran,autoPrice, breastTumor, cpu, fishcatch, hungarian, meta, pwLinear, servo, vineyard.
• The defect prediction data sets from the PROMISE repostitory: CM1, KC1, KC2, KC3,MC2, MW1, PC1
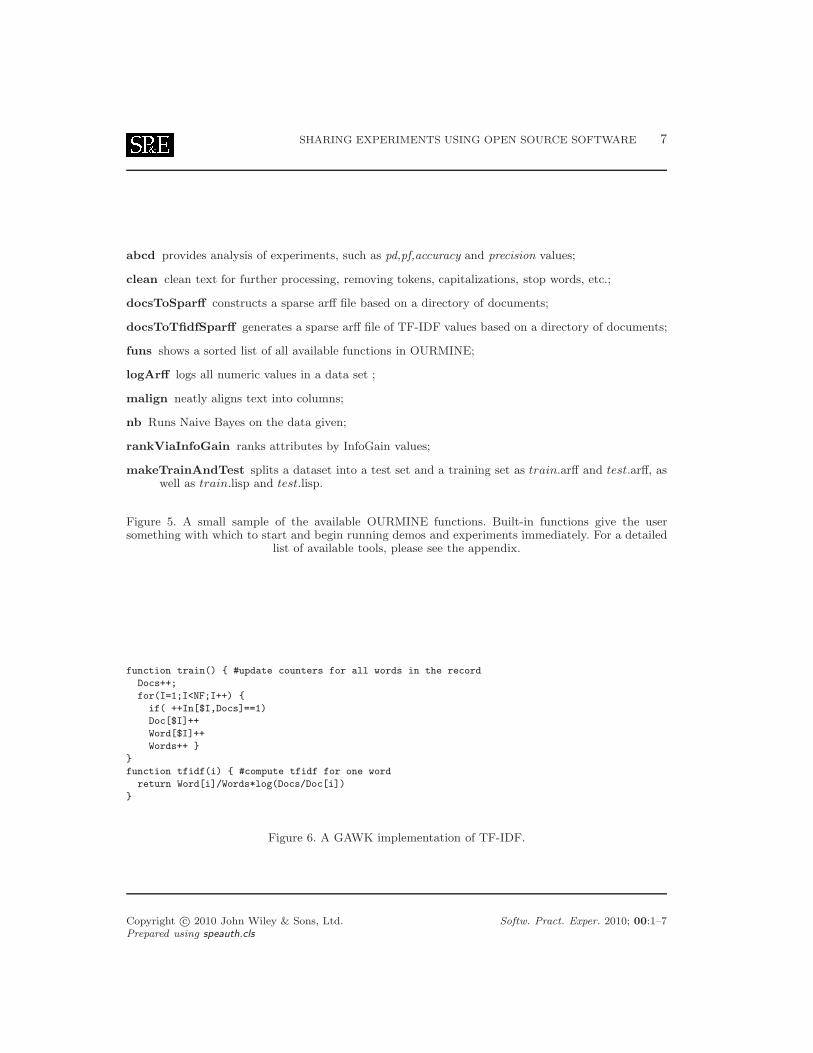
OURMINE also comes with a variety of built-in functions to perform data mining andtext mining tasks. For a sample of these functions, see Figure 5. For a complete list, see theappendix.
2.2. Learning and Teaching with OURMINE
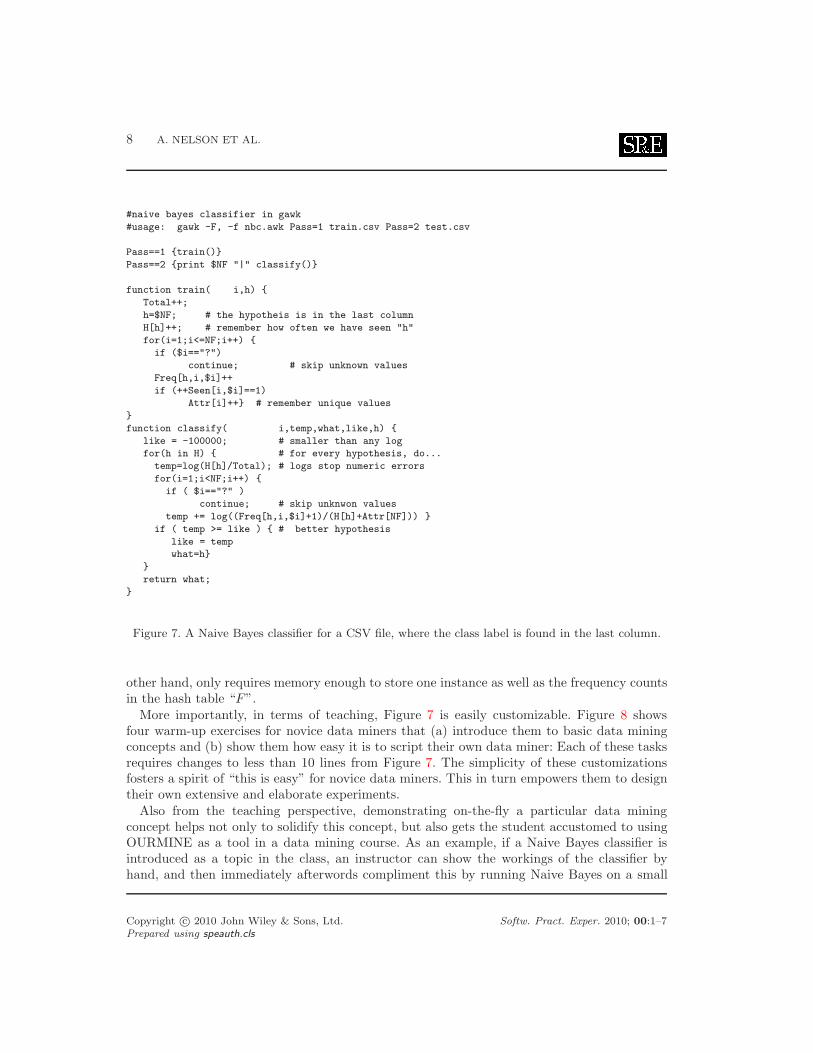
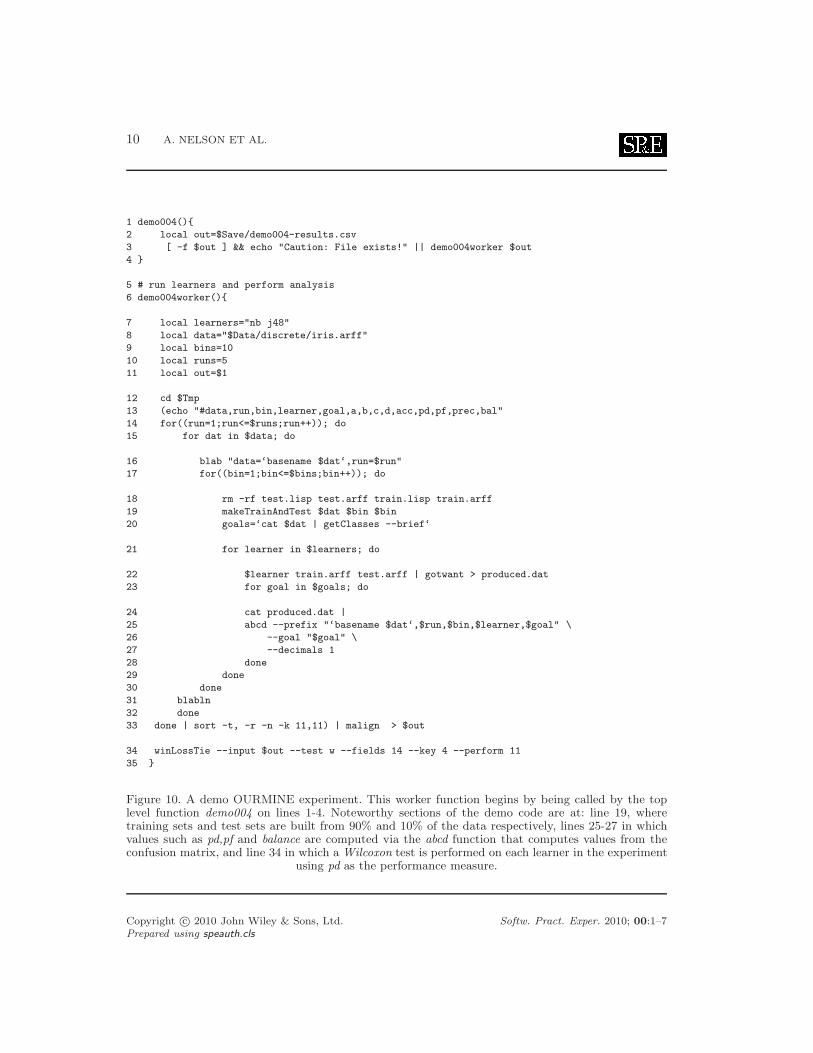
Data mining concepts become complex when implemented in a complex manner. For thisreason, OURMINE utilizes simple scripting tools (written mostly in BASH or GAWK) tobetter convey the inner-workings of these concepts. For instance, Figure 6 shows a GAWKimplementation used by OURMINE to determine the TF-IDF [18] values of each term in adocument. This script is simple and concise, while a C++ or Java implementation would belarge and overly complex. An additional example demonstrating the brevity of OURMINEscript can be seen in Figure 10, which is a complete experiment whose form can easily betaught and duplicated in future experiments.
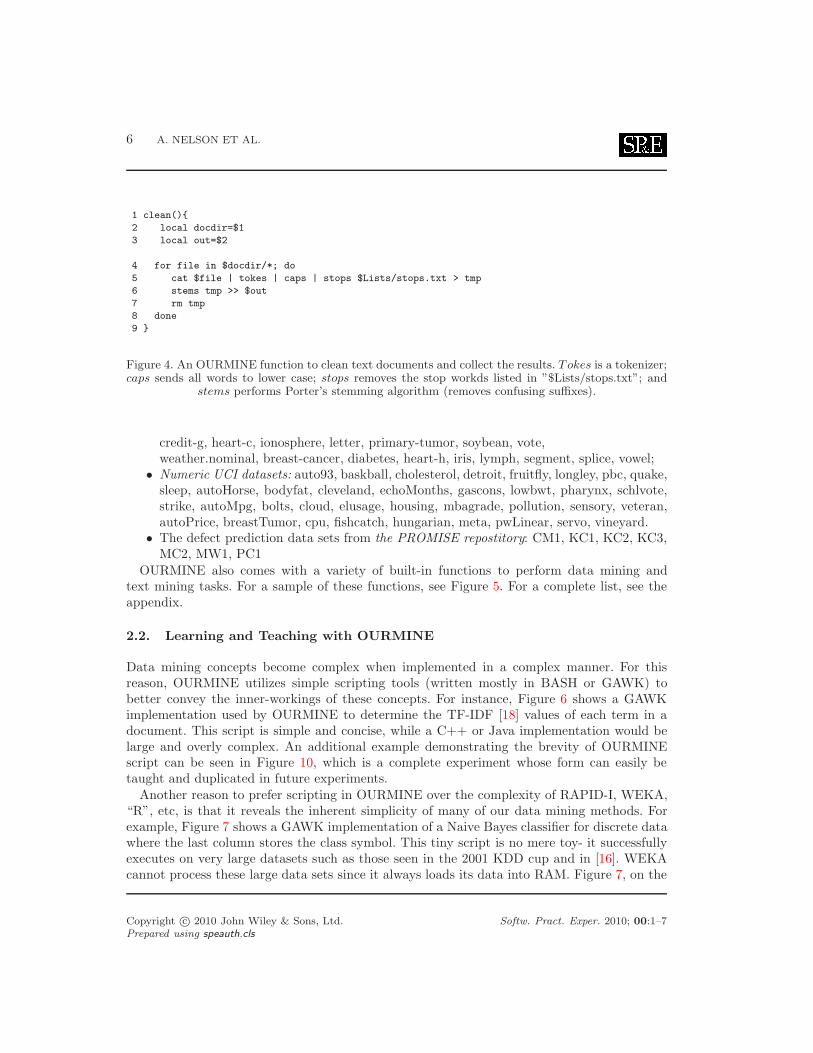
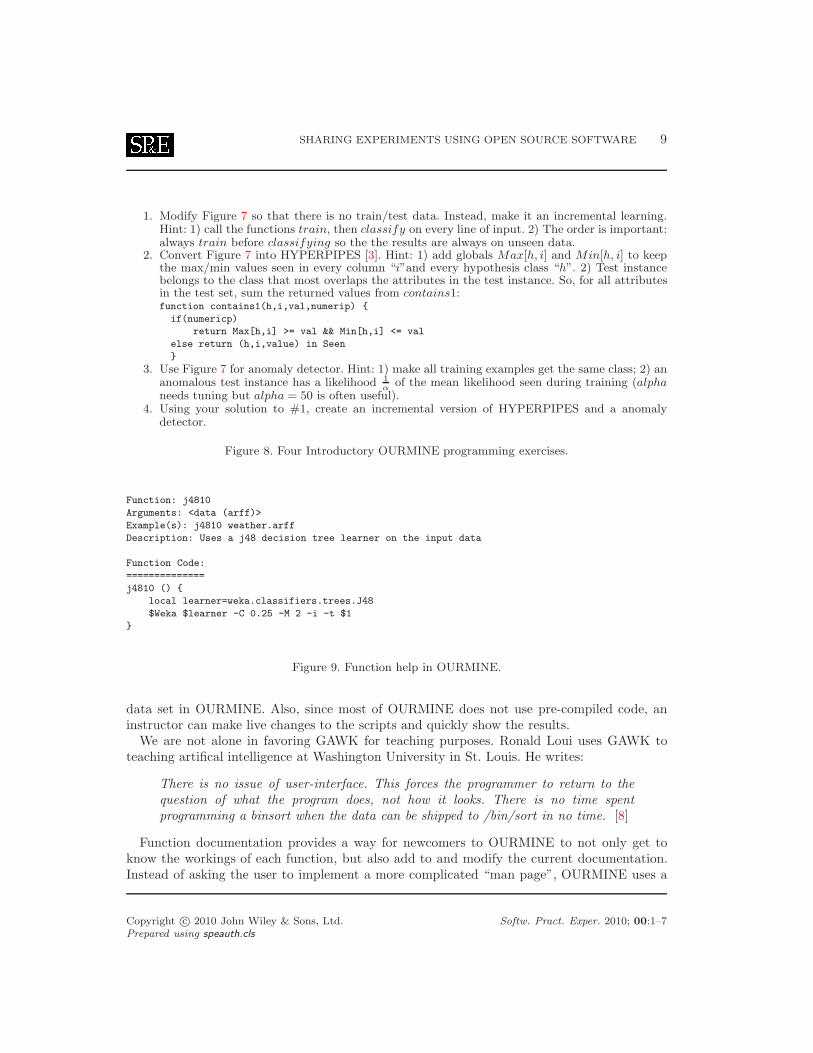
Another reason to prefer scripting in OURMINE over the complexity of RAPID-I, WEKA,“R”, etc, is that it reveals the inherent simplicity of many of our data mining methods. Forexample, Figure 7 shows a GAWK implementation of a Naive Bayes classifier for discrete datawhere the last column stores the class symbol. This tiny script is no mere toy- it successfullyexecutes on very large datasets such as those seen in the 2001 KDD cup and in [16]. WEKAcannot process these large data sets since it always loads its data into RAM. Figure 7, on the
Copyright c⃝ 2010 John Wiley & Sons, Ltd. Softw. Pract. Exper. 2010; 00:1–7Prepared using speauth.cls
SHARING EXPERIMENTS USING OPEN SOURCE SOFTWARE 7
abcd provides analysis of experiments, such as pd,pf,accuracy and precision values;
clean clean text for further processing, removing tokens, capitalizations, stop words, etc.;
docsToSparff constructs a sparse arff file based on a directory of documents;
docsToTfidfSparff generates a sparse arff file of TF-IDF values based on a directory of documents;
funs shows a sorted list of all available functions in OURMINE;
logArff logs all numeric values in a data set ;
malign neatly aligns text into columns;
nb Runs Naive Bayes on the data given;
rankViaInfoGain ranks attributes by InfoGain values;
makeTrainAndTest splits a dataset into a test set and a training set as train.arff and test.arff, aswell as train.lisp and test.lisp.
Figure 5. A small sample of the available OURMINE functions. Built-in functions give the usersomething with which to start and begin running demos and experiments immediately. For a detailed
list of available tools, please see the appendix.
function train() { #update counters for all words in the recordDocs++;for(I=1;I<NF;I++) {if( ++In[$I,Docs]==1)Doc[$I]++Word[$I]++Words++ }
}function tfidf(i) { #compute tfidf for one word
return Word[i]/Words*log(Docs/Doc[i])}
Figure 6. A GAWK implementation of TF-IDF.
Copyright c⃝ 2010 John Wiley & Sons, Ltd. Softw. Pract. Exper. 2010; 00:1–7Prepared using speauth.cls
8 A. NELSON ET AL.
#naive bayes classifier in gawk#usage: gawk -F, -f nbc.awk Pass=1 train.csv Pass=2 test.csv
Pass==1 {train()}Pass==2 {print $NF "|" classify()}
function train( i,h) {Total++;h=$NF; # the hypotheis is in the last columnH[h]++; # remember how often we have seen "h"for(i=1;i<=NF;i++) {if ($i=="?")
continue; # skip unknown valuesFreq[h,i,$i]++if (++Seen[i,$i]==1)
Attr[i]++} # remember unique values}function classify( i,temp,what,like,h) {
like = -100000; # smaller than any logfor(h in H) { # for every hypothesis, do...temp=log(H[h]/Total); # logs stop numeric errorsfor(i=1;i<NF;i++) {
if ( $i=="?" )continue; # skip unknwon values
temp += log((Freq[h,i,$i]+1)/(H[h]+Attr[NF])) }if ( temp >= like ) { # better hypothesis
like = tempwhat=h}
}return what;
}
Figure 7. A Naive Bayes classifier for a CSV file, where the class label is found in the last column.
other hand, only requires memory enough to store one instance as well as the frequency countsin the hash table “F”.
More importantly, in terms of teaching, Figure 7 is easily customizable. Figure 8 showsfour warm-up exercises for novice data miners that (a) introduce them to basic data miningconcepts and (b) show them how easy it is to script their own data miner: Each of these tasksrequires changes to less than 10 lines from Figure 7. The simplicity of these customizationsfosters a spirit of “this is easy” for novice data miners. This in turn empowers them to designtheir own extensive and elaborate experiments.
Also from the teaching perspective, demonstrating on-the-fly a particular data miningconcept helps not only to solidify this concept, but also gets the student accustomed to usingOURMINE as a tool in a data mining course. As an example, if a Naive Bayes classifier isintroduced as a topic in the class, an instructor can show the workings of the classifier byhand, and then immediately afterwords compliment this by running Naive Bayes on a small
Copyright c⃝ 2010 John Wiley & Sons, Ltd. Softw. Pract. Exper. 2010; 00:1–7Prepared using speauth.cls
SHARING EXPERIMENTS USING OPEN SOURCE SOFTWARE 9
1. Modify Figure 7 so that there is no train/test data. Instead, make it an incremental learning.Hint: 1) call the functions train, then classify on every line of input. 2) The order is important:always train before classifying so the the results are always on unseen data.
2. Convert Figure 7 into HYPERPIPES [3]. Hint: 1) add globals Max[h, i] and Min[h, i] to keepthe max/min values seen in every column “i”and every hypothesis class “h”. 2) Test instancebelongs to the class that most overlaps the attributes in the test instance. So, for all attributesin the test set, sum the returned values from contains1:function contains1(h,i,val,numerip) {if(numericp)
return Max[h,i] >= val && Min[h,i] <= valelse return (h,i,value) in Seen}
3. Use Figure 7 for anomaly detector. Hint: 1) make all training examples get the same class; 2) ananomalous test instance has a likelihood 1
α of the mean likelihood seen during training (alphaneeds tuning but alpha = 50 is often useful).
4. Using your solution to #1, create an incremental version of HYPERPIPES and a anomalydetector.
Figure 8. Four Introductory OURMINE programming exercises.
Function: j4810Arguments: <data (arff)>Example(s): j4810 weather.arffDescription: Uses a j48 decision tree learner on the input data
Function Code:==============j4810 () {
local learner=weka.classifiers.trees.J48$Weka $learner -C 0.25 -M 2 -i -t $1
}
Figure 9. Function help in OURMINE.
data set in OURMINE. Also, since most of OURMINE does not use pre-compiled code, aninstructor can make live changes to the scripts and quickly show the results.
We are not alone in favoring GAWK for teaching purposes. Ronald Loui uses GAWK toteaching artifical intelligence at Washington University in St. Louis. He writes:
There is no issue of user-interface. This forces the programmer to return to thequestion of what the program does, not how it looks. There is no time spentprogramming a binsort when the data can be shipped to /bin/sort in no time. [8]
Function documentation provides a way for newcomers to OURMINE to not only get toknow the workings of each function, but also add to and modify the current documentation.Instead of asking the user to implement a more complicated “man page”, OURMINE uses a
Copyright c⃝ 2010 John Wiley & Sons, Ltd. Softw. Pract. Exper. 2010; 00:1–7Prepared using speauth.cls
10 A. NELSON ET AL.
1 demo004(){2 local out=$Save/demo004-results.csv3 [ -f $out ] && echo "Caution: File exists!" || demo004worker $out4 }
5 # run learners and perform analysis6 demo004worker(){
7 local learners="nb j48"8 local data="$Data/discrete/iris.arff"9 local bins=1010 local runs=511 local out=$1
12 cd $Tmp13 (echo "#data,run,bin,learner,goal,a,b,c,d,acc,pd,pf,prec,bal"14 for((run=1;run<=$runs;run++)); do15 for dat in $data; do
16 blab "data=‘basename $dat‘,run=$run"17 for((bin=1;bin<=$bins;bin++)); do
18 rm -rf test.lisp test.arff train.lisp train.arff19 makeTrainAndTest $dat $bin $bin20 goals=‘cat $dat | getClasses --brief‘
21 for learner in $learners; do
22 $learner train.arff test.arff | gotwant > produced.dat23 for goal in $goals; do
24 cat produced.dat |25 abcd --prefix "‘basename $dat‘,$run,$bin,$learner,$goal" \26 --goal "$goal" \27 --decimals 128 done29 done30 done31 blabln32 done33 done | sort -t, -r -n -k 11,11) | malign > $out
34 winLossTie --input $out --test w --fields 14 --key 4 --perform 1135 }
Figure 10. A demo OURMINE experiment. This worker function begins by being called by the toplevel function demo004 on lines 1-4. Noteworthy sections of the demo code are at: line 19, wheretraining sets and test sets are built from 90% and 10% of the data respectively, lines 25-27 in whichvalues such as pd,pf and balance are computed via the abcd function that computes values from theconfusion matrix, and line 34 in which a Wilcoxon test is performed on each learner in the experiment
using pd as the performance measure.
Copyright c⃝ 2010 John Wiley & Sons, Ltd. Softw. Pract. Exper. 2010; 00:1–7Prepared using speauth.cls
SHARING EXPERIMENTS USING OPEN SOURCE SOFTWARE 11
very simple system consisting of keywords such as name, args and eg to represent a functionname, its arguments and an example of how to use it. Using this documentation is simple.Entering funs at the OURMINE prompt provides a sorted list of all available functions inourmine. Then, by typing help X, where X is the name of the function, information about thatfunction is printed to the screen. See Figure 9 for an example of viewing the help documentfor the function j4810. Documentation for a function is added by supplying a text file to thehelpdocs directory in OURMINE named after the function.
3. Using Ourmine for ResearchOURMINE is not just a simple demonstration system for novice data miners. It can also beused to generate journal-level publishable results. In the last three years, the authors of thispaper have published six papers in leading software engineering journals and conferences usingOURMINE [20,4, 14, 13, 2, 12].
In order to demonstate OURMINE’s use in leading edge research, we present here twoexperiments. Experiment #1 reproduces an important recent result by Turhan et al. [20].Kitchenham et al. report that there is no clear consensus on the relative value of effortestimation models learned from either local or imported data [6]. Since this matter has notbe previously studied in the defect prediction literature, Turhan et al. conducted a seriesof experiments with ten data sets from different companies. In their within-company (WC)experiments, defect predictors were learned from 90% of the local data, then tested on theremaining 10%. In the cross-company (CC) experiments, defect predictors wehre learned fromnine companies then tested on the tenth. Turhan et al. found that the CC predictions wereuseless since they suffered from very high false alarm rates. However, after applying a simplerelevancy filter, they found that imported CC learning yielded predictors that were nearly asgood as the local WC learning.
Experiment #2 checks a recent text mining result from an as-yet-unpublished WVU mastersthesis. Matheny [9] benchmarked various lightweight learning methods (TF*IDF, the GENICstochastic clusterer) against other, slower, more rigorous learning methods (PCA, K-means).As expected, the rigorous learning methods ran much slower than the stochastic methods.But, unexpectedly, Matheny found that the leightweight methods perform nearly as well asthe rigorous methods.
In a mature scientific discipline, it is standard practice to reproduce important results. Boththe results need to be reproduced since they are important:
• If the Experiment #1 results are correct, then organizations make quality predictionsabout their source code, even when they lack local historical logs.
• If the Experiment #2 results are correct, then text mining methods can scale to muchlarger data sets.
The rest of this section describes the use of OURMINE to reproduce Experiment #1 and #2.
Copyright c⃝ 2010 John Wiley & Sons, Ltd. Softw. Pract. Exper. 2010; 00:1–7Prepared using speauth.cls
12 A. NELSON ET AL.
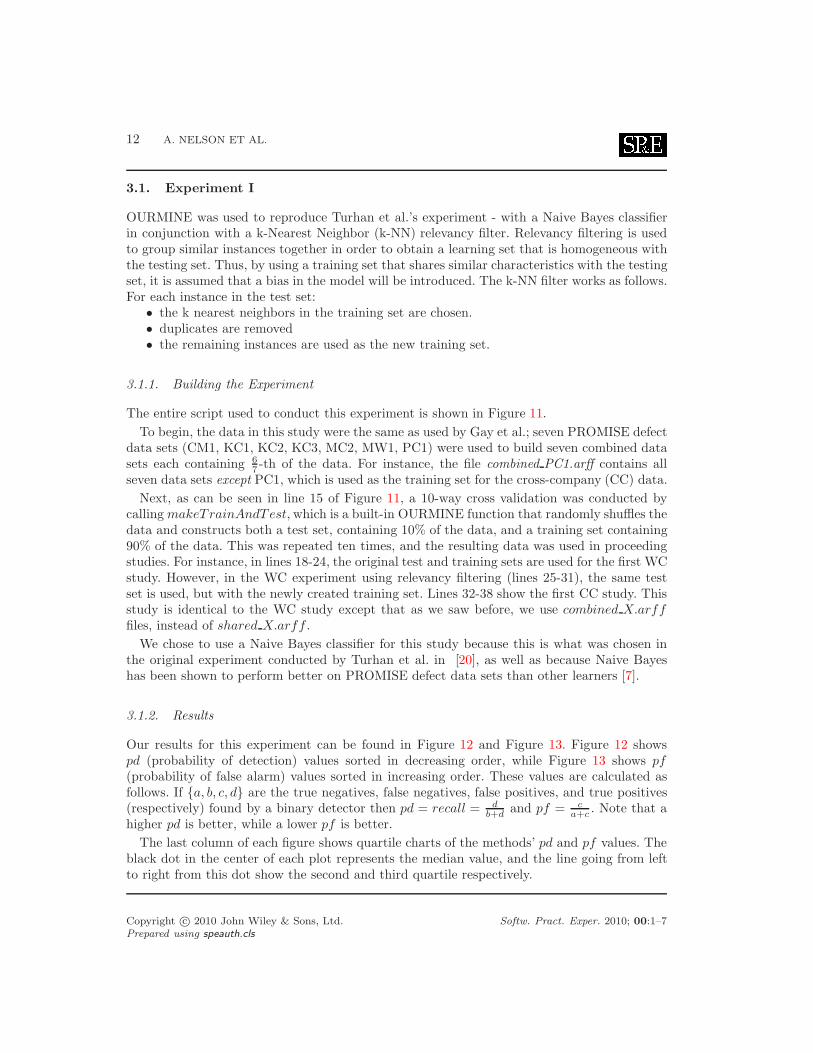
3.1. Experiment I
OURMINE was used to reproduce Turhan et al.’s experiment - with a Naive Bayes classifierin conjunction with a k-Nearest Neighbor (k-NN) relevancy filter. Relevancy filtering is usedto group similar instances together in order to obtain a learning set that is homogeneous withthe testing set. Thus, by using a training set that shares similar characteristics with the testingset, it is assumed that a bias in the model will be introduced. The k-NN filter works as follows.For each instance in the test set:
• the k nearest neighbors in the training set are chosen.• duplicates are removed• the remaining instances are used as the new training set.
3.1.1. Building the Experiment
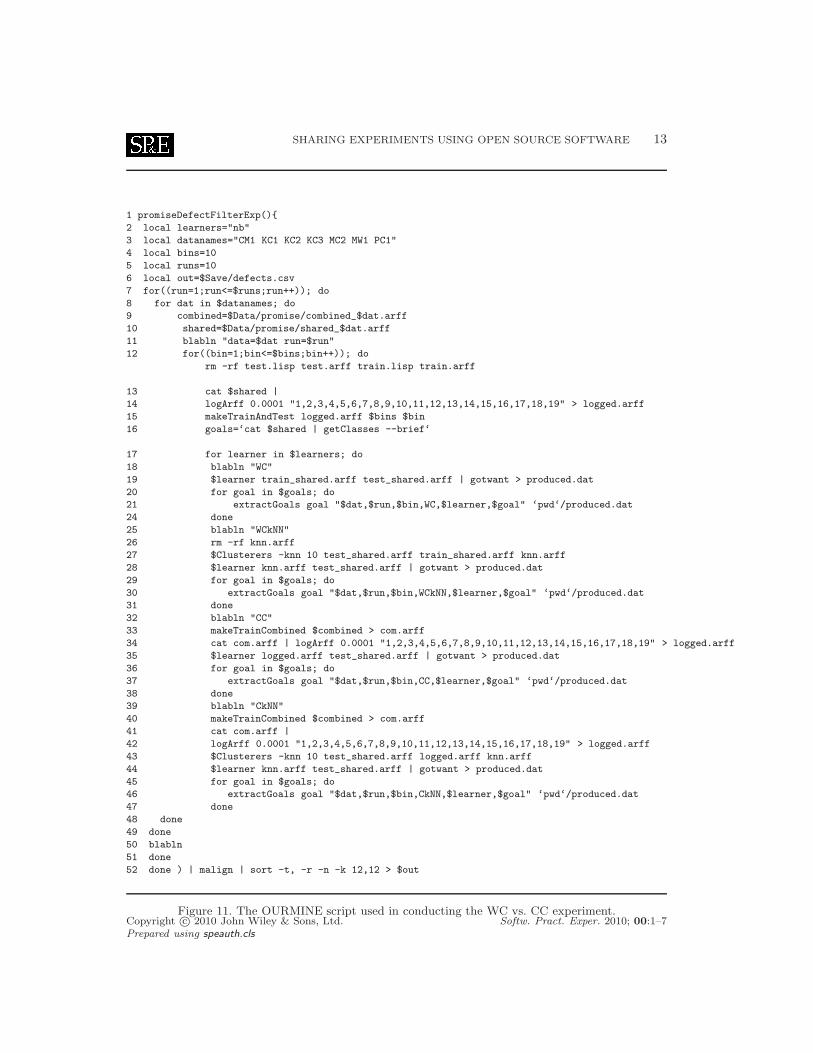
The entire script used to conduct this experiment is shown in Figure 11.To begin, the data in this study were the same as used by Gay et al.; seven PROMISE defect
data sets (CM1, KC1, KC2, KC3, MC2, MW1, PC1) were used to build seven combined datasets each containing 6
7 -th of the data. For instance, the file combined PC1.arff contains allseven data sets except PC1, which is used as the training set for the cross-company (CC) data.
Next, as can be seen in line 15 of Figure 11, a 10-way cross validation was conducted bycalling makeTrainAndTest, which is a built-in OURMINE function that randomly shuffles thedata and constructs both a test set, containing 10% of the data, and a training set containing90% of the data. This was repeated ten times, and the resulting data was used in proceedingstudies. For instance, in lines 18-24, the original test and training sets are used for the first WCstudy. However, in the WC experiment using relevancy filtering (lines 25-31), the same testset is used, but with the newly created training set. Lines 32-38 show the first CC study. Thisstudy is identical to the WC study except that as we saw before, we use combined X.arfffiles, instead of shared X.arff .
We chose to use a Naive Bayes classifier for this study because this is what was chosen inthe original experiment conducted by Turhan et al. in [20], as well as because Naive Bayeshas been shown to perform better on PROMISE defect data sets than other learners [7].
3.1.2. Results
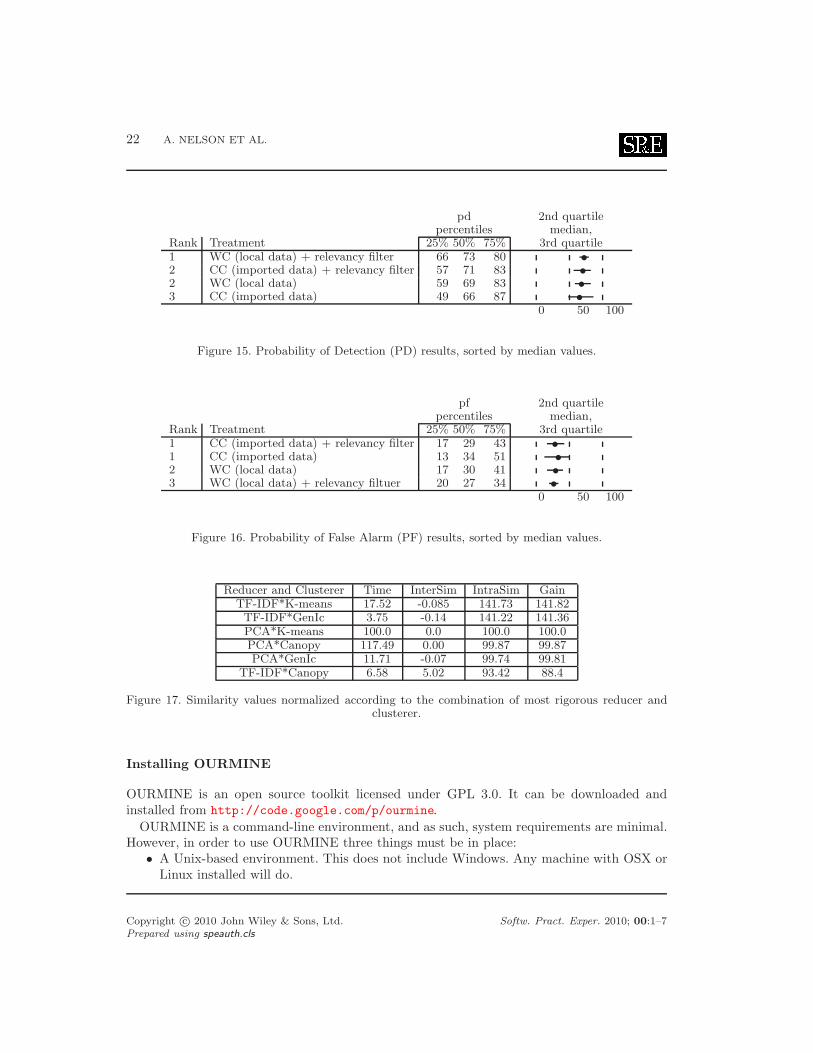
Our results for this experiment can be found in Figure 12 and Figure 13. Figure 12 showspd (probability of detection) values sorted in decreasing order, while Figure 13 shows pf(probability of false alarm) values sorted in increasing order. These values are calculated asfollows. If {a, b, c, d} are the true negatives, false negatives, false positives, and true positives(respectively) found by a binary detector then pd = recall = d
b+d and pf = ca+c . Note that a
higher pd is better, while a lower pf is better.The last column of each figure shows quartile charts of the methods’ pd and pf values. The
black dot in the center of each plot represents the median value, and the line going from leftto right from this dot show the second and third quartile respectively.
Copyright c⃝ 2010 John Wiley & Sons, Ltd. Softw. Pract. Exper. 2010; 00:1–7Prepared using speauth.cls
SHARING EXPERIMENTS USING OPEN SOURCE SOFTWARE 13
1 promiseDefectFilterExp(){2 local learners="nb"3 local datanames="CM1 KC1 KC2 KC3 MC2 MW1 PC1"4 local bins=105 local runs=106 local out=$Save/defects.csv7 for((run=1;run<=$runs;run++)); do8 for dat in $datanames; do9 combined=$Data/promise/combined_$dat.arff10 shared=$Data/promise/shared_$dat.arff11 blabln "data=$dat run=$run"12 for((bin=1;bin<=$bins;bin++)); do
rm -rf test.lisp test.arff train.lisp train.arff
13 cat $shared |14 logArff 0.0001 "1,2,3,4,5,6,7,8,9,10,11,12,13,14,15,16,17,18,19" > logged.arff15 makeTrainAndTest logged.arff $bins $bin16 goals=‘cat $shared | getClasses --brief‘
17 for learner in $learners; do18 blabln "WC"19 $learner train_shared.arff test_shared.arff | gotwant > produced.dat20 for goal in $goals; do21 extractGoals goal "$dat,$run,$bin,WC,$learner,$goal" ‘pwd‘/produced.dat24 done25 blabln "WCkNN"26 rm -rf knn.arff27 $Clusterers -knn 10 test_shared.arff train_shared.arff knn.arff28 $learner knn.arff test_shared.arff | gotwant > produced.dat29 for goal in $goals; do30 extractGoals goal "$dat,$run,$bin,WCkNN,$learner,$goal" ‘pwd‘/produced.dat31 done32 blabln "CC"33 makeTrainCombined $combined > com.arff34 cat com.arff | logArff 0.0001 "1,2,3,4,5,6,7,8,9,10,11,12,13,14,15,16,17,18,19" > logged.arff35 $learner logged.arff test_shared.arff | gotwant > produced.dat36 for goal in $goals; do37 extractGoals goal "$dat,$run,$bin,CC,$learner,$goal" ‘pwd‘/produced.dat38 done39 blabln "CkNN"40 makeTrainCombined $combined > com.arff41 cat com.arff |42 logArff 0.0001 "1,2,3,4,5,6,7,8,9,10,11,12,13,14,15,16,17,18,19" > logged.arff43 $Clusterers -knn 10 test_shared.arff logged.arff knn.arff44 $learner knn.arff test_shared.arff | gotwant > produced.dat45 for goal in $goals; do46 extractGoals goal "$dat,$run,$bin,CkNN,$learner,$goal" ‘pwd‘/produced.dat47 done48 done49 done50 blabln51 done52 done ) | malign | sort -t, -r -n -k 12,12 > $out
Figure 11. The OURMINE script used in conducting the WC vs. CC experiment.Copyright c⃝ 2010 John Wiley & Sons, Ltd. Softw. Pract. Exper. 2010; 00:1–7Prepared using speauth.cls
14 A. NELSON ET AL.
Column one of each figure gives a method its rank based on a Mann-Whitney test at 95%confidence. A rank is determined by how many times a learner or learner/filter loses comparedto another. The method that lost the least number of times is given the highest rank.
The following are important conclusions derived from these results:
• When CC data is used, relevancy filtering is crucial. According to our results, cross-company data with no filtering yields the worst pd and pf values.
• When relevancy filtering is performed on this CC data, we obtain better pd and pfresults than using just CC and Naive Bayes.
• When considering only filtered data or only unfiltered data, the highest pd and lowestpf values are obtained by using WC data as opposed to CC data. This suggests thatWC data gives the best results.
These finds were consistent with Turhan et al.’s results:
• Significantly better defect predictors are produced from using WC data.• However, CC data leads to defect predictors nearly as effective as WC data when using
relevancy filtering.
Thus, this study also makes the same conclusions as Turhan et al. A company should uselocal data to develop defect predictors if that local development data is available. However, iflocal data is not available, relevancy-filtered cross-company data provides a feasible means tobuild defect predictors.
3.2. Experiment II
As stated above, the purpose of this experiment conducted for this paper is to verify iflightweight data mining methods perform slower or worse than more thorough and rigorousones.
The data sets used in this experiment are:
• EXPRESS schemas: AP-203, AP-214• Text mining datasets: BBC, Reuters, The Guardian (multi-view text datasets), 20
Newsgroup subsets: sb-3-2, sb-8-2, ss-3-2, sl-8-2.
3.2.1. Classes of Methods
This experiment compares different row and column reduction methods. Given a table of datawhere each row is one example and each columns counts different features, then:
• Row reduction methods cluster related rows into the same group;• Column reduction methods remove columns with little information.
Reduction methods are essential in text mining. For example:
∗http://mlg.ucd.ie/datasets
Copyright c⃝ 2010 John Wiley & Sons, Ltd. Softw. Pract. Exper. 2010; 00:1–7Prepared using speauth.cls
SHARING EXPERIMENTS USING OPEN SOURCE SOFTWARE 15
• A standard text mining corpus may store information in tens of thousands of columns.For such data sets, column reduction is an essential first step before any other algorithmcan execute
• The process of clustering data into similar groups can be used in a wide variety ofapplications, such as:
– Marketing: finding groups of customers with similar behaviors given a largedatabase of customer data
– Biology: classification of plants and animals given their features– WWW: document classification and clustering weblog data to discover groups of
similar access patterns.
3.2.2. The Algorithms
While there are many clustering algorithms used today, this experiment focused on three: anaive K-Means implementation, GenIc [5], and clustering using canopies [10]:
1. K-means, a special case of a class of EM algorithms, works as follows:
(a) Select initial K centroids at random;(b) Assign each incoming point to its nearest centroid;(c) Adjusts each cluster’s centroid to the mean of each cluster;(d) Repeat steps 2 and 3 until the centroids in all clusters stop moving by a noteworthy
amount
Here we use a naive implementation of K-means, requiring K*N *I comparisons, whereN and I represent the total number of points and maximum iterations respectively.
2. GenIc is a single-pass, stochastic clustering algorithm. It begins by intially selecting Kcentroids at random from all instances in the data. At the beginning of each generation,set the centroid weight to one. When new instances arrive, nudge the nearest centroid tothat instance and increase the score for that centroid. In this process, centroids become“fatter” and slow down the rate at which they move toward newer examples. When ageneration ends, replace the centroids with less than X percent of the max weight withN more random centroids. Genic repeats for many generations, then returns the highestscoring centroids.
3. Canopy clustering, developed by Google, reduces the need for comparing all items in thedata using an expensive distance measure, by first partitioning the data into overlappingsubsets called canopies. Canopies are first built using a cheap, approximate distancemeasure. Then, more expensive distance measures are used inside of each canopy tocluster the data.
As to column reduction, we will focus on two methods:1. PCA, or Principal Components Analysis, is a reduction method that treats every instance
in a dataset as a point in N-dimensional space. PCA looks for new dimensions that better
†http://home.dei.polimi.it/matteucc/Clustering/tutorial_html/
Copyright c⃝ 2010 John Wiley & Sons, Ltd. Softw. Pract. Exper. 2010; 00:1–7Prepared using speauth.cls
16 A. NELSON ET AL.
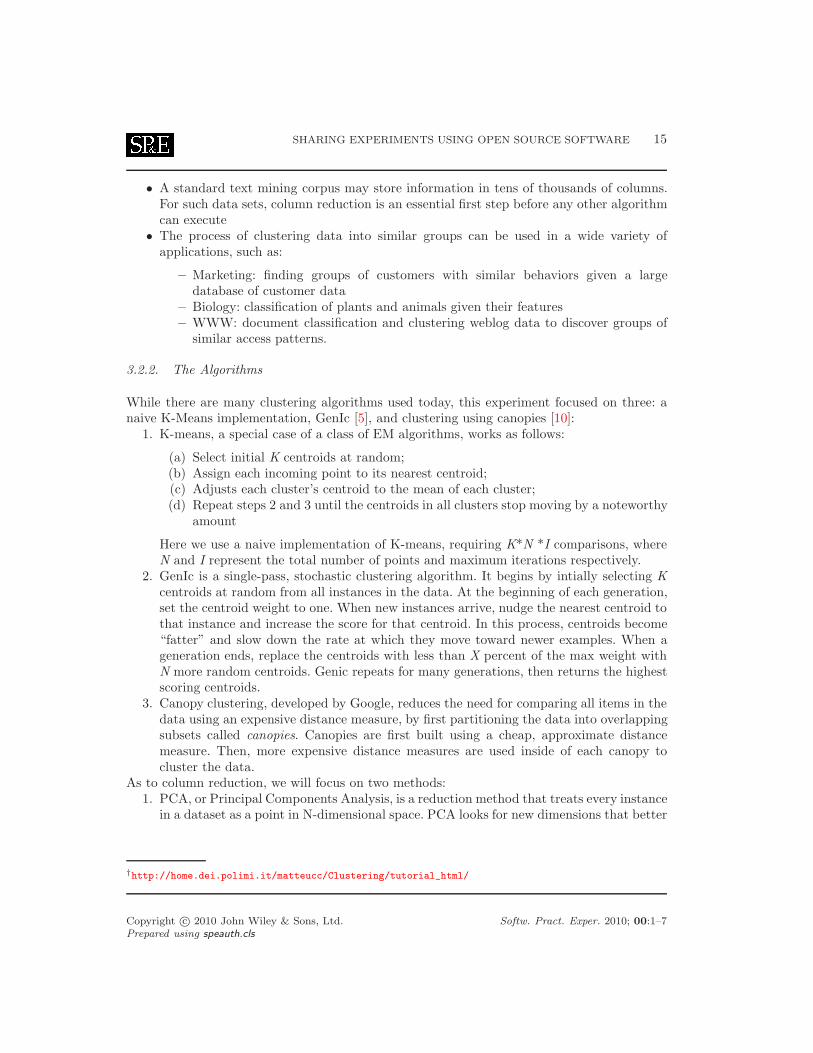
Figure 12. A PCA dimension feature.
fit these points. PCA involves the calculation of the eigenvalue decomposition of a datacovariance matrix or singular value decomposition of a data matrix. Figure 14 showsan example of PCA. Before, on the left-hand-side, the data exists in a two-dimensionalspace, neither of which captures the distribution of the data. Afterwards, on the right-hand-side, a new dimension has been syntethesized that is more relevant to the datadistribution.
2. TF-IDF, or term frequency times inverse document frequency, reduces the number ofterms (dimensions) by describing how important a term is in a document (or collectionof documents) by incrementing its importance according to how many times the termappears in a document. However, this importance is also offset by the frequency of theterm in the entire corpus. Thus, we are concerned with only terms that occur frequentlyin a small set of documents, and very infrequently everywhere else. To calculate theTf*IDF value for each term in a document, we use the following equation:
Tf ∗ df(t, Dj) =tf(ti, Dj)
|Dj |log(
|D|df(ti)
) (1)
To reduce all terms (and thus, dimensions), we must find the sum of the above
Tf ∗ Ifdsum(t) =!
DjϵD
Tf ∗ Idf(t, Dj) (2)
In theory, TF*IDF and GenIc should perform worse than K-Means, canopy clustering andPCA:
• Any single-pass algorithm like GenIc can be confused by “order effects”; i.e. if the dataarrives in some confusing order then the single-pass algorithm can perform worse thanother algorithms that are allowed to examine all the data.
• TF*IDF is a heuristic method while PCA is a well-founded mathematical techniqueOn the other hand, the more rigorous methods are slower to compute:
• Computing the correlation matrix used by PCA requires at least a O(N2) calculation.• As shown below, K-means is much slower than the other methods studied here.
Copyright c⃝ 2010 John Wiley & Sons, Ltd. Softw. Pract. Exper. 2010; 00:1–7Prepared using speauth.cls
SHARING EXPERIMENTS USING OPEN SOURCE SOFTWARE 17
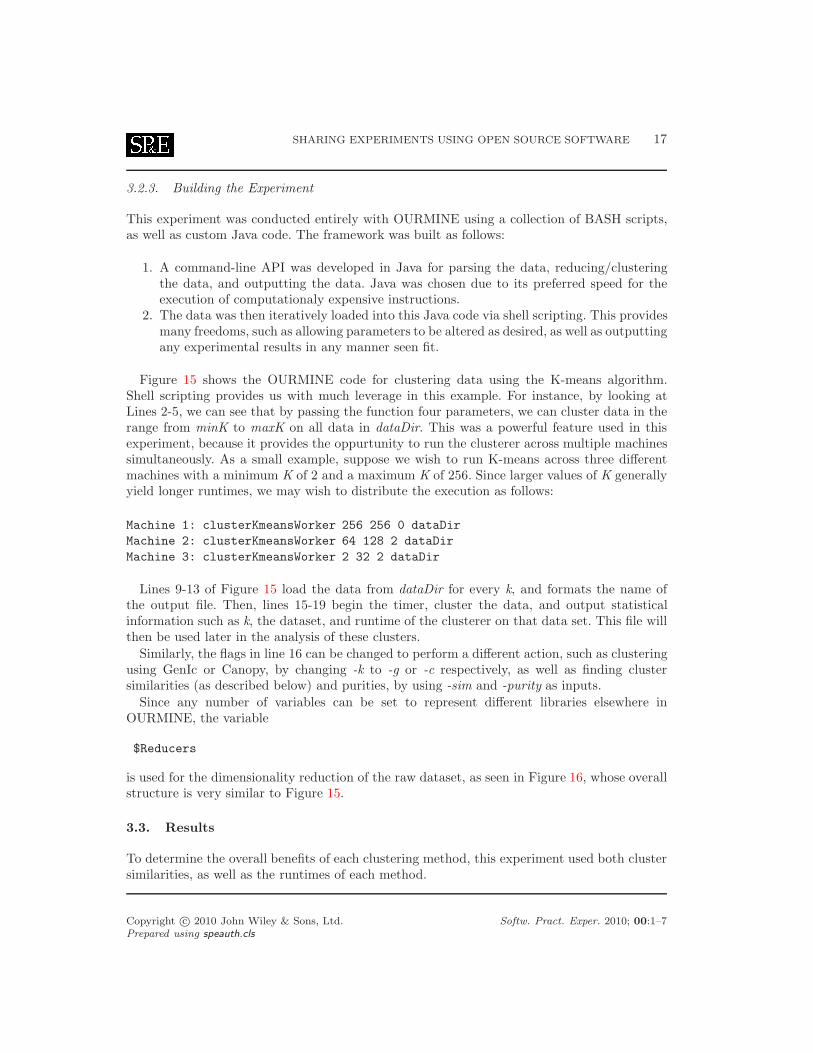
3.2.3. Building the Experiment
This experiment was conducted entirely with OURMINE using a collection of BASH scripts,as well as custom Java code. The framework was built as follows:
1. A command-line API was developed in Java for parsing the data, reducing/clusteringthe data, and outputting the data. Java was chosen due to its preferred speed for theexecution of computationaly expensive instructions.
2. The data was then iteratively loaded into this Java code via shell scripting. This providesmany freedoms, such as allowing parameters to be altered as desired, as well as outputtingany experimental results in any manner seen fit.
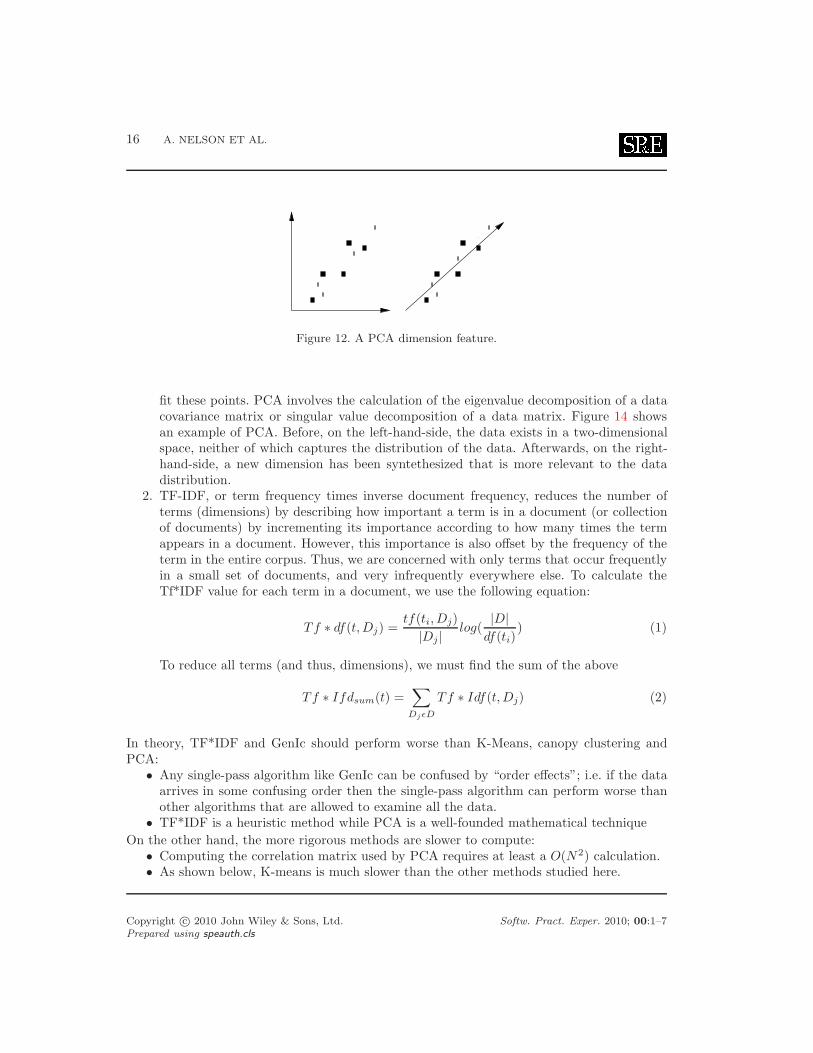
Figure 15 shows the OURMINE code for clustering data using the K-means algorithm.Shell scripting provides us with much leverage in this example. For instance, by looking atLines 2-5, we can see that by passing the function four parameters, we can cluster data in therange from minK to maxK on all data in dataDir. This was a powerful feature used in thisexperiment, because it provides the oppurtunity to run the clusterer across multiple machinessimultaneously. As a small example, suppose we wish to run K-means across three differentmachines with a minimum K of 2 and a maximum K of 256. Since larger values of K generallyyield longer runtimes, we may wish to distribute the execution as follows:
Machine 1: clusterKmeansWorker 256 256 0 dataDirMachine 2: clusterKmeansWorker 64 128 2 dataDirMachine 3: clusterKmeansWorker 2 32 2 dataDir
Lines 9-13 of Figure 15 load the data from dataDir for every k, and formats the name ofthe output file. Then, lines 15-19 begin the timer, cluster the data, and output statisticalinformation such as k, the dataset, and runtime of the clusterer on that data set. This file willthen be used later in the analysis of these clusters.
Similarly, the flags in line 16 can be changed to perform a different action, such as clusteringusing GenIc or Canopy, by changing -k to -g or -c respectively, as well as finding clustersimilarities (as described below) and purities, by using -sim and -purity as inputs.
Since any number of variables can be set to represent different libraries elsewhere inOURMINE, the variable
$Reducers
is used for the dimensionality reduction of the raw dataset, as seen in Figure 16, whose overallstructure is very similar to Figure 15.
3.3. Results
To determine the overall benefits of each clustering method, this experiment used both clustersimilarities, as well as the runtimes of each method.
Copyright c⃝ 2010 John Wiley & Sons, Ltd. Softw. Pract. Exper. 2010; 00:1–7Prepared using speauth.cls
18 A. NELSON ET AL.
1 clusterKmeansWorker(){2 local minK=$13 local maxK=$24 local incVal=$35 local dataDir=$46 local stats="clusterer,k,dataset,time(seconds)"7 local statsfile=$Save/kmeans_runtimes8 echo $stats >> $statsfile9 for((k=$minK;k<=$maxK;k*=$incVal)); do10 for file in $dataDir/*.arff; do11 filename=‘basename $file‘12 filename=${filename%.*}13 out=kmeans_k="$k"_$filename.arff14 echo $out15 start=$(date +%s.%N)16 $Clusterers -k $k $file $Save/$out17 end=$(date +%s.%N)18 time=$(echo "$end - $start" | bc)19 echo "kmeans,$k,$filename,$time" >> $statsfile20 done21 done22 }
Figure 13. An OURMINE worker function to cluster data using the K-means algorithm. Note thatexperiments using other clustering methods (such as GenIc and Canopy), could be conducted by
calling line 16 above in much the same way, but with varying flags to represent the clusterer.
3.3.1. Similarities
Cluster similarities tell us how similar points are, either within a cluster (Intra-similarity), orwith members of other clusters (Inter-similarity). The idea here is simple: gauge how well aclustering algorithm groups similar documents, and how well it separates different documents.Therefore, intra-cluster similarity values should be maximized, while minimizing inter-clustersimilarities.
Similarities are obtained by using the cosine similarity between two documents. The cosinesimilarity measure defines the cosine of the angle between two documents, each containingvectors of terms. The similarity measure is represented as
sim(Di, Dj) =Di · Dj
||Di||||Dj ||= cos(θ) (3)
where Di and Dj denote two specific documents.Cluster similarities are determined as follows:
• Cluster intra-similarity: For each document d in cluster Ci, find the cosine similaritybetween d and all documents belonging to Ci
Copyright c⃝ 2010 John Wiley & Sons, Ltd. Softw. Pract. Exper. 2010; 00:1–7Prepared using speauth.cls
SHARING EXPERIMENTS USING OPEN SOURCE SOFTWARE 19
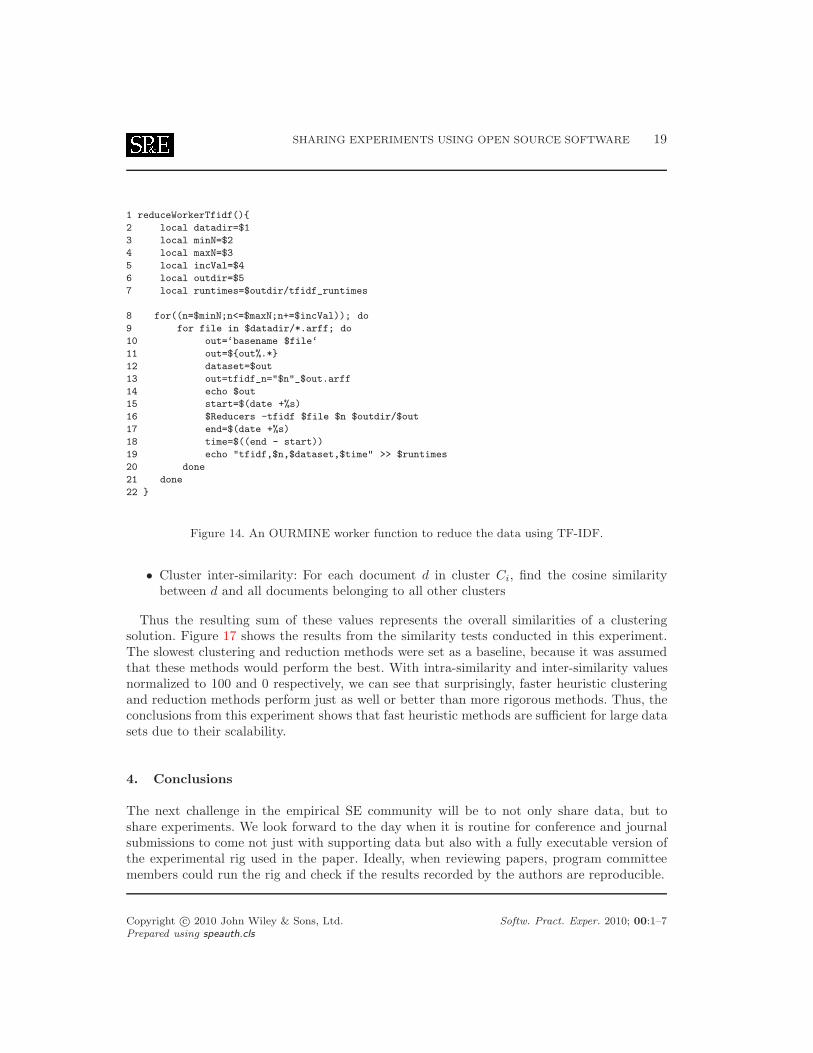
1 reduceWorkerTfidf(){2 local datadir=$13 local minN=$24 local maxN=$35 local incVal=$46 local outdir=$57 local runtimes=$outdir/tfidf_runtimes
8 for((n=$minN;n<=$maxN;n+=$incVal)); do9 for file in $datadir/*.arff; do10 out=‘basename $file‘11 out=${out%.*}12 dataset=$out13 out=tfidf_n="$n"_$out.arff14 echo $out15 start=$(date +%s)16 $Reducers -tfidf $file $n $outdir/$out17 end=$(date +%s)18 time=$((end - start))19 echo "tfidf,$n,$dataset,$time" >> $runtimes20 done21 done22 }
Figure 14. An OURMINE worker function to reduce the data using TF-IDF.
• Cluster inter-similarity: For each document d in cluster Ci, find the cosine similaritybetween d and all documents belonging to all other clusters
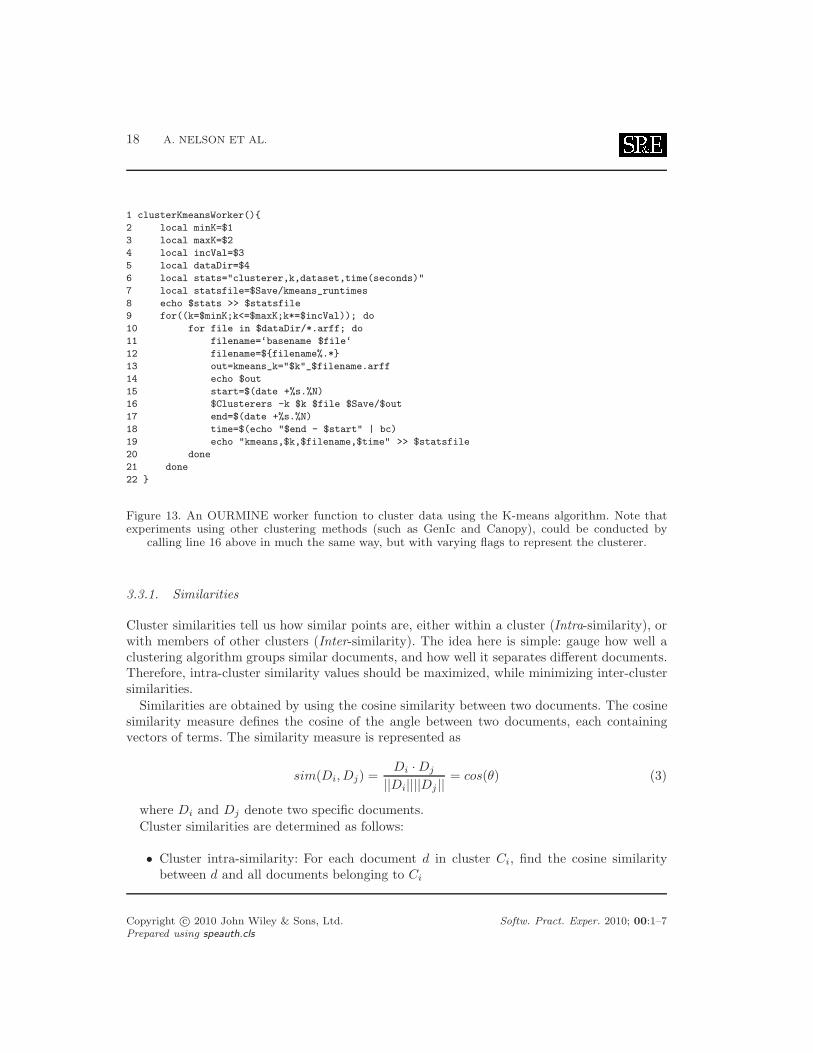
Thus the resulting sum of these values represents the overall similarities of a clusteringsolution. Figure 17 shows the results from the similarity tests conducted in this experiment.The slowest clustering and reduction methods were set as a baseline, because it was assumedthat these methods would perform the best. With intra-similarity and inter-similarity valuesnormalized to 100 and 0 respectively, we can see that surprisingly, faster heuristic clusteringand reduction methods perform just as well or better than more rigorous methods. Thus, theconclusions from this experiment shows that fast heuristic methods are sufficient for large datasets due to their scalability.
4. Conclusions
The next challenge in the empirical SE community will be to not only share data, but toshare experiments. We look forward to the day when it is routine for conference and journalsubmissions to come not just with supporting data but also with a fully executable version ofthe experimental rig used in the paper. Ideally, when reviewing papers, program committeemembers could run the rig and check if the results recorded by the authors are reproducible.
Copyright c⃝ 2010 John Wiley & Sons, Ltd. Softw. Pract. Exper. 2010; 00:1–7Prepared using speauth.cls
20 A. NELSON ET AL.
This paper has reviewed a UNIX scripting tool called OURMINE as a method ofdocumenting, executing, and sharing data mining experiments. We have used OURMINEto reproduce and check two important result. In our first experiment, we concluded that:
• When local data is available, that data should be used to build defect predictors• If local data is not available, however, imported data can be used to build defect
predictors when using relevancy filtering, because...• Imported data that uses relevency filtering performs nearly as well as using local data
to build defect predictors
In our second experiment, we learned:
• When examining cluster inter/intra similarities resulting from each clustering/reductionsolution, we found that faster heuristic methods can outperform more rigorous ones whenobserving decreases in runtimes.
• This means that faster solutions are suitable on large datasets due to scalability.
We prefer OURMINE to other tools. Four features are worthy of mention:1. OURMINE is very succinct. As seen above, a few lines can describe even complex
experiments.2. OURMINE’s experimental descriptions are complete. There is nothing hidden in
Figure 11; it is not the pseudocode of an experiment, it is the experiment.3. OURMINE code like in Figure 11, Figure 15 and Figure 16 is executable and can be
executed by other researchers directly.4. Lastly, the execution environment of OURMINE is readily available. Unlike RAPID-I,
WEKA, “R”, etc, there is nothing to debug or install. Many machines already have thesupport tools required for OURMINE. For example, we have run OURMINE on Linux,Mac, and Windows machines (with Cygwin installed).
Like Ritthol et al., we doubt that the standard interfaces of tools like WEKA, etc, areadequate for representing the space of possible experiments. Impressive visual programmingenvironments are not the answer: their sophistication can either distract or discouragenovice data miners from extensive modification and experimentation. Also, we find that thefunctionality of the visual environments can be achieved with a little BASH and GAWKscripts, with a fraction of the development effort and a greatly increased chance that noviceswill modify the environment.
OURMINE is hence a candidate format for sharing descriptions of experiments. ThePROMISE community might find this format unacceptable but discussions about thedrawbacks (or strengths) of OURMINE would help evolve not just OURMINE, but also thediscussion on how to represent data mining experiments for software engineering.
Copyright c⃝ 2010 John Wiley & Sons, Ltd. Softw. Pract. Exper. 2010; 00:1–7Prepared using speauth.cls
SHARING EXPERIMENTS USING OPEN SOURCE SOFTWARE 21
REFERENCES
1. Brian W. Kernighan Alfred V. Aho and Peter J. Weinberger. The AWK Programming Language. Addison-Wesley, 1988.
2. Zhihao Chen, Tim Menzies, Dan Port, and Barry Boehm. Finding the right data for software costmodeling. IEEE Software, Nov 2005.
3. Jacob Eisenstein and Randall Davis. Visual and linguistic informationin gesture classification. In ICMI, pages 113–120, 2004. Avaliable fromhttp://iccle.googlecode.com/svn/trunk/share/pdf/eisenstein04.pdf.
4. Greg Gay, Tim Menzies, and Bojan Cukic. How to build repeatable experiments. In PROMISE ’09:Proceedings of the 5th International Conference on Predictor Models in Software Engineering, pages 1–9,New York, NY, USA, 2009. ACM.
5. Chetan Gupta and Robert Grossman. Genic: A single pass generalized incremental algorithm forclustering. In In SIAM Int. Conf. on Data Mining. SIAM, 2004.
6. B. A. Kitchenham, E. Mendes, and G. H. Travassos. Cross- vs. within-company cost estimation studies:A systematic review. IEEE Transactions on Software Engineering, pages 316–329, May 2007.
7. S. Lessmann, B. Baesens, C. Mues, and S. Pietsch. Benchmarking classification models for software defectprediction: A proposed framework and novel findings. IEEE Transactions on Software Engineering, May2008. Available from http://iccle.googlecode.com/svn/trunk/share/pdf/lessmann08.pdf.
8. R. Loui. Gawk for ai. Class Lecture. Available from http://menzies.us/cs591o/?lecture=gawk.9. A. Matheny. Scaling up text mining, 2009. Masters thesis, Lane Department of Computer Science and
Electrical Engineering, West Virginia University.10. Andrew McCallum, Kamal Nigam, and Lyle H. Ungar. Efficient clustering of high-dimensional data sets
with application to reference matching. In KDD ’00: Proceedings of the sixth ACM SIGKDD internationalconference on Knowledge discovery and data mining, pages 169–178, New York, NY, USA, 2000. ACM.
11. T. Menzies. Evaluation issues for visual programming languages, 2002. Available fromhttp://menzies.us/pdf/00vp.pdf.
12. T. Menzies, D. Port, Z. Chen, J. Hihn, and S. Stukes. Specialization and extrapolation of induceddomain models: Case studies in software effort estimation. 2005. IEEE ASE, 2005, Available fromhttp://menzies.us/pdf/05learncost.pdf.
13. Tim Menzies, Zhihao Chen, Jairus Hihn, and Karen Lum. Selecting best practices for effortestimation. IEEE Transactions on Software Engineering, November 2006. Available fromhttp://menzies.us/pdf/06coseekmo.pdf.
14. Tim Menzies, Jeremy Greenwald, and Art Frank. Data mining static code attributes to learndefect predictors. IEEE Transactions on Software Engineering, January 2007. Available fromhttp://menzies.us/pdf/06learnPredict.pdf.
15. I. Mierswa, M. Wurst, and R. Klinkenberg. Yale: Rapid prototyping for complex data mining tasks. InKDD’06, 1996.
16. A.S. Orrego. Sawtooth: Learning from huge amounts of data, 2004.17. Chet Ramey. Bash, the bourne-again shell. 1994. Available from
http://tiswww.case.edu/php/chet/bash/rose94.pdf.18. Juan Ramos. Using tf-idf to determine word relevance in document queries. In Pro-
ceedings of the First Instructional Conference on Machine Learning, 2003. Available fromhttp://www.cs.rutgers.edu/~mlittman/courses/ml03/iCML03/papers/ramos.pdf.
19. O. Ritthoff, R. Klinkenberg, S. Fischer, I. Mierswa, and S. Felske. Yale: Yet another learning environment.In LLWA 01 - Tagungsband der GI-Workshop-Woche, Dortmund, Germany, pages 84–92, October 2001.Available from http://ls2-www.cs.uni-dortmund.de/~fischer/publications/YaleLLWA01.pdf.
20. Burak Turhan, Tim Menzies, Ayse B. Bener, and Justin Di Stefano. On the relative value of cross-companyand within-company data for defect prediction. Empirical Software Engineering, 2009. Available fromhttp://menzies.us/pdf/08ccwc.pdf.
Copyright c⃝ 2010 John Wiley & Sons, Ltd. Softw. Pract. Exper. 2010; 00:1–7Prepared using speauth.cls
22 A. NELSON ET AL.
pd 2nd quartilepercentiles median,
Rank Treatment 25% 50% 75% 3rd quartile1 WC (local data) + relevancy filter 66 73 80 ✇2 CC (imported data) + relevancy filter 57 71 83 ✇2 WC (local data) 59 69 83 ✇3 CC (imported data) 49 66 87 ✇
0 50 100
Figure 15. Probability of Detection (PD) results, sorted by median values.
pf 2nd quartilepercentiles median,
Rank Treatment 25% 50% 75% 3rd quartile1 CC (imported data) + relevancy filter 17 29 43 ✇1 CC (imported data) 13 34 51 ✇2 WC (local data) 17 30 41 ✇3 WC (local data) + relevancy filtuer 20 27 34 ✇
0 50 100
Figure 16. Probability of False Alarm (PF) results, sorted by median values.
Reducer and Clusterer Time InterSim IntraSim GainTF-IDF*K-means 17.52 -0.085 141.73 141.82TF-IDF*GenIc 3.75 -0.14 141.22 141.36PCA*K-means 100.0 0.0 100.0 100.0PCA*Canopy 117.49 0.00 99.87 99.87PCA*GenIc 11.71 -0.07 99.74 99.81
TF-IDF*Canopy 6.58 5.02 93.42 88.4
Figure 17. Similarity values normalized according to the combination of most rigorous reducer andclusterer.
Installing OURMINE
OURMINE is an open source toolkit licensed under GPL 3.0. It can be downloaded andinstalled from http://code.google.com/p/ourmine.
OURMINE is a command-line environment, and as such, system requirements are minimal.However, in order to use OURMINE three things must be in place:
• A Unix-based environment. This does not include Windows. Any machine with OSX orLinux installed will do.
Copyright c⃝ 2010 John Wiley & Sons, Ltd. Softw. Pract. Exper. 2010; 00:1–7Prepared using speauth.cls
SHARING EXPERIMENTS USING OPEN SOURCE SOFTWARE 23
• The Java Runtime Environment. This is required in order to use the WEKA, as well asany other Java code written for OURMINE.
• The GAWK Programming Language. GAWK will already be installed with up-to-dateLinux versions. However, OSX users will need to install this.
To install and run OURMINE, navigate to http://code.google.com/p/ourmine and followthe instructions.
Copyright c⃝ 2010 John Wiley & Sons, Ltd. Softw. Pract. Exper. 2010; 00:1–7Prepared using speauth.cls
24 A. NELSON ET AL.
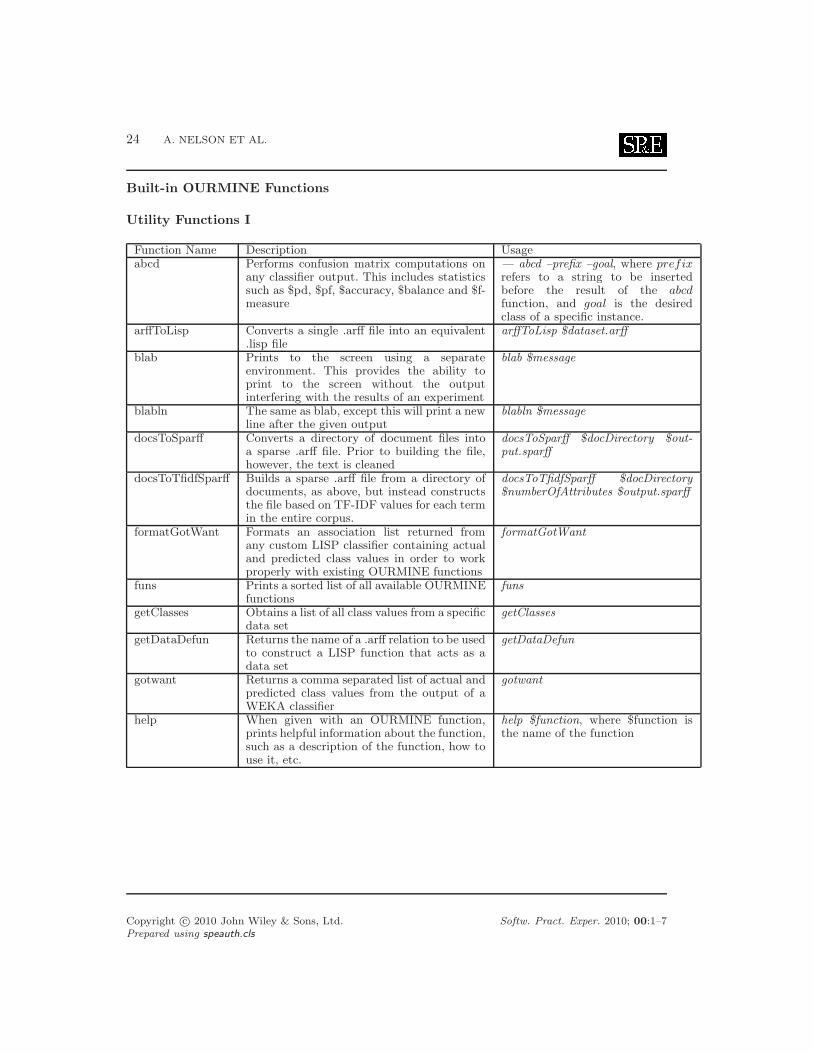
Built-in OURMINE Functions
Utility Functions I
Function Name Description Usageabcd Performs confusion matrix computations on
any classifier output. This includes statisticssuch as $pd, $pf, $accuracy, $balance and $f-measure
— abcd –prefix –goal, where prefixrefers to a string to be insertedbefore the result of the abcdfunction, and goal is the desiredclass of a specific instance.
arffToLisp Converts a single .arff file into an equivalent.lisp file
arffToLisp $dataset.arff
blab Prints to the screen using a separateenvironment. This provides the ability toprint to the screen without the outputinterfering with the results of an experiment
blab $message
blabln The same as blab, except this will print a newline after the given output
blabln $message
docsToSparff Converts a directory of document files intoa sparse .arff file. Prior to building the file,however, the text is cleaned
docsToSparff $docDirectory $out-put.sparff
docsToTfidfSparff Builds a sparse .arff file from a directory ofdocuments, as above, but instead constructsthe file based on TF-IDF values for each termin the entire corpus.
docsToTfidfSparff $docDirectory$numberOfAttributes $output.sparff
formatGotWant Formats an association list returned fromany custom LISP classifier containing actualand predicted class values in order to workproperly with existing OURMINE functions
formatGotWant
funs Prints a sorted list of all available OURMINEfunctions
funs
getClasses Obtains a list of all class values from a specificdata set
getClasses
getDataDefun Returns the name of a .arff relation to be usedto construct a LISP function that acts as adata set
getDataDefun
gotwant Returns a comma separated list of actual andpredicted class values from the output of aWEKA classifier
gotwant
help When given with an OURMINE function,prints helpful information about the function,such as a description of the function, how touse it, etc.
help $function, where $function isthe name of the function
Copyright c⃝ 2010 John Wiley & Sons, Ltd. Softw. Pract. Exper. 2010; 00:1–7Prepared using speauth.cls
SHARING EXPERIMENTS USING OPEN SOURCE SOFTWARE 25
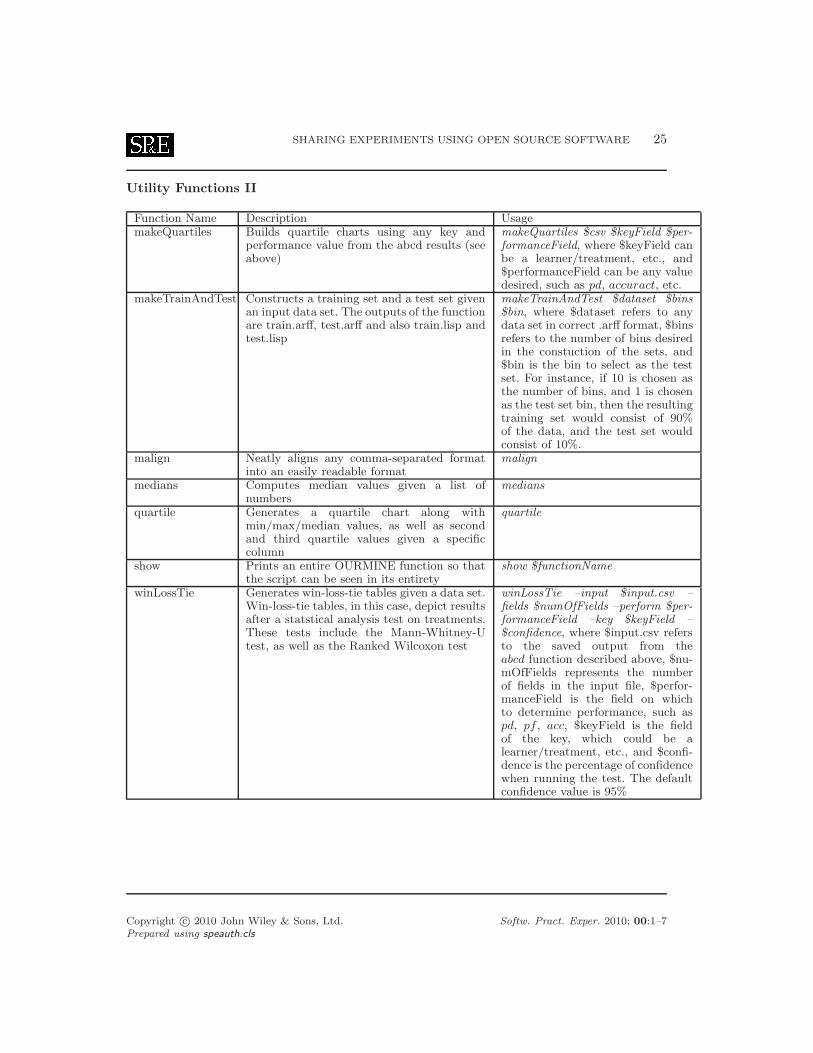
Utility Functions II
Function Name Description UsagemakeQuartiles Builds quartile charts using any key and
performance value from the abcd results (seeabove)
makeQuartiles $csv $keyField $per-formanceField, where $keyField canbe a learner/treatment, etc., and$performanceField can be any valuedesired, such as pd, accuract, etc.
makeTrainAndTest Constructs a training set and a test set givenan input data set. The outputs of the functionare train.arff, test.arff and also train.lisp andtest.lisp
makeTrainAndTest $dataset $bins$bin, where $dataset refers to anydata set in correct .arff format, $binsrefers to the number of bins desiredin the constuction of the sets, and$bin is the bin to select as the testset. For instance, if 10 is chosen asthe number of bins, and 1 is chosenas the test set bin, then the resultingtraining set would consist of 90%of the data, and the test set wouldconsist of 10%.
malign Neatly aligns any comma-separated formatinto an easily readable format
malign
medians Computes median values given a list ofnumbers
medians
quartile Generates a quartile chart along withmin/max/median values, as well as secondand third quartile values given a specificcolumn
quartile
show Prints an entire OURMINE function so thatthe script can be seen in its entirety
show $functionName
winLossTie Generates win-loss-tie tables given a data set.Win-loss-tie tables, in this case, depict resultsafter a statstical analysis test on treatments.These tests include the Mann-Whitney-Utest, as well as the Ranked Wilcoxon test
winLossTie –input $input.csv –fields $numOfFields –perform $per-formanceField –key $keyField –$confidence, where $input.csv refersto the saved output from theabcd function described above, $nu-mOfFields represents the numberof fields in the input file, $perfor-manceField is the field on whichto determine performance, such aspd, pf , acc, $keyField is the fieldof the key, which could be alearner/treatment, etc., and $confi-dence is the percentage of confidencewhen running the test. The defaultconfidence value is 95%
Copyright c⃝ 2010 John Wiley & Sons, Ltd. Softw. Pract. Exper. 2010; 00:1–7Prepared using speauth.cls
26 A. NELSON ET AL.
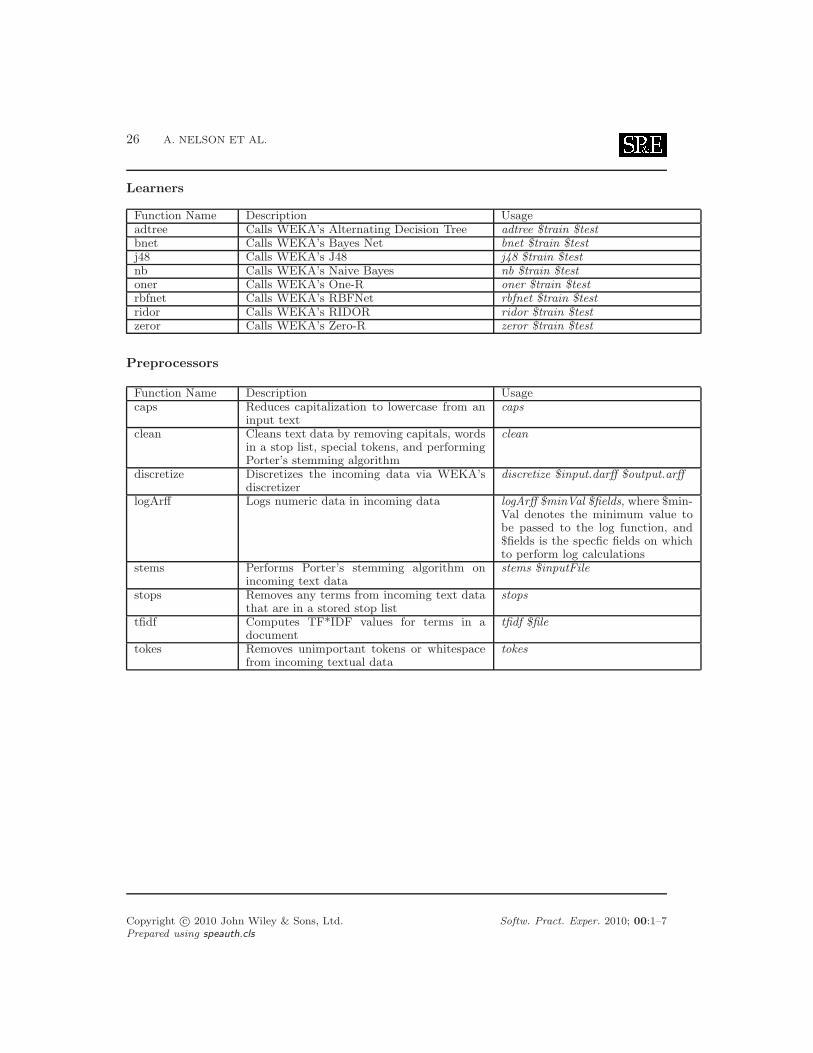
Learners
Function Name Description Usageadtree Calls WEKA’s Alternating Decision Tree adtree $train $testbnet Calls WEKA’s Bayes Net bnet $train $testj48 Calls WEKA’s J48 j48 $train $testnb Calls WEKA’s Naive Bayes nb $train $testoner Calls WEKA’s One-R oner $train $testrbfnet Calls WEKA’s RBFNet rbfnet $train $testridor Calls WEKA’s RIDOR ridor $train $testzeror Calls WEKA’s Zero-R zeror $train $test
Preprocessors
Function Name Description Usagecaps Reduces capitalization to lowercase from an
input textcaps
clean Cleans text data by removing capitals, wordsin a stop list, special tokens, and performingPorter’s stemming algorithm
clean
discretize Discretizes the incoming data via WEKA’sdiscretizer
discretize $input.darff $output.arff
logArff Logs numeric data in incoming data logArff $minVal $fields, where $min-Val denotes the minimum value tobe passed to the log function, and$fields is the specfic fields on whichto perform log calculations
stems Performs Porter’s stemming algorithm onincoming text data
stems $inputFile
stops Removes any terms from incoming text datathat are in a stored stop list
stops
tfidf Computes TF*IDF values for terms in adocument
tfidf $file
tokes Removes unimportant tokens or whitespacefrom incoming textual data
tokes
Copyright c⃝ 2010 John Wiley & Sons, Ltd. Softw. Pract. Exper. 2010; 00:1–7Prepared using speauth.cls
SHARING EXPERIMENTS USING OPEN SOURCE SOFTWARE 27
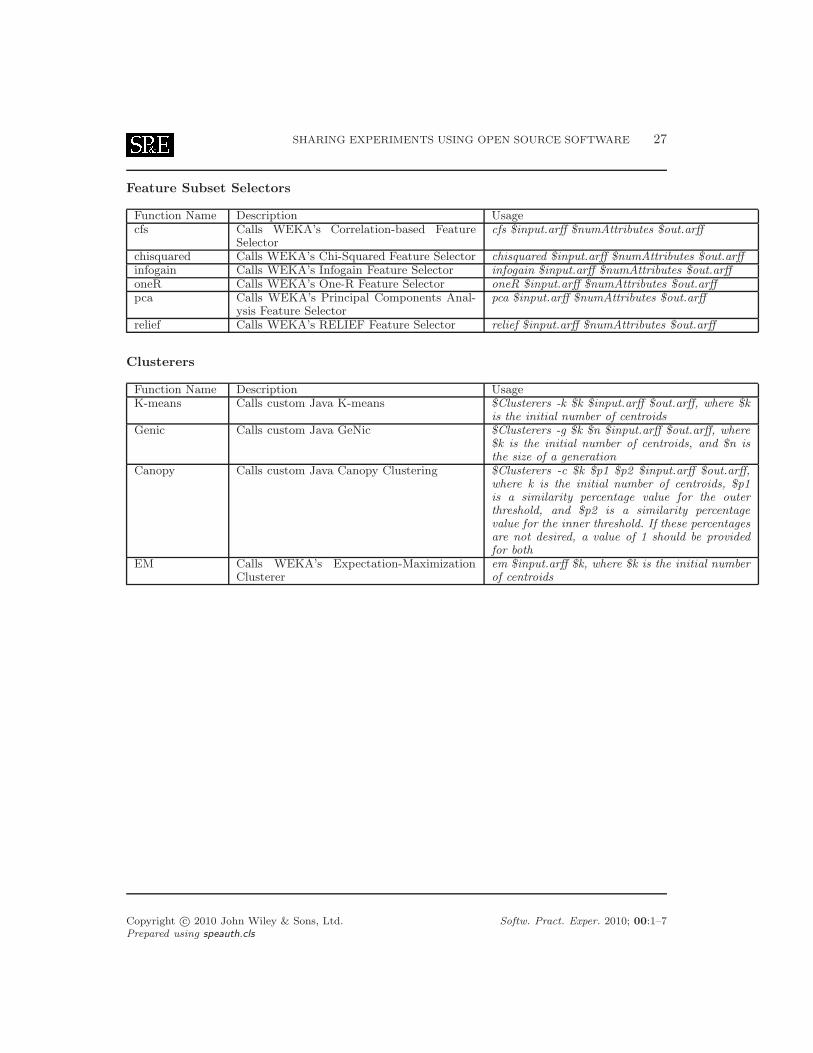
Feature Subset Selectors
Function Name Description Usagecfs Calls WEKA’s Correlation-based Feature
Selectorcfs $input.arff $numAttributes $out.arff
chisquared Calls WEKA’s Chi-Squared Feature Selector chisquared $input.arff $numAttributes $out.arffinfogain Calls WEKA’s Infogain Feature Selector infogain $input.arff $numAttributes $out.arffoneR Calls WEKA’s One-R Feature Selector oneR $input.arff $numAttributes $out.arffpca Calls WEKA’s Principal Components Anal-
ysis Feature Selectorpca $input.arff $numAttributes $out.arff
relief Calls WEKA’s RELIEF Feature Selector relief $input.arff $numAttributes $out.arff
Clusterers
Function Name Description UsageK-means Calls custom Java K-means $Clusterers -k $k $input.arff $out.arff, where $k
is the initial number of centroidsGenic Calls custom Java GeNic $Clusterers -g $k $n $input.arff $out.arff, where
$k is the initial number of centroids, and $n isthe size of a generation
Canopy Calls custom Java Canopy Clustering $Clusterers -c $k $p1 $p2 $input.arff $out.arff,where k is the initial number of centroids, $p1is a similarity percentage value for the outerthreshold, and $p2 is a similarity percentagevalue for the inner threshold. If these percentagesare not desired, a value of 1 should be providedfor both
EM Calls WEKA’s Expectation-MaximizationClusterer
em $input.arff $k, where $k is the initial numberof centroids
Copyright c⃝ 2010 John Wiley & Sons, Ltd. Softw. Pract. Exper. 2010; 00:1–7Prepared using speauth.cls