Calibration and validation of grapevine budburst models using growth-room experiments as data source
11
Agricultural and Forest Meteorology 160 (2012) 69–79 Contents lists available at SciVerse ScienceDirect Agricultural and Forest Meteorology jou rn al h om epa g e: www.elsevier.com/locate/agrformet Calibration and validation of grapevine budburst models using growth-room experiments as data source Gianni Fila a,e,∗ , Bruno Di Lena b,d , Massimo Gardiman a , Paolo Storchi c , Diego Tomasi a , Oriana Silvestroni d , Andrea Pitacco e a Centro di Ricerca per la Viticoltura (CRA-VIT), I-31015, Conegliano (TV), Italy b Regione Abruzzo, ARSSA, Centro Agrometeorologico Regionale, I-66020, Scerni (CH), Italy c Unità di Ricerca per la Viticoltura (CRA-VIC), I-52100, Arezzo, Italy d Università Politecnica delle Marche, Dipartimento di Scienze Ambientali e Produzioni Vegetali, I-60131, Ancona, Italy e Università di Padova, Dipartimento di Agronomia Animali Alimenti Risorse Naturali e Ambiente - DAFNAE, Agripolis, I-35020, Legnaro (PD), Italy a r t i c l e i n f o Article history: Received 8 September 2011 Received in revised form 13 February 2012 Accepted 6 March 2012 Keywords: Grapevine Budburst Phenology Modelling Dormancy Climate change a b s t r a c t Robust calibration of phenological models requires long term field observations, which are not always available or sufficiently widespread. This has motivated the evaluation of short-term experiments using cuttings under semi-controlled conditions as an alternative data source. Single-node cuttings from two grapevine cultivars were exposed to variable chilling durations and allowed to sprout in a growth room. The observed budburst dates and temperature series were used to calibrate two budburst models, which were validated against a 39-year field observation dataset by means of a fuzzy-logic based integrated index (FI). Satisfying validation scores were obtained, ranging from 0.262 to 0.411 on a 0-1 scale (best- worst response). The experiment was then inverted, using field data for calibration and cuttings for validation, and FI scores ranging between 0.352 and 0.495 were obtained. On this occasion however, the models were not able to estimate budburst occurring after short chilling exposures, where they returned either high over- estimations or failed completely. This was due to the narrow winter length variability in the field dataset, which made the optimization algorithm converge towards unrealistically high chilling requirements and artifactual descriptions of the temperature effects on dormancy. Cutting-based calibration on the other hand produced parameterizations that were more consistent with available experimental knowledge. Despite this difference between them, the two approaches proved to be equivalent under the cli- matic conditions present, but not when tested on projected scenarios of climate change over the period 1990–2090, where cutting-calibrated models, which are more sensitive to decreasing winter length, predicted higher variations of the budburst dates. © 2012 Elsevier B.V. All rights reserved. 1. Introduction Models of grapevine phenology are becoming popular tools for assessing the impact of climate change on viticulture (Webb et al., 2007; Kwon et al., 2008; Caffarra and Eccel, 2011; Duchêne et al., 2010) and for supporting GIS-assisted zoning studies to identify the most suitable areas for specific cultivars (Bois et al., 2008; Scaglione et al., 2008). Given the growing interest in these kinds of appli- cations, which are characterized by high degrees of extrapolation across many environmental conditions on both spatial and time scales, model robustness represents a crucial issue (Caffarra and Eccel, 2010). ∗ Corresponding author at: Centro di Ricerca per la Viticoltura (CRA-VIT), I-31015 Conegliano (TV), Italy. Tel.: +39 0438 456778; fax: +39 0438 450773. E-mail address: gianni.fi[email protected] (G. Fila). The more up-to-date phenology models of perennial plants combine the description of dormancy dynamics in overwintering buds with a heat-sensitive development phase, often termed “forc- ing phase”, leading to budburst (e.g. Richardson et al., 1974; Cannell and Smith, 1983; Cesaraccio et al., 2004; Chuine, 2000; de Cortázar- Atauri et al., 2009). They are considered an evolution from the more traditional ones, based only on the accumulation of heat units from a fixed date, which are collectively referred to as “Thermal Time models” (e.g. Cannell and Smith, 1983; Linkosalo et al., 2008) or “Spring Warming models” (e.g. Hunter and Lechowicz, 1992; Parker et al., 2011). These latter models differ in how heat units are calcu- lated: Growing Degree Day (GDD, Winkler et al., 1974; Bonhomme, 2000), or variously defined functions of daily temperature (e.g. Chuine et al., 1999b; Parker et al., 2011). Compared to Thermal Time models, those accounting both for chilling and forcing adapt more easily to environment and geno- type variability, but due to increased complexity they require 0168-1923/$ – see front matter © 2012 Elsevier B.V. All rights reserved. doi:10.1016/j.agrformet.2012.03.003
-
Upload
independent -
Category
Documents
-
view
0 -
download
0
Transcript of Calibration and validation of grapevine budburst models using growth-room experiments as data source

Ce
GOa
b
c
d
e
a
ARRA
KGBPMDC
1
a22mecasE
C
0d
Agricultural and Forest Meteorology 160 (2012) 69– 79
Contents lists available at SciVerse ScienceDirect
Agricultural and Forest Meteorology
jou rn al h om epa g e: www.elsev ier .com/ locate /agr formet
alibration and validation of grapevine budburst models using growth-roomxperiments as data source
ianni Filaa,e,∗, Bruno Di Lenab,d, Massimo Gardimana, Paolo Storchic, Diego Tomasia,riana Silvestronid, Andrea Pitaccoe
Centro di Ricerca per la Viticoltura (CRA-VIT), I-31015, Conegliano (TV), ItalyRegione Abruzzo, ARSSA, Centro Agrometeorologico Regionale, I-66020, Scerni (CH), ItalyUnità di Ricerca per la Viticoltura (CRA-VIC), I-52100, Arezzo, ItalyUniversità Politecnica delle Marche, Dipartimento di Scienze Ambientali e Produzioni Vegetali, I-60131, Ancona, ItalyUniversità di Padova, Dipartimento di Agronomia Animali Alimenti Risorse Naturali e Ambiente - DAFNAE, Agripolis, I-35020, Legnaro (PD), Italy
r t i c l e i n f o
rticle history:eceived 8 September 2011eceived in revised form 13 February 2012ccepted 6 March 2012
eywords:rapevineudbursthenologyodellingormancylimate change
a b s t r a c t
Robust calibration of phenological models requires long term field observations, which are not alwaysavailable or sufficiently widespread. This has motivated the evaluation of short-term experiments usingcuttings under semi-controlled conditions as an alternative data source. Single-node cuttings from twograpevine cultivars were exposed to variable chilling durations and allowed to sprout in a growth room.The observed budburst dates and temperature series were used to calibrate two budburst models, whichwere validated against a 39-year field observation dataset by means of a fuzzy-logic based integratedindex (FI). Satisfying validation scores were obtained, ranging from 0.262 to 0.411 on a 0-1 scale (best-worst response).
The experiment was then inverted, using field data for calibration and cuttings for validation, and FIscores ranging between 0.352 and 0.495 were obtained. On this occasion however, the models were notable to estimate budburst occurring after short chilling exposures, where they returned either high over-estimations or failed completely. This was due to the narrow winter length variability in the field dataset,which made the optimization algorithm converge towards unrealistically high chilling requirements and
artifactual descriptions of the temperature effects on dormancy. Cutting-based calibration on the otherhand produced parameterizations that were more consistent with available experimental knowledge.Despite this difference between them, the two approaches proved to be equivalent under the cli-matic conditions present, but not when tested on projected scenarios of climate change over the period1990–2090, where cutting-calibrated models, which are more sensitive to decreasing winter length,
ns of
predicted higher variatio. Introduction
Models of grapevine phenology are becoming popular tools forssessing the impact of climate change on viticulture (Webb et al.,007; Kwon et al., 2008; Caffarra and Eccel, 2011; Duchêne et al.,010) and for supporting GIS-assisted zoning studies to identify theost suitable areas for specific cultivars (Bois et al., 2008; Scaglione
t al., 2008). Given the growing interest in these kinds of appli-ations, which are characterized by high degrees of extrapolation
cross many environmental conditions on both spatial and timecales, model robustness represents a crucial issue (Caffarra andccel, 2010).∗ Corresponding author at: Centro di Ricerca per la Viticoltura (CRA-VIT), I-31015onegliano (TV), Italy. Tel.: +39 0438 456778; fax: +39 0438 450773.
E-mail address: [email protected] (G. Fila).
168-1923/$ – see front matter © 2012 Elsevier B.V. All rights reserved.oi:10.1016/j.agrformet.2012.03.003
the budburst dates.© 2012 Elsevier B.V. All rights reserved.
The more up-to-date phenology models of perennial plantscombine the description of dormancy dynamics in overwinteringbuds with a heat-sensitive development phase, often termed “forc-ing phase”, leading to budburst (e.g. Richardson et al., 1974; Cannelland Smith, 1983; Cesaraccio et al., 2004; Chuine, 2000; de Cortázar-Atauri et al., 2009). They are considered an evolution from the moretraditional ones, based only on the accumulation of heat units froma fixed date, which are collectively referred to as “Thermal Timemodels” (e.g. Cannell and Smith, 1983; Linkosalo et al., 2008) or“Spring Warming models” (e.g. Hunter and Lechowicz, 1992; Parkeret al., 2011). These latter models differ in how heat units are calcu-lated: Growing Degree Day (GDD, Winkler et al., 1974; Bonhomme,2000), or variously defined functions of daily temperature (e.g.
Chuine et al., 1999b; Parker et al., 2011).Compared to Thermal Time models, those accounting both forchilling and forcing adapt more easily to environment and geno-type variability, but due to increased complexity they require
7 Forest Meteorology 160 (2012) 69– 79
cat
iifiarm
gduocetbgtlAuwlba
tg1bsp
ffisa
2
2
aadatSpmItJ
cvifiod
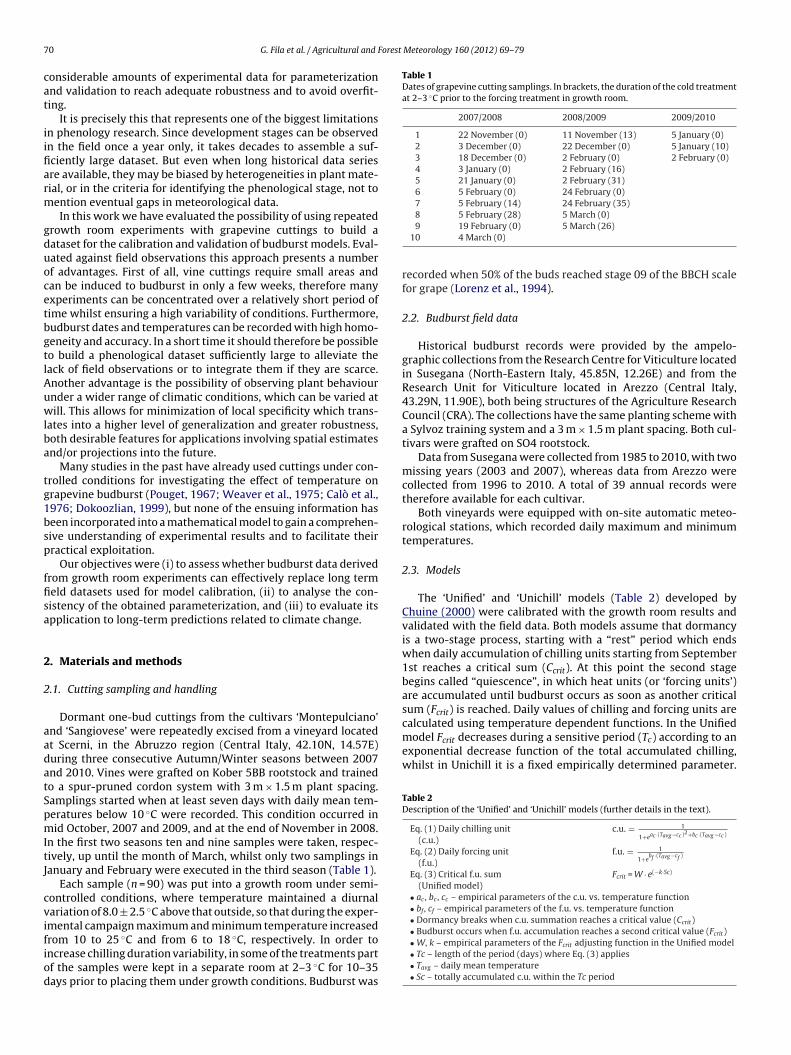
Table 1Dates of grapevine cutting samplings. In brackets, the duration of the cold treatmentat 2–3 ◦C prior to the forcing treatment in growth room.
2007/2008 2008/2009 2009/2010
1 22 November (0) 11 November (13) 5 January (0)2 3 December (0) 22 December (0) 5 January (10)3 18 December (0) 2 February (0) 2 February (0)4 3 January (0) 2 February (16)5 21 January (0) 2 February (31)6 5 February (0) 24 February (0)7 5 February (14) 24 February (35)8 5 February (28) 5 March (0)
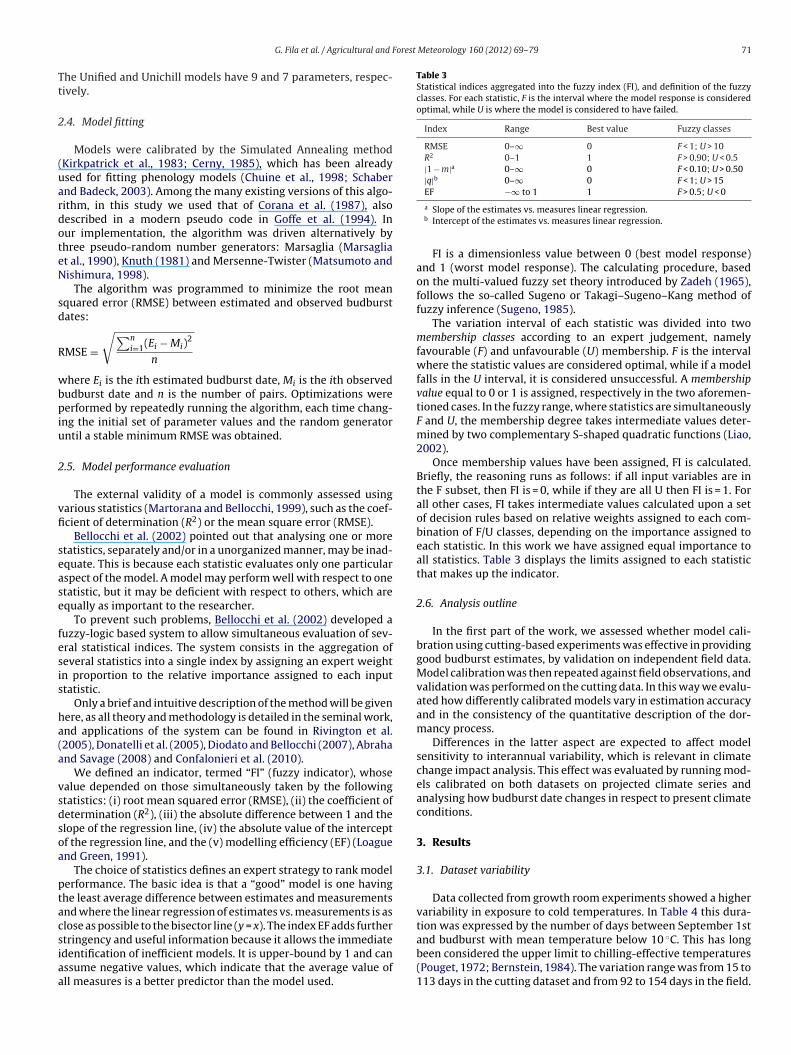
calculated using temperature dependent functions. In the Unifiedmodel Fcrit decreases during a sensitive period (Tc) according to anexponential decrease function of the total accumulated chilling,whilst in Unichill it is a fixed empirically determined parameter.
Table 2Description of the ‘Unified’ and ‘Unichill’ models (further details in the text).
Eq. (1) Daily chilling unit(c.u.)
c.u. = 1
1+eac ·(Tavg −cc )2+bc ·(Tavg −cc )
Eq. (2) Daily forcing unit(f.u.)
f.u. = 1
1+ebf ·(Tavg −cf )
Eq. (3) Critical f.u. sum(Unified model)
Fcrit = W · e(−k·Sc)
• ac , bc , cc – empirical parameters of the c.u. vs. temperature function• bf , cf – empirical parameters of the f.u. vs. temperature function• Dormancy breaks when c.u. summation reaches a critical value (Ccrit)• Budburst occurs when f.u. accumulation reaches a second critical value (F )
0 G. Fila et al. / Agricultural and
onsiderable amounts of experimental data for parameterizationnd validation to reach adequate robustness and to avoid overfit-ing.
It is precisely this that represents one of the biggest limitationsn phenology research. Since development stages can be observedn the field once a year only, it takes decades to assemble a suf-ciently large dataset. But even when long historical data seriesre available, they may be biased by heterogeneities in plant mate-ial, or in the criteria for identifying the phenological stage, not toention eventual gaps in meteorological data.In this work we have evaluated the possibility of using repeated
rowth room experiments with grapevine cuttings to build aataset for the calibration and validation of budburst models. Eval-ated against field observations this approach presents a numberf advantages. First of all, vine cuttings require small areas andan be induced to budburst in only a few weeks, therefore manyxperiments can be concentrated over a relatively short period ofime whilst ensuring a high variability of conditions. Furthermore,udburst dates and temperatures can be recorded with high homo-eneity and accuracy. In a short time it should therefore be possibleo build a phenological dataset sufficiently large to alleviate theack of field observations or to integrate them if they are scarce.nother advantage is the possibility of observing plant behaviournder a wider range of climatic conditions, which can be varied atill. This allows for minimization of local specificity which trans-
ates into a higher level of generalization and greater robustness,oth desirable features for applications involving spatial estimatesnd/or projections into the future.
Many studies in the past have already used cuttings under con-rolled conditions for investigating the effect of temperature onrapevine budburst (Pouget, 1967; Weaver et al., 1975; Calò et al.,976; Dokoozlian, 1999), but none of the ensuing information haseen incorporated into a mathematical model to gain a comprehen-ive understanding of experimental results and to facilitate theirractical exploitation.
Our objectives were (i) to assess whether budburst data derivedrom growth room experiments can effectively replace long termeld datasets used for model calibration, (ii) to analyse the con-istency of the obtained parameterization, and (iii) to evaluate itspplication to long-term predictions related to climate change.
. Materials and methods
.1. Cutting sampling and handling
Dormant one-bud cuttings from the cultivars ‘Montepulciano’nd ‘Sangiovese’ were repeatedly excised from a vineyard locatedt Scerni, in the Abruzzo region (Central Italy, 42.10N, 14.57E)uring three consecutive Autumn/Winter seasons between 2007nd 2010. Vines were grafted on Kober 5BB rootstock and trainedo a spur-pruned cordon system with 3 m × 1.5 m plant spacing.amplings started when at least seven days with daily mean tem-eratures below 10 ◦C were recorded. This condition occurred inid October, 2007 and 2009, and at the end of November in 2008.
n the first two seasons ten and nine samples were taken, respec-ively, up until the month of March, whilst only two samplings inanuary and February were executed in the third season (Table 1).
Each sample (n = 90) was put into a growth room under semi-ontrolled conditions, where temperature maintained a diurnalariation of 8.0 ± 2.5 ◦C above that outside, so that during the exper-mental campaign maximum and minimum temperature increased
rom 10 to 25 ◦C and from 6 to 18 ◦C, respectively. In order toncrease chilling duration variability, in some of the treatments partf the samples were kept in a separate room at 2–3 ◦C for 10–35ays prior to placing them under growth conditions. Budburst was9 19 February (0) 5 March (26)10 4 March (0)
recorded when 50% of the buds reached stage 09 of the BBCH scalefor grape (Lorenz et al., 1994).
2.2. Budburst field data
Historical budburst records were provided by the ampelo-graphic collections from the Research Centre for Viticulture locatedin Susegana (North-Eastern Italy, 45.85N, 12.26E) and from theResearch Unit for Viticulture located in Arezzo (Central Italy,43.29N, 11.90E), both being structures of the Agriculture ResearchCouncil (CRA). The collections have the same planting scheme witha Sylvoz training system and a 3 m × 1.5 m plant spacing. Both cul-tivars were grafted on SO4 rootstock.
Data from Susegana were collected from 1985 to 2010, with twomissing years (2003 and 2007), whereas data from Arezzo werecollected from 1996 to 2010. A total of 39 annual records weretherefore available for each cultivar.
Both vineyards were equipped with on-site automatic meteo-rological stations, which recorded daily maximum and minimumtemperatures.
2.3. Models
The ‘Unified’ and ‘Unichill’ models (Table 2) developed byChuine (2000) were calibrated with the growth room results andvalidated with the field data. Both models assume that dormancyis a two-stage process, starting with a “rest” period which endswhen daily accumulation of chilling units starting from September1st reaches a critical sum (Ccrit). At this point the second stagebegins called “quiescence”, in which heat units (or ‘forcing units’)are accumulated until budburst occurs as soon as another criticalsum (Fcrit) is reached. Daily values of chilling and forcing units are
crit
• W, k – empirical parameters of the Fcrit adjusting function in the Unified model• Tc – length of the period (days) where Eq. (3) applies• Tavg – daily mean temperature• Sc – totally accumulated c.u. within the Tc period
orest Meteorology 160 (2012) 69– 79 71
Tt
2
(uardoteN
sd
R
wbpiu
2
vfi
sease
fesis
ha(a
vsdsoa
ptacsiaa
Table 3Statistical indices aggregated into the fuzzy index (FI), and definition of the fuzzyclasses. For each statistic, F is the interval where the model response is consideredoptimal, while U is where the model is considered to have failed.
Index Range Best value Fuzzy classes
RMSE 0–∞ 0 F < 1; U > 10R2 0–1 1 F > 0.90; U < 0.5|1 − m|a 0–∞ 0 F < 0.10; U > 0.50|q|b 0–∞ 0 F < 1; U > 15EF −∞ to 1 1 F > 0.5; U < 0
G. Fila et al. / Agricultural and F
he Unified and Unichill models have 9 and 7 parameters, respec-ively.
.4. Model fitting
Models were calibrated by the Simulated Annealing methodKirkpatrick et al., 1983; Cerny, 1985), which has been alreadysed for fitting phenology models (Chuine et al., 1998; Schabernd Badeck, 2003). Among the many existing versions of this algo-ithm, in this study we used that of Corana et al. (1987), alsoescribed in a modern pseudo code in Goffe et al. (1994). Inur implementation, the algorithm was driven alternatively byhree pseudo-random number generators: Marsaglia (Marsagliat al., 1990), Knuth (1981) and Mersenne-Twister (Matsumoto andishimura, 1998).
The algorithm was programmed to minimize the root meanquared error (RMSE) between estimated and observed budburstates:
MSE =√∑n
i=1(Ei − Mi)2
n
here Ei is the ith estimated budburst date, Mi is the ith observedudburst date and n is the number of pairs. Optimizations wereerformed by repeatedly running the algorithm, each time chang-
ng the initial set of parameter values and the random generatorntil a stable minimum RMSE was obtained.
.5. Model performance evaluation
The external validity of a model is commonly assessed usingarious statistics (Martorana and Bellocchi, 1999), such as the coef-cient of determination (R2) or the mean square error (RMSE).
Bellocchi et al. (2002) pointed out that analysing one or moretatistics, separately and/or in a unorganized manner, may be inad-quate. This is because each statistic evaluates only one particularspect of the model. A model may perform well with respect to onetatistic, but it may be deficient with respect to others, which arequally as important to the researcher.
To prevent such problems, Bellocchi et al. (2002) developed auzzy-logic based system to allow simultaneous evaluation of sev-ral statistical indices. The system consists in the aggregation ofeveral statistics into a single index by assigning an expert weightn proportion to the relative importance assigned to each inputtatistic.
Only a brief and intuitive description of the method will be givenere, as all theory and methodology is detailed in the seminal work,nd applications of the system can be found in Rivington et al.2005), Donatelli et al. (2005), Diodato and Bellocchi (2007), Abrahand Savage (2008) and Confalonieri et al. (2010).
We defined an indicator, termed “FI” (fuzzy indicator), whosealue depended on those simultaneously taken by the followingtatistics: (i) root mean squared error (RMSE), (ii) the coefficient ofetermination (R2), (iii) the absolute difference between 1 and thelope of the regression line, (iv) the absolute value of the interceptf the regression line, and the (v) modelling efficiency (EF) (Loaguend Green, 1991).
The choice of statistics defines an expert strategy to rank modelerformance. The basic idea is that a “good” model is one havinghe least average difference between estimates and measurementsnd where the linear regression of estimates vs. measurements is aslose as possible to the bisector line (y = x). The index EF adds further
tringency and useful information because it allows the immediatedentification of inefficient models. It is upper-bound by 1 and canssume negative values, which indicate that the average value ofll measures is a better predictor than the model used.a Slope of the estimates vs. measures linear regression.b Intercept of the estimates vs. measures linear regression.
FI is a dimensionless value between 0 (best model response)and 1 (worst model response). The calculating procedure, basedon the multi-valued fuzzy set theory introduced by Zadeh (1965),follows the so-called Sugeno or Takagi–Sugeno–Kang method offuzzy inference (Sugeno, 1985).
The variation interval of each statistic was divided into twomembership classes according to an expert judgement, namelyfavourable (F) and unfavourable (U) membership. F is the intervalwhere the statistic values are considered optimal, while if a modelfalls in the U interval, it is considered unsuccessful. A membershipvalue equal to 0 or 1 is assigned, respectively in the two aforemen-tioned cases. In the fuzzy range, where statistics are simultaneouslyF and U, the membership degree takes intermediate values deter-mined by two complementary S-shaped quadratic functions (Liao,2002).
Once membership values have been assigned, FI is calculated.Briefly, the reasoning runs as follows: if all input variables are inthe F subset, then FI is = 0, while if they are all U then FI is = 1. Forall other cases, FI takes intermediate values calculated upon a setof decision rules based on relative weights assigned to each com-bination of F/U classes, depending on the importance assigned toeach statistic. In this work we have assigned equal importance toall statistics. Table 3 displays the limits assigned to each statisticthat makes up the indicator.
2.6. Analysis outline
In the first part of the work, we assessed whether model cali-bration using cutting-based experiments was effective in providinggood budburst estimates, by validation on independent field data.Model calibration was then repeated against field observations, andvalidation was performed on the cutting data. In this way we evalu-ated how differently calibrated models vary in estimation accuracyand in the consistency of the quantitative description of the dor-mancy process.
Differences in the latter aspect are expected to affect modelsensitivity to interannual variability, which is relevant in climatechange impact analysis. This effect was evaluated by running mod-els calibrated on both datasets on projected climate series andanalysing how budburst date changes in respect to present climateconditions.
3. Results
3.1. Dataset variability
Data collected from growth room experiments showed a highervariability in exposure to cold temperatures. In Table 4 this dura-tion was expressed by the number of days between September 1st
and budburst with mean temperature below 10 ◦C. This has longbeen considered the upper limit to chilling-effective temperatures(Pouget, 1972; Bernstein, 1984). The variation range was from 15 to113 days in the cutting dataset and from 92 to 154 days in the field.
72 G. Fila et al. / Agricultural and Forest Meteorology 160 (2012) 69– 79
Table 4Variability of budburst date and chilling duration in the two datasets used for calibration and validation of the phenology models.
Data source Budburst date (day of the year) No. of days with Tmean < 10 ◦C (from 1st September to budburst)
Range of variation Stand. deviation Range of variation Stand. deviation
Cuttings −11 to 106 29.9 15–113 30.4Field 86–120 8.0 92–154 14.2
Table 5Fitting and validation results of the ‘Unified’ and ‘Unichill’ model on Montepulciano and Sangiovese grapevine cultivars. In Part (A) (Cutting calibration), models were fittedon the laboratory data and validated on a 39-year field data pooled from two sites. In Part (B) (Field calibration) models were fitted on field data and validated on the cuttingdataset.
Statistics ‘Unified’ model ‘Unichill’ model
Montepulciano Sangiovese Montepulciano Sangiovese
Fitting Validation Fitting Validation Fitting Validation Fitting Validation
(A) Cutting calibrationRMSE 2.866 5.697 2.725 5.935 3.375 5.582 2.803 4.656R2 0.989 0.559 0.991 0.746 0.985 0.613 0.990 0.739|1 − slope| 0.014 0.052 0.012 0.041 0.014 0.114 0.035 0.052|Intercept| 1.153 6.247 0.870 8.152 0.912 11.294 1.827 6.479EF 0.989 0.121 0.990 0.453 0.985 0.139 0.989 0.663
FI 0.023 0.348 0.019 0.304 0.035 0.411 0.026 0.262
(B) Field calibrationRMSE 3.211 3.778 3.704 4.408 2.969 4.615 3.558 5.342R2 0.775 0.976 0.825 0.963 0.777 0.981 0.822 0.982|1 − slope| 0.012 0.163 0.015 0.137 0.098 0.153 0.036 0.169|Intercept| 1.492 15.516 1.393 12.628 11.069 16.213 3.795 16.157EF 0.715 0.937 0.781 0.918 0.756 0.913 0.798 0.901
0.352
F ded b
Tae
3
ctUmy(
fifUV
TPdcr
FI 0.089 0.429 0.071
or field calibration, validation was only tested on a subset of data, which only inclu
he higher chilling duration variability in cutting data was associ-ted with a longer time span between the first and last budburstvents, which was 117 days vs. 34 days in the field dataset.
.2. Model fitting and validation
Both models showed good fit when they were calibrated onutting data for both cultivars, with FI scores ranging from 0.019o 0.035. At validation the best performance was obtained bynichill on Sangiovese (FI = 0.262) and the worst by the sameodel on Montepulciano (FI = 0.411), whereas the Unified model
ielded comparable scores (0.348 and 0.304) on the two cultivarsTable 5A).
Good fit was also obtained when the models were calibrated on
eld data. The Unified model scored FI values of 0.089 and 0.071or Montepulciano and Sangiovese respectively, while according tonichill the corresponding values were 0.252 and 0.121 (Table 5B).alidation statistics were only calculated for budburst recorded
able 6arameters of Unified and Unichill models for the cultivars ‘Montepulciano’ (M) and ‘Saerived from growth room experiments or field data. For comparison purposes the tableutting dataset. These latter values are reported in brackets because in the Unified modeelevant differences in Ccrit and Fcrit values (see text for details and discussion).
Model/cv ac bc cc bf cf
Cutting calibrationUnified/M 1.154 −10.964 0.537 −0.264 12.Unified/S 3.298 −23.197 0.886 −0.292 14.Unichill/M 2.560 23.668 9.838 −0.232 13.Unichill/S 3.441 23.839 8.182 −0.267 13.
Field calibrationUnified/M 1.180 −28.201 −8.832 −0.201 15.Unified/S 0.282 −10.708 0.214 −0.217 13.Unichill/M 1.190 −20.322 −1.897 −0.194 15.Unichill/S 0.431 −17.597 −1.501 −0.165 15.
0.252 0.445 0.121 0.495
udburst events observed after the 60th day of the year (see text).
after about mid-February, as models failed or returned strong over-estimations before this time (Fig. 1). The thus calculated FI valueswere also satisfying, but higher than in cutting-based models,between 0.352 and 0.495.
3.3. Chilling and forcing requirements
In the models adopted in this study, chilling and forcing require-ments are quantified by the Ccrit and Fcrit parameters, whichrepresent the number of days the cultivar has to spend at thespecific optimal temperatures to release the dormancy rest andquiescence phases.
The values taken by model parameters, including Ccrit and Fcrit,are displayed in Table 6. For comparison purposes the table also
shows Fcrit for the Unified model, although for this model it is notactually a parameter, but a variable depending on the total amountof chilling received. The values reported in brackets are the averagevalues ± the standard deviation calculated on the cutting dataset.ngiovese’ (S) as resulting from the numerical optimization against budburst data displays Fcrit (average ± stand. dev.) also for the Unified model, calculated on thel Fcrit is a variable and not a parameter. Cutting- and field- parameterization show
Ccrit W K Tc Fcrit
069 8.5 45.2 −0.0058 100 (37.9 ± 1.44)203 12.5 20.7 −0.0004 166 (20.1 ± 0.08)135 9.1 35.5642 11.7 23.6
472 112.7 17.6 −9.3 × 10⁻⁵ 193 (17.4 ± 0.01)187 132.5 24.5 −0.0004 167 (22.9 ± 0.06)041 114.9 19.0145 127.4 22.3

G. Fila et al. / Agricultural and Forest Meteorology 160 (2012) 69– 79 73
F h-rooma alibra
oCwhbd
t1ttF
tStcu
tiT
TAc
ig. 1. Validation of field-calibrated models on budburst data obtained with growtn arbitrary out-of-range value. Double arrows indicate the variation range of the c
As far as chilling requirement is concerned, in models calibratedn cutting data the optimization converged towards low values ofcrit, around 10 days on average. This differs sharply from whatas obtained from field-calibrated models, where Ccrit took muchigher values, all above 110 days for all cultivars and models. Inoth calibrations Ccrit was higher in Sangiovese, while no relevantifferences were found between models.
The low Ccrit in cutting calibrated models allowed early comple-ion of the dormancy rest phase, which ended between November7th and 30th when calculated on the field dataset. The more thanen-fold higher chilling requirements obtained after field calibra-ion caused the models to delay rest break until January 8th toebruary 9th (Table 7).
The required forcing period in cutting-based models for Mon-epulciano was 37.9 or 35.5 days, and 20.1 or 23.6 days forangiovese according to the Unified and Unichill models, respec-ively. Shorter durations as well as smaller differences betweenultivars were obtained in field-calibrated models, where Fcrit val-es were about 20 days on average (Table 6).
Forcing requirements were expected to be complementary to
hose of chilling: for a given budburst date, the longer the chill-ng duration, the shorter the forcing phase must be and vice versa.his is what was effectively observed in Montepulciano, where theable 7verage dormancy-break dates as estimated by the Unified and Unichill modelsalibrated either on cutting or field data.
Model Cultivar Cutting calibration Field calibration
Unified Montepulciano 17 November 09 FebruarySangiovese 30 November 15 January
Unichill Montepulciano 20 November 07 FebruarySangiovese 29 November 08 January
experiments. Downward triangles stand for failed estimation, which were givention dataset.
field-derived Fcrit were half the values of those obtained fromcutting calibration, but not in Sangiovese, where Fcrit remainedunaltered, with an average value of 22.2, despite a ten-fold increasein Ccrit when passing from cuttings to field calibration.
These contrasting behaviours between cutting- and field-basedmodels were analysed by taking into account the chilling tempera-ture intervals, which resulted very different in the two calibrationtypes. The interval width of optimal chilling temperatures is strictlyrelated to chilling requirement, since the former determines howfast the latter is fulfilled.
3.4. Chilling temperatures
In models calibrated on cuttings the temperature-dependentfunction of chilling units was characterized by a rectangular shape,where the range of optimal temperatures was 0–10.5 ◦C in Mon-tepulciano and 0.7–8.3 ◦C in Sangiovese, with very little variationbetween models (Fig. 2, upper graphs). Field-calibrated modelsshowed the same function shape, but with a broader optimal tem-perature interval, and a wider difference between cultivars. InMontepulciano the optimal ranges were −9.1 to 15.3 ◦C (Unifiedmodel) and −2.3 to 15.6 ◦C (Unichill model), while in Sangiovesethey were −0.6 to 39.5 ◦C (Unified) and −2.0 to 39.8 ◦C (Unichill)(Fig. 2, bottom graphs).
3.5. Forcing temperatures
The optimized functions relating forcing units to tempera-
ture were plotted in Fig. 3, where they are compared to somedata from Pouget (1967) and Moncur et al. (1989), the onlystudies, to our knowledge, that have attempted to assess a quan-titative relationship between temperature and budburst rate.
74 G. Fila et al. / Agricultural and Forest Meteorology 160 (2012) 69– 79
F (grey
o
Fwewtidd
ig. 2. Chilling unit functions as resulting from calibrating the models ‘Unified’
bservations.
our cultivars were examined in Pouget’s study. We examinedhat he found to be the earliest (‘Perle de Csaba’) and the lat-
st budbursters (‘Ugni blanc’). In both papers the original dataere expressed as budburst speed (in days−1 dimensions), so
hey were normalised to maximum speed temperature (25 ◦Cn Pouget, and 20 ◦C in Moncur et al.) to convert them intoaily relative rate units, thus making them comparable to ourata.
Fig. 3. Forcing unit functions derived from cutting- and field-calibrated Unified and U
solid line) and ‘Unichill’ (black dashed line) against growth-room data and field
Since the asymptotic nature of the curves did not present dis-tinct values which could be taken as reference limits to the intervalof forcing-effective temperatures, we defined as “minimum activetemperature” the one at which the forcing unit is equal to 0.05,
and as “minimum optimal temperature” the one above which theforcing unit is ≥0.95.According to this criterion, small differences were obtainedwithin curves yielded by cutting-calibration, where the minimum
nichill models. Point data represent literature results (see text) for comparison.

G. Fila et al. / Agricultural and Forest
Table 8Variations of Autumn, Winter and Spring average temperature for three emissionscenarios and three time projections as predicted by the HadCM3 model for theSusegana site.
Scenario Projections Autumn(10.7 ◦C)
Winter(5.2 ◦C)
Spring(16.0 ◦C)
2020 +0.2 +0.8 +0.9A1B 2055 +1.9 +2.1 +2.4
2090 +3.2 +3.7 +4.2
2020 0.0 +0.8 +0.9A2 2055 +1.5 +1.7 +2.2
2090 +3.2 +3.7 +4.4
2020 −0.2 +0.8 +1.0B1 2055 +1.0 +1.6 +2.0
2090 +2.4 +2.7 +2.8
V1
ao
tmcswa
pcfi
3
3
pmmssrAtHd2tj‘
gencicict2
aAae
alues in brackets represent present-days values, calculated for the period980–1999.
ctive temperature varied from 0.5 to 4.2 ◦C, and the minimumptimal temperature fell to between 23.3 and 25.9 ◦C.
Even in the field-based models the forcing functions appearedo be similar among models and cultivars, except for the Unified
odel on Sangiovese. With respect to those derived from cuttingalibration these were broader by an average of 1.2 ◦C and lessteep. The minimum active temperature varied from −2.7 to 0.9 ◦C,hile the optimal values of the forcing unit started at between 26.8
nd 33.0 ◦C.All the curves showed good correspondence with literature
oint data. Cutting-derived curves were, however, closer to Mon-ur’s data, on the cool edge of the variation interval, whereas theeld-based ones were more fitting to Pouget’s data.
.6. Budburst predictions under climate change scenarios
.6.1. Weather data generationSynthetic daily time series of minimum and maximum tem-
erature were built upon the predictions of a general circulationodel, to test the behaviour of the models under changing cli-ate conditions. The task was achieved by means of the LARS-WG5
oftware (Racsko et al., 1991; Semenov and Stratonovitch, 2010), atochastic weather generator which, in its latest version incorpo-ates predictions from 15 climate models used in the fourth IPCCssessment Report (IPCC, 2007). Using local weather records for
he period 1960–2010 to calibrate the system, predictions from theadCM3 model were downscaled for the Susegana site, to generateaily time series for three time periods in the future: 2011–2033,046–2065 and 2080–2099, which will be hereafter referred to byheir intermediate years, i.e. 2020, 2055 and 2090. One set of pro-ections was generated for each of the three emission scenarios,A1B’, ‘A2’ and ‘B1’.
The A1B scenario predicts rapid economic and populationrowth up to 2050, and a gradual decrease thereafter. The variousnergy sources are equilibrated and new and more efficient tech-ologies are developed. In the A2 scenario, population increasesontinually, technology and per capita income changes slowly andn a fragmented way. B1 is the most ecologically-friendly scenarioonsidered. Population and economy grows and then declines asn A1, but with rapid changes towards a service- and information-entred economy leading to reductions in material intensity andhe introduction of clean and resource efficient technologies (IPCC,007).
The downscaled predictions from HadCM3 for the Susegana site
re shown in Table 8, with respect to the average temperatures ofutumn, Winter and Spring, which are the seasons pertinent to thedopted models. Comparison to present time is made with refer-nce to the baseline period 1980–1999, referred to with the yearMeteorology 160 (2012) 69– 79 75
1990, which is the same used in the IPCC Fourth Assessment Report.As the table shows, the emission scenario A2 is the most pessimistic,showing the highest increments, which are not, however, very dif-ferent from A1B. The highest increment, predicted by 2090 is +4.4 ◦Cfor the average Spring temperature. The B1 scenario was the mostoptimistic one, with a maximum increment of 2.8 ◦C for Spring in2090. In general, temperature increments in Autumn and Winterare lower than those predicted for Spring.
3.6.2. Model simulationsThe Unified and Unichill models were run on the generated tem-
perature series, and the dates of budburst and dormancy rest breakwere estimated. As expected, model application to future emis-sion scenarios predicted forward shifts of budburst timing, whichincreased as projections move further into the future. Overall, A2was the scenario with the maximum estimated changes, thoughthey were not very far from those observed on A1B, which differedfrom the former by no more than 1.8 days, while that with thelowest variations was B1 (Fig. 4).
In Montepulciano the estimates derived from cutting- and field-calibrated models were coincident or with a maximum difference of2.7 days until 2020, then they diverged, and at the 2090 projectionthey differed by between 5 (Unified model on B1 scenario) and 12days (Unichill on A1B scenario). In this cultivar, cutting-calibratedmodels therefore predicted higher shifts of the budburst date, witha maximum of 16.5 days (Unified model on A2) vs. 12.3 (Unified onA2) predicted by their counterpart models.
In Sangiovese, the two calibration types showed a parallelvariation across the projected time periods, with a maximum dif-ference of three days in the Unified model, while with Unichillthey were almost coincident (Fig. 4). The overall predicted changeof the budburst date was 21.5 days, averaging over models andcultivars in the A2 and A1B scenarios, while in B1 it was 13days.
The difference in cultivar response is more evident when look-ing at the predicted dates of rest release (Fig. 5). Whilst climatewarming is known to accelerate the heat-sensitive forcing phase,thus contributing to bringing forward budburst timing, the inverseeffect is generally expected on rest completion, as more time isneeded to accumulate chilling units in milder Autumns/Winters.
This response was found on both cultivars and both modelswhen they were calibrated on cuttings. The largest shifts of the restrelease date, 19.7 days on average, were estimated in A1B, whilethe lowest ones (14.6 days on average) were observed again in B1(Fig. 5).
Field-calibrated models predicted a strongly different responsebetween cultivars. In Montepulciano rest exit was delayed as incutting-calibrated models, but the variation took place about 80days later, in the first to the third week of February. In Sangiovesethere was almost no change in the rest exit date, which remained inthe second week of January irrespectively of model and projectedtime period.
Delays in rest exit are known to counterbalance the advancingtrend of Spring phenology (Yu et al., 2010). In our results how-ever, this effect is noticeable only in field-based predictions forMontepulciano. In cutting-based estimates the rest exit delay wasmostly restricted to Autumn even in the latest climate projections,that is, largely before heat accumulation starts.
4. Discussion
4.1. Can growth room experiments surrogate field observations to
calibrate/validate budburst models?When used as data source for model calibration, growthroom experiments estimated budburst with good accuracy. As a

76 G. Fila et al. / Agricultural and Forest Meteorology 160 (2012) 69– 79
F hill me
vet
to
4p
ctssEfwmaer
4
vr
ig. 4. Budburst dates estimated by cutting- and field-calibrated Unified and Unicmission scenarios.
alidation dataset they provided a stringent test platform thatvaluated the models across a large set of conditions, well beyondhe variation interval of the field dataset used for calibration.
Observing budburst on cuttings kept under controlled condi-ions proved therefore to represent a viable alternative to the lackf field data to support model-based applications.
.2. Do cutting-calibrated models provide consistentarameterizations?
Despite strong differences in the time required to completehilling and forcing, as well as in how these processes respond toemperature (Figs. 2 and 3), cutting- and field-calibrated modelshowed comparable performances over a wide range of cold expo-ure durations, provided these stay above a critical value (Fig. 1).stimation accuracy was therefore unrelated to how chilling andorcing dynamics were described, and this raises questions abouthether the parameters of these models have a real physiologicaleaning for grapevine. A comparison of our results to literature
vailable on the subject was carried out to find out which param-terization method gives the more consistent and informativeesults.
.2.1. Chilling-related parameterizationGrowth-room experiments showed that the grapevine culti-
ars under study had low chilling requirements, as budburst waseached even by the earliest samplings in November.
odels at present time and at three different projected time periods for three CO2-
The optimization process had to select from iteratively gen-erated solutions that accounted for both early and late budburstrealizations. This led optimization to converge towards low Ccritvalues, whose principal effect is to favour early exits from Win-ter rest. Another outcome of training models on a very variabledataset is the obtaining of a narrow interval of optimal chillingtemperatures, in this case between 0 and 10.5 ◦C or less. This makesmodels more sensitive to interannual variability: the time taken toaccumulate the required amount of chilling units rises in milderAutumn/Winters, since fewer days are active on dormancy andvice versa in colder years. These results are fully consistent withprevious studies reporting that chilling exposures between 50 and400 h at temperatures <7 ◦C are sufficient for normal bud sprouting(Dokoozlian, 1999; Botelho et al., 2007).
As for the optimal temperature interval for chilling, thosederived from cutting-calibration confirm what is known from theavailable experimental knowledge. The temperature of 10 ◦C asupper limit to optimal chilling temperatures is a long establishednotion for grapevine (Pouget, 1972; Bernstein, 1984) and for othertree species (Perry, 1971; Hänninen and Backman, 1994; Sarvas,1974). Calò et al. (1976) working on 22 cultivars found that a coldpre-treatment at 1 ◦C was more effective than one at −6 ◦C foraccelerating sprouting. Dokoozlian (1999) observed little or no dif-
ference in the effect on budburst when chilling temperatures variedbetween 0 and 10◦.These previous findings render the longer chilling requirementsobtained from field-calibration unrealistic, most likely artefacts

G. Fila et al. / Agricultural and Forest Meteorology 160 (2012) 69– 79 77
Fig. 5. Estimated dates for rest exit as predicted by cutting- and field-calibrated Unified and Unichill models. Predictions were calculated for present time and three differentp
goataa
Nitioemb
cJyt
rifl
rojected time periods for three CO2-emission scenarios.
enerated by the low variability of the field dataset. In the field mostf the forcing process takes place after January–February, long afterctual rest release. Under these conditions the exact assessment ofhe date of rest break is not critical, and the lack of constraintsllows Ccrit and the chilling response function to temperature tossume nonsense values.
This especially applies to parameters obtained for Sangiovese.o previous report or common practical experience supports chill-
ng effects of temperatures close to 40 ◦C. With such a wide optimalemperature interval, almost every day in Autumn/Winter can sat-sfy chilling requirements and contribute to rest completion. Inther words, Winter variability is not accounted for by this param-terization, which can ultimately be simplified to a Thermal Timeodel, which considers only heat summation for predicting bud-
urst.Although field-derived Ccrit in Sangiovese is very high, the wide
hilling temperature interval allowed to fulfil it at the beginning ofanuary, in a period where normally forcing units accumulation haset to start. Therefore, differently from what was observed in Mon-epulciano, Fcrit was not affected by the high Ccrit value (Table 6).
This reasoning may help interpretation of similar findings
ecently reported by Caffarra and Eccel (2010) who parameter-zed a modified version of the Unified model against field datarom a Chardonnay vineyard in Conegliano, North-Eastern Italy,ocated only 6 km from where part of our field data come from.These authors obtained a wide range of optimal chilling tem-peratures, and a Ccrit of 79 days, and recognized the connectionbetween these two results. They remarked that neither such ahigh chilling requirement, neither a chilling effect of temperaturesabove 10 ◦C are supported by existing experimental knowledge.They therefore suggested that “chilling accumulation”, as describedby the model, in fact may have been influenced by an effect ofAutumn mild temperatures in anticipating dormancy onset, and bya delaying effect of warm temperatures, above 20 ◦C, on dormancybreak.
Whilst confirming the possibility that field-based calibrationcan result in parameterizations contrasting with experimental evi-dence, our results also proved that this does not prevent modelsfrom giving accurate estimates, at least under present climatic con-ditions.
Further evidence was reported by Parker et al. (2011), whoshowed that Unichill and Thermal Time models, tested on a verywide dataset, gave comparable performances.
4.2.2. Forcing-related parameterizationBoth cutting- and field-calibrated forcing unit curves corrobo-
rated literature data reported in Fig. 3. A comparison with thesedata requires some caution, particularly with those of Pouget’s,since they were taken on cuttings pre-treated with a hot-waterbath to break rest. This treatment is known to accelerate budburst

7 Forest
(sr
twtotFplcdfipp2crasa
ciC2‘dlWct
4
tclvgIttia
mbbe
ueu
aobmct
8 G. Fila et al. / Agricultural and
Orffer and Goussard, 1980; Halaly et al., 2008) and it could pos-ibly have altered the relation between temperature and forcingate.
A noteworthy side-result is the small standard deviation ofhe Fcrit predicted by the Unified model, since higher variationsere expected on the basis of previous experience, showing that
he time taken to budburst varies sensitively on the total amountf chilling received (Dokoozlian, 1999). In fact, in our resultshe optimized Unified model tends to assume fixed values forcrit, hence cancelling the difference with Unichill, which at thisoint is to be considered the preferable model, giving equiva-
ent performances with a more simple structure. The apparentontradiction with experimental data may be explained by theifficulty of separating the effect of early heat unit accumulationrom that of eventual reduction of Fcrit due to increased chill-ng. As a matter of fact, accumulation of forcing units can takelace even at temperatures <10◦ C, as our forcing functions andrevious studies show (de Cortázar-Atauri et al., 2009; Nendel,010), so this may contribute to quiescence completion duringold periods following rest exit, thus being confused with an Fcriteduction effect. A similar interpretation was advanced by Chuinend Cour (1999), who even questioned the existence of an Fcritensitivity to chilling and considered the possibility a modellingrtefact.
The low chilling requirements found in cutting-based modelsomplements a longer forcing time, between 20 and 40 days whichs not incompatible with the available experimental knowledge.alò et al. (1976) observed durations of 13.5–35.5 days at 23 ◦C on2 cultivars. Hellman et al. (2006) recorded 28 days at 21 ◦C for
Sangiovese’. Dokoozlian (1999) found that at 22 ◦C it may take anyuration from about 18 to more than 40 days, depending on the
ength and temperature of the chilling treatments (cv. ‘Perlette’).eaver et al. (1975) reported that cuttings from the middle of the
ane of ‘Carignane’ taken from October to February, took from 20o about 40 days at 25 ◦C.
.3. Long term budburst estimation
Under present climatic conditions the two parameterizationypes showed similar budburst estimation capacity, provided thatold Winter conditions last long enough to prevent heat accumu-ation from starting before mid-February. In the study regions it isery unlikely for this to occur, but ongoing climate changes couldradually increase the probability of approaching this critical time.t is therefore reasonable to wonder whether and to what extenthe calibration data source may affect long-term budburst estima-ion. According to Figs. 4 and 5, the parameterization type had anmpact on model response when they were applied to scenarionalysis.
The increasing divergence between cutting- and field-basedodels which was observed in Montepulciano, highlighted the
etter capacity of the cutting-based models to simulate grapevineehaviour in very short Winters, as already seen in growth chamberxperiments.
This finding suggests that caution should be observed whensing field-calibrated models in applications involving highxtrapolation degrees, since the magnitude of change may benderestimated.
Further caution is advisable even when field-based modelsppear to provide results similar to those from cutting-basednes, such as those observed on Sangiovese, as this may not
e due to model accuracy, but to possible irrelevance of a dor-ancy dynamics description when cool conditions over-fulfilhilling requirements, which does not necessarily always holdrue.
Meteorology 160 (2012) 69– 79
5. Conclusions
A series of experiments under semi-controlled conditions wasdesigned for the purpose of inducing budburst in cuttings exposedto different chilling treatments. The observations were assem-bled into a dataset which was used to calibrate and validate twograpevine budburst models. From results obtained we draw thefollowing conclusions:
• Datasets built on growth-room experiments can effectivelyreplace decade long field observations for calibrating and/orvalidating grapevine budburst models. When used for model cal-ibration they allow obtaining more consistent parameterizationsthan with field data.
• Although calibrations carried out on field observations or growthroom experiments yielded contradictory parameterizations, theycan both perform well under present climatic conditions. Dis-crepancies between the two types of calibration emerged,however, when they were applied to climate change scenarioanalysis.
• When using field data for model calibration, the size of the datasetdoes not guarantee against inconsistent parameterization if itsvariability is low. Some caution is therefore recommended whenfield-calibrated models are used in applications involving a highdegree of extrapolation.
References
Abraha, M.G., Savage, M.J., 2008. Comparison of estimates of daily solar radiationfrom air temperature range for application in crop simulations. Agric. ForestMeteorol. 148, 401–416.
Bellocchi, G., Acutis, M., Fila, G., Donatelli, M., 2002. An indicator of solar radiationmodel performance based on a fuzzy expert system. Agron. J. 94, 1222–1233.
Bernstein, Z., 1984. L’amélioration de la régulation de débourrement dans les régionsà hiver doux. Bull OIV 57, 478–488.
Bois, B., Van Leeuwen, C., Pieri, C., Gaudillere, J.P., Saur, E., Joly, D., Wald, L., Grimal,D., 2008. Viticultural agroclimatic cartography and zoning at mesoscale levelusing terrain information, remotely sensed data and weather station measure-ments. Case study of Bordeaux winegrowing area. In: Proceedings of the VIIthInternational Terroir Congress, Nyon, Switzerland, 19–23 May 2008.
Bonhomme, R., 2000. Bases and limits to using ‘degree day’ units. Eur. J. Agron. 13,1–10.
Botelho, R.V., Pavanello, A.P., Pires, E.J.P., Terra, M.M., Muller, M.M.L., 2007. Effectsof chilling and garlic extract on bud dormancy release in Cabernet Sauvignoncuttings. Am. J. Enol. Viticult. 58, 402–404.
Caffarra, A., Eccel, E., 2011. Projecting the impacts of climate change on the phenol-ogy of grapevine in a mountain area. Aust. J. Grape Wine Res. 17, 52–61.
Caffarra, A., Eccel, E., 2010. Increasing the robustness of phenological models for Vitisvinifera cv. Chardonnay. Int. J. Biometeorol. 54, 255–267.
Calò, A., Costacurta, A., Nicolin, G., 1976. Indagini sul ruolo della temperatura e sulcomportamento di alcune varietà di vite (V. vinifera L.) in relazione al momentodel germogliamento. Riv. Di Viticult. Enol. 4, 135–147.
Cannell, M.G.R., Smith, R.I., 1983. Thermal time, chill days and prediction of budburstin Picea sitchensis. J. Appl. Ecol. 20, 951–963.
Cerny, V., 1985. A thermodynamical approach to the travelling salesman problem:an efficient simulation algorithm. J. Optimiz. Theory Appl. 45, 41–51.
Cesaraccio, C., Spano, D., Snyder, R.L., Duce, P., 2004. Chilling and forcing model topredict bud-burst of crop and forest species. Agric. Forest Meteorol. 126, 1–13.
Chuine, I., Cour, P., Rousseau, D.D., 1998. Fitting models predicting dates of flower-ing of temperate-zone trees using simulated annealing. Plant Cell Environ. 21,455–466.
Chuine, I., Cour, P., 1999. Climatic determinants of budburst seasonality in fourtemperate-zone-tree species. New Phytol. 143, 339–349.
Chuine, I., Cour, P., Rousseau, D.D., 1999b. Selecting models to predict the timing offlowering of temperate trees: implications for tree phenology modelling. PlantCell Environ. 22, 1–13.
Chuine, I., 2000. A unified model for budburst of trees. J. Theor. Biol. 207, 337–347.Confalonieri, R., Bregaglio, S., Bocchi, S., Acutis, M., 2010. An integrated procedure
to evaluate hydrological models. Hydrol. Process. 24, 2762–2770.Corana, A., Marchesi, M., Martini, C., Ridella, S., 1987. Minimizing multimodal func-
tions of continuous variables with the ‘simulated annealing’ algorithm. ACMTrans. Math. Softw. 13, 262–280.
de Cortázar-Atauri, I.G., Brisson, N., Gaudillere, J.P., 2009. Performance of severalmodels for predicting budburst date of grapevine (Vitis vinifera L.). Int. J. Biome-teorol. 53, 317–326.
Diodato, N., Bellocchi, G., 2007. Modelling solar radiation overcomplex terrains usingmonthly climatological data. Agric. Forest Meteorol. 144, 111–126.

orest
D
D
D
G
K
K
K
H
H
H
H
I
L
L
L
L
M
M
M
Winkler, A.J., Cook, J., Kliewer, W., Lider, L., 1974. General Viticulture. University of
G. Fila et al. / Agricultural and F
onatelli, M., Wösten, J.H.M., Bellocchi, G., 2005. Evaluation of pedotransfer func-tions. In: Pachepsky, Y.A., Rawls, W. (Eds.), Development of PedotransferFunctions in Soil Hydrology. Developments in Soil Science, vol. 30. Elsevier,Amsterdam, pp. 357–363.
okoozlian, N.K., 1999. Chilling temperature and duration interact on the budbreakof ‘Perlette’ grapevine cuttings. HortScience 34, 1–3.
uchêne, E., Huard, F., Dumas, V., Schneider, C., Merdinoglu, D., 2010. The challengeof adapting grapevine varieties to climate change. Clim. Res. 41, 193–204.
offe, W.L., Ferrier, G.D., Rogers, J., 1994. Global optimization of statistical functionswith simulated annealing. J. Econometrics 60, 65–99.
irkpatrick, S., Gelatt Jr., C.D., Vecchi, M.P., 1983. Optimization by simulated anneal-ing. Science 220 (4598), 671–680.
nuth, D.E., 1981. The Art of Computer Programming: Seminumerical Algorithms,vol. 2., 2nd ed. Addison-Wesley, Reading, MA.
won, E.-Y., Jung, J.-E., Chung, U., Yun, J.I., 2008. Using thermal time to simulatedormancy depth and bud-burst of vineyards in Korea for the twentieth century.J. Appl. Meteorol. 47, 1792–1801.
alaly, T., Pang, X., Batikoff, T., Crane, O., Keren, A., Venkateswari, J., Ogrodovitch,A., Sadka, A., Lavee, S., Or, E., 2008. Similar mechanisms might be triggered byalternative external stimuli that induce dormancy release in grape buds. Planta228, 79–88.
änninen, H., Backman, R., 1994. Rest break in Norway spruce seedlings: test of adynamic temperature response hypothesis. Can. J. Forest Res. 24, 558–563.
ellman, E., Shelby, S., Lowery, C., 2006. Exogenously applied abscisic acid did notconsistently delay budburst of deacclimating grapevines. J. Am. Pomol. Soc. 60,178–186.
unter, A.F., Lechowicz, M.J., 1992. Predicting the timing of budburst in temperatetrees. J. Appl. Ecol. 29, 597–604.
PCC, 2007. Climate Change 2007. The Fourth Assessment Report (AR4) of the UnitedNations Intergovernmental Panel on Climate Change (IPCC), Working Group I,The Physical Science Basis of Climate Change.
iao, T.W., 2002. A fuzzy C-medians variant for the generation of fuzzy term sets.Int. J. Intell. Syst. 17, 21–43.
inkosalo, T., Lappalainen, H.K., Pertti, H., 2008. A comparison of phenological modelsof leaf bud burst and flowering of boreal trees using independent observations.Tree Physiol. 28, 1873–1882.
oague, K., Green, R.E., 1991. Statistical and graphical methods for evaluating solutetransport models. Overview and application. J. Contam. Hydrol. 7, 51–73.
orenz, D.H., Eichhorn, K.W., Bleiholder, H., Klose, R., Meier, U., Weber, E., 1994.Phänologische Entwicklungsstadien der Weinrebe (Vitis vinifera L. ssp. vinifera).Viticult. Enol. Sci. 49, 66–70.
arsaglia, G., Zaman, A., Tsang, W.W., 1990. Toward a universal random numbergenerator. Stat. Probabil. Lett. 8, 35–39.
artorana, F., Bellocchi, G., 1999. A review of methodologies to evaluate agroecosys-tem simulation models. Ital. J. Agron. 3, 19–39.
atsumoto, M., Nishimura, T., 1998. Mersenne Twister: a 623-dimensionallyequidistributed uniform pseudorandom number generator. ACM Trans. Model.Comput. Simul. 8, 3–30.
Meteorology 160 (2012) 69– 79 79
Moncur, M.W., Rattigan, K., MacKenzie, D.H., Mc Intyre, G.N., 1989. Base tempera-tures for budbreak and leaf appearance of grapevines. Am. J. Enol. Viticult. 40,21–26.
Nendel, C., 2010. Grapevine bud break prediction for cool winter climates. Int. J.Biometeorol. 54, 231–241.
Orffer, C.J., Goussard, P.G., 1980. Effect of hot-water treatments on budburst androoting of grapevine cuttings. Vitis 19, 1–3.
Parker, A.K., de Cortázar-Atauri, I.G., Van Leewen, C., Chuine, I., 2011. General phe-nological model to characterise the timing of flowering and veraison of Vitisvinifera L. Aust. J. Grape Wine Res. 17, 206–216.
Perry, T.O., 1971. Dormancy of trees in winter. Science 171, 29–36.Pouget, R., 1972. Considérations générales sur le rythme végétatif et la dormance
des bourgeons de la vigne. Vitis 11, 198–217.Pouget, R., 1967. Méthode d’appréciation de l’évolution physiologique des bour-
geons pendant la phase de pré-débourrement: application à l’étude comparéedu débourrement de la Vigne. Vitis 6, 294–302.
Racsko, P., Szeidl, L., Semenov, M.A., 1991. A serial approach to local stochasticweather models. Ecol. Model. 57, 27–41.
Richardson, E.A., Seeley, S.D., Walker, D.R., 1974. A model for estimating thecompletion of rest for Redhaven and Elberta peach trees. HortScience 82,302–306.
Rivington, M., Bellocchi, G., Matthews, K.B., Buchan, K., 2005. Evaluation of threemodel estimations of solar radiation at 24 UK stations. Agric. Forest Meteorol.135, 228–243.
Sarvas, R., 1974. Investigations on the annual cycle of development of foresttrees. Autumn dormancy and winter dormancy. Commun. Inst. For. Fenn. 84,1–101.
Scaglione, G., Pasquarella, C., Federico, R., Bonfante, A., Terribile, F., 2008. A multi-disciplinary approach to grapevine zoning using GIS technology: an example ofthermal data elaboration. Vitis 47, 131–132.
Schaber, J., Badeck, F.W., 2003. Physiology-based phenology models for forest treespecies in Germany. Int. J. Biometeorol. 47, 193–201.
Semenov, M.A., Stratonovitch, P., 2010. Use of multi-model ensembles from globalclimate models for assessment of climate change impacts. Clim. Res. 41, 1–14.
Sugeno, M., 1985. An Introductory Survey of Fuzzy Control, vol. 36. Inf. Sci., NY, pp.59–83.
Weaver, R.J., Lavee, S., Johnson, J., 1975. Rooting and end of rest in ‘Carignane’ cut-tings as affected by collection time and cane segment used. Am. J. Enol. Viticult.26, 164–167.
Webb, L.B., Whetton, P.H., Barlow, E.W.R., 2007. Modelled impact of future climatechange on the phenology of winegrapes in Australia. Aust. J. Grape Wine Res.13, 165–175.
California Press, Berkeley.Yu, H., Luedeling, E., Xu, J., 2010. Winter and spring warming result in delayed spring
phenology on the Tibetan plateau. Proc. Natl. Acad. Sci. 107 (51), 22151–22156.Zadeh, L.A., 1965. Fuzzy sets. Inf. Control 8, 338–353.