Shared and idiosyncratic cortical activation patterns in autism revealed under continuous real-life...
19
Shared and idiosyncratic cortical activation patterns in autism revealed under continuous real-life viewing conditions Uri Hasson 1 , Galia Avidan 2 , Hagar Gelbard 3 , Ignacio Vallines 4 , Michal Harel 3 , Nancy Minshew 5 , and Marlene Behrmann 6 1 Department of Psychology and the Neuroscience Institute, Princeton University, Princeton, NJ, USA 2 Department of Psychology, Ben-Gurion University of the Negev, Beer-Sheva, Israel 3 Department of Neurobiology, Weizmann Institute of Science, Rehovot, Israel 4 Institute for Experimental Psychology, University of Regensburg, Germany 5 Department of Psychiatry and Neurology, University of Pittsburgh School of Medicine, Pittsburgh, PA, USA 6 Department of Psychology, Carnegie Mellon University, Pittsburgh, PA, USA Scientific abstract Although widespread alterations in cortical structure have been documented in individuals with autism, the functional implications of these alterations remain to be determined. Here, we adopted a novel inter-subject (inter-SC) and intra-subject (intra-SC) correlation technique to quantify the reliability of the spatio-temporal responses of functional MR activity across the entire cortex in adults with autism during free-viewing of a popular audio-visual movie. Whereas these complex stimuli evoke highly reliable shared response time courses in typical individuals, cortical activity was more variable across individuals with autism (low inter-SC). Interestingly, when we measured the responses within an autistic individual across repeated presentations of the movie, we observed a unique, idiosyncratic response time course that was reliably replicated within each individual (high intra-SC). Encouragingly, after filtering out the idiosyncratic responses from each individual time course, we were able to uncover a more typical response profile, which resembles the shared responses seen in the typical subjects. These findings indicate that, under conditions approximating real-life situations, the neural activity of individuals with autism is characterized by individualistic responses that, although reliable within an autistic individual, are both highly variable across autistic individuals and different from the responses observed within the typical subjects. These idiosyncratic responses may underlie the atypical behaviors observed in autism. At the same time, we are encouraged by the presence of the more typical activation pattern lurking beneath these idiosyncratic fluctuations. Taken together, these findings may pave the way to future research aimed at characterizing the idiosyncratic response profiles, which, in turn, might contribute to a better understanding of the heterogeneity of the autism spectrum and its diagnosis. Correspondence should be directed to: Uri Hasson Department of Psychology and the Neuroscience Institute Princeton University, Princeton, NJ 08544, USA [email protected]. Author contributions: U. H. and M. B. took the major responsibility for the design of the study, worked on the analyses and co-wrote the manuscript. N. M. recruited, diagnosed, and selected the autism participants and provided expertise in interpreting the data from the individuals with autism. G. A. assisted in the data collection and analysis. H. G. contributed to the analysis of the inter-SC data, M. H. contributed to the anatomical segmentation of the brains of all participants, and I. V. assisted in the eye movement studies and analyses. The authors declare no competing financial interests. NIH Public Access Author Manuscript Autism Res. Author manuscript; available in PMC 2010 August 1. Published in final edited form as: Autism Res. 2009 August ; 2(4): 220–231. doi:10.1002/aur.89. NIH-PA Author Manuscript NIH-PA Author Manuscript NIH-PA Author Manuscript
Transcript of Shared and idiosyncratic cortical activation patterns in autism revealed under continuous real-life...

Shared and idiosyncratic cortical activation patterns in autismrevealed under continuous real-life viewing conditions
Uri Hasson1, Galia Avidan2, Hagar Gelbard3, Ignacio Vallines4, Michal Harel3, NancyMinshew5, and Marlene Behrmann6
1Department of Psychology and the Neuroscience Institute, Princeton University, Princeton, NJ,USA2Department of Psychology, Ben-Gurion University of the Negev, Beer-Sheva, Israel3Department of Neurobiology, Weizmann Institute of Science, Rehovot, Israel4Institute for Experimental Psychology, University of Regensburg, Germany5Department of Psychiatry and Neurology, University of Pittsburgh School of Medicine,Pittsburgh, PA, USA6Department of Psychology, Carnegie Mellon University, Pittsburgh, PA, USA
Scientific abstractAlthough widespread alterations in cortical structure have been documented in individuals withautism, the functional implications of these alterations remain to be determined. Here, we adopteda novel inter-subject (inter-SC) and intra-subject (intra-SC) correlation technique to quantify thereliability of the spatio-temporal responses of functional MR activity across the entire cortex inadults with autism during free-viewing of a popular audio-visual movie. Whereas these complexstimuli evoke highly reliable shared response time courses in typical individuals, cortical activitywas more variable across individuals with autism (low inter-SC). Interestingly, when we measuredthe responses within an autistic individual across repeated presentations of the movie, we observeda unique, idiosyncratic response time course that was reliably replicated within each individual(high intra-SC). Encouragingly, after filtering out the idiosyncratic responses from each individualtime course, we were able to uncover a more typical response profile, which resembles the sharedresponses seen in the typical subjects. These findings indicate that, under conditionsapproximating real-life situations, the neural activity of individuals with autism is characterized byindividualistic responses that, although reliable within an autistic individual, are both highlyvariable across autistic individuals and different from the responses observed within the typicalsubjects. These idiosyncratic responses may underlie the atypical behaviors observed in autism. Atthe same time, we are encouraged by the presence of the more typical activation pattern lurkingbeneath these idiosyncratic fluctuations. Taken together, these findings may pave the way to futureresearch aimed at characterizing the idiosyncratic response profiles, which, in turn, mightcontribute to a better understanding of the heterogeneity of the autism spectrum and its diagnosis.
Correspondence should be directed to: Uri Hasson Department of Psychology and the Neuroscience Institute Princeton University,Princeton, NJ 08544, USA [email protected] contributions: U. H. and M. B. took the major responsibility for the design of the study, worked on the analyses and co-wrotethe manuscript. N. M. recruited, diagnosed, and selected the autism participants and provided expertise in interpreting the data fromthe individuals with autism. G. A. assisted in the data collection and analysis. H. G. contributed to the analysis of the inter-SC data, M.H. contributed to the anatomical segmentation of the brains of all participants, and I. V. assisted in the eye movement studies andanalyses.The authors declare no competing financial interests.
NIH Public AccessAuthor ManuscriptAutism Res. Author manuscript; available in PMC 2010 August 1.
Published in final edited form as:Autism Res. 2009 August ; 2(4): 220–231. doi:10.1002/aur.89.
NIH
-PA Author Manuscript
NIH
-PA Author Manuscript
NIH
-PA Author Manuscript

IntroductionAutism is a neurodevelopmental disorder in which affected individuals exhibit atypicalbehaviors in social interaction and communication, and have restricted or stereotypedpatterns of behaviors (Baron-Cohen & Belmonte, 2005; Behrmann, Thomas, & Humphreys,2006; Frith & Happe, 2005). Consistent with the fact that multiple cognitive and affectivebehaviors are implicated in autism (Williams, Goldstein, & Minshew, 2006),neuroanatomical studies have reported widespread changes in cerebral grey and white matterin, among other regions, the amygdala, hippocampus, caudate nucleus and cerebellum(Amaral, Schumann, & Nordahl, 2008; Bachevalier & Loveland, 2006; Belmonte, et al.,2004; Herbert, 2005; Herbert, et al., 2004; McAlonan, et al., 2005). Additionally, recentneuroimaging studies have revealed disruptions in the structural and functional connectivitywithin and between cortical regions in individuals with autism during the execution ofpredefined tasks as well as during resting state conditions (Barnea-Goraly, et al., 2004;Hrdlicka, 2008; Kennedy, Redcay, & Courchesne, 2006; Kleinhans, et al., 2008;Vandenbroucke, Scholte, Engeland, Lamme, & Kemner, 2008). What remains unknown ishow these neural disruptions manifest under real-life circumstances, and to what extent theyhave functional consequences for the individual's behavioral and cognitive profile.
To characterize the cortical response under conditions approximating real-lifecircumstances, we used fMRI to map the whole-brain activation profile in adults with autismduring free-viewing of an engaging movie and we compared this profile to that evinced bytypical participants. The carefully orchestrated audio-visual movie sequence is well-suitedfor driving reliable activation simultaneously in multiple brain areas (Hanson, Gagliardi, &Hanson, 2008; Hasson, Furman, Clark, Dudai, & Davachi, 2008; Hasson, Nir, Levy,Fuhrmann, & Malach, 2004; Hasson, Yang, Vallines, Heeger, & Rubin, 2008a;Jaaskelainen, et al., 2008; Wilson, Molnar-Szakacs, & Iacoboni, 2008). The data wereanalyzed by comparing the evoked fMRI response time courses across different subjects(inter-subject correlation, henceforth inter-SC; (Hasson, et al., 2004), and by comparingresponse time courses elicited by repeated presentations of the same stimulus within thesame individual (intra-subject correlation, henceforth intra-SC; (Golland, et al., 2007).Computing the inter-SC within the typical individuals (typical-typical), on a voxel-by-voxelbasis, quantifies the reliability of the response time courses in each brain area in the typicalgroup. Using this analysis, we demonstrated that, across typical observers, approximately30%–65% of the cerebrum evinces similar shared response time courses under free viewingof complex naturalistic stimuli (Hasson, Furman, et al., 2008; Hasson, et al., 2004; Hasson,Yang, Vallines, Heeger, & Rubin, 2008b). Moreover, these reliable responses, althoughwidespread, are nonetheless selective (i.e., the response time courses differ from one brainarea to another; (Hasson, Malach, & Heeger, submitted).
Here, we compare the cortical responses of individuals with autism against this typicalresponse benchmark. Computing the inter-SC between the typical and the autism groups(typical-autism) provides a measure of similarity in the functional response in each brainarea across the two groups. Low inter-SC between the typical-autism groups in conjunctionwith high inter-SC within the typical group would indicate that the response time course in agiven brain area is markedly different in individuals with autism. Moreover, high inter-SCwithin the autism group (autism-autism) in conjunction with low inter-SC between thetypical-autism groups can identify reliable response time courses, which are unique to theautism group and are not observed in the typical subjects. Finally, computing the intra-SCwithin each autistic individual across repeated presentations can reveal the unique set ofresponse time courses, which, although possibly variable across the group, are nonethelessreliable within an individual. Critically, this type of functional analysis does not make any apriori assumptions about affected regions. Rather, the within- and between-groups inter-SC
Hasson et al. Page 2
Autism Res. Author manuscript; available in PMC 2010 August 1.
NIH
-PA Author Manuscript
NIH
-PA Author Manuscript
NIH
-PA Author Manuscript

and within-individual intra-SC analyses permit an unbiased exploration of the entire cortexin the quest for differences in the patterns of brain responses between members of the twogroups.
MethodsSubjects
Twelve adults with autism and eight typical subjects were scanned at the Brain ImagingResearch Center in Pittsburgh. All subjects watched a 10-minute excerpt of a complexaudio-visual movie sequence (see description below in the main movie experiment section);and an object localizer was used to define particular regions of interest (see descriptionbelow in the object localizer experiment section). Eight of the subjects (4 from each group)watched the movie twice. To identify and localize a set of functional regions of interest(ROI) independently, an additional eight typical subjects were scanned at NYU's Center forBrain Imaging. All subjects had normal or corrected-to-normal vision and provided writteninformed consent. All protocols and procedures were approved by the University Committeeon Activities Involving Human Subjects at the University of Pittsburgh, Carnegie MellonUniversity, and New York University. Data from three autism participants were removedfrom all analysis due to excessive head movements during the main movie watchingexperiment.
All participants with autism had Wechsler Full Scale and Verbal IQ scores of 80 or above(Autism mean VIQ=102, mean PIQ=105) and their diagnosis was confirmed on the AutismDiagnostic Revised Interview (Lord, Rutter, & Le Couteur, 1994), the Autism DiagnosticObservation Schedule (social mean=8; communication mean=4.8; (Lord, Cook, Leventhal,& Amaral, 2000) and by expert clinical diagnosis. Exclusion criteria for autism includedassociated disorders such as fragile-X syndrome or tuberous sclerosis, evidence of birthasphyxia, head injury, or seizure disorder, based on neurological history and examinationand chromosomal analysis. The typical participants were community volunteers matched tothe autism individuals in age, gender, and handedness as closely as possible. Although theIQ data were not available for all typical participants, no obvious link has been foundbetween IQ and performance on non-speeded visual perceptual tasks in either typical(Deary, McCrimmon, & Bradshaw, 1997) or autism (Behrmann, et al., 2006) individuals,nor is there a statistically reliable IQ-fMRI relationship in autism (Kennedy & Courchesne,2008).
MRI setupSubjects were scanned in a 3T Siemens Allegra scanner equipped with a standard head coil(same scanner at Pittsburgh and NYU). Blood oxygenation level dependent (BOLD)contrast was acquired using gradient-echo echo-planner imaging (EPI) sequence (TE=35msec, flip angle=90°, FOV=210×210mm2, matrix size 64×64). A TR of 3000ms was usedfor the main experiments. The scanned volume included 35 axial slices of 3mm thicknesswith no gap. High-resolution anatomical scans (T1-weighted 3D MPRAGE) were acquiredfor cortical segmentation, reconstruction, and volume-based statistical analysis (TE=3.49,flip angle=80°, FOV=256×256mm2, matrix size=256×256, slice thickness=1mm, number ofslices=160–192, sagittal orientation).
Main movie experimentWe compared the patterns of brain activation of typical and autistic individuals acrossmultiple cortical regions under maximally naturalistic conditions. To drive activitysimultaneously in as many brain areas as possible, the participants viewed a 10-minuteuninterrupted excerpt from the classic Western feature film, “The Good, the Bad and the
Hasson et al. Page 3
Autism Res. Author manuscript; available in PMC 2010 August 1.
NIH
-PA Author Manuscript
NIH
-PA Author Manuscript
NIH
-PA Author Manuscript
Ugly,” directed by Sergio Leone (Hasson, et al., 2004); for a similar approach, see (Hanson,et al., 2008; Jaaskelainen, et al., 2008; Wilson, et al., 2008). The experiment started with a30-second blank followed by 9 seconds of patterned stimuli, which were excluded from theanalysis. To ensure that participants comprehended the movie sequence, following themovie, we administered a set of comprehension questions outside of the scanner. Thequestions were designed to determine whether the participants were able to track events orcharacters from the excerpt, for example, “Where does the movie take place?” (Wild West)and “What do the main characters look like?”, as well as questions about the main eventsthat occurred such as “What happened prior to the main character being captured?”. Allparticipants from both groups provided accurate answers to all questions.
Data analysisData analysis was performed using BrainVoyager QX (Brain Innovation, Maastricht,Netherlands) and complementary in-house software written in Matlab. For each subject, thecortical surface was reconstructed and flattened (see Figure 1). Preprocessing of functionalscans included filtering out of low frequencies (e.g., slow drift), up to five cycles perexperiment, and 3D-motion correction. The 3D algorithm adjusts for small head movementsby rigid body transformations of all slices to the first reference volume (see note aboveregarding exclusion of three individuals with autism who showed excessive motion).
Mapping inter-subject correlationTo measure the reliability of the response time courses between corresponding regionsacross subjects (inter-subject correlation, inter-SC) and within a subject (intra-subjectcorrelation, intra-SC), we first transformed all brains into the Talairach coordinate system(Talairach & Tournoux, 1988), and applied a Gaussian filter of 8mm full width at halfmaximum value (FWHM) to the data. To remove pre-processing artifacts, we excluded fromthe analysis the first and last 10 time points of the experiment. The inter-SC and intra-SCwere computed between the entire response time courses in each pair of subjects/or within asubject across repeated presentations of the movie on a voxel-by-voxel basis. In a separateanalysis, we computed the inter-SC and intra-SC for the average time courses within eachpredefined ROI. We computed the inter-SC and the intra-SC separately within the typicalgroup (typical-typical) and within the autistic group (autism-autism). We also computed theinter-SC between the groups (typical-autism). We then calculated the average correlationcoefficient (r) per voxel or per ROI, after applying the Fisher transformation to theindividual coefficients. To ensure that these mean correlation values were not biased byoutliers, we performed a second order t-test analysis on the pair-wise values within eachcomparison to confirm that the mean was significantly different from zero.
To correct for the multiple comparisons in the inter-SC and intra-SC analyses, we estimatedthe arbitrary correlation values that might arise in such a complex data set across the entirevolume (all voxels), when taking two unrelated time courses. This was achieved by flippingthe time course of each subject and calculating the correlations between the forward andflipped time courses (using same procedure as outlined above). Because the forward andreversed time courses are not aligned, the correlation between them should be low and, asexpected, this was the case. The highest value exhibited by any voxel in this analysis servedas a conservative statistical criterion for thresholding the inter-SC and intra-SC maps(r>0.14).
Object localizerTo assess further the reliability of responses within each group, we analyzed the timecourses in several regions of interest (ROIs). Regions of interests (ROIs) were defined usingindependent fMRI measurements of cortical activity evoked by select object categories. This
Hasson et al. Page 4
Autism Res. Author manuscript; available in PMC 2010 August 1.
NIH
-PA Author Manuscript
NIH
-PA Author Manuscript
NIH
-PA Author Manuscript
experiment was composed of 32 epochs (15 seconds long) of movie clips, divided into fourcategories: shots of faces under various natural situations (e.g., walking in the street),navigation of the camera through a building area, navigation of the camera through openfields, and movie clips of miscellaneous images from various object categories (machines,cars); (for additional information, see (Hasson, et al., 2004). This task has been usedsuccessfully to evaluate cortical activity in autism (Humphreys, Hasson, Avidan, Minshew,& Behrmann, 2008).
Auditory localizerA five-minute soundtrack taken from an audio book (“Alice's Adventures in Wonderland”)was played to the subjects. The soundtrack was muted every 10 seconds for 6 seconds tocreate block-like alterations with 17 non-continuous 10-second segments of the storysoundtrack followed by 6 seconds of silence.
Selection of regions of interest (ROI)Consistent with other studies (Hadjikhani, et al., 2004; Humphreys, et al., 2008; Pierce,Muller, Ambroses, Allen, & Courchesne, 2001), the cortical activation pattern for differentobject categories (faces, buildings, and common objects) in the autism individuals washighly irregular, relative to the typical pattern (Hasson, Harel, Levy, & Malach, 2003), withhyperactivation for the objects and hypoactivation for the face stimuli (also see (Humphreys,et al., 2008; Schultz, et al., 2000). Given this irregularity, identifying a functionally definedface- and object-related ROI for each individual with autism could not be done reliably at acorrected threshold. Although we were able to identify consistent ROIs in all typicalsubjects, the use of these ROIs would bias the analysis toward the typical group. Wetherefore used the average ROIs, obtained from a separate and independent group of 8typical subjects, and applied their coordinates to derive ROIs in each of the currentparticipants. This ensures that the activation profile measured from voxels within each ROIis not biased towards the typical group and ensures that the strong inter-SC within thetypical group is not a function of the ROI selection per se. To confirm further that thereliance on an independent typical group for selecting these ROIs did not bias the responsesin favor of the typical subjects, we also defined the same ROIs based on the responsesobtained in our autistic group for the same stimuli. Given the inherent variability in theautism group, we used an uncorrected fixed effect analysis for this procedure. Thisprocedure biased the responses toward the autism group, but, importantly, resulted in similarresults, thereby confirming the outcome of the previous analysis (see Supplementary Figure1).
Eye movement analysisTo ensure that any group differences did not result from differential viewing of the movieand to confirm that participants were indeed watching the movie at all times, we monitoredtheir eye movement trajectories in the scanner, using an infrared video camera equippedwith a custom-built MRI telephoto lens (Applied Sciences Laboratories, Model 504LRO;http://www.a-s-l.com). The camera was focused on the right eye through the same mirrorwith which participants viewed the visual display. For 8 runs (4 from each group), we alsomeasured the precise eye gaze pattern during the fMRI sessions, using the same camera andsampling x, y eye position at 60Hz. Nine points on the screen were used to calibrate thecoordinates of the eye tracker at the beginning and end of each run. Eye traces were median-filtered, normalized, and converted to video frame coordinates. A cross correlation indexwas calculated independently for x and y.
Hasson et al. Page 5
Autism Res. Author manuscript; available in PMC 2010 August 1.
NIH
-PA Author Manuscript
NIH
-PA Author Manuscript
NIH
-PA Author Manuscript
Power spectrumAs a means of ensuring that the differences in BOLD response between the autism andtypical individuals were not simply due to a decrease in the overall response amplitude inthe autism individuals, we measured the power spectral density in each subject. Testscomparing power spectrum were conducted on time courses sampled from the average timecourse of all voxels correlated to the ventral occipital temporal lobe (VOT). Power spectrumwas defined as the base-10 logarithm of the squared absolute value of the Fast FourierTransform components. Significant differences in the power spectrum were defined by apaired t-test (p<0.05) separately for each frequency range. This analysis was used todemonstrate that observed differences in correlation values across groups were not a resultof a differential decrease in the response amplitudes in any frequency band.
ResultsIncreased variability in response time courses to natural stimuli within the autism group
To characterize the shared response time courses within the typical group, we usedfunctional magnetic resonance imaging (fMRI) to measure cortical activity while observersviewed complex, naturalistic stimuli (a segment from an engaging commercial film). Afternormalizing all brains to the Talairach coordinate system, we calculated the inter-SC acrossthe entire movie sequence within the typical group on a voxel-by-voxel basis (see Methods).This was done separately for every voxel. High inter-SC within the typical group indicatesthat response time courses in a particular brain region are similar, hence shared, acrosssubjects. Low inter-SC reliability is interpreted as a different temporal evolution of neuronalevents across the two groups.
Despite the seemingly uncontrolled (free viewing) task and complex nature of the stimuli,and, consistent with our previous findings, the movie evoked highly reliable brain activity inmany brain areas within the typical subjects (Figure 1A; typical subjects, n=8 subjects, seeSupplementary Figure 2A for the inter-SC maps of each typical individual). Compared tothe typical group (Figure 1A), the response time courses were highly variable within theautistic group (Figure 1B; autistic subjects, n=9 subjects; see Supplementary Figure 2B forthe inter-SC maps of each autistic individual) with some inter-SC in early visual andauditory areas (Fig. 1B). Importantly, there were no regions that exhibited shared responses(high inter-SC) within the autistic individuals alone but not within the typical individuals.Finally, as in the autism-autism comparison, the analysis of the inter-SC between the autistic(n=9) and typical subjects (n=8) also reveals robust and widespread disruption of the inter-subject correlation of the BOLD signal (Fig. 1C) with, again, somewhat better correlation inprimary sensory regions (auditory and visual cortices) and with systematic decrement as oneproceeds to higher-order areas (see also Figure 2D).
To assess further the reliability of responses within each group, we analyzed the timecourses in several regions of interest (ROIs), functionally defined based on the activationpatterns of 8 subjects whose data were not included in subsequent analyses (see Methods).Figure 2A shows the activation profile sampled from the vicinity of the calcarine sulcus,which include the primary visual cortex and nearby early visual areas (termed area V1+ inthe paper) for each individual in each group, plotted across the entire movie sequence. Thisarea was chosen as an illustrative example of the findings; similar results were obtained inthe other independently defined ROIs (see Figure 2D). As is evident, the response timecourses in area V1+ were reliable across all typical subjects (inter-SC: 0.32±0.01), whereasthe time courses from the same area in the individuals with autism, although highlyfluctuating (rather than remaining unchanged, see also spectral analysis below), show muchgreater variability across subjects (inter-SC: 0.13±0.02; see Figure 2B).
Hasson et al. Page 6
Autism Res. Author manuscript; available in PMC 2010 August 1.
NIH
-PA Author Manuscript
NIH
-PA Author Manuscript
NIH
-PA Author Manuscript

The reduction in the reliability of the response time courses in individuals with autism heldacross large regions of posterior cortex. Figure 2D presents the average inter-SC values forthe within- and between-group comparisons across the preselected ROIs. The highcorrelation values within the group of typical subjects (typical-typical: red) replicate ourprevious findings (Hasson, et al., 2004) and, additionally, validate the use of the externallydefined unbiased ROIs. In all ROIs (including early and higher-order regions), the autism-autism analysis (dark green) and the autism-typical analysis (light green) showed asubstantially reduced correlation of about 40–50%, relative to the typical subjects' inter-SCvalues. Although the overall inter-SC values are higher in primary sensory cortices, thereduction in the reliability of responses was evident in all regions. Also, as mentioned above,no region exhibited a high correlation within the autistic individuals but not within thetypical individuals. To ensure further that our procedure for selecting the ROIs did not biasthe responses in favor of the typical subjects, we also defined the same set of ROIs based onthe autism group (see Methods). Although, such a selection naturally biases the responsestoward the autism group, similar results were obtained for this analysis as for theindependent-ROI definition analysis (see Supplementary Figure 1). In sum, the reduction ininter-SC observed within the individuals with autism appears to be driven by signalfluctuations (Figure 2B), which deviate from the typical response time courses observed intypical subjects (Figure 2A), and diminish the reliability of responses across individuals withautism (Figure 2D).
The variable responses in autistic individuals are partially attributable to idiosyncraticresponses
To evaluate whether the variable fluctuations in the autism group result from a consistentbut unique viewing approach employed by each individual with autism, we calculated theintra (within)-SC and inter (between)-SC across repeated presentations of the movie on avoxel-by-voxel basis in eight individuals, four from each group (see Figure 3). High intra-SC implies that the responses to the movie stimuli are reliable within an individual, and highinter-SC adds information regarding the similarity of responses across all members of thegroup. In the typical subjects, we observed a high degree of overlap between the intra-SCand inter-SC maps (Figure 3A; orange), indicating that most response time courses aresimilar both within and between all individuals. In contrast, in the autism individuals, wedetected a unique idiosyncratic signal that was apparently stable and reliable within a givenindividual across repeated presentations (high intra-SC; red), but was not similar acrossautistic individuals (low inter-SC; notice the absence of orange in the display). Thus, theincreased intra-SC suggests that at least some of the variability in the autism group might beattributed to the idiosyncratic response time courses, which are uniquely and differentiallycharacteristic of each individual.
The idiosyncratic signal fluctuations do not abolish the processing of the movie and theoverall activation level is not altered in autism
One possible explanation for the reduction in inter-SC in autism may be that the individualswith autism were distracted and did not consistently attend to the movie. However, the eyemovement patterns (acquired via a built-in video camera in the scanner, see Method) assuredus that each individual was indeed looking at the movie. Moreover, finding high intra-SCwithin each autistic individual (Figure 3B) implies that the variability in response timecourses across the autistic individuals (Figures 1B, C; 2B, D) is not attributable to someerratic process, but, rather, emerges from replicable processes within an individual. Thereduction in the inter-SC is also not attributable to decreased activation in the autism group;analyses of the variance and spectral content of the time courses did not reveal anysignificant differences between the two groups at any frequency (see Methods and timecourses in Figure 2B).
Hasson et al. Page 7
Autism Res. Author manuscript; available in PMC 2010 August 1.
NIH
-PA Author Manuscript
NIH
-PA Author Manuscript
NIH
-PA Author Manuscript

The idiosyncratic signal fluctuations mask the underlying stimulus-evoked activityDespite the variable signal fluctuations, a post-scan questionnaire revealed that all autisticindividuals achieved at least a reasonable understanding of the movie plot. This findingprompted us to search for a more typical response time course embedded within the variablesignal fluctuations, which might mediate the apparent comprehension of the movie plot.When the cortical responses are averaged across the individuals of the autism group (ratherthan considered individual-by-individual), the average response sampled from V1+ begins tobe better correlated with the average response of the typical subjects (Figure 2C). Thus, theaverage time course of the autism group (red curve) and that of the typical group (bluecurve) yields a correlation of 0.67, noticeably higher than the average inter-SC between thepairwise typical subjects (correlation of 0.32). A similar increment in the between-groupscorrelations values was apparent in each ROI (Figure 2E, green bars). To assess the impactof averaging the data on the typical group, we calculated the correlation between the averagesignals obtained from splitting the typical group into two subgroups (n=4 in each group),averaging the signal within each ROI, and then computed the correlation between the twoaverage time courses (Figure 2E, red bars). As can be seen, aggregating the signal across allautistic individuals averaged out some of the uncorrelated and idiosyncratic fluctuations, andrevealed a more typical response time course in all cortical regions that is similar to thesignal seen in the typical subjects (Figure 2C, E).
Finally, to unmask the typical activation patterns within each autistic individual on a voxel-by-voxel basis, we used the average spatio-temporal activation profile of all typical subjectsas a predictor for the activity pattern in each autistic brain. Correlating the autisticindividuals' response time courses with the average typical response time courses enabled usto recover more typical response time courses in each individual with autism (Figure 4presents the average mean inter-SC map across all autistic individuals, SupplementaryFigure 2C presents the inter-SC maps for each autistic individual). This analysis revealedtypical response time courses in each autistic individual across all regions that exhibitedhigh inter-SC in typical subjects (compare with Figure 1A). Thus, beneath the variable anduncorrelated internal signal fluctuations (as seen in Figures 2B and 2D), we uncovered morestandard responses in many brain regions in the autism individuals (Figures 2E, 4 andSupplementary Figure 2C).
Ruling out alternative explanations for fluctuations in autismThe idiosyncratic cortical fluctuations found within each autistic individual (high intra-SC,Figure 3B) can not be attributable to idiosyncratic repeatable head movement artifact withineach individual (recall that three individuals with head motion were already excluded fromthe analysis). To detect and correct for head motion in the current individuals, we applied acorrection algorithm and calculated the magnitude of the head movements as the square rootsum of all x, y, z rotations and translations in space (mm). No observable head motionpatterns were found between the derivative of the head motion across repeated presentationsof the movie within autistic individuals (correlations 0.035±0.02).
It is also not the case that the low inter-SC in the autism group emerges from the autismindividuals' failure to watch the display. The eye movement patterns (acquired via a built-invideo camera in the scanner) assured us that each individual was looking at the movie (seeabove). It is the case, however, that unusual eye movement patterns are not uncommon inautism (Klin, Jones, Schultz, Volkmar, & Cohen, 2002b; Pelphrey, Morris, & McCarthy,2005; Ristic, et al., 2005) and may lead to reduced activation in, for example, the FusiformFace Area (FFA; (Dalton, et al., 2005; Morris, Pelphrey, & McCarthy, 2007). To monitorindividuals' eye movement trajectories, we recorded the eye movements of four typical andfour autism subjects. As evident in Figure 5, eye movement patterns were similar across the
Hasson et al. Page 8
Autism Res. Author manuscript; available in PMC 2010 August 1.
NIH
-PA Author Manuscript
NIH
-PA Author Manuscript
NIH
-PA Author Manuscript

two presentations of the movie for the typical (x-axis r=0.28±0.02; y-axis r=0.27±0.03) butnot for the autistic individuals (x-axis r=0.09±0.09; y-axis r=0.11±0.02), replicating thereports of irregular eye movement trajectories in individuals with autism (Cody, Pelphrey, &Piven, 2002). The differences across the groups in eye movements, however, do not offer acomplete explanation of the current findings, as we see typical mean response time courses(after removing the idiosyncratic responses) within autistic individuals (see Figures 2C, 4)even in the absence of reliable eye movement trajectories across repeated presentations.Thus, the variability in eye movements within the autism group is not sufficient forabolishing the typical responses within each autistic individual. It will be interesting toexplore whether the eye movements within an individual with autism are reliable acrossrepeated presentations, hence contributing to the increase in intra-SC observed in the autisticindividuals.
DiscussionAutism is a profound disorder of brain development and, despite the rigorous scientificattention paid to it, many fundamental questions remain unanswered. Classically, the studyof autism has focused on specific aspects such as the atypicalities in social cognition, theoryof mind, joint attention, language, and emotional regulation, and the alterations in thosebrain regions that underlie these behaviors (Behrmann, et al., 2006; Dakin & Frith, 2005;Klin, Jones, Schultz, Volkmar, & Cohen, 2002a; Luna, et al., 2002; Peterson, Wellman, &Liu, 2005). Here, using naturalistic, rich sensory stimulation, and an assumption-free inter-SC and intra-SC analysis, we explore the whole-brain activation profile in high-functioningadults with autism, and demonstrate that the functional response time courses in autismduring natural viewing are markedly atypical across many brain regions (Figure 1B). Inparticular, the expected cortical response profile is masked by idiosyncratic alterations in theresponse time courses in areas ranging from primary sensory cortices all the way through tohigh-level association areas (Figure 3B).
Specifically, we document three major findings. First, relative to the well-defined andpredictable patterns of activity in typical subjects, the cortical activation patterns inindividuals with autism were highly disrupted in multiple cortical areas, including bothprimary sensory areas and higher-order areas (Figures 1B–C and 2D). This suggests thatautism is associated with a broad neuronal dysfunction, affecting multiple, disparate corticalareas. Second, within each individual with autism, retested under identical circumstances,the intra-SC was higher than the inter-SC (Figure 3B). This suggests that at least part of thevariability observed in each autistic individual might emerge from a consistent butidiosyncratic activation pattern in response to the sensory input (Rogers, Hepburn,Stackhouse, & Wehner, 2003). Finally, given that we were able to uncover typical responsetime courses in each autistic individual (Figure 4 and Supplementary Figure 2), theidiosyncratic fluctuations appear to interfere with, but not entirely abolish, the neuronalprocessing of the movie. Indeed, all of the individuals with autism achieved at least someunderstanding of the movie's plot, as revealed by the post-scan questionnaire, indicating thatthe fluctuations observed in each autistic individual did not eliminate their ability tocomprehend the external input. At the same time, the breakdown in the inter-SC observedwithin the individuals with autism (Figure 1B–C) attests to the presence of idiosyncraticsignal fluctuations even while the individuals are actively watching the movie.
These idiosyncratic response time courses are not attributable to irregular head movements,or to the irregular eye movement patterns observed in individuals with autism acrossrepeated presentations of the movie, or to group differences in signal amplitude. Finally, thefinding that each individual with autism was able to follow the movie's plot, together withthe fact that we were able to uncover a typical signal in the autism group and the test-retest
Hasson et al. Page 9
Autism Res. Author manuscript; available in PMC 2010 August 1.
NIH
-PA Author Manuscript
NIH
-PA Author Manuscript
NIH
-PA Author Manuscript

replicability, argue against the likelihood that the idiosyncratic response time courses aresimply induced by a lack of attention to the movie.
What is the source of the idiosyncratic response time courses observed in each autisticindividual? First, the responses might be related to a set of individualized strategiesemployed by each autism subject in response to the rich sensory input. These strategies canvary from individual to individual, but still be highly reliable within an autistic individual.Thus, it could be that the increase in reliable responses within each autistic individual(increased intra-SC within the autism group; Figure 3B) uncovers the singularity of theneuronal responses in each autistic individual. These individual profiles may serve as theneural correlate for the extensive heterogeneity in behavioral symptoms (social behavior,communication abilities, and restricted, repetitive or stereotyped patterns of behavior)expressed, not just across the autism spectrum, but even within individuals falling at thesame point along the continuum. Note that, in contrast to the substantial inter-individualvariability observed in individuals who are diagnosed with autism that is co-morbid withattention deficit disorder (Geurts, et al., 2008), we see relatively stable, repeatable patternswithin, although not between, individuals. Further studies are needed in order to identify theramifications of these individual profiles and to assess whether it is indeed the case that thebehavioral heterogeneity is mediated by the differing individual neural patterns. It is, ofcourse, also crucial to understand how the observed variability across autistic individualsgives rise to the well-known triad of symptoms common in autism.
Another possibility, albeit not mutually exclusive, is that these idiosyncratic responses arerelated to more generalized physiological and/or structural alternations in the autistic's brain.For example, the idiosyncratic activity in autism may result from disproportionately higherlevels of excitation and/or lower levels of inhibition in the individuals (Polleux & Lauder,2004; Rubenstein & Merzenich, 2003), resulting in hyperexcitable cortex. This would beconsistent with reports of high levels of noisy spike activity on EEG/MEG (Daoust,Limoges, Bolduc, Mottron, & Godbout, 2004; Hurley, Lewine, Jones, Orrison, & Taber,2000) and increased seizure incidence in autism (Hughes & Melyn, 2005; Tuchman, 2000).However, it is important to note that fMRI provides only an indirect measure of the neuronalresponses (Logothetis, Pauls, Augath, Trinath, & Oeltermann, 2001; Mukamel, et al., 2005),and thus we cannot directly assess this hypothesis with the current data set. Moreover, theidiosyncratic response time courses may be due to an excess of white matter tracts in autism,relative to matched controls (Courchesne, et al., 2001; Freitag, et al., 2009; Hendry, et al.,2005; Herbert, 2005; Herbert, et al., 2004). Regardless of the source of the variability acrossindividuals with autism, whether it be physiological or structural, our results indicate thatthese irregularities are expressed in a lawful manner within each individual under real-lifeviewing conditions. In other words, the idiosyncratic responses are reliably induced (i.e.,time locked) to the external stimuli with each autistic individual, and cannot be attributed toan internally induced erratic and unstable set of responses.
Finally, our findings of idiosyncratic response time courses may be linked with the claimthat individuals with autism experience sensory overload (for example, (Crane, Goddard, &Pring, 2009). These results are also consistent with the recent “intense world syndrome”model of autism (Markram, Rinaldi, & Markram, 2007), in which the excessive neuronalprocessing in circumscribed circuits in individuals with autism leads to hyper-reactivity,which interferes with the processing of the incoming information, which, in turn, leads tosocial and environmental withdrawal. On this account, in response to this excessive neuronalactivation, the neural system is thought to “lock down” the individual to a small repertoire ofidiosyncratic behaviors, which are repeated with high frequency. In our data, we observedstrong idiosyncratic fluctuations (see Figure 2B) and these may be associated (either as
Hasson et al. Page 10
Autism Res. Author manuscript; available in PMC 2010 August 1.
NIH
-PA Author Manuscript
NIH
-PA Author Manuscript
NIH
-PA Author Manuscript
cause or effect) with the hypersensitivity and hyperfunctionality observed in autisticindividuals.
ConclusionIn sum, we have exploited a novel inter-correlation approach, which has enabled us todocument both typical and atypical aspects of the cortical activation patterns in highfunctioning adults with autism. Our study exposes the extensive presence of idiosyncraticresponse time courses in the individuals with autism during the processing of complex,dynamic external stimuli. Any full theoretical account of autism will need to be able toexplain both the common aspects of the response as well as the apparent idiosyncratic,repeatable within-subject neural profile. We note that this analytic approach has muchpotential to elucidate the neural dynamics that are activated in naturalistic conditions inindividuals with autism, as reflected by its ability to distinguish clearly between individualswith autism and their typical counterparts. Taken together, these findings may pave the wayto future research focusing on identifying and characterizing the underline sources of suchidiosyncratic fluctuations, which may also help developing diagnostic tools for autism in at-risk populations.
Supplementary MaterialRefer to Web version on PubMed Central for supplementary material.
AcknowledgmentsSpecial thanks to Rafael Malach for his valuable input to this project. We thank David Heeger, Nava Rubin, IfatLevy, Kate Humphreys, Cibu Thomas, and Yoram Bonneh for fruitful discussions and comments on themanuscript. Funding was provided by an International Human Frontier Science Program Organization long-termfellowship (U. H.) and NICHD/NIDCD PO1/U19 (M. B. and N. M.), which is part of the NICHD/NIDCDCollaborative Programs for Excellence in Autism. We thank Grace Lee Leonard, Lauren Lorenzi, and Stacy Chofor assistance in data collection and the individuals at the Collaborative Program for Excellence in Autism researchat the University of Pittsburgh for their help in recruiting, scheduling, and testing subjects.
ReferencesAmaral DG, Schumann CM, Nordahl CW. Neuroanatomy of autism. Trends Neurosci. 2008Bachevalier J, Loveland KA. The orbitofrontal-amygdala circuit and self-regulation of social-
emotional behavior in autism. Neurosci Biobehav Rev. 2006; 30(1):97–117. [PubMed: 16157377]Barnea-Goraly N, Kwon H, Menon V, Eliez S, Lotspeich L, Reiss AL. White matter structure in
autism: preliminary evidence from diffusion tensor imaging. Biol Psychiatry. 2004; 55(3):323–326.[PubMed: 14744477]
Baron-Cohen S, Belmonte MK. Autism: a window onto the development of the social and the analyticbrain. Annu Rev Neurosci. 2005; 28:109–126. [PubMed: 16033325]
Behrmann M, Thomas C, Humphreys K. Seeing it differently: visual processing in autism. TrendsCogn Sci. 2006; 10(6):258–264. [PubMed: 16713326]
Belmonte MK, Cook EH Jr. Anderson GM, Rubenstein JL, Greenough WT, Beckel-Mitchener A, etal. Autism as a disorder of neural information processing: directions for research and targets fortherapy(1). Mol Psychiatry. 2004; 9(7):646–663. [PubMed: 15037868]
Cody H, Pelphrey K, Piven J. Structural and functional magnetic resonance imaging of autism. Int JDev Neurosci. 2002; 20(3–5):421–438. [PubMed: 12175882]
Courchesne E, Karns CM, Davis HR, Ziccardi R, Carper RA, Tigue ZD, et al. Unusual brain growthpatterns in early life in patients with autistic disorder: An MRI study. Neurology. 2001; 57(2):245–254. [PubMed: 11468308]
Crane L, Goddard L, Pring L. Sensory processing in adults with autism spectrum disorders. Autism.2009; 13(3):215–228. [PubMed: 19369385]
Hasson et al. Page 11
Autism Res. Author manuscript; available in PMC 2010 August 1.
NIH
-PA Author Manuscript
NIH
-PA Author Manuscript
NIH
-PA Author Manuscript
Dakin S, Frith U. Vagaries of visual perception in autism. Neuron. 2005; 48(3):497–507. [PubMed:16269366]
Dalton KM, Nacewicz BM, Johnstone T, Schaefer HS, Gernsbacher MA, Goldsmith HH, et al. Gazefixation and the neural circuitry of face processing in autism. Nat Neurosci. 2005; 8(4):519–526.[PubMed: 15750588]
Daoust AM, Limoges E, Bolduc C, Mottron L, Godbout R. EEG spectral analysis of wakefulness andREM sleep in high functioning autistic spectrum disorders. Clin Neurophysiol. 2004; 115(6):1368–1373. [PubMed: 15134704]
Deary IJ, McCrimmon RJ, Bradshaw J. Visual information processing and intelligence. Intelligence.1997; 24(3):461–479.
Freitag CM, Luders E, Hulst HE, Narr KL, Thompson PM, Toga AW, et al. Total Brain Volume andCorpus Callosum Size in Medication-Naive Adolescents and Young Adults with Autism SpectrumDisorder. Biol Psychiatry. 2009
Frith U, Happe F. Autism spectrum disorder. Curr Biol. 2005; 15(19):R786–790. [PubMed: 16213805]Geurts HM, Grasman RP, Verte S, Oosterlaan J, Roeyers H, van Kammen SM, et al. Intra-individual
variability in ADHD, autism spectrum disorders and Tourette's syndrome. Neuropsychologia.2008; 46(13):3030–3041. [PubMed: 18619477]
Golland Y, Bentin S, Gelbard H, Benjamini Y, Heller R, Nir Y, et al. Extrinsic and intrinsic systems inthe posterior cortex of the human brain revealed during natural sensory stimulation. Cereb Cortex.2007; 17(4):766–777. [PubMed: 16699080]
Hadjikhani N, Chabris CF, Joseph RM, Clark J, McGrath L, Aharon I, et al. Early visual cortexorganization in autism: an fMRI study. Neuroreport. 2004; 15(2):267–270. [PubMed: 15076750]
Hanson SJ, Gagliardi AD, Hanson C. Solving the brain synchrony eigenvalue problem: conservationof temporal dynamics (fMRI) over subjects doing the same task. J Comput Neurosci. 2008
Hasson U, Furman O, Clark D, Dudai Y, Davachi L. Enhanced intersubject correlations during movieviewing correlate with successful episodic encoding. Neuron. 2008; 57(3):452–462. [PubMed:18255037]
Hasson U, Harel M, Levy I, Malach R. Large-scale mirror-symmetry organization of human occipito-temporal object areas. Neuron. 2003; 37(6):1027–1041. [PubMed: 12670430]
Hasson U, Malach R, Heeger D. Reliability of cortical activity during natural stimulation. Trends CognSci. (submitted).
Hasson U, Nir Y, Levy I, Fuhrmann G, Malach R. Intersubject synchronization of cortical activityduring natural vision. Science. 2004; 303(5664):1634–1640. [PubMed: 15016991]
Hasson U, Yang E, Vallines I, Heeger DJ, Rubin N. A hierarchy of temporal receptive windows inhuman cortex. J Neurosci. 2008a; 28(10):2539–2550. [PubMed: 18322098]
Hasson U, Yang E, Vallines I, Heeger DJ, Rubin N. A Hierarchy of Temporal Receptive Windows inHuman Cortex. J Neurosci. 2008b; 28(10):2539–2550. [PubMed: 18322098]
Hendry J, Devito T, Gelman N, Densmore M, Rajakumar N, Pavlosky W, et al. White matterabnormalities in autism detected through transverse relaxation time imaging. Neuroimage. 2005
Herbert MR. Large brains in autism: the challenge of pervasive abnormality. Neuroscientist. 2005;11(5):417–440. [PubMed: 16151044]
Herbert MR, Ziegler DA, Makris N, Filipek PA, Kemper TL, Normandin JJ, et al. Localization ofwhite matter volume increase in autism and developmental language disorder. Ann Neurol. 2004;55(4):530–540. [PubMed: 15048892]
Hrdlicka M. Structural neuroimaging in autism. Review. Neuro Endocrinol Lett. 2008; 29(3):281–286.[PubMed: 18580841]
Hughes JR, Melyn M. EEG and seizures in autistic children and adolescents: further findings withtherapeutic implications. Clin EEG Neurosci. 2005; 36(1):15–20. [PubMed: 15683193]
Humphreys K, Hasson U, Avidan G, Minshew N, Behrmann M. Functional mapping of category-related object areas in high-functioning adults with autism. Autism Research. 2008; 1
Hurley RA, Lewine JD, Jones GM, Orrison WW Jr. Taber KH. Application ofmagnetoencephalography to the study of autism. J Neuropsychiatry Clin Neurosci. 2000; 12(1):1–3. [PubMed: 10678505]
Hasson et al. Page 12
Autism Res. Author manuscript; available in PMC 2010 August 1.
NIH
-PA Author Manuscript
NIH
-PA Author Manuscript
NIH
-PA Author Manuscript

Jaaskelainen PI, Koskentalo K, Balk HM, Autti T, Kauramaki J, Pomren C, et al. Inter-SubjectSynchronization of Prefrontal Cortex Hemodynamic Activity During Natural Viewing. The OpenNeuroimaging Journal. 2008; 2(1):14–19. [PubMed: 19018313]
Kennedy DP, Courchesne E. The intrinsic functional organization of the brain is altered in autism.Neuroimage. 2008; 39(4):1877–1885. [PubMed: 18083565]
Kennedy DP, Redcay E, Courchesne E. Failing to deactivate: resting functional abnormalities inautism. Proc Natl Acad Sci U S A. 2006; 103(21):8275–8280. [PubMed: 16702548]
Kleinhans NM, Richards T, Sterling L, Stegbauer KC, Mahurin R, Johnson LC, et al. Abnormalfunctional connectivity in autism spectrum disorders during face processing. Brain. 2008; 131(Pt4):1000–1012. [PubMed: 18234695]
Klin A, Jones W, Schultz R, Volkmar F, Cohen D. Defining and quantifying the social phenotype inautism. American Journal of Psychiatry. 2002a; 159:895–908. [PubMed: 12042174]
Klin A, Jones W, Schultz R, Volkmar F, Cohen D. Visual fixation patterns during viewing ofnaturalistic social situations as predictors of social competence in individuals with autism. ArchGen Psychiatry. 2002b; 59(9):809–816. [PubMed: 12215080]
Logothetis NK, Pauls J, Augath M, Trinath T, Oeltermann A. Neurophysiological investigation of thebasis of the fMRI signal. Nature. 2001; 412(6843):150–157. [PubMed: 11449264]
Lord C, Cook EH, Leventhal BL, Amaral DG. Autism spectrum disorders. Neuron. 2000; 28(2):355–363. [PubMed: 11144346]
Lord C, Rutter M, Le Couteur A. Autism Diagnostic Interview-Revised: A revised version of adiagnostic interview for caregivers of individuals with possible pervasive developmental disorders.Journal of Autism and Developmental Disorders. 1994; 24:659–685. [PubMed: 7814313]
Luna B, Minshew NJ, Garver KE, Lazar NA, Thulborn KR, Eddy WF, et al. Neocortical systemabnormalities in autism: an fMRI study of spatial working memory. Neurology. 2002; 59(6):834–840. [PubMed: 12297562]
Markram H, Rinaldi T, Markram K. The intense world syndrome – an alternative hypothesis forautism. Frontiers in Neuroscience. 2007; 1(1):77–96. [PubMed: 18982120]
McAlonan GM, Cheung V, Cheung C, Suckling J, Lam GY, Tai KS, et al. Mapping the brain inautism. A voxel-based MRI study of volumetric differences and intercorrelations in autism. Brain.2005; 128(Pt 2):268–276. [PubMed: 15548557]
Morris JP, Pelphrey KA, McCarthy G. Controlled scanpath variation alters fusiform face activation.Soc Cogn Affect Neurosci. 2007; 2(1):31–38. [PubMed: 18176625]
Mukamel R, Gelbard H, Arieli A, Hasson U, Fried I, Malach R. Coupling between neuronal firing,field potentials, and FMRI in human auditory cortex. Science. 2005; 309(5736):951–954.[PubMed: 16081741]
Pelphrey KA, Morris JP, McCarthy G. Neural basis of eye gaze processing deficits in autism. Brain.2005; 128(Pt 5):1038–1048. [PubMed: 15758039]
Peterson CC, Wellman HM, Liu D. Steps in theory-of-mind development for children with deafness orautism. Child Dev. 2005; 76(2):502–517. [PubMed: 15784096]
Pierce K, Muller RA, Ambroses J, Allen G, Courchesne E. Face processing occurs outside thefusiform `face area' in autism: evidence from fMRI. Brain. 2001; 124:2059–2073. [PubMed:11571222]
Polleux F, Lauder JM. Toward a developmental neurobiology of autism. Ment Retard Dev Disabil ResRev. 2004; 10(4):303–317. [PubMed: 15666334]
Ristic J, Mottron L, Friesen CK, Iarocci G, Burack JA, Kingstone A. Eyes are special but not foreveryone: the case of autism. Brain Res Cogn Brain Res. 2005; 24(3):715–718. [PubMed:16099372]
Rogers SJ, Hepburn SL, Stackhouse T, Wehner E. Imitation performance in toddlers with autism andthose with other developmental disorders. J Child Psychol Psychiatry. 2003; 44(5):763–781.[PubMed: 12831120]
Rubenstein JL, Merzenich MM. Model of autism: increased ratio of excitation/inhibition in key neuralsystems. Genes Brain Behav. 2003; 2(5):255–267. [PubMed: 14606691]
Hasson et al. Page 13
Autism Res. Author manuscript; available in PMC 2010 August 1.
NIH
-PA Author Manuscript
NIH
-PA Author Manuscript
NIH
-PA Author Manuscript
Schultz RT, Gauthier I, Klin A, Fulbright RK, Anderson AW, Volkmar F, et al. Abnormal ventraltemporal cortical activity during face discrimination among individuals with autism and Aspergersyndrome. Arch Gen Psychiatry. 2000; 57(4):331–340. [PubMed: 10768694]
Talairach, J.; Tournoux, P. Co-Planar Stereotaxic Atlas of the Human Brain. Thieme MedicalPublishers; New York: 1988.
Tuchman R. Treatment of seizure disorders and EEG abnormalities in children with autism spectrumdisorders. J Autism Dev Disord. 2000; 30(5):485–489. [PubMed: 11098889]
Vandenbroucke MW, Scholte HS, Engeland HV, Lamme VA, Kemner C. A neural substrate foratypical low-level visual processing in autism spectrum disorder. Brain. 2008
Williams DL, Goldstein G, Minshew NJ. Neuropsychologic functioning in children with autism:further evidence for disordered complex information-processing. Child Neuropsychol. 2006; 12(4–5):279–298. [PubMed: 16911973]
Wilson SM, Molnar-Szakacs I, Iacoboni M. Beyond superior temporal cortex: intersubject correlationsin narrative speech comprehension. Cereb Cortex. 2008; 18(1):230–242. [PubMed: 17504783]
Hasson et al. Page 14
Autism Res. Author manuscript; available in PMC 2010 August 1.
NIH
-PA Author Manuscript
NIH
-PA Author Manuscript
NIH
-PA Author Manuscript
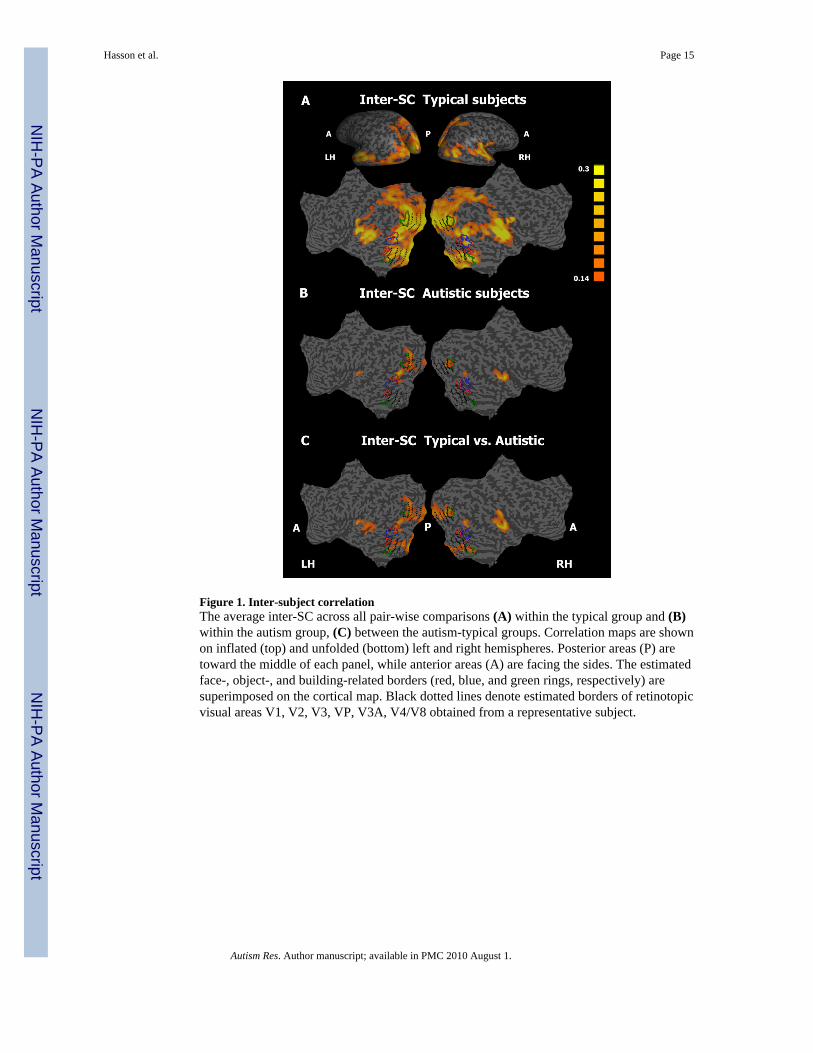
Figure 1. Inter-subject correlationThe average inter-SC across all pair-wise comparisons (A) within the typical group and (B)within the autism group, (C) between the autism-typical groups. Correlation maps are shownon inflated (top) and unfolded (bottom) left and right hemispheres. Posterior areas (P) aretoward the middle of each panel, while anterior areas (A) are facing the sides. The estimatedface-, object-, and building-related borders (red, blue, and green rings, respectively) aresuperimposed on the cortical map. Black dotted lines denote estimated borders of retinotopicvisual areas V1, V2, V3, VP, V3A, V4/V8 obtained from a representative subject.
Hasson et al. Page 15
Autism Res. Author manuscript; available in PMC 2010 August 1.
NIH
-PA Author Manuscript
NIH
-PA Author Manuscript
NIH
-PA Author Manuscript

Figure 2. Signal fluctuations within regions of interestVisual cortex (V1+) response time courses for (A) each typical subject and (B) eachparticipant with autism. (C) The average signal for the typical (red line) and autism (blueline) group. (D) The mean inter-SC values for the within-typical group (typical-typical, redbars), within-autism group (autism-autism, light green bars), and between the two groups(autism-typical, green bars) for selected ROIs. ROI abbreviations: A1+, primary andsecondary auditory cortices; V1+, primary and secondary visual cortices; LOFA, lateraloccipital cortex responsive to pictures of faces; Obj-ITS, object-related area in the inferiortemporal sulcus; PPA, parahippocampal place area; FFA, fusiform face area; PCS, posteriorcentral sulcus responsive to pictures of objects; TOS, transverse occipital sulcus responsiveto pictures of places; STS-Face, area in superior temporal sulcus responsive to pictures offaces. (E) The inter-SC between the average autism-typical time courses (green bars) andthe typical-typical time courses (red bars) in each ROI (same abbreviations as in D). Notethe extent of variability in signal fluctuation in the autism individuals relative to the typicalsubjects. Moreover, note that by averaging the time courses within a group the responsesbecome highly correlated across groups.
Hasson et al. Page 16
Autism Res. Author manuscript; available in PMC 2010 August 1.
NIH
-PA Author Manuscript
NIH
-PA Author Manuscript
NIH
-PA Author Manuscript
Figure 3. Inter (between)- and intra (within)-subject correlation for both typical and autismgroupsThe average intra-SC and inter-SC across all pair-wise comparisons within the (A) typicalgroup and (B) autism group. Similar abbreviations as in Figure 1. The intra-SC wascomputed first within each subject across repeated presentations of the movie and thenaveraged separately for the subjects in the typical (n=4) and autism group (n=4). Forcomparison, we plot the inter-SC computed for the same subjects (similar to the procedureabove, see Figure 1). Note that in the typical subjects the signal was reliable within andacross subjects (overlap between the inter-SC and intra-SC; orange color), in the autismgroup, we detected reliable responses within each autistic individual (high intra-SC; redcolor) even in areas that fail to show reliable responses across group members (low inter-SC).
Hasson et al. Page 17
Autism Res. Author manuscript; available in PMC 2010 August 1.
NIH
-PA Author Manuscript
NIH
-PA Author Manuscript
NIH
-PA Author Manuscript
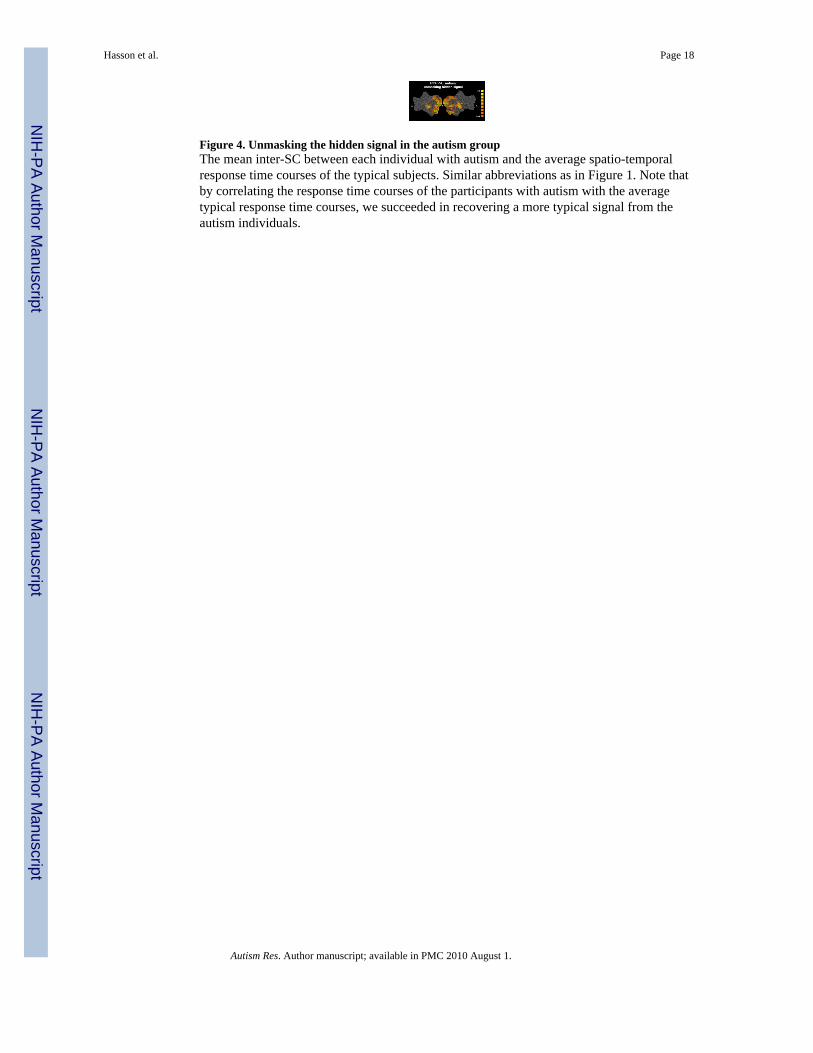
Figure 4. Unmasking the hidden signal in the autism groupThe mean inter-SC between each individual with autism and the average spatio-temporalresponse time courses of the typical subjects. Similar abbreviations as in Figure 1. Note thatby correlating the response time courses of the participants with autism with the averagetypical response time courses, we succeeded in recovering a more typical signal from theautism individuals.
Hasson et al. Page 18
Autism Res. Author manuscript; available in PMC 2010 August 1.
NIH
-PA Author Manuscript
NIH
-PA Author Manuscript
NIH
-PA Author Manuscript

Figure 5. Intrinsic fluctuations cannot be attributed to differences in eye movementsCorrelation of the eye movement pattern (computed separately for the x-axis and y-axis)within the typical and autism groups during the movie watching. The decreased correlationin the eye movement patterns within the individuals with autism points to an irregular eyemovement pattern across repeated presentations of the movie.
Hasson et al. Page 19
Autism Res. Author manuscript; available in PMC 2010 August 1.
NIH
-PA Author Manuscript
NIH
-PA Author Manuscript
NIH
-PA Author Manuscript