Shape Memory Effect and Properties ... - Archive ouverte HAL
12
HAL Id: hal-00984685 https://hal.archives-ouvertes.fr/hal-00984685 Submitted on 30 Apr 2014 HAL is a multi-disciplinary open access archive for the deposit and dissemination of sci- entific research documents, whether they are pub- lished or not. The documents may come from teaching and research institutions in France or abroad, or from public or private research centers. L’archive ouverte pluridisciplinaire HAL, est destinée au dépôt et à la diffusion de documents scientifiques de niveau recherche, publiés ou non, émanant des établissements d’enseignement et de recherche français ou étrangers, des laboratoires publics ou privés. Shape Memory Effect and Properties Memory Effect of Polyurethane Sedigheh Farzaneh, Joseph Fitoussi, Albert Lucas, Michel Bocquet, Abbass Tcharkhtchi To cite this version: Sedigheh Farzaneh, Joseph Fitoussi, Albert Lucas, Michel Bocquet, Abbass Tcharkhtchi. Shape Mem- ory Effect and Properties Memory Effect of Polyurethane. Journal of Applied Polymer Science, Wiley, 2013, 128 (5), pp.3240-3249. 10.1002/app.38530. hal-00984685
-
Upload
khangminh22 -
Category
Documents
-
view
2 -
download
0
Transcript of Shape Memory Effect and Properties ... - Archive ouverte HAL
HAL Id: hal-00984685https://hal.archives-ouvertes.fr/hal-00984685
Submitted on 30 Apr 2014
HAL is a multi-disciplinary open accessarchive for the deposit and dissemination of sci-entific research documents, whether they are pub-lished or not. The documents may come fromteaching and research institutions in France orabroad, or from public or private research centers.
L’archive ouverte pluridisciplinaire HAL, estdestinée au dépôt et à la diffusion de documentsscientifiques de niveau recherche, publiés ou non,émanant des établissements d’enseignement et derecherche français ou étrangers, des laboratoirespublics ou privés.
Shape Memory Effect and Properties Memory Effect ofPolyurethane
Sedigheh Farzaneh, Joseph Fitoussi, Albert Lucas, Michel Bocquet, AbbassTcharkhtchi
To cite this version:Sedigheh Farzaneh, Joseph Fitoussi, Albert Lucas, Michel Bocquet, Abbass Tcharkhtchi. Shape Mem-ory Effect and Properties Memory Effect of Polyurethane. Journal of Applied Polymer Science, Wiley,2013, 128 (5), pp.3240-3249. �10.1002/app.38530�. �hal-00984685�

Science Arts & Métiers (SAM)is an open access repository that collects the work of Arts et Métiers ParisTech
researchers and makes it freely available over the web where possible.
This is an author-deposited version published in: http://sam.ensam.euHandle ID: .http://hdl.handle.net/10985/8054
To cite this version :
Sedigeh FARZANEH, Joseph FITOUSSI, Albert LUCAS, Michel BOCQUET, AbbassTCHARKHTCHI - Shape Memory Effect and Properties Memory Effect of Polyurethane - Journalof Applied Polymer Science - Vol. 128, n°5, p.3240-3249 - 2013
Any correspondence concerning this service should be sent to the repositoryAdministrator : [email protected]
Shape Memory Effect and Properties Memory Effect of Polyurethane
S. Farzaneh, J. Fitoussi, A. Lucas, M. Bocquet, A. TcharkhtchiArt et M�etiers ParisTech, UMR 8006, PIMM, 151 bd de l’Hopital, 75013 Paris, France
Correspondence to: A. Tcharkhtchi (E-mail: [email protected])
�
ABSTRACT: The relationship between shape and properties memory effect, especially viscoelastic properties of polyurethane understudy is the main aim of this research work. Tensile tests have been performed in order to introduce 100% of deformation in the pol-yurethane samples. Under this deformation, stress–relaxation experiments have been performed in order to eliminate the residualstresses. This deformation of the samples has been fixed by cooling. Recovery tests, then, were carried out at different isothermal tem-
peratures that varied from 30�C t o6 0 C. Viscoelastic behavior has been studied by a biparabolic model and by using the Cole–Cole method. It was shown that this model describes the behavior of the polymer at the different states of shape memory tests. The con-stants of this model then have been determined. This study leads to a better understanding of the mechanism of shape memory
effect. The comparison between the virgin polymer and the polymer after a recovery test by DMTA (dynamic mechanical thermal
analysis) and by Cole–Cole method has illustrated that the polymer does not obtain its initial properties even when it was totallyregained its initial shape. These results have been confirmed by three successive shape memory tests on the same sample and by com-
paring the mechanical characteristics of different cycles because ‘‘shape memory effect’’ and ‘‘properties memory effect’’ do notfollow the same mechanisms.
INTRODUCTION
The shape memory polymers (SMPs) are able to present single
or multiple shape changes,1–6 when they are activated by exter-
nal stimuli like thermal energy. This behavior applies to these
polymers’ broad fields of application.7–11 For example, in manu-
facturing of micro-biomedical components and medical devices,
smart textiles, sensors, aerospace deployable equipments, and so
on.
The polymers can show shape memory effect (SME) when they
are able to present two different mechanical behaviors related to
two distinct (hard and soft) morphologies.12,13 The hard mor-
phology stabilizes the permanent shape of the structure, whereas
the soft morphology allows the passage from permanent to tem-
porary state or vice versa.
In the case of crosslinked polyurethanes (thermosets and elasto-
mers), the crosslinking points and the segments of the isocya-
nate molecules directly linked to these points may be considered
as the hard zones of the morphology; because there is not a sig-
nificant local molecular motion in these zones. These zones are
responsible of permanent state of the polymer.
Between the crosslinking points and isocyanate molecules, the
molecular chains (related to polyols) are generally long and
with more mobility. If the b-transition temperature of polymer
is lower than the room temperature (which is the case), it will
be ductile and may show high deformation capacity during ten-
sile test. In this case, the molecular chains of soft segments may
be stretched and oriented in the direction of the applied load.
Releasing a stretched sample above its glass transition tempera-
ture, allows the sample to return to its initial position and to
regain its original shape. However, it is possible to fix this tem-
porary shape by cooling the sample after stretching it.
The soft segments of polyurethane may be used as a kind of
molecular switch, when the stretched network is thermally
stimulated. This switching permits the recovery and the regain
of initial shape. To have the switching function, the soft seg-
ment must be heated at a temperature higher than the tempera-
ture of the beginning of the glass transition zone. At this tem-
perature the soft segments become enough flexible to have this
switch function.
It is usually common to consider shape memory effect (SME)
as macroscopic and visual shape changes. However, this effect
may be observed also in certain cases when the shape change is
in a microscopic scale. For example, in the following cases, one
can see the effect of shape memory:
• Elasticity is a reversible phenomenon. In an elastic zone,
the deformation is generally small and the shape (volume)
change of the sample may be in microscopic scale. This
change depends on the strain and Poisson’s ratio. Releasing
the specimen in this zone, without any external stimulation,
it regains its initial shape.
• Shrinkage is also another phenomenon illustrating SME. In
the case of semicrystalline polymers, shrinkage is usually
observed at the end of molding, when the molten polymer
is crystallized by cooling. The microchange in dimensions
of the sample during the time after the injection molding
cycle can be considered as recovery and regain the perma-
nent shape.
• Polymers may absorb water. The water may fill the free vol-
ume of the molecular structure and push on the molecular
chains. The change of volume is microscopic. The water
absorption capacity of a polymer depends on diffusion and
solubility coefficients.14,15 The result is the swelling and mi-
croscopic volume expansion. Drying the sample, water goes
out and the sample regains its initial form.
• The dimensions of a specimen may also change by thermal
stimulation. In fact, when the sample is heated the ampli-
tude of molecular motion increases, increasing the average
molecular distance. The thermal expansion coefficient of
polymers16 depends on the physical state of the polymer. In
the rubbery state this coefficient is more important than in
the glassy state.
In all of these examples, the microchange of the shape (volume)
has an important effect on the microstructure and properties of
the polymer. For SMPs, this microchange of the shape may be
reversible; whereas, the modification of microstructure may be
irreversible. The ‘‘micro-SME’’ is referred to as the reversibility
of these microchanges of the shape.
It is possible to fix the microchange of the shape by gaining a
temporary shape to the polymer. The sample then, in the next
step, regains its initial volume by stimulation; but it is not sure
that it can regain its initial properties. So in the study of SME,
one of the major questions is about the relation between SME
and properties memory effect.
In this article, we try to explain the mechanism of SME of poly-
urethane. Using a biparabolic model, we will show that the
polymer after recovery does not keep the same properties as the
initial polymer. This phenomenon also will be verified by tensile
tests successively performed on the same sample.
MATERIALS AND METHODS
Materials
The polymer used for this study is a polyurethane supplied by
the RAIGI Company. This polymer is the result of the reaction
between an isocyanate and a polyol. The isocyanate is diphenyl-
methane diisocyanate (MDI) with a functionality of more than
two. The polyol is a polyester with molecular weight of 800 g/mol.
The ratio of NCO/OH is equal to 19.8. This polyol is then mixed
with another polyol (PES4), chain extender, with a molecular
weight of 400 g/mol. Catalysts of the type of aluminosilicate
and diamine have been used for the reactions. The result of this
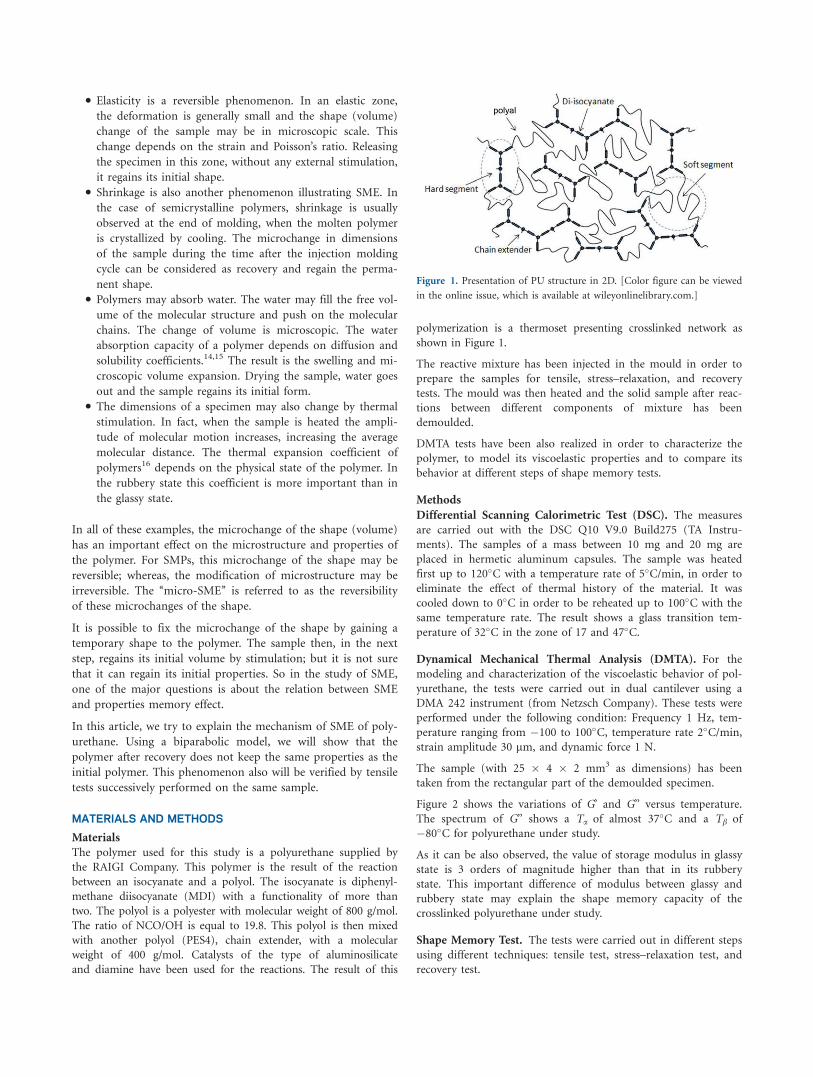
polymerization is a thermoset presenting crosslinked network as
shown in Figure 1.
The reactive mixture has been injected in the mould in order to
prepare the samples for tensile, stress–relaxation, and recovery
tests. The mould was then heated and the solid sample after reac-
tions between different components of mixture has been
demoulded.
DMTA tests have been also realized in order to characterize the
polymer, to model its viscoelastic properties and to compare its
behavior at different steps of shape memory tests.
Methods
Differential Scanning Calorimetric Test (DSC). The measures
are carried out with the DSC Q10 V9.0 Build275 (TA Instru-
ments). The samples of a mass between 10 mg and 20 mg are
placed in hermetic aluminum capsules. The sample was heated
first up to 120�C with a temperature rate of 5�C/min, in order to
eliminate the effect of thermal history of the material. It was
cooled down to 0�C in order to be reheated up to 100�C with the
same temperature rate. The result shows a glass transition tem-
perature of 32�C in the zone of 17 and 47�C.
Dynamical Mechanical Thermal Analysis (DMTA). For the
modeling and characterization of the viscoelastic behavior of pol-
yurethane, the tests were carried out in dual cantilever using a
DMA 242 instrument (from Netzsch Company). These tests were
performed under the following condition: Frequency 1 Hz, tem-
perature ranging from �100 to 100�C, temperature rate 2�C/min,
strain amplitude 30 mm, and dynamic force 1 N.
The sample (with 25 � 4 � 2 mm3 as dimensions) has been
taken from the rectangular part of the demoulded specimen.
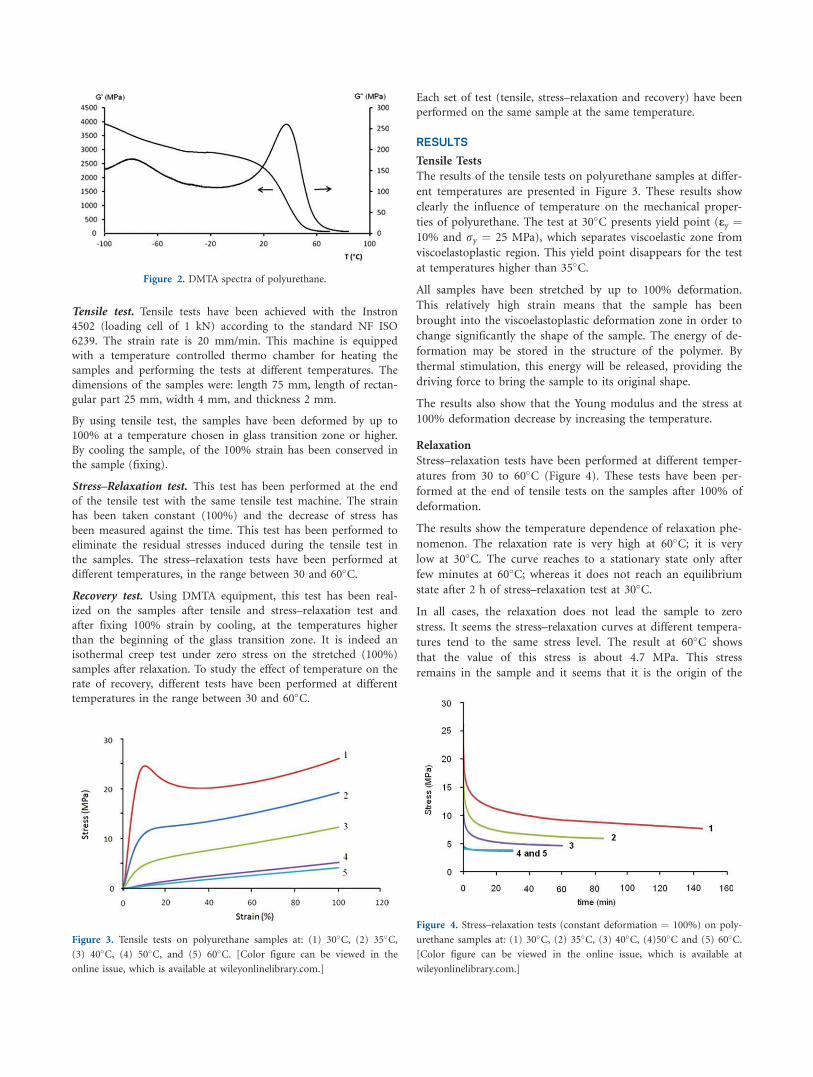
Figure 2 shows the variations of G’ and G’’ versus temperature.
The spectrum of G’’ shows a Ta of almost 37�C and a Tb of
�80�C for polyurethane under study.
As it can be also observed, the value of storage modulus in glassy
state is 3 orders of magnitude higher than that in its rubbery
state. This important difference of modulus between glassy and
rubbery state may explain the shape memory capacity of the
crosslinked polyurethane under study.
Shape Memory Test. The tests were carried out in different steps
using different techniques: tensile test, stress–relaxation test, and
recovery test.
Figure 1. Presentation of PU structure in 2D. [Color figure can be viewed
in the online issue, which is available at wileyonlinelibrary.com.]
Tensile test. Tensile tests have been achieved with the Instron
4502 (loading cell of 1 kN) according to the standard NF ISO
6239. The strain rate is 20 mm/min. This machine is equipped
with a temperature controlled thermo chamber for heating the
samples and performing the tests at different temperatures. The
dimensions of the samples were: length 75 mm, length of rectan-
gular part 25 mm, width 4 mm, and thickness 2 mm.
By using tensile test, the samples have been deformed by up to
100% at a temperature chosen in glass transition zone or higher.
By cooling the sample, of the 100% strain has been conserved in
the sample (fixing).
Stress–Relaxation test. This test has been performed at the end
of the tensile test with the same tensile test machine. The strain
has been taken constant (100%) and the decrease of stress has
been measured against the time. This test has been performed to
eliminate the residual stresses induced during the tensile test in
the samples. The stress–relaxation tests have been performed at
different temperatures, in the range between 30 and 60�C.
Recovery test. Using DMTA equipment, this test has been real-
ized on the samples after tensile and stress–relaxation test and
after fixing 100% strain by cooling, at the temperatures higher
than the beginning of the glass transition zone. It is indeed an
isothermal creep test under zero stress on the stretched (100%)
samples after relaxation. To study the effect of temperature on the
rate of recovery, different tests have been performed at different
temperatures in the range between 30 and 60�C.
Each set of test (tensile, stress–relaxation and recovery) have been
performed on the same sample at the same temperature.
RESULTS
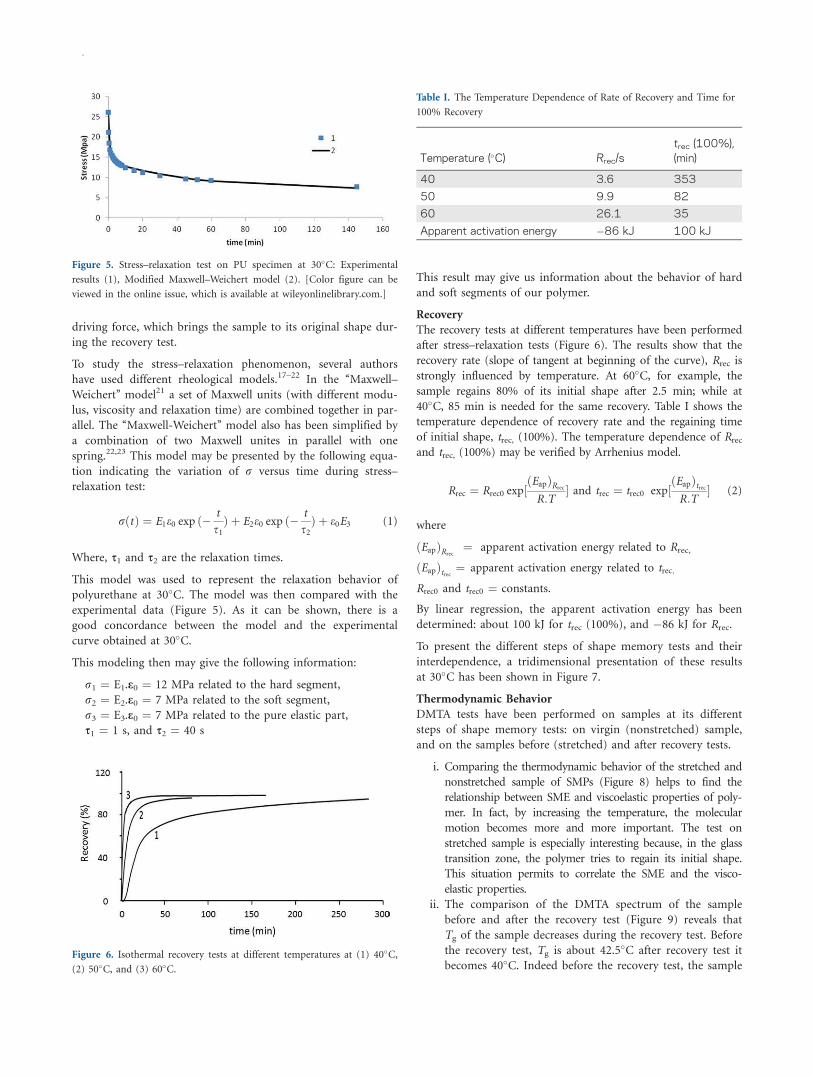
Tensile Tests
The results of the tensile tests on polyurethane samples at differ-
ent temperatures are presented in Figure 3. These results show
clearly the influence of temperature on the mechanical proper-
ties of polyurethane. The test at 30�C presents yield point (ey ¼10% and ry ¼ 25 MPa), which separates viscoelastic zone from
viscoelastoplastic region. This yield point disappears for the test
at temperatures higher than 35�C.
All samples have been stretched by up to 100% deformation.
This relatively high strain means that the sample has been
brought into the viscoelastoplastic deformation zone in order to
change significantly the shape of the sample. The energy of de-
formation may be stored in the structure of the polymer. By
thermal stimulation, this energy will be released, providing the
driving force to bring the sample to its original shape.
The results also show that the Young modulus and the stress at
100% deformation decrease by increasing the temperature.
Relaxation
Stress–relaxation tests have been performed at different temper-
atures from 30 to 60�C (Figure 4). These tests have been per-
formed at the end of tensile tests on the samples after 100% of
deformation.
The results show the temperature dependence of relaxation phe-
nomenon. The relaxation rate is very high at 60�C; it is very
low at 30�C. The curve reaches to a stationary state only after
few minutes at 60�C; whereas it does not reach an equilibrium
state after 2 h of stress–relaxation test at 30�C.
In all cases, the relaxation does not lead the sample to zero
stress. It seems the stress–relaxation curves at different tempera-
tures tend to the same stress level. The result at 60�C shows
that the value of this stress is about 4.7 MPa. This stress
remains in the sample and it seems that it is the origin of the
Figure 2. DMTA spectra of polyurethane.
Figure 3. Tensile tests on polyurethane samples at: (1) 30�C, (2) 35�C,
(3) 40�C, (4) 50�C, and (5) 60�C. [Color figure can be viewed in the
online issue, which is available at wileyonlinelibrary.com.]
Figure 4. Stress–relaxation tests (constant deformation ¼ 100%) on poly-
urethane samples at: (1) 30�C, (2) 35�C, (3) 40�C, (4)50�C and (5) 60�C.
[Color figure can be viewed in the online issue, which is available at
wileyonlinelibrary.com.]
driving force, which brings the sample to its original shape dur-
ing the recovery test.
To study the stress–relaxation phenomenon, several authors
have used different rheological models.17–22 In the ‘‘Maxwell–
Weichert’’ model21 a set of Maxwell units (with different modu-
lus, viscosity and relaxation time) are combined together in par-
allel. The ‘‘Maxwell-Weichert’’ model also has been simplified by
a combination of two Maxwell unites in parallel with one
spring.22,23 This model may be presented by the following equa-
tion indicating the variation of r versus time during stress–
relaxation test:
rðtÞ ¼ E1e0 exp ð�t
s1Þ þ E2e0 exp ð�
t
s2Þ þ e0E3 (1)
Where, s1 and s2 are the relaxation times.
This model was used to represent the relaxation behavior of
polyurethane at 30�C. The model was then compared with the
experimental data (Figure 5). As it can be shown, there is a
good concordance between the model and the experimental
curve obtained at 30�C.
This modeling then may give the following information:
r1 ¼ E1.e0 ¼ 12 MPa related to the hard segment,
r2 ¼ E2.e0 ¼ 7 MPa related to the soft segment,
r3 ¼ E3.e0 ¼ 7 MPa related to the pure elastic part,
s1 ¼ 1 s, and s2 ¼ 40 s
This result may give us information about the behavior of hard
and soft segments of our polymer.
Recovery
The recovery tests at different temperatures have been performed
after stress–relaxation tests (Figure 6). The results show that the
recovery rate (slope of tangent at beginning of the curve), Rrec is
strongly influenced by temperature. At 60�C, for example, the
sample regains 80% of its initial shape after 2.5 min; while at
40�C, 85 min is needed for the same recovery. Table I shows the
temperature dependence of recovery rate and the regaining time
of initial shape, trec, (100%). The temperature dependence of Rrecand trec, (100%) may be verified by Arrhenius model.
Rrec ¼ Rrec0 exp½ðEapÞRrec
R:T� and trec ¼ trec0 exp½
ðEapÞtrecR:T
� (2)
where
ðEapÞRrec¼ apparent activation energy related to Rrec,
ðEapÞtrec ¼ apparent activation energy related to trec;
Rrec0 and trec0 ¼ constants.
By linear regression, the apparent activation energy has been
determined: about 100 kJ for trec (100%), and �86 kJ for Rrec.
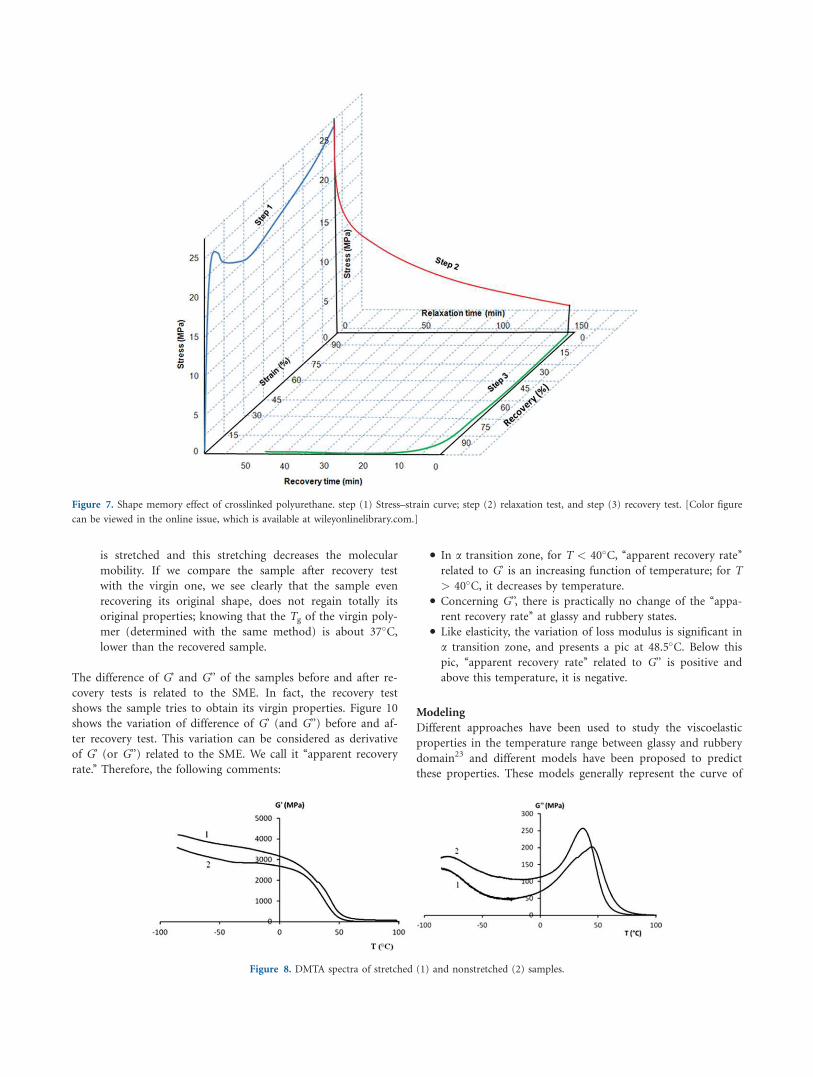
To present the different steps of shape memory tests and their
interdependence, a tridimensional presentation of these results
at 30�C has been shown in Figure 7.
Thermodynamic Behavior
DMTA tests have been performed on samples at its different
steps of shape memory tests: on virgin (nonstretched) sample,
and on the samples before (stretched) and after recovery tests.
i. Comparing the thermodynamic behavior of the stretched and
nonstretched sample of SMPs (Figure 8) helps to find the
relationship between SME and viscoelastic properties of poly-
mer. In fact, by increasing the temperature, the molecular
motion becomes more and more important. The test on
stretched sample is especially interesting because, in the glass
transition zone, the polymer tries to regain its initial shape.
This situation permits to correlate the SME and the visco-
elastic properties.
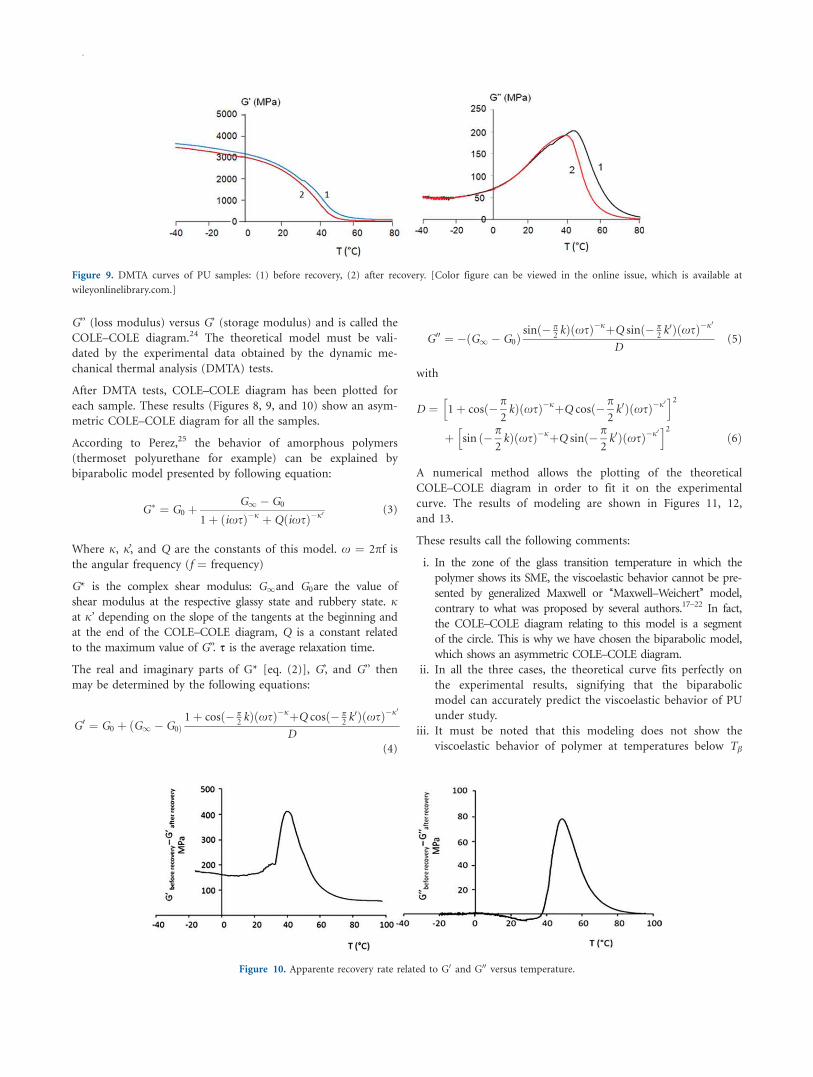
ii. The comparison of the DMTA spectrum of the sample
before and after the recovery test (Figure 9) reveals that
Tg of the sample decreases during the recovery test. Before
the recovery test, Tg is about 42.5�C after recovery test it
becomes 40�C. Indeed before the recovery test, the sample
Figure 5. Stress–relaxation test on PU specimen at 30�C: Experimental
results (1), Modified Maxwell–Weichert model (2). [Color figure can be
viewed in the online issue, which is available at wileyonlinelibrary.com.]
Figure 6. Isothermal recovery tests at different temperatures at (1) 40�C,
(2) 50�C, and (3) 60�C.
Table I. The Temperature Dependence of Rate of Recovery and Time for
100% Recovery
Temperature (�C) Rrec/s
trec (100%),
(min)
40 3.6 353
50 9.9 82
60 26.1 35
Apparent activation energy �86 kJ 100 kJ
is stretched and this stretching decreases the molecular
mobility. If we compare the sample after recovery test
with the virgin one, we see clearly that the sample even
recovering its original shape, does not regain totally its
original properties; knowing that the Tg of the virgin poly-
mer (determined with the same method) is about 37�C,
lower than the recovered sample.
The difference of G’ and G’’ of the samples before and after re-
covery tests is related to the SME. In fact, the recovery test
shows the sample tries to obtain its virgin properties. Figure 10
shows the variation of difference of G’ (and G’’) before and af-
ter recovery test. This variation can be considered as derivative
of G’ (or G’’) related to the SME. We call it ‘‘apparent recovery
rate.’’ Therefore, the following comments:
• In a transition zone, for T < 40�C, ‘‘apparent recovery rate’’
related to G’ is an increasing function of temperature; for T
> 40�C, it decreases by temperature.
• Concerning G’’, there is practically no change of the ‘‘appa-
rent recovery rate’’ at glassy and rubbery states.
• Like elasticity, the variation of loss modulus is significant in
a transition zone, and presents a pic at 48.5�C. Below this
pic, ‘‘apparent recovery rate’’ related to G’’ is positive and
above this temperature, it is negative.
Modeling
Different approaches have been used to study the viscoelastic
properties in the temperature range between glassy and rubbery
domain23 and different models have been proposed to predict
these properties. These models generally represent the curve of
Figure 7. Shape memory effect of crosslinked polyurethane. step (1) Stress–strain curve; step (2) relaxation test, and step (3) recovery test. [Color figure
can be viewed in the online issue, which is available at wileyonlinelibrary.com.]
Figure 8. DMTA spectra of stretched (1) and nonstretched (2) samples.
G’’ (loss modulus) versus G’ (storage modulus) and is called the
COLE–COLE diagram.24 The theoretical model must be vali-
dated by the experimental data obtained by the dynamic me-
chanical thermal analysis (DMTA) tests.
After DMTA tests, COLE–COLE diagram has been plotted for
each sample. These results (Figures 8, 9, and 10) show an asym-
metric COLE–COLE diagram for all the samples.
According to Perez,25 the behavior of amorphous polymers
(thermoset polyurethane for example) can be explained by
biparabolic model presented by following equation:
G� ¼ G0 þG1 � G0
1þ ðixsÞ�j þ QðixsÞ�j0(3)
Where j, j’, and Q are the constants of this model. x ¼ 2pf is
the angular frequency (f ¼ frequency)
G* is the complex shear modulus: G1and G0are the value of
shear modulus at the respective glassy state and rubbery state. j
at j’ depending on the slope of the tangents at the beginning and
at the end of the COLE–COLE diagram, Q is a constant related
to the maximum value of G’’. s is the average relaxation time.
The real and imaginary parts of G* [eq. (2)], G’, and G’’ then
may be determined by the following equations:
G0 ¼ G0 þ ðG1 � G0Þ
1þ cosð� p2kÞ xsð Þ�jþQ cosð� p
2k0Þ xsð Þ�j0
D
(4)
G00 ¼ �ðG1 � G0Þsinð� p
2kÞ xsð Þ�jþQ sinð� p
2k0Þ xsð Þ�j0
D(5)
with
D ¼ 1þ cosð�p
2kÞ xsð Þ�jþQ cosð�
p
2k0Þ xsð Þ�j0
h i2
þ sin ð�p
2kÞ xsð Þ�jþQ sinð�
p
2k0Þ xsð Þ�j0
h i2
ð6Þ
A numerical method allows the plotting of the theoretical
COLE–COLE diagram in order to fit it on the experimental
curve. The results of modeling are shown in Figures 11, 12,
and 13.
These results call the following comments:
i. In the zone of the glass transition temperature in which the
polymer shows its SME, the viscoelastic behavior cannot be pre-
sented by generalized Maxwell or ‘‘Maxwell–Weichert’’ model,
contrary to what was proposed by several authors.17–22 In fact,
the COLE–COLE diagram relating to this model is a segment
of the circle. This is why we have chosen the biparabolic model,
which shows an asymmetric COLE–COLE diagram.
ii. In all the three cases, the theoretical curve fits perfectly on
the experimental results, signifying that the biparabolic
model can accurately predict the viscoelastic behavior of PU
under study.
iii. It must be noted that this modeling does not show the
viscoelastic behavior of polymer at temperatures below Tb
Figure 9. DMTA curves of PU samples: (1) before recovery, (2) after recovery. [Color figure can be viewed in the online issue, which is available at
wileyonlinelibrary.com.]
Figure 10. Apparente recovery rate related to G0 and G00 versus temperature.
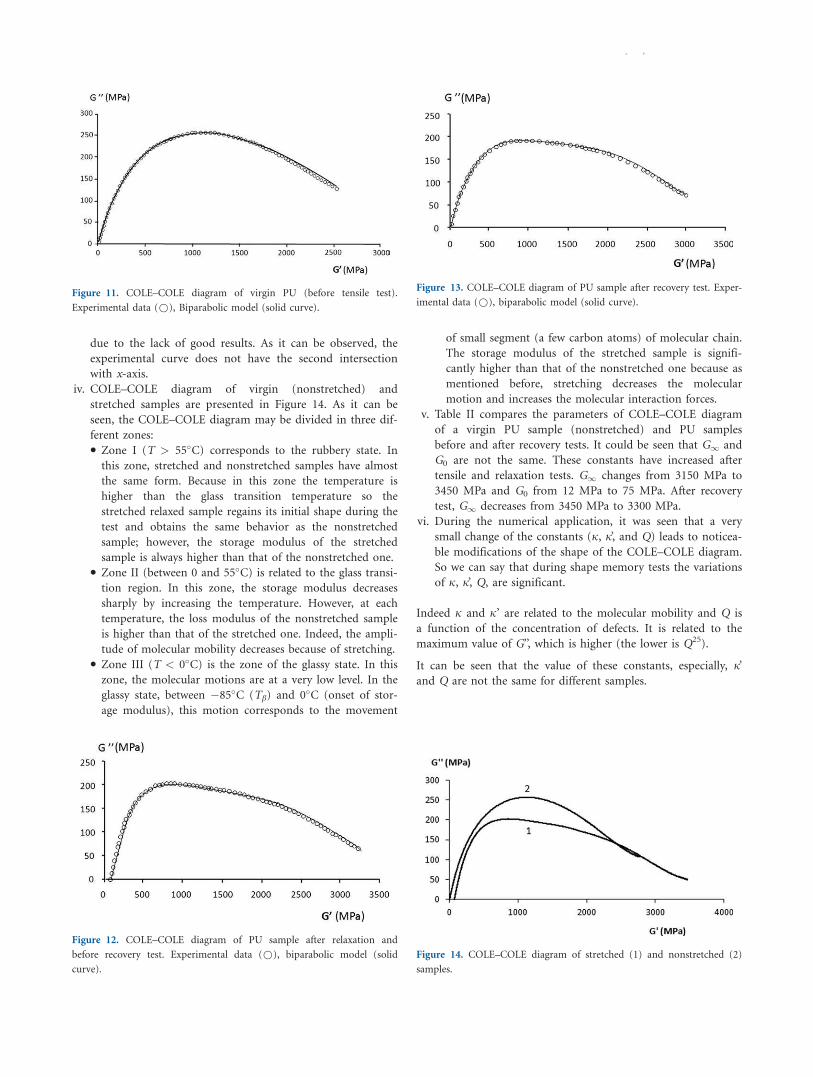
due to the lack of good results. As it can be observed, the
experimental curve does not have the second intersection
with x-axis.
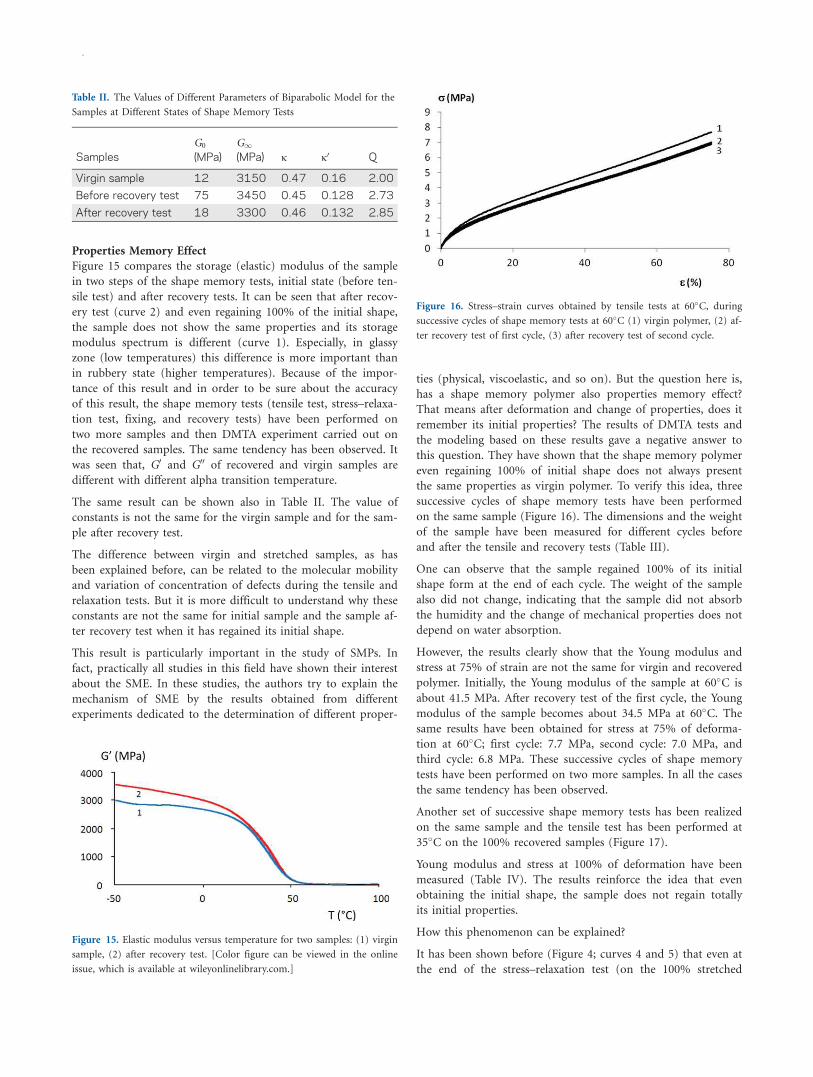
iv. COLE–COLE diagram of virgin (nonstretched) and
stretched samples are presented in Figure 14. As it can be
seen, the COLE–COLE diagram may be divided in three dif-
ferent zones:
• Zone I (T > 55�C) corresponds to the rubbery state. In
this zone, stretched and nonstretched samples have almost
the same form. Because in this zone the temperature is
higher than the glass transition temperature so the
stretched relaxed sample regains its initial shape during the
test and obtains the same behavior as the nonstretched
sample; however, the storage modulus of the stretched
sample is always higher than that of the nonstretched one.
• Zone II (between 0 and 55�C) is related to the glass transi-
tion region. In this zone, the storage modulus decreases
sharply by increasing the temperature. However, at each
temperature, the loss modulus of the nonstretched sample
is higher than that of the stretched one. Indeed, the ampli-
tude of molecular mobility decreases because of stretching.
• Zone III (T < 0�C) is the zone of the glassy state. In this
zone, the molecular motions are at a very low level. In the
glassy state, between �85�C (Tb) and 0�C (onset of stor-
age modulus), this motion corresponds to the movement
of small segment (a few carbon atoms) of molecular chain.
The storage modulus of the stretched sample is signifi-
cantly higher than that of the nonstretched one because as
mentioned before, stretching decreases the molecular
motion and increases the molecular interaction forces.
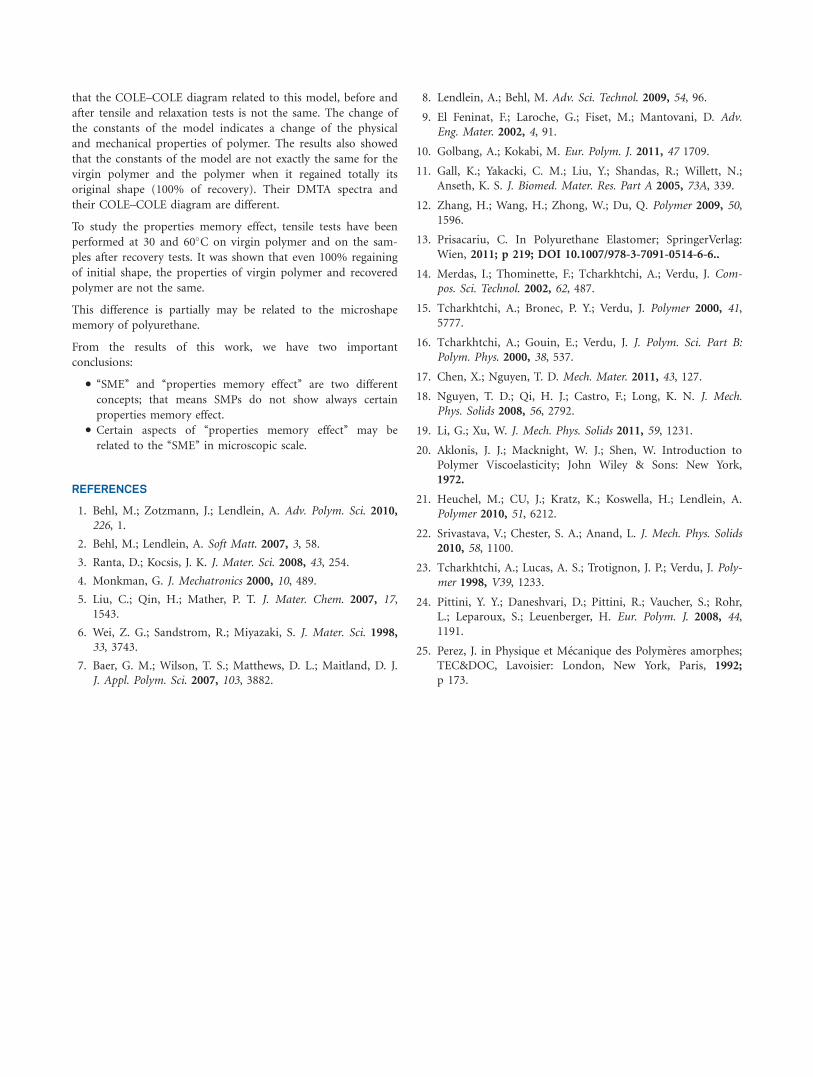
v. Table II compares the parameters of COLE–COLE diagram
of a virgin PU sample (nonstretched) and PU samples
before and after recovery tests. It could be seen that G1 and
G0 are not the same. These constants have increased after
tensile and relaxation tests. G1 changes from 3150 MPa to
3450 MPa and G0 from 12 MPa to 75 MPa. After recovery
test, G1 decreases from 3450 MPa to 3300 MPa.
vi. During the numerical application, it was seen that a very
small change of the constants (j, j’, and Q) leads to noticea-
ble modifications of the shape of the COLE–COLE diagram.
So we can say that during shape memory tests the variations
of j, j’, Q, are significant.
Indeed j and j’ are related to the molecular mobility and Q is
a function of the concentration of defects. It is related to the
maximum value of G’’, which is higher (the lower is Q25).
It can be seen that the value of these constants, especially, j’
and Q are not the same for different samples.
Figure 11. COLE–COLE diagram of virgin PU (before tensile test).
Experimental data (*), Biparabolic model (solid curve).
Figure 12. COLE–COLE diagram of PU sample after relaxation and
before recovery test. Experimental data (*), biparabolic model (solid
curve).
Figure 13. COLE–COLE diagram of PU sample after recovery test. Exper-
imental data (*), biparabolic model (solid curve).
Figure 14. COLE–COLE diagram of stretched (1) and nonstretched (2)
samples.
Properties Memory Effect
Figure 15 compares the storage (elastic) modulus of the sample
in two steps of the shape memory tests, initial state (before ten-
sile test) and after recovery tests. It can be seen that after recov-
ery test (curve 2) and even regaining 100% of the initial shape,
the sample does not show the same properties and its storage
modulus spectrum is different (curve 1). Especially, in glassy
zone (low temperatures) this difference is more important than
in rubbery state (higher temperatures). Because of the impor-
tance of this result and in order to be sure about the accuracy
of this result, the shape memory tests (tensile test, stress–relaxa-
tion test, fixing, and recovery tests) have been performed on
two more samples and then DMTA experiment carried out on
the recovered samples. The same tendency has been observed. It
was seen that, G0 and G00 of recovered and virgin samples are
different with different alpha transition temperature.
The same result can be shown also in Table II. The value of
constants is not the same for the virgin sample and for the sam-
ple after recovery test.
The difference between virgin and stretched samples, as has
been explained before, can be related to the molecular mobility
and variation of concentration of defects during the tensile and
relaxation tests. But it is more difficult to understand why these
constants are not the same for initial sample and the sample af-
ter recovery test when it has regained its initial shape.
This result is particularly important in the study of SMPs. In
fact, practically all studies in this field have shown their interest
about the SME. In these studies, the authors try to explain the
mechanism of SME by the results obtained from different
experiments dedicated to the determination of different proper-
ties (physical, viscoelastic, and so on). But the question here is,
has a shape memory polymer also properties memory effect?
That means after deformation and change of properties, does it
remember its initial properties? The results of DMTA tests and
the modeling based on these results gave a negative answer to
this question. They have shown that the shape memory polymer
even regaining 100% of initial shape does not always present
the same properties as virgin polymer. To verify this idea, three
successive cycles of shape memory tests have been performed
on the same sample (Figure 16). The dimensions and the weight
of the sample have been measured for different cycles before
and after the tensile and recovery tests (Table III).
One can observe that the sample regained 100% of its initial
shape form at the end of each cycle. The weight of the sample
also did not change, indicating that the sample did not absorb
the humidity and the change of mechanical properties does not
depend on water absorption.
However, the results clearly show that the Young modulus and
stress at 75% of strain are not the same for virgin and recovered
polymer. Initially, the Young modulus of the sample at 60�C is
about 41.5 MPa. After recovery test of the first cycle, the Young
modulus of the sample becomes about 34.5 MPa at 60�C. The
same results have been obtained for stress at 75% of deforma-
tion at 60�C; first cycle: 7.7 MPa, second cycle: 7.0 MPa, and
third cycle: 6.8 MPa. These successive cycles of shape memory
tests have been performed on two more samples. In all the cases
the same tendency has been observed.
Another set of successive shape memory tests has been realized
on the same sample and the tensile test has been performed at
35�C on the 100% recovered samples (Figure 17).
Young modulus and stress at 100% of deformation have been
measured (Table IV). The results reinforce the idea that even
obtaining the initial shape, the sample does not regain totally
its initial properties.
How this phenomenon can be explained?
It has been shown before (Figure 4; curves 4 and 5) that even at
the end of the stress–relaxation test (on the 100% stretched
Table II. The Values of Different Parameters of Biparabolic Model for the
Samples at Different States of Shape Memory Tests
Samples
G0
(MPa)
G1
(MPa) j j0 Q
Virgin sample 12 3150 0.47 0.16 2.00
Before recovery test 75 3450 0.45 0.128 2.73
After recovery test 18 3300 0.46 0.132 2.85
Figure 15. Elastic modulus versus temperature for two samples: (1) virgin
sample, (2) after recovery test. [Color figure can be viewed in the online
issue, which is available at wileyonlinelibrary.com.]
Figure 16. Stress–strain curves obtained by tensile tests at 60�C, during
successive cycles of shape memory tests at 60�C (1) virgin polymer, (2) af-
ter recovery test of first cycle, (3) after recovery test of second cycle.

sample), a residual stress (4.7 MPa) remains in the sample. This
stress may be considered as the driving force responsible for
SME. The driving force is more important in the stretched nonre-
laxed sample. It seems that this deriving force does not depend
on the temperature of the stress–relaxation test. At all tempera-
tures (Figure 4), the curves tend to the same value (4.7 MPa).
But the value of this driving force may depend on the importance
of stretching. For 100% of deformation, as it was shown before,
this value is 4.7 MPa. The results of stress–relaxation test on 75%
stretched samples show that this value decreased to 4 MPa.
Besides, when the implied strain is significant, the microstruc-
ture of polymer may be also modified. Some of these modifica-
tions may be irreversible. So 100% regaining of initial shape is
not a guarantee for totally regaining of initial properties. In
fact, the SME is generally a macroscopic phenomenon. It
depends on the microstructure but this dependence is not
always direct. For example, under a mechanical load some cohe-
sive energy may be lost due to friction between macromolecules.
This phenomenon may change the properties of the material
without having an effect on the shape of the material.
In our opinion, there are two types of properties:
• The properties like density or Poison’s ratio that are related
directly to the macrostructure (shape) of the sample. This
type of properties may be regained after recovery test.
• The properties like modulus or glass transition temperature
that are related to the microstructure (in molecular or mac-
romolecular scale). During shape memory test, the mecha-
nism of their evolution is not the same as the mechanism
of the SME. So this type of properties may not be regained
totally after recovery test. Another physical property that is
related to the microstructure is free volume. In shape mem-
ory test, as the implied deformation during tensile test is
very important (100%), the free volume fraction may be
modified significantly and this modification may be irre-
versible after recovery test when the sample regained its ini-
tial form.
After recovery test and regaining initial shape, it is possible that
the sample does not regain some of its initial properties because
of microstructure irreversible changes. This microstructure
changes may induce the microchange of volume, which cannot
be regained after recovery test. In study of SME, generally, the
authors measure the macrochange of volume. They do not
show attention on this microchange of volume. In fact in the
macroscopic scale, the microchanges are negligible.
CONCLUSIONS
The polyurethane under study is a shape memory polymer with
a capacity of 100% recovery. It may be deformed by mechanical
load and heating, fixed to obtain a temporary shape by cooling,
and recovered by heating again. The viscoelastic behavior of this
polymer can be modeled by a biparabolic model. It was seen
Table III. Dimensions and Properties (Young Modulus and Stress at 75% of Strain) Change During Successive Cycles of Shape Memory Tests at 608C
No. of cycle Different tests
Length
(mm)
Width
(mm)
Thickness
(mm) Weight (g)
Stress at 75%
of strain (MPa)
Modulus
(MPa)
1 Before tensile test 74.62 4.02 2.98 2.2940 7.7 41.5
After tensile test 93.16 3.18 2.38
Before recovery test 93.07 3.18 2.40
After recovery test 74.60 3.98 2.98 2.2938
2 After tensile test 94.06 3.20 2.42 2.2938 7.0 34.5
Before recovery test 93.88 3.21 2.43
After recovery test 74.62 3.98 3.00 2.2933
3 After tensile test 93.53 3.24 2.43 2.2935 6.8 33
Before recovery test 93.40 3.23 2.43
After recovery test 74.60 3.97 2.98 2.2933
Figure 17. Stress–strain curves obtained by tensile tests at 35�C, during
successive cycles of shape memory tests at 60�C (1) virgin polymer, (2)
after recovery test of first cycle, (3) after recovery test of second cycle.
[Color figure can be viewed in the online issue, which is available at
wileyonlinelibrary.com.]
Table IV. Evolution of Young Modulus and Stress at 100% of Strain
(obtained at 358C), During Successive Cycles of Shape Memory Tests at
608C
No. of cycle
Young
modulus (MPa)
Stress at
100% strain
Virgin polymer 165 20
At the end of first cycle 128 17.4
At the end of second cycle 104 16.5
that the COLE–COLE diagram related to this model, before and
after tensile and relaxation tests is not the same. The change of
the constants of the model indicates a change of the physical
and mechanical properties of polymer. The results also showed
that the constants of the model are not exactly the same for the
virgin polymer and the polymer when it regained totally its
original shape (100% of recovery). Their DMTA spectra and
their COLE–COLE diagram are different.
To study the properties memory effect, tensile tests have been
performed at 30 and 60�C on virgin polymer and on the sam-
ples after recovery tests. It was shown that even 100% regaining
of initial shape, the properties of virgin polymer and recovered
polymer are not the same.
This difference is partially may be related to the microshape
memory of polyurethane.
From the results of this work, we have two important
conclusions:
• ‘‘SME’’ and ‘‘properties memory effect’’ are two different
concepts; that means SMPs do not show always certain
properties memory effect.
• Certain aspects of ‘‘properties memory effect’’ may be
related to the ‘‘SME’’ in microscopic scale.
REFERENCES
1. Behl, M.; Zotzmann, J.; Lendlein, A. Adv. Polym. Sci. 2010,226, 1.
2. Behl, M.; Lendlein, A. Soft Matt. 2007, 3, 58.
3. Ranta, D.; Kocsis, J. K. J. Mater. Sci. 2008, 43, 254.
4. Monkman, G. J. Mechatronics 2000, 10, 489.
5. Liu, C.; Qin, H.; Mather, P. T. J. Mater. Chem. 2007, 17,1543.
6. Wei, Z. G.; Sandstrom, R.; Miyazaki, S. J. Mater. Sci. 1998,33, 3743.
7. Baer, G. M.; Wilson, T. S.; Matthews, D. L.; Maitland, D. J.J. Appl. Polym. Sci. 2007, 103, 3882.
8. Lendlein, A.; Behl, M. Adv. Sci. Technol. 2009, 54, 96.
9. El Feninat, F.; Laroche, G.; Fiset, M.; Mantovani, D. Adv.Eng. Mater. 2002, 4, 91.
10. Golbang, A.; Kokabi, M. Eur. Polym. J. 2011, 47 1709.
11. Gall, K.; Yakacki, C. M.; Liu, Y.; Shandas, R.; Willett, N.;Anseth, K. S. J. Biomed. Mater. Res. Part A 2005, 73A, 339.
12. Zhang, H.; Wang, H.; Zhong, W.; Du, Q. Polymer 2009, 50,1596.
13. Prisacariu, C. In Polyurethane Elastomer; SpringerVerlag:Wien, 2011; p 219; DOI 10.1007/978-3-7091-0514-6-6..
14. Merdas, I.; Thominette, F.; Tcharkhtchi, A.; Verdu, J. Com-
pos. Sci. Technol. 2002, 62, 487.
15. Tcharkhtchi, A.; Bronec, P. Y.; Verdu, J. Polymer 2000, 41,5777.
16. Tcharkhtchi, A.; Gouin, E.; Verdu, J. J. Polym. Sci. Part B:
Polym. Phys. 2000, 38, 537.
17. Chen, X.; Nguyen, T. D. Mech. Mater. 2011, 43, 127.
18. Nguyen, T. D.; Qi, H. J.; Castro, F.; Long, K. N. J. Mech.
Phys. Solids 2008, 56, 2792.
19. Li, G.; Xu, W. J. Mech. Phys. Solids 2011, 59, 1231.
20. Aklonis, J. J.; Macknight, W. J.; Shen, W. Introduction toPolymer Viscoelasticity; John Wiley & Sons: New York,1972.
21. Heuchel, M.; CU, J.; Kratz, K.; Koswella, H.; Lendlein, A.Polymer 2010, 51, 6212.
22. Srivastava, V.; Chester, S. A.; Anand, L. J. Mech. Phys. Solids
2010, 58, 1100.
23. Tcharkhtchi, A.; Lucas, A. S.; Trotignon, J. P.; Verdu, J. Poly-mer 1998, V39, 1233.
24. Pittini, Y. Y.; Daneshvari, D.; Pittini, R.; Vaucher, S.; Rohr,L.; Leparoux, S.; Leuenberger, H. Eur. Polym. J. 2008, 44,1191.
25. Perez, J. in Physique et M�ecanique des Polymeres amorphes;TEC&DOC, Lavoisier: London, New York, Paris, 1992;
p 173.