Shadow Report on the Implementation of the UN Covenant on ...
114
Shadow Report on the Implementation of the Covenant on Social, Cultural and Economic Rights: 2 Resource Center for Human Rights (CReDO), www.CReDO.md, Roma National Center (RNC), www.ROMA.md 1 Resource Center for Human Rights (CReDO Roma National Center (RNC) Shadow Report on the Implementation of the U Covenant on Economic, Cultural Social Rights: 2003-09 Content Abstract......................................................... General Considerations.............................................. Challenges for Social Protection System in Moldova............... Coruption and Accountability System in the Health Sector......... Coruption Phenomenon in Educational System of Moldova ........... Article 2. Non discrimination ...................................... Ombudsman non-involvement in discrimination cases................ Article 3. Equal right to men and women............................. Gender Equality.................................................. Article 6. Right to work, living, steady economic, social and cultur Gender and labour market ........................................ Article 7. Fair Wages, Equal Remuneration Women, decent conditions a families, safe and healthy work conditions, rest, leisure.......... The average rate for the pension is around 40% of the earned inco the deputies, government and customs office is around 75% of thei Unemployment of Roma ............................................ Article 9. Social security and ensurance............................ Social Assitance and ensurance policies in Moldova............... Newly introduced social support law ............................. Article 11. Adequate standard for living, free from hunger, adequate Adequate standard of living...................................... Children with disabilities in Moldova ........................... Article 12. Highest standard of living, infant mortality, healthy de hygiene, prevention of epidemic, conditions for medical service .... Health Care Policy priorities ................................... Article 13. Right to education, dignity, tolerance. Primary educatio choose school....................................................... Right to education............................................... Educational policies priorities ................................. Education of Ukrainians and Bulgarians to education in their nati state language .................................................. Right to education in Transnistria .............................. Roma and Education...............................................
-
Upload
khangminh22 -
Category
Documents
-
view
1 -
download
0
Transcript of Shadow Report on the Implementation of the UN Covenant on ...
Shadow Report on the Implementation of the Covenant on Social, Cultural and Economic Rights: 2003-09 Resource Center for Human Rights (CReDO), www.CReDO.md, Roma National Center (RNC), www.ROMA.md
1
Resource Center for Human Rights (CReDO) Roma National Center (RNC)
Shadow Report on the Implementation of the UN
Covenant on Economic, Cultural and Social Rights: 2003-09
Content
Abstract............................................................................................................................2 General Considerations............................................................................................................3
Challenges for Social Protection System in Moldova.....................................................3 Coruption and Accountability System in the Health Sector............................................4 Coruption Phenomenon in Educational System of Moldova ........................................22
Article 2. Non discrimination ................................................................................................26 Ombudsman non-involvement in discrimination cases.................................................31
Article 3. Equal right to men and women..............................................................................33 Gender Equality.............................................................................................................33
Article 6. Right to work, living, steady economic, social and cultural development............36 Gender and labour market .............................................................................................36
Article 7. Fair Wages, Equal Remuneration Women, decent conditions and standards for families, safe and healthy work conditions, rest, leisure......................................................37
The average rate for the pension is around 40% of the earned income, while in case of the deputies, government and customs office is around 75% of their income. .............38 Unemployment of Roma ...............................................................................................38
Article 9. Social security and ensurance................................................................................40 Social Assitance and ensurance policies in Moldova....................................................40 Newly introduced social support law ............................................................................55
Article 11. Adequate standard for living, free from hunger, adequate nutrition ...................60 Adequate standard of living...........................................................................................60 Children with disabilities in Moldova ...........................................................................62
Article 12. Highest standard of living, infant mortality, healthy development of child, hygiene, prevention of epidemic, conditions for medical service .........................................73
Health Care Policy priorities .........................................................................................73 Article 13. Right to education, dignity, tolerance. Primary education, liberty of parents to choose school.........................................................................................................................83
Right to education..........................................................................................................83 Educational policies priorities .......................................................................................85 Education of Ukrainians and Bulgarians to education in their native languages and in state language ..............................................................................................................102 Right to education in Transnistria ...............................................................................112 Roma and Education....................................................................................................113
Shadow Report on the Implementation of the Covenant on Social, Cultural and Economic Rights: 2003-09 Resource Center for Human Rights (CReDO), www.CReDO.md, Roma National Center (RNC), www.ROMA.md
2
Abstract
The report provides an overview of the key issues regarding the implementation of the social, cultural and economic rights based on the provisions of the Covenant during the period of 2003-2009. The report follows an approach to present the information on article-by-article. For each article we provide the relevant information from the policy implementation perspective. To make the information more relevant we provide the discussion of various issues releant to the article. Finally we provide for each issue discussed a set of conclusions and suggested recommendations; they could be easily identified in the beginning or the end of the text in bol letters. This report is based havily on the findings and conclusions of the reports and information collected, with due refernce under each article and issue:
� Strategic Review of the Social Sector Policies, Resource Center for Human Rights (CReDO), 2008-09 � Establishing accountability institutions in health care, Resource Center for Human Rights (CReDO), 2008 � report presentation “Corruption in Higher Education in the Republic of Moldova”, by Student Incoruptus, and Managing Corruption in Higher Education of Moldova, by Vanessa Valentino � Review of Nondoscrimination Policies in Moldova by Resource Center for Human Rights (CReDO), 2009 � Human Rights report on the Situation of Roma in Moldova, by Roma National Center, 2009 � draft Report on the Millenium Development Goals Implementation, UNDP Moldova, 2009 � Budget Analysis of Administrative Institutions and Sector Policies in the Social Area. Report by Resource Center for Human Rights (CReDO), 2008 � Budget Analysis of Administrative Institutions and Sector Policies in the Health Sector. Resource Center for Human Rights (CReDO � EVALUATION OF MENTAL HEALTH OPPORTUNITIES PROGRAMS IN MOLDOVA, Resource Center for Human Rights (CReDO) � Budget Analysis of Administrative Institutions and Sector Policies in the Education Sector. Resource center for Human Rights (CReDO), 2008 � Evaluation of Linguistic educational policies for national Minorities in Moldova by Resource Center for Human Rights (CReDO).

Shadow Report on the Implementation of the Covenant on Social, Cultural and Economic Rights: 2003-09 Resource Center for Human Rights (CReDO), www.CReDO.md, Roma National Center (RNC), www.ROMA.md
3
General Considerations
Challenges for Social Protection System in Moldova1
Moldova inherited a social protection, composed of the social insurance and social assistance, which relies heavily on the cash benefits and transfers on a solely category-based principle. Social protection system, excepting health and education, constitutes 30% of the national public budget (around 13% of GDP2). More than 70% of the social expenditure constitutes pensions, while the remaining are more than two dozens of fragmented social programmes. Fragmented social programmes are financed from the State budget (Social assistance programmes) and Social Insurance Budget in proportion of 40 to 60% respectively. With some exceptions, notably the nominative compensation programme3 and merit-based allocation/entitlement programmes4, the state budget matches the priorities of the insurance-based programmes, extending the benefits to some uninsured categories of people. In 2008 alone, the cost of the largest social programme - nominative compensation, paid from the state budget - constituted around 300m MDL (50% of all state social budget allocations). Growing inequalities accumulated since the start of the transition to a market economy prove the inadequacy of the existing social protection system. The analysis of HBS 2007 data on the receipt of the cash-benefits and transfers show that the two wealthy quintiles receive significant percentage of the social cash-benefits instead of the poor quintiles5. Poverty concentrates in poor and predominantly rural communities, with households comprising persons with disabilities and affects households with more children. Evidence shows that category-based programmes accumulate inefficiency and do not target adequately, their contribution to reduce poverty rate is inadequate. Some cash benefits programmes, as nominative compensations and disability pensions, have been claimed to accumulate significant parts of unintended beneficiaries in the programmes and largely stimulate entrance into the programme contributing to self-withdrawal from labour market and exclusion from the society of the vulnerable groups. The social policy programmes delivery has been an exclusive matter of the central authorities by means of National Social Insurance House’ de-concentrated territorial offices. For all category-based programmes, these territorial offices managed the registration of the applicants, determined the beneficiaries and handled the payments. The Departments of social assistance (SADs) of the local authorities have only been involved in identification of the social assistance needs. Absence of institutions for the inspection social assistance fraud or abuse of cash benefits presents inherent risks jeopardising accountability.
1 Strategic Review of the Social Sector Policies, Resource Center for Human Rights (CReDO), 2008-09, www.CReDO.md 2 The overall social expenditures including social, education, health, culture reach 70% of National Public Budget or slightly less than 30% of GDP. 3 Category-based programme to compensate some 25-75 percent the targeted beneficiaries from the additional cost of heating, electricity during the winter months of the year. 4 Category-based entitlements 5 Ministry of Economy and Commerce, Evaluation of the Impact of Social Policies, HBS data, 2007
Shadow Report on the Implementation of the Covenant on Social, Cultural and Economic Rights: 2003-09 Resource Center for Human Rights (CReDO), www.CReDO.md, Roma National Center (RNC), www.ROMA.md
4
Government prompted by the mounting evidence of inefficiency of the existing social assistance system programme, rising inequalities, deepening poverty despite growing allocations and transfers of the cash-benefits, determined to reform. While rethinking the category-based social protection system, the law on social support was put in place in 2008 to address some of the outlined deficiencies. The Law on Social Support 133-2008 is intended as a purely means-tested cash benefit transfer programme. The law aims at replacing some of the existing programmes and abolish nominative compensations. However, during passage in Parliament changes were made to the law which meant that discontinuation of category based compensation were not included. Therefore, law 133 on social support runs in parallel with the existing category-based programmes. However, it is understood that new application for category based compensations will end by 01.01.2010. The recession continued in 2009 and Moldova’s economy, contracted further by the drop in the external demand remittances The Government, facing the parliamentary elections, recognised the difficulties to maintain budgetary expenditures in late spring 2009. By the end of 2009 GDP and contracted some 10%. The reduced public budget put a strain on the social expenditures.
Coruption and Accountability System in the Health Sector6
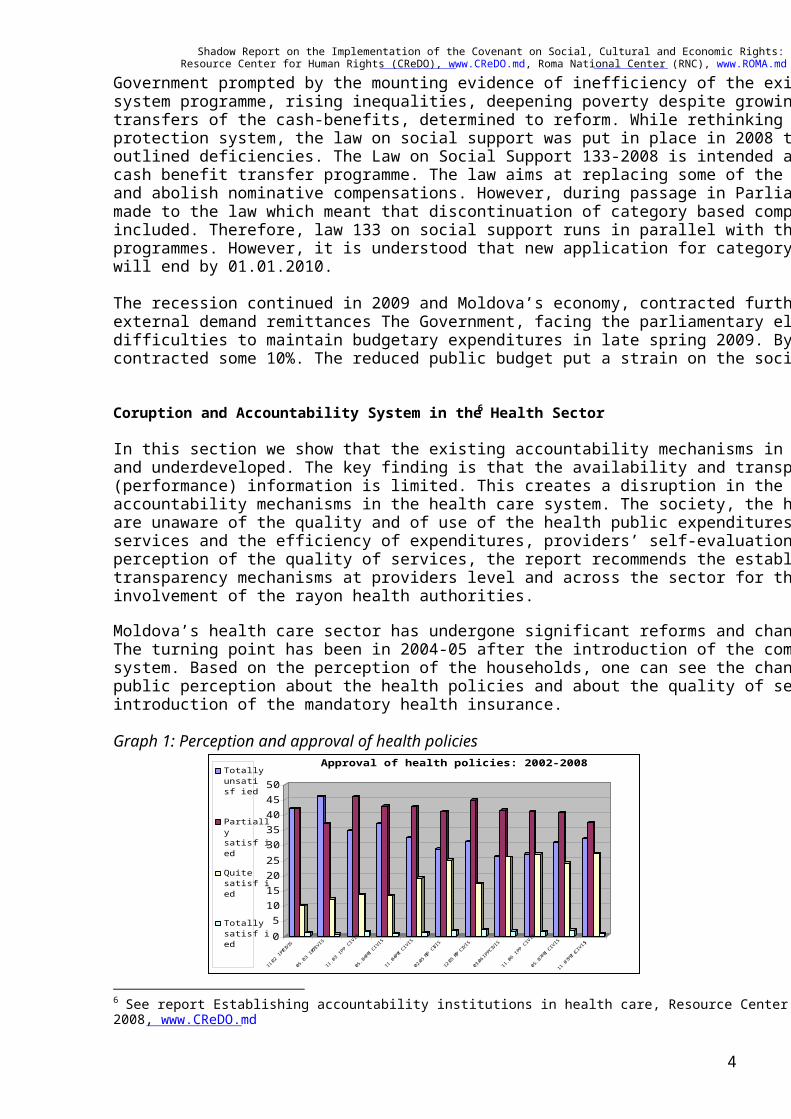
In this section we show that the existing accountability mechanisms in the health sector are weak and underdeveloped. The key finding is that the availability and transparency of the (performance) information is limited. This creates a disruption in the functioning of the accountability mechanisms in the health care system. The society, the households as customers are unaware of the quality and of use of the health public expenditures. Assessing the quality of services and the efficiency of expenditures, providers’ self-evaluation through customer perception of the quality of services, the report recommends the establishment of the budget transparency mechanisms at providers level and across the sector for the comparison, involvement of the rayon health authorities. Moldova’s health care sector has undergone significant reforms and changes over the past years. The turning point has been in 2004-05 after the introduction of the compulsory health insurance system. Based on the perception of the households, one can see the change and the shift in the public perception about the health policies and about the quality of services prior and after the introduction of the mandatory health insurance. Graph 1: Perception and approval of health policies
05101520253035404550
11.02 IPP CIVIS
05.03 IPP CIVIS
11.03 IPP CIVIS
05.04 IPP CIVIS
11.04 IPP CIVIS
02.05 IPP CIVIS
12.05 IPP CIVIS
03.06 IPP CIVIS
11.06 IPP CIVIS
05.07 IPP CIVIS
11.07 IPP (CIVIS)
Approval of health policies: 2002-2008Totallyunsatisf ied
Partiallysatisf ied
Quitesatisf ied
Totallysatisf ied
6 See report Establishing accountability institutions in health care, Resource Center for Human Rights (CReDO), 2008, www.CReDO.md
Shadow Report on the Implementation of the Covenant on Social, Cultural and Economic Rights: 2003-09 Resource Center for Human Rights (CReDO), www.CReDO.md, Roma National Center (RNC), www.ROMA.md
5
Source: IPP/CIVIS, 2001-2007 The shift to compulsory health insurance resulted in a positive perception on policy among the households. In November 2004 and in February 2005, after introducing health insurance, there is an obvious increase of people that were having quite satisfied attitude towards the health policy. February 2005 data show a double increase (25%) compared to February 2004 (12%) of policy approval. The trend of people that are totally unsatisfied decreases starting from the beginning of 2005. The percentage of persons that are partially satisfied remains the same with some oscillations. Finally, the percentage of persons that are totally satisfied has several percents increase. Overall, the introduction of the health insurance system has been perceived positively by the households.
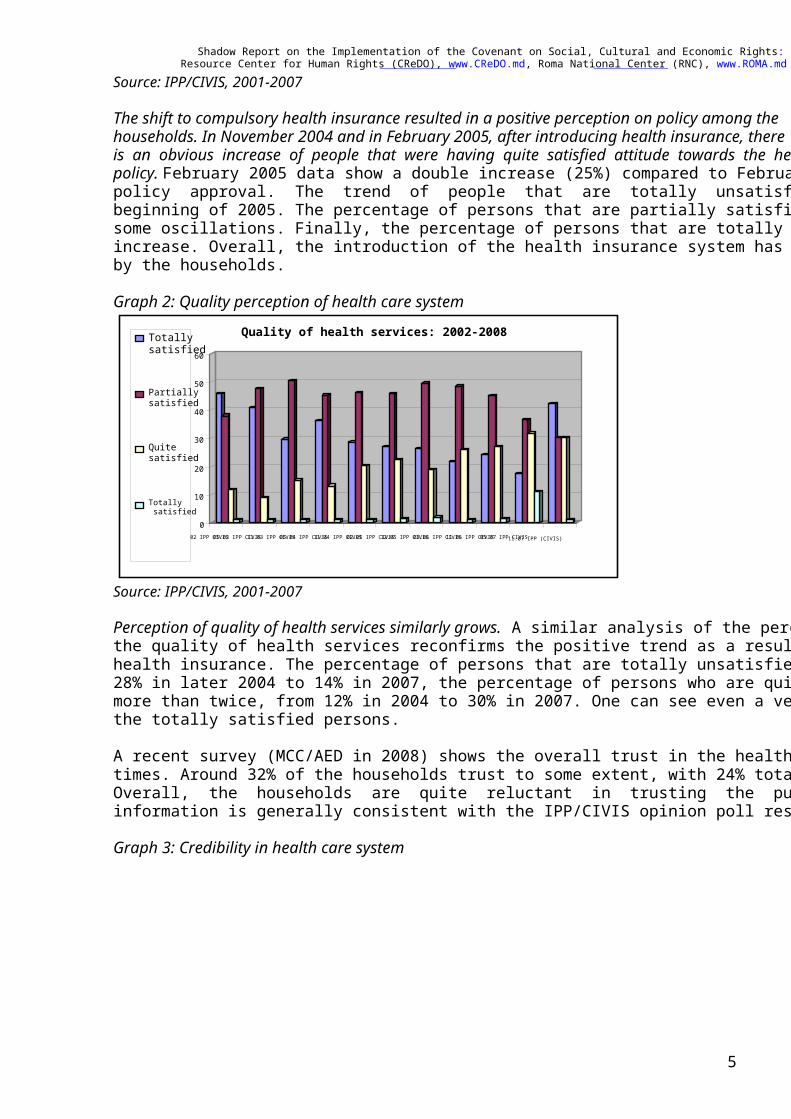
Graph 2: Quality perception of health care system
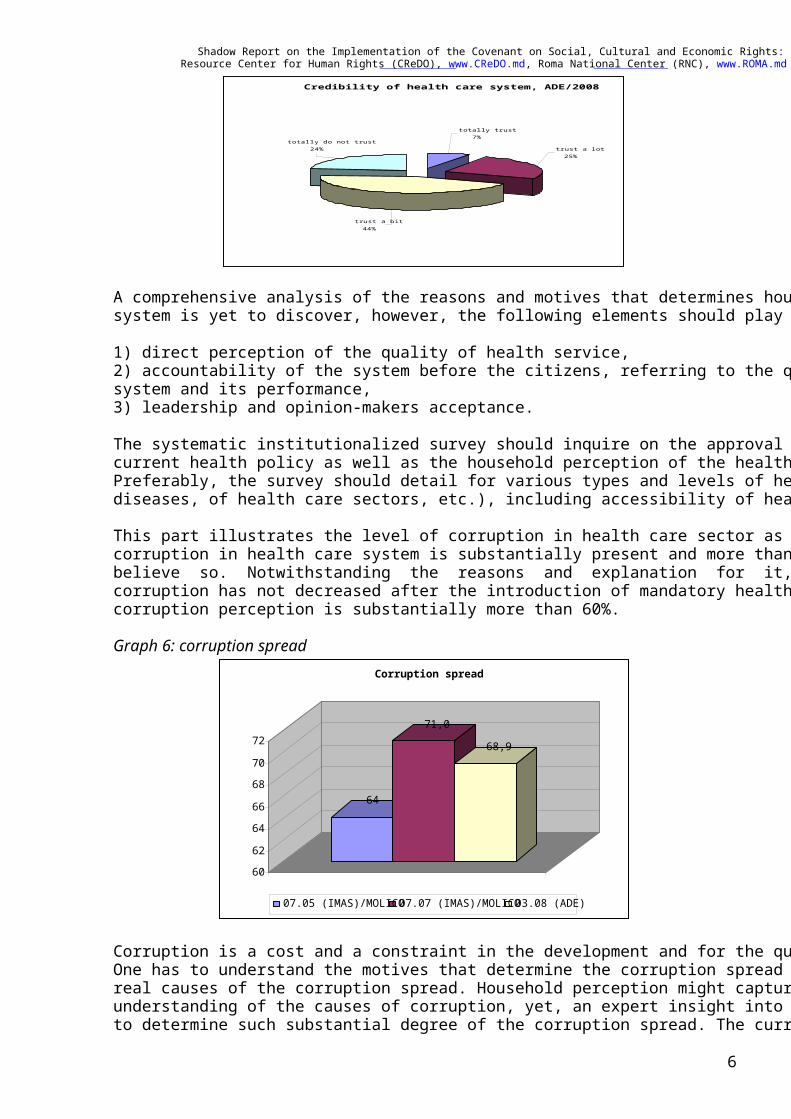
Source: IPP/CIVIS, 2001-2007 Perception of quality of health services similarly grows. A similar analysis of the perception of the quality of health services reconfirms the positive trend as a result of the introduction of the health insurance. The percentage of persons that are totally unsatisfied decreased twice, from 28% in later 2004 to 14% in 2007, the percentage of persons who are quite satisfied increased more than twice, from 12% in 2004 to 30% in 2007. One can see even a very modest increase of the totally satisfied persons. A recent survey (MCC/AED in 2008) shows the overall trust in the health care system at present times. Around 32% of the households trust to some extent, with 24% totally distrusts the system. Overall, the households are quite reluctant in trusting the public health care system. This information is generally consistent with the IPP/CIVIS opinion poll results. Graph 3: Credibility in health care system
0
10
20
30
40
50
60
11.02 IPP CIVIS05.03 IPP CIVIS11.03 IPP CIVIS05.04 IPP CIVIS11.04 IPP CIVIS02.05 IPP CIVIS12.05 IPP CIVIS03.06 IPP CIVIS11.06 IPP CIVIS05.07 IPP CIVIS11.07 IPP (CIVIS)
Quality of health services: 2002-2008Totally satisfied Partially satisfied Quite satisfied Totally satisfied
Shadow Report on the Implementation of the Covenant on Social, Cultural and Economic Rights: 2003-09 Resource Center for Human Rights (CReDO), www.CReDO.md, Roma National Center (RNC), www.ROMA.md
6
Credibility of health care system, ADE/2008
trust a bit44%
totally do not trust24%
totally trust7%
trust a lot25%
A comprehensive analysis of the reasons and motives that determines household trust in the system is yet to discover, however, the following elements should play an important role: 1) direct perception of the quality of health service, 2) accountability of the system before the citizens, referring to the quality information about the system and its performance, 3) leadership and opinion-makers acceptance. The systematic institutionalized survey should inquire on the approval by the households of the current health policy as well as the household perception of the health services quality. Preferably, the survey should detail for various types and levels of health services (by levels of diseases, of health care sectors, etc.), including accessibility of health services. This part illustrates the level of corruption in health care sector as perceived by households. The corruption in health care system is substantially present and more than half of the households believe so. Notwithstanding the reasons and explanation for it, the households’ perception of corruption has not decreased after the introduction of mandatory health insurance system. The corruption perception is substantially more than 60%. Graph 6: corruption spread
64
71,0
68,9
6062
6466
6870
72
Corruption spread
07.05 (IMAS)/MOLICO07.07 (IMAS)/MOLICO03.08 (ADE)
Corruption is a cost and a constraint in the development and for the quality of health services. One has to understand the motives that determine the corruption spread perception as well as the real causes of the corruption spread. Household perception might capture to some degree the understanding of the causes of corruption, yet, an expert insight into various aspects is necessary to determine such substantial degree of the corruption spread. The current perception of
Shadow Report on the Implementation of the Covenant on Social, Cultural and Economic Rights: 2003-09 Resource Center for Human Rights (CReDO), www.CReDO.md, Roma National Center (RNC), www.ROMA.md
7
corruption spread is very high, and should this be true, the whole health insurance system would be under the jeopardy. Most experts assess the financial aspects of the current health insurance system as more than satisfactory and present the Moldovan system serves as a positive example for other countries in the region. The financial aspects of the system are just part of the system, the quality of services that are directly experienced by the households depend on many other factors. Still, the corruption spread perception most possibly exaggerated due to the misunderstanding of corruption phenomenon, and tendency to attribute other phenomenon to the notion of corruption7. Based on these arguments, an institutional survey should address explicitly situations and cases where households directly experience corruption, include different questions that help distinguishing cases of corruption.
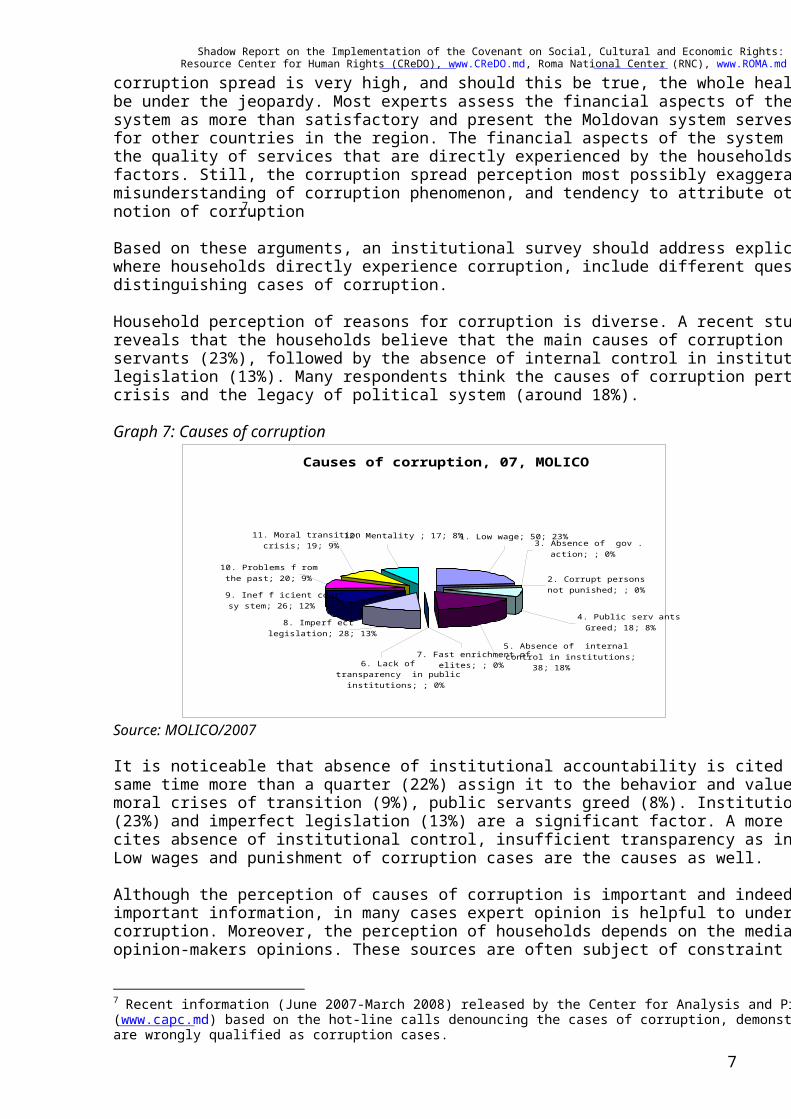
Household perception of reasons for corruption is diverse. A recent study on corruption causes reveals that the households believe that the main causes of corruption are: low payment of public servants (23%), followed by the absence of internal control in institutions (18%) and imperfect legislation (13%). Many respondents think the causes of corruption pertain also to the transition crisis and the legacy of political system (around 18%). Graph 7: Causes of corruption
Causes of corruption, 07, MOLICO
6. Lack of transparency in public
institutions; ; 0%
8. Imperf ect legislation; 28; 13%
9. Inef f icient court sy stem; 26; 12%
10. Problems f rom the past; 20; 9%
7. Fast enrichment of elites; ; 0%
5. Absence of internal control in institutions;
38; 18%
4. Public serv ants Greed; 18; 8%
2. Corrupt persons not punished; ; 0%
3. Absence of gov . action; ; 0%
1. Low wage; 50; 23%12. Mentality ; 17; 8%11. Moral transition crisis; 19; 9%
Source: MOLICO/2007
It is noticeable that absence of institutional accountability is cited as one cause (18%), at the same time more than a quarter (22%) assign it to the behavior and value system: mentality (8%), moral crises of transition (9%), public servants greed (8%). Institutional weakness of low salary (23%) and imperfect legislation (13%) are a significant factor. A more recent study (AED, 2008) cites absence of institutional control, insufficient transparency as institutional causes as well. Low wages and punishment of corruption cases are the causes as well. Although the perception of causes of corruption is important and indeed the perception reveals important information, in many cases expert opinion is helpful to understand better the causes of corruption. Moreover, the perception of households depends on the media reflection, popular opinion-makers opinions. These sources are often subject of constraint given the insufficient
7 Recent information (June 2007-March 2008) released by the Center for Analysis and Prevention of Corruption (www.capc.md) based on the hot-line calls denouncing the cases of corruption, demonstrates that 80% of the cases are wrongly qualified as corruption cases.
Shadow Report on the Implementation of the Covenant on Social, Cultural and Economic Rights: 2003-09 Resource Center for Human Rights (CReDO), www.CReDO.md, Roma National Center (RNC), www.ROMA.md
8
quality of media reporting skills, limited degree of media independence, and very limited availability of quality expertise on the level/type of corruption.
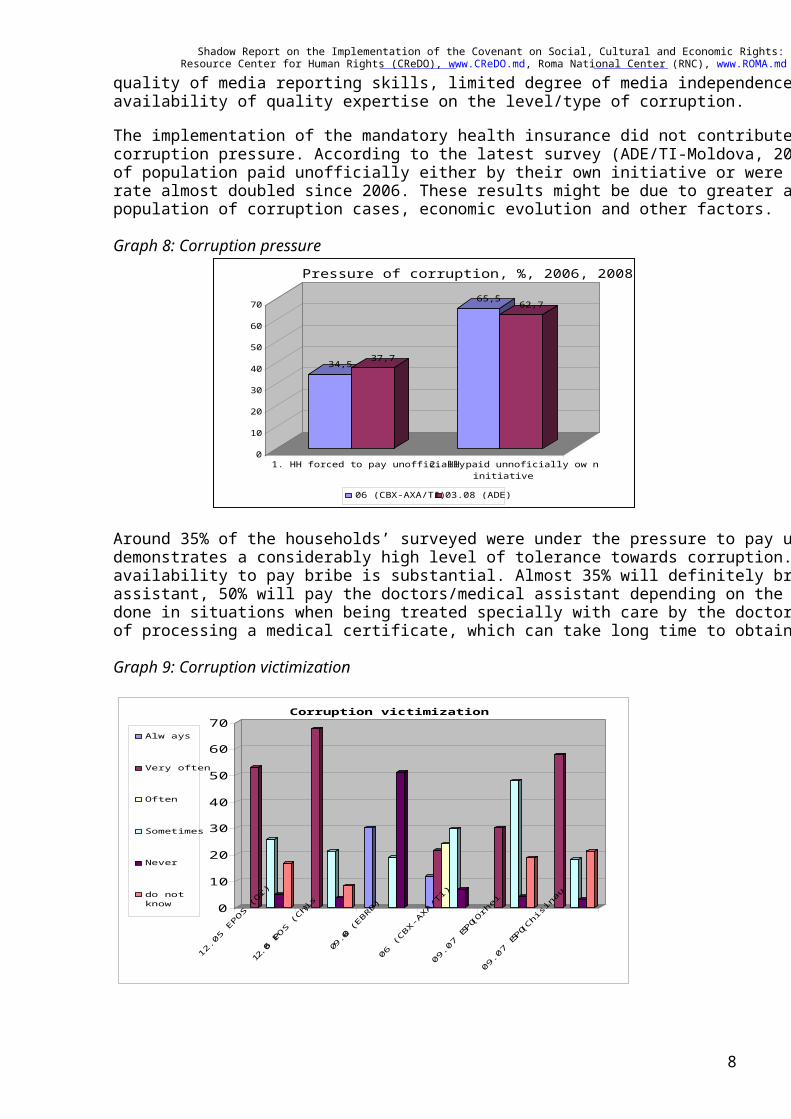
The implementation of the mandatory health insurance did not contribute to the diminishing the corruption pressure. According to the latest survey (ADE/TI-Moldova, 2008), more than a half of population paid unofficially either by their own initiative or were forced to. The corruption rate almost doubled since 2006. These results might be due to greater awareness of the population of corruption cases, economic evolution and other factors. Graph 8: Corruption pressure
34,5 37,7
65,5 62,7
0
10
20
30
40
50
60
70
1. HH forced to pay unofficially2. HH paid unnoficially ow ninitiative
Pressure of corruption, %, 2006, 2008
06 (CBX-AXA/TI)03.08 (ADE)
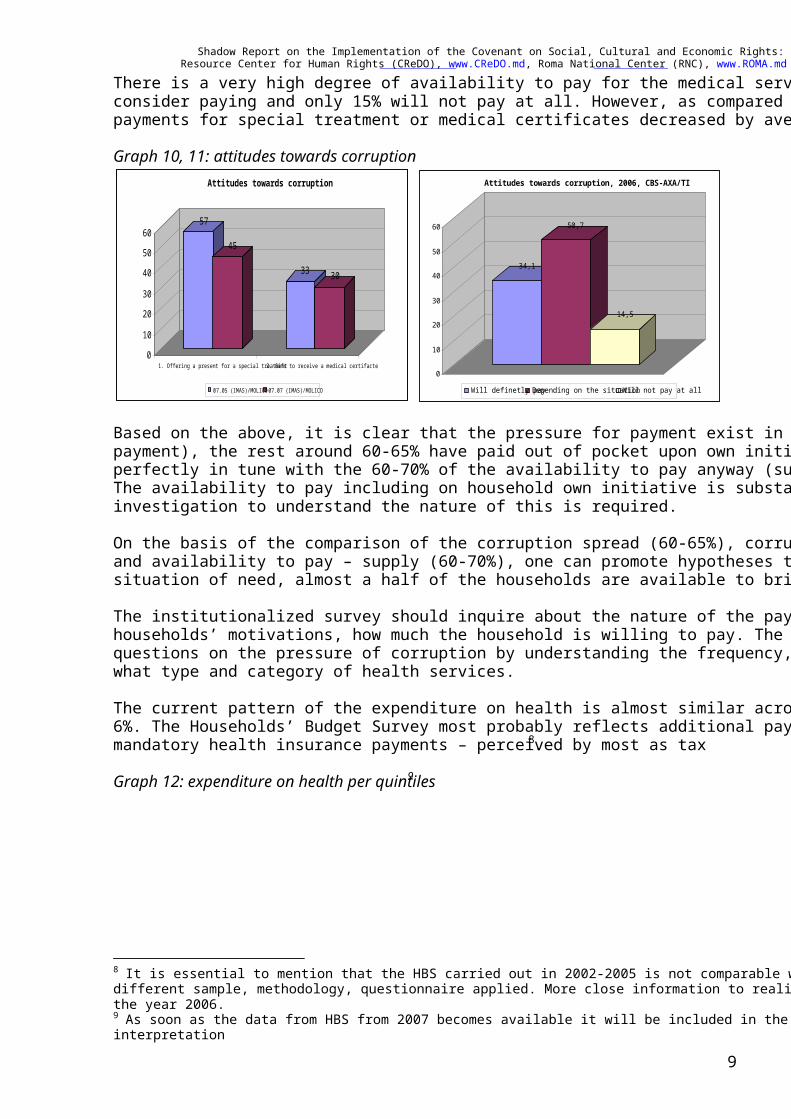
Around 35% of the households’ surveyed were under the pressure to pay unofficially. It also demonstrates a considerably high level of tolerance towards corruption. The household availability to pay bribe is substantial. Almost 35% will definitely bribe a doctor/medical assistant, 50% will pay the doctors/medical assistant depending on the situation. This will be done in situations when being treated specially with care by the doctor, or when there is the need of processing a medical certificate, which can take long time to obtain. Graph 9: Corruption victimization
0
10
20
30
40
50
60
70
12.05 EPOS (Or)
12.05 EPOS (Chis)
09.06 (EBRD)
06 (CBX-AXA/TI)
09.07 EPO
S (Orhei
09.07 EPO
S (Chisinau
Corruption victimization
Alw ays
Very often
Often
Sometimes
Never
do notknow
Shadow Report on the Implementation of the Covenant on Social, Cultural and Economic Rights: 2003-09 Resource Center for Human Rights (CReDO), www.CReDO.md, Roma National Center (RNC), www.ROMA.md
9
There is a very high degree of availability to pay for the medical services, more than 75% consider paying and only 15% will not pay at all. However, as compared to 2005, the extra-payments for special treatment or medical certificates decreased by averagely 10% in 2007. Graph 10, 11: attitudes towards corruption
57
45
33 30
010
2030
405060
1. Offering a present for a special treatment2. Gifs to receive a medical certifacte
Attitudes towards corruption
07.05 (IMAS)/MOLICO 07.07 (IMAS)/MOLICO
34,1
50,7
14,5
0
10
20
30
40
50
60
Attitudes towards corruption, 2006, CBS-AXA/TI
Will definetly payDepending on the situationWill not pay at all Based on the above, it is clear that the pressure for payment exist in around 30-35% (demand for payment), the rest around 60-65% have paid out of pocket upon own initiative, the later is perfectly in tune with the 60-70% of the availability to pay anyway (supply for extra-payment). The availability to pay including on household own initiative is substantial and a further investigation to understand the nature of this is required. On the basis of the comparison of the corruption spread (60-65%), corruption pressure (30-35%) and availability to pay – supply (60-70%), one can promote hypotheses that if there is the situation of need, almost a half of the households are available to bribe. The institutionalized survey should inquire about the nature of the payments, what are the households’ motivations, how much the household is willing to pay. The survey should also ask questions on the pressure of corruption by understanding the frequency, amount paid and for what type and category of health services. The current pattern of the expenditure on health is almost similar across the quintiles, within 4-6%. The Households’ Budget Survey most probably reflects additional payments apart from the mandatory health insurance payments – perceived by most as tax8. Graph 12: expenditure on health per quintiles9
8 It is essential to mention that the HBS carried out in 2002-2005 is not comparable with the latest ones, due to different sample, methodology, questionnaire applied. More close information to reality can be found in HBS from the year 2006. 9 As soon as the data from HBS from 2007 becomes available it will be included in the graph for further interpretation

Shadow Report on the Implementation of the Covenant on Social, Cultural and Economic Rights: 2003-09 Resource Center for Human Rights (CReDO), www.CReDO.md, Roma National Center (RNC), www.ROMA.md
10
Source: HBS/2002-06 The most rapid increase experienced the poorest quintile: from a bit more than 1% to 4% (almost four times more); the richest quintile experienced a most increase from 4.6% in 2005 to 5.8% in 2006. Specific figures for 2006 indicate annual payments by quintile, where the richest quintile pays 1 380 MDL, while the poorest only 171 MDL. Graph 13, 14: household expenditure on health per quintile and insurance premium evolution
171285
457
703
1.389
0
200
400
600
800
1.000
1.200
1.400
Yearly expenditure per quintile in 2006, MDL
IIIIIIIVV
Expenditure on health per quintile (%): 2002-06
0
1
2
3
4
5
6
7
2002 2003 2004 2005 2006,0
IIIIII IV V
Shadow Report on the Implementation of the Covenant on Social, Cultural and Economic Rights: 2003-09 Resource Center for Human Rights (CReDO), www.CReDO.md, Roma National Center (RNC), www.ROMA.md
11
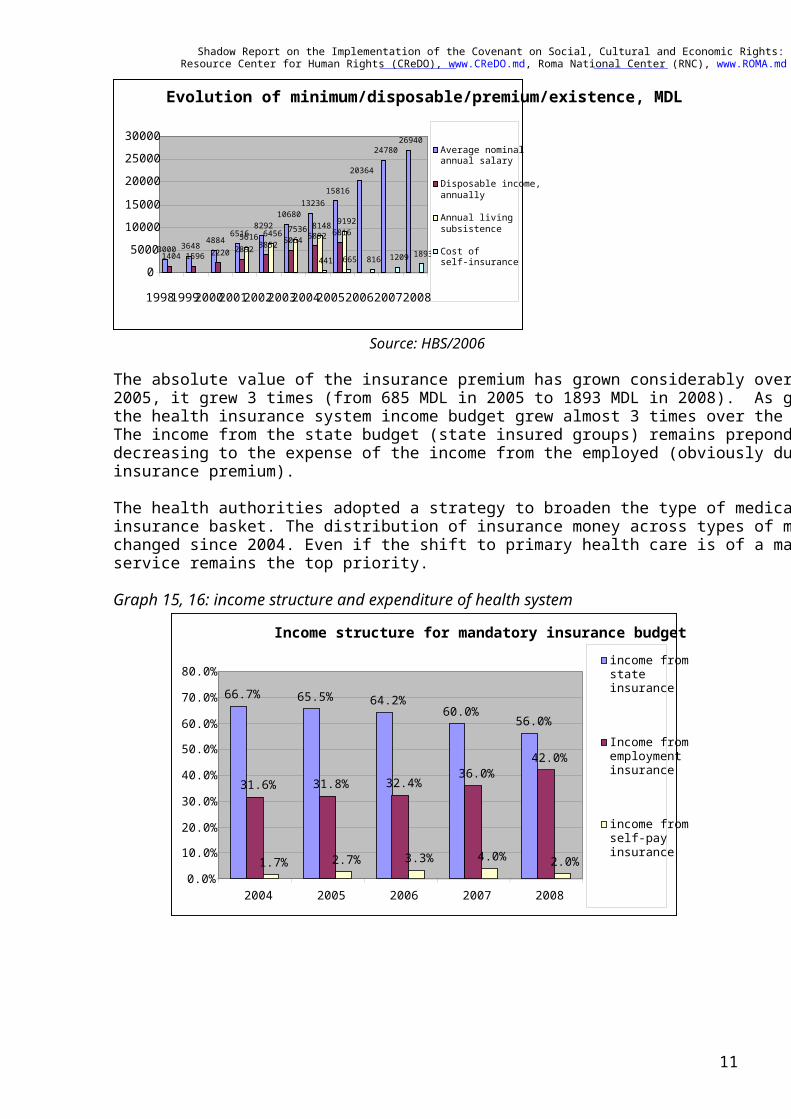
Source: HBS/2006 The absolute value of the insurance premium has grown considerably over the last 2 years. Since 2005, it grew 3 times (from 685 MDL in 2005 to 1893 MDL in 2008). As graphs below show the health insurance system income budget grew almost 3 times over the same period of time. The income from the state budget (state insured groups) remains preponderant while slightly decreasing to the expense of the income from the employed (obviously due to the increase of the insurance premium). The health authorities adopted a strategy to broaden the type of medical services included in the insurance basket. The distribution of insurance money across types of medical services has not changed since 2004. Even if the shift to primary health care is of a main concern, the hospital service remains the top priority. Graph 15, 16: income structure and expenditure of health system
Income structure for mandatory insurance budget
66.7% 65.5% 64.2%60.0% 56.0%
31.6% 31.8% 32.4% 36.0%42.0%
1.7% 2.7% 3.3% 4.0% 2.0% 0.0% 10.0% 20.0% 30.0% 40.0% 50.0% 60.0% 70.0% 80.0%
2004 2005 2006 2007 2008
income fromstate insurance
Income fromemploymentinsurance
income fromself-pay insurance
Evolution of minimum/disposable/premium/existence, MDL
3000 3648 48846516
829210680
1323615816
20364
2478026940
1404 1596 2220 2892 3852 5064 5892 68165616 6456 7536 8148 9192
441 665 816 1209 1893
0 5000 10000 15000 20000 25000 30000
1998 1999 2000 2001 2002 2003 2004 2005200620072008
Average nominal annual salary Disposable income,annually
Annual livingsubsistence
Cost of self-insurance
Shadow Report on the Implementation of the Covenant on Social, Cultural and Economic Rights: 2003-09 Resource Center for Human Rights (CReDO), www.CReDO.md, Roma National Center (RNC), www.ROMA.md
12
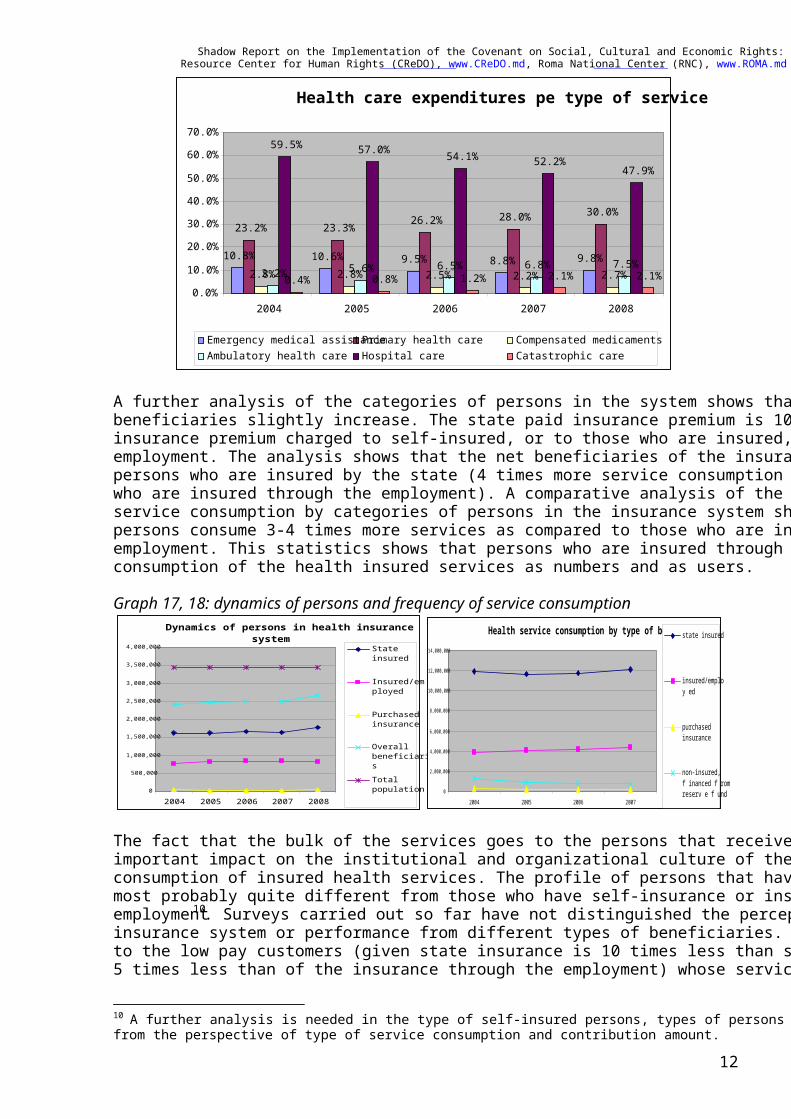
A further analysis of the categories of persons in the system shows that state insured beneficiaries slightly increase. The state paid insurance premium is 10 times smaller than of the insurance premium charged to self-insured, or to those who are insured, through the employment. The analysis shows that the net beneficiaries of the insurance health system are the persons who are insured by the state (4 times more service consumption as compared to those who are insured through the employment). A comparative analysis of the frequency of medical service consumption by categories of persons in the insurance system shows that state insured persons consume 3-4 times more services as compared to those who are insured through the employment. This statistics shows that persons who are insured through the state dominate consumption of the health insured services as numbers and as users. Graph 17, 18: dynamics of persons and frequency of service consumption
Dynamics of persons in health insurance system
0
500,000
1,000,000
1,500,000
2,000,000
2,500,000
3,000,000
3,500,000
4,000,000
2004 2005 2006 2007 2008
Stateinsured
Insured/employed
Purchasedinsurance
OverallbeneficiariesTotalpopulation
Health service consumption by type of beneficiary
0
2,000,000
4,000,000
6,000,000
8,000,000
10,000,000
12,000,000
14,000,000
2004 2005 2006 2007
state insured
insured/employ ed
purchasedinsurance
non-insured,f inanced f romreserv e f und
The fact that the bulk of the services goes to the persons that receive state insurance can have an important impact on the institutional and organizational culture of the provision and consumption of insured health services. The profile of persons that have state insurance will be most probably quite different from those who have self-insurance or insured through the employment10. Surveys carried out so far have not distinguished the perception of health insurance system or performance from different types of beneficiaries. The provision of services to the low pay customers (given state insurance is 10 times less than self-insurance and at least 4-5 times less than of the insurance through the employment) whose service financially most likely
10 A further analysis is needed in the type of self-insured persons, types of persons ensured through the employment from the perspective of type of service consumption and contribution amount.
Health care expenditures pe type of service
10.8% 10.6% 9.5% 8.8% 9.8% 23.2% 23.3% 26.2% 28.0% 30.0%
2.8% 2.8% 2.5% 2.2% 2.7% 3.2% 5.6% 6.5% 6.8% 7.5%
59.5% 57.0% 54.1% 52.2% 47.9%
0.4% 0.8% 1.2% 2.1% 2.1%0.0% 10.0% 20.0% 30.0% 40.0% 50.0% 60.0% 70.0%
2004 2005 2006 2007 2008 Emergency medical assistancePrimary health care Compensated medicaments Ambulatory health care Hospital care Catastrophic care

Shadow Report on the Implementation of the Covenant on Social, Cultural and Economic Rights: 2003-09 Resource Center for Human Rights (CReDO), www.CReDO.md, Roma National Center (RNC), www.ROMA.md
13
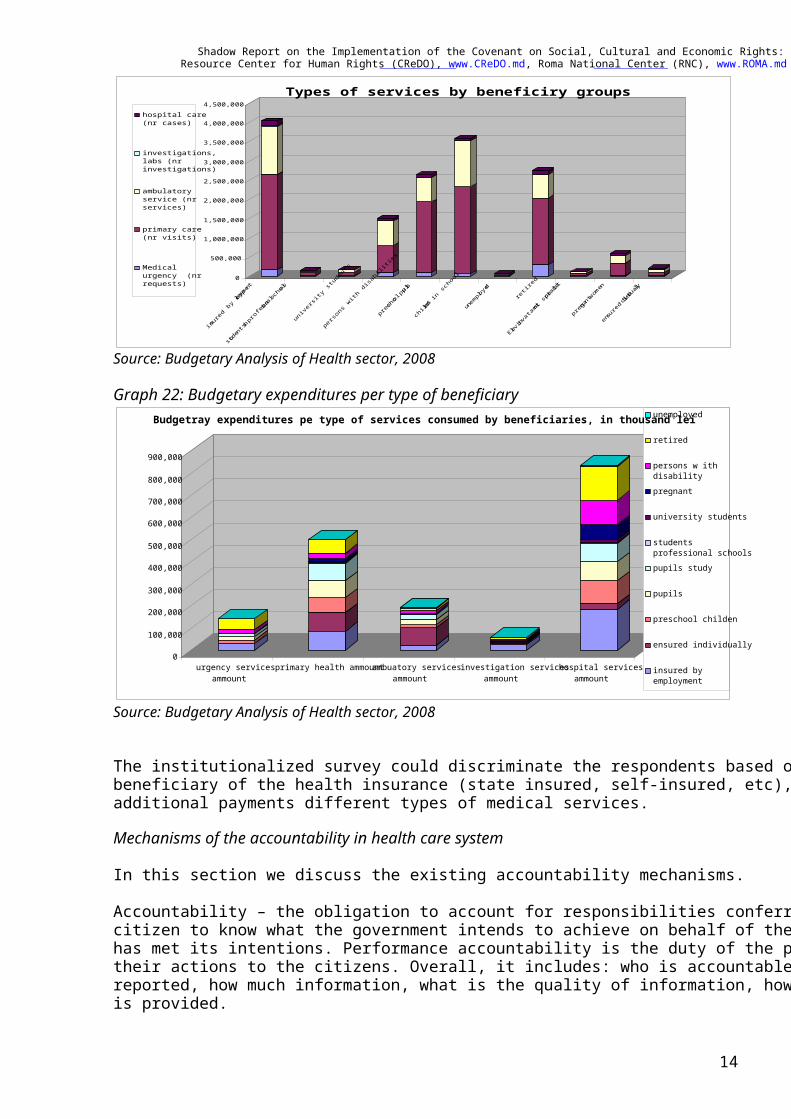
does not cover service production probably stretches and drives the system into the pattern of the chip, low quality medical services. There is no evidence and information on whether the service is over-demanded by the state insured clients or if the production of services suffers through the use of the improper technologies or inefficient procedures in service production11. These aspects should be dealt with in the institutionalized survey and further researched. Graph 19, 20: types of beneficiaries of health care insurance
Graph 20: categories of beneficiaries of health care insurance
Source: Budgetary analysis of health care sector, 2008 Based on the data from 2007, one can see that there are a substantial number of state insured beneficiaries. The percentage is around 60-70% and therefore the system is driven by the perception of the state running money rather than by the insured based contribution. The health bureaucracy understands the large portion of state money that come to fill in the financial functioning of the system anyway, currently the system only partly depends on the contribution mechanisms. The insurance system is preponderantly used by those who are state insured (67%). Graph 21: types of beneficiaries in health care
11 There is a widespread perception of the improper allocation of time by he family doctors, who are required to manually fill in a number of information.
26.4%24.0%
0.8% 0.4% 2.4%1.5% 3.9%
14.2%
36.3%
10.8%
1.1%0.7%
12.8%
19.8%
2.1% 8.9%
2.3% 5.2%
0.0% 5.0% 10.0% 15.0% 20.0% 25.0% 30.0% 35.0% 40.0%
insured byemployment
students in professional schools
universitystudents
persons withdisabilities
pupils unemployed retired pregnant women ensured
individually
Policy holder vs service user
Police holdersService access
Type of persons in mandatory insurance, 2007
state budget insured71%
individual insurance1%
Insured by mandatory contribution (employment)
28%
Shadow Report on the Implementation of the Covenant on Social, Cultural and Economic Rights: 2003-09 Resource Center for Human Rights (CReDO), www.CReDO.md, Roma National Center (RNC), www.ROMA.md
14
0
500,000
1,000,000
1,500,000
2,000,000
2,500,000
3,000,000
3,500,000
4,000,000
4,500,000
insured by emp
loyment
students in professional schools
university students
persons with disabilities
preschool pupils
children in school
unemployed
retired
Elevi invatamint specializat
pregnant women
ensured individually
Types of services by beneficiry groupshospital care(nr cases)
investigations,labs (nrinvestigations)
ambulatoryservice (nrservices)
primary care(nr visits)
Medicalurgency (nrrequests)
Source: Budgetary Analysis of Health sector, 2008 Graph 22: Budgetary expenditures per type of beneficiary
0
100,000
200,000
300,000
400,000
500,000
600,000
700,000
800,000
900,000
urgency servicesammount
primary health ammountambuatory servicesammount
investigation servicesammount
hospital servicesammount
Budgetray expenditures pe type of services consumed by beneficiaries, in thousand leiunemployed
retired
persons w ithdisabilitypregnant
university students
studentsprofessional schoolspupils study
pupils
preschool childen
ensured individually
insured byemployment
Source: Budgetary Analysis of Health sector, 2008 The institutionalized survey could discriminate the respondents based on the type of the beneficiary of the health insurance (state insured, self-insured, etc), income level as well as additional payments different types of medical services. Mechanisms of the accountability in health care system In this section we discuss the existing accountability mechanisms. Accountability – the obligation to account for responsibilities conferred, establishing the right of citizen to know what the government intends to achieve on behalf of the citizens and how well it has met its intentions. Performance accountability is the duty of the public officials to report their actions to the citizens. Overall, it includes: who is accountable, what information should be reported, how much information, what is the quality of information, how and when information is provided.
Shadow Report on the Implementation of the Covenant on Social, Cultural and Economic Rights: 2003-09 Resource Center for Human Rights (CReDO), www.CReDO.md, Roma National Center (RNC), www.ROMA.md
15
Agencies and specifically the providers of the services are accountable by clear targets, provision of business plans and performance. The provision of the insurance based health care at hospital level faces the situation of the complete monopoly at regional level or for some type of specialized services. Therefore, the situation resembles the case of the health care providing bureaucracy that engages in the maximization of their institutional budgets formulating take-it-or-leave it position. The assumed monopoly will drive costs and budgets higher reducing from the performance accountability of the health care providers. Virtually monopolistic providers tend to hide true functional costs and concentrate on the process indicators to justify the increase of the costs and budgets. The accountability of the health care providers becomes defuse when the buyers of services and the public is unaware or incapable to monitor the providers performance. The diffusion of the accountability claims becomes even more emphasis if there is a significant number of beneficiaries become the clients of the system through the state covered system of insurance. Te state insurance also transfers a type of mentality and treatment for the “minority shareholders” of the insurance based system. The structure of the competition of the health care market for different type of services has traditionally been seen as a market accountability approach. The state policies tend to narrow the access of the alternative providers of the health services, raise barriers to access the market or provide subsidies (in kind or in cash) for the state providers of the health services. This could also take the form by artificially lowering the capacity of the policy-making competences concentrating resources (given large health bureaucracy and powerful extensive health care providers) in the extensive health care providers. The later continue to exercise lobby for the resources and prevent the consolidation of the effective policy-making functions.
Shadow Report on the Implementation of the Covenant on Social, Cultural and Economic Rights: 2003-09 Resource Center for Human Rights (CReDO), www.CReDO.md, Roma National Center (RNC), www.ROMA.md
16
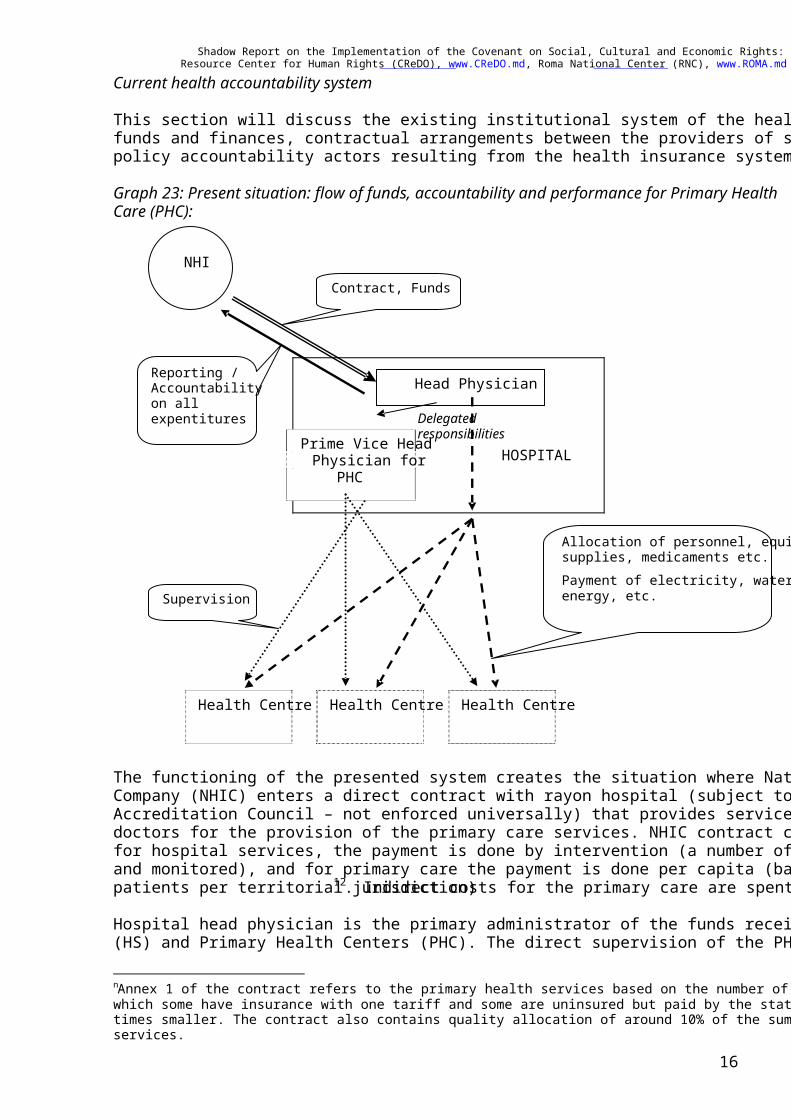
Current health accountability system This section will discuss the existing institutional system of the health care, including flow of funds and finances, contractual arrangements between the providers of services, contractors and policy accountability actors resulting from the health insurance system. Graph 23: Present situation: flow of funds, accountability and performance for Primary Health Care (PHC):
The functioning of the presented system creates the situation where National Health Insurance Company (NHIC) enters a direct contract with rayon hospital (subject to licensing from Health Accreditation Council – not enforced universally) that provides services subcontracting family doctors for the provision of the primary care services. NHIC contract contains 2 annexes where for hospital services, the payment is done by intervention (a number of interventions is planned and monitored), and for primary care the payment is done per capita (based on the number of patients per territorial jurisdiction)12. Indirect costs for the primary care are spent by the hospital. Hospital head physician is the primary administrator of the funds received for Hospital Services (HS) and Primary Health Centers (PHC). The direct supervision of the PHC is done by the prime nAnnex 1 of the contract refers to the primary health services based on the number of persons that are to be served of which some have insurance with one tariff and some are uninsured but paid by the state with tariff that is several times smaller. The contract also contains quality allocation of around 10% of the sum contracted for the health care services.
NHI
Delegated responsibilities Prime Vice Head
Physician for PHC
HOSPITAL
Health Centre Health Centre Health Centre
Head Physician
Contract, Funds
Reporting / Accountability on all expentitures
Allocation of personnel, equipment, supplies, medicaments etc. Payment of electricity, water, energy, etc. Supervision
Shadow Report on the Implementation of the Covenant on Social, Cultural and Economic Rights: 2003-09 Resource Center for Human Rights (CReDO), www.CReDO.md, Roma National Center (RNC), www.ROMA.md
17
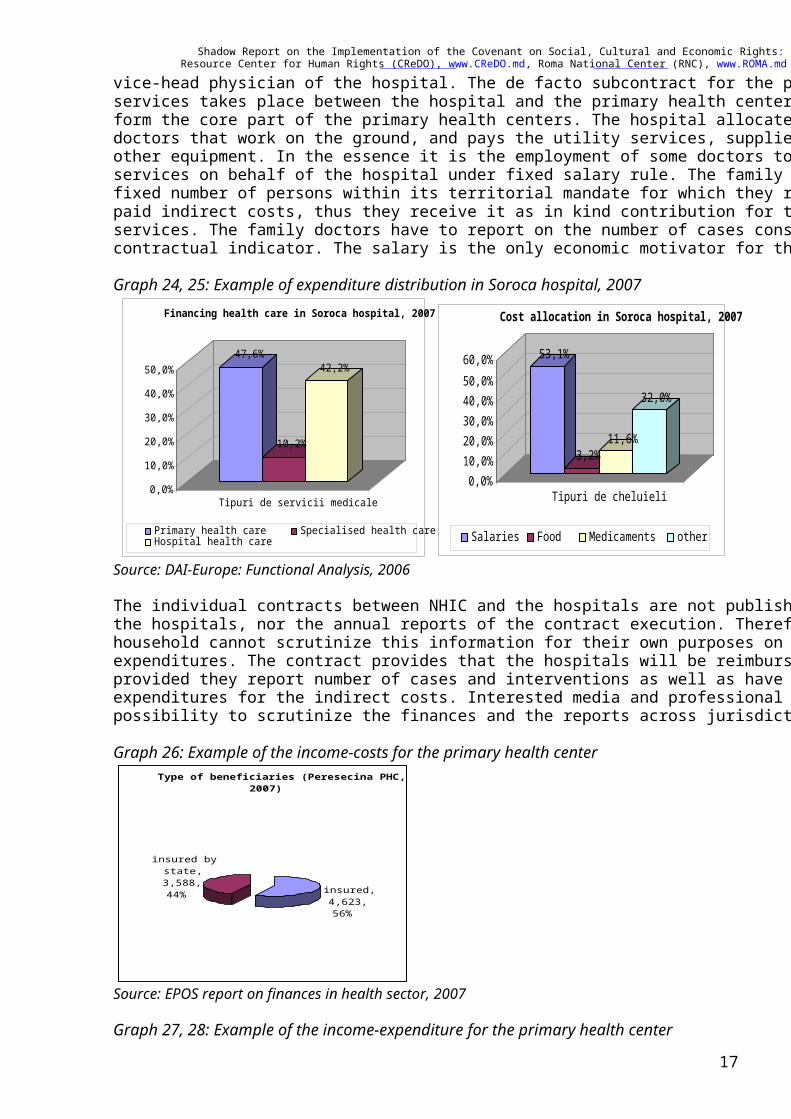
vice-head physician of the hospital. The de facto subcontract for the provision of primary health services takes place between the hospital and the primary health centers’ family doctors who form the core part of the primary health centers. The hospital allocates salaries for the family doctors that work on the ground, and pays the utility services, supplies with the medical and other equipment. In the essence it is the employment of some doctors to perform certain medical services on behalf of the hospital under fixed salary rule. The family doctors have to serve a fixed number of persons within its territorial mandate for which they receive a fixed salary and paid indirect costs, thus they receive it as in kind contribution for the provision of medical services. The family doctors have to report on the number of cases consulted, this being the key contractual indicator. The salary is the only economic motivator for the family doctors. Graph 24, 25: Example of expenditure distribution in Soroca hospital, 2007
47,6%
10,2%
42,2%
0,0%
10,0%
20,0%
30,0%
40,0%
50,0%
Tipuri de servicii medicale
Financing health care in Soroca hospital, 2007
Primary health care Specialised health careHospital health care
53,1%
3,2%11,6%
32,0%
0,0%10,0%20,0%30,0%40,0%50,0%60,0%
Tipuri de cheluieli
Cost allocation in Soroca hospital, 2007
Salaries Food Medicaments other
Source: DAI-Europe: Functional Analysis, 2006 The individual contracts between NHIC and the hospitals are not published either by NHI or by the hospitals, nor the annual reports of the contract execution. Therefore, the interested household cannot scrutinize this information for their own purposes on the costs and expenditures. The contract provides that the hospitals will be reimbursed on semester basis provided they report number of cases and interventions as well as have proof for the expenditures for the indirect costs. Interested media and professional think tanks do not have the possibility to scrutinize the finances and the reports across jurisdictions. Graph 26: Example of the income-costs for the primary health center
Type of beneficiaries (Peresecina PHC, 2007)
insured, 4,623, 56%
insured by state, 3,588, 44%
Source: EPOS report on finances in health sector, 2007 Graph 27, 28: Example of the income-expenditure for the primary health center

Shadow Report on the Implementation of the Covenant on Social, Cultural and Economic Rights: 2003-09 Resource Center for Human Rights (CReDO), www.CReDO.md, Roma National Center (RNC), www.ROMA.md
18
PHC income, Peresecina PHC, 2007
income paraclinic services, 115,575, 17%
income treated cases, 79,750, 12%
income from state insured,
21,528, 3%
income from
insured, 474,273, 68%
Expenditures, Pelivan PHC, 2007
utilities; 49.387; 7%
repair/maintenance; 24.627; 4%
med materials; 23.100; 3%
medications; 121.475; 18%
milk pow der; 101.375; 15%
training, trips; 119.375; 18% salary; 225.247;
35%
Source: EPOS report on finances in health sector, 2007 An insured person brings a bit more than 100 MDL as income into the budget of Primary Health Cener (PHC), while state insured person brings only 6 MDL. The insured people’s contribution to the PHC budget is about 70%, with the state insured less tan 5%. At the same time if to compare with the actual rate of use of the services, one can see that around 70% of services are provided to the persons that are state insured. Another aspect of the principal-agent relationship between NHIC and the hospitals is that the contract contains input only indicators (number of cases – primary care) or process only indicators (number of interventions – hospital services). These contractual arrangements might drive undesirable consequences for the quality of treatment and the interests of the households. One should consider putting in place a number of institutional accountability mechanisms through proper contract indicators (a combination of input-process-output and outcome indicators as well as benchmarks for the productivity and te use of technology), obligation of accessibility and publication of the annual financial and performance reports as well as a more hand-on approach from NHIC in managing contracts. The contracts should contain the stimulus through NHIC specialized programs and indirect higher allocations for discretionary use by the providers for the health services, should the providers of services perform better on the conracts. This secondary layer of principal-agent relationship is not accessible and transparent for the NHIC and the households and violates the principle of the principle-agent relationship. This relationship lacks the necessary institutional accountability mechanisms. Conclusions regarding accountability performance mechanisms: 1) absence of direct principal-agent relationship between the principal (buyer of services) and agent (provider-family doctors), 2) hospital administrator is biased towards the greater allocation of contracted sums to the provision of hospital services, 3) contractual indicators provide reporting simply input indicator of persons served, 4) primary health is financed based on the principle of the fixed sum allocation and in kind allocation for the support of provision of medical services that creates disincentives for quality and results, 5) there is no direct accountability line between the provision of primary health services and the household,
Shadow Report on the Implementation of the Covenant on Social, Cultural and Economic Rights: 2003-09 Resource Center for Human Rights (CReDO), www.CReDO.md, Roma National Center (RNC), www.ROMA.md
19
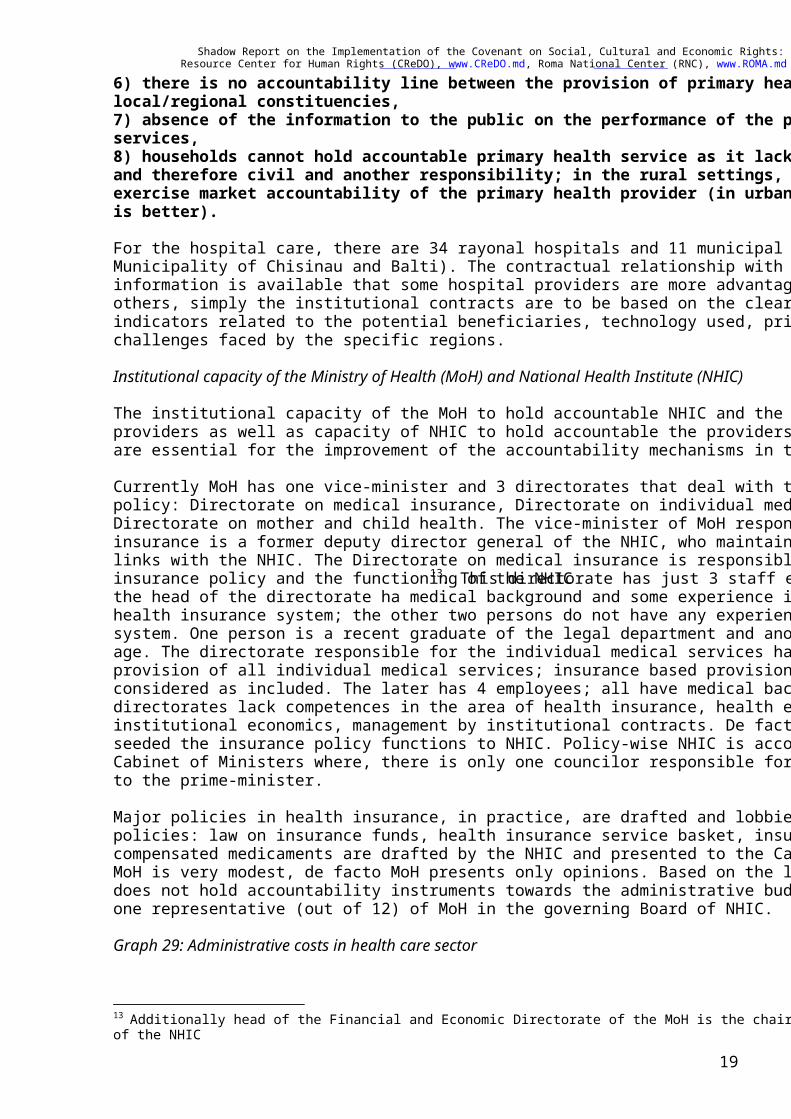
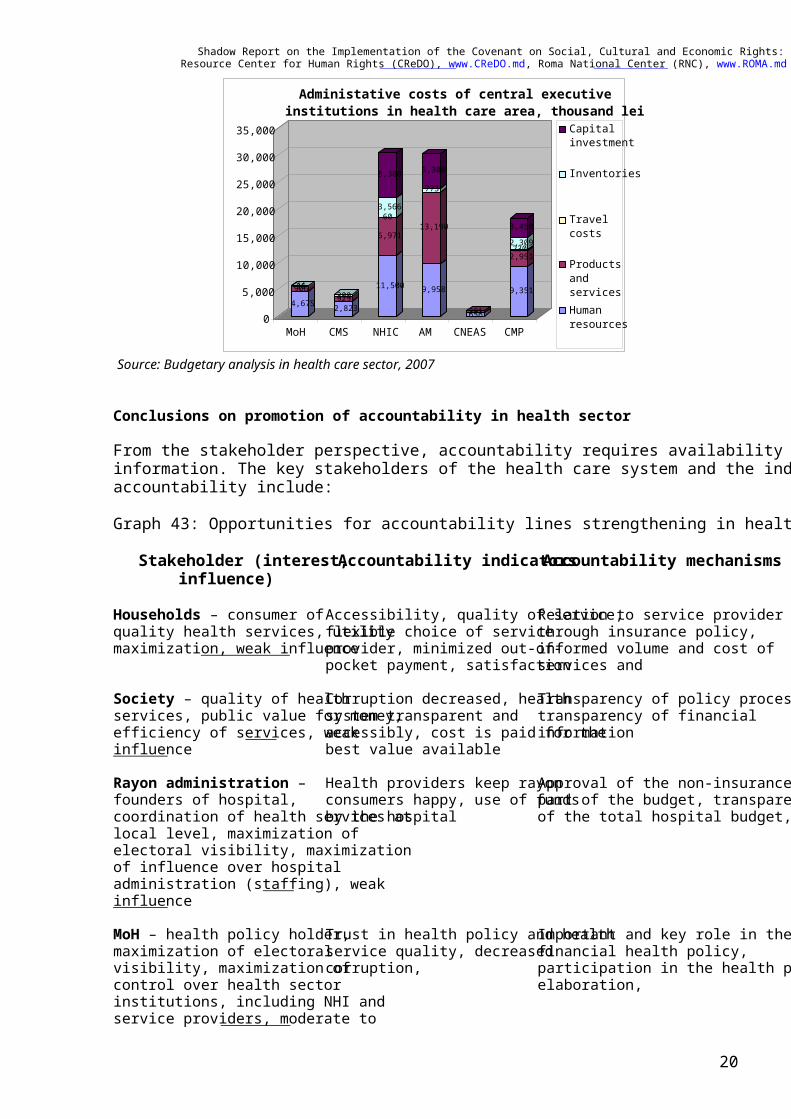
6) there is no accountability line between the provision of primary health services and the local/regional constituencies, 7) absence of the information to the public on the performance of the primary health services, 8) households cannot hold accountable primary health service as it lacks legal personality and therefore civil and another responsibility; in the rural settings, the households cannot exercise market accountability of the primary health provider (in urban areas the situation is better). For the hospital care, there are 34 rayonal hospitals and 11 municipal hospitals (for the Municipality of Chisinau and Balti). The contractual relationship with the providers differ and information is available that some hospital providers are more advantaged as compared to the others, simply the institutional contracts are to be based on the clear criteria that combine indicators related to the potential beneficiaries, technology used, prior performance and the challenges faced by the specific regions. Institutional capacity of the Ministry of Health (MoH) and National Health Institute (NHIC) The institutional capacity of the MoH to hold accountable NHIC and the providers of the health providers as well as capacity of NHIC to hold accountable the providers of the health services are essential for the improvement of the accountability mechanisms in the health care system. Currently MoH has one vice-minister and 3 directorates that deal with the health insurance policy: Directorate on medical insurance, Directorate on individual medical services and Directorate on mother and child health. The vice-minister of MoH responsible for the health insurance is a former deputy director general of the NHIC, who maintains direct contacts and links with the NHIC. The Directorate on medical insurance is responsible for the health insurance policy and the functioning of the NHIC13. This directorate has just 3 staff employees, the head of the directorate ha medical background and some experience in working with the health insurance system; the other two persons do not have any experience in health insurance system. One person is a recent graduate of the legal department and another one is in pre-pension age. The directorate responsible for the individual medical services has the mandate over the provision of all individual medical services; insurance based provision of services is also considered as included. The later has 4 employees; all have medical background. The directorates lack competences in the area of health insurance, health economics and finances, institutional economics, management by institutional contracts. De facto, the two directorates seeded the insurance policy functions to NHIC. Policy-wise NHIC is accountable directly to the Cabinet of Ministers where, there is only one councilor responsible for the health area reporting to the prime-minister. Major policies in health insurance, in practice, are drafted and lobbied by NHIC. The key policies: law on insurance funds, health insurance service basket, insurance premium, and cost of compensated medicaments are drafted by the NHIC and presented to the Cabinet. The role of MoH is very modest, de facto MoH presents only opinions. Based on the law on NHIC, MoH does not hold accountability instruments towards the administrative budget of NHI; there is only one representative (out of 12) of MoH in the governing Board of NHIC. Graph 29: Administrative costs in health care sector
13 Additionally head of the Financial and Economic Directorate of the MoH is the chair of the Censor Commission of the NHIC
Shadow Report on the Implementation of the Covenant on Social, Cultural and Economic Rights: 2003-09 Resource Center for Human Rights (CReDO), www.CReDO.md, Roma National Center (RNC), www.ROMA.md
20
4,6759063644
2,823929300
11,500
6,971
603,566
8,300
9,958
13,190
773
6,300
656391
9,351
2,9512302,3093,450
0
5,000
10,000
15,000
20,000
25,000
30,000
35,000
MoH CMS NHIC AM CNEAS CMP
Administative costs of central executive institutions in health care area, thousand lei
Capitalinvestment
Inventories
Travelcosts
ProductsandservicesHumanresources
Source: Budgetary analysis in health care sector, 2007 Conclusions on promotion of accountability in health sector From the stakeholder perspective, accountability requires availability and provision of the information. The key stakeholders of the health care system and the indicator of the accountability include: Graph 43: Opportunities for accountability lines strengthening in health care sector
Stakeholder (interest, influence)
Accountability indicators Accountability mechanisms
Households – consumer of quality health services, utility maximization, weak influence
Accessibility, quality of service, flexible choice of service provider, minimized out-of-pocket payment, satisfaction
Relation to service provider through insurance policy, informed volume and cost of services and
Society – quality of health services, public value for money, efficiency of services, weak influence
Corruption decreased, health system transparent and accessibly, cost is paid for the best value available
Transparency of policy process, transparency of financial information
Rayon administration – founders of hospital, coordination of health services at local level, maximization of electoral visibility, maximization of influence over hospital administration (staffing), weak influence
Health providers keep rayon consumers happy, use of funds by the hospital
Approval of the non-insurance part of the budget, transparency of the total hospital budget,
MoH – health policy holder, maximization of electoral visibility, maximization of control over health sector institutions, including NHI and service providers, moderate to
Trust in health policy and health service quality, decreased corruption,
Important and key role in the financial health policy, participation in the health policy elaboration,
Shadow Report on the Implementation of the Covenant on Social, Cultural and Economic Rights: 2003-09 Resource Center for Human Rights (CReDO), www.CReDO.md, Roma National Center (RNC), www.ROMA.md
21
strong influence NHI – health financial policy developer and implementer, efficiency and sustainability of insurance health financing, maximization of role in health policy, maximization of financial resources in health, strong influence
Money spend by providers as contracted,
Individual contracts
Centers for primary health care – provider of health services, maximization of professional reputation and cost of services, competes with specialized and hospital care, weak influence
Customer accountability
Hospitals – provider of health services, maximization of professional reputation and cost of services, competes with specialized, moderate influence
Customer accountability
Private providers of health services - provider of health services, maximization of professional reputation, access to insurance funds, competes with public providers, weak influence
Accessibility and efficiency in health insurance, price and cost responding to market rules, contracting is clear, predictable and fair
Customer accountability
Medical professional groups – maximization of professional reputation, financial resources, technology, moderate influence
Health finances pay adequately for the medical profession
Cost of labour comparable and attractive
The analysis shows that most influential members of health policy elaboration and implementation community are NHIC (finances, technology, extended autonomy) followed by MoH (non-insurance finances, administrative appointments of hospital administrators, accreditation policy), Hospital providers and medical profession groups (major beneficiaries of health expenditures). These actors drive the current health policy framework. With low technological and professional competences within MoH, the policy is misbalanced towards the financial interests of NHIC and hospitals (and related medical groups). Customer accountability mechanisms are absent, as well as market accountability mechanisms. The qualitative performance indicators are almost absent from the policy-making health agenda. Conclusions and recomendations: Based on this analysis, the report proposes the development of the additional accountability mechanisms. Institutional accountability mechanisms should include:
- NHIC contracts should be negotiated for each category of health insurance (hospital, family doctors, etc),
Shadow Report on the Implementation of the Covenant on Social, Cultural and Economic Rights: 2003-09 Resource Center for Human Rights (CReDO), www.CReDO.md, Roma National Center (RNC), www.ROMA.md
22
- NHIC contracts with providers of health services include input-process-output-outcome indicators,
- NHIC institutional contracts and their execution published and accessible for the public review and cross institutional comparison,
- NHIC contracts to be based on the justifiable criteria of beneficiaries per region, technology and quality used, past performance, stimuli for innovation, as well as to retain additional income for investment in the provision of services,
- NHIC capacity to supervise the contracts’ performance, look into the content of the services and not only the finances of the contracts.
Public accountability mechanisms should include:
- Transparency and reporting on the overall budgets of the health providers, including performance by the medical service providers (hospitals, family doctors, etc),
- MoH substantial role in health policy (law on insurance budgets, insurance service basket, administrative budget of NHIC),
- MoH policy-making capacity in the insurance area strengthened and greater involvement of the private-public partnerships,
- Rayon health authorities should play important role in overall hospital budgeting process and review of the performance,
- Health care providers patients’ satisfaction surveys and evaluations (to be taken into consideration for the accreditation and budget allocation),
Market accountability mechanisms should include:
- Cost-by-service and value created by the current contracted providers of medical services (hospitals and family doctors),
- Clear eligibility of private providers into the insurance market (primary family doctors and the providers of specialized services).
Coruption Phenomenon in Educational System of Moldova14
The corruption phenomena in higher education persist. The presented below information provide an overview of the students perception about it. 57.3 % of subjects believe that the problem with the corruption in higher education is not controlled by the concerned authorities
z 76,7 % of students have heard about illegal ways of admission; z 38,4 % believe that in their faculties there are possibilities to bypass the official selection
process; z 41 % of students are considered to have used illegal methods of admission at the faculties; z 39,9% of subjects have colleagues and friends who bypassed the official selection process;
The most frequent methods of illegal admission
- 36.1%, A possibility for admission test scores to be illegally changed? - 17,5% Case of illegal activities concerning students ranked in the admissions list (such as
improper rearrangement of the list)? - 32, 4% Any illegal change in the quotas of those who pay and don’t pay?
14 See report presentation “Corruption in Higher Education in the Republic of Moldova”, by Student Incoruptus, and Managing Corruption in Higher Education of Moldova, by Vanessa Valentino

Shadow Report on the Implementation of the Covenant on Social, Cultural and Economic Rights: 2003-09 Resource Center for Human Rights (CReDO), www.CReDO.md, Roma National Center (RNC), www.ROMA.md
23
- 36,6% Exam used for an admission that is received as a part of being tutored by a University professor?
- 37, 9% Criteria in admissions tests used for admitting students who can bribe?
Regarding the admissions, the respondents provide this perception:
z 12.5% have been in a situation of buying the admission exam z 5.6% accepted the offer made by mediator, professor, colleague, administrator invoking reasons
like: z To pass my exams z Because everybody else did it z To get better results z To receive a scholarship (to be a budget student) z It was easier this way
3.3% didn’t accept the offer because: z Because I trust my knowledge z It is against my principles z I was sure that I am able to pass the exams with my own forces z I was not sure about the success z I did not have the necessary amount
The reasons of not reporting the corrupted person are:
z I didn’t consider this as necessary z It could have caused me troubles z It was for my own use z The competent bodies are not able of solving anything z He/she is a good friend z I did not know whom to turn to
3,8% of subjects have bypassed the official selection process by:
? Offering money to the teacher ? Paying the dean ? Buying the admission exams ? Through particular hours ? Through intermediaries
z 22.5% would agreed to be illegally accepted in the faculty knowing that they wouldn’t be caught z The acceptable penalties if they were caught in an illegal admission activity:
z Expulsion and the rigorous verification the next time during the admission exams z Penalty by doubling/tripling the paid amount z Any penalties is not acceptable z To punish both parties according to the law z Repeating the year / no admission at any other university during that year z Harsh reproof z No scholarship and payment of the contract z I would not avoid it z Not to allow to continue the studies at that university
z 13.000 students in Moldova have been in a situation of buying an admission exam. 6.000 of them
have accepted the offer. z 24.000 students would not mind to be admitted at the university using some illegal method, if
they will not be caught. Perception of about the Grades
z 46% of subjects have heard about bribing for exams
Shadow Report on the Implementation of the Covenant on Social, Cultural and Economic Rights: 2003-09 Resource Center for Human Rights (CReDO), www.CReDO.md, Roma National Center (RNC), www.ROMA.md
24
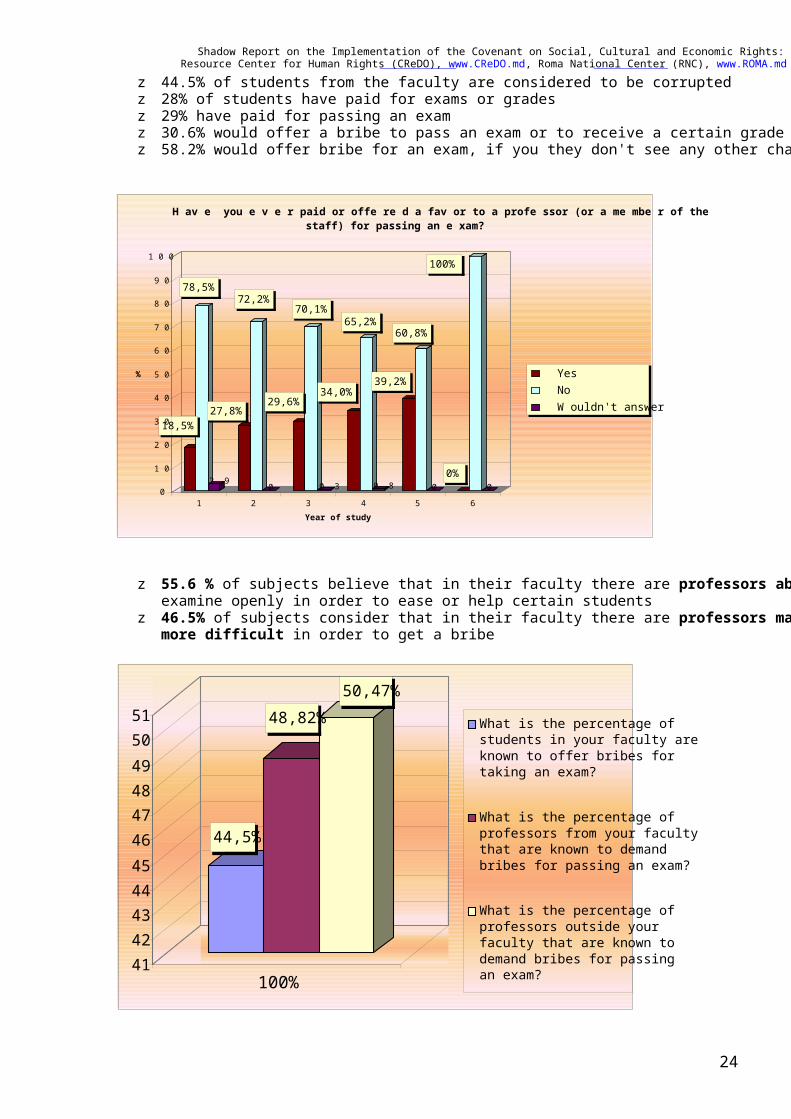
z 44.5% of students from the faculty are considered to be corrupted z 28% of students have paid for exams or grades z 29% have paid for passing an exam z 30.6% would offer a bribe to pass an exam or to receive a certain grade z 58.2% would offer bribe for an exam, if you they don't see any other chance of passing
z 55.6 % of subjects believe that in their faculty there are professors abusing their right to examine openly in order to ease or help certain students
z 46.5% of subjects consider that in their faculty there are professors making their examinations more difficult in order to get a bribe
44,5%
48,82%50,47%
4142434445464748495051
100%
What is the percentage ofstudents in your faculty areknown to offer bribes fortaking an exam?
What is the percentage ofprofessors from your facultythat are known to demandbribes for passing an exam?
What is the percentage ofprofessors outside yourfaculty that are known todemand bribes for passingan exam?
18,5%
78,5%
2 ,9
27,8%
72,2%
0
29,6%
70,1%
0 ,3
34,0%
65,2%
0 ,8
39,2%
60,8%
00%
100%
00
1 0
2 0
3 0
4 0
5 0
6 0
7 0
8 0
9 0
1 0 0
%
1 2 3 4 5 6Year of study
H av e you e v e r paid or offe re d a fav or to a profe ssor (or a me mbe r of the staff) for passing an e xam?
Yes No W ouldn't answer

Shadow Report on the Implementation of the Covenant on Social, Cultural and Economic Rights: 2003-09 Resource Center for Human Rights (CReDO), www.CReDO.md, Roma National Center (RNC), www.ROMA.md
25
z 18.3 % would report if they heard about case of bribing for taking an exam to:
z Dean – 7.2% z Students’ organizations – 4.9% z Administration – 3.5% z Police – 2.2%
z 64.6% wouldn’t report because z Denunciation of one single case would not change anything z I am afraid of the consequences z It is only about the people who take and give bribe z I can not prove it z The teachers are to blame z It is not correct related to my colleagues z Maybe I will give bribe someday too z I do not want to look ridiculous z I do not know whom to address z Teachers take bribe to survive, due to the law salaries
The attitude of the student’s parents position towards giving bribe is the following:
z They are totally against – 45.7 % z They do not know about bribe and do not give anything – 11% z They give me money to bribe, if I don’t pass exams or to get higher marks – 8.6% z They would be ready to bribe – 6,8% z I am not interested in their opinion – 5.3% z They do not give money to me, but take bribing as something normal – 3.4% z They are indifferent towards it – 2% z They suggest me to bribe – 2.0%
58,4 % of respondents consider that students that live in a dormitory, have paid or done a favor or given a gift to a member of the administration in order to get the place in the dorm 69,2 % consider a university administrator to be a profitable job
Shadow Report on the Implementation of the Covenant on Social, Cultural and Economic Rights: 2003-09 Resource Center for Human Rights (CReDO), www.CReDO.md, Roma National Center (RNC), www.ROMA.md
26
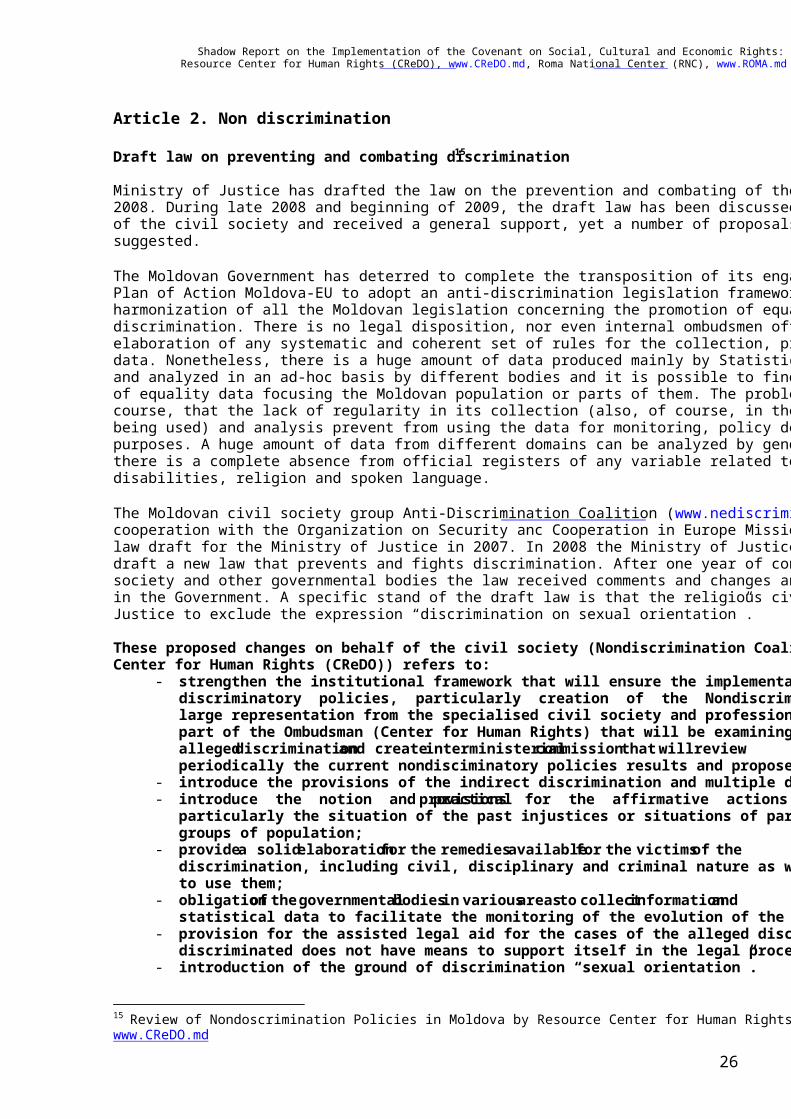
Article 2. Non discrimination Draft law on preventing and combating discrimination15 Ministry of Justice has drafted the law on the prevention and combating of the discrimination in late 2008. During late 2008 and beginning of 2009, the draft law has been discussed with the representatives of the civil society and received a general support, yet a number of proposals to improve have been suggested. The Moldovan Government has deterred to complete the transposition of its engagement according to the Plan of Action Moldova-EU to adopt an anti-discrimination legislation framework, which aims at the harmonization of all the Moldovan legislation concerning the promotion of equality and the banning of discrimination. There is no legal disposition, nor even internal ombudsmen offices rules, requiring the elaboration of any systematic and coherent set of rules for the collection, production and uses of equality data. Nonetheless, there is a huge amount of data produced mainly by Statistics of Moldovan Government and analyzed in an ad-hoc basis by different bodies and it is possible to find the whole repertoire of types of equality data focusing the Moldovan population or parts of them. The problem with all this data is, of course, that the lack of regularity in its collection (also, of course, in the methods and operationalisations being used) and analysis prevent from using the data for monitoring, policy design and policy evaluation purposes. A huge amount of data from different domains can be analyzed by gender, origin and age, but there is a complete absence from official registers of any variable related to sexual orientation, disabilities, religion and spoken language. The Moldovan civil society group Anti-Discrimination Coalition (www.nediscriminare.md) in cooperation with the Organization on Security anc Cooperation in Europe Mission to Moldova proposed a law draft for the Ministry of Justice in 2007. In 2008 the Ministry of Justice has launched an initiative to draft a new law that prevents and fights discrimination. After one year of consultation with the civil society and other governmental bodies the law received comments and changes and was send for review in the Government. A specific stand of the draft law is that the religious civil society lobby Ministry of Justice to exclude the expression “discrimination on sexual orientation”.
These proposed changes on behalf of the civil society (Nondiscrimination Coalition, Resource Center for Human Rights (CReDO)) refers to:
- strengthen the institutional framework that will ensure the implementation of the non-discriminatory policies, particularly creation of the Nondiscrimination Council (with large representation from the specialised civil society and professional associations), as part of the Ombudsman (Center for Human Rights) that will be examining cases of the alleged discrimination and create interministerial commission that will review periodically the current nondisciminatory policies results and propose changes;
- introduce the provisions of the indirect discrimination and multiple discrimination - introduce the notion and practical provisions for the affirmative actions to target
particularly the situation of the past injustices or situations of particularly disadvantaged groups of population;
- provide a solid elaboration for the remedies available for the victims of the discrimination, including civil, disciplinary and criminal nature as well as detailed steps to use them;
- obligation of the governmental bodies in various areas to collect information and statistical data to facilitate the monitoring of the evolution of the non-discrimination;
- provision for the assisted legal aid for the cases of the alleged discrimination when the discriminated does not have means to support itself in the legal proceedings;
- introduction of the ground of discrimination “sexual orientation”. 15 Review of Nondoscrimination Policies in Moldova by Resource Center for Human Rights (CReDO), 2009, www.CReDO.md
Shadow Report on the Implementation of the Covenant on Social, Cultural and Economic Rights: 2003-09 Resource Center for Human Rights (CReDO), www.CReDO.md, Roma National Center (RNC), www.ROMA.md
27
The proposals for the improvement of the draft law on prevention and combating of the discrimination have not been considered by the Ministry of Justice. The new Government Program of Activities: 2009-2013 does not provide for the adoption of the legislation that prevents and combats discrimination. Government sources refer to the draft Action Plan on Human Rights elaborated by the previous government, that provide the elaboration and adoption of the law on prevention and combating of the discrimination. Roma situation16 The Centre for Human Rights of Moldova has only about 5 cases of discrimination by ethnic principle. No one of them was investigated by the criminal authorities in accordance with 176 and 346 of Criminal Code of the Republic of Moldova. Research of Roma National Center shows that there is lack of information regarding this issue. In February 2008 the Moldovan Government has submitted its periodic report to CERD Committee and thus has failed to answer all this questions regarding government initiatives towards improving the employment, housing, healthcare, education, social assistance and access to public services for Roma people. The official report provides description of the various actions undertaken by public and private actors that is only insignificantly improves the situation of Roma. On the basis of the report it is difficult to judge the extent to which the situation of Roma can be improved. The actions of the public authorities as described in the official report primarily rely on the following information is based on the comprehensive research provided in the reports of the Center of Moldovan Human Rights NGOs (CReDO) and Roma National Center.
- Material situation Roma communities’ material situation is extremely poor in comparative and absolute standards. The study has taken the comparative approach to the non Roma communities of the administratively related communes and comparatively to Ungheni or Chisinau judet settlements as well as to the generally accepted living standards. All of these comparisons could hardly be compared. Schinoasa, Ursari, Parcani, Huzun and Stejareni communities are still among the worst cases of the extremely inferior level of material conditions. Vulcanesti and Bursuc are somewhat better compared to the previous. Paved or hard covered roads to or within the community were inexistent, unless a regional road would pass through the community thus the access was precluded in the time of heavy rains or snows, especially in autumn, spring and winter. Researching the public allocations for roads has revealed the pattern for the systematic negligence for Roma communities. Central government allocations or international funding agencies programs (Social Investment Fund, etc) have not been sensitive towards the Roma communities, while non-Roma villages of the same commune have received allocations for the renovations and building upon the decision of the local and regional decisionmaking bodies. In practice, the team has not found any of the external funding and allocations into Roma villages. The most characteristic were the example of Schinoasa, Vulcanesti, Parcani, Huzun and Stejareni communities that are situated couple of km off the main road so the people of community had to carry ill people in hands up to the main road should they need an urgent medical intervention. There was not even hundred meters of hard-paved road in Roma villages. Generally houses of three rooms are common wide, still people live in only one room during cold times and men stay outside during summer over the night. The houses had only natural land ground. For heating, left over of wood or animal residues are used. For instance, in Schinoasa village one man was sentenced to 6 months for cutting one dry tree to keep the worm of his house with three children. People basically use just basic alimentation product cornflower, potatoes and some vegetables grown up during the summer. Humanitarian aid, when reached the villages, is a very important source for survival. Meat or fish is practically absent from diet. Children wear nothing during the worm times or just clothes donated through humanitarian aid during cold times. Second hand and humanitarian aid clothes are the prime source for them. In majority of cases, as is the case of Schinoasa, Ursari, Parcani no shops of any kind
16 Human Rights report on the Situation of Roma in Moldova, by Roma National Center, www.roma.md, 2009
Shadow Report on the Implementation of the Covenant on Social, Cultural and Economic Rights: 2003-09 Resource Center for Human Rights (CReDO), www.CReDO.md, Roma National Center (RNC), www.ROMA.md
28
(food, clothes, medicine, etc) exist. Health care is limited to a medical point in all those places (Schinoasa exception) that would be open several hours a day and operating upon the requests. Pharmaceutical points have been considered to be removed by public authorities as considered costineffective; no allocations are given to the public health care from central or local budgets. Information comes only through people coming and going out of community. Nobody subscribes to papers or listen to radio, etc for lacking money to pay. No telephone connection exists in majority of communities, as is the example of Ursari village and Schinoasa community. No running water or wells and access to drinking water are a general features for the communities. For instance, in Schinoasa community with population of about 500 persons there were only 4 wells of which only two used for drinking purposes, but even there, the water was already visibly bad. In another example, in Ursari village, people complained of two wells drinking water as if left over the night, some condensate would be clearly visible. In majority of cases no electricity had been available for different reasons of lack of resources to pay or electricity system destroyed. For instance in Schinoasa village, the community was disconnected totally more five years and in another instance in Ursari village, as it situated on the main road, only some of the people would have the electricity close to the next Moldovan village and around the school.
- Access to income generation activities After the establishment of Moldovan independence, Roma were systematically denied access to the assets of collective farms during the privatisation process. Land is the major asset and survival resource in the primarily rural economy of Moldova. Roma communities have traditionally been identified as “settlements without future” (asezaminte fara perspectiva), a term which set them outside the system of local governance and set outside the target of public expenditure and allocation of public finances for decades. By treating Roma villages and settlements as temporary, makeshift “settlements” of transient people (even if they were actually permanent communities that had existed for many years), non-Roma political leaders could avoid directing resources toward the political and administrative organization of Roma communities, effectively ignoring their existence. Thus the Roma “settlements” traditionally lacked local mayoralties, which would allow them to tap into the funding system, which flowed from the central government. These policies substantially economically and socially disadvantaged the people of Roma communities in Soviet times, and this pattern of deprivation continued after the Moldovan independence. As a result rural Roma were not in a position to claim their share of the country’s resources when the privatization process began. As a guideline for the privatization of Moldovan land, the government created the “Land Code”, Law No. 228-XII, which declared that land would only be granted to individuals who had worked on a kolkhoz, or collective farm, during Soviet times. Though many Roma were excluded because they had never worked on the collective farms (whether or not they were given the opportunity to do so is unclear), even those few Roma individuals who had worked on collective farms were not allocated the shares of land to which they should have been entitled. As the land is the major asset generation and survival source in the rural communities. The rate of participation in the land privatization process, for example, in Schinoasa, a Roma community, is on average 40-50 times less than in nearby non-Roma communities, with the result that nearby fertile land was shifted largely to non-Roma communities. Local authorities qualified only 5% of persons living in Schinoasa for privatization, contrasted with 95% in a neighboring non-Roma community. In Parcani and Ursari the rate of participation in privatization is somewhat higher but in none of the communities reaching 15%, while in non-Roma components of communes it has been never less than 60%. These figures speak for themselves, and they indicate a pervasive pattern of discrimination against Roma individuals and communities. Even if the government simply carried over the discriminatory policies of the past through the structure of its eligibility rules, it has certainly failed to “undertake to guarantee that the rights enunciated in the [ICESCR] will be exercised without discrimination of any kind…”. Since the privatization process has now been completed, the new era in Moldova will unfortunately carry forward the deprivation and disenfranchisement that Roma people have long suffered, unless action is taken to correct the disproportionate and unfair distribution of land among the people of Moldova. Similar patters No job employments opportunities exist in Roma communities either in public or private sectors or in nearby villages as Roma are considered apt to only season works or day-today engagements.
Shadow Report on the Implementation of the Covenant on Social, Cultural and Economic Rights: 2003-09 Resource Center for Human Rights (CReDO), www.CReDO.md, Roma National Center (RNC), www.ROMA.md
29
Comparing with other localities of Moldova inhabited by this national minority, the community from Vulcanesti presents a progress in what regards Roma material situation. Nevertheless, the inhabitants of Vulcanesti community have very little land in their possession. This situation brings a lot of negative consequences upon Roma, making them to search incomes through other methods. As a result of the described practices, Roma community adults would have two primarily sources of income: earning outside of country on agricultural works (Ukraine) for 3-5 months a year and work on daily basis on agricultural works at private individuals. In first instance Roma would be frequently robbed at the border by Ukrainian customs or mafia networks linked with Ukrainian customs (as the project team was given plenty of documented examples) and their season earnings would not averagely exceed 600-700 EURO. In the second case the daily payment would not exceed 0.8-0.9 EURO per day including food. Roma discrimination cases17 Housing In general, the housing issues are related more to poverty and less to justice. There are some cases that say much about vulnerability and instability and are connected to other rights such as health, private life, property and in some cases even to the right to life. Mostly poor living conditions are imposed by the fact that Roma families are big in number and live narrowly in a few square meter dwellings, do not have utilities or are even cut out from them. The housing is also related to the issues of residence registration. Mostly the Roma who do not have registered residence have difficulties in accessing/requesting the housing rights. a) Pinonic Maria had lived in the town of Vatra (Chisinau municipality) for over 40 years and has a domicile registration respectively in Vatra town. She has nine children out of which one is disabled, and with five nephews they live all together. She lives in squalid conditions and is mainly dependant of state’s social assistance as she also cannot work due to her bad health condition. From 1990 on she has approached local authorities to improve her living conditions as her house was in a very bad condition and she was forced to find a new place to live in a 45 m2 basement of a house block. Mrs. Maria Pinonic informed the local authorities about her movement and they accepted to let her stay in the basement of the block house until her situation would be clarified. She improved her conditions thereby connecting herself to a water pipe, electricity and gas thus paying monthly for the utilities. In July 2007 after the local elections Regia Communal Locative of Vatra sent a letter informing Mrs. Pinonic Maria that she has to be evacuated by force. The Parliamentary Commission of the Human Rights, local and central authorities were informed about her situation. For the period of 2007-2008, the local mayor decided that during the cold period Pinonic family can stay in the basement flat and they were offered even some financial support. However till today Mrs. Pinonic was not informed of any improvements in her regard. b) Bogdan Babulina was born and lives in the town of Vatra. She has five children and has lived with her parents for many years. In July 2006 she made a request to local council and asked to be included in the lists for beneficiaries of land for construction. In August 2006, according to the local council the decision was included. In 2007 the planning of the land and the lists of the beneficiaries were made public. However, Mrs. Bogdan Babulina was not on the list. In 2008 a new inquiry was made regarding why she was not on the lists. According to the Mayor, Bogdan Babulina was excluded first because no more sites were available and because she was not entitled longer to be included as the criteria had been changed. c) Olimpiada Bogdan, lives in the village of Maramonovca, Donduseni district with her four children. She is also disabled and dependant of social benefits. From 1983 on, she has approached the local authorities because of her bad living conditions. In an inspection made back in 1983 it was confirmed that the house needs to be demolished and that it is not subjected for repair. New expertise was made in 1996 and 2005 to Mrs. Bogdan Olimpiada’s house stating that the house is not subjected for repair. In September 2007 Mrs. Bogdan Olimpiada made an appeal to the Head of the District Council and requested to be offered either support or a house with better conditions. In October 2007, the council issued the decision nr.3/10 refusing financial support to be provided to Mrs. Bogdan Olimpiada with a reference that such financial means are not available in the local budget. 17 Human Rights report on the Situation of Roma in Moldova, by Roma National Center, www.roma.nd, 2009
Shadow Report on the Implementation of the Covenant on Social, Cultural and Economic Rights: 2003-09 Resource Center for Human Rights (CReDO), www.CReDO.md, Roma National Center (RNC), www.ROMA.md
30
Health Health and medical assistance are basic rights that are protected by the Moldovan Constitution and international conventions. In general, the health situation depends mainly on living conditions, way of life, socio-economic factors and the level of education. The UNDP report “Roma in the Republic of Moldova” from 2006 refers to health indicators (life expectancy, infantile mortality, maternal mortality, etc) that are the most important indicators on human development in every society and these indicators referred to the Roma population are lower than those of the general population of Moldova. On the other hand, the poor health of the Roma people is also indirectly a consequence of unequal treatment on behalf of the doctors, lack of infrastructure and facilities, high costs of medical services and medication. Bogdan Ion from the village of Suruceni, Ialoveni district, had been suffering of tuberculosis from 1983 on and in 2007 his sickness had progressed and was diagnosed as fibro-cavity lung tuberculosis as BAHR +, fourth category. He is categorized as a first-degree invalid. At the same time Mr. Bogdan Ion is dependant of the state’s social benefits that are equivalent of 70 MDL (5 Euro) per month. He also lives with his old mother and is supporting and raising a daughter of 16 years who suffers from the same illness. In March 2007, he was hospitalized in the Phtiziopneumology Clinic Hospital, section number 3 in Chisinau. In the same hospital there were other patients who were treated with 1) Ethionamidi 0,25 and 2) Paraminosalycilic 0,5 – special medication for the gravity of this sickness offered according to the DOTS program, which is financed by Global Fund of combating HIV/AIDS, Tuberculosis and Malaria, under the supervision of the Ministry of Health. In the investigation we found out that he was offered other medication such as 1) Izoniazidă, 2) Cicloserină, 3) Pirazinamidă, 4) Canamicină, 5) Ofloxacină that are considered to be insufficient for Mr. Bogdan. Mr. Bogdan asked his doctor Mr. Sain why he receives this medicine as it does not help him. The doctor replied that he is a gypsy and a poor person. In a letter sent to the Ministry of Health Mr. Bogdan Ion was included later in the special program DOTS. In june 2008, Mr. Bogdan Ion died. LGBT discrimination On 10.05.2008 GenderDoc-M. On 11 May 2008 participants in the Seventh Moldovan Pride were precluded from marching peacefully in support of anti-discrimination legislation and tolerance in the centre of Chisinau. Police did not guarantee the right to freedom of assembly. Large aggressive co-ordinated groups, including extremist religious groups, members of the neo-fascist movement “New Right”, and legionnaires blocked the bus, forced the door, violently hit the windows, and attempted to remove the engine, while shouting “lets get them out and beat them up”.
The police distanced themselves from the event and remained passive observers. GenderDoc-M had informed the local authorities and the Ministry of Internal Affairs as early as 21 April about the route of the march and asked for protection. The law on freedom of assembly of Moldova guarantees peaceful assembly to everyone and obliges the police to guarantee the exercise of this right and the safety of participants. The police did not facilitate the exit of Pride participants from the bus into the street, did not prevent the rival aggressive groups from intervening and through their passivity encouraged an escalation of violence and the build-up of a hostile atmosphere. Independent human rights observers witnessed hate speech, such as “Beat them to death”, “Don’t let them escape”.
About 60 people were blocked in the bus for over 45 minutes. Two unidentified well-built men wearing the signs of the rival groups forced the doors from both sides of the bus and demanded all march materials (banners asking for anti-discrimination law and tolerance, European Union and Moldovan flags and rainbow balloons) as a condition for lifting the blockage of the bus.
According to the estimates of independent observers, between 200 and 400 people surrounded the bus. The core of the crowd were teenagers, some dressed military-style, some wearing black masks and others skinhead-like carrying A4 posters with derogatory messages and signs. The outer ring of the crowd was mostly middle-aged men wearing black clothes who encouraged the former. No police were identified by the observers at the bus, although some six traffic police cars stood approximately 100 meters away without taking any action whatsoever. GenderDoc-M made nine unsuccessful attempts to call the police.
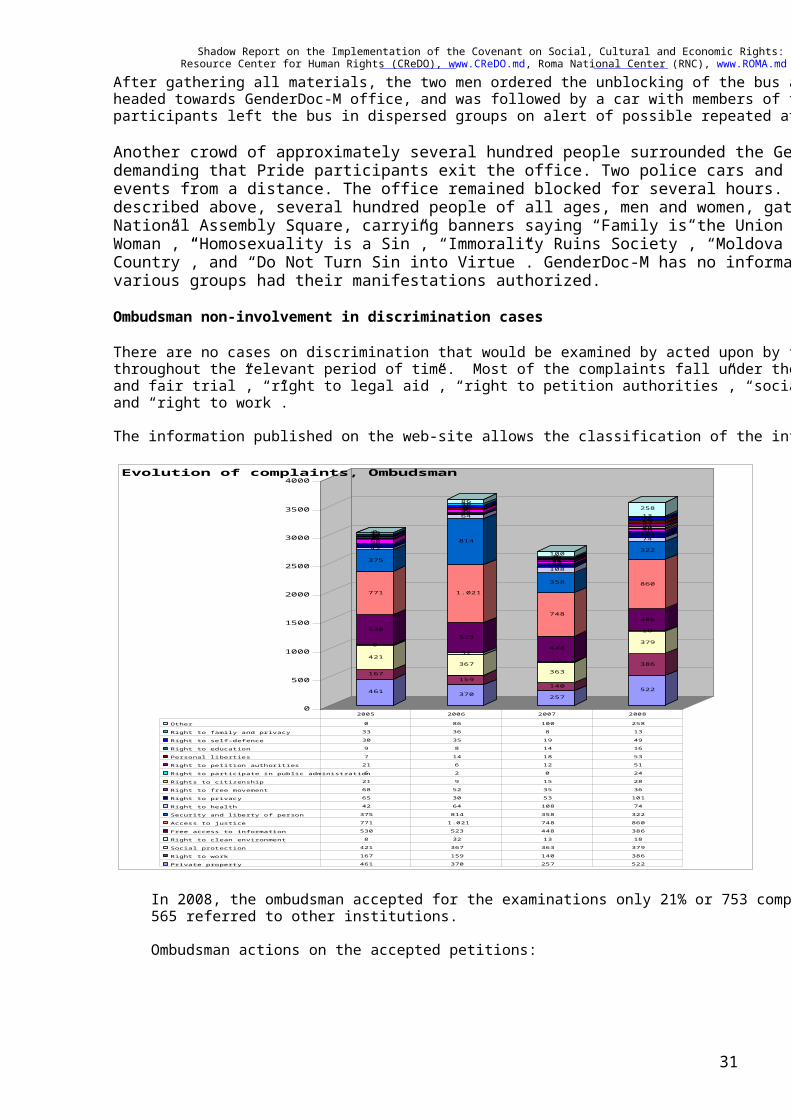
Shadow Report on the Implementation of the Covenant on Social, Cultural and Economic Rights: 2003-09 Resource Center for Human Rights (CReDO), www.CReDO.md, Roma National Center (RNC), www.ROMA.md
31
After gathering all materials, the two men ordered the unblocking of the bus and allowed it to go. The bus headed towards GenderDoc-M office, and was followed by a car with members of the crowd. The Pride participants left the bus in dispersed groups on alert of possible repeated attack by the crowd.
Another crowd of approximately several hundred people surrounded the GenderDoc-M office demanding that Pride participants exit the office. Two police cars and an ambulance observed the events from a distance. The office remained blocked for several hours. In parallel to the events described above, several hundred people of all ages, men and women, gathered at the Great National Assembly Square, carrying banners saying “Family is the Union between Man and Woman”, “Homosexuality is a Sin”, “Immorality Ruins Society”, “Moldova – Christian Country”, and “Do Not Turn Sin into Virtue”. GenderDoc-M has no information whether these various groups had their manifestations authorized.
Ombudsman non-involvement in discrimination cases
There are no cases on discrimination that would be examined by acted upon by the Ombudsman throughout the relevant period of time. Most of the complaints fall under the area of “access to justice and fair trial”, “right to legal aid”, “right to petition authorities”, “social protection”, “private property” and “right to work”. The information published on the web-site allows the classification of the information as below:
461
167
421
8
530
771
375
426568216217930330
370
159
367
32
523
1.021
814
643052926148353686
257
140
363
13
448
748
358
1085335150121814198100
522
386
379
18
386
860
322
741013628245153164913258
0
500
1000
1500
2000
2500
3000
3500
4000Evolution of complaints, Ombudsman
Other 0 86 100 258
Right to family and privacy 33 36 8 13
Right to self-defence 30 35 19 49
Right to education 9 8 14 16
Personal liberties 7 14 18 53
Right to petition authorities 21 6 12 51
Right to participate in public administration6 2 0 24
Rights to citizenship 21 9 15 28
Right to free movement 68 52 35 36
Right to privacy 65 30 53 101
Right to health 42 64 108 74
Security and liberty of person 375 814 358 322
Access to justice 771 1.021 748 860
Free access to information 530 523 448 386
Right to clean environment 8 32 13 18
Social protection 421 367 363 379
Right to work 167 159 140 386
Private property 461 370 257 522
2005 2006 2007 2008
In 2008, the ombudsman accepted for the examinations only 21% or 753 complaints and 44% or 1 565 referred to other institutions. Ombudsman actions on the accepted petitions:
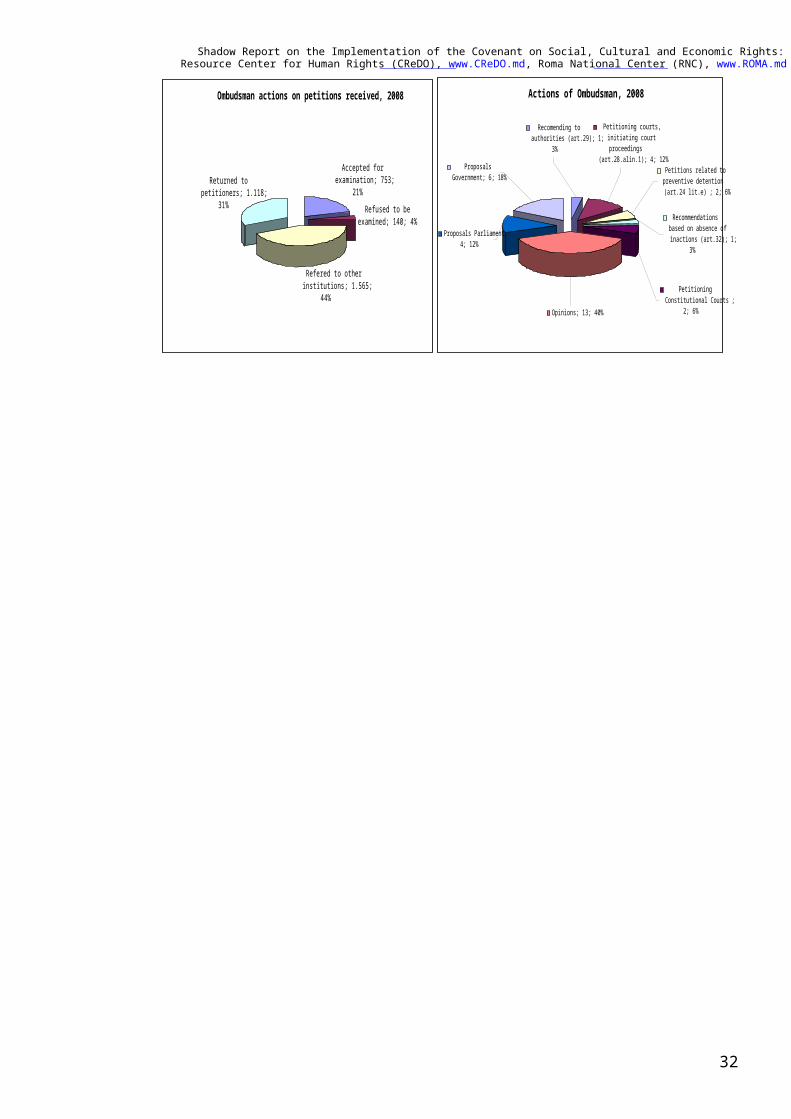
Shadow Report on the Implementation of the Covenant on Social, Cultural and Economic Rights: 2003-09 Resource Center for Human Rights (CReDO), www.CReDO.md, Roma National Center (RNC), www.ROMA.md
32
Ombudsman actions on petitions received, 2008
Accepted for examination; 753;
21%Refused to be
examined; 140; 4%
Refered to other institutions; 1.565;
44%
Returned to petitioners; 1.118;
31%
Actions of Ombudsman, 2008
Recommendations based on absence of inactions (art.32); 1;
3%
Petitions related to preventive detention (art.24 lit.e) ; 2; 6%
Petitioning courts, initiating court proceedings
(art.28.alin.1); 4; 12%
Recomending to authorities (art.29); 1;
3%
Proposals Government; 6; 18%
Petitioning Constitutional Courts ;
2; 6%Opinions; 13; 40%
Proposals Parliament; 4; 12%
Shadow Report on the Implementation of the Covenant on Social, Cultural and Economic Rights: 2003-09 Resource Center for Human Rights (CReDO), www.CReDO.md, Roma National Center (RNC), www.ROMA.md
33
Article 3. Equal right to men and women
Gender Equality18
Increased representation of women at decision making level (from 26.5% in local councils in 2007-40% in 2015 from 13.2% in district councils in 2007 to 25% in 2015 to 18% of women mayors in 2007-25% in 2015 and 22% women MPs in Parliament in 2005 to 30% in 2015) Increasing women's political participation in governance structures is considered one of the basic ways to enhance gender balance in society. In reality, the representation of women in decision-making is highly heterogeneous and depend on the administrative and political events of each year. At local government level, women have extended their representation in leadership structures. Thus, in 2008, the share of women mayors was 17.4%, decreasing from 2007, when this ratio was 18% (before local elections in June 2007). Meanwhile, from 2004 the number of women mayors increased by 24 persons, in 2004 the share of women mayors in total was 14.8%. Regarding the number of women presidents of districts in 2008 has not changed since 2004. Thus, only one woman (3.1% of total) is President of the district. Locally, the only position where women are more numerous than men is the last in the hierarchy, ie consultant / specialist (68.4% women). When it comes to heads of departments / directorates, is relatively balanced gender distribution (47.3% women). The number of counselors of women expanded. Thus the number of district councilors women increased in 2008 and constituted 16.9% of district councilors, compared with 13.2% in 2007. Situation is better in local councils, where the total number of women in local councilors was in 2008 - 28.7%, compared with 26.5% in 2007. In the Legislative power, the current situation is more favorable for women. Thus the number of women deputies in Parliament was just rising from 22% in 2005 up from 25.7% in 2009, the legislature Eighteenth Moldovan Parliament, elected in July 29, 2009, entered 26 Members. However, because the last few weeks there have been changes and new designations within the Government, on the expiry of six months in which Members have the right to combine the new feature with that of Member / as these figures may look different. Regarding representation of women in decision-making in the executive office in Moldova has highlighted the following trends: even if the ministries and other central administrative authorities, there is a gender balance and even distribution of employees in positions of decision as they submit to the hierarchy of decision-making positions, the number of men compared to women decreased. Thus, the positions of Deputy Minister / Deputy Director has certified a percentage below 20% and the Minister / Director, women represented only 26.7%. Although women's representation in local and district councils and the Parliament is growing, finding women in decision-making can not be anticipated, depending largely on how equal opportunities issues are perceived by each party. But proceeding from the fact that the number of women in decision-making positions is growing, if its growth rate will be constant, could the 2015 MDG targets to be achieved
18 See draft Report on the Millenium Development Goals Implementation, UNDP Moldova, 2009
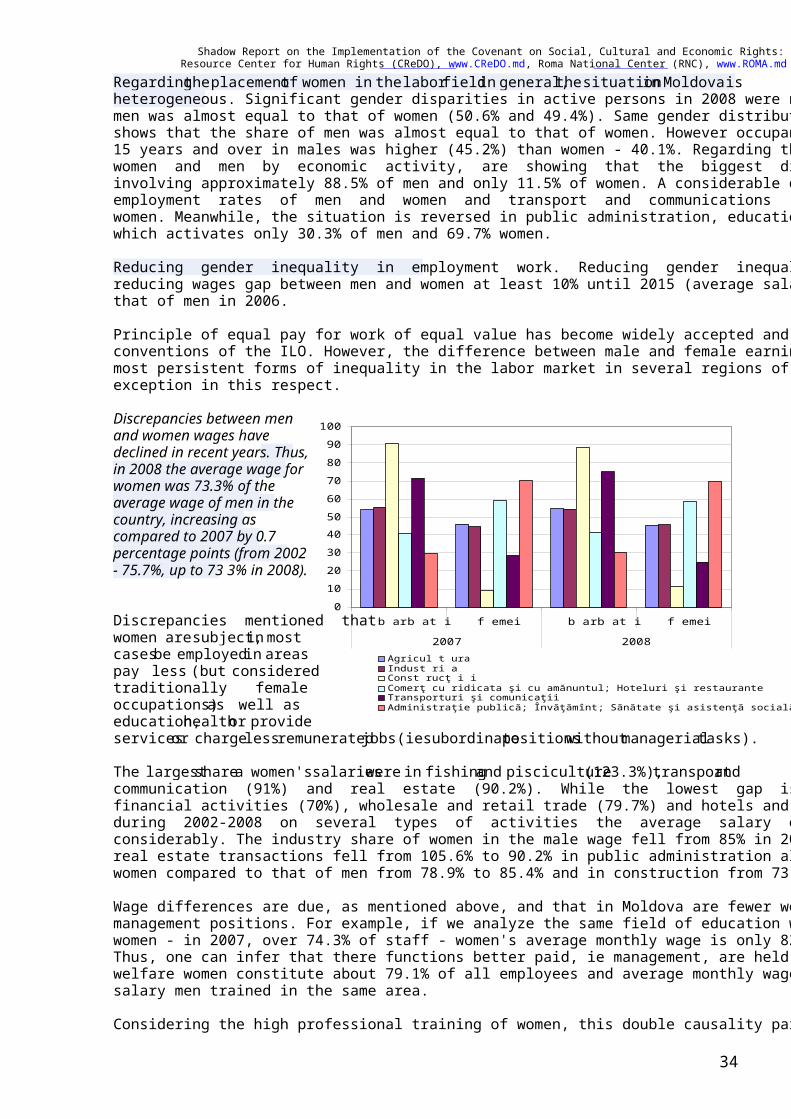
Shadow Report on the Implementation of the Covenant on Social, Cultural and Economic Rights: 2003-09 Resource Center for Human Rights (CReDO), www.CReDO.md, Roma National Center (RNC), www.ROMA.md
34
0102030405060708090
100
b arb at i f emei b arb at i f emei2007 2008
Agricul t uraIndust ri aConst rucţ i iComerţ cu ridicata şi cu amănuntul; Hoteluri şi restauranteTransporturi şi comunicaţiiAdministraţie publică; Învăţămînt; Sănătate şi asistenţă socială
Regarding the placement of women in the labor field in general, the situation in Moldova is heterogeneous. Significant gender disparities in active persons in 2008 were not registered: the number of men was almost equal to that of women (50.6% and 49.4%). Same gender distribution of employment shows that the share of men was almost equal to that of women. However occupancy rate of population 15 years and over in males was higher (45.2%) than women - 40.1%. Regarding the employment rate for women and men by economic activity, are showing that the biggest differences are in construction involving approximately 88.5% of men and only 11.5% of women. A considerable difference between the employment rates of men and women and transport and communications - 75% in men and 25% for women. Meanwhile, the situation is reversed in public administration, education, health and social care which activates only 30.3% of men and 69.7% women. Reducing gender inequality in employment work. Reducing gender inequality in the labor market by reducing wages gap between men and women at least 10% until 2015 (average salary of women is 68.1% that of men in 2006. Principle of equal pay for work of equal value has become widely accepted and is reflected in several conventions of the ILO. However, the difference between male and female earnings remains one of the most persistent forms of inequality in the labor market in several regions of the world. Moldova is no exception in this respect. Discrepancies between men and women wages have declined in recent years. Thus, in 2008 the average wage for women was 73.3% of the average wage of men in the country, increasing as compared to 2007 by 0.7 percentage points (from 2002 - 75.7%, up to 73 3% in 2008). Discrepancies mentioned that women are subject, in most cases be employed in areas pay less (but considered traditionally female occupations) as well as education, health or provide services or charge less remunerated jobs (ie subordinate positions without managerial tasks). The largest share a women's salaries were in fishing and pisciculture (123.3%), transport and communication (91%) and real estate (90.2%). While the lowest gap is recorded in industry (69.5%), financial activities (70%), wholesale and retail trade (79.7%) and hotels and restaurants (79.8%). While during 2002-2008 on several types of activities the average salary of men to women has changed considerably. The industry share of women in the male wage fell from 85% in 2002 to 69.5% in 2008. In real estate transactions fell from 105.6% to 90.2% in public administration also increased the salary of women compared to that of men from 78.9% to 85.4% and in construction from 73.8% to 82.1%. Wage differences are due, as mentioned above, and that in Moldova are fewer women in upper management positions. For example, if we analyze the same field of education where there are more women - in 2007, over 74.3% of staff - women's average monthly wage is only 82.0% of salary men. Thus, one can infer that there functions better paid, ie management, are held by men. Public health and welfare women constitute about 79.1% of all employees and average monthly wage - only 73.4% of salary men trained in the same area. Considering the high professional training of women, this double causality paradox some exclude the
Shadow Report on the Implementation of the Covenant on Social, Cultural and Economic Rights: 2003-09 Resource Center for Human Rights (CReDO), www.CReDO.md, Roma National Center (RNC), www.ROMA.md
35
direct and explicit discrimination based on gender. Moreover, the same paradox is, in turn, precludes the involvement of men in important social activities, but low-paid (eg., Education), because even if a boy likes this job and is intended for her is less likely that he will practice because this area is less well paid and he which under other gender stereotypes must be at the family welfare, can not admit to earn less money than his partner for life. The same thing happens and women, only opposite: although training in areas considered the prerogative of men (% of female students at these colleges is higher than men), women are found in areas less well paid, including due to lifestyle which is interwoven both work and family ambitions. Meanwhile, despite receiving lower remuneration women, their income is more important to support their families, with or without children, because women are more likely than men to use income to purchase food, education services and the medical impact on the welfare of children.
System of pensioning Number of retired women is higher than that of men, and gender structure of the existing pension recipients, indicating the percentage difference between women and men, around 8%. This is due to the fact that women in Moldova live longer than men (about 8 years more). Analysis reveals that the sphere of social protection of gender differences retirement age and expected length of life pension disadvantage both women and men as well. In other words, statistics confirm that women living in Moldova "worse, but more and better men, but less." Preservation of traditional forms of making domestic responsibilities, through over-involvement of women and the natural processes of birth of children, combined with the "socio-culturally determined" child care seems to be somewhat offset "by a women's retirement age in May young. Lack of contribution of women equal to men, due to periods of birth / raising children or the sick and aged care and the gender gap in wages is reflected negatively on the amount of their pensions, which is lower than men. UNIFEM Programme in Moldova conducted a brief analysis of the pension system in terms of gender, which revealed that women have a shorter labor market participation than men, so their contribution period is less than that. It was also established that although the pension calculation formula contains elements that favor women or men, it relies on the contributions of ancient history and thus reduce pension differentiate essential. In conclusion, the current pension system is largely dependent on factors outside the system itself, such as demographic differences between men and women, gender stereotypes in the family and society, traditional gender roles in relation to employment, etc.. There are however some features of the pension system which is reflected on the constant difference between the amount of pensions to men and women.
Shadow Report on the Implementation of the Covenant on Social, Cultural and Economic Rights: 2003-09 Resource Center for Human Rights (CReDO), www.CReDO.md, Roma National Center (RNC), www.ROMA.md
36
Article 6. Right to work, living, steady economic, social and cultural development
Gender and labour market19
Gender analysis of labor market highlight several important issues such as: limiting the opportunities for equal participation of women to men in employment, training and segregation wage discrepancy between men and women, low levels of female entrepreneurship, and lack of state programs to stimulate it, particularly in rural areas. In 1999 the unemployment rate of women were identical to those of men until the age of 50 years, recording lower values in the following age groups. In 2008, the unemployment rate for women was lower than in men. However, unemployment rate among men is higher. Also, more men than women work in conditions of employment that do not meet sanitary standards, is involved in heavy physical work and inadequate lucîrnd in rooms. The number of men is because they are more frequently involved in high risk areas such as construction or transport. If we look at the fields by women, such as education, number of women working in poor conditions is greater for men than himself. Gender analysis of data on facilities and bonuses granted to employees to unfavorable working conditions show that more women than men receive additional leave, reduced working program and bonuses for bad working conditions and more men than women have plus tariff wage and state pension entitlements granted on favorable terms. In conclusion, it appears that women rather have privileges for bad working conditions, while men have more cash bonuses and compensation ("Women and men in Moldova, 2008). In 2007 a group of researchers from the Academy of Economic Studies has conducted an extensive sociological research (1786 women) to analyze quantitative and qualitative situation of women in the labor market. The study provides a data series that come to acknowledge women's disadvantage in the labor market, complete the picture with new data. For example, the results show that 38.1% of businesses consider that women encountering more difficulties than men in the labor market. Also, 42.5% consider that women face discrimination in the labor market situation. Traders recognize that prefer to hire men, even if they have a weaker than training women aspiring to function to "prevent any fluctuations caused by staff going on maternity leave. Traders say that most often discriminate against women occurs in employment (56.7%) while 37.8% believe that this phenomenon occurs mainly in promotion. Surprising and alarming at the same time, is that traders realize that there employees better than the phenomenon of discrimination. Regarding the managerial skills of women, 42.7% of businesses surveyed considered that the organization no women with skills and managerial qualities, and 30.7% are convinced that "only men are the most suitable for job management. For 21.3% of businesses participating in the survey the main reason why women prefer not to high office is that they "need to share work with family, which prevents the performance level work properly. It concludes that: ¬ Women Meet in the labor market more difficulties than men; ¬ There are government policies that aim to protect the interests of women in the labor market; ¬ On the labor market in Moldova is showing many forms of discrimination against women; ¬ There is no anti-discrimination policies and strategies in the organizations; ¬ certifying workers' sexual harassment; ¬ Women in management positions are present in the labor market in a relatively small number; ¬ the increasing involvement of women in the pursuit of informal activities (self); ¬ low involvement of women in developing their business; ¬ Increase discourage unemployed women. 19 draft Report on the Millenium Development Goals Implementation, UNDP Moldova, 2009
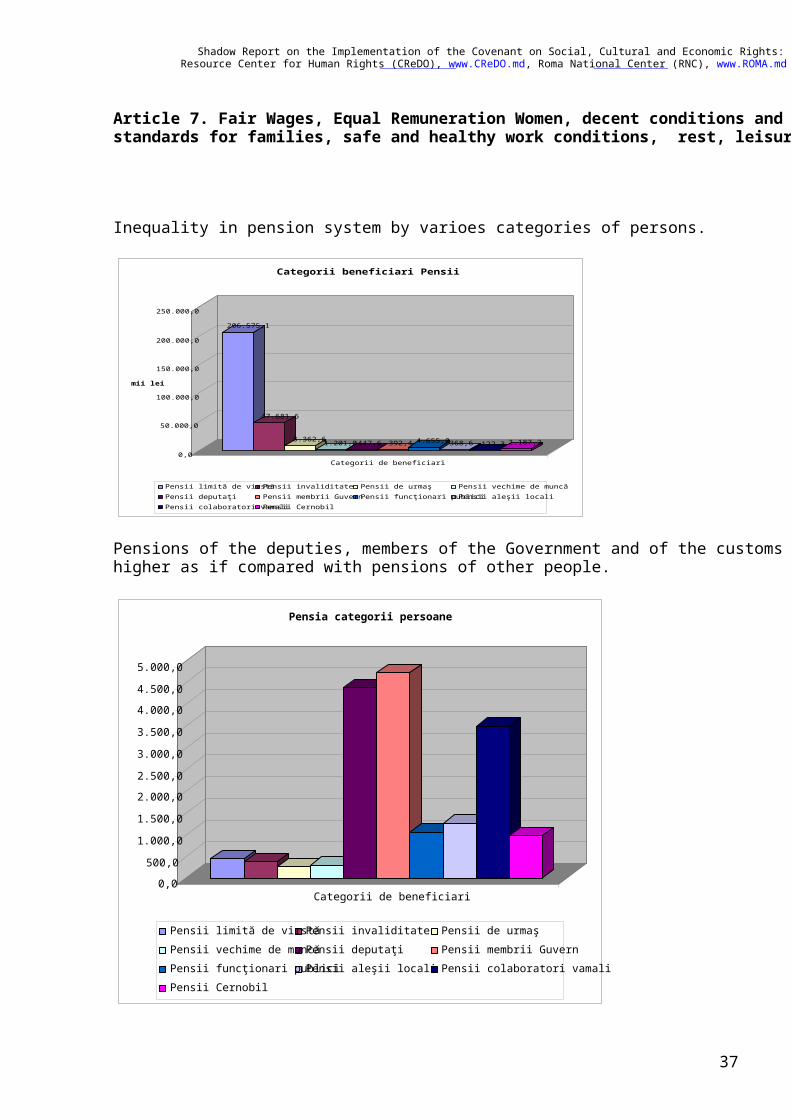
Shadow Report on the Implementation of the Covenant on Social, Cultural and Economic Rights: 2003-09 Resource Center for Human Rights (CReDO), www.CReDO.md, Roma National Center (RNC), www.ROMA.md
37
Article 7. Fair Wages, Equal Remuneration Women, decent conditions and standards for families, safe and healthy work conditions, rest, leisure
Inequality in pension system by varioes categories of persons.
206.575,1
47.681,6
8.362,61.201,0447,6 392,4 4.655,0368,6 122,3 2.187,20,0
50.000,0
100.000,0
150.000,0
200.000,0
250.000,0
mii lei
Categorii de beneficiari
Categorii beneficiari Pensii
Pensii limită de virstăPensii invaliditate Pensii de urmaş Pensii vechime de muncăPensii deputaţi Pensii membrii GuvernPensii funcţionari publiciPensii aleşii localiPensii colaboratori vamaliPensii Cernobil
Pensions of the deputies, members of the Government and of the customs officer are 3-4 times higher as if compared with pensions of other people.
0,0500,0
1.000,01.500,02.000,02.500,03.000,03.500,04.000,04.500,05.000,0
Categorii de beneficiari
Pensia categorii persoane
Pensii limită de virstăPensii invaliditate Pensii de urmaşPensii vechime de muncăPensii deputaţi Pensii membrii GuvernPensii funcţionari publiciPensii aleşii locali Pensii colaboratori vamaliPensii Cernobil

Shadow Report on the Implementation of the Covenant on Social, Cultural and Economic Rights: 2003-09 Resource Center for Human Rights (CReDO), www.CReDO.md, Roma National Center (RNC), www.ROMA.md
38
The average rate for the pension is around 40% of the earned income, while in case of the deputies, government and customs office is around 75% of their income.
Unemployment of Roma20
The account of unemployed persons by ethnic criteria is not realised in the Republic of Moldova. The Plan of Action on Support of Gipsy / Roma from the Republic of Moldova for 2007-2010 foresees realization of the following actions:
- ensuring of specialists training by professions and traditional trades of Roma in professional educational institutions, monitoring of employment of graduates Roma; - informing and consultation of Roma on questions about vacancies on the labour market, assistance to their professional training and retraining; - revival and development of traditional Roma trades, creation of ethno-craft zones in places compact populated by Roma; - assistance to development of private business among Roma.
The Roma and other NGO have not the possibility to carry out effective monitoring of the implementation of the Plan of Actions on Support of Roma, because the Bureau of Interethnic Relations keeps back the information about the ministries and department’s plan of actions for 2007 – 2009 and the information about realization of the Plan in 2007- 200. The representatives of the Roma non-governmental organisations did not participate in elaboration of the Plan of Actions on Support of Gipsy / Roma from the Republic of Moldova for 2007-2010, approved by the Government on 21 December 2006. Therefore the Plan of Actions does not foreseen a number of activities which have to be undertaken for support of Roma and combating of racial discrimination. In accordance to the Plan of actions, ministries and departments have to elaborate annually plans for implementation of the Governmental decision. The only which did not elaborated its internal plan for 2007 is the Bureau of Interethnic Relations. The Roma and other NGO have not the possibility to carry out effective monitoring of the implementation of the Plan of Actions on Support of Roma, because the Bureau of Interethnic Relations keeps back the information about the ministries and department’s plan of actions for 2007 - 2008 and the information about realisation of the Plan in 2007. The state admits the fact that dissimilar look serve an argument to treat (p.49 of Governmental actual report) Roma/Gypsies differently by the local authorities as this in fact serve a cause of racial discrimination. This position appears to misinterpret or fail to take into account Article 1(4) of the Convention, which provides for differences to be made between impermissible racial discrimination and permissible special measures “[...] taken for the sole purpose of securing adequate advancement of certain racial or ethnic groups or individuals requiring such protection as may be necessary in order to ensure such groups or individuals equal enjoyment or exercise of human rights or fundamental freedoms [...]”. 5. To date Government has totally failed in bringing up the issue of Roma on the Governmental agenda. Considering Governmental efforts in adopting special measures to improve Roma situation has shown its interest to nullify the needs of Roma people by allocating for implementation of this policies zero financial support on behalf of State budget. First of all the respective Plan of Action lack a clear mechanism of its implementation as well a specific method to evaluate or monitor the implementation of the Action Plan, nor clear on a timeframe and responsibilities given to relevant public authorities undersigned to implement the Plan of Action. Despite the fact that Roma NGOs has proposed a Plan of Actions (2003) – the respective state public authority has replied in a manner – that reserves its rights to selects those “33 points” without to make them public until the adoption of the Action Plan on 21st December 2006 by the Government.
a) Under the New Action Plan our Center has advocated the Government to consider adherence to Roma Decade of Inclusion 2005-2015 (www.romadecade.org). The Steering
20 Human Rights report on the Situation of Roma in Moldova, by Roma National Center, www.roma.nd, 2009

Shadow Report on the Implementation of the Covenant on Social, Cultural and Economic Rights: 2003-09 Resource Center for Human Rights (CReDO), www.CReDO.md, Roma National Center (RNC), www.ROMA.md
39
Committee of Roma Decade for several times has invited Moldovan Government to its meetings (in May 2005 by Romanian Government, in August-September 2006 by Bulgarian Government, in October 2007 by Hungarian Government) thus showing a completely indifference of attending, even when in some situation financial means where provided by the organizers. Under the arguments of public officials that the member fee is very high (twenty thousands Euro) the World Bank proposed to the Government a special loan, however the benefits of the Decade for improving the Roma situation a fifty times higher. b) RNC is not aware of any single activity where the state has brought to light any measures from the New Action Plan adopted in December 2006 till today February 2008.
Finally, in its Report, the Government has provided a wealth of information on measures taken to secure the cultural rights of minorities.3 Based on the information provided in the Government Report, it is apparent that Government measures to secure the cultural rights of Roma to date pale by comparison with other minorities. For example, in the description of the Government:
• There is half an hour per month of broadcasting "in the Gypsy language" on a state radio station; • There are a number of Romani "ethnic-cultural organizations" officially registered with the
Ministry of Justice; and • The Government's Department for National Relations and Languages has "[taken] part in a
number of meetings, round tables and other activities dedicated to the history of the Ukrainians, Jews, Germans, Gypsies, etc."
Shadow Report on the Implementation of the Covenant on Social, Cultural and Economic Rights: 2003-09 Resource Center for Human Rights (CReDO), www.CReDO.md, Roma National Center (RNC), www.ROMA.md
40
Article 9. Social security and ensurance
Social Assitance and ensurance policies in Moldova21
In this section we provide a discussion of the social policies in Moldova Conclusions of the section on analysis of budget policies in the social area:
- the main beneficiary groups are the retired and disabled persons, - the beneficiary groups receive funds on the basis of outdated compensation or current
situation maintenance patterns, - expenditure programs with a good social value are restricted, - the portion of expenditures for services is extremely small and insufficient for development.
Conclusions on budget expenditures related to social policies:
- the analysis of programs by beneficiary groups offers a clear understanding of the effect of money and services for each beneficiary group,
- all budget expenditure programs are not linked to the income level of people, - the tables regarding the social and public value of expenditure programs reveal the
existence of programs with a low social value, - funding of innovative services, closer to beneficiaries, is accomplished through innovations
introduced by public authorities; the state budgets are conservative and maintain the funding of residential services.
The social policies are a priority of public expenditures. The expenditures for social needs have a constant share of over 30% in the national public budget. The expenditures for health care account for 13%, and those for education – for 16% of the national public budget. The total value of social expenditures accounts for over 60% of the national public budget. This figure maintained its share over the last 3 years. Figure 1
21 Based on Budget Analysis of Administrative Institutions and Sector Policies in the Social Area. Report by Resource Center for Human Rights (CReDO), 2008, www.CReDO.md
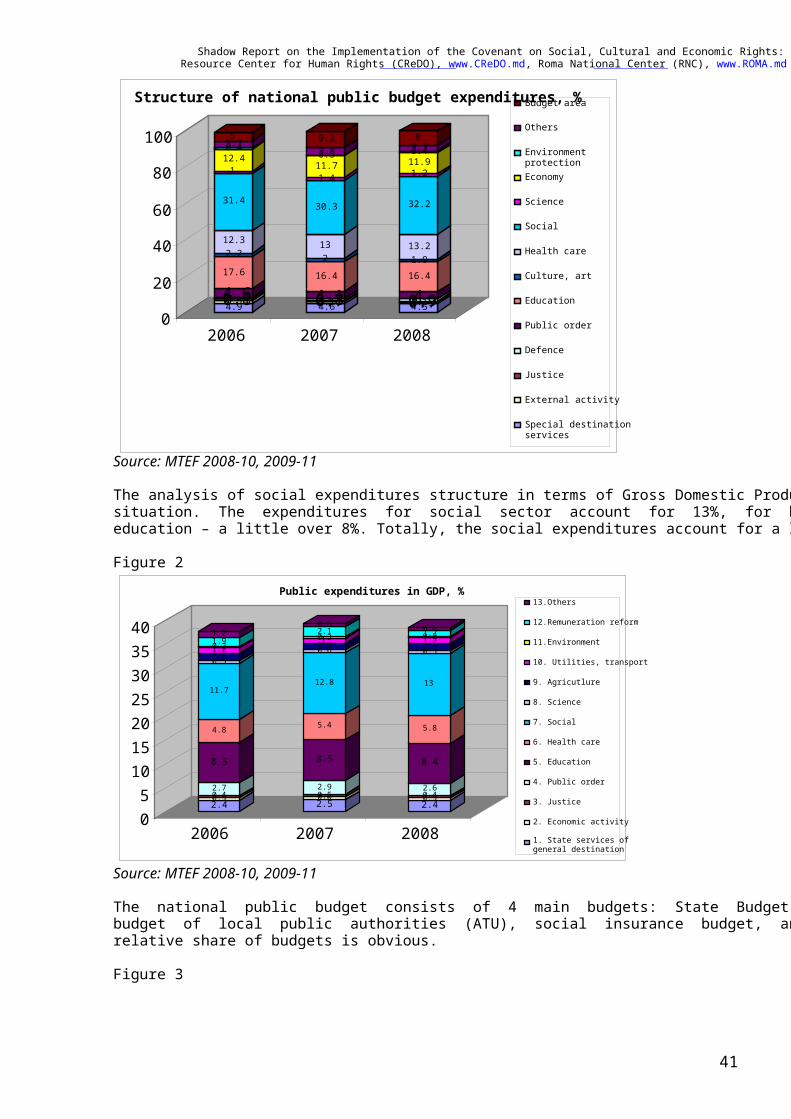
Shadow Report on the Implementation of the Covenant on Social, Cultural and Economic Rights: 2003-09 Resource Center for Human Rights (CReDO), www.CReDO.md, Roma National Center (RNC), www.ROMA.md
41
Source: MTEF 2008-10, 2009-11 The analysis of social expenditures structure in terms of Gross Domestic Product (GDP) reveals a similar situation. The expenditures for social sector account for 13%, for health care – almost 6%, and for education – a little over 8%. Totally, the social expenditures account for a little less than 30% of GDP. Figure 2
Source: MTEF 2008-10, 2009-11 The national public budget consists of 4 main budgets: State Budget (revenues from taxes and fees), budget of local public authorities (ATU), social insurance budget, and health insurance budget. The relative share of budgets is obvious. Figure 3
2.40.50.42.7
8.5
4.8
11.7
0.51.51.20.21.91.2
2.50.60.52.9
8.5
5.4
12.8
0.61.410.32.10.6
2.40.50.42.6
8.4
5.8
13
0.51.51.30.21.20.6
0 5 10 15 20 25 30 35 40
2006 2007 2008
Public expenditures in GDP, %13.Others
12.Remuneration reform 11.Environment
10. Utilities, transport 9. Agricutlure
8. Science
7. Social 6. Health care
5. Education
4. Public order 3. Justice
2. Economic activity 1. State services of general destination
4.91.50.81.14.617.62.212.3
31.4
112.40.43.75
4.61.10.70.84.116.4213
30.3
1.411.70.53.89.2
4.51.10.70.9416.41.913.2
32.2
1.211.90.43.38
0
20
40
60
80
100
2006 2007 2008
Structure of national public budget expenditures, %Budget area
Others
Environmentprotection Economy Science
Social
Health care
Culture, art
Education
Public order
Defence
Justice
External activity Special destination services
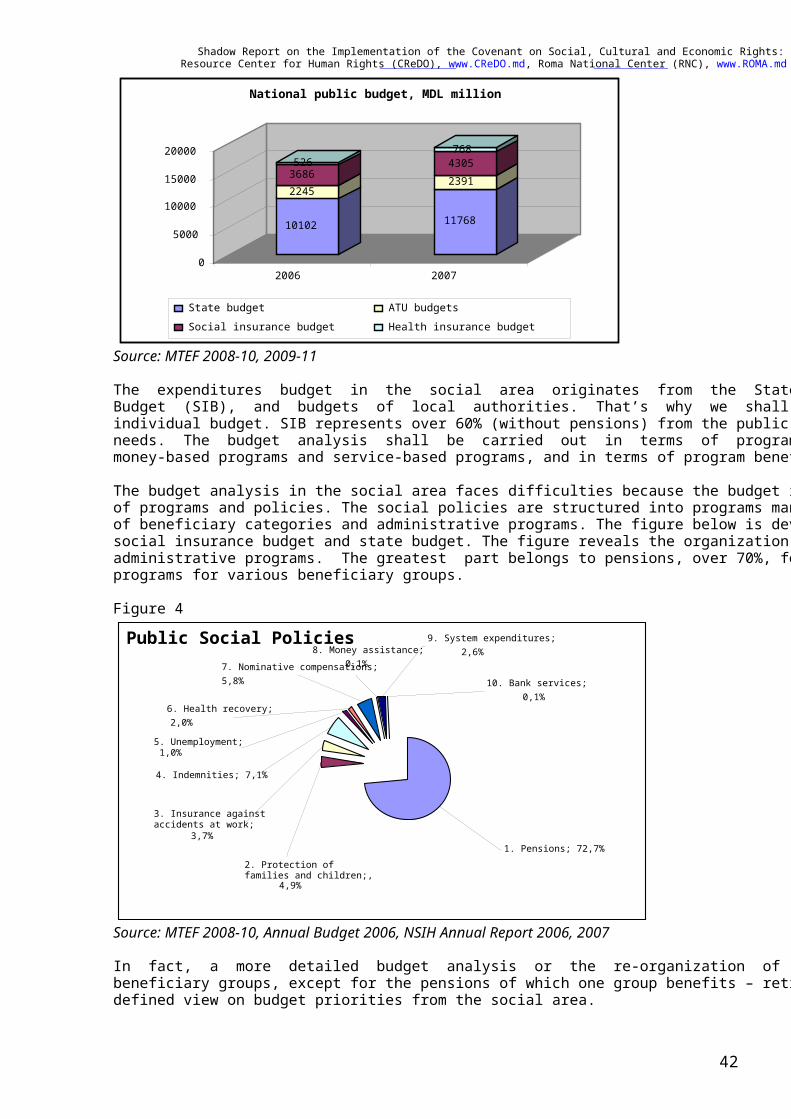
Shadow Report on the Implementation of the Covenant on Social, Cultural and Economic Rights: 2003-09 Resource Center for Human Rights (CReDO), www.CReDO.md, Roma National Center (RNC), www.ROMA.md
42
Source: MTEF 2008-10, 2009-11 The expenditures budget in the social area originates from the State Budget (SB), Social Insurance Budget (SIB), and budgets of local authorities. That’s why we shall analyze the priorities of each individual budget. SIB represents over 60% (without pensions) from the public expenditures for social needs. The budget analysis shall be carried out in terms of programs, including the discrimination of money-based programs and service-based programs, and in terms of program beneficiary groups. The budget analysis in the social area faces difficulties because the budget is not yet formulated in terms of programs and policies. The social policies are structured into programs managed from the perspective of beneficiary categories and administrative programs. The figure below is developed on the basis of the social insurance budget and state budget. The figure reveals the organization of budgets by categories of administrative programs. The greatest part belongs to pensions, over 70%, followed by small parts of programs for various beneficiary groups. Figure 4
Source: MTEF 2008-10, Annual Budget 2006, NSIH Annual Report 2006, 2007 In fact, a more detailed budget analysis or the re-organization of budgets from the social area by beneficiary groups, except for the pensions of which one group benefits – retired persons, offers a well-defined view on budget priorities from the social area.
Public Social Policies
2. Protection of families and children;,
4,9%
3. Insurance against accidents at work;
3,7%
10. Bank services; 0,1%
9. System expenditures; 2,6%8. Money assistance;
0,1%7. Nominative compensations; 5,8%
4. Indemnities; 7,1%
6. Health recovery; 2,0%
1. Pensions; 72,7%
5. Unemployment; 1,0%
10102
2245 3686 526
11768
23914305768
0
5000 10000 15000 20000
2006 2007
National public budget, MDL million
State budget ATU budgetsSocial insurance budget Health insurance budget
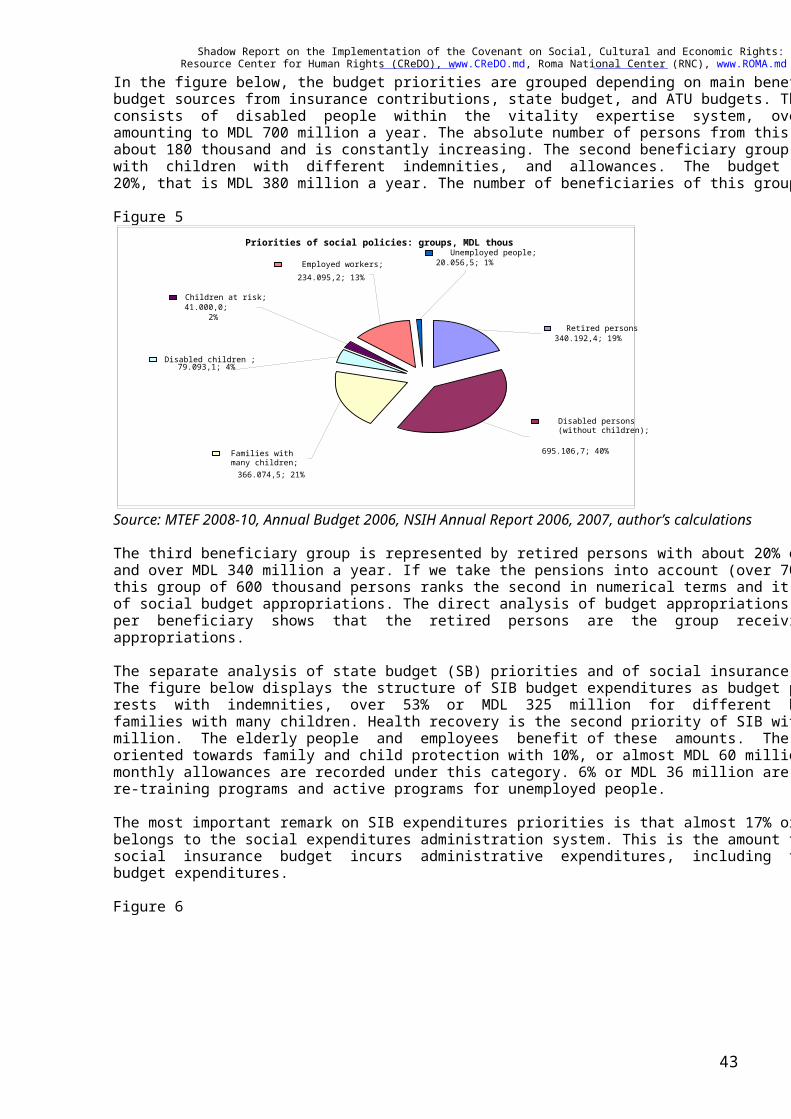
Shadow Report on the Implementation of the Covenant on Social, Cultural and Economic Rights: 2003-09 Resource Center for Human Rights (CReDO), www.CReDO.md, Roma National Center (RNC), www.ROMA.md
43
In the figure below, the budget priorities are grouped depending on main beneficiary groups, including budget sources from insurance contributions, state budget, and ATU budgets. The main beneficiary group consists of disabled people within the vitality expertise system, over 40% of social budget sources amounting to MDL 700 million a year. The absolute number of persons from this beneficiary group is about 180 thousand and is constantly increasing. The second beneficiary group is represented by families with children with different indemnities, and allowances. The budget appropriations account for over 20%, that is MDL 380 million a year. The number of beneficiaries of this group is the greatest of all. Figure 5
Source: MTEF 2008-10, Annual Budget 2006, NSIH Annual Report 2006, 2007, author’s calculations The third beneficiary group is represented by retired persons with about 20% of budget appropriations and over MDL 340 million a year. If we take the pensions into account (over 70% of the social budget), this group of 600 thousand persons ranks the second in numerical terms and it is the greatest beneficiary of social budget appropriations. The direct analysis of budget appropriations that belong to retired persons per beneficiary shows that the retired persons are the group receiving the greatest social budget appropriations. The separate analysis of state budget (SB) priorities and of social insurance budget (SIB) is characteristic. The figure below displays the structure of SIB budget expenditures as budget programs. The greatest part rests with indemnities, over 53% or MDL 325 million for different beneficiary categories, including families with many children. Health recovery is the second priority of SIB with 14%, or almost MDL 90 million. The elderly people and employees benefit of these amounts. The next expenditure category is oriented towards family and child protection with 10%, or almost MDL 60 million. The birth bonuses and monthly allowances are recorded under this category. 6% or MDL 36 million are spent for professional re-training programs and active programs for unemployed people. The most important remark on SIB expenditures priorities is that almost 17% or over MDL 100 million belongs to the social expenditures administration system. This is the amount that belongs to NSIH. The social insurance budget incurs administrative expenditures, including those for administration of state budget expenditures. Figure 6
Priorities of social policies: groups, MDL thous
Retired persons 340.192,4; 19%
Disabled persons (without children);
695.106,7; 40%Families with many children; 366.074,5; 21%
Disabled children ;79.093,1; 4%
Children at risk; 41.000,0;
2%
Unemployed people; 20.056,5; 1%Employed workers;
234.095,2; 13%
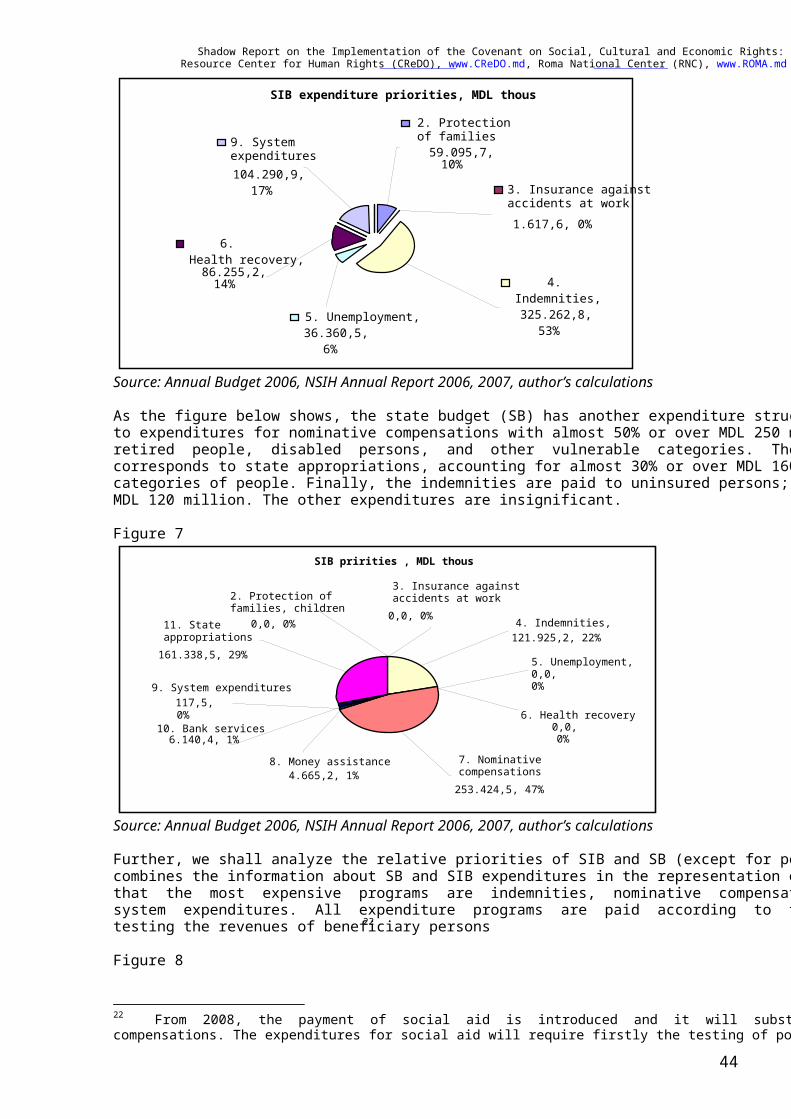
Shadow Report on the Implementation of the Covenant on Social, Cultural and Economic Rights: 2003-09 Resource Center for Human Rights (CReDO), www.CReDO.md, Roma National Center (RNC), www.ROMA.md
44
Source: Annual Budget 2006, NSIH Annual Report 2006, 2007, author’s calculations As the figure below shows, the state budget (SB) has another expenditure structure. The priority belongs to expenditures for nominative compensations with almost 50% or over MDL 250 million that are paid to retired people, disabled persons, and other vulnerable categories. The second expenditure category corresponds to state appropriations, accounting for almost 30% or over MDL 160 million for different categories of people. Finally, the indemnities are paid to uninsured persons; they consume 22% or over MDL 120 million. The other expenditures are insignificant. Figure 7
Source: Annual Budget 2006, NSIH Annual Report 2006, 2007, author’s calculations Further, we shall analyze the relative priorities of SIB and SB (except for pensions). The figure below combines the information about SB and SIB expenditures in the representation of programs. We notice that the most expensive programs are indemnities, nominative compensations, state allowances, and system expenditures. All expenditure programs are paid according to the category principle, without testing the revenues of beneficiary persons22 Figure 8
22 From 2008, the payment of social aid is introduced and it will substitute gradually the nominative compensations. The expenditures for social aid will require firstly the testing of population revenues.
SIB pririties , MDL thous
8. Money assistance 4.665,2, 1%
5. Unemployment, 0,0, 0%
2. Protection of families, children
0,0, 0% 4. Indemnities, 121.925,2, 22%
9. System expenditures 117,5, 0%
10. Bank services 6.140,4, 1%
11. State appropriations 161.338,5, 29%
3. Insurance against accidents at work
0,0, 0%
6. Health recovery 0,0, 0%
7. Nominative compensations253.424,5, 47%
SIB expenditure priorities, MDL thous
2. Protection of families 59.095,7, 10%
9. System expenditures 104.290,9,
17%
6. Health recovery, 86.255,2, 14%
5. Unemployment,36.360,5,
6%
3. Insurance against accidents at work 1.617,6, 0%
4. Indemnities, 325.262,8,
53%
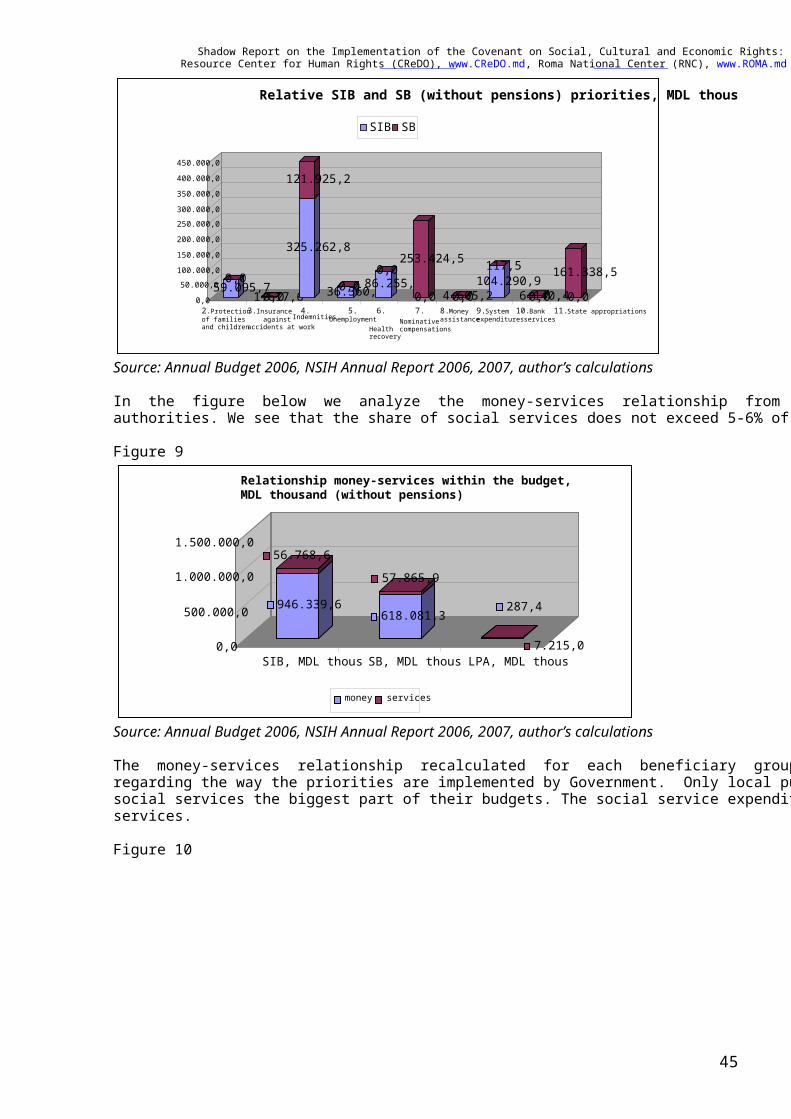
Shadow Report on the Implementation of the Covenant on Social, Cultural and Economic Rights: 2003-09 Resource Center for Human Rights (CReDO), www.CReDO.md, Roma National Center (RNC), www.ROMA.md
45
Source: Annual Budget 2006, NSIH Annual Report 2006, 2007, author’s calculations In the figure below we analyze the money-services relationship from SIB, SB, and budgets of local authorities. We see that the share of social services does not exceed 5-6% of total expenditures. Figure 9
Source: Annual Budget 2006, NSIH Annual Report 2006, 2007, author’s calculations The money-services relationship recalculated for each beneficiary group contains useful information regarding the way the priorities are implemented by Government. Only local public authorities spend for social services the biggest part of their budgets. The social service expenditures are dominated by resident services. Figure 10
946.339,6
56.768,6
618.081,3
57.865,9
287,4
7.215,0 0,0
500.000,0
1.000.000,0
1.500.000,0
SIB, MDL thous SB, MDL thous LPA, MDL thous
Relationship money-services within the budget, MDL thousand (without pensions)
money services
59.095,7 0,01.617,6 0,0
325.262,8
121.925,2
36.360,50,0 86.255,20,0
0,0
253.424,5
0,04.665,2104.290,9117,5
0,06.140,40,0 161.338,5
0,050.000,0 100.000,0150.000,0200.000,0250.000,0300.000,0350.000,0400.000,0450.000,0
2. Protection of families and children
3. Insurance against accidents at work
4.Indemnities
5. Unemployment
6.
Health recovery
7.Nominative compensations
8. Money assistance
9. System expenditures
10. Bank services
11. State appropriations
Relative SIB and SB (without pensions) priorities, MDL thous
SIB SB
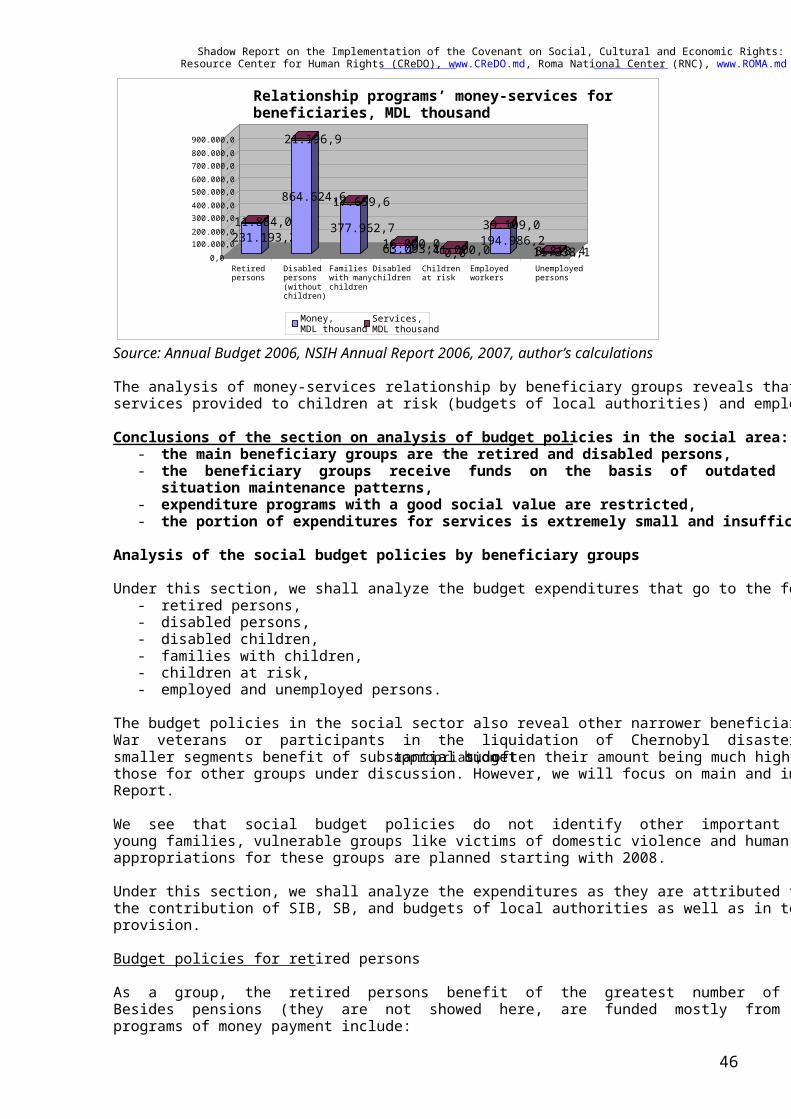
Shadow Report on the Implementation of the Covenant on Social, Cultural and Economic Rights: 2003-09 Resource Center for Human Rights (CReDO), www.CReDO.md, Roma National Center (RNC), www.ROMA.md
46
Source: Annual Budget 2006, NSIH Annual Report 2006, 2007, author’s calculations The analysis of money-services relationship by beneficiary groups reveals that money is spent mainly for services provided to children at risk (budgets of local authorities) and employees – unemployed persons. Conclusions of the section on analysis of budget policies in the social area:
- the main beneficiary groups are the retired and disabled persons, - the beneficiary groups receive funds on the basis of outdated compensation or current
situation maintenance patterns, - expenditure programs with a good social value are restricted, - the portion of expenditures for services is extremely small and insufficient for development.
Analysis of the social budget policies by beneficiary groups Under this section, we shall analyze the budget expenditures that go to the following beneficiary groups:
- retired persons, - disabled persons, - disabled children, - families with children, - children at risk, - employed and unemployed persons.
The budget policies in the social sector also reveal other narrower beneficiary segments, like Afghanistan War veterans or participants in the liquidation of Chernobyl disaster consequences. Sometimes these smaller segments benefit of substantial budget appropriations, often their amount being much higher than those for other groups under discussion. However, we will focus on main and important groups in this Report. We see that social budget policies do not identify other important groups of the society, like: youth, young families, vulnerable groups like victims of domestic violence and human trafficking. Small budget appropriations for these groups are planned starting with 2008. Under this section, we shall analyze the expenditures as they are attributed to beneficiary groups, showing the contribution of SIB, SB, and budgets of local authorities as well as in terms of money and service provision. Budget policies for retired persons As a group, the retired persons benefit of the greatest number of programs and budget expenditures. Besides pensions (they are not showed here, are funded mostly from SIB), the most important budget programs of money payment include:
231.193,2 11.884,0
864.624,6
21.196,9
377.962,7
17.659,6
63.093,116.000,0 0,041.000,0194.986,239.109,0
11.238,1 8.818,4 0,0100.000,0200.000,0300.000,0400.000,0500.000,0600.000,0700.000,0800.000,0900.000,0
Retired persons
Disabled persons (without children)
Families with many children
Disabled children
Children at risk Employed
workers Unemployed persons
Relationship programs’ money-services for beneficiaries, MDL thousand
Money, MDL thousand
Services, MDL thousand
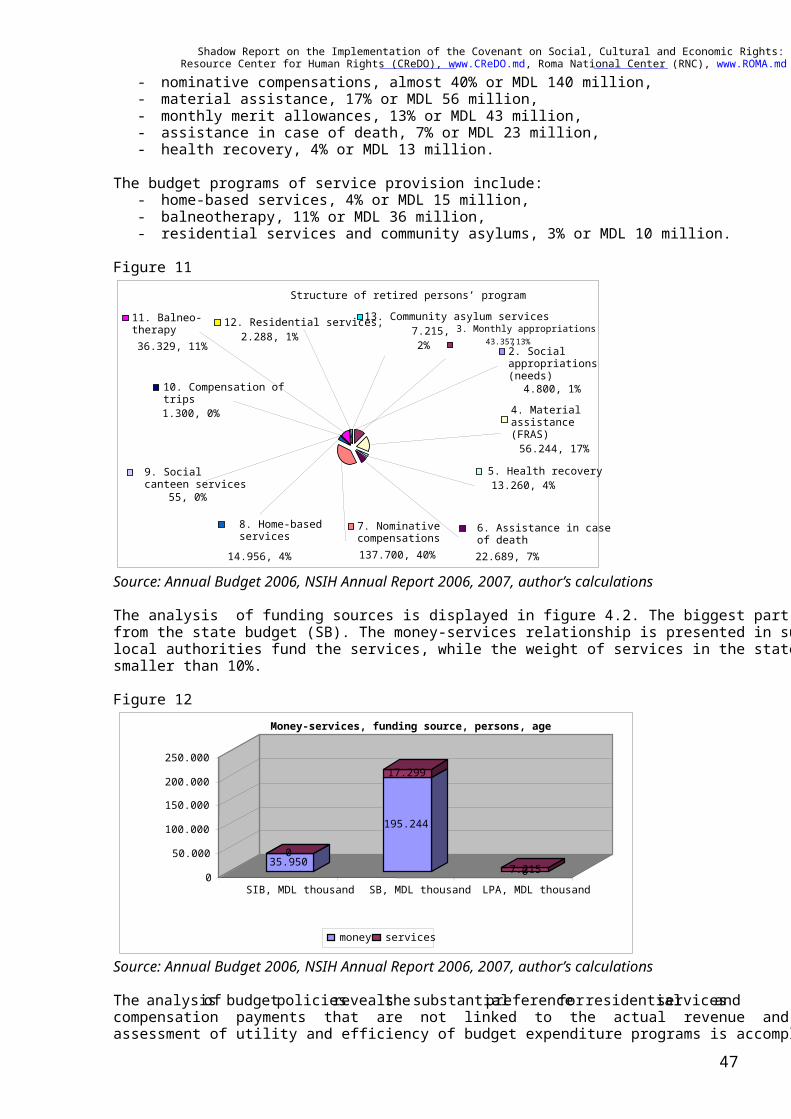
Shadow Report on the Implementation of the Covenant on Social, Cultural and Economic Rights: 2003-09 Resource Center for Human Rights (CReDO), www.CReDO.md, Roma National Center (RNC), www.ROMA.md
47
- nominative compensations, almost 40% or MDL 140 million, - material assistance, 17% or MDL 56 million, - monthly merit allowances, 13% or MDL 43 million, - assistance in case of death, 7% or MDL 23 million, - health recovery, 4% or MDL 13 million.
The budget programs of service provision include:
- home-based services, 4% or MDL 15 million, - balneotherapy, 11% or MDL 36 million, - residential services and community asylums, 3% or MDL 10 million.
Figure 11
Source: Annual Budget 2006, NSIH Annual Report 2006, 2007, author’s calculations The analysis of funding sources is displayed in figure 4.2. The biggest part, MDL 220 million, comes from the state budget (SB). The money-services relationship is presented in such a way that we notice that local authorities fund the services, while the weight of services in the state budget (managed by NSIH) is smaller than 10%. Figure 12
Source: Annual Budget 2006, NSIH Annual Report 2006, 2007, author’s calculations The analysis of budget policies reveals the substantial preference for residential services and compensation payments that are not linked to the actual revenue and needs of the given group. The assessment of utility and efficiency of budget expenditure programs is accomplished in the table below.
35.950 0
195.244
17.299
07.2150 50.000
100.000 150.000 200.000 250.000
SIB, MDL thousand SB, MDL thousand LPA, MDL thousand
Money-services, funding source, persons, age
money services
Structure of retired persons’ program
9. Social canteen services
55, 0% 8. Home-based services
10. Compensation of trips 1.300, 0%
12. Residential services, 2.288, 1%
11. Balneo- therapy 36.329, 11% 2. Social
appropriations (needs)
4.800, 1%
13. Community asylum services 7.215, 2%
3. Monthly appropriations 43.357, 13%
4. Material assistance (FRAS) 56.244, 17%
5. Health recovery 13.260, 4%
6. Assistance in case of death
7. Nominative compensations137.700, 40% 22.689, 7%14.956, 4%
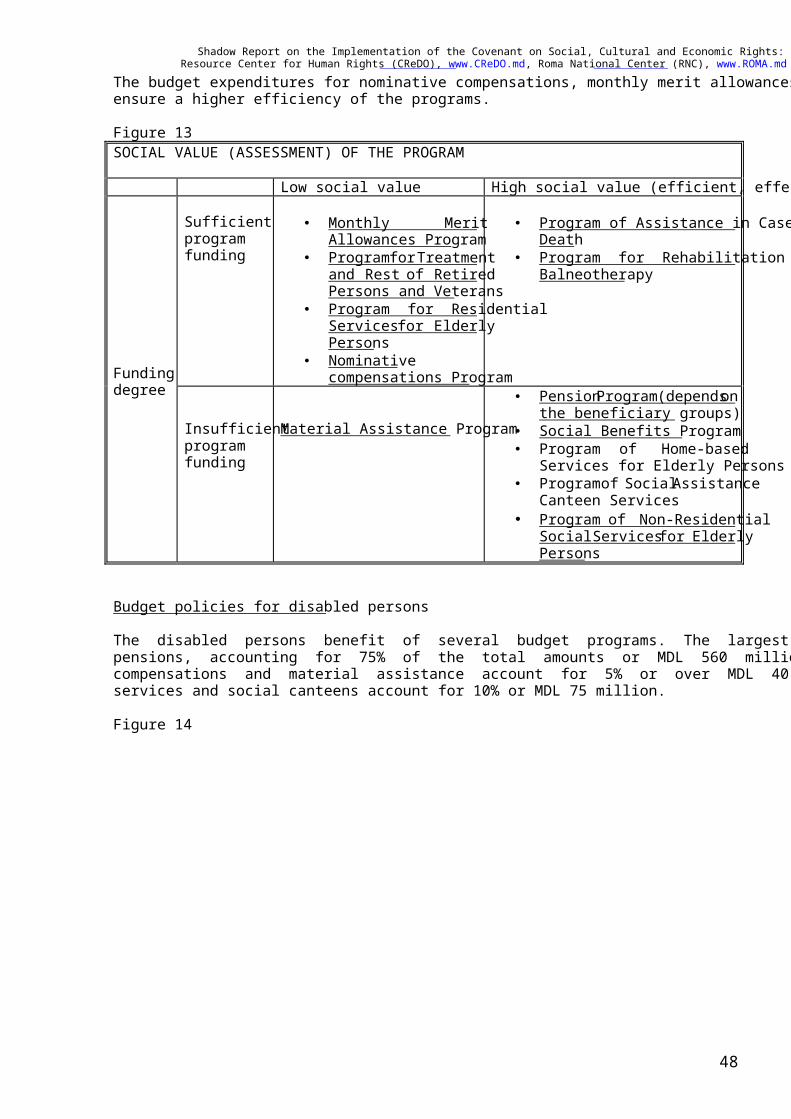
Shadow Report on the Implementation of the Covenant on Social, Cultural and Economic Rights: 2003-09 Resource Center for Human Rights (CReDO), www.CReDO.md, Roma National Center (RNC), www.ROMA.md
48
The budget expenditures for nominative compensations, monthly merit allowances should be reviewed to ensure a higher efficiency of the programs. Figure 13 SOCIAL VALUE (ASSESSMENT) OF THE PROGRAM Low social value High social value (efficient, effective)
Sufficient program funding
• Monthly Merit
Allowances Program • Program for Treatment
and Rest of Retired Persons and Veterans
• Program for Residential Services for Elderly Persons
• Nominative compensations Program
• Program of Assistance in Case of
Death • Program for Rehabilitation and
Balneotherapy
Funding degree
Insufficient program funding
Material Assistance Program
• Pension Program (depends on the beneficiary groups)
• Social Benefits Program • Program of Home-based
Services for Elderly Persons • Program of Social Assistance
Canteen Services • Program of Non-Residential
Social Services for Elderly Persons
Budget policies for disabled persons The disabled persons benefit of several budget programs. The largest program is that of disability pensions, accounting for 75% of the total amounts or MDL 560 million a year. The nominative compensations and material assistance account for 5% or over MDL 40 million; the balneotherapy services and social canteens account for 10% or MDL 75 million. Figure 14
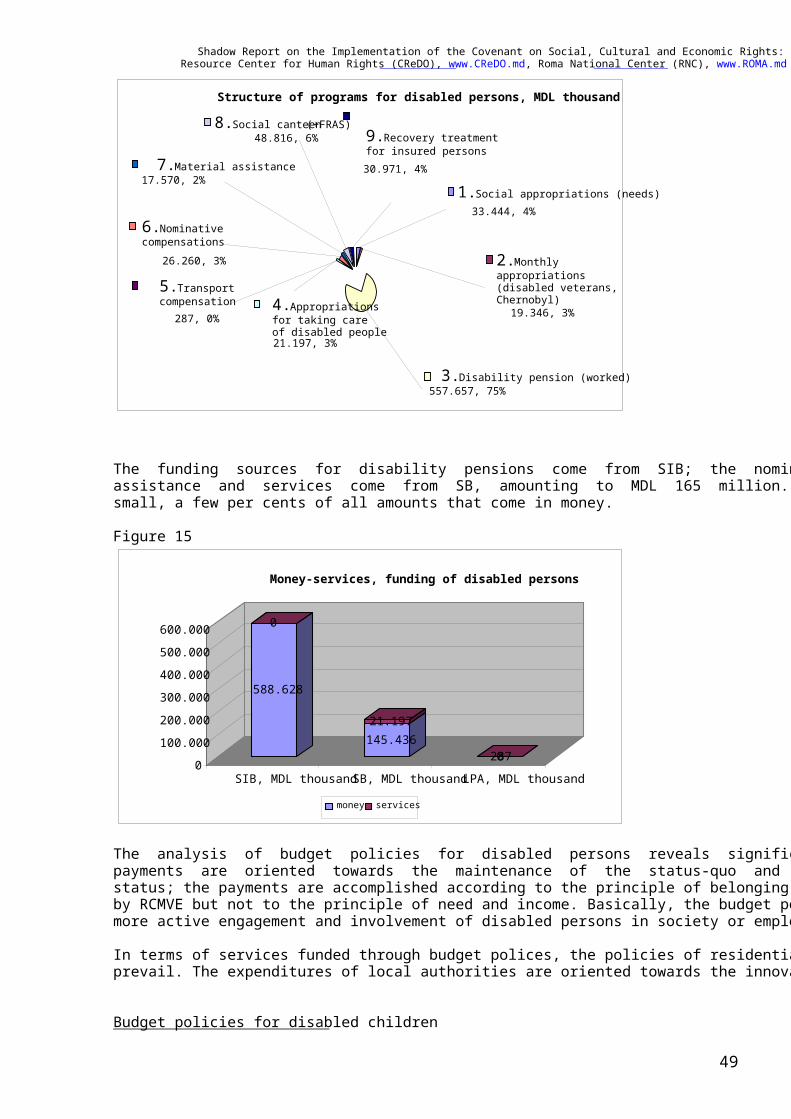
Shadow Report on the Implementation of the Covenant on Social, Cultural and Economic Rights: 2003-09 Resource Center for Human Rights (CReDO), www.CReDO.md, Roma National Center (RNC), www.ROMA.md
49
The funding sources for disability pensions come from SIB; the nominative compensations, social assistance and services come from SB, amounting to MDL 165 million. The share of services is very small, a few per cents of all amounts that come in money. Figure 15
The analysis of budget policies for disabled persons reveals significant financial expenditures. The payments are oriented towards the maintenance of the status-quo and compensation of the disability status; the payments are accomplished according to the principle of belonging to the category established by RCMVE but not to the principle of need and income. Basically, the budget policies do not promote a more active engagement and involvement of disabled persons in society or employment. In terms of services funded through budget polices, the policies of residential services and social canteens prevail. The expenditures of local authorities are oriented towards the innovative non-residential services. Budget policies for disabled children
588.628
0
145.43621.197
28700 100.000 200.000 300.000 400.000 500.000 600.000
SIB, MDL thousandSB, MDL thousandLPA, MDL thousand
Money-services, funding of disabled persons
money services
Structure of programs for disabled persons, MDL thousand
1. Social appropriations (needs) 33.444, 4%
6. Nominative compensations
26.260, 3%
7. Material assistance 17.570, 2%
8. Social canteen (+FRAS)48.816, 6% 9. Recovery treatment
for insured persons 30.971, 4%
2. Monthly appropriations (disabled veterans, Chernobyl)
19.346, 3%
5. Transport compensation 287, 0% 4. Appropriations
for taking care of disabled people21.197, 3%
3. Disability pension (worked) 557.657, 75%
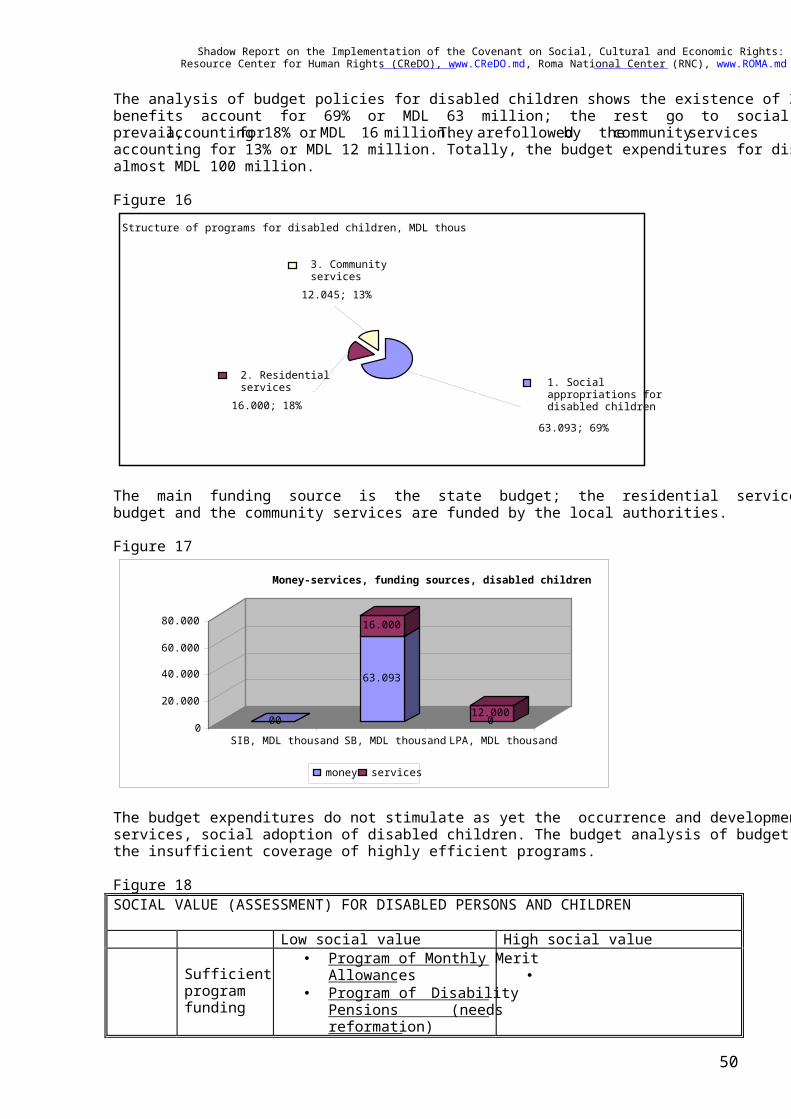
Shadow Report on the Implementation of the Covenant on Social, Cultural and Economic Rights: 2003-09 Resource Center for Human Rights (CReDO), www.CReDO.md, Roma National Center (RNC), www.ROMA.md
50
The analysis of budget policies for disabled children shows the existence of 3 programs, of which social benefits account for 69% or MDL 63 million; the rest go to social services. The residential services prevail, accounting for 18% or MDL 16 million. They are followed by the community services accounting for 13% or MDL 12 million. Totally, the budget expenditures for disabled children amount to almost MDL 100 million. Figure 16
The main funding source is the state budget; the residential services are funded mostly from the state budget and the community services are funded by the local authorities. Figure 17
The budget expenditures do not stimulate as yet the occurrence and development of social community services, social adoption of disabled children. The budget analysis of budget programs portfolio reveals the insufficient coverage of highly efficient programs. Figure 18 SOCIAL VALUE (ASSESSMENT) FOR DISABLED PERSONS AND CHILDREN Low social value High social value
Sufficient program funding
• Program of Monthly Merit Allowances
• Program of Disability Pensions (needs reformation)
•
00
63.093
16.000
012.0000
20.000 40.000 60.000 80.000
SIB, MDL thousand SB, MDL thousand LPA, MDL thousand
Money-services, funding sources, disabled children
money services
Structure of programs for disabled children, MDL thous
2. Residential services
16.000; 18%
3. Community services
12.045; 13%
1. Social appropriations for disabled children
63.093; 69%
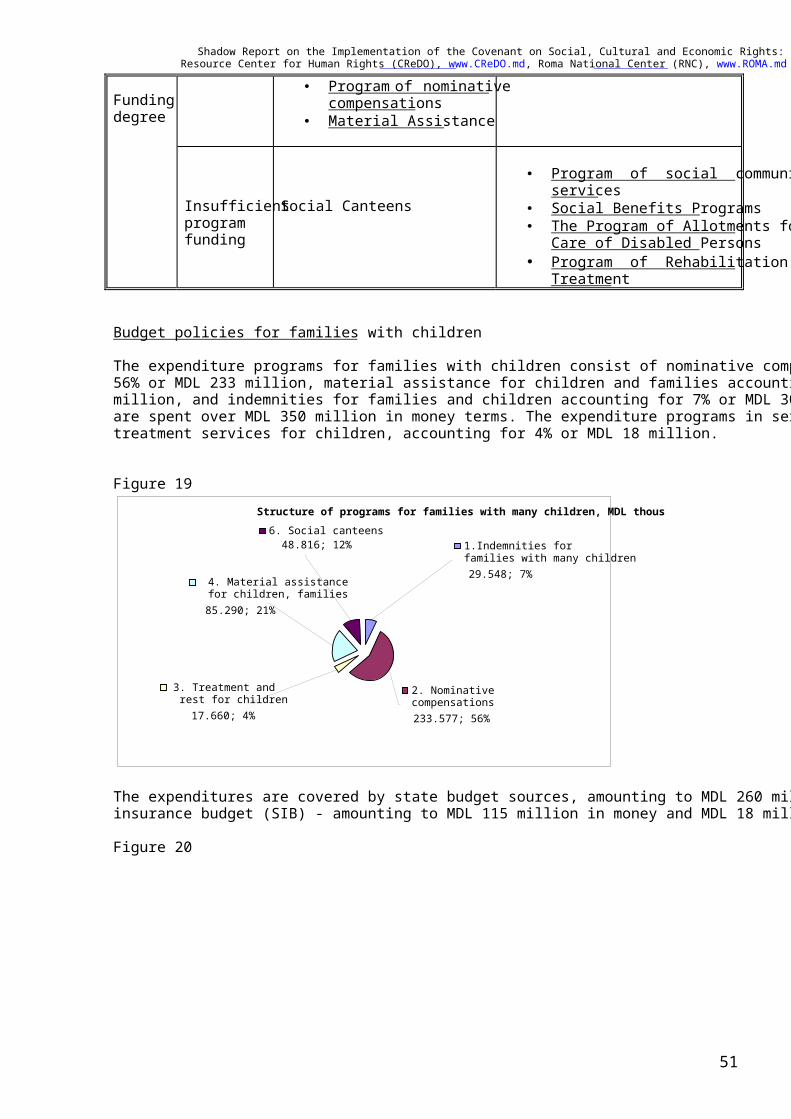
Shadow Report on the Implementation of the Covenant on Social, Cultural and Economic Rights: 2003-09 Resource Center for Human Rights (CReDO), www.CReDO.md, Roma National Center (RNC), www.ROMA.md
51
• Program of nominative compensations
• Material Assistance
Funding degree
Insufficient program funding
Social Canteens
• Program of social community
services • Social Benefits Programs • The Program of Allotments for
Care of Disabled Persons • Program of Rehabilitation and
Treatment Budget policies for families with children The expenditure programs for families with children consist of nominative compensations accounting for 56% or MDL 233 million, material assistance for children and families accounting for 21% or MDL 85 million, and indemnities for families and children accounting for 7% or MDL 30 million. All in all, there are spent over MDL 350 million in money terms. The expenditure programs in services come out through treatment services for children, accounting for 4% or MDL 18 million. Figure 19
The expenditures are covered by state budget sources, amounting to MDL 260 million and from the social insurance budget (SIB) - amounting to MDL 115 million in money and MDL 18 million in services. Figure 20
6. Social canteens48.816; 12%
2. Nominative compensations233.577; 56%
1.Indemnities for families with many children 29.548; 7%
3. Treatment and rest for children
17.660; 4%
4. Material assistance for children, families
85.290; 21%
Structure of programs for families with many children, MDL thous
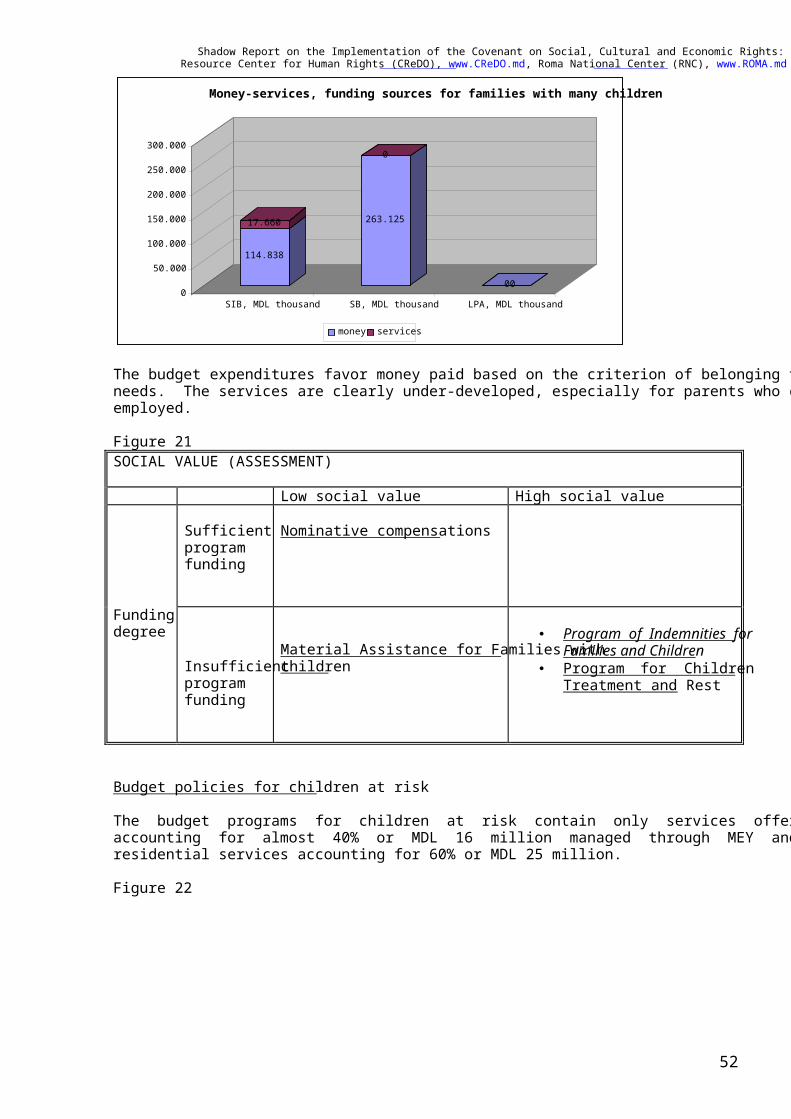
Shadow Report on the Implementation of the Covenant on Social, Cultural and Economic Rights: 2003-09 Resource Center for Human Rights (CReDO), www.CReDO.md, Roma National Center (RNC), www.ROMA.md
52
The budget expenditures favor money paid based on the criterion of belonging to a category and not on needs. The services are clearly under-developed, especially for parents who chose to return and get re-employed. Figure 21 SOCIAL VALUE (ASSESSMENT) Low social value High social value
Sufficient program funding
Nominative compensations
Funding degree
Insufficient program funding
Material Assistance for Families with children
• Program of Indemnities for
Families and Children • Program for Children
Treatment and Rest
Budget policies for children at risk The budget programs for children at risk contain only services offered in contrast: residential services accounting for almost 40% or MDL 16 million managed through MEY and social community non-residential services accounting for 60% or MDL 25 million. Figure 22
114.838
17.660 263.125
0
000
50.000
100.000
150.000
200.000
250.000
300.000
SIB, MDL thousand SB, MDL thousand LPA, MDL thousand
Money-services, funding sources for families with many children
money services
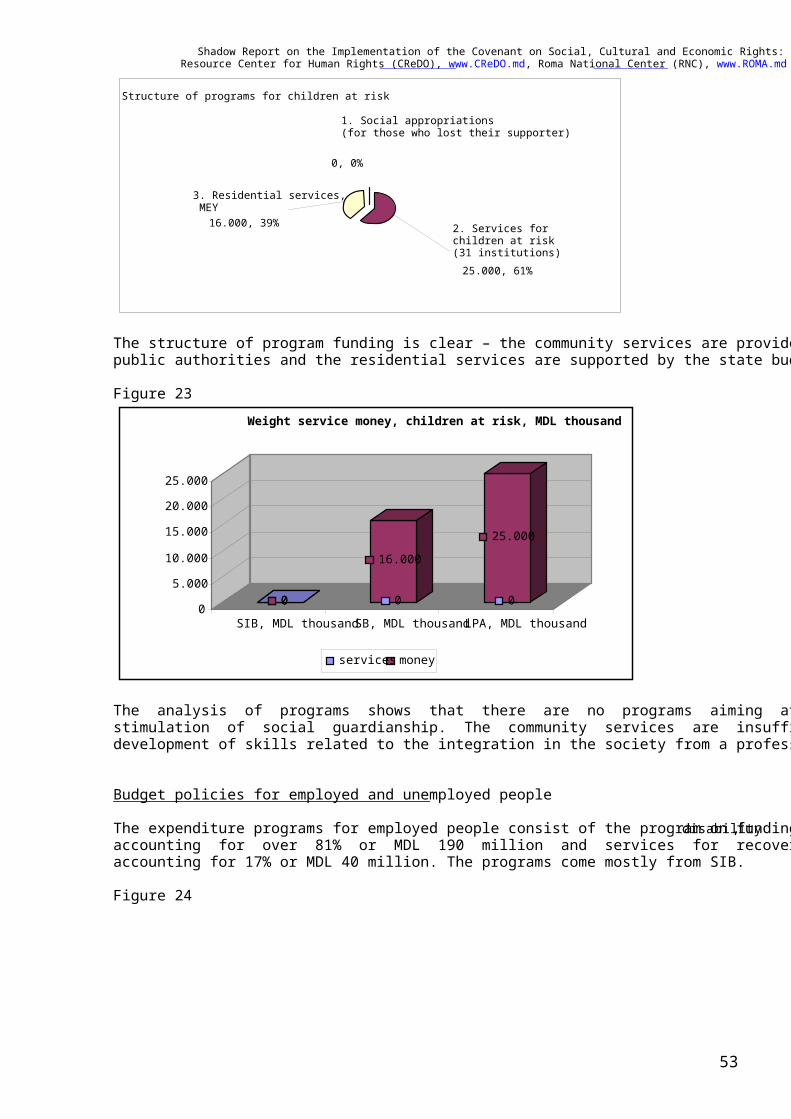
Shadow Report on the Implementation of the Covenant on Social, Cultural and Economic Rights: 2003-09 Resource Center for Human Rights (CReDO), www.CReDO.md, Roma National Center (RNC), www.ROMA.md
53
The structure of program funding is clear – the community services are provided and supported by local public authorities and the residential services are supported by the state budget. Figure 23
The analysis of programs shows that there are no programs aiming at social adoption through the stimulation of social guardianship. The community services are insufficient; there are no programs on development of skills related to the integration in the society from a professional point of view. Budget policies for employed and unemployed people The expenditure programs for employed people consist of the program on funding of temporary disability, accounting for over 81% or MDL 190 million and services for recovery of employees in sanatoria accounting for 17% or MDL 40 million. The programs come mostly from SIB. Figure 24
0 0 0
16.000
0
25.000
0 5.000
10.000 15.000 20.000 25.000
SIB, MDL thousandSB, MDL thousandLPA, MDL thousand
Weight service money, children at risk, MDL thousand
services money
Structure of programs for children at risk
1. Social appropriations (for those who lost their supporter)
0, 0%
2. Services for children at risk (31 institutions) 25.000, 61%
3. Residential services, MEY 16.000, 39%
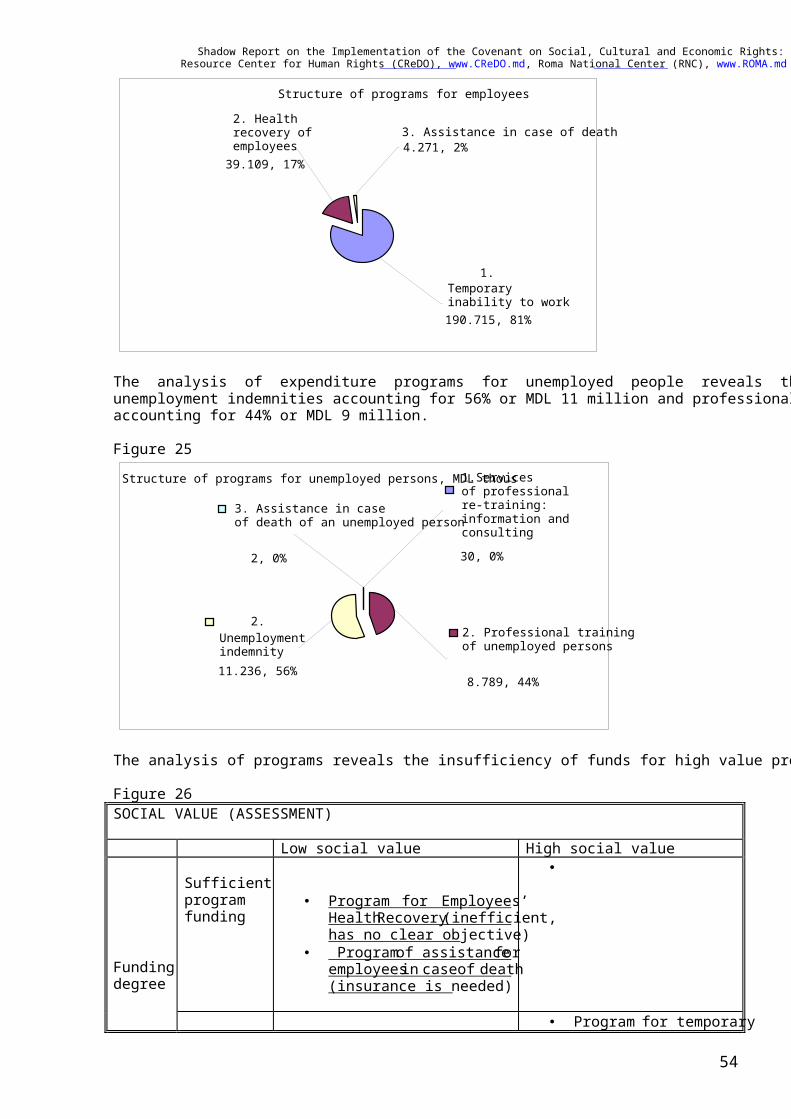
Shadow Report on the Implementation of the Covenant on Social, Cultural and Economic Rights: 2003-09 Resource Center for Human Rights (CReDO), www.CReDO.md, Roma National Center (RNC), www.ROMA.md
54
The analysis of expenditure programs for unemployed people reveals the existence of 2 programs: unemployment indemnities accounting for 56% or MDL 11 million and professional re-training services accounting for 44% or MDL 9 million. Figure 25
The analysis of programs reveals the insufficiency of funds for high value programs. Figure 26 SOCIAL VALUE (ASSESSMENT) Low social value High social value
Sufficient program funding
• Program for Employees’ Health Recovery (inefficient, has no clear objective)
• Program of assistance for employees in case of death (insurance is needed)
• Funding degree
• Program for temporary
Structure of programs for unemployed persons, MDL thous
2. Unemployment indemnity 11.236, 56%
1.Services of professional re-training: information and consulting 30, 0%
3. Assistance in case of death of an unemployed person
2, 0%
2. Professional training of unemployed persons
8.789, 44%
Structure of programs for employees
3. Assistance in case of death 4.271, 2%
2. Health recovery of employees
39.109, 17%
1. Temporary inability to work 190.715, 81%
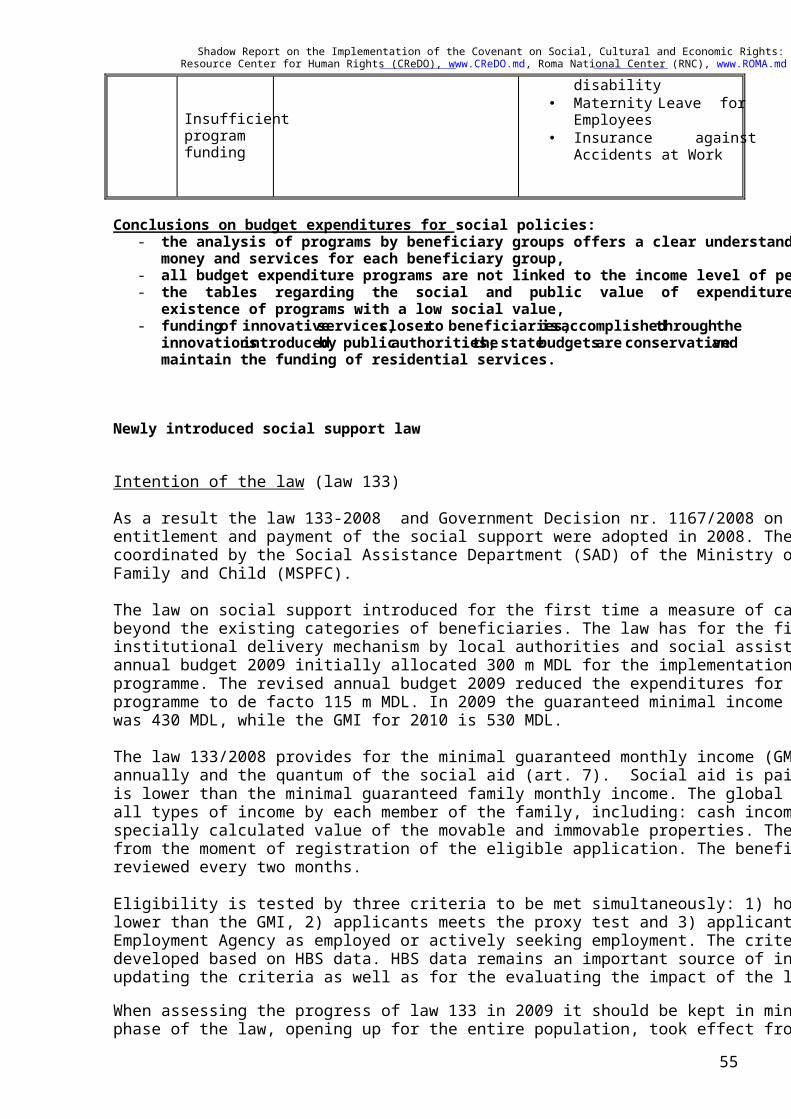
Shadow Report on the Implementation of the Covenant on Social, Cultural and Economic Rights: 2003-09 Resource Center for Human Rights (CReDO), www.CReDO.md, Roma National Center (RNC), www.ROMA.md
55
Insufficient program funding
disability • Maternity Leave for
Employees • Insurance against
Accidents at Work
Conclusions on budget expenditures for social policies:
- the analysis of programs by beneficiary groups offers a clear understanding of the effect of money and services for each beneficiary group,
- all budget expenditure programs are not linked to the income level of people, - the tables regarding the social and public value of expenditure programs reveal the
existence of programs with a low social value, - funding of innovative services, closer to beneficiaries, is accomplished through the
innovations introduced by public authorities; the state budgets are conservative and maintain the funding of residential services.
Newly introduced social support law
Intention of the law (law 133) As a result the law 133-2008 and Government Decision nr. 1167/2008 on Regulation for entitlement and payment of the social support were adopted in 2008. Their elaboration has been coordinated by the Social Assistance Department (SAD) of the Ministry of Social Protection Family and Child (MSPFC). The law on social support introduced for the first time a measure of cash entitlements (social aid) beyond the existing categories of beneficiaries. The law has for the first time created a different institutional delivery mechanism by local authorities and social assistants. MTEF 2009-11 and annual budget 2009 initially allocated 300 m MDL for the implementation of the social support programme. The revised annual budget 2009 reduced the expenditures for the social support programme to de facto 115 m MDL. In 2009 the guaranteed minimal income (GMI) for a person was 430 MDL, while the GMI for 2010 is 530 MDL. The law 133/2008 provides for the minimal guaranteed monthly income (GMI) (art. 6) set annually and the quantum of the social aid (art. 7). Social aid is paid if the global family income is lower than the minimal guaranteed family monthly income. The global income includes (art.8) all types of income by each member of the family, including: cash income and cash benefits, specially calculated value of the movable and immovable properties. The social support is paid from the moment of registration of the eligible application. The beneficiary eligibility is reviewed every two months. Eligibility is tested by three criteria to be met simultaneously: 1) household monthly income is lower than the GMI, 2) applicants meets the proxy test and 3) applicant is registered with the Employment Agency as employed or actively seeking employment. The criteria have been developed based on HBS data. HBS data remains an important source of information for updating the criteria as well as for the evaluating the impact of the law on poverty reduction. When assessing the progress of law 133 in 2009 it should be kept in mind that the third and last phase of the law, opening up for the entire population, took effect from July 2009.
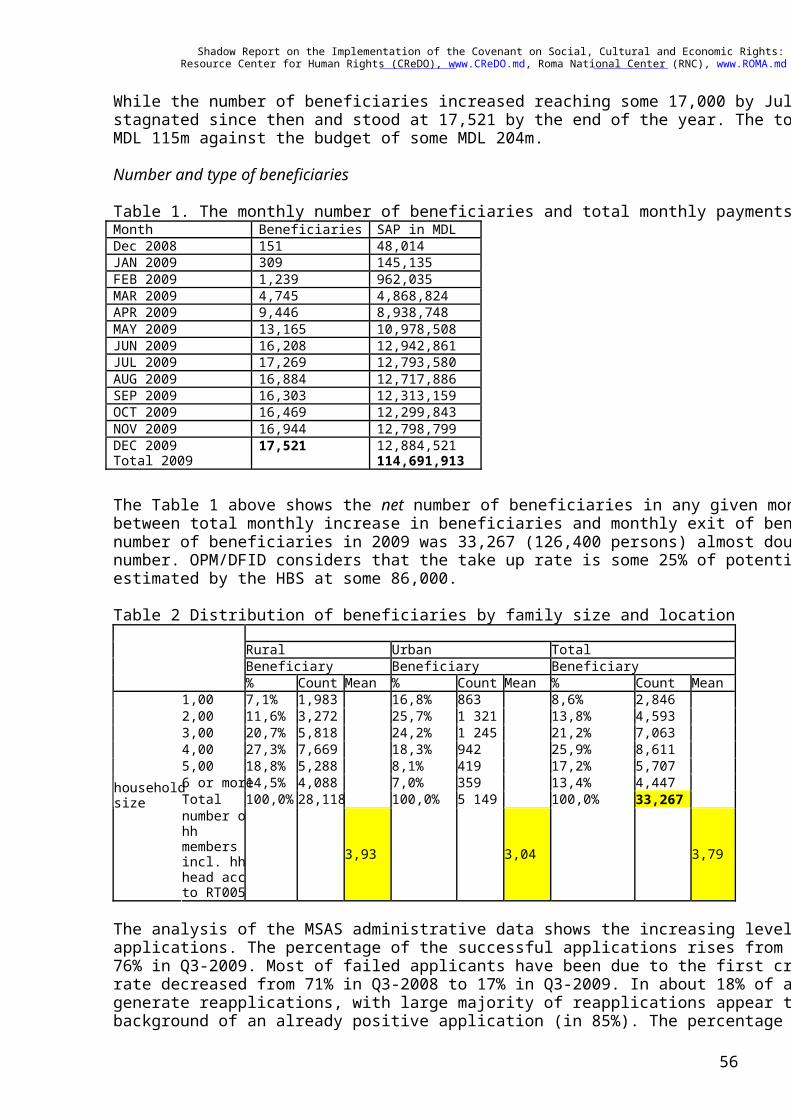
Shadow Report on the Implementation of the Covenant on Social, Cultural and Economic Rights: 2003-09 Resource Center for Human Rights (CReDO), www.CReDO.md, Roma National Center (RNC), www.ROMA.md
56
While the number of beneficiaries increased reaching some 17,000 by July 2009, the number has stagnated since then and stood at 17,521 by the end of the year. The total amount paid was some MDL 115m against the budget of some MDL 204m. Number and type of beneficiaries Table 1. The monthly number of beneficiaries and total monthly payments
The Table 1 above shows the net number of beneficiaries in any given month - the difference between total monthly increase in beneficiaries and monthly exit of beneficiaries. The total gross number of beneficiaries in 2009 was 33,267 (126,400 persons) almost double the end-year net number. OPM/DFID considers that the take up rate is some 25% of potential beneficiaries estimated by the HBS at some 86,000. Table 2 Distribution of beneficiaries by family size and location Rural Urban Total Beneficiary Beneficiary Beneficiary % Count Mean % Count Mean % Count Mean
1,00 7,1% 1,983 16,8% 863 8,6% 2,846 2,00 11,6% 3,272 25,7% 1 321 13,8% 4,593 3,00 20,7% 5,818 24,2% 1 245 21,2% 7,063 4,00 27,3% 7,669 18,3% 942 25,9% 8,611 5,00 18,8% 5,288 8,1% 419 17,2% 5,707 6 or more 14,5% 4,088 7,0% 359 13,4% 4,447 Total 100,0% 28,118 100,0% 5 149 100,0% 33,267
household size
number of hh members incl. hh head acc. to RT005
3,93 3,04 3,79
The analysis of the MSAS administrative data shows the increasing level of the successful applications. The percentage of the successful applications rises from 17% in Q4-2008 to almost 76% in Q3-2009. Most of failed applicants have been due to the first criteria of the GMI, yet its rate decreased from 71% in Q3-2008 to 17% in Q3-2009. In about 18% of applications, they generate reapplications, with large majority of reapplications appear to be made on the background of an already positive application (in 85%). The percentage of reapplications on
Month Beneficiaries SAP in MDL Dec 2008 151 48,014 JAN 2009 309 145,135 FEB 2009 1,239 962,035 MAR 2009 4,745 4,868,824 APR 2009 9,446 8,938,748 MAY 2009 13,165 10,978,508 JUN 2009 16,208 12,942,861 JUL 2009 17,269 12,793,580 AUG 2009 16,884 12,717,886 SEP 2009 16,303 12,313,159 OCT 2009 16,469 12,299,843 NOV 2009 16,944 12,798,799 DEC 2009 17,521 12,884,521 Total 2009 114,691,913
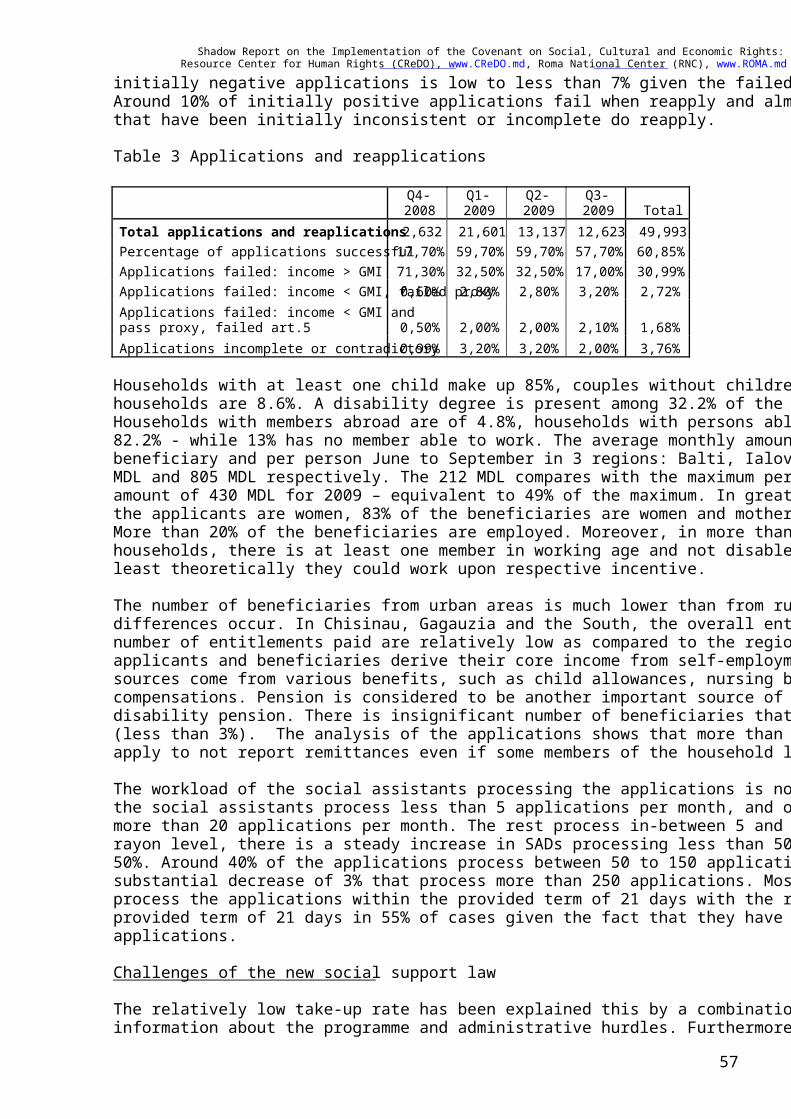
Shadow Report on the Implementation of the Covenant on Social, Cultural and Economic Rights: 2003-09 Resource Center for Human Rights (CReDO), www.CReDO.md, Roma National Center (RNC), www.ROMA.md
57
initially negative applications is low to less than 7% given the failed proxy or income tests. Around 10% of initially positive applications fail when reapply and almost 100% of applications that have been initially inconsistent or incomplete do reapply. Table 3 Applications and reapplications
Q4-2008
Q1-2009
Q2-2009
Q3-2009 Total
Total applications and reaplications 2,632 21,601 13,137 12,623 49,993 Percentage of applications successful 17,70% 59,70% 59,70% 57,70% 60,85% Applications failed: income > GMI 71,30% 32,50% 32,50% 17,00% 30,99% Applications failed: income < GMI, failed proxy 0,60% 2,80% 2,80% 3,20% 2,72% Applications failed: income < GMI and pass proxy, failed art.5 0,50% 2,00% 2,00% 2,10% 1,68% Applications incomplete or contradictory 0,99% 3,20% 3,20% 2,00% 3,76% Households with at least one child make up 85%, couples without children 7% and single person households are 8.6%. A disability degree is present among 32.2% of the beneficiaries. Households with members abroad are of 4.8%, households with persons able to work are of 82.2% - while 13% has no member able to work. The average monthly amount paid per beneficiary and per person June to September in 3 regions: Balti, Ialoveni and Leova were 212 MDL and 805 MDL respectively. The 212 MDL compares with the maximum per person amount of 430 MDL for 2009 – equivalent to 49% of the maximum. In great majority of cases, the applicants are women, 83% of the beneficiaries are women and mothers beyond 30 years old. More than 20% of the beneficiaries are employed. Moreover, in more than 80% of beneficiary households, there is at least one member in working age and not disabled, thus suggesting that at least theoretically they could work upon respective incentive. The number of beneficiaries from urban areas is much lower than from rural areas and regional differences occur. In Chisinau, Gagauzia and the South, the overall entitlement amount and the number of entitlements paid are relatively low as compared to the regions’ population. Most applicants and beneficiaries derive their core income from self-employment in agriculture. Other sources come from various benefits, such as child allowances, nursing benefit and nominative compensations. Pension is considered to be another important source of income including disability pension. There is insignificant number of beneficiaries that also receive remittances (less than 3%). The analysis of the applications shows that more than 80% of households that apply to not report remittances even if some members of the household leave abroad. The workload of the social assistants processing the applications is not heavy. Around 60% of the social assistants process less than 5 applications per month, and only around 4% process more than 20 applications per month. The rest process in-between 5 and 20 applications. At the rayon level, there is a steady increase in SADs processing less than 50 applications - around 50%. Around 40% of the applications process between 50 to 150 applications and there is a substantial decrease of 3% that process more than 250 applications. Most of SADs - 74% - process the applications within the provided term of 21 days with the rest overstepping the provided term of 21 days in 55% of cases given the fact that they have to process more than 250 applications. Challenges of the new social support law The relatively low take-up rate has been explained this by a combination of inadequate information about the programme and administrative hurdles. Furthermore, a United Nations
Shadow Report on the Implementation of the Covenant on Social, Cultural and Economic Rights: 2003-09 Resource Center for Human Rights (CReDO), www.CReDO.md, Roma National Center (RNC), www.ROMA.md
58
report23 based on preliminary HBS 2009 data supports the opinion of inadequate information about the Law stating that: It is significant that 47.2 per cent of the representatives of household with children did not know about the social aid. Another 36.1% knew, but they mentioned that they did not meet the requirements. A further 7.3% said they did not need it, 2.9% did not have the documents needed to apply for social aid, and 3.2% said that the procedure for aid provision were too complicated. The low take-up rate also shows geographical variation. The number of actual and potential beneficiaries in the south is smaller than in the north which may be due to a higher degree of self-reliance or differently put, a perception of becoming stigmatised by applying for social aid. Larger households tend to benefit more from social aid, perhaps because entitlements are calculated per adult equivalent24 the more substantial benefit as compared to smaller households. Those who already receive other social assistance tend to apply more for support under law 133. The Table below shows the average household size of beneficiaries. The national average size is 3.8 persons, ranging from 3.04 in urban areas to 3.93 in rural areas, as 85% of beneficiaries live in rural areas. The administrative burden by applicants is said to be another factor that prevents programme accessibility. This may be explained by the number of the documents to be presented and the time and cost involved:
- obtaining original documents, - establishment of correct family residency place, - establishment of correct family structure, - family incomes assessment, - specifying the necessary acts and work procedures in specific cases: - interpreting the notion of common or separate families and households; - improving cooperation with territorial agencies of NSIH and of the Employment Agency; - compatibility and communication of the NIH data base and of the MSAS data base.
Other reasons for relatively low take-up so far may be found in self-exclusion: either because applicants consider themselves ‘on the margin of eligibility’ or because of being stigmatised. By contrast, larger households would reap economies of scale in collecting the necessary information, given the GMI is calculated per household member. This seems to be confirmed by the difference of the average support paid to households with smaller and larger members. Finally, field research reveals that social assistants tend to discourage border case households to apply25. Mitigating measures comprise amendments to GD 1167 expected to be effective early 2010:
- exclude the proxy of land ownership in case households are unable to cultivate or receive rent from land holdings
- stimulate continuing employment by deducting 60 MDL from salary earned - rework some of the proxies and points allocated
Targeting the poor
23 Impact of the Economic Crisis on Poverty and Social Exclusion in the Republic of Moldova, 2009 24 The conversion of household members to “eligible adult equivalent” is defined by GD 1167. For instance, 1 child = 0.5 adult, and 1 disabled child = 1.5 adult. 25 Conseil Sante: Interim Report nr. 2, November 2009
Shadow Report on the Implementation of the Covenant on Social, Cultural and Economic Rights: 2003-09 Resource Center for Human Rights (CReDO), www.CReDO.md, Roma National Center (RNC), www.ROMA.md
59
Work done by the OPM/DFID project shows that some categories of potential beneficiaries are not reached. Households of adults only, single person households and households with disabilities are underreported compared to HBS data on households. An element of self-exclusion may as well be at play. For instance, HBS data indicate more than 16% of eligible households rely mainly on salary income, while MSAS data reveal less than 8% of beneficiaries get their main income from salaries. There seem to be also a perception that the social support programme is some sort of substitution of the child allowance programme or other, coupled with the existing perception of those who deserve the benefit. At this point there are indications that the poorest two quintiles are not being reached, however a proper poverty impact assessment should be carried out by the beginning of 2011 to provide firm evidence.
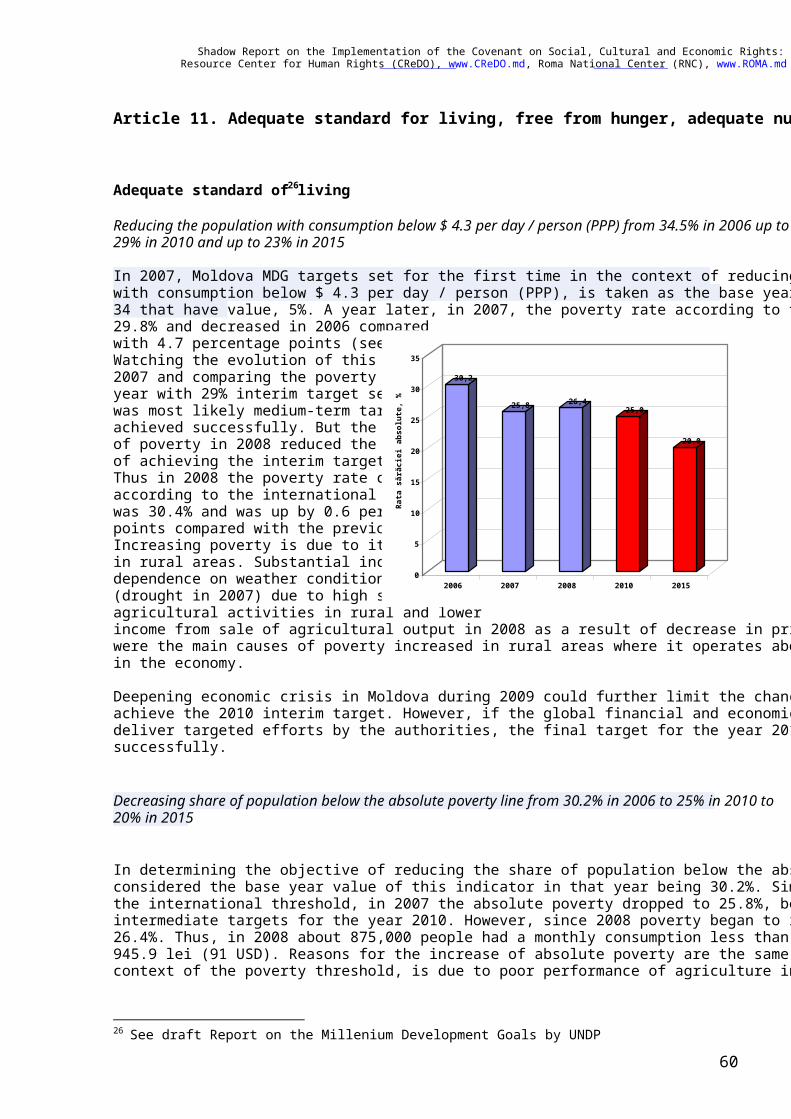
Shadow Report on the Implementation of the Covenant on Social, Cultural and Economic Rights: 2003-09 Resource Center for Human Rights (CReDO), www.CReDO.md, Roma National Center (RNC), www.ROMA.md
60
Article 11. Adequate standard for living, free from hunger, adequate nutrition
Adequate standard of living26
Reducing the population with consumption below $ 4.3 per day / person (PPP) from 34.5% in 2006 up to 29% in 2010 and up to 23% in 2015 In 2007, Moldova MDG targets set for the first time in the context of reducing the share of population with consumption below $ 4.3 per day / person (PPP), is taken as the base year 2006 when the indicator 34 that have value, 5%. A year later, in 2007, the poverty rate according to the international threshold was 29.8% and decreased in 2006 compared with 4.7 percentage points (see figure). Watching the evolution of this indicator in 2007 and comparing the poverty of that year with 29% interim target set for 2010, was most likely medium-term target to be achieved successfully. But the evolution of poverty in 2008 reduced the likelihood of achieving the interim target by 2010. Thus in 2008 the poverty rate calculated according to the international threshold was 30.4% and was up by 0.6 percentage points compared with the previous year. Increasing poverty is due to its expansion in rural areas. Substantial incomes dependence on weather conditions (drought in 2007) due to high share of agricultural activities in rural and lower income from sale of agricultural output in 2008 as a result of decrease in prices of fruits and vegetables were the main causes of poverty increased in rural areas where it operates about one third of employment in the economy. Deepening economic crisis in Moldova during 2009 could further limit the chances of Moldova to achieve the 2010 interim target. However, if the global financial and economic crisis in Moldova will deliver targeted efforts by the authorities, the final target for the year 2015 could be achieved successfully.
Decreasing share of population below the absolute poverty line from 30.2% in 2006 to 25% in 2010 to 20% in 2015
In determining the objective of reducing the share of population below the absolute poverty in 2006 was considered the base year value of this indicator in that year being 30.2%. Similar poverty rate changes as the international threshold, in 2007 the absolute poverty dropped to 25.8%, being close to the value of intermediate targets for the year 2010. However, since 2008 poverty began to increase, constituting 26.4%. Thus, in 2008 about 875,000 people had a monthly consumption less than absolute poverty - 945.9 lei (91 USD). Reasons for the increase of absolute poverty are the same as in the international context of the poverty threshold, is due to poor performance of agriculture in rural areas. However, in
26 See draft Report on the Millenium Development Goals by UNDP
30,2
25,8 26,425,0
20,0
0
5
10
15
20
25
30
35
Rata s
ărăcie
i ab
solute
, %
2006 2007 2008 2010 2015
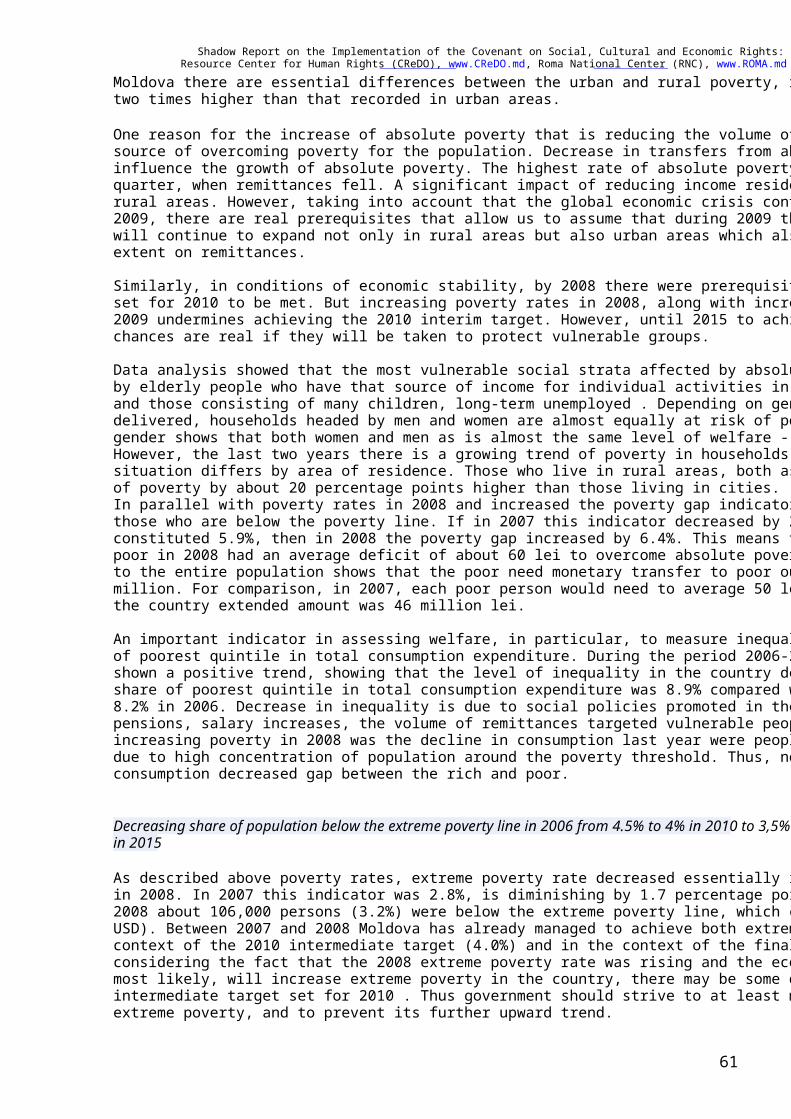
Shadow Report on the Implementation of the Covenant on Social, Cultural and Economic Rights: 2003-09 Resource Center for Human Rights (CReDO), www.CReDO.md, Roma National Center (RNC), www.ROMA.md
61
Moldova there are essential differences between the urban and rural poverty, rural poverty is more than two times higher than that recorded in urban areas.
One reason for the increase of absolute poverty that is reducing the volume of remittances is an important source of overcoming poverty for the population. Decrease in transfers from abroad in particular influence the growth of absolute poverty. The highest rate of absolute poverty has been some in the fourth quarter, when remittances fell. A significant impact of reducing income residents work abroad came in rural areas. However, taking into account that the global economic crisis continued to worsen during 2009, there are real prerequisites that allow us to assume that during 2009 the phenomenon of poverty will continue to expand not only in rural areas but also urban areas which also depend to a considerable extent on remittances. Similarly, in conditions of economic stability, by 2008 there were prerequisites for the intermediate target set for 2010 to be met. But increasing poverty rates in 2008, along with increasing economic crisis in 2009 undermines achieving the 2010 interim target. However, until 2015 to achieve that objective chances are real if they will be taken to protect vulnerable groups. Data analysis showed that the most vulnerable social strata affected by absolute poverty are represented by elderly people who have that source of income for individual activities in agriculture, large families and those consisting of many children, long-term unemployed . Depending on gender, poverty issues not delivered, households headed by men and women are almost equally at risk of poverty. Thus, analysis by gender shows that both women and men as is almost the same level of welfare - about 26%. However, the last two years there is a growing trend of poverty in households headed by men. The situation differs by area of residence. Those who live in rural areas, both as women and men have a risk of poverty by about 20 percentage points higher than those living in cities. In parallel with poverty rates in 2008 and increased the poverty gap indicator that shows how poor are those who are below the poverty line. If in 2007 this indicator decreased by 2 percentage points and constituted 5.9%, then in 2008 the poverty gap increased by 6.4%. This means that each person absolutely poor in 2008 had an average deficit of about 60 lei to overcome absolute poverty. That amount extended to the entire population shows that the poor need monetary transfer to poor out of poverty is about 52 million. For comparison, in 2007, each poor person would need to average 50 lei to escape poverty and the country extended amount was 46 million lei. An important indicator in assessing welfare, in particular, to measure inequality in the country is the share of poorest quintile in total consumption expenditure. During the period 2006-2008 this indicator has shown a positive trend, showing that the level of inequality in the country declined. Thus, in 2008 the share of poorest quintile in total consumption expenditure was 8.9% compared with 8.8% in 2007 and 8.2% in 2006. Decrease in inequality is due to social policies promoted in the state such as indexation of pensions, salary increases, the volume of remittances targeted vulnerable people. Also a cause of increasing poverty in 2008 was the decline in consumption last year were people above the poverty line due to high concentration of population around the poverty threshold. Thus, non-poor people to cut consumption decreased gap between the rich and poor.
Decreasing share of population below the extreme poverty line in 2006 from 4.5% to 4% in 2010 to 3,5% in 2015 As described above poverty rates, extreme poverty rate decreased essentially in 2007, but recorded a rise in 2008. In 2007 this indicator was 2.8%, is diminishing by 1.7 percentage points compared with 2006. In 2008 about 106,000 persons (3.2%) were below the extreme poverty line, which comprises 511.5 lei (49 USD). Between 2007 and 2008 Moldova has already managed to achieve both extreme poverty set in the context of the 2010 intermediate target (4.0%) and in the context of the final target in 2015 (3.5%). Also considering the fact that the 2008 extreme poverty rate was rising and the economic crisis in Moldova, most likely, will increase extreme poverty in the country, there may be some difficulties in achieving the intermediate target set for 2010 . Thus government should strive to at least maintain the current level of extreme poverty, and to prevent its further upward trend.
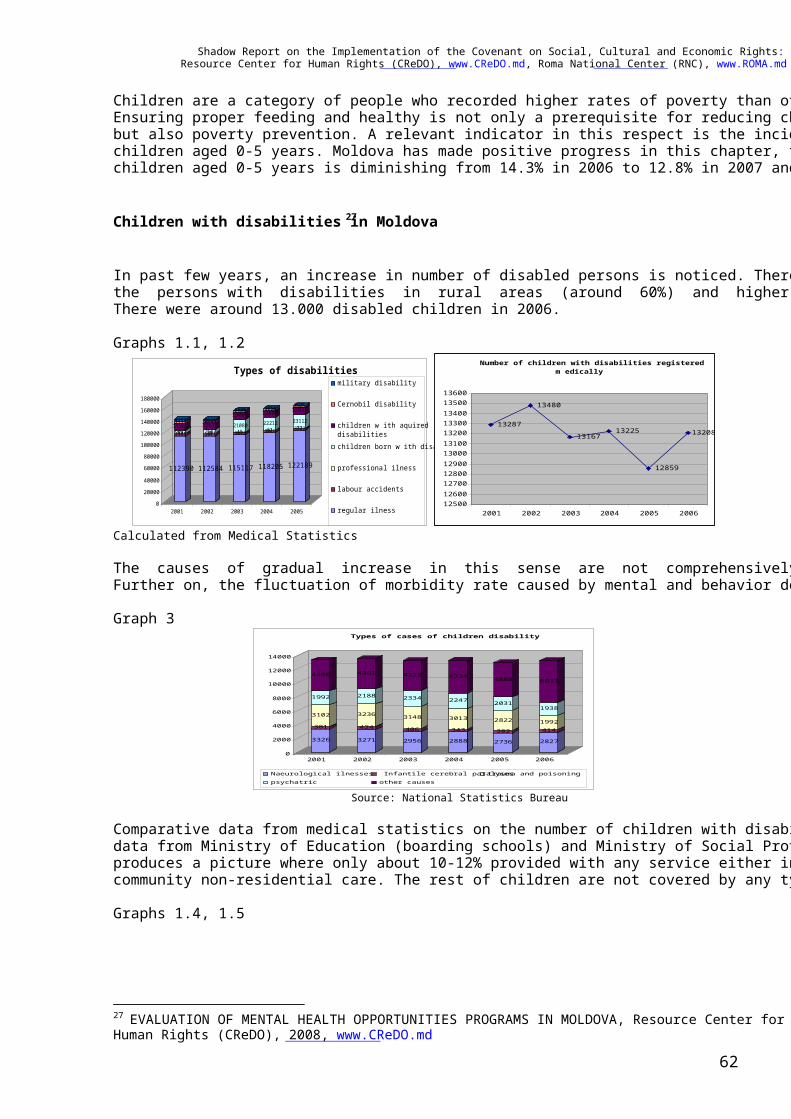
Shadow Report on the Implementation of the Covenant on Social, Cultural and Economic Rights: 2003-09 Resource Center for Human Rights (CReDO), www.CReDO.md, Roma National Center (RNC), www.ROMA.md
62
Children are a category of people who recorded higher rates of poverty than other categories of persons. Ensuring proper feeding and healthy is not only a prerequisite for reducing child mortality and morbidity, but also poverty prevention. A relevant indicator in this respect is the incidence rate of malnutrition in children aged 0-5 years. Moldova has made positive progress in this chapter, the share of underweight children aged 0-5 years is diminishing from 14.3% in 2006 to 12.8% in 2007 and 11% in 2008.
Children with disabilities in Moldova27
In past few years, an increase in number of disabled persons is noticed. There is a higher percentage of the persons with disabilities in rural areas (around 60%) and higher incidence rate among men (56%). There were around 13.000 disabled children in 2006. Graphs 1.1, 1.2
112390
45584360151196221134252
112584
39713875471261520992521
115117
387245210801300621031470
118205
381962222121286021291053
122189
37727223112
129352125616
020000
40000
6000080000100000120000140000160000
180000
2001 2002 2003 2004 2005
Types of disabilitiesmilitary disability
Cernobil disability
children w ith aquireddisabilitieschildren born w ith disabilities
professional ilness
labour accidents
regular ilness
Number of children with disabilities registered m edically
13287
13480
1316713225
12859
13208
125001260012700128001290013000131001320013300134001350013600
2001 2002 2003 2004 2005 2006
Calculated from Medical Statistics The causes of gradual increase in this sense are not comprehensively presented by national statistics. Further on, the fluctuation of morbidity rate caused by mental and behavior defect is presented. Graph 3
3326
381
3102
1992
4486
3271
424
3236
2188
4361
2956
406
3148
2334
4323
2888
343
3013
2247
4734
2736
382
2822
2031
4888
2827
4141992
1938
6037
0
2000
4000
6000
8000
10000
12000
14000
2001 2002 2003 2004 2005 2006
Types of cases of children disability
Naeurological ilnesses Infantile cerebral paralysestrauma and poisoningpsychatric other causes
Source: National Statistics Bureau Comparative data from medical statistics on the number of children with disabilities and administrative data from Ministry of Education (boarding schools) and Ministry of Social Protection, Child and Family produces a picture where only about 10-12% provided with any service either in residential care or community non-residential care. The rest of children are not covered by any type of service. Graphs 1.4, 1.5
27 EVALUATION OF MENTAL HEALTH OPPORTUNITIES PROGRAMS IN MOLDOVA, Resource Center for Human Rights (CReDO), 2008, www.CReDO.md

Shadow Report on the Implementation of the Covenant on Social, Cultural and Economic Rights: 2003-09 Resource Center for Human Rights (CReDO), www.CReDO.md, Roma National Center (RNC), www.ROMA.md
63
3160
678
8124
3160
678
8777
3160
678
9168
3160
678
9022
3160
678
9097
731
3160
678
9172
731
02000400060008000100001200014000
2001 2002 2003 2004 2005 2006
Children with disabilities and type of social service
community servicesrest of childrenresidential care Ministry of Social Protectionresidential care in Ministry Education
13287
31606780 1
13480
31606780
13167
31606780
13225
3160678600
12859
3160678731
13208
31606787310
5000
10000
15000
2001 2002 2003 2004 2005 2006
Children with disabilities: receipt of benefits and social care
Numarul copiilor cu disabilitati total pe tara, miiresidential care M ETresidential care M inistry of Social Protectioncommunity services#REF!
The break down of geographical distribution per districts of children with the disability and the reasons for the disability is shown below: Graphs 1.6, 1.7
Number of children with disabilitis per district
1998483
319117
262394
222308
197245288
153360
138318
398372
223468
434189
261160
538196
290468
407409
212371
149436439
630
1947492
318129
301363
181289
424250
317159
387126
378374354
238474
427200242
168544
202270
452
415415
215384
162439432
740
0 500 1000 1500 2000 2500
mun. Chisinaumun. BaltiAnenii Noi
BasarabeascaBriceniCahul
CantemirCalarasiCauseniCimisliaCriuleni
DonduseniDrochiaDubasari
EdinetFalestiFlorestiGlodeniHincestilaloveniLeova
NisporeniOcnilaOrhei
RezinaRiscaniSmgereiSorocaStraseni
SoldanestiStefan-Voda
TaracliaTelenestiUngheni
UTA Gagauzia
2005 2006
Types of disability per district, 2006
86522212471621496686221
6714193201
35191
1211678923016885103892118111117514812710417558219132
453
44487
642458
892980
837965
6177
3456
10990
5665
96255835
786450791101013161
3878
111162
27475
541725
542755
534734
-2031
21337445
404963
9320
722440
524955
2232
242665
82
397
10221
1416
104
823
212
34102
102211
91
48
512
2340
1312
111411
16
325101
6615
13557
4358
634954
2366
33946050
4310889
7248
40175
2857
14474132
45104
31102113
27
-500 0 500 1000 1500 2000 2500
mun. Chisinau
mun. Balti
Anenii Noi
Basarabeasca
Briceni
Cahul
Cantemir
Calarasi
Causeni
Cimislia
Criuleni
Donduseni
Drochia
Dubasari
Edinet
Falesti
Floresti
Glodeni
Hincesti
laloveni
Leova
Nisporeni
Ocnila
Orhei
Rezina
Riscani
Smgerei
Soroca
Straseni
Soldanesti
Stefan-Voda
Taraclia
Telenesti
Ungheni
UTA Gagauzia
other neurologic infantile cerebral parelisestraume and poisoningpsychatric The knowledge of the geographical distribution of the children with disabilities is important in order to provide the supply of the social services based in the communities. Policies for children with disabilities Before stating the main policy programs addressed to children with disabilities, it is important to mention that the priority spending from social policy for the children with disabilities is the social allocations and cash benefits, and a reduced percentage from Social Budget is addressed to services (around 3%). Yet, more children stay at home than are in the residential care. Graphs 2.14, 2.15
Social policies for children with disabilities, mln MDL
1. Social allocations for disability; 63.093; 69%
3. Community-based
services; 12.045; 13%
2. Residential services;
16.000; 18% 00
63.093
16.000
000
20.000
40.000
60.000
80.000
BAS, mii lei BS, mii lei APL, mii lei
Money-services ratei, source of finance, children with disabilities, mln MDL
banii servicii
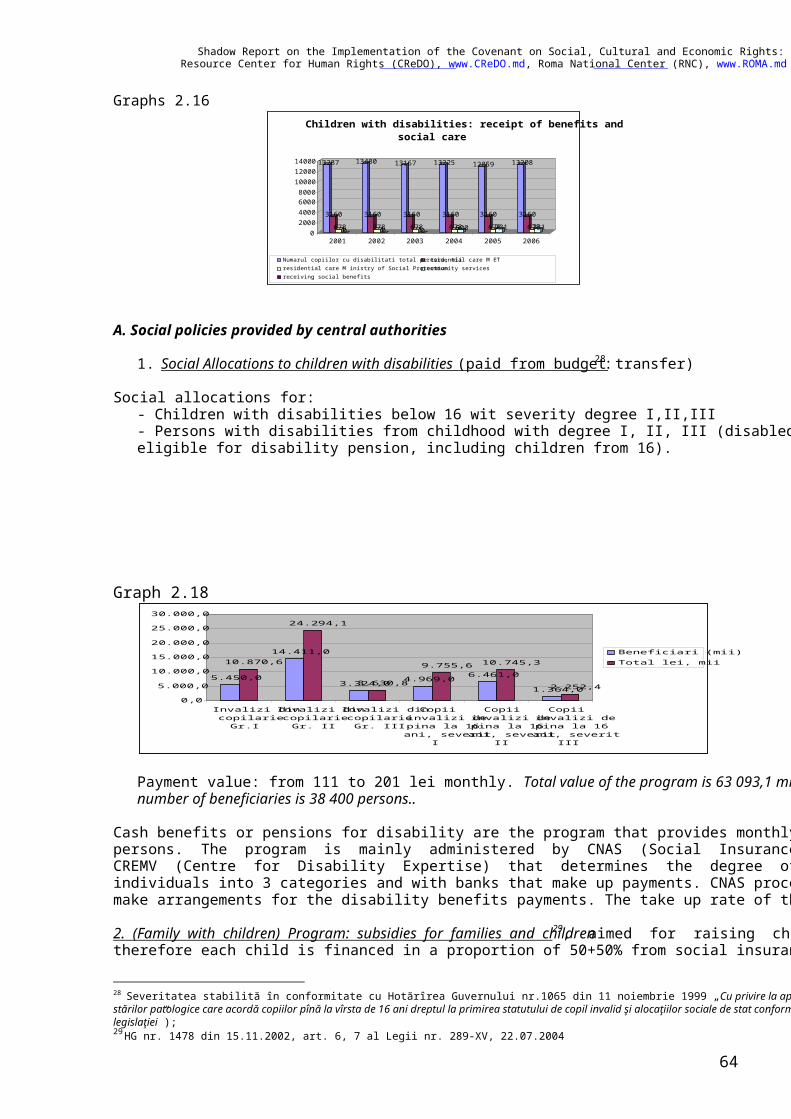
Shadow Report on the Implementation of the Covenant on Social, Cultural and Economic Rights: 2003-09 Resource Center for Human Rights (CReDO), www.CReDO.md, Roma National Center (RNC), www.ROMA.md
64
Graphs 2.16
13287
31606780
13480
31606780
13167
31606780
13225
3160678600
12859
3160678731
13208
3160678731
02000400060008000100001200014000
2001 2002 2003 2004 2005 2006
Children with disabilities: receipt of benefits and social care
Numarul copiilor cu disabilitati total pe tara, miiresidential care M ETresidential care M inistry of Social Protectioncommunity servicesreceiving social benefits
A. Social policies provided by central authorities
1. Social Allocations to children with disabilities (paid from budget transfer)28: Social allocations for:
- Children with disabilities below 16 wit severity degree I,II,III - Persons with disabilities from childhood with degree I, II, III (disabled from childhood, that are not eligible for disability pension, including children from 16).
Graph 2.18
5.450,0
14.411,0
3.324,0 4.969,0 6.461,0
1.364,0
10.870,6
24.294,1
3.630,8
9.755,6 10.745,3
2.252,4
0,0
5.000,0
10.000,0
15.000,0
20.000,0
25.000,0
30.000,0
Invalizi dincopilarieGr.I
Invalizi dincopilarieGr. II
Invalizi dincopilarieGr. III
Copiiinvalizi depina la 16ani, severit
I
Copiiinvalizi depina la 16ani, severit
II
Copiiinvalizi depina la 16ani, severit
III
Beneficiari (mii)Total lei, mii
Payment value: from 111 to 201 lei monthly. Total value of the program is 63 093,1 mii lei, total number of beneficiaries is 38 400 persons..
Cash benefits or pensions for disability are the program that provides monthly benefits for the qualified persons. The program is mainly administered by CNAS (Social Insurance Office) in cooperation with CREMV (Centre for Disability Expertise) that determines the degree of disability fitting the qualified individuals into 3 categories and with banks that make up payments. CNAS processes individual files and make arrangements for the disability benefits payments. The take up rate of the benefit is very high. 2. (Family with children) Program: subsidies for families and children29, aimed for raising children, therefore each child is financed in a proportion of 50+50% from social insurance and state budget, is one
28 Severitatea stabilită în conformitate cu Hotărîrea Guvernului nr.1065 din 11 noiembrie 1999 „Cu privire la aprobarea Listei bolilor şi stărilor patologice care acordă copiilor pînă la vîrsta de 16 ani dreptul la primirea statutului de copil invalid şi alocaţiilor sociale de stat conform legislaţiei”); 29 HG nr. 1478 din 15.11.2002, art. 6, 7 al Legii nr. 289-XV, 22.07.2004
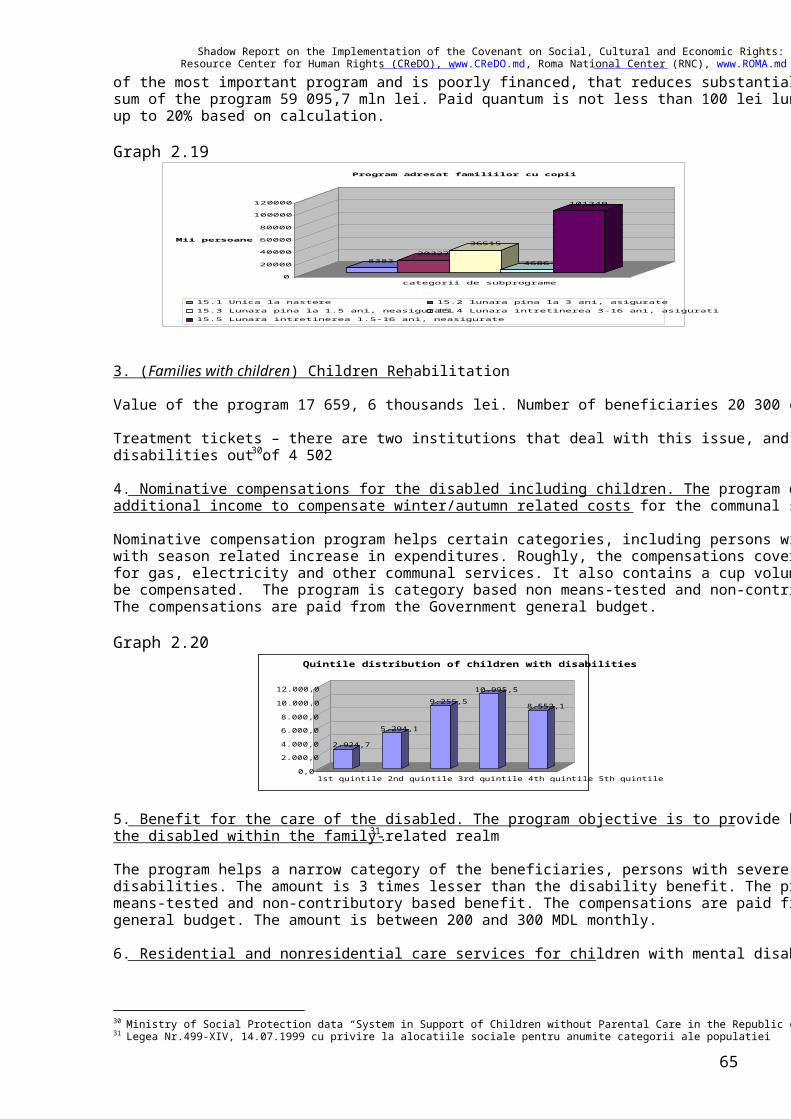
Shadow Report on the Implementation of the Covenant on Social, Cultural and Economic Rights: 2003-09 Resource Center for Human Rights (CReDO), www.CReDO.md, Roma National Center (RNC), www.ROMA.md
65
of the most important program and is poorly financed, that reduces substantially the given program. Total sum of the program 59 095,7 mln lei. Paid quantum is not less than 100 lei lunar per children, but it gets up to 20% based on calculation. Graph 2.19
838320327
36515
4686
101249
0
20000
40000
60000
80000
100000
120000
Mii persoane
categorii de subprograme
Program adresat familiilor cu copii
15.1 Unica la nastere 15.2 lunara pina la 3 ani, asigurate15.3 Lunara pina la 1.5 ani, neasigurati15.4 Lunara intretinerea 3-16 ani, asigurati15.5 Lunara intretinerea 1.5-16 ani, neasigurate
3. (Families with children) Children Rehabilitation Value of the program 17 659, 6 thousands lei. Number of beneficiaries 20 300 children. Treatment tickets – there are two institutions that deal with this issue, and that covered 479 children with disabilities out of 4 50230. 4. Nominative compensations for the disabled including children. The program objective is to provide additional income to compensate winter/autumn related costs for the communal services. Nominative compensation program helps certain categories, including persons with disabilities to cope with season related increase in expenditures. Roughly, the compensations cover 50% of the expenditures for gas, electricity and other communal services. It also contains a cup volume of the services that are to be compensated. The program is category based non means-tested and non-contributory based benefit. The compensations are paid from the Government general budget. Graph 2.20
2.924,7
5.294,1
9.255,510.995,5
8.552,1
0,0
2.000,0
4.000,0
6.000,08.000,0
10.000,0
12.000,0
1st quintile 2nd quintile 3rd quintile 4th quintile 5th quintile
Quintile distribution of children with disabilities
5. Benefit for the care of the disabled. The program objective is to provide basic necessary social care for the disabled within the family-related realm31. The program helps a narrow category of the beneficiaries, persons with severe specifically intellectual disabilities. The amount is 3 times lesser than the disability benefit. The program is category based non means-tested and non-contributory based benefit. The compensations are paid from the Government general budget. The amount is between 200 and 300 MDL monthly. 6. Residential and nonresidential care services for children with mental disabilities
30 Ministry of Social Protection data “System in Support of Children without Parental Care in the Republic of Moldova” 31 Legea Nr.499-XIV, 14.07.1999 cu privire la alocatiile sociale pentru anumite categorii ale populatiei

Shadow Report on the Implementation of the Covenant on Social, Cultural and Economic Rights: 2003-09 Resource Center for Human Rights (CReDO), www.CReDO.md, Roma National Center (RNC), www.ROMA.md
66
6a Residential care for children with severe disabilities (Ministry of Social Protection, Family and Child coordinate the activity of two residential social institutions): Data analysis shows that the total number of children with mental disabilities, covered by the survey, amounts to 3,260 children. In terms of gender characteristics we ascertain that boys account for 61.65%, and girls, accordingly, for 38.35%. Diagram No. 2 shows the data as to the number of children in terms of age. Graph 2.21
3 27
8161296 1083
350
500
1000
1500
Repartizarea copiilor pe vîrste
0-3 ani4-7 ani 8-11 ani12-14 ani15-18 aniMai mult de 18 ani Data analysis confirms that the children in 72.98% of cases fall under the age group of 12 – 18 years. This fact demonstrates that the number of children in such institutions shall decrease by around 20% in the time span 2007-2009, due to the children leaving the residential system upon completing their education. At the moment of the study there were 2 institutions of protection of the children with severe disabilities in the Republic of Moldova, subordinated to the Ministry of Health and Social Protection and financed from the central budget. The Ministry of Health and Social Protection completed these institutions according to the conclusions of the republican medico-psycho pedagogic consultation. The children’s homes for children with severe disabilities are situated in edifices built according to projects-model intended to the education institutions with an outdating period of 20-45 years. The institutions from Hincesti and Orhei are situated near the outskirts of the town at a distance of 5 km. In 2 children’s homes for children with severe disabilities, at the moment of the study were present 633 children, which represent 93.36% of the total number of children present in lists—678 children, but 673 children were surveyed. The total number of children on January 1, 2006 constitutes 640 children, distributed according to the sex criterion, among which 320 boys in Orhei and 320 girls in Hincesti. According to the data of the Ministry of Social Protection, there are 8 residential institutions, of which 2 are for children with severe disabilities (Boarding school for mentally disabled children from or. Hînceşti and from the city of Orhei). Furthermore, if in 2001, residential institutions of MSP were 517 children, then in 2005 their number reached 640. The number of chronically psychological problem, their number increased from 1444 in 2001 to 1554 in 2005. In the same time, the institutionalization rate from this period increased with 12,9%. It is important to mention that mentioned above indicators reflect the necessity of the population of these services, but are determined by limited capacities of such institutions and limited access of disabled persons to other types of social assistance.
RESIDENTIAL INSTITUIONS HINCESTI ORHEI
Beneficiaries 345 334
Alimentation spending per day 15,66 lei/day 16,5 lei/ day
Mantainance expenditures 71,1 lei/ day 63,7 lei/ day
Institutions maintaince expenditures 7 731,4 mii lei/year 7 599,3 mii day Evaluation data indicates a reduced quality of residential type of services, oriented mainly to providing basic needs, undeveloped psychological and physical services. A problem that affects directly the quality of provided services in residential care is related directly to the employees that are at the moment insufficient, lack of social assistants units, low salaries. Another aspect is related to a continuous system of professional development32. 6b Residential services for less severe disabilities for children (Ministry of Education and Youth):
32 Annual Social Report, 2006 by Ministry of Social Protection, Family and Child
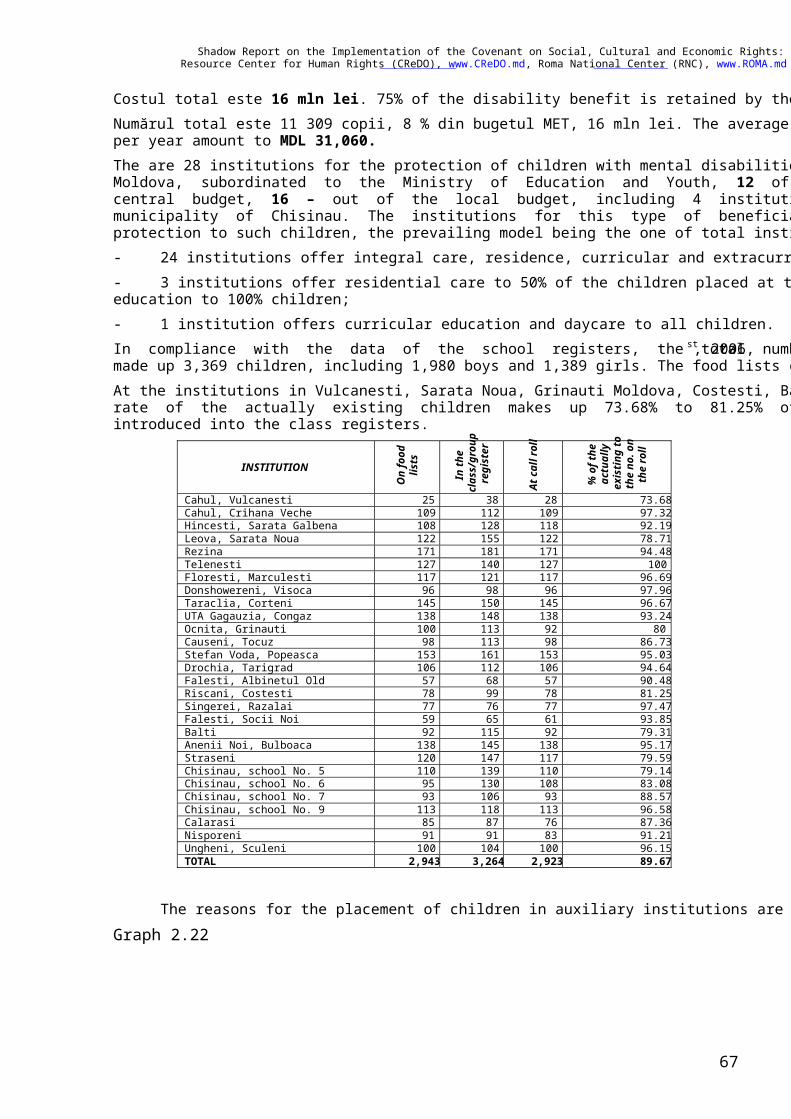
Shadow Report on the Implementation of the Covenant on Social, Cultural and Economic Rights: 2003-09 Resource Center for Human Rights (CReDO), www.CReDO.md, Roma National Center (RNC), www.ROMA.md
67
Costul total este 16 mln lei. 75% of the disability benefit is retained by the institutions. Numărul total este 11 309 copii, 8 % din bugetul MET, 16 mln lei. The average general costs per child per year amount to MDL 31,060. The are 28 institutions for the protection of children with mental disabilities operating in the Republic of Moldova, subordinated to the Ministry of Education and Youth, 12 of them were financed out of the central budget, 16 – out of the local budget, including 4 institutions financed out of the budget of the municipality of Chisinau. The institutions for this type of beneficiaries have 3 models of providing protection to such children, the prevailing model being the one of total institutionalization. - 24 institutions offer integral care, residence, curricular and extracurricular education; - 3 institutions offer residential care to 50% of the children placed at the institution and curricular education to 100% children; - 1 institution offers curricular education and daycare to all children. In compliance with the data of the school registers, the total number of children on January 1st, 2006, made up 3,369 children, including 1,980 boys and 1,389 girls. The food lists covered 2,923 children. At the institutions in Vulcanesti, Sarata Noua, Grinauti Moldova, Costesti, Balti, Straseni, Chisinau the rate of the actually existing children makes up 73.68% to 81.25% of the total number of the children introduced into the class registers.
INSTITUTION
On
food
lis
ts
In th
e cl
ass/
grou
p re
gist
er
At c
all r
oll
% o
f the
ac
tual
ly
exis
ting
to
the
no. o
n th
e ro
ll
Cahul, Vulcanesti 25 38 28 73.68 Cahul, Crihana Veche 109 112 109 97.32 Hincesti, Sarata Galbena 108 128 118 92.19 Leova, Sarata Noua 122 155 122 78.71 Rezina 171 181 171 94.48 Telenesti 127 140 127 100 Floresti, Marculesti 117 121 117 96.69 Donshowereni, Visoca 96 98 96 97.96 Taraclia, Corteni 145 150 145 96.67 UTA Gagauzia, Congaz 138 148 138 93.24 Ocnita, Grinauti 100 113 92 80 Causeni, Tocuz 98 113 98 86.73 Stefan Voda, Popeasca 153 161 153 95.03 Drochia, Tarigrad 106 112 106 94.64 Falesti, Albinetul Old 57 68 57 90.48 Riscani, Costesti 78 99 78 81.25 Singerei, Razalai 77 76 77 97.47 Falesti, Socii Noi 59 65 61 93.85 Balti 92 115 92 79.31 Anenii Noi, Bulboaca 138 145 138 95.17 Straseni 120 147 117 79.59 Chisinau, school No. 5 110 139 110 79.14 Chisinau, school No. 6 95 130 108 83.08 Chisinau, school No. 7 93 106 93 88.57 Chisinau, school No. 9 113 118 113 96.58 Calarasi 85 87 76 87.36 Nisporeni 91 91 83 91.21 Ungheni, Sculeni 100 104 100 96.15 TOTAL 2,943 3,264 2,923 89.67
The reasons for the placement of children in auxiliary institutions are reflected
Graph 2.22
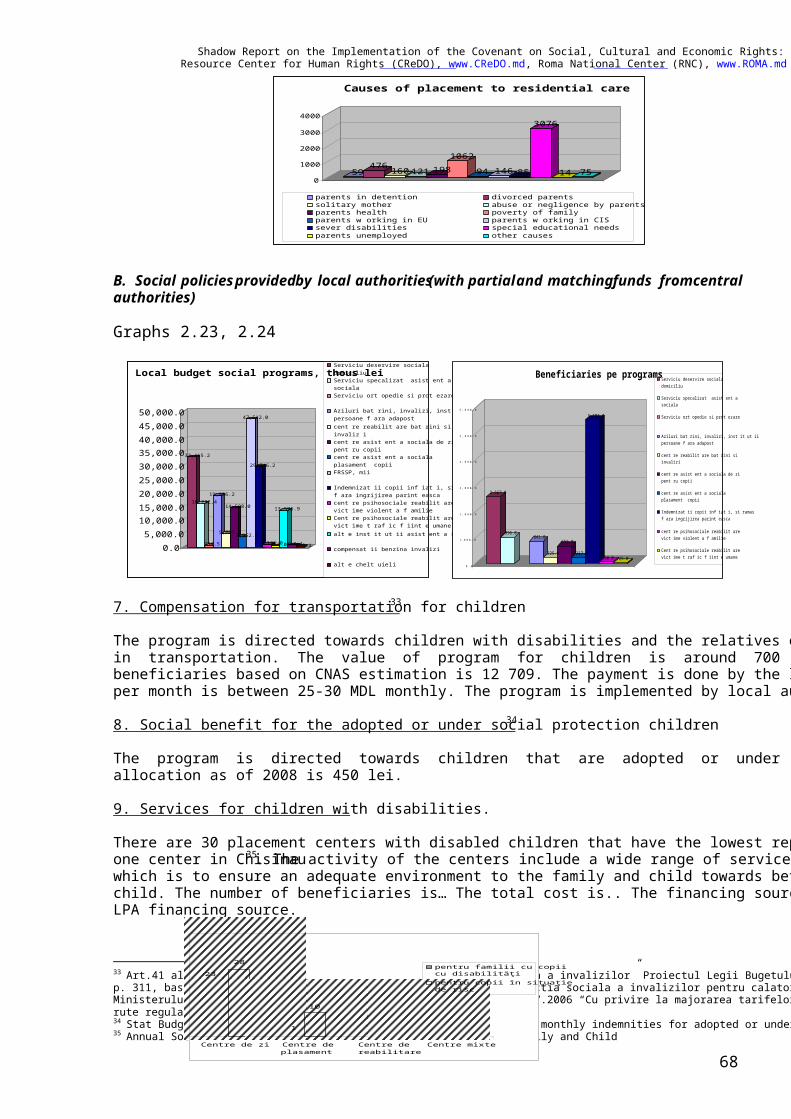
Shadow Report on the Implementation of the Covenant on Social, Cultural and Economic Rights: 2003-09 Resource Center for Human Rights (CReDO), www.CReDO.md, Roma National Center (RNC), www.ROMA.md
68
59476 160 121 198
106294 146 85
3076
14 750
1000
2000
3000
4000
Causes of placement to residential care
parents in detention divorced parentssolitary mother abuse or negligence by parentsparents health poverty of familyparents w orking in EU parents w orking in CISsever disabilities special educational needsparents unemployed other causes
B. Social policies provided by local authorities (with partial and matching funds from central authorities) Graphs 2.23, 2.24
33,415.2
16,232.4
734.5
19,056.2
5,007.0
14,598.0
3,962.3
47,512.0
29,716.2
1,136.0568.0
13,595.9
818.4190.10.05,000.010,000.015,000.020,000.025,000.030,000.035,000.040,000.045,000.050,000.0
Local budget social programs, thous leiServiciu deservire socialadomiciliuServiciu specalizat asist ent asocialaServiciu ort opedie si prot ezare
Aziluri bat rini, invalizi, inst it ut iipersoane f ara adapostcent re reabilit are bat rini siinvaliz icent re asist ent a sociala de zipent ru copiicent re asist ent a socialaplasament copiiFRSSP, mii
Indemnizat ii copii inf iat i, si ramasf ara ingrijirea parint eascacent re psihosociale reabilit arevict ime violent a f amilieCent re psihosociale reabilit arevict ime t raf ic f iint e umanealt e inst it ut ii asist ent a sociala
compensat ii benzina invalizi
alt e chelt uieli
2,567.0
996.0841.0
225.0
656.0
217.0
5,503.0
50.0 25.00 . 0
1, 0 0 0 . 0
2 , 0 0 0 . 0
3 , 0 0 0 . 0
4 , 0 0 0 . 0
5 , 0 0 0 . 0
6 , 0 0 0 . 0
Beneficiaries pe programsServiciu deservire socialadomiciliu
Serviciu specalizat asist ent asociala
Serviciu ort opedie si prot ezare
Aziluri bat rini, invalizi, inst it ut iipersoane f ara adapost
cent re reabilit are bat rini siinvalizi
cent re asist ent a sociala de zipent ru copii
cent re asist ent a socialaplasament copii
Indemnizat ii copii inf iat i, si ramasf ara ingrijirea parint easca
cent re psihosociale reabilit arevict ime violent a f amilie
Cent re psihosociale reabilit arevict ime t raf ic f iint e umane
7. Compensation for transportation for children33 The program is directed towards children with disabilities and the relatives of children that assist children in transportation. The value of program for children is around 700 000 lei. Number of children beneficiaries based on CNAS estimation is 12 709. The payment is done by the local authorities. The cost per month is between 25-30 MDL monthly. The program is implemented by local authorotoes. 8. Social benefit for the adopted or under social protection children34 The program is directed towards children that are adopted or under social protection. The monthly allocation as of 2008 is 450 lei. 9. Services for children with disabilities. There are 30 placement centers with disabled children that have the lowest representativity, functioning as one center in Chisinau35. The activity of the centers include a wide range of services that have the aim of which is to ensure an adequate environment to the family and child towards better social integration of the child. The number of beneficiaries is… The total cost is.. The financing source is mixed, 51% is from LPA financing source.
33 Art.41 al Legii nr.821-XII, 24.12.1991 “Privind protectia sociala a invalizilor” Proiectul Legii Bugetului de stat pe anul 2008, septembrie 2007, p. 311, based on art.41 Legea nr.821-XII, 24.12.1991 privind protectia sociala a invalizilor pentru calatoria in ransport comun, Ordinul Ministerului Transprtului si Gospodariei Drumurilor nr. 7 din 12.07.2006 “Cu privire la majorarea tarifelor in transportul de calatori si bagaje pe rute regulate” 34 Stat Budget draft law for the year 2008, September 2007, p. 311, monthly indemnities for adopted or under tutelage children 35 Annual Social Report, 2006 by Ministry of Social Protection, Family and Child
1
6910 10
23
28
Centre de zi Centre deplasament
Centre dereabilitare
Centre mixte
pentru familii cu copiicu disabilităţipentru copii în situaţiede risc
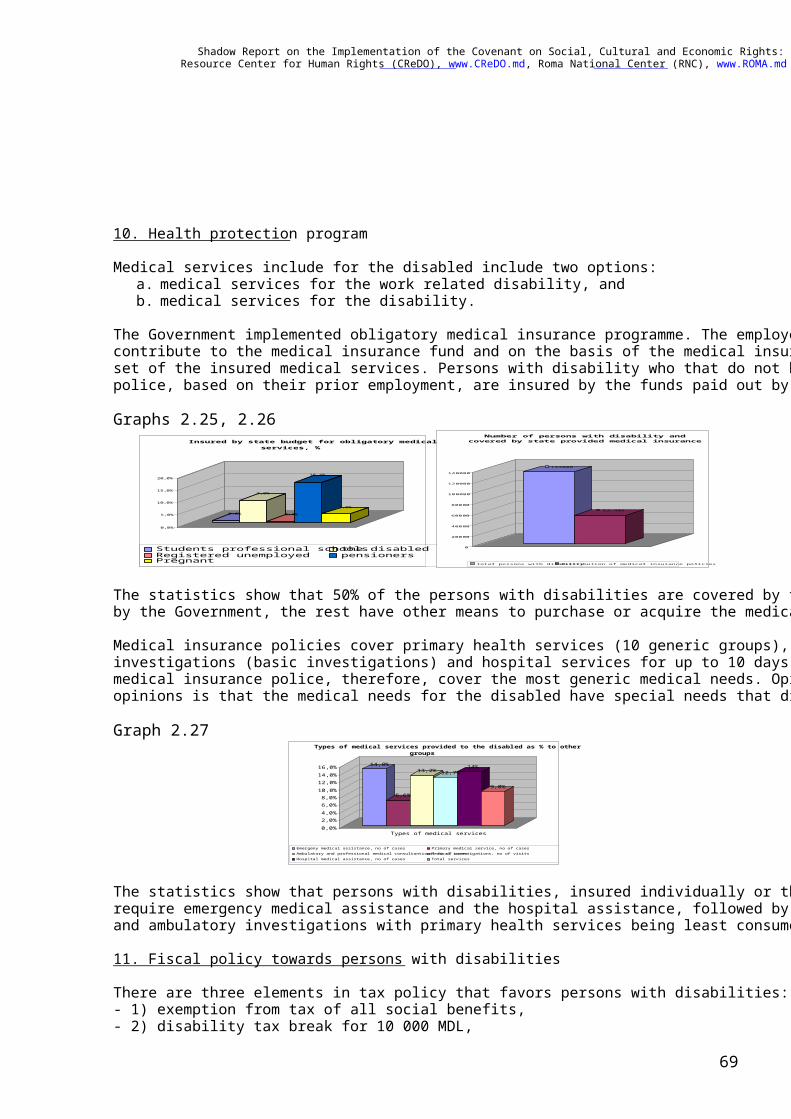
Shadow Report on the Implementation of the Covenant on Social, Cultural and Economic Rights: 2003-09 Resource Center for Human Rights (CReDO), www.CReDO.md, Roma National Center (RNC), www.ROMA.md
69
10. Health protection program Medical services include for the disabled include two options:
a. medical services for the work related disability, and b. medical services for the disability.
The Government implemented obligatory medical insurance programme. The employed persons contribute to the medical insurance fund and on the basis of the medical insurance police benefit from a set of the insured medical services. Persons with disability who that do not have the medical insurance police, based on their prior employment, are insured by the funds paid out by the Government.
Graphs 2.25, 2.26
0,8%
9,0%
0,4%
16,4%
3,5%
0,0%
5,0%
10,0%
15,0%
20,0%
Insured by state budget for obligatory medical services, %
Students professional schoolsthe disabledRegistered unemployed pensionersPregnant
134000
52.486
0
20000
40000
60000
80000
100000
120000
140000
Number of persons with disability and covered by state provided medical insurance
total persons with disabilitydistribution of medical insurance policies The statistics show that 50% of the persons with disabilities are covered by the insurance policies paid out by the Government, the rest have other means to purchase or acquire the medical insurance policies. Medical insurance policies cover primary health services (10 generic groups), medical consultations and investigations (basic investigations) and hospital services for up to 10 days (including the medicine). The medical insurance police, therefore, cover the most generic medical needs. Opinion of the experts’ opinions is that the medical needs for the disabled have special needs that differ in some substantial part. Graph 2.27
14,8%
6,6%
13,2% 12,7%14%
9,0%
0,0%2,0%4,0%6,0%8,0%10,0%12,0%14,0%16,0%
Types of medical services
Types of medical services provided to the disabled as % to other groups
Emergeny medical assistance, no of cases Primary medical service, no of casesAmbulatory and professional medical consultantions, no of casesMedical investigations, no of visitsHospital medical assistance, no of cases Total services
The statistics show that persons with disabilities, insured individually or through the state insurance, require emergency medical assistance and the hospital assistance, followed by specialised consultations and ambulatory investigations with primary health services being least consumed. 11. Fiscal policy towards persons with disabilities There are three elements in tax policy that favors persons with disabilities: - 1) exemption from tax of all social benefits, - 2) disability tax break for 10 000 MDL,
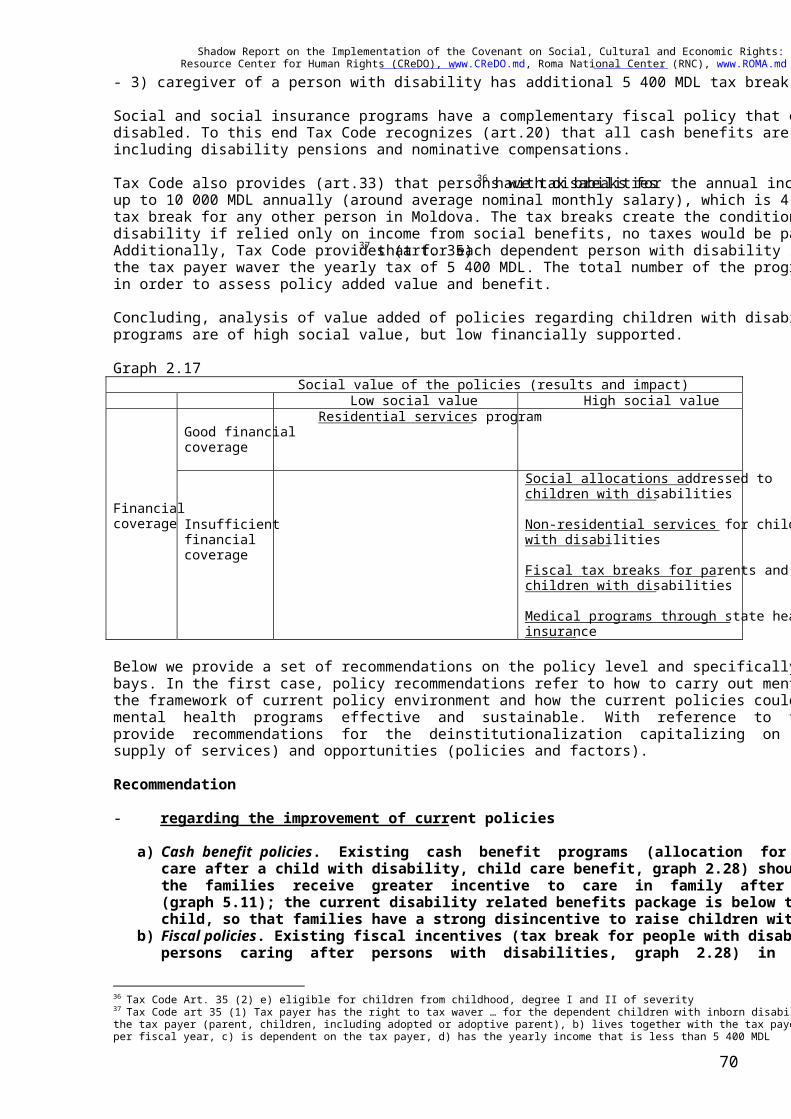
Shadow Report on the Implementation of the Covenant on Social, Cultural and Economic Rights: 2003-09 Resource Center for Human Rights (CReDO), www.CReDO.md, Roma National Center (RNC), www.ROMA.md
70
- 3) caregiver of a person with disability has additional 5 400 MDL tax break. Social and social insurance programs have a complementary fiscal policy that enhances the income of the disabled. To this end Tax Code recognizes (art.20) that all cash benefits are not taxable to the recipients, including disability pensions and nominative compensations. Tax Code also provides (art.33) that persons with disabilities36 have tax breaks for the annual income of up to 10 000 MDL annually (around average nominal monthly salary), which is 4 times higher than the tax break for any other person in Moldova. The tax breaks create the conditions that if the persons with disability if relied only on income from social benefits, no taxes would be payable from this income. Additionally, Tax Code provides (art. 35)37 that for each dependent person with disability including child the tax payer waver the yearly tax of 5 400 MDL. The total number of the program beneficiaries is known in order to assess policy added value and benefit. Concluding, analysis of value added of policies regarding children with disabilities show that most of the programs are of high social value, but low financially supported. Graph 2.17
Social value of the policies (results and impact) Low social value High social value
Good financial coverage
Residential services program Financial coverage
Insufficient financial coverage
Social allocations addressed to children with disabilities Non-residential services for children with disabilities Fiscal tax breaks for parents and for children with disabilities Medical programs through state health insurance
Below we provide a set of recommendations on the policy level and specifically for the Orhei School for bays. In the first case, policy recommendations refer to how to carry out mental health policy programs in the framework of current policy environment and how the current policies could be improved to make the mental health programs effective and sustainable. With reference to the Orhei School for boys, we provide recommendations for the deinstitutionalization capitalizing on the existing resources (existing supply of services) and opportunities (policies and factors). Recommendation - regarding the improvement of current policies
a) Cash benefit policies. Existing cash benefit programs (allocation for disability, benefit to care after a child with disability, child care benefit, graph 2.28) should be increased so that the families receive greater incentive to care in family after the children with disabilities (graph 5.11); the current disability related benefits package is below the poverty line per child, so that families have a strong disincentive to raise children with disabilities at home;
b) Fiscal policies. Existing fiscal incentives (tax break for people with disabilities, tax break for persons caring after persons with disabilities, graph 2.28) in practice target only persons
36 Tax Code Art. 35 (2) e) eligible for children from childhood, degree I and II of severity 37 Tax Code art 35 (1) Tax payer has the right to tax waver … for the dependent children with inborn disability for 5 400 MDL: a) is a relative of the tax payer (parent, children, including adopted or adoptive parent), b) lives together with the tax payer or day studies for more than 5 months per fiscal year, c) is dependent on the tax payer, d) has the yearly income that is less than 5 400 MDL
Shadow Report on the Implementation of the Covenant on Social, Cultural and Economic Rights: 2003-09 Resource Center for Human Rights (CReDO), www.CReDO.md, Roma National Center (RNC), www.ROMA.md
71
with at least average and high incomes, still the tax breaks are insufficient in order to make its use systematic and interested, therefore an increase in tax breaks as suggested in graph 5.11 would be beneficial;
c) Preference for nonresidential care. Nonresidential care system proves to be less costly (graph 2.29) and as other research and practice show much more effective in the integration of the children into society; current practice of the supply of the nonresidential care (sections 3.1 and 3.2) provide a number of best practices with the operational costs per child varying around 8 000 MDL per year (which is several times less than residential care costs, graph 2.29); therefore, the nonresidential care should be the preferred option that will capitalize on the relevant cash benefit and fiscal policies (above a) and b)) and further develop the community based services as per best practice referred to;
d) Social services provision. Currently non-residential care services for the children with disabilities barely cover 8-9% of the children needed (graph 3.2) with the varying degree of quality, the insufficient supply is due to the lack of local authorities financial capacity (graph 5.2, 5.3) and the lack of central government program priority for the creation of social services in general and specifically for the children (with disabilities) (graph 5.1, graph 2.4, graphs 2.14, 2.15); therefore, service components of the policies should be developed based on the best practices of nonresidential care (more efficient and effective) with specific centrally financed and locally co-financed programs for children with disabilities; as graph 5.10 shows, to match the existing needs for the social services for the children with disabilities, a program of 50 mln MDL of operational costs per country with 5-6 000 MDL per child will be needed to produce sustainable and effective results (redirecting funds from nominative compensation program is just one source for the program);
e) Social service financing. With the current system of fiscal centralization, the source of financing of the social service should come from the central authorities budget (graph 2.5) as specialized programs run on 3 years bases that will be managed by the local authorities (capitalizing on the existing practice in local-central authorities cooperation, graph 5.8) and co-matched from the budgets of the local authorities with up to 25%; the provision of the social services could be done on tender-based principles by local authorities on the principles of at least 10% to 20% of matching funds from the social services supplies matching funds;
f) Financial mechanism for socials services. Effective introduction of the social services require a financial mechanism, whereby a package of social service cost will be estimated for a child (person) with disabilities; the calculated package should be planned based on the community residence of the child with disability and follow the child while (s)he decides to move out of the community; this system will produce a greater incentive to local authorities to develop the supply of social services;
g) Creation of accreditation, standards. To put the suggested system of social service in practice, as explained in section 2.2, there is a need for the accreditation and quality of social service system as well as the minimal standards for social service provision; these are absent for the moment;
h) Quality of professionals. The number of social service professionals increases, currently satisfying the needs (in the conditions of incipient development of social service provision), however should the provision of social service increase as recommended, the market of social workers and professionals will suffer from shortages; indeed currently around 5 000 professionals exist with about 1 000 entering the market (graph 4.1, 4.2), however only 40% are interested in joining the market, professionals satisfy less than 10% (300-400) of social service needs (graph 3.2), therefore around 3 000 will be needed for children with disabilities only; the quality of education remain the question in point as it suffers from being extensively theoretical with few opportunities to practice on the ground;
i) Insufficient coverage with social service. Estimation of children with disabilities reveals that only up to 20% are covered by any kind of service (including Ministry of Health hospitals not assessed in the policy research), the rest are hidden from the society.
- regarding carrying out of mental health programs capitalizing on the current policy framework
Shadow Report on the Implementation of the Covenant on Social, Cultural and Economic Rights: 2003-09 Resource Center for Human Rights (CReDO), www.CReDO.md, Roma National Center (RNC), www.ROMA.md
72
a) Make use of cash benefits policies. Promotion of mental health services based on nonresidential care and community based services should make use of the existing cash benefits and fiscal policies for families, households and persons with individuals; promotion of social services usually disregard these policies and no assistance is provided to access them;
b) Make use of fiscal policies. Social adoption or social support institutions for the children or persons with disabilities could be strengthened while making use of the cash benefits and fiscal policies;
c) Local authorities service provision model. Promotion of social service development should capitalize on the existing local authorities programs (negotiated with central authorities as per normative per beneficiary allocation, graph 5.8) for provision of social services as this follows the principle of making the services closer to the beneficiary rather then follow the practice of financing social services from central budget (information in section 5.1);
d) Capitalize on good practice. Existing good practice provision of relevant social services should be strongly capitalized on, the quality upgraded and specifically developed methods and practice of social entrepreneurship around the existing models.
Shadow Report on the Implementation of the Covenant on Social, Cultural and Economic Rights: 2003-09 Resource Center for Human Rights (CReDO), www.CReDO.md, Roma National Center (RNC), www.ROMA.md
73
Article 12. Highest standard of living, infant mortality, healthy development of child, hygiene, prevention of epidemic, conditions for medical service
Health Care Policy priorities38
Conclusions of the section on analysis of budget policies in the health area:
- the main beneficiary groups, except for the persons insured through employment, are the retired persons, disabled people, and persons insured individually,
- the main national programs aim at investing in the material and technical basis or supplementing the medical treatment at the level of hospital services,
- the public health care and prevention programs are at an incipient stage. The analysis of the information submitted reveals greater administrative costs in the social sector. The amounts paid for human resources are also higher in this sector. Conclusions on health care policies:
- the analysis determines the costs and expenditures for beneficiary groups, - the main users of health care services, except for the persons insured through employment,
are the retired and disabled persons, who use mostly hospital services, - the persons insured individually consume the greatest amount of funds per beneficiary, - the national programs are mostly oriented towards the consolidation of material basis and
are indirectly oriented towards the provision of hospital services, - programs for healthy life style promotion and prevention of health care risks are under-
financed, the relative appropriations are much lower than the investments made in materials.
The social policies are a priority of public expenditures. The expenditures for social needs have a constant share of over 30% in the national public budget. The expenditures for health care account for 13%, and those for education – for 16% of the national public budget. The total value of social expenditures accounts for over 60% of the national public budget. This figure maintains its share over the last 3 years. Figure 1
38 Based on Budget Analysis of Administrative Institutions and Sector Policies in the Health Sector. Resource Center for Human Rights (CReDO), 2008

Shadow Report on the Implementation of the Covenant on Social, Cultural and Economic Rights: 2003-09 Resource Center for Human Rights (CReDO), www.CReDO.md, Roma National Center (RNC), www.ROMA.md
74
Source: MTEF 2008-10, 2009-11 The analysis of social expenditures structure in terms of Gross Domestic Product (GDP) reveals a similar situation. The expenditures for social sector account for 13%, for health care – almost 6%, and for education – a little over 8%. Totally, the social expenditures account for a little less than 30% of GDP. Figure 2
Source: MTEF 2008-10, 2009-11 The national public budget consists of 4 main budgets: state Budget (revenues from taxes and fees), budget of local public authorities (ATU), social insurance budget, and health insurance budget. The relative share of budgets is obvious. Figure 3
2.40.50.42.7
8.5
4.8
11.7
0.51.51.20.21.91.2
2.50.60.52.9
8.5
5.4
12.8
0.61.410.32.10.6
2.40.50.42.6
8.4
5.8
13
0.51.51.30.21.20.6
0 5 10 15 20 25 30 35 40
2006 2007 2008
Public expenditures in GDP, %13. Other
12. Remuneration reform
11. Environment
10. Utilities, transport 9. Agriculture
8. Science
7. Social
6. Health care
5. Education
4. Public order
3. Justice
2. Economic activity 1. State services with general destination
4.91.50.81.14.617.62.212.3
31.4
112.40.43.75
4.61.10.70.84.116.4213
30.3
1.411.70.53.89.2
4.51.10.70.9416.41.913.2
32.2
1.211.90.43.38
0
20
40
60
80
100
2006 2007 2008
Structure of expenditures from the national public budget, %Budget area Others
Environment protection Economy Science
Social
Health care Culture, art Education
Public order Defence Justice
External activity
Special designation services
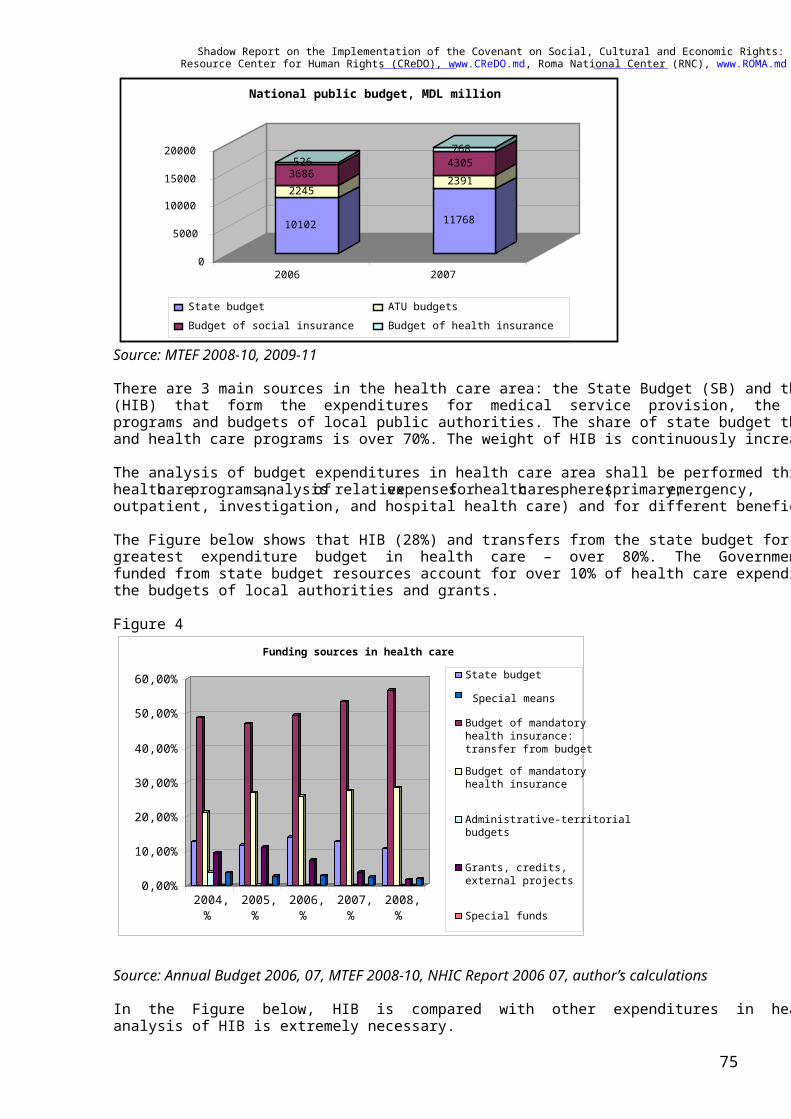
Shadow Report on the Implementation of the Covenant on Social, Cultural and Economic Rights: 2003-09 Resource Center for Human Rights (CReDO), www.CReDO.md, Roma National Center (RNC), www.ROMA.md
75
Source: MTEF 2008-10, 2009-11 There are 3 main sources in the health care area: the State Budget (SB) and the health insurance budget (HIB) that form the expenditures for medical service provision, the state budget through health care programs and budgets of local public authorities. The share of state budget through contributions to HIB and health care programs is over 70%. The weight of HIB is continuously increasing. The analysis of budget expenditures in health care area shall be performed through the analysis of public health care programs, analysis of relative expenses for health care spheres (primary, emergency, outpatient, investigation, and hospital health care) and for different beneficiary categories. The Figure below shows that HIB (28%) and transfers from the state budget for insurance (55%) form the greatest expenditure budget in health care – over 80%. The Government public health care programs funded from state budget resources account for over 10% of health care expenditures; the rest belongs to the budgets of local authorities and grants. Figure 4
Source: Annual Budget 2006, 07, MTEF 2008-10, NHIC Report 2006 07, author’s calculations In the Figure below, HIB is compared with other expenditures in health care sector. So, the detailed analysis of HIB is extremely necessary.
0,00%
10,00%
20,00%
30,00%
40,00%
50,00%
60,00%
2004, %
2005, %
2006, %
2007,%
2008,%
Funding sources in health care
State budget
Budget of mandatory health insurance:transfer from budget Budget of mandatory health insurance
Administrative-territorial budgets
Grants, credits,external projects
Special funds
Special means
10102
2245 3686 526
11768
23914305768
0 5000
10000 15000 20000
2006 2007
National public budget, MDL million
State budget ATU budgetsBudget of social insurance Budget of health insurance
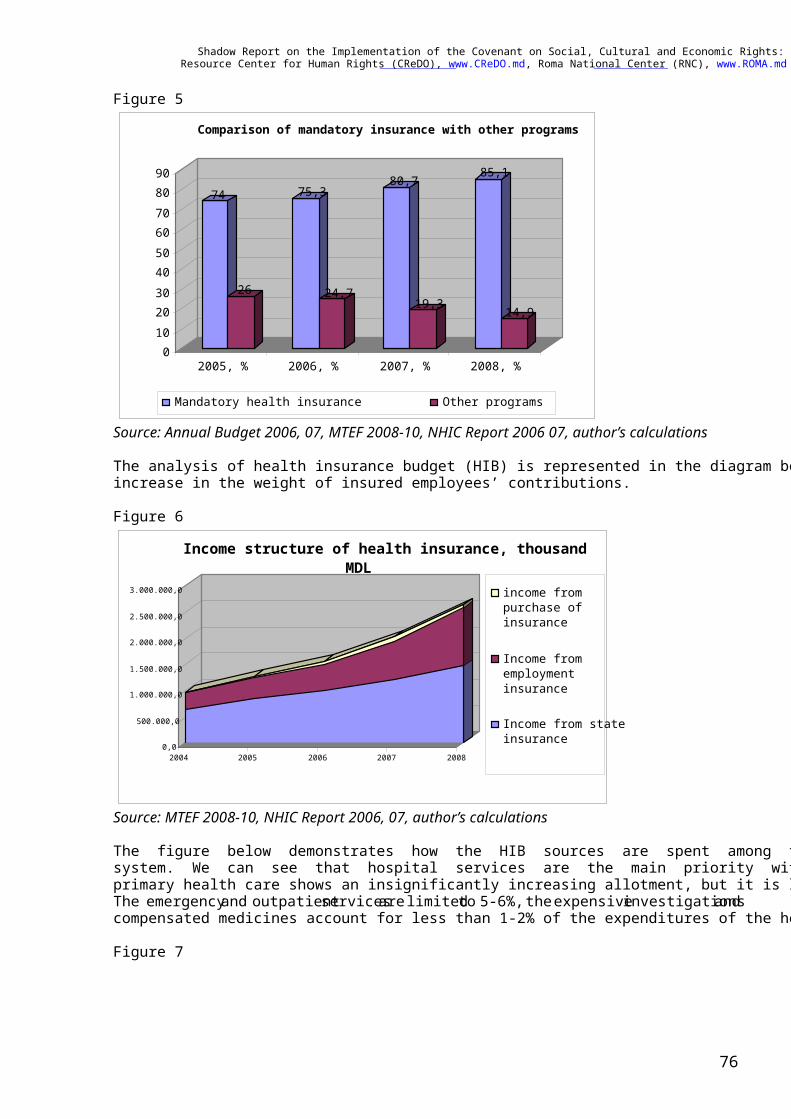
Shadow Report on the Implementation of the Covenant on Social, Cultural and Economic Rights: 2003-09 Resource Center for Human Rights (CReDO), www.CReDO.md, Roma National Center (RNC), www.ROMA.md
76
Figure 5
Source: Annual Budget 2006, 07, MTEF 2008-10, NHIC Report 2006 07, author’s calculations The analysis of health insurance budget (HIB) is represented in the diagram below. We can notice a slight increase in the weight of insured employees’ contributions. Figure 6
Source: MTEF 2008-10, NHIC Report 2006, 07, author’s calculations The figure below demonstrates how the HIB sources are spent among the spheres of health insurance system. We can see that hospital services are the main priority with over 60% of expenditures. The primary health care shows an insignificantly increasing allotment, but it is limited to 35% of expenditures. The emergency and outpatient services are limited to 5-6%, the expensive investigations and compensated medicines account for less than 1-2% of the expenditures of the health insurance system. Figure 7
74
26
75,3
24,7
80,7
19,3
85,1
14,9
0 10 20 30 40 50 60 70 80 90
2005, % 2006, % 2007, % 2008, %
Comparison of mandatory insurance with other programs
Mandatory health insurance Other programs
0,0
500.000,0
1.000.000,0
1.500.000,0
2.000.000,0
2.500.000,0
3.000.000,0
2004 2005 2006 2007 2008
Income structure of health insurance, thousand MDL
income from purchase of insurance
Income from employment insurance
Income from state insurance
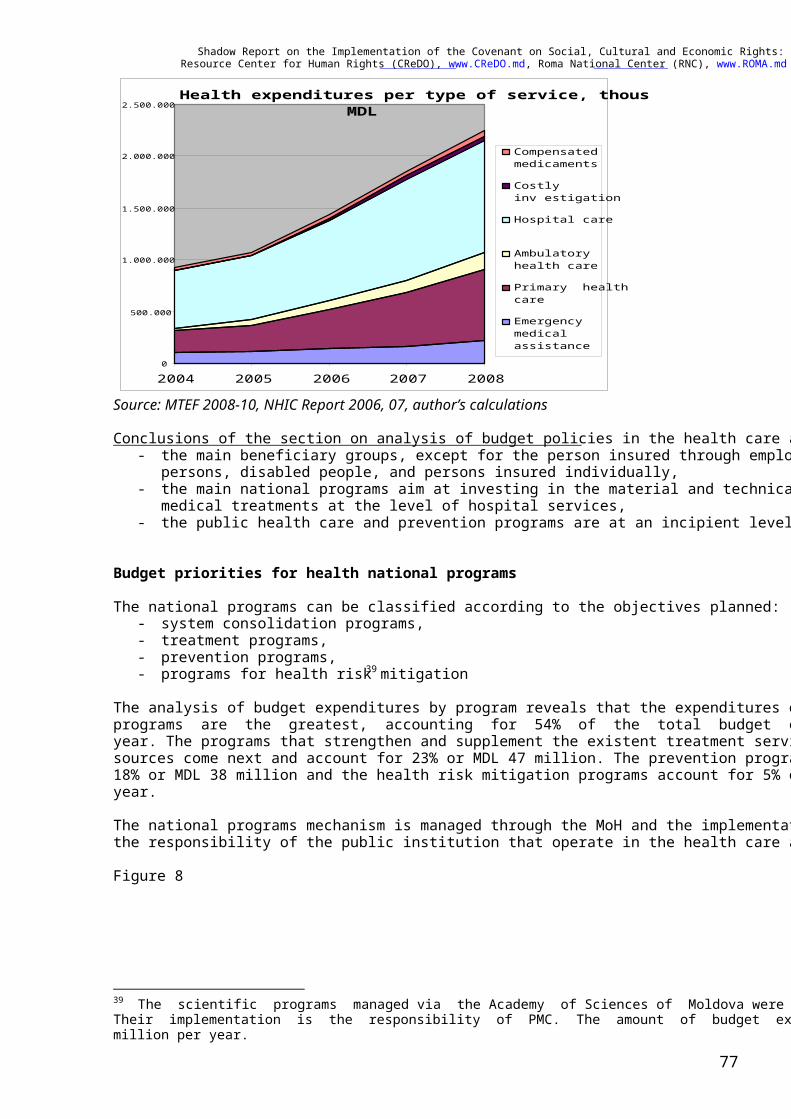
Shadow Report on the Implementation of the Covenant on Social, Cultural and Economic Rights: 2003-09 Resource Center for Human Rights (CReDO), www.CReDO.md, Roma National Center (RNC), www.ROMA.md
77
Health expenditures per type of service, thous MDL
0
500.000
1.000.000
1.500.000
2.000.000
2.500.000
2004 2005 2006 2007 2008
Compensatedmedicaments
Costlyinv estigation
Hospital care
Ambulatoryhealth care
Primary healthcare
Emergencymedicalassistance
Source: MTEF 2008-10, NHIC Report 2006, 07, author’s calculations Conclusions of the section on analysis of budget policies in the health care area:
- the main beneficiary groups, except for the person insured through employment, are the retired persons, disabled people, and persons insured individually,
- the main national programs aim at investing in the material and technical basis or enhancing the medical treatments at the level of hospital services,
- the public health care and prevention programs are at an incipient level. Budget priorities for health national programs The national programs can be classified according to the objectives planned:
- system consolidation programs, - treatment programs, - prevention programs, - programs for health risk mitigation39
The analysis of budget expenditures by program reveals that the expenditures of the system consolidation programs are the greatest, accounting for 54% of the total budget expenditures or MDL 110 million a year. The programs that strengthen and supplement the existent treatment services funded from insurance sources come next and account for 23% or MDL 47 million. The prevention programs account for only 18% or MDL 38 million and the health risk mitigation programs account for 5% or MDL 11 million a year. The national programs mechanism is managed through the MoH and the implementation of programs is the responsibility of the public institution that operate in the health care area. Figure 8
39 The scientific programs managed via the Academy of Sciences of Moldova were not analyzed in this section. Their implementation is the responsibility of PMC. The amount of budget expenditures is lower than MDL 15 million per year.
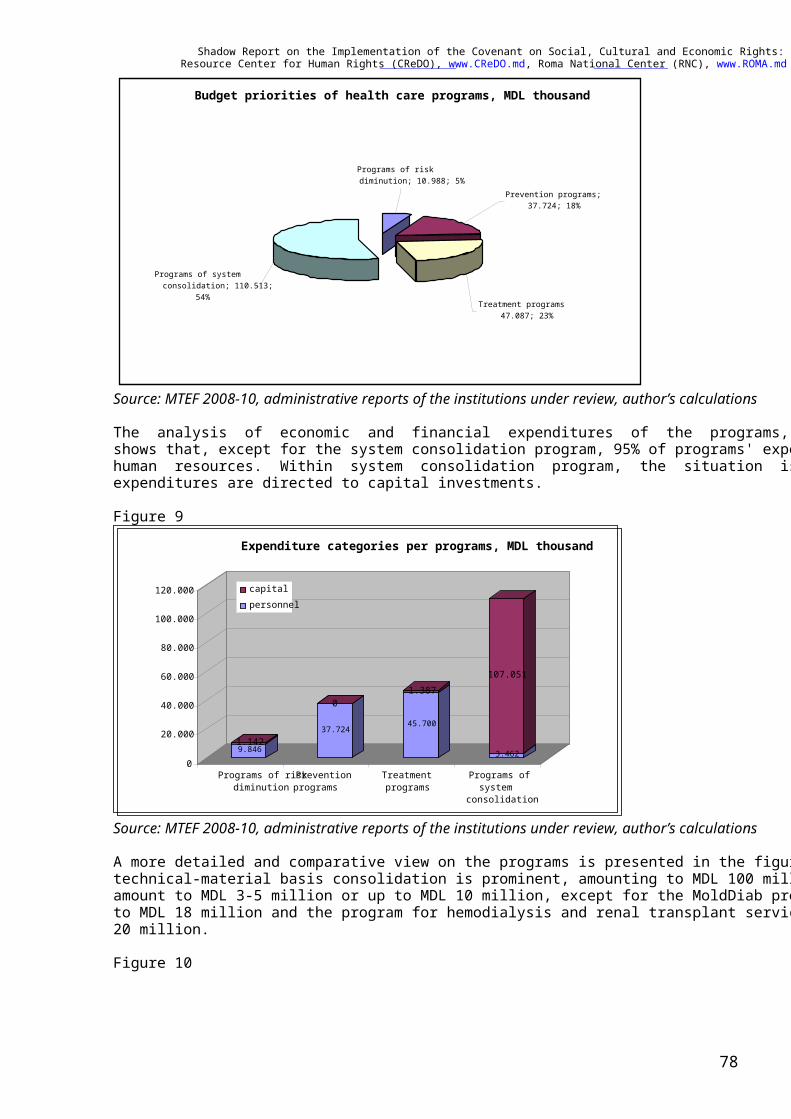
Shadow Report on the Implementation of the Covenant on Social, Cultural and Economic Rights: 2003-09 Resource Center for Human Rights (CReDO), www.CReDO.md, Roma National Center (RNC), www.ROMA.md
78
Source: MTEF 2008-10, administrative reports of the institutions under review, author’s calculations The analysis of economic and financial expenditures of the programs, displayed in the figure below, shows that, except for the system consolidation program, 95% of programs' expenditures are directed to human resources. Within system consolidation program, the situation is reversed, so that 95% of expenditures are directed to capital investments. Figure 9
Source: MTEF 2008-10, administrative reports of the institutions under review, author’s calculations A more detailed and comparative view on the programs is presented in the figure below. The program for technical-material basis consolidation is prominent, amounting to MDL 100 million. The other programs amount to MDL 3-5 million or up to MDL 10 million, except for the MoldDiab program, which amounts to MDL 18 million and the program for hemodialysis and renal transplant services that amounts to MDL 20 million. Figure 10
Budget priorities of health care programs, MDL thousand
Prevention programs; 37.724; 18%
Programs of risk diminution; 10.988; 5%
Programs of systemconsolidation; 110.513;
54%Treatment programs
47.087; 23%
9.8461.142
37.724
0
45.700
1.387
3.462
107.051
0
20.000
40.000
60.000
80.000
100.000
120.000
Programs of risk diminution
Prevention programs
Treatment programs
Programs ofsystem
consolidation
Expenditure categories per programs, MDL thousand
capitalpersonnel
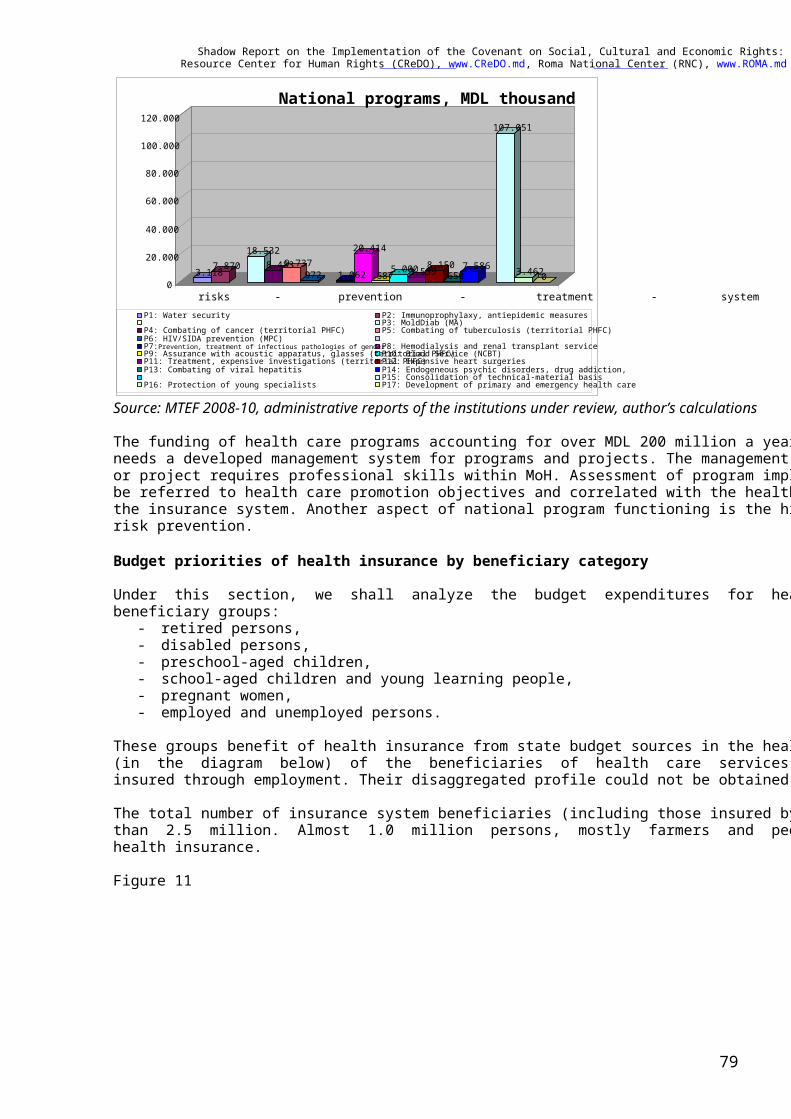
Shadow Report on the Implementation of the Covenant on Social, Cultural and Economic Rights: 2003-09 Resource Center for Human Rights (CReDO), www.CReDO.md, Roma National Center (RNC), www.ROMA.md
79
Source: MTEF 2008-10, administrative reports of the institutions under review, author’s calculations The funding of health care programs accounting for over MDL 200 million a year and their management needs a developed management system for programs and projects. The management cycle of a program or project requires professional skills within MoH. Assessment of program implementation results should be referred to health care promotion objectives and correlated with the health care services provided via the insurance system. Another aspect of national program functioning is the high role they play in health risk prevention. Budget priorities of health insurance by beneficiary category Under this section, we shall analyze the budget expenditures for health care that go to the following beneficiary groups:
- retired persons, - disabled persons, - preschool-aged children, - school-aged children and young learning people, - pregnant women, - employed and unemployed persons.
These groups benefit of health insurance from state budget sources in the health insurance system. 30% (in the diagram below) of the beneficiaries of health care services through insurance are the persons insured through employment. Their disaggregated profile could not be obtained from the existent data. The total number of insurance system beneficiaries (including those insured by the State) is a little more than 2.5 million. Almost 1.0 million persons, mostly farmers and people from rural regions, hold no health insurance. Figure 11
3.1187.87018.532
8.4839.737972 1.062
20.414
6875.0003.5398.150
6507.586
107.051
3.46200
20.000
40.000
60.000
80.000
100.000
120.000
risks - prevention - treatment - system
National programs, MDL thousand
P1: Water security P2: Immunoprophylaxy, antiepidemic measuresP3: MoldDiab (MA)
P4: Combating of cancer (territorial PHFC) P5: Combating of tuberculosis (territorial PHFC)P6: HIV/SIDA prevention (MPC) P7: Prevention, treatment of infectious pathologies of gender P8: Hemodialysis and renal transplant serviceP9: Assurance with acoustic apparatus, glasses (territorial PHFC)P10: Blood Service (NCBT)P11: Treatment, expensive investigations (territorial PHFC)P12: Expensive heart surgeriesP13: Combating of viral hepatitis P14: Endogeneous psychic disorders, drug addiction,
P15: Consolidation of technical-material basisP16: Protection of young specialists P17: Development of primary and emergency health care
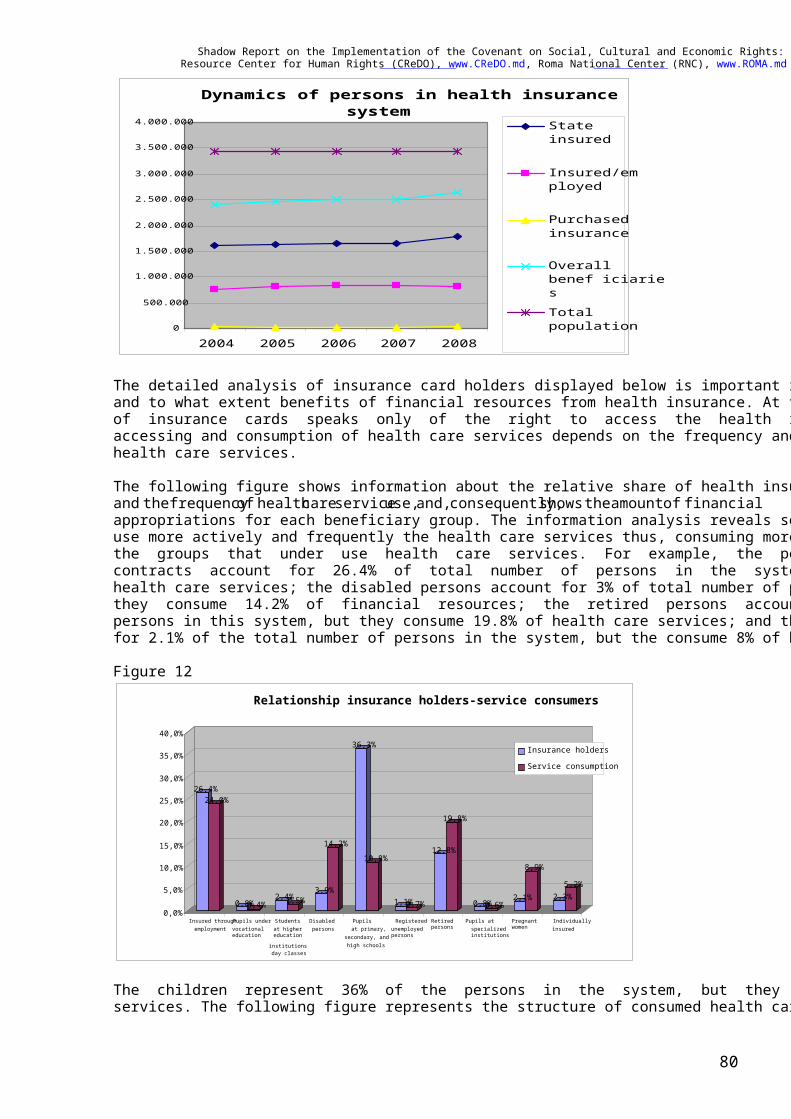
Shadow Report on the Implementation of the Covenant on Social, Cultural and Economic Rights: 2003-09 Resource Center for Human Rights (CReDO), www.CReDO.md, Roma National Center (RNC), www.ROMA.md
80
Dynamics of persons in health insurance system
0
500.000
1.000.000
1.500.000
2.000.000
2.500.000
3.000.000
3.500.000
4.000.000
2004 2005 2006 2007 2008
Stateinsured
Insured/employed
Purchasedinsurance
Overallbenef iciariesTotalpopulation
The detailed analysis of insurance card holders displayed below is important in order to understand who and to what extent benefits of financial resources from health insurance. At the same time, the possession of insurance cards speaks only of the right to access the health insurance system, while the actual accessing and consumption of health care services depends on the frequency and consistency of accessing health care services. The following figure shows information about the relative share of health insurance system beneficiaries and the frequency of health care service use, and, consequently, shows the amount of financial appropriations for each beneficiary group. The information analysis reveals some groups of persons that use more actively and frequently the health care services thus, consuming more funds, and it also reveals the groups that under use health care services. For example, the persons insured through employment contracts account for 26.4% of total number of persons in the system, but they consume only 24% of health care services; the disabled persons account for 3% of total number of persons in the system, but they consume 14.2% of financial resources; the retired persons account for 12.8% of total number of persons in this system, but they consume 19.8% of health care services; and the pregnant women account for 2.1% of the total number of persons in the system, but the consume 8% of health care services. Figure 12
The children represent 36% of the persons in the system, but they consume only 10% of health care services. The following figure represents the structure of consumed health care services per category of
26,4%24,0%
0,8%0,4%2,4%1,5%
3,9%
14,2%
36,3%
10,8%
1,1%0,7%
12,8%
19,8%
0,8%0,6%2,1%
8,9%
2,3%5,2%
0,0%
5,0%
10,0%
15,0%
20,0%
25,0%
30,0%
35,0%
40,0%
Insured through employment
Pupils under vocationaleducation
Studentsat higher education
institutions day classes
Disabled persons
Pupilsat primary,
secondary, andhigh schools
Registered unemployedpersons
Retired persons
Pupils at specialized institutions
Pregnant women
Individually insured
Relationship insurance holders-service consumers
Insurance holders
Service consumption
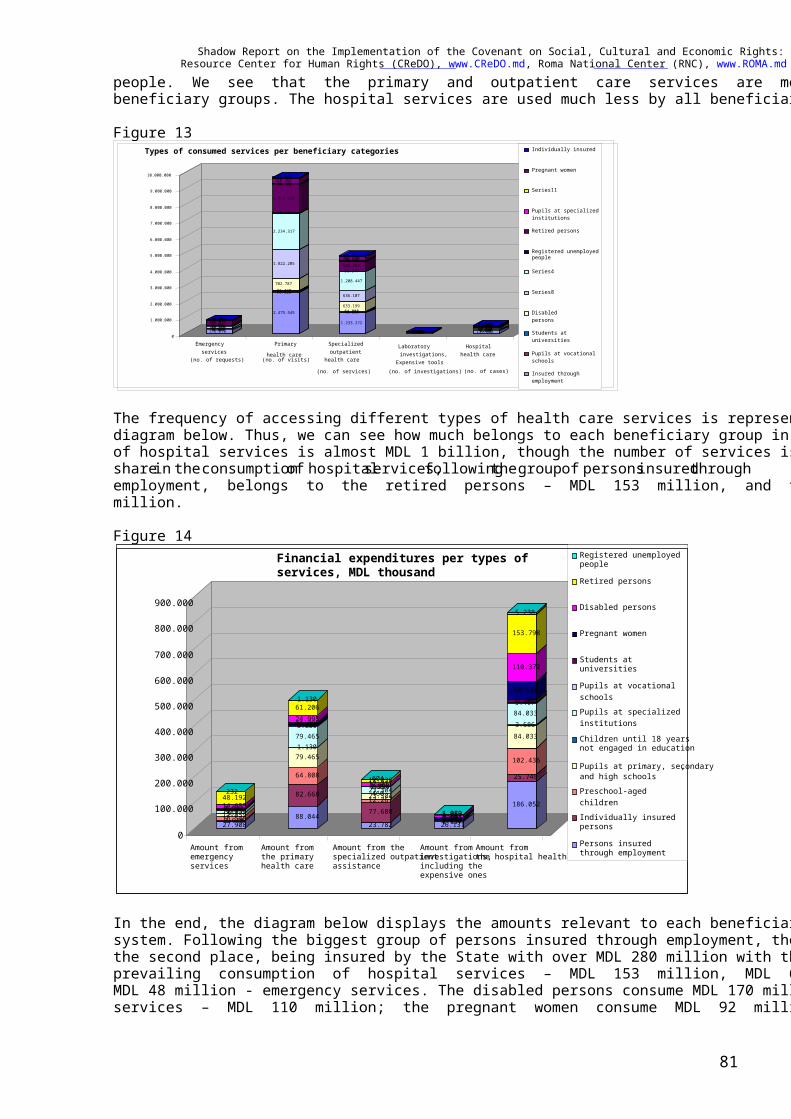
Shadow Report on the Implementation of the Covenant on Social, Cultural and Economic Rights: 2003-09 Resource Center for Human Rights (CReDO), www.CReDO.md, Roma National Center (RNC), www.ROMA.md
81
people. We see that the primary and outpatient care services are most frequently used by almost all beneficiary groups. The hospital services are used much less by all beneficiary groups. Figure 13
The frequency of accessing different types of health care services is represented in money terms in the diagram below. Thus, we can see how much belongs to each beneficiary group in money terms. The cost of hospital services is almost MDL 1 billion, though the number of services is 0.6 million. The greatest share in the consumption of hospital services, following the group of persons insured through employment, belongs to the retired persons – MDL 153 million, and to disabled persons – MDL 110 million. Figure 14
In the end, the diagram below displays the amounts relevant to each beneficiary group from the insurance system. Following the biggest group of persons insured through employment, the retired persons rank on the second place, being insured by the State with over MDL 280 million with the following structure of prevailing consumption of hospital services – MDL 153 million, MDL 61 million - primary care, and MDL 48 million - emergency services. The disabled persons consume MDL 170 million, mainly hospital services – MDL 110 million; the pregnant women consume MDL 92 million, the hospital services
176.0702.49111.23792.458104.39979.2361.462304.0392.9342.28822.53818.3582.475.545
90.82893.430702.787
1.822.205
2.234.317
31.773
1.720.939
78.18231.773318.70782.668
1.233.272
41.80364.008633.199
636.107
1.208.447
31.347624.26226.61123.830202.19977.680
20.6863968835.4281.8132.8058624.633116343.8801.137 119.8022.1947.61971.07065.96054.1103.37399.0332.9022.30944.20125.749
0 1.000.000
2.000.000
3.000.000
4.000.000
5.000.000
6.000.000
7.000.000
8.000.000
9.000.000
10.000.000
Emergencyservices
(no. of requests)
Primary
health care(no. of visits)
Specializedoutpatient
health care
(no. of services)
Laboratory investigations,
Expensive tools(no. of investigations)
Hospital health care
(no. of cases)
Types of consumed services per beneficiary categories Individually insured
Pregnant women
Series11
Pupils at specialized institutions
Retired persons
Registered unemployed people
Series4
Series8
Disabled persons
Students at universities
Pupils at vocational schools
Insured through employment
27.9082.91016.54812.55936312.5593951.7813.57214.65548.192232
88.044 82.668 64.808 79.465 1.130 79.465 3.230 3.323 11.335 24.995 61.206 1.130
23.78277.68012.26723.30446023.3048061.2343.89912.21112.038604
26.1311.1372.2903.543433.5435001.1154.9016.8575.8531.089186.052
25.749
102.436
84.0333.58684.0333.40711.83268.644
110.372
153.798
5.238
0 100.000 200.000 300.000 400.000 500.000 600.000 700.000 800.000 900.000
Amount from emergency services
Amount from the primary health care
Amount from the specialized outpatientassistance
Amount from investigations, including the expensive ones
Amount from the hospital health care
Financial expenditures per types of services, MDL thousand
Registered unemployedpeople Retired persons
Disabled persons
Pregnant women
Students atuniversities
Pupils at vocationalschoolsPupils at specialized institutionsChildren until 18 years not engaged in education
Pupils at primary, secondary, and high schoolsPreschool-agedchildrenIndividually insured persons
Persons insured through employment
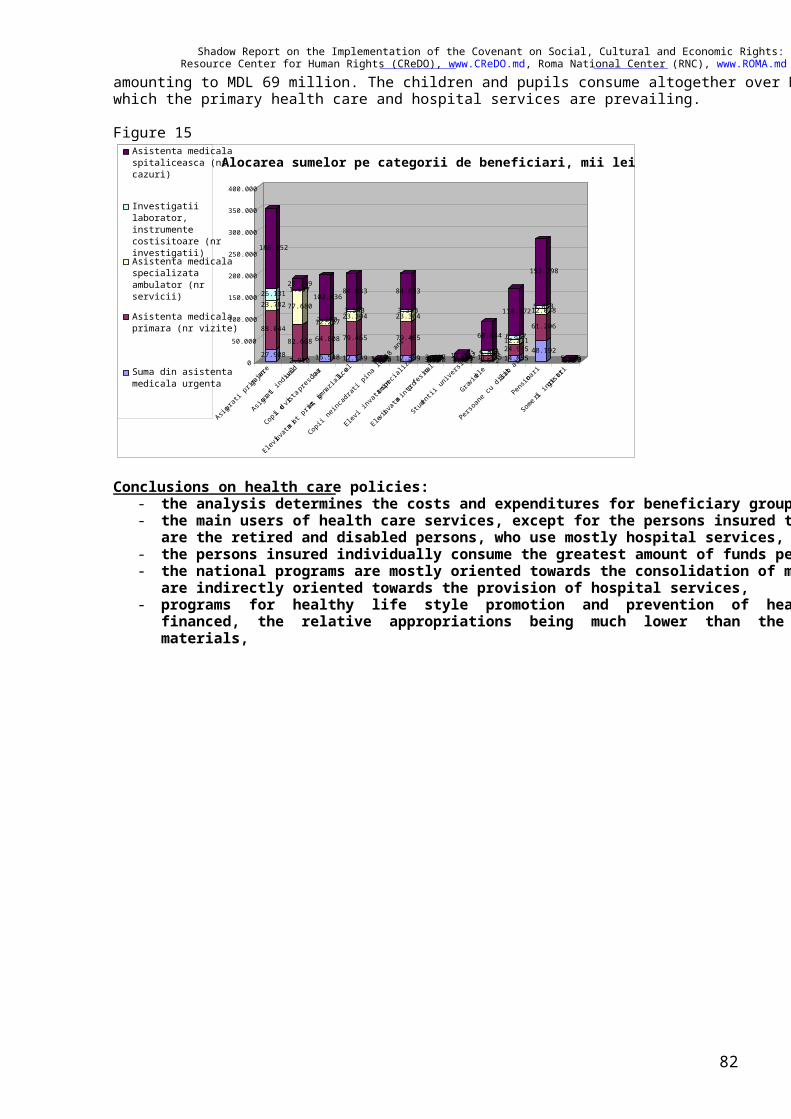
Shadow Report on the Implementation of the Covenant on Social, Cultural and Economic Rights: 2003-09 Resource Center for Human Rights (CReDO), www.CReDO.md, Roma National Center (RNC), www.ROMA.md
82
amounting to MDL 69 million. The children and pupils consume altogether over MDL 200 million, of which the primary health care and hospital services are prevailing. Figure 15
27.908
88.044
23.78226.131
186.052
2.910
82.668
77.680
1.13725.749
16.548
64.808
12.2672.290
102.436
12.559
79.465
23.3043.543
84.033
3631.130460433.586 12.559
79.465
23.3043.543
84.033
3953.2308065003.407 1.7813.3231.2341.11511.832 3.57211.3353.8994.901
68.644
14.65524.99512.2116.857
110.372
48.192
61.206
12.0385.853
153.798
2321.1306041.0895.2380
50.000
100.000
150.000
200.000
250.000
300.000
350.000
400.000
Asigurati prin an
gajare
Asigurati individual
Copii de virsta prescolara
Elevi invatamint primar, gim
nazial, liceal
Copii neincadrati pina la 18 ani
Elevi invatamin
t specializat
Elevi invatam int profesional
Studentii universitari
Gravidele
Persoane cu disab
ilit ati
Pensionari
Somerii inregistrati
Alocarea sumelor pe categorii de beneficiari, mii leiAsistenta medicalaspitaliceasca (nrcazuri)
Investigatiilaborator,instrumentecostisitoare (nrinvestigatii)Asistenta medicalaspecializataambulator (nrservicii)
Asistenta medicalaprimara (nr vizite)
Suma din asistentamedicala urgenta
Conclusions on health care policies:
- the analysis determines the costs and expenditures for beneficiary groups, - the main users of health care services, except for the persons insured through employment,
are the retired and disabled persons, who use mostly hospital services, - the persons insured individually consume the greatest amount of funds per beneficiary, - the national programs are mostly oriented towards the consolidation of material basis and
are indirectly oriented towards the provision of hospital services, - programs for healthy life style promotion and prevention of health care risks are under-
financed, the relative appropriations being much lower than the investments made in materials,
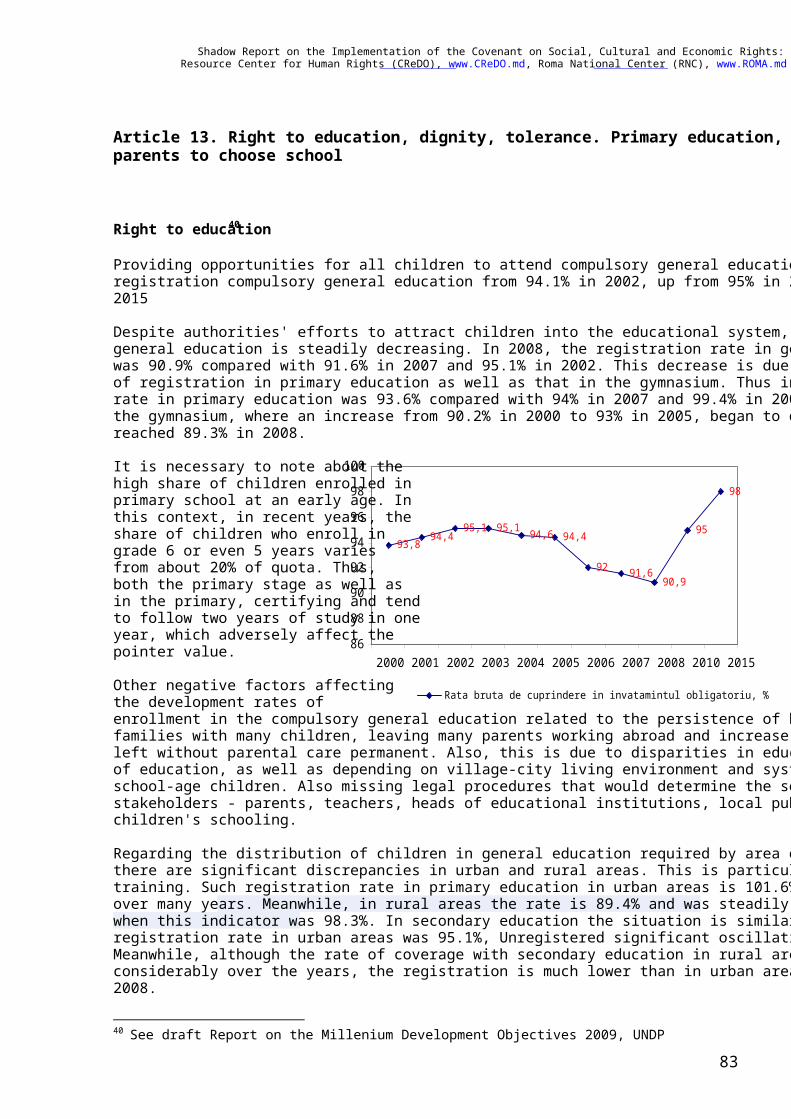
Shadow Report on the Implementation of the Covenant on Social, Cultural and Economic Rights: 2003-09 Resource Center for Human Rights (CReDO), www.CReDO.md, Roma National Center (RNC), www.ROMA.md
83
93,8 94,495,1 95,1 94,6 94,4
92 91,690,9
95
98
86889092949698100
2000 2001 2002 2003 2004 2005 2006 2007 2008 2010 2015
Rata bruta de cuprindere in invatamintul obligatoriu, %
Article 13. Right to education, dignity, tolerance. Primary education, liberty of parents to choose school
Right to education40
Providing opportunities for all children to attend compulsory general education. Crude rate of increase in registration compulsory general education from 94.1% in 2002, up from 95% in 2010 and up to 98% in 2015 Despite authorities' efforts to attract children into the educational system, enrollment rate in compulsory general education is steadily decreasing. In 2008, the registration rate in general compulsory education was 90.9% compared with 91.6% in 2007 and 95.1% in 2002. This decrease is due to both reduce the rate of registration in primary education as well as that in the gymnasium. Thus in 2008 the gross registration rate in primary education was 93.6% compared with 94% in 2007 and 99.4% in 2000. Registration rate in the gymnasium, where an increase from 90.2% in 2000 to 93% in 2005, began to decline since 2006 and reached 89.3% in 2008. It is necessary to note about the high share of children enrolled in primary school at an early age. In this context, in recent years, the share of children who enroll in grade 6 or even 5 years varies from about 20% of quota. Thus, both the primary stage as well as in the primary, certifying and tend to follow two years of study in one year, which adversely affect the pointer value. Other negative factors affecting the development rates of enrollment in the compulsory general education related to the persistence of high poverty, especially in families with many children, leaving many parents working abroad and increase the number of children left without parental care permanent. Also, this is due to disparities in education funding levels and stages of education, as well as depending on village-city living environment and system inefficiencies out of school-age children. Also missing legal procedures that would determine the social responsibilities of all stakeholders - parents, teachers, heads of educational institutions, local public administration - regarding children's schooling. Regarding the distribution of children in general education required by area of residence, we find that there are significant discrepancies in urban and rural areas. This is particularly pronounced in primary training. Such registration rate in primary education in urban areas is 101.6% and was at this high level over many years. Meanwhile, in rural areas the rate is 89.4% and was steadily decreased since 2000, when this indicator was 98.3%. In secondary education the situation is similar. Thus, in 2008 the registration rate in urban areas was 95.1%, Unregistered significant oscillations during previous years. Meanwhile, although the rate of coverage with secondary education in rural areas has not changed considerably over the years, the registration is much lower than in urban areas, constituting 86.3% in 2008.
40 See draft Report on the Millenium Development Objectives 2009, UNDP
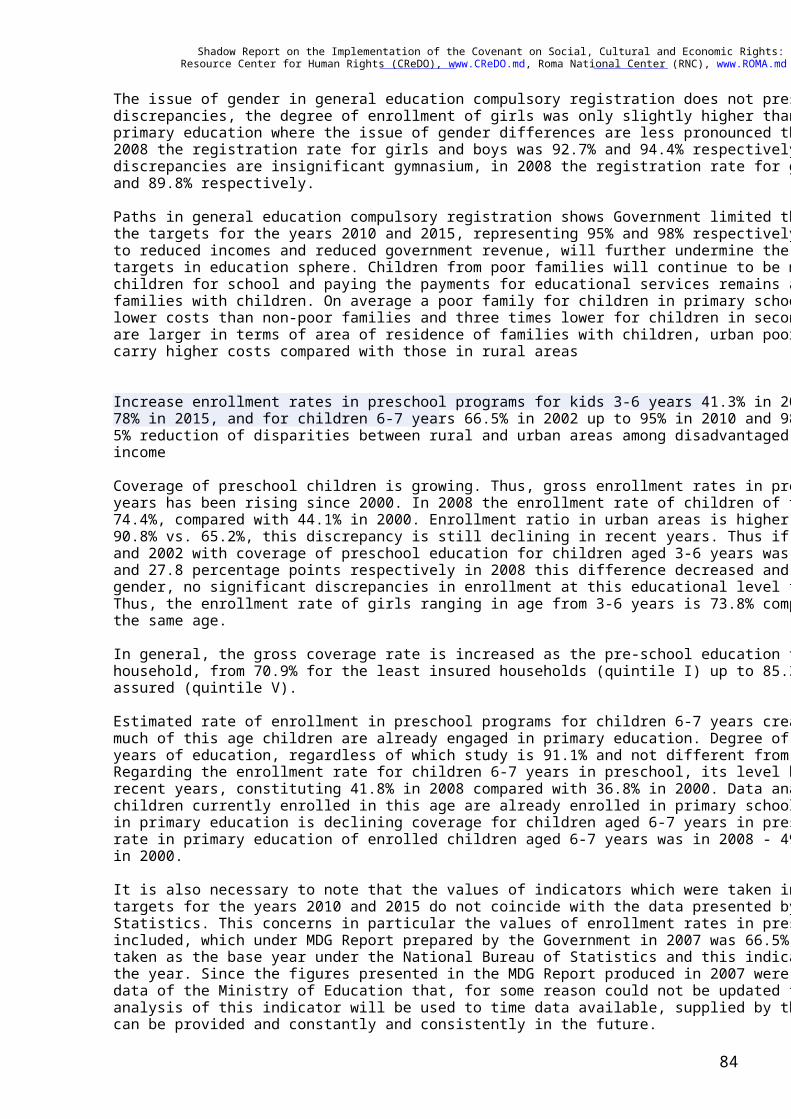
Shadow Report on the Implementation of the Covenant on Social, Cultural and Economic Rights: 2003-09 Resource Center for Human Rights (CReDO), www.CReDO.md, Roma National Center (RNC), www.ROMA.md
84
The issue of gender in general education compulsory registration does not present significant discrepancies, the degree of enrollment of girls was only slightly higher than that of boys. Thus in primary education where the issue of gender differences are less pronounced than in the gymnasium, in 2008 the registration rate for girls and boys was 92.7% and 94.4% respectively. Meanwhile, the discrepancies are insignificant gymnasium, in 2008 the registration rate for girls and boys being 88.8% and 89.8% respectively. Paths in general education compulsory registration shows Government limited the possibility of achieving the targets for the years 2010 and 2015, representing 95% and 98% respectively. The economic crisis led to reduced incomes and reduced government revenue, will further undermine the achievement of MDG targets in education sphere. Children from poor families will continue to be most affected. Preparing children for school and paying the payments for educational services remains a burden on the budget for families with children. On average a poor family for children in primary school performed two times lower costs than non-poor families and three times lower for children in secondary schools. Discrepancies are larger in terms of area of residence of families with children, urban poor families are in a position to carry higher costs compared with those in rural areas Increase enrollment rates in preschool programs for kids 3-6 years 41.3% in 2002 to 75% in 2010 and 78% in 2015, and for children 6-7 years 66.5% in 2002 up to 95% in 2010 and 98% in 2015, and at least 5% reduction of disparities between rural and urban areas among disadvantaged groups and middle-income Coverage of preschool children is growing. Thus, gross enrollment rates in preschool at the age of 3-6 years has been rising since 2000. In 2008 the enrollment rate of children of that age in preschool was 74.4%, compared with 44.1% in 2000. Enrollment ratio in urban areas is higher than in rural areas, being 90.8% vs. 65.2%, this discrepancy is still declining in recent years. Thus if the difference between 2000 and 2002 with coverage of preschool education for children aged 3-6 years was 29.6 percentage points and 27.8 percentage points respectively in 2008 this difference decreased and was 25.6 pp. The issue of gender, no significant discrepancies in enrollment at this educational level for the age category concerned. Thus, the enrollment rate of girls ranging in age from 3-6 years is 73.8% compared with 74.9% for boys the same age. In general, the gross coverage rate is increased as the pre-school education to improve the welfare of the household, from 70.9% for the least insured households (quintile I) up to 85.3% for households best assured (quintile V). Estimated rate of enrollment in preschool programs for children 6-7 years creates difficulties because much of this age children are already engaged in primary education. Degree of coverage of children 6-7 years of education, regardless of which study is 91.1% and not different from the level recorded in 2000. Regarding the enrollment rate for children 6-7 years in preschool, its level has increased significantly in recent years, constituting 41.8% in 2008 compared with 36.8% in 2000. Data analysis shows that more children currently enrolled in this age are already enrolled in primary school, although înmaptricilare rate in primary education is declining coverage for children aged 6-7 years in preschool. Thus, the registration rate in primary education of enrolled children aged 6-7 years was in 2008 - 49.3%, compared with 54.4% in 2000. It is also necessary to note that the values of indicators which were taken in 2007 as a basis for setting targets for the years 2010 and 2015 do not coincide with the data presented by the National Bureau of Statistics. This concerns in particular the values of enrollment rates in preschool children aged 6-7 years included, which under MDG Report prepared by the Government in 2007 was 66.5% for 2002 which was taken as the base year under the National Bureau of Statistics and this indicator was that only 37.1% for the year. Since the figures presented in the MDG Report produced in 2007 were based on administrative data of the Ministry of Education that, for some reason could not be updated for subsequent years, the analysis of this indicator will be used to time data available, supplied by the Bureau National Statistics can be provided and constantly and consistently in the future.
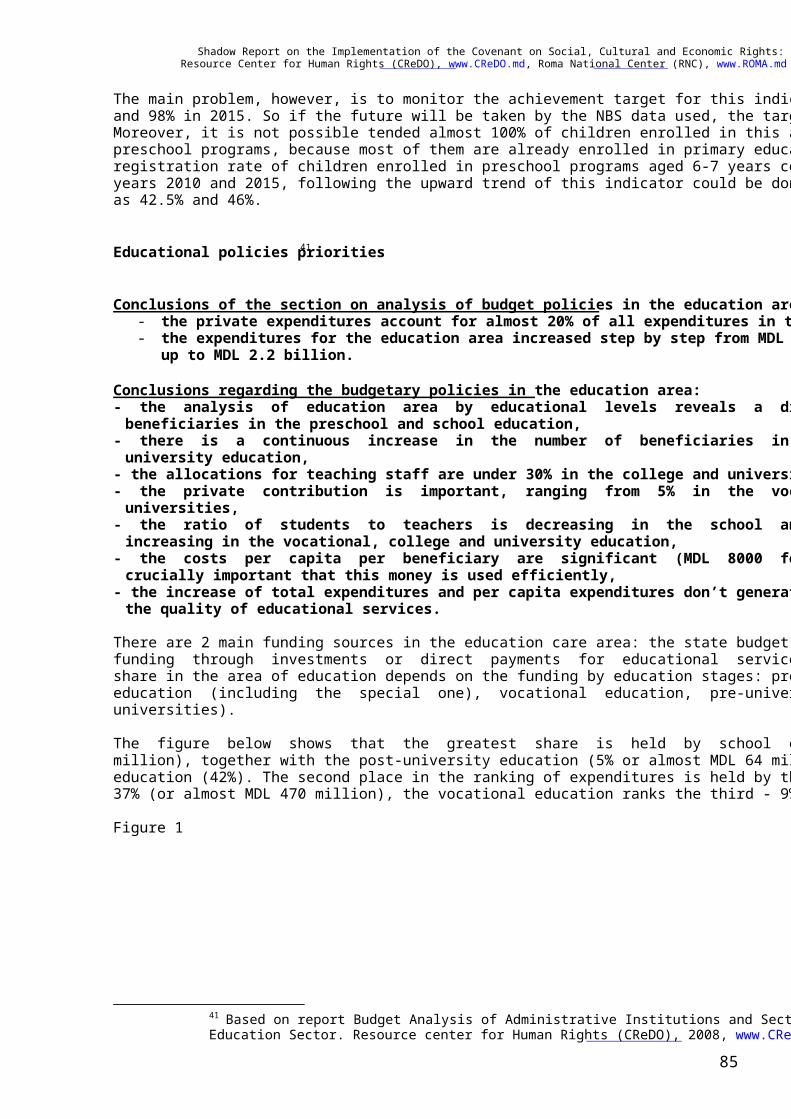
Shadow Report on the Implementation of the Covenant on Social, Cultural and Economic Rights: 2003-09 Resource Center for Human Rights (CReDO), www.CReDO.md, Roma National Center (RNC), www.ROMA.md
85
The main problem, however, is to monitor the achievement target for this indicator which is 95% in 2010 and 98% in 2015. So if the future will be taken by the NBS data used, the targets will be modified. Moreover, it is not possible tended almost 100% of children enrolled in this age to be enrolled in preschool programs, because most of them are already enrolled in primary education. So if in 2008 the registration rate of children enrolled in preschool programs aged 6-7 years constitute 41.8%, then the years 2010 and 2015, following the upward trend of this indicator could be done some values higher, such as 42.5% and 46%.
Educational policies priorities41
Conclusions of the section on analysis of budget policies in the education area:
- the private expenditures account for almost 20% of all expenditures in the education area, - the expenditures for the education area increased step by step from MDL 1.5 billion in 2002
up to MDL 2.2 billion. Conclusions regarding the budgetary policies in the education area: - the analysis of education area by educational levels reveals a diminution of the number of beneficiaries in the preschool and school education,
- there is a continuous increase in the number of beneficiaries in the vocational, college and university education,
- the allocations for teaching staff are under 30% in the college and university education, - the private contribution is important, ranging from 5% in the vocational education to 25% in universities,
- the ratio of students to teachers is decreasing in the school and pre-school education, and is increasing in the vocational, college and university education,
- the costs per capita per beneficiary are significant (MDL 8000 for universities), therefore it is crucially important that this money is used efficiently,
- the increase of total expenditures and per capita expenditures don’t generate a similar increase of the quality of educational services.
There are 2 main funding sources in the education care area: the state budget (SB) and private sources of funding through investments or direct payments for educational services. The analysis of expenditures share in the area of education depends on the funding by education stages: pre-school education, school education (including the special one), vocational education, pre-university education (in colleges and universities). The figure below shows that the greatest share is held by school education – 43% (or over MDL 550 million), together with the post-university education (5% or almost MDL 64 million) it equals the school education (42%). The second place in the ranking of expenditures is held by the university education – 37% (or almost MDL 470 million), the vocational education ranks the third - 9% (or MDL 109 million). Figure 1
41 Based on report Budget Analysis of Administrative Institutions and Sector Policies in the Education Sector. Resource center for Human Rights (CReDO), 2008, www.CReDO.md
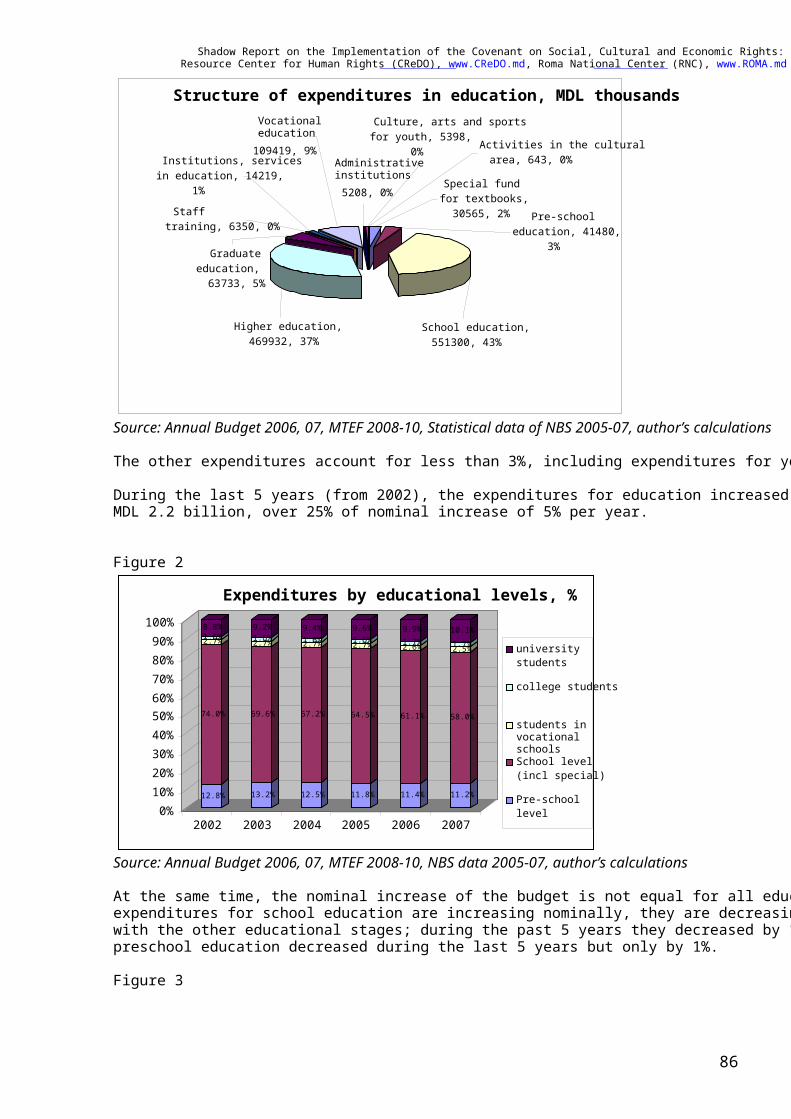
Shadow Report on the Implementation of the Covenant on Social, Cultural and Economic Rights: 2003-09 Resource Center for Human Rights (CReDO), www.CReDO.md, Roma National Center (RNC), www.ROMA.md
86
Source: Annual Budget 2006, 07, MTEF 2008-10, Statistical data of NBS 2005-07, author’s calculations The other expenditures account for less than 3%, including expenditures for youth and others. During the last 5 years (from 2002), the expenditures for education increased from MDL 1.5 billion up to MDL 2.2 billion, over 25% of nominal increase of 5% per year. Figure 2
Source: Annual Budget 2006, 07, MTEF 2008-10, NBS data 2005-07, author’s calculations At the same time, the nominal increase of the budget is not equal for all educational stages. Although the expenditures for school education are increasing nominally, they are decreasing relatively in comparison with the other educational stages; during the past 5 years they decreased by 16%. Only the education for preschool education decreased during the last 5 years but only by 1%. Figure 3
Structure of expenditures in education, MDL thousands
Administrative institutions 5208, 0%
Staff training, 6350, 0%
Culture, arts and sports for youth, 5398,
0%
Vocational education 109419, 9%
Graduate education, 63733, 5%
Institutions, servicesin education, 14219,
1%
Higher education, 469932, 37%
Activities in the cultural area, 643, 0%
Special fund for textbooks,
30565, 2% Pre-school education, 41480,
3%
School education, 551300, 43%
12.8%
74.0%
2.7%1.6%8.8%
13.2%
69.6%
2.7%1.6%9.2%
12.5%
67.2%
2.7%1.6%9.4%
11.8%
64.5%
2.7%1.6%9.6%
11.4%
61.1%
2.6%1.7%9.9%
11.2%
58.0%
2.5%1.7%10.1%
0% 10% 20% 30% 40% 50% 60% 70% 80% 90% 100%
2002 2003 2004 2005 2006 2007
Expenditures by educational levels, %
university students
college students
students in vocational schoolsSchool level(incl special)
Pre-school level
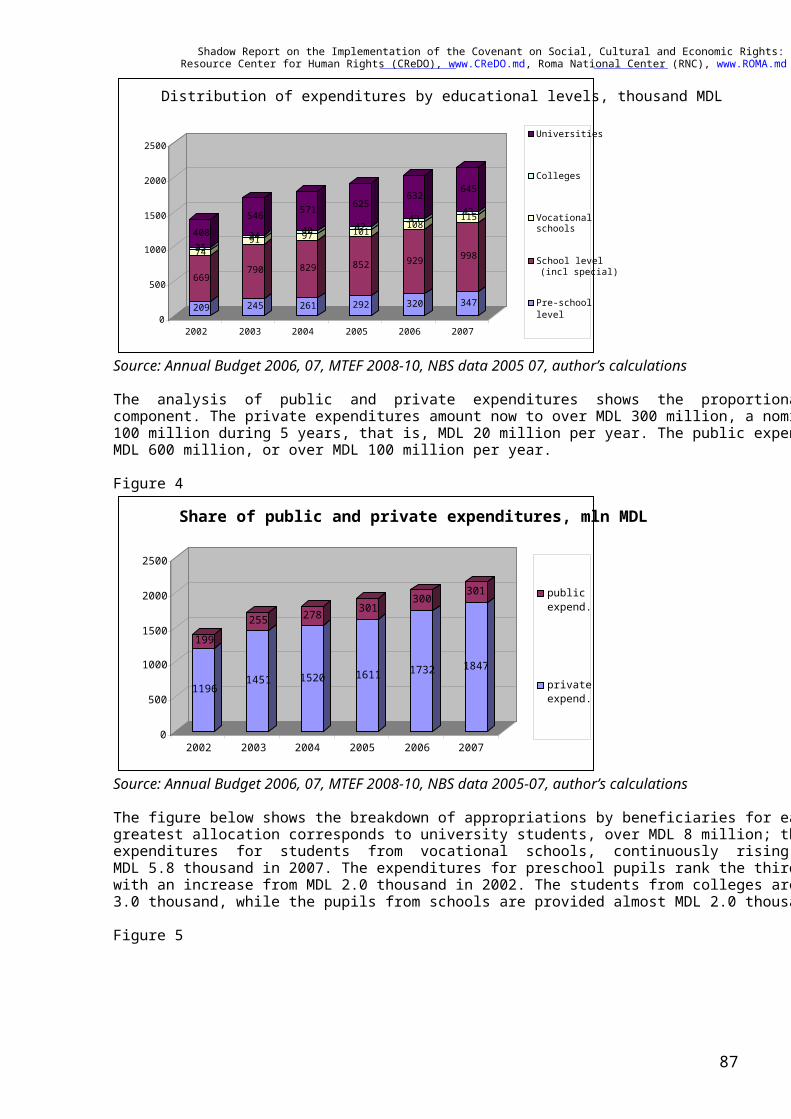
Shadow Report on the Implementation of the Covenant on Social, Cultural and Economic Rights: 2003-09 Resource Center for Human Rights (CReDO), www.CReDO.md, Roma National Center (RNC), www.ROMA.md
87
Source: Annual Budget 2006, 07, MTEF 2008-10, NBS data 2005 07, author’s calculations The analysis of public and private expenditures shows the proportional nominal increase of each component. The private expenditures amount now to over MDL 300 million, a nominal increase of MDL 100 million during 5 years, that is, MDL 20 million per year. The public expenditures increased by over MDL 600 million, or over MDL 100 million per year. Figure 4
Source: Annual Budget 2006, 07, MTEF 2008-10, NBS data 2005-07, author’s calculations The figure below shows the breakdown of appropriations by beneficiaries for each educational level. The greatest allocation corresponds to university students, over MDL 8 million; the second place belongs to expenditures for students from vocational schools, continuously rising from MDL 3.4 thousand up to MDL 5.8 thousand in 2007. The expenditures for preschool pupils rank the third with MDL 3.9 thousand, with an increase from MDL 2.0 thousand in 2002. The students from colleges are provided almost MDL 3.0 thousand, while the pupils from schools are provided almost MDL 2.0 thousand. Figure 5
209
669
7435408
245
790
9134
546
261
829
9740
571
292
852
10142
625
320
929
10843
632
347
998
11543
645
0
500
1000
1500
2000
2500
2002 2003 2004 2005 2006 2007
Distribution of expenditures by educational levels, thousand MDL
Universities
Colleges
Vocational schools School level (incl special) Pre-schoollevel
1196
199
1451
255
1520
278
1611
301
1732
300
1847
301
0
500
1000
1500
2000
2500
2002 2003 2004 2005 2006 2007
Share of public and private expenditures, mln MDL
publicexpend.
private expend.
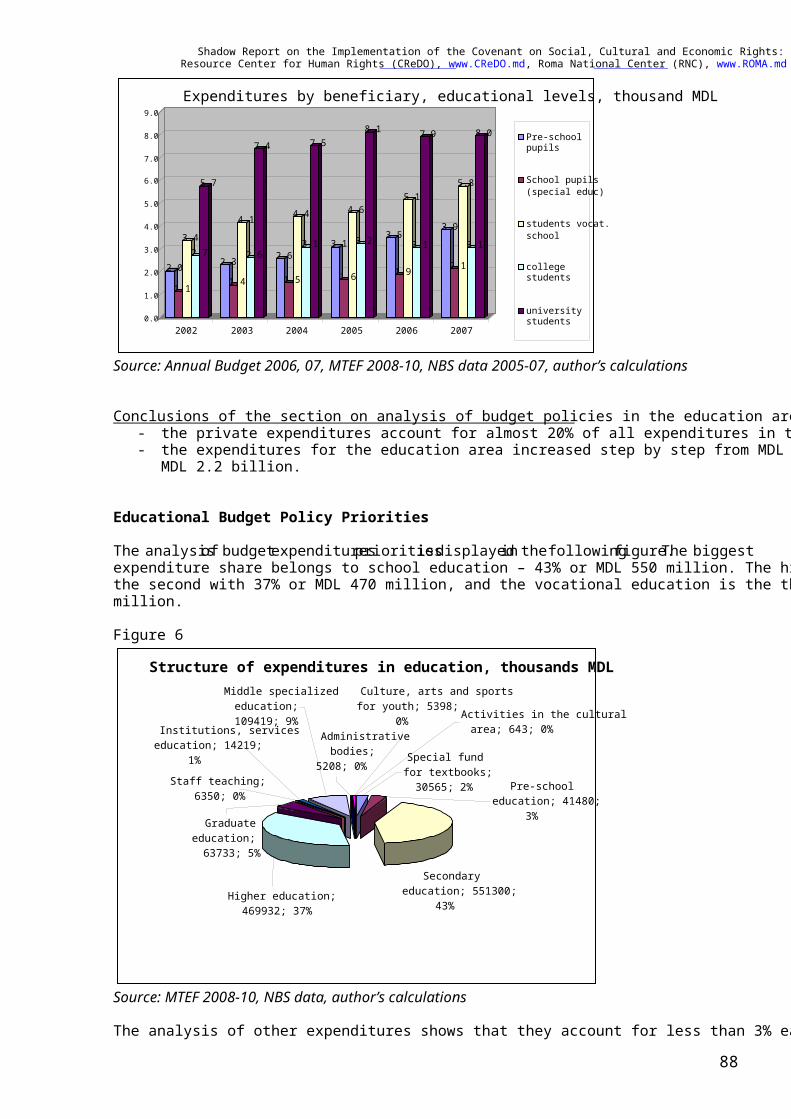
Shadow Report on the Implementation of the Covenant on Social, Cultural and Economic Rights: 2003-09 Resource Center for Human Rights (CReDO), www.CReDO.md, Roma National Center (RNC), www.ROMA.md
88
Source: Annual Budget 2006, 07, MTEF 2008-10, NBS data 2005-07, author’s calculations Conclusions of the section on analysis of budget policies in the education area:
- the private expenditures account for almost 20% of all expenditures in the education area, - the expenditures for the education area increased step by step from MDL 1.5 billion in 2002 up to
MDL 2.2 billion. Educational Budget Policy Priorities The analysis of budget expenditures priorities is displayed in the following figure. The biggest expenditure share belongs to school education – 43% or MDL 550 million. The higher education ranks the second with 37% or MDL 470 million, and the vocational education is the third with 9% or MDL 110 million. Figure 6
Source: MTEF 2008-10, NBS data, author’s calculations The analysis of other expenditures shows that they account for less than 3% each.
Administrativebodies;
5208; 0%Staff teaching;
6350; 0%
Culture, arts and sportsfor youth; 5398;
0%
Middle specialized education; 109419; 9%
Graduate education; 63733; 5%
Institutions, serviceseducation; 14219;
1%
Higher education; 469932; 37%
Activities in the cultural area; 643; 0%
Special fundfor textbooks;30565; 2% Pre-school
education; 41480; 3%
Secondaryeducation; 551300;
43%
Structure of expenditures in education, thousands MDL
2.0
1.1
3.42.7
5.7
2.3
1.4
4.1
2.6
7.4
2.6
1.5
4.4
3.1
7.5
3.1
1.6
4.6
3.2
8.1
3.5
1.9
5.1
3.1
7.9
3.9
2.1
5.8
3.1
8.0
0.0
1.0
2.0
3.0
4.0
5.0
6.0
7.0
8.0
9.0
2002 2003 2004 2005 2006 2007
Expenditures by beneficiary, educational levels, thousand MDL
Pre-school pupils
School pupils(special educ)
students vocat.school
college students
university students
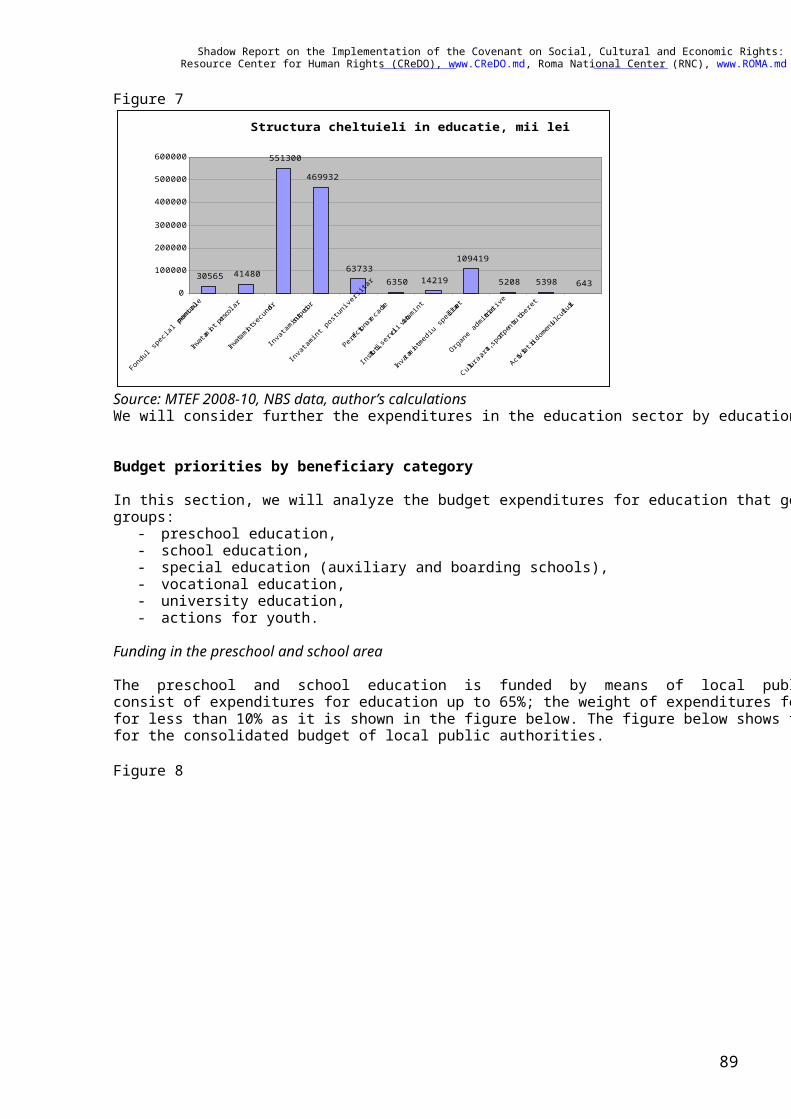
Shadow Report on the Implementation of the Covenant on Social, Cultural and Economic Rights: 2003-09 Resource Center for Human Rights (CReDO), www.CReDO.md, Roma National Center (RNC), www.ROMA.md
89
Figure 7
Structura cheltuieli in educatie, mii lei
30565 41480
551300
469932
637336350 14219
109419
5208 5398 6430
100000
200000
300000
400000
500000
600000
Fondul special pentru
manuale
Invatamint prescolar
Invatamint secundar
Invatamint superior
Invatamint postuniversitar
Perfectionare cadre
Institutii, servicii invatamint
Invatamint mediu specia
litate
Organe administrative
Cultura, arta, sport pentru tineret
Activitati in domeniul culturii
Source: MTEF 2008-10, NBS data, author’s calculations We will consider further the expenditures in the education sector by educational levels. Budget priorities by beneficiary category In this section, we will analyze the budget expenditures for education that go to the following beneficiary groups:
- preschool education, - school education, - special education (auxiliary and boarding schools), - vocational education, - university education, - actions for youth.
Funding in the preschool and school area The preschool and school education is funded by means of local public authorities. The local budgets consist of expenditures for education up to 65%; the weight of expenditures for social protection accounts for less than 10% as it is shown in the figure below. The figure below shows the cumulative expenditures for the consolidated budget of local public authorities. Figure 8
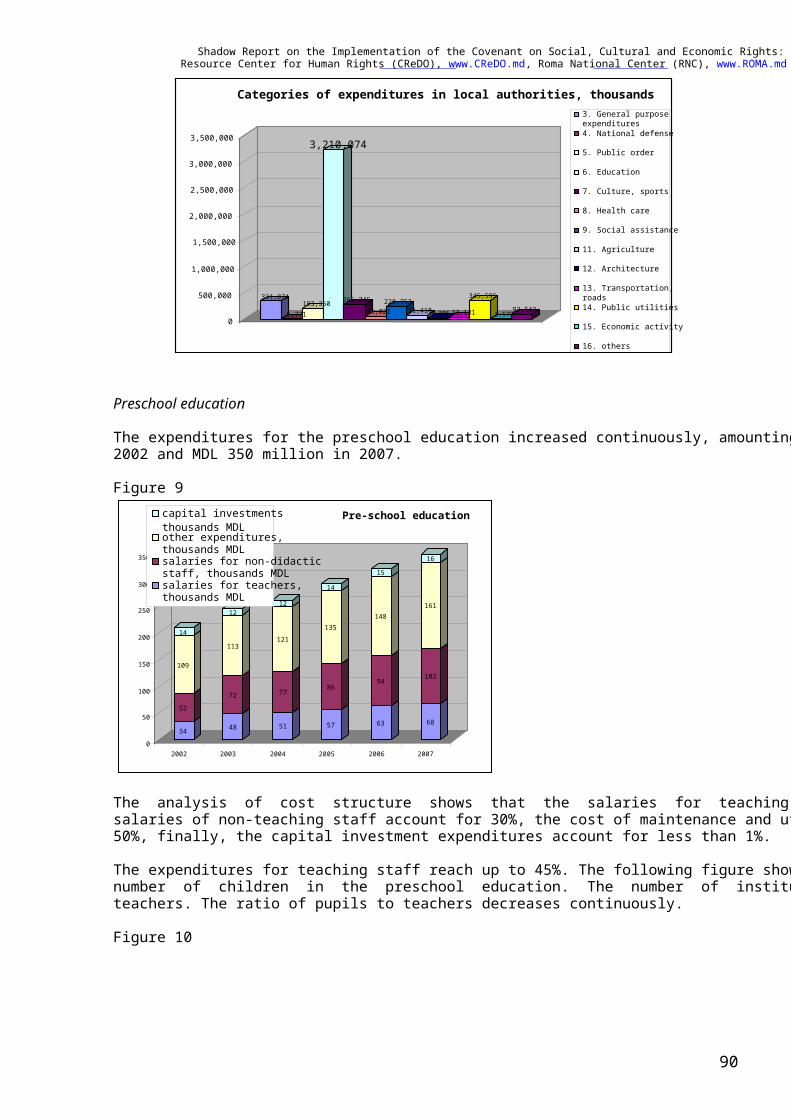
Shadow Report on the Implementation of the Covenant on Social, Cultural and Economic Rights: 2003-09 Resource Center for Human Rights (CReDO), www.CReDO.md, Roma National Center (RNC), www.ROMA.md
90
Preschool education The expenditures for the preschool education increased continuously, amounting to MDL 200 million in 2002 and MDL 350 million in 2007. Figure 9
The analysis of cost structure shows that the salaries for teaching staff account for almost 20%, the salaries of non-teaching staff account for 30%, the cost of maintenance and utilities account for almost 50%, finally, the capital investment expenditures account for less than 1%. The expenditures for teaching staff reach up to 45%. The following figure shows a gradual decrease of number of children in the preschool education. The number of institutions is stable, as the number of teachers. The ratio of pupils to teachers decreases continuously. Figure 10
331,874
5,771193,350
3,210,074
265,74551,021
228,75371,4189,305 33,131
345,595
3,57292,5420
500,000 1,000,000 1,500,000 2,000,000 2,500,000 3,000,000 3,500,000
Categories of expenditures in local authorities, thousands3. General purpose expenditures4. National defense 5. Public order
6. Education 7. Culture, sports
8. Health care 9. Social assistance 11. Agriculture 12. Architecture 13. Transportation, roads14. Public utilities
15. Economic activity 16. others
34 52
109
14
48
72
113
12
51
77
121
12
57
86
135
14
63
94
148
15
68
102
161
16
0 50
100 150 200 250 300 350
2002 2003 2004 2005 2006 2007
Pre-school educationcapital investmentsthousands MDLother expenditures, thousands MDLsalaries for non-didactic staff, thousands MDL salaries for teachers, thousands MDL

Shadow Report on the Implementation of the Covenant on Social, Cultural and Economic Rights: 2003-09 Resource Center for Human Rights (CReDO), www.CReDO.md, Roma National Center (RNC), www.ROMA.md
91
School education The figure below shows the distribution of pupils by age. It can be noticed that the number of children will be decreasing. Figure 11
Figure 12
1234
103000
7000 16000
1234
106000
8000
19000 1234
101000
7000
18000 1234
95000
7000
17000
1234
92000
6000
16000
1234
90000
6000
16000
0
20000
40000
60000
80000
100000
120000
2002 2003 2004 2005 2006 2007
Share of teachers, pupils, institutions
number of institutions
number of pupils
number of teachers,
number of non-didacticstaff,
0
10.000
20.000
30.000
40.000
50.000
60.000
Preparatory formsForm 1 Form 2 Form 3 Form4 Form 5 Form 6 Form 7 Form 8 Form 9 Form 10 Form 11 Form 12
Age structure of pupils
Total rural Total urban
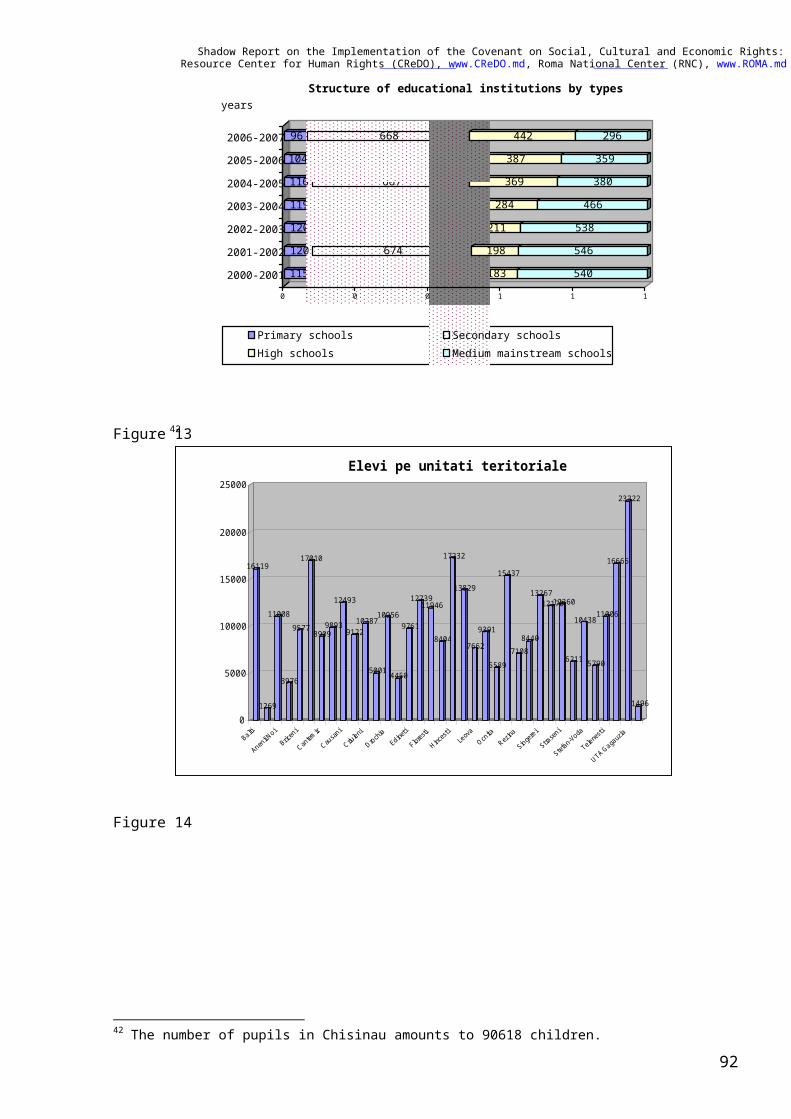
Shadow Report on the Implementation of the Covenant on Social, Cultural and Economic Rights: 2003-09 Resource Center for Human Rights (CReDO), www.CReDO.md, Roma National Center (RNC), www.ROMA.md
92
115 674 183 540
120 674 198 546
120 672 211 538
119 669 284 466
116 667 369 380
104 664 387 359
96 668 442 296
0 0 0 1 1 1
2000-2001
2001-2002
2002-2003
2003-2004
2004-2005
2005-2006
2006-2007
yearsStructure of educational institutions by types
Primary schools Secondary schoolsHigh schools Medium mainstream schools
Figure 1342
16119
1269
11008
3976
9577
17010
89099893
12493
912210287
5001
10956
4450
9761
1273911946
8404
17232
13829
7662
9391
5589
15437
71088440
132671217012360
6211
10438
5790
11006
16665
23322
1496
0
5000
10000
15000
20000
25000
Balti
Anenii Noi
Briceni
Cantem ir
C ausa
ni
Criuleni
D rochia
Edineti
Floresti
Hincesti
Leova
Ocnita
Rezina
Singerei
Strase
ni
Stefan-Vo
da
Telene
sti
U TA G
agauzia
Elevi pe unitati teritoriale
Figure 14
42 The number of pupils in Chisinau amounts to 90618 children.
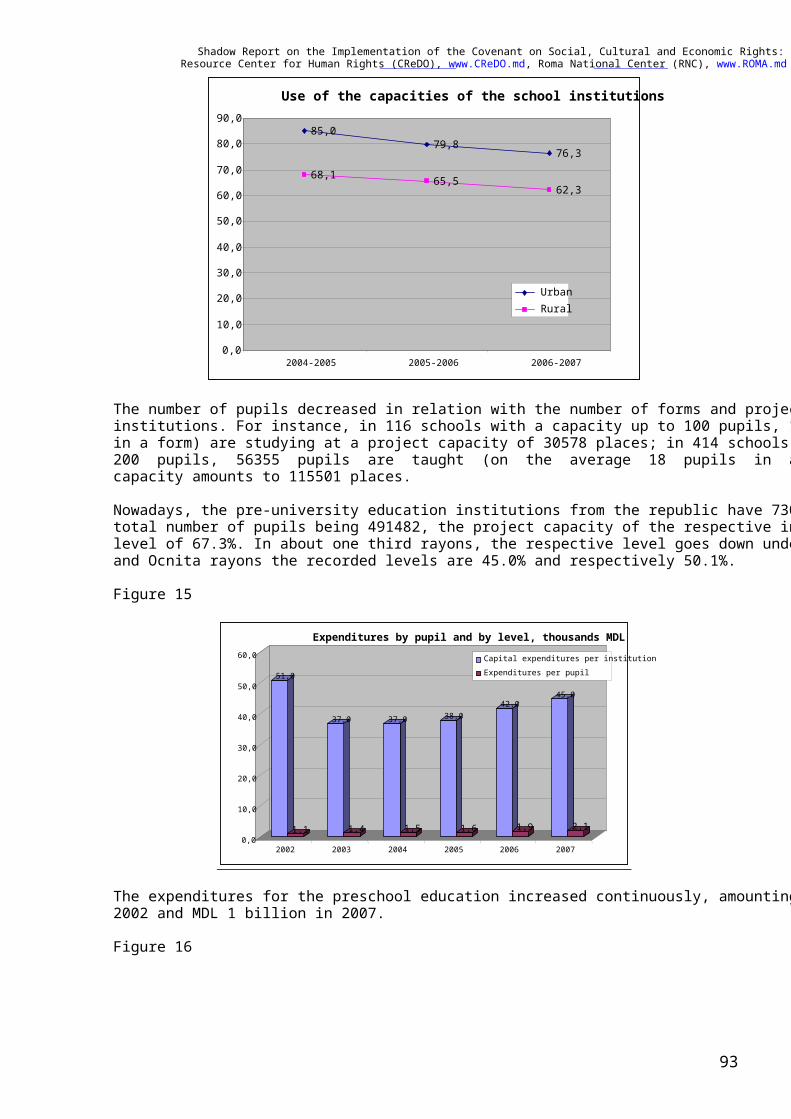
Shadow Report on the Implementation of the Covenant on Social, Cultural and Economic Rights: 2003-09 Resource Center for Human Rights (CReDO), www.CReDO.md, Roma National Center (RNC), www.ROMA.md
93
The number of pupils decreased in relation with the number of forms and project capacity of educational institutions. For instance, in 116 schools with a capacity up to 100 pupils, 12591 (on the average 14 pupils in a form) are studying at a project capacity of 30578 places; in 414 schools with a capacity from 101 to 200 pupils, 56355 pupils are taught (on the average 18 pupils in a form), while the overall project capacity amounts to 115501 places. Nowadays, the pre-university education institutions from the republic have 730198 places for studies. The total number of pupils being 491482, the project capacity of the respective institutions is used only at a level of 67.3%. In about one third rayons, the respective level goes down under 60%, and in Donduseni and Ocnita rayons the recorded levels are 45.0% and respectively 50.1%. Figure 15
The expenditures for the preschool education increased continuously, amounting to MDL 700 million in 2002 and MDL 1 billion in 2007. Figure 16
Use of the capacities of the school institutions
85,079,8
76,3 68,1 65,5
62,3
0,0
10,0
20,0
30,0
40,0
50,0
60,0
70,0
80,0
90,0
2004-2005 2005-2006 2006-2007
Urban Rural
51,0
1,1
37,0
1,4
37,0
1,5
38,0
1,6
42,0
1,9
45,0
2,10,0
10,0
20,0
30,0
40,0
50,0
60,0
2002 2003 2004 2005 2006 2007
Expenditures by pupil and by level, thousands MDL Capital expenditures per institutionExpenditures per pupil
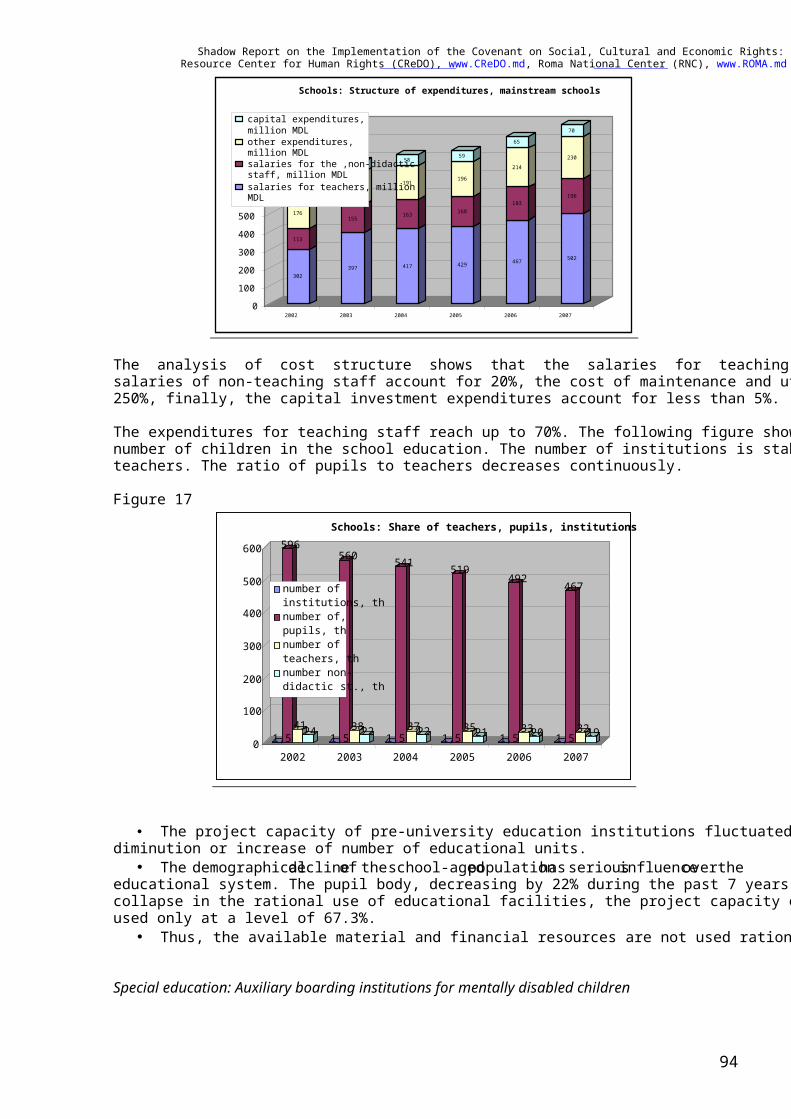
Shadow Report on the Implementation of the Covenant on Social, Cultural and Economic Rights: 2003-09 Resource Center for Human Rights (CReDO), www.CReDO.md, Roma National Center (RNC), www.ROMA.md
94
The analysis of cost structure shows that the salaries for teaching staff account for almost 50%, the salaries of non-teaching staff account for 20%, the cost of maintenance and utilities account for almost 250%, finally, the capital investment expenditures account for less than 5%. The expenditures for teaching staff reach up to 70%. The following figure shows a gradual decrease of number of children in the school education. The number of institutions is stable, as the number of teachers. The ratio of pupils to teachers decreases continuously. Figure 17
• The project capacity of pre-university education institutions fluctuated fundamentally, in limits of diminution or increase of number of educational units.
• The demographical decline of the school-aged population has serious influence over the educational system. The pupil body, decreasing by 22% during the past 7 years, generated an essential collapse in the rational use of educational facilities, the project capacity of educational institutions being used only at a level of 67.3%.
• Thus, the available material and financial resources are not used rationally. Special education: Auxiliary boarding institutions for mentally disabled children
302
113 176 78
397
155
182
56
417
163
191
58
429
168
196
59
467
183
214
65
502
196
230 70
0100200300400500600700800900
1000
2002 2003 2004 2005 2006 2007
Schools: Structure of expenditures, mainstream schools
capital expenditures, million MDLother expenditures, million MDL salaries for the ,non-didactic staff, million MDL salaries for teachers, million MDL
1,5
596
41 24 1,5
560
3822 1,5
541
3722 1,5
519
3521 1,5
492
3320 1,5
467
3219 0
100
200
300
400
500
600
2002 2003 2004 2005 2006 2007
Schools: Share of teachers, pupils, institutions
number of institutions, thnumber of,pupils, thnumber ofteachers, thnumber non-didactic st., th
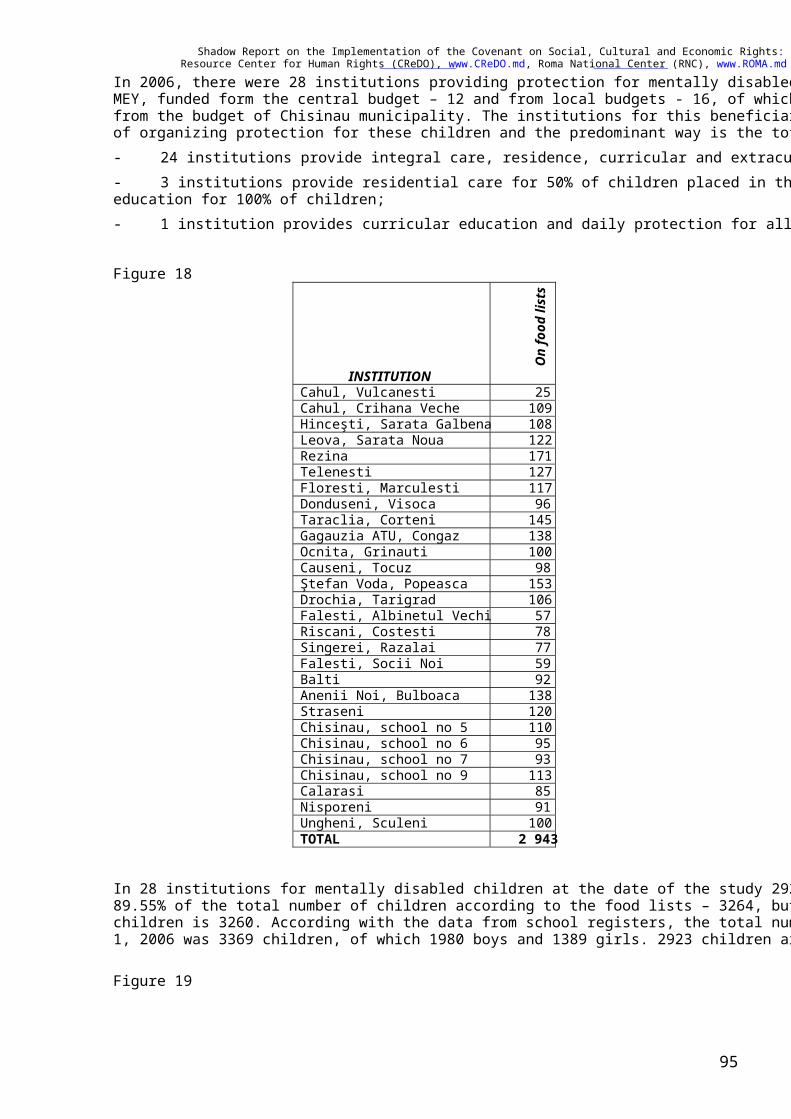
Shadow Report on the Implementation of the Covenant on Social, Cultural and Economic Rights: 2003-09 Resource Center for Human Rights (CReDO), www.CReDO.md, Roma National Center (RNC), www.ROMA.md
95
In 2006, there were 28 institutions providing protection for mentally disabled children, subordinated to MEY, funded form the central budget – 12 and from local budgets - 16, of which 4 institutions are funded from the budget of Chisinau municipality. The institutions for this beneficiary category have three ways of organizing protection for these children and the predominant way is the total institutionalization. - 24 institutions provide integral care, residence, curricular and extracurricular education; - 3 institutions provide residential care for 50% of children placed in the institution and curricular education for 100% of children; - 1 institution provides curricular education and daily protection for all children. Figure 18
INSTITUTION On
food
list
s
Cahul, Vulcanesti 25 Cahul, Crihana Veche 109 Hinceşti, Sarata Galbena 108 Leova, Sarata Noua 122 Rezina 171 Telenesti 127 Floresti, Marculesti 117 Donduseni, Visoca 96 Taraclia, Corteni 145 Gagauzia ATU, Congaz 138 Ocnita, Grinauti 100 Causeni, Tocuz 98 Ştefan Voda, Popeasca 153 Drochia, Tarigrad 106 Falesti, Albinetul Vechi 57 Riscani, Costesti 78 Singerei, Razalai 77 Falesti, Socii Noi 59 Balti 92 Anenii Noi, Bulboaca 138 Straseni 120 Chisinau, school no 5 110 Chisinau, school no 6 95 Chisinau, school no 7 93 Chisinau, school no 9 113 Calarasi 85 Nisporeni 91 Ungheni, Sculeni 100 TOTAL 2 943
In 28 institutions for mentally disabled children at the date of the study 2923 children were present, that is 89.55% of the total number of children according to the food lists – 3264, but the number of interviewed children is 3260. According with the data from school registers, the total number of children on January 1, 2006 was 3369 children, of which 1980 boys and 1389 girls. 2923 children are on the food lists. Figure 19
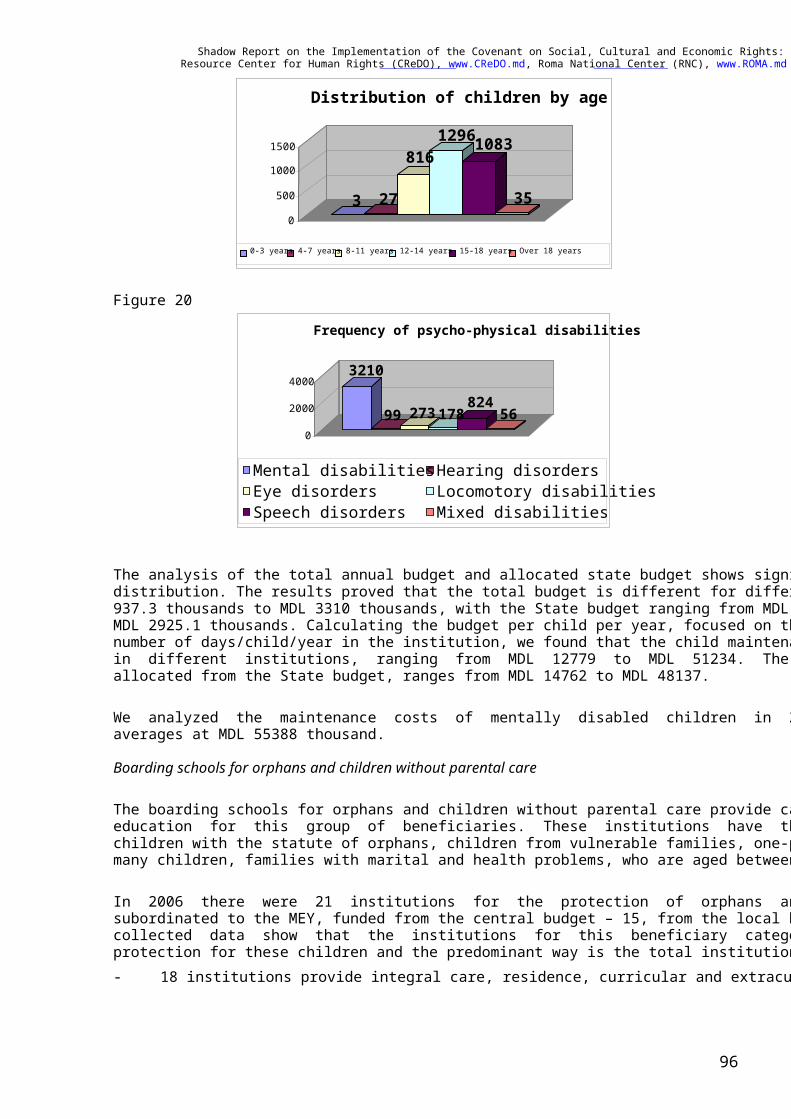
Shadow Report on the Implementation of the Covenant on Social, Cultural and Economic Rights: 2003-09 Resource Center for Human Rights (CReDO), www.CReDO.md, Roma National Center (RNC), www.ROMA.md
96
Figure 20
The analysis of the total annual budget and allocated state budget shows significant discrepancies in its distribution. The results proved that the total budget is different for different schools, varying from MDL 937.3 thousands to MDL 3310 thousands, with the State budget ranging from MDL 937.3 thousands to MDL 2925.1 thousands. Calculating the budget per child per year, focused on the expenditures for the number of days/child/year in the institution, we found that the child maintenance costs are very different in different institutions, ranging from MDL 12779 to MDL 51234. The budget per child per year, allocated from the State budget, ranges from MDL 14762 to MDL 48137. We analyzed the maintenance costs of mentally disabled children in 28 institutions, and found that it averages at MDL 55388 thousand. Boarding schools for orphans and children without parental care The boarding schools for orphans and children without parental care provide care, residence and general education for this group of beneficiaries. These institutions have the following beneficiaries: orphans, children with the statute of orphans, children from vulnerable families, one-parent families, families with many children, families with marital and health problems, who are aged between 3 and 16 years. In 2006 there were 21 institutions for the protection of orphans and children without parental care, subordinated to the MEY, funded from the central budget – 15, from the local budget – 6 institutions. The collected data show that the institutions for this beneficiary category have two ways of organizing protection for these children and the predominant way is the total institutionalization: - 18 institutions provide integral care, residence, curricular and extracurricular education;
3 27
81612961083
350
500 1000 1500
Distribution of children by age
0-3 years 4-7 years 8-11 years 12-14 years 15-18 years Over 18 years
3210
99 273 178824
560
2000 4000
Frequency of psycho-physical disabilities
Mental disabilitiesHearing disordersEye disorders Locomotory disabilities Speech disorders Mixed disabilities
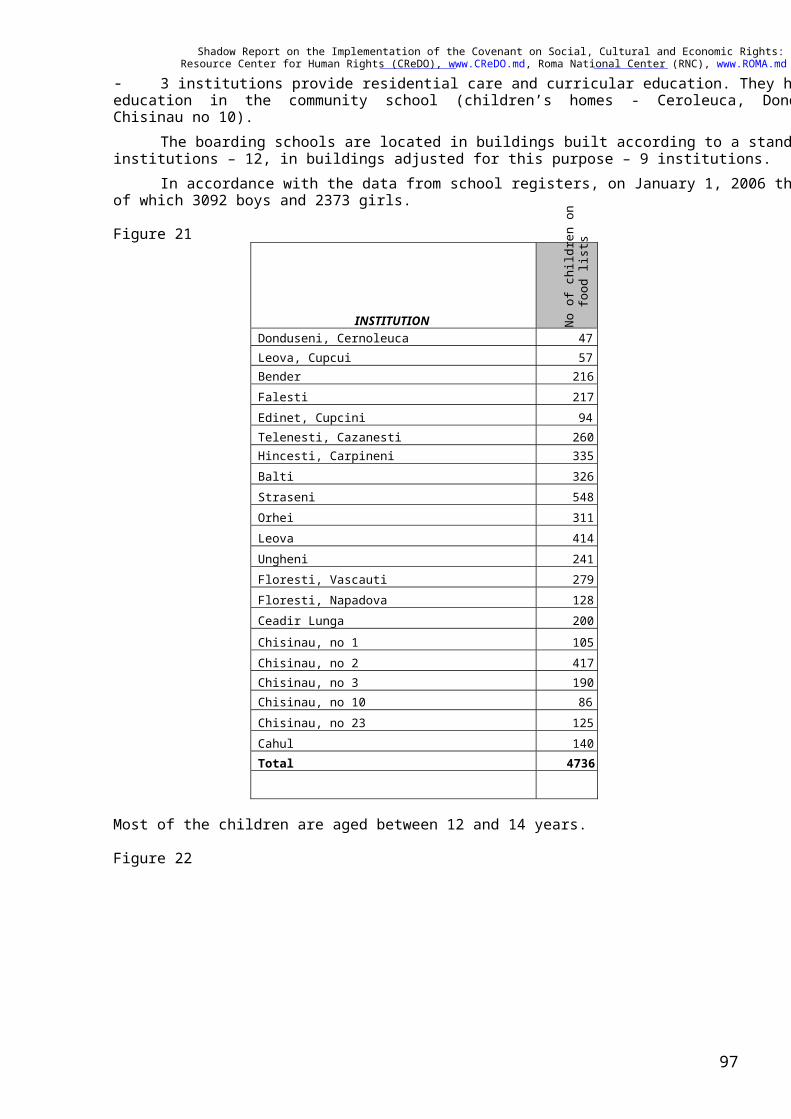
Shadow Report on the Implementation of the Covenant on Social, Cultural and Economic Rights: 2003-09 Resource Center for Human Rights (CReDO), www.CReDO.md, Roma National Center (RNC), www.ROMA.md
97
- 3 institutions provide residential care and curricular education. They have access to the curricular education in the community school (children’s homes - Ceroleuca, Donduseni, Cupcui, Leova and Chisinau no 10). The boarding schools are located in buildings built according to a standard design for educational institutions – 12, in buildings adjusted for this purpose – 9 institutions.
In accordance with the data from school registers, on January 1, 2006 there were 5465 children, of which 3092 boys and 2373 girls. Figure 21
INSTITUTION No of children on
food lists
Donduseni, Cernoleuca 47 Leova, Cupcui 57 Bender 216 Falesti 217 Edinet, Cupcini 94 Telenesti, Cazanesti 260 Hincesti, Carpineni 335 Balti 326 Straseni 548 Orhei 311 Leova 414 Ungheni 241 Floresti, Vascauti 279 Floresti, Napadova 128 Ceadir Lunga 200 Chisinau, no 1 105 Chisinau, no 2 417 Chisinau, no 3 190 Chisinau, no 10 86 Chisinau, no 23 125 Cahul 140 Total 4736
Most of the children are aged between 12 and 14 years.
Figure 22
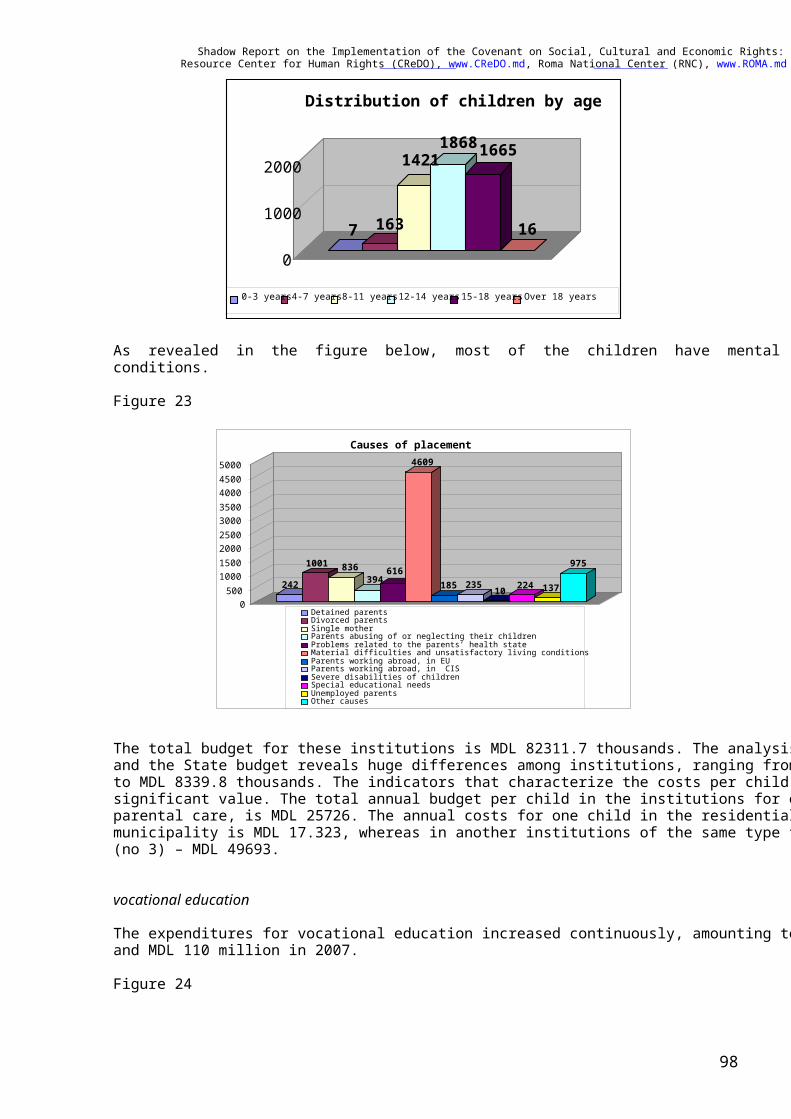
Shadow Report on the Implementation of the Covenant on Social, Cultural and Economic Rights: 2003-09 Resource Center for Human Rights (CReDO), www.CReDO.md, Roma National Center (RNC), www.ROMA.md
98
As revealed in the figure below, most of the children have mental retards and unsatisfactory living conditions. Figure 23
The total budget for these institutions is MDL 82311.7 thousands. The analysis of the total annual budget and the State budget reveals huge differences among institutions, ranging from MDL 11155.5 thousands to MDL 8339.8 thousands. The indicators that characterize the costs per child are informative and have a significant value. The total annual budget per child in the institutions for orphans and children without parental care, is MDL 25726. The annual costs for one child in the residential institution no 1 of Chisinau municipality is MDL 17.323, whereas in another institutions of the same type from Chisinau municipality (no 3) – MDL 49693. vocational education The expenditures for vocational education increased continuously, amounting to MDL 70 million in 2002 and MDL 110 million in 2007. Figure 24
7 163
142118681665
160
1000
2000
Distribution of children by age
0-3 years4-7 years8-11 years12-14 years15-18 yearsOver 18 years
242
1001 836394
616
4609
185 235 10 224 137
975
0500
100015002000250030003500400045005000
Causes of placement
Detained parentsDivorced parentsSingle motherParents abusing of or neglecting their childrenProblems related to the parents’ health stateMaterial difficulties and unsatisfactory living conditionsParents working abroad, in EUParents working abroad, in CISSevere disabilities of childrenSpecial educational needsUnemployed parentsOther causes

Shadow Report on the Implementation of the Covenant on Social, Cultural and Economic Rights: 2003-09 Resource Center for Human Rights (CReDO), www.CReDO.md, Roma National Center (RNC), www.ROMA.md
99
The analysis of cost structure shows that the salaries for teaching staff account for almost 20%, the salaries of non-teaching staff account for 20%, the cost of maintenance and utilities account for almost 50%, finally, the capital investment expenditures account for less than 5%. The private expenditures account for 10% of all expenditures for this level. The expenditures for teaching staff reach up to 50%. The following figure shows a gradual decrease of number of children in the vocational education. The number of institutions is stable, as the number of teachers. The ration of pupils to teachers decreases continuously. Figure 25
Education in colleges The expenditures for the college education increased continuously, amounting to MDL 90 million in 2002 and MDL 150 million in 2007. Figure 26
15
11
33
69
20
15
41
510
22
16
43
511
22
17
45
512
24
18
49
512
26
19
52
612
0
20
40
60
80
100
120
2002 2003 2004 2005 2006 2007
Vocational schools: Structure of expenditures
extra-budgetary expenditures, thousands MDLcapital expenditures, thousands MDLother expenditures, thousands MDLsalaries to non-didactic staff, thousands MDLsalaries to teachers, thousands MDL
13
1,5 2
13
1,62,1
13
1,62,1
13
1,62,1
14
1,72,2
14
1,72,2
0
2
4
6
8
10
12
14
2002 2003 2004 2005 2006 2007
Colleges: Share of teachers, students, institutions
number of students, thousands number of teachers,thousands
number of non-didacticstaff, thousands
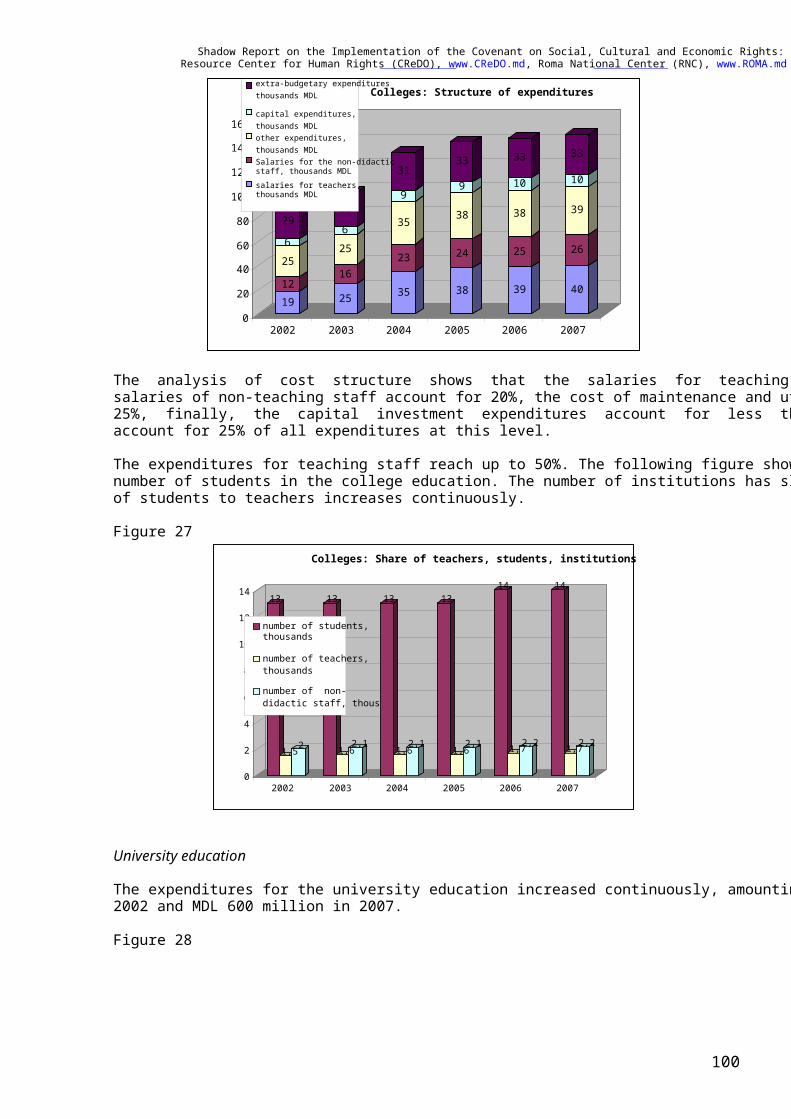
Shadow Report on the Implementation of the Covenant on Social, Cultural and Economic Rights: 2003-09 Resource Center for Human Rights (CReDO), www.CReDO.md, Roma National Center (RNC), www.ROMA.md
100
The analysis of cost structure shows that the salaries for teaching staff account for almost 30%, the salaries of non-teaching staff account for 20%, the cost of maintenance and utilities account for almost 25%, finally, the capital investment expenditures account for less than 10%. The private expenditures account for 25% of all expenditures at this level. The expenditures for teaching staff reach up to 50%. The following figure shows a gradual increase of number of students in the college education. The number of institutions has slightly increased. The ratio of students to teachers increases continuously. Figure 27
University education The expenditures for the university education increased continuously, amounting to MDL 400 million in 2002 and MDL 600 million in 2007. Figure 28
19 12 25 6 29
25
16
25628
35
23
35
9
31
38
24
38
9
33
39
25
38
10
33
40
26
39
10
33
0
20 40 60 80 100
120
140
160
2002 2003 2004 2005 2006 2007
Colleges: Structure of expendituresextra-budgetary expendituresthousands MDL
capital expenditures,thousands MDL
other expenditures,thousands MDL
Salaries for the non-didactic staff, thousands MDLsalaries for teachers, thousands MDL
13
1,52
13
1,62,1
13
1,62,1
13
1,62,1
14
1,72,2
14
1,72,2
0 2 4 6 8 10
12
14
2002 2003 2004 2005 2006 2007
Colleges: Share of teachers, students, institutions
number of students, thousands number of teachers,thousands
number of non-didactic staff, thous
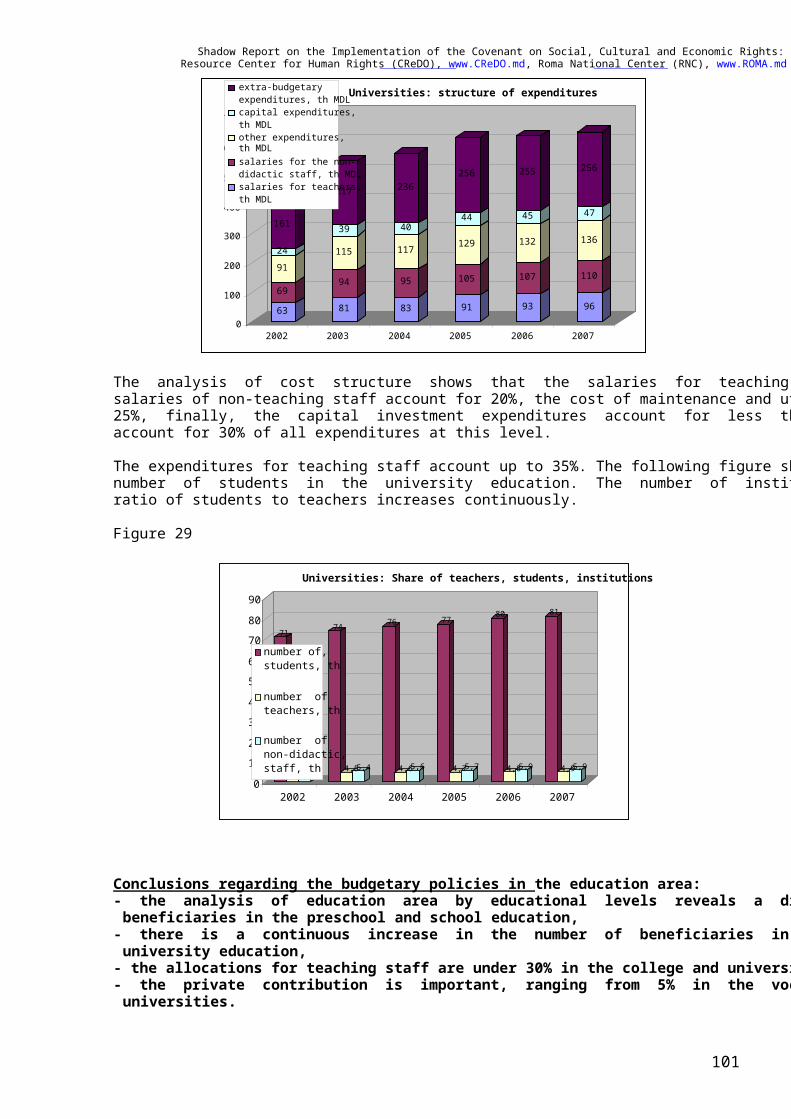
Shadow Report on the Implementation of the Covenant on Social, Cultural and Economic Rights: 2003-09 Resource Center for Human Rights (CReDO), www.CReDO.md, Roma National Center (RNC), www.ROMA.md
101
The analysis of cost structure shows that the salaries for teaching staff account for almost 15%, the salaries of non-teaching staff account for 20%, the cost of maintenance and utilities account for almost 25%, finally, the capital investment expenditures account for less than 10%. The private expenditures account for 30% of all expenditures at this level. The expenditures for teaching staff account up to 35%. The following figure shows a gradual increase of number of students in the university education. The number of institutions has slightly increased. The ratio of students to teachers increases continuously. Figure 29
Conclusions regarding the budgetary policies in the education area: - the analysis of education area by educational levels reveals a diminution of the number of beneficiaries in the preschool and school education,
- there is a continuous increase in the number of beneficiaries in the vocational, college and university education,
- the allocations for teaching staff are under 30% in the college and university education, - the private contribution is important, ranging from 5% in the vocational education to 25% in universities.
63
69
9124
161
81
94
115
39
217
83
95
117
40
236
91
105
129
44
256
93
107
132
45
255
96
110
136 47
256
0
100
200
300
400
500
600
700
2002 2003 2004 2005 2006 2007
Universities: structure of expendituresextra-budgetaryexpenditures, th MDLcapital expenditures,th MDLother expenditures, th MDL salaries for the non- didactic staff, th MDL salaries for teachers,th MDL
71
4,35,3
74
4,55,4
76
4,65,6
77
4,75,7
80
4,85,9
81
4,95,9
010 20 30 40 50 60 70 80 90
2002 2003 2004 2005 2006 2007
Universities: Share of teachers, students, institutions
number of, students, th number of teachers, th number of non-didactic, staff, th
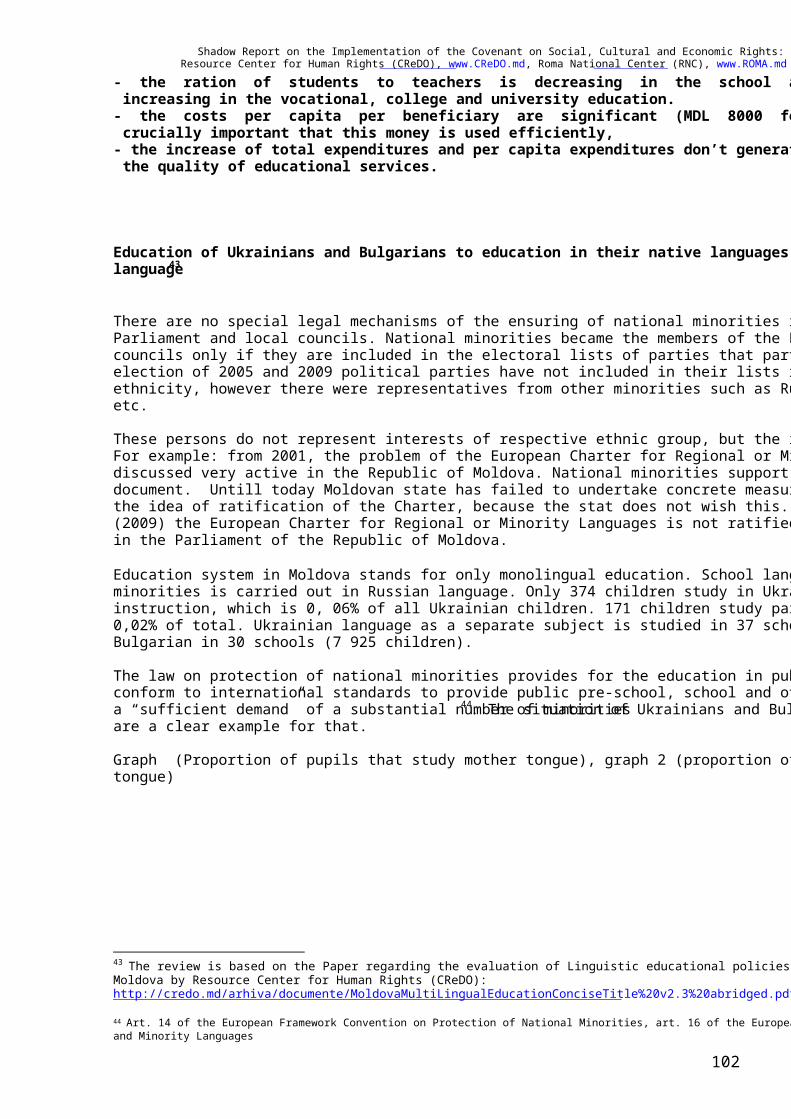
Shadow Report on the Implementation of the Covenant on Social, Cultural and Economic Rights: 2003-09 Resource Center for Human Rights (CReDO), www.CReDO.md, Roma National Center (RNC), www.ROMA.md
102
- the ration of students to teachers is decreasing in the school and pre-school education, and is increasing in the vocational, college and university education.
- the costs per capita per beneficiary are significant (MDL 8000 for universities), therefore it is crucially important that this money is used efficiently,
- the increase of total expenditures and per capita expenditures don’t generate a similar increase of the quality of educational services.
Education of Ukrainians and Bulgarians to education in their native languages and in state language43
There are no special legal mechanisms of the ensuring of national minorities representation in the Parliament and local councils. National minorities became the members of the Parliament or local councils only if they are included in the electoral lists of parties that participate to elections. During the election of 2005 and 2009 political parties have not included in their lists representatives of Roma ethnicity, however there were representatives from other minorities such as Russians, Gagaus, Bulgarian, etc. These persons do not represent interests of respective ethnic group, but the interests of respective party. For example: from 2001, the problem of the European Charter for Regional or Minority Languages is discussed very active in the Republic of Moldova. National minorities support the ratification of this document. Untill today Moldovan state has failed to undertake concrete measures for the promotion of the idea of ratification of the Charter, because the stat does not wish this. As a consequence, till now (2009) the European Charter for Regional or Minority Languages is not ratified. No Roma is represented in the Parliament of the Republic of Moldova.
Education system in Moldova stands for only monolingual education. School language education for minorities is carried out in Russian language. Only 374 children study in Ukrainian as language of instruction, which is 0, 06% of all Ukrainian children. 171 children study partially in Bulgarian, which is 0,02% of total. Ukrainian language as a separate subject is studied in 37 schools (5 984 children) and Bulgarian in 30 schools (7 925 children). The law on protection of national minorities provides for the education in public schools only. It fails to conform to international standards to provide public pre-school, school and other education where there is a “sufficient demand” of a substantial number of minorities44. The situation of Ukrainians and Bulgarians are a clear example for that. Graph (Proportion of pupils that study mother tongue), graph 2 (proportion of pupils that study in mother tongue)
43 The review is based on the Paper regarding the evaluation of Linguistic educational policies for national Minorities in Moldova by Resource Center for Human Rights (CReDO): http://credo.md/arhiva/documente/MoldovaMultiLingualEducationConciseTitle%20v2.3%20abridged.pdf 44 Art. 14 of the European Framework Convention on Protection of National Minorities, art. 16 of the European Charter for Regional and Minority Languages
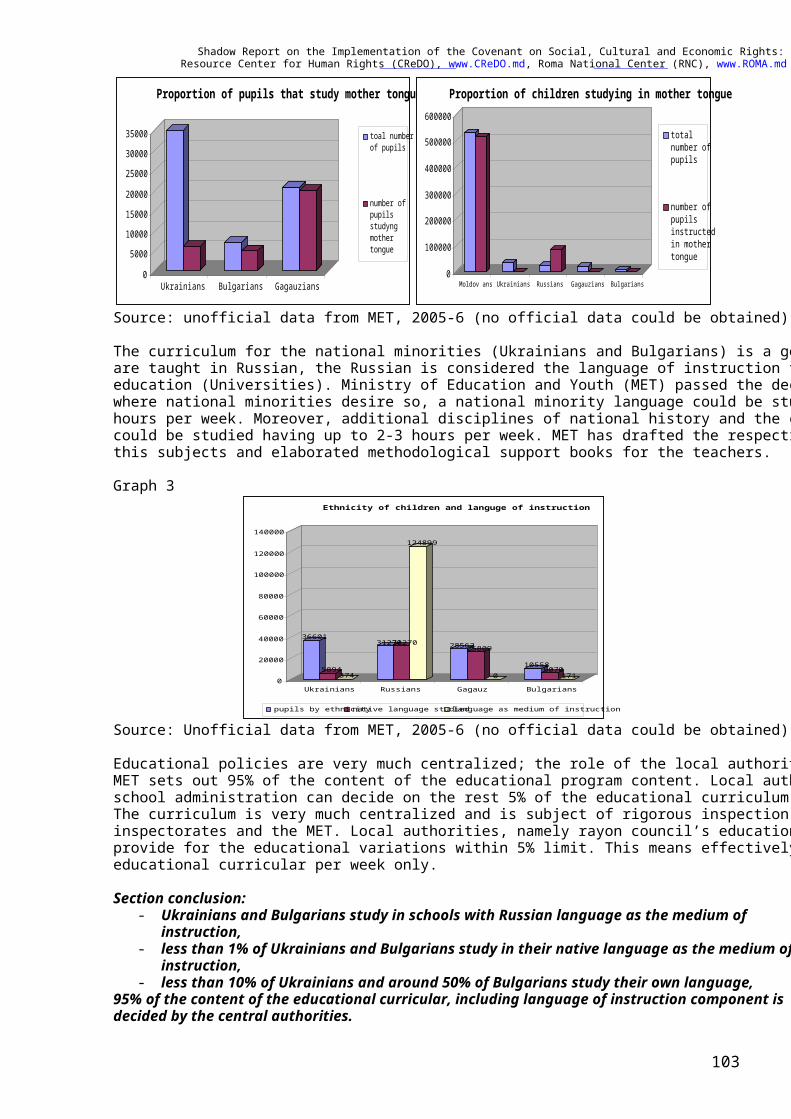
Shadow Report on the Implementation of the Covenant on Social, Cultural and Economic Rights: 2003-09 Resource Center for Human Rights (CReDO), www.CReDO.md, Roma National Center (RNC), www.ROMA.md
103
0
5000100001500020000
250003000035000
Ukrainians Bulgarians Gagauzians
Proportion of pupils that study mother tongue
toal numberof pupils
number ofpupilsstudyngmothertongue
0
100000
200000
300000
400000
500000
600000
Moldov ans Ukrainians Russians Gagauzians Bulgarians
Proportion of children studying in mother tongue
totalnumber ofpupils
number ofpupilsinstructedin mothertongue
Source: unofficial data from MET, 2005-6 (no official data could be obtained) The curriculum for the national minorities (Ukrainians and Bulgarians) is a generic one. All the subjects are taught in Russian, the Russian is considered the language of instruction from the kindergarten to high education (Universities). Ministry of Education and Youth (MET) passed the decision that in the areas where national minorities desire so, a national minority language could be studied as a discipline for 2-3 hours per week. Moreover, additional disciplines of national history and the culture of national minority could be studied having up to 2-3 hours per week. MET has drafted the respective educational plans for this subjects and elaborated methodological support books for the teachers. Graph 3
36601
5894374
3127031270
124899
2856225809
0105586070
1710
20000
40000
60000
80000
100000
120000
140000
Ukrainians Russians Gagauz Bulgarians
Ethnicity of children and languge of instruction
pupils by ethnicitynative language studiedlanguage as medium of instruction Source: Unofficial data from MET, 2005-6 (no official data could be obtained) Educational policies are very much centralized; the role of the local authorities in education is limited. MET sets out 95% of the content of the educational program content. Local authorities together with the school administration can decide on the rest 5% of the educational curriculum in terms of the disciplines. The curriculum is very much centralized and is subject of rigorous inspection from the rayon educational inspectorates and the MET. Local authorities, namely rayon council’s educational administration can provide for the educational variations within 5% limit. This means effectively, 2-3 hours of the educational curricular per week only. Section conclusion:
- Ukrainians and Bulgarians study in schools with Russian language as the medium of instruction,
- less than 1% of Ukrainians and Bulgarians study in their native language as the medium of instruction,
- less than 10% of Ukrainians and around 50% of Bulgarians study their own language, 95% of the content of the educational curricular, including language of instruction component is decided by the central authorities.

Shadow Report on the Implementation of the Covenant on Social, Cultural and Economic Rights: 2003-09 Resource Center for Human Rights (CReDO), www.CReDO.md, Roma National Center (RNC), www.ROMA.md
104
- Perception by Bulgarians Data from 2003 shows45 that knowledge of the state language differs according to the age structure of the respondents. 55% of the population segment of 70 and older speak state language. A similar pattern is almost matched for the segment 14-18 years, where almost 40% speak state language. The lowest knowledge of the state language is registered for the segment of 19-25 years (20%), followed by 41-55 years, 56-70 years (22-24 %). The use of the Bulgarian language among spouses is substantial. It reaches 58% and together with the use of mixture of Bulgarian and Russian reaches 86%, less than 12% speak among themselves only Russian. The use of languages among parents-children shows a rather similar pattern, where Bulgarian is used in 56% and plus a mixture of Bulgarian and Russian reaches 87%. The use of only Russian is only in 8%. The use of Bulgarian, among the children, decreases almost twofold to 29% and together with the use of mixture of Bulgarian and Russian to 60%. The use of only Russian registers an increase to 24%. One can see that the place of Bulgarian is being taken over by Russian and partly by mixture of Russian/Bulgarian/Romanian languages. Graph 4 (Bulgarians, command of state language by age, %), 5 (Bulgarians: use of languages, %)
0.0%
10.0%
20.0%
30.0%
40.0%
50.0%
60.0%
70.0%
80.0%
14 - 18 19 - 25 26 – 40 41 – 55 56 - 70 older 70
Command of state language by Bulgarians by language groups, 2003
yesno
58.1
2811.911
56.1
29.3842.6
29.3
30.7
24124.7
0
20
40
60
80
100
120
among spouses parents-children among children
Use of languages by Bulgarians
Bulgarian Bulgarian/Russian RussianRomanian/Russian/BulgarianOther (incl Romanian)
Source: Sociological investigation by the author’s team, 2008 The following graphs show parents-children language communication. 77% of respondents consider state language as important, 23% somewhat important, while 46% of children consider sate language as very important and 39% consider it as important. One can see that children give a higher value to the state language than their parents. The situation with Russian language mirrors the state language situation. There is a significant difference in children appreciation of the Bulgarian language as compared to the value that is given by their parents. The pattern of importance of the Bulgarian language in children perception is somewhat similar to the responses given to the state and Russian languages, yet the importance for Bulgarian languages is higher than of Russian and less important than state language. The value of the parents for Bulgarian language is considerable smaller than those of the children. Graph 5 (parents-children importance of language, % in columns: 1) state language-parents, 2) state-language children, 3) Bulgarian language-parents, 4) Bulgarian language children, 5) Russian language-parents, 6) Russian language-children)
45 Research conducted by Center for Minority Rights and Resource Center for Human Rights in 2003 [3].
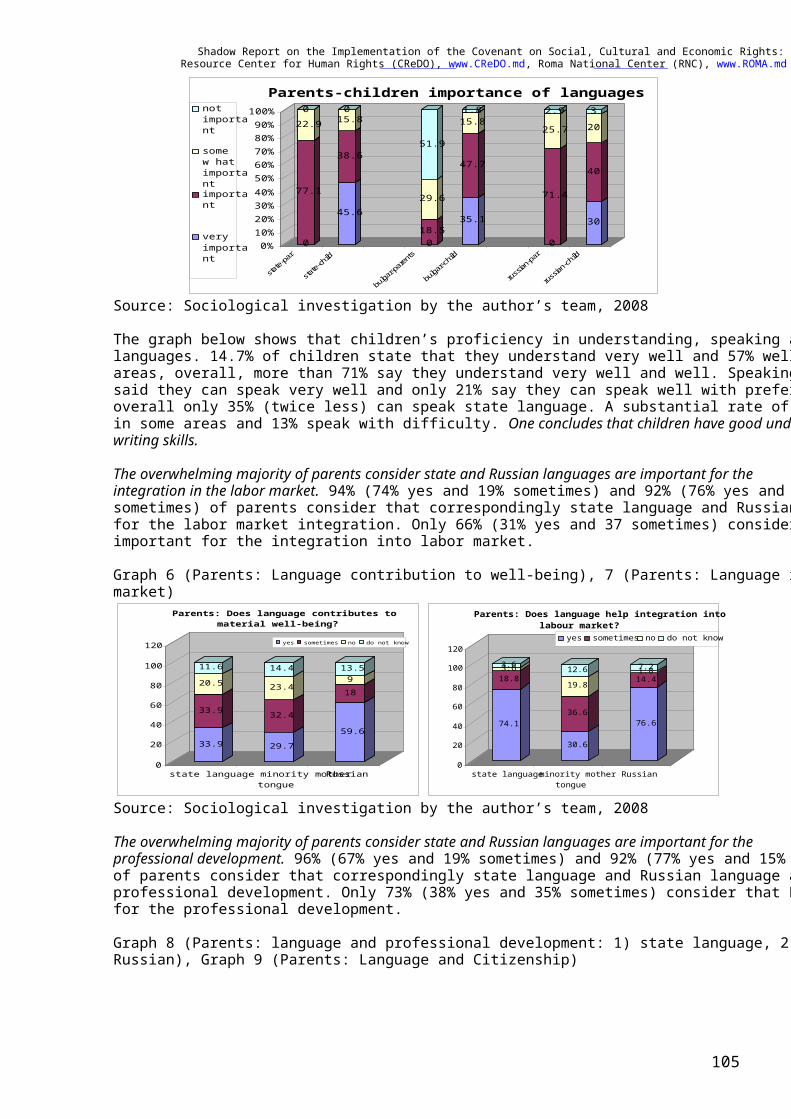
Shadow Report on the Implementation of the Covenant on Social, Cultural and Economic Rights: 2003-09 Resource Center for Human Rights (CReDO), www.CReDO.md, Roma National Center (RNC), www.ROMA.md
105
0
77.1
22.90
45.6
38.6
15.80
018.5
29.6
51.9
35.1
47.7
15.81.8
0
71.4
25.7
2.9
30
40
203
0%10%20%30%40%50%60%70%80%90%100%
state-par
state-child
bulgar-parents
bulgar-child
russian-par
russian-child
Parents-children importance of languagesnotimportant
somew hatimportantimportant
veryimportant
Source: Sociological investigation by the author’s team, 2008 The graph below shows that children’s proficiency in understanding, speaking and writing in state languages. 14.7% of children state that they understand very well and 57% well with preferences in some areas, overall, more than 71% say they understand very well and well. Speaking pattern differs, only 13% said they can speak very well and only 21% say they can speak well with preference in some areas, overall only 35% (twice less) can speak state language. A substantial rate of 32% say they can speak only in some areas and 13% speak with difficulty. One concludes that children have good understanding and writing skills. The overwhelming majority of parents consider state and Russian languages are important for the integration in the labor market. 94% (74% yes and 19% sometimes) and 92% (76% yes and 14% sometimes) of parents consider that correspondingly state language and Russian language are important for the labor market integration. Only 66% (31% yes and 37 sometimes) consider that Bulgarian is important for the integration into labor market. Graph 6 (Parents: Language contribution to well-being), 7 (Parents: Language integration in labour market)
33.9
33.9
20.5
11.6
29.7
32.4
23.4
14.4
59.6
189
13.5
0
20
40
60
80
100
120
state language minority mothertongue
Russian
Parents: Does language contributes to material well-being?
yes sometimes no do not know
74.1
18.83.63.6
30.6
36.6
19.812.6
76.6
14.41.87.2
0
20
40
60
80
100
120
state languageminority mothertongue
Russian
Parents: Does language help integration into labour market?
yes sometimes no do not know
Source: Sociological investigation by the author’s team, 2008 The overwhelming majority of parents consider state and Russian languages are important for the professional development. 96% (67% yes and 19% sometimes) and 92% (77% yes and 15% sometimes) of parents consider that correspondingly state language and Russian language are important for the professional development. Only 73% (38% yes and 35% sometimes) consider that Bulgarian is important for the professional development. Graph 8 (Parents: language and professional development: 1) state language, 2) mother tongue, 3) Russian), Graph 9 (Parents: Language and Citizenship)
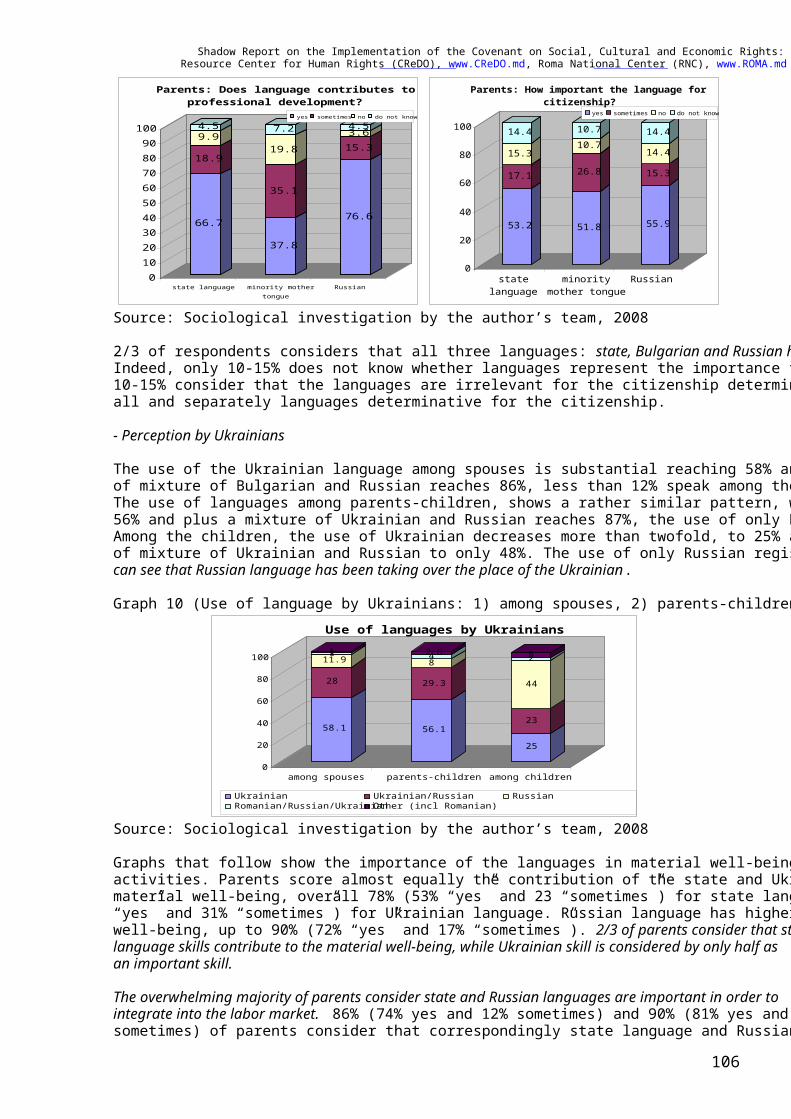
Shadow Report on the Implementation of the Covenant on Social, Cultural and Economic Rights: 2003-09 Resource Center for Human Rights (CReDO), www.CReDO.md, Roma National Center (RNC), www.ROMA.md
106
66.7
18.9
9.94.5
37.8
35.1
19.8
7.2
76.6
15.33.64.5
0102030405060708090100
state language minority mothertongue
Russian
Parents: Does language contributes to professional development?
yes sometimes no do not know
53.2
17.1
15.3
14.4
51.8
26.8
10.710.7
55.9
15.3
14.4
14.4
0
20
40
60
80
100
statelanguage
minoritymother tongue
Russian
Parents: How important the language for citizenship?
yes sometimes no do not know
Source: Sociological investigation by the author’s team, 2008 2/3 of respondents considers that all three languages: state, Bulgarian and Russian have equal value. Indeed, only 10-15% does not know whether languages represent the importance for the citizenship, and 10-15% consider that the languages are irrelevant for the citizenship determination. Around 70% consider all and separately languages determinative for the citizenship. - Perception by Ukrainians The use of the Ukrainian language among spouses is substantial reaching 58% and together with the use of mixture of Bulgarian and Russian reaches 86%, less than 12% speak among themselves only Russian. The use of languages among parents-children, shows a rather similar pattern, where Ukrainian is used in 56% and plus a mixture of Ukrainian and Russian reaches 87%, the use of only Russian is only 8%. Among the children, the use of Ukrainian decreases more than twofold, to 25% and together with the use of mixture of Ukrainian and Russian to only 48%. The use of only Russian registers increase to 44%. One can see that Russian language has been taking over the place of the Ukrainian. Graph 10 (Use of language by Ukrainians: 1) among spouses, 2) parents-children, 3) among children)
58.1
28
11.911
56.1
29.3
842.6
25
23
44
25
0
20
40
60
80
100
among spouses parents-children among children
Use of languages by Ukrainians
Ukrainian Ukrainian/Russian RussianRomanian/Russian/UkrainianOther (incl Romanian)
Source: Sociological investigation by the author’s team, 2008 Graphs that follow show the importance of the languages in material well-being and in income-generation activities. Parents score almost equally the contribution of the state and Ukrainian languages for the material well-being, overall 78% (53% “yes” and 23 “sometimes”) for state language and only 59% (28% “yes” and 31% “sometimes”) for Ukrainian language. Russian language has higher score for the material well-being, up to 90% (72% “yes” and 17% “sometimes”). 2/3 of parents consider that state and Russian language skills contribute to the material well-being, while Ukrainian skill is considered by only half as an important skill. The overwhelming majority of parents consider state and Russian languages are important in order to integrate into the labor market. 86% (74% yes and 12% sometimes) and 90% (81% yes and 9% sometimes) of parents consider that correspondingly state language and Russian language are important
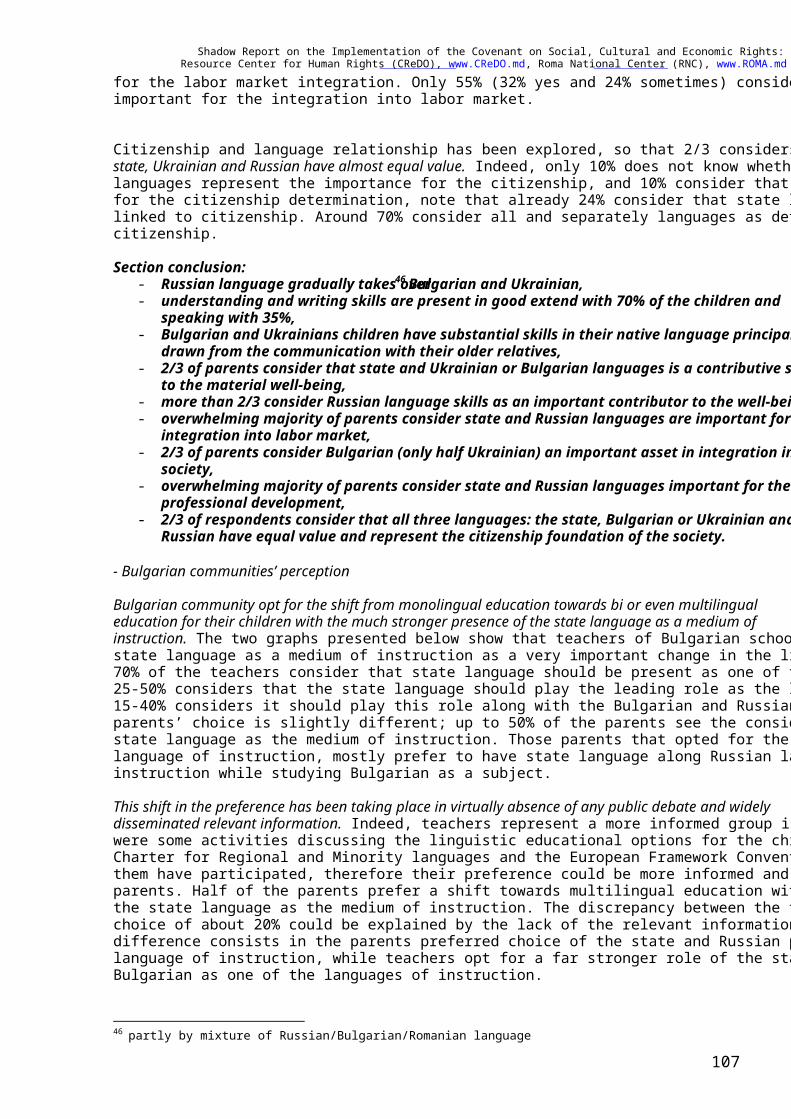
Shadow Report on the Implementation of the Covenant on Social, Cultural and Economic Rights: 2003-09 Resource Center for Human Rights (CReDO), www.CReDO.md, Roma National Center (RNC), www.ROMA.md
107
for the labor market integration. Only 55% (32% yes and 24% sometimes) consider that Ukrainian is important for the integration into labor market. Citizenship and language relationship has been explored, so that 2/3 considers that all three languages: state, Ukrainian and Russian have almost equal value. Indeed, only 10% does not know whether languages represent the importance for the citizenship, and 10% consider that the languages are irrelevant for the citizenship determination, note that already 24% consider that state language knowledge is not linked to citizenship. Around 70% consider all and separately languages as determinative for the citizenship. Section conclusion:
- Russian language gradually takes over46 Bulgarian and Ukrainian, - understanding and writing skills are present in good extend with 70% of the children and
speaking with 35%, - Bulgarian and Ukrainians children have substantial skills in their native language principally
drawn from the communication with their older relatives, - 2/3 of parents consider that state and Ukrainian or Bulgarian languages is a contributive skill
to the material well-being, - more than 2/3 consider Russian language skills as an important contributor to the well-being, - overwhelming majority of parents consider state and Russian languages are important for the
integration into labor market, - 2/3 of parents consider Bulgarian (only half Ukrainian) an important asset in integration into
society, - overwhelming majority of parents consider state and Russian languages important for the
professional development, - 2/3 of respondents consider that all three languages: the state, Bulgarian or Ukrainian and
Russian have equal value and represent the citizenship foundation of the society.
- Bulgarian communities’ perception Bulgarian community opt for the shift from monolingual education towards bi or even multilingual education for their children with the much stronger presence of the state language as a medium of instruction. The two graphs presented below show that teachers of Bulgarian schools see the presence of state language as a medium of instruction as a very important change in the linguistic educational policy. 70% of the teachers consider that state language should be present as one of the languages of instruction. 25-50% considers that the state language should play the leading role as the language of instruction and 15-40% considers it should play this role along with the Bulgarian and Russian languages. Bulgarians parents’ choice is slightly different; up to 50% of the parents see the considerable improved role of the state language as the medium of instruction. Those parents that opted for the state language as the language of instruction, mostly prefer to have state language along Russian language as the medium of instruction while studying Bulgarian as a subject. This shift in the preference has been taking place in virtually absence of any public debate and widely disseminated relevant information. Indeed, teachers represent a more informed group in the society, there were some activities discussing the linguistic educational options for the children related to European Charter for Regional and Minority languages and the European Framework Convention where some of them have participated, therefore their preference could be more informed and educated than of the parents. Half of the parents prefer a shift towards multilingual education with a much stronger presence of the state language as the medium of instruction. The discrepancy between the teachers and parents’ choice of about 20% could be explained by the lack of the relevant information for the parents. Another difference consists in the parents preferred choice of the state and Russian playing the leading role as the language of instruction, while teachers opt for a far stronger role of the state language of instruction, sees Bulgarian as one of the languages of instruction. 46 partly by mixture of Russian/Bulgarian/Romanian language
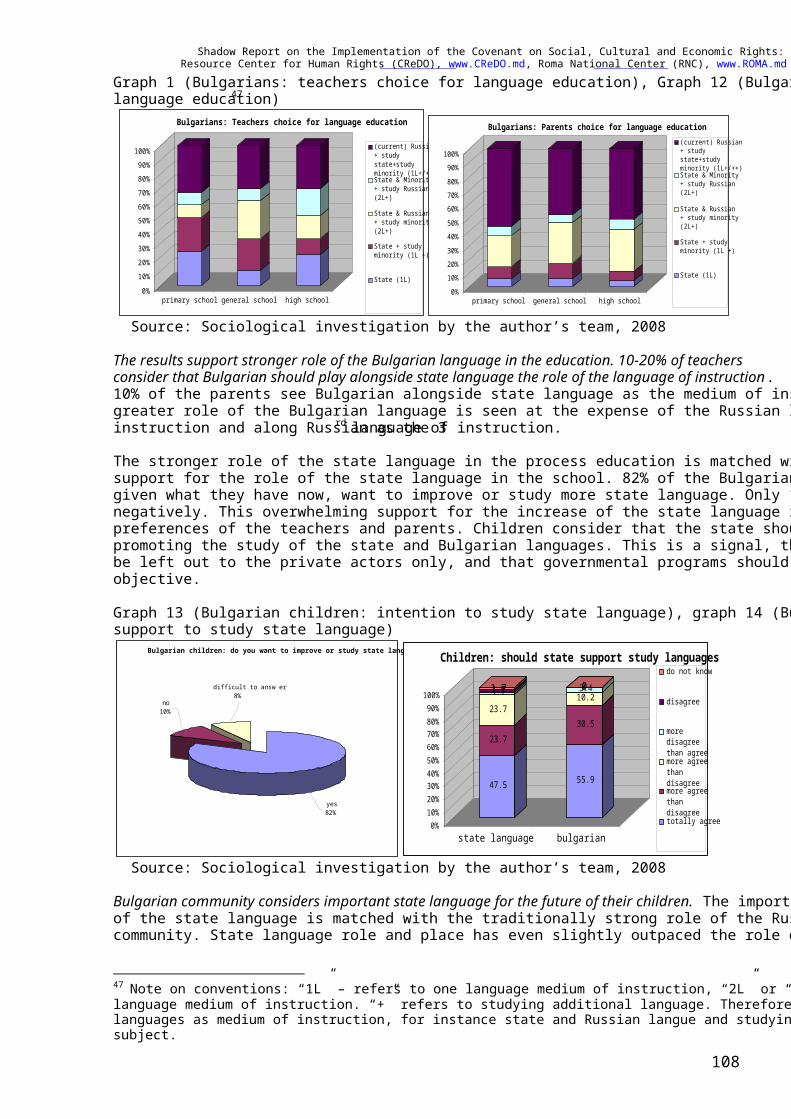
Shadow Report on the Implementation of the Covenant on Social, Cultural and Economic Rights: 2003-09 Resource Center for Human Rights (CReDO), www.CReDO.md, Roma National Center (RNC), www.ROMA.md
108
Graph 1 (Bulgarians: teachers choice for language education), Graph 12 (Bulgarians: Parents choice for language education)47
0%10%20%30%40%50%60%70%80%90%100%
primary school general school high school
Bulgarians: Teachers choice for language education
(current) Russian+ studystate+studyminority (1L+/++)State & Minority+ study Russian(2L+)
State & Russian+ study minority(2L+)
State + studyminority (1L +)
State (1L)0%10%20%30%40%50%60%70%80%90%100%
primary school general school high school
Bulgarians: Parents choice for language education(current) Russian+ studystate+studyminority (1L+/++)State & Minority+ study Russian(2L+)
State & Russian+ study minority(2L+)
State + studyminority (1L +)
State (1L)
Source: Sociological investigation by the author’s team, 2008 The results support stronger role of the Bulgarian language in the education. 10-20% of teachers consider that Bulgarian should play alongside state language the role of the language of instruction. 5-10% of the parents see Bulgarian alongside state language as the medium of instruction. In both cases, the greater role of the Bulgarian language is seen at the expense of the Russian language as the medium of instruction and along Russian as the 3rd language of instruction. The stronger role of the state language in the process education is matched with the children strong support for the role of the state language in the school. 82% of the Bulgarian children consider that they, given what they have now, want to improve or study more state language. Only 10% consider it negatively. This overwhelming support for the increase of the state language is coherent with the above preferences of the teachers and parents. Children consider that the state should play an important role in promoting the study of the state and Bulgarian languages. This is a signal, that this objective should not be left out to the private actors only, and that governmental programs should be in place to achieve this objective. Graph 13 (Bulgarian children: intention to study state language), graph 14 (Bulgarian children: state support to study state language)
Bulgarian children: do you want to improve or study state language?
no10%
difficult to answ er8%
yes82%
47.5
23.7
23.71.71.71.7
55.9
30.5
10.23.400
0%10%20%30%40%50%60%70%80%90%100%
state language bulgarian
Children: should state support study languagesdo not know
disagree
moredisagreethan agreemore agreethandisagreemore agreethandisagreetotally agree
Source: Sociological investigation by the author’s team, 2008 Bulgarian community considers important state language for the future of their children. The importance of the state language is matched with the traditionally strong role of the Russian language in the minority community. State language role and place has even slightly outpaced the role of the Russian language. At
47 Note on conventions: “1L” – refers to one language medium of instruction, “2L” or “1L + L” refers to two language medium of instruction. “+” refers to studying additional language. Therefore “2L+” model means use 2 languages as medium of instruction, for instance state and Russian langue and studying Ukrainian or Bulgarian as a subject.
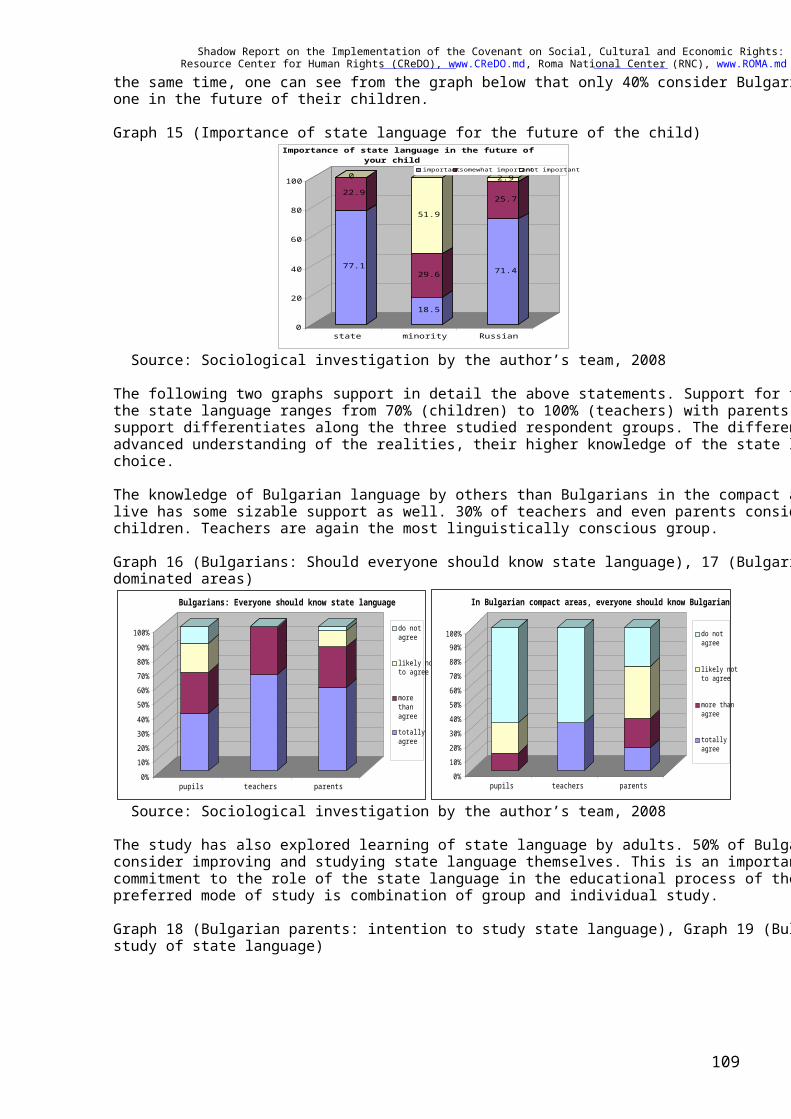
Shadow Report on the Implementation of the Covenant on Social, Cultural and Economic Rights: 2003-09 Resource Center for Human Rights (CReDO), www.CReDO.md, Roma National Center (RNC), www.ROMA.md
109
the same time, one can see from the graph below that only 40% consider Bulgarian language as important one in the future of their children. Graph 15 (Importance of state language for the future of the child)
77.1
22.9
0
18.5
29.6
51.9
71.4
25.7
2.9
0
20
40
60
80
100
state minority Russian
Importance of state language in the future of your child
importantsomewhat importantnot important
Source: Sociological investigation by the author’s team, 2008 The following two graphs support in detail the above statements. Support for the universal knowledge of the state language ranges from 70% (children) to 100% (teachers) with parents at 88%. This strong support differentiates along the three studied respondent groups. The difference might lie in the teachers advanced understanding of the realities, their higher knowledge of the state language and more educated choice. The knowledge of Bulgarian language by others than Bulgarians in the compact areas where Bulgarians live has some sizable support as well. 30% of teachers and even parents consider it so and 10% of children. Teachers are again the most linguistically conscious group. Graph 16 (Bulgarians: Should everyone should know state language), 17 (Bulgarians: in Bulgaria dominated areas)
0%10%20%30%40%50%60%70%80%90%100%
pupils teachers parents
Bulgarians: Everyone should know state language
do notagree
likely notto agree
morethanagree
totallyagree
0%10%20%30%40%50%60%70%80%90%100%
pupils teachers parents
In Bulgarian compact areas, everyone should know Bulgarian
do notagree
likely notto agree
more thanagree
totallyagree
Source: Sociological investigation by the author’s team, 2008 The study has also explored learning of state language by adults. 50% of Bulgarian parents want and consider improving and studying state language themselves. This is an important sign if considering their commitment to the role of the state language in the educational process of their children. The most preferred mode of study is combination of group and individual study. Graph 18 (Bulgarian parents: intention to study state language), Graph 19 (Bulgarian parents: mode of study of state language)
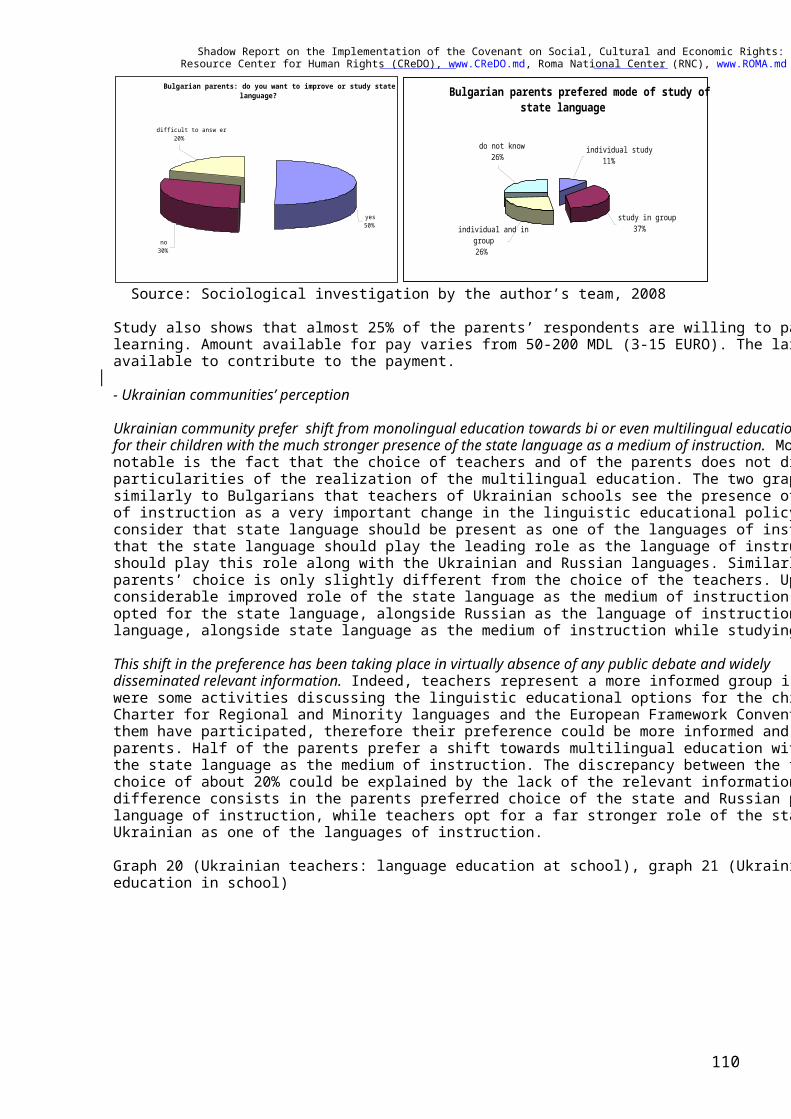
Shadow Report on the Implementation of the Covenant on Social, Cultural and Economic Rights: 2003-09 Resource Center for Human Rights (CReDO), www.CReDO.md, Roma National Center (RNC), www.ROMA.md
110
Bulgarian parents: do you want to improve or study state language?
no30%
difficult to answ er20%
yes50%
Bulgarian parents prefered mode of study of state language
individual and in group26%
do not know26%
individual study11%
study in group37%
Source: Sociological investigation by the author’s team, 2008 Study also shows that almost 25% of the parents’ respondents are willing to pay for the state language learning. Amount available for pay varies from 50-200 MDL (3-15 EURO). The largest group is not available to contribute to the payment. - Ukrainian communities’ perception Ukrainian community prefer shift from monolingual education towards bi or even multilingual education for their children with the much stronger presence of the state language as a medium of instruction. Most notable is the fact that the choice of teachers and of the parents does not differ substantially, only in particularities of the realization of the multilingual education. The two graphs presented below shows similarly to Bulgarians that teachers of Ukrainian schools see the presence of state language as a medium of instruction as a very important change in the linguistic educational policy. 70-90% of the teachers consider that state language should be present as one of the languages of instruction. 20-60% considers that the state language should play the leading role as the language of instruction and 20-40% considers it should play this role along with the Ukrainian and Russian languages. Similarly to Bulgarians, Ukrainians parents’ choice is only slightly different from the choice of the teachers. Up to 80% of the parents see the considerable improved role of the state language as the medium of instruction. Ukrainian parents equally opted for the state language, alongside Russian as the language of instruction, and for the Russian language, alongside state language as the medium of instruction while studying Ukrainian as a subject. This shift in the preference has been taking place in virtually absence of any public debate and widely disseminated relevant information. Indeed, teachers represent a more informed group in the society, there were some activities discussing the linguistic educational options for the children related to European Charter for Regional and Minority languages and the European Framework Convention where some of them have participated, therefore their preference could be more informed and educated than of the parents. Half of the parents prefer a shift towards multilingual education with a much stronger presence of the state language as the medium of instruction. The discrepancy between the teachers and parents’ choice of about 20% could be explained by the lack of the relevant information for the parents. Another difference consists in the parents preferred choice of the state and Russian playing the leading role as the language of instruction, while teachers opt for a far stronger role of the state language of instruction, sees Ukrainian as one of the languages of instruction. Graph 20 (Ukrainian teachers: language education at school), graph 21 (Ukrainian parents: language education in school)
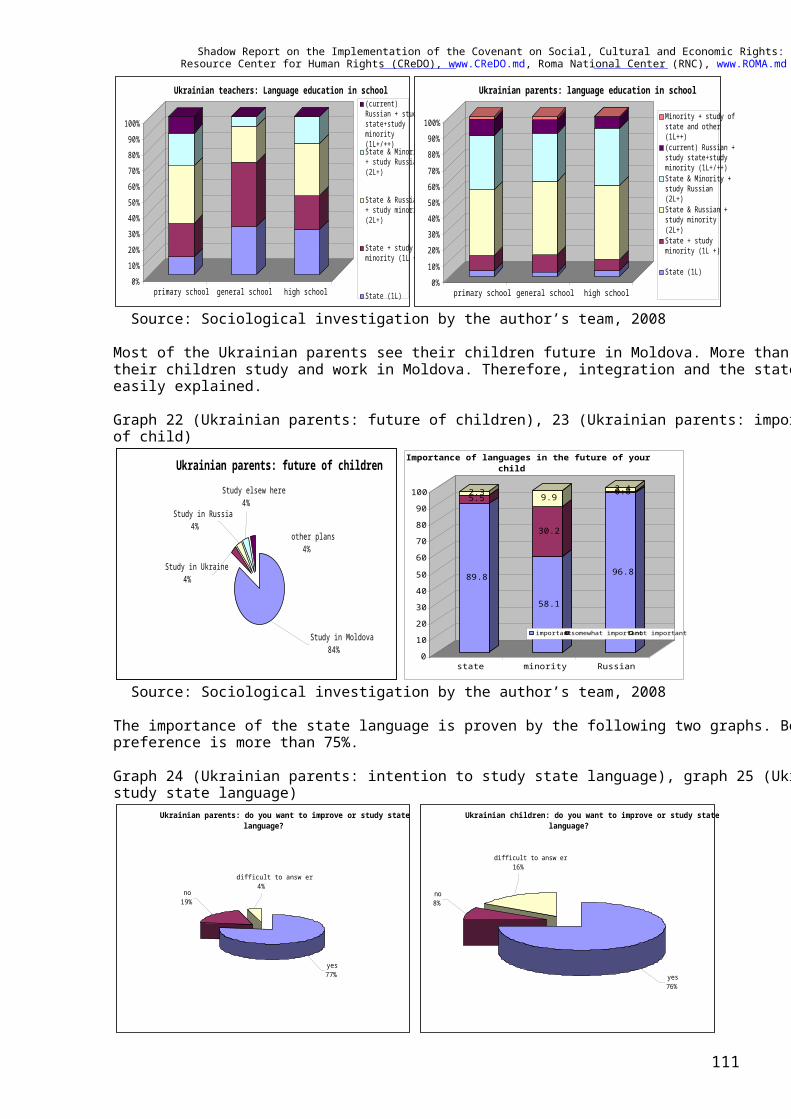
Shadow Report on the Implementation of the Covenant on Social, Cultural and Economic Rights: 2003-09 Resource Center for Human Rights (CReDO), www.CReDO.md, Roma National Center (RNC), www.ROMA.md
111
0%10%20%30%40%50%60%70%80%90%100%
primary school general school high school
Ukrainian teachers: Language education in school(current)Russian + studystate+studyminority(1L+/++)State & Minority+ study Russian(2L+)
State & Russian+ study minority(2L+)
State + studyminority (1L +)
State (1L)0%10%20%30%40%50%60%70%80%90%100%
primary school general school high school
Ukrainian parents: language education in school
Minority + study ofstate and other(1L++)(current) Russian +study state+studyminority (1L+/++)State & Minority +study Russian(2L+)State & Russian +study minority(2L+)State + studyminority (1L +)
State (1L)
Source: Sociological investigation by the author’s team, 2008 Most of the Ukrainian parents see their children future in Moldova. More than 80% of the parents see their children study and work in Moldova. Therefore, integration and the state language importance are easily explained. Graph 22 (Ukrainian parents: future of children), 23 (Ukrainian parents: importance of langue for future of child)
Ukrainian parents: future of children
Study in Russia4%
Study in Ukraine4%
Study elsew here4%
other plans4%
Study in Moldova84%
89.8
5.52.3
58.1
30.2
9.9
96.8
0.82.4
01020304050
60708090100
state minority Russian
Importance of languages in the future of your child
importantsomewhat importantnot important
Source: Sociological investigation by the author’s team, 2008 The importance of the state language is proven by the following two graphs. Both parents and children preference is more than 75%. Graph 24 (Ukrainian parents: intention to study state language), graph 25 (Ukrainian children: intention to study state language)
Ukrainian parents: do you want to improve or study state language?
no19%
difficult to answ er4%
yes77%
Ukrainian children: do you want to improve or study state language?
no8%
difficult to answ er16%
yes76%
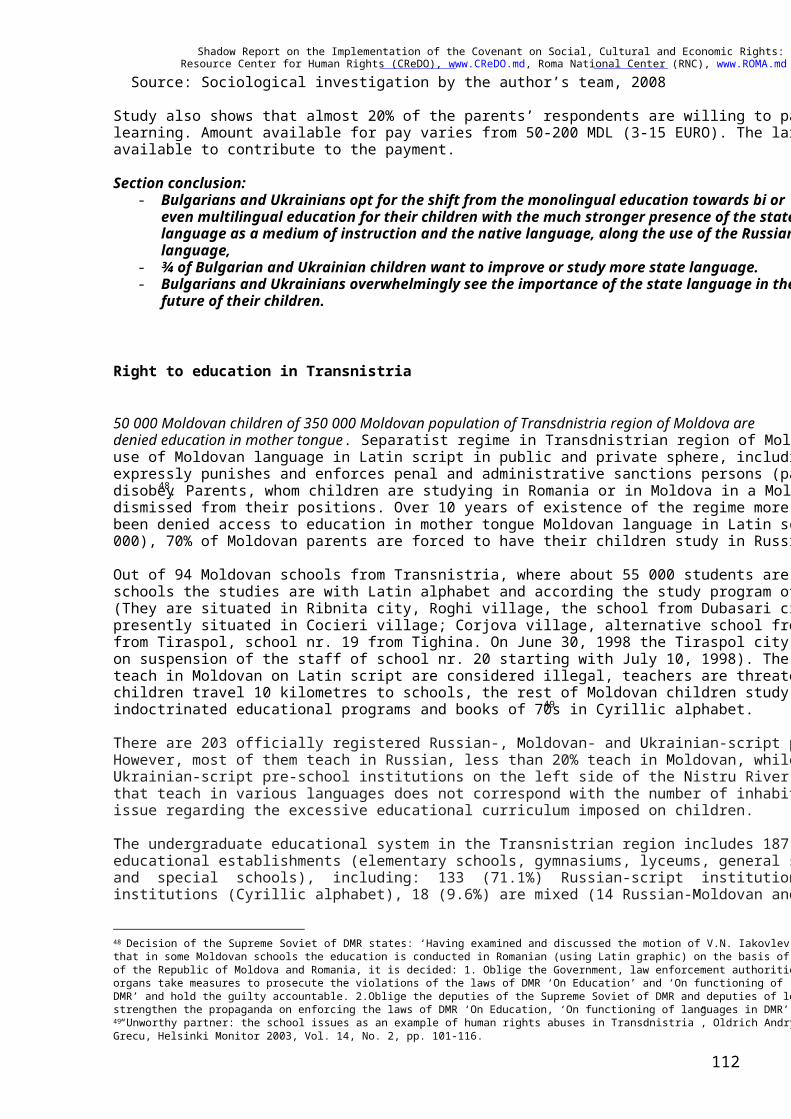
Shadow Report on the Implementation of the Covenant on Social, Cultural and Economic Rights: 2003-09 Resource Center for Human Rights (CReDO), www.CReDO.md, Roma National Center (RNC), www.ROMA.md
112
Source: Sociological investigation by the author’s team, 2008 Study also shows that almost 20% of the parents’ respondents are willing to pay for the state language learning. Amount available for pay varies from 50-200 MDL (3-15 EURO). The largest group is not available to contribute to the payment. Section conclusion:
- Bulgarians and Ukrainians opt for the shift from the monolingual education towards bi or even multilingual education for their children with the much stronger presence of the state language as a medium of instruction and the native language, along the use of the Russian language,
- ¾ of Bulgarian and Ukrainian children want to improve or study more state language. - Bulgarians and Ukrainians overwhelmingly see the importance of the state language in the
future of their children.
Right to education in Transnistria
50 000 Moldovan children of 350 000 Moldovan population of Transdnistria region of Moldova are denied education in mother tongue. Separatist regime in Transdnistrian region of Moldova outlawed the use of Moldovan language in Latin script in public and private sphere, including the education. It expressly punishes and enforces penal and administrative sanctions persons (parents, teachers, etc) for not disobey48. Parents, whom children are studying in Romania or in Moldova in a Moldovan school, are dismissed from their positions. Over 10 years of existence of the regime more than 100 000 children have been denied access to education in mother tongue Moldovan language in Latin script (currently around 50 000), 70% of Moldovan parents are forced to have their children study in Russian language. Out of 94 Moldovan schools from Transnistria, where about 55 000 students are studying, only in 7 schools the studies are with Latin alphabet and according the study program of the Republic of Moldova. (They are situated in Ribnita city, Roghi village, the school from Dubasari city has been evacuated and is presently situated in Cocieri village; Corjova village, alternative school from Grigoriopol, school nr. 20 from Tiraspol, school nr. 19 from Tighina. On June 30, 1998 the Tiraspol city soviet adopted the decision on suspension of the staff of school nr. 20 starting with July 10, 1998). The existing 7 private schools that teach in Moldovan on Latin script are considered illegal, teachers are threatened with physical retaliation, children travel 10 kilometres to schools, the rest of Moldovan children study according to outdated indoctrinated educational programs and books of 70s in Cyrillic alphabet.49 There are 203 officially registered Russian-, Moldovan- and Ukrainian-script pre-schools in the region. However, most of them teach in Russian, less than 20% teach in Moldovan, while there are practically no Ukrainian-script pre-school institutions on the left side of the Nistru River. The number of institutions that teach in various languages does not correspond with the number of inhabitants. Also, there is the issue regarding the excessive educational curriculum imposed on children.
The undergraduate educational system in the Transnistrian region includes 187 elementary and secondary educational establishments (elementary schools, gymnasiums, lyceums, general schools, evening schools and special schools), including: 133 (71.1%) Russian-script institutions, 33 (17.6%) Moldovan-script institutions (Cyrillic alphabet), 18 (9.6%) are mixed (14 Russian-Moldovan and four Russian-Ukrainian),
48 Decision of the Supreme Soviet of DMR states: ‘Having examined and discussed the motion of V.N. Iakovlev, in respect of the fact that in some Moldovan schools the education is conducted in Romanian (using Latin graphic) on the basis of educational programs of the Republic of Moldova and Romania, it is decided: 1. Oblige the Government, law enforcement authorities and controlling organs take measures to prosecute the violations of the laws of DMR ‘On Education’ and ‘On functioning of official languages in DMR’ and hold the guilty accountable. 2.Oblige the deputies of the Supreme Soviet of DMR and deputies of local soviets to strengthen the propaganda on enforcing the laws of DMR ‘On Education, ‘On functioning of languages in DMR’. 49“Unworthy partner: the school issues as an example of human rights abuses in Transdnistria”, Oldrich Andrysek and Mihai Grecu, Helsinki Monitor 2003, Vol. 14, No. 2, pp. 101-116.
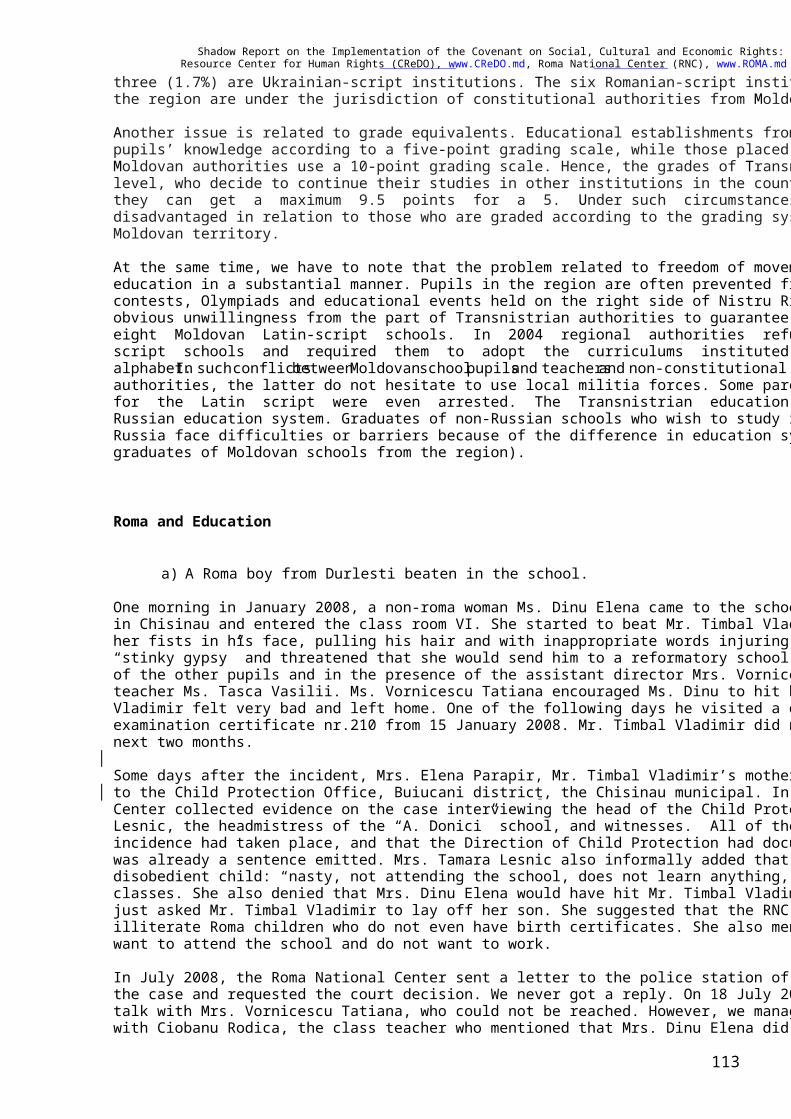
Shadow Report on the Implementation of the Covenant on Social, Cultural and Economic Rights: 2003-09 Resource Center for Human Rights (CReDO), www.CReDO.md, Roma National Center (RNC), www.ROMA.md
113
three (1.7%) are Ukrainian-script institutions. The six Romanian-script institutions (Latin alphabet) from the region are under the jurisdiction of constitutional authorities from Moldova. Another issue is related to grade equivalents. Educational establishments from the territory evaluate their pupils’ knowledge according to a five-point grading scale, while those placed under the jurisdiction of Moldovan authorities use a 10-point grading scale. Hence, the grades of Transnistrian graduates of any level, who decide to continue their studies in other institutions in the country are „transformed”, so that they can get a maximum 9.5 points for a 5. Under such circumstances, children are discriminated and disadvantaged in relation to those who are graded according to the grading system applied in the rest of Moldovan territory. At the same time, we have to note that the problem related to freedom of movement affects the right to education in a substantial manner. Pupils in the region are often prevented from participating in various contests, Olympiads and educational events held on the right side of Nistru River. Even today there is an obvious unwillingness from the part of Transnistrian authorities to guarantee proper functioning of the eight Moldovan Latin-script schools. In 2004 regional authorities refused to register Romanian Latin-script schools and required them to adopt the curriculums instituted by local authorities in Cyrillic alphabet. In such conflicts between Moldovan school pupils and teachers and non-constitutional authorities, the latter do not hesitate to use local militia forces. Some parents or teachers who had pleaded for the Latin script were even arrested. The Transnistrian education system promotes and mimics the Russian education system. Graduates of non-Russian schools who wish to study in countries other than Russia face difficulties or barriers because of the difference in education systems (this generally applies to graduates of Moldovan schools from the region).
Roma and Education
a) A Roma boy from Durlesti beaten in the school.
One morning in January 2008, a non-roma woman Ms. Dinu Elena came to the school Nr.5 “A. Donici” in Chisinau and entered the class room VI. She started to beat Mr. Timbal Vladimir (13 years old) with her fists in his face, pulling his hair and with inappropriate words injuring his ethnicity calling him a “stinky gypsy” and threatened that she would send him to a reformatory school. All this occurred in front of the other pupils and in the presence of the assistant director Mrs. Vornicescu Tatiana and labour teacher Ms. Tasca Vasilii. Ms. Vornicescu Tatiana encouraged Ms. Dinu to hit him more. Mr. Timbal Vladimir felt very bad and left home. One of the following days he visited a doctor and got medical examination certificate nr.210 from 15 January 2008. Mr. Timbal Vladimir did not attend school for the next two months. Some days after the incident, Mrs. Elena Parapir, Mr. Timbal Vladimir’s mother, submitted a complaint to the Child Protection Office, Buiucani district, the Chisinau municipal. In July 2008, Roma National Center collected evidence on the case interviewing the head of the Child Protection Office, Mrs. Tamara Lesnic, the headmistress of the “A. Donici” school, and witnesses. All of them confirmed that the incidence had taken place, and that the Direction of Child Protection had documented the case and there was already a sentence emitted. Mrs. Tamara Lesnic also informally added that Mr. Timbal Vladimir is a disobedient child: “nasty, not attending the school, does not learn anything, and runs away from the classes. She also denied that Mrs. Dinu Elena would have hit Mr. Timbal Vladimir and stated that she had just asked Mr. Timbal Vladimir to lay off her son. She suggested that the RNC could work more with the illiterate Roma children who do not even have birth certificates. She also mentioned that the Roma do not want to attend the school and do not want to work. In July 2008, the Roma National Center sent a letter to the police station of Buiucani district concerning the case and requested the court decision. We never got a reply. On 18 July 2008 the RNC tried to have a talk with Mrs. Vornicescu Tatiana, who could not be reached. However, we managed to have a discussion with Ciobanu Rodica, the class teacher who mentioned that Mrs. Dinu Elena did not beat Mr. Timbal
Shadow Report on the Implementation of the Covenant on Social, Cultural and Economic Rights: 2003-09 Resource Center for Human Rights (CReDO), www.CReDO.md, Roma National Center (RNC), www.ROMA.md
114
Vladimir and the case was closed. The only person who mentioned that the incident had occurred was Mr. Tasca Vasilii who also intervened and asked Ms. Dinu Elena not to beat him but to find other ways to solve the situation. In the following study year 2008-2009, Mrs. Elena Parapir transferred Mr. Timbal Vladimir to another school nr.64 from the town of Durlesti. b) A Roma girl refused free admission to school. Ms. Lepadatu Regina is 18 years old and has graduated from ,,N. Levitchi” Upper Secondary School in Chisinau. In August 2008 she handed in matriculation acts at Nr.1 Vocational High School in Chisinau requesting to study there for a period of three years. However, she was told by the Admission Committee member Mr. Ion Stratulat that she can study there just for one year and has to pay the study fees as she has too poor marks. The case was solved by the Roma National Center’s intervention and she was admitted to study for three years receiving thus a state scholarship. c) Upper secondary school is refusing to accept Roma children. In July 2008, the Headmistress of the Upper Secondary School “A. I. Cuza” refused an admission to Stan Romina and Stan Daniel to continue their studies in the school, and asked Mr. Ion Coniuc (the father) to find another school because the program was too challenging for his children. In August 2008, the RNC had a discussion with the Headmistress Maria Grosu, who stated that Stan Romina and Stan Daniel had poor marks, skipped the classes and did not attend the school. She said that she had earlier had some unpleasant disputes with their grandmother Mrs. Ahtirseaia Eugenia who came to the school and made a big scene, which reminded her of a “gypsy bazaar”. She claimed that the school did not support her grandsons. During the interview, Mrs. Maria Grosu’s assistant Eugenia Burlacu, mathematics teacher Mrs. Rimis Parascovia, and psychologist Chicu Irina supported the Headmistress for the refusal of the admission. However, there are regulations for the admission and they can compete but she suggested them to go to the school nr.46 were they have more Roma children. At the time being, the children are not enrolled in any school.