ARTS,SOCIAL SCIENCES SCIENTIFIC STUDIES - Covenant ...
219
Scottish Journal of Arts, Social Sciences and Scientific Studies - ISSN 2047-1278 http://scottishjournal.co.uk 1 SCOTTISH JOURNAL OF ARTS, SOCIAL SCIENCES AND SCIENTIFIC STUDIES VOLUME 9, ISSUE I FEBRUARY, 2013 Articles Promoting Sustainable Tourism through Tourism Infrastructure Development in Nigeria 3 Ayeni, Dorcas A 3 Synthesis and Characterization of a Novel 1, 4-diazabutadiene (α-diimine) Complex of Palladium(II) by the in situ one-pot template reaction 15 Ali Sadi Başak 15 Halim Ayrancı 15 The Challenges of Public Housing in a Democratic Nigeria: a case study of the Presidential Mandate Housing Scheme 23 Eziyi O. Ibem 23 Akunnaya P. Opoko 23 Egidario B. Aduwo 23 Depth-area stratification of groundwater quality in part of Lagos State, Nigeria. 39 Y. A. Asiwaju-Bello 39 O.S. Oladeji 39 Effects of Global Economic Recession on Foreign Private Capital Inflows and Economic Growth in Nigeria 53 Benjamin Ayodele Folorunso 53 Examination of the Effect of Job Satisfaction on Burnout of University Teaching Staff with Structural Equation Model 73
-
Upload
khangminh22 -
Category
Documents
-
view
1 -
download
0
Transcript of ARTS,SOCIAL SCIENCES SCIENTIFIC STUDIES - Covenant ...

Scottish Journal of Arts, Social Sciences and Scientific Studies - ISSN 2047-1278
http://scottishjournal.co.uk
1
SCOTTISH JOURNAL OF
ARTS, SOCIAL SCIENCES AND
SCIENTIFIC STUDIES
VOLUME 9, ISSUE I
FEBRUARY, 2013
Articles Promoting Sustainable Tourism through Tourism Infrastructure Development in
Nigeria 3
Ayeni, Dorcas A 3
Synthesis and Characterization of a Novel 1, 4-diazabutadiene (α-diimine) Complex
of Palladium(II) by the in situ one-pot template reaction 15
Ali Sadi Başak 15
Halim Ayrancı 15
The Challenges of Public Housing in a Democratic Nigeria: a case study of the
Presidential Mandate Housing Scheme 23
Eziyi O. Ibem 23
Akunnaya P. Opoko 23
Egidario B. Aduwo 23
Depth-area stratification of groundwater quality in part of Lagos State, Nigeria. 39
Y. A. Asiwaju-Bello 39
O.S. Oladeji 39
Effects of Global Economic Recession on Foreign Private Capital Inflows and
Economic Growth in Nigeria 53
Benjamin Ayodele Folorunso 53
Examination of the Effect of Job Satisfaction on Burnout of University Teaching
Staff with Structural Equation Model 73

Scottish Journal of Arts, Social Sciences and Scientific Studies - ISSN 2047-1278
http://scottishjournal.co.uk
2
Veysel Yilmaz, Hülya ŞEN 73
Flora of Karaköy (Bilecik-Turkey) and Its Environs 84
Onur Koyuncu 84
Ö. Koray Yaylacı 84
Okan Sezer 84
Kurtuluş Özgişi 84
Derviş Öztürk 84
Süleyman Tokur 84
Women, Poverty and Child-labor: The Contending Evils with Child Development in
Akure Region, Nigeria. 135
Basorun, Joseph Omoniyi. 135
Personalized offline signature verification using multiple HMM-classifiers and SOM-
fuzzy decision fusion 148
Sharifah Mumtazah Syed Ahmad 148
Abdul Rahim Ahmad 148
Asma Shakil 148
Mustafa Agil Muhamed Balbed 148
Wan Azizun Wan Adnan 148
The needs of families of persons with mental health difficulties 166
Namino Kunitoh 166
Risk Propensity, Gender and Entrepreneurial Ability 186
Fagbohungbe, Oni Bamikole 186
Jayeoba, Foluso Ilesanmi 186
The Economic Cost of Fiscal Centralization on the Growth of the Nigerian Economy
200
Abachi Terhemen Philip. PhD 200

Scottish Journal of Arts, Social Sciences and Scientific Studies - ISSN 2047-1278
http://scottishjournal.co.uk
3
Promoting Sustainable Tourism
through Tourism Infrastructure
Development in Nigeria
Ayeni, Dorcas A
Department of Architecture, School of Environmental Technology, Federal
University of Technology, Akure, Nigeria
Email: [email protected]
Abstract
Tourism is appreciated globally as a major economic earner of many developed nations
and acknowledged by many researchers that tourism could play a significant role in
economic development of many developing countries. The Nigeria tourism sector is not
left out of the several benefits Vis-à-vis economic, socio, cultural and environmental; that
is associated with tourism only if the tourism infrastructures are well developed. Given
the rich and diverse tourism potentials, Nigeria can transform its tourism sector through
tourism infrastructure development. The paper aims to investigate the need for tourism
infrastructure in Nigeria. Using the literature review and the quantitative method of data
collection, the paper identified the importance of tourism infrastructure in sustainable
tourism development. It appreciates tourism as an important sector that needs to be
developed through the provision of tourism infrastructure if the gains from tourism are to
be of immense benefit to Nigeria. The paper further sees the lack or slow pace of tourism
infrastructure development as a major setback to sustainable tourism development in
Nigeria. Furthermore, the paper examined the need for tourism infrastructure
improvement for sustainable tourism development in Nigeria and concludes that tourism,
if developed through the provision of tourism infrastructure will not only be of benefit to
the Nigerian Nation as a whole but also to the individual.
Keywords: Development, Infrastructure, Nigeria, Sustainable Tourism.

Scottish Journal of Arts, Social Sciences and Scientific Studies - ISSN 2047-1278
http://scottishjournal.co.uk
4
1. Introduction
As acknowledged by several researcher (Aniah et al, 2009; Ebohon et al, 2009;
Draghici et al, 2010; Ayeni, 2011) tourism is one of the fastest growing industry globally
and a main engine for the local economy. With its benefits and importance, which ranges
from economic, social, cultural and environmental, being constantly recognised
worldwide, its full potentials are yet to be realised by developing countries (Ajala, 2008),
with no exception to Nigeria as a developing nation.
Whilst there are ‘unquantifiable’ benefits from the social physical (Aniah et al,
2009), the economic benefits brings the development of local economies through
agriculture, construction, transport and trading (Draghici et al, 2010). These, conversely
leads to employment, and as such, through tourism infrastructure development in Nigeria,
apart from generating foreign exchange, tourism will be capable of reducing
unemployment and generally improving the standard of the people.
UNWTO’s defines tourism as ‘comprising the activities of persons travelling to
and staying in places outside their usual environment for not more than one consecutive
year for leisure, business and other purposes’ (Ugurlu, 2010). The definition greatly
implies as noted by Akeredolu and Ayoola (2010) that tourism serves as a source of
pleasure, holiday and travels as well as job opportunities for many people. However,
these cannot be achieved without adequate provision of tourism supporting infrastructure.
In this vein, Ajala (2008) argued that tourism environment comprises the physical
component, that is, the landscape scenery, weather, climate, water and biodiversity of
plants and animals; as well as the human component ranging from history, culture, to
tradition. All these combine to give the tourists memorable experiences whether good or
bad (Ayeni, Ebohon and Taki, 2011) as well as learning about ‘new world or
environment’ (Aniah, et al, 2009). Furthermore, the elements which make up these
components to give the tourist experience can collectively be referred to as tourism
infrastructure (Hamzah, 2009; Ayeni, 2011) and noting the importance of infrastructure
in tourism, Draghici et al, (2010) argued that infrastructure serves as a determinant factor
for a tourists’ satisfaction.
Nigeria as a nation is blessed with vast tourism potentials virtually in all the
thirty-six states and the federal capital that make up Nigeria; however, these remain
largely untapped and many characterised by the absence and dearth of tourism
infrastructure. In spite of the awareness of its importance, tourism remains at its infancy
stage (Akeredolu and Ayoola, 2010). For tourism to be sustainable in Nigeria, necessary
infrastructures and social amenities such as road, electricity, water, accommodations as
noted by Eja (2011) should be provided.
Thus, the objective of this paper therefore is to investigate the importance of
tourism infrastructure and the need for sustainable tourism development in Nigeria.
2. Importance of Tourism Infrastructure
Tourism as noted by Ford (2010) accounts for 5-10 per cent of Gross Domestic
Product (GDP), being the world’s biggest economic activities. If developed properly is
capable of creating jobs and economic wealth for host communities, however, Least
Developed Countries (LDCs) continue to play only a minor role in global tourism,
receiving a mere 1 per cent of the world’s travel exports ( Schiedermair, 2011).

Scottish Journal of Arts, Social Sciences and Scientific Studies - ISSN 2047-1278
http://scottishjournal.co.uk
5
South Africa as averred by Ford (2010) is by far the most popular destination in
sub-Saharan Africa with 9.5 million visitors a year, while the three North Africa states of
Egypt, Morocco, and Tunisia collectively attract 27.1 million tourists a year. This is
followed by Botswana with 2.1 million visitors a year. From this assertion, tourist visit in
Nigeria is still a mirage; as Itayemi (2012) noted, with many tourist attractions,
infrastructure is usually the ‘sore point’ as no tourist attraction whether artificial or
natural can flourish without infrastructure. As such, Ford (2010) argued that the lack of
infrastructure which is still a major concern still pose as a big challenge in many African
countries in spite of the diverse cultural attractions and beautiful landscapes, in addition,
many developing countries possess poor infrastructure which has hampered their growth
and the ability to trade in the global economy (EUROPEAID, 2012). Furthermore, there
cannot be effective tourism activities without major investment in infrastructure.
Infrastructures as defined by Akogun (2011) are the basic facilities and services
essential to institution, economic and social development. Also, Dwyer, Fosyth and
Dwyer (2010) refer to infrastructure as the basic physical and organisational structure
needed for a society to function effectively. In that token, a society cannot function
effectively as argued by Ayeni (2011) without infrastructure. As noted by EUROPEAID
(2012), good quality infrastructure is a key ingredient for sustainable development. More
so, investment in infrastructure helps to contribute to business and help improve
environmental conditions. As such, efficient infrastructure is needed for any country to
prosper. In the same vein, Cernat and Gourton (2011) averred that infrastructure assets
are key requirements to sustainable development since accessibility to specific tourism
destinations depend on the quality of the overall infrastructure.
Tourism infrastructure on the other hand, is the physical element that is created or
made to cater for tourists, including the visible elements of landscape (Tress and Tress,
2003; Hamzah, 2009; Ayeni, 2011) this implies as further argued by Ayeni (2011) that
every physical element seen in and around tourist environment which enhances tourism
development can be referred to as tourism infrastructure. Going by the ethos of
sustainable development, Boers and Cottrell (2005) defines sustainable tourism
infrastructure as tourism infrastructure that ‘enables sustainable tourism development’
and enables visitors to realise desire and expected experiences. Furthermore, Seetanah et
al (2011) stated that infrastructure play the role of determining the overall impression of a
destination by the tourists, and the use, level or lack of infrastructure in a destination
determines features that can enhance the tourist’s trip experience.
By the definition of tourism as activities that involve moving from one place to
another, Dabur (2003) noted that the tourism industry encompasses all socio-economic
activities that require infrastructure which directly or indirectly provide services to
tourists and include the services of ‘transportation, hotels and lodging, food and
beverages, cultural and entertainment, banking and finance, and promotion and
publicity’. Still in line with tourism, Seetanah et al (2011) stated that the infrastructure
base of a country serves as a potential determinant of the attractiveness of a tourism
destination. As such, infrastructure forms an integral part of tourism package.
Akinwale (2010) and Akogun (2011) categorised infrastructure under the classes
of communication, rendering services such as telephone, telex, telegraph; transportation
which deal with movement of people from one place to another and made possible
through airports, seaways, railways; portable water supply; drainage/sewage that is

Scottish Journal of Arts, Social Sciences and Scientific Studies - ISSN 2047-1278
http://scottishjournal.co.uk
6
infrastructure for disposal of waste. Also is the electricity, health facilities, educational
infrastructure, sanitation and solid waste disposal through the removal of refuse; as well
as social infrastructure which include recreational facilities such as play ground, parks
and gardens. However, Khadaroo and Seetanah (2007) argued that transport
infrastructure is an important and essential component because it ‘induces the creation of
new attractions and the growth of existing ones’. Summarising these various aspects in
tourism, Seetanah et al (2011) stated that while transportation infrastructure enhances
accessibility of tourists, the airport infrastructure ensures comfortable transition from
plane to destinations. Furthermore, communication infrastructure give maximum
information about destination, while electricity, waste and others give reliable services,
thereby is enhancing the attractiveness of a destination. Also, Khadaroo and Seetanah
(2007) argued that tourism is characterised by a process in which tourists use multiple
services which include information, transportation, accommodation and recreation; in
addition, infrastructure and technology are key features of a destination. As such all these
in combination create the tourist memorable experience.
3. Setbacks to Sustainable Tourism Development in Nigeria
Nigeria is renowned for its beautiful scenery, natural landscapes and cultural
heritage; dotting virtually across all the thirty six states and the federal capital. However,
Emelike (20100, Ememou et al (2011) acknowledged that in spite of the abundance of
tourism resources; and even with the fast growth and the advancement of tourism
globally, the tourism sector in Nigeria is still at low ebb and operating at a slow pace and
far below capacity.
Although several attempts and efforts are being made by the government to make
Nigeria accessible for tourists as a way to diversify from the long dependant on crude oil
as a major source of revenue; these efforts as noted by Jacobson (2012) are constantly
being faced with streams of problems. And unless these problems are tackled, there
cannot be any visible advancement and progress in the tourism sector; as such may not be
able to serve as an alternative to boosting and diversifying the Nigerian economy.
Visible among the setback to tourism development in Nigeria are the dearth of
infrastructure; and in any tourist destination, infrastructure contributes to the
attractiveness of a destination. As posits by Orga (2010), attractions are the most
important component in the tourism system; as they serve as motivators for tourists’
choice and trip. Noting these setbacks, Jacobson (2010); Akogun (2012) stated that
infrastructure is a major problem holding tourism back in Nigeria which as further argued
are generally not reliable, not available or very weak where they exist. Also, Akinwale
(2010) identified that infrastructure in Nigeria are meagre and improving them has not
yielded desired results. Furthermore, several urban areas and even tourist destinations in
Nigeria lack basic infrastructure like roads, water supply, electricity, parks, play grounds,
health facilities, schools and open spaces, Akogun (2011).in addition, ‘no new
developments in expanding roads or railways since 1970’ (Jacobson, 2010). These have
caused Nigeria to be less competitive at the global level as argued by Emelike (2010).
Apart from the lack of good infrastructure, Ijasan and Oladunni (2012) identified
some setback to development to include poor communication systems, poor communal
facilities, shortage of staff, lack of ethnic unity, poor research facilities, as well as poor
maintenance culture. Others include inadequate government intervention, lack of interest,
negligence and corruption. Other setback as identified by Emelike (2010); Enemou et al

Scottish Journal of Arts, Social Sciences and Scientific Studies - ISSN 2047-1278
http://scottishjournal.co.uk
7
(2012); Jacobson (2012); Sanni (2009); Orga (2010) and Ibimilua (2011) include
government’s inconsistency in policy, short term planning, undue political interference,
insufficient funds, low level man power, low safety and security measures. Above all,
infrastructure seems to be the bane to sustainable tourism development in Nigeria.
Indeed, tourism cannot exist without the adequate provision of tourism
infrastructure, as such, Orga (2010) opined that provision of infrastructure should be
encouraged as they not only help develop tourism, but also serve the purpose of
employment in order for the employed to carry out the tourism services. Conversely, this
will raise the hope of tourism both now and in the future; as such, infrastructure should be
provided and maintained for sustainable tourism to develop.
4. The Need for Tourism Infrastructure Improvement for Sustainable Tourism
Development in Nigeria
It is a well known fact that diversifying the Nigerian economy from crude oil to
tourism has immense benefit, both to the country as a whole as well as to the individual
and the host communities’ vis-à-vis revenue generation, employment, development,
among other benefits. These are possible based on the enormous tourism potentials in
several parts of Nigeria and as argued by Tunde (2012), the only way to realise the
important roles tourism play is by having a well developed , packaged and promoted
tourist attractions.
Again, Ayeni and Ebohon (2012) noted that the tourism development without
proper planning and integration with local values and the environment can lead to socio-
cultural, environmental and economic damage. Similarly, Dantata (2011) averred that,
apart from the financial gains from tourism, if properly developed, would help beautify
and conserve the environment as well as improve the infrastructural development for both
tourists, and the locals. As such, the ‘future of tourism in Nigeria is dependent on the
opportunities and challenges being exploited and addressed as posit by Dantata, (2011).
However, these benefits cannot be achieved without putting adequate and necessary
infrastructure in place. For the sector to develop as Eboh (2009) rightly asserts, necessary
infrastructure need to be put in place in order to boost the tourism sector.
Tourism as noted by Tunde (2012), is an activity that contributes to a better
understanding of places, people, and their culture; and for it to be successful in Nigeria, it
should adhere to the economic, social, environmental and ethnic considerations in the
host communities in order to achieve a maximum benefit and visitors experience. And in
achieving the experience, Sustainable Tourism Online (2012) noted that adequate
infrastructure such as road, water supply, waste water system, public toilet, signage, car
parks and other public utilities are critical; and need to be provided as these are central to
meeting visitors’ needs.
Ayeni and Ebohon (2012) stated that the problem of inadequate tourism
infrastructure i Nigeria is much pronounced because of the inability to maintain the few
existing ones and these has put tremendous strain on the few available (Bello and Bello,
2012). Furthermore, the lack of infrastructure is most pronounced in rural areas where
most tourist sites are located. However, tourism will have its impact on economic
development and positive gains maximized if the infrastructure is given adequate
attention. Oyakhilome (2005) noted that tourism cannot thrive without the provision of
basic infrastructural facilities, which should be the sole responsibility of government with
adequate participation by the private sector and for any meaningful tourism development,

Scottish Journal of Arts, Social Sciences and Scientific Studies - ISSN 2047-1278
http://scottishjournal.co.uk
8
Ajadi (2012) argued that the provision of tourism infrastructure are essential because, the
development of a destination is largely dependent upon the infrastructure and tourism
resources available. This is because infrastructures are fundamental requirements for
development which help to improve the standard of life of the individual and that of the
host region as well as satisfying the tourist’s experience.
Indeed, infrastructure is a basic necessity for any business or society to function
properly. Hence, if tourism is to contribute significantly to the Nigerian economy, basic
infrastructure must be provided and maintained to enhance and promote sustainable
tourism development.
5. Methodology
The study is a part of a research carried out between 2010 and 2012 and was
conducted in Nigeria, within two geopolitical zones (South-west and North-central)
randomly selected from the six geopolitical zones that make up Nigeria. That is, the
North-west, North-east, North-central, South-south, South-west, and South-east and
explored the quantitative method of data collection.
The research population are all tourist attractions in Nigeria and the study
population are tourist attractions within the two geopolitical zones randomly selected and
from where the sample frame was drawn which was made up of four states; Kogi, Ekiti,
Ondo and the Federal Capital Territory, Abuja.. This is because, due to the size of Nigeria
and the enormous tourist attractions, it is impossible to carry out the research on all the
tourist attractions at the same time. The sample chosen from the sample frame is made up
of people in the tourism industry including staff of tourism board, hotels, travel agent;
government offices, that is, public and civil servants; individuals and tourists from whom
the questionnaires were administered in each of the study areas.
A sample size of eight hundred and fifty was estimated for accuracy and precision
and a stratified sampling technique was employed in administering the questionnaires to
the respondents. Data was also gathered from the secondary source using books, journals,
and internet websites to appreciate previous works and identify any gaps. At the end of
the questionnaire administration, seven hundred and forty five questionnaires were
returned filled, making a total of about eighty seven percent response rate. Data was then
analysed using the statistical packages for Social Sciences (SPSSx) and results expressed
using descriptive statistics and results expressed in simple percentages.
6. Findings and Discussion
6.1 Respondents General Information
Out of a total of seven hundred and forty five responses received, about sixty
three percent were male and about thirty seven percent were female; the mode is 1 and
represents the male, and shows that more male participated in the survey and are likely to
be interested in tourism activities than the female.
The results also showed that all the respondents that participated are matured
enough to take part in the survey as those within the age bracket of 20-30 years were
three hundred and thirty five representing forty five percent. One hundred and fifty two
which is about twenty one percent were between the age brackets of 30-40 years. Also,
one hundred and thirty six represented about eighteen percent and in the age bracket of

Scottish Journal of Arts, Social Sciences and Scientific Studies - ISSN 2047-1278
http://scottishjournal.co.uk
9
40-50 years, while above 50 years of age were eighty and represents about eleven percent
and a total of forty two which is about six percent did not respond.
Majority of the respondents were government workers among the respondents
accounted for three hundred and sixty seven, about forty nine percent and revealed in
mode as 2. The unemployed were one hundred and sixty two, about twenty two percent;
while the private sector employees were eighty two, about eleven percent and the self
employed were a total of one hundred and thirty representing about seventeen percent and
one respondent was indifferent.
The tertiary level ranked the highest in the educational level accounting for four
hundred and ninety respondents, making about sixty five percent. A total of ninety four of
the respondents, about thirteen percent hold secondary school certificate; while ninety
one, representing about twelve percent hold the primary school certificate. Also, about
sixty six respondents do not have any formal education and needed a form of assistance
of interpreting and filling the questionnaires while four respondents, about one percent
did not respond.
A total of four hundred and thirty nine, which is about fifty nine percent
respondents were married; two hundred and ninety one were single, that is thirty nine
percent, while twelve respondents were widowed and three did not respond. Furthermore,
the monthly income expressed in the Nigerian Naira show that three hundred and sixty
three, that is, forty nine percent receive monthly income of between N1 – N100,
000.00k, those who earn between N100, 000.00k – N500, 000.00k were one hundred and
eighty seven, about twenty five percent.
6.2 Adequacy of Tourism Infrastructure in Nigeria
For a destination to satisfy the tourist experience there has to be adequate
infrastructure and the infrastructure are the all the components that make up the
destination which combine to give a memorable experience. Going by the literature,
tourism serves as a source for pleasure and satisfies other needs. However, in many of the
tourist destinations in Nigeria as noted in the literature, tourism infrastructure are either
meagre or absent. The implication of this is that where the infrastructure does not exist,
tourists would not be attracted to such destinations.
In a bid to find out if tourism infrastructure in many of the tourist attractions in
Nigeria is adequate, respondents’ opinions were sought. Analyses from the survey
showed that about thirty six percent, that is, two hundred and sixty six respondents said it
was fairly adequate and twenty six percent, which is one hundred and ninety four
respondents believe it is adequate. Also, about nineteen percent, that is, one hundred and
forty three said it is not adequate while about fifteen percent, that is, one hundred and
fourteen responded that it was very adequate and about four percent did not respond. It
can be seen from the analyses that about fifty five percent consider tourism infrastructure
inadequate and about forty percent consider it adequate. From the results, it implies that
adequate infrastructure is required to meet up the tourists expectations; conversely, other
benefits would come with the provision.
6.3 Infrastructure and Tourism Development
Tourism brings growth, development and reduces unemployment as gathered
from the literature and the basic infrastructure which characterise a destination
determines a tourist’s satisfaction. Also, a destination cannot flourish without

Scottish Journal of Arts, Social Sciences and Scientific Studies - ISSN 2047-1278
http://scottishjournal.co.uk
10
infrastructure and these as identified from the literature have hampered tourism growth in
Nigeria.
From the analysis, respondents were asked to rate their response on whether they
agree or disagree that infrastructure can enhance tourism development. The results show
that about fifty nine percent which represents four hundred and forty two respondents
strongly agree that infrastructure can enhance tourism development in Nigeria and about
thirty two percent, that is, two hundred and forty agree. Also, about three percent
representing twenty respondents strongly disagree while two percent, that is, seventeen
disagree and four percent, that is, twenty six did not respond. The analysis gave a total of
about ninety two percent that agree to the notion. The mean is 3.41 and reveals that the
data is located around this value and the standard deviation is .932 and shows the spread
and dispersion of the data.
Indeed, the value of destination is increased if there is functioning infrastructure
and this implies growth and continuous visits by tourists far and near; this will enable
sustainable tourism development. Unless the infrastructures of many of the attractions are
improved upon, tourism growth in Nigeria will be a mirage.
6.4 Accommodation, Transportation and Electricity as Necessary Infrastructure
Also in categories of infrastructure as seen from literature are accommodation,
transportation and electricity. These were also posed as questions to respondents in order
to ascertain if they agree or disagree that they are necessary infrastructure in a tourist
attraction.
Results from the analyses show that accommodation is considered necessary; with
a total of about eighty nine percent respondents in support. From the results, about sixty
percent, that is, four hundred and forty eight consider accommodation as very necessary
while about thirty which is two hundred and twenty one consider it necessary. Also,
about four percent, that is, thirty three respondents consider it fairly necessary while one
percent as not necessary and five percent , that is, thirty nine respondents did not
respond,
Likewise, about sixty nine percent which is five hundred and eleven consider
transportation very necessary and twenty four percent, that is, one hundred and seventy
seven consider it as necessary. Also, three percent, that is twenty one respondents said it
is fairly necessary while less than one percent said it is not necessary and about five
percent, that is, thirty five did not respond. The mode is 4 and reveals that very necessary
occurs the most and shows its importance to respondents.
Electricity was also considered very necessary by about seventy percent
respondents which came to five hundred and sixteen and about twenty four percent, that
is, one hundred and one necessary. Also, about two percent, that is, thirteen respondents
considers it fairly necessary, not necessary was nil and about five percent did not
respond. This shows the strength of feeling regarding electricity interruptions and
intermittent supply
Results from the above analyses corroborate the literature and shows the
inadequacy of tourism infrastructure in Nigeria as well as the need for infrastructure
development for tourism growth. Likewise, respondents support the fact that
infrastructure such as electricity, accommodation, transportation to mention but a few are
very necessary for sustainable tourism development in Nigeria. Whilst there is the need

Scottish Journal of Arts, Social Sciences and Scientific Studies - ISSN 2047-1278
http://scottishjournal.co.uk
11
for its provision, there is also the need for the maintenance in order to keep tourism
going, both for the present and that of the future.
Also in dare need of attention are the various problems causing setback for the
Nigerian tourism industry and unless the government tackles these problems in addition
to providing infrastructure, tourism would not be able to serve as alternative to boost the
Nigerian economy.
7. Conclusion
The study has identified the inadequacy of tourism infrastructure in Nigeria and
confirms that tourism serves as a sector for economic diversification for Nigeria. In
addition, it affirms that tourism serves as an avenue for infrastructural development; not
only in tourist destinations but also in the regions and country as a whole. However, this
can only be evident if adequate and necessary infrastructure is provided and maintained
in many of the tourist attractions in order to attract tourists far and wide.

Scottish Journal of Arts, Social Sciences and Scientific Studies - ISSN 2047-1278
http://scottishjournal.co.uk
12
References
Ajadi, B. S. (2012). An Evaluation of the Performance of a National Tourism
Organisation: Nigeria Tourism Development Coorperation. European Journal of
Business and Social Sciences, 1(1), 40-48.
Ajala, O. A. (2008). Employment and Income Potentiality of Tourism
Development in Amhara Region Ethiopia. Ethiopian Journal of Environmental
Studies and Management 1(2), 74-82.
Akeredolu, O. E., & Ayoola, S. O. (2010). Assement of Aqua-Tourism Potentials
in some Fishing Sites in Bitumen Bearing wetlands of Ondo State-Nigeria. World
Journal Of Fish and Marine Sciences, 2(4), 297-302.
Akinwale, A. A. (2010). The Manace of Inadequate Infrastructure in Nigeria.
African Journal of Science, Technology, Innovation and Development, 2(3), 207-
228.
Akogun, I. T. (2011). A Survey of Infrastructureal Facilities and their Effects on
Rental Values of Residential Properties in Ilorin Metropolis. Environmental
Sciences and Resource Management, 36-45.
Aniah, E. J., Eja, E. I., Otu, J. E., & Ushie, M. A. (2009). Resort Potentials as a
Strategy for Sustainable Tourism Development in Plateau State, Nigeria.
Sustainable Development 2(2), 73-79.
Ayeni, D., Ebohon, O. J., & Taki, A. H. (2011). The Likely effect of Sustainable
Landscape on the Quality of Life through Tourism. Paper presented at the West
Africa Built Environment Research (WABER) Conference 19-21 July, 2011,
Accra, Ghana.
Ayeni, D. A. (2011). Identifying Landscape Elements as Tourism Infrastructure:
the Case of Nigeria. Paper presented at the 3rd International Postgraduate
Conference on Infrastructure and Environment, 12th -14th July, 2011, Hong Kong
Polytechnic, Hong Kong.
Ayeni, D. A., & Ebohon, O. J. (2012). Exploring Sustainable Tourism in Nigeria
for Developmental Growth. European Scientific Journal, 8(20), 126-140.
Bello, Y. O., & Bello, M. B. (2012). Infrastructure Development: A Strategic
Approach for Sustainable Hospitality Business in Edo State(A Study of Selected
Hotels in Benin City). Continental Journal of Sustainable Development, 3(1), 47-
54.
Boer, B., & Cottrell, S. (2005). Sustain Tourism Infrastructure Planning: a GIS
Based Approach. Paper presented at the 2005 North-eastern Recreation Research
Symposium.

Scottish Journal of Arts, Social Sciences and Scientific Studies - ISSN 2047-1278
http://scottishjournal.co.uk
13
Cemat, K., & Gourdon, J. (2011). Is the Concept of Sustainable Tourism
Sustainable? Developing the Sustainable Tourism Bench Making Tool. CERDI,
Etudes et Documents, E2007.08.
Dabour, N. (2003). Problems and Prospects of Sustainable Tourism Development
in the OIC Countries: Ecotourism. Economic Cooperation, 24(1), 25-62.
Datata, M. A. (2011). Tourism Development in Nigeria: Challenges and Prospects
for Resource Diversification. Retrieved from www.nihotour.org. Accessed on
24/09/12
Drăghici, C. C., Peptenatu, D., Pintilli, R. D., Peptenatu, A., & Stoian, D. (2010).
The Role of Infrastructure in Generating Multiplying Effects for Tourism
Development: Case Study the Influence Area of the City Râmnicu Vâlcea. Annals
of Valahia University of Târgovişte, Geographical Series, Tome 125-136.
Dwyer, L., Forsyth, P., & Dwyer, W. (2010). Tourism Economics and Policy.
Bristol, UK: Channelview Publications.
Eboh, M. (2009). Tourism Development in Nigeria Undermine by Decay of
Infrastructure. Retrieved from www.vanguardngr.com Accessed on 26/09/12
Ebohon, O. J., Ayeni, D. A., & Taki, A. H. (2009). The Need to Explore
Sustainable Tourism for Developmental Growth in Nigeria , . Paper presented at
the Fourth International Conference for Postgraduate Researchers of the Built and
natural Environment (PRoBE), Glasgow Caledonia University, Glasgow,
Scotland. 19-20 November 2009.
Eja, E. I., Otu, J. E., Ewa, E. E., & Ndomah, B. N. (2011). The Role of Private
Sector Participation in Sustainable Tourism Development in Cross River State,
Nigeria. International Journal of Business and Social Science 2(2), 153-161.
Emelike, O. (2010). What Is Wrong With Nigeria’s Tourism Industry? ,
Businessday, Tuesday, 23 March 2010
Enemou, O. B., Anozie, G., & Otta, C. (2011). Tourism Development a Panacea
to Economic Development in The South-Eastern Nigeria. An International
Journal of Science and Management 1(1), 72-76.
EUROPEAID. (2012). Infrastructure for Sustainable Development. Retrieved
from http://ec.europa.eu/europeaid/what/infrastructure-transport/index_en.htm
Accessed on 20/09/12
Ford, N. (2010). Tourism Africa's Heartbeat. New African (500), 59-65.
Hamzah, A. (2009). Infrastructure Development- Fundamentals for Perak
Tourism. Retrieved from http://www.slideboom.com. Accessed on 12/09/12

Scottish Journal of Arts, Social Sciences and Scientific Studies - ISSN 2047-1278
http://scottishjournal.co.uk
14
Ibimilua, A. F. (2011). Tourism Participation: Attractions, Influences and Key
Trends in Ekiti State, Nigeria African Research Review, 244-251.
Ijasan, K., & Oladunni, I. M. (2012). Assessing Community engagement in
Tourism Planning and Development in Nigeria: A case Study of Arinta Waterfall
Tourist Resort, Ipole Ikon, Ekiti. Transnational Journal of Science and
Technology, 2(4), 11-20.
Itayemi, O. (2012). Ondo state: Life Beyond the Idanre Hills, Thisday Life, 7 July,
2012.
Jacobson. (2012). Infrastructure: Bane of tourism development in Nigeria
National Daily News Paper, Monday, 04 June 2012
Khadaroo, J., & Seetanah, B. (2007). Transport Infrastructure and Tourism
Development. Annals of Tourism Research, 34(4), 1021-1032.
Orga , D. Y. (2010). Problems in The Development of Tourism Attractions in
Benue State,Nigeria. Journal of Research in National Development, 8(1).
Sanni, M. R. (2009). The Influence of the Economy on Hospitality Industry in
Nigeria. Ethiopian Journal of Environmental Studies and Management, 2(1), 25-
34.
Schiedermair, T. (2011). Colaboration Tourism. International Trade Forum(2),
20-29.
Seetanah, B., Juwaheer, T. D., Lamport, M. J., Rojid, S., Sannasee, R. V., &
Subadar, A. U. (2011). Does Infrastructure Matter in Tourism Development?
University of Mauritius Research Journal, 17, 89-108.
Sustainable Tourism Online. (2011). Public Infrastructure. Retrieved from
www.sustainabletourismonline.com . Accessed on 11/10/12
Tress, B., & Tress, G. (2003). Scenario Visualisation for Participatory Landscape
Planning: A Study from Denmark. Landscape and Urban Planning, 64(3), 161-
178.
Tunde, A. M. (2012). Harnessing Tourism Potential for Sustainable Development:
A case of Owu Waterfalls in Nigeria. Sustainable Development in Africa, 14(1),
119-133.
Ugurlu, T. (2010). Unwto of Tourism / What Is Tourism. Retrieved from
www.tugberkugurlu.com/archive/definition-of-tourism-unwto-definition .
Accessed on 18/08/2012.

Scottish Journal of Arts, Social Sciences and Scientific Studies - ISSN 2047-1278
http://scottishjournal.co.uk
15
Synthesis and Characterization of a
Novel 1, 4-diazabutadiene (α-diimine)
Complex of Palladium(II) by the in situ
one-pot template reaction
Ali Sadi Başak
Department of Chemistry, Marmara University, Faculty of Art and Science, 34730,
Göztepe, Istanbul, Turkey
Halim Ayrancı
Department of Chemistry, Marmara University, Faculty of Art and Science, 34730,
Göztepe, Istanbul, Turkey
Abstract
Template reactions involving formaldehyde and amines facilitate the preparation of
saturated multidentate complexes. The reactions are simple “one-pot reactions”, cheap
and high yielding. DAB ligands possess different possible modes of coordination as 2-, 4-
, 6-, and even 8-electron donors in terminal, chelating and bridging arrangements. As α-
diimine ligands, DAB ligands have electronic structural similarities to the more
extensively studied heteroaromatic chelating agents 2,2’-bipyridine and 1,10-
phenantroline. DABs are readily available from the condensation of glyoxal with primary
amines. Their coordination versatility stems from the flexibility of N=C-C=N backbone
and strong σ-donating and п-accepting properties. A novel α-diimine (DAB: 1,4-
diazabütadiene) palladium(II)chloride complex was synthesized by the in situ one-pot
template reaction of appropriate primary amine (4-Aminophtalic acid), dialdehyde
(Glyoxal) and PdCl2. The structure of the newly synthesized complex was proposed
according to MALDI-TOF-MS, FT-IR and UV-VİS spectral data.
Keywords: α-diimine ligands, Palladium(II) complex, synthesis, one-pot

Scottish Journal of Arts, Social Sciences and Scientific Studies - ISSN 2047-1278
http://scottishjournal.co.uk
16
1. Introduction
Metal template syntheses often provide selective routes toward products that are
not obtainable in the absence of metal ions. Especially, template reactions involving
formaldehyde and amines facilitate the preparation of saturated multidentate complexes.
The reactions are simple “one-pot reactions”, cheap and high yielding [1]. Late transition
metal complexes of 1,4-diazabutadiene ligands (DABs) have lately received renewed
attention, primarily due to their utility as homogeneous polymerization catalyst. As a
result, the reaction chemistry of this class of diimine ligand with a variety of transition
metals has become well established [2,3,4,5]. Bidentate nitrogen donor ligands have been
used in many catalytic studies including the enantioselective carbonylation of olefins,
hydrogenation, the borylation of alkanes and alkenes and diboration [6,7]. In particular,
over the past decade cationic Ni(II) α-diimine and Pd(II) α-diimine complexes have
gained considerable attention in the field of Ziegler-Natta catalysis[8]. DABs are readily
available from the condensation of glyoxal with primary amines. Their coordination
versatility stems from the flexibility of N=C-C=N backbone and strong σ-donating and п-
accepting properties [9,10]. Herein, we report the synthesis and characterization of
divalent palladium compound with an acidic 1,4-diazabütadiene ligand.
2. Experimental
4-Aminophtalic acid was obtained from the hydrogenation of 4-Nitrophtalic acid
in a stainless-steel 300 mL Parr Reactor (Parr Co.) [11,12]. Other reagents were obtained
from commercial sources and used as received. All of the reactions and manupilations
involving transition metal compounds were performed under N2 using standard inert
atmosphere. Solvents were dried and distilled by standard procedures. Thin Layer
Chromatography (TLC) was made on Silica gel type 60 plates (Merck D.64271
Germany) using chloroform/methanol as the mobile phase. IR spectra were recorded on
a Shimadzu FTIR-8300 spectrophotometer. UV-Vis was recorded on a Shimadzu UV-
1601 spectrophotometer. Mass spectra were measured on an Auto Flex III MALDI-TOF-
MS mass spectrometer.
2.1. Synthesis of 3,4-dicarboxyaniline (4-aminophtalic acid)(a)
A 4-Nitrophtalic acid solution (21,4237 g was dissolved in 200 mL Methanol)
hydrogenated in a stainless-steel 300 mL Parr reactor with equivalent amount of Pd/C (as
catalyst) at a temperature of 70-80 °C and a pressure of 11 mp of H2 gas with a residence
time of 48 h. After stirring for two days in Parr reactor, the mixture was filtered and the
methanol removed in vacuo. The remaining dark yellow solid was recrystallised from
methanol. Yield 16,6 g, (77%). MS (MALDI-TOF) m/z [M] 181.1726; [M + Na+]
204.15; [M + 2Na+] 227.19; [M + CH3OH] 213.53; [M + K
+] 219.53. IR (KBr) ν (cm
-1)
3400 - 3500
2.2. Synthesis of PdCl2(L),[L: N,N'-(ethane-1,2-diylidene)di-(3,4-
dicarboxyaniline)](b)
PdCl2 (0,0424 g, 0,236 mmol) and 4-Aminophtalic acid (0,1571 g, 0,867 mmol)
were mixed in a porcelain crucible and dissolved in DMF (25 mL). Hydrochloric acid
(36.5%, 3 drops) and glyoxal (0.03 mL) (0,01524 g) were added dropwise. The resulting
solution was heated to 60°C for 24 h to complete transformation to the desired product
and to evaporate the solvent. The residue was then cooled to room temperature,
transferred to a beaker with THF (25 mL) and tested for the presence of any impurities by

Scottish Journal of Arts, Social Sciences and Scientific Studies - ISSN 2047-1278
http://scottishjournal.co.uk
17
TLC. Aluminium foil was placed over the beaker and the following day the dark brown
precipitate which had formed was collected by filtration and dried under vacuum. Yield
0,2508 g (71%). MS (MALDI-TOF) m/z [M] 561,34; [M + 2CH3OH] 625,26; IR (KBr)
ν (cm-1
) 1000 - 750; 1599; 1701; 2924; UV-Vis (nm) λmax 283 - 284
3. Results and discussion
The synthetic procedure for obtaining 3,4-dicarboxyaniline (a) is outlined in
Figure 1, starting from commercially available 4-Nitrophtalic acid. The details of each
step leading to (a), (b) and pertinent spectroscopic data for each compounds can be found
in the Experimental Section. The condensation reaction between 3,4-dicarboxyaniline and
glyoxal was initially attempted by refluxing stoichiometric amounts of these reagents in
methanol. All efforts to form the desired diimine ligand L by this method were
unsuccessful. Using ethanol as a solvent and changing reaction conditions were also
ineffective. Thus, the one-cup template reaction method employed by Niasari and
Adaryani for the formation of similar complexes was used. Reaction of glyoxal with two
mole equivalents of 3,4-dicarboxyaniline and stoichiometric amount of PdCl2 in
adequate amount of DMF with a catalytic amount of hydrochloric acid affords the Pd(II)
complex of L [L: N,N'-(ethane-1,2-diylidene)di-(3,4-dicarboxyaniline)] (Figure 2.) in
moderate yield. It was observed that the product obtained from the reactions was largely
affected by the molar ratio of the reactants.
Figure 1. Synthetic scheme for the preparation of 3,4-dicarboxyaniline (4-aminophtalic
acid) (a)
Figure 2. Synthetic scheme for the preparation of PdCl2(L) (b)
COOH
COOHNH2
C
C
H
H O
O
+ 2. + PdCl2
DMF
HCl
C
C
H
H N
N
COOH
COOH
COOH
COOH
Pd2+
Cl
Cl
+ 2 H2O

Scottish Journal of Arts, Social Sciences and Scientific Studies - ISSN 2047-1278
http://scottishjournal.co.uk
18
The molecular formula of the compounds “4-aminophtalic acid” and
“PdCl2(L),[L: N,N'-(ethane-1,2-diylidene)di-(3,4-dicarboxyaniline)]” have been assigned
on the basis of the results of their elemental analyses and the molecular ion peaks in the
mass spectra (MALDI-TOF). Mass spectra showed molecular ion peaks for molecular
weight of (a) and (b) and also one mole of Na+ cation coordinated to (a), two mole of
Na+ cation coordinated to (a), one mole of K
+ cation coordinated to (a) one mole of
methanol coordinated to (a) and two mole of methanol coordinated to (b) (Figure 3 and
Figure 4), thus supporting the proposed starting material and complex are synthesized.
Figure 3. Mass spectra of 3,4-dicarboxyaniline (4-aminophtalic acid)(a)
Figure 4. Mass spectra of PdCl2(L) (b)

Scottish Journal of Arts, Social Sciences and Scientific Studies - ISSN 2047-1278
http://scottishjournal.co.uk
19
A preliminary identification of the primary amine and complex was made on the
basis of their IR spectra. The IR spectra of 4-aminophthalic acid (Figure 5) exhibits no
bands characteristics of υC-NO2 around 1300 cm-1
-1370 cm-1
and 1500 cm-1
-1570 cm-1
when compared with the IR spectra of starting material 4-nitrophthalic acid (Figure 6)
and also showed a single sharp absorption around ˜3400 cm-1
which may arise from a
primary amine, υN-H, thus supporting the proposed compound. The single absorbtion
around ˜2924 cm-1
in IR spectra
of the complex “PdCl2(L),[L: N,N'-(ethane-1,2-
diylidene)di-(3,4-dicarboxyaniline)]” (Figure 7) indicates the C=O functional groups and
C=O stretching frequency, 1701 cm-1
. Also C=N stretching frequency of this complex is
1599 cm-1
as seen in spectra. The absorption bands in the 750-1000 cm-1
regions observed
in the complex may reasonably correspond to =C-H stretching and =C-H bending
vibrational modes. However, a medium intensity band at 403-415 cm-1
may
unambiguously be assigned to the M-Cl stretching mode in complex.
40060080010001200140016001800200024002800320036004000
1/cm
30
40
50
60
70
80
90
100
%T
FTIR Measurement
Figure 5. IR spectra of 3,4-dicarboxyaniline (4-aminophtalic acid)(a)

Scottish Journal of Arts, Social Sciences and Scientific Studies - ISSN 2047-1278
http://scottishjournal.co.uk
20
Figure 6. IR spectra of 4-nitrophtalic acid
4000.0 3600 3200 2800 2400 2000 1800 1600 1400 1200 1000 800 600 400.0
31.0
35
40
45
50
55
60
65
70
75
80
85
90
95
100.5
cm-1
%T
2924.60
2533.08
1701.08
1599.03
1534.72
1375.62
1227.40
1135.70
1063.94
843.14
768.50
744.68
651.95
547.09 459.11
425.11
403.96
Figure 7. IR spectra of PdCl2(L) (b)
The UV-Vis spectrum of this dark brown colored complex is dominated by
intense charge-transfer absorptions in the visible and UV portions of the spectra. The
spectrum is tabulated for identification purpose only; no detailed assignment will be
made due to the overlap of ligand field and charge-transfer absorptions. Generally, the
lowest energy bands of the spectra for Pd(II) complexes are d → π* charge-transfer bands

Scottish Journal of Arts, Social Sciences and Scientific Studies - ISSN 2047-1278
http://scottishjournal.co.uk
21
which have been extensively studied and characterized in other α-diimine complexes
[13,14].
4. Conclusion
First, DAB ligands possess different possible modes of coordination as 2-, 4-, 6-,
and even 8 - electron donors in terminal, chelating and bridging arrangements. Second, as
α-diimine ligands, DAB ligands have electronic structural similarities to the more
extensively studied heteroaromatic chelating agents 2,2’-bipyridine and 1,10-
phenantroline. In 2005, for example, Vimal K. Jain and Leela Jain [14] showed that
square planar Ni(II) diimine dithiolate complexes containing 1,10-phenantroline and
DAB ligand biacetetyl bis(anil) (R= Ph, R’= Me) were spectroscopically similar with
common low-energy charge transfer to diimine absorbtion. Third, Palladium (II) complex
of “N,N'-(ethane-1,2-diylidene)di-(3,4-dicarboxyaniline)” (α-diimine) can be prepared by
the simple in situ one-pot template reaction by using 4-Aminophtalic acid, glyoxal and
PdCl2. The spectra of the complex show that two nitrogen (α-diimine) atoms are
coordinated to the palladium(II) ion.

Scottish Journal of Arts, Social Sciences and Scientific Studies - ISSN 2047-1278
http://scottishjournal.co.uk
22
References
[1] Salavati-Niasari M., Rezai-Adaryani M., Polyhedron, 2004, 23, 1325-1331.
[2] Brian P. Buffin, Abjhit Kundu, , Inorg. Chem. Commun., 2003, 6, 680-
684.
[3] Albano G.A., Bandini M., Monari M., Piccinelli F., Tommasi S., Umani-
Rochi A., Inorg. Chim. Acta, 2007, 360, 1000-1008.
[4] Purkayshta A., Baruah J.B., Some aspects of palladium and rhodium
catalysis for synthesis of silylethers from Si-H bond, J. Mol. Catal. A: Chem.,
2003, 198, 47-55.
[5] Liang P., Xiong H., Guo H., Yin G., Catal. Commun., 2010, 11 560-562.
[6] Coventry D.N., Batsanov A.S., Goeta A.E., Howard J.A.K., Marder T.B.,
Polyhedron, 2004, 23 2789-2795.
[7] Yang K., Lachiotte R.J., Eisenberg R., Organometallics, 1997, 16, 5234-
5243.
[8] Maldanis R.J, Wood J.S., Chandrasekaran A., Rausch M.D., Chien J.C.W.,
J. Organomet. Chem., 2002, 645, 158-167.
[9] Morishita M., Amii H., J. Organomet. Chem., 2007, 692, 620-624.
[10] Vicente J., Arcas A., Coord. Chem. Rev., 2005, 294, 1135-1154.
[11] Ovalles C., Filgueiras E., Morales A., Scott E.C., Gimenez F.G., Embaid
B.P., Fuel, 2003, 82 887-892.
[12] Kuuisto J., Mikkola J.P., Casal P.P., Karhu H., Vayrynen J., Salmi T., Chem.
Eng. J., 2005, 115, 93-102.
[13] Van Der Poel, H.; Van Koten, G.; Vrıeze, K., Inorg. Chem., 1980, 19 1154–
1151.
[14] Jain, K.V.; Jain L., Coord. Chem. Rev., 2005, 249, 3075-3197.

Scottish Journal of Arts, Social Sciences and Scientific Studies - ISSN 2047-1278
http://scottishjournal.co.uk
23
The Challenges of Public Housing in
a Democratic Nigeria: a case study of
the Presidential Mandate Housing
Scheme
Eziyi O. Ibem
Department of Architecture, College of Science & Technology Covenant University,
Canaan Land, Ota, Ogun State, Nigeria
Akunnaya P. Opoko
Department of Architecture, College of Science & Technology Covenant University,
Canaan Land, Ota, Ogun State, Nigeria
Egidario B. Aduwo
Department of Architecture, College of Science & Technology Covenant University,
Canaan Land, Ota, Ogun State, Nigeria
Abstract
This study examined the challenges of public housing in a democratic Nigeria using the
Presidential Mandate Housing Scheme as a case study. Data were derived from
purposively selected members of staff of public institutions charged with the
responsibility of implementing this scheme in urban areas of Southern Nigeria through
interview enquiries and participant observation. These were analyzed using content
analysis. The result shows that the scheme was implemented in very few States in
Southern part of Nigeria with miniscule number of housing units constructed in those
States. Poor programme conception and planning, funding inadequacies and the dearth of
preferred building materials were identified as the key challenges that led to the failure of
this scheme. The paper argues that despite the return of democratic rule in 1999 and
subsequent adoption of the New National Housing and Urban Development Policy in
2002, low organizational capacity of public housing agencies, the lack of collaborations
between these agencies and private sector organizations and the none availability of
reliable local building materials constitute serious impediments to smooth and successfull
implementation of public housing programmes in Nigeria. It therefore suggests that the
prospects of public housing in democratic Nigeria are contingent upon addressing these
challenges.
Keywords: Public Housing Agencies; Public Housing; Urban Areas; Presidential
Housing Mandate; Nigeria

Scottish Journal of Arts, Social Sciences and Scientific Studies - ISSN 2047-1278
http://scottishjournal.co.uk
24
1. Introduction
In the hierarchy of human needs, housing is ranked next to food as a basic
necessity of life. This is because housing has a profound impact on the quality of life,
health, productivity and proper socio-economic status of man (Bashir, 2002; Aliu and
Adebayo, 2010) and plays a vital role in security, physical development and natural
disaster mitigation in the community (UN-HABITAT, 2006a). To this end, access to
adequate housing is one of the fundamental human rights entrenched in the constitution
and policy documents in different countries across the world (Thiele, 2002) and thus,
making the need for housing one of those that should be fulfilled by the state.
Unfortunately, in most urban centers in sub-Saharan Africa, governments have not been
able to discharge this obligation satisfactorily as access to decent and affordable housing
has continued to elude many middle- and low-income earners in urban areas in this
region (Tipple, 1994; UN-HABITAT, 2010; Basorun and Fadairo, 2012). For instance, in
Nigeria, the period between October 1960 when she gained political independence from
Britain and May 1999 when the current democratic experience commenced was devoted
to the struggle for freedom from autocratic military rule. As Katsina (2011) and Olu-
Adeyemi (2012) rightly observed, the 29 years of military rule after political
independence was characterized by massive decay of urban infrastructure,
unemployment, crime, deprivation, poverty, corruption and stunted economic growth in
Nigeria. Consequently, the resources that should have been invested in securing and
sustaining the economic, social and cultural rights of the people; including the right to
access to adequate housing were massively diverted to political struggle.
In addition to the long period of military rule, studies have also established that
among other factors, rapid urbanization, high cost of building materials, ineffective
housing policies, (Adejumo, 2010), housing finance inadequacies (Ajanlekoko, 2001;
Basorun and Fadairo, 2012) and corruption (Mba, 1992; Ayodele, 2010; Oloyede et al.,
2011) have marred smooth implementation of public housing programmes, and by
extension contributed to exacerbating urban housing crisis in Nigeria (Awotona, 1987,
Olotuah and Bobadoye, 2009). Therefore, the return of democratic rule in May 1999 was
expected to usher in the era of good governance and improvement in the social welfare of
most urban residents through proper implementation of social intervention programmes
in the housing, health and educational sectors in Nigeria. It was therefore not surprising
that in April 2004, the government of President Olusegun Obasanjo initiated the
Presidential Mandate Housing Scheme (PMHS) as the first national housing programme
under the current democratic dispensation. Etim et al (2007) noted that this was a
commendable effort of the government to embark on social housing programme in favour
of the less privileged Nigerians after a long time of neglect. However, looking back eight
years after the PMHS was initiated; it thus appears that much has not been achieved in
the implementation of this scheme in urban areas in Nigeria. Although, there is a dearth
of reliable data on the number of housing units constructed under the PMHS across this
country, available statistics suggest that no State has yet achieved the minimum set target
of 500 housing units in the scheme. Hence, contrary to all expectations, the goal of the
PMHS has not been achieved despite the prevailing democratic atmosphere; and thus
urban housing crisis has continued to escalate unabated in Nigeria. This is no doubt a
striking paradox as democracy is associated with the delivery of the dividends of
democracy, including safe guarding fundamental human rights (Abdullahi, 2012), good

Scottish Journal of Arts, Social Sciences and Scientific Studies - ISSN 2047-1278
http://scottishjournal.co.uk
25
governance, effective and efficient use of resources and rapid economic growth
(Dellapiane-Avellaneda, 2009; UNDP, 2007; Ude and Coker, 2012).
A reflection of the above calls to question certain issues that stand as
challenges of effective public housing delivery system in urban areas in a democratic
Nigeria. Therefore, the aim of this study was to investigate the challenges of public
housing in a democratic Nigeria using the Presidential Mandate Housing Scheme as a
case study. The study attempted to answer two main research questions; firstly, what are
the possible explanations to the failure of the PMHS to achieve its goal? Secondly, why
has public housing continued to lag behind in urban areas in a democratic Nigeria? In
order to provide answer to these questions, the succeeding sections of this paper have
been structured to provide an overview of relevant literature, explain the research
methodology used, present and discuss study findings and make concluding remarks.
2. Urban Housing Crisis and Public Housing Provision in Nigeria: an Overview
The recent statistics released by the United Nations Population Funds (UNPF) in
2012 shows that Nigeria with a population figure of about 160 million people is the most
populous country in Africa; contributing about 3.6 percent of the world’s total population
of about 7 billion people. Although she is the sixth largest producer of crude oil in the
world, the World Bank (2010) classified Nigeria as a low-middle income country with a
gross national income (GNI) of US$175.6 billion. Politically, before independence in
1960, Nigeria operated a regional structure of government, but it currently operates a
federal system of government with a three-tier of government structure consisting federal,
state and local government. There are presently 36 States and 774 local government areas
in Nigeria with Abuja as the administrative capital.
Nigeria’s experience in public housing provision has witnessed significant
changes over the last fifty years as documented by several authors (Onibokun, 1985;
Awotona, 1990; Ikejiofor; 1999; Omole, 2001; Mustapha, 2002; Ademiluyi, 2010). It is
however interesting to note that over 90 percent of the housing stock in Nigeria can be
traced to the ingenuity of her people (UN-HABITAT, 2006b), who despite the constraints
of low income, high cost of building materials and economic hardship have struggled to
put roof over their heads. On the part of the government, a number of policies and
programmes have been underway to facilitate access by Nigerians to decent housing.
Although, this appears to be in line with the submission by Sykora (1999) that
government can use housing as a development instrument to reduce unemployment,
improve public health and productivity and mitigate the impact of market forces that tend
to exclude the less-privileged people from enjoying the benefits of decent housing; Ogu
and Ogbuozobe, (2001) and Adejumo (2010) have observed that some of the public
housing programmes in Nigeria have remained mere intentions while others were
implemented haphazardly. As a result, most of the previous schemes have not contributed
much to reducing exclusion, urban poverty, and improvement of public health in this
country (Ikejiofor, 1999).
Balchin et al. (2000) argued that the different ways in which government
intervenes in promoting access to adequate housing by citizens depend on the scale of
need, operational welfare regime and housing policy systems in a country. In the context
of Nigeria, government intervention in the housing sector which began in the colonial era
has taken varying forms, including direct construction of housing units (Awotona, 1990;
Ibem, 2011a), creation of institutional structures (Omole, 2001) and financial

Scottish Journal of Arts, Social Sciences and Scientific Studies - ISSN 2047-1278
http://scottishjournal.co.uk
26
mechanisms; restructuring of the finance framework (Ajanlekoko, 2001) and policy
formulation (Aribigbola, 2008). A number of strategies and approaches, including direct
construction of housing units, urban renewal and slum clearance, site and services and
public-private-partnerships have also been adopted (Ali, 1996; Ademiluyi, 2010; Ibem,
2011b; Aribigbola and Ayeniyo, 2012). Despite all these, it is observed that quantitative
and qualitative inadequacies, housing affordability challenges and homelessness have
remained common features in urban areas in Nigeria (Ajanlekoko, 2002; UN-HABITAT,
2006b; Olotuah and Bobadoye, 2009). In fact, public housing in this country has been
associated with low productivity (Akinmoladun and Oluwoye, 2007), poor quality and
expensive housing units (Mba, 1992). Consequently, most low-income people have been
denied access to decent housing at affordable cost (Awotona, 1987; Bana, 1991; Olotuah
and Bobadoye, 2009) leading to the proliferation of urban slums and shanties, which
constitute serious threat to sustainable urban growth and development in Nigeria.
It has been established in the literature that a number of factors have precluded
full realization of government housing policies and programmes in Nigeria in the past
few decades. Indeed there is a substantial agreement in the literature that rapid
urbanization, the absence of proper monitoring and evaluation of public housing policies
and programmes (Awotona, 1990; Federal Republic of Nigeria, 1991; Akinmoladun and
Oluwoye, 2007), the lack of easy access to land and high cost of building materials and
other housing inputs (Federal Republic of Nigeria, 1991; UN-HABITAT, 2006b), low
capacity of public housing agencies (Ibem and Solanke, 2011); high incidence of
corruption (Mba, 1992; Ayodele et al., 2011; Oloyede et al., 2011); politicisation and
poor implementation of housing programmes (Ali, 1996; Ademiluyi 2010; Ibem et al.,
2011) and adoption of unrealistically high housing standards (UN-HABITAT, 2006b) are
responsible for the high rate of failure of public housing programmes and current urban
housing crisis in Nigeria. Ndubueze (2009) was of the view that in the face of increasing
urban population, the real challenge is how to ensure adequate supply and access to land,
housing finance, infrastructure, and building materials within a framework that
guarantees the supply of decent housing at costs affordable to all households. The
implication of this is that government in Nigeria is faced with two key challenges. First,
is how to improve the quality of housing in existing urban slums and squatter settlements;
and secondly, ways and means to assists those with critical housing need to gain access to
urban land and housing.
From the foregoing, it is obvious that rapid urbanization, bureaucracy, political
upheavals and gross economic mismanagement at all levels of government are at the root
of urban housing crisis in Nigeria. Under the current democratic dispensation, a number
of steps have been taken by the government to address these problems. Chief among them
include the formulation and adoption of the New National Housing and Urban
Development Policy (NNHUDP) in 2002; and restructuring of the housing finance sub-
sector to include secondary mortgage institutions. It is important to mention that the
NNHUDP which seeks to address the inadequacies of previous policies and ensures that
Nigerians have access to decent and sanitary housing through private sector-led initiatives
(Aribigbola, 2008) is instrumental for the adoption of Public-Private-Partnerships (PPPs)
in public housing delivery in Nigeria. Another step taken was to encourage the use of
local building materials in the provision of mass housing. It was in pursuant to this
objective that the then president - Chief Olusegun Obasanjo in April 2004 mandated three
key agencies in the housing sector, namely, Association of Housing Corporations,

Scottish Journal of Arts, Social Sciences and Scientific Studies - ISSN 2047-1278
http://scottishjournal.co.uk
27
(AHCN), Nigerian Building and Road Research Institute (NBRRI) and the Federal
Mortgage Bank of Nigeria, (FMBN) to commence the construction of at least 500
housing units in each State of the federation and in the Federal Capital Territory-Abuja
using local building materials. This gave birth to the Presidential Mandate Housing
Scheme, which was originally intended to provide at least 18,500 housing units across the
country in its introductory stage before the end of 2006 (Etim et al., 2007).
To achieve the target of this scheme, the AHCN, which is the umbrella
organization of all State government-owned housing agencies in Nigeria, was expected to
provide land in their respective States for the scheme and be directly involved in the
actual construction of the housing units. The NBRRI, which is the foremost federal
government-owned research institute established in 1978 to undertake integrated research
and development in building and road construction was to provide relevant technology in
the production of interlocking laterite bricks for walling and walkway paving stones for
landscaping; while the FMBN- the apex mortgage institution in Nigeria, which currently
manages the National Housing Fund (NHF) was to provide financial backing for the
scheme. Therefore, the scheme was expected to contribute to sustainable urban housing
development by circumventing most of the challenges associated with access to land,
finance and building materials that hitherto contributed to the failure of previous public
housing schemes in Nigerian cities. Although, there are no published works on the
performance of this scheme; evidence around us today suggests that this scheme has
performed below expectations. Hence, the current study is justified as it attempted at
examining the key challenges surrounding the conception and implementation of the
PMHS as a feedback to public sector managers and programme designers of the
challenges confronting public housing under current democratic milieu in Nigeria; and to
highlight the need for improved performance in the planning and implementation of
public housing programmes in this country.
3. Methods
Data used in this paper were derived using qualitative research method. Primary
data were obtained through a survey of public housing agencies in States within Southern
Nigeria, and participant observation. Extensive review of literature and official records
was used in sourcing secondary data. It would be of interest to know that Nigeria is
divided into six geo-political zones, three in the North and three in the South. Since the
current study is focused on States in the Southern part of Nigeria; Ogun, Rivers and Abia
States, representing Southwest, South-south and Southeast geo-political zones,
respectively, were chosen as the study area. Lagos was however added to this list by
virtue of its strategic importance as the host State of the national headquarters of the
AHCN and its peculiar housing situation in Nigeria. Table 1 shows the public housing
institutions that participated in this study. These agencies were purposively selected
because they were the agencies charged with the responsibility of implementing the
PMHS.
The field work involved the use of purposive sampling technique in selecting key
informants from these institutions. We adopted this sampling technique because of its
advantage in allowing the selection of informants to be narrowed down to specific
group(s) of people who can provide the desired information on the subject investigated.
The principal data gathering instrument used in extracting data from the respondents was
the interview guide prepared by the researchers. To reduce variation and provide

Scottish Journal of Arts, Social Sciences and Scientific Studies - ISSN 2047-1278
http://scottishjournal.co.uk
28
flexibility in the interviews, the interview guide contained both structured and open-
ended questions related to the subject investigated. Before the interviews were conducted,
visits were made to the selected agencies, and subsequently, telephone calls were put
across to the officers to book convenient dates and time for the interviews. A total of
seven officers of grade levels 14 and above drawn from each of the agencies listed in
Table 1 were interviewed between December 2011 and June 2012. Some of the
interviews were on one-on-one basis, while others were through telephone conversations.
The officers were asked questions related to the key challenges associated with the
implementation, and outcome of the PMHS in the study area. The interviews were
recorded manually and electronically, with the former later transcribed in preparation for
the analysis.
Table 1: Government Agencies Selected for the Study
Data from the interviews were complimented by the records of involvement of the
second researcher in NBRRI when this housing scheme was initiated. The key type of
analysis data were subjected to was content analysis. This involved coding and
organizing of the information gathered from the interviews and secondary sources into
common themes and ideas. This helped in identifying patterns and highlighting crucial
issues expressed by the informants. Result of the analysis is presented in the subsequent
section of the paper.
4. Study Findings
4.1. Implementation of the Presidential Housing Mandate Scheme
From the interviews, it was found that prior to the implementation of this scheme,
the Chief Executive Officers of the three aforementioned agencies that were given the
mandate to implement the scheme held series of high-level meetings. These meetings
culminated in the setting up of a Technical Committee comprising representatives of
these organizations, and the committee was charged with the responsibility of examining
the mandate and making recommendations to the Chief Executives. This was followed by
three separate workshops held in three strategic locations of Ota in Ogun State (South
West), Kaduna in Kaduna State (North) and Umuahia in Abia State (South East). The
main thrust of the workshops was to train the potential team leaders of the scheme in the
production and use of the preferred local building materials. It was expected that the team
leaders so trained would go back to their respective organizations and replicate the
training for their team members. The workshops focused on two of the local construction
materials, namely; the interlocking laterite bricks for walling and walkway paving stones
Agencies Locations
Association of Housing Corporations of Nigeria (AHCN) Lagos National Office
Ogun State Housing Corporation (OSHC) Abeokuta
Nigerian Building and Road Research, (NBRRI) Ota
Federal Mortgage Bank of Nigeria (FMBN) Lagos
Abia State Housing Corporation (ASHC) Umuahia
Rivers State Housing & Property Development Authority
(RSHPDA) Port Harcourt
Lagos State Property Development Corporation, (LSPDC) Ikeja, Lagos
Scottish Journal of Arts, Social Sciences and Scientific Studies - ISSN 2047-1278
http://scottishjournal.co.uk
29
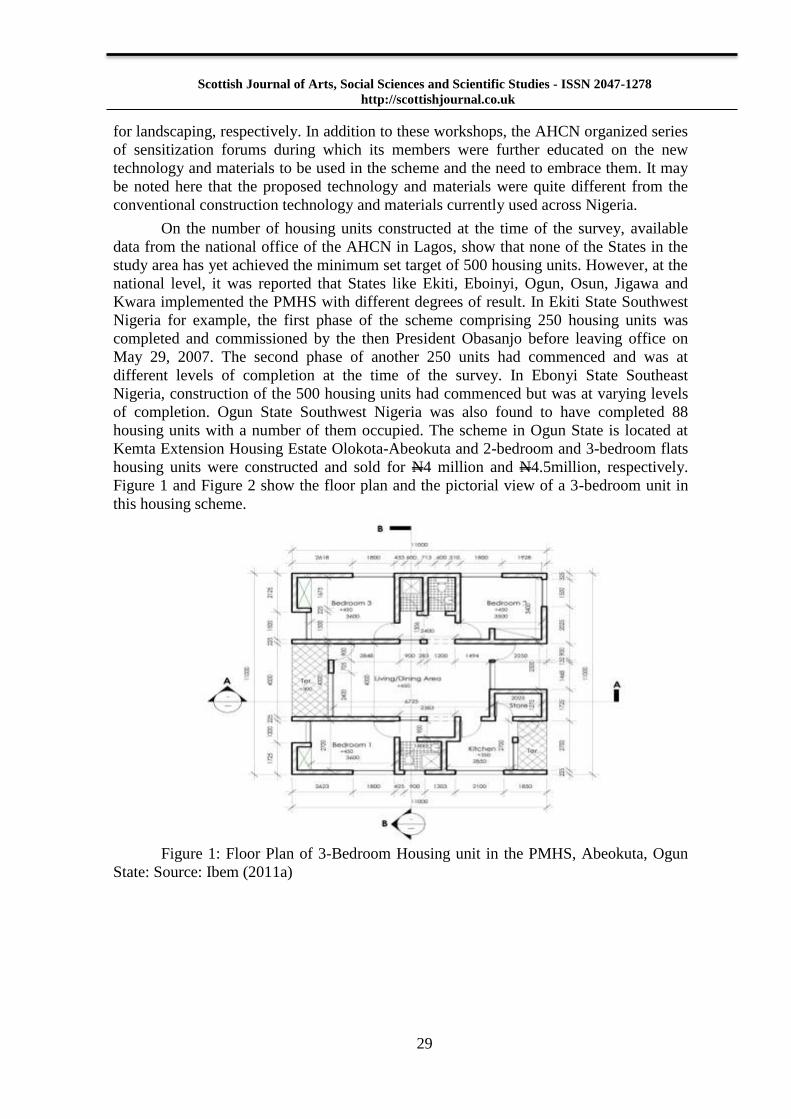
for landscaping, respectively. In addition to these workshops, the AHCN organized series
of sensitization forums during which its members were further educated on the new
technology and materials to be used in the scheme and the need to embrace them. It may
be noted here that the proposed technology and materials were quite different from the
conventional construction technology and materials currently used across Nigeria.
On the number of housing units constructed at the time of the survey, available
data from the national office of the AHCN in Lagos, show that none of the States in the
study area has yet achieved the minimum set target of 500 housing units. However, at the
national level, it was reported that States like Ekiti, Eboinyi, Ogun, Osun, Jigawa and
Kwara implemented the PMHS with different degrees of result. In Ekiti State Southwest
Nigeria for example, the first phase of the scheme comprising 250 housing units was
completed and commissioned by the then President Obasanjo before leaving office on
May 29, 2007. The second phase of another 250 units had commenced and was at
different levels of completion at the time of the survey. In Ebonyi State Southeast
Nigeria, construction of the 500 housing units had commenced but was at varying levels
of completion. Ogun State Southwest Nigeria was also found to have completed 88
housing units with a number of them occupied. The scheme in Ogun State is located at
Kemta Extension Housing Estate Olokota-Abeokuta and 2-bedroom and 3-bedroom flats
housing units were constructed and sold for N4 million and N4.5million, respectively.
Figure 1 and Figure 2 show the floor plan and the pictorial view of a 3-bedroom unit in
this housing scheme.
Figure 1: Floor Plan of 3-Bedroom Housing unit in the PMHS, Abeokuta, Ogun
State: Source: Ibem (2011a)
Scottish Journal of Arts, Social Sciences and Scientific Studies - ISSN 2047-1278
http://scottishjournal.co.uk
30
Figure 2: Pictorial view of the 3-bedroom houisng unit constructed in PHMS,
Abeokuta, Ogun State Source: Ibem (2011a)
It can be deduced from the foregoing, that the setting up of a Technical
Committee by the agencies to examine the mandate and make recommendations to the
Chief Executive Officers was a step in the right direction in ensuring successful
implementation of this scheme. However, findings of the study suggest that this is not all
it takes to implement a nationwide programme of this nature. It thus appears that the
agencies did not have a well articulated plan of action on the implementation strategies
for this scheme. This assertion is based on a number of observations. In the first instance,
we view the organization of the training workshops in only three locations as not proper
and inadequate. Considering the fact that the scheme was a national housing programme,
and given the geographical spread of Nigeria, one would have expected that the training
workshops be held initially in the six geo-political zones and later in every State capital
and Abuja to create enough awareness on the scheme. Secondly, given the number of
stakeholders in the building construction industry, the sensitization forums should also
have included tradesmen and artisans who will be directly involved in the new
technology and materials at the building construction sites. Unfortunately, these were not
done; and thus it is not surprising the result achieved in this scheme.
4.2 Challenges of the PMHS
Looking at the rate of success in the implementation of the PMHS, as discussed
in the preceding paragraph, it is obvious that there were a number of challenges in the
conception and implementation of the scheme. In the context of this study and for the
purpose of clarity, these challenges are classified into two groups: challenges related to
the conception, and those related to the implementation of the scheme.
4.2.1Challenges Related to the Conception of the PMHS
It is evident from our introduction section of this paper and discussions with the
officers interviewed that the PMHS came into existence through a presidential directive
and not as a well articulated housing programme. This suggests that this scheme was not
well conceived. Consequently, the agencies in a bid to obey a presidential order hastily
jump-started the scheme without adequate planning and preparations. Most worrisome is
the fact that in the conception of the scheme, there was no clear definition of what

Scottish Journal of Arts, Social Sciences and Scientific Studies - ISSN 2047-1278
http://scottishjournal.co.uk
31
constituted ‘local building materials’, and thus it was assumed that laterite bricks was the
most appropriate local material; perhaps because it requires less cement compared with
the sandcrete blocks, which is the conventional walling material used in Nigeria. Another
aspect of ill-conception in the scheme was the assumption that the NBRRI was the only
research and development outfit in the housing sector in Nigeria to warrant the kind of
responsibility given to it under this scheme. On the contrary, there are several institutions
engaged in research and development in the housing sector in Nigeria. In the light of the
above, we argue that it would have been better if the NBRRI had been given the role of a
co-ordinating agency or clearing warehouse for the local material content of the scheme.
In such a capacity, NBRRI would have been able to collate information on available local
building materials and technologies; and assess their viability and appropriateness for the
scheme. This is in view of the fact that some materials, for instance, may be more suitable
for use in certain parts of the country due to their availability, prevailing local weather
condition and socio-cultural practices. These ambiguities, among others, surrounding the
conception of the scheme may explain why there seems to have been unrealistic
expectations from the three participating agencies, and the subsequent failure of the
scheme to realise its goal.
4.2.2 Challenges related to the Implementation of the Scheme
(a) Pre-Commencement Activities
During the pre-commencement training workshops for the participating agencies,
it was observed that only one machine was used for the training per location. This no
doubt was grossly inadequate for the number of participants. It was also observed that the
training duration was just few days, which was insufficient for participants to acquire
enough skills and develop the level of confidence they needed to transfer the knowledge
to their team members on returning to their stations. Indeed, the trainings appeared to be
more like demonstration sessions, which had very low hands-on component. As a result,
staff members of the organizations under AHCN were not adequately equipped
technically and otherwise to manage the huge housing development envisaged in the
scheme using a new technology and materials. One of the manifestations of this was that
the housing units were designed without due regard to the peculiar demands of the
technology. For example, the lack of consideration for the dimensions of the bricks meant
that bricks had to be cut. Apart from the difficulties in cutting the bricks; it resulted to
material wastage and exposure of cut surface to water, thereby impacting negatively on
the quality and durability of the walling materials. This goes to suggest that adequate
technical information was not given to those who were supposed to implement the
scheme in the field before the programme took-off.
(b) Funding
In support of previous studies, the dearth of funds was identified as one of the
critical constraints to successful implementation of the scheme. With a capital base of
only N2.5billion, the FMBN appears not to have the required capital base to support the
scheme, given its other commitments as the apex mortgage institution in Nigeria. The
study found out that as at the end of 2010, FMBN could only fund the construction of 500
housing units in this scheme across the country. The interviewees noted that accessing
funds from this apex mortgage bank was further constrained by stringent requirements
which members of the AHCN were expected to meet. For instance, the FMBN insisted on

Scottish Journal of Arts, Social Sciences and Scientific Studies - ISSN 2047-1278
http://scottishjournal.co.uk
32
a ‘standing order’ which would empower it to deduct loan repayments from the office of
the Accountant General of the Federation for any State whose housing corporation
defaulted in repayments. This implies a reduction in the monthly allocation to such State
from the Federation account. It was for this reason many of the State governments who
were supposed to stand as guarantors for their housing corporations were very
uncomfortable with this condition and therefore reluctant and in some cases were
unwilling to endorse the contract agreement. To worsen the funding situation,
disbursement of funds by the FMBN was in phases. Going by the bureaucratic
bottlenecks in the administration of housing finance by the FMBN, there were usually
delays in the release of funds. Consequently, the implementation of the housing scheme
by members of the AHCN was delayed and negatively affected by inflationary trends in
this country. In some States where the scheme was implemented, this resulted in upward
review of project costs leading to cost overrun and a hike in the cost at which completed
housing units were sold to the interested members of the public.
In Ogun State for example, where a number of 88 housing units were completed,
it was found that only 15 housing units were occupied at the time of the survey. This was
because a key service such as water supply was yet to be provided in the housing estate.
Although, work was in progress in the housing estates as more housing units were
planned for construction, according the Director of Estate in the Ogun State Housing
Corporation (OSHC), the agency had to slow down the pace of work on the scheme due
to the challenge of accessing funding from the FMBN. It is noteworthy that the use of
local materials was to make the houses affordable to low- and middle-income earners, but
going by the cost of the housing units constructed in this scheme in Ogun State, which
was between N4 million and N4.5million, it is clear that the scheme did not benefit low-
income people, who were the target population. As pointed out in the preceding
paragraph, in addition to the funding challenge, other issues related to the administration
of the scheme could have contributed to the cost of housing provided in this scheme as
observed in Ogun State.
(c) Building Materials and Technology
Interestingly, the availability of land was not identified as having posed a
challenge to the smooth implementation of this scheme. However, the inability of the
NBRRI to deliver on its own aspect of the mandate was identified as one of the key
challenges that prevented full implementation of the PMHS across the country. The study
revealed that the promised technology that was to be provided by the NBRRI had
apparently not gone through the full circle in the process of development prior to its
deployment for use in the scheme. It was observed that during the workshops and
trainings sessions at the NBRRI’s National Laboratory and Production Complex in Ota,
Ogun State, the machines used were different from those developed by the Institute. This
was really a source of concern to the participants on the ability of the NBRRI to fulfil its
obligation. This apprehension eventually became real when members of the AHCN
needed the machines to commence the production of the building materials, and they
were not available. Consequently, the organizations had to wait for a long time, even after
payments were made to the NBRRI. It was obvious that the NBRRI did not have funds to
finance the production of the machines; hence, money paid to the Institute by members of
AHCN was used to finance the production of the machines. On the other hand, members
of the AHCN whose machines were delivered reported frustrations and delays in the

Scottish Journal of Arts, Social Sciences and Scientific Studies - ISSN 2047-1278
http://scottishjournal.co.uk
33
production of the building materials due to frequent breakdowns and recurrent need for
repairs. Apart from these difficulties, there were also reported cases of dimensional
variations in the walling material (laterite bricks), not only from different machines but
also from the same machine. This led to some constraints in using the resulting bricks as
the walling material; and thus slowed down the rate of construction work on the project
sites.
Specifically, the failure of the NBRRI to deliver the machines as was expected
might be due to obvious reasons. Notably, the mandate setting up the Institute did not
empower it to handle the level of responsibilities given to it in the PMHS. As a research
and development organization, the NBRRI did not have the capacity to venture into
commercial production of its research findings. This is because it lacks the financial,
personnel and infrastructural capacity to produce brick making machines for the scheme.
In fact, it was found out that the few machines produced were contracted out and
fabricated by other organizations outside the Institute. In some cases, these organizations
failed to deliver the machines due to inadequate funding and unrealistic delivery time
frame given to them.
Generally speaking, it is evident from findings of this study that government may
have had a good intention for initiating this housing scheme, but the implementation did
not record reasonable success due to avoidable lapses at the conception, planning and
implementation stages. The PMHS failed at the conception and design stages as little or
no feasibility studies were carried to examine whether or not the scheme was in line with
the operational National Housing Policy- the NNHUDP of 2002 mentioned earlier. In fact
the scheme was not in line with the goal of this policy, as private sector organizations
were not officially recognised as part of the institutional framework for the
implementation of the scheme. The inclusion of the private organizations as partners by
the three agencies at the training workshops before the took-off of this scheme could have
produced better result. At least, the private sector could have been involved in the
fabrication of the bricks making machines, the actual production of bricks and provision
of funds for the scheme, and perhaps injected its resources in boasting the performance of
the public-sector agencies in actualising the goal of the scheme. Another aspect that
contributed to the failure of the scheme was the lack of understanding of the capacity of
the three agencies entrusted with responsibility of delivering the mandate to produce the
designed result. As a result, the agencies went into the scheme unprepared in swift
response to the directive of the then President. This goes to suggest that the lack of
adequate organizational capacity contributed to the dismal performance of this scheme;
and that this explains why public housing has continued to lag behind in Nigeria in most
recent times.
5. Conclusions
This study examined the challenges of public housing in democratic Nigeria using
the Presidential Mandate Housing Scheme as a case study. It is evident from this study
that even in the democratic era a number of challenges militate against the smooth
implementation of public housing schemes in Nigeria. These include poor conception and
design of housing programmes, poor implementation strategies, funding difficulties and
poor organizational capacity of public housing agencies.
One of the lessons from this study is that political leaders, policy makers and
managers in the public sector should know that social intervention programmes are not

Scottish Journal of Arts, Social Sciences and Scientific Studies - ISSN 2047-1278
http://scottishjournal.co.uk
34
political programmes that are based on mere proclamations and directives; but are rather
based on proper conception and design based on reliable data on the prevailing situation.
This call for proper conception and designing, as well as adequate planning of public
housing projects programmes to take-off to avoid or minimise project failure. The study
has also shown that for effective performance of public housing schemes in the
democratic era, capacity building is required in public housing agencies in the areas of
information management, manpower development and funding. This can be achieved
through partnership with private sector organizations in these areas. Another lesson from
this study is that only materials and technologies that have been perfected and tested
should be used in executing a nationwide scheme that has the capacity to generate
multiplier effect on the life of people and national economy. Lastly, in the spirit of
democracy, which thrives on popular participation, it has become imperative that public
housing programmes be conceived based on the inputs of all the stakeholders in both the
public and private sectors to ensure better implementation and performance of such
programmes in addressing current needs of the people.

Scottish Journal of Arts, Social Sciences and Scientific Studies - ISSN 2047-1278
http://scottishjournal.co.uk
35
References
Abdullahi, D.(2012). Good Governance as Panacea to the Socio-Economic Crises
in Nigeria, IOSR Journal of Business and Management (IOSRJBM), 2(3), 36-40.
Adejumo, A. (2010) Some Thoughts On Affordable And Social Housing In
Nigeria Accesses from
http://www.nigeriavillagesquare.com/index.php/content/view/10905/55]2010 on
5th
September 2012
Ademiluyi I.A. (2010). Public Housing Delivery Strategies in Nigeria: A
Historical Perspective of Policies and Programmes. Journal of Sustainable
Development in Africa,12 (6),153-161
Ajanlekoko J. S. (2001) Sustainable Housing Development in Nigeria – The
Financial and Infrastructural Implication International Conference on Spatial
Information for Sustainable Development Nairobi, Kenya 2–5 October2001
Ajanlekoko K.S. (2002). Appraisal of the National Housing Policy. Housing
Today, 1 (6): 13-20
Akinmoladun OI and Oluwoye J. 2007. An Assessment of Why the Problems of
Housing Shortages Persist in Developing Countries: A case of Study of Lagos
Metropolis, Nigeria. Pakistan Journal of Social Science, 4(4),589-598.
Ali I. (1996). The National Housing Programme-The Way Forward. Housing
Today- The Journal of the Association of Housing Corporations of Nigeria, 11
(2),16-19.
Aliu, I.R. and Adebayo, A. (2010) Evaluating the Influence of Housing Quality on
Urban Residents’ Wellbeing: The Case of Lagos, Nigeria. International Journal
of Academic Reserach, 2(6),401-410.
Aribigbola, A. and Ayeniyo, O.I. (2012) Site-and-Services as a Strategy for
Achieving Adequate
Housing in Nigeria in the 21st Century, International Journal of Humanities and
Social Science, 2 (2) 126-132.
Aribigbola A. 2008. Housing Policy Formulation in Developing Countries:
Evidences of Programme Implementation from Akure, Ondo State Nigeria.
Journal of Human Ecology, 23(2);125-134.
Awotona A. (1987). Housing Policy in Nigeria: Government Policies for Housing
Nigeria’s Urban Poor and the Working Class, Laudable Great Expectation,
Colossal Failure. Habitat International, 11(2), 89-103.

Scottish Journal of Arts, Social Sciences and Scientific Studies - ISSN 2047-1278
http://scottishjournal.co.uk
36
Awotona A. (1990). Nigerian Government Participation in Housing: 1970- 1980.
Habitat International, 14 (10), 17-40
Ayedun, C.A. and Oluwatobi, A.O. (2011) Issues and Challenges Militating
against Sustainability of Affordable Housing Provision in Nigeria. Business
Management Dynamics, 1(4), 01-08.
Ayodele A. O.; Ogunbode, A. B.; Ariyo, Ibironke, E. And Alabi, O. M.(2011).
Corruption in the Construction Industry of Nigeria: Causes and Solutions, Journal
of Emerging Trends in Economics and Managment Sciences (JETEMS) 2(3), 156-
159
Balchin P.R, Isaac D and Chen J. (2000). Urban Economics: A Global
Perspective. New York: Palgrave
Bana P.M. (1991). Housing the Urban Poor in Nigeria. The Nigerian Institute of
Architects Journal, 6(1), 22-25.
Bashir, S.A. (2002) Home is Where the Harm is: Inadequate Housing as a Public
health Crisis. American Journal of Public Health 92 (5), 733-738.
Basorun, J.O. and Fadairo, G (2012). Government Challenges in Housing the
Urban Poor in Ado-Ekiti, Nigeria, Journal of Sustainable Society, 1(2), 31-35.
Dellapiane-Avellaneda, S. (2009). Review article: Good governance, institutions
and economic evelopment: Beyond conventional wisdom. British Journal of
Political Science, 40: 195- 224.
Etim, E.E., Aster, J. and Akpabio, F. (2007). The New Social Housing Scheme in
Nigeria: How Beneficial for the Less Privileged? Global Journal of Social
Sciences, 6(1), 1-6
Federal Republic of Nigeria (1991). National Housing Policy, Lagos: Federal
Government Press
Ibem E.O. (2011a). Evaluation of Public Housing in Ogun State, Nigeria, Ph.D
Thesis Submitted to the School of Postgraduate Studies , Covenant University,
Ota, Nigeria for the award of Doctorate Degree in Architecture,
Ibem, E.O. (2011b). The Contribution of Public Private Partnerships (PPPs) to
Improving Accessibility of Low-Income Earner to Housing in Southern Nigeria.
Journal of Housing and the Built Environment. 26(2),201-217
Ibem, E.O; Anosike, M.N. and Azuh, D.E. (2011). Challenges in Public Housing
Provision in the Post- Independence Era in Nigeria. International Journal of
Human Sciences 8 (2), 421-443.

Scottish Journal of Arts, Social Sciences and Scientific Studies - ISSN 2047-1278
http://scottishjournal.co.uk
37
Ibem, E.O and Solanke, O. (2011). Assessing Organizational Capacity in Housing
Provision: A Survey of Public Housing Agencies in Ogun State, Nigeria. Journal
of Social and Development Sciences, 2(6),275-285
Ikejiofor U. (1999). The God that Failed: A Critique of Public Housing in Nigeria,
1975-1995. Habitat International, 23(2), 177-188.
Katsina, A.M.(2011), Trend Analysis of Poverty and Urban Crime in Nigeria
Since 1999 International Journal of Arts and Commerce, 1(2), 113-130.
Mba H.C. (1992). The Dilemmas of Housing Programmes in Nigeria in H. C.
Mba, J.U.Ogbazi & K. O. Efobi (Eds.) Principles and Practice of Urban and
Regional Planning in Nigeria, Awka: Mekslink Publishers Nigeria, 52-62.
Mustapha I. (2002) Overview of Housing and Urban Development Programme
Since Independence. Housing Today-Journal of the Association of Housing
Corporations of Nigeria, 1 (6),28-30.
Ndubueze, O.J. (2009). Urban housing affordability and the housing policy
dilemmas in Nigeria. University of Birmingham: Unpublished Ph.D thesis.
Ogu , V I and Ogbuozobe, J E, (2001) “Housing policy in Nigeria: towards
enablement of private housing development” Habitat International, 25, (4), 473-
492
Olotuah AO and Bobadoye SA. (2009). Sustainable Housing Provision for the
Urban Poor: A Review of Public Sector Intervention in Nigeria. The Built &
Human Environment Review, (2), 51-63.
Oloyede, S.A., Iroham, E.O., Ayedun, C.A.(2011). Informal Land Market:
Alternative Approach to Mass Residential Housing Provision in South-Western
Nigeria, Journal of Geography and Regional Planning, 4 (11), 598-603.
Olu-Adeyemi, L. (2012). The Challenges of Democratic Governance in Nigeria,
International Journal of Business and Social Science, 3(5), 167-171
Omole F.K. (2001). Basis Issues in Housing Development. Femo Bless
Publishers: Ondo
Onibokun AG. (1985). Public Housing Delivery System in Nigeria (1979-1983).
A Critical Review. Housing in Nigeria, Onibokun, A. G. (Ed.) Nigerian Institute
of Social and Economic Research, NISER, Ibadan, 429-446.
Sykora L. (1999). Processes of socio-spatial differentiation in post-communist
Prague. Housing Studies 14 (5), 679-701.

Scottish Journal of Arts, Social Sciences and Scientific Studies - ISSN 2047-1278
http://scottishjournal.co.uk
38
Tipple, A. G. (1994). The need for new Urban housing in Sub-Saharan Africa:
Problem or Opportunity .African Affairs, 93(373)587–608
Thiele, B. (2002) The Human Right to Adequate Housing: A Tool for Promoting
and Protecting Individual and Community Health. American Journal of Public
Health 92 (5) 712-715
Ude, U. And Coker, M.A.(2012). Democratisation as Social Empowerment:
Nigeria, a Focus of Study. International Journal of Humanities and Social
Science, 2(14), 179-188
UNDP (2007) Governance for Sustainable Human Development, A UNDP Policy
Paper.
UN-HABITAT (2006a) Shelter for All: The Potential of Housing Policy in the
Implementation of the Habitat Agenda, Nairobi: UN-HABITAT Information
Services
UN-HABITAT (2006b). National Trends in Housing –Production Practices
Volume 4: Nigeria, United Nations Centre for Human Settlements: Nairobi
UN-HABITAT (2010). The State of African Cities 2010-Governance, Inequality,
Urban Land Markets. Nairobi: United Nations Human Settlements Programme
(UN-HABITAT).
World Bank (2010). World Development Report 2010: Development and Climate
Change. Washington DC: World Bank.

Scottish Journal of Arts, Social Sciences and Scientific Studies - ISSN 2047-1278
http://scottishjournal.co.uk
39
Depth-area stratification of
groundwater quality in part of Lagos
State, Nigeria.
Y. A. Asiwaju-Bello
Dept of Applied Geology,
Federal University of Technology, Akure.
Nigeria.
O.S. Oladeji
Dept of Civil Engineering,
Ladoke Akintola University of Technology, Ogbomoso.
Nigeria. Email: [email protected]
Telephone: +2348163240876
Abstract
This work presents depth-area stratification of groundwater quality within Lagos
metropolis, Nigeria. The hydrochemical data were checked for validity via ionic balance
to ensure an acceptable 5 % error limit. Spatially, two major hydrogeochemical regimes,
namely Na-Cl and Na-HCO3- facies types were identified in the study area. Also, depth-
dependent geochemical facies transformation from Cl-SO42-
type at shallow horizons,
through Cl-SO42-
-HCO3- at the lower horizons, and to HCO3
--Cl-SO4
2- at the deep
horizons were observed. Results of the algebraic-graphical analysis of the observed
salinity suggest an ancient water origin entrapped by marine sediments rather than recent
salt water intrusion. The pH values indicate higher (5.3) acidity in the northern part as
compared with the central (5.9) and the southern (6.0) regions of the study area. The
major ionic concentrations viz: Ca2+
, Mg2+
, Na+, K
+, SO4
2-, HCO3
-, and Cl
-, generally fall
below the W.H.O. suggested desirable limits. The SAR limits of between 3.08 and 14.0
were observed for the water samples in the area, and this suggests excellent to good water
type for irrigation purposes. Regular routine chemical analysis is recommended to
monitor possible ingress of salinity into the aquifers.
KEYWORDS: Hydrochemistry; groundwater quality; hydrochemical regimes; statistical
approach

Scottish Journal of Arts, Social Sciences and Scientific Studies - ISSN 2047-1278
http://scottishjournal.co.uk
40
Introduction
The success of the global efforts in the development of groundwater resources
potential depends largely on the ability to adequately protect this subterranean water from
the increasing threat of subsurface pollution. However, the compelling desires to reduce
surface environmental pollution has caused some practitioners in the waste management
fields to covet the subsurface environment as a waste disposal unit, thereby aggravating
the potential for groundwater pollution. Hence, the interest on the geochemistry of
groundwater is increasing as a result of a large number of groundwater pollution cases
resulting from incidents like underground liquid waste storage, accidental contaminant of
groundwater bodies by lethal substances, leakages from sanitary landfills, ponds and
lagoons, as well as leaching of animal wastes, fertilizers and pesticides from agricultural
soils (Adekunle, et. al., 2007; Olayinka and Alo, 2004; Ikem et. al., 2002).
Generally, the results of the chemical analysis of a large number of samples
usually yield a clumsy mass of data where quick visual comparison is difficult (Asiwaju-
Bello and Oladeji, 2001). Easily comprehensible techniques of analyzing these data are
the graphical methods. Examples of these are the spatial variational maps, bar charts,
circular diagrams, and Stiff diagrams. Others include trilinear diagrams developed by
Piper (1953), with similar design by Hill (1940), and the semi-logarithmic diagram
developed by Scholler (1962). Consequently, it is apparent that the combination of the
different types of graphical techniques will be useful in extracting obscured facts from
water analytical results.
Reports on geochemical characteristics of groundwater within some parts of the
basement (Ako et al., 1990; Malomo et al., 1990; Gbadebo, 2012), as well as some
sedimentary basins of Nigeria (Tijani and Uma, 1998; Ekwere and Ukpong, 1994;
Akujieze et al., 2003), are available in the literature. However, within Lagos State, there
have been few published works, with the exception of consultant reports which are not
freely accessible. Few authors, e,g, Longe et al., (1986), provided little details on the
water quality in the areas within the framework of their hydrogeological study. However,
the depth of sampling could not be related to the samples analyzed. Therefore, this paper
intends to study water quality depth stratification by integrating statistical enquiry and
graphical techniques so as to utilize the advantages of the individual methods in the
analyses of the hydrochemical results obtained from the study area. The Piper and
Schoeller graphical techniques are favoured in this work because of their ability to reflect
differences or similarities among different water samples, and their limited space
requirement.
The study area
Lagos State is located along the coastal region of south-western Nigeria, and
bounded by longtitudes 3ᵒ00’ – 4
ᵒ15’ E and latitudes 6
ᵒ15’ – 6
ᵒ45’ N (Figure 1). The area
of investigation is generally low-lying with several points virtually at the sea level, and is
therefore prone to flooding. Jones and Hockey (1964) recognized three distinct
topographical forms which include the northern uplands, the Ewekoro depression and the
low-lying marshy belt at the southern part. The area is drained by four major river
systems, namely Ogun in the centre, Ona and Osun in the east, and the Yewa in the west.
Two climatic seasons exist in the area. These are the dry season, spanning from
November to March, and wet season, which extends from April to October, with an

Scottish Journal of Arts, Social Sciences and Scientific Studies - ISSN 2047-1278
http://scottishjournal.co.uk
41
average annual rainfall of 1700 mm (Akintola, 1986). The rainfall serves as a major
source of groundwater replenishment in the area.
Figure 1: Description of the study area
Geology and Hydrogeology
The geological map of the study area is presented in Figure 2. The area forms the
eastern part of the regional Dahomey basin, and extends from Accra in Ghana to Benin
hinge line in Nigeria, where it is separated from the Niger Delta by the Okitipupa ridge.
The basal portion of Dahomey basin consists essentially of sandstones and gravels devoid
of fossils. This is overlain by marine shales, sandstones and limestones of Albian to
Santonian ages. Generally, the geosequence of the Dahomey basin covers Pre-Cambrian
to Recent. The Recent sediments occur as alluvial deposits along the major rivers and
coastal belts. It consist essentially of unconsolidated coarse to poorly sorted sands, clay
lenses and mud, with presence of pyritic fragments and traces of lignites in sediments
within the area.
The aquifers within this horizon are unconfined (Asiwaju-Bello and Oladeji,
2001). The Coastal Plains Sands consist of poorly sorted clays with traces of lignites and
pyritic fragments and thicknesses increasing from north to south. Kampsax and Sshwed
(1977) subdivided the Coastal Plains Sands into the upper and lower portions separated
by impermeable argillaceous materials. Details about the geology of the basin can be
found in reports by Jones and Hockey (1964), Omatsola and Adegoke (1981), and Fayose
(1970).

Scottish Journal of Arts, Social Sciences and Scientific Studies - ISSN 2047-1278
http://scottishjournal.co.uk
42
Figure 2: Geology of the study area
Methodology
This study utilizes geochemical results of groundwater samples obtained from the
study area (see Figure 1). The analyses include the following physical parameters
namely, the temperature, conductivity, pH, and colour. The major ionic concentrations
included in the analyses are Ca2+
, Mg2+
, Na+, K
+, SO4
2-, HCO3
-, Cl
-, total Fe, Si, NO3
-,
and NH4+. The physical parameters which include temperature, conductivity, and the pH
were measured on the field using mercury thermometer, HANNA pH meter, and Mettler-
Toledo EC/TDS meter, respectively. The cations and the anions were determined using
Perkin-Elmer 305B model of atomic adsorption spectrophotometer and titration methods
(PerkinElmer, 1996), respectively. The hydrochemical data were checked for validity via
ionic balance and the data that fall outside the acceptable percentage error of 5 % (Freeze
and Cherry, 1979) were discarded.
The data were sorted out based on the area and depth stratification. The study area
was subdivided into the northern, the central and the southern parts. The geographical
areas that constitute the northern part in this study are Ikeja, Ipaja, Shasha, Ilupeju,
Ikorodu, Itoikin, Eredo, and Epe. The central part of the study area is occupied by Igando,
Oshodi, Mushin, Isolo, Shomolu, Badore, Lakowe, and Bariga. Also, the southern part
consist of Festac, Ijanikin, Apapa, Ojoo, Amuwo, Lekki, Kirikiri, Akodo, Victoria Island,
Ikoyi and Badagry. The depth stratification range used for each of the area based on the
available data on the depths of completed boreholes are <100 m, 100 – 200 m, and > 300
m, and these hereafter are referred to as the first, second and third horizons, respectively.
The statistical parameters used for the descriptions of the hydrochemical data
include the mean, measure of central tendencies, degree of dispersions and correlation.
These helped to reduce the mass of data to a smaller representative collection that

Scottish Journal of Arts, Social Sciences and Scientific Studies - ISSN 2047-1278
http://scottishjournal.co.uk
43
adequately summarizes the entire set of data, measure consistencies and aid in its
comprehension. The water samples were classified in terms of the water types, based on
the concept of hydrochemical facies, and correlated using integrated graphical techniques
developed by Piper (1953) and Schoeller (1962). Possible mixtures of water were tested
by observations within the three fields of the trilinear diagrams, and by the application of
the graphical-algebraic criteria suggested by Piper (1953). Comparisons were made
between the ionic ratios from various water sources in order to establish the origin of
anomalous chemical concentrations. Finally, the suitability of the waters for irrigation
purposes was tested using Sodium Adsorption Ratio (SAR) formula proposed by the US
Salinity Laboratory (1954).
Results and discussions
The arithmetic mean, range of values, standard deviations and coefficient of
variations for the specific electrical conductivity (SEC), temperature, pH, colour, total
dissolved solids (TDS) and the major ionic concentrations of the samples obtained from
the northern, central and the southern parts of the study area are presented in Tables 1 – 3,
respectively. The tables indicate important similarities and differences between the
various depth horizons. In all the horizons within the study area, the values of coefficient
of variations are considered to be low, and therefore suggest a high degree of
consistencies in the hydrochemical data obtained from the study area. Also, in all the
horizons, the hydrochemical data indicate a good correlation between the SEC and TDS,
with the average ratio of the latter to the former being 0.6. The concentration of other
ions in the samples correlated favourably well with the observed trends of the TDS and
SEC. The highest values of the TDS are observed at the central area, probably due to
more intense anthropogenic activities. The temperature shows an increase with depth and
also increases from the north towards the south. The pH value is highest in the north and
decreases towards the south. The relatively high pH in the north is perhaps due to the
presence of pyritic fragments and traces of lignites in sediments within the area. The
colour indicator measured on the Hazen unit increases towards the south which suggest
increasing turbidity.

Scottish Journal of Arts, Social Sciences and Scientific Studies - ISSN 2047-1278
http://scottishjournal.co.uk
44
Table 1: Analytical results of depth stratification of water quality for the northern
area
Parameter
Northern Sub area
First Horizon Second Horizon Third Horizon
Ῡ Yn – Y1
σ n σ1 Ῡ
Yn – Y1
σ n σ1 Ῡ
Yn – Y1
σ n σ1
Conductivity (µS/cm) 150 0 0 1 0 51 53 20 5 0.4 360 156 78 2 0.4
Temperature (ᵒC) - - - - - 29 2.4 0.8 5 0 30 22 10 3 0.2
pH 5.5 0 0 1 0 5.3 0.9 0.4 5 0.1 6.1 0.7 1.3 2 0.2
Colour 1 0 0 1 0 1 1 0.6 5 0.6 7 10 5 2 0.7
TDS (mgL-1
) 101 0 0 1 0 34 44 16 5 0.5 249 339 142 3 0.6
Ca2+ (mgL-1
) 14 0 0 1 0 5.1 4.9 1.7 5 0.3 31 58 24 3 0.8
Mg2+ (mgL-1
) 1.2 0 0 1 0 0.4 0.3 0.1 4 0.3 4.5 8.3 3.4 3 0.8
Na+ (mgL-1
) 11 0 0 1 0 5.1 6.3 2.1 5 0.4 44 53 22 3 0.5
K+ (mgL-1
) 3.8 0 0 1 0 1.3 4 1.5 5 1.2 15 23 9.8 3 0.6
Total Fe (mgL-1
) - - - - - 0.2 0.5 0.2 3 1 3.2 3.4 1.6 3 0.5
Si (mgL-1
) 8 0 0 1 0 8 17 6.9 4 0.9 21 35 15 3 0.7
Cl- (mgL
-1) 22 0 0 1 0 8.8 14 4.7 5 0.5 15 11 4.5 3 0.3
HCO3- (mgL
-1) 9.6 0 0 1 0 8.1 12 4 5 0.5 183 255 111 3 0.6
SO42-
(mgL-1
) 5 0 0 1 0 2.3 0.5 0.3 5 0.1 3 2 1 2 0.3
NO3- (mgL
-1) 33 0 0 1 0 11 13 5.2 4 0.5 5.6 7.7 3.2 3 0.6
NH4+ (mgL
-1) 0.5 0 0 1 0 0.5 0.1 0.1 4 0.2 1.6 2.6 1.1 3 0.7
Ῡ: Arithmetic mean; Yn – Y1: Data Range; σ: Standard deviation; n: Number of data; σ1:
Coefficient of deviation.

Scottish Journal of Arts, Social Sciences and Scientific Studies - ISSN 2047-1278
http://scottishjournal.co.uk
45
Table 2: Analytical results of depth stratification of water quality for the central
area
Parameter
Central Sub area
First Horizon Second Horizon Third Horizon
Ῡ Yn – Y1 σ n σ1 Ῡ Yn – Y1 σ n σ1 Ῡ Yn – Y1 σ n σ1
Conductivity (µS/cm) 318 502 146 7 0.5 60 7.8 5.3 2 0.1 199 0 0 1 0
Temperature (ᵒC) 29 2 0.6 7 0 30 0 0 1 0 31 0 0 1 0
pH 5.9 2.7 0.9 7 0.2 5.9 0.2 0.1 2 0 6.7 0 0 1 0
Colour 2 3 1 5 0.5 2 0 0 1 0 1 0 0 1 0
TDS (mgL-1
) 210 372 125 6 0.4 45 0 0 1 0 135 0 0 1 0
Ca2+ (mgL-1
) 23 39 13 7 0.6 3.7 0.9 0.5 2 0.1 17 0 0 1 0
Mg2+ (mgL-1
) 2.4 4.4 1.4 7 0.6 0.2 0 0 1 0 - - - - -
Na+ (mgL-1
) 50 85 29 7 0.6 6.8 3.4 1.7 2 0.3 32 0 0 1 0
K+ (mgL-1
) 8.1 16 5 7 0.6 1.9 1.2 0.6 2 0.3 4.9 0 0 1 0
Total Fe (mgL-1
) 0.6 2.2 0.8 5 1.3 4.4 2.4 1.2 2 0.3 3.5 0 0 1 0
Si (mgL-1
) - - - - - - - - - - - - - - -
Cl- (mgL
-1) 65 13 45 7 0.7 19 0 0 1 0 13 0 0 1 0
HCO3- (mgL
-1) 24 51 17 7 0.7 19 7.1 3.5 2 0.2 109 0 0 1 0
SO42-
(mgL-1
) 8 0 0 1 0 3 2 1 2 0.3 2 0 0 1 0
NO3- (mgL
-1) 63 125 38 7 0.6 18 0 0 1 0 8.8 0 0 1 0
NH4+ (mgL
-1) 3.4 9.7 3.8 5 1.1 - - - - - - - - - -
Table 3: Analytical results of depth stratification of water quality for the southern
area
Parameter
Southern Sub area
First Horizon Second Horizon Third Horizon
Ῡ Yn – Y1 σ n σ1 Ῡ Yn – Y1 σ n σ1 Ῡ Yn – Y1 σ n σ1
Conductivity (µS/cm) 226 223 96 3 0.4 127 172 67 4 0.5 90 134 48 11 0.5
Temperature (ᵒC) 30 0.8 0.3 3 0 31 1.5 0.6 4 0 33 5.1 1.9 4 0.1
pH 6.5 1 0.5 3 0.1 6 1.4 0.5 4 0.1 6.1 1.3 0.5 6 0.1
Colour 7 13 4.8 4 0.7 6 21 7.3 6 1.2 2 7 1.8 11 0,9
TDS (mgL-1
) 166 158 66 4 0.4 65 63 20 6 0.3 54 77 28 11 0.5
Ca2+ (mgL-1
) 29 39 15 4 0.6 6.3 8.1 3.5 6 0.6 5.3 10 2.9 11 0.5
Mg2+ (mgL-1
) 1.2 1.3 0.5 4 0.4 0.9 2.1 0.7 6 0.8 0.6 1.5 0.4 8 0.7
Na+ (mgL-1
) 29 41 1.6 4 0.6 12 13 4.4 6 0.4 15 27 8.3 11 0.6
K+ (mgL-1
) 6.8 16 5.8 4 0.9 2.9 4 1.7 6 0.6 2.7 6.3 1.9 10 0.7
Total Fe (mgL-1
) 1.5 1.5 0.7 3 0.5 12 37 12 6 1 3.7 9.3 2.8 11 0.8
Si (mgL-1
) 8.3 4.5 2.3 2 0.3 12 12 4.4 4 0.4 7.7 9.8 3.5 4 1.5
Cl- (mgL
-1) 22 28 10 4 0.5 12 21 7.6 6 0.7 11 23 7 10 0.6
HCO3- (mgL
-1) 73 147 57 4 0.8 36 41 14 6 0.4 33 64 21 11 0.7
SO42-
(mgL-1
) 13 18 7.7 4 0.8 2.3 3 0.9 6 0.4 2.4 3.5 0.8 11 0.3
NO3- (mgL
-1) 18 20 9.4 3 0.5 12 11 4.5 5 0.4 10 7.4 3 9 0.3
NH4+ (mgL
-1) 1.5 2.9 1.2 4 0.8 1.1 1 0.4 4 0.4 0.8 0.5 0.2 4 0.3

Scottish Journal of Arts, Social Sciences and Scientific Studies - ISSN 2047-1278
http://scottishjournal.co.uk
46
Within the third horizons in the north and central areas, HCO3- is the dominant
anion, followed by Cl- ions. The average ratio of the latter to the former within these
horizons is approximately 10. The Cl- and NO3
-ions dominate the first horizons of the
north and the central parts. The relative concentrations of the alkaline and alkali earth
metals within the horizons are similar in these areas. The patterns of the chemical
characteristics of the water samples from all the horizons as shown by the Schoeller’s
semi-logarithmic diagrams are presented in Figure 3. Generally, in all the areas and the
horizons, the pH values of 5.3 - 6.7 obtained indicate slight acidity when compared with
the WHO (2011) recommended guideline of 6.5 – 9.2. However, the pH values observed
in this study agrees with the work of Edet, et. al., 2011, where it was observed that most
groundwater samples in Nigeria have pH values of between 4.86 and 7.05. The average
values obtained for TDS (34 – 305 mgL-1
), Mg2+
(0.2 – 4.5 mgL-1
), Na+ (5.1 – 50 mgL
-1),
Cl- (8.8 – 65 mgL
-1) and SO4
2- (2.0 – 13 mgL
-1) fall below the recommended highest
desirable limits of 500, 30, 100, 200, and 200 mgL-1
, respectively.
Also, Si, HCO3-, Ca
2+, and NO3
- ions fall largely below the W.H.O. (2011)
recommended limits. The average total iron concentration within the study area is
generally high. In the south, high iron concentration was observed in all the three
horizons with average values of 1.5, 12, and 3.7 mgL-1
, in the first, second and third
horizons, respectively. These iron concentrations exceed the WHO (2011) maximum
permissible level of 1.0 mgL-1
. The suitability of the waters for irrigation purpose is
dependent on the types of plant, soil and the climate. The replacement of Ca and Mg ions
by sodium ions which could cause reduction in the soil permeability and hardening of the
soils is measured by the SAR formula (US Salinity Laboratory, 1954), given as:
√
(1)
The SAR values have been computed for the waters in all the horizons of the
study area and the results are presented in Table 4, and the range of the SAR values is
3.08 – 14.00. According to the classification presented by Etu-Efeotor (1981), all the
water samples in the study area are described as ‘Excellent to Good’, and therefore are
suitable for irrigation purposes.
On the Piper’s trilinear diagram (Figure 4), the water samples are categorized
based on the classification proposed by Piper (1953). In the northern area, samples from
the second horizon plotted at sub-area 4 of the diamond-shaped field, and this suggests
that the strong acids exceed the weak acids.
Table 4: Values obtained for the SAR
Horizon SAR Values Water Class (after
Etu-Efeotor, 1981) North Central South
First 3.98 14 7.8 Excellent - Good
Second 3.08 4.87 6.06 Excellent
Third 10.46 11.04 8.5 Excellent - Good

Scottish Journal of Arts, Social Sciences and Scientific Studies - ISSN 2047-1278
http://scottishjournal.co.uk
47
Figure 3: Scholler semi-logarithmic diagram
The relatively high pH value earlier observed in this horizon agrees with this
deduction. The third horizon in the north falls into the sub-area 3 of the diamond field,
and this suggests the prevalence of weak acids as compared to strong acids. The first and
the second horizons in the central part fall within the sub-area 7 of the field, and this
suggests primary salinity where the chemical properties of the waters are dominated by
the alkalis and strong acids, typifying the oceanic waters and brine.
In order to demonstrate conclusively that certain water is a quantitative mixture of
two other waters, Piper (1953) suggested that the apparent mixture must plot on a straight
line between the plotting of its two inferred components in each of the three fields of the
trilinear diagram. In addition, the following equations should also be satisfied:
( ⁄ ) ⁄ (2) ( ⁄ ) ⁄ (3)
( ) ( )⁄ (4)
( )⁄ (5)
( )⁄ (6)
where

Scottish Journal of Arts, Social Sciences and Scientific Studies - ISSN 2047-1278
http://scottishjournal.co.uk
48
a, b: distances measured on the diamond field of the Piper’s diagram
: concentrations in the samples a and b, and mixture m, respectively.
: Proportionate volume of samples a and b in the mixture m.
Therefore, with reference to Figure 4, the samples which show a degree of
alignment with the plotting of the inferred components of rain water and sea water
concentrations are the samples from the first and second horizons in the central parts. The
compliance of these samples with equations 2 – 6 was further tested and the results
indicate a percentage difference of 50.5 and 25, respectively, between the empirically
determined and computed concentrations. This suggests that the salinity of the two
samples earlier observed is not due to the sea water intrusion. Furthermore, Table 5
presents the ionic ratios of the major chemical parameters of the samples obtained from
the central and southern areas, as well as similar ratios for the sea water constituents in
the same area. Similarities exist in the values of the ionic ratios between the two sea
water samples obtained from Akodo and Bar Beaches. However, there are large
discrepancies between the set of the two sea water samples and those obtained from the
horizons (Table 5). This further supports the deduction that the observed salinity is not
due to sea water intrusions.
The summary of the hydrofacies classification of the water samples obtained from
the study area in all the horizons is presented in Table 6. With the exception of the third
horizons in the north and central parts that are dominated by the HCO3- facies type, all the
remaining horizons within the study area are dominated by Cl- facies type. In the north
and the central parts, transformation of the water facies type from Cl--SO4
2- type at the
first horizon through Cl--SO4
2--HCO3
- type at the second, and to HCO3
--Cl
--SO4
2- at the
third horizon was observed. In the southern area, the observed water facies is Cl-- SO4
2-
HCO3- in all the horizons.
The chemical composition of dissolved salts can be used to characterize the origin
of salinity in water samples. Shale consists essentially of clay minerals that have capacity
for ionic exchange. Also, the high porous aquifers in the horizons where relatively high
chloride values are observed are likely to be composed of an appreciable percentage of
colloidal sizes particles which have the capability to exchange ion constituents that are
adsorbed on the particle surfaces. Hence, it may be concluded that the major sources of
these relatively high chloride values observed are the ionic exchange and dissolution of
minerals within the strata. Other probable sources could be the presence of the remnants
of marine water trapped through ancient transgression episodes, with subsequent
chemical alteration by interaction with the aquifer materials and differential dilution
caused by the infiltrating fresh water, though this is not substantiated in this study.

Scottish Journal of Arts, Social Sciences and Scientific Studies - ISSN 2047-1278
http://scottishjournal.co.uk
49
Figure 4: Trilinear Piper plot for the chemical characters of the water
samples.
Table 5: Calculated ionic ratio of some of the chemical parameters.
Sample source ⁄ ⁄ ( )
⁄
⁄
First Horizon (Central) 6.15 0.77 0.89 0.37
Second Horizon (Central) 3.58 0.35 0.45 0.95
First Horizon (South) 4.21 1.29 1.6 3.29
Second Horizon (South) 3.97 0.99 1.24 2.99
Third Horizon (South) 5.4 1.3 1.54 2.9
Akodo sea water 24.57 0.52 0.56 0.01
Bar Beach sea water 32.12 0.55 0.57 0.01
Table 6: Hydrochemical facies classification of waters with the horizons
Horizon North Central South
Anion Cation Total Anion Cation Total Anion Cation Total
First Cl NDT* Cl-SO4 Cl Na-K Cl-SO4 NDT* Na-K Cl-SO4-HCO3
Second Cl NDT* Cl-SO4-HCO3 Cl Na-K Cl-SO4-HCO3 NDT* Na-K Cl-SO4-HCO3
Third HCO3 Na-K HCO3-Cl-SO4 HCO3 Na-K HCO3-Cl-SO4 Cl Na-K Cl-SO4-HCO3
*: No dominant type
Conclusion
Two hydrochemical regimes are revealed by the analyses carried out in this study.
The first regime is found within the three horizons in the south, as well as in the two

Scottish Journal of Arts, Social Sciences and Scientific Studies - ISSN 2047-1278
http://scottishjournal.co.uk
50
upper horizons in the north and the central parts. This regime is dominated by Na+-Cl
-
facies type, with relatively high iron concentrations. The second hydrochemical regime,
dominated by Na+-HCO3
- facies type, is found within the third horizon of the north and
central parts of the study area. The results of the analyses of the relatively high chloride
values observed within the first hydrochemical regime support a non-sea water intrusion
source but rather, believed to be due to ionic exchange, ionic precipitation and dissolution
of the host geologic materials. Other probable sources that are not substantiated in this
work could be the presence of water of ancient origin, trapped by marine sediments or
concentrated by shale membrane. The spatial variation observed may be due to
differential dilution by the infiltrating precipitates. The pH values indicate high acidity in
the northern part, and this may be due to the presence of pyritic fragments in this sub-
area. However, within the central and the southern parts, the pH values fall within the
WHO recommended maximum permissible limits. The SAR values of the waters in the
study area vary between 3.08 and 14.0 and hence described as excellent to good for
irrigation purposes.
Arising from the above, it can be suggested that waters from the first
hydrochemical regime require some amount of treatment to achieve wholesomeness,
among which is aeration for the removal of iron. The waters within the second
hydrochemical regime can be said to be of better quality. However, in order to ensure
regular and continuous supply of wholesome waters for public uses, regular routing
chemical analysis is recommended to monitor possible spread of contaminant into the
aquifers.

Scottish Journal of Arts, Social Sciences and Scientific Studies - ISSN 2047-1278
http://scottishjournal.co.uk
51
References
Adekunle, I.M.; Adetunji, M.T.; Gbadebo, A.M.; Banjoko, O.B. Assessment of
Groundwater Quality in a Typical Rural Settlement in Southwest Nigeria. Int. J.
Environ. Res. Public Health 2007, 4, 307-318.
Akintola, J.O., 1986. Rainfall distribution in Nigeria, 1892 – 1983. Impact
Publishers Nig. Ltd., Ibadan. 380p.
Akujieze, C.N., Coker, S., and Oteze, G., 2003. Groundwater in Nigeria – a
millennium experience – distribution, practice, problems and
solutionsHydrogeology Journal; 11(2): 259-274.
Ako, B.D., Adeniyi, F.I., and Adepoju, J.F., 1990. Statistical tests and chemical
quality of shallow groundwater from a metamorphic terrain, Ile-Ife/Modakeke,
SW Nigeria. Journal of African Earth Sciences. Vol. 10, No. 4; Pp 603 – 613.
Asiwaju-Bello, Y.A. amd Oladeji, O.S., 2001. A numerical model of groundwater
flow patterens within Lagos Metropolis, Nigeria. Journal of Mining and Geology.
Vol. 37, No.2; Pp 185-194.
Edet, A., Nganje, T,N., Ukpong, A.J., and Ekwere, A.S. 2011. Groundwater
chemistry and quality of Nigeria: A status review. African Journal of
Environmental Science and Technology. 5(13): 1152 – 1169.
Ekwere, S.J. and Ukpong, E.E., 1994. Geochemistry of saline groundwater in
Ogoja, Cross-River State of Nigeria. Journal of Mining and Geology. Vol. 30, No.
2; Pp 11 – 15.
Etu-Efeotor, J.O., 1981. Preliminary hydrochemical investigations of sub-surface
waters in parts of the Niger Delta. Journal of Mining and Geology, Vol. 18, No. 2;
Pp 103 – 105.
Fayose, A.E., 1970. Biostratigraphy of the Dahomey basin. Journal of Mining,
Geology and Metallurgical Society of Nigeria. Vol. 5, Pp 54 – 67.
Freeze, R.A. and Cherry, J.A., 1979. Groundwater. Prentice-Hall Inc., Englewood
Cliffs, United States. 97p.
Gbadebo, A.M., 2012. Groundwater fluoride and dental fluorosis in southwestern
Nigeria. Environmental Geochemistry and Health; 34(5): 597-604.
Hill, R.A., 1940. Geochemical patterns in Coechella valley. Americal
Geophysical Union. Part 1, Pp 46 – 49.

Scottish Journal of Arts, Social Sciences and Scientific Studies - ISSN 2047-1278
http://scottishjournal.co.uk
52
Ikem, A., Osibanjo, O., Sridhar, M.K.C., and Sobande, A. 2002. Evaluation of
Groundwater Quality Characteristics near Two Waste Sites in Ibadan and Lagos,
Nigeria. Water, Air, & Soil Pollution, 140 (1-4): 307-333.
Jones, H.A. and Hockey, R.D., 1964. The geology of parts of south-western
Nigeria. Geological Survey of Nigeria Bulletin. No. 31, Pp 1 – 101.
Kampsax-kruger and Sshwed Associates Report, 1977. Underground water
resources investigation of the metropolitan Lagos (Unpublished). Pp 1 – 304.
Longe, E.O., Malomo, S., and Olorunniwo, M.A., 1986. Hydrogeology of Lagos
Metropolis. Journal of African Sciences. Vol. 6, No. 2; Pp 163 – 174.
Malomo, S., Okufarasin, Y.A., Olurunniwo, M.A., and Omode, D.A., 1990.
Groundwater chemistry of weathered zone aquifers of an area underlain by
Basement Complex rocks. Journal of African Sciences. Vol. 11, No. 3/4; Pp 357 –
371.
Olayinka, K.O and Alo, B. I., 2004. Studies on Industrial Pollution in Nigeria:
The effect of Textile effluents on the quality of Groundwater in some parts of
Lagos. Nigerian Journal of Health and Biomedical Sciences; 3(1): 44-50.
Omatsola, M.E. and Adegoke, O.S., 1981. Technique evolution and Cretaceous
stratigraphy of the Dahomey basin, Nigeria. Journal of Mining and Geology. Vol.
18, No. 1; Pp 130 – 137.
PerkinElmer, 1996. Analytical methods for atomic adsorption sprctroscopy.The
PerkinElmer Inc., USA. 310p.
Piper M.A., 1953. A graphic procedure in the geochemical interpretation of water
analysis. US Department of the Interior. Geological Survey (Water Resources
Division). No. 12, Pp 1 – 14.
Schoeller, H., 1955. Geochimie des equx souterraines. Rev. Inst. Fanc. Petrole,
Paris. Vol. 10, No. 3; Pp 151 – 213; and No. 4; Pp 219 – 246.
Tijani, M.N. and Uma, K.O., 1998. Geological, geophysical and hydrochemical
studies of the Okpoma brine field lower Benue trough, south eastern Nigeria.
Journal of Mining and Geology. Vol. 34, No. 2; Pp 55 – 68.
U.S. Salinity Laboratory (1954). Diagnosis and improvement of saline and alkali
soils. U.S. Department Agricultural Handbook; Vol. 60, Pp 69 – 82.
World Health Organization (WHO), 2011. Guidelines for drinking-water quality -
4th Ed. Pp 541.

Scottish Journal of Arts, Social Sciences and Scientific Studies - ISSN 2047-1278
http://scottishjournal.co.uk
53
Effects of Global Economic
Recession on Foreign Private Capital
Inflows and Economic Growth in
Nigeria
Benjamin Ayodele Folorunso
Department of Economics, Faculty of Social Sciences
Obafemi Awolowo University, Ile-Ife, Osun State, Nigeria
E-mail: [email protected] or [email protected]
Abstract:
The paper examined the effects of global economic recession on both the foreign
private capital inflows and growth of the Nigeria’s economy. Data were sourced from the
Statistical Bulletin published by the Central Bank of Nigeria and UNDP Human
Development Reports published while cointegration and error correction mechanism
(ECM) were employed in analyzing the data. Granger causality tests were also used in
determining direction of causation between measures of global economic recession
indicators, foreign private capital inflows, foreign reserves, trade openness and Nigeria’s
real GDP growth series. The paper found that global economic crisis portended a
significant negative effect on the Nigerian economy. Indeed, global economic recession
dampened the inflows of foreign private capital inflows into the country which in turn
resulted in the poor growth of the economy. The paper confirmed that Keynes’ advocacy
was still relevant in addressing the negative effect of global economic recession on the
growth of the Nigeria economy indicating the effective use of fiscal stimulus to stimulate
effective demand and reduction in income and corporate taxes. The paper, however,
concluded that the present economic situation in the country permits the use of policy
mixture of both monetary and fiscal measures to counter the effect of global economic
downturn.
Key words: global economic recession; foreign private capital; economic growth;
granger causality; time series; fiscal stimulus. JEL Classification: C32, G21

Scottish Journal of Arts, Social Sciences and Scientific Studies - ISSN 2047-1278
http://scottishjournal.co.uk
54
I Introduction:
No country lives in autarky; countries interact with one another, as no country is
an island or self-sufficient. Globalization; the integration of world economies, manifests
in the greater movement of people, goods, capital and ideas, due to increased economic
integration, which in turn is propelled by increased trade and investment. However,
integration is multifaceted; it can be financial, trade, political, cultural and what have you.
Indeed, it has to do with the sharing of goods, services, knowledge and cultures among
people and countries. Today, improvement in technology and the dismantling of various
barriers between countries have made the speed of these exchanges much faster.
Globalization has consequently occasioned a global market built on an international
financial system. The integration is expected to bring about accelerated development in
all countries and also bridge the gap between the rich and poor countries.
Evidence of development across the globe is, however, contrary to the
expectation. Now, with globalization, ripples in the economy of any part of the world can
easily spread to other parts. For instance, according to UNDP Human Development
Report for 2011 reported in Table 1, most countries in Africa and Nigeria in particular
belong to low human development, life expectancy and GNI index group. Table 1 clearly
shows that development index in Nigeria is still far behind countries in other regions of
the world; it ranked 156th
among 187 countries. While few countries in Africa appear to
have developed their economies above average, many, including Nigeria, are still
suffering from low expectancy rate, low calorie intake, poor housing, low and poor level
of education, high level of corruption and low per capita GNI.
The issue of whether or not the global village is in recession is not controversial.
World output growth as reported in Table 2 fell from 3.8 per cent in 2007 to 2.2 per cent
in 2008 and experienced a negative growth of – 0.6 per cent in 2009 and 2.1 per cent in
2010 marking the lowest rates so far since World War II. Despite wide-ranging policy
actions, financial strains remain acute, pulling down the real global economy. The most
affected countries facing the current economic depression are the advanced economies
(including the USA where it all emancipated from) and the countries whose financial
institutions heavily invested in buying debt bonds from the US financial system
especially countries like the UK, Germany, Canada, Spain etc. The output growth records
for Africa, Sub-Sahara Africa and emerging and developing economies from 2007 to
2010, though not negative, followed the same trend with that of the global trend.
Global output and trade plummeted from 2007 to 2009 as reported in Table 2
which is an indication of global recession. The crisis ravaging the global economy is
naturally a serious issue for concern to investors all over the world, hence the concern for
countries, like Nigeria, facing poor and sluggish economic growth, high unemployment
rate and high level of inflation. Some measures have been made already by the regulatory
authorities to forestall the spill over of the crisis into the Nigerian economy, how
effective are these measures in combating the negative effect of the global economic
crisis in the country? The major issue for investigation is whether global economic
recession affects the Nigerian economy and canvass for appropriate policy measures to be
adopted to arrest the unwanted effect of the ugly scenario in the country. The paper fills
these gaps.
Given that economic recession is synonymous with slow growth, the paper argues
that global economic downturn portends negative effect on the Nigeria’s macroeconomic

Scottish Journal of Arts, Social Sciences and Scientific Studies - ISSN 2047-1278
http://scottishjournal.co.uk
55
variables. The paper therefore determines the effects of the current global economic crisis
on foreign capital inflows into the country and economic growth in the country. The
remaining part of the paper is organized as follows: Section II overviews the meaning and
provides the synopsis of the global economic downturn while section III focuses on the
review of both the theoretical and empirical literature. Section IV presents the model
specifications and methodology adopted. While section V focuses on the discussion of
major findings, section VI concludes the study.
II Meaning and Synopsis of Global Economic Recession:
Today, the world has created a lot of problems for itself and it is doubtful if the
world could find just enough solutions to the myriad of problems it has created for itself.
Why? This is simply because in a capitalist system, which the global world has now
embraced and which Nigeria is also aspiring to build, productive resources are owned and
controlled by private economic agents. Such an economy is therefore driven by the
private sector. In such a system, it is assumed that scarce productive resources would be
efficiently allocated through the interplay of market forces of demand and supply. The
allocation and adjustment during period of distortions is assumed, therefore, to be
automatically carried out by price mechanism (i.e., through the invisible hand). This view
has, however, been refuted with the global economic recession experienced in recent
times.
a) Meaning of Global Recession:
There is so much confusion about what scholars mean when they talk about a
“global recession”. Recession is seen as a period of general economic decline;
specifically, a decline in GDP for two or more consecutive periods (quarters or years).
Gross Domestic Product is the total market of all final goods and services produced in a
country in a given year, which is equal to total consumer, investment and government
spending, plus the value of exports, minus the value of imports {C + I + G + (X – M)}.
However, growth in GDP is what matters, and if there is negative growth for 2
consecutive quarters, the economy enters recession. The developed countries; America,
Britain, and other European countries and Japan are almost certainly already in recession
according to the popular rule of thumb of two successive quarters of falling GDP. But is
the recession in these countries really justified for the world as a whole?
The IMF in World Economic Outlook (2008) predicted that world GDP growth
would fall to 2.2% in 2009, based on purchasing-power parity (PPP) weights, from 5% in
2007 and 3.7% in 2008. In the past, the IMF has said that global growth of less than 3%
implied a world recession, so its latest forecasts would push the world over the edge.
Some forecasts by private-sector firms are even gloomier, with several now predicting
global GDP growth rates of no more than 1.5% in 2009.
But why does the IMF think that a world economy growing by less than 3% a
year is in recession? To many people, growth of 2.9%, say, sounds pretty robust. Surely a
drop in output is required? The trouble is that there is no agreed definition of a global
recession. The popular benchmark used in developed economies—two successive
quarters of decline—is not helpful when looking at the world as a whole, because many
emerging economies do not report seasonally adjusted quarterly GDP figures. Also,
downturns are rarely perfectly synchronized across countries, so even if most countries
contract at some stage during a two-year period, global GDP growth may not turn

Scottish Journal of Arts, Social Sciences and Scientific Studies - ISSN 2047-1278
http://scottishjournal.co.uk
56
negative. Indeed, global GDP has never fallen in any year since the 1930s Depression. Its
worst years since then were 1982 and 1991, with growth of 0.9% and 1.5% respectively
(see left-hand chart of Fig. 1).
It is only the developed world that faces severe recession (see right-hand chart of
Fig. 1). The IMF’s revised figures now forecast that the advanced economies will shrink
by 0.3% in 2009, which would be the first annual contraction since the war. The IMF has
become markedly more bearish on emerging economies since October, revising its
forecasts downward by an average of a percentage point. But emerging economies are
still tipped to grow by around 5%. This is a sharp slowdown from recent growth of 7 –
8%, but still above their average growth rate over the past three decades and considerably
higher than their typical growth in previous global downturns.
When tracking such diverse economies, it does make much more sense to define a
global recession not as an absolute fall in GDP, but as when growth falls significantly
below its potential rate. This can cause anomalies, however. Using the IMF’s definition
(i.e., growth below 3%), the world economy has been in recession for no fewer than 11
out of the past 28 years. This sits oddly with the fact that America, the world’s biggest
economy, has been in recession for only 38 months during that time, according to the
National Bureau of Economic Research (the country’s official arbiter of recessions),
which defines a recession as a decline in economic activity. It is confusing to have
different definitions of recession in rich and poor economies.
Before proclaiming global recession, it is also important to consider the extent to
which a downturn has spread around the world. As stock markets and currencies have
slumped in emerging economies and some governments have had to knock on the IMF’s
door, it might appear as if these economies are being hit harder than rich countries. Even
in China, growth seems to be slowing sharply, prompting the government to lift its quotas
on bank lending at the start of this month. Yet most emerging economies are still widely
expected to hold up much better than in previous global downturns.
The repeated sequence of sustained decline in output followed a longer interval of
rising output is classified as a business cycle. A sustained decline in real GDP for two or
more consecutive period (usually quarter) is seen as recession and it is a short run
phenomenon. The case of Nigeria can be examined from the real GDP trend shown in
Fig.2. The Fig.2 clearly shows that there no evidence of recession in recent time going by
the conventional definition of recession except in the first half of 1980s. The recession
witnessed from 1980–1985 then called for the implementation of the Structural
Adjustment programme as the Nigerian economic experienced major distortions in
macroeconomic variables. The Nigerian economy was therefore deregulated to allow for
the of market forces of demand and supply to determine prices in all markets. The
recession in the Nigeria economy (measured by the negative growth in real GDP) during
this period could be attributed the global recession of that time. However, the question
that readily comes to mind is to determine whether the recent global economic recession
has any effect on the Nigerian economy.
b) Synopsis of Global Economic Recession:
So far, there had been three major economic crises in the history of the United
States of America, which more or less, had spread to other countries. The earliest we can
remember occurred in the 1830s. The global spread of the 1830s depression was largely
restricted due to limited communication and globalization. However, that depression still

Scottish Journal of Arts, Social Sciences and Scientific Studies - ISSN 2047-1278
http://scottishjournal.co.uk
57
sneaked across the US borders to some European countries. One hundred years later, in
the 1930s, another economic crisis struck the USA. The 1930s economic crisis was
regarded as the most vicious, and therefore referred to as the Great Depression. The
1930s depression was more global in spread, partly because the world was more closely
knit through advancements in communication technology. In 2008, nearly another one
hundred years, another economic crisis has hit the United States, which is fast spreading
to other parts of the world, again, because the world has become, more than ever before, a
'global village' as predicted by Marshall Mac Luhan. “The current economic crisis, more
dramatically than ever before exposed the true nature of global interdependence”, says
British Prime Minister, Gordon Brown.
The Developed or rich countries faced the effect of the global recession
experienced in the 1930s mostly while for many developing or poorer countries the effect
was still relatively mild. Many economists are now predicting the worst global recession
since the 1930s. Indeed, as depicted in Fig. 1, global recession has also been reported for
the 1970s, second half of 1980s, and also the second half the 2000s. Warnings of the
future global economic recession continue unabated in the literature. Such grim warnings
discourage spending by households and businesses, depressing output even more.
This decline in the growth of world output reflects a weakening of the three major
engines of growth of the global economy; US manufacturing sector faltered, Japan’s
economy entered into another recession resulting from contraction of the economy with
its ripple effect on the EU economies coupled with the September 11 attack on the World
Trade centre in America. The simultaneous weakening of the three major engines of
global output growth represents a distinguishing feature of the current global economic
slowdown if one compares it with similar downturns in recent years. In 1998, for
example, the decline in world output growth was caused mainly by the Asian economic
crisis; and as the economies of USA as well as EU countries were continuing their strong
growth, recovery of the Asian economies was easier. Similarly, when the US economy
was in recession in the early 1990s, the EU countries and Japan were still growing. And
so were the emerging economies of Asia. Thus, when certain parts of the world suffered
declines in economic growth while others continued to grow, the former could ride out of
the difficulties by utilizing the benefits of linkage with the latter.
The current global crisis started as a ‘financial crisis’ in US in August 2007 but
now a ‘global economic crisis’. The crisis is unprecedented in severity of credit
contraction (credit crunch and capital crunch). The roots are in banking rather than in
securities market or foreign exchange and the crisis started in the U.S (due to certain
laxities in the US financial system) which later spread to Europe, and has now become
global. Even countries not affected by the financial crisis are now affected by ‘second-
round effects’ as the crisis now becomes ‘economic’.
The financial crisis in US started with sub-prime mortgage crisis as households
faced difficulties in making higher payments on adjustable mortgages. By the first quarter
of 2008, there was widespread "credit contraction,” as financial institutions in the US
tightened their credit standards in light of deteriorating balance sheets. By the fourth
quarter of 2008, increased delinquency rates affected not only sub-prime loans but also
spilled over into consumer and other credits. The effect of this crisis is credit squeeze
leading to reduction in lending to the real sector (supply side) and reduction in household
demand (demand side). The wealth effect is the decrease in asset values such as stocks

Scottish Journal of Arts, Social Sciences and Scientific Studies - ISSN 2047-1278
http://scottishjournal.co.uk
58
and real estate leading to a loss of consumer confidence and a precipitous decline in
consumption. These events translated into sharp decline in economic activities which
resulted in massive job losses in most sectors of the economy the US economy.
III Review of the Theoretical and Empirical Literature:
a) Theoretical Literature on the Causes of Economic Recession
Economic depression can be explained from the Classical and Keynesian
perspective. The Classical school attributes recurrent recessions to changes in the labour
market and/or adverse aggregate supply shock. i.e., decrease in real aggregate output
which might be as a result of an adverse supply shock and/or a change in the supply of
labour. Simply put, causality runs from decline in real output to recession which leads to
further decline in real output if not checked.
Real Output Recession Aggregate Investment
Given the Cobb-Douglas production function KALY (where Y is aggregate
output, L is the supply of labour input, K is the supply of capital input and A is the scale
parameter), a drastic fall in labour supply and decline in investment (which is define as a
change in capital stock) results in decline in aggregate supply which dovetailed into a
recession as a final result.
The Keynesians, on the other hand, attribute a recession to a slow wage and/or
price response to a decline in aggregate demand. i.e., output decline where there is a
decrease in aggregate spending and insufficient decline in prices in response to the lower
spending level. Simply put, price rigidity during decline in aggregate demand is the cause
of economic downturn. This negates the classical assumption of price flexibility in both
direction and the validity of Say’s law that “supply creates its own demand”. The
implication of the Keynesian proposition is that the predictable outcome of a decline in
aggregate demand is economic recession and thus, causality runs from decline in
aggregate demand to recession.
Aggregate Demand {C + I + G + (X – M)} Recession
In Fig. 3, the initial aggregate demand (AD1) represent the amount of good and
services that individuals, business and government plan to purchase at different price
levels. The initial aggregate supply (AS1) represents potential output and therefore the
economy’s ability to produce. The initial equilibrium is e1 with y1 and p1 clearing the
market. Suppose a decline in spending shifts aggregate demand (AD1) downward to AD2
which causes disequilibrium in the economy. With output remaining at y1, it is expected
that price will fall from p1 to p2 to achieve equilibrium at e2. Lower price (p2) will cause
output to fall to (y2). However, with price stickiness, retaining price at (p1), an economy
enters a recession in short run when aggregate demand declines, but the response of price
is insufficient to keep spending levels at their full employment level.

Scottish Journal of Arts, Social Sciences and Scientific Studies - ISSN 2047-1278
http://scottishjournal.co.uk
59
Fig 3: Economic Recession by the Keynesian
From all indication, Keynesian and neo-Keynesian see recession as being caused
by the failure of the market system in which price flexibility is assumed to restore
equilibrium in case of distortions in the market. Hence, the call for government
intervention through increased fiscal spending or stimulus (i.e., canvassing for mega-
deficit spending by governments). It is expected that this short-term increase in the public
debt will retard the rise in unemployment, limit the impact and duration of the economic
recession and in the long run lead to overall better economic performance, with limited
effect on the ratio of public debt to GDP. Though advocates and opponents can offer
differing views on the historical validity of Keynes and his counter-cyclical concepts of
sovereign intervention in the economy, there is no doubt that his theory is intellectually
cogent and based on a serious analysis of economic problems, particularly in regards to
the Great Depression of the 1930s and of our time.
A recession normally takes place when consumers lose confidence in the growth
of the economy and spend less. This leads to a decreased demand for goods and services,
which in turn leads to a decrease in production, lay-offs and a sharp rise in
unemployment. Investors spend less as they fear stocks values will fall and thus stock
markets fall on negative sentiment. The economy and the stock market are closely
related. The stock markets reflect the buoyancy of the economy.
b) Empirical Literature on the Effect of Global Economic Recession
The effect of global recession on any economy is usually being examined from
different perspectives. The review of the literature is, however, focused on the growth
effect it portends through foreign inflow of capital {either foreign private capital (FPC) or
foreign direct investment (FDI)} on an economy. Macroeconomic studies generally
suggest that FDI exerts a positive impact on economic growth. For example,
Balasubramanyam et al. (1996) found that the effect of FDI on growth is more significant
in the presence of trade openness, and Borensztein et al. (1998) argued that FDI is an
important channel for the transfer of technology and contributes to economic growth
when the country has a highly educated workforce. In turn, Alfaro et al. (2003) found that
FDI was beneficial for economic growth when the country had sufficiently developed
financial markets. However, Carkovic and Levine (2002) conducted a Generalized
Method of Moments (GMM) panel analysis on pooled data from 72 countries in the

Scottish Journal of Arts, Social Sciences and Scientific Studies - ISSN 2047-1278
http://scottishjournal.co.uk
60
period 1960-1995 and found that FDI flows do not exert a positive impact on economic
growth.
Very few studies examined the growth effect of portfolio equity flows. Bekeart
and Harvey (1998) found that portfolio equity inflows increase economic growth in 14
out of 19 lower-income countries under study. Durham (2004) suggested that portfolio
equity flows promote economic growth in countries with relatively large equity markets
and limited corruption. Carkovic and Levine (2002), instead, found that portfolio inflows
have no impact on economic growth.
There is very little specific literature on the effects of debt flows on economic
growth. This category of capital inflows is more often taken into account in recent studies
investigating simultaneously the growth impact of different types of capital flows. For
example, Reisen and Soto (2001) measured the independent growth effect of bond flows
as well as FDI, portfolio equity flows, official flows and short-term and long-term bank
lending on a sample of 44 developing countries around the world over the period 1986-
1997. Using GMM panel data analysis, they find that FDI and portfolio equity flows
exerted a significant impact on growth, whereas bonds and official flows did not have any
significant effect on growth. Furthermore, short- and long-term bank lending was found
to negatively affect economic growth in the recipient country, except when local banks
are sufficiently capitalized.
Durham (2004) examined the impact on growth of bond foreign portfolio
investment (BFPI) as well as total foreign portfolio investment (FPI) and other foreign
investment (OFI), which includes cross-border bank lending, using a sample of 88
countries from 1977 through 2000. Most of the results suggested that FPI, BFPI and OFI
had no effect on economic growth. However, there was some evidence that OFI might
have a negative impact on economic growth depending on the level of financial and legal
development of the recipient country.
On the other hand, Gheeraert and Mansour (2005) used a structural econometric
model and found a significantly positive relationship between growth and various
measures of capital flows (i.e. FDI, equity investment, debt investment and flows in
financial derivatives). More recently, de Vita and Kyaw (2009), using a dynamic panel
model on a large sample of 126 developing countries for the period 1985-2002, examine
the impact of FDI and portfolio investment flows on the economic growth of low, lower
middle and upper middle income countries. They found that only developing countries
that have reached a minimum level of economic development and absorptive capacity are
able to capture the growth-enhancing effects of both forms of investment inflows.
Macias and Massa (2009) used a panel cointegration analysis to examine the long-
run relationship between economic growth and four different types of private capital
inflows (cross-border bank lending, foreign direct investment (FDI), bonds flows and
portfolio equity flows) on a sample of selected sub-Saharan African countries over the
period 1980-2007. The results showed that FDI and cross-border bank lending exert a
significant and positive impact on sub-Saharan Africa’s growth, whereas portfolio equity
flows and bonds flows had no growth impact. The estimates suggested that a drop by
10% in FDI inflows might lead to a 0.5% decrease of income per capita in sub-Saharan
Africa, and a 10% decrease in cross-border bank lending might reduce growth by up to
0.7%. The paper concluded that the global financial crisis was likely to have an important

Scottish Journal of Arts, Social Sciences and Scientific Studies - ISSN 2047-1278
http://scottishjournal.co.uk
61
effect on sub-Saharan Africa’s growth through the private capital inflows channel (half a
percent of growth is worth around $5 billion in lost output).
Kumo (2009) reviewed Keynesian business cycle theory and identifies the cause
of economic crisis to blind investment and lack of demand. The paper also indicated that
fundamentally, the 1939 Great Depression and current global economic recession are the
inevitable outcomes of capitalist mode of production. It also demonstrated that the
strategy of trying to develop public economy as well as increasing its influences and
controls over investment and consumption was the only way to limit vicious expansion of
capitalist mode of production and prevent future economic crises.
Studies on Nigeria revealed that there is no consensus on the effect of global
economic recession on the economy. For instance, Lynch (2009) declared Nigeria as one
of the safest economies in the world. The author argued that the Nigeria’s economy was
highly insulated from the global financial crisis experienced in recent time. Many
economic scholars and researchers were quick to challenge the finding. The critics opine
that most Nigerian banks failed to disclose critical data for assessing their operations thus
warned that Lynch’s finding should be taken with caution.
Conde (2009) examined the background of the recession, including the conception
of recession, as well as the causes of recession, and the Current crisis in the US. The
paper then discussed the relationship between the US and Nigeria, and the role of oil
industry of Nigeria in her economy. The author concluded the influence of the US
recession to the oil industry of Nigeria. Some other authors claimed that global economic
crisis will definitely affect Nigeria though the level of severity is not yet determined. The
review of the exiting studies by authors and Central Bank of Nigeria (2009) indicates that
global recession will have seven major effects on the Nigerian economy ranging from
aggravation of the ongoing stock market crisis, dwindling petroleum prices, deficit
national budget, reduction in development funds, reduction in absolute and net capital
flows, lower growth and worsen poverty in the country.
It was reported that foreign portfolio investors have withdrawn some US$15
billion from our capital markets while lower fuel prices had led to a severe reduction in
foreign exchange earnings. Due to lower oil revenue, it is expected that there will be less
funds available for much-needed investment in infrastructures. All these effects portend
slow growth of the economy which dovetailed into a slowdown in the fight against
poverty.
The controversy on the effect of global economic crisis on Nigeria’s economic
growth is not yet resolved. In order to empirically resolve the issue, the paper examine
whether or no the global economic crisis has significant effect on the Nigeria’s economic
growth. Measures identified in the literature to effectively address the possible slowdown
of the Nigerian economy include, the implementation of cost-cutting measures such as e-
governance by the Nigerian government, addressing the severe infrastructure constraints
and supply-side issues, and effective anti-monopolies regime which put a halt to the
symmetry of cartels that are feeding fat on the Nigerian economy and defrauding
customers by charging exorbitantly for poor services and products.
IV Model Specifications and Analytical Techniques:
The global recession affect countries through a variety of mechanisms, or
channels, including a decline in global trade, a drop in foreign direct investment, falling

Scottish Journal of Arts, Social Sciences and Scientific Studies - ISSN 2047-1278
http://scottishjournal.co.uk
62
external reserves, and possible cuts in foreign aid. These channels are largely connected
to Nigeria’s “real” economy, rather than its financial sector. It is therefore pertinent to
examine the effects of these variables on the growth of the Nigerian economy. The
examination of the effects of global recession on growth is preceded the determination of
causal relationship between the series. The paper employs the standard Granger-causality
test by examining whether past changes in one variable (say X) help to explain the current
changes in another variable (say Y) over and above the explanation provided by past
changes in variable Y. If otherwise, then one concludes that X does not Granger-cause Y.
To determine whether causality runs in the opposite direction, i.e., from Y to X, one repeats
the test with Y and X interchanged (Granger, 1969; Folorunso, 2000). Causal relationship
models in a Granger causality sense are expressed as thus:
)2....(............................................................
)1.....(............................................................
11
11
t
k
j
jtj
k
i
itit
t
k
j
jtj
k
i
itit
YXX
eXYY
Y and X stand for the pair-wise series under consideration and k is the appropriate
lag length to be determined by Akaike (1969)'s Final Prediction Error (FPE) criterion. If
j =0 and j =0, then X does not Granger cause Y in equation (1) and Y does not
Granger cause X in equation (2). This then implies that X and Y are assumed to be
independent. The study performs pair-wise Granger causality tests between world GDP
growth rate, foreign private capital inflows, trade openness, external reserves and
economic growth series.
If the causality tests confirm that world GDP growth rate (wgdp), trade openness
(open), foreign private capital (fpc) and foreign reserves (res) series cause economic
growth, the effects they portend on economic growth are then examined using the
endogenous growth model. The model specification involves economic growth (rgdp) as
the dependent variables while world GDP growth rate (wgdp), foreign private capital
(fpc), foreign reserves (res) and trade openness (open) are the explanatory variables. In
order to avoid omitting variables bias, macroeconomic variables such as gross fixed
capital formation (gfcf), a proxy for domestic investment, inflation rate (inf), monetary
variable (m2) and fiscal variable (gexp) are included into the model. Several attempts
have also been made to incorporate different measures of uncertainty in growth equation
(Servén, 2002). In order to avoid the problem of autocorrelation, only exchange rate
uncertainty (uexr) is employed. When the measure of macroeconomic uncertainty is
included, the basic aggregate foreign private capital inflows and economic growth model
specifications considered in this paper thus become:
.....(3)..........0.........α0,α 0,α 0,α 0,α 0,α 0,α 0,α 0,α
ε uexrα infαgexpα m2α gfcf openα fdiα α α rgdp
987654321
tt9t8t7t6t5t3t210t
or
reswgdp t 4
....(4)..........0......... 0, 0, 0, 0, 0, 0, 0,
e uexr infgexp m2 gfcf open rgdp fdi
987654321
tt9t87t6t5t3t210t
,0
4
or
reswgdp t

Scottish Journal of Arts, Social Sciences and Scientific Studies - ISSN 2047-1278
http://scottishjournal.co.uk
63
All series except for world real GDP growth rate (wgdp), inflation rate (inf), trade
openness (open) and exchange rate uncertainty (uexr), are measured in natural
logarithmic form.
The study employed Error Correction Mechanism (ECM) econometric method to
capture both the short and the long run effects of global economic downturn measures on
economic growth and foreign investment. The time series properties of series were first
examined using Augmented-Dickey Fuller (ADF) and Phillips-Perron (PP) unit root tests.
These were then followed by testing for possible cointegration among the series using
ADF test. Granger causality tests were also performed on pairs of global economic
recession measure and economic growth, foreign private capital inflows, foreign reserves
and trade openness; pairs of economic growth, foreign private capital inflows, foreign
reserves and trade openness measures; pairs of foreign private capital inflows, foreign
reserves and trade openness measures; and pair of foreign reserves and trade openness
measures. Annual time series were employed in the estimation of the equation (3) and (4)
and time series data were gathered mainly from Central Bank of Nigeria’s Statistical
Bulletin (2009) and IMF publication for various years. The sample period is from 1970 to
2009.
V Presentation and Discussion of Results:
Except for world GDP (wgdp), inflation rate (inf), real interest rate (rir) and
exchange rate uncertainty (uexr) indicators, the results in Table 3 clearly show that all
macroeconomic variables are non-stationary; they are indeed I(1) series at 5 per cent level
of significance using both the ADF and Phillips-Perron unit root tests. Log of real GDP
(lrgdp), nominal GDP (lngdp), gross fixed capital formation (lgfcf), foreign private
capital (lfpc), foreign reserves (lres), broad money (lm2), public expenditure (lgexp) and
trade openness (open) indicators are I(1) series which implies that they need to be
differenced once before they attain stationarity. The unit root test results were then
applied in testing for causality and the estimations of growth and FDI models specified in
equation (3) and (4) respectively. Evidence of long run relationships were also confirmed
for equation (3) and (4).
The Granger causality results reported in Table 4 reveal causality runs one
direction from Nigeria’s real GDP to foreign private capital inflows at 1 per cent level of
significance while it runs to foreign reserves at 5 per cent level of significance. The
opposite causation was not confirmed. Causality also runs from foreign private capital
inflows to trade openness at 5 per cent level of significance with no evidence of reverse
causality. However, causality runs from both directions from foreign reserves and trade
openness which indicate a bi-directional causal relationship at 5 per cent level of
significance. Also, foreign reserves Granger caused trade openness while world output
growth rate and other variables failed to cause each other.
The result of the estimated economic growth model is reported in Table 5. The
result reveals a well-defined error correction term with a feedback effect of 0.85 of the
previous year’s disequilibrium from the long run elasticity of identified explanatory
variables in the estimated economic growth model. The effect of the error correction is
not only large but also has significant a-priori negative sign. The result clearly supports
the finding that the identified explanatory variables are indeed cointegrated with
economic growth series.

Scottish Journal of Arts, Social Sciences and Scientific Studies - ISSN 2047-1278
http://scottishjournal.co.uk
64
The result also shows that the coefficient estimate for the catch-up term or the
existing economic growth level, i.e., lagged real GDP (RGDP(-1)), is significantly
positive at 5 per cent level of significance. The result implies that the immediate past
level of economic growth portends positive effect on the current level of economic
growth in Nigeria. This finding is in harmony with both theory and empirical evidence
from most countries of the world.
The cause-effect relationship revealed that the Nigerian economy is not insulated
from global economic recession while the magnitude of the effect might be substantial
given the degree of vulnerability of the Nigeria economy. The effect of global economic
crisis is, however, of different dimensions. For instance, the results presented in Table 5
reveals a significant negative influence of current world GDP growth at 1 per cent level
of significance but positive lagged effect on Nigeria’s economic growth at 5 per cent
level of significance.
Both current levels of foreign private capital (LFPC) and trade openness (OPEN)
portend insignificant negative effect on economic growth in the country. The implication
of the result is that global economic recession negatively affected inflows of foreign
capital and degree of trade openness which in turns retards economic growth. However,
the current and lagged values of foreign reserves {(RES) and RES(-1)} show significant
positive effect in the short run at 1 per cent and 10 per cent level of significant.
The current level of domestic investment (GFCF) portends a significant positive
effect while both the current levels of broad money supply (M2) and government
expenditure (GEXP) portend insignificant negative effect of the Nigeria’ economy
growth. The results further support the view that money has macroeconomic real effect
while government expenditure is dominated by the recurrent expenditure which had been
confirmed to have to positive effect on the economic growth in Nigeria. Inflation rate
(INF) portends significant positive effect on economic growth at 1 per cent level of
significance while its lagged value (INF(-1)) portends significant negative effect also at 1
per cent level of significance. The coefficient of lagged value of the measure of
macroeconomic uncertainty (UEXR(-1)) is negative as expected but not significant.
The result of the estimated foreign private capital inflows model is reported in
Table 6. The result also reveals a well-defined error correction term with a feedback
effect of 0.86 of the previous year’s disequilibrium from the long run elasticity of
identified explanatory variables in the estimated foreign private capital inflows model.
The effect of the error correction is not only large but also has significant a-priori
negative sign. The result clearly supports the finding that the identified explanatory
variables are indeed cointegrated with foreign private capital inflows series.
The result also indicates that the coefficient estimate for the catch-up term or the
existing FPC level, i.e., lagged foreign private capital (FPC(-1)), is insignificantly
positive at 5 per cent level of significance. The cause-effect relationship revealed that the
foreign private capital into the country is negatively influenced by the global economic
recession (WGDP) but not significant at 5 per cent level of significance. The effect of
real GDP of Nigeria on foreign capital inflow is significantly negative which indicate that
the poor growth of the Nigerian’s economy has discouraged inflows of foreign private
capital into the economy. The results presented in Table 6 reveals a significant negative
influence of current real GDP at 10 per cent level of significance but insignificant
negative lagged effect on Nigeria’s foreign private capital inflows.

Scottish Journal of Arts, Social Sciences and Scientific Studies - ISSN 2047-1278
http://scottishjournal.co.uk
65
Trade openness (OPEN) bears a significant negative effect on foreign private
capital inflows while the lagged value of foreign reserves (RES(-1)) bears significant
positive effect at 5 per cent level of significance. The implication of the result is that
foreign reserves determines the level of capital inflows into the country and when global
economic recession raises its ugly head, it depletes foreign reserves which in turns
discourage foreign private investors in flowing capital into the country.
Both the current and lagged levels of domestic investment {GFCF and GFCF(-1)}
portend significant positive effects at 1 per cent and 10 per cent respectively. The effect
of money supply is mixed. While the current level of broad money supply (M2) bears
significant positive effect, its lagged value portends a significant negative effect. Also,
lagged value of government expenditure (GEXP) portends significant negative effect on
foreign capital inflows into the country. Inflation rate (INF) portends significant positive
effect at 10 per cent level of significance while effect of macroeconomic uncertainty is
mixed. The coefficient of lagged value of the measure of macroeconomic uncertainty
(UEXR(-1)) is significantly negative at 1 per cent level of significance while its current
level (UEXR) portends significant positive effect at 5 per cent level of significance.
VI Conclusion:
Many economic analysts have described the global economic crisis as imposing
serious greatest threat to the world economy since the end of World War II. Most analysts
view past global economic and financial turmoil been confined to some particular regions
with little or no effect on other economies of the world. However, the effect of the current
global economic crisis, as being experienced in America and Europe is far spreading to
other regions of the globe. Indeed, if urgent remedy is not proffered to address the ugly
scenario and restore confidence in the global economy, the whole world will face a deep
and prolonged recession.
Nigeria faces poor and uncertain macroeconomic situations both in the near and
far future as a result of the global economic recession. In the country at moment, prices
are unstable, financial market remained unorganized as banks are struggling while
foreign private capital inflows dwindle. Low level of capital formation and dominance of
oil sector continue to bedevil the country, calling for the need to adjust public expenditure
and upcoming budget accordingly while the foreign reserves situation remains an enigma
wrapped in a mystery for now.
The appropriate policy measure to address the effect of global economic recession
on Nigerian economy would be the adoption of the demand-side management measures
by implementing an expansionary policy in order to stabilize the macro-economy. The
paper suggests that the government through fiscal and monetary control measures can
stabilize and promote long term economic prosperity in Nigeria. The paper therefore
advocates for the expansion of government spending to stimulate consumption, reduce
the interest rate and increase effective aggregate demand, in order to achieve long-term
full employment, price stability and sustainable economic growth in the country.
The paper concluded that a sustained economic recovery will not be possible until
the whole financial sector’s functionality is restored and credit markets are unclogged.
Both monetary and fiscal policies need to become even more supportive of aggregate
demand and sustain this stance over the foreseeable future, while developing strategies to
ensure long-term fiscal sustainability. Macroeconomic environment has to stable and
international cooperation is critical in designing and implementing these policies.

Scottish Journal of Arts, Social Sciences and Scientific Studies - ISSN 2047-1278
http://scottishjournal.co.uk
66
References
Akaike, H. (1969): “Fitting Autoregressive Models for Regression”, Annals of the
Institute of Statistical Mathematics, Vol.21, pp.243-247.
Alfaro, L., Areendam, C., Kalemli-Ozcan, S and Selin, S. (2003): “FDI and
Economic Growth: The Role of Local Financial Markets”, Journal of
International Economics, Vol.61, No.1, pp.512-533.
Balasubramanyam, V.N., Salisu, M. and Sapsford, D. (1996): “Foreign Direct
Investment and Growth in EP and IS Countries”, Economic Journal, Vol.106,
No.434, pp.92-105.
Bekaert G. and Harvey, C. (1998): “Capital Flows and the Behavior of Emerging
Market Equity Returns, NBER Working Paper 6669, Cambridge, MA.
Borensztein, E., de Gregorio, J. and Lee, J.W (1998): “How Does Foreign Direct
Investment Affect Economic Growth?”, Journal of International Economics,
Vol.45, No.1, pp.115-135.
Carcovic, M. and Levine, R. (2002): “Does Foreign Direct Investment Accelerate
Economic Growth?”, Department of Business Finance, University of Minessota
Working paper Series.
Central Bank of Nigeria (2009): Statistical Bulletin”, CBN, Nigeria.
Conde, S. (2009): “American Recession and Impact on the Oil Industry of
Nigeria”, Journal of International Relations,
de Vita, G. and Kyaw, K.S. (2009): “Growth Effects of FDI and Portfolio
Investment Flows to Developing Countries: A Disaggregated Analysis by Income
Levels”, Applied Economic Letters, Vol.16, No.3, pp.277-283.
Durham, J, (2004): “Absorptive Capacity and the Effects of Foreign Direct
Investment and Equity Foreign Portfolio Investment on Economic Growth”,
European Economic Review, Vol.48, No.2 (April), pp.285-306.
Folorunso, B.A. (2000): "An Empirical Investigation of the Relationship between
Currency Devaluation and Inflation in Nigeria (1970-1998)", The Nigerian
Economic and Financial Review, Vol.5, No.2, (December), pp.77-89.
Gheeraert, L. and Mansour, J.M. (2005): “On the Impact of Private Capital Flows
on Economic Growth and Development”, Working Paper 05/003. Brussels: CEB.
Granger, C.W.J. (1969): "Investigating Causal Relations by Econometric Methods
and Cross-Spectral Methods", Econometrica, Vol.34, pp.424-438.

Scottish Journal of Arts, Social Sciences and Scientific Studies - ISSN 2047-1278
http://scottishjournal.co.uk
67
International Monetary Fund (2009): “World Economic Outlook”, IMF.
Kumo, W.L. (2009): “The Global Economic Crisis and the Resurgence of
Keynesian Economics”, American Chronicle, February 28.
Kumo, W.L. (2011): “The Global Economic Crisis Alters the Pattern of FDI
Flows”, American Chronicle, January 23.
Lynch, M. (2009): “How the Global Recession Will Affect Nigeria in 2009”
Macias, J.B. and Massa, I. (2009): “The Global Financial Crisis and sub-Saharan
Africa: The Effects of Slowing Private Capital Inflows on Growth”, Overseas
Development Institute Working Paper 304.
Mankiw, N. G. and Romer, D. (1991), New Keynesian Economics, (edn),
Cambridge: MIT Press,
Reisen, H. and Soto, M. (2001): “Which Types of Capital Inflows Foster
Developing-Country Growth?”, International Finance, Vol.4, Issue 1, (Spring),
pp.1-14.
Stiglitz, J. (1998) “Capital Flows, Crises and Growth” Paper presented at the
African Economic Research Consortium Plenary Session on ‘Financial and
Currency Crises” Nairobi, 6 December.
UNDP (2009): “Human Development Report”, United Nation.

Scottish Journal of Arts, Social Sciences and Scientific Studies - ISSN 2047-1278
http://scottishjournal.co.uk
68
Appendix I:
Table 1: Human Development Index (HDI) for Nigeria and Regions of the World
(2011) Country HDI
Value
Life
Expectancy
at Birth
(Years)
Expected
Years of
Schooling
(Years)
GNI Per
Capita
(Constant
2005 PPP$)
Non-
Income
HDI
Value
VHHD (Very High Human
Development)
0.889 80.0 15.9 33,352 0.918
HHD (High Human
Development)
0.741 73.1 13.6 11,579 0.769
MHD (Medium Human
Development)
0.630 69.7 11.2 5,276 0.658
LHD (Low Human
Development)
0.456 58.7 8.3 1,585 0.478
Arab States 0.641 70.5 10.2 8,554 0.643
East Asia and the Pacific 0.671 72.4 11.7 6,466 0.709
Europe and the Central Asia 0.751 71.3 13.4 12,004 0.785
Latin America and the
Caribbean
0.731 74.4 13.6 10,119 0.767
South Asia 0.548 65.9 9.8 3,435 0.569
Sub-Saharan Africa 0.463 54.4 9.2 1,966 0.467
Least Developed Countries 0.439 59.1 8.3 1,327 0.467
Small Island Developing States 0.640 69.6 10.8 5,200 0.675
Nigeria 0.459 59.1 8.9 2,069 0.471
World 0.682 69.8 11.3 10,082 0.683
Source: UNDP Human Development Report (2011)

Scottish Journal of Arts, Social Sciences and Scientific Studies - ISSN 2047-1278
http://scottishjournal.co.uk
69
Table 2: Overview of the World Economic Output ((Percent change)
2007 2008 2009 2010
World output growth based
on market exchange rates
3.8 2.2 -0.6 2.1
World trade volume (goods
and services)
7.2 4.1 -2.8 3.2
Advanced economies 2.7 1.0 -2.0 1.1
United States 2.0 1.1 -1.6 1.6
Euro area 2.6 1.0 -2.0 0.2
Germany 2.5 1.3 -2.5 0.1
France 2.2 0.8 -1.9 0.7
Spain 3.7 1.2 -1.7 -0.1
Japan 2.4 -0.3 -2.6 0.6
United Kingdom 3.0 0.7 -2.8 0.2
Canada 2.7 0.6 -1.2 1.6
Other advanced economies 4.6 1.9 -2.4 2.2
Newly industrialized Asian
economies
5.6 2.1 -3.9 3.1
Emerging and developing
economies
8.3 6.3 3.3 5.0
Africa 6.2 5.2 3.4 4.9
Sub-Sahara 6.9 5.4 3.5 5.0
Source: World Economic Outlook (2010)
APPENDIX II:
Fig.1: Global Economic Recession
Scottish Journal of Arts, Social Sciences and Scientific Studies - ISSN 2047-1278
http://scottishjournal.co.uk
70
Fig.2: Nigeria’s Real GDP Trend (1960 – 2009)
0
100000
200000
300000
400000
500000
600000
700000
800000
1960 1963 1966 1969 1973 1976 1979 1982 1985 1988 1991 1994 1997 2000 2003 2006 2009
Year
Re
al G
DP
(=
N=
m)
Real GDP

Scottish Journal of Arts, Social Sciences and Scientific Studies - ISSN 2047-1278
http://scottishjournal.co.uk
71
APPENDIX III:
Table 3: Unit Root Test Results (1970-2009)
Level First Difference Order of
Integration
Series ADF PP ADF PP
World GDP growth rate (wgdp) -3.7454**
3.0118**
= = I(0)
Log of Real GDP (lrgdp) -2.4668 -2.5861 -4.5172**
-5.7400**
I(1)
Log of Nominal GDP (lngdp) -0.2063 -0.1901 -39209**
-5.3234**
I(1)
Log Gross Fixed Capital Formation
(lgfcf)
-0.3093 -0.6341 -4.3555**
-4.7485**
I(1)
Log of Foreign Private Capital (lfpc) -0.7993 -1.5619 -7.7917**
-9.2345**
I(1)
Log of Forein Reserves (lres) -1.6521 -1.6190 -5.3146**
-6.5346**
I(1)
Log of Broad Money (lm2) -0.1769 -0.4894 -3.8445**
-3.9753**
I(1)
Log of Public Expenditure (lgexp) -0.6051 -0.5497 -5.4868**
-9.6400**
I(1)
Trade/Nominal GDP (open) -1.8976 -2.7247 -5.4530**
-9.8961**
I(1)
Inflation rate (inf) -3.7999**
-3.2632**
= = I(0)
Nominal Interest Rate (int) -1.6228 -2.0344 -8.2440**
-9.7489**
I(1)
Naira/Dollar Exchange rate (exr) 0.6446 0.7566 -3.9089**
-5.4775**
I(1)
Exchange rate uncertainty (uexr) -4.1511**
-6.0113**
= = I(0)
Real Interest Rate (rir) -3.8784**
-3.6381**
= = I(0)
5% Critical Values for the rejection
of hypothesis of unit root
-2.9399 -2.9378 -2.9422 2.9399
Source: Estimates from E-View Econometric Package **
significant at 5%
level
Table 4: Pairwise Granger Causality Tests (Sample 1970 to 2009) Null Hypothesis: Obs F-Statistic Probability
WGDP does not Granger Cause LRGDP 39 0.00029 0.98648
LRGDP does not Granger Cause WGDP 0.79140 0.37958
LFPC does not Granger Cause LRGDP 39 0.08144 0.77699
LRGDP does not Granger Cause LFPC 11.3496 0.00181
OPEN does not Granger Cause LRGDP 39 0.52150 0.47487
LRGDP does not Granger Cause OPEN 1.71905 0.19812
LRES does not Granger Cause LRGDP 39 0.00264 0.95930
LRGDP does not Granger Cause LRES 6.39525 0.01597
LFPC does not Granger Cause WGDP 39 0.68236 0.41422
WGDP does not Granger Cause LFPC 0.00110 0.97372
OPEN does not Granger Cause WGDP 39 1.25222 0.27054
WGDP does not Granger Cause OPEN 0.54066 0.46692
LRES does not Granger Cause WGDP 39 1.70386 0.20006
WGDP does not Granger Cause LRES 0.18951 0.66593
OPEN does not Granger Cause LFPC 39 0.05894 0.80955
LFPC does not Granger Cause OPEN 3.96524 0.05408
LRES does not Granger Cause LFPC 39 5.83478 0.02091
LFPC does not Granger Cause LRES 4.01330 0.05271
LRES does not Granger Cause OPEN 39 2.96035 0.09392
OPEN does not Granger Cause LRES 0.02801 0.86802

Scottish Journal of Arts, Social Sciences and Scientific Studies - ISSN 2047-1278
http://scottishjournal.co.uk
72
Appendix IV:
Table 5: Modeling Nigeria’s Economic Growth Dependent Variable: D(LRGDP)
Variable Coefficient Std. Error t-Statistic Prob.
C -0.086613 0.255633 -0.338819 0.7380
D(LRGDP(-1)) 0.596424 0.277150 2.151993 0.0426
WGDP -0.109363 0.040436 -2.704559 0.0129
WGDP(-1) 0.122778 0.054063 2.271032 0.0333
D(LFPC) -0.069017 0.064170 -1.075537 0.2938
D(OPEN) -0.269379 0.539840 -0.498998 0.6227
D(LRES) 0.196214 0.071733 2.735358 0.0121
D(LRES(-1)) 0.157419 0.088139 1.786042 0.0879
D(LGFCF) 1.100171 0.276194 3.983328 0.0006
D(LGFCF(-1)) -0.144432 0.239834 -0.602216 0.5532
D(LM2) -0.567511 0.446982 -1.269651 0.2175
D(LGEXP) -0.130842 0.100498 -1.301937 0.2064
INF 0.013430 0.004537 2.960098 0.0072
INF(-1) -0.011864 0.003848 -3.082927 0.0054
UEXR -0.000215 0.000155 -1.384473 0.1801
ECM1(-1) -0.851424 0.334738 -2.543549 0.0185
R-squared 0.593014 Mean dependent var 0.132214
Adjusted R-squared 0.315523 S.D. dependent var 0.348446
S.E. of regression 0.288281 Akaike info criterion 0.645796
Sum squared resid 1.828325 Schwarz criterion 1.335306
Log likelihood 3.729870 F-statistic 2.137061
Durbin-Watson stat 2.025957 Prob(F-statistic) 0.051407
Table 6: Modeling Nigeria’s Foreign Private Capital Inflows Dependent Variable: D(LFPC)
Variable Coefficient Std. Error t-Statistic Prob.
C -0.040425 0.360721 -0.112066 0.9118
D(LFPC(-1)) 0.108681 0.174688 0.622144 0.5402
WGDP -0.060005 0.063137 -0.950401 0.3522
D(LRGDP) -0.473194 0.255614 -1.851203 0.0776
D(LRGDP(-1)) -0.295746 0.283284 -1.043991 0.3078
D(OPEN) -2.765046 1.047866 -2.638740 0.0150
D(LRES(-1)) 0.350957 0.166548 2.107244 0.0467
D(LGFCF) 1.991702 0.615284 3.237045 0.0038
D(LGFCF(-1)) 0.716450 0.391306 1.830921 0.0807
D(LM2) 1.558635 0.779329 1.999971 0.0580
D(LM2(-1)) -2.683587 0.793199 -3.383246 0.0027
D(LGEXP(-1)) -0.384672 0.177153 -2.171413 0.0410
INF 0.010871 0.005909 1.839801 0.0793
UEXR 0.000631 0.000254 2.488119 0.0209
UEXR(-1) -0.001270 0.000231 -5.496056 0.0000
ECM2(-1) -0.860105 0.262062 -3.282073 0.0034
R-squared 0.834325 Mean dependent var 0.117977
Adjusted R-squared 0.721365 S.D. dependent var 0.885290
S.E. of regression 0.467308 Akaike info criterion 1.611905
Sum squared resid 4.804290 Schwarz criterion 2.301415
Log likelihood -14.62620 F-statistic 7.386028
Durbin-Watson stat 2.110485 Prob(F-statistic) 0.000018

Scottish Journal of Arts, Social Sciences and Scientific Studies - ISSN 2047-1278
http://scottishjournal.co.uk
73
Examination of the Effect of Job
Satisfaction on Burnout of University
Teaching Staff with Structural Equation
Model
Veysel Yilmaz, Hülya ŞEN
Eskişehir Osmangazi University, Faculty of Arts and Science, Department of Statistics,
+90 26480 Eskişehir, Turkey
Tel: +90 222 2393750; fax: +90 222 2393578
E-mail: [email protected] ;[email protected]
Abstract:
The main purpose of the present study is to investigate the relationship between and job
satisfaction (JS) and burnout of academician by a structural equation model (SEM). For
this reason with the assistance of LISREL 8.54 was used to try to develop a model, and
fitness of the model has been discussed considering goodness-fit measures. The other
purpose of the study is to test for the factorial validity of the Maslach Burnout Inventory
(MBI) and JS, for this purpose surveyed 312 university teaching staff. First, we
determined the factors MBI and JS by means of the explanatory factor analysis (EFA),
then utilizing confirmatory factor analyze (CFA) we showed the validity of those factor.
Keywords: Job satisfaction, Burnout, University Teaching Staff, Structural Equation
Model
Scottish Journal of Arts, Social Sciences and Scientific Studies - ISSN 2047-1278
http://scottishjournal.co.uk
74
Introduction
If the beliefs and attitudes, regarding a specific subject, of the employees working
for a particular corporation are foreknown, their behaviors could be also estimated and
corrected. For example, if the beliefs and attitudes of the employees toward workplace
arrangement, behaviors of managers and wage policy are already known, particular
measures could be taken for operating the corporation at a better social environment and
in more efficient manner. This enables company managers to develop a program that
would be satisfactory to employees. An individual involved in a family, school, several
associations and other organizations relating to business life will strive at satisfying
his/her needs whether easily or hardly, depending upon availability or unavailability of
such fields. A person, who has any means and tackles his/her needs, would be satisfied
and become tranquil in psychological sense. Otherwise, specific adverse psychological
cases called dissatisfaction and burnout may arise (Eren, 2001).
In this study, an effort was made to examine the existence of a causal relationship
between JS and burnout of academicians, by proposing a SEM. In this study, the
statistical units are defined as assistant professors, executive lecturers, and researchers
working for Eskişehir Osmangazi University (ESOGU) and Anadolu University (AU)
during April-May 2007. Questionnaire was taken through website and 312 academicians
who responded to the whole questionnaire constitute the sampling group. At the first
stage of the study, the data obtained from 312 academicians was subjected to CFA with
LISREL 8.54 to define the dimensions of MBI, and then EFA and CFA were done to
examine the factor structure of JS inventory comprised of 37 items. Cronbach’s Alpha,
Split-Half Method, Parallel Technique, and ANOVA were used to try to determine the
reliability of inventories. Finally, A SEM was proposed for the relationship between JS
and burnout, and the convenience of the model was tested fit considering goodness-of-fit
measures.
JS and Burnout
JS is the sign of emotions developed by employees towards their physical and
mental health as well as their work and institution for which they work. JS connotes the
material benefits gained from work, the colleagues with whom you enjoy working and
the happiness from doing work. Therefore, JS signifies the enjoyment or positive
emotional state of an employee as a result of the evaluation of his/her own business life
(Samadov, 2006). JS depends on two main components. The first component is an
individual’s structure, emotions, thoughts and wishes as well as needs and their intensity,
while the second component is the working conditions. This comprises the physical and
mental conditions of the work as well as to what extent such conditions respond to an
employee’s expectations. JS will be as much as the magnitude of meeting those
expectations. Such wishes and needs that remain unmet may cause mental stress and
balance disorders as time passes, creating a burnout emotion and reducing productivity.
Akman et. al. (2006) researched the factors affecting JS of university lecturers. Sampling
group is a total of 488 lecturers from 24 universities in Turkey, who responded to a
questionnaire sent through electronic mail. Chi-square analysis shows that some opinions
of the academicians concerning JS have significant differences depending on their
gender, seniority, and academic status. Özyurt et. al. (2006) suggested that the physicians
in Istanbul have a JS above average and a lower level in terms of burnout, according to
the study on the level of JS and burnout performed on 598 physicians by applying the

Scottish Journal of Arts, Social Sciences and Scientific Studies - ISSN 2047-1278
http://scottishjournal.co.uk
75
MBI and Minnesota Satisfaction Questionnaire (MSQ). A strong, negative, and
statistically significant relation was found between JS and burnout, and this finding has
been assessed as an anticipated result. Ok (2002) examined the burnout level of bank
employees in terms of JS, role conflict, role similarity and certain individual properties.
999 persons were involved in the study, on a voluntary basis. MBI was used to gain the
data, while in order to collect the data concerning independent variables MSI was carried
out to determine JS of employees and “role conflict and role ambiguity questionnaire” to
define role conflict and role ambiguity. According to the findings of the study, when
trying to find out the effect of gender on the emotional burnout level of bank employees,
the contribution of gender to satisfaction of emotional burnout level is significant if JS,
role conflict and role ambiguity of those employees are kept under control. Koustelios
and Tsigilis (2005) examined the multivariate relationship between job satisfaction and
burnout, experienced by Greek physical education school-based teachers. The sample
consisted of 175 physical education teachers, from primary and secondary education. The
MBI and the Employee Satisfaction Inventory used to assess burnout and job satisfaction
respectively. Canonical correlation analysis revealed a negative multivariate relationship
between the two constructs (r =0.61). Canonical loadings indicate that job satisfaction is
primarily affected by ‘job itself’ followed by ‘supervision’ and ‘working conditions’,
whereas burnout is affected by ‘personal accomplishment’ and ‘emotional exhaustion’.
Intrinsic aspects of job satisfaction seemed to correlate stronger to burnout than the
extrinsic. Tsigilis et. al. (2006) was to examine perceived levels of burnout and job
satisfaction of Greek early educators, across public and private sector. One hundred and
seventy eight childhoodeducators participated in the study. Participants were
administered the Employees Satisfaction Inventory and the emotional exhaustion
subscale of the MBI. They found that early educators experienced moderate levels of
emotional exhaustion. Public sector early educators were more satisfied from thejob itself
and their immediate supervisor than their counterparts in the private sector.
Method and Material
Factor analysis is a statistical process used to investigate relationships among
observed and latent variable sets. Two basic factor analyses are EFA and CFA. EFA, the
researcher is not aware of the number of factors measured through the measurement tool.
When attempting to obtain information on the nature of factors detected a priori, instead
of examining a specific hypothesis, the researcher uses exploratory factor analysis. In
case of examining a theory developed by the researcher to test a hypothesis, CFA is used
(Sharma, 1996; Wlash and Betz, 1995; Yılmaz and Çelik, 2008). The linear structural
relation (LISREL 8.54) analysis program was used for CFA, with the aim of examining
the fit of the factor models carried out by the exploratory analysis. In determining the fit
of the model, multi-fit measures are used. In this study, adjusted goodness-of-fit index
(AGFI), goodness-of-fit index (GFI), normed fit index (NFI), nonnormed fit index
(NNFI), root mean square error of approximation (RMSEA) and Standardized Root Mean
Square Residual (RMR). Data were analyzed in two stages. Responses were assigned to
two data sets and these two data sets were subjected to a two-stage factor analysis. The
first data set (n1 = 145) was used to explore the underlying factor structure of the scale
using EFA. The second data set (n2 = 167) was used to confirm the factorial structure
derived from the EFA procedure using CFA. The research also used Bartlett’s Test of
Sphericity (BTS) which test the hypothesis ‘correlation matrix = unit matrix. The
rejection of the hypothesis shows that correlation between the variables is different from

Scottish Journal of Arts, Social Sciences and Scientific Studies - ISSN 2047-1278
http://scottishjournal.co.uk
76
1.0 and the factor analysis is appropriate for the variables (Hutcheson & Sofroniou,
1999). Both the Bartlett test of sphericity and the Kaiser–Meyer–Olkin measure of
sampling adequacy indicated that there were sufficient inter-item correlations within the
data for performing factor analysis.
In the study, first, original 3-factor model of MBI was handled and the factor
structure for Turkish academicians discussed by examining it with CFA. Then, uni-
dimensionalty of JS structure was studied with EFA and CFA. Finally, JS was defined as
exogenous latent and burnout as endogenous latent variable and a SEM recommended in
order describing the relationship between them.
Measurement Tools
Attitude scales are the foremost and most widely used method to measure the
attitudes. Attitude scales are called those questionnaires that are designed for an
individual to respond to a series of propositions prepared to unveil the interior of that
individual. By this method, the response of individuals to a series of propositions relating
to a particular subject is investigated. In these studies, such accepted scales as previously
verified in terms of reliability and validity may be used; or, sometimes researchers may
change such existing scales after verifying validity thereof for different occupational
groups, and use these scales as changed. Sometimes those scales developed for different
countries, cultures and occupational groups may not be verified on every country, or a
difference may occur in the size of a scale (or in the number of propositions). JS attitude
items used in the study were created using the scale developed by Spector (1985), the
MSQ (Minnesota Satisfaction Questionnaire ) and the study of Akman et. al. (2006),
while the burnout items using the MBI. Factor structures of the scales were reexamined. As
a result of the analyses some propositions were not even analyzed. This questionnaire
contains attitude items concerning relations with management, award, and opportunity for
promotion, and loyalty to company as well as attitude items belonging to the MBI.
Academicians’ responses to attitude items were measured on a 5-point Likert-type scale.
Sample
The universe of this study includes the researchers, executive lecturers, and
assistant professors working for Eskişehir Osmangazi University and Anadolu University
during the academic year of 2006-2007. The study sample is 312 academicians, who have
worked for the said universities during the same period and completed the questionnaire
through website. 167 academicians from Eskişehir Osmangazi University (58 Women,
109 Men; 110 Researchers, 25 Executive Lecturer, 32 Assistant Professors) and 145
academicians from Anadolu University (58 Women, 75 Men; 85 Researchers, 32
Executive Lecturers, 28 Assistant Professors) filled-in the questionnaire.
Data Analysis
EFA and CFA for Burnout Measurement Model
MBI developed by Maslach and Jackson (1981 and 1986) was used to determine
the burnout of academic staff. Inventory burnout comprised of a total of 22 items is
considered in three sub-dimensions: Emotional Exhaustion (EE), Depersonalization (DP),
and Personal Accomplishment (PA). Subscale EE describes feeling of emotionally
overextended and exhausted by one’s work. This subscale includes 9 items relating to
fatigue, boredom, and decrease of emotional energy. Depersonalization has 6 items and

Scottish Journal of Arts, Social Sciences and Scientific Studies - ISSN 2047-1278
http://scottishjournal.co.uk
77
refers to a set of callous and sensitive behaviors displayed by an individual toward his/her
clients. Subscale PA refers to feelings of qualification and accomplishment and includes
8 items. Some authors have investigated about three-dimensionality of burnout inventory
since EE and DP dimensions have higher correlation with each other and suggested that it
would be more appropriate to express this inventory with two dimensions (Cordes and
Dougherty, 1993; Boles et. al., 2000). Lee and Ashforth (1996) found a correlation of
0.64 between EE and DP. These authors claimed that the said two factors are laid on a
single factor. Byrne (1991) investigated the validity of factor structure in MBI with CFA
over primary education 163, secondary education 162, and university lecturers. When
investigating the three-factor structure, he expressed that 4 items should be cancelled. In
the study, the burnout inventory comprised of 22 items was reduced to 12 items by the
help of reliability and EFA results. Then, fit was investigated using three-factor model
CFA. From Figure 1, the correlation is 0.86 between EE and DP, -0.39 between EE and
PA, while 0.54 between DP and PA. As understood from the correlation values, the
correlation between EE and DP factors is too high. This indicates that these two factors
may be handled in one single factor, indeed.
Figure. 1. CFA Results of MBI CFA
When the items concerning such factors are investigated, it may be claimed that
all of them has a negative meaning and are comprised of similar items. According to
interpretation of the correlation coefficients calculated as a result of the analysis: DP will
increase as EE increases (or vice-versa), PA will decrease as EE increases, while PA will
decrease as DP increases. These results are consistent with those seen in the literature.
At a later stage EFA and then CFA were performed in order to find out whether
MBI could be explained in two factors (by combining EE and DP). EFA was
implemented for 145 data obtained from Anadolu University. As a result of the analysis
was reached two factors with eigenvalue 4.68 and 2.67 and explained variance 38.97(%)
and 22.27(%), respectively. For the two factors, Emotional Exhaustion Exertion (EEE):
s27 mch3 (0.83); s26mch2 (0.80); s28mch4 (0.79); s32mch8 (0.77); s31mch7 (0.71);
s33mch9 (0.70); s25mch1 (0.70); s34mch10 (0.69), and PA: s37mch13 (0.84); s38mch14
(0.77); s36mch12 (0.75); s39mch15 (0.72). KMO was found 0.88 and Bartlett Test Chi-

Scottish Journal of Arts, Social Sciences and Scientific Studies - ISSN 2047-1278
http://scottishjournal.co.uk
78
Square=1853.98, p=0.000. As a result of EFA, it was suggested that the two factors
explains 61% of the total variance and their factor loads vary between 0,69 and 0,84. If
these findings are also verified with CFA results, it would be possible to express that the
two-factor burnout model is more appropriate. CFA verification of two-dimension case
found by EFA was done using 167 data obtained from Eskişehir Osmangazi University.
As understood from the Figure 2, the correlation between two factors is -0.48. Detection
of a negative relation between two factors is reasonable as PA items have positive while
EEE items, combination of EE and DP, have negative meaning.
Figure 2. CFA Results of Two-Factor Burnout Model
Multi-fit measures calculated for compliance of two-factor model were found as:
RMSEA=0.09; NFI=0.93; CFI=0.94; RMR=0.07; GFI= 0.87. According to these
measures the fit of the model is within reasonable limits. Reliability analysis of the
burnout inventory comprised of 12 attitude items suggested the following results: 1.
Cronbach Alpha=0.88; 2. Split-Half Method, α1=0.90 (6 items) ; α2=0.70 (6 items);
correlation=0.58; 3. Guttman Split-Half Method, Reliability Coefficient=0.70; 4. Parallel
Technique, Chi-Square=521.02 (df=151), p=0.000; 5. Tukey’s Test for Additivity
F=0.213 (df=11;1), p=0.645; 6. ANOVA, F=10.13; (df=166;11), p=0.000.
Development of Structural Equation Model
This stage, a SEM was suggested to test the hypotheses indicated herein-below.
The suggested model is given in Figure 3. In order to test the relations as set out the
model in Figure 3 the following hypotheses may be developed: H1: EEE will decrease as
JS of academicians increases; H2: PA will increase as JS of academicians increases; H3:
EEE will decrease as PA of academicians increases.

Scottish Journal of Arts, Social Sciences and Scientific Studies - ISSN 2047-1278
http://scottishjournal.co.uk
79
Figure. 3. Model Suggested for the Relationship between JS and Burnout
Figure. 4. Results of SEM suggested for defining the relationship between JS and
burnout for academicians
The results of a SEM suggested for defining the relationship between JS and
burnout of the academicians are given in Figure.4. Fit measure of the model found with
LISREL 8.54 program were calculated as RMSE=0.09; NFI=0.89; CFI=0.91;
RMR=0.08; GFI=0.80. According to examination of fit measure the suggested SEM is
understood to remain within the acceptable limits. The factor loads for JS indicate that the
attitude items “43. I believe that the bond between employees and management is strong”
and “50. There is a mutual sense of trust between individuals and units” have the highest
factor loads (0.81 and 0.80, respectively). R2 values of these attitude items are 0.66 and
0.64, respectively. Such attitude items, which have effects on development of JS factor,
were determined as “20. I find the company I work for an ideal workplace”, “42. Our
managers become integrated with us and strive at solving our problems”, and “51. There
is a permanent exchange of views among managers and their staff”. When these attitude
items are examined, it may be expressed that the words “bond”, “trust”, “integration”,
“exchange of views”, and “managers” should be underlined. According to review of the
factor loads of EEE dimension, the loads are found to be 0.64-0.78. The factor load of
those items “32. I’m worried that this work sears me emotionally”, “28. I feel myself
disappointed because of my work”, and “27. I feel myself exhausted because of my
work” is 0.78. The highest factor load for PA is (0.80) with “38. I easily create a
comfortable working environment together with individuals working for our

Scottish Journal of Arts, Social Sciences and Scientific Studies - ISSN 2047-1278
http://scottishjournal.co.uk
80
organization”. Please find below the structural equations gained as a result of the
analysis.
EEE = - 0.27*PE – 0.35JS ; R² = 0.31
(t=-3.33) (t=-4.49)
PE = 0.61*JS R² = 0.37
(t=8.04)
Test statistics calculated for the test of hypothesis H1 was found as -4.49.
Absolute value of this being higher than 2 indicates the coefficient is statistically
significant. This result means the hypothesis H1 is verified. The regression coefficient
between JS and EEE was expected to be -0.35. This coefficient’s being negative makes
academicians think that EEE will decrease as JS increases. t value calculated for the test
of hypothesis H3 was found as -3.33. The regression coefficient was expected to be -0.27.
This coefficient has also negative meaning and H3 was verified. Test statistics calculated
for the test of hypothesis “PA will increase as JS increases” was 8.04. The estimated
coefficient was 0.61, which has a positive meaning. In brief, a one-point decrease of JS
will result in 0.35-point increase of EEE, one-point increase of PA will result in 0.27-
point decrease of EEE, while one-point increase of JS will cause 0.61-point increase of
PA.
Conclusion
According to the results of SEM, the need for the managers to make certain
arrangements for raising JS of academicians has arisen. The reason is JS’s affecting PA in
a positive way and the decrease of EEE by reasons of the increase of PA. From these
relationships, if it is desired to increase PA and decrease EEE, it is required to implement
those decisions on raising JS of the academicians. Therefore, the major factors affecting
JS should be determined and it would be vital to take corrective decisions with respect
thereto.
The hypothesis suggesting that there is no significant difference between the
burnout averages of the academicians in terms of gender was tested with ANOVA to
reach the values F=4.17 (df=1;300), p=0.04. This result indicates that the burnout
averages in terms of gender are different, with the average higher for men. A study was
done in two universities to find out whether their burnout value is same, and the values
found were F=0.14 (df=1;300), p=0.71. This result claimed that the burnout averages of
these two universities were similar. The difference between the burnout averages in terms
of academic position was found significant, with F=6.02 (df=2;300), p=0.002. The
burnout level of assistant professors was higher than that of other two positions. The
highest value for EEE was 40, while the lowest value 8. The highest averages relating to
the expressions contained in EEE are those numbered 31, 28 and 27, respectively.
Beckstead (2002) investigated the burnout level of 151 nurses working in Florida,
with CFA and using MBI. The author determined a 0.65-point correlation between
emotional exhaustion and depersonalization, -0.16-point correlation between emotional
exhaustion and personal achievement, and -0.25-point correlation between

Scottish Journal of Arts, Social Sciences and Scientific Studies - ISSN 2047-1278
http://scottishjournal.co.uk
81
depersonalization and personal achievement. In the study performed by Proctor and
Steadman (2003) 63 psychologists constituted the sampling group to find out the effects
of burnout and job satisfaction. In the study, a 28-point Likert-type scale was used to
collect data. According to the findings achieved at the end of the study, it was found that
gender, age or experience has no effect on JS and burnout and that those who have higher
JS experience lower level of exhaustion. Sarı (2004) investigated the factors affecting JS
and burnout of 295 private school teachers. He determined that, particularly, gender and
work experience factors are significant. In a study on the employees working for a library
in Greece, Tsigilis et.al. (2004) examined the relationship between burnout and job
satisfaction. A questionnaire was applied to 135 academic librarians to find out burnout
and JS levels. Interrelated two-factor model was assumed and supported. The authors
determined a higher negative correlation (-0.75) between two structures, through SEM.
Chiang Ku Fan and Chen-Liang Cheng (2007) analyzed with MBI the burnout levels of
those employees working in the life-insurance sector in Taiwan, and determined that
gender and working hours are important factors.
In later studies, especially the factor structure of JS scale should be reexamined
with new items. The model mentioned in this study is initially and of suggestion level, so
it is considered that new factors should be added to improve it.

Scottish Journal of Arts, Social Sciences and Scientific Studies - ISSN 2047-1278
http://scottishjournal.co.uk
82
References
Akman, Y., Kelecioğlu, H., Bilge, F., (2006). The Views of Faculty Personnel on
the Factors Affecting Job Satisfaction. H.U. Journal of Education 30, 11-20.
Beckstead, J.S., (2002). Confirmatory factor analysis of the Maslach Burnout
Inventory among Florida nurses. International Journal of Nursing Studies 39,
785–792.
Boles, J. S., Dwyane H. Dean, Joe M. Ricks, Jeremy C. Short, and Guangping
Wang, (2000). The Dimensionality of the MBI Across Small Business Owners
and Educators. Journal of Vocational Behavior 56, 12-34.
Byrne, B. M., (1991). The Maslach Burnout Inventory: Validating factorial
structure and invariance across intermediate, secondary, and university educators.
Multivariate Behavioral Research 26, 477–499.
Chiang Ku Fan and Chen-Liang Cheng, (2007). Gender differences in Burnout
among life insurance sales representatives in Taiwan. Journal of American
Academy of Business, Cambridge 11(1), 214-222.
Cordes, C. L. and Dougherty, T. W., (1993). A review and an integration of
research on job burnout. Academy of Management Review 18, 621–656.
Eren, E., (2001). Organizational Behavior and Management Psychology, Beta
Basım A.Ş., İstanbul.
Hutcheson, G. and Sofroniou, N., (1999). The multivariate social scientist:
Introductory statistics using generalized linear models, Thousand Oaks, CA: Sage
Publication.
Koustelios,A. and Tsigilis, N. ( 2005). The relationship between burnout and job
satisfaction among physical education teachers: a multivariate approach.
European Physical Education Review 11 (2), 189-203.
Lee, R. T. and Ashforth, B. E., (1996). A meta-analytic examination of the
correlates of the three dimensions of job burnout. Journal of Applied Psychology
81, 123–133.
Maslach, C., Jackson, S. E., (1981). The measurement of experienced burnout.
Journal of Occupational Behaviour 2, 99-113.
-(1986). MBI manual (2nd ed.). Palo Alto, CA: Consulting Psychologists Press.
Ok, S., (2002). The Study of Job Satisfaction in Bank Personnel from the
Perspective of Some Variables. Unpublished Post-Graduate Thesis, Ankara:
Hacettepe University, Institute of Social Sciences

Scottish Journal of Arts, Social Sciences and Scientific Studies - ISSN 2047-1278
http://scottishjournal.co.uk
83
Özyurt,A., Hayran, A.and Sur, H., ( 2006). Predictors of burnout and Job
Satisfaction among Turkish physicians. Q J Med 99, 161–169.
Proctor, B.E. and Steadman, T., (2003). Job satisfaction, burnout, and perceived
effectiveness of in-house versus traditional school psychologists. Psychology in
the Schools 40, 237 - 243.
Samadov, S., (2006). Job Satisfaction and Organizational Loyalty: An Application
in the Private Sector, Post-Graduate Thesis, Dokuz Eylül University, Institute of
Social Sciences, Business Administration Department, Management and
Organization Program, İzmir
Sarı, H., (2004). An analysis of burnout and Job Satisfaction among Turkish
special school head teachers and teachers, and the factors effecting their burnout
and job satisfaction. Educational Studies 30(3), 291-306.
Sharma, S., (1996). Applied multivariate techniques. United States: John Wiley
and Sons.
Spector, P.E., (1985). Measurement of Human Service Job Satisfaction:
Development of the Job Satisfaction Survey. American Journal of Community
Psychology 13, 693-712.
Tsigilis, N., Koustelios, A. and Togia, A., (2004). Multivariate relationship and
discriminant validity between Job Satisfaction and burnout, Journal of
Managerial Psychology 19(7), 666-675.
Tsigilis, N., Zachopoulou, E., and Grammatikopoulos, V. (2006). Job satisfaction
and burnout among Greek earlyeducators: A comparison between public and
privatesector employees. Educational Research and Review 1 (8), 256-261.
Yılmaz, V. and Çelik, H.E. (2008). A Model for Explanation of Personal
Attitudes toward Traffic of Candidate Drivers Attending Drivers’ Courses: Risky
Candidate Driver’s Attitude Model. Transportation Research Part F: Traffic
Psychology and Behaviour 11(4), 233-241.
Wlash, W. B. and Betz, N. E., (1995). Test and assessment (3rd ed.). Prentice
Hall.

Scottish Journal of Arts, Social Sciences and Scientific Studies - ISSN 2047-1278
http://scottishjournal.co.uk
84
Flora of Karaköy (Bilecik-Turkey)
and Its Environs
Onur Koyuncu
Eskişehir Osmangazi University, Faculty of Science and Art, Department of Biology,
26480, Meşelik-Eskişehir, Turkey.
Ö. Koray Yaylacı
Eskişehir Osmangazi University, Faculty of Science and Art, Department of Biology,
26480, Meşelik-Eskişehir, Turkey.
Okan Sezer
Eskişehir Osmangazi University, Faculty of Science and Art, Department of Biology,
26480, Meşelik-Eskişehir, Turkey.
Kurtuluş Özgişi
Eskişehir Osmangazi University, Faculty of Science and Art, Department of Biology,
26480, Meşelik-Eskişehir, Turkey.
Derviş Öztürk
Eskişehir Osmangazi University, Faculty of Science and Art, Department of Biology,
26480, Meşelik-Eskişehir, Turkey.
Süleyman Tokur
Eskişehir Osmangazi University, Faculty of Science and Art, Department of Biology,
26480, Meşelik-Eskişehir, Turkey.
Abstract
In this study, vascular flora of Karaköy (Bilecik-Turkey) and its environs were
investigated between 1996 and 2012. Our study area comprises Karaköy (Bilecik-Turkey)
and 17 villages (Fig. 1). It is located at the junction point of A2, A3, B2 and B3 squares
according to the grid system adopted in the Flora of Turkey and Aegean Islands. The
flora of study area consisted of 546 taxa including 544 species, 1 subspecies and 1 variety
belonging to 345 genera of 80 families. Among these, 46 taxa (2 taxa VU, 5 taxa NT, 3
taxa CD and 36 taxa LC) are endemic to Turkey and the ratio of endemism is 8.42 %.
Distribution of taxa according to their floristic region reveals that the Mediterranean
elements are the most abundant with 16.85 % (92 taxa). Ratio of Euro-Siberian elements
is 14.28 % (78 taxa) and this is followed by Irano-Turanian elements with 8.06 % (44
taxa). The rest 322 taxa (60.81 %) are elements of one or more floristic regions or their
floristic regions are unknown. The largest family in study area is Asteraceae which
contains 61 taxa (11.17 %). Second largest is Fabaceae includes 47 taxa (8.06 %) and
third is Lamiaceae includes 43 taxa (7.87 %).
Keywords: Bilecik, Biodiversity, Endemism, Flora, Karaköy, Turkey

Scottish Journal of Arts, Social Sciences and Scientific Studies - ISSN 2047-1278
http://scottishjournal.co.uk
85
Introduction
Turkey has considerable topographical, climatical and ecological diversity
because of the effects of different events which occurred in geological formation process
(Akman, 1990). Also, Turkey is located at intersection of the Euro-Siberian,
Mediterranean and Irano-Turanian floristic regions and so act as a bridge between Asia
and Europe continents. From all reasons above, Turkey has very high biological diversity
(about 12.000 taxa) in comparison with neighboring countries (Davis, 1965; Erik and
Tarıkahya, 2004).
The first studies on flora of Turkey were started with botanical excursions of
Tournefort in 1702 (Erik and Tarıkahya, 2004). Afterwards, many native and foreign
researchers have studied on flora of Turkey until today. First notable study between these
studies is Boissier’s Flora Orientalis. But undoubtedly that the most important and
detailed study between these is Flora of Turkey and Aegean Islands which performed by
P.H. Davis et al. Although Flora of Turkey and Aegean Islands and other studies have
contributed significantly to the flora of Turkey, detailed floristic structure of provinces
and grids haven’t been identified yet (Davis, 1965-1985; Davis et al., 1988; Güner et al.,
2000; Ocak and Tokur, 2000; Türe and Tokur, 2000).
The study area comprises Karaköy (Bilecik) and 17 villages (Fig. 1). It is located
at the junction point of A2, A3, B2 and B3 squares according to the grid system adopted
in the Flora of Turkey and Aegean Islands. The area at the latitudes of 39° 54'- 40° 06' N
and the longitudes of 29° 56' - 30° 04' E. Altitude of area is ranging from 400 to 1200 m
and surface is 500 km2.
Major soil groups of the study area are composed of brown forest soil, colluvial
soil, red-brown soil, alluvial soil and non calcareous brown soil. The most widespread is
the brown forest soil type. Major rock structures are limestone (Bilecik Toprak Su
Envanteri, 1983).
Climatic features of study area have been evaluated according to the obtained data
from Bilecik, Bozüyük, Pazaryeri and Söğüt meteorological stations. The average
temperature of Bilecik is 12.3°C, Bozüyük is 10.4°C, Pazaryeri is 11.2°C and Söğüt is
11.4°C. Annual precipitation of Bilecik is 436.6 mm, Bozüyük is 484.5 mm, Pazaryeri is
436.5 mm and Söğüt is 472.7 mm. When all the climatic data is evaluated according to
the Emberger method, climate type of study area is determined as semi arid
Mediterranean type. The precipitation regime belongs to the East Mediterranean (Akman,
1990; Türe and Tokur, 2000; Meteoroloji Gn. Md., 1998).
There have been no other specific studies related to the flora of Karaköy (Bilecik)
and its environs. The aim of this study was to determine the floristic characteristics of
Karaköy (Bilecik) and its environs. We hope that, this study will make contribution to the
all related researches and plant diversity of Turkey.

Scottish Journal of Arts, Social Sciences and Scientific Studies - ISSN 2047-1278
http://scottishjournal.co.uk
86
Figure 1. Geographic map of the study area.
Material and Methods
This study based on 1723 plant specimens, which were collected from 20
localities in Karaköy (Bilecik) and its environs between 1996 and 2012. The majority of
the specimens were identified with the help of the Flora of Turkey and the East Aegean
Islands (Davis, 1965-1988; Güner et al., 2000). Some doubtful identifications were
checked in Flora Europaea (Tutin et al., 1964-1980), Flora Iranica (Reichinger, 1965-
1977), Flora Palestina (Zohary, 1966-1986), Flora of Iraq (Guest and Townsend, 1966-
1985), Flora Orientalis (Boissier, 1867-1888). The herbaria of GAZI, ANK and OUFE
were used to check the specimens. The plant specimens prepared for herbarium
collections have been stored in the Herbarium at OUFE. The floral data are listed in the
appendix. All taxa in the floristic list are given according to the Angiosperm Phylogeny
Group (APG III, 2009). In the floristic list, locality, altitude, OUFE number, collection
date, phytogeographical region, whether the plant is endemic or not and threatened
categories it belongs to are mentioned at the end. Author’s abbreviations follow Brummitt
and Powell (1992) and The International Plant Names Index (2012). Threatened
categories are proposed for endemic and some non-endemic taxa according to IUCN risk
categories (IUCN, 2001; Ekim et al., 2000). The abbreviations used in the text and the
floristic list are as follows: Ir.-Tur.: Irano-Turanian; Medit.: Mediterranean; E. Medit.
(mt.): East Mediterranean (mountain); Omni Medit.; Omni Mediterranean; Eur.-Sib.:
Euro-Siberian; Eux.: Euxine; End.: Endemic; CR: Critically endangered; EN:
Endangered; VU: Vulnerable; NT: Near threatened; CD: Conservation dependent; LC:

Scottish Journal of Arts, Social Sciences and Scientific Studies - ISSN 2047-1278
http://scottishjournal.co.uk
87
Least concern; ANK: Ankara University Herbaria; GAZI: Gazi University Herbaria;
OUFE: Eskişehir Osmangazi Univeristy Herbaria.
Result and Discussion
In this study, 546 taxa belonging to 80 families and 345 genera were identified.
Three of these taxa are Pteridophyta, and other 543 taxa are Spermatophyta which
includes 5 taxa from the Gymnospermae and 538 taxa from the Angiospermae.
The Angiospermae includes 468 taxa from the Magnoliopsida and 70 taxa from
Liliopsida. The dispersion of the plant taxa that were defined in the study area according
to the large taxonomical groups is shown in Table 1.
Phytogeographical distributions of 214 taxa are given in Table 1. Apart from
these, other 359 taxa are multi-regional elements or their phytogeographic region is
unknown. The percentage of phytogeographical origins of 187 taxa was 92 (16.85 %)
Mediterranean, 78 (14.28 %) Euro-Siberian, and 44 (8.06 %) Irano-Turanian. The rest of
the 332 (60.81 %) taxa are either multi-area elements or single elements which have not
yet been accepted as members of the phytogeographical area.
The largest families of study area according to number of taxa are Asteraceae (61
taxa), Fabaceae (47 taxa), Lamiaceae (43 taxa), Brassicaceae (42 taxa) and Poaceae (32
taxa).
The richest genera of study area according to number of taxa are Salvia (9 taxa),
Trifolium (8 taxa), Centaurea (8 taxa), Geranium (7 taxa), Alyssum (6 taxa), Silene (6
taxa), Hypericum (5 taxa), Stachys (5 taxa) and Galium (5 taxa).
Endemism ratio of study area is 8.42 % and includes 46 taxa (2 taxa VU, 5 taxa
NT, 3 taxa CD and 36 taxa LC). Endemism ratio of study area is very low in comparison
with the average endemism ratio (34.5%) of the Flora of Turkey (Güner et al., 2000).
The results of this study generally show accordance with other similar studies
(Ocak and Tokur, 2000; Türe and Tokur, 2000; Koyuncu et al., 2012a; Koyuncu et al.,
2012b). In the research area, the most important treated factors of the floristic structure
are urbanization, livestocking, agricultural acitivities and erosion. Fistly, this study aims
to identifiy, conservate and examination of the floristic diversity in Turkey

Scottish Journal of Arts, Social Sciences and Scientific Studies - ISSN 2047-1278
http://scottishjournal.co.uk
88
Table 1. Floristic properties of the research area.
Taxonomic Groups
Total
Ratio of total
taxa in the
research area
(%)
Pteridophyta Gymnospermae Angiospermae
Dicots. Monocots.
Families 3 3 63 11 80
Genera 3 4 289 49 345
Species and Under
Species Taxa 3 5 468 70 546
Species 3 5 466 70 544
Subspecies - - 1 - 1
Varieties - - 1 - 1
Distribution of taxa to Phytogeographic Regions
Euro-Siberian
(Total)
- 1 66 11 78 14.28
Euro-Siberian - 1 60 11 72 13.18
Euxine - - 6 - 6 1.10
Mediterranean
(Total)
- - 72 20 92 16.85
Mediterranean - - 56 15 71 13.00
E. Medit. (mt) - - 15 5 20 3.66
Omni Medit. - - 1 - 1 0.19
Irano-Turanian - - 39 5 44 8.06
Others 3 4 291 34 332 60.81
Endemism and Risk Categories (IUCN 2001).
Endemic Taxa - - - - 46 8.42
VU - - 2 - 2 0.36
NT - 1 3 1 5 0.91
CD - - 3 - 3 0.55
LC - - 36 - 36 6.60

Scottish Journal of Arts, Social Sciences and Scientific Studies - ISSN 2047-1278
http://scottishjournal.co.uk
89
References
Akman, Y. (1990). İklim ve Biyoiklim. Ankara: Palme Yayınları (in Turkish).
APG III, (2009). An update of the Angiosperm Phylogeny Group classification
for the orders and families of flowering plants: APG III. Botanical Journal of the
Linnean Society 161: 105-121.
Boissier, E. (ed.) (1867-1888). Flora Orientalis. Vols. 1-6, Geneva.
Brummitt, RK. and Powell, C.E. (eds.) (1992). Authors of Plant Names. Kew:
Royal Botanic Gardens.
Davis, P.H. (1965-1985). Flora of Turkey and the East Aegean Island. Vols:1-9.
Edinburg: Edinb. Univ. Press.
Davis, P.H., Mill, R.R., Tan, K. (1988). Flora of Turkey and the East Aegean
Islands, First Supplement. Edinburgh: Edinburgh University Press, Vol. 10.
Ekim, T., Koyuncu, M., Vural, M., Duman, H., Aytaç, Z. and Adıgüzel, N.
(2000). Türkiye Bitkileri Kırmızı Kitabı (Pteridophta ve Spermatophyta). Ankara:
TTKD ve Van 100. Yıl Üniversitesi (in Turkish).
Erik, S. and Tarıkahya, B. (2004). Türkiye Florası Üzerine. Kebikeç, 17: 139-163
(in Turkish).
Guest, E. and Townsend, CC. (1966-1985). Flora of Iraq. Vols. 1-9. Ministry of
Agriculture and Agrarian Press, Baghdad.
Güner, A., Özhatay N., Ekim T. and Başer KHC. (eds.) (2000). Flora of Turkey
and the East Aegean Islands, Second Supplement. Edinburgh: Edinburgh
University Press, Vol. 11.
IUCN (2001). Red List Categories: Version 3.1. Prepared by the IUCN Species
Survival Commission. IUCN, Gland Switzerland and Cambridge, UK: IUCN.
Koyuncu, O., Yaylacı, Ö.K., Öztürk, D. and Tokur, S. (2012a). Vascular Plant
Diversity in Geyve Gorge (Sakarya/Turkey) and its Environs. Biological
Diversity and Conservation, 5 (3), 98-122.
Koyuncu, O., Yaylacı, Ö.K., Öztürk, D., Özgişi, K., Sezer, O., Savaroğlu, F.,
Potoğlu Erkara, İ. and Ocak, A. (2012b). Vascular Plant Diversity of Osmaneli
(Bilecik-Turkey). Scottish Journal of Arts, Social Sciences and Scientific Studies,
Vol. 7, 78-129.
Meteoroloji Genel Müdürlüğü. (1998). Bilecik Bölge Müdürlüğü, Bilecik (in
Turkish).

Scottish Journal of Arts, Social Sciences and Scientific Studies - ISSN 2047-1278
http://scottishjournal.co.uk
90
Ocak, A. and Tokur, S. (2000). The Flora of Gülümbe Dağı (Bilecik-Turkey).
Turk J. Bot., 24: 121-141.
Rechinger, HK. (ed.) (1965-77). Flora Iranica. Graz-Austria: Akademische Druck,
Verlanglanstalt.
Tarım ve Köy İşleri Bakanlığı. (1983). Toprak Su Genel Müdürlüğü, Bilecik İl
Toprak Envanter Planları (in Turkish).
The International Plant Names Index (2012). Published on the Internet
http://www.ipni.org [accessed 1 July 2012].
Tutin, TG., Heywood, VH., Burges, NA., Moore, DM., Valentine, DH., Walters,
S and Webb, BA. (eds.) (1964-80). Flora Europaea. Vols. 1-5. Cambridge:
Cambridge University Press.
Türe, C. and Tokur, S. (2000). The Flora of the Forest Series of Yirce-Bürmece-
Kömürsu and Muratdere (Bilecik-Bursa, Turkey). Turk J. Bot., 24: 47-66.
Zohary, M. (1966-1986). Flora Palaestina. Vols. 1-4. Jerusalem: Academic Press,
Israel.
Appendix
List of Flora
PTERIDOPHYTA
SPHENOPSIDA
HYPOLEPIDACEAE
Pteridium Scop.
P. aquilinum (L.) Kuhn.
Environs of Bekdemir village, 220m., OUFE 7794, 18 vii 1997.
ASPLENIACEAE
Asplenium L.
A. trichomanes L.
25-30 km of Bozüyük-Bilecik road, 330m., OUFE 7795, 01 iix 1997.
ASPIDIACEAE
Dryopteris Adans.
D. filix-mas (L.) Schott
Environs of Kurtköy village, 600m., OUFE 7796, 12 vi 1997.
SPERMATOPHYTA

Scottish Journal of Arts, Social Sciences and Scientific Studies - ISSN 2047-1278
http://scottishjournal.co.uk
91
GYMNOSPERMAE
PINACEAE
Abies Mill.
A. nordmanniana (Stev.) Spach subsp. equi-trojani (Asch.&Sint. ex Boiss.)
Coode&Cullen
Environs of Küplü village, 290m., OUFE 7797, 22 iii 1998, End. (NT), Eur.-Sib.
Pinus L.
P. nigra Arn. subsp. pallasiana (Lamb.) Holmb. var. caramanica
1-25 km of Bozüyük-Bilecik road, 680m., OUFE 7798, 01 v 1997.
CUPRESSACEAE
Juniperus L.
J. oxycedrus L. subsp. oxycedrus
1-25 km of Bozüyük-Bilecik road, 580m., OUFE 7800, 01 v 1997.
J. foetidissima Willd.
Environs of Kızıltepe village, 1000m., OUFE 7801, 10 ix 1997.
EPHEDRACEAE
Ephedra L.
E. major Host
Environs of Bekdemir village, 290m., OUFE 7802, 06 iix 1998.
ANGIOSPERMAE
DICOTYLEDONAE
RANUNCULACEAE
Helleborus L.
H. orientalis Lam.
25-30 km of Bozüyük-Bilecik road, 260m., OUFE 7803, 03 x 1998, Eux.
Nigella L.
N. arvensis L. var. glauca Boiss.
Environs of Kurtköy village, 740m., OUFE 7804, 06 iix 1998.
N. elata Boiss.
Environs of Şükraniye village, 725m., OUFE 7805, 19 ix 1997.
Delphinium L.
D. venulosum Boiss.
1-25 km of Bozüyük-Bilecik road, 690m., OUFE 7806, 18 vii 1997, End., (LC),
Ir-Tur.

Scottish Journal of Arts, Social Sciences and Scientific Studies - ISSN 2047-1278
http://scottishjournal.co.uk
92
D. peregrinum L.
1-25 km of Bozüyük-Bilecik road, 530m., OUFE 7807, 01 iix 1997.
Consolida (DC.) S.F. Gray
C. orientalis (J.Gay) Schrödinger
Environs of Yeniköy village, 330m., OUFE 7808, 25 vii 1997.
C. regalis Gray subsp. paniculata (Host) Soó var. paniculata
Environs of Kurtköy village, 740m., OUFE 7809, 06 iix 1998.
C. raveyi (Boiss.) Schrödinger
Environs of Karaköy village, 690m., OUFE 16593, 11 vii 2000, End., (LC).
Anemone L.
A. coronaria L.
1-25 km of Bozüyük-Bilecik road, 670m., OUFE 16594, 18 iii 2001, Medit.
Clematis L.
C. cirrhosa L.
Environs of Kızıldamlar village, 810m., OUFE 16595, 06 ii 1999, Medit.
C. vitalba L.
25-30 km of Bozüyük-Bilecik road, 450m., OUFE 7810, 29 v 1997.
C. viticella L.
1-25 km of Bozüyük-Bilecik road, 710m., OUFE 7811, 19 ix 1997.
Adonis L.
A. annua L.
1-25 km of Bozüyük-Bilecik road, 580m., OUFE 7812, 13 vi 1997, Medit.
A. flammea Jacq.
Environs of Şükraniye village, 700m., OUFE 16596, 04 v 2005.
Ranunculus L.
R. constantinopolitanus (DC.) d'Urv.
Environs of Demirköy village, 700m., OUFE 7814, 25 vii 1998.
R. arvensis L.
25-30 km of Bozüyük-Bilecik road, 310m., OUFE 7815, 02 xi 1997.
Ficaria Guett.
F. verna subsp. ficariiformis (Rouy&Foucaud) B.Walln.
Environs of Kurtköy village, 730m., OUFE 16597, 13 iv 2007.
Thalictrum L.
T. lucidum L.
Environs of Karaköy village, 600m., OUFE 16598, 24 vi 2010.
PAPAVERACEAE

Scottish Journal of Arts, Social Sciences and Scientific Studies - ISSN 2047-1278
http://scottishjournal.co.uk
93
Chelidonium L.
C. majus L.
1-25 km of Bozüyük-Bilecik road, 550m., OUFE 16599, 12 vi 2011, Eur.-Sib.
Glaucium Adans.
G. corniculatum (L.) Curtis
1-25 km of Bozüyük-Bilecik road, 580m., OUFE 16600, 13 vi 2004.
G. leiocarpum Boiss.
Environs of Aşağıköy village, 260m., OUFE 7816, 04 iv 1998.
Papaver L.
P. apokrinomenon Fedde
25-30 km of Bozüyük-Bilecik road, 360m., OUFE 7817, 04 vii 1997, End., (LC).
P. rhoeas L.
Environs of Karaköy village, 690m., OUFE 7819, 11 vii 1997.
P. virchowii Asch.&Sint. ex Boiss.
25-30 km of Bozüyük-Bilecik road, 230m., OUFE 7820, 21 v 1998, End., (CD).
Hypecoum L.
H. imberbe Sm.
Environs of Şükraniye village, 700m., OUFE 16601, 04 v 2011.
Corydalis Medik.
C. solida (L.) Clairv. subsp. solida
Environs of Karaköy village, 600m., OUFE 7821, 24 vi 1998.
Fumaria L.
F. officinalis L.
Environs of Süleymaniye village, 650m., OUFE 7822, 12 vi 1997, Medit.
BRASSICACEAE (CRUCIFERAE)
Brassica L.
B. elongata Ehrh.
25-30 km of Bozüyük-Bilecik road, 380m., OUFE 7823, 06 vi 1997.
Sinapis L.
S. arvensis L.
Environs of Şükraniye village, 700m., OUFE 16602, 04 v 2002.
Hirschfeldia Moench
H. incana (L.) Lagr.-Foss.
1-25 km of Bozüyük-Bilecik road, 580m., OUFE 16603, 13 vi 2012.
Diplotaxis DC.
D. tenuifolia (L.) DC.

Scottish Journal of Arts, Social Sciences and Scientific Studies - ISSN 2047-1278
http://scottishjournal.co.uk
94
25-30 km of Bozüyük-Bilecik road, 350m., OUFE 16604, 14 v 2011.
Eruca Mill.
E. vesicaria (L.) Cav.
Environs of Şükraniye village, 700m., OUFE 7824, 04 v 1998.
Raphanus L.
R. raphanistrum L.
Environs of Küplü village, 240m., OUFE 16605, 04 v 2010.
Crambe L.
C. tataria Sebeok var. tataria
Environs of Hamidiye village, 920m., OUFE 16606, 04 v 2008.
Rapistrum Crantz
R. rugosum (L.) All.
Environs of Hamidiye village, 920m., OUFE 7825, 03 x 1998.
Lepidium L.
L. latifolium L.
1-25 km of Bozüyük-Bilecik road, 670m., OUFE 7826, 18 vii 1997.
L. draba L. subsp. draba
1-25 km of Bozüyük-Bilecik road, 690m., OUFE 7827, 18 vii 1997.
Iberis L.
I. simplex DC.
Environs of Demirköy village, 660m., OUFE 7828, 25 vii 1997.
Aethionema R. BR.
A. arabicum (L.) Andrz. ex DC.
Environs of Alibeydüzü village, 940m. OUFE 16607, 12 v 2006.
Thlaspi L.
T. arvense L.
1-25 km of Bozüyük-Bilecik road, 670m., OUFE 16608, 18 iii 2003.
Capsella Medik.
C. bursa-pastoris (L.) Medik.
1-25 km of Bozüyük-Bilecik road, 580m., OUFE 7829, 13 vi 1997.
Boreava Jaub. et Spach
B. orientalis Jaub. et Spach
1-25 km of Bozüyük-Bilecik road, 600m., OUFE 16609, 15 v 2001.
Neslia Desv.
N. paniculata subsp. thracica (Velen.) Bornm.
Environs of Küplü village, 290m., OUFE 7847, 11 vii 1997.
Fibigia Medik

Scottish Journal of Arts, Social Sciences and Scientific Studies - ISSN 2047-1278
http://scottishjournal.co.uk
95
F. clypeata (L.) Medik.
Environs of Süleymaniye village, 780m., OUFE 7830, 06 iix 1998.
F. eriocarpa (DC.) Boiss.
Environs of Yeniköy village, 300m., OUFE 7831, 22 iix 1998.
Alyssum L.
A. desertorum Stapf var. desertorum
Environs of Kızıldamlar village, 810m., OUFE 7832, 06 iix 1998.
A. minutum Patrin ex DC.
1-25 km of Bozüyük-Bilecik road, 690m., OUFE 7833, 18 vii 1997.
A. simplex Rudolph
1-25 km of Bozüyük-Bilecik road, 670m., OUFE 7834, 06 iix 1998.
A. strigosum Banks et Sol. subsp. strigosum
Environs of Akçapınar village, 900m., OUFE 7835, 03 x 1998.
A. obtusifolium Steven ex DC.
25-30 km of Bozüyük-Bilecik road, 310m., OUFE 7837, 19 ix 1997.
A. sibiricum Willd.
1-25 km of Bozüyük-Bilecik road, 570m., OUFE 16610, 27 vi 2000.
Clypeola L.
C. jonthlaspi L.
1-25 km of Bozüyük-Bilecik road, 580m., OUFE 16611, 22 v 2010.
Draba L.
D. bruniifolia Stev. subsp. olympica (DC.) Coode&Cullen
Environs of Kızıltepe village, 910m., OUFE 16612, 04 v 2010.
Erophila DC.
E. verna (L.) DC. subsp. verna
Environs of Küplü village, OUFE 16613, 300m., 04 v 2009.
Arabis L.
A. alpina L. subsp. caucasica (Willd.) Briq.
Environs of Kızıldamlar village, OUFE 16614, 810m., 06 iix 2007.
A. nova Vill.
Environs of Kurtköy village, 560m., OUFE 7838, 18 vii 1997.
Turritis L.
T. glabra L.
Environs of Hamidiye village, 920m., OUFE 16615, 04 v 2003.
T. laxa (Sm.) Hayek
Environs of Hamidiye village, 920m., OUFE 16616, 04 v 2002.
Rorippa Scop.

Scottish Journal of Arts, Social Sciences and Scientific Studies - ISSN 2047-1278
http://scottishjournal.co.uk
96
R. sylvestris (L.) Besser
Environs of Ahmetpınar village, 400m., OUFE 7839, 18 vii 1997.
Cardamine L.
C. bulbifera (L.) Crantz
Environs of Kurtköy village, 740m., OUFE 7840, 06 iix 1998, Eur.-Sib.
C. hirsuta L.
Environs of Aşağıarmutlu village, 890m., OUFE 16617, 04 iv 2010.
Aubrieta Adans.
A. deltoidea (L.) DC.
Environs of Hamidiye village, 920m., OUFE 16618, 04 v 2009.
Matthiola R. Br.
M. longipetala (Vent.) DC. subsp. bicornis (Sm.) P.W. Ball
Environs of Aşağıköy village, 310m., OUFE 16619, 15 vi 2010.
Malcolmia R. Br.
M. africana (L.) R. Br.
Environs of Hamidiye village, 920m., OUFE 16620, 04 v 2011.
Erysimum L.
E. crassipes Fisch. et Mey.
Environs of Süleymaniye village, 730m., OUFE 7843, 04 v 1998.
Sisymbrium L.
S. altissimum L.
Environs of Akçapınar village, 870m., OUFE 16621, 04 v 2008.
Descurainia Webb et Berth.
D. sophia (L.) Webb ex Prantl
Environs of Hamidiye village, 920m., OUFE 16622, 04 v 2005.
Camelina Crantz
C. rumelica Velen.
Environs of Süleymaniye village, 750m., OUFE 7844, 10 ix 1997.
C. microcarpa Andrz. ex DC.
Environs of Kızıldamlar village, 810m., OUFE 7845, 06 iix 1998.
RESEDACEAE
Reseda L.
R. lutea L. var. lutea
Environs of Demirköy village, 560m., OUFE 7846, 06 iix 1998.
CISTACEAE

Scottish Journal of Arts, Social Sciences and Scientific Studies - ISSN 2047-1278
http://scottishjournal.co.uk
97
Cistus L.
C. laurifolius L.
1-25 km of Bozüyük-Bilecik road, 680m., OUFE 16623, 01 v 2000, Medit.
C. creticus L.
Environs of Küplü village, 290m., OUFE 7847, 11 vii 1997, Omni Medit.
Helianthemum Adans.
H. nummularium (Cav.) Losa&Rivas Goday subsp. nummularium
1-25 km of Bozüyük-Bilecik road, 580m., OUFE 7848, 22 v 1997.
Fumana Spach
F. aciphylla Boiss.
Environs of Çamyayla village, 810m., OUFE 16624, 24 v 2009, Ir. Tur.
VIOLACEAE
Viola L.
V. odorata L.
Environs of Kızıldamlar village, 630m., OUFE 7850, 12 vii 1997.
V. occulta Lehm.
Environs of Alibeydüzü village, 940m., OUFE 16625, 12 v 2010.
POLYGALACEAE
Polygala L.
P. pruinosa Boiss. subsp. pruinosa
1-25 km of Bozüyük-Bilecik road, 670m., OUFE 7852, 18 vii 1997.
P. supina Schreb.
1-25 km of Bozüyük-Bilecik road, 690m., OUFE 7853, 18 vii 1997.
P. monspeliaca L.
Environs of Küplü village, 240m., OUFE 7854, 04 v 1997, Medit.
CARYOPHYLLACEAE
Arenaria L.
A. serpyllifolia L.
Environs of Karaköy village, 580m., OUFE 16626, 12 vi 1999.
Minuartia L.
M. hamata (Hausskn.) Mattf.
1-25 km of Bozüyük-Bilecik road, 560m., OUFE 7855, 04 vii 1997.
M. anatolica (Boiss.) Woronow var. polymorpha
Environs of Karaköy village, 690m., OUFE 7856, 11 vii 1997.

Scottish Journal of Arts, Social Sciences and Scientific Studies - ISSN 2047-1278
http://scottishjournal.co.uk
98
Stellaria L.
S. media (L.) Vill. subsp. media
1-25 km of Bozüyük-Bilecik road, 530m., OUFE 16627, 01 iix 2011.
Cerastium L.
C. banaticum (Rochel) Heuff.
Environs of Kurtköy village, 310m., OUFE 7857, 02 xi 1997.
C. perfoliatum L.
Environs of Aşağıarmutlu village, 890m., OUFE 7858, 04 iv 1998.
Holosteum L.
H. umbellatum L. var. umbellatum L.
Environs of Hamidiye village, 920m., OUFE 16628, 04 v 2010.
Moenchia Ehrh.
M. mantica (L.) Bartl. subsp. mantica
Environs of Küplü village, 300m., OUFE 16629, 04 v 2011.
Telephium L.
T.imperati L. subsp. orientale (Boiss.) Nyman
Environs of Ahmetpınar village, 440m., OUFE 7859, 30 v 1998.
Dianthus L.
D. micranthus Boiss. et Heldr.
Environs of Çamyayla village, 810m., OUFE 7860, 19 ix 1997.
D. zonatus Fenzl var. zonatus
Environs of Karaköy village, 800m., OUFE 16630, 18 vii 2012.
D. cruentus Griseb.
Environs of Karaköy village, 720m., OUFE 16631, 11 vii 2010.
D. cibrarius Clem.
Environs of Alibeydüzü village, 940m., OUFE 7862, 26 ix 1998, End., (NT).
Velezia L.
V. rigida L.
Environs of Karaköy village, 700m., OUFE 16632, 11 vii 2008.
Saponaria L.
S. glutinosa M.Bieb.
Environs of Akçapınar village, 900m., OUFE 16633, 03 v 2010.
S. kotschyi Boiss.
Environs of Alibeydüzü village, 940m., OUFE 16634, 26 vi 2010, End., (LC).
Gypsophila L.
G. pilosa Huds.
1-25 km of Bozüyük-Bilecik road, 530m., OUFE 16635, 27 vi 2010, Ir.-Tur.

Scottish Journal of Arts, Social Sciences and Scientific Studies - ISSN 2047-1278
http://scottishjournal.co.uk
99
Bolanthus (Ser.) Eichb.
B. minuartioides (Jaub. et Spach) Hub.-Mor.
Environs of Akçapınar village, 900m., OUFE 16636, 18 vii 2009, End., (LC).
Silene L.
S. italica (L.) Pers.
25-30 km of Bozüyük-Bilecik road, 330m., OUFE 7863, 27 vi 1997.
S. latifolia Poir.
Environs of Karaköy village, 690m., OUFE 16637, 11 vii 2001.
S. behen L.
1-25 km of Bozüyük-Bilecik road, 530m., OUFE 7864, 01 iix 1997.
S. dichotoma Ehrh. subsp. sibthorpiana (Reichb.) Rech.
25-30 km of Bozüyük-Bilecik road, 320m., OUFE 16638, 26 vii 2010.
S. conica L. subsp. subconica (Friv.) Gavioli
Environs of Alibeydüzü village, 940m., OUFE 16639, 26 vii 2010.
S. conoidea L.
Environs of Karaköy village, 700m., OUFE 16640, 11 vii 2010.
Agrostemma L.
A. githago L.
Environs of Demirköy village, 690m., OUFE 16641, 25 vii 2010.
Herniaria L.
H. hirsuta L.
1-25 km of Bozüyük-Bilecik road, 870m., OUFE 16642, l2 iv 2007.
Paronychia Mill.
P. carica Chaudhri var. carica
1-25 km of Bozüyük-Bilecik road, 580m., OUFE 16643, 06 vi 2001.
Scleranthus L.
S. annuus L. subsp. verticillatus (Tausch) Arcang.
Environs of Kurtköy village, 715m., OUFE 16644, 24 v 2000.
POLYGONACEAE
Polygonum L.
P. cognatum Meisn.
1-25 km of Bozüyük-Bilecik road, 570m., OUFE 7865, 27 vi 1997.
P. aviculare L.
25-30 km of Bozüyük-Bilecik road, 570m., OUFE 7866, 20 vi 1997.
P. bellardii All.
Environs of Aşağıarmutlu village, 890m., OUFE 7867, 04 iv 1998.

Scottish Journal of Arts, Social Sciences and Scientific Studies - ISSN 2047-1278
http://scottishjournal.co.uk
100
Rumex L.
R. acetosella L.
1-25 km of Bozüyük-Bilecik road, 670m., OUFE 7868, 18 vii 1997.
R. crispus L.
1-25 km of Bozüyük-Bilecik road, 580m., OUFE 7869, 22 v 1997.
AMARANTHACEAE
Chenopodium L.
C. foliosum Asch.
1-25 km of Bozüyük-Bilecik road, 670m., OUFE 7870, 18 vii 1997.
TAMARICACEAE
Tamarix L.
T. smyrnensis Bunge
Environs of Aşağıköy village, 320m., OUFE 7871, 26 ix 1998.
HYPERICACEAE (GUTTIFERAE)
Hypericum L.
H. calycinum L.
1-25 km of Bozüyük-Bilecik road, 580m., OUFE 16645, 13 vi 2010, Eur.-Sib.
H. perfoliatum L.
Environs of Süleymaniye village, 700m., OUFE 7872, 24 iix 1997, Medit.
H. origanifolium Willd.
25-30 km of Bozüyük-Bilecik road, 310m., OUFE 7873, 24 iix 1997.
H. aviculariifolium Jaub. et Spach subsp. depilatum (Freyn et Bornm.) Robson
var. depilatum
Environs of Karaköy village, 720m., OUFE 16645, 11 vii 2010, End., (LC), Ir.-
Tur.
H. perforatum L.
Environs of Çamyayla village, 810m., OUFE 7874, 19 ix 1997.
MALVACEAE
Hibiscus L.
H. trionum L.
Environs of Kurtköy village, 740m., OUFE 16646, 06 iix 2009.
Malva L.
M. sylvestris L.

Scottish Journal of Arts, Social Sciences and Scientific Studies - ISSN 2047-1278
http://scottishjournal.co.uk
101
1-25 km of Bozüyük-Bilecik road, 670m., OUFE 7875, 06 iix 1998.
M. neglecta Wallr.
Environs of Küplü village, 300m., OUFE 16647, 23 iix 2008.
Alcea L.
A. pallida (Willd.) Waldst.&Kit.
25-30 km of Bozüyük-Bilecik road, 350m., OUFE 7877, 14 v 1998.
Althaea L:
A. hirsuta L.
1-25 km of Bozüyük-Bilecik road, 580m., OUFE 7876, 22 v 1997.
LINACEAE
Linum L.
L. nodiflorum L.
Environs of Çamyayla village, 810m., OUFE 7878, 19 iix 1997, Medit.
L. hirsutum L. subsp. anatolicum (Boiss.) Hayek var. anatolicum
25-30 km of Bozüyük-Bilecik road, 570m., OUFE 16648, 20 vi 2010, End., (LC),
Ir.-Tur.
L. bienne Mill.
Environs of Ahmetpınar village, 410m., OUFE 7879, 25 vii 1997, Medit.
GERANIACEAE
Geranium L.
G. lucidum L.
1-25 km of Bozüyük-Bilecik road, 530m., OUFE 7880, 01 iix 1997.
G. purpureum Vill.
1-25 km of Bozüyük-Bilecik road, 530m., OUFE 7881, 27 vi 1997.
G. robertianum L.
Environs of Kızıldamlar village, 810m., OUFE 7882, 06 iix 1998.
G. rotundifolium L.
Environs of Yeniköy village, 300m., OUFE 7883, 22 iix 1998.
G.dissectum L.
Environs of Bekdemir village, 230m., OUFE 7884, 24 v 1997.
G. asphodeloides Burm.f. subsp. asphodeloides
1-25 km of Bozüyük-Bilecik road, 620m., OUFE 7887, 08 v 1997, Eux.
G. pyrenaicum Burm.f.
1-25 km of Bozüyük-Bilecik road, 690m., OUFE 16649, 18 vii 2005.
Erodium L' Herit.

Scottish Journal of Arts, Social Sciences and Scientific Studies - ISSN 2047-1278
http://scottishjournal.co.uk
102
E. ciconium (L.) L'Hér.
Environs of Alibeydüzü village, 940m., OUFE 16650, 12 v 2006.
E. absinthoides Willd. subsp. absinthoides
25-30 km of Bozüyük-Bilecik road, 310m., OUFE 16651, 28 vi 2008, End., (LC),
Ir.-Tur.
E. cicutarium (L.) L'Hér. subsp. cicutarium
Environs of Alibeydüzü village, 940m., OUFE 7890, 26 ix 1998.
RUTACEAE
Ruta L.
R. montana (L.) L.
1-25 km of Bozüyük-Bilecik road, 690m., OUFE 7892, 18 vii 1997.
R. thesioides Fisch. ex DC.
1-25 km of Bozüyük-Bilecik road, 560m., OUFE 7894, 04 vii 1997.
SIMAROUBACEAE
Ailanthus Desf.
A. altissima (Mill.) Swingle
25-30 km of Bozüyük-Bilecik road, 600m., OUFE 7895, 12 ix 1997.
VITACEAE
Vitis L.
V. vinifera L.
Environs of Karaköy village, 580m., OUFE 7896, 12 vi 1998.
RHAMNACEAE
Paliurus Mill.
P. spina-christi Mill.
1-25 km of Bozüyük-Bilecik road, 580m., OUFE 7897, 22 v 1997.
Rhamnus L.
R. rhodopea Velen.
1-25 km of Bozüyük-Bilecik road, 530m., OUFE 7898, 01 iix 1997.
ANACARDIACEAE
Rhus L.
R. coriaria L.
Environs of Bekdemir village, 220m., OUFE 7900, 23 iix 1998.

Scottish Journal of Arts, Social Sciences and Scientific Studies - ISSN 2047-1278
http://scottishjournal.co.uk
103
Pistacia
P. terebinthus L. subsp. palaestina (Boiss.) Engler
Environs of Aşağıarmutlu village, 890m., OUFE 16651, 04 iv 2009, Medit.
CELASTRACEAE
Euonymus L.
E. latifolius (L.) Mill. subsp. latifolius
1-25 km of Bozüyük-Bilecik road, 870m., OUFE 7901, l2 iv 1997, Eur.-Sib.
FABACEAE (LEGUMINOSAE)
Cytisus L.
C. austriacus L.
Environs of Kızıltepe village, 910m., OUFE 16652, 24 v 2007, Eur.-Sib.
Genista L.
G. tinctoria L.
Environs of Aşağıarmutlu village, 890m., OUFE 7902, 04 iv 1998, Eur.-Sib.
G. lydia Boiss. var. lydia Griseb.
Environs of Kızıltepe village, 910m., OUFE 7903, 04 v 1998, Medit.
Lotononis Eckl. et Zeyh.
L. genistoides (Fenzl) Benth.
Environs of Kurtköy village, 740m., OUFE 7904, 06 iix 1998, Ir.-Tur.
Argyrolobium Eckl. et Zeyh.
A. biebersteinii P.W.Ball
25-30 km of Bozüyük-Bilecik road, 220m., OUFE 7905, 13 v 1997.
Robinia L.
R. pseudoacacia L.
1-25 km of Bozüyük-Bilecik road, 580m., OUFE 7906, 06 vi 1997, Culture.
Galega L.
G. officinalis L.
1-25 km of Bozüyük-Bilecik road, 670m., OUFE 7907, 12 ix 1997, Eur.-Sib.
Astragalus L.
A. glycyphyllos L. subsp. glycyphyllos
1-25 km of Bozüyük-Bilecik road, 690m., OUFE 16653, 18 vii 2005, Eur.-Sib.
A. angustiflorus K. Koch subsp. anatolicus (Boiss.) D.F.Chamb.
Environs of Alibeydüzü village, 940m., OUFE 16654, 26 vi 2004, End., (LC), E.
Medit.
A. macrocephalus Willd. subsp. macrocephalus

Scottish Journal of Arts, Social Sciences and Scientific Studies - ISSN 2047-1278
http://scottishjournal.co.uk
104
Environs of Demirköy village, 690m., OUFE 16655, 25 vii 2001, End., (NT), Ir.-
Tur.
A. lydius Boiss.
Environs of Akçapınar village, 900m., OUFE 16656, 24 vii 2011, End., (LC) Ir.-
Tur.
Tragacantha Mill.
T. elongata (Willd.) Kuntze
Environs of Çamyayla village, 810m., OUFE 7910, 19 ix 1997, Ir.-Tur.
Bituminaria C.H.Stirt.
B. bituminosa (L.) C.H.Stirt.
1-25 km of Bozüyük-Bilecik road, 660m., OUFE 7911, 25 vii 1997, Medit.
Vicia L.
V. cassubica L.
Environs of Demirköy village, 690m., OUFE 7912, 25 vii 1997, Eur.-Sib.
V. tenuifolia subsp. dalmatica (A.Kern.) Greuter
Environs of Hamidiye village, 920m., OUFE 7913, 04 v 1998.
V. grandiflora Scop. var. grandiflora
Environs of Süleymaniye village, 780m., OUFE 7914, 06 iix 1998.
Lathyrus L.
L. aureus (Steven) D.Brandza
Environs of Karaköy village, 600m., OUFE 7915, 24 vi 1998, Eux.
L. digitatus (M.Bieb.) Fiori
Environs of Kızıldamlar village, 810m., OUFE 7916, 06 iix 2010, E. Medit.
L. undulatus Boiss.
Environs of Kurtköy village, 715m., OUFE 7917, 12 iv 1998, End., (VU), Eur.-
Sib.
L. nissolia L.
Environs of Demirköy village, 650m., OUFE 7919, 01 iv 1997.
Pisum L.
P. sativum L. subsp. elatius (M.Bieb.) Asch.&Graebn. var. elatius
1-25 km of Bozüyük-Bilecik road, 600m., OUFE 7920, 29 iv 1997, Medit.
Trifolium L.
T. repens L. var repens
Environs of Akçapınar village, 900m., OUFE 7921, 03 x 1998.
T. hybridum L. var hybridum
Environs of Alibeydüzü village, 940m., OUFE 7922, 26 ix 1998.
T. campestre Schreb.
Environs of Küplü village, 290m., OUFE 16657, 22 iii 2000.

Scottish Journal of Arts, Social Sciences and Scientific Studies - ISSN 2047-1278
http://scottishjournal.co.uk
105
T. nigrescens Viv. subsp. petrisavii (Clementi) Holmboe
1-25 km of Bozüyük-Bilecik road, 620m., OUFE 7923, 08 v 1997.
T. physodes M.Bieb. var. physodes
Environs of Karaköy village, 580m., OUFE 7924, 28 vii 1998, Medit.
T. pratense L. var. pratense Boiss. et Bal.
Environs of Kızıltepe village, 910m., OUFE 7925, 04 v 1998.
T. arvense L. var. arvense
Environs of Aşağıköy village, 260m., OUFE 16658, 04 iv 2010.
T. hirtum All.
Environs of Aşağıarmutlu village, 890m., OUFE 7928, 04 iv 1998, Medit.
Melilotus L.
M. officinalis (L.) Pall.
1-25 km of Bozüyük-Bilecik road, 680m., OUFE 7929, 27 iv 1997.
M. alba Desr.
1-25 km of Bozüyük-Bilecik road, 570m., OUFE 7930, 27 vi 1997.
Trigonella L.
T. cretica (L.) Boiss.
25-30 km of Bozüyük-Bilecik road, 350m., OUFE 16659, 14 v 2003, End., (NT),
E. Medit.
T. lunata Boiss.
Environs of Süleymaniye village, 720m., OUFE 16660, 25 v 2004, Ir.-Tur.
T. spruneriana Boiss. var. spruneriana
Environs of Bekdemir village, 220m., OUFE 7932, 26 iix 1997, Ir.-Tur.
Medicago L.
M. monantha (C.A.Mey.) Trautv. subsp. monantha
1-25 km of Bozüyük-Bilecik road, 570m., OUFE 16661, 27 vi 2008, Ir.-Tur.
M. radiata L.
Environs of Kurtköy village, 740m., OUFE 7933, 06 iix 1998, Ir.-Tur.
M. minima (L.) L. var. minima
Environs of Küplü village, 300m., OUFE 16662, 22 v 2008.
M. lupulina L.
Environs of Karaköy village, 800m., OUFE 16663, 18 vii 2009.
M. sativa L. subsp. sativa
1-25 km of Bozüyük-Bilecik road, 530m., OUFE 7934, 01 iix 1997.
Dorycnium Mill.
D. graecum (L.) Ser.
Environs of Yeniköy village, 320m., OUFE 7936, 25 v 1998, Eux.

Scottish Journal of Arts, Social Sciences and Scientific Studies - ISSN 2047-1278
http://scottishjournal.co.uk
106
D. pentaphyllum Scop. subsp. herbaceum (Vill.) Rouy
Environs of Demirköy village, 650m., OUFE 7937, 01 iix 1997.
Lotus L.
L. corniculatus L. var. corniculatus (Bieb.) Arc.
Environs of Kızıldamlar village, 810m., OUFE 7938, 06 iix 1998.
Coronilla L.
C. scorpioides (L.) Koch
25-30 km of Bozüyük-Bilecik road, 570m., OUFE 16664, 20 vi 2009.
Hedysarum L.
H. varium Willd.
Environs of Alibeydüzü village, 940m., OUFE 16665, 26 vi 2010, Ir.-Tur.
Onobrychis Adans.
O. caput-galli (L.) Lam.
Environs of Kızıltepe village, 910m., OUFE 7940, 04 v 1998.
O. hypargyrea Boiss.
Environs of Karaköy village, 580m., OUFE 16666, 24 iv 2010.
Securigera DC.
S. varia (L.) Lassen
Environs of Kızılkaplan village, 400m., OUFE 16667, 10 iix 2009.
ROSACEAE
Prunus L.
P. amygdalus Batsch
Environs of Demirköy village, 650m., OUFE 7948, 01 iix 1997, Culture.
P. spinosa L. subsp. dasyphylla (Schur) Domin
Environs of Karaköy village, 580m., OUFE 7943, 29 v 1997.
P. x domestica L.
1-25 km of Bozüyük-Bilecik road, 560m., OUFE 7944, 26 ix 1998.
Cerasus Duhamel
C. avium (L.) Moench
Environs of Küplü village, 290m., OUFE 7945, 26 ix 1998, Culture.
Filipendula Mill.
F. vulgaris Moench
Environs of Aşağıköy village, 310m., OUFE 16668, 15 vi 2007, Eur.-Sib.
Rubus L.
R. ulmifolius Schott subsp. sanctus (Schreb.) Sudre
Environs of Demirköy village, 660m., OUFE 7949, 25 vii 1997.

Scottish Journal of Arts, Social Sciences and Scientific Studies - ISSN 2047-1278
http://scottishjournal.co.uk
107
R. tomentosus Borkh. var. canescens (DC.) Wirtg.
Environs of Karaköy village, 570m., OUFE 7950, 06 iix 1998.
Potentilla L.
P. recta L.
Environs of Küplü village, 300m., OUFE 7951, 04 v 1998.
P. reptans L.
1-25 km of Bozüyük-Bilecik road, 670m., OUFE 16669, 18 vii 2006.
Fragaria L.
F. vesca L.
Environs of Karaköy village, 560m., OUFE 16670, 23 iv 2008.
Geum L.
G. urbanum L.
1-25 km of Bozüyük-Bilecik road, 670m., OUFE 16671, 18 vii 2008, Eur.-Sib.
Agrimonia L.
A. eupatoria L.
1-25 km of Bozüyük-Bilecik road, 620m., OUFE 7952, 08 v 1997.
Poterium L.
P. lasiocarpum Boiss.&Hausskn.
Environs of Kızıldamlar village, 810m., OUFE 16672, 06 iix 2009.
Rosa L.
R. foetida Herrm.
Environs of Bekdemir village, 220m., OUFE 7953, 28 vi 1998, Ir.-Tur.
R. turcica Rouy
1-25 km of Bozüyük-Bilecik road, 550m., OUFE 7954, 12 vi 1998.
R. canina L.
1-25 km of Bozüyük-Bilecik road, 690m., OUFE 7955, 18 vii 1997.
Cotoneaster Medik.
C. nummularius Fisch.&C.A. Mey.
Environs of Süleymaniye village, 720m., OUFE 16673, 25 v 2010.
Crataegus L.
C. orientalis Pall. ex Bieb. var. orientalis
Environs of Karaköy village, 800m., OUFE 16674, 18 vii 2009.
C. monogyna Jacq. subsp. monogyna
1-25 km of Bozüyük-Bilecik road, 530m., OUFE 7956, 04 v 1998.
Malus Mill.
M. domestica Borkh.
Environs of Karaköy village, 580m., OUFE 7957, 29 v 1997, Culture.
Scottish Journal of Arts, Social Sciences and Scientific Studies - ISSN 2047-1278
http://scottishjournal.co.uk
108
Pyrus L.
P. communis L. subsp. communis
Environs of Bekdemir village, 220m., OUFE 7958, 19 ix 1997, E. Medit.
CUCURBITACEAE
Ecballium A. Rich.
E. elaterium (L.) A.Rich.
1-25 km of Bozüyük-Bilecik road, 670m., OUFE 16675, 24 ix 2008, Medit.
LYTHRACEAE
Lythrum L.
L. salicaria L.
Environs of Alibeydüzü village, 940m., OUFE 16676, 26 v 2011, Eur.-Sib.
ONAGRACEAE
Epilobium L.
E. angustifolium L.
Environs of Alibeydüzü village, 940m., OUFE 16677, 26 vii 2011.
E. hirsutum L.
Environs of Karaköy village, 290m., OUFE 7959, 11 vii 1997.
E. parviflorum Schreb.
1-25 km of Bozüyük-Bilecik road, 570m., OUFE 7960, 27 vi 1997.
CRASSULACEACEAE
Umbilicus DC.
U. luteus (Huds.) Webb&Berthel.
Environs of Kızıldamlar village, 810m., OUFE 16678, 06 iix 2012.
Sedum L.
S. acre L.
1-25 km of Bozüyük-Bilecik road, 690m., OUFE 7963, 18 vii 1997.
S. album L.
Environs of Çamyayla village, 810m., OUFE 7964, 19 ix 1997.
UMBELLIFERAE (APIACEAE)
Sanicula L.
S. elata Buch.-Ham. ex D. Don.
Environs of Yeniköy village, 300m., OUFE 7965, 22 iix 1998, Eur.-Sib.

Scottish Journal of Arts, Social Sciences and Scientific Studies - ISSN 2047-1278
http://scottishjournal.co.uk
109
Eryngium L.
E. campestre L. var. virens (Link) Weins
Environs of Alibeydüzü village, 940m., OUFE 7966, 26 ix 1998.
Echinophora L.
E. tenuifolia L. subsp. sibthorpiana (Guss.) Tutin
Environs of Kızılkaplan village, 310m., OUFE 16679, 10 ix 2010, Ir.-Tur.
Chaerophyllum L.
C. byzantinum Boiss.
Environs of Kızıltepe village, 1000m., OUFE 16680, 19 ix 2009, Eur.-Sib.
Anthriscus Pers.
A. nemorosa (M.Bieb.) Spreng.
Environs of Akçapınar village, 900m., OUFE 16681, 03 v 2000.
Scandix L.
S. stellata Banks&Sol.
1-25 km of Bozüyük-Bilecik road, 580m., OUFE 7967, 22 v 1997.
S. pecten-veneris L.
1-25 km of Bozüyük-Bilecik road, 580m., OUFE 7968, 06 vi 1997.
Smyrnium L.
S. perfoliatum L.
Environs of Küplü village, 300m., OUFE 7969, 22 v 1997.
Pimpinella L.
P. lithophila Schischk.
Environs of Akçapınar village, 900m., OUFE 7971, 03 x 1998.
Oenanthe L.
Oe. silaifolia Bieb.
Environs of Karaköy village, 800m., OUFE 7972, 18 vii 1997.
Conium L.
C. maculatum L.
Environs of Demirköy village, 660m., OUFE 16682, 25 vi 2003.
Bupleurum L.
B. rotundifolium L.
Environs of Kızıltepe village, 910m., OUFE 16683, 04 vii 2001.
B. sulphureum Boiss.&Balansa
Environs of Kurtköy village, 740m., OUFE 16684, 06 iix 2002, End., (LC), Ir.-
Tur.
Falcaria Fabr.
F. vulgaris Bernh.

Scottish Journal of Arts, Social Sciences and Scientific Studies - ISSN 2047-1278
http://scottishjournal.co.uk
110
Environs of Küplü village, 280m., OUFE 16685, 18 iix 2007.
Ferulago W. Koch
F. macrosciadea Boiss.&Balansa
Environs of Hamidiye village, 920m., OUFE 7973, 04 v 1998, End., (LC), Medit.
Malabaila Hoffm.
M. secacul Banks&Sol.
Environs of Demirköy village, 700m., OUFE 16686, 25 vii 2004.
Heracleum L.
H. platytaenium Boiss.
Environs of Karaköy village, 690m., OUFE 16687, 11 vii 2009, End., (LC), Eur.-
Sib.
Tordylium L.
T. maximum L.
Environs of Akçapınar village, 900m., OUFE 7975, 03 x 1998.
Torilis Adans.
T. arvensis (Huds.) Link subsp. arvensis
Environs of Aşağıarmutlu village, 780m., OUFE7976, 06 iix 1998.
T. leptophylla (L.) Rchb. f.
Environs of Kızılkaplan village, 400m., OUFE 7977, 10 iix 1997.
Turgenia Hoffm.
T. latifolia (L.) Hoffm.
Environs of Küplü village, 240m., OUFE 16688, 04 v 2010.
Daucus L.
D. carota L.
Environs of Kurtköy village, 320m., OUFE 7978, 06 iix 1998.
Artedia L.
A. squamata L.
Environs of Alibeydüzü village, 940m. OUFE 16689, 12 v 2010.
ARALIACEAE
Hedera L.
H. helix L.
25-30 km of Bozüyük-Bilecik road, 310m., OUFE 7979, 02 xi 1997.
CORNACEAE
Cornus L.
C. mas L.

Scottish Journal of Arts, Social Sciences and Scientific Studies - ISSN 2047-1278
http://scottishjournal.co.uk
111
Environs of Kurtköy village, 715m., OUFE 7980, 24 v 1997.
ADOXACEAE
Sambucus L.
S. ebulus L.
Environs of Aşağıarmutlu village, 890m., OUFE 7981, 04 vii 1998, Eur.-Sib.
CAPRIFOLIACEAE
Valeriana L.
V. dioscoridis Sm.
Environs of Aşağıarmutlu village, 890m., OUFE 7982, 04 vii 1998, E. Medit.
Valerianella Mill.
V. coronata DC.
1-25 km of Bozüyük-Bilecik road, 680m., OUFE 16690, 27 vii 2011.
V. turgida Betcke
Environs of Kızıltepe village, 910m., OUFE 16691, 04 v 2012.
Dipsacus L.
D. laciniatus L.
1-25 km of Bozüyük-Bilecik road, 600m., OUFE 7983, 29 v 1997.
Knautia L.
K. orientalis L.
Environs of Çamyayla village, 810m., OUFE 7986, 19 ix 1997, E. Medit.
Scabiosa L.
S. atropurpurea L. subsp. maritima (L.) Arc.
1-25 km of Bozüyük-Bilecik road, 600m., OUFE 7984, 15 v 1997.
Pterocephalus Vaill. ex Adanson
P. plumosus Coult.
Environs of Yeniköy village, 300m., OUFE 16692, 22 iix 2003.
ASTERACEAE (COMPOSITAE)
Ceratocephalus Moench.
C. falcatus (L.) Pers.
Environs of Şükraniye village, 700m., OUFE 16693, 04 v 2000.
Xanthium L.
X. spinosum L.
Environs of Çamyayla village, 810m., OUFE 7988, 24 v 1998.
X. strumarium L.subsp. strumarium.

Scottish Journal of Arts, Social Sciences and Scientific Studies - ISSN 2047-1278
http://scottishjournal.co.uk
112
Environs of Çamyayla village, 810m., OUFE 7989, 19 ix 1997.
Inula L.
I. ensifolia L.
Environs of Yeniköy village, 300m., OUFE 7991, 22 iix 1998, Eur.-Sib.
I. heterolepis Boiss.
Environs of Hamidiye village, 920m., OUFE 7992, 04 v 1998, E. Medit.
Pulicaria Gaertner
P. dysenterica (L.) Bernh.
Environs of Yeniköy village, 300m., OUFE 7993, 22 iix 1998.
Filago L.
F. pyramidata L.
1-25 km of Bozüyük-Bilecik road, 600m., OUFE 16694, 15 v 2003.
Bombycilaena (DC.) Smolj.
B. erecta (L.) Smoljan.
Environs of Hamidiye village, 920m., OUFE 16695, 04 v 2004.
Erigeron L.
E. acer L. subsp. acer
Environs of Kurtköy village, 740m., OUFE 7996, 06 iix 1998.
Conyza Less.
C. canadensis (L.) Cronquist
Environs of Yeniköy village, 300m., OUFE 7997, 22 iix 1998.
Doronicum L.
D. orientale Hoffm.
1-25 km of Bozüyük-Bilecik road, 570m., OUFE 7998, 27 vi 1997.
Senecio L.
S. leucanthemifolius Poir. subsp. vernalis (Waldst.&Kit.) Greuter
Environs of Aşağıarmutlu village, 890m., OUFE 7999, 04 iv 1998.
Tussilago L.
T. farfara L.
1-25 km of Bozüyük-Bilecik road, 670m., OUFE 8000, 24 v 1998, Eur.-Sib.
Eupatorium L.
E. cannabinum L.
1-25 km of Bozüyük-Bilecik road, 580m., OUFE 8001, 13 vi 1997, Eur.-Sib.
Anthemis L.
A. cretica L. subsp. anatolica. (Boiss.) Grierson
Environs of Kurtköy village, 740m., OUFE 8002, 06 iix 1998.
A. tinctoria L. var. tinctoria

Scottish Journal of Arts, Social Sciences and Scientific Studies - ISSN 2047-1278
http://scottishjournal.co.uk
113
1-25 km of Bozüyük-Bilecik road, 600m., OUFE 16696, 29 v 2006.
A. tinctoria L. var. pallida DC.
Environs of Çamyayla village, 810m., OUFE 8004, 19 ix 1997.
A. wiedemanniana Fish. et Mey.
1-25 km of Bozüyük-Bilecik road, 560m., OUFE 8005, 04 vii 1997, End., (LC).
Achillea L.
A. santolinoides Lag. subsp. wilhelmsii (K.Koch) Greuter
1-25 km of Bozüyük-Bilecik road, 690m., OUFE 8006, 18 vii 1997, Ir.-Tur.
A. nobilis L. subsp. neilreichii (A.Kern.) Velen.
Environs of Kızıldamlar village, 810m., OUFE 16697, 06 iix 2008, Eur.-Sib.
A. biebersteinii Afan.
Environs of Akçapınar village, 900m., OUFE 16698, 18 vii 2001, Ir.-Tur.
Arctium L.
A. minus (Hill) Bernh. subsp. minus
Environs of Süleymaniye village, 780m., OUFE 8008, 06 iix 1998, Eur.-Sib.
Onopordum L.
O. tauricum Willd.
Environs of Yeniköy village, 320m., OUFE 16699, 30 vii 2001, Eur.-Sib.
Cirsium Mill.
C. vulgare (Savi) Ten.
Environs of Alibeydüzü village, 940m., OUFE 8011, 26 ix 1998.
C. hypoleucum DC.
1-25 km of Bozüyük-Bilecik road, 620m., OUFE 8012, 08 v 1997.
C. arvense (L.) Scop.
25-30 km of Bozüyük-Bilecik road, 330m., OUFE 16700, 01 iix 2001.
Picnomon Adans.
P. acarna (L.) Cass.
Environs of Şükraniye village, 725m., OUFE 16701, 19 ix 2003, Medit.
Carduus L.
C. nutans L. subsp. trojanus P.H. Davis
1-25 km of Bozüyük-Bilecik road, 670m., OUFE 8013, 18 vii 1997, End., (CD).
C. arabicus Jacq.
Environs of Kurtköy village, 730m., OUFE 16702, 24 v 2004.
Tyrimnus Cass.
T. leucographus (L.) Cass.
1-25 km of Bozüyük-Bilecik road, 580m., OUFE 16703, 13 vi 2007, Medit.
Jurinea Cass.

Scottish Journal of Arts, Social Sciences and Scientific Studies - ISSN 2047-1278
http://scottishjournal.co.uk
114
J. pontica Hausskn.&Freyn ex Hausskn.
Environs of Bekdemir village, 290m., OUFE 16704, 06 iix 2009, End., (LC), Ir.-
Tur.
Centaurea L.
C. wiedemanniana Fisch.&C.A.Mey.
1-25 km of Bozüyük-Bilecik road, 580m., OUFE 8017, 13 vi 1997, End., (VU).
C. virgata Lam.
Environs of Kurtköy village, 740m., OUFE 16705, 06 iix 2010, Ir.-Tur.
C. thracica (Janka) Janka ex Gugler
1-25 km of Bozüyük-Bilecik road, 690m., OUFE 8018, 18 vii 1997,
C. solstitialis L. subsp. solstitialis
Environs of Süleymaniye village, 780m., OUFE 8019, 06 iix 1998.
C. iberica Trevir. ex Spreng.
1-25 km of Bozüyük-Bilecik road, 530m., OUFE 8020, 27 vi 1997.
C. urvillei DC. subsp. urvillei
Environs of Kurtköy village, 740m., OUFE 8021, 06 iix 1998,
C. urvillei DC. subsp. stepposa
Environs of Karaköy village, 800m., OUFE 16706, 18 vii 2008, End., (LC), E.
Medit.
C. depressa M.Bieb.
25-30 km of Bozüyük-Bilecik road, 450m., OUFE 16707, 29 v 2007.
Crupina (Pers.) DC.
C. vulgaris Pers. ex Cass.
Environs of Hamidiye village, 920m., OUFE 8022, 04 v 1998.
Carthamus L.
C. dentatus Vahl
Environs of Süleymaniye village, 780m., OUFE 16708, 06 iix 2001.
Carlina L.
C. vulgaris L.
Environs of Karaköy village, 800m., OUFE 8023, 18 vii 1997.
Xeranthemum L.
X. annuum. L.
1-25 km of Bozüyük-Bilecik road, 530m., OUFE 8024, 24 v 1998.
Echinops L.
E. ritro L.
Environs of Aşağıarmutlu village, 890m., OUFE 8027, 04 iv 1998.
E. microcephalus Sm.

Scottish Journal of Arts, Social Sciences and Scientific Studies - ISSN 2047-1278
http://scottishjournal.co.uk
115
1-25 km of Bozüyük-Bilecik road, 670m., OUFE 8025, 12 vi 1998.
Scolymus L.
S. hispanicus L.
Environs of Çamyayla village, 810m., OUFE 16709, 19 iix 2010, Medit.
Cichorium L.
C. intybus L.
Environs of Yeniköy village, 300m., OUFE 8029, 22 iix 1998.
Scorzonera L.
S. laciniata L. subsp. lacinata
Environs of Bekdemir village, 230m., OUFE 8031, 06 iix 1998.
S. cana (C.A.Mey.) O.Hoffm. var. cana
25-30 km of Bozüyük-Bilecik road, 310m., OUFE 16710, 28 vi 2004.
S. eriophora DC.
Environs of Hamidiye village, 920m., OUFE 16711, 04 v 2004, End., (LC).
Tragopogon L.
T. porrifolius L. subsp. longirostris (Sch.Bip.) Greuter
Environs of Karaköy village, 580m., OUFE 8032, 24 v 1998.
Leontodon L.
L. crispus Vill.
Environs of Karaköy village, 290m., OUFE 16712, 11 vii 2009.
Picris L.
P. angustifolia DC.
Environs of Alibeydüzü village, 940m., OUFE 16713, 26 ix 2007, Eur.-Sib.
Sonchus L.
S. asper (L.) Hill subsp. glaucescens (Jord.) Ball ex Ball
Environs of Kızıltepe village, 910m., OUFE 8034, 24 v 1998.
Hieracium L.
H. pannosum Boiss. subsp. bornmuelleri (Freyn)
1-25 km of Bozüyük-Bilecik road, 690m., OUFE 16714, 18 vii 2000, End., (LC).
Pilosella Hill
P. hoppeana (Schultes) C.H. et F.W. Schultz subsp. macrantha (Ten.)
S.Bräut.&Greuter
Environs of Kızıldamlar village, 630m., OUFE 16715, 12 vii 2001.
Mycelis Cass.
M. muralis (L.) Dumort.
Environs of Aşağıköy village, 260m., OUFE 8036, 10 x 1998, Eur.-Sib.
Lapsana L.

Scottish Journal of Arts, Social Sciences and Scientific Studies - ISSN 2047-1278
http://scottishjournal.co.uk
116
L. communis L. subsp. adenophora (Boiss.) Rech.f.
Environs of Çamyayla village, 810m., OUFE 16716, 19 ix 2012.
Taraxacum Wiggers
T. serotinum (Waldst.&Kit.) Poir.
1-25 km of Bozüyük-Bilecik road, 810m., OUFE 8037, 10 v 1998.
Chondrilla L.
C. juncea L. var. juncea
Environs of Karaköy village, 600m., OUFE 8038, 24 v 1998.
Crepis L.
C. commutata Greuter
Environs of Süleymaniye village, 730m., OUFE 16717, 04 v 2010.
CAMPANULACEAE
Campanula L.
C. lyrata Lam. subsp. lyrata
Environs of Hamidiye village, 920m., OUFE 8039, 04 v 1998, End., (LC), Medit.
C. rapunculoides L. subsp. cordifolia (K.Koch) Damboldt
Environs of Süleymaniye village, 780m., OUFE 16718, 06 iix 2008.
C. olympica Boiss.
Environs of Kurtköy village, 750m., OUFE 8040, 12 iv 1998.
Asyneuma Griseb. et Schenk
A. limonifolium (L.) Janch. subsp. limonifolium
Environs of Karaköy village, 600m., OUFE 16719, 24 v 2000.
Legousia Durande
L. speculum-veneris (L.) Durande ex Vill.
Environs of Akçapınar village, 870m., OUFE 16720, 04 v 2010, Medit.
L. pentagonia (L.) Thell.
Environs of Karaköy village, 720m., OUFE 8041, 11 vii 1997, E. Medit.
ERICACEAE
Erica L.
E. arborea L.
Environs of Karaköy village, 800m., OUFE 16721, 18 vii 2010.
Arbutus L.
A. unedo L.
Environs of Ahmetpınar village, 400m., OUFE 16722, 03 x 2005.

Scottish Journal of Arts, Social Sciences and Scientific Studies - ISSN 2047-1278
http://scottishjournal.co.uk
117
PRIMULACEAE
Primula L.
P. vulgaris Huds. subsp. vulgaris
1-25 km of Bozüyük-Bilecik road, 670m., OUFE 16723, 24 v 2007, Eur.-Sib.
Cyclamen L.
C. coum Mill. var. coum
1-25 km of Bozüyük-Bilecik road, 500m., OUFE 8042, 01 iix 1997.
Lysimachia L.
L. vulgaris L.
1-25 km of Bozüyük-Bilecik road, 670m., OUFE 8043, 24 ix 1997.
Anagallis L.
A. arvensis L. subsp. foemina (Mill.) Schinz&Thell.
1-25 km of Bozüyük-Bilecik road, 690m., OUFE 8044, 18 vii 1997, Medit.
OLEACEAE
Jasminum L.
J. fruticans L.
Environs of Kurtköy village, 740m., OUFE 8045, 06 iix 1998, Medit.
Olea L.
O. europaea L. var. europaea
Environs of Kızılkaplan village, 310m., OUFE 8046, 10 ix 1997.
APOCYNACEAE
Vinca L.
V. major L. subsp. major
Environs of Karaköy village, 890m., OUFE 16724, 04 vi 2009, Medit.
Periploca L.
P. graeca L. var. graeca Boiss. et Heldr.
1-25 km of Bozüyük-Bilecik road, 600m., OUFE 16725, 29 v 2002, E. Medit.
Cynanchum L.
C. acutum L. subsp. acutum
1-25 km of Bozüyük-Bilecik road, 690m., OUFE 16726, 18 vii 2003.
Vincetoxicum N.M. Wolf
V. fuscatum intermedium Taliev
1-25 km of Bozüyük-Bilecik road, 560m., OUFE 16727, 04 vii 2010.
Cionura Griseb.
C. erecta (L.) Griseb.
Scottish Journal of Arts, Social Sciences and Scientific Studies - ISSN 2047-1278
http://scottishjournal.co.uk
118
Environs of Bekdemir village, 220m., OUFE 16728, 13 v 2005, E. Medit.
GENTIANACEAE
Gentiana L.
G. asclepiadea L.
Environs of Hamidiye village, 920m., OUFE 16729, 04 v 2009, Eur.-Sib.
CONVOLVULACEAE
Convolvulus L.
C. cantabricus L.
Environs of Aşağıarmutlu village, 890m., OUFE 8047, 04 iv 1998.
C. holosericeus M. Bieb. subsp. holosericeus
Environs of Yeniköy village, 330m., OUFE 16730, 25 vii 2008.
C. arvensis L.
Environs of Karaköy village, 700m., OUFE 8048, 11 vii 1997.
C. betonicifolius Mill. subsp. betonicifolius
1-25 km of Bozüyük-Bilecik road, 660m., OUFE 8049, 25 vii 1997.
Calystegia R. Br.
C. sepium (L.) R. Br. subsp. sepium
1-25 km of Bozüyük-Bilecik road, 600m., OUFE 8050, 29 v 1997.
BORAGINACEAE
Heliotropium L.
H. europaeum L.
Environs of Akçapınar village, 870m., OUFE 8051, 04 v 1998, Medit.
Lappula Fabricius
L. barbata (M. Bieb.) Gürke
Environs of Akçapınar village, 900m., OUFE 16731, 18 vii 2007, Ir.-Tur.
Myosotis L.
M. arvensis (L.) Hill
Environs of Kızılkaplan village, 310m., OUFE 8053, 10 ix 1997, Eur.-Sib.
M. densiflora C. Koch
Environs of Bekdemir village, 220m., OUFE 16732, 18 vii 2010.
M. sicula Guss.
Environs of Kızılkaplan village, 400m., OUFE 8054, 10 iix 1997.
Cynoglossum L.
C. creticum Mill.

Scottish Journal of Arts, Social Sciences and Scientific Studies - ISSN 2047-1278
http://scottishjournal.co.uk
119
1-25 km of Bozüyük-Bilecik road, 530m., OUFE 8055, 27 vi 1997, Eur.-Sib.
C. montanum L.
Environs of Çamyayla village, 810m., OUFE , 19 ix 1997.
Aegonychon Gray
A. purpurea-coeruleum Holub.
Environs of Alibeydüzü village, 940m., OUFE 8056, 26 ix 1998, Eur.-Sib.
Echium L.
E. italicum L.
Environs of Karaköy village, 720m., OUFE 8057, 11 vii 1997, Eur.-Sib.
E. vulgare L.
Environs of Kızıldamlar village, 810m., OUFE 8058, 06 iix 1998, Medit.
Onosma L.
O. bracteosa Hausskn.&Bornm.
Environs of Hamidiye village, 920m., OUFE 8059, 04 v 1998, End., (LC), Ir.-Tur.
O. brevifolia DC. ex Boiss.
1-25 km of Bozüyük-Bilecik road, 580m., OUFE 16733, 01 v 2009, End., (LC).
O. x bornmuelleri Hausskn.&Bornm.
Environs of Demirköy village, 660m., OUFE 8060, 25 vii 1997, End., (LC).
O. aucheriana DC.
25-30 km of Bozüyük-Bilecik road, 310m., OUFE 8061, 02 xi 1997, E. Medit.
Cerinthe L.
C. minor L. subsp. auriculata (Ten.) Domac
Environs of Süleymaniye village, 780m., OUFE 8062, 12 ix 1998.
Symphytum L.
S. tuberosum subsp. nodosum (Schur) Soo
1-25 km of Bozüyük-Bilecik road, 600m., OUFE 8063, 15 v 1997, Eur.-Sib.
Anchusa L.
A. leptophylla Roem.&Schult. subsp. leptophylla
Environs of Hamidiye village, 920m., OUFE 8064, 04 v 1998.
A. undulata L. subsp. hybrida (Ten.) Cout.
Environs of Çamyayla village, 810m., OUFE 8065, 19 ix 1997, Medit.
A. stylosa M.Bieb.
Environs of Akçapınar village, 870m., OUFE 8066, 04 v 1998.
Alkanna Tausch
A. orientalis (L.) Boiss. var. leucantha (Bornm.) Hub.-Mor.
Environs of Kurtköy village, 740m., OUFE 16734, 06 iix 2004, End., (CD), Ir.-
Tur.
Scottish Journal of Arts, Social Sciences and Scientific Studies - ISSN 2047-1278
http://scottishjournal.co.uk
120
A. tinctoria Tausch subsp. tinctoria
1-25 km of Bozüyük-Bilecik road, 600m., OUFE 16735, 29 v 2008, Medit.
SOLANACEAE
Solanum L.
S. dulcamara L.
Environs of Kurtköy village, 740m., OUFE 8067, 06 iix 1998, Eur.-Sib.
Datura L.
D. stramonium L.
Environs of Aşağıarmutlu village, 890m., OUFE 8068, 04 iv 1998.
Hyoscyamus L.
H. niger L.
Environs of Karaköy village, 690m., OUFE 8069, 11 vii 1997.
SCROPHULARIACEAE
Verbascum L.
V. orientale (L.) All.
1-25 km of Bozüyük-Bilecik road, 670m., OUFE 8070, 12 ix 1997, Medit.
V. glomeratum Boiss.
Environs of Süleymaniye village, 780m., OUFE 8071, 12 ix 1998.
V. cheiranthifolium Boiss. var. asperulum (Boiss.) Murb.
Environs of Küplü village, 300m., OUFE 8072, 23 iix 1997, End., (LC).
OROBANCHACEAE
Orobanche L.
O. alba Stephan
Environs of Karaköy village, 700m., OUFE 8079, 11 vii 1997.
O. minor Sm.
1-25 km of Bozüyük-Bilecik road, 570m., OUFE 8080, 27 vi 1997.
Melampyrum L.
M. arvense L. var. arvense
Environs of Alibeydüzü village, 940m., OUFE 8078, 26 ix 1998, Eur.-Sib.
ACANTHACEAEA
Acanthus L.
A. hirsutus Boiss.
Environs of Süleymaniye village, 700m., OUFE 8081, 24 iix 1998, End., (LC).

Scottish Journal of Arts, Social Sciences and Scientific Studies - ISSN 2047-1278
http://scottishjournal.co.uk
121
LAMIACEAE (LABIATAE)
Ajuga L.
A. orientalis L.
Environs of Akçapınar village, 900m., OUFE 8083, 24 vii 1998.
A. chamaepitys (L.) Schreb. subsp. chia (Schreb.) Arcang. var. chia
1-25 km of Bozüyük-Bilecik road, 670m., OUFE 8084, 12 ix 1997.
Teucrium L.
T. chamaedrys L. subsp. chamaedrys
Environs of Kızıldamlar village, 810m., OUFE 8085, 06 iix 1998, Eur.-Sib.
T. polium L.
Environs of Kurtköy village, 740m., OUFE 8086, 06 iix 1998.
Scutellaria L.
S. albida L. subsp. albida
Environs of Süleymaniye village, 780m., OUFE 8088, 06 iix 1998.
S. orientalis L. subsp. pinnatifida Edmondson
Environs of Kurtköy village, 740m., OUFE 16736, 06 iix 2009, Ir.-Tur.
Phlomis L.
P. pungens Willd. var. hispida Hub.-Mor.
Environs of Süleymaniye village, 780m., OUFE 16737, 06 iix 2008.
P. russeliana (Sims) Lag. ex Benth.
Environs of Alibeydüzü village, 940m., OUFE 16738, 26 ix 2010, End., (LC),
Eur.-Sib.
Lamium L.
L. amplexicaule L.
1-25 km of Bozüyük-Bilecik road, 620m., OUFE 8093, 08 v 1997, Eur.-Sib.
L. purpureum L. var. purpureum
Environs of Aşağıarmutlu village, 890m., OUFE 8094, 04 iv 1998, Eur.-Sib.
L. orientale (Fisch.&C.A.Mey.) E.H.L.Krause.
Environs of Hamidiye village, 920m., OUFE 16739, 04 v 2011, Ir.-Tur.
Ballota L.
B. nigra L. subsp. anatolica P.H. Davis
Environs of Karaköy village, OUFE 8096¸ 12 ix 1998, End., (LC), Ir.-Tur.
Marrubium L.
M. vulgare L.
1-25 km of Bozüyük-Bilecik road, 600m., OUFE 16740, 15 v 2011.
M. parviflorum Fisch.&C.A.Mey. subsp. parviflorum

Scottish Journal of Arts, Social Sciences and Scientific Studies - ISSN 2047-1278
http://scottishjournal.co.uk
122
Environs of Karaköy village, 700m., OUFE 16741, 11 vii 2010, Ir.-Tur.
M. peregrinum L.
Environs of Aşağıarmutlu village, 890m., OUFE 8099, 04 iv 1998.
Sideritis L.
S. montana L. subsp. montana
Environs of Aşağıarmutlu village, 890m., OUFE 8100, 04 iv 1998, Medit.
S. germanicopolitana Bornm. subsp. germanicopolitana
Environs of Süleymaniye village, 700m., OUFE 8102, 24 iix 1997, End., (LC).
Stachys L.
S. tmolea Boiss.
Environs of Demirköy village, 560m., OUFE 8103, 23 iix 1997, End., (LC), E.
Medit.
S. cretica L. subsp. anatolica Rech. Fil.
Environs of Karaköy village, 600m., OUFE 16742, 24 v 2010, End., (LC), Ir.-Tur.
S. byzantina K.Koch
Environs of Alibeydüzü village, 940m., OUFE 8105, 26 vii 1998, Eur.-Sib.
S. thirkei K.Koch
Environs of Karaköy village, 690m., OUFE 8106, 11 vii 1997.
S. annua (L.) L. subsp. annua var. lycaonica Bhattacharjee
Environs of Kızıldamlar village, 810m., OUFE 8108, 06 iix 1998, Ir.-Tur.
Nepeta L.
N. italica L.
1-25 km of Bozüyük-Bilecik road, 570m., OUFE 8110, 20 vi 1997.
Prunella L.
P. vulgaris L.
Environs of Süleymaniye village, 780m., OUFE 8111, 12 ix 1998, Eur.-Sib.
Origanum L.
O. sipyleum L.
Environs of Bekdemir village, 220m., OUFE 16743, 28 vi 2007, End., (LC), E.
Medit.
O. vulgare L.
Environs of Karaköy village, 670m., OUFE 8112, 12 iv 1997.
Clinopodium L.
C. vulgare L. subsp. vulgare
1-25 km of Bozüyük-Bilecik road, 530m., OUFE 8115, 27 iv 1997.
Micromeria Bentham
M. myrtifolia Boiss.&Hohen.

Scottish Journal of Arts, Social Sciences and Scientific Studies - ISSN 2047-1278
http://scottishjournal.co.uk
123
1-25 km of Bozüyük-Bilecik road, 500m., OUFE 8116, 01 iix 2006, E. Medit.
Thymus L.
T. longicaulis C. Presl subsp. longicaulis var. subisophyllus
1-25 km of Bozüyük-Bilecik road, 560m., OUFE 16744, 04 vii 2002.
T. sipyleus Boiss. subsp. sipyleus var. sipyleus
Environs of Ahmetpınar village, 410m., OUFE 16745, 25 vii 2003, End., (LC).
Mentha L.
M. pulegium L.
1-25 km of Bozüyük-Bilecik road, 660m., OUFE 8121, 25 vii 1997.
M. longifolia (L.) Huds. subsp. typhoides (Briq.) Harley
Environs of Akçapınar village, 900m., OUFE 16746, 03 x 2010.
Ziziphora L.
Z. capitata L.
1-25 km of Bozüyük-Bilecik road, 530m., OUFE 8123, 18 vi 1997, Ir.-Tur.
Z. tenuior L.
1-25 km of Bozüyük-Bilecik road, 600m., OUFE 8124, 15 v 1997, Ir.-Tur.
Salvia L.
S. tomentosa Mill.
Environs of Yeniköy village, 300m., OUFE 8125, 22 iix 1998, Medit.
S. bracteata Banks&Sol.
Environs of Kurtköy village, 740m., OUFE 16747, 06 iix 2008, Ir.-Tur.
S. cadmica Boiss.
1-25 km of Bozüyük-Bilecik road, 690m., OUFE 8126, 18 vii 1997, End., (LC).
S. viridis L.
Environs of Demirköy village, 660m., OUFE 8127, 25 vii 1997.
S. sclarea L.
Environs of Hamidiye village, 920m., OUFE 8128, 04 v 1998.
S. aethiopis L.
Environs of Karaköy village, 580m., OUFE 16748, 24 vi 2003.
S. argentea L.
Environs of Süleymaniye village, 720m., OUFE 16749, 25 v 2009, Medit.
S. cyanescens Boiss.&Balansa
Environs of Kurtköy village, 740m., OUFE 8129, 06 iix 1998, End., (LC).
S. virgata Jacq.
1-25 km of Bozüyük-Bilecik road, 580m., OUFE 8130, 22 v 1997, Ir.-Tur.
PLUMBAGINACEAE

Scottish Journal of Arts, Social Sciences and Scientific Studies - ISSN 2047-1278
http://scottishjournal.co.uk
124
Plumbago L.
P. europaea L.
Environs of Süleymaniye village, 780m., OUFE 16750, 06 iix 2005, Eur.-Sib.,
Acantholimon Boiss.
A. acerosum (Willd.) Boiss. var. acerosum
Environs of Akçapınar village, 900m., OUFE 8132, 18 vii 1998, Ir.-Tur.
PLANTAGINACEAE
Plantago L.
P. major L. subsp. major
Environs of Karaköy village, 690m., OUFE 8133, 11 vii 1997.
P. lanceolata L.
Environs of Hamidiye village, 920m., OUFE 8134, 04 v 1998.
P. scabra Moench
Environs of Demirköy village, 690m., OUFE 16751, 25 vii 2007.
Linaria Mill.
L. corifolia Desf.
Environs of Ahmetpınar village, 400m., OUFE 8073, 20 ix 1997, End., (LC).
Digitalis L.
D. ferruginea L. subsp. ferruginea
Environs of Aşağıarmutlu village, 890m., OUFE 8074, 04 iv 1998, Eur.-Sib.
D. lamarckii Ivanina
Environs of Alibeydüzü village, 940m., OUFE 16752, 26 ix 2007, End., (LC), Ir.-
Tur.
Veronica L.
V. bozakmanii M.A.Fisch.
Environs of Kızıldamlar village, 630m., OUFE 16753, 12 vii 2001, Ir.-Tur.
V. persica Poir.
1-25 km of Bozüyük-Bilecik road, 690m., OUFE 8076, 18 vii 1997.
V. anagallis-aquatica L.
1-25 km of Bozüyük-Bilecik road, 570m., OUFE 8077, 27 vi 1997.
Globularia L.
G. trichosantha Fisch.&C.A.Mey.
Environs of Hamidiye village, 920m., OUFE 8082, 04 v 1998.
THYMELAEACEAE
Daphne L.

Scottish Journal of Arts, Social Sciences and Scientific Studies - ISSN 2047-1278
http://scottishjournal.co.uk
125
D. pontica L.
Environs of Kızıldamlar village, 810m., OUFE 8135, 06 iix 1998, Eux.
D. sericea Vahl
1-25 km of Bozüyük-Bilecik road, 600m., OUFE 8136, 29 v 1997, E. Medit.
ELAEAGNACEAE
Elaeagnus L.
E. angustifolia L.
Environs of Aşağıarmutlu village, 890m., OUFE 8137, 04 iv 1998.
SANTALACEAE
Osyris L.
O. alba L.
Environs of Yeniköy village, 300m., OUFE 8138, 22 iix 1998, Medit.
Viscum L.
V. album L. subsp. album
Environs of Karaköy village, 690m., OUFE 8139, 11 vii 1997.
ARISTOLOCHIACEAE
Aristolochia L.
A. pallida Willd.
Environs of Hamidiye village, 920m., OUFE 8140, 04 v 1998.
A. hirta L.
Environs of Akçapınar village, 870m., OUFE 8141, 04 v 1998.
EUPHORBIACEAE
Andrachne L.
A. telephioides L.
Environs of Kurtköy village, 740m., OUFE 16754, 06 iix 2002.
Chrozophora A. Juss.
C. tinctoria (L.) A.Juss.
Environs of Çamyayla village, 810m., OUFE 16755, 19 ix 2008.
Mercurialis L.
M. annua L.
1-25 km of Bozüyük-Bilecik road, 570m., OUFE 16756, 20 vi 2008.
Euphorbia L.
E. apios L.

Scottish Journal of Arts, Social Sciences and Scientific Studies - ISSN 2047-1278
http://scottishjournal.co.uk
126
1-25 km of Bozüyük-Bilecik road, 600m., OUFE 8136, 29 v 1997, E. Medit.
E. helioscopia L.
1-25 km of Bozüyük-Bilecik road, 530m., OUFE 8143, 18 vi 1997.
E. taurinensis All.
Environs of Alibeydüzü village, 940m., OUFE 16757, 26 vi 2006.
E. herniariifolia Willd. var. herniariifolia
Environs of Karaköy village, 800m., OUFE 8144, 18 vii 1997.
URTICACEAE
Urtica L.
U. dioica L.
Environs of Karaköy village, 690m., OUFE 8145, 11 vii 1997, Eur.-Sib.
MORACEAE
Morus L.
M. alba L.
Environs of Küplü village, 260m., OUFE 8146, 10 ix 1997.
Ficus L.
F. carica L. subsp. carica (All.) Schinz et Thell.
1-25 km of Bozüyük-Bilecik road, 670m., OUFE 8147, 18 vii 1997.
ULMACEAE
Ulmus L.
U. glabra Huds.
Environs of Kızıldamlar village, 810m., OUFE 8148, 06 iix 1998, Eur.-Sib.
CANNABACEAE
Celtis L.
C. australis L.
1-25 km of Bozüyük-Bilecik road, 690m., OUFE 8149, 18 vii 1997, Medit.
JUNGLANDACEAE
Junglans L.
J. regia L.
Environs of Karaköy village, 690m., OUFE 8150, 11 vii 1997.
PLATANACEAE

Scottish Journal of Arts, Social Sciences and Scientific Studies - ISSN 2047-1278
http://scottishjournal.co.uk
127
Platanus L.
P. orientalis L.
Environs of Karaköy village, 580m., OUFE 8151, 28 vii 1998, Eur.-Sib.
FAGACEAE
Fagus L.
F. orientalis Lipsky
1-25 km of Bozüyük-Bilecik road, 690m., OUFE 8152, 18 vii 1997, Eur.-Sib.
Castanea Mill.
C. sativa Mill.
Environs of Kızıltepe village, 920m., OUFE 8153, 24 ix 1998, Eur.-Sib.
Quercus L.
Q. petraea (Mattuschka) Liebl. subsp. petraea
1-25 km of Bozüyük-Bilecik road, 500m., OUFE 8154, 01 iix 1997.
Q. pubescens Willd.
1-25 km of Bozüyük-Bilecik road, 570m., OUFE 8155, 20 vi 1997.
Q. coccifera L.
Environs of Kızıltepe village, 1000m., 19 ix 1997, OUFE 8156, Medit.
BETULACEAE
Carpinus L.
C. betulus L.
1-25 km of Bozüyük-Bilecik road, 600m., OUFE 8157, 15 v 1997, Eur.-Sib.
Corylus L.
C. avellana L. var. avellana
Environs of Akçapınar village, 900m., OUFE 8158, 24 ix 1998, Eur.-Sib.
SALICACEAE
Salix L.
S. alba
Environs of Karaköy village, 700m., OUFE 8159, 11 vii 1997, Eur.-Sib.
S. cinerea L.
Environs of Alibeydüzü village, 940m., OUFE 8160, 26 ix 1998, Eur.-Sib.
Populus L.
P. alba L.
25-30 km of Bozüyük-Bilecik road, 310m., OUFE 8161, 02 xi 1997, Eur.-Sib.
P. tremula L.

Scottish Journal of Arts, Social Sciences and Scientific Studies - ISSN 2047-1278
http://scottishjournal.co.uk
128
Environs of Aşağıarmutlu village, 890m., OUFE 8162, 04 iv 1998.
RUBIACEAE
Asperula L.
A. lilaciflora Boiss. subsp. phrygia (Bornm.) Schönb.-Tem.
25-30 km of Bozüyük-Bilecik road, 360m., OUFE 8164, 04 vii 1997, End., (LC).
A. involucrata Wahlenb.
1-25 km of Bozüyük-Bilecik road, 570m., OUFE 8165, 20 vi 1997, Eux.
A. arvensis L.
1-25 km of Bozüyük-Bilecik road, 670m., OUFE 8166, 18 vii 1997, Medit.
Galium L.
G. rotundifolium L.
Environs of Kızıldamlar village, 810m., OUFE 8169, 06 iix 1998.
G. odoratum (L.) Scop.
1-25 km of Bozüyük-Bilecik road, 530m., OUFE 8167, 18 vi 1997, Eur.-Sib.
G. rivale (Sibth.&Sm.) Griseb.
Environs of Yeniköy village, 300m., OUFE 16758, 22 iix 1998, Eur.-Sib.
G. verum L. subsp. verum
1-25 km of Bozüyük-Bilecik road, 500m., OUFE 8168, 01 iix 1997, Eur.-Sib.
G. paschale Forssk.
Environs of Demirköy village, 660m., OUFE 8170, 25 vii 1997, E. Medit.
Rubia L.
R. tinctorium L.
25-30 km of Bozüyük-Bilecik road, 320m., OUFE 8172, 26 vii 1998, Ir.-Tur.
MONOCOTYLEDONE
ARACEAE
Arum L.
A. elongatum Steven subsp. elongatum
1-25 km of Bozüyük-Bilecik road, 690m., OUFE 16759, 18 vii 2001.
LILIACEAE
Fritillaria L.
F. fleischeriana Steud.&Hochst. ex Schult.&Schult.f.
Environs of Kurtköy village, 715m., OUFE 16760, 24 v 2010, End., (NT), Ir.-
Tur.
Tulipa L.

Scottish Journal of Arts, Social Sciences and Scientific Studies - ISSN 2047-1278
http://scottishjournal.co.uk
129
T. armena Boiss. var. armena
1-25 km of Bozüyük-Bilecik road, 570m., OUFE 16761, 20 vi 2002, Ir.-Tur.
Gagea Salisb.
G. bohemica (Zauschn.) Schult.&Schult.f.
Environs of Aşağıarmutlu village, 890m., OUFE 16762, 04 iv 2004.
G. granatellii (Parl.) Parl.
Environs of Aşağıarmutlu village, 890m., OUFE 8186, 04 iv 1998, Ir.-Tur.
G. villosa (M.Bieb.) Sweet var. villosa
Environs of Süleymaniye village, 780m., OUFE 16763, 06 v 2010, Medit.
ASPARAGACEAE
Ruscus L.
R. aceulatus L. var. aceulatus
Environs of Akçapınar village, 900m., OUFE 8173, 03 v 1998.
Asparagus L.
A. tenuifolius Lam.
Environs of Karaköy village, 690m., OUFE 8174, 11 vii 1997, Eur.-Sib.
Prospero Salisb.
P. autumnale (L.) Speta
Environs of Kızıldamlar village, 810m., OUFE 16764, 06 iix 2001, Medit.
Ornithogalum L.
O. pyrenaicum L.
1-25 km of Bozüyük-Bilecik road, 570m., OUFE 8179, 27 vi 1997.
O. oligophyllum E.D.Clarke
Environs of Kızıldamlar village, 810m., OUFE 16765, 06 iix 2008.
O. comosum L.
1-25 km of Bozüyük-Bilecik road, 530m., OUFE 8180, 01 vi 1997.
Leopoldia Herb.
L. comosa (L.) Parl.
1-25 km of Bozüyük-Bilecik road, 530m., OUFE 8181, 18 vi 1997, Medit.
L. tenuiflora (Tausch) Heldr.
Environs of Kızıldamlar village, 610m., OUFE 8182, 26 vii 1997.
Muscari Mill.
M. neglectum Guss. ex Ten.
Environs of Kızıldamlar village, 810m., OUFE 8184, 06 v 1998.
AMARYLLIDACEAE

Scottish Journal of Arts, Social Sciences and Scientific Studies - ISSN 2047-1278
http://scottishjournal.co.uk
130
Allium L.
A. paniculatum L. subsp. paniculatum
Environs of Alibeydüzü village, 940m., OUFE 8176, 26 v 1998, Medit.
A. ampeloprasum L.
Environs of Süleymaniye village, 780m., OUFE 8178, 06 v 1998, Medit.
A. guttatum Steven subsp. sardoum (Moris) Stearn
Environs of Çamyayla village, 810m., OUFE 16766, 24 v 2010, Medit.
A. rotundum L.
1-25 km of Bozüyük-Bilecik road, 550m., OUFE 16767, 12 vi 2002, Eur.-Sib.
COLCHICACEAE
Colchicum L.
C. atticum Spruner ex Tommas.
Environs of Demirköy village, 690m., OUFE 16768, 25 xii 2007, E. Medit.
IRIDACEAE
Iris L.
I. orientalis Mill.
25-30 km of Bozüyük-Bilecik road, 220m., OUFE 8187, 13 v 1997, E. Medit.
I. pumila L. subsp. attica (Boiss.&Heldr.) K.Richt.
1-25 km of Bozüyük-Bilecik road, 810m., OUFE 8188, 13 v 1998, E. Medit.
Crocus L.
C. chrysanthus (Herb.) Herb.
Environs of Kızıldamlar village, 810m., OUFE 8189, 06 ii 1998.
C. olivieri J.Gay subsp. olivieri
1-25 km of Bozüyük-Bilecik road, 670m., OUFE 8191, 18 iii 1997.
C. pallasii Goldb. subsp. pallasi
Environs of Akçapınar village, 900m., OUFE 8190, 03 x 1998.
ORCHIDACEAE
Cephalanthera L.C.M. Richard
C. epipactoides Fisch.&C.A.Mey.
1-25 km of Bozüyük-Bilecik road, 570m., OUFE 8192, 20 ii 1997, E. Medit.
C. rubra (L.) Rich.
Environs of Süleymaniye village, 780m., OUFE 16769, 06 iix 2009.
C. damasonium (Mill.) Druce
Environs of Akçapınar village, 900m., OUFE 16770, 03 v 2007, Eur.-Sib.

Scottish Journal of Arts, Social Sciences and Scientific Studies - ISSN 2047-1278
http://scottishjournal.co.uk
131
Epipactis Zinn
E. helleborine (L.) Crantz
Environs of Demirköy village, 660m., OUFE 8193, 25 vii 1997.
Limodorum Boehmer
L. abortivum (L.) Sw. var. abortivum
Environs of Karaköy village, 800m., OUFE 16771, 18 vii 2002.
Platanthera L. C. M. Richard
P. chlorantha (Custer) Rchb.
Environs of Hamidiye village, 920m., OUFE 16772, 04 v 2010.
Anacamptis L. M. C. Richard
A. pyramidalis (L.) Rich.
Environs of Alibeydüzü village, 940m., OUFE 16773, 26 vii 2001.
Orchis L.
O. purpurea Huds.
Environs of Kızıltepe village, 910m., OUFE 16774, 04 v 2007, Eur.-Sib.
O. mascula L. subsp. mascula
Environs of Bekdemir village, 220m., OUFE 8194, 13 v 1998, E. Medit.
Dactylorhiza Necker et Nevski
D. romana (Sebast.) Soó subsp. romana
Environs of Alibeydüzü village, 940m., OUFE 8195, 26 vi 1998, Medit.
TYPHACEAE
Typha L.
T. domingensis Pers.
Environs of Karaköy village, 560m., OUFE 16775, 23 iv 2009.
JUNCACEAE
Juncus L.
J. bufonius L.
Environs of Demirköy village, 690m., OUFE 8196, 25 vii 1997.
CYPERACEAE
Carex L.
C. pendula Huds.
Environs of Hamidiye village, 920m., OUFE 8198, 04 v 1998, Eur.-Sib.
POACEAE (GRAMINAE)

Scottish Journal of Arts, Social Sciences and Scientific Studies - ISSN 2047-1278
http://scottishjournal.co.uk
132
Brachypodium L.
B. sylvaticum (Huds.) P.Beauv.
Environs of Alibeydüzü village, 940m., OUFE 8199, 26 iix 1998.
B. pinnatum (L.) P.Beauv.
25-30 km of Bozüyük-Bilecik road, 330m., OUFE 8200, 26 iix 1998, Eur.-Sib.
Elymus L.
E. hispidus (Opiz) Melderis subsp. hispidus
Environs of Çamyayla village, 810m., OUFE 8202, 19 iix 1997.
Aegilops L.
Ae. umbellulata Zhuk. subsp. umbellulata
1-25 km of Bozüyük-Bilecik road, 560m., OUFE 16776, 04 vii 2007, Ir.-Tur.
Ae. geniculata Roth
Environs of Aşağıarmutlu village, 890m., OUFE 8205, 04 vii 1998, Medit.
Hordeum L.
H. bulbosum L.
Environs of Kızılkaplan village, 400m., OUFE 8206, 10 iix 1997.
Bromus L.
B. japonicus Thunb. subsp. japonicus
1-25 km of Bozüyük-Bilecik road, 530m., OUFE 8208, 27 vi 1997.
B. sterilis L.
Environs of Alibeydüzü village, 940m., OUFE 8209, 26 vii 1998.
Avena L.
A. barbata Pott ex Link subsp. barbata
Environs of Küplü village, 290m., OUFE 8211, 11 vii 1997, Medit.
Arrhenatherum P. Beauv.
A. elatius (L.) P.Beauv. ex J.Presl&C.Presl. subsp. elatius
1-25 km of Bozüyük-Bilecik road, 680m., OUFE 8213, 12 iix 1997, Eur.-Sib.
Rostraria Trin.
R. cristata (L.) Tzvelev var. cristata
Environs of Kurtköy village, 740m., OUFE 8214, 06 iix 1998.
Koeleria Pers.
K. nitidula Velen.
1-25 km of Bozüyük-Bilecik road, 500m., OUFE 8215, 01 iix 1997.
K. cristata (L.) Tzvelev
Environs of Kızıltepe village, 910m., OUFE 8216, 04 vii 2010.
Alopecurus L.
A. myosuroides Huds. var. myosuroides

Scottish Journal of Arts, Social Sciences and Scientific Studies - ISSN 2047-1278
http://scottishjournal.co.uk
133
1-25 km of Bozüyük-Bilecik road, 500m., OUFE 8221, 01 iix 1997, Eur.-Sib.
Phleum L.
P. montanum K.Koch subsp. montanum
Environs of Karaköy village, 800m., OUFE 16777, 18 vii 2004.
Festuca L.
F. callieri (Hack.) Markgr. subsp. callieri
Environs of Kurtköy village, 740m., OUFE 8224, 06 iix 1998.
F. beckeri (Hack.) Trautv.
25-30 km of Bozüyük-Bilecik road, 450m., OUFE 8225, 29 v 1997.
F. valesiaca Schleich. ex Gaudin
1-25 km of Bozüyük-Bilecik road, 680m., OUFE , 01 v 1997.
Lolium L.
L. perenne L.
Environs of Kurtköy village, 300m., OUFE 8226, 22 iix 1998, Eur.-Sib.
Poa L.
P. trivialis L.
Environs of Kurtköy village, 750m., OUFE 8228, 12 iv 1998.
P. pratensis L.
Environs of Kızıldamlar village, 810m., OUFE 8229, 06 iix 1996.
P. bulbosa L.
Environs of Karaköy village, 690m., OUFE 16778, 11 vii 2007.
Dactylis L.
D. glomerata L. subsp. hispanica (Roth) Nyman
1-25 km of Bozüyük-Bilecik road, 500m., OUFE 8230, 01 iix 1997, Eur.-Sib.
Cynosurus L.
C. cristatus L.
1-25 km of Bozüyük-Bilecik road, 560m., OUFE 16779, 04 vii 2012, Eur.-Sib.
Briza L.
B. media L.
Environs of Kurtköy village, 930m., OUFE 8233, 16 vi 2009.
Echinaria Desf.
E. capitata (L.) Desf.
1-25 km of Bozüyük-Bilecik road, 680m., OUFE 8234, 12 iix 1997.
Melica L.
M. ciliata L. subsp. ciliata
Environs of Kızılkaplan village, 310m., OUFE 8235, 10 ix 1997, Ir.-Tur.
Glyceria R.Br.

Scottish Journal of Arts, Social Sciences and Scientific Studies - ISSN 2047-1278
http://scottishjournal.co.uk
134
G. notata Chevall.
Environs of Demirköy village, 580m., OUFE 8236, 13 x 1997.
Stipa L.
S. bromoides (L.) Dörfl.
Environs of Hamidiye village, 920m., OUFE 8237, 04 v 1998, Medit.
Oryzopsis Michx.
O. coerulescens (Desf.) Hack.
1-25 km of Bozüyük-Bilecik road, 570m., OUFE 8238, 20 vi 1997.
Chrysopogon Trin.
C. gryllus (L.) Trin. subsp. gryllus
Environs of Küplü village, 280m., OUFE 8241, 18 iix 1998.
Bothriochloa O. Kuntze
B. ischaemum (L.) Keng
1-25 km of Bozüyük-Bilecik road, 680m., OUFE 8242, 12 iix 1997.

Scottish Journal of Arts, Social Sciences and Scientific Studies - ISSN 2047-1278
http://scottishjournal.co.uk
135
Women, Poverty and Child-labor:
The Contending Evils with Child
Development in Akure Region, Nigeria.
Basorun, Joseph Omoniyi.
Department of Urban and Regional Planning,
School of Environmental Technology,
Federal University of Technology, Akure.
Abstract
The share of the great proportion of the problems of poverty by women, no doubt,
has significant correlation with child-labor in Nigerian cities today. This paper, therefore,
investigates specifically child-labor in trading activities –being the major job of women
in Akure, Nigeria. It equally looks at the influence of these women (mothers) on the
child-laborers in the face of poverty. The study adopts simple descriptive statistics and a
pair-wise association between child-laborers and employers, using the Pearson’s
Correlation test. Results show that women associate highly statistically (0.96) with child-
labor. To reduce the menace, some policy measures are recommended including poverty-
targeted/social assistance programs, gender gap reduction in tertiary education, initiation
of projects on vocational skills, introduction of peer educators to campaign against child
labor and intensification of family planning awareness to combat the menace.
Keywords: Women, Poverty, Trading, Child-labor, Akure, Ondo State, Nigeria

Scottish Journal of Arts, Social Sciences and Scientific Studies - ISSN 2047-1278
http://scottishjournal.co.uk
136
1. Introduction
Childhood is a critical period of development in life. This is a period when
children are particularly vulnerable to exploitation and abuse because they are still
growing physically and are dependent on adults for their wellbeing and security
(Marshall, 2003). In many societies, children within the family have particular
developmental needs and rights which are met by parents. Women are naturally
equipped and disposed to nature succeeding generations of the human species
(Ogbuigwe, 1996), hence, tend to attend to children’s needs than men (fathers). Within
the context of this study, women are referred to as ‘mothers’ and the child as a youth in
the family under the working age of 18.
The focus of this research is the use of child labor by women, which is the
engagement of a child in harmful work considered illegal, hazardous or extremely
exploitative. In 1998, the International Labor Organization (ILO) reported that 250
million children worldwide are victims of child-labor; 80 million of which is in Africa,
and are under the minimum age of employment 18. The 1998 ILO report further reveals
that these children were engaged in commercial agriculture, manufacturing or industrial
labor, domestic service, salary and bonded labor as well as prostitution – all which, either
keep them out of school or put them at health and development risk.
Poor families rely upon child-labor to attain basic necessities. About one-fifth of
the world’s 6 billion people live in absolute poverty – the main cause of child-labor in
parts of Africa, Asia and Latin America (Cause of Child Labor, 2009). The African
continent is generally poor, but sub-Saharan Africa (to which Nigeria belongs) stands out
as the world’s most poverty-stricken region, when measured by the conventional
yardstick (Christian Michelsen Institute, 1998) of living below US $1 per day. In Nigeria,
for instance, the size of the poor rose from 36 million in 1985 (Osinubi, 2003) to 40
million in 1995, of which 43 percent lived in urban areas (FOS Survey, 1996/97). In
1999, at least 87 percent of Nigerian 120million lived in poverty (Nnamani, 2003).
Poverty is about a lack of economic, social, physical, environmental, cultural and
political resources that prevent people of all ages from fulfilling their potential (Marshall,
2003).
Women in particular, represent a disproportionate share of the poor. Typically,
they occupy lower paid and lower status jobs than men; women’s unemployment rates are
higher than men’s and far more women than men work in the ”informal sector”
occupations like street vending and market work (Ashford, 2001). His reports indicate
that, worldwide, more men (80 percent) than women (64 percent) are literate; in many
societies the laws pertaining to family, disallow them from inheriting land and other
properties – a disadvantaged position that perpetuates their early entry into motherhood,
and a continued circle of poverty. The social, political and economic inequalities that
women face are the results of historically rooted culture, outdated traditions, retrograde
taboos and inadequate policies (Kanshahu, 2000:45)
Women do most agricultural work (the major occupation in Nigeria) and carry out
local trading (Mallum, 1990). Majority of them bear “dual burden” of working outside
the home while at the same time doing a larger share of work in the home than men –
such as child bearing, cooking, and cleaning (Ashford, 2001). It is often argued that
women are most frequent with the children; they spend more time at home with them
than men and often dictate the kind of activities they carry out. Greater percentages of

Scottish Journal of Arts, Social Sciences and Scientific Studies - ISSN 2047-1278
http://scottishjournal.co.uk
137
the unemployed in Nigeria are women (Afonja, et al, 2002:2). The great proportion of
the family responsibilities women bear, therefore, suggests why most children in the
cities today turn to laborers to compliment their mother’s effort.
The highest incidence of child labor is found in Africa, where one in three
children works (Bass, 2004). The work typically done by African children in the home
are apprentices and in commercial labor markets (Kielland and Tovo, 2006).
Assumptions are often made that policies targeted at the adults and households will be of
tremendous impacts on the survival, protection and development of the children. This
study, therefore, aims at investigating the role of women in the use of child labor at
market places in Akure region, Nigeria. The objectives are to: (1)the category of children
engaged in the act; (2) investigate the type job done; (3) assess the locations of operation;
and (4) examine the factors responsible. Understanding the fundamental causes will
assist in setting policy measures aimed at raising women’s efficiency and productivity
while reducing child labor in Nigerian cities.
2.0 Theoretical Framework of Study
The theories and concepts that provide the basis for understanding child labor in
human societies include the concept of discrimination, social exclusion, marginalization
and vulnerability and childhood poverty.
Discrimination embraces separateness from the life experience common to the
majority within a society (Anderson, 2000). The concept focuses on the multi-
dimensionality of deprivation. That is, the different treatment of others based on their
membership in a socially distinct group or category such as race, ethnicity, sex, religion,
age or disability. Discrimination can be favorable or unfavorable, depending on whether
a person receives favors or opportunities, or is denied them (Dorsen and Liberman,
2007). There are no societies in which children enjoy the same opportunities as adults.
Examples of such discrimination include the prohibition to allocate land to them, the right
to choose a career, and lack of accessibility to real properties, and job positions
(Kanshahu, 2000:45). This indirectly implies exclusion (deprivation) in the economic,
social as well as political realms.
Social exclusion is similar to various types of social disadvantage that is related to
special problems such as unemployment, ghetoisation, fundamental changes in family life
etc (Cannan, 1997). Excluded categories include a wide variety of people, not only the
women, but also the poor, ‘handicapped, suicidal people and abused children (De Hann,
1999:1). These are individuals or groups who are wholly or partially excluded from full
participation in the society within which they live. The UNDP (1997:73) reveals that the
discourse, procedures, structures and functions of governance, for instance, remain
heavily skewed in favors of adults (men) in many countries of the world, thus, resulting
in unequal sharing of power and resources – time, incomes and property between children
and adults. Many concede that this concept is useful because, it helps to focus not just
on the existence of poverty and inequality, but also on the dynamic processes whereby
they are created and perpetuated (De Hann, 1999:2-3).
The concept of marginalization can be applied to people and environments to
illuminate restrictions in people’s options in the management of their environment
(Blaikie, 1985). In highlighting marginalization, the concern is for fair treatment, such
that no one or group of people is excluded in the community. In practice, children are
subordinated historically, always striving for equality through right to basic necessities

Scottish Journal of Arts, Social Sciences and Scientific Studies - ISSN 2047-1278
http://scottishjournal.co.uk
138
and securing voice in public matters, not only to provide access to an important resource
for children in the same term as adults enjoy, but as positive steps to redress the injustice
of marginalization. A marginalized child lacks access to resources needed to overcome
the restrictions of living beyond the limits of subsistence or poverty. Marginalization,
therefore, correlates with “vulnerability as a dynamic concept of susceptibility to risks of
falling into poverty” (Moser, 1998) and by extension, abuse. In practical term, the more
assets people have, the less vulnerable they are and the greater their security against
poverty.
Childhood poverty means children and young people growing up without access
to different types of resources that are vital for their wellbeing and for them to fulfill their
potentials (Marshall, 2003). Poverty at this level, share causes and manifestations in
inadequate livelihood, lack of family and community structures that nurture and protect
children and opportunities for their collective voice. Much of children and young
people’s experience of poverty is clearly similar to and share with that of their families,
communities and countries (Marshall, 2003). Nigerian population in 2006 was
140,431,790 (Gazette, 2009), of which 70.2% were poor. Poverty in the family, therefore,
underpins childhood poverty with important consequences of hunger, getting into
enormous stress, having to drop out of school, missing out on critical health care, and
wearing old or torn clothing by children.
3.0 Justification for the Study
Akure was selected for this study in view of its major geographical and economic
distinction. As a state capital since 1976, it has witnessed growth in terms of built-up
areas, population density, volume of traffic and commercial activities. The rapid growth
of the city, particularly within the last three decades, has made it one of the fastest
growing metropolitan areas in South-western Nigeria. The population of Akure grew
significantly from 198,228 in 1986 to 304,883 in 2002 and “387,400 in 2004” (World
Gazetteer, 2004) with a growth in retail and industrial ventures which traders and
children exploit to escape poverty.
Poverty indicators that characterize urban poor (especially in the developing
countries) include: visible evidence of growing numbers of working children and
homeless people, as well as increased numbers of young people who are unable to find
formal or semi-formal sector employment (Abugre and Holland, 1998). Underage
children, therefore, do all sorts of jobs in Akure, usually because they and their families
are extremely poor.
Ebigbo (1977) observes that several parents in northern Nigeria, for example,
have entrusted their wards to Mallams (Koranic teachers) who, as custodians live on the
children by sending them out to the streets to beg for arms and collect food from dumps.
His report also reveals that as many as 298,000 children were engaged in agricultural
labor in Anambra State in 1979. Out of the 112 laboring children investigated in Enugu,
most of them came from neighboring villages, while 67 were girls, 45 were boys; 64 of
them were housekeepers whose work ranged from children minding, cooking, house
cleaning, laundry, shopping, gardening to hawking and attending to several other chores
in the house (Ebigbo, 1977).
Child abuse is at its highest degree in Lagos, Nigeria, where young children are
seen hawking wares, meat pie, chin-chin, ice cream and more often pure water from day
break to sunset (Boga, 2000). Investigations show that the vice is thriving so much in

Scottish Journal of Arts, Social Sciences and Scientific Studies - ISSN 2047-1278
http://scottishjournal.co.uk
139
Ibadan, Oshogbo, Benin, Akure, Port-Harcourt, Calabar, Enugu, Abuja, Jos and a host of
other urban centres (usually state capitals) and tertiary institutions in Nigeria. This denies
children the opportunities to quality education, life skills and health services that will
affect the rest of their life.
South Asia and sub-Saharan Africa are homes to the large number of the 1.2
billion poor people in the world (Dasgupa, 2003). Approximately 40 percent of sub-
Saharan African children do not attend school (Causes of Child-labor, 2009) with high
vulnerability to abuse. Poverty experienced by parents, increase pressure on them to
become child laborers. In view of the prevalence of the use of child-labor by women in
diverse ramifications in Akure and the negative consequences on the children, it becomes
imperative to adopt feasible strategies for combating the menace.
4.0 Materials and Methods
4.1 Research Locale: The research was carried out in Akure the political and
administrative capital of Ondo State, which locates in the western region of Nigeria. It is
a largely traditional and agrarian settlement that situates at about 311 kilometers North
East of Lagos and about 415 kilometers South West of Abuja (the new Federal capital
city). Geographically, the city is compact; of about 7-kilometre radius from the city
centre and contains roughly 600 residential family and public layouts as well as
administrative quarters that are served with about fifteen markets. The city is dominated
by three major roads – Oba-Adesida/Oyemekun, Ondo/Arakale/Igbatoro and Oke-Aro /
Araromi roads along which 80 percent of the city markets locate. Major private and
public land uses along these routes were examined to elicit the complimentary roles
played in attracting population to boost trading in the markets.
Table 1: Major landuses along the main routes in Akure S/N Route Area Market Major landuse
1 Oba-Adesida/Oyemekun King’s main (1) King’s palace (2) Town hall (3) Post office (4)
Museum
Odokoyi (5) Banks (6) Central mosque (7) Shopping complexes
Isolo (8) Maternity centers (9) Police stations (10)Warehouses
Oritagun (11) Cultural centre, (12) Sacred-heart cathedral, (13) Schools,
(14) Ilesa garage
2 Ondo/Arakale/Igbatoro Isikan (1) Prison, (2) Television, (3) Ondo motor park, (4)
Cocacola depot,
NEPA (5) Army barracks, (6) Aluminum industry (7) Hotel (8)
Churches
Oluwatuyi (9) Power Holding Company, (10) Governor’s House,
Adedeji (11) State House of Assembly (12) State secretariats
(13) Federal Secretariat (14) School of Nursing
3 Oke-Aro/Araromi Iralepo (1) Idanre garage (2) Churches (3) Hospitals (4) Stadium
Onyarugbulem (5) Schools (6) Sawmills
Idanre garage
Ararom
Source: Author’s Findings, 2011

Scottish Journal of Arts, Social Sciences and Scientific Studies - ISSN 2047-1278
http://scottishjournal.co.uk
140
At the city core is the main market otherwise called the ‘King’s market’, and two
other markets, both which locate at about 200 meters from the main market. As a result
of high concentration of population, commercial or business activities around the
markets, there is attraction of heavier volume of traffic and child labor at their respective
locations. The city is popular for its bustling commercial environment, and the parts are
adequately linked with road network, thereby creating possible avenue for trading and
hawking by its residents.
4.2 Database Description: Two types of interview were conducted with the child
laborers and their employers. Children hawking and selling in the market places were
purposefully targeted as subjects. Findings reported herein are based on responses from
the child-laborers, sought in pre-coded alternatives provided for closed-ended questions
meant to ascertain their levels of involvement in hawking and trading, and who is
responsible for this. Follow-up oral interviews with a few employers were used to
elaborate on the child laborers’ responses and solicit additional comments not covered by
the research questions.
Ten final (fifth) year Urban and Regional students of the Federal University of
Technology, Akure, who acted in the capacity of research assistants and had earlier been
tutored by the author, administered the questionnaires. Only one questionnaire was
administered on each child laborer. Although the questions were in English, they were

Scottish Journal of Arts, Social Sciences and Scientific Studies - ISSN 2047-1278
http://scottishjournal.co.uk
141
translated into Yoruba (the major language in the Western region of Nigeria) in cases
where the respondents did not understand English.
In the survey, 840 questionnaire were administered out of which 761 (i.e. 90
percent and above) were retrieved in usable form and analyzed. The interview which
lasted two weeks were carried out in 10 out of the 15 market places, which indeed are the
busiest commercial areas; a few with intra-city parks. Majority of the child laborers are
fairly literates who operate freely. They provided answers promptly and adequately with
little stress of interpreting questions in the local dialect. Survey utilized simple stratified
systematic sampling techniques to select cases, while analysis adopted the Pearson’s
Correlation Co-efficient (r) statistical measure of association for pair-wise variables.
5.0 Research Findings and Discussion
The analysis is disaggregated spatially into the core (the Central Business District)
the transition zone between the core and suburban, and the periphery (suburban area).
The markets in the designated zones represent the study sites. These markets vary in size
(land area covered and population) and intensity of patronage. Table 1 presents ranking
of the markets, the basis upon which the sample size (of child laborers) was taken.
Table 2: Level of Child Involvement in Trading /Hawking by Women at Ten
Market Locations in Akure
S/N Market Zone Ranking No of children Employment by
sampled (X) Women (Y)
1. King’s /Main Core 1 120 41
2. Araromi Core 11 80 22
3. Odokoyi Core 12 60 18
4. Isikan Transition 2 100 30
5. NEPA Transition 3 100 26
6. Iloro Transition 6 80 23
7. Mojere Transition 4 80 21
8. Isolo Transition 9 60 15
9. Iralepo Transition 13 21 7
10. Oluwatuyi Periphery 7 60 16
TOTAL 761 219
Source: Author’s Fieldwork, 2011
All the three markets at the city core (King’s/Main, Araromi and Odokoyi
markets) were, selected due to their central location. Six (Isikan, NEPA, Iloro, Mojere,
Isolo and Iralepo markets) out of the ten markets that locate within the transition zone, as
well as, one (Oluwatuyi market) out of the two sited at the periphery were picked for
sampling. The spatial disaggregating approach, therefore, allows survey to cut across the
whole city, covering all its major segments (residential quarters) and at least 50 percent of
the markets in the designated zones. Five basic socio-demographic factors were identified
as stimulants of child-labor, which the research actually investigated in connection with
women. These include: household size, education, job preference, rate of income and

Scottish Journal of Arts, Social Sciences and Scientific Studies - ISSN 2047-1278
http://scottishjournal.co.uk
142
employer, which in an overall sense may really explain child involvement in trading by
women at the market locations in Akure.
Analysis of survey indicates that 74.3 percent and 75.2 percent of the laboring
children have their fathers and mothers alive respectively. This attests to the facts that,
majority of the children have living parents who are aware of their activities. Nearly half
of the child-laborers interviewed claimed to belong to a fairly large household, an
indication of high responsibility and large burden for their parents. About 35.5 percent of
the children attributed their involvement in trading to the need to assist mainly their
mothers. In Nigeria, it is easy to notice discrepancies between fathers and mothers by
children. More affection is accorded to mother as a major care-taker from childhood with
whom children commonly share their feelings and financial obligations. Earning a living
and preparing for academic pursuit were the reasons given by 32.2 percent and 14.0
percent respectively. As expected, most Nigerians are poor, hence, are “characterized by
low income, unstable employment, low status of job, large families, absence of savings
and constant struggle for survival” (Onibokun and Kumuyi, 1996, Olanrewaju, 2004).
Generally, the children lack adequate educational background that could earn them well-
paid jobs. The highest attainment was secondary education (44.7 percent), followed by
primary education (39.6 percent). Only 15.7 percent had no formal education.
As a result of the little interest in monthly-paid jobs which attracts low wages,
women in Nigerian societies often like to expose their children to trading at an early age
so that they can be enterprising or acquire basic trading knowledge. Seeing this as a
regular source of income in an economy with poor capital base, explains why a
significant proportion of the respondents (49.3 percent) preferred hawking to any other
kind of business. This dominates the commerce of light manufactured goods like
cosmetics, food stuffs and fruits with small capital resources. Since the activity does not
take place in a fixed location, no rent or rate payment is demanded. Greater percentage
(45.6 percent) was seen hawking at the motor parks in the markets and 37.2 percent
inside the markets. Only a few rendered hired labor such as carrying loads, using wheel
barrow in most cases and keeping shops.
The big threat to the contemporary Nigerian traditional family that is so obvious is
the changing roles of women as providers in their poor status. Apparently, in recent time,
men have seen themselves less and less as breadwinners, and have ceased to measure
their masculinity through their success as husbands and providers (Jaja and Emelike,
2002). This suggests that, an increasingly large proportion of women of urban families,
bear sole responsibility for their children’s well-being. Considering this implication, and
the degree at which living in the city is expensive with the escalated economic hardship,
it is expected that an average woman (mother), therefore, would desire to be creative,
energetic and courageous, to be able to make ends meet. The highest employment (28.8
percent) of child laborers in Akure by women, however, is not unconnected with the
failure on the side of men (fathers) to meet their responsibilities in the family. However,
the unusual influence of fathers on child-labor (3.7percent) is not unlikely predicated on
their desires to rely on the total support of mothers, who turn round to exploit the
children.
Incessant illness, accidents and cases of theft remain the prominent problems of
these child laborers in Akure. About 28.8 percent of them claim to work all-day-round,
thus, often fall sick on account of regular stress. These children face the risk of being

Scottish Journal of Arts, Social Sciences and Scientific Studies - ISSN 2047-1278
http://scottishjournal.co.uk
143
knocked down by vehicles in the process of chasing buyers on motion in order to sell
their articles. On several occasion, some (females in particular) are sexually harassed,
while a few others (usually the young ones) are threatened by police for child abuse.
A hypothesis was established to determine if any significant correlation exists
between the number of children engaged in trading (hawking) at the market areas and
employment by women in the city. In the analysis, two variables were involved viz: level
of child labor (X) and level of employment by women (Y). The Pearson’s Correlation
test was employed to determine the degree of correlation. The ‘r’ value in the correlation
analysis is highly positive (i.e. 0.96) - a strong indication that a significant correlation
exists between the level of child involvement in trading (hawking) and employment by
women at the market areas in Akure.
6.0 Conclusion and Policy Implication
In this study, the role of women in child labor under the influence of poverty have
been identified and analyzed. Research results indicate that concentration of markets and
other business activities are the major locational factors that motivate childlabour in the
core, transition and the peripheral areas of Akure. On the other hand, enlarged household
size, poor education and interest of mothers in trading as a regular source of income are
the socio-demographic factors that have implications for the continuous involvement of
their children or wards in labor in the city.
Poverty is undoubtedly a potential cause of child labor in Akure as the situation is
anchored on the desires of both the child and mother to alleviate family economic
problems. The government therefore, needs to encourage more investment in those
preventive measures such as poverty targeted social assistance programs that will provide
cash grants to poor families with school age children. To compliment this effort,
government should increase the scholarship awards / grants to the state indigenes in the
tertiary institutions, and subsidize school fees at this level to make education affordable
for all, especially the poor.
The World Bank regards women’s education as the “single most influential
investment that can be made in the developing world” (Ashford, 2001). The government
therefore, should intensify effort to support women education more at the tertiary level by
granting them “maintenance allowance” to serve as incentive for reducing the gender gap
– differences in boys’ and girls’ enrollment in tertiary education. Also, government
should try as much as possible to increase opportunities for women’s employment and
tackle the problems of retrenchment and low income to reduce family hardships that
prompt child labor.
The existing law that proscribes children’s (less than 18 years) employment
should be enforced by government in the State. The free education programs (at the
primary and post-primary level) of the State government, as well as the Universal Basic
Education program of the Federal Government are laudable strategies that will enhance
formal education of these children. In collaboration with these efforts, the State
government, through the Ministry of Women Affairs and Youth Development should
organize training of ‘peer educators’ to reach out to these young people and preach
against child labor. The peer educators will carry out such duty like peer counseling,
where more young people are trained to talk to their peers in the school, the workplace,
playground or other public places frequented by children. Such message can also be
delivered via the mass media and entertainment like songs, videos, television spots and

Scottish Journal of Arts, Social Sciences and Scientific Studies - ISSN 2047-1278
http://scottishjournal.co.uk
144
theatre performances. This will prove appealing while reaching the children in many
settings.
Finally, the education and awareness of the women on the danger of uncontrolled
birth should be intensified by the State Ministry of Health through the Family Planning
Department, Hospitals and the Local Government Maternity and Health Centers in the
town. Reduction in the current national population growth rate of 2.9 percent to 2.0
percent or lower by 2015, encouragement of child spacing, increase in the use of modern
contraceptives by at least 2.0 percent points per year through family planning among
others, are specific targets of the National policy on population which the health
institutions must emphasize for sustainable development.
Finally, there should be regular campaign on child abuse by government and non-
governmental agencies through publications, workshops, seminars, public lectures and so
on. In this vein, it is necessary for government to initiate projects meant to teach
vocational skills like; carpentry, sewing, painting, hair dressing and other small scale
manufacturing to provide employment for those children who are interested in creative
work. As practiced in Bangladesh, Mobile Training Schools can be introduced in Akure,
such that classes are run in specific vocational skill at the market locations where child
labor is common for career training. If these policies are adopted, the issue of child labor
will certainly be minimized in Nigerian cities.

Scottish Journal of Arts, Social Sciences and Scientific Studies - ISSN 2047-1278
http://scottishjournal.co.uk
145
References
Abugre, C. and Holland, J. 1998. Ghana: Water Sector Improvement Project. A
Poverty Analysis in support of Project preparation, Kumasi, London, DFID.
Afonja, S, Mill-Teltey, R. and Omole, D. 2000. “Gender differentials in Access
to Land and Housing in a Nigerian City”. A Monography of Obafemi Awolowo
University, Ile-Ife.
Anderson, I. 2000. ‘Housing and Social Exclusion: The Changing Debate in I.
Anderson and D. Sim (eds), Social Exclusion and Housing: Context and
Challenges (6-21) Coventry: Chartered Institute of Housing.
Arayela, T. 1996. “Motivating and Mobilizing Women in the Task of Increasing
Housing Stock in Nigeria” in Yomi Oruwari (ed). Women Development and the
Nigerian Environment Ibadan Vantage Publishers (Int) Ltd, 304 – 310.
Ashford, Lori 2001. New Population Policies: Advancing Women’s Health and
Rights, Population Bulletin, Population Reference Bureau, USA, Washington D.C
44p.
Bass, Loretta 2004. “Child Labor in Sub-Saharan Africa”, retrieved on
December 15, 2009 From http://www.reinner.com/tittle/Child_Labour_in
Sub_Saharan _Africa.
Blaikie, P. 1985. The Political Economy of Soil Erosion in Developing
Countries, London, Longman.
Boga, Thomas 2000, Sept. 24. “Hawking: A Child’s Nightmare”, Commet, 17.
Cannan, C. 1997. The Struggle against Social Exclusion: Urban Social
Development in France. IDS Bulletin, 77 – 85.
Causes of Child Labour 2009. “Poverty and Unemployment levels are high”,
retrieved December 15, 2009 from http://www.cpmtonuetolern.uiowa.edu/labou
ctr/Child-labor/about/casues.html.
Christian Michelsen Institute, 1998. Evaluation Report 7.98, The World Bank
And Poverty in Africa, Norway Ministry of Foreign Affairs.
Dasgupa, Partha, 2003. “World Poverty: Centre and Pathways”, Lecture
delivered at the World Bank Conference on Development Economics,
Washington, D.C.
De Hann, A. 1999. Social Exclusion: Towards a Holistic understanding of
Deprivation, London, Department of International Development (DFID).

Scottish Journal of Arts, Social Sciences and Scientific Studies - ISSN 2047-1278
http://scottishjournal.co.uk
146
Dorsen, N. and Lieberman, J.K. 2007. “Discrimination” Microsoft Student 2008
(DVD) Redmond, W.A.: Microsoft Corporation, 2007.
Ebigbo, P.O. 1997. “View Reported in Varieties of Child Abuse” Daily Times,
May 10, 1999, 15.
Federal Office of Statistics – FOS, 1996/1997. Lagos National Consumer Survey,
in Giwa, R.F. 1992. Thoughts on the Nigeria Economy: An Industrialist’s
Experience, Lagos Mednet Publications Ltd, 90 – 96.
Gazette, 2009. Federal Republic of Nigeria Official Gazette, 96(2): 20
International Labor Office – ILO 1998. World Labor Report. 1992, 105.
Jaja, S.A and Emelike, E.N., 2002 . ‘Women Development and the Industrial
Workplace: The Vexed Phenomenon’ International Journal of Social and Policy
Issues 1 (1): 269.
Kanshahu, I.A., 2000. Planning and Implementing Sustainable Projects in
Developing Countries - Theory, Practice and Economics (2nd
Rev. & Enl. Ed)
Hilversum, Agbe Publishing.
Kielland, A. and Tovo, M. 2006. ‘Children at Work: Child Labor Practices in
Africa’, retrieved on December 15, 2009 from http://www.reinner.com/tittle/Children
at _Work_Child_Labor_Practices in Africa.
Mallum, A. Y. 1990. “Women Education in Plateau State, Nigeria”, Ph.D Thesis,
Nigeria, University of Jos.
Marshall, J. 2003. “Children and Poverty: Some Questions Answered”, retrieved
on December 21, 2009 from
http://www.childoodpoverty.org/index.php/action=documentfeed/doctype=pdf/id
=46/
Moser, C. 1998. The Asset Vulnerability Framework: Reassessing Urban
Poverty Reduction Strategies, World Development, 26(1).
National Population Commission – NPC, 1991. Census Provisional Results.
Nnamani, Chimaroke, 2003. ‘Poverty in Nigeria: Eroding the Dignity of Man’.
The fifth edition of Pre-convocation Lecture on Dignity of Man, Nsukka,
University of Nigeria.
Ogbuigwe, A.E., 1996. “Sustainable Development in Nigeria: The Role of
Women” in Yomi Oruwari (ed). Women Development and the Nigerian
Environment, Ibadan ,Vantage Publishers (Int) Ltd, 69.

Scottish Journal of Arts, Social Sciences and Scientific Studies - ISSN 2047-1278
http://scottishjournal.co.uk
147
Olanrewaju, D.O., 2004. Town Planning: A Veritable Mean for Poverty
Reduction, Inaugural Lecture series 38, Federal University of Technology,
Akure.
Onibokun, A.G. and Kumuyi, A.S., 1995. Urban Poverty in Nigeria: Towards
Sustainable Strategies for its Alleviation. Centre for African Settlement Studies
and Development (CASSAD).
Osinubi, S., T. 2003. ‘Urban Poverty in Nigeria: A case study of Agege Area of
Lagos State, Nigeria, Monography, Ibadan. Department of Economics, Faculty
of Social Sciences, University of Ibadan.
United Nations Development Programme (UNDP), 1997. Reconceptualizing
Governance, UNDP, New York.
What is Child Labor? 2009. “What is Child Labor’? retrieved on December 17th
,
2009 from http://www.continuetolern-uiowa-
edu/laborcrt/child_labor/about/what_is_child_labor_html
World Gazetteer, 2004. Current Population Figure for Cities, Towns and Places
of all Countries (Ondo State Nigeria).

Scottish Journal of Arts, Social Sciences and Scientific Studies - ISSN 2047-1278
http://scottishjournal.co.uk
148
Personalized offline signature
verification using multiple HMM-
classifiers and SOM-fuzzy decision
fusion
Sharifah Mumtazah Syed Ahmad
Department of Computer and Communication Systems Engineering, Faculty of
Engineering, Universiti Putra Malaysia, 43400 Serdang, Selangor, Malaysia
Abdul Rahim Ahmad
College of Information Technology, Universiti Tenaga Nasional (UNITEN), Kajang,
Selangor, 43000, Malaysia
Asma Shakil
College of Information Technology, Universiti Tenaga Nasional (UNITEN), Kajang,
Selangor, 43000, Malaysia
Mustafa Agil Muhamed Balbed
College of Information Technology, Universiti Tenaga Nasional (UNITEN), Kajang,
Selangor, 43000, Malaysia
Wan Azizun Wan Adnan
Department of Computer and Communication Systems Engineering, Faculty of
Engineering, Universiti Putra Malaysia, 43400 Serdang, Selangor, Malaysia
Abstract.
This paper presents a user-optimized multiple classifiers approach for an offline
signature verification system. Local features are extracted from a sliding window that
slides across the signature images. Multiple HMM-based classifiers are used for the soft
decisions, where each classifier is trained on a particular feature. In this work, we select
the two best features to represent each user via ANOVA statistical analysis. A fuzzy
decision fusion system that is tuned using SOM based clustering technique is used to
combine the soft decisions from the selected HMM classifiers in producing the final
verification output. The system has been tested on SIGMA signature database which is a
collection of over 6000 genuine and 2000 forged signatures. Results show that our
personalized multiple classifiers approach out performs common single classifier
systems.
Keywords: Fuzzy Decision Fusion, Hidden Markov Model, Multiple Classifiers,
Offline Signature Verification System, Self Organizing Maps
INSPEC Code: (C10) Systems and control theory, (C61) Software techniques
and systems, (C78) Other computer applications.

Scottish Journal of Arts, Social Sciences and Scientific Studies - ISSN 2047-1278
http://scottishjournal.co.uk
149
1. Introduction
Handwriting signature is a widely used form of human identification for paper
based applications such as in legal document bindings and financial transactions. It is
popular due to the ongoing tradition and also being the least pervasive form (Popel and
Popel, 2005). Handwritten signature verification can either be in online (Alonso-
Fernandez et al., 2005, Baltzakis and Papamarkos, 2001, Fierrez and Ortega-Garcia,
2008, Pascual-Gaspar and Cardenoso-Payo, 2007, Pascual-Gaspar et al., 2011, Sánchez-
Diaz et al., 2010, Yanikoglu and Kholmatov, 2009) or offline domain (Das and Dulger,
2009, Freire et al., 2007, Frias-Martinez et al., 2006, José Vélez et al., 2009, Justino et al.,
2005, Kertész and K˝ovári, 2008, Ma et al., 2007, Piyush Shanker and Rajagopalan,
2007, Ruiz-del-Solar et al., 2008, Woo et al., 2006). In online domain, temporal and
spatial signals captured by tablets and pens during the signing (Alonso-Fernandez et al.,
2005, Baltzakis and Papamarkos, 2001, Fierrez and Ortega-Garcia, 2008, Pascual-Gaspar
and Cardenoso-Payo, 2007, Pascual-Gaspar et al., 2011, Sánchez-Diaz et al., 2010,
Yanikoglu and Kholmatov, 2009) are used, while in the offline domain, signature images
captured on paper are scanned into digital images to be processed (Das and Dulger, 2009,
Freire et al., 2007, Frias-Martinez et al., 2006, José Vélez et al., 2009, Justino et al., 2005,
Kertész and K˝ovári, 2008, Ma et al., 2007, Piyush Shanker and Rajagopalan, 2007,
Ruiz-del-Solar et al., 2008, Woo et al., 2006). A lot of research has been done in both
domains, with the aim of improving the accuracy in verifying human signatures.
Signature verification is challenging since there are two conflicting needs that
must be fulfilled (Baltzakis and Papamarkos, 2001, Das and Dulger, 2009, Fierrez and
Ortega-Garcia, 2008, Frias-Martinez et al., 2006, José Vélez et al., 2009, Justino et al.,
2005, Pascual-Gaspar et al., 2011, Sánchez-Diaz et al., 2010, Yanikoglu and Kholmatov,
2009). One is that it must be flexible in accommodating variations inherent in human
signatures. Unlike in other biometrics such as fingerprint and iris patterns which are
highly stable and consistent, signature of a person differ in each instance of signing.
Another need is that it must be accurate to reject skilled forgeries which is crucial,
particularly in the offline domain which rely solely on the spatial images. It is easier to
forge the shape of the signatures without being noticed. In the online domain, verification
is performed using the dynamic signals (Alonso-Fernandez et al., 2005, Baltzakis and
Papamarkos, 2001, Fierrez and Ortega-Garcia, 2008, Pascual-Gaspar and Cardenoso-
Payo, 2007, Pascual-Gaspar et al., 2011, Sánchez-Diaz et al., 2010, Yanikoglu and
Kholmatov, 2009), which are more resilient to spoofing as it is harder to obtain and to
imitate dynamic signals (Sánchez-Diaz et al., 2010).In this work, we focus on increasing
the accuracy of signature verification in the offline domain only. This is challenging as
the two conflicting requirements mentioned earlier need to be satisfied simultaneously.
To perform offline signature verification, a set of features from the signature
image needs to be extracted (Freire et al., 2007, José Vélez et al., 2009, Justino et al.,
2005, Kertész and K˝ovári, 2008, Ma et al., 2007). As the signature signal of each person
is not unique across different users and less stable between samples of the same user, it is
not effective to use the same set of features for all users. Many researchers tend to
personalize the signature verification process at the classification level in both the online
domain (Pascual-Gaspar and Cardenoso-Payo, 2007) and offline domain (José Vélez et
al., 2009). Pascual and Cardenoso (Pascual-Gaspar and Cardenoso-Payo, 2007) for
example performed user customization by modifying the HMM architecture to adjust the
number of states and their Gaussian distributions to individual needs. José (José Vélez et

Scottish Journal of Arts, Social Sciences and Scientific Studies - ISSN 2047-1278
http://scottishjournal.co.uk
150
al., 2009) use snake adjustment technique to tune a fuzzy classifier system that is
optimized to individual signer.
We hypothesize that different features provide different discriminating
capabilities on different users; hence user customization needs to be done at both feature
and classification levels. To prove that, we performed analysis on a single HMM based
classifier built on a per feature basis across the signature population (Balbed et al., 2009).
This leads to the building of an offline signature verification system optimized and
customized to each user’s needs by choosing the best set of features that can be used to
characterize that user’s signature.
Figure1. A Generic multiple classifier approach
We then present a multiple classifier approach in Figure 1 that determines the best
features to be used and how to combine them to increase the system verification accuracy
taking into account the intra and inter user variability. This work is motivated by our
earlier study on feature based analysis (Balbed et al., 2009) which indicated that feature
selection per individual is necessary. The experiments reported in this paper were
conducted on the SIGMA database (Ahmad et al., 2008) which consists of over 6000
genuine and 2000 skilled forged signatures. The database was collected, following
closely the recommendations made by the UK Biometrics Group (Mansfield and
Wayman, 2002) and the best practices made by International Organization of
Standardization (ISO) (19795-2:2007, 2007) that emphasize on scenario evaluation. The
data collection strategy used by SIGMA database ensures that it reflects a subset of
signature samples of the Malaysian population, capturing the intra user variability of the
target user population. Additionally, only forged signature samples of close resemblance
are accepted into the database.
In this work, we improved the offline signature verification by using four
localized static features; pixel density, centre of gravity, angle and distance, all computed
within a sliding window of 5 × 5 pixels across the image. The signatures are modeled by
Hidden Markov Models (HMM) to cater for intra user variability in them as done by
other researchers (Alonso-Fernandez et al., 2005, Fierrez and Ortega-Garcia, 2008,
Justino et al., 2005, Pascual-Gaspar and Cardenoso-Payo, 2007). The p-values obtained
by ANOVA statistical analysis (Balbed et al., 2009, Guest, 2004) was used to identify the
best two features for each user. The features are then used by a Fuzzy Logic module to
fuse the soft HMM probability decisions into a final hard decision of accepts or reject.
The Fuzzy Logic is tuned via Self Organizing Maps (SOM) (Rabiner, 1989) which is
customized to individual user.

Scottish Journal of Arts, Social Sciences and Scientific Studies - ISSN 2047-1278
http://scottishjournal.co.uk
151
The rest of this paper is organized as follows: Section 2 presents the SIGMA
database used in this work. In Section 3, experimental setups, categorization of signature
samples, testing methodology and performance measurements are described. Sections 4
and 5 explain the overall framework of both the single classifier (pre-processing, feature
extraction, HMM modeling, verification, z-score comparator) and multiple classifiers
approach (ANOVA feature selection, fuzzy decision system and SOM). The experimental
results and discussions are presented in section 6followed by a conclusion.
2. SIGMA database
The experiments conducted in this work were done using the SIGMA database,
compiled by the authors. The data collection strategies for SIGMA were presented in
(Ahmad et al., 2008). The database contains over 6000 genuine and 2000 forged
signature samples. It was compiled from a population of Malaysians. Genuine signature
samples were taken in three different occasions to capture the necessary intra user
variability. All forgeries in the database are ‘skilled’ as forgers were given sufficient
genuine signature samples and ample time to practice. Only forged signature samples
with high level of imitation were accepted into the database. Both offline and online
signals were captured for each signature but in this work we only use the offline images.
The samples were signed within guided boxes on A4 papers. The papers were
then scanned to obtain grey-scale images of 600 dpi resolution. Signature images were
cropped to achieve invariability in orientation, position and size. The total number of
genuine and skilled forged signature samples for each user is 30 and 10 respectively. The
image resolution, number of samples, number of users, and type of forgeries are
comparable to other offline signature databases such as GPDS (Vargas et al., 2007) and
MCYT (Freire et al., 2007), as illustrated in Table 1. SIGMA database has slightly less
skilled forged signature samples but this is compensated by the inclusion of random
forgeries in the testing of false claim of identity (see Section 3).
Table 1.Comparisons between several offline signature databases
Criterion GPDS MCYT SIGMA
Total number of writers 160 75 265
Types of forgery Skilled Skilled & Random Skilled
Total number of genuine samples /
writer
24 15 30
Total number of forged samples /
writer
30 15 10
Demographic types of writer Spanish Spanish Malaysian
3. Experimental Set-ups
Our experiments were carried out according to the best practices of biometrics
testing and reporting (19795-2:2007, Mansfield and Wayman, 2002) .Two tests were
done; genuine claim of identity and false claim of identity. In the first, genuine samples
are compared against the claimed reference model. Invalid verification leads to False
Rejection Rate (FRR) or Type I error. In the second one, the false claim of identity test,
two different samples can be used to compare against the claimed reference model;

Scottish Journal of Arts, Social Sciences and Scientific Studies - ISSN 2047-1278
http://scottishjournal.co.uk
152
random forgeries (different user signature samples) or skilled forgeries (skilled forged
signature samples). In both cases, any valid verification for false claim of identity gives
rise to False Acceptance Rate (FAR) or also known as Type II error.
For our experiments, the SIGMA database is divided into 3 different sets for
different purposes as shown in Figure 2. Each set is chosen so as to avoid any biasness in
results. Set I (which consists of 10 genuine samples) is used to build the reference model
for each user, Set II (which consists of 10 genuine, 5 random forged and 5 skilled forged
samples) is used to investigate the performance of the individual classifier and to tune the
multiple classifier system and Set III (consisting of 10 genuine, 5 random forged and 5
skilled forged samples) is used to investigate the performance of the multiple classifier
system.
Figure 2. The categorization of signature samples
System performance is measured in terms of the Equal Error Rate (EER) which is
the most commonly used metric in the signature verification research domain (Alonso-
Fernandez et al., 2005, Fierrez and Ortega-Garcia, 2008, José Vélez et al., 2009, Pascual-
Gaspar and Cardenoso-Payo, 2007, Sánchez-Diaz et al., 2010, Woo et al., 2006,
Yanikoglu and Kholmatov, 2009). EER is the crossing point between False Acceptance
Rate (FAR) and False Rejection Rate (FRR). We are not able to compare the EER results
of our experiments with other researchers as we used our own dataset, namely the
SIGMA database as mentioned earlier. It is worthy to mention that due to the data
collection strategies of the SIGMA database which are different from other databases as
highlighted in Section 2, objective comparisons between our results and those of others
cannot be made(Woo et al., 2006, Yanikoglu and Kholmatov, 2009). Instead, in our
work, we measure the performance improvement (PM) as in Equation 1, between single
and multiple classifier approaches. The next two sections present in detail the
methodologies of these two approaches.
iergleclassif
ifiermulticlassiergleclassif
EER
EEMEERPM
sin
sin%
(1)

Scottish Journal of Arts, Social Sciences and Scientific Studies - ISSN 2047-1278
http://scottishjournal.co.uk
153
4. The Single classifier approach
As shown in Figure 3, this approach involves 5 stages which are pre-processing,
feature extraction, modeling, verification and z-score comparator. The first two are
common for training and testing. Four features are extracted and used in a single
classifier, giving four single classifiers. The modeling and verification stages make use of
Hidden Markov Model (HMM). Each of the five stages is described in the following sub-
sections.
Figure 3. The Single classifier system
4.1Pre-processing
Offline signature images often contain noise introduced on the paper and during
the scanning process. Pre-processing step is needed to remove the noise (Kertész and
K˝ovári, 2008, Ma et al., 2007, Piyush Shanker and Rajagopalan, 2007, Woo et al., 2006)
to ensure that only the desired signals are fed to the feature extractor (José Vélez et al.,
2009, Justino et al., 2005, Kertész and K˝ovári, 2008, Ma et al., 2007, Piyush Shanker
and Rajagopalan, 2007, Ruiz-del-Solar et al., 2008, Woo et al., 2006). Pre-processing
involves binarization and noise removal. Binarization converts the scanned gray image
into black and white. It was performed using Otsu’s (Ostu, 1979) global image threshold
to reduce inter class variance of black and white pixels. Noise removal was done using
median filter with a 3 × 3 mask (Ma et al., 2007). Figure 4 shows examples of the
resulting images after each pre-processing step. Normalization of the image size,
orientation and position was not carried out they are already so.
(a) Scanned Image (b) Binaries Image (c) Noise Removed Image
Figure 4. The results of pre-processing on signature image

Scottish Journal of Arts, Social Sciences and Scientific Studies - ISSN 2047-1278
http://scottishjournal.co.uk
154
4.2Feature extraction.
In this work, features are extracted on sliding windows of 5 × 5 pixels along
horizontal lines across all pixels of the image.
.
Figure 5. The5 × 5 sliding window for feature extraction
There are four features extracted in each window; pixel density, centre of gravity,
angle and distance. Computation of pixel density and centre of gravity is straight forward
(Justino et al., 2005). In Equation 2, Pixel density (PD) measures the total number of
black pixels in the window, whereas in Equation 3,centre of gravity (CG) calculated as
the average position of all black pixels from the bottom left most corner of the window
(x0, y0).
blackpixelPD (2)
2
0
2
0 yyxxCG blackpixelblackpixel (3)
Extraction of angle and distance require skeletonization of the image to reduce the
thickness of black lines to 1 pixel thick. Angle (Agl) as in Equation 4, is then computed
by taking the average angle of each black pixels in the skeletonized image window with
respect to the bottom left pixel (x0, y0). In Equation 5, Distance (Dist) is taken as the
average distance from each black pixel to the bottom left pixel (x0, y0).
PD
xx
yy
Aglblackpixel
blackpixel)(tan
0
01
(4)
PD
xx
yy
DISTblackpixel
blackpixel)(
0
0
(5)
4.2HMM-based reference modeling
Discrete Hidden Markov Model (HMM) is used to model individual local features
extracted from the sliding windows of the genuine signature samples for each user. HMM

Scottish Journal of Arts, Social Sciences and Scientific Studies - ISSN 2047-1278
http://scottishjournal.co.uk
155
(Rabiner, 1989) is a doubly embedded stochastic process; one hidden process observable
through another stochastic process that produce a sequence of observations (Rabiner,
1989). An HMM is described by Equation 6.
),,( BA (6)
where,
A = matrix of the probabilities of transition from one state to another
B = matrix of the probabilities of observation in a particular state
π= the initial probability distribution for the states
In our work, an ergodic (fully connected) 5-state discrete HMM as in Figure 6 is
used.
Figure 6. The discrete HMM topology
The topology was chosen to reduce the occurrence of infinity results in the
discrete HMM (due to non-occurrence of a symbol) and to cater for intra user variability.
The choice was made after empirically tuning the HMM by varying the number of states
in an ergodic HMM network. It was discovered a 5-state topology gives the most
optimum and stable results. The Baum-Welch algorithm (Rabiner, 1989) was solved. A
series of similar features (feature i) from the sliding windows was used to build the
reference model λx,i for a particular user x. This was done for all four features, producing
four reference models for user x (i.e. λx,PD, λx,CG, λx,Agl. and λx,Dist. for models based on
pixel density, centre of gravity, angle and distance respectively). To account for intra-user
variability the model was built from a set of 10 genuine signature samples belonging to
user x from Dataset I. The HMM models are then stored in the reference database
indexed on user IDs.
4.4HMM-based verification
For verification, an unknown test sample t is tested for authenticity. The
verification solves HMM Problem 1 of Rabiner (Rabiner, 1989): evaluates the probability
that the sample t matches the reference model λx,i (P(ti |λx,i).
4.5 Z - score comparator.
The output of the verification module P (ti |λx,i) is transformed into its equivalent
z-score value zP(ti |λx,i). In order to ease the threshold setting using the formula in
Equation 7.

Scottish Journal of Arts, Social Sciences and Scientific Studies - ISSN 2047-1278
http://scottishjournal.co.uk
156
ix
ixixi
ixi
tPtzP
,
,,
, )(
(7)
where
µx,i= mean value for P (ti |λx,i) for the training data set I
x,i= standard deviation value for P (ti |λx,i) for the training data set I
In the z-score comparator it is assumed that zP(ti |λx,i) follows a normal
distribution, lying closely to the centre of z-score distribution (i.e. when z-score is near
zero). The value of zP(ti |λx,i) is compared against a thresholdi to arrive at the decision of
accepting the test sample as ‘genuine’ or rejecting it as ‘forgeries’ using Equation 8.
If AbsolutezP(ti|x,i) threshold, then Accept: else Reject (8)
As mentioned in section 3, Dataset II (10 genuine and 10 forged signature
samples per user) is used during testing where performance is measured in Equal Error
Rate (EER). As EER is the crossing point between False Acceptance Rate (FAR) and
False Rejection Rate (FRR), thresholdi is adjusted globally for all users until the
equivalent EERi is achieved.
5. The multiple classifier approach
In the multiple classifier approach, HMM classifiers were used on each feature as
in the single classifier approach. Next, the best two features for each individual user were
selected based on ANOVA statistical analysis (Figure 7). However, for combining the
results of individual feature modeling P (ti |λx,i), the z-score comparator was not used. In
the multiple classifiers system, a more practical approach for combining the soft HMM
based decisions is devised.
A study of the existing classifier systems being used in offline signature
verification systems (José Vélez et al., 2009, Woo et al., 2006) revealed that the use of a
soft decision module such as a Fuzzy classifier would yield the most optimum results in
our case. Therefore in this work we use a Fuzzy decision fusion module tuned by SOM to
combine the soft decisions from multiple classifiers to arrive at a final accept/reject
decision as shown in Figure 7.
Figure 7. The multiple classifiers system

Scottish Journal of Arts, Social Sciences and Scientific Studies - ISSN 2047-1278
http://scottishjournal.co.uk
157
5.1ANOVA statistical analysis
Analysis of Variance (ANOVA) is a statistical technique that can be used to
determine the existence of differences among several population means. Guest (Guest,
2004) used ANOVA to study the stability of a set of global features in human signatures.
It is not possible to analyze local features directly using ANOVA, therefore in this work,
we apply ANOVA on P (ti |λx,i) of the HMM verification results to identify the stability
of each local feature (Balbed et al., 2009). We used ANOVA on Dataset II to evaluate the
p-values for the features. A low p-value (less than 0.05) indicates that the feature is stable
(consistent across genuine samples, different between genuine and forged samples). An
ideal p-value is 0, however, for feature selection purposes, it is sufficient to rank the
features according to their p-values. We select only two features with the lowest p-values.
5.2 SOM-guided fuzzy decisions fusion
The Fuzzy Decision Fusion has been successfully applied in the offline signature
verification domain (José Vélez et al., 2009, Woo et al., 2006). It consists of fuzzy
membership functions and fuzzy rules encapsulated in the fuzzy association matrix. It is
used to combine the results of the best features selected earlier. Its output is a final
verified output from the HMM probabilistic decisions of the different classifiers. It can
also combine soft decisions from imprecise data. Tuning of the system is done on every
user. A SOM-based clustering technique is used to aid in the task of modeling the most
optimum fuzzy classifier for each user. SOM is an unsupervised neural network (Chen
and Mynett, 2004) which provides a representation in 2-dimensions that describes the
clustering of signatures belonging to different groups. This was again done on Dataset II
described earlier. A similar approach has been applied successfully in other domain(Chen
and Mynett, 2004) where fuzzy induction rules are only constructed whenever there is no
statistically significant overlap between SOM clusters of 97.5% confidence interval
bands. Figure 8 illustrates an example of U Matrix and SOM diagrams for two best
features for a user (centre of gravity (CG) and angle (Agl)). The U-Matrix (Unified
Distance Matrix) is a representation of a SOM where the Euclidean distance between the
codebook vectors of the neighboring neurons is depicted in a gray scale image to
visualize the data in a high dimensional space.
(a) (b) (c)
Figure 8. (a) The SOM diagram for centre of gravity feature, (b) The SOM for
diagram for Angle Feature, (c) The overall U-matrix

Scottish Journal of Arts, Social Sciences and Scientific Studies - ISSN 2047-1278
http://scottishjournal.co.uk
158
The SOM information is used to tune the fuzzy membership and to construct the
fuzzy association matrix. The fuzzy membership function consists of triangular shapes
for three fuzzy sets, namely Low, Medium and High. The triangular shapes were chosen
due to their simplicity of configuration (Woo et al., 2006). The boundaries are
customized to individual user using the SOM data. In this work, we used only two input
features in order to reduce the complexity of the fuzzy association matrix that contains
the inference rules. Figure 9 shows an example of a personalized fuzzy membership
function and Figure 10 illustrates a fuzzy association matrix.
Figure 9. A Personalized fuzzy membership function for angle feature
1.if (CG is high) and (Agl is high) then (Decision is accept)
2.if (CG is high) and (Agl is medium) then (Decision is accept)
3.if (CG is high) and (Agl is low) then (Decision is accept)
4.if (CG is medium) and (Agl is high) then (Decision is reject)
5.if (CG is medium) and (Agl is medium) then (Decision is reject)
6.if (CG is medium) and (Agl is low) then (Decision is reject)
7.if (CG is low) and (Agl is high) then (Decision is reject)
8.if (CG is low) and (Agl is medium) then (Decision is reject)
9.if (CG is low) and (Agl is low) then (Decision is reject)
Figure 10. A Personalized fuzzy association matrix
6. Results and discussions
The error rate of a single classifier using one feature is as shown in Figure 11. The
x and y axis represents the threshold and the system the error rate respectively. The False
Rejection Rate (FRR) is the error rate that a genuine signature is wrongly rejected, while
the False Acceptance Rate (FAR) is the error rate that a forged signature is mistakenly
accepted. Figure 11 also shows two types of FAR; skilled and random. It consistently
shows that the skilled forgeries gives higher FAR than the random ones for all features.
This is expected since the skillfully forged signatures are of closer resemblance to
genuine signature images.

Scottish Journal of Arts, Social Sciences and Scientific Studies - ISSN 2047-1278
http://scottishjournal.co.uk
159
(a) Angle (b) Centre of Gravity
(c) Distance (d) Pixel Density
Figure 11. Performance of a single classifier for each feature where x and y axis
represents threshold and error rate respectively.
Table 2 gives the Equal Error Rates (EERs); the common point for the
combination of both FARs (skilled and random forgeries) with the FRR for all single
classifiers. The values for each feature ranges from 36% to 37% which is considerably
high.
Table 2.Equal error rates (EER) for feature based HMM classifiers
Feature based HMM classifier EER
Centre of Gravity (CG) 37.0%
Pixel Density (PD) 37.5%
Distance (Dist.) 36.0%
Angle (Agl.) 36.75%
Table 3 shows the results of ANOVA analyses. As can be seen from the table, the
percentage of user population with p-value less than 0.5 varies among the classifiers and
is in the 50% range. It indicates that the individual classifiers are stable for only half the

Scottish Journal of Arts, Social Sciences and Scientific Studies - ISSN 2047-1278
http://scottishjournal.co.uk
160
user population thus making it difficult to construct an accurate signature verifier that
relies on a single feature.
Table 3.Statistics of users with P-value less than 0.05
Feature based HMM classifier Percentage (%) of user
population
Centre of Gravity (CG) 57.7%
Pixel Density (PD) 55.4%
Distance (Dist.) 58.5%
Angle (Agl.) 59.2%
There are also large variations in the frequency of each feature being selected as
one of the two best features. In Table 4, the percentage column shows how many percent
of the time the particular feature is being selected. Distance feature is the least frequently
selected although it gives the second highest percentage of users with p-values less than
0.05 and the lowest EER indicating that a good feature across the user population may
not be amongst the two best features to describe an individual user signature.
Table 4. Statistics of feature being selected as the two best features
Feature Percentage (%) of user
population
Centre of Gravity (CG) 54.6%
Pixel Density (PD) 50.8%
Distance (Dist.) 40.8%
Angle (Agl.) 53.8%
With four features, there are six possible combinations of the best two features.
Table 5 shows the percentage appearance of each two-feature combinations. Each
combination gives different identifying or discriminating effects, indicating that it is not
practical to identify a common set of features effective for all users. This justifies the
need to individually select feature(s) for each individual user.

Scottish Journal of Arts, Social Sciences and Scientific Studies - ISSN 2047-1278
http://scottishjournal.co.uk
161
Table 5.Statistics of the best two selected features
Feature Percentage (%) of user
population
CG and PD 26.15%
CG and Dist. 6.15%
CG and Agl. 22.3%
PD and Dist. 13.8%
PD and Agl. 10.8%
Dist. And Agl. 20.8%
The performance of our personalized Automatic Signature Verification (ASV)
system using multiple classifiers approach is shown in Figure 12. FAR in the Figure 12
represents both the skilled and random forgeries. It indicates significant reduction on the
overall EER to 13% resulting in system performance improvement of approximately
64%.
Figure12. Performance of multiple classifiers system
7. Conclusion
We have developed automatic signature verification (ASV) system that uses
signature data samples with inconsistencies in the genuine samples and low degree of
uniqueness between samples of different users. The results obtained in the analyses done
shows that for signature biometrics, it is difficult to use a single feature which is effective
for all users, thus the need to use a selection of features. However, to obtain an optimum
set of features common for all users is also not practical since different set of features
give different identifying or discriminating effects on different users. In this work, we
proposed the use of personalized feature set for each individual user. We have presented
the design of an offline ASV system using multiple classifiers that selects and combines
features systematically. The proposed technique has been proven effective in comparison
to the single classifier approach where the overall EER has been reduced significantly

Scottish Journal of Arts, Social Sciences and Scientific Studies - ISSN 2047-1278
http://scottishjournal.co.uk
162
from 37% to 13%, resulting in a 64% performance improvement. The proposed technique
can be applied to other biometrics which suffer from similar intra and inter user
variability issues, such as speaker and gait recognition systems.

Scottish Journal of Arts, Social Sciences and Scientific Studies - ISSN 2047-1278
http://scottishjournal.co.uk
163
References
19795-2:2007, I.I., 2007. Information technology - Biometric performance testing
and reporting - Part 2: Testing methodologies for technology and scenario
evaluation, International Organization for Standardization.
Ahmad, S.M.S., Shakil, A., Ahmad, A.R., Agil, M., Balbed, M., Anwar, R.M.,
2008. SIGMA-A Malaysian signature's database, ACS International Conference
on Computer Systems and Applications (AICCSA), pp. 919-920.
Alonso-Fernandez, F., Fierrez-Aguilar, J., Ortega-Garcia, J., 2005. Sensor
interoperability and fusion in signature verification: A case study using Tablet PC.
Advances in Biometric Person Authentication, 180-187.
Balbed, M.A.M., Ahmad, S.M.S., Shakil, A., 2009. ANOVA-based feature
analysis and selection in HMM-based offline signature verification system, the
Conference on Innovation Technologies in Intelligent Systems and Industrial
Applications pp. 66-69.
Baltzakis, H., Papamarkos, N., 2001. A new signature verification technique
based on a two-stage neural network classifier. Engineering applications of
Artificial intelligence 14, 95-103.
Chen, Q., Mynett, A.E., 2004. A robust fuzzy logic approach to modeling algae
biomass. Journal of Hydraulic Research 42, 303-309.
Das, M.T., Dulger, L.C., 2009. Signature verification (SV) toolbox: Application
of PSO-NN. Engineering Applications of Artificial Intelligence 22, 688-694.
Fierrez, J., Ortega-Garcia, J., 2008. Function-based online signature verification.
Advances in Biometrics, 225-245.
Freire, M.R., Fierrez, J., Martinez-Diaz, M., Ortega-Garcia, J., 2007. On the
applicability of off-line signatures to the fuzzy vault construction, 9th
International
Conference on Document Analysis and Recognition. IEEE, pp. 1173-1177.
Frias-Martinez, E., Sanchez, A., Velez, J., 2006. Support vector machines versus
multi-layer perceptrons for efficient off-line signature recognition. Engineering
Applications of Artificial Intelligence 19, 693-704.
Guest, R.M., 2004. The repeatability of signatures, 9th
International Workshop on
Frontiers in Handwriting Recognition, pp. 492-497.
José Vélez, J., Sánchez, A., Moreno, B., Esteban, J.L., 2009. Fuzzy shape-
memory snakes for the automatic off-line signature verification problem. Fuzzy
Sets and Systems 160, 182-197.

Scottish Journal of Arts, Social Sciences and Scientific Studies - ISSN 2047-1278
http://scottishjournal.co.uk
164
Justino, E.J.R., Bortolozzi, F., Sabourin, R., 2005. A comparison of SVM and
HMM classifiers in the off-line signature verification. Pattern Recognition Letters
26, 1377-1385.
Kertész, Z., K˝ovári, B., 2008. Off-Line Signature Verification using Feature
Based Image Registration. Advances in Intelligent and Distributed Computing,
277-282.
Ma, Z., Zeng, X., Zhang, L., Li, M., Zhou, C., 2007. A Novel Off-Line Signature
Verification Based on Adaptive Multi-resolution Wavelet Zero-Crossing and
One-Class-One-Network. Advances in Neural Network,lecture notes in computer
sciences(LNCS) 4493, 1077-1086.
Mansfield, A.J., Wayman, L., 2002. Best practices in testing and reporting
performance of biometric devices, Communications-Electronics Security Group
(CESG). 2.01.
Ostu, N., 1979. A threshold selection method from gray-level histogram. IEEE
Transactions on Systems, Man and Cybernetics 9, 62-66.
Pascual-Gaspar, J., Cardenoso-Payo, V., 2007. Automatic Online Signature
Verification Using HMMs with User-Dependent Structure. Advances in
Biometrics, 1057-1066.
Pascual-Gaspar, J.M., Faundez-Zanuy, M., Vivaracho, C., 2011. Fast on-line
signature recognition based on VQ with time modeling. Engineering Applications
of Artificial Intelligence 24, 368-377.
Piyush Shanker, A., Rajagopalan, A.N., 2007. Off-line signature verification
using DTW. Pattern Recognition Letters 28, 1407-1414.
Popel, D.V., Popel, E.I., 2005. BIOGLYPH: biometric identification in pervasive
environments. 7th
International Symposium on Multimedia (ISM'05), pp. 713-718.
Rabiner, L.R., 1989. A tutorial on hidden Markov models and selected
applications in speech recognition. Proceedings of the IEEE 77, 257-286.
Ruiz-del-Solar, J., Devia, C., Loncomilla, P., Concha, F., 2008. Offline signature
verification using local interest points and descriptors. Progress in Pattern
Recognition, Image Analysis and Applications,lecture notes in computer sciences
(LNCS) 5197, 22-29.
Sánchez-Diaz, J., Ramírez-Cortes, J., Enriquez-Caldera, R., Gomez-Gil, P., 2010.
On-line signature verification based on modified dynamic time warping and
wavelet sub-band coding. Advances in Pattern Recognition, 210-219.

Scottish Journal of Arts, Social Sciences and Scientific Studies - ISSN 2047-1278
http://scottishjournal.co.uk
165
Vargas, F, Ferrer, M A., Travieso, C, M., Alonso, JB.2007. Off-line Handwritten
Signature GPDS-960 Corpus, 9th
International Conference on Document Analysis
and Recognition, pp 764-768,
Woo, Y., Han, S., Jang, K., 2006. Off-line signature verification based on
directional gradient spectrum and a fuzzy classifier. Advances in Image and
Video Technology, 1018-1029.
Yanikoglu, B., Kholmatov, A., 2009. Online signature verification using fourier
descriptors. EURASIP Journal on Advances in Signal Processing, Article ID
260516.

Scottish Journal of Arts, Social Sciences and Scientific Studies - ISSN 2047-1278
http://scottishjournal.co.uk
166
The needs of families of persons
with mental health difficulties
Namino Kunitoh
Department of Social Science, Health and Medicine, School of Social Science and
Public Policy, King’s College, the University of London
Abstract
Background: Families of persons with mental health difficulties play a significant role in
mental health care, and studies have shown the efficacy of support programmes for
families. It is important to understand families’ needs in order to design an effective
programme, yet review studies on the needs have been limited. Aims: To clarify families’
needs and correlations between families’ or their relatives’ characteristics and the number
or kind of needs, with a review of lately published articles. Methods: PubMed and Web
of Knowledge were searched with the terms of ‘mental illness’ OR ‘mental disorder’
AND ‘family’ AND ‘needs’. Results: Sixteen articles were identified by the search.
Families generally showed great needs for information about their relatives’ illness.
Families wanted emotional care as well. Some studies found associations between
families’ characteristics such as age and gender and the number or kind of needs, while
associations between relatives’ characteristics such as duration of illness and the number
or kind of needs among families were detected in some other studies. Conclusions:
Families needed to understand their relatives’ illness and to cope with it, whereas families
also wanted to be emotionally cared for. It is important to care not only for persons with
mental health difficulties, but also their families in order to help them deal with their
situations better.
Keywords: carer, caregiver, family, needs, schizophrenia, persons with mental
health difficulties

Scottish Journal of Arts, Social Sciences and Scientific Studies - ISSN 2047-1278
http://scottishjournal.co.uk
167
Introduction
Families of persons with mental health difficulties have received attention in
various studies. Families play a significant role in efforts towards recovery of their
relatives (Addington et al., 2005; Jones, 2009), hence they being important key workers
in mental health care.
Whilst families can have positive gains such as becoming more sensitive to
persons with disabilities, engendering a greater sense of inner strength and intensification
of a relationship with members having mental health difficulties by caring for them
(Bauer et al., 2012; Chen and Greenberg, 2004), it is also common that families
experience a burden, stress (Caqueo-Urízar and Gutiérrez-Maldonado, 2006; Chan, 2011;
Loukissa, 1995; Maji et al., 2011; Saunders, 2003; Teschinsky, 2000) and low quality of
life (Boyer et al., 2012; Wong et al., 2012). Furthermore, a study with a follow-up period
of 15 years (Brown & Birtwistle, 1998) found that families’ distress unchanged between
baseline and follow-up, which suggests that families can continue to feel distressed for a
long time.
In response to families’ difficult experiences, services have been offered to them
in order to help them cope with their situations better. A systematic review of 12 studies
(Bademli & Çetinkaya Duman, 2011) revealed that family-to-family support programmes
for families of patients with schizophrenia had a favourable impact on families, such as
bringing about a decrease in the burden and depressive symptoms and an increase in
family functioning. In addition, such programmes affected patients positively as well,
including an increase in functioning and decrease in readmissions.
To design an effective programme for families, which can have a positive
influence both on families and persons with mental health difficulties, it is important to
understand what families want. Literature reviews would be useful for this purpose.
However, there have been few reviews on needs of families. Noble and Douglas (2004)
reviewed 12 articles on families’ needs, showing that they wanted information,
involvement in decision making, supportive and communicative staff and good
coordination among services. Over half of the family participants in the articles reviewed
were caring for patients with schizophrenia spectrum disorder. These articles were
published between 2001 and 2003. Considering that families’ needs might have changed
over the past ten years, it would need to review recent studies in order to gain new
findings. Furthermore, it would also be helpful to understand what factors are correlated
with greater, fewer or specific needs, as such understanding can lead to more appropriate
service provision with families.
The aims of the present study were, therefore, twofold: to clarify (1) needs of
families of persons with mental health difficulties and (2) correlations between families’
or their relatives’ characteristics and the number or kind of needs, with a review of
studies published since 2004.
Methods
Inclusion/exclusion criteria
Included are empirical studies (1) in which 90% and over of the whole sample
consists of families of persons with mental health difficulties or (2) in which 90% and
over of one of the sample groups consists of such families and (3) investigating the
families’ needs or (4) investigating the families’ needs and correlations between needs

Scottish Journal of Arts, Social Sciences and Scientific Studies - ISSN 2047-1278
http://scottishjournal.co.uk
168
and characteristics of the family respondents. In the present study, families were defined
as relatives such as parents, partners, children and siblings, and persons with mental
health difficulties were defined as those who have a psychiatric diagnosis. Studies
focusing only on families’ opinions on their relatives’ needs were excluded because these
were not the needs of families but the needs of the persons with mental health difficulties.
Search strategy
Two electronic databases were searched between 2004 and November 2012:
PubMed and Web of Knowledge. English language studies were searched, with the
search terms being ‘mental illness’ OR ‘mental disorder’ AND ‘family’ AND ‘needs’. In
the search on Web of Knowledge, the terms were used for Topic search, and Document
types were restricted to Article.
Study selection
Articles were retrieved for further assessment if the title or abstract suggested that
they dealt with the needs of families of persons with mental health difficulties. If an
abstract did not provide sufficient information, the full text was screened for eligibility.
Results
Search results
A total of 4,086 titles were identified by the database search. Of these, 4,051 were
excluded upon reading the title and abstract. In the next stage, full texts of fifteen articles
of which an abstract provides insufficient information were read, leaving ten articles
excluded because of the non-eligibility. Thus, potentially appropriate articles were 25.
After the inclusion criteria were applied to these articles, a further nine were excluded:
four assessed families’ opinions on relatives’ needs; the relationship between persons
with mental health difficulties and those who care for them was unknown in three
articles; and the proportion of non-family participants such as friends exceeded 10% in
the remaining two articles. As a result, 16 articles were included for the review in the
present study. Of the 16 articles, two (Graap et al., 2008a; Graap et al., 2008b) were
counted as one study, with these describing the same study. Thus, the present study
reviewed 15 studies.
Studies and participants
Of the 15 studies, only one employed a prospective design with the follow-up
period of nine months (Pickett-Schenk et al., 2006). The participants were randomly
allocated into two groups: a family-led education programme (an intervention group,
N=231) and a control group who were on a waiting list for the programme (N=231).
These groups did not significantly differ in demographic or other background features,
nor did demographic and psychiatric characteristics of their relatives with mental health
difficulties differ. The education programme included participants receiving information
on the mental health service system and learning how to access services. Communication
and problem-solving skills training were also provided. The participants in the
intervention group were interviewed one month before the start of the programme, at
course termination and six months after the programme, and the participants in the
control group were interviewed at baseline, three months after baseline and eight months
post-baseline. The study employed the Family Information Needs scale to assess their

Scottish Journal of Arts, Social Sciences and Scientific Studies - ISSN 2047-1278
http://scottishjournal.co.uk
169
needs. Follow-up rates for both groups were 93% at the second interview and 89% at the
third interview. The total number of persons with mental health difficulties was 369, of
which 45% were living with the participants and 16% were living with other family
members or friends.
The other 14 studies used a cross-sectional design, of which 11 were quantitative
studies and 3 were qualitative studies. Table 1 shows characteristics of the 11 quantitative
studies. Wancata et al. (2006) used two different sample groups of families: 56 family
carers and another 50 carers. However, only findings of the latter sample were included
in the present study, as the interview with the former was conducted in order to test
whether carers agreed with the content of the research instrument developed by the
authors rather than assessing their needs. Mulligan et al. (2012) followed eleven
participants after the initial assessment, yet findings of the follow-up were not taken into
consideration in the present study because it was for assessing test-retest reliability.
Characteristics of the three qualitative studies are shown in Table 2. Of these three
studies, one employed the focus group discussion method, where several participants
discuss the same topic, whilst the remainder used one-to-one semi-structured interviews.
Table 3 reports gender distribution, age and family participants’ relationship to persons
with mental health difficulties in the 15 studies included. Gender, age and diagnosis of
persons with mental health difficulties are presented in Table 4.
Families’ needs
Quantitative studies
Of the 12 studies, half investigated families’ needs comprehensively, whilst three
focussed on educational needs, as did one on information needs, another one on
information and educational needs, and the remainder on service needs.
With respect to comprehensive needs, Wancata et al. (2006) found that
Counselling and support of the carer by a professional (74%) was most frequently needed
by the participants, followed by Self-help group for family members and Relatives group
guided by a member of the professional team (66% respectively). The most frequent
unmet needs were observed in Printed information material (28%) and Multi-family
groups (24%). In a study by Graap et al. (2008a), carers of persons with anorexia nervosa
needed Individual psychoeducation, Psychoeducational group and Printed information
material most often (93.8% respectively), while carers of persons with bulimia nervosa
needed Support/counselling of the carer by a professional most frequently (93.8%),
followed by Individual psychoeducation and Family counselling by a professional (87.6%
respectively). The most common needs among carers of persons with schizophrenia were
noted in Support/counselling of the carer by a professional (90%), Individual
psychoeducation (80%) and Printed information material and Family counselling by a
professional (73.4% respectively). On the total scores of needs, carers of persons with
anorexia nervosa and schizophrenia had significantly higher values than carers of persons
with bulimia nervosa. Furthermore, higher ratings were detected in female carers
compared to male counterparts. There was no significant correlation between the severity
of the relatives’ symptoms and duration of illness and the total score. Wancata et al.
(2008) found that the intervention needed most frequently was Counselling and support
of the carer (mother: 75%, father: 60.6%), followed by Individual psychoeducation
(57.8% and 27.8% respectively) and Relatives group guided by a professional (50.9% and

Scottish Journal of Arts, Social Sciences and Scientific Studies - ISSN 2047-1278
http://scottishjournal.co.uk
170
30.8% respectively). Mothers voiced higher frequencies of needs than fathers in all items,
with the total score of needs being significantly higher in mothers. Among mothers there
was a positive correlation between the Positive and Negative Syndrome Scale (PANSS)
general sub-scores of their relatives and the number of needs. A shorter duration of illness
was associated with a higher number of needs.
In a study by Yeh et al. (2008), the prevalence of needs in sub-scales was highest
in Assisting the aggravating patients (87.2%), Occupational therapy (83.3%) and
Transport of the aggravating patient to service setting (79.4%). The mean prevalence of
the four need clusters was as follows: Assistance with patient care (77.6%), Access to
relevant information (68.2%), Societal support (66.1%) and Burden release (27.2%).
Respondents whose patients had duration of illness of more than two years reported needs
for Understanding mental health laws and Advice on intimate relationships for a patient
more often. Furthermore, younger carers were more likely to need General psychological
or practical support and Coping with medical teams. Absalom-Hornby, Gooding and
Tarrier (2011) observed that relatives showed the greatest needs for Information about
schizophrenia and Relapse prevention (both 100%), followed by the need for Antisocial
behaviour classified into the category of Coping with symptoms (83%). In a study by
Mulligan et al. (2012), Monitoring of early warning signs was the most needed item (total
score = 28), followed by Information (total score = 27) and Emotional experience
difficulties (total score = 25), whereas the most urgent needs were noted in Emotional
experience difficulties (total score = 25), Affective difficulties (total score = 20) and
Constructive difficulties (total score = 19). The overall mean number of needs was 7.58,
of which 6.03, on average, was classified as urgent needs.
Regarding educational needs, Sung, Hixson and Yorker (2004) revealed that
relatives were most interested in Ways of managing stress more effectively (mean score =
4.08; range = 1-5), Coping with depression and suicidal thoughts and Managing ‘burnout’
(mean = 4.06 respectively). In a study by Gümüş (2008), relatives needed education on
Legal rights of patients with schizophrenia, with an average score of 2.8 (range = 1-3).
Education needs for Symptoms that occur when schizophrenia is recurring and for
Coping with problems that occur from being a patient with schizophrenia in society
received average scores of 2.73. Relatives who had not received education about
schizophrenia generally had greater needs compared to those who had received it. The
mean scores for needs among families were not statistically different according to their
age and gender. In a study by Wei and colleagues (2010), the highest mean scores were
observed in needs for Ways of managing stress more effectively (4.19; range = 1-5),
Psychiatric medications (4.18) and Loss of pleasure (4.17). Carers of persons with
schizophrenia showed more significant unmet needs in items focussing on managing the
symptoms of schizophrenia compared to carers of persons with mood disorder.
Pickett-Schenk et al. (2006) investigated information needs on problem
management and enhancing patients’ social functioning. The study revealed that
respondents who had relatives with a primary diagnosis of schizophrenia showed
significantly higher needs for social functioning information across all time points. Older
participants needed both problem management and social functioning information
significantly more than younger counterparts. As for changes in needs, participants in the
intervention group showed a significant decrease in both needs for problem management
and social functioning information immediately after the programme, and the
improvements were sustained over the follow-up period. Drapalski and colleagues (2008)

Scottish Journal of Arts, Social Sciences and Scientific Studies - ISSN 2047-1278
http://scottishjournal.co.uk
171
found that 65% of respondents wanted information about Future planning for care, with
57% of them indicating a need for Advocating for services for their relatives and 52%
needing information about Assertive community treatment. Although 96% of participants
had received information, the majority of them showed a continued need for that same
information. Furthermore, some specific characteristics were associated with fewer or
more unmet needs; those whose relative had a more recently occurring or disabling form
of illness and whose relative had a shorter length of illness reported significantly greater
unmet needs, whilst respondents having a relative with duration of illness of ten years or
more voiced fewer unmet needs. Older respondents showed significantly fewer unmet
needs. There was no correlation between gender and the number of needs.
Yeh, Liu and Hwu (2011) investigated carers’ needs and demands for community
psychiatric rehabilitation programmes. In the study a need was defined as a necessity of
carers for a specific programme, and a demand was noted when they wanted to use such a
programme. The most needed programmes were Structured day service (43.4%), Drop-in
service (37.4%) and Caregiver support (25.3%), while carers’ most frequent demands
were found in Structured day service (39.6%), Drop-in service (36.3%) and Club house
(31.9%). Carers who were younger were significantly more likely to need and demand
Structured day service than older carers, but older respondents showed a significantly
higher demand for Home care than younger counterparts.
Qualitative studies
In the study by Jagannathan et al. (2011), participants were asked to list their
needs, group the list of needs into main themes, define the themes and rank them
according to the importance. The score on each theme ranged from 0 to 6, with a higher
score meaning greater needs. The total score of each item was obtained by adding up the
score in each group. Results showed that the theme of Managing illness behaviour of
patients received the highest score with 23 (27.7%), followed by the themes of Managing
social-vocational problems of patients (17; 20.5%) and of Health of caregivers (15;
18.1%). Social-vocational problems included, for instance, patients’ lack of interest in
socialisation and difficulty in finding and maintaining a job, whereas the theme of Health
of caregivers included managing their emotions such as anger, handling stress and
reduced personal life, and so forth. Sin et al. (2012) revealed that the majority of the
interviewees wished for information on illness, treatment and available services the most.
Although their current needs were similar to those indicated at the onset of patients’
illness, they also needed specific information on prognosis and the future at the time of
interviews (on average, participants were interviewed approximately 18 months since the
onset of symptoms). Doucet, Letourneau and Blackmore (2012) found that respondents
needed instrumental support around the house, with their greatest need being having
someone look after their infants. All of them wanted information on their partners’ health
status, treatment plans and long-term prognoses. Their particular interest was in
information on managing their partners’ illness when home from hospital. In addition,
many of them wished for practical support to get out of the house for refreshment. They
also needed emotional and affirmational support, wishing to be reassured that everything
was going to be fine.
Discussion
The participants in the studies reviewed were predominantly parents of persons
with mental health difficulties, with the proportion of mothers exceeding that of fathers in

Scottish Journal of Arts, Social Sciences and Scientific Studies - ISSN 2047-1278
http://scottishjournal.co.uk
172
all studies where the proportion was shown. Females occupied more than half in the
majority of the studies. With respect to persons with mental health difficulties, most of
the studies included those suffering from schizophrenia or related disorders. This finding
is in line with that in the study by Noble and Douglas (2004). Thus, needs of families of
individuals with schizophrenia or related disorders have been well studied compared to
needs of families of individuals who suffer from other mental illness. Although the
present study reviewed only three qualitative studies, these focussed on areas which have
been less investigated by quantitative studies, such as needs of families in India, those of
siblings and those of males whose partners suffered from postpartum psychosis. The
findings of qualitative studies were in line with those of quantitative studies. This
suggests that families of persons with mental health difficulties have some common
needs regardless of country, their relationship to patients or their relatives’ diagnosis.
The present study revealed that families generally showed great needs for
information. The contents of information needed included problem management,
patients’ social functioning, mental illness, relapse prevention, treatment and prognoses.
Needs for information were detected in the earlier review study (Noble and Douglas,
2004) as well. The continuous need suggests that families still find difficulties in
obtaining information.
Another finding of the present study is that families often wanted emotional
support, including counselling of a carer, managing stress and so on. Although emotional
support was not a major topic in the previous review, this finding in the present study
suggests that more families need such support. As emotional distress is common among
families (Winefield and Harvey, 1993; Yusuf and Nuhu, 2011), it may be helpful for
them to receive services focussing on reducing it. Foster (2011) showed that an emotional
support service piloted in a family education programme benefited family carers. The
service was individual-based and ranged from one-off sessions to regular support, with
the provision type being face-to-face contact, telephone and/or e-mail. It was offered by a
qualified allied health professional who herself was also a family carer. Carers who
received the service felt being understood and accepted, and learnt different ways to
communicate with their relatives, became more aware of self-care and had greater self-
confidence. Although family services which focus on emotional support have been
relatively limited to date, it would be important to investigate the effects of such a service
further.
In the present study, four Taiwanese studies found that families were often
interested in needs in which persons with mental health difficulties seemingly require
more than their families, such as needs for coping with depression and suicidal thoughts
and for structured day service. This might be due to Taiwanese culture, in which families
are heavily involved in the treatment of patients (Sung, Hixson and Yorker, 2004).
Overall, the review of the 15 studies observed that families needed to understand
and manage patients’ illness, including monitoring a sign for a relapse, whilst they
wanted to be cared for as well. The importance of families’ obtaining a better
understanding about their relatives’ illness has been well recognised, resulting in offering
a variety of education programmes to families. These programmes were found useful to
increase families’ knowledge (Pickett-Schenk et al., 2008; Stengård, 2003) and to
decrease their burden (Sharif, Shaygan and Mani, 2012; Tanrıverdi and Ekinci, 2012).
However, care for families, particularly emotional care, has been a relatively unexploited
area. Since caring for someone with mental health difficulties can be a difficult

Scottish Journal of Arts, Social Sciences and Scientific Studies - ISSN 2047-1278
http://scottishjournal.co.uk
173
experience and families need emotional support, it is hoped that services in which
families are listened to and can feel being understood and supported will be offered more
in future.
Regarding the correlation between needs and families’ characteristics, two studies
(Graap et al., 2008a; Wancata et al., 2008) found that female respondents had greater
needs than male counterparts. However, gender was not associated with the number of
needs or mean score of needs among the participants in the other two studies (Drapalski
et al.,2008; Gümüş, 2008). The inconsistency between these studies might be explained
by the research instruments employed; the studies in which females’ higher needs were
detected used similar assessment measurements, whereas the other two studies employed
different instruments. There might be a possibility that the assessment tools used in the
former include more items which women need more.
The finding that families of persons with schizophrenia needed information about
social functioning significantly more often than those of persons with other mental
illnesses probably reflects the fact that impairment in social functioning is common
among people suffering from schizophrenia (Bartles, Mueser and Miles, 1997;
Bottlender, Strauss and Möller, 2010; Fleck et a., 2007; Mueser et al., 2010; Patterson et
al., 2001). In addition, greater unmet needs were noted in items focussing on management
of symptoms of schizophrenia among families of persons with schizophrenia in the study
by Wei et al. (2010). These suggest that whilst families share some common needs, there
are also specific needs depending upon relatives’ symptoms. Therefore, future research
will need to focus on particular needs of families as well.
In the study by Wancata et al. (2006), the number of mothers’ needs was
positively related to the PANSS general sub-scale of their relatives. Drapalski et al.
(2008) showed that families of persons with a disabling condition reported a greater
number of unmet needs. Thus, families of persons with a more severe form of illness
experience wanted more help and had more unmet needs. However, Graap et al. (2008)
revealed that the severity of the relatives’ illness was not associated with the number of
needs. This is puzzling when considering that Wancata et al. (2006) and Graap et al.
(2008) employed similar instruments to assess families’ needs, and both studies assessed
relatives’ symptoms over the past four weeks using the PANSS. As Graap et al. (2008)
point out, factors such as personality of persons with mental health difficulties and
situations of families might have led to the lack of a correlation. Although it seems
natural that families of people with a more severe form of illness experience had more
needs and unmet needs, the correlation between the severity of patients’ symptoms and
families’ needs and unmet needs might require further exploration.
Duration of patients’ illness was often related to greater needs or unmet needs
among families. In the study by Drapalski et al. (2008), relatives of individuals having a
shorter length of illness reported greater unmet needs, while those of individuals with a
longer period of illness showed fewer unmet needs. Wancata et al. (2006) found that a
shorter duration of patients’ illness correlated with a higher number of needs among
mothers. Meanwhile, relatives of persons suffering from schizophrenia for a longer
period had higher needs in some specific areas in the study by Yeh et al (2008). Although
the finding in the study by Wancata et al. (2006) partially disagrees with the finding in
the study by Yeh et al. (2008), it should be noted that families who had persons with
longer duration of illness in the latter showed greater needs, not in all areas but in some
particular areas. Therefore, it would be reasonable to say that whereas needs and unmet

Scottish Journal of Arts, Social Sciences and Scientific Studies - ISSN 2047-1278
http://scottishjournal.co.uk
174
needs of families generally decrease as they get used to patients’ care, they can also be
more aware of specific needs as time passes. However, one study (Graap et al., 2008)
observed no correlation between the severity of patients’ symptoms and the number of
families’ needs. Again, this might be due to factors which were not shown in the data,
such as patients’ personality and families’ situations.
The respondents’ age predicted greater needs in several studies. In the studies by
Yeh et al. (2008) and Yeh, Liu and Hwu (2011), younger participants had greater needs
or demands in some particular areas, while the latter study revealed that older participants
also showed a greater demand in one area. Pickett-Schenk et al. (2006) observed that
older respondents reported overall greater needs compared to younger respondents.
Meanwhile, in the study by Drapalski et al. (2008), older participants showed fewer
unmet needs. These findings suggest that, first of all, each age group has particular needs.
Secondly, older family members’ needs are generally met probably because they are
more used to caring for their relatives, and families have a better understanding of what
resources are available for their needs. Thirdly, however, older family members can also
have more needs probably because they want more specific support after their general
needs were fulfilled.
Understandably, families who had not received education about schizophrenia
generally showed more needs compared to those who had received it. In contrast, families
who had received information reported a continued need for the same information. Thus,
although it is important to offer education and information to families who had not
received them before, it is also important to provide families with them on a continuous
basis, regardless of prior receipt of education and information.
Conclusions
The present study reviewed 16 articles on needs of families of persons with
mental health difficulties, with major findings being that families generally had great
needs for information and emotional support. It also revealed that whilst families shared
some common needs, they also had specific needs depending upon their age, their
relatives’ symptoms or their duration of illness. Overall, families needed to gain a better
understanding about their relatives’ illness and to cope with it, including monitoring a
sign suggesting a relapse, whereas families also wanted to be emotionally cared for. The
findings in the present study suggest that it is important to not only care for persons with
mental health difficulties, but also to care for their families as well.

Scottish Journal of Arts, Social Sciences and Scientific Studies - ISSN 2047-1278
http://scottishjournal.co.uk
175
References
Absalom-Hornby, V., Gooding, P., & Tarrier, N. (2011). Coping with
schizophrenia in forensic services: the needs of relatives. Journal of Nervous and
Mental Disease, 199(6), 398-402.
Addington, J., Collins, A., McCleery, A., & Addington, D. (2005). The role of
family work in early psychosis. Schizophrenia Research, 79, 77-83.
Bademli, K., & Çetinkaya Duman, Z. (2011). Family to family support programs
for the caregivers of schizophrenia patients: a systematic review. Turkish Journal
of Psychiatry, 22(4), 255-265.
Bartles, S. J., Mueser, K. T., & Miles, K. M. (1997). Functional impairments in
elderly patients with schizophrenia and major affective illness in the community:
social skills, living skills, and bahavior problems. Behavior Therapy, 28, 43-63.
Bauer, R., Sterzinger, L., Koepke, F., & Spiessl, H. (2012). Rewards of
Caregiving and Coping Strategies of Caregivers of Patients With Mental Illness.
Psychiatric Services, Dec 3. doi: 10.1176/appi.ps.001212012.
Boyer, L., Caqueo-Urízar, A., Richieri, R., Lancon, C., Gutiérrez-Maldonado, J.,
& Auquier, P. (2012). Quality of life among caregivers of patients with
schizophrenia: a cross-cultural comparison of Chilean and French families. BMC
Family Practice, Jul 6;13:42. doi: 10.1186/1471-2296-13-42.
Bottlender, R., Strauss, A., & Möller, H. J. (2010). Social disability in
schizophrenic, schizoaffective and affective disorders 15 years after first
admission. Schizophrenia Research, 116(1), 9-15.
Brown, S., & Birtwistle, J. (1998). People with schizophrenia and their families.
Fifteen-year outcome. British Journal of Psychiatry, 173:139-144.
Caqueo-Urízar, A., & Gutiérrez-Maldonado, J. (2006). Burden of care in families
of patients with schizophrenia. Quality of Life Research, 15, 719–724.
Chan, S. W. (2011). Global perspective of burden of family caregivers for persons
with schizophrenia. Archives of Psychiatric Nursing, 25(5), 339-349.
Chen, F., & Greenberg, J. S. (2004). A positive aspect of caregiving: the influence
of social support on caregiving gains for family members of relatives with
schizophrenia. Community Mental Health Journal, 40(5), 423-435.
Doucet, S., Letourneau, N., & Blackmore, E. R. (2012). Support needs of mothers
who experience postpartum psychosis and their partners. Journal of Obstetric,
Gynecologic, and Neonatal Nursing, 41(2), 236-45.

Scottish Journal of Arts, Social Sciences and Scientific Studies - ISSN 2047-1278
http://scottishjournal.co.uk
176
Drapalski, A. L., Marshall, T., Seybolt, D., Medoff, D., Peer, J., Leith, J., &
Dixon, L. B. (2008). Unmet needs of families of adults with mental illness and
preferences regarding family services. Psychiatric Services, 59(6), 655-62.
Fleck, M. P., Wagner, L., Wagner, M., & Dias, M. (2007). Long-stay patients in a
psychiatric hospital in Southern Brazil. Revista de Saúde Pública, 41(1), 124-30.
Foster, K. (2011). 'I wanted to learn how to heal my heart': family carer
experiences of receiving an emotional support service in the Well Ways
programme. International Journal of Mental Health Nursing, 20(1), 56-62.
Graap, H., Bleich, S., Herbst, F., Scherzinger, C., Trostmann, Y., Wancata, J., &
de Zwaan, M. (2008a). The needs of carers: a comparison between eating
disorders and schizophrenia. Social Psychiatry and Psychiatric Epidemiology,
43(10), 800-807.
Graap, H., Bleich, S., Herbst, F., Trostmann, Y., Wancata, J., & de Zwaan, M.
(2008b). The needs of carers of patients with anorexia and bulimia nervosa.
European Eating Disorders Review, 16(1), 21-29.
Gümüş, A. B. (2008). Health education needs of patients with schizophrenia and
their relatives. Archives of Psychiatric Nursing, 22(3), 156-65.
Jagannathan, A., Thirthalli, J., Hamza, A., Hariprasad, V. R., Nagendra, H. R., &
Gangadhar, B. N. (2011). A qualitative study on the needs of caregivers of
inpatients with schizophrenia in India. International Journal of Social Psychiatry,
57(2), 180-94.
Jones, K. (2009). Addressing the needs of carers during early psychosis. Early
Intervention in Psychiatry, 3, S22-26.
Loukissa, D. A. (1995). Family burden in chronic mental illness: a review of
research studies. Journal of Advanced Nursing, 21, 248-255.
Maji, K. R., Sood, M., Sagar, R., & Khandelwal, S. K. (2011). A follow-up study
of family burden in patients with bipolar affective disorder. International Journal
of Social Psychiatry, 58(2), 217-223.
Mueser, K., Bellack, A. S., Wade, J. H., Sayers, S. L., & Rodenthal, C. K. (1992).
An assessment of the educational needs of chronic psychiatric patients and their
relatives. British Journal of Psychiatry, 160, 674-680.
Mueser, K. T., Pratt, S. I., Bartels, S. J., Forester, B., Wolfe, R., & Cather, C.
(2010). Neurocognition and social skill in older persons with schizophrenia and
major mood disorders: An analysis of gender and diagnosis effects. Journal of
Neurolinguistics, 23(3), 297-317.

Scottish Journal of Arts, Social Sciences and Scientific Studies - ISSN 2047-1278
http://scottishjournal.co.uk
177
Mulligan, J., Sellwood, W., Reid, G. S., Riddell, S., & Andy, N. (2012). Informal
caregivers in early psychosis: evaluation of need for psychosocial intervention
and unresolved grief. Early Intervention in Psychiatry, Jun 28. doi:
10.1111/j.1751-7893.2012.00369.x.
Noble, L. M., & Douglas, B. C. (2004). What users and relatives want from
mental health services. Current Opinion in Psychiatry, 17, 289–296.
Patterson, T. L., Moscona, S., McKibbin, C. L., Davidson, K., & Jeste, D. V.
(2001). Social skills performance assessment among older patients with
schizophrenia. Schizophrenia Research, 48(2-3),351-360.
Pickett-Schenk, S. A., Bennett, C., Cook, J.A., Steigman, P., Lippincott, R.,
Villagracia, I., & Grey, D. (2006). Changes in caregiving satisfaction and
information needs among relatives of adults with mental illness: results of a
randomized evaluation of a family-led education intervention. American Journal
of Orthopsychiatry, 76(4), 545-553.
Pickett-Schenk, S. A., Lippincott, R. C., Bennett, C., & Steigman, P. J. (2008).
Improving knowledge about mental illness through family-led education: the
journey of hope. Psychiatric Services, 59(1), 49-56.
Saunders, J. C. (2003). Families living with severe mental illness: a literature
review. Issues in Mental Health Nursing, 24, 175–198.
Sharif, F., Shaygan, M., & Mani, A. (2012). Effect of a psycho-educational
intervention for family members on caregiver burdens and psychiatric symptoms
in patients with schizophrenia in Shiraz, Iran. BMC Psychiatry, May 25;12:48.
doi: 10.1186/1471-244X-12-48.
Sin, J., Moone, N., Harris, P., Scully, E., & Wellman, N. (2012). Understanding
the experiences and service needs of siblings of individuals with first-episode
psychosis: a phenomenological study. Early Intervention in Psychiatry, 6(1), 53-
59.
Stengård, E. (2003). Educational intervention for the relatives of schizophrenia
patients in Finland. Nordic Journal Psychiatry, 57(4), 271-277.
Sung, S. C., Hixson, A., & Yorker, B. C. (2004). Predischarge psychoeducational
needs in Taiwan: comparisons of psychiatric patients, relatives, and professionals.
Issues in Mental Health Nursing, 25(6), 579-88.
Teschinsky, U. (2000). Living with schizophrenia: the family illness experience.
Issues in Mental Health Nursing, 21, 387–396.

Scottish Journal of Arts, Social Sciences and Scientific Studies - ISSN 2047-1278
http://scottishjournal.co.uk
178
Tanrıverdi, D., & Ekinci, M. (2012). The effect psychoeducation intervention has
on the caregiving burden of caregivers for schizophrenic patients in Turkey.
International Journal of Nursing Practice, 18(3), 281-288.
Wancata, J., Krautgartner, M., Berner, J., Scumaci, S., Alexandrowicz, M. F. R.,
& Rittmannsberger, H. (2006). The ‘‘Carers’ needs assessment for
Schizophrenia’’:An instrument to assess the needs of relatives caring for
schizophrenia patients. Social Psychiatry and Psychiatric Epidemiology, 41, 221-
229.
Wancata, J., Freidl, M., Krautgartner, M., Friedrich, F., Matschnig, T., Unger, A.,
Gössler, R., & Frühwald, S. (2008). Gender aspects of parents' needs of
schizophrenia patients. Social Psychiatry and Psychiatric Epidemiology, 43, 968-
974.
Wei, S.J., Cooke, M., Moyle, W., & Creedy, D. (2010). Health education needs of
family caregivers supporting an adolescent relative with schizophrenia or a mood
disorder in Taiwan. Archives of Psychiatric Nursing, 24(6), 418-28.
Winefield, H. R., & Harvey, E. J. (1993). Determinants of psychological distress
in relatives of people with chronic schizophrenia. Schizophrenia Bulletin, 19(3),
619-625.
Wong, D. F. K., Lam, A. Y. K., Chan, S. K., & Chan, S. F. (2012). Quality of life
of caregivers with relatives suffering from mental illness in Hong Kong: roles of
caregiver characteristics, caregiving burdens, and satisfaction with psychiatric
services. Health and Quality of Life Outcomes, Jan 31;10:15. doi: 10.1186/1477-
7525-10-15.
Yeh, L. L., Hwu, H. G, Chen, C. H., Chen, C. H, & Wu, A. C. (2008). Factors
related to perceived needs of primary caregivers of patients with schizophrenia.
Journal of Formosan Medical Association, 107(8), 644-652.
Yeh, L. L., Liu, S. K, Hwu, H. G. (2011). Needs and demands for community
psychiatric rehabilitation programs from the perspectives of patients and
caregivers. Community Mental Health Journal, 47(4), 415-423.
Yusuf, A. J., & Nuhu, F. T. (2011). Factors associated with emotional distress
among caregivers of patients with schizophrenia in Katsina, Nigeria. Social
Psychiatry and Psychiatric Epidemiology, 46(1), 11-16.

Scottish Journal of Arts, Social Sciences and Scientific Studies - ISSN 2047-1278
http://scottishjournal.co.uk
179
Appendix
Table 1. Characteristics of Quantitative Studies
Study Setting Family sample
% of family
members
living with a
person with
mental health
difficulty
Measurement
Sung,
Hixson
and
Yorker
(2004)
Taiwan
One hundred relatives of
psychiatric inpatients who
were prepared to be
discharged from a hospital.
Not available
An
original
questionnaire
based on
Muser et al.
(1992)
Wancata
et al.
(2006)
Austria
Fifty relatives of persons
suffering from schizophrenia
or schizoaffective disorders.
52 CNA-S†
Drapalski
et al.
(2008)
USA
Three hundred and sixteen
members of the Maryland
chapter of the National
Alliance on Mental Illness.
33
A
questionnaire
adapted from
the FANS‡
Graap et
al.
(2008a);
Graap et
al.
(2008b)
Germany
Sixteen carers of persons
with anorexia nervosa (AN),
16 carers of persons with
bulimia nervosa (BN) and 22
carers of persons with
schizophrenia.
Carers of
persons with
AN: 68.8
Carers of
persons with
BN: 56.3
Carers of
persons with
schizophrenia:
63.3
CNA§
Gümüş
(2008) Turkey
Eighty relatives of
psychiatric patients. 100
The
Evaluation of
Health
Educational
Needs Form
Wancata
et al.
(2008)
Austria
Mothers (N=101) and
fathers (N=101) of the same
patients suffering from
schizophrenia.
Mothers:40.6
Fathers:38.6 CNA-S
Yeh et al.
(2008) Taiwan
One hundred and seventy-
seven caregivers of inpatients
with schizophrenia.
100 FBNS¶

Scottish Journal of Arts, Social Sciences and Scientific Studies - ISSN 2047-1278
http://scottishjournal.co.uk
180
Table 1. (Continued)
Study Setting Family sample
% of family
members
living with a
person with
mental health
difficulty
Measurement
Wei et al.
(2010) Taiwan
Two hundred and sixty-one
family caregivers of an
adolescent diagnosed with
schizophrenia or a mood
disorder.
100 CM-ENQ††
Absalom-
Hornby ,
Gooding
and
Tarrier
(2011)
England
Eighteen relatives who had
a family member at a forensic
unit with a diagnosis of
schizophrenia.
0 RCNS‡‡
Yeh et al.
(2011) Taiwan
One hundred and eighty-
two caregivers of an
outpatient with either
schizophrenia or affective
disorder.
Not available INDCPR§§
Mulligan
et al.
(2012)
England
Thirty primary carers of
users involved with Early
Intervention in Psychosis
services (EIP).
70 RUNS-EI†††
† CNA-S: The Carers’ Needs Assessment for Schizophrenia
‡ FANS: The Yale–Northeast Program Evaluation Center Family Assessment of
Needs for Services § CNA: The carers’ Needs Assessment
¶ FBNS: The Family Caregiver Burden and Need Schedule
†† CM-ENQ: The Chinese version of the Modified Educational Needs
Questionnaire ‡‡
RCNS: The Relatives’ Cardinal Needs Schedule §§
INDCPR: The Inventory of Needs and Demands for Community Psychiatric
Rehabilitation †††
RUNS-EI: The Relatives’ Urgent Needs Schedule Early Intervention version

Scottish Journal of Arts, Social Sciences and Scientific Studies - ISSN 2047-1278
http://scottishjournal.co.uk
181
Table 2. Characteristics of Qualitative Studies
Study Setting Family sample
% of family members
living with a person
with mental health
difficulty
Jagannathan
et al. (2011) India
Thirty caregivers of inpatients
with schizophrenia. Not available
Sin et al.
(2012) England
Thirty-one siblings of service
users treated by local Early
Intervention in Psychosis Services.
Not available
Doucet,
Letourneau
and
Blackmore
(2012)
Canada and
USA
Eight male partners of women
who suffered from postpartum
psychosis within the last 10 years.
100

Scottish Journal of Arts, Social Sciences and Scientific Studies - ISSN 2047-1278
http://scottishjournal.co.uk
182
Table 3. Sample Features in the Studies (Families)
Study Gender Mean age (years) Relationship to persons with
mental health difficulties
Sung,
Hixson and
Yorker
(2004)
Not available Not available Parent=39%, spouse=36%
Wancata et
al. (2006) Female=68% 55.3 Parent=82%, partner=12%
Pickett-
Schenk et
al. (2006)
Total sample:
male=90 (20%),
female=372
(80%)
Total sample: 51.25
Total sample: parent=255
(55%), adult child=59 (13%),
sibling=57 (12%),
spouse/significant other=54
(12%), other=37 (8%)
Drapalski et
al. (2008)*
Female=223
(73%) 63.17
Mother=174 (58%), father=60
(20%), sibling=28 (9%),
spouse=18 (6%), child=9 (3%),
other=10 (3%)
Graap et al.
(2008a);
Graap et al.
(2008b)
Carers of
persons with AN:
female=9 (56.3%)
Carers of persons
with BN:
female=7 (43.8%)
Carers of persons
with
schizophrenia:
female=22 (73%)
Carers of persons
with AN: 43.8
Carers of persons with
BN: 39.1
Carers of persons with
schizophrenia: 51.7
Carers of persons with AN:
mother=8 (50%), partner=5
(31.3%), father=2 (12.5%),
friend= 1 (6.3%)
Carers of persons with BN:
mother=6 (37.5%), partner=6
(37.5%), father=3 (18.8%),
friend=1 (6.3%)
Carers of persons with
schizophrenia: mother=14
(46.7%), partner=10 (33.3%),
father=5 (16.7%), sibling=1
(3.3%)
Gümüş
(2008) Female=51.3% 46.16 Parent=71.3%
Wancata et
al. (2008)
Male=101 (50%),
female=101
(50%)
Mothers=54.76,
fathers=59.10
Mother=101 (50%), father=101
(50%)
Yeh et al.
(2008)
Male=92 (54%),
female=85 (46%)
Not available
(<30 years=5.6%, >60 years=29.8%, 31-
60 years=64.6%)
Parent=70.1%,
child/sibling=18.6%,
spouse=11.3%

Scottish Journal of Arts, Social Sciences and Scientific Studies - ISSN 2047-1278
http://scottishjournal.co.uk
183
Table 3. (Continued)
Study Gender Mean age (years) Relationship to persons with
mental health difficulties
Wei et al.
(2010)
Total sample:
Male=60 (23%),
female=201
(77%)
Total sample: 48.88
Total sample: Mother=186
(71.2%), father=53 (20.3%),
sibling=10 (3.8%),
grandparent=4 (1.6%), other
relative=4 (1.6%), adoptive
parent=4 (1.5%)
Absalom-
Hornby ,
Gooding
and Tarrier.
(2011)
Male=6 (33)%,
female=12 (67%) 54.5
Mother=8 (44%), father=4
(22%), sister=3 (17%),
brother=2 (11%), aunt=1 (6%)
Jagannathan
et al. (2011)
Male=13 (43.3%),
female=17
(56.7%)
50.6
Parent=21 (70%), sibling=4
(13.3%), other=3 (10%),
spouse=2 (6.7%)
Sin et al.
(2011)
Male=9 (29%),
female=22 (71%) 22.7
Elder sister=young sister=14
(45%), 8 (26%), elder brother=5
(16%), young brother=4 (13%)
Yeh, Liu
and Hwu
(2011)
Male=78 (42.9%),
female=104
(57.1%)
55.2
Parent=122 (67.1%),
Sibling=25 (13.7%), Spouse=22
(12.1%), Other=9 (4.9%),
Child=4 (2.2%)
Doucet,
Letourneau
and
Blackmore
(2012)
Male=8 (100%) 36.25 Partner=8 (100%)
Mulligan et
al. (2012)
Male=8 (26.7%),
female=22
(73.3%)
48.97 Mother=20 (66.7%), father=6
(20%), partner=4 (13.3%)
* Because of missing data, Ns are different.

Scottish Journal of Arts, Social Sciences and Scientific Studies - ISSN 2047-1278
http://scottishjournal.co.uk
184
Table 4. Sample Features in the Studies (Persons with Mental Health Difficulties)
Study Gender Age (mean) Diagnosis
Sung et
al. (2004) Not available Not available
Major depression=44%,
schizophrenia=40%, bipolar
disorder=14%, other=2%
Wancata
et al.
(2006)
Male=68% 31.4 Schizophrenia=90%,
schizoaffective psychosis=10%
Pickett-
Schenk
et al.
(2006)
Total sample:
male=197 (53%),
female=172 (47%)
Total sample:
36.23
Total sample: bipolar
disorder=168 (45%), depression=69
(19%), schizophrenia=66 (18%),
schizoaffective disorder=20 (5%),
obsessive-compulsive disorder=12
(3%), other=34 (2%)
Drapalski
et al.
(2008)*
Male=201 (67%) 40.22
Schizophrenia or schizoaffective
disorder=169 (56%), bipolar
disorder=90 (30%), major
depression=38 (13%), anxiety
disorder=27 (9%), borderline
personality disorder=17 (6%),
substance abuse disorder=17 (6%),
obsessive-compulsive disorder=15
(5%), other=18 (6%)
Graap et
al.
(2008a);
Graap et
al.
(2008b)
Persons with AN:
female= 15
(93.8%)
Persons with BN:
female=16 (100%)
Persons with
schizophrenia:
female=12 (40%)
Persons with AN:
24.3
Persons with BN:
22.1
Persons with
schizophrenia: 35
Anorexia nervosa=16 (26%),
Bulimia nervosa=16 (26%),
schizophrenia=30 (48%)
Gümüş
(2008)
Male=70%,
female=30% 31.38 Schizophrenia=80 (100%)
Wancata
et al.
(2008)
Exact data not
available (about
two thirds were
male)
28.3 Schizophrenia=101 (100%)
Yeh et al.
(2008)
Male=86 (49%),
female=91 (51%)
Not available
(>30
years=52.5%, 21-
30 years=39.2%,
<20 years=8.3%)
Schizophrenia=177 (100%)

Scottish Journal of Arts, Social Sciences and Scientific Studies - ISSN 2047-1278
http://scottishjournal.co.uk
185
Table 4. (Continued)
Study Gender Age (mean) Diagnosis
Wei et al.
(2010)
Male=137 (52%),
female=124 (48%) 18.54
Schizophrenia=170 (65%),
depression=54 (21%), bipolar
disorder=35 (13%), bipolar 1
'mania'=2 (0.8%)
Absalom-
Hornby et
al. (2011)
Not available Not available Schizophrenia=18 (100%)
Jagannathan
et al. (2011)
Male=17 (58.6%),
female= 12
(41.4%)
31 Schizophrenia =29 (100%)
Sin et al.
(2011)
Male=20 (80%),
female=5 (20%) 23.5 Not available
Yeh et al.
(2011)
Male=93 (51.1%),
female=89 (48.9%) 36.2
Schizophrenia=151 (83%),
affective disorder=31 (17%)
Doucet et
al. (2012) Female=9 (100%) 34 Postpartum psychosis=9 (100%)
Mulligan et
al. (2012)
Male=17 (56.7%),
female=13 (43.3%) 24.73
Not available (they suffered from
psychosis such as hallucinations or
delusions or both).

Scottish Journal of Arts, Social Sciences and Scientific Studies - ISSN 2047-1278
http://scottishjournal.co.uk
186
Risk Propensity, Gender and
Entrepreneurial Ability
Fagbohungbe, Oni Bamikole
Department Of Psychology, Faculty Of Social Sciences
University Of Lagos
Jayeoba, Foluso Ilesanmi
Department Of Industrial Relations And Personnel Management
Faculty Of Management Sciences
Lagos State University, Ojo
Abstract
The study surveyed 668 (Male = 356, Female = 312) University undergraduates of two
Nigerian Universities in Western Nigeria. Using the correlation and factorial statistical
designs, the study which examined the influence of Risk propensity and gender on
entrepreneurial abilities, found that gender has no significant influence on entrepreneurial
abilities. Risk propensity has significant but inverse correlation with entrepreneurial
ability (r = - 0.23). High and low risk propensity differs significantly on entrepreneurial
abilities with low risk takers ( x = 126.55) showing greater entrepreneurial abilities than
high risk (F (1/651) =31.044, p<.05; critical F = 3.84). Gender difference does not
influence entrepreneurial abilities as indicated by findings in this study (F (1/651) =
0.522, p<0.05). Though literatures appear to suggest that entrepreneurs are people with
high risk propensity, this was not confirmed in this study, rather low risk takers shows
greater entrepreneurial abilities. There was no significant difference in entrepreneurial
abilities of male and female participants. This result is an indication that hypothesized
relationship between certain personality variables and entrepreneurship should be viewed
with caution. Equally the belief that entrepreneurship is a ‘male turf’ is not necessarily
true. Further local study of these variables is suggested to further confirm these findings.
Key words: Entrepreneurial abilities, Risk propensity, Gender.
Scottish Journal of Arts, Social Sciences and Scientific Studies - ISSN 2047-1278
http://scottishjournal.co.uk
187
Introduction
Risk taking has long been associated with entrepreneurship (McClelland, 1961,
1965), but the relationship between entrepreneurship and risk taking has long puzzled
researchers (Naldi, Nordqvist, Sjoberg and Wiklund, 2007). Research has found little
empirical evidence to support the idea that entrepreneurs take considerable risks. On the
average, entrepreneurs do not take greater risks than managers (Brockaus, 1980).
Entrepreneurs have been referred to as risk avoiders (Miner, 1990) or risk optimizers
(McClelland, 1961). According to Petrakis (2005) risk propensity is determined within
the entrepreneurial behaviour framework. Indeed the issue of risk is central to the study
of entrepreneurial behaviour and performance and different points of view are employed
in entrepreneurial risk research agenda (Norton and Moore, 2002). Although not many
studies have focused specifically on gender difference among entrepreneurs, it is
common to observe many women in Nigeria engaged in entrepreneurial activities
especially in the informal sector. Are these in any way different from their male
counterparts especially on personality characteristics commonly associated with
entrepreneurship? Some studies have however tried to distinguish between male and
female managers along these dimensions (Baron, 1999; Wallach, M.A. & Kogan, N.
(1959). It is useful to find out how risk propensity and gender influence entrepreneurship
in view of dearth of local research on these variables.
Aim and objectives
The first and major aim of this study is to provide local data on the personality of
the entrepreneur, by considering the influence of risk propensity and gender on
entrepreneurial abilities. Specifically, the study confirms the relationship between risk
propensity and entrepreneurship and examines the extent of influence of risk propensity
on entrepreneurial abilities. Also the study will investigate gender differences in locus of
control and entrepreneurial ability.
Hypotheses
1. There will be significant correlation between risk propensity and entrepreneurial
abilities.
2. Participants with high risk propensity will possess greater entrepreneurial abilities
than those with low risk propensity.
3. Males and females will differ in risk propensity and entrepreneurial abilities.
Significance of study.
The study is significant in two aspects. Knowledge of the variables influencing
entrepreneurship is desirable using Nigerian samples and the implication of risk taking as
an explanatory variable though often taken for granted is obvious if confirmed to the
contrary.
Operational definition of key terms.
Entrepreneurial Abilities. For the purpose of this study, entrepreneurship as a
term popularly used in literature is more of a constitutive definition and capable of having
surplus meaning (Kerlinger, 1973). In this wise, Entrepreneurial Ability is used in this
study and conceived as possession of abilities necessary for the starting and nurturing to
growth of a new enterprise, especially in a competitive environment. That is, the ability to
start, nurture and grow businesses to both profitability and survival. This definition
Scottish Journal of Arts, Social Sciences and Scientific Studies - ISSN 2047-1278
http://scottishjournal.co.uk
188
conceives entrepreneurship as a form of ability/potential that can be measured using
appropriate psychometric procedure. The Entrepreneurial Ability Scale developed as part
of a PhD thesis is used to measure entrepreneurial abilities.
Risk Propensity. Risk taking propensity refers to the probability of an individual
to exhibit risk taking or risk avoidance when confronted with risky situations. It goes with
the probability of receiving the rewards associated with success of a proposed situation,
which is required by an individual before he is subjected to the consequences associated
with failure, the alternative situation providing less reward as well as less severe
consequences than the proposed situation. Risk propensity can be classified fro low,
moderate to high risk propensity and has been measured as such (Brockaus, 1980)
Gender. The term gender, though a categorical variable has social significance in
the sense that it is about assignment of roles rather than a biological phenomena. The
term therefore is conceived as those roles that distinguish males from females and here in
focus, their roles as owners and operators of businesses.
Theoretical backdrop
Personality or trait theory. It is a popular notion that individual factors, focusing
on personality characteristics of entrepreneurs affect entrepreneurial behaviour. This
theory according to Thomas and Mueller (2000) rests on the assumption entrepreneurs
have certain unique characteristics, attitudes and values that provide impetus for them and
distinguish them from others. The key questions among trait theorists are, whom the
entrepreneurs are, why they become entrepreneurs and the characteristics of successful
and unsuccessful entrepreneurs (Littunen, 2000). The trait theory has according to Gurol
and Atsan (2006) been a significant element of research on entrepreneurship. Some of the
traits commonly associated with entrepreneurship are; achievement motivation
(McClelland, 1961, 1965), locus of control (Rotter 1966; Littunnen, 2000), tolerance for
ambiguity (Entrialgo, Fernandez, and Vazquez, 2000)
Risk-taking propensity.
In the overall, entrepreneurs have been shown to be moderate risk-takers and do
not significantly differ from managers on this trait (Sexton and Bowman, 1985;
Brockhaus, 1980). This is contrary to common belief that entrepreneurs are high risk
managers and their ability to achieve goals viewed as impossible by others pitch them as
high risk takers in common perception. In reality, entrepreneurship includes the risks
related to the financial well being of self, family, career opportunities, emotional states
and psychic well being. Common sense will suggest therefore that entrepreneurs are not
averse to risks. In literature, entrepreneurs are characterized as having greater propensity
to take risks than other groups (Crommie, 2000; Thomas and Mueller; Teoh and Foo.
1997).
Literature Review
Risk propensity and entrepreneurship.
According to Gurol and Atsan (2006) entrepreneurship is historically related with
risk taking. One of the earliest studies by Chantilon (1755) reported that the main factor
in differentiating entrepreneurs from employed workers was the uncertainty and risk
taken by the former (Entrialgo et al, 2000; Thomas and Mueller, 2000) Expectancy
theorists, especially Atkinson (1957) have stimulated much study of risk preferences;

Scottish Journal of Arts, Social Sciences and Scientific Studies - ISSN 2047-1278
http://scottishjournal.co.uk
189
Atkinson’s risk taking model is derived from the relationship that McClelland found
between need for achievement and preference for moderate probabilities for success. The
model proposes that risk taking involve six variables; the subjective probability of
success, the subjective probability of failure, the incentive value of success, the incentive
value of avoiding failure, the achievement motive and the motive to avoid failure.
According to him, performance level should be greatest when there is greatest uncertainty
about the outcome (when subjective probability of success is .50) and this he observed to
be true regardless of whether the motive to achieve or the motive to avoid failure is
stronger in an individual. Persons in whom the achievement motive is stronger however
should avoid intermediate risk, preferring instead either very easy and safe undertakings
or extremely difficult and speculative ones.
Also, though no empirical data was made available by him, Mancuso (1975) said
that there are three levels of risk preferences - low, intermediate or moderate risk
preference. Although previous research have not specifically compared risk taking
propensity of individuals who decided to start business ventures of their own, with that of
individual not so inclined (Brockhaus, 1980), research conducted by Meyer, Walker and
Litwin (1961) found that managers selected to represent the entrepreneurial role show
greater preferences for intermediate risks on a risk preferences questionnaire than did
specialist of comparable age, education and job level. It is notable however that Mill
(1848) had included risk bearing as major distinguishing characteristics between the
functions of a manager and those of an entrepreneur.
Wallach and Kogan (1959, 1961) in studies of risk preferences in everyday life
developed choice dilemmas questionnaire (CDQ) based on 12 hypothetical choice
situations. Items require the respondent to choose between a safe alternative and a more
attractive but risky one. Also, the respondent is asked to indicate the probability of
success sufficient for him to select the risky alternative.
This measure was adopted by Brockhaus (1980) in a study using three group of
participants composing of (1) individual who had ceased to work for their employees and
now own and manage their own business. (2) One group of managers had recently
changed organisations while (3) the other had only changed positions within an
organization. A total of 158 questionnaires were administered to entrepreneurs previously
invited to a meeting and those who could not attend had their questionnaires mailed. Of
these, 131 were usable. The managers in group (1) had 106 questionnaires of which 35
were usable while those in group (2) who had joined a new organization had 36 usable
questionnaires turned in. The last group returned 28 usable questionnaires.
The null hypothesis for the study is; that individuals who have ceased working for
their employers and now own as well as manage business ventures, will have the same
risk-taking propensity as will; (a) individuals who have ceased working for their
employers and now are managers for different employers (b) individuals who have
assumed new managerial positions with the same firms with which they have been
associated for a year or more. Mean CDQ score for entrepreneurs was 71, while the
transferred managers’ mean was 72.52 and promoted managers’ mean score was 66.97.
This mean difference on subjection to analysis of variance test was found to be
statistically significant. Meaning that risk taking propensity of entrepreneurs does not
differ significantly from the other group of managers. The study does not support
theoretical position that entrepreneurs are more moderate risk takers. It could however be

Scottish Journal of Arts, Social Sciences and Scientific Studies - ISSN 2047-1278
http://scottishjournal.co.uk
190
argued that both managers and entrepreneurs are more moderate risk takers since in
Wallach and Kogan’s data, scores of respondent were clustered around the means. Earlier
study of Mancuso (1975) had however indicated moderate risk taking behaviour for
entrepreneurs. The reviewed study also showed that 64% of the entrepreneurs have a
propensity for moderate level of risk.
Another, more recent, study by Stewart and Roth (2001) did a meta-analytical
review of risk taking propensities of entrepreneurs and managers and found conflicting
report. In the first instance, there was a definitional dilemma. For instance, given that
entrepreneurs are individuals who independently owns and actively manage a business
(Carland, Hoy, Boulton and Carland, 1984), are entrepreneurs who focus on profit and
those focusing on growth different, especially in terms of risk propensity? Apart from
small samples (Greenberger and Sexton, 1988), there is also noted discord concerning
entrepreneurial risk propensity (Kogan and Wallach, 1961, Jackson, 1976).
A view of Stewart and Roth’s findings produced mixed results. While Brockhaus
(1980), Ray (1982), Master and Meier (1988), Richard (1989) and Patich and Bagby
(1995) found no significant difference in risk propensity of entrepreneurs and managers,
Sexton and Bousman (1983), Begley and Boyd (1987), Carland and Carland (1991),
Carland Ill, Carland and Pearce (1995), Seth and Sen (1995) and Stewart, Walton and
Carland and Carland (1999) found significant difference. Stewart and Roth considered
that there is a difference between managers and entrepreneurs in risk propensities and that
the significance of the difference depends on ones definition of entrepreneurs. Assuming
that the term entrepreneurs include owners with variation in goals for the business, the
meta-analysis indicates that entrepreneurs have somewhat higher risk propensity than
managers. If focus is on entrepreneurs with growth aspirations versus managers, the
difference in risk propensity becomes very large indeed. Small samples measurement and
conceptualization were noted limitations of research in this field. Also much concern had
been shown to difference in gender which often is little considered except for Carland et
al (1991).
Risk Propensity.
Liles (1974) discussed what he observed from a new venture. He argued that in
becoming an entrepreneur an individual risks financial well-being, career opportunity,
family relations and psychological well-being. Propensity for risk taking according to
Brockhaus (1980) is explained as the probability of receiving the rewards associated with
success of a proposed situation, which is required by an individual before he is subjected
to the consequences associated with failure, the alternative situation providing less
reward as well as less severe consequences than the proposed situation. The entrepreneur
is faced with this type of situation before he establishes a new business venture for which
he is totally responsible for either its failure or its success. His skill and level of control of
event surrounding the business environment is of primary importance. McClelland (1961)
has however stated that the different situations in which an individual’s degree of control
or skill is most important are moderately risky situations rather than very risky or very
certain ones.

Scottish Journal of Arts, Social Sciences and Scientific Studies - ISSN 2047-1278
http://scottishjournal.co.uk
191
Methodology
Research setting and sample characteristics Setting.
Participants were drawn from two universities located in Lagos and Agowoye,
Ogun State, that is, Lagos State University (LASU) and Olabisi Onabanjo University
(OOU). The two institutions were visited while in session. Students at 300 and 400 levels
of academic career were considered as appropriate sample. This is because attributes and
abilities are to be measured and educational level cannot possibly contaminate the
outcome of study
Sampling and Sample Characteristics.
Participants in the main study were 668 students (M = 312, F = 356) drawn from
two Nigerian Universities in the Western part of the country. 334 students were sampled
from each of the Universities. By selecting university students, the moderating role of
intelligence as well as age, was controlled for. Age of participants range between 18 and
27 years and the average age is 21years.
Data collection instruments
Risk Propensity Scale (SRP). Risk Propensity was assessed using the Risk
Propensity Scale (SRP) by Brockaus (1980). It is a 31 item scale constructed in the Likert
format ranging from Strongly Disagree A=1 to Strongly Agree E=5. The scale has
reported reliabilities of .07. In the pilot study, the scale was found to have reliabilities as
follows; Alpha= .79 and standardized item alpha= .80. Further exploration shows
Guttman split half .71. (Alpha part1= .57, part 2=.76. Equal-length Spearman Brown .72
and unequal-length .72
The entrepreneurial Ability Scale (EAS) is self-constructed by loading items on
those indicant entrepreneurial attributes earlier identified. It is a multidimensional scale
set in the Likert format and designed to yield quantitative scores useful for statistical
analysis. A 42-item scale was derived as explained in table 4.1 below in such a way that
the domains of entrepreneurship attributes are adequately sampled.
Scoring of Scales.
Two scales were used in all. These were scored as follows:
i. EAS. The options range from A-F; A=5, B=4, C=3, D=2, E=1 and F=0 i.e. from
‘statement applies in every instance’ to ‘statement does not apply at all’. All the 42 items
were scored in the same direction.
ii. SRP. The options range from A-E i.e. from ‘strongly disagree’ to ‘strongly
agree’; A=1, B=2, C=3, D=4 and E=5. Items 4,11,17,18 and 19 were reverse scored.
Research Design.
The study employs non-experimental survey design, using Ex-post-Facto and
correlational techniques. Statistical designs used includes: correlations and factorial
designs.
Study procedures.
In deciding on choice of University, the list of State Universities in the Western
states of Nigeria were made and two - Lagos State University (LASU), Ojo and Olabisi
Onabanjo University (OOU), Agowoye - were randomly selected. Since course of study

Scottish Journal of Arts, Social Sciences and Scientific Studies - ISSN 2047-1278
http://scottishjournal.co.uk
192
could have moderating role on the variables under study, it was decided that participants
will be those pursuing similar course of study in either the social or management
sciences. Using random selection, two courses; Industrial Relations and Personnel
Management and Psychology were selected. At the time of collecting the data only a
handful of students were on enrolment in the Psychology programme at The Lagos State
University. It was decided that students studying Industrial Relations and Personnel
Management which exist in good numbers in both Universities be sampled. Finally
participants were drawn using the simple random sampling technique. The sampled
population was stratified into male and female. Though unintended, it turned out that
equal number of males and females, that is, 344, took part in completing the scales from
both Universities.
Data Analyses.
Responses to the instruments were entered into the Statistical Package for the
Social Sciences (SPSS) software, version 13, after they were appropriately coded and the
various analyses; correlation and factorial analyses were carried out.
Presentation of results of study.
The Pearson Product Moment correlation index between entrepreneurial abilities
and risk propensity was - 0.23, significant at p < 0.01, critical r =
The results obtained are presented in tables 1 and 2 as descriptive and inferential
statististics.
Table1: Mean and standard deviation of scores on entrepreneurial abilities scale of
male/female low and high risk takers
Respondent at 2 levels of sex and risk propensity Mean Std. deviation N
Male Low
High
Total
127.12
121.77
124.46
19.27
18.72
19.15
156
154
310
Female Low
High
Total
126.15
116.95
122.65
16.83
17.57
17.67
222
136
358
Total Low
High
Total
126.55
119.51
123.49
17.86
18.32
18.38
378
290
668
There are, from table 1, noticeable mean differences in entrepreneurial abilities of
the studied low and high risk groups of students. How statistically significant, with
respect to stated hypotheses, are the observed differences? Table 2 shows the factorial
analysis of observed mean differences in risk propensity of male and female
undergraduates.

Scottish Journal of Arts, Social Sciences and Scientific Studies - ISSN 2047-1278
http://scottishjournal.co.uk
193
Table 2: A 2x2 Analysis of variance of mean differences between 2 levels of gender and
risk propensity
Source Sum of squares df Mean
square
F Comment
Corrected model
Intercept
Sex
Risk Propensity
Sex*Risk Propensity
Error
Total
Corrected total
9896.70
9775093.79
1351.30
8548.91
598.92
215446.24
10412364.00
225342.95
3
1
1
1
1
664
668
667
3298.90
9775093.79
1351.30
8548.91
598.92
324.47
10.17
30126.60
4.16*
26.35**
1.84
Significant
Significant
Significant
Significant
Not Significant
*Significant at P< 0.05 df = 1/664, Critical F = 3.84
**Significant at P< 0.01
Discussion
It is noteworthy that the direction of relationship is negative for risk propensity.
This appears to suggest that low rather than high risk propensity is important in
entrepreneurship. According to Mancuso (1975), there are three risk preferences - low,
intermediate or moderate risk takers and high risk takers. The current finding is in line
with the view that entrepreneurs according to Sexton and Brown (1985) are moderate risk
takers. This view is also supported by Petrakis (2005). Common belief tends to portray
entrepreneur as high risk takers. Also Bewley (1989) had proposed that uncertainty
construct, rather than risk, appears more related to entrepreneurship. This is because
innovation lies at the core of entrepreneurial activity. Entrepreneurs faced technical,
demand and competitive uncertainties. In the real sense, risk taking propensity refers to
probability that an individual will exhibit risk taking or risk avoidance behaviour when
confronted with risky situation. One can infer from the outcome of this study and in line
with (Cromie, 2000; Teoh and Foo,1997) that risk and uncertainty are elements of the
entrepreneurial behaviours. The degree of risk propensity however needs further
investigation. The work of Forlani and Mullins (2000) showed that the risk reflects the
degree of uncertainty and potential loss associated with outcomes which may follow a
given behaviour or set of behaviours. The basic element of risk according to Yates and
Stone (1992) are the potential loss and the significance of those losses. When
extrapolated to the concern of would be entrepreneur, significance loss of income may
result in starting business of one’s’ own when compared to seek employment option. The
potential loss is however mitigated by unemployment. This means that in reality, there is
income loss in the long period of search for the non-existing jobs. Viewed in that way,
risk perception is moderated by lack of viable alternative to entrepreneurship. The
predictive ability of high risk propensity is however questionable (Cherry and Fraedrich,
2002). Equally, if risk taking will be predictive of entrepreneurship several factors should
be put into consideration such as, (1) General environmental changes e.g. in regulation
and technology (Cooper and Schendel, 1976); (2) Industry characteristics e.g. number of
competitors (Bain, 1968), (3) Number of supplier and customers (Porter, 1980), (4)
Mobility barriers (Fox, 1973), (5) Project characteristics e.g. inter cycle and pay back

Scottish Journal of Arts, Social Sciences and Scientific Studies - ISSN 2047-1278
http://scottishjournal.co.uk
194
minimal project size (Bearer, Kettler and Scholes, 1970), (6) Risk return profitability
(Markowitz, 1952) (7) Characteristic of decision makers such as age, experience and
knowledge, (8) Characteristics of the problem under consideration-complexity ambiguity,
controllability (Vlek and Stallen, 1980), (9) Probability of loss (Slovic, 1967) and (10)
Problem framing (Tversky and kahnemani, 1981).
Risk propensity affects, as it is, the way entrepreneurs decide to finance their
ventures, how they evaluate the origin of their sources of funds, how long the required the
decision about required payback period might be and finally decision about project size.
Entrepreneurs’ nominal risk propensity is also influenced by two other important traits;
their tendencies towards independence and their need for achievement (Petrakis, 2005).
Will high risk takers differ in entrepreneurial ability? The second hypothesis in this study
addressed this question. Factorial analysis showed that observed mean differences
between high and low risk takers produce statistically significant difference. Contrary to
expectation, low risk takers are higher on entrepreneurial ability as indicated by the mean
scores. On the surface, this result is puzzling. When juxtaposed with the negative
correlation between risk propensity and entrepreneurship light is thrown on this outcome.
As the study of Mancuso (1975) earlier showed, only moderate risk is involved in
entrepreneurship. The current result may however need further investigation. Why will
the group lower in risk propensity display higher entrepreneurial ability? Since earlier
studies have concentrated on difference between managers and entrepreneurs (brokhaus,
1980; Ray, 1982; Sexton and Bronwn, 1983; Carland and Carland, 1991, and Stewart,
Walton, Carland and Carland, 1999), more studies will be needed to explore differences
among individuals of differing degrees of risk propensity.
Conclusion. The study shows that hypothesized relationship between risk
propensity and entrepreneurial ability need further study, exploration and explanation.
That low risk takers indicated higher entrepreneurial abilities presents out of tune with
popular belief to the contrary. Also that male and female did not differ in entrepreneurial
abilities may confirm the preponderance of females in self-employment activities
especially in the growing informal sector of the Nigerian economy. It will appear that
capital mediation, sociological factors, especially role aspiration of females, historical
and other factors rather than ability may be the likely explanation for more men as
entrepreneurs in Nigeria as well as most economies.
Suggestion for future studies
Much research work is required to understand issues that are militating against
entrepreneurship in Nigeria. Other personality variables like motivation,
creativity/problem-solving, tolerance of ambiguity, Locus of control and achievement
motivation need to be examined on their influence on entrepreneurial ability, behaviour
and success and failures of enterprises. Studies of sociodemographic variables like age,
education, work history and the role of technology and support systems in fostering
entrepreneurial culture are equally required (Allen, 2006; Hisrich, and Peters, 2002).

Scottish Journal of Arts, Social Sciences and Scientific Studies - ISSN 2047-1278
http://scottishjournal.co.uk
195
References
Ahmed, S.U. (1985) ‘’nAch, risk-taking, locus of control and entrepreneurship’’.
Personality and Individual differences 6, 781-782.
Ajzen, I. (2002) “Perceived behavioural control, self-efficacy, locus of control
and the theory of planned behaviour”. Journal of applied Psychology, 32 (4), 665-
683
Ajzen, I. (1988) Attitudes, Personality and Behaviour. Chicago, IL: Dorsey Press.
Allen, K. R. (2006) Launching new ventures; an entrepreneurial approach.
Boston: Houghton MifflinCompany
Alstede, J. W. (2002) “On becoming an entrepreneur: an evolving typology”.
International Journal of Entrepreneurial behaviour and research, 8 (4), 222-234
Amit, R., Glosten, L. and Muller, E. (1990a). ‘’Entrepreneurial ability, venture
investments and risk sharing’’. Management Science, 36, 10
Anastasi, A. (1982) Psychometric Testing (5th
Ed.). New York: MacMillan
Atkinson, J. W. (1957) “Motivational determinant of risk taking behaviour”.
Psychological Review, 64, 357-372
Awodun, M. (2005) “A process Approach Towards Defining Entrepreneurship”.
Lagos Organisation Review, 1, 118-120,
Baron, R.A. (2000b) Psychological perspectives on Entrepreneurship: Cognitive
and social factors in entrepreneurs’ success. Current Directions in psychological
science, 9 15-18.
Baron, R.A. (1999). Perceptions of entrepreneurs. Evidence for a positive
stereotype. Unpublished manuscript, Reuscelaer Polytechnic Institute. In R.A
Baron, G.D. Markman and A. Hirsa perceptions of women and men as
Entrepreneurs. Evidence for differential Effects of Attributional Augmenting.
Journal of Applied psychology, 86 (5) 923-929.
Baron, R.A., Markman, G.D. and Hirsa, A. (2001) “Perceptions of women
and men as Entrepreneurs: Evidence for Differential Effects of
attributional Augmenting” Journal of Applied psychology, 86 (5) 923- 929.
Barrick, M. and Mount, M. (1991) “The Big Eve personality dimensions and job
performance. A meta-analysis”. Personnel psychology, 44 1-26.
Brockhaus, R.H. (1980) “Risk Taking propensity of Entrepreneurs”.
Academy of journal, 23 (3) 509-520.

Scottish Journal of Arts, Social Sciences and Scientific Studies - ISSN 2047-1278
http://scottishjournal.co.uk
196
Brockaus, R. H. Sr. and Horwitz, P.S. (1985) “The psychology of the
entrepreneur’’. The Art and Science of Entrepreneurship. Cambridge, Mass.:
Barlinger, 25-48
Busenitz, L.W. (1999) “Entrepreneurial risk and strategic decision making, it’s a
matter of Perspective”. The Journal of Applied Behaviourial Science, 35 (3) 325-
341
Carland J.C. & Carland J.W. (1991). An empirical investigation into distinction
between male and female entrepreneurs and managers. Risk propensity
differences between Entrepreneur and Mangers: A meter Analytic Review.
Journal of Applied psychology, 86 (1) 145-153.
Collins, D.F. and Moore, D.G.L. (1964) The enterprising man. In R.H.
Brauckhaus (1980) Risk propensity of Entrepreneurs. Academy of Management
Journal, 23 (3), 509-520.
Cromie, S. (2000) “Assessing entrepreneurial inclinations: some approaches
empirical evidence”. European Journal of work and Organisational Psychology,
9 (1), 7-30
Drucker, P (1985) Innovation and Entrepreneurship. New York: Harper & Row
Entrialgo, M., Fernandez, E. and Vazquez, C. (2000) “Characteristics of managers
as determinants of entrepreneurial orientation: some Spanish evidence”.
Enterprise and Innovation Management Studies, 1 (2), 187-205
Eysench, H.J. (1972). Encyclopedia of psychology, London: Search Press.
Heilman, M.E. (1983). Sex bias in work settings: The lack of fit model. B.M.
Staw and L.I. Cummings (Eds.), Research in Organization behaviour,5 269-298.
Greenwich, CT: JAI Press.
Hosada, M. and Stone, D.L; (in press). Current gender stereotypes and their
evaluative content. Perception and Motor Skills. In R.A. Baron, G.D. Markman
and A. Hirza, perceptions of women and men as Entrepreneurs: Evidence for
Differential Effects of Attributional Augmenting. Journal of Applied
Psychological, 86(5) 923-929.
Jackson, D.N. (1976). Personality Inventory Manual, Goshen, N.Y. Research
Psychologists Press. In W.H. Stewart and P.L. Roth. Risk propensity: Differences
between Entrepreneurs and Managers: A meta- Analytic Review. Journal of
psychology, 86 (1), 145-153.
Jayeoba, F. I. and Asokere, A. S. (2010) ‘The Entrepreneur: Attributes and
motivations’. Proceedings of African Regional Conference on Sustainable
Development. 4(8) 14-18

Scottish Journal of Arts, Social Sciences and Scientific Studies - ISSN 2047-1278
http://scottishjournal.co.uk
197
Jayeoba, F. I. and Aremo, M. (2010) ‘Modeling Entrepreneurship’. In K. Subair
Perspectives of Entrepreneurship and Economic Development in Nigeria. Ilorin:
Olad Publishers Nigeria Limited
Knight, F. (1921) Risk, Uncertainty and Profit. Boston, Mass.: Houghton Mifflin
Kogan, N. and Wallach, M.A. (1964) Risk taking. New York: Holt, Rinehart’s &
Winston.
Littunen, H. (2000) “Entrepreneurship and the characteristics of the
entrepreneurial personality”. International Journal of Entrepreneurial Behaviour, 6
(6), 295-309
Long, W. (1983) “The meaning of entrepreneurship” American Journal of Small
Business 8(2) pp 47-58.
Low, M. B. and MacMillan, I. C. (1988) ‘’Entrepreneurship; Past research and
future challenges’’. Journal of Management, 14 (2) 139-161.
Lumpkin, G. T. (2007) The Psychology of Entrepreneurship. Lawrence Erlbaum
Associates, Mahwah, NJ: SIOP Organisational Frontiers Series.
McClelland, D.C. (1967) The Achieving Society. New York: Free Press
McClelland, D.C. (1965) N-Achievement and Entrepreneurship: A longitudinal
study. Journal of personality and social psychology, 1(4), 389-392.
McClelland, D.C. (1962) “Business Drive and National Achievement.” Harvard
Business Review. New York: Free Press.
McClelland, D.C. (1961) The Achieving Society. Princeton NJ: Van Nostrand.
Meyer, H.H., Walker., W.B., and Litwin, G.H. (1961) Motive patterns and risk
preferences associated with entrepreneurship. Journal of Abnormal and Social
Psychology. 63, 570-574.
Naldi, L, Nordquist, M., Sjoberg, K. and Miklund, J. (2007) “Entrepreneurial
Orientation Risk taking and performance in Family Forms”. Family Business
Review, 20 (1) 33-48
Norton, W. I. and Moore, W. T. ( 2002) “Entrepreneurial risk: Have we been
asking the wrong question?” Small economics, 18 (4), 281-287
Palich, L.E. and Bagley, D.R. (1995). Using cognitive theory to explain
entrepreneurial risk taking challenging conventional wisdom. Journal of Business
Venturing, 10, 425-438.

Scottish Journal of Arts, Social Sciences and Scientific Studies - ISSN 2047-1278
http://scottishjournal.co.uk
198
Petrakis, P. E. (2005) Risk Perception, Risk Propensity and Entrepreneurial
Behaviour: The Greek case. Journal of American Academy of Business, 7 (1)
233-243
Ray, D.M (1982). “An empirical examination of the characteristics and attribute
of entrepreneurs, franchise owners and managers engaged in retail ventures”. In
W.H. Stewart and P.L. Roth: Risk propensity differences between entrepreneurs
and managers? A Meta-Analytic Review. Journal of Applied Psychology, 86 (1)
145-153
Richard, J. C. (1989). “A comparison of the social characteristics, personalities
and managerial style of managers and entrepreneurs”. Unpublished doctoral
dissertation, University of Windsor, Canada, In W.H Stewart and P. L. Roth: Risk
propensity differences between entrepreneurs and managers? A Meta-Analytic
Review. Journal of Applied Psychology, 86 (1) 145-153
Robbins, S. P. (2001) Organisational Behaviour. New Delhi: Prentice-Hall of
India private Ltd.
Ruble, T. L, Cohen, R. and Ruble, D.M (1984) “Stereotype: Occupational barriers
for woman”. American Behavioural Scientist, 27, 339 -356,
Schumpeter J. A. (1954) Ed. “History of Economic Analysis. In Brockhaus, R. H.
“Risk Taking propensity of entrepreneurs Academy of management Journal, 23
(23), 509-520.
Seth, S and Sen, A. (1995) “Behavioural characteristics of woman entrepreneurs
executives vis-à-vis their male counterparts: An empirical study”. Social Science
International, 11, 18-33
Sexton, D. L and Bowman, N.B (1985) ‘’The entrepreneur: A capable executive
and more’’. Journal of Business Venturing, I (1), 129-140
Sexton, D. L and Bowman, N.B (1983). “Comparative entrepreneurship
characteristics of student: preliminary results”. In J. Hornaday, J. Timmons and K
Vesper (Eds.), Frontiers of entrepreneurship research, 213-225. Wellesley, MA:
Babson College.
Shapero and Sokol (1982) ‘’The social dimension of entrepreneurship’’.
Encyclopedia of Entrepreneurship. Englewood Cliffs, N. J.: Prentice-Hall.
Stewart, W.H. and Roth, P.L. (2001). Risk Propensity Differences between
Entrepreneurs and Mangers: A meta- Analytic Review. Journal of Applied
Psychology. 86 (1), 145-153.
Teoh, H. Y. and Foo, S. L. (1997) “Moderating effects of tolerance for ambiguity
and risk propensity on the role conflict-perceived performance relationship:

Scottish Journal of Arts, Social Sciences and Scientific Studies - ISSN 2047-1278
http://scottishjournal.co.uk
199
evidence from Singaporean entrepreneurs”. Journal of Business Venturing, 12,
67-81
Wallach, M.A. & Kogan, N. (1959). Sex differences and judgment processes.
Journal of personality, 27, 555- 564.
Wallach, M.A., & Kogan, N. (1961). Aspect of judgement and decision-making,
interrelationships and changes with age: Behavioural science 6, 23-36.
Webbler’s Third New International Dictionary. Unabridged Chicago: Merriam
Co.
Wolleat, P.L. (1980) Sex Differences in High School Student causal attributions
and performance in Mathematics. Journal of Mathematics Education, 11, 356-366.
Yalan, S. and Kapu, H. (2008) “Entrepreneurial Dimension in Transitional
Economics: A renew of relevant literature and the case of Kyrgyzstan”. Formal of
Developmental Entrepreneurship, 13 (2) 185-205

Scottish Journal of Arts, Social Sciences and Scientific Studies - ISSN 2047-1278
http://scottishjournal.co.uk
200
The Economic Cost of Fiscal
Centralization on the Growth of the
Nigerian Economy
Abachi Terhemen Philip. PhD
Department of Economics,
Benue State University, Makurdi, Nigeria
Email: [email protected]
Abstract
Fiscal centralization in Nigeria has generated regional, vertical and horizontal
contestations over resource control issues. These contestations have led to militancy and
open rebellion that have resulted in oil production shut- in, rising costs of operations in
the oil industry, risks and uncertainties for investments and a rise in the cost of
maintaining security in Nigeria. This study measures the economic cost of fiscal
centralization in the light of the consequences of the militancy and rebellion that have
been associated with it. Impacts such as production shut-in, rise in operational costs and
uncertainties as well as growth in cost of maintaining security have led to some economic
effects that need to be measured and analyzed. The study develops a framework and
measures the costs of fiscal centralization in Nigeria. Findings from the study revealed
that the oil related cost, expenditure allocation cost and social/human cost of fiscal
centralization in the country are very high and rising. Based on these results, we
recommend (i) a negotiated decentralization and (ii) economic and political actions that
will completely eliminate militancy and its associated economic costs.
Keywords: Fiscal centralization, fiscal decentralization, militancy, costs, Niger Delta,
Nigeria

Scottish Journal of Arts, Social Sciences and Scientific Studies - ISSN 2047-1278
http://scottishjournal.co.uk
201
Introduction
The present fiscal structure in Nigeria consists of 36 states, the Federal capital
Territory (FCT) and 774 local government areas and the fiscal matters are centralized.
The fiscal centralization of the Nigerian state is established from the institutional
framework for fiscal federalism in Nigeria. The constitutional provisions on the
assignment of responsibilities among the three tiers of government clearly show a
deliberate concentration of powers at the central government. The intergovernmental
fiscal relations in Nigeria also exhibit fiscal centralization in tax assignment and revenue
sharing arrangements. Regarding tax assignment, the major revenue heads in the country,
including custom duties, mining rents and royalties, petroleum profit tax and company
income tax, all of which account for over 80 per cent of total national recurrent revenues,
fall under the legislative and administrative jurisdiction of the federal government, while
the less productive and less buoyant sources are devolved to the fiscal jurisdiction of
states and local governments.
The rates and principles used for vertical and horizontal revenue sharing are
usually from the recommendations of ad hoc committees or commissions formed at
particular periods. The rates and principles were often amended by the use of Decrees and
annual budget pronouncements by the governments in power. All the revenue sharing
rates used, from Philipson Commission in 1946 through to the present, favour the federal
government more than lower levels of governments. The principles for horizontal
revenue sharing among the states too tend to favour some states more than others.
The present fiscal centralized system has therefore generated severe contestations
in Nigeria. The key players in the agitations and conflicts, who also have varied interests,
are;
i) The Federal Government, the 36 States of the Federation and the Federal
Capital Territory (FCT) and the 774 Local Government Areas.
ii) The Federal Government, the oil producing states (Niger Delta region)
and the non-oil producing states.
iii) The Federal Government, oil producing states, communities in Niger
Delta region and the multinational oil companies.
The central issue of concern that generates the contestations is the quest for
‘resource control’. Among the levels of governments, the disagreement is over the rates
of revenue allocation, and among the states, the contentions are over the principles used
in sharing the states allocations. For the third category, the agitation revolves around
issues of oil rents, compensation and provision of infrastructure, claims to ownership of
oil fields, environmental degradation and profit maximization. With oil being strategic as
the anchor for Nigeria’s fiscal system and as the main source of foreign exchange inflow,
contestations that might impact negatively on oil revenue due to fiscal centralization
would definitely have severe cost on the Nigerian economy.
Particularly from 1999, the contestations linked to fiscal centralization
degenerated to militancy and rebellion. The militancy and rebellion have involved; (i)
damages to oil facilities leading to production shut-in; (ii) kidnapping and loss of lives
that have increased uncertainties and risks for investment in Oil and Gas Sub-sector (iii)
rising cost of operations; and (iv) growing costs of maintaining security in the Niger

Scottish Journal of Arts, Social Sciences and Scientific Studies - ISSN 2047-1278
http://scottishjournal.co.uk
202
Delta Region which may crowd-out spending on agriculture, education, health and
economic infrastructure. These developments suggest that net economic cost of fiscal
centralization in Nigeria is positive and increasing.
The sustained struggles among the key players, especially the communities in
the Niger Delta Region resulted to rebellion and open conflicts. Initially, these
communities formed themselves into non-violent groups, agitating for the development
of the region but the formations gradually transformed into militant groups. Some of the
groups include the Movement for the Survival of Ogoni People (MOSOP), the Ijaw
Youth Council (IYC), the Movement for the Survival of Ijaw in the Niger Delta
(MOSIEND), the Environmental Right Action (ERA), the Pan-Niger Delta Resistance
Movement, the Movement for Reparation to Ogbia (MORETO) etc. Over the years, the
activities of these movements have changed from their conceived peaceful formation to
violent ones.
Before the Amnesty Programme of Late President Musa Ya’adua, if the
communities in the Niger Delta were not in conflict with the multinational oil
companies over land rights or compensation for environmental degradation, they were
in dispute with the government over oil wealth and resource control or they were in
conflict with one another over claims to ownership of oil fields. Therefore, the situation
in the region was not whether there was trouble, but it was a question of when and
where (Garba, 2004). The amnesty programme indeed brought some relative peace in
the region in particular and the country at large, but the truth however is that fiscal
centralization, which resulted to militancy, had severe costs on the Nigerian economy.
The question then is, how are these cost measured and analyzed? This is the question
the study is set to find answers to.
Theoretical Framework
The discussion in this section specifically centers on fiscal decentralization and
fiscal centralization in relation to economic growth. Following Markus, (2004) and
Susan, (2006), we examine the dimension and the potential impact of fiscal centralization
and fiscal decentralization on economic growth. The theoretical overview tries in
particular to depict precisely the various channels through which fiscal centralization and
fiscal decentralization influence economic growth. The theoretical justification of fiscal
centralization is based the following arguments:
External Effects and Economies of scale
The realization of economies of scale and the internalization of external effects
are often considered the main factors for fiscal centralization, especially with respect to
the central provision of public goods where average costs can be reduced with increasing
output (Ola, 2001, and Parker and Judith, 2006). From empirical investigation, this
position does not have a unanimous acceptance among researchers. Samekal, (2001)
argues that, for the decreasing costs reason, fiscal centralization recommendation is not
tenable because the information costs for the local citizens, the control costs for the
central level and lack of accommodativeness would rather increase the overall costs. In
terms of internalization of externalities, central government deals with inter-jurisdictional
externalities (pollution abatement) and regulates natural monopolies based on national
networks, while local levels tend to control activities that have a regional limited impact
(Hemming and Spahn, 1997). Hooghe and Marks (2001) argues further that, externalities
arising from the provision of public goods too vary immensely. So, in order to internalize

Scottish Journal of Arts, Social Sciences and Scientific Studies - ISSN 2047-1278
http://scottishjournal.co.uk
203
these multifaceted externalities, multilevel governance is needed. Based on the above
empirical findings therefore, the link between fiscal centralization and economic growth
depends on the nature of the economy, the type of externalities and the economies of
scale in question.
Markus (2004) argues that if externality effects are satisfactorily internalized
through fiscal centralization, structural imbalances within the economy will be reduced
and chances for faster economic growth can be enhanced. Also, cost reductions at the
sub-national levels should, ceteris paribus, allow for more growth enhancing investments.
The situation in Less Development Countries (LDCs) is different from the
relationship explained above. Given the structural fiscal imbalances in developing
economies and the difficulties involved in the implementation of effective coordination
within the economy, Markus (2004) argued further that the ‘imposition’1 of fiscal
decentralization would result to macroeconomic instability. The scenario would
eventually result to negative growth effects. This argument is depicted in Figure 1 below.
Figure 1: Stabilization Task, Co-ordination Problems
From Figure 1, fiscal adjustments are needed to eliminate structural imbalances
among different levels of governments, especially in developing economies. In reality,
fiscal matters usually show imbalances among the levels of governments in LDCs. In
Nigeria’s case, these issues are well documented2. Also fiscal adjustment is a
constitutional issue which is subject to serious debates. More so, the parties involved
usually take positions that are reluctant to shift grounds, so it becomes difficult to arrive
at a consensus on such issues. Hence, the needed fiscal adjustments are hardly met and
the imbalance among the levels of governments persists. Fiscal decentralization may
create perverse incentives and may even worsen structural imbalances. Supplemented by
the potential contribution of fiscal decentralisation to predatory and unpredictable
taxation, macroeconomic instability could arise. Accompanied by co-ordination
difficulties, considerable negative effects on growth could be the consequence.
1 By imposition of fiscal decentralization it means a situation where fiscal variables in LDCs are not fully
decentralized but policies are handled as if such fiscal matters are decentralized. 2 See Akpan H. Ekpo (1999), Abachi (2007),

Scottish Journal of Arts, Social Sciences and Scientific Studies - ISSN 2047-1278
http://scottishjournal.co.uk
204
Quality of Governance and Corruption The quality of governance and the level
of corruption under fiscal decentralization system would result to negative impact on
growth, particularly in developing economies. The discussion is based on the works of
Prud’homme (1994), Tanzi (1995) and Markus (2004) as depicted in Figure 2 below.
Figure 2: Quality of Governance and Corruption
They argument is that decentralization can increase disparities, jeopardizes
stability, undermine efficiency and encourage corruption. In terms of the quality of
governance, the central level attracts more qualified people because of better career
opportunities and salaries and would therefore achieve a higher quality of governance.
The lower levels on the other hand experience scarcity of qualified personnel and that
seriously impede decentralization efforts. As for corruption, they argued that local elites
(and indeed national politicians) usually get improved access to public resources via
decentralization, which eventually increase opportunities for corruption.
If fiscal centralization is in place, the qualified people would improve the quality
of governance and with less corruption in the system; economic growth will be the result.
However, the implementation of fiscal decentralisation leads, ceteris paribus, to a lower
quality of governance and/or to more corruption (Fisman and Gatti, 2000), what in turn
impedes proper economic growth.
On the other hand, many factors are advanced to support fiscal decentralisation as
being responsibility for economic growth. Some of these include the following:
Heterogeneous Preferences
The presence of heterogeneous preferences in a country is viewed by Oates
(1972) as a strong case for decentralization. His decentralization theorem justifies the
existence of different governments by demonstrating that given non-homogenous
preferences, the public goods supply should be diversified. The main assumption being
that the central government is unable to diversify its supply and there are no spillovers.
According to the correspondence principle, the jurisdiction determining the level of
provision of each public good should precisely include the set of individuals consuming
it. In other words, it asserts that each public good should be provided by the jurisdiction
that has control over the minimum geographic area that would internalize the benefits and
costs of each provision.
Markus (2004) believes that when population groups are smaller, the demands of
any randomly chosen household will be closer to the demand of the average household in
the group. Economic welfare will thus be improved, as the provision of services for each

Scottish Journal of Arts, Social Sciences and Scientific Studies - ISSN 2047-1278
http://scottishjournal.co.uk
205
group is closer to each member household’s optimum. Therefore, a uniform level of
public services offered in each community is inappropriate. “Pareto efficiency can be
raised through fiscal decentralization” (Thießen, 2000). Cremer, Estache and Seabright
(1994) put it that “each type of good should be provided by a level of government
enjoying a comparative advantage in accounting for the diversity of preferences in its
choice of service delivery.” To sum it up: a strong case in favour of decentralization can
be deduced from the consideration of the diversity of local preferences. However,
Hemming and Spahn (1997) and Ter-Minassian (1997) contended that it is unrealistic to
possess complete knowledge of the citizen’s tastes and “ the administrative weakness at
the sub-national level, especially the lack of modern and transparent public expenditure
management systems” could off- set the expected efficiency gain from decentralization
induced by heterogeneous preferences.
Figure 3: Decentralization Theorem
If decentralisation attempts are able to satisfy these different preferences, positive
economic growth effects may occur. Efficiency gains, the diminution of information,
transaction and control costs as well as the realization of comparative advantages may be
the source of these positive growth effects.
Inter-jurisdictional Competition
Inter-jurisdictional competition is another theoretical case for fiscal
decentralization. According to Markus (2004), the degree of mobility of regional
population, the regional propensity to innovate (approximated by the region’s share of
total patents issued within a country), the degree of inter-jurisdictional economic
integration, or the degree of openness (measured by the ratio of the trade volume to GDP)
would steer the competition.
With respect to trade and economic integration, empirical works provide diverse
suggestions. On the one hand, explaining the fact that small countries can prosper when
trade is liberal and markets are open, Alesina and Spolaore (2003) concluded that
economic integration and political disintegration go hand in hand. Hence, economic
integration is expected to increase fiscal and political autonomy. A positive impact of
economic integration on fiscal decentralisation should be the consequence. On the other
hand, Letelier (2003 ) argued that “trade oriented economies tend to concentrate a large
proportion of taxes on the hands of the central government through the collection of
import and/or export tariffs and other related duties”. Accordingly, a negative impact of
openness on fiscal decentralisation should be expected. Stegarescu (2003) tests the
hypothesis that by increasing the market size and the benefits of local provision of public
goods and taxes, economic integration could have triggered the recent process of
decentralisation. His results found for OECD countries are consistent with a strong
decentralising effect of economic integration as well as of trade openness.
The channels explaining the relation between inter-jurisdiction competition and
economic growth is hereby explained and illustrated.

Scottish Journal of Arts, Social Sciences and Scientific Studies - ISSN 2047-1278
http://scottishjournal.co.uk
206
Figure 4 : Productivity Enhancement Hypothesis
Decentralized government systems enforce competition between the different authorities
and strengthen political and organizational innovation. They can realize efficiency gains
by utilizing their comparative advantages and by dividing labour efforts corresponding to
the respective local resources (Markus, 2004, Raffaele and Emanuela, 2004; Susan,
2006). Positive economic growth effects can therefore be expected. In other words,
Figure 4 depicts the productivity enhancement hypothesis, which indicates that fiscal
decentralization enforces not only inter-jurisdictional competition but also the
accountability of Sub-national Governments (SNGs), what, in turn, gives more incentives
for product innovations of governments. Higher efficiency in the supply of public goods
enhances economic growth.
Leviathan Model
The Leviathan Model is also used to make a case for fiscal decentralization
(Brennan and Buchanan 1980). The leviathan based assumption contends that
decentralization limits the expansion of the central government’s structure and
competition between jurisdictions. In other words, the model posits that if taxes and
expenditures are greatly decentralized, total government’s intrusion into the economy,
ceteris paribus, should be smaller.
Figure 5: Leviathan Restraint Hypothesis
Figure 5 above illustrates the Leviathan-restraint-hypothesis. We start the
analysis with the works of political economists who consider the effects of inter-
jurisdictional competition and to check the relationship between a fragmented territorial
structure and the size of the public sector (Kirchgässner and Schaltegger, 2002): The
connection between government expenditures and revenues is strengthened by the
existence of a fragmented system, stricter budget discipline is effected and therefore a
diminution of the size of the public sector can be expected (Markus, 2004). Thus, an
oversupply of public goods and inefficiency in the public sector can be prevented
(Thießen, 2000). Fiscal decentralisation triggers inter-jurisdictional competition and
stricter budget discipline. Decreasing inefficiency is the consequence, having, in turn,
positive effects on economic growth.

Scottish Journal of Arts, Social Sciences and Scientific Studies - ISSN 2047-1278
http://scottishjournal.co.uk
207
These conclusions of political economists are based primarily on the “central
policy failure”-theorem: imperfect information, rent-seeking politicians as well as
lobbying-activities of interest groups characterize the Leviathan-behaviour, which leads
to a sub-optimal consideration of local preferences and hence to welfare losses. This
influence of vested interest can only be enforcement of the political responsibility of the
government, what, in turn, can be reached satisfactory through decentralization.
Figure 6: Dispersion of Vested Interests
Figure 6 show that fiscal decentralization diminishes the concentration of political
power at the central level. Vested interests can be weakened and democracy can be
augmented. The favourable effects from democracy on economic growth include
maintenance of the rule of law; free markets, small government consumption, and high
human capital.
Methodology
The methodology is conceptualized in order to achieve the main objective of
measuring and analyzing the cost of fiscal centralization in Nigeria. The various costs of
fiscal centralization to the country considered in the paper include the following: (i) the
cost of shut-in of oil production (ii) cost of damage to infrastructure (iii) the increase in
expenditure on defence and internal security (iv) damages during military attacks and
counter attacks (v) illegal oil bunkering (vi) loss of lives. For convenience, we group
these cost items into three broad categories. These are:
(i) Oil related costs. The costs elements under this group include the cost of
shut in of oil production, military damages and illegal oil bunkering.
(ii) The expenditure allocation costs are the expenditure on defence and internal
security and
(iii) Social/Human costs. The cost elements here include cost of damages to
infrastructure and loss of lives.
The total cost of the above listed cost items are presented algebraically as follows:
),,,,,( LOLBKNMDDEDICISfTC -------------------------------------------------1
Where,
CSI = Cost of shut in of oil production
DI = Replacement costs for damaged facilities
DE = Expenditure on defence and internal security
MD = Military damages
BKN = Illegal oil bunkering
LOL = Loss of lives
The conflicts in the Niger Delta Region were violent and took different forms and
dimensions. It was either the militants were at war with the government security agents,
or they were in contestations with the oil companies or the communities were at war

Scottish Journal of Arts, Social Sciences and Scientific Studies - ISSN 2047-1278
http://scottishjournal.co.uk
208
among themselves. In all these, massive destruction of lives and properties was usually
the end result. But since the exact number of people lost in such confrontations can not
be correctly ascertained and their monetary value can not be estimated, we exclude loss
of lives from equation 1
Therefore;
BKNMDDEDICSITC --------------------------------------------- 2
Each of these costs is measured and the monetary value indicated. Detail of how
the costs are measured is presented in Table 1, Appendix 1
Cost Analysis
We use the information from Table 1 to estimate the costs of fiscal centralization
in Nigeria. The listed cost items (except loss of lives and damaged facilities) are
estimated from 2001 to 2008.
Oil related costs
(i) Shut-in of oil production
Militants’ activities usually force oil companies to shut down production. That
started when the agitations in the Niger Delta took violent dimensions. So many instances
involving the amount of crude oil lost have been reported (Garba, 2004, Hassan, 2007,
Fagbadebo and Osaretin, 2010). A summary of shut in of oil production and the amount
of oil lost is presented in Table 2
Table 2: Shut in of oil production (2001 to 2008)
Year Incidence and Daily costs
1997 Shell Company declares majeure at Bonny Terminal due to local protests and
disrupted 210, 000 barrel of crude oil per day
2002 Chevron declares force majeure on its exports for 10 days due to protests and fire.
Between 300,000 and 400,000 barrels per day were halted. The cost is between
$0.076 billion and $0.10billion for 10 days.
Before the fire, about 110,000 barrels per day interrupted by protestors
2003 Chevron, Texaco, Royal Dutch/Shell, Total and Elf shut in operations due to
militancy. That affected 768,000 barrels per day in the Western Niger Delta and
50,000 barrels per day in the Eastern Niger Delta Source: Garba (2004), Table 2, indicates that the barrels of oil lost due to shut in of oil production kept
increasing as the activities of militants intensified. To obtain the trend of crude oil lost
from 2001 to 2008, we assume that the crude oil lost was 210,000 barrels per day from
2001 and 2002. From 2003 to 2008, we estimate the loss of crude oil due to shut in of oil
production to be 250, 000 barrels per day. Based on these estimates, we obtain a trend of
barrels of oil lost from shut in of oil production from 2001 to 2008 as shown in Table 3

Scottish Journal of Arts, Social Sciences and Scientific Studies - ISSN 2047-1278
http://scottishjournal.co.uk
209
Table 3: Estimated costs of shut in of oil production (2001 to 2008)
Year Estimated
loss of oil
per day
(barrels)
Annual
loss of oil
(barrels)
Oil Price
($/barrel) Annual
Cost
($’billion)
Exchange
Rate (N/$) Cost in
Naira
(N’billion)
2001 210,000 76,650,000 $ 24.5 $ 1.88 111.2312 209.1
2002 210,000 76,650,000 $ 25.4 $ 1.95 120.5782 235.1
2003 250,000 91,250,000 $ 29.1 $ 2.66 129.2224 343.7
2004 250,000 91,250,000 $ 38.7 $ 3.53 132.8880 469.1
2005 250,000 91,250,000 $ 57.6 $ 5.26 131.3000 690.6
2006 250,000 91,250,000 $ 42.8 $ 3.91 127.4000 498.1
2007 250,000 91,250,000 $ 41.5 $ 3.79 125.83 476.9
2008 250,000 91,250,000 $ 40.2 $ 3.67 126.50 464.3 Source: Computed by Author.
Given that there are 365 days in a year, we multiplied the estimated loss of barrels
of oil per day by the number of days to generate the series for annual loss of barrels of oil
from 2001 to 2008. Oil prices and exchange rates are obtained from CBN Statistical
Bulletins. By multiplying international oil prices by annual loss of barrels of oil, we
obtained the annual costs of shut in of oil production in Dollars. Again, by multiplying
the annual costs ($’billion) by their respective exchange rates (N/$), we obtained the
equivalent values in Naira for the respective years.
(ii). Illegal oil bunkering
Bunkering is the illegal siphoning of oil from oil pipes. Militancy in the Niger
Delta Region made illegal bunkering of oil to thrive and it became the key source of
founds for the militant groups. Several militant warlords have either publicly or privately
admitted involvementi. According to a report of the Brussels based International Crisis
Group, Nigeria losses anywhere from 70,000 to 300,000 barrels per day to illegal
bunkering, the equivalent output of a small oil producing country. In its annual report in
August 2006, Shell Nigeria estimated illegal bunkering losses at 40,000 to 60,000 in 2004
and from 20,000 to 40,000 barrels per day in 2005. These estimates and their financial
equivalent at the appropriate oil prices are presented in Table 4
Table 4: Illegal Oil Bunkering by Militants.
Year Estimated barrels
per day
Oil Price
($/barrel) Estimated costs per day
($billion) Estimated Annual
Costs ($billion) 2004 40,000 – 60, 000 $38.7 $0.00155 -$0.0023 $0.565 - $0.84
2005 20, 000 – 40, 000 $57.6 $0.0012 - $0.0023 $0.37 - $0.84
2006 70, 000 – 300, 000 $42.8 $0.0030 - $0.013 $1.095- $4.69 Source: Ogbadebo and Osaretin, 2009
From Table 4, the estimated annual costs resulting from bunkering increased from
$0.37 billion - $0.84 billion in 2005 to $1.095 billion- $4.69 billion in 2006. Taking the
average of the ranges from the estimated annual costs, we have $0.985, $0.61 and $2.89
for 2004, 2005 and 2006 respectively. We assume that bunkering activities were not so
severe from 2001 to 2003, so assigned annual costs of $ 0.5. From 2007 and 2008,
despite the intensity of the militia activities, we assume however that the 2006 value

Scottish Journal of Arts, Social Sciences and Scientific Studies - ISSN 2047-1278
http://scottishjournal.co.uk
210
prevailed in these years. We therefore obtain a series from 2001 to 2008 as presented in
Table 5
Table 5: Costs through illegal oil Bunkering
Year Annual Cost
($’billion) Exchange Rate
(N/$) Cost in Naira
(N’billion)
2001 $0.50 111.2312 55.6
2002 $ 0.50 120.5782 60.3
2003 $0.985 129.2224 127.3
2004 $0.61 132.8880 81.1
2005 $ 2.89 131.3000 379.5
2006 $ 2.89 127.4000 368.2
2007 $ 2.89 125.83 363.6
2008 $ 2.89 126.5 365.6 Source: Computed by Author
(iii). Military Damages
In Nigeria, all forms of violent protests are usually handled by the security agents.
In the Niger Delta too, military formations are usually directed to intervene in pretests
and agitations by the militants. Specifically, there was the crushing of Adaka Boro
rebellion in the 1960s, the Major Okutima Internal Security Task Force of the 1990s, the
Odi invasion of 1999, the Joint Task Force of 2003, the Operation Restore Hope, led by
Brigadier General Elias Zamani and the use of the Mobile Police Units of the Nigerian
Police at several instances to restore peace which often resort to destruction of properties
and killings.
Attacks by the Niger Delta militants on the oil industry as well as individuals both
Nigerians and expatriates, have been massive. The militant groups were fighting for a
greater share of the region’s oil wealth after the purported decades of neglect. From
January 2006 to August, 2007, there were 59 major attacks. In all those attacks, the Joint
Task Force intervened to combat the militants’ activities and the destruction was massive.
The confrontation between the militants and the government security agents led to a
minimum loss of 600, 000 barrels of crude oil per dayii, besides the destruction of
properties and lost of lives (Fagbadebo and Osaretin, 2010). That means there was a
minimum loss of $9.37 billion from January to December, 2006 and $6.02 billion from
January to August, 2007 and $9.15 billion in the whole of 2007.
This period was the period of intense, continuous and sustained fighting between
the militants and government security formations. Prior to 2006, there were cases of
military combats with the militias, but the cases were not as severe as the ones reported in
2006/2007. We therefore assume an annual cost of 1.5 US dollars from 2001 to 2003 and
1.8 US Dollars from 2004 to 2005. We also assume that there were no militants’ activities
that could warrant military intervention from September to December of 2007, so the cost
from January to August is maintained for 2007. Assuming again that the cost of military
damages in 2008 was 2.5 US Dollars and given the exchange rate of the Naira, the costs
from 2001 to 2008 are presented in Table 6.
The oil related costs are summarily presented in Table 7

Scottish Journal of Arts, Social Sciences and Scientific Studies - ISSN 2047-1278
http://scottishjournal.co.uk
211
Table 7: Summary of Oil Related Costs (N Billion)
Year Shut in of Oil
Production
Illegal Oil
Bunkering
Military
Damages
TOTAL
2001 209.1 55.6 166.8 431.5
2002 235.1 60.3 180.9 476.3
2003 343.7 127.3 193.8 664.8
2004 469.1 81.1 239.2 789.4
2005 690.6 379.5 236.3 1306.4
2006 498.1 368.2 1193.7 2060
2007 476.9 363.6 757.5 1598
2008 464.3 365.6 316.3 1146.2
TOTAL 3386.9 1801.2 3284.5 8472.6 Source: Compiled from Tables 3, 5 and 6
Table 7 shows the totals from costs of shut in of oil production, illegal oil
bunkering and military damages. As revealed from the table, the total costs of oil related
costs items from 2001 to 2008 is eight thousand, four hundred and seventy three billion
Naira. This is hug loss of revenue to the government.
Expenditure Allocation Cost
Records for this aspect of cost which concerns the expenditure on defence and
internal security are readily available in CBN Statistical bulletin. Evidence indicates that
from 1960 – 1967, there were provisions for defence and internal security, from 1968 –
1993, there was none. Within that period, the provision for internal security was made
under general administration. But from 1994 to date, within the period of intense
militancy in the Niger Delta region, adequate provisions were made for defence and
internal security. In other words, militancy makes the government to provide and spend
more money on defence and internal security. As expected, the expenses on defence and
internal security keep increasing as militancy in the Niger Delta Region keeps
intensifying.
The expenditure on defence and internal security increased steadily from 1994 to
1998. From 1999 to 2008 however, the increase was continuous and astronomical,
indicating the excessive expenditure allocated to maintain security in the country. It
suggests that if there were no militancy, the trend seen from 1994 to 1998 would have
continued to 2008. To obtain the excess expenditure allocated to combat militancy in the
Niger Delta Region, a univariate time series model for government expenditure on
security (GES) was usediii
. The actual series of the variable (GES) from 1980 to 1998
was used to forecast the trend values from 1999 to 2008. The difference between the
actual expenditure on defence and internal security and the trend from 1999 to 2008
represents the excess expenditure allocated to combat militancy. The result is presented in
Table 8.

Scottish Journal of Arts, Social Sciences and Scientific Studies - ISSN 2047-1278
http://scottishjournal.co.uk
212
Table 8: Expenditure Allocation Cost of Militancy
Years Actual Expenditure on
Defence and Internal
Security (GES)
(N’million)
Forecast Values of
Expenditure on GES
(N’ million)
Difference Between
the Actual and the
Forecast Expenditure
on GES (N’ million) 1999 96475.6 17631.29 78844.31
2000 74511.9 17687.32 56824.58
2001 107136.1 17732.51 89403.59
2002 164892 17768.96 147123
2003 138596.1 17798.36 120797.7
2004 195524.6 17822.07 177702.5
2005 195214.3 17841.2 177373.1
2006 185340.9 17856.63 167484.3
2007 241923.5 17869.07 224054.4
2008 206913.2 17879.11 189034.1 Source: Computed by Author
Social/Human Costs
(i) Cost of Damages to Infrastructures
In the course of fighting in the Niger Delta Region, many infrastructures were
destroyed. In 1990, a protest in Umuechem, east of Port Harcourt led to the police
destroying or badly damaging 495 houses. In March 2003, the militants were engaged in
fierce gun battles with the government security forces. The clashes saw several village
communities such as Okerenkoko, Ogbogbene, Benikrukru, Inikorogha, Oburu,
Kunukunama, Opuedebubo, Oporoza, Kokodiagbene, Tebujor and many more, invaded
by the military and many houses, and other properties were destroyed. Other items such
as vehicles, market stalls, electricity, etc were destroyed. The monetary value of replacing
such damages can not be estimated but it is important to acknowledge that such costs are
incurred.
(ii) Loss of Lives
As explained earlier, the incessant combats between the military formations and
the militants resulted to loss of lives. On October 30th
and 31st , 1990, a protest at Shell’s
facility at Umuechem, east of Port Harcourt led to the police killing some eighty unarmed
demonstrators. In 1992, at the insistent of Shell, some youth were killed in Bonny during
a peaceful demonstration against the activities of the oil company. In January 1993, about
300,000 Ogoni organized protestors protested against the activities of oil companies in
the area and their action was followed by repeated harassment, arrests, and killing of
Ogonis by the Federal government troops. On January 11, 1999, Ijaw women who were
engaged in a peaceful demonstration against the marginalization of their people in Port
Harcourt were violently tear-gassed, beaten, stripped, and detained by a combined team
of policemen and soldiers. Also, the Warri wars of 2003 were allegedly instigated by the
activities of some oil companies and Nigerian Naval officers and many people died in the
process. The exact number of people lost in the combat between the government security
agents and the militants can not be correctly ascertained and the monetary value may not
be estimated but it is a huge cost to the country that must be acknowledged.

Scottish Journal of Arts, Social Sciences and Scientific Studies - ISSN 2047-1278
http://scottishjournal.co.uk
213
Generally, if N8472.6 billion were not lost to militancy, the money accruable to the
levels of governments would have been much higher. They would have been able; ceteris
paribus to embark on growth oriented programmes at all levels of governments that
would have enhanced the growth of the Nigerian economy.
It is also noted that majority of the states in Nigeria can not survive without the
monthly support of the Federal Government exception of Lagos State in recent times.
Rather than develop locally based resources, the states now wait for the Federal
Government, in the name of allocations from oil revenue every month. It implies
therefore that fiscal centralization in Nigeria has stifled local initiatives. The whole
attention is on the federally collected revenue so much that efforts to develop solid
minerals at the states and federal levels are not accorded any priority. Other sources of
revenue are also not vigorously exploited. As Ajefia, (2007) rightly asked; what
happened to the groundnut pyramids, the cotton, the plywood, the rubber, the timber, the
cocoa and the palm oil/kernel which the governments of the former four regions
depended upon to fund their respective economic and infrastructure development
programmes before the advent of Oil?. It is clear therefore that the present fiscal
centralization has not only killed the initiatives to exploit new sources of revenue but has
also brought about a total neglect of former viable revenue sources.
Also, the system has promoted inefficiency and fostered a sense of over dependence
on the Federal Government. In fact, it has created a situation, a system or mechanism that
makes lower levels of governments depend on the sharing of federally collected revenue
every month. As states and local governments depend almost entirely on revenue sharing
without production and increased economic activity, economic development in the
country can not be assured. This system cannot be sustained, especially with the
increasing costs it generates in the Nigerian Economy.
Findings from the study generally revealed that the estimated oil related costs-
(costs of shut in of oil production, illegal oil bunkering, and military damages) from 2001
to 2008, sum up to about N8472.6 billion. The revenue allocated to defence and internal
security has been increasing, particularly from 1999 to combat militancy in the Niger
Delta Region, and damages to infrastructure and loss of lives constitute other devastating
cost to the Nigerian economy.
Conclusion and Recommendation
The thesis of the study was that the cost of maintaining fiscal centralization in
Nigeria is positive and increasing. The outcome of the study indicates that the costs
involved in maintaining fiscal centralization in Nigeria was indeed very high. The oil
related costs, expenditure allocation costs and social/human costs are all positive and
increasing.
Based on the conclusion drawn from the study, we recommend that the
government should evolve economic and political actions that will completely eliminate
militancy and all its associated costs. This may require constitutional changes to the
structure of the federalism and greater effectiveness and efficiency in the delivery of
public goods and services at all levels of governments. The aspect that requires further

Scottish Journal of Arts, Social Sciences and Scientific Studies - ISSN 2047-1278
http://scottishjournal.co.uk
214
study is the examination of the impact of these costs on the macroeconomic variables in
Nigeria or on the growth of the Nigerian economy.

Scottish Journal of Arts, Social Sciences and Scientific Studies - ISSN 2047-1278
http://scottishjournal.co.uk
215
References
Abachi P.T and I. Salamatu (2012) “An Analysis of the Effect of Fiscal
Decentralisation on Economic Growth in Nigeria” International Journal of
Humanities and Social Science Vol. 2 No. 8
Abachi P.T (2007) “Fiscal Federalism and Financial Imbalance among Tiers of
Governments in Nigeria” In P. Ogoji (Ed) The Nigerian Economy: Challenges
and Directions for growth in the Next 25 years. Aboki Publishers, Makurdi,
Nigeria
Adesopo A. A, Agboola A.A and Akinlo O.O (2004) “Centralization of
Intergovernmental Fiscal Power and Lower levels of Governments in a
Federation: The Nigerian Experience” Journal of Social Sciences Vol.8 (9)
pp.179-195
Aigbokhan B E (1999) “Fiscal Federalism and Economic Growth in Nigeria”
Selected Paper presented at the 1999 Annual Conference of the Nigerian
Economic Society, Ibadan
Akai, N., Sakata, M., (2002) “Fiscal Decentralization Contributes to Economic
Growth: Evidence from State-level Cross-section Data for the United States”
Journal of Urban Economics 2: 93- 108.
Akpan H. Ekpo (1999) “Fiscal Federalism and Local Government Finances in
Nigeria” Paper presented at the 1999 Annual Conference of the Nigerian
Economic Society, Ibadan
Alesina, A., Perotti, R., Spolaore, E. (1995) “Together or Separately? Issues on
the Costs and
Benefits of Political and Fiscal Unions” European Economic Review 39(3-4):
751-58.
Anynawu C. J. (1999) “Fiscal Relations among the Various Tiers of Governments
in Nigeria” Paper presented at the 1999 Annual Conference of the Nigerian
Economic Society, Ibadan
Breuss, F., Eller, M., (2003) “On the Optimal Assignment of Competences in a
Multi-Level Governed European Union” European Integration online Papers
(EioP)7(8): http://eiop.or.at/eiop/texte/2003-008a.htm.
Chete N. L (1998) “Fiscal Decentralisation and Macroeconomic Management in
Nigeria” Journal of Economic Management Vol. 5 No. 1
Ellioth P. and Thornton Judith (2007) “Fiscal Centralisation and Decentralisation
in Russia and China” Comparative Economic Studies

Scottish Journal of Arts, Social Sciences and Scientific Studies - ISSN 2047-1278
http://scottishjournal.co.uk
216
www. Palgrave-journal.com/ces
Garba, A. G (2004)” Who Controls, can Control and Should Control the Oil and
Gas Resources in the Niger Delta?” Mimeo
Garba, A. G (2004) “The International Politics and Economics of Oil and Gas and
its Implication for the Niger Delta Crisis” Occasional paper, Department of
Economics, ABU, Zaria
Giampaolo A; (2002) “Fiscal Decentralization and the Autonomy of the Local
Government in Italy” Department of Economics, Mathematics and Statistics,
University of Lecce
Hiroko Uchumura and Yurika S (2009) “Measuring Fiscal Decentralization in the
Philippines” Institute of Developing Economics Discussing Paper No. 209
http://www.ide.go.jp/English/publich/Download/DP/pdf/209.pdf.
Hooghe, L., Marks, G., (2001) “Types of Multi-Level Governance” European
Integration online Papers (EIoP) 5(11):
http://eiop.or.at/eiop/texte/2001-011a.htm.
Letelier, L., (2001) “Effect of Fiscal Decentralisation on the Efficiency of the
Public Sector. The Cases of Education and Health” Conference paper, 57th
Congress of the International Institute of Public Finance (IIPF), Linz, August 27-
30, 2001
Markus E.(2004) “The Determinants of Fiscal Decentralisation and its Impact on
Economic Growth: Empirical Evidence from a Panel of OECD Countries”
http//wwww.wu.wien.ac.at/usu/h98d/h9851615
Marius R. B (2007) “The Impact of Fiscal Decentralisation on Education and
Other Types of Spending” Max-Plank Institute for the Study of Societies
Discussion Paper 07/8
www.mpifg.de
Mbanefoh G. F (1993) “Unsettled Issues in Nigerian Fiscal Federalism and the
National Question” in the National Question and Economic Development in
Nigeria. NES 1993 Annual Conference
Odd-Helge F.(2001) “ Intergovernmental Fiscal Relations in Developing
countries: A review of issues”. CMI working paper No. 11 http//www.cmi.no

Scottish Journal of Arts, Social Sciences and Scientific Studies - ISSN 2047-1278
http://scottishjournal.co.uk
217
OECD (2003) “Fiscal Relations across Levels of Government” in: OECD
Economic Outlook, Vol. 2003/2, No. 74, December 2003: 143-60.
Omola A. S (1999) “Restructuring Nigeria’s Fiscal System: Rationale, Strategies
and Policies” Paper presented at the 1999 Annual Conference of the Nigerian
Economic Society, Ibadan
Raffaele M and Emanuela T (2004) “Administrative Decentralization versus
Fiscal Federalism, Some remarks based on the Italian and European Countries’
Evidence” Paper presented at the Villa Mondragone International Economic
Seminar on Rules, International Economy and Growth, CEIS- University of Rome
Tor Vergata
Susan S.(2006) “ Decentralisation in Uganda: Exploring the Constraints for
poverty Reduction” German Institute for Global and Area Studies. Working paper
No. 31 http//www.giga.hamburg.de
Ubogu R. E (1983) “Fiscal Decentralisation and Economic Development among
Nigerian States” Journal of Economic Development
Uwafiokun Idemudia and E.I.Uwem (2006) “Demystifying the Niger Delta
Conflict: Towards an Integrated Explanation” Review of African Political
Economy POAPE No. 109, 2006.

Scottish Journal of Arts, Social Sciences and Scientific Studies - ISSN 2047-1278
http://scottishjournal.co.uk
218
End Notes i According to European University Centre for Peace Studies (EPU) research report, bunkers
consider the practice a defensible means of providing funds for sustaining the crisis and providing for
aggrieved and impoverished residents of the communities in the region. Specifically, one day’s worth of
illegal bunkering – at 100, 000 barrels and $15 per barrel - will buy quality weapons and sustain a group of
over 1000 militants for two months.
ii This loss of crude oil is mainly from breakdown of oil pipes in the course of fighting and
purposeful attacks on oil tanks and storage facilities by militants.
iii
The model is specified as GES t = α + GES t -1 + μ t
Appendix 1
Table 1: Costs Measurement and Data Sources.
Cost
Elements
Measurement Indicators Data sources
Shut in of oil
production i. Oil companies declaring force majeure
ii. Shut down operations due to protests and fire
iii. Combats between militants and security
agents
iv. Barrels per day of crude oil lost was noted
v. From oil price and barrels of oil lost, shut in
costs were estimated.
Published works,
News papers, and
relevant web sites.
Replacement
costs for
damaged
facilities
i. Incidences of severe fighting were examined
ii. Destroyed and damaged infrastructures listed
iii. The extent of damage made assessed and
iv. Costs of replacement estimated.
Web sites, published
works and news
papers
Illegal oil
bunkering
i. Available incidences of oil bunkering within
the period of militancy were listed
ii. The barrels of oil lost through bunkering
noted
iii. Using the annual oil price with the estimated
quantity of oil lost through bunkering, costs
were estimated.
Published works, web
sites, and news papers

Scottish Journal of Arts, Social Sciences and Scientific Studies - ISSN 2047-1278
http://scottishjournal.co.uk
219
Expenditure
on Defence
and Internal
Security
i. Both capital and recurrent expenditure on
defence and internal security were noted.
ii. The information was obtained as reported in
official sources of data in the country.
CBN Statistical
Bulletin (various
years)
Military
damage i. Military combats with the militants were
noted
ii. Particular events that led to military
formation of Joint Task Force and the use of
Mobile Police Units of the Nigerian Police
Force will be noted.
iii. Particular amount of damages were estimated
Published works, web
sites and news papers.
Loss of lives i. From the fighting, we shall know the
estimated number of lives lost from the
militants, the security agents, the armless
communities and expatriates if any.
Published works, web
sites and News papers.