Automatic quality control of seam puckers based on shadow detection
14
Int. J. Computer Aided Engineering and Technology, Vol. 1, No. 2, 2009 225 Copyright © 2009 Inderscience Enterprises Ltd. Automatic quality control of seam puckers based on shadow detection Ioannis G. Mariolis* Department of Electrical Engineering and Computer Technology, University of Patras, 26500, Patras, Greece Fax: +30 2610 996 476 E-mail: [email protected] *Corresponding author Evangelos S. Dermatas Department of Electrical Engineering and Computer Technology, University of Patras, 26500, Patras, Greece Fax: +30 2610 996 189 E-mail: [email protected] Abstract: A novel method performing automatic seam quality control based on visual information is introduced. More specifically, oblique illumination is applied and greyscale images of seam specimens are acquired. The amount of shadowing present in each image is being estimated through dynamic thresholding and first order statistics and is used by a simple linear classifier to estimate the seam quality by means of ordinary least squares (OLS) regression. The proposed method has been evaluated in the case of 112 seam specimens classified by human experts into five discrete quality grades and a correct classification rate of 84.82% has been produced exceeding the experts’ average performance. Moreover, in case one grade disagreement is acceptable, the classification results become error free. Keywords: seam quality; seam puckering; machine vision; shadow detection; regression. Reference to this paper should be made as follows: Mariolis, I.G. and Dermatas, E.S. (2009) ‘Automatic quality control of seam puckers based on shadow detection’, Int. J. Computer Aided Engineering and Technology, Vol. 1, No. 2, pp.225–238. Biographical notes: Ioannis G. Mariolis was born in 1979 in New Jersey, USA. He received his Diploma degree in Engineering from the Department of Electrical Engineering and Computer Technology of the University of Patras, Patras, Greece in 2002 and in the same year was accepted as a PhD Student of the same department. His research interests include machine vision, visual servoing, pattern recognition and signal processing. Evangelos S. Dermatas is an Assistant Professor in the Department of Electrical and Computer Engineering of the University of Patras, Patras, Hellas. He received his Diploma and PhD degrees from the Department of Electrical Engineering of the University of Patras, Patras, Greece in 1985 and 1991 respectively. His research interests include statistical signal processing, pattern recognition, computer security and information extraction.
Transcript of Automatic quality control of seam puckers based on shadow detection

Int. J. Computer Aided Engineering and Technology, Vol. 1, No. 2, 2009 225
Copyright © 2009 Inderscience Enterprises Ltd.
Automatic quality control of seam puckers based on shadow detection
Ioannis G. Mariolis* Department of Electrical Engineering and Computer Technology, University of Patras, 26500, Patras, Greece Fax: +30 2610 996 476 E-mail: [email protected] *Corresponding author
Evangelos S. Dermatas Department of Electrical Engineering and Computer Technology, University of Patras, 26500, Patras, Greece Fax: +30 2610 996 189 E-mail: [email protected]
Abstract: A novel method performing automatic seam quality control based on visual information is introduced. More specifically, oblique illumination is applied and greyscale images of seam specimens are acquired. The amount of shadowing present in each image is being estimated through dynamic thresholding and first order statistics and is used by a simple linear classifier to estimate the seam quality by means of ordinary least squares (OLS) regression. The proposed method has been evaluated in the case of 112 seam specimens classified by human experts into five discrete quality grades and a correct classification rate of 84.82% has been produced exceeding the experts’ average performance. Moreover, in case one grade disagreement is acceptable, the classification results become error free.
Keywords: seam quality; seam puckering; machine vision; shadow detection; regression.
Reference to this paper should be made as follows: Mariolis, I.G. and Dermatas, E.S. (2009) ‘Automatic quality control of seam puckers based on shadow detection’, Int. J. Computer Aided Engineering and Technology, Vol. 1, No. 2, pp.225–238.
Biographical notes: Ioannis G. Mariolis was born in 1979 in New Jersey, USA. He received his Diploma degree in Engineering from the Department of Electrical Engineering and Computer Technology of the University of Patras, Patras, Greece in 2002 and in the same year was accepted as a PhD Student of the same department. His research interests include machine vision, visual servoing, pattern recognition and signal processing.
Evangelos S. Dermatas is an Assistant Professor in the Department of Electrical and Computer Engineering of the University of Patras, Patras, Hellas. He received his Diploma and PhD degrees from the Department of Electrical Engineering of the University of Patras, Patras, Greece in 1985 and 1991 respectively. His research interests include statistical signal processing, pattern recognition, computer security and information extraction.
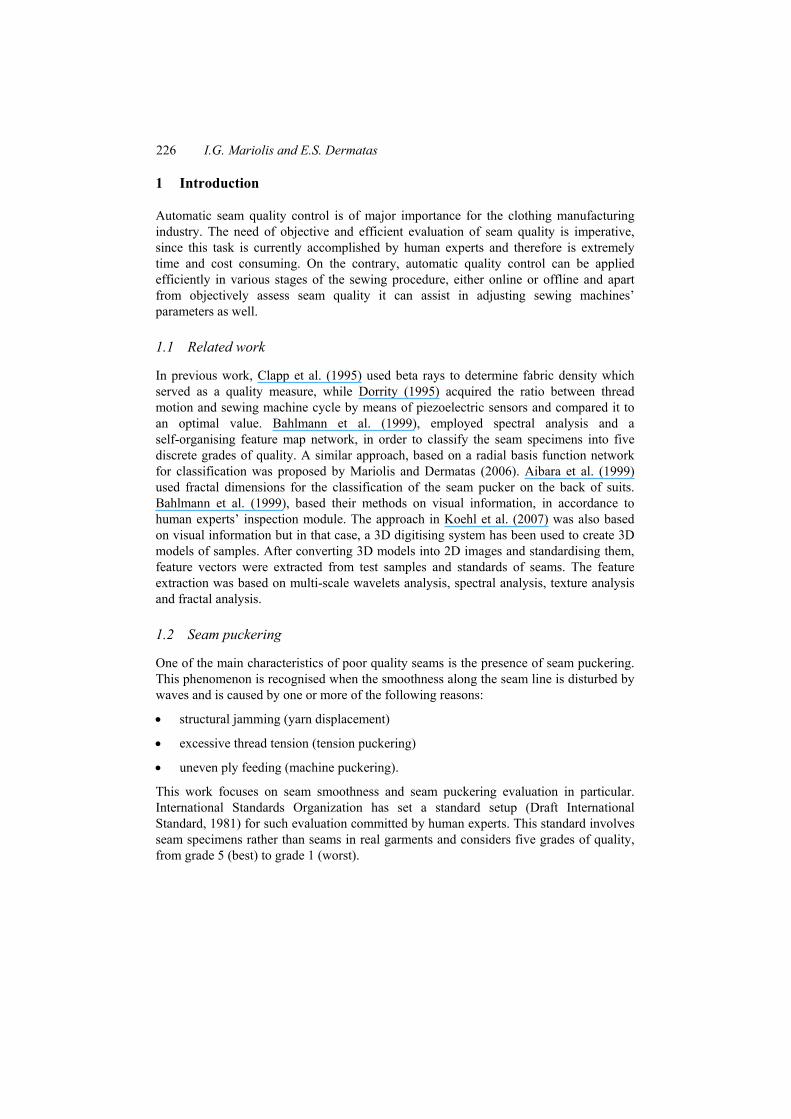
226 I.G. Mariolis and E.S. Dermatas
1 Introduction
Automatic seam quality control is of major importance for the clothing manufacturing industry. The need of objective and efficient evaluation of seam quality is imperative, since this task is currently accomplished by human experts and therefore is extremely time and cost consuming. On the contrary, automatic quality control can be applied efficiently in various stages of the sewing procedure, either online or offline and apart from objectively assess seam quality it can assist in adjusting sewing machines’ parameters as well.
1.1 Related work
In previous work, Clapp et al. (1995) used beta rays to determine fabric density which served as a quality measure, while Dorrity (1995) acquired the ratio between thread motion and sewing machine cycle by means of piezoelectric sensors and compared it to an optimal value. Bahlmann et al. (1999), employed spectral analysis and a self-organising feature map network, in order to classify the seam specimens into five discrete grades of quality. A similar approach, based on a radial basis function network for classification was proposed by Mariolis and Dermatas (2006). Aibara et al. (1999) used fractal dimensions for the classification of the seam pucker on the back of suits. Bahlmann et al. (1999), based their methods on visual information, in accordance to human experts’ inspection module. The approach in Koehl et al. (2007) was also based on visual information but in that case, a 3D digitising system has been used to create 3D models of samples. After converting 3D models into 2D images and standardising them, feature vectors were extracted from test samples and standards of seams. The feature extraction was based on multi-scale wavelets analysis, spectral analysis, texture analysis and fractal analysis.
1.2 Seam puckering
One of the main characteristics of poor quality seams is the presence of seam puckering. This phenomenon is recognised when the smoothness along the seam line is disturbed by waves and is caused by one or more of the following reasons:
• structural jamming (yarn displacement)
• excessive thread tension (tension puckering)
• uneven ply feeding (machine puckering).
This work focuses on seam smoothness and seam puckering evaluation in particular. International Standards Organization has set a standard setup (Draft International Standard, 1981) for such evaluation committed by human experts. This standard involves seam specimens rather than seams in real garments and considers five grades of quality, from grade 5 (best) to grade 1 (worst).
Automatic quality control of seam puckers based on shadow detection 227
1.3 Present work
Since this work deals with automatic seam puckering evaluation, the aforementioned ISO standard is employed for more objective comparison of the results to that of human experts.
Seam puckering results to surface roughness and by appropriate illumination settings, self shadowing occurs. Thus, this contribution proposes a method for objective seam quality evaluation based on the volume of these shadows.
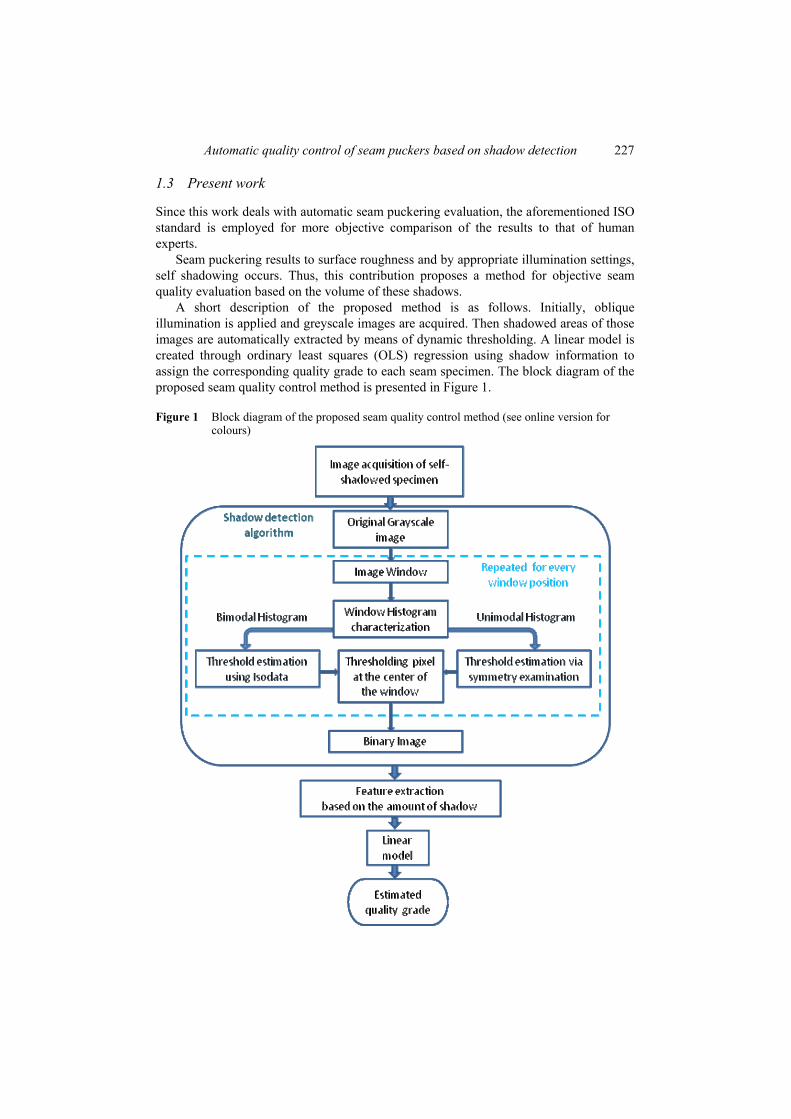
A short description of the proposed method is as follows. Initially, oblique illumination is applied and greyscale images are acquired. Then shadowed areas of those images are automatically extracted by means of dynamic thresholding. A linear model is created through ordinary least squares (OLS) regression using shadow information to assign the corresponding quality grade to each seam specimen. The block diagram of the proposed seam quality control method is presented in Figure 1.
Figure 1 Block diagram of the proposed seam quality control method (see online version for colours)
228 I.G. Mariolis and E.S. Dermatas
The structure of this paper is as follows. In Section 2, the image acquisition module is presented, describing the geometry of the scene and the illumination setup. Section 3 focuses on the process of shadow detection and Section 4 deals with OLS regression and classification. Finally, Section 5 contains the experimental results, while the paper concludes in Section 6.
2 Image acquisition
2.1 Seam specimens’ position
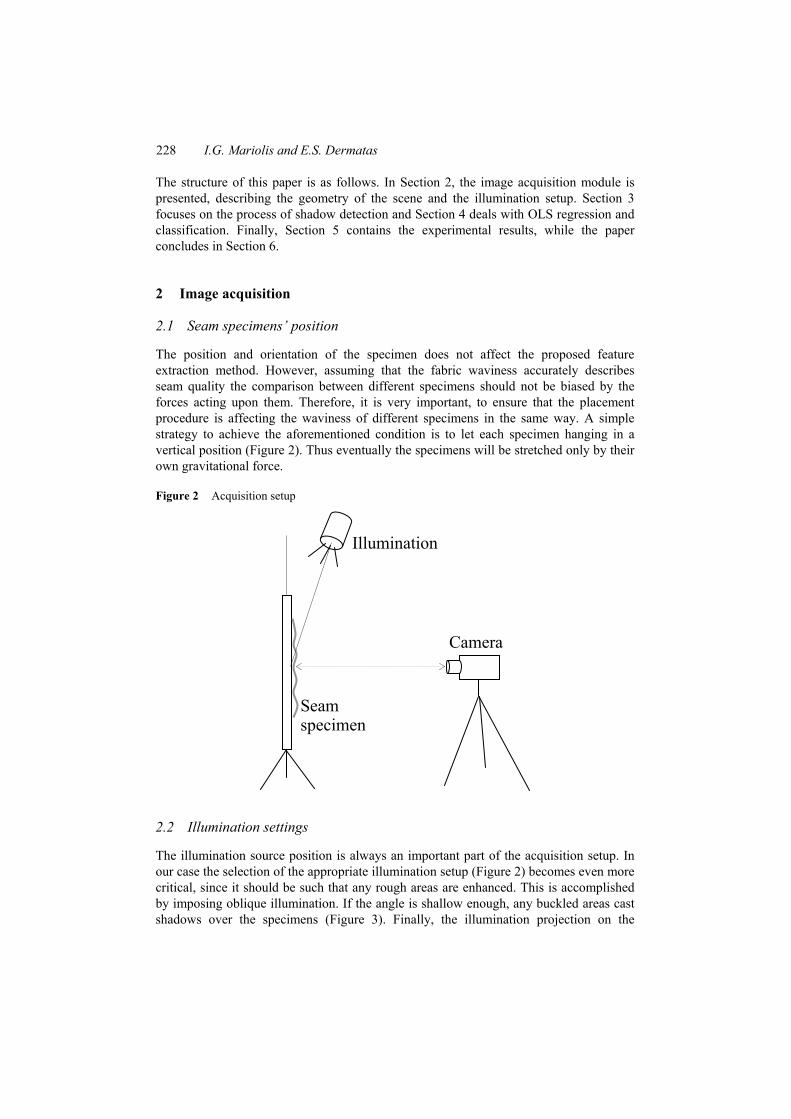
The position and orientation of the specimen does not affect the proposed feature extraction method. However, assuming that the fabric waviness accurately describes seam quality the comparison between different specimens should not be biased by the forces acting upon them. Therefore, it is very important, to ensure that the placement procedure is affecting the waviness of different specimens in the same way. A simple strategy to achieve the aforementioned condition is to let each specimen hanging in a vertical position (Figure 2). Thus eventually the specimens will be stretched only by their own gravitational force.
Figure 2 Acquisition setup
2.2 Illumination settings
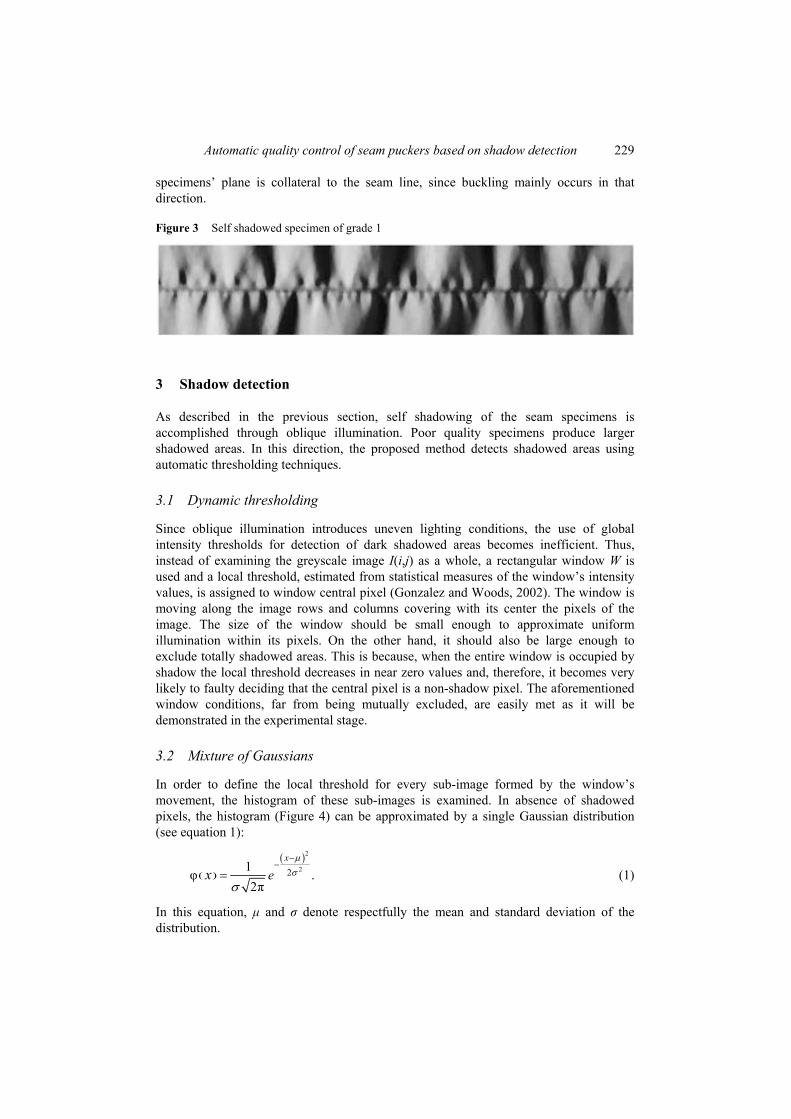
The illumination source position is always an important part of the acquisition setup. In our case the selection of the appropriate illumination setup (Figure 2) becomes even more critical, since it should be such that any rough areas are enhanced. This is accomplished by imposing oblique illumination. If the angle is shallow enough, any buckled areas cast shadows over the specimens (Figure 3). Finally, the illumination projection on the
Camera
Illumination
Seam specimen
Automatic quality control of seam puckers based on shadow detection 229
specimens’ plane is collateral to the seam line, since buckling mainly occurs in that direction.
Figure 3 Self shadowed specimen of grade 1
3 Shadow detection
As described in the previous section, self shadowing of the seam specimens is accomplished through oblique illumination. Poor quality specimens produce larger shadowed areas. In this direction, the proposed method detects shadowed areas using automatic thresholding techniques.
3.1 Dynamic thresholding
Since oblique illumination introduces uneven lighting conditions, the use of global intensity thresholds for detection of dark shadowed areas becomes inefficient. Thus, instead of examining the greyscale image I(i,j) as a whole, a rectangular window W is used and a local threshold, estimated from statistical measures of the window’s intensity values, is assigned to window central pixel (Gonzalez and Woods, 2002). The window is moving along the image rows and columns covering with its center the pixels of the image. The size of the window should be small enough to approximate uniform illumination within its pixels. On the other hand, it should also be large enough to exclude totally shadowed areas. This is because, when the entire window is occupied by shadow the local threshold decreases in near zero values and, therefore, it becomes very likely to faulty deciding that the central pixel is a non-shadow pixel. The aforementioned window conditions, far from being mutually excluded, are easily met as it will be demonstrated in the experimental stage.
3.2 Mixture of Gaussians
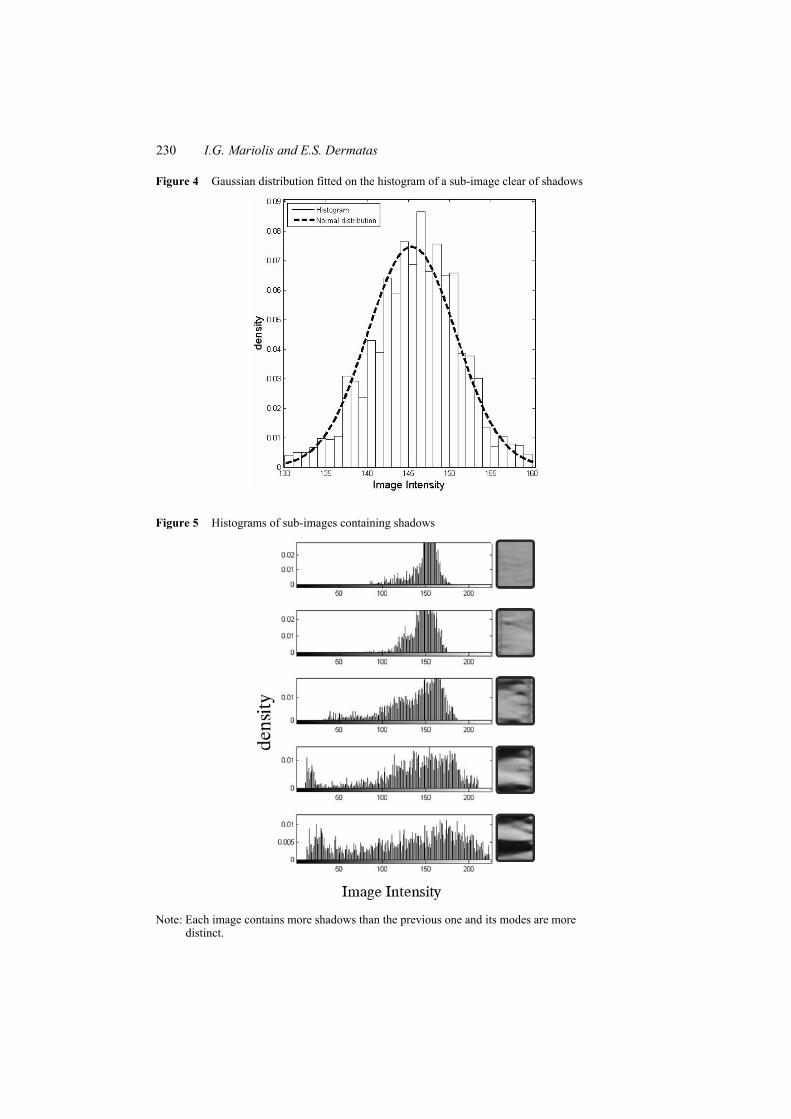
In order to define the local threshold for every sub-image formed by the window’s movement, the histogram of these sub-images is examined. In absence of shadowed pixels, the histogram (Figure 4) can be approximated by a single Gaussian distribution (see equation 1):
( )
( )2221φ .
2π
x
exμσ
σ
−−
= (1)
In this equation, μ and σ denote respectfully the mean and standard deviation of the distribution.
230 I.G. Mariolis and E.S. Dermatas
Figure 4 Gaussian distribution fitted on the histogram of a sub-image clear of shadows
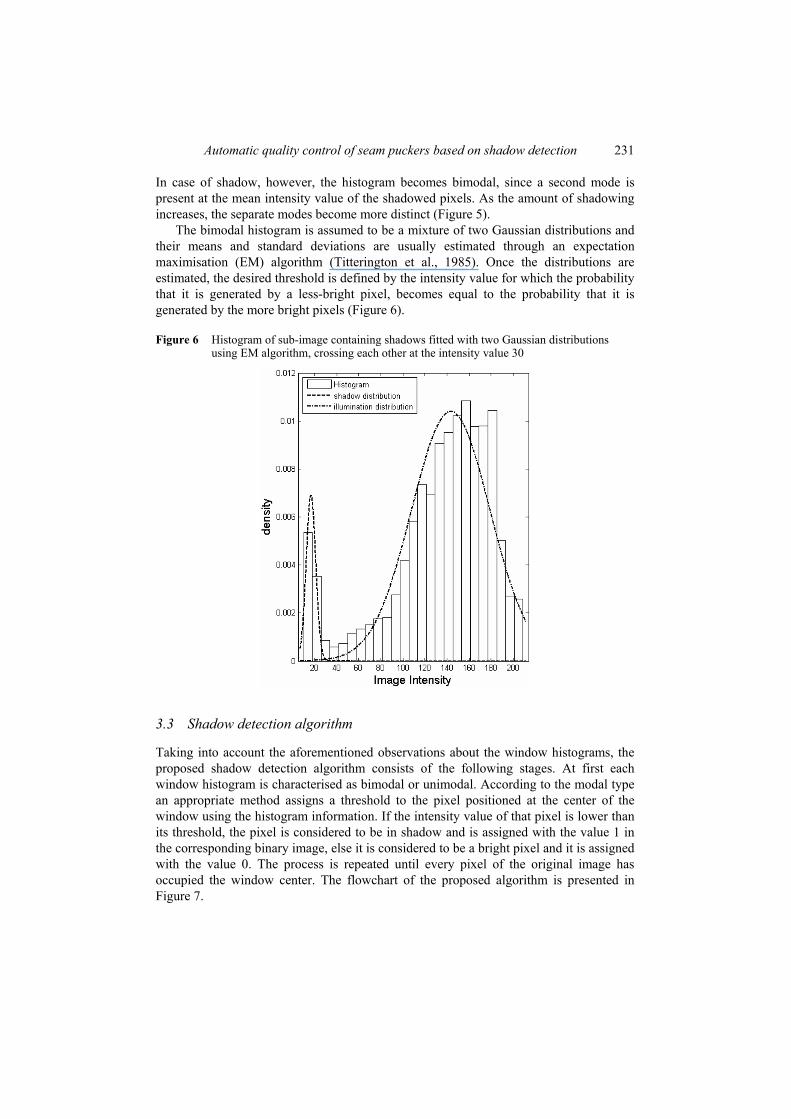
Figure 5 Histograms of sub-images containing shadows
Note: Each image contains more shadows than the previous one and its modes are more distinct.
Automatic quality control of seam puckers based on shadow detection 231
In case of shadow, however, the histogram becomes bimodal, since a second mode is present at the mean intensity value of the shadowed pixels. As the amount of shadowing increases, the separate modes become more distinct (Figure 5).
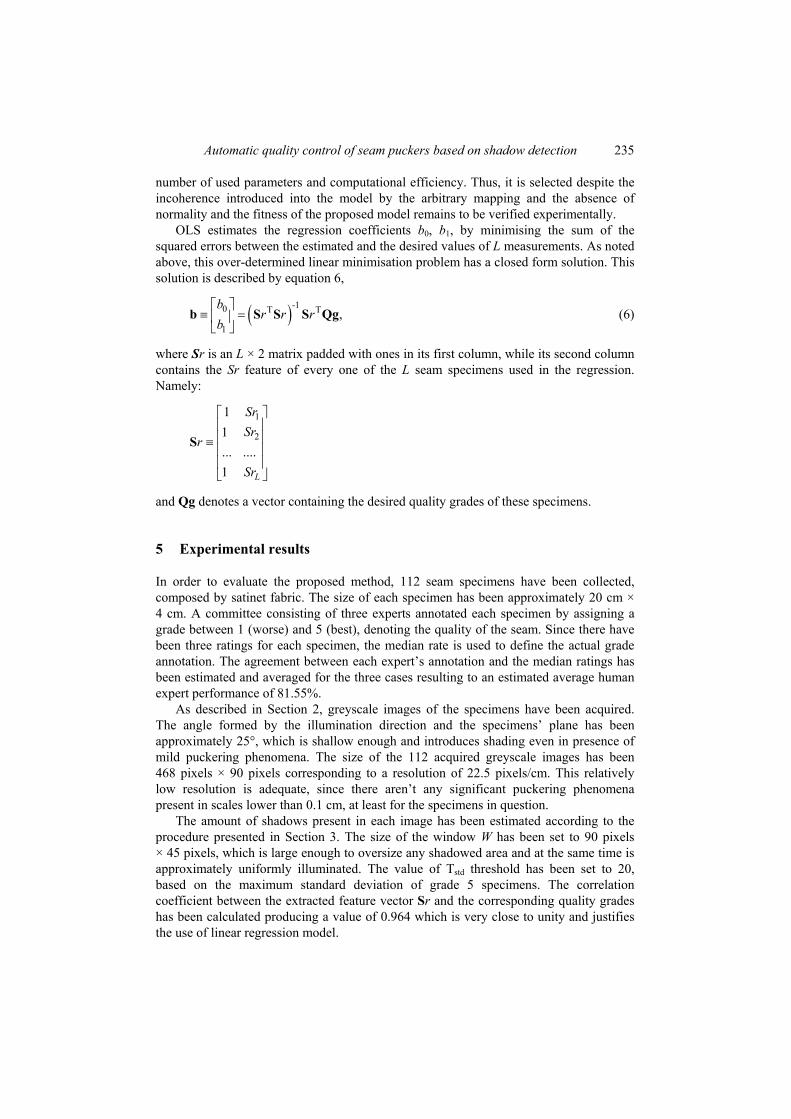
The bimodal histogram is assumed to be a mixture of two Gaussian distributions and their means and standard deviations are usually estimated through an expectation maximisation (EM) algorithm (Titterington et al., 1985). Once the distributions are estimated, the desired threshold is defined by the intensity value for which the probability that it is generated by a less-bright pixel, becomes equal to the probability that it is generated by the more bright pixels (Figure 6).
Figure 6 Histogram of sub-image containing shadows fitted with two Gaussian distributions using EM algorithm, crossing each other at the intensity value 30
3.3 Shadow detection algorithm
Taking into account the aforementioned observations about the window histograms, the proposed shadow detection algorithm consists of the following stages. At first each window histogram is characterised as bimodal or unimodal. According to the modal type an appropriate method assigns a threshold to the pixel positioned at the center of the window using the histogram information. If the intensity value of that pixel is lower than its threshold, the pixel is considered to be in shadow and is assigned with the value 1 in the corresponding binary image, else it is considered to be a bright pixel and it is assigned with the value 0. The process is repeated until every pixel of the original image has occupied the window center. The flowchart of the proposed algorithm is presented in Figure 7.

232 I.G. Mariolis and E.S. Dermatas
Figure 7 Flowchart of the proposed shadow detection method
3.3.1 Histogram characterisation
A criterion is needed for discriminating between bimodal and unimodal histograms. Typically, this type of discrimination can be achieved by employing a statistical test, such as a chi-square statistic. However, in order to increase calculation efficiency, instead of employing a typical statistical test, a fast and efficient method using the histogram sample deviation is proposed. Namely, if the sample standard deviation of a certain histogram exceeds a global threshold Tstd, the histogram is considered bimodal, else it is considered unimodal. The value of Tstd depends on the acquisition setup and the fabric’s texture and is selected to be slightly greater than the maximum standard deviation of the histograms produced by the images of all available grade 5 specimens.
3.3.2 Threshold estimation in bimodal case
In case of bimodal histograms the EM algorithm could be used for estimating the appropriate threshold. However, such implementation requires a great number of calculations, especially since it has to be repeated for every sub-image having a bimodal histogram (Figure 6). The computational complexity can be significantly reduced if

Automatic quality control of seam puckers based on shadow detection 233
instead of the EM algorithm, the isodata method (Ridler and Calvard, 1978) is used in each individual thresholding.
According to the isodata algorithm, the histogram is initially segmented into two parts using a starting threshold value such as T0= 2D–1, half the maximum dynamic range. In our case D = 8 since the intensity can take 256 different values. The sample mean (mb,0) of the grey values associated with the bright pixels and the sample mean (md,0) of the grey values associated with the dark pixels are computed. A new threshold value T1 is now computed as the average of these two sample means:
( )b, 1 d, 11T .2k k km m− −= + (2)
The process is repeated, based upon the new threshold, until convergence, i.e., the threshold value does not change any more.
3.3.3 Threshold estimation in unimodal case
In the unimodal case the histograms are approximated by a single Gaussian distribution. In absence of shadow the histogram is approximately symmetric. In presence of minor shadow areas however, the histogram is skewed. Thus, in order to detect any minor shadowing, the sample mean is estimated and the histogram’s symmetry is examined. The distance between the first intensity value of the bright part of the histogram having zero occurrence and the estimated mean is calculated. Then the threshold is defined as the intensity value of the dark part of the histogram, with the same distance from the estimated mean.
3.3.4 Detection of shadow pixels
Using the proposed procedure, the intensity threshold Tint(i,j) is calculated for every pixel and a binary image is being produced after thresholding. The bright areas of the binary image consist of pixels with intensities lower than their threshold, namely, I(i,j) < Tint(i,j) and they are areas assumed to be in shadow.
3.4 Feature extraction
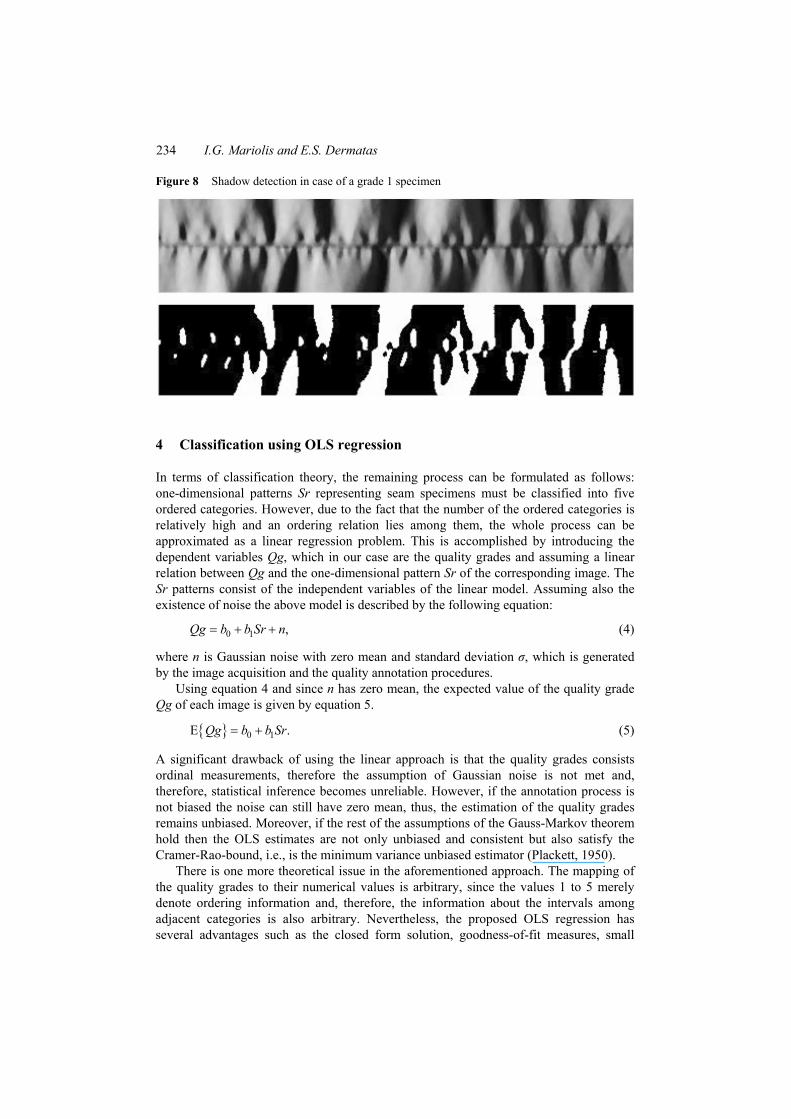
The shadow areas present in the original image is identified by the bright pixels in the corresponding binary image B(i,j) as illustrated in Figure 8. Finally, the ratio between the sum of the binary image’s bright pixels and the total number of pixels in each image is estimated forming a feature Sr bounded by 0 and 1.
1 1
.
.
1 ( , ) M N
i j
No of shadow pixels
Total No of pixelsSr i j
MN = =
= = ∑∑B (3)
In equation 3, M denotes the total number of rows of the binary image, while N denotes the total number of columns.
234 I.G. Mariolis and E.S. Dermatas
Figure 8 Shadow detection in case of a grade 1 specimen
4 Classification using OLS regression
In terms of classification theory, the remaining process can be formulated as follows: one-dimensional patterns Sr representing seam specimens must be classified into five ordered categories. However, due to the fact that the number of the ordered categories is relatively high and an ordering relation lies among them, the whole process can be approximated as a linear regression problem. This is accomplished by introducing the dependent variables Qg, which in our case are the quality grades and assuming a linear relation between Qg and the one-dimensional pattern Sr of the corresponding image. The Sr patterns consist of the independent variables of the linear model. Assuming also the existence of noise the above model is described by the following equation:
0 1 ,Qg b b Sr n= + + (4)
where n is Gaussian noise with zero mean and standard deviation σ, which is generated by the image acquisition and the quality annotation procedures.
Using equation 4 and since n has zero mean, the expected value of the quality grade Qg of each image is given by equation 5.
{ } 0 1E .Qg b b Sr= + (5)
A significant drawback of using the linear approach is that the quality grades consists ordinal measurements, therefore the assumption of Gaussian noise is not met and, therefore, statistical inference becomes unreliable. However, if the annotation process is not biased the noise can still have zero mean, thus, the estimation of the quality grades remains unbiased. Moreover, if the rest of the assumptions of the Gauss-Markov theorem hold then the OLS estimates are not only unbiased and consistent but also satisfy the Cramer-Rao-bound, i.e., is the minimum variance unbiased estimator (Plackett, 1950).
There is one more theoretical issue in the aforementioned approach. The mapping of the quality grades to their numerical values is arbitrary, since the values 1 to 5 merely denote ordering information and, therefore, the information about the intervals among adjacent categories is also arbitrary. Nevertheless, the proposed OLS regression has several advantages such as the closed form solution, goodness-of-fit measures, small
Automatic quality control of seam puckers based on shadow detection 235
number of used parameters and computational efficiency. Thus, it is selected despite the incoherence introduced into the model by the arbitrary mapping and the absence of normality and the fitness of the proposed model remains to be verified experimentally.
OLS estimates the regression coefficients b0, b1, by minimising the sum of the squared errors between the estimated and the desired values of L measurements. As noted above, this over-determined linear minimisation problem has a closed form solution. This solution is described by equation 6,
( )-10 T T
1,
br r r
b⎡ ⎤
≡ =⎢ ⎥⎣ ⎦
b S S S Qg (6)
where Sr is an L × 2 matrix padded with ones in its first column, while its second column contains the Sr feature of every one of the L seam specimens used in the regression. Namely:
1
2
11... ....1 L
SrSr
r
Sr
⎡ ⎤⎢ ⎥⎢ ⎥≡⎢ ⎥⎢ ⎥⎣ ⎦
S
and Qg denotes a vector containing the desired quality grades of these specimens.
5 Experimental results
In order to evaluate the proposed method, 112 seam specimens have been collected, composed by satinet fabric. The size of each specimen has been approximately 20 cm × 4 cm. A committee consisting of three experts annotated each specimen by assigning a grade between 1 (worse) and 5 (best), denoting the quality of the seam. Since there have been three ratings for each specimen, the median rate is used to define the actual grade annotation. The agreement between each expert’s annotation and the median ratings has been estimated and averaged for the three cases resulting to an estimated average human expert performance of 81.55%.
As described in Section 2, greyscale images of the specimens have been acquired. The angle formed by the illumination direction and the specimens’ plane has been approximately 25°, which is shallow enough and introduces shading even in presence of mild puckering phenomena. The size of the 112 acquired greyscale images has been 468 pixels × 90 pixels corresponding to a resolution of 22.5 pixels/cm. This relatively low resolution is adequate, since there aren’t any significant puckering phenomena present in scales lower than 0.1 cm, at least for the specimens in question.
The amount of shadows present in each image has been estimated according to the procedure presented in Section 3. The size of the window W has been set to 90 pixels × 45 pixels, which is large enough to oversize any shadowed area and at the same time is approximately uniformly illuminated. The value of Tstd threshold has been set to 20, based on the maximum standard deviation of grade 5 specimens. The correlation coefficient between the extracted feature vector Sr and the corresponding quality grades has been calculated producing a value of 0.964 which is very close to unity and justifies the use of linear regression model.

236 I.G. Mariolis and E.S. Dermatas
Throughout the experimental procedure, the quality grades belong to {1, 2, 3, 4, 5}, assuming equal intervals between adjacent quality classes and also that the patterns are classified to the nearest quality grade according to their regression results. Patterns not included in the regression can always be linearly transformed using the regression coefficients and the estimated quality grades can be used for further evaluation of the proposed method.
At the first stage of the experiments, the entire set of 112 available patterns has been included in the regression. The estimated R-square is 0.929, while the variance analysis of the regression also shows a good fit as indicated by Table 1. In this table, the regression sum of squares displays information about the variation accounted for by the linear model, while the residual sum of squares displays information about the variation that is not accounted for by the model. The low residual with respect to the regression sum of squares indicates that the model explains well the variation of the dependent variable, i.e., the quality grades. The goodness-of-fit has been examined further through a statistical measure which follows F-distribution and is defined as the ratio between the regression mean square and the residual mean square (David, 1949). Since the significance value of the statistic denoting the probability to get such high F-value by chance is approximately zero the model is accepted. Table 1 Analysis of variance (ANOVA) table of the regression
Sum of squares dfa Mean square Fb Sig.
Regression 184.93 1 184.93 1435 0 Residual 14.17 110 0.129 Total 199.11 111
Notes: a df stands for degrees of freedom. b The significance value (sig.) of the F statistic is approximately zero indicating
that the independent variable explains well the variation in the dependent variable.
However, it must be reminded that due to the ordinal nature of the dependent variable the statistic results can be disputed. Therefore, the main criterion about the fitness of the proposed model is the classification performance. Using the regression results and nearest neighbour classification, a correct classification rate (CCR) of 84.82% has been achieved. More specifically, 95 specimens were classified to their actual quality grade, while the classification of the rest 17 specimens depicted only by one grade. Table 2 contains the confusion matrix of the classification, while Table 3 presents recall, precision, F-measure separately for each quality grade and kappa statistic (Cohen, 1960) for the total classification results. All four measures of Table 3 belong to [0, 1] and the closer they are to unity, the higher the performance of the classifier is considered.

Automatic quality control of seam puckers based on shadow detection 237
Table 2 Confusion matrix of the actual to the estimated by OLS quality grades, using 112 patterns for regressiona
Actual quality grade
1 2 3 4 5
1 20 1 0 0 0
2 2 22 4 0 0
3 0 1 19 4 0
4 0 0 0 19 0
Est.
qual
ity g
rade
5 0 0 0 5 15
Note: a The diagonal values, denoting correctly classified specimens, are dominating producing a trace of 95.
Table 3 Metrics for classification evaluation
Actual quality grade
1 2 3 4 5 Recall 0.91 0.92 0.83 0.68 1.00 Precision 0.95 0.79 0.79 1.0 0.75 F-measure 0.93 0.85 0.81 0.81 0.86 K-statistic 0.81
At the second set of the experiments, OLS classification has been furthered evaluated through the statistically reliable method of stratified K-fold cross validation (Kohavi, 1995). In case of ten (disjoint) folds, the number of training patterns of each instance is 101. The process is repeated for ten instances and the produced CCR is calculated as the average CCR of all instances. None of the patterns used in the test set was used in training and the performance evaluation is not biased. Nevertheless, the produced CCR has been equally high (84.17%). Moreover, if we repeat the process after swapping the number of the training patterns with that used for testing, namely using just 11 patterns for estimating the regressors and the remaining 101 for testing, a CCR of 82.04% is produced. This indicates that even if very few training patterns are available the proposed method can still be efficient.
6 Conclusions
This work proposes a novel approach to automatic seam quality control. First an innovating shadow detection technique is introduced. It is designed to perform under uneven illumination conditions, since shadowing has been deliberately imposed in the scene through unbalanced illumination. The extracted shadowed area forms a feature suitable for seam quality assessment, which is highly correlated to the quality grades of the specimens. Then OLS regression is applied making use of this linear relation and resulting to CCR of about 85%. Thus, the performance of the proposed method is

238 I.G. Mariolis and E.S. Dermatas
superior to that of human experts (81.55%) and the use of the linear regression model despite the ordinal nature of the quality grades is justified.
Moreover as shown by the regression with just 11 specimens, the method can perform well even if very few training patterns (i.e., specimens already evaluated by human experts) are available. Future work could focus on the determination of the exact spacing between the categories. This way the mapping can become optimal and the regression even more efficient.
Acknowledgements
This work has been supported by the General Secretariat of Research and Technology and ELKEDE, project PENED2001 No. 3049.
References Aibara, T., Mabuchi, T. and Kenji, O. (1999) ‘Automatic evaluation of the appearance of seam
puckers on suits’, Proceedings of the SPIE 3652, Vol. 110. Bahlmann, C., Heidemann, G. and Ritter, H. (1999) ‘Artificial neural networks for automated
quality control of textile seams’, Pattern Recognition, Vol. 32, No. 6, pp.1049–1060. Clapp, T.G., Titus, K.J. and Olson, L.H. and Dorrity, J.L. (1995) ‘The online inspection of sewn
seams’, National Textile Center Annual Report, available at http://ntc.tx.ncsu.edu/html/REPORTS/YEAR-FOLDER/online.html (accessed on 11/3/2004).
Cohen, J. (1960) ‘A coefficient of agreement for nominal scales’, Educational and Psychological Measurement, Vol. 20, pp.37–46.
David, F.N. (1949) ‘The moments of the z and F Distributions’, Biometrika, Vol. 36, pp.394–403. Dorrity, J.L. (1995) ‘New developments for seam quality monitoring in sewing applications’, IEEE
Transactions on Industrial Applications, Vol. 31, pp.1371–1375. Draft International Standard (1981) ‘ISO/DIS 7770; textiles – method of test for evaluating the
appearance of seams in durable press products after domestic washing and drying’, Draft International Standard, ISO/DIS 7770, 1981.
Gonzalez, R.C. and Woods, R.E. (2002) Digital Image Processing, 2nd ed., DIP/2e, Prentice Hall. Koehl, L., Miou, J.C. and Zeng, X. (2007) ‘Selecting relevant features from fabric images for
automated quality control of seam pucker using data analysis and human experts grading’, in Computational Textile, pp.39–54, Springer Berlin/Heidelberg.
Kohavi, R. (1995) ‘A study of cross-validation and bootstrap for accuracy estimation and model selection’, Proceedings of the 14th International Joint Conference on Artificial Intelligence, Vol. 2, No. 12, pp.1137–1143.
Mariolis, I.G. and Dermatas, E.S. (2006) ‘Automated quality control of textile seams based on puckering evaluation’, Paper presented at the 37th International Symposium on Novelties in Textiles, June, Ljubljana, Slovenia.
Plackett, R.L. (1950) ‘Some theorems in least squares’, Biometrika, Vol. 37, pp.149–157. Ridler, T.W. and Calvard, S. (1978) ‘Picture thresholding using an iterative selection method’,
IEEE Transactions on System, Man and Cybernetics, SMC-8 630632. Titterington, D., Smith, A. and Makov, U. (1985) Statistical Analysis of Finite Mixture
Distributions, John Wiley and Sons, Chichester, UK.