Serving Robots: Management and Applications for Restaurant ...
15
sustainability Article Serving Robots: Management and Applications for Restaurant Business Sustainability Ha-Won Jang and Soo-Bum Lee * College of Hotel and Tourism Management, Kyung Hee University, Seoul 02447, Korea; [email protected] * Correspondence: [email protected]; Tel.: +82-2-961-9385 Received: 28 April 2020; Accepted: 12 May 2020; Published: 13 May 2020 Abstract: This study focuses on the attributes of serving robots, which include “anthropomorphism,” “animacy,” “likeability,” “intelligence,” and “safety,” and their effect on restaurant customers. The study aims to provide a sustainable development model for the restaurant business, which is suffering from a shortage of manpower. The study identifies the relationships among serving robots’ attributes, perceived benefits, perceived risks, perceived value, satisfaction, and revisit intention of customers. An online survey was conducted with customers, aged eighteen years or older, of restaurants that use serving robots. A total of 294 surveys were used for the final analysis. The results indicate that there are statistically significant relationships between “likeability” and perceived benefits, “intelligence” and perceived benefits, “safety” and perceived benefits, and “safety” and perceived risks. It also confirms that perceived benefits have a positive effect on perceived value, and perceived value has a positive effect on satisfaction and revisit intention. Moreover, satisfaction has a positive effect on revisit intention. Based on these findings, several meaningful theoretical and practical implications that can lead to the sustainability of restaurants are presented. Keywords: serving robots’ attributes; perceived benefits; perceived risks; perceived value; satisfaction; revisit intention; restaurant business; value-based adoption model 1. Introduction Artificial intelligence (AI)-based robots are being used across the world [1]. These robots, which have been created with the combination of advanced hardware and AI technologies, are intended for human-centered innovation, recognizing people, and responding to human emotions [2]. Social robots that can function as friends for humans are considered to be an area of significant future value [2]. Currently, housekeeping robots, hospitality robots, beverage-making robots, medicine robots, table tennis coaches, and others are available [3]. In fact, not only electronics companies but also household goods companies are focusing on robot development [3]. Meanwhile, the nation's dining industry is facing trouble because of rising minimum labor costs, rent, and material costs, and it is likely that the utilization of robots in restaurants will gradually increase [4]. These rising costs have already led to an increase in the use of serving robots in the United States, Japan, China, and other countries around the world [4]. In addition, researchers predict that serving robots will contribute in many ways to the sustainability of the restaurant business in the future; this has become especially apparent in the face of the widespread use of non-contact services caused by the COVID-19 pandemic worldwide [5]. As part of this trend, serving robots are seen as leaders in convenience in the dining industry. In South Korea, serving robots are used in various restaurant franchises, and their usage is gradually increasing [6]. Particularly, serving robots that can replace employees in provincial towns’ restaurants, as there is a shortage of manpower compared to Seoul and the metropolitan area, are drawing the attention of restaurant owners and also offer a unique experience for customers [7]. Sustainability 2020, 12, 3998; doi:10.3390/su12103998 www.mdpi.com/journal/sustainability
-
Upload
khangminh22 -
Category
Documents
-
view
1 -
download
0
Transcript of Serving Robots: Management and Applications for Restaurant ...
sustainability
Article
Serving Robots: Management and Applications forRestaurant Business Sustainability
Ha-Won Jang and Soo-Bum Lee *
College of Hotel and Tourism Management, Kyung Hee University, Seoul 02447, Korea; [email protected]* Correspondence: [email protected]; Tel.: +82-2-961-9385
Received: 28 April 2020; Accepted: 12 May 2020; Published: 13 May 2020�����������������
Abstract: This study focuses on the attributes of serving robots, which include “anthropomorphism,”“animacy,” “likeability,” “intelligence,” and “safety,” and their effect on restaurant customers.The study aims to provide a sustainable development model for the restaurant business, which issuffering from a shortage of manpower. The study identifies the relationships among serving robots’attributes, perceived benefits, perceived risks, perceived value, satisfaction, and revisit intentionof customers. An online survey was conducted with customers, aged eighteen years or older, ofrestaurants that use serving robots. A total of 294 surveys were used for the final analysis. The resultsindicate that there are statistically significant relationships between “likeability” and perceivedbenefits, “intelligence” and perceived benefits, “safety” and perceived benefits, and “safety” andperceived risks. It also confirms that perceived benefits have a positive effect on perceived value,and perceived value has a positive effect on satisfaction and revisit intention. Moreover, satisfactionhas a positive effect on revisit intention. Based on these findings, several meaningful theoretical andpractical implications that can lead to the sustainability of restaurants are presented.
Keywords: serving robots’ attributes; perceived benefits; perceived risks; perceived value; satisfaction;revisit intention; restaurant business; value-based adoption model
1. Introduction
Artificial intelligence (AI)-based robots are being used across the world [1]. These robots, whichhave been created with the combination of advanced hardware and AI technologies, are intended forhuman-centered innovation, recognizing people, and responding to human emotions [2]. Social robotsthat can function as friends for humans are considered to be an area of significant future value [2].Currently, housekeeping robots, hospitality robots, beverage-making robots, medicine robots, tabletennis coaches, and others are available [3]. In fact, not only electronics companies but also householdgoods companies are focusing on robot development [3]. Meanwhile, the nation's dining industry isfacing trouble because of rising minimum labor costs, rent, and material costs, and it is likely that theutilization of robots in restaurants will gradually increase [4]. These rising costs have already led to anincrease in the use of serving robots in the United States, Japan, China, and other countries aroundthe world [4]. In addition, researchers predict that serving robots will contribute in many ways to thesustainability of the restaurant business in the future; this has become especially apparent in the face ofthe widespread use of non-contact services caused by the COVID-19 pandemic worldwide [5]. As partof this trend, serving robots are seen as leaders in convenience in the dining industry. In South Korea,serving robots are used in various restaurant franchises, and their usage is gradually increasing [6].Particularly, serving robots that can replace employees in provincial towns’ restaurants, as there isa shortage of manpower compared to Seoul and the metropolitan area, are drawing the attention ofrestaurant owners and also offer a unique experience for customers [7].
Sustainability 2020, 12, 3998; doi:10.3390/su12103998 www.mdpi.com/journal/sustainability
Sustainability 2020, 12, 3998 2 of 15
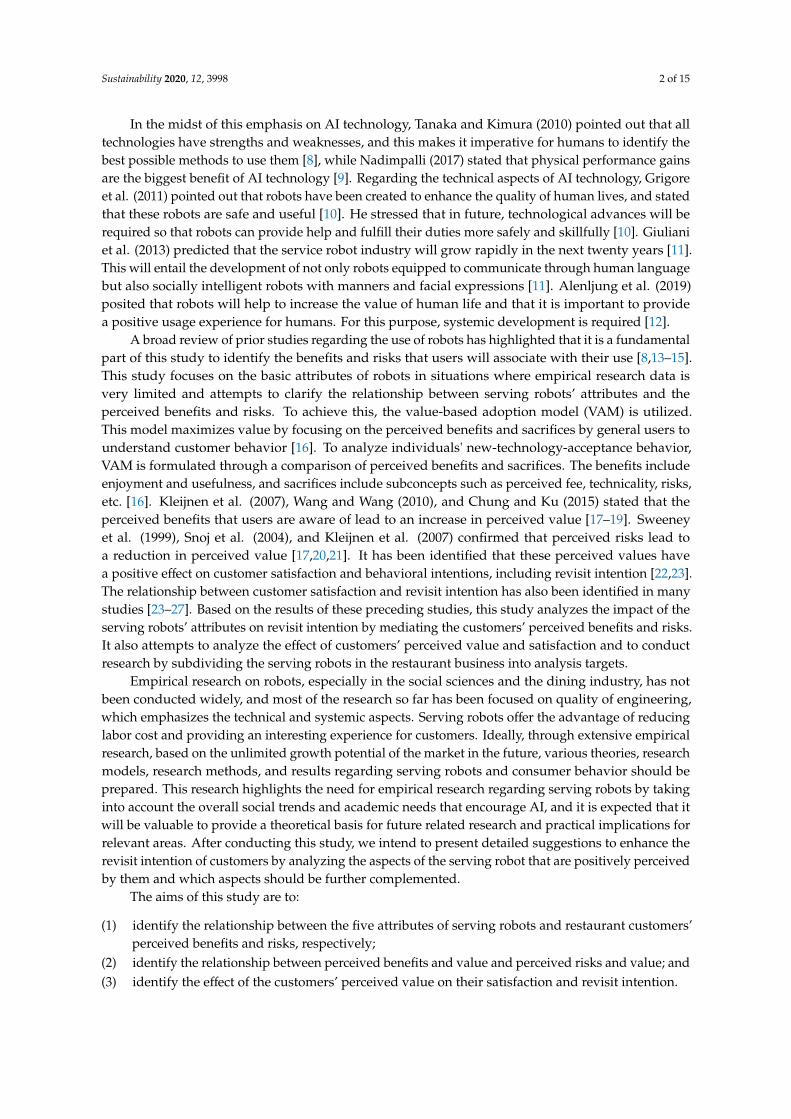
In the midst of this emphasis on AI technology, Tanaka and Kimura (2010) pointed out that alltechnologies have strengths and weaknesses, and this makes it imperative for humans to identify thebest possible methods to use them [8], while Nadimpalli (2017) stated that physical performance gainsare the biggest benefit of AI technology [9]. Regarding the technical aspects of AI technology, Grigoreet al. (2011) pointed out that robots have been created to enhance the quality of human lives, and statedthat these robots are safe and useful [10]. He stressed that in future, technological advances will berequired so that robots can provide help and fulfill their duties more safely and skillfully [10]. Giulianiet al. (2013) predicted that the service robot industry will grow rapidly in the next twenty years [11].This will entail the development of not only robots equipped to communicate through human languagebut also socially intelligent robots with manners and facial expressions [11]. Alenljung et al. (2019)posited that robots will help to increase the value of human life and that it is important to providea positive usage experience for humans. For this purpose, systemic development is required [12].
A broad review of prior studies regarding the use of robots has highlighted that it is a fundamentalpart of this study to identify the benefits and risks that users will associate with their use [8,13–15].This study focuses on the basic attributes of robots in situations where empirical research data isvery limited and attempts to clarify the relationship between serving robots’ attributes and theperceived benefits and risks. To achieve this, the value-based adoption model (VAM) is utilized.This model maximizes value by focusing on the perceived benefits and sacrifices by general users tounderstand customer behavior [16]. To analyze individuals' new-technology-acceptance behavior,VAM is formulated through a comparison of perceived benefits and sacrifices. The benefits includeenjoyment and usefulness, and sacrifices include subconcepts such as perceived fee, technicality, risks,etc. [16]. Kleijnen et al. (2007), Wang and Wang (2010), and Chung and Ku (2015) stated that theperceived benefits that users are aware of lead to an increase in perceived value [17–19]. Sweeneyet al. (1999), Snoj et al. (2004), and Kleijnen et al. (2007) confirmed that perceived risks lead toa reduction in perceived value [17,20,21]. It has been identified that these perceived values havea positive effect on customer satisfaction and behavioral intentions, including revisit intention [22,23].The relationship between customer satisfaction and revisit intention has also been identified in manystudies [23–27]. Based on the results of these preceding studies, this study analyzes the impact of theserving robots’ attributes on revisit intention by mediating the customers’ perceived benefits and risks.It also attempts to analyze the effect of customers’ perceived value and satisfaction and to conductresearch by subdividing the serving robots in the restaurant business into analysis targets.
Empirical research on robots, especially in the social sciences and the dining industry, has notbeen conducted widely, and most of the research so far has been focused on quality of engineering,which emphasizes the technical and systemic aspects. Serving robots offer the advantage of reducinglabor cost and providing an interesting experience for customers. Ideally, through extensive empiricalresearch, based on the unlimited growth potential of the market in the future, various theories, researchmodels, research methods, and results regarding serving robots and consumer behavior should beprepared. This research highlights the need for empirical research regarding serving robots by takinginto account the overall social trends and academic needs that encourage AI, and it is expected that itwill be valuable to provide a theoretical basis for future related research and practical implications forrelevant areas. After conducting this study, we intend to present detailed suggestions to enhance therevisit intention of customers by analyzing the aspects of the serving robot that are positively perceivedby them and which aspects should be further complemented.
The aims of this study are to:
(1) identify the relationship between the five attributes of serving robots and restaurant customers’perceived benefits and risks, respectively;
(2) identify the relationship between perceived benefits and value and perceived risks and value; and(3) identify the effect of the customers’ perceived value on their satisfaction and revisit intention.
Sustainability 2020, 12, 3998 3 of 15
2. Research Background
2.1. Serving Robots’ Attributes
A serving robot is a robot that carries out useful tasks for human beings or replaces equipment [28].These robots are used for various goals such as cleaning, cooking, healthcare, and serving asa collaborator [28]. Xue et al. (2011) studied ice cream serving robots from an engineering standpoint [29].Neeti et al. (2016) explained the birth of a new generation of electronic waiters and analyzed them froma technical perspective [30]. Iqbal, Khan, and Khalid (2017) analyzed the system aspects of servingrobots in the restaurant industry [31]. Morita et al. (2018) studied the robot system of a tea house [32].Thanh, Vinh, and Nghi (2019) studied the development of sensors to assist robots in maintaininga stable serving speed in the dining industry [33]. From this, it is evident that most of the relevantstudies are based on the engineering aspects related to the technology of serving robots.
Attributes are the features or characteristics of things and are critical antecedents of customers’behavioral intentions in various industries [34]. It is clear that empirical research on serving robots isstill in the initial stages, and so this study focuses on their attributes. It also explores how customersjudge serving robots on five factors—anthropomorphism, likeability, animacy, safety, and intelligence,which are based on the scales established by Bartneck et al. (2008) [35]. The reliability and validity ofthese scales have been confirmed through several empirical studies [35]. These attributes are definedas follows: “Anthropomorphism” involves the attribution of human characteristics, human form, andhuman behavior, to something that is nonhuman such as, a robot or a computer [35]. “Animacy”implies being lifelike. For example, how lifelike the characters in a computer game are affects theemotions of the player [36]. “Likeability” implies a positive first impression, which leads to a morepositive evaluation by that person [37]. “Intelligence” refers to how intelligently a robot completesa task, and development of this is ongoing as robots are built on AI technology [35]. “Safety” refers tohow safe users feel when interacting with a robot [35]. Very few empirical studies have been conductedon the attributes of serving robots in the restaurant business. This study is expected to be a theoreticalfoundation for relevant research in the future.
2.2. Value-Based Adoption Model
The VAM, proposed by Kim et al. (2007), is a theory that maximizes the value of a newtechnology [16]. VAM considers benefits (enjoyment and usefulness) and sacrifice (perceived fee andtechnicality) as the main factors of perceived value and analyzes behavioral intentions [38]. Van DerVoordt et al. (2016) emphasized that sacrifice includes time, cost, and risk factors [39]. This studyattempts to analyze the relationship of perceived risks, by focusing on the risk factors of sacrifice, as theresearch is based on serving robots, and in this context, the risk factors and the perceived benefitsare both important. Technical acceptance for VAM is described based on Zeithaml’s (1988) perceivedvalue concept [40]. This reflects that the decision-making process is dependent on a comparison of thebenefits and risks of uncertainty while choosing a new technology or product [41].
Till date, most research on mobile internet [16,42], smart home services [38], and accommodationapplications [43] has been conducted based on VAM. This study focuses on the customers’ perceivedvalue and revisit intention, based on the perceived benefits and risks. So far, there has been very littleresearch on serving robots in the restaurant business based on VAM. Therefore, this study is expectedto provide a theoretical base for future related studies.
2.3. Development of Research Hypotheses
Hypotheses to identify the relationship between serving robots’ attributes, perceived benefits,perceived risks, perceived value, satisfaction, and revisit intention of costumers have been establishedbased on the discussion above.
Sustainability 2020, 12, 3998 4 of 15
2.3.1. Effect of Serving Robots’ Attributes on Perceived Benefits for Restaurants
Hypothesis 1 relates to the relationship between the serving robots’ attributes and the customers’perceived benefits. As empirical analysis has not been conducted on the relationship between thesetwo factors in the context of the restaurant industry, the relationship between them is presumed on thebasis of the results of exploratory research on robots.
In a study on robots for drug manufacturing at a British hospital, Goundrey-Smith (2008)explained that the benefits of using robots included reduction of service delivery errors, increased drugmanufacturing efficiency, and increased shelf or space utilization [13]. Kim et al. (2013) analyzed howperceived benefits of their use can be linked to the perception of user’s trust, enjoyment, satisfaction,and intelligence in a study on caregiving robots [15]. This research found that the role of robots hasa meaningful effect on perceived benefits [15]. Moreover, it also emphasized that, the greater theperceived benefits relative to the perceived risks of robots, the more positive the perception [15].
As discussed above, empirical research on the relationship between serving robots’ attributes andtheir perceived benefits has helped to establish the following assumptions. These aim to demonstratethe relationship between the two variables and provide a theoretical basis for future related studies.Based on these assumptions, to examine the significant effects of the five serving robots’ attributes oncustomers’ perceived benefits in the restaurant context, we propose the following five hypotheses:
Hypothesis 1a: The serving robot’s attribute of “anthropomorphism” will have a positive effect on the customers’perceived benefits.
Hypothesis 1b: The serving robot’s attribute of “animacy” will have a positive effect on the customers’ perceivedbenefits.
Hypothesis 1c: The serving robot’s attribute of “likeability” will have a positive effect on the customers’perceived benefits.
Hypothesis 1d: The serving robot’s attribute of “intelligence” will have a positive effect on the customers’perceived benefits.
Hypothesis 1e: The serving robot’s attribute of “safety” will have a positive effect on the customers’perceived benefits.
2.3.2. Effect of Serving Robots’ Attributes on Perceived Risks for Restaurants
Hypothesis 2 relates to the serving robot’s attributes and the customers’ perceived risks, and therelationship between the two variables is presumed based on the results of exploratory studies on therisk factors of robot use.
In his research on robots in the medical field, Goundrey-Smith (2008) explained the variousbenefits of their use as well as the risk factors [13]. Pointing out the risk of labeling errors in the courseof drug manufacturing, he emphasized that human services are required while using robots [13].He elaborated that robots cannot cope with certain unexpected events, for example, if a drug is soldout [13]. Furthermore, robots cannot accomplish tasks accurately if drugs do not have barcodes [13].Nadimpalli (2017) pointed out in a hospital study on AI technology that in the event of a criticalsituation for patients, technology could lead to serious errors [9]. Additionally, it reduces human jobsand creates ethical problems as it replaces human intelligence [9].
As such, there is no empirical research on the serving robots’ attributes and the customers’perceived risks, and the following assumptions have been established in this study to provide basicdata applicable for relevant areas in future. Based on these assumptions, to examine the significanteffects of the five serving robots’ attributes on customers’ perceived risks in the restaurant context,we propose the following five hypotheses:

Sustainability 2020, 12, 3998 5 of 15
Hypothesis 2a: The serving robot’s attribute of “anthropomorphism” will have a negative effect on the customers’perceived risks.
Hypothesis 2b: The serving robot’s attribute of “animacy” will have a negative effect on the customers’perceived risks.
Hypothesis 2c: The serving robot’s attribute of “likeability” will have a negative effect on the customers’perceived risks.
Hypothesis 2d: The serving robot’s attribute of “intelligence” will have a negative effect on the customers’perceived risks.
Hypothesis 2e: The serving robot’s attribute of “safety” will have a negative effect on the customers’perceived risks.
2.3.3. Effects of Perceived Benefits on Perceived Value
Hypothesis 3 relates to the relationship between the perceived benefits and perceived value forcustomers who have experienced being served by a robot, and empirical research regarding this hasnot yet been conducted. This study is based on the results of studies conducted in other fields.
Kleijnen et al. (2007) stated that as benefits of mobile channel services increase, the users’perceived value of the service increases as well [17]. Wang and Wang (2010) pointed out that thebenefits of the mobile hotel reservation system have a significant impact on the customers’ perceivedvalue [18], while Han et al. (2013) stated that the benefits of smartphone use positively affect the users’perceived value [44]. In addition, Chung and Ku (2015) stated that perceived benefits of searching fortravel-related information using social networking services have a significant effect on users’ perceivedvalues [19]. Kim (2016), based on a smart home service study, stated that the users’ perceived benefitshave a significant effect on perceived values [45].
As such, most prior studies have indicated that perceived benefits have a positive effect onperceived value. Based on these findings, it is expected that the restaurant customers’ perceivedbenefits have a positive effect on perceived value. Therefore, we propose the following hypothesis:
Hypothesis 3: The customers’ perceived benefits will have a positive effect on perceived value.
2.3.4. Effects of Perceived Risks on Perceived Value
Hypothesis 4 relates to the customers’ perceived risks and perceived value based on theirexperience with a serving robot. Empirical research has not been conducted regarding the relationshipbetween the two variables and serving robots, and so this study is based on the relationship betweenthe two variables as seen in the results of studies conducted in other areas.
Sweeney et al. (1999) studied the relationship between perceived risks and perceived value inthe distribution environment and revealed that the perceived risk has a significant inverse effect onperceived value [20]. Snoj et al. (2004) studied the relationship between product quality, perceived risks,and perceived value for cell phone users and found that perceived risks significantly and inverselyaffect perceived value [21]. Based on a mobile channel service study, Kleijnen et al. (2007) stated thatperceived value decreases as users' perceived risks increases [17], while in a smart home service study,Kim (2016) pointed out that privacy risks have a significant impact on perceived value [45].
As such, most prior studies have shown that perceived risks have a negative impact on perceivedvalue. Based on these findings, it is expected that restaurant customers’ perceived risks will havea negative effect on perceived value. Therefore, we propose the following hypothesis:
Hypothesis 4: Restaurant customers’ perceived risks will have a negative effect on perceived value.
Sustainability 2020, 12, 3998 6 of 15
2.3.5. Effects of Perceived Value on Satisfaction
Hypothesis 5 relates to the relationship between the customers’ perceived value and satisfactionwith the experience of a serving robot. Empirical research on perceived value and satisfaction relatingto a serving robot has not been conducted so far, therefore the relationship between the two variablesis presumed based on studies conducted in other fields.
In a study on mobile applications, Lin and Wang (2006) stated that the consumers’ perceivedvalue has a direct impact on satisfaction [22]. In a study about casual restaurants, Ryu et al. (2008)stated that the customers’ perceived value has a significant effect on satisfaction [23]. Similarly, Kimet al. (2015) stated that the perceived value of tourist mobile applications has a positive effect onsatisfaction [46], and Kang and Moon (2016) stated that the users’ perceived value regarding socialcommerce has a significant effect on satisfaction [47].
Most of these studies on the relationship between perceived value and satisfaction have shownthat perceived value has a positive effect on satisfaction. Based on these findings, it is expected thatrestaurant customers’ perceived value has a positive effect on satisfaction. Therefore, we propose thefollowing hypothesis:
Hypothesis 5: Restaurant customers’ perceived value will have a positive effect on satisfaction.
2.3.6. Effects of Perceived Value on Revisit Intention
Hypothesis 6 is based on the relationship between customers’ perceived value and revisit intentionwhen a serving robot is used. There is no empirical research that elaborates on the relationship betweenthe two variables in terms of the usage of a serving robot. Therefore, the relationship between the twovariables is presumed based on research conducted in other areas.
Kim et al. (2007) stated that customers intention to use a product or service is based on theperceived value, which reflects perceived benefits and perceived risks [16]. Similarly, Sirdeshmukhet al. (2002) found that if a customer has a positive perception about a product or service, it hasa positive impact on revisit intention and that this intention decreases if the perception is negative. [48].Kim et al. (2008) stated that the perceived value based on the use of products has a significant effect oncustomer's behavioral intentions [49]. In a study regarding a mobile application, Lin and Wang (2006)stated that the customers’ perceived value directly affect behavioral intentions [22], while Ryu et al.(2008), in a casual restaurant study, also elaborated that customers’ perceived value significantly affectbehavioral intentions [23].
Studies on the relationship between customers’ perceived value and revisit intention have beenconducted extensively in all fields, and most studies have indicated that perceived value has a positiveinfluence on revisit intention. Based on these findings, it is expected that restaurant customers’ perceivedvalue has a positive effect on revisit intention. Therefore, we propose the following hypothesis:
Hypothesis 6: Restaurant customers’ perceived value will have a positive effect on revisit intention.
2.3.7. Effects of Satisfaction on Revisit Intention
Hypothesis 7 is based on customers’ satisfaction and revisit intention when a serving robot isused. The relationship is assumed between the two variables based on research conducted in generalrestaurants as there is little empirical research that reveals the relationship between the two variablesbased on the use of a serving robot.
In a hotel restaurant study, Han and Hyun (2017) stated that customers’ satisfaction affects revisitintention [24]. In a family restaurant image study, Jeon (2017) elaborated that customers’ satisfactionhas a positive effect on revisit intention [25]. In a study on restaurant food, Abdullah et al. (2018)revealed that quality of service and price fairness have an impact on customers satisfaction andsignificantly affect restaurant reuse intention [26]. In a chicken restaurant study, Kim and Shim (2019)stated that customers’ satisfaction has a positive effect on behavioral intentions [27].
Sustainability 2020, 12, 3998 7 of 15
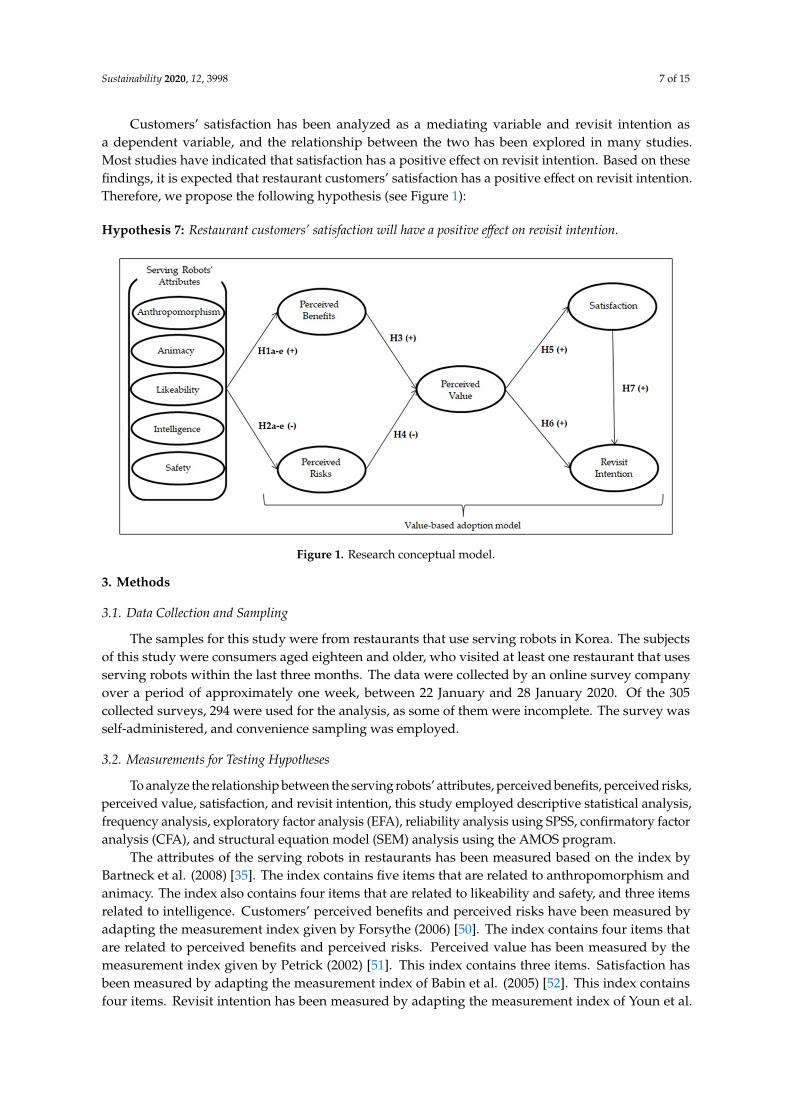
Customers’ satisfaction has been analyzed as a mediating variable and revisit intention asa dependent variable, and the relationship between the two has been explored in many studies.Most studies have indicated that satisfaction has a positive effect on revisit intention. Based on thesefindings, it is expected that restaurant customers’ satisfaction has a positive effect on revisit intention.Therefore, we propose the following hypothesis (see Figure 1):
Hypothesis 7: Restaurant customers’ satisfaction will have a positive effect on revisit intention.Sustainability 2020, 12, x FOR PEER REVIEW 7 of 16
Figure 1. Research conceptual model.
3. Methods
3.1. Data Collection and Sampling
The samples for this study were from restaurants that use serving robots in Korea. The subjects
of this study were consumers aged eighteen and older, who visited at least one restaurant that uses
serving robots within the last three months. The data were collected by an online survey company
over a period of approximately one week, between January 22 and January 28, 2020. Of the 305
collected surveys, 294 were used for the analysis, as some of them were incomplete. The survey was
self-administered, and convenience sampling was employed.
3.2. Measurements for Testing Hypotheses
To analyze the relationship between the serving robots’ attributes, perceived benefits, perceived risks, perceived value, satisfaction, and revisit intention, this study employed descriptive statistical analysis, frequency analysis, exploratory factor analysis (EFA), reliability analysis using SPSS, confirmatory factor analysis (CFA), and structural equation model (SEM) analysis using the AMOS program.
The attributes of the serving robots in restaurants has been measured based on the index by Bartneck et al. (2008) [35]. The index contains five items that are related to anthropomorphism and animacy. The index also contains four items that are related to likeability and safety, and three items related to intelligence. Customers’ perceived benefits and perceived risks have been measured by adapting the measurement index given by Forsythe (2006) [50]. The index contains four items that are related to perceived benefits and perceived risks. Perceived value has been measured by the measurement index given by Petrick (2002) [51]. This index contains three items. Satisfaction has been measured by adapting the measurement index of Babin et al. (2005) [52]. This index contains four items. Revisit intention has been measured by adapting the measurement index of Youn et al. (2019) [53]. This index contains four items. A five-point scale (ranging from 1 = Highly disagree to 5 = Highly agree) was used for all of the items.
4. Results
Table 1 shows the collected samples’ demographic characteristics. A large proportion of the respondents were in their thirties (42.5%), and the percentage of male (49.7%) and female (50%)
Figure 1. Research conceptual model.
3. Methods
3.1. Data Collection and Sampling
The samples for this study were from restaurants that use serving robots in Korea. The subjectsof this study were consumers aged eighteen and older, who visited at least one restaurant that usesserving robots within the last three months. The data were collected by an online survey companyover a period of approximately one week, between 22 January and 28 January 2020. Of the 305collected surveys, 294 were used for the analysis, as some of them were incomplete. The survey wasself-administered, and convenience sampling was employed.
3.2. Measurements for Testing Hypotheses
To analyze the relationship between the serving robots’ attributes, perceived benefits, perceived risks,perceived value, satisfaction, and revisit intention, this study employed descriptive statistical analysis,frequency analysis, exploratory factor analysis (EFA), reliability analysis using SPSS, confirmatory factoranalysis (CFA), and structural equation model (SEM) analysis using the AMOS program.
The attributes of the serving robots in restaurants has been measured based on the index byBartneck et al. (2008) [35]. The index contains five items that are related to anthropomorphism andanimacy. The index also contains four items that are related to likeability and safety, and three itemsrelated to intelligence. Customers’ perceived benefits and perceived risks have been measured byadapting the measurement index given by Forsythe (2006) [50]. The index contains four items thatare related to perceived benefits and perceived risks. Perceived value has been measured by themeasurement index given by Petrick (2002) [51]. This index contains three items. Satisfaction hasbeen measured by adapting the measurement index of Babin et al. (2005) [52]. This index containsfour items. Revisit intention has been measured by adapting the measurement index of Youn et al.

Sustainability 2020, 12, 3998 8 of 15
(2019) [53]. This index contains four items. A five-point scale (ranging from 1 = Highly disagree to5 = Highly agree) was used for all of the items.
4. Results
Table 1 shows the collected samples’ demographic characteristics. A large proportion of therespondents were in their thirties (42.5%), and the percentage of male (49.7%) and female (50%)respondents was similar. In terms of marital status, the married respondents (56.1%) were morenumerous than unmarried respondents. In terms of education, university students and graduates(68.7%) were the highest. Monthly income of the respondents was high and fell in the $2000 range(26.2%) and $3000 range (25.5%). The respondents had office jobs (66.7%), professional jobs (11.9%),self-employed (5.8%), or were homemakers (6.5%), students (6.1%), or others (3.1%).
Table 1. Respondent characteristics (N = 294).
Characteristics n (%) Characteristics n (%)
Age(years) Monthly income10–19 19 (6.5%) <$1000 13 (4.4%)20–29 50 (17.0%) $1001–$2000 12 (4.1%)30–39 125 (42.5%) $2001–$3000 77 (26.2%)40–49 56 (19.0%) $3001–$4000 75 (25.5%)50–59 32 (10.9%) $4001–$5000 47 (16.0%)
Over 60 12 (4.1%) $5001≤ 70 (23.8%)Gender Occupation
Male 146 (49.7%) Student 18 (6.1%)Female 148 (50.3%) Office job 196 (66.7%)
Marital status Self-employed 17 (5.8%)Unmarried 129 (43.9%) Professional job 35 (11.9%)
Married 165 (56.1%) Homemaker 19 (6.5%)Educational level Other 9 (3.1%)
High school 29 (9.9%)Two-year college 38 (12.9%)
University 202 (68.7%)Graduate school 25 (8.5%)
4.1. Validity and Reliability of Measurements
Exploratory factor analysis (EFA) was performed on the serving robots’ attributes, as researchon these robots is still in the initial stages. The results of EFA are shown in Table 2. The servingrobots’ attributes were divided into five concepts, all eigen values are more than 1, Kaiser-Meyer-Olkin(KMO) = 0.899, total variance explained = 72.620, all results were shown to meet the criteria [54].The serving robots’ attributes were labeled as, “anthropomorphism,” “animacy,” “likeability,”“intelligence,” and “safety.”
Table 2. Exploratory factor analysis results.
Construct Factor Loading Eigen Value % of Variance
Anthropomorphism 1 0.780 9.560 45.5222 0.7013 0.6164 0.7285 0.758
Animacy 1 0.576 1.700 8.0942 0.7643 0.7774 0.7615 0.727

Sustainability 2020, 12, 3998 9 of 15
Table 2. Cont.
Construct Factor Loading Eigen Value % of Variance
Likeability 1 0.834 1.652 7.8692 0.6003 0.8314 0.662
Intelligence 1 0.834 1.264 6.0212 0.8653 0.810
Safety 1 0.709 1.074 5.1152 0.7333 0.6094 0.744
Notes: Kaiser-Meyer-Olkin (KMO) = 0.899, χ2 = 4493.958 (df = 210, p < 0.001), total variance explained = 72.620.
Confirmatory factor analysis (CFA) was performed to examine the validity and reliability of themeasured items. After analyzing a total of forty items, Tucker–Lewis index (TLI) = 0.932; comparativefit index (CFI) = 0.940; incremental fit index (IFI) = 0.940; and root mean square error of approximation(RMSEA) = 0.053 were identified. All these results are consistent with standards [54].
The composite reliability of all construct items was 0.7 or above. As the average variance extracted(AVE) was also 0.5 or above, convergent validity was verified [54]. There was no problem regardingreliability as Cronbach’s alpha ranged from 0.820 to 0.939 (see Table 3).
Table 3. Validity and reliability of measures.
Construct StandardizedLoadings t-Value CCR a AVE b Cronbach’s
Alpha
Anthropomorphism 0.865 0.563 0.862The appearance of a serving robot is similar to that of
a human being 0.819
A serving robot looks similar to a human 0.775 14.589 ***Serving robots seem to have the ability to perceive and
judge like human beings 0.675 12.226 ***
Serving robots look natural 0.715 13.135 ***Serving robots move gracefully like human beings 0.758 14.171 ***
Animacy 0.851 0.535 0.868Serving robots are similar to living creatures 0.736
The serving robot looks energetic 0.783 10.463 ***The activity of a serving robot is similar to that of a human 0.815 18.775 ***
The interaction with a serving robot is smooth 0.663 11.189 ***Serving robots are highly responsive 0.645 9.214 ***
Likeability 0.876 0.640 0.874Serving robots are cool 0.850
Serving robots are friendly 0.848 19.528 ***Serving robots are kind 0.694 11.705 ***
Serving robots make me feel good 0.799 11.933 ***
Intelligence 0.947 0.856 0.939A serving robot is good at its job 0.938Serving robots look intelligent 0.925 28.691 ***
The use of serving robots is practical 0.913 26.650 ***
Safety 0.822 0.537 0.820A serving robot is safe to use 0.738Serving robots move safely 0.721 12.055 ***
The serving robot looks comfortable in its movements 0.739 11.777 ***Serving robots look safe 0.732 11.962 ***
Sustainability 2020, 12, 3998 10 of 15
Table 3. Cont.
Construct StandardizedLoadings t-Value CCR a AVE b Cronbach’s
Alpha
Perceived benefits 0.822 0.536 0.820A serving robot offers a new experience 0.745 12.643 ***
Using a serving robot is fun 0.781 11.968 ***Using a serving robot is a new feeling 0.708 11.637 ***
The use of serving robot is novel 0.690
Perceived risks 0.835 0.558 0.833A serving robot does not meet my needs 0.712Robot serving takes longer than the staff 0.766 11.361 ***
There are many problems related to smooth interactionwith serving robots 0.723 11.523 ***
Robots serve slowly 0.785 12.333 ***
Perceived value 0.933 0.823 0.884Using a serving robot gives me pleasure 0.926
Serving robots have excellent performance 0.906 25.989 ***The service quality of the serving robot is excellent 0.890 24.487 ***
Satisfaction 0.922 0.750 0.916I am satisfied with the choice of a restaurant company
with a serving robot 0.858
I am satisfied with the meal at a restaurant witha serving robot 0.986 17.551 ***
I am very happy to visit a restaurant with a serving robot 0.902 29.287 ***I am very satisfied with visiting a restaurant that uses
a serving robot 0.692 14.733 ***
Revisit intention 0.907 0.710 0.895I will continue to visit the restaurant 0.875
I am inclined to visit the restaurant repeatedly 0.793 17.515 ***I will revisit the restaurant 0.960 19.684 ***
I will recommend the restaurant to my acquaintances 0.725 13.620 ***
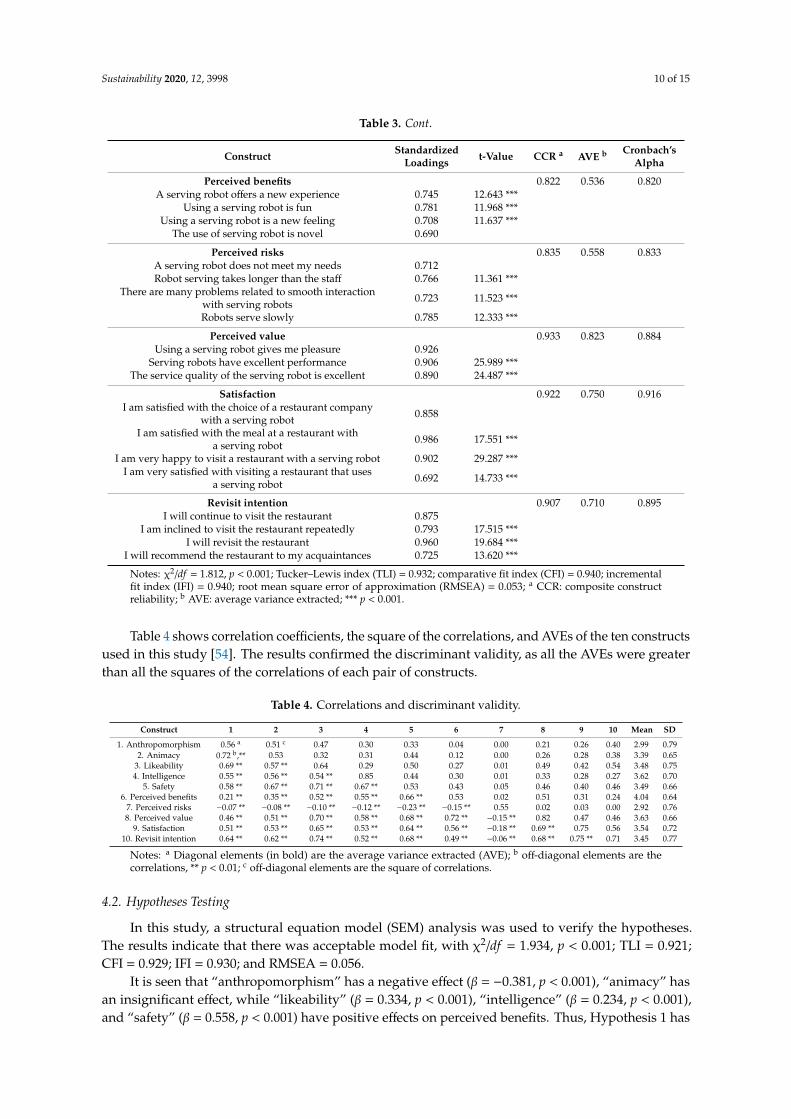
Notes: χ2/df = 1.812, p < 0.001; Tucker–Lewis index (TLI) = 0.932; comparative fit index (CFI) = 0.940; incrementalfit index (IFI) = 0.940; root mean square error of approximation (RMSEA) = 0.053; a CCR: composite constructreliability; b AVE: average variance extracted; *** p < 0.001.
Table 4 shows correlation coefficients, the square of the correlations, and AVEs of the ten constructsused in this study [54]. The results confirmed the discriminant validity, as all the AVEs were greaterthan all the squares of the correlations of each pair of constructs.
Table 4. Correlations and discriminant validity.
Construct 1 2 3 4 5 6 7 8 9 10 Mean SD
1. Anthropomorphism 0.56 a 0.51 c 0.47 0.30 0.33 0.04 0.00 0.21 0.26 0.40 2.99 0.792. Animacy 0.72 b,** 0.53 0.32 0.31 0.44 0.12 0.00 0.26 0.28 0.38 3.39 0.65
3. Likeability 0.69 ** 0.57 ** 0.64 0.29 0.50 0.27 0.01 0.49 0.42 0.54 3.48 0.754. Intelligence 0.55 ** 0.56 ** 0.54 ** 0.85 0.44 0.30 0.01 0.33 0.28 0.27 3.62 0.70
5. Safety 0.58 ** 0.67 ** 0.71 ** 0.67 ** 0.53 0.43 0.05 0.46 0.40 0.46 3.49 0.666. Perceived benefits 0.21 ** 0.35 ** 0.52 ** 0.55 ** 0.66 ** 0.53 0.02 0.51 0.31 0.24 4.04 0.64
7. Perceived risks −0.07 ** −0.08 ** −0.10 ** −0.12 ** −0.23 ** −0.15 ** 0.55 0.02 0.03 0.00 2.92 0.768. Perceived value 0.46 ** 0.51 ** 0.70 ** 0.58 ** 0.68 ** 0.72 ** −0.15 ** 0.82 0.47 0.46 3.63 0.66
9. Satisfaction 0.51 ** 0.53 ** 0.65 ** 0.53 ** 0.64 ** 0.56 ** −0.18 ** 0.69 ** 0.75 0.56 3.54 0.7210. Revisit intention 0.64 ** 0.62 ** 0.74 ** 0.52 ** 0.68 ** 0.49 ** −0.06 ** 0.68 ** 0.75 ** 0.71 3.45 0.77
Notes: a Diagonal elements (in bold) are the average variance extracted (AVE); b off-diagonal elements are thecorrelations, ** p < 0.01; c off-diagonal elements are the square of correlations.
4.2. Hypotheses Testing
In this study, a structural equation model (SEM) analysis was used to verify the hypotheses.The results indicate that there was acceptable model fit, with χ2/df = 1.934, p < 0.001; TLI = 0.921;CFI = 0.929; IFI = 0.930; and RMSEA = 0.056.
It is seen that “anthropomorphism” has a negative effect (β = −0.381, p < 0.001), “animacy” hasan insignificant effect, while “likeability” (β = 0.334, p < 0.001), “intelligence” (β = 0.234, p < 0.001),and “safety” (β = 0.558, p < 0.001) have positive effects on perceived benefits. Thus, Hypothesis 1 has
Sustainability 2020, 12, 3998 11 of 15
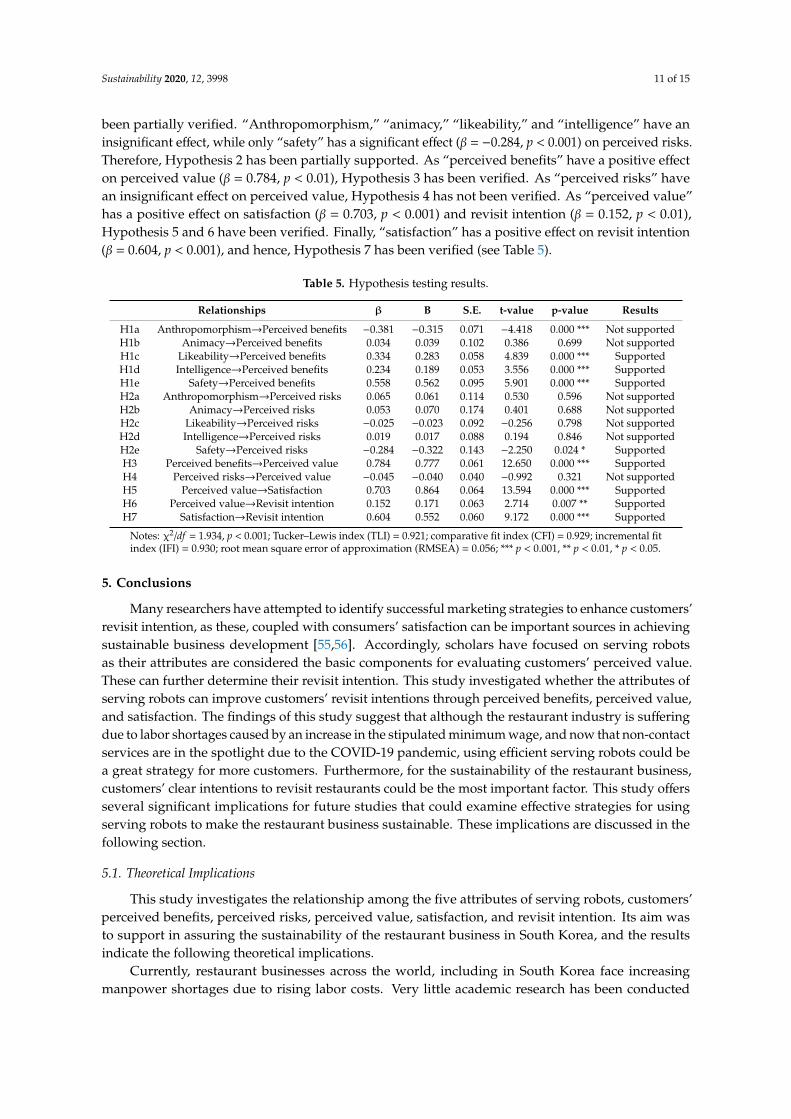
been partially verified. “Anthropomorphism,” “animacy,” “likeability,” and “intelligence” have aninsignificant effect, while only “safety” has a significant effect (β = −0.284, p < 0.001) on perceived risks.Therefore, Hypothesis 2 has been partially supported. As “perceived benefits” have a positive effecton perceived value (β = 0.784, p < 0.01), Hypothesis 3 has been verified. As “perceived risks” havean insignificant effect on perceived value, Hypothesis 4 has not been verified. As “perceived value”has a positive effect on satisfaction (β = 0.703, p < 0.001) and revisit intention (β = 0.152, p < 0.01),Hypothesis 5 and 6 have been verified. Finally, “satisfaction” has a positive effect on revisit intention(β = 0.604, p < 0.001), and hence, Hypothesis 7 has been verified (see Table 5).
Table 5. Hypothesis testing results.
Relationships β B S.E. t-value p-value Results
H1a Anthropomorphism→Perceived benefits −0.381 −0.315 0.071 −4.418 0.000 *** Not supportedH1b Animacy→Perceived benefits 0.034 0.039 0.102 0.386 0.699 Not supportedH1c Likeability→Perceived benefits 0.334 0.283 0.058 4.839 0.000 *** SupportedH1d Intelligence→Perceived benefits 0.234 0.189 0.053 3.556 0.000 *** SupportedH1e Safety→Perceived benefits 0.558 0.562 0.095 5.901 0.000 *** SupportedH2a Anthropomorphism→Perceived risks 0.065 0.061 0.114 0.530 0.596 Not supportedH2b Animacy→Perceived risks 0.053 0.070 0.174 0.401 0.688 Not supportedH2c Likeability→Perceived risks −0.025 −0.023 0.092 −0.256 0.798 Not supportedH2d Intelligence→Perceived risks 0.019 0.017 0.088 0.194 0.846 Not supportedH2e Safety→Perceived risks −0.284 −0.322 0.143 −2.250 0.024 * SupportedH3 Perceived benefits→Perceived value 0.784 0.777 0.061 12.650 0.000 *** SupportedH4 Perceived risks→Perceived value −0.045 −0.040 0.040 −0.992 0.321 Not supportedH5 Perceived value→Satisfaction 0.703 0.864 0.064 13.594 0.000 *** SupportedH6 Perceived value→Revisit intention 0.152 0.171 0.063 2.714 0.007 ** SupportedH7 Satisfaction→Revisit intention 0.604 0.552 0.060 9.172 0.000 *** Supported
Notes: χ2/df = 1.934, p < 0.001; Tucker–Lewis index (TLI) = 0.921; comparative fit index (CFI) = 0.929; incremental fitindex (IFI) = 0.930; root mean square error of approximation (RMSEA) = 0.056; *** p < 0.001, ** p < 0.01, * p < 0.05.
5. Conclusions
Many researchers have attempted to identify successful marketing strategies to enhance customers’revisit intention, as these, coupled with consumers’ satisfaction can be important sources in achievingsustainable business development [55,56]. Accordingly, scholars have focused on serving robotsas their attributes are considered the basic components for evaluating customers’ perceived value.These can further determine their revisit intention. This study investigated whether the attributes ofserving robots can improve customers’ revisit intentions through perceived benefits, perceived value,and satisfaction. The findings of this study suggest that although the restaurant industry is sufferingdue to labor shortages caused by an increase in the stipulated minimum wage, and now that non-contactservices are in the spotlight due to the COVID-19 pandemic, using efficient serving robots could bea great strategy for more customers. Furthermore, for the sustainability of the restaurant business,customers’ clear intentions to revisit restaurants could be the most important factor. This study offersseveral significant implications for future studies that could examine effective strategies for usingserving robots to make the restaurant business sustainable. These implications are discussed in thefollowing section.
5.1. Theoretical Implications
This study investigates the relationship among the five attributes of serving robots, customers’perceived benefits, perceived risks, perceived value, satisfaction, and revisit intention. Its aim wasto support in assuring the sustainability of the restaurant business in South Korea, and the resultsindicate the following theoretical implications.
Currently, restaurant businesses across the world, including in South Korea face increasingmanpower shortages due to rising labor costs. Very little academic research has been conducted
Sustainability 2020, 12, 3998 12 of 15
on serving robots compared to research regarding AI as a part of our lives more generally. Mostrobot-related research has focused on the development and utilization of robots in engineering.
First, research focused on identifying the relative importance of the attributes of a serving robotthat have an impact on the customers’ perceived benefits and perceived risks is insufficient. Analysishas shown that among the five attributes of serving robots, “likeability,” “intelligence,” and “safety”have a positive effect on perceived benefits, and “safety” has a negative effect on perceived risks. Thisstudy confirms the reliability and validity of the five attributes, and it provides a theoretical foundationfor future research.
Second, this study attempts to incorporate VAM, a theory that maximizes users' value for newtechnologies, to provide basic data for future studies. The research related to the restaurant businessbased on VAM so far, is believed to be of academic significance, although most of it has been on deliveryapplications, online to offline (O2O) services, and Kiosk, which are mainly categorized as a part of theinformation technology (IT) field. Not many studies have been conducted on serving robots. Thisstudy is expected to expand the research area on serving robots and customers' behavioral intentionsby introducing new influential variables and related theories to ensure a positive dining experience.
Finally, this study analyzes various variables (perceived benefits, perceived risks, perceived value,and satisfaction), in relation to serving robots’ attributes (independent variable) and the revisit intention(dependent variable) of customers and identifies causal relationships and influences. The study presentsnew research models and research methods related to serving robots in South Korea’s restaurantbusiness. There is no prior empirical research in this field. Additionally, the approach introduced inthis study, regarding the use of serving robots in the restaurant business, is expected to be applied toresearch in other areas to provide new academic subjects.
5.2. Practical Implications
This study was designed to examine sustainable and effective restaurant businesses. Based on theresults, practical implications that can assist in establishing strategies for sustainable development inthe restaurant industry are provided.
First, out of the five attributes of serving robots analyzed in this study, “likeability,” “intelligence,”and “safety” have positive effects on customers’ perceived benefits: while, “safety” lowers perceivedrisks. With a focus on these results, restaurant managers need to emphasize the friendly image,positive first impression, smart serving ability, and safety of serving robots to enhance customers’perceived benefits. Furthermore, “safety” has emerged as an important attribute that has a positiveand negative effect on perceived benefits and perceived risks, respectively. This implies that managersneed to be aware that customers value the “safety” of the serving robot. On the other hand,the “anthropomorphism” of the serving robot seems to have a significant effect on customers’ perceivedbenefits, but Hypothesis 1a is not supported as it indicates a negative effect. This indicates thatcustomers do not like serving robots that resemble and mimic people.
Second, it was found that the customers’ perceived benefits, through the use of serving robots,have a positive effect on perceived value. However, customers’ perceived risks do not have a significanteffect on perceived value. Based on the results of this study, it is necessary to focus on the relationshipbetween perceived benefits and perceived value. Restaurant managers should develop strategiesto enhance the likeability, intelligence, and safety of serving robots, and reduce anthropomorphism,so that the perceived benefits can be maximized and, in turn, increase perceived value.
Lastly, the relationships among the customers’ perceived value, satisfaction, and revisit intentionwere found to have a positively significant effect. In particular, the focus should be on the serving robots’attributes, which is the starting point of this study, to increase the customer's revisit intention. The studyfound that among the serving robots’ attributes, customers’ perceived benefits were significantlyinfluenced by the order of “safety,” “likeability,” and “intelligence,” and perceived benefits weremediated by perceived value, which has a significant effect on satisfaction and revisit intention.Restaurant owners should refer to these results and eventually aim to raise the customers’ revisit
Sustainability 2020, 12, 3998 13 of 15
intention. In other words, restaurant owners need to highlight the “safety” of the serving robot mostand ensure that a friendly and highly likeable image of the robot is created. The owners need to offerrobot services that can intelligently and adequately fulfill the customers’ desires.
6. Limitations and Future Research
This study has various practical and theoretical implications. However, the study has certainlimitations and there are some underexplored areas that could be studied in future.
First, this study is based on customers of restaurants that use serving robots in South Korea.For more generalized and reliable results, related research is needed for a wider variety of restaurantcustomers in the future. As there will be various results from serving robots’ attributes, future researchon serving robots should be further expanded to provide more diverse marketing strategies acrossdifferent fields or industries.
Second, this study was completed on the basis of an online survey by people who are eighteen orolder and live in Korea. They responded to the questionnaire based on the memory of their experienceof dining in a restaurant that uses serving robots within the last three months. The fact that an onsitesurvey was not completed within the restaurants themselves could be a limitation of this study andshould be addressed in future studies.
Finally, the fundamental significance of this research lies in the fact that human beings are fallible,whereas robots have no collective consciousness or genetic memory, and are result oriented. Withfurther research in this field and appropriate application of the findings of such research in practicalcontexts, AI can be used to enhance the quality of human lives.
Author Contributions: All authors contributed equally to this work. All authors have read and agreed to thepublished version of the manuscript
Conflicts of Interest: The authors declare no conflicts of interest.
References
1. Lim, J.Y. LG, Woowa Brothers to Collaborate on Food Robotics. Available online: http://www.koreaherald.com/view.php?ud=20200228000540&ACE_SEARCH=1 (accessed on 28 February 2020).
2. Song, S.H. [CES 2020] Samsung Unveils Life Companion Bot Ballie. Available online: http://www.koreaherald.com/view.php?ud=20200107000762&ACE_SEARCH=1 (accessed on 7 January 2020).
3. Kim, Y.W. KT Plans to Make AI Available Everywhere. Available online: http://www.koreaherald.com/view.php?ud=20200106000532&ACE_SEARCH=1 (accessed on 6 January 2020).
4. Lee, J.W. Self-Portrait of a Cooking Robot. Available online: http://www.thescoop.co.kr/news/articleView.html?idxno=36635 (accessed on 27 September 2019).
5. Rokonuzzaman, M. Post-COVID-19 Pandemic: Touch-Free Localised Production. Availableonline: https://thefinancialexpress.com.bd/views/views/post-covid-19-pandemic-touch-free-localised-production-1585407944 (accessed on 28 March 2020).
6. Cho, M.H. LG Deploys Service Robot in Seoul Restaurant. Available online: https://www.zdnet.com/article/
lg-deploys-service-robot-in-seoul-restaurant/ (accessed on 3 February 2020).7. Choi, H.J. Restaurant Owners Looking for Serving Robots, Why Are There More Local Cities Than Seoul?
Available online: https://www.hankyung.com/it/article/202001081838i (accessed on 8 January 2020).8. Tanaka, F.; Kimura, T. Care-receiving robot as a tool of teachers in child education. Interact. Stud. 2010,
11, 263. [CrossRef]9. Nadimpalli, M. Artificial intelligence risks and benefits. Artif. Intell. 2017, 6.10. Grigore, E.C.; Eder, K.; Lenz, A.; Skachek, S.; Pipe, A.G.; Melhuish, C. Towards safe human-robot interaction.
In Conference Towards Autonomous Robotic Systems; Springer: Berlin/Heidelberg, Germany, 2011; pp. 323–335.11. Giuliani, M.; Petrick, R.; Foster, M.E.; Gaschler, A.; Isard, A.; Pateraki, M.; Sigalas, M. Comparing task-based
and socially intelligent behaviour in a robot bartender. In Proceedings of the 15th ACM on InternationalConference on Multimodal Interaction, New York, NY, USA, 13 December 2013; pp. 263–270.
Sustainability 2020, 12, 3998 14 of 15
12. Alenljung, B.; Lindblom, J.; Andreasson, R.; Ziemke, T. User Experience in Social Human-Robot Interaction.In Rapid Automation: Concepts, Methodologies, Tools, and Applications; IGI Global: Hershey, PA, USA, 2019;pp. 1468–1490.
13. Goundrey-Smith, S. Pharmacy robots in UK hospitals: The benefits and implementation issues. Pharm. J.2008, 280, 599–602.
14. Broadbent, E.; Jayawardena, C.; Kerse, N.; Stafford, R.Q.; MacDonald, B.A. Human-Robot Interaction Researchto Improve Quality of Life in Elder Care—An Approach and Issues. In Proceedings of the Workshops at theTwenty-Fifth AAAI Conference on Artificial Intelligence, San Francisco, CA, USA, 8 August 2011.
15. Kim, K.J.; Park, E.; Sundar, S.S. Caregiving role in human–robot interaction: A study of the mediating effectsof perceived benefit and social presence. Comput. Hum. Behav. 2013, 29, 1799–1806. [CrossRef]
16. Kim, H.W.; Chan, H.C.; Gupta, S. Value-based adoption of mobile internet: An empirical investigation.Decis. Support Syst. 2007, 43, 111–126. [CrossRef]
17. Kleijnen, M.; De Ruyter, K.; Wetzels, M. An assessment of value creation in mobile service delivery and themoderating role of time consciousness. J. Retail. 2007, 83, 33–46. [CrossRef]
18. Wang, H.Y.; Wang, S.H. Predicting mobile hotel reservation adoption: Insight from a perceived valuestandpoint. Int. J. Hosp. Manag. 2010, 29, 598–608. [CrossRef]
19. Chung, N.; Koo, C. The use of social media in travel information search. Telemat. Inform. 2015, 32, 215–229.[CrossRef]
20. Sweeney, J.C.; Soutar, G.N.; Johnson, L.W. The role of perceived risk in the quality-value relationship: A studyin a retail environment. J. Retail. 1999, 75, 77–105. [CrossRef]
21. Snoj, B.; Pisnik Korda, A.; Mumel, D. The relationships among perceived quality, perceived risk and perceivedproduct value. J. Prod. Brand Manag. 2004, 13, 156–167. [CrossRef]
22. Lin, H.H.; Wang, Y.S. An examination of the determinants of customer loyalty in mobile commerce contexts.Inf. Manag. 2006, 43, 271–282. [CrossRef]
23. Ryu, K.; Han, H.; Kim, T.H. The relationships among overall quick-casual restaurant image, perceived value,customer satisfaction, and behavioral intentions. Int. J. Hosp. Manag. 2008, 27, 459–469. [CrossRef]
24. Han, H.; Hyun, S.S. Impact of hotel-restaurant image and quality of physical-environment, service, and foodon satisfaction and intention. Int. J. Hosp. Manag. 2017, 63, 82–92. [CrossRef]
25. Jeon, Y.M. A study on influence of family restaurant image on satisfaction, trust and revisit intention.Culin. Sci. Hosp. Res. 2017, 23, 74–85.
26. Abdullah, D.; Hamir, N.; Nor, N.M.; Krishnaswamy, J.; Rostum, A.M.M. Food quality, service quality, pricefairness and restaurant re-patronage intention: The mediating role of customer satisfaction. Int. J. Acad. Res.Bus. Soc. Sci. 2018, 8, 211–226.
27. Kim, H.S.; Shim, J.H. The effects of quality factors on customer satisfaction, trust and behavioral intention inchicken restaurants. J. Ind. Distrib. Bus. 2019, 10, 43–56. [CrossRef]
28. Selaka, H.S.; Perera, K.A.T.S.; Deepal, M.A.W.T.; Sanjeewa, P.D.R.; Sirithunge, H.C.; Jayasekara, A.G.B.P.Fuzzy-Bot: A Food Serving Robot as a Teaching and Learning Platform for Fuzzy Logic. In Proceedings of the2018 Moratuwa Engineering Research Conference, Moratuwa, Sri Lanka, 30 May–1 June 2018; pp. 565–570.
29. Xue, Z.; Ruehl, S.; Hermann, A.; Kerscher, T.; Dillmann, R. An autonomous ice-cream serving robot.In Proceedings of the 2011 IEEE International Conference on Robotics and Automation, Shanghai, China,5 April 2011; pp. 3451–3452.
30. Neeti, M.; Alpana, S.; Neetu, R.; Pratibha, P. Serving robot: New generation electronic waiter. Int. J. Eng. Sci.2016, 6, 4.
31. Iqbal, J.; Khan, Z.H.; Khalid, A. Prospects of robotics in food industry. Food Sci. Technol. 2017, 37, 159–165.[CrossRef]
32. Morita, T.; Kashiwagi, N.; Yorozu, A.; Walch, M.; Suzuki, H.; Karagiannis, D.; Yamaguchi, T. Practice ofmulti-robot teahouse based on PRINTEPS and evaluation of service quality. In Proceedings of the 2018 IEEE42nd Annual Computer Software and Applications Conference (COMPSAC), Tokyo, Japan, 23–27 July 2018;Volume 2, pp. 147–152.
33. Thanh, V.N.; Vinh, D.P.; Nghi, N.T. Restaurant Serving Robot with Double Line Sensors Following Approach.In Proceedings of the 2019 IEEE International Conference on Mechatronics and Automation (ICMA), Tianjin,China, 4–8 August 2019; pp. 235–239.
Sustainability 2020, 12, 3998 15 of 15
34. Yu, Y.S.; Luo, M.; Zhu, D.H. The effect of quality attributes on visiting consumers’ patronage intentions ofgreen restaurants. Sustainability 2018, 10, 1187. [CrossRef]
35. Bartneck, C.; Croft, E.; Kulic, D. Measuring the anthropomorphism, animacy, likeability, perceived intelligenceand perceived safety of robots. Proceedings of the Metrics for Human-Robot Interaction Workshop inaffiliation with the 3rd ACM/IEEE International Conference on Human-Robot Interaction (HRI 2008).Tech. Rep. 2008, 471, 37–44.
36. Fogg, B.J. Persuasive technology: Using computers to change what we think and do. Ubiquity 2002, 2.[CrossRef]
37. Robbins, T.L.; DeNisi, A.S. A closer look at interpersonal affect as a distinct influence on cognitive processingin performance evaluations. J. Appl. Psychol. 1994, 79, 341. [CrossRef]
38. Kim, Y.; Park, Y.; Choi, J. A study on the adoption of IoT smart home service: Using Value-based AdoptionModel. Total Qual. Manag. Bus. Excell. 2017, 28, 1149–1165. [CrossRef]
39. Van Der Voordt, T.; Anker, J.P.; Gerard, H.J.; Bergsma, F. Value Adding Management of buildings and facilityservices in four steps. Corp. Real Estate J. 2016, 6, 42–56.
40. Zeithaml, V.A. Consumer perceptions of price, quality, and value: A means-end model and synthesis ofevidence. J. Mark. 1988, 52, 2–22. [CrossRef]
41. Lin, T.C.; Wu, S.; Hsu, J.S.C.; Chou, Y.C. The integration of value-based adoption and expectation –confirmationmodels: An example of IPTV continuance intention. Decis. Support Syst. 2012, 54, 63–75. [CrossRef]
42. Roostika, R. Mobile internet acceptance among university students: A value-based adoption model. Int. J.Res. Manag. Technol. (IJRMT) 2012, 2, 21–28.
43. Kim, S.H.; Bae, J.H.; Jeon, H.M. Continuous Intention on Accommodation Apps: Integrated Value-BasedAdoption and Expectation–Confirmation Model Analysis. Sustainability 2019, 11, 1578. [CrossRef]
44. Han, J.H.; Kang, S.B.; Moon, T.S. An Empirical Study on Perceived Value and Continuous Intention to Use ofSmart Phone, and the Moderating Effect of Personal Innovativeness. Asia Pac. J. Inf. Syst. 2013, 23, 53–84.[CrossRef]
45. Kim, Y.H. A Study on Adoption of IoT Smart Home Service: Based on Contingent Valuation Method andValue-Based Adoption Model. Doctoral dissertation, Soongsil University, Seoul, Korea, 2016.
46. Kim, J.H.; Bai, L.Z.; Byun, J.W. The Impact of Tourism Mobile App Characteristic on Perceived Value, UserSatisfaction, Continuous Use Intention: Focused on Chinese Tourist. J. Tour. Leis. Res. 2015, 27, 5–22.
47. Kang, J.H.; Moon, T.S. Influence of Perceived Value of Social Commerce on Repurchase Intention andMediating Effect of User Satisfaction. J. Internet Electron. Commer. Res. 2016, 16, 209–224.
48. Sirdeshmukh, D.; Singh, J.; Sabol, B. Consumer trust, value, and loyalty in relational exchanges. J. Mark.2002, 66, 15–37. [CrossRef]
49. Kim, S.J.; Kim, S.H.; Kim, E.K. A Study of the Effect of Perceived Wine Value on Customer Satisfaction, Trust,Repurchase Intention. J. Foodserv. Manag. 2008, 11, 221–241.
50. Forsythe, S.; Liu, C.; Shannon, D.; Gardner, L.C. Development of a scale to measure the perceived benefitsand risks of online shopping. J. Interact. Mark. 2006, 20, 55–75. [CrossRef]
51. Petrick, J.F. Development of a multi-dimensional scale for measuring the perceived value of a service. J. Leis.Res. 2002, 34, 119–134. [CrossRef]
52. Babin, B.J.; Lee, Y.K.; Kim, E.J.; Griffin, M. Modeling consumer satisfaction and word-of-mouth: Restaurantpatronage in Korea. J. Serv. Mark. 2005, 19, 133–139. [CrossRef]
53. Youn, H.; Yin, R.; Kim, J.H.; Li, J.J. Examining traditional restaurant diners’ intention: An application of theVBN theory. Int. J. Hosp. Manag. 2019, 85, 102360. [CrossRef]
54. Hair, J.F.; Black, W.C.; Babin, B.J.; Anderson, R.E. Multivariate Data Analysis: Pearson New International Edition;Pearson Education Limited: Essex, UK, 2014.
55. Zheng, Y.; Wang, J.; Tsai, S.B.; Li, G.; Wang, J.; Zhou, J. Research on Customer Satisfaction in Marine Culturaland Sustainable Tourism—A Case Study of Shanghai. Sustainability 2017, 9, 921. [CrossRef]
56. Su, L.; Huang, Y. How does perceived destination social responsibility impact revisit intentions: Themediating roles of destination preference and relationship quality. Sustainability 2019, 11, 133. [CrossRef]
© 2020 by the authors. Licensee MDPI, Basel, Switzerland. This article is an open accessarticle distributed under the terms and conditions of the Creative Commons Attribution(CC BY) license (http://creativecommons.org/licenses/by/4.0/).