FACES OF LINN COUNTY SERVING YOU
174
FACES OF LINN COUNTY SERVING YOU www.LinnCounty.org 2014 Annual Budget for Linn County, Iowa Deputy Kevin Louis & K-9 Gompie Debbie Ironside, Recorder’s Office Bill Micheel, Planning & Development Cindy Fiester, Public Health Kim McElree, Attorney’s Office Anastasia Wilson, Attorney’s Office Brock Holub, Secondary Roads
-
Upload
khangminh22 -
Category
Documents
-
view
1 -
download
0
Transcript of FACES OF LINN COUNTY SERVING YOU

FACES OF LINN COUNTYSERVING YOU
www.LinnCounty.org
2014 Annual Budget for Linn County, Iowa
Deputy Kevin Louis & K-9 Gompie
Debbie Ironside, Recorder’s Office
Bill Micheel, Planning & Development
Cindy Fiester, Public Health
Kim McElree, Attorney’s Office
Anastasia Wilson, Attorney’s Office
Brock Holub, Secondary Roads
County of Linn, Iowa
Fiscal Year 2014
Annual Budget
Board of Supervisors
John Harris, Chairperson
Lu Barron, Supervisor
Linda Langston, Supervisor
Ben Rogers, Supervisor
Brent Oleson, Supervisor
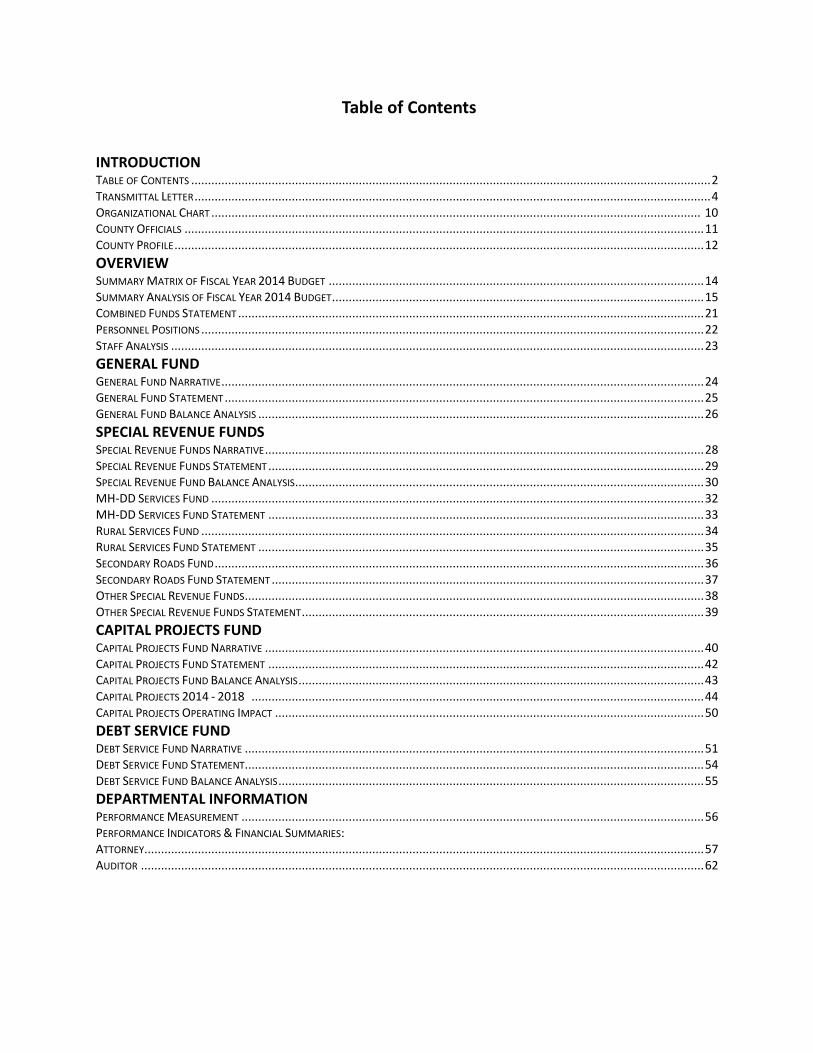
INTRODUCTION TABLE OF CONTENTS ........................................................................................................................................................... 2 TRANSMITTAL LETTER .......................................................................................................................................................... 4 ORGANIZATIONAL CHART .................................................................................................................................................. 10 COUNTY OFFICIALS ........................................................................................................................................................... 11 COUNTY PROFILE .............................................................................................................................................................. 12
OVERVIEW
SUMMARY MATRIX OF FISCAL YEAR 2014 BUDGET ................................................................................................................ 14 SUMMARY ANALYSIS OF FISCAL YEAR 2014 BUDGET ............................................................................................................... 15 COMBINED FUNDS STATEMENT ........................................................................................................................................... 21 PERSONNEL POSITIONS ...................................................................................................................................................... 22 STAFF ANALYSIS ............................................................................................................................................................... 23
GENERAL FUND
GENERAL FUND NARRATIVE ................................................................................................................................................ 24 GENERAL FUND STATEMENT ............................................................................................................................................... 25 GENERAL FUND BALANCE ANALYSIS ..................................................................................................................................... 26
SPECIAL REVENUE FUNDS SPECIAL REVENUE FUNDS NARRATIVE ................................................................................................................................... 28 SPECIAL REVENUE FUNDS STATEMENT .................................................................................................................................. 29 SPECIAL REVENUE FUND BALANCE ANALYSIS .......................................................................................................................... 30 MH-DD SERVICES FUND ................................................................................................................................................... 32 MH-DD SERVICES FUND STATEMENT .................................................................................................................................. 33 RURAL SERVICES FUND ...................................................................................................................................................... 34 RURAL SERVICES FUND STATEMENT ..................................................................................................................................... 35 SECONDARY ROADS FUND .................................................................................................................................................. 36 SECONDARY ROADS FUND STATEMENT ................................................................................................................................. 37 OTHER SPECIAL REVENUE FUNDS ......................................................................................................................................... 38 OTHER SPECIAL REVENUE FUNDS STATEMENT ........................................................................................................................ 39
CAPITAL PROJECTS FUND
CAPITAL PROJECTS FUND NARRATIVE ................................................................................................................................... 40 CAPITAL PROJECTS FUND STATEMENT .................................................................................................................................. 42 CAPITAL PROJECTS FUND BALANCE ANALYSIS ......................................................................................................................... 43 CAPITAL PROJECTS 2014 - 2018 ....................................................................................................................................... 44 CAPITAL PROJECTS OPERATING IMPACT ................................................................................................................................ 50
DEBT SERVICE FUND
DEBT SERVICE FUND NARRATIVE ......................................................................................................................................... 51 DEBT SERVICE FUND STATEMENT ......................................................................................................................................... 54 DEBT SERVICE FUND BALANCE ANALYSIS ............................................................................................................................... 55
DEPARTMENTAL INFORMATION
PERFORMANCE MEASUREMENT .......................................................................................................................................... 56 PERFORMANCE INDICATORS & FINANCIAL SUMMARIES: ATTORNEY ....................................................................................................................................................................... 57 AUDITOR ........................................................................................................................................................................ 62
(Continued)
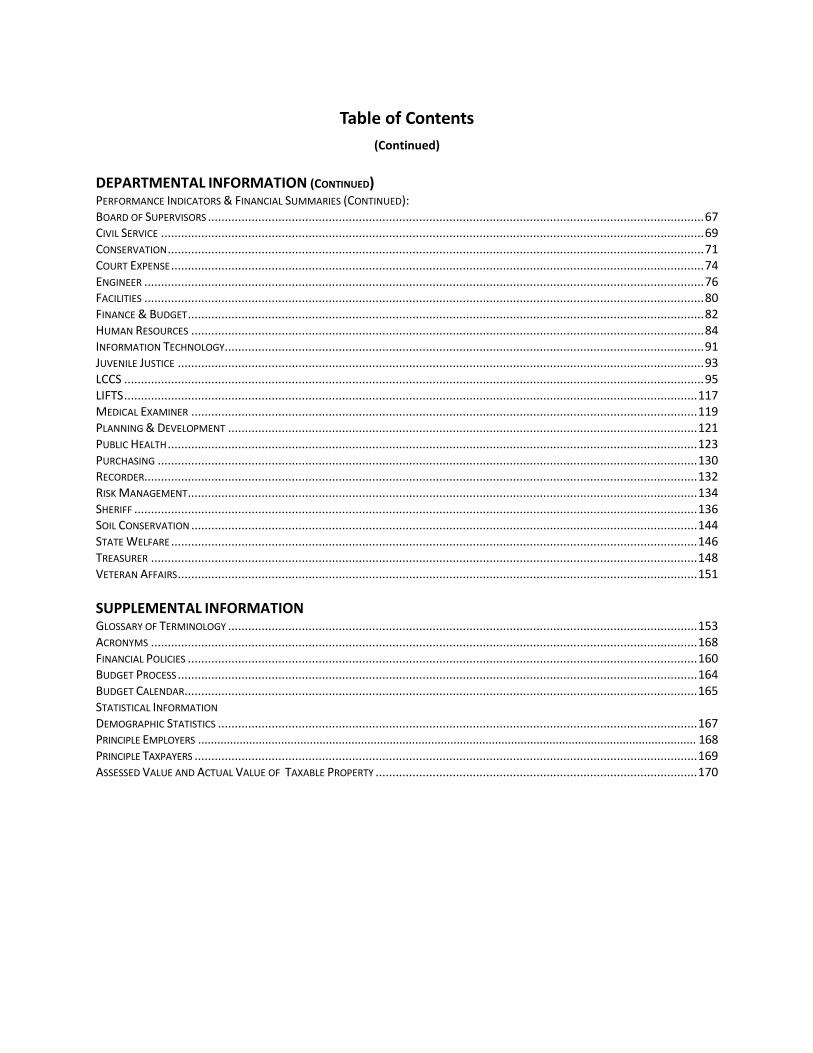
DEPARTMENTAL INFORMATION (CONTINUED)
PERFORMANCE INDICATORS & FINANCIAL SUMMARIES (CONTINUED): BOARD OF SUPERVISORS .................................................................................................................................................... 67 CIVIL SERVICE .................................................................................................................................................................. 69 CONSERVATION ................................................................................................................................................................ 71 COURT EXPENSE ............................................................................................................................................................... 74 ENGINEER ....................................................................................................................................................................... 76 FACILITIES ....................................................................................................................................................................... 80 FINANCE & BUDGET .......................................................................................................................................................... 82 HUMAN RESOURCES ......................................................................................................................................................... 84 INFORMATION TECHNOLOGY ............................................................................................................................................... 91 JUVENILE JUSTICE ............................................................................................................................................................. 93 LCCS ............................................................................................................................................................................. 95 LIFTS ........................................................................................................................................................................... 117 MEDICAL EXAMINER ....................................................................................................................................................... 119 PLANNING & DEVELOPMENT ............................................................................................................................................ 121 PUBLIC HEALTH .............................................................................................................................................................. 123 PURCHASING ................................................................................................................................................................. 130 RECORDER..................................................................................................................................................................... 132 RISK MANAGEMENT ........................................................................................................................................................ 134 SHERIFF ........................................................................................................................................................................ 136 SOIL CONSERVATION ....................................................................................................................................................... 144 STATE WELFARE ............................................................................................................................................................. 146 TREASURER ................................................................................................................................................................... 148 VETERAN AFFAIRS ........................................................................................................................................................... 151
SUPPLEMENTAL INFORMATION GLOSSARY OF TERMINOLOGY ............................................................................................................................................ 153 ACRONYMS ................................................................................................................................................................... 168 FINANCIAL POLICIES ........................................................................................................................................................ 160 BUDGET PROCESS ........................................................................................................................................................... 164 BUDGET CALENDAR ......................................................................................................................................................... 165 STATISTICAL INFORMATION DEMOGRAPHIC STATISTICS ............................................................................................................................................... 167 PRINCIPLE EMPLOYERS ............................................................................................................................................................ 168 PRINCIPLE TAXPAYERS ...................................................................................................................................................... 169 ASSESSED VALUE AND ACTUAL VALUE OF TAXABLE PROPERTY ................................................................................................ 170
4
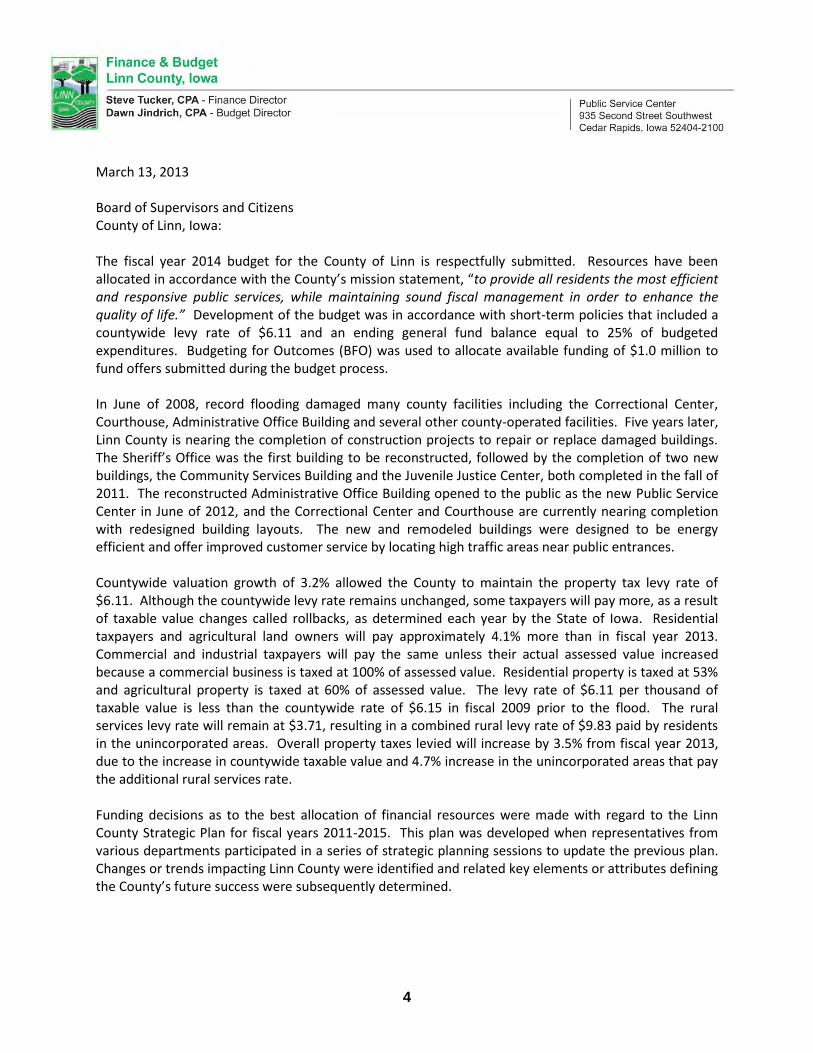
March 13, 2013 Board of Supervisors and Citizens County of Linn, Iowa: The fiscal year 2014 budget for the County of Linn is respectfully submitted. Resources have been allocated in accordance with the County’s mission statement, “to provide all residents the most efficient and responsive public services, while maintaining sound fiscal management in order to enhance the quality of life.” Development of the budget was in accordance with short-term policies that included a countywide levy rate of $6.11 and an ending general fund balance equal to 25% of budgeted expenditures. Budgeting for Outcomes (BFO) was used to allocate available funding of $1.0 million to fund offers submitted during the budget process. In June of 2008, record flooding damaged many county facilities including the Correctional Center, Courthouse, Administrative Office Building and several other county-operated facilities. Five years later, Linn County is nearing the completion of construction projects to repair or replace damaged buildings. The Sheriff’s Office was the first building to be reconstructed, followed by the completion of two new buildings, the Community Services Building and the Juvenile Justice Center, both completed in the fall of 2011. The reconstructed Administrative Office Building opened to the public as the new Public Service Center in June of 2012, and the Correctional Center and Courthouse are currently nearing completion with redesigned building layouts. The new and remodeled buildings were designed to be energy efficient and offer improved customer service by locating high traffic areas near public entrances. Countywide valuation growth of 3.2% allowed the County to maintain the property tax levy rate of $6.11. Although the countywide levy rate remains unchanged, some taxpayers will pay more, as a result of taxable value changes called rollbacks, as determined each year by the State of Iowa. Residential taxpayers and agricultural land owners will pay approximately 4.1% more than in fiscal year 2013. Commercial and industrial taxpayers will pay the same unless their actual assessed value increased because a commercial business is taxed at 100% of assessed value. Residential property is taxed at 53% and agricultural property is taxed at 60% of assessed value. The levy rate of $6.11 per thousand of taxable value is less than the countywide rate of $6.15 in fiscal 2009 prior to the flood. The rural services levy rate will remain at $3.71, resulting in a combined rural levy rate of $9.83 paid by residents in the unincorporated areas. Overall property taxes levied will increase by 3.5% from fiscal year 2013, due to the increase in countywide taxable value and 4.7% increase in the unincorporated areas that pay the additional rural services rate. Funding decisions as to the best allocation of financial resources were made with regard to the Linn County Strategic Plan for fiscal years 2011-2015. This plan was developed when representatives from various departments participated in a series of strategic planning sessions to update the previous plan. Changes or trends impacting Linn County were identified and related key elements or attributes defining the County’s future success were subsequently determined.
5
The plan includes a list of seven strategies and goals for each of the strategies as follows: Strategy 1: Excel in Customer Satisfaction Provide excellent service to customers with responsive and accurate information. Goals:
A. Solicit and consider feedback from customers when making decisions B. Select and retain qualified people and provide high quality training C. Establish measurable customer service standards D. Create a consistent service message that can be shared by all departments
Strategy 2: Develop a Communications Plan Utilize diverse channels to increase awareness of services and programs provided to customers and encourage shared communication. Goals:
A. Maintain regular communications with the public B. Share and discuss important information with employees C. Educate the public by providing information about who we are and what we do D. Create a County branding strategy E. Promote and share successes
Strategy 3: Improve Infrastructure Ensure infrastructure meets the needs of employees and the public. Goals:
A. Build, rebuild, and maintain county buildings, equipment, and facilities, including damage caused by the Flood of 2008
B. Update and maintain a disaster recovery plan C. Increase energy efficiency D. Maintain and enhance technology utilizing the employee technology committee
Strategy 4: Enhance Quality of Life Provide and promote opportunities to improve emotional, social, environmental, economic, and physical well-being. Goals:
A. Provide a properly maintained secondary roads system B. Promote public access to trails, waterways, parks, green space, bike paths, camping, and
other recreational activities C. Maintain a professional, responsive, and efficient public safety, public health, and social
welfare system
6
Strategy 5: Build Partnerships Participate in effective partnerships and new opportunities for joint participation in projects and delivery of services. Goals:
A. Collaborate to address problems, common issues, concerns, or needs B. Actively engage in open communications and build equitable relationships C. Collectively define roles and responsibilities in partnerships D. Provide opportunities for increased partner interactions E. Address emerging trends
Strategy 6: Create and Foster a Culture of Ownership Demonstrate a sense of pride in the organization along with shared responsibility for outcomes. Goals:
A. Develop and cultivate diverse and respectful employee relationships B. Promote positive results through employee empowerment C. Recognize and acknowledge employee achievements D. Offer effective and applicable employee training E. Create and support a safe, positive, fun, and engaging work place
Strategy 7: Be Fiscally Responsible Demonstrate sound fiscal practices. Goals:
A. Demonstrate use of financial analysis in county decisions B. Establish outcome based quality assurance C. Recognize employees for fiscally responsible decisions D. Proactively seek alternative resources for funding E. Identify potential liabilities and exposures to minimize risk F. Utilize an effective risk management policy and plan
7
The Budget in Brief The fiscal 2014 budget was developed using the following objectives:
Countywide tax rate of $6.11 per thousand
General fund uses not to exceed revenues
General fund ending balance of 25%
Wage increases funded for existing staff
No increase in operations
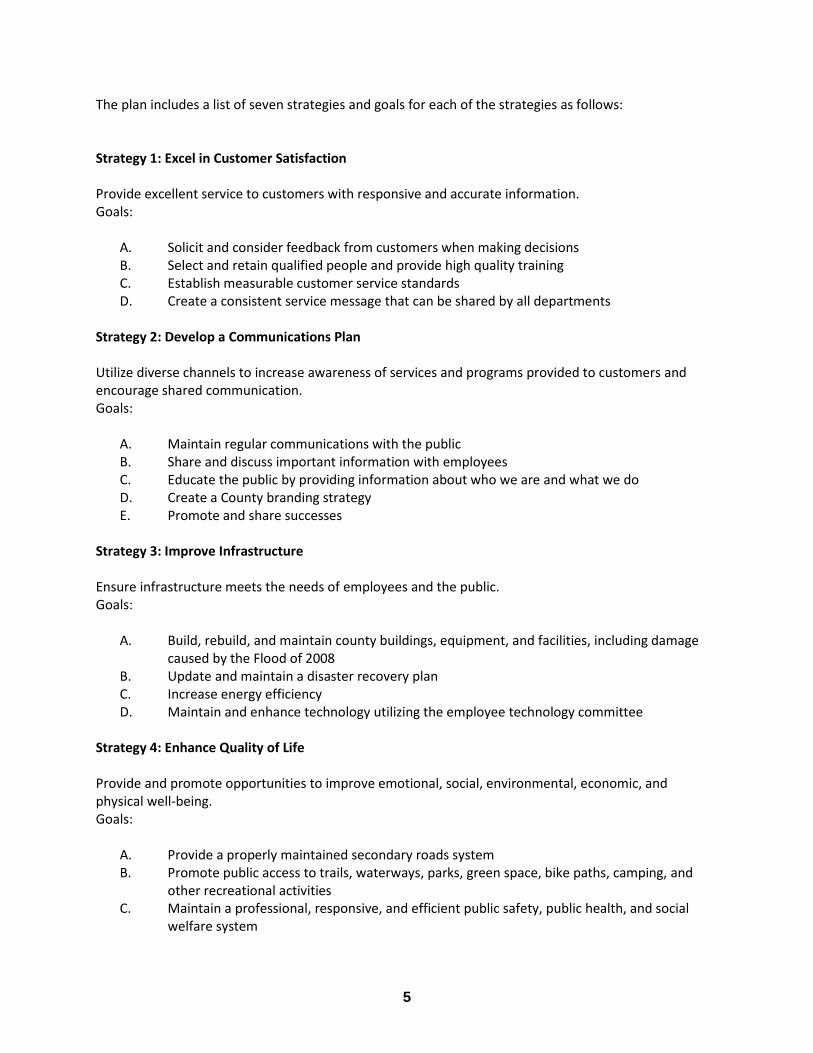
Funding of $1.0 million for offers Revenues for all governmental funds total $108,510,000 – a decrease of $9,075,000 or 7.7% from the fiscal 2013 adopted budget, primarily due to reductions in mental health services resulting from state funding cuts. Net property taxes will increase by 3.1% or $1,758,000 from fiscal 2013 as a result of valuation growth. The countywide levy rate will remain at $6.11 per thousand dollars of taxable value. Net property tax revenue represents 53.6% of total revenues, an increase from 48.0% in fiscal 2013 with the larger percentage primarily due to overall revenues decreasing. Rural residents will pay $9.83 per thousand dollars of taxable value, including the rural services levy rate of $3.71 with net property taxes increasing by the amount of valuation growth. Delinquent collections and penalties and interest will decrease $45,000 and $10,000 respectively from the 2013 budget, based on current year collections. Other county taxes will decrease $499,000 or 6.1% from reduced excise tax revenues on utilities. Intergovernmental revenues will decrease by $10,108,000 or 24.4% from the current budget due to reductions in mental health funding by the State of Iowa. Licenses and permits revenue will increase by $104,000 or 12.1% to $961,000 from increased restaurant inspection fees in the Public Health budget and weapons permit increases in the Sheriff’s Department. Charges for services revenue will decrease by $136,000 or 1.8% due to mental health service reductions. Use of money and property revenue will decrease $185,000 or 23.3% due to reductions in rent collection from the Abbe Center, a mental health provider operating the County’s care facility. Miscellaneous revenue increases of $46,000 or 3.5% are due to fees from private sources and materials collected by the Engineer.
Fiscal Year 2014 Revenues
Property Tax 54%
Use of Money 1%
Intergovt. 29%
Other Tax 7%
Charges for Service
7%
Miscellaneous 1%
Licenses & Permits
1%
8
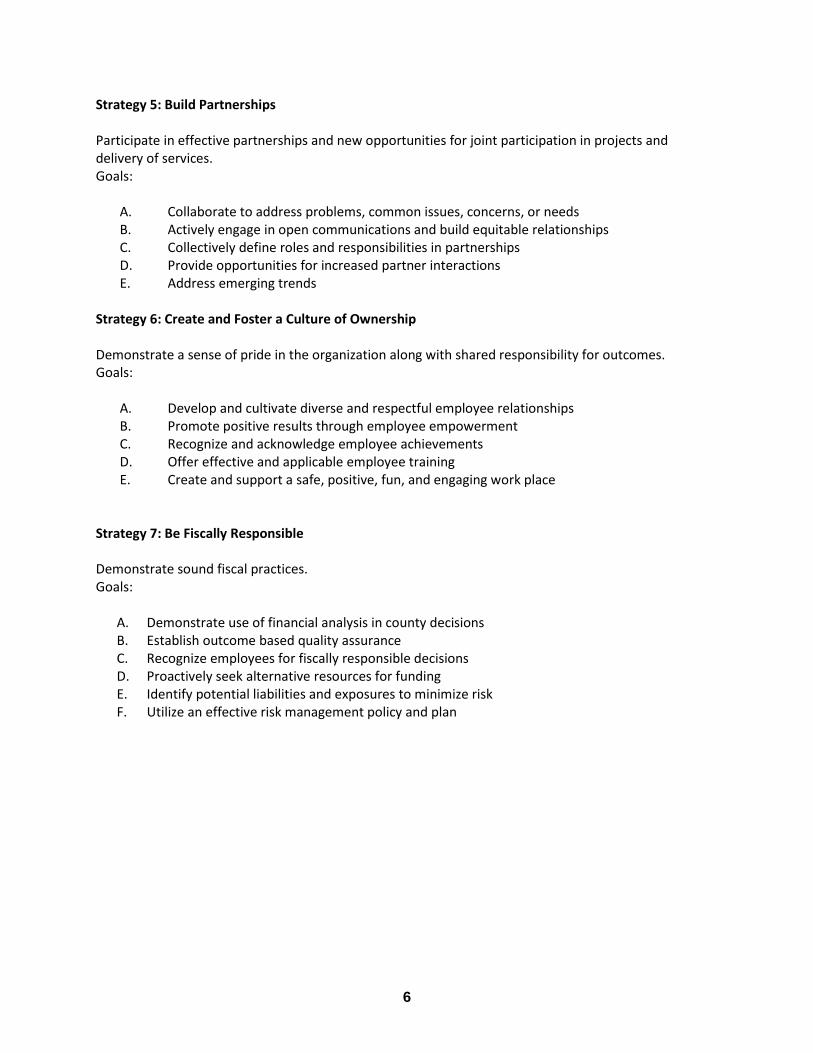
The expenditure budget for fiscal year 2014 is $108,410,000 – an overall decrease of $10,801,000 or 9.1% from the fiscal 2013 adopted budget. Public safety and legal services expenditures will increase $982,000 or 4.2% primarily due to wage and benefit cost increases of $589,000 and operational increases of $319,000 in the Sheriff’s Department, including an additional deputy position. Physical health and social services will increase by $957,000 or 6.5% to $15,576,000 in fiscal 2014 as a result of increased grant funding in the Public Health and Linn County Community Services (LCCS) departments. Mental health expenditures will decrease $13,828,000 or 39.2% due to budget cuts based on state funding reductions. County environment and education is budgeted to decrease slightly by $5,000 or 0.1% from the current fiscal year. Roads and transportation will increase by $167,000 or 1.4% from additional funding for road maintenance due to valuation growth. Government services to residents will increase by $194,000 or 4.9% due to local election costs for cities and schools in fiscal 2014. Administration will increase by $656,000 or 5.0% due to wage and benefit increases and one-time projects including document imaging software. Debt service will decrease by $8,000 or 0.5% based on actual principle and interest costs. Capital projects will increase $84,000 or 1.0% in fiscal 2014 due to the completion of flood recovery projects offset by an increase in Conservation Department projects.
Fiscal Year 2014 Expenditures
Total staffing is budgeted at 788.19 full-time equivalents, a net decrease of 2.13 FTEs from the 2013 adopted budget. Salary and benefit costs of $60,962,000 represent a slight increase from the $59,192,000 budgeted in fiscal 2013. Wages and benefits comprise 56.2% of the total expenditure budget. Wage increases are budgeted at 2.25% for AFSCME bargaining unit employees and 2.95% for PPME bargaining unit employees per contract agreements. Managers and elected officials are budgeted to receive 2.25% wage increases in fiscal year 2014.
Public Safety &
Legal Services
22%
Physical Health &
Social Services
14% Mental Health
20%
County
Environment
6%
Roads & Transport.
11%
Government
Services
4%
Administration
13%
Debt Service
2%
Capital Projects
8%
9
ACKNOWLEDGMENTS The Government Finance Officers Association of the United States and Canada (GFOA) presented the Distinguished Budget Presentation Award to the County for its fiscal year 2013 budget document. This was the 17th consecutive year that the County has received this prestigious award. Preparation of the annual budget document would not have been accomplished without the assistance of all department heads and elected officials, especially in the area of performance measurement reporting. The challenge of providing services to the residents of the County while maintaining public facilities and infrastructure continues. By working cooperatively with the public, we are confident that the County will continue to maximize the services provided to meet the needs of residents in the most effective and efficient manner. Respectfully submitted, _________________________ _________________________ Dawn Jindrich, Budget Director Steve Tucker, Finance Director
10
Residents of
Linn County
Board of
Supervisors
Auditor Treasurer Recorder Sheriff
Facilities
Conservation
Medical
Examiner
Civil
Service
Attorney
Child Support
Recovery Unit
Juvenile
Justice
Court
Services
State
Welfare
General
Assistance
Services for
People with Disabilities
Youth
Services
Community
Services
Linn County Comm.
Services Advisory Board
Zoning
Commission
Board of
Adjustment
Building Board
of Appeals
Electrical Board
of Appeals
Plumbing Board
of Appeals
Mechanical Board
of Appeals
Planning &
Development
Public Health
Board of
Health
Conservation
Board
Veteran
Affairs
Information
Technology
Risk
Management
Human
Resources
Engineer Finance & Budget
Purchasing LIFTS
Soil Conservation Emergency
Management
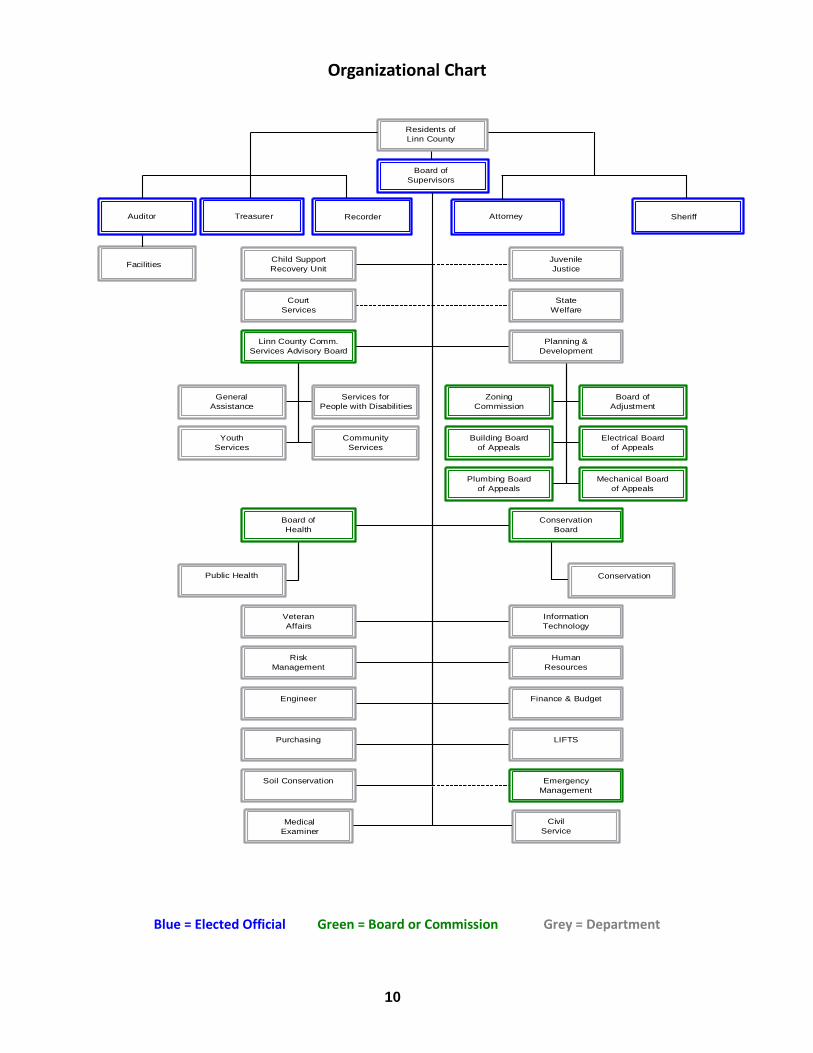
Blue = Elected Official Green = Board or Commission Grey = Department
11
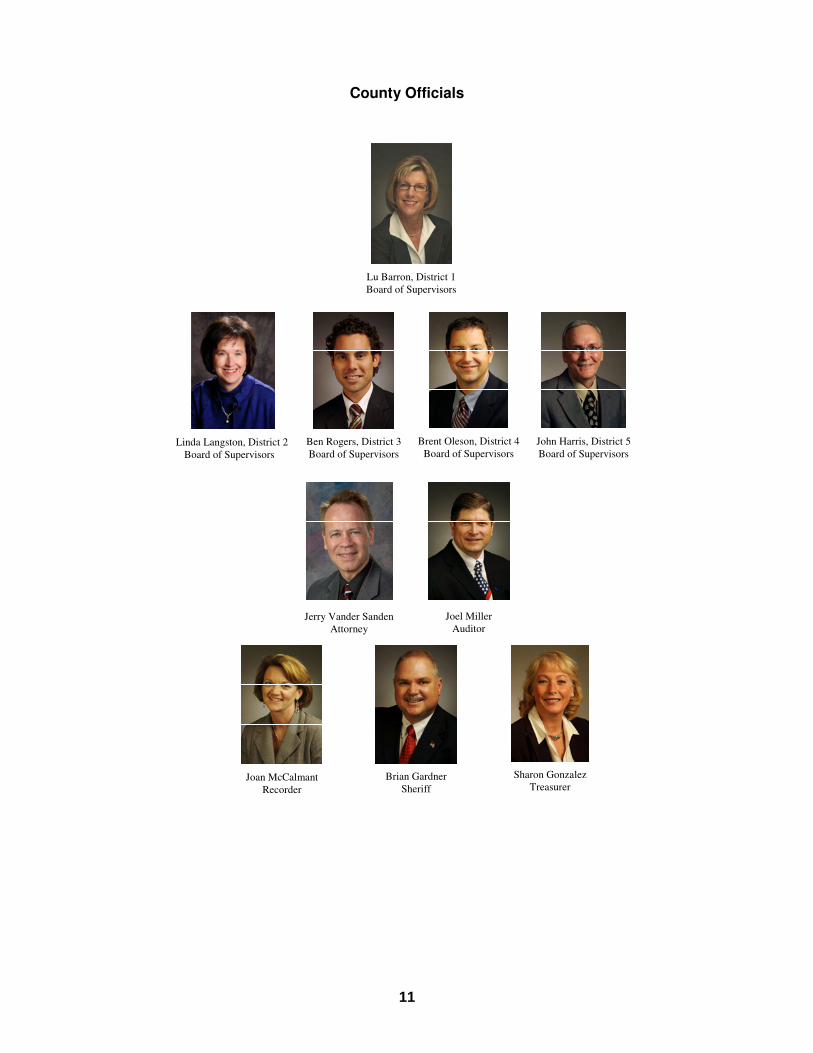
County Officials
Lu Barron, District I
Board of Supervisors
Oleson, District 4 John Harris, District 5
Board of Supervisors Board of Supervisors
Board of Supervisors Board of Supervisors
Joan McCalmant
Recorder
Brian Gardner
Sheriff
Sharon Gonzalez
Treasurer
Jerry Vander Sanden
Attorney
Joel Miller
Auditor
Linda Langston, District 2
Board of Supervisors
Ben Rogers, District 3
Board of Supervisors
Brent Oleson, District 4
Board of Supervisors
John Harris, District 5
Board of Supervisors
Lu Barron, District 1
Board of Supervisors
11
County Officials
Lu Barron, District I
Board of Supervisors
Oleson, District 4 John Harris, District 5
Board of Supervisors Board of Supervisors
Board of Supervisors Board of Supervisors
Joan McCalmant
Recorder
Brian Gardner
Sheriff
Sharon Gonzalez
Treasurer
Jerry Vander Sanden
Attorney
Joel Miller
Auditor
Linda Langston, District 2
Board of Supervisors
Ben Rogers, District 3
Board of Supervisors
Brent Oleson, District 4
Board of Supervisors
John Harris, District 5
Board of Supervisors
Lu Barron, District 1
Board of Supervisors
12
History – Originally home to the Sac, Fox and Winnebago tribes, this area’s first settlers arrived in 1836. In 1839, the area was named Linn County in recognition of Lewis Fields Linn, a Missouri senator and strong proponent of Western expansion and development.
The town of Marion was selected as the first County Seat. A struggle to relocate the County Seat to Cedar Rapids lasted nearly 65 years, ending with a 1919 election favoring Cedar Rapids. The City of Cedar Rapids then deeded a portion of Mays Island to the county as the site for a new courthouse.
Linn County was experiencing rapid growth during this time. The first rail line was established in Cedar Rapids in 1859. Barge and rail transportation were key in the emergence of Cedar Rapids as the freight, commerce, and grain milling center of Eastern Iowa. Today, the city is home to some of the largest grain processing companies in the world—Quaker Oats, Cargill, ADM Corn Processing, Penford Products, Genencor, Ralston Foods, and General Mills.
The rural areas of Linn County were growing as well. Farmsteads appeared and small communities began to develop. The communities varied in size, but often retail merchandise, professional services, or social activities were available for those nearby.
Population – With approximately 200,000 residents, Linn County is the second most populous county in the state of Iowa. There are 18 incorporated communities and 11 villages. The urban center is located in the southern part of the county and encompasses the City of Cedar Rapids, and the smaller communities of Marion, Hiawatha, and Robins.
Linn County is one of the few areas in Iowa experiencing growth. A report from the Population and Economic Forecasts Technical Advisory Committee predicted a 10 percent population increase each decade through 2030 and job growth of 14 percent to 21 percent each decade.
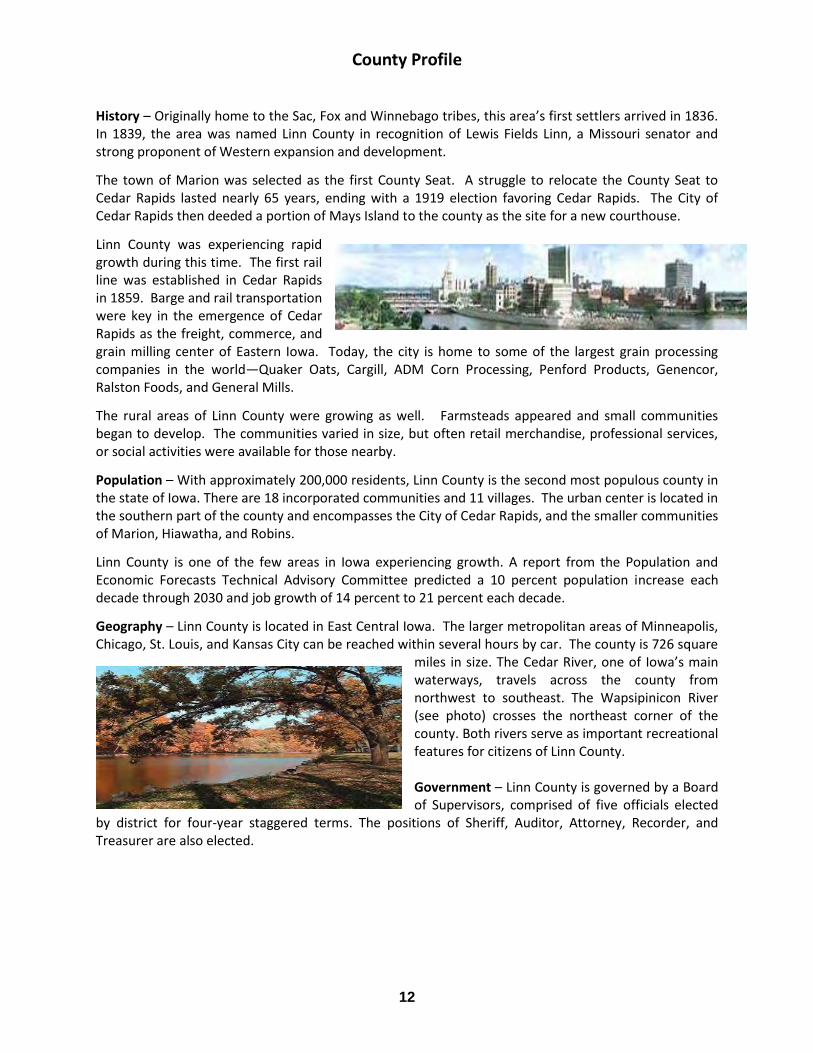
Geography – Linn County is located in East Central Iowa. The larger metropolitan areas of Minneapolis, Chicago, St. Louis, and Kansas City can be reached within several hours by car. The county is 726 square
miles in size. The Cedar River, one of Iowa’s main waterways, travels across the county from northwest to southeast. The Wapsipinicon River (see photo) crosses the northeast corner of the county. Both rivers serve as important recreational features for citizens of Linn County. Government – Linn County is governed by a Board of Supervisors, comprised of five officials elected
by district for four-year staggered terms. The positions of Sheriff, Auditor, Attorney, Recorder, and Treasurer are also elected.
13
Economy – Linn County continues to be Iowa’s largest manufacturing center with total goods producing employment of 22,900 or 19.7% of total non-farm employment. Service producing employment of 93,200 represents the balance of non-farm employment. The diverse agricultural, industrial and service based companies provide economic stability to the local economy. Modest growth in manufacturing will continue even though major employment gains continue to be in service industries with financial activities representing the largest growth area from the prior year. Only about 2% of Linn County employment population is directly employed in farming. Education – Three private four-year liberal arts colleges are located in Linn County, and the University of Iowa, University of Northern Iowa, and Iowa State University are all within easy driving distance. Iowa’s third-largest educational institution, Kirkwood Community College, provides two-year vocational and technical training degrees and ample continuing education opportunities.
Life – Residents of Linn County enjoy the excitement of a modern and bustling metro area and the beauty and solitude of the bucolic countryside. The Cedar and Wapsipinicon Rivers offer boating, fishing, and swimming opportunities. The Linn County Conservation Department also maintains many public parks, recreational, and natural areas for enjoyment. The award-winning Cedar Rapids Symphony offers regular performances and the Paramount Theatre, a picturesque 1920s downtown landmark, provides a variety of cultural events throughout the year.
14
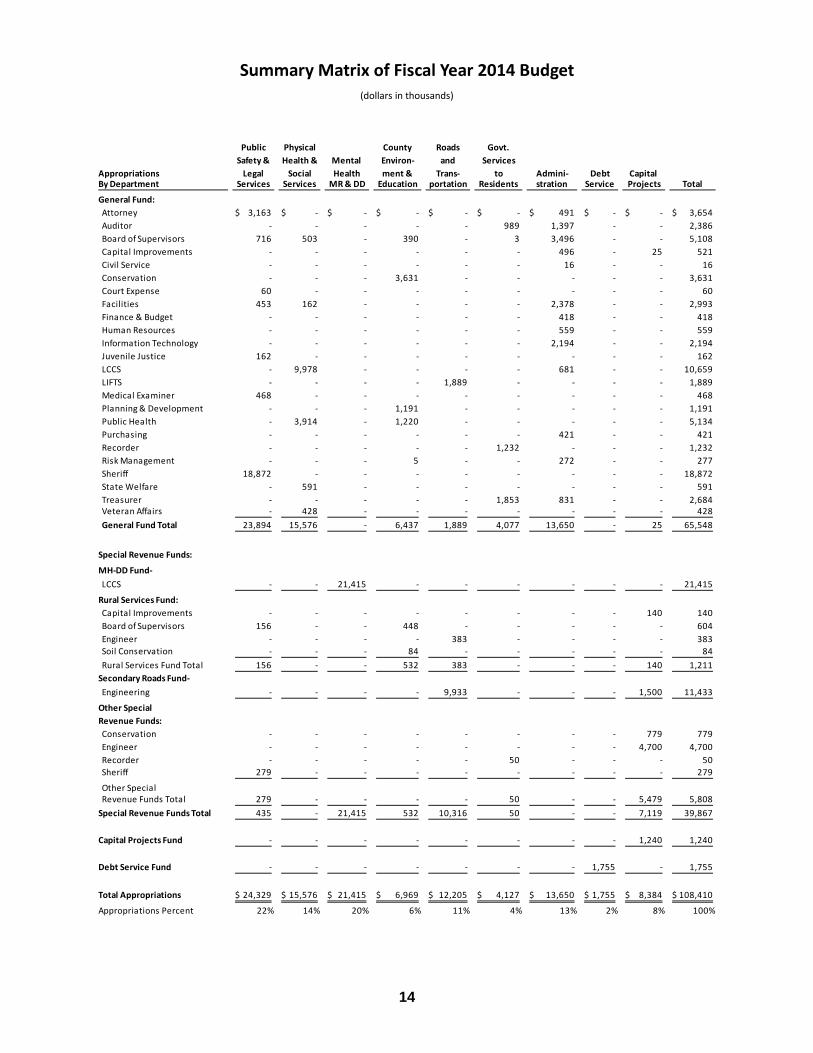
(dollars in thousands)
Public Physical County Roads Govt.
Safety & Health & Mental Environ- and Services
Appropriations Legal Social Health ment & Trans- to Admini- Debt Capital By Department Services Services MR & DD Education portation Residents stration Service Projects Total
General Fund:
Attorney 3,163$ -$ -$ -$ -$ -$ 491$ -$ -$ 3,654$
Auditor - - - - - 989 1,397 - - 2,386
Board of Supervisors 716 503 - 390 - 3 3,496 - - 5,108
Capital Improvements - - - - - - 496 - 25 521
Civil Service - - - - - - 16 - - 16
Conservation - - - 3,631 - - - - - 3,631
Court Expense 60 - - - - - - - - 60
Facilities 453 162 - - - - 2,378 - - 2,993
Finance & Budget - - - - - - 418 - - 418
Human Resources - - - - - - 559 - - 559
Information Technology - - - - - - 2,194 - - 2,194
Juvenile Justice 162 - - - - - - - - 162
LCCS - 9,978 - - - - 681 - - 10,659
LIFTS - - - - 1,889 - - - - 1,889
Medical Examiner 468 - - - - - - - - 468
Planning & Development - - - 1,191 - - - - - 1,191
Public Health - 3,914 - 1,220 - - - - - 5,134
Purchasing - - - - - - 421 - - 421
Recorder - - - - - 1,232 - - - 1,232
Risk Management - - - 5 - - 272 - - 277
Sheriff 18,872 - - - - - - - - 18,872
State Welfare - 591 - - - - - - - 591
Treasurer - - - - - 1,853 831 - - 2,684 Veteran Affairs - 428 - - - - - - - 428
General Fund Total 23,894 15,576 - 6,437 1,889 4,077 13,650 - 25 65,548
Special Revenue Funds:
MH-DD Fund-
LCCS - - 21,415 - - - - - - 21,415
Rural Services Fund:
Capital Improvements - - - - - - - - 140 140
Board of Supervisors 156 - - 448 - - - - - 604
Engineer - - - - 383 - - - - 383
Soil Conservation - - - 84 - - - - - 84
Rural Services Fund Total 156 - - 532 383 - - - 140 1,211
Secondary Roads Fund-
Engineering - - - - 9,933 - - - 1,500 11,433
Other Special
Revenue Funds:
Conservation - - - - - - - - 779 779
Engineer - - - - - - - - 4,700 4,700
Recorder - - - - - 50 - - - 50
Sheriff 279 - - - - - - - - 279
Other Special Revenue Funds Total 279 - - - - 50 - - 5,479 5,808
Special Revenue Funds Total 435 - 21,415 532 10,316 50 - - 7,119 39,867
Capital Projects Fund - - - - - - - - 1,240 1,240
Debt Service Fund - - - - - - - 1,755 - 1,755
Total Appropriations 24,329$ 15,576$ 21,415$ 6,969$ 12,205$ 4,127$ 13,650$ 1,755$ 8,384$ 108,410$
Appropriations Percent 22% 14% 20% 6% 11% 4% 13% 2% 8% 100%
15
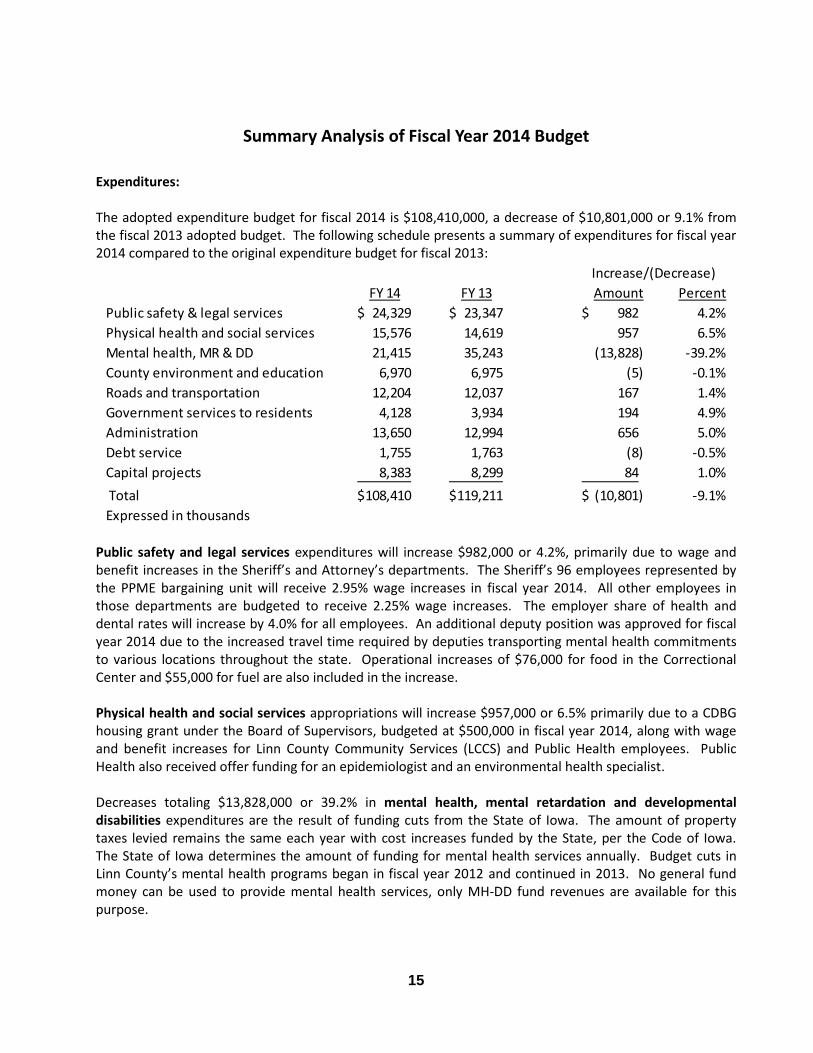
Expenditures: The adopted expenditure budget for fiscal 2014 is $108,410,000, a decrease of $10,801,000 or 9.1% from the fiscal 2013 adopted budget. The following schedule presents a summary of expenditures for fiscal year 2014 compared to the original expenditure budget for fiscal 2013:
Public safety and legal services expenditures will increase $982,000 or 4.2%, primarily due to wage and benefit increases in the Sheriff’s and Attorney’s departments. The Sheriff’s 96 employees represented by the PPME bargaining unit will receive 2.95% wage increases in fiscal year 2014. All other employees in those departments are budgeted to receive 2.25% wage increases. The employer share of health and dental rates will increase by 4.0% for all employees. An additional deputy position was approved for fiscal year 2014 due to the increased travel time required by deputies transporting mental health commitments to various locations throughout the state. Operational increases of $76,000 for food in the Correctional Center and $55,000 for fuel are also included in the increase. Physical health and social services appropriations will increase $957,000 or 6.5% primarily due to a CDBG housing grant under the Board of Supervisors, budgeted at $500,000 in fiscal year 2014, along with wage and benefit increases for Linn County Community Services (LCCS) and Public Health employees. Public Health also received offer funding for an epidemiologist and an environmental health specialist. Decreases totaling $13,828,000 or 39.2% in mental health, mental retardation and developmental disabilities expenditures are the result of funding cuts from the State of Iowa. The amount of property taxes levied remains the same each year with cost increases funded by the State, per the Code of Iowa. The State of Iowa determines the amount of funding for mental health services annually. Budget cuts in Linn County’s mental health programs began in fiscal year 2012 and continued in 2013. No general fund money can be used to provide mental health services, only MH-DD fund revenues are available for this purpose.
Increase/(Decrease)
FY 14 FY 13 Amount Percent
Public safety & legal services 24,329$ 23,347$ 982$ 4.2%
Physical health and social services 15,576 14,619 957 6.5%
Mental health, MR & DD 21,415 35,243 (13,828) -39.2%
County environment and education 6,970 6,975 (5) -0.1%
Roads and transportation 12,204 12,037 167 1.4%
Government services to residents 4,128 3,934 194 4.9%
Administration 13,650 12,994 656 5.0%
Debt service 1,755 1,763 (8) -0.5%
Capital projects 8,383 8,299 84 1.0%
Total 108,410$ 119,211$ (10,801)$ -9.1%
Expressed in thousands
16
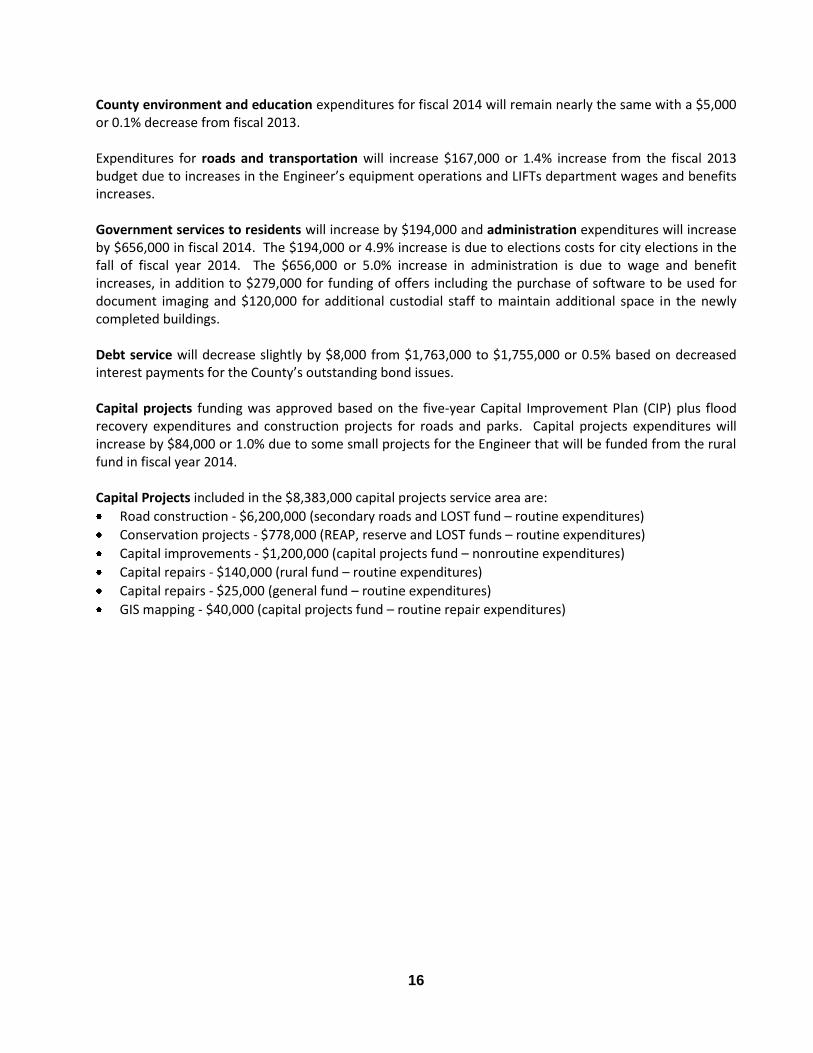
County environment and education expenditures for fiscal 2014 will remain nearly the same with a $5,000 or 0.1% decrease from fiscal 2013. Expenditures for roads and transportation will increase $167,000 or 1.4% increase from the fiscal 2013 budget due to increases in the Engineer’s equipment operations and LIFTs department wages and benefits increases. Government services to residents will increase by $194,000 and administration expenditures will increase by $656,000 in fiscal 2014. The $194,000 or 4.9% increase is due to elections costs for city elections in the fall of fiscal year 2014. The $656,000 or 5.0% increase in administration is due to wage and benefit increases, in addition to $279,000 for funding of offers including the purchase of software to be used for document imaging and $120,000 for additional custodial staff to maintain additional space in the newly completed buildings. Debt service will decrease slightly by $8,000 from $1,763,000 to $1,755,000 or 0.5% based on decreased interest payments for the County’s outstanding bond issues. Capital projects funding was approved based on the five-year Capital Improvement Plan (CIP) plus flood recovery expenditures and construction projects for roads and parks. Capital projects expenditures will increase by $84,000 or 1.0% due to some small projects for the Engineer that will be funded from the rural fund in fiscal year 2014. Capital Projects included in the $8,383,000 capital projects service area are:
Road construction - $6,200,000 (secondary roads and LOST fund – routine expenditures)
Conservation projects - $778,000 (REAP, reserve and LOST funds – routine expenditures)
Capital improvements - $1,200,000 (capital projects fund – nonroutine expenditures)
Capital repairs - $140,000 (rural fund – routine expenditures)
Capital repairs - $25,000 (general fund – routine expenditures)
GIS mapping - $40,000 (capital projects fund – routine repair expenditures)
17
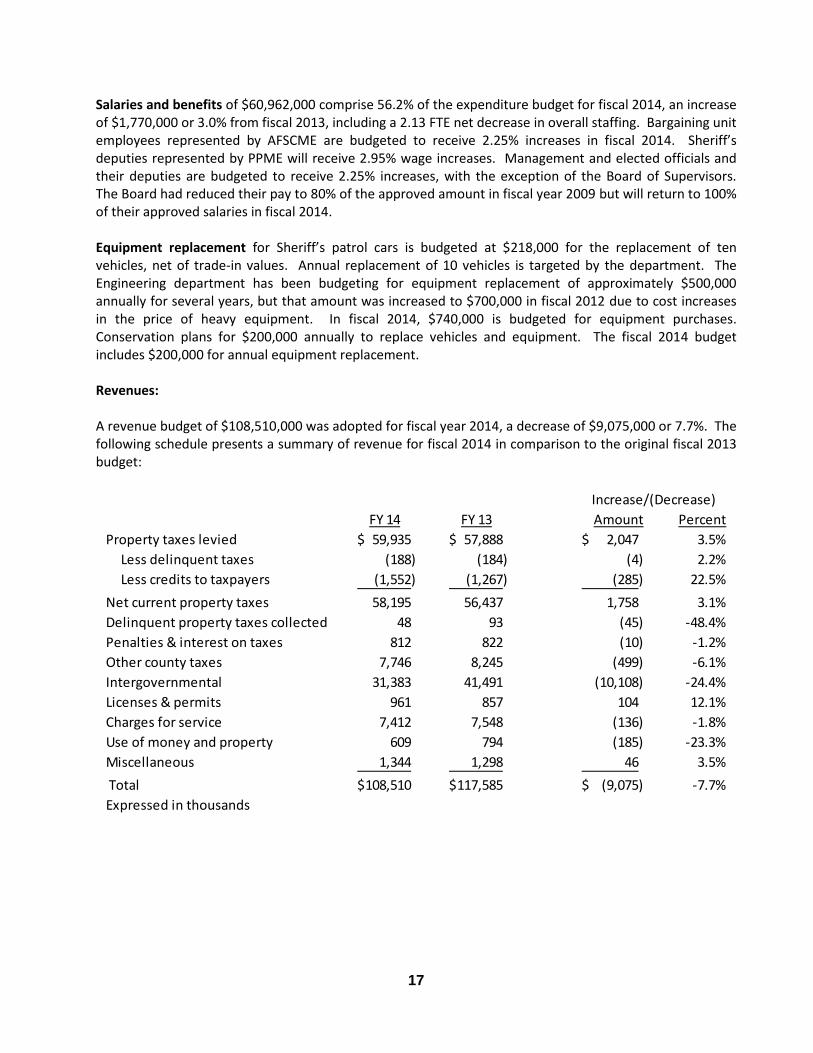
Salaries and benefits of $60,962,000 comprise 56.2% of the expenditure budget for fiscal 2014, an increase of $1,770,000 or 3.0% from fiscal 2013, including a 2.13 FTE net decrease in overall staffing. Bargaining unit employees represented by AFSCME are budgeted to receive 2.25% increases in fiscal 2014. Sheriff’s deputies represented by PPME will receive 2.95% wage increases. Management and elected officials and their deputies are budgeted to receive 2.25% increases, with the exception of the Board of Supervisors. The Board had reduced their pay to 80% of the approved amount in fiscal year 2009 but will return to 100% of their approved salaries in fiscal 2014. Equipment replacement for Sheriff’s patrol cars is budgeted at $218,000 for the replacement of ten vehicles, net of trade-in values. Annual replacement of 10 vehicles is targeted by the department. The Engineering department has been budgeting for equipment replacement of approximately $500,000 annually for several years, but that amount was increased to $700,000 in fiscal 2012 due to cost increases in the price of heavy equipment. In fiscal 2014, $740,000 is budgeted for equipment purchases. Conservation plans for $200,000 annually to replace vehicles and equipment. The fiscal 2014 budget includes $200,000 for annual equipment replacement. Revenues: A revenue budget of $108,510,000 was adopted for fiscal year 2014, a decrease of $9,075,000 or 7.7%. The following schedule presents a summary of revenue for fiscal 2014 in comparison to the original fiscal 2013 budget:
Increase/(Decrease)
FY 14 FY 13 Amount Percent
Property taxes levied 59,935$ 57,888$ 2,047$ 3.5%
Less delinquent taxes (188) (184) (4) 2.2%
Less credits to taxpayers (1,552) (1,267) (285) 22.5%
Net current property taxes 58,195 56,437 1,758 3.1%
Delinquent property taxes collected 48 93 (45) -48.4%
Penalties & interest on taxes 812 822 (10) -1.2%
Other county taxes 7,746 8,245 (499) -6.1%
Intergovernmental 31,383 41,491 (10,108) -24.4%
Licenses & permits 961 857 104 12.1%
Charges for service 7,412 7,548 (136) -1.8%
Use of money and property 609 794 (185) -23.3%
Miscellaneous 1,344 1,298 46 3.5%
Total 108,510$ 117,585$ (9,075)$ -7.7%
Expressed in thousands
18
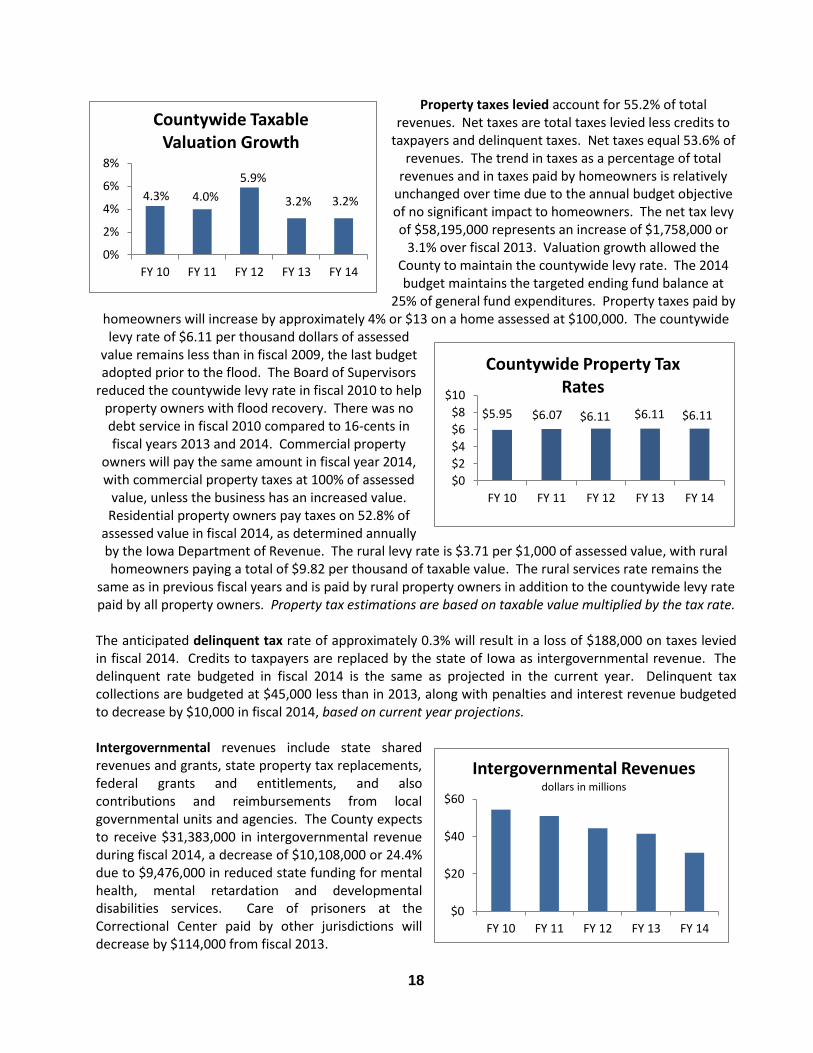
Property taxes levied account for 55.2% of total revenues. Net taxes are total taxes levied less credits to
taxpayers and delinquent taxes. Net taxes equal 53.6% of revenues. The trend in taxes as a percentage of total
revenues and in taxes paid by homeowners is relatively unchanged over time due to the annual budget objective of no significant impact to homeowners. The net tax levy of $58,195,000 represents an increase of $1,758,000 or
3.1% over fiscal 2013. Valuation growth allowed the County to maintain the countywide levy rate. The 2014 budget maintains the targeted ending fund balance at
25% of general fund expenditures. Property taxes paid by homeowners will increase by approximately 4% or $13 on a home assessed at $100,000. The countywide levy rate of $6.11 per thousand dollars of assessed
value remains less than in fiscal 2009, the last budget adopted prior to the flood. The Board of Supervisors
reduced the countywide levy rate in fiscal 2010 to help property owners with flood recovery. There was no debt service in fiscal 2010 compared to 16-cents in fiscal years 2013 and 2014. Commercial property
owners will pay the same amount in fiscal year 2014, with commercial property taxes at 100% of assessed
value, unless the business has an increased value. Residential property owners pay taxes on 52.8% of
assessed value in fiscal 2014, as determined annually by the Iowa Department of Revenue. The rural levy rate is $3.71 per $1,000 of assessed value, with rural homeowners paying a total of $9.82 per thousand of taxable value. The rural services rate remains the
same as in previous fiscal years and is paid by rural property owners in addition to the countywide levy rate paid by all property owners. Property tax estimations are based on taxable value multiplied by the tax rate.
The anticipated delinquent tax rate of approximately 0.3% will result in a loss of $188,000 on taxes levied in fiscal 2014. Credits to taxpayers are replaced by the state of Iowa as intergovernmental revenue. The delinquent rate budgeted in fiscal 2014 is the same as projected in the current year. Delinquent tax collections are budgeted at $45,000 less than in 2013, along with penalties and interest revenue budgeted to decrease by $10,000 in fiscal 2014, based on current year projections. Intergovernmental revenues include state shared revenues and grants, state property tax replacements, federal grants and entitlements, and also contributions and reimbursements from local governmental units and agencies. The County expects to receive $31,383,000 in intergovernmental revenue during fiscal 2014, a decrease of $10,108,000 or 24.4% due to $9,476,000 in reduced state funding for mental health, mental retardation and developmental disabilities services. Care of prisoners at the Correctional Center paid by other jurisdictions will decrease by $114,000 from fiscal 2013.
4.3% 4.0%
5.9%
3.2% 3.2%
0%
2%
4%
6%
8%
FY 10 FY 11 FY 12 FY 13 FY 14
Countywide Taxable Valuation Growth
$5.95 $6.07 $6.11 $6.11 $6.11
$0
$2
$4
$6
$8
$10
FY 10 FY 11 FY 12 FY 13 FY 14
Countywide Property Tax Rates
$0
$20
$40
$60
FY 10 FY 11 FY 12 FY 13 FY 14
Intergovernmental Revenues dollars in millions
19
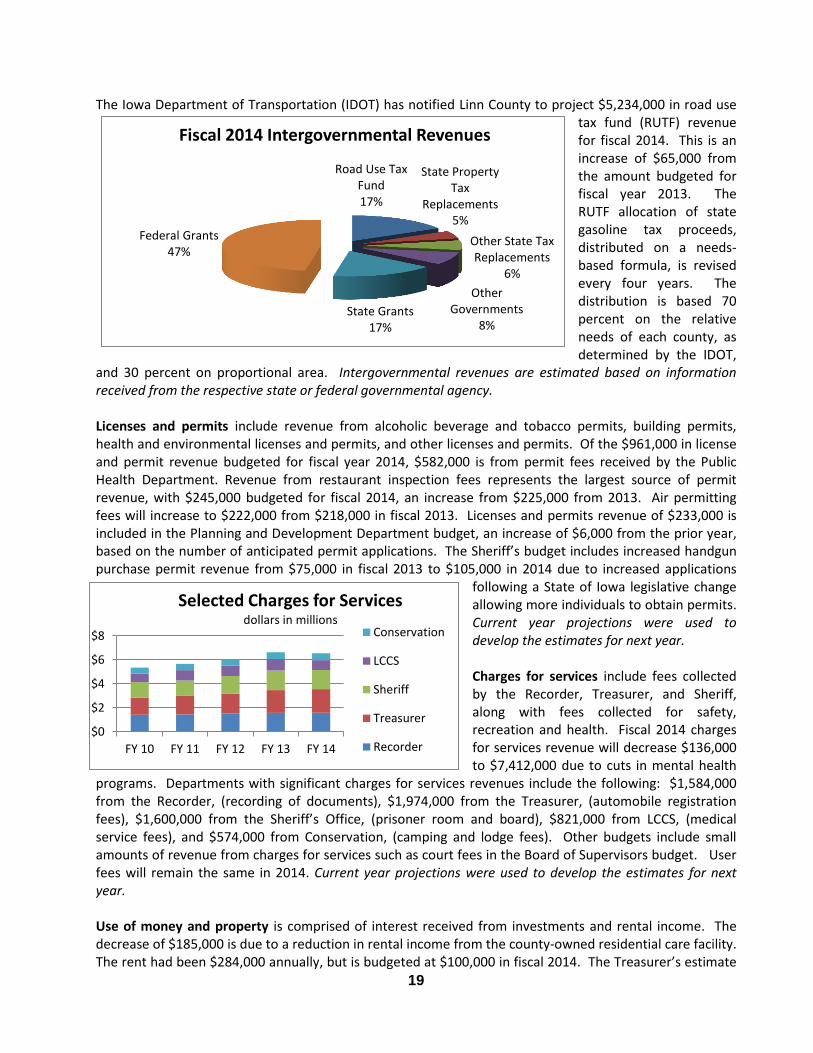
The Iowa Department of Transportation (IDOT) has notified Linn County to project $5,234,000 in road use tax fund (RUTF) revenue for fiscal 2014. This is an increase of $65,000 from the amount budgeted for fiscal year 2013. The RUTF allocation of state gasoline tax proceeds, distributed on a needs-based formula, is revised every four years. The distribution is based 70 percent on the relative needs of each county, as determined by the IDOT,
and 30 percent on proportional area. Intergovernmental revenues are estimated based on information received from the respective state or federal governmental agency. Licenses and permits include revenue from alcoholic beverage and tobacco permits, building permits, health and environmental licenses and permits, and other licenses and permits. Of the $961,000 in license and permit revenue budgeted for fiscal year 2014, $582,000 is from permit fees received by the Public Health Department. Revenue from restaurant inspection fees represents the largest source of permit revenue, with $245,000 budgeted for fiscal 2014, an increase from $225,000 from 2013. Air permitting fees will increase to $222,000 from $218,000 in fiscal 2013. Licenses and permits revenue of $233,000 is included in the Planning and Development Department budget, an increase of $6,000 from the prior year, based on the number of anticipated permit applications. The Sheriff’s budget includes increased handgun purchase permit revenue from $75,000 in fiscal 2013 to $105,000 in 2014 due to increased applications
following a State of Iowa legislative change allowing more individuals to obtain permits. Current year projections were used to develop the estimates for next year. Charges for services include fees collected by the Recorder, Treasurer, and Sheriff, along with fees collected for safety, recreation and health. Fiscal 2014 charges for services revenue will decrease $136,000 to $7,412,000 due to cuts in mental health
programs. Departments with significant charges for services revenues include the following: $1,584,000 from the Recorder, (recording of documents), $1,974,000 from the Treasurer, (automobile registration fees), $1,600,000 from the Sheriff’s Office, (prisoner room and board), $821,000 from LCCS, (medical service fees), and $574,000 from Conservation, (camping and lodge fees). Other budgets include small amounts of revenue from charges for services such as court fees in the Board of Supervisors budget. User fees will remain the same in 2014. Current year projections were used to develop the estimates for next year. Use of money and property is comprised of interest received from investments and rental income. The decrease of $185,000 is due to a reduction in rental income from the county-owned residential care facility. The rent had been $284,000 annually, but is budgeted at $100,000 in fiscal 2014. The Treasurer’s estimate
$0
$2
$4
$6
$8
FY 10 FY 11 FY 12 FY 13 FY 14
Selected Charges for Services dollars in millions
Conservation
LCCS
Sheriff
Treasurer
Recorder
Road Use Tax Fund 17%
State Property Tax
Replacements 5%
Other State Tax Replacements
6%
Other Governments
8% State Grants
17%
Federal Grants 47%
Fiscal 2014 Intergovernmental Revenues
20
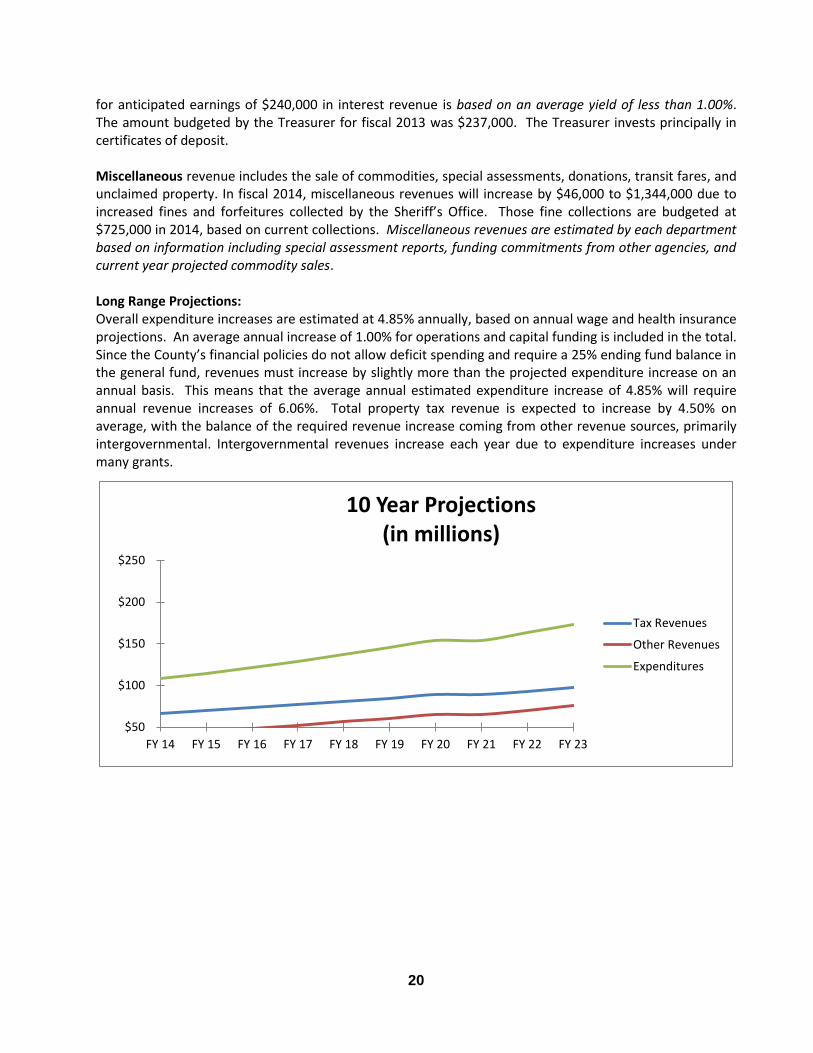
for anticipated earnings of $240,000 in interest revenue is based on an average yield of less than 1.00%. The amount budgeted by the Treasurer for fiscal 2013 was $237,000. The Treasurer invests principally in certificates of deposit. Miscellaneous revenue includes the sale of commodities, special assessments, donations, transit fares, and unclaimed property. In fiscal 2014, miscellaneous revenues will increase by $46,000 to $1,344,000 due to increased fines and forfeitures collected by the Sheriff’s Office. Those fine collections are budgeted at $725,000 in 2014, based on current collections. Miscellaneous revenues are estimated by each department based on information including special assessment reports, funding commitments from other agencies, and current year projected commodity sales. Long Range Projections: Overall expenditure increases are estimated at 4.85% annually, based on annual wage and health insurance projections. An average annual increase of 1.00% for operations and capital funding is included in the total. Since the County’s financial policies do not allow deficit spending and require a 25% ending fund balance in the general fund, revenues must increase by slightly more than the projected expenditure increase on an annual basis. This means that the average annual estimated expenditure increase of 4.85% will require annual revenue increases of 6.06%. Total property tax revenue is expected to increase by 4.50% on average, with the balance of the required revenue increase coming from other revenue sources, primarily intergovernmental. Intergovernmental revenues increase each year due to expenditure increases under many grants.
$50
$100
$150
$200
$250
FY 14 FY 15 FY 16 FY 17 FY 18 FY 19 FY 20 FY 21 FY 22 FY 23
10 Year Projections (in millions)
Tax Revenues
Other Revenues
Expenditures
21
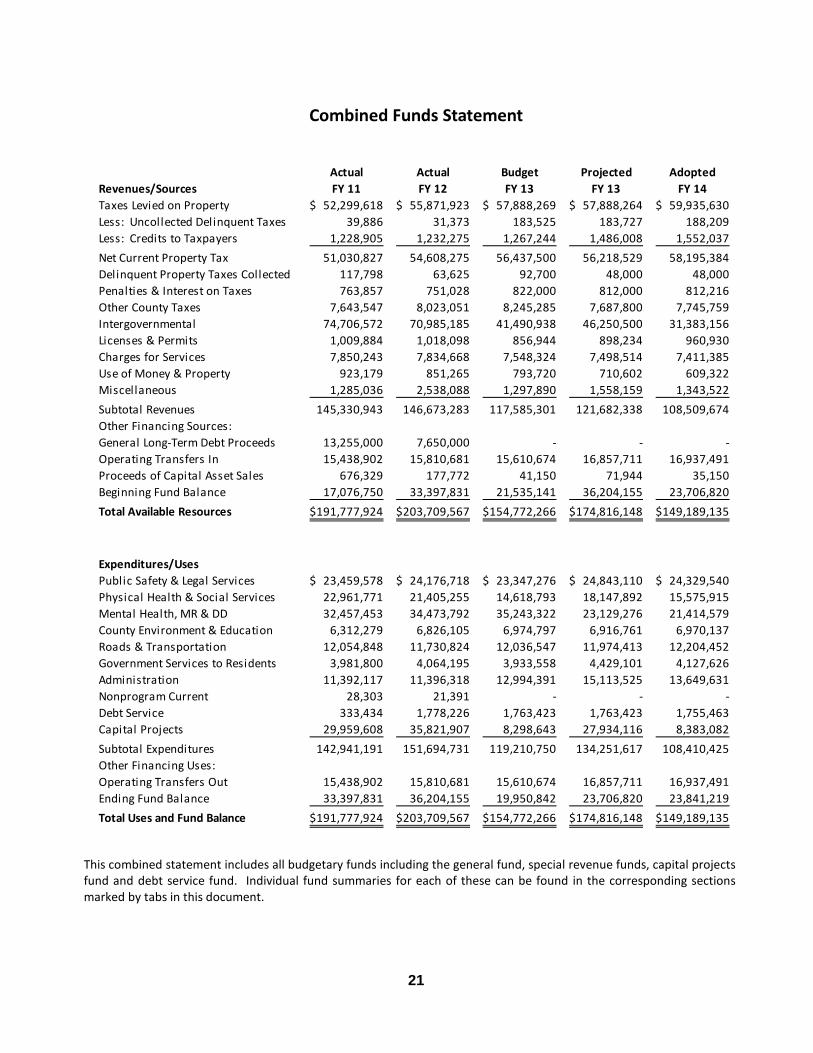
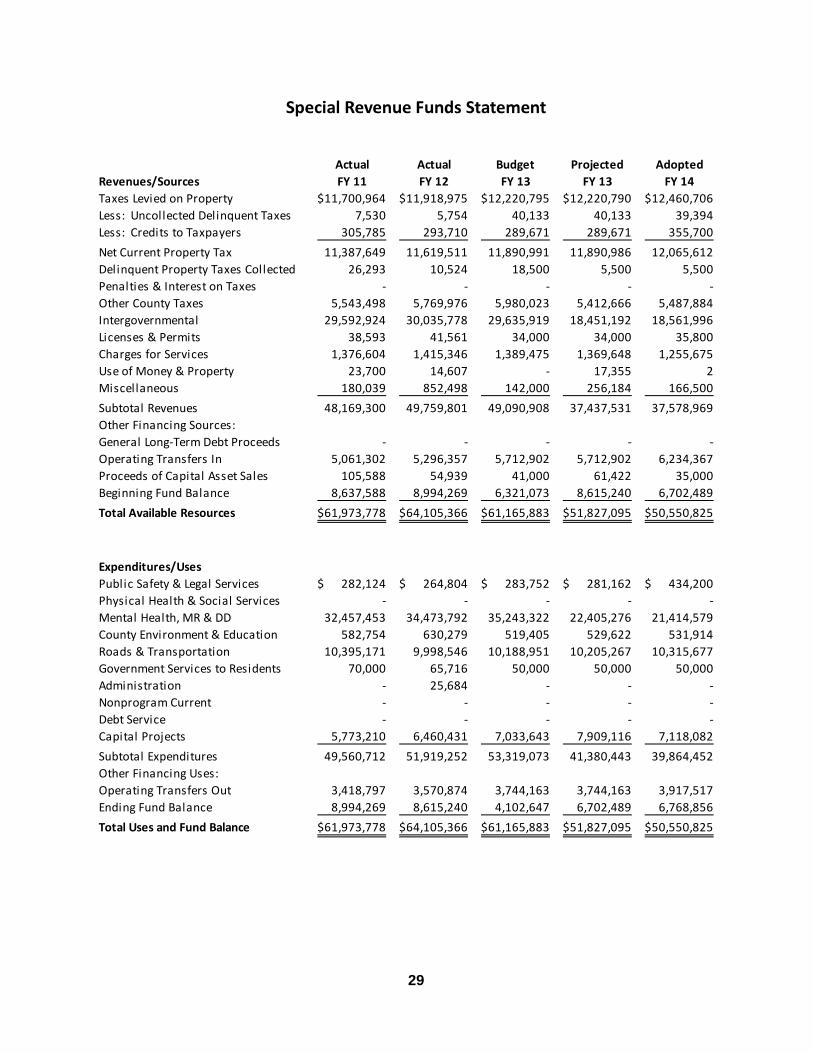
This combined statement includes all budgetary funds including the general fund, special revenue funds, capital projects fund and debt service fund. Individual fund summaries for each of these can be found in the corresponding sections marked by tabs in this document.
Actual Actual Budget Projected Adopted
Revenues/Sources FY 11 FY 12 FY 13 FY 13 FY 14
Taxes Levied on Property 52,299,618$ 55,871,923$ 57,888,269$ 57,888,264$ 59,935,630$
Less: Uncollected Delinquent Taxes 39,886 31,373 183,525 183,727 188,209
Less: Credits to Taxpayers 1,228,905 1,232,275 1,267,244 1,486,008 1,552,037
Net Current Property Tax 51,030,827 54,608,275 56,437,500 56,218,529 58,195,384
Delinquent Property Taxes Collected 117,798 63,625 92,700 48,000 48,000
Penalties & Interest on Taxes 763,857 751,028 822,000 812,000 812,216
Other County Taxes 7,643,547 8,023,051 8,245,285 7,687,800 7,745,759
Intergovernmental 74,706,572 70,985,185 41,490,938 46,250,500 31,383,156
Licenses & Permits 1,009,884 1,018,098 856,944 898,234 960,930
Charges for Services 7,850,243 7,834,668 7,548,324 7,498,514 7,411,385
Use of Money & Property 923,179 851,265 793,720 710,602 609,322
Miscellaneous 1,285,036 2,538,088 1,297,890 1,558,159 1,343,522
Subtotal Revenues 145,330,943 146,673,283 117,585,301 121,682,338 108,509,674
Other Financing Sources:
General Long-Term Debt Proceeds 13,255,000 7,650,000 - - -
Operating Transfers In 15,438,902 15,810,681 15,610,674 16,857,711 16,937,491
Proceeds of Capital Asset Sales 676,329 177,772 41,150 71,944 35,150
Beginning Fund Balance 17,076,750 33,397,831 21,535,141 36,204,155 23,706,820
Total Available Resources 191,777,924$ 203,709,567$ 154,772,266$ 174,816,148$ 149,189,135$
Expenditures/Uses
Public Safety & Legal Services 23,459,578$ 24,176,718$ 23,347,276$ 24,843,110$ 24,329,540$
Physical Health & Social Services 22,961,771 21,405,255 14,618,793 18,147,892 15,575,915
Mental Health, MR & DD 32,457,453 34,473,792 35,243,322 23,129,276 21,414,579
County Environment & Education 6,312,279 6,826,105 6,974,797 6,916,761 6,970,137
Roads & Transportation 12,054,848 11,730,824 12,036,547 11,974,413 12,204,452
Government Services to Residents 3,981,800 4,064,195 3,933,558 4,429,101 4,127,626
Administration 11,392,117 11,396,318 12,994,391 15,113,525 13,649,631
Nonprogram Current 28,303 21,391 - - -
Debt Service 333,434 1,778,226 1,763,423 1,763,423 1,755,463
Capital Projects 29,959,608 35,821,907 8,298,643 27,934,116 8,383,082
Subtotal Expenditures 142,941,191 151,694,731 119,210,750 134,251,617 108,410,425
Other Financing Uses:
Operating Transfers Out 15,438,902 15,810,681 15,610,674 16,857,711 16,937,491
Ending Fund Balance 33,397,831 36,204,155 19,950,842 23,706,820 23,841,219
Total Uses and Fund Balance 191,777,924$ 203,709,567$ 154,772,266$ 174,816,148$ 149,189,135$
22
Department
Actual FY 11
Actual FY 12
Budget FY 13
Proposed
FY 14
Change
Attorney 38.30 37.30 38.30 37.30 (1.00)
Auditor 17.50 17.50 18.60 19.10 0.50
Board of Supervisors 9.88 10.25 10.25 10.25 0.00
Child Support Recovery Unit 22.00 20.00 0.00 0.00 0.00
Civil Service 0.30 0.30 0.30 0.30 0.00
Conservation 39.01 41.01 41.74 41.74 0.00
Court Expense 0.00 0.00 0.00 0.00 0.00
Engineer 68.00 66.00 70.80 68.80 (2.00)
Facilities 31.50 30.90 29.50 31.25 1.75
Finance & Budget 3.50 3.50 3.50 3.50 0.00
Human Resources 4.50 4.50 4.50 4.50 0.00
Information Technology 17.00 16.00 18.00 18.00 0.00
Juvenile Justice 0.00 0.00 0.00 0.00 0.00
LCCS 231.39 216.47 228.20 224.12 (4.08)
LIFTS 22.40 22.40 22.40 22.40 0.00
Medical Examiner 0.00 0.00 0.00 0.00 0.00
Planning & Development 13.00 13.70 13.70 13.70 0.00
Public Health 58.67 46.30 46.80 48.80 2.00
Purchasing 3.70 3.70 3.70 3.70 0.00
Recorder 14.00 14.00 14.00 14.00 0.00
Risk Management 3.00 3.00 3.00 3.00 0.00
Sheriff 177.52 177.80 183.60 184.60 1.00
Soil Conservation 1.00 1.00 1.00 1.00 0.00
State Welfare 0.00 0.00 0.00 0.00 0.00
Treasurer 34.00 35.00 35.30 35.00 (0.30)
Veteran Affairs 3.13 3.13 3.13 3.13 0.00
Total Full -Time Equivalents 813.30 783.76 790.32 788.19 (2.13)
23
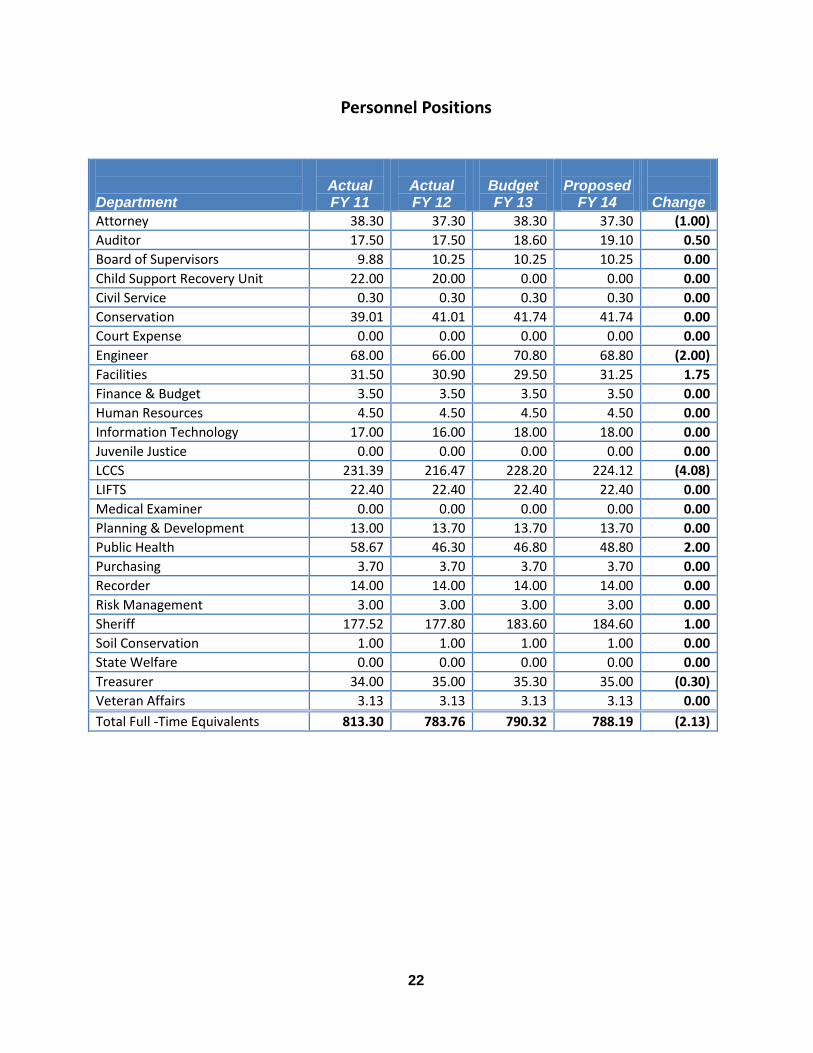
Staffing for fiscal year 2014 included a net decrease of 2.13 FTEs. Departmental changes included the following:
Attorney – eliminated 1.00 FTE attorney position
Auditor – reduced 0.50 FTE elected official position budgeted in Facilities department for FY 14. Added 1.00 FTE administrative secretary position budgeted in Facilities department for FY 13.
Engineer – eliminated 2.00 FTE equipment operators.
Facilities – added 0.50 FTE elected official position budgeted in the Auditor’s office for FY 13. Reduced 1.00 FTE administrative secretary position budgeted in the Auditor’s office for FY 14. Added 2.25 FTE part-time custodian positions.
LCCS – MHDD staffing decreased 0.87 FTEs including a 1.00 FTE reduction related to the SCL level of service and a 0.13 increase in clerical services. Core services decreased staffing by 4.68 FTEs. Included is a reduction of the General Assistance director from full-time to a 0.50 FTE position, a reduction of 2.00 FTE social workers in Home Health due to loss of Medicaid funding, a 0.25 FTE increase in Child and Youth Development substitute positions, a 1.43 FTE reduction in protective homemakers as a result of reorganization with the Family Visitation Center staff and the Protective Home Health program, and a reduction of two 0.50 FTE clerical staff positions in General Home Health and Aging and Disability Resource Center, the result of funding reductions. Juvenile Detention and Alternatives increased staffing by 1.47 FTEs. A loss in funding reduced Detention Education staff by 0.30 FTEs while increased grant funding for “trackers” increased LINK Tracker program by 1.77 FTEs.
Public Health – added a 1.00 FTE epidemiologist and a 1.00 FTE environmental health specialist.
Sheriff – added a 1.00 FTE from patrol deputy for mental health transportation.
24
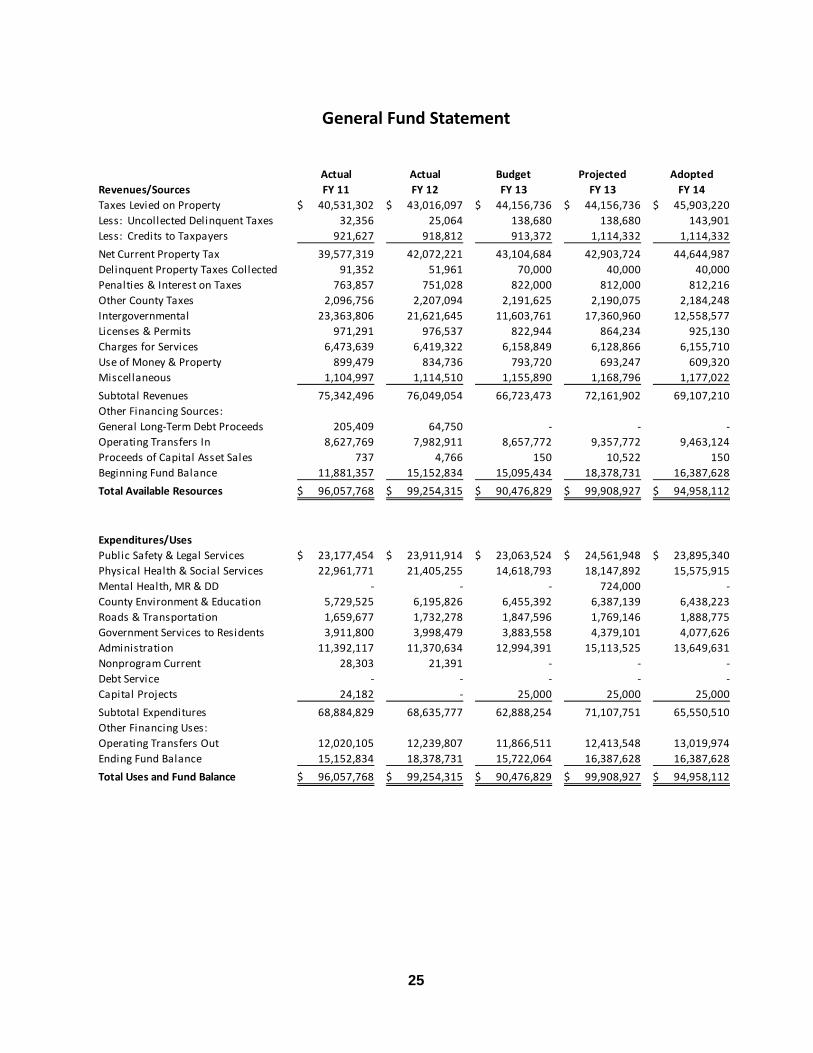
The general fund is the operating fund of Linn County. It is used to account for all financial resources except those required legally or by sound financial management to be accounted for in another fund. The general fund is comprised of two separate funds, the general basic and the general supplemental. The general basic has a maximum levy rate of $3.50 per $1,000 of taxable valuation. The general supplemental fund is for specific uses as defined in Section 331.424 of the Code of Iowa. These uses include substance abuse care and treatment, foster care for a child under jurisdiction of the juvenile court, elections and voter registration, employee benefits, tort liability and property insurance, operation of the courts, and local emergency management agency funding. The fiscal year 2014 general basic fund levy rate per thousand is $3.50 and the general supplemental levy rate per thousand is $1.58019. The general basic rate is the same as in fiscal 2013 and the general supplemental rate represents a 3-cent increase. General fund taxes levied on property total $45,903,220 in fiscal 2014.
25
Actual Actual Budget Projected Adopted
Revenues/Sources FY 11 FY 12 FY 13 FY 13 FY 14
Taxes Levied on Property 40,531,302$ 43,016,097$ 44,156,736$ 44,156,736$ 45,903,220$
Less: Uncollected Delinquent Taxes 32,356 25,064 138,680 138,680 143,901
Less: Credits to Taxpayers 921,627 918,812 913,372 1,114,332 1,114,332
Net Current Property Tax 39,577,319 42,072,221 43,104,684 42,903,724 44,644,987
Delinquent Property Taxes Collected 91,352 51,961 70,000 40,000 40,000
Penalties & Interest on Taxes 763,857 751,028 822,000 812,000 812,216
Other County Taxes 2,096,756 2,207,094 2,191,625 2,190,075 2,184,248
Intergovernmental 23,363,806 21,621,645 11,603,761 17,360,960 12,558,577
Licenses & Permits 971,291 976,537 822,944 864,234 925,130
Charges for Services 6,473,639 6,419,322 6,158,849 6,128,866 6,155,710
Use of Money & Property 899,479 834,736 793,720 693,247 609,320
Miscellaneous 1,104,997 1,114,510 1,155,890 1,168,796 1,177,022
Subtotal Revenues 75,342,496 76,049,054 66,723,473 72,161,902 69,107,210
Other Financing Sources:
General Long-Term Debt Proceeds 205,409 64,750 - - -
Operating Transfers In 8,627,769 7,982,911 8,657,772 9,357,772 9,463,124
Proceeds of Capital Asset Sales 737 4,766 150 10,522 150
Beginning Fund Balance 11,881,357 15,152,834 15,095,434 18,378,731 16,387,628
Total Available Resources 96,057,768$ 99,254,315$ 90,476,829$ 99,908,927$ 94,958,112$
Expenditures/Uses
Public Safety & Legal Services 23,177,454$ 23,911,914$ 23,063,524$ 24,561,948$ 23,895,340$
Physical Health & Social Services 22,961,771 21,405,255 14,618,793 18,147,892 15,575,915
Mental Health, MR & DD - - - 724,000 -
County Environment & Education 5,729,525 6,195,826 6,455,392 6,387,139 6,438,223
Roads & Transportation 1,659,677 1,732,278 1,847,596 1,769,146 1,888,775
Government Services to Residents 3,911,800 3,998,479 3,883,558 4,379,101 4,077,626
Administration 11,392,117 11,370,634 12,994,391 15,113,525 13,649,631
Nonprogram Current 28,303 21,391 - - -
Debt Service - - - - -
Capital Projects 24,182 - 25,000 25,000 25,000
Subtotal Expenditures 68,884,829 68,635,777 62,888,254 71,107,751 65,550,510
Other Financing Uses:
Operating Transfers Out 12,020,105 12,239,807 11,866,511 12,413,548 13,019,974
Ending Fund Balance 15,152,834 18,378,731 15,722,064 16,387,628 16,387,628
Total Uses and Fund Balance 96,057,768$ 99,254,315$ 90,476,829$ 99,908,927$ 94,958,112$
26
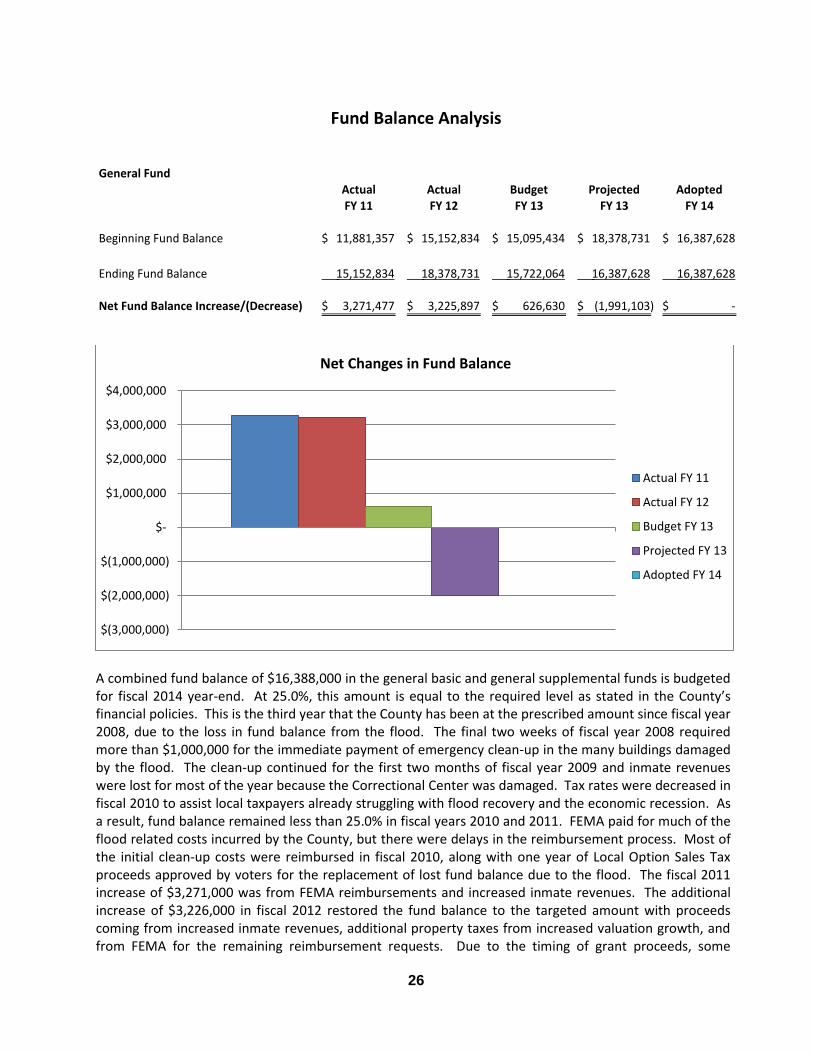
General FundActual Actual Budget Projected Adopted
FY 11 FY 12 FY 13 FY 13 FY 14
Beginning Fund Balance 11,881,357$ 15,152,834$ 15,095,434$ 18,378,731$ 16,387,628$
Ending Fund Balance 15,152,834 18,378,731 15,722,064 16,387,628 16,387,628
Net Fund Balance Increase/(Decrease) 3,271,477$ 3,225,897$ 626,630$ (1,991,103)$ -$
A combined fund balance of $16,388,000 in the general basic and general supplemental funds is budgeted for fiscal 2014 year-end. At 25.0%, this amount is equal to the required level as stated in the County’s financial policies. This is the third year that the County has been at the prescribed amount since fiscal year 2008, due to the loss in fund balance from the flood. The final two weeks of fiscal year 2008 required more than $1,000,000 for the immediate payment of emergency clean-up in the many buildings damaged by the flood. The clean-up continued for the first two months of fiscal year 2009 and inmate revenues were lost for most of the year because the Correctional Center was damaged. Tax rates were decreased in fiscal 2010 to assist local taxpayers already struggling with flood recovery and the economic recession. As a result, fund balance remained less than 25.0% in fiscal years 2010 and 2011. FEMA paid for much of the flood related costs incurred by the County, but there were delays in the reimbursement process. Most of the initial clean-up costs were reimbursed in fiscal 2010, along with one year of Local Option Sales Tax proceeds approved by voters for the replacement of lost fund balance due to the flood. The fiscal 2011 increase of $3,271,000 was from FEMA reimbursements and increased inmate revenues. The additional increase of $3,226,000 in fiscal 2012 restored the fund balance to the targeted amount with proceeds coming from increased inmate revenues, additional property taxes from increased valuation growth, and from FEMA for the remaining reimbursement requests. Due to the timing of grant proceeds, some
$(3,000,000)
$(2,000,000)
$(1,000,000)
$-
$1,000,000
$2,000,000
$3,000,000
$4,000,000
Net Changes in Fund Balance
Actual FY 11
Actual FY 12
Budget FY 13
Projected FY 13
Adopted FY 14
27
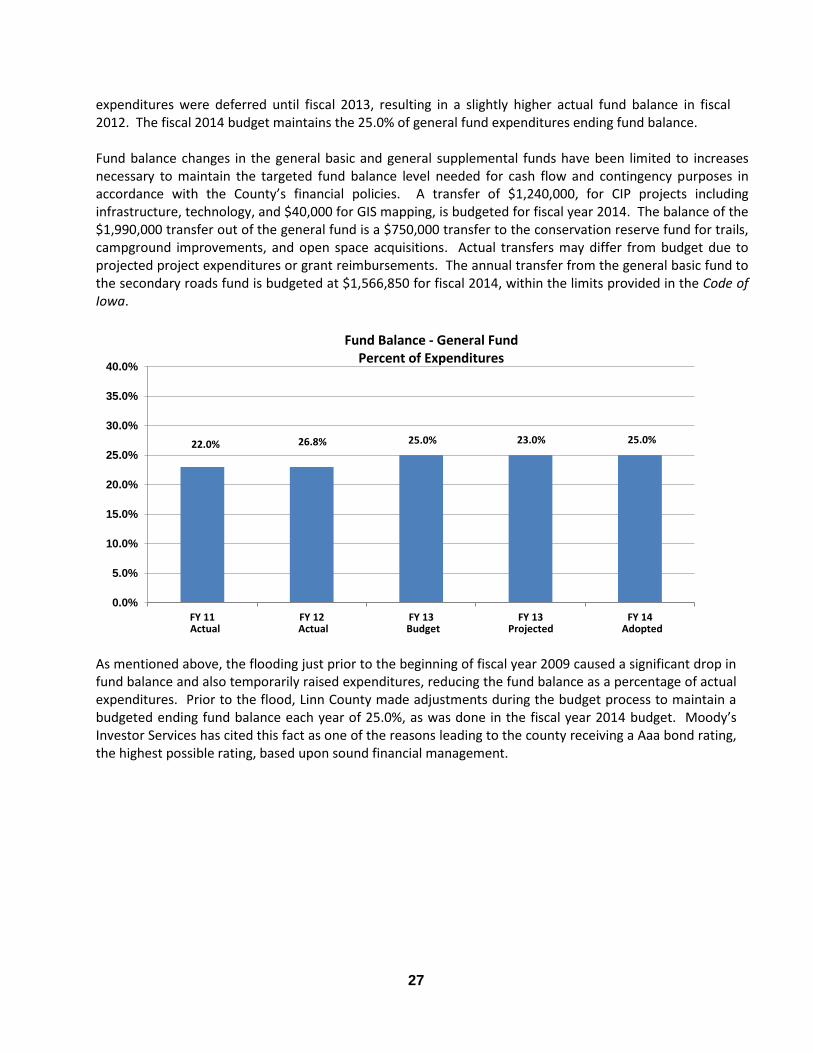
expenditures were deferred until fiscal 2013, resulting in a slightly higher actual fund balance in fiscal 2012. The fiscal 2014 budget maintains the 25.0% of general fund expenditures ending fund balance. Fund balance changes in the general basic and general supplemental funds have been limited to increases necessary to maintain the targeted fund balance level needed for cash flow and contingency purposes in accordance with the County’s financial policies. A transfer of $1,240,000, for CIP projects including infrastructure, technology, and $40,000 for GIS mapping, is budgeted for fiscal year 2014. The balance of the $1,990,000 transfer out of the general fund is a $750,000 transfer to the conservation reserve fund for trails, campground improvements, and open space acquisitions. Actual transfers may differ from budget due to projected project expenditures or grant reimbursements. The annual transfer from the general basic fund to the secondary roads fund is budgeted at $1,566,850 for fiscal 2014, within the limits provided in the Code of Iowa.
As mentioned above, the flooding just prior to the beginning of fiscal year 2009 caused a significant drop in fund balance and also temporarily raised expenditures, reducing the fund balance as a percentage of actual expenditures. Prior to the flood, Linn County made adjustments during the budget process to maintain a budgeted ending fund balance each year of 25.0%, as was done in the fiscal year 2014 budget. Moody’s Investor Services has cited this fact as one of the reasons leading to the county receiving a Aaa bond rating, the highest possible rating, based upon sound financial management.
22.0% 26.8% 25.0% 23.0% 25.0%
0.0%
5.0%
10.0%
15.0%
20.0%
25.0%
30.0%
35.0%
40.0%
FY 11 FY 12 FY 13 FY 13 FY 14Actual Actual Projected Adopted
Fund Balance - General Fund Percent of Expenditures
Budget
28
Special revenue funds are used to account for the proceeds of specific revenue sources (other than special assessments or major capital projects) that are legally restricted to expenditures for specified purposes. The funds included in this section and their purposes are as follows: MH - DD Fund – To account for taxes levied to provide mental health services to the mentally ill, the mentally
retarded, and the developmentally disabled.
Rural Services Fund – To account for taxes levied to benefit the rural residents of the County. The primary
use of this fund is for the transfer of funds to the secondary roads fund.
Inmate Commissary Fund – To account for the sale of personal and convenience items to prisoners in the
correctional center and revenues from inmate phone calls with profits used for purposes of prisoner welfare
and rehabilitation.
Gifts and Donations Fund – Gifts and donations received by the County are accounted for in this fund, with
the exception of Conservation gifts which are deposited in the Conservation Reserve fund.
Secondary Roads Fund – To account for state revenues allocated to the County to be used to maintain and
improve the county's roads.
Recorder's Records Management Fund – To account for fees collected for each recorded transaction to be
used for the purpose of preserving and maintaining public records.
Conservation Reserve Fund – To account for funds deposited with the County to be used for conservation
purposes.
Conservation Resource Enhancement and Protection (REAP) Fund – To account for state funds received by
the County to be used for County conservation land acquisition and capital improvement projects.
Air Pollution Title V Fund – To account for permit fees collected from industry for all major sources of air
pollution emissions.
Local Option Sales Tax Funds – To account for the use of sales tax proceeds by the Engineer and
Conservation, a separate fund has been established for each of these departments.
County Direct Services Fund – To account for mental health fees that fund services provided directly by Linn
County staff and no longer included in the MH-DD fund.
29
Actual Actual Budget Projected Adopted
Revenues/Sources FY 11 FY 12 FY 13 FY 13 FY 14
Taxes Levied on Property 11,700,964$ 11,918,975$ 12,220,795$ 12,220,790$ 12,460,706$
Less: Uncollected Delinquent Taxes 7,530 5,754 40,133 40,133 39,394
Less: Credits to Taxpayers 305,785 293,710 289,671 289,671 355,700
Net Current Property Tax 11,387,649 11,619,511 11,890,991 11,890,986 12,065,612
Delinquent Property Taxes Collected 26,293 10,524 18,500 5,500 5,500
Penalties & Interest on Taxes - - - - -
Other County Taxes 5,543,498 5,769,976 5,980,023 5,412,666 5,487,884
Intergovernmental 29,592,924 30,035,778 29,635,919 18,451,192 18,561,996
Licenses & Permits 38,593 41,561 34,000 34,000 35,800
Charges for Services 1,376,604 1,415,346 1,389,475 1,369,648 1,255,675
Use of Money & Property 23,700 14,607 - 17,355 2
Miscellaneous 180,039 852,498 142,000 256,184 166,500
Subtotal Revenues 48,169,300 49,759,801 49,090,908 37,437,531 37,578,969
Other Financing Sources:
General Long-Term Debt Proceeds - - - - -
Operating Transfers In 5,061,302 5,296,357 5,712,902 5,712,902 6,234,367
Proceeds of Capital Asset Sales 105,588 54,939 41,000 61,422 35,000
Beginning Fund Balance 8,637,588 8,994,269 6,321,073 8,615,240 6,702,489
Total Available Resources 61,973,778$ 64,105,366$ 61,165,883$ 51,827,095$ 50,550,825$
Expenditures/Uses
Public Safety & Legal Services 282,124$ 264,804$ 283,752$ 281,162$ 434,200$
Physical Health & Social Services - - - - -
Mental Health, MR & DD 32,457,453 34,473,792 35,243,322 22,405,276 21,414,579
County Environment & Education 582,754 630,279 519,405 529,622 531,914
Roads & Transportation 10,395,171 9,998,546 10,188,951 10,205,267 10,315,677
Government Services to Residents 70,000 65,716 50,000 50,000 50,000
Administration - 25,684 - - -
Nonprogram Current - - - - -
Debt Service - - - - -
Capital Projects 5,773,210 6,460,431 7,033,643 7,909,116 7,118,082
Subtotal Expenditures 49,560,712 51,919,252 53,319,073 41,380,443 39,864,452
Other Financing Uses:
Operating Transfers Out 3,418,797 3,570,874 3,744,163 3,744,163 3,917,517
Ending Fund Balance 8,994,269 8,615,240 4,102,647 6,702,489 6,768,856
Total Uses and Fund Balance 61,973,778$ 64,105,366$ 61,165,883$ 51,827,095$ 50,550,825$
30
Special Revenue Funds
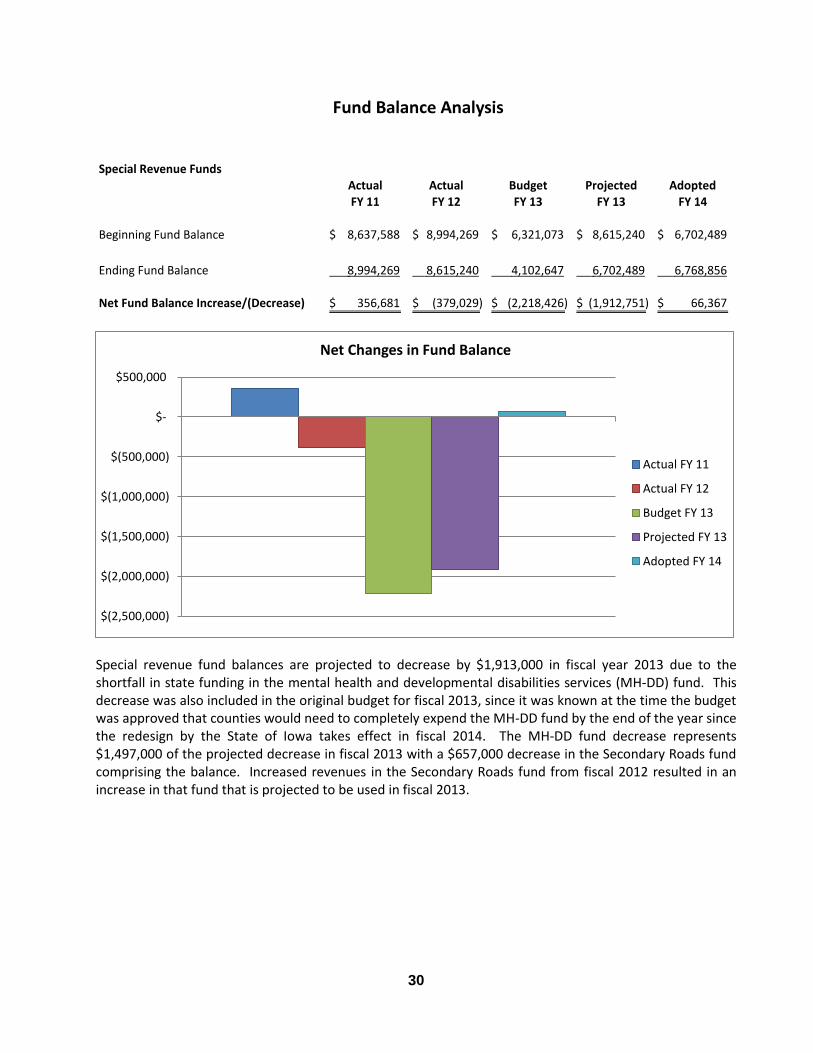
Actual Actual Budget Projected Adopted FY 11 FY 12 FY 13 FY 13 FY 14
Beginning Fund Balance 8,637,588$ 8,994,269$ 6,321,073$ 8,615,240$ 6,702,489$
Ending Fund Balance 8,994,269 8,615,240 4,102,647 6,702,489 6,768,856
Net Fund Balance Increase/(Decrease) 356,681$ (379,029)$ (2,218,426)$ (1,912,751)$ 66,367$
Special revenue fund balances are projected to decrease by $1,913,000 in fiscal year 2013 due to the shortfall in state funding in the mental health and developmental disabilities services (MH-DD) fund. This decrease was also included in the original budget for fiscal 2013, since it was known at the time the budget was approved that counties would need to completely expend the MH-DD fund by the end of the year since the redesign by the State of Iowa takes effect in fiscal 2014. The MH-DD fund decrease represents $1,497,000 of the projected decrease in fiscal 2013 with a $657,000 decrease in the Secondary Roads fund comprising the balance. Increased revenues in the Secondary Roads fund from fiscal 2012 resulted in an increase in that fund that is projected to be used in fiscal 2013.
$(2,500,000)
$(2,000,000)
$(1,500,000)
$(1,000,000)
$(500,000)
$-
$500,000
Net Changes in Fund Balance
Actual FY 11
Actual FY 12
Budget FY 13
Projected FY 13
Adopted FY 14
31
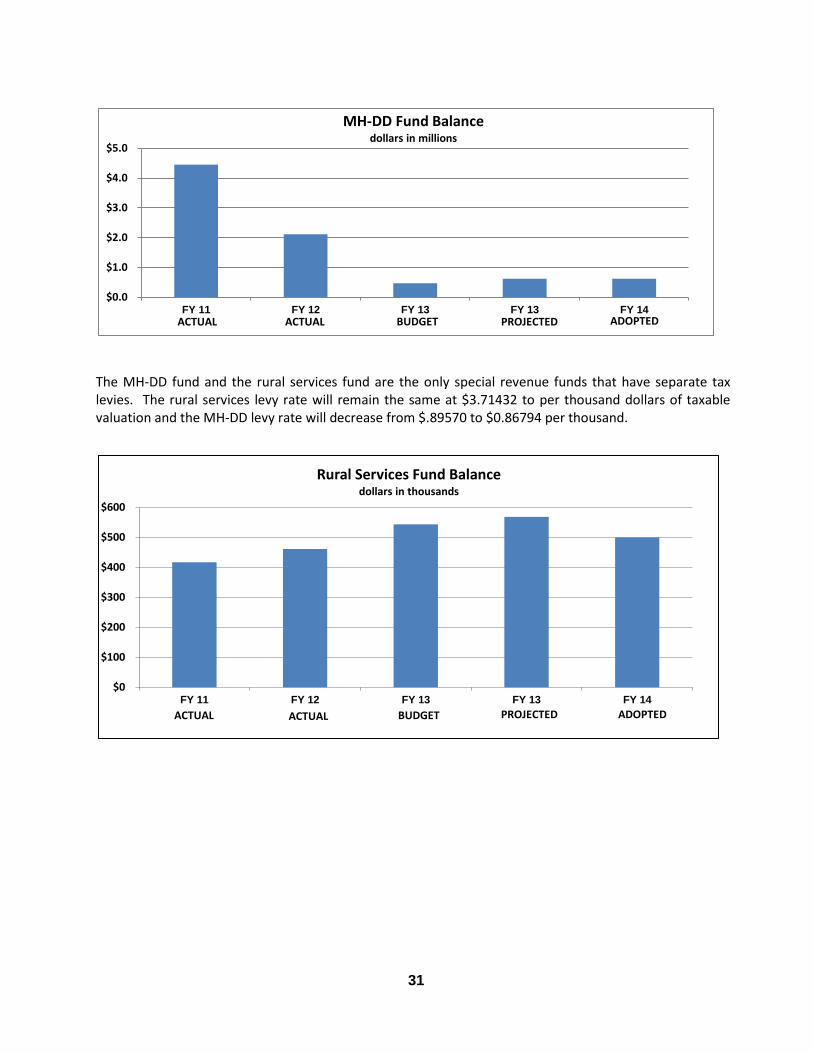
The MH-DD fund and the rural services fund are the only special revenue funds that have separate tax levies. The rural services levy rate will remain the same at $3.71432 to per thousand dollars of taxable valuation and the MH-DD levy rate will decrease from $.89570 to $0.86794 per thousand.
$0.0
$1.0
$2.0
$3.0
$4.0
$5.0
FY 11 FY 12 FY 13 FY 13 FY 14
MH-DD Fund Balance dollars in millions
ACTUAL ACTUAL BUDGET PROJECTED ADOPTED
$0
$100
$200
$300
$400
$500
$600
FY 11 FY 12 FY 13 FY 13 FY 14
Rural Services Fund Balance dollars in thousands
ACTUAL ACTUAL BUDGET PROJECTED ADOPTED
32
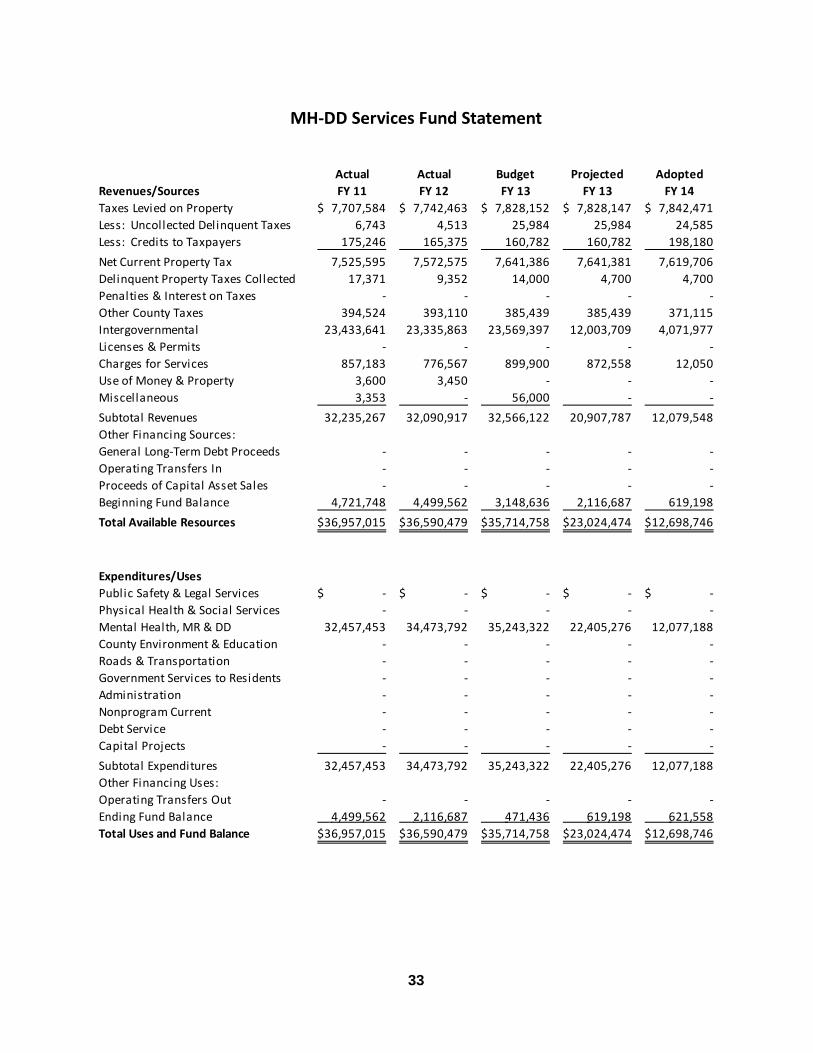
MH-DD Services Fund
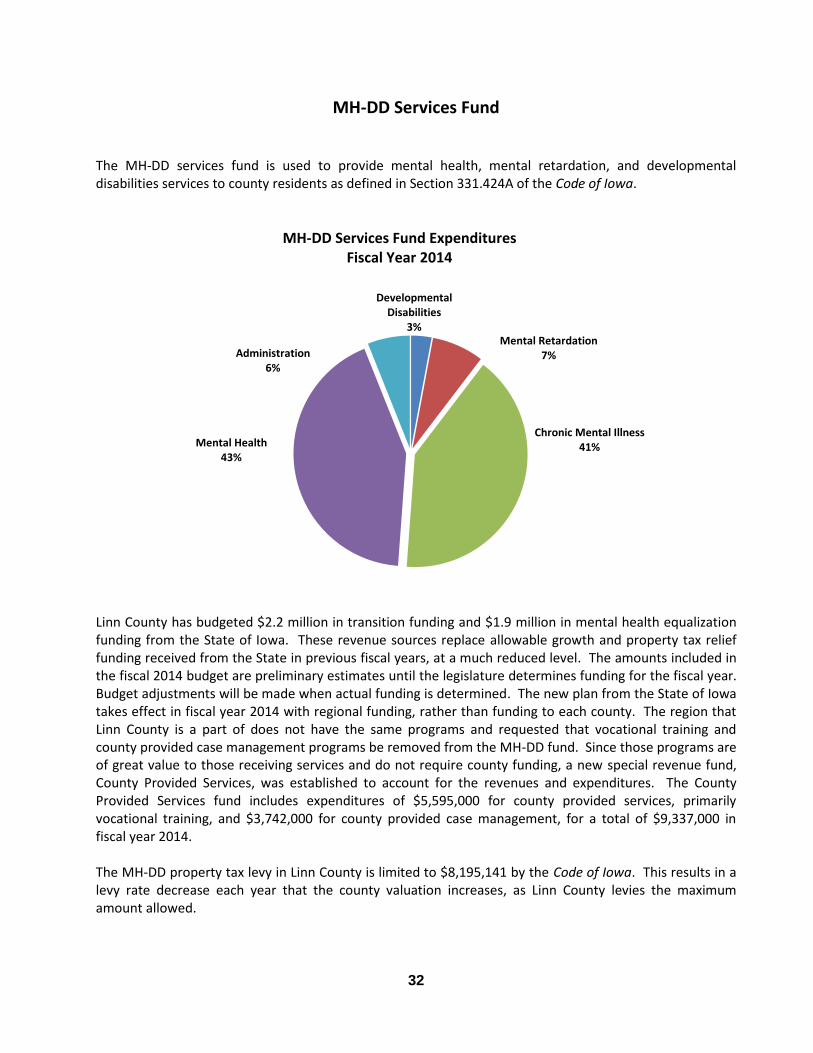
The MH-DD services fund is used to provide mental health, mental retardation, and developmental disabilities services to county residents as defined in Section 331.424A of the Code of Iowa.
Linn County has budgeted $2.2 million in transition funding and $1.9 million in mental health equalization funding from the State of Iowa. These revenue sources replace allowable growth and property tax relief funding received from the State in previous fiscal years, at a much reduced level. The amounts included in the fiscal 2014 budget are preliminary estimates until the legislature determines funding for the fiscal year. Budget adjustments will be made when actual funding is determined. The new plan from the State of Iowa takes effect in fiscal year 2014 with regional funding, rather than funding to each county. The region that Linn County is a part of does not have the same programs and requested that vocational training and county provided case management programs be removed from the MH-DD fund. Since those programs are of great value to those receiving services and do not require county funding, a new special revenue fund, County Provided Services, was established to account for the revenues and expenditures. The County Provided Services fund includes expenditures of $5,595,000 for county provided services, primarily vocational training, and $3,742,000 for county provided case management, for a total of $9,337,000 in fiscal year 2014. The MH-DD property tax levy in Linn County is limited to $8,195,141 by the Code of Iowa. This results in a levy rate decrease each year that the county valuation increases, as Linn County levies the maximum amount allowed.
Developmental Disabilities
3% Mental Retardation
7%
Chronic Mental Illness 41% Mental Health
43%
Administration 6%
MH-DD Services Fund Expenditures Fiscal Year 2014
33
-
Actual Actual Budget Projected Adopted
Revenues/Sources FY 11 FY 12 FY 13 FY 13 FY 14
Taxes Levied on Property 7,707,584$ 7,742,463$ 7,828,152$ 7,828,147$ 7,842,471$
Less: Uncollected Delinquent Taxes 6,743 4,513 25,984 25,984 24,585
Less: Credits to Taxpayers 175,246 165,375 160,782 160,782 198,180
Net Current Property Tax 7,525,595 7,572,575 7,641,386 7,641,381 7,619,706
Delinquent Property Taxes Collected 17,371 9,352 14,000 4,700 4,700
Penalties & Interest on Taxes - - - - -
Other County Taxes 394,524 393,110 385,439 385,439 371,115
Intergovernmental 23,433,641 23,335,863 23,569,397 12,003,709 4,071,977
Licenses & Permits - - - - -
Charges for Services 857,183 776,567 899,900 872,558 12,050
Use of Money & Property 3,600 3,450 - - -
Miscellaneous 3,353 - 56,000 - -
Subtotal Revenues 32,235,267 32,090,917 32,566,122 20,907,787 12,079,548
Other Financing Sources:
General Long-Term Debt Proceeds - - - - -
Operating Transfers In - - - - -
Proceeds of Capital Asset Sales - - - - -
Beginning Fund Balance 4,721,748 4,499,562 3,148,636 2,116,687 619,198
Total Available Resources 36,957,015$ 36,590,479$ 35,714,758$ 23,024,474$ 12,698,746$
Expenditures/Uses
Public Safety & Legal Services -$ -$ -$ -$ -$
Physical Health & Social Services - - - - -
Mental Health, MR & DD 32,457,453 34,473,792 35,243,322 22,405,276 12,077,188
County Environment & Education - - - - -
Roads & Transportation - - - - -
Government Services to Residents - - - - -
Administration - - - - -
Nonprogram Current - - - - -
Debt Service - - - - -
Capital Projects - - - - -
Subtotal Expenditures 32,457,453 34,473,792 35,243,322 22,405,276 12,077,188
Other Financing Uses:
Operating Transfers Out - - - - -
Ending Fund Balance 4,499,562 2,116,687 471,436 619,198 621,558
Total Uses and Fund Balance 36,957,015$ 36,590,479$ 35,714,758$ 23,024,474$ 12,698,746$
34
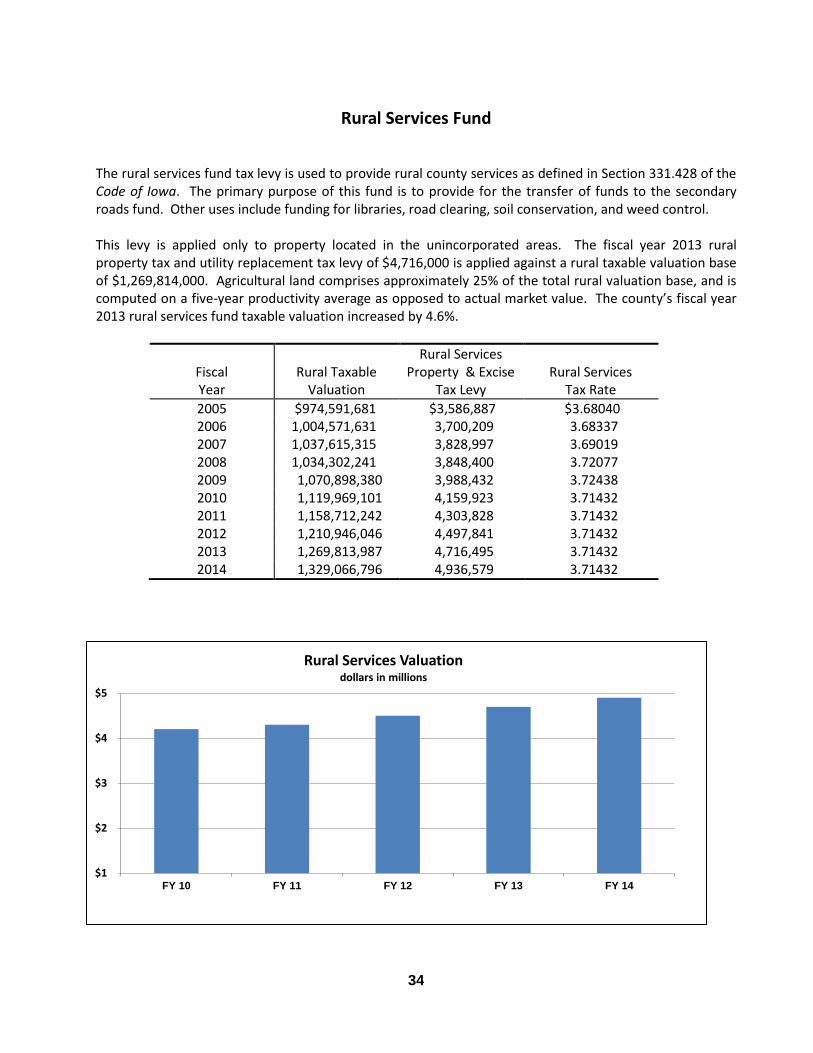
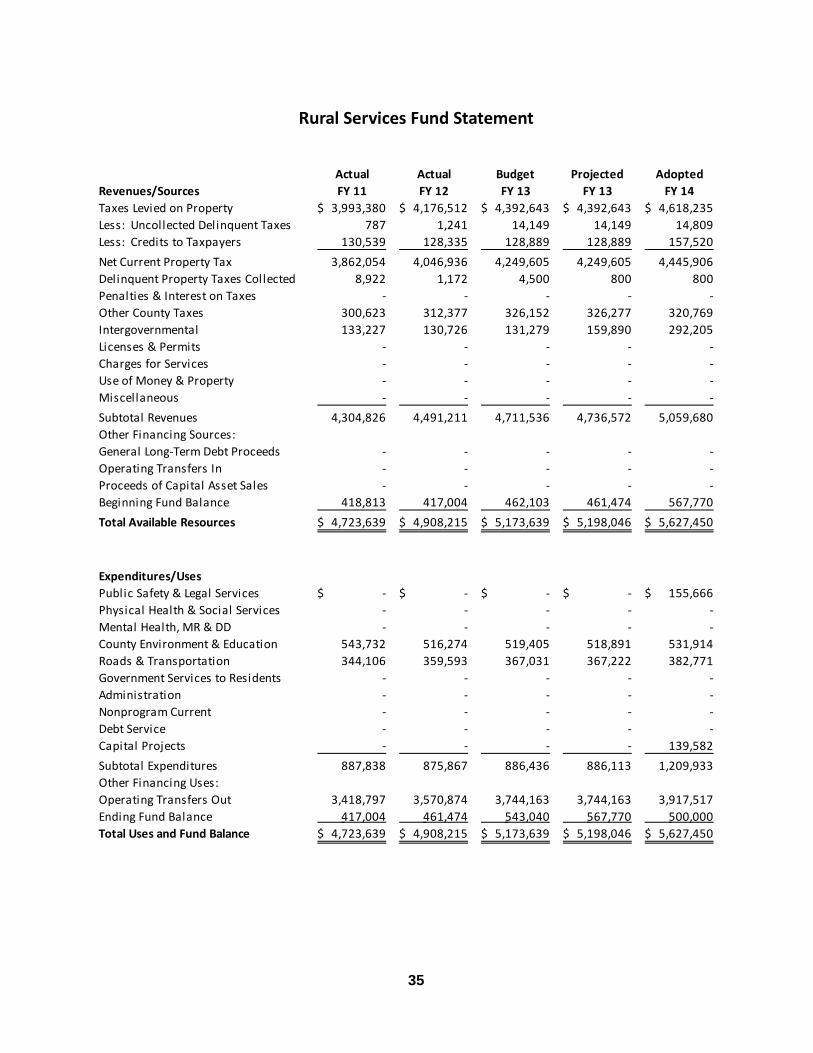
The rural services fund tax levy is used to provide rural county services as defined in Section 331.428 of the Code of Iowa. The primary purpose of this fund is to provide for the transfer of funds to the secondary roads fund. Other uses include funding for libraries, road clearing, soil conservation, and weed control. This levy is applied only to property located in the unincorporated areas. The fiscal year 2013 rural property tax and utility replacement tax levy of $4,716,000 is applied against a rural taxable valuation base of $1,269,814,000. Agricultural land comprises approximately 25% of the total rural valuation base, and is computed on a five-year productivity average as opposed to actual market value. The county’s fiscal year 2013 rural services fund taxable valuation increased by 4.6%.
Fiscal Year
Rural Taxable
Valuation
Rural Services Property & Excise
Tax Levy
Rural Services
Tax Rate
2005 $974,591,681 $3,586,887 $3.68040 2006 1,004,571,631 3,700,209 3.68337 2007 1,037,615,315 3,828,997 3.69019 2008 1,034,302,241 3,848,400 3.72077 2009 1,070,898,380 3,988,432 3.72438 2010 1,119,969,101 4,159,923 3.71432 2011 1,158,712,242 4,303,828 3.71432 2012 1,210,946,046 4,497,841 3.71432 2013 1,269,813,987 4,716,495 3.71432 2014 1,329,066,796 4,936,579 3.71432
$1
$2
$3
$4
$5
FY 10 FY 11 FY 12 FY 13 FY 14
Rural Services Valuation dollars in millions
35
Actual Actual Budget Projected Adopted
Revenues/Sources FY 11 FY 12 FY 13 FY 13 FY 14
Taxes Levied on Property 3,993,380$ 4,176,512$ 4,392,643$ 4,392,643$ 4,618,235$
Less: Uncollected Delinquent Taxes 787 1,241 14,149 14,149 14,809
Less: Credits to Taxpayers 130,539 128,335 128,889 128,889 157,520
Net Current Property Tax 3,862,054 4,046,936 4,249,605 4,249,605 4,445,906
Delinquent Property Taxes Collected 8,922 1,172 4,500 800 800
Penalties & Interest on Taxes - - - - -
Other County Taxes 300,623 312,377 326,152 326,277 320,769
Intergovernmental 133,227 130,726 131,279 159,890 292,205
Licenses & Permits - - - - -
Charges for Services - - - - -
Use of Money & Property - - - - -
Miscellaneous - - - - -
Subtotal Revenues 4,304,826 4,491,211 4,711,536 4,736,572 5,059,680
Other Financing Sources:
General Long-Term Debt Proceeds - - - - -
Operating Transfers In - - - - -
Proceeds of Capital Asset Sales - - - - -
Beginning Fund Balance 418,813 417,004 462,103 461,474 567,770
Total Available Resources 4,723,639$ 4,908,215$ 5,173,639$ 5,198,046$ 5,627,450$
Expenditures/Uses
Public Safety & Legal Services -$ -$ -$ -$ 155,666$
Physical Health & Social Services - - - - -
Mental Health, MR & DD - - - - -
County Environment & Education 543,732 516,274 519,405 518,891 531,914
Roads & Transportation 344,106 359,593 367,031 367,222 382,771
Government Services to Residents - - - - -
Administration - - - - -
Nonprogram Current - - - - -
Debt Service - - - - -
Capital Projects - - - - 139,582
Subtotal Expenditures 887,838 875,867 886,436 886,113 1,209,933
Other Financing Uses:
Operating Transfers Out 3,418,797 3,570,874 3,744,163 3,744,163 3,917,517
Ending Fund Balance 417,004 461,474 543,040 567,770 500,000
Total Uses and Fund Balance 4,723,639$ 4,908,215$ 5,173,639$ 5,198,046$ 5,627,450$
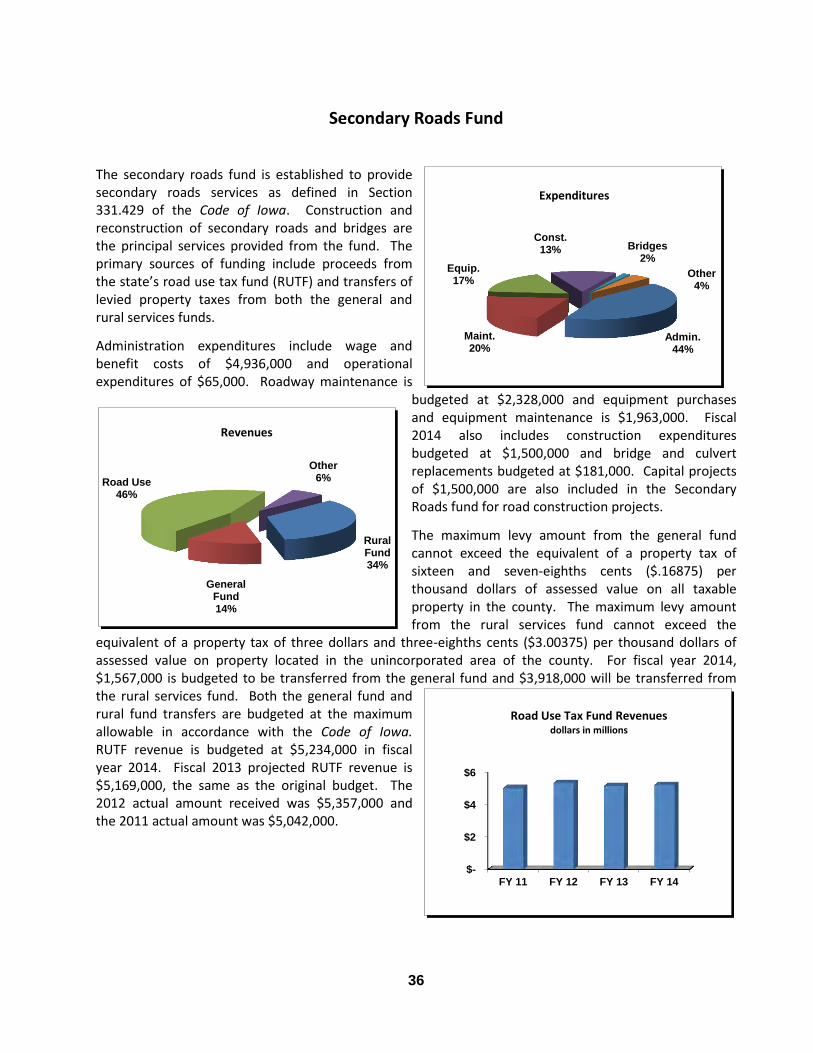
36
The secondary roads fund is established to provide secondary roads services as defined in Section 331.429 of the Code of Iowa. Construction and reconstruction of secondary roads and bridges are the principal services provided from the fund. The primary sources of funding include proceeds from the state’s road use tax fund (RUTF) and transfers of levied property taxes from both the general and rural services funds.
Administration expenditures include wage and benefit costs of $4,936,000 and operational expenditures of $65,000. Roadway maintenance is
budgeted at $2,328,000 and equipment purchases and equipment maintenance is $1,963,000. Fiscal 2014 also includes construction expenditures budgeted at $1,500,000 and bridge and culvert replacements budgeted at $181,000. Capital projects of $1,500,000 are also included in the Secondary Roads fund for road construction projects.
The maximum levy amount from the general fund cannot exceed the equivalent of a property tax of sixteen and seven-eighths cents ($.16875) per thousand dollars of assessed value on all taxable property in the county. The maximum levy amount from the rural services fund cannot exceed the
equivalent of a property tax of three dollars and three-eighths cents ($3.00375) per thousand dollars of assessed value on property located in the unincorporated area of the county. For fiscal year 2014, $1,567,000 is budgeted to be transferred from the general fund and $3,918,000 will be transferred from the rural services fund. Both the general fund and rural fund transfers are budgeted at the maximum allowable in accordance with the Code of Iowa. RUTF revenue is budgeted at $5,234,000 in fiscal year 2014. Fiscal 2013 projected RUTF revenue is $5,169,000, the same as the original budget. The 2012 actual amount received was $5,357,000 and the 2011 actual amount was $5,042,000.
Admin. 44%
Maint. 20%
Equip. 17%
Const. 13% Bridges
2%
Other 4%
Expenditures
$-
$2
$4
$6
FY 11 FY 12 FY 13 FY 14
Road Use Tax Fund Revenues dollars in millions
Rural Fund 34%
General Fund 14%
Road Use 46%
Other 6%
Revenues
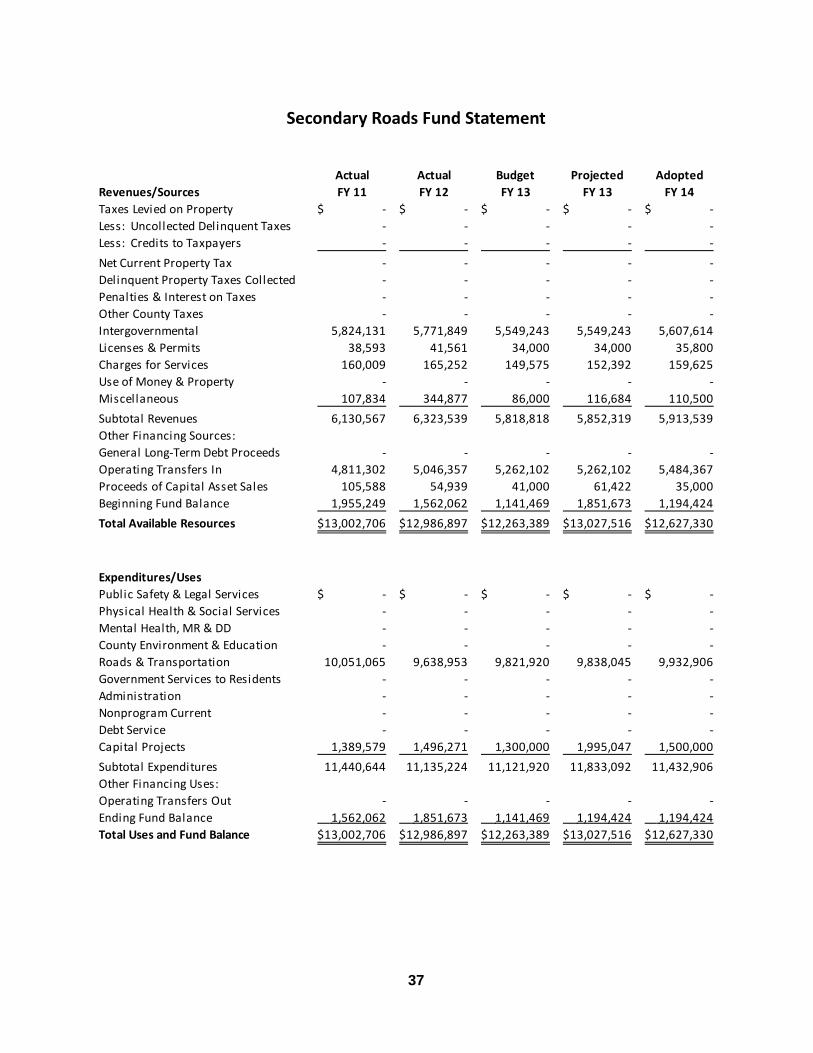
37
Actual Actual Budget Projected Adopted
Revenues/Sources FY 11 FY 12 FY 13 FY 13 FY 14
Taxes Levied on Property -$ -$ -$ -$ -$
Less: Uncollected Delinquent Taxes - - - - -
Less: Credits to Taxpayers - - - - -
Net Current Property Tax - - - - -
Delinquent Property Taxes Collected - - - - -
Penalties & Interest on Taxes - - - - -
Other County Taxes - - - - -
Intergovernmental 5,824,131 5,771,849 5,549,243 5,549,243 5,607,614
Licenses & Permits 38,593 41,561 34,000 34,000 35,800
Charges for Services 160,009 165,252 149,575 152,392 159,625
Use of Money & Property - - - - -
Miscellaneous 107,834 344,877 86,000 116,684 110,500
Subtotal Revenues 6,130,567 6,323,539 5,818,818 5,852,319 5,913,539
Other Financing Sources:
General Long-Term Debt Proceeds - - - - -
Operating Transfers In 4,811,302 5,046,357 5,262,102 5,262,102 5,484,367
Proceeds of Capital Asset Sales 105,588 54,939 41,000 61,422 35,000
Beginning Fund Balance 1,955,249 1,562,062 1,141,469 1,851,673 1,194,424
Total Available Resources 13,002,706$ 12,986,897$ 12,263,389$ 13,027,516$ 12,627,330$
Expenditures/Uses
Public Safety & Legal Services -$ -$ -$ -$ -$
Physical Health & Social Services - - - - -
Mental Health, MR & DD - - - - -
County Environment & Education - - - - -
Roads & Transportation 10,051,065 9,638,953 9,821,920 9,838,045 9,932,906
Government Services to Residents - - - - -
Administration - - - - -
Nonprogram Current - - - - -
Debt Service - - - - -
Capital Projects 1,389,579 1,496,271 1,300,000 1,995,047 1,500,000
Subtotal Expenditures 11,440,644 11,135,224 11,121,920 11,833,092 11,432,906
Other Financing Uses:
Operating Transfers Out - - - - -
Ending Fund Balance 1,562,062 1,851,673 1,141,469 1,194,424 1,194,424
Total Uses and Fund Balance 13,002,706$ 12,986,897$ 12,263,389$ 13,027,516$ 12,627,330$
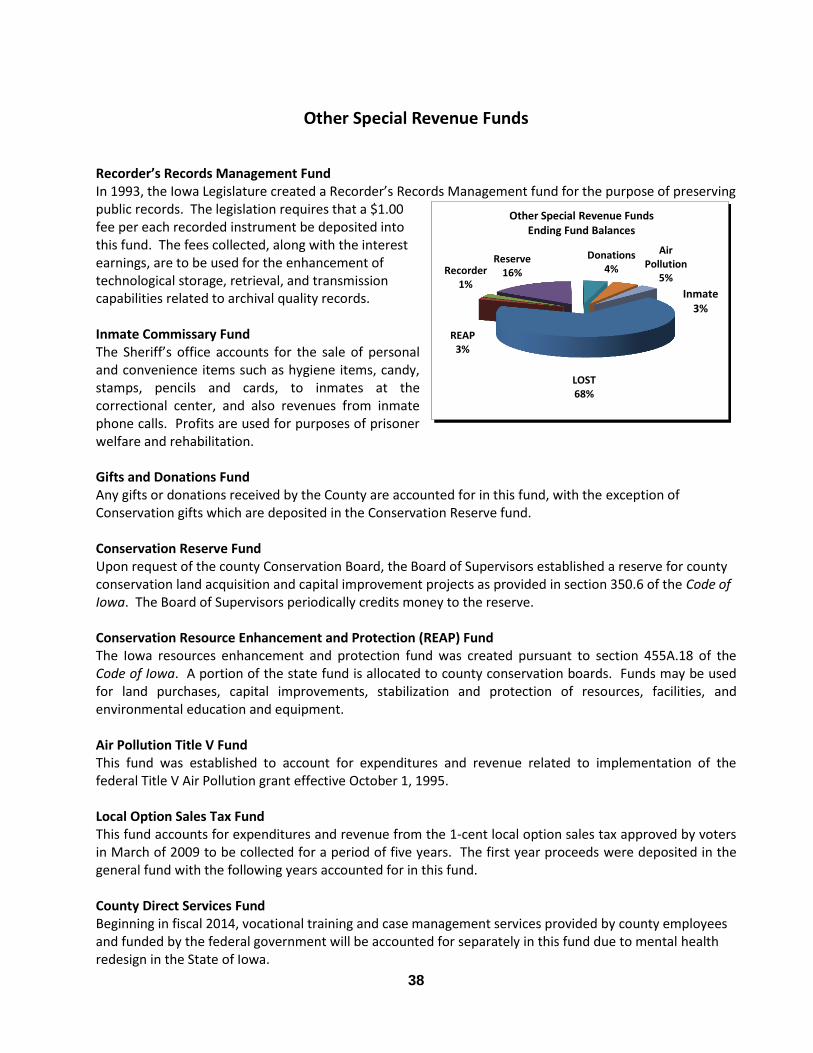
38
Recorder’s Records Management Fund In 1993, the Iowa Legislature created a Recorder’s Records Management fund for the purpose of preserving public records. The legislation requires that a $1.00 fee per each recorded instrument be deposited into this fund. The fees collected, along with the interest earnings, are to be used for the enhancement of technological storage, retrieval, and transmission capabilities related to archival quality records. Inmate Commissary Fund The Sheriff’s office accounts for the sale of personal and convenience items such as hygiene items, candy, stamps, pencils and cards, to inmates at the correctional center, and also revenues from inmate phone calls. Profits are used for purposes of prisoner welfare and rehabilitation. Gifts and Donations Fund Any gifts or donations received by the County are accounted for in this fund, with the exception of Conservation gifts which are deposited in the Conservation Reserve fund. Conservation Reserve Fund Upon request of the county Conservation Board, the Board of Supervisors established a reserve for county conservation land acquisition and capital improvement projects as provided in section 350.6 of the Code of Iowa. The Board of Supervisors periodically credits money to the reserve. Conservation Resource Enhancement and Protection (REAP) Fund The Iowa resources enhancement and protection fund was created pursuant to section 455A.18 of the Code of Iowa. A portion of the state fund is allocated to county conservation boards. Funds may be used for land purchases, capital improvements, stabilization and protection of resources, facilities, and environmental education and equipment. Air Pollution Title V Fund This fund was established to account for expenditures and revenue related to implementation of the federal Title V Air Pollution grant effective October 1, 1995. Local Option Sales Tax Fund This fund accounts for expenditures and revenue from the 1-cent local option sales tax approved by voters in March of 2009 to be collected for a period of five years. The first year proceeds were deposited in the general fund with the following years accounted for in this fund. County Direct Services Fund Beginning in fiscal 2014, vocational training and case management services provided by county employees and funded by the federal government will be accounted for separately in this fund due to mental health redesign in the State of Iowa.
LOST 68%
Recorder 1%
REAP 3%
Reserve 16%
Donations 4%
Air Pollution
5%
Inmate 3%
Other Special Revenue Funds Ending Fund Balances
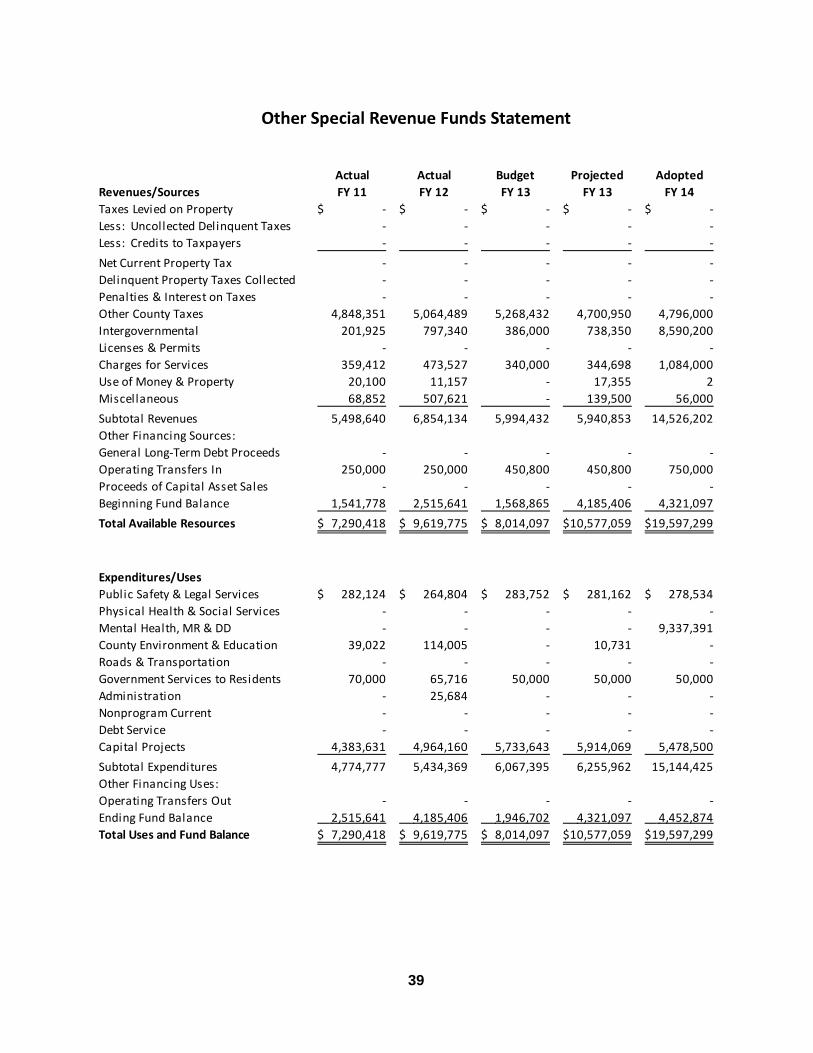
39
Actual Actual Budget Projected Adopted
Revenues/Sources FY 11 FY 12 FY 13 FY 13 FY 14
Taxes Levied on Property -$ -$ -$ -$ -$
Less: Uncollected Delinquent Taxes - - - - -
Less: Credits to Taxpayers - - - - -
Net Current Property Tax - - - - -
Delinquent Property Taxes Collected - - - - -
Penalties & Interest on Taxes - - - - -
Other County Taxes 4,848,351 5,064,489 5,268,432 4,700,950 4,796,000
Intergovernmental 201,925 797,340 386,000 738,350 8,590,200
Licenses & Permits - - - - -
Charges for Services 359,412 473,527 340,000 344,698 1,084,000
Use of Money & Property 20,100 11,157 - 17,355 2
Miscellaneous 68,852 507,621 - 139,500 56,000
Subtotal Revenues 5,498,640 6,854,134 5,994,432 5,940,853 14,526,202
Other Financing Sources:
General Long-Term Debt Proceeds - - - - -
Operating Transfers In 250,000 250,000 450,800 450,800 750,000
Proceeds of Capital Asset Sales - - - - -
Beginning Fund Balance 1,541,778 2,515,641 1,568,865 4,185,406 4,321,097
Total Available Resources 7,290,418$ 9,619,775$ 8,014,097$ 10,577,059$ 19,597,299$
Expenditures/Uses
Public Safety & Legal Services 282,124$ 264,804$ 283,752$ 281,162$ 278,534$
Physical Health & Social Services - - - - -
Mental Health, MR & DD - - - - 9,337,391
County Environment & Education 39,022 114,005 - 10,731 -
Roads & Transportation - - - - -
Government Services to Residents 70,000 65,716 50,000 50,000 50,000
Administration - 25,684 - - -
Nonprogram Current - - - - -
Debt Service - - - - -
Capital Projects 4,383,631 4,964,160 5,733,643 5,914,069 5,478,500
Subtotal Expenditures 4,774,777 5,434,369 6,067,395 6,255,962 15,144,425
Other Financing Uses:
Operating Transfers Out - - - - -
Ending Fund Balance 2,515,641 4,185,406 1,946,702 4,321,097 4,452,874
Total Uses and Fund Balance 7,290,418$ 9,619,775$ 8,014,097$ 10,577,059$ 19,597,299$
40
I. INTRODUCTION
The Capital Improvement Program (CIP) is a policy making and management tool to facilitate the planning, scheduling and execution of a series of public improvements for building assets and grounds over a multiple year period. The CIP for Linn County involves the planning, scheduling and coordination of physical improvements over a five-year period that is reassessed each year. A prioritized list is developed based upon assessment of need and importance within the constraints of the County’s ability to finance, implement and administer the projects. The benefits of a CIP plan include:
A. Attention is focused on the needs, goals and capabilities of the County. B. Capital improvement programming promotes the optimal use of taxpayer dollars by
guiding the Board of Supervisors in making sound annual budget decisions. C. A sound and stable financial program is maintained by proposing projects and identifying
their cost elements, identifying available financial resources and constraints, and developing a realistic financing program. Appropriations, tax rates, and bonded indebtedness can be established to address the capital projects needs that have been identified.
D. A comprehensive picture of Linn County’s capital improvement projects provides a manner
by which capital needs are relayed to the public. II. DEFINITION A CIP is a plan for capital expenditures to be incurred each year over a five-year period to meet
capital needs in future years. The plan sets forth each project or other contemplated expenditures in which the County is to have a part and specifies the resources estimated to be available to finance the projected expenditures. Generally, the capital projects fund is used to account for acquisition or construction of major capital facilities. However, additional expenditures can be made from the fund if the following criteria are met:
1. Exceed $5,000.
2. Do not occur annually.
The capital projects service area, as defined under the Code of Iowa, includes construction projects such as roads, bridges and certain conservation projects. The funding of these projects is not included in the annual CIP and are not financed through the capital projects fund.
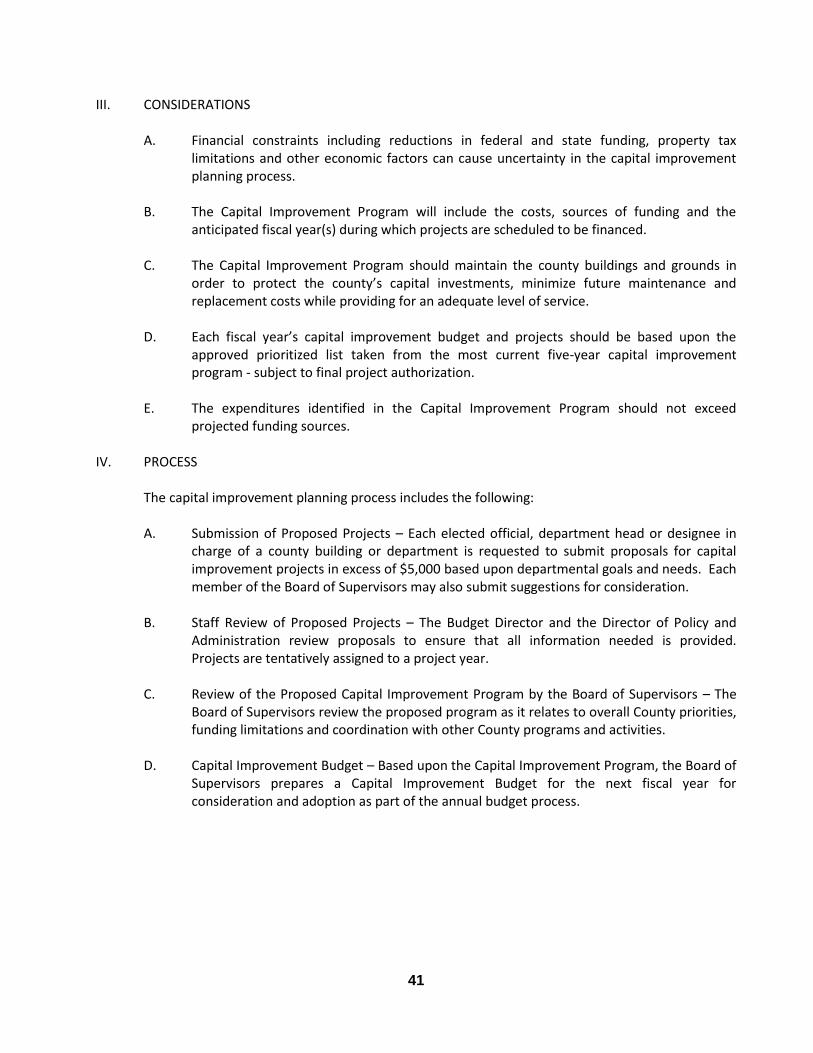
41
III. CONSIDERATIONS
A. Financial constraints including reductions in federal and state funding, property tax limitations and other economic factors can cause uncertainty in the capital improvement planning process.
B. The Capital Improvement Program will include the costs, sources of funding and the
anticipated fiscal year(s) during which projects are scheduled to be financed.
C. The Capital Improvement Program should maintain the county buildings and grounds in order to protect the county’s capital investments, minimize future maintenance and replacement costs while providing for an adequate level of service.
D. Each fiscal year’s capital improvement budget and projects should be based upon the
approved prioritized list taken from the most current five-year capital improvement program - subject to final project authorization.
E. The expenditures identified in the Capital Improvement Program should not exceed
projected funding sources. IV. PROCESS The capital improvement planning process includes the following:
A. Submission of Proposed Projects – Each elected official, department head or designee in charge of a county building or department is requested to submit proposals for capital improvement projects in excess of $5,000 based upon departmental goals and needs. Each member of the Board of Supervisors may also submit suggestions for consideration.
B. Staff Review of Proposed Projects – The Budget Director and the Director of Policy and
Administration review proposals to ensure that all information needed is provided. Projects are tentatively assigned to a project year.
C. Review of the Proposed Capital Improvement Program by the Board of Supervisors – The
Board of Supervisors review the proposed program as it relates to overall County priorities, funding limitations and coordination with other County programs and activities.
D. Capital Improvement Budget – Based upon the Capital Improvement Program, the Board of
Supervisors prepares a Capital Improvement Budget for the next fiscal year for consideration and adoption as part of the annual budget process.
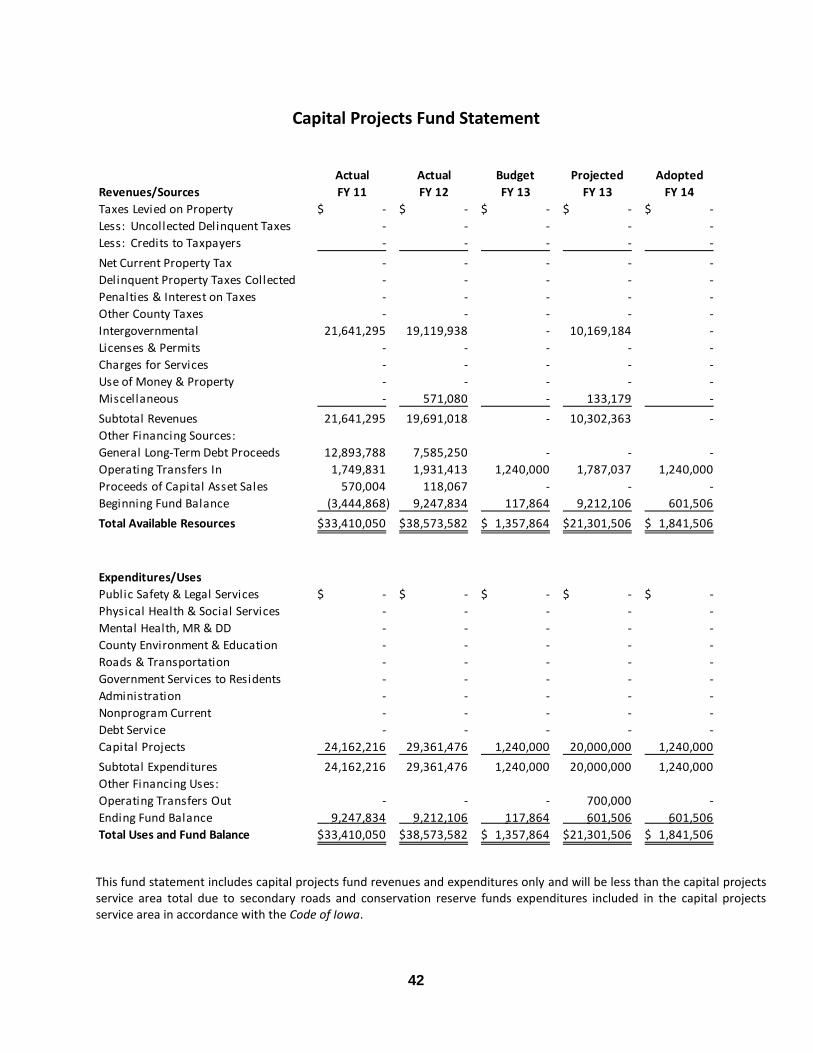
42
This fund statement includes capital projects fund revenues and expenditures only and will be less than the capital projects service area total due to secondary roads and conservation reserve funds expenditures included in the capital projects service area in accordance with the Code of Iowa.
Actual Actual Budget Projected Adopted
Revenues/Sources FY 11 FY 12 FY 13 FY 13 FY 14
Taxes Levied on Property -$ -$ -$ -$ -$
Less: Uncollected Delinquent Taxes - - - - -
Less: Credits to Taxpayers - - - - -
Net Current Property Tax - - - - -
Delinquent Property Taxes Collected - - - - -
Penalties & Interest on Taxes - - - - -
Other County Taxes - - - - -
Intergovernmental 21,641,295 19,119,938 - 10,169,184 -
Licenses & Permits - - - - -
Charges for Services - - - - -
Use of Money & Property - - - - -
Miscellaneous - 571,080 - 133,179 -
Subtotal Revenues 21,641,295 19,691,018 - 10,302,363 -
Other Financing Sources:
General Long-Term Debt Proceeds 12,893,788 7,585,250 - - -
Operating Transfers In 1,749,831 1,931,413 1,240,000 1,787,037 1,240,000
Proceeds of Capital Asset Sales 570,004 118,067 - - -
Beginning Fund Balance (3,444,868) 9,247,834 117,864 9,212,106 601,506
Total Available Resources 33,410,050$ 38,573,582$ 1,357,864$ 21,301,506$ 1,841,506$
Expenditures/Uses
Public Safety & Legal Services -$ -$ -$ -$ -$
Physical Health & Social Services - - - - -
Mental Health, MR & DD - - - - -
County Environment & Education - - - - -
Roads & Transportation - - - - -
Government Services to Residents - - - - -
Administration - - - - -
Nonprogram Current - - - - -
Debt Service - - - - -
Capital Projects 24,162,216 29,361,476 1,240,000 20,000,000 1,240,000
Subtotal Expenditures 24,162,216 29,361,476 1,240,000 20,000,000 1,240,000
Other Financing Uses:
Operating Transfers Out - - - 700,000 -
Ending Fund Balance 9,247,834 9,212,106 117,864 601,506 601,506
Total Uses and Fund Balance 33,410,050$ 38,573,582$ 1,357,864$ 21,301,506$ 1,841,506$
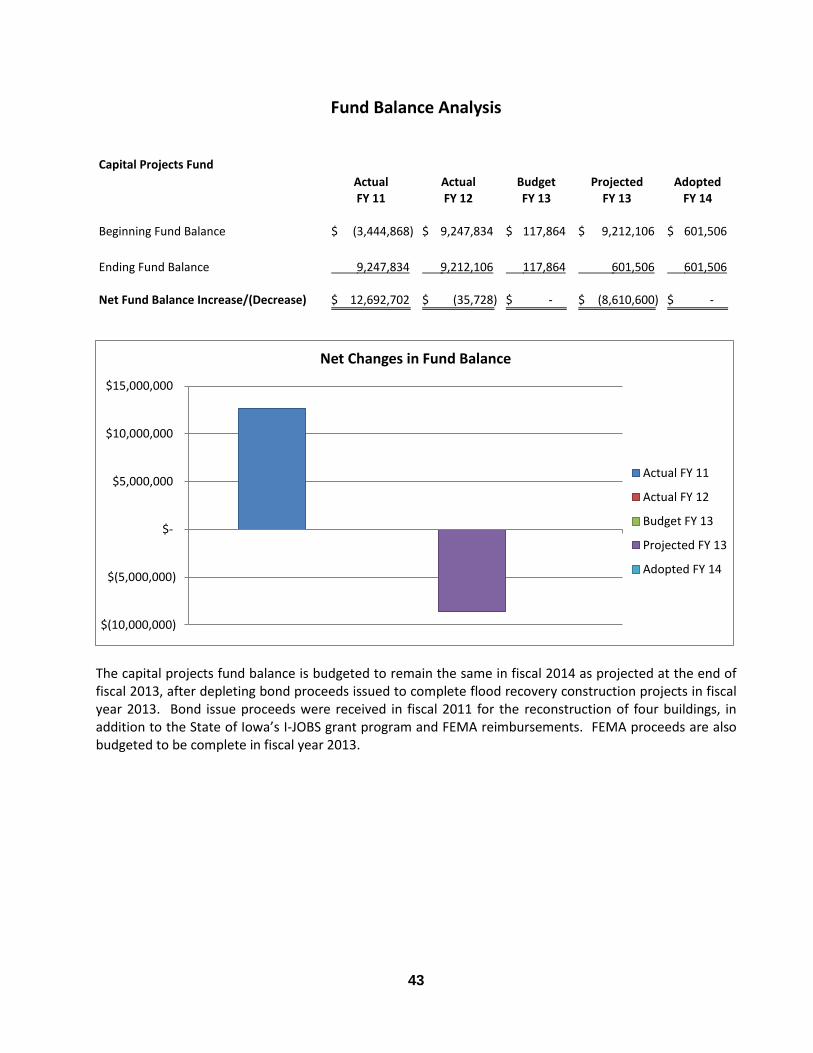
43
Capital Projects Fund
Actual Actual Budget Projected Adopted FY 11 FY 12 FY 13 FY 13 FY 14
Beginning Fund Balance (3,444,868)$ 9,247,834$ 117,864$ 9,212,106$ 601,506$
Ending Fund Balance 9,247,834 9,212,106 117,864 601,506 601,506
Net Fund Balance Increase/(Decrease) 12,692,702$ (35,728)$ -$ (8,610,600)$ -$
The capital projects fund balance is budgeted to remain the same in fiscal 2014 as projected at the end of fiscal 2013, after depleting bond proceeds issued to complete flood recovery construction projects in fiscal year 2013. Bond issue proceeds were received in fiscal 2011 for the reconstruction of four buildings, in addition to the State of Iowa’s I-JOBS grant program and FEMA reimbursements. FEMA proceeds are also budgeted to be complete in fiscal year 2013.
$(10,000,000)
$(5,000,000)
$-
$5,000,000
$10,000,000
$15,000,000
Net Changes in Fund Balance
Actual FY 11
Actual FY 12
Budget FY 13
Projected FY 13
Adopted FY 14
44
–
Capital projects fund expenditures of $1,240,000 are budgeted for fiscal year 2014, with $1,200,000 for capital projects included in the capital improvement plan and $40,000 to be reserved for a GIS mapping update. These projects are funded through tax dollars. Projects included in the CIP are non-routine and may or may not impact other operating budgets. Impact to other operating budgets is identified for each project. The plan includes the following projects:
Precinct Atlas Funding Year: 2014 Cost: $29,000 (total project is $71,677) Completion: 2014 Description: Purchase of laptop computers and related equipment for use with software
provided by the State for use as a polling place management system. Impact: No impact to other budgets. Justification: This system will ensure that correct procedures are followed at polling places and
that paperwork is completed accurately.
Public Service Center Parking Lot Funding Year: 2014 Cost: $115,000 (total project is $650,000) Completion: 2014 Description: Acquire additional land adjacent to existing employee parking lot, demolish existing
flood damaged structures and pave lot. Impact: No impact to other budgets. Justification: Existing parking is inadequate according to code requirements.
Squaw Creek Park Maintenance Shop Funding Year: 2014 Cost: $531,000 (total project is $691,000) Completion: 2014 Description: Construction of a maintenance facility to replace existing shop built over 40 years
ago. Impact: Operating costs in Conservation Department’s budget will decrease $4,200 by
replacing the old shop at the fairgrounds, maintenance will increase $500 and utilities will increase $2,000, for a net annual savings of $1,700.
Justification: The existing shop is inadequate for the staff assigned to that location and the heated portion is not energy efficient and the overall condition is poor.
Courthouse Tuckpointing Funding Year: 2014 Cost: $182,000 (total project is $275,000) Completion: 2014 Description: Mortar joints in building and courtyard show deterioration and need to be repaired
to prevent moisture damage to structure. Impact: No impact to other budgets. Justification: Severe damage to the structure would result with each freeze and thaw cycle.
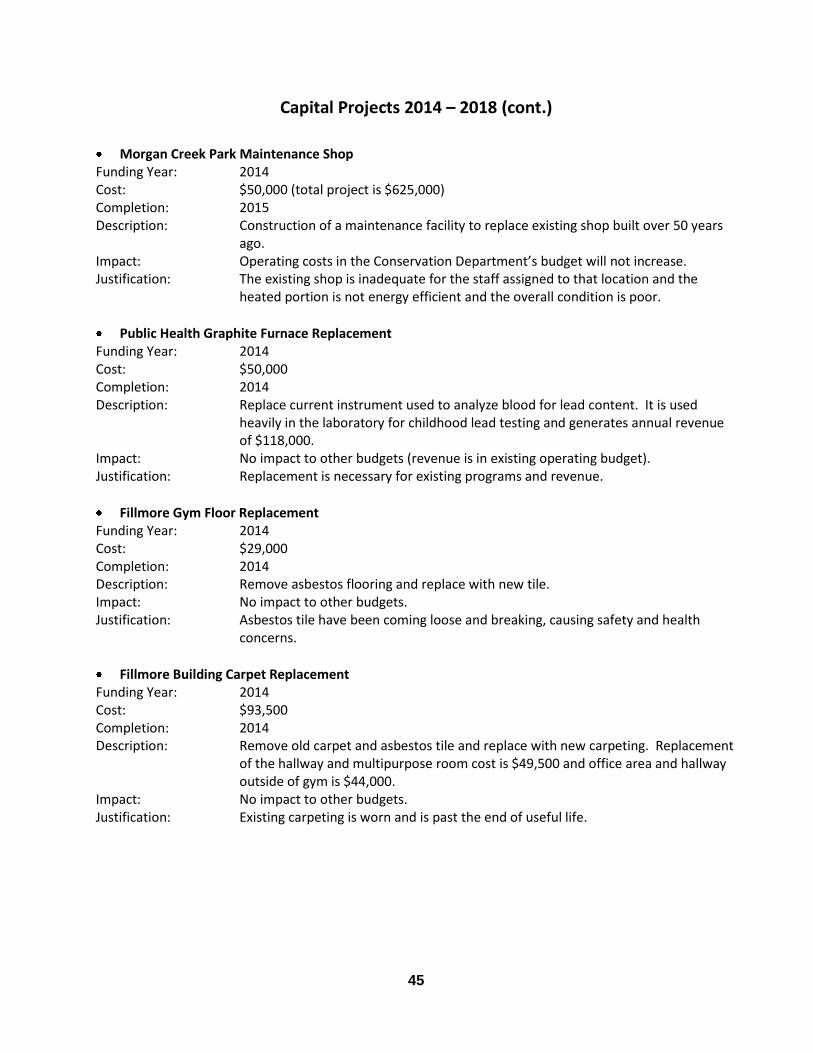
45
–
Morgan Creek Park Maintenance Shop Funding Year: 2014 Cost: $50,000 (total project is $625,000) Completion: 2015 Description: Construction of a maintenance facility to replace existing shop built over 50 years
ago. Impact: Operating costs in the Conservation Department’s budget will not increase. Justification: The existing shop is inadequate for the staff assigned to that location and the
heated portion is not energy efficient and the overall condition is poor.
Public Health Graphite Furnace Replacement Funding Year: 2014 Cost: $50,000 Completion: 2014 Description: Replace current instrument used to analyze blood for lead content. It is used
heavily in the laboratory for childhood lead testing and generates annual revenue of $118,000.
Impact: No impact to other budgets (revenue is in existing operating budget). Justification: Replacement is necessary for existing programs and revenue.
Fillmore Gym Floor Replacement Funding Year: 2014 Cost: $29,000 Completion: 2014 Description: Remove asbestos flooring and replace with new tile. Impact: No impact to other budgets. Justification: Asbestos tile have been coming loose and breaking, causing safety and health
concerns.
Fillmore Building Carpet Replacement Funding Year: 2014 Cost: $93,500 Completion: 2014 Description: Remove old carpet and asbestos tile and replace with new carpeting. Replacement
of the hallway and multipurpose room cost is $49,500 and office area and hallway outside of gym is $44,000.
Impact: No impact to other budgets. Justification: Existing carpeting is worn and is past the end of useful life.
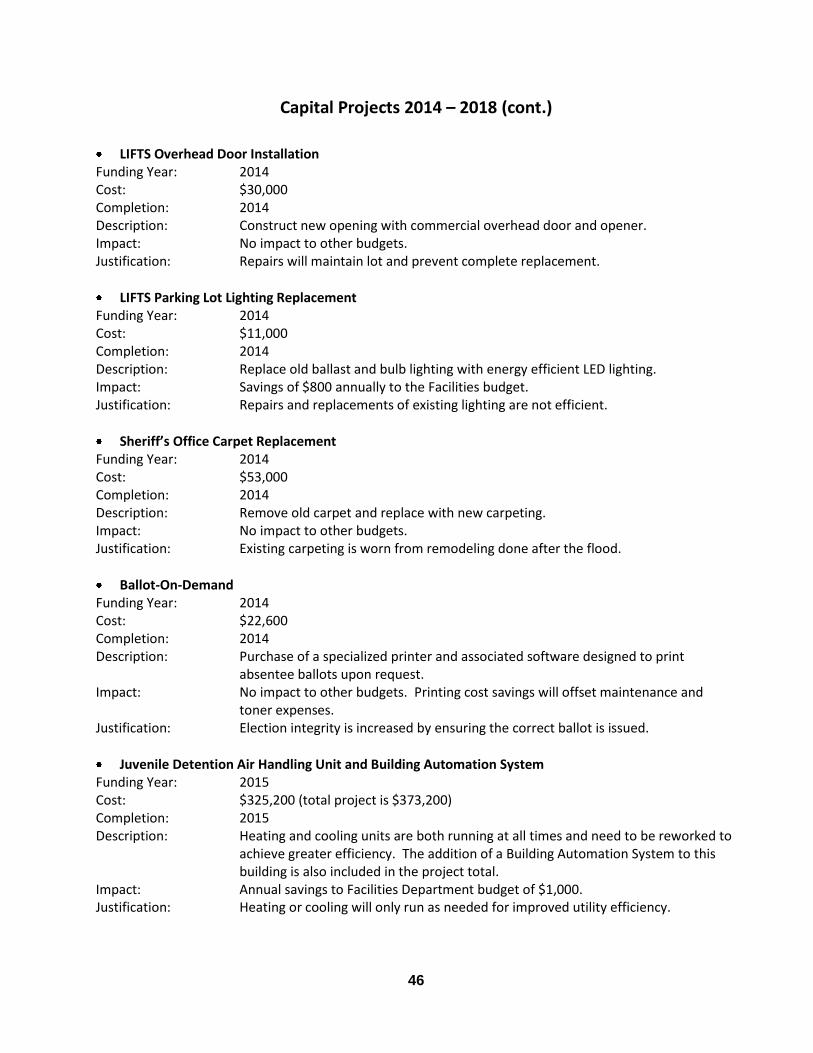
46
–
LIFTS Overhead Door Installation Funding Year: 2014 Cost: $30,000 Completion: 2014 Description: Construct new opening with commercial overhead door and opener. Impact: No impact to other budgets. Justification: Repairs will maintain lot and prevent complete replacement.
LIFTS Parking Lot Lighting Replacement Funding Year: 2014 Cost: $11,000 Completion: 2014 Description: Replace old ballast and bulb lighting with energy efficient LED lighting. Impact: Savings of $800 annually to the Facilities budget. Justification: Repairs and replacements of existing lighting are not efficient.
Sheriff’s Office Carpet Replacement Funding Year: 2014 Cost: $53,000 Completion: 2014 Description: Remove old carpet and replace with new carpeting. Impact: No impact to other budgets. Justification: Existing carpeting is worn from remodeling done after the flood.
Ballot-On-Demand Funding Year: 2014 Cost: $22,600 Completion: 2014 Description: Purchase of a specialized printer and associated software designed to print
absentee ballots upon request. Impact: No impact to other budgets. Printing cost savings will offset maintenance and
toner expenses. Justification: Election integrity is increased by ensuring the correct ballot is issued.
Juvenile Detention Air Handling Unit and Building Automation System Funding Year: 2015 Cost: $325,200 (total project is $373,200) Completion: 2015 Description: Heating and cooling units are both running at all times and need to be reworked to
achieve greater efficiency. The addition of a Building Automation System to this building is also included in the project total.
Impact: Annual savings to Facilities Department budget of $1,000. Justification: Heating or cooling will only run as needed for improved utility efficiency.
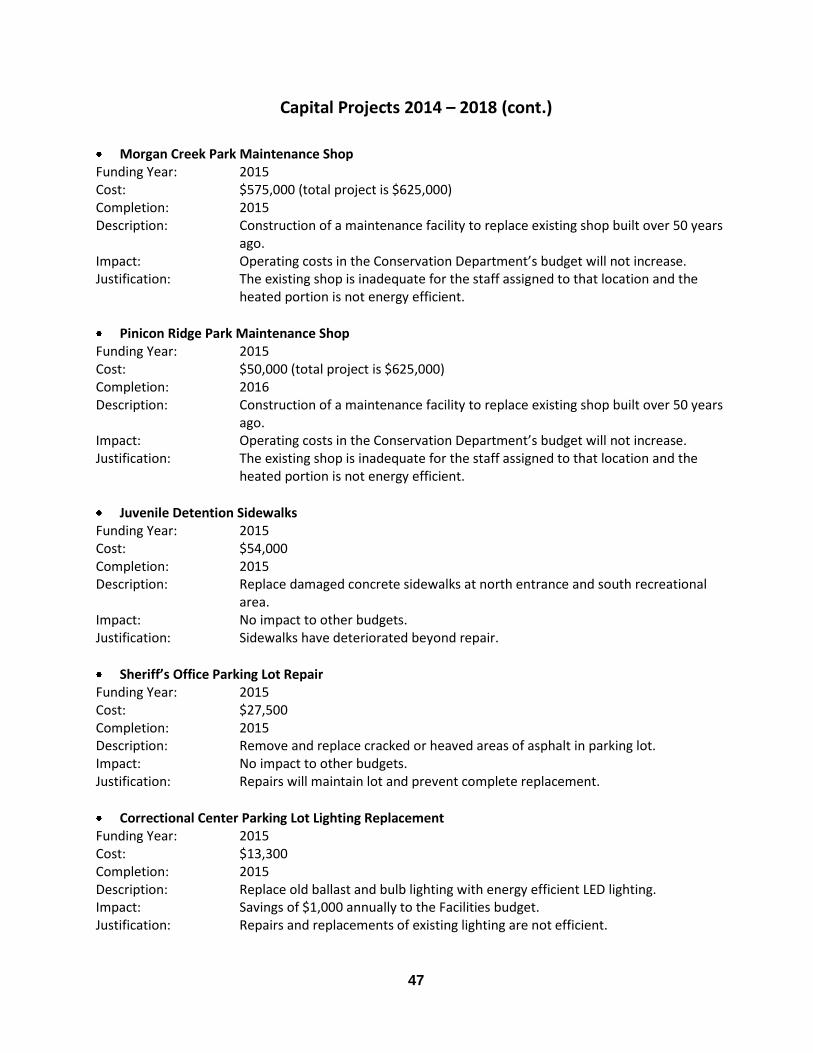
47
–
Morgan Creek Park Maintenance Shop Funding Year: 2015 Cost: $575,000 (total project is $625,000) Completion: 2015 Description: Construction of a maintenance facility to replace existing shop built over 50 years
ago. Impact: Operating costs in the Conservation Department’s budget will not increase. Justification: The existing shop is inadequate for the staff assigned to that location and the
heated portion is not energy efficient.
Pinicon Ridge Park Maintenance Shop Funding Year: 2015 Cost: $50,000 (total project is $625,000) Completion: 2016 Description: Construction of a maintenance facility to replace existing shop built over 50 years
ago. Impact: Operating costs in the Conservation Department’s budget will not increase. Justification: The existing shop is inadequate for the staff assigned to that location and the
heated portion is not energy efficient.
Juvenile Detention Sidewalks Funding Year: 2015 Cost: $54,000 Completion: 2015 Description: Replace damaged concrete sidewalks at north entrance and south recreational
area. Impact: No impact to other budgets. Justification: Sidewalks have deteriorated beyond repair.
Sheriff’s Office Parking Lot Repair Funding Year: 2015 Cost: $27,500 Completion: 2015 Description: Remove and replace cracked or heaved areas of asphalt in parking lot. Impact: No impact to other budgets. Justification: Repairs will maintain lot and prevent complete replacement.
Correctional Center Parking Lot Lighting Replacement Funding Year: 2015 Cost: $13,300 Completion: 2015 Description: Replace old ballast and bulb lighting with energy efficient LED lighting. Impact: Savings of $1,000 annually to the Facilities budget. Justification: Repairs and replacements of existing lighting are not efficient.
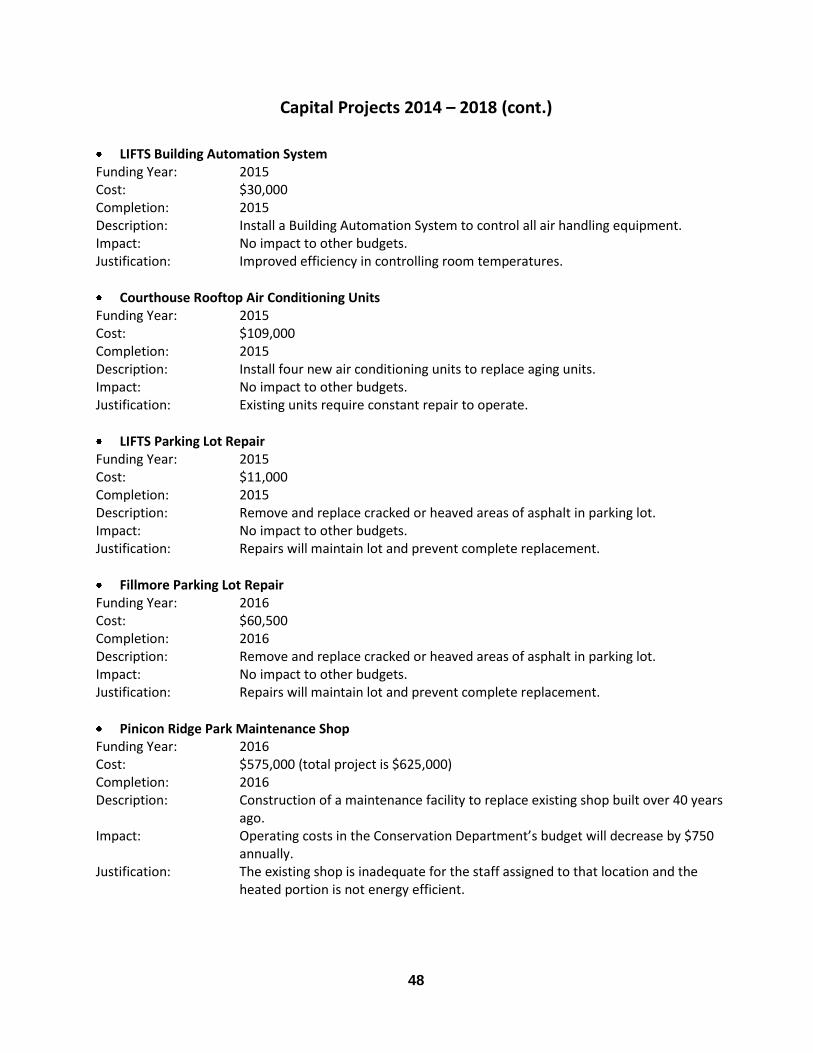
48
–
LIFTS Building Automation System Funding Year: 2015 Cost: $30,000 Completion: 2015 Description: Install a Building Automation System to control all air handling equipment. Impact: No impact to other budgets. Justification: Improved efficiency in controlling room temperatures.
Courthouse Rooftop Air Conditioning Units Funding Year: 2015 Cost: $109,000 Completion: 2015 Description: Install four new air conditioning units to replace aging units. Impact: No impact to other budgets. Justification: Existing units require constant repair to operate.
LIFTS Parking Lot Repair Funding Year: 2015 Cost: $11,000 Completion: 2015 Description: Remove and replace cracked or heaved areas of asphalt in parking lot. Impact: No impact to other budgets. Justification: Repairs will maintain lot and prevent complete replacement.
Fillmore Parking Lot Repair Funding Year: 2016 Cost: $60,500 Completion: 2016 Description: Remove and replace cracked or heaved areas of asphalt in parking lot. Impact: No impact to other budgets. Justification: Repairs will maintain lot and prevent complete replacement.
Pinicon Ridge Park Maintenance Shop Funding Year: 2016 Cost: $575,000 (total project is $625,000) Completion: 2016 Description: Construction of a maintenance facility to replace existing shop built over 40 years
ago. Impact: Operating costs in the Conservation Department’s budget will decrease by $750
annually. Justification: The existing shop is inadequate for the staff assigned to that location and the
heated portion is not energy efficient.
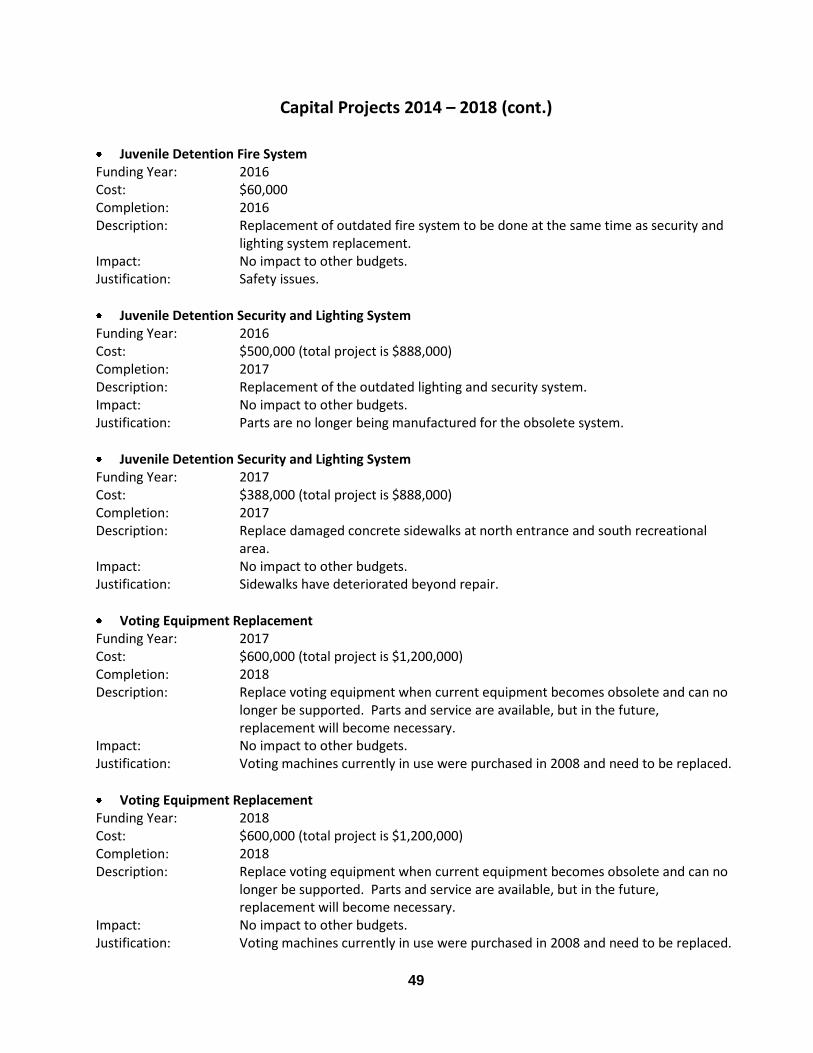
49
–
Juvenile Detention Fire System Funding Year: 2016 Cost: $60,000 Completion: 2016 Description: Replacement of outdated fire system to be done at the same time as security and
lighting system replacement. Impact: No impact to other budgets. Justification: Safety issues.
Juvenile Detention Security and Lighting System Funding Year: 2016 Cost: $500,000 (total project is $888,000) Completion: 2017 Description: Replacement of the outdated lighting and security system. Impact: No impact to other budgets. Justification: Parts are no longer being manufactured for the obsolete system.
Juvenile Detention Security and Lighting System Funding Year: 2017 Cost: $388,000 (total project is $888,000) Completion: 2017 Description: Replace damaged concrete sidewalks at north entrance and south recreational
area. Impact: No impact to other budgets. Justification: Sidewalks have deteriorated beyond repair.
Voting Equipment Replacement Funding Year: 2017 Cost: $600,000 (total project is $1,200,000) Completion: 2018 Description: Replace voting equipment when current equipment becomes obsolete and can no
longer be supported. Parts and service are available, but in the future, replacement will become necessary.
Impact: No impact to other budgets. Justification: Voting machines currently in use were purchased in 2008 and need to be replaced.
Voting Equipment Replacement Funding Year: 2018 Cost: $600,000 (total project is $1,200,000) Completion: 2018 Description: Replace voting equipment when current equipment becomes obsolete and can no
longer be supported. Parts and service are available, but in the future, replacement will become necessary.
Impact: No impact to other budgets. Justification: Voting machines currently in use were purchased in 2008 and need to be replaced.
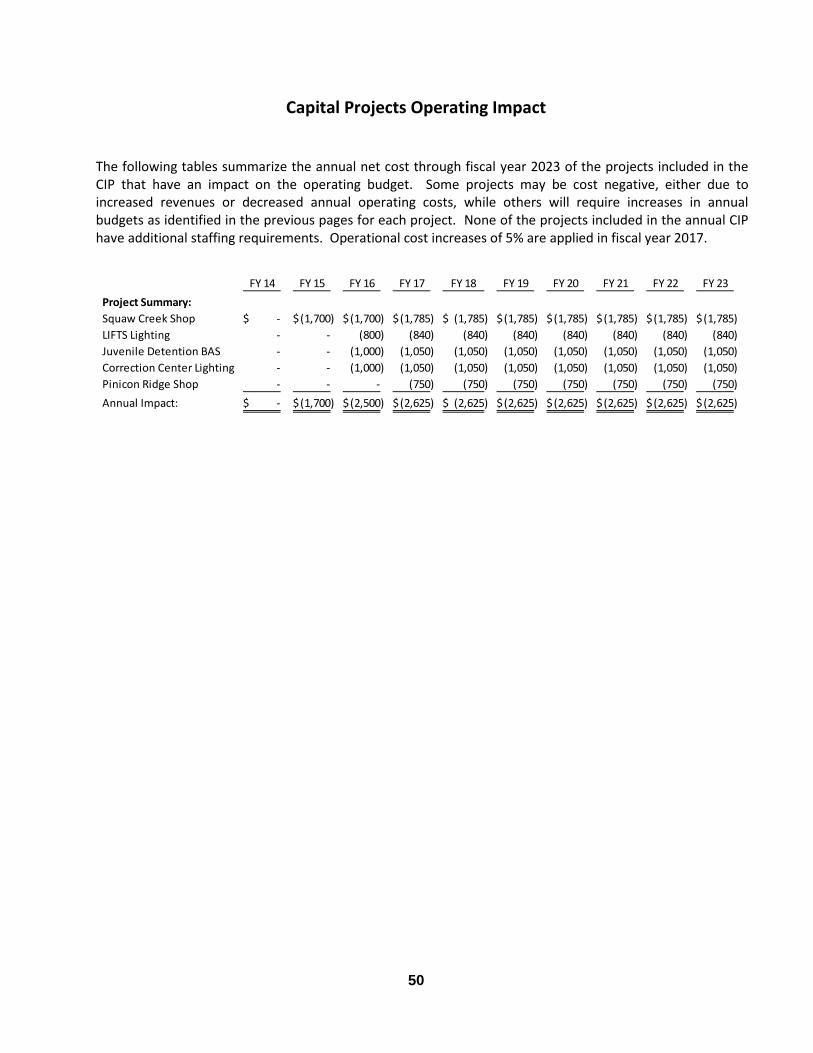
50
Capital Projects Operating Impact
The following tables summarize the annual net cost through fiscal year 2023 of the projects included in the CIP that have an impact on the operating budget. Some projects may be cost negative, either due to increased revenues or decreased annual operating costs, while others will require increases in annual budgets as identified in the previous pages for each project. None of the projects included in the annual CIP have additional staffing requirements. Operational cost increases of 5% are applied in fiscal year 2017.
FY 14 FY 15 FY 16 FY 17 FY 18 FY 19 FY 20 FY 21 FY 22 FY 23
Project Summary:
Squaw Creek Shop -$ (1,700)$ (1,700)$ (1,785)$ (1,785)$ (1,785)$ (1,785)$ (1,785)$ (1,785)$ (1,785)$
LIFTS Lighting - - (800) (840) (840) (840) (840) (840) (840) (840)
Juvenile Detention BAS - - (1,000) (1,050) (1,050) (1,050) (1,050) (1,050) (1,050) (1,050)
Correction Center Lighting - - (1,000) (1,050) (1,050) (1,050) (1,050) (1,050) (1,050) (1,050)
Pinicon Ridge Shop - - - (750) (750) (750) (750) (750) (750) (750)
Annual Impact: -$ (1,700)$ (2,500)$ (2,625)$ (2,625)$ (2,625)$ (2,625)$ (2,625)$ (2,625)$ (2,625)$
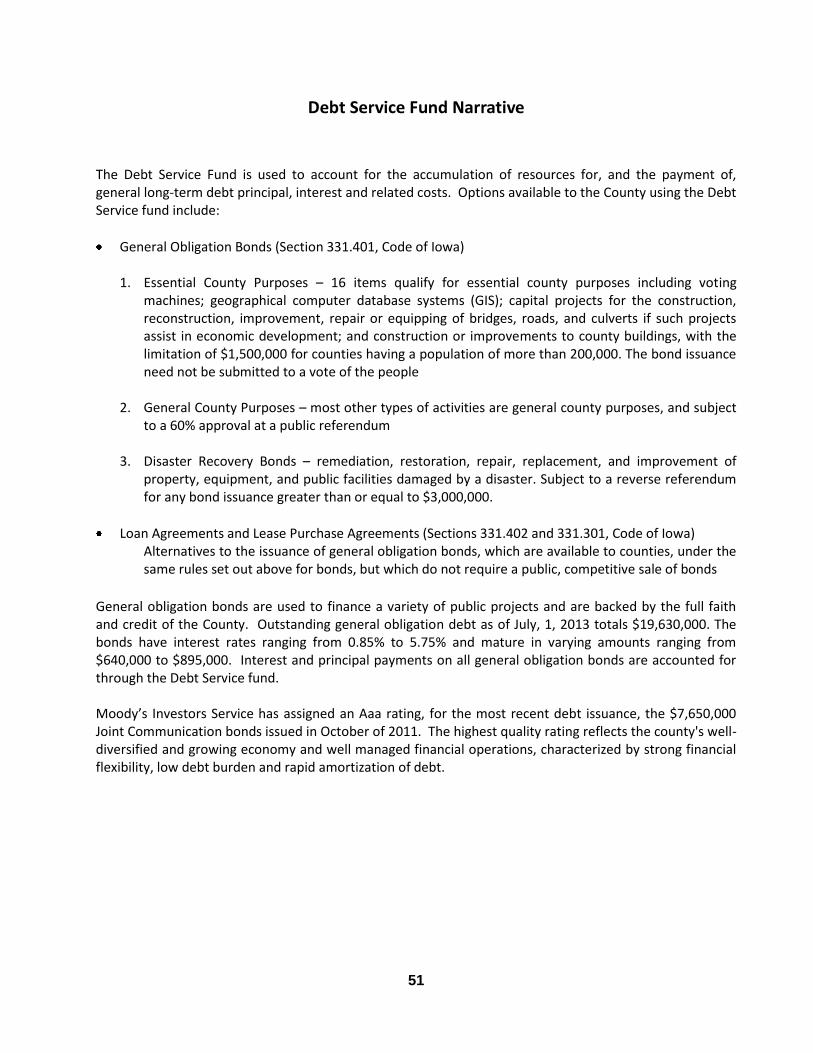
51
The Debt Service Fund is used to account for the accumulation of resources for, and the payment of, general long-term debt principal, interest and related costs. Options available to the County using the Debt Service fund include:
General Obligation Bonds (Section 331.401, Code of Iowa) 1. Essential County Purposes – 16 items qualify for essential county purposes including voting
machines; geographical computer database systems (GIS); capital projects for the construction, reconstruction, improvement, repair or equipping of bridges, roads, and culverts if such projects assist in economic development; and construction or improvements to county buildings, with the limitation of $1,500,000 for counties having a population of more than 200,000. The bond issuance need not be submitted to a vote of the people
2. General County Purposes – most other types of activities are general county purposes, and subject to a 60% approval at a public referendum
3. Disaster Recovery Bonds – remediation, restoration, repair, replacement, and improvement of property, equipment, and public facilities damaged by a disaster. Subject to a reverse referendum for any bond issuance greater than or equal to $3,000,000.
Loan Agreements and Lease Purchase Agreements (Sections 331.402 and 331.301, Code of Iowa) Alternatives to the issuance of general obligation bonds, which are available to counties, under the same rules set out above for bonds, but which do not require a public, competitive sale of bonds
General obligation bonds are used to finance a variety of public projects and are backed by the full faith and credit of the County. Outstanding general obligation debt as of July, 1, 2013 totals $19,630,000. The bonds have interest rates ranging from 0.85% to 5.75% and mature in varying amounts ranging from $640,000 to $895,000. Interest and principal payments on all general obligation bonds are accounted for through the Debt Service fund. Moody’s Investors Service has assigned an Aaa rating, for the most recent debt issuance, the $7,650,000 Joint Communication bonds issued in October of 2011. The highest quality rating reflects the county's well-diversified and growing economy and well managed financial operations, characterized by strong financial flexibility, low debt burden and rapid amortization of debt.
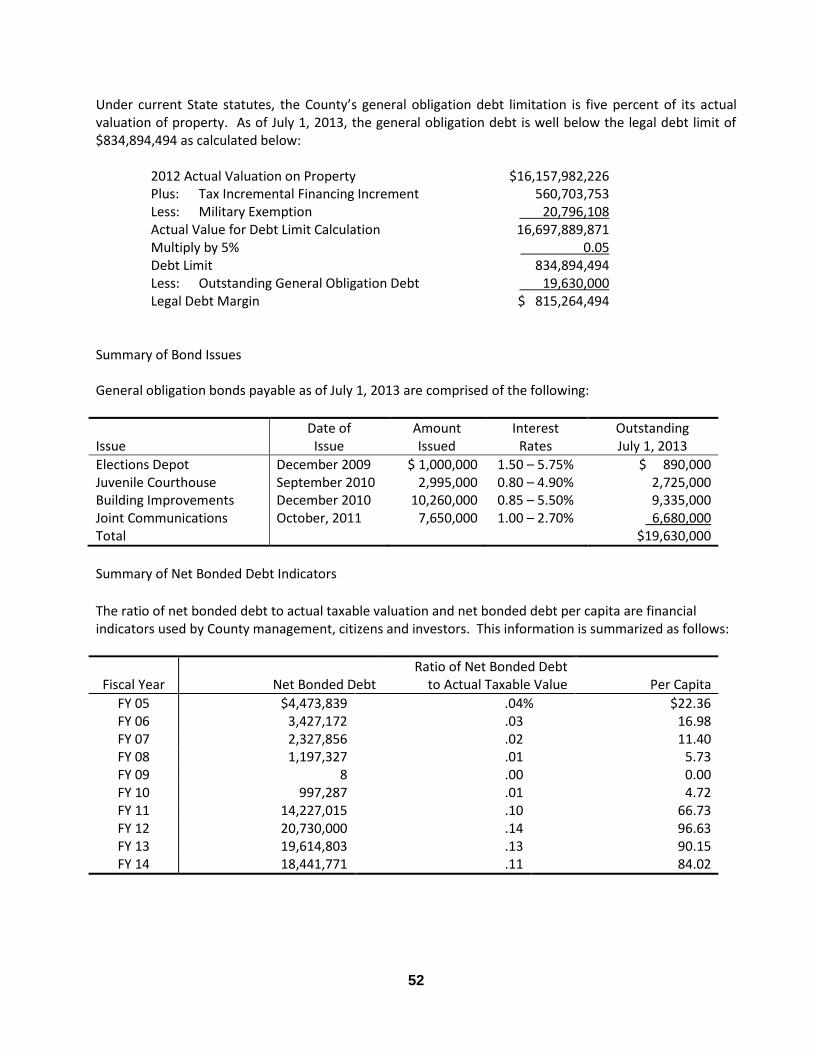
52
Under current State statutes, the County’s general obligation debt limitation is five percent of its actual valuation of property. As of July 1, 2013, the general obligation debt is well below the legal debt limit of $834,894,494 as calculated below:
2012 Actual Valuation on Property $16,157,982,226 Plus: Tax Incremental Financing Increment 560,703,753 Less: Military Exemption 20,796,108 Actual Value for Debt Limit Calculation 16,697,889,871 Multiply by 5% 0.05 Debt Limit 834,894,494 Less: Outstanding General Obligation Debt 19,630,000 Legal Debt Margin $ 815,264,494
Summary of Bond Issues General obligation bonds payable as of July 1, 2013 are comprised of the following:
Date of Amount Interest Outstanding Issue Issue Issued Rates July 1, 2013
Elections Depot December 2009 $ 1,000,000 1.50 – 5.75% $ 890,000 Juvenile Courthouse September 2010 2,995,000 0.80 – 4.90% 2,725,000 Building Improvements December 2010 10,260,000 0.85 – 5.50% 9,335,000 Joint Communications October, 2011 7,650,000 1.00 – 2.70% 6,680,000 Total $19,630,000
Summary of Net Bonded Debt Indicators
The ratio of net bonded debt to actual taxable valuation and net bonded debt per capita are financial indicators used by County management, citizens and investors. This information is summarized as follows:
Fiscal Year
Net Bonded Debt
Ratio of Net Bonded Debt to Actual Taxable Value
Per Capita
FY 05 $4,473,839 .04% $22.36 FY 06 3,427,172 .03 16.98 FY 07 2,327,856 .02 11.40 FY 08 1,197,327 .01 5.73 FY 09 8 .00 0.00 FY 10 997,287 .01 4.72 FY 11 14,227,015 .10 66.73 FY 12 20,730,000 .14 96.63 FY 13 19,614,803 .13 90.15 FY 14 18,441,771 .11 84.02
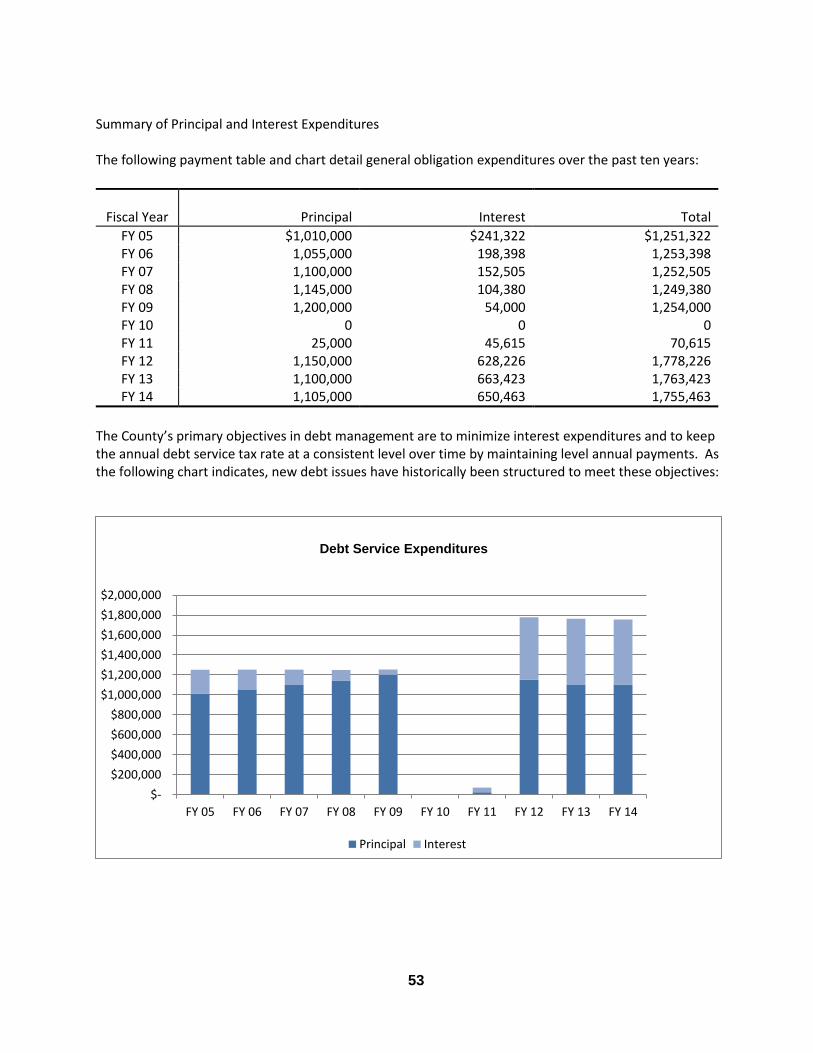
53
Summary of Principal and Interest Expenditures The following payment table and chart detail general obligation expenditures over the past ten years:
Fiscal Year
Principal
Interest
Total
FY 05 $1,010,000 $241,322 $1,251,322 FY 06 1,055,000 198,398 1,253,398 FY 07 1,100,000 152,505 1,252,505 FY 08 1,145,000 104,380 1,249,380 FY 09 1,200,000 54,000 1,254,000 FY 10 0 0 0 FY 11 25,000 45,615 70,615 FY 12 1,150,000 628,226 1,778,226 FY 13 1,100,000 663,423 1,763,423 FY 14 1,105,000 650,463 1,755,463
The County’s primary objectives in debt management are to minimize interest expenditures and to keep the annual debt service tax rate at a consistent level over time by maintaining level annual payments. As the following chart indicates, new debt issues have historically been structured to meet these objectives:
$-
$200,000
$400,000
$600,000
$800,000
$1,000,000
$1,200,000
$1,400,000
$1,600,000
$1,800,000
$2,000,000
FY 05 FY 06 FY 07 FY 08 FY 09 FY 10 FY 11 FY 12 FY 13 FY 14
Principal Interest
Debt Service Expenditures
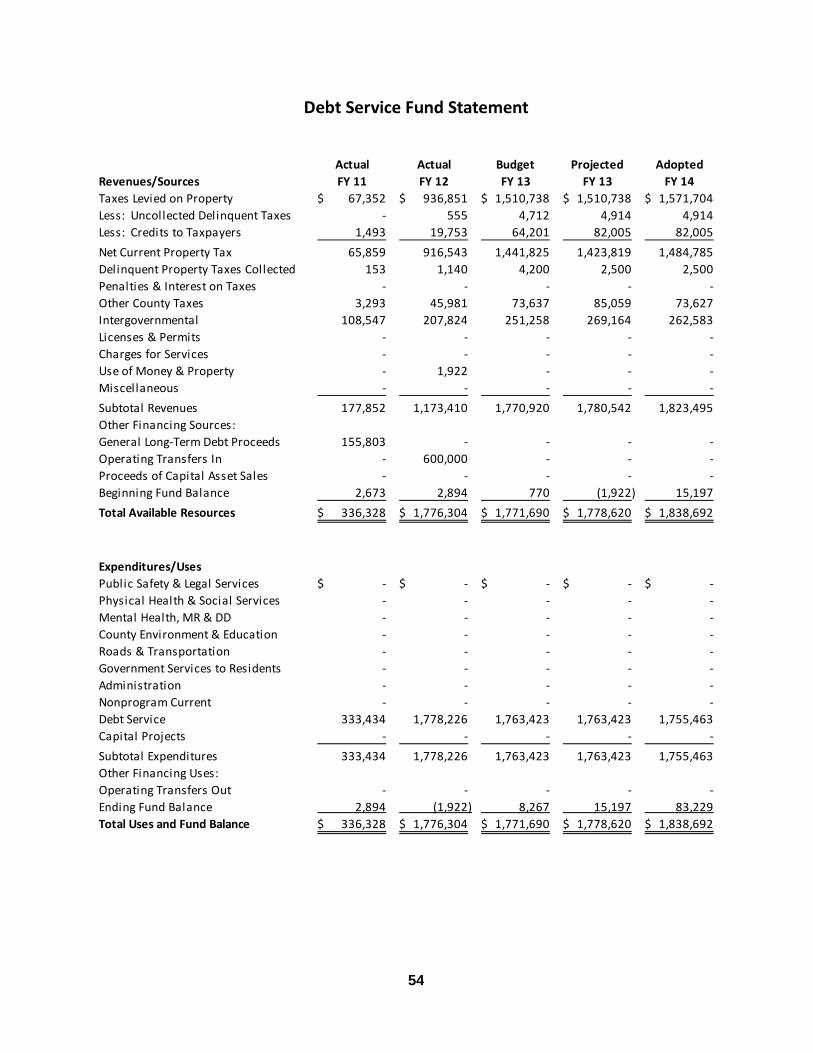
54
Actual Actual Budget Projected Adopted
Revenues/Sources FY 11 FY 12 FY 13 FY 13 FY 14
Taxes Levied on Property 67,352$ 936,851$ 1,510,738$ 1,510,738$ 1,571,704$
Less: Uncollected Delinquent Taxes - 555 4,712 4,914 4,914
Less: Credits to Taxpayers 1,493 19,753 64,201 82,005 82,005
Net Current Property Tax 65,859 916,543 1,441,825 1,423,819 1,484,785
Delinquent Property Taxes Collected 153 1,140 4,200 2,500 2,500
Penalties & Interest on Taxes - - - - -
Other County Taxes 3,293 45,981 73,637 85,059 73,627
Intergovernmental 108,547 207,824 251,258 269,164 262,583
Licenses & Permits - - - - -
Charges for Services - - - - -
Use of Money & Property - 1,922 - - -
Miscellaneous - - - - -
Subtotal Revenues 177,852 1,173,410 1,770,920 1,780,542 1,823,495
Other Financing Sources:
General Long-Term Debt Proceeds 155,803 - - - -
Operating Transfers In - 600,000 - - -
Proceeds of Capital Asset Sales - - - - -
Beginning Fund Balance 2,673 2,894 770 (1,922) 15,197
Total Available Resources 336,328$ 1,776,304$ 1,771,690$ 1,778,620$ 1,838,692$
Expenditures/Uses
Public Safety & Legal Services -$ -$ -$ -$ -$
Physical Health & Social Services - - - - -
Mental Health, MR & DD - - - - -
County Environment & Education - - - - -
Roads & Transportation - - - - -
Government Services to Residents - - - - -
Administration - - - - -
Nonprogram Current - - - - -
Debt Service 333,434 1,778,226 1,763,423 1,763,423 1,755,463
Capital Projects - - - - -
Subtotal Expenditures 333,434 1,778,226 1,763,423 1,763,423 1,755,463
Other Financing Uses:
Operating Transfers Out - - - - -
Ending Fund Balance 2,894 (1,922) 8,267 15,197 83,229
Total Uses and Fund Balance 336,328$ 1,776,304$ 1,771,690$ 1,778,620$ 1,838,692$
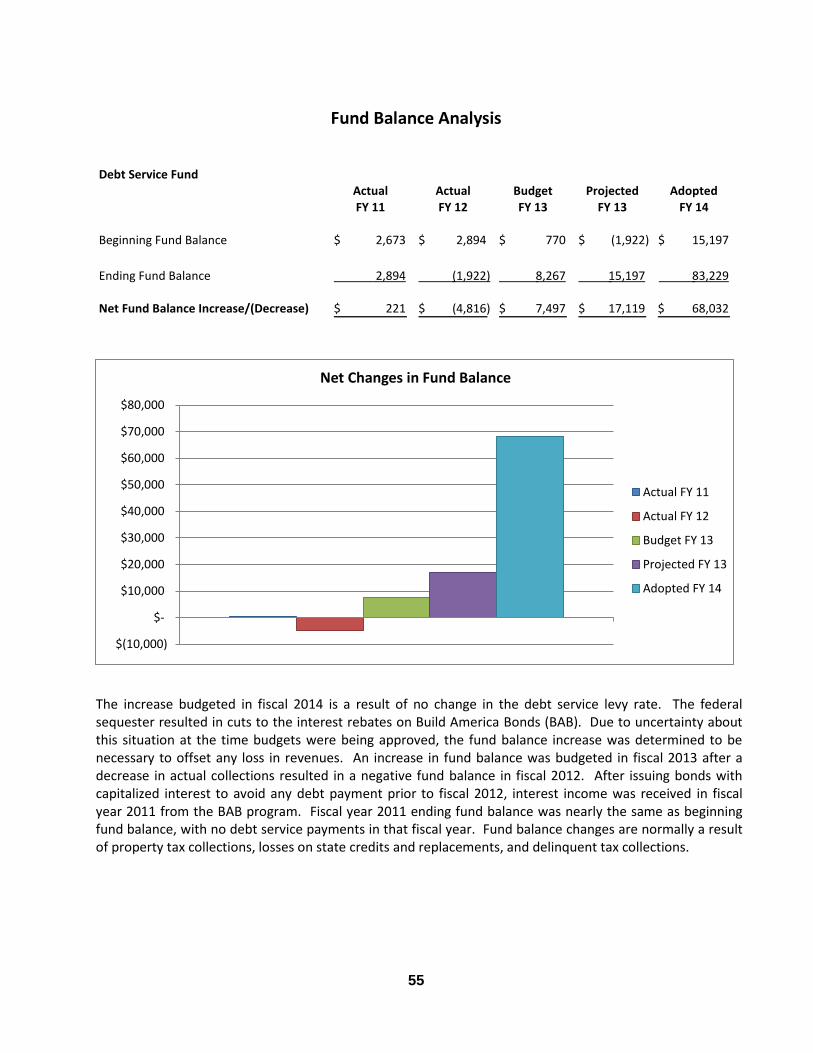
55
Debt Service FundActual Actual Budget Projected Adopted
FY 11 FY 12 FY 13 FY 13 FY 14
Beginning Fund Balance 2,673$ 2,894$ 770$ (1,922)$ 15,197$
Ending Fund Balance 2,894 (1,922) 8,267 15,197 83,229
Net Fund Balance Increase/(Decrease) 221$ (4,816)$ 7,497$ 17,119$ 68,032$
The increase budgeted in fiscal 2014 is a result of no change in the debt service levy rate. The federal sequester resulted in cuts to the interest rebates on Build America Bonds (BAB). Due to uncertainty about this situation at the time budgets were being approved, the fund balance increase was determined to be necessary to offset any loss in revenues. An increase in fund balance was budgeted in fiscal 2013 after a decrease in actual collections resulted in a negative fund balance in fiscal 2012. After issuing bonds with capitalized interest to avoid any debt payment prior to fiscal 2012, interest income was received in fiscal year 2011 from the BAB program. Fiscal year 2011 ending fund balance was nearly the same as beginning fund balance, with no debt service payments in that fiscal year. Fund balance changes are normally a result of property tax collections, losses on state credits and replacements, and delinquent tax collections.
$(10,000)
$-
$10,000
$20,000
$30,000
$40,000
$50,000
$60,000
$70,000
$80,000
Net Changes in Fund Balance
Actual FY 11
Actual FY 12
Budget FY 13
Projected FY 13
Adopted FY 14
56
In fiscal year 1996, the Linn County Board of Supervisors committed to implementing performance based budgeting. It was decided, by the Office of Finance & Budget, that the Governmental Accounting Standards Board (GASB), approach to performance measurement would be utilized. In its various research reports on Service Efforts and Accomplishments reporting, the GASB identifies the basic categories of performance measures as follows:
measures of effort or “inputs”
measures of accomplishments or “outputs”
measures that relate efforts to accomplishments or “outcome” and “efficiency”
explanatory information
As performance data is collected and analyzed, including comparisons with other public and private entities, informed decisions can be made regarding public services and the efficient use of tax dollars.
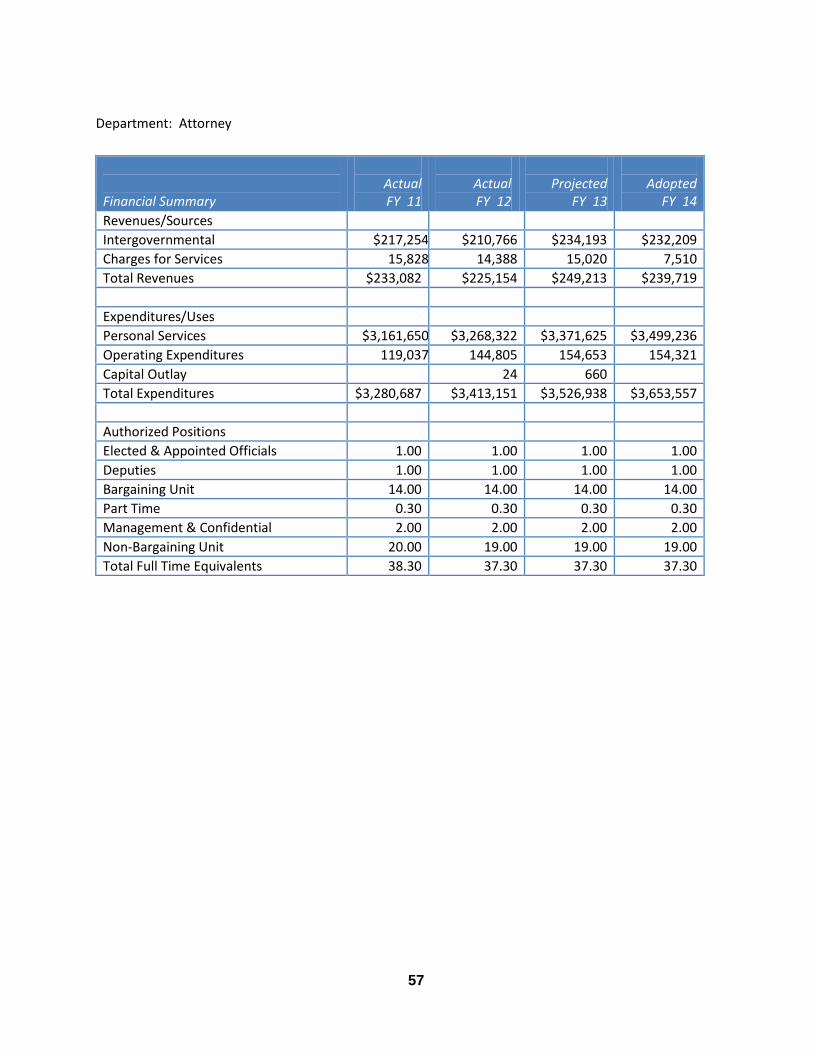
57
Department: Attorney
Financial Summary
Actual FY 11
Actual FY 12
Projected
FY 13
Adopted
FY 14
Revenues/Sources
Intergovernmental $217,254 $210,766 $234,193 $232,209
Charges for Services 15,828 14,388 15,020 7,510
Total Revenues $233,082 $225,154 $249,213 $239,719
Expenditures/Uses
Personal Services $3,161,650 $3,268,322 $3,371,625 $3,499,236
Operating Expenditures 119,037 144,805 154,653 154,321
Capital Outlay 24 660
Total Expenditures $3,280,687 $3,413,151 $3,526,938 $3,653,557
Authorized Positions
Elected & Appointed Officials 1.00 1.00 1.00 1.00
Deputies 1.00 1.00 1.00 1.00
Bargaining Unit 14.00 14.00 14.00 14.00
Part Time 0.30 0.30 0.30 0.30
Management & Confidential 2.00 2.00 2.00 2.00
Non-Bargaining Unit 20.00 19.00 19.00 19.00
Total Full Time Equivalents 38.30 37.30 37.30 37.30
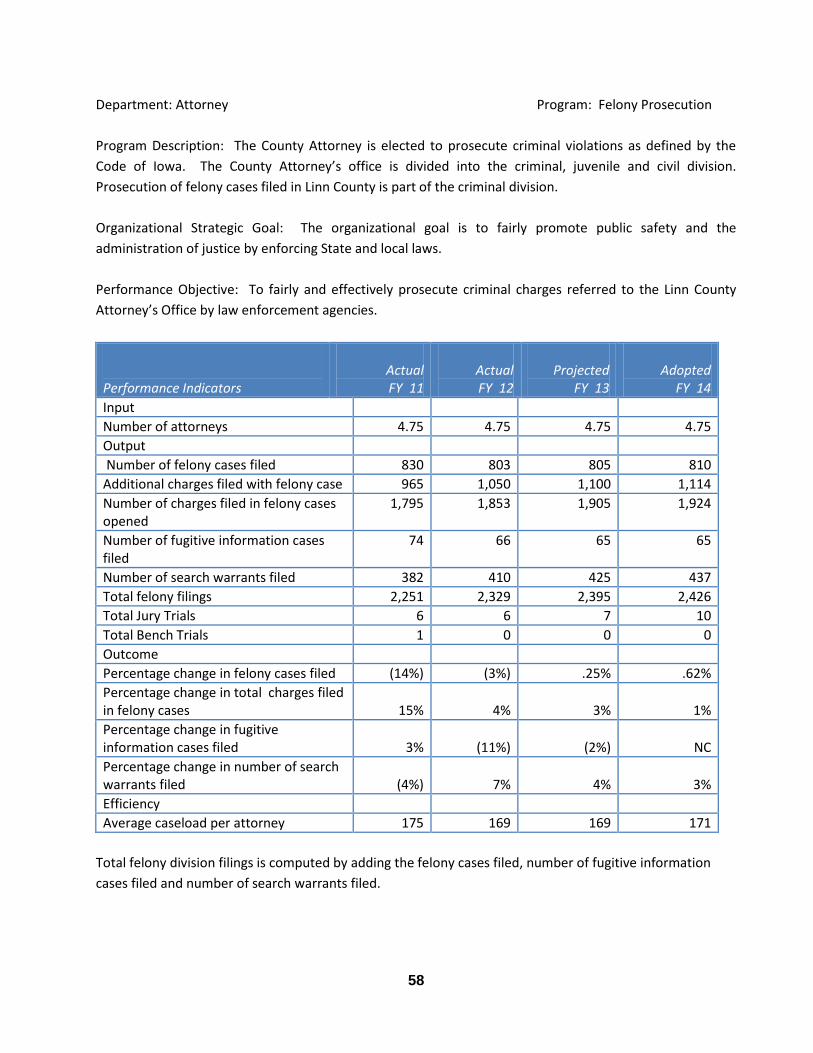
58
Department: Attorney Program: Felony Prosecution
Program Description: The County Attorney is elected to prosecute criminal violations as defined by the
Code of Iowa. The County Attorney’s office is divided into the criminal, juvenile and civil division.
Prosecution of felony cases filed in Linn County is part of the criminal division.
Organizational Strategic Goal: The organizational goal is to fairly promote public safety and the
administration of justice by enforcing State and local laws.
Performance Objective: To fairly and effectively prosecute criminal charges referred to the Linn County
Attorney’s Office by law enforcement agencies.
Performance Indicators
Actual FY 11
Actual FY 12
Projected
FY 13
Adopted
FY 14
Input
Number of attorneys 4.75 4.75 4.75 4.75
Output
Number of felony cases filed 830 803 805 810
Additional charges filed with felony case 965 1,050 1,100 1,114
Number of charges filed in felony cases opened
1,795 1,853 1,905 1,924
Number of fugitive information cases filed
74 66 65 65
Number of search warrants filed 382 410 425 437
Total felony filings 2,251 2,329 2,395 2,426
Total Jury Trials 6 6 7 10
Total Bench Trials 1 0 0 0
Outcome
Percentage change in felony cases filed (14%) (3%) .25% .62%
Percentage change in total charges filed in felony cases
15%
4%
3%
1%
Percentage change in fugitive information cases filed
3%
(11%)
(2%)
NC
Percentage change in number of search warrants filed
(4%)
7%
4%
3%
Efficiency
Average caseload per attorney 175 169 169 171
Total felony division filings is computed by adding the felony cases filed, number of fugitive information
cases filed and number of search warrants filed.
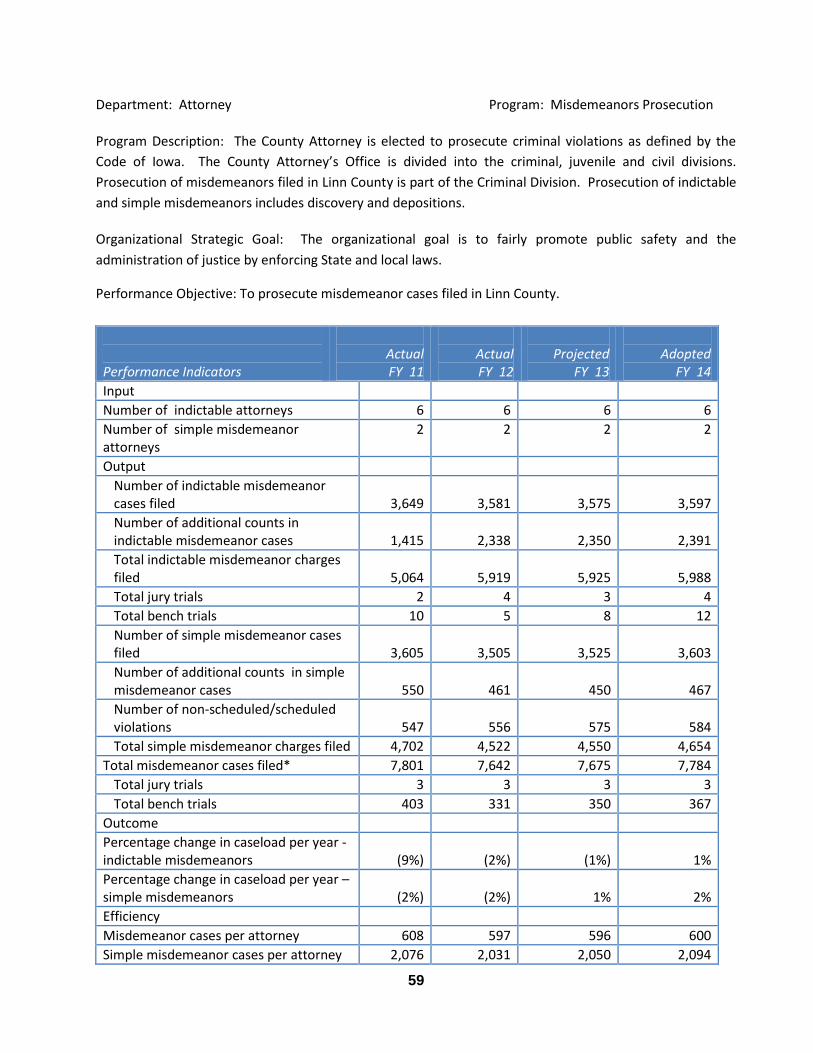
59
Department: Attorney Program: Misdemeanors Prosecution
Program Description: The County Attorney is elected to prosecute criminal violations as defined by the
Code of Iowa. The County Attorney’s Office is divided into the criminal, juvenile and civil divisions.
Prosecution of misdemeanors filed in Linn County is part of the Criminal Division. Prosecution of indictable
and simple misdemeanors includes discovery and depositions.
Organizational Strategic Goal: The organizational goal is to fairly promote public safety and the
administration of justice by enforcing State and local laws.
Performance Objective: To prosecute misdemeanor cases filed in Linn County.
Performance Indicators
Actual FY 11
Actual FY 12
Projected
FY 13
Adopted
FY 14
Input
Number of indictable attorneys 6 6 6 6
Number of simple misdemeanor attorneys
2 2 2 2
Output
Number of indictable misdemeanor cases filed
3,649
3,581
3,575
3,597
Number of additional counts in indictable misdemeanor cases
1,415
2,338
2,350
2,391
Total indictable misdemeanor charges filed
5,064
5,919
5,925
5,988
Total jury trials 2 4 3 4
Total bench trials 10 5 8 12
Number of simple misdemeanor cases filed
3,605
3,505
3,525
3,603
Number of additional counts in simple misdemeanor cases
550
461
450
467
Number of non-scheduled/scheduled violations
547
556
575
584
Total simple misdemeanor charges filed 4,702 4,522 4,550 4,654
Total misdemeanor cases filed* 7,801 7,642 7,675 7,784
Total jury trials 3 3 3 3
Total bench trials 403 331 350 367
Outcome
Percentage change in caseload per year - indictable misdemeanors
(9%)
(2%)
(1%)
1%
Percentage change in caseload per year – simple misdemeanors
(2%)
(2%)
1%
2%
Efficiency
Misdemeanor cases per attorney 608 597 596 600
Simple misdemeanor cases per attorney 2,076 2,031 2,050 2,094
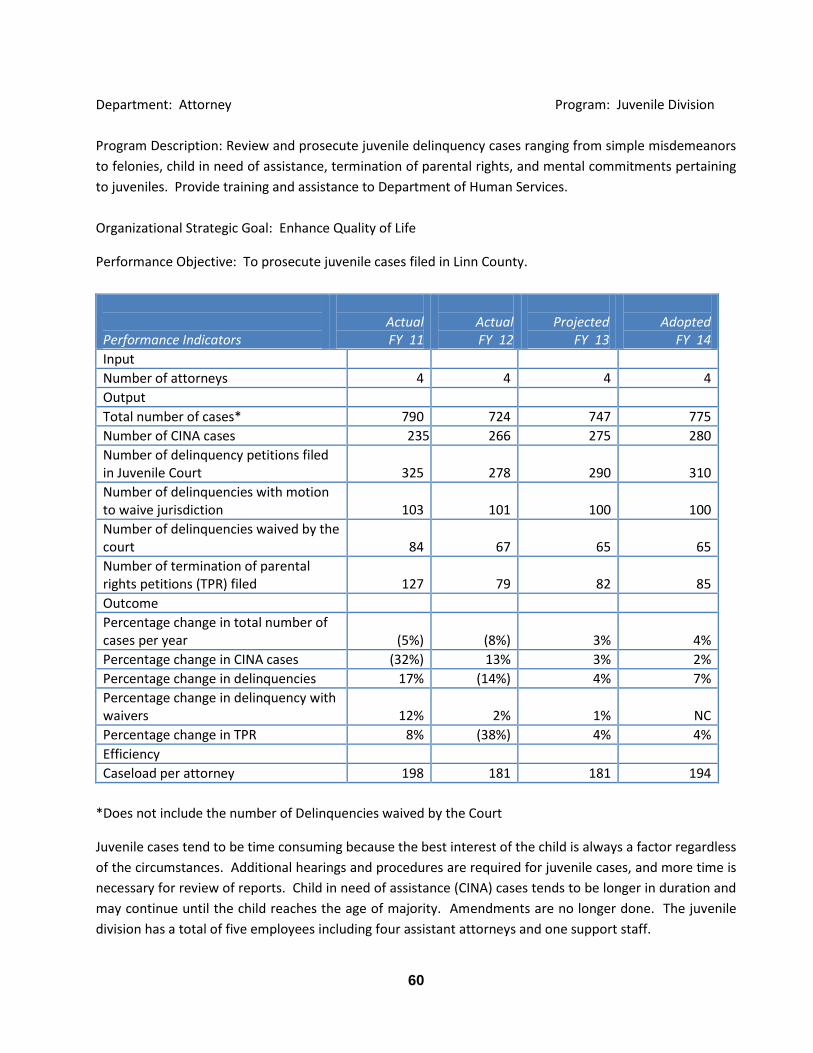
60
Department: Attorney Program: Juvenile Division
Program Description: Review and prosecute juvenile delinquency cases ranging from simple misdemeanors
to felonies, child in need of assistance, termination of parental rights, and mental commitments pertaining
to juveniles. Provide training and assistance to Department of Human Services.
Organizational Strategic Goal: Enhance Quality of Life
Performance Objective: To prosecute juvenile cases filed in Linn County.
Performance Indicators
Actual FY 11
Actual FY 12
Projected
FY 13
Adopted
FY 14
Input
Number of attorneys 4 4 4 4
Output
Total number of cases* 790 724 747 775
Number of CINA cases 235 266 275 280
Number of delinquency petitions filed in Juvenile Court
325
278
290
310
Number of delinquencies with motion to waive jurisdiction
103
101
100
100
Number of delinquencies waived by the court
84
67
65
65
Number of termination of parental rights petitions (TPR) filed
127
79
82
85
Outcome
Percentage change in total number of cases per year
(5%)
(8%)
3%
4%
Percentage change in CINA cases (32%) 13% 3% 2%
Percentage change in delinquencies 17% (14%) 4% 7%
Percentage change in delinquency with waivers
12%
2%
1%
NC
Percentage change in TPR 8% (38%) 4% 4%
Efficiency
Caseload per attorney 198 181 181 194
*Does not include the number of Delinquencies waived by the Court
Juvenile cases tend to be time consuming because the best interest of the child is always a factor regardless
of the circumstances. Additional hearings and procedures are required for juvenile cases, and more time is
necessary for review of reports. Child in need of assistance (CINA) cases tends to be longer in duration and
may continue until the child reaches the age of majority. Amendments are no longer done. The juvenile
division has a total of five employees including four assistant attorneys and one support staff.
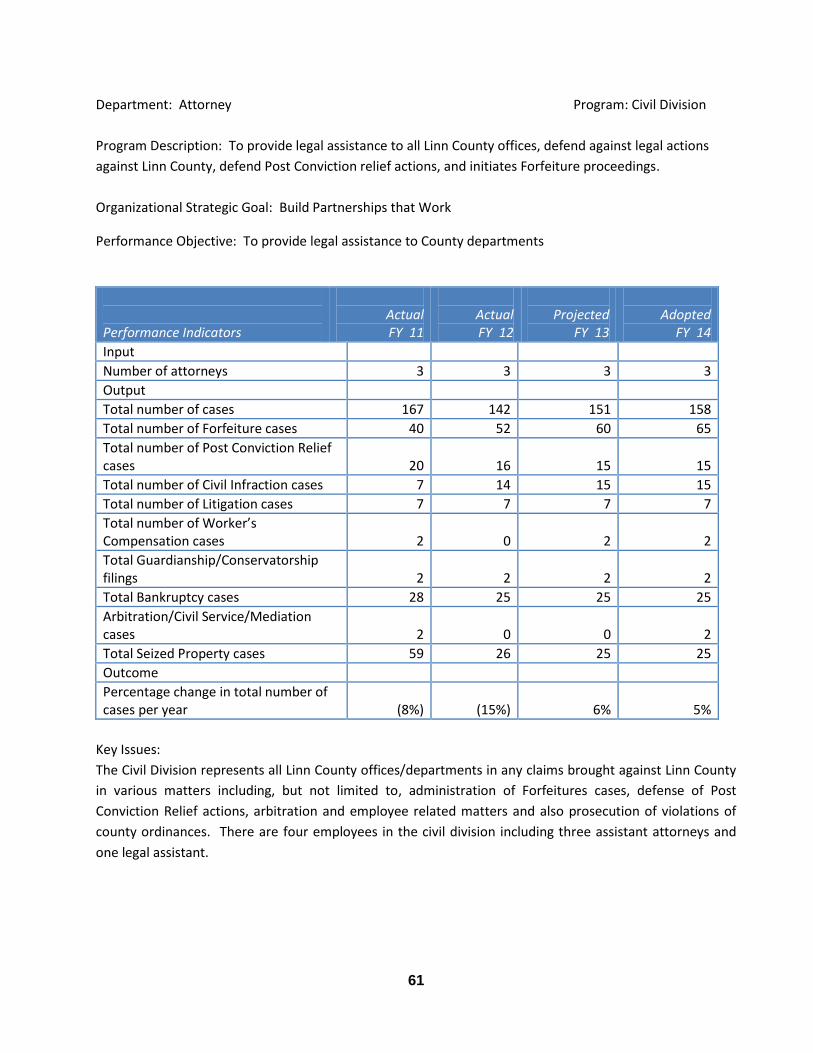
61
Department: Attorney Program: Civil Division
Program Description: To provide legal assistance to all Linn County offices, defend against legal actions
against Linn County, defend Post Conviction relief actions, and initiates Forfeiture proceedings.
Organizational Strategic Goal: Build Partnerships that Work
Performance Objective: To provide legal assistance to County departments
Performance Indicators
Actual FY 11
Actual FY 12
Projected
FY 13
Adopted
FY 14
Input
Number of attorneys 3 3 3 3
Output
Total number of cases 167 142 151 158
Total number of Forfeiture cases 40 52 60 65
Total number of Post Conviction Relief cases
20
16
15
15
Total number of Civil Infraction cases 7 14 15 15
Total number of Litigation cases 7 7 7 7
Total number of Worker’s Compensation cases
2
0
2
2
Total Guardianship/Conservatorship filings 2 2 2 2
Total Bankruptcy cases 28 25 25 25
Arbitration/Civil Service/Mediation cases 2 0 0 2
Total Seized Property cases 59 26 25 25
Outcome
Percentage change in total number of cases per year
(8%)
(15%)
6%
5%
Key Issues:
The Civil Division represents all Linn County offices/departments in any claims brought against Linn County
in various matters including, but not limited to, administration of Forfeitures cases, defense of Post
Conviction Relief actions, arbitration and employee related matters and also prosecution of violations of
county ordinances. There are four employees in the civil division including three assistant attorneys and
one legal assistant.
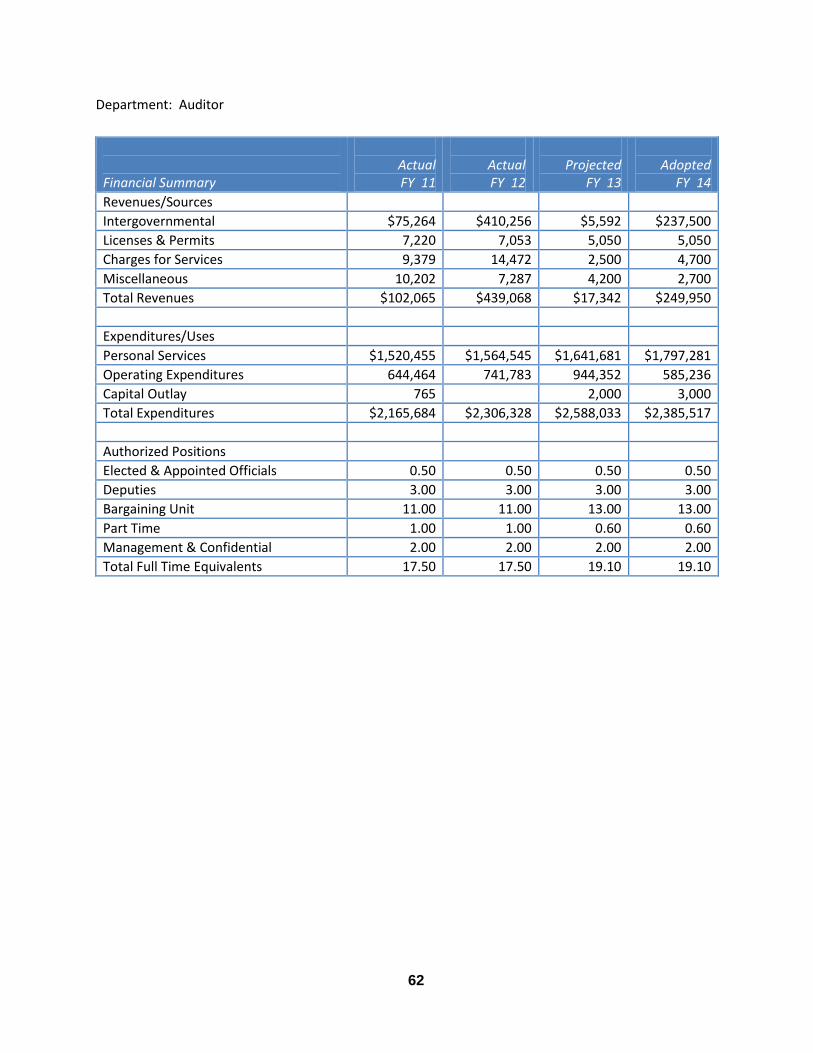
62
Department: Auditor
Financial Summary
Actual FY 11
Actual FY 12
Projected
FY 13
Adopted
FY 14
Revenues/Sources
Intergovernmental $75,264 $410,256 $5,592 $237,500
Licenses & Permits 7,220 7,053 5,050 5,050
Charges for Services 9,379 14,472 2,500 4,700
Miscellaneous 10,202 7,287 4,200 2,700
Total Revenues $102,065 $439,068 $17,342 $249,950
Expenditures/Uses
Personal Services $1,520,455 $1,564,545 $1,641,681 $1,797,281
Operating Expenditures 644,464 741,783 944,352 585,236
Capital Outlay 765 2,000 3,000
Total Expenditures $2,165,684 $2,306,328 $2,588,033 $2,385,517
Authorized Positions
Elected & Appointed Officials 0.50 0.50 0.50 0.50
Deputies 3.00 3.00 3.00 3.00
Bargaining Unit 11.00 11.00 13.00 13.00
Part Time 1.00 1.00 0.60 0.60
Management & Confidential 2.00 2.00 2.00 2.00
Total Full Time Equivalents 17.50 17.50 19.10 19.10
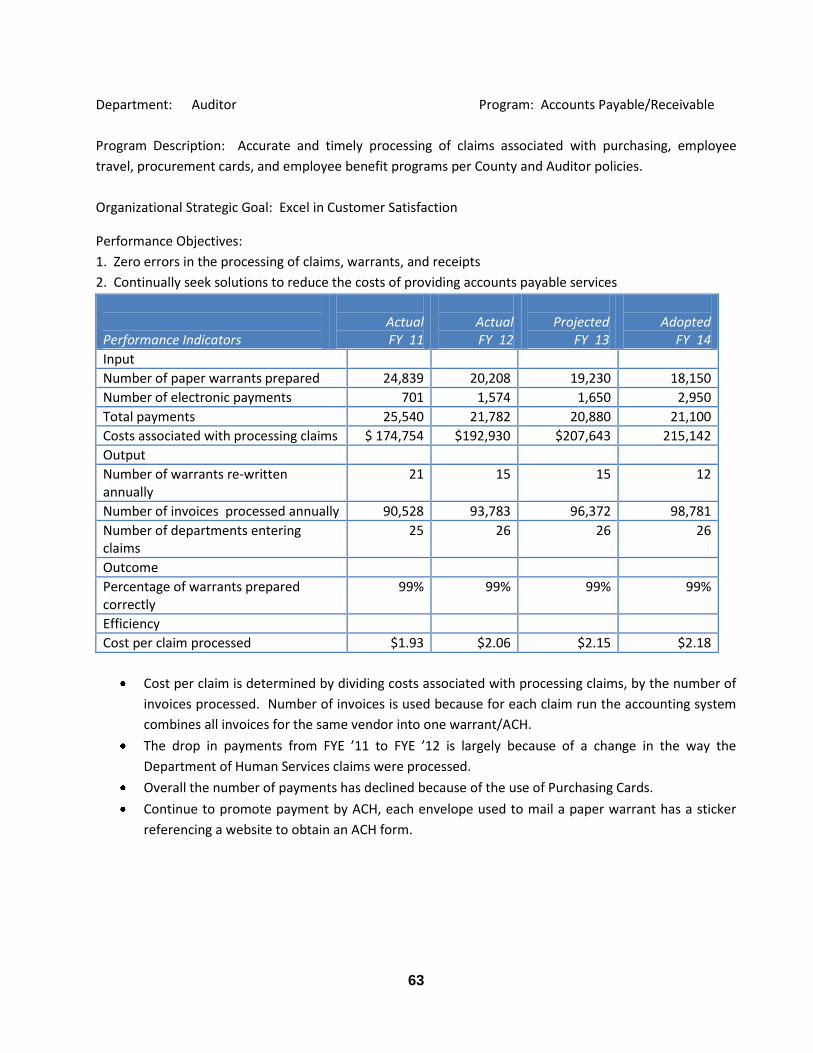
63
Department: Auditor Program: Accounts Payable/Receivable
Program Description: Accurate and timely processing of claims associated with purchasing, employee
travel, procurement cards, and employee benefit programs per County and Auditor policies.
Organizational Strategic Goal: Excel in Customer Satisfaction
Performance Objectives:
1. Zero errors in the processing of claims, warrants, and receipts
2. Continually seek solutions to reduce the costs of providing accounts payable services
Performance Indicators
Actual FY 11
Actual FY 12
Projected
FY 13
Adopted
FY 14
Input
Number of paper warrants prepared 24,839 20,208 19,230 18,150
Number of electronic payments 701 1,574 1,650 2,950
Total payments 25,540 21,782 20,880 21,100
Costs associated with processing claims $ 174,754 $192,930 $207,643 215,142
Output
Number of warrants re-written annually
21 15 15 12
Number of invoices processed annually 90,528 93,783 96,372 98,781
Number of departments entering claims
25 26 26 26
Outcome
Percentage of warrants prepared correctly
99% 99% 99% 99%
Efficiency
Cost per claim processed $1.93 $2.06 $2.15 $2.18
Cost per claim is determined by dividing costs associated with processing claims, by the number of
invoices processed. Number of invoices is used because for each claim run the accounting system
combines all invoices for the same vendor into one warrant/ACH.
The drop in payments from FYE ’11 to FYE ’12 is largely because of a change in the way the
Department of Human Services claims were processed.
Overall the number of payments has declined because of the use of Purchasing Cards.
Continue to promote payment by ACH, each envelope used to mail a paper warrant has a sticker
referencing a website to obtain an ACH form.
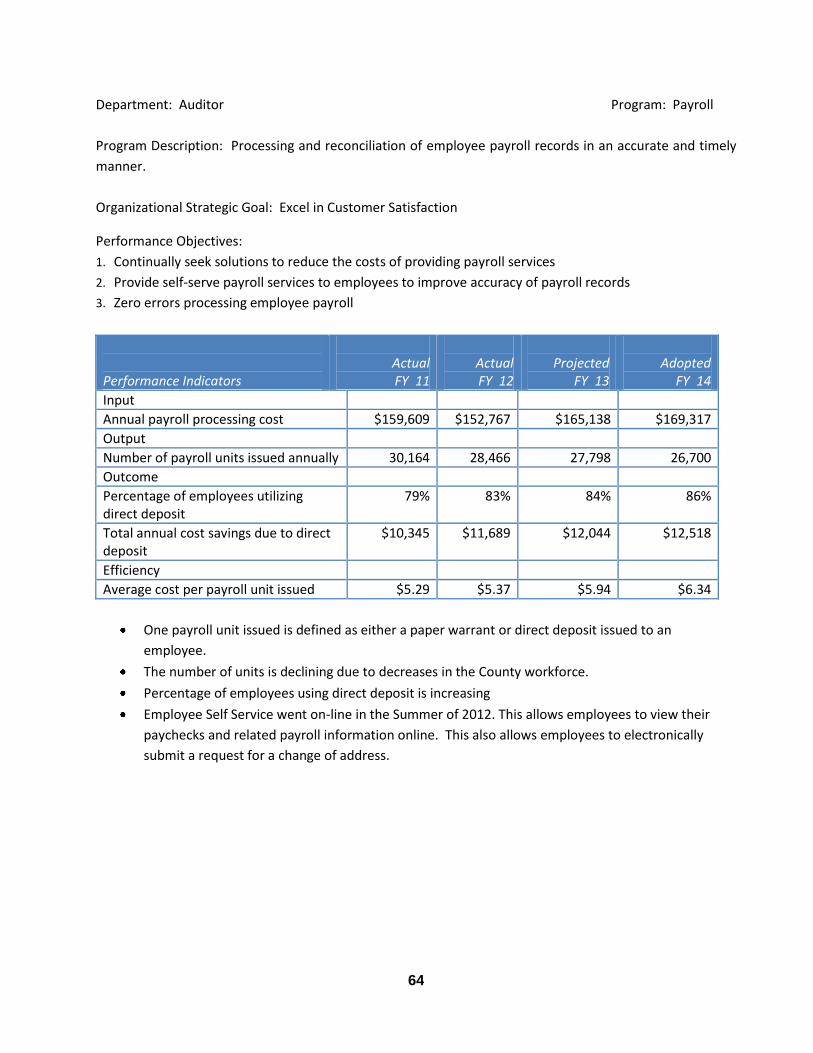
64
Department: Auditor Program: Payroll
Program Description: Processing and reconciliation of employee payroll records in an accurate and timely
manner.
Organizational Strategic Goal: Excel in Customer Satisfaction
Performance Objectives:
1. Continually seek solutions to reduce the costs of providing payroll services
2. Provide self-serve payroll services to employees to improve accuracy of payroll records
3. Zero errors processing employee payroll
Performance Indicators
Actual FY 11
Actual FY 12
Projected
FY 13
Adopted
FY 14
Input
Annual payroll processing cost $159,609 $152,767 $165,138 $169,317
Output
Number of payroll units issued annually 30,164 28,466 27,798 26,700
Outcome
Percentage of employees utilizing direct deposit
79% 83% 84% 86%
Total annual cost savings due to direct deposit
$10,345 $11,689 $12,044 $12,518
Efficiency
Average cost per payroll unit issued $5.29 $5.37 $5.94 $6.34
One payroll unit issued is defined as either a paper warrant or direct deposit issued to an
employee.
The number of units is declining due to decreases in the County workforce.
Percentage of employees using direct deposit is increasing
Employee Self Service went on-line in the Summer of 2012. This allows employees to view their
paychecks and related payroll information online. This also allows employees to electronically
submit a request for a change of address.
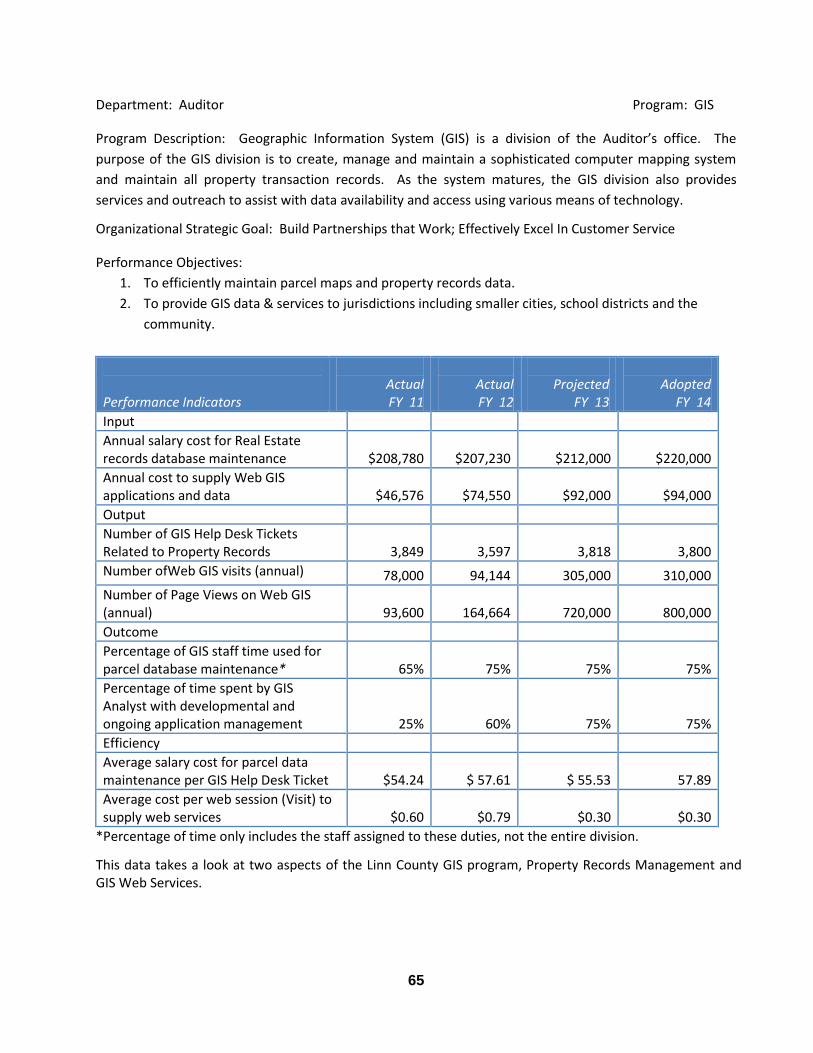
65
Department: Auditor Program: GIS
Program Description: Geographic Information System (GIS) is a division of the Auditor’s office. The
purpose of the GIS division is to create, manage and maintain a sophisticated computer mapping system
and maintain all property transaction records. As the system matures, the GIS division also provides
services and outreach to assist with data availability and access using various means of technology.
Organizational Strategic Goal: Build Partnerships that Work; Effectively Excel In Customer Service
Performance Objectives:
1. To efficiently maintain parcel maps and property records data.
2. To provide GIS data & services to jurisdictions including smaller cities, school districts and the
community.
Performance Indicators
Actual FY 11
Actual FY 12
Projected
FY 13
Adopted
FY 14
Input
Annual salary cost for Real Estate records database maintenance
$208,780 $207,230 $212,000 $220,000
Annual cost to supply Web GIS applications and data
$46,576 $74,550 $92,000 $94,000
Output
Number of GIS Help Desk Tickets Related to Property Records 3,849 3,597 3,818 3,800
Number ofWeb GIS visits (annual) 78,000 94,144 305,000 310,000
Number of Page Views on Web GIS (annual) 93,600 164,664 720,000 800,000
Outcome
Percentage of GIS staff time used for parcel database maintenance*
65% 75% 75% 75%
Percentage of time spent by GIS Analyst with developmental and ongoing application management
25% 60% 75% 75%
Efficiency
Average salary cost for parcel data maintenance per GIS Help Desk Ticket
$54.24 $ 57.61 $ 55.53 57.89
Average cost per web session (Visit) to supply web services
$0.60 $0.79 $0.30 $0.30
*Percentage of time only includes the staff assigned to these duties, not the entire division.
This data takes a look at two aspects of the Linn County GIS program, Property Records Management and GIS Web Services.
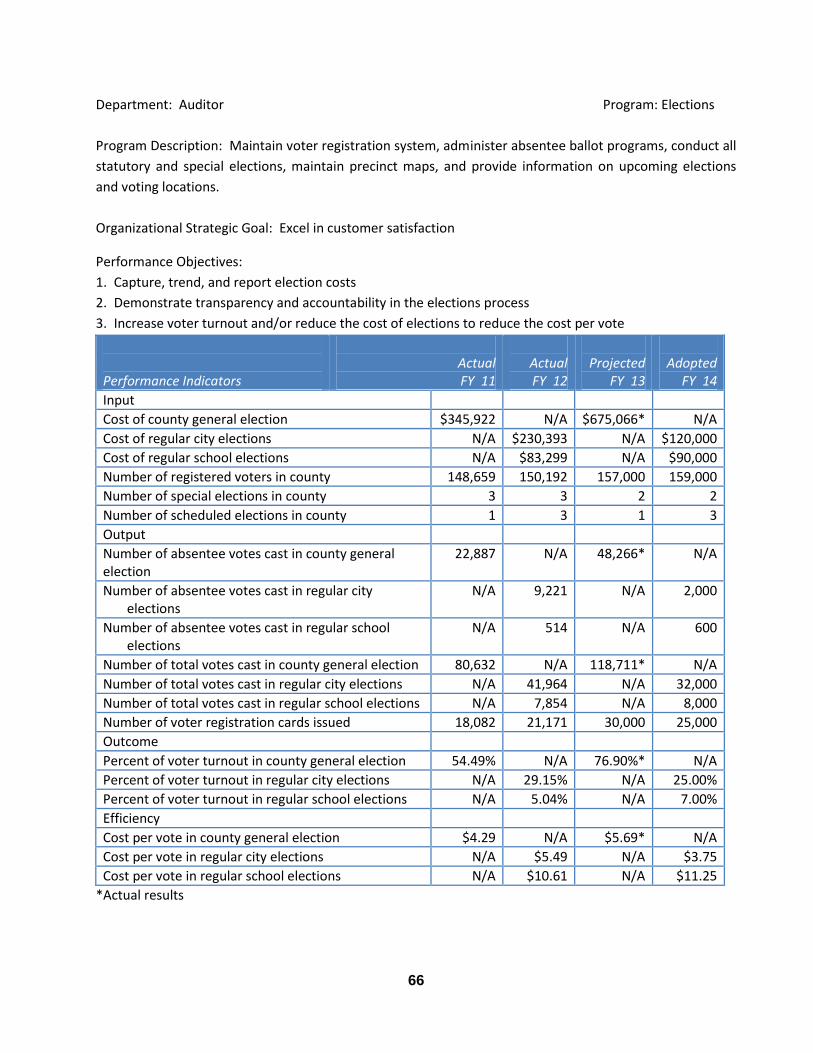
66
Department: Auditor Program: Elections
Program Description: Maintain voter registration system, administer absentee ballot programs, conduct all
statutory and special elections, maintain precinct maps, and provide information on upcoming elections
and voting locations.
Organizational Strategic Goal: Excel in customer satisfaction
Performance Objectives:
1. Capture, trend, and report election costs
2. Demonstrate transparency and accountability in the elections process
3. Increase voter turnout and/or reduce the cost of elections to reduce the cost per vote
Performance Indicators
Actual FY 11
Actual FY 12
Projected
FY 13
Adopted
FY 14
Input
Cost of county general election $345,922 N/A $675,066* N/A
Cost of regular city elections N/A $230,393 N/A $120,000
Cost of regular school elections N/A $83,299 N/A $90,000
Number of registered voters in county 148,659 150,192 157,000 159,000
Number of special elections in county 3 3 2 2
Number of scheduled elections in county 1 3 1 3
Output
Number of absentee votes cast in county general election
22,887 N/A 48,266* N/A
Number of absentee votes cast in regular city elections
N/A 9,221 N/A 2,000
Number of absentee votes cast in regular school elections
N/A 514 N/A 600
Number of total votes cast in county general election 80,632 N/A 118,711* N/A
Number of total votes cast in regular city elections N/A 41,964 N/A 32,000
Number of total votes cast in regular school elections N/A 7,854 N/A 8,000
Number of voter registration cards issued 18,082 21,171 30,000 25,000
Outcome
Percent of voter turnout in county general election 54.49% N/A 76.90%* N/A
Percent of voter turnout in regular city elections N/A 29.15% N/A 25.00%
Percent of voter turnout in regular school elections N/A 5.04% N/A 7.00%
Efficiency
Cost per vote in county general election $4.29 N/A $5.69* N/A
Cost per vote in regular city elections N/A $5.49 N/A $3.75
Cost per vote in regular school elections N/A $10.61 N/A $11.25
*Actual results
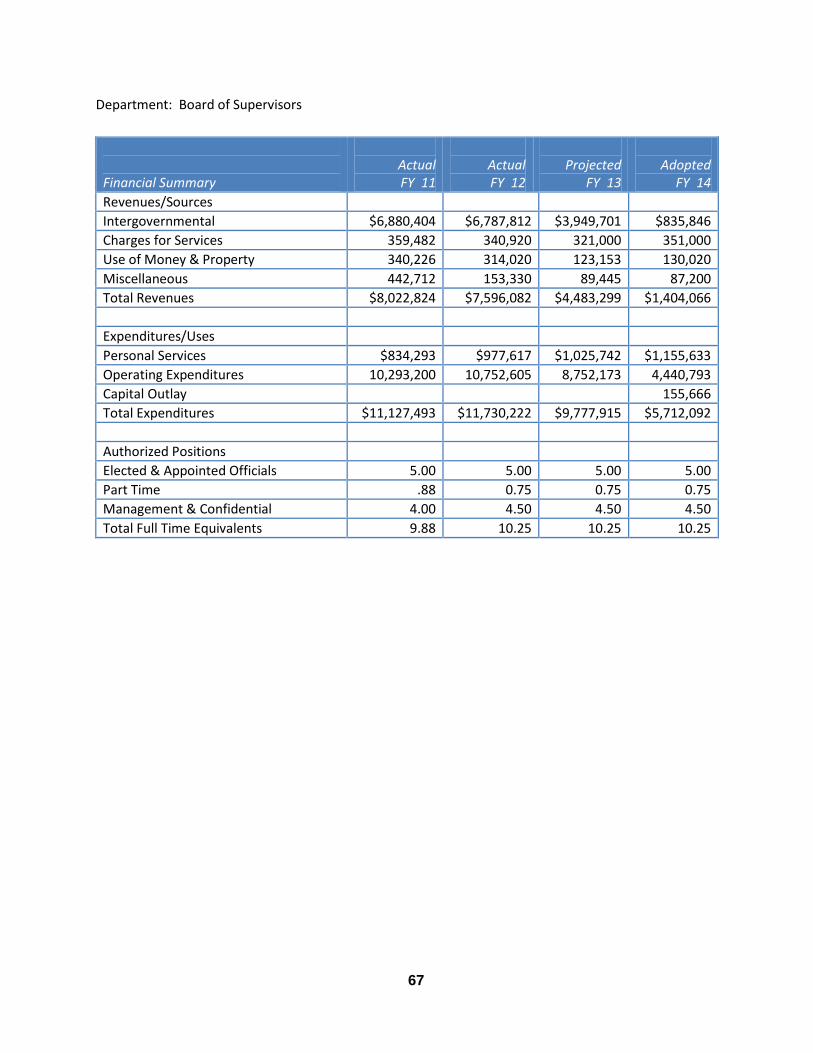
67
Department: Board of Supervisors
Financial Summary
Actual FY 11
Actual FY 12
Projected
FY 13
Adopted
FY 14
Revenues/Sources
Intergovernmental $6,880,404 $6,787,812 $3,949,701 $835,846
Charges for Services 359,482 340,920 321,000 351,000
Use of Money & Property 340,226 314,020 123,153 130,020
Miscellaneous 442,712 153,330 89,445 87,200
Total Revenues $8,022,824 $7,596,082 $4,483,299 $1,404,066
Expenditures/Uses
Personal Services $834,293 $977,617 $1,025,742 $1,155,633
Operating Expenditures 10,293,200 10,752,605 8,752,173 4,440,793
Capital Outlay 155,666
Total Expenditures $11,127,493 $11,730,222 $9,777,915 $5,712,092
Authorized Positions
Elected & Appointed Officials 5.00 5.00 5.00 5.00
Part Time .88 0.75 0.75 0.75
Management & Confidential 4.00 4.50 4.50 4.50
Total Full Time Equivalents 9.88 10.25 10.25 10.25
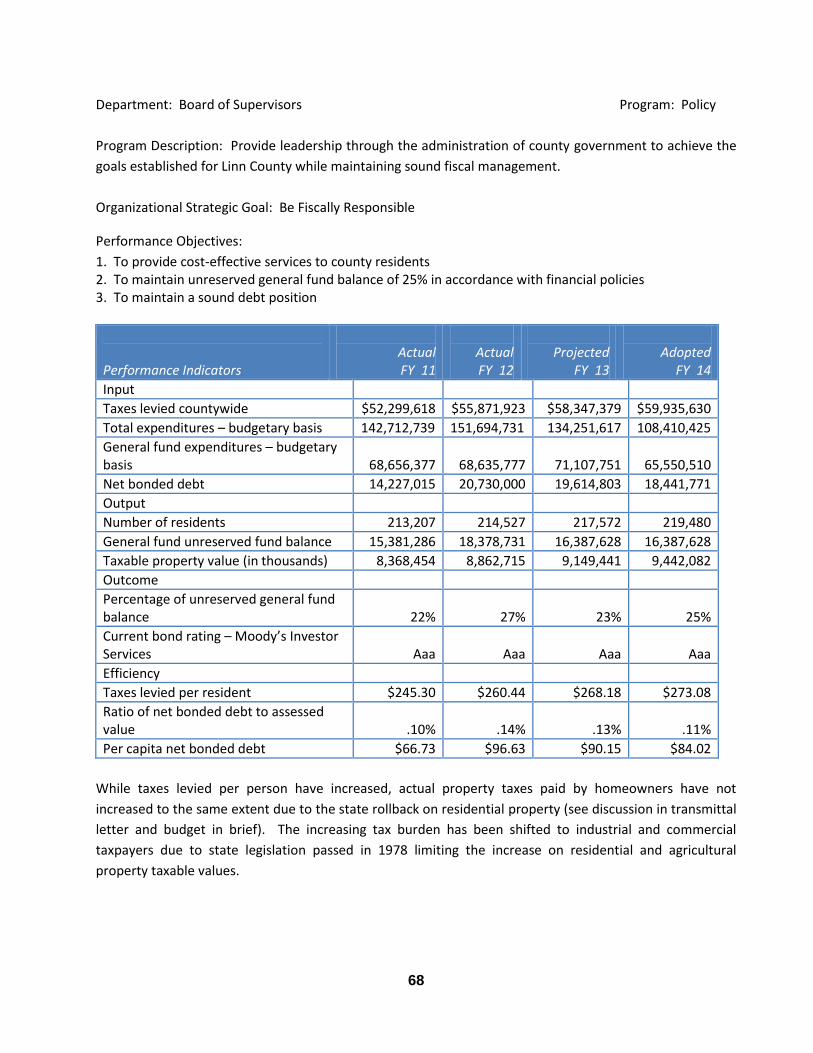
68
Department: Board of Supervisors Program: Policy
Program Description: Provide leadership through the administration of county government to achieve the
goals established for Linn County while maintaining sound fiscal management.
Organizational Strategic Goal: Be Fiscally Responsible
Performance Objectives:
1. To provide cost-effective services to county residents 2. To maintain unreserved general fund balance of 25% in accordance with financial policies 3. To maintain a sound debt position
Performance Indicators
Actual FY 11
Actual FY 12
Projected
FY 13
Adopted
FY 14
Input
Taxes levied countywide $52,299,618 $55,871,923 $58,347,379 $59,935,630
Total expenditures – budgetary basis 142,712,739 151,694,731 134,251,617 108,410,425
General fund expenditures – budgetary basis
68,656,377 68,635,777 71,107,751 65,550,510
Net bonded debt 14,227,015 20,730,000 19,614,803 18,441,771
Output
Number of residents 213,207 214,527 217,572 219,480
General fund unreserved fund balance 15,381,286 18,378,731 16,387,628 16,387,628
Taxable property value (in thousands) 8,368,454 8,862,715 9,149,441 9,442,082
Outcome
Percentage of unreserved general fund balance
22% 27% 23% 25%
Current bond rating – Moody’s Investor Services
Aaa Aaa Aaa Aaa
Efficiency
Taxes levied per resident $245.30 $260.44 $268.18 $273.08
Ratio of net bonded debt to assessed value
.10% .14% .13% .11%
Per capita net bonded debt $66.73 $96.63 $90.15 $84.02
While taxes levied per person have increased, actual property taxes paid by homeowners have not
increased to the same extent due to the state rollback on residential property (see discussion in transmittal
letter and budget in brief). The increasing tax burden has been shifted to industrial and commercial
taxpayers due to state legislation passed in 1978 limiting the increase on residential and agricultural
property taxable values.
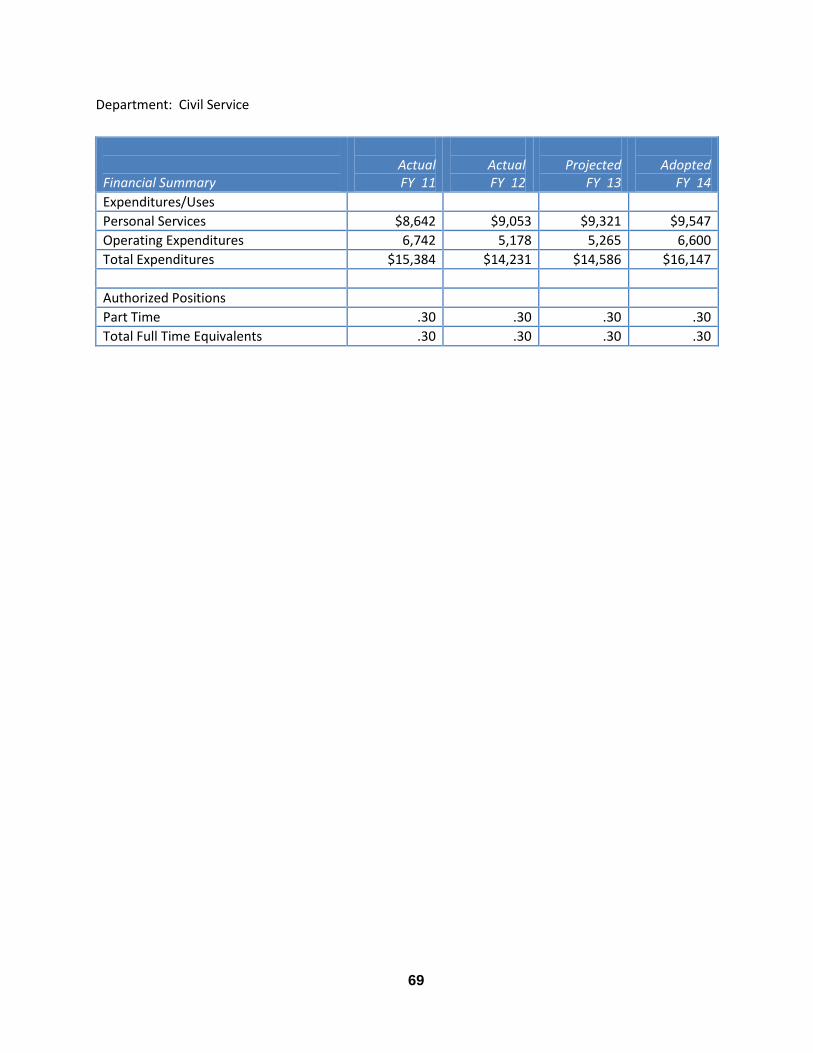
69
Department: Civil Service
Financial Summary
Actual FY 11
Actual FY 12
Projected
FY 13
Adopted
FY 14
Expenditures/Uses
Personal Services $8,642 $9,053 $9,321 $9,547
Operating Expenditures 6,742 5,178 5,265 6,600
Total Expenditures $15,384 $14,231 $14,586 $16,147
Authorized Positions
Part Time .30 .30 .30 .30
Total Full Time Equivalents .30 .30 .30 .30
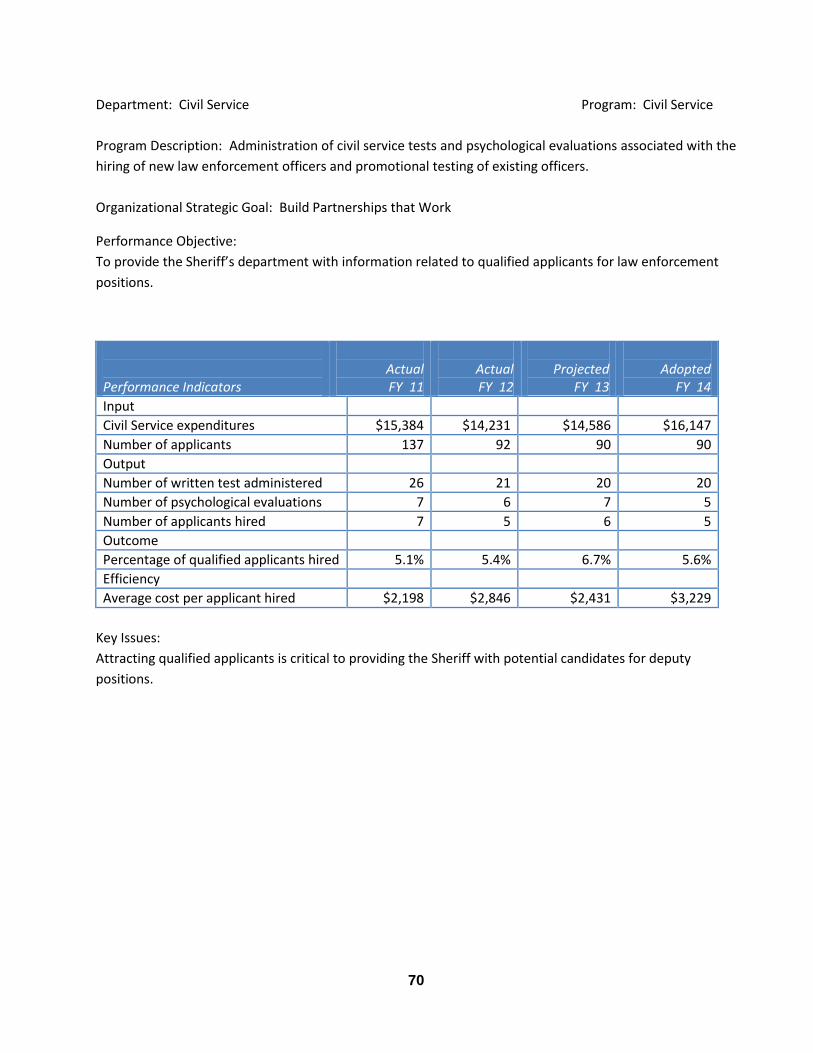
70
Department: Civil Service Program: Civil Service
Program Description: Administration of civil service tests and psychological evaluations associated with the
hiring of new law enforcement officers and promotional testing of existing officers.
Organizational Strategic Goal: Build Partnerships that Work
Performance Objective:
To provide the Sheriff’s department with information related to qualified applicants for law enforcement
positions.
Performance Indicators
Actual FY 11
Actual FY 12
Projected
FY 13
Adopted
FY 14
Input
Civil Service expenditures $15,384 $14,231 $14,586 $16,147
Number of applicants 137 92 90 90
Output
Number of written test administered 26 21 20 20
Number of psychological evaluations 7 6 7 5
Number of applicants hired 7 5 6 5
Outcome
Percentage of qualified applicants hired 5.1% 5.4% 6.7% 5.6%
Efficiency
Average cost per applicant hired $2,198 $2,846 $2,431 $3,229
Key Issues:
Attracting qualified applicants is critical to providing the Sheriff with potential candidates for deputy
positions.
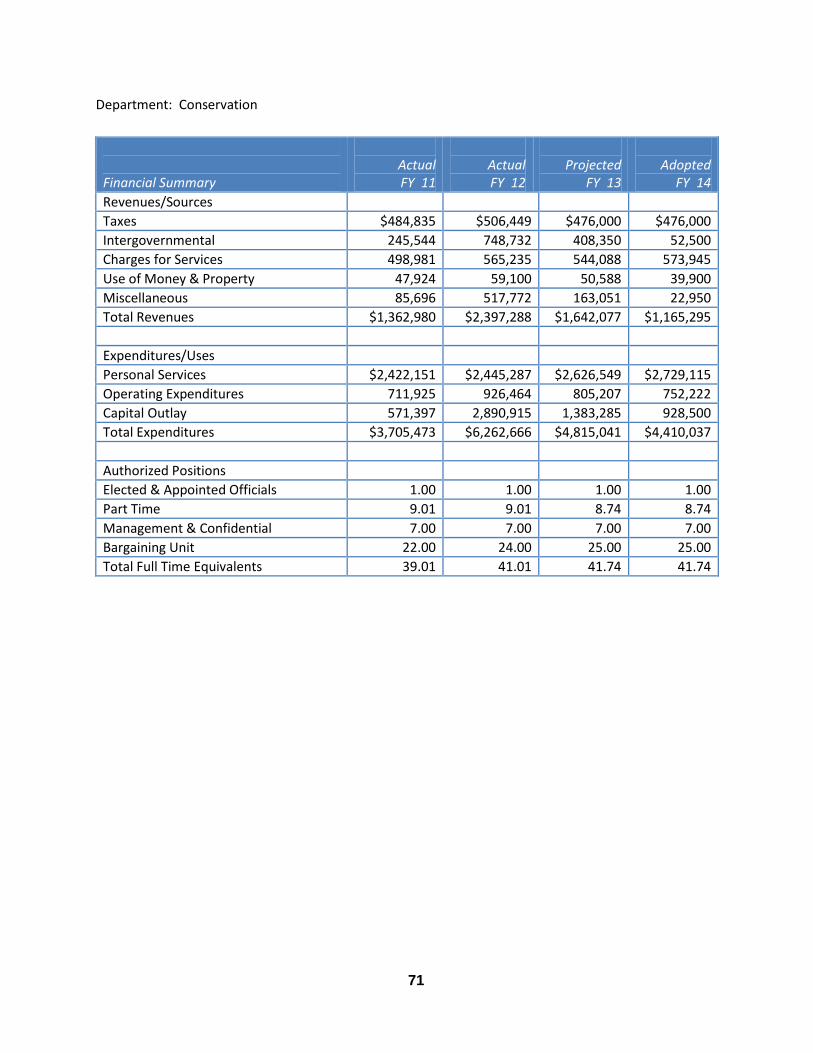
71
Department: Conservation
Financial Summary
Actual FY 11
Actual FY 12
Projected
FY 13
Adopted
FY 14
Revenues/Sources
Taxes $484,835 $506,449 $476,000 $476,000
Intergovernmental 245,544 748,732 408,350 52,500
Charges for Services 498,981 565,235 544,088 573,945
Use of Money & Property 47,924 59,100 50,588 39,900
Miscellaneous 85,696 517,772 163,051 22,950
Total Revenues $1,362,980 $2,397,288 $1,642,077 $1,165,295
Expenditures/Uses
Personal Services $2,422,151 $2,445,287 $2,626,549 $2,729,115
Operating Expenditures 711,925 926,464 805,207 752,222
Capital Outlay 571,397 2,890,915 1,383,285 928,500
Total Expenditures $3,705,473 $6,262,666 $4,815,041 $4,410,037
Authorized Positions
Elected & Appointed Officials 1.00 1.00 1.00 1.00
Part Time 9.01 9.01 8.74 8.74
Management & Confidential 7.00 7.00 7.00 7.00
Bargaining Unit 22.00 24.00 25.00 25.00
Total Full Time Equivalents 39.01 41.01 41.74 41.74
72
Department: Conservation Program: Parks & Outdoor Recreation
Program Description: To improve community through people, parks, trails, and open spaces.
Organizational Strategic Goal: Enhance Quality of Life
Performance Objectives:
1. Steward Linn County’s Park and Open Spaces Long-term sustainability
a. Enhance county-wide planning for parks and open spaces
b. Increase restoration of Linn County’s natural systems
c. Actively acquire land in anticipation of projected county conservation needs and demands
2. Provide recreation and learning opportunities
a. Encourage healthy and active lifestyles
b. Foster environmental appreciation and enjoyment through programming
3. Maintain county parks and facilities, trails and lands
a. Increase funding to adequately operate and maintain parks and facilities, trails, and land to enrich
recreational experiences of patrons
b. Invest at least 1% of the value of county conservation assets for maintenance
c. Increase funding for equipment purchases
4. Expand capital projects and park improvements to meet the public’s expectations for quality parks,
facilities, and trails
a. Maintain a capital projects and park improvements program
b. Consider a change in county policy to allow conservation board park fee revenues to be dedicated
for capital projects and park improvements
5. Develop conservation team and organizational structure
a. Increase opportunities for professional development and team learning
b. Effectively communicate park and recreation services
c. Provide volunteer opportunities and community stewardship projects.
d. Increase staffing levels to provide appropriate administrative, maintenance, area security, and park
visitor services
The Linn County Conservation Board has developed this strategic investment plan – “A Bridge to the
Future” for the purpose of securing more reliable and sustainable funding for county park and trail
improvements, open spaces acquisition, conservation education, park maintenance and operations, and
conservation (water quality) measures including rivers and stream improvements.
Linn County, Iowa is a growing community of 200,000 people whom are interested and many actively
use its county parks, trails, and natural areas and resources. The increased demand and use associated
with the expanding population requires investments in green infrastructure to meet the needs of a
growing population. A greater and more sustainable investment would fund acquisitions to protect
sensitive areas, connect greenways, buffer parks and wildlife areas, improve water quality and reduce
flooding in Linn County. It would also enhance accessible outdoor recreation, conservation education,
and complete trail connections that would connect communities and encourage healthy lifestyles.
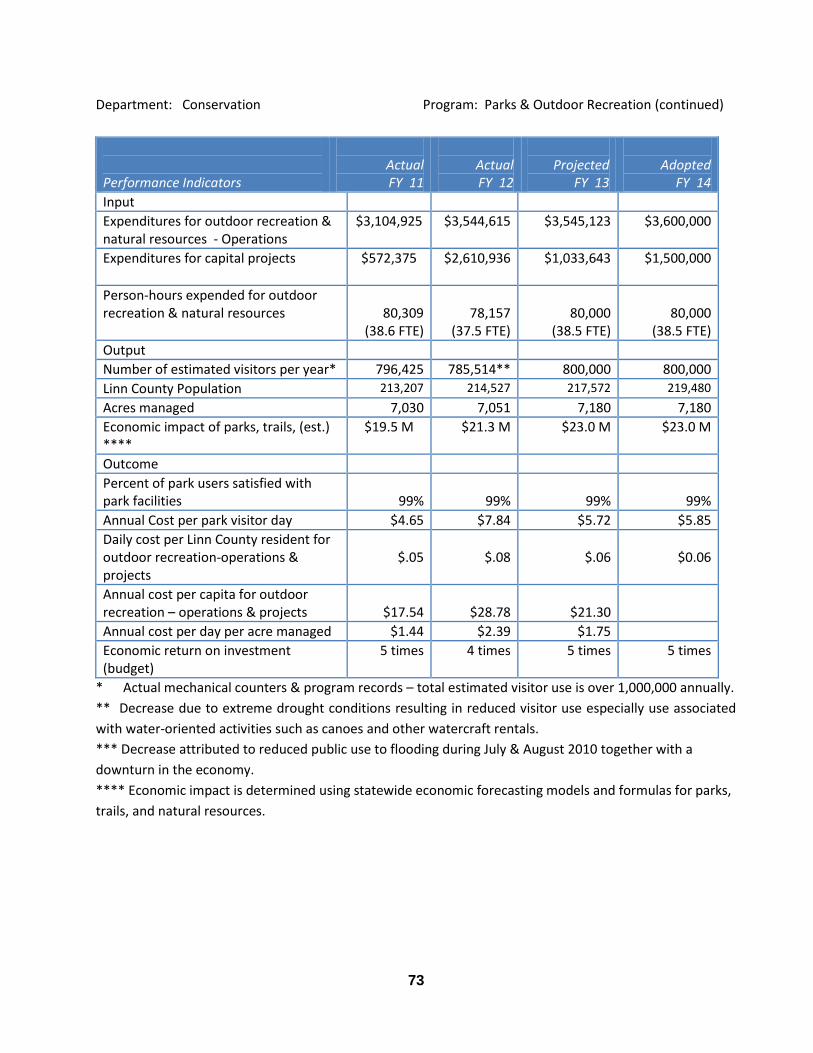
73
Department: Conservation Program: Parks & Outdoor Recreation (continued)
Performance Indicators
Actual FY 11
Actual FY 12
Projected
FY 13
Adopted
FY 14
Input
Expenditures for outdoor recreation & natural resources - Operations
$3,104,925
$3,544,615 $3,545,123 $3,600,000
Expenditures for capital projects
$572,375 $2,610,936 $1,033,643 $1,500,000
Person-hours expended for outdoor recreation & natural resources
80,309
(38.6 FTE)
78,157
(37.5 FTE)
80,000
(38.5 FTE)
80,000
(38.5 FTE)
Output
Number of estimated visitors per year* 796,425 785,514** 800,000 800,000
Linn County Population 213,207 214,527 217,572 219,480
Acres managed 7,030 7,051 7,180 7,180
Economic impact of parks, trails, (est.) ****
$19.5 M $21.3 M $23.0 M $23.0 M
Outcome
Percent of park users satisfied with park facilities
99%
99%
99%
99%
Annual Cost per park visitor day $4.65 $7.84 $5.72 $5.85
Daily cost per Linn County resident for outdoor recreation-operations & projects
$.05
$.08
$.06
$0.06
Annual cost per capita for outdoor recreation – operations & projects
$17.54
$28.78
$21.30
Annual cost per day per acre managed $1.44 $2.39 $1.75
Economic return on investment (budget)
5 times 4 times 5 times 5 times
* Actual mechanical counters & program records – total estimated visitor use is over 1,000,000 annually.
** Decrease due to extreme drought conditions resulting in reduced visitor use especially use associated
with water-oriented activities such as canoes and other watercraft rentals.
*** Decrease attributed to reduced public use to flooding during July & August 2010 together with a
downturn in the economy.
**** Economic impact is determined using statewide economic forecasting models and formulas for parks,
trails, and natural resources.
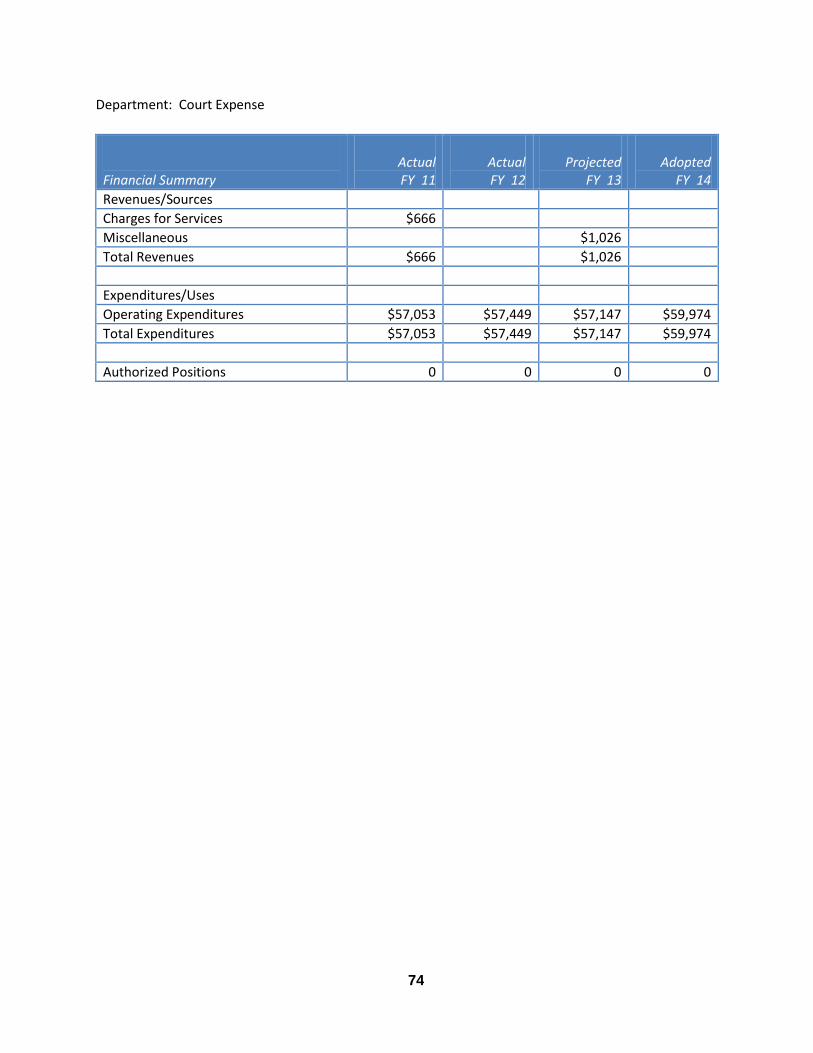
74
Department: Court Expense
Financial Summary
Actual FY 11
Actual FY 12
Projected
FY 13
Adopted
FY 14
Revenues/Sources
Charges for Services $666
Miscellaneous $1,026
Total Revenues $666 $1,026
Expenditures/Uses
Operating Expenditures $57,053 $57,449 $57,147 $59,974
Total Expenditures $57,053 $57,449 $57,147 $59,974
Authorized Positions 0 0 0 0
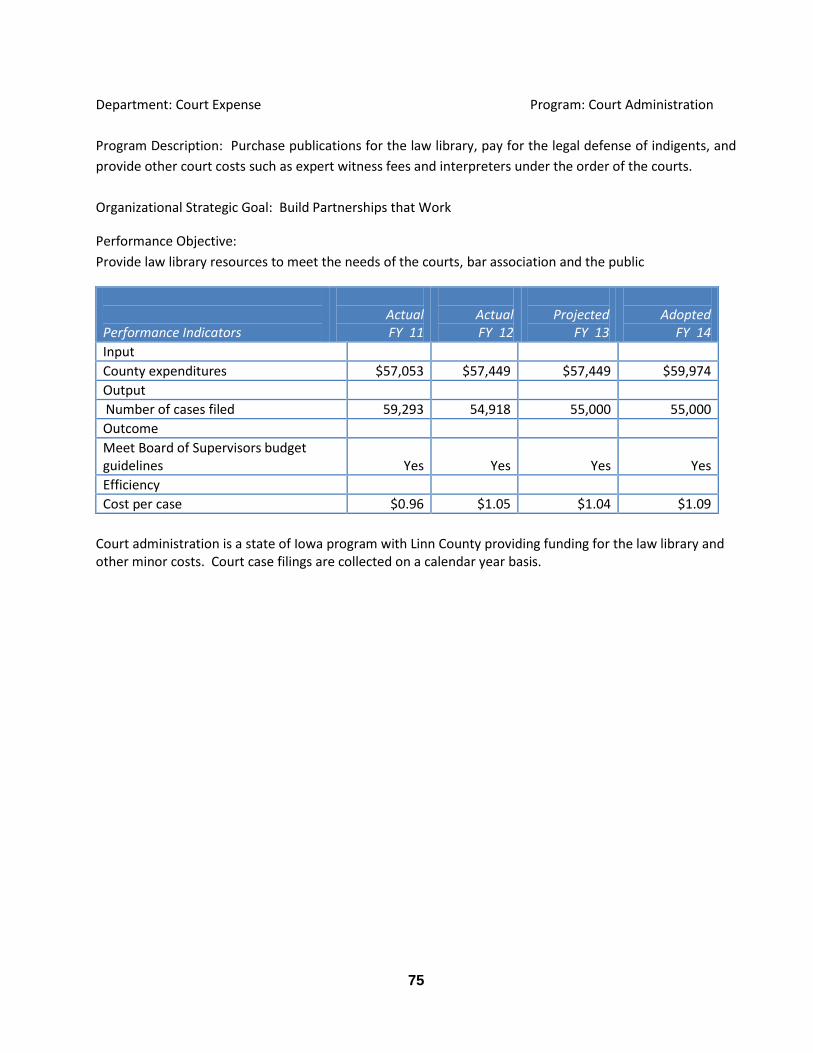
75
Department: Court Expense Program: Court Administration
Program Description: Purchase publications for the law library, pay for the legal defense of indigents, and
provide other court costs such as expert witness fees and interpreters under the order of the courts.
Organizational Strategic Goal: Build Partnerships that Work
Performance Objective:
Provide law library resources to meet the needs of the courts, bar association and the public
Performance Indicators
Actual FY 11
Actual FY 12
Projected
FY 13
Adopted
FY 14
Input
County expenditures $57,053 $57,449 $57,449 $59,974
Output
Number of cases filed 59,293 54,918 55,000 55,000
Outcome
Meet Board of Supervisors budget guidelines
Yes Yes Yes Yes
Efficiency
Cost per case $0.96 $1.05 $1.04 $1.09
Court administration is a state of Iowa program with Linn County providing funding for the law library and other minor costs. Court case filings are collected on a calendar year basis.
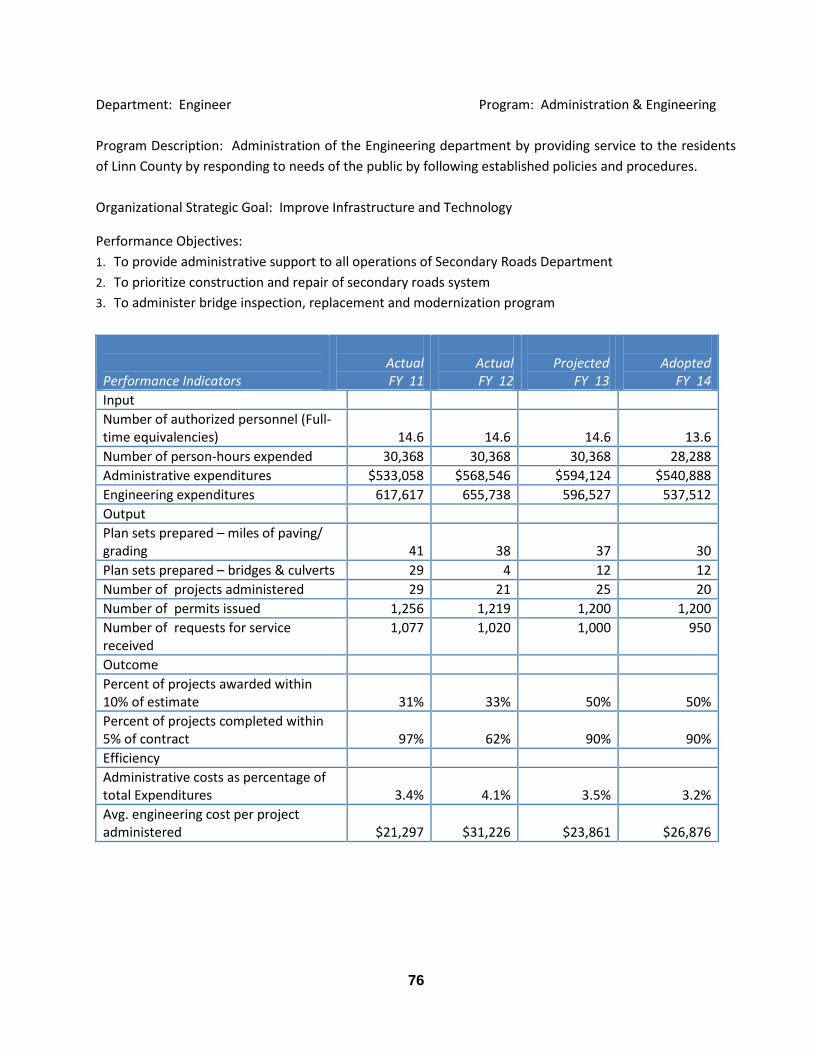
76
Department: Engineer Program: Administration & Engineering
Program Description: Administration of the Engineering department by providing service to the residents
of Linn County by responding to needs of the public by following established policies and procedures.
Organizational Strategic Goal: Improve Infrastructure and Technology
Performance Objectives:
1. To provide administrative support to all operations of Secondary Roads Department
2. To prioritize construction and repair of secondary roads system
3. To administer bridge inspection, replacement and modernization program
Performance Indicators
Actual FY 11
Actual FY 12
Projected
FY 13
Adopted
FY 14
Input
Number of authorized personnel (Full-time equivalencies)
14.6
14.6
14.6
13.6
Number of person-hours expended 30,368 30,368 30,368 28,288
Administrative expenditures $533,058 $568,546 $594,124 $540,888
Engineering expenditures 617,617 655,738 596,527 537,512
Output
Plan sets prepared – miles of paving/ grading
41
38
37
30
Plan sets prepared – bridges & culverts 29 4 12 12
Number of projects administered 29 21 25 20
Number of permits issued 1,256 1,219 1,200 1,200
Number of requests for service received
1,077 1,020 1,000 950
Outcome
Percent of projects awarded within 10% of estimate
31%
33%
50%
50%
Percent of projects completed within 5% of contract
97%
62%
90%
90%
Efficiency
Administrative costs as percentage of total Expenditures
3.4%
4.1%
3.5%
3.2%
Avg. engineering cost per project administered
$21,297
$31,226
$23,861
$26,876
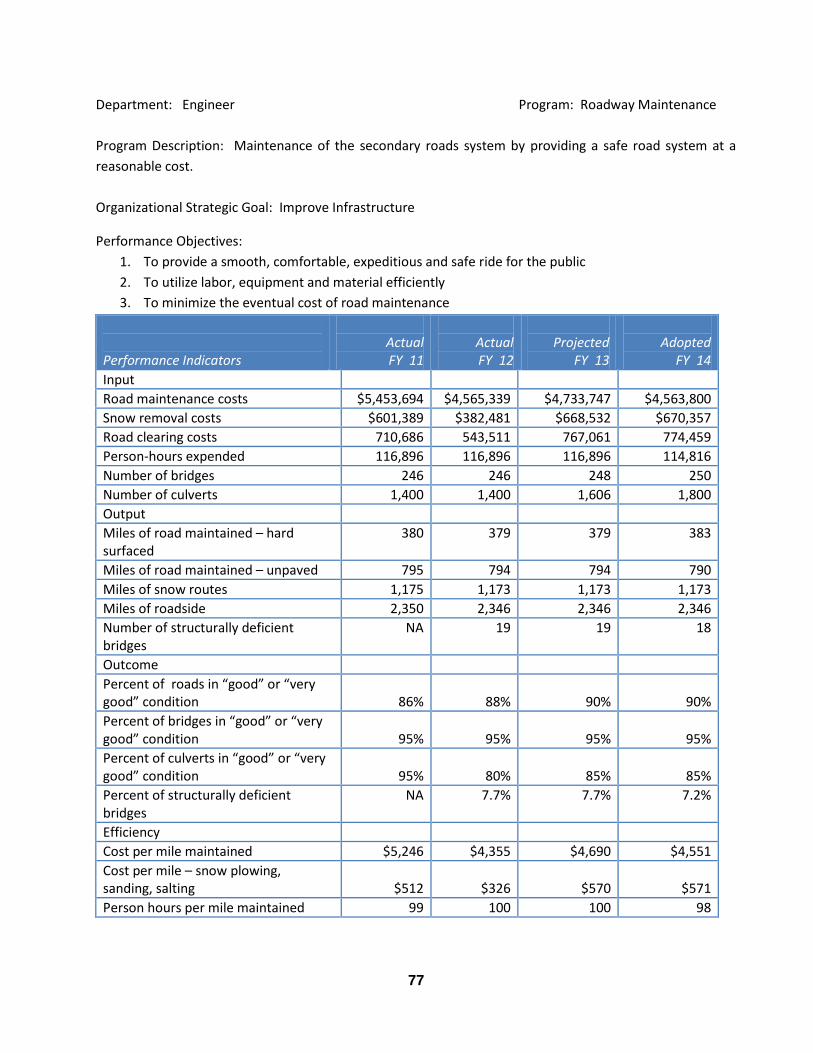
77
Department: Engineer Program: Roadway Maintenance
Program Description: Maintenance of the secondary roads system by providing a safe road system at a
reasonable cost.
Organizational Strategic Goal: Improve Infrastructure
Performance Objectives:
1. To provide a smooth, comfortable, expeditious and safe ride for the public
2. To utilize labor, equipment and material efficiently
3. To minimize the eventual cost of road maintenance
Performance Indicators
Actual FY 11
Actual FY 12
Projected
FY 13
Adopted
FY 14
Input
Road maintenance costs $5,453,694 $4,565,339 $4,733,747 $4,563,800
Snow removal costs $601,389 $382,481 $668,532 $670,357
Road clearing costs 710,686 543,511 767,061 774,459
Person-hours expended 116,896 116,896 116,896 114,816
Number of bridges 246 246 248 250
Number of culverts 1,400 1,400 1,606 1,800
Output
Miles of road maintained – hard surfaced
380 379 379 383
Miles of road maintained – unpaved 795 794 794 790
Miles of snow routes 1,175 1,173 1,173 1,173
Miles of roadside 2,350 2,346 2,346 2,346
Number of structurally deficient bridges
NA 19 19 18
Outcome
Percent of roads in “good” or “very good” condition
86%
88%
90%
90%
Percent of bridges in “good” or “very good” condition
95%
95%
95%
95%
Percent of culverts in “good” or “very good” condition
95%
80%
85%
85%
Percent of structurally deficient bridges
NA 7.7% 7.7% 7.2%
Efficiency
Cost per mile maintained $5,246 $4,355 $4,690 $4,551
Cost per mile – snow plowing, sanding, salting
$512
$326
$570
$571
Person hours per mile maintained 99 100 100 98
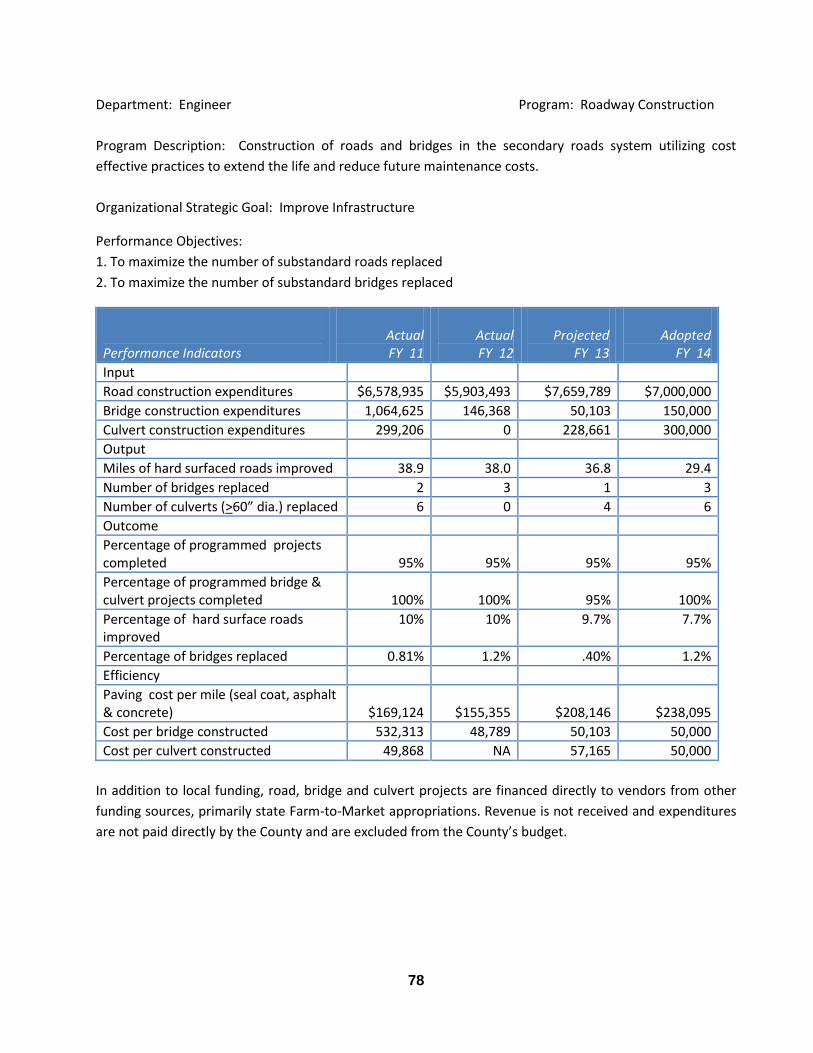
78
Department: Engineer Program: Roadway Construction
Program Description: Construction of roads and bridges in the secondary roads system utilizing cost
effective practices to extend the life and reduce future maintenance costs.
Organizational Strategic Goal: Improve Infrastructure
Performance Objectives:
1. To maximize the number of substandard roads replaced
2. To maximize the number of substandard bridges replaced
Performance Indicators
Actual FY 11
Actual FY 12
Projected
FY 13
Adopted
FY 14
Input
Road construction expenditures $6,578,935 $5,903,493 $7,659,789 $7,000,000
Bridge construction expenditures 1,064,625 146,368 50,103 150,000
Culvert construction expenditures 299,206 0 228,661 300,000
Output
Miles of hard surfaced roads improved 38.9 38.0 36.8 29.4
Number of bridges replaced 2 3 1 3
Number of culverts (>60” dia.) replaced 6 0 4 6
Outcome
Percentage of programmed projects completed
95%
95%
95%
95%
Percentage of programmed bridge & culvert projects completed
100%
100%
95%
100%
Percentage of hard surface roads improved
10% 10% 9.7% 7.7%
Percentage of bridges replaced 0.81% 1.2% .40% 1.2%
Efficiency
Paving cost per mile (seal coat, asphalt & concrete)
$169,124
$155,355
$208,146
$238,095
Cost per bridge constructed 532,313 48,789 50,103 50,000
Cost per culvert constructed 49,868 NA 57,165 50,000
In addition to local funding, road, bridge and culvert projects are financed directly to vendors from other
funding sources, primarily state Farm-to-Market appropriations. Revenue is not received and expenditures
are not paid directly by the County and are excluded from the County’s budget.
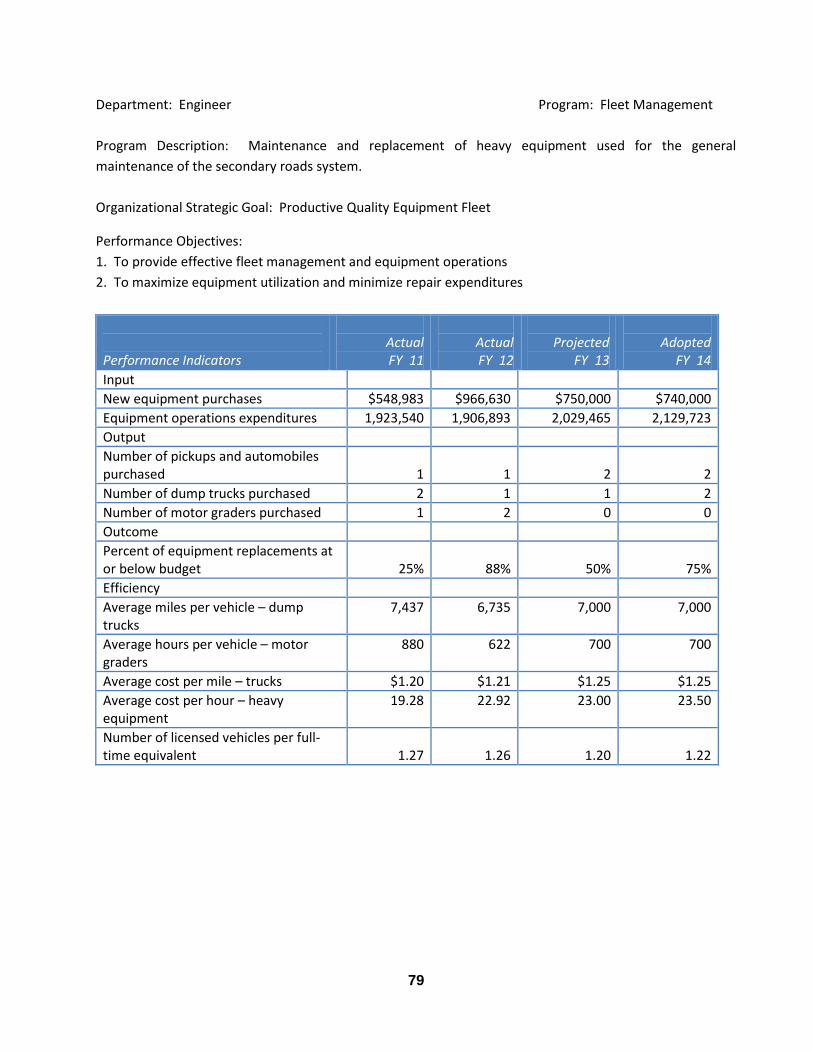
79
Department: Engineer Program: Fleet Management
Program Description: Maintenance and replacement of heavy equipment used for the general
maintenance of the secondary roads system.
Organizational Strategic Goal: Productive Quality Equipment Fleet
Performance Objectives:
1. To provide effective fleet management and equipment operations
2. To maximize equipment utilization and minimize repair expenditures
Performance Indicators
Actual FY 11
Actual FY 12
Projected
FY 13
Adopted
FY 14
Input
New equipment purchases $548,983 $966,630 $750,000 $740,000
Equipment operations expenditures 1,923,540 1,906,893 2,029,465 2,129,723
Output
Number of pickups and automobiles purchased
1
1
2
2
Number of dump trucks purchased 2 1 1 2
Number of motor graders purchased 1 2 0 0
Outcome
Percent of equipment replacements at or below budget
25%
88%
50%
75%
Efficiency
Average miles per vehicle – dump trucks
7,437 6,735 7,000 7,000
Average hours per vehicle – motor graders
880 622 700 700
Average cost per mile – trucks $1.20 $1.21 $1.25 $1.25
Average cost per hour – heavy equipment
19.28 22.92 23.00 23.50
Number of licensed vehicles per full-time equivalent
1.27
1.26
1.20
1.22
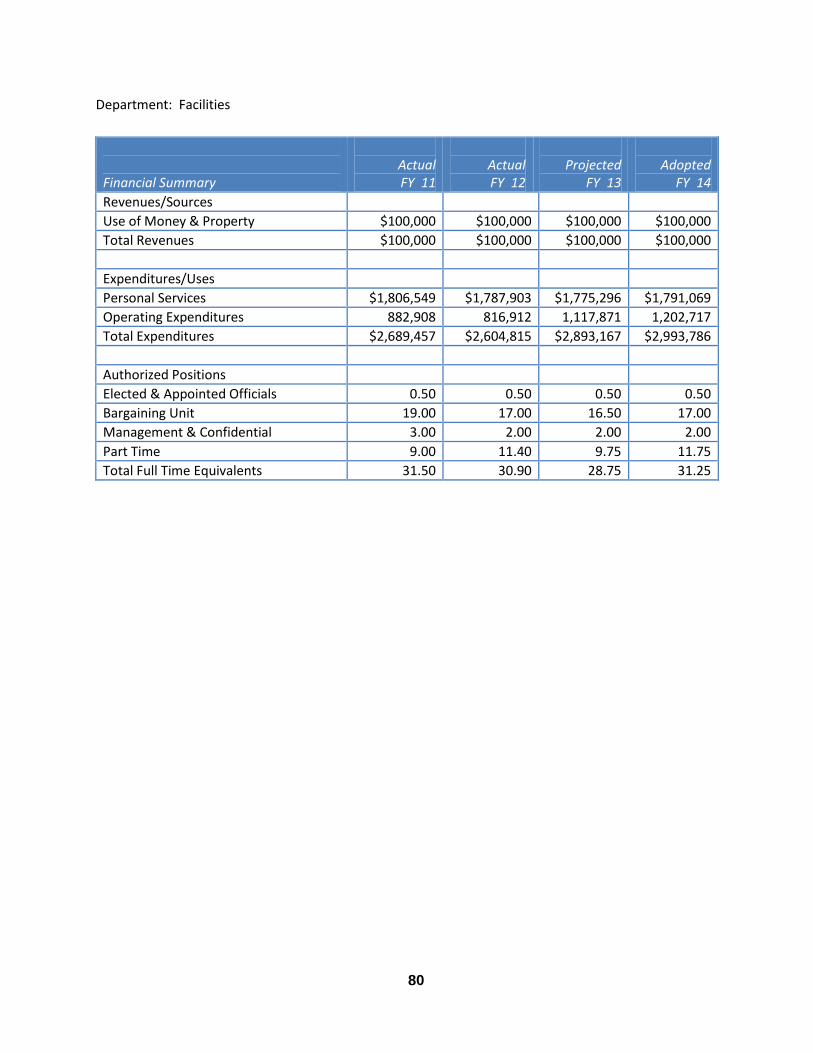
80
Department: Facilities
Financial Summary
Actual FY 11
Actual FY 12
Projected
FY 13
Adopted
FY 14
Revenues/Sources
Use of Money & Property $100,000 $100,000 $100,000 $100,000
Total Revenues $100,000 $100,000 $100,000 $100,000
Expenditures/Uses
Personal Services $1,806,549 $1,787,903 $1,775,296 $1,791,069
Operating Expenditures 882,908 816,912 1,117,871 1,202,717
Total Expenditures $2,689,457 $2,604,815 $2,893,167 $2,993,786
Authorized Positions
Elected & Appointed Officials 0.50 0.50 0.50 0.50
Bargaining Unit 19.00 17.00 16.50 17.00
Management & Confidential 3.00 2.00 2.00 2.00
Part Time 9.00 11.40 9.75 11.75
Total Full Time Equivalents 31.50 30.90 28.75 31.25
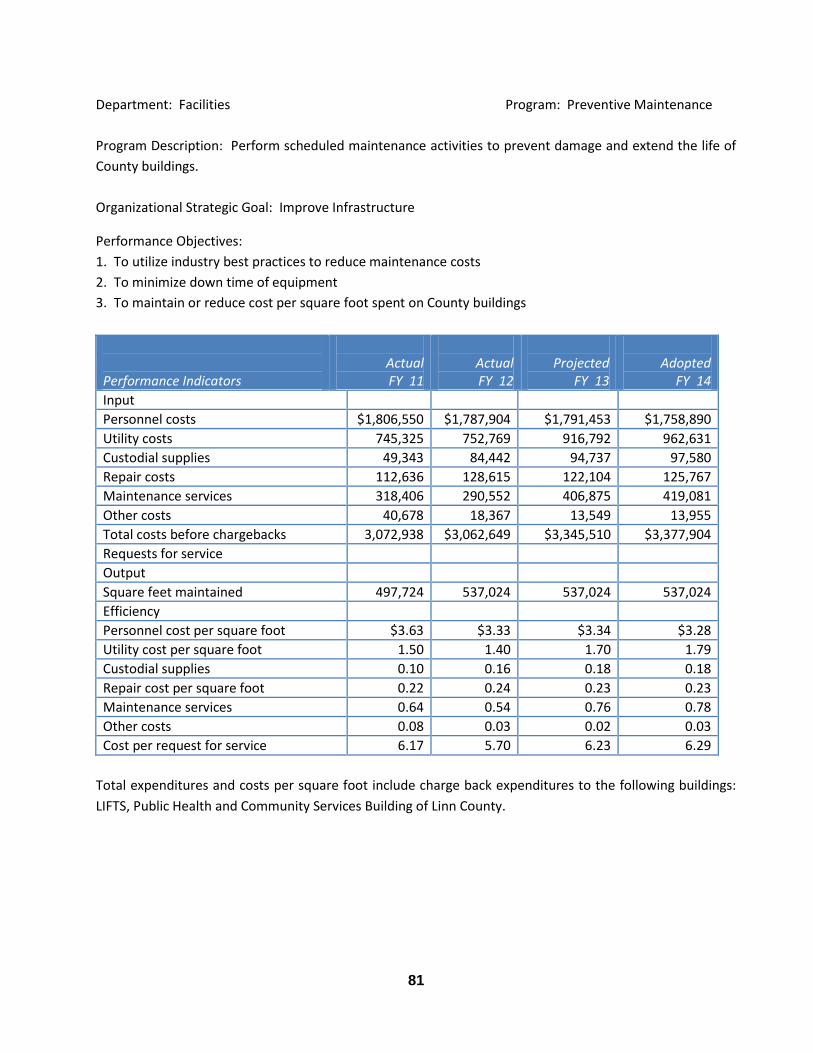
81
Department: Facilities Program: Preventive Maintenance
Program Description: Perform scheduled maintenance activities to prevent damage and extend the life of
County buildings.
Organizational Strategic Goal: Improve Infrastructure
Performance Objectives:
1. To utilize industry best practices to reduce maintenance costs
2. To minimize down time of equipment
3. To maintain or reduce cost per square foot spent on County buildings
Performance Indicators
Actual FY 11
Actual FY 12
Projected
FY 13
Adopted
FY 14
Input
Personnel costs $1,806,550 $1,787,904 $1,791,453 $1,758,890
Utility costs 745,325 752,769 916,792 962,631
Custodial supplies 49,343 84,442 94,737 97,580
Repair costs 112,636 128,615 122,104 125,767
Maintenance services 318,406 290,552 406,875 419,081
Other costs 40,678 18,367 13,549 13,955
Total costs before chargebacks 3,072,938 $3,062,649 $3,345,510 $3,377,904
Requests for service
Output
Square feet maintained 497,724 537,024 537,024 537,024
Efficiency
Personnel cost per square foot $3.63 $3.33 $3.34 $3.28
Utility cost per square foot 1.50 1.40 1.70 1.79
Custodial supplies 0.10 0.16 0.18 0.18
Repair cost per square foot 0.22 0.24 0.23 0.23
Maintenance services 0.64 0.54 0.76 0.78
Other costs 0.08 0.03 0.02 0.03
Cost per request for service 6.17 5.70 6.23 6.29
Total expenditures and costs per square foot include charge back expenditures to the following buildings:
LIFTS, Public Health and Community Services Building of Linn County.
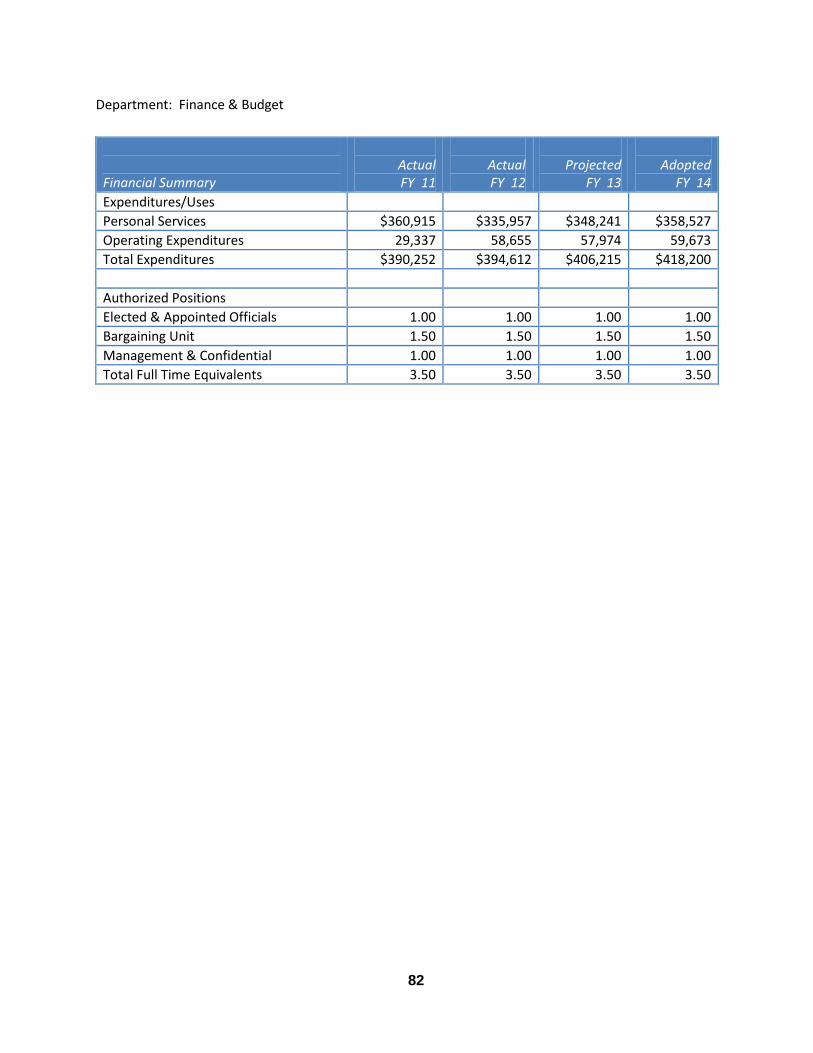
82
Department: Finance & Budget
Financial Summary
Actual FY 11
Actual FY 12
Projected
FY 13
Adopted
FY 14
Expenditures/Uses
Personal Services $360,915 $335,957 $348,241 $358,527
Operating Expenditures 29,337 58,655 57,974 59,673
Total Expenditures $390,252 $394,612 $406,215 $418,200
Authorized Positions
Elected & Appointed Officials 1.00 1.00 1.00 1.00
Bargaining Unit 1.50 1.50 1.50 1.50
Management & Confidential 1.00 1.00 1.00 1.00
Total Full Time Equivalents 3.50 3.50 3.50 3.50
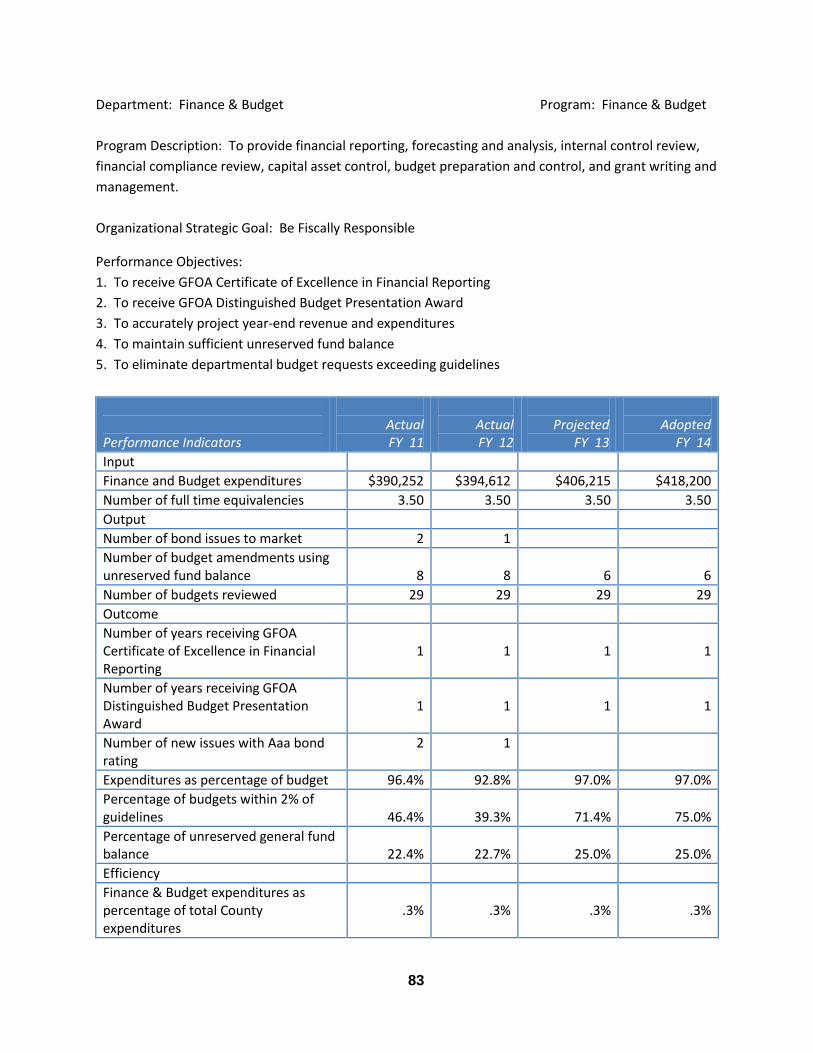
83
Department: Finance & Budget Program: Finance & Budget
Program Description: To provide financial reporting, forecasting and analysis, internal control review,
financial compliance review, capital asset control, budget preparation and control, and grant writing and
management.
Organizational Strategic Goal: Be Fiscally Responsible
Performance Objectives:
1. To receive GFOA Certificate of Excellence in Financial Reporting
2. To receive GFOA Distinguished Budget Presentation Award
3. To accurately project year-end revenue and expenditures
4. To maintain sufficient unreserved fund balance
5. To eliminate departmental budget requests exceeding guidelines
Performance Indicators
Actual FY 11
Actual FY 12
Projected
FY 13
Adopted
FY 14
Input
Finance and Budget expenditures $390,252 $394,612 $406,215 $418,200
Number of full time equivalencies 3.50 3.50 3.50 3.50
Output
Number of bond issues to market 2 1
Number of budget amendments using unreserved fund balance
8
8
6
6
Number of budgets reviewed 29 29 29 29
Outcome
Number of years receiving GFOA Certificate of Excellence in Financial Reporting
1
1
1
1
Number of years receiving GFOA Distinguished Budget Presentation Award
1
1
1
1
Number of new issues with Aaa bond rating
2 1
Expenditures as percentage of budget 96.4% 92.8% 97.0% 97.0%
Percentage of budgets within 2% of guidelines
46.4%
39.3%
71.4%
75.0%
Percentage of unreserved general fund balance
22.4%
22.7%
25.0%
25.0%
Efficiency
Finance & Budget expenditures as percentage of total County expenditures
.3%
.3%
.3%
.3%
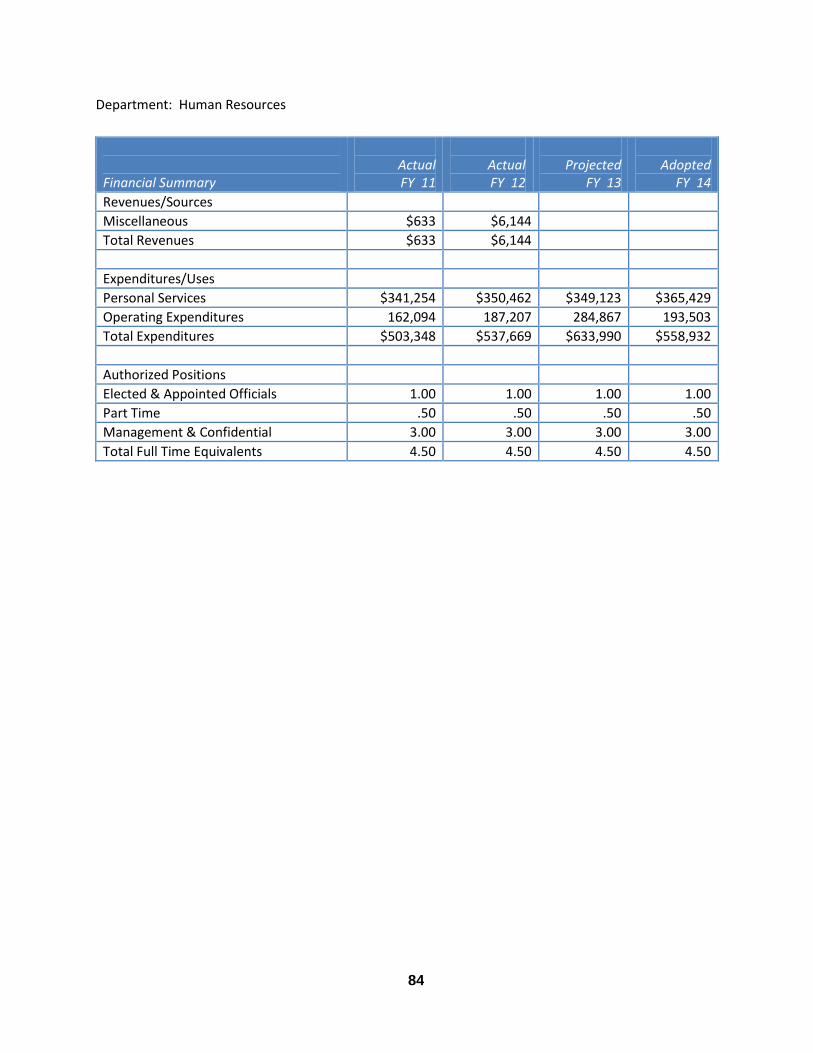
84
Department: Human Resources
Financial Summary
Actual FY 11
Actual FY 12
Projected
FY 13
Adopted
FY 14
Revenues/Sources
Miscellaneous $633 $6,144
Total Revenues $633 $6,144
Expenditures/Uses
Personal Services $341,254 $350,462 $349,123 $365,429
Operating Expenditures 162,094 187,207 284,867 193,503
Total Expenditures $503,348 $537,669 $633,990 $558,932
Authorized Positions
Elected & Appointed Officials 1.00 1.00 1.00 1.00
Part Time .50 .50 .50 .50
Management & Confidential 3.00 3.00 3.00 3.00
Total Full Time Equivalents 4.50 4.50 4.50 4.50
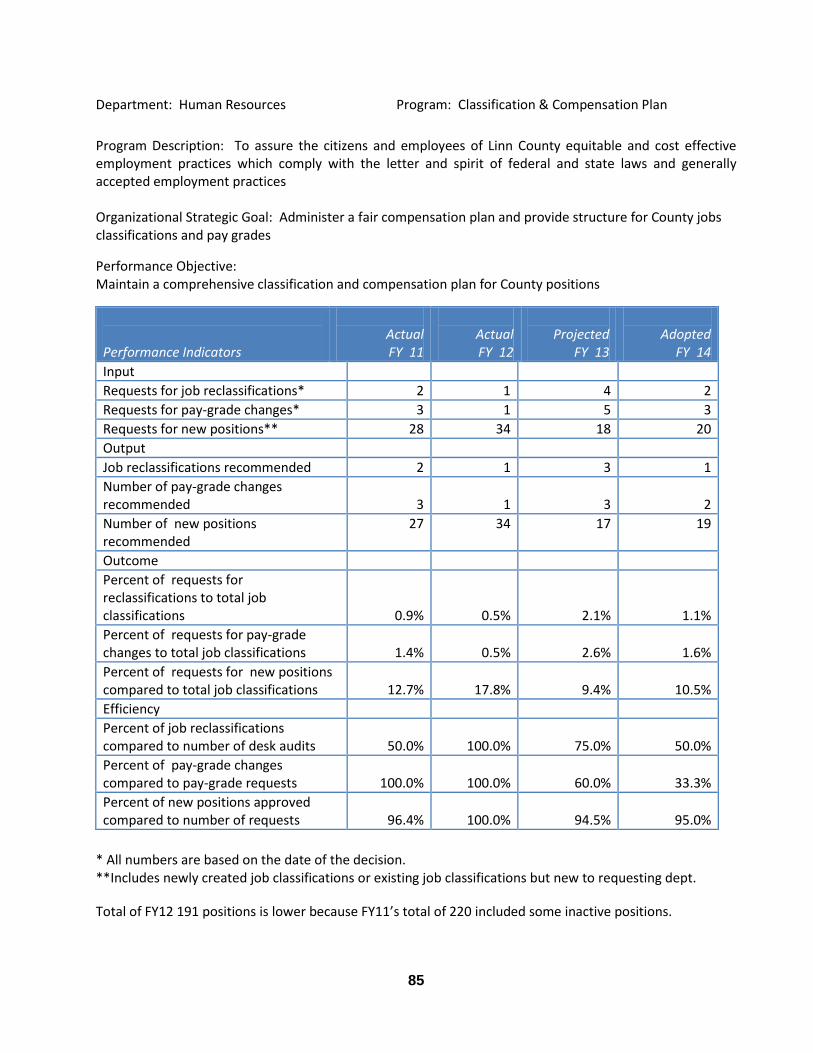
85
Department: Human Resources Program: Classification & Compensation Plan
Program Description: To assure the citizens and employees of Linn County equitable and cost effective employment practices which comply with the letter and spirit of federal and state laws and generally accepted employment practices Organizational Strategic Goal: Administer a fair compensation plan and provide structure for County jobs classifications and pay grades
Performance Objective: Maintain a comprehensive classification and compensation plan for County positions
Performance Indicators
Actual FY 11
Actual FY 12
Projected
FY 13
Adopted
FY 14
Input
Requests for job reclassifications* 2 1 4 2
Requests for pay-grade changes* 3 1 5 3
Requests for new positions** 28 34 18 20
Output
Job reclassifications recommended 2 1 3 1
Number of pay-grade changes recommended
3
1
3
2
Number of new positions recommended
27 34 17 19
Outcome
Percent of requests for reclassifications to total job classifications
0.9%
0.5%
2.1%
1.1%
Percent of requests for pay-grade changes to total job classifications
1.4%
0.5%
2.6%
1.6%
Percent of requests for new positions compared to total job classifications
12.7%
17.8%
9.4%
10.5%
Efficiency
Percent of job reclassifications compared to number of desk audits
50.0%
100.0%
75.0%
50.0%
Percent of pay-grade changes compared to pay-grade requests
100.0%
100.0%
60.0%
33.3%
Percent of new positions approved compared to number of requests
96.4%
100.0%
94.5%
95.0%
* All numbers are based on the date of the decision. **Includes newly created job classifications or existing job classifications but new to requesting dept.
Total of FY12 191 positions is lower because FY11’s total of 220 included some inactive positions.
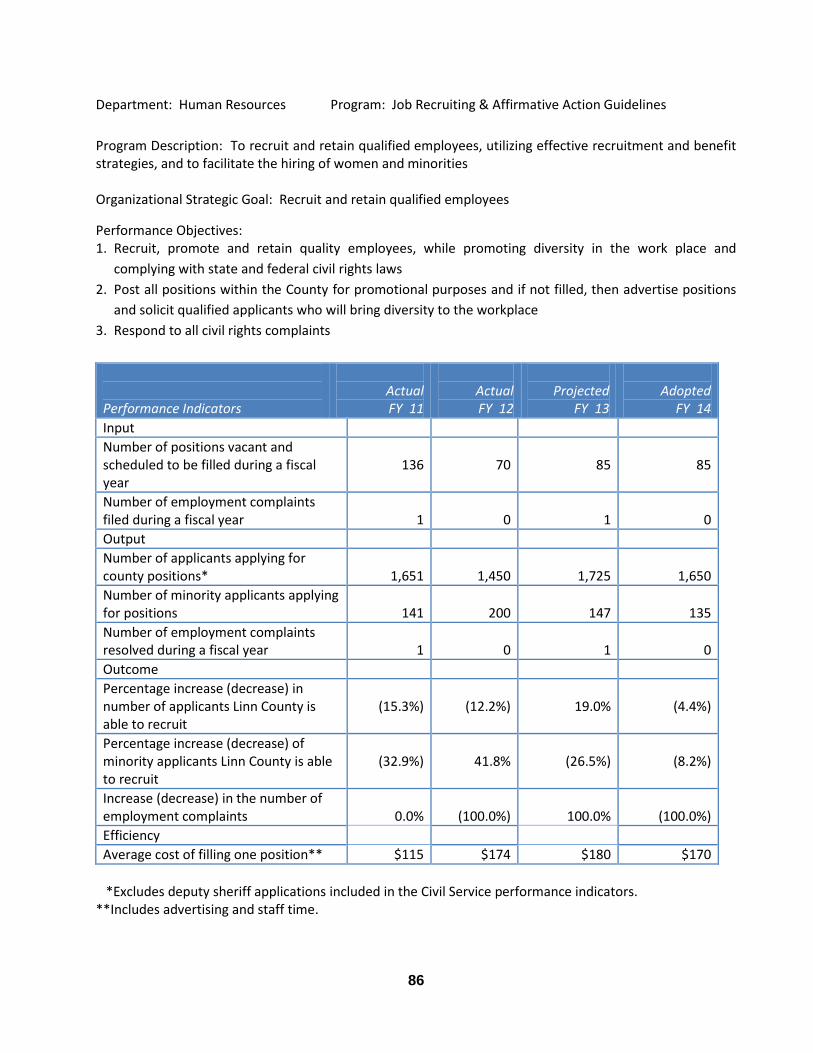
86
Department: Human Resources Program: Job Recruiting & Affirmative Action Guidelines
Program Description: To recruit and retain qualified employees, utilizing effective recruitment and benefit strategies, and to facilitate the hiring of women and minorities Organizational Strategic Goal: Recruit and retain qualified employees
Performance Objectives: 1. Recruit, promote and retain quality employees, while promoting diversity in the work place and
complying with state and federal civil rights laws
2. Post all positions within the County for promotional purposes and if not filled, then advertise positions
and solicit qualified applicants who will bring diversity to the workplace
3. Respond to all civil rights complaints
Performance Indicators
Actual FY 11
Actual FY 12
Projected
FY 13
Adopted
FY 14
Input
Number of positions vacant and scheduled to be filled during a fiscal year
136
70
85
85
Number of employment complaints filed during a fiscal year
1
0
1
0
Output
Number of applicants applying for county positions*
1,651
1,450
1,725
1,650
Number of minority applicants applying for positions
141
200
147
135
Number of employment complaints resolved during a fiscal year
1
0
1
0
Outcome
Percentage increase (decrease) in number of applicants Linn County is able to recruit
(15.3%)
(12.2%)
19.0%
(4.4%)
Percentage increase (decrease) of minority applicants Linn County is able to recruit
(32.9%)
41.8%
(26.5%)
(8.2%)
Increase (decrease) in the number of employment complaints
0.0%
(100.0%)
100.0%
(100.0%)
Efficiency
Average cost of filling one position** $115 $174 $180 $170
*Excludes deputy sheriff applications included in the Civil Service performance indicators. **Includes advertising and staff time.
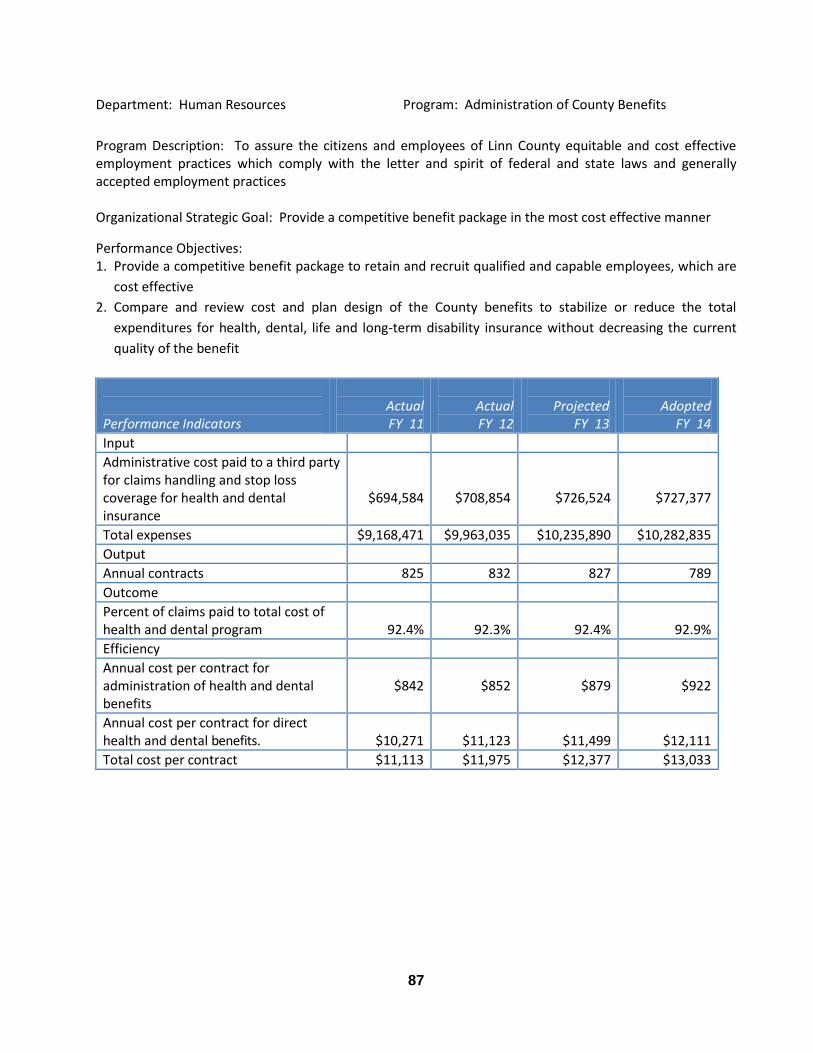
87
Department: Human Resources Program: Administration of County Benefits
Program Description: To assure the citizens and employees of Linn County equitable and cost effective employment practices which comply with the letter and spirit of federal and state laws and generally accepted employment practices Organizational Strategic Goal: Provide a competitive benefit package in the most cost effective manner
Performance Objectives: 1. Provide a competitive benefit package to retain and recruit qualified and capable employees, which are
cost effective
2. Compare and review cost and plan design of the County benefits to stabilize or reduce the total
expenditures for health, dental, life and long-term disability insurance without decreasing the current
quality of the benefit
Performance Indicators
Actual FY 11
Actual FY 12
Projected
FY 13
Adopted
FY 14
Input
Administrative cost paid to a third party for claims handling and stop loss coverage for health and dental insurance
$694,584
$708,854
$726,524
$727,377
Total expenses $9,168,471 $9,963,035 $10,235,890 $10,282,835
Output
Annual contracts 825 832 827 789
Outcome
Percent of claims paid to total cost of health and dental program
92.4%
92.3%
92.4%
92.9%
Efficiency
Annual cost per contract for administration of health and dental benefits
$842
$852
$879
$922
Annual cost per contract for direct health and dental benefits.
$10,271
$11,123
$11,499
$12,111
Total cost per contract $11,113 $11,975 $12,377 $13,033
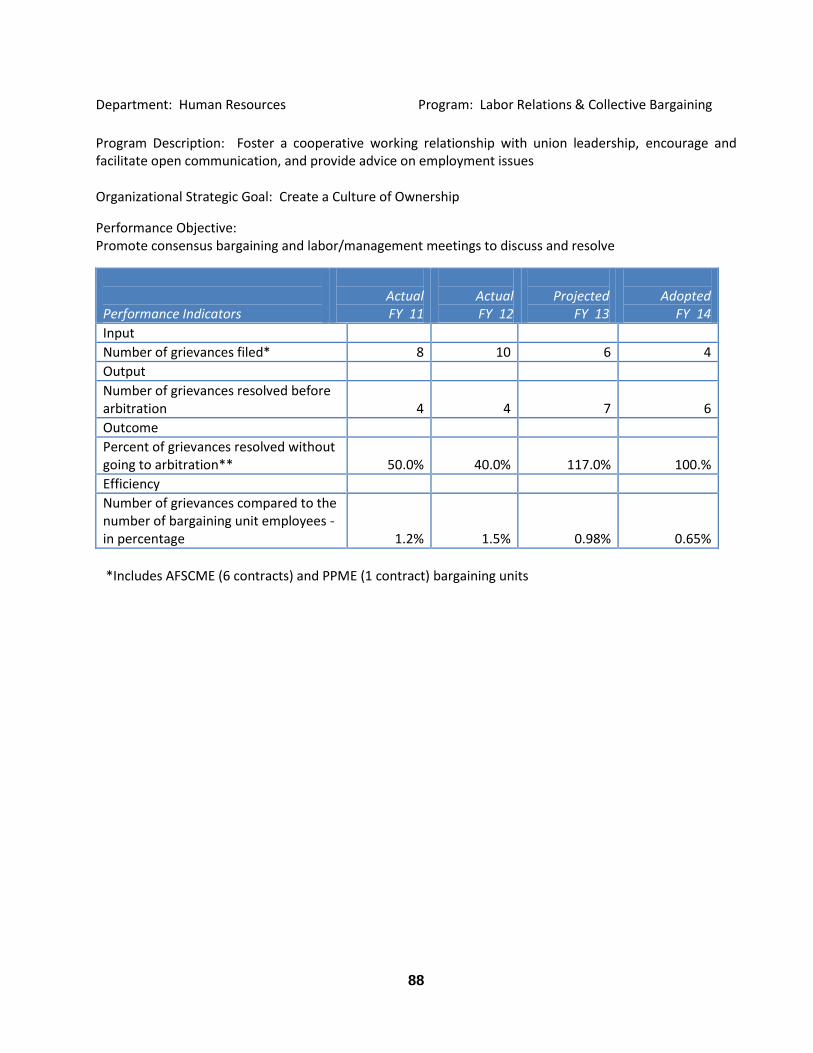
88
Department: Human Resources Program: Labor Relations & Collective Bargaining
Program Description: Foster a cooperative working relationship with union leadership, encourage and facilitate open communication, and provide advice on employment issues Organizational Strategic Goal: Create a Culture of Ownership
Performance Objective: Promote consensus bargaining and labor/management meetings to discuss and resolve
Performance Indicators
Actual FY 11
Actual FY 12
Projected
FY 13
Adopted
FY 14
Input
Number of grievances filed* 8 10 6 4
Output
Number of grievances resolved before arbitration
4
4
7
6
Outcome
Percent of grievances resolved without going to arbitration**
50.0%
40.0%
117.0%
100.%
Efficiency
Number of grievances compared to the number of bargaining unit employees - in percentage
1.2%
1.5%
0.98%
0.65%
*Includes AFSCME (6 contracts) and PPME (1 contract) bargaining units
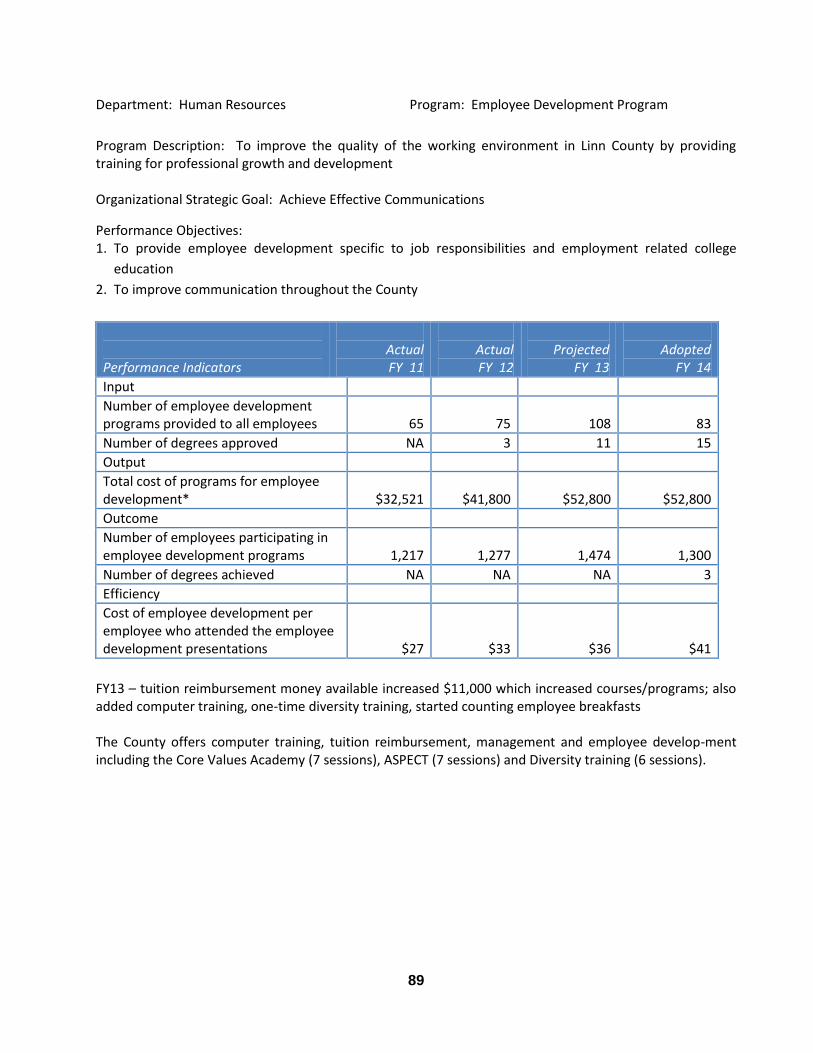
89
Department: Human Resources Program: Employee Development Program
Program Description: To improve the quality of the working environment in Linn County by providing training for professional growth and development Organizational Strategic Goal: Achieve Effective Communications
Performance Objectives: 1. To provide employee development specific to job responsibilities and employment related college
education
2. To improve communication throughout the County
Performance Indicators
Actual FY 11
Actual FY 12
Projected
FY 13
Adopted
FY 14
Input
Number of employee development programs provided to all employees
65
75
108
83
Number of degrees approved NA 3 11 15
Output
Total cost of programs for employee development*
$32,521
$41,800
$52,800
$52,800
Outcome
Number of employees participating in employee development programs
1,217
1,277
1,474
1,300
Number of degrees achieved NA NA NA 3
Efficiency
Cost of employee development per employee who attended the employee development presentations
$27
$33
$36
$41
FY13 – tuition reimbursement money available increased $11,000 which increased courses/programs; also added computer training, one-time diversity training, started counting employee breakfasts The County offers computer training, tuition reimbursement, management and employee develop-ment including the Core Values Academy (7 sessions), ASPECT (7 sessions) and Diversity training (6 sessions).
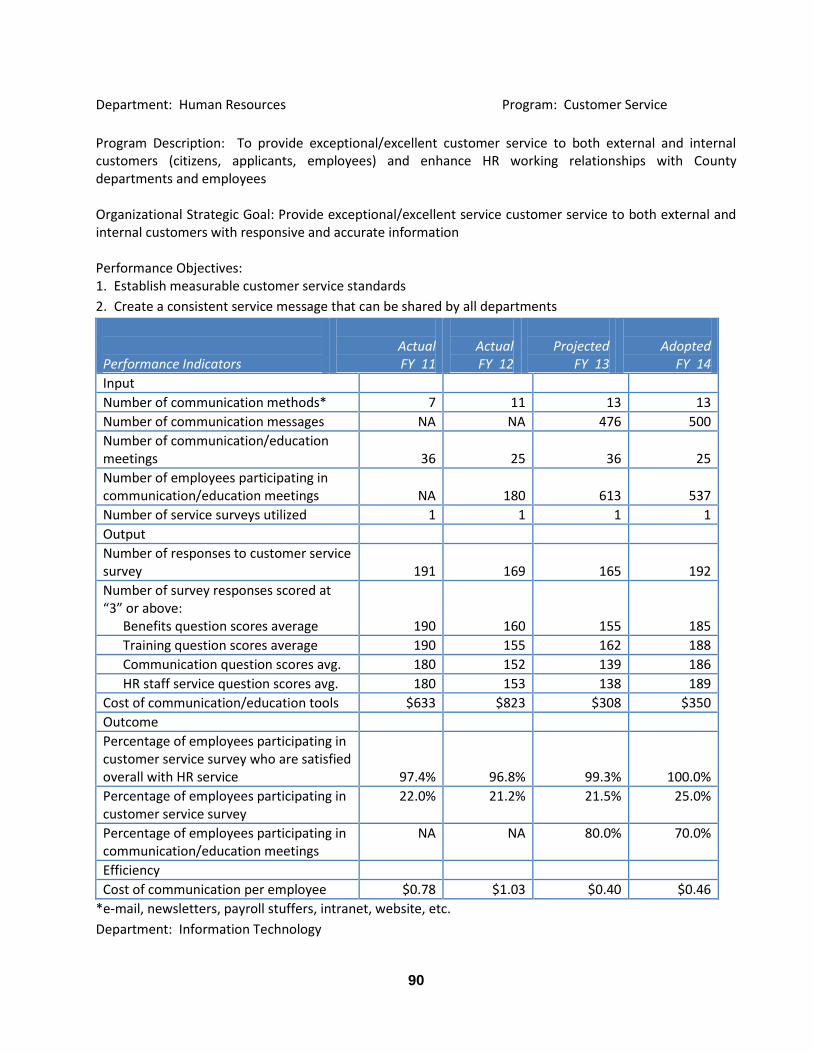
90
Department: Human Resources Program: Customer Service
Program Description: To provide exceptional/excellent customer service to both external and internal customers (citizens, applicants, employees) and enhance HR working relationships with County departments and employees Organizational Strategic Goal: Provide exceptional/excellent service customer service to both external and internal customers with responsive and accurate information Performance Objectives: 1. Establish measurable customer service standards
2. Create a consistent service message that can be shared by all departments
Performance Indicators
Actual FY 11
Actual FY 12
Projected
FY 13
Adopted
FY 14
Input
Number of communication methods* 7 11 13 13
Number of communication messages NA NA 476 500
Number of communication/education meetings
36
25
36
25
Number of employees participating in communication/education meetings
NA
180
613
537
Number of service surveys utilized 1 1 1 1
Output
Number of responses to customer service survey
191
169
165
192
Number of survey responses scored at “3” or above: Benefits question scores average
190
160
155
185
Training question scores average 190 155 162 188
Communication question scores avg. 180 152 139 186
HR staff service question scores avg. 180 153 138 189
Cost of communication/education tools $633 $823 $308 $350
Outcome
Percentage of employees participating in customer service survey who are satisfied overall with HR service
97.4%
96.8%
99.3%
100.0%
Percentage of employees participating in customer service survey
22.0% 21.2% 21.5% 25.0%
Percentage of employees participating in communication/education meetings
NA NA 80.0% 70.0%
Efficiency
Cost of communication per employee $0.78 $1.03 $0.40 $0.46
*e-mail, newsletters, payroll stuffers, intranet, website, etc.
Department: Information Technology
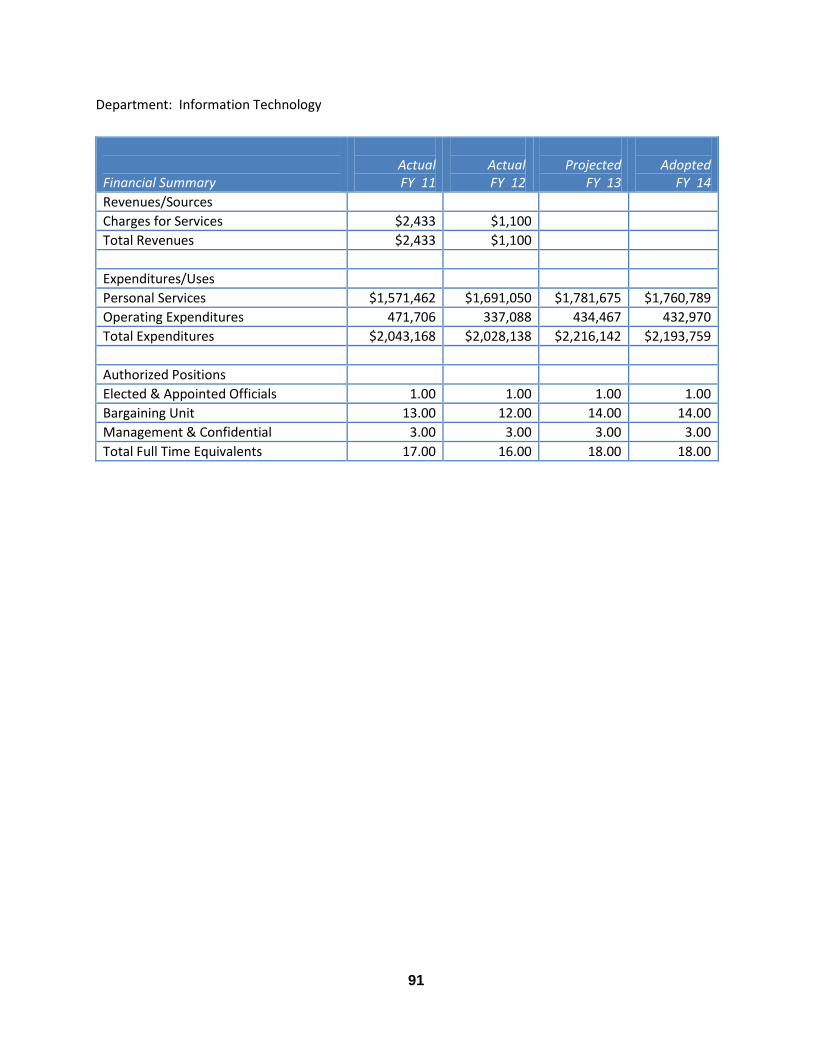
91
Department: Information Technology
Financial Summary
Actual FY 11
Actual FY 12
Projected
FY 13
Adopted
FY 14
Revenues/Sources
Charges for Services $2,433 $1,100
Total Revenues $2,433 $1,100
Expenditures/Uses
Personal Services $1,571,462 $1,691,050 $1,781,675 $1,760,789
Operating Expenditures 471,706 337,088 434,467 432,970
Total Expenditures $2,043,168 $2,028,138 $2,216,142 $2,193,759
Authorized Positions
Elected & Appointed Officials 1.00 1.00 1.00 1.00
Bargaining Unit 13.00 12.00 14.00 14.00
Management & Confidential 3.00 3.00 3.00 3.00
Total Full Time Equivalents 17.00 16.00 18.00 18.00
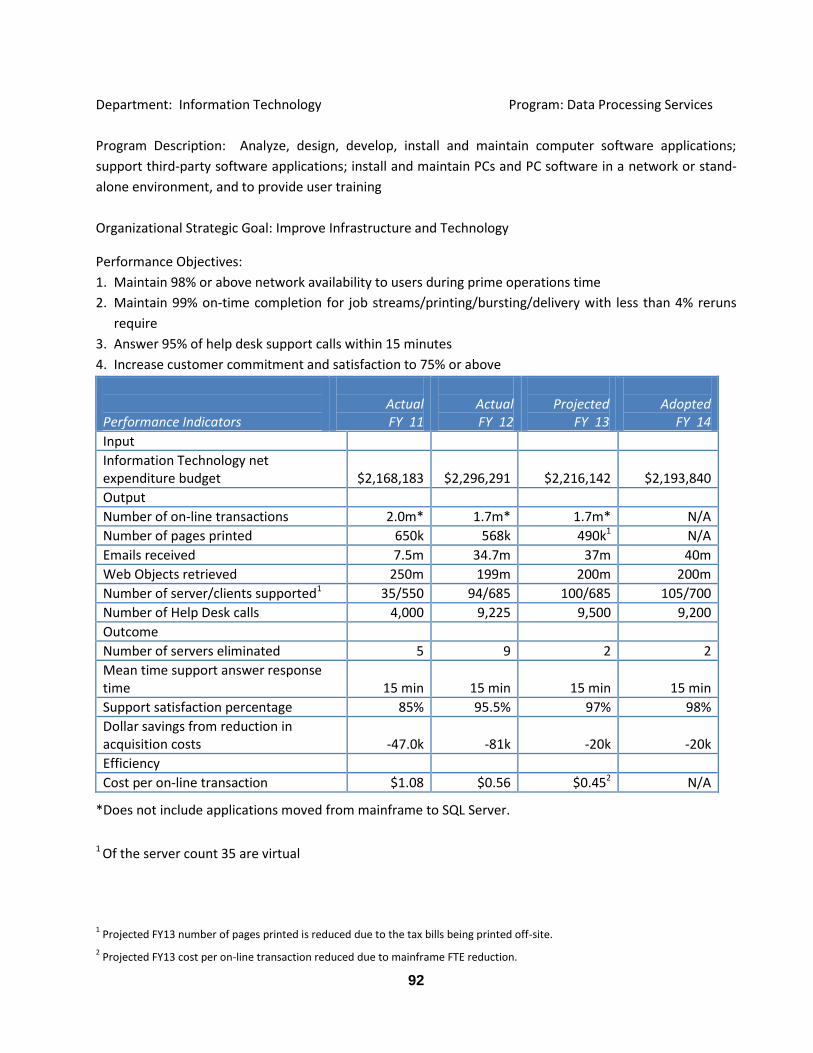
92
Department: Information Technology Program: Data Processing Services
Program Description: Analyze, design, develop, install and maintain computer software applications;
support third-party software applications; install and maintain PCs and PC software in a network or stand-
alone environment, and to provide user training
Organizational Strategic Goal: Improve Infrastructure and Technology
Performance Objectives:
1. Maintain 98% or above network availability to users during prime operations time
2. Maintain 99% on-time completion for job streams/printing/bursting/delivery with less than 4% reruns
require
3. Answer 95% of help desk support calls within 15 minutes
4. Increase customer commitment and satisfaction to 75% or above
Performance Indicators
Actual FY 11
Actual FY 12
Projected
FY 13
Adopted
FY 14
Input
Information Technology net expenditure budget
$2,168,183
$2,296,291
$2,216,142
$2,193,840
Output
Number of on-line transactions 2.0m* 1.7m* 1.7m* N/A
Number of pages printed 650k 568k 490k1 N/A
Emails received 7.5m 34.7m 37m 40m
Web Objects retrieved 250m 199m 200m 200m
Number of server/clients supported1 35/550 94/685 100/685 105/700
Number of Help Desk calls 4,000 9,225 9,500 9,200
Outcome
Number of servers eliminated 5 9 2 2
Mean time support answer response time
15 min
15 min
15 min
15 min
Support satisfaction percentage 85% 95.5% 97% 98%
Dollar savings from reduction in acquisition costs
-47.0k
-81k
-20k
-20k
Efficiency
Cost per on-line transaction $1.08 $0.56 $0.452 N/A
*Does not include applications moved from mainframe to SQL Server.
1 Of the server count 35 are virtual
1 Projected FY13 number of pages printed is reduced due to the tax bills being printed off-site.
2 Projected FY13 cost per on-line transaction reduced due to mainframe FTE reduction.
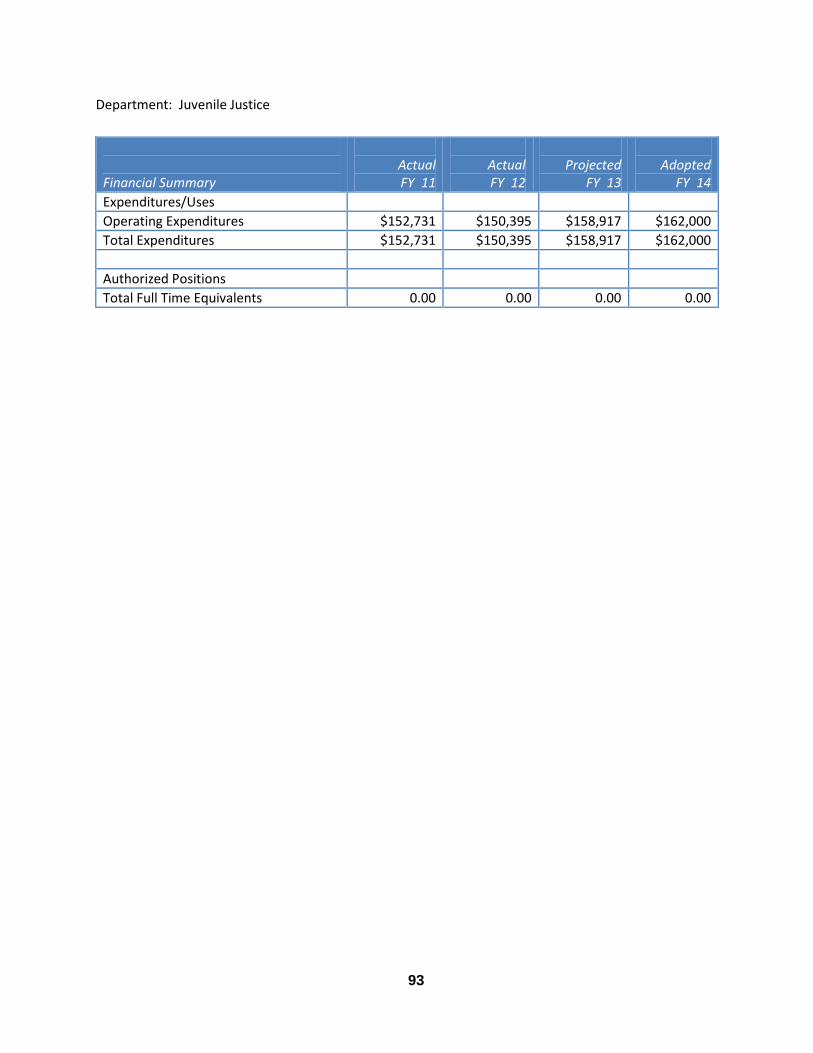
93
Department: Juvenile Justice
Financial Summary
Actual FY 11
Actual FY 12
Projected
FY 13
Adopted
FY 14
Expenditures/Uses
Operating Expenditures $152,731 $150,395 $158,917 $162,000
Total Expenditures $152,731 $150,395 $158,917 $162,000
Authorized Positions
Total Full Time Equivalents 0.00 0.00 0.00 0.00
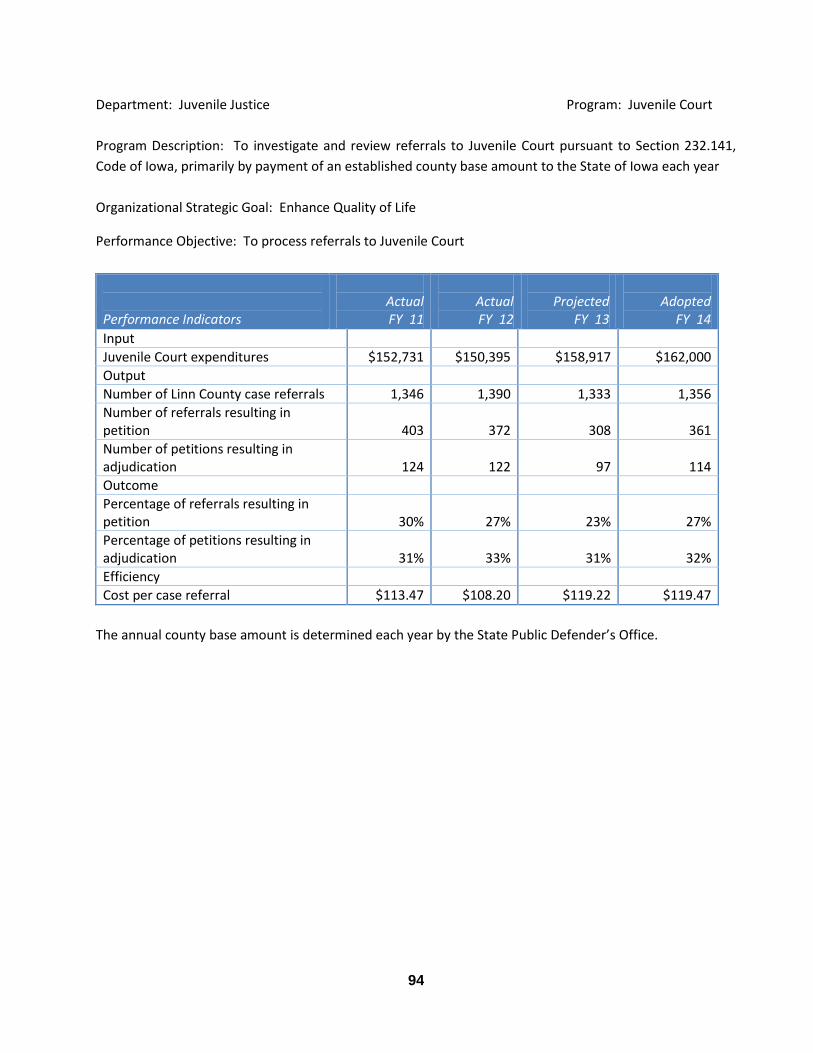
94
Department: Juvenile Justice Program: Juvenile Court
Program Description: To investigate and review referrals to Juvenile Court pursuant to Section 232.141,
Code of Iowa, primarily by payment of an established county base amount to the State of Iowa each year
Organizational Strategic Goal: Enhance Quality of Life
Performance Objective: To process referrals to Juvenile Court
Performance Indicators
Actual FY 11
Actual FY 12
Projected
FY 13
Adopted
FY 14
Input
Juvenile Court expenditures $152,731 $150,395 $158,917 $162,000
Output
Number of Linn County case referrals 1,346 1,390 1,333 1,356
Number of referrals resulting in petition 403 372 308 361
Number of petitions resulting in adjudication 124 122 97 114
Outcome
Percentage of referrals resulting in petition 30% 27% 23% 27%
Percentage of petitions resulting in adjudication 31% 33% 31% 32%
Efficiency
Cost per case referral $113.47 $108.20 $119.22 $119.47
The annual county base amount is determined each year by the State Public Defender’s Office.
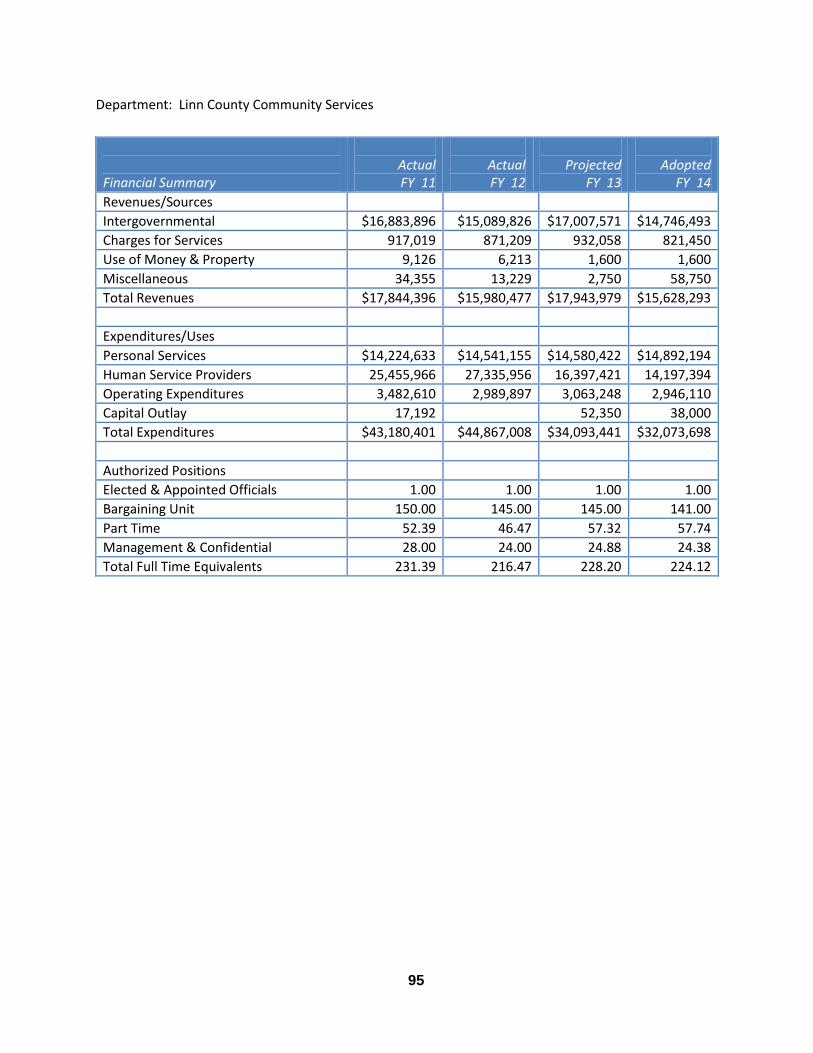
95
Department: Linn County Community Services
Financial Summary
Actual FY 11
Actual FY 12
Projected
FY 13
Adopted
FY 14
Revenues/Sources
Intergovernmental $16,883,896 $15,089,826 $17,007,571 $14,746,493
Charges for Services 917,019 871,209 932,058 821,450
Use of Money & Property 9,126 6,213 1,600 1,600
Miscellaneous 34,355 13,229 2,750 58,750
Total Revenues $17,844,396 $15,980,477 $17,943,979 $15,628,293
Expenditures/Uses
Personal Services $14,224,633 $14,541,155 $14,580,422 $14,892,194
Human Service Providers 25,455,966 27,335,956 16,397,421 14,197,394
Operating Expenditures 3,482,610 2,989,897 3,063,248 2,946,110
Capital Outlay 17,192 52,350 38,000
Total Expenditures $43,180,401 $44,867,008 $34,093,441 $32,073,698
Authorized Positions
Elected & Appointed Officials 1.00 1.00 1.00 1.00
Bargaining Unit 150.00 145.00 145.00 141.00
Part Time 52.39 46.47 57.32 57.74
Management & Confidential 28.00 24.00 24.88 24.38
Total Full Time Equivalents 231.39 216.47 228.20 224.12
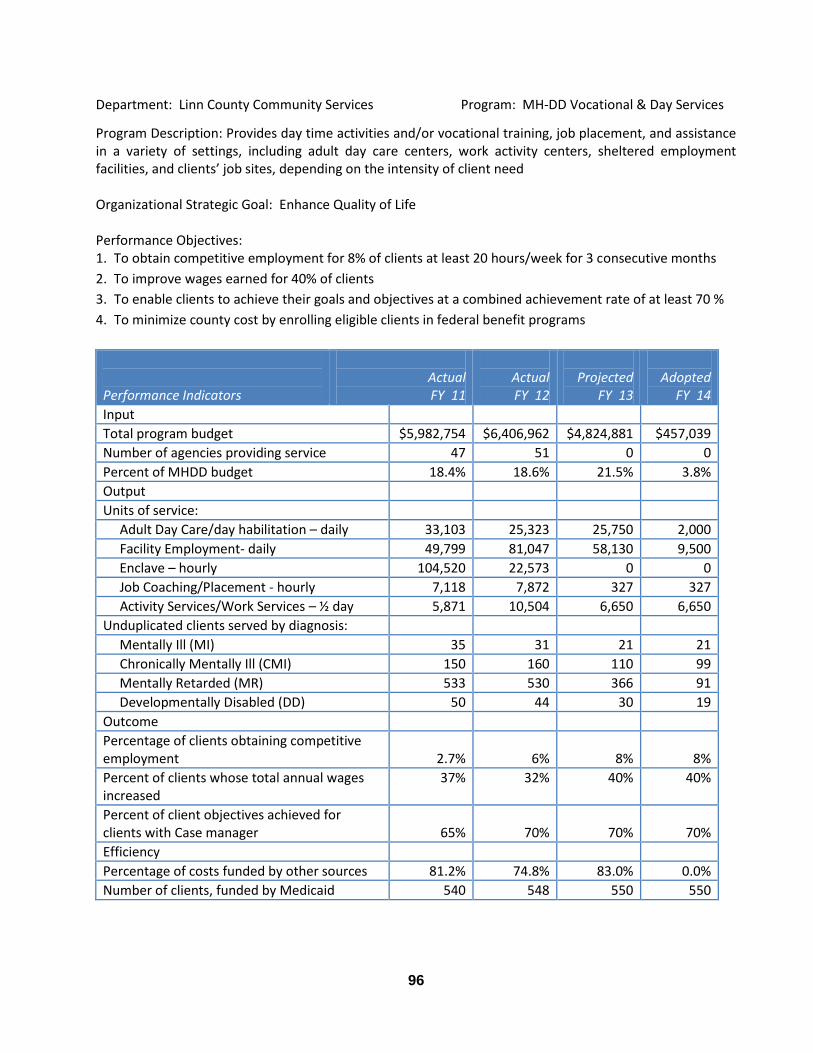
96
Department: Linn County Community Services Program: MH-DD Vocational & Day Services
Program Description: Provides day time activities and/or vocational training, job placement, and assistance in a variety of settings, including adult day care centers, work activity centers, sheltered employment facilities, and clients’ job sites, depending on the intensity of client need Organizational Strategic Goal: Enhance Quality of Life Performance Objectives: 1. To obtain competitive employment for 8% of clients at least 20 hours/week for 3 consecutive months
2. To improve wages earned for 40% of clients
3. To enable clients to achieve their goals and objectives at a combined achievement rate of at least 70 %
4. To minimize county cost by enrolling eligible clients in federal benefit programs
Performance Indicators
Actual FY 11
Actual FY 12
Projected
FY 13
Adopted
FY 14
Input
Total program budget $5,982,754 $6,406,962 $4,824,881 $457,039
Number of agencies providing service 47 51 0 0
Percent of MHDD budget 18.4% 18.6% 21.5% 3.8%
Output
Units of service:
Adult Day Care/day habilitation – daily 33,103 25,323 25,750 2,000
Facility Employment- daily 49,799 81,047 58,130 9,500
Enclave – hourly 104,520 22,573 0 0
Job Coaching/Placement - hourly 7,118 7,872 327 327
Activity Services/Work Services – ½ day 5,871 10,504 6,650 6,650
Unduplicated clients served by diagnosis:
Mentally Ill (MI) 35 31 21 21
Chronically Mentally Ill (CMI) 150 160 110 99
Mentally Retarded (MR) 533 530 366 91
Developmentally Disabled (DD) 50 44 30 19
Outcome
Percentage of clients obtaining competitive employment
2.7%
6%
8%
8%
Percent of clients whose total annual wages increased
37% 32% 40% 40%
Percent of client objectives achieved for clients with Case manager
65%
70%
70%
70%
Efficiency
Percentage of costs funded by other sources 81.2% 74.8% 83.0% 0.0%
Number of clients, funded by Medicaid 540 548 550 550
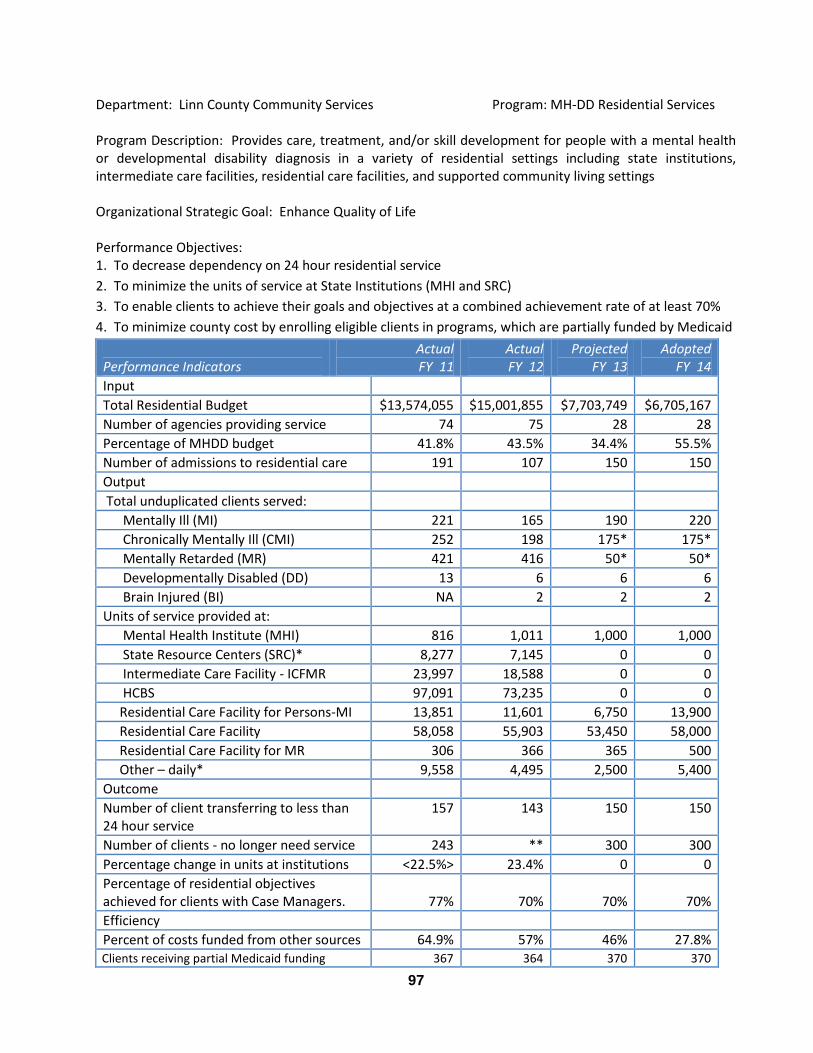
97
Department: Linn County Community Services Program: MH-DD Residential Services Program Description: Provides care, treatment, and/or skill development for people with a mental health or developmental disability diagnosis in a variety of residential settings including state institutions, intermediate care facilities, residential care facilities, and supported community living settings Organizational Strategic Goal: Enhance Quality of Life Performance Objectives: 1. To decrease dependency on 24 hour residential service
2. To minimize the units of service at State Institutions (MHI and SRC)
3. To enable clients to achieve their goals and objectives at a combined achievement rate of at least 70%
4. To minimize county cost by enrolling eligible clients in programs, which are partially funded by Medicaid
Performance Indicators
Actual FY 11
Actual FY 12
Projected FY 13
Adopted FY 14
Input
Total Residential Budget $13,574,055 $15,001,855 $7,703,749 $6,705,167
Number of agencies providing service 74 75 28 28
Percentage of MHDD budget 41.8% 43.5% 34.4% 55.5%
Number of admissions to residential care 191 107 150 150
Output
Total unduplicated clients served:
Mentally Ill (MI) 221 165 190 220
Chronically Mentally Ill (CMI) 252 198 175* 175*
Mentally Retarded (MR) 421 416 50* 50*
Developmentally Disabled (DD) 13 6 6 6
Brain Injured (BI) NA 2 2 2
Units of service provided at:
Mental Health Institute (MHI) 816 1,011 1,000 1,000
State Resource Centers (SRC)* 8,277 7,145 0 0
Intermediate Care Facility - ICFMR 23,997 18,588 0 0
HCBS 97,091 73,235 0 0
Residential Care Facility for Persons-MI 13,851 11,601 6,750 13,900
Residential Care Facility 58,058 55,903 53,450 58,000
Residential Care Facility for MR 306 366 365 500
Other – daily* 9,558 4,495 2,500 5,400
Outcome
Number of client transferring to less than 24 hour service
157 143 150 150
Number of clients - no longer need service 243 ** 300 300
Percentage change in units at institutions <22.5%> 23.4% 0 0
Percentage of residential objectives achieved for clients with Case Managers.
77%
70%
70%
70%
Efficiency
Percent of costs funded from other sources 64.9% 57% 46% 27.8% Clients receiving partial Medicaid funding 367 364 370 370
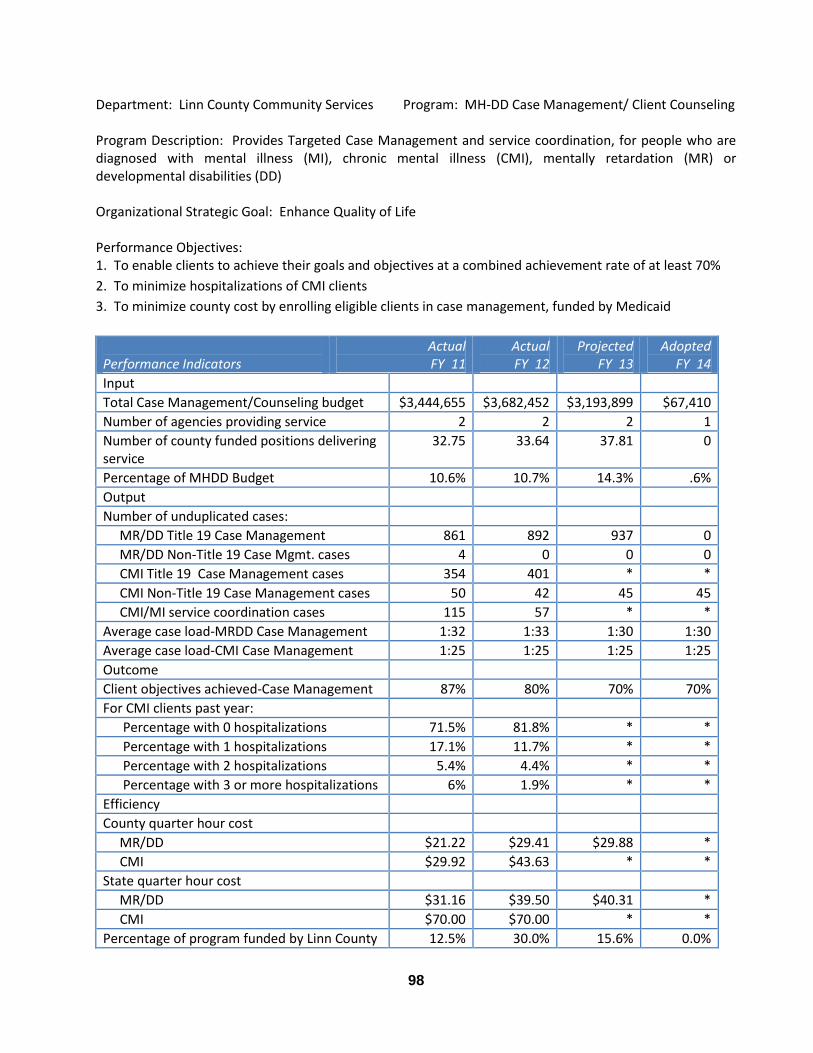
98
Department: Linn County Community Services Program: MH-DD Case Management/ Client Counseling Program Description: Provides Targeted Case Management and service coordination, for people who are diagnosed with mental illness (MI), chronic mental illness (CMI), mentally retardation (MR) or developmental disabilities (DD) Organizational Strategic Goal: Enhance Quality of Life Performance Objectives: 1. To enable clients to achieve their goals and objectives at a combined achievement rate of at least 70%
2. To minimize hospitalizations of CMI clients
3. To minimize county cost by enrolling eligible clients in case management, funded by Medicaid
Performance Indicators
Actual FY 11
Actual FY 12
Projected FY 13
Adopted FY 14
Input
Total Case Management/Counseling budget $3,444,655 $3,682,452 $3,193,899 $67,410
Number of agencies providing service 2 2 2 1
Number of county funded positions delivering service
32.75 33.64 37.81 0
Percentage of MHDD Budget 10.6% 10.7% 14.3% .6%
Output
Number of unduplicated cases:
MR/DD Title 19 Case Management 861 892 937 0
MR/DD Non-Title 19 Case Mgmt. cases 4 0 0 0
CMI Title 19 Case Management cases 354 401 * *
CMI Non-Title 19 Case Management cases 50 42 45 45
CMI/MI service coordination cases 115 57 * *
Average case load-MRDD Case Management 1:32 1:33 1:30 1:30
Average case load-CMI Case Management 1:25 1:25 1:25 1:25
Outcome
Client objectives achieved-Case Management 87% 80% 70% 70%
For CMI clients past year:
Percentage with 0 hospitalizations 71.5% 81.8% * *
Percentage with 1 hospitalizations 17.1% 11.7% * *
Percentage with 2 hospitalizations 5.4% 4.4% * *
Percentage with 3 or more hospitalizations 6% 1.9% * *
Efficiency
County quarter hour cost
MR/DD $21.22 $29.41 $29.88 *
CMI $29.92 $43.63 * *
State quarter hour cost
MR/DD $31.16 $39.50 $40.31 *
CMI $70.00 $70.00 * *
Percentage of program funded by Linn County 12.5% 30.0% 15.6% 0.0%
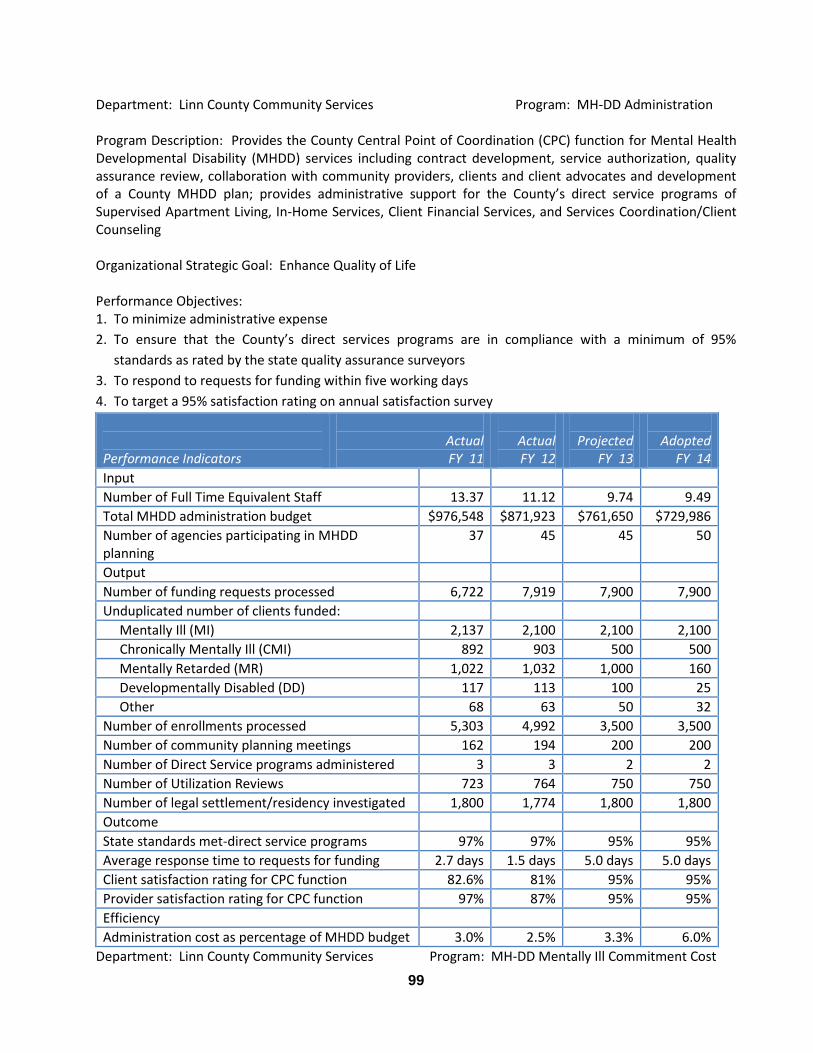
99
Department: Linn County Community Services Program: MH-DD Administration Program Description: Provides the County Central Point of Coordination (CPC) function for Mental Health Developmental Disability (MHDD) services including contract development, service authorization, quality assurance review, collaboration with community providers, clients and client advocates and development of a County MHDD plan; provides administrative support for the County’s direct service programs of Supervised Apartment Living, In-Home Services, Client Financial Services, and Services Coordination/Client Counseling Organizational Strategic Goal: Enhance Quality of Life Performance Objectives: 1. To minimize administrative expense
2. To ensure that the County’s direct services programs are in compliance with a minimum of 95%
standards as rated by the state quality assurance surveyors
3. To respond to requests for funding within five working days
4. To target a 95% satisfaction rating on annual satisfaction survey
Performance Indicators
Actual FY 11
Actual FY 12
Projected
FY 13
Adopted
FY 14
Input
Number of Full Time Equivalent Staff 13.37 11.12 9.74 9.49
Total MHDD administration budget $976,548 $871,923 $761,650 $729,986
Number of agencies participating in MHDD planning
37 45 45 50
Output
Number of funding requests processed 6,722 7,919 7,900 7,900
Unduplicated number of clients funded:
Mentally Ill (MI) 2,137 2,100 2,100 2,100
Chronically Mentally Ill (CMI) 892 903 500 500
Mentally Retarded (MR) 1,022 1,032 1,000 160
Developmentally Disabled (DD) 117 113 100 25
Other 68 63 50 32
Number of enrollments processed 5,303 4,992 3,500 3,500
Number of community planning meetings 162 194 200 200
Number of Direct Service programs administered 3 3 2 2
Number of Utilization Reviews 723 764 750 750
Number of legal settlement/residency investigated 1,800 1,774 1,800 1,800
Outcome
State standards met-direct service programs 97% 97% 95% 95%
Average response time to requests for funding 2.7 days 1.5 days 5.0 days 5.0 days
Client satisfaction rating for CPC function 82.6% 81% 95% 95%
Provider satisfaction rating for CPC function 97% 87% 95% 95%
Efficiency
Administration cost as percentage of MHDD budget 3.0% 2.5% 3.3% 6.0%
Department: Linn County Community Services Program: MH-DD Mentally Ill Commitment Cost
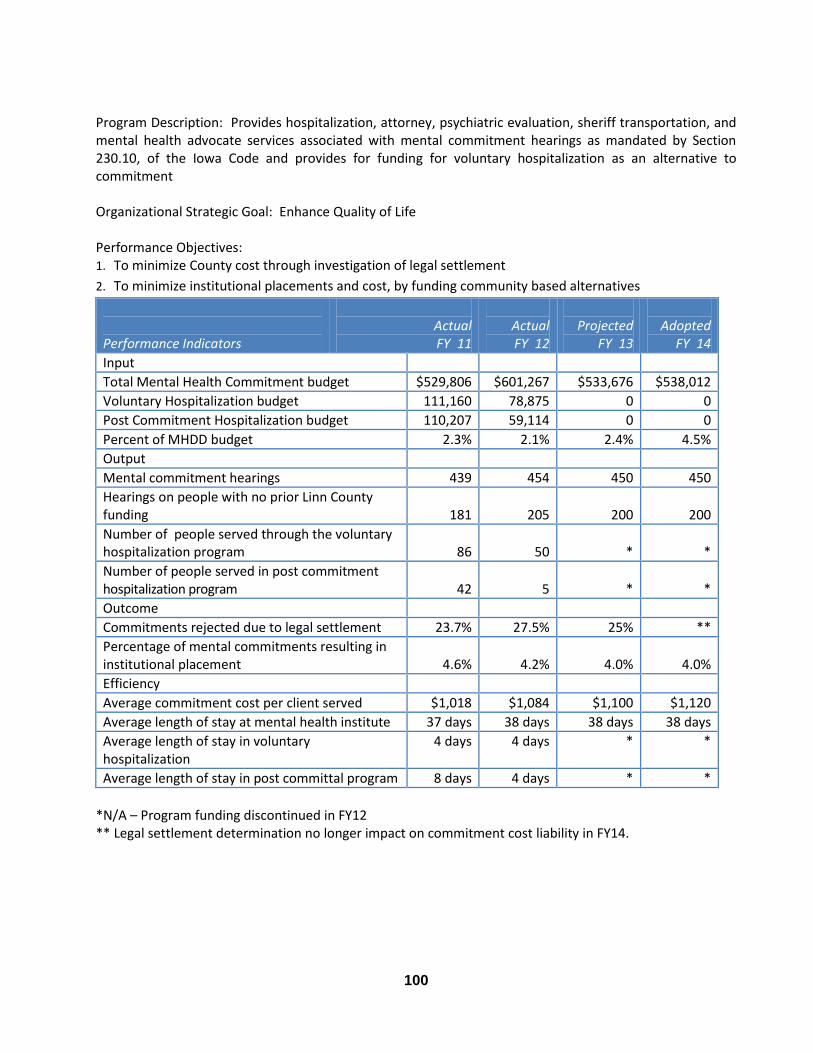
100
Program Description: Provides hospitalization, attorney, psychiatric evaluation, sheriff transportation, and mental health advocate services associated with mental commitment hearings as mandated by Section 230.10, of the Iowa Code and provides for funding for voluntary hospitalization as an alternative to commitment Organizational Strategic Goal: Enhance Quality of Life Performance Objectives: 1. To minimize County cost through investigation of legal settlement
2. To minimize institutional placements and cost, by funding community based alternatives
Performance Indicators
Actual FY 11
Actual FY 12
Projected
FY 13
Adopted
FY 14
Input
Total Mental Health Commitment budget $529,806 $601,267 $533,676 $538,012
Voluntary Hospitalization budget 111,160 78,875 0 0
Post Commitment Hospitalization budget 110,207 59,114 0 0
Percent of MHDD budget 2.3% 2.1% 2.4% 4.5%
Output
Mental commitment hearings 439 454 450 450
Hearings on people with no prior Linn County funding
181
205
200
200
Number of people served through the voluntary hospitalization program
86
50
*
*
Number of people served in post commitment hospitalization program
42
5
*
*
Outcome
Commitments rejected due to legal settlement 23.7% 27.5% 25% **
Percentage of mental commitments resulting in institutional placement
4.6%
4.2%
4.0%
4.0%
Efficiency
Average commitment cost per client served $1,018 $1,084 $1,100 $1,120
Average length of stay at mental health institute 37 days 38 days 38 days 38 days
Average length of stay in voluntary hospitalization
4 days 4 days * *
Average length of stay in post committal program 8 days 4 days * *
*N/A – Program funding discontinued in FY12 ** Legal settlement determination no longer impact on commitment cost liability in FY14.
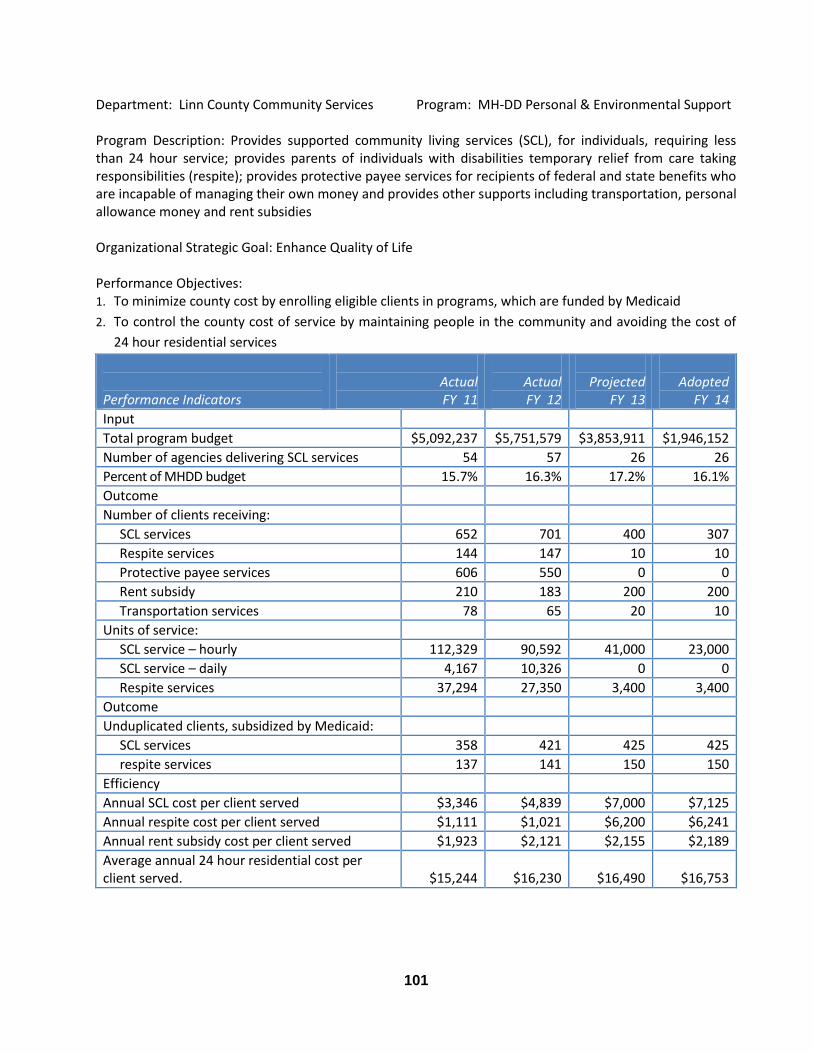
101
Department: Linn County Community Services Program: MH-DD Personal & Environmental Support Program Description: Provides supported community living services (SCL), for individuals, requiring less than 24 hour service; provides parents of individuals with disabilities temporary relief from care taking responsibilities (respite); provides protective payee services for recipients of federal and state benefits who are incapable of managing their own money and provides other supports including transportation, personal allowance money and rent subsidies Organizational Strategic Goal: Enhance Quality of Life Performance Objectives: 1. To minimize county cost by enrolling eligible clients in programs, which are funded by Medicaid
2. To control the county cost of service by maintaining people in the community and avoiding the cost of
24 hour residential services
Performance Indicators
Actual FY 11
Actual FY 12
Projected
FY 13
Adopted
FY 14
Input
Total program budget $5,092,237 $5,751,579 $3,853,911 $1,946,152
Number of agencies delivering SCL services 54 57 26 26
Percent of MHDD budget 15.7% 16.3% 17.2% 16.1%
Outcome
Number of clients receiving:
SCL services 652 701 400 307
Respite services 144 147 10 10
Protective payee services 606 550 0 0
Rent subsidy 210 183 200 200
Transportation services 78 65 20 10
Units of service:
SCL service – hourly 112,329 90,592 41,000 23,000
SCL service – daily 4,167 10,326 0 0
Respite services 37,294 27,350 3,400 3,400
Outcome
Unduplicated clients, subsidized by Medicaid:
SCL services 358 421 425 425
respite services 137 141 150 150
Efficiency
Annual SCL cost per client served $3,346 $4,839 $7,000 $7,125
Annual respite cost per client served $1,111 $1,021 $6,200 $6,241
Annual rent subsidy cost per client served $1,923 $2,121 $2,155 $2,189
Average annual 24 hour residential cost per client served.
$15,244
$16,230
$16,490
$16,753
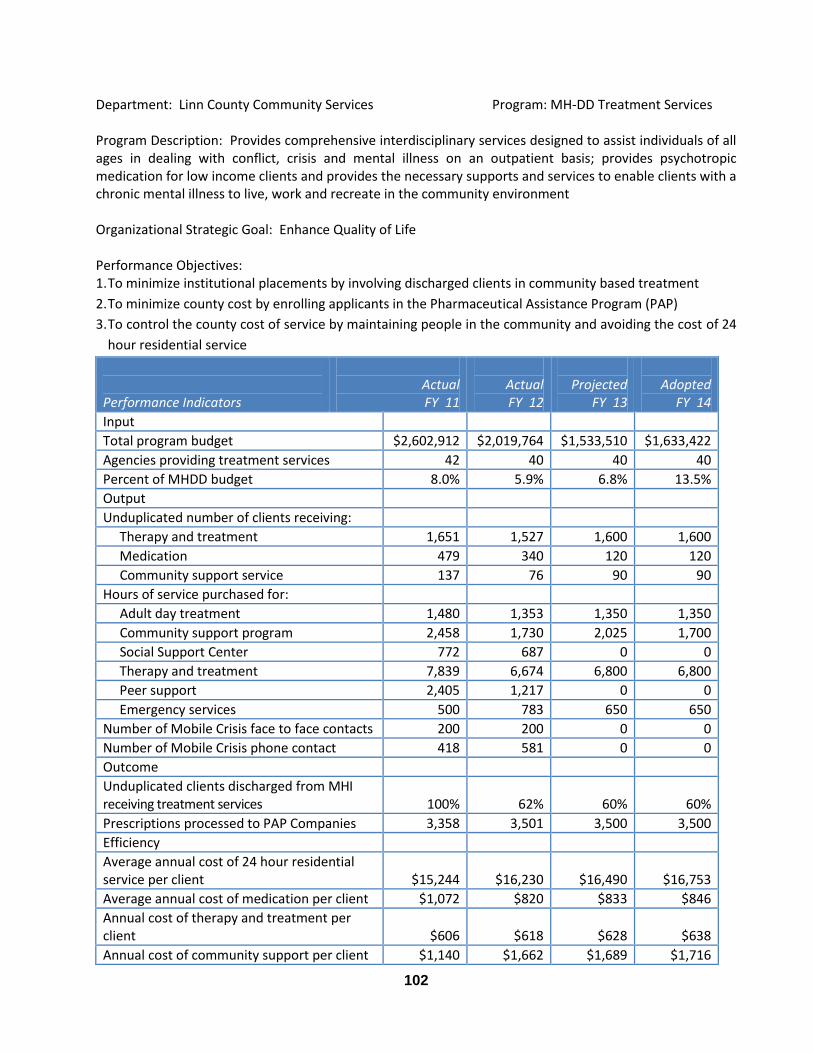
102
Department: Linn County Community Services Program: MH-DD Treatment Services Program Description: Provides comprehensive interdisciplinary services designed to assist individuals of all ages in dealing with conflict, crisis and mental illness on an outpatient basis; provides psychotropic medication for low income clients and provides the necessary supports and services to enable clients with a chronic mental illness to live, work and recreate in the community environment Organizational Strategic Goal: Enhance Quality of Life Performance Objectives: 1. To minimize institutional placements by involving discharged clients in community based treatment
2. To minimize county cost by enrolling applicants in the Pharmaceutical Assistance Program (PAP)
3. To control the county cost of service by maintaining people in the community and avoiding the cost of 24
hour residential service
Performance Indicators
Actual FY 11
Actual FY 12
Projected
FY 13
Adopted
FY 14
Input
Total program budget $2,602,912 $2,019,764 $1,533,510 $1,633,422
Agencies providing treatment services 42 40 40 40
Percent of MHDD budget 8.0% 5.9% 6.8% 13.5%
Output
Unduplicated number of clients receiving:
Therapy and treatment 1,651 1,527 1,600 1,600
Medication 479 340 120 120
Community support service 137 76 90 90
Hours of service purchased for:
Adult day treatment 1,480 1,353 1,350 1,350
Community support program 2,458 1,730 2,025 1,700
Social Support Center 772 687 0 0
Therapy and treatment 7,839 6,674 6,800 6,800
Peer support 2,405 1,217 0 0
Emergency services 500 783 650 650
Number of Mobile Crisis face to face contacts 200 200 0 0
Number of Mobile Crisis phone contact 418 581 0 0
Outcome
Unduplicated clients discharged from MHI receiving treatment services
100%
62%
60%
60%
Prescriptions processed to PAP Companies 3,358 3,501 3,500 3,500
Efficiency
Average annual cost of 24 hour residential service per client
$15,244
$16,230
$16,490
$16,753
Average annual cost of medication per client $1,072 $820 $833 $846
Annual cost of therapy and treatment per client
$606
$618
$628
$638
Annual cost of community support per client $1,140 $1,662 $1,689 $1,716
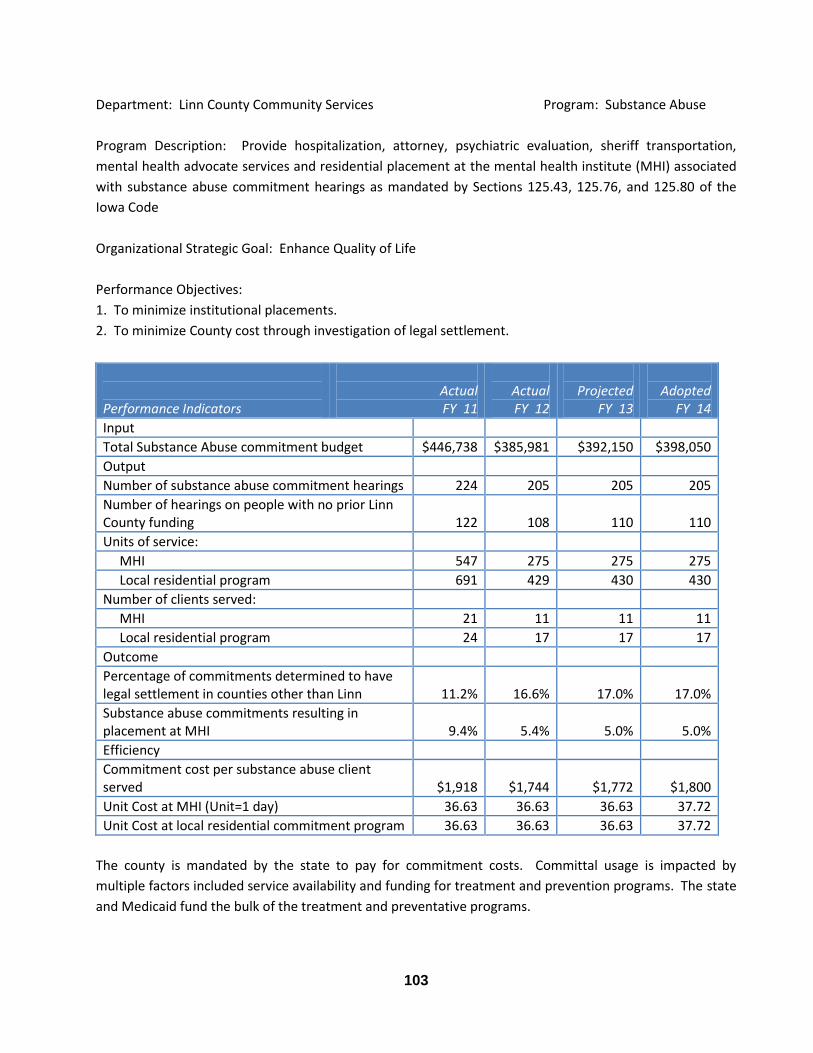
103
Department: Linn County Community Services Program: Substance Abuse
Program Description: Provide hospitalization, attorney, psychiatric evaluation, sheriff transportation,
mental health advocate services and residential placement at the mental health institute (MHI) associated
with substance abuse commitment hearings as mandated by Sections 125.43, 125.76, and 125.80 of the
Iowa Code
Organizational Strategic Goal: Enhance Quality of Life
Performance Objectives:
1. To minimize institutional placements.
2. To minimize County cost through investigation of legal settlement.
Performance Indicators
Actual FY 11
Actual FY 12
Projected
FY 13
Adopted
FY 14
Input
Total Substance Abuse commitment budget $446,738 $385,981 $392,150 $398,050
Output
Number of substance abuse commitment hearings 224 205 205 205
Number of hearings on people with no prior Linn County funding
122
108
110
110
Units of service:
MHI 547 275 275 275
Local residential program 691 429 430 430
Number of clients served:
MHI 21 11 11 11
Local residential program 24 17 17 17
Outcome
Percentage of commitments determined to have legal settlement in counties other than Linn
11.2%
16.6%
17.0%
17.0%
Substance abuse commitments resulting in placement at MHI
9.4%
5.4%
5.0%
5.0%
Efficiency
Commitment cost per substance abuse client served
$1,918
$1,744
$1,772
$1,800
Unit Cost at MHI (Unit=1 day) 36.63 36.63 36.63 37.72
Unit Cost at local residential commitment program 36.63 36.63 36.63 37.72
The county is mandated by the state to pay for commitment costs. Committal usage is impacted by
multiple factors included service availability and funding for treatment and prevention programs. The state
and Medicaid fund the bulk of the treatment and preventative programs.
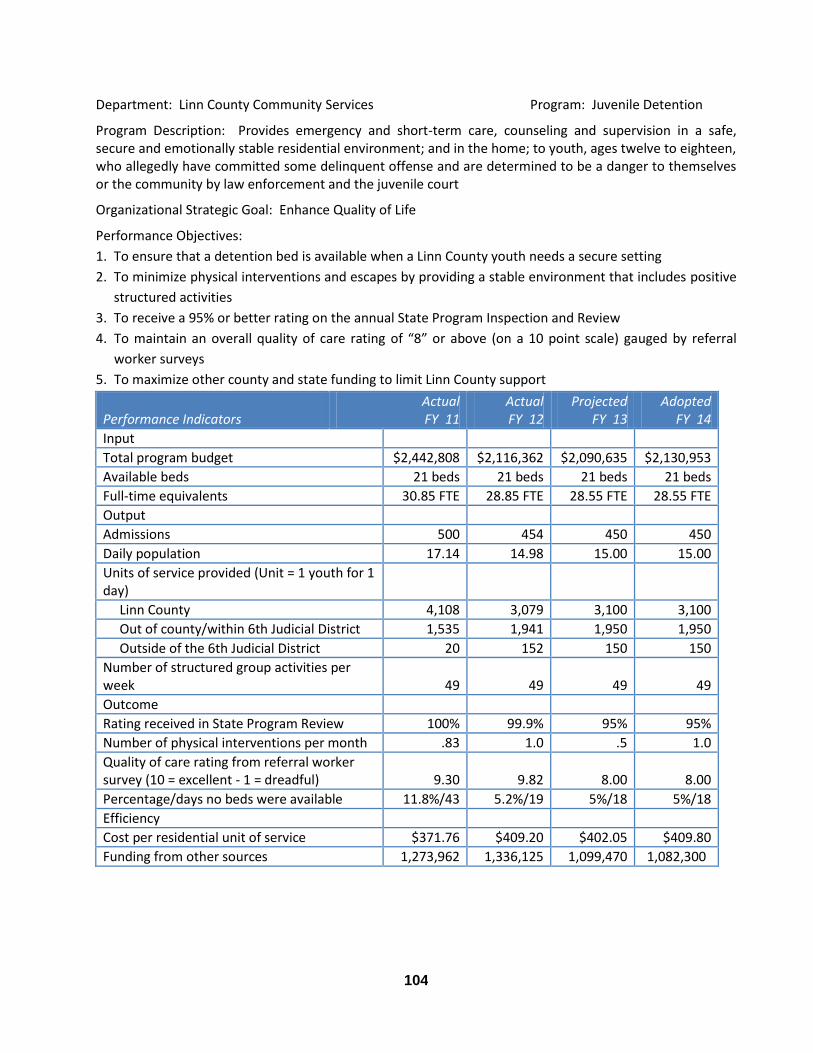
104
Department: Linn County Community Services Program: Juvenile Detention
Program Description: Provides emergency and short-term care, counseling and supervision in a safe, secure and emotionally stable residential environment; and in the home; to youth, ages twelve to eighteen, who allegedly have committed some delinquent offense and are determined to be a danger to themselves or the community by law enforcement and the juvenile court
Organizational Strategic Goal: Enhance Quality of Life
Performance Objectives:
1. To ensure that a detention bed is available when a Linn County youth needs a secure setting
2. To minimize physical interventions and escapes by providing a stable environment that includes positive
structured activities
3. To receive a 95% or better rating on the annual State Program Inspection and Review
4. To maintain an overall quality of care rating of “8” or above (on a 10 point scale) gauged by referral
worker surveys
5. To maximize other county and state funding to limit Linn County support
Performance Indicators
Actual FY 11
Actual FY 12
Projected FY 13
Adopted FY 14
Input
Total program budget $2,442,808 $2,116,362 $2,090,635 $2,130,953
Available beds 21 beds 21 beds 21 beds 21 beds
Full-time equivalents 30.85 FTE 28.85 FTE 28.55 FTE 28.55 FTE
Output
Admissions 500 454 450 450
Daily population 17.14 14.98 15.00 15.00
Units of service provided (Unit = 1 youth for 1 day)
Linn County 4,108 3,079 3,100 3,100
Out of county/within 6th Judicial District 1,535 1,941 1,950 1,950
Outside of the 6th Judicial District 20 152 150 150
Number of structured group activities per week
49
49
49
49
Outcome
Rating received in State Program Review 100% 99.9% 95% 95%
Number of physical interventions per month .83 1.0 .5 1.0
Quality of care rating from referral worker survey (10 = excellent - 1 = dreadful)
9.30
9.82
8.00
8.00
Percentage/days no beds were available 11.8%/43 5.2%/19 5%/18 5%/18
Efficiency
Cost per residential unit of service $371.76 $409.20 $402.05 $409.80
Funding from other sources 1,273,962 1,336,125 1,099,470 1,082,300
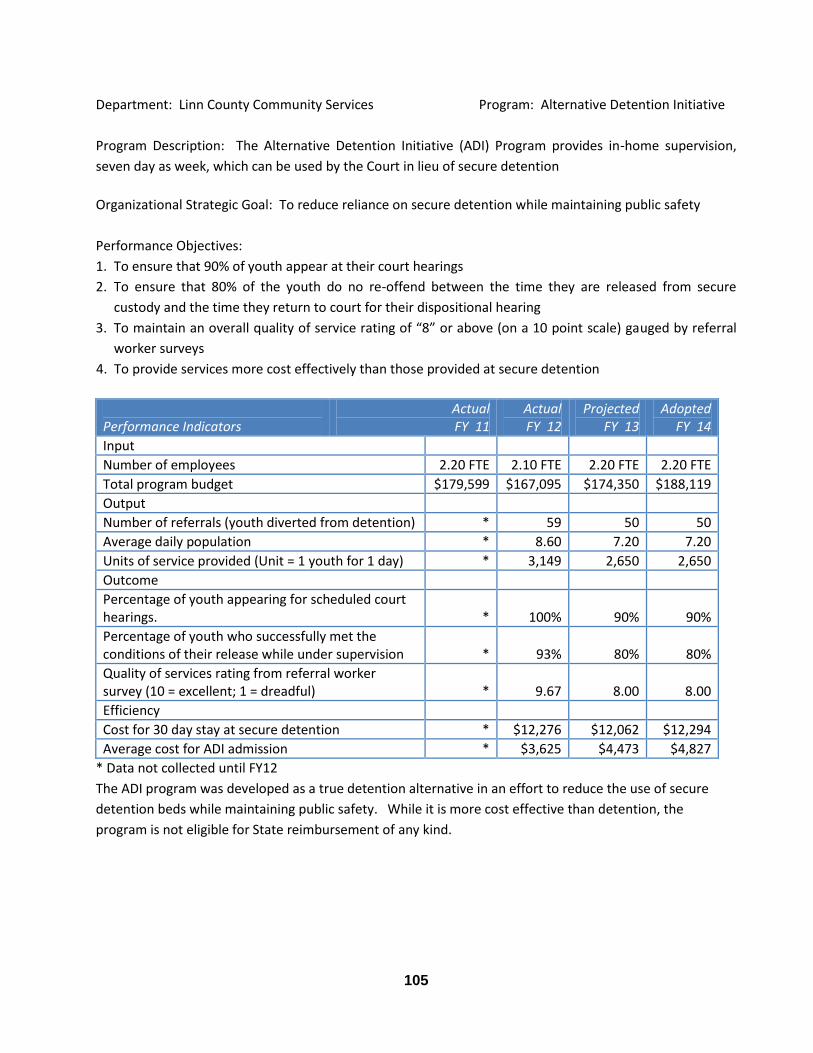
105
Department: Linn County Community Services Program: Alternative Detention Initiative
Program Description: The Alternative Detention Initiative (ADI) Program provides in-home supervision,
seven day as week, which can be used by the Court in lieu of secure detention
Organizational Strategic Goal: To reduce reliance on secure detention while maintaining public safety
Performance Objectives:
1. To ensure that 90% of youth appear at their court hearings
2. To ensure that 80% of the youth do no re-offend between the time they are released from secure
custody and the time they return to court for their dispositional hearing
3. To maintain an overall quality of service rating of “8” or above (on a 10 point scale) gauged by referral
worker surveys
4. To provide services more cost effectively than those provided at secure detention
Performance Indicators
Actual FY 11
Actual FY 12
Projected FY 13
Adopted FY 14
Input
Number of employees 2.20 FTE 2.10 FTE 2.20 FTE 2.20 FTE
Total program budget $179,599 $167,095 $174,350 $188,119
Output
Number of referrals (youth diverted from detention) * 59 50 50
Average daily population * 8.60 7.20 7.20
Units of service provided (Unit = 1 youth for 1 day) * 3,149 2,650 2,650
Outcome
Percentage of youth appearing for scheduled court hearings.
*
100%
90%
90%
Percentage of youth who successfully met the conditions of their release while under supervision
*
93%
80%
80%
Quality of services rating from referral worker survey (10 = excellent; 1 = dreadful)
*
9.67
8.00
8.00
Efficiency
Cost for 30 day stay at secure detention * $12,276 $12,062 $12,294
Average cost for ADI admission * $3,625 $4,473 $4,827
* Data not collected until FY12
The ADI program was developed as a true detention alternative in an effort to reduce the use of secure
detention beds while maintaining public safety. While it is more cost effective than detention, the
program is not eligible for State reimbursement of any kind.
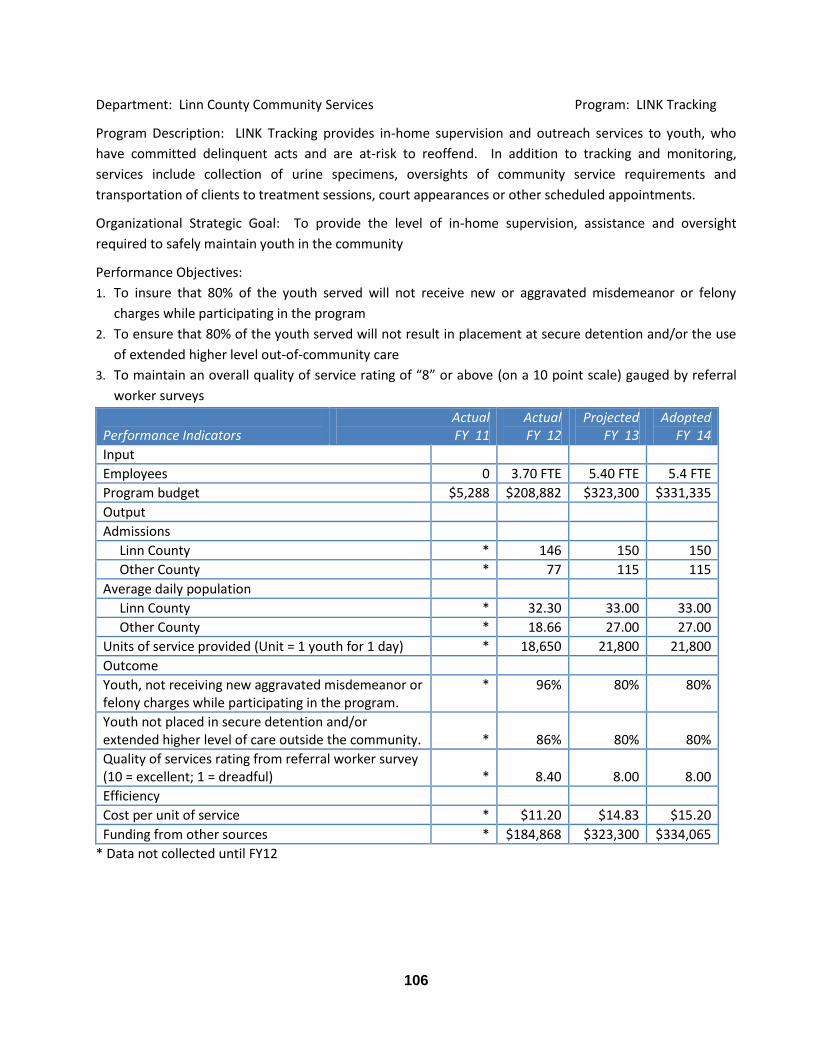
106
Department: Linn County Community Services Program: LINK Tracking
Program Description: LINK Tracking provides in-home supervision and outreach services to youth, who
have committed delinquent acts and are at-risk to reoffend. In addition to tracking and monitoring,
services include collection of urine specimens, oversights of community service requirements and
transportation of clients to treatment sessions, court appearances or other scheduled appointments.
Organizational Strategic Goal: To provide the level of in-home supervision, assistance and oversight
required to safely maintain youth in the community
Performance Objectives:
1. To insure that 80% of the youth served will not receive new or aggravated misdemeanor or felony
charges while participating in the program
2. To ensure that 80% of the youth served will not result in placement at secure detention and/or the use
of extended higher level out-of-community care
3. To maintain an overall quality of service rating of “8” or above (on a 10 point scale) gauged by referral
worker surveys
Performance Indicators
Actual FY 11
Actual FY 12
Projected FY 13
Adopted FY 14
Input
Employees 0 3.70 FTE 5.40 FTE 5.4 FTE
Program budget $5,288 $208,882 $323,300 $331,335
Output
Admissions
Linn County * 146 150 150
Other County * 77 115 115
Average daily population
Linn County * 32.30 33.00 33.00
Other County * 18.66 27.00 27.00
Units of service provided (Unit = 1 youth for 1 day) * 18,650 21,800 21,800
Outcome
Youth, not receiving new aggravated misdemeanor or felony charges while participating in the program.
* 96% 80% 80%
Youth not placed in secure detention and/or extended higher level of care outside the community.
*
86%
80%
80%
Quality of services rating from referral worker survey (10 = excellent; 1 = dreadful)
*
8.40
8.00
8.00
Efficiency
Cost per unit of service * $11.20 $14.83 $15.20
Funding from other sources * $184,868 $323,300 $334,065
* Data not collected until FY12
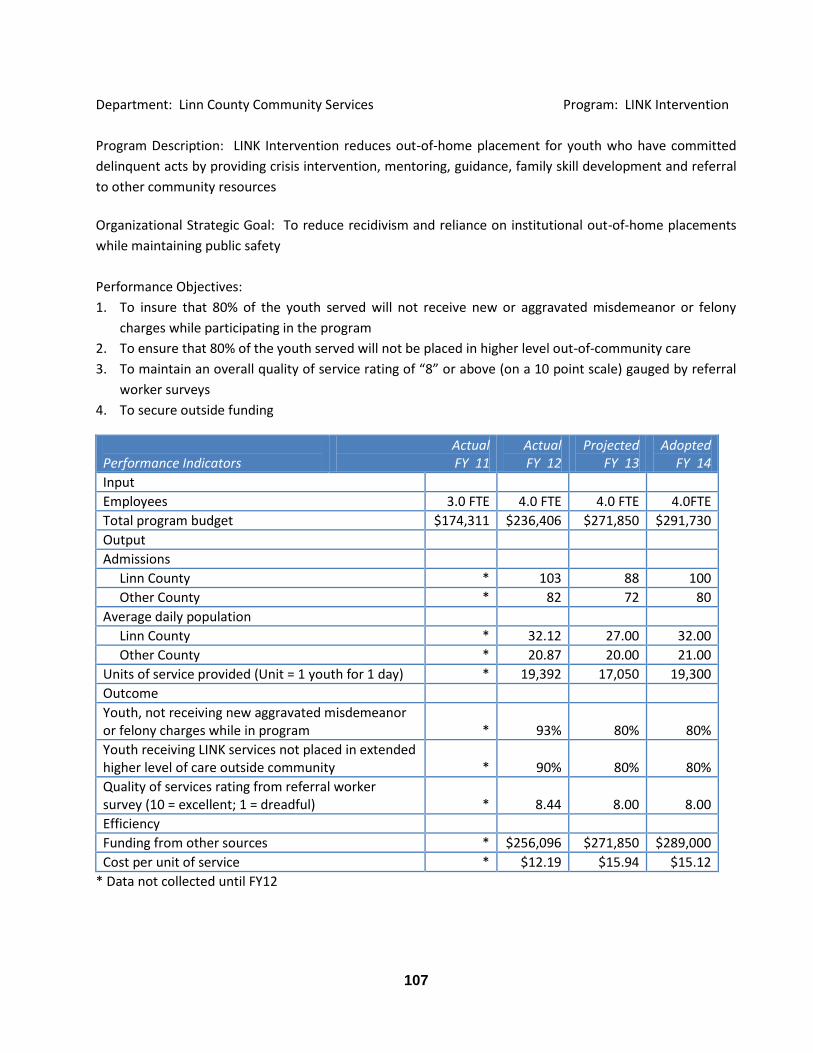
107
Department: Linn County Community Services Program: LINK Intervention
Program Description: LINK Intervention reduces out-of-home placement for youth who have committed
delinquent acts by providing crisis intervention, mentoring, guidance, family skill development and referral
to other community resources
Organizational Strategic Goal: To reduce recidivism and reliance on institutional out-of-home placements
while maintaining public safety
Performance Objectives:
1. To insure that 80% of the youth served will not receive new or aggravated misdemeanor or felony
charges while participating in the program
2. To ensure that 80% of the youth served will not be placed in higher level out-of-community care
3. To maintain an overall quality of service rating of “8” or above (on a 10 point scale) gauged by referral
worker surveys
4. To secure outside funding
Performance Indicators
Actual FY 11
Actual FY 12
Projected FY 13
Adopted FY 14
Input
Employees 3.0 FTE 4.0 FTE 4.0 FTE 4.0FTE
Total program budget $174,311 $236,406 $271,850 $291,730
Output
Admissions
Linn County * 103 88 100
Other County * 82 72 80
Average daily population
Linn County * 32.12 27.00 32.00
Other County * 20.87 20.00 21.00
Units of service provided (Unit = 1 youth for 1 day) * 19,392 17,050 19,300
Outcome
Youth, not receiving new aggravated misdemeanor or felony charges while in program
*
93%
80%
80%
Youth receiving LINK services not placed in extended higher level of care outside community
*
90%
80%
80%
Quality of services rating from referral worker survey (10 = excellent; 1 = dreadful)
*
8.44
8.00
8.00
Efficiency
Funding from other sources * $256,096 $271,850 $289,000
Cost per unit of service * $12.19 $15.94 $15.12
* Data not collected until FY12
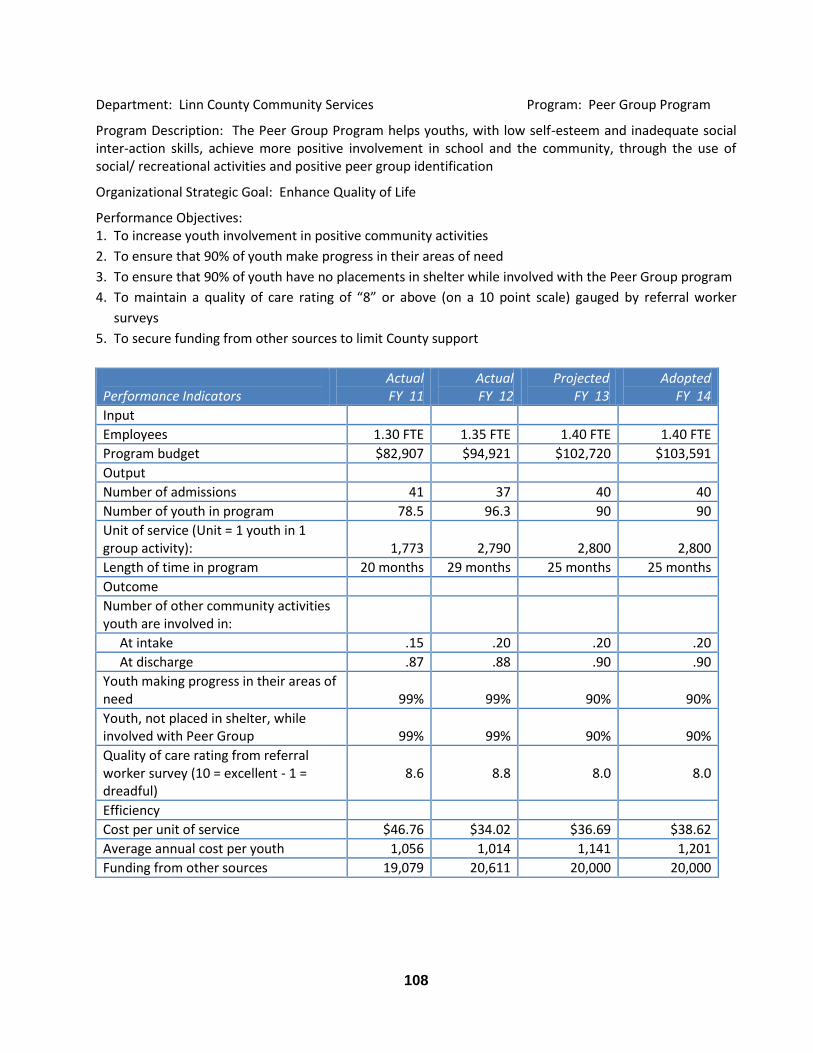
108
Department: Linn County Community Services Program: Peer Group Program
Program Description: The Peer Group Program helps youths, with low self-esteem and inadequate social inter-action skills, achieve more positive involvement in school and the community, through the use of social/ recreational activities and positive peer group identification
Organizational Strategic Goal: Enhance Quality of Life
Performance Objectives: 1. To increase youth involvement in positive community activities
2. To ensure that 90% of youth make progress in their areas of need
3. To ensure that 90% of youth have no placements in shelter while involved with the Peer Group program
4. To maintain a quality of care rating of “8” or above (on a 10 point scale) gauged by referral worker
surveys
5. To secure funding from other sources to limit County support
Performance Indicators
Actual FY 11
Actual FY 12
Projected FY 13
Adopted FY 14
Input
Employees 1.30 FTE 1.35 FTE 1.40 FTE 1.40 FTE
Program budget $82,907 $94,921 $102,720 $103,591
Output
Number of admissions 41 37 40 40
Number of youth in program 78.5 96.3 90 90
Unit of service (Unit = 1 youth in 1 group activity):
1,773
2,790
2,800
2,800
Length of time in program 20 months 29 months 25 months 25 months
Outcome
Number of other community activities youth are involved in:
At intake .15 .20 .20 .20
At discharge .87 .88 .90 .90
Youth making progress in their areas of need
99%
99%
90%
90%
Youth, not placed in shelter, while involved with Peer Group
99%
99%
90%
90%
Quality of care rating from referral worker survey (10 = excellent - 1 = dreadful)
8.6
8.8
8.0
8.0
Efficiency
Cost per unit of service $46.76 $34.02 $36.69 $38.62
Average annual cost per youth 1,056 1,014 1,141 1,201
Funding from other sources 19,079 20,611 20,000 20,000
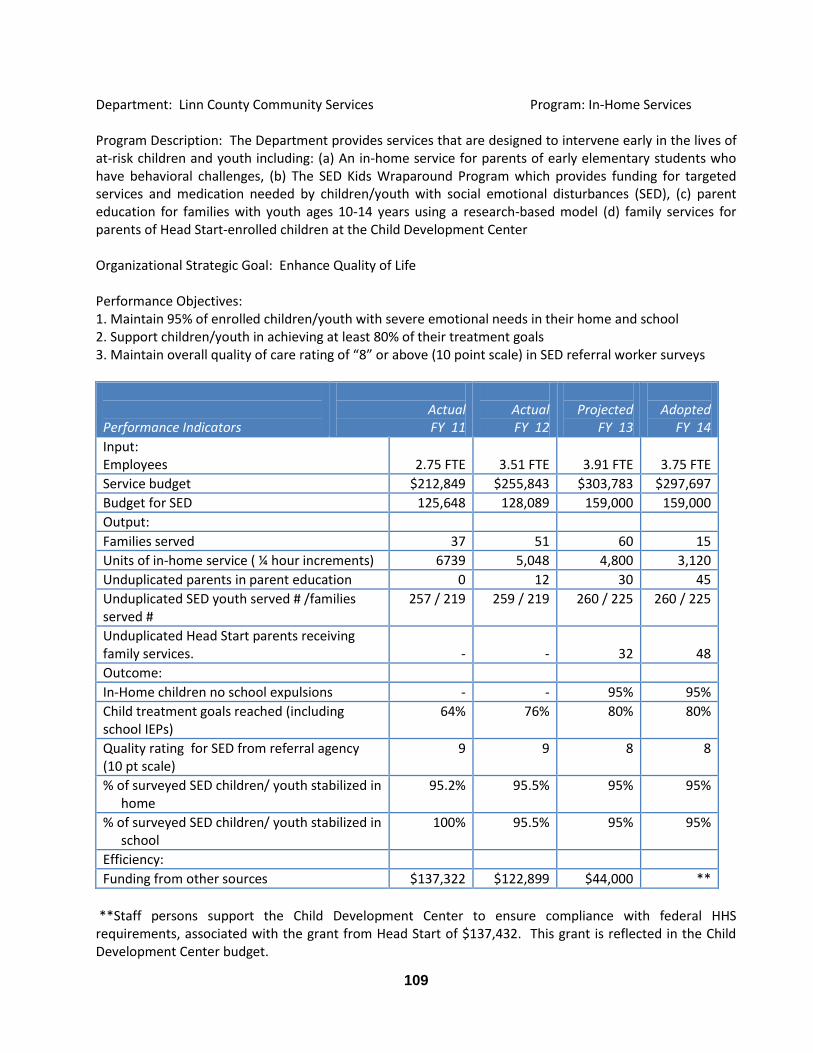
109
Department: Linn County Community Services Program: In-Home Services Program Description: The Department provides services that are designed to intervene early in the lives of at-risk children and youth including: (a) An in-home service for parents of early elementary students who have behavioral challenges, (b) The SED Kids Wraparound Program which provides funding for targeted services and medication needed by children/youth with social emotional disturbances (SED), (c) parent education for families with youth ages 10-14 years using a research-based model (d) family services for parents of Head Start-enrolled children at the Child Development Center Organizational Strategic Goal: Enhance Quality of Life Performance Objectives: 1. Maintain 95% of enrolled children/youth with severe emotional needs in their home and school 2. Support children/youth in achieving at least 80% of their treatment goals 3. Maintain overall quality of care rating of “8” or above (10 point scale) in SED referral worker surveys
Performance Indicators
Actual FY 11
Actual FY 12
Projected
FY 13
Adopted
FY 14
Input: Employees
2.75 FTE
3.51 FTE
3.91 FTE
3.75 FTE
Service budget $212,849 $255,843 $303,783 $297,697
Budget for SED 125,648 128,089 159,000 159,000
Output:
Families served 37 51 60 15
Units of in-home service ( ¼ hour increments) 6739 5,048 4,800 3,120
Unduplicated parents in parent education 0 12 30 45
Unduplicated SED youth served # /families served #
257 / 219 259 / 219 260 / 225 260 / 225
Unduplicated Head Start parents receiving family services.
-
-
32
48
Outcome:
In-Home children no school expulsions - - 95% 95%
Child treatment goals reached (including school IEPs)
64% 76% 80% 80%
Quality rating for SED from referral agency (10 pt scale)
9 9 8 8
% of surveyed SED children/ youth stabilized in home
95.2% 95.5% 95% 95%
% of surveyed SED children/ youth stabilized in school
100% 95.5% 95% 95%
Efficiency:
Funding from other sources $137,322 $122,899 $44,000 **
**Staff persons support the Child Development Center to ensure compliance with federal HHS requirements, associated with the grant from Head Start of $137,432. This grant is reflected in the Child Development Center budget.
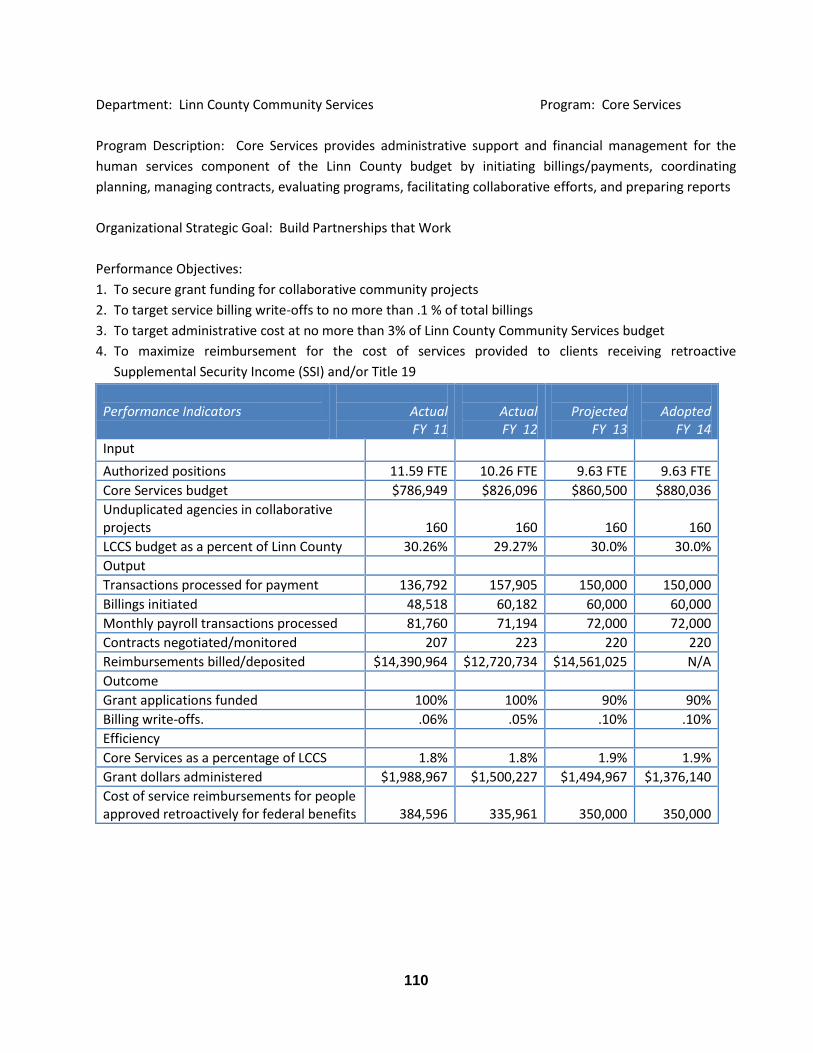
110
Department: Linn County Community Services Program: Core Services
Program Description: Core Services provides administrative support and financial management for the
human services component of the Linn County budget by initiating billings/payments, coordinating
planning, managing contracts, evaluating programs, facilitating collaborative efforts, and preparing reports
Organizational Strategic Goal: Build Partnerships that Work
Performance Objectives:
1. To secure grant funding for collaborative community projects
2. To target service billing write-offs to no more than .1 % of total billings
3. To target administrative cost at no more than 3% of Linn County Community Services budget
4. To maximize reimbursement for the cost of services provided to clients receiving retroactive
Supplemental Security Income (SSI) and/or Title 19
Performance Indicators
Actual FY 11
Actual FY 12
Projected
FY 13
Adopted
FY 14
Input
Authorized positions 11.59 FTE 10.26 FTE 9.63 FTE 9.63 FTE
Core Services budget $786,949 $826,096 $860,500 $880,036
Unduplicated agencies in collaborative projects
160
160
160
160
LCCS budget as a percent of Linn County 30.26% 29.27% 30.0% 30.0%
Output
Transactions processed for payment 136,792 157,905 150,000 150,000
Billings initiated 48,518 60,182 60,000 60,000
Monthly payroll transactions processed 81,760 71,194 72,000 72,000
Contracts negotiated/monitored 207 223 220 220
Reimbursements billed/deposited $14,390,964 $12,720,734 $14,561,025 N/A
Outcome
Grant applications funded 100% 100% 90% 90%
Billing write-offs. .06% .05% .10% .10%
Efficiency
Core Services as a percentage of LCCS 1.8% 1.8% 1.9% 1.9%
Grant dollars administered $1,988,967 $1,500,227 $1,494,967 $1,376,140
Cost of service reimbursements for people approved retroactively for federal benefits
384,596
335,961
350,000
350,000
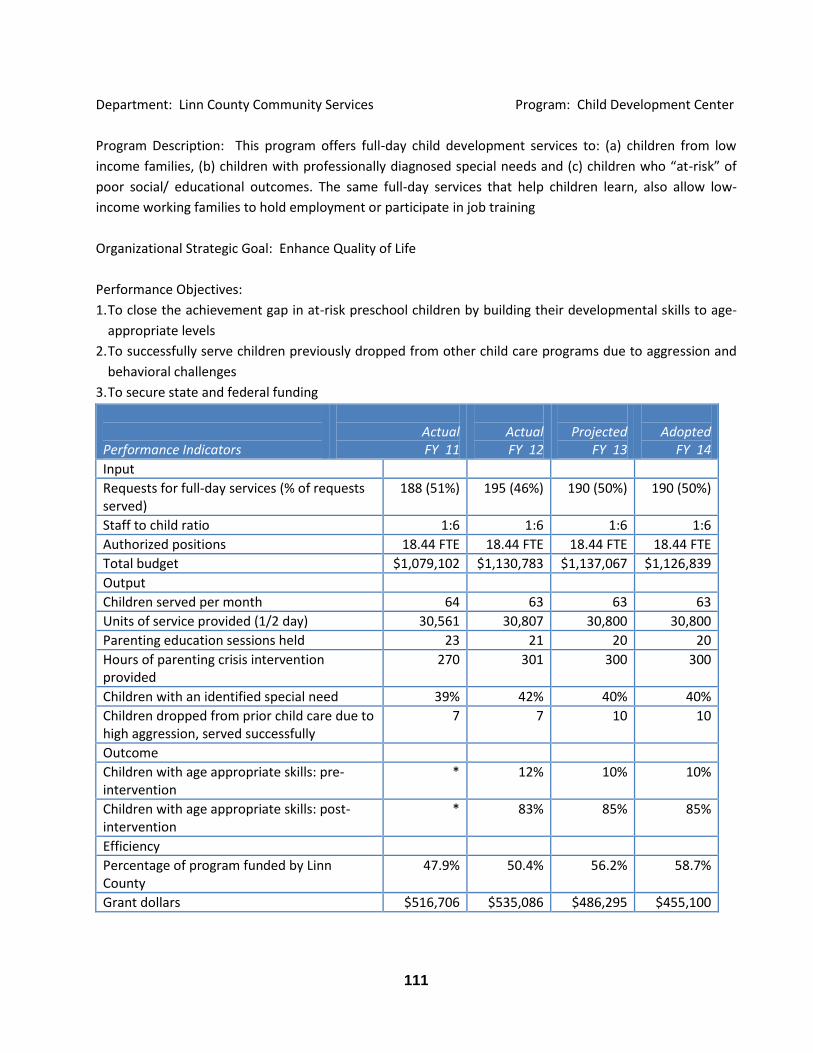
111
Department: Linn County Community Services Program: Child Development Center
Program Description: This program offers full-day child development services to: (a) children from low
income families, (b) children with professionally diagnosed special needs and (c) children who “at-risk” of
poor social/ educational outcomes. The same full-day services that help children learn, also allow low-
income working families to hold employment or participate in job training
Organizational Strategic Goal: Enhance Quality of Life
Performance Objectives:
1. To close the achievement gap in at-risk preschool children by building their developmental skills to age-
appropriate levels
2. To successfully serve children previously dropped from other child care programs due to aggression and
behavioral challenges
3. To secure state and federal funding
Performance Indicators
Actual FY 11
Actual FY 12
Projected
FY 13
Adopted
FY 14
Input
Requests for full-day services (% of requests served)
188 (51%) 195 (46%) 190 (50%) 190 (50%)
Staff to child ratio 1:6 1:6 1:6 1:6
Authorized positions 18.44 FTE 18.44 FTE 18.44 FTE 18.44 FTE
Total budget $1,079,102 $1,130,783 $1,137,067 $1,126,839
Output
Children served per month 64 63 63 63
Units of service provided (1/2 day) 30,561 30,807 30,800 30,800
Parenting education sessions held 23 21 20 20
Hours of parenting crisis intervention provided
270 301 300 300
Children with an identified special need 39% 42% 40% 40%
Children dropped from prior child care due to high aggression, served successfully
7 7 10 10
Outcome
Children with age appropriate skills: pre-intervention
* 12% 10% 10%
Children with age appropriate skills: post-intervention
* 83% 85% 85%
Efficiency
Percentage of program funded by Linn County
47.9% 50.4% 56.2% 58.7%
Grant dollars $516,706 $535,086 $486,295 $455,100
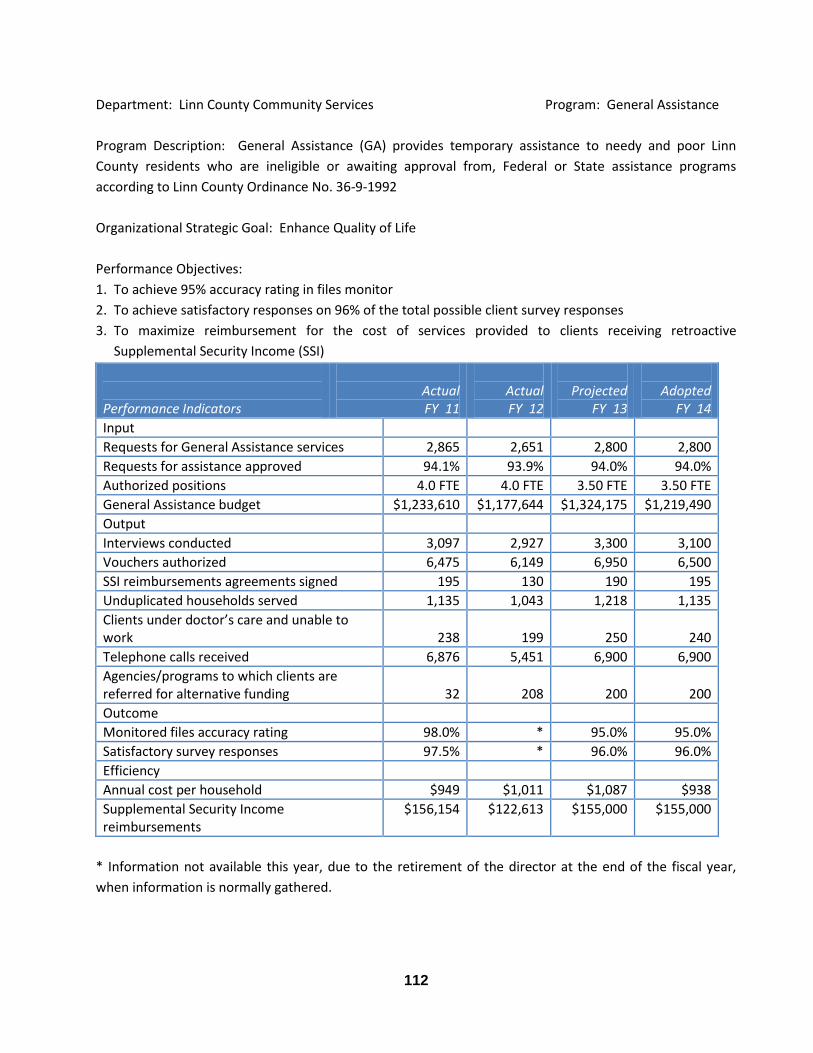
112
Department: Linn County Community Services Program: General Assistance
Program Description: General Assistance (GA) provides temporary assistance to needy and poor Linn
County residents who are ineligible or awaiting approval from, Federal or State assistance programs
according to Linn County Ordinance No. 36-9-1992
Organizational Strategic Goal: Enhance Quality of Life
Performance Objectives:
1. To achieve 95% accuracy rating in files monitor
2. To achieve satisfactory responses on 96% of the total possible client survey responses
3. To maximize reimbursement for the cost of services provided to clients receiving retroactive
Supplemental Security Income (SSI)
Performance Indicators
Actual FY 11
Actual FY 12
Projected
FY 13
Adopted
FY 14
Input
Requests for General Assistance services 2,865 2,651 2,800 2,800
Requests for assistance approved 94.1% 93.9% 94.0% 94.0%
Authorized positions 4.0 FTE 4.0 FTE 3.50 FTE 3.50 FTE
General Assistance budget $1,233,610 $1,177,644 $1,324,175 $1,219,490
Output
Interviews conducted 3,097 2,927 3,300 3,100
Vouchers authorized 6,475 6,149 6,950 6,500
SSI reimbursements agreements signed 195 130 190 195
Unduplicated households served 1,135 1,043 1,218 1,135
Clients under doctor’s care and unable to work
238
199
250
240
Telephone calls received 6,876 5,451 6,900 6,900
Agencies/programs to which clients are referred for alternative funding
32
208
200
200
Outcome
Monitored files accuracy rating 98.0% * 95.0% 95.0%
Satisfactory survey responses 97.5% * 96.0% 96.0%
Efficiency
Annual cost per household $949 $1,011 $1,087 $938
Supplemental Security Income reimbursements
$156,154 $122,613 $155,000 $155,000
* Information not available this year, due to the retirement of the director at the end of the fiscal year,
when information is normally gathered.
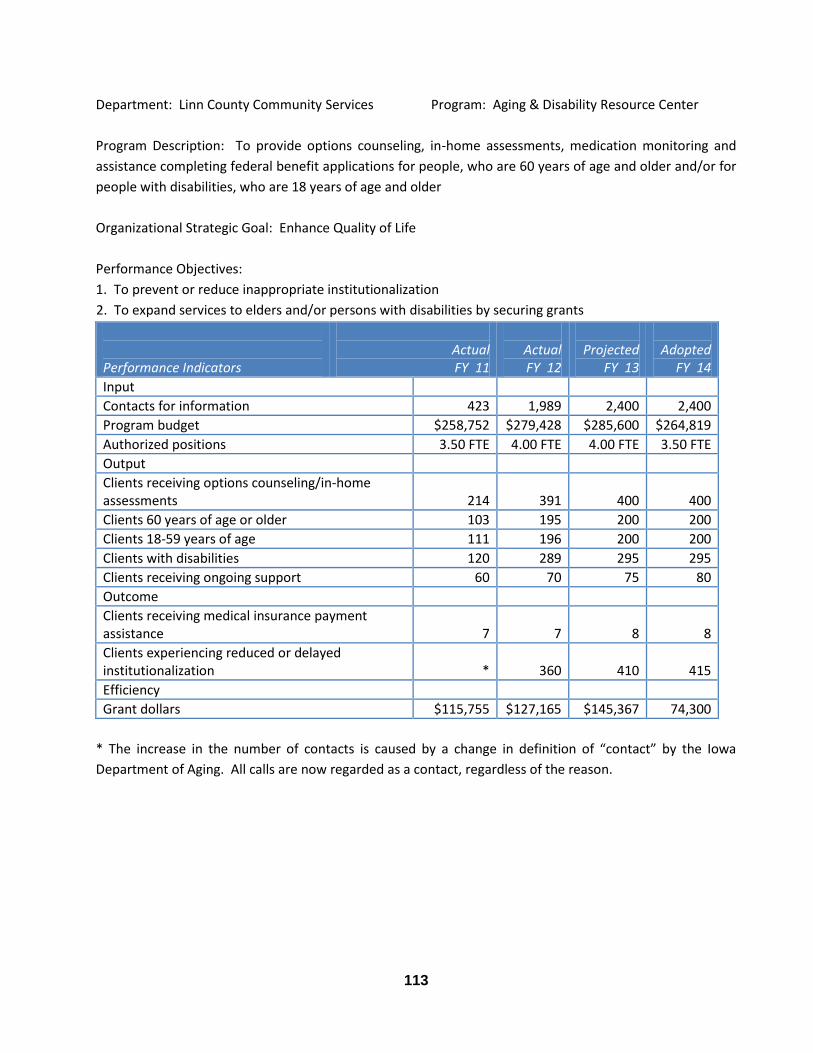
113
Department: Linn County Community Services Program: Aging & Disability Resource Center
Program Description: To provide options counseling, in-home assessments, medication monitoring and
assistance completing federal benefit applications for people, who are 60 years of age and older and/or for
people with disabilities, who are 18 years of age and older
Organizational Strategic Goal: Enhance Quality of Life
Performance Objectives:
1. To prevent or reduce inappropriate institutionalization
2. To expand services to elders and/or persons with disabilities by securing grants
Performance Indicators
Actual FY 11
Actual FY 12
Projected
FY 13
Adopted
FY 14
Input
Contacts for information 423 1,989 2,400 2,400
Program budget $258,752 $279,428 $285,600 $264,819
Authorized positions 3.50 FTE 4.00 FTE 4.00 FTE 3.50 FTE
Output
Clients receiving options counseling/in-home assessments
214
391
400
400
Clients 60 years of age or older 103 195 200 200
Clients 18-59 years of age 111 196 200 200
Clients with disabilities 120 289 295 295
Clients receiving ongoing support 60 70 75 80
Outcome
Clients receiving medical insurance payment assistance
7
7
8
8
Clients experiencing reduced or delayed institutionalization
*
360
410
415
Efficiency
Grant dollars $115,755 $127,165 $145,367 74,300
* The increase in the number of contacts is caused by a change in definition of “contact” by the Iowa
Department of Aging. All calls are now regarded as a contact, regardless of the reason.
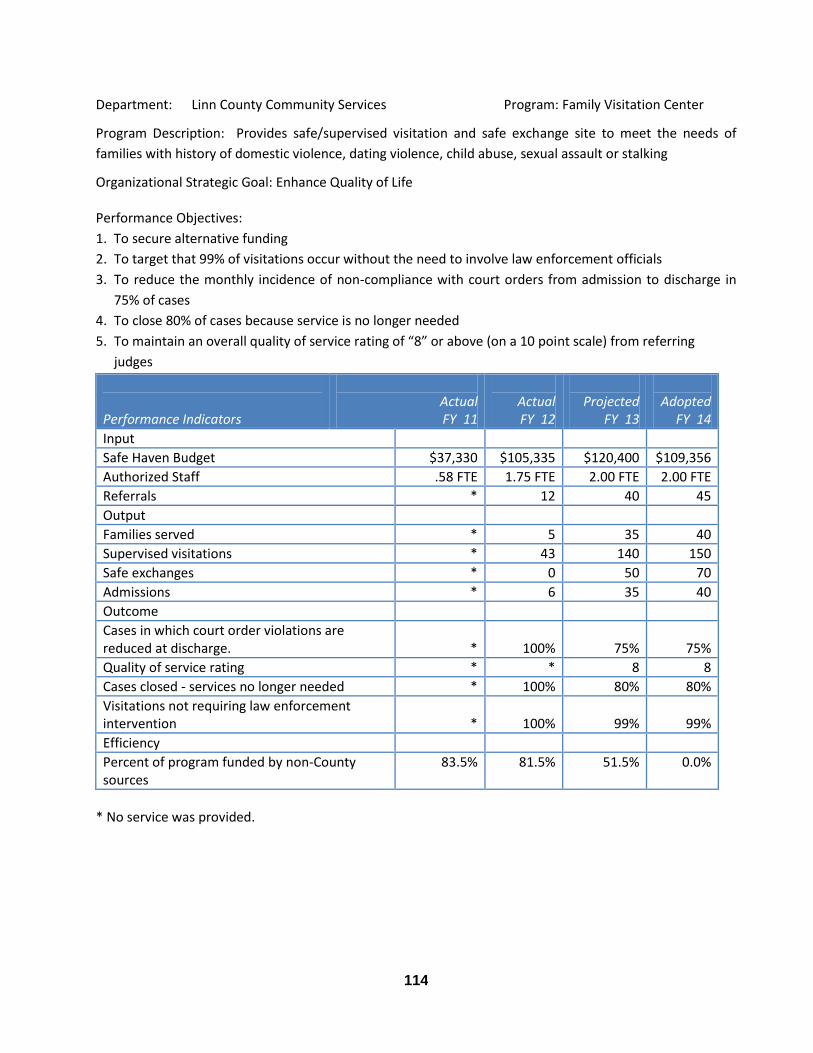
114
Department: Linn County Community Services Program: Family Visitation Center
Program Description: Provides safe/supervised visitation and safe exchange site to meet the needs of
families with history of domestic violence, dating violence, child abuse, sexual assault or stalking
Organizational Strategic Goal: Enhance Quality of Life Performance Objectives:
1. To secure alternative funding
2. To target that 99% of visitations occur without the need to involve law enforcement officials
3. To reduce the monthly incidence of non-compliance with court orders from admission to discharge in
75% of cases
4. To close 80% of cases because service is no longer needed
5. To maintain an overall quality of service rating of “8” or above (on a 10 point scale) from referring
judges
Performance Indicators
Actual FY 11
Actual FY 12
Projected
FY 13
Adopted
FY 14
Input
Safe Haven Budget $37,330 $105,335 $120,400 $109,356
Authorized Staff .58 FTE 1.75 FTE 2.00 FTE 2.00 FTE
Referrals * 12 40 45
Output
Families served * 5 35 40
Supervised visitations * 43 140 150
Safe exchanges * 0 50 70
Admissions * 6 35 40
Outcome
Cases in which court order violations are reduced at discharge.
*
100%
75%
75%
Quality of service rating * * 8 8
Cases closed - services no longer needed * 100% 80% 80%
Visitations not requiring law enforcement intervention
*
100%
99%
99%
Efficiency
Percent of program funded by non-County sources
83.5% 81.5% 51.5% 0.0%
* No service was provided.
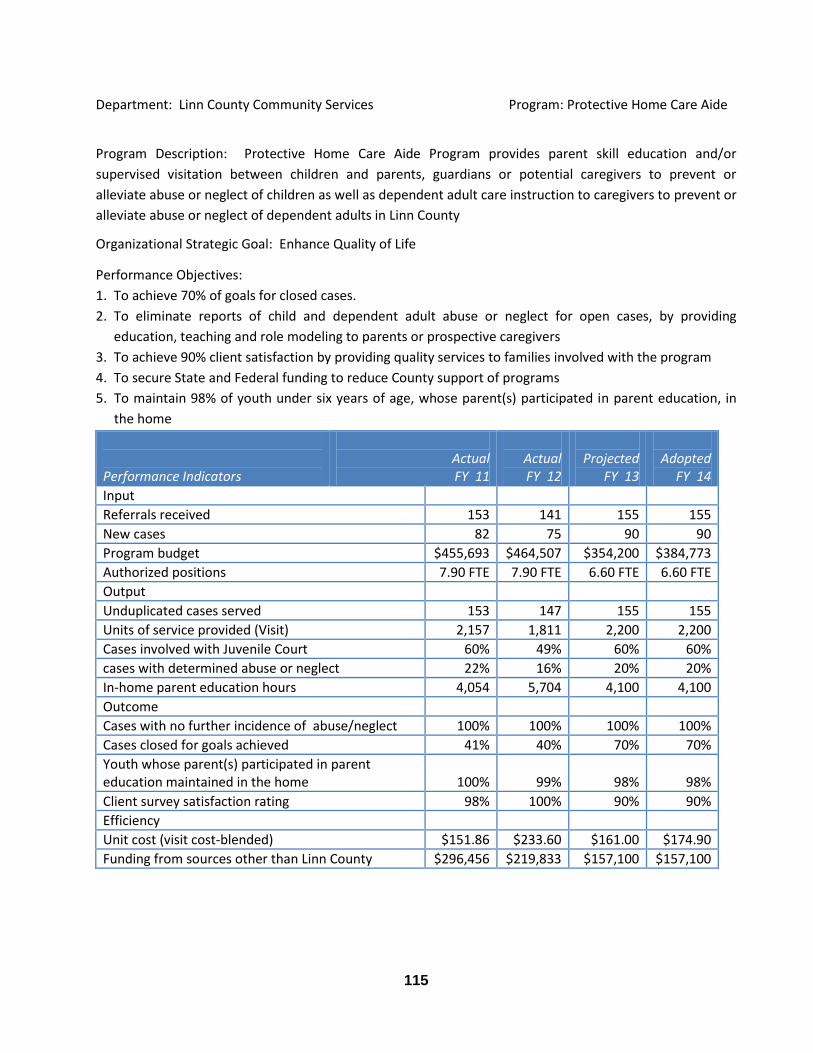
115
Department: Linn County Community Services Program: Protective Home Care Aide
Program Description: Protective Home Care Aide Program provides parent skill education and/or
supervised visitation between children and parents, guardians or potential caregivers to prevent or
alleviate abuse or neglect of children as well as dependent adult care instruction to caregivers to prevent or
alleviate abuse or neglect of dependent adults in Linn County
Organizational Strategic Goal: Enhance Quality of Life
Performance Objectives:
1. To achieve 70% of goals for closed cases.
2. To eliminate reports of child and dependent adult abuse or neglect for open cases, by providing
education, teaching and role modeling to parents or prospective caregivers
3. To achieve 90% client satisfaction by providing quality services to families involved with the program
4. To secure State and Federal funding to reduce County support of programs
5. To maintain 98% of youth under six years of age, whose parent(s) participated in parent education, in
the home
Performance Indicators
Actual FY 11
Actual FY 12
Projected
FY 13
Adopted
FY 14
Input
Referrals received 153 141 155 155
New cases 82 75 90 90
Program budget $455,693 $464,507 $354,200 $384,773
Authorized positions 7.90 FTE 7.90 FTE 6.60 FTE 6.60 FTE
Output
Unduplicated cases served 153 147 155 155
Units of service provided (Visit) 2,157 1,811 2,200 2,200
Cases involved with Juvenile Court 60% 49% 60% 60%
cases with determined abuse or neglect 22% 16% 20% 20%
In-home parent education hours 4,054 5,704 4,100 4,100
Outcome
Cases with no further incidence of abuse/neglect 100% 100% 100% 100%
Cases closed for goals achieved 41% 40% 70% 70%
Youth whose parent(s) participated in parent education maintained in the home
100%
99%
98%
98%
Client survey satisfaction rating 98% 100% 90% 90%
Efficiency
Unit cost (visit cost-blended) $151.86 $233.60 $161.00 $174.90
Funding from sources other than Linn County $296,456 $219,833 $157,100 $157,100
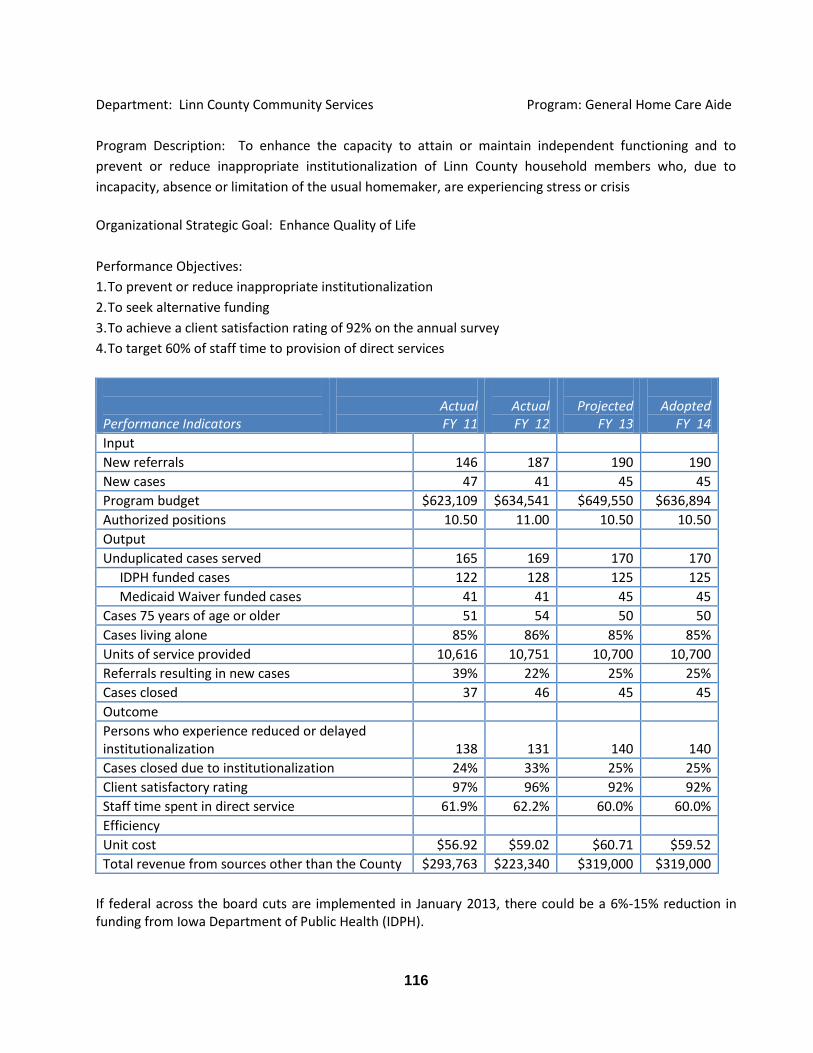
116
Department: Linn County Community Services Program: General Home Care Aide
Program Description: To enhance the capacity to attain or maintain independent functioning and to
prevent or reduce inappropriate institutionalization of Linn County household members who, due to
incapacity, absence or limitation of the usual homemaker, are experiencing stress or crisis
Organizational Strategic Goal: Enhance Quality of Life
Performance Objectives:
1. To prevent or reduce inappropriate institutionalization
2. To seek alternative funding
3. To achieve a client satisfaction rating of 92% on the annual survey
4. To target 60% of staff time to provision of direct services
Performance Indicators
Actual FY 11
Actual FY 12
Projected
FY 13
Adopted
FY 14
Input
New referrals 146 187 190 190
New cases 47 41 45 45
Program budget $623,109 $634,541 $649,550 $636,894
Authorized positions 10.50 11.00 10.50 10.50
Output
Unduplicated cases served 165 169 170 170
IDPH funded cases 122 128 125 125
Medicaid Waiver funded cases 41 41 45 45
Cases 75 years of age or older 51 54 50 50
Cases living alone 85% 86% 85% 85%
Units of service provided 10,616 10,751 10,700 10,700
Referrals resulting in new cases 39% 22% 25% 25%
Cases closed 37 46 45 45
Outcome
Persons who experience reduced or delayed institutionalization
138
131
140
140
Cases closed due to institutionalization 24% 33% 25% 25%
Client satisfactory rating 97% 96% 92% 92%
Staff time spent in direct service 61.9% 62.2% 60.0% 60.0%
Efficiency
Unit cost $56.92 $59.02 $60.71 $59.52
Total revenue from sources other than the County $293,763 $223,340 $319,000 $319,000
If federal across the board cuts are implemented in January 2013, there could be a 6%-15% reduction in funding from Iowa Department of Public Health (IDPH).
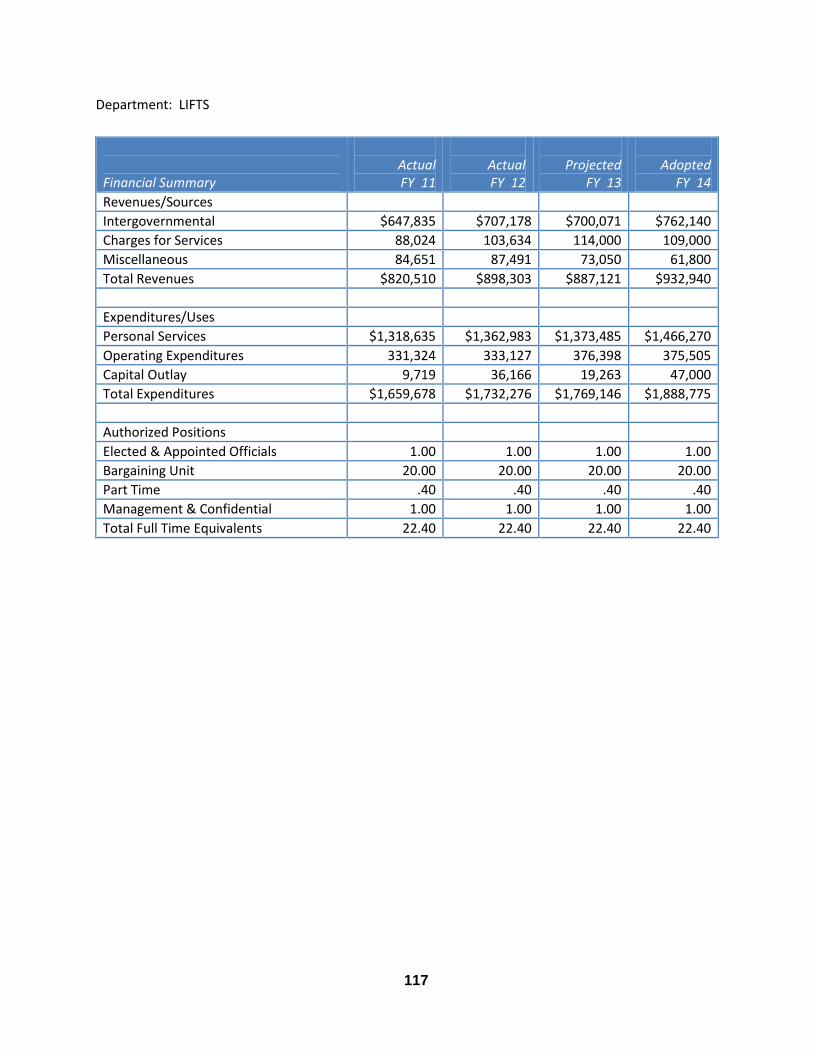
117
Department: LIFTS
Financial Summary
Actual FY 11
Actual FY 12
Projected
FY 13
Adopted
FY 14
Revenues/Sources
Intergovernmental $647,835 $707,178 $700,071 $762,140
Charges for Services 88,024 103,634 114,000 109,000
Miscellaneous 84,651 87,491 73,050 61,800
Total Revenues $820,510 $898,303 $887,121 $932,940
Expenditures/Uses
Personal Services $1,318,635 $1,362,983 $1,373,485 $1,466,270
Operating Expenditures 331,324 333,127 376,398 375,505
Capital Outlay 9,719 36,166 19,263 47,000
Total Expenditures $1,659,678 $1,732,276 $1,769,146 $1,888,775
Authorized Positions
Elected & Appointed Officials 1.00 1.00 1.00 1.00
Bargaining Unit 20.00 20.00 20.00 20.00
Part Time .40 .40 .40 .40
Management & Confidential 1.00 1.00 1.00 1.00
Total Full Time Equivalents 22.40 22.40 22.40 22.40
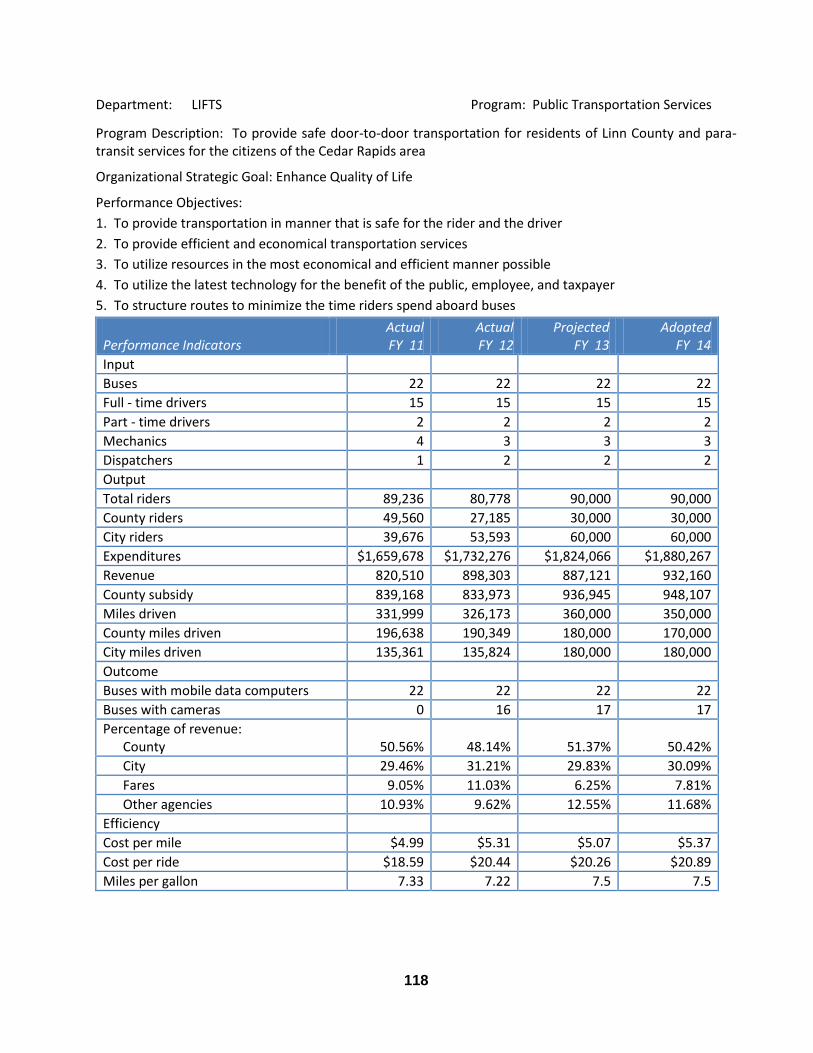
118
Department: LIFTS Program: Public Transportation Services
Program Description: To provide safe door-to-door transportation for residents of Linn County and para-transit services for the citizens of the Cedar Rapids area
Organizational Strategic Goal: Enhance Quality of Life
Performance Objectives:
1. To provide transportation in manner that is safe for the rider and the driver
2. To provide efficient and economical transportation services
3. To utilize resources in the most economical and efficient manner possible
4. To utilize the latest technology for the benefit of the public, employee, and taxpayer
5. To structure routes to minimize the time riders spend aboard buses
Performance Indicators
Actual FY 11
Actual FY 12
Projected FY 13
Adopted FY 14
Input
Buses 22 22 22 22
Full - time drivers 15 15 15 15
Part - time drivers 2 2 2 2
Mechanics 4 3 3 3
Dispatchers 1 2 2 2
Output
Total riders 89,236 80,778 90,000 90,000
County riders 49,560 27,185 30,000 30,000
City riders 39,676 53,593 60,000 60,000
Expenditures $1,659,678 $1,732,276 $1,824,066 $1,880,267
Revenue 820,510 898,303 887,121 932,160
County subsidy 839,168 833,973 936,945 948,107
Miles driven 331,999 326,173 360,000 350,000
County miles driven 196,638 190,349 180,000 170,000
City miles driven 135,361 135,824 180,000 180,000
Outcome
Buses with mobile data computers 22 22 22 22
Buses with cameras 0 16 17 17
Percentage of revenue: County
50.56%
48.14%
51.37%
50.42%
City 29.46% 31.21% 29.83% 30.09%
Fares 9.05% 11.03% 6.25% 7.81%
Other agencies 10.93% 9.62% 12.55% 11.68%
Efficiency
Cost per mile $4.99 $5.31 $5.07 $5.37
Cost per ride $18.59 $20.44 $20.26 $20.89
Miles per gallon 7.33 7.22 7.5 7.5
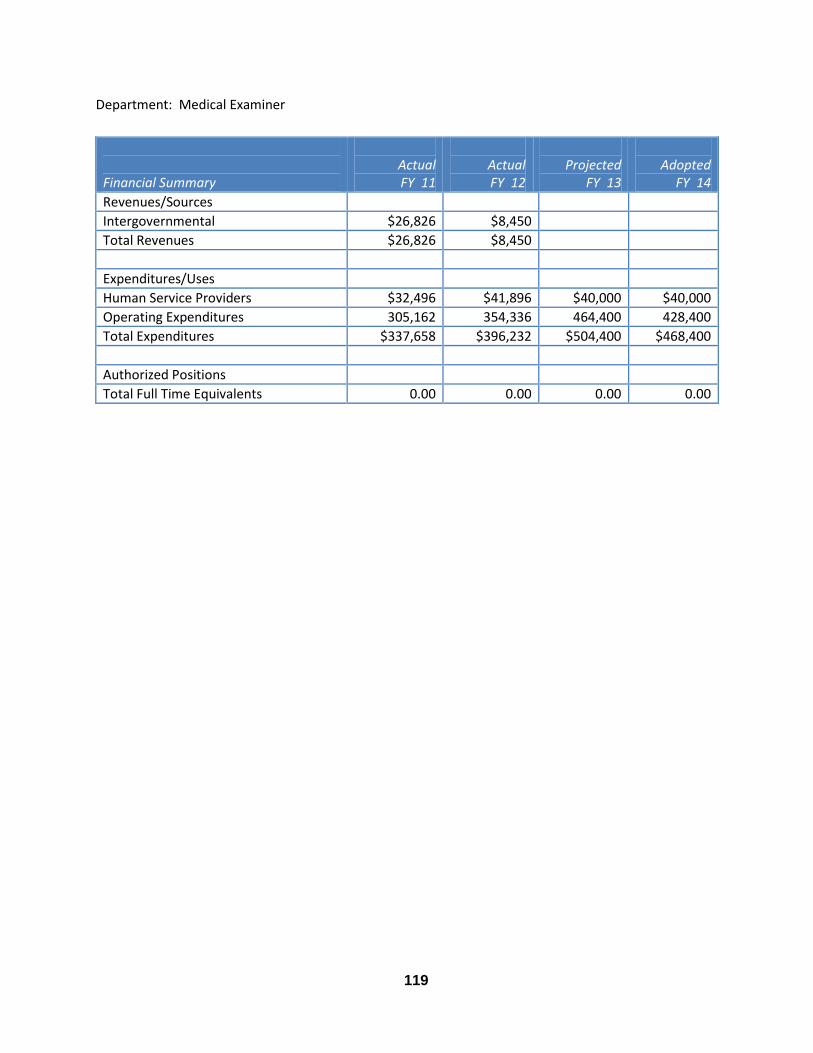
119
Department: Medical Examiner
Financial Summary
Actual FY 11
Actual FY 12
Projected
FY 13
Adopted
FY 14
Revenues/Sources
Intergovernmental $26,826 $8,450
Total Revenues $26,826 $8,450
Expenditures/Uses
Human Service Providers $32,496 $41,896 $40,000 $40,000
Operating Expenditures 305,162 354,336 464,400 428,400
Total Expenditures $337,658 $396,232 $504,400 $468,400
Authorized Positions
Total Full Time Equivalents 0.00 0.00 0.00 0.00
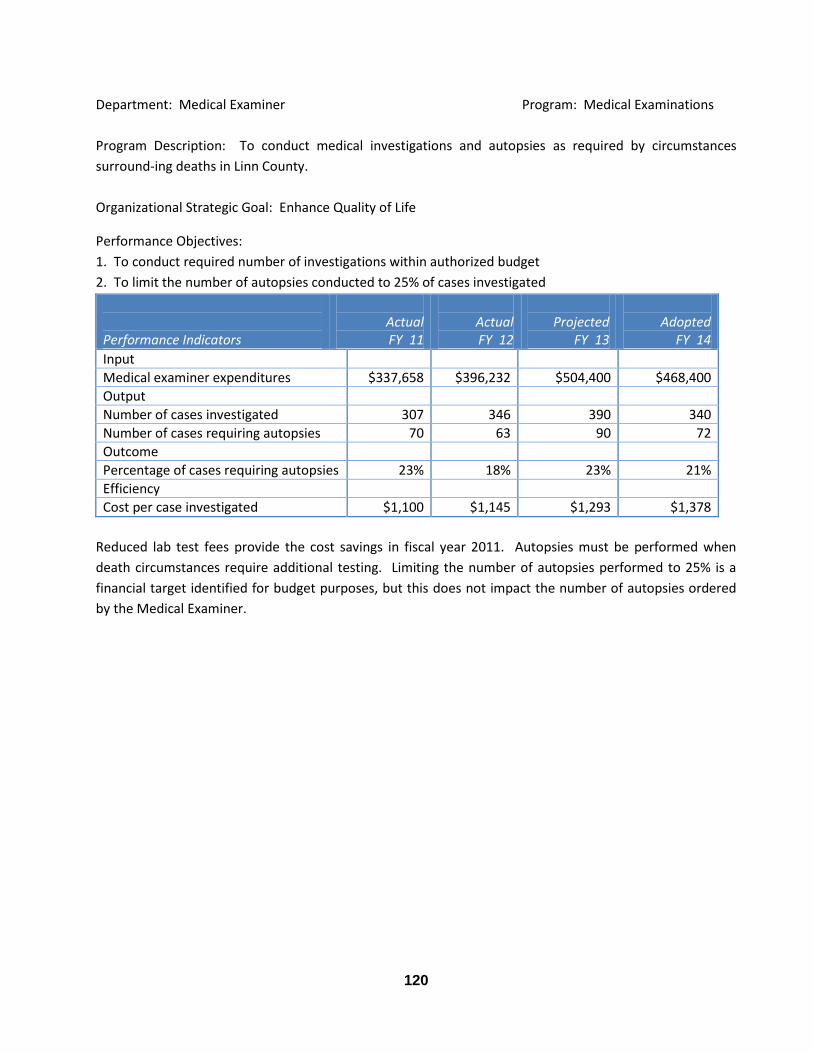
120
Department: Medical Examiner Program: Medical Examinations
Program Description: To conduct medical investigations and autopsies as required by circumstances
surround-ing deaths in Linn County.
Organizational Strategic Goal: Enhance Quality of Life
Performance Objectives:
1. To conduct required number of investigations within authorized budget
2. To limit the number of autopsies conducted to 25% of cases investigated
Performance Indicators
Actual FY 11
Actual FY 12
Projected
FY 13
Adopted
FY 14
Input
Medical examiner expenditures $337,658 $396,232 $504,400 $468,400
Output
Number of cases investigated 307 346 390 340
Number of cases requiring autopsies 70 63 90 72
Outcome
Percentage of cases requiring autopsies 23% 18% 23% 21%
Efficiency
Cost per case investigated $1,100 $1,145 $1,293 $1,378
Reduced lab test fees provide the cost savings in fiscal year 2011. Autopsies must be performed when
death circumstances require additional testing. Limiting the number of autopsies performed to 25% is a
financial target identified for budget purposes, but this does not impact the number of autopsies ordered
by the Medical Examiner.
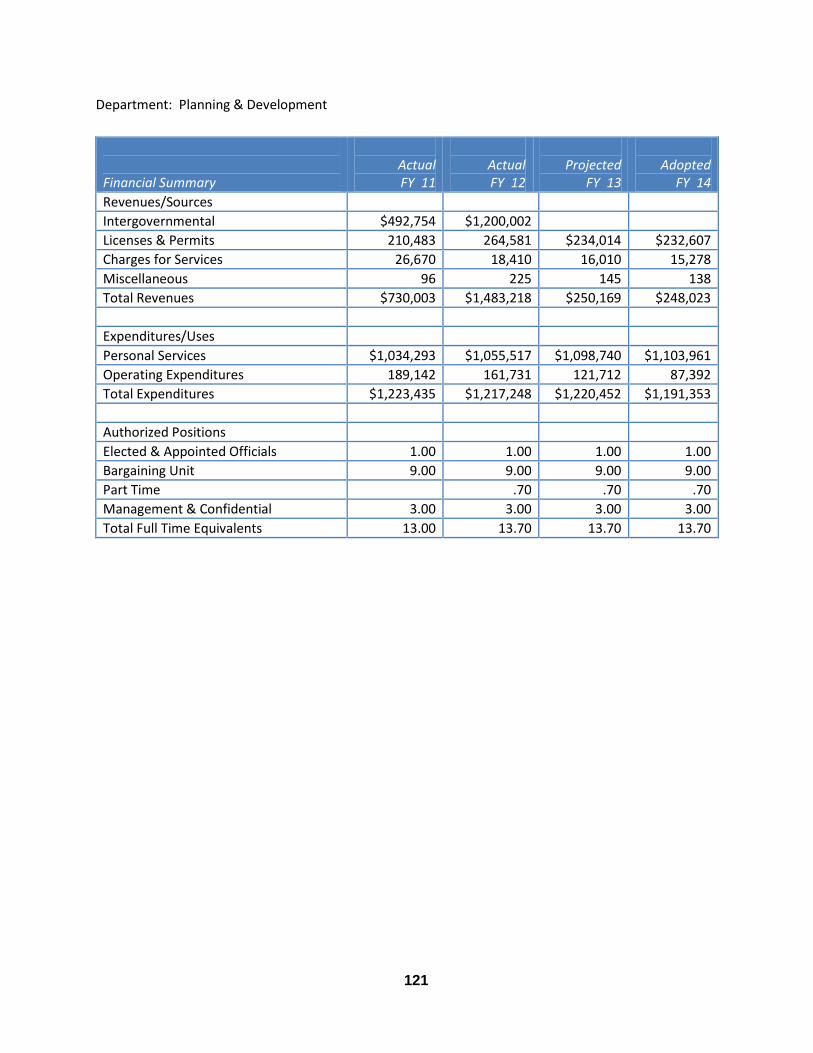
121
Department: Planning & Development
Financial Summary
Actual FY 11
Actual FY 12
Projected
FY 13
Adopted
FY 14
Revenues/Sources
Intergovernmental $492,754 $1,200,002
Licenses & Permits 210,483 264,581 $234,014 $232,607
Charges for Services 26,670 18,410 16,010 15,278
Miscellaneous 96 225 145 138
Total Revenues $730,003 $1,483,218 $250,169 $248,023
Expenditures/Uses
Personal Services $1,034,293 $1,055,517 $1,098,740 $1,103,961
Operating Expenditures 189,142 161,731 121,712 87,392
Total Expenditures $1,223,435 $1,217,248 $1,220,452 $1,191,353
Authorized Positions
Elected & Appointed Officials 1.00 1.00 1.00 1.00
Bargaining Unit 9.00 9.00 9.00 9.00
Part Time .70 .70 .70
Management & Confidential 3.00 3.00 3.00 3.00
Total Full Time Equivalents 13.00 13.70 13.70 13.70
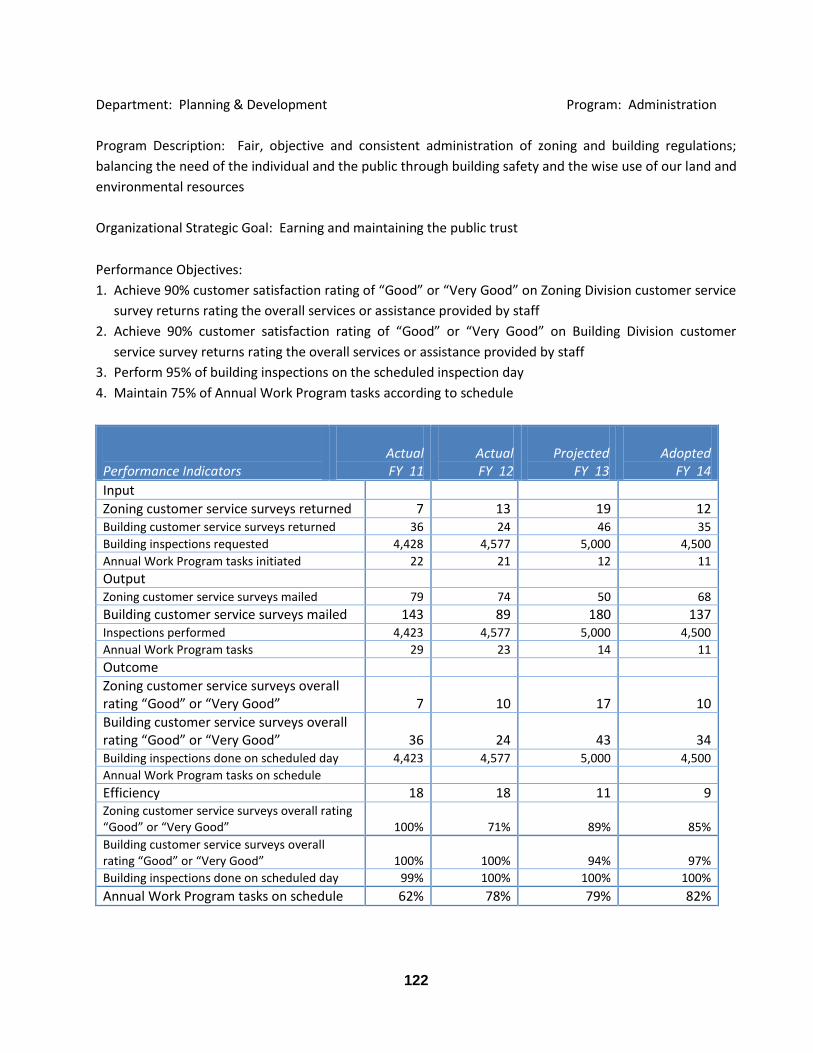
122
Department: Planning & Development Program: Administration
Program Description: Fair, objective and consistent administration of zoning and building regulations;
balancing the need of the individual and the public through building safety and the wise use of our land and
environmental resources
Organizational Strategic Goal: Earning and maintaining the public trust
Performance Objectives:
1. Achieve 90% customer satisfaction rating of “Good” or “Very Good” on Zoning Division customer service
survey returns rating the overall services or assistance provided by staff
2. Achieve 90% customer satisfaction rating of “Good” or “Very Good” on Building Division customer
service survey returns rating the overall services or assistance provided by staff
3. Perform 95% of building inspections on the scheduled inspection day
4. Maintain 75% of Annual Work Program tasks according to schedule
Performance Indicators
Actual FY 11
Actual FY 12
Projected
FY 13
Adopted
FY 14
Input
Zoning customer service surveys returned 7 13 19 12 Building customer service surveys returned 36 24 46 35
Building inspections requested 4,428 4,577 5,000 4,500
Annual Work Program tasks initiated 22 21 12 11
Output Zoning customer service surveys mailed 79 74 50 68
Building customer service surveys mailed 143 89 180 137 Inspections performed 4,423 4,577 5,000 4,500
Annual Work Program tasks 29 23 14 11
Outcome
Zoning customer service surveys overall rating “Good” or “Very Good” 7 10 17 10
Building customer service surveys overall rating “Good” or “Very Good” 36 24 43 34 Building inspections done on scheduled day 4,423 4,577 5,000 4,500
Annual Work Program tasks on schedule
Efficiency 18 18 11 9 Zoning customer service surveys overall rating “Good” or “Very Good” 100% 71% 89% 85%
Building customer service surveys overall rating “Good” or “Very Good” 100% 100% 94% 97%
Building inspections done on scheduled day 99% 100% 100% 100%
Annual Work Program tasks on schedule 62% 78% 79% 82%

123
Department: Public Health
Financial Summary
Actual FY 11
Actual FY 12
Projected
FY 13
Adopted
FY 14
Revenues/Sources
Intergovernmental $3,367,590 $3,075,513 $2,105,339 $1,943,001
Licenses & Permits 540,513 529,208 525,170 582,473
Charges for Services 625,137 633,960 185,862 211,343
Miscellaneous 3,192 947 2,830 925
Total Revenues $4,536,432 $4,239,628 $2,819,201 $2,737,742
Expenditures/Uses
Personal Services $4,324,821 $3,935,235 $3,802,264 $4,104,964
Human Service Providers 15,679 113,927 26,226 121,333
Operating Expenditures 1,338,738 1,127,592 1,056,805 874,122
Capital Outlay 139,705 76,996 21,700 33,000
Total Expenditures $5,818,943 $5,253,750 $4,906,995 $5,133,419
Authorized Positions
Elected & Appointed Officials 1.00 1.00 1.00 1.00
Bargaining Unit 44.00 33.00 35.00 37.00
Part Time 1.67 2.30 0.80 0.80
Management & Confidential 12.00 10.00 10.00 10.00
Total Full Time Equivalents 58.67 46.30 46.80 48.80
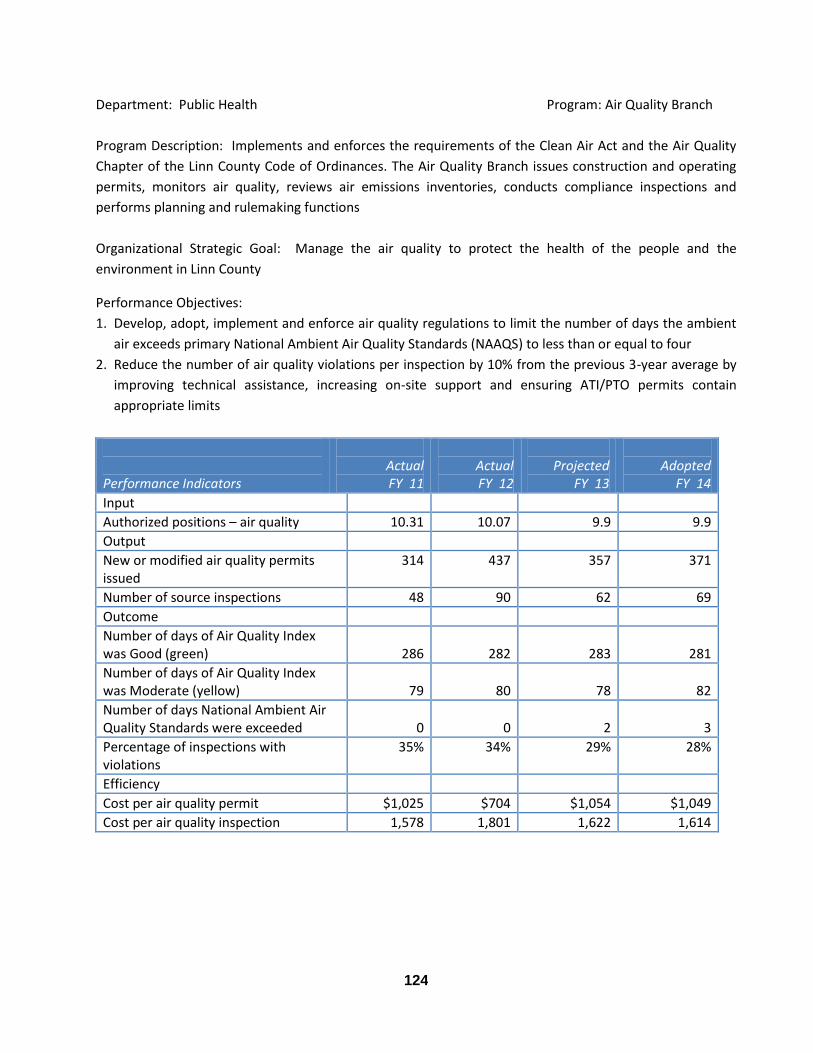
124
Department: Public Health Program: Air Quality Branch
Program Description: Implements and enforces the requirements of the Clean Air Act and the Air Quality
Chapter of the Linn County Code of Ordinances. The Air Quality Branch issues construction and operating
permits, monitors air quality, reviews air emissions inventories, conducts compliance inspections and
performs planning and rulemaking functions
Organizational Strategic Goal: Manage the air quality to protect the health of the people and the
environment in Linn County
Performance Objectives:
1. Develop, adopt, implement and enforce air quality regulations to limit the number of days the ambient
air exceeds primary National Ambient Air Quality Standards (NAAQS) to less than or equal to four
2. Reduce the number of air quality violations per inspection by 10% from the previous 3-year average by
improving technical assistance, increasing on-site support and ensuring ATI/PTO permits contain
appropriate limits
Performance Indicators
Actual FY 11
Actual FY 12
Projected
FY 13
Adopted
FY 14
Input
Authorized positions – air quality 10.31 10.07 9.9 9.9
Output
New or modified air quality permits issued
314 437 357 371
Number of source inspections 48 90 62 69
Outcome
Number of days of Air Quality Index was Good (green)
286
282
283
281
Number of days of Air Quality Index was Moderate (yellow)
79
80
78
82
Number of days National Ambient Air Quality Standards were exceeded
0
0
2
3
Percentage of inspections with violations
35% 34% 29% 28%
Efficiency
Cost per air quality permit $1,025 $704 $1,054 $1,049
Cost per air quality inspection 1,578 1,801 1,622 1,614
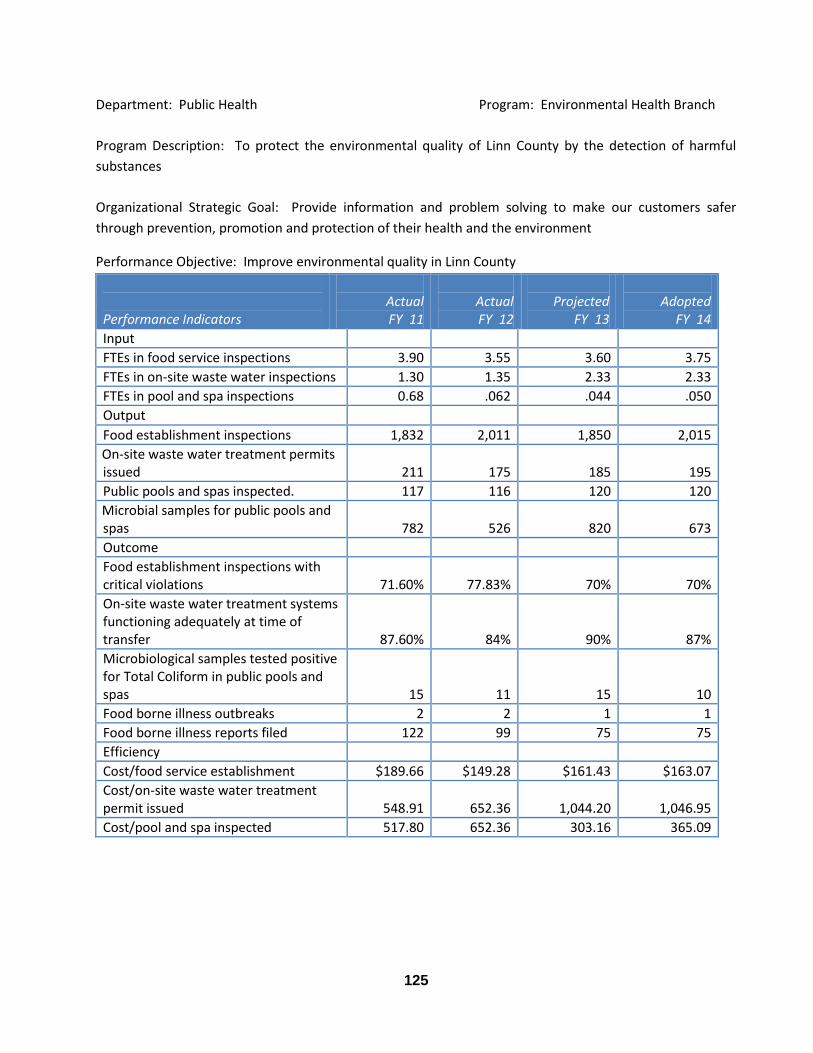
125
Department: Public Health Program: Environmental Health Branch
Program Description: To protect the environmental quality of Linn County by the detection of harmful
substances
Organizational Strategic Goal: Provide information and problem solving to make our customers safer
through prevention, promotion and protection of their health and the environment
Performance Objective: Improve environmental quality in Linn County
Performance Indicators
Actual FY 11
Actual FY 12
Projected
FY 13
Adopted
FY 14
Input
FTEs in food service inspections 3.90 3.55 3.60 3.75
FTEs in on-site waste water inspections 1.30 1.35 2.33 2.33
FTEs in pool and spa inspections 0.68 .062 .044 .050
Output
Food establishment inspections 1,832 2,011 1,850 2,015
On-site waste water treatment permits issued
211
175
185
195
Public pools and spas inspected. 117 116 120 120
Microbial samples for public pools and spas
782
526
820
673
Outcome
Food establishment inspections with critical violations
71.60%
77.83%
70%
70%
On-site waste water treatment systems functioning adequately at time of transfer
87.60%
84%
90%
87%
Microbiological samples tested positive for Total Coliform in public pools and spas
15
11
15
10
Food borne illness outbreaks 2 2 1 1
Food borne illness reports filed 122 99 75 75
Efficiency
Cost/food service establishment $189.66 $149.28 $161.43 $163.07
Cost/on-site waste water treatment permit issued
548.91
652.36
1,044.20
1,046.95
Cost/pool and spa inspected 517.80 652.36 303.16 365.09
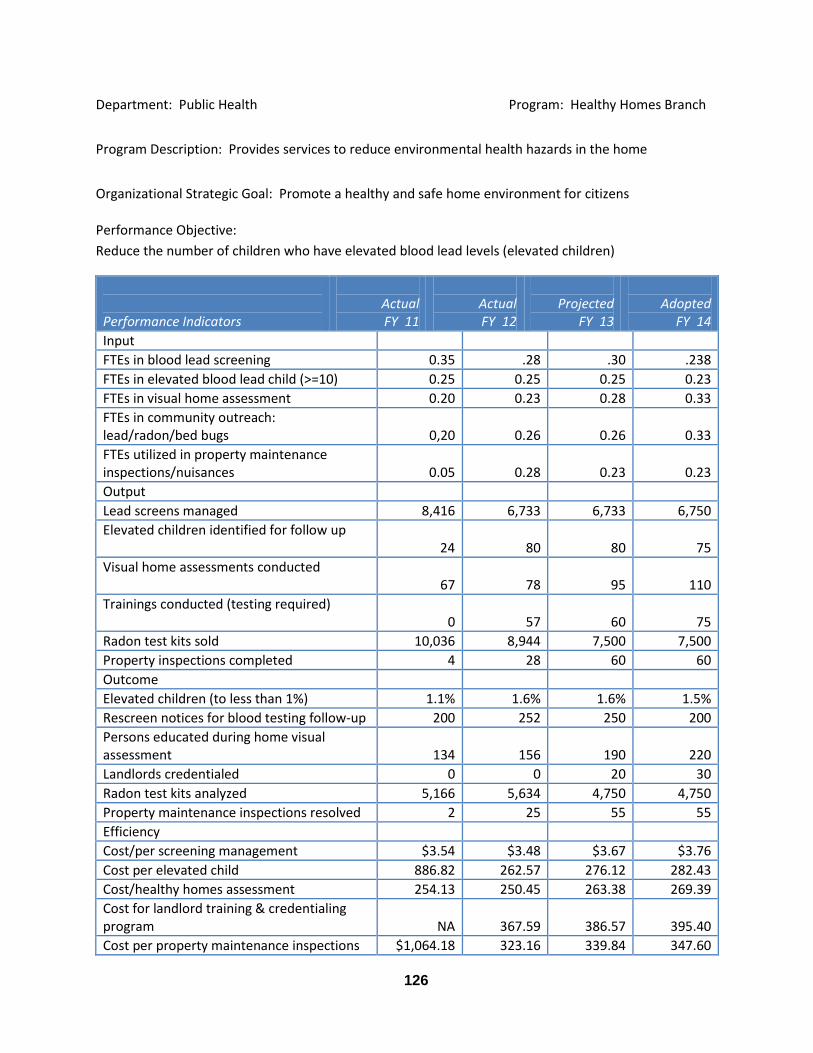
126
Department: Public Health Program: Healthy Homes Branch
Program Description: Provides services to reduce environmental health hazards in the home
Organizational Strategic Goal: Promote a healthy and safe home environment for citizens
Performance Objective:
Reduce the number of children who have elevated blood lead levels (elevated children)
Performance Indicators
Actual FY 11
Actual FY 12
Projected
FY 13
Adopted
FY 14
Input
FTEs in blood lead screening 0.35 .28 .30 .238
FTEs in elevated blood lead child (>=10) 0.25 0.25 0.25 0.23
FTEs in visual home assessment 0.20 0.23 0.28 0.33
FTEs in community outreach: lead/radon/bed bugs
0,20
0.26
0.26
0.33
FTEs utilized in property maintenance inspections/nuisances
0.05
0.28
0.23
0.23
Output
Lead screens managed 8,416 6,733 6,733 6,750
Elevated children identified for follow up 24
80
80
75
Visual home assessments conducted 67
78
95
110
Trainings conducted (testing required) 0
57
60
75
Radon test kits sold 10,036 8,944 7,500 7,500
Property inspections completed 4 28 60 60
Outcome
Elevated children (to less than 1%) 1.1% 1.6% 1.6% 1.5%
Rescreen notices for blood testing follow-up 200 252 250 200
Persons educated during home visual assessment
134
156
190
220
Landlords credentialed 0 0 20 30
Radon test kits analyzed 5,166 5,634 4,750 4,750
Property maintenance inspections resolved 2 25 55 55
Efficiency
Cost/per screening management $3.54 $3.48 $3.67 $3.76
Cost per elevated child 886.82 262.57 276.12 282.43
Cost/healthy homes assessment 254.13 250.45 263.38 269.39
Cost for landlord training & credentialing program
NA
367.59
386.57
395.40
Cost per property maintenance inspections $1,064.18 323.16 339.84 347.60
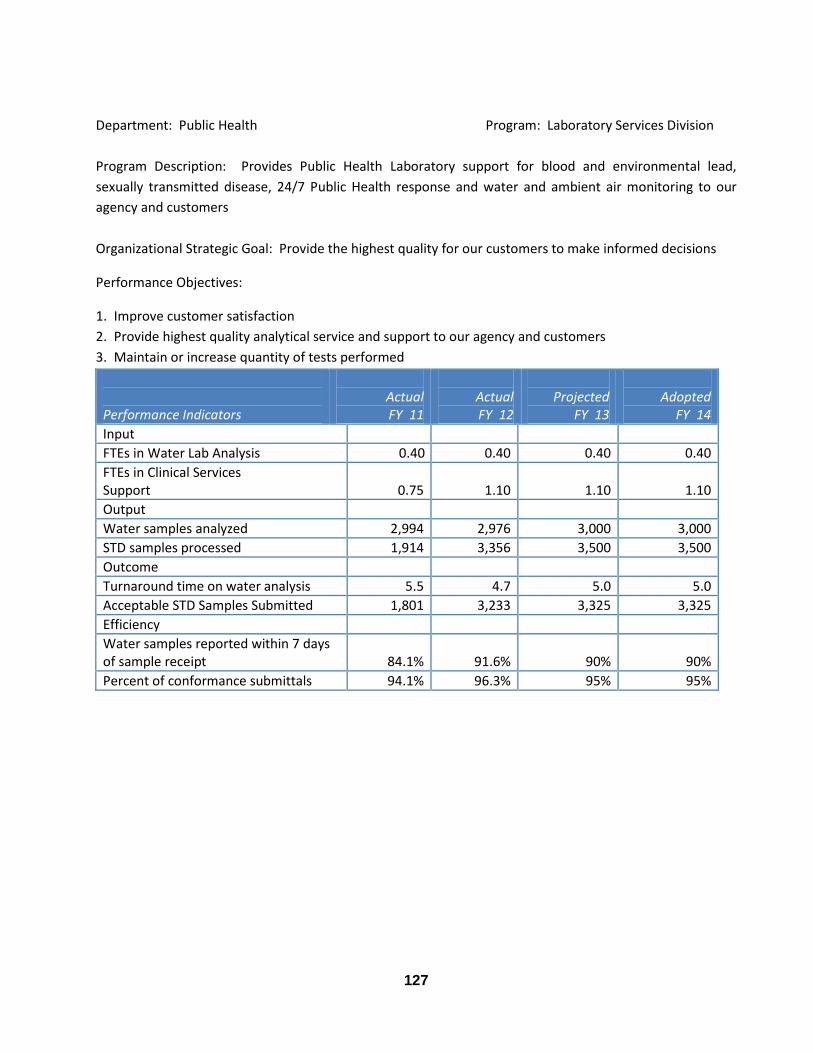
127
Department: Public Health Program: Laboratory Services Division
Program Description: Provides Public Health Laboratory support for blood and environmental lead,
sexually transmitted disease, 24/7 Public Health response and water and ambient air monitoring to our
agency and customers
Organizational Strategic Goal: Provide the highest quality for our customers to make informed decisions
Performance Objectives:
1. Improve customer satisfaction
2. Provide highest quality analytical service and support to our agency and customers
3. Maintain or increase quantity of tests performed
Performance Indicators
Actual FY 11
Actual FY 12
Projected
FY 13
Adopted
FY 14
Input
FTEs in Water Lab Analysis 0.40 0.40 0.40 0.40
FTEs in Clinical Services Support
0.75
1.10
1.10
1.10
Output
Water samples analyzed 2,994 2,976 3,000 3,000
STD samples processed 1,914 3,356 3,500 3,500
Outcome
Turnaround time on water analysis 5.5 4.7 5.0 5.0
Acceptable STD Samples Submitted 1,801 3,233 3,325 3,325
Efficiency
Water samples reported within 7 days of sample receipt
84.1%
91.6%
90%
90%
Percent of conformance submittals 94.1% 96.3% 95% 95%
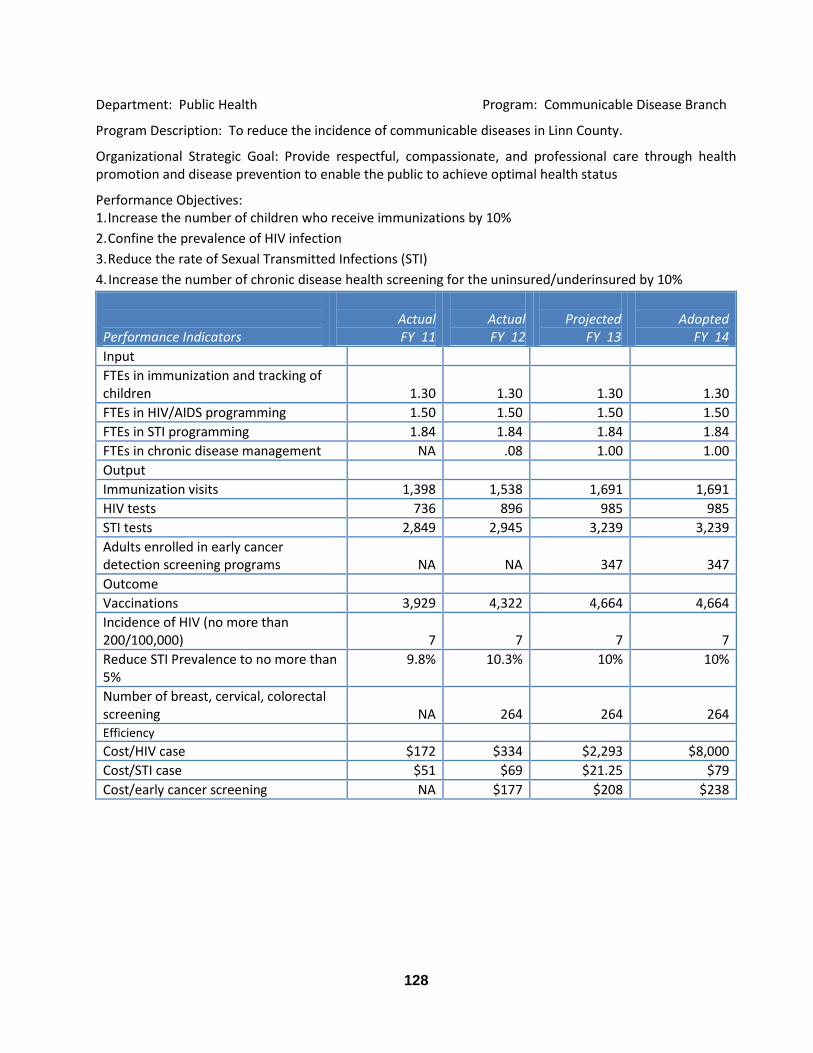
128
Department: Public Health Program: Communicable Disease Branch
Program Description: To reduce the incidence of communicable diseases in Linn County.
Organizational Strategic Goal: Provide respectful, compassionate, and professional care through health promotion and disease prevention to enable the public to achieve optimal health status
Performance Objectives: 1. Increase the number of children who receive immunizations by 10%
2. Confine the prevalence of HIV infection
3. Reduce the rate of Sexual Transmitted Infections (STI)
4. Increase the number of chronic disease health screening for the uninsured/underinsured by 10%
Performance Indicators
Actual FY 11
Actual FY 12
Projected
FY 13
Adopted
FY 14
Input
FTEs in immunization and tracking of children
1.30
1.30
1.30
1.30
FTEs in HIV/AIDS programming 1.50 1.50 1.50 1.50
FTEs in STI programming 1.84 1.84 1.84 1.84
FTEs in chronic disease management NA .08 1.00 1.00
Output
Immunization visits 1,398 1,538 1,691 1,691
HIV tests 736 896 985 985
STI tests 2,849 2,945 3,239 3,239
Adults enrolled in early cancer detection screening programs
NA
NA
347
347
Outcome
Vaccinations 3,929 4,322 4,664 4,664
Incidence of HIV (no more than 200/100,000)
7
7
7
7
Reduce STI Prevalence to no more than 5%
9.8% 10.3% 10% 10%
Number of breast, cervical, colorectal screening
NA
264
264
264
Efficiency
Cost/HIV case $172 $334 $2,293 $8,000
Cost/STI case $51 $69 $21.25 $79
Cost/early cancer screening NA $177 $208 $238
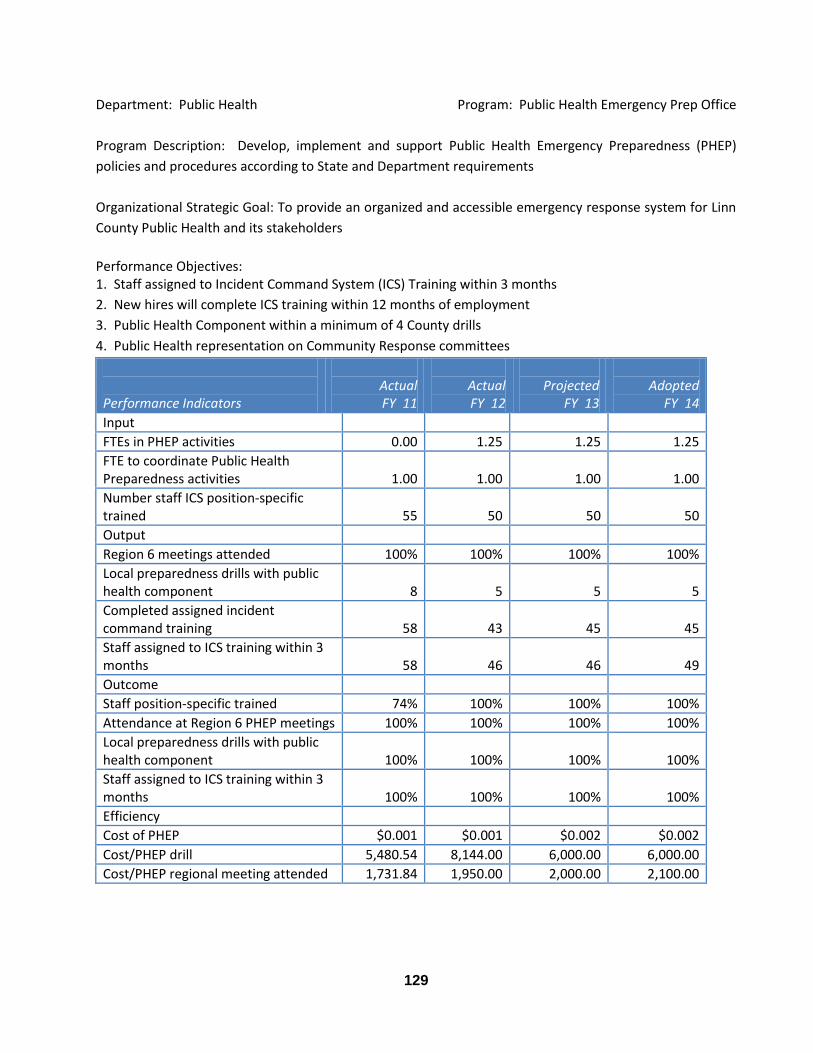
129
Department: Public Health Program: Public Health Emergency Prep Office
Program Description: Develop, implement and support Public Health Emergency Preparedness (PHEP)
policies and procedures according to State and Department requirements
Organizational Strategic Goal: To provide an organized and accessible emergency response system for Linn
County Public Health and its stakeholders
Performance Objectives: 1. Staff assigned to Incident Command System (ICS) Training within 3 months
2. New hires will complete ICS training within 12 months of employment
3. Public Health Component within a minimum of 4 County drills
4. Public Health representation on Community Response committees
Performance Indicators
Actual FY 11
Actual FY 12
Projected
FY 13
Adopted
FY 14
Input
FTEs in PHEP activities 0.00 1.25 1.25 1.25
FTE to coordinate Public Health Preparedness activities
1.00
1.00
1.00
1.00
Number staff ICS position-specific trained
55
50
50
50
Output
Region 6 meetings attended 100% 100% 100% 100%
Local preparedness drills with public health component
8
5
5
5
Completed assigned incident command training
58
43
45
45
Staff assigned to ICS training within 3 months
58
46
46
49
Outcome
Staff position-specific trained 74% 100% 100% 100%
Attendance at Region 6 PHEP meetings 100% 100% 100% 100%
Local preparedness drills with public health component
100%
100%
100%
100%
Staff assigned to ICS training within 3 months
100%
100%
100%
100%
Efficiency
Cost of PHEP $0.001 $0.001 $0.002 $0.002
Cost/PHEP drill 5,480.54 8,144.00 6,000.00 6,000.00
Cost/PHEP regional meeting attended 1,731.84 1,950.00 2,000.00 2,100.00
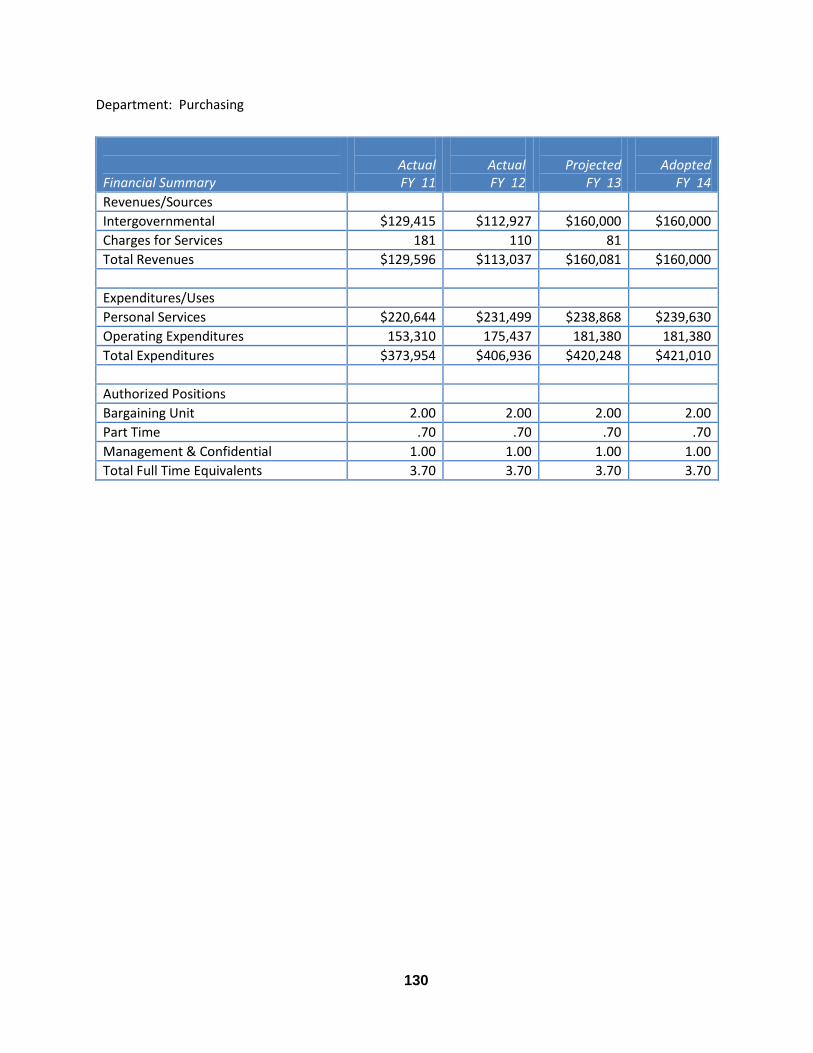
130
Department: Purchasing
Financial Summary
Actual FY 11
Actual FY 12
Projected
FY 13
Adopted
FY 14
Revenues/Sources
Intergovernmental $129,415 $112,927 $160,000 $160,000
Charges for Services 181 110 81
Total Revenues $129,596 $113,037 $160,081 $160,000
Expenditures/Uses
Personal Services $220,644 $231,499 $238,868 $239,630
Operating Expenditures 153,310 175,437 181,380 181,380
Total Expenditures $373,954 $406,936 $420,248 $421,010
Authorized Positions
Bargaining Unit 2.00 2.00 2.00 2.00
Part Time .70 .70 .70 .70
Management & Confidential 1.00 1.00 1.00 1.00
Total Full Time Equivalents 3.70 3.70 3.70 3.70
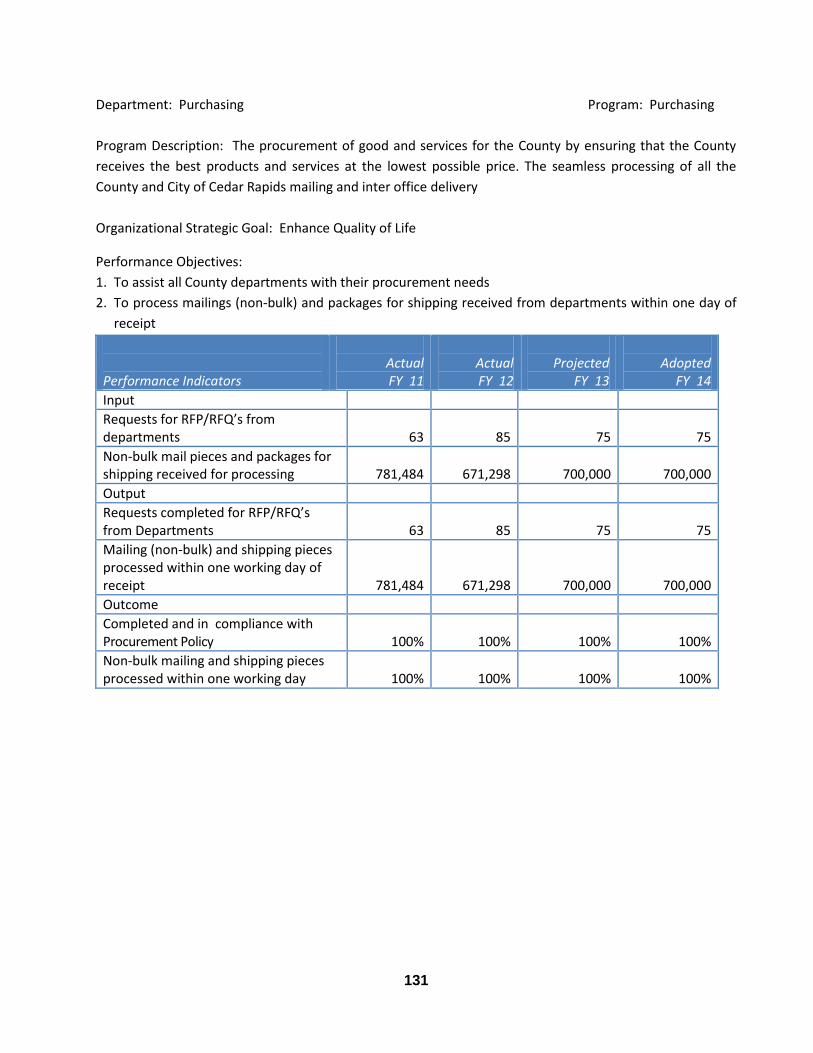
131
Department: Purchasing Program: Purchasing
Program Description: The procurement of good and services for the County by ensuring that the County
receives the best products and services at the lowest possible price. The seamless processing of all the
County and City of Cedar Rapids mailing and inter office delivery
Organizational Strategic Goal: Enhance Quality of Life
Performance Objectives:
1. To assist all County departments with their procurement needs
2. To process mailings (non-bulk) and packages for shipping received from departments within one day of
receipt
Performance Indicators
Actual FY 11
Actual FY 12
Projected
FY 13
Adopted
FY 14
Input
Requests for RFP/RFQ’s from departments
63
85
75
75
Non-bulk mail pieces and packages for shipping received for processing
781,484
671,298
700,000
700,000
Output
Requests completed for RFP/RFQ’s from Departments
63
85
75
75
Mailing (non-bulk) and shipping pieces processed within one working day of receipt
781,484
671,298
700,000
700,000
Outcome
Completed and in compliance with Procurement Policy
100%
100%
100%
100%
Non-bulk mailing and shipping pieces processed within one working day
100%
100%
100%
100%

132
Department: Recorder
Financial Summary
Actual FY 11
Actual FY 12
Projected
FY 13
Adopted
FY 14
Revenues/Sources
Charges for Services $1,700,971 $1,587,171 $1,661,000 $1,584,000
Use of Money & Property 713 648 802 802
Total Revenues $1,701,684 $1,587,819 $1,661,802 $1,584,802
Expenditures/Uses
Personal Services $946,217 $993,902 $1,017,413 $1,045,086
Operating Expenditures 306,081 254,796 235,229 237,383
Total Expenditures $1,252,298 $1,248,698 $1,252,642 $1,282,469
Authorized Positions
Elected & Appointed Officials 1.00 1.00 1.00 1.00
Deputies 3.00 3.00 3.00 3.00
Bargaining Unit 10.00 10.00 10.00 10.00
Total Full Time Equivalents 14.00 14.00 14.00 14.00
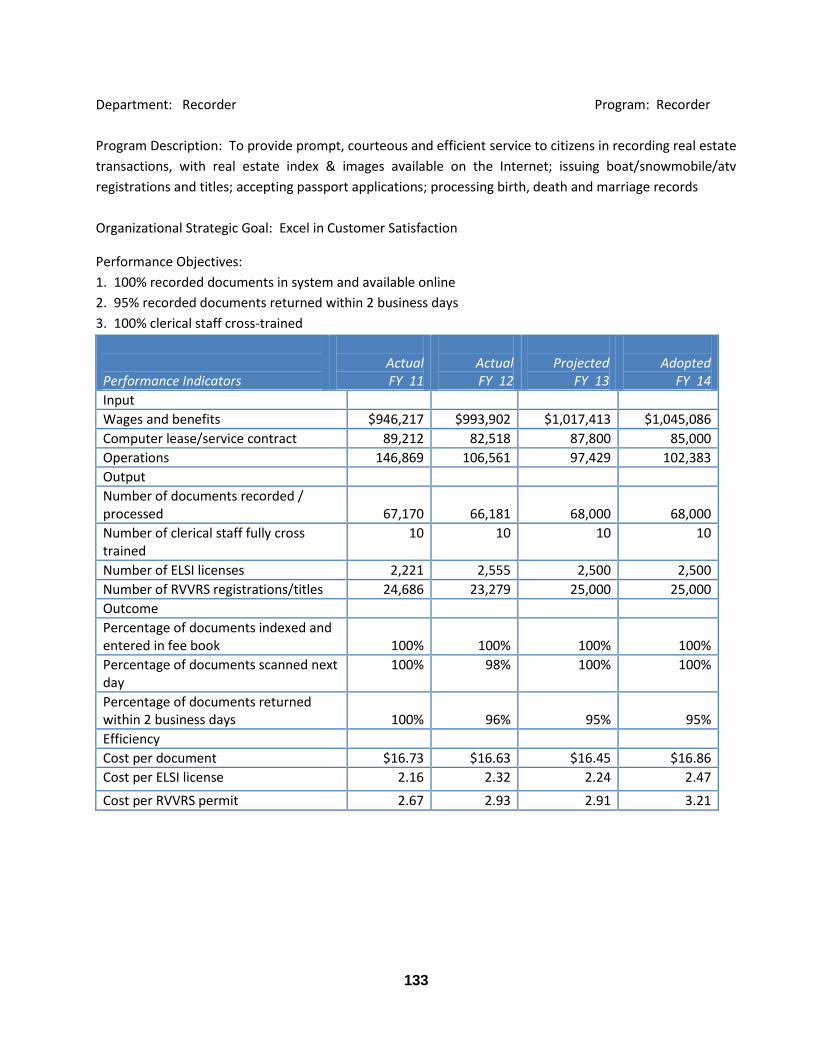
133
Department: Recorder Program: Recorder
Program Description: To provide prompt, courteous and efficient service to citizens in recording real estate
transactions, with real estate index & images available on the Internet; issuing boat/snowmobile/atv
registrations and titles; accepting passport applications; processing birth, death and marriage records
Organizational Strategic Goal: Excel in Customer Satisfaction
Performance Objectives:
1. 100% recorded documents in system and available online
2. 95% recorded documents returned within 2 business days
3. 100% clerical staff cross-trained
Performance Indicators
Actual FY 11
Actual FY 12
Projected
FY 13
Adopted
FY 14
Input
Wages and benefits $946,217 $993,902 $1,017,413 $1,045,086
Computer lease/service contract 89,212 82,518 87,800 85,000
Operations 146,869 106,561 97,429 102,383
Output
Number of documents recorded / processed
67,170
66,181
68,000
68,000
Number of clerical staff fully cross trained
10 10 10 10
Number of ELSI licenses 2,221 2,555 2,500 2,500
Number of RVVRS registrations/titles 24,686 23,279 25,000 25,000
Outcome
Percentage of documents indexed and entered in fee book
100%
100%
100%
100%
Percentage of documents scanned next day
100% 98% 100% 100%
Percentage of documents returned within 2 business days
100%
96%
95%
95%
Efficiency
Cost per document $16.73 $16.63 $16.45 $16.86
Cost per ELSI license 2.16 2.32 2.24 2.47
Cost per RVVRS permit 2.67 2.93 2.91 3.21
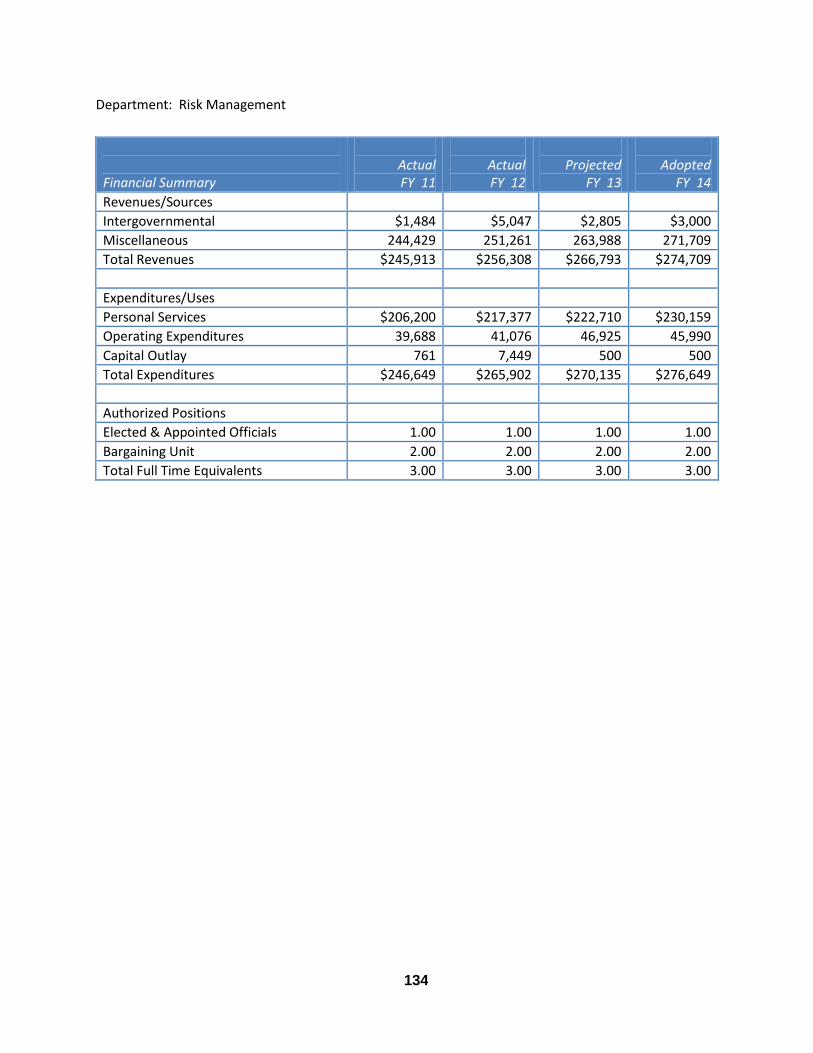
134
Department: Risk Management
Financial Summary
Actual FY 11
Actual FY 12
Projected
FY 13
Adopted
FY 14
Revenues/Sources
Intergovernmental $1,484 $5,047 $2,805 $3,000
Miscellaneous 244,429 251,261 263,988 271,709
Total Revenues $245,913 $256,308 $266,793 $274,709
Expenditures/Uses
Personal Services $206,200 $217,377 $222,710 $230,159
Operating Expenditures 39,688 41,076 46,925 45,990
Capital Outlay 761 7,449 500 500
Total Expenditures $246,649 $265,902 $270,135 $276,649
Authorized Positions
Elected & Appointed Officials 1.00 1.00 1.00 1.00
Bargaining Unit 2.00 2.00 2.00 2.00
Total Full Time Equivalents 3.00 3.00 3.00 3.00
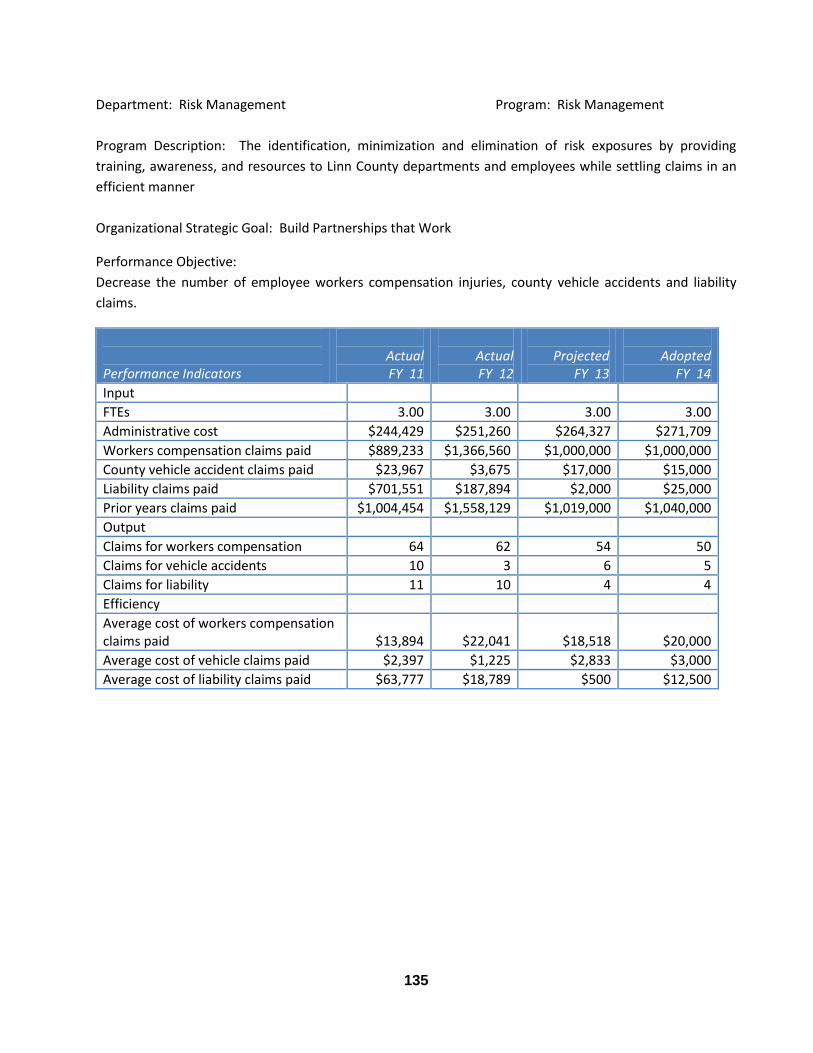
135
Department: Risk Management Program: Risk Management
Program Description: The identification, minimization and elimination of risk exposures by providing
training, awareness, and resources to Linn County departments and employees while settling claims in an
efficient manner
Organizational Strategic Goal: Build Partnerships that Work
Performance Objective:
Decrease the number of employee workers compensation injuries, county vehicle accidents and liability
claims.
Performance Indicators
Actual FY 11
Actual FY 12
Projected
FY 13
Adopted
FY 14
Input
FTEs 3.00 3.00 3.00 3.00
Administrative cost $244,429 $251,260 $264,327 $271,709
Workers compensation claims paid $889,233 $1,366,560 $1,000,000 $1,000,000
County vehicle accident claims paid $23,967 $3,675 $17,000 $15,000
Liability claims paid $701,551 $187,894 $2,000 $25,000
Prior years claims paid $1,004,454 $1,558,129 $1,019,000 $1,040,000
Output
Claims for workers compensation 64 62 54 50
Claims for vehicle accidents 10 3 6 5
Claims for liability 11 10 4 4
Efficiency
Average cost of workers compensation claims paid
$13,894 $22,041 $18,518 $20,000
Average cost of vehicle claims paid $2,397 $1,225 $2,833 $3,000
Average cost of liability claims paid $63,777 $18,789 $500 $12,500
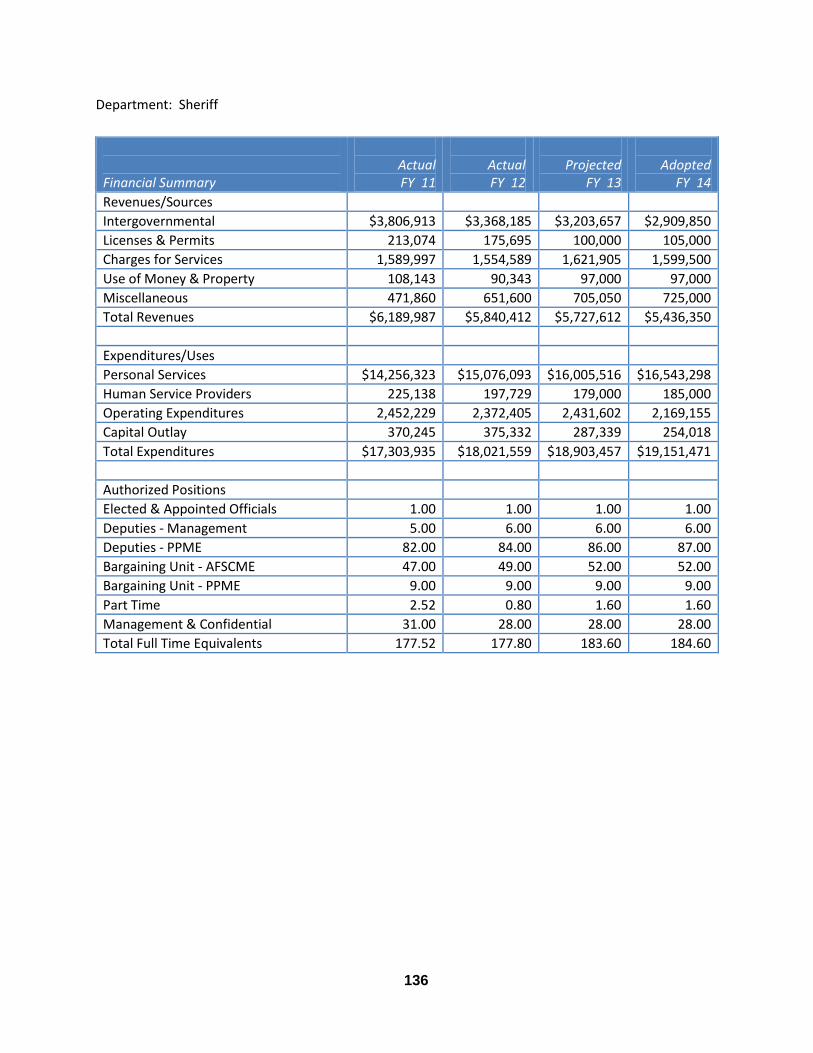
136
Department: Sheriff
Financial Summary
Actual FY 11
Actual FY 12
Projected
FY 13
Adopted
FY 14
Revenues/Sources
Intergovernmental $3,806,913 $3,368,185 $3,203,657 $2,909,850
Licenses & Permits 213,074 175,695 100,000 105,000
Charges for Services 1,589,997 1,554,589 1,621,905 1,599,500
Use of Money & Property 108,143 90,343 97,000 97,000
Miscellaneous 471,860 651,600 705,050 725,000
Total Revenues $6,189,987 $5,840,412 $5,727,612 $5,436,350
Expenditures/Uses
Personal Services $14,256,323 $15,076,093 $16,005,516 $16,543,298
Human Service Providers 225,138 197,729 179,000 185,000
Operating Expenditures 2,452,229 2,372,405 2,431,602 2,169,155
Capital Outlay 370,245 375,332 287,339 254,018
Total Expenditures $17,303,935 $18,021,559 $18,903,457 $19,151,471
Authorized Positions
Elected & Appointed Officials 1.00 1.00 1.00 1.00
Deputies - Management 5.00 6.00 6.00 6.00
Deputies - PPME 82.00 84.00 86.00 87.00
Bargaining Unit - AFSCME 47.00 49.00 52.00 52.00
Bargaining Unit - PPME 9.00 9.00 9.00 9.00
Part Time 2.52 0.80 1.60 1.60
Management & Confidential 31.00 28.00 28.00 28.00
Total Full Time Equivalents 177.52 177.80 183.60 184.60
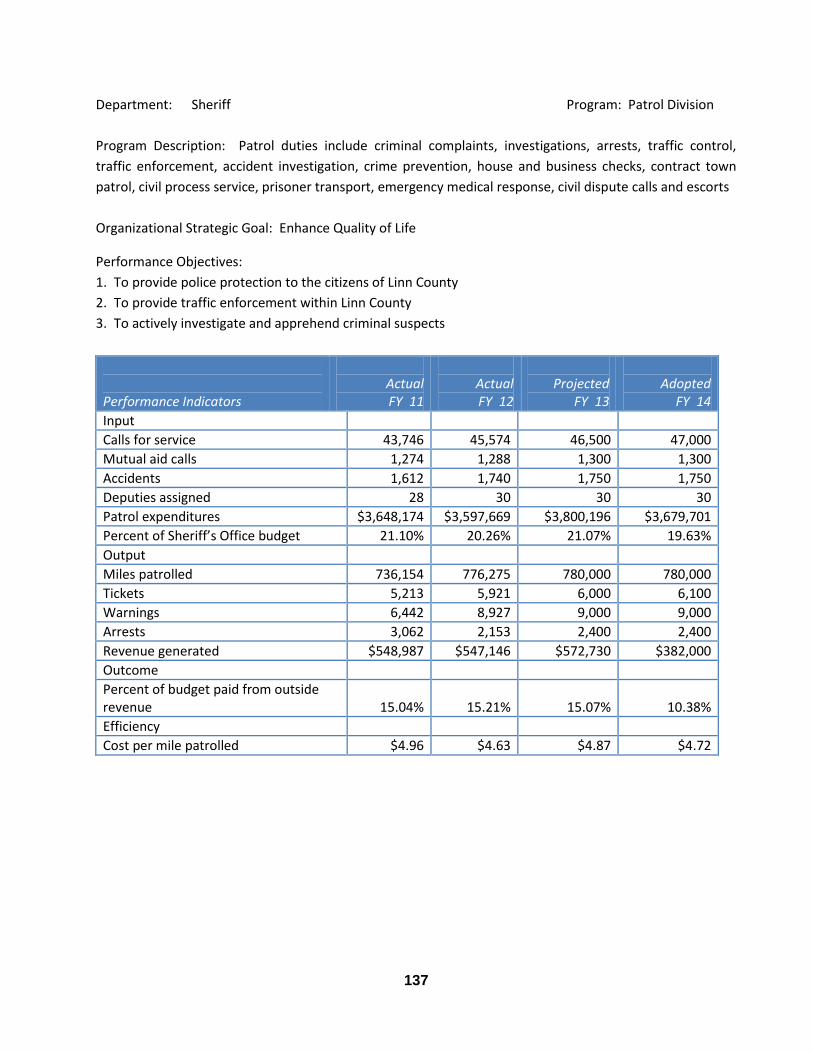
137
Department: Sheriff Program: Patrol Division
Program Description: Patrol duties include criminal complaints, investigations, arrests, traffic control,
traffic enforcement, accident investigation, crime prevention, house and business checks, contract town
patrol, civil process service, prisoner transport, emergency medical response, civil dispute calls and escorts
Organizational Strategic Goal: Enhance Quality of Life
Performance Objectives:
1. To provide police protection to the citizens of Linn County
2. To provide traffic enforcement within Linn County
3. To actively investigate and apprehend criminal suspects
Performance Indicators
Actual FY 11
Actual FY 12
Projected
FY 13
Adopted
FY 14
Input
Calls for service 43,746 45,574 46,500 47,000
Mutual aid calls 1,274 1,288 1,300 1,300
Accidents 1,612 1,740 1,750 1,750
Deputies assigned 28 30 30 30
Patrol expenditures $3,648,174 $3,597,669 $3,800,196 $3,679,701
Percent of Sheriff’s Office budget 21.10% 20.26% 21.07% 19.63%
Output
Miles patrolled 736,154 776,275 780,000 780,000
Tickets 5,213 5,921 6,000 6,100
Warnings 6,442 8,927 9,000 9,000
Arrests 3,062 2,153 2,400 2,400
Revenue generated $548,987 $547,146 $572,730 $382,000
Outcome
Percent of budget paid from outside revenue
15.04%
15.21%
15.07%
10.38%
Efficiency
Cost per mile patrolled $4.96 $4.63 $4.87 $4.72
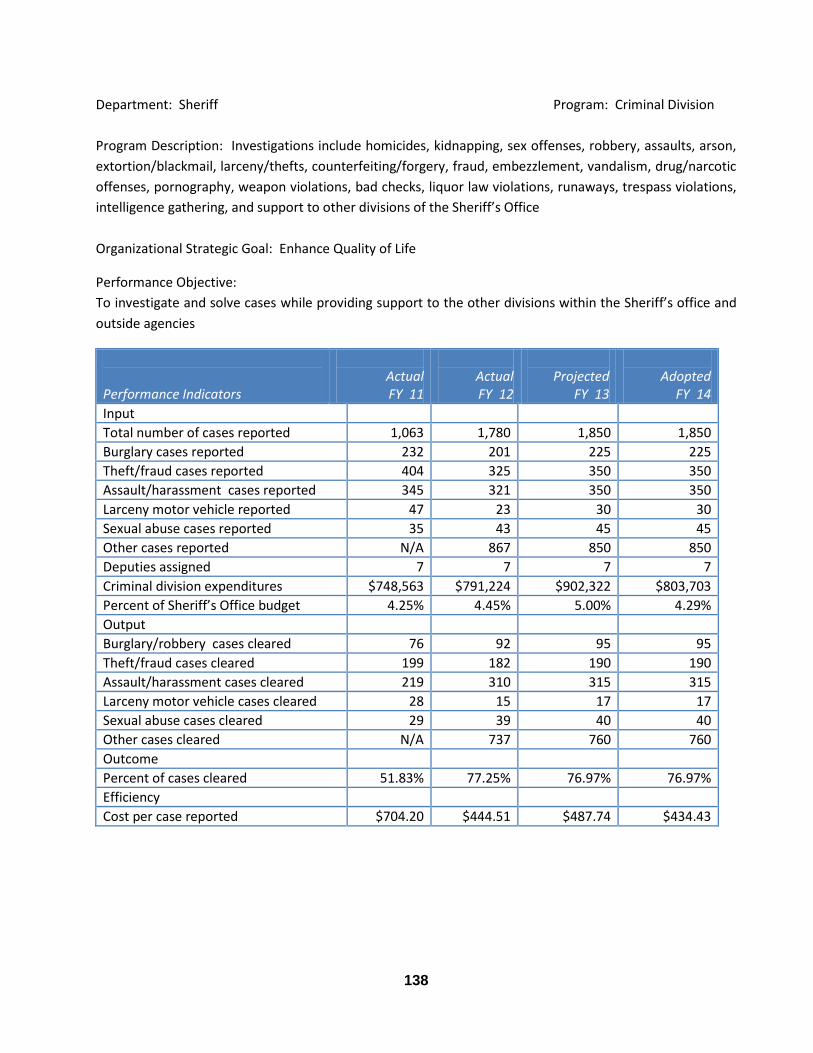
138
Department: Sheriff Program: Criminal Division
Program Description: Investigations include homicides, kidnapping, sex offenses, robbery, assaults, arson,
extortion/blackmail, larceny/thefts, counterfeiting/forgery, fraud, embezzlement, vandalism, drug/narcotic
offenses, pornography, weapon violations, bad checks, liquor law violations, runaways, trespass violations,
intelligence gathering, and support to other divisions of the Sheriff’s Office
Organizational Strategic Goal: Enhance Quality of Life
Performance Objective:
To investigate and solve cases while providing support to the other divisions within the Sheriff’s office and
outside agencies
Performance Indicators
Actual FY 11
Actual FY 12
Projected
FY 13
Adopted
FY 14
Input
Total number of cases reported 1,063 1,780 1,850 1,850
Burglary cases reported 232 201 225 225
Theft/fraud cases reported 404 325 350 350
Assault/harassment cases reported 345 321 350 350
Larceny motor vehicle reported 47 23 30 30
Sexual abuse cases reported 35 43 45 45
Other cases reported N/A 867 850 850
Deputies assigned 7 7 7 7
Criminal division expenditures $748,563 $791,224 $902,322 $803,703
Percent of Sheriff’s Office budget 4.25% 4.45% 5.00% 4.29%
Output
Burglary/robbery cases cleared 76 92 95 95
Theft/fraud cases cleared 199 182 190 190
Assault/harassment cases cleared 219 310 315 315
Larceny motor vehicle cases cleared 28 15 17 17
Sexual abuse cases cleared 29 39 40 40
Other cases cleared N/A 737 760 760
Outcome
Percent of cases cleared 51.83% 77.25% 76.97% 76.97%
Efficiency
Cost per case reported $704.20 $444.51 $487.74 $434.43
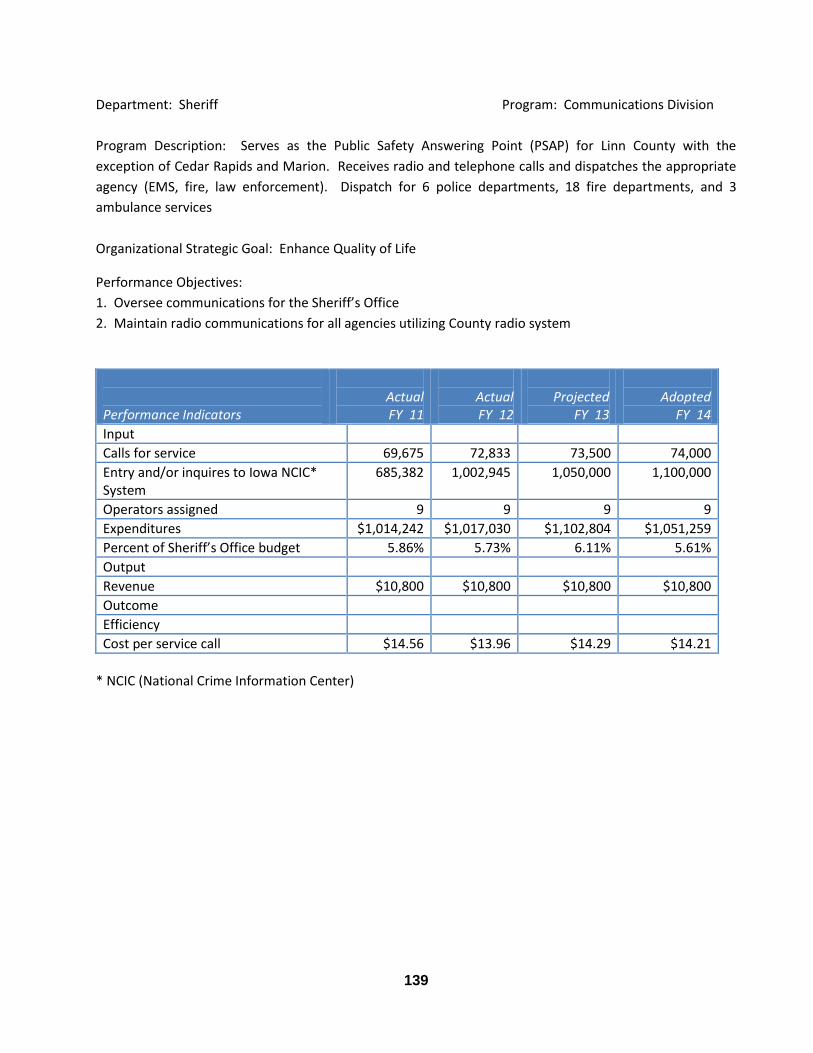
139
Department: Sheriff Program: Communications Division
Program Description: Serves as the Public Safety Answering Point (PSAP) for Linn County with the
exception of Cedar Rapids and Marion. Receives radio and telephone calls and dispatches the appropriate
agency (EMS, fire, law enforcement). Dispatch for 6 police departments, 18 fire departments, and 3
ambulance services
Organizational Strategic Goal: Enhance Quality of Life
Performance Objectives:
1. Oversee communications for the Sheriff’s Office
2. Maintain radio communications for all agencies utilizing County radio system
Performance Indicators
Actual FY 11
Actual FY 12
Projected
FY 13
Adopted
FY 14
Input
Calls for service 69,675 72,833 73,500 74,000
Entry and/or inquires to Iowa NCIC* System
685,382 1,002,945 1,050,000 1,100,000
Operators assigned 9 9 9 9
Expenditures $1,014,242 $1,017,030 $1,102,804 $1,051,259
Percent of Sheriff’s Office budget 5.86% 5.73% 6.11% 5.61%
Output
Revenue $10,800 $10,800 $10,800 $10,800
Outcome
Efficiency
Cost per service call $14.56 $13.96 $14.29 $14.21
* NCIC (National Crime Information Center)
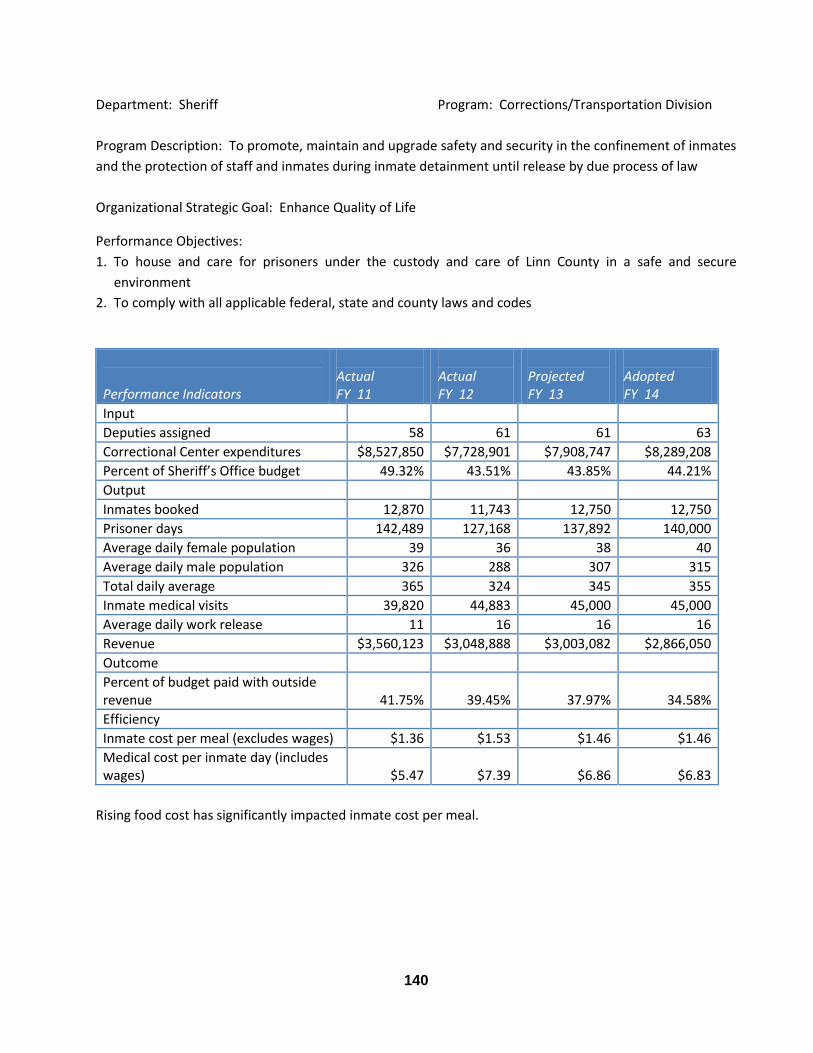
140
Department: Sheriff Program: Corrections/Transportation Division
Program Description: To promote, maintain and upgrade safety and security in the confinement of inmates
and the protection of staff and inmates during inmate detainment until release by due process of law
Organizational Strategic Goal: Enhance Quality of Life
Performance Objectives:
1. To house and care for prisoners under the custody and care of Linn County in a safe and secure
environment
2. To comply with all applicable federal, state and county laws and codes
Performance Indicators
Actual FY 11
Actual FY 12
Projected FY 13
Adopted FY 14
Input
Deputies assigned 58 61 61 63
Correctional Center expenditures $8,527,850 $7,728,901 $7,908,747 $8,289,208
Percent of Sheriff’s Office budget 49.32% 43.51% 43.85% 44.21%
Output
Inmates booked 12,870 11,743 12,750 12,750
Prisoner days 142,489 127,168 137,892 140,000
Average daily female population 39 36 38 40
Average daily male population 326 288 307 315
Total daily average 365 324 345 355
Inmate medical visits 39,820 44,883 45,000 45,000
Average daily work release 11 16 16 16
Revenue $3,560,123 $3,048,888 $3,003,082 $2,866,050
Outcome
Percent of budget paid with outside revenue
41.75%
39.45%
37.97%
34.58%
Efficiency
Inmate cost per meal (excludes wages) $1.36 $1.53 $1.46 $1.46
Medical cost per inmate day (includes wages)
$5.47
$7.39
$6.86
$6.83
Rising food cost has significantly impacted inmate cost per meal.
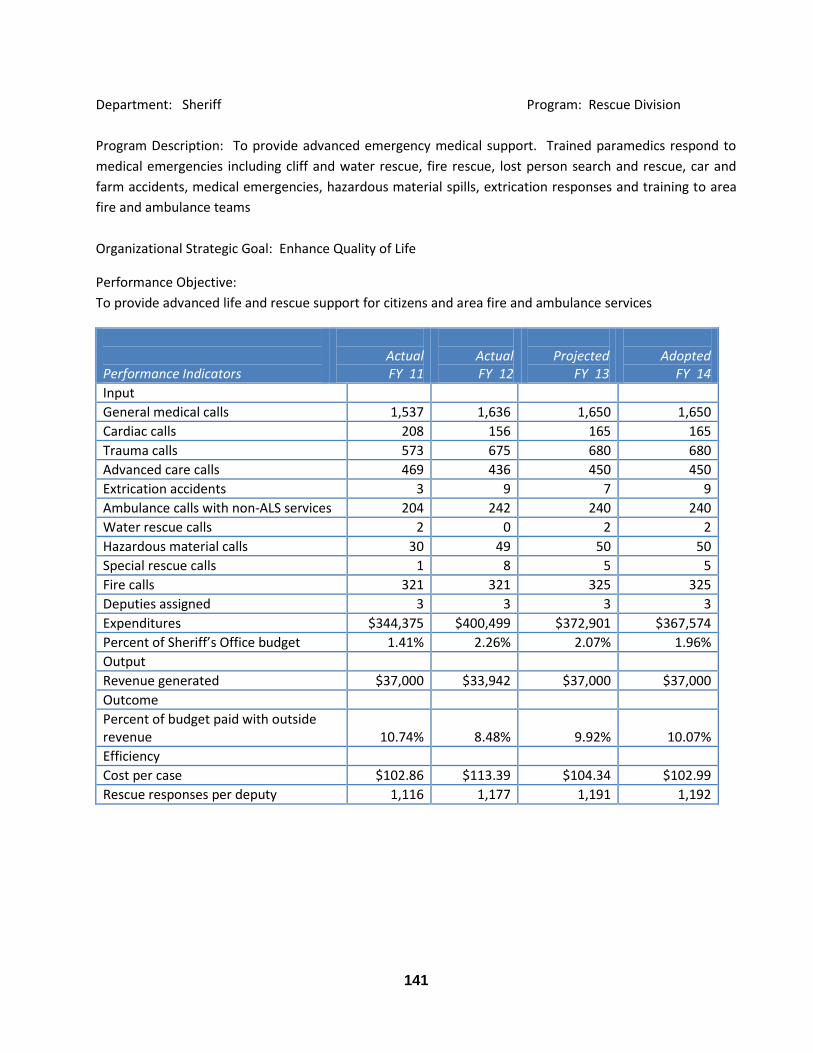
141
Department: Sheriff Program: Rescue Division
Program Description: To provide advanced emergency medical support. Trained paramedics respond to
medical emergencies including cliff and water rescue, fire rescue, lost person search and rescue, car and
farm accidents, medical emergencies, hazardous material spills, extrication responses and training to area
fire and ambulance teams
Organizational Strategic Goal: Enhance Quality of Life
Performance Objective:
To provide advanced life and rescue support for citizens and area fire and ambulance services
Performance Indicators
Actual FY 11
Actual FY 12
Projected
FY 13
Adopted
FY 14
Input
General medical calls 1,537 1,636 1,650 1,650
Cardiac calls 208 156 165 165
Trauma calls 573 675 680 680
Advanced care calls 469 436 450 450
Extrication accidents 3 9 7 9
Ambulance calls with non-ALS services 204 242 240 240
Water rescue calls 2 0 2 2
Hazardous material calls 30 49 50 50
Special rescue calls 1 8 5 5
Fire calls 321 321 325 325
Deputies assigned 3 3 3 3
Expenditures $344,375 $400,499 $372,901 $367,574
Percent of Sheriff’s Office budget 1.41% 2.26% 2.07% 1.96%
Output
Revenue generated $37,000 $33,942 $37,000 $37,000
Outcome
Percent of budget paid with outside revenue
10.74%
8.48%
9.92%
10.07%
Efficiency
Cost per case $102.86 $113.39 $104.34 $102.99
Rescue responses per deputy 1,116 1,177 1,191 1,192
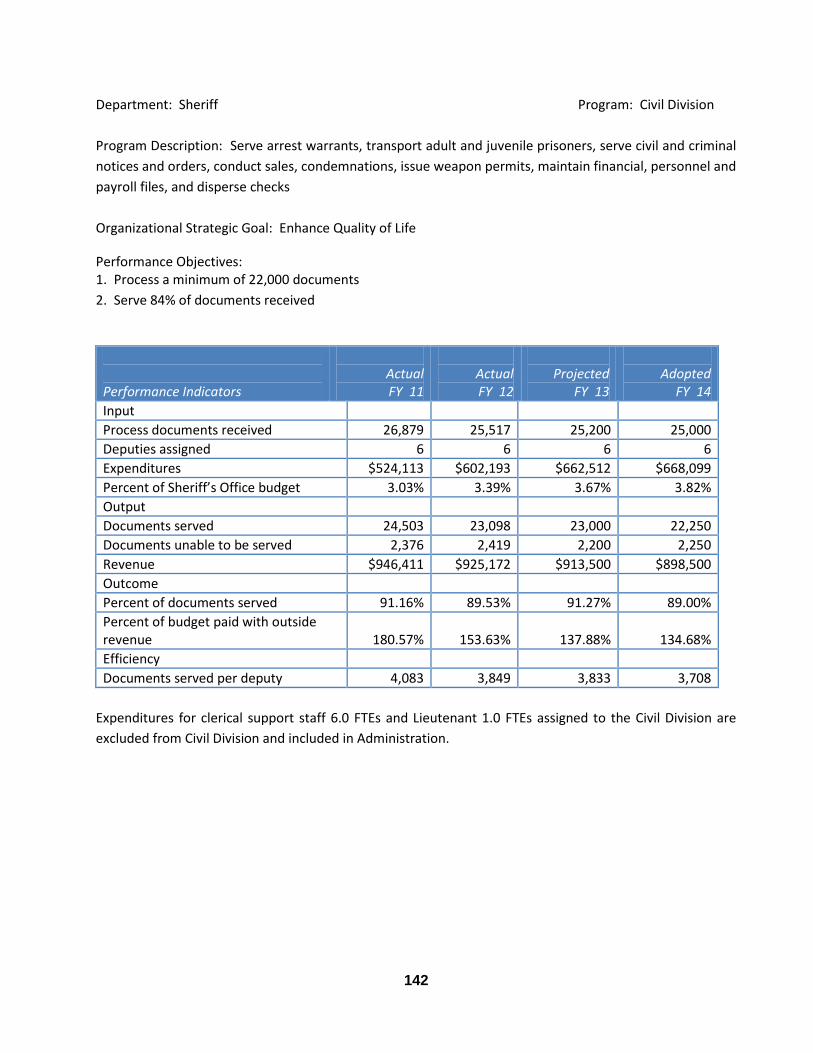
142
Department: Sheriff Program: Civil Division
Program Description: Serve arrest warrants, transport adult and juvenile prisoners, serve civil and criminal
notices and orders, conduct sales, condemnations, issue weapon permits, maintain financial, personnel and
payroll files, and disperse checks
Organizational Strategic Goal: Enhance Quality of Life
Performance Objectives: 1. Process a minimum of 22,000 documents
2. Serve 84% of documents received
Performance Indicators
Actual FY 11
Actual FY 12
Projected
FY 13
Adopted
FY 14
Input
Process documents received 26,879 25,517 25,200 25,000
Deputies assigned 6 6 6 6
Expenditures $524,113 $602,193 $662,512 $668,099
Percent of Sheriff’s Office budget 3.03% 3.39% 3.67% 3.82%
Output
Documents served 24,503 23,098 23,000 22,250
Documents unable to be served 2,376 2,419 2,200 2,250
Revenue $946,411 $925,172 $913,500 $898,500
Outcome
Percent of documents served 91.16% 89.53% 91.27% 89.00%
Percent of budget paid with outside revenue
180.57%
153.63%
137.88%
134.68%
Efficiency
Documents served per deputy 4,083 3,849 3,833 3,708
Expenditures for clerical support staff 6.0 FTEs and Lieutenant 1.0 FTEs assigned to the Civil Division are
excluded from Civil Division and included in Administration.
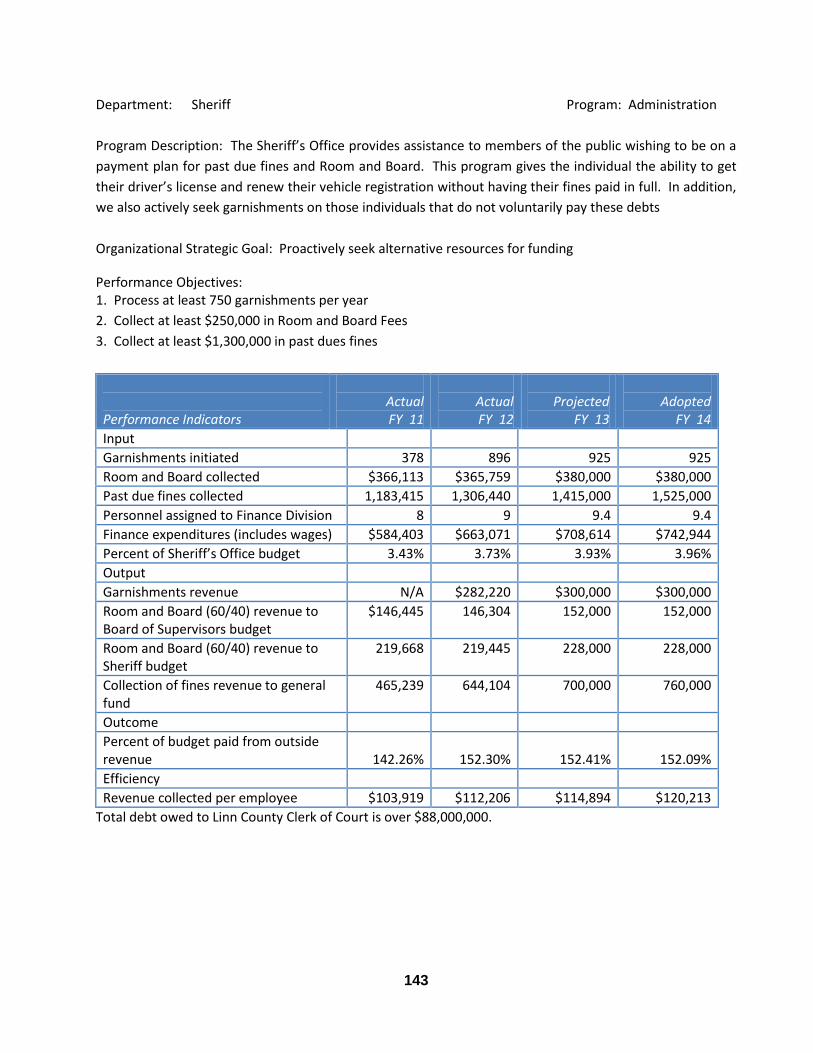
143
Department: Sheriff Program: Administration
Program Description: The Sheriff’s Office provides assistance to members of the public wishing to be on a
payment plan for past due fines and Room and Board. This program gives the individual the ability to get
their driver’s license and renew their vehicle registration without having their fines paid in full. In addition,
we also actively seek garnishments on those individuals that do not voluntarily pay these debts
Organizational Strategic Goal: Proactively seek alternative resources for funding
Performance Objectives: 1. Process at least 750 garnishments per year
2. Collect at least $250,000 in Room and Board Fees
3. Collect at least $1,300,000 in past dues fines
Performance Indicators
Actual FY 11
Actual FY 12
Projected
FY 13
Adopted
FY 14
Input
Garnishments initiated 378 896 925 925
Room and Board collected $366,113 $365,759 $380,000 $380,000
Past due fines collected 1,183,415 1,306,440 1,415,000 1,525,000
Personnel assigned to Finance Division 8 9 9.4 9.4
Finance expenditures (includes wages) $584,403 $663,071 $708,614 $742,944
Percent of Sheriff’s Office budget 3.43% 3.73% 3.93% 3.96%
Output
Garnishments revenue N/A $282,220 $300,000 $300,000
Room and Board (60/40) revenue to Board of Supervisors budget
$146,445 146,304 152,000 152,000
Room and Board (60/40) revenue to Sheriff budget
219,668 219,445 228,000 228,000
Collection of fines revenue to general fund
465,239 644,104 700,000 760,000
Outcome
Percent of budget paid from outside revenue
142.26%
152.30%
152.41%
152.09%
Efficiency
Revenue collected per employee $103,919 $112,206 $114,894 $120,213
Total debt owed to Linn County Clerk of Court is over $88,000,000.
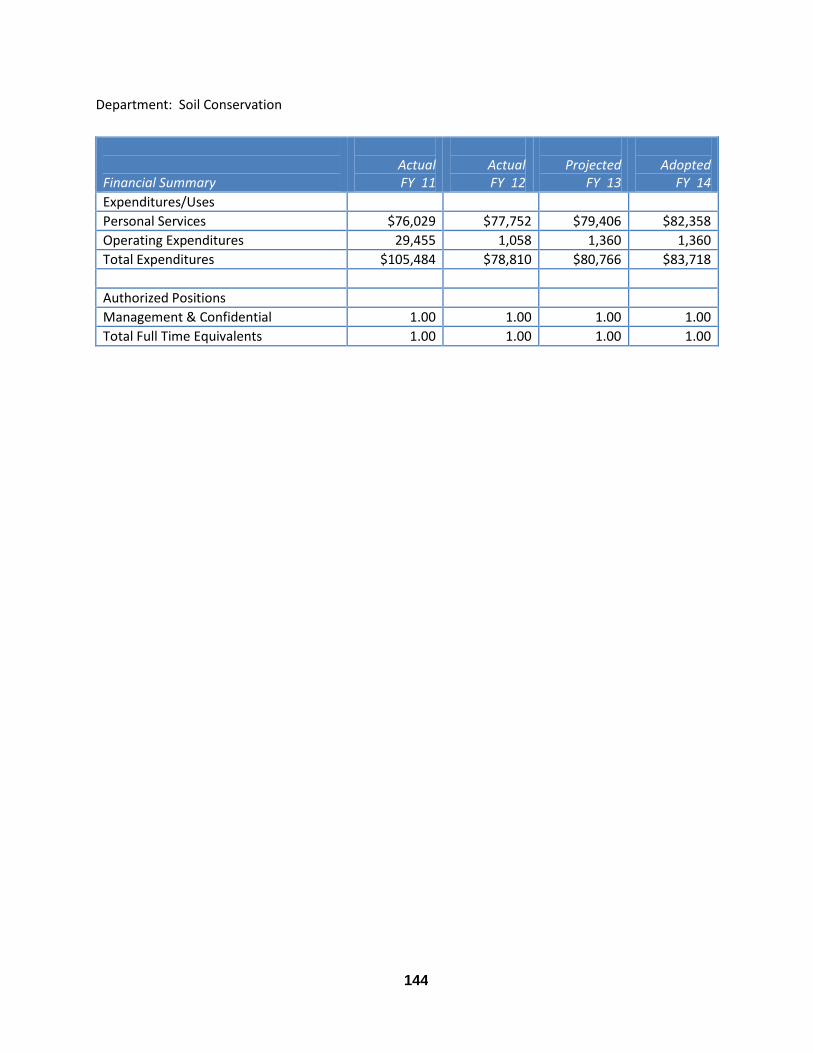
144
Department: Soil Conservation
Financial Summary
Actual FY 11
Actual FY 12
Projected
FY 13
Adopted
FY 14
Expenditures/Uses
Personal Services $76,029 $77,752 $79,406 $82,358
Operating Expenditures 29,455 1,058 1,360 1,360
Total Expenditures $105,484 $78,810 $80,766 $83,718
Authorized Positions
Management & Confidential 1.00 1.00 1.00 1.00
Total Full Time Equivalents 1.00 1.00 1.00 1.00
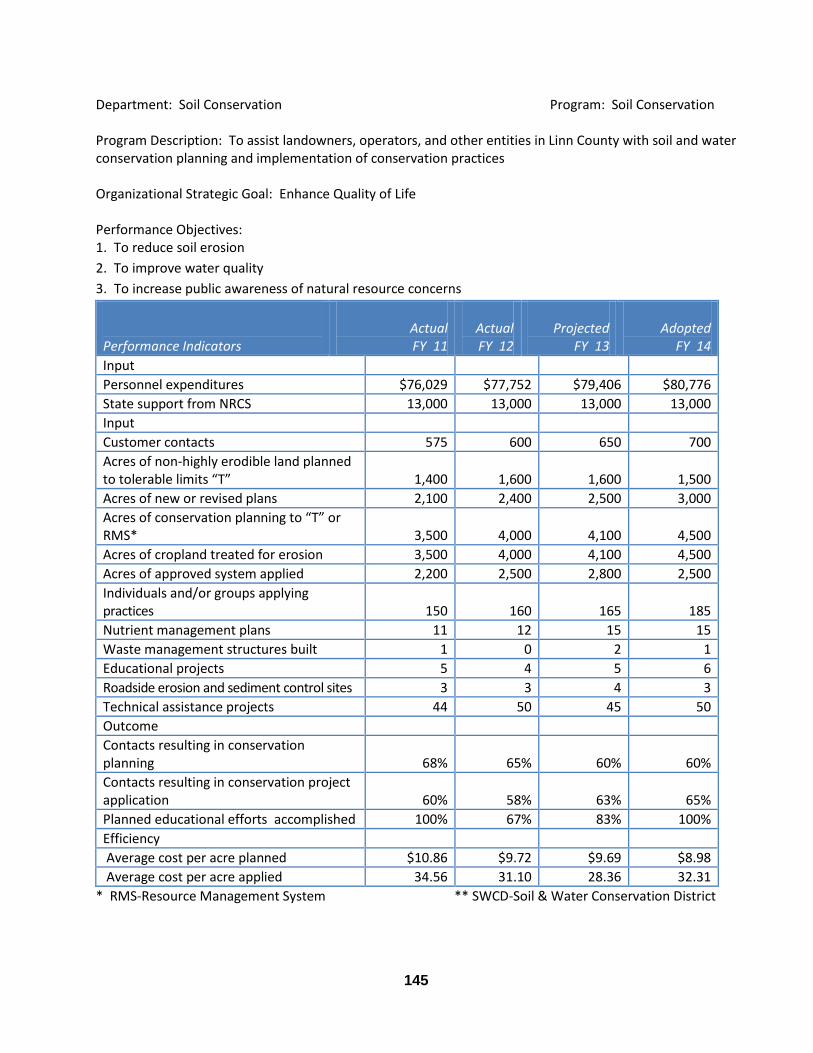
145
Department: Soil Conservation Program: Soil Conservation Program Description: To assist landowners, operators, and other entities in Linn County with soil and water conservation planning and implementation of conservation practices Organizational Strategic Goal: Enhance Quality of Life Performance Objectives: 1. To reduce soil erosion
2. To improve water quality
3. To increase public awareness of natural resource concerns
Performance Indicators
Actual FY 11
Actual FY 12
Projected
FY 13
Adopted
FY 14
Input
Personnel expenditures $76,029 $77,752 $79,406 $80,776
State support from NRCS 13,000 13,000 13,000 13,000
Input
Customer contacts 575 600 650 700
Acres of non-highly erodible land planned to tolerable limits “T”
1,400
1,600
1,600
1,500
Acres of new or revised plans 2,100 2,400 2,500 3,000
Acres of conservation planning to “T” or RMS*
3,500
4,000
4,100
4,500
Acres of cropland treated for erosion 3,500 4,000 4,100 4,500
Acres of approved system applied 2,200 2,500 2,800 2,500
Individuals and/or groups applying practices
150
160
165
185
Nutrient management plans 11 12 15 15
Waste management structures built 1 0 2 1
Educational projects 5 4 5 6
Roadside erosion and sediment control sites 3 3 4 3
Technical assistance projects 44 50 45 50
Outcome
Contacts resulting in conservation planning
68%
65%
60%
60%
Contacts resulting in conservation project application
60%
58%
63%
65%
Planned educational efforts accomplished 100% 67% 83% 100%
Efficiency
Average cost per acre planned $10.86 $9.72 $9.69 $8.98
Average cost per acre applied 34.56 31.10 28.36 32.31
* RMS-Resource Management System ** SWCD-Soil & Water Conservation District
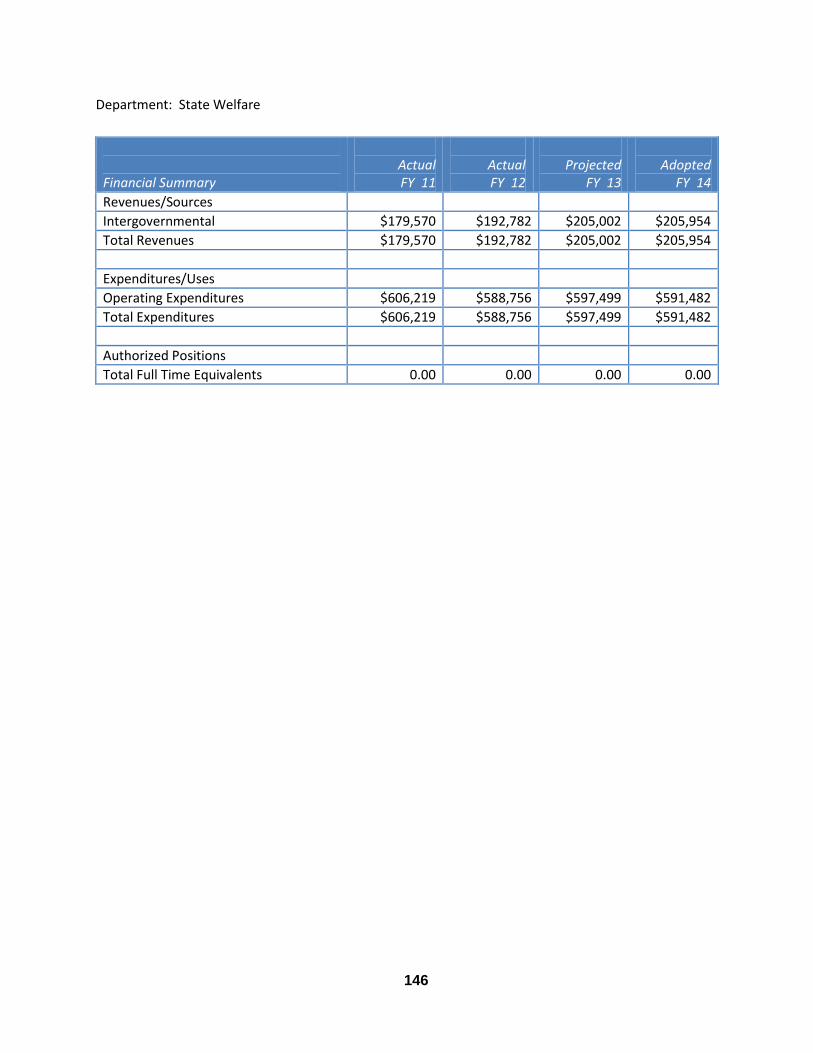
146
Department: State Welfare
Financial Summary
Actual FY 11
Actual FY 12
Projected
FY 13
Adopted
FY 14
Revenues/Sources
Intergovernmental $179,570 $192,782 $205,002 $205,954
Total Revenues $179,570 $192,782 $205,002 $205,954
Expenditures/Uses
Operating Expenditures $606,219 $588,756 $597,499 $591,482
Total Expenditures $606,219 $588,756 $597,499 $591,482
Authorized Positions
Total Full Time Equivalents 0.00 0.00 0.00 0.00
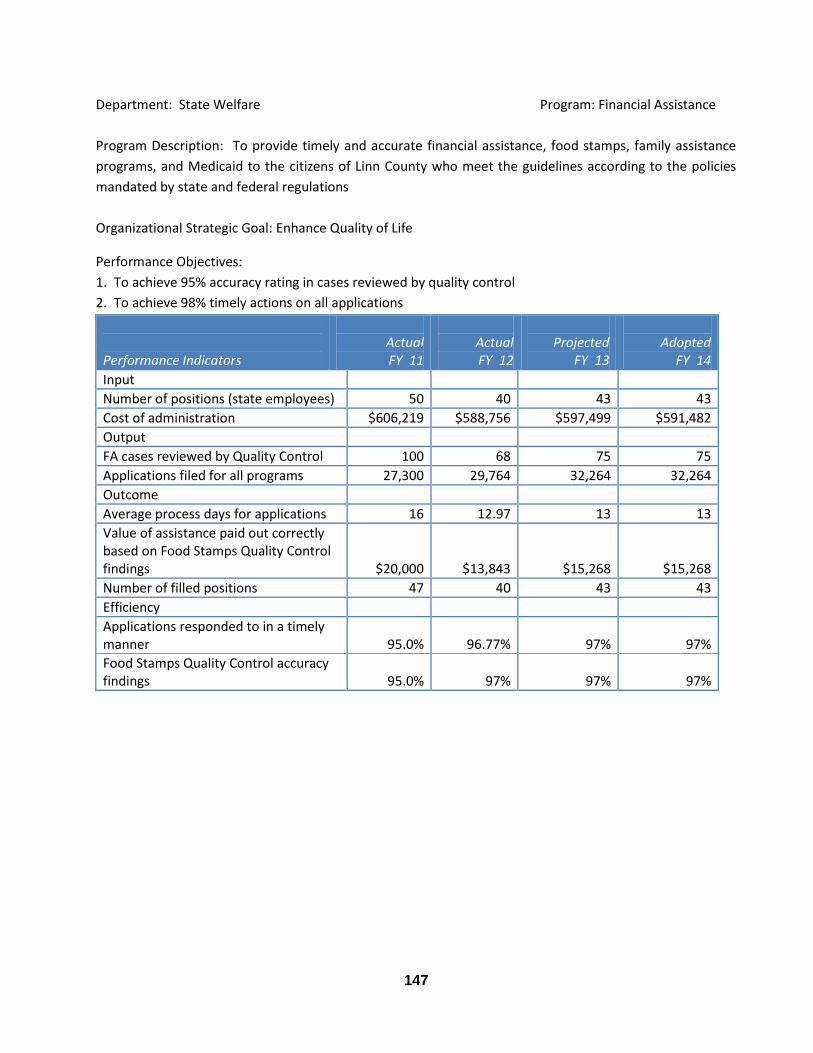
147
Department: State Welfare Program: Financial Assistance
Program Description: To provide timely and accurate financial assistance, food stamps, family assistance
programs, and Medicaid to the citizens of Linn County who meet the guidelines according to the policies
mandated by state and federal regulations
Organizational Strategic Goal: Enhance Quality of Life
Performance Objectives:
1. To achieve 95% accuracy rating in cases reviewed by quality control
2. To achieve 98% timely actions on all applications
Performance Indicators
Actual FY 11
Actual FY 12
Projected
FY 13
Adopted
FY 14
Input
Number of positions (state employees) 50 40 43 43
Cost of administration $606,219 $588,756 $597,499 $591,482
Output
FA cases reviewed by Quality Control 100 68 75 75
Applications filed for all programs 27,300 29,764 32,264 32,264
Outcome
Average process days for applications 16 12.97 13 13
Value of assistance paid out correctly based on Food Stamps Quality Control findings
$20,000
$13,843
$15,268
$15,268
Number of filled positions 47 40 43 43
Efficiency
Applications responded to in a timely manner
95.0%
96.77%
97%
97%
Food Stamps Quality Control accuracy findings
95.0%
97%
97%
97%

148
Department: Treasurer
Financial Summary
Actual FY 11
Actual FY 12
Projected
FY 13
Adopted
FY 14
Revenues/Sources
Charges for Services $1,856,987 $1,964,215 $1,932,598 $1,974,034
Use of Money & Property 270,836 281,226 237,459 240,000
Total Revenues $2,127,823 $2,245,441 $2,170,057 $2,214,034
Expenditures/Uses
Personal Services $2,187,699 $2,191,172 $2,320,261 $2,354,918
Operating Expenditures 268,073 280,172 355,098 329,407
Capital Outlay 13,997 19,228
Total Expenditures $2,469,769 $2,490,572 $2,675,359 $2,684,325
Authorized Positions
Elected & Appointed Officials 1.00 1.00 1.00 1.00
Deputies 4.00 5.00 5.00 5.00
Bargaining Unit 29.00 29.00 29.00 29.00
Total Full Time Equivalents 34.00 35.00 35.00 35.00
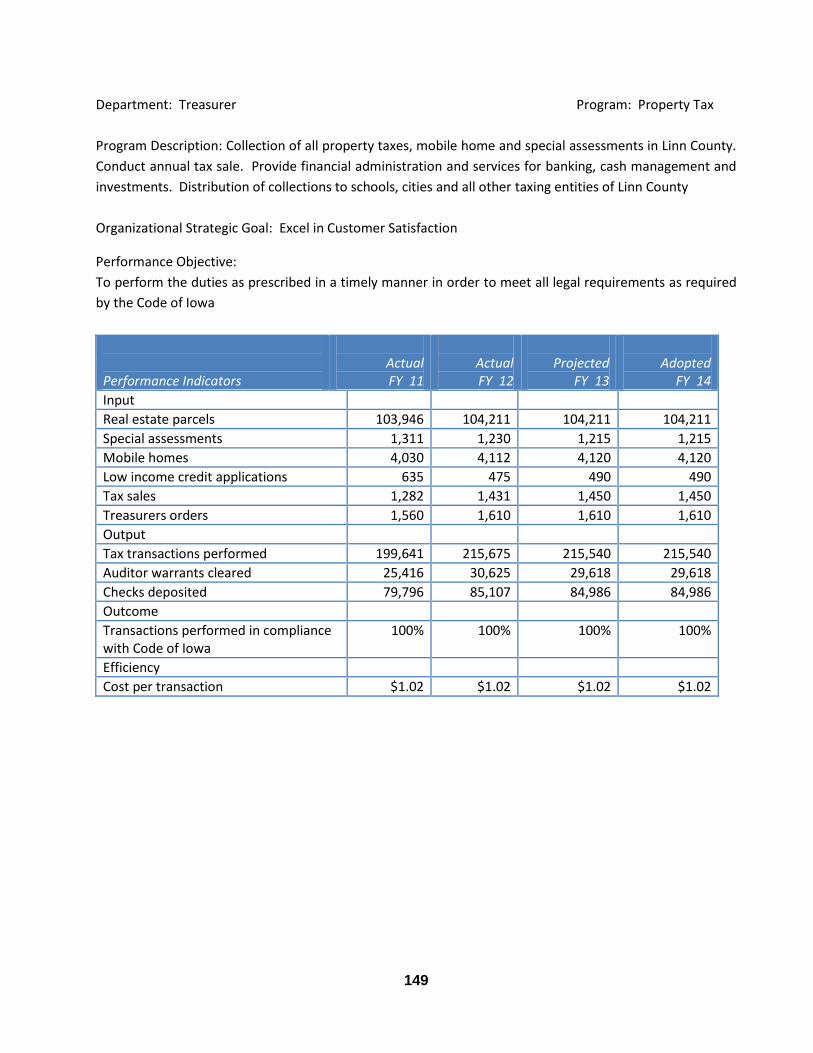
149
Department: Treasurer Program: Property Tax
Program Description: Collection of all property taxes, mobile home and special assessments in Linn County.
Conduct annual tax sale. Provide financial administration and services for banking, cash management and
investments. Distribution of collections to schools, cities and all other taxing entities of Linn County
Organizational Strategic Goal: Excel in Customer Satisfaction
Performance Objective:
To perform the duties as prescribed in a timely manner in order to meet all legal requirements as required
by the Code of Iowa
Performance Indicators
Actual FY 11
Actual FY 12
Projected
FY 13
Adopted
FY 14
Input
Real estate parcels 103,946 104,211 104,211 104,211
Special assessments 1,311 1,230 1,215 1,215
Mobile homes 4,030 4,112 4,120 4,120
Low income credit applications 635 475 490 490
Tax sales 1,282 1,431 1,450 1,450
Treasurers orders 1,560 1,610 1,610 1,610
Output
Tax transactions performed 199,641 215,675 215,540 215,540
Auditor warrants cleared 25,416 30,625 29,618 29,618
Checks deposited 79,796 85,107 84,986 84,986
Outcome
Transactions performed in compliance with Code of Iowa
100% 100% 100% 100%
Efficiency
Cost per transaction $1.02 $1.02 $1.02 $1.02
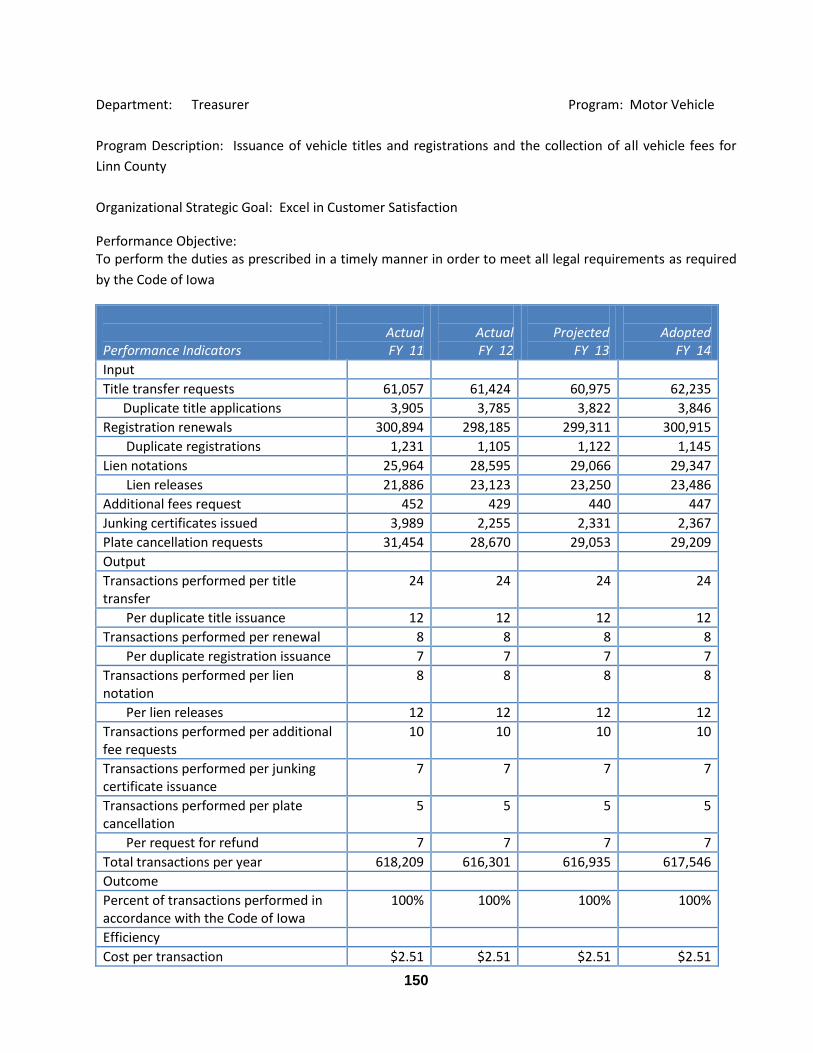
150
Department: Treasurer Program: Motor Vehicle
Program Description: Issuance of vehicle titles and registrations and the collection of all vehicle fees for
Linn County
Organizational Strategic Goal: Excel in Customer Satisfaction
Performance Objective: To perform the duties as prescribed in a timely manner in order to meet all legal requirements as required
by the Code of Iowa
Performance Indicators
Actual FY 11
Actual FY 12
Projected
FY 13
Adopted
FY 14
Input
Title transfer requests 61,057 61,424 60,975 62,235
Duplicate title applications 3,905 3,785 3,822 3,846
Registration renewals 300,894 298,185 299,311 300,915
Duplicate registrations 1,231 1,105 1,122 1,145
Lien notations 25,964 28,595 29,066 29,347
Lien releases 21,886 23,123 23,250 23,486
Additional fees request 452 429 440 447
Junking certificates issued 3,989 2,255 2,331 2,367
Plate cancellation requests 31,454 28,670 29,053 29,209
Output
Transactions performed per title transfer
24 24 24 24
Per duplicate title issuance 12 12 12 12
Transactions performed per renewal 8 8 8 8
Per duplicate registration issuance 7 7 7 7
Transactions performed per lien notation
8 8 8 8
Per lien releases 12 12 12 12
Transactions performed per additional fee requests
10 10 10 10
Transactions performed per junking certificate issuance
7 7 7 7
Transactions performed per plate cancellation
5 5 5 5
Per request for refund 7 7 7 7
Total transactions per year 618,209 616,301 616,935 617,546
Outcome
Percent of transactions performed in accordance with the Code of Iowa
100% 100% 100% 100%
Efficiency
Cost per transaction $2.51 $2.51 $2.51 $2.51
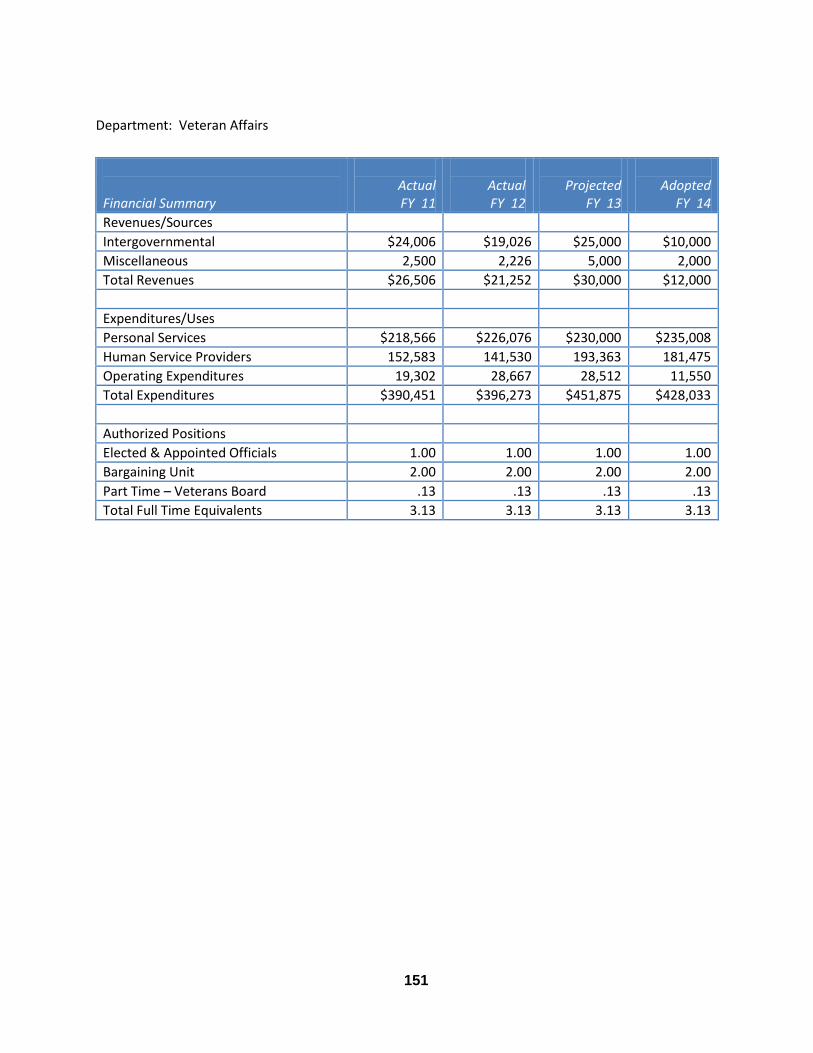
151
Department: Veteran Affairs
Financial Summary
Actual FY 11
Actual FY 12
Projected
FY 13
Adopted
FY 14
Revenues/Sources
Intergovernmental $24,006 $19,026 $25,000 $10,000
Miscellaneous 2,500 2,226 5,000 2,000
Total Revenues $26,506 $21,252 $30,000 $12,000
Expenditures/Uses
Personal Services $218,566 $226,076 $230,000 $235,008
Human Service Providers 152,583 141,530 193,363 181,475
Operating Expenditures 19,302 28,667 28,512 11,550
Total Expenditures $390,451 $396,273 $451,875 $428,033
Authorized Positions
Elected & Appointed Officials 1.00 1.00 1.00 1.00
Bargaining Unit 2.00 2.00 2.00 2.00
Part Time – Veterans Board .13 .13 .13 .13
Total Full Time Equivalents 3.13 3.13 3.13 3.13
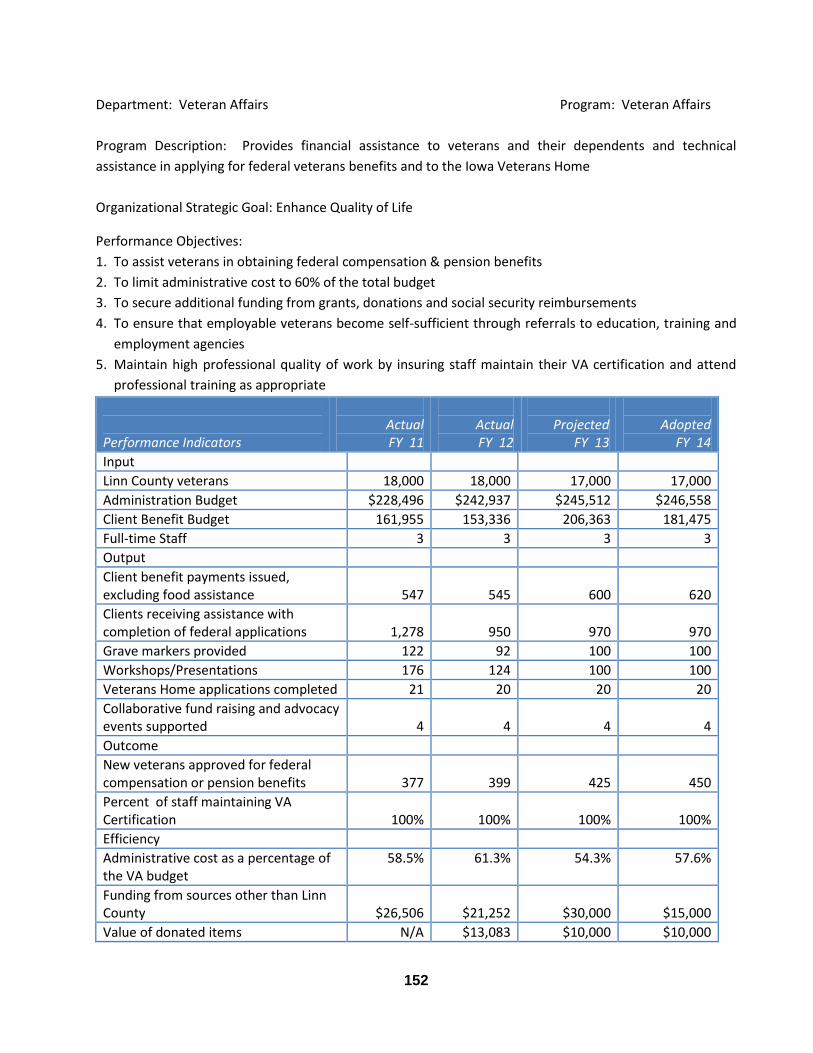
152
Department: Veteran Affairs Program: Veteran Affairs
Program Description: Provides financial assistance to veterans and their dependents and technical
assistance in applying for federal veterans benefits and to the Iowa Veterans Home
Organizational Strategic Goal: Enhance Quality of Life
Performance Objectives:
1. To assist veterans in obtaining federal compensation & pension benefits
2. To limit administrative cost to 60% of the total budget
3. To secure additional funding from grants, donations and social security reimbursements
4. To ensure that employable veterans become self-sufficient through referrals to education, training and
employment agencies
5. Maintain high professional quality of work by insuring staff maintain their VA certification and attend
professional training as appropriate
Performance Indicators
Actual FY 11
Actual FY 12
Projected
FY 13
Adopted
FY 14
Input
Linn County veterans 18,000 18,000 17,000 17,000
Administration Budget $228,496 $242,937 $245,512 $246,558
Client Benefit Budget 161,955 153,336 206,363 181,475
Full-time Staff 3 3 3 3
Output
Client benefit payments issued, excluding food assistance
547
545
600
620
Clients receiving assistance with completion of federal applications
1,278
950
970
970
Grave markers provided 122 92 100 100
Workshops/Presentations 176 124 100 100
Veterans Home applications completed 21 20 20 20
Collaborative fund raising and advocacy events supported
4
4
4
4
Outcome
New veterans approved for federal compensation or pension benefits
377
399
425
450
Percent of staff maintaining VA Certification
100%
100%
100%
100%
Efficiency
Administrative cost as a percentage of the VA budget
58.5% 61.3% 54.3% 57.6%
Funding from sources other than Linn County
$26,506
$21,252
$30,000
$15,000
Value of donated items N/A $13,083 $10,000 $10,000
153
Glossary of Terminology
Accrual Basis: The recording of the financial effects on a government of transactions and other events and circumstances that have cash consequences for the government in the periods in which those transactions, events and other circumstances occur rather than only in the periods in which cash is received or paid by the government. Agent: Individual authorized by another person, called the principal, to act in the latter’s behalf in transactions involving a third party. Appropriation: An authorization made by the Board of Supervisors which permits the County to incur obligations and to make expenditures of resources. Appropriation Resolution: The official enactment by the Board of Supervisors to establish legal authority for County officials to obligate and expend resources. Assessed Valuation: A value that is established for real or personal property for use as a basis for levying property taxes. (Note: Property values are established by the City and County Assessors.) Audit: A comprehensive investigation of the manner in which the government’s resources were actually utilized. A financial audit is a review of the accounting system and financial information to determine how government funds were spent and whether expenditures were in compliance with the legislative body's appropriations. Balance Sheet: A financial statement that discloses the assets, liabilities, reserves and balances of an entity at a specified date in accordance with GAAP. Bond: A written promise to pay a sum of money on a specific date at a specified interest rate. The interest payments and the repayment of the principal are detailed in a bond resolution. The most common types of bonds are general obligation and revenue bonds. These are most frequently used for construction of large capital projects, such as buildings, park improvements, roads and bridges. Budget: A financial plan for a specified period of time (fiscal year) that matches all planned revenues and expenditures with various County services. Budget Amendment: A legal procedure utilized by the Board of Supervisors to revise a budgeted service area appropriation or revenue. The Code of Iowa also requires Board approval through the adoption of a resolution for any interdepartmental or inter-fund adjustments. Budget Calendar: The schedule of key dates or events which County departments and authorized agencies follow in the preparation, adoption, and administration of the budget. Budget Document: The instrument used by the budget-making authority to present a comprehensive financial program to the Board of Supervisors.
154
(Continued) Budgeted Funds: Funds that are planned for certain uses but have not been formally or legally appropriated by the legislative body. The budget document that is submitted for Board approval is composed of budgeted funds. Budget Message: A general discussion of the budget presentation written by the Financial Director and Budget Director as part of the budget document. The budget message contains an explanation of the primary issues addressed in the budget process, along with information related to changes from the previous fiscal year. Budgetary Control: The control or management of a governmental unit or enterprise in accordance with an approved budget for the purpose of keeping expenditures within the limitations of available appropriations and available revenues. Capital Asset: Tangible asset of a long-term nature, intended to be held or used, such as land, buildings, machinery, furniture and other equipment. Capital Improvement Plan: A separate plan from the operating budget. The CIP for Linn County is included in the budget document. Items in the CIP are usually construction projects designed to improve the value of the government assets. Examples of capital improvement projects include new roads, buildings, recreational facilities and large scale remodeling. Cash Basis: A basis of accounting in which transactions are recorded when cash is either received or disbursed. The budget document is prepared on the cash basis. The annual financial report is prepared on the accrual and modified accrual basis of accounting. Cash Management: The management of cash necessary to pay for government services while investing temporary cash excesses in order to earn interest revenue. Cash management refers to the activities of forecasting the inflows and outflows of cash, mobilizing cash to improve its availability for investment, establishing and maintaining banking relationships, and investing funds in order to achieve the highest interest while maintaining safety of capital and liquidity. Current Taxes: Taxes that are levied and due within one year. Debt Service: The county's obligation to pay the principal and interest of all bonds and other debt instruments according to a pre-determined payment schedule. Delinquent Taxes: Taxes that remain unpaid on or after the date on which a penalty for non-payment is attached. Department: A major administrative division of the County which indicates overall management responsibility for an operation or a group of related operations as defined by Iowa law or by County ordinance.
155
(Continued) Disbursement: Payment in cash. Encumbrance: Commitments related to contracts not yet performed and used to control expenditures for the year and to enhance cash management. Estimated Revenue: The amount of projected revenue to be collected during the fiscal year. The amount of revenue appropriated is the amount approved by the Board of Supervisors. Expenditure: This term refers to the decreases in net financial resources such as for an asset obtained or goods and services received. This term applies to all governmental funds. Fiduciary: A person, company, or association holding assets in trust of a beneficiary. Fiscal Year: The time period designated by the County signifying the beginning and ending period for recording financial transactions. Linn County has specified July 1 to June 30 as its fiscal year. FTE: Full time equivalent; authorized position equivalent to working 2,080 hours in a year. Fund: An accounting entity that has a set of self-balancing accounts and that records all financial transactions for specific activities or government functions. Eight commonly used funds in governmental accounting are: general fund, special revenue funds, debt service fund, capital projects fund, enterprise funds, agency funds, internal service funds, and special assessment funds. Fund Balance: Fund balance is the difference between assets and liabilities. Full Faith and Credit: A pledge of the general taxing power of a government to repay debt obligations (typically used in reference to bonds). General Obligation Bonds: Bonds that finance a variety of public projects such as roads, buildings, and improvements; the repayment of these bonds is usually made from the debt service fund, and are backed by the full faith and credit of the County. Generally Accepted Accounting Principles (GAAP): Uniform minimum standards and guidelines for financial accounting and reporting. The primary authoritative body on the application of GAAP to the County is the Governmental Accounting Standards Board. Grant: A contribution by a government or other organization to support a particular function. Grants may be classified as either categorical or block depending upon the amount of discretion allowed the grantee.
156
(Continued) Intergovernmental Revenue: Revenue received from another government for a specified purpose. Internal Service Fund: Funds used to account for the financing of goods or services provided by one department to another department on a cost reimbursement basis. IT: The County’s Information Technology department, responsible for data processing functions. LCCS: Linn County Community Services. This department is responsible for the administration of mental health services, vocational services, and youth programs. Levy: To impose taxes, special assessments, or service charges for the support of County activities. LIFTS: Linn Intra-County Facilitating Transportation System, the County’s department responsible for meeting the transportation needs of the elderly and disabled population. MH-DD Fund: The Mental Health and Development Disabilities fund is a separate fund to account for operations related to services for the mentally ill, mentally retarded, and developmentally disabled. Operating Budget: The portion of the budget that pertains to daily operations that provide basic governmental services. The operating budget contains appropriations for such expenditures as personnel, supplies, utilities, materials, travel and fuel. Performance Objectives: Specific quantitative and qualitative measures of work performed as an objective of the department. Program Budget: A budget that focuses upon the goals and objectives of an agency or jurisdiction rather than upon its organizational budget units or object classes of expenditure. Program Performance Budget: A budget that focuses upon activities rather than line items. Demand, workload, productivity, and effectiveness indicator data are collected in order to assess the efficiency of services. Typical data collected might include miles of road needed to be paved, miles of roads paved, cost of paved roads per mile, percent of roads not able to be paved. Property Tax: Taxes levied according to the property's taxable value and the tax rate. Property Tax Credit: A credit given against taxes on eligible property under the Code of Iowa.
157
(Continued) Property Tax Replacement: Moneys apportioned by the State each year to replace all or a portion of the tax that would be due on property eligible for a credit under the Code of Iowa. Reserved Fund Balance: Portion of a fund balance legally restricted for a specific purpose and is not available for general appropriation. Revenue: Increases in net current assets other than expenditure refunds and transfers. It includes such items as tax payments, fees from specific services, receipts from other governments, grants, shared revenues and interest income. Revenue Bonds: Bonds whose principal and interest are payable from earnings. Risk Management: All ways and means used to avoid accidental loss or to reduce its consequences if it does occur. RUTF: Road Use Tax Fund is an allocation of state funding to cities and counties for road construction purposes. Sequester: An amount of money equal to the difference between the cap set in the Budget Resolution and the amount actually appropriated is withheld by the Treasury and not handed over to the agencies to which it was originally appropriated by Congress. Special Revenue Fund: A fund used to account for and report the proceeds of specific revenue sources that are restricted for specified purposes other than debt service or capital projects. Transfers: All inter-fund transfers (e.g., legally authorized transfers from a fund receiving revenue to the fund through which the resources are to be expended). Warrant: An order drawn by the County upon the County Treasurer directing the Treasurer to pay a specified amount to the person named or to the bearer. A warrant is payable upon demand and circulates the same as a bank check.
158
AFSCME American Federation of State, County and Municipal Employees AIDS Acquired Immunodeficiency Syndrome ALS Acute Life Services ARO Adult Rehabilitation Option BAB Build America Bond BOS Board of Supervisors CABS Coalition to Augment the Bus System CAFR Comprehensive Annual Financial Report CINA Child In Need of Assistance CMI Chronically Mentally Ill CPC Central Point of Coordination DD Developmentally Disabled
DEA Drug Enforcement Agency
DWLUS Driving While License Under Suspension EMS Emergency Medical Services EPIC Employers Partnering in Child Support FEMA Federal Emergency Management Agency GAAS Generally Accepted Auditing Standards GASB Governmental Accounting Standards Board GFOA Government Finance Officers Association GIS Geographic Information System GPN Geo-reference Parcel Number GPS Global Positioning Satellite HAZMAT Hazardous materials HCBS Home and Community Based Services HIV Human Immunodeficiency Virus ICF Intermediate Care Facility IDOT Iowa Department of Transportation IDPH Iowa Department of Public Health IFMC Iowa Foundation for Medical Care MHDD Mental Health and Developmentally Disabled MHI Mental Health Institute MI Mentally Ill MR Mentally Retarded NACo National Association of Counties NCIC National Crime Information Center NHEL Non Highly Erodible Land PAP Pharmaceutical Assistance Program PPME Public Professional Maintenance Employees PSAP Public Safety Answering Point RCF Residential Care Facility REAP Resource Enhancement and Protection RMS Resource Management System RTSS Rehabilitative Treatment and Support Services SCL Supported Community Living SCSU Specialized Customer Service Unit SHS State Hospital School

159
SNF Skilled Nursing Facility
SPR Site Plan Review SSI Supplemental Security Income START Supervisory Training and Retention Tools STD Sexually Transmitted Disease SWCD Soil and Water Conservation District
160
The Linn County Board of Supervisors approved the financial policies included in this document. Policies are reviewed and revised periodically, as recommended by the Office of Finance and Budget. The County is in compliance with all of its adopted financial policies.
Accounting, Auditing and Financial Reporting Specific Objective: To establish and maintain the highest standard of financial accounting, reporting and auditing. Policy Statements: 1. Linn County (the “County”) will maintain an accounting system that will enable the presentation of
financial statements in conformity with Generally Accepted Accounting Principles (GAAP).
2. The County will obtain an annual audit of its financial statements in accordance with Generally Accepted Auditing Standards (GAAS). The County will utilize an independent auditing firm, which is periodically selected on a competitive basis. The financial results will be published annually in the Comprehensive Annual Financial Report (CAFR).
3. The CAFR will be submitted annually to the Government Finance Officers Association for evaluation. 4. An effective internal control structure will be maintained and annually reviewed by the Office of
Finance and Budget. 5. Periodically, the County will review its capitalization threshold policies to determine their applicability
to the current financial environment.
6. Periodically, the County will perform a physical inventory of its capital assets.
Budget and Financial Management
Specific Objective: To maintain the integrity of the County’s finances through effective financial planning.
161
Policy Statements: 1. Departmental budgets shall be adopted based on the application of a percentage of the prior year
approved budget of expenditures. The percentage will be based on estimated valuation, valuation rollback, projected cost of labor and the projected state and local governmental price index.
2. New or expanded services will not be implemented if inclusion of the service results in the
departmental budget exceeding net guidelines unless specifically authorized by the Board of Supervisors.
3. The mental health appropriation will be in accordance with Iowa Code section 331.438, less the
amount of property tax relief to be received pursuant to section 426B(2). 4. Budget versus actual operating statements will be distributed monthly to departments. 5. Budget documentation will include a concise summary and guide to key issues for both the operating
and capital budgets.
6. A balanced budget will be adopted. A balanced budget requires that general fund operating revenues should be sufficient to support operating expenditures without use of fund balance.
7. The County will endeavor to maintain diversified and stable revenue sources.
8. A review of user fees and charges for services will be made periodically to determine that an appropriate level is maintained, in terms of comparability and cost to provide service.
9. The County will annually adopt a five-year capital program.
10. The County will maintain general fund cash reserves at a level determined as sufficient to provide working capital for general governmental operations, at 25% of general fund annual expenditures.
11. Governmental funds, except for the general fund, will have reserves based on a review of working
capital needs.
12. All internal service funds will be expected to maintain revenue sufficient to cover all direct and indirect costs, including an allowance for depreciation over the long-term.
13. Long-term debt proceeds shall not provide for current operating expenditures. 14. The County shall adopt procedures and thresholds related to the purchase of goods and services
subject to periodic review by the Board of Supervisors.
162
Capital Improvement Budget Policy
Specific Objective: The County will establish an annual budget for the purpose of maintaining its infrastructure. Policy Statements: 1. The County will make capital improvements in accordance with the adopted Capital Improvement
Program (CIP), except for unanticipated capital improvements approved by the Board of Supervisors. 2. Physical assets will be maintained at a level determined as sufficient to protect the County’s capital
investment and minimize future maintenance and replacement costs. 3. A five-year capital improvement plan will be developed and updated annually. 4. The County will appropriate no less than $800,000 annually in the capital projects fund. 5. Estimated costs of each capital improvement will be identified in the plan. 6. Future operating cost projections associated with the capital improvement will be included in the CIP
budget request. 7. The County will make road improvements in accordance with the adopted road construction plan. 8. The County will appropriate no less than $600,000 annually for road construction projects.
Debt Management
Specific Objective: To raise capital, maintain a sound debt position and protect the County’s credit quality. Policy Statements: 1. The County may access the capital markets to finance infrastructure projects and capital equipment. 2. The County will not exceed its legal debt margin of five percent of actual valuation. 3. Financing alternatives include general obligation bonds, revenue bonds and capital leases. 4. Maturities of the debt will be set equal to or less than the useful life of the project or equipment.
5. When possible, the new debt issuance will be wrapped around existing debt to avoid spikes in debt service requirements.
163
6. Redemption provisions, including mandatory and optional call features, will be an issuance consideration.
7. The County shall determine appropriate use of credit enhancements such as insurance or letters of
credit to assure market attraction. 8. The County will publish an official statement for all general obligation bond issues. 9. The County will obtain a rating on each bond issue in excess of $1.0 million. 10. The County will strive to maintain the highest credit rating that its criteria will support. 11. The authorized method of sale will be on a competitive basis. 12. An independent financial advisory firm and bond counsel will be retained on the basis of qualifications
and experience with state of Iowa statutes. 13. Refundings will be analyzed both internally by staff and externally by the financial advisor to determine
net present value benefit opportunities. 14. The County will file an annual report for continuing disclosure as well as report any material events on
a periodic basis. 15. The County will be in compliance with all federal tax law provisions involving debt issuance including
arbitrage rebate reporting requirements.
16. Capital planning will be integrated with debt financing activities. 17. Bond proceeds will be invested in direct government obligations with a local government investment
pool formally registered with the Securities and Exchange Commission (SEC), such as the Iowa Public Agency Investment Trust (IPAIT).
164
Budget Process On or before December 22, each County officer and department head submits budget estimates to the Budget Director, using the goals and initiatives established in the strategic planning session as a framework. The estimates must show the proposed disbursements of the office or department for the next fiscal year and include an estimate of the receipts, excluding property taxes, expected to be collected for the County by that department during the next fiscal year. The Budget Director compiles the budget estimates received from the elected officials and department heads. The Budget Director and Finance Director then review this information, with recommendations presented to the Board of Supervisors by the second week of February. The five-year Capital Improvement Plan (CIP) is approved by the Board concurrently. The Office of Finance and Budget then prepares the proposed annual budget based on the Board’s directions. The Board then sets a time and place for a public hearing to be held prior to certification.
The annual budget is adopted by majority vote of the five-member Board of Supervisors, for all governmental funds by fund and by major class of expenditure, also referred to as service area. The 10 major classes of expenditures are public safety and legal services, physical health and social services, mental health, county environment and education, roads and transportation, government services to residents, administration, non-program current, debt service and capital projects. The highest legal level of control is by major expenditure class for all governmental funds. The Board appropriates by resolution, by major class of expenditures, the amounts approved for the ensuing fiscal year. The Board also appropriates by resolution, the authorized expenditures for each of the county officers and departments. It is unlawful for a county official to authorize expenditures exceeding the amount appropriated by the Board. Increases or decreases in appropriations may be made by resolution and approved by majority vote of the Board, if none of the major classes of expenditures are to be increased. Any increase to a major expenditure class requires a public hearing and formal budget amendment. Decreases in appropriations of an office or department of more than 10 percent or $5,000, whichever is greater, are not effective until the Board holds a public hearing on the proposed decrease, and publishes notice of the hearing not less than 10 nor more than 20 days prior to the hearing.
Linn County has adopted the cash basis of accounting for budgetary reporting purposes. All funds are budgeted on a cash basis. This means that revenues are recorded when cash is received and expenditures are recorded when cash is disbursed. This reporting basis is not the same as prescribed by generally accepted accounting principles (GAAP). The County maintains records to permit presentation of financial statements in conformity with GAAP in its financial reports. This information is included in the Comprehensive Annual Financial Report (CAFR). The primary differences between the budgetary reports and GAAP reports are the timing of revenues and expenditures, depreciation expense, and compensated absences (accrued but unused vacation leave). The Comprehensive Annual Financial Report shows fund expenditures and revenues on both a GAAP basis and budget basis for comparison purposes. The accounts of Linn County are organized by fund. Fund accounting segregates funds according to their intended purpose and is used to aid management in demonstrating compliance with financial and legal requirements. All funds presented in this document are governmental type funds.
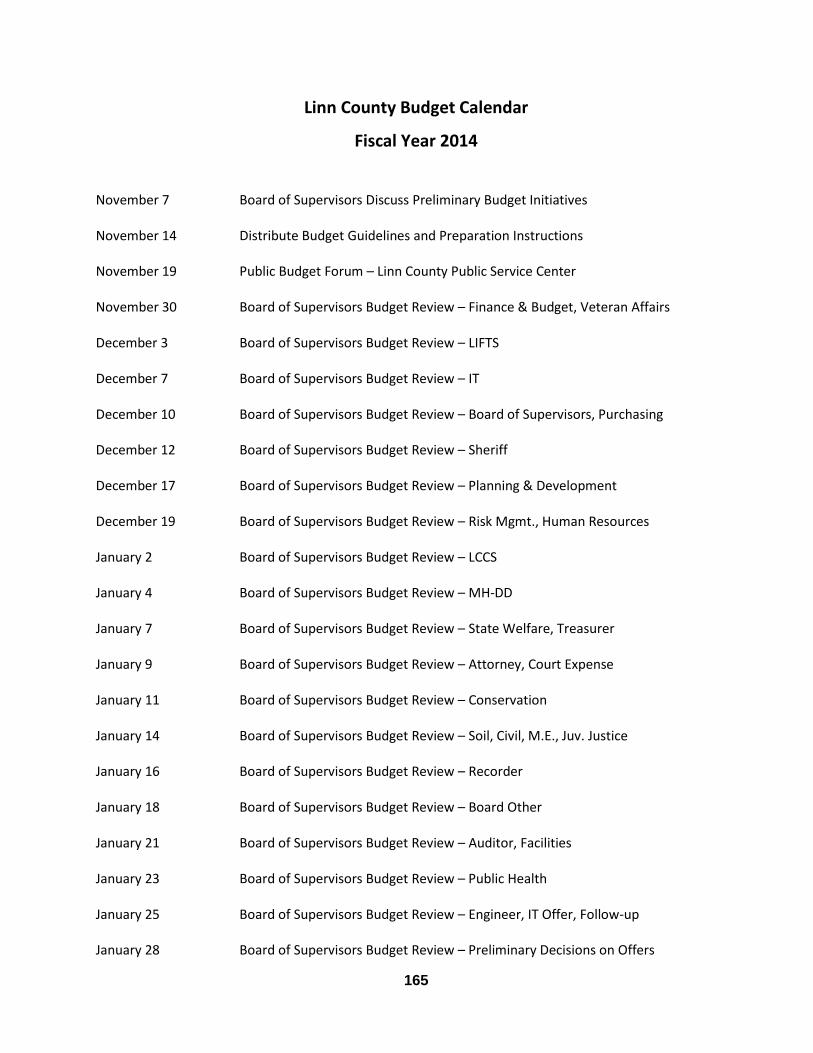
165
Linn County Budget Calendar
Fiscal Year 2014
November 7 Board of Supervisors Discuss Preliminary Budget Initiatives November 14 Distribute Budget Guidelines and Preparation Instructions November 19 Public Budget Forum – Linn County Public Service Center November 30 Board of Supervisors Budget Review – Finance & Budget, Veteran Affairs December 3 Board of Supervisors Budget Review – LIFTS December 7 Board of Supervisors Budget Review – IT December 10 Board of Supervisors Budget Review – Board of Supervisors, Purchasing December 12 Board of Supervisors Budget Review – Sheriff December 17 Board of Supervisors Budget Review – Planning & Development December 19 Board of Supervisors Budget Review – Risk Mgmt., Human Resources January 2 Board of Supervisors Budget Review – LCCS January 4 Board of Supervisors Budget Review – MH-DD January 7 Board of Supervisors Budget Review – State Welfare, Treasurer January 9 Board of Supervisors Budget Review – Attorney, Court Expense January 11 Board of Supervisors Budget Review – Conservation January 14 Board of Supervisors Budget Review – Soil, Civil, M.E., Juv. Justice January 16 Board of Supervisors Budget Review – Recorder January 18 Board of Supervisors Budget Review – Board Other January 21 Board of Supervisors Budget Review – Auditor, Facilities January 23 Board of Supervisors Budget Review – Public Health January 25 Board of Supervisors Budget Review – Engineer, IT Offer, Follow-up January 28 Board of Supervisors Budget Review – Preliminary Decisions on Offers
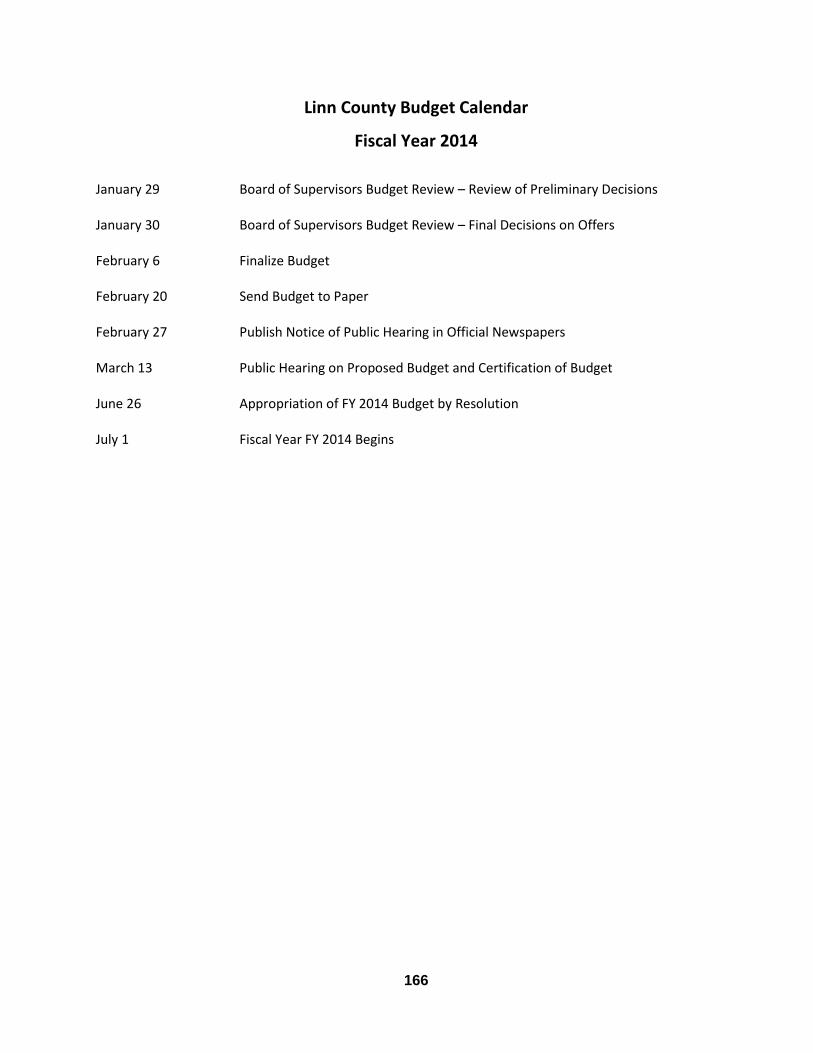
166
Linn County Budget Calendar
Fiscal Year 2014
January 29 Board of Supervisors Budget Review – Review of Preliminary Decisions January 30 Board of Supervisors Budget Review – Final Decisions on Offers February 6 Finalize Budget February 20 Send Budget to Paper February 27 Publish Notice of Public Hearing in Official Newspapers March 13 Public Hearing on Proposed Budget and Certification of Budget June 26 Appropriation of FY 2014 Budget by Resolution July 1 Fiscal Year FY 2014 Begins
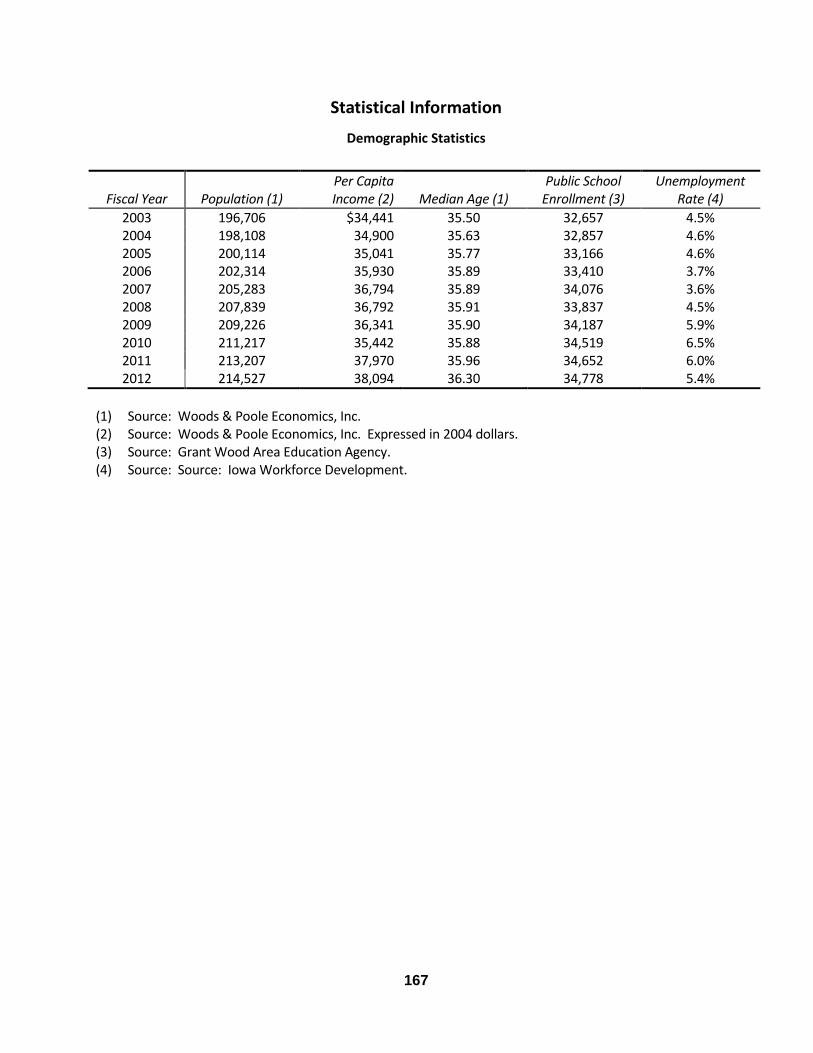
167
Demographic Statistics
Fiscal Year
Population (1)
Per Capita Income (2)
Median Age (1)
Public School Enrollment (3)
Unemployment Rate (4)
2003 196,706 $34,441 35.50 32,657 4.5% 2004 198,108 34,900 35.63 32,857 4.6% 2005 200,114 35,041 35.77 33,166 4.6% 2006 202,314 35,930 35.89 33,410 3.7% 2007 205,283 36,794 35.89 34,076 3.6% 2008 207,839 36,792 35.91 33,837 4.5% 2009 209,226 36,341 35.90 34,187 5.9% 2010 211,217 35,442 35.88 34,519 6.5% 2011 213,207 37,970 35.96 34,652 6.0% 2012 214,527 38,094 36.30 34,778 5.4%
(1) Source: Woods & Poole Economics, Inc. (2) Source: Woods & Poole Economics, Inc. Expressed in 2004 dollars. (3) Source: Grant Wood Area Education Agency. (4) Source: Source: Iowa Workforce Development.
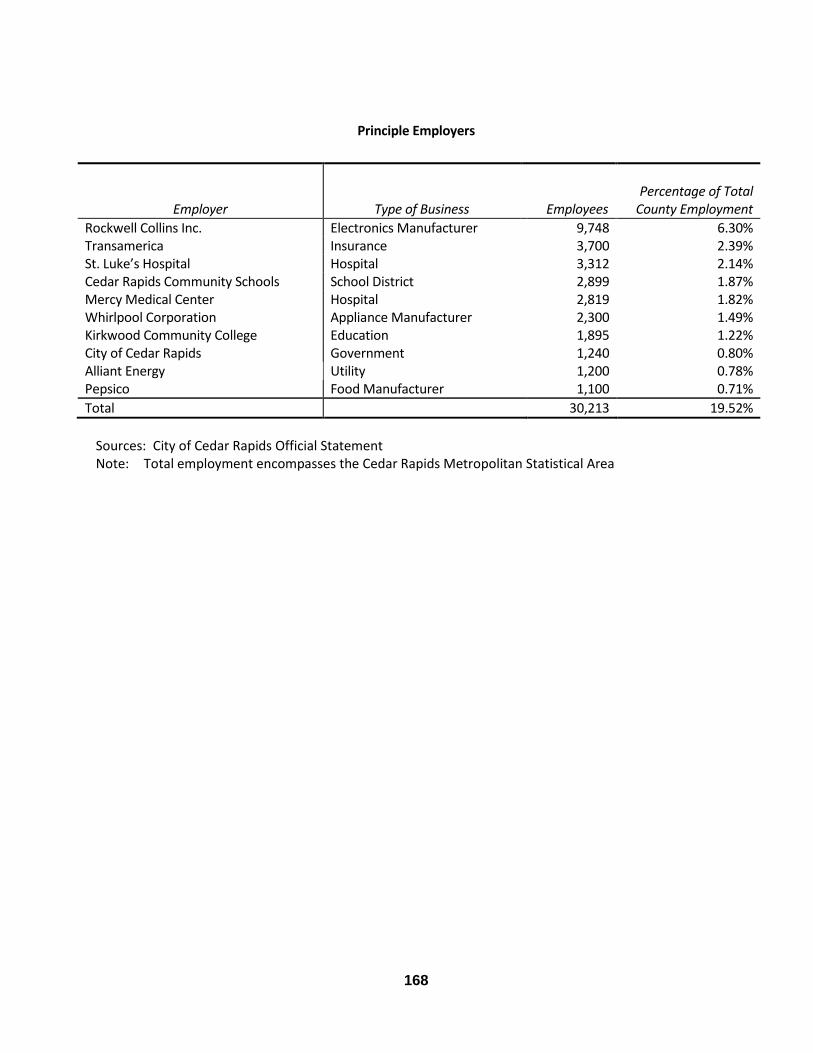
168
Principle Employers
Employer
Type of Business
Employees
Percentage of Total
County Employment
Rockwell Collins Inc. Electronics Manufacturer 9,748 6.30% Transamerica Insurance 3,700 2.39% St. Luke’s Hospital Hospital 3,312 2.14% Cedar Rapids Community Schools School District 2,899 1.87% Mercy Medical Center Hospital 2,819 1.82% Whirlpool Corporation Appliance Manufacturer 2,300 1.49% Kirkwood Community College Education 1,895 1.22% City of Cedar Rapids Government 1,240 0.80% Alliant Energy Utility 1,200 0.78% Pepsico Food Manufacturer 1,100 0.71%
Total 30,213 19.52%
Sources: City of Cedar Rapids Official Statement Note: Total employment encompasses the Cedar Rapids Metropolitan Statistical Area
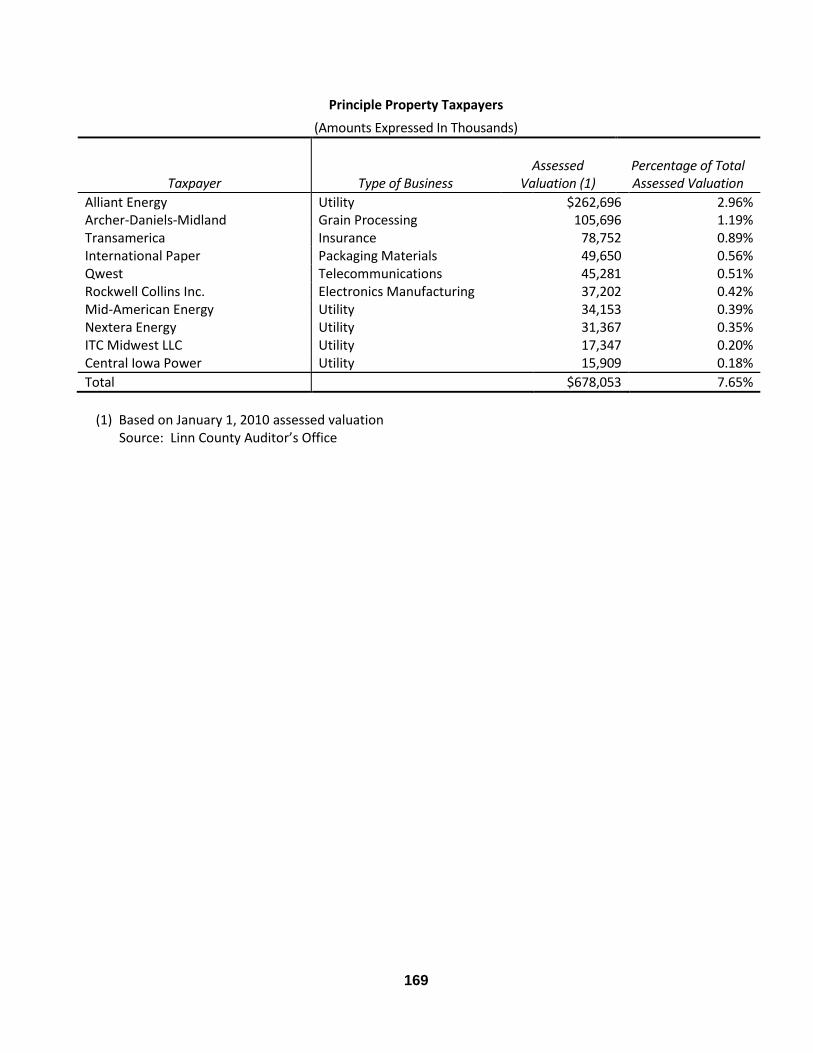
169
Principle Property Taxpayers
(Amounts Expressed In Thousands)
Taxpayer
Type of Business
Assessed
Valuation (1)
Percentage of Total Assessed Valuation
Alliant Energy Utility $262,696 2.96% Archer-Daniels-Midland Grain Processing 105,696 1.19% Transamerica Insurance 78,752 0.89% International Paper Packaging Materials 49,650 0.56% Qwest Telecommunications 45,281 0.51% Rockwell Collins Inc. Electronics Manufacturing 37,202 0.42% Mid-American Energy Utility 34,153 0.39% Nextera Energy Utility 31,367 0.35% ITC Midwest LLC Utility 17,347 0.20% Central Iowa Power Utility 15,909 0.18%
Total $678,053 7.65%
(1) Based on January 1, 2010 assessed valuation Source: Linn County Auditor’s Office
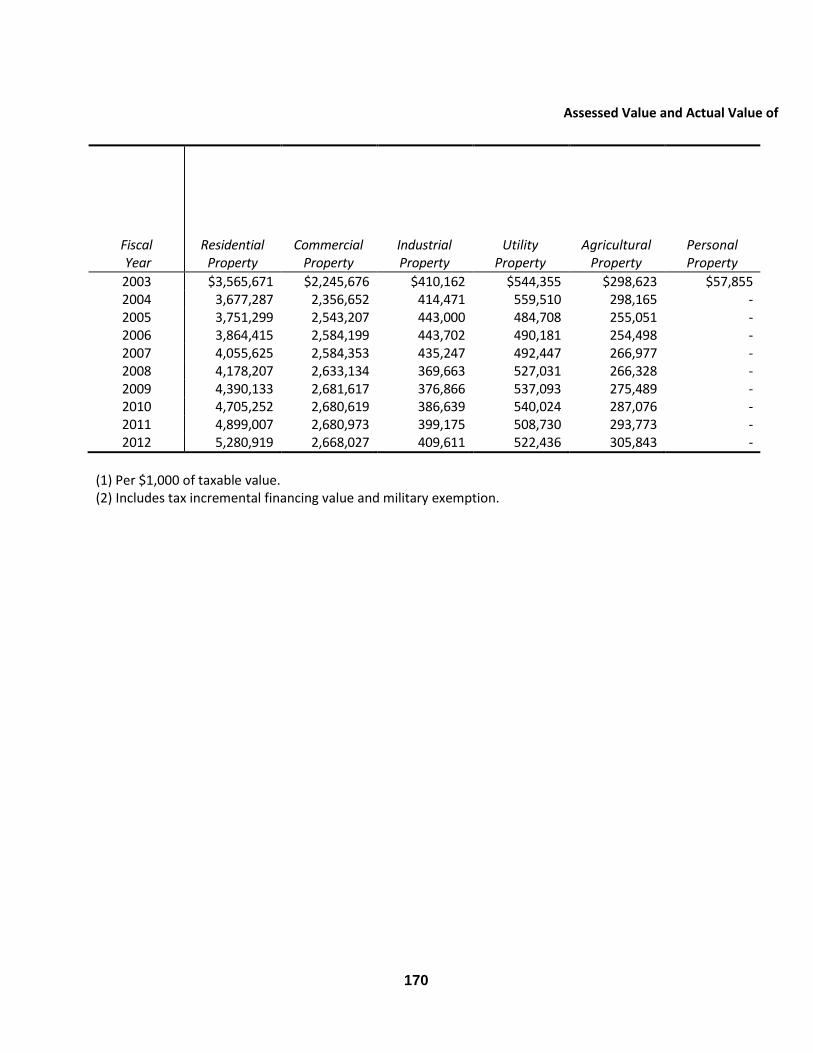
170
Assessed Value and Actual Value of
Fiscal Year
Residential Property
Commercial Property
Industrial Property
Utility Property
Agricultural Property
Personal Property
2003 $3,565,671 $2,245,676 $410,162 $544,355 $298,623 $57,855 2004 3,677,287 2,356,652 414,471 559,510 298,165 - 2005 3,751,299 2,543,207 443,000 484,708 255,051 - 2006 3,864,415 2,584,199 443,702 490,181 254,498 - 2007 4,055,625 2,584,353 435,247 492,447 266,977 - 2008 4,178,207 2,633,134 369,663 527,031 266,328 - 2009 4,390,133 2,681,617 376,866 537,093 275,489 - 2010 4,705,252 2,680,619 386,639 540,024 287,076 - 2011 4,899,007 2,680,973 399,175 508,730 293,773 - 2012 5,280,919 2,668,027 409,611 522,436 305,843 -
(1) Per $1,000 of taxable value. (2) Includes tax incremental financing value and military exemption.
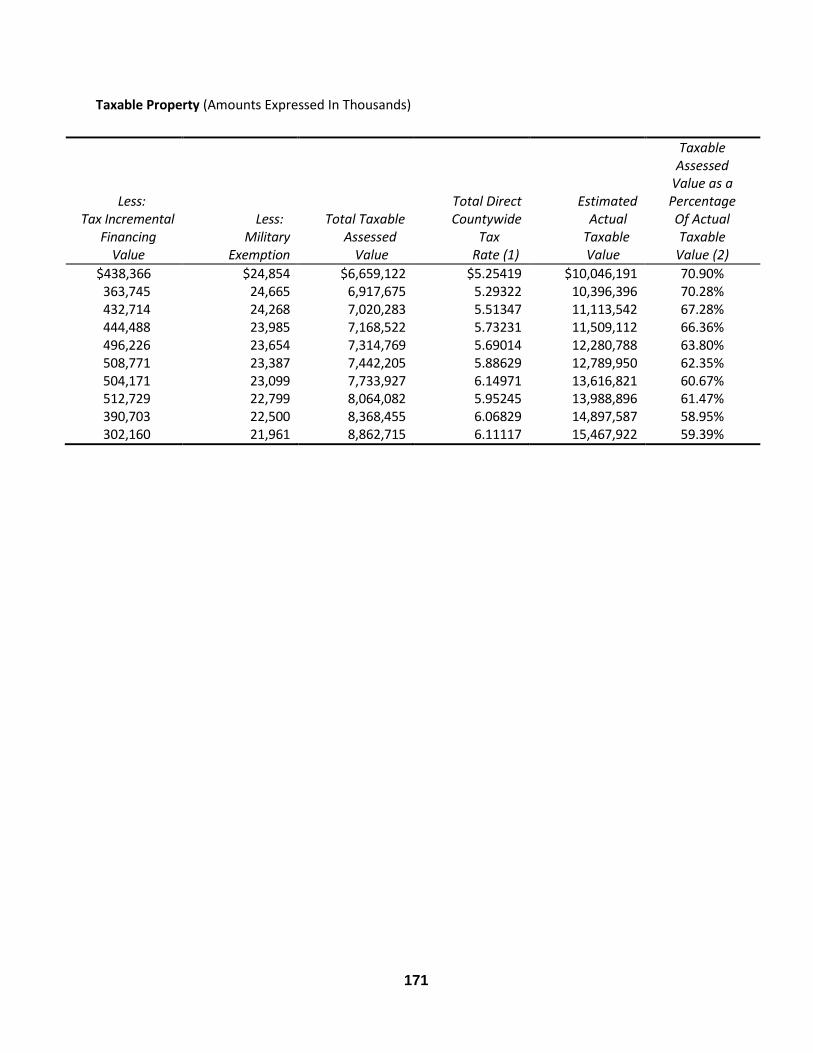
171
Taxable Property (Amounts Expressed In Thousands)
Less: Tax Incremental
Financing Value
Less: Military
Exemption
Total Taxable Assessed
Value
Total Direct Countywide
Tax Rate (1)
Estimated Actual Taxable
Value
Taxable Assessed
Value as a Percentage Of Actual Taxable
Value (2)
$438,366 $24,854 $6,659,122 $5.25419 $10,046,191 70.90% 363,745 24,665 6,917,675 5.29322 10,396,396 70.28% 432,714 24,268 7,020,283 5.51347 11,113,542 67.28% 444,488 23,985 7,168,522 5.73231 11,509,112 66.36% 496,226 23,654 7,314,769 5.69014 12,280,788 63.80% 508,771 23,387 7,442,205 5.88629 12,789,950 62.35% 504,171 23,099 7,733,927 6.14971 13,616,821 60.67% 512,729 22,799 8,064,082 5.95245 13,988,896 61.47% 390,703 22,500 8,368,455 6.06829 14,897,587 58.95% 302,160 21,961 8,862,715 6.11117 15,467,922 59.39%

172