
a naturalistic cohort study of recorded morbidity - CiteSeerX
Upload
independentCategory
view
0download
0
HPY 16(1) Healy 1/28/05 9:03 AM Page 1
History of Psychiatry, 16(1): 027–041 Copyright © 2005 SAGE Publications(London, Thousand Oaks, CA and New Delhi) www.sagepublications.com[200503] DOI: 10.1177/0957154X05044604
is heexin
Kra
Introd
Psychiaof men
* AddrWales C
The 1896 and 1996 populations of North-West Wales are similar in number,ethnic and social mix and rurality, enabling a study of the comparativeprevalence of service utilization, as well as the morbidity and mortalityassociated with mental illness in 1894–96 and 1996. The 1996 data reveal a15 times greater prevalence of admissions for all diagnoses, and three timesgreater prevalence of admissions by detention, compared with 1896. Patientsnow spend more time in a service bed than they did 100 years ago. Death as adirect consequence of mental illness is commoner now than 100 years ago. There
Service utilization in 1896 and 1996: morbidityand mortality data from North Wales
DAVID HEALY*
MARGARET HARRIS1
PAMELA MICHAEL2
DINAH CATTELL1
MARIE SAVAGE1
PADMAJA CHALASANI1
DAVID HIRST2
therefore a major disjunction between the rhetoric and the reality of mentalalth service utilization. General factors related to changing health care andpectations and specific factors linked to mental health appear to have led to ancreased rate of service utilization in the modern period.
eywords: history; mortality and morbidity from mental illness; psychiatry;tes of detention; service utilization; 19th century; 20th century
uction
tric texts regularly contain graphs showing that the hospital populationtal hospitals in the Western world rose from the time of the opening of
ess for correspondence: North Wales Department of Psychological Medicine, University ofollege of Medicine, Bangor LL57 2PW, UK. Email: [email protected]
28 HISTORY OF PSYCHIATRY 16(1)
the asylums around the 1840s through to 1955. The inpatient population in theUK rose progressively year on year despite changes in legislation such as theLunacy Act of 1890 or the Mental Treatment Act of 1930 and despite arange of other psychosocial interventions of one sort or the other. By 1955the inpatient population in the UK stood at 155,000 people.
From 1955, following the introduction of chlorpromazine, this inpatientfigure started falling rapidly and progressively, resulting in a graph with itsapex at 1955. This image dominates psychiatric practice today. Politiciansmay not have closed the asylums because of evidence such as this but, whenrequired to justify their actions in closing the asylums, this is the evidencethat is appealed to. This is also the evidence that, more than any other, isportrayed in the media as the basis for our current supposedly community-oriented policies of care towards the mentally ill (Porter, 2002).
The argument that a range of administrative changes happening in theasylums at the time might have contributed toward this decline have littleimpact. Few know, for instance, that after the introduction of chlorpromazinethe asylum population in Japan quadrupled – indicating that there is nonecessary connection between the new biological treatments in psychiatryand de-institutionalization (Healy, 2002). The image of a graph with its apexin 1955 remains the image that commands the intellectual high ground anddictates both clinical practice and research priorities.
The North Wales Hospital was no exception to the general UnitedKingdom pattern. From the year of its opening in 1848 through to 1948, theinpatient population in the North Wales Hospital rose exactly in parallel withthe general rise in the asylum population. But, in contrast to elsewhere, for anumber of reasons the asylum and psychiatric services in North-West Walesoffer opportunities to establish what was happening in Western psychiatrybetween 1840 and the present day. First, compared with elsewhere, NWWales did not have a general increase in its population over this period. Acensus of the population broken down by age in 1891 showed that there were232,000 people, and in 1991 there were 241,000 in the same area. For thecritical age groups between 15 and 55, the respective populations were 117,000and 119,000 people. Second, while there has been a shift in populations, sothat it becomes uncertain whether it is possible to compare admissions to arural asylum 100 years ago with admissions to an urban DGH Unit now, thisdid not happen in NW Wales.
Third, in other areas a variety of geographical and financial factors make itdifficult to determine if those who accessed a service a century ago or do sotoday are representative of the whole population of the mentally ill, butgeography and finance have conspired in NW Wales to ensure that patientseffectively had only one point of access to services in both 1896 and 1996.Any geographical map of North Wales makes it clear that the areas beingserved are locked in by the Irish Sea on one side and the Snowdonianmountain range on the other. In 1896 it was simply not possible to access
HPY 16(1) Healy 1/28/05 9:03 AM Page 2
D. HEALY ET AL.: SERVICE UTILIZATION IN 1896 AND 1996 29
easily any other service within a hundred miles, other than the asylum atDenbigh. Similar constraints applied in 1996 with the extra proviso thatNational Health Service requirements meant that any patients from NWWales accessing a service elsewhere in the country were liable to be returnedfor treatment. In 1896 NW Wales was one of the poorest areas of thecountry, and it remains so today. There was an essentially negligible amountof private practice in 1896, and this was still so in 1996.
These features of NW Wales have permitted us to institute a study ofservice utilization over 100 years. The first results were reported recently(Healy, Savage, Michael, Harris, et al., 2001), and we now extend this studyby reporting data on lengths of stay in care in the 1896 and 1996 populations,as well as 5-year mortality rates in the two populations.
Methods
In NW Wales there are comprehensive and clear records from the DenbighAsylum, from its opening in 1848 through to its closure. The historicalbackground to the asylum, the populations involved in this study and themethods of data entry are set out in Healy et al. (2001).
As the number of admissions from NW Wales to the Denbigh Asylum wasconsiderably lower in 1896 than in 1996, we have collected admissions from1894, 1895 and 1896 into an 1896 sample; the annual figures presentedbelow are means of the figures for these three years.
In the mid 1990s admissions from NW Wales were to a 60-bed DistrictGeneral Hospital (DGH) Unit, the Hergest Unit. At the time of this project,this unit had seven adult mental illness consultants delivering a sectorizedservice. It was a high morale service with few staff vacancies, a low bedoccupancy rate (80%) compared to UK standards and well established andwell functioning mental health teams.
DiagnosisThe 1896 and 1996 records from what would now be termed differentsectors were given to the sector consultant looking after the geographical areafrom which the patients would now come. This meant that whatever biasesan individual consultant may have applied to the 1996 sample was alsoapplied to the 1896 sample.
The 1896 records contained the details of the behaviour and symptomswhich had led to certification, as well as relatively clear descriptions of themental and physical state of the patient at the time of admission, followed inmost cases by detailed notes of the subsequent hospital stay. In the case ofpatients with prior or subsequent admissions, we were able to track down allearlier records back to 1865, and all further admissions through to 1940.When making a diagnosis on the 1896 sample, the sector consultants had allprior and subsequent records available to them, and accordingly diagnostic
HPY 16(1) Healy 1/28/05 9:03 AM Page 3
30 HISTORY OF PSYCHIATRY 16(1)
judgements were made on the overall career of the patient rather than simplyon the details of the presenting mental state.
The 1996 comparative sample consisted of all admissions to a 60-bedDGH psychiatric unit, between 1 April 1996 and 31 March 1997. The areais sectorized with each sector covered by one consultant. Admissions couldbe through walk-ins, referral from the local DGH, referrals from generalpractitioners, from the police, from mental health teams or through thesector consultant. Admissions consisted of general adult mental illness cases(childhood, adolescent, learning disabilities and dementia patients wentelsewhere). This service had access to support bed hostels, a generousprovision of Elderly Mentally Ill (EMI) assessment, respite and long staybeds, and separate services for childhood disorders and learning disabilities.
The traditional methodological caveat about diagnosis in historicalepidemiology concerns the validity of diagnoses made on a deceased sample.For the purposes of this argument, however, patients were categorized insuch broad diagnostic groups – psychosis, affective disorder, personalitydisorder, and delirium or dementia – that this factor plays as restricted a roleas can be expected in a study of this kind. We have not sought diagnosticrefinements beyond these broad groups and we believe the data make it clearthat there would have to be some extraordinary bias to overturn the resultsobtained using this approach.
An unrecognized methodological concern, however, must lie with thecontemporary sample. Recent research (Bush, Fink, Petrides, Dowling andFrancis, 1996) suggests that up to 10% of patients going through a DGHunit today will have catatonic features. Catatonia, which has beenobituarized extensively, in fact appears not to have gone away but, incredibly,modern psychiatrists simply do not see quite bizarre and striking features ofthe mental states of their patients under their noses.
As part of a study to estimate career lengths of stay in psychiatric facilities,we conducted a study between 1 October 1998 and 30 November 1998aimed at mapping total career bed usage in a cohort of patients passingthrough the Hergest Unit (see below). Simultaneously, this sample ofpatients was screened for catatonic features. A comparable group of patientsadmitted to a regional psychiatric facility in Hyderabad, India, during thecourse of two weeks in March 1999 was also screened. Both groups had 13%of patients with catatonic features. Modern diagnostic procedures, it seems,do not capture these clinical features.
Analysis of dataWe first compared the per annum admission rate in the 1896 and 1996 samples.We defined admission prevalence as the number of individuals admitted in aone-year period. Second, we examined the hospitalized incidence rates forschizophrenia, non-affective disorder psychoses and bipolar disorders. Third, wecalculated the length of stay of patients and the numbers of prior admissions.
HPY 16(1) Healy 1/28/05 9:03 AM Page 4
D. HEALY ET AL.: SERVICE UTILIZATION IN 1896 AND 1996 31
Fourth, we sought figures for both mean length of stay and overall usage ofservice beds by disease cohorts. Finally, we compared recovery, relief andmortality rates from the two samples.
As noted above, there was a similar age distribution between the populationsin 1896 and 1996 across the 15–65 age groups, and in particular for the15–55 age groups. As the 15–65 age groups account for the ages of origin forour incidence figures for syndromes other than dementia, we have onlysupplied the numerators for the main syndromes.
Based on criteria used in the 1896 sample, we developed operationalcriteria to categorize the course of the illness. In both 1896 and 1996samples, there were four possible outcomes for patients. They could bedischarged ‘recovered’; such patients had to have less than 3 admissions inthe 3 years prior to the first admission, to be discharged home with a clinicaldiagnosis of recovery recorded in their notes and no admission during theyear after discharge. A second possibility was to be discharged ‘relieved’, inwhich case the clinical notes recorded that the acute symptoms had passedbut the patient was not back to normal and was discharged to a hostel (1996)or to the workhouse or lodgings (1896). Such patients characteristically had3 or more prior admissions in the 3-year-period before the first admissionand/or an admission in the year after discharge. A third option was discharge‘not improved’. Finally, patients could die in care. Using these operationaldefinitions, 7 patients designated as recovered in 1896 by their clinicianswere re-designated as relieved on the basis of a further admission within ayear of their apparent recovery.
In order to compare death rates between the samples, we followed the1896 patient group after discharge into the community. It was clear from therecords that some of those discharged relieved or not improved had in factbeen discharged to die. All patients discharged were tracked in the 1896 and1996 samples to 5 years from the end of the sample period. Rates aretherefore expressed in terms of 5-year mortality rates. The 5-year mortalityrates of the 1996 cohort were established by following up these patientsthrough to 31 March 2002.
In order to establish the number of bed days occupied in 1896, weaccessed all prior records of this cohort of patients and summed their lengthsof stay. For the 1996 cohort we adopted the following procedure. In the caseof all 112 patients admitted in October and November 1998 in North Wales,as part of the catatonia prevalence study outlined above, we accessed all priorrecords, and from these established the length of stay in any mental healthservice bed at any stage in their previous psychiatric career; these bedsincluded hostel beds or any other bed paid for by the health service. Fromthe mean lengths of stay in 1998 and the total length of stay for all bipolardisorder patients as a group, all non-affective psychotic patients as a group,all personality disorder patients as a group, etc., it was possible to constructan index linking length of stay in 1996 with career psychiatric service bed
HPY 16(1) Healy 1/28/05 9:03 AM Page 5
32 HISTORY OF PSYCHIATRY 16(1)
usage for each cohort of patients. Median lengths of stay in 1996 for eachdiagnostic cohort were multiplied by the length of stay factor for thatdiagnosis.
Results
At the end of 1896 there were 667 beds in the asylum. Patients from NWWales accounted for 267 of these. In 1996 there were 60 acute mental illnessbeds, as well as 66 EMI assessment and respite beds, 8 longstay and 31hostel beds, and 42 beds in registered residential care. There were a further216 registered residential care for the elderly beds and an unknown numberof other elderly residential care beds. Finally, there were 140 beds in aregional hospital for learning disabilities, of which 56 were occupied bypatients from NW Wales.
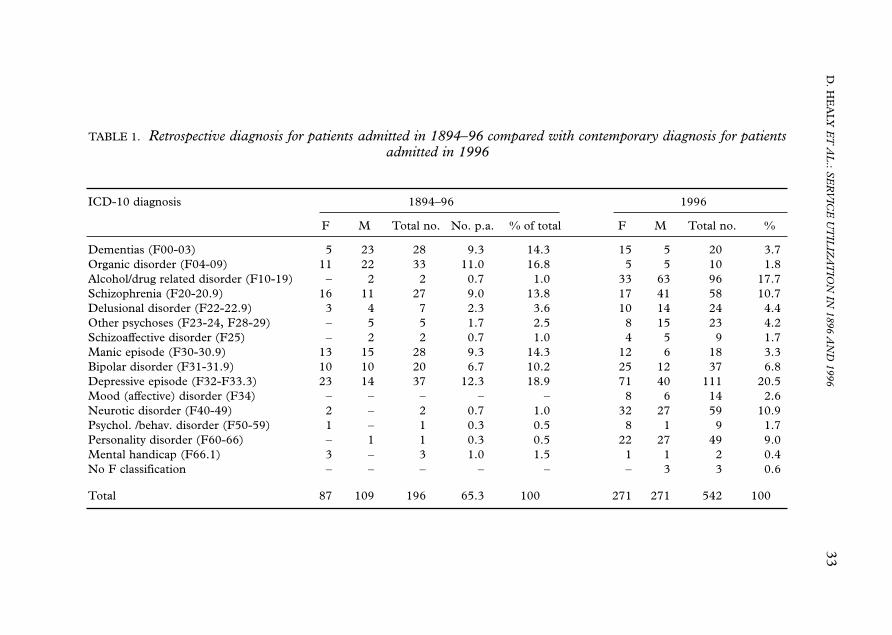
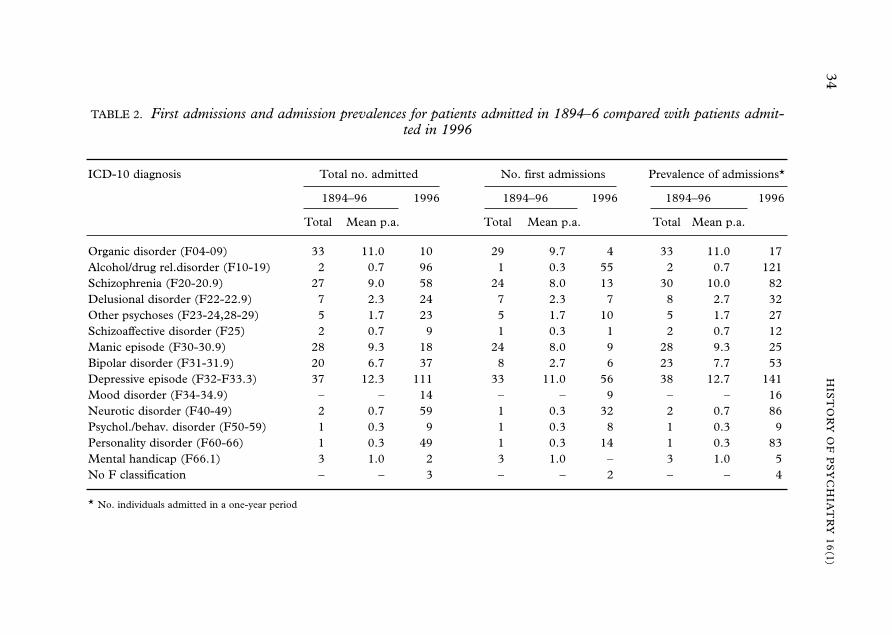
Details on the numbers of patients admitted in 1896 and 1996 have beenprovided previously (Healy et al., 2001). A summary of these data and thediagnoses of patients is given in Tables 1 and 2. Comparative data on theincidence of service utilization for the major psychosyndromes have also beenprovided previously (Healy et al., 2001).
Comparative prevalence of hospital admissionsThe 1896 figure minus dementias (28), organic disorders except GPI (29)and mental handicap (3) gives an average admission prevalence of 48 perannum for functional mental illness from 45 individuals. This contrasts withan admission prevalence of 713 (total minus 24 dementias) from 522individuals in 1996. There were 6.7 admissions then for every 100 now, a15-fold increase. The inclusion of dementias and learning disabilities doesnot shift the ratio in favour of the present day, if the admissions for dementiaor learning disabilities to all facilities in 1996 are taken into account.Considering compulsory detentions only in 1996 gives a 3-fold increasecompared with 1896.
Focusing on the seriously mentally ill (SMI) groups in both samples –excluding dementias, organic psychoses, learning disabilities, alcohol anddrug dependence, personality disorders and behavioural/neurotic problems –gave 42 individuals per annum diagnosed with SMI in 1896, with a meanage of 40 years; in 1996 there were 294 individuals with a mean age of 48.7years. Of these 294, 111 had depressive episodes, 114 psychotic episodes and69 other affective episodes. This is a 7-fold difference in admission prevalence(see Table 2).
In 1896 there were no individuals receiving a contemporary diagnosis ofpersonality disorder, neuroses or behavioural disorders. Retrospective diagnosesyields 4 admissions. In 1996, 49 patients accounting for 83 admissions werediagnosed as having a personality disorder. Fifty-nine patients, accounting for86 admissions, were diagnosed with a neurotic disorder and 52.5% of these had
HPY 16(1) Healy 1/28/05 9:03 AM Page 6
D. H
EA
LY E
T A
L.: S
ER
VIC
E U
TIL
IZA
TIO
N IN
1896 AN
D 1996
33
TABLE 1. Retrospective diagnosis for patients admitted in 1894–96 compared with contemporary diagnosis for patientsadmitted in 1996
ICD-10 diagnosis 1894–96 1996
F M Total no. No. p.a. % of total F M Total no. %
Dementias (F00-03) 5 23 28 9.3 14.3 15 5 20 3.7Organic disorder (F04-09) 11 22 33 11.0 16.8 5 5 10 1.8Alcohol/drug related disorder (F10-19) – 2 2 0.7 1.0 33 63 96 17.7Schizophrenia (F20-20.9) 16 11 27 9.0 13.8 17 41 58 10.7Delusional disorder (F22-22.9) 3 4 7 2.3 3.6 10 14 24 4.4Other psychoses (F23-24, F28-29) – 5 5 1.7 2.5 8 15 23 4.2Schizoaffective disorder (F25) – 2 2 0.7 1.0 4 5 9 1.7Manic episode (F30-30.9) 13 15 28 9.3 14.3 12 6 18 3.3Bipolar disorder (F31-31.9) 10 10 20 6.7 10.2 25 12 37 6.8Depressive episode (F32-F33.3) 23 14 37 12.3 18.9 71 40 111 20.5Mood (affective) disorder (F34) – – – – – 8 6 14 2.6Neurotic disorder (F40-49) 2 – 2 0.7 1.0 32 27 59 10.9Psychol. /behav. disorder (F50-59) 1 – 1 0.3 0.5 8 1 9 1.7Personality disorder (F60-66) – 1 1 0.3 0.5 22 27 49 9.0Mental handicap (F66.1) 3 – 3 1.0 1.5 1 1 2 0.4No F classification – – – – – – 3 3 0.6
Total 87 109 196 65.3 100.0 271 271 542 100.0
HPY 16(1) Healy 1/28/05 9:03 AM Page 7
34H
IST
OR
Y O
F P
SY
CH
IAT
RY
16
(1)
TABLE 2. First admissions and admission prevalences for patients admitted in 1894–6 compared with patients admit-ted in 1996
ICD-10 diagnosis Total no. admitted No. first admissions Prevalence of admissions*
1894–96 1996 1894–96 1996 1894–96 1996
Total Mean p.a. Total Mean p.a. Total Mean p.a.
Organic disorder (F04-09) 33 11.0 10 29 9.7 4 33 11.0 17Alcohol/drug rel.disorder (F10-19) 2 0.7 96 1 0.3 55 2 0.7 121Schizophrenia (F20-20.9) 27 9.0 58 24 8.0 13 30 10.0 82Delusional disorder (F22-22.9) 7 2.3 24 7 2.3 7 8 2.7 32Other psychoses (F23-24,28-29) 5 1.7 23 5 1.7 10 5 1.7 27Schizoaffective disorder (F25) 2 0.7 9 1 0.3 1 2 0.7 12Manic episode (F30-30.9) 28 9.3 18 24 8.0 9 28 9.3 25Bipolar disorder (F31-31.9) 20 6.7 37 8 2.7 6 23 7.7 53Depressive episode (F32-F33.3) 37 12.3 111 33 11.0 56 38 12.7 141Mood disorder (F34-34.9) – – 14 – – 9 – – 16Neurotic disorder (F40-49) 2 0.7 59 1 0.3 32 2 0.7 86Psychol./behav. disorder (F50-59) 1 0.3 9 1 0.3 8 1 0.3 9Personality disorder (F60-66) 1 0.3 49 1 0.3 14 1 0.3 83Mental handicap (F66.1) 3 1.0 2 3 1.0 – 3 1.0 5No F classification – – 3 – – 2 – – 4
* No. individuals admitted in a one-year period
HPY 16(1) Healy 1/28/05 9:03 AM Page 8
D. HEALY ET AL.: SERVICE UTILIZATION IN 1896 AND 1996 35
adjustment disorder; 47% were also diagnosed as having a significantpersonality component to their problems. Personality disorders and neuroticdisorders accounted for 25% of all admissions in 1996. Admissions with adiagnosis of dysthymia (F341) represented a further 2% of the total. In thecase of a majority of individuals admitted for substance abuse problems,secondary diagnoses of personality disorder were made. Adding these groupstogether, admissions with a significant personality element accounted for40% of all admissions. These figures are in line with those reported byDowson, Sussams and Grounds (1997).
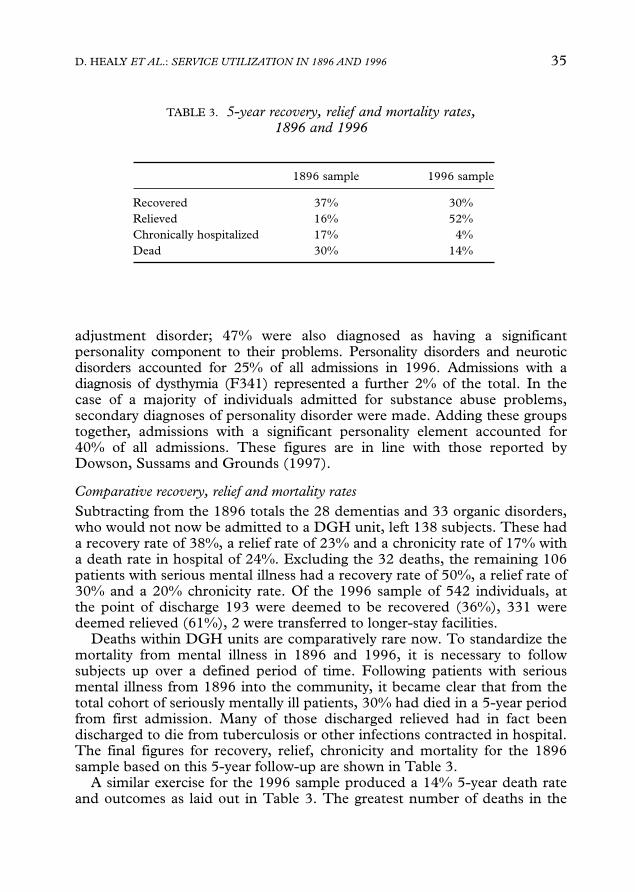
Comparative recovery, relief and mortality ratesSubtracting from the 1896 totals the 28 dementias and 33 organic disorders,who would not now be admitted to a DGH unit, left 138 subjects. These hada recovery rate of 38%, a relief rate of 23% and a chronicity rate of 17% witha death rate in hospital of 24%. Excluding the 32 deaths, the remaining 106patients with serious mental illness had a recovery rate of 50%, a relief rate of30% and a 20% chronicity rate. Of the 1996 sample of 542 individuals, atthe point of discharge 193 were deemed to be recovered (36%), 331 weredeemed relieved (61%), 2 were transferred to longer-stay facilities.
Deaths within DGH units are comparatively rare now. To standardize themortality from mental illness in 1896 and 1996, it is necessary to followsubjects up over a defined period of time. Following patients with seriousmental illness from 1896 into the community, it became clear that from thetotal cohort of seriously mentally ill patients, 30% had died in a 5-year periodfrom first admission. Many of those discharged relieved had in fact beendischarged to die from tuberculosis or other infections contracted in hospital.The final figures for recovery, relief, chronicity and mortality for the 1896sample based on this 5-year follow-up are shown in Table 3.
A similar exercise for the 1996 sample produced a 14% 5-year death rateand outcomes as laid out in Table 3. The greatest number of deaths in the
TABLE 3. 5-year recovery, relief and mortality rates,1896 and 1996
1896 sample 1996 sample
Recovered 37% 30%Relieved 16% 52%Chronically hospitalized 17% 4%Dead 30% 14%
HPY 16(1) Healy 1/28/05 9:03 AM Page 9
36 HISTORY OF PSYCHIATRY 16(1)
1996 sample came predictably from older patients in the age range over 70.However, a substantial number came from the 15- to 55-year-old age groups(N = 24; 4.4%). Of these the greatest single cause of death was death bysuicide (9) followed by death from an illegal substance overdose (3). In total,therefore, in these age groups 54% of deaths stemmed from the patients’mental illness.
In scrutinizing 2892 records from NW Wales between 1875 and 1915,there were only 3 inpatient suicides and two suicides from patients recentlydischarged; the hospital recorded all suicides of patients who were dischargedagainst their advice. The recent United Kingdom survey of suicides inpsychiatric patients suggests that a comparable volume of patients todaywould give rise to 10 inpatient suicides and 240 suicides in the course of theyear following discharge. Standardizing for length of stay might be expectedto yield up to 100 inpatient suicides from a comparable volume 1996 sample(Department of Health, 1999).
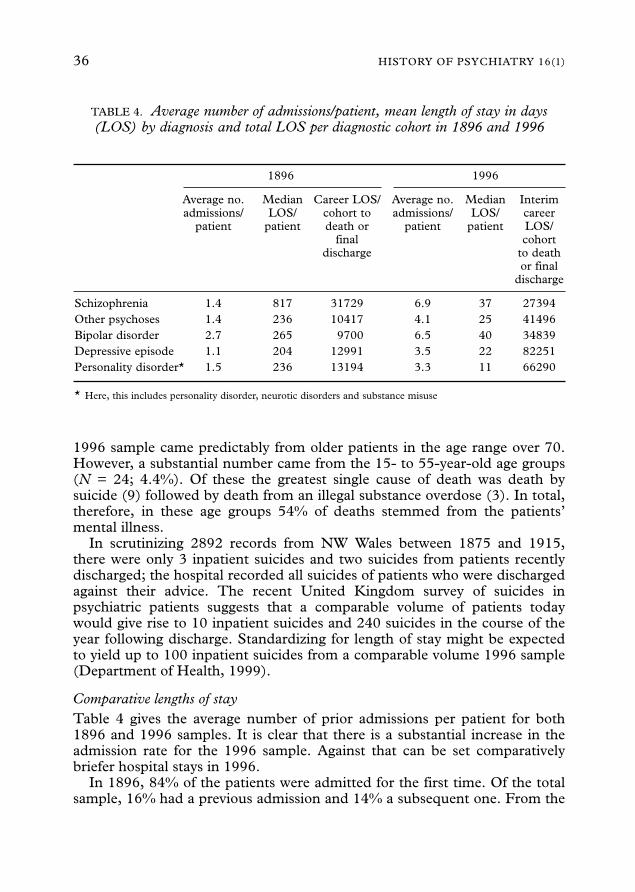
Comparative lengths of stayTable 4 gives the average number of prior admissions per patient for both1896 and 1996 samples. It is clear that there is a substantial increase in theadmission rate for the 1996 sample. Against that can be set comparativelybriefer hospital stays in 1996.
In 1896, 84% of the patients were admitted for the first time. Of the totalsample, 16% had a previous admission and 14% a subsequent one. From the
TABLE 4. Average number of admissions/patient, mean length of stay in days(LOS) by diagnosis and total LOS per diagnostic cohort in 1896 and 1996
1896 1996
Average no. Median Career LOS/ Average no. Median Interimadmissions/ LOS/ cohort to admissions/ LOS/ career
patient patient death or patient patient LOS/final cohort
discharge to deathor final
discharge
Schizophrenia 1.4 817 31729 6.9 37 27394Other psychoses 1.4 236 10417 4.1 25 41496Bipolar disorder 2.7 265 9700 6.5 40 34839Depressive episode 1.1 204 12991 3.5 22 82251Personality disorder* 1.5 236 13194 3.3 11 66290
* Here, this includes personality disorder, neurotic disorders and substance misuse
HPY 16(1) Healy 1/28/05 9:03 AM Page 10
D. HEALY ET AL.: SERVICE UTILIZATION IN 1896 AND 1996 37
serious mental illness group, 47 (58%) were admitted for the first and last timein 1896, while the remaining 33 (42%) had other admissions. In 1996, 25% ofpatients were admitted for the first time. Of the 737 admissions, 195 wererepeat admissions that year (26%). Of these, 130 patients were readmitted onceduring the 12 months of the study, 47 were readmitted twice, 14 three timesand 5 on more than 4 occasions. In addition, 311 patients had a previousadmission (60%) and 110 had at least one subsequent admission to the HergestUnit (20%). This figure excludes those patients referred to the day hospital,support bed units or EMI units after discharge from the acute services. Of the294 SMI individuals in 1996, 24% were first admissions. The remaining 76%had up to 3 previous and/or up to 3 subsequent admissions or were referred tosupport bed facilities after discharge.
Table 4 presents the mean length of stay of patients from differentdiagnostic categories during the course of their stay in hospital, includingstays beyond the study period. This table also presents data using the indexdetailed in the Methods section. In the case of the 1896 sample, it has beenpossible to produce a reliable figure for bed-days occupied by each diagnosticcohort. In the 1996 cohort, the extrapolation yields figures that hold up tothe end of 1996. These patients will go on to spend a further period of timein hospital. Ongoing analysis of the bipolar cohort of patients in the periodfrom 1875 to 1914 compared with the modern period supports the validity ofthe figures drawn from this sample.
Discussion
This analysis extends the previous analysis of this database by offering figureson the length of stay of modern patients and their mortality rates. It does soin sets of historical and modern populations of service users almostcompletely free from economic or clinical selection factors.
As regards length of stay, the figures can be expressed as follows. Wherean annual cohort of patients with schizophrenia were likely to spend 400years (1896 cohort days scaled up to 1 million people) in a hospital bed in1896 per million population, every million people today will have aschizophrenia cohort who at the time of writing will have already spent thatlength of time in a service bed and this cohort will spend several hundredmore years in a service bed before they die. In the case of depression, anymillion population will have in their midst a cohort of depressed patients whohave already spent 1000 years in a service bed. This cohort will spend a greatdeal more years in service beds before they die.
As regards mortality rates, it appears that, while patients in 1996 are lesslikely to die in the 5-year period after admission to a psychiatric facility, theyare more likely to die eventually from their mental illness than they were in1896. These figures are so much at odds with the contemporary rhetoric ofmental health service delivery that they call for explanation.
HPY 16(1) Healy 1/28/05 9:03 AM Page 11
38 HISTORY OF PSYCHIATRY 16(1)
First, there is the rather obvious point that the treatments we now haverelieve rather than cure the conditions for which they are given. In 1956, justafter chlorpromazine had been introduced, the NIMH organized a symposiumunder the auspices of Jonathan Cole and Ralph Gerard to discuss how toevaluate the impact of treatments like chlorpromazine and how to progress newdrug development. The meeting endorsed the need for randomized trials, ratingscales and all the paraphernalia of modern psychiatry (Cole and Gerard, 1959).A rare dissenting view came from Evarts of the NIMH who argued that, but forsome accidents of history, chlorpromazine might have been celebrated as atreatment of dementia paralytica (Evarts, 1959). If asked to build onchlorpromazine’s utility for dementia paralytica, the field would then beadvocating clinical trials and rating scales and drug development approaches ofthe sort that were being proposed for chlorpromazine in schizophrenia. This, heargued, would have produced a therapy, research and pharmaceuticalestablishment that probably would have been inimical to the recognition of thefact that penicillin rather than chlorpromazine was the cure for dementiaparalytica. The figures from this study suggest that mental health services mayhave fallen rather dramatically into the pit that Evarts outlined in 1956.
In the light of these data, the changes demonstrated in RCTs for moderntreatments stand quite clearly as evidence of treatment effects rather thanevidence of efficacy. Modern treatments clearly allowed the discharge ofmany chronically hospitalized patients in the 1950s and 1960s, andcontribute to shorter lengths of stay now than formerly, but from the start theuse of these same treatments has been associated with an increased numberof readmissions, a proportion of which may be associated with discon-tinuation syndromes or other complicating factors linked to treatment ratherthan illness relapse (Battegay, 2000).
Modern treatments therefore appear to have set up a revolving door. As aconsequence, a more accurate image of mental health service delivery to theimage of hospital populations that has its apex in 1955 would be a graphshowing a steep rise in admission rates, starting in the 1950s and possiblyreaching a plateau in the 1980s. In this regard, the findings from our studyhave been replicated in other studies (Mulholland, 1998). The current studyoffers an element of quantification lacking in other studies.
A second factor is the professionalization of care-giving during the periodunder consideration. If this professionalization plays a part in the growingnumber of admissions in mental health, then that increase might be reflectedin an increased number of admissions to the rest of the medical services. InWales in the period from 1955 to 1997 there was an increase in dischargesand deaths from mental illness beds from 5656 to 17,588 per annum. In therest of the medical services generally, there was an increase from 171,430 to503,073 (Healy et al., 2001). The rise in admissions in psychiatry, therefore,was in line with – albeit slightly greater than – that happening in the rest ofmedicine.
HPY 16(1) Healy 1/28/05 9:03 AM Page 12
D. HEALY ET AL.: SERVICE UTILIZATION IN 1896 AND 1996 39
During this period we have made drugs available on prescription only andhave otherwise forced patients through a funnel in order to access medicalcare. It may well be that the true incidence and prevalence of the seriousmental illness was just the same in 1896 as now, but that service utilization isdramatically greater now. Indeed, as the increase cuts across all illnessgroups, it seems less likely to stem from a change in the virulence of theillnesses and more likely to stem from other factors. These data offer somesupport to Scull’s thesis that increased psychiatric bed occupancy/usagereflects an extension of services rather than an increase in hospitalizedincidence of the index conditions (Hare, 1986; Scull, 1984).
However, while there may be a general factor affecting both mental healthand general medical services, a greater proportion (up to 30%) of generalmedical service contacts stem from a rising old age population, with anassociated set of morbidities, and this is not found in psychiatry. In contrast,there is apparently an explosion in the apparent incidence of mentaldisorders in young persons, with depression and ADHD leading to a muchgreater increase in mental health service utilization than is found amongyoung persons for general medical service utilization.
As regards differences in length of stay in hospital between the twoperiods, the first admissions were considerably shorter in 1996 than theywere in 1896. However, patient cohorts appear to spend longer in a servicebed now than they did 100 years ago. This might arise for a number ofreasons. First, there is an earlier onset of service utilization for the functionalpsychoses in the modern period. Second, aside from the flagship DGH beds,mental health services provide a range of community, hostel or other long-term hospital beds that are not typically factored into calculations of bedusage – although the increase in service usage proposed here holds true evenwhen comparisons are limited to DGH unit beds only. Third, notwith-standing an increased rate of death by suicide, patients now are likely to livelonger than they did in 1896.
The critical question, then, is whether the service utilization we have nowis a good thing. In the rest of medicine iatrogenic injury and death isrecognized as being one of the leading causes of injury and death (Lazarou,Pomeranz and Corey, 1998). It is clear from the figures reported here that insome respects this holds true for mental illnesses also. To what extent wesimply do not know. The rhetoric of service delivery appears to precludesuch considerations. There is some evidence, however, that life expectancyfor schizophrenia has been falling in recent years (Osby, Correia, Brandt,Ekbom and Sparen, 2000), and considerable evidence that modern anti-psychotic drugs may lead to increased rates of suicide in schizophrenia(Healy, Harris, Tranter, Gutting, Austin and Roberts, in press).
The figures on mortality from mental illness in the nineteenth centuryreported here update the paradigmatic figures reported by William Farr(1975), who found death rates of 11% for patients of the better classes, 12%
HPY 16(1) Healy 1/28/05 9:03 AM Page 13
40 HISTORY OF PSYCHIATRY 16(1)
for paupers in Hanwell and up to 21% for paupers in other establishments(Healy et al., in press). Our 30% 5-year mortality figures for serious mentalillness come from a population that had a 12% mortality rate in the year afteradmission. Grim though these figures are, when set against the moderncomparator figure of a 14% mortality rate over 5 years the figures from the1890s do not look bad, if it is taken into account that effective antibioticswould have led to a dramatic drop in the 1896 mortality figures.
One surprising aspect of the 1896 data is the relatively good recoveryrates, which bear comparison with modern rates. Several factors may accountfor this. First, the availability of mental health teams today is trumpeted as ameans of keeping patients out of hospital, but the regular monitoring ofchanges in mental state in current climates of risk management are alwaysliable to lead to admissions that might have been less likely 50 years ago.This is particularly the case given a comparative destigmatization of mentalillness. Second, the assumption that patients admitted earlier or with lesssevere problems should be easier to ‘cure’ may in fact not hold true. Third,the quality of modern remissions may not be as secure as we like to think, oralternatively we have become more demanding about the quality of clinicalresponses. Finally, current treatments may increase rates of relapse either inpatients remaining on treatment or in those who discontinue and haveconsequent withdrawal-induced disturbances.
This study of service utilization factors makes no attempt to get at any‘real illness entities’ that may underpin utilization. In one sense, studies likethis will always resemble post-mortems, in that both are as likely to indicatewhat social bodies in the one case and human bodies in the other can livewith, as they are to reveal what has afflicted them.
Whatever the relation between increased service utilization and illnessentities, the relationship between service utilization and the number ofpsychiatrists is one that is amenable to further investigation. There were, forexample, no forensic psychiatrists in Britain in 1966 whereas there are nowover 250. This increase parallels an increase in the number of patients nowlocked up in secure facilities compared with 1966. Just as the increase in the
HPY 16(1) Healy 1/28/05 9:03 AM Page 14
number of cardiologists and cardiac surgeons leads to an increasing numberof coronary artery bypass operations and other such procedures despite anabsence of evidence that many of these procedures are effective, it might benaïve to think we could have expected that a massive increase in the numberof psychiatrists would ever lead to anything other than the treatment of morepatients than ever before.
Notes
1. North Wales Department of Psychological Medicine, University of Wales College ofMedicine, Bangor, UK.
2. School of Social Sciences, University of Wales, Bangor, UK.
HPY 16(1) Healy 1/28/05 9:03 AM Page 15
D. HEALY ET AL.: SERVICE UTILIZATION IN 1896 AND 1996 41
References
Battegay, R. (2000) Forty-four years of psychiatry and psychopharmacology. In D. Healy, ThePsychopharmacologists, Vol. 3 (London: Arnold), 371–94.
Bush, G., Fink, M., Petrides, G., Dowling, F. and Francis, A. (1996) Catatonia Rating scaleand standardised examination. Acta Psychiatrica Scandinavica, 93, 129–36
Cole, J. O. and Gerard, R. W. (1959) Psychopharmacology: Problems in Evaluation (WashingtonDC: National Academy of Sciences/National Research Council, Publication 583).
Department of Health [UK] (1999) Safer Services. National Confidential Inquiry into Suicideand Homicide by People with Mental Illness (Crown Copyright, Department of Health).
Dowson, J. H., Sussams, P. and Grounds, A. T. (1997) Characteristics of inpatients withoutpsychosis. Implications for service provision and the recognition of personality disorder.Psychiatric Bulletin, 21, 553–6.
Evarts, E. (1959) A discussion of the relevance of effects of drugs on animal behavior to thepossible effects of drugs on psychopathological processes in man. In J. O. Cole and R. W.Gerard (eds), Psychopharmacology: Problems in Evaluation (Washington, DC: NationalAcademy of Science, Publication 583), 284–306, esp. 302.
Farr, W. (1975) Vital Statistics: A Memorial Volume of Selections from the Reports and Writings ofWilliam Farr (Metachen, NJ: Scarecrow Press), 423–35.
Hare, E. (1986) Aspects of the epidemiology of schizophrenia. British Journal of Psychiatry,149, 554–61
Healy, D. (2002) The Creation of Psychopharmacology (Cambridge, MA: Harvard UniversityPress).
Healy, D., Harris, M., Tranter, R., Gutting, P., Austin, R. and Roberts, A. P. (in press)Suicide in the course of the treatment of schizophrenia. British Journal of Psychiatry.
Healy, D., Savage, M., Michael, P., Harris, M., Hirst, D., Carter, M., Cattell, D.,McMonagle, T., Sohler, N. and Susser, E. (2001) Psychiatric bed utilisation: 1896 and1996 compared. Psychological Medicine, 31, 779–90.
Lazarou, J., Pomeranz, B. H. and Corey, P. N. (1998) Incidence of adverse drug reactions inhospitalised patients. Journal of the American Medical Association, 279, 1200–5.
Mulholland, M. (1998) To Comfort Always. A History of Holywell Hospital 1898–1998 (Belfast:Universities Press).
Osby, U., Correia, N., Brandt, L., Ekbom, A. and Sparen, P. (2000) Time trends inschizophrenia mortality in Stockholm County, Sweden: a cohort study. British MedicalJournal, 321, 483–4.
Porter, R. (2002) Madness: A Brief History (Oxford: Oxford University Press).Scull, A. (1984) Was insanity increasing? A response to Edward Hare. British Journal of
Psychiatry, 144, 432–6.
Copyright © 2022 FDOKUMEN