Content-access QoS in peer-to-peer networks using a fast MDS erasure code
Upload
independentCategory
view
2download
0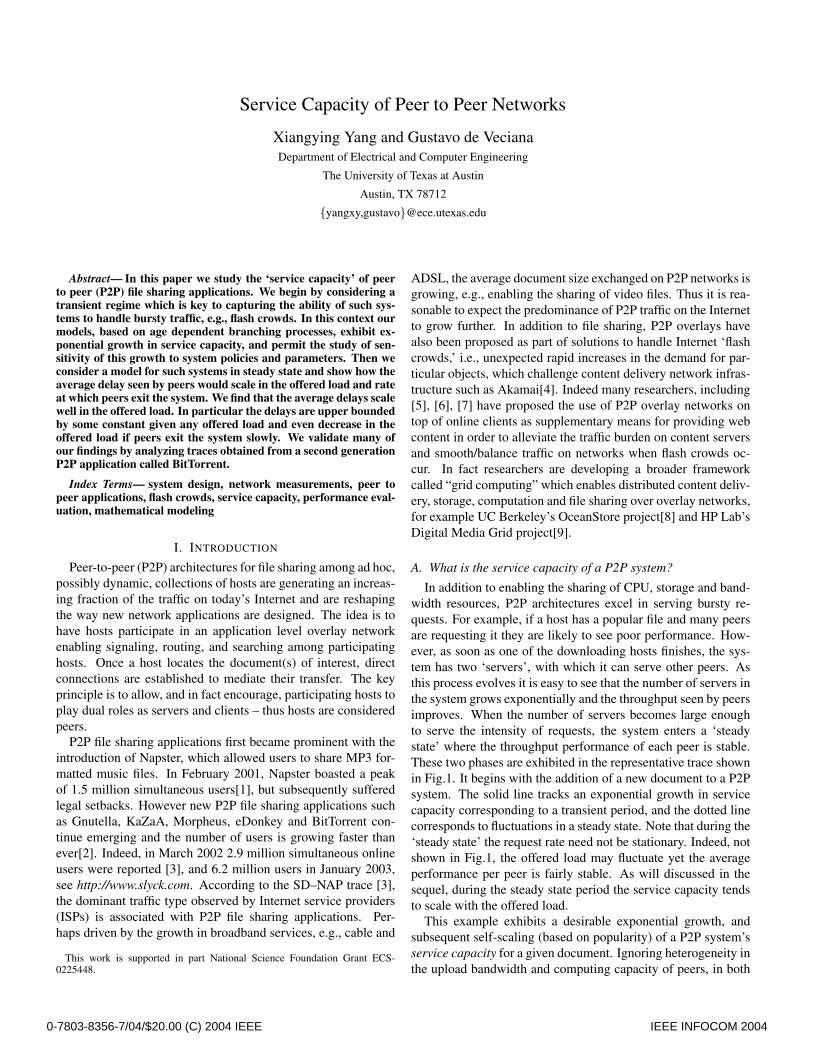
Service Capacity of Peer to Peer Networks
Xiangying Yang and Gustavo de VecianaDepartment of Electrical and Computer Engineering
The University of Texas at Austin
Austin, TX 78712
{yangxy,gustavo}@ece.utexas.edu
Abstract— In this paper we study the ‘service capacity’ of peerto peer (P2P) file sharing applications. We begin by considering atransient regime which is key to capturing the ability of such sys-tems to handle bursty traffic, e.g., flash crowds. In this context ourmodels, based on age dependent branching processes, exhibit ex-ponential growth in service capacity, and permit the study of sen-sitivity of this growth to system policies and parameters. Then weconsider a model for such systems in steady state and show how theaverage delay seen by peers would scale in the offered load and rateat which peers exit the system. We find that the average delays scalewell in the offered load. In particular the delays are upper boundedby some constant given any offered load and even decrease in theoffered load if peers exit the system slowly. We validate many ofour findings by analyzing traces obtained from a second generationP2P application called BitTorrent.
Index Terms— system design, network measurements, peer topeer applications, flash crowds, service capacity, performance eval-uation, mathematical modeling
I. INTRODUCTION
Peer-to-peer (P2P) architectures for file sharing among ad hoc,possibly dynamic, collections of hosts are generating an increas-ing fraction of the traffic on today’s Internet and are reshapingthe way new network applications are designed. The idea is tohave hosts participate in an application level overlay networkenabling signaling, routing, and searching among participatinghosts. Once a host locates the document(s) of interest, directconnections are established to mediate their transfer. The keyprinciple is to allow, and in fact encourage, participating hosts toplay dual roles as servers and clients – thus hosts are consideredpeers.
P2P file sharing applications first became prominent with theintroduction of Napster, which allowed users to share MP3 for-matted music files. In February 2001, Napster boasted a peakof 1.5 million simultaneous users[1], but subsequently sufferedlegal setbacks. However new P2P file sharing applications suchas Gnutella, KaZaA, Morpheus, eDonkey and BitTorrent con-tinue emerging and the number of users is growing faster thanever[2]. Indeed, in March 2002 2.9 million simultaneous onlineusers were reported [3], and 6.2 million users in January 2003,see http://www.slyck.com. According to the SD–NAP trace [3],the dominant traffic type observed by Internet service providers(ISPs) is associated with P2P file sharing applications. Per-haps driven by the growth in broadband services, e.g., cable and
This work is supported in part National Science Foundation Grant ECS-0225448.
ADSL, the average document size exchanged on P2P networks isgrowing, e.g., enabling the sharing of video files. Thus it is rea-sonable to expect the predominance of P2P traffic on the Internetto grow further. In addition to file sharing, P2P overlays havealso been proposed as part of solutions to handle Internet ‘flashcrowds,’ i.e., unexpected rapid increases in the demand for par-ticular objects, which challenge content delivery network infras-tructure such as Akamai[4]. Indeed many researchers, including[5], [6], [7] have proposed the use of P2P overlay networks ontop of online clients as supplementary means for providing webcontent in order to alleviate the traffic burden on content serversand smooth/balance traffic on networks when flash crowds oc-cur. In fact researchers are developing a broader frameworkcalled “grid computing” which enables distributed content deliv-ery, storage, computation and file sharing over overlay networks,for example UC Berkeley’s OceanStore project[8] and HP Lab’sDigital Media Grid project[9].
A. What is the service capacity of a P2P system?
In addition to enabling the sharing of CPU, storage and band-width resources, P2P architectures excel in serving bursty re-quests. For example, if a host has a popular file and many peersare requesting it they are likely to see poor performance. How-ever, as soon as one of the downloading hosts finishes, the sys-tem has two ‘servers’, with which it can serve other peers. Asthis process evolves it is easy to see that the number of servers inthe system grows exponentially and the throughput seen by peersimproves. When the number of servers becomes large enoughto serve the intensity of requests, the system enters a ‘steadystate’ where the throughput performance of each peer is stable.These two phases are exhibited in the representative trace shownin Fig.1. It begins with the addition of a new document to a P2Psystem. The solid line tracks an exponential growth in servicecapacity corresponding to a transient period, and the dotted linecorresponds to fluctuations in a steady state. Note that during the‘steady state’ the request rate need not be stationary. Indeed, notshown in Fig.1, the offered load may fluctuate yet the averageperformance per peer is fairly stable. As will discussed in thesequel, during the steady state period the service capacity tendsto scale with the offered load.
This example exhibits a desirable exponential growth, andsubsequent self-scaling (based on popularity) of a P2P system’sservice capacity for a given document. Ignoring heterogeneity inthe upload bandwidth and computing capacity of peers, in both
0-7803-8356-7/04/$20.00 (C) 2004 IEEE IEEE INFOCOM 2004
0 200 400 600 800 1000 12000
5
10
15
20
25
30
35
40
45
50
←Exponential Growth of Throughput
←Steady ThroughputA
vg T
hrou
ghpu
t
Time
Fig. 1. Two-phases in the evolution of the average throughput per peer versustime for a single document introduced into a P2P network.
cases the number of peers willing to serve the document is thedriver. Yet service capacity should be viewed in two regimes: the‘transient’ and ‘steady state’. In the transient regime one mightwish to assess how quickly a P2P network starting with a limitednumber of servers can grow its service capacity to meet the loadassociated with a burst of demands. While in the steady stateregime, one might wish to assess the average throughput/delayperformance seen by a typical peer. Note that in the transientregime, the system is server constrained, i.e., requests are back-logged and hence the service capacity increases exponentiallyfast with a rate that reflects the system’s intrinsic ability to lever-age its resources to share limited service capacity. By contrast, insteady state the service capacity depends and/or adapts to fluctu-ations in demand; in this regime the service capacity is demandconstrained.
The service capacity in these two regimes depends on a num-ber of factors:
• data management: a document may be partitioned into vari-ous parts permitting concurrent downloading from multiplepeers; the granularity and placement of these is critical;
• peer selection: the mechanism whereby a peer is selected asa server may take into account load balancing, bandwidthavailability, and differentiate among peers who contributemore to the community;
• admission and scheduling policy: limiting the number ofconcurrent downloaders and/or scheduling to provide dif-ferentiation/priority among them;
• traffic: the request processes for documents along with thedynamics of how peers stay online and/or delete docu-ments.
These factors are interrelated in complex ways. For exam-ple, a good peer selection scheme may favor peers that are likelyto subsequently stay as servers for the document and thus con-tribute to the system’s service capacity. Multi-part downloadscan increase the rate at which files get duplicated while at thesame time allowing users to serve as peers for parts they havealready obtained prior to completing downloads. Allowing largenumbers of peers to download from one another may increasethe subsequent potential service capacity for a document but mayincrease delays. Spatial clustering of peers may impact the ser-vice capacity of a P2P system in subtle ways, since serving a
peer which is far away and may have low bandwidth, may sub-sequently help to quickly serve an entire neighborhood of inter-ested peers. Recognizing some of these relationships new P2Papplications attempt to use simple credit based systems so as toprovide incentives for peers to stay online and ‘open’ their up-load bandwidth to serve other peers. This is often done by keep-ing peers’ credit history and based on their behavior give themdifferent priority in transfers or access. Such mechanisms aregeared at modifying user behavior and thus the offered load. Aswe will see in the sequel their impact on performance may besubtle. These complex relationships motivate the need for a sys-tematic study of these factors and tradeoffs on a P2P system’stransient as well as its stationary service capacity which is thestarting point for our work.
B. Related Work
Most research on P2P systems so far has emphasized design,traffic measurement and workload analysis but not performanceevaluation. Early work by [10][11][12] studied traces of P2Papplications like Gnutella and Napster. They focused on char-acterizing the overall P2P system, e.g., request patterns, trafficvolume, traffic categorization and properties of shared onlinecontent as well P2P structure and dynamics, e.g., connectivityand peer/host behaviors. More recent research in the directionof evaluating P2P systems has focused on performance. Peerselection schemes were evaluated in [13], where measurementsare used to optimize the selection of good peers and improvethe overall system performance. A few researchers have usedanalytical models to study the performance of P2P networks.For example, [14] constructed a model for signaling messages inthe Gnutella network and concluded that signaling might signifi-cantly compromise performance. The work in [15] is among thefirst to model a general P2P system and evaluate its performance.Their model, a closed queuing system, provides basic insights onthe stationary performance of a P2P system; among these, thedependence of performance on parameters like the peer requestrate and number of peers in the system.
C. Our Contributions
In this paper we study the performance characteristics of 2ndgeneration P2P applications, e.g., BitTorrent (BT), which im-plement various performance optimizations, via both trace mea-surement and analysis. We believe that policies aimed at im-proving system performance are crucial to building viable P2Papplications. Our measurement work is also unique in that weconsider performance as a function of time at the granularity ofa single P2P transfer session. These measurements highlight theneed for performance analysis focusing on both user experiencein steady state and system performance in the transient regime.
With this in mind we study two measures for the service ca-pacity of a P2P system. We model the transient service capacityof a P2P network by a branching process. Based on this model,we consider how to optimize service policies in order to maxi-mize the service capacity growth rate. We are not aware of anyprevious work that has analyzed the transient capacity of a P2P
0-7803-8356-7/04/$20.00 (C) 2004 IEEE IEEE INFOCOM 2004

system. In addition to our transient model, we propose a sim-ple steady state model, which captures the impact of peer depar-tures or document deletions on the stationary service capacity ofsuch systems. Our analytical results and measurements suggesthow various mechanisms might be designed to make a P2P sys-tem suitable for handling very bursty and large volume demandsand/or provide users good performance when the P2P networkmembership is dynamic and possibly heterogeneous.
D. Organization of this paper
The rest of the paper is organized as follows. We proposea transient model for P2P systems in Section II and considerhow various policies would impact the speed at which the servicecapacity grows, i.e., catches up with demands. In Section III wepropose a model and study the performance of a P2P system insteady state. We perform a detailed trace analysis of the BT P2Papplication in Section IV which supports in part the validity ofour models for P2P networks in a more complex environment.Finally we conclude our work in Section V.
II. TRANSIENT ANALYSIS OF SERVICE CAPACITY
The purpose of our transient analysis to investigate howquickly the service capacity of a P2P system can catch up witha burst of demands. This is crucial since popular files are oftenintroduced by a single peer, and may be subject to large bursts ofrequests far exceeding the available service capacity. Our goal isthus to ensure a document is disseminated as quickly as possibleto interested peers until the system reaches a steady state wherethe service capacity is commensurate with demands.
A. Deterministic model
Let us first consider a simple model for file sharing in the tran-sient regime. Suppose that n− 1 users wish to acquire a docu-ment which is initially available at one peer. To make deriva-tions simple let n = 2k. Assume that each peer has a limitedupload capacity but the network capacity is otherwise uncon-strained. More specifically, each peer has an upload bandwidth
Fig. 2. File sharing in a P2P system.
of b bps, and can serve a document only once it has been fullydownloaded. Suppose the document has size s bits. Thus toserve n− 1 requests (n− 1)s bits will need to be exchanged. Itshould be clear that a good strategy is to first serve one user atrate b, at which point the service capacity grows to 2b, and thenhave these two peers serve additional users, until the n−1 usersare served. As shown in Fig.2, under this idealized strategy peerswill complete service every τ = s/b seconds, at which point the
number of peers that can serve the document doubles, leadingto an exponential growth of 2t/τ in the “service capacity”, i.e.,the number of peers available to serve the document. This deter-ministic model exhibits the great potential of a P2P frameworkto support large bursts of requests in a decentralized manner.
Under the proposed strategy the n−1 peers will be served bytime τ log2(n+1) = τk. During this transient regime the averagedelay d̄ experienced by peers can be computed as follows. Let d j
denote the delay experienced by the jth peer and note that 2i−knpeers complete service at time (i + 1)τ. Assume the peer whoinitially has the file experiences zero delay. Thus,
d̄ =1n
n
∑j=1
d j =k−1
∑i=0
2i−kτ(i+1) = kτ− n−1n
τ
= τ(
log2 n− n−1n
) ≈ τ log2 n.
Hence although the system sees an initial burst of n requests theaverage delay seen by peers scales as log2 n which is favorablerelative to a linear scaling expected for a server-client model witha fixed set of servers.
Next let us consider multi-part downloads. Suppose the fileis divided into m chunks with identical size. Now instead ofwaiting to finish downloading the whole file, as soon as a peerfinishes downloading a file chunk, it can start to serve it. In-tuitively by dividing the download process into smaller chunks,transfers can be pipelined among participating peers so perfor-mance should be significantly improved. To illustrate this ideaconsider the following idealized strategy. We shall track servicecompletions in time slots of size s
bm = τm . Suppose the source
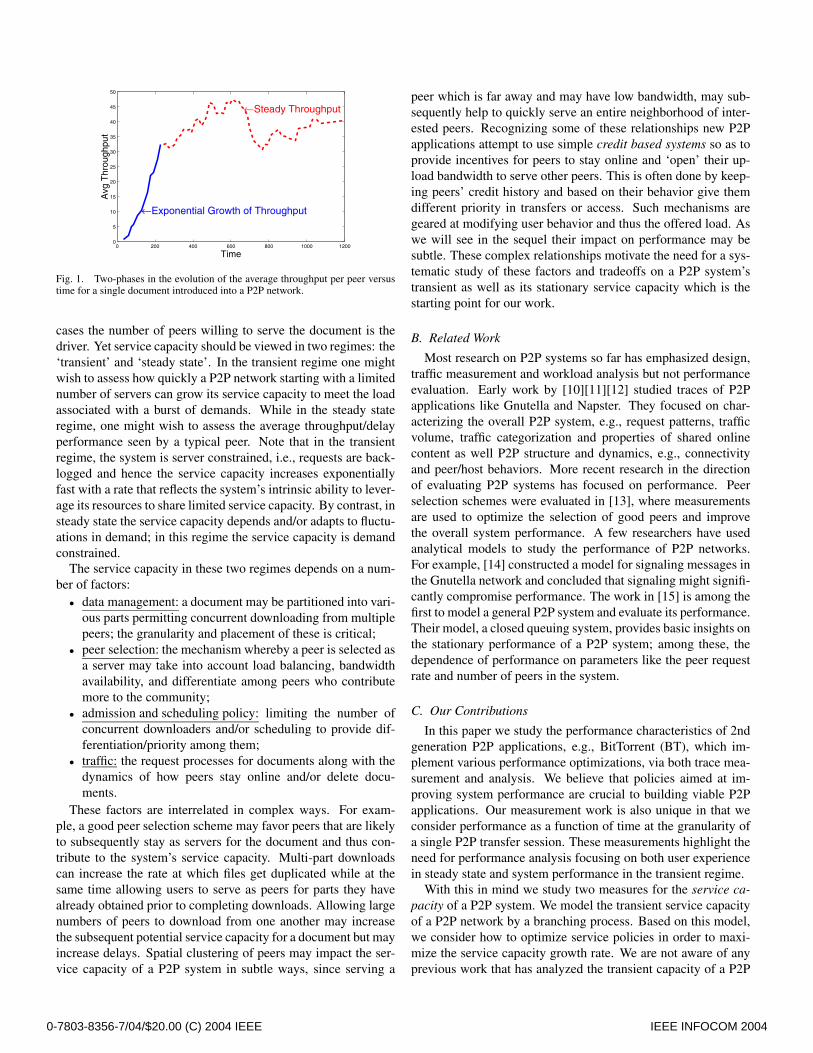
of the file sends Chunk 1 to a peer, Chunk 2 to another peer,and so on until it finishes delivering the last Chunk m on slot m.Meanwhile each chunk i is being duplicated in the system. Tooptimize dissemination, when possible, a peer which currentlyhas a chunk serves another that has not yet obtained any chunk;this can be done until time slot k at which time every peer in thesystem has a chunk of the file. As shown in Fig.3(a), at time kslots, the n peers can be partitioned into k sets Ai, i = 1, . . . ,k,with |Ai| = 2k−i and Ai corresponds to peers which have onlyreceived the ith chunk. Now consider the (k + 1)th time slot.Suppose the peers in A1 transfer Chunk 1 to the n/2 peers thathave not yet received it. Meanwhile the peers in Ai, i > 1, trans-fer chunk i to a node in A1 choosing a peer that has at this pointonly received Chunk 1. Hence, as shown in Fig.3(b), after the(k +1)th time slot, all peers have Chunk 1, n
2 peers have Chunk2 and similarly n
2i−1 peers have chunk i. Continuing this pro-cess, all chunks are eventually delivered to all users by time slotk +m = τ
m (log2(n−1)+m). This corresponds to a reduction bya factor of m versus the scheme without multi-part downloads.We can compute the average delay d̄(m) seen by peers in thismulti-part download scenario as follows. Since half the peershave received all chunks when Chunk m−1 completes duplica-tion across all peers at time slot k +m−1 and the rest peers willreceive chunk m during the last time slot k + m, the average de-
lay experienced by peers can be computed as follows. Let d(m)j
0-7803-8356-7/04/$20.00 (C) 2004 IEEE IEEE INFOCOM 2004
A1
A2
A3
A4
Time slot k
A2
Time slot k+1part 1 has finished
A4
A3
Fig. 3. Concurrent multi-part downloads among a set of n peers.
denote the delay for the jth peer in the multi-part download, then
d̄(m) =1n
n
∑j=1
d(m)j =
12((k +m−1)+(k +m))
τm
=τm
(log2 n+
2m−12
) ≈ τm
log2 n.
Thus a large m, i.e., small chunk size, leads to a factor of m im-provement in average delay for this transient regime. In practice,however, we must also take into account overheads associatedwith signaling and or coordinating chunk availability informa-tion and realizing the various exchanges. Thus one would expectP2P systems with multi-part downloading to see less aggressivegains in m.
The models in this section provide the basic intuition for thebenefits of P2P systems during the transient regime. Howeverour models are somewhat idealized. We have assumed thereis no congestion in the system, i.e, the upload bandwidth of apeer is not shared by peers requesting different documents, thenetwork is not bottle-necked, and idealized scheduling and peerselection per chunk. This motivates us to consider a stochasticmodel that captures the variability in serving peers due to con-gestion as well as some other aspects of real P2P systems, e.g.,speed at which peers leave the system.
B. Branching process model
In this section, we propose a branching process model for aP2P system in the transient regime. Our objective is to study thesensitivity of the exponential growth rate to system parametersor peer behavior.
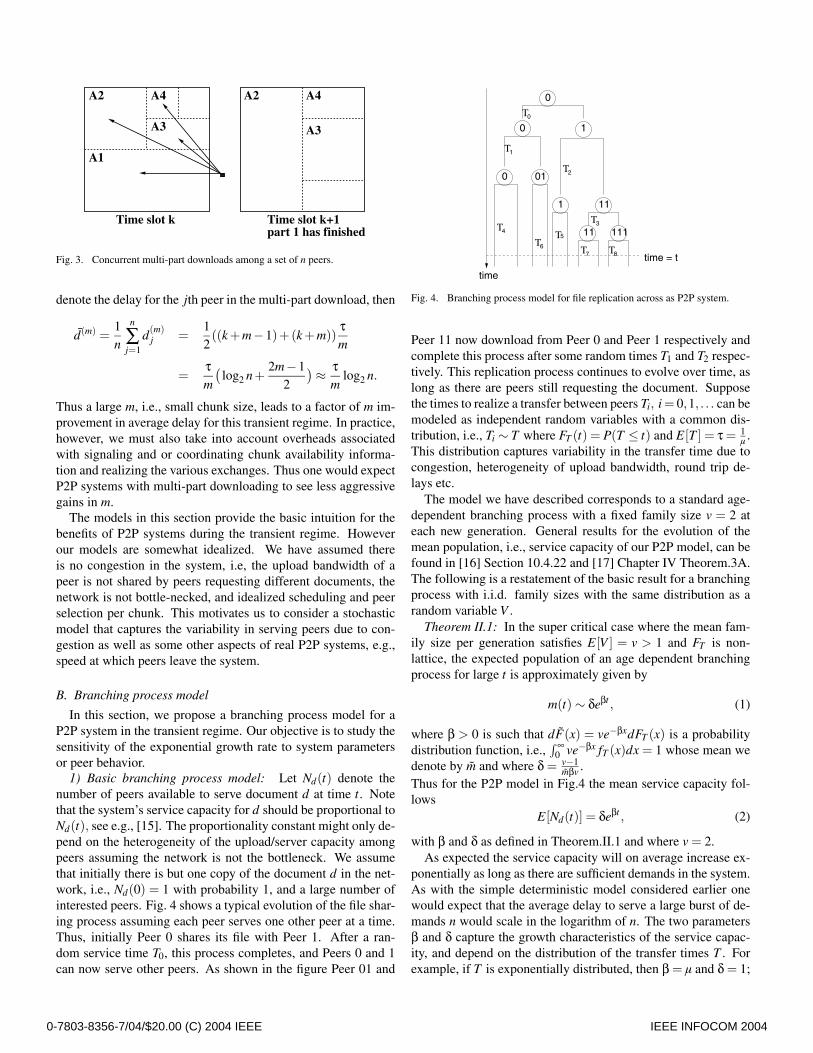
1) Basic branching process model: Let Nd(t) denote thenumber of peers available to serve document d at time t. Notethat the system’s service capacity for d should be proportional toNd(t), see e.g., [15]. The proportionality constant might only de-pend on the heterogeneity of the upload/server capacity amongpeers assuming the network is not the bottleneck. We assumethat initially there is but one copy of the document d in the net-work, i.e., Nd(0) = 1 with probability 1, and a large number ofinterested peers. Fig. 4 shows a typical evolution of the file shar-ing process assuming each peer serves one other peer at a time.Thus, initially Peer 0 shares its file with Peer 1. After a ran-dom service time T0, this process completes, and Peers 0 and 1can now serve other peers. As shown in the figure Peer 01 and
0
010
T6
T5T4
1
0
11
11 111
time = t
0
T
T
T T
T
T
1
2
3
7 8
time
1
Fig. 4. Branching process model for file replication across as P2P system.
Peer 11 now download from Peer 0 and Peer 1 respectively andcomplete this process after some random times T1 and T2 respec-tively. This replication process continues to evolve over time, aslong as there are peers still requesting the document. Supposethe times to realize a transfer between peers Ti, i = 0,1, . . . can bemodeled as independent random variables with a common dis-tribution, i.e., Ti ∼ T where FT (t) = P(T ≤ t) and E[T ] = τ = 1
µ .This distribution captures variability in the transfer time due tocongestion, heterogeneity of upload bandwidth, round trip de-lays etc.
The model we have described corresponds to a standard age-dependent branching process with a fixed family size v = 2 ateach new generation. General results for the evolution of themean population, i.e., service capacity of our P2P model, can befound in [16] Section 10.4.22 and [17] Chapter IV Theorem.3A.The following is a restatement of the basic result for a branchingprocess with i.i.d. family sizes with the same distribution as arandom variable V .
Theorem II.1: In the super critical case where the mean fam-ily size per generation satisfies E[V ] = v > 1 and FT is non-lattice, the expected population of an age dependent branchingprocess for large t is approximately given by
m(t) ∼ δeβt , (1)
where β > 0 is such that dF̃(x) = ve−βxdFT (x) is a probabilitydistribution function, i.e.,
∫ ∞0 ve−βx fT (x)dx = 1 whose mean we
denote by m̃ and where δ = v−1m̃βv .
Thus for the P2P model in Fig.4 the mean service capacity fol-lows
E[Nd(t)] = δeβt , (2)
with β and δ as defined in Theorem.II.1 and where v = 2.As expected the service capacity will on average increase ex-
ponentially as long as there are sufficient demands in the system.As with the simple deterministic model considered earlier onewould expect that the average delay to serve a large burst of de-mands n would scale in the logarithm of n. The two parametersβ and δ capture the growth characteristics of the service capac-ity, and depend on the distribution of the transfer times T . Forexample, if T is exponentially distributed, then β = µ and δ = 1;
0-7803-8356-7/04/$20.00 (C) 2004 IEEE IEEE INFOCOM 2004

by contrast1, as shown in the previous subsection if T is deter-ministic β = µ ln2 and δ = 1, leading to an exponential growth2t/τ.
Consider two branching processes with different generationtime distributions, i.e., T (1) and T (2) such that E[T (1)] = E[T (2)]and there is an increasing convex ordering (I.C.X.) on T (1) andT (2), i.e., T (1) ≤icx T (2)[18]. In this case one can show thatβ(1) < β(2). Indeed since β has to solve the integral equation inTheorem.II.1, in which the left hand side can be interpreted as anexpectation of the convex function e−βx, it follows that I.C.X. or-
dering ensures that given a β, E[e−βT (1)] ≤ E[e−βT (2)
] and hencethe relation β(1) < β(2) has to be true to ensure both of them tosolve the integral equation. Also note that with T (1) ≤icx T (2) andE[T (1)] = E[T (2)], it then follows that Var(T (1)) ≤ Var(T (2)).Thus we see that for a fixed mean, variability in generation timesimproves the growth exponent β, e.g., in the exponential caseβ = µ and in deterministic case β = µ ln2 < µ.
2) Modeling parallel uploads when v > 2: Most P2P appli-cations allow nodes to simultaneously serve a number, say v−1,of peers interested in the same document. Thus in a saturatednetwork, peers may compete for upload bandwidth or CPU re-sources resulting in longer service times. As a simple modelfor systems allowing parallel uploads, consider our branchingprocess model, with a fixed family size v > 2. Suppose the dis-tribution for transfer time between two peers is slowed down bya factor v− 1 causing the mean download to increase by v− 1times. On one hand, this process will have longer regenerationtimes. Yet on the other hand each time it regenerates, a largernumber v− 1 of peers will become available. Thus one mightask whether parallel uploading with v > 2 would lead to fastergrowth rates.
With the proposed re-scaling of the transfer times density, i.e.,1
v−1 fT ( tv−1 ), according to Theorem.II.1 the growth rate β must
satisfy∫ ∞
0ve−βxdFT (
xv−1
) = 1.
For the case where download times are exponentially dis-tributed, when v > 2, one can show that β = µ and δ = 1. Thus, inthis case the expected service capacity E[Nd(t)] = eµt = e
tτ , does
not depend on v. For the case of deterministic download times,one need only modify the model in Section II-A by reducing theregeneration time to τ
v−1 and increasing the number at each re-
generation to v. This gives the exponential growth of vt
(v−1)τ , i.e.,β = lnv
v−1 µ and δ = 1. This indicates that the growth exponentβ, decreases with v. The deterministic transfer time for a par-ticular file is perhaps closer to practice to P2P systems, whichsee upload bandwidth constraints and limit the number of con-current peers. This result suggests that the growth rate β mightdecrease, albeit moderately, if v is large. Moreover, consideringthe overheads associated with each transfer and non-linearitiesin performance degradation when v > 2, the actual performancewith parallel uploading could be even worse. Thus it may make
1Note that deterministic time does not satisfy the conditions of Theorem.II.1,but growth rates are easily computed
sense to limit the number of peers that any server will serve con-currently.
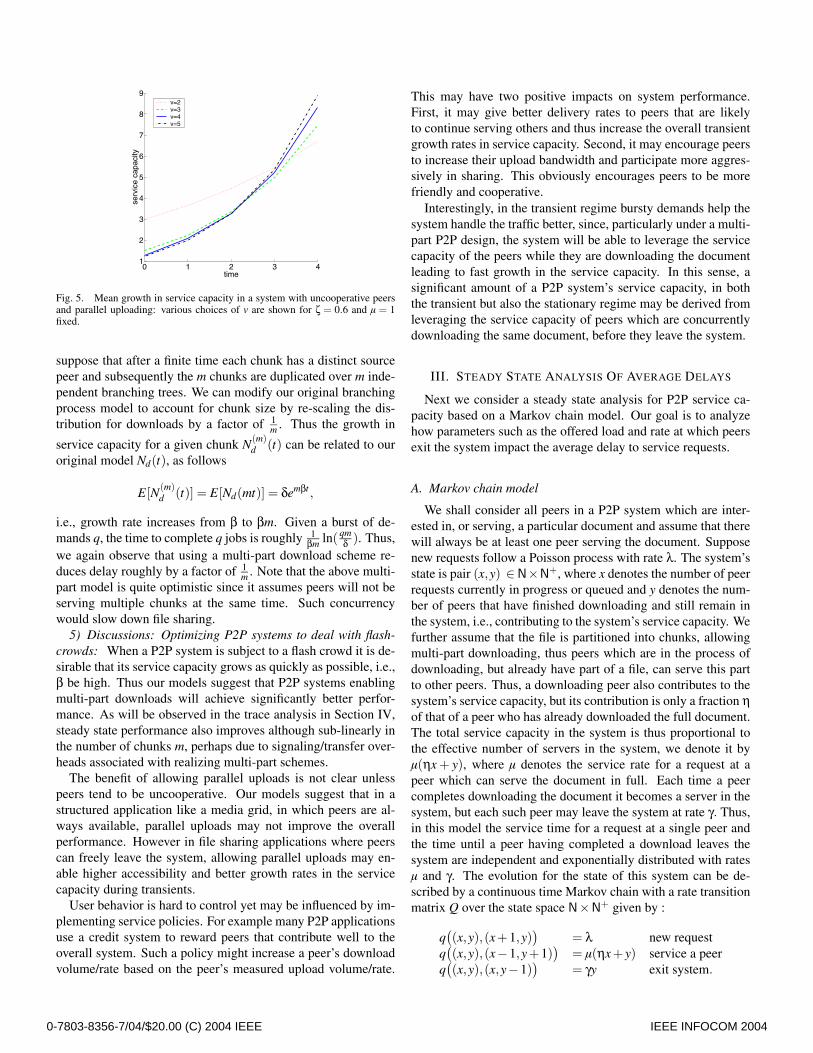
3) Uncooperative peers under a parallel uploading scenario:We have concluded that the growth rate in service capacity for
a P2P network in the transient regime might be highest whena peer serves a limited number of other ones at a time. How-ever, in practice peers that have completed a transfer may leavethe system or delete the file. In this section we will show thatwhen peers exhibit such uncooperative behavior parallel upload-ing may help achieve higher growth rates.
Consider once again our branching process model, where eachpeer serves v−1 others at a time. Upon completing their down-loads, each peer independently determines whether it stays inthe system and with probability 1− ζ exits the system. Thusthe family size is in fact a random variable with mean vζ. Un-der these dynamics our branching process may become ‘extinct’,i.e., eventually no peers are available to serve the document. Infact, standard results, see [17] Chapter IV, show the process willbecome extinct with probability 1 if vζ < 1. Hence if our goal isto maximize the growth rate and avoid extinction it is desirableto select a family size satisfying vζ > 1.
Assuming vζ > 1, let us consider the growth rates that wouldbe achieved. Again based on Theorem.II.1, but incorporatinguncooperative peers, and the transfer time re-scaling associatedwith v− 1 parallel uploads the new growth rate β′ and constantδ′ satisfy
∫ ∞
0vζF(
xv−1
)β′e−β′xdx = 1 and δ′ =1
m̃′β′ [1−1vζ
].
In this case it is no longer the case that the maximal growth rate isachieved when v is as small as possible. For example, as shownearlier assuming exponential peer to peer transfer times, β = µand δ = 1, i.e., the growth rates do not depend on v. Now con-sidering the peer departure dynamics modeled by ζ, the new pa-rameters for the growth process are given by
β′ = (ζ− 1−ζv−1
)µ and δ′ = 1+1−ζvζ−1
.
Note that the growth exponent β′ increases, albeit slowly, inv. Fig. 5 shows different mean growth trajectories for variouschoices of v when ζ = 0.6 and µ = 1. When v = 2, the servicecapacity has the smallest growth exponent β′. When v > 2, β′still increases in v but not significantly. Thus when some frac-tion of peers exit the system upon completion of their download,allowing parallel uploads may help assure document availabil-ity and improve the overall exponential growth of the system’sservice capacity.
4) Role of multi-part downloads on transient capacity: Ear-lier, based on our idealized deterministic model, we showed thatmulti-part downloads will help further speed up growth and thusdelays by a linear factor m. A similar benefit also exists for ourbranching process model.
Suppose a file is partitioned into m identical sized chunks, andassume that the number of requesting peers is large. As a simplemodel for service capacity growth under multi-part downloading
0-7803-8356-7/04/$20.00 (C) 2004 IEEE IEEE INFOCOM 2004
0 1 2 3 41
2
3
4
5
6
7
8
9
time
serv
ice
capa
city
v=2v=3v=4v=5
Fig. 5. Mean growth in service capacity in a system with uncooperative peersand parallel uploading: various choices of v are shown for ζ = 0.6 and µ = 1fixed.
suppose that after a finite time each chunk has a distinct sourcepeer and subsequently the m chunks are duplicated over m inde-pendent branching trees. We can modify our original branchingprocess model to account for chunk size by re-scaling the dis-tribution for downloads by a factor of 1
m . Thus the growth in
service capacity for a given chunk N(m)d (t) can be related to our
original model Nd(t), as follows
E[N(m)d (t)] = E[Nd(mt)] = δemβt ,
i.e., growth rate increases from β to βm. Given a burst of de-mands q, the time to complete q jobs is roughly 1
βm ln( qmδ ). Thus,
we again observe that using a multi-part download scheme re-duces delay roughly by a factor of 1
m . Note that the above multi-part model is quite optimistic since it assumes peers will not beserving multiple chunks at the same time. Such concurrencywould slow down file sharing.
5) Discussions: Optimizing P2P systems to deal with flash-crowds: When a P2P system is subject to a flash crowd it is de-sirable that its service capacity grows as quickly as possible, i.e.,β be high. Thus our models suggest that P2P systems enablingmulti-part downloads will achieve significantly better perfor-mance. As will be observed in the trace analysis in Section IV,steady state performance also improves although sub-linearly inthe number of chunks m, perhaps due to signaling/transfer over-heads associated with realizing multi-part schemes.
The benefit of allowing parallel uploads is not clear unlesspeers tend to be uncooperative. Our models suggest that in astructured application like a media grid, in which peers are al-ways available, parallel uploads may not improve the overallperformance. However in file sharing applications where peerscan freely leave the system, allowing parallel uploads may en-able higher accessibility and better growth rates in the servicecapacity during transients.
User behavior is hard to control yet may be influenced by im-plementing service policies. For example many P2P applicationsuse a credit system to reward peers that contribute well to theoverall system. Such a policy might increase a peer’s downloadvolume/rate based on the peer’s measured upload volume/rate.
This may have two positive impacts on system performance.First, it may give better delivery rates to peers that are likelyto continue serving others and thus increase the overall transientgrowth rates in service capacity. Second, it may encourage peersto increase their upload bandwidth and participate more aggres-sively in sharing. This obviously encourages peers to be morefriendly and cooperative.
Interestingly, in the transient regime bursty demands help thesystem handle the traffic better, since, particularly under a multi-part P2P design, the system will be able to leverage the servicecapacity of the peers while they are downloading the documentleading to fast growth in the service capacity. In this sense, asignificant amount of a P2P system’s service capacity, in boththe transient but also the stationary regime may be derived fromleveraging the service capacity of peers which are concurrentlydownloading the same document, before they leave the system.
III. STEADY STATE ANALYSIS OF AVERAGE DELAYS
Next we consider a steady state analysis for P2P service ca-pacity based on a Markov chain model. Our goal is to analyzehow parameters such as the offered load and rate at which peersexit the system impact the average delay to service requests.
A. Markov chain model
We shall consider all peers in a P2P system which are inter-ested in, or serving, a particular document and assume that therewill always be at least one peer serving the document. Supposenew requests follow a Poisson process with rate λ. The system’sstate is pair (x,y) ∈N×N+, where x denotes the number of peerrequests currently in progress or queued and y denotes the num-ber of peers that have finished downloading and still remain inthe system, i.e., contributing to the system’s service capacity. Wefurther assume that the file is partitioned into chunks, allowingmulti-part downloading, thus peers which are in the process ofdownloading, but already have part of a file, can serve this partto other peers. Thus, a downloading peer also contributes to thesystem’s service capacity, but its contribution is only a fraction ηof that of a peer who has already downloaded the full document.The total service capacity in the system is thus proportional tothe effective number of servers in the system, we denote it byµ(ηx + y), where µ denotes the service rate for a request at apeer which can serve the document in full. Each time a peercompletes downloading the document it becomes a server in thesystem, but each such peer may leave the system at rate γ. Thus,in this model the service time for a request at a single peer andthe time until a peer having completed a download leaves thesystem are independent and exponentially distributed with ratesµ and γ. The evolution for the state of this system can be de-scribed by a continuous time Markov chain with a rate transitionmatrix Q over the state space N×N+ given by :
q((x,y),(x+1,y)
)= λ new request
q((x,y),(x−1,y+1)
)= µ(ηx+ y) service a peer
q((x,y),(x,y−1)
)= γy exit system.
0-7803-8356-7/04/$20.00 (C) 2004 IEEE IEEE INFOCOM 2004
0.51
1.52
1
2
30
1
2
3
γ/µ
(a) Avg Job Num
λ/µ 0.51
1.52
1
2
3
2
4
6
8
γ/µ
(b) Avg Server Num
λ/µ 0.51
1.52
1
2
30.2
0.4
0.6
0.8
1
γ/µ
(c) Avg Delay in 1/µ
λ/µ
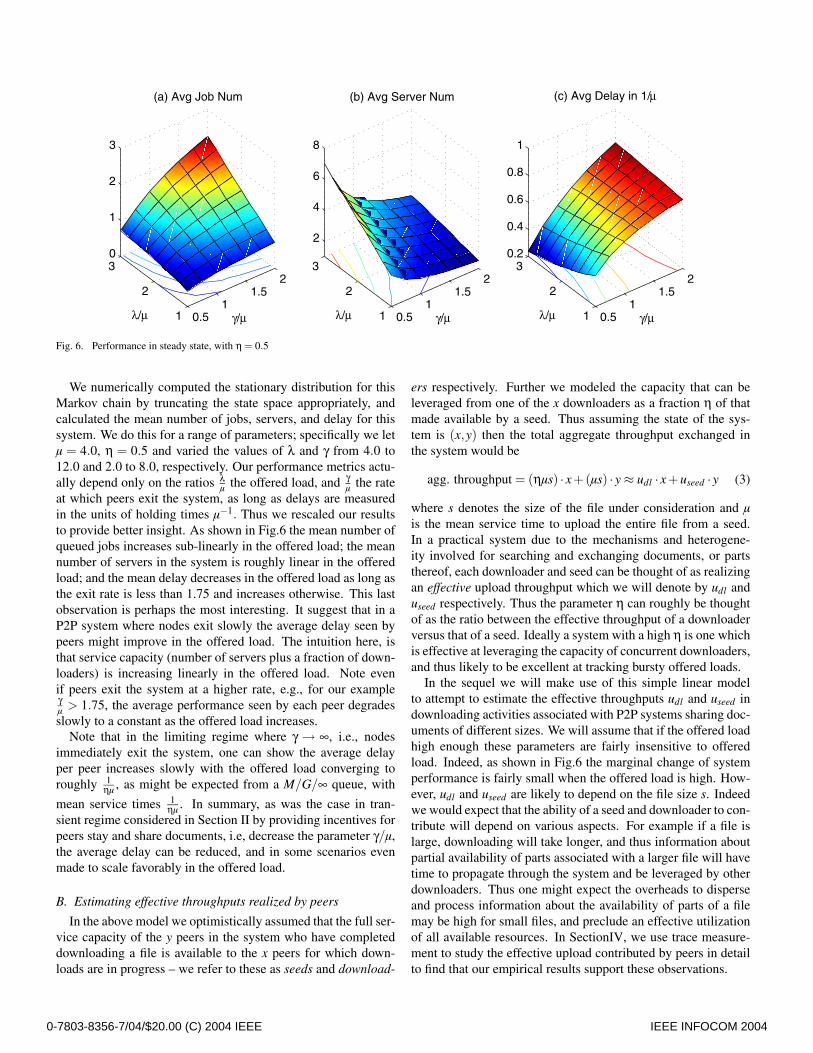
Fig. 6. Performance in steady state, with η = 0.5
We numerically computed the stationary distribution for thisMarkov chain by truncating the state space appropriately, andcalculated the mean number of jobs, servers, and delay for thissystem. We do this for a range of parameters; specifically we letµ = 4.0, η = 0.5 and varied the values of λ and γ from 4.0 to12.0 and 2.0 to 8.0, respectively. Our performance metrics actu-ally depend only on the ratios λ
µ the offered load, and γµ the rate
at which peers exit the system, as long as delays are measuredin the units of holding times µ−1. Thus we rescaled our resultsto provide better insight. As shown in Fig.6 the mean number ofqueued jobs increases sub-linearly in the offered load; the meannumber of servers in the system is roughly linear in the offeredload; and the mean delay decreases in the offered load as long asthe exit rate is less than 1.75 and increases otherwise. This lastobservation is perhaps the most interesting. It suggest that in aP2P system where nodes exit slowly the average delay seen bypeers might improve in the offered load. The intuition here, isthat service capacity (number of servers plus a fraction of down-loaders) is increasing linearly in the offered load. Note evenif peers exit the system at a higher rate, e.g., for our exampleγµ > 1.75, the average performance seen by each peer degradesslowly to a constant as the offered load increases.
Note that in the limiting regime where γ → ∞, i.e., nodesimmediately exit the system, one can show the average delayper peer increases slowly with the offered load converging toroughly 1
ηµ , as might be expected from a M/G/∞ queue, with
mean service times 1ηµ . In summary, as was the case in tran-
sient regime considered in Section II by providing incentives forpeers stay and share documents, i.e, decrease the parameter γ/µ,the average delay can be reduced, and in some scenarios evenmade to scale favorably in the offered load.
B. Estimating effective throughputs realized by peers
In the above model we optimistically assumed that the full ser-vice capacity of the y peers in the system who have completeddownloading a file is available to the x peers for which down-loads are in progress – we refer to these as seeds and download-
ers respectively. Further we modeled the capacity that can beleveraged from one of the x downloaders as a fraction η of thatmade available by a seed. Thus assuming the state of the sys-tem is (x,y) then the total aggregate throughput exchanged inthe system would be
agg. throughput = (ηµs) · x+(µs) · y ≈ udl · x+useed · y (3)
where s denotes the size of the file under consideration and µis the mean service time to upload the entire file from a seed.In a practical system due to the mechanisms and heterogene-ity involved for searching and exchanging documents, or partsthereof, each downloader and seed can be thought of as realizingan effective upload throughput which we will denote by udl anduseed respectively. Thus the parameter η can roughly be thoughtof as the ratio between the effective throughput of a downloaderversus that of a seed. Ideally a system with a high η is one whichis effective at leveraging the capacity of concurrent downloaders,and thus likely to be excellent at tracking bursty offered loads.
In the sequel we will make use of this simple linear modelto attempt to estimate the effective throughputs udl and useed indownloading activities associated with P2P systems sharing doc-uments of different sizes. We will assume that if the offered loadhigh enough these parameters are fairly insensitive to offeredload. Indeed, as shown in Fig.6 the marginal change of systemperformance is fairly small when the offered load is high. How-ever, udl and useed are likely to depend on the file size s. Indeedwe would expect that the ability of a seed and downloader to con-tribute will depend on various aspects. For example if a file islarge, downloading will take longer, and thus information aboutpartial availability of parts associated with a larger file will havetime to propagate through the system and be leveraged by otherdownloaders. Thus one might expect the overheads to disperseand process information about the availability of parts of a filemay be high for small files, and preclude an effective utilizationof all available resources. In SectionIV, we use trace measure-ment to study the effective upload contributed by peers in detailto find that our empirical results support these observations.
0-7803-8356-7/04/$20.00 (C) 2004 IEEE IEEE INFOCOM 2004

IV. TRACE MEASUREMENTS AND TRAFFIC
CHARACTERIZATION
In this section we will analyze several traces obtained on theBitTorrent(BT) P2P application. Our purpose is to study sys-tem performance and validate, in part, some of the results andobservations in Sections II and III.
A. BitTorrent P2P application and measurement setup
We sampled system data on BT P2P over a period of severaldays. Information on this open-source project can be found athttp://bitconjurer.org/BitTorrent/. Many aspects of BT’s archi-tecture are captured by the models we have been discussing.Specifically a document is introduced by a single peer whichis encouraged to stay in system for a long period of time, i.e.,even after subsequent peers have successfully downloaded thedocument. BT supports multi-part downloads with a chunk sizeof roughly 220 bytes, allowing peers to do parallel uploading ona fairly fine granularity. A credit system in BT keeps track ofupload and download volumes among peers and tries to achievefairness in service such that upload and download volumes areequalized.
We collected a trace of network performance reports gener-ated by a program called BT tracker, which has the format ex-hibited in Table.I. Here # seeds refers to the number of peerswith complete replicas of a document that are currently on line;# downloaders is the number of peers currently downloading thedocument; # finished is the number of completed downloads sofar; TX vol is the cumulative data volume transferred associatedwith the given document; throughput is the sum of the through-puts seen by peers currently downloading a document; and life isthe time that has elapsed since the document was first introducedin the system. This data is updated approximately every 5 min-utes. The system simultaneously tracks about 150–200 files thathave been recently inserted. Thus a trace permits one to evaluatehow the system capacity for an individual file evolves over time.
B. Methodology
1) Service capacity: Since BT uses multi-part downloadsservice capacity must be carefully defined. We estimate the ser-vice capacity as
effective # of servers =“total storage space shared”
size,
i.e., the effective number of replicas available in the system, in-cluding partial downloads. Since peers may exit or delete a fileupon completing a download, we can estimate service capacitybased on the following formula
TX vol− (# finished−# seeds+1)× sizesize
.
2) Throughput and delay of each peer: We estimate the av-erage instantaneous throughput seen by each peer as follows
avg throughput per peer =throughput
# downloaders,
and we define the KByte transmission delay for each peer as
1avg throughput per peer
=# downloaders
throughput.
This is roughly the current average (across peers) delay to trans-fer 1KByte of data, which is but a rough estimate for averagetransfer delays seen by peers.
3) Estimating effective throughputs for seeds and download-ers: As discussed in Section III-B we let udl and useed denotethe effective upload throughputs realized by typical download-ers and seeds respectively. Based on the measurements we wereable to directly collect estimates for the peer upload throughputs.To circumvent problem we sampled the file sharing dynamicsassociated with particular files to obtained multiple triples com-prising the # seeds, # downloaders, and (aggregate) throughputexchanged by peers over time. We then did a least squares fit tothis data to the linear model presented earlier, see Eq.(3). Thisessentially corresponds to performing a two-dimensional regres-sion to obtain the sensitivity of throughput to number of seedsand downloaders correspond to udl and useed .
This study was conducted for sets of peers sharing popularfiles, i.e., typically involving more than 100 concurrent down-loaders and associated with file sizes ranged from 200MB to2GB. The objective was to study the relative values of udl anduseed and their sensitivities to file size.
C. Is there an exponential growth in the transient service capac-ity and average throughput per peer?
0 200 400 600 800 10000
500
1000
1500
2000
2500
3000
3500
4000
4500
5000
Total Throughput→
Time (minutes)
Tot
al T
hrou
ghpu
t (K
Byt
e/se
c)
←Num of Seeds
←Num of Downloads
Num
ber
of S
eeds
/Dow
nloa
ders
0
50
100
150
Fig. 7. Total throughput, number of seeds, and downloaders associated with afile in the BT system.
Fig.7, shows the total throughput, number of seeds and num-ber of downloads (demands) for a representative (popular) docu-ment of size 1310 MBytes over time. We note that in the first 200minutes or so, the number of seeds stays fixed at 1, although thetotal throughput increases exponentially. This clearly exhibitshow fast increases in service capacity in the initial transientmode are enabled by multi-part downloading, i.e., downloading
0-7803-8356-7/04/$20.00 (C) 2004 IEEE IEEE INFOCOM 2004

insert time file name size #seeds #downloaders #finished TX vol throughput life
6.24.2003.10:45 F1 challenge 678MB 2 8 104 75.05GB 265.31KB/s 3 10:43
TABLE IFORMAT OF BT TRACE FILE
0 200 400 600 800 10000
5
10
15
20
25
30
35
40
45
50
55
←Avg Throughput Per Peer
Time (minutes)
Avg
Thr
ough
put P
er P
eer
(KB
yte/
sec)
←Service CapacityS
ervi
ce C
apac
ity
0
20
40
60
80
100
120
140
160
Fig. 8. Average throughput per peer and service capacity for a file in BT system.
peers are making significant contributions to the service capac-ity. We note that at around 500 minutes the number of seeds inthe system peaks, and subsequently decreases to a steady stateof roughly 20 seeds so uncooperative peers are exiting the sys-tem quickly. Meanwhile the number of peers downloading thedocument increases in bursts from 50 to 75 to about 125. Thetotal throughput in the system continues increasing after an ini-tial exponential growth although it tracks the bursty increases innumber of downloaders ( e.g. the upsurge mentioned at time 500minutes) slowly instead of exponentially fast. This suggests thatthe ability of the system to leverage the dynamic service capac-ity offered by a large number of concurrently downloading peersmay not scale as effectively as it did at the start. We suspect thisis due to the impact of the credit system as mentioned in SectionI. In particular it would give priority to peers that have been inthe system and downloading for quite sometime at the expense ofnew peers (with low credit) and thus reduce the growth rate. Thismight also due to the signaling overheads among larger numberof peers scaling poorly.
Fig.8 shows the average throughput per peer and service ca-pacity of the system as a function of time. The exponentialgrowth of throughput per peer is remarkable during the first 300minutes. Thereafter the individual peer’s throughputs track theservice capacity fairly well. The drop at time 600 minutes seemsto be associated with a sharp drop in the number of seeds with aconcurrent large increase in the number of downloaders.
0 50 100 150 200 250 3000
0.05
0.1
Offered Load
KB
yte
Tra
nsm
issi
on D
elay
(sec
)
Running Average
Fig. 9. The KByte transmission delay versus offered load(estimated by sum-ming over download + seed) of files in BT system.
D. How does the offered load impact average throughput per-formance per peer?
The data shown in Fig.9 corresponds to a sample of 500 fileswith file sizes ranging from 400MBytes to 1.1GBytes, for whichthe system capacity appeared to be in the steady state, i.e., one tofour days have elapsed since these documents were introducedto the system and the service capacity and throughput per peershould be representative of their popularity/offered loads. Foreach file, we plot the KByte transmission delay, i.e., inverse ofthe average throughput per peer (in KByte/sec), versus the num-ber of seeds and downloaders participating in the system. Thenumber of participants is roughly linear in the offered load fora each file, i.e., a proxy for the popularity of the document. Forfiles with less than 50 peers participating in the system, i.e., notvery popular, the performance is seen to be quite unpredictable.Intuitively, this big variance is due to the fact that the numberof peers is small and heterogeneity among peers is reflected indifferences in performance. However, for files that are very pop-ular, the performance improves, albeit slowly, in the number ofparticipants. This matches our analytical results very well, i.e.,average delays might go down in the offered load. For example,as marked in Fig.9, when number of peers is 200, the averagethroughput per peer is roughly 40KBytes/sec, i.e., the delay totransmit 1Kbyte is 0.025sec and when peer number is 100 theaverage throughput per peer is only about 25Kbyte/sec, i.e., adelay of 0.04sec per 1Kbyte. This improvement as the numberof peers grows, is less significant when the number of peers ex-ceeds 200, possibly due to TCP flow control. Comparing thisperformance characteristics with those for the model shown in
0-7803-8356-7/04/$20.00 (C) 2004 IEEE IEEE INFOCOM 2004
Fig.6(c), we noted that the average delay performance gets bet-ter in the offered load but the marginal gains decrease.
E. Impact of file size on the per seed and downloader’s effectivethroughput?
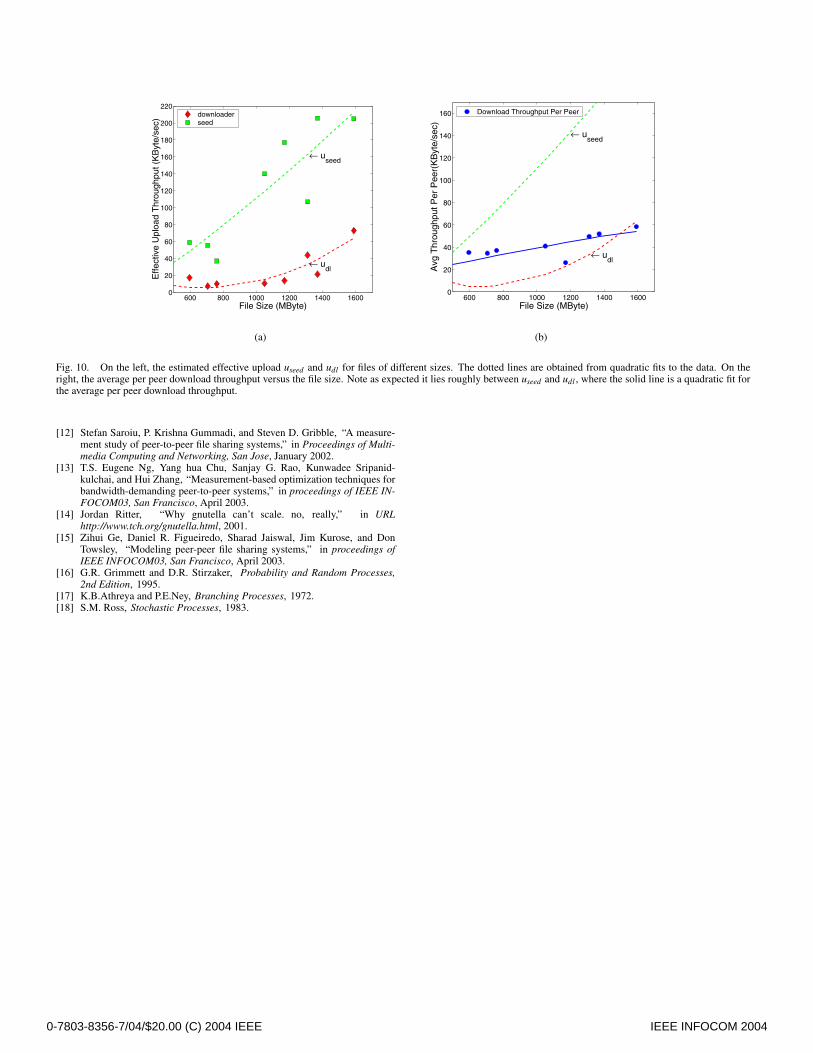
Let us first consider the dependence of the effective uploaduseed and udl on the file size. Fig.10(a) shows estimated param-eters for files of various sizes. It should be clear that both useed
and udl improve with the increasing file size, which, as expected,is due to the improved capability of peers to leveraging servicecapacity via multi-part downloading if the file being exchangedis large. Also, as shown in Fig.10(b), the average per peer down-load throughput also improves with the increasing file size. In-deed since downloaders can share the service capacity leveragefrom both downloaders and seeds, it is natural to observe that theaverage download throughput per peer, which is roughly udl plusa fraction of useed , mostly lies above udl . We note however, thatthis data is intended to only show rough trends, and the reliabil-ity of the collected data would not warrant a conclusive claim onthe precise trend, i.e., linear or sub-linear. In particular the 95%confidence intervals on the point estimates shown in Fig.10(a)range from ±32 KByte/sec to ±227 KByte/sec. A detailed in-vestigation of our data sets revealed the presence of outliers thatwe believe are due to resetting of BitTorrent trackers. Further-more the simple linear model we are using to capture the sys-tem’s performance may be a crude approximation. Indeed it ispossible that offered loads to seeds versus downloaders dependon the relative quantities of these, i.e., useed and udl might de-pend on the ratio of y/x and thus change the model. For thisreason the data shown in the figure is associated with files andsamples having roughly the same orders of magnitude for x,y.
F. Discussion
To summarize we have observed two different stages of thedynamics of P2P systems. First an initial transient flash crowdphase wherein the overall service capacity is low but quicklycatches up with the demands leveraging peers that are down-loading a multi-part file to serve others. This is clearly a regimewhere the system’s service capacity is limited yet can quicklybenefit from the crowd to bootstrap its ability to serve peers.In a second regime, a steady state, the overall service capacityincreases slowly and fluctuates along with demands with an av-erage throughput per peer remaining fairly stable. The steadystate performance seen by peers improves in the popularity ofthe file, i.e., number of participating peers. However we notedan example where subsequent burst of demands does not leadto a dramatic exponential growth in the aggregate throughput,in fact it looks more like a linear response. As explained ear-lier, we conjecture that this may be due to either a lack scalabil-ity, perhaps signaling overheads or be the result of a credit sys-tem geared at favoring some peers, versus increasing the rate ofgrowth. We leave this conjecture to further research, but suggestthat in steady state, when the number of peers is already large,a credit system may be biased against peers who just enter andpenalize the ability of a P2P system to catch up exponentially
further upsurges in demands. Finally we observed that multi-partdownloading allows significant improvement in the performanceas the file size increase.
V. CONCLUSION
In this paper, we have modeled the service capacity of a P2Psystem in two regimes. One is the transient phase in which thesystem tries to catch up bursty demands (flash crowd). Both ouranalytical model and trace measurements exhibit the exponen-tial growth of service capacity during the transient phase. In thesecond regime, the steady state, we show that the service capac-ity of a P2P system will scale with and track the offered loads,so individual user’s performance will not degrade significantly.Moreover, both our analysis and empirical data suggest that athigher offered loads and with cooperative users the system per-formance might improve. These characteristics are particularlydesirable in systems designed to handle exceedingly bursty de-mands.
In addition, we studied various techniques that might help im-prove P2P performance. Multi-part combined with parallel up-loading when properly optimized will generally improve systemperformance, particularly when peers exit the system at a highrate. A credit system might help provide peers incentives toshare and thus improve performance. Yet even a simple creditsystem based on ‘short term’ history of peer’s upload down-load volume may limit the system’s capability to deal with flashcrowds above and beyond an established steady state.
REFERENCES
[1] “Report: Napster users lose that sharing feeling,” in CNNnews, URL: http://www.cnn.com/2001/TECH/internet/06/28/napster.usage/.
[2] “Peer-to-peer file sharing: The effects of file sharing on a service provider’snetwork,” in Industry White Paper, Sandvine Incorporated, 2002.
[3] “Top applications (bytes) for subinterface: Sd-nap traffic,” in CAIDAworkload analysis of SD-NAP data, URL: http://www.caida.org/analysis/workload/byapplication/sdnap/index.xml,2002.
[4] Jaeyeon Jung, Balachander Krishnamurthy, and Michael Rabinovich,“Flash crowds and denial of service attacks: Characterization and impli-cations for cdns and web sites,” in Proceedings of the International WorldWide Web Conference (WWW’02), May, 2002.
[5] Dan Rubenstein and Sambit Sahu, “An analysis of a simple p2p proto-col for flash crowd document retrieval,” in Technical report EE011109-1,Columbia University, November 2001.
[6] Angelos Stavrou, Dan Rubenstein, and Sambit Sahu, “A lightweight, ro-bust p2p system to handle flash crowds,” in Proceedings of IEEE ICNP2002, Paris, France, November, 2002.
[7] Tyron Stading, Petros Maniatis, and Mary Baker, “Peer-to-peer cachingschemes to address flash crowds,” in Proceedings of IPTPS’02, Cam-bridge, MA, March 2002.
[8] Sean Rhea, Chris Wells, and Patrick Eaton et al, “Maintenance-free globaldata storage,” in IEEE Internet Computing, pages 40–49, September-October 2001.
[9] Sven Graupner, Winfried Kalfa, and Carsten Reimann, “Modeling andsimulation of media-on-demand services - evaluating a digital media gridarchitecture,” in HP Laboratories technical report, HPL-2002-192, 2002.
[10] Matei Ripeanu, Ian Foster, and Adriana Iamnitchi, “Mapping the gnutellanetwork: Properties of large-scale peer-to-peer systems and implicationsfor system design,” IEEE Internet Computing, vol. 6, no. 1, pp. 50–57,Jan.-Feb.2002.
[11] Matei Ripeanu, “Peer-to-peer architecture case study: Gnutella network,”in Proceedings of First International Conference on Peer-to-Peer Comput-ing, pages 99–100, 2001.
0-7803-8356-7/04/$20.00 (C) 2004 IEEE IEEE INFOCOM 2004
600 800 1000 1200 1400 16000
20
40
60
80
100
120
140
160
180
200
220
File Size (MByte)
Effe
ctiv
e U
ploa
d T
hrou
ghpu
t (K
Byt
e/se
c)← u
seed
← udl
downloaderseed
(a)
600 800 1000 1200 1400 16000
20
40
60
80
100
120
140
160
File Size (MByte)
Avg
Thr
ough
put P
er P
eer(
KB
yte/
sec)
← useed
← udl
Download Throughput Per Peer
(b)
Fig. 10. On the left, the estimated effective upload useed and udl for files of different sizes. The dotted lines are obtained from quadratic fits to the data. On theright, the average per peer download throughput versus the file size. Note as expected it lies roughly between useed and udl , where the solid line is a quadratic fit forthe average per peer download throughput.
[12] Stefan Saroiu, P. Krishna Gummadi, and Steven D. Gribble, “A measure-ment study of peer-to-peer file sharing systems,” in Proceedings of Multi-media Computing and Networking, San Jose, January 2002.
[13] T.S. Eugene Ng, Yang hua Chu, Sanjay G. Rao, Kunwadee Sripanid-kulchai, and Hui Zhang, “Measurement-based optimization techniques forbandwidth-demanding peer-to-peer systems,” in proceedings of IEEE IN-FOCOM03, San Francisco, April 2003.
[14] Jordan Ritter, “Why gnutella can’t scale. no, really,” in URLhttp://www.tch.org/gnutella.html, 2001.
[15] Zihui Ge, Daniel R. Figueiredo, Sharad Jaiswal, Jim Kurose, and DonTowsley, “Modeling peer-peer file sharing systems,” in proceedings ofIEEE INFOCOM03, San Francisco, April 2003.
[16] G.R. Grimmett and D.R. Stirzaker, Probability and Random Processes,2nd Edition, 1995.
[17] K.B.Athreya and P.E.Ney, Branching Processes, 1972.[18] S.M. Ross, Stochastic Processes, 1983.
0-7803-8356-7/04/$20.00 (C) 2004 IEEE IEEE INFOCOM 2004
Copyright © 2022 FDOKUMEN