Topology-Aware Routing in Structured Peer-to-Peer Overlay Networks
19
Topology-aware routing in structured peer-to-peer overlay networks Miguel Castro Peter Druschel Y. Charlie Hu Antony Rowstron Microsoft Research, 7 J J Thomson Close, Cambridge, CB3 0FB, UK. Rice University, 6100 Main Street, MS-132, Houston, TX 77005, USA. Purdue University, 1285 EE Building, West Lafayette, IN 47907, USA. Technical Report MSR-TR-2002-82 Structured peer-to-peer (p2p) overlay networks like CAN,Chord, Pastry and Tapestry offer a novel plat- form for a variety of scalable and decentralized distributed applications. They provide efficient and fault-tolerant routing, object location and load balancing within a self-organizing overlay network. One important aspect of these systems is how they exploit network proximity in the underlying Internet. We present a study of topology-aware routing approaches in p2p overlays, identify proximity neigbor selec- tion as the most promising technique, and present an improved design in Pastry. Results obtained via analysis and via simulation of two large-scale topology models indicate that it is possible to efficiently exploit network proximity in self-organizing p2p substrates. Proximity neighbor selection incurs only a modest additional overhead for organizing and maintaining the overlay network. The resulting locality properties improve application performance and reduce network usage in the Internet substantially. Fi- nally, we show that the impact of proximity neighbor selection on the load balancing in the p2p overlay is minimal. Microsoft Research Microsoft Corporation One Microsoft Way Redmond, WA 98052 http://www.research.microsoft.com
-
Upload
independent -
Category
Documents
-
view
0 -
download
0
Transcript of Topology-Aware Routing in Structured Peer-to-Peer Overlay Networks
Topology-aware routing in structured peer-to-peer overlaynetworks
Miguel Castro�
Peter Druschel�
Y. Charlie Hu�
Antony Rowstron�
�
Microsoft Research, 7 J J Thomson Close, Cambridge, CB3 0FB, UK.�
Rice University, 6100 Main Street, MS-132, Houston, TX 77005, USA.�
Purdue University, 1285 EE Building, West Lafayette, IN 47907, USA.
Technical ReportMSR-TR-2002-82
Structured peer-to-peer (p2p) overlay networks like CAN, Chord, Pastry and Tapestry offer a novel plat-form for a variety of scalable and decentralized distributed applications. They provide efficient andfault-tolerant routing, object location and load balancing within a self-organizing overlay network. Oneimportant aspect of these systems is how they exploit network proximity in the underlying Internet. Wepresent a study of topology-aware routing approaches in p2p overlays, identify proximity neigbor selec-tion as the most promising technique, and present an improved design in Pastry. Results obtained viaanalysis and via simulation of two large-scale topology models indicate that it is possible to efficientlyexploit network proximity in self-organizing p2p substrates. Proximity neighbor selection incurs only amodest additional overhead for organizing and maintaining the overlay network. The resulting localityproperties improve application performance and reduce network usage in the Internet substantially. Fi-nally, we show that the impact of proximity neighbor selection on the load balancing in the p2p overlay isminimal.
Microsoft ResearchMicrosoft Corporation
One Microsoft WayRedmond, WA 98052
http://www.research.microsoft.com
1 Introduction
Several recent systems (e.g., CAN, Chord, Pastry andTapestry [7, 13, 10, 16, 6]) provide a self-organizing sub-strate for large-scale peer-to-peer applications. Amongother uses, these systems can implement a scalable, fault-tolerant distributed hash table, in which any item can belocated within a bounded number of routing hops, usinga small per-node routing table. While there are algorith-mic similarities among each of these systems, one impor-tant distinction lies in the approach they take to consider-ing and exploiting proximity in the underlying Internet.Chord in its original design, for instance, does not con-sider network proximity at all. As a result, its protocolfor maintaining the overlay network is very light-weight,but messages may travel arbitrarily long distances in theInternet in each routing hop.
In a version of CAN, each node measures its networkdelay to a set of landmark nodes, in an effort to deter-mine its relative position in the Internet and to constructan Internet topology-aware overlay. Tapestry and Pastryconstruct a topology-aware overlay by choosing nearbynodes for inclusion in their routing tables. Early resultsfor the resulting locality properties are promising. How-ever, these results come at the expense of a significanlymore expensive overlay maintenance protocol, relative toChord. Also, proximity based routing may compromisethe load balance in the p2p overlay network. Moreover,it remains unclear to what extent the locality propertieshold in the actual Internet, with its complex, dynamic,and non-uniform topology. As a result, the cost and ef-fectiveness of proximity based routing in these p2p over-lays remain unclear.
This paper presents a study of proximity based routingin structured p2p overlay networks, and presents resultsof an analysis and of simulations based on two large-scale Internet topology models. The specific contribu-tions of this paper include
� a comparison of approaches to proximity basedrouting in structured p2p overlay networks, whichidentifies proximity neighbor selection in prefix-based protocols like Tapestry and Pastry as the mostpromising technique;
� improved node join and overlay maintenance pro-tocols for proximity neighbor selection in Pastry,which significancly reduce the overhead of creatingand maintaining a topology-aware overlay;
� a study of the costs and benefits of proximity neigh-bor selection via analysis and simulation based ontwo large-scale Internet topology models;
� a study of the impact of proximity neighbor selec-tion on the load balancing in the p2p overlay basedon simulations on a large-scale topology model.
Compared to the original Pastry paper [10], this workadds a comparison with other proposed approaches totopology-aware routing, new node join and overlay main-tenance protocols that dramatically reduce the cost ofoverlay construction and maintenance, a new protocol tolocate a nearby contact node, results of a formal analysisof Pastry’s routing properties and extensive simulationresults on two different network topology models.
The rest of this paper is organized as follows. Pre-vious work on structured p2p overlays is discussed inSection 2. Approaches to topology-aware routing in p2poverlays are presented in Section 3. Section 4 presentsPastry’s implementation of proximity neighbor selection,including new efficient protocols for node join and over-lay maintenance. An analysis of Pastry’s locality proper-ties follow in Section 5. Section 6 presents experimentalresults, and we conclude in Section 7.
2 Background and prior work
In this section, we present some background on struc-tured p2p overlay protocols like CAN, Chord, Tapestryand Pastry. (We do not consider unstructured p2p over-lays like Gnutella and Freenet in this paper [1, 2]). Spacelimitations prevent us from a detailed discussion of eachprotocol. Instead, we give a more detailed description ofPastry, as an example of a structured p2p overlay net-work, and then point out relevant differences with theother protocols.
2.1 Pastry
Pastry is a scalable, fault resilient, and self-organizingpeer-to-peer substrate. Each Pastry node has a unique,uniform randomly assigned nodeId in a circular 128-bitidentifier space. Given a 128-bit key, Pastry routes anassociated message towards the live node whose nodeIdis numerically closest to the key. Moreover, each Pastrynode keeps track of its neighboring nodes in the names-pace and notifies applications of changes in the set.
1
0x
1x
2x
3x
4x
5x
7x
8x
9x
ax
bx
cx
dx
ex
fx
60x
61x
62x
63x
64x
66x
67x
68x
69x
6ax
6bx
6cx
6dx
6ex
6fx
650x
651x
652x
653x
654x
655x
656x
657x
658x
659x
65bx
65cx
65dx
65ex
65fx
65a0x
65a2x
65a3x
65a4x
65a5x
65a6x
65a7x
65a8x
65a9x
65aax
65abx
65acx
65adx
65aex
65afx
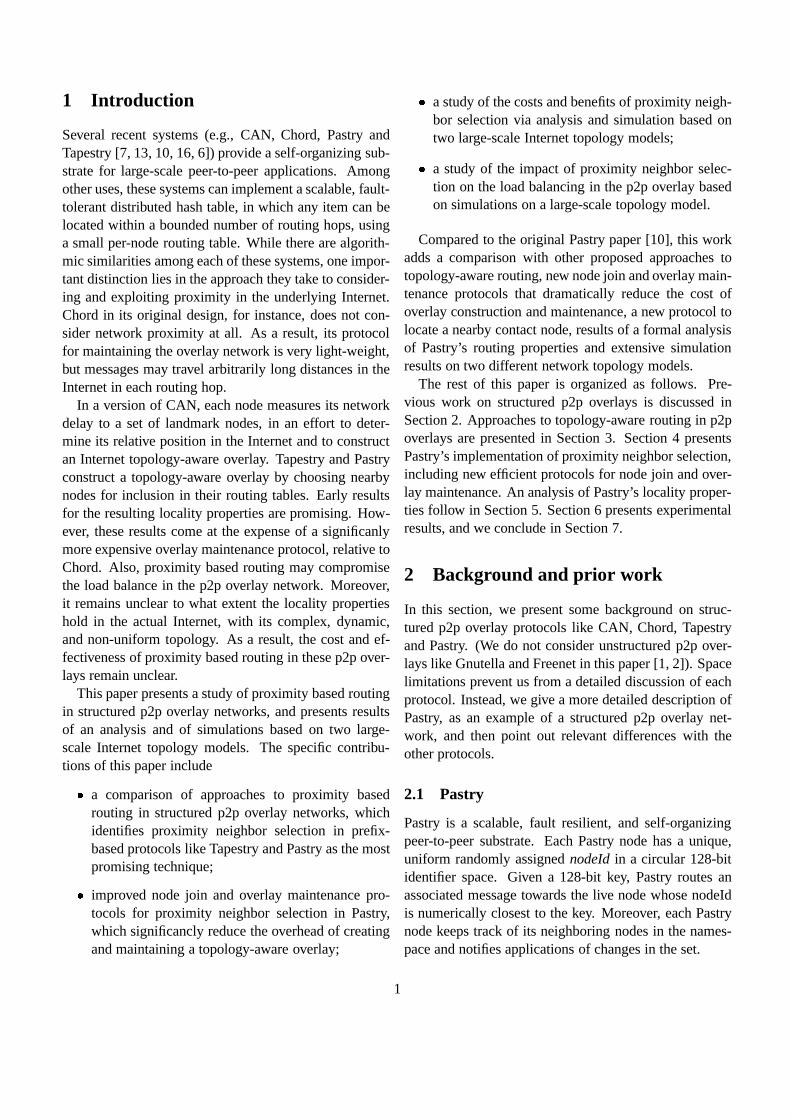
Figure 1: Routing table of a Pastry nodewith nodeId
���������, � � . Digits are in
base 16,�
represents an arbitrary suffix.
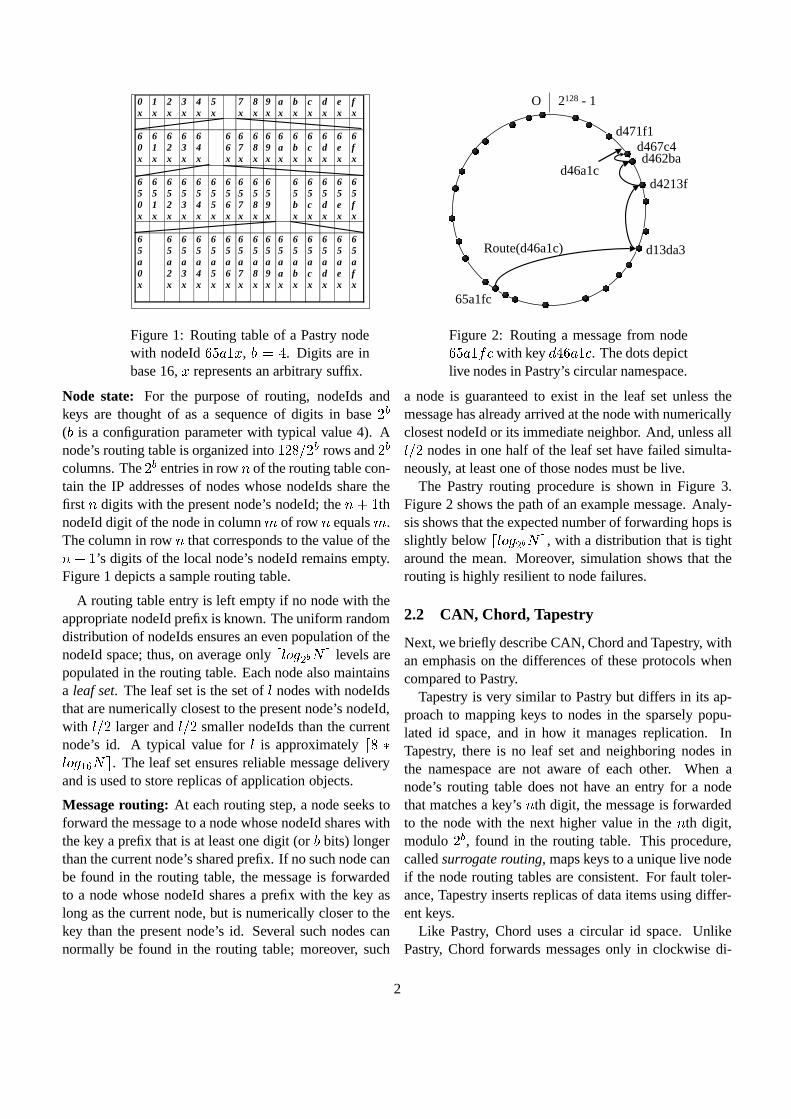
d46a1c
Route(d46a1c)
d462ba
d4213f
d13da3
65a1fc
d467c4d471f1
O 2128 - 1
Figure 2: Routing a message from node�����������with key ��� ������� . The dots depict
live nodes in Pastry’s circular namespace.
Node state: For the purpose of routing, nodeIds andkeys are thought of as a sequence of digits in base ���( is a configuration parameter with typical value 4). Anode’s routing table is organized into
� ��������� rows and ���columns. The ��� entries in row � of the routing table con-tain the IP addresses of nodes whose nodeIds share thefirst � digits with the present node’s nodeId; the ��� �
thnodeId digit of the node in column � of row � equals � .The column in row � that corresponds to the value of the��� �
’s digits of the local node’s nodeId remains empty.Figure 1 depicts a sample routing table.
A routing table entry is left empty if no node with theappropriate nodeId prefix is known. The uniform randomdistribution of nodeIds ensures an even population of thenodeId space; thus, on average only �! #"%$ �'&)(+* levels arepopulated in the routing table. Each node also maintainsa leaf set. The leaf set is the set of nodes with nodeIdsthat are numerically closest to the present node’s nodeId,with ,��� larger and ,��� smaller nodeIds than the currentnode’s id. A typical value for is approximately �#�.- #"%$ �0/ (+* . The leaf set ensures reliable message deliveryand is used to store replicas of application objects.
Message routing: At each routing step, a node seeks toforward the message to a node whose nodeId shares withthe key a prefix that is at least one digit (or bits) longerthan the current node’s shared prefix. If no such node canbe found in the routing table, the message is forwardedto a node whose nodeId shares a prefix with the key aslong as the current node, but is numerically closer to thekey than the present node’s id. Several such nodes cannormally be found in the routing table; moreover, such
a node is guaranteed to exist in the leaf set unless themessage has already arrived at the node with numericallyclosest nodeId or its immediate neighbor. And, unless all ,��� nodes in one half of the leaf set have failed simulta-neously, at least one of those nodes must be live.
The Pastry routing procedure is shown in Figure 3.Figure 2 shows the path of an example message. Analy-sis shows that the expected number of forwarding hops isslightly below �! #"%$ �'&)(+* , with a distribution that is tightaround the mean. Moreover, simulation shows that therouting is highly resilient to node failures.
2.2 CAN, Chord, Tapestry
Next, we briefly describe CAN, Chord and Tapestry, withan emphasis on the differences of these protocols whencompared to Pastry.
Tapestry is very similar to Pastry but differs in its ap-proach to mapping keys to nodes in the sparsely popu-lated id space, and in how it manages replication. InTapestry, there is no leaf set and neighboring nodes inthe namespace are not aware of each other. When anode’s routing table does not have an entry for a nodethat matches a key’s � th digit, the message is forwardedto the node with the next higher value in the � th digit,modulo ��� , found in the routing table. This procedure,called surrogate routing, maps keys to a unique live nodeif the node routing tables are consistent. For fault toler-ance, Tapestry inserts replicas of data items using differ-ent keys.
Like Pastry, Chord uses a circular id space. UnlikePastry, Chord forwards messages only in clockwise di-
2
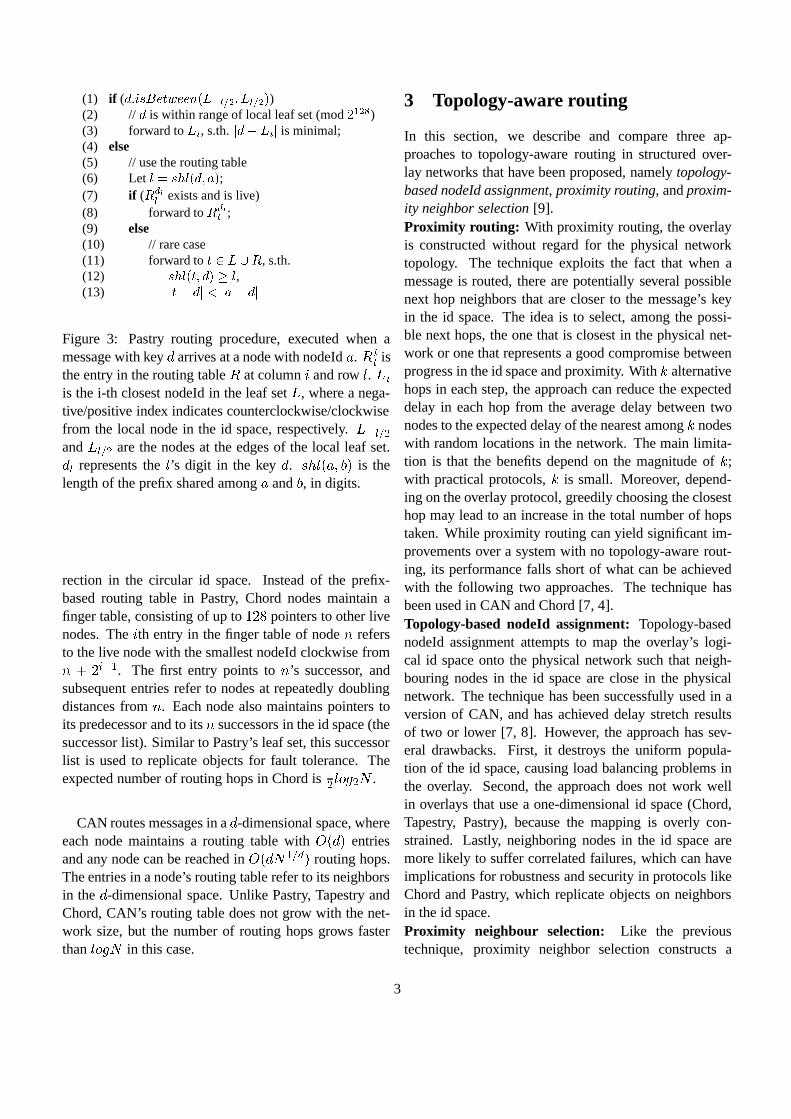
(1) if ( ��� ��������� ������������� ��������� ����� )(2) // � is within range of local leaf set (mod � � ��! )(3) forward to �#" , s.th. $ �&%'�("�$ is minimal;(4) else(5) // use the routing table(6) Let )+*,��-�).������/0� ;(7) if ( 13254� exists and is live)(8) forward to 1 254� ;(9) else(10) // rare case(11) forward to #67�98:1 , s.th.(12) ��-�).�;5��� �#<=) ,(13) $ >%'�?$ @A$ /&%'�?$
Figure 3: Pastry routing procedure, executed when amessage with key � arrives at a node with nodeId
�. B:CD is
the entry in the routing table B at column E and row . F Cis the i-th closest nodeId in the leaf set F , where a nega-tive/positive index indicates counterclockwise/clockwisefrom the local node in the id space, respectively. FHG D I �
and F D I � are the nodes at the edges of the local leaf set.� D represents the ’s digit in the key � . JLK 5M �ON �P is thelength of the prefix shared among
�and , in digits.
rection in the circular id space. Instead of the prefix-based routing table in Pastry, Chord nodes maintain afinger table, consisting of up to
� ��� pointers to other livenodes. The E th entry in the finger table of node � refersto the live node with the smallest nodeId clockwise from� � �LC G �
. The first entry points to � ’s successor, andsubsequent entries refer to nodes at repeatedly doublingdistances from � . Each node also maintains pointers toits predecessor and to its � successors in the id space (thesuccessor list). Similar to Pastry’s leaf set, this successorlist is used to replicate objects for fault tolerance. Theexpected number of routing hops in Chord is
�
� #"%$ � ( .
CAN routes messages in a � -dimensional space, whereeach node maintains a routing table with Q9M#�?P entriesand any node can be reached in Q9M#� ( � ISR P routing hops.The entries in a node’s routing table refer to its neighborsin the � -dimensional space. Unlike Pastry, Tapestry andChord, CAN’s routing table does not grow with the net-work size, but the number of routing hops grows fasterthan #"%$ ( in this case.
3 Topology-aware routing
In this section, we describe and compare three ap-proaches to topology-aware routing in structured over-lay networks that have been proposed, namely topology-based nodeId assignment, proximity routing, and proxim-ity neighbor selection [9].Proximity routing: With proximity routing, the overlayis constructed without regard for the physical networktopology. The technique exploits the fact that when amessage is routed, there are potentially several possiblenext hop neighbors that are closer to the message’s keyin the id space. The idea is to select, among the possi-ble next hops, the one that is closest in the physical net-work or one that represents a good compromise betweenprogress in the id space and proximity. With T alternativehops in each step, the approach can reduce the expecteddelay in each hop from the average delay between twonodes to the expected delay of the nearest among T nodeswith random locations in the network. The main limita-tion is that the benefits depend on the magnitude of T ;with practical protocols, T is small. Moreover, depend-ing on the overlay protocol, greedily choosing the closesthop may lead to an increase in the total number of hopstaken. While proximity routing can yield significant im-provements over a system with no topology-aware rout-ing, its performance falls short of what can be achievedwith the following two approaches. The technique hasbeen used in CAN and Chord [7, 4].Topology-based nodeId assignment: Topology-basednodeId assignment attempts to map the overlay’s logi-cal id space onto the physical network such that neigh-bouring nodes in the id space are close in the physicalnetwork. The technique has been successfully used in aversion of CAN, and has achieved delay stretch resultsof two or lower [7, 8]. However, the approach has sev-eral drawbacks. First, it destroys the uniform popula-tion of the id space, causing load balancing problems inthe overlay. Second, the approach does not work wellin overlays that use a one-dimensional id space (Chord,Tapestry, Pastry), because the mapping is overly con-strained. Lastly, neighboring nodes in the id space aremore likely to suffer correlated failures, which can haveimplications for robustness and security in protocols likeChord and Pastry, which replicate objects on neighborsin the id space.Proximity neighbour selection: Like the previoustechnique, proximity neighbor selection constructs a
3
topology-aware overlay. However, instead of biasing thenodeId assignment, the idea is to choose routing table en-tries to refer to the topologically nearest among all nodeswith nodeId in the desired portion of the id space. Thesuccess of this technique depends on the degree of free-dom an overlay protocol has in choosing routing tableentries without affecting the expected number of rout-ing hops. In prefix-based protocols like Tapestry andPastry, the upper levels of the routing table allow greatfreedom in this choice, with lower levels leaving expo-nentially less choice. As a result, the expected delay ofthe first hop is very low, it increases exponentially witheach hop, and the delay of the final hop dominates. Asone can show, this leads to low delay stretch and otheruseful properties. A limitation of this technique is that itdoes not work for overlay protocols like CAN and Chord,which require that routing table entries refer to specificpoints in the id space.Discussion: Proximity routing is the most light-weighttechnique, since it does not construct a topology-awareoverlay. But, its performance is limited since it can onlyreduce the expected per-hop delay to the expected delayof the nearest among a small number T of nodes withrandom locations in the network. With topology-awarenodeId assignment, the expected per-hop delay can beas low as the average delay among neighboring overlaynodes in the network. However, the technique suffersfrom load imbalance and requires a high-dimensional idspace to be effective.
Proximity-neighbor selection can be viewed as a com-promise that preserves the load balance and robust-ness afforded by a random nodeId assignment, but stillachieves a small constant delay stretch. In the follow-ing sections, we show that proximity neighbor selec-tion can be implemented in Pastry and Tapestry withlow overhead, that it achieves comparable delay stretchto topology-based nodeId assignment without sacrific-ing load balancing or robustness, and that is has addi-tional route convergence properties that facilitate effi-cient caching and multicasting in the overlay. Moreover,we confirm these results via simulations on two large-scale Internet topology models.
4 Proximity neighbor selection: Pastry
This section shows how proximity based neighbor se-lection is used in Pastry. We describe new node join
and overlay maintenance protocols that significantly re-duce the overhead compared to the original protocols de-scribed in [10]. Moreover, we present a new protocolthat allows nodes that wish to join the overlay to locatean appropriate contact node.
It is assumed that each Pastry node can measure its dis-tance, in terms of a scalar proximity metric, to any nodewith a known IP address. The choice of a proximity met-ric depends on the desired qualities of the resulting over-lay (e.g., low delay, high bandwidth, low network utiliza-tion). In practice, average round-trip time has proven tobe a good metric.
Pastry uses proximity neighbor selection as introducedin the previous section. Selecting routing table entries torefer to the precisely nearest node with an appropriatenodeId is expensive in a large system, because it requiresQ9M ( P communication. Therefore, Pastry uses heuristicsthat require only Q9M# #"%$ �'& ( P communication but only en-sure that routing table entries are close but not necessarilythe closest. More precisely, Pastry ensures the followinginvariant for each node’s routing table:Proximity invariant: Each entry in a node � ’s routingtable refers to a node that is near � , according to theproximity metric, among all live Pastry nodes with theappropriate nodeId prefix.
In Section 4.1, we show how Pastry’s node joining pro-tocol maintains the proximity invariant. Next, we con-sider the effect of the proximity invariant on Pastry’srouting. Observe that as a result of the proximity in-variant, a message is normally forwarded in each rout-ing step to a nearby node, according to the proximitymetric, among all nodes whose nodeId shares a longerprefix with the key. Moreover, the expected distancetraveled in each consecutive routing step increases ex-ponentially, because the density of nodes decreases ex-ponentially with the length of the prefix match. Fromthis property, one can derive three distinct properties ofPastry with respect to network locality:Total distance traveled (delay stretch): The expecteddistance of the last routing step tends to dominate thetotal distance traveled by a message. As a result, the av-erage total distance traveled by a message exceeds thedistance between source and destination node only by asmall constant value.Local route convergence: The paths of two Pastry mes-sages sent from nearby nodes with identical keys tend toconverge at a node near the source nodes, in the prox-imity space. To see this, observe that in each consecutive
4
routing step, the messages travel exponentially larger dis-tances towards an exponentially shrinking set of nodes.Thus, the probability of a route convergence increases ineach step, even in the case where earlier (smaller) rout-ing steps have moved the messages farther apart. This re-sult has significance for caching applications layered onPastry. Popular objects requested by a nearby node andcached by all nodes along the route are likely to be foundwhen another nearby node requests the object. Also, thisproperty is exploited in Scribe [12] to achieve low linkstress in an application level multicast system.Locating the nearest replica: If replicas of an objectare stored on T nodes with adjacent nodeIds, Pastry mes-sages requesting the object have a tendency to first reacha node near the client node. To see this, observe thatPastry messages initially take small steps in the proxim-ity space, but large steps in the nodeId space. Applica-tions can exploit this property to make sure that clientrequests for an object tend to be handled by a replica thatis near the client. Exploiting this property is application-specific, and is discussed in [11].
An analysis of these properties follows in Section 5.Simulation and measurement results that confirm andquantify these properties follow in Section 6.
4.1 Maintaining the overlay
Next, we present the new protocols for node join, nodefailure and routing table maintenance in Pastry and showhow these protocols maintain the proximity invariant.The new node join and routing table maintenance pro-tocols supersede the “second phase” of the join protocoldescribed in the original Pastry paper, which had muchhigher overhead [10].
When joining the Pastry overlay, a new node withnodeId � must contact an existing Pastry node � . � thenroutes a message using � as the key, and the new nodeobtains the � th row of its routing table from the nodeencountered along the path from � to � whose nodeIdmatches � in the first ��� �
digits. We will show thatthe proximity invariant holds on � ’s resulting routing ta-ble, if node � is near node � , according to the proximitymetric.
First, consider the top row of � ’s routing table, ob-tained from node � . Assuming the triangle inequalityholds in the proximity space, it is easy to see that the en-tries in the top row of � ’s routing table are also close to
� . Next, consider the � th row of � ’s routing table, ob-
tained from the node ��� encountered along the path from� to � . By induction, this node is Pastry’s approxima-tion to the node closest to � that matches � ’s nodeId inthe first ��� �
digits. Therefore, if the triangle inequal-ity holds, we can use the same argument to conclude thatthe entries of the � th row of ��� ’s routing table should beclose to � .
At this point, we have shown that the proximity invari-ant holds in � ’s routing table. To show that the node joinprotocol maintains the proximity invariant globally in allPastry nodes, we must next show how the routing tablesof other affected nodes are updated to reflect � ’s arrival.Once � has initialized its own routing table, it sends the� th row of its routing table to each node that appears asan entry in that row. This serves both to announce itspresence and to propagate information about nodes thatjoined previously. Each of the nodes that receives a rowthen inspects the entries in the row, performs probes tomeasure if � or one of the entries is nearer than the cor-responding entry in its own routing table, and updates itsrouting table as appropriate.
To see that this procedure is sufficient to restore theproximity invariant in all affected nodes, consider that �and the nodes that appear in row � of � ’s routing tableform a group of ��� nearby nodes whose nodeIds matchin the first � digits. It is clear that these nodes need toknow of � ’s arrival, since � may displace a more distantnode in one of the node’s routing tables. Conversely, anode with identical prefix in the first � digits that is nota member of this group is likely to be more distant fromthe members of the group, and therefore from � ; thus,
� ’s arrival is not likely to affect its routing table and,with high probability, it does not need to be informed of
� ’s arrival.Node failure: Failed routing tables entries are repairedlazily, whenever a routing table entry is used to route amessage. Pastry routes the message to another node withnumerically closer nodeId. If the downstream node has arouting table entry that matches the next digit of the mes-sage’s key, it automatically informs the upstream node ofthat entry.
We need to show that the entry supplied by this proce-dure satisfies the proximity invariant. If a numericallycloser node can be found in the routing table, it mustbe an entry in the same row as the failed node. If thatnode supplies a substitute entry for the failed node, itsexpected distance from the local node is therefore low,since all three nodes are part of the same group of nearby
5
nodes with identical nodeId prefix. On the other hand,if no replacement node is supplied by the downstreamnode, we trigger the routing table maintenance task (de-scribed in the next section) to find a replacement entry.In either case, the proximity invariant is preserved.
Routing table maintenance: The routing table entriesproduced by the node join protocol and the repair mech-anisms are not guaranteed to be the closest to the localnode. Several factors contribute to this, including theheuristic nature of the node join and repair mechanismswith respect to locality. Also, many practical proxim-ity metrics do not strictly satisfy the triangle inequalityand may vary over time. However, limited imprecisionis consistent with the proximity invariant, and as we willshow in Section 6, it does not have a significant impacton Pastry’s locality properties.
However, one concern is that deviations could cascade,leading to a slow deterioration of the locality propertiesover time. To prevent a deterioration of the overall routequality, each node runs a periodic routing table mainte-nance task (e.g., every 20 minutes). The task performsthe following procedure for each row of the local node’srouting table. It selects a random entry in the row, andrequests from the associated node a copy of that node’scorresponding routing table row. Each entry in that rowis then compared to the corresponding entry in the localrouting table. If they differ, the node probes the distanceto both entries and installs the closest entry in its ownrouting table.
The intuition behind this maintenance procedure is toexchange routing information among groups of nearbynodes with identical nodeId prefix. A nearby node withthe appropriate prefix must be know to at least one mem-ber of the group; the procedure ensures that the entiregroup will eventually learn of the node, and adjust theirrouting tables accordingly.
Whenever a Pastry node replaces a routing table entrybecause a closer node was found, the previous entry iskept in a list of alternate entries (up to ten such entriesare saved in the implementation). When the primary en-try fails, one of the alternates is used until and unless acloser entry is found during the next periodic routing ta-ble maintenance.
4.2 Locating a nearby node
Recall that for the node join algorithm to preserve theproximity invariant, the starting node � must be close to
(1)discover(seed)(2) nodes = getLeafSet(seed)(3) forall node in nodes(4) nearNode = closerToMe(node,nearNode)(5) depth = getMaxRoutingTableLevel(nearNode)(6) while (depth � 0)(7) nodes = getRoutingTable(nearNode,depth - -)(8) forall node in nodes(9) nearNode = closerToMe(node,nearNode)(10) end while(11) do(12) nodes = getRoutingTable(nearNode,0)(13) currentClosest = nearNode(14) forall node in nodes(15) nearNode = closerToMe(node,nearNode)(16) while (currentClosest != nearNode)(17) return nearNode
Figure 4: Simplified nearby node discovery algorithm.seed is the Pastry node initially known to the joiningnode.
the new node � , among all live Pastry nodes. This begsthe question of how a newly joining node can detect anearby Pastry node. One way to achieve this is to per-form an “expanding ring” IP multicast, but this assumesthe availability of IP multicast. In Figure 4, we present anew, efficient algorithm by which a node may discover anearby Pastry node, given that it has knowledge of somePastry node at any location. Thus, a joining node is onlyrequired to obtain knowledge of any Pastry node throughout-of-band means, as opposed to obtaining knowledgeof a nearby node. The algorithm exploits the propertythat location of the nodes in the seeds’ leaf set shouldbe uniformly distributed over the network. Next, hav-ing discovered the closest leaf set member, the routingtable distance properties are exploited to move exponen-tially closer to the location of the joining node. This isachieved bottom up by picking the closest node at eachlevel and getting the next level from it. The last phase re-peats the process for the top level until no more progressis made.
5 Analysis
In this section, we present analytical results for Pastry’srouting properties. First, we analyze the distribution ofthe number of routing hops taken when a Pastry messagewith a randomly chosen key is sent from a randomly cho-
6
sen Pastry node. This analysis then forms the basis for ananalysis of Pastry’s locality properties. Throughout thisanalysis, we assume that each Pastry node has a perfectrouting table. That is, a routing table entry may be emptyonly if no node with an appropriate nodeId prefix exists,and all routing table entries point to the nearest node, ac-cording to the proximity metric. In practice, Pastry doesnot guarantee perfect routing tables. Simulation resultspresented in Section 6 show that the performance degra-dation due to this inaccuracy is minimal. In the follow-ing, we present the main analytical results and leave outthe details of the proofs in Appendix A.
5.1 Route probability matrix
Although the number of routing hops in Pastry is asymp-totically �! #"%$ �'& (+* , the actual number of routing hops isaffected by the use of the leafset and the probability thatthe message key already shares a prefix with the nodeIdof the starting node and intermediate nodes along therouting path. In the following, we analyze the distribu-tion of the number of routing hops based on the statisticalpopulation of the nodeId space. Since the assignment ofnodeIds is assumed to be randomly uniform, this popula-tion can be captured by the binomial distribution (see, forexample, [3]). For instance, the distribution of the num-ber of nodes with a given value of the most significantnodeId digit, out of ( nodes, is given by M�T�� ( N�� ������P .
Recall from Figure 3 that at each node, a message canbe forwarded using one of three branches in the forward-ing procedure. In case ��� , the message is forwarded us-ing the leaf set F (line 3); in case ��� using the routingtable B (line 8); and in case ��� using a node in F� B(lines 11-13). We formally define the probabilities of tak-ing these branches as well as of two special cases in thefollowing.
Definition 1 Let ���"� M�K N N ( N �� P denote the probabil-ity of taking branch �� N ����� � N�� N����
, at the M�K � � P thhop in routing a message with random key, starting froma node randomly chosen from ( nodes, with a leaf setof size . Furthermore, we define ���"� M�K N N ( N ���� P asthe probability that the node encountered after the K -th hop is already the numerically closest node to themessage, and thus the routing terminates, and define���"� M�K N N ( N ���� P as the probability that the node en-countered after the K -th hop already shares the M�K.� � Pdigits with the key, thus skipping the M�K � � P th hop.
We denote ���"� M�K N N ( N �� P N K���� � N�� ������ � �� �N �!�� � N �"� N�� N�� � N���� as the probability matrix of Pastry rout-ing. The following Lemma gives the building block forderiving the full probability matrix as a function of (and .
Lemma 1 Assume branch ��� has been taken during thefirst K hops in routing a random message # , i.e. the mes-sage # is at an intermediate node � which shares thefirst K digits with # . Let $ be the total number of ran-dom uniformly distributed nodeIds that share the first Kdigits with # . The probabilities in taking different pathsat the M�K � � P th hop is%&&&&
'(*),+.- � -+��)��0/9�01�2>�(*),+.- � -+��)��0/9�01432 �(*),+.- � -+��)��0/9�01�5#�(*),+.- � -+��)��0/9�01435 �(*),+.- � -+��)��0/9�01�6��
798888: *
�<;.� �=2<>@?
A=BDC >@?- � E ?GF /9�IH�GJ ��K
A � BDC=B >@?- � E F / %LE ? � �
�GJ>% H ��K (*),+.- ( / -NM � E �OE ? �0/ %LE ? %LE �S-+��) �where ���"� � � MQP D N P.R N P,S N K N �P calculates the five prob-abilities assuming there are P D N P.R N P,S nodeIds that sharedthe first K digits with # , but whose M�K.� � P th digits aresmaller than, equal to, and larger than that of # , respec-tively.
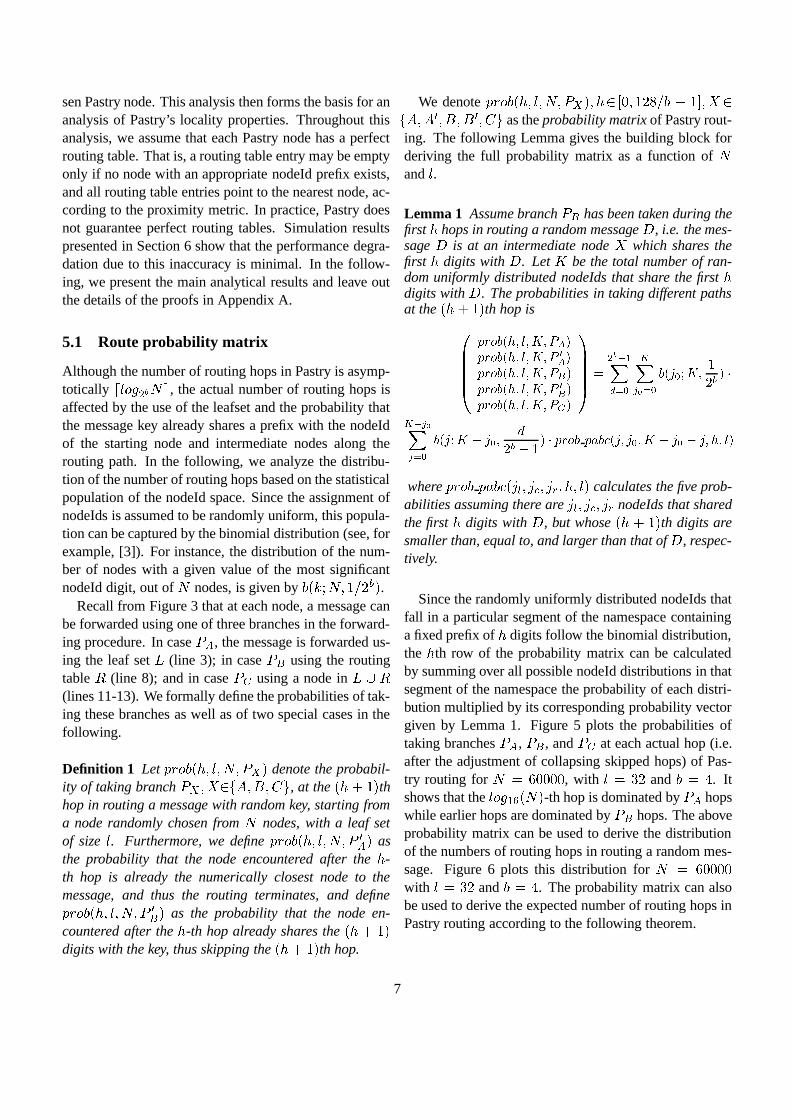
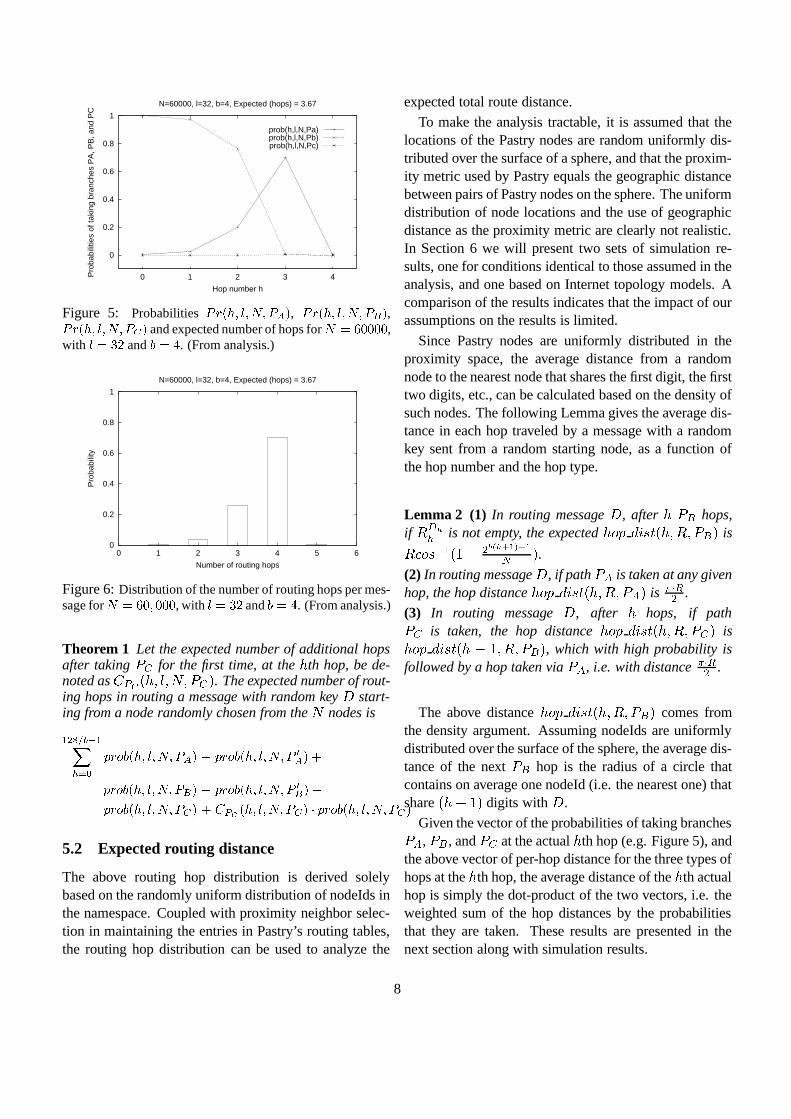
Since the randomly uniformly distributed nodeIds thatfall in a particular segment of the namespace containinga fixed prefix of K digits follow the binomial distribution,the K th row of the probability matrix can be calculatedby summing over all possible nodeId distributions in thatsegment of the namespace the probability of each distri-bution multiplied by its corresponding probability vectorgiven by Lemma 1. Figure 5 plots the probabilities oftaking branches ��� , ��� , and ��� at each actual hop (i.e.after the adjustment of collapsing skipped hops) of Pas-try routing for ( � �T�T�T� , with VU�� and . � . Itshows that the #"%$ �0/ M ( P -th hop is dominated by ��� hopswhile earlier hops are dominated by �W� hops. The aboveprobability matrix can be used to derive the distributionof the numbers of routing hops in routing a random mes-sage. Figure 6 plots this distribution for ( � �T�T�T�with XU�� and � . The probability matrix can alsobe used to derive the expected number of routing hops inPastry routing according to the following theorem.
7
0
0.2
0.4
0.6
0.8
1
0 1 2 3 4Pro
babi
litie
s of
taki
ng b
ranc
hes
PA
, PB
, and
PC
Hop number h
N=60000, l=32, b=4, Expected (hops) = 3.67
prob(h,l,N,Pa)prob(h,l,N,Pb)prob(h,l,N,Pc)
Figure 5: Probabilities 1 ) � -+��)���� �01 2 � , 1 ) � -+��)���� �01�5#� ,1 ) � -+��)���� �01�6(� and expected number of hops for � *���������� ,with )O*��L� and - *�� . (From analysis.)
0
0.2
0.4
0.6
0.8
1
0 1 2 3 4 5 6
Pro
babi
lity
Number of routing hops
N=60000, l=32, b=4, Expected (hops) = 3.67
Figure 6: Distribution of the number of routing hops per mes-sage for � *���� ������� , with )+*�L� and - *�� . (From analysis.)
Theorem 1 Let the expected number of additional hopsafter taking ��� for the first time, at the K th hop, be de-noted as
�� � M�K N N ( N ��� P . The expected number of rout-ing hops in routing a message with random key # start-ing from a node randomly chosen from the ( nodes is
� ��!S� J � �=� >@?
(*),+.- � -+��)���� �01�2 � % (*),+.- � -+��)���� �01 32 ���(*),+.- � -+��)���� �01�5#� % (*),+.- � -+��)���� �01 35 ���(*),+.- � -+��)���� �01�6���������(� -+��)���� �01�6(� K (*),+.- � -+��)���� �01�6(�
5.2 Expected routing distance
The above routing hop distribution is derived solelybased on the randomly uniform distribution of nodeIds inthe namespace. Coupled with proximity neighbor selec-tion in maintaining the entries in Pastry’s routing tables,the routing hop distribution can be used to analyze the
expected total route distance.
To make the analysis tractable, it is assumed that thelocations of the Pastry nodes are random uniformly dis-tributed over the surface of a sphere, and that the proxim-ity metric used by Pastry equals the geographic distancebetween pairs of Pastry nodes on the sphere. The uniformdistribution of node locations and the use of geographicdistance as the proximity metric are clearly not realistic.In Section 6 we will present two sets of simulation re-sults, one for conditions identical to those assumed in theanalysis, and one based on Internet topology models. Acomparison of the results indicates that the impact of ourassumptions on the results is limited.
Since Pastry nodes are uniformly distributed in theproximity space, the average distance from a randomnode to the nearest node that shares the first digit, the firsttwo digits, etc., can be calculated based on the density ofsuch nodes. The following Lemma gives the average dis-tance in each hop traveled by a message with a randomkey sent from a random starting node, as a function ofthe hop number and the hop type.
Lemma 2 (1) In routing message # , after K �W� hops,if B ���� is not empty, the expected K "9 � E�J���M�K N B N ��� P is
B � "0J G � M � � � &�� ���! #"$�! % P .(2) In routing message # , if path ��� is taken at any givenhop, the hop distance K "9 � E�J���M�K N B N ��� P is &(' )� .
(3) In routing message # , after K hops, if path��� is taken, the hop distance K "9 � E�J���M�K N B N ��� P isK "9 � E�J���M�K � � N B N ��� P , which with high probability isfollowed by a hop taken via ��� , i.e. with distance &(' )� .
The above distance K "9 � E�J���M�K N B N ��� P comes fromthe density argument. Assuming nodeIds are uniformlydistributed over the surface of the sphere, the average dis-tance of the next ��� hop is the radius of a circle thatcontains on average one nodeId (i.e. the nearest one) thatshare M�K � � P digits with # .
Given the vector of the probabilities of taking branches��� , ��� , and ��� at the actual K th hop (e.g. Figure 5), andthe above vector of per-hop distance for the three types ofhops at the K th hop, the average distance of the K th actualhop is simply the dot-product of the two vectors, i.e. theweighted sum of the hop distances by the probabilitiesthat they are taken. These results are presented in thenext section along with simulation results.
8
5.3 Local route convergence
Next, we analyze Pastry’s route convergence property.Specifically, when two random Pastry nodes send a mes-sage with the same randomly chosen key, we analyze theexpected distance the two messages travel in the proxim-ity space until the point where their routes converge, as afunction of the distance between the starting nodes in theproximity space.
To simplify the analysis, we consider three scenarios.In the worst-case scenario, it is assumed that at each rout-ing hop prior to the point where their routes converge,the messages travel in opposite directions in the prox-imity space. In the average-case scenario, it is assumedthat prior to convergence, the messages travel such thattheir distance in the proximity space does not change. Inthe best case scenario, the messages travel towards eachother in the proximity space prior to their convergence.
For each of the above three scenarios, we derive theprobability that the two routes converge after each hop.The probability is estimated as the intersecting area ofthe two circles potentially covered by the two routes ateach hop as a percentage of the area of each circle. Cou-pling this probability vector with the distance vector (fordifferent hops) gives the expected distance till route con-vergence.
Theorem 2 Let� �
and� � be the two starting nodes
on a sphere of radius B from which messages with anidentical, random key are being routed. Let the distancebetween
� �and
� � be �*� . Then the expected distancethat the two messages will travel before their paths mergeis
� ��� ����� ��13��*� ����� ; �=B >@?
"�� B�" >@? � H %
(*),+.- - +<( �;�S����� ��13�.�.- +<( � ��� � E ��13�where ���"� K "9 MQP N �*� N B P �
� ��� R C���� ��� )�� � R ��� )������������� �!"� ��� R C���� ��� )�� � )�� ,�0P �*� � �$#&%('�)*�',+.- K "9 � E�J���MQP N B P in the worst case,
or �0P �*� in the average case, or �0P � ��� MO� N �*� ��/#*%('�)*�',+.- K "9 � E�J���MQP N B P5P in the best case, respectively,0 M � N � N B P denotes the intersecting area of two circles ofradius � centered at two points on a sphere of radius Bthat are a distance of �21 � � apart, and
0��3 S�4,59R�6 M � N B P
denotes the surface area of a circle of radius � on asphere of radius B .
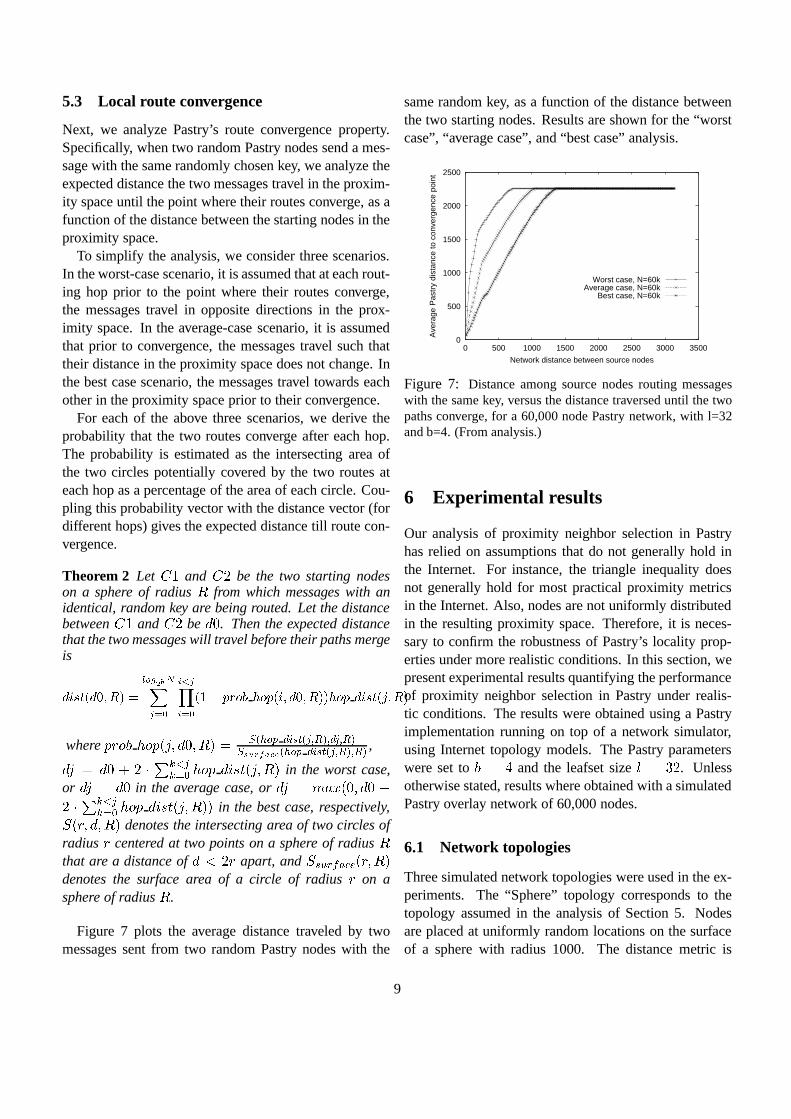
Figure 7 plots the average distance traveled by twomessages sent from two random Pastry nodes with the
same random key, as a function of the distance betweenthe two starting nodes. Results are shown for the “worstcase”, “average case”, and “best case” analysis.
0
500
1000
1500
2000
2500
0 500 1000 1500 2000 2500 3000 3500
Ave
rage
Pas
try
dist
ance
to c
onve
rgen
ce p
oint
Network distance between source nodes
Worst case, N=60kAverage case, N=60k
Best case, N=60k
Figure 7: Distance among source nodes routing messageswith the same key, versus the distance traversed until the twopaths converge, for a 60,000 node Pastry network, with l=32and b=4. (From analysis.)
6 Experimental results
Our analysis of proximity neighbor selection in Pastryhas relied on assumptions that do not generally hold inthe Internet. For instance, the triangle inequality doesnot generally hold for most practical proximity metricsin the Internet. Also, nodes are not uniformly distributedin the resulting proximity space. Therefore, it is neces-sary to confirm the robustness of Pastry’s locality prop-erties under more realistic conditions. In this section, wepresent experimental results quantifying the performanceof proximity neighbor selection in Pastry under realis-tic conditions. The results were obtained using a Pastryimplementation running on top of a network simulator,using Internet topology models. The Pastry parameterswere set to + � and the leafset size U�� . Unlessotherwise stated, results where obtained with a simulatedPastry overlay network of 60,000 nodes.
6.1 Network topologies
Three simulated network topologies were used in the ex-periments. The “Sphere” topology corresponds to thetopology assumed in the analysis of Section 5. Nodesare placed at uniformly random locations on the surfaceof a sphere with radius 1000. The distance metric is
9
based on the topological distance between two nodes onthe sphere’s surface. Results produced with this topol-ogy model should correspond closely to the analysis, andit was used primarily to validate the simulation environ-ment. However, the sphere topology is not realistic, be-cause it assumes a uniform random distribution of nodeson the Sphere’s surface, and its proximity space is veryregular and strictly satisfies the triangle inequality.
A second topology was generated using the GeorgiaTech transit-stub network topology model [15]. Theround-trip delay (RTT) between two nodes, as providedby the topology graph generator, is used as the proximitymetric with this topology. We use a topology with 5050nodes in the core, where a LAN with an average of 100nodes is attached to each core node. Out of the result-ing 505,000 LAN nodes, 60,000 randomly chosen nodesform a Pastry overlay network. As in the real Internet, thetriangle inequality does not hold for RTTs among nodesin the topology model.
Finally, we used the Mercator topology and routingmodels [14]. The topology model contains 102,639routers and it was obtained from real measurements ofthe Internet using the Mercator program [5]. The authorsof [14] used real data and some simple heuristics to as-sign an autonomous system to each router. The resultingAS overlay has 2,662 nodes. Routing is performed hier-archically as in the Internet. A route follows the shortestpath in the AS overlay between the AS of the source andthe AS of the destination. The routes within each AS fol-low the shortest path to a router in the next AS of the ASoverlay path.
We built a Pastry overlay with 60,000 nodes on thistopology by picking a router for each node randomly anduniformly, and attaching the node directly to the routerwith a LAN link. Since the topology is not annotatedwith delay information, the number of routing hops inthe topology was used as the proximity metric for Pastry.We count the LAN hops when reporting the length ofthe Pastry routes. This is conservative because the costof these hops is usually negligible and Pastry’s overheadwould be lower if we did not count LAN hops.
6.2 Pastry routing hops and distance ratio
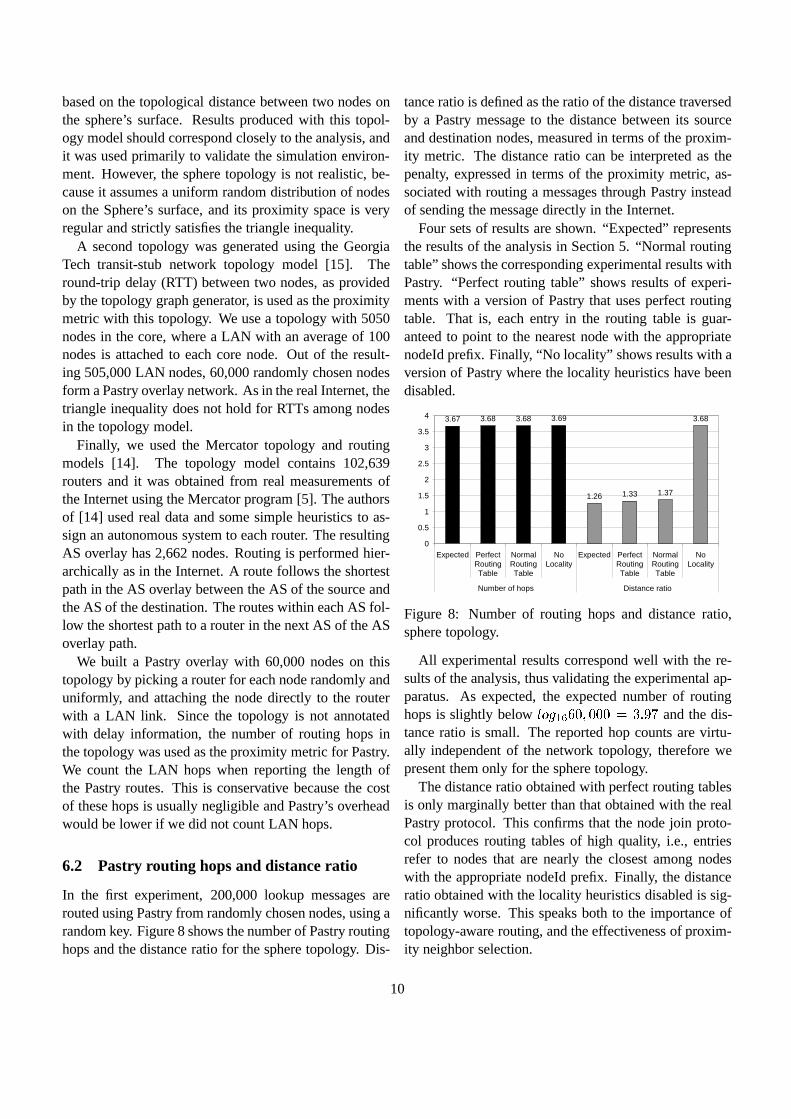
In the first experiment, 200,000 lookup messages arerouted using Pastry from randomly chosen nodes, using arandom key. Figure 8 shows the number of Pastry routinghops and the distance ratio for the sphere topology. Dis-
tance ratio is defined as the ratio of the distance traversedby a Pastry message to the distance between its sourceand destination nodes, measured in terms of the proxim-ity metric. The distance ratio can be interpreted as thepenalty, expressed in terms of the proximity metric, as-sociated with routing a messages through Pastry insteadof sending the message directly in the Internet.
Four sets of results are shown. “Expected” representsthe results of the analysis in Section 5. “Normal routingtable” shows the corresponding experimental results withPastry. “Perfect routing table” shows results of experi-ments with a version of Pastry that uses perfect routingtable. That is, each entry in the routing table is guar-anteed to point to the nearest node with the appropriatenodeId prefix. Finally, “No locality” shows results with aversion of Pastry where the locality heuristics have beendisabled.
3.67 3.68 3.68 3.69
1.26 1.33 1.37
3.68
0
0.5
1
1.5
2
2.5
3
3.5
4
Expected PerfectRoutingTable
NormalRoutingTable
NoLocality
Expected PerfectRoutingTable
NormalRoutingTable
NoLocality
Number of hops Distance ratio
Figure 8: Number of routing hops and distance ratio,sphere topology.
All experimental results correspond well with the re-sults of the analysis, thus validating the experimental ap-paratus. As expected, the expected number of routinghops is slightly below #"%$ �0/ � � N �T�T� U�� ��� and the dis-tance ratio is small. The reported hop counts are virtu-ally independent of the network topology, therefore wepresent them only for the sphere topology.
The distance ratio obtained with perfect routing tablesis only marginally better than that obtained with the realPastry protocol. This confirms that the node join proto-col produces routing tables of high quality, i.e., entriesrefer to nodes that are nearly the closest among nodeswith the appropriate nodeId prefix. Finally, the distanceratio obtained with the locality heuristics disabled is sig-nificantly worse. This speaks both to the importance oftopology-aware routing, and the effectiveness of proxim-ity neighbor selection.
10
6.3 Routing distance
0
200
400
600
800
1000
1200
1400
1600
1800
1 2 3 4 5Hop number
Per
-hop
dis
tanc
e
Expected
Perfect Routing Table
Normal Routing Table
No Locality
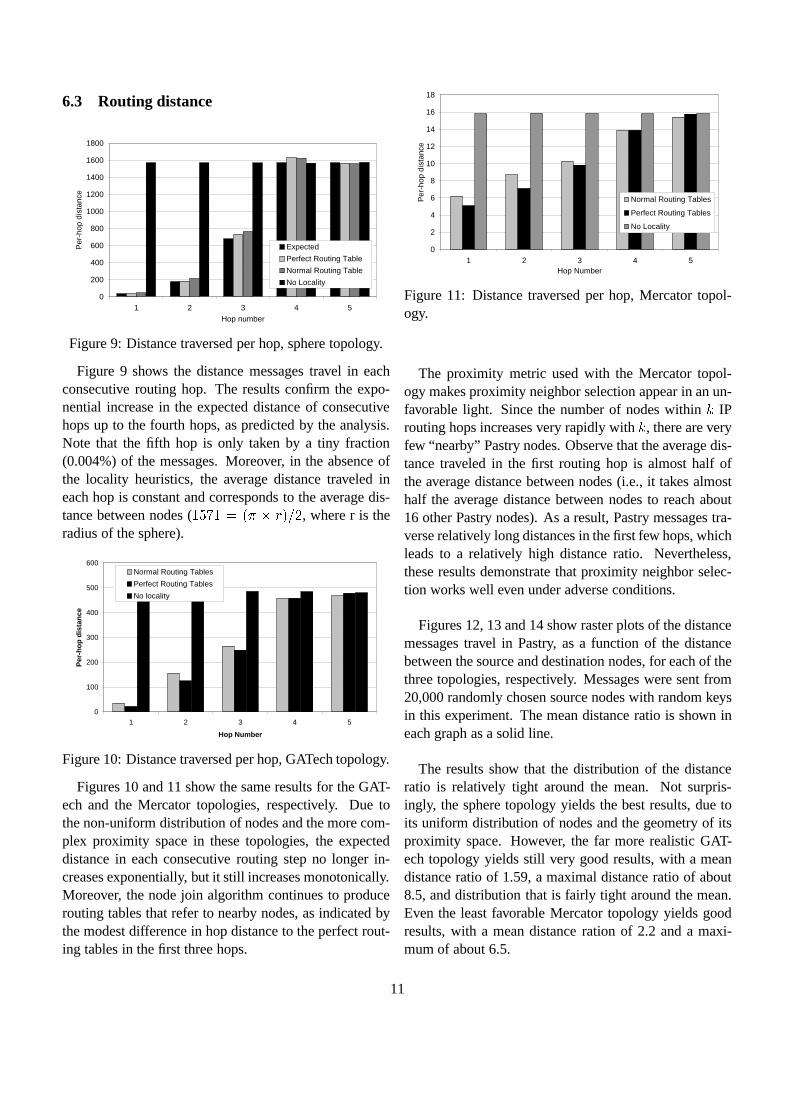
Figure 9: Distance traversed per hop, sphere topology.
Figure 9 shows the distance messages travel in eachconsecutive routing hop. The results confirm the expo-nential increase in the expected distance of consecutivehops up to the fourth hops, as predicted by the analysis.Note that the fifth hop is only taken by a tiny fraction(0.004%) of the messages. Moreover, in the absence ofthe locality heuristics, the average distance traveled ineach hop is constant and corresponds to the average dis-tance between nodes (
������� M���� ��P'��� , where r is theradius of the sphere).
0
100
200
300
400
500
600
1 2 3 4 5
Hop Number
Per
-ho
p d
ista
nce
Normal Routing Tables
Perfect Routing Tables
No locality
Figure 10: Distance traversed per hop, GATech topology.
Figures 10 and 11 show the same results for the GAT-ech and the Mercator topologies, respectively. Due tothe non-uniform distribution of nodes and the more com-plex proximity space in these topologies, the expecteddistance in each consecutive routing step no longer in-creases exponentially, but it still increases monotonically.Moreover, the node join algorithm continues to producerouting tables that refer to nearby nodes, as indicated bythe modest difference in hop distance to the perfect rout-ing tables in the first three hops.
0
2
4
6
8
10
12
14
16
18
1 2 3 4 5Hop Number
Per
-hop
dis
tanc
e
Normal Routing Tables
Perfect Routing Tables
No Locality
Figure 11: Distance traversed per hop, Mercator topol-ogy.
The proximity metric used with the Mercator topol-ogy makes proximity neighbor selection appear in an un-favorable light. Since the number of nodes within T IProuting hops increases very rapidly with T , there are veryfew “nearby” Pastry nodes. Observe that the average dis-tance traveled in the first routing hop is almost half ofthe average distance between nodes (i.e., it takes almosthalf the average distance between nodes to reach about16 other Pastry nodes). As a result, Pastry messages tra-verse relatively long distances in the first few hops, whichleads to a relatively high distance ratio. Nevertheless,these results demonstrate that proximity neighbor selec-tion works well even under adverse conditions.
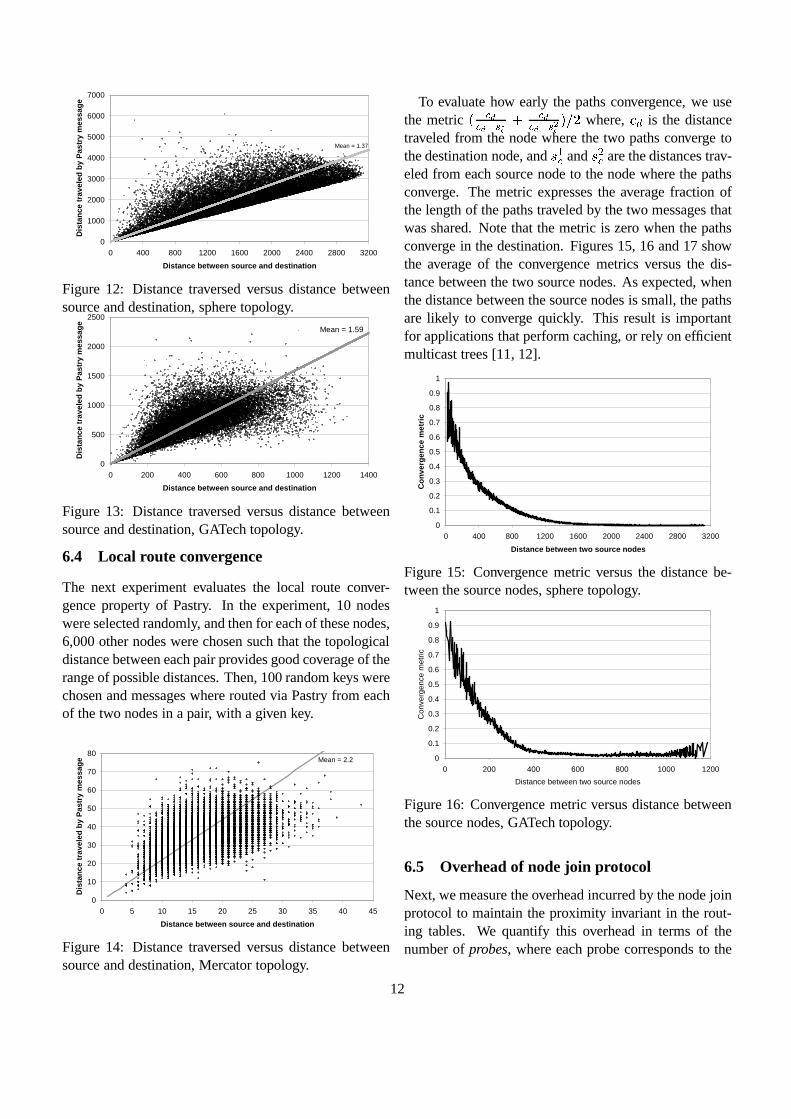
Figures 12, 13 and 14 show raster plots of the distancemessages travel in Pastry, as a function of the distancebetween the source and destination nodes, for each of thethree topologies, respectively. Messages were sent from20,000 randomly chosen source nodes with random keysin this experiment. The mean distance ratio is shown ineach graph as a solid line.
The results show that the distribution of the distanceratio is relatively tight around the mean. Not surpris-ingly, the sphere topology yields the best results, due toits uniform distribution of nodes and the geometry of itsproximity space. However, the far more realistic GAT-ech topology yields still very good results, with a meandistance ratio of 1.59, a maximal distance ratio of about8.5, and distribution that is fairly tight around the mean.Even the least favorable Mercator topology yields goodresults, with a mean distance ration of 2.2 and a maxi-mum of about 6.5.
11
0
1000
2000
3000
4000
5000
6000
7000
0 400 800 1200 1600 2000 2400 2800 3200
Distance between source and destination
Dis
tan
ce t
rave
led
by
Pas
try
mes
sag
e
Mean = 1.37
Figure 12: Distance traversed versus distance betweensource and destination, sphere topology.
0
500
1000
1500
2000
2500
0 200 400 600 800 1000 1200 1400
Distance between source and destination
Dis
tan
ce t
rave
led
by
Pas
try
mes
sag
e
Mean = 1.59
Figure 13: Distance traversed versus distance betweensource and destination, GATech topology.
6.4 Local route convergence
The next experiment evaluates the local route conver-gence property of Pastry. In the experiment, 10 nodeswere selected randomly, and then for each of these nodes,6,000 other nodes were chosen such that the topologicaldistance between each pair provides good coverage of therange of possible distances. Then, 100 random keys werechosen and messages where routed via Pastry from eachof the two nodes in a pair, with a given key.
0
10
20
30
40
50
60
70
80
0 5 10 15 20 25 30 35 40 45
Distance between source and destination
Dis
tan
ce t
rave
led
by
Pas
try
mes
sag
e Mean = 2.2
Figure 14: Distance traversed versus distance betweensource and destination, Mercator topology.
To evaluate how early the paths convergence, we usethe metric M R��R���� � � R��R���� � � P'��� where,
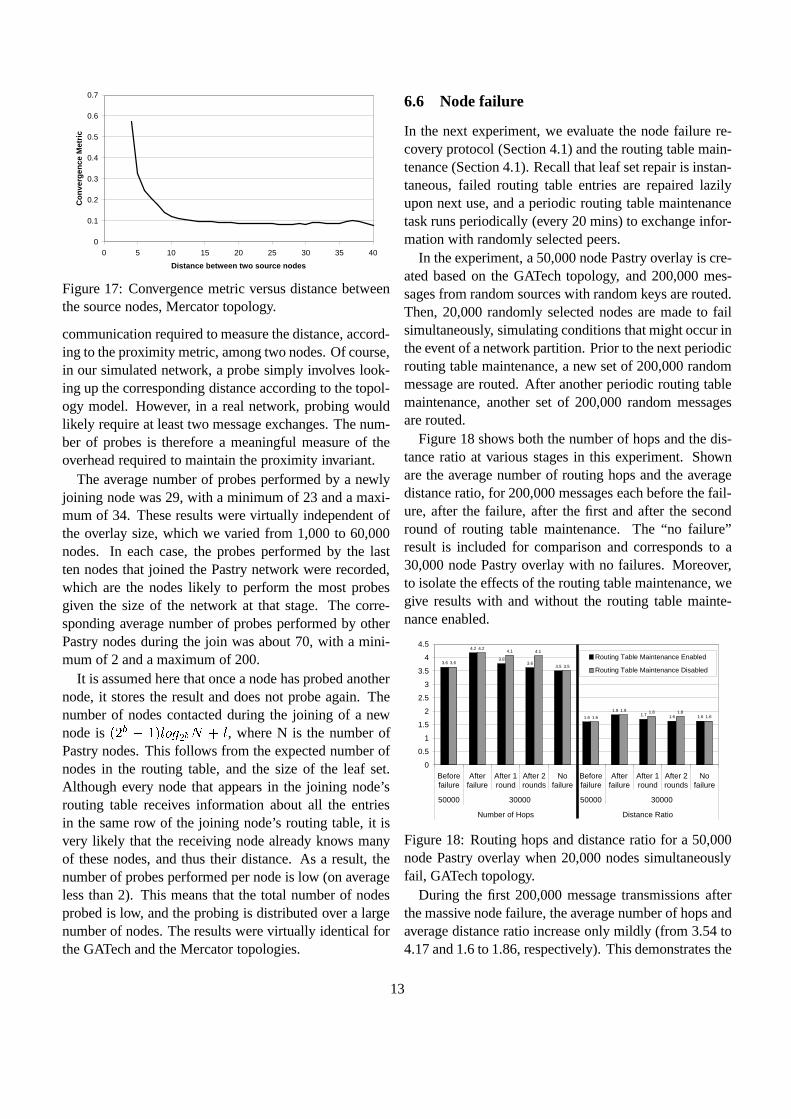
� R is the distancetraveled from the node where the two paths converge tothe destination node, and J �R and J �R are the distances trav-eled from each source node to the node where the pathsconverge. The metric expresses the average fraction ofthe length of the paths traveled by the two messages thatwas shared. Note that the metric is zero when the pathsconverge in the destination. Figures 15, 16 and 17 showthe average of the convergence metrics versus the dis-tance between the two source nodes. As expected, whenthe distance between the source nodes is small, the pathsare likely to converge quickly. This result is importantfor applications that perform caching, or rely on efficientmulticast trees [11, 12].
0
0.1
0.2
0.3
0.4
0.5
0.6
0.7
0.8
0.9
1
0 400 800 1200 1600 2000 2400 2800 3200
Distance between two source nodes
Co
nve
rgen
ce m
etri
c
Figure 15: Convergence metric versus the distance be-tween the source nodes, sphere topology.
0
0.1
0.2
0.3
0.4
0.5
0.6
0.7
0.8
0.9
1
0 200 400 600 800 1000 1200
Distance between two source nodes
Con
verg
ence
met
ric
Figure 16: Convergence metric versus distance betweenthe source nodes, GATech topology.
6.5 Overhead of node join protocol
Next, we measure the overhead incurred by the node joinprotocol to maintain the proximity invariant in the rout-ing tables. We quantify this overhead in terms of thenumber of probes, where each probe corresponds to the
12
0
0.1
0.2
0.3
0.4
0.5
0.6
0.7
0 5 10 15 20 25 30 35 40
Distance between two source nodes
Co
nve
rgen
ce M
etri
c
Figure 17: Convergence metric versus distance betweenthe source nodes, Mercator topology.
communication required to measure the distance, accord-ing to the proximity metric, among two nodes. Of course,in our simulated network, a probe simply involves look-ing up the corresponding distance according to the topol-ogy model. However, in a real network, probing wouldlikely require at least two message exchanges. The num-ber of probes is therefore a meaningful measure of theoverhead required to maintain the proximity invariant.
The average number of probes performed by a newlyjoining node was 29, with a minimum of 23 and a maxi-mum of 34. These results were virtually independent ofthe overlay size, which we varied from 1,000 to 60,000nodes. In each case, the probes performed by the lastten nodes that joined the Pastry network were recorded,which are the nodes likely to perform the most probesgiven the size of the network at that stage. The corre-sponding average number of probes performed by otherPastry nodes during the join was about 70, with a mini-mum of 2 and a maximum of 200.
It is assumed here that once a node has probed anothernode, it stores the result and does not probe again. Thenumber of nodes contacted during the joining of a newnode is M ��� � � P #"%$ �'&)( � , where N is the number ofPastry nodes. This follows from the expected number ofnodes in the routing table, and the size of the leaf set.Although every node that appears in the joining node’srouting table receives information about all the entriesin the same row of the joining node’s routing table, it isvery likely that the receiving node already knows manyof these nodes, and thus their distance. As a result, thenumber of probes performed per node is low (on averageless than 2). This means that the total number of nodesprobed is low, and the probing is distributed over a largenumber of nodes. The results were virtually identical forthe GATech and the Mercator topologies.
6.6 Node failure
In the next experiment, we evaluate the node failure re-covery protocol (Section 4.1) and the routing table main-tenance (Section 4.1). Recall that leaf set repair is instan-taneous, failed routing table entries are repaired lazilyupon next use, and a periodic routing table maintenancetask runs periodically (every 20 mins) to exchange infor-mation with randomly selected peers.
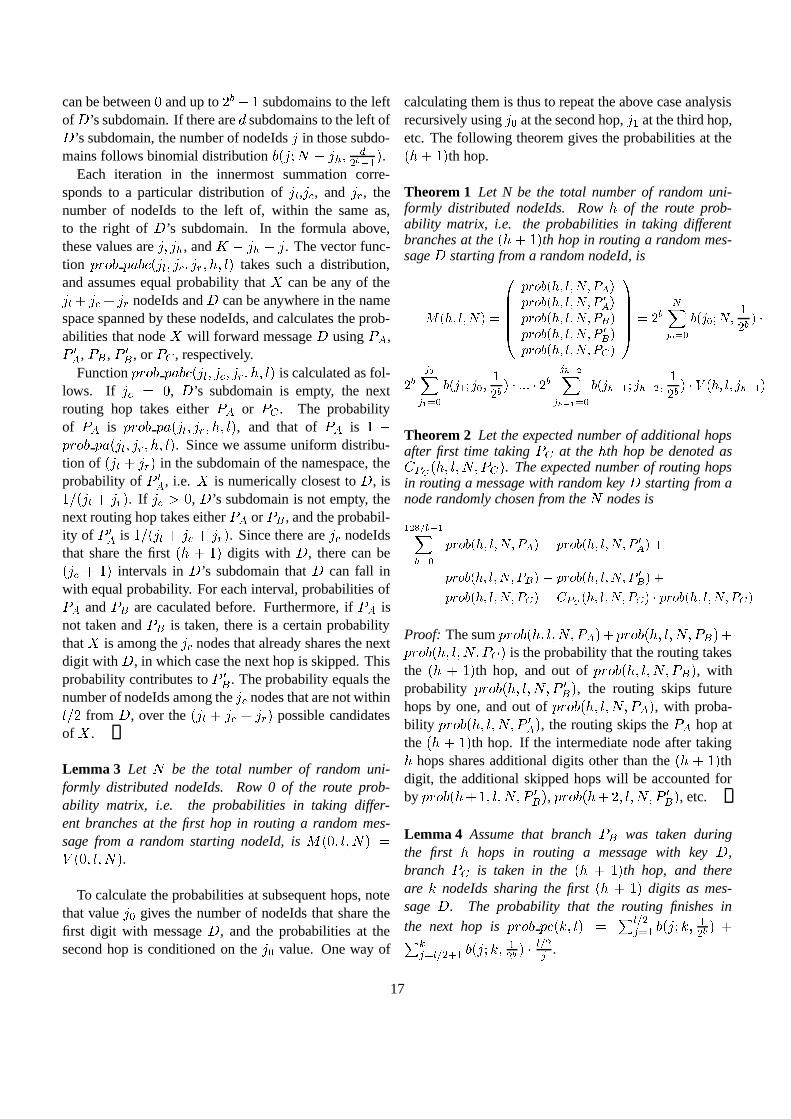
In the experiment, a 50,000 node Pastry overlay is cre-ated based on the GATech topology, and 200,000 mes-sages from random sources with random keys are routed.Then, 20,000 randomly selected nodes are made to failsimultaneously, simulating conditions that might occur inthe event of a network partition. Prior to the next periodicrouting table maintenance, a new set of 200,000 randommessage are routed. After another periodic routing tablemaintenance, another set of 200,000 random messagesare routed.
Figure 18 shows both the number of hops and the dis-tance ratio at various stages in this experiment. Shownare the average number of routing hops and the averagedistance ratio, for 200,000 messages each before the fail-ure, after the failure, after the first and after the secondround of routing table maintenance. The “no failure”result is included for comparison and corresponds to a30,000 node Pastry overlay with no failures. Moreover,to isolate the effects of the routing table maintenance, wegive results with and without the routing table mainte-nance enabled.
3.6
4.2
3.83.6
3.5
1.6
1.91.7 1.6 1.6
3.6
4.24.1 4.1
3.5
1.6
1.9 1.8 1.81.6
0
0.5
1
1.5
2
2.5
3
3.5
4
4.5
Beforefailure
Afterfailure
After 1round
After 2rounds
Nofailure
Beforefailure
Afterfailure
After 1round
After 2rounds
Nofailure
50000 30000 50000 30000
Number of Hops Distance Ratio
Routing Table Maintenance Enabled
Routing Table Maintenance Disabled
Figure 18: Routing hops and distance ratio for a 50,000node Pastry overlay when 20,000 nodes simultaneouslyfail, GATech topology.
During the first 200,000 message transmissions afterthe massive node failure, the average number of hops andaverage distance ratio increase only mildly (from 3.54 to4.17 and 1.6 to 1.86, respectively). This demonstrates the
13

robustness of Pastry in the face of massive node failures.After each round, the results improve and approach thosebefore the failure after two rounds.
With the routing table maintenance disabled, both thenumber of hops and the distance ratio do not recover asquickly. Consider that the routing table repair mecha-nism is lazy and only repairs entries that are actuallyused. Moreover, a repair generally involves an extra rout-ing hop, because the message is routed to a node that doesnot share a longer prefix with the key. Each consecutiveburst of 200,000 messages is likely to encounter differentrouting table entries that have not yet been fixed (about95,000 entries were repaired during each bursts). The pe-riodic routing table maintenance, on the other hand, re-places failed entries that have not yet been used as part ofits routine. It is intuitive to see why the distance ratio re-covers more slowly without routing table maintenance.The replacement entry provided by the repair mecha-nisms is generally relatively close, but not necessarilyamong the closest. The periodic routing table mainte-nance performs probing and is likely to replace such anentry with a better one. Finally, we point out that routingtable maintanance also takes care of changing distancesamong nodes over time.
We also measured the cost of the periodic routing tablemaintenance, in terms of network probes, to determinethe distance of nodes. On average, less than 20 nodesare being probed each time a node performs routing tablemaintenance, with a maximum of 82 probes. Since therouting table maintenance is performed every 20 minutesand the probes are likely to target different nodes, thisoverhead is not significant.
6.7 Load balance
Next, we consider how maintaining the proximity invari-ant in the routing tables affects load balance in the Pastryrouting fabric. In the simple Pastry algorithm without thelocality heuristics, or in protocols like Chord that don’tconsider network proximity, the “indegree” of a node,i.e., the number of routing table entries referring to a anygiven node, should be balanced across all nodes. This isa desirable property, as it tends to balance message for-warding load across all participating nodes in the overlay.
When routing tables entries are initialized to refer tothe nearest node with the appropriate prefix, this prop-erty may be compromised, because the distribution of in-degrees is now influenced by the structure of the underly-
ing physical network topology. Thus, there is an inherenttradeoff between proximity neighbor selection and loadbalance in the routing fabric. The purpose of the nextexperiment is to quantify the degree of imbalance in in-degrees of nodes, caused by the proximity invariant.
Figure 19 shows the cumulative distribution of inde-grees for a 60,000 node Pastry overlay, based on theGATech topology. As expected, the results show thatthe distribution of indegrees is not perfectly balanced.The results also show that the imbalance is most signif-icant at the top levels of the routing table (not shown inthe graph), and that the distribution has a thin tail. Thissuggests that it is appropriate to deal with these poten-tial hotspots reactively rather than proactively. If one ofthe nodes with a high indegree becomes a hotspot, whichwill depend on the workload, it can send backoff mes-sages. The nodes that receive such a backoff messagefind an alternative node for the same slot using the sametechnique as if the node was faulty. Since the most sig-nificant imbalance occurs at the top levels of the routingtable, changing routing table entries to point to an alter-native node will not increase the distance ratio signifi-cantly. There are many alternative nodes that can fill outthese slots and the distance traversed in the first hops ac-counts for a small fraction of the total distance traversed.We conclude that imbalance in the routing fabric as a re-sult of the proximity invariant does not appear to be asignificant problem.
0
10000
20000
30000
40000
50000
60000
1 10 100 1000 10000
In-degree
Cu
mal
ativ
e n
um
ber
of
no
des
1023
Figure 19: Indegree distribution of 60,000 Pastry nodes,GATech topology.
6.8 Discovering a nearby seed node
Next, we evaluate the discovery algorithm used to find anearby node, presented in Section 4.2. In each of 1,000trials, we chose a pair of nodes randomly among the60,000 Pastry nodes. One node in the pair is considered
14

Exact Average Average Numberclosest Distance RT0 Distance Probes
Sphere 95.3% 11.0 37.1 157GATech 83.7% 82.1 34.1 258Mercator 32.1% 2.6 6.0 296
Table 1: Results for the closest node discovery algorithm.
the joining node that wishes to locate a nearby Pastrynode, the other is treated as the seed Pastry node knownto the joining node. Using this seed node, the node dis-covery algorithm was used to discover a node near thejoining node, according to the proximity metric. Table 1shows the results for the three different topologies. Thefirst column shows the number of times the algorithmproduced the closest existing node. The second columnshows the average distance, according to the proximitymetric, of the node produced by the algorithm, in thecases where the nearest node was not found. For com-parison, the third column shows the average distance be-tween a node and its row zero routing table entries. Thefourth column shows the number of probes performedper trial.
In the sphere topology, over 95% of the found nodesare the closest. When the closest is not found, the aver-age distance to the found node is significantly less thanthe average distance to the entries in the first level ofthe routing table. More interestingly, this is also truefor the Mercator topology, even though the number oftimes the closest node was found is low with this topol-ogy. The GATech result is interesting, in that the fractionof cases where the nearest node was found is very high(almost 84%), but the average distance of the producesnode in the cases where the closest node was not foundis high. The reason is that the highly regular structure ofthis topology causes the algorithm to sometimes get intoa “local minimum”, by getting trapped in a nearby net-work. Overall, the algorithm for locating a nearby node iseffective. Results show that the algorithms allows newlyjoining nodes to efficiently discover a nearby node in theexisting Pastry overlay.
6.9 Testbed measurements
Finally, we performed preliminary measurements in asmall testbed of about 20 sites throughout the US andEurope. The measured results were as expected, but thetestbed is too small to obtain interesting an representativeresults. We expect that a current initiative by a number
of organizations to put together a larger wide-area testbedwill allow us to include such results in the final versionof this paper.
7 Conclusion
This paper presents a study of topology-aware routingin structured p2p overlay protocols. We compare ap-proaches to topology-aware routing and identify prox-imity neighbor selection as the most promising tech-nique. We present improved protocols for proximitybased neighbor selection in Pastry, which significantlyreduce the overhead of topology-aware overlay construc-tion and maintenance. Analysis and simulations confirmthat proximity neighbor selection yields good perfor-mance at very low overhead. We conclude that topology-aware routing can be accomplished effectively and withlow overhead in a self-organizing, structured peer-to-peeroverlay network.
References
[1] The Gnutella protocol specification, 2000.http://dss.clip2.com/GnutellaProtocol04.pdf.
[2] I. Clarke, O. Sandberg, B. Wiley, and T. W. Hong.Freenet: A distributed anonymous information storageand retrieval system. In Workshop on Design Issuesin Anonymity and Unobservability, pages 311–320, July2000. ICSI, Berkeley, CA, USA.
[3] T. H. Cormen, C. E. Leiserson, and R. L. Rivest. Intro-duction to Algorithms. The MIT Press, Cambridge, MA,1990.
[4] F. Dabek, M. F. Kaashoek, D. Karger, R. Morris, andI. Stoica. Wide-area cooperative storage with cfs. In18th ACM Symposium on Operating Systems Principles,Oct. 2001.
[5] R. Govindan and H. Tangmunarunkit. Heuristics for in-ternet map discovery. In Proc. 19th IEEE INFOCOM,pages 1371–1380, Tel Aviv, Israel, March 2000. IEEE.
[6] P. Maymounkov and D. Mazieres. Kademlia: A peer-to-peer information system based on the xor metric. InProceedings of the 1st International Workshop on Peer-to-Peer Systems (IPTPS’02), Boston, MA, Mar. 2002.
[7] S. Ratnasamy, P. Francis, M. Handley, R. Karp, andS. Shenker. A Scalable Content-Addressable Network.In Proc. of ACM SIGCOMM, Aug. 2001.
15

[8] S. Ratnasamy, M. Handley, R. Karp, and S. Shenker.Topologically-aware overlay construction and server se-lection. In Proc. 21st IEEE INFOCOM, New York, NY,June 2002.
[9] S. Ratnasamy, S. Shenker, and I. Stoica. Routing algo-rithms for dhts: Some open questions. In Proceedings ofthe 1st International Workshop on Peer-to-Peer Systems(IPTPS’02), Boston, MA, Mar. 2002.
[10] A. Rowstron and P. Druschel. Pastry: Scalable, dis-tributed object location and routing for large-scale peer-to-peer systems. In International Conference on Dis-tributed Systems Platforms (Middleware), Nov. 2001.
[11] A. Rowstron and P. Druschel. Storage management andcaching in PAST, a large-scale, persistent peer-to-peerstorage utility. In 18th ACM Symposium on OperatingSystems Principles, Oct. 2001.
[12] A. Rowstron, A.-M. Kermarrec, M. Castro, and P. Dr-uschel. Scribe: The design of a large-scale event noti-fication infrastructure. In Third International Workshopon Networked Group Communications, Nov. 2001.
[13] I. Stoica, R. Morris, D. Karger, M. F. Kaashoek, andH. Balakrishnan. Chord: A scalable peer-to-peer lookupservice for internet applications. In Proceedings of theACM SIGCOMM ’01 Conference, San Diego, California,August 2001.
[14] H. Tangmunarunkit, R. Govindan, D. Estrin, andS. Shenker. The impact of routing policy on internetpaths. In Proc. 20th IEEE INFOCOM, Alaska, USA,Apr. 2001.
[15] E. Zegura, K. Calvert, and S. Bhattacharjee. How tomodel an internetwork. In INFOCOM96, 1996.
[16] B. Y. Zhao, J. D. Kubiatowicz, and A. D. Joseph.Tapestry: An infrastructure for fault-resilient wide-arealocation and routing. Technical Report UCB//CSD-01-1141, U. C. Berkeley, April 2001.
Appendix A: Proofs of analytical results
We give proofs for the Lemmas and Theorems stated inSection 5. Their numberings here may be different frombefore.
A.1 Route probability matrix
Lemma 1 states the probability of taking path ��� at aspecific hop during the routing of a random message.
Lemma 1 Assume path ��� has been taken during thefirst K hops in routing message with key # , i.e. the mes-sage is at a node � that shares the first K digits with # . Ifthere exist P D nodeIds smaller than # that share the sameK digits with # , and P.S nodeIds larger than # that sharethe same K digits with # , then the probability that node
� will forward the message using ��� (i.e., # is within� ’s leaf set) is
���"� � MQP D N P,S N K N �P � D
��� � � � if h = 0min ��� � D I � � � min � � � D I � �
��� � � � if h � 0
Proof: Assume the numerically closest nodeId alwaysshares some prefix with the message key. When themessage key is within ,��� nodes from the boundaryof the subdomain sharing the same prefix of K dig-its, the number of nodes in the subdomain whose leaf-sets cover # drops to min MQP D N ,��� P � min MQP,S N ,��� P , andthus the probability that ��� will be taken next ismin ��� � D I � � � min � � � D I � �
��� � � � . In the very first hop, the pre-fix is of zero length, thus there is no bundary effect.
Since the numerically closest nodeId to message #may not share any leading digits with the key, the aboveprobability fails to account for one additional routing hopin such cases. Since this case is rare in practice, it has vir-tually no effect on the above probability.
Lemma 2 Assume branch ��� has been taken during thefirst K hops in routing a random message # , i.e. the mes-sage # is at a node � which shares the first K digits with# . Let $ be the total number of random uniformly dis-tributed nodeIds that share the first K digits with # . Theprobabilities in taking different branches at the M�K � � P thhop is
� � -+��)��0/ ��*
%&&&&'(*),+.- � -+��)��0/9�01�2 �(*),+.- � -+��)��0/9�01 32 �(*),+.- � -+��)��0/9�01�5#�(*),+.- � -+��)��0/9�01435 �(*),+.- � -+��)��0/9�01�6(�
798888: *
�<;�� �=2<>@?
A=B�� >@?- � E � F /9�IH�GJ � K
A � B��=B >@?- � E F / %LE � � �
�GJ>% H ��K (*),+.- ( / -NM � E �OE � �0/ %LE � %LE �S-+��) �Proof: There are ��� subdomains of nodeIds that share thefirst K digits as # but differ in the M�K � � P th digit. Withequal probabilities, # and � can fall into any of these��� subdomains. Within each subdomain, the number ofnodes P � follows the binomial distribution, i.e. with prob-ability MQP � ��$ N �
�'& P , P � nodes can end up in each subdo-main. Depending on which subdomain # falls into, there
16
can be between � and up to ��� � �subdomains to the left
of # ’s subdomain. If there are � subdomains to the left of# ’s subdomain, the number of nodeIds P in those subdo-mains follows binomial distribution MQP@� ( � P � N R
�'& G � P .Each iteration in the innermost summation corre-
sponds to a particular distribution of P D ,P.R , and P,S , thenumber of nodeIds to the left of, within the same as,to the right of # ’s subdomain. In the formula above,these values are P N P � , and $ � P � � P . The vector func-tion ���"� � � MQP D N P.R N P,S N K N �P takes such a distribution,and assumes equal probability that � can be any of theP D � P.R�� P,S nodeIds and # can be anywhere in the namespace spanned by these nodeIds, and calculates the prob-abilities that node � will forward message # using �W� ,���� , ��� , ���� , or ��� , respectively.
Function ���"� � � MQP D N P.R N P,S N K N �P is calculated as fol-lows. If PGR � , # ’s subdomain is empty, the nextrouting hop takes either ��� or ��� . The probabilityof ��� is ���"� � MQP D N P,S N K N �P , and that of ��� is
� ����"� � MQP D N P,S N K N �P . Since we assume uniform distribu-tion of MQP D � P,S P in the subdomain of the namespace, theprobability of � �� , i.e. � is numerically closest to # , is� �?MQP D � P,S P . If P.R � � , # ’s subdomain is not empty, thenext routing hop takes either ��� or ��� , and the probabil-ity of ���� is
� �?MQP D � P.R � P,S P . Since there are PGR nodeIdsthat share the first M�K � � P digits with # , there can beMQP.R � � P intervals in # ’s subdomain that # can fall inwith equal probability. For each interval, probabilities of��� and ��� are caculated before. Furthermore, if ��� isnot taken and ��� is taken, there is a certain probabilitythat � is among the PGR nodes that already shares the nextdigit with # , in which case the next hop is skipped. Thisprobability contributes to ���� . The probability equals thenumber of nodeIds among the P R nodes that are not within ,��� from # , over the MQP D �P.R �P,S P possible candidatesof � .
Lemma 3 Let ( be the total number of random uni-formly distributed nodeIds. Row 0 of the route prob-ability matrix, i.e. the probabilities in taking differ-ent branches at the first hop in routing a random mes-sage from a random starting nodeId, is
� MO� N N ( P � MO� N N ( P .To calculate the probabilities at subsequent hops, note
that value P - gives the number of nodeIds that share thefirst digit with message # , and the probabilities at thesecond hop is conditioned on the P - value. One way of
calculating them is thus to repeat the above case analysisrecursively using P - at the second hop, P � at the third hop,etc. The following theorem gives the probabilities at theM�K�� � P th hop.
Theorem 1 Let N be the total number of random uni-formly distributed nodeIds. Row K of the route prob-ability matrix, i.e. the probabilities in taking differentbranches at the M�K � � P th hop in routing a random mes-sage # starting from a random nodeId, is
� � -+��)���� � *
%&&&&'(*),+.- � -+��)���� �01�2 �(*),+.- � -+��)���� �01432 �(*),+.- � -+��)���� �01�5#�(*),+.- � -+��)���� �01435 �(*),+.- � -+��)���� �01�6(�
798888: *,� J �=BDC >@?
- � E ?GF � � H�GJ � K
� J BDC=B�� >@?- � E � F E ? �IH�GJ � K � � �.K�� J
B���� �=B���� � >@?- � E � � � F E � �?� �IH�GJ � K � � -+��)��OE � � � �
Theorem 2 Let the expected number of additional hopsafter first time taking ��� at the K th hop be denoted as� � M�K N N ( N ��� P . The expected number of routing hopsin routing a message with random key # starting from anode randomly chosen from the ( nodes is
� ��!S� J � �=� >@?
(*),+.- � -+��)���� �01�2 �#% (*),+.- � -+��)���� �01 32 � �(*),+.- � -+��)���� �01�5#�#% (*),+.- � -+��)���� �01 35 � �(*),+.- � -+��)���� �01�6(� � �����(� -+��)���� �01�6�� K (*),+.- � -+��)���� �01�6(�
Proof: The sum ���"� M�K N N ( N ����P��L���"� M�K N N ( N ��� P�����"� M�K N N ( N ��� P is the probability that the routing takesthe M�K � � P th hop, and out of ���"� M�K N N ( N ��� P , withprobability ���"� M�K N N ( N � �� P , the routing skips futurehops by one, and out of ���"� M�K N N ( N ����P , with proba-bility ���"� M�K N N ( N � �� P , the routing skips the ��� hop atthe M�K.� � P th hop. If the intermediate node after takingK hops shares additional digits other than the M�K � � P thdigit, the additional skipped hops will be accounted forby ���"� M�K � � N N ( N ���� P , ���"� M�K � � N N ( N ���� P , etc.
Lemma 4 Assume that branch ��� was taken duringthe first K hops in routing a message with key # ,branch ��� is taken in the M�K � � P th hop, and thereare T nodeIds sharing the first M�K � � P digits as mes-sage # . The probability that the routing finishes inthe next hop is ���"� � M�T N �P % D I �
� + � MQP@� T N �
�'& P �% '� + D I � � � MQP@� T N �
�'& P # D I �
� .
17
Proof: Let the node reached after taking branch �I� forthe first time be node � . Recall � is selected from F � Bthat is numerically closest to # whose nodeId also sharesthe first K digits with # . Let
0��be the set of nodeIds in
� ’s subdomain, i.e. sharing the first M�K.� � P digits with� . The routing finishes in one step after � if
�0���� ,��� . The probability is % D I �
� + � MQP@� T N �
�'& P . Or,
�0�� � ,��� , and the ��� hop reached one of the right-most ,��� nodes in
0��. The probability of
0�� � ,���is % '� + D I � � � MQP@� T N �
�'& P . The probability of later isD I �
�� , because under random uniform distribution, theprobability of any of the rightmost ,��� nodes in
0�shows up as any node’s routing table entry is
D I �
� .
The distribution of ���"� M�K N N ( N ��� P shows that itsvalue only becomes not insignificant when K+ #"%$ �'& ( ,when the value T above follows binomial distribution M�T�� ( N�� ����� � P . In such cases, ���"� � M�T N �P � � � � ��� .Thus, for non-insignificant values of ���"� M�K N N ( N �W� P ,with very high probability, the routing takes one extrahop after taking ��� , i.e.
� � M�K N N ( N ��� P � �.
A.2 Local route convergence
Theorem 3 Let� �
and� � be the two starting nodes
on a sphere of radius B from which messages with anidentical, random key are being routed. Let the distancebetween
� �and
� � be �*� . Then the expected distancethat the two messages will travel before their paths mergeis
� ��� ����� ��13��*� ��� � ; �=B >@?
"�� B�" >@? � H %
(*),+.- - +<( �;�S����� ��13�.�.- +<( � ��� � E ��13�where ���"� K "9 MQP N �*� N B P �
� ��� R C���� ��� )�� � R ��� )������������� �!"� ��� R C���� ��� )�� � )�� ,�0P �*� � �$#&%('�)*�',+.- K "9 � E�J���MQP N B P in the worst case,
or �0P �*� in the average case, or �0P � ��� MO� N �*� ��/#*%('�)*�',+.- K "9 � E�J���MQP N B P5P in the best case, respectively,0 M � N � N B P denotes the intersecting area of two circles ofradius � centered at two points on a sphere of radius Bthat are a distance of �21 � � apart, and
0��3 S�4,59R�6 M � N B P
denotes the surface area of a circle of radius � on asphere of radius B .
Proof: Without loss of generality, we assume the twostarting nodes are on the equator of the sphere. Theexpected distance of the first hop traveled in Pas-try routing is K "9 � E�J���MO� N B P . If we draw two cir-cles around the two starting nodes with radius ofK "9 � E�J���MO� N B P , the intersecting area of the two cir-cles will be
0 M�K "9 � E�J���MO� N B P N � N B P . Thus the prob-ability that, after the first hop, the two paths con-verge into the same node is ���"� K "9 MO� N �*� N B P 0 M�K "9 � E�J���MO� N B P N �*� N B P'� 0 ��3 S�4,59R�6 M�K "9 � E�J���MO� N B P N B P .
If the two paths did not converge after the first hop, inthe worst case, the two messages move in opposite di-rections, and the distance between the two nodes reachedby the two messages is � � �*� � �0K "9 � E�J���MO� N B P ; inthe best case, � � � ��� MO� N �*� � �0K "9 � E�J���MO� N B P5P ; andsince with equal probability the hop may move in all di-rections, � � �*� in the average case.
Since the expected distance of the second hop trav-eled in Pastry routing is K "9 � E�J���M � N B P , the prob-ability that after second hop, the two paths con-verge into the same node is ���"� K "9 M � N �*� N B P 0 M�K "9 � E�J���M � N B P N � � N B P'� 0 ��3 S�4,59R�6 M�K "9 � E�J���M � N B P N B P .
The analysis for subsequent hops is analogous.
18