Serial Analysis of Gene Expression (SAGE) in the Skeletal Muscle of Pig
14
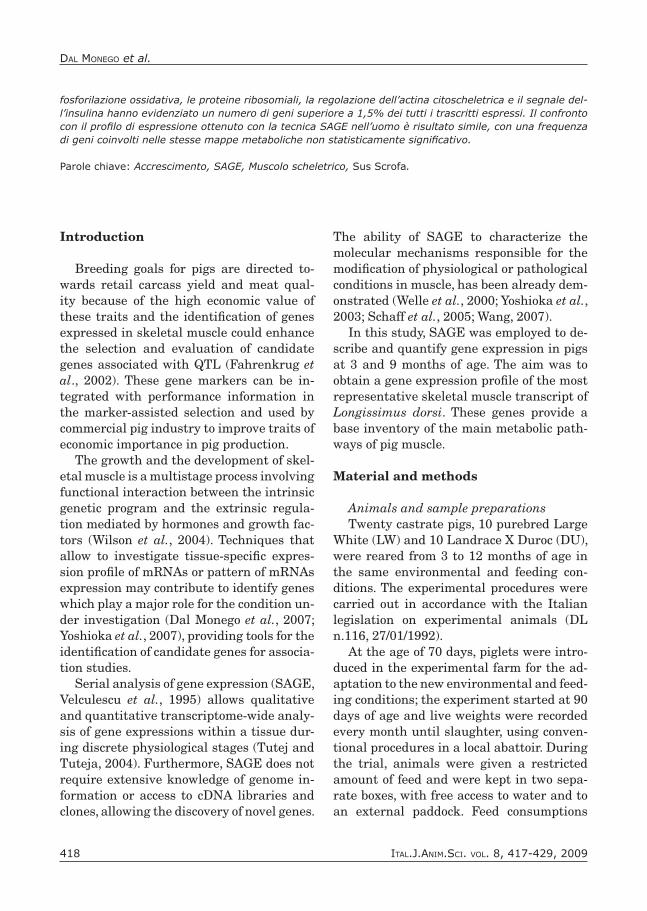
Serial Analysis of Gene Expression (SAGE) in the Skeletal Muscle of Pig Simeone Dal Monego 1 , Alberto Pallavicini 1 , Giorgio Graziosi 1 , Bruno Stefanon 2 1 Dipartimento di Biologia. Università di Trieste, Italy 2 Dipartimento di Scienze Animali. Università di Udine, Italy. Corresponding author: Prof. Bruno Stefanon. Dipartimento di Scienze Animali. Università degli Studi di Udine. Via delle Scienze 208, 33100 Udine, Italy - Tel. +39 0432 558581 - Fax: +39 0432 558585 - Email: [email protected] Received October 26, 2008; accepted January 21, 2009 ABSTRACT Skeletal muscle growth represents one of the main economic traits in pig production. To gain a better un- derstanding of expressions profile in pig muscle, serial analysis of gene expression (SAGE) was performed in Longissimus dorsi of two pigs at 3 and 9 months of age. A total of 53,120 long tags were obtained and sequenced from the four muscle SAGE libraries, representing 17,902 different tags, or putative transcrip- ts, 0.64% (+0.09) of which had a relative expression level higher than 1‰. Overall, a total of 218 tags were highly expressed and 31 had a frequency higher than 3‰. Functional characterisation of the expression profiles was performed using Kyoto Encyclopedia of Genes and Genomes metabolic maps and 139 pathways were identified for swine skeletal muscle. Focal adhesion, Mitogen-Activated Protein Kinase signalling, oxidative phosphorylation, ribosomal proteins, regulation of actin cytoskeleton and insulin signalling pathways showed an abundance of genes greater than 1.5% of all the expressed transcripts. A comparison with human SAGE library indicated no statistical differences for the frequency of genes involved in these metabolic pathways. Key words: Growth, SAGE, Skeletal muscle, Sus Scrofa. RIASSUNTO ANAlISI SERIAlE dEll’ESPRESSIONE GENIcA (SAGE) NEl MUScOlO SchElETRIcO dI SUINO L’accrescimento muscolare costituisce uno dei principali aspetti economici della produzione del suino. Al fine di aumentare la conoscenza del profilo di espressione genica nel suino, è stata applicata la tecnica SAGE (Serial Analysis of Gene Expression) a campioni bioptici di Longissimus dorsi ottenuti da 2 suini a 3 e a 9 mesi di età. Dalle 4 librerie SAGE, sono stati ottenuti e sequenziati 53120 tags complessivamente, corrispondenti a 17902 tags differenti, o trascritti putativi, di cui 0,64% (+0,09) con un livello relativo di espressione superiore a 1‰. I tags altamente espressi sono risultati pari a 218, di cui 31 presentano una frequenza superiore al 3‰. La caratterizzazione funzionale dei profilo di espressione è stata condotta utilizzando le mappe metaboli- che della Kyoto Encyclopedia of Genes and Genomes (KEGG) e i trascritti hanno interessato 139 cammini di muscolo scheletrico del suino. L’adesione focale, il segnale delle protein-chinasi attivate da mitogeni, la ITAL.J.ANIM.SCI. VOL. 8, 417-429, 2009 417
-
Upload
independent -
Category
Documents
-
view
0 -
download
0
Transcript of Serial Analysis of Gene Expression (SAGE) in the Skeletal Muscle of Pig
Serial Analysis of Gene Expression (SAGE)
in the Skeletal Muscle of Pig
Simeone Dal Monego1, Alberto Pallavicini1, Giorgio Graziosi1, Bruno Stefanon2
1Dipartimento di Biologia. Università di Trieste, Italy2Dipartimento di Scienze Animali. Università di Udine, Italy.
Corresponding author: Prof. Bruno Stefanon. Dipartimento di Scienze Animali. Università degli Studi di Udine. Via delle Scienze 208, 33100 Udine, Italy - Tel. +39 0432 558581 - Fax: +39 0432 558585 - Email: [email protected]
Received October 26, 2008; accepted January 21, 2009
ABSTRACT
Skeletal muscle growth represents one of the main economic traits in pig production. To gain a better un-derstanding of expressions profile in pig muscle, serial analysis of gene expression (SAGE) was performed in Longissimus dorsi of two pigs at 3 and 9 months of age. A total of 53,120 long tags were obtained and sequenced from the four muscle SAGE libraries, representing 17,902 different tags, or putative transcrip-ts, 0.64% (+0.09) of which had a relative expression level higher than 1‰. Overall, a total of 218 tags were highly expressed and 31 had a frequency higher than 3‰.Functional characterisation of the expression profiles was performed using Kyoto Encyclopedia of Genes and Genomes metabolic maps and 139 pathways were identified for swine skeletal muscle. Focal adhesion, Mitogen-Activated Protein Kinase signalling, oxidative phosphorylation, ribosomal proteins, regulation of actin cytoskeleton and insulin signalling pathways showed an abundance of genes greater than 1.5% of all the expressed transcripts. A comparison with human SAGE library indicated no statistical differences for the frequency of genes involved in these metabolic pathways.
Key words: Growth, SAGE, Skeletal muscle, Sus Scrofa.
RIASSUNTO
ANAlISI SERIAlE dEll’ESPRESSIONE GENIcA (SAGE) NEl MUScOlO SchElETRIcO dI SUINO
L’accrescimento muscolare costituisce uno dei principali aspetti economici della produzione del suino. Al fine di aumentare la conoscenza del profilo di espressione genica nel suino, è stata applicata la tecnica SAGE (Serial Analysis of Gene Expression) a campioni bioptici di Longissimus dorsi ottenuti da 2 suini a 3 e a 9 mesi di età. Dalle 4 librerie SAGE, sono stati ottenuti e sequenziati 53120 tags complessivamente, corrispondenti a 17902 tags differenti, o trascritti putativi, di cui 0,64% (+0,09) con un livello relativo di espressione superiore a 1‰. I tags altamente espressi sono risultati pari a 218, di cui 31 presentano una frequenza superiore al 3‰.La caratterizzazione funzionale dei profilo di espressione è stata condotta utilizzando le mappe metaboli-che della Kyoto Encyclopedia of Genes and Genomes (KEGG) e i trascritti hanno interessato 139 cammini di muscolo scheletrico del suino. L’adesione focale, il segnale delle protein-chinasi attivate da mitogeni, la
Ital.J.anIm.ScI. vol. 8, 417-429, 2009 417
08_STEFANON.indd 417 23-09-2009 11:36:38
Ital.J.anIm.ScI. vol. 8, 417-429, 2009418
Dal monego et al.
fosforilazione ossidativa, le proteine ribosomiali, la regolazione dell’actina citoscheletrica e il segnale del-l’insulina hanno evidenziato un numero di geni superiore a 1,5% dei tutti i trascritti espressi. Il confronto con il profilo di espressione ottenuto con la tecnica SAGE nell’uomo è risultato simile, con una frequenza di geni coinvolti nelle stesse mappe metaboliche non statisticamente significativo.
Parole chiave: Accrescimento, SAGE, Muscolo scheletrico, Sus Scrofa.
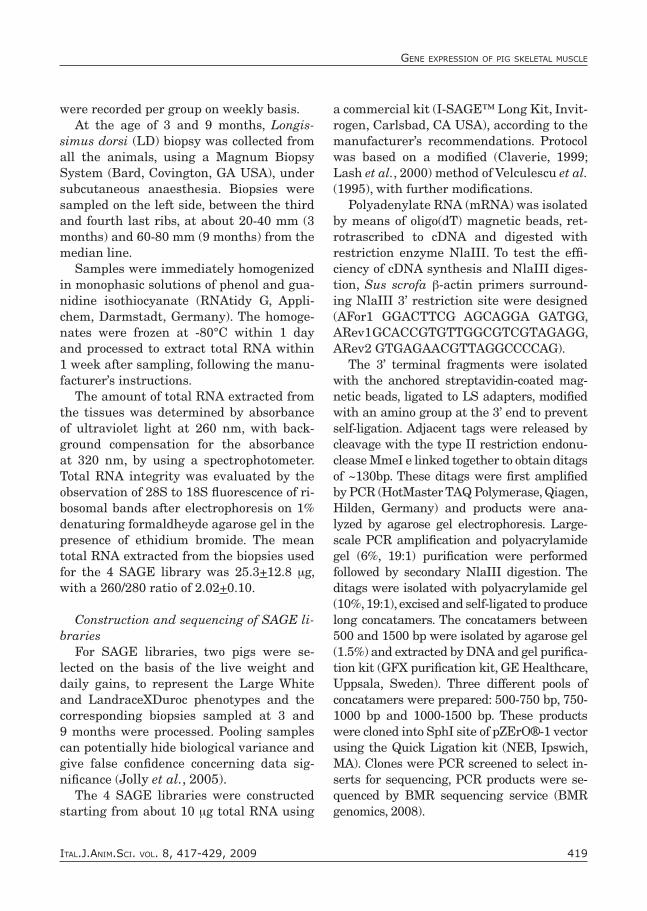
Introduction
Breeding goals for pigs are directed to-wards retail carcass yield and meat qual-ity because of the high economic value of these traits and the identification of genes expressed in skeletal muscle could enhance the selection and evaluation of candidate genes associated with QTL (Fahrenkrug et al., 2002). These gene markers can be in-tegrated with performance information in the marker-assisted selection and used by commercial pig industry to improve traits of economic importance in pig production.
The growth and the development of skel-etal muscle is a multistage process involving functional interaction between the intrinsic genetic program and the extrinsic regula-tion mediated by hormones and growth fac-tors (Wilson et al., 2004). Techniques that allow to investigate tissue-specific expres-sion profile of mRNAs or pattern of mRNAs expression may contribute to identify genes which play a major role for the condition un-der investigation (Dal Monego et al., 2007; Yoshioka et al., 2007), providing tools for the identification of candidate genes for associa-tion studies.
Serial analysis of gene expression (SAGE, Velculescu et al., 1995) allows qualitative and quantitative transcriptome-wide analy-sis of gene expressions within a tissue dur-ing discrete physiological stages (Tutej and Tuteja, 2004). Furthermore, SAGE does not require extensive knowledge of genome in-formation or access to cDNA libraries and clones, allowing the discovery of novel genes.
The ability of SAGE to characterize the molecular mechanisms responsible for the modification of physiological or pathological conditions in muscle, has been already dem-onstrated (Welle et al., 2000; Yoshioka et al., 2003; Schaff et al., 2005; Wang, 2007).
In this study, SAGE was employed to de-scribe and quantify gene expression in pigs at 3 and 9 months of age. The aim was to obtain a gene expression profile of the most representative skeletal muscle transcript of Longissimus dorsi. These genes provide a base inventory of the main metabolic path-ways of pig muscle.
Material and methods
Animals and sample preparationsTwenty castrate pigs, 10 purebred Large
White (LW) and 10 Landrace X Duroc (DU), were reared from 3 to 12 months of age in the same environmental and feeding con-ditions. The experimental procedures were carried out in accordance with the Italian legislation on experimental animals (DL n.116, 27/01/1992).
At the age of 70 days, piglets were intro-duced in the experimental farm for the ad-aptation to the new environmental and feed-ing conditions; the experiment started at 90 days of age and live weights were recorded every month until slaughter, using conven-tional procedures in a local abattoir. During the trial, animals were given a restricted amount of feed and were kept in two sepa-rate boxes, with free access to water and to an external paddock. Feed consumptions
08_STEFANON.indd 418 23-09-2009 11:36:38
Ital.J.anIm.ScI. vol. 8, 417-429, 2009 419
gene expreSSIon of pIg Skeletal muScle
were recorded per group on weekly basis.At the age of 3 and 9 months, Longis-
simus dorsi (LD) biopsy was collected from all the animals, using a Magnum Biopsy System (Bard, Covington, GA USA), under subcutaneous anaesthesia. Biopsies were sampled on the left side, between the third and fourth last ribs, at about 20-40 mm (3 months) and 60-80 mm (9 months) from the median line.
Samples were immediately homogenized in monophasic solutions of phenol and gua-nidine isothiocyanate (RNAtidy G, Appli-chem, Darmstadt, Germany). The homoge-nates were frozen at -80°C within 1 day and processed to extract total RNA within 1 week after sampling, following the manu-facturer’s instructions.
The amount of total RNA extracted from the tissues was determined by absorbance of ultraviolet light at 260 nm, with back-ground compensation for the absorbance at 320 nm, by using a spectrophotometer. Total RNA integrity was evaluated by the observation of 28S to 18S fluorescence of ri-bosomal bands after electrophoresis on 1% denaturing formaldheyde agarose gel in the presence of ethidium bromide. The mean total RNA extracted from the biopsies used for the 4 SAGE library was 25.3+12.8 µg, with a 260/280 ratio of 2.02+0.10.
Construction and sequencing of SAGE li-braries
For SAGE libraries, two pigs were se-lected on the basis of the live weight and daily gains, to represent the Large White and LandraceXDuroc phenotypes and the corresponding biopsies sampled at 3 and 9 months were processed. Pooling samples can potentially hide biological variance and give false confidence concerning data sig-nificance (Jolly et al., 2005).
The 4 SAGE libraries were constructed starting from about 10 µg total RNA using
a commercial kit (I-SAGE™ Long Kit, Invit-rogen, Carlsbad, CA USA), according to the manufacturer’s recommendations. Protocol was based on a modified (Claverie, 1999; Lash et al., 2000) method of Velculescu et al. (1995), with further modifications.
Polyadenylate RNA (mRNA) was isolated by means of oligo(dT) magnetic beads, ret-rotrascribed to cDNA and digested with restriction enzyme NlaIII. To test the effi-ciency of cDNA synthesis and NlaIII diges-tion, Sus scrofa β-actin primers surround-ing NlaIII 3’ restriction site were designed (AFor1 GGACTTCG AGCAGGA GATGG, ARev1 GCACCGTGTTGGCGTCGTAGAGG, ARev2 GTGAGAACGTTAGGCCCCAG).
The 3’ terminal fragments were isolated with the anchored streptavidin-coated mag-netic beads, ligated to LS adapters, modified with an amino group at the 3’ end to prevent self-ligation. Adjacent tags were released by cleavage with the type II restriction endonu-clease MmeI e linked together to obtain ditags of ~130bp. These ditags were first amplified by PCR (HotMaster TAQ Polymerase, Qiagen, Hilden, Germany) and products were ana-lyzed by agarose gel electrophoresis. Large-scale PCR amplification and polyacrylamide gel (6%, 19:1) purification were performed followed by secondary NlaIII digestion. The ditags were isolated with polyacrylamide gel (10%, 19:1), excised and self-ligated to produce long concatamers. The concatamers between 500 and 1500 bp were isolated by agarose gel (1.5%) and extracted by DNA and gel purifica-tion kit (GFX purification kit, GE Healthcare, Uppsala, Sweden). Three different pools of concatamers were prepared: 500-750 bp, 750-1000 bp and 1000-1500 bp. These products were cloned into SphI site of pZErO®-1 vector using the Quick Ligation kit (NEB, Ipswich, MA). Clones were PCR screened to select in-serts for sequencing, PCR products were se-quenced by BMR sequencing service (BMR genomics, 2008).
08_STEFANON.indd 419 23-09-2009 11:36:39

Ital.J.anIm.ScI. vol. 8, 417-429, 2009420
Dal monego et al.
The entire SAGE dataset was submitted to the GEO repository (Gene Expression Omnibus, 2008), and have been assigned GEO series accession number GSE6062.
Bionformatic analysis of SAGE taq se-quences
The sequence and occurrence of each of the transcript tags were determined using the software SAGEparser, a Perl program, developed by Dinel et al. (2005). This soft-ware is freely available on the net for use in research. Taq annotations and Sus scrofa - Homo sapiens correlations were investigat-ed by means of several in-house Perl scripts (BioPerl, 2007).
Annotation of SAGE tag via NCBI tables
The flow chart of annotation process is reported in Figure 1. In the first attempt, the annotation of the transcripts was car-ried out by matching the 17 bp SAGE tags with a public database (Gene Expres-sion Omnibus, 2008). Sus scrofa files from SAGEmap (SAGEmap_tag_ug-full.zip, release of 2007-03-01) and from UniGene (Ssc.data.gz, Ssc.seq.all.gz and Ssc.seq.uniq.gz; build 28, 2007-03-01) were down-loaded. These databases were merged in or-der to construct a local database (MySQL, 2007) containing all information necessary for the annotations. Using this tool, all 17 bp tags were linked to a UniGene cluster. This process resulted in tags either asso-ciated with unique, multiple or not associ-
Figure 1. A flow chart illustrating the annotation process of SAGE tags to Sus Scrofa Unigene clusters and the following link to homo sapiens UniGene cluster.
08_STEFANON.indd 420 23-09-2009 11:36:40
Ital.J.anIm.ScI. vol. 8, 417-429, 2009 421
gene expreSSIon of pIg Skeletal muScle
ated with any UniGene cluster.Annotation of SAGE tag via sequence
similarity To have a better annotation, avoiding re-
dundancy of association between SAGE tags and UniGene clusters and to better identify tags that matched UniGene clusters, a sec-ond approach was performed. The NlaIII recognition sequence “CATG” was appended to the 5’ end of each SAGE tag to yield a 21 bp tag for database comparison. A local Blast was performed against the total set of Sus scrofa UniGene sequences (Blastn pa-rameters: -e 1000; -W 7 -F F). Only sequenc-es with a fully perfect 21 bp matches were considered for subsequent analysis. Since the sequence hits repetitively pointed to different UniGene clusters, the cluster hit by the most abundant number of ESTs was selected as reference.
Linking Sus scrofa to Homo sapiens Uni-Gene cluster
Each Sus scrofa UniGene sequence was launched in a TBlastx session Vs the full Homo sapiens UniGene dataset (Hs.seq.all.gz, build 196, 2007-02-28), masked for re-peated sequences. If a discrepancy among the annotation of linked human and swine cluster was observed, a manual verification was performed. Final annotation was used for Gene Ontology studies.
Comparing human and pig skeletal mus-cle SAGE tag profiles
Data from the inventory of SAGE tags from young and old human skeletal muscle (Welle et al., 2000) were downloaded from GEO (GSM819 and GSM824). The two tag sequence data, each consisting of about 53000 tags, were linked to Homo sapiens UniGene clusters with the NCI table. The swine and human data both pointed to a sin-gle human reference index, allowing a com-parative functional characterisation of the
expression profiles. All tags were merged by organism and KEGG pathways comparative analysis was carried out using the Fatigo+ web tool of Babelomics suite (Al-Shahrour et al., 2006).
Significant differentially expressed genes between 3 and 9 months were identified by analysing SAGE libraries using the IDEG6 software, a web tool for detection of differen-tially expressed genes, with Bonferroni cor-rection and a significance Chi square level of 0.05 (Romualdi et al., 2003).
Results
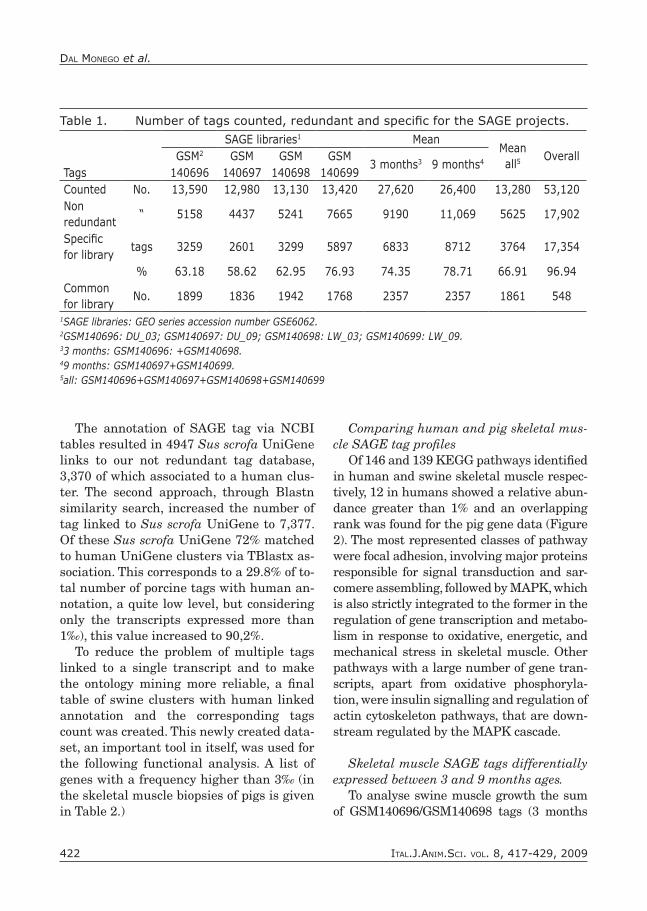
SAGE resultsA total of 53120 long tags were obtained
and sequenced from the 4 muscle SAGE li-braries, 13590 tags for DU_03 (GSM140696), 12980 for DU_09 (GSM140697), 13130 for LW_03 (GSM140698) and 13420 for LW_09 (GSM140699) (Table 1). Combining to-gether, the 4 libraries represented 17902 different tags, or putative transcripts, and 5158, 4437, 5241 and 7665 putative tran-script unique for GSM140696, GSM140697, GSM140698 and GSM140699, respectively. Considering the skeletal muscle growth, an high percentage of tags were specific for 3 and 9 months (74.35 and 78.71%, respec-tively) and 11.64% of the non redundant tags were common.
The relative tags frequencies obtained via SAGE reflected the expression level of the transcripts represented by those tags. The rate of occurrence of unique tags revealed that 0.64% (+0.09) of the transcripts have a relative expression level of more than 1‰.
The SAGEmap NCBI database reposi-tory contains an outdated table and several mismatches were found in the annotation fields. For this reason and for better min-ing of data for ontology and physiology, the porcine SAGE tags were linked directly to human UniGene clusters.
08_STEFANON.indd 421 23-09-2009 11:36:40
Ital.J.anIm.ScI. vol. 8, 417-429, 2009422
Dal monego et al.
The annotation of SAGE tag via NCBI tables resulted in 4947 Sus scrofa UniGene links to our not redundant tag database, 3,370 of which associated to a human clus-ter. The second approach, through Blastn similarity search, increased the number of tag linked to Sus scrofa UniGene to 7,377. Of these Sus scrofa UniGene 72% matched to human UniGene clusters via TBlastx as-sociation. This corresponds to a 29.8% of to-tal number of porcine tags with human an-notation, a quite low level, but considering only the transcripts expressed more than 1‰), this value increased to 90,2%.
To reduce the problem of multiple tags linked to a single transcript and to make the ontology mining more reliable, a final table of swine clusters with human linked annotation and the corresponding tags count was created. This newly created data-set, an important tool in itself, was used for the following functional analysis. A list of genes with a frequency higher than 3‰ (in the skeletal muscle biopsies of pigs is given in Table 2.)
Comparing human and pig skeletal mus-cle SAGE tag profiles
Of 146 and 139 KEGG pathways identified in human and swine skeletal muscle respec-tively, 12 in humans showed a relative abun-dance greater than 1% and an overlapping rank was found for the pig gene data (Figure 2). The most represented classes of pathway were focal adhesion, involving major proteins responsible for signal transduction and sar-comere assembling, followed by MAPK, which is also strictly integrated to the former in the regulation of gene transcription and metabo-lism in response to oxidative, energetic, and mechanical stress in skeletal muscle. Other pathways with a large number of gene tran-scripts, apart from oxidative phosphoryla-tion, were insulin signalling and regulation of actin cytoskeleton pathways, that are down-stream regulated by the MAPK cascade.
Skeletal muscle SAGE tags differentially expressed between 3 and 9 months ages.
To analyse swine muscle growth the sum of GSM140696/GSM140698 tags (3 months
Table 1. Number of tags counted, redundant and specific for the SAGE projects.
SAGE libraries1 MeanMeanall5
OverallGSM2 GSM GSM GSM3 months3 9 months4
Tags 140696 140697 140698 140699Counted No. 13,590 12,980 13,130 13,420 27,620 26,400 13,280 53,120Non redundant
“ 5158 4437 5241 7665 9190 11,069 5625 17,902
Specific for library
tags 3259 2601 3299 5897 6833 8712 3764 17,354
% 63.18 58.62 62.95 76.93 74.35 78.71 66.91 96.94Common for library
No. 1899 1836 1942 1768 2357 2357 1861 548
1SAGE libraries: GEO series accession number GSE6062.2GSM140696: DU_03; GSM140697: DU_09; GSM140698: LW_03; GSM140699: LW_09.33 months: GSM140696: +GSM140698.49 months: GSM140697+GSM140699.5all: GSM140696+GSM140697+GSM140698+GSM140699
08_STEFANON.indd 422 23-09-2009 11:36:40

Ital.J.anIm.ScI. vol. 8, 417-429, 2009 423
gene expreSSIon of pIg Skeletal muScle
old) and of GSM140697/GSM140699 tags (9 months old) were considered. To have a deeper insight into the genes differentially expressed during the two ages, statistical evaluation and functional analysis was performed.
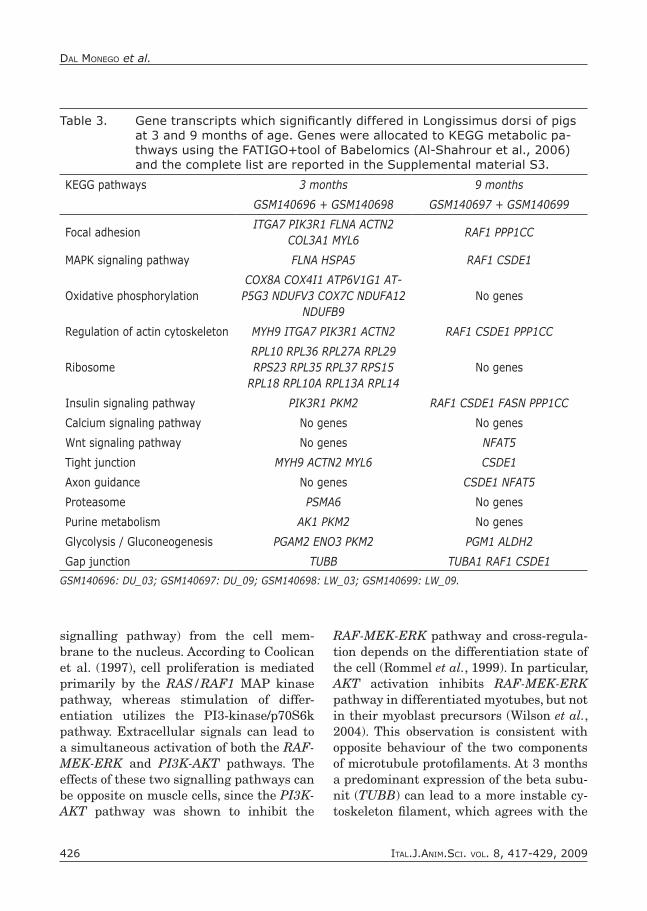
The comparison of transcripts abundance between 3 and 9 months was performed with IDEG6 using the chi square test (Romualdi et al., 2003). A set of 190 differentially ex-pressed genes (47 without annotation) with a P value lower than 0.05 was iden-tified, 114 of which featured the 3 months. The functional analysis described for the human-swine comparison was applied to classify the age-specific genes to the KEGG pathway (Table 3).
Discussion
The number of unique putative tran-scripts accounted for 5158, 4437, 5241
and 7665 for GSM140696, GSM140697, GSM140698 and GSM140699, respectively (Table 1). The putative transcripts common to the four SAGE projects were 548. A lim-ited number of common tags between SAGE projects and a large number of tags with very low abundance in muscle samples were also reported by Welle et al. (2000), compar-ing young and old muscle in man in a da-tabase cataloguing more than 100,000 tags. Moreover, the limited number of transcripts sequenced can have also contributed to the reduced number of common tags between the 4 libraries.
The almost complete overlapping of KEGG pathways between human and swine skeletal muscle transcriptomes (Figure 2) in-dicates that the number of tags sequenced in the present study can represent, at least, the more abundant transcripts in this tissue.
Bortoluzzi and Danieli (1999) described
0.0
0.5
1.0
1.5
2.0
2.5
3.0
Foca
l adh
esion
MAPK
signa
ling pa
thway
Oxida
tive ph
osph
orylation
Regu
latio
n of actin cytos
keleto
n
Ribo
some
Insu
lin signa
ling pa
thway
Calci
um signa
ling pa
thway
Wnt
signa
ling pa
thway
Tigh
t jun
ction
Axon
guida
nce
Prot
easo
me
Purin
e metab
olism
Man
Pig
Figure 2. Frequency (%) of genes involved in the KEGG pathways in pig and man based on present SAGE libraries for pigs and published library for human (GSM819/GSM824).
Graphs report the list for the 15 more represented pathways.Pig: 146 KEGG pathways and 2213 genes with annotation.Human: 139 KEGG pathways and 1619 genes with annotation.
08_STEFANON.indd 423 23-09-2009 11:36:41

Ital.J.anIm.ScI. vol. 8, 417-429, 2009424
Dal monego et al.
Table 2. The most abundant tags (>3‰ of total tags) in Longissimus dorsi mu-scle of pig and the corresponding annotation to human UniGene clusters (SAGE libraries in the GEO series accession number GSE6062).
Transcript Homo sapiens Tag frequency
TAG Cluster Name All tagsGSM GSM GSM GSM
140696 140697 140698 140699
CTTTTCTCCACTCAAAG 334347 cKM 35.8 41.7 34.3 44.3 22.9
GAGGCCGTGGCCGCCCA 632642 PGAM2 29.3 41.1 31.7 29.5 14.7
TACCATCAATAAAGTAC 534770 PKM2 23.6 13.9 26.0 37.9 17.2
CCTACTAAGCGGGGAGG 513490 AldOA 22.9 24.6 31.6 20.6 15.1
TGGGCAGCCTTCCCTCC 50889 MYLPF 22.9 27.9 30.4 21.1 12.1
TGGGCAGCCTTCCCCCC 50889 MYLPF 22.2 27.0 28.4 22.2 11.4
AGGATTGAGGAGGCTCT 224171 ENO3 11.3 13.0 12.8 12.0 7.6
GACGGCTACATCGATGC 182421 TNNC2 10.5 11.4 15.7 7.5 7.5
CCCATTGTACTTGAACT Mitochond.l cOX2 9.7 5.7 12.1 11.3 9.6
AAGATCAAGATCATCGC 1288 ACTA1 9.7 5.7 9.2 16.5 7.4
GGGCTTGCAGGGACAAG 2795 ldhA 8.8 7.8 14.2 7.8 5.4
GAGGGCCGCAAGAAGAT 523403 TNNI2 8.5 6.8 12.2 9.9 5.2
AACGTCCGGGCCAGAGT 73454 TNNT3 8.3 6.4 15.1 6.3 5.7
ACCACTTACCGGAGCCC Mitochond.l cOX3 6.8 2.4 11.4 8.4 5.1
ACTTCAACCCGGATGTG 523443 hBB 6.2 17.3 2.6 1.8 2.8
TGATGTCAAGGAAATAA 499745 MYh2 5.9 1.2 7.8 9.5 5.3
GCGCCCTACAAGGGGGC 445037 ACTN3 5.6 6.7 8.0 4.6 3.2
GACAGCCGAACACTAAA 175473 AK1 5.6 6.8 6.5 5.8 3.2
TGAATAAAGTTGTCAAC 334629 SLN 5.5 4.9 5.8 6.5 5.0
ACTAACTGTCCAAATCT 187338 MYL1 5.1 3.5 6.5 6.7 3.7
AGAGCCTTGGCGGCGGC 534404 RPL10 5.0 8.3 4.6 4.0 3.1
TTCAAATAAACAGGAGG 247831 MYLC2PL 4.1 3.8 1.7 8.0 3.1
CAGGTTTAAGTTCGATT 134602 TTN 4.1 1.5 3.9 7.7 3.4
AATTGGAGGACAACCCG Mitochond.l CYTB 3.9 1.9 6.2 4.9 2.8
GGCGCCAACTACAGCAG 73454 TNNT3 3.9 3.2 4.1 6.4 1.9
GACACTGGATTTGTTTC 505662 PPP1R1A 3.6 3.9 4.0 4.0 2.5
GTCCCTTACTTTCCCAG 594952 dES 3.6 3.4 5.3 3.2 2.5
ATGGCCGAGGAGCTGAA 499745 MYh2 3.5 1.0 5.5 5.1 2.5
AAAAATCATCGTTGTAC Mitochond.l tRNA-Glu 3.3 1.0 4.2 4.6 3.4
AAAATAAACATCCTCGG 533040 PdlIM7 3.3 4.0 2.4 3.1 3.6
TCGCGTGCCTGAGGGCG 320890 TNNI1 3.2 4.6 3.5 3.4 1.2All tags: GSM140696+GSM140697+GSM140698+GSM140699.GSM140696: DU_03; GSM140697: DU_09; GSM140698: LW_03; GSM140699: LW_09.
08_STEFANON.indd 424 23-09-2009 11:36:42

Ital.J.anIm.ScI. vol. 8, 417-429, 2009 425
gene expreSSIon of pIg Skeletal muScle
the transcriptional profile of human muscle using an in silico and a SAGE database of over 53,875 tag sequences, of which 295 tags were considered highly expressed, since they were detected more than 20 times. Applying the same criteria to the present database, a total of 218 tags were found to be highly ex-pressed and those with a frequency higher than 3‰ are reported in Table 2.
The functional analysis of the 190 differ-entially expressed genes (P<0.05) between 3 and 9 months of age was performed allocat-ing the genes to the same KEGG pathways using for the human-swine comparison, in order to find those which can elicit the physiological status of muscle at the two analysed ages (Table 3).
Analysing both Figure 2 and Table 3 one can observe three KEGG pathways, insulin signalling, focal adhesion and regulation of actin cytoskeleton closely interacting be-tween them and that are involved in the regulation of protein synthesis in mammals (Dardevet et al., 1996; Goel and Dey, 2002). The initiation phase of translation for the formation of 80S initiation complex is a lim-iting step of protein synthesis (Pain, 1996) and is controlled by some major proteins, such as eIF2, eIF2B, 4E-BPI and ribosomal protein S6 kinase (S6K1). S6K1 has been reported to be among the major proteins in-volved in the control of initiation phase of mRNA translation (Tesseraud et al., 2003) and is phosphorylated by PIK3, a gene of the phospatidyl inositol signalling system, involved in the insulin signalling, focal ad-hesion and regulation of actin cytoskeleton pathways. This gene is down-stream to IRS in the insulin signalling pathway and the activation of the PI3K-mTOR signal trans-duction results in a more intense protein synthesis, through modulation of multiple steps involved in the initiation of mRNA translation and ribosome biogenesis (Bol-ster et al., 2004). This process and the fol-
lowing elongation and protein synthesis is very energy demanding.
The observed up regulation of PIKR1 at 3 months of age (Table 3) agrees with the increased abundance of all the significant ribosomal and oxidative phosphorylation proteins related transcripts in younger pigs, as a sign of the intense metabolic activity. The age-related decline of genes involved in electron transport and ATP synthesis is consistent with the study of Welle et al. (2000), in which SAGE method was used to compare transcriptional profile of young and old Vastus lateralis muscles. Similar results were also obtained with microarray method applied to young and old mice (Lee et al., 1999).
Within the focal adhesion pathway, COL3A1 and ITGA7, other than PIK3R1, were up regulated at the 3 months of age. PIK3R1 promotes ACTN2, a F-actin cross-linking protein which is thought to anchor actin to a variety of intracellular structures. Collagen type 1 alpha (COL3A1), is involved in the ECM receptor interaction and takes part of the regulation of integrins, as in-tegrin alpha-7 (ITGA7), that is a primary laminin receptor on skeletal myoblasts and adult myofibers (Song et al., 1993).
ITGA7, together with PIK3R1 and ACTN2 genes, are also part of the regula-tion of actin cytoskeleton KEGG pathway. During myogenic differentiation, ITGA7 may induce changes in the shape and mo-bility of myoblasts, and facilitate their lo-calization at laminin-rich sites of secondary fiber formation, indicating that myofibers cytoarchitecture is still active at a younger age (Ziober et al., 1993).
Older animals exhibited increased abun-dance of CSDE1, an NRAS upstream gene protein, which in turn regulated RAF1, a proto-oncogene serine/threonine-protein kinase. RAS and RAF1 are also part of the transduction of mitogenic signals (MAPK
08_STEFANON.indd 425 23-09-2009 11:36:43
Ital.J.anIm.ScI. vol. 8, 417-429, 2009426
Dal monego et al.
signalling pathway) from the cell mem-brane to the nucleus. According to Coolican et al. (1997), cell proliferation is mediated primarily by the RAS/RAF1 MAP kinase pathway, whereas stimulation of differ-entiation utilizes the PI3-kinase/p70S6k pathway. Extracellular signals can lead to a simultaneous activation of both the RAF-MEK-ERK and PI3K-AKT pathways. The effects of these two signalling pathways can be opposite on muscle cells, since the PI3K-AKT pathway was shown to inhibit the
RAF-MEK-ERK pathway and cross-regula-tion depends on the differentiation state of the cell (Rommel et al., 1999). In particular, AKT activation inhibits RAF-MEK-ERK pathway in differentiated myotubes, but not in their myoblast precursors (Wilson et al., 2004). This observation is consistent with opposite behaviour of the two components of microtubule protofilaments. At 3 months a predominant expression of the beta subu-nit (TUBB) can lead to a more instable cy-toskeleton filament, which agrees with the
Table 3. Gene transcripts which significantly differed in longissimus dorsi of pigs at 3 and 9 months of age. Genes were allocated to KEGG metabolic pa-thways using the FATIGO+tool of Babelomics (Al-Shahrour et al., 2006) and the complete list are reported in the Supplemental material S3.
KEGG pathways 3 months 9 months
GSM140696 + GSM140698 GSM140697 + GSM140699
Focal adhesionITGA7 PIK3R1 FLNA ACTN2
COL3A1 MYL6RAF1 PPP1CC
MAPK signaling pathway FLNA HSPA5 RAF1 CSDE1
Oxidative phosphorylationCOX8A COX4I1 ATP6V1G1 AT-P5G3 NDUFV3 COX7C NDUFA12
NDUFB9No genes
Regulation of actin cytoskeleton MYH9 ITGA7 PIK3R1 ACTN2 RAF1 CSDE1 PPP1CC
RibosomeRPL10 RPL36 RPL27A RPL29 RPS23 RPL35 RPL37 RPS15
RPL18 RPL10A RPL13A RPL14No genes
Insulin signaling pathway PIK3R1 PKM2 RAF1 CSDE1 FASN PPP1CC
Calcium signaling pathway No genes No genes
Wnt signaling pathway No genes NFAT5
Tight junction MYH9 ACTN2 MYL6 CSDE1
Axon guidance No genes CSDE1 NFAT5
Proteasome PSMA6 No genes
Purine metabolism AK1 PKM2 No genes
Glycolysis / Gluconeogenesis PGAM2 ENO3 PKM2 PGM1 ALDH2
Gap junction TUBB TUBA1 RAF1 CSDE1
GSM140696: DU_03; GSM140697: DU_09; GSM140698: LW_03; GSM140699: LW_09.
08_STEFANON.indd 426 23-09-2009 11:36:43

Ital.J.anIm.ScI. vol. 8, 417-429, 2009 427
gene expreSSIon of pIg Skeletal muScle
function of microtubules during the skeletal muscle growth and differentiation (Pizon et al., 2005). In the later phase of growth (9 months) a stabilization of skeletal muscle structure is expected, justifying the preva-lence of alpha subunits (TUBA) of tubulin isoforms.
A similar IDEG6 analysis crossing data between the two breeds do not produce con-sistent results. The lack of transcripts fea-turing this two breeds mean that the differ-ences between them are to ascribe to genes transcribed at lower level than this work can discriminate. This observation moreo-ver is confirmed by microarray analysis on the same population (manuscript in prepa-ration).
Conclusions
This first SAGE database of pig muscle of more than 50,000 tags may be a useful resource for researchers interested in func-tional genomics and in the relative mRNA expression in muscle tissues. For the most abundant mRNA species, the data provided can be considered accurate. But for the less abundant transcripts, an increase of tag database may be required. However, these results demonstrate the power of transcrip-
tional profiling for gene discovery and pro-vide opportunities for investigating new proteins potentially involved in different aspects of growth factor action in muscle tissues.
In the paper, data mining was mainly based on human KEGG maps, assuming the correspondence with swine cellular regula-tion and metabolism, but many of the dif-ferences identified by SAGE involve protein products or full mRNA sequences that have not been characterized in swine. The possibil-ity to compare the activation or inhibition of specific pathways during growth would also offer the opportunity to identify candidate genes with regulatory activities in skeletal muscle. As soon as the pig genome project will be completed, the species-specific path-ways for pigs will be available and a critical reconsideration of these results will prob-ably required, to provide information about the expression profile of muscle in pigs.
We thank Jeena Devasia for her critical and English reading of the manuscript.
The research was fonded by Ministry of Edu-cation, University and Research. Project FIRB 2001-2005.
REFERENcES
Al-Shahrour, F., Minguez, P., Tárraga, J., Montaner, D., Alloza, E., Vaquerizas, J.M.M., Conde, L., Bla-schke, C.,Vera, J., Dopazo, J., 2006. Babelomics: a systems biology perspective in the functional annotation of genome-scale experiments. Nucleic Acids Res. 34:W472-W476.
BioPerl, 2007. Home page address: http://www.biop-erl.org/
BMR genomics, 2008. Home page address: http://www.bmr-genomics.it/
Bolster, D.R., Jefferson, L.S., Kimball, S.R., 2004. Regulation of protein synthesis associated with skeletal muscle hypertrophy by insulin, aminoac-id and exercise induced signalling. P. Nutr. Soc. 63:351-356.
Bortoluzzi, S., Danieli, G.A., 1999. Towards an in silico analysis of transcription patterns. Trends Genet. 15:118-119.
Claverie, J.M., 1999. Computational methods for the identification of differential and coordinated gene expression. Hum. Mol. Genet. 8:1821-1832.
Coolican, S.A., Samuel, D.S., Ewton, D.Z., McWade,
08_STEFANON.indd 427 23-09-2009 11:36:43
Ital.J.anIm.ScI. vol. 8, 417-429, 2009428
Dal monego et al.
F.J., Florini, J.R., 1997. The mitogenic and myo-genic actions of insulin-like growth factors uti-lize distinct signaling pathways. J. Biol. Chem. 272:6653-6662.
Dal Monego, S., Colitti, M., Pallavicini, A., D’Andrea, M., Pilla, F., Graziosi, G., Stefanon, B., 2007. Eval-uation of gene expression profiles of pig skeletal muscle in response to energy content of the diets using human microarrays. Ital. J. Anim. Sci. 6:45-59.
Dardevet, D., Sornet, C., Vary, T., Grizard, J., 1996. Phosphatidyl-inositol 3-kinase and p70 S6 kinase participate in the regulation of protein turnover in skeletal muscle by insulin and insulin-like growth factor 1. Endocrinology 137:4087-4094.
Dinel, S., Bolduc, C., Belleau, P., Boivin, A., Yoshioka, M., Calvo, E., Piedboeuf, B., Snyder, E.E., Labrie, F., St-Amand, J., 2005. Reproducibility, bioinfor-matic analysis and power of the SAGE method to evaluate changes in transcriptome. Nucleic Acids Res. 33:1-8.
Fahrenkrug, S.C., Smith, T.P., Freking, B.A., Cho, J., White, J., Vallet, J., Wise, T., Rohrer, G., Pertea, G., Sultana, R., Quackenbush, J., Keele, J.W., 2002. Porcine gene discovery by normalized cDNA-library sequencing and EST cluster assembly. Mamm. Genome 13:475-478.
Gene Expression Omnibus database, 2008. Home page address: http://www.ncbi.nlm.nih.gov/geo/
Goel, H.L., Dey, C.S., 2002. Insulin stimulates spread-ing of skeletal muscle cells involving the activa-tion of focal adhesion kinase, phosphatidylinosi-tol 3-kinase and extracellular signal regulated kinases. J. Cell. Physiol. 193:187-198.
Jolly, R.A., Goldstein, K.M., Hong Gao, T.W., Chen, P., Huang, S., Colet, J.M., Ryan, T.P., Thomas, C.E., Estrem S.T., 2005. Pooling samples within micro-array studies: a comparative analysis of rat liver transcription response to prototypical toxicants. Physiol. Genomics 22:346-355.
Lash, A.E., Tolstoshev, C.M., Wagner, L., Schuler, G.D., Strausberg, R.L., Riggins, G.J., Altschul, S.F, 2000. SAGEmap: a public gene expression resource. Genome Res. 10:1051-1060.
Lee, C.K., Klopp, R.G., Weindruch, R., Prolla, T.A.,
1999. Gene expression profile of aging and its re-tardation by caloric restriction. Science 285:1390-1393.
MySQl, 2007. Home page address: http://www.mysql.com/
Pain, V.M., 1996 Initiation of protein synthesis in eu-karyotic cells. Eur. J. Biochem. 236:747-771.
Pizon V., Gerbal, F., Diaz C.C., Karsenti, E., 2005. Mi-crotubule-dependent transport and organization of sarcomeric myosin during skeletal muscle dif-ferentiation. EMBO J. 24:3781-3792.
Rommel, C., Clarke, B.A., Zimmermann, S., Nunez, L., Rossman, R., Reid, K., Moelling, K., Yancopou-los, G.D., Glass, D.J., 1999. Differentiation stage specific inhibition of the Raf-MEK-ERK pathway by Akt. Science 286:1738-1741.
Romualdi, C., Bortoluzzi, S., D’Alessi, F., Danieli, G.A., 2003. IDEG6: a web tool for detection of differen-tially expressed genes in multiple tag sampling ex-periments. Physiol. Genomics. 12:159-162.
Schaaf, G.J., Ruijter, J.M., van Ruissen, F., Zwij-nenburg, D.A., Waaijer, R., Valentijn, L.J., Benit-Deekman, J., van Kampen, A.H.C., Baas, F., Kool, M., 2005. Full transcriptome analysis of rhab-domyosarcoma, normal and fetal skeletal muscle: statistical comparison of multiple SAGE lubrar-ies. FASEB J. 19:404-406.
Song, W.K., Wang, W., Sato, H., Bielser, D.A., Kauf-man S.J., 1993. Expression of alpha 7 integrin cy-toplasmic domains during skeletal muscle devel-opment: alternate forms, conformational change, and homologies with serine/threonine kinases and tyrosine phosphatases. J. Cell Sci. 106:1139-1152.
Tesseraud, S., Bigot, K., Taouis, M., 2003. Amino acid availability regulates S6K1 and protein synthe-sis in avian insulin-insensitive QM7 myoblasts. FEBS Lett. 540:176-180.
Tutej, R., Tuteja, N., 2004. Serial Analysis of Gene Expression: Applications in Human Studies. J. Biomed. Biotech. 2:113-120.
Velculescu, V.E., Zhang, L., Vogelstein, B., Kinzler, K.W., 1995. Serial analysis of gene expression. Science 270:484-487.
Wang, S.M.., 2007. Understanding SAGE data.
08_STEFANON.indd 428 23-09-2009 11:36:43
Ital.J.anIm.ScI. vol. 8, 417-429, 2009 429
gene expreSSIon of pIg Skeletal muScle
Trends Genet. 23:42-50.Welle, S., Bhatt, K., Thornton, C.A., 2000. High-
abundance mRNAs in human muscle: compari-son between young and old. J. Appl. Physiol. 89:297-304.
Wilson, E.M., Tureckova, J., Rotwein, P., 2004. Per-missive role of phosphatidyl inositol 3-kinase and Akt in skeletal myocyte maturation. Mol. Biol. Cell 15:497-505.
Yoshioka, M., Tanaka, H., Shono, N., Snyder, E.E., Shindo, M., St-Amand, J., 2003. Serial analysis of
gene expression in the skeletal muscle of endur-ance athlets compared to sedentary men. FASEB J. 17:1812-1819.
Yoshioka, M., Tanaka, H., Shono, N., Shindo, M., St-Amand, J., 2007. Gene expression profile of sprint-er‘s muscle. Int. J. Sports Med. 28:1053-1058.
Ziober, B.L., Wu, M.P., Waleh, N., Crawford, J., Lin, C.S., Kramer, R.H., 1993. Alternative extracellu-lar and cytoplasmic domains of the integrin a7 subunit are differentially expressed during devel-opment. J. Biol. Chem. 268:26773-26783.
08_STEFANON.indd 429 23-09-2009 11:36:44

08_STEFANON.indd 430 23-09-2009 11:36:44