September 2021
25
September 2021 PAGE 0
-
Upload
khangminh22 -
Category
Documents
-
view
0 -
download
0
Transcript of September 2021

September 2021
PAGE 0

This presentation is for informational purposes only and does not constitute an offer to sell, a solicitation of any offer to buy, or a recommendation to purchase any securities of or any of its affiliates (as such term is defined under the U.S. federal securities laws). The presentation shall not constitute a solicitation of a proxy, consent or authorization with respect to any securities. This presentation shall also not constitute an offer to sell or the solicitation of an offer to buy any securities, nor shall there be any sale of securities in any jurisdictions in which such offer, solicitation or sale would be unlawful prior to registration or qualification under the securities laws of any such jurisdiction. No offering of securities shall be made except by means of a prospectus meeting the requirements of Section 10 of the Securities Act of 1933, as amended.
Forward-Looking StatementsThe statements in this presentation that are not historical facts are “forward-looking statements” within the meaning of the safe harbor provisions of the United States Private SecuritiesLitigation Reform Act of 1995. Forward-looking statements may be identified by the use of words such as “anticipate”, “believe”, “expect”, “estimate”, “project”, “budget”, “forecast”, “intend”, “plan”, “may”, “will”, “could”, “should”, “predicts”, “potential”, “continue”, and other similar expressions that predict or indicate future events or trends or that are not statements of historical matters. Such forward-looking statements are based on current expectations, estimates and projections about the industry and markets in which Yatra operates. Yatra’s beliefs and assumptions are made by its management and are not predictions or guarantees of actual performance. Accordingly, actual results and performance may materially differ from results or performance expressed or implied by the forward-looking statements. No representation is made as to the reasonableness of the assumptions made within or the accuracy or completeness of any forward-looking statements or other information contained herein. Factors that could cause future results and performance to differ from the forward-looking statements include but are not limited to: (1) Yatra’s history of operating losses; (2) competition in the Indian travel industry; (3) declines or disruptions in the Indian economy;(4) risks relating to any unforeseen liabilities of Yatra;(5) future capital expenditures, expenses, revenues, earnings, synergies, economic performance, indebtedness, financialcondition, losses and future prospects; businesses and management strategies and the expansion and growth of the operations of Yatra; (6) the limited liquidity and trading of Yatra’ssecurities; (7) changes in applicable laws or regulations; (8) the possibility that Yatra may be adversely affected by other economic, business, and/or competitive factors; and (9) otherrisks and uncertainties indicated from time to time in Yatra’s filings with the Securities and Exchange Commission (the “SEC”).
Yatra cautions that the foregoing list of factors is not exclusive. Additional information concerning these and other risk factors is contained in Yatra’s most recent filings with the SEC. All subsequent written and oral forward looking statements or other matters are expressly qualified in their entirety by the cautionary statements above. Yatra cautions readers not to place undue reliance upon forward looking statements, which speak only as of the date made. Yatra undertakes no obligation to update or revise any forward-looking statements, whether as a result of new information, future events or otherwise, except as required by law.
Non-IFRS Financial MeasuresIn addition to the IFRS financial measures, this presentation includes certain non-IFRS financial measures, including Adjusted Revenue, Adjusted EBITDA (Loss), Net Revenue Margin and Gross Bookings. The non-IFRS measures have limitations as analytical tools and you should not consider them in isolation or as a substitute for an analysis of our results under IFRS as issued by the IAB. The Company considers these non-IFRS financial measures to be important because they provide useful measures of the operating performance of the Company, exclusive of unusual events or factors that do not directly affect what we consider to be our core operating performance, and are used by the Company's management for that purpose. All non-IFRS financial measures are reconciled to their directly comparable IFRS financial measures. These reconciliations are presented in the Appendix at the end of this presentation.
Industry and Market DataIndustry and market data used in this presentation have been obtained from industry publications and sources as well as from research reports prepared for other purposes. While Yatra believes such information to be reliable, it has not independently verified the data obtained from these sources.
OtherAll years are calendar years unless otherwise noted as “fiscal year” or “FY”.
PAGE 1
Disclaimer

PAGE 2
Key Highlights
Yatra is one of the most well recognized “home-grown” Indian Internet brands and the largest Corporate
Travel Services provider in India.
Yatra remains well-positioned to benefit from India’s massive and growing travel market that is rapidlyshifting online. Due to COVID this shift is accelerating.
Focus on the bottom line in a challenging market environment driven by cost optimization, disciplinedmarketing spend, and execution.
AdJ. Revenue recovered to $13.3M in Jan - Mar-21 Quarter (60% of pre-covid level). AdJ. EBITDA margincame in at ~10%, reflecting the efforts around cost optimization. Adj Revenue declined to $6.6mil in the June 21
qtr due to the Second Wave in India but has again begun to recover strongly in July and August ‘21.

PAGE 3
1. Management estimates2. Numbers for FY18 Include ATB performance for 8 months3. FY numbers are as per audited results;4. Cumulative as of March 31, 2021; does not include data for B2B businesses5. Data for 12 months ended March 31, 2021 for flagship brand Yatra.com only and excludes data from B2E and B2B businesses6. As of Mar 31, 20217. As of Mar 31, 2021
11.7Mcumulative customers4
129MVisits5
~94k+hotels in
~1,400 cities6
94%of transactions
from repeat customers5
700+large corporate
customers7
85%Of traffic
from Mobile
Yatra – A Comprehensive Online Travel PlatformWe are one of India’s largest B2C OTA’s and the leader in corporate travel1

Strong Track record of sustained growthGrowth of business impacted by Ebix merger in FY2020 and Covid in FY2021, however beginning to show signs of recovery
Gross Bookings2,3
(INR billion)
57.679.2
97.677.4
13.0
10.4
13.4
13.5
7.9
14.71.7
FY17 FY18 FY19 FY20 FY21Hotels
3,6575,013 5,708
3,958
1,487
1,6971,880
785399
1,147
697
1,323
1,240
353351
5,203
7,408
FY17 FY18 FY19 FY20 FY21
Others (Inc. Other Income)
68.0
CAGR 28% CAGR 31%
AirHotelsAir
92.5
111.2
Adjusted Revenue 2,3
(INR million)
85.3
Impact of EBIX merger related
restrictions and Covid
Impact of COVID-19 pandemic
*Business under constraints of now terminated EBIX Merger Agreement
PAGE 3
Quarterly Gross Bookings2,3
(INR million)Quarterly Adjusted Revenue
(INR million)
Decline due to second wave
Oct-Dec-19 Adj. revenue (INR 1,587 mn) – Jan-Mar ’21 revenue 61% of pre-Covid
61% Decline due to second wave
1,804
5,943
7,709
2,403
Jul-Sep-20 Oct-Dec-20 Jan-Mar-21 Apr-Jun-21
378
607
970
489
Jul-Sep-20 Oct-Dec-20 Jan-Mar-21 Apr-Jun-21
8,911Impact of EBIX merger related
restrictions and Covid
Impact of COVID-19 pandemic
5,983
2,190

PAGE 4
Our Differentiated Go-To-Market Strategy
1 B2CLeverage our brand and business
footprint to grow our B2C business
~$19BConsumer travel industry
market1
~38%Online consumer
penetration for hotels and air2
~11.7MCustomers3
Leverage our platform to profitably gain scale and address tier 2 and tier
3 markets
2 B2E 3 B2BFocus on the “right demographics”- the business traveler, India’s main
consuming class
~$32BCorporate travel industry
market4
While other Indian OTAs focus mainly on the B2C segment, we deliver a full suite of leisure and corporate offering that enables us to target travelers holistically
The Platform
~62%Offline consumer
travel market7
700+Corporate Clients6
~27,000agents in
860+ cities8
<5-10%Online penetrations for
corporate travel5
1. Research done by Strategy& for the company- Market in 20172. Phocuswright; Online Travel in India: 10th Edition (2017); online refers to online leisure /
unmanaged business travel in India consumer market3. Cumulative as of Mar 31, 2021; does not include data for B2B businesses4. Research done by Strategy& for the company- Market in 2017
5. Management estimates for India online penetrations for corporate travel6. Approximate count as of Mar 31, 20217. Phocuswright Offline Market percentage for Air & Hotels for 2017E in India consumer market8. Approximate count as of Mar 31, 2021
41,000+SME8
PAGE 5
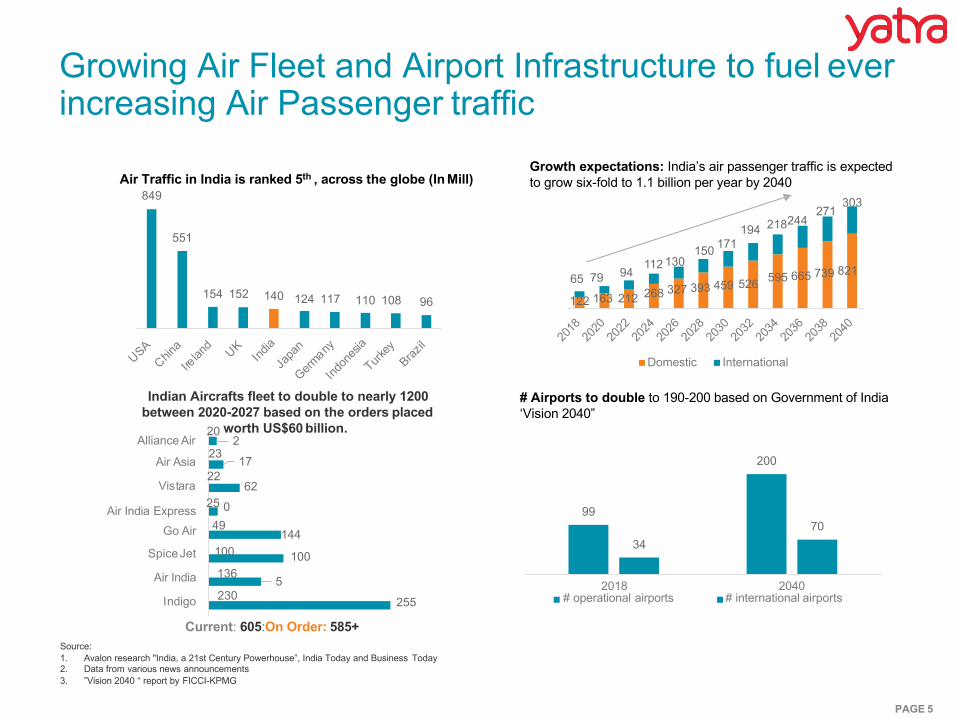
Growing Air Fleet and Airport Infrastructure to fuel ever increasing Air Passenger traffic
Indian Aircrafts fleet to double to nearly 1200 between 2020-2027 based on the orders placed
Source:1. Avalon research "India, a 21st Century Powerhouse”, India Today and Business Today2. Data from various news announcements3. ”Vision 2040 “ report by FICCI-KPMG
Air Traffic in India is ranked 5th , across the globe (In Mill)849
551
154 152 140 124 117 110 108 96
USAChin
a
Irelan
d UKInd
ia
Japa
n
Germany
Indon
esia
Turkey
Brazil
Growth expectations: India’s air passenger traffic is expected to grow six-fold to 1.1 billion per year by 2040
230
136
100
49
23
22
20 worth US$60 billion.
255
5
100
144
25 0
62
17
2Alliance Air
Air Asia
Vistara
Air India ExpressGo Air
SpiceJet
Air India
Indigo
Current: 605:On Order: 585+
122 163 212 268 327 393 459 526 595 665 739 82165 79 94
150112 130
171194 218244
271303
2018
2020
2022
2024
2026
2028
2030
2032
2034
2036
2038
2040
99
200
3470
Domestic International
# Airports to double to 190-200 based on Government of India ‘Vision 2040”
2018# operational airports
2040# international airports

PAGE 6
Consumer Market shift accelerating towards online Post-Covid with OTA share growing the fastest
1) Phocuswright; Online Travel in India: 10th Edition (2017)
Offline 61%
Online 39%
Offline 55%
Online45%
2017 2021
Consumer Travel Market – Online v/s Offline1 Market split by Channel1
6%
21% 21%
18% 23%
61% 55%
2017 2021
Offline
OTA
Supplier Direct-Online
16%
9%
CAGR %
03% 04%
51% 47%77% 67%
18% 27%5% 5%
48%
1%
43%
2%
56%32% 34%51%
17% 19%
97% 96%
2017 2021 2017 2021Hotels
2017 2021Rail
2017 2021Car Rental
Offline
OTA
Supplier Direct -Online
Market split by Channel and Product1
Air

Corporate travel market in India is ~INR 2,150 Bn (~$32Bn) and was growing at 12% CAGR Pre-COVID
2,1502,360
2,6903,050
2017 2018 2019 2020 2021
India Corp Travel Market Gross Bookings (INR Billion)1
3,430Margin %
>10%
50-60%
25-35%
5-10%
2017
Others
Hotels
Air
Market split by product1
5-12%
4-6%
CAGR:12%
($32B)
($51B)
• GDP growth: IMF projects 8.3% growth in GDP in 2021, implying higher business activity, and related travel• GST implementation: ~10mil companies in India with registered GSTIN - greater scope for organized TMCs• Growth in MICE: High margin (~20%) & high demand frequency; expected growth in off-sites, dealer meets
Demand side
• Improved hotel supply for corporates: Increase in number of chain hotels and some OTT players focusing on the corporate market have organized hotel supply.
• Improved connectivity: Per Vision 2040 number of Airport to double to 190-200 by 2040.
Supply side
1) Source: Research done by Strategy& for the company PAGE 7

Highly fragmented market shifting towards online & organized segment – Top 13k companies account for 28% of volume
Corporate Travel Market – Type of Player(%)
Small Travel
Agents, 60%
Supplier Direct, 30%
LargeTMCs,10%
2017
Major Players
4%5%6%
8%
9%
Corporate Travel Market – Travel Spend >INR 10 mil1
1%
~INR 2,150 B ($32B)
2%
2017
69%
1%
28% Highly fragmented
market
30-50 mil>50 mil 10-30 mil<10 mil Rest of the market
Travel Spend (in INR)
~INR 650 B ($9.5B)
32%
4%
2017
• Market is highly fragmented; ~70% of travel spend is from companies with < INR 10M spend
• Within companies with travel spend of > INR 10M, IT has 28% share followed by Engineering & Pharma
• ~1,900 companies across these eight industries account for ~70% share
• Direct bookings are primarily for air travel (SMEs) & hotel bookings (SMEs and corporates)
• Yatra has the largest share amongst the organized players
3%
IT – 3.0%Engineering – 1.1%Pharma – 1.9%Energy - 0.2%Finance - 0.4%Auto - 0.6%BPO/ITeS – 3.5%Telecom – 0.6%Others – 0.6%
Industry – Travel spend % ofrevenue
28%
1) Source: Research done by Strategy& for the company PAGE 8

COVID Trends in India Steadily Improving
Number of daily COVID cases in India continue to be on a steady decline post the second wave since peaking on May 8th
at ~403k cases.
Total vaccination doses are on right trajectory, with India currently administering approx. 626 million doses (till Aug 28,
2021) with over 10% of the population now fully vaccinated and ~36% having received at least one dose.
Daily new cases on decline Increased vaccination doses
PAGE 9

Travel Trends in India
Domestic passenger traffic declined to a 2021 low of 2.1M passengers in May-21 but have since recovered to 5M
passengers in July-21.
The Government has recently eased operational capacity for airlines from 50% to 65% since July 5th 2021.
India Domestic Air Traffic (PassengerMill)
PAGE 10
12.8 12.4
7.8
- 0.3
2.0 2.1 2.8
3.9
5.3 6.4
7.3 7.7 7.8 7.8
5.7
2.0 3.1
4.9
7.0
Jan-2
0
Feb-20
Mar-20
Apr-20
May-20
Jun-2
0Ju
l-20
Aug-20
Sep-20
Oct-20
Nov-20
Dec-20
Jan-2
1
Feb-21
Mar-21
Apr-21
May-21
Jun-2
1Ju
l-21
Aug-21

PAGE 11
Our Differentiated Approach – A CommonPlatform Seamlessly Linking All Channels, Products, and CustomersRewards program connecting business and leisure travelers
Complete offerings
Air7 Domestic carriers
400+ International carriers
Hotels & Lodging~94,000 Indian
propertiesplus growing homestays
Holiday packages
Rail, bus, activities, others
Multi-channel customer access
Direct-to-consumer “B2C”
~129M visits1 ;~11.7M customers2
Corporate travelers “B2E”
Corporate customers have more than 6.9M
employees3
Travel agents “B2B”
~27,000 registered agents across India3
1. Data for the 12months ended March 31, 2021 for flagship brand Yatra.com only and excludes data from B2E and B2B businesses2. Cumulative as of March 31, 2021; does not include data for B2B businesses3. Approximate count as of Mar 31, 2021

PAGE 12
We Are One of The Leading Consumer Brands in India
1. Awarded by The Economic Times for the year 2015 and 20162. For flagship brand Yatra.com only3. YOY Growth in transacting customer base from FY19 to FY20 and does not include data for B2B businesses4. Approximate cumulative customers as on March 31, 2021 and does not include data for B2B businesses
Most Trusted Travel Brand 2 times1
Our foundation is built on customers’ trust and loyalty
National Tourism Award 4 times
• Strong direct and organic traffic dynamics –92% in FY21
• Strong overall traffic – total visits 129Min FY21
• Overall customer growth3 5.4% –11.7M cumulative customers (11.1M customers in FY20)4

PAGE 13
Yatra for Business – Largest Corporate Travel Platform in India
l More than 6.9M people employed by organizations – supporting household of ~28M travelers2
l Using eCash to drive cross sell
l Largest player in the countryl Over 700+ large corporate customers1
l More than 41,000 SME customers as on 31 March 2021
l Comprehensive Self Book Platform available across devices.l Integrates seamlessly into ERP/ HRIS systems of customersl Manages complex approval processes and ensures tight policy compliance
l Opportunity to manage customers’ hotel and lodging programsl Opportunity to provide expense management solutions, freight management solutionsl Other services like insurance, car rental, forex, travel visas etc.
l Over 13,000 large corporationsl Over 100,000 SMEsl 60%+ of India’s travel spend
Large Market Opportunity
Cross Sell –‘Bleisure’
Multiple Revenue Opportunities
Differentiated Offering
Market Leader
1. Approximate count as of Mar 31,20212. Assumes a family size of 4; More than 6 mm people employed by corporate customers of Yatra as of March 31, 2021
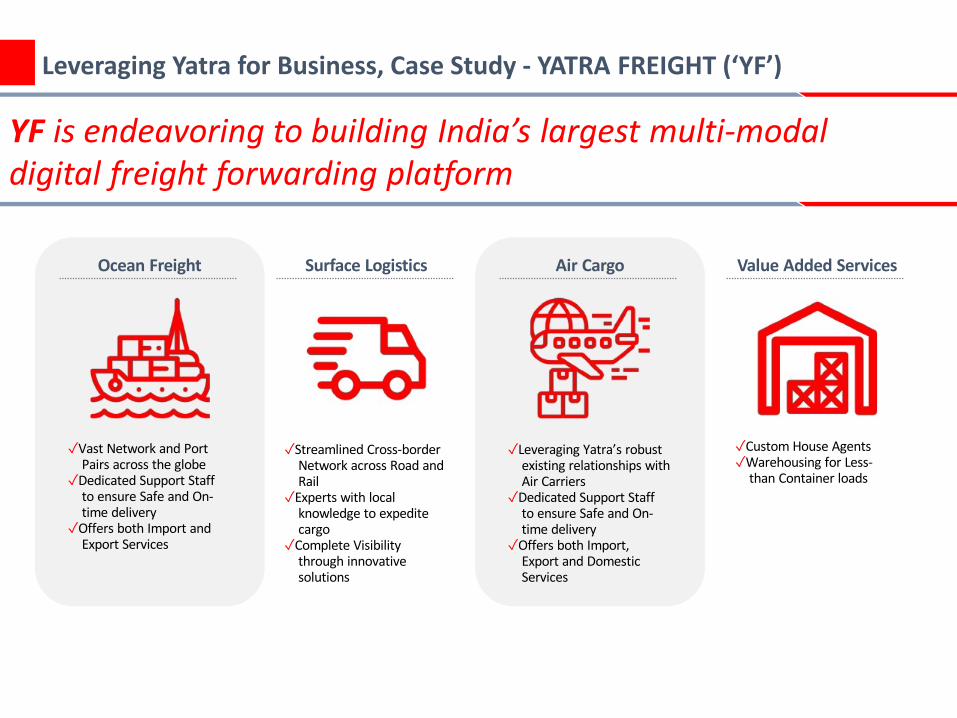
Leveraging Yatra for Business, Case Study - YATRA FREIGHT (‘YF’)
YF is endeavoring to building India’s largest multi-modaldigital freight forwarding platform
Ocean Freight Surface Logistics Air Cargo Value Added Services
✓Vast Network and PortPairs across the globe
✓Dedicated Support Staffto ensure Safe and On-time delivery
✓Offers both Import andExport Services
✓Streamlined Cross-borderNetwork across Road andRail
✓Experts with localknowledge to expeditecargo
✓Complete Visibilitythrough innovativesolutions
✓Leveraging Yatra’s robustexisting relationships withAir Carriers
✓Dedicated Support Staffto ensure Safe and On-time delivery
✓Offers both Import,Export and DomesticServices
✓Custom House Agents✓Warehousing for Less-
than Container loads

We are Uniquely Positioned to Capture Market Share
Strong YATRA Brand RecognitionYatra.com has extremely high recall andbrand recognition. Consumers expect alevel of service quality from Yatra
Access to Large Customer baseAccess to 700+ large corporate customers and 35,000+ SME customers
Strong Supplier RelationshipsCompany has built robust workingrelationships with airlines over 15 years
Rich Experience of building Scalable Tech PlatformsManagement team with deep industryexperience and knowledge backed by ateam of ~200 people
1
3
2
4

PAGE 15
FY21 Highlights- QoQ and YoY
ROE: 1 US$ = INR 73.54
During FY21, we continued our concerted efforts
to significantly lower costs, to achieve
operational efficiency and attain profitability.
Initiatives such as headcount rationalization,
renegotiation of rent, and reduction in consumer
promotions have significantly lowered the cost
structure.
During Mar’21 quarter, the travel market in India started showing signs of recovery, as a result
our adjusted revenue improved 60% QoQ to US$13.3 M, and our adjusted EBITDA improved
from negative US$0.5 M to positive US$1.3 M.
Adj. revenue/Adj. EBITDA (USD $M)
3.1
5.1
8.3
13.3
6.6
(4.1)
(1.7) (0.5)
1.3 0.5
Apr-Jun-20 Jul-Sep-20 Oct-Dec-20 Jan-Mar-21 Apr-Jun-21
Adjusted revenue Adjusted EBITDA
Improving profitability

PAGE 16
Yatra Measures Taken Post COVID-19
Cost Optimization and Improved Efficiency led to a
reduction in Fixed costs from $3.8M/mo (Mar-19) to
$2.7M/mo (Mar-20), which then were further optimized
during the pandemic to $1.2M/mo (May-20)
Some of the steps undertaken during the pandemic.
• Reduced Management salaries by 50%
• Variable reduction in salaries of 25-75% across the board.
Optimized the cost side to better align with operations
and minimize cash usage.
Enhanced our automation capabilities to largely
automate re-scheduling and cancellation of bookings.
Monthly Fixed Costs Trajectory In USD mn
PersonnelIT Expense
Rent & Utilities
OutsourcingLegal &
Professional
Others
Fixed Cost Components
ROE: 1 US$ = INR 73.54
3.8
2.7
1.2 1.3
Mar-19 Mar-20 May-20 Jun-21
52% decline in monthly fixed costs
Liquidity Profile
As of June 30th, 2021, our total Cash Balance was US$30.3M. Our Total Outstanding Debt
was US$0.08M.
Maintained Adj EBITDA margins at ~10% in June ‘21 quarter as well despite Adj. Revenue
declining 50% QonQ on account of Second Wave, reflecting the efforts around cost
optimization.
We believe we have adequate liquidity to weather any adverse environment for an extended
period of time.
ROE: 1 US$ = INR 73.14PAGE 19

In Conclusion
Leading Corporate Travel Services Provider in India (700+ large customers) targeting a TAM of $32B
growing at a 12% CAGR pre-COVID. High Corporate customer retention and renewal rates.
Second largest Consumer OTA in India with a widely recognized Indian consumer brand name.
Adequate level of Liquidity with US$30.3M in cash, US$0.08M in debt as of June 30, 2021 and
demonstrated profitability thru tight cost control
Multiple levers to deliver sustained growth including Greenfield opportunities like digital freight
forwarding to to farm our existing Corporate Customer base
ROE: 1 US$ = INR 73.14PAGE 20

Appendix

The historical financial information regarding Yatra included in this investor presentation reflects Yatra’s fiscal year end of March 31, and has been derived from audited financial statements of Yatra and its subsidiaries that were prepared in accordance with International Financial Reporting Standards, or IFRS as issued by IASB, on a consolidated basis.This presentation presents the metrics Adjusted Revenue, Adjusted EBITDA Losses, and Net Revenue Margin, which are non-IFRS measures. The presentation of these non-IFRS measures, which are defined below, is not meant to be considered in isolation or as a substitute for Yatra’s consolidated financial results prepared in accordance with IFRS as issued by the IASB and included in the previous filings with SEC. The non-IFRS financial metrics may not be comparable to similarly titled measures reported by other companies due to potential differences in the method of calculation. A reconciliation of these non-IFRS measures to the most comparable IFRS metric is set forth in this Appendix.Description of Adjusted Revenue : As certain parts of Yatra’s revenue are recognized on a “net” basis and other parts of revenue are recognized on a “gross” basis, Yatra evaluates its financial performance based on Adjusted Revenue, which is a non-IFRS measure. Adjusted Revenue represents revenue and other income after deducting service costs and adding back expenses related to consumer promotions and loyalty program costs that had been reduced from revenue due to the adoption of new accounting standard, IFRS 15, effective from April 1, 2018.Yatra believes that Adjusted Revenue provides investors with useful supplemental information about the financial performance of Yatra’s business and more accurately reflects the value addition of the travel services that Yatra provides to its customers. The presentation of this non-IFRS information is not meant to be considered in isolation or as a substitute for Yatra’s consolidated financial results prepared in accordance with IFRS as issued by the IASB. Yatra’s Adjusted Revenue may not be comparable to similarly titled measures reported by other companies due to potential differences in the method of calculation. This Appendix reconciles Yatra’s revenue, which is an IFRS measure, to Adjusted Revenue, which is a non-IFRS measure.Description of Adjusted EBITDA: In addition to referring to Adjusted Revenue, we also refer to Adjusted EBITDA (Loss). We use financial statements that exclude employee share-based compensation cost, listing and related expenses, depreciation and amortization and change in fair value of warrants for our internal management reporting, budgeting and decision making purposes, including comparing our operating results to that of our competitors. Because of varying available valuation methodologies and subjective assumptions that companies can use when adopting IFRS 2 “Share based payment”, management believes that providing non-IFRS financial measures that exclude such expenses allows investors to make additional comparisons between our operating results and those of other companies. Accordingly, we believe that adjusted EBITDA (loss) is useful in measuring the results of our company and provide investors and analysts a more accurate representation of our operating results. However, the presentation of these non-IFRS measures are not meant to be considered in isolation or as a substitute for our consolidated financial results prepared in accordance with IFRS as issued by the IASB. These non-IFRS measures may not be comparable to similarly titled measures reported by other companies due to potential differences in the method of calculation. The IFRS measures most directly comparable to adjusted EBITDA (loss) is Profit/(loss) for the period as per IFRS. A limitation of using Adjusted EBITDA (Loss) as against using the measures in accordance with IFRS as issued by the IASB are that these non-IFRS financial measures exclude share-based compensation cost, listing and related expenses, depreciation and amortization, change in fair value of warrants, Share of loss of joint venture, Finance income, Finance costs and Income-Tax. Management compensates for this limitation by providing specific information on the IFRS amounts excluded from Profit/(loss) for the period as per IFRS.
Description of Net Revenue Margin: Net Revenue Margin is defined as Adjusted Revenue as a percentage of Gross Bookings and represent the commissions, fees, incentive payments and other amounts earned in our business. We follow Net Revenue Margin trends closely across our various lines of business to gain insight into the performance of our various businesses.Description of Gross Bookings: This presentation also uses the operating metric “Gross Bookings” which represents the total amount paid by our customers forthe travel services and products booked through us, including taxes, fees and other charges, and are net of cancellations and refunds.All years are calendar years unless otherwise noted as “fiscal year” or “FY”.
PAGE 22
Basis of Financial Presentation and Use of Non-IFRS Measures

Reconciliation of Non-IFRS Measures-Adjusted Revenue
Notes- 3 months numbers are as per unaudited results; FY numbers are as per audited results; Numbers for FY18 include ATB performance for 8 months; Q3FY20 and Q3Y21 include ATB performance for 3 monthsPAGE 23
Amount in INR millionAir ticketing
Fiscal Year Ended Mar’312017 2018 2019 2020 2021
Hotel and PackagesRevenue 5,326 6,628 4,914 3,602 173Customer promotional expenses - - 1,249 106 199Service cost (4,179) (4,931) (4,283) (2,923) (22)Adjusted Revenue 1,147 1,697 1,880 785 351
OthersRevenue 373 607 995 1,048 205Customer promotional expenses - - 64 32 16Service cost - - - 0 -Adjusted Revenue 373 607 1,059 1,080 221
TotalRevenue 9,357 12,249 9,359 7,259 1,271Customer promotional expenses - - 3,571 1,486 810Service cost (4,179) (4,931) (4,283) (2,923) (22)Other Income 25 90 264 160 132Adjusted Revenue 5,203 7,408 8,911 5,982 2,191
Revenue 3,657 5,013 3,449 2,610 893Customer promotional expenses - - 2,259 1,348 594Service cost - - - - -Adjusted Revenue 3,657 5,013 5,708 3,958 1,487

Reconciliation of Non-IFRS Measures-Adjusted EBITDA (Loss)1
INR million
Profit/(loss) for the period as per IFRS
FY17
(5,937)
FY18
(4,052)
FY19
(1,194)
FY20
(840)
FY21
(1195)
Employee share-based compensation costs 587 730 283 5 77
Depreciation and Amortization 276 426 582 666 750
Share of loss of joint venture 9 11 13 11 4
Finance income (139) (92) (41) (59) (82)
Finance costs 150 153 263 193 117
Change in fair value of warrants (230) 563 (1,667) (0) (379)
Listing and related expense 4,243 - - - -
Remeasurement of contingent consideration - 294 485 (390) -
Impairment of Goodwill - - - 222 265
Income-Tax 41 57 48 70 64
Adjusted EBITDA (Loss) (1,001) (1,910) (1,228) (122) (379)
Notes- 3 months numbers are as per unaudited results; FY numbers are as per audited results; Numbers for FY18 include ATB performance for 8 months; Q3FY20 and Q3Y21 include ATB performance for 3 monthsPAGE 24