Mission Planning Systems for Commercial Small-Sat Earth Observation Constellations
Upload
khangminh22Category
view
2download
0
HAL Id: hal-03327692https://hal.archives-ouvertes.fr/hal-03327692
Submitted on 27 Aug 2021
HAL is a multi-disciplinary open accessarchive for the deposit and dissemination of sci-entific research documents, whether they are pub-lished or not. The documents may come fromteaching and research institutions in France orabroad, or from public or private research centers.
L’archive ouverte pluridisciplinaire HAL, estdestinée au dépôt et à la diffusion de documentsscientifiques de niveau recherche, publiés ou non,émanant des établissements d’enseignement et derecherche français ou étrangers, des laboratoirespublics ou privés.
Distributed under a Creative Commons Attribution| 4.0 International License
Semantic Integration of Raster Data for EarthObservation on Territorial Units
Ba-Huy Tran, Nathalie Aussenac-Gilles, Catherine Comparot, Cassia Trojahn
To cite this version:Ba-Huy Tran, Nathalie Aussenac-Gilles, Catherine Comparot, Cassia Trojahn. Semantic Integrationof Raster Data for Earth Observation on Territorial Units. 4th International workshop on GeoSpatialLinked Data (GeoLD 2021@ESWC 2021), Mohamed Ahmed Sherif; Beyza Yaman; Armin Haller;Axel-Cyrille Ngonga Ngomo, Jun 2021, Hersonissos, Greece. pp.1-12. �hal-03327692�

Semantic Integration of Raster Data for EarthObservation on Territorial Units ?
Ba-Huy Tran??, Nathalie Aussenac-Gilles,Catherine Comparot, and Cassia Trojahn
IRIT, Universite de Toulouse, CNRS, Toulouse, [email protected]
Abstract. Raster is a common data format in satellite image process-ing. A raster allows us to model geographic phenomena as a regularsurface in which each cell (or pixel) is associated with a phenomenonvalue. Many rasters can be provided for the same geographic area, forthe same phenomenon at different dates or different phenomena; theycan be compared, combined, used to generate a new one, etc. A recurrentissue however is to transfer data from pixels to features to qualify ter-ritorial units, which requires complex aggregation processes. This paperaddresses this issue thanks to a semantic data integration process basedon spatial and temporal properties. We propose i) a modular and genericontology used for the homogeneous representation of data qualifying ageographical area of interest; and ii) a Semantic Extraction, Transfor-mation, and Load (ETL) process that relies on the ontology and dataextracted from rasters and that maps the aggregated data to the corre-sponding areas. We evaluate our approach in terms of the (i) adaptabilityof the proposed model and pipeline to accommodate different use cases,(ii) added value of the generated datasets in helping decision making,and (iii) approach scalability.
Keywords: Earth observation, semantic data integration, spatio-temporal,change detection, land cover, NDVI
Earth Observation (EO) is a domain that has greatly evolved in the lastyears thanks to large-scale Earth monitoring programs, such as the US LandsatProgramand the EU Copernicus Program In particular, with the Copernicusprogram launched by the European Space Agency (ESA), EO satellites provideusers with free, reliable, and up-to-date Earth image data and metadata. Theavailability of these data sources has opened the opportunity to better supportexisting domain-oriented applications and to foster emerging new ones, fromagriculture to forestry, environmental monitoring to urban planning, climatestudies, and disaster monitoring. These sources of data, coupled with the devel-opment of machine learning algorithms have boosted the image processing fieldand their application in those different domains.
? Supported by H2020 grant for the CANDELA project from an H2020 EC research?? Copyright ©2021 for this paper by its authors. Use permitted under Creative Com-
mons License Attribution 4.0 International (CC BY 4.0).

2 B-H. Tran et al.
One common data format in satellite image processing is raster. A rastermodels geographic phenomena as a regular surface in which each cell (or pixel)is associated with an indicator or a phenomenal value according to a predefinedcodification or classification. Such representations may be automatically builtby different types of algorithms including machine learning. Several rasters canbe provided for the same geographic area to monitor the same phenomenonat different dates or different phenomena; they can be compared, combined,used to generate a new one [19]. However, in a decision-making perspective, theinterpretation of their content requires higher-level representations associatedwith features that bring meaning to the areas of interest on Earth.
This paper addresses the integration of data calculated from rasters as away of qualifying geographic areas of interest, based on their spatio-temporalproperties. These areas of interest are usually represented as geospatial featuresin a vector format. We are interested in studying (i) the kind of ontology requiredto support knowledge extraction from EO data and to describe homogeneouslydifferent analysis results provided by the rasters; (ii) how to make accessible andusable rich EO data and (iii) how to enable the data traceability to enhance userconfidence and data exploitation. The contributions of this paper are as follows:(i) a generic vocabulary that allows the semantic and homogeneous descriptionof spatio-temporal data to qualify predefined areas (ii) a configurable semanticETL process based on the proposed model (iii) an EO eco-system that allowsfor exploiting Sentinel images.
The rest of this paper is organized as follows. Section 1 presents the semanticmodel for integrating geographic areas and data extracted from rasters, throughtheir spatial and temporal dimensions. Section 2 details the semantic data inte-gration process. Section 3 discusses the experimental evaluation of our approach.The main related work is discussed in section 4 and finally, section 5 ends thepaper and presents the perspectives for future work.
1 Semantic model
We propose a semantic model to represent data from rasters that provide ob-served properties of a geographic area of interest (land parcel, administrativeunit, forest, etc.) along with their spatio-temporal dimensions. This model alsoallows keeping track of integrated data and image metadata. To this end, itrelies on a generic and modular ontology that extends vocabularies availableas OGC standards such as GeoSPARQL, and W3C recommendations such asOWL-Time1, SOSA2, DCAT3, and PROV-O4.
The model is composed of several sub-models describing the various kindsof data without the need of instantiating the whole model. These sub-modelsare a) a territorial observation model (for representing geospatial units and their
1 https://www.w3.org/TR/owl-time/2 https://www.w3.org/TR/vocab-ssn/3 https://www.w3.org/TR/vocab-dcat-2/4 https://www.w3.org/TR/prov-o/
Semantic Integration of Raster Data 3
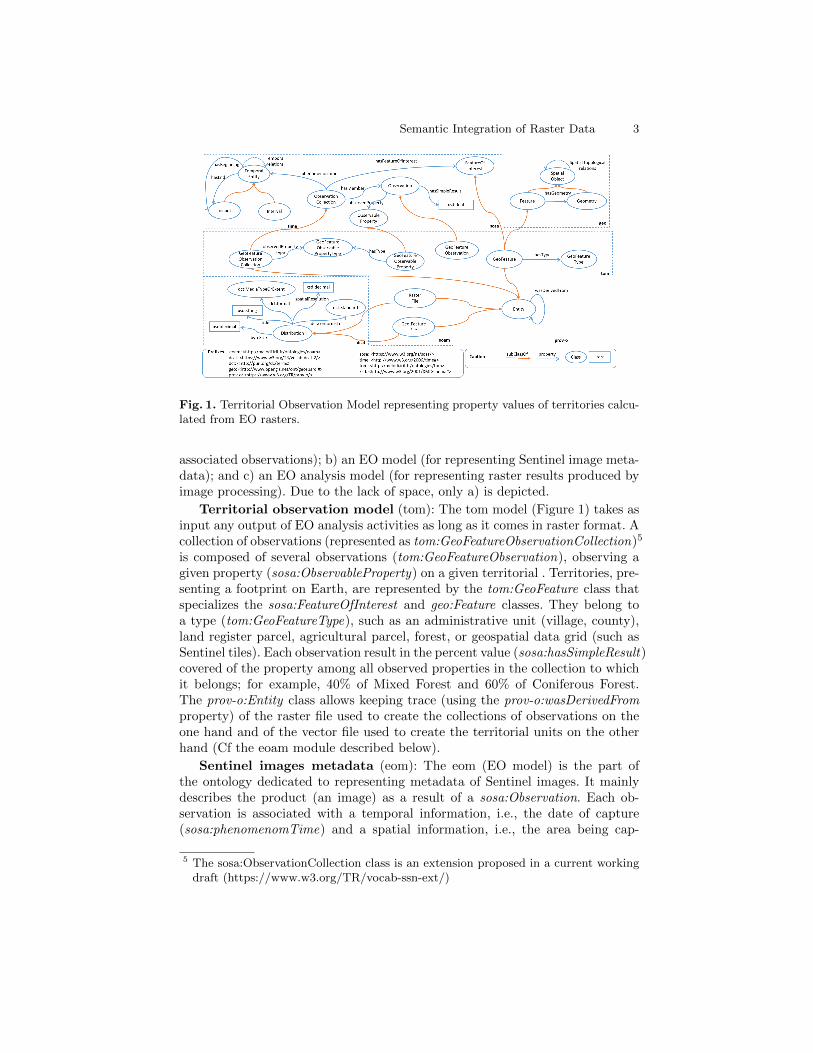
Fig. 1. Territorial Observation Model representing property values of territories calcu-lated from EO rasters.
associated observations); b) an EO model (for representing Sentinel image meta-data); and c) an EO analysis model (for representing raster results produced byimage processing). Due to the lack of space, only a) is depicted.
Territorial observation model (tom): The tom model (Figure 1) takes asinput any output of EO analysis activities as long as it comes in raster format. Acollection of observations (represented as tom:GeoFeatureObservationCollection)5
is composed of several observations (tom:GeoFeatureObservation), observing agiven property (sosa:ObservableProperty) on a given territorial . Territories, pre-senting a footprint on Earth, are represented by the tom:GeoFeature class thatspecializes the sosa:FeatureOfInterest and geo:Feature classes. They belong toa type (tom:GeoFeatureType), such as an administrative unit (village, county),land register parcel, agricultural parcel, forest, or geospatial data grid (such asSentinel tiles). Each observation result in the percent value (sosa:hasSimpleResult)covered of the property among all observed properties in the collection to whichit belongs; for example, 40% of Mixed Forest and 60% of Coniferous Forest.The prov-o:Entity class allows keeping trace (using the prov-o:wasDerivedFromproperty) of the raster file used to create the collections of observations on theone hand and of the vector file used to create the territorial units on the otherhand (Cf the eoam module described below).
Sentinel images metadata (eom): The eom (EO model) is the part ofthe ontology dedicated to representing metadata of Sentinel images. It mainlydescribes the product (an image) as a result of a sosa:Observation. Each ob-servation is associated with a temporal information, i.e., the date of capture(sosa:phenomenomTime) and a spatial information, i.e., the area being cap-
5 The sosa:ObservationCollection class is an extension proposed in a current workingdraft (https://www.w3.org/TR/vocab-ssn-ext/)
4 B-H. Tran et al.
tured (either by the geometry property of the eom:Product or through thesosa:hasFeatureOfInterest relation).
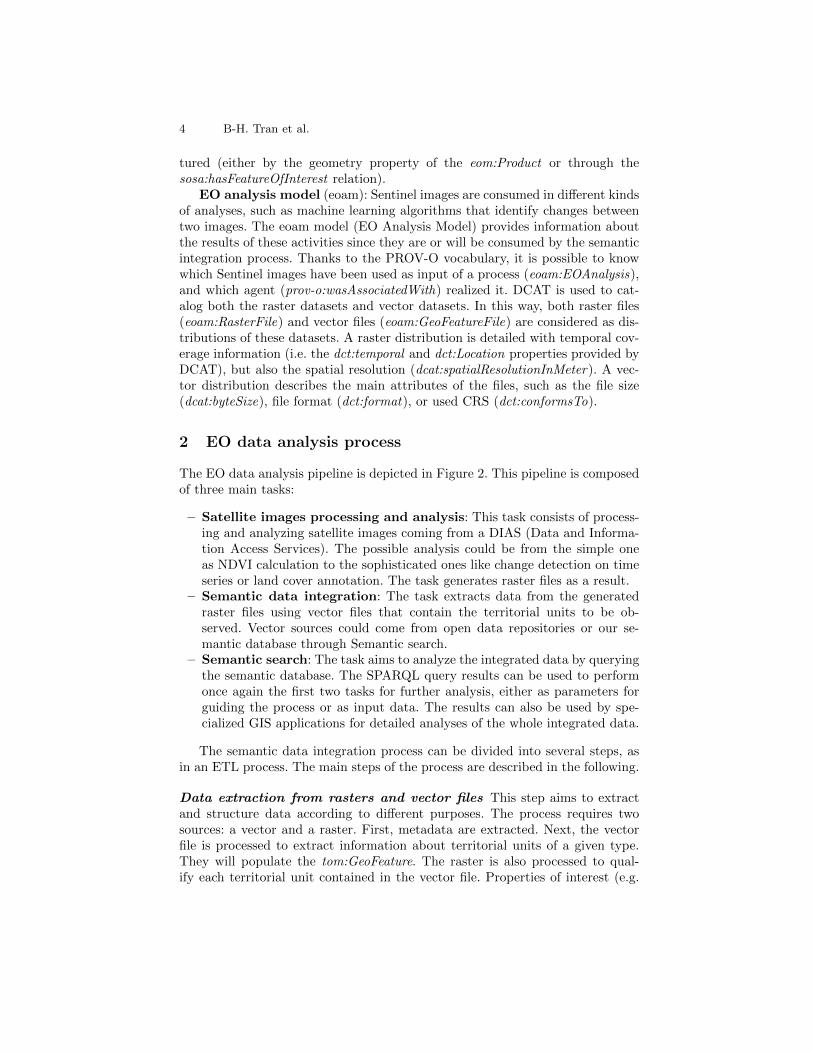
EO analysis model (eoam): Sentinel images are consumed in different kindsof analyses, such as machine learning algorithms that identify changes betweentwo images. The eoam model (EO Analysis Model) provides information aboutthe results of these activities since they are or will be consumed by the semanticintegration process. Thanks to the PROV-O vocabulary, it is possible to knowwhich Sentinel images have been used as input of a process (eoam:EOAnalysis),and which agent (prov-o:wasAssociatedWith) realized it. DCAT is used to cat-alog both the raster datasets and vector datasets. In this way, both raster files(eoam:RasterFile) and vector files (eoam:GeoFeatureFile) are considered as dis-tributions of these datasets. A raster distribution is detailed with temporal cov-erage information (i.e. the dct:temporal and dct:Location properties provided byDCAT), but also the spatial resolution (dcat:spatialResolutionInMeter). A vec-tor distribution describes the main attributes of the files, such as the file size(dcat:byteSize), file format (dct:format), or used CRS (dct:conformsTo).
2 EO data analysis process
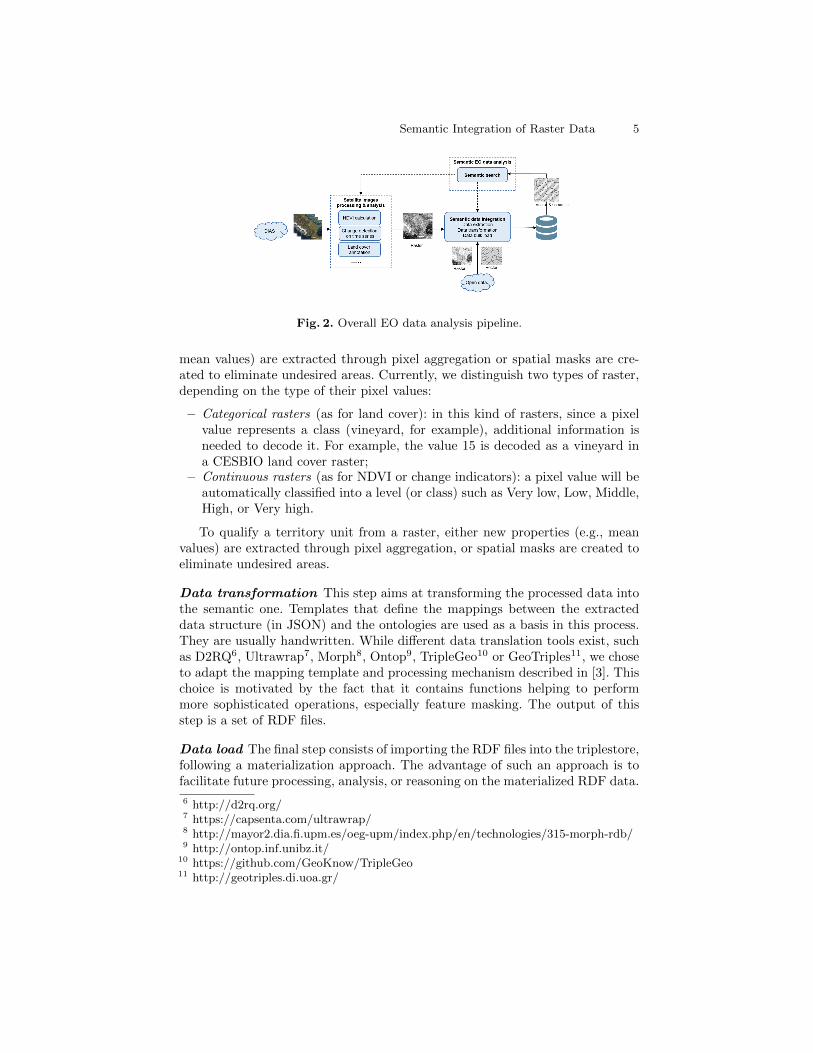
The EO data analysis pipeline is depicted in Figure 2. This pipeline is composedof three main tasks:
– Satellite images processing and analysis: This task consists of process-ing and analyzing satellite images coming from a DIAS (Data and Informa-tion Access Services). The possible analysis could be from the simple oneas NDVI calculation to the sophisticated ones like change detection on timeseries or land cover annotation. The task generates raster files as a result.
– Semantic data integration: The task extracts data from the generatedraster files using vector files that contain the territorial units to be ob-served. Vector sources could come from open data repositories or our se-mantic database through Semantic search.
– Semantic search: The task aims to analyze the integrated data by queryingthe semantic database. The SPARQL query results can be used to performonce again the first two tasks for further analysis, either as parameters forguiding the process or as input data. The results can also be used by spe-cialized GIS applications for detailed analyses of the whole integrated data.
The semantic data integration process can be divided into several steps, asin an ETL process. The main steps of the process are described in the following.
Data extraction from rasters and vector files This step aims to extractand structure data according to different purposes. The process requires twosources: a vector and a raster. First, metadata are extracted. Next, the vectorfile is processed to extract information about territorial units of a given type.They will populate the tom:GeoFeature. The raster is also processed to qual-ify each territorial unit contained in the vector file. Properties of interest (e.g.
Semantic Integration of Raster Data 5
Fig. 2. Overall EO data analysis pipeline.
mean values) are extracted through pixel aggregation or spatial masks are cre-ated to eliminate undesired areas. Currently, we distinguish two types of raster,depending on the type of their pixel values:
– Categorical rasters (as for land cover): in this kind of rasters, since a pixelvalue represents a class (vineyard, for example), additional information isneeded to decode it. For example, the value 15 is decoded as a vineyard ina CESBIO land cover raster;
– Continuous rasters (as for NDVI or change indicators): a pixel value will beautomatically classified into a level (or class) such as Very low, Low, Middle,High, or Very high.
To qualify a territory unit from a raster, either new properties (e.g., meanvalues) are extracted through pixel aggregation, or spatial masks are created toeliminate undesired areas.
Data transformation This step aims at transforming the processed data intothe semantic one. Templates that define the mappings between the extracteddata structure (in JSON) and the ontologies are used as a basis in this process.They are usually handwritten. While different data translation tools exist, suchas D2RQ6, Ultrawrap7, Morph8, Ontop9, TripleGeo10 or GeoTriples11, we choseto adapt the mapping template and processing mechanism described in [3]. Thischoice is motivated by the fact that it contains functions helping to performmore sophisticated operations, especially feature masking. The output of thisstep is a set of RDF files.
Data load The final step consists of importing the RDF files into the triplestore,following a materialization approach. The advantage of such an approach is tofacilitate future processing, analysis, or reasoning on the materialized RDF data.
6 http://d2rq.org/7 https://capsenta.com/ultrawrap/8 http://mayor2.dia.fi.upm.es/oeg-upm/index.php/en/technologies/315-morph-rdb/9 http://ontop.inf.unibz.it/
10 https://github.com/GeoKnow/TripleGeo11 http://geotriples.di.uoa.gr/

6 B-H. Tran et al.
3 Experimental evaluation
3.1 Application use cases
Two use cases of the CANDELA project have been chosen for demonstration:
– Vineyard use case: The objective of the use case is to retrieve changes invineyards that were damaged by natural hazards such as frost or hail. Thearea of study is located in the Aquitaine region, in France. The vineyards ofthe area were reported heavily damaged by frost on the 20th of April 2017.
– Urban expansion use case: The use case aims at studying the changesrelated to urban expansion in agricultural areas. We study changes in villagesaround Bordeaux city, one of the largest cities in France, and it is surroundedby agricultural areas, between 2017 and 2020.
Both use cases share a common set of raster types:
– Change indicator: Change indicators, representing the probability of changes(between 0 and 1) of pixels of two Sentinel images, are obtained by executingtools from partners of the project.
– NDVI: NDVI information is obtained by processing near-infrared and redsensors of Sentinel images. The output values are between -1 and 1. Sincethe values between -1 and 0 represent the elements composed of water, thesevalues are set to 0 so that the rasters only contain values between 0 and 1.
– Land cover: The datasets provide land cover information given an area onEarth. The CESBIO land cover datasets12 are used for our use cases. Theycover the French territory with a spatial resolution of 10m2.
Regarding the territorial units (vector data), land register data is used forthe first use case while the second consumes administrative unit data:
– Land register: Land register data is available from the French governmentdata website13 in GeoJSON format or shapefiles.
– Administrative unit data: Information of villages inside an area of interestcan be obtained from the French government website14. The datasets areavailable in shapefiles and are updated yearly. Administrative units are linkedto the INSEE RDF database15.
3.2 Model genericity
The genericity of the model is proved by the facts that: (i) The model treatsin the same manner whatever the raster datasets, and their versions, as long asthey exist in the right format; (ii) Different classifications can be used to observethe same type of EO property; (iii) The system can consume whatever the vectorsource describes any territorial divisions.
12 http://osr-CESBIO.ups-tlse.fr/ oso/13 https://cadastre.data.gouv.fr/datasets/cadastre-etalab14 https://www.data.gouv.fr/en/datasets/decoupage-administratif-communal-
francais-issu-d-openstreetmap15 https://rdf.insee.fr/

Semantic Integration of Raster Data 7
3.3 Pipeline genericity
Since the components of the pipeline are organized as services (python functionsand docker images), the users can customize the pipeline by choosing and chain-ing up as many services as they like through Jupyter notebooks of the platform.
– Vineyard use case: (i) we first obtain all parcels of the Saint Emilion villagefrom the land register data and CESBIO land cover raster for 2017. Semanticdata integration is next used to integrate land cover and parcel information.(ii) Vineyard parcels inside the villages are retrieved via Semantic search. (iii)Appropriated Sentinel-2 images are used for NDVI calculation. (iv) Theseimages are also used for change detection. (v) The generated rasters fromthe 3rd and 4th steps along with the vector from the 2nd step are integratedinto the semantic database. (vi) Finally, semantic search can be used foranalyzing all integrated information related to the vineyard of interest.
– Urban expansion use case: (i) We first select adapted Sentinel images andexecute NDVI calculation. (ii) These images are also used for change detec-tion. (iii) We obtain vector data of all villages of the Gironde department.Semantic data integration is next launched using the raster generated fromthe previous step and the obtained vector files. iv) Finally, we perform asemantic search to analyze the integrated data related to the villages ofinterest.
Fig. 3. Analyse on the vineyards during the period 19th April 2017 - 29th April 2017.Left: Change level detected. Right: Degradation of NDVI.
The semantic data integration is configurable with a set of parameters thatcan be provided as raster metadata or as function parameters. Users can alsoprovide custom thresholds for class classification since the results of image pro-cessing and analysis may highly depend on the scenarios.

8 B-H. Tran et al.
3.4 Use cases analysis
We evaluate the result obtained using the pipeline presented in 3.3, knowingthat the results highly depend on the precision of the algorithms provided byour partners.
– Vineyard use case: Two Sentinel-2 images collected on the T30TYQ tileare used for change detection and NDVI computation; they are respectivelydated 2017/04/19 and 2017/04/29: the choice of these images is based onthe fact that they have very low cloud cover (0% and 15%) and the intervalbetween these observations covers the period of study.Figure 3 represents an overview of the change levels detected and the degra-dation of NDVI The Very low change level is eliminated since it’s not veryrelevant. The NDVI degradation indicator represents the total percentage ofdegradation of five NDVI levels. We also eliminated parcels having the NDVIdegradation below 20% . Finally, there are 858 parcels detected as havingchanged, 756 parcels detected as having NDVI degradation above 20%, and510 parcels detected in both cases.
– Urban expansion use case: For NDVI calculation and change detection,it is recommended to collect images in the same period and in summerto limit the cloud cover and the influence of vegetation growth. So, twoSentinel-2 images were collected on 2nd August 2017 and 6th August 2020and have 0% of cloud cover. Figure 4 (right) represents an overview of thechange levels detected and the NDVI levels degraded between these twodates, together with the source Sentinel images (left). We can observe that:(i) the change levels detected match quite well with the degraded NDVI dueto urbanization; (ii) the more the village approaches the city, the more itis changed. The next analysis could be comparing change, NDVI and landcover information at parcel level for particular villages.
Fig. 4. Analyse on urban expansion (2017-2020) at village level. Left (Sentinel images).Right: village INSEE code, change and NDVI indicators.

Semantic Integration of Raster Data 9
3.5 Approach scalability
In terms of triplestore, we first opted for Strabon16 for its many advantages.It has a good overall performance thanks to particular optimization techniquesthat allow spatial operations to take advantage of PostGIS functionality insteadof relying on external libraries [16]. For complex applications that include bothspatial joins or spatial aggregations, Strabon is the only RDF store that performswell [13]. While Strabon performed well when considering a reduced numberof triples in the data store, we faced scalability problems when increasing thenumber of triples. Indeed, the same remarks are reported in [17]. For thesereasons, we thus examined query federation approaches where the data is storedin different triplestores. In our case, Strabon is used only for spatial data andGraphDB17 for the rest. Preliminary experiments showed several advantages ofthis option: (i) faster response time for non-spatial queries (ii) scalable and robustas it ensures the result regardless of the amount of integrated data. In terms ofthe size of the generated RDF datasets, we populated 0.5M geofeatures (about2.5M triples) in Strabon and 4M observations (97.5M triples) in GraphDB usingtheir API. The processing and loading time on a virtual node (4 cores CPU at2.6GHz, 8GB of RAM, and SSD disk) was about 40 hours.
4 Related Work
4.1 Semantic ETL and models for EO data integration
Different semantic ETL proposals have addressed the transformation and in-tegration of (open) EO data to LOD. In [20], the authors model EO imageryas a data cube with a specific place and time, thanks to the W3C RDF DataCube (QB) ontology [9]. This model combines standard vocabularies such asSSN, OWL-Time, SKOS, and PROV-O. In [14], QB was used to publish tabulartime series data and to structure it into slices that support multiple views onthe data. As a spatio-temporal data cube, the semantic EO data cube [5] con-tains EO data where for each observation at least one nominal interpretation isavailable. Following a semantic ETL approach along with ontology-based dataaccess (OBDA), [7] extends Data Cube, GeoSPARQL, and OWL-Time ontolo-gies to offer access to Copernicus services information. Here, SOSA is adoptedto represent observation collections but alignments18 exist between SOSA andQB. Closer to us, [11] defined an ETL process to integrate EO image and ex-ternal data sources, such as Corine Land cover, Urban Atlas and Geonames.The process is carried out based on their SAR ontology. Another close work interms of datasets is from [18], where data is integrated and published as LODbased on an ontology, called proDataMarket. Three data sources, the Spanishland parcel identification system, Sentinel-2 satellite, and LiDAR flights, are
16 http://strabon.di.uoa.gr/17 https://graphdb.ontotext.com/18 https://www.w3.org/TR/vocab-ssn/

10 B-H. Tran et al.
integrated. In [1], satellite images are classified and enriched with additional se-mantic data to enable queries about what can be found at a particular location.In our approach, an exploitation of our integrated data could also be facilitatingthe image search. Finally, while we do not fully address the scalability of ourapproach, several works are addressing the issue of managing large volumes ofEO data.
4.2 Processing of raster data in a semantic framework
Raster data can be represented following two approaches: either by treating theentire raster grid as coverage or by providing procedures to extract vector objectsfrom the raster matrix. The first approach relies on constructing a semanticrepresentation of the raster pixels so that each pixel attributes (geometry, values)are maintained. In [2] the RDF Grid coverage ontology is designed to allow anative integration of coverage in RDF triplestores. The gridded structure of thedata is preserved and can be queried using SciSPARQL. Recently, the Ontop-spatial extension [8] has been developed to process raster data and create virtualgeospatial RDF views above it.
The second approach consists of extracting entities from rasters and repre-senting them as ontological features. These entities are sets of raster elements(i.e. sets of pixels) that meet a certain context-dependent definition. In [4], theapproach integrates and processes vector and raster data from LOD repositoriesusing vectorization and mathematical tools for geo-processing. First, boundingboxes for input raster are used to query LOD endpoints for entities correspond-ing to a certain concept. The returned entities along with their geometry arenext used to select raster pixels for supervised training based on content-baseddescriptors. Finally, the results can be vectorized and inserted back into theoriginal repository. In [11], the approach proposes to restructure the images inpatches that have a fixed size, on which external information is associated. Eachpatch is directly transformed into a feature based on the ontology. [12] extendscurrent standards to represent raster geo-data. A region of interest is first poly-gonized and then the data is transformed into a semantic representation usingR2RML mapping rules. This workaround is arguably not a complete solution torepresent raster files in RDF as the original geometric source of the data is notpreserved [15]. Here, the areas of interest are predefined, hence the geometries(polygons) are known. Another close work is from [10], where a raster allowsfor modeling geographic phenomena as a regular surface in which each cell (orpixel) is associated with a phenomenon value. However, they store each valueassociated with a pixel corresponding to an observation. Here, we aggregate thevalues of a region. While their modeling is close to ours in terms of reused vo-cabularies, they do not represent metadata and provenance nor exploit Sentinelimages. Finally, our work adapts the one presented in [6] in several ways, witha different focus on the pipeline that generates RDF data from EO rasters andother data sources. Moreover, we do not need to consider versions of adminis-trative units, and we explicitly refer to satellite images thanks to which we cancompute new indices

Semantic Integration of Raster Data 11
5 Conclusion
This paper presented an approach for the integration of data calculated fromrasters as a way of qualifying territorial units, based on their spatio-temporalfeatures. We proposed a modular and generic ontology for semantically and ho-mogeneously describing spatio-temporal data that qualify predefined areas, to-gether with the provenance of all sources of data. This ontology is generic enoughfor describing data that can be calculated from any source that conforms to araster format. We defined a configurable semantic ETL process guided by thisontology. The process extracts data from rasters and links observations to ter-ritorial units through their spatio-temporal dimensions. This process producesa semantic database that can be exploited for different purposes. We illustratedthe approach by integrating various raster datasets for two use cases of a jointproject. As future work, we plan to exploit big data scenarios with the manage-ment of Natura 2000 areas19. We also consider extending the proposed approachto deal with data coming from CSV, especially, weather observation data. Finally,we would like to publish our knowledge base as linked open data for scientificpurposes.
References
1. Marjan Alirezaie, Andrey Kiselev, Martin Langkvist, Franziska Klugl, and AmyLoutfi. An ontology-based reasoning framework for querying satellite images fordisaster monitoring. Sensors, 17(11), 2017.
2. A. Andrejev, D. Misev, P. Baumann, and T. Risch. Spatio-temporal gridded dataprocessing on the semantic web. In 2015 IEEE International Conference on DataScience and Data Intensive Systems, pages 38–45, Dec 2015.
3. H. Arenas, N. Aussenac-Gilles, C. Comparot, and C. Trojahn. Semantic Integrationof Geospatial Data from Earth Observations. In 20th Int. Conf. on KnowledgeEngineering and Knowledge Management, pages 97–100, 2016.
4. J. Arocena, J. Lozano, M. Quartulli, I. Olaizola, and J. Bermudez. Linked opendata for raster and vector geospatial information processing. In 2015 IEEE Inter-national Geoscience and Remote Sensing Symposium, pages 5023–5026, 2015.
5. Hannah Augustin, Martin Sudmanns, Dirk Tiede, Stefan Lang, and AndreaBaraldi. Semantic earth observation data cubes. Data, 4(3):102, 2019.
6. Tran B-H, Aussenac-Gilles N, Comparot C, and Trojahn C. Semantic Integrationof Raster Data for Earth Observation: An RDF Dataset of Territorial Unit Versionswith their Land Cover. International Journal of Geo-Information, 9(9), 2020.
7. Konstantina Bereta, Herve Caumont, Ulrike Daniels, Erwin Goor, ManolisKoubarakis, Despina-Athanasia Pantazi, George Stamoulis, Sam Ubels, ValentijnVenus, and Firman Wahyudi. The copernicus app lab project: Easy access tocopernicus data. In EDBT, 2019.
8. Konstantina Bereta, Guohui Xiao, and Manolis Koubarakis. Ontop-spatial: Ontopof geospatial databases. Journal of Web Semantics, 58:100514, 2019.
9. Dmitry Brizhinev, Sam Toyer, Kerry Taylor, and Zhiduo Zhang. Publishing andusing earth observation data with the rdf data cube and the discrete global gridsystem. Technical report, W3C and OGC, 2017.
19 https://www.eea.europa.eu/data-and-maps/data/natura-11
12 B-H. Tran et al.
10. L. Ding, G. Xiao, D. Calvanese, and L. Meng. A framework uniting ontology-based geodata integration and geovisual analytics. ISPRS International Journalof Geo-Information, 9(9), 2020.
11. Daniela Espinoza-Molina, Charalampos Nikolaou, Corneliu Octavian Dumitru,Konstantina Bereta, Manolis Koubarakis, Gottfried Schwarz, and Mihai Datcu.Very-High-Resolution SAR Images and Linked Open Data Analytics Based onOntologies. IEEE Journal of Selected Topics in Applied Earth Observations andRemote Sensing, 8(4):1696 – 1708, 2015.
12. Timo Homburg, Claire Prudhomme, Falk Wurriehausen, Ashish Karmacharya,Frank Boochs, Ana Roxin, and Christophe Cruz. Interpreting heterogeneousgeospatial data using semantic web technologies. In Osvaldo Gervasi, BeniaminoMurgante, Sanjay Misra, Ana Maria A.C. Rocha, Carmelo M. Torre, David Taniar,Bernady O. Apduhan, Elena Stankova, and Shangguang Wang, editors, Compu-tational Science and Its Applications – ICCSA 2016, pages 240–255, Cham, 2016.Springer International Publishing.
13. Theofilos Ioannidis, George Garbis, Kostis Kyzirakos, Konstantina Bereta, andManolis Koubarakis. Evaluating geospatial RDF stores using the benchmark geo-graphica 2. CoRR, abs/1906.01933, 2019.
14. Laurent Lefort, Josh Bobruk, Armin Haller, Kerry Taylor, and Andrew Woolf. Alinked sensor data cube for a 100 year homogenised daily temperature dataset. InProceedings of the 5th International Conference on Semantic Sensor Networks -Volume 904, SSN’12, page 1–16, Aachen, DEU, 2012. CEUR-WS.org.
15. Ikrom Nishanbaev, Erik Champion, and David Mcmeekin. A survey of geospatialsemantic web for cultural heritage. Heritage, 2:1471–1498, 05 2019.
16. K. Patroumpas, G. Giannopoulos, and S. Athanasiou. Towards geospatial seman-tic data management: Strengths, weaknesses, and challenges ahead. In Proc. ofthe 22Nd ACM SIGSPATIAL Int. Conf. on Advances in Geographic InformationSystems, pages 301–310, New York, USA, 2014. ACM.
17. Hoan Nguyen Mau Quoc, M. Serrano, Han Nguyen Mau, John G. Breslin, andDanh Le-Phuoc. A performance study of rdf stores for linked sensor data. viXra,2019.
18. Dina Sukhobok, Hector Sanchez, Jesus Estrada, and Dumitru Roman. Linkeddata for common agriculture policy: Enabling semantic querying over sentinel-2 and lidar data. ISWC 2017 Posters & Demonstrations and Industry Tracks(ISWC-PD-Industry), number 1963 in CEUR Workshop Proceedings, 2017.
19. Jesus Villegas, Hector Sanchez Pastor, Lorena Hernanz, Marıa Checa, and DumitruRoman. Enabling the use of sentinel-2 and lidar data for common agriculture policyfunds assignment. International Journal of Geo-Information, 6:255, 08 2017.
20. Christian Zinke and Axel-Cyrille Ngonga Ngomo. Discovering and linking spatio-temporal big linked data. IGARSS 2018 - 2018 IEEE International Geoscienceand Remote Sensing Symposium, pages 411–414, 2018.
Copyright © 2022 FDOKUMEN