Selective NH 3 oxidation on (110) and (111) iridium surfaces
11
Journal of Catalysis 235 (2005) 92–102 www.elsevier.com/locate/jcat Selective NH 3 oxidation on (110) and (111) iridium surfaces C.J. Weststrate a,∗ , J.W. Bakker a , E.D.L. Rienks a , J.R. Martinez a , C.P. Vinod a,b , S. Lizzit c , L. Petaccia c , A. Baraldi d,e , B.E. Nieuwenhuys a,b a Leids Instituut voor chemisch onderzoek, Universiteit Leiden, PO Box 9502, Einsteinweg 55, 2333 CC Leiden, The Netherlands b Technische Universiteit Eindhoven, Schuit Institute of Catalysis, PO Box 5600 MB, Eindhoven, The Netherlands c Sincrotrone Trieste, Strada Statale 14, km 163.5, I-34012 Basovizza, Italy d Physics Department and Center of Excellence for Nanostructured Materials, Trieste University, Via Valerio 2, I-34127 Trieste, Italy e Laboratorio TASC-INFM, S.S. 14, km 163.5, I-34012 Trieste, Italy Received 10 June 2005; revised 22 July 2005; accepted 25 July 2005 Available online 22 August 2005 Abstract Ammonia oxidation was studied in situ on Ir(110) and Ir(111) under low-pressure (∼10 −7 mbar) conditions. NH 3 does not dissociate on a flat Ir(111) surface, but surface defects and O ad facilitate NH 3 ad decomposition. High-energy resolution fast XPS measurements were used to monitor the surface coverage during reaction on Ir(110), and temperature-programmed reaction measurements were applied to reveal the gas phase reaction products during reaction. The steady-state NH 3 oxidation reaction starts between 350 and 500 K on both surfaces, which also show similar selectivity. Below 600 K, N 2 and H 2 O are the principal reaction products. Above 600 K, the selectivity changes to NO and H 2 O, with the exact temperature depending on the NH 3 :O 2 pressure ratio. The surface population changes from NH ad /N ad to O ad around 500 K, about 200 K lower than the selectivity change from N 2 to NO observed in the gas phase. This behavior can be explained by considering the activation energies for N 2 and NO ad formation. We present a model to explain why Ir is more selective toward N 2 than Pt. 2005 Elsevier Inc. All rights reserved. PACS: 82.20.-w; 82.30.-b; 82.45.Jn; 82.65.+r; 82.80.Pv Keywords: NH 3 ; Ammonia oxidation; Ir(110); Ir(111); Iridium; X-Ray photoelectron spectroscopy; Selective oxidation; Catalytic surface science 1. Introduction Since the advent of strict pollution control regulations, clean processes and waste gas stream cleaning have become important issues in the chemical industry. Ammonia is one of the pollutants that must be removed from waste streams. In the environment, NH 3 is converted to nitrite and nitrate. Nitrate contributes to acid rain and can cause unwanted fer- tilization of surface waters and delicate ecosystems. Ammo- nia can be removed from a waste stream via oxidation toward N 2 and H 2 O, using a heterogeneous catalyst. Van den Broek, Grondelle, and van Santen [38] have shown that Ir is an active catalyst for the oxidation of NH 3 * Corresponding author. E-mail address: [email protected] (C.J. Weststrate). into N 2 and H 2 O. Ir catalysts also show a high selectivity toward N 2 rather than NO x . Carabineiro and Nieuwenhuys [9,10] investigated the oxidation of NH 3 on Ir(110) and Ir(510) using temperature-programmed desorption (TPD) and temperature-programmed reaction (TPR) between 300 and 800 K. They found that the Ir(110) surface showed se- lectivity toward N 2 , but a small amount of N 2 O was also observed. They concluded that Ir(510) is more active and selective (less N 2 O) than Ir(110). In contrast to what was re- ported for Ir(110), Ir(510) and Ir(100) [9,10,12,34,39], NH 3 does not dissociate on Ir(111) [27,32]. In recent work, we discussed some fundamental aspects of adsorption and decomposition of NH 3 on Ir(110), as well as the effect of oxygen on ammonia adsorption and decom- position [39,40]. In these experiments we adsorbed ammonia at a low surface temperature and subsequently heated the 0021-9517/$ – see front matter 2005 Elsevier Inc. All rights reserved. doi:10.1016/j.jcat.2005.07.022
Transcript of Selective NH 3 oxidation on (110) and (111) iridium surfaces
t
ewereied to revealces,
es to
ed by
Journal of Catalysis 235 (2005) 92–102
www.elsevier.com/locate/jca
Selective NH3 oxidation on (110) and (111) iridium surfaces
C.J. Weststratea,∗, J.W. Bakkera, E.D.L. Rienksa, J.R. Martineza, C.P. Vinoda,b, S. Lizzitc,L. Petacciac, A. Baraldid,e, B.E. Nieuwenhuysa,b
a Leids Instituut voor chemisch onderzoek, Universiteit Leiden, PO Box 9502, Einsteinweg 55, 2333 CC Leiden, The Netherlandsb Technische Universiteit Eindhoven, Schuit Institute of Catalysis, PO Box 5600 MB, Eindhoven, The Netherlands
c Sincrotrone Trieste, Strada Statale 14, km 163.5, I-34012 Basovizza, Italyd Physics Department and Center of Excellence for Nanostructured Materials, Trieste University, Via Valerio 2, I-34127 Trieste, Italy
e Laboratorio TASC-INFM, S.S. 14, km 163.5, I-34012 Trieste, Italy
Received 10 June 2005; revised 22 July 2005; accepted 25 July 2005
Available online 22 August 2005
Abstract
Ammonia oxidation was studied in situ on Ir(110) and Ir(111) under low-pressure(∼10−7 mbar) conditions. NH3 does not dissociaton a flat Ir(111) surface, but surface defects and Oad facilitate NH3 ad decomposition. High-energy resolution fast XPS measurementsused to monitor the surface coverage during reaction on Ir(110), and temperature-programmed reaction measurements were applthe gas phase reaction products during reaction. The steady-state NH3 oxidation reaction starts between 350 and 500 K on both surfawhich also show similar selectivity. Below 600 K, N2 and H2O are the principal reaction products. Above 600 K, the selectivity changNO and H2O, with the exact temperature depending on the NH3:O2 pressure ratio. The surface population changes from NHad/Nad to Oadaround 500 K, about 200 K lower than the selectivity change from N2 to NO observed in the gas phase. This behavior can be explainconsidering the activation energies for N2 and NOad formation. We present a model to explain why Ir is more selective toward N2 than Pt. 2005 Elsevier Inc. All rights reserved.
PACS:82.20.-w; 82.30.-b; 82.45.Jn; 82.65.+r; 82.80.Pv
Keywords:NH3; Ammonia oxidation; Ir(110); Ir(111); Iridium; X-Ray photoelectron spectroscopy; Selective oxidation; Catalytic surface science
ns,comnems..fer-
mo-ard
H
itys
PD)300se-
ande-
ects
om-nia
d the
1. Introduction
Since the advent of strict pollution control regulatioclean processes and waste gas stream cleaning have beimportant issues in the chemical industry. Ammonia is oof the pollutants that must be removed from waste streaIn the environment, NH3 is converted to nitrite and nitrateNitrate contributes to acid rain and can cause unwantedtilization of surface waters and delicate ecosystems. Amnia can be removed from a waste stream via oxidation towN2 and H2O, using a heterogeneous catalyst.
Van den Broek, Grondelle, and van Santen[38] haveshown that Ir is an active catalyst for the oxidation of N3
* Corresponding author.E-mail address:[email protected](C.J. Weststrate).
0021-9517/$ – see front matter 2005 Elsevier Inc. All rights reserved.doi:10.1016/j.jcat.2005.07.022
e
into N2 and H2O. Ir catalysts also show a high selectivtoward N2 rather than NOx . Carabineiro and Nieuwenhuy[9,10] investigated the oxidation of NH3 on Ir(110) andIr(510) using temperature-programmed desorption (Tand temperature-programmed reaction (TPR) betweenand 800 K. They found that the Ir(110) surface showedlectivity toward N2, but a small amount of N2O was alsoobserved. They concluded that Ir(510) is more activeselective (less N2O) than Ir(110). In contrast to what was rported for Ir(110), Ir(510) and Ir(100)[9,10,12,34,39], NH3
does not dissociate on Ir(111)[27,32].In recent work, we discussed some fundamental asp
of adsorption and decomposition of NH3 on Ir(110), as wellas the effect of oxygen on ammonia adsorption and decposition[39,40]. In these experiments we adsorbed ammoat a low surface temperature and subsequently heate

C.J. Weststrate et al. / Journal of Catalysis 235 (2005) 92–102 93
and
e ofnia,
ite
eenn
.oniach-
:
lec-
ized
he
-
t-n Ptity.HK
da-st
con-
ap-andting
d attemec-
iresfront
ED
ts.s, tospe-
of
A,c-
ergyec-
r
eat-ved
on
des-itiveCO
g
ofthe,nts
ithnore-ured
hhis
surface in vacuum. The results demonstrated that NH3 de-composition takes place on Ir(110) in both the presencethe absence of Oad. Nitrogen formed via NH3 ad decompo-sition desorbs between 500 and 700 K in the absencOad. When oxygen is adsorbed before dosing the ammoa larger fraction of the NH3 ad decomposes. Oad especiallyenhances NHad dissociation, which would otherwise inhibNH3 ad dissociation below the NH3 desorption temperatur(400 K). In the presence of Oad we observed N2 formation at350 K, about 200 K lower than in the absence of Oad. This ef-fect of oxygen is assigned to repulsive interactions betwNad and Oad [14,28,40]. NOad/NO (g) was observed in aexperiment where a mixed Oad/NH3 ad layer was heated inthe presence of O2 (∼1× 10⁻⁷ mbar). NO forms when bothNad and Oad are present on the surface and above 450 K
Several steps in the mechanism responsible for ammoxidation on Ir catalysts remain topics of debate. Two meanisms have been proposed for N2 formation on Ir and PtNad combination[8,30,39] [Eq. (1)] and NHx ad combina-tion [17,19,20][Eq. (2)]
2Nad → N2(g), (1)
2NHx ad → N2(g) + xH2(g). (2)
Similar mechanisms are proposed for NO formation
Nad + Oad → NOad, (3)
NHx ad + (x + 1)Oad → NOad + xOHad. (4)
Another issue under discussion is the difference in setivity between Ir and Pt. Bradley, Hopkinson and King[8,26]proposed a reaction model for Pt(100), which is summarin the following set of equations:
2NH3 ad + 3Oad → 2Nad + 3H2O(g), (5)
Nad + Oad → NOad, (6)
NOad → Nad + Oad (>350 K), (7)
2Nad → N2(g), (8)
NOad → NO(g). (9)
Eq. (5) describes Oad-induced NH3 ad dehydrogenation. Nadformed in this step can desorb as N2 [Eq. (8)], but the majorpart reacts with Oad to form NOad [Eq. (6)]. NO dissociation[Eq. (7)] occurs only above 350 K, and is inhibited when tOad coverage is larger than 0.2 l. Above 350 K, Nad (formedvia NOad dissociation) desorbs as N2(g) via Eq.(8). Above400 K, NOad desorbs [Eq.(9)], a process favored over dissociation. In this way the selectivity shifts toward NO(g).
Van den Broek et al.[38] extended this model to Ir caalysts and attributed the difference in selectivity betweeand Ir catalysts to a difference in NO dissociation activNO dissociates more easily on Ir than on Pt; in the Bmodel this means that the reaction rate of Eq.(7) is larger,and thus N2 is the principal product.
We report new experimental results for ammonia oxition on Ir(110), obtained with high-energy resolution fa
XPS and TPR. XPS allows us to measure the nature andcentration of different surface species (NHx ad, Oad, NOad)in situ during reaction, for different temperatures. Thisproach, combining information about surface coveragegas phase products, is a powerful method for investigathe reaction mechanism.
2. Experimental
The TPD and TPR measurements were performethe Leiden Institute of Chemistry using a vacuum sysequipped with a differentially pumped, shielded mass sptrometer, to reduce the contribution from the heating wand the edges of the crystal. The sample was placed inof a 2-mm-wide hole, at a distance of∼2 mm. The system isequipped with a sputter gun for sample cleaning, and LEoptics. The base pressure of the system is<5× 10⁻¹⁰ mbar.A heating rate of 0.5 K/s was used for all TPR experimenA linear background was subtracted from the TPR resultcorrect for the slow increase in the partial pressures, ecially for m/e = 28 (N2 and CO) andm/e = 18 (H2O).
For the TPD experiments on Ir(111), a heating rate5 K/s was used. In some experiments15NH3 was used todistinguish between N2 and CO.
High-energy resolution fast XPS measurements[4,6]were performed at the SuperESCA beamline of ELETTRthe synchrotron radiation facility in Trieste, Italy. The vauum system, with a base pressure of∼1 × 10⁻¹⁰ mbar, isequipped with a double-pass hemispherical electron enanalyzer[7], a sputter gun for sample cleaning, a mass sptrometer, and LEED optics.
Both Ir(110) and Ir(111) surfaces were cleaned with A+sputtering and annealing cycles (∼1200 K), followed byoxygen treatments at 700–1000 K and a final hydrogen trment to remove oxygen. Residual hydrogen was remoby a flash to 700 K. O1s and C1s core level regions didnot show oxygen or carbon contamination after cleaningIr(110). For Ir(111), LEED, AES, and oxygen TPD[24,36]were used to check for surface contaminants. Thermalorption of an oxygen-covered surface is especially sensfor surface carbon. Carbon present on the surface formsor CO2 in the presence of Oad, which is then detected durinthe heating ramp.
N1s spectra were measured with a photon energy496 eV; O1s spectra, with a photon energy of 650 eV. Fortemperature-programmed XPS (TP-XPS)[5] measurementsa heating rate of 0.3 K/s was used. The XPS measuremewere done only for Ir(110).
The XPS data were evaluated by fitting the spectra wDoniach–Sunjic functions[25], convoluted with a Gaussiafunction and superimposed on a linear background. Clevel binding energies of the different species were measwith respect to the Fermi level.
According to Ibbotson et al.[36] a surface saturated witO2 at 200 K results in a coverage of 1 monolayer (ML). T
94 C.J. Weststrate et al. / Journal of Catalysis 235 (2005) 92–102
trily
ts,c-rethem-S,
t the
n
per-ved,
theaf-)
hat
v-
d
eb-
ilar
l
110)
ethe
ess10),
ina-
es
-dred.
red
asesthatn
was used to calibrate theO1s signal. Because we do nohave any reference structure for nitrogen we have arbitranormalized the sum of all N1s species at 300 K to 1.
The ammonia pressure was 5× 10⁻⁸ mbar during theTP-XPS and 1× 10⁻⁷ mbar during the TPR measuremenrespectively, and the O2 partial pressure was adjusted acording to the NH3:O2 pressure ratio. A different pressuwas used in the TPR experiments to compensate forshielded MS. Because of the close proximity of the saple surface to the entrance of the differentially pumped Mthe reactant pressure is expected to be slightly lower asample surface than in the rest of the vacuum chamber.
3. Results and discussion
3.1. NH3 decomposition on Ir(111): TPD experiments
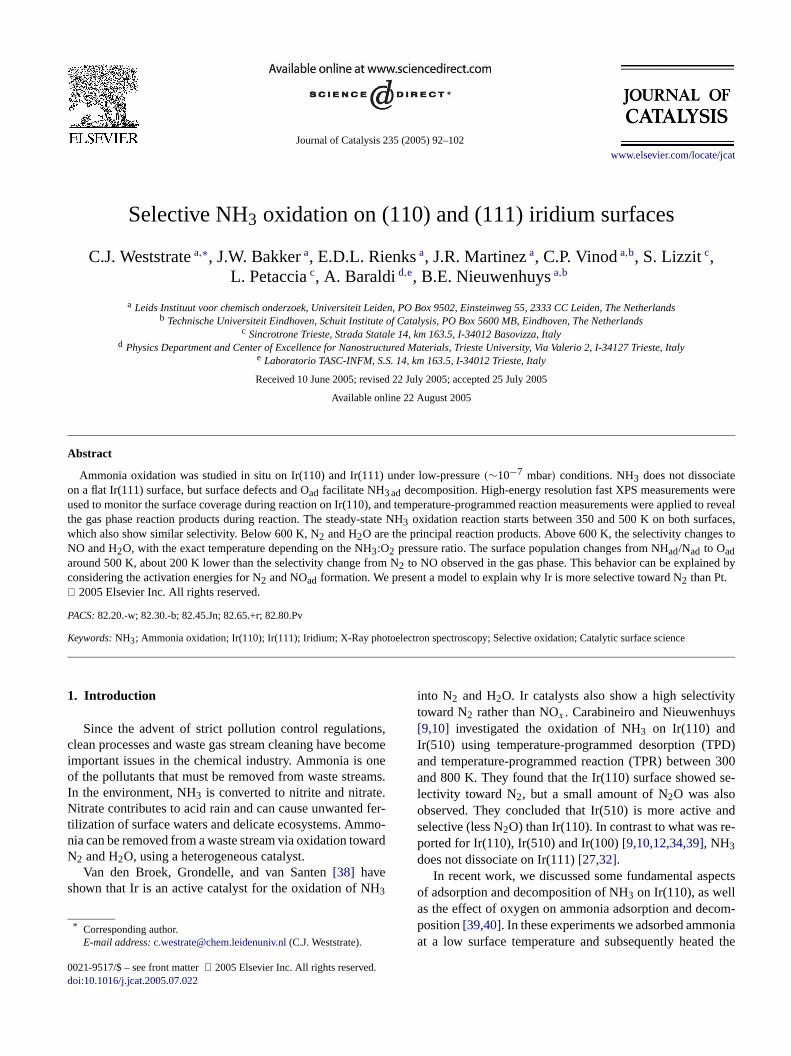
TPD and TPR experiments (Fig. 1) were performedto characterize NH3 ad adsorption and decomposition oIr(111). Panel (a) shows NH3 desorption (TPD, 5 K/s) afterdifferent exposures to ammonia at 100 K. In these eximents only molecular ammonia desorption was obserwithout the formation of N2(g) and H2(g). This result con-firms the finding of Purtell et al.[32] that NH3 ad does notdecompose on Ir(111).
Panel (b) shows the effect of preadsorbed oxygen onstability of NH3 ad. The desorption spectra were obtainedter the surface was exposed to O2(10 L at 200 K, saturationand subsequently exposed to15NH3 (5 L, saturation). BothN2 and H2O desorption are observed. In contrast to wwas found for the initially clean surface, NH3 ad dissociatedin the presence of Oad, similar to what was observed for seeral other transition metals, such as Pt, Ni, Cu, and Ag[1,11,16,18,21,22,35,37]. 15N2 desorption occurred at aroun500 K, a temperature comparable to the N2 desorption peakmeasured after NH3 decomposition from Ir(100), but unlikthe N2 desorption observed from Ir(110) in either the asence (620 K[9,39,40]) or the presence (350 K[40]) of Oad.Water formation occurred between 200 and 400 K, simto what was observed for Ir(110)[40]. Nitrogen desorptionoccurred around 500 K, above the H2O formation temper-ature. This shows that Nad combination rather than NH3 addehydrogenation is the rate-determining step for N2 forma-tion. Comparing the15N2 desorption of panel (b) with pane(c), e.g. N2 formation in the absence of Oad shows that thepresence of Oad exerts only a small influence on the N2 des-orption temperature, not as large as that observed for Ir((repulsive interaction[14,28,40]). An explanation for thisobservation could be that all Oad is consumed during thNH3 ad dehydrogenation and there is no oxygen left attemperature where Nad desorption occurs.
The fact that NH3 dissociates spontaneously on the ldensely packed (110) and (100) surface structures Ir(1but not on Ir(111), suggests that atoms with a low coordtion number play an important role in the NH3 decomposi-
Fig. 1. NH3 decomposition on Ir(111). (a) Molecular NH3 desorption afteruptake at 100 K (no decomposition observed, heating rate 5 K/s); (b)15N2desorption after exposure of an Oad covered surface to15NH3 (5 L 15NH3,5 K/s); and (c) steady state15NH3 decomposition on sputtered surfac(15NH3 pressure 1× 10⁻⁷ mbar, heating rate 0.5 K/s).
tion process. Mortensen et al.[31] reported that the dissociative sticking coefficient of NH3 on Ru(0001), a close-packestructure, is enhanced when the surface is slightly sputteThe present study found similar behavior for NH3 dissocia-tion on Ir(111). Panel (c) shows that15NH3 decompositionoccurs as a steady-state reaction (1× 10⁻⁷ mbar 15NH3,heating rate 0.5 K/s) after the surface has been sputte(energy, 2 keV; sample current,∼5 µA, time 0–180 s). Thereaction rate reaches a maximum at 580 K and decreabove this temperature. This behavior is very similar toof steady-state NH3 decomposition on Ir(110), shown i
C.J. Weststrate et al. / Journal of Catalysis 235 (2005) 92–102 95
t aminde-
thatem-edredcanhedre,erdel
ddur-
80 Kowslu-
uslyd to
te
Oe-
low
ciesnt
x-
e-–t-
-d
spec-) Thein a
400l-
r N
ag
state
omatture,-e
er(g)
ep-
Ref. [39], in which a similar maximum was observed asimilar temperature. The fact that the smooth surface (0of sputtering) also shows some activity is attributed tofects on the annealed surface. Some authors reportedNH3 dissociates on Pt surfaces above its desorptionperature [23,30], and this might contribute to the observactivity of the untreated surface as well. For the sputtesurfaces, the heating and cooling branches show signifidifferences in activity. The maximum temperature reacduring the experiments was 1100 K. At this temperatuthe surface partially reorders, and thus reactivity is lowin the cooling branch. Our observations support the moproposed by Mortensen et al.[31] in which defects, suchas steps and kinks, are responsible for NH3 dissociation onsmooth surfaces like Ru(0001) and Ir(111).
3.2. TPR and XPS measurements during the NH3/O2
reaction on Ir(110)
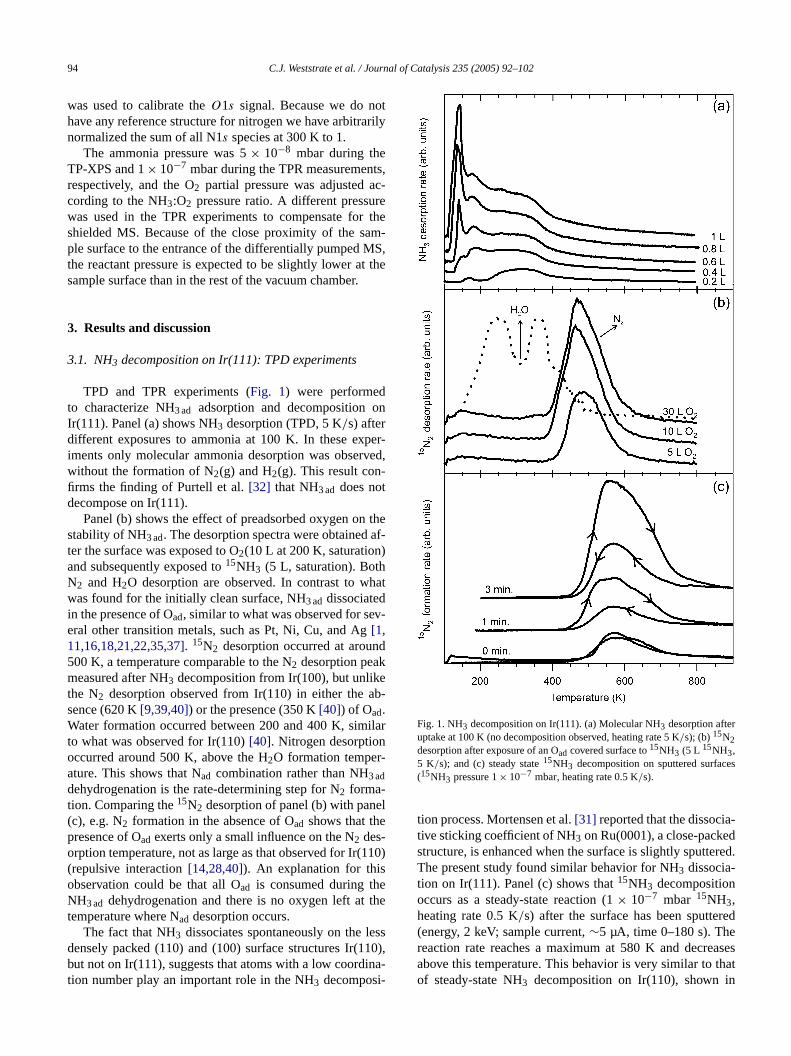
Fig. 2 shows the different N1s surface species probewith the high-energy resolution fast XPS measurementsing TP-XPS of a coadsorbed layer in NH3 and O2 (5 ×10⁻⁸ mbar NH3, 5× 10⁻⁷ mbar O2). Panel (a) shows twoaveraged spectra (average of three spectra, at 400 and 5in which the fitting components are shown. Panel (b) shsome of the actual spectra, in which the thermal evotion of the different peaks can be seen. We have previoshown[39,40] that the observed peaks can be assigneNOad (400.0 eV), NH3 ad (399.0 eV), NHad (397.5 eV) andNad(396.6 eV) respectively. In one of these publications[39]we suggested that NH2 ad is a very unstable intermediathat decomposes immediately after formation toward NHad.Thus, it is not observed in our experiments. In the O1s spec-tra (not shown) obtained during the in situ experiments,ad
(530.5 eV) and NOad (533.0 eV) were found. Any peaks rlated to OH or H2O were not observed above 200 K[40]so the surface concentration of these species was veryunder reaction conditions.
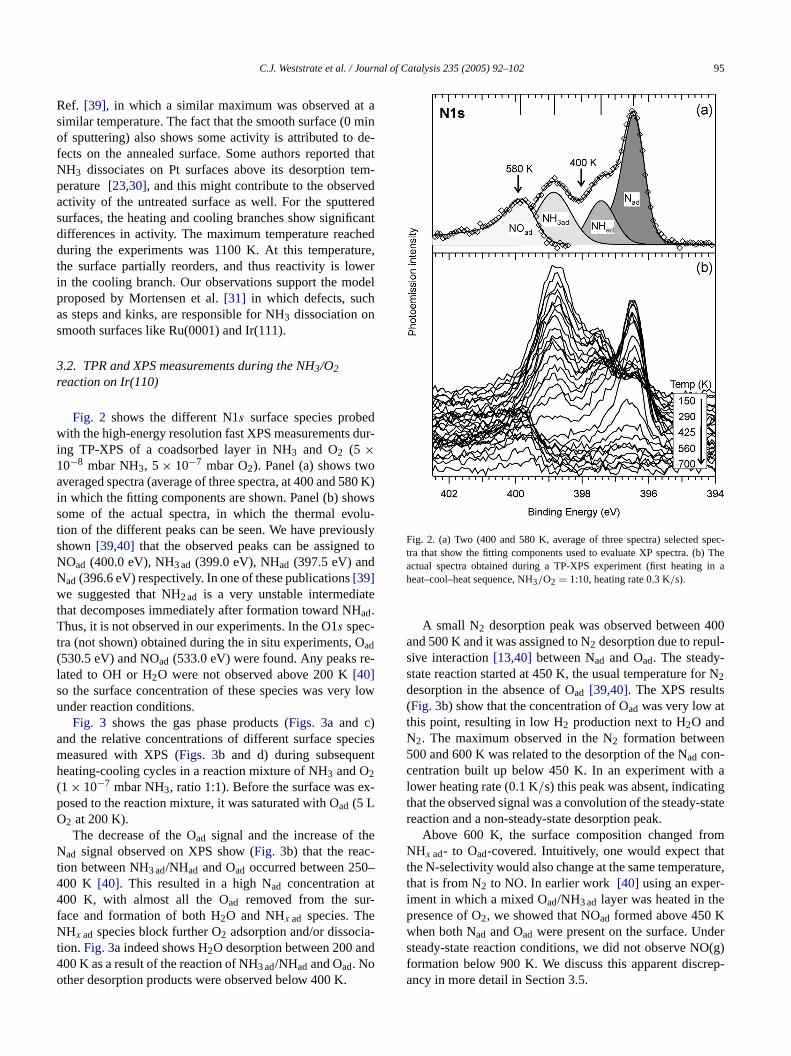
Fig. 3 shows the gas phase products (Figs. 3a and c)and the relative concentrations of different surface spemeasured with XPS (Figs. 3b and d) during subsequeheating-cooling cycles in a reaction mixture of NH3 and O2
(1× 10⁻⁷ mbar NH3, ratio 1:1). Before the surface was eposed to the reaction mixture, it was saturated with Oad (5 LO2 at 200 K).
The decrease of the Oad signal and the increase of thNad signal observed on XPS show (Fig. 3b) that the reaction between NH3 ad/NHad and Oad occurred between 250400 K [40]. This resulted in a high Nad concentration a400 K, with almost all the Oad removed from the surface and formation of both H2O and NHx ad species. TheNHx ad species block further O2 adsorption and/or dissociation. Fig. 3a indeed shows H2O desorption between 200 an400 K as a result of the reaction of NH3 ad/NHad and Oad. Noother desorption products were observed below 400 K.
t
t
)
Fig. 2. (a) Two (400 and 580 K, average of three spectra) selectedtra that show the fitting components used to evaluate XP spectra. (bactual spectra obtained during a TP-XPS experiment (first heatingheat–cool–heat sequence, NH3/O2 = 1:10, heating rate 0.3 K/s).
A small N2 desorption peak was observed betweenand 500 K and it was assigned to N2 desorption due to repusive interaction[13,40] between Nad and Oad. The steady-state reaction started at 450 K, the usual temperature fo2
desorption in the absence of Oad [39,40]. The XPS results(Fig. 3b) show that the concentration of Oad was very low atthis point, resulting in low H2 production next to H2O andN2. The maximum observed in the N2 formation between500 and 600 K was related to the desorption of the Nad con-centration built up below 450 K. In an experiment withlower heating rate (0.1 K/s) this peak was absent, indicatinthat the observed signal was a convolution of the steady-reaction and a non-steady-state desorption peak.
Above 600 K, the surface composition changed frNHx ad- to Oad-covered. Intuitively, one would expect ththe N-selectivity would also change at the same temperathat is from N2 to NO. In earlier work [40] using an experiment in which a mixed Oad/NH3 ad layer was heated in thpresence of O2, we showed that NOad formed above 450 Kwhen both Nad and Oad were present on the surface. Undsteady-state reaction conditions, we did not observe NOformation below 900 K. We discuss this apparent discrancy in more detail in Section3.5.

96 C.J. Weststrate et al. / Journal of Catalysis 235 (2005) 92–102
Fig. 3. In situ measurements during the NH3/O2 reaction with a pressure ratio 1:1. (a) TPR during first heating (0.5 K/s, 1× 10⁻⁷ mbar NH3), (b) TP-XPSduring first heating (0.3 K/s, 5× 10⁻⁸ mbar NH3), (c) TPR during cooling (0.5 K/s, 1× 10⁻⁷ mbar NH3), and (c) TP-XPS during cooling (0.3 K/s,5× 10−8 mbar NH3).
C.J. Weststrate et al. / Journal of Catalysis 235 (2005) 92–102 97
blyra-
mxy-N
ped
dter.the
K,
ch,
e-
chN
posiwo
not
theange
er ae,K,
ob-tureO
rfor-
was-
Forrod-,
en it
:5e
een. At
he-s in
ition
d
heyging
-
e
ool-timi-
ed.ed athewhen
re intion
ing
The observed reaction rate (−d[NH3]/dt ≡ d[H2O]/dt)decreased slightly with increasing temperature. It probawas limited by the availability of reactants at high tempeture; that is, NH3 ad desorption was competing with NH3 addissociation[39].
In the cooling branch (Figs. 3c and d), N-selectivitychanged back to N2 at ∼900 K. The surface changed froOad- to Nad-covered at about 600 K, and the surface ogen concentration was close to zero below 500 K. The2formation rate was low at 500 K, and the reaction stopcompletely at 400 K, due to inhibition by NHx ad, whichblocks O2 adsorption.
In the cooling branch no H2 formation was observed, anthe only reaction product containing hydrogen was waThis finding can be explained by hysteresis observed inOad coverage. During the heating branch, the Oad concen-tration was negligible at 400 K; it started to grow at 600so not enough Oad was available to react with all of the Hadproduced between 400 K and 600 K. In the cooling branOad was present down to 500 K, allowing H2O formation atthis temperature.
We also observed a slow decrease in the Nad concen-tration in the cooling branch, even below 400 K. This dcrease cannot be due to N2 desorption, because N2 desorp-tion was not observed below 400 K in the cooling bran(seeFig. 3c). Therefore, we assigned the decrease in theadcoverage (Fig. 3d) to rehydrogenation of Nad to NHad [39].
3.3. The influence of the NH3:O2 pressure ratio on theactivity and selectivity
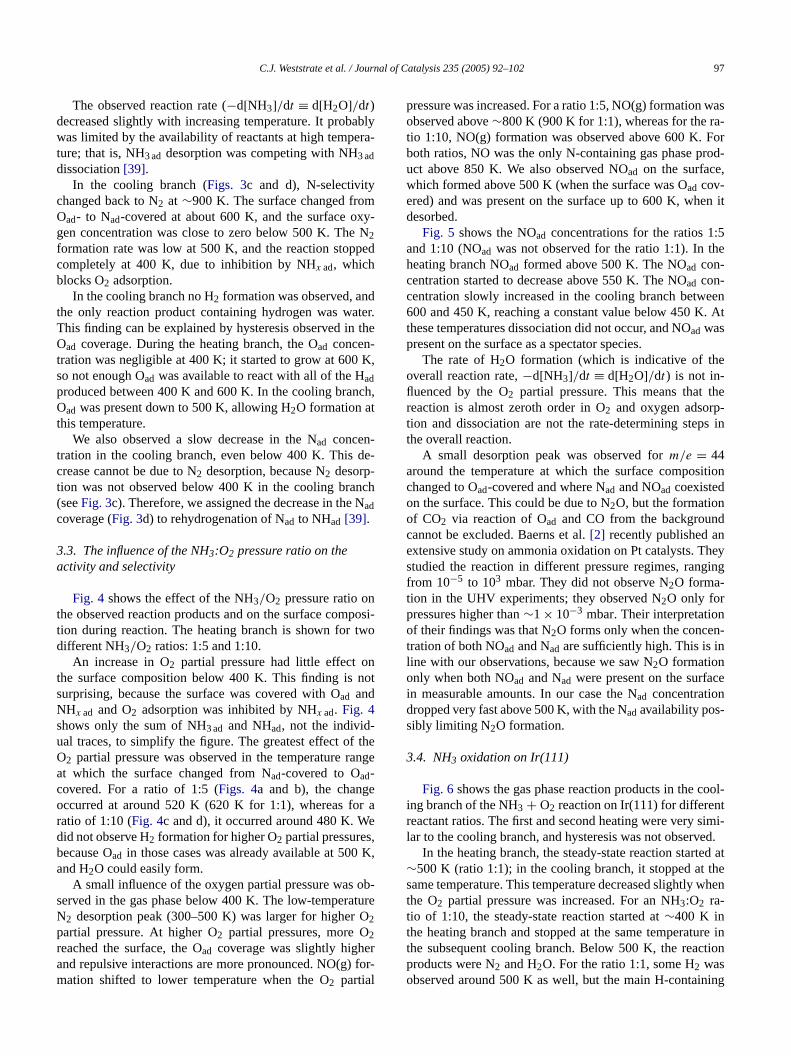
Fig. 4 shows the effect of the NH3/O2 pressure ratio onthe observed reaction products and on the surface comtion during reaction. The heating branch is shown for tdifferent NH3/O2 ratios: 1:5 and 1:10.
An increase in O2 partial pressure had little effect othe surface composition below 400 K. This finding is nsurprising, because the surface was covered with Oad andNHx ad and O2 adsorption was inhibited by NHx ad. Fig. 4shows only the sum of NH3 ad and NHad, not the individ-ual traces, to simplify the figure. The greatest effect ofO2 partial pressure was observed in the temperature rat which the surface changed from Nad-covered to Oad-covered. For a ratio of 1:5 (Figs. 4a and b), the changoccurred at around 520 K (620 K for 1:1), whereas foratio of 1:10 (Fig. 4c and d), it occurred around 480 K. Wdid not observe H2 formation for higher O2 partial pressuresbecause Oad in those cases was already available at 500and H2O could easily form.
A small influence of the oxygen partial pressure wasserved in the gas phase below 400 K. The low-temperaN2 desorption peak (300–500 K) was larger for higher2partial pressure. At higher O2 partial pressures, more O2reached the surface, the Oad coverage was slightly higheand repulsive interactions are more pronounced. NO(g)mation shifted to lower temperature when the O2 partial
-
pressure was increased. For a ratio 1:5, NO(g) formationobserved above∼800 K (900 K for 1:1), whereas for the ratio 1:10, NO(g) formation was observed above 600 K.both ratios, NO was the only N-containing gas phase puct above 850 K. We also observed NOad on the surfacewhich formed above 500 K (when the surface was Oad cov-ered) and was present on the surface up to 600 K, whdesorbed.
Fig. 5 shows the NOad concentrations for the ratios 1and 1:10 (NOad was not observed for the ratio 1:1). In thheating branch NOad formed above 500 K. The NOad con-centration started to decrease above 550 K. The NOad con-centration slowly increased in the cooling branch betw600 and 450 K, reaching a constant value below 450 Kthese temperatures dissociation did not occur, and NOad waspresent on the surface as a spectator species.
The rate of H2O formation (which is indicative of theoverall reaction rate,−d[NH3]/dt ≡ d[H2O]/dt) is not in-fluenced by the O2 partial pressure. This means that treaction is almost zeroth order in O2 and oxygen adsorption and dissociation are not the rate-determining stepthe overall reaction.
A small desorption peak was observed form/e = 44around the temperature at which the surface composchanged to Oad-covered and where Nad and NOad coexistedon the surface. This could be due to N2O, but the formationof CO2 via reaction of Oad and CO from the backgrouncannot be excluded. Baerns et al.[2] recently published anextensive study on ammonia oxidation on Pt catalysts. Tstudied the reaction in different pressure regimes, ranfrom 10−5 to 103 mbar. They did not observe N2O forma-tion in the UHV experiments; they observed N2O only forpressures higher than∼1× 10⁻³ mbar. Their interpretationof their findings was that N2O forms only when the concentration of both NOad and Nad are sufficiently high. This is inline with our observations, because we saw N2O formationonly when both NOad and Nad were present on the surfacin measurable amounts. In our case the Nad concentrationdropped very fast above 500 K, with the Nad availability pos-sibly limiting N2O formation.
3.4. NH3 oxidation on Ir(111)
Fig. 6shows the gas phase reaction products in the cing branch of the NH3 + O2 reaction on Ir(111) for differenreactant ratios. The first and second heating were very slar to the cooling branch, and hysteresis was not observ
In the heating branch, the steady-state reaction start∼500 K (ratio 1:1); in the cooling branch, it stopped at tsame temperature. This temperature decreased slightlythe O2 partial pressure was increased. For an NH3:O2 ra-tio of 1:10, the steady-state reaction started at∼400 K inthe heating branch and stopped at the same temperatuthe subsequent cooling branch. Below 500 K, the reacproducts were N2 and H2O. For the ratio 1:1, some H2 wasobserved around 500 K as well, but the main H-contain

98 C.J. Weststrate et al. / Journal of Catalysis 235 (2005) 92–102
Fig. 4. The effect of the NH3/O2 ratio on the selectivity of the surface and on the nature of the reaction products (heating 1). (a) TPR (0.5 K/s, 1× 10⁻⁷ mbarNH3) and (b) TP-XPS (0.3 K/s, 5× 10⁻⁸ mbar NH3) for the NH3/O2 ratio 1:5; and (c) TPR (0.5 K/s, 1× 10⁻⁷ mbar NH3) and (d) TP-XPS (0.3 K/s,5× 10−8 mbar NH3) for the ratio 1:10.

C.J. Weststrate et al. / Journal of Catalysis 235 (2005) 92–102 99
a-
ed.0).and
ces.mi-
aswithate),ing-to
ts
N-se-
lar
of
o inalso
still
ha-
rg-
n
stsby
artsnd
e-
ace
ap-
O
e, inre
n,K.
O-in
ges
ce ispo-at
he
eyre asthat
nsi-
Fig. 5. TP-XPS data showing NOad (400.0 eV) formation during NH3 ox-idation for two different NH3:O2 pressure ratios (1:5 and 1:10, 0.3 K/s,5× 10−8 mbar NH3).
product was always H2O. NO was formed at higher tempertures, depending on the NH3/O2 ratio. For a ratio of 1:1, NOformed above 800 K, whereas for a ratio of 1:10, it formabove 500 K and for a ratio of 1:5 it formed above 600 K
The results are similar to the results obtained for Ir(11The temperature range where the reaction startedstopped was between 400 and 500 K for both surfaMoreover, a change in N-selectivity also occurred at silar temperatures.
A significant difference between Ir(111) and Ir(110) wthat the reaction rate on Ir(111) increased much moreincreasing O2 partial pressure. On Ir(111), the reaction rwas almost first order in O2 pressure, whereas on Ir(110the reaction rate did not change significantly with increasO2 pressure. This indicates that O2 adsorption and dissociation is a very important step on Ir(111), in contrastwhat we found for Ir(110). This is in line with the resulof TPD experiments presented in Section3.1, which showedthat chemisorbed oxygen is needed for NH3 ad dissociation.
We assume that the mechanism responsible for theselectivity is similar on both Ir surfaces, because thelectivity of NH3 oxidation on both surfaces showed simibehavior for different temperatures and different NH3:O2pressure ratios. The mechanism responsible for NH3 dissoci-ation might be different because of the different reactivitythe surfaces. On Ir(111), we needed Oad for the initial NH3 addissociation step, whereas on Ir(110), it proceeded alsthe absence of oxygen. On Ir(111), the reaction ratestrongly depended on the O2 pressure and not on Ir(110).
3.5. The selectivity of the NH3 oxidation on Ir(110) andIr(111)
In Section1 several issues were mentioned that areunder debate. One of these was the mechanism of N2 andNOad formation. For both reactions, two possible mecnisms have been proposed, one involving only Nad and Oadand the other involving NHx ad and Oad. In our previousstudy in the absence of Oad, we showed[39] that N2 forms
via Nad + Nad rather than via NHx ad + NHx ad. In the pres-ence of Oad on the surface, the NHad concentration is lowethan in the absence of Oad [40], and a mechanism involvinNHx ad species is not likely. N2 formation via a reaction between NOad and NH3 adis also not very likely, because NOadis observed only above 450 K, where the NH3 ad concentra-tion is very low.
In earlier work we showed[40] that NOad formation oc-curs via Nad + Oad rather than via NHx ad + Oad, becausethe NHx ad concentration is negligible when the NOad for-mation starts.Fig. 4 shows the same thing: NO formatiostarts when the NHx ad concentration is zero.
The difference in selectivity between Pt and Ir catalyis not yet completely understood. In the model proposedBradley, Hopkinson, and King (BHK)[8] for Pt(100) NOformation at low temperature and NO dissociation[3,29,33] at higher temperature play a crucial role [Eqs.(5)–(9)].NOad forms around 250 K on Pt(100) and dissociation stat 350 K. TP-RAIRS experiments done by Kim, Pratt aKing [26] show ed that NOad was present on Pt(100) btween 250 and 500 K, in line with the BHK model.
In our measurements we monitored in situ all the surfspecies during the reaction (NOad, NH3 ad, NHad, Nad andOad). Our results suggest that the BHK model cannot beplied to Ir(110) or Ir(111). In their model NOad is observedbetween 250 and 500 K, whereas in our measurements Nadformation is observed only above 500 K. NHad, Nad, and Oadcoexist on the surface between 200 and 400 K and hencprinciple, NOad could be formed. This suggests that theis a kinetic limitation for the formation of NOad. The pres-ence of NOad in the cooling branch, without dissociatioindicates that NO dissociation does not occur below 400In our experiment the surface was always covered withadwhen NOad was present. Because Oad blocks NO dissociation [8,13,14]it is also very unlikely that NO dissociatesthis temperature regime under reaction conditions.
During the reaction, Ir(110) surface composition chanat a certain temperature from NHx ad to Oad (Fig. 4). The ob-served selectivity in the gas phase also changes from N2 toNO, but the temperature at which this change takes pla200 K higher than the observed change of surface comsition. To explain this large difference, we need to looksome simple kinetic equations
(10)d[N2]
dt= kN2θ
2N,
(11)d[NO]
dt= kNOθNθO.
If kN2 and kNO would have the same value, then (i) tselectivity of the reaction (above the NO and N2 desorp-tion temperature, i.e.,>600 K) would depend only on thNad and Oad (θN and θO) coverage, and (ii) the selectivitchange toward NO would occur at the same temperatuthe change of the surface composition. Our results showthis is not the case, so differences in thek values insteadof the coverages of the different species must be respo

100 C.J. Weststrate et al. / Journal of Catalysis 235 (2005) 92–102
K
Fig. 6. TPR results for NH3 oxidation on Ir(111). The cooling branch for different NH3/O2 pressure ratios (1:1, 1:5, 1:10) is shown (heating rate 0.5/s,1× 10−7 mbar NH3).itionre-
ra-e-
Nd
r-
sion
-
nts.
.-
ble for the observed difference between surface composand product selectivity. The experimental results can beproduced when we assume thatkN2 is larger thankNO, thatis, N2 formation is easier than NO formation. The tempeture dependence of thek values is described by the Arrhnius equation,k = A0e−Ea/(RT ), wherek is a prefactor andEa is the activation energy. Because both N2 and NO for-mation proceed via simple recombination reactions ofad+ Nad or Nad + Oad [39,40] the prefactors are expecteto be rather similar for both NOad and N2 formation [15].In that case differentk values should be related to diffe
ences in activation energies. This leads to the concluthat theEa is greater for NO formation than for N2 forma-tion.
Our recently published study concerning the effect of Oadon the NH3 ad chemistry on Ir(110)[40] gave more information on the activation energies for NO and N2 formation. N2formation was observed around 600 K in TPD experimeHeating of a mixed NH3/Oad layer in the presence of O2(g)resulted in the formation of NOad, starting around 450 KThese two observations suggest that NOad forms more easily than N2. We also found that N2 formation is influenced

C.J. Weststrate et al. / Journal of Catalysis 235 (2005) 92–102 101
than
n Ptbe
Ptrts
so-
but
en-
Onsthe
romin
turesthe
onH
at-if-
,ess
iallineie
theofo-erpro
B.ro-
rf.
r-.
G.995)
ei,
i.
(1)
5)
63–
95.rni,
Yi,
A.7–
A.4–
o,ical
aki,
. van
s.),r and
107
0–
rf.
elat.
9–
108
(5)
ntz,
.zit,7.
by the presence of O2. In the presence of Oad, N2 forma-tion occurs around 350 K, so in that case it is more easyNOad formation.
In summary, we suggest that the difference betweeand Ir surfaces during catalytic ammonia oxidation canfound in the lower activation energy for NO formation onwith respect to Ir. This contradicts earlier literature repoin which the difference was explained in terms of NO disciation[38].
4. Summary and conclusions
We studied the adsorption and dissociation of NH3 onIr(111). Ammonia does not dissociate on this surface,defects created by sputtering can facilitate NH3 ad dissocia-tion on this surface. Oad also facilitates NH3 ad dissociationand NH3 adsorption on a sputtered surface and an oxygcovered surface results in N2 formation around 500 K.
We also studied the steady-state NH3 oxidation reactionon Ir(110) and Ir(111) under low-pressure conditions.both surfaces, the steady-state NH3 oxidation reaction startaround 400 K (with the exact temperature depending onNH3/O2 pressure ratio), the initial products being N2 andH2O. The surface composition changes around 500 K fNHx ad to Oad, but the selectivity of the products observedthe gas phase changes at a significantly higher tempera
An increase in O2 partial pressure greatly enhancesreaction rate on Ir(111)and enhances it by much lessIr(110). This difference is explained by the fact that N3dissociates on Ir(110) even in the absence of Oad, whereason Ir(111) Oad is needed for significant NH3 dissociation.
The different behavior of Ir and Pt catalysts during calytic ammonia oxidation is explained in terms of the dferent activity of these metals in NO formation. NOad formsreadily on Pt surfaces (above 300 K[26]), whereas on IrNOad formation occurs only above 450 K, in a large excof Oad. N2 is more easily formed under these conditions (Oadlowers the activation energy of N2 formation) than is NO onIr(110), resulting in preferential N2(g) formation even whenthe surface is Oad-covered.
Acknowledgments
The authors thank ELETTRA and the E.U. for financsupport for the measurements at the SuperESCA beamof ELETTRA. They also acknowledge R.C.V. van Schfor providing technical support. C.J.W. acknowledgesTechnology Foundation STW, Applied Science DivisionNWO and the Technology Program of the Ministry of Ecnomic Affairs for financial support under project numbUPC.5037. J.R.M. acknowledges the Socrates/Erasmusgram for the opportunity to come to Leiden University. A.acknowledges financial support from the MIUR under pgram PRIN2003.
.
-
References
[1] B. Afsin, P.R. Davies, A. Paskusky, M.W. Roberts, D. Vincent, SuSci. 284 (1993) 109–120.
[2] M. Baerns, R. Imbihl, V.A. Kondratenko, R. Kraehnert, W.K. Offemans, R.A. van Santen, A. Scheibe, J. Catal. 232 (2005) 226–238
[3] W.F. Banholzer, R.I. Masel, Surf. Sci. 137 (1984) 339–360.[4] A. Baraldi, M. Barnaba, B. Brena, D. Cocco, G. Comelli, S. Lizzit,
Paolucci, R. Rosei, J. Electron. Spectrosc. Relat. Phenom. 76 (1145–149.
[5] A. Baraldi, G. Comelli, S. Lizzit, D. Cocco, G. Paolucci, R. RosSurf. Sci. 367 (3) (1995) L67–L72.
[6] A. Baraldi, G. Comelli, S. Lizzit, M. Kiskinova, G. Paolucci, Surf. ScRep. 49 (6–8) (2003) 169–224.
[7] A. Baraldi, V.R. Dhanak, J. Electron Spectrosc. Relat. Phenom. 67(1994) 211–220.
[8] J.M. Bradley, A. Hopkinson, D.A. King, J. Phys. Chem. 99 (19917032–17042.
[9] S.A.C. Carabineiro, B.E. Nieuwenhuys, Surf. Sci. 505 (2002) 1170.
[10] S.A.C. Carabineiro, B.E. Nieuwenhuys, Surf. Sci. 532 (2003) 87–[11] A.F. Carley, P.R. Davies, K.R. Harikumar, R.V. Jones, G.U. Kulka
M.W. Roberts, Top. Catal. 12 (1–4) (2001) 101–109.[12] T.V. Choudhary, A.K. Santra, C. Sivadinaranaya, B.K. Min, C.-W.
K. Davis, D.W. Goodman, Catal. Lett. 77 (1–3) (2001) 1–5.[13] C.A. de Wolf, J.W. Bakker, P.T. Wouda, B.E. Nieuwenhuys,
Baraldi, S. Lizzit, M. Kiskinova, J. Chem. Phys. 113 (2000) 107110722.
[14] C.A. de Wolf, J.W. Bakker, P.T. Wouda, B.E. Nieuwenhuys,Baraldi, S. Lizzit, M. Kiskinova, J. Phys. Chem. B. 105 (2001) 4254262.
[15] J.A. Dumesic, D.F. Rudd, L.M. Aparicio, J.E. Rekoske, A.A. TreviñThe Microkinetics of Heterogeneous Catalysis, American ChemSociety, 1993.
[16] A. Fahmi, R.A. van Santen, Z. Phys. Chem. 197 (1996) 203–217.[17] H. Gerischer, A. Mauerer, J. Electroanal. Chem. 25 (1970) 421.[18] J.M. Gohndrone, C.W. Olsen, A.L. Backman, T.R. Gow, E. Yagas
R.I. Masel, J. Vac. Sci. Technol. A 7 (3) (1988) 1986–1990.[19] J.F. Gootzen, A.H. Wonders, W. Visscher, R.A. van Santen, J.A.R
Veen, Electrochim. Acta 43 (1998) 1851.[20] V.V. Gorodetskii, V.A. Sobyanin, in: T. Seiyama, K. Tanabe (Ed
Proceedings of 7th International Congress on Catalysis, ElsevieKodansha LTD, Tokyo, 1980, pp. 566–577.
[21] H. Guo, D. Chrysostomou, J. Flowers, F. Zaera, J. Phys. Chem. B(2003) 502–511.
[22] H. Guo, F. Zaera, Surf. Sci. 524 (2003) 1–14.[23] W.L. Guthrie, J.D. Sokol, G.A. Somorjai, Surf. Sci. 109 (1981) 39
418.[24] D.I. Hagen, B.E. Nieuwenhuys, G. Rovida, G.A. Somorjai, Su
Sci. 57 (2) (1976) 632–650.[25] J.J. Joyce, M. del Guidice, J.H. Weaver, J. Electron Spectrosc. R
Phenom. 49 (1) (1989) 31–45.[26] M. Kim, S.J. Pratt, D.A. King, J. Am. Chem. Soc. 122 (2000) 240
2410.[27] W.P. Krekelberg, J. Greeley, M. Mavrikakis, J. Phys. Chem. B
(2004) 987–994.[28] E.S. Kurkina, N.L. Semendyaeva, A.I. Boronin, Kinet. Catal. 42
(2001) 773–789.[29] R.I. Masel, Catal. Rev. Sci. Eng. 28 (1986) 335–369.[30] W.D. Mieher, W. Ho, Surf. Sci. 322 (1995) 151.[31] H. Mortensen, L. Diekhöner, A. Baurichter, E. Jensen, A.C. Lu
J. Chem. Phys. 113 (16) (2000) 6882–6887.[32] R.J. Purtell, P. Merrill, Phys. Rev. Lett. 44 (19) (1980) 1279–1281[33] E.D.L. Rienks, J.W. Bakker, A. Baraldi, S.A.C. Carabineiro, S. Liz
C.J. Weststrate, B.E. Nieuwenhuys, Surf. Sci. 516 (2002) 109–11

102 C.J. Weststrate et al. / Journal of Catalysis 235 (2005) 92–102
-
ten,
9)
8–
. 185
cia,18)
tac-em.
[34] A.K. Santra, B.K. Min, C.W. Yi, K. Luo, T.V. Choudhary, D.W. Goodman, J. Phys. Chem. B 106 (2001) 340–344.
[35] D.P. Sobczyk, A.M. de Jong, E.J.M. Hensen, R.A. van SanJ. Catal. 219 (2003) 156–166.
[36] J.L. Taylor, D.E. Ibbotson, W.H. Weinberg, Surf. Sci. 79 (2) (197349–384.
[37] D.M. Thornburg, R.J. Madix, Surf. Sci. 220 (2–3) (1989) 26294.
[38] A.C.M. van den Broek, J. van Grondelle, R.A. van Santen, J. Catal(1999) 297–306.
[39] C.J. Weststrate, J.W. Bakker, E.D.L. Rienks, S. Lizzit, L. PetacA. Baraldi, C.P. Vinod, B.E. Nieuwenhuys, J. Chem. Phys. 122 ((2005) 184705.
[40] C.J. Weststrate, J.W. Bakker, E.D.L. Rienks, S. Lizzit, L. Pecia, A. Baraldi, C.P. Vinod, B.E. Nieuwenhuys, Phys. Chem. ChPhys. 7 (13) (2005) 2629–2634.