Defective Autophagy in Parkinson’s Disease: Role of Oxidative Stress
Upload
independentCategory
view
2download
0
Selective Molecular Alterations in the AutophagyPathway in Patients with Lewy Body Disease and inModels of a-SynucleinopathyLeslie Crews1, Brian Spencer2, Paula Desplats2, Christina Patrick2, Amy Paulino2, Edward Rockenstein2,
Lawrence Hansen1,2, Anthony Adame2, Douglas Galasko2, Eliezer Masliah1,2*
1 Department of Pathology, University of California San Diego, La Jolla, California, United States of America, 2 Department of Neurosciences, University of California San
Diego, La Jolla, California, United States of America
Abstract
Background: Lewy body disease is a heterogeneous group of neurodegenerative disorders characterized by a-synucleinaccumulation that includes dementia with Lewy bodies (DLB) and Parkinson’s Disease (PD). Recent evidence suggests thatimpairment of lysosomal pathways (i.e. autophagy) involved in a-synuclein clearance might play an important role. For thisreason, we sought to examine the expression levels of members of the autophagy pathway in brains of patients with DLBand Alzheimer’s Disease (AD) and in a-synuclein transgenic mice.
Methodology/Principal Findings: By immunoblot analysis, compared to controls and AD, in DLB cases levels of mTor wereelevated and Atg7 were reduced. Levels of other components of the autophagy pathway such as Atg5, Atg10, Atg12 andBeclin-1 were not different in DLB compared to controls. In DLB brains, mTor was more abundant in neurons displaying a-synuclein accumulation. These neurons also showed abnormal expression of lysosomal markers such as LC3, andultrastructural analysis revealed the presence of abundant and abnormal autophagosomes. Similar alterations wereobserved in the brains of a-synuclein transgenic mice. Intra-cerebral infusion of rapamycin, an inhibitor of mTor, or injectionof a lentiviral vector expressing Atg7 resulted in reduced accumulation of a-synuclein in transgenic mice and ameliorationof associated neurodegenerative alterations.
Conclusions/Significance: This study supports the notion that defects in the autophagy pathway and more specifically inmTor and Atg7 are associated with neurodegeneration in DLB cases and a-synuclein transgenic models and supports thepossibility that modulators of the autophagy pathway might have potential therapeutic effects.
Citation: Crews L, Spencer B, Desplats P, Patrick C, Paulino A, et al. (2010) Selective Molecular Alterations in the Autophagy Pathway in Patients with Lewy BodyDisease and in Models of a-Synucleinopathy. PLoS ONE 5(2): e9313. doi:10.1371/journal.pone.0009313
Editor: Tsuneya Ikezu, University of Nebraska Medical Center, United States of America
Received December 22, 2009; Accepted January 28, 2010; Published February 19, 2010
Copyright: � 2010 Crews et al. This is an open-access article distributed under the terms of the Creative Commons Attribution License, which permitsunrestricted use, distribution, and reproduction in any medium, provided the original author and source are credited.
Funding: This work was supported by NIH grants AG18440 and AG5131. The funders had no role in study design, data collection and analysis, decision topublish, or preparation of the manuscript.
Competing Interests: The authors have declared that no competing interests exist.
* E-mail: [email protected]
Introduction
Alzheimer’s disease (AD) and Parkinson’s disease (PD) are the
most common causes of dementia and movement disorders in the
elderly [1,2]. While progressive accumulation of Ab dimers and
oligomers has been identified as one of the central toxic events in
AD leading to synaptic dysfunction [3,4], accumulation of a-
synuclein (a-syn) resulting in the formation of oligomers has been
linked to the pathogenesis of PD [5,6,7,8,9].
The pathology of AD and PD overlap in a heterogeneous group
of conditions denominated jointly Lewy body disease (LBD)
[10,11,12,13,14]. While in patients with dementia with Lewy
bodies (DLB) the clinical presentation is of dementia followed by
parkinsonism, in patients with PD dementia (PDD) the initial signs
are of parkinsonism followed by dementia [15,16,17,18]. In DLB,
Ab promotes a-syn aggregation and toxicity in vivo [19], and Aband a-syn might directly interact [20] to form hybrid channel like
structures [21].
Alterations in the rate of synthesis, aggregation and clearance of
these proteins might be responsible for the formation of toxic Aband a-syn oligomers in DLB [22]. Impaired clearance of the a-syn
aggregates might play an important role in the pathogenesis of PD
and DLB [23,24]. Among the lysosomal pathways involved, the
autophagy signaling cascade has emerged as a key mechanism for
the removal of a-syn aggregates. Autophagy is the major pathway
involved in the degradation of long-lived proteins and organelles,
cellular remodeling, and survival during nutrient starvation
[25,26]. There are three distinct autophagic pathways [27,28]: i)
macroautophagy, ii) microautophagy and iii) chaperone-mediated
autophagy (CMA). Autophagy has been linked to neuronal cell
death [29,30] and is abnormally activated in mouse models of
neurodegeneration and in neurodegenerative disorders such as
AD, PD and Huntington’s disease (HD) [31,32]. Macroautophagy
is constitutively active and highly efficient in healthy neurons and
recent studies indicate that the autophagic pathology observed in
AD most likely arises from impaired clearance of autophagic
PLoS ONE | www.plosone.org 1 February 2010 | Volume 5 | Issue 2 | e9313

vacuoles (AVs) rather than strong autophagy induction alone [33]
suggesting selective alterations in molecular components of the
autophagy pathway. For example, in the brains of patients with
AD, levels of the AV protein Beclin-1 are severely down
modulated [34].
In PD recent studies have suggested that a-syn aggregates might
interfere with the autophagy mechanisms and lead to neurode-
generation [23,35,36,37,38,39]. Mutant forms of a-syn found in
familial PD patients [23] as well as oxidized forms of a-syn [40]
found in sporadic PD and DLB have been shown to block
autophagy, and a-syn contains a consensus sequence for CMA
targeting. In neuronal cell cultures [41] and in transgenic (tg) mice,
a-syn overexpression is associated with impaired autophagy and
neurodegeneration that is reversed by Beclin-1 [42]. Further
supporting a role for lysosomal dysfunction in LBD, previous
studies have shown that in lysosomal storage disorders such as
Gaucher disease [43,44] and Niemann-Pick disease [45], there is
increased susceptibility to develop parkinsonism and a-syn
accumulation.
Taken together, these lines of evidence suggest that in DLB and
PD, specific molecular defects in the autophagy pathway might
play a role in the pathogenesis of these disorders. In this context,
the main objective of the present study was to investigate
alterations in components of the autophagy pathway in DLB
and in a-syn tg models. We found that levels of mTor were
increased and Atg7 levels were reduced in the brains of patients
with DLB and a-syn tg mice. Moreover, activating autophagy by
rapamycin treatment or viral-mediated delivery of Atg7 amelio-
rated a-syn accumulation and the related neuropathology. This
supports the notion that alterations in the autophagy pathway play
a role in DLB/PD and supports the possibility that modulators of
the autophagy pathway might have potential therapeutic effects.
Materials and Methods
Ethics StatementThis study was conducted according to the principles expressed
in the Declaration of Helsinki. For studies utilizing human tissues,
all tissues were obtained from the University of California, San
Diego Alzheimer’s Disease Research Center (ADRC). Written
informed consent for neurobehavioral evaluation, autopsy, and for
the collection of samples and subsequent analysis was obtained
from the patient and caregiver (usually the next of kin) before
neuropsychological testing and after the procedures of the study
had been fully explained. The study procedures conformed to
Federal guidelines for the protection of human subjects and were
reviewed and approved by the UCSD Institutional Review Board.
For animal studies, all animals were handled in strict accordance
with good animal practice and all procedures were completed
under the specifications set forth by the UCSD Institutional
Animal Care and Use Committee.
Cases and Neuropathological EvaluationThe study included a total of 24 cases (Table 1); of them, 6 were
non-demented controls, 12 were DLB cases and the other 6 were
AD cases. For the present study we chose to focus on DLB because
of its frequency and widespread accumulation of a-syn in
neocortical and limbic structures [46,47,48]. Autopsy material
was obtained from patients studied neurologically and psycho-
metrically at the UCSD ADRC. At autopsy, brains were divided
sagittally, and samples from the left mid temporal cortex were
fixed in 4% paraformaldehyde (PFA) and sectioned at 40 mm for
immunocytochemical analysis. Frozen samples from the right were
used for immunoblot analysis. The temporal cortex was selected
because previous studies have shown considerable pathology and
accumulation of a-syn in this region in patients with DLB
[47,48,49].
For routine neuropathological diagnosis, paraffin sections from
neocortical, limbic and subcortical regions were stained with
haematoxylin and eosin (H&E) or thioflavine-S [50,51], and Braak
stage was assessed [52]. Based on previously published clinical and
pathological findings [53], cases were subdivided into: 1) non-
demented age-matched controls, 2) AD cases, and 3) DLB cases.
All cases met the Consortium to Establish a Registry for AD
(CERAD) and National Institute of Aging (NIA) criteria for
diagnosis and displayed neuritic plaques and tangle formation in
the neocortex and limbic system [12,54]. The diagnosis of DLB
was based on the clinical presentation of dementia and the
pathological findings of LBs in the locus coeruleus, substantia
nigra (SN), or nucleus basalis of Meynert, as well as in cortical
regions. LBs were detected using H&E stain or anti-ubiquitin and
anti-a-syn antibodies as recommended by the Consortium on DLB
criteria for a pathologic diagnosis of DLB [12]. In addition to the
presence of LBs, the great majority of these cases displayed
sufficient plaques and tangles to be classified as Braak stages III–
IV. Specifically, DLB cases had abundant plaques in the neocortex
and limbic system but fewer tangles compared to AD cases.
a-Synuclein Transgenic Mice and TreatmentsFor this study, heterozygous tg mice (Line D) expressing human
wildtype a-syn under the regulatory control of the PDGFbpromoter [55] were used. These animals were selected because
they display abnormal accumulation of detergent-insoluble a-syn
in the neocortex and limbic system and develop a-syn-immuno-
reactive inclusion-like structures in the brain [56]. Although some
nuclear staining has been observed in this model, distinct
cytoplasmic inclusion-like structures have been consistently
identified by confocal and electron microscopy [19,55,56,57].
Furthermore, these animals also display neurodegenerative and
behavioral deficits that mimic certain aspects of DLB. For western
blot and immunocytochemical studies levels of components of the
autophagy pathway were compared to littermate non tg controls
and to an APP tg model (line J9M) of AD-like pathology. These
Table 1. Summary of clinico-pathological characteristics.
Diagnosis N =Mean Age(yrs)
Mean brainweight Gender M/F
Mean PMT(hrs)
MeanDuration (yrs)
Blessedscore
Frontal cortex AmyloidPlaques (0.1sq mm)
Temporal cortex Lewybodies (0.1sq mm)
Control 6 79.862 11506115 4/2 6.562 NA 0–1 0 0
AD 6 8161 1058697 3/3 861 12.861 19–33 50 0
DLB 12 82.762 10746119 4/8 7.261.5 9.86 5–32 33 1262
doi:10.1371/journal.pone.0009313.t001
mTor Activation in LBD
PLoS ONE | www.plosone.org 2 February 2010 | Volume 5 | Issue 2 | e9313

mice express human APP 770/751 and 695 under the PDGFbpromoter [58].
Additional experiments with the a-syn tg mice included
treatments with the autophagy activator rapamycin (Sigma-
Aldrich, St. Louis, MO). Because rapamycin poorly crosses into
the CNS, it was infused intra-cerebrally into the lateral ventricle of
9-month old mice at a concentration of 20mg/kg. Briefly as
previously described [59], mice were anesthetized and under
sterile conditions a 26 gauge stainless steel cannula was implanted
stereotaxically into the lateral ventricle using the bregma as a
reference (Franklin and Paxinos, bregma 0.5mm; 1.1mm lateral;
depth 3mm) and secured to the cranium using superglue. The
cannula was connected via a 5 mm coil of V3 Biolab vinyl to a
model 1007D osmotic minipump (Alzet, Cupertino, CA) surgically
placed subcutaneously beneath the shoulder. The solutions were
delivered at a flow rate of 0.5ul per hour for 2 weeks. The pump
was left for an additional 2 weeks and mice were euthanized one
month after the initiation of the infusions. Brains were removed
and divided sagittally. One hemibrain was postfixed in phosphate-
buffered 4% PFA, pH 7.4, at 4uC for 48 h and sectioned at 40 mm
with a Vibratome 2000 (Leica, Nussloch, Germany) and placed in
cryosolution, while the other hemibrain was snap frozen and
stored at 270uC for RNA and protein analysis.
Construction of Lentiviral Vectors and Injection ofLV-Atg7 into a-Synuclein Transgenic Mice
The mouse Atg7 cDNA (Open Biosystems, Huntsville, AL) was
PCR amplified and cloned into the third generation self-
inactivating lentivirus vector (LV) [60] with the CMV promoter
driving expression. Lentiviruses expressing a-syn, Atg7, luciferase,
shAtg7, GFP, shLuciferase, or empty vector (as controls) were
prepared by transient transfection in 293T cells [60,61]. The
empty LV contained the viral genome with the CMV promoter,
with no gene inserted downstream of the promoter.
A total of 12 a-syn tg mice from line D (9 months old) were
injected with 3 ml of the LV preparations (2.56107 TU) into the
temporal cortex and hippocampus (using a 5 ml Hamilton syringe).
Briefly, as previously described [62], mice were placed under
anesthesia on a Koft stereotaxic apparatus and coordinates
(hippocampus: AP 22.0 mm, lateral 1.5 mm, depth 1.3 mm
and cortex: AP 2.5 mm, lateral 1.5 mm, depth 1.0 mm) were
determined as per the Franklin and Paxinos Atlas. The LVs were
delivered using a Hamilton syringe connected to a hydraulic
system to inject the solution at a rate of 1 ml every 2 min. To allow
diffusion of the solution into the brain tissue, the needle was left for
an additional 5 min after the completion of the injection. Mice
received unilateral injections (right side) to allow comparisons
against the contralateral side, with either LV-Atg7 (n = 6), or LV-
control (n = 6). Additional controls were performed by injecting
non tg littermates with either LV-Atg7 (n = 6), or LV-control
(n = 6). Mice survived for 1 month after the lentiviral injection. As
an additional control for LV injection, age matched littermates
were injected with LV-luciferase. Since no differences were
observed between the LV-control and the LV-luciferase, all data
presented here are shown with the LV-control vector.
Following NIH guidelines for the humane treatment of animals,
mice were anesthetized with chloral hydrate and flush-perfused
transcardially with 0.9% saline. Brains and peripheral tissues were
removed and divided sagittally. The right hemibrain was post-
fixed in phosphate-buffered 4% PFA (pH 7.4) at 4uC for 48 hours
for neuropathological analysis, while the left hemibrain was snap-
frozen and stored at 270uC for subsequent RNA and protein
analysis.
Cell Culture and TreatmentsFor in vitro experiments we used the previously described rat
neuroblastoma cell line B103 [63]. This model was selected
because overexpression of a-syn in these cells interferes with
neuronal plasticity (reduced neurite outgrowth and adhesion) but
does not result in overt cell death [63,64]. This model mimics the
early pathogenic process of PD where cell death is preceded by
reduced neurite outgrowth and synaptic alterations. For all
experiments, cells were plated in complete media (DMEM
[Invitrogen, Carlsbad, CA] supplemented with 10% FBS (Irvine
Scientific, Santa Ana, CA) and infected with LVs expressing a-syn,
Atg7, shAtg7, or controls at a multiplicity of infection (MOI) of 40.
After infection, cells were incubated for 48 hr in a humidified 5%
CO2 atmosphere at 37uC. All experiments were conducted in
triplicate to ensure reproducibility.
To investigate whether LC3 levels are modulated by a-syn or
Atg7 over-expression or knockdown, LC3 levels were analyzed in
coverslips with LC3-GFP. B103 cells were grown as described above
and were then plated onto poly L-lysine coated glass coverslips at a
density of 56104 cells. Five hours after plating, cells were infected
with the LV-asyn and/or LV-Atg7 or LV-shAtg7 (or controls) and
incubated for 48 hours. All coverslips were also co-infected with an
LV expressing LC3-GFP at an MOI of 40. Cultures were then
washed 26with serum-free DMEM and then fed either complete
media or serum-free media for 12 hours before fixation with 4%
PFA. Briefly as previously described [34], coverslips were treated
with Prolong Gold antifading reagent with DAPI (Invitrogen) and
imaged with the LSCM to determine the number of GFP-positive
granular structures consistent with autophagolysosomes using
semiautomatic image analysis system and the ImageQuant software.
For each condition an average of 50 cells were analyzed.
AntibodiesFor western blot and immunohistochemical analysis of the
autophagy pathway, polyclonal antibodies against mTor (1:1000,
Sigma); phosphorylated-mTor (p-mTor, 1:1000, Cell Signaling
Technology, Beverly, MA); Atg5 (1:1000, Abcam, Cambridge,
MA); Atg6 or Beclin-1 (1:1000, Novus Biologicals, Littleton, CO);
Atg7 (1:500, Abcam); Atg8 or LC3 (1:1000, Abcam); Atg10 (1:500,
Abcam); Atg12 (1:1000, Abcam); Cathepsin D (1:500, Calbio-
chem, San Diego, CA). Detection of a-syn was performed with a
rabbit polyclonal (1:500, Millipore, Temecula, CA) and a mouse
monoclonal antibody (1:500, clone syn211, Sigma).
Immunohistochemistry, Image Analysis and LaserScanning Confocal Microscopy
Briefly, as previously described [65], free-floating 40 mm thick
vibratome sections were washed with Tris buffered saline (TBS,
pH 7.4), pre-treated in 3% H2O2, and blocked with 10% serum
(Vector Laboratories, Burlingame, CA), 3% bovine serum
albumin (Sigma), and 0.2% gelatin in TBS-Tween (TBS-T). For
human brains, sections from the temporal cortex were used; for
the mice sagittal sections from the complete brain were studied.
Sections were incubated at 4uC overnight with the primary
antibodies. Sections were then incubated in secondary antibody
(1:75, Vector), followed by Avidin D-horseradish peroxidase
(HRP, ABC Elite, Vector) and reacted with diaminobenzidine
(DAB, 0.2 mg/ml) in 50 mM Tris (pH 7.4) with 0.001% H2O2.
Control experiments consisted of incubation with pre-immune
rabbit serum. To investigate the effects of postmortem delay and
fixation on the levels of mTor immunoreactivity, preliminary
studies were performed in a subset of cases (n = 5) with
postmortem delay ranging from 4–48 h.
mTor Activation in LBD
PLoS ONE | www.plosone.org 3 February 2010 | Volume 5 | Issue 2 | e9313
Immunostained sections were imaged with a digital Olympus
microscope and assessment of levels of mTor, Atg7, LC3 and
Cathepsin D immunoreactivity was performed utilizing the Image-
Pro Plus program (Media Cybernetics, Silver Spring, MD). For
each case a total of three sections (10 images per section) were
analyzed in order to estimate the average number of immunola-
beled cells per unit area (mm2) and the average intensity of the
immunostaining (corrected optical density).
Double-immunocytochemical analyses was performed utilizing
the Tyramide Signal AmplificationTM-Direct (Red) system (NEN
Life Sciences, Boston, MA). Specificity of this system was tested by
deleting each primary antibody. For this purpose, sections were
double-labeled with the monoclonal antibodies against a-syn
(1:20,000, Cell Signaling) detected with Tyramide Red, and either
mTor, Cathepsin D or LC3 detected with fluorescein isothiocy-
anate (FITC)-conjugated secondary antibodies (1:75, Vector).
All sections were processed simultaneously under the same
conditions and experiments were performed twice for reproduc-
ibility. Sections were imaged with a Zeiss 63X (N.A. 1.4) objective
on an Axiovert 35 microscope (Zeiss, Germany) with an attached
MRC1024 laser scanning confocal microscope (LSCM) system
(BioRad, Hercules, CA).
Analysis of NeurodegenerationTo evaluate the integrity of the dendritic system, blind-coded
40mm-thick vibratome sections from mouse brains fixed in 4%
PFA were immunolabeled with the mouse monoclonal antibody
against microtubule associated protein 2 (MAP2) (dendritic
marker, 1:40, Millipore), as previously described [66]. After an
overnight incubation with the primary antibody, sections were
incubated with FITC-conjugated horse anti-mouse IgG secondary
antibody (1:75, Vector), transferred to SuperFrost slides (Fisher
Scientific, Tustin, CA) and mounted under glass coverslips with
anti-fading media (Vector). All sections were processed under the
same standardized conditions. The immunolabeled blind-coded
sections were imaged with the LSCM (MRC1024, Bio-Rad) and
analyzed with the Image 1.43 program (NIH), as previously
described [66,67].
Western Blot AnalysisImmunoblot analysis was performed as previously described
[68]. Briefly, brain homogenates (temporal cortex for human
tissues and cortex for mice) or cultured cells were solubilized in
lysis buffer (1% Triton X-100, 10% glycerol, 50 mM HEPES,
pH 7.4, 140 mM NaCl, 1mM EDTA, 1mM Na3VO4, 20 mM b-
glycerophosphate, and proteinase inhibitor cocktails). Brain
homogenates were separated into cytosolic and membrane
fractions by centrifugation at 100,0006g for 1 hr at 4C. Isolation
of lysosomal fractions from brain tissue was performed by
differential centrifugation in a sucrose-based buffer essentially as
previously described [69]. Briefly, tissues were minced with a razor
blade and homogenized in ice-cold 50 mM Tris/HCl buffer,
pH = 7.4, containing 0.25 M sucrose, 10 mM EDTA, 3 mM
MgCl2, with protease and phosphatase inhibitor cocktails
(Calbiochem) added fresh (sucrose/Tris buffer). After filtration
through a mesh to remove cell debris and capsular fragments, the
homogenate was centrifuged at 1000 g for 5 min to obtain the
nuclear fraction (pellet 1, P1). The supernatant was centrifuged
again at 10,000 g for 10 min to collect the mitochondrial fraction
(pellet 2, P2). The resulting supernatant was centrifuged at
20,000 g for 10 min to obtain the lysosomal fraction (pellet 3,
P3). Finally, the supernatant remaining after the removal of the
lysosomal fraction was centrifuged at 180,000 g for 30 min to
separate the microsomal fraction (pellet 4, P4) from the cytosol/
extracellular fluid fraction (supernatant 4, S4). Pellets were gently
resuspended in 0.25 mL sucrose/Tris buffer, and all fractions were
stored at 280uC until further processing.
For western blot analysis, 20 mg of each fraction was resolved by
SDS-PAGE on 4–12% Bis-Tris gels (Invitrogen) and electroblotted
onto Immobilon membranes (Millipore). The membranes were
blocked with phosphate-buffered saline (PBS) with 0.2% Tween-
20 (PBST) containing 3% skim milk or bovine serum albumin
(BSA), followed by incubation with primary antibodies in PBST
containing 5% BSA. After washing with PBS, the membranes
were incubated with rabbit anti-mouse secondary antibodies
(1:5000, American Qualex, San Clemente, CA) and visualized
with enhanced chemiluminescence (ECL, PerkinElmer, Wellesley,
MA) and analyzed with the VersaDoc gel imaging system
(BioRad).
Electron MicroscopyBriefly, as previously described [42], vibratome sections from
control, DLB brains and a-syn tg mice were post-fixed in 1%
glutaraldehyde, then treated with osmium tetraoxide and
embedded in epon araldite. Once the resin hardened, blocks were
sectioned with an ultramicrotome (Leica). Grids were analyzed
with a Zeiss OM 10 electron microscope as previously described
[70]. Micrographs from pyramidal neurons in the temporal cortex
were randomly acquired from 3 grids, and electron micrographs
were acquired at a magnification of 25,000 each.
Statistical AnalysisAll experiments were conducted in triplicate on blind-coded
samples. After the results were obtained, the code was broken and
data were analyzed with the StatView program (SAS Institute,
Inc., NC). Comparison among groups of expression levels of
components of the autophagy pathway were performed by one-
way ANOVA with post-hoc Dunnett’s or Tukey-Kramer. All
results are expressed as mean 6 SEM.
Results
Alterations in the Levels of mTor and Atg7 AreAssociated with Lysosomal Alterations the Brains of DLBPatients
Recent evidence suggests that impaired functioning of the
lysosomal pathways (eg: autophagy) involved in a-syn clearance
might play a role in the pathogenesis of DLB [23,24]. For this
reason, expression levels of members of the autophagy pathway
were analyzed in the temporal cortex of control, AD and DLB
patients. By immunoblot analysis, mTor was identified as a triplet
band at an estimated molecular weight of 280–290 kDa that was
more abundant in the membrane than in the cytosolic fraction
(Figure 1A, B). Compared to non-demented controls and AD
cases, levels of mTor and phosphorylated-mTor (p-mTor) were
elevated in the brains of DLB cases (Figure 1A, C). In both the
membrane and cytosolic fractions Atg7 was identified as a doublet
at an estimated molecular weight of 78 kDa (Figure 1A, B). In
DLB cases, levels of Atg7 were moderately reduced compared to
controls and AD cases (Figure 1A, D). No differences were
observed between controls and AD cases (Figure 1A, D). Other
components of the autophagy pathway such as Atg5 (32 kDa) and
Atg12 (20kDa) were identified as single bands that were more
abundant in the membrane than in the cytosolic fractions
(Figure 1A, B). No differences were detected among the 3 groups
in the levels of these Atg proteins (Figure 1A, D). Beclin-1 was
detected as a single band at 50 kDa that was more abundant in the
membrane than the cytosolic fraction (Figure 1A, B). Consistent
mTor Activation in LBD
PLoS ONE | www.plosone.org 4 February 2010 | Volume 5 | Issue 2 | e9313
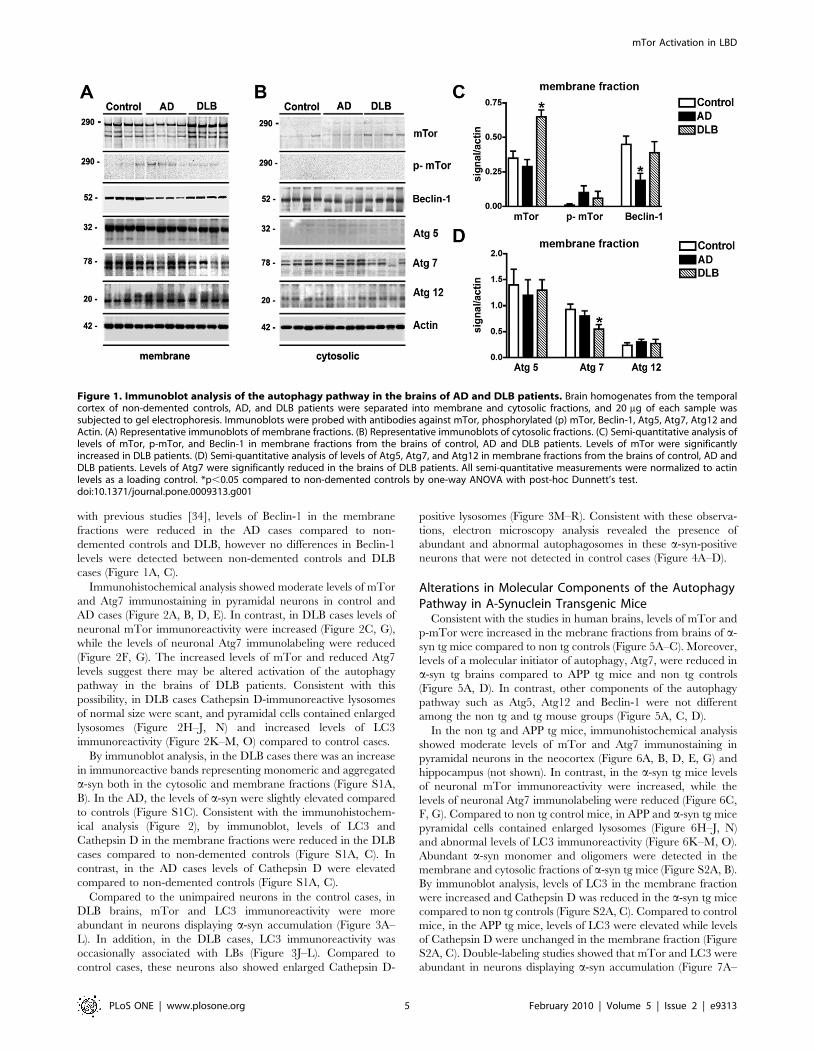
with previous studies [34], levels of Beclin-1 in the membrane
fractions were reduced in the AD cases compared to non-
demented controls and DLB, however no differences in Beclin-1
levels were detected between non-demented controls and DLB
cases (Figure 1A, C).
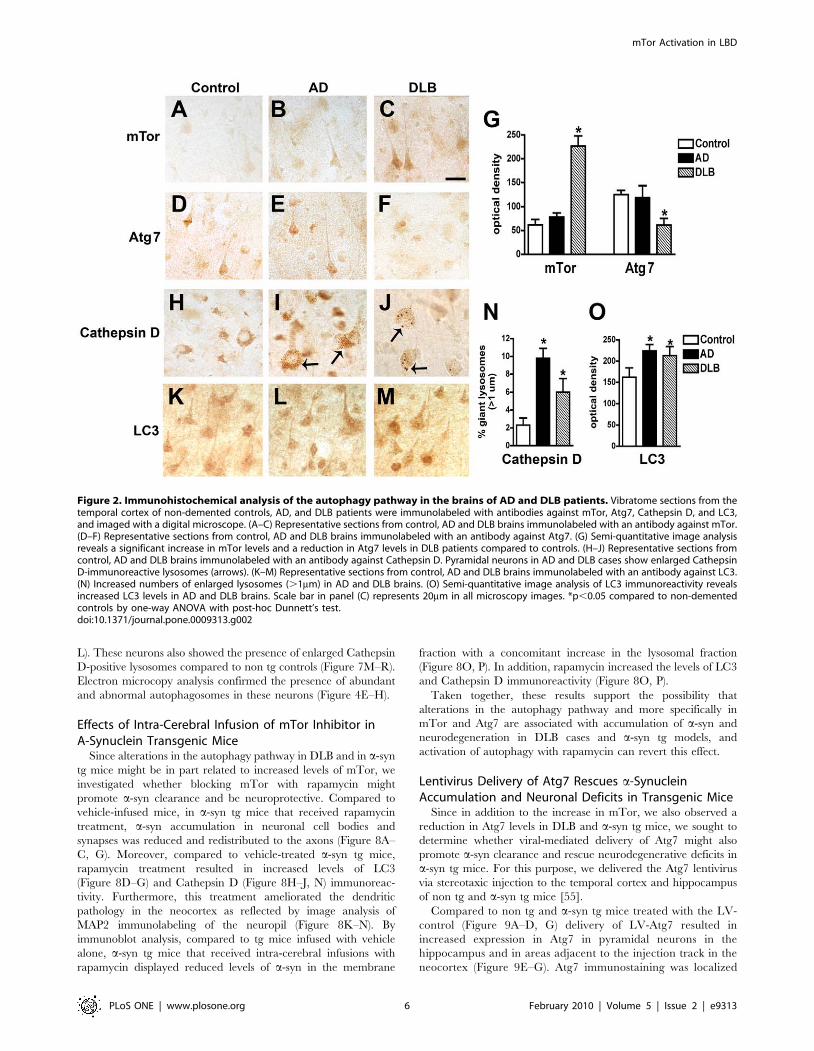
Immunohistochemical analysis showed moderate levels of mTor
and Atg7 immunostaining in pyramidal neurons in control and
AD cases (Figure 2A, B, D, E). In contrast, in DLB cases levels of
neuronal mTor immunoreactivity were increased (Figure 2C, G),
while the levels of neuronal Atg7 immunolabeling were reduced
(Figure 2F, G). The increased levels of mTor and reduced Atg7
levels suggest there may be altered activation of the autophagy
pathway in the brains of DLB patients. Consistent with this
possibility, in DLB cases Cathepsin D-immunoreactive lysosomes
of normal size were scant, and pyramidal cells contained enlarged
lysosomes (Figure 2H–J, N) and increased levels of LC3
immunoreactivity (Figure 2K–M, O) compared to control cases.
By immunoblot analysis, in the DLB cases there was an increase
in immunoreactive bands representing monomeric and aggregated
a-syn both in the cytosolic and membrane fractions (Figure S1A,
B). In the AD, the levels of a-syn were slightly elevated compared
to controls (Figure S1C). Consistent with the immunohistochem-
ical analysis (Figure 2), by immunoblot, levels of LC3 and
Cathepsin D in the membrane fractions were reduced in the DLB
cases compared to non-demented controls (Figure S1A, C). In
contrast, in the AD cases levels of Cathepsin D were elevated
compared to non-demented controls (Figure S1A, C).
Compared to the unimpaired neurons in the control cases, in
DLB brains, mTor and LC3 immunoreactivity were more
abundant in neurons displaying a-syn accumulation (Figure 3A–
L). In addition, in the DLB cases, LC3 immunoreactivity was
occasionally associated with LBs (Figure 3J–L). Compared to
control cases, these neurons also showed enlarged Cathepsin D-
positive lysosomes (Figure 3M–R). Consistent with these observa-
tions, electron microscopy analysis revealed the presence of
abundant and abnormal autophagosomes in these a-syn-positive
neurons that were not detected in control cases (Figure 4A–D).
Alterations in Molecular Components of the AutophagyPathway in A-Synuclein Transgenic Mice
Consistent with the studies in human brains, levels of mTor and
p-mTor were increased in the mebrane fractions from brains of a-
syn tg mice compared to non tg controls (Figure 5A–C). Moreover,
levels of a molecular initiator of autophagy, Atg7, were reduced in
a-syn tg brains compared to APP tg mice and non tg controls
(Figure 5A, D). In contrast, other components of the autophagy
pathway such as Atg5, Atg12 and Beclin-1 were not different
among the non tg and tg mouse groups (Figure 5A, C, D).
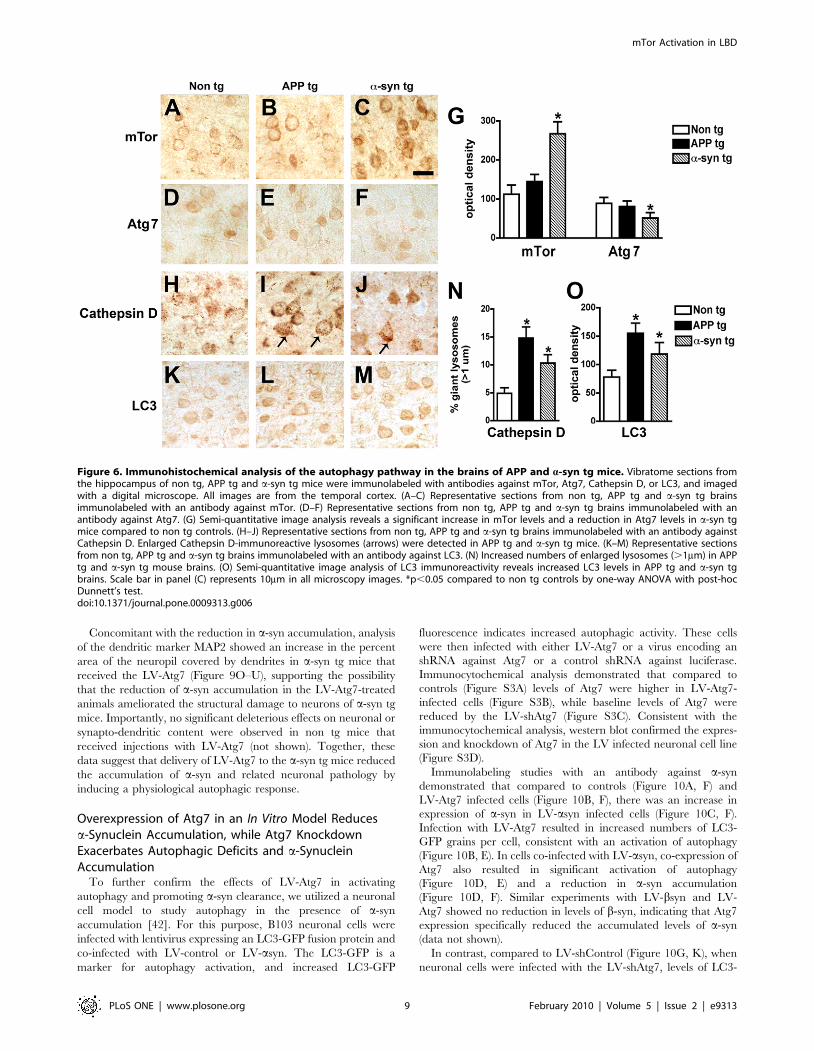
In the non tg and APP tg mice, immunohistochemical analysis
showed moderate levels of mTor and Atg7 immunostaining in
pyramidal neurons in the neocortex (Figure 6A, B, D, E, G) and
hippocampus (not shown). In contrast, in the a-syn tg mice levels
of neuronal mTor immunoreactivity were increased, while the
levels of neuronal Atg7 immunolabeling were reduced (Figure 6C,
F, G). Compared to non tg control mice, in APP and a-syn tg mice
pyramidal cells contained enlarged lysosomes (Figure 6H–J, N)
and abnormal levels of LC3 immunoreactivity (Figure 6K–M, O).
Abundant a-syn monomer and oligomers were detected in the
membrane and cytosolic fractions of a-syn tg mice (Figure S2A, B).
By immunoblot analysis, levels of LC3 in the membrane fraction
were increased and Cathepsin D was reduced in the a-syn tg mice
compared to non tg controls (Figure S2A, C). Compared to control
mice, in the APP tg mice, levels of LC3 were elevated while levels
of Cathepsin D were unchanged in the membrane fraction (Figure
S2A, C). Double-labeling studies showed that mTor and LC3 were
abundant in neurons displaying a-syn accumulation (Figure 7A–
Figure 1. Immunoblot analysis of the autophagy pathway in the brains of AD and DLB patients. Brain homogenates from the temporalcortex of non-demented controls, AD, and DLB patients were separated into membrane and cytosolic fractions, and 20 mg of each sample wassubjected to gel electrophoresis. Immunoblots were probed with antibodies against mTor, phosphorylated (p) mTor, Beclin-1, Atg5, Atg7, Atg12 andActin. (A) Representative immunoblots of membrane fractions. (B) Representative immunoblots of cytosolic fractions. (C) Semi-quantitative analysis oflevels of mTor, p-mTor, and Beclin-1 in membrane fractions from the brains of control, AD and DLB patients. Levels of mTor were significantlyincreased in DLB patients. (D) Semi-quantitative analysis of levels of Atg5, Atg7, and Atg12 in membrane fractions from the brains of control, AD andDLB patients. Levels of Atg7 were significantly reduced in the brains of DLB patients. All semi-quantitative measurements were normalized to actinlevels as a loading control. *p,0.05 compared to non-demented controls by one-way ANOVA with post-hoc Dunnett’s test.doi:10.1371/journal.pone.0009313.g001
mTor Activation in LBD
PLoS ONE | www.plosone.org 5 February 2010 | Volume 5 | Issue 2 | e9313
L). These neurons also showed the presence of enlarged Cathepsin
D-positive lysosomes compared to non tg controls (Figure 7M–R).
Electron microcopy analysis confirmed the presence of abundant
and abnormal autophagosomes in these neurons (Figure 4E–H).
Effects of Intra-Cerebral Infusion of mTor Inhibitor inA-Synuclein Transgenic Mice
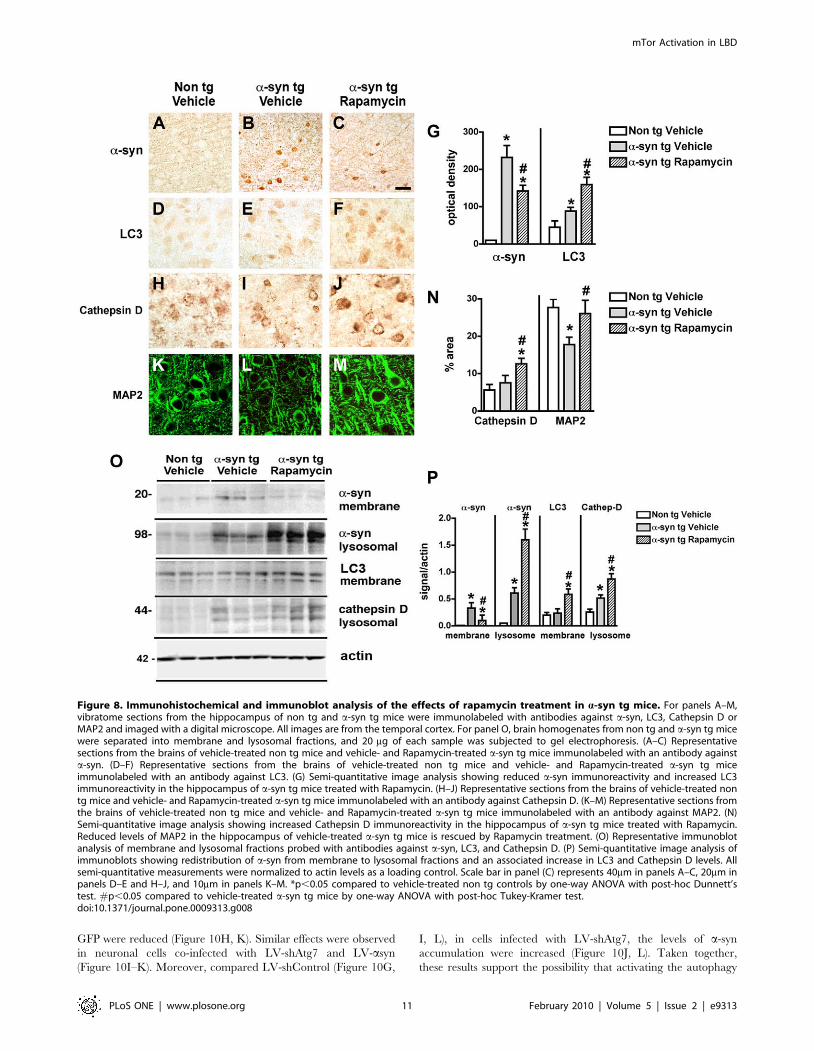
Since alterations in the autophagy pathway in DLB and in a-syn
tg mice might be in part related to increased levels of mTor, we
investigated whether blocking mTor with rapamycin might
promote a-syn clearance and be neuroprotective. Compared to
vehicle-infused mice, in a-syn tg mice that received rapamycin
treatment, a-syn accumulation in neuronal cell bodies and
synapses was reduced and redistributed to the axons (Figure 8A–
C, G). Moreover, compared to vehicle-treated a-syn tg mice,
rapamycin treatment resulted in increased levels of LC3
(Figure 8D–G) and Cathepsin D (Figure 8H–J, N) immunoreac-
tivity. Furthermore, this treatment ameliorated the dendritic
pathology in the neocortex as reflected by image analysis of
MAP2 immunolabeling of the neuropil (Figure 8K–N). By
immunoblot analysis, compared to tg mice infused with vehicle
alone, a-syn tg mice that received intra-cerebral infusions with
rapamycin displayed reduced levels of a-syn in the membrane
fraction with a concomitant increase in the lysosomal fraction
(Figure 8O, P). In addition, rapamycin increased the levels of LC3
and Cathepsin D immunoreactivity (Figure 8O, P).
Taken together, these results support the possibility that
alterations in the autophagy pathway and more specifically in
mTor and Atg7 are associated with accumulation of a-syn and
neurodegeneration in DLB cases and a-syn tg models, and
activation of autophagy with rapamycin can revert this effect.
Lentivirus Delivery of Atg7 Rescues a-SynucleinAccumulation and Neuronal Deficits in Transgenic Mice
Since in addition to the increase in mTor, we also observed a
reduction in Atg7 levels in DLB and a-syn tg mice, we sought to
determine whether viral-mediated delivery of Atg7 might also
promote a-syn clearance and rescue neurodegenerative deficits in
a-syn tg mice. For this purpose, we delivered the Atg7 lentivirus
via stereotaxic injection to the temporal cortex and hippocampus
of non tg and a-syn tg mice [55].
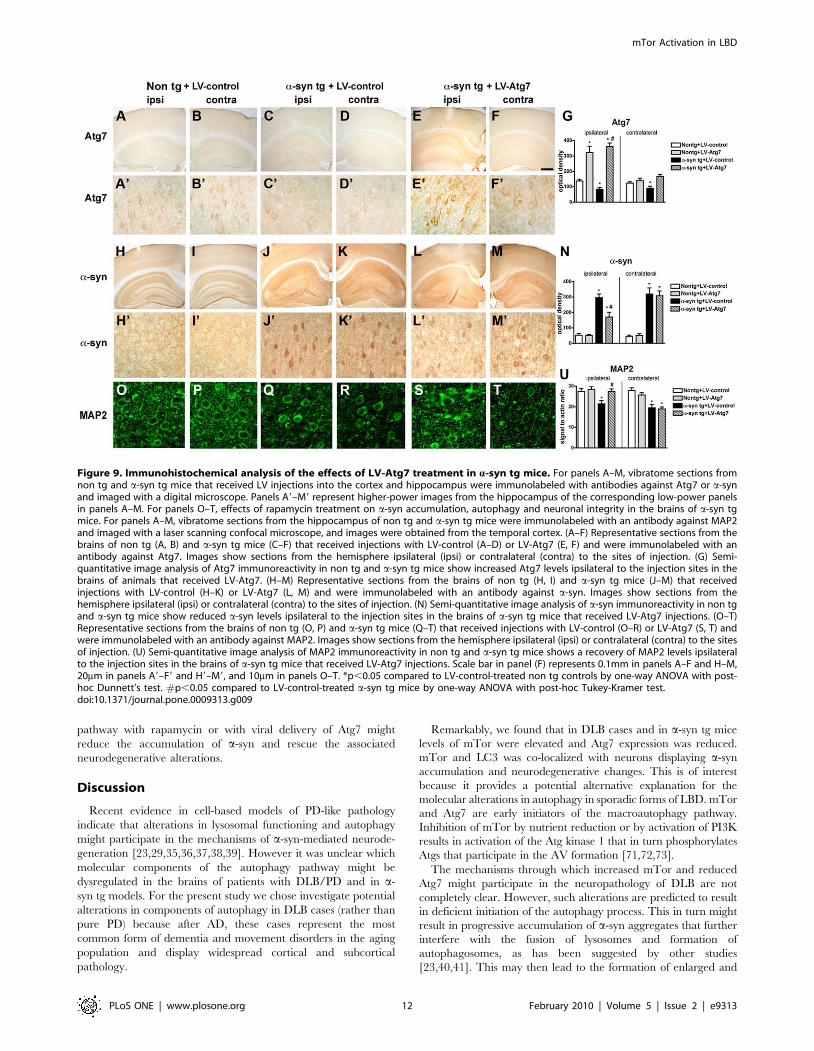
Compared to non tg and a-syn tg mice treated with the LV-
control (Figure 9A–D, G) delivery of LV-Atg7 resulted in
increased expression in Atg7 in pyramidal neurons in the
hippocampus and in areas adjacent to the injection track in the
neocortex (Figure 9E–G). Atg7 immunostaining was localized
Figure 2. Immunohistochemical analysis of the autophagy pathway in the brains of AD and DLB patients. Vibratome sections from thetemporal cortex of non-demented controls, AD, and DLB patients were immunolabeled with antibodies against mTor, Atg7, Cathepsin D, and LC3,and imaged with a digital microscope. (A–C) Representative sections from control, AD and DLB brains immunolabeled with an antibody against mTor.(D–F) Representative sections from control, AD and DLB brains immunolabeled with an antibody against Atg7. (G) Semi-quantitative image analysisreveals a significant increase in mTor levels and a reduction in Atg7 levels in DLB patients compared to controls. (H–J) Representative sections fromcontrol, AD and DLB brains immunolabeled with an antibody against Cathepsin D. Pyramidal neurons in AD and DLB cases show enlarged CathepsinD-immunoreactive lysosomes (arrows). (K–M) Representative sections from control, AD and DLB brains immunolabeled with an antibody against LC3.(N) Increased numbers of enlarged lysosomes (.1mm) in AD and DLB brains. (O) Semi-quantitative image analysis of LC3 immunoreactivity revealsincreased LC3 levels in AD and DLB brains. Scale bar in panel (C) represents 20mm in all microscopy images. *p,0.05 compared to non-dementedcontrols by one-way ANOVA with post-hoc Dunnett’s test.doi:10.1371/journal.pone.0009313.g002
mTor Activation in LBD
PLoS ONE | www.plosone.org 6 February 2010 | Volume 5 | Issue 2 | e9313
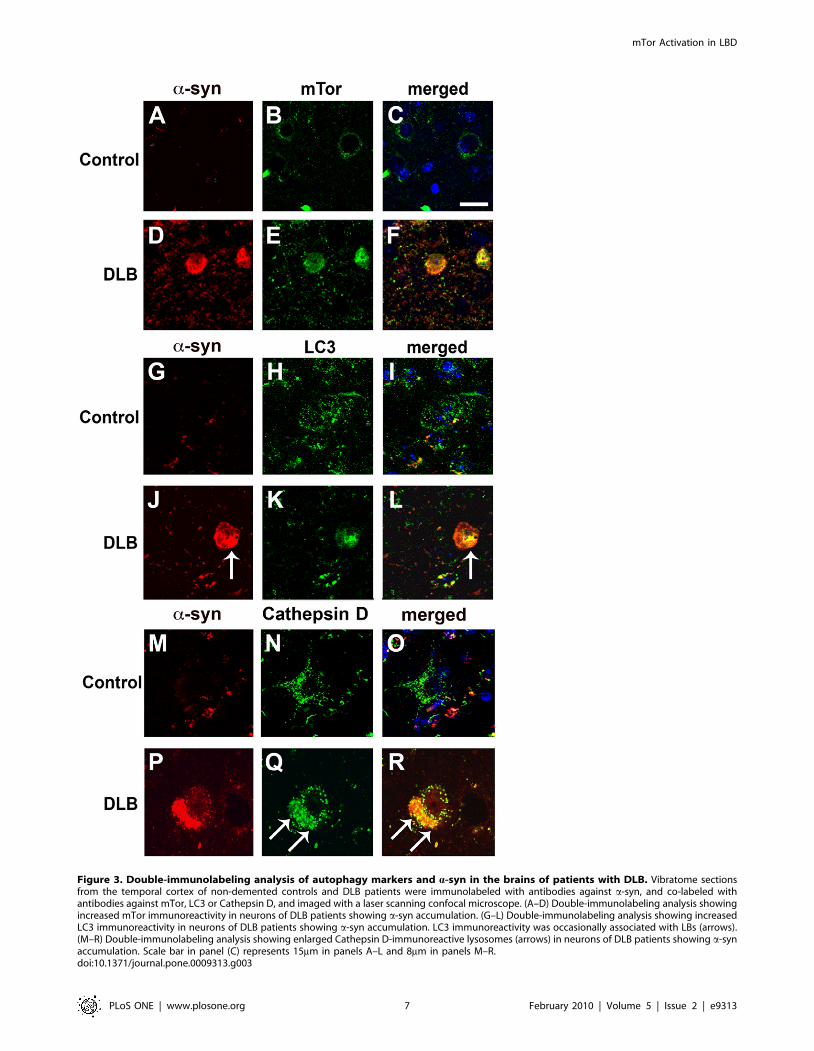
Figure 3. Double-immunolabeling analysis of autophagy markers and a-syn in the brains of patients with DLB. Vibratome sectionsfrom the temporal cortex of non-demented controls and DLB patients were immunolabeled with antibodies against a-syn, and co-labeled withantibodies against mTor, LC3 or Cathepsin D, and imaged with a laser scanning confocal microscope. (A–D) Double-immunolabeling analysis showingincreased mTor immunoreactivity in neurons of DLB patients showing a-syn accumulation. (G–L) Double-immunolabeling analysis showing increasedLC3 immunoreactivity in neurons of DLB patients showing a-syn accumulation. LC3 immunoreactivity was occasionally associated with LBs (arrows).(M–R) Double-immunolabeling analysis showing enlarged Cathepsin D-immunoreactive lysosomes (arrows) in neurons of DLB patients showing a-synaccumulation. Scale bar in panel (C) represents 15mm in panels A–L and 8mm in panels M–R.doi:10.1371/journal.pone.0009313.g003
mTor Activation in LBD
PLoS ONE | www.plosone.org 7 February 2010 | Volume 5 | Issue 2 | e9313

primarily to the neuronal perykaria surrounding the injection
track with some extension to the apical dendrites (Figure 9E).
Compared to non tg mice (Figure 9H, I), a-syn tg mice injected
with the LV-control contained abundant intracellular aggregates
of a-syn (Figure 9J, K); in contrast, following LV-Atg7 injection,
there was a considerable reduction in the intra-neuronal a-syn
accumulation in the areas adjacent to the injection track
(Figure 9L–N).
Figure 4. Electron microscopic analysis of abnormal autophagosomes in patients with DLB and in a-syn tg mice. (A) Representativeimage from a non-demented control case showing normal neuronal lysosomes (arrow). (B–D) Abnormal autophagosomes and accumulation ofelectrodense deposits (arrows) in intraneuronal membrane-bound structures in the brains of patients with DLB. (E) Representative image from a nontg mouse brain showing normal neuronal lysosomes (arrow). (F–H) Abnormal autophagosome morphology and accumulation of electrodensedeposits (arrows) in intraneuronal membrane-bound structures in the brains of a-syn tg mice. Scale bar in panel (C) represents 0.5mm in all panels.doi:10.1371/journal.pone.0009313.g004
Figure 5. Immunoblot analysis of the autophagy pathway in the brains of APP and a-syn tg mice. Brain homogenates from non tg, APPtg, and a-syn tg mice were separated into membrane and cytosolic fractions, and 20 mg of each sample was subjected to gel electrophoresis.Immunoblots were probed with antibodies against mTor, phosphorylated (p) mTor, Beclin-1, Atg5, Atg7, Atg12 and Actin. (A) Representativeimmunoblots of membrane fractions. (B) Representative immunoblots of cytosolic fractions. (C) Semi-quantitative analysis of levels of mTor, p-mTor,and Beclin-1 in membrane fractions from the brains of non tg, APP tg and a-syn tg mice. Levels of mTor were significantly increased in APP tg and a-syn tg brains. (D) Semi-quantitative analysis of levels of Atg5, Atg7, and Atg12 in membrane fractions from the brains of non tg, APP tg and a-syn tgmice. Levels of Atg7 were significantly reduced in the brains of a-syn tg mice. All semi-quantitative measurements were normalized to actin levels asa loading control. *p,0.05 compared to non tg controls by one-way ANOVA with post-hoc Dunnett’s test.doi:10.1371/journal.pone.0009313.g005
mTor Activation in LBD
PLoS ONE | www.plosone.org 8 February 2010 | Volume 5 | Issue 2 | e9313
Concomitant with the reduction in a-syn accumulation, analysis
of the dendritic marker MAP2 showed an increase in the percent
area of the neuropil covered by dendrites in a-syn tg mice that
received the LV-Atg7 (Figure 9O–U), supporting the possibility
that the reduction of a-syn accumulation in the LV-Atg7-treated
animals ameliorated the structural damage to neurons of a-syn tg
mice. Importantly, no significant deleterious effects on neuronal or
synapto-dendritic content were observed in non tg mice that
received injections with LV-Atg7 (not shown). Together, these
data suggest that delivery of LV-Atg7 to the a-syn tg mice reduced
the accumulation of a-syn and related neuronal pathology by
inducing a physiological autophagic response.
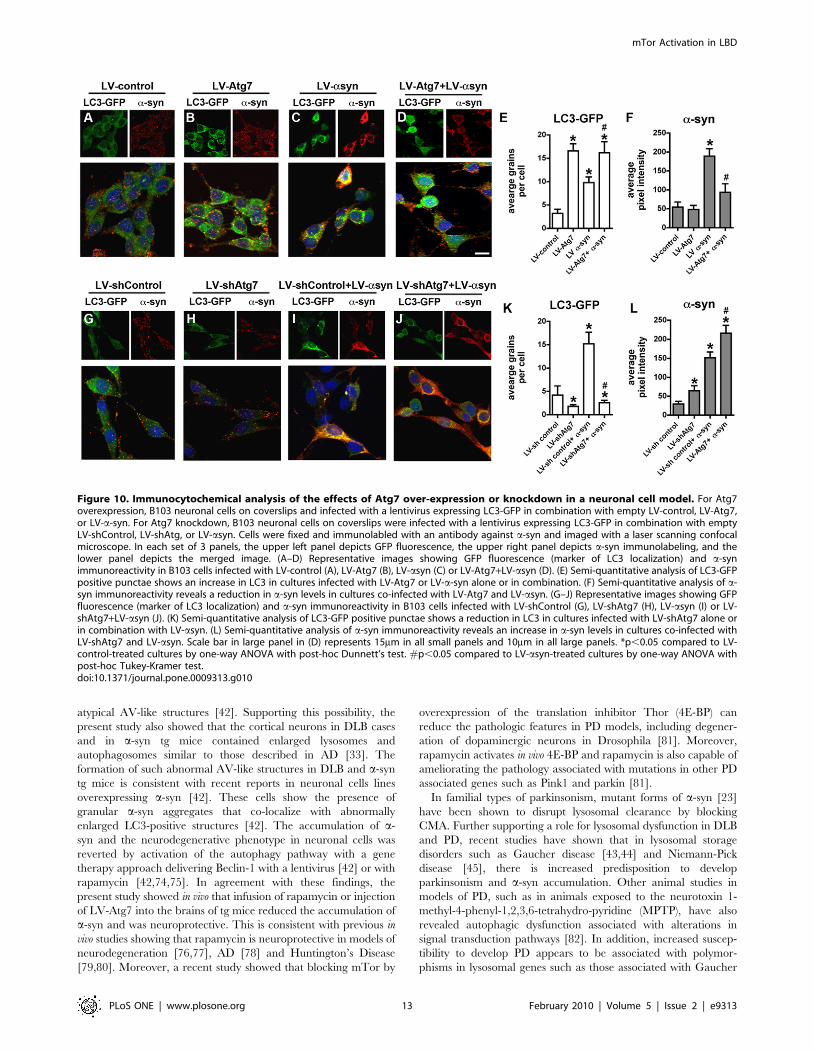
Overexpression of Atg7 in an In Vitro Model Reducesa-Synuclein Accumulation, while Atg7 KnockdownExacerbates Autophagic Deficits and a-SynucleinAccumulation
To further confirm the effects of LV-Atg7 in activating
autophagy and promoting a-syn clearance, we utilized a neuronal
cell model to study autophagy in the presence of a-syn
accumulation [42]. For this purpose, B103 neuronal cells were
infected with lentivirus expressing an LC3-GFP fusion protein and
co-infected with LV-control or LV-asyn. The LC3-GFP is a
marker for autophagy activation, and increased LC3-GFP
fluorescence indicates increased autophagic activity. These cells
were then infected with either LV-Atg7 or a virus encoding an
shRNA against Atg7 or a control shRNA against luciferase.
Immunocytochemical analysis demonstrated that compared to
controls (Figure S3A) levels of Atg7 were higher in LV-Atg7-
infected cells (Figure S3B), while baseline levels of Atg7 were
reduced by the LV-shAtg7 (Figure S3C). Consistent with the
immunocytochemical analysis, western blot confirmed the expres-
sion and knockdown of Atg7 in the LV infected neuronal cell line
(Figure S3D).
Immunolabeling studies with an antibody against a-syn
demonstrated that compared to controls (Figure 10A, F) and
LV-Atg7 infected cells (Figure 10B, F), there was an increase in
expression of a-syn in LV-asyn infected cells (Figure 10C, F).
Infection with LV-Atg7 resulted in increased numbers of LC3-
GFP grains per cell, consistent with an activation of autophagy
(Figure 10B, E). In cells co-infected with LV-asyn, co-expression of
Atg7 also resulted in significant activation of autophagy
(Figure 10D, E) and a reduction in a-syn accumulation
(Figure 10D, F). Similar experiments with LV-bsyn and LV-
Atg7 showed no reduction in levels of b-syn, indicating that Atg7
expression specifically reduced the accumulated levels of a-syn
(data not shown).
In contrast, compared to LV-shControl (Figure 10G, K), when
neuronal cells were infected with the LV-shAtg7, levels of LC3-
Figure 6. Immunohistochemical analysis of the autophagy pathway in the brains of APP and a-syn tg mice. Vibratome sections fromthe hippocampus of non tg, APP tg and a-syn tg mice were immunolabeled with antibodies against mTor, Atg7, Cathepsin D, or LC3, and imagedwith a digital microscope. All images are from the temporal cortex. (A–C) Representative sections from non tg, APP tg and a-syn tg brainsimmunolabeled with an antibody against mTor. (D–F) Representative sections from non tg, APP tg and a-syn tg brains immunolabeled with anantibody against Atg7. (G) Semi-quantitative image analysis reveals a significant increase in mTor levels and a reduction in Atg7 levels in a-syn tgmice compared to non tg controls. (H–J) Representative sections from non tg, APP tg and a-syn tg brains immunolabeled with an antibody againstCathepsin D. Enlarged Cathepsin D-immunoreactive lysosomes (arrows) were detected in APP tg and a-syn tg mice. (K–M) Representative sectionsfrom non tg, APP tg and a-syn tg brains immunolabeled with an antibody against LC3. (N) Increased numbers of enlarged lysosomes (.1mm) in APPtg and a-syn tg mouse brains. (O) Semi-quantitative image analysis of LC3 immunoreactivity reveals increased LC3 levels in APP tg and a-syn tgbrains. Scale bar in panel (C) represents 10mm in all microscopy images. *p,0.05 compared to non tg controls by one-way ANOVA with post-hocDunnett’s test.doi:10.1371/journal.pone.0009313.g006
mTor Activation in LBD
PLoS ONE | www.plosone.org 9 February 2010 | Volume 5 | Issue 2 | e9313

Figure 7. Double-immunolabeling analysis of autophagy and a-syn in the brains of a-syn tg mice. Vibratome sections from the brains ofnon tg and a-syn tg mice were immunolabeled with antibodies against a-syn, and co-labeled with antibodies against mTor, LC3 or Cathepsin D, andimaged with a laser scanning confocal microscope. All images are from the temporal cortex. (A–D) Double-immunolabeling analysis showingincreased mTor immunoreactivity in a-syn-positive neurons in a-syn tg mice. (G–L) Double-immunolabeling analysis showing increased LC3immunoreactivity in neurons of a-syn tg mice showing a-syn accumulation. (M–R) Double-immunolabeling analysis showing enlarged Cathepsin D-immunoreactive lysosomes (arrows) in neurons of a-syn tg mice showing a-syn accumulation. Scale bar in panel (C) represents 20mm in panels A–Land 10mm in panels M–R.doi:10.1371/journal.pone.0009313.g007
mTor Activation in LBD
PLoS ONE | www.plosone.org 10 February 2010 | Volume 5 | Issue 2 | e9313
GFP were reduced (Figure 10H, K). Similar effects were observed
in neuronal cells co-infected with LV-shAtg7 and LV-asyn
(Figure 10I–K). Moreover, compared LV-shControl (Figure 10G,
I, L), in cells infected with LV-shAtg7, the levels of a-syn
accumulation were increased (Figure 10J, L). Taken together,
these results support the possibility that activating the autophagy
Figure 8. Immunohistochemical and immunoblot analysis of the effects of rapamycin treatment in a-syn tg mice. For panels A–M,vibratome sections from the hippocampus of non tg and a-syn tg mice were immunolabeled with antibodies against a-syn, LC3, Cathepsin D orMAP2 and imaged with a digital microscope. All images are from the temporal cortex. For panel O, brain homogenates from non tg and a-syn tg micewere separated into membrane and lysosomal fractions, and 20 mg of each sample was subjected to gel electrophoresis. (A–C) Representativesections from the brains of vehicle-treated non tg mice and vehicle- and Rapamycin-treated a-syn tg mice immunolabeled with an antibody againsta-syn. (D–F) Representative sections from the brains of vehicle-treated non tg mice and vehicle- and Rapamycin-treated a-syn tg miceimmunolabeled with an antibody against LC3. (G) Semi-quantitative image analysis showing reduced a-syn immunoreactivity and increased LC3immunoreactivity in the hippocampus of a-syn tg mice treated with Rapamycin. (H–J) Representative sections from the brains of vehicle-treated nontg mice and vehicle- and Rapamycin-treated a-syn tg mice immunolabeled with an antibody against Cathepsin D. (K–M) Representative sections fromthe brains of vehicle-treated non tg mice and vehicle- and Rapamycin-treated a-syn tg mice immunolabeled with an antibody against MAP2. (N)Semi-quantitative image analysis showing increased Cathepsin D immunoreactivity in the hippocampus of a-syn tg mice treated with Rapamycin.Reduced levels of MAP2 in the hippocampus of vehicle-treated a-syn tg mice is rescued by Rapamycin treatment. (O) Representative immunoblotanalysis of membrane and lysosomal fractions probed with antibodies against a-syn, LC3, and Cathepsin D. (P) Semi-quantitative image analysis ofimmunoblots showing redistribution of a-syn from membrane to lysosomal fractions and an associated increase in LC3 and Cathepsin D levels. Allsemi-quantitative measurements were normalized to actin levels as a loading control. Scale bar in panel (C) represents 40mm in panels A–C, 20mm inpanels D–E and H–J, and 10mm in panels K–M. *p,0.05 compared to vehicle-treated non tg controls by one-way ANOVA with post-hoc Dunnett’stest. #p,0.05 compared to vehicle-treated a-syn tg mice by one-way ANOVA with post-hoc Tukey-Kramer test.doi:10.1371/journal.pone.0009313.g008
mTor Activation in LBD
PLoS ONE | www.plosone.org 11 February 2010 | Volume 5 | Issue 2 | e9313
pathway with rapamycin or with viral delivery of Atg7 might
reduce the accumulation of a-syn and rescue the associated
neurodegenerative alterations.
Discussion
Recent evidence in cell-based models of PD-like pathology
indicate that alterations in lysosomal functioning and autophagy
might participate in the mechanisms of a-syn-mediated neurode-
generation [23,29,35,36,37,38,39]. However it was unclear which
molecular components of the autophagy pathway might be
dysregulated in the brains of patients with DLB/PD and in a-
syn tg models. For the present study we chose investigate potential
alterations in components of autophagy in DLB cases (rather than
pure PD) because after AD, these cases represent the most
common form of dementia and movement disorders in the aging
population and display widespread cortical and subcortical
pathology.
Remarkably, we found that in DLB cases and in a-syn tg mice
levels of mTor were elevated and Atg7 expression was reduced.
mTor and LC3 was co-localized with neurons displaying a-syn
accumulation and neurodegenerative changes. This is of interest
because it provides a potential alternative explanation for the
molecular alterations in autophagy in sporadic forms of LBD. mTor
and Atg7 are early initiators of the macroautophagy pathway.
Inhibition of mTor by nutrient reduction or by activation of PI3K
results in activation of the Atg kinase 1 that in turn phosphorylates
Atgs that participate in the AV formation [71,72,73].
The mechanisms through which increased mTor and reduced
Atg7 might participate in the neuropathology of DLB are not
completely clear. However, such alterations are predicted to result
in deficient initiation of the autophagy process. This in turn might
result in progressive accumulation of a-syn aggregates that further
interfere with the fusion of lysosomes and formation of
autophagosomes, as has been suggested by other studies
[23,40,41]. This may then lead to the formation of enlarged and
Figure 9. Immunohistochemical analysis of the effects of LV-Atg7 treatment in a-syn tg mice. For panels A–M, vibratome sections fromnon tg and a-syn tg mice that received LV injections into the cortex and hippocampus were immunolabeled with antibodies against Atg7 or a-synand imaged with a digital microscope. Panels A9–M9 represent higher-power images from the hippocampus of the corresponding low-power panelsin panels A–M. For panels O–T, effects of rapamycin treatment on a-syn accumulation, autophagy and neuronal integrity in the brains of a-syn tgmice. For panels A–M, vibratome sections from the hippocampus of non tg and a-syn tg mice were immunolabeled with an antibody against MAP2and imaged with a laser scanning confocal microscope, and images were obtained from the temporal cortex. (A–F) Representative sections from thebrains of non tg (A, B) and a-syn tg mice (C–F) that received injections with LV-control (A–D) or LV-Atg7 (E, F) and were immunolabeled with anantibody against Atg7. Images show sections from the hemisphere ipsilateral (ipsi) or contralateral (contra) to the sites of injection. (G) Semi-quantitative image analysis of Atg7 immunoreactivity in non tg and a-syn tg mice show increased Atg7 levels ipsilateral to the injection sites in thebrains of animals that received LV-Atg7. (H–M) Representative sections from the brains of non tg (H, I) and a-syn tg mice (J–M) that receivedinjections with LV-control (H–K) or LV-Atg7 (L, M) and were immunolabeled with an antibody against a-syn. Images show sections from thehemisphere ipsilateral (ipsi) or contralateral (contra) to the sites of injection. (N) Semi-quantitative image analysis of a-syn immunoreactivity in non tgand a-syn tg mice show reduced a-syn levels ipsilateral to the injection sites in the brains of a-syn tg mice that received LV-Atg7 injections. (O–T)Representative sections from the brains of non tg (O, P) and a-syn tg mice (Q–T) that received injections with LV-control (O–R) or LV-Atg7 (S, T) andwere immunolabeled with an antibody against MAP2. Images show sections from the hemisphere ipsilateral (ipsi) or contralateral (contra) to the sitesof injection. (U) Semi-quantitative image analysis of MAP2 immunoreactivity in non tg and a-syn tg mice shows a recovery of MAP2 levels ipsilateralto the injection sites in the brains of a-syn tg mice that received LV-Atg7 injections. Scale bar in panel (F) represents 0.1mm in panels A–F and H–M,20mm in panels A9–F9 and H9–M9, and 10mm in panels O–T. *p,0.05 compared to LV-control-treated non tg controls by one-way ANOVA with post-hoc Dunnett’s test. #p,0.05 compared to LV-control-treated a-syn tg mice by one-way ANOVA with post-hoc Tukey-Kramer test.doi:10.1371/journal.pone.0009313.g009
mTor Activation in LBD
PLoS ONE | www.plosone.org 12 February 2010 | Volume 5 | Issue 2 | e9313
atypical AV-like structures [42]. Supporting this possibility, the
present study also showed that the cortical neurons in DLB cases
and in a-syn tg mice contained enlarged lysosomes and
autophagosomes similar to those described in AD [33]. The
formation of such abnormal AV-like structures in DLB and a-syn
tg mice is consistent with recent reports in neuronal cells lines
overexpressing a-syn [42]. These cells show the presence of
granular a-syn aggregates that co-localize with abnormally
enlarged LC3-positive structures [42]. The accumulation of a-
syn and the neurodegenerative phenotype in neuronal cells was
reverted by activation of the autophagy pathway with a gene
therapy approach delivering Beclin-1 with a lentivirus [42] or with
rapamycin [42,74,75]. In agreement with these findings, the
present study showed in vivo that infusion of rapamycin or injection
of LV-Atg7 into the brains of tg mice reduced the accumulation of
a-syn and was neuroprotective. This is consistent with previous in
vivo studies showing that rapamycin is neuroprotective in models of
neurodegeneration [76,77], AD [78] and Huntington’s Disease
[79,80]. Moreover, a recent study showed that blocking mTor by
overexpression of the translation inhibitor Thor (4E-BP) can
reduce the pathologic features in PD models, including degener-
ation of dopaminergic neurons in Drosophila [81]. Moreover,
rapamycin activates in vivo 4E-BP and rapamycin is also capable of
ameliorating the pathology associated with mutations in other PD
associated genes such as Pink1 and parkin [81].
In familial types of parkinsonism, mutant forms of a-syn [23]
have been shown to disrupt lysosomal clearance by blocking
CMA. Further supporting a role for lysosomal dysfunction in DLB
and PD, recent studies have shown that in lysosomal storage
disorders such as Gaucher disease [43,44] and Niemann-Pick
disease [45], there is increased predisposition to develop
parkinsonism and a-syn accumulation. Other animal studies in
models of PD, such as in animals exposed to the neurotoxin 1-
methyl-4-phenyl-1,2,3,6-tetrahydro-pyridine (MPTP), have also
revealed autophagic dysfunction associated with alterations in
signal transduction pathways [82]. In addition, increased suscep-
tibility to develop PD appears to be associated with polymor-
phisms in lysosomal genes such as those associated with Gaucher
Figure 10. Immunocytochemical analysis of the effects of Atg7 over-expression or knockdown in a neuronal cell model. For Atg7overexpression, B103 neuronal cells on coverslips and infected with a lentivirus expressing LC3-GFP in combination with empty LV-control, LV-Atg7,or LV-a-syn. For Atg7 knockdown, B103 neuronal cells on coverslips were infected with a lentivirus expressing LC3-GFP in combination with emptyLV-shControl, LV-shAtg, or LV-asyn. Cells were fixed and immunolabled with an antibody against a-syn and imaged with a laser scanning confocalmicroscope. In each set of 3 panels, the upper left panel depicts GFP fluorescence, the upper right panel depicts a-syn immunolabeling, and thelower panel depicts the merged image. (A–D) Representative images showing GFP fluorescence (marker of LC3 localization) and a-synimmunoreactivity in B103 cells infected with LV-control (A), LV-Atg7 (B), LV-asyn (C) or LV-Atg7+LV-asyn (D). (E) Semi-quantitative analysis of LC3-GFPpositive punctae shows an increase in LC3 in cultures infected with LV-Atg7 or LV-a-syn alone or in combination. (F) Semi-quantitative analysis of a-syn immunoreactivity reveals a reduction in a-syn levels in cultures co-infected with LV-Atg7 and LV-asyn. (G–J) Representative images showing GFPfluorescence (marker of LC3 localization) and a-syn immunoreactivity in B103 cells infected with LV-shControl (G), LV-shAtg7 (H), LV-asyn (I) or LV-shAtg7+LV-asyn (J). (K) Semi-quantitative analysis of LC3-GFP positive punctae shows a reduction in LC3 in cultures infected with LV-shAtg7 alone orin combination with LV-asyn. (L) Semi-quantitative analysis of a-syn immunoreactivity reveals an increase in a-syn levels in cultures co-infected withLV-shAtg7 and LV-asyn. Scale bar in large panel in (D) represents 15mm in all small panels and 10mm in all large panels. *p,0.05 compared to LV-control-treated cultures by one-way ANOVA with post-hoc Dunnett’s test. #p,0.05 compared to LV-asyn-treated cultures by one-way ANOVA withpost-hoc Tukey-Kramer test.doi:10.1371/journal.pone.0009313.g010
mTor Activation in LBD
PLoS ONE | www.plosone.org 13 February 2010 | Volume 5 | Issue 2 | e9313
disease and Niemann-Pick disease. Moreover, recent studies have
shown that reduced Cathepsin D expression results in a-syn
accumulation and degeneration of the dopaminergic system in
experimental models and in patients with PD [83]. Cathepsin D is
now considered one of the main lysosomal enzymes involved in a-
syn degradation [84] and overexpression of Cathepsin D reduces
the pathology associated with a-syn accumulation [85].
Selective alterations in molecular components of the autophagy
pathway might result in degeneration of specific neuronal
populations in neurological disorders. For example, previous
studies have shown that in sporadic AD there is a profound
reduction in the levels of Beclin-1 [34], while the neurodegener-
ative process in familial forms of fronto-temporal dementia and
ALS has been linked to mutations in charged multivesicular body
protein-2B (CHMP2B) [86,87,88], and in Huntington’s Disease
polyglutamate aggregates trap mTor and disrupt autophagy [80].
The mechanisms through which levels of mTor might be
upregulated and Atg7 downregulated in DLB and a-syn tg mice
are not completely clear. However, targeted reduction of
autophagy genes including Atg7 results in behavioral defects,
including abnormal limb-clasping reflexes and a reduction in
coordinated movement, and died within 28 weeks of birth.
Furthermore, Atg7 deficiency results in neurodegeneration of the
cerebral and cerebellar cortices [89].
In conclusion, this study supports the notion that selective
molecular alterations in the autophagy pathway and more
specifically in mTor and Atg7 are associated with DLB and a-
syn tg models and supports the possibility that modulators of the
autophagy pathway might have potential therapeutic effects.
Supporting Information
Figure S1 Immunoblot analysis of a-syn levels and lysosomal
markers in the brains of AD and DLB patients. Brain
homogenates from the temporal cortex of non-demented controls,
AD, and DLB patients were separated into membrane and
cytosolic fractions, and 20 mg of each sample was subjected to gel
electrophoresis. Immunoblots were probed with antibodies against
a-syn, Cathepsin D, LC3 and Actin. (A) Representative immuno-
blots of membrane fractions. (B) Representative immunoblots of
cytosolic fractions. (C) Semi-quantitative analysis of levels of a-syn,
Cathepsin D and LC3 in membrane fractions from the brains of
control, AD and DLB patients. Levels of Cathepsin D were
increased in the brains of AD patients but reduced in the brains of
DLB patients, while levels of LC3 were increased in the brains of
both AD and DLB patients. All semi-quantitative measurements
were normalized to actin levels as a loading control. *p,0.05
compared to non-demented controls by one-way ANOVA with
post-hoc Dunnett’s test.
Found at: doi:10.1371/journal.pone.0009313.s001 (0.41 MB TIF)
Figure S2 Immunoblot analysis of a-syn levels and lysosomal
markers in the brains of APP tg and a-syn tg mice. Brain
homogenates from non tg, APP tg, and a-syn tg mice were
separated into membrane and cytosolic fractions, and 20 mg of
each sample was subjected to gel electrophoresis. Immunoblots
were probed with antibodies against a-syn, Cathepsin D, LC3 and
Actin. (A) Representative immunoblots of membrane fractions. (B)
Representative immunoblots of cytosolic fractions. (C) Semi-
quantitative analysis of levels of a-syn, Cathepsin D and LC3 in
membrane fractions from the brains of non tg, APP tg and a-syn tg
mice. Levels of Cathepsin D were significantly reduced in a-syn tg
brains, while levels of LC3 were increased in the brains of APP tg
and a-syn tg mice. All semi-quantitative measurements were
normalized to actin levels as a loading control. *p,0.05 compared
to non tg controls by one-way ANOVA with post-hoc Dunnett’s
test.
Found at: doi:10.1371/journal.pone.0009313.s002 (0.33 MB TIF)
Figure S3 Immunocytochemical and immunoblot characteriza-
tion of lentivirus-mediated Atg7 over-expression and knockdown
in a neuronal cell line. B103 neuronal cells on coverslips were
infected with LV-Atg7 or LV-shAtg7, followed by fixation and
immunolabeling with an antibody against Atg7, or lysis and
immunoblot analysis with antibodies against Atg7 or Actin. (A)
Representative image of endogenous Atg7 immunoreactivity in
cells infected with empty LV-control. (B) Representative image
showing increased Atg7 immunoreactivity in cells infected with
LV-Atg7. (C) Representative image showing reduced Atg7
immunoreactivity in cells infected with LV-shAtg7. (D) Represen-
tative immunoblot showing Atg7 levels in cells infected with LV-
Atg7 or LV-shAtg7. Scale bar in panel (C) represents 40mm in all
microscopy images.
Found at: doi:10.1371/journal.pone.0009313.s003 (0.80 MB
TIF)
Author Contributions
Conceived and designed the experiments: LC BS PD ER LH DG EM.
Performed the experiments: LC BS PD CP ADP ER AA EM. Analyzed the
data: LC BS PD CP ADP ER LH AA DG EM. Contributed reagents/
materials/analysis tools: EM. Wrote the paper: LC PD EM. Critical
revision of the article: CP ADP LH DG.
References
1. Dauer W, Kholodilov N, Vila M, Trillat AC, Goodchild R, et al. (2002)
Resistance of alpha -synuclein null mice to the parkinsonian neurotoxin MPTP.
Proc Natl Acad Sci U S A 99: 14524–14529.
2. Dauer W, Przedborski S (2003) Parkinson’s disease: mechanisms and models.
Neuron 39: 889–909.
3. Walsh DM, Selkoe DJ (2004) Oligomers on the brain: the emerging role of
soluble protein aggregates in neurodegeneration. Protein Pept Lett 11:
213–228.
4. Klein WL, Krafft GA, Finch CE (2001) Targeting small Abeta oligomers: the
solution to an Alzheimer’s disease conundrum? Trends Neurosci 24:
219–224.
5. Hashimoto M, Rockenstein E, Crews L, Masliah E (2003) Role of protein
aggregation in mitochondrial dysfunction and neurodegeneration in Alzheimer’s
and Parkinson’s diseases. Neuromolecular Med 4: 21–36.
6. Lee M, Hyun D, Halliwell B, Jenner P (2001) Effect of the overexpression of
wild-type or mutant alpha-synuclein on cell susceptibility to insult. J Neurochem
76: 998–1009.
7. Giasson BI, Duda JE, Murray IV, Chen Q, Souza JM, et al. (2000) Oxidative
damage linked to neurodegeneration by selective alpha-synuclein nitration in
synucleinopathy lesions. Science 290: 985–989.
8. Lashuel HA, Petre BM, Wall J, Simon M, Nowak RJ, et al. (2002) Alpha-
synuclein, especially the Parkinson’s disease-associated mutants, forms pore-like
annular and tubular protofibrils. J Mol Biol 322: 1089–1102.
9. Lashuel HA, Hartley D, Petre BM, Walz T, Lansbury PT, Jr. (2002)
Neurodegenerative disease: amyloid pores from pathogenic mutations. Nature
418: 291.
10. Lippa CF, Duda JE, Grossman M, Hurtig HI, Aarsland D, et al. (2007) DLB
and PDD boundary issues: diagnosis, treatment, molecular pathology, and
biomarkers. Neurology 68: 812–819.
11. McKeith IG (2000) Spectrum of Parkinson’s disease, Parkinson’s dementia, and
Lewy body dementia. Neurol Clin 18: 865–902.
12. McKeith IG, Galasko D, Kosaka K, Perry EK, Dickson DW, et al. (1996)
Consensus guidelines for the clinical and pathologic diagnosis of dementia with
Lewy bodies (DLB): report of the consortium on DLB international workshop.
Neurology 47: 1113–1124.
13. Burn DJ (2006) Cortical Lewy body disease and Parkinson’s disease dementia.
Curr Opin Neurol 19: 572–579.
14. Aarsland D, Ballard CG, Halliday G (2004) Are Parkinson’s disease with
dementia and dementia with Lewy bodies the same entity? J Geriatr Psychiatry
Neurol 17: 137–145.
mTor Activation in LBD
PLoS ONE | www.plosone.org 14 February 2010 | Volume 5 | Issue 2 | e9313
15. Jellinger KA, Attems J (2006) Does striatal pathology distinguish Parkinsondisease with dementia and dementia with Lewy bodies? Acta Neuropathol (Berl)
112: 253–260.
16. Litvan I, MacIntyre A, Goetz CG, Wenning GK, Jellinger K, et al. (1998)Accuracy of the clinical diagnoses of Lewy body disease, Parkinson disease, and
dementia with Lewy bodies: a clinicopathologic study. Arch Neurol 55:969–978.
17. Janvin CC, Larsen JP, Salmon DP, Galasko D, Hugdahl K, et al. (2006)
Cognitive profiles of individual patients with Parkinson’s disease and dementia:comparison with dementia with lewy bodies and Alzheimer’s disease. Mov
Disord 21: 337–342.
18. McKeith IG, Dickson DW, Lowe J, Emre M, O’Brien JT, et al. (2005) Diagnosis
and management of dementia with Lewy bodies: third report of the DLB
Consortium. Neurology 65: 1863–1872.
19. Masliah E, Rockenstein E, Veinbergs I, Sagara Y, Mallory M, et al. (2001) beta-
amyloid peptides enhance alpha-synuclein accumulation and neuronal deficits ina transgenic mouse model linking Alzheimer’s disease and Parkinson’s disease.
Proc Natl Acad Sci U S A 98: 12245–12250.
20. Mandal PK, Pettegrew JW, Masliah E, Hamilton RL, Mandal R (2006)Interaction between Abeta peptide and alpha synuclein: molecular mechanisms
in overlapping pathology of Alzheimer’s and Parkinson’s in dementia with Lewybody disease. Neurochem Res 31: 1153–1162.
21. Tsigelny IF, Crews L, Desplats P, Shaked GM, Sharikov Y, et al. (2008)
Mechanisms of hybrid oligomer formation in the pathogenesis of combinedAlzheimer’s and Parkinson’s diseases. PLoS ONE 3: e3135.
22. Crews L, Tsigelny I, Hashimoto M, Masliah E (2009) Role of synucleins inAlzheimer’s disease. Neurotox Res 16: 306–317.
23. Cuervo AM, Stefanis L, Fredenburg R, Lansbury PT, Sulzer D (2004) Impaired
degradation of mutant alpha-synuclein by chaperone-mediated autophagy.Science 305: 1292–1295.
24. Bendiske J, Bahr BA (2003) Lysosomal activation is a compensatory response
against protein accumulation and associated synaptopathogenesis–an approachfor slowing Alzheimer disease? J Neuropathol Exp Neurol 62: 451–463.
25. Klionsky DJ, Emr SD (2000) Autophagy as a regulated pathway of cellulardegradation. Science 290: 1717–1721.
26. Levine B (2005) Eating oneself and uninvited guests: autophagy-related
pathways in cellular defense. Cell 120: 159–162.
27. Cuervo AM (2004) Autophagy: in sickness and in health. Trends Cell Biol 14:
70–77.
28. Larsen KE, Sulzer D (2002) Autophagy in neurons: a review. Histol Histopathol17: 897–908.
29. Chu CT (2006) Autophagic stress in neuronal injury and disease. J NeuropatholExp Neurol 65: 423–432.
30. Edinger AL, Thompson CB (2004) Death by design: apoptosis, necrosis and
autophagy. Curr Opin Cell Biol 16: 663–669.
31. Bahr BA, Bendiske J (2002) The neuropathogenic contributions of lysosomal
dysfunction. J Neurochem 83: 481–489.
32. Nixon RA, Wegiel J, Kumar A, Yu WH, Peterhoff C, et al. (2005) Extensive
involvement of autophagy in Alzheimer disease: an immuno-electron micros-
copy study. J Neuropathol Exp Neurol 64: 113–122.
33. Nixon RA, Cataldo AM (2006) Lysosomal system pathways: genes to
neurodegeneration in Alzheimer’s disease. J Alzheimers Dis 9: 277–289.
34. Pickford F, Masliah E, Britschgi M, Lucin K, Narasimhan R, et al. (2008) Theautophagy-related protein beclin 1 shows reduced expression in early Alzheimer
disease and regulates amyloid beta accumulation in mice. J Clin Invest 118:2190–2199.
35. Rockenstein E, Schwach G, Ingolic E, Adame A, Crews L, et al. (2005)
Lysosomal pathology associated with alpha-synuclein accumulation in transgenicmodels using an eGFP fusion protein. J Neurosci Res 80: 247–259.
36. Rideout HJ, Lang-Rollin I, Stefanis L (2004) Involvement of macroautophagy inthe dissolution of neuronal inclusions. Int J Biochem Cell Biol 36: 2551–2562.
37. Nakajima T, Takauchi S, Ohara K, Kokai M, Nishii R, et al. (2005) Alpha-
synuclein-positive structures induced in leupeptin-infused rats. Brain Res 1040:73–80.
38. Meredith GE, Totterdell S, Petroske E, Santa Cruz K, Callison RC, Jr., et al.(2002) Lysosomal malfunction accompanies alpha-synuclein aggregation in a
progressive mouse model of Parkinson’s disease. Brain Res 956: 156–165.
39. Stefanis L, Larsen KE, Rideout HJ, Sulzer D, Greene LA (2001) Expression ofA53T mutant but not wild-type alpha-synuclein in PC12 cells induces alterations
of the ubiquitin-dependent degradation system, loss of dopamine release, andautophagic cell death. J Neurosci 21: 9549–9560.
40. Martinez-Vicente M, Talloczy Z, Kaushik S, Massey AC, Mazzulli J, et al.
(2008) Dopamine-modified alpha-synuclein blocks chaperone-mediated autoph-agy. J Clin Invest 118: 777–788.
41. Xilouri M, Vogiatzi T, Vekrellis K, Park D, Stefanis L (2009) Abberant alpha-synuclein confers toxicity to neurons in part through inhibition of chaperone-
mediated autophagy. PLoS ONE 4: e5515.
42. Spencer B, Potkar R, Trejo M, Rockenstein E, Patrick C, et al. (2009) Beclin 1gene transfer activates autophagy and ameliorates the neurodegenerative
pathology in alpha-synuclein models of Parkinson’s and Lewy body diseases.J Neurosci 29: 13578–13588.
43. Varkonyi J, Rosenbaum H, Baumann N, MacKenzie JJ, Simon Z, et al. (2003)
Gaucher disease associated with parkinsonism: four further case reports.Am J Med Genet A 116: 348–351.
44. Tayebi N, Callahan M, Madike V, Stubblefield BK, Orvisky E, et al. (2001)
Gaucher disease and parkinsonism: a phenotypic and genotypic characteriza-
tion. Mol Genet Metab 73: 313–321.
45. Saito Y, Suzuki K, Hulette C, Murayama S (2004) Aberrant phosphorylation of
alpha-synuclein in human Niemann-Pick type C1 disease. J Neuropathol Exp
Neurol 63: 323–328.
46. Uchikado H, Lin WL, DeLucia MW, Dickson DW (2006) Alzheimer disease
with amygdala Lewy bodies: a distinct form of alpha-synucleinopathy.
J Neuropathol Exp Neurol 65: 685–697.
47. Hansen L (1997) The Lewy body variant of Alzheimer disease. JNeural Transm
51: 111–121.
48. Braak H, Braak E (2000) Pathoanatomy of Parkinson’s disease. J Neurol 247
Suppl 2: II3–10.
49. Dickson DW (2001) Alpha-synuclein and the Lewy body disorders. Curr Opin
Neurol 14: 423–432.
50. Hansen L, Daniel S, Wilcock G, Lowe S (1998) Neocortical synaptophysin in
Lewy body disease: relationship to Alzheimer’s disease and dementia.
JNeurolNeurosurgPsych.
51. Hansen L, Masliah E, Quijada-Fawcett S, Rexin D (1991) Entorhinal
neurofibrillary tangles in Alzheimer disease with Lewy bodies. NeurosciLett
129: 269–272.
52. Braak H, Braak E (1991) Neuropathological stageing of Alzheimer-related
changes. Acta Neuropathol 82: 239–259.
53. McKeith IG (2006) Consensus guidelines for the clinical and pathologic
diagnosis of dementia with Lewy bodies (DLB): report of the Consortium on
DLB International Workshop. J Alzheimers Dis 9: 417–423.
54. Jellinger KA, Bancher C (1998) Neuropathology of Alzheimer’s disease: a critical
update. J Neural Transm Suppl 54: 77–95.
55. Masliah E, Rockenstein E, Veinbergs I, Mallory M, Hashimoto M, et al. (2000)
Dopaminergic loss and inclusion body formation in alpha-synuclein mice:
Implications for neurodegenerative disorders. Science 287: 1265–1269.
56. Rockenstein E, Mallory M, Hashimoto M, Song D, Shults CW, et al. (2002)
Differential neuropathological alterations in transgenic mice expressing alpha-
synuclein from the platelet-derived growth factor and Thy-1 promoters.
J Neurosci Res 68: 568–578.
57. Masliah E, Rockenstein E, Adame A, Alford M, Crews L, et al. (2005) Effects of
alpha-Synuclein Immunization in a Mouse Model of Parkinson’s Disease.
Neuron 46: 857–868.
58. Mucke L, Masliah E, Yu GQ, Mallory M, Rockenstein EM, et al. (2000) High-
level neuronal expression of abeta 1–42 in wild-type human amyloid protein
precursor transgenic mice: synaptotoxicity without plaque formation. J Neurosci
20: 4050–4058.
59. Veinbergs I, Van Uden E, Mallory M, Alford M, McGiffert C, et al. (2001) Role
of apolipoprotein E receptors in regulating the differential in vivo neurotrophic
effects of apolipoprotein E. Exp Neurol 170: 15–26.
60. Naldini L, Blomer U, Gallay P, Ory D, Mulligan R, et al. (1996) In vivo gene
delivery and stable transduction of nondividing cells by a lentiviral vector.
Science 272: 263–267.
61. Tiscornia G, Singer O, Verma IM (2006) Design and cloning of lentiviral vectors
expressing small interfering RNAs. Nat Protoc 1: 234–240.
62. Marr RA, Rockenstein E, Mukherjee A, Kindy MS, Hersh LB, et al. (2003)
Neprilysin gene transfer reduces human amyloid pathology in transgenic mice.
J Neurosci 23: 1992–1996.
63. Takenouchi T, Hashimoto M, Hsu L, Mackowski B, Rockenstein E, et al. (2001)
Reduced neuritic outgrowth and cell adhesion in neuronal cells transfected with
human a-synuclein. MolCell Neurosci 17: 141–150.
64. Hashimoto M, Takenouchi T, Rockenstein E, Masliah E (2003) Alpha-synuclein
up-regulates expression of caveolin-1 and down-regulates extracellular signal-
regulated kinase activity in B103 neuroblastoma cells: role in the pathogenesis of
Parkinson’s disease. J Neurochem 85: 1468–1479.
65. Masliah E, Alford M, Adame A, Rockenstein E, Galasko D, et al. (2003) Abeta1-
42 promotes cholinergic sprouting in patients with AD and Lewy body variant of
AD. Neurology 61: 206–211.
66. Mucke L, Abraham C, Ruppe M, Rockenstein E, Toggas S, et al. (1995)
Protection against HIV-1 gp120-induced brain damage by neuronal overex-
pression of human amyloid precursor protein (hAPP). JExpMed 181:
1551–1556.
67. Toggas S, Masliah E, Rockenstein E, Mucke L (1994) Central nervous system
damage produced by expression of the HIV-1 coat protein gp120 in transgenic
mice. Nature 367: 188–193.
68. Hashimoto M, Sagara Y, Everall IP, Mallory M, Everson A, et al. (2002)
Fibroblast growth factor 1 regulates signaling via the GSK3{beta} pathway:
implications for neuroprotection. J Biol Chem 277: 32985–32991.
69. van Kats JP, van Meegen JR, Verdouw PD, Duncker DJ, Schalekamp MA, et al.
(2001) Subcellular localization of angiotensin II in kidney and adrenal.
J Hypertens 19: 583–589.
70. Rockenstein E, Hansen LA, Mallory M, Trojanowski JQ, Galasko D, et al.
(2001) Altered expression of the synuclein family mRNA in Lewy body and
Alzheimer’s disease. Brain Res 914: 48–56.
71. Blommaart EF, Krause U, Schellens JP, Vreeling-Sindelarova H, Meijer AJ
(1997) The phosphatidylinositol 3-kinase inhibitors wortmannin and LY294002
inhibit autophagy in isolated rat hepatocytes. Eur J Biochem 243: 240–246.
mTor Activation in LBD
PLoS ONE | www.plosone.org 15 February 2010 | Volume 5 | Issue 2 | e9313
72. Chang YY, Juhasz G, Goraksha-Hicks P, Arsham AM, Mallin DR, et al. (2009)
Nutrient-dependent regulation of autophagy through the target of rapamycin
pathway. Biochem Soc Trans 37: 232–236.
73. Kawamata T, Kamada Y, Kabeya Y, Sekito T, Ohsumi Y (2008) Organization
of the pre-autophagosomal structure responsible for autophagosome formation.
Mol Biol Cell 19: 2039–2050.
74. Webb JL, Ravikumar B, Atkins J, Skepper JN, Rubinsztein DC (2003) Alpha-
Synuclein is degraded by both autophagy and the proteasome. J Biol Chem 278:
25009–25013.
75. Williams A, Jahreiss L, Sarkar S, Saiki S, Menzies FM, et al. (2006) Aggregate-
prone proteins are cleared from the cytosol by autophagy: therapeutic
implications. Curr Top Dev Biol 76: 89–101.
76. Ravikumar B, Duden R, Rubinsztein DC (2002) Aggregate-prone proteins with
polyglutamine and polyalanine expansions are degraded by autophagy. Hum
Mol Genet 11: 1107–1117.
77. Pan T, Kondo S, Zhu W, Xie W, Jankovic J, et al. (2008) Neuroprotection of
rapamycin in lactacystin-induced neurodegeneration via autophagy enhance-
ment. Neurobiol Dis 32: 16–25.
78. Boland B, Kumar A, Lee S, Platt FM, Wegiel J, et al. (2008) Autophagy
induction and autophagosome clearance in neurons: relationship to autophagic
pathology in Alzheimer’s disease. J Neurosci 28: 6926–6937.
79. Sarkar S, Rubinsztein DC (2008) Small molecule enhancers of autophagy for
neurodegenerative diseases. Mol Biosyst 4: 895–901.
80. Ravikumar B, Vacher C, Berger Z, Davies JE, Luo S, et al. (2004) Inhibition of
mTOR induces autophagy and reduces toxicity of polyglutamine expansions in
fly and mouse models of Huntington disease. Nat Genet 36: 585–595.
81. Tain LS, Mortiboys H, Tao RN, Ziviani E, Bandmann O, et al. (2009)
Rapamycin activation of 4E-BP prevents parkinsonian dopaminergic neuronloss. Nat Neurosci 12: 1129–1135.
82. Zhu JH, Horbinski C, Guo F, Watkins S, Uchiyama Y, et al. (2007) Regulation
of autophagy by extracellular signal-regulated protein kinases during 1-methyl-4-phenylpyridinium-induced cell death. Am J Pathol 170: 75–86.
83. Chu Y, Dodiya H, Aebischer P, Olanow CW, Kordower JH (2009) Alterationsin lysosomal and proteasomal markers in Parkinson’s disease: relationship to
alpha-synuclein inclusions. Neurobiol Dis 35: 385–398.
84. Sevlever D, Jiang P, Yen SH (2008) Cathepsin D is the main lysosomal enzymeinvolved in the degradation of alpha-synuclein and generation of its carboxy-
terminally truncated species. Biochemistry 47: 9678–9687.85. Cullen V, Lindfors M, Ng J, Paetau A, Swinton E, et al. (2009) Cathepsin D
expression level affects alpha-synuclein processing, aggregation, and toxicity invivo. Mol Brain 2: 5.
86. Lee JA, Gao FB (2009) Inhibition of autophagy induction delays neuronal cell
loss caused by dysfunctional ESCRT-III in frontotemporal dementia. J Neurosci29: 8506–8511.
87. Skibinski G, Parkinson NJ, Brown JM, Chakrabarti L, Lloyd SL, et al. (2005)Mutations in the endosomal ESCRTIII-complex subunit CHMP2B in
frontotemporal dementia. Nat Genet 37: 806–808.
88. Parkinson N, Ince PG, Smith MO, Highley R, Skibinski G, et al. (2006) ALSphenotypes with mutations in CHMP2B (charged multivesicular body protein
2B). Neurology 67: 1074–1077.89. Komatsu M, Waguri S, Chiba T, Murata S, Iwata J, et al. (2006) Loss of
autophagy in the central nervous system causes neurodegeneration in mice.Nature 441: 880–884.
mTor Activation in LBD
PLoS ONE | www.plosone.org 16 February 2010 | Volume 5 | Issue 2 | e9313
Copyright © 2022 FDOKUMEN