Selecting easier words instead of more accurate ones Mark J ...
42
Running head: GOOD-ENOUGH PRODUCTION Good-enough production: Selecting easier words instead of more accurate ones Mark J. Koranda* 1 , Martin Zettersten 1,2 & Maryellen C. MacDonald 1 1 Department of Psychology, University of Wisconsin-Madison, 1202 W Johnson Street, Madison, WI 53706 U.S.A. 2 Department of Psychology, Princeton University, South Dr, Princeton, NJ 08540 U.S.A. *Corresponding author: [email protected] Data availability statement: The data that support the findings of this study are openly available in a publicly accessible repository on the Open Science Framework (OSF) at https://osf.io/3svge/?view_only=7f98d3e153a1427f8eb60503113bb157. Word Count: 1994
-
Upload
khangminh22 -
Category
Documents
-
view
1 -
download
0
Transcript of Selecting easier words instead of more accurate ones Mark J ...

Running head: GOOD-ENOUGH PRODUCTION
Good-enough production: Selecting easier words instead of more accurate ones
Mark J. Koranda*1, Martin Zettersten1,2 & Maryellen C. MacDonald1
1Department of Psychology, University of Wisconsin-Madison, 1202 W Johnson Street,
Madison, WI 53706 U.S.A.
2Department of Psychology, Princeton University, South Dr, Princeton, NJ 08540 U.S.A.
*Corresponding author: [email protected]
Data availability statement:
The data that support the findings of this study are openly available in a publicly accessible
repository on the Open Science Framework (OSF) at
https://osf.io/3svge/?view_only=7f98d3e153a1427f8eb60503113bb157.
Word Count: 1994

GOOD-ENOUGH PRODUCTION 2
Abstract
Dominant theories of language production suggest that word choice—lexical selection—is
driven by alignment with the intended message: to talk about a young feline, we choose the most
aligned word, kitten. Another factor that could shape lexical selection is word accessibility, or
how easy it is to produce a given word (e.g., cat is more accessible than kitten). To test whether
producers are also influenced by word accessibility, we designed an artificial lexicon with high-
and low-frequency words with word meanings corresponding to compass directions. Participants
earned points by producing compass directions, often requiring an implicit decision between a
high- vs low-frequency word. A trade-off was observed across four experiments, such that
high-frequency words were produced even when less aligned with messages. These results
suggest that implicit decisions between words are impacted by accessibility. Of all the times that
people have produced cat, sometimes they likely meant kitten.
Keywords: language production; lexical selection; artificial language game; word
accessibility; word frequency

GOOD-ENOUGH PRODUCTION 3
Statement of Relevance
In theories of motor control, actions are selected via probabilistic decision making,
weighing both an action’s alignment to a goal and its efficiency. Language production – whether
signed, spoken, or written – is a form of action, yet most theories of word selection posit very
different decision processes: only one factor, fit to the intended message, governs word selection.
It has been difficult to compare this deterministic word selection account to a probabilistic
alternative. We designed a novel language communication game allowing independent
manipulation of a word’s alignment to a message and its efficiency. In four experiments, we
found consistent support for probabilistic word selection, quantifying the degree to which
producers favored easily produced words over more precise ones. These results have important
implications for the relationship between language and nonlinguistic action, and the probabilistic
patterns of word choice inform theories of how word usage and word meanings change over
time.

GOOD-ENOUGH PRODUCTION 4
Introduction
Options for a behavior, such as which word to say or which hand to reach with, require a
decision process. Recent theories of motor control have hypothesized probabilistic
decision-making processes that maximize utility of actions in the face of uncertainty (e.g.,
Wolpert & Landy, 2012). Language production – whether signed, spoken, or written – is a form
of action that offers abundant alternative behaviors to convey a message, including alternative
words and phrases. Measuring the costs and benefits between alternatives has been difficult,
because researchers must know the utility of alternative choices in conveying a producer’s
intended message, which is not readily available.
Theories of word choice (lexical selection), have not favored the probabilistic approach
seen in motor control research. In lexical selection accounts, early grammatical encoding
processes settle on words to fit the message, and later processes develop the phonological code
for overt production (Levelt et al., 1999). On this view, a speaker’s word choices, such as cat vs.
kitten, are guided solely by which words best fit the intended message (i.e., “message
alignment”), not by word “accessibility” factors such as a word’s frequency or length, which
could affect ease of production. Probabilistic and interactive production approaches have been
invoked to account for related phenomena, including findings that accessibility affects word
order (Bock, 1982), speed of production (Sevald & Dell, 1994), and distributions of speech
errors (Dell & Reich, 1981). However, within the domain of lexical selection itself, the dominant
view is that the producer’s message drives word choice (Jescheniak & Levelt, 1994; cf. Dell,
1986). In this paper, we investigate whether lexical selection is determined by message
alignment or is more probabilistic, as seen in the motor literature. The results have important

GOOD-ENOUGH PRODUCTION 5
implications for the ways in which the uniquely human behavior of language production does
and does not differ from other forms of action that are seen across species (MacDonald, 2013).
Several studies have investigated whether lexical selection is truly controlled by a single
deterministic factor. Ferreira and Griffin (2003) examined errors in picture naming and found
that compared to a control condition, speakers misnamed pictures more often when the
phonological form of an incorrect competitor word had been primed. Ferreira and Griffin termed
this result “good enough production,” meaning that beyond message alignment, the accessibility
of phonological forms also affect lexical selection. Similarly, producers increasingly avoid
difficult words more when describing pictures under phonological interference (Jaeger, Furth &
Hilliard, 2012; Koranda & MacDonald, 2018; Rapp & Samuel, 2002), and learners will extend
familiar morphemes to novel grammatical categories (Harmon and Kapatsinski, 2017). Together,
these studies are consistent with an interactive process account of lexical selection (Dell, 1986),
in which accessibility constrains producers’ word choices.
A possible limitation of these studies is that they have no independent assessment of
message alignment, making it difficult to distinguish alignment and accessibility effects on
lexical selection. There are reasons to believe that message alignment, e.g. between a stimulus
picture and a word describing it, could vary across producers and contexts. Dialects and other
variations in experience affect word use (Melinger, 2021), but they may also affect producers’
messages. Similarly, studies of word usage in different discourse contexts, e.g., saying tummy vs.
stomach to different audiences (Stoll et al., 2009), could have either an accessibility or message
alignment interpretation. More generally, highly accessible words might be chosen both because
they fit the message and have been used frequently (Bock, 1982). Because of difficulties

GOOD-ENOUGH PRODUCTION 6
distinguishing alternative accounts, studies promoting good enough production have had
comparatively little influence on the deterministic approach to lexical selection.
Testing the hypothesis that speakers weigh both message alignment and production
difficulty requires that we have evidence of both. This information would help quantify
probabilistic decision processes. In other words, is lexical selection effectively a deterministic
process except in unusual cases such as homophone production, or is probabilistic integration of
several factors part of lexical selection, as is hypothesized in other motor behaviors?
To address this question, we designed a small artificial lexicon that allowed us to
precisely manipulate the strength of both message alignment and accessibility in four
experiments, in order to quantify the interplay between these factors. We assigned novel words
equidistantly along a single, continuous semantic space—directions on a compass. Participants
communicated compass directions via typed responses to help elves hunt for treasure. The task
of using a small number of compass terms to describe many different directions resembles a
common feature of everyday language. For example, the cities of Detroit and Pittsburgh are
located at different precise compass directions from Chicago, but we can describe both of them
as “east” of Chicago. We varied the frequency of the compass direction names in an initial
training phase, thereby affecting participants’ practice with different words and thus their
accessibility—the ease with which these words could be retrieved and produced. We then
assessed lexical selection behavior in a “treasure hunting” communication game.
If production choices are driven only by message alignment, then participants should
produce directions that best match the message prompt (compass arrow). However, if lexical
selection also entails probabilistic integration of accessibility, then producers’ should sometimes

GOOD-ENOUGH PRODUCTION 7
respond with high-frequency words even when the low-frequency alternative is more aligned
with the message. Because our artificial lexicon exactly specified the messages in the compass
points in both learning and test, and because we also controlled the relative frequency - and
consequently the accessibility - of different words in the language, we can quantify how message
alignment and frequency affect lexical selection in a way that has not been possible to date.
Experiments 1 and 2
Our small artificial lexicon contained four novel high-frequency and four novel
low-frequency words, each of which referred to a precise direction on a compass. Experiment 1
tests the degree to which message alignment and word frequency affect participants’ use of
words in the language, and Experiment 2 replicates and extends our results to a different layout
of compass points.
Method
Participants
Eighty-three University of Wisconsin-Madison undergraduates participated for course
credit (39 in Experiment 1, 44 in Experiment 2, 51 female; mean age: 18.6 years). With one
exception in each experiment, participants were native speakers of English.
Materials
For each participant, eight novel words were drawn randomly from a set of 18
pseudo-words (pim, dak, vorg, yeen, grah, skod, gled, veek, blit, peka, sarp, minada, hoon, clate,
noobda, gorm, frabda, mog) developed by Amato and MacDonald (2010). Each participants’ set

GOOD-ENOUGH PRODUCTION 8
of eight words was randomly assigned to eight equidistant compass directions across the
360-degree face of a compass image: 15°, 60°, 105°, 150°, 195°, 240°, 285°, and 330° (see
Figure 1). These compass positions were chosen to avoid translation to standard directions such
as “north”.
Each direction was assigned to a high-frequency or a low-frequency category in one of
two counterbalanced compass arrangements. In Experiment 1 (Figure 1A), the arrangement of
low-frequency/high-frequency words was designed to maximize the number of compass regions
in which a high-frequency word was adjacent to a low-frequency word. The arrangement in
Experiment 2 (Figure 1B) created an even balance between trials in which a high-frequency
word was adjacent to another high-frequency word vs. a low-frequency word (and vice versa).

GOOD-ENOUGH PRODUCTION 9
Figure 1. The eight compass directions learned and word frequency assigned to each compass
direction (HF = high-frequency; LF = low-frequency) during training in (A) Experiment 1 and
(B) Experiment 2. Novel words shown are examples; each participant received a different
random assignment of words for the eight compass directions.
Procedure
Participants played a game — programmed in PsychoPy (Peirce, 2007) — in which their
job was to help elves hunt for gold by indicating a search direction for buried treasure. The
experiment consisted of a Training Phase, in which participants were taught novel words for the
8 compass directions (see Figure 1), and a Treasure Hunt described as a language game, in which

GOOD-ENOUGH PRODUCTION 10
participants were tested on angles that varied in distance from the trained compass directions. All
instructions and trials were presented on screen, and participants typed all responses. Typing is a
common method in language production, and typing and speaking have been shown to produce
comparable results in studies of production choices (Gennari et al., 2012). Typing is known to be
sensitive to word frequency, including in tasks with nonwords (Baus, Strijkers, & Costa, 2013;
Kapatsinski, 2010; Barry & Seymour, 1988).
Training Phase. Participants were first presented with each compass direction and its
assigned word, and they typed each of the novel words into a text box. Next, participants
completed a Word Learning training in which they were presented with one of the eight compass
directions and chose which of two words (a target and foil) matched that direction. Participants
typed their response into a text box prompt and received immediate feedback on their answer.
Critically, words in the high-frequency condition occurred four times more frequently (as both a
target and as a foil) than the low-frequency words. The Word Learning Phase proceeded in
blocks of 20 trials presented in random order. Each block contained four presentations of each
high-frequency word and one presentation of each low-frequency word. If participants scored
below 80% on a 20-trial block, they were presented with another block of 20 Word Learning
trials. Once participants achieved 80% accuracy on a 20-trial block, they proceeded to the Word
Recall Phase.
In the Word Recall Phase, participants’ explicit recall of the words for the eight compass
directions was tested. Participants were prompted to recall each word via typed responses. If
participants made an error, they returned to the Word Learning Phase. The Training Phase
continued until participants achieved 100% accuracy on all 8 words during the Word Recall

GOOD-ENOUGH PRODUCTION 11
trials. Thus, all participants entered the Treasure Hunt having learned the word for each compass
direction, but having experienced high-frequency words four times more frequently than
low-frequency words.
Treasure Hunt. The Treasure Hunt contained two phases. The first phase was described
to participants as a game directing elves hunting for gold. The game was designed to test
participants’ naming responses to new compass directions. Following the game, the second phase
consisted of two test blocks designed to re-check participants’ knowledge of the original trained
compass directions.
The first phase of the Treasure Hunt contained two trial types: Near Distance trials and
Far Distance trials. In Near Distance trials, participants described randomly generated angles that
were clearly nearer to one of the 8 compass directions than to others (see Figures 2A & 2C).
Each test stimulus direction was 0° to 11° away from a previously trained compass direction. For
these trials, the 4:1 ratio of high-frequency to low-frequency words was maintained. Participants
saw a compass direction near each high-frequency word 12 times and a compass direction near
each low-frequency word 3 times, for a total of 60 test trials. For each trial, participants were
asked to type a direction word into the text box based on the compass to direct a group of elves
towards a hidden treasure. Trials timed out after 5s if participants did not begin typing.

GOOD-ENOUGH PRODUCTION 12
Figure 2. Gray shading indicates directions tested on (A) Near Distance and (B) Far
Distance trials in Experiment 1, with examples of a (C) Near Distance and (D) Far Distance trial
during the Treasure Hunt. For directions tested, the same distance manipulation was introduced
in all experiments. The frequency of the trained compass directions is shown with the
configuration used in Experiment 1. Red (dark) compass points were trained four times as often
as blue (light) points in the Training Phase. For experiment trials (C & D), participants saw only
the direction in black. The two nearest compass directions and words in light blue
(low-frequency) and light red (high-frequency) are added for illustration purposes and were not
visible to participants.
GOOD-ENOUGH PRODUCTION 13
In Far Distance trials, participants were tested with randomly generated angles that were
close to the midline of two compass directions, between 11° - 22° from each, creating conflict
between two words that could guide the elves (see Figures 2B & 2D; n = 64). On critical Far
Distance trials, the angle fell between a low-frequency and a high-frequency word (Experiment
1: n = 48; Experiment 2: n = 32), though the compass direction always lay at least two degrees
closer to one compass direction than another. The trial design and feedback were otherwise
identical to Near Distance trials. In Experiment 1, participants saw the Near Distance trials,
followed by the 64 Far Distance trials. In Experiment 2, participants first completed 20 Near
Distance trials, to ensure that the task goal was clear to participants during the initial Treasure
Hunt trials. On the remaining trials, Near Distance trials (n = 40) and Far Distance trials (n = 64)
were randomly intermixed.
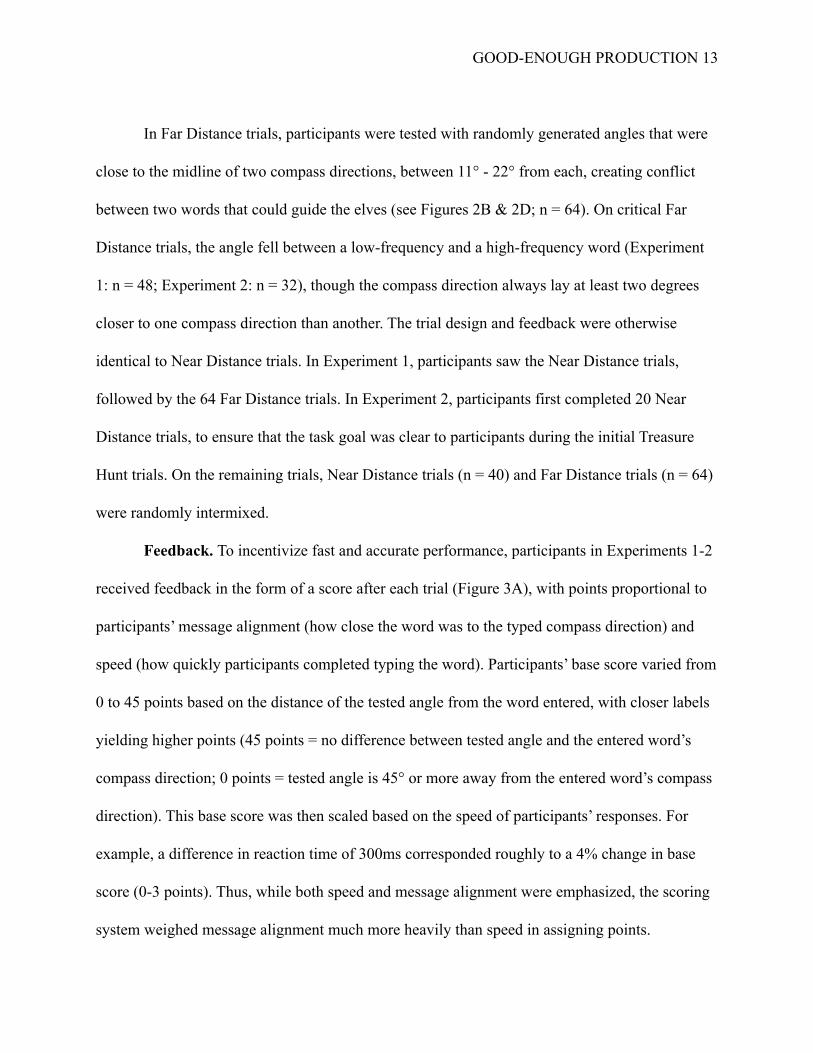
Feedback. To incentivize fast and accurate performance, participants in Experiments 1-2
received feedback in the form of a score after each trial (Figure 3A), with points proportional to
participants’ message alignment (how close the word was to the typed compass direction) and
speed (how quickly participants completed typing the word). Participants’ base score varied from
0 to 45 points based on the distance of the tested angle from the word entered, with closer labels
yielding higher points (45 points = no difference between tested angle and the entered word’s
compass direction; 0 points = tested angle is 45° or more away from the entered word’s compass
direction). This base score was then scaled based on the speed of participants’ responses. For
example, a difference in reaction time of 300ms corresponded roughly to a 4% change in base
score (0-3 points). Thus, while both speed and message alignment were emphasized, the scoring
system weighed message alignment much more heavily than speed in assigning points.

GOOD-ENOUGH PRODUCTION 14
Participants received a score of 0 if they did not complete typing before the trial timed out or if
their response was a word that named a direction more than 45° from the indicated compass
direction.
Figure 3. Example of immediate feedback (A) vs. intermittent feedback (B). In
Experiments 1 and 2, participants received feedback after each game trial showing their response
and gold coins earned (A). In Experiments 3 and 4, participants received no feedback after each
response, and after every eight trials were shown the cumulative amount of gold coins earned
during those trials (B).
Word retention. In the second phase of the game, participants were re-tested on their
knowledge of the eight trained compass directions. The first eight retention trials (the 8 original
compass directions, randomized) preserved task demands of the previous trials and from the

GOOD-ENOUGH PRODUCTION 15
participants’ perspective were simply additional trials in the game. These trials thus provided a
covert Timed Retention test. Participants were then introduced to a new block of trials described
as being separate from the treasure hunting game. This block served as an Untimed Retention
test. Eight trials (the trained compass directions, randomized) appeared, and participants recalled
the words without time limits. No feedback was presented.
Results
Word Training Performance
Participants’ accuracy across all word learning blocks was high (Experiment 1: M =
95.2%, SD=3.1%; Experiment 2: M = 95.8%, SD=3.2%). On average, participants completed
approximately 5 learning blocks (Experiment 1: M = 4.59, SD = 1.93; Experiment 2: M = 4.36,
SD = 2.62) before reaching the required perfect performance on the recall test, progressing to the
treasure hunt portion of the game.
Word Retention
At the end of the task, participants in both experiments showed high retention of both
high-frequency (Experiment 1: M = 97.4%, 95% CI = [94.8%, 100%]; Experiment 2: M =
98.9%, 95% CI = [96.3%, 100%]) and low-frequency words (Experiment 1: M = 97.4%, 95% CI
= [94.8%, 100%]; Experiment 2: M = 94.9%, 95% CI = [92.3%, 97.5%]) on the Untimed
Retention test. These results suggest that participants maintained high levels of accuracy on both
high- and low-frequency words at the end of the Treasure Hunt. High retention of the 8 compass
directions across participants ensures that any shifts in decision boundary during the Treasure
Hunt are unlikely to be driven by forgetting particular labels (particularly the low-frequency
GOOD-ENOUGH PRODUCTION 16
labels). Participants also showed no significant difference in how quickly they responded
correctly to high-frequency and low-frequency words in the Untimed Retention task in either
Experiment 1 or 2 (measured from the onset of a test prompt to the participant pressing the Enter
key after typing the word). On the timed retention block, accuracy and reaction times for
high-frequency words were comparable, though participants’ were slightly more accurate and
faster to respond for high-frequency words than low-frequency words, collapsing across
Experiments 1 and 2. There was no main effect of experiment version (Experiment 1 vs. 2) on
accuracy and reaction times and no interaction between experiment version and frequency for
either block, suggesting the general learning patterns were similar across experiments. See
section S4 in Supplementary Materials for further details, including an overview of participants’
recall and response times for high- and low-frequency words in the final two retention tests at the
end of each experiment.
Test Performance
Our main question was whether word frequency experience during training would
increase the likelihood of participants overextending high-frequency words during test (the first
phase of the Treasure Hunt), including in situations when a more message-aligned word (closer
on the compass) was available. To investigate participants’ tendency to overextend words, we
focused specifically on low-frequency/high-frequency trials, in which a compass direction was
tested in between a low-frequency and a high-frequency trained direction. We considered
participants’ likelihood of choosing the word for the nearest trained compass direction,
dependent on whether that compass direction was a high- or a low-frequency word, while
controlling for the distance from the nearest learned compass direction. As a conservative test,

GOOD-ENOUGH PRODUCTION 17
we focused exclusively on trials in which participants chose one of the two principal direction
words within 45° of the stimulus direction (Experiment 1: 94.4% of responses; Experiment 2:
93.8% of responses). All of the patterns of findings remain identical if all
low-frequency/high-frequency trials are considered.
Experiment 1. We used the lme4 package version 1.1–27.1 in R to fit a logistic
mixed-effects model predicting the likelihood of choosing the nearest word from Word
Frequency (centered; High = -0.5 vs. Low = -0.5) and the distance of the stimulus from the
nearest compass direction (Bates et al., 2015; R Development Core Team, 2021). We included
by-subject and by-item random intercepts as well as by-subject random slopes for word
frequency and distance. The likelihood of choosing the nearest word decreased with increasing
distance from the nearest compass direction, b = -0.23, Wald 95% CI = [-0.25, -0.20], z = -16.89,
p < .001. Crucially, controlling for distance from the nearest principal direction, participants
were more likely to use the nearest word when it was a high-frequency word compared to a
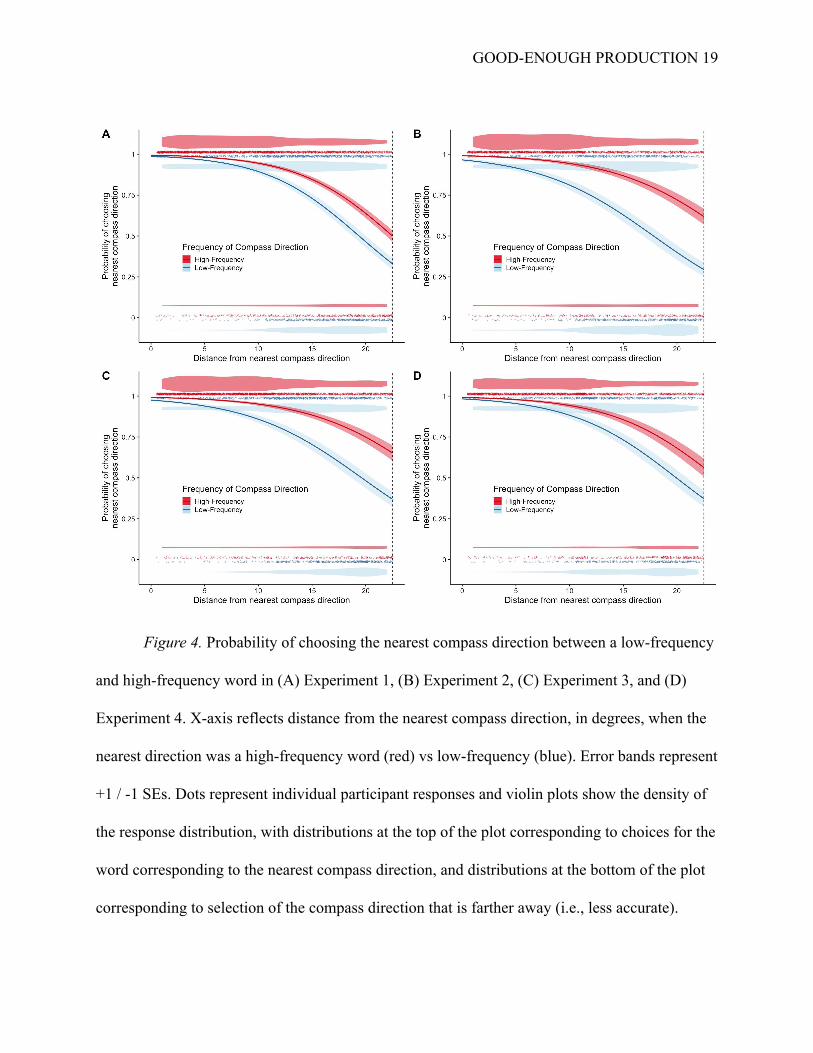
low-frequency word, b = 0.71, Wald 95% CI = [0.30, 1.12], z = 3.37, p < .001 (Figure 4A). This
effect corresponded to an estimated 3.1° shift (95% CI = [1.3°, 4.9°]) in participants’ decision
boundary toward high-frequency words as compared to low-frequency words. There was no
interaction between frequency and Near vs. Far Distance trials.
To ensure that this effect is not an artifact of participants’ being slightly more likely to
forget the low-frequency labels, we conducted a series of robustness checks. First, to account for
the fact that participants varied in their final accuracy for each label in the Untimed Retention
test, we fit the same model while controlling for participants’ average final accuracy for the two
compass directions to either side of the target angle on a given trial. We treated participants’

GOOD-ENOUGH PRODUCTION 18
average final accuracy on the two neighboring compass directions as a fixed effect, and also
added a random slope for average final accuracy to the main model. The frequency effect in
participants’ choices remained highly similar (b = 0.72, Wald 95% CI = [0.31, 1.13], z = 3.41, p
< .001) even after controlling for participants’ average final accuracy on the two neighboring
compass directions.
Next, as an even more conservative test of the robustness of the frequency effect, we refit
the original logistic mixed-effects model including only participants who successfully named all
compass directions correctly in the Untimed Retention at the end of the experiment (n = 34). The
effect held even after removing all participants who did not perfectly name all compass
directions at the conclusion of the experiment, b = 0.54, Wald 95% CI = [0.16, 0.92], z = 2.76, p
= .006.
Experiment 2. To test the impact of frequency on participants’ overextension tendencies,
we fit the same model as in Experiment 1. Controlling for angle distance from the nearest
compass direction, participants were more likely to use the nearest trained word when it was a
high-frequency word as compared to a low-frequency word, b = 1.36, Wald 95% CI = [0.75,
1.97], z = 4.37, p < .001 (Figure 4B). This effect corresponded to an estimated 7.2° degree shift
(95% CI = [4.0°, 10.5°]) in participants’ decision boundary for high-frequency words as
compared to low-frequency words. There was no interaction between Near vs. Far Distance
trials. The effect held after controlling for participants’ average final accuracy on the two
neighboring compass directions (b = 1.36, Wald 95% CI = [0.75, 1.97], z = 4.38, p < .001) and
when including only participants (n = 35) with perfect accuracy in the Untimed Retention test at
the end of the experiment (b = 1.19, Wald 95% CI = [0.66, 1.73], z = 4.42, p < .001).
GOOD-ENOUGH PRODUCTION 19
Figure 4. Probability of choosing the nearest compass direction between a low-frequency
and high-frequency word in (A) Experiment 1, (B) Experiment 2, (C) Experiment 3, and (D)
Experiment 4. X-axis reflects distance from the nearest compass direction, in degrees, when the
nearest direction was a high-frequency word (red) vs low-frequency (blue). Error bands represent
+1 / -1 SEs. Dots represent individual participant responses and violin plots show the density of
the response distribution, with distributions at the top of the plot corresponding to choices for the
word corresponding to the nearest compass direction, and distributions at the bottom of the plot
corresponding to selection of the compass direction that is farther away (i.e., less accurate).

GOOD-ENOUGH PRODUCTION 20
Experiment 3
Experiments 1-2 showed that participants’ word use was affected by the frequency of
potential responses. One concern with our findings is that they may have been driven by the
explicit feedback given on every trial, as such consistent feedback is not a regular feature of
natural language use. If explicit feedback is a key explanation for our frequency effect, then
intermittent feedback should reduce or eliminate the effect. Experiment 3 removed frequent
feedback and provided only multi-trial, aggregated updates on scores.
Method
Participants
A new group of University of Wisconsin-Madison psychology undergraduate students (n
= 55; 38 female; mean age: 18.9 years, SD = 0.88; 54 native speakers of English) participated for
course credit. Four additional participants were excluded because they did not complete the
study. The larger sample size was due to unintentional over-collection of data.
Design and Procedure
The experimental design and procedure was identical to Experiment 2, with the following
differences. First, to prevent excessive perseverance on the learning block, a participant was
limited to 10 learning test blocks before automatically advancing to the Treasure Hunt. Second,
unlike in previous experiments, participants were instructed that they would receive intermittent
feedback on their performance during the Treasure Hunt. A single, cumulative score was
displayed every eighth trial (Figure 3B).

GOOD-ENOUGH PRODUCTION 21
Results
Word Training Performance
Participants’ accuracy across all pair learning blocks was high (M = 94.4%, SD=4.2%).
On average, participants completed around 5 pair learning blocks (M = 4.64, SD = 1.99) before
progressing to the Treasure Hunt.
Word Retention
Participants’ accuracy and response times were similar for high-frequency and
low-frequency words on both timed and untimed trials at the end of the Treasure Hunt, with the
exception that participants’ were slightly faster to respond to high-frequency words during the
Timed Retention test (see Table S3 in the Supplementary Materials for details).
Test Performance
To test the impact of frequency on participants’ overextension tendencies, we fit the same
model as in Experiments 1 and 2. Controlling for angle distance from the nearest compass
direction, participants were more likely to use the nearest word when it was a high-frequency
word as compared to a low-frequency word (Figure 4C), b = 1.17, Wald 95% CI = [0.58, 1.77], z
= 3.89, p < .001. This effect corresponded to an estimated 6.0° degree shift (95% CI = [3.0°,
9.0°]) in participants’ decision boundary for high-frequency words as compared to
low-frequency words. The effect held after controlling for participants’ average final accuracy on
the two neighboring compass directions (b = 1.21, Wald 95% CI = [0.62, 1.80], z = 4.05, p <
.001) and when including only participants (n = 42) with perfect accuracy in the Untimed

GOOD-ENOUGH PRODUCTION 22
Retention test at the end of the experiment (b = 0.98, Wald 95% CI = [0.34, 1.62], z = 2.98, p =
.003).
Experiment 4
A concern about Experiments 1-3 is that familiarity of the trained compass direction is
confounded with frequency of producing a word, because every presentation of a compass
direction was accompanied by the participant typing that direction’s name. Thus, it is possible
that the frequency effects in Experiments 1-3 are driven by familiarity with the visual stimuli
rather than by word frequency. Therefore we added a new compass direction task to Experiment
4 in order to unconfound the frequency of visual stimuli and associated words.
Method
Participants
A new group of University of Wisconsin-Madison psychology undergraduate students (n
= 43; 24 female; mean age: 18.7 years, SD = 0.88; all native speakers of English) participated for
course credit.
Design & Procedure
The experiment design and procedure was identical to Experiment 3, with two main
adjustments to the Training Phase described below.
Compass Practice Block. This new block preceded word learning and contained no
words. On each trial, a compass circle was displayed and one of the eight compass directions
appeared for 500 ms before disappearing. Next, a second randomly generated compass direction

GOOD-ENOUGH PRODUCTION 23
appeared from among the remaining seven compass directions. The participant was then
instructed to adjust the angle to match the previous orientation by rotating the computer mouse
click wheel. To ensure that participants only received exposure to the eight compass directions,
the angle moved in 45° increments. Once the participant was satisfied with the angle position,
they left-clicked with the mouse to end the trial. Feedback then appeared on screen informing
them of recall accuracy (correct or incorrect). Participants completed 100 trials, in random order.
In order to unconfound compass direction exposure and word frequency, the compass
directions for which a low-frequency name would later be assigned appeared four times more
often than the compass directions for which a high-frequency name would be assigned. This was
true of both the targets displayed for 500 ms and also the starting position for participants’
response. Thus after participants completed this Compass Practice block and the Word learning
block, they had encountered each of the eight compass directions the same number of times. By
contrast, the associated words for each compass direction were presented at either high or low
frequencies, as in the previous experiments.
Word Learning Block. In order to match compass direction experience across high- and
low-frequency words, it was necessary to fix the number of learning trial blocks for participants.
In this experiment, participants advanced to the Treasure Hunt after five Learning Blocks, which
was the modal number of learning blocks that participants completed in Experiments 1-3.

GOOD-ENOUGH PRODUCTION 24
Results
Compass and Word Training Performance
Participants were highly accurate in their memory for compass directions (M = 97.7%,
SD = 3.8%) and across all pair learning blocks (M = 93.0%, SD = 7.7%).
Word Retention
As in the previous experiments, retention for high- and low-frequency words did not
differ significantly in either the Timed Retention or Untimed Retention tasks, although
accuracies were numerically higher for high-frequency words compared to low-frequency words
(see Table S3 in the Supplementary Materials).
Test Performance
The model with the full random effects structure from Experiments 1 - 3 did not
successfully converge, leading us to prune the random effects structure by removing the random
slope for angle distance (the predictor of least theoretical interest) to achieve model convergence.
The results including the full random effects structure from Experiments 1-3 yield qualitatively
similar results. Controlling for angle distance from the nearest compass direction, participants
were more likely to use the nearest word when it was a high-frequency word as compared to a
low-frequency word (Figure 4D), b = 0.77, Wald 95% CI = [0.17, 1.38], z = 2.51, p = .012. This
effect corresponded to an estimated 3.8° degree shift (95% CI = [0.8°, 6.8°]) in participants’
decision boundary for high-frequency words as compared to low-frequency words. The effect
held after controlling for participants’ average final accuracy on the two neighboring compass
directions (b = 0.78, Wald 95% CI = [0.17, 1.39], z = 2.51, p = .01). However, the effect of
GOOD-ENOUGH PRODUCTION 25
frequency was not significant when including only participants (n = 33) with perfect accuracy in
the Untimed Retention test at the end of the experiment (b = 0.42, Wald 95% CI = [-0.19, 1.04], z
= 1.35, p = .18), indicating that the effect was more sensitive to the inclusion of participants with
imperfect final retention of all compass directions in Experiment 4.
Unlike in Experiments 1-3, participants could advance to the Treasure Hunt prior to
achieving 100% accuracy on the eight compass directions during the Word Learning Phase, since
the number of Word Learning blocks was fixed at five. We therefore additionally investigated
whether the effect depended on the inclusion of participants who had not yet learned all compass
labels perfectly. The effect of frequency remained similar even after removing all participants
who did not correctly label all words at the end of the Training Phase (n = 29), b = 0.73, Wald
95% CI = [0.02, 1.45], z = 2.00, p = .045.
General Discussion
Our novel language and communication game allowed us to quantify, for the first time,
the degree to which language producers engage in probabilistic lexical selection and weigh both
word accessibility and message alignment. In critical conditions across four studies,
high-frequency words were favored over more precise low-frequency alternatives. This trade-off
emerged even when participants knew low-frequency words well, as evidenced by performance
on a post-test, and despite the fact that the point system in the communication game always
rewarded message alignment more than speed. These results suggest that lexical selection can be
characterized as “good enough” (Ferreira & Griffin, 2003), via probabilistic decision making that
weighs message alignment and accessibility, broadly consistent with other accounts of action
(Wolpert & Landy, 2012).
GOOD-ENOUGH PRODUCTION 26
These results are consistent with prior evidence that phonologically-based accessibility
factors may influence the choice of words in language production (Ferreira & Griffin, 2003;
Jaeger, Furth & Hilliard, 2012; Koranda & MacDonald, 2018; Rapp & Samuel, 2002). Our work
extends these findings to effects of word frequency (see also Harmon & Kapatsinski, 2017) and
furthermore quantifies the degree to which accessibility results in deviations from message
alignment, owing to unique design features of our paradigm that allowed independent
manipulation of message and accessibility.
These findings are related to several other language production phenomena, though more
work is needed to determine whether similarities reflect related underlying processes. For
example, this work may provide insight into some types of speech errors. When speakers make
word-substitution errors, such as saying salt when pepper is intended, a higher-frequency word
tends to replace a lower-frequency intended word (Harley & MacAndrew, 2001). This outcome
might reflect the same probabilistic decision making that we advocate here, in which a more
accessible word is chosen over a more accurate but less accessible alternative, such as speakers'
use of high-frequency words like cat, instead of the less accessible but more accurate word,
kitten. Relatedly, children are sometimes found to produce overextensions for frequent words
(e.g., calling a sheep a dog) despite comprehending the relevant word meanings
(Gershkoff-Stowe et al., 2006; Naigles & Gelman, 1995).
Our results have several implications for theories of language production. First,
feed-forward models of language production in which lexical selection is influenced only by
message alignment and not by linguistic form (e.g., Levelt et al., 1999) do not predict our finding
that implicit production choices balance message alignment and accessibility. Other accounts

GOOD-ENOUGH PRODUCTION 27
suggest that word form has only a limited effect on lexical selection because selection is
generally completed before word-form computations have begun (e.g., Dell & O’Seaghdha,
1991; Goldrick, 2006). The consideration of lexical selection as a form of probabilistic decision
making may be broadly consistent with this view, but our findings that lexical selection shifts
away from message alignment suggests that weighing of multiple factors may be more pervasive
than these theories have posited.
Second, this work places constraints on the extent to which language production
accommodates the listener’s perspective (Arnold, 2008). While an accessible, but less accurate
word would not benefit the comprehender, our results suggest such trade-offs might be
communicatively optimal. Piantadosi et al. (2012) present computational simulations showing
that selection of vague, common words over rare precise ones can result in a more efficient
communicative system (see also MacDonald, 2013 that increased efficiency for the producer aids
the comprehender). In our communication game, points awarded for message alignment
reinforce accurate communication to elf “listeners”, yet participants still selected frequent words.
Other studies have shown that producers regularly produce ungrammatical phrases, impairing
comprehension but easing the task for the producer (Morgan et al. 2020). Together with our
results, such findings suggest that people may routinely generate utterances that are easier to
produce and “good enough” to communicate a message, despite increasing comprehension
difficulty.
This work also has implications for how language production processes modulate
language change over time (MacDonald, 2013). Probabilistic decisions favoring more accessible,
high-frequency words may account for how the meaning of accessible words changes (Bybee,

GOOD-ENOUGH PRODUCTION 28
2008) or how grammatical patterns are regularized over generations of use (Hudson Kam &
Newport, 2005). Recently, Harmon and Kapatsinski (2017) showed that when two semantically
equal options could describe a novel meaning, the high-frequency one was more reliably
extended. Consistent with Bock’s observation (1982), links between concepts and words may
become stronger for frequent compared to infrequent words, or high activation can itself become
a probabilistic cue to message alignment. Our results suggest such extensions may occur even
when high-frequency words are actually less precise, predicting a robust influence of frequency
on diachronic change.
In summary, our data reveal that lexical selection is not deterministically driven by
alignment with a message but is instead good enough—a probabilistic compromise between
utility and efficiency. In other words, what we say is not always what we mean. Because similar
utility-efficiency trade-offs also arise in nonlinguistic motor behaviors in humans and other
species, this work narrows the range of production behavior that is unique to human language.

GOOD-ENOUGH PRODUCTION 29
Acknowledgements
This research was supported by NIH T32DC005359, NSF-GRFP-DGE-1747503,
NSF-1849236, and the Wisconsin Alumni Research Foundation (WARF). The content is solely
the responsibility of the authors and does not necessarily represent the official views of the NIH,
NSF or WARF.

GOOD-ENOUGH PRODUCTION 30
References
Amato, M. S., & MacDonald, M. C. (2010). Sentence processing in an artificial language:
Learning and using combinatorial constraints. Cognition, 116(1), 143–148.
https://doi.org/10.1016/j.cognition.2010.04.001
Arnold, J. E. (2008). Reference production: Production-internal and addressee-oriented
processes. Language and Cognitive Processes, 23(4), 495–527.
https://doi.org/10.1080/01690960801920099
Barry, C., & Seymour, P. H. K. (1988). Lexical Priming and Sound-to-Spelling Contingency
Effects in Nonword Spelling. The Quarterly Journal of Experimental Psychology Section
A, 40(1), 5–40. https://doi.org/10.1080/14640748808402280
Bates, D., Mächler, M., Bolker, B. M., & Walker, S. C. (2015). Fitting linear mixed-effects
models using lme4. Journal of Statistical Software, 67(1), 1–48.
https://doi.org/10.18637/jss.v067.i01
Baus, C., Strijkers, K., & Costa, A. (2013). When does word frequency influence written
production? Frontiers in Psychology, 4. https://doi.org/10.3389/fpsyg.2013.00963
Bock, J. K. (1982). Toward a cognitive psychology of syntax: Information processing
contributions to sentence formulation. Psychological Review, 89(1), 1–47.
Bybee, J. (2008). Formal universals as emergent phenomena: The origins of structure
preservation. Linguistic universals and language change, 108–121.
Dell, G. S. (1986). A spreading-activation theory of retrieval in sentence production.
Psychological Review, 93(3), 283.

GOOD-ENOUGH PRODUCTION 31
Dell, G. S., & O’Seaghdha, P. G. (1991). Mediated and convergent lexical priming in language
production: A comment on Levelt et al (1991). Psychological Review, 98(4), 604–614.
http://dx.doi.org.ezproxy.library.wisc.edu/10.1037/0033-295X.98.4.604
Dell, G. S., & Reich, P. A. (1981). Stages in sentence production: An analysis of speech error
data. Journal of Verbal Learning and Verbal Behavior, 20(6), 611–629.
https://doi.org/10.1016/S0022-5371(81)90202-4
Ferreira, V. S., & Griffin, Z. M. (2003). Phonological influences on lexical (mis) selection.
Psychological Science, 14(1), 86–90. https://doi.org/10.1111%2F1467-9280.01424
Gennari, S. P., Mirković, J., & MacDonald, M. C. (2012). Animacy and competition in relative
clause production: A cross-linguistic investigation. Cognitive Psychology, 65(2),
141–176. https://doi.org/10.1016/j.cogpsych.2012.03.002
Gershkoff-Stowe, L., Connell, B., & Smith, L. (2006). Priming overgeneralizations in two- and
four-year-old children. Journal of Child Language, 33(3), 461-486.
https://doi.org/10.1017/S0305000906007562
Goldrick, M. (2006). Limited interaction in speech production: Chronometric, speech error, and
neuropsychological evidence. Language and Cognitive Processes, 21(7–8), 817–855.
https://doi.org/10.1080/01690960600824112
Harley, T. A., & MacAndrew, S. B. (2001). Constraints upon word substitution speech errors.
Journal of Psycholinguistic Research, 30(4), 395–418.
https://doi.org/10.1023/A:1010421724343

GOOD-ENOUGH PRODUCTION 32
Harmon, Z., & Kapatsinski, V. (2017). Putting old tools to novel uses: The role of form
accessibility in semantic extension. Cognitive Psychology, 98, 22–44.
https://doi.org/10.1016/j.cogpsych.2017.08.002
Hudson Kam, C., & Newport, E. (2005). Regularizing unpredictable variation: The roles of adult
and child learners in language formation and change. Language Learning and
Development, 1(2), 151-195. https://doi.org/10.1080/15475441.2005.9684215
Jaeger, T. F., Furth, K., & Hilliard, C. (2012). Incremental phonological encoding during
unscripted sentence production. Frontiers in Psychology, 3, 481.
https://doi.org/10.3389/fpsyg.2012.00481
Jescheniak, J. D., & Levelt, W. J. M. (1994). Word frequency effects in speech production:
Retrieval of syntactic information and of phonological form. Journal of Experimental
Psychology: Learning, Memory, and Cognition, 20(4), 824.
https://psycnet.apa.org/doi/10.1037/0278-7393.20.4.824
Kapatsinski, V. (2010). What is it I am writing? Lexical frequency effects in spelling Russian
prefixes: Uncertainty and competition in an apparently regular system. Corpus
Linguistics and Linguistic Theory, 6(2). https://doi.org/10.1515/cllt.2010.007
Koranda, M. J., & MacDonald, M. C. (2018). The breadth of phonological interference in word
choice. Presented at CUNY Sentence Processing, Davis, CA.
Levelt, W., Roelofs, A., & Meyer, A. (1999). A theory of lexical access in speech production.
Behavioral and Brain Sciences, 22(1), 1-38.
https://doi.org/10.1017/S0140525X99001776
GOOD-ENOUGH PRODUCTION 33
MacDonald, M. C. (2013). How language production shapes language form and comprehension.
Frontiers in Psychology, 4. https://doi.org/10.3389/fpsyg.2013.00226
Melinger, A. (2021). Do elevators compete with lifts?: Selecting dialect alternatives. Cognition,
206, 104471. https://doi.org/10.1016/j.cognition.2020.104471
Morgan, A. M., von der Malsburg, T., Ferreira, V. S., & Wittenberg, E. (2020). Shared syntax
between comprehension and production: Multi-paradigm evidence that resumptive
pronouns hinder comprehension. Cognition, 205, 104417.
https://doi.org/10.1016/j.cognition.2020.104417
Naigles, L. G., & Gelman, S. A. (1995). Overextensions in comprehension and production
revisited: Preferential-looking in a study of dog, cat, and cow. Journal of Child
Language, 22(1), 19-46. https://doi.org/10.1017/S0305000900009612
Peirce, J. W. (2007). PsychoPy - Psychophysics software in Python. Journal of Neuroscience
Methods, 162 (1-2), 8-13. https://doi.org/10.1016/j.jneumeth.2006.11.017
Piantadosi, S. T., Tily, H., & Gibson, E. (2012). The communicative function of ambiguity in
language. Cognition, 122(3), 280–291. https://doi.org/10.1016/j.cognition.2011.10.004
R Development Core Team (2021). R: A language and environment for statistical computing.
Vienna, Austria: R Foundation for Statistical Computing. Retrieved from
https://www.r-project.org/
Rapp, D. N., & Samuel, A. G. (2002). A reason to rhyme: Phonological and semantic influences
on lexical access. Journal of Experimental Psychology: Learning, Memory, and
Cognition, 28(3), 564–571.
http://dx.doi.org.ezproxy.library.wisc.edu/10.1037/0278-7393.28.3.564

GOOD-ENOUGH PRODUCTION 34
Sevald, C. A., & Dell, G. S. (1994). The sequential cuing effect in speech production. Cognition,
53(2), 91–127. https://doi.org/10.1016/0010-0277(94)90067-1
Stoll, S., Abbot-Smith, K., & Lieven, E. (2009). Lexically Restricted Utterances in Russian,
German, and English Child-Directed Speech. Cognitive Science, 33(1), 75–103.
https://doi.org/10.1111/j.1551-6709.2008.01004.x
Wolpert, D. M., & Landy, M. S. (2012). Motor control is decision-making. Current Opinion in
Neurobiology, 22(6), 996–1003. https://doi.org/10.1016/j.conb.2012.05.003
1
Supplementary Materials
All analysis results (including additional detail beyond the material presented here) can be found
in our publicly available data and analysis scripts:
● OSF: https://osf.io/3svge/?view_only=7f98d3e153a1427f8eb60503113bb157
● R Markdown Analysis Walkthrough: https://rpubs.com/zcm/good_enough_production
S1: Main logistic mixed-effects analyses in Experiments 1-4
S1.1. Overview over modeling results.
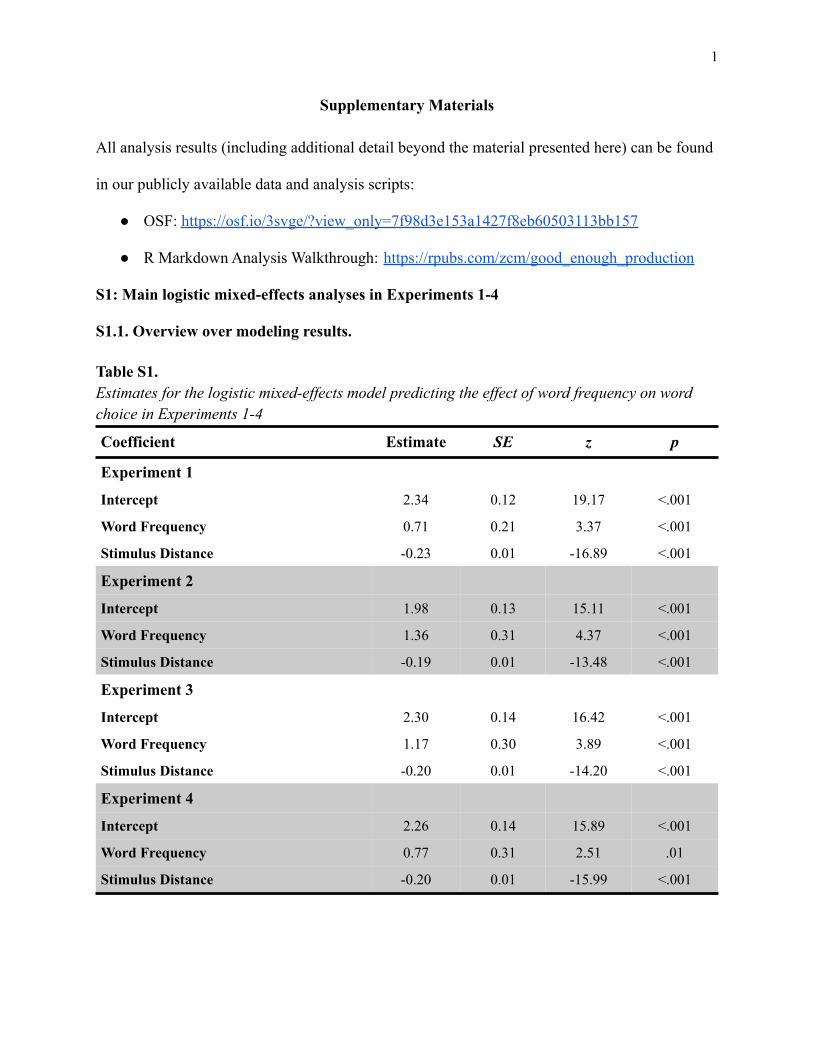
Table S1.Estimates for the logistic mixed-effects model predicting the effect of word frequency on wordchoice in Experiments 1-4
Coefficient Estimate SE z p
Experiment 1
Intercept 2.34 0.12 19.17 <.001
Word Frequency 0.71 0.21 3.37 <.001
Stimulus Distance -0.23 0.01 -16.89 <.001
Experiment 2
Intercept 1.98 0.13 15.11 <.001
Word Frequency 1.36 0.31 4.37 <.001
Stimulus Distance -0.19 0.01 -13.48 <.001
Experiment 3
Intercept 2.30 0.14 16.42 <.001
Word Frequency 1.17 0.30 3.89 <.001
Stimulus Distance -0.20 0.01 -14.20 <.001
Experiment 4
Intercept 2.26 0.14 15.89 <.001
Word Frequency 0.77 0.31 2.51 .01
Stimulus Distance -0.20 0.01 -15.99 <.001

2
S1.2. Computing the decision boundary shift
In interpreting the parameter estimate of the frequency effect, we establish the corresponding
shift in decision boundary in terms of distance from the nearest compass direction. This shift in
decision boundary is computed from the parameter estimates (beta coefficients) of the logistic
mixed-effects model estimating the difference between frequency conditions (the main model in
the paper). To compute the decision boundary shift, we answer the following question: what shift
in angle distance (from the nearest compass direction) corresponds to moving from the
low-frequency condition (coded as -0.5) to the high-frequency condition (coded as 0.5), based on
the model predictions? Model predictions are based on the fixed effects of the model (predictions
are in logit/ log-odds space in logistic regression):
In particular, we are asking what adjustment c to distance allows the prediction for the
low-frequency condition (condition=-0.5) to be equal to the prediction for the high frequency
condition (condition=0.5). This means that the decision boundary shift c can be determined by
solving the following equation:
This equation can be simplified to:
95% confidence intervals for the decision boundary shift are computed analogously using the
confidence bounds of the model parameter estimates.

3
S2: Latency Analyses during the Treasure Hunt Phase.
For each experiment we investigated participants’ speed in responding on trials in which
they chose the nearest word (thereby maximizing message alignment). We fit linear
mixed-effects models predicting participants’ reaction times from Word Frequency (centered;
High = -0.5 vs. Low = -0.5) and Distance from Nearest Principal Direction, including
by-participant and by-item random intercepts and a random slope for Word Frequency. Error
degrees of freedom were obtained using the Satterthwaite approximation with the help of the R
package lmerTest (version 3.1-3; Kuznetsova et al., 2017). In all four experiments, participants
responded faster when the nearest principal direction was a high-frequency word compared to a
low-frequency word, and slower as the test stimulus’ distance from the nearest principal
direction increased (see Table S2). The effects were similar for both the Far Distance trials and
the Near Distance trials in each experiment (no near vs. far trial type by frequency or distance
interaction).
Table S2Mean Reaction Times and linear mixed-effects model results comparing High-Frequency (HF)and Low-Frequency (LF) Compass DirectionsExperiment HF words LF words Model result
Experiment 1 2208ms[2160ms, 2256ms]
2663ms[2577ms, 2749ms]
b = -405.4, Wald 95% CI: [-525.6,-285.2],t(39.9) = -6.61, p < .001
Experiment 2 2278ms[2220ms, 2336ms]
2501ms[2397ms, 2605ms]
b = -220.3, Wald 95% CI: [-349.9,-90.7],t(33.2) = -3.33, p = .002
Experiment 3 2289ms[2237ms, 2341ms]
2573ms[2488ms, 2658ms]
b = -257.8, Wald 95% CI: [-349.0,-166.6],t(54.7) = -5.54, p < .001
Experiment 4 2262ms[2205ms, 2319ms]
2565ms[2471ms, 2659ms]
b = -251.0, Wald 95% CI: [-367.7,-134.4],t(36.8) = -4.22, p < .001
Note. Values in square brackets represent 95% within-participants confidence intervals (Morey, 2008).
4
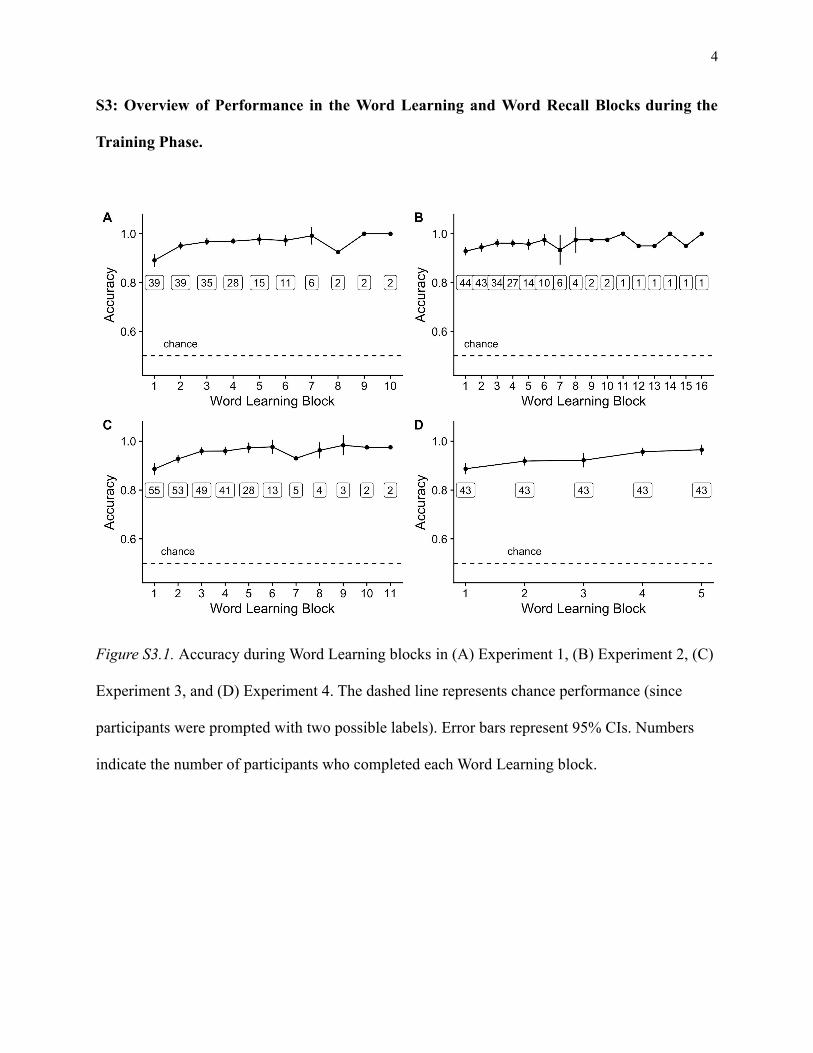
S3: Overview of Performance in the Word Learning and Word Recall Blocks during the
Training Phase.
Figure S3.1. Accuracy during Word Learning blocks in (A) Experiment 1, (B) Experiment 2, (C)
Experiment 3, and (D) Experiment 4. The dashed line represents chance performance (since
participants were prompted with two possible labels). Error bars represent 95% CIs. Numbers
indicate the number of participants who completed each Word Learning block.

5
Figure S3.2. Accuracy during Word Recall Blocks in (A) Experiment 1, (B) Experiment 2, (C)
Experiment 3, and (D) Experiment 4. Error bars represent 95% CIs. Numbers indicate the
number of participants who completed each Word Recall block.
S4: Overview of Performance on Word Retention Trials.
Table S3Mean Accuracy and Reaction Times (correct trials) and linear mixed-effects model resultscomparing High-Frequency (HF) and Low-Frequency (LF) Compass Directions in Untimed andTimed Retention
Test Block HF words LF words Model result
Experiment 1Timed Retention
Accuracy 91.7% [86.6%, 96.7%] 84.6% [79.5%, 89.7%] b = 0.59, z = 1.30, p = .19Reaction Time 2315ms [2173ms, 2458ms] 2583ms [2440ms, 2726ms] b = -205.3, t(120.0) = -2.11, p = .04
Untimed RetentionAccuracy 97.4% [94.8%, 100%] 97.4% [94.8%, 100%] b = -1.12, z = -0.30, p = .76
Reaction Time 2726ms [2470ms, 2982ms] 3050ms [2795ms, 3306ms] b = -295.4, t(32.4) = -1.58, p = .12

6
Test Block HF words LF words Model result
Experiment 2Timed Retention
Accuracy 93.8% [88.8%, 98.7%] 84.7% [79.7%, 89.6%] b = 0.75, z = 1.42, p = .16Reaction Time 2303ms [2169ms, 2438ms] 2436ms [2301ms, 2570ms] b = -99.3, t(17.1) = -0.99, p = .34
Untimed RetentionAccuracy 98.9% [96.3%, 100%] 94.9% [92.3%, 97.5%] b = 6.2, z = 1.85, p = .06
Reaction Time 2684ms [2478ms, 2890ms] 2812ms [2606ms, 3017ms] b = -118.3, t(32.8) = -0.86, p = .40
Experiment 3Timed Retention
Accuracy 91.8% [87.5%, 96.2%] 89.5% [85.2%, 93.9%] b = 0.12, z = 0.17, p = .87Reaction Time 2217ms [2113ms, 2321ms] 2413ms [2309ms, 2517ms] b = -190.2, t(26.5) = -2.31, p = .029
Untimed RetentionAccuracy 97.7% [95.0%, 100%] 95.0% [92.3%, 97.7%] b = -0.42, z = -0.33, p = .75
Reaction Time 2559ms [2414ms, 2703ms] 2505ms [2360 ms, 2649ms] b = 46.2, t(174.9) = 0.43, p = .67
Experiment 4Timed Retention
Accuracy 92.4% [88.2%, 96.7%] 83.1% [78.9%, 87.4%] b = 1.22, z = 1.77, p = .08Reaction Time 2342ms [2233ms, 2452ms] 2455ms [2346ms, 2565ms] b = -1.36, t(75.5) = -1.66, p = .10
Untimed RetentionAccuracy 97.7% [93.6%, 100%] 91.9% [87.8%, 95.9%] b = -3.89, z = -1.58, p = .11
Reaction Time 2567ms [2387ms, 2747ms] 2691ms [2511 ms, 2871ms] b = -134.9, t(48.05) = -1.14, p = .26Note. Values in square brackets represent 95% within-participants confidence intervals (Morey, 2008).
S5: Additional covariates in the main logistic mixed-effects analyses in Experiments 1-4
Word length. The target labels used to identify compass directions in the present
experiments (pim, dak, vorg, yeen, grah, skod, gled, veek, blit, peka, sarp, minada, hoon, clate,
noobda, gorm, frabda, mog) varied in character length across participants. While labels were
randomly assigned to compass directions across participants, and the variation in character
length was generally small, we conducted additional exploratory analyses to ensure that the
effect of frequency on lexical selection was robust to variability in word length. In the main
logistic mixed-effects analyses demonstrating the effect of word frequency on lexical selection,
we also fit models controlling for the character length of the nearest compass direction. In these
models, we included the character length of the nearest compass direction as a fixed effect, as
well as a by-participant random slope for character length (since character length varied within

7
participants). All effects held after controlling for character length, and we found no significant
effects of character length (all ps > .22).
Number of word learning blocks during training. Participants varied in the duration of
their training in Experiments 1, 2, and 3. The extent to which participants were trained on the
compass directions may have influenced the degree to which participants exhibited a frequency
effect on lexical selection. In the main logistic mixed-effects analyses demonstrating the effect of
word frequency on lexical selection, we also fit models controlling for differences in training
duration by including the number of training blocks as a fixed effect. All effects held after
controlling for number of word learning blocks during training, with no significant effects of
number of word learning blocks in Experiments 1-3 (all ps > .14).
S6: Details on the scoring system during the Treasure Hunt Phase
Participants received a graded reward (points) contingent on message alignment and
speed during the Treasure Hunt. For a given response, participants’ score was a product of a base
score corresponding to message alignment (how close the word was to the typed compass
direction) and response speed (how quickly participants completed typing the word). The arc (in
degrees) between the tested angle and the word entered determined base score (0-45), with closer
labels yielding more points. This base score was then scaled by the speed of participants’
responses using the following formula:
References
Kuznetsova, A., Brockhoff, P.B., & Christensen, R. H. B. (2017). lmerTest Package: Tests in
linear mixed effects models. Journal of Statistical Software, 82(13), 1–26.
https://doi.org/10.18637/jss.v082.i13

8
Morey, R. D. (2008). Confidence Intervals from Normalized Data: A correction to Cousineau
(2005). Tutorials in Quantitative Methods for Psychology, 4(2), 61–64.
https://doi.org/10.20982/tqmp.04.2.p061