Selected socio-economic factors affecting the willingness to minimise solid waste in Dhaka city,...
23
This article was downloaded by: [University of Malaya] On: 17 June 2013, At: 00:32 Publisher: Routledge Informa Ltd Registered in England and Wales Registered Number: 1072954 Registered office: Mortimer House, 37-41 Mortimer Street, London W1T 3JH, UK Journal of Environmental Planning and Management Publication details, including instructions for authors and subscription information: http://www.tandfonline.com/loi/cjep20 Selected socio-economic factors affecting the willingness to minimise solid waste in Dhaka city, Bangladesh Rafia Afroz a , Rabaah Tudin b , Keisuke Hanaki c & Muhammad Mehedi Masud a a Department of Economics, Faculty of Economics and Management Science, International Islamic University Malaysia, Kuala Lumpur, 50728, Malaysia b Department of Economics, Faculty of Economics and Business, University Malaysia Sarawak c Department of Urban Engineering, Faculty of Engineering, The University of Tokyo, Japan Published online: 17 Jun 2011. To cite this article: Rafia Afroz , Rabaah Tudin , Keisuke Hanaki & Muhammad Mehedi Masud (2011): Selected socio-economic factors affecting the willingness to minimise solid waste in Dhaka city, Bangladesh, Journal of Environmental Planning and Management, 54:6, 711-731 To link to this article: http://dx.doi.org/10.1080/09640568.2010.527472 PLEASE SCROLL DOWN FOR ARTICLE Full terms and conditions of use: http://www.tandfonline.com/page/terms-and- conditions This article may be used for research, teaching, and private study purposes. Any substantial or systematic reproduction, redistribution, reselling, loan, sub-licensing, systematic supply, or distribution in any form to anyone is expressly forbidden. The publisher does not give any warranty express or implied or make any representation that the contents will be complete or accurate or up to date. The accuracy of any instructions, formulae, and drug doses should be independently verified with primary sources. The publisher shall not be liable for any loss, actions, claims, proceedings,
-
Upload
independent -
Category
Documents
-
view
0 -
download
0
Transcript of Selected socio-economic factors affecting the willingness to minimise solid waste in Dhaka city,...

This article was downloaded by: [University of Malaya]On: 17 June 2013, At: 00:32Publisher: RoutledgeInforma Ltd Registered in England and Wales Registered Number: 1072954 Registeredoffice: Mortimer House, 37-41 Mortimer Street, London W1T 3JH, UK
Journal of Environmental Planning andManagementPublication details, including instructions for authors andsubscription information:http://www.tandfonline.com/loi/cjep20
Selected socio-economic factorsaffecting the willingness to minimisesolid waste in Dhaka city, BangladeshRafia Afroz a , Rabaah Tudin b , Keisuke Hanaki c & MuhammadMehedi Masud aa Department of Economics, Faculty of Economics andManagement Science, International Islamic University Malaysia,Kuala Lumpur, 50728, Malaysiab Department of Economics, Faculty of Economics and Business,University Malaysia Sarawakc Department of Urban Engineering, Faculty of Engineering, TheUniversity of Tokyo, JapanPublished online: 17 Jun 2011.
To cite this article: Rafia Afroz , Rabaah Tudin , Keisuke Hanaki & Muhammad Mehedi Masud(2011): Selected socio-economic factors affecting the willingness to minimise solid waste in Dhakacity, Bangladesh, Journal of Environmental Planning and Management, 54:6, 711-731
To link to this article: http://dx.doi.org/10.1080/09640568.2010.527472
PLEASE SCROLL DOWN FOR ARTICLE
Full terms and conditions of use: http://www.tandfonline.com/page/terms-and-conditions
This article may be used for research, teaching, and private study purposes. Anysubstantial or systematic reproduction, redistribution, reselling, loan, sub-licensing,systematic supply, or distribution in any form to anyone is expressly forbidden.
The publisher does not give any warranty express or implied or make any representationthat the contents will be complete or accurate or up to date. The accuracy of anyinstructions, formulae, and drug doses should be independently verified with primarysources. The publisher shall not be liable for any loss, actions, claims, proceedings,

demand, or costs or damages whatsoever or howsoever caused arising directly orindirectly in connection with or arising out of the use of this material.
Dow
nloa
ded
by [
Uni
vers
ity o
f M
alay
a] a
t 00:
32 1
7 Ju
ne 2
013

Selected socio-economic factors affecting the willingness to minimise
solid waste in Dhaka city, Bangladesh
Rafia Afroza*, Rabaah Tudinb, Keisuke Hanakic and Muhammad Mehedi Masuda
aDepartment of Economics, Faculty of Economics and Management Science, InternationalIslamic University Malaysia, Kuala Lumpur 50728, Malaysia; bDepartment of Economics,Faculty of Economics and Business, University Malaysia Sarawak; cDepartment of Urban
Engineering, Faculty of Engineering, The University of Tokyo, Japan
(Received 30 September 2009; final version received 24 September 2010)
This paper examines the factors that influence the waste generation and willingnessto minimise solid waste in Dhaka city, Bangladesh. Information on wastegeneration, willingness to minimise, socio-economic characteristics, and behaviourof the households towards solid waste management were obtained from interviewswith 402 households in Dhaka city. Of these, 103 households regularly practisedrecycling activities. Ordinary least square (OLS) regression and logistic regressionanalysis were used to determine the dominant factors that might influence thewaste generation and households’ willingness to minimise solid waste, respectively.The results found that the waste generation of the households in Dhaka city wassignificantly affected by environmental consciousness, income groups, particularlythe middle-income earners, and willingness to separate. The significant factors forwillingness to minimise solid waste were environmental consciousness, incomegroups particularly the middle-income earners, young adults mainly those agedbetween 25 to 35 years and storage facility. Establishment of a solid wastemanagement programme could be an effective strategy for implementingsustainable waste management in Bangladesh. For this strategy to succeed,however, active partnership between the respondents and waste managementservice department is required. The respondents’ behaviour toward solid wastemanagement practices should be taken into consideration, as should the results ofthis study, which are important indicators of respondents’ positive attitudestoward sustainable waste management in Dhaka city.
Keywords: waste minimisation; waste generation; recycling; logistic regressionmodel; perception and attitude
1. Introduction
Urban solid waste management is considered to be one of the most seriousenvironmental problems confronting urban areas in developing countries (Pfam-matter and Schertenleib 1996, WRI 1996, Sinha and Enayetullah 2000), andBangladesh is no exception. Bangladesh has the highest density of population of allcountries of the world. It has very little open physical space and empty terrain tocushion the country against environmental shocks. Therefore, any environmental
*Corresponding author. Email: [email protected]
Journal of Environmental Planning and Management
Vol. 54, No. 6, July 2011, 711–731
ISSN 0964-0568 print/ISSN 1360-0559 online
� 2011 University of Newcastle upon Tyne
DOI: 10.1080/09640568.2010.527472
http://www.informaworld.com
Dow
nloa
ded
by [
Uni
vers
ity o
f M
alay
a] a
t 00:
32 1
7 Ju
ne 2
013

contagion in Bangladesh is sure to spread very fast and affect millions of people(Salequzzaman and Stocker 2001). If the population increases, resource consumptionalso increases as a side effect (Haden et al. 2009), and the highest population has thehighest generation of waste (Ayotamuno and Gobo 2004). Urbanisation inBangladesh is no different to what has happened in China, where urban migrationhas become a burden to economic development and a problem for the environment(Ling and Isaac 1996). Bangladesh’s population density is already 50 times higherthan that of the USA, six times higher than that of China, and the country is theworst victim of environmental degradation, therefore, protection of the environmentis necessary even from the view of social justice (Salequzzaman and Stocker 2001).
Dhaka, the capital city of Bangladesh, with more than 10 million inhabitants, isone of the fastest growing mega cities in the world. In the period from 1991 to 2004,Dhaka’s population had an average of more than 4% annual growth rate (DOE2004). The Dhaka metropolitan area occupies approximately 1353 km2 (Enayetullahand Sinha 1999). Approximately 6 million residents live under the management ofDhaka city corporation (DCC), covering an area of 344 km2 (Enayetullah and Sinha1999). In Dhaka, solid waste generation amounts to 3500 ton/day, of which 1800tons are collected and dumped by the Dhaka city corporation (DCC), 900 tons endup in backyards and informal landfills, 400 tons end up on roadsides or open space,300 tons are recycled by the Tokais (destitute slum children acting as scavengers),and 100 tons go through informal recycling at the point of generation (DCC 2005).Irrespective of the municipal authorities’ ability to collect it, both collected anduncollected waste creates problems for the city residents. A household awarenesssurvey was conducted by DCC in 2004 in Dhaka city, which found that 88% of theupper-income group, 95% of the middle-income group and 100% of the lower-income group were not willing to participate in recycling activities. Unfortunately,public participation in waste management (including waste minimisation) indeveloping countries, including Dhaka, is very low.
The general situation of poverty and illiteracy of the masses makes Bangladeshvery vulnerable to environmental damage, and the general populace of Bangladeshis too busy trying to meet their basic material needs, therefore they have little scopeto be concerned about environmental amenities (Salequzzaman and Stocker 2001).The Summary Report (BBS 1995) shows that 46.7% of the urban population(14.5 million) lives in absolute poverty and in Dhaka some 40 to 45% of the peoplelive in slums and slum-like areas (Zuberi 1998). A number of homeless individualsmake the road their home, while some use boxes as their shelter which they callhome, and some people consider these ‘boxes’ as waste. Alternatively, low-incomehouseholds have too little to recycle, and middle-income households might have nospace in their homes to keep recycled materials so they have few incentives tomanage waste.
In addition, at present no structured recycling mechanism is being implementedfor households in Dhaka. Many people do not know the location of the nearestcollection point. Knowledge of the location of collection points is poor or they aretoo far away, so it easier to throw the recyclables into the street than to bring them toa collection point (Sujauddin et al. 2008). Finding adequate waste disposal sites forthe future is also very difficult at present considering the increased population andhorizontal expansion of the city. Overall, the city corporations have failed to managethe solid waste of this increasing population, mainly because of a lack of financialsupport and willingness to pay (WTP) and low participation of the households for
712 R. Afroz et al.
Dow
nloa
ded
by [
Uni
vers
ity o
f M
alay
a] a
t 00:
32 1
7 Ju
ne 2
013

overall sustainable solid waste management policies. Therefore, there is an urgentrequirement to increase public awareness of the waste minimisation problem and toestimate the factors that are responsible for the increasing generation of waste.Identification of these factors would be helpful for the environmental and wastemanagement planners in their decision making for managing waste and environ-mental pollution. A considerable amount of research work on solid wastemanagement has already been conducted in Bangladesh (Salequzzaman et al.1998, 2001, Salequzzaman 2000, Ahmed and Rahman 2000, Alam et al. 2002, Hasanand Chowdhury 2005, Enayetullah et al. 2005, Rahman et al. 2006, Sinha 2006).However, so far no study has yet been undertaken which investigates the effect of thesocio-economic level of householders on solid waste generation and minimisation.
The objectives of the current study were, therefore, to contribute to a betterunderstanding of household waste management behaviour by examining wastemanagement practices and behaviours of the residents of Dhaka city, Bangladesh.More specifically, it analyses the factors that promote a household’s waste generationand their willingness to minimise the household waste. The results of the studywill provide inputs into the formulation of local waste minimisation plans andprogrammes, particularly on waste segregation and recycling activities of theresidents of Dhaka city, Bangladesh.
2. Methodology
2.1. Theoretical framework for waste generation of the households
In developing an effective waste minimisation strategy for a given region, it isimportant to know the amount of waste generated and the composition of the wastestream as these have direct effects on the socio-economic factors. In the past,economists discussed the socio-economic factors influencing household wastegeneration. Viewed from an economic perspective, Wertz (1976) analysed householdbehaviour with regard to waste generation in terms of changes in income, price of arefuse service, frequency of the service, site of refuse collection and packaging.Household size, cultural patterns, education and personal attitudes (Grossmannet al. 1974, Al-Momani 1994) also influence solid waste generation. Economists havealso compared the composition and quantity of waste in terms of income level,household size and age structure of the household as these affect the quantity andcomposition of solid waste. For example, the study by Richardson and Havlicek(1978) showed that grass, yard wastes and the newspaper that people read werepositively correlated with the level of income. Hence the current project considersage, education, knowledge, income, household size and extra land as importantcomponents that affect the solid waste generation.
Maturity of the respondents might affect their attitude towards environmentalissues. In a poor country, if a household includes teenagers, they might not considerenvironmental issues as their priority in life compared to retired people who spendmany hours taking care of their home. Similarly, level of education affects the waypeople lead their lives. A person with a higher level of education will most probablybe more articulate and undertake analytical reasoning. Ling and Isaac (1996)conducted research in China, and they claimed that national awareness relatingto environmental protection needs to be stimulated by education. Ignorance andpoverty were recognised as being responsible for the acceptance of toxic/hazardouswastes from industrialised countries (Sangodoyin and Ipadeola 2000). An informed
Journal of Environmental Planning and Management 713
Dow
nloa
ded
by [
Uni
vers
ity o
f M
alay
a] a
t 00:
32 1
7 Ju
ne 2
013

population will mean that measures of environmental protection can be easilyimplemented (Ling and Isaac 1996). Education, training and research in the field ofenvironment management is necessary (Zuberi 1998).
Environmental education and care is not new in Bangladesh, however, the largemajority of people in Bangladesh have had no chance to go through formaleducation; they have been using their own devices to cope with the environmentalproblems (Salequzzaman and Stocker 2001). The illiteracy only aggravatesBangladesh’s environmental problem because it acts as a barrier for them evento understand the damaging impact on their own physical and mental health of theenvironmental degradation that is occurring in their immediate environment(Salequzzaman and Stocker 2001). Thus, inclusion and dissemination of environ-mental knowledge and information in the formal and non-formal systems ofeducation and the media should be ensured (Salequzzaman and Stocker 2001).Information and facts about the past, present and possible future scenario shouldbe presented to the public. Research by Barr et al. (2001) indicated that recyclingbehaviour is influenced by convenience, knowledge and access to a kerbsidescheme, whereas waste minimisation behaviour is driven more by a concern aboutenvironmental issues. For many people, income will determine what they buy,when they buy, where they buy and how frequently they buy the products. Ifincome is low, most items purchased will probably be items of necessity, but thosewith high incomes will buy luxury and non-essential items. Thus, there is a positiverelation between income and waste generation (Nilanthi et al. 2006). Sangodoyinand Ipadeola (2000) investigated environmental issues in Nigeria, and the wasteproduced differs according to the level of household income.
Size of the household is associated with the population of a country. When thesize of households increases, the country’s population will directly increase. Thequickening pace of development, industrialisation, urbanisation and populationgrowth in Bangladesh increase the environmental challenges (Salequzzaman andStocker 2001). Various authors have shown that the amount of waste generated by acountry is proportional to its population, and the mean living standards of thepeople (Wertz 1976, Grossmann et al. 1974, Medina 1997) relate to their incomelevels, hence the generation of individual household waste is correlated. Forexample, the average rate of waste generation in Port Harourt is approximately 1.25kg/persons/household per annum (Ayotamuno and Gobo 2004). As a city grows inpopulation and physical size, so its land use becomes more complex (Ayotamunoand Gobo 2004). For example, with the cultivation of land come the negative effectsof extensive deforestation (Haden et al. 2009). As the land use becomes morecomplex, the solid waste generated increases in volume and variety (Ayotamuno andGobo 2004). Extra land can also be used as storage or warehouses for unused orunwanted products. This study examines household waste generation using amultiple regression model considering the studies discussed above.
2.2. Theoretical framework for waste minimisation
Willingness to pay for waste management services or facilities is very important tothe success of participation by the private sector in solid waste managementprogrammes. The willingness to pay or not to pay could have a direct impact(positive or negative) on the reliability and success of any solid waste managementstrategy (Epp and Mauger 1989, Rahman et al. 2006).
714 R. Afroz et al.
Dow
nloa
ded
by [
Uni
vers
ity o
f M
alay
a] a
t 00:
32 1
7 Ju
ne 2
013

This is, therefore, a question of demand or economics of household wastemanagement, especially in a developing country such as Bangladesh. Householddemand for solid waste services is a function of the unit price of solid wasteservices and other determining factors such as wage, non-wage income, prices ofconsumption goods, prices received for recyclables, waste components of marketgoods and quantity of waste generated by non-market goods (Jenkins 1993). Othersocio-economic characteristics are included in models such as household size, ageand education. The variables income and household size are surrogates for theunobserved household production activities which generate waste as a by-product(Hong et al. 1993). Some researchers have used this demand for solid waste servicesas a framework to model the determinants of household waste recycling (Hong et al.1993, Reschovsky and Stone 1994, Jenkins et al. 2000). Jenkins et al. 2000 examinedthe intensity of recycling different waste materials using an ordered probit model,where the dependent variable, i.e. intensity of recycling each material (categorised atthree levels), is a function of unit price of waste disposal, some characteristics of thelocal waste management system, and socio-economic factors such as householdincome, age and homeownership. Using the same model, Hong et al. 1993 modelledhousehold recycling participation or the number of times it recycles over a period oftime (categorised at five levels) as a function of disposal price and socio-economicvariables. Finally, using a simple probit model, Reschovsky and Stone (1994)examined the probability of recycling a specific material and included socio-economic variables and characteristics of recycling programmes as independentvariables. The first two models examined mainly the influence of waste disposal priceon household recycling behaviour, while the third model examined the differentialeffects of recycling systems when combined with unit pricing.
Research on waste recycling in the developing world places less emphasis onunderstanding the indirect motives of a person’s behaviour (i.e. the recyclingresearch focus in developed countries), but more emphasis on the practical, directfactors influencing the institutions and elements associated with waste management.Studies conducted in developing countries such as Malaysia, China and Mexico havefound that recycling activities are further influenced by the availability of storagespace in the home, the presence of recycling agents and the proximity of collectioncentres to households. It has also been observed that competencies were the bestpredictors of actual behaviour, whereas beliefs were more indicative of perceptionsof behaviour or desired behaviour. In the case of recycling, a person was more likelyto recycle waste when they fully understood the correct methods and the reasons todo it as opposed to simply having a desire to recycle (Corral-Verdugo 1997, Harvieand Jaques 2003).
The present study examines household waste minimisation behaviour usingbinary choice modelling following the studies discussed above. Waste minimisationis an activity undertaken to facilitate recycling and disposal and thus entailshousehold resources such as time, space and effort in the same manner as wasterecycling. This household activity basically consists of the separation or sorting ofwastes into recyclables and non-recyclables, and storing these wastes in separatecontainers to facilitate recycling and disposal. It is therefore reasonable to assumethat the household’s decision to engage in waste minimisation will be determined bythe same factors that influence its decision to engage in recycling activities. However,since the amount or level of effort of waste segregation done by the household is alsonot observable, the study adopted a dichotomous or binary choice model.
Journal of Environmental Planning and Management 715
Dow
nloa
ded
by [
Uni
vers
ity o
f M
alay
a] a
t 00:
32 1
7 Ju
ne 2
013

2.3. Econometric model of waste generation of the households
To determine the factors that affect waste generation of the households selected, thisstudy followed a multiple regression model. In this regression analysis, the total solidwaste generation of the households per month is regressed due to its quantitativenature by several independent variables. The model is:
Y ¼ b1 þ b2X2 þ b3X3 þ :::::::::::::: þ bkXk þ e
Y ¼ b1 þ b2Genderþ b3householdsizeþ b4Age1þ b5Age2þ b6income1
þ b7Income2þ b8EnvConcernþ b9willingtoseparateþ b10Extraland
where:
Y ¼ total waste generation by the households per monthXk ¼independent variablesb1 ¼ constant termbi ¼ coefficient of independent variablese ¼ the error or disturbance term.
In this model the household is viewed as a production unit producing solid wastes.Hypotheses about the nature of the waste production relationship can be stated ashypotheses about coefficient signs of the variables included in the model. Gender wasentered as a dummy (Male) that was assigned a value of 1 for males and 0 otherwise.Household size refers to the number of family members living in the same household.Monthly income was measured by two dummies: lower income (Income 1)representing the �TK 3000 group and middle income (Income 2) representing theTK3000 to TK15,000 group; the high income (4TK15,000) category was omitted.Multicollinearity between income and education forced us to drop the latter from theestimated equation. Keeping income (rather than education) yielded a better loglikelihood ratio and McFadden R2 statistics. Age was entered as two dummies: Age1and Age2 representing the 16 to 24 and 25 to 35 age categories, respectively; theabove 35 age group was omitted. Concern for the environment was a dummy(Environ cons) assigned a value of 1 if the individual was concerned and 0 otherwise.Extra land within the compound was assigned a value of 1 if the household had extraland within their compound and 0 otherwise. Willingness to separate the wastewas assigned a value of 1 if the individual was willing to separate the waste and 0otherwise.
2.4. Econometric model of willingness to minimise solid waste
The study examines household solidwasteminimisation behaviour using binary choicemodelling (logit model) following the studies discussed above. The MaximumLikelihood (ML) method was employed to estimate the parameters in logisticregression model. The likelihood ratio index has been measured as an indicator ofgoodness of fit for the logistic regression model. As such, the model assesses therelationship between various factors and the respondents’ willingness forminimisationof solid waste. The dependent variable is designed as a dichotomous dummy because ofassuming whether the household is willing for the minimisation of solid waste or not.
716 R. Afroz et al.
Dow
nloa
ded
by [
Uni
vers
ity o
f M
alay
a] a
t 00:
32 1
7 Ju
ne 2
013

The data collected via the survey were used to run a logit regression model of theform:
Log P=ð1� PÞ½ � ¼ b1 þ b2X2 þ b3X3 þ :::::::::::::: þ bkXk þ e
Log P=ð1� PÞ½ � ¼ b1 þ b2Genderþ b3Age1þ b4Age2þ b5Income1þ b6Income2
þ b7EnvConcernþ b8storage
where:
Pi ¼ 1 if the household is willing to minimise solid wastePi ¼ 0 for otherwiseXi ¼independent variablesb1 ¼ constant termbi ¼ coefficient of independent variablese ¼ the error or disturbance termi ¼ 1, 2, 3, . . . n
Therefore, in this study p/(1 7 p) may be interpreted as the ratio of the probabilitythat the respondent will minimise the waste to the probability that he/she will not.Alternatively, it is the odds of the respondent participating in waste minimisation.Gender was entered as a dummy (Male) that was assigned a value of 1 for malesand 0 otherwise. Monthly income was measured by two dummies: lower income(Income 1) representing the �TK3000 group and middle income (Income 2)representing the TK3000 to TK15,000 group; the high income (4TK15,000)category was omitted. Multicollinearity between income and education forced us todrop the latter from the estimated equation. Keeping income (rather thaneducation) yielded a better log likelihood ratio and McFadden R2 statistics. Agewas entered as two dummies: Age1 and Age2 representing the 16 to 24 and 25 to35 age categories, respectively; the above 35 age group was omitted. Concern forthe environment was a dummy (Environ cons) assigned a value of 1 if thehousehold was concerned and 0 otherwise. The storage facility was a dummy(storage) assigned a value of 1 if the household had a storage facility in house and0 otherwise. Most of the variables are derived from the interviews, in which it isconsidered relevant from theoretical point of view and included as independentvariables.
2.5. Survey design and sampling method
Dhaka was chosen as the location for this study. Residents in Dhaka are theimmediate beneficiaries of door-to-door waste collection systems that have beenintroduced by Dhaka city corporation (DCC). The unit of analysis is household –either in an independent house, an apartment, a flat or a shanty and a residence-cumoffice/business. Those staying in barracks or orphanages and homeless individualswere excluded from the target population as they do not form a household for taxpurposes. The reason for choosing ‘household’ as the unit of analysis is linked to thecultural practice in Bangladesh. In most cases a joint-family structure still exists andincomes are combined for the purpose of any expenditure decision. Hence, ‘income’in this study refers to household income.
Journal of Environmental Planning and Management 717
Dow
nloa
ded
by [
Uni
vers
ity o
f M
alay
a] a
t 00:
32 1
7 Ju
ne 2
013

Dhaka comprises 10 zones and within these zones there are 90 wards(subdivision) (BBS 2001). Each ward is composed of one or more mohallas (blocks),each of which contains one or a few streets and a varying number of households. Intotal, there are 659 mohallas and the number of households in Dhaka city is 643,016(BBS 1995). This project utilises a stratification process and random sampling on thenumber of households. First, from each zone we selected one ward with the highestlevel of waste generation. Two mohallas from each ward were then chosen. Thisresulted in a total of 20 mohallas from the 10 wards. Next, from these 20 mohallas413 households were randomly selected in proportion to each zone’s population.Face-to-face interviews were employed in this study because in Bangladesh theliteracy rate is low (47.9%) (CIA 2010). After censoring for missing information andinconsistent answers, 402 (97%) were valid for further investigation. According toSekaran (2003), sample sizes larger than 30 and less than 500 are appropriate formost research. Leedy and Ormrod (2005) also believed that a sample size of 400 isadequate if the target population size is beyond 5000. All the respondents were olderthan 17 years of age.
Before the final data were collected, two pre-tests were conducted in April 2006.The first pre-test involved 10 participants, to test their understanding and clarity ofthe questions. One week later, 50 individuals were interviewed based on the modifiedquestions from the first pre-test. In August 2006 the final data were collected inDhaka city.
The questions in each interview had three sections. In Section A respondentswere asked who normally collected and placed solid waste generated in theirhouseholds, how many containers of waste each household produced in 3 to 4 days,weight of each container, whether they received a door-to-door collection service andwhat happened if they failed to get the door-to-door collection, and their knowledgeand concern about the environment. ‘Knowledge’ here refers to a respondent’sawareness of waste minimisation and recycling issues, information on what arerecyclable and non-recyclable wastes, who can collect wastes and where solid wastecan be disposed of (as advertised by Bangladesh Government in the mass media). Itshould be noted that the government of Bangladesh frequently advertises to explainwaste minimisation on television, radio and in newspapers. Among other aspects, themessages in these advertisements include: what is waste, how individuals can recycle,recyclable and non-recyclable items, benefits of waste minimisation and the impactof minimisation of waste. A respondent’s concern for the environment was evaluatedbased on responses to a set of five questions in the questionnaire. The respondentwas only classified as being environmentally conscious if, in response to thesequestions, he/she satisfied all of the following criteria: perceived a clean environmentas a personal responsibility, not the responsibility of other parties; participated inany clean environment campaign or project; disposed of waste responsibly duringoutings when no waste bins were available; was involved in some environmentalprotection activity; and rated him/herself as being environmentally conscious.
Section B asked the respondents about their sources of knowledge, recyclingactivity, waste disposal practices and whether they were willing to minimise theirhousehold waste. Here, waste minimisation refers to separating the solid waste fromrecyclable materials, composting organic materials, giving the solid waste to wastecollectors and selling the recyclable materials. Next respondents were asked howoften they recycled their solid waste. Section C covered socio-economic character-istics (education level, employment, household monthly income, age and number of
718 R. Afroz et al.
Dow
nloa
ded
by [
Uni
vers
ity o
f M
alay
a] a
t 00:
32 1
7 Ju
ne 2
013

family members) and miscellaneous issues (extra land and any other comments thatrespondents wished to express).
3. Results
3.1. Socio-economic characteristics of the respondents
Tables 1 and 2 show the socio-economic characteristics of the respondents. Table 1shows the gender, religion, education and employment characteristics. The studyfound that 67.1% of the respondents were male and 32.9% female. Dhaka’spopulation growth is at 56.5% (2001 Census) (BBS 2001) and the gender ratio is 1.26male to 1 female (Hassan 2008). In this survey, 80.2% of the respondents followedIslam, 16.4% were Hindu, 3.0% were Christians and 0.4% were Buddhists. A totalof 83% of Bangladeshis (CIA 2010) are Muslim and Islam is the dominant religion inDhaka city. The highest percentage of the respondents had a university degree (61%)followed by diploma (13.4%), higher secondary certificate (11.8%), secondaryschool certificate (5.7%), primary level (4.8%) and 3.3% had no formal education.Most of the respondents appeared to have tertiary education. A total of 47.9% ofBangladesh’s population are literate, and the figure is 62.3% in Dhaka (Wikipedia).The proportion of respondents with a university degree was quite high for adeveloping country like Bangladesh. It could be that many of those who have atertiary education decide to reside in Dhaka city. Most of the respondents (53.7%)were service providers (in paid employment), 22.4% were businessmen, 19.5% werehousewives and 4.4% were retired. The unemployment rate in Bangladesh is 2.5%,with the workforce in agriculture (45%), industry (30%) and services (25%). Whileunemployment in Dhaka remains high at 23%, half the workforce is employed inhousehold and unorganised labour, while approximately 800,000 work in the textileindustry (Wikipedia 2010).
Table 1. Gender, religion, education and employment of respondents.
Item Number of respondents (N ¼ 402) Percentage
GenderMale 270 67.1Female 132 32.9
ReligionIslam 322 80.2Hindu 66 16.4Christian 12 3.0Buddhist 2 0.4
EducationNo formal education 13 3.3Primary education 19 4.8Secondary school certificate (SSC) 23 5.7Higher school certificate (HSC) 47 11.8Diploma 54 13.4University 246 61.0
EmploymentService holder 216 53.7Business man 90 22.4Housewife 78 19.5Retired 18 4.4
Journal of Environmental Planning and Management 719
Dow
nloa
ded
by [
Uni
vers
ity o
f M
alay
a] a
t 00:
32 1
7 Ju
ne 2
013

Table 2 shows the respondents’ socio-economic background in terms ofhousehold income, age, number of family members and extra land in the compound.On average the monthly household income of the respondents was US$176.1(US$1 ¼ 70.1BD Taka). Despite many having tertiary education, the respondentsearned far less than the target population. It was reported that Bangladesh’s GDP percapita (purchasing power parity) is $1600 (CIA 2010) per month while the annual percapita income of Dhaka is estimated at $ 500, with 48% of households living belowthe poverty line, including a large segment of the population coming from the villagesin search of employment, with many surviving on less than $10 a day (Wikipedia2010). Based on the amount of household income, the respondents were divided intothree groups: below TK3000 (lower group), TK3000 to TK15,000 (middle group) andabove TK15,000 (higher group). A total of 56% of the households were from thehigher group, 23% from the middle group and 11% from the lower group. Contraryto this division, Dhaka city has a growing middle-class population (Wikipedia 2010).The average age was just under 39, with the lowest being 32 and the highest 65 yearsold. The average household size was four, the maximum ten and minimum two. Theaverage size of extra land in the compound was 0.5 acres.
3.2. Waste generation in the households
The respondents were asked who normally collected and placed solid waste generatedin the households. Servants/maids were in charge of waste disposal for 89% of thehigher-income group and 79% of the middle-income group, while members of thehouseholds, mostly wives and daughters, were in charge among 94% of the lower-incomegroup.Attitudes towardswaste disposal (as amenial task) or the social status ofsuch a job imply that evenwithin a household this task is likely to be done by theweakermembers, for example, children or dependentwomen such as awidowor a daughter-in-law or house maid. The respondents were asked how many containers of waste eachhousehold produced every three to four days. Most respondents (56.4%) producedthree to four waste containers (Figure 1). A typical waste container contained around1 kg of waste. Waste generation in the study area averaged 38kg/month for eachhousehold. As the household average number is four, the waste generation averaged is0.3kg/day per capita, which is similar to the findings of DCC (2005). A door-to-doorcollection service was received by 82% of the upper-income group households, 75%ofthe middle-income group and 30% of the lower-income group. This shows that thedoor-to-door collection services are not consistent for all households and thosebelonging to the upper-income group of households are more fortunate. Failing to getthe door-to-door collection services, 51% of the lower-income group of householdsdumped their waste in vacant lands/river/marshes, while 5% of the upper-incomegroup and 4% of middle-income groups behaved in a similar manner.
Table 2. Respondents’ household income, age, number of family members and extra landavailable.
Item Number of respondents Average
Household monthly income Taka (US$) 120,00 (176.1)Age in years 402 39Family members (number of persons) 402 4Extra land with the compound 402 0.5 acres
720 R. Afroz et al.
Dow
nloa
ded
by [
Uni
vers
ity o
f M
alay
a] a
t 00:
32 1
7 Ju
ne 2
013

3.3. Knowledge about solid waste minimisation
The respondents were asked about their knowledge of solid waste minimisation. Amajority of the respondents (61.94%) stated that they had knowledge about solidwaste minimisation. Figure 2 shows that the majority obtained their source ofknowledge from newspapers (50.2%), television (20.9%) and radio (4%). In thiscase, newspapers and television have been most influential in promoting environ-mental issues.
3.4. Waste recycling practices
With regard to solid waste minimisation, the respondents were asked how often theyrecycled their solid waste. Concerning recycling practices, only 25.6% regularlyrecycled (Table 3), 18.2% seldom recycled and 56.2% never recycled. It should benoted that most people in Dhaka have not been, and still are not, served by any
Figure 1. Packages of waste in 3–4 days (n ¼ 402). Note: 1 package ¼ 11 inches x 15 inchesplastic shopping bag, contained about 1 kg of waste.
Figure 2. Sources of knowledge about recycling (n ¼ 402).
Journal of Environmental Planning and Management 721
Dow
nloa
ded
by [
Uni
vers
ity o
f M
alay
a] a
t 00:
32 1
7 Ju
ne 2
013

convenient recycling network. The high figure for those who seldom or never recycle(74.4%) agrees with the study conducted by DCC, showing a high level of solidwaste in Dhaka city. Of those who regularly recycled (25.6%), a majority separatedrecyclable materials from solid waste and sold it (74.4%), followed by those whoseparated the waste and gave it to waste collectors (20.9%) and those who separatedthe waste, sold recyclable materials and composted the organic materials (4.7%)(Table 4). The reasons given (Table 4) by those who practised waste separation at thesource were: good for the environment (68.0%), earn extra income (21.4%) andallows for waste composting (10.7%). Table 5 shows why respondents seldom ornever recycled their wastes (74.4%), reasons given were: lack of time (38.49%), nospace at home (37.2%), recycling is expensive (12.0%), no economic incentives(3.9%), no recycling facilities (3.09%) and no reason (5.4%). This group ofhouseholds (seldom or never undertake recycling) were also presented with another
Table 3. Practice of recycling.
Answer Number of respondents Percentage
Never practised recycling 226 56.2Seldom did 73 18.2Regularly practised it 103 25.6Total 402 100
Table 4. Respondents who regularly recycle.
Number ofrespondents (N ¼ 103) Percentage
Method of recyclingSeparate the recyclable materials from the
waste and sell them77 74.4
Separate the waste and give them to wastecollectors
22 20.9
Separate the waste, sell the recyclable materialsand compost the organic materials
4 4.7
Reasons for regularly recyclingGood for environment 70 68.0Allows for composting 11 10.7Earn for extra income 22 21.4
Table 5. Reasons for seldom or never recycling.
Reasons Number of respondents Percentage
There was no facility for recycling 9 3.1Lack of time 115 38.5No economic incentive 12 3.9No space at home 111 37.2No reason 16 5.4Expensive to recycle 36 12.0Total 226 100
722 R. Afroz et al.
Dow
nloa
ded
by [
Uni
vers
ity o
f M
alay
a] a
t 00:
32 1
7 Ju
ne 2
013

scenario in which the government provided them with a container to keep andseparate their household waste. Interestingly, 30.1% of the respondents were willingto minimise their waste if facilities were provided.
3.5. Perception and attitude of the respondents about solid waste management
Table 6 shows the questions related to the perception, willingness to pay andattitudes of the households. Questions 1 to 4 concerned their perception; questions 5to 7 concerned the households’ willingness to pay; and questions 8 to 10 concernedthe attitudes of the households. All data collected were then analysed using statisticaltools for simple percentages, frequency analysis and severity index calculations. Theanswers to questions were displayed on a 0 to 4 point Likert Scale, while the severityindex (SI) was calculated using the following equation developed by Al-Hammedand Assaff (1966):
SI ¼P4
i aixi
4P4
i xið100;%Þ;
where:ai ¼ the index of a class; constant expressing the weight given to the classxi ¼ the frequency of responsei ¼ 0, 1, 2, 3, 4 and described as below, where X0, X1, X3, X4 are the frequencies
of response corresponding to a0, ¼ 0, a1, ¼ 1, a3, ¼ 3 and a4 ¼ 4 respectively. Therating classification was adapted developed by Majid and McCaffer (1997).
a0 ¼ strongly disagree 0.00 �SI �12.5a1 ¼ disagree 12.5 �SI �37.5a2 ¼ neutral 37.5 �SI �62.5a3 ¼ agree 62.5 �SI �87.5a4 ¼ strongly agree 87.5 �SI �100
On the point scale, the ratings given to the households are as follows: stronglydisagree (0), disagree (1), neutral (2), agree (3), and strongly agree (4). For the ease ofinterpretation, each rating is given the following denotation:
Strongly disagree (SD)Disagree (D)Neutral (N)Agree (A)Strongly Agree (SA)
Only the responses to the questionnaires directly related to the scope of thepresent study have been analysed and discussed. The results of the assessment of thegeneral perception, willingness to pay and attitudes of households to wastemanagement are presented in Table 6. Table 6 presents calculated values of severityindices related to the perception of the households about waste management. Thevalues ranged between 46.9% and 60.1%. The values are found within the neutralopinion range of 37.5 �SI �62.5 (Majid and McCaffer 1997, Isa et al. 2005). Withthis opinion range the households affirm the existence of an organised solid waste
Journal of Environmental Planning and Management 723
Dow
nloa
ded
by [
Uni
vers
ity o
f M
alay
a] a
t 00:
32 1
7 Ju
ne 2
013

management system in Dhaka. The survey results indicate that the rate of willingnessto pay is relatively high across the study area. The values are found within the agreedopinion range of 62.5 �SI �87.5 (Majid and McCaffer 1997, Isa et al. 2005). Thestudy has also found that the values of severity index related to the attitude ofthe households ranged between 45.3% and 68.3%. The values are found within the
Table 6. Perception, willingness to pay and attitude of the respondents about solid wastemanagement.
Frequency
SD(0) D(1) N(2) A(3) SA(4)
Questions NR PR NR PR NR PR NR PR NR PR (SI)%
1. There is anorganised wastedisposalprogramme in myarea
28 7 57 14.2 124 30.8 165 42 28 7 56.7
2. I am satisfied withthe services of theservice provider inmy area
61 15.2 133 33.2 59 14.8 92 23 57 14 46.9
3. Separate plasticbags for wastecollection shouldbe provided by thewaste collector
57 14.3 43 10.6 49 12.1 192 47.8 62 15.2 60.1
4. Wastemanagementimprovement is notimportant
101 25.3 90 22.4 18 4.5 96 24 97 23.8 54.9
5. I am ready to payfor the disposal ofwaste I generate
77 19.2 91 22.7 23 5.9 92 22.8 118 29.4 55.0
6. I am not ready topay for the disposalof waste I generate
5 1.2 5 1.2 9 2.3 154 38.3 229 57 87.1
7. Earning moreincome willencourage paymentfor waste disposalservices
82 20.3 62 15.3 36 9 90 22.5 132 32.9 57.9
8. I am willing toimplement andparticipate in awaste managementprogramme
49 12.1 53 13.2 28 7 94 23.6 177 44.1 68.3
9. Practise wastesegregationregularly
116 29.1 84 21.0 13 3.2 129 32.2 58 14.5 45.3
10. Encouragecommunity topractise wastemanagement atsource
72 17.9 81 20.2 20 4.9 125 31.2 104 25.8 56.7
724 R. Afroz et al.
Dow
nloa
ded
by [
Uni
vers
ity o
f M
alay
a] a
t 00:
32 1
7 Ju
ne 2
013
neutral opinion range of 37.5 �SI �62.5 (Majid and McCaffer 1997, Isa et al. 2005).The values indicate that the households are willing to implement and participate in awaste management programme and encourage the community to practice wastemanagement at source.
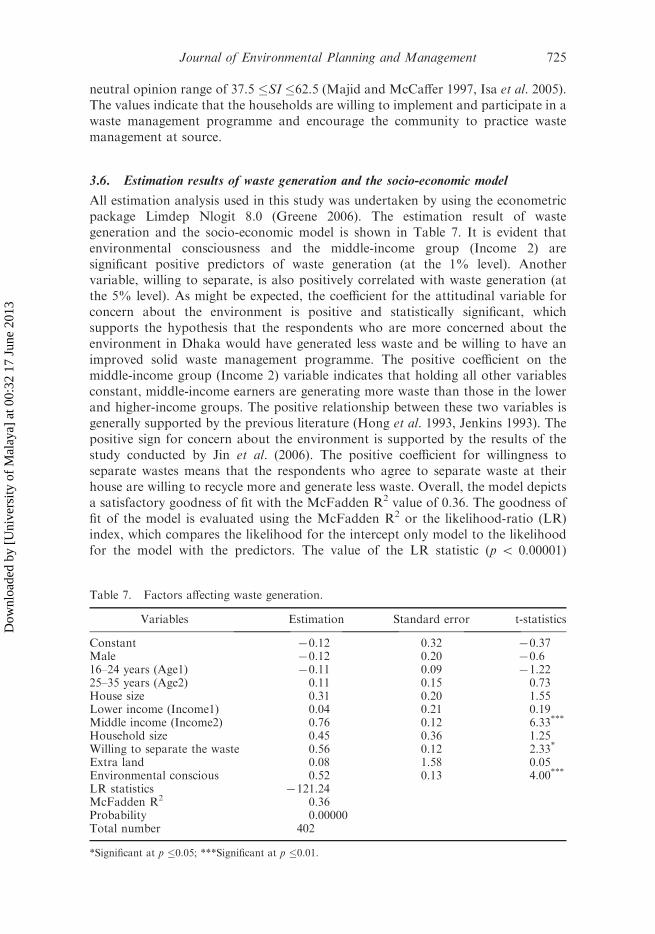
3.6. Estimation results of waste generation and the socio-economic model
All estimation analysis used in this study was undertaken by using the econometricpackage Limdep Nlogit 8.0 (Greene 2006). The estimation result of wastegeneration and the socio-economic model is shown in Table 7. It is evident thatenvironmental consciousness and the middle-income group (Income 2) aresignificant positive predictors of waste generation (at the 1% level). Anothervariable, willing to separate, is also positively correlated with waste generation (atthe 5% level). As might be expected, the coefficient for the attitudinal variable forconcern about the environment is positive and statistically significant, whichsupports the hypothesis that the respondents who are more concerned about theenvironment in Dhaka would have generated less waste and be willing to have animproved solid waste management programme. The positive coefficient on themiddle-income group (Income 2) variable indicates that holding all other variablesconstant, middle-income earners are generating more waste than those in the lowerand higher-income groups. The positive relationship between these two variables isgenerally supported by the previous literature (Hong et al. 1993, Jenkins 1993). Thepositive sign for concern about the environment is supported by the results of thestudy conducted by Jin et al. (2006). The positive coefficient for willingness toseparate wastes means that the respondents who agree to separate waste at theirhouse are willing to recycle more and generate less waste. Overall, the model depictsa satisfactory goodness of fit with the McFadden R2 value of 0.36. The goodness offit of the model is evaluated using the McFadden R2 or the likelihood-ratio (LR)index, which compares the likelihood for the intercept only model to the likelihoodfor the model with the predictors. The value of the LR statistic (p 5 0.00001)
Table 7. Factors affecting waste generation.
Variables Estimation Standard error t-statistics
Constant 70.12 0.32 70.37Male 70.12 0.20 70.616–24 years (Age1) 70.11 0.09 71.2225–35 years (Age2) 0.11 0.15 0.73House size 0.31 0.20 1.55Lower income (Income1) 0.04 0.21 0.19Middle income (Income2) 0.76 0.12 6.33***
Household size 0.45 0.36 1.25Willing to separate the waste 0.56 0.12 2.33*
Extra land 0.08 1.58 0.05Environmental conscious 0.52 0.13 4.00***
LR statistics 7121.24McFadden R2 0.36Probability 0.00000Total number 402
*Significant at p �0.05; ***Significant at p �0.01.
Journal of Environmental Planning and Management 725
Dow
nloa
ded
by [
Uni
vers
ity o
f M
alay
a] a
t 00:
32 1
7 Ju
ne 2
013

shows that all the variables have a significant effect on the waste generation of thehouseholds.
3.7. Estimation results of willingness to minimise solid waste and the socio-economicmodel
Table 8 shows the estimation results of willingness to minimise solid waste and thesocio-economic model. It is evident that environmental consciousness is a significantpositive predictor of waste minimisation (at the 1% level). The middle-income group(Income 2) is also positively correlated with waste minimisation (at the 5% level).Another two variables, age (25–35 years) and storage, are also significant (at the 5%level) but age has a negative relationship with waste minimisation.
The results in Table 8 confirm that environmentally conscious individuals aremore likely to minimise waste, although this is not consistent with some studies(Knussen et al. 2004, Oom et al. 2005, Carrus et al. 2008). According to Mohai(1985), decisions and attitudes towards the environmental protection effort dependon degrees of personal efficacy and resource availability. With regard to thepredictive effect of family income on participation in environmental developmentprogrammes, several studies have shown that households with higher income levelsare more propitious to engage in environmental development programmes (Jacobset al. 1984, McGuire 1984, Vining and Ebreo 1992, Berger 1997, Owens et al.2000).
Similarly, the present study also shows a positive relationship between incomeand willingness to minimise solid waste. More interestingly, the middle-age groupof respondents (25–35 years) is significantly more likely to be willing to minimisewaste than those in the youngest and oldest age groups. These results may beinterpreted as follows: the youngest respondents have not yet accepted the need tominimise waste, while the oldest respondents belong to a generation that never sawthe need to minimise waste. Waste minimisation and concern for the environment isa relatively recent phenomenon; in time, it is likely that the positive correlationbetween the likelihood of waste minimisation and age will become more apparentin Dhaka, Bangladesh. Demographic variables such as gender and age have not
Table 8. Factors affecting willingness to minimise solid waste.
Variables Estimation Standard error t-statistics
Constant 71.12 0.32 73.5Male 70.28 0.20 71.4116–24 years (Age1) 70.03 0.14 70.2125–35 years (Age2) 0.54 0.21 2.57*
Lower income (Income1) 0.02 0.41 0.04Middle income (Income2) 0.54 0.26 2.07*
Storage 0.92 0.45 2.04*
Environmental conscious 0.52 0.13 4.56***
LR statistics 7112.3McFadden R2 0.41Probability 0.00000Total number 402
*Significant at p �0.05; ***Significant at p �0.01.
726 R. Afroz et al.
Dow
nloa
ded
by [
Uni
vers
ity o
f M
alay
a] a
t 00:
32 1
7 Ju
ne 2
013

shown consistently significant correlation with recycling behaviour. Studies in theNetherlands, Germany and Norway suggest that older respondents are morededicated to recycling (cited in Fenech 2002, Martin et al. 2006). It washypothesized that this concern reflected the frugality of the older generation.Several authors (Jenkins et al. 2000, Barr et al. 2001, Guerin et al. 2001, Barr andGilg 2005) have reported similar findings. Blaine et al. (2001) and Fenech (2002), onthe other hand, suggest that older people recycle simply because they have moretime on their hands, indeed, recycling is a time-intensive activity (Bruvoll et al.2002, Martin et al. 2006). Overall, the model depicts a satisfactory goodness of fitwith a McFadden R2 value of 0.41. The value of the LR statistic (p 5 0.00001)shows that all the variables have a significant effect on the waste minimisation ofhouseholds.
4. Conclusion and policy implications
The willingness to minimise household waste is an important component for thesustainable development of waste minimisation projects in Bangladesh. As theresidents of Dhaka city are the main group of contributors to the waste minimisationprogramme, the success of this programme depends on their willingness toimplement it. This study investigated factors that affect waste generation andrespondents’ willingness to minimise solid waste. Important determinants of thewaste generation are environmental consciousness, the middle-income group(TK3000 up to TK15,000) and willingness to separate. Environmental conscious-ness, the middle-income group (TK 3000 up to TK15,000), young adults (25 to 35years old) and storage facilities are the most important factors for respondents’willingness to minimise solid waste in Dhaka city.
In recent years reducing and recycling household waste has become increasinglyimperative because waste generation has been increasing due to population growthand economic development, and resources are becoming scarce, making recyclingnot only a sensible practice but essential. Although there is widespread publicsupport for reducing and recycling household waste, this is not reflected inparticipation levels in Bangladesh.
With regard to issues about the reduction of solid waste, the findings of this studyare helpful to environmental and waste minimisation planners as well as to policymakers. First, this study found that there are important indicators of positiveattitudes of residents toward solid waste minimisation. For example, 30.1% of thehouseholds in the study were willing to minimise their household waste. The studyalso found that only 25.6% of the households were recycling regularly. Using theseverity index analysis, it was found that the households agreed to implement andparticipate in the waste management improvement programme. Now, the question isif they agree to separate their waste and agree to implement and participate in thewaste management programme, why is there low participation in waste minimisa-tion? The study suggests that we should investigate what discourages them fromparticipating. In order for the waste minimisation programme to be successful, thebehaviour of the households in Dhaka city toward solid waste minimisation shouldbe taken into consideration.
Second, another way to reduce solid waste is by encouraging the residents ofDhaka to recycle and separate their waste at source, as is done in many developedcountries. It is evident that concerted efforts to raise environmental consciousness
Journal of Environmental Planning and Management 727
Dow
nloa
ded
by [
Uni
vers
ity o
f M
alay
a] a
t 00:
32 1
7 Ju
ne 2
013

through education and more publicity regarding waste separating, reducing andrecycling could affect households’ waste generation.
Third, a door-to-door waste collection service is not available to all households inDhaka. The DCC should monitor this service, observe the satisfaction of thehouseholds with the service and ensure all households receive the same treatmentfrom the solid waste collectors. For example, in their study Afroz et al. 2009 foundthat 54.6% of the households in door-to-door waste collection receiving areas werenot satisfied with the waste collectors in Dhaka. They suggested that waste collectorscould motivate the households to minimise their solid waste.
Fourth, findings in this study show that households who are environmentallyconscious are more willing to minimise their waste. As such, policies should beformulated to focus on raising awareness, promoting knowledge and motivatinghouseholds with regard to the environment, waste generation and waste minimisa-tion practices.
Fifth, since in Dhaka the recycling centres are not near to the households and thedustbins are also some distance away, the DCC should look into this matter carefully.
Sixth, findings in this study show that middle-aged people are more willing tominimise waste than those who are young or old. Old people are more resistant tonew ideas because they do not want to change their beliefs and lifestyle. However,young people could be encouraged at school or college by introducing topics ondifferent environmental problems, including waste management, in their syllabus. Ifthey learn about it at school or college, it would be easy for them to adopt wasteminimisation practices in later life. On the other hand, parents can also play theirrole in waste minimisation. Setthasakko (2009) conducted a qualitative approachresearch in Thailand, and the findings showed that the culture about wastemanagement, especially recycling, should be taught to children from a very youngage. Parents must be committed to implement a waste management system in theirhousehold, and if this system is not followed by the whole family the parents canform a penalty that relates to environmentally-friendly activities such as cleaning adrain, mowing the lawn or planting flowers.
Finally, recycling should be encouraged by legal and business policy mandates, aswell as by increasing taxes on virgin resources (Tiemstra 2002). In this project,compliance suffers when individual households cannot be held accountable for theirbehaviour (Gandy 1993).
5. Limitations of the study and future research
There are a few limitations to this study. First, the sample in the study is notrepresentative of Dhaka as a whole, thus the findings cannot be generalised. Thefindings are applicable and limited to the area under investigation. Second, thepopulation sample for those who practice recycling regularly is low (103respondents, 25.6%), thus the findings should be used with caution. Third, thenumber of respondents who had extra land was extremely limited so the researcherwas unable to analyse this perspective. Therefore, future researchers should considerall these limitations when they plan their research relating to solid wastemanagement. Conducting research specifically targeting those in the sample whoparticipate in solid waste management might give a different outcome to the study.Moreover, researching a target sample who have extra land in their compound mightshow another view of solid waste management.
728 R. Afroz et al.
Dow
nloa
ded
by [
Uni
vers
ity o
f M
alay
a] a
t 00:
32 1
7 Ju
ne 2
013

References
Afroz, R., Keisuke, H., and Tuddin, R., 2009. A survey of recycling behaviour of thehouseholds in Dhaka city, Bangladesh. Journal of waste management and research, 28,552–560.
Ahmed,M.F. and Rahman,M.M., 2000. Solid waste management: water supply and sanitation –rural and low income urban communities. ITN – Bangladesh Center for Water Supply andWaste Management, BUET, Dhaka, Bangladesh, with contributions from IRC, Interna-tional Water and Sanitation Center, Delft, The Netherlands.
Alam, A.K.M.M., Saha, S.K., and Rahman, M.M.S., 2002. Aspects of solid wastemanagement – a case study at Nirala residential area, Khulna. In: M.F. Ahmed, S.A.Tanveer, and A.B.M. Badruzzaman, eds. Bangladesh environment. Bangladesh: Bangla-desh Poribesh Andolon (BAPA), 698–711.
Al-Hammed, A. and Assaf, S., 1996. Assessment of the work performance contractors inSaudi Arabia. Journal of management in engineering, ASCE, 12, 44–49.
Al-Momani, A.H., 1994. Solid waste management: sampling, analysis and assessment ofhousehold waste in the city of Amman. International journal of environmental healthresearch, 4, 208–222.
Ayotamuno, J.M. and Gobo, A.E., 2004. Municipal solid waste management in PortHarcourt, Nigeria: obstacles and prospects. Management of environmental quality: aninternational journal, 15 (4), 389–398.
BBS (Bangladesh Bureau of Statistics), 1995. Population census 1991.BBS, 2001. Population census 2001.Barr, S. and Gilg, A.W., 2005. Conceptualizing and analyzing household attitudes and actions
to a growing environmental problem – development and application of a framework toguide local waste policy. Applied geography, 25, 226–247.
Barr, S., Gilg, A.W., and Ford, N.J., 2001. A conceptual framework for understanding andanalysing attitudes towards household-waste management. Environment and planning A,33 (11), 2025–2048.
Berger, I., 1997. The demographics of recycling and the structure of environmental behavior.Environment and behavior, 29, 515–531.
Blaine, W., Mascarella, D., and Davis, N., 2001. An examination of rural recycling drop-offparticipation. Journal of extension, 39 (5) [online]. Available from: http://www.joe.org/joe/2001October/rbl.php [Accessed August 2010].
Bruvoll, A., Halvorsen, B., and Nyborg, K., 2002. Households’ recycling efforts. Resources,conservation and recycling, 36 (4), 337–354.
CIA (Central Intelligence Agency), 2010. The world factbook. [online] Available from:https://www.cia.gov/library/publications/the-world-factbook/geos/bg.html [Accessed 8July 2010].
Carrus, G., Passafaro, C., and Bonnes, M., 2008. Emotions, habits and rational choices inecological behaviours: the case of recycling and use of public transportation. Journal ofenvironmental psychology, 28, 51–62.
Corral-Verdugo, V., 1997. Dual ‘realities’ of conservation behavior: self reports vsobservations of re-use and recycling behavior. Journal of environmental psychology, 17,135–145.
DCC (Dhaka City Corporation), 2005. Clean Dhaka master plan: The study on the solid wastemanagement in Dhaka City. Final Report.
DOE (Department of Environment), 2004. SAARC Workshop on solid waste management –country paper. . Dhaka, Bangladesh.
Enayetullah, I. and Sinha, A.H.M.M., 1999. Community based composting-experience of wasteconcern in Dhaka – case study no. 3. Urban Management Program for Asia and the Pacific.
Enayetullah, I., Sinha, A.H.M.M., and Khan, S.S.A., 2005. Urban solid waste managementscenario of Bangladesh: problems and prospects. Waste Concern technical documentation,Dhaka: Bangladesh.
Epp, D.J. and Mauger, P.C., 1989. Attitudes and household characteristics influencing solidwaste generation: a household garbage analysis. Northeastern journal of agricultural andresource economics, 18, 46–51.
Fenech, M., 2002. Understanding public participation in source separation of waste. Thesis(MSc), Institute for Industrial Environmental Economics, Lund, Sweden.
Journal of Environmental Planning and Management 729
Dow
nloa
ded
by [
Uni
vers
ity o
f M
alay
a] a
t 00:
32 1
7 Ju
ne 2
013

Gandy, M., 1993. Recycling and waste, exploratin of contemporary environmental policy.Avebury studies in green research series. London: Ashgate Publishing Ltd., 55.
Greene, W.H., 2006. LIMDEP version 8.0, econometric modeling guide. NY: EconometricSoftware.
Grossmann, D., Hudson, J.F., andMarks, D.H., 1974.Waste generation models for solid wastecollection. Journal of the environmental engineering division, 100, 1219–1230.
Guerin, D., Crete, J., and Mercie, J., 2001. A multilevel analysis of the determinantsof recycling behaviour in the European countries. Social science research, 30 (2), 195–218.
Haden, S.S.P., Oyler, J.D., and Humphreys, J.H., 2009. Historical, practical, and theoreticalperspectives on green management: an exploratory analysis. Management decision, 47 (7),1041–1055.
Harvie, M. and Jaques, P., 2003. Public awareness and the environment: ‘how do weencourage environmentally responsible behavior’? Water supply, 3, 247–254.
Hasan, G.M.J. and Chowdhury, M.A.I., 2005. Municipal waste management and environ-mental hazards in Bangladesh. Pakistan journal of biological science, 8 (6), 921–928.
Hassan, S., 2008. Rapid urban growth and poverty in Dhaka city. Bangladesh e-journal ofsociology, 5 (1), 1–24. [online] Availale from: http://www.bangladeshsociology.org/BEJ5%205.1%20Rrapid%20urban%20Growth%20and%20Poverty%20final.pdf [Ac-cessed August 2010].
Hong, S., Adams, R.M., and Love, A.H., 1993. An economic analysis of household recyclingof solid wastes: the case of Portland, Oregon. Journal of environmental economics andmanagement, 25, 136–146.
Isa, M.H., et al., 2005. Solid waste collection and recycling in Nibong, Tebal, Penang,Malaysia: a case study. Waste management and research, 23, 565–570.
Jacobs, H., Bailey, J., and Crews, J., 1984. Development and analysis of a community-basedrecourse recovery program. Journal of applied behavior analysis, 17, 127–145.
Jenkins, R.B., 1993. The economics of solid waste reduction. The impacts of user fees.Cheltenham: Edward Elgar.
Jenkins, R.B., et al., 2000. The determinants of household recycling: a material specific analysisof recycling program features and unit pricing. Discussion paper 99-41-REV WashingtonDC: Resources for the Future.
Jin, J., Wang, Z., and Ran, S., 2006. Estimating the public preferences for solid wastemanagement programs using choice experiments in Macao. Waste management research,24, 301–309.
Knussen, C., et al., 2004. An analysis of intentions to recycle household waste: the roles of pastbehaviour, perceived habit and perceived lack of facilities. Journal of environmentalpsychology, 23, 237–246.
Leedy, P.D. and Ormrod, J.E., 2005. Practical research: planning and design. 8th ed. UpperSaddle River, NJ: Merrill Prentice Hall.
Ling, L. and Isaac, D., 1996. Environmental management issues in China: problems andstrategies. Property management, 14 (3), 17–26.
Majid, M.Z.A. and McCaffer, R., 1997. Discussion of assessment of work performanceofmaintenance contractors in Saudi Arabia. Journal of management in engineering, ASCE, 13.
Martin, M., Williams, I., and Clark, M., 2006. Social, cultural and structural influences onhousehold waste recycling: a case study. Resources, conservation and recycling, 48, 357–395.
Medina, M., 1997. The effect of income on municipal solid waste generation rates for countriesof varying levels of economic development: a model. Journal of resource management andtechnology, 24, 149–155.
McGuire, R., 1984. Recycling: great expectations and garbage outcomes. American behavioralscientist, 18, 93–114.
Mohai, P., 1985. Public concern and elite involvement in environmental conservation issues.Social science, 66, 820–838.
Nilanthi, J.G.J.B., et al., 2006. Relation of waste generation and composition to socio-economicfactors: a case study. Journal of environmental monitoring assessment, 135, 31–39.
Oom, D.V.P., et al., 2005. Combining behavioural theories to predict recycling involvement.Environment and behaviour, 37, 364–396.
Owens, J., Dickerson, S., and Macintosh, D., 2000. Demographic covariates of residentialrecycling efficiency. Environment and behavior, 32, 637–650.
730 R. Afroz et al.
Dow
nloa
ded
by [
Uni
vers
ity o
f M
alay
a] a
t 00:
32 1
7 Ju
ne 2
013

Pfammatter, R. and Schertenleib, R., 1996. Non-governmental refuse collection in low-incomeurban areas. Lessons learned from selected schemes in Asia, Africa and Latin America.SANDEC report no. 1/96. Duebendorf, Switzerland: Water and Sanitation in DevelopingCountries EAWAG/SANDEC.
Rahman, M.A., Fllam, M.S., and Al-Amin, M., 2006. Segregation of biodegradable solidwaste of chittagong metropolitan are based on specific physical and chemical properties.Pakistan journal of biological science, 9 (3), 460–464.
Rahman, M.M., et al., 1999. Characterization of municipal solid waste and preliminaryenvironment impact assessment of collection and disposal wastes in Dhaka City. Dhaka:Bureau of Research, Testing and Consultation (BRTC), BUET.
Reschovsky, J.D. and Stone, S.E., 1994. Market incentives to encourage household wasterecycling: paying for what you throw away. Journal of policy analysis and management, 13,120–139.
Richardson, R.A. and Havlicek, J. Jr., 1978. Economic analysis of composition of householdsolid wastes. Journal of environmental economics and management, 5, 103–111.
Salequzzaman, M., 2000. Perceptions of vehicle air pollution in Khulna, Bangladesh. In:Proceedings of the Habitus 2000 conference. Perth, Western Australia, 5–9 September.
Salequzzaman, M. and Stocker, L., 2001. The context and prospects for environmentaleducation and environmental careers in Bangladesh. International journal of sustainabilityin higher education, 2 (2), 104–127.
Salequzzaman, M., Murtaza, M.G., and Saroar, M., 1998. Evaluation study on municipal solidwaste management project in Khulna City. PRODIPAN, Shaheb Bari Road, Khulna 9203,Bangladesh.
Salequzzaman, M., Awal, M., and Alam, M., 2001. Willingness to pay: community based solidwaste management and its sustainability in Bangladesh. In: Proceedings of the internationalconference ‘the future is here’. RMIT, Melbourne, Victoria, 15–19 January.
Sangodoyin, A.Y. and Ipadeola, S.F., 2000. Hazardous wastes: assessing the efficacy ofstructures and approaches to management in Nigeria. Environmental management andhealth, 11 (1), 39–46.
Sekaran, U., 2003. Research methods for business: a skill-building approach. 4th ed. New York:John Wiley and Sons.
Setthasakko, W., 2009. Barriers to implementing corporate environmental responsibility inThailand: a qualitative approach. International journal of organizational analysis, 17 (3),169–183.
Sinha, A.H.M.M., 2006. Community based solid waste management through public-privatecommunity partnerships: experience of waste concern in Bangladesh. Paper presented atthe 3R South Asia expert workshop, Katmandu, Nepal.
Sinha, A.H.M.M. and Enayetullah, M.I., 2000. Community based solid waste management: theAsian experience. Dhaka, Bangladesh: Waste Concern and USAID.
Sujauddin, M., Huda, M.S.M.S., and Rafiqul, A.T.M., 2008. Household solid wastecharacteristics and management in Chittagong, Bangladesh. Journal of waste management,28, 1688–1695.
Tiemstra, J.P., 2002. Wasting time and wasting the earth. International journal of socialeconomics, 29 (4), 260–270.
Vining, J. and Ebreo, A., 1992. Predicting recycling behavior from global and specificenvironmental attitudes and changes in recycling opportunities. Journal of applied socialpsychology, 22, 1580–1607.
Wertz, K.L., 1976. Economic factors influencing household’s production of refuse. Journal ofenvironmental management and economics, 2, 263–272.
WRI (World Resources Institute, United Nations Environment Programme), 1996. UnitedNations Development Programme, World Bank. World Resources—a guide to the globalenvironment, 1996–97. The urban environment. Oxford University Press.
Zuberi, M.I., 1998. Environmental, socio-cultural and developmental linkages in a SouthAsian set-up. International journal of social economics, 25 (6/7/8), 1112–1127.
Journal of Environmental Planning and Management 731
Dow
nloa
ded
by [
Uni
vers
ity o
f M
alay
a] a
t 00:
32 1
7 Ju
ne 2
013