Découverte d'une enceinte de l'Antiquité tardive ou du Haut Moyen Âge à Nimes (Gard – France)
Upload
irsp-ouidahCategory
view
4download
0
For Peer Review
Rigo et al., 2007 Nimes seismicity 15/11/07
1
Seismicity rate and wave-velocity variations as consequences of rainfall: the case of the
catastrophic storm of September 2002 in the Nîmes Fault region (Gard, France).
Alexis Rigo1 , Nicole Béthoux2, Frédéric Masson3, Jean-François Ritz4
1 Laboratoire Dynamique Terrestre et Planétaire (UMR 5562), Université de Toulouse -
CNRS, 14 Ave. Edouard Belin, 31400 Toulouse, France – e-mail: [email protected] Géosciences Azur (UMR 6526), Université Sophia-Antipolis - CNRS, Nice, France3 Institut de Physique du Globe de Strasbourg (UMR 7516), Université Louis Pasteur - CNRS,
Strasbourg, France.4 Laboratoire Géosciences Montpellier (UMR 5243), Université Montpellier II – CNRS,
Montpellier, France
Accepted xxxxx. Received xxxx; in original form 8 Dec. 06
Corresponding author: Observatoire Midi-Pyrénées – UMR 5562 – 14 Avenue Edouard Belin, 31400
Toulouse, France. Phone: (0033) 561 33 29 69, fax: (0033) 561 33 29 00, e-mail: [email protected]
In revision for Geophysical Journal International
Summary
The western Provence in southern France is an intraplate low deforming region, cut by largesinistral strike-slip faults as the Nîmes Fault. The deformation rate of this fault was estimatedat 0.1 mm/yr from geological and morphological observations. Nevertheless, some largeearthquakes occurred in this area in historical times inducing well-documented partialdestructions on the roman monument “Pont-du-Gard“. In order to investigate if this area isseismically active, we installed a temporary seismological network of 13 stations between thecities of Nîmes and Avignon for a 1-year period (July 2002 – June 2003). We recorded andlocated a total amount of 80 earthquakes of magnitude Ml smaller than 2.8, and of 153 quarryblasts. The seismic event locations are interpreted in terms of regional tectonics as well as ofgeometry at depth of the Nîmes Fault and of possible seismic activity of the RoquemaureFault. At the beginning of September 2002, a catastrophic storm occurred in the same areawith cumulated precipitations at 600 mm in 28 hours, causing casualties and majorinundations and damages. We identified a clear and sudden increase of the seismic activity asan immediate consequence of this exceptional meteorological phenomenon. We interpret thisrainfall triggering of earthquakes as the response of the crust to an abrupt vertical loading.The geological context of this zone is characterized by the presence of sedimentary basins andof an important karstic network in a calcareous environment allowing the retention of a thirdof the total rainwater volume during few weeks after the catastrophic storm. Month by monthinversion of the seismic wave velocities for only the first 1-km thick layer of the crust allows
Page 83 of 131 Geophysical Journal International
123456789101112131415161718192021222324252627282930313233343536373839404142434445464748495051525354555657585960

For Peer Review
Rigo et al., 2007 Nimes seismicity 15/11/07
2
investigating the influence of the stored water. A clear decrease of both P- and S-velocities,and an increase of the Vp/Vs ratio are evidenced. The variations obtained are at 2%, 6% and4.5% for P-, S-velocities and Vp/Vs ratio respectively. These variations are discussed inconfront of previous studies and can be directly related to the known water volume.
Keywords: seismicity, rainfall triggering, seismic wave velocity, seismotectonics, southernFrance, Nîmes Fault
1 Introduction
South of France is an intraplate slow deforming region submitted to the far field effect of
African-Eurasian collision converging at a rate of around 0.8 cm/y (De Mets et al. 1990). The
deformation is principally located in the Pyrenees and in the Alps mountain ranges where
several historical earthquakes of intensities greater than VIII occurred in the last 1,000 years
(Lambert & Levret-Albaret 1996). Between these two active mountain belts characterized by
thicken crust, sets the Provence region limited to the north by the Massif Central range with a
thinned crust and to the south by the Mediterranean Sea with oceanic crust.
Faults and folds affect the Provence region with E-W trending structures corresponding to
folds and thrusts, and NE-SW to NNE-SSW trending structures corresponding to active
sinistral strike-slip faults. The overall pattern shows a N-S regional compression, which
would absorb approximately 1.5% of the African-Eurasian convergence (Schlupp et al. 2001).
Because of this low deformation rate, the morphology and the activity of these crustal
structures are difficult to characterise unambiguously and are still debated (e.g. Sébrier et al.
1998; Mattauer 2005).
In the summer 2002, we installed for a 1-year period a temporary seismological network. Our
objective was to observe if seismic activity exists around the Nîmes Fault, and, if it is the
case, what is its relationship with the faults and the regional tectonics. We then selected the
area delimited to the west by the city of Remoulins where the roman monument “Pont-du-
Gard“ is located, to the east and to the north by the city of Châteaunauf-du-Pape and to the
south by the city of Beaucaire (Fig. 1). This choice was guided by: (i) the occurrence of
historical seismic events of intensities greater than VI as in 1769 near Avignon (I0=VII) and in
1946 south of Remoulins (I0=VI-VII), (ii) the presence of three faults with clear morphology
and (iii) to avoid installing seismological stations in the alluvial deposits of the Rhône River,
a calcareous area being better conditions to obtain seismological records of good quality.
Two months after installing our temporary network, the 8-9 September 2002, a catastrophic
rainfall event affected this area resulting in 24 casualties, the damages being estimated to 1.2
Page 84 of 131Geophysical Journal International
123456789101112131415161718192021222324252627282930313233343536373839404142434445464748495051525354555657585960

For Peer Review
Rigo et al., 2007 Nimes seismicity 15/11/07
3
billion euros. As a consequence, the rivers had immediate hydrologic responses with
discharges reaching values never seen before (Delrieu et al. 2005). According to the rivers,
the response was different due to geomorphological factors and to the influence of karst. In
fact, the karstic network was saturated and retained a great quantity of water, which was
discharged during the following weeks.
The role of fluids in seismological processes is today a subject of great interest. Since a long
time, seismicity induced by fluid injection or extraction in reservoirs or by filling up of dams
is well known (Grasso & Wittlinger 1990; Grasso et al. 1992; Utkucu 2006; Shapiro et al.
2006). Fluids and their migration or concentration in the crust are also invoked to explain
changes in the stress field around the faults, particularly in the nucleation zone of the
earthquakes (Audin et al. 2002; Boullier et al. 2004; Miller et al. 2004). The influence of
fluids was also evidenced during post-seismic and inter-seismic deformation processes
(Yamashita 2003; Fialko 2004). Above all, presence of fluids in the crust induces changes of
the elastic properties of the crust and, then, of the characteristics of the seismic wave
propagation. Some laboratory experiments were done in order to calibrate P- and S-wave
velocities under different pore pressure (fluid filled materials) and lithostatic pressure
conditions (Nur & Simmons 1969; O’Connell & Budiansky 1974). Inversely, the seismic
wave velocities are used to characterise crust and fault rheologies affected by fluid pressure
(Watanabe 1993; Stern et al. 2001).
In this paper we study the influence of the sudden and intensive rainfall of September 2002 on
the upper part of the continental crust. We will show that this meteorological event was so
exceptional to clearly modify the rate of seismic activity and the seismic wave velocities in
the Nîmes - Avignon area during the three months following the two-day storm. Especially,
the P- and S-wave velocities were clearly affected in the most superficial part of the crust
most probably related to the geological context dominated by a well-developed gallery
network in karst. We will then analyse and discuss these results with respect to previous
studies focused on fault and on crust mechanical properties in the presence of fluids and pore
overpressure.
2 Seismotectonic setting
The Provence region corresponds to a sedimentary cover made of Mesozoic and Cenozoic
ages above a Paleozoic crustal basement. The thickness of this sedimentary cover varies from
7 km in the NW Cévennes-Nîmes region to 2 km to the East (Baudrimont & Dubois 1977).
During the last 6 Ma, this region was affected by important variations of the sea level
Page 85 of 131 Geophysical Journal International
123456789101112131415161718192021222324252627282930313233343536373839404142434445464748495051525354555657585960

For Peer Review
Rigo et al., 2007 Nimes seismicity 15/11/07
4
inducing the formation of various successive erosion surfaces and canyons (Clauzon 1996),
which are used as morphotectonic markers, as the one found at 0.8 km depth near
Châteauneuf-du-Pape (Schlupp et al. 2001).
At present, the N-S deformation rate is estimated at 0.1 mm/yr by geological considerations
over a period of 20 Ma (Champion et al. 2000). Elsewhere, the geodetic estimates of the
deformation rate vary from 0.6 mm/yr to 2 mm/yr over a wide area including at least the
Durance and the Nîmes faults (Ferhat et al. 1998; Nocquet & Calais 2003).
The region of our interest is in the centre of the Provence domain, around the city of Avignon,
on the western side of the Rhône River (Fig. 1). This zone comprises three major faults: a 65-
km long segment of the Nîmes Fault, the Pujaut Fault and the Roquemaure Fault (respectively
NF, PF and RF in Fig. 1). Since Messinian (-5 Ma) age, the Nîmes Fault would have a
sinistral strike-slip fault movement at a deformation rate of 0.08 ± 0.01 mm/yr (Schlupp et al.
2001). However, although a paleoseismic evidence was found near Courthézon North-East of
Châteauneuf-du-Pape city (Combes et al. 1993) showing the occurrence of one, maybe two,
seismic ruptures in the past 250000 years, no cumulated deformation was observed in the
adjacent Miocene deposits suggesting that the deformation rate is extremely low. The Pujaut
Fault corresponds to a normal fault with a steep north dipping acting during the Oligo-
Miocene time, the northward downthrown footwall being called the Pujaut graben or Pujaut
Basin (Fig. 1). Finally, the Roquemaure Fault is a somehow an “unknown“ fault, ignored by
much of geologists, being considered either as inexistent or inactive.
In Fig. 1, we also reported historical (1397 – 1946 period) and instrumental (1980 – 2000
period) seismicity. The seismicity is diffuse all over the studied area with no immediate
relationship between earthquakes and faults. The most relevant historical events are the two
1769 earthquakes (I0= VII) so-called “Avignon earthquakes“ but both located at the
Châteauneuf-du-Pape city at the tip of the mapped Nîmes Fault, and the 1946 earthquake
(I0=VII) southeast of the city of Theziers, in the southward extension of the Pujaut Fault.
Archaeological studies of the roman monument “Pont-du-Gard” evidence successive partial
destructions most probably due to seismic events occurred in the centuries I, IV and VI
(Combes et al. 1997). Over the instrumental period, the seismicity with magnitude Ml ranging
between 1.8 and 3.6, is distributed in the entire considered region without clear link with the
faults, excepted for two events located on the Roquemaure Fault. Marin et al. (2004)
estimated that the return time period for a characteristic event of magnitude 5.3 is of 250
Page 86 of 131Geophysical Journal International
123456789101112131415161718192021222324252627282930313233343536373839404142434445464748495051525354555657585960

For Peer Review
Rigo et al., 2007 Nimes seismicity 15/11/07
5
years when for a characteristic event of magnitude 7 is more than 5000 years on the Nîmes
Fault.
3 The rainfall event of September 2002
The 8-9 September 2002, this region was affected by a catastrophic storm causing the death of
24 people and economic damages estimated to 1.2 billion euros. The heavy precipitations
began the 8 September at 08:00 UT to finish the 9 September at 12:00 UT. This area is part of
the hydro-meteorological observatory of the Cévennes-Vivarais region (OHM-CV) managed
by LTHE laboratory in Grenoble, which allowed, in collaboration with Météo-France, having
numerous collected data and a good knowledge of what happened during this event (Delrieu
et al. 2005). Particularly, several rain gauges in different parts of the area recorded hourly the
precipitation amounts as shown in Fig. 2 for the Remoulins and Châteauneuf-du-Pape
stations, two sites corresponding respectively to the western and eastern limits of our
seismological network (Fig. 1). The cumulated precipitations in the centre of our temporary
network (between Nîmes and Pujaut faults) reached the value of 400 mm in 28 hours, when it
reached 650-700 mm in the Alès city to the north.
Consequently and with short delays, most important floods affected the major rivers of the
region and produced also flash floods of many upstream tributaries. The peak discharges
reached values of 5 – 10 m3 s-1 km-2 when the 10-year return period discharge is typically 2 m3
s-1 km-2 for Provence area. According to the measurements done at different parts of the area,
these river floods were estimated to correspond to 70% to 100% of the total amount of
rainfall. Especially, it appears that in the karstic area the rainfall water retention capacities
should be about 30%. We observed that the karstic network released the stored rainwater and
the Pujaut Basin remained inundated over 1 – 1.5 months after the rainfall event.
4 Seismological network
We maintained the seismological network from the beginning of July 2002 to the end of June
2003. We carried out 14 stations over an area of 34 x 28 km2 (Fig. 1), but considering various
technical problems on the instruments (power supply, inundations, electronic failures), the
network had a maximum of 13 and a minimum of 10 simultaneous working stations. In
particular, station VAL drown under 2 m of water was stopped during two months
(September and October 2002), station MND was definitively stopped in December 2002
consecutively to a complete breakdown and was substituted by station ISS, and station NEUF
was stolen in April 2003 (Table A1).
Page 87 of 131 Geophysical Journal International
123456789101112131415161718192021222324252627282930313233343536373839404142434445464748495051525354555657585960

For Peer Review
Rigo et al., 2007 Nimes seismicity 15/11/07
6
A station is constituted of a digital recorder with a three component short-period seismometer
and a GPS or DCF antenna for absolute time recorded in parallel with the internal station
clock. The stations were in a continuous mode recording with a sampling rate of 125 Hz.
Generally the stations were rather noisy, because located in a region of intense economic
activities as major railroads, highways, and quarries. Nevertheless, the accuracy of the P- and
S-arrival time readings was estimated to be better than 0.05 s.
5 Data analysis
5-1 Preliminary locations
The seismological signals of major amplitude were automatically extracted from the
continuous records and the events were separated from noise caused by human activities near
the stations. During the period of survey, 15 earthquakes with magnitude Ml ranging from 1.7
to 2.8 were located in the same area by the French permanent networks (Réseau National de
Surveillance Sismique – RéNaSS, and Commissariat à l’Énergie Atomique/Laboratoire de
Détection Géophysique – CEA/LDG, data available on http://www.bcsf.prd.fr/). The
magnitude of the other events we detected is fixed to 1 because of the impossibility to
determine it precisely.
The first question to solve was to determine a regional 1-D P-velocity model unconstrained
until now. For that, we used the geological knowledge and the 15 common earthquakes
detected by the temporary and the permanent networks. We then fixed a superficial layer of 1
km of thickness corresponding to the sediment filling in the Messinian canyons as those
observed near Châteauneuf-du-Pape and Pujaut (Schlupp et al. 2001). We also fixed a
velocity contrast at 7 km depth corresponding to the maximum thickness of the Mesozoic and
Cenozoic cover (Baudrimont & Dubois 1977). Other three velocity contrasts were imposed at
12 km, 18 km and at 30 km depth, this last one being the mean position of the base of the
continental crust in France. Our aim was to obtain the minimum residuals for the earthquake
locations at both the temporary and permanent seismological stations. Thus, we used Hypo71
code (Lee & Lahr 1975) in a trial-and-error mode, in order to determine a preliminary P- (and
S-) velocity model M1 (Table 1), the Vp/Vs ratio being fixed at the common French value of
1.73. To avoid refracted waves, the maximum epicentral distance was imposed at 120 km, the
nearest permanent station being approximately at 40 km from the centre of the temporary
network.
5-2 Discrimination between seismic events and blasts
Page 88 of 131Geophysical Journal International
123456789101112131415161718192021222324252627282930313233343536373839404142434445464748495051525354555657585960
For Peer Review
Rigo et al., 2007 Nimes seismicity 15/11/07
7
The second step was to distinguish the quarry blasts from the seismic events. A first
differentiation was done by the specific waveform of blasts recorded at some specific stations.
This way allows recognising 5% of the blasts only. Secondly, we located all the events with
the velocity model M1 and we extract from the clusters found, the events occurring
approximately at the same hours during the working days and the working hours. This
selection of events as quarry blasts was confirmed by a decrease of their location residuals
when fixing their depth at 0 km, the locations being at a distance smaller than 5 km from the
known quarries. We were then able to locate a final set of 80 earthquakes and 153 quarry
blasts with reasonable residuals (smaller than 0.5 s).
5-3 1-D seismic wave velocity model determination
Finally, we inverted simultaneously the P- and S- velocities and the earthquake locations
using the Velest code (Kissling et al. 1994). The blast locations were fixed at the quarry
positions and at 0 km depth, the thicknesses of the layer of the velocity model were also fixed
at the model M1 values. We then obtained the velocity model Vc (Table 1). We estimate from
several inversion processes varying the number of iterations and modifying the initial
velocities that the uncertainties of P-, S- velocities and of Vp/Vs ratio are respectively of 0.05
km/s, 0.10 km/s and 0.06. As the same, the earthquake location uncertainties are estimated at
0.8 km for the epicentral position and at 1 km for the depth location. The determination of a
3-D seismic velocity model was not realistic because of the predominance of quarry blasts
respect to the seismic events implying an insufficient sampling of the crust.
6 Temporal variations
Among the 80 located earthquakes (Table A2), only 24 are located in the temporary
seismological network, i.e. these events have their epicentral position in the surface covered
by the temporary network and, thus, are the best located. Figs 3a and 3b show the evolution
with time over the 1-year observation period of all the seismicity recorded. These figures
reveal a clear increase of the seismic activity just after the rainfall of September 2002 (vertical
arrow in Fig. 3), when the mean weekly seismic activity is at around 1 – 2 earthquakes.
Among the 24 in-network earthquakes, 8 events (three of them with magnitudes Ml 1.4, 1.9
and 2.0 – Table A2) occurred during the week following the catastrophic rainfall of
September 2002 (Fig. 3c). Another aspect of this after-rainfall seismic activity is the
predominance of shallower events with depth smaller than 5 km (Fig. 3a), as 5 of the 8
earthquakes occurring the week after the rainfall in the network (Table A2).
Page 89 of 131 Geophysical Journal International
123456789101112131415161718192021222324252627282930313233343536373839404142434445464748495051525354555657585960

For Peer Review
Rigo et al., 2007 Nimes seismicity 15/11/07
8
Other two specific features can be noticed about this clear rain-triggered seismic activity: (i)
the triggering initiates only 15 hours after the end of the storm (event of September, 10 at 3:29
UT – Table A2) at 1.8 km depth, (ii) the events are distributed all over the area of the survey
and not concentrated in clusters (Fig. 6). These characteristics are significantly different from
the commonly observed seismicity induced by rain and by artificial water reservoirs,
specifically named Reservoir-Induced-Seismicity (RIS). Firstly, in both cases, the seismicity
is always described as being distributed in clusters with hundreds of events (see Gupta 2002
for a review, Kraft et al. 2006a, 2006b), when in our study no swarm is distinguished.
Secondly, the time delay between the cause of triggering and the beginning of the induced
seismicity is generally days and months and not hours (Gupta 2002). For impoundments of
dams, the time delay is 1-3 months (Gupta 2002, do Nascimento et al. 2004, Peinke et al.
2006), and for rain-triggered seismicity as at Mt. Hochstaufen, SE-Germany is 9-11 days
(Kraft et al. 2006a).
Although, the triggering mode of this type of seismicity is still in debate, several authors (e.g.
Bell & Nur 1978, Gupta 2002) have underlined three main possible mechanisms: (i) the
loading effect due to the filling of the reservoirs or of the karstic network inducing an increase
of the elastic stress in the crust, (ii) the increase of the pore fluid pressure in response to
elastic stress increase, and (iii) the pore fluid pressure changes due to fluid migration into the
hypocentral zone. Most probably the three mechanisms act all together, but with different
time delay of response. In fact, it is considered that loading effect generates a rapid response
of the seismicity when fluid migration generates the most delayed response. In our study, the
seismicity response being very rapid should be considered directly related to a loading effect
due to the quantity of rainwater stored in a brief period. Nevertheless, pore fluid pressure
diffusion and, maybe, fluid migration, should be responsible for the later seismic events as the
M=2 event of October 1st (Table A2).
The inundations and the runoff of the water from the karstic network were observed until the
mid of the month of October. The presence of such a quantity of water in the superficial
geological layer would have consequences on P- and S-wave velocities (Vp and Vs
respectively). We tested this hypothesis inverting month by month the event locations, and Vp
and Vs in only the first layer on the Vc model (Table 1) with Velest code. The initial
conditions of the inversion are the Vc velocity model and the associated event and quarry
blast locations. Off the located earthquakes, only 3 have depths smaller than 1 km, when,
obviously, all the quarry blasts are at the surface of the first layer but with fixed locations.
The P- and S-wave velocities for the layers deeper than 1 km are fixed at the Vc model
Page 90 of 131Geophysical Journal International
123456789101112131415161718192021222324252627282930313233343536373839404142434445464748495051525354555657585960

For Peer Review
Rigo et al., 2007 Nimes seismicity 15/11/07
9
values. The changes in the final earthquake locations obtained by this new inversion process
are in the uncertainties of those obtained with the Vc model and, then, do not modify the
pattern of the distribution of the seismicity. The monthly P- and S-wave velocities, and then
the Vp/Vs ratio obtained for the first 1-km thick layer vary also in the uncertainties excepted
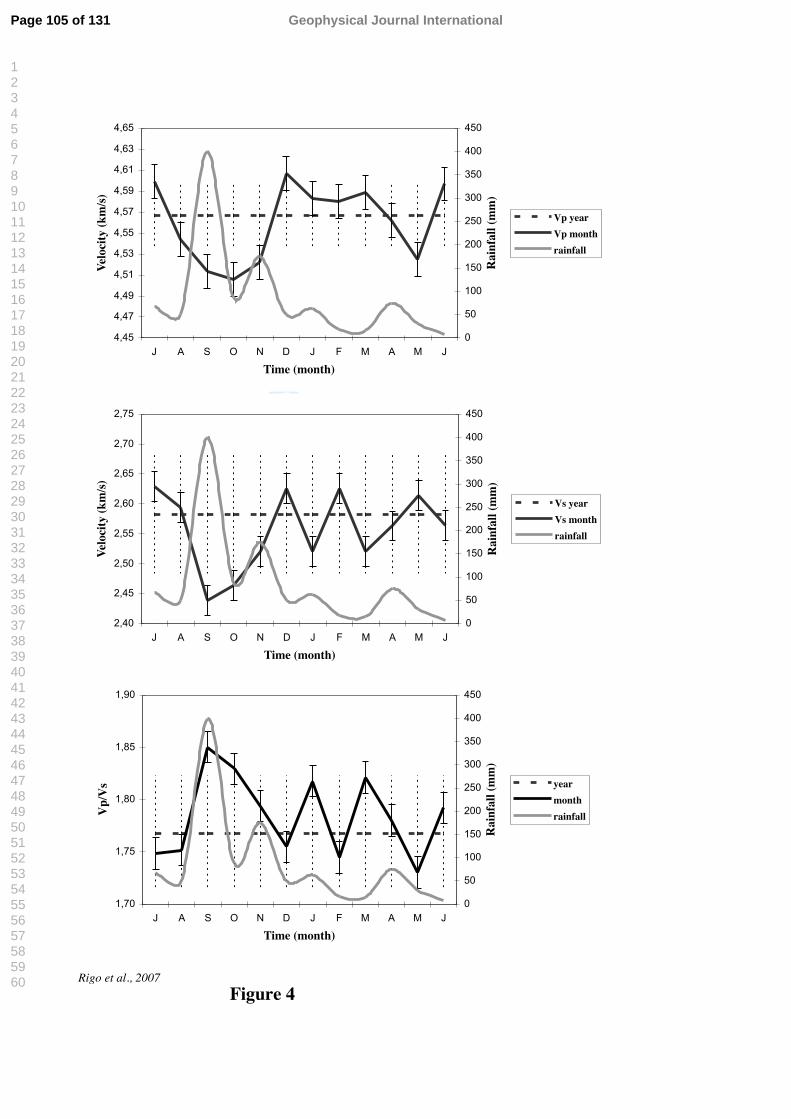
for the months of September, October and November (Fig. 4). The P-wave velocity (Fig. 4a)
decreases to the value of 4.50 km/s in September, remains at this level in October and
increases to return to its mean value of 4.58 km/s in November and December. Then, the
maximum variation here obtained is 1.5 %. The S-wave velocity (Fig. 4b) shows the same
behaviour with a decrease to a value of 2.45 km/s when the mean value is 2.58 km/s, implying
a maximum variation of 5.5%. The S-wave velocity returned to its mean value in November
more rapidly than the P-wave velocity. Thus, the Vp/Vs ratio (Fig. 4c) shows an abrupt
increase in September to the value of 1.85 when the mean value for the year is 1.77, i.e. a
maximum variation of 4.5%. As it can be noticed, Vs and the Vp/Vs ratio show oscillations
after November. These oscillations are due to the small number of events (a mean of 20
events, i.e. earthquakes and blasts) used to invert the velocity model at each month. The
Vp/Vs oscillations are principally related to the oscillations of Vs for which the arrival times
used are less precise and less numerous than for Vp. In fact, the oscillations disappear when
we subdivide the year in 6 periods of two months, increasing the data used for each inversion
as shown in Fig. 5. This last figure also confirms the clear decrease of the P- and S-wave
velocities and the increase of the Vp/Vs ratio just after the storm of September.
We then suggest that these variations of the wave velocities are clearly related to the rainfall
event and, then, to the filling of the local karstic network and the saturation of the ground
waters. The return of the wave velocities to their mean values in November and not in
October as it would be expected, is most probably due to new episodes of rainfall in
November delaying the flowing of the water stored in September.
7 Seismic events distribution
The final locations of the earthquakes is shown in Fig. 6 and listed in Table A2 (Appendix). It
is also shown the P-residuals (NS bars, positive to the north) and S-residuals (EW bars,
positive to the east) at each station. The mean values are 0.1 s and 0.3 s for P- and S-residuals
respectively. The most important residues are found at the stations NEUF and ABAY. For the
first one, these high values are due to the location of the station in the Rhône River valley on
alluvial terraces, and for the second one they are most probably due to a local site effect.
Page 91 of 131 Geophysical Journal International
123456789101112131415161718192021222324252627282930313233343536373839404142434445464748495051525354555657585960

For Peer Review
Rigo et al., 2007 Nimes seismicity 15/11/07
10
The seismicity distribution appears quite similar to that observed with the historical and
instrumental seismicity (Fig. 1) with no immediate evidence of relationship between seismic
events and faults. Especially, the seismic activity occurring between the cities of Remoulins
and Rochefort, and near the stations of SLA and THE, seems to be a permanent feature
through time. The earthquake with largest magnitude (Ml = 2.8; April 6, 2003; Table A2) well
felt by inhabitants is located east of station THE where earthquakes occurred in historical and
instrumental times. The same observation should be done for the area around SLA station on
the Roquemaure Fault. A specific feature concerns the events located north to the city of
Châteauneuf-du-Pape. This activity is in an area including 3 quarries named J, K and L (Fig.
6). These events were analysed with great caution and they are effectively considered as
seismic events because (i) some of them are detected by permanent stations, (ii) others
occurred in not working hours and days, and (iii) for the events out of the two first
circumstances, the location residuals are greater than 1-1.5 s when they are fixed on the
quarry positions.
We present in Fig. 7, NS and EW cross-sections with all the events projected, the shaded
diamonds being the historical and instrumental seismicity for which depths are unconstrained
and fixed to 5 km. If a major part of the 2002-2003 observed events have depths smaller than
10 km, few earthquakes are located at depths between 10 km and 20 km, and few at depths
greater than 30 km. These last ones located south of the city of Nîmes being out of and far
from the temporary network, their depths have greater uncertainties and they are therefore
difficult to interpret. Then, the major part of the observed seismic activity takes place in the
sedimentary cover of Mesozoic and Cenozoic ages.
In order to analyse more precisely the seismicity located in the network and its relationship
with the faults, we realise two other cross-sections with a half-band width of projection of 9
km, indicated as 1 and 2 on Fig. 6 and shown in Fig. 8. On both sections, no earthquakes are
associated with the Pujaut Fault for which we have poor knowledge on the geometry at depth.
Some events can be linked to the Nîmes Fault plane at depth. The geometry at depth of this
fault deduced from seismic images is considered as a vertical plane until 5 km at maximum
and flattened to the SE (Benedicto et al. 1996). Section 1 (Fig. 8a) may confirm that the
Nîmes Fault plane is vertical until at least 5 km depth, when section 2 (Fig. 8b) shows
seismicity sparser and maybe related to the Nîmes Fault until 10 km depth. In any case, it is
impossible here to image and to confirm the low-angle geometry at depth of the Nîmes Fault
as proposed by Benedicto et al. (1996). As concerns the Roquemaure Fault, section 2 (Fig.
8b) shows seismicity north to the fault with a dip to the north. This suggests that the
Page 92 of 131Geophysical Journal International
123456789101112131415161718192021222324252627282930313233343536373839404142434445464748495051525354555657585960
For Peer Review
Rigo et al., 2007 Nimes seismicity 15/11/07
11
Roquemaure Fault might have some activity contrarily to what was considered until now. The
observed activity is located to its eastward apparent termination. It might be also triggered by
the rainfall event of September.
8 Discussion and conclusions
8-1 What about the geometry and activity of faults?
Maintaining a temporary seismological network of 10-13 stations over a 1-year period (July
2002 – June 2003) in the Provence region between the cities of Nîmes and Avignon (south-
east of France), we precisely located 80 earthquakes with magnitude Ml smaller than 2.8 and
with depths mainly smaller than 10 km. The distribution of these events seems to follow a
SW-NE trend parallel to the Nîmes Fault direction (Fig. 6). As also seen on the cross-sections
(Figs 7 and 8), only a part of this seismic activity seems to be linked to the Nîmes Fault and
the Roquemaure Fault. Our observations do not allow to confirm if the south-western part of
the Nîmes Fault is really active today despite the suspicion that it was responsible of
earthquakes damaging the roman aqueduct “Pont-du-Gard“ in historical times. However, the
observed seismicity suggests that its central part is still active, already postulated from the
distribution of both historical and instrumental events (Fig. 1). Concerning the geometry of
the faults at depth, our data shows that the Nîmes Fault is vertical until 5 km depth and that
the Roquemaure Fault may have some activity within its eastern termination when two
earthquakes are associated to its central part (1986/06/18 Ml = 2.6; 1997/06/26 Ml = 3.1 –
Fig. 1). The event distribution at depth shows a possible dip of 50-60° to the north until 10 km
depth (Fig. 8).
8-2 A triggering effect of rainfall
Among the 80 located events, 24 are in the network for which 11, i.e. 40%, occurred during
the two weeks following the catastrophic rainfall of September 8-9, 2002. There is a clear link
between this meteorological event and the triggering of the earthquakes (Fig. 3). As
mentioned before, three mechanisms are invoked to explain the triggering of earthquakes by
artificial water reservoir filling or by rainfalls. The time delay separating the formal cause of
the triggering and the occurrence of the first earthquake allows distinguishing in between
these three processes. In commonly studied cases (Gupta 2002), the mechanism admitted is
the pore fluid pressure change at hypocentral depths due to fluid migration. This mechanism
is timely controlled by the pore pressure diffusion, the increase of the seismicity having
commonly a delay of 1-3 months after a specific event concerning water reservoir level
Page 93 of 131 Geophysical Journal International
123456789101112131415161718192021222324252627282930313233343536373839404142434445464748495051525354555657585960

For Peer Review
Rigo et al., 2007 Nimes seismicity 15/11/07
12
(filling or discharge), the known shorter delay being at 10 days in the case of the rainfall-
triggered earthquakes in the SE Germany (Hainzl et al. 2006, Kraft et al. 2006a). In our study,
the triggering of earthquakes initiates 15 hours after the end of the storm excluding a pore
fluid diffusion. The most important consequence of the great quantity of fallen water is an
abrupt vertical loading on the ground surface. If we consider a high porosity for the 0.8 km
thick sediment filling up of the Messinian canyons (Schlupp et al., 2001) associated with a
well-developed karstic network, that might correspond to a 800 m water column at maximum,
and then to a maximum overpressure of 80 bars (or 8 Mpa). This is largely sufficient to
trigger seismic activity in the first kilometres of the crust. In fact, stress variations deduced
from static Coulomb Failure Function have generally triggering earthquake thresholds of
about 0.1 bar (e.g. Reasenberg and Simpson 1992). An example of triggering earthquakes due
to vertical loading on the ground was observed after the construction of the Taipei 101 tower
(Taiwan). In this case, the vertical loading was estimated to be ‘only’ 5 bars (0.5 Mpa),
clearly sufficient to trigger seismicity until 10 km depth (Lin 2005). If we consider this value
of 5 bars for the vertical loading in our case study in the French Provence as reasonable and
sufficient to trigger the observed seismicity until 8 km depth, that corresponds to a 50 m water
column, which seems to be also reasonable and perhaps more consistent with the geological
and the meteorological contexts. Moreover, in our study, we can consider two categories of
earthquakes following Simpson et al. (1988). (i) The ‘rapid response’ category including the
earthquakes occurring the two weeks after the storm, and for which the triggering is linked to
the vertical loading of the rain-water on the ground. The stress increase might be transferred
into the upper crust (2 – 5 km depth) due to soft sediments and, maybe, to fluid saturated
rocks, vertical stress diffusing more rapidly than pore fluid. (ii) The ‘delayed response’
category for the events occurring in the weeks following, where stress variations due to the
previous earthquakes, pore fluid diffusion and fluid migration act. In any considered case, it
seems clear that the triggered seismicity is facilitated by the pre-existing faults and associated
fractures in the upper crust.
8-3 A wave-velocity variation effect
At least a third of the total volume of rainfall water of the September storm was stored
saturating the ground water reservoirs and the galleries of the karst (Delrieu et al. 2005). We
observed that this stored water was released during 1.5 months after the storm. Such
saturation of the superficial part of the crust should have consequences on the seismic wave
velocities (Nur & Simmons 1969; O’Connell & Budiansky 1974; Stern et al. 2001; Husen &
Page 94 of 131Geophysical Journal International
123456789101112131415161718192021222324252627282930313233343536373839404142434445464748495051525354555657585960

For Peer Review
Rigo et al., 2007 Nimes seismicity 15/11/07
13
Kissling 2001). We tested this hypothesis and we found a significant decrease of wave
velocities in the first 1-km thick layer of our Vc velocity model determined for the 1-year
observation period (Fig. 4). Both P- and S-wave velocities are affected during the months of
September, October and with less evidences of November. As observed by Husen & Kissling
(2001) in Chile for the 1995, MW = 6.6 Antofagasta earthquake, the decrease of S-velocity is
more important than of P-wave velocity decrease implying an increase of the Vp/Vs ratio.
Husen & Kissling (2001) and Stern et al. (2001) showed variations of Vp/Vs ratio and P-
wave velocity at around 6%-10%. In our study, the variations for P-, S-wave velocities and
Vp/Vs ratio are 1.5%-2%, 5%-6% and 4%-5% respectively, i.e. twice smaller than the
previous mentioned studies. Considering a mean cumulated rainfall height of 600 mm over an
area of 1500 km2 (Delrieu et al. 2005), we obtain a water volume of 825 106 m3, a third of this
being at least of 250-300 106 m3 corresponding to the volume of stored water during the first
weeks following the catastrophic rainfall. The variations of wave velocities and Vp/Vs ratio
detected in the crust are commonly interpreted as variations of pore and fluid pressures
without any quantification, except in terms of in or out lithostatic/hydrostatic pressure
conditions. This quantification is not possible without its direct measurement, because of the
lack of direct correlation between wave velocities and associated fluid volumes. According to
our results, we then suggest here that a variation of 5% of S-wave velocity and Vp/Vs ratio
and a variation of 2% of P-wave velocity might be due to, at least, a volume of 108-109 m3 of
water.
Acknowledgments
We are grateful to Brice Boudevillain from LTHE laboratory in Grenoble and Météo-France
who provided meteorological data over the 2002-2003 period. We are in debt to all people
who welcomed us and provided one spot in their property for the installation of the
seismological stations. We also thank Yann Michel, Marc Béchet-Bailly, Mendy Bengoubou,
Dorin Mogos, Jessica Tastet and Anthony Memin for participating in data processing, Anne
Deschamps and Christophe Maron for their field help, Sébastien Benahmed and Jean-François
Fels for their technical support. We would like to thank two anonymous reviewers for
constructive comments. This work was supported by the Programme National Risque Naturel
(PNRN) of the French Institut National des Sciences de l’Univers (CNRS/INSU).
References
Page 95 of 131 Geophysical Journal International
123456789101112131415161718192021222324252627282930313233343536373839404142434445464748495051525354555657585960

For Peer Review
Rigo et al., 2007 Nimes seismicity 15/11/07
14
Audin, L., Avouac, J.-P., Flouzat, M. & Plantet, J.-L., 2002. Fluid-driven seismicity in a
stable tectonic context: The Remiremont fault zone, Vosges, France, Geophys. Res. Lett.,
29, doi:10.1029/2001GL012988.
Baudrimont, A.-F. & Dubois, F., 1977. Un bassin mésogéen du domaine péri-alpin : le Sud-
Est de la France, Bull. Centres Rech. Explor.-Prod. Elf Aquitaine, 1, 261-308.
Bell, M.L. & Nur, A., 1978. Strength changes due to reservoir-induced pore pressure and
stresses and application to Lake Oroville, J. Geophys. Res., 83, 4469-4483.
Benedicto, A., Labaume, P., Séguret, M. & Séranne, M., 1996. Low-angle crustal ramp and
basin geometry in the Gulf of Lion passive margin : Oligocene-Aquitanian Vistrenque
graben, SE France, Tectonics, 15, 1192-1212.
Boullier, A.-M., Fujimoto, K., Ohtani, T., Roman-Ross, G., Lewin, E., Ito, H., Pezard, P. &
Ildefonse, B., 2004. Textural evidence for recent co-seismic circulation of fluids in the
Nojima fault zone, Awaji island, Japan, Tectonophysics, 378, 165-181.
Champion, C., Choukroune, P. & Clauzon, G., 2000. Déformation post-miocène en Provence
occidentale, Geodin acta, 13, 67-85.
Clauzon, G., 1996. Limites de séquences et évolution géodynamique, Géomorphologie, 1, 3-
22.
Combes, P., Fabre, G., Fiches, J.-L., Gazenbeek, M. & Paillet, J.-L., 1997. L’aqueduc romain
de Nîmes et l’enregistrement d’événements sismiques, in Fiches, J.-L., Helly, B. and
Levret, A. editors, Archéologie et sismicité – Autour d’un grand monument le Pont du
Gard, APDCA Ed., Sophia-Antipolis, 171pp.
Combes, P., Carbon, D., Cushing, M., Granier, T. & Vaskou, P., 1993. Mise en évidence d’un
paléoséisme pléistocène supérieur dans la vallée du Rhône : implications sur la
connaissance de la sismicité en France, C.R. Acad. Sci. Paris, 317, 689-696.
Delrieu, G., Ducrocq, V., Gaume, E., Nicol, J., Payrastre, O., Yates, E., Andrieu, H., Ayral,
P.-A., Bouvier, C., Creutin, J.-D., Livet, M., Anquetin, S., Lang, M., Neppel, L., Obled,
C., Parent-du-Châtelet, J., Saulnier, G.-M., Walpersdorf, A. & Wobrock, W., 2005. The
catastrophic flash-flood event of 8-9 September 2002 in the Gard region, France: a first
case study for the Cévennes-Vivarais Mediterranean Hydro-meteorological Observatory,
J. Hydrometeor., 6, 34-52.
De Mets, C., Gordon, R.G., Argus, D.F. & Stein, S., 1990. Current plate motions, Geophys. J.
Int., 101, 425-478.
Page 96 of 131Geophysical Journal International
123456789101112131415161718192021222324252627282930313233343536373839404142434445464748495051525354555657585960

For Peer Review
Rigo et al., 2007 Nimes seismicity 15/11/07
15
Do Nascimento, A.F., Cowie, P.A., Lunn, R.J. & Pearce, R.G., 2004. Spatio-temporal
evolution of induced seismicity at Açu reservoir, NE Bazil, Geophys. J. Int, 158, 1041-
1052.
Ferhat, G., Feigl, K., Ritz, J.-F. & Souriau A., 1998. Geodetic measurement of tectonic
deformation in the southern Alps and Provence, France, Earth and Planet. Sci. Lett., 159,
35-46.
Fialko, Y., 2004. Evidence of fluid-filled upper crust from observations of postseismic
deformation due to the 1992 Mw7.3 Landers earthquake, J. Geophys. Res., 109,
doi:10.1029/2004JB002985.
Grasso, J.-R. & Wittlinger, G., 1990. 10 years of seismic monitoring over a gas field area,
Bull. Seism. Soc. Am., 80, 450-473.
Grasso, J.-R., Guyoton, F., Fréchet, J. & Gamond, J.-F., 1992. Triggered earthquakes as stress
jauge: Implication for the uppercrust behavior in the Grenoble area, France, Pageoph,
139, 579-605.
Gupta, H.K., 2002. A review of recent studies of triggered earthquakes by artificial water
reservoirs with special emphasis on earthquakes in Koyna, India, Earth-Science Reviews,
58, 279-310.
Hainzl, S., Kraft, T., Wassermann, J., Igel, H. & Schmedes, E., 2006. Evidence for rainfall-
triggered earthquake activity, Geophys. Res. Lett., 33, L19303,
doi :10.1029/2006GL027642.
Husen, S. & Kissling, E., 2001. Postseismic fluid flow after the large subduction earthquake
of Antofagasta, Chile, Geology, 29, 847-850.
Kissling, E., Ellsworth, W.L., Eberhart-Phillips, D. & Kradolfer, U., 1994. Initial reference
models in local earhquake tomography, J. Geophys. Res., 99, 19,635-19,646.
Kraft, T., Wassermann, J., Schmedes, E. & Igel, H., 2006a. Meteorological triggering of
earthquake swarms at Mt Hochstaufen, SE-Germany, Tectonophysics, 424, 245-258.
Kraft, T., Wassermann, J. & Igel, H., 2006b. High-precision relocation and focal mechanism
of the 2002 rain-triggered earthquake swarms at Mt Hochstaufen, SE Germany, Geophys.
J. Int., 167, 1513-1528.
Lambert, J. & Levret-Albaret, A., 1996. Mille ans de séismes en France. BRGM, Nantes, 78
pp.
Lee, W.H.K. & Lahr, J.C., 1975. HYPO71 (revised): a computer program for determining
hypocenter, magnitude and first motion pattern of local earthquakes, U.S. Geol. Survey
Open-File report, 75-311,.
Page 97 of 131 Geophysical Journal International
123456789101112131415161718192021222324252627282930313233343536373839404142434445464748495051525354555657585960

For Peer Review
Rigo et al., 2007 Nimes seismicity 15/11/07
16
Lin, C.-H., 2005. Seismicity increase after the construction of the world’s tallest building: An
active blind fault beneath the Taipei 101, Geophys. Res. Lett., 32, L22313,
doi:10.1029/2005GL024223.
Marin, S., Avouac, J.-P., Nicolas, M. & Schlupp, A., 2004. A probabilistic approach to
seismic hazard in metropolitan France, Bull. Seism. Soc. Am., 94, 2137-2163.
Mattauer, M., 2005. Commentaires à la note de D.Chardon et O.Bellier, Bull. Soc. Géol.
France, 176, 1, 121-123.
Miller, S.A., Collettini, C., Chiaraluce, L., Cocco, M., Barchi, M. & Kaus, B.J.P., 2004.
Aftershocks driven by a high-pressure CO2 source at depth, N a t u r e ,
doi:10.1038/nature02251.
Nocquet, J.-M. & Calais, E., 2003. Crustal velocity field of western Europe from permanent
GPS array solutions, 1996-2001, Geophys. J. Int., 154, 72-88.
Nur, A. & Simmons, G., 1969. The effect of saturation on velocity in low porosity rocks,
Earth Planet. Sci. Lett., 7, 183-193.
O'Connell, R.J. & Budiansky, B., 1974. Seismic velocities in dry and saturated cracked solids,
J. Geophys. Res., 79, 5412-5426.
Peinke, J., Matcharashvili, T., Chelidze, T., Gogiashvili, J., Nawroth, A., Lursmanashvili, O.
& Javakhishvili, Z., 2006. Influence of periodic variations in water level on regional
seismic activity around large reservoir: Field data and laboratory model, Phys. Earth
Planet. Int., 156, 130-142.
Reasenberg, P.A. & Simpson, R.W., 1992. Response of regional seismicity to the static stress
change produced by the Loma Prieta earthquake, Science, 407, 69-72.
Schlupp, A., Clauzon, G. & Avouac, J.-P., 2001. Mouvement post-messinien sur la faille de
Nîmes: implications pour la sismotectonique de la Provence, Bull. Soc. géol. France, 172,
697-711.
Sébrier, M., Bellier, O., Peulvast, J.-P. & Vergély, P., 1998. Commentaire à la note de Robin
Lacassin, Bertrand Meyer, Lucilla Benedetti, Rolando Armijo et Paul Tapponnier
<<Signature morphologique de l'activité de la Faille des Cévennes (Languedoc,
France)>>, C. R. Acad. Sci. Paris, 327, 855-856.
Shapiro, S.A., Kummerow, J., Dinske, C., Asch, G., Rothert, E., Erzinger, J., Kümpel, H.-J.,
& Kind, R., 2006. Fluid induced seismicity guided by a continental fault: Injection
experiment of 2004/2005 at the German Deep Drilling Site (KTB), Geophys. Res. Lett.,
33, L01309, doi:10.1029/2005GL024659.
Page 98 of 131Geophysical Journal International
123456789101112131415161718192021222324252627282930313233343536373839404142434445464748495051525354555657585960
For Peer Review
Rigo et al., 2007 Nimes seismicity 15/11/07
17
Simpson, D.W., Leith, W.S. & Scholz, C.H., 1988. Two types of reservoir induced seismicity,
Bull. Seismol. Soc. Am., 78, 2025-2040.
Stern, T., Kleffmann, S., Okaya, D., Scherwath, M. & Bannister, S., 2001. Low seismic-wave
speeds and enhanced fluid pressure beneath the Southern Alps of New Zealand, Geology,
29, 679-682.
Utkucu, M., 2006. Implications for the water level change triggered moderate (M 4.0)
earthquakes in Lake Van basin, Eastern Turkey, J. Seismology, 10, 105-117.
Watanabe, T., 1993. Effects of water and melt on seismic velocities and their application to
characterization of seismic reflectors, Geophys. Res. Lett., 20, 2933-2936.
Yamashita, T., 2003. Regularity and complexity of aftershock occurrence due to mechanical
interactions between fault slip and fluid flow, Geophys. J. Int., 152, 20-33.
Page 99 of 131 Geophysical Journal International
123456789101112131415161718192021222324252627282930313233343536373839404142434445464748495051525354555657585960
For Peer Review
Rigo et al., 2007 Nimes seismicity 15/11/07
18
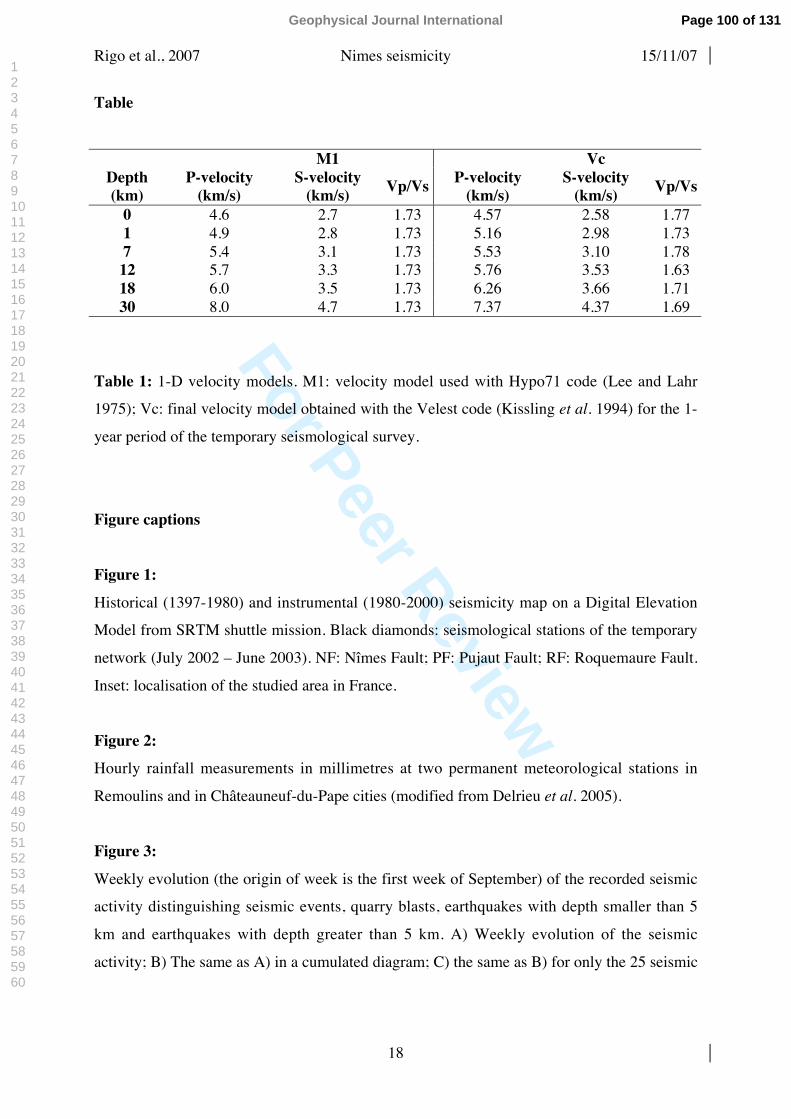
Table
Table 1: 1-D velocity models. M1: velocity model used with Hypo71 code (Lee and Lahr
1975); Vc: final velocity model obtained with the Velest code (Kissling et al. 1994) for the 1-
year period of the temporary seismological survey.
Figure captions
Figure 1:
Historical (1397-1980) and instrumental (1980-2000) seismicity map on a Digital Elevation
Model from SRTM shuttle mission. Black diamonds: seismological stations of the temporary
network (July 2002 – June 2003). NF: Nîmes Fault; PF: Pujaut Fault; RF: Roquemaure Fault.
Inset: localisation of the studied area in France.
Figure 2:
Hourly rainfall measurements in millimetres at two permanent meteorological stations in
Remoulins and in Châteauneuf-du-Pape cities (modified from Delrieu et al. 2005).
Figure 3:
Weekly evolution (the origin of week is the first week of September) of the recorded seismic
activity distinguishing seismic events, quarry blasts, earthquakes with depth smaller than 5
km and earthquakes with depth greater than 5 km. A) Weekly evolution of the seismic
activity; B) The same as A) in a cumulated diagram; C) the same as B) for only the 25 seismic
M1 VcDepth(km)
P-velocity(km/s)
S-velocity(km/s)
Vp/Vs P-velocity(km/s)
S-velocity(km/s)
Vp/Vs
0 4.6 2.7 1.73 4.57 2.58 1.771 4.9 2.8 1.73 5.16 2.98 1.737 5.4 3.1 1.73 5.53 3.10 1.7812 5.7 3.3 1.73 5.76 3.53 1.6318 6.0 3.5 1.73 6.26 3.66 1.7130 8.0 4.7 1.73 7.37 4.37 1.69
Page 100 of 131Geophysical Journal International
123456789101112131415161718192021222324252627282930313233343536373839404142434445464748495051525354555657585960

For Peer Review
Rigo et al., 2007 Nimes seismicity 15/11/07
19
events located in the temporary seismological network. Vertical arrow indicates the
occurrence of the catastrophic rainfall of September 8-9, 2002.
Figure 4:
Monthly variations of P-velocity (top), S-velocity (middle) and Vp/Vs ratio (bottom) for the
first 1-km thick layer of the Vc velocity model, the yearly values are from Vc model (see text
for more details). Vertical error bars are standard deviations. Monthly cumulated rainfall is
also shown (data from Météo-France).
Figure 5:
The same as figure 4 for the year divided in 6 periods of two months: p1: July-August 2002;
p2: September-October 2002; p3: November-December 2002; p4: January-February 2003; p5:
March-April 2003; p6: May-June 2003.
Figure 6:
Map of the final location of the seismic events recorded by the temporary seismological
network over the 1-year period (July 2002 – June 2003). The P-residuals (NS bars, positive to
the north) and S-residuals (EW bars, positive to the east) are given at each seismological
station. Triangles quoted A to G locate the quarries. Dotted lines named 1 and 2 indicate the
position of the two cross-sections shown in Fig. 8.
Figure 7:
NS (A) and EW (B) cross-sections cutting at the centre of the temporary seismological
network with all the seismic events projected. Shaded diamonds are the instrumental
earthquakes (data from the French permanent seismological network - Bureau Central
Sismologique Français – BCSF). Vertical arrows locate the surface traces of the faults: NF:
Nîmes Fault, PF: Pujaut Fault and RF: Roquemaure Fault.
Figure 8:
Cross-sections 1 and 2 located in Fig. 6. Symbols and abbreviations are the same as Fig. 7. PF
plane is drawn with a dip of 45° and RF plane with a dip of 60°.
Page 101 of 131 Geophysical Journal International
123456789101112131415161718192021222324252627282930313233343536373839404142434445464748495051525354555657585960

For Peer Review
AVIGNON
BEAUCAIRE
REMOULINS
NIMES
CHATEAURENARD
CHATEAUNEUF DU PAPE
UZES
BAGNOLS S/ CEZE
SAUVETERRE
ROCHEFORT
THEZIERS
43°42
43°45
43°48
43°51
43°54
43°57
44°00
44°03
44°06
44°09
4°18 4°24 4°30 4°36 4°42 4°48 4°54 5°00
GBYNDG
MND
VAL
THE
SLA
ABAY
NEUFSVT
PDG
CARL
DEV
BAU
ISS
N F
N F
P F
R F
Figure 1
Rigo et al., 2007
GARDON
RHÔ
NE
Io = VII
Ml = 3.6
Pujaut Basin
P Y R E N E E S
A L P S
M A S S I FC E N T R A L
0∞-5∞ 5∞
45∞
50∞
Page 102 of 131Geophysical Journal International
123456789101112131415161718192021222324252627282930313233343536373839404142434445464748495051525354555657585960

For Peer Review100
80
60
40
20
0
Rai
nfal
l (m
m)
2002
0908
08
2002
0908
10
2002
0908
12
2002
0908
14
2002
0908
16
2002
0908
18
2002
0908
20
2002
0908
22
2002
0909
00
2002
0909
02
2002
0909
04
2002
0909
06
2002
0909
08
2002
0909
10
2002
0909
12
Time
REMOULINS
100
80
60
40
20
0
Rai
nfal
l (m
m)
2002
0908
08
2002
0908
10
2002
0908
12
2002
0908
14
2002
0908
16
2002
0908
18
2002
0908
20
2002
0908
22
2002
0909
00
2002
0909
02
2002
0909
04
2002
0909
06
2002
0909
08
2002
0909
10
2002
0909
12
Time
CHATEAUNEUF DU PAPE
Figure 2
Rigo et al., 2007
Page 103 of 131 Geophysical Journal International
123456789101112131415161718192021222324252627282930313233343536373839404142434445464748495051525354555657585960

For Peer Review
Rigo et al., 2007
Figure 3
0
20
40
60
80
100
120
140
160
-7 -5 -3 -1 1 3 5 7 9 11 13 15 17 19 21 23 25 27 29 31 33 35 37 39 41Time (week)
Cum
ulat
ed n
umbe
r of
loca
ted
even
ts
Seismic eventsBlastsDepth <= 5 kmDepth > 5 km
0
5
10
15
20
25
-7 -5 -3 -1 1 3 5 7 9 11 13 15 17 19 21 23 25 27 29 31 33 35 37 39 41Time (week)
Cum
ulat
ed n
umbe
r of
loca
ted
even
ts
Seismic eventsDepth <= 5 kmDepth > 5 km
B
C
-1
1
3
5
7
9
11
-7 -5 -3 -1 1 3 5 7 9 11 13 15 17 19 21 23 25 27 29 31 33 35 37 39 41
Time (week)
Num
ber
of lo
cate
d ev
ents
Seismic eventsBlastsDepth <= 5 kmDepth > 5 km
A
Page 104 of 131Geophysical Journal International
123456789101112131415161718192021222324252627282930313233343536373839404142434445464748495051525354555657585960
For Peer Review
Rigo et al., 2007Figure 4
4,45
4,47
4,49
4,51
4,53
4,55
4,57
4,59
4,61
4,63
4,65
J A S O N D J F M A M J
Time (month)
Velo
city
(km
/s)
0
50
100
150
200
250
300
350
400
450
Rai
nfal
l (m
m)
Vp yearVp monthrainfall
2,40
2,45
2,50
2,55
2,60
2,65
2,70
2,75
J A S O N D J F M A M J
Time (month)
Velo
city
(km
/s)
0
50
100
150
200
250
300
350
400
450
Rai
nfal
l (m
m)
Vs yearVs monthrainfall
1,70
1,75
1,80
1,85
1,90
J A S O N D J F M A M J
Time (month)
Vp/
Vs
0
50
100
150
200
250
300
350
400
450
Rai
nfal
l (m
m)
yearmonthrainfall
Page 105 of 131 Geophysical Journal International
123456789101112131415161718192021222324252627282930313233343536373839404142434445464748495051525354555657585960

For Peer Review
Rigo et al., 2007
Figure 5
4,42
4,44
4,46
4,48
4,50
4,52
4,54
4,56
4,58
4,60
4,62
4,64
p1 p2 p3 p4 p5 p6
Time (2_months)
Velo
city
(km
/s)
0
100
200
300
400
500
600
Rai
nfal
l (m
m)
Vp yearVp 2_monthsrainfall
2,35
2,40
2,45
2,50
2,55
2,60
2,65
2,70
p1 p2 p3 p4 p5 p6Time (2_months)
Velo
city
(km
/s)
0
100
200
300
400
500
600
Rai
nfal
l (m
m)
Vs yearVs 2_monthsrainfall
1,70
1,75
1,80
1,85
1,90
p1 p2 p3 p4 p5 p6
Time (2_months)
Vp/
Vs
0
100
200
300
400
500
600
Rai
nfal
l (m
m)
year2_monthsrainfall
Page 106 of 131Geophysical Journal International
123456789101112131415161718192021222324252627282930313233343536373839404142434445464748495051525354555657585960

For Peer Review
AVIGNON
BEAUCAIRENIMES
CHATEAURENARD
CHATEAUNEUF DU PAPE
UZES
ROCHEFORT
AB C
EI
K
L
GBYNDG
MND
VAL
THE
SLA
ABAY
NEUF
BAGNOLS
SAUVETERRESVT
H
J
PDG REMOULINS
CARL
DEV
G
F
BAU
43°42
43°45
43°48
43°51
43°54
43°57
44°00
44°03
44°06
44°09
4°18 4°24 4°30 4°36 4°42 4°48 4°54 5°00
1
2ISS
N F
N F
P F
R F
Figure 6
Rigo et al., 2006
GARDON
RHÔ
NE
0.3 sec.
Ml=2.0Ml=2.8
Ml=1.0
Page 107 of 131 Geophysical Journal International
123456789101112131415161718192021222324252627282930313233343536373839404142434445464748495051525354555657585960

For Peer Review
-35
-30
-25
-20
-15
-10
-5
0
0 5 10 15 20 25 30 35 40 45 50 55
S N
-35
-30
-25
-20
-15
-10
-5
0
0 5 10 15 20 25 30 35 40 45 50 55 60
W E
Distance (km)
Dept
h (k
m)
Distance (km)
Dept
h (k
m)
RFNFPF
NF PF
Figure 7Rigo et al., 2007
A
B
Page 108 of 131Geophysical Journal International
123456789101112131415161718192021222324252627282930313233343536373839404142434445464748495051525354555657585960

For Peer Review
SE NWPF
-15
-10
-5
0
0 2 4 6 8 10 12 14 16 18 20
S N
NF
PF NF RF
-20
-15
-10
-5
0
0 2 4 6 8 10 12 14 16 18 20 22Distance (km)
Dept
h (k
m)
Distance (km)
Dept
h (k
m)
Figure 8Rigo et al., 2007
1
2
Page 109 of 131 Geophysical Journal International
123456789101112131415161718192021222324252627282930313233343536373839404142434445464748495051525354555657585960
For Peer Review
Rigo et al, 2006 Nimes seismicity 25/03/07
1
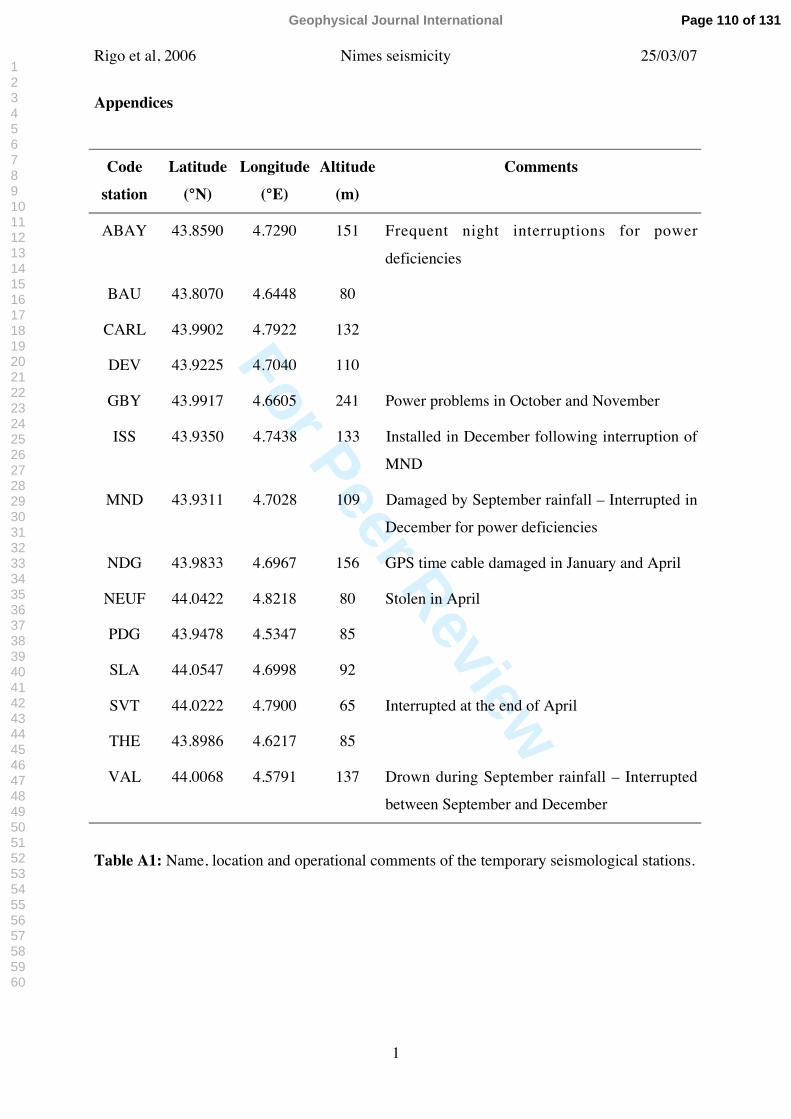
Appendices
Code
station
Latitude
(°N)
Longitude
(°E)
Altitude
(m)
Comments
ABAY 43.8590 4.7290 151 Frequent night interruptions for power
deficiencies
BAU 43.8070 4.6448 80
CARL 43.9902 4.7922 132
DEV 43.9225 4.7040 110
GBY 43.9917 4.6605 241 Power problems in October and November
ISS 43.9350 4.7438 133 Installed in December following interruption of
MND
MND 43.9311 4.7028 109 Damaged by September rainfall – Interrupted in
December for power deficiencies
NDG 43.9833 4.6967 156 GPS time cable damaged in January and April
NEUF 44.0422 4.8218 80 Stolen in April
PDG 43.9478 4.5347 85
SLA 44.0547 4.6998 92
SVT 44.0222 4.7900 65 Interrupted at the end of April
THE 43.8986 4.6217 85
VAL 44.0068 4.5791 137 Drown during September rainfall – Interrupted
between September and December
Table A1: Name, location and operational comments of the temporary seismological stations.
Page 110 of 131Geophysical Journal International
123456789101112131415161718192021222324252627282930313233343536373839404142434445464748495051525354555657585960

For Peer Review
Rigo et al, 2006 Nimes seismicity 25/03/07
2
Date HourLongitude
(°N)
Latitude
(°E)
Depth
(km)
Magnitude
Ml
Location
rms
02/07/16 10 1 43.9538 4.4773 1.71 1.0 .1302/07/17 7 35 43.9614 4.4774 21.31 1.0 .1102/07/22 10 51 43.7690 4.2759 7.31 1.0 .0502/07/23 9 20 43.7999 4.5444 12.99 1.0 .1102/08/07 15 2 43.9931 4.6729 15.02 1.0 .0302/09/01 5 29 43.8922 4.6058 2.08 1.0 .0802/09/08 9 29 43.9415 4.5961 4.67 1.0 .0802/09/10 3 29 43.9487 4.6032 1.75 1.0 .1102/09/10 7 23 43.9625 4.6423 3.33 1.0 .0302/09/12 10 33 44.0418 4.7131 5.18 2.0 .1102/09/12 21 1 44.0573 4.7717 8.95 1.4 .2502/09/12 22 33 44.0465 4.7682 8.96 1.9 .1102/09/13 1 3 43.9771 4.6585 3.26 1.0 .0402/09/14 0 4 44.0343 4.3613 5.51 1.0 .0902/09/14 5 34 43.9329 4.5965 4.19 1.0 .0102/09/15 8 25 43.9832 4.6628 3.06 1.0 .0402/09/16 10 51 43.9777 4.6902 0.81 1.0 .0902/09/17 9 56 44.0204 4.8362 7.10 1.0 .0902/09/20 9 52 44.0001 4.6945 8.41 1.0 .1802/09/27 9 54 43.9486 4.4857 17.46 1.0 .0202/09/30 0 45 43.9862 4.7264 0.86 1.0 .0502/10/01 15 8 44.1218 4.8245 2.56 1.0 .1702/10/01 22 13 43.9768 4.6411 1.18 2.0 .2402/10/07 8 41 44.0745 4.8420 4.89 1.0 .0802/10/10 21 4 44.0758 4.9079 6.71 2.5 .1902/10/13 17 45 43.9760 4.7141 0.09 1.0 .0202/10/15 5 53 44.0719 4.8701 1.43 1.0 .0602/10/18 14 30 44.0389 4.7456 4.38 1.0 .1102/10/31 12 23 44.0885 4.4299 8.93 1.0 .0902/11/06 14 7 44.1064 4.8383 1.08 1.0 .0902/11/08 10 55 44.0977 4.7792 6.55 1.0 .0702/11/13 10 45 43.7601 4.5835 5.55 1.0 .0402/11/13 16 29 44.1147 4.8300 4.82 1.0 .0602/11/14 16 7 44.1043 4.8372 6.74 1.0 .0402/11/19 18 1 44.1207 4.8189 5.69 1.0 .0702/11/20 16 15 44.0827 4.8409 3.18 1.0 .0602/11/21 8 23 44.0817 4.7685 4.62 1.0 .0202/11/22 1 21 43.9878 4.6379 2.12 1.0 .0302/11/25 9 39 44.0900 4.7223 7.39 1.0 .0502/12/02 7 0 43.5825 4.4202 13.18 2.1 .2202/12/14 20 7 44.3890 4.7981 13.79 1.0 .0902/12/21 7 8 43.6315 4.3389 16.63 2.1 .1302/12/28 10 23 43.6469 4.3561 19.69 2.2 .2202/12/28 10 32 43.6730 4.3827 30.25 2.3 .0602/12/28 10 34 43.6651 4.3475 21.28 1.9 .10
Page 111 of 131 Geophysical Journal International
123456789101112131415161718192021222324252627282930313233343536373839404142434445464748495051525354555657585960

For Peer Review
Rigo et al, 2006 Nimes seismicity 25/03/07
3
Date HourLongitude
(°N)
Latitude
(°E)
Depth
(km)
Magnitude
Ml
Location
rms
02/12/30 13 56 43.6422 4.3923 13.82 1.0 .1503/01/31 6 45 43.6850 4.3815 32.84 2.3 .1203/02/06 17 27 44.1454 4.6838 8.25 1.0 .1303/02/09 0 58 43.9228 4.5589 5.33 1.0 .1003/02/09 2 25 43.6387 4.3868 29.43 1.9 .1503/02/11 9 23 43.7712 4.5843 4.43 1.0 .1303/02/13 10 32 43.7769 4.5851 4.67 1.0 .0903/02/15 7 37 43.6479 4.4088 27.10 1.0 .1003/02/17 4 18 44.0626 5.0554 3.86 1.0 .2403/02/17 11 14 44.1963 4.3699 5.36 1.0 .0303/02/20 3 56 43.6827 4.3583 21.08 1.9 .1603/02/20 11 52 43.6013 4.4224 19.29 1.0 .1603/02/25 12 0 44.1060 4.8191 4.60 1.0 .0603/02/27 13 51 44.1116 4.8186 7.24 1.0 .0603/03/10 17 44 44.0960 4.8111 2.96 1.0 .0603/03/11 11 2 44.0681 4.8237 1.08 1.0 .1503/03/12 20 47 44.1132 4.8175 2.60 1.0 .1103/03/16 9 6 43.9752 4.9601 7.96 2.1 .1903/03/17 16 55 44.0990 4.8275 5.33 1.0 .1203/03/18 11 5 44.0627 4.7587 3.47 1.0 .1903/03/20 11 9 44.0737 4.7616 5.70 1.0 .0803/03/26 10 19 44.0649 4.7547 4.43 1.0 .1403/04/06 1 28 43.8902 4.6687 1.97 2.8 .1903/04/14 22 59 44.0842 4.8168 7.62 1.0 .1203/04/15 10 44 44.1198 4.7988 2.01 1.0 .1603/04/29 7 30 44.1486 4.2873 7.46 1.0 .0503/04/30 9 35 43.7830 4.5758 3.28 1.0 .1103/05/05 0 36 43.9708 4.6862 5.00 1.0 .0303/05/14 8 53 44.0608 4.7560 10.02 1.0 .0703/05/22 9 42 43.8150 4.4613 18.38 1.0 .2603/05/28 14 25 44.0177 4.8545 10.95 1.0 .0403/06/06 8 38 44.0965 4.8153 3.73 1.0 .0203/06/10 10 59 44.0801 4.8285 4.15 1.0 .2003/06/11 20 12 43.8306 4.6368 6.16 1.0 .1503/06/13 7 23 44.1133 4.8186 1.94 1.0 .11
Table A2: List of the seismic events located with the monthly velocity models – The 24
highlighted events are located in the network. The events with magnitude greater than 1.0 are
those detected and located by the ReNaSS/LDG permanent network.
Page 112 of 131Geophysical Journal International
123456789101112131415161718192021222324252627282930313233343536373839404142434445464748495051525354555657585960
Copyright © 2022 FDOKUMEN