Cyclic Modeling of Bolted Beam-to-Column Connections: Component Approach
Upload
khangminh22Category
view
3download
0
SEISMIC PERFORMANCE OF CONCRETE BEAM-SLAB-COLUMN
SYSTEMS CONSTRUCTED WITH A RE-USEABLE SHEET METAL
FORMWORK SYSTEM
by
Upul Perera
Submitted in total fulfillment of the requirements of the degree of
Master of Engineering Science by Research
The Department of Civil and Environmental Engineering
The University of Melbourne
November 2007

ii
ABSTRACT
This report describes an investigation of seismic performance of a ribbed slab system
constructed with an innovative re-usable sheet metal formwork system. Experimental
results from quasi-static cyclic lateral load tests on half-scale reinforced concrete interior
beam-slab-column subassemblages are presented. The test specimen was detailed
according to the Australian code (AS 3600) without any special provision for seismicity.
This specimen was tested up to a drift ratio of 4.0 %. Some reinforcement detailing
problems were identified from the first test. The damaged specimen was then rectified
using Carbon Fibre Reinforced Polymer (CFRPs), considering detailing deficiencies
identified in the first test. The repaired test specimen was tested under a lateral cyclic load
as per the original test arrangement up to a drift level of 4%. The performance of the
repaired specimen showed significant improvement with respect to the level of damage
and strength degradation. The results of the rectified specimen indicate that the use of
CFRPs may offer a viable retrofit/repair strategy in the case of damaged structures, where
this damage may be significant.
Two finite element analysis models were created and results of the first test were used to
calibrate the FE model. The second FE model was used to obtain detail information about
stress and strain behaviour of various components of the beam-column subassemblage
and to check the overall performance before carrying out expensive lab tests. It was
concluded that finite element modelling predictions were reliable and could be used to
obtain more information compared to conventional type laboratory tests.
Time-history analyses show that the revised detailing is suitable to withstand very large
earthquakes without significant structural damage.

iii
Declaration
This thesis is less than 40,000 words in length exclusive of tables, bibliographies and
appendices. This thesis comprises of my original work except where due references is
made in the text.
Upul Perera

iv
Acknowledgements
I would like to express my gratitude to my supervisor A/Prof. Priyan Mendis for
initiating this project and for providing continuous support and encouragement.
I thank other academics, Dr Nelson Lam and Dr.John Wilson for teaching me a lot about
earthquakes and also Dr. Nick Haritos for teaching me about structural theory. I thank Dr
John Stehle for helping me in finite element modeling issues.
The financial support provided by Andy Stodulka of Decoin Pty. Ltd and Australian
Research Council are greatly appreciated. Mr. Stodulka also provided significant
additional in-kind support.
I would like to sincerely thank Andrew Sarkady of MBT (Aust) Pty. Ltd. for materials
support for this test program. I would like to acknowledge Richard O’Connor and staff of
Structural Systems Pty.Ltd. for carrying out the rectification work.
I would like to thank Grant Rivett and Graeme Bannister, the laboratory technicians for
their help, thoughtfulness and dedication in the undertaking of the experimental work.
I thank my wife Thushari, and two sons Matheesha and Kaveesha for their patience and
support without which this project would not have been possible.

v
CONTENTS
Abstract……………………………..……………………………………………................ ii
Declaration............................................................................................................................ iii
Acknowledgements................................................................................................................iv
Contents ..................................................................................................................................v
List of Figures.........................................................................................................................x
List of Tables .......................................................................................................................xvi
List of Notations ................................................................................................................ xvii
CHAPTER 1 INTRODUCTION............................................................................................1
1.1 BACKGROUND .............................................................................................................1
1.2 PURPOSE ......................................................................................................................2
1.3 MEANS TO ACHIEVE OUTCOMES...................................................................................2
1.4 AIMS............................................................................................................................3
1.5 ARRANGEMENT OF THE THESIS ....................................................................................3
CHAPTER 2 LITERATURE REVIEW .................................................................................5
2.1 INTRODUCTION ...............................................................................................................5
2.2 EARTHQUAKE DESIGN TECHNIQUES ................................................................................5
2.2.1 Static analysis ....................................................................................................7
2.2.2 Dynamic analysis...............................................................................................8
2.2.2.1 Member stiffness ................................................................................9
2.2.2.2 Effective flange width.......................................................................12
2.2.3 Displacement-based seismic design ................................................................13
2.3 FACTORS AFFECTING THE EARTHQUAKE PERFORMANCE OF REINFORCED CONCRETE
STRUCTURES .................................................................................................................14
2.3.1 Strength and ductility of materials...................................................................17
2.3.1.1 Reinforcement...................................................................................17
2.3.1.2 CONCRETE BEHAVIOUR .....................................................................18

vi
2.3.2 Dynamic behaviour of multi-storey frames.....................................................19
2.3.3 Bar slip and bond deterioration........................................................................20
2.3.4 Joint shear deformation....................................................................................21
2.4 PERFORMANCE ASSESSMENT ........................................................................................21
2.4.1 Displacement ductility and capacity................................................................21
2.4.2 Energy dissipation capacity .............................................................................22
2.5 FINITE ELEMENT ANALYSIS...........................................................................................23
2.5.1 The material models ........................................................................................26
2.5.1.1FAILURE CRITERIA FOR CONCRETE.............................................................................26
2.5.2 Non-linear solution ..........................................................................................27
2.5.2.1 Load stepping and failure definition for FE models.........................28
2.5.3 Evolution of crack patterns..............................................................................31
2.6 RIBBED SLAB CONSTRUCTION .......................................................................................31
2.6.1 Code Recommendation for Rib Slab Design...................................................34
2.7 PREVIOUS RELEVANT EXPERIMENTAL WORK ON RIBBED SLAB SYSTEM .....................35
2.7.1 Research work carried out by Shao-Yeh et al. (1976).....................................35
2.7.2 Research work carried out by Durrani et al. (1987) ........................................39
2.7.3 Research work carried out by Pantazopoulou et al. (2001) .............................40
2.7.4 New Zealand Code (SANZ, 1995) recommendations.....................................41
2.7.5 Research work carried out by Scribner et al. (1982) .......................................42
2.8 SUMMARY.................................................................................................................43
CHAPTER 3 EXPERIMENTAL STUDY ............................................................................44
3.1 INTRODUCTION .............................................................................................................44
3.2 DESIGN .........................................................................................................................45
3.3 TEST SPECIMEN ............................................................................................................50
3.3.1 Scale.................................................................................................................50
3.3.2 Specimen details ..............................................................................................52
3.3.3 Material properties...........................................................................................54
3.4 TEST CONFIGURATION ..................................................................................................55
3.4.1 Specimen loading.............................................................................................55

vii
3.4.2 Test setup .........................................................................................................65
3.4.3 Construction of test specimen..........................................................................70
3.5 INSTRUMENTATION.......................................................................................................71
3.5.1 Strain gauges....................................................................................................71
3.5.2 Displacement transducers ................................................................................73
3.5.3 Load cells.........................................................................................................73
3.6 TESTING SEQUENCE ......................................................................................................74
3.7 2ND TEST SPECIMEN......................................................................................................75
3.7.1 General.............................................................................................................75
3.7.2 Use of externally bonded FRP for structural repair work................................77
3.7.3 Structural repair work ......................................................................................80
3.7.3.1 Surface preparation for FRP application ..........................................82
3.7.3.2 CFRP application to prepared surface ..............................................83
3.8 INSTRUMENTATION FOR SECOND TEST SPECIMEN..........................................................86
3.8.1 Photogrammetry-based measurement..............................................................87
3.9 SUMMARY.................................................................................................................88
CHAPTER 4 EXPERIMENTAL RESULTS ........................................................................89
4.1 INTRODUCTION .............................................................................................................89
4.2 1ST INTERIOR SPECIMEN................................................................................................89
4.2.1 Observed behaviour .........................................................................................89
4.2.1.1 General..............................................................................................89
4.2.1.2 Types and formation of cracks .........................................................90
4.2.1.3 Flexural cracking in the flange slab..................................................92
4.2.1.4 Flexural cracking in the ribbed beam ...............................................94
4.2.1.5 Flexural cracking in columns............................................................95
4.2.2 Measured behaviour.........................................................................................96
4.2.2.1 Hysteretic response...........................................................................96
4.2.2.2 Strain gauge readings........................................................................98
4.2.2.3 Displacement transducer readings ..................................................102
4.2.2.4 Load cell values ..............................................................................103

viii
4.2.3 Performance assessment ................................................................................104
4.2.3.1 Strength behaviour..........................................................................104
4.2.3.2 Stiffness behaviour .........................................................................106
4.2.3.3 Energy dissipation ..........................................................................108
4.2.3.4 Ductility and displacement capacity...............................................111
4.3 2ND INTERIOR SPECIMEN.............................................................................................112
4.3.1 Observed behaviour .......................................................................................112
4.3.1.1 General............................................................................................112
4.3.1.2 Types and formation of cracks .......................................................112
4.3.1.3 Flexural cracking in the flange slab................................................114
4.3.1.4 Flexural cracking in the ribbed beam. ............................................115
4.3.1.5 Flexural cracking in columns..........................................................117
4.3.2 Measured behaviour.......................................................................................117
4.3.2.1 Hysteretic response.........................................................................117
4.3.2.2 Photogrammetry-based measurement.............................................119
4.3.2.3 Strain gauge readings on reinforcement .........................................121
4.3.2.4 Displacement transducer readings ..................................................130
4.3.2.5 Load cell values ..............................................................................131
4.3.3 Performance assessment ................................................................................132
4.3.3.1 Strength behaviour..........................................................................132
4.3.3.2 Stiffness behaviour .........................................................................134
4.3.3.3 Energy dissipation ..........................................................................135
4.3.3.4 Ductility and displacement capacity...............................................136
4.4 SUMMARY...............................................................................................................137
CHAPTER 5 ANALYTICAL WORK ...............................................................................138
5.1 INTRODUCTION ...........................................................................................................138
5.2 FINITE ELEMENT ANALYSIS.........................................................................................138
5.2.1 Element types.................................................................................................139
5.2.1.1 Reinforce concrete ..........................................................................139
5.2.2 Steel plates .....................................................................................................140

ix
5.3 MATERIAL PROPERTIES...............................................................................................141
5.3.1 Concrete.........................................................................................................141
5.3.1.1 FEM Input Data ..............................................................................143
5.3.1.2 Reinforcement.................................................................................144
5.3.1.3 Geometry and finite mesh...............................................................145
5.3.1.4 Boundary conditions and loading ...................................................148
5.3.2 Non-linear solution ........................................................................................150
5.3.2.1 Calibration ......................................................................................150
5.4 THE SECOND FINITE ELEMENT MODEL.........................................................................159
5.5 TIME HISTORY ANALYSIS ............................................................................................166
5.6 SUMMARY...............................................................................................................171
CHAPTER 6 CONCLUSIONS AND RECOMMENDATIONS ..............................................172
6.1 CONCLUSIONS FROM EXPERIMENTAL STUDIES ............................................................172
6.2 FINITE ELEMENT ANALYSIS.........................................................................................173
6.3 DESIGN RECOMMENDATIONS ......................................................................................174
6.4 RECOMMENDATIONS FOR FURTHER WORK..................................................................175
6.4.1 Influence of flange slab reinforcement ..........................................................175
6.4.2 Amount of bottom reinforcement ..................................................................176
6.4.3 Shear reinforcement.......................................................................................176
BIBLIOGRAPHY...............................................................................................................178
APPENDIX A: Prototype Frame load Evaluation.........................................................A1-A9
APPENDIX B: Prototype frame Analysis of Data and Results .................................. B1-B11
APPENDIX C: Test Column moment and shear capacity calculation.......................... C1-C6
APPENDIX D: RESPONSE Analysis and RUAUMOKO input file data ....................D1-D7

x
LIST OF FIGURES
Figure 2-1: Effective bi-linear yield curvature [After (Priestley, 1998b)] ......................11
Figure 2-2: effective flange width calculation (after (Paulay and Priestley, 1992).........12
Figure 2-3: Typical stress-strain curves for reinforcing steel (a) with monotonic
loading (b) with cyclic loading mainly in the tensile range of strain. ..........18
Figure 2-4: Non-linear stress-strain relation for confined and unconfined concrete.......19
Figure 2-5: Definition of equivalent viscous damping ratio heq ......................................23
Figure 2-6: 3-D failure surface for concrete (ANSYS, 2003) .........................................27
Figure 2-7: Newton-Raphson iterative solution (3 load increments) (ANSYS, 2003) ...28
Figure 2-8: Reinforced concrete behavior in RC beam (After Kachlakev et al., 2001) ..29
Figure 2-9: (a) Integration points in concrete solid element (b) Cracking sign
[After(ANSYS, 2003)] .................................................................................31
Figure 2-10: Typical conventional ribbed slab construction .............................................32
Figure 2-11: Typical cross section of Corcon slab formwork system...............................33
Figure 2-12: Corcon rib beam and slab soffit....................................................................34
Figure 2-13: All longitudinal steel placed within shaded area to be included in
flexural resistance of beam [After (SANZ, 1995)].......................................42
Figure 2-14: Different ligatures configurations used ........................................................43
Figure 3-1: Prototype frame dimensions. ........................................................................47
Figure 3-2: Dimensions of mainframe beam section.......................................................47
Figure 3-3: Dimensions of test sub-assemblage. .............................................................53
Figure 3-4: Beam and column cross-section of test subassembly ...................................53
Figure 3-5: Top view of flange slab with reinforcement.................................................53
Figure 3-6: Bending moment diagram for beams - full scale gravity loading ................56
Figure 3-7: Shear force diagram for beams - full scale gravity loading..........................56
Figure 3-8: Axial force diagram for columns – full scale gravity loading ......................57
Figure 3-9: Bending moment diagram for beams - half scale gravity loading................57
Figure 3-10: Shear force diagram for beams - half scale gravity loading .........................58

xi
Figure 3-11: Axial force diagram for columns - half scale gravity loading ......................58
Figure 3-12: Bending moment diagram for beams - full scale earthquake loading ..........59
Figure 3-13: Bending moment diagram for columns -full scale earthquake loading........59
Figure 3-14: Shear force diagram for beams – full scale earthquake loading...................60
Figure 3-15: Shear force diagram for columns -full scale earthquake loading .................60
Figure 3-16: Bending moment diagram for beams - half scale earthquake loading..........61
Figure 3-17: Bending moment diagram for columns - half scale earthquake loading ......61
Figure 3-18: Shear force diagram for beams - half scale earthquake loading ...................62
Figure 3-19: Shear force diagram for columns - half scale earthquake loading................62
Figure 3-20: Setup for lateral loading................................................................................63
Figure 3-21: Adopted setup for lateral and gravity loading ..............................................64
Figure 3-22: Bending moment diagram for beams - Adopted half scale gravity
loading ..........................................................................................................64
Figure 3-23: Shear force moment diagram for beams - Adopted half scale gravity
loading ..........................................................................................................65
Figure 3-24: Axial force diagram for columns - Adopted half scale gravity loading .......65
Figure 3-25: Top view of the built test assembly ..............................................................66
Figure 3-26: Side view of the built test assembly .............................................................67
Figure 3-27: Photo of beam-end vertical link....................................................................68
Figure 3-28: Calibration of North vertical link .................................................................69
Figure 3-29: Calibration of South vertical link .................................................................69
Figure 3-30: Specimen ready for concreting .....................................................................71
Figure 3-31: Location of strain gauges on beam reinforcement........................................72
Figure 3-32: Location of strain gauges on column reinforcement ....................................72
Figure 3-33: Locations of displacement transducers.........................................................73
Figure 3-34: Lateral Cyclic loading sequence...................................................................75
Figure 3-35: Details of CFRP system used for rectification .............................................76
Figure 3-36: Positive moment –curvature with different reinforcing materials................78
Figure 3-37: Negative moment –curvature with different reinforcing materials ..............78
Figure 3-38: Specimen before epoxy injection..................................................................80
Figure 3-39: Filling of wide cracks with low shrinkage structural grout. .........................81
Figure 3-40: Mortar build-up near the beam column joint ................................................82

xii
Figure 3-41: Prepared concrete surface to receive FRP application .................................83
Figure 3-42: Application of Epoxy resin...........................................................................84
Figure 3-43: Laying CFRP on the Epoxy applied surface.................................................85
Figure 3-44: A ribbed roller used to impregnate resin into the fabric material.................85
Figure 3-45: CFRP repaired test specimen ready for instrumentation ..............................86
Figure 3-46: Location of strain gauges on CFRP..............................................................87
Figure 3-47: test specimen with photosensitive target points............................................88
Figure 4-1: Sketch of cracks found in the specimen .......................................................91
Figure 4-2: Location and extent of main cracking after last cycle (North side beam) ....93
Figure 4-3: Main crack in flange slab top surface (North side beam).............................94
Figure 4-4: Concrete spalling at beam-column interface ................................................95
Figure 4-5: Hysteretic response showing pin slip in subassemblage ..............................97
Figure 4-6: Fully corrected hysteretic response ..............................................................97
Figure 4-7: Strain history of a top beam bar at north column face (East corner) ............99
Figure 4-8: Strain history of a top beam bar at north column face (West corner).........100
Figure 4-9: Strain history of the beam bottom main bar (North side) ...........................101
Figure 4-10: Strain history of strain gauge in a southeast corner bottom column bar ....102
Figure 4-11: Bending moment versus beam curvature (North).......................................103
Figure 4-12: Bending moment versus beam curvature (South).......................................103
Figure 4-13: Column prestressing force versus Actuator load ........................................104
Figure 4-14: Stiffness degradation of Corcon and other specimens................................108
Figure 4-15: Drift ratio versus equivalent viscous damping ratio ...................................110
Figure 4-16: Sketch of cracks found in the repaired specimen .......................................113
Figure 4-17: Location and extent of main cracking after last cycle (North side beam) ..115
Figure 4-18: Part of rib beam (north side).......................................................................116
Figure 4-19: Cracking near the built up chamfer area.....................................................116
Figure 4-20: Fully corrected hysteretic response (second test) .......................................118
Figure 4-21: Vertical deformation of the beam (North displacement of actuator)..........119
Figure 4-22: Horizontal deformation of the beam (North displacement of actuator) .....119
Figure 4-23: Vertical deformation of the beam (south displacement of actuator) ..........120
Figure 4-24: Horizontal deformation of the beam (South displacement of actuator) .....120

xiii
Figure 4-25: Strain history of a top beam bar at north column face (East corner) ..........122
Figure 4-26: Strain history of a top beam bar at north column face (West corner).........123
Figure 4-27: Strain history of top CFRP at north column face (East corner)..................124
Figure 4-28: Strain history of top CFRP at north column face (West corner) ................124
Figure 4-29: Strain history of a top CFRP at 1.0 m away from column (East side) .......125
Figure 4-30: Strain history of a top CFRP at 1.0 m away from column (West side) ......125
Figure 4-31: Strain history of the beam bottom main bar (North side) ...........................126
Figure 4-32: Strain history of north beam bottom CFRP at 600 mm away from
column (West side) .....................................................................................127
Figure 4-33: Strain history of north beam bottom CFRP at 200 mm away from
column (West side) .....................................................................................128
Figure 4-34: Strain history of strain gauge in a southeast corner- bottom column bar ...129
Figure 4-35: Strain history of strain gauge in a southwest corner -top column bar ........129
Figure 4-36: Bending moment versus beam curvature (North).......................................130
Figure 4-37: Bending moment versus beam curvature (South).......................................131
Figure 4-38: Column prestressing force versus Actuator load ........................................132
Figure 5-1: Solid65 – 3-D reinforced concrete solid (ANSYS 2003) ...........................139
Figure 5-2: Link 8 – 3-D spar (ANSYS 2003) ..............................................................140
Figure 5-3: Solid45 – 3-D solid (ANSYS 2003) ...........................................................141
Figure 5-4: Stress-strain curve for 40 MPa concrete (Vecchio and Collins, 1986).......142
Figure 5-5: Simplified compressive stress-strain curve for concrete used in FE
model ..........................................................................................................142
Figure 5-6: Stress-strain curve for steel (obtained from testing reinforcement) ...........145
Figure 5-7: Modified stress-strain curve for steel (adopted in ANSYS model) ............145
Figure 5-8: Element connectivity: (a) concrete solid and link elements; (b) concrete
solid and steel solid element .......................................................................147
Figure 5-9: Finite element mesh used (selected concrete elements removed to
illustrate internal reinforcement) ................................................................147
Figure 5-10: Rib beam end restraints used in FE model .................................................148
Figure 5-11: Column top end restraints used in FE model..............................................149
Figure 5-12: Load versus displacement-1st test specimen test results and FE results ....151

xiv
Figure 5-13: Smeared cracks formed parallel to vertical dashed lines at 65 mm
displacement (3.42 % drift)- (a) Top view of full beam, (b) Enlarged part151
Figure 5-14: Compressive stress vectors flow at 65 mm displacement ..........................153
Figure 5-15: Compressive stresses direction in the flange slab at 65 mm displacement 153
Figure 5-16: Deformation of subassembly at 65 mm displacement- 1st specimen.........154
Figure 5-17: Longitudinal stress distribution of subassembly at 65 mm displacement-
1st FE model ...............................................................................................154
Figure 5-18: 3rd principal strain distribution of subassembly at 65 mm displacement ..155
Figure 5-19: Deformation along the beam at 65 mm displacement-1st FEM results......156
Figure 5-20: Variation of reinforcement stresses along the beam at 65 mm
displacement ...............................................................................................157
Figure 5-21: Variation of top main reinforcement stresses along the beam at different
displacements..............................................................................................158
Figure 5-22: Variation of bottom main reinforcement stresses along the beam at
different displacements-1st FEM results ....................................................158
Figure 5-23: Variation of mesh reinforcement stresses along the beam at 19 mm
displacement ...............................................................................................158
Figure 5-24: Load versus displacement-1st test specimen test results and FE model 1
&2 results....................................................................................................160
Figure 5-25: Deformation of subassembly at 65 mm displacement- 2nd FE model .......161
Figure 5-26: Deformation along the beam at 65 mm displacement- 2nd FE model .......161
Figure 5-27: Longitudinal stress distribution of subassembly at 65 mm displacement-
2nd FE model..............................................................................................162
Figure 5-28: 3rd principal strain distribution of subassembly at 65 mm displacement-
2nd FE model..............................................................................................163
Figure 5-29: Variation of reinforcement stresses along the beam at 65 mm
displacement ...............................................................................................164
Figure 5-30: Variation of top main reinforcement stresses along the beam at 65 mm
displacement ...............................................................................................165
Figure 5-31: Variation of bottom main reinforcement stresses along the beam at
different displacements- 2nd FEM results..................................................165

xv
Figure 5-32: Variation of mesh reinforcement stresses along the beam at 19 mm
displacement ...............................................................................................166
Figure 5-33: Variation of mesh reinforcement stresses along the beam at 38 mm
displacement ...............................................................................................166
Figure 5-34: Modified Takeda Degrading Stiffness Hysteresis Rule [After (Carr,
1998)]..........................................................................................................167
Figure 5-35: Concrete Beam-Column Yield Interaction Surface [After (Carr, 1998)] ...167
Figure 5-36: Peak interstorey drift ratio versus earthquake category..............................170

xvi
LIST OF TABLES
Table 2-1: Formulae to calculate the fundamental natural frequency of a building ........7
Table 2-2 Summary of load step sizes for beam model (After Kachlakev et al.,
2001) .............................................................................................................29
Table 3-1: Ultimate wind velocity and Acceleration coefficient for major cities in
Australia........................................................................................................48
Table 3-2: Design values adopted ..................................................................................49
Table 3-3: Reinforcement details of beam and column (Test specimen).......................51
Table 3-4: Consistent Scaling relationship -After (Stehle, 2002) ..................................51
Table 3-5: Reinforcement properties..............................................................................54
Table 3-6: Uniaxial compressive strength of concrete...................................................55
Table 3-7: Geometrical and mechanical properties of fibre...........................................77
Table 4-1: Comparison of attained actions and theoretical capacities .........................106
Table 4-2: Energy dissipation and equivalent damping ratio.......................................109
Table 4-3: Comparison of attained actions and theoretical capacities (2nd Test) .......134
Table 4-4: Energy dissipation and equivalent damping ratio (2nd Test) .....................136
Table 5-1: Definition of earthquake categories............................................................170

xvii
LIST OF NOTATIONS
No Fundamental Natural Frequency of a building
Ie Effective Stiffness
Ig Gross Stiffness
φy Yield curvature
Mn Nominal flextural strength
Ec Elastic modulus of concrete
Es Elastic modulus of steel reinforcement
f′c Compressive strength of concrete
ft, Tensile strength of concrete
υ Poisson’s ratio
βt Shear Transfer coefficient
b Effective flange width
bw Beam web width
µ Displacement ductility
∆max Maximum displacement
∆y Yield displacement
Ast Area of longitudinal tensile reinforcing steel
Asv Cross sectional area of the shear stirrups
s Spacing of the stirrup
εc Strain at peak stress of concrete
εs Strain of steel bars

1
Chapter 1
INTRODUCTION
1.1 Background
When designing for earthquake induced loading, most conventional, popular gravity
dominated structural systems possess a major inherent deficiency because of undesirable
member proportions. Many structures designed and constructed in Australia belong to this
category. The purpose of this study is to investigate the seismic performance of a beam-
slab-column system constructed with a re-usable sheet metal formwork system, which is
becoming popular in Australia and overseas. This innovative formwork system, Corcon,
has been developed and patented throughout the world, by the industry partner, Andy
Stodulka of Decoin Pty Ltd.
‘Corcon’ derives its name from the combination of CORrugation and CONcrete. This
reusable lightweight sheet metal form system optimises the traditional rib slab
construction by using corrugated arch metal sheet spanning over series of sheet metal
beam moulds to form the suspended concrete slab. The corrugated arched metal sheet
enables the rib beam spacing to be increased to 1200 mm from the conventional 600 mm.
There have been no investigations reported on the seismic behaviour of these types of
concrete beam-arch slab systems, both locally and internationally. The University of
Melbourne worked with the industry partner, Decoin Pty Ltd., to find an appropriate and
economical solution for this important problem.

2
1.2 Purpose
The purpose of the research presented in this thesis is to investigate the seismic
performance of Corcon slab system for various levels of seismicity, with the aim that
design recommendations are to be formulated.
The main goal is to assess current Australian design practice and to provide design
guidelines for these beam-slab-column systems constructed with the Corcon form work
system and to find a detailing strategy which will ensure a sufficient level of ductility for
various levels of seismic demands.
1.3 Means to achieve outcomes
The seismic performance of Corcon slab system was assessed through a comprehensive
experimental and analytical study.
A theoretical model of a four-storey framed structure equivalent to those in a typical frame
structure constructed with Corcon system was designed and detailed according to the
existing rules given in the Australian Concrete Structures Code, AS 3600. The Program
RUAUMOKO was used to predict the inelastic dynamic responses of the frame structure,
and to determine the expected maximum drift levels for different levels of seismicity.
The experimental work, consisted of two tests and was conducted taking an isolated half-
scale Corcon interior beam-column subassembly to understand the performance of the real
Corcon system under cyclic lateral loads. The second test was conducted after repairing
the damaged first specimen to test the effectiveness of the modified detailing and
retrofitting procedure.

3
The finite element modelling of the sub assemblage was performed using Program
ANSYS. The experimental results were used to calibrate the finite element model. The
second finite element model was prepared and used to test the performance with improved
reinforcement detailing to overcome the deficiencies identified in the experiment. A state-
of-the art photogrammetric system was used to measure the deformation of specimens
under lateral cyclic loads.
1.4 Aims
The main aims of the study are
• To investigate the seismic performance of an existing Corcon system designed only for gravity loads.
• Develop an appropriate retrofitting procedure to strengthen, the existing structures built using the Corcon system to resist seismic loads.
• Conduct a finite-element analysis to model the experimental specimens, for comparison.
• Conduct a time-history analysis to derive drift levels of a prototype system subjected to different earthquakes.
1.5 Arrangement of the thesis
This thesis is presented in the following manner:
Chapter 2 presents a range of earthquake engineering topics and structural modelling
aspects; a review of literature related to experimental testing, current design practice,
theoretical strength evaluation and modelling techniques such as finite element analysis.
Chapter 3 deals with construction and testing of interior Corcon rib beam-column
subassemblages tested in the Francis Laboratory at The University of Melbourne.

4
Chapter 4 presents the results from the half scale interior Corcon rib beam-column
subassemblage.
Chapter 5 presents the analytical components of this investigation, such as finite element
analysis and time history analysis.
Chapter 6 gives the overall conclusions and recommendations for future work.

5
Chapter 2
LITERATURE REVIEW
2.1 Introduction
This chapter presents an overview of previous work on related topics that provide the
necessary background for the purpose of this research. The literature review concentrates
on a range of earthquake engineering topics and structural modelling aspects. For the
understanding of seismic capacity, a review of literature is required in experimental
testing, current design practice, theoretical strength evaluation and analytical techniques
such as finite element modelling. The literature review begins with a coverage of general
earthquake engineering topics, which serves to set the context of the research.
At present, there is no information available on seismic performance of arched rib slab
systems. However, some limited researches on similar types of systems have been
conducted and the available literatures on those projects are reviewed in following
sections.
2.2 Earthquake design techniques
The objective of design codes is to have structures that will behave elastically under
earthquakes that can be expected to occur more than once in the life of the building. It is
also expected that the structure would survive major earthquakes without collapse that
might occur during the life of the building. To avoid collapse during a large earthquake,
members must be ductile enough to absorb and dissipate energy by post-elastic
deformations. Nevertheless, during a large earthquake the deflection of the structure

6
should not be such as to endanger life or cause a loss of structural integrity. Ideally, the
damage should be repairable. The repair may require the replacement of crushed concrete
and/or the injection of epoxy resin into cracks in the concrete caused by yielding of
reinforcement. In some cases, the order of ductility involved during a severe earthquake
may be associated with large permanent deformations and in those cases, the resulting
damage could be beyond repair.
Even in the most seismically active areas of the world, the occurrence of a design
earthquake is a rare event. In areas of the world recognised as being prone to major
earthquakes, the design engineer is faced with the dilemma of being required to design for
an event, which has a small chance of occurring during the design life time of the building.
If the designer adopts conservative performance criteria for the design of the building, the
client will be faced with extra costs, which may be out of proportion to the risks involved.
On the other hand, to ignore the possibility of a major earthquake could be construed as
negligence in these circumstances. To overcome this problem, buildings designed to these
prescriptive provisions would (1) not collapse under very rare earthquakes; (2) provide life
safety for rare earthquakes; (3) suffer only limited repairable damage in moderate shaking;
and (4) be undamaged in more frequent, minor earthquakes.
The design seismic forces acting on a structure as a result of ground shaking are usually
determined by one of the following methods:
• Static analysis, using equivalent seismic forces obtained from response spectra for
horizontal earthquake motions.
• Dynamic analysis, either modal response spectrum analysis or time history analysis
with numerical integration using earthquake records.

7
2.2.1 Static analysis
Although earthquake forces are of dynamic nature, for majority of buildings, equivalent
static analysis procedures can be used. These have been developed on the basis of
considerable amount of research conducted on the structural behaviour of structures
subjected to base movements. These methods generally determine the shear acting due to
an earthquake as equivalent static base shear. It depends on the weight of the structure,
the dynamic characteristics of the building as expressed in the form of natural period or
natural frequency, the seismic risk zone, the type of structure, the geology of the site and
importance of the building.
The natural frequency, which is the reciprocal of natural period, can be calculated using
the following formulae (Smith and Coull, 1991) as given in Table 2-1.
Table 2-1: Formulae to calculate the fundamental natural frequency of a building
(Smith and Coull, 1991)
Formula Notation Type of lateral load resisting
system
No = D1/2/0.091H D = base dimension in the direction
of motion in meters.
H = height of the building in meters
Reinforced concrete shear wall
buildings and braced steel frames
No = 10/N N = number of storeys Moment resisting frame
No = 1/CTH3/4 CT= 0.035 for steel structures, 0.025
for concrete structures,
H = height of the building in feet
Moment resisting frame is the
sole lateral load resisting system.
No = 46/H H = height of the building in meters For any type of building
The static equivalent earthquake load mainly depends on the accuracy of natural period
calculation. The Australian code (AS1170.4, 1993) recommends No = 46/H formula to

8
calculate the natural frequency of the building. The calculation of equivalent earthquake
force in the Australian code is similar to the method recommended by UBC (1997).
2.2.2 Dynamic analysis
The dynamic time-history analysis can be classified as either linear elastic or inelastic
(Chopra, 1995). The linear elastic modelling and analysis of Reinforced Concrete (RC)
structures is a well-established technique. Several commercial packages are available for
the 3-D elastic analysis of structures and are in widespread use. e.g. SAP2000, ETABS,
SPACE-GASS, Mictrostran etc. However, the results of the linear analysis are not useful
in the determination of the actual behaviour of the RC structures and the seismic safety
analysis, which depends more on inelastic displacement and deformation up to collapse
than on forces. It is necessary to take advantage of the inelastic capacity of various
components of the structure. The response spectrum approach is based on the linear force
response of an equivalent single degree of freedom (SDOF) system. There have been
several developments in the response spectrum approach including modifications to
account for some non-linear effects such as inelasticity and ductility using a response
modification factor. The use of the capacity-spectrum technique in the evaluation of RC
buildings has been suggested (ATC40, 1996). The recent developments in the field of
displacement-based response spectra (Bommer et al., 1988; Priestley and Kowalaky, 2000)
represent a promising approach that may be adapted to the simple seismic assessment of
buildings. In general, the response spectrum approach has its limitations. It does not
account for the different failure modes and sequence of component failure. It does not
provide information on the degree of damage or the ultimate collapse mechanism of a
deficient RC structure. The inelastic analysis of structures requires a non-linear dynamic
time-history procedure past the elastic response and up to collapse (Chopra, 1995). The

9
two principal approaches to model RC component behaviour are microscopic finite
element (FE) analysis and macroscopic phenomenological models. Although accurate, it is
not feasible to analyse an entire structure using microscopic FE models. It is practical to
study the behaviour of an isolated element such as a beam, column, connection, structural
wall, slab-column and slab-wall so that their macroscopic analytical models defined in
terms of global parameters are developed for use in the analysis of a complete structure.
“RUAUMOKO” (Carr, 1998) is one of the most popular programs available to carry out
time history analysis for two or three dimensional frame structures, which has a loading
input of a discretely defined acceleration record (The actual acceleration record is digitised
in 0.005, 0.01, 0.02 or 0.025-second time intervals). This program has various types of
hysteretic elements to represent the member behaviour. The commonly used simple
element in RUAUMOKO for reinforced concrete members is the modified Takeda,
stiffness-degrading model (Takeda et al., 1970). More complex elements such as Fukada
degrading Tri-linear hysteresis are also available for more refined analysis. Li Xinrong
(Carr, 1998) reinforced concrete column hysteresis rule is available in RUAUMOKO to
model concrete columns, which allows for the changes in the stiffness of a reinforced
column as the axial force in the column changes. More details about these models are
given later in Chapter 5.
2.2.2.1 Member stiffness
When analysing concrete frame structures for gravity and wind loads, it is generally
considered acceptable to base member stiffness on the uncracked section properties and to
ignore the stiffness contribution of longitudinal reinforcement. This is due to, under
service-level gravity loads, the extent of cracking will normally be comparatively minor

10
and relative and therefore absolute values of stiffness are all that are needed to obtain
accurate member forces (Paulay and Priestley, 1992).
Under seismic actions, however, it is important that the distribution of member forces be
based on the realistic stiffness values applying close to member yield forces, as this will
ensure that the hierarchy of formation of member yield conforms to assumed distributions.
The structural deformations due to seismic loading will generally be associated with high
stresses. Consequently extensive cracking in the tension zone of reinforced concrete
beams, columns or walls must be expected. The estimation of deflections for the purposes
of determining period of vibration and inter-storey drifts, will be more realistic if an
allowance for the effect of cracking on the stiffness of the member is made. The New
Zealand concrete code (SANZ, 1995) recommends a value for beam stiffness of Ie= 0.4 Ig
for rectangular sections, and Ie= 0.35 Ig for T-beam sections. More detail
recommendations for stiffness modelling of beams and columns are available elsewhere
(e.g. Carr, 1994; Paulay and Priestley, 1992). In recent papers published by Priestley
(1998a) and Priestley et al. (1998b), they have highlighted that beam stiffness is heavily
dependent on reinforcement content, and hence on strength. The use of member stiffness
based on just the second moment of area of a member, may lead to significant errors in
calculation of building period and the expected drift.
The recommended procedure of calculating the member stiffness (Priestley, 1998b) to be
used in time-history analysis is as follows:
• The first step is to obtain the moment curvature curve for the beam section using a
specialised computer program such as RESPONSE (Bentz and Collins, 2000) that
considers strain hardening effects and confinement of concrete, where appropriate.

11
Figure 2-1 shows a typical moment-curvature curve for a doubly reinforced flanged T-
beam.
• The nominal flexural strength (Mn) is determined at a curvature equal to 5 times the
nominal yield curvature (see Figure 2-1), which involves an iterative solution.
• The effective stiffness can be calculated from Equation 2-1.
Equation 2-1
• The above procedure is carried out for both negative and positive moment-curvatures.
The average stiffness value is recommended for the seismic analysis. The average is
appropriate as a consequence of moment reversal along the beam length under seismic
loading conditions.
Figure 2-1: Effective bi-linear yield curvature [After (Priestley, 1998b)]
ggcy
ne I
IEMI
⎥⎥⎦
⎤
⎢⎢⎣
⎡=
φ

12
2.2.2.2 Effective flange width
The flange contribution to stiffness in L and T-beams is typically less than the contribution
to flexural strength (Paulay and Priestley, 1992), as a result of the moment reversal
occurring across beam-column joints and the low contribution of tension flange to flexural
stiffness. Therefore, an effective flange width has to be evaluated to calculate both flexural
compressive strength and stiffness. These values are given in Figure 2-2.
Figure 2-2: effective flange width calculation ( after Paulay and Priestley, 1992)
Identical guide lines to determine the effective flange width for strength evaluation are
given in USA (ACI-318, 2002) and New Zealand codes (SANZ, 1995), while slightly
different recommendations are given in British (BS8110, 1997) and Australian codes
(AS3600, 2001).
)(1.0
)(2.0
beamsLlbb
beamsTlbb
zweff
zweff
−−+=
−−+=
Where zl is the distance between points of zero bending moment.
Equation 2-2: effective flange width calculation [after (AS3600, 2001; BS8110, 1997)]
These effective flange widths are used in analytical work described later in Chapter 5.

13
2.2.3 Displacement-based seismic design
In recent years there have been extensive examinations of the current seismic design
philosophy, which is based on provision of a required minimum strength, related to initial
stiffness, seismic intensity and a force reduction or ductility factor, considered to be a
characteristic of a particular structural system and construction material. There are two
inappropriate fundamental assumptions of the force-based design: (1) that the initial
stiffness of a structure determines its displacement response and (2) that a ductility
capacity can be assigned to a structural system regardless of its geometry, member
strength, and foundation conditions (Priestley and Kowalaky, 2000).
The damage sustained by structures during seismic events is closely related to their
displacements and deformation. For this reason, deformation-based design approaches
have been developed to create a structure with controlled and predictable performance.
This design process is consistent with the capacity design philosophy, as it requires control
over deformation demand and supply of the energy dissipation zones. The direct
displacement-based design has now matured to the stage where seismic assessment of
existing structures or design of new structures can be carried out to ensure that particular
deformation-based criteria are met.

14
2.3 Factors affecting the earthquake performance of reinforced
concrete structures
As reported by Sanders, (1995), the poor performance of buildings was generally due to a
combination of inadequate strength and stiffness of the overall seismic resisting system
and a poor distribution of strength and stiffness over successive storeys, leading to soft
storey formation, a lack of provision of an adequate load path through the structure leading
to partial or complete failure of the structure, and poor detailing of joints and connections
leading to various types of non- ductile failures.
• Ductility Capacity :
As described by Park (1992), the term ductility in structural design is used to define the
ability of a structure to undergo large inelastic deformations in the post-elastic range
without a substantial reduction in strength. Ductility is an essential design requirement for
a structure to behave satisfactorily under a severe earthquake excitation. The ductility
demand of a structure under seismic loading is dependent on the construction material, the
design elastic strength and the structural system.
The required ductility of a structure, element or section can be expressed in terms of the
maximum imposed deformations. Often it is convenient to express the maximum
deformation in terms of ductility factors, where the ductility factor is defined as the
maximum deformation divided by the corresponding deformation present when yielding
first occurs. The use of a ductility factor permits the maximum deformations to be
expressed in non-dimensional terms as indices of post-elastic deformation for design and
analysis. Ductility factors have been commonly expressed in terms of the various
parameters related to deformations, i.e. displacements, rotations, curvatures and strains.

15
• Effects of drift:
In flexible buildings, there can be relatively large lateral movements between consecutive
storeys, which is called the inter-storey drift. This can damage the structure and can also
lead to unacceptable damage to the cladding and non-structural elements. This effect can
be controlled with careful design and detailing. The control of the estimated lateral drift is
another design aspect, which has a significant effect on the seismic performance of
structures. Australian code (AS1170.4, 1993) requires that the maximum inter-storey drift
be restricted to 1.5% of the storey height.
• P-Delta effect:
P-delta effects reduce seismic performance because the moments in lateral load resisting
structural system are increased as lateral displacements increase. This has the effect of
further increasing the lateral displacement, and placing higher demand on the structural
system. Damage will therefore occur sooner than in similar systems without a significant
P-delta effect. The importance of P-delta effects on the seismic performance of structures
depends upon both the extent of vertical load being carried by the lateral resisting system
and the stiffness of that system. If vertical loads are carried by columns, which are not
part of the lateral load resisting system, then P-delta effects are not likely to be significant.
Stiffer structural systems, such as shear walls, are less prone to P-delta effects because the
lower lateral displacements control the additional over-turning moments due to vertical
loads.
P-delta effects are significant for flexible systems, e.g. Moment-resisting frames, which
carry both vertical and lateral loads to the foundation. They are most significant for fully
ductile systems, because the relative values of vertical to lateral load are increased and the

16
lateral load resisting system is more flexible than for structures with limited ductility.
Therefore P-delta effects in ductile systems are generally reduced somewhat below the
limiting drift values allowed by the code. P-delta effects should be included in determining
the deflection at the ultimate limit state, with some exceptions, e.g. Short period (stiff)
structures, low-rise structures, and structures that are designed to respond elastically.
Sway effects produced by vertical loads acting on the structure in its displaced
configuration also should be taken in to account. The extent to which such effects are
included by designers of flexible ductile systems which carry both vertical and lateral
loads can have a significant effect on the seismic performance of such structures,
particularly when ground motions may be substantially greater than those for which the
structure has been designed (Heidebrecht, 1997).
• Effects of strong beams and weak columns:
Under earthquake and gravity loading, the critical bending moments develop in the
vicinity of the frame joints. If these moments exceed the limit state capacity of the
sections, plastic hinges will develop. These hinges may develop mainly in beams, columns
or in a combination of locations. The Beam hinge mechanism is more suitable for
achieving ductility in concrete frames than the column mechanism, because:
• A greater number of plastic hinges need to form before a collapse mechanism
develops leading to smaller inelastic rotations in each hinge.
• Columns are more critical because they carry the total gravity load from the
structure above and damage to them could lead to catastrophic failures.
• Beam hinges are more ductile because they are subjected to lower axial loads
than column hinges.

17
2.3.1 Strength and ductility of materials
2.3.1.1 Reinforcement
Figure 2-3(a) taken from Park (1992) shows typical stress-strain curves measured for
reinforcing bars under monotonic loading. In practice, the actual yield strength of the steel
will normally exceed the lower characteristic yield strength fy. Also, in the plastic hinge
regions during a major earthquake, the longitudinal reinforcement may reach strains in the
order of 20 or more times the strain at the first yield, and a further increase in steel stress
due to strain hardening may occur. The resulting increase in the flexural strength in
plastic hinge regions due to these two factors is of concern, since it is accompanied by an
increase in the shear forces, which could result in brittle failure, and an increase in the
column bending moments, which could cause column plastic hinges. A capacity design
procedure should be used to ensure that flexural yielding occurs only at the chosen plastic
hinge locations during a severe earthquake. In the capacity design procedure, when
designing regions other than plastic hinges, it is assumed that actions are those associated
with the development of the maximum probable flexural strength at the plastic hinges,
referred to as the ‘flexural over-strength’. It is evident that the properties of the
reinforcing steel to be used in seismic design should be based on rigorous statistical
analysis of the stress-stain properties, to determine the lower and upper bounds of the
flexural strength of reinforced concrete elements.
Figure 2-3(b) shows the stress-stain curves measured for reinforcing steel under cyclic
loading. The ‘rounding’ of the stress-stain curve during loading reversals in the post
elastic range is due to the Bauschinger effect. This reduction in the tangent modulus of the
steel at relatively low compressive stress during reversed loading makes the buckling of

18
compression steel more likely than would be expected during monotonic loading. It is
very important that statistical information on the stress-strain properties of the reinforcing
steel used in seismic regions be available. A proper capacity design cannot be undertaken
without the knowledge of the likely variations of steel properties to obtain strength factors,
and adequate ductility of plastic hinges of members cannot be ensured if the steel is brittle
(Park, 1992).
(a)
(b)
Figure 2-3: Typical stress-strain curves for reinforcing steel (a) with monotonic loading (b) with cyclic loading mainly in the tensile range of strain.
2.3.1.2 Concrete Behaviour
Figure 2-4 taken from Mander et al., (1988) illustrates a typical non-linear stress-strain
relationship for confined and unconfined concrete. The confinement is provided by the

19
lateral reinforcement. Concrete is a strain-softening material, unlike structural steel, which
is a strain-hardening material. Strain softening is a decline of stress at advance strain, and
is reflected in the moment-curvature diagrams of flexural members.
Figure 2-4: Non-linear stress-strain relation for confined and unconfined concrete.
2.3.2 Dynamic behaviour of multi-storey frames
It is shown from non-linear dynamic analysis that unexpected distribution of bending
moments may occur in columns of multi-storey frames, compared with the distribution
obtained from static lateral loading (Paulay and Priestley, 1992). Static lateral load
analyses indicated that points of contraflexure exist generally close to mid height of
columns. However, non linear dynamic analyses suggest that at certain times during the
response of the structure to earthquake ground motions, the point of contraflexure in a
column between floors may be close to the beam-column joint and the column may even
be in single curvature. The reasons for the unexpected distribution of column bending
moments at some instants of time is the strong influence of higher modes of vibration,
particularly second and third modes (Paulay and Priestley, 1992).

20
The shift of point of contraflexure in the columns to positions well away from mid height
in some cases means that the column moments induced may be much higher than the
moments obtained from the static lateral load analysis and may lead to plastic hinges
forming in columns. Thus, columns will need extra lateral reinforcement to provide
sufficient confinement for concrete.
Frames subjected to severe earthquake motions will undergo several reversals of loading
well into the inelastic range during an earthquake. The factors that affect the load
deflection relationship of concrete members subjected to large cyclic inelastic
deformations are:
1. The inelastic behaviour of the steel reinforcement: when subjected to reversed loading,
the stress strain curve becomes non-linear at a much lower stress than the initial yield
strength.
2. The extent of cracking of concrete: The opening and closing of cracks will cause a
deterioration of concrete, hence will result in stiffness degradation. The larger the
portion of load carried by the concrete, the larger the stress degradation.
3. The effectiveness of bond and anchorage: A gradual deterioration of bond between
concrete and steel occurs under high intensity cyclic loading.
4. The presence of shear: High shear forces will cause further loss of stiffness because of
increase in shear deformation in plastic hinge zones under reversed loading.
2.3.3 Bar slip and bond deterioration
Bar bond slip plays a significant role in the performance of reinforced concrete structures
such as in the case of inadequate anchorage of the beam bottom reinforcement. After
yielding of the beam longitudinal reinforcement the bond slip propagates to the beam–

21
column joint causing additional rotation at the beam–column interface. When the bottom
longitudinal reinforcement starts to slip, pullout of the bottom reinforcement occurs which
reduces the positive moment capacity substantially. This in turn will reduce the shear in
the joint. The beam will experience rigid body rotation with pronounced pinching (Paulay
and Priestley, 1992).
2.3.4 Joint shear deformation
Joint shear deformation is an important component of the local and overall deformations
of the structure. Experimental measurements on specimens representing existing beam–
column joints showed that joint shear deformation contributes over 30% of the story drift
(Miranda, 1996). Shear failure in the joint element can be defined by compressive failure
of deteriorated concrete due to cracking defined by maximum strain in concrete and tensile
failure when the reinforcement bar reaches the limit state. In spite of the tremendous
advances in the development of sophisticated models for the non-linear analysis of RC
structures, the accuracy and reliability of the results remain to be established. The lack of
reliability with current analysis methods is partly because of limitations in modelling and
the adopted simplifying assumptions (Miranda, 1996).
2.4 Performance assessment
2.4.1 Displacement ductility and capacity
Most researchers relate adequate performance to a certain level of displacement ductility
factor. Displacement ductility factor is defined as:
y∆
∆= maxµ Equation 2-3
Where, max∆ = Maximum displacement, y∆ = Displacement at yield

22
The displacement ductility factor required for a typical structure is usually between 3 to 6.
Most design codes refer to this, as the ductility required of a structure responding to a
major earthquake. One disadvantage of using ductility factors as a performance criterion is
that very often the load-deflection relation for a structural component does not have a
well-defined yield point. Because of the difficulties in the definition of yield displacement,
some researchers (Durrani and Wight, 1985; Park, 1988) have suggested that the
deformation history used in quasi-static testing should be based on the drift ratio rather
than the ductility factor. Also, for the case of interior connections, where significant
pinching of the hysteretic responses occurs as a result of slippage of beam reinforcement,
the ductility factor becomes a meaningless parameter. Paulay (1988) suggested that
structures withstanding a storey drift of up to 3% are satisfactory. A maximum inter-storey
drift ratio of 2% has also been a commonly accepted limit. The Australian earthquake
loading code (AS1170.4, 1993) also states that the design storey drift should not exceed
1.5%. It should also be noted that the New Zealand loading code (NZS4203, 1992) states
that the design storey drift should not exceed 2% for hn≤15m, where hn is the height from
base of building to the level of uppermost principal seismic weight.
2.4.2 Energy dissipation capacity
Energy dissipation capacity has been proposed by many investigators as a measure of
member performance. Energy dissipation capacity can be easily obtained as the area
within the hysteretic loops. However, the energy dissipation capacity of a test specimen is
dependent on several parameters that include material properties, reinforcing details,
geometry of the unit and peak deformations. Hence the use of the total energy dissipation
capacity in order to assess the performance of test specimens of different characteristics
and tested under different conditions would be doubtful.

23
One of the more common approaches adopted for the measure of energy dissipation is the
use of equivalent viscous damping ratio (heq). This heq value is defined by Kitayama et al.
(1991) as the ratio of the energy dissipated within half a cycle to π2 times the strain
energy at peak of an equivalent linear elastic system. This heq value is used to determine
the energy dissipated in a particular loading cycle, and to measure the degree of pinching
of the hysteretic loops. The definition of heq is illustrated in Figure 2-5.
Figure 2-5: Definition of equivalent viscous damping ratio heq
[After (Quintero-Febres and Wight, 1997)]
2.5 Finite element analysis
The application of the finite element modelling (FEM) to RC structures has been
underway for the last 20 years, during which time it has proven to be a very powerful tool
in engineering analysis. The wide dissemination of computers and development of
advanced finite element techniques have provided means for analysis of much more
complex systems in a much more realistic way.
For any type of structure, the more complicated its structural geometric configuration
becomes the requirement for a computer-based numerical solution is increased. It has also

24
been shown that experimental investigations are time consuming, capital intensive and
even often impractical. The FEM is now firmly accepted as a very powerful general
technique for the numerical solution of a variety of problems encountered in engineering.
For concrete structures in particular, because of complexities of concrete behaviour in
tension and compression together with integrity of concrete and steel, extreme difficulties
are encountered in modelling and obtaining closed form solutions, even for very simple
problems (Abdollahi, 1996).
The civil engineering structures are today designed with respect to the limit state of
serviceability and limit states of the strength and stability. These complex problems of a
different nature are possible to be solved by FEM methods. Nonlinear elastic concrete
models have been extensively used in finite element analysis of RC structures with vary-
ing degrees of success.
The main obstacle to finite element analysis of reinforced concrete structures is the
difficulty in characterizing the material properties. Much effort has been spent in search of
a realistic model to predict the behaviour of reinforced concrete structures. Due mainly to
the complexity of the composite nature of the material, proper modelling of such
structures is a challenging task. Despite the great advances achieved in the fields of
plasticity, damage theory and fracture mechanics, among others, a unique and complete
constitutive model for reinforced concrete is still lacking.

25
Finite element analysis has advantages over most other numerical analysis methods,
including versatility and physical appeal. The major advantages of finite element analysis
can be summarised as follows (Cook et al., 2002):
Finite element analysis is applicable to any field problem.
There is no geometric restriction. The body analysed may have any shape.
Boundary conditions and loading are not restricted.
Material properties are not restricted to isotropy and may change from one element
to another or even within an element.
Components that have different behaviours, and different mathematical descriptions,
can be combined.
A finite element analysis closely resembles the actual body or region.
The approximation is easily improved by grading the mesh.
Some disadvantages of finite element analysis are:
It is fairly complicated, making it time-consuming and expensive to use.
It is possible to use finite element analysis programs while having little knowledge of
the analysis method or the problem to which it is applied. Finite element analyses
carried out without sufficient knowledge may lead to results that are worthless and
some critics say that most finite element analysis results are worthless (Cook et al.,
2002).
Specifically developed computer programs are used in finite element analyses of
reinforced concrete structures. However, many commercially available general-purpose
codes provide some kind of simplified material models intended to be employed in the
analysis of concrete structures.

26
2.5.1 The material models
The program ANSYS, Version 8 (2003) was used in this study to model the test
specimens. Stehle (2002) used successfully in the past to model beam-column
subassemblages. Its reinforced concrete model consists of a material model to predict the
failure of brittle materials, applied to a three-dimensional solid element in which
reinforcing bars may be included. The material is capable of cracking in tension and
crushing in compression. It can also undergo plastic deformation and creep. Three
different uniaxial materials, capable of tension and compression only, may be used as
smeared reinforcement, each one in any direction. Details of element types used for
concrete and reinforcement are given in Chapter 5.
2.5.1.1 Failure Criteria for Concrete
The concrete model in ANSYS is capable of predicting failure for concrete materials. As
mentioned in the previous section both cracking and crushing failure modes are accounted
for. The two input strength parameters – i.e., ultimate uniaxial tensile and compressive
strengths – are needed to define a failure surface for the concrete. Consequently, a
criterion for failure of the concrete due to a multi-axial stress state can be calculated
(William and Warnke, 1975).
A three-dimensional failure surface for concrete is shown in Figure 2-6. The most
significant nonzero principal stresses are in the x and y directions, represented by σxp and
σyp, respectively. Three failure surfaces are shown as projections on the σxp-σyp plane. The
mode of failure is a function of the sign of σzp (principal stress in the z direction). For
example, if σxp and σyp are both negative (compressive) and σzp is slightly positive (tensile),

27
cracking would be predicted in a direction perpendicular to σzp. However, if it is zero or
slightly negative, the material is assumed to crush (ANSYS, 2003).
Figure 2-6: 3-D failure surface for concrete (ANSYS, 2003)
2.5.2 Non-linear solution
In non-linear analysis, the total load applied to a finite element model is divided into a
series of load increments called load steps. At the completion of each incremental solution,
the stiffness matrix of the model is adjusted to reflect nonlinear changes in structural
stiffness before proceeding to the next load increment. The program ANSYS, 2003 uses
Newton-Raphson equilibrium iterations for updating the model stiffness. Program ANSYS
is used in finite element analysis in Chapter 5.
Newton-Raphson equilibrium iterations provide convergence at the end of each load
increment within tolerance limits. Figure 2-7 shows the use of the Newton-Raphson
approach in a single degree of freedom nonlinear analysis.

28
Displacement
Load
Converged Solutions
Figure 2-7: Newton-Raphson iterative solution (3 load increments) (ANSYS, 2003)
Prior to each solution, the Newton-Raphson approach assesses the out-of-balance load
vector, which is the difference between the restoring forces (the loads corresponding to the
element stresses) and the applied loads. Subsequently, the program carries out a linear
solution, using the out-of-balance loads, and checks for convergence. If convergence
criteria are not satisfied, the out-of-balance load vector is re-evaluated, the stiffness matrix
is updated, and a new solution is attained. This iterative procedure continues until the
problem converges (ANSYS, 2003).
2.5.2.1 Load stepping and failure definition for FE models
For the non-linear analysis, automatic time stepping in the ANSYS program predicts and
controls load step sizes. Based on the previous solution history and the physics of the
models, if the convergence behaviour is smooth, automatic time stepping will increase the
load increment up to a selected maximum load step size. If the convergence behaviour is
abrupt, automatic time stepping will bisect the load increment until it is equal to a selected

29
minimum load step size. The maximum and minimum load step sizes are required for the
automatic time stepping.
In the FE study conducted by Kachlakev et al. (2001), it was shown that the convergence
of the models depended heavily on the behaviour of the reinforced concrete structure. A
full size RC bridge beam model was used by Kachlakev et al. (2001) to demonstrate the
load stepping. Figure 2-8 shows the load-deflection plot of the beam with four identified
regions exhibiting different reinforced concrete behaviour. The load step sizes have been
adjusted, depending upon the reinforced concrete behaviour occurring in the model as
shown in Table 2-2.
Figure 2-8: Reinforced concrete behavior in RC beam (After Kachlakev et al., 2001)
Table 2-2 Summary of load step sizes for beam model (After Kachlakev et al., 2001)
Table 2-2 shows the load step sizes used by Kachlakev et al. (2001) to obtain the
converged solution for non-linear analysis. As shown in the table, the load step sizes do

30
not need to be small in the linear range (Region 1). At the beginning of Region 2, cracking
of the concrete starts to occur, so the loads have been applied gradually with small load
increments. A load step size of 9.1 N (2 lb) is defined for the automatic time stepping
within this region. As first cracking occurs, the solution becomes difficult to converge. If a
load applied on the model is not small enough, the automatic time stepping will bisect the
load until it is equal to the minimum load step size. After the first cracking load, the
solution becomes easier to converge. Therefore the automatic time stepping increases the
load increment up to the defined maximum load step size, which is 340 N (75 lb) for this
region. If the load step size is too large, the solution either needs a large number of
iterations to converge, which increases the computational time considerably, or it diverges.
In Region 3, the solution becomes more difficult to converge due to yielding of the steel.
Therefore, the maximum load step size is reduced to 110 N (25 lb). A minimum load step
size of 4.5 N (1 lb) has been defined to ensure that the solution will converge, even if a
major crack occurs within this region. Finally, for Region 4, a large number of cracks
occur as the applied load increases. The maximum load step size has been defined to be
22.7 N (5 lb), and a 4.5 N (1 lb) load increment is specified for the minimum load step size
for this region. For this study, a load step size of 4.5 N (1 lb) is generally small enough to
obtain converged solutions for the models. It should be noted that the above procedure
cannot be used without at least having a rough idea of the load deformation curve,
therefore, this becomes a trial and error iterative procedure.
The failure of the models has been defined when the solution for a 4.5 N (1 lb) load
increment still does not converge. The program then gives a message specifying that the
models have a significantly large deflection, exceeding the displacement limitation of the
ANSYS program.

31
2.5.3 Evolution of crack patterns
In ANSYS, stress and strain outputs are calculated at integration points of the concrete
solid elements. Figure 2-9(a) shows the integration points in a concrete solid element. A
cracking sign represented by a circle appears when a principal tensile stress exceeds the
ultimate tensile strength of the concrete. The cracking sign appears perpendicular to the
direction of the principal stress as illustrated in Figure 2-9(b). The smeared cracked pattern
in ANSYS can be displayed at each integration point or at element centroid.
(a) (b)
Figure 2-9: (a) Integration points in concrete solid element (b) Cracking sign [After(ANSYS, 2003)]
2.6 Ribbed slab construction
Rib beam slab systems have long been regarded as one of the most economically efficient
forms of reinforced concrete “Gravity Load Resisting Systems” (GLRS). Specially for
long span slabs or slabs with very high-imposed loading, rib slab construction is extremely
economical and viable. The first rib slab system invented by Francois Hennebique, has
been patented in early 1900’s,which had fallen into disuse due to the high cost of timber
and labour. The innovative long span light weight formwork system, Corcon, has been
developed and patented throughout the world, by Decoin Pty Ltd in response to an
increasing shortage of good quality plywood and the increasing need for a safe,
economical and durable structural slab system. The Corcon slab, in contrast to the

32
conventional rib slab system, is easier and less expensive to construct from both labour
and material points of view. The Corcon system has better performance with respect to
environmental benefits such as greenhouse gas emission, less use of embodied energy and
reduction of whole of the cycle cost in terms of maintenance and energy used (Dragh,
2000).
This reusable lightweight sheet metal form system optimises the traditional rib slab
construction (see Figure 2-10) by using corrugated arch metal sheet spanning over series
of sheet metal beam moulds to form the suspended concrete slab. The corrugated arched
metal sheet enables the rib beam spacing to be increased to 1200 mm from the
conventional 600 mm. A typical cross section of the Corcon formwork system is shown in
Figure 2-11. This system could be designed to span up to 9.0 m with simple reinforcement
and to span 14.0 m with post-tensioning.
600 mm Typical
Plastic / plywood Rib moulds
Figure 2-10: Typical conventional ribbed slab construction

33
Figure 2-11: Typical cross section of Corcon slab formwork system
The use of ribs to the soffit of the slab reduces the quantity of concrete and reinforcement
and also the weight of the floor. The saving of materials of the conventional ribbed slab
systems will be offset by the complication of formwork and placement of reinforcement.
However, formwork complication is minimised by use of standard, modular, reusable
formwork, usually made from polypropylene or fibreglass. The Corcon formwork system
is further refined to achieve additional savings over the conventional formwork system,
such as reduction of scaffolding frames by over 50 % resulting in 50 % labour saving. The
reduction of the formwork supporting points are possible due to the fact that the sheet
metal rib forms are capable of spanning a greater distance and the use of a special
bracketing system, which will prevent the buckling of formwork. This continuously cast
rib slab system gives enhanced structural performance by making use of the high shear
resistance of the slab and the high flexural resistance of the ribs. The slab between ribs is
capable of supporting considerable superimposed dead and live loads, due to the natural
arching action. The first Corcon slab was installed in a two-storey house in Queanbeyan,
NSW in March 1995. Since then, over 80 000 m2 has been placed including 10 000 m2
installed in Kuala Lumpur. Figure 2-12 illustrates the slab soffit of a Corcon slab system.

34
Figure 2-12: Corcon rib beam and slab soffit
2.6.1 Code Recommendation for Rib Slab Design
For conventional rib slab systems various minimum member sizes, proportions and rib
spacing have been specified in British and U.S. codes. ACI code(ACI-318, 2002) limits
the maximum clear rib spacing to 800 mm, New Zealand code (SANZ, 1995) limits the
maximum clear rib spacing to 750 mm, whereas British code (BS8110, 1997) allows a rib
spacing of up to 1500 mm. The commentary to the U.S. and New Zealand codes indicates
that the size and spacing limitations for rib slab construction are based on successful
performance in the past and with an allowance of 10% higher shear stress carried by
concrete.
ACI and New Zealand codes recommend that rib depth excluding topping should not be
greater than 3-1/2 times the minimum width of the rib. The minimum width of the rib
should not be less than 100 mm. The minimum thickness of slab should not be less than 50
mm or one-twelfth of clear distance between ribs whichever is greater. In contrast BS
Code requires that the depth excluding topping should not be greater than four times the

35
width of the rib. The minimum width of the rib is determined by the consideration of
cover, bar spacing, fire and durability. BS code also specifies that the minimum thickness
of slab should not be less than 50 mm or one tenth of clear distance between ribs
whichever is greater.
Clearly, experimental work is required to explore performance of this new rib system,
which is quite different to the conventional system. It must be noted that Australian
concrete structures Code (AS3600, 2001) does not provide any design guidelines for rib
slab construction.
2.7 Previous Relevant Experimental Work on Ribbed Slab Systems
There have been no investigations reported on seismic behaviour of concrete beam-arch
slab systems, both locally and internationally. However, there has been a limited amount
of research into reinforced concrete T-beams and beams with flanges. As no directly
related research work was found, some relevant research projects were reviewed and
presented in following sections.
2.7.1 Research work carried out by Shao-Yeh et al. (1976)
The work covered by Shao-Yeh et al. includes an experimental and analytical study
program to investigate the inelastic behaviour of critical regions that may develop in a
beam near its connection with the column of a reinforced concrete ductile moment-
resisting space frame when subjected to severe earthquake excitations. In the experimental
program, a series of nine cantilever beams, representing half-scale models of the lower
story girder of a 20-storey ductile moment-resisting reinforced concrete office building
was designed according to ACI 318-71 Code. These cantilever beams were designed in

36
order to study the effects of (1) the slab by testing T-beams with a top slab width equal to
the effective width specified by the ACI 318-71 Code; (2) relative amounts of top and
bottom reinforcement by varying the amounts of bottom reinforcement.
The amount of instrumentation (mostly electronic transducers) used in the experimental
set up provided valuable data for obtaining the overall response of the test beams, as well
as for studying in detail most of their deformation and resistance mechanisms. Data from
the continuously recorded hysteretic force deformation diagrams provided excellent
information on the overall beam behaviour since the history of stiffness degradation,
strength degradation and energy dissipation were easily deduced using such data.
Photogrammetric techniques were used for studying the deformation pattern of critical
regions in order to detect the nature of shear distortion. Shao-Yeh et al. concluded that
more realistic models, such as beam-column subassemblages, should be tested to study the
effect of critical regions near beam-column connections and the contribution of different
types of floor systems in the overall behaviour of these assemblages.
It was found that the stiffness degradation occurring in R/C beams has been identified to
be very sensitive to the loading history. It has been observed that once the peak
deformation of a cycle increased in either direction during inelastic load reversals the
initial stiffness and energy dissipation per cycle were observed to degrade during
subsequent reversals. Stiffness degradation also occurs due to repeated applications of
loading reversals at constant large beam displacement ductilities. In the low shear stress
situations, the Bauschinger effects of steel and bond deterioration have been considered
the main sources of stiffness degradation.

37
The failure of unsymmetrically reinforced beams (commonly found in T-beams with
unequal top and bottom reinforcement) subjected to reversals after flexural yielding,
precipitated or accelerated by local buckling of the bottom bars near the beam support
when these bars were compressed during downward loadings. For the symmetrically
reinforced beams, failure appears to have been caused by the gradual loss of shear transfer
capability along large cracks, which opened up across the entire beam section.
It was identified that the energy dissipation capacity of R/C beams can be increased by
delaying the degradation of stiffness and the early failure of the beam, which may result
from buckling of the compression bars. More specifically, this can be achieved in the
following ways: by providing supplementary cross-ties to support the compression bars
unrestrained by corners ties. Using supplementary ties, a 74% increase in the energy
dissipation capacity was obtained when compared to a beam without such ties. By
increasing the amount of bottom steel by 89 %, there was an improvement in the energy
dissipation capacity by 55%.
It was found that the bond stress behaviour of anchored main bars in compression and
tension is different. The length required to develop applied compression forces along
cyclically loaded anchored main bars was less than that required to develop tension, i.e., a
larger maximum bond stress was developed along compression bars than along tension
bars. There were two areas where bond stress could not develop effectively. One was near
the beam-column interface, where bond disruption occurred as a consequence of the shear
that developed in the bar due to dowel action at the interface crack. The other area where
the bond could not be properly developed was along the length where yielding took place

38
at the peaks of cyclic loading. Here, bond disruption was mainly due to considerable
contraction of the bar.
It was concluded that the main influence of the slab on the inelastic behaviour of T-beams
was the contribution of slab reinforcement to the top tensile steel area. The increase in
downward moment capacity due to slab reinforcement caused more energy dissipation per
cycle. However, this increase imposed higher compression in the bottom compression
zone, and higher shear force acting in the downward direction. These increased
compression and shear forces could cause early buckling of bottom bars and increase the
amount of shear degradation. These factors should be considered in the analysis and
design of the critical regions near beam-column connections. Therefore confinement of
compression bars in T-form beams (such as rib beams) is required.
A comparison of the hysteretic behaviour of beams with different lateral tie reinforcement
indicated the advantages of providing lateral supports for main compression bars by means
of stirrup-tie corners or by supplementary cross-ties. It was recommended, therefore, that
current provisions for the arrangement of lateral ties for longitudinal bars in the columns
also apply to compression bars in beams. Therefore, it may be essential to keep ligatures in
rib beams, even if the shear requirement is not critical.
It was concluded that when full deformational reversals are expected to occur in the beam
critical regions near the column connections, there is a significant improvement in energy
dissipation capacity. It was recommended that the bottom (positive moment) steel be at
least 75 percent of the top (negative moment) steel to achieve this condition. This rule may
be useful to check the performance of a rib beam with different bottom steel percentages.

39
2.7.2 Research work carried out by Durrani et al. (1987)
The work covered by Durrani et al. includes an experimental and analytical study program
to investigate the behaviour of interior beam-to-column connections including a floor slab.
They tested three subassemblages. The length of the beam and the height of the columns
represented one half of the span and storey height, respectively. This testing arrangement
was based on the assumption that for moment-resisting frames subjected to lateral loading,
the inflection points will occur approximately at mid span of beams and at mid-height of
columns and will remain stationary during load reversals. This assumption resulted in test
specimens that were convenient for laboratory testing. Despite this simplification, such
tests have given considerable insight into the behaviour of joints.
The test specimens have been designed based on the assumption that when the slab beam
was in negative bending, the beam longitudinal reinforcement and the slab longitudinal
reinforcement over the entire width of the slab would yield simultaneously. The columns
were designed to be at least 20 percent stronger than the slab beam to ensure the formation
of flexural hinges in the beams.
It was identified from the test results of subassemblages, that the hysteretic loops became
increasingly pinched after the 2% drift. This was attributed mainly to the opening and
closing of wide flexural cracks at the bottom of the main beams. It was also observed that
a major flexural crack formed at the beam-to-column interface of the specimen.

40
Cracking of the joint core due to shear in the joint was identified as an important factor
that affects the bond of reinforcing bars passing through the joint. It was also identified
that there is a better anchorage of top bars compared to the bottom bars. This can be partly
attributed to the confinement of the upper portion of the joint by the slab. However, the
major factor was the larger amount of top steel compared to the bottom steel.
Durrani etal. observed that main beam top reinforcements started yielding at the drift of
1.5 % while the slab reinforcement remained elastic and the strain in the slab
reinforcement decreased with the distance away from the beam. However, once the main
beam top reinforcement yielded, the strain in the slab reinforcement increased rapidly, the
reinforcing bars away from the main beam experienced higher strain than the bars close to
the main beam. At a drift level of 4%, the reinforcement in the entire width of the slab had
yielded. Thus, for server earthquake loading, the contribution of the slab in calculating the
beam flexural strength cannot be ignored.
It was concluded that beams with slab sections (T beams) with unequal amounts of top and
bottom steel (more top steel than bottom steel), the range of strain demand during reversed
cyclic loading will be more severe for the bottom steel. Thus, bond deterioration and bar
slip problems will be more significant for the bottom steel.
2.7.3 Research work carried out by Pantazopoulou et al. (2001)
The work covered by Pantazopoulou et al. includes an experimental and analytical study
program to investigate the effect of slab participation in seismic design. Until recently, it
was an established design practice to neglect the presence of the slab in estimating beam
stiffness and strength, except when the slab was located in the compression zone of the
beam (known as T beam design). Experimental evidence from tests on complete frames

41
and slab-beam-column assemblies has illustrated that this practice resulted in the gross
underestimation of beam flexural strength in the assumed plastic hinge regions (at the face
of beam column connections). This neglected source of beam flexural over strength has
significant consequences in the realization of the objectives of the established capacity
design frame work for reinforced concrete (RC) where beam shear design, joint
dimensioning, and column flexure/shear detailing are controlled by the requirement of
beam flexural yielding.
Experimental studies have shown that at large drifts, the entire width of the slab might be
engaged as additional tension reinforcement to the beams subjected to hogging moments.
Therefore, in the design, the effects such as increased slab participation on structural
stiffness, bar curtailment, beam shear demands must be considered.
2.7.4 New Zealand Code (SANZ, 1995) recommendations
The New Zealand earthquake code (SANZ, 1995) provides some rules to include slab
participation. According to the New Zealand code recommendations, only some of the
reinforcement in slabs parallel and integrally built with a beam can be taken into
consideration in resisting negative moments at the supports of continuous beams. When
earthquake induced moments are to be resisted the tensile and compression forces in the
beams must be transferred to the core of the column beam joints. The effectiveness of
force transfer to the joint core from slab bars, situated a large distance from the column, is
doubtful. On the other hand the moment input capacity of the beams to the columns during
large inelastic lateral displacements of the frame must not be grossly underestimated if
columns are to be protected against early yielding. The Code intended to permit the in-
clusion of the slab steel, within the prescribed width limits, into the evaluation of the

42
negative moment of resistance of the section and to require it to be considered when the
over strength of the section is being assessed.
Where transverse beams of comparable size to that under consideration frame into a
column, a larger slab width is considered in recognition of a more efficient force transfer
to the column beam joint core. The four cases normally encountered are illustrated in
Figure 2-13.
Figure 2-13: All longitudinal steel placed within shaded area to be included in flexural resistance of beam [After (SANZ, 1995)]
2.7.5 Research work carried out by Scribner et al. (1982)
Scribner et al. have studied the influence of different arrangement of ligatures on the
behaviour of doubly reinforced flanged concrete T- beams during repeated reversed
inelastic flexure loading. The types of ligatures used are shown in Figure 2-14.

43
Type-1 Type-2 Type-3
Figure 2-14: Different ligatures configurations used
The results indicated that the use of type 1 and type 2 ligatures has no significant effect on
the cyclic flexural behaviour. However, the use of type 3 ligatures indicated little loss of
cyclic flexural capacity.
It was found that the shear requirement in rib slab design was not critical for the specimen
used in this project. The experimental details are given in Chapter 3. The design
calculations for the test specimen are presented in Appendix–B. V-shape ligature (similar
to type-3) was used in the rib beam test assembly to improve the ease of construction.
2.8 Summary
The information on seismic performance of arched rib-slab system is not available. A
review has been done on the available research findings on similar types of systems. The
earthquake design techniques have been presented. In this study due consideration is given
to static, dynamic analysis and displacement based seismic designs. The factors affecting
the earthquake performance of reinforced concrete structures have been discussed with
data obtained by various researches on topics such as ductility capacity, P-delta effect,
effect of strong beam and weak column etc. The research findings on strength and ductility
of materials, performance assessment, finite element analysis and ribbed slab construction
have been dealt in detail with reference to experimental data and applications in the field.

44
Chapter 3
EXPERIMENTAL STUDY
3.1 Introduction
This chapter describes the design, construction and testing of two interior Corcon rib
beam-column subassemblages tested in the Francis Laboratory at The University of
Melbourne. The second test specimen was the Carbon Fibre Reinforced Polymer (CFRP)
repaired version of the damaged first specimen.
The first section of this chapter describes the design of prototype model structure and the
test specimen. Details of test specimen, the material properties used and the design
parameters used in designing of prototype structure are presented. The details of test set up
and instrumentation used in the test are presented and discussed.
The approximate dead and live loading of the prototype structure was represented by
adjusting the end reactions. The column axial loading was simulated by prestressing
column ends of the test specimen. The specimens were tested in the reaction frame, with
increasing ratios of quasi-static cyclic drift being applied.
Details of CFRP rectification work of the damaged original test specimen are presented in
section 3.7. The related CFRP design process and the additional instrumentation for the
second test are also presented.

45
3.2 Design
The planning of the experimental program was done considering configuration of the
existing reaction frame at Francis Laboratory at The University of Melbourne. This was
one of the criteria in planning the test procedure and configuration of the test specimen
due to limited funding available for modification or rebuilding a new test set up. This
reaction frame has been designed to investigate seismic performance of reinforced
concrete wide band beam frame interior and exterior connections (Abdouka, 2003; Stehle,
2002). As found in Chapter 2, the existing reaction frame is more or less similar to the
reaction frames used by other researchers for testing beam-column subassemblages. Since
one of the main objective was to assess current Australian design practice and to provide
design guidelines for these beam-slab-column systems constructed with the Corcon form
work, it was decided that the first test specimen should be designed in accordance with
Australian code requirements (AS-1170.4, 1993; AS-3600, 2001). However, basic design
guidelines for rib slabs are not available in Australian code (AS-3600, 2001) and therefore,
main design assumptions and procedure were gathered from British and US codes (ACI-
318, 1999; BS-8110, 1995). The Corcon reinforced concrete rib beam section was
designed using Australian standards. Details of adopted design are presented in Appendix
A.
A typical four-storey, six bay ordinary moment resisting framed building constructed with
Corcon system as shown in Figure 1, was considered as a prototype model structure for
the study. A mainframe spacing of 6.0 m in the transverse direction was assumed. A
column size of 500 mm square and beams of 894 mm total depth and 2400 mm wide
flange slab were selected. These sizes are consistent with typical Corcon formwork

46
dimensions. As shown in Figure 2, a one way spanning 170 mm thick solid slab was used
between the main flange beams. A half scale of this prototype was used in testing.
The building was designed as an Ordinary Moment Resisting Frame (OMRF), according
to current Australian loading codes (AS1170.0, 2002; AS1170.1, 2002; AS1170.2, 2002;
AS1170.4, 1993) and concrete code (AS3600, 2001) which make no special detailing
requirements mandatory for these type of frames.
The main frame shown in Figure 1 was designed to resist wind and earthquake lateral
loading, while in the transverse direction, lateral loading was assumed to be resisted by
symmetrically placed shear walls or a perimeter frame. As the prototype structure
considered is symmetrical, there are no torsional effects. Therefore inelastic analysis can
be limited to simplified two-dimensional analysis.

47
Interior subassemblage
8.4 m 9.6 m9.6 m 8.4 m9.6 m 9.6 m
4.2 m
3.4 m
3.4 m
3.4 m
Transverse mainframe spacing: 6000 mm
Beams: 2400 mm wide flange, 894 mm deep rib beam
Columns: 500 x 500 mm
Slab: 170 mm one way spanning solid slab between main beams.
Figure 1: Prototype frame dimensions.
2.4 m
6.0 m
894 mm
170 mm
Figure 2: Dimensions of mainframe beam section
In order to determine various loading factors, it was assumed that the frame was an office
building (for imposed live load consideration) situated on a rock site in Newcastle,
Australia. It should be noted that Newcastle has the highest peak ground acceleration
coefficient (for a major city). Wind and earthquake loading parameters for selected cities
are listed in Table 3-1. The design loading parameters adopted for the structure as situated
in Newcastle, are given in Table 3-2. The basic appropriate load combinations for the
ultimate limit states used in checking strength of the prototype frame, as specified in
Australian code (AS-1170.0, 2002), are given in Equation 3-1.

48
QEGeWGd
QWGcQGb
Ga
u
u
u
4.00.1)9.0)
4.02.1)5.12.1)
35.1)
++→+→
++→+→
→
Equation 3-1
Table 3-1: Ultimate wind velocity and Acceleration coefficient for major cities in Australia
City
Ultimate wind velocity (m/sec)
Peak ground acceleration coefficient (g)
Melbourne Sydney
Adelaide Brisbane
Perth Hobart
Canberra Newcastle
Alice Spring Darwin
50 50 50 60 50 50 50 50 50 70
0.08 0.08 0.10 0.06 0.09 0.05 0.08 0.11 0.09 0.08

49
Table 3-2: Design values adopted
Design parameter
Value
Gravity
Superimposed dead load
Live load
Ultimate wind velocity
Region
Terrain category
Topographic multiplier
Shielding multiplier
Importance multiplier (for wind)
Earthquake acceleration coefficient
Site factor
Structural response modification factor
Importance factor (for earthquakes)
9.81 m/s2
1.5 kPa
4.0 kPa
50 m/s
A
2
1.0
1.0
1.0
0.11g
1.0
4.0
1.0
Prototype frame loading was evaluated using actual member self-weights, based on the
sectional dimensions. Earthquake and wind loading were calculated based on the
parameters given in Table 3-2. A limit state design was employed, considering the entire
load combinations specified in Equation 3-1. A structural modification factor of 4.0 was
used, representing a frame of limited ductility. A fundamental period of 0.31 s was
calculated using the Australian code (AS-1170.4, 1993) specified formula (i.e. T=h/46).
As seen from the Australian code method, the equivalent static earthquake load, mainly
depends on the accuracy of the fundamental period of the structure. As discussed in
Chapter 2, there are different formulae presented in different codes and textbooks to
calculate the fundamental period. In general, use of code specified methods to calculate
the earthquake force is more conservative than the calculations based on inelastic dynamic
analysis methods. Code requirements, however, prevent the earthquake force being

50
reduced below 80 % of that determined using the formula for fundamental period specified
in the code (AS-1170.4, 1993). The calculation of equivalent earthquake force in
Australian code is similar to the method used in UBC (1997). Details of earthquake and
wind load calculations are presented in Appendix A.
The frame was found to have higher earthquake loading than wind loading. It was found
that ultimate gravity load combination governed the design of most members except
columns, for which the ultimate earthquake load combination governed. It should be noted
that the area of reinforcement required for the negative bending moments at supports were
calculated ignoring the area of slab reinforcement. The structure was also designed using
the capacity design method to prevent the formation of a column sideway mechanism (i.e.
beam hinges were designed to form before the formation of column hinges).
3.3 Test Specimen
The two-dimensional prototype frame analysis revealed that the first interior beam-column
joint in the first floor as shown in Figure 1, is more critical in terms of magnitude of the
out of balance moment applied to the joint. Therefore, it was selected to be tested in this
investigation.
3.3.1 Scale
In terms of test subassemblage dimensions, half scale testing was chosen, as this was the
maximum possible scale that could be tested in the reaction frame available, which was
used by Stehle (2002) and Abdouka (2003) for testing of wide band beam-column joints.
There was no adjustment of reinforcement bar spacing of the prototype and the test
specimen as per the Code (AS-3600, 2001) requirements. Table 3-3 shows the

51
reinforcement detailing used in the test specimen. The nominal aggregate size was scaled
down from 20 to 10 mm and the cover provided to reinforcement in beam and column was
scaled down to half. The scaling factors for the respective actions and dimensions are
presented in Table 3-4. It should be noted that a 2:1 scale factor is required for material
density since gravitational acceleration cannot be scaled. This effect was tackled by
including extra weight in the applied dead loading.
Table 3-3: Reinforcement details of beam and column (Test specimen)
Test subassembly
Rib beam Top reinforcement over the support
Rib beam Bottom reinforcement
Rib beam flange slab reinforcement
Rib beam shear ligatures
2Y20
1Y20
F 72 (Mesh)
R6-200 Crs
Column main reinforcement
Column shear links
12Y16
R6-175 Crs
Table 3-4: Consistent Scaling relationship -After (Stehle, 2002)
Dimension Scale factor (Modal : Prototype)
Stress, pressure 1:1 Length, displacement 1:2
Area, bar area 1:4 Volume 1:8
Force, shear 1:4 Moment, Torsion 1:8
Density 2:1

52
3.3.2 Specimen details
An isolated half-scale Corcon interior beam-slab-column subassembly, taken from the
prototype model frame structure is shown in Figure 3. The test specimen represents a half
scale model of prototype. It was terminated at column mid height and beam mid span,
representing approximate locations of points of contraflexure under lateral loading of the
prototype. The height of column is 1900 mm and the beam length is 4800 mm. The width
of the rib beam is 1200 mm, which is the typical rib beam width of Corcon slab system.
The reinforcement details of rib beam and column are shown in Figure 4. Shear ligatures
were provided to entire length of beam at uniform spacing, except in the beam-column
joint area. Similarly, column ligatures were provided to full height except within beam
depth. Figure 5 illustrates the reinforcement provided in the flange slab. It should be noted
that main top reinforcement has been curtailed 1000 mm from column centre. This
curtailment point was taken as per the critical bending moment envelope corresponding to
the gravity load case (i.e. 1.25G+1.5Q).

53
1900 mm
1200 mm4800 mm
447 mm
850mm
Figure 3: Dimensions of test sub-assemblage.
Figure 4: Beam and column cross-section of test subassembly
Main Top R/FF72 Mesh
Figure 5: Top view of flange slab with reinforcement.

54
3.3.3 Material properties
The nominal strength and the measured strength of reinforcement bars used in the test
specimen are given in Table 3-5. Two types of high strength twisted/ribbed reinforcement
types were used, and defined in terms of strength. Those types are specified as: ‘Y’ bars
and ‘N’ bars. ‘Y’ bars have nominal yield strength of 400 MPa and ‘N’ bars have a
nominal strength of 500 MPa. These reinforcements were used in rib beam and column as
main bars. Other type of reinforcement, specified as ‘R’ round bars, has a nominal strength
of 250 MPa, used in beam and column, as shear ligatures.
Nominal concrete compression cylinder strengths at 28 days of 40 MPa and 32 MPa were
used for the design of column and rib beam respectively. The measured cylinder
compressive strengths at the time of testing subassemblage are presented in Table 3-6.
Table 3-5: Reinforcement properties
Bar Type Y16 Y20 N7 R6
Nominal bar diameter (mm)
Area (mm2)
Nominal yield stress (MPa)
Actual yield stress (MPa)
Actual ultimate stress (MPa)
16
201
400
442
542
20
314
400
448
539
6.75
35
500
510
684
6
28
250
345
502

55
Table 3-6: Uniaxial compressive strength of concrete.
Member Target 28 day compressive strength (MPa)
Measured strength at the time of testing (MPa)1
Rib Beam 32 40.6
Column 40 47.4
3.4 Test configuration
3.4.1 Specimen loading
According to the load combinations given in AS 1170.0 (2002), the gravity loading to be
taken at ultimate limit state, in an event of earthquake is assumed to be 100% dead load
and 40% of live load on the structure (1.0G+0.4Q). The performance of the test specimen
under lateral loading has to be investigated with the scaled portion of gravity loading on
the model, so that conditions present during testing are same as prototype structure.
Since the purpose of the test is to investigate the performance of the specimen during an
earthquake event, only the earthquake load combination was simulated on the test
specimen during testing. Bending moments, shear forces and axial loads in beam and
column are shown in Figure 6 to Figure 8 for the prototype structure and from Figure 9 to
Figure 11 for half scale test specimen. These diagrams were obtained from a 2-
dimensional analysis conducted using Program “Space Gass”. The results of the analysis
are presented in Appendix B. Axial force diagram for beam and bending moment and
shear force diagrams for the column are not shown since very small values were obtained.
1 Concrete strength measured at the day of testing. Testing was done one month after casting of beam and 45 days after casting of upper column.

56
A similar set of diagrams is presented from Figure 12 to Figure 19 for the static
earthquake loading applied according to AS 1170.4 (1993).
-500
-400
-300
-200
-100
0
100
200
300
-4.8 -4 -3.2 -2.4 -1.6 -0.8 0 0.8 1.6 2.4 3.2 4 4.8
Distance along span (m)
Ben
ding
Mom
ent (
kNm
)
Figure 6: Bending moment diagram for beams - full scale gravity loading
-300
-200
-100
0
100
200
300
-4.8 -4 -3.2 -2.4 -1.6 -0.8 0 0.8 1.6 2.4 3.2 4 4.8
Distance along span (m)
She
ar fo
rce
(kN
)
Figure 7: Shear force diagram for beams - full scale gravity loading

57
-2.1-1.8
-1.5-1.2-0.9
-0.6-0.3
0
0.30.60.91.2
1.5
0 500 1000 1500 2000 2500
Axial force (kN)
Dis
tanc
e al
ong
colu
mn
heig
ht (m
)
Figure 8: Axial force diagram for columns – full scale gravity loading
-100
-80
-60
-40
-20
0
20
40
-2.4 -2 -1.6 -1.2 -0.8 -0.4 0 0.4 0.8 1.2 1.6 2 2.4
Distance along span (m)
Bend
ing
Mom
ent (
kNm
)
Ms
Figure 9: Bending moment diagram for beams - half scale gravity loading

58
-100
-80
-60
-40
-20
0
20
40
60
80
100
-2.4 -2 -1.6 -1.2 -0.8 -0.4 0 0.4 0.8 1.2 1.6 2 2.4
Distance along span (m)
She
ar fo
rce
(kN
)
Figure 10: Shear force diagram for beams - half scale gravity loading
-1.05
-0.75
-0.45
-0.15
0.15
0.45
0.75
0 100 200 300 400 500 600
Axial force (kN)
Dis
tanc
e al
ong
colu
mn
heig
ht (m
)
Figure 11: Axial force diagram for columns - half scale gravity loading

59
-250
-200
-150
-100
-50
0
50
100
150
200
250
-4.8 -4 -3.2 -2.4 -1.6 -0.8 0 0.8 1.6 2.4 3.2 4 4.8
Distance along span (m)
Ben
ding
mom
ent (
kNm
)
Figure 12: Bending moment diagram for beams - full scale earthquake loading
-2.1-1.8
-1.5-1.2
-0.9-0.6-0.3
00.3
0.60.91.2
1.5
-300 -250 -200 -150 -100 -50 0 50 100 150 200 250 300
Bending moment (kNm)
Dis
tanc
e al
ong
colu
mn
heig
ht (m
)
Figure 13: Bending moment diagram for columns -full scale earthquake loading

60
-75
-50
-25
0
25
50
75
-4.8 -4 -3.2 -2.4 -1.6 -0.8 0 0.8 1.6 2.4 3.2 4 4.8
Distance along span (m)
She
ar fo
rce
(kN
)
Figure 14: Shear force diagram for beams – full scale earthquake loading
-2.1-1.8
-1.5-1.2-0.9
-0.6-0.3
0
0.30.60.91.2
1.5
50 60 70 80 90 100 110 120 130 140 150
Shear force (kN)
Dist
ance
alo
ng c
olum
n he
ight
(m)
Figure 15: Shear force diagram for columns -full scale earthquake loading

61
-100
-80
-60
-40
-20
0
20
40
60
80
100
-2.4 -2 -1.6 -1.2 -0.8 -0.4 0 0.4 0.8 1.2 1.6 2 2.4
Distance along span (m)
Ben
ding
mom
ent (
kNm
)
Figure 16: Bending moment diagram for beams - half scale earthquake loading
-1.05
-0.75
-0.45
-0.15
0.15
0.45
0.75
-100 -75 -50 -25 0 25 50 75 100
Bending moment (kNm)
Dis
tanc
e al
ong
colu
mn
heig
ht (m
)
Figure 17: Bending moment diagram for columns - half scale earthquake loading

62
-50
-40
-30
-20
-10
0
10
20
30
40
50
-2.4 -2 -1.6 -1.2 -0.8 -0.4 0 0.4 0.8 1.2 1.6 2 2.4
Distance along span (m)
Shea
r fo
rce
(kN
)
Figure 18: Shear force diagram for beams - half scale earthquake loading
-1.1
-0.8
-0.5
-0.2
0.1
0.4
0.7
0 10 20 30 40 50 60 70 80 90 100
Shear force (kN)
Dis
tanc
e al
ong
colu
mn
heig
ht (m
)
Figure 19: Shear force diagram for columns - half scale earthquake loading
The lateral loading setup is shown in Figure 20. This setup demonstrates the boundary
conditions and the loading arrangement to simulate the prototype structure. It can be seen
from bending moment and shear force diagrams for lateral earthquake loading (Figures 3-
12 to 3-19) that mid span bending moment is zero and the shear force is constant along the
span. These bending and shear force diagrams were achieved by using pin connections at

63
ends of beams and column and providing lateral loading at bottom end of the column as
shown in Figure 20. In this setup, axial load developed in columns due to earthquake
loading is neglected, as it is small compared with gravity loading.
+ Loading- Loading
Figure 20: Setup for lateral loading
The dead and live load effects were approximately modelled by adjusting the beam-end
reactions as shown in Figure 21. In this arrangement two roller supports were allowed to
freely deflect under beam self-weight and a further downward reaction was applied
through each roller pin connection. The resulting bending moment and shear force
diagrams are shown in Figure 22 and Figure 23 respectively.
The axial loading on the column was simulated by using external prestressing. The
prestressing loading framework moved with the lateral displacement of the
subassemblage. Therefore, the applied axial load was able to keep concentric with column
regardless of the lateral displacement of the specimen. The required axial load on the
bottom column was calculated as 490 kN. The adopted axial load diagram is shown in

64
Figure 24. This force was achieved with four 12.7 mm diameter-prestressing strands. The
prestress force was transferred to the column via transfer beams at the top and bottom
level of the column. (see Fig.3-25)
Free vertical deflection allowed under self weight of the beam before connected to pin roller.
RR R=15.3 kN, reaction force is applied through pin roller connection link.
Applied lateral load
Applied axial load
Figure 21: Adopted setup for lateral and gravity loading
-100
-80
-60
-40
-20
0
20
40
-2.4 -2 -1.6 -1.2 -0.8 -0.4 0 0.4 0.8 1.2 1.6 2 2.4
Distance along span (m)
Bend
ing
Mom
ent (
kNm
)
Figure 22: Bending moment diagram for beams - Adopted half scale gravity loading

65
-50
-40
-30
-20
-10
0
10
20
30
40
50
-2.4 -2 -1.6 -1.2 -0.8 -0.4 0 0.4 0.8 1.2 1.6 2 2.4
Distance along span (m)
Shea
r for
ce (k
N)
Figure 23: Shear force moment diagram for beams - Adopted half scale gravity loading
-1.05
-0.75
-0.45
-0.15
0.15
0.45
0.75
0 100 200 300 400 500 600
Axial force (kN)
Dis
tanc
e al
ong
colu
mn
heig
ht (m
)
Figure 24: Axial force diagram for columns - Adopted half scale gravity loading
3.4.2 Test setup
The reaction frame has been designed to provide a pin connection to the top column end,
two roller supports which allow vertical deflection under the specimen self weight, a pin
connection at the bottom of the column to which the actuator was attached and a

66
prestressing system to apply the axial load to the column. This setup was originally
designed by Stehle (2002) and Abdouka (2003) for wide band beam testing. The same test
rig was used with minor modified to suit the loading system used for the specimen tested
in this project.
The top and side views of the test setup are shown in Figure 25 and Figure 26 respectively.
The bracings have been provided at top level and on two side faces of the test rig to
provide the lateral stiffness. The pin connection at the top of the column was provided by
using a mild steel pin that was inserted into a hole in the test rig. Once pinned, the
specimen was able to hang freely at the centre of the test rig. At the base of the column,
another mild steel pin was used to connect the actuator arm. The pin supports at the beam-
ends were created using vertical links, which hang down from the test rig.
Top-level bracings
Side bracings
Column external prestressing strands
Compound channel at column top and bottom to transfer axial force.
Figure 25: Top view of the built test assembly

67
Pin connections
ActuatorActuator hydraulic controller
computer based data logging system
Figure 26: Side view of the built test assembly
All pin supports have been designed with 50 mm diameter mild steel pins through 52 mm
diameter holes. Hence, a pin slip at the connection was expected and the force-
displacement hysteresis results had to be adjusted. Other researchers using the same test
rig (Siah, 2001; Stehle, 2002) had encountered similar pin slip problems. The correction
procedure to take account of this slip is described later in Chapter 4.
The two vertical link pin supports, one at each beam end were also supported by the
reaction frame. These vertical links allow free horizontal movement of the beam, but not
vertical movement. Beam end reactions were applied to simulate gravity loading on the
specimen so that the joint bending moment at the beginning of the test is consistent with
the prototype structure, as mentioned earlier in section 3.4.1. The reactions at the beam-
ends were provided by adjusting the length of the threaded bolt by screwing or unscrewing
it. A photo of the vertical link is shown in Figure 27. The amount of reaction applied was
measured by four strain gauges, which were installed around the circumference of the

68
threaded rod that connects the top and bottom parts of the vertical link. The calibration of
these strain gauges for each vertical link was done prior to the testing of the specimen and
shown in Figure 28 and Figure 29.
Adjusting Threaded rod
50mm Ø pin connections
Figure 27: Photo of beam-end vertical link

69
y = 0.2859x + 0.9694R2 = 0.9999
-80
-60
-40
-20
0
20
40
60
80
-300 -200 -100 0 100 200 300
Average Microstrain
Forc
e (k
N)
Figure 28: Calibration of North vertical link
y = 0.2874x - 0.8555R2 = 1
-80
-60
-40
-20
0
20
40
60
80
-300 -200 -100 0 100 200 300
Average Microstrain
Forc
e (k
N)
Figure 29: Calibration of South vertical link

70
3.4.3 Construction of test specimen
The construction details of test specimen were presented in Figure 3 to Figure 5. The
construction sequence of test specimen followed here is slightly different to the
conventional construction sequence. The followed construction sequence was mainly
determined by the specimen installation procedure (to test rig). The steps of construction
were as follows:
♦ Cut and bend column and beam reinforcement as required.
♦ Fabrication of column cage with tie wires.
♦ End bearings plates welded to top and bottom end of column cage.
♦ Fixing of strain gauges and associated wiring.
♦ Construct formwork around column cage from top bearing plate to beam top level.
♦ Upper Column casting as horizontal member and curing with wet rugs for 7 days.
♦ Remove column formwork and lift column into position in test rig and join to transfer
beams.
♦ Place the reinforcement mesh for slab with temporary supports.
♦ Erect Corcon beam and slab sheet metal formwork and formwork for the lower part of
the column.
♦ Place pre-sized and strain gauged beam bars in position with shear links. Figure 30
shows the top view of beam ready for next stage concreting.
♦ Concreting lower column and beam.
♦ Curing with wet rugs for 7 days.
♦ Remove formwork.

71
Upper column after the completion of 1st
stage concreting
Figure 30: Specimen ready for concreting
3.5 Instrumentation
Three types of instrumentation, i.e. Strain gauges, displacement transducers and load cells,
were used to monitor the behaviour of the specimen during the test. All the data from the
instruments were collected through a computer based data logging system.
3.5.1 Strain gauges
The strain gauges were attached to beam and column reinforcement. The strain gauges
used were Kyowa Type KFG-5-120-C1-11. The locations of strain gauges on beam and
column reinforcement are shown in Figure 31 and Figure 32 respectively.

72
BTG1 BTG2
BTG3 BTG4
Beam Top view
BBG1 BBG2
Beam Side view
1200 mm 1200 mm
NS
NS
Figure 31: Location of strain gauges on beam reinforcement
South
North
SWC1
SEC2 NWC3
NEC4
Note : Only column Corner R/F is shown for clarity.
Figure 32: Location of strain gauges on column reinforcement

73
3.5.2 Displacement transducers
Displacement transducers were used to calculate the curvatures of the central portion of
the beam at the beam-column joint. The locations of these transducers are shown in Figure
33.
T1 T2
T3 T4
Figure 33: Locations of displacement transducers
3.5.3 Load cells
Load cells were used to determine the load in each column-prestressing strand. Calibration
of the load cells was done before the setup, so that the correct load could be obtained. A
total of four load cells were used for strands. The inbuilt load cell in the actuator was used
to measure the lateral load applied at different displacements.

74
3.6 Testing sequence
As described in section 3.4.2, the reactions to simulate the gravity loading had to be
applied before the testing commenced. The sequence of the loading of the specimen was
as follows:
♦ Apply column axial load of 400 kN using four prestressing stands.
♦ Release the vertical link connection at the end of beam and allow beams to freely
deflect under its self-weight.
♦ Reconnect the beam-ends to vertical links, such that no tension or compression
developed in the vertical links.
♦ Apply a downward force of 15.3kN by turning the threaded bar of the vertical links.
This was done by setting the vertical link strain gauge reading to an equivalent micro-
strain value as per the calibration graphs shown in Figure 28 and Figure 29.
♦ Finally connect the actuator arm to the bottom end of the column.
At this stage the specimen was ready for the application of cyclic loading. The specimen
cyclic loading sequence was based on specimen drift rather than the ductility index
because of the difficulty in predefining a yield displacement in beam-column
subassemblage. The lateral loading sequence used for the test is shown in Figure 34. It
consisted of repeated cyclic loading of increasing drift ratio up to the maximum stroke of
the actuator, which corresponds to a nominal drift of 4%. The test results and observations
are presented in Chapter 4.

75
-5-4-3-2-1012345
0 1a 1b 2a 2b 3a 3b 4a 4b 5a 5b 6a 6b 7a 7b 8a 8b 9a 9b 10a
Drift Ratio (%)
Cycle No.
Figure 34: Lateral Cyclic loading sequence
3.7 2nd test specimen
3.7.1 General
The second test specimen was a retrofitted version of the damaged first specimen. It was
very clear from the test results and observations that the first test specimen was
experiencing reinforcement detailing problems. These observations are described in
Chapter 4. Having identified the detailing problems in the first test, it was decided to
repair the damaged specimen using a Carbon Fibre Reinforced Polymer (CFRP) system, as
a cost-effective alternative. The repaired version of the specimen was then re-tested to
ascertain its post-repair performance at high drift limits and to observe any improvements
that may have resulted from the proposed repair process. Figure 35 shows the adopted
CFRP system.

76
Mortar build-upBolted steel plates
2-layers of CFRP from A-D
An additional layers of CFRP from B-C
2-layers of CFRP from E-F on each face
Figure 35: Details of CFRP system used for rectification

77
3.7.2 Use of externally bonded FRP for structural repair work
For this repair work, externally bonded carbon fibre in fabric form (CFRP) was selected
after performing a parametric analytical study of the performance of two different types of
FRP systems. The relevant geometrical and mechanical properties of the material chosen,
provided by the supplier, are given in Table 3-7.
Table 3-7: Geometrical and mechanical properties of fibre
Fibre Type Carbon fibre Glass fibre
Reference CF130 EG-90/10A
Width/Thickness 300 mm/0.176 mm 670 mm/0.154 mm
E-modulus 240,000 MPa 73,000 MPa
Ultimate tensile strain 1.55 % 4.5 %
Tensile strength 3800 MPa 3400 MPa
Design tensile force 211 kN/m @ 0.6% strain/m width 264 kN/m @ ult. strain/m width
The moment curvature relation for the (rib beam section at column face) strengthening
system shown in Figure 35 was obtained from sectional analysis program “RESPONSE-
2000”(Bentz and Collins, 2000) The positive and negative moment-curvature relationship
for Carbon, Glass fibre and the reinforcement used in the first test specimen are shown in
Figures 3-36 and 3-37 respectively.

78
0
25
50
75
100
125
150
175
200
225
0 25 50 75 100 125
Curvature (Rad/km)
Mom
ent (
kNm
)+ve Moment-R/F
+ve Moment-CF130(200 mm2)+ve Moment-Eglass(400 mm2)
Figure 36: Positive moment –curvature with different reinforcing materials
0
25
50
75
100
125
150
175
200
225
0 25 50 75
Curvature (Rad/km)
Mom
ent (
kNm
)
-ve Moment -R/F
-Ve Moment-CF130(450 mm2)-ve Moment-Eglass(900 mm2)
Figure 37: Negative moment –curvature with different reinforcing materials

79
The following facts had to be considered when selecting the retrofitting system. The use of
FRP as a means of flexural strengthening may compromise the ductility of the original
reinforcement system. Significant increases in moment capacity with FRP sheets are
afforded at the sake of ductility. The approach taken by MBrace (2002), follows the
philosophy of Appendix B of ACI 318, where a section with low ductility must
compensate with a higher strength reserve. The higher reserve of strength is achieved by
applying a strength reduction factor of 0.70 to brittle sections as opposed to 0.90 for
ductile sections.
Both concrete crushing and FRP rupture before yielding of the steel are considered as
brittle failure modes. Steel yielding followed by concrete crushing provides some level of
ductility depending on how far the steel is strained over the yield strain. Steel yielding
followed by FRP rupture is typically ductile because the level of strain needed to rupture
FRP is significantly higher than the strain level needed to yield the steel.
The moment-curvature behaviour of Carbon and Glass fibre was compared with
reinforcement, as shown in Figure 3-36 and Figure 37, the Carbon fibre behaviour was
closely matching with reinforcement than that of Glass fibre. It should also be noted that
the area of carbon fibre required to provide same moment capacity was approximately half
compared to the glass fibre. In addition the high strength, high modulus and negligible
creep rupture behaviour make carbon fibres ideal for flexural strengthening applications.
Therefore, the carbon fibre was selected for this repair work, as the overall cost of repair
would be drastically reduced due to the less material and labour involvement. Generally,
major portion of total cost is the labour cost, as the preparation and application of FRP
requires highly trained skilled workers.

80
3.7.3 Structural repair work
Since the composite element of an FRP repair system is required to be bonded onto the
concrete substrate, the efficiency of the system depends on the integrity of this bond at the
interface layer. A minimum tensile strength of 1.5 MPa is recommended for the substrate
for this type of CFRP design (MBrace, 2002). Any loose material in areas where the CFRP
system was to be applied was removed and patched with suitable mortars. All cracks
greater than 0.3 mm in width were repaired by epoxy injection. Figure 38 illustrates the
prepared specimen for epoxy injection. Wide cracks, similar to those shown in Figure 39,
were repaired adopting pour techniques using low shrinkage structural grout.
Figure 38: Specimen before epoxy injection

81
Figure 39: Filling of wide cracks with low shrinkage structural grout.
It was observed that an uneven surface was created near the large cracks, after repair, due
to geometric deformation. Care was taken to flatten these areas using suitable mortars.
Alternatively grinding to flatten out the surface can also prevent possible CFRP peel-off
failure due to unevenness of the substrate.
Other important considerations when applying a CFRP repair system to a damaged
structure, concerns detailing. Material-specific use restrictions for CFRP necessitate
avoidance of sharp corners in structural elements to which they may be applied. Such
corners need to be rounded to decrease the chance of fibre fracture due to stress
concentrations induced by sharp edges. In this specimen, the column and beam dimensions
are different, therefore in order to provide smooth transition for CFRP bottom layer over
the column width, an additional mortar build-up was created near the beam column joint.
In addition to the treatment near the column-beam joint described above, four mild steel
plates (40 mm wide x 3 mm thick) were placed over the FRP layer and bolted using 10
mm diameter through bolts to the rib beam. The steel plates, as shown in Figure 35

82
provided restraining (clamping) forces to prevent delamination of the CFRP due to
diverting forces created in the fibres from the mortar build-up.
Figure 40: Mortar build-up near the beam column joint
3.7.3.1 Surface preparation for FRP application
After completing all the structural repair work, the concrete surface had to be prepared to
receive the FRP application. The concrete surface has to be clean, sound and free of
surface moisture, any foreign matter such as dust, laitance, grease, curing compounds and
other bond inhibiting materials have to be removed from the surface by blast cleaning or
equivalent mechanical means. The surface preparation was done using a mechanical wire
brush instead of sand blasting. The general requirement is to prepare the surface similar to
60-grit sandpaper. Figure 41 shows the prepared surface at the bottom of the rib beam
adjacent to the beam column joint.

83
Prepared concrete surface by removing excess surface grout.
Figure 41: Prepared concrete surface to receive FRP application
3.7.3.2 CFRP application to prepared surface
The first step in the FRP application process was the priming of the concrete surface with
the penetrating primer prior to the application of any subsequent coatings applied using a
roller. The primer was applied uniformly in sufficient quantity to fully penetrate the
concrete and produce a non-porous film in the surface approximately 100-150 microns in
thickness after full penetration. It must be noted that the volume to be applied may vary
depending on the porosity and roughness of the concrete surface.
The next step was to apply an epoxy resin on the primed surface and lay the FRP sheet.
According to the manufactures guidelines, the resin has to be applied to the primed surface
using a medium nap roller (approx. 10 mm) to approximately 500 - 750 microns wet film
thickness (1.3-2 m2 per litre) or sufficient to achieve a wet-out of the FRP Fabric Sheet.

84
This value will vary depending on the weight of the FRP Fabric Sheet as well as the
ambient conditions and wastage. The mixed batch resin has to be used before expiration of
its batch-life, as increased resin viscosity will prevent proper impregnation of the FRP
fabric materials. Figure 42 shows the application of epoxy resin over the primer layer.
Epoxy Resin application
Previous Primer layer
Figure 42: Application of Epoxy resin
FRP Fabric Sheets had to be cut beforehand into required lengths using appropriate
scissors. The FRP Fabric Sheet was placed with the fibre side placed on the concrete
surface and work in the direction of the fibres and work from the centre of the length of
the sheet to the ends, to remove any entrapped air. The other subsequent layers of FRP
were laid similar to the first layer. Figure 43 shows the application of the first CFRP layer.
It should be noted that the application of resin has to be done before and after the laying of
each new FRP fabric layer. A hard roller was used to enhance the impregnation of the
fabric material. The backing polythene paper was then peeled away. The surface of
adhered fabric was squeezed in the longitudinal direction of the fibre using a ribbed roller
in order to impregnate resin into the fabric material and remove any air bubbles (see
Figure 44). Figure 45 depicts the completely repaired test specimen.

85
Figure 43: Laying CFRP on the Epoxy applied surface
Figure 44: A ribbed roller used to impregnate resin into the fabric material

86
Figure 45: CFRP repaired test specimen ready for instrumentation
3.8 Instrumentation for second test specimen
The instrumentation used for the second test was same as for the first test. Additional
strain gauges were installed on the CFRP. The locations of strain gauges on beam top
flange and beam rib are shown in Figure 46. All the data from the instruments were
collected through a computer based data logging system similar to the first test.

87
N S
N S
CG1 CG2 CG3 CG4 CG5 CG6 CG7 CG8
CG13 CG14 CG15 CG16
CG9 CG10 CG11 CG12
CG17 CG18 CG19 CG20Beam west side strain gauge numberingBeam east side strain gauge
numbering
Figure 46: Location of strain gauges on CFRP
3.8.1 Photogrammetry-based measurement
A photogrammetry-based measurement setup was used to follow the deformations in the
repaired specimen during the test. Approximately 200 highly reflective photosensitive
targets were introduced on one side of the concrete beam as well as on the CFRP surfaces.
Figure 47 shows the test specimen with photosensitive target points. Using a purpose-
specific camera, three-dimensional digital measurements were determined from these
target locations from a series of multiple photographs taken at different stages within the
loading cycles. These measurements enabled both global and local deformation of the test
specimen to be followed during the testing.

88
Figure 47: test specimen with photosensitive target points
3.9 Summary
The experimental component, design of prototype model structure, details of test set up,
instrumentation and construction and cyclic loading testing of half scaled interior Corcon
rib beam-column subassemblages were carried out at Francis Laboratory of the University
of Melbourne. Details of instrumentation used to monitor the behaviour of the specimen
during the testing, CFRP rectification work of the damaged original test specimen and
photogrammetry-based measurement technique were presented in this chapter.

89
Chapter 4
EXPERIMENTAL RESULTS
4.1 Introduction
This chapter presents the results from the testing of half scale interior Corcon rib beam-
column subassemblage and the FRP repaired subassemblage.
As described in Chapter 3, the original undamaged specimen was detailed according to the
current Australian design practice with no special provision for seismicity. The repaired
specimen was retrofitted to cover detailing problems identified in the original specimen.
The results and various observations related to the tests are presented in this chapter. The
overall performance of the specimen is assessed and discussed in terms of strength,
stiffness, energy dissipation, ductility and displacement capacity.
4.2 1st interior specimen
4.2.1 Observed behaviour
4.2.1.1 General
There were no visible cracks in the specimen before the test and after applying the initial
gravity loading. All new cracks and extensions of old cracks were numbered according to
the cycle number in which they were first seen. The specimen appeared to perform fairly
well under lateral deformations up to 3% drift level. The cracks found on the specimen

90
were mainly cracks due to flexure on the beam and column. There were no cracks
appeared due to secondary effects, such as torsion.
4.2.1.2 Types and formation of cracks
As mentioned previously all cracks were numbered according to the cycle number in
which they were first seen. However, there is a possibility that some cracks may have
formed in an earlier cycle but were too fine to be detected. Cracks formed under positive
loading were marked in red, while those formed under negative loading were marked in
blue. The direction of loading (positive and negative) was indicated in Figure 3-20 of
Chapter 3. Figure 4-1 illustrates the cracks found in the specimen after completing all
loading cycles. This gives a clear picture of the overall cracking pattern of the specimen.

91
N S
C7-0
.5 to
C8-2
.0
C6-0
.2
C8-0
.8C4
-0.1
C4-0
.5
C5-0
.2
C4-0
.5C4
-0.2
N STop View
N S
C8-0
.2
C4-0
.1C7
-2.0
C4-0
.2
C3-0
.3 to
C6-0
.6
C6-0
.1
C6-0
.2
C6-0
.8
C4-0
.2
C4-0
.2
C4-0
.1
C4-0
.1
C5-0
.1
C5-0.2
C4-0
.5 to
C8-3
.0West Elevation
C4-0
.2
C5-0
.1
C4-0
.2
C5-0
.1
C8-0.2
C4-0
.1
C4-0
.3
C7-0
.6
C4-0
.1C4-0
.1
C4-0
.2
C6-0
.1
C4-0.1C6-0.1
East Elevation
NS
Figure 4-1: Sketch of cracks found in the specimen

92
4.2.1.3 Flexural cracking in the flange slab
The first flexural crack in the top surface of the beam was observed running across the
beam column intersection at a nominal specimen drift ratio of 1.0 %. The width of the
crack at this stage was very small and varied from around 0.1 mm to 0.25 mm along the
length of the crack. As the specimen drift was increased, flexural cracking propagated
away from the beam column connection and cracks formed in earlier cycles widened. All
the cracks formed were almost perpendicular to the beam spanning direction. Some of
cracks in the top surface propagated up to the slab bottom level. It was observed that
cracking in slab bottom level is going through the thinnest section of the corrugated slab.
Cracking in the longitudinal direction was not seen, indicating the non-existence of
secondary effects. Crushing or spalling of concrete in flange slab was not observed.
A sudden widening of one of the cracks was observed at the drift level of 3.5 %. A width
of 2.0 mm was measured for this crack, which was significantly higher than the widths of
other cracks at this stage. This main crack formed on top of the flange slab extended
across the full width of the slab and its location coincided with the location of the main top
longitudinal reinforcement curtailment point. During the last cycle with a nominal drift
ratio of 4 %, the same crack widened to 4-5 mm and propagated in to the beam as shown
in Figure 4-2. It was noted that at this instance a snapping sound came as a result of
breaking internal mesh reinforcement. The main crack formed in the flange slab top
surface, at the end of the test, is shown in Figure 4-3. As seen from Figure 4-2, the depth
of the crack had extended over half of the depth. It was also noted that during the last
cycle (75 mm displacement) of the test, a snapping sound came as a result of breaking
internal mesh reinforcement. This was confirmed later during the rectification process,

93
while removing loose material at the crack interface. This indicates that the mesh
reinforcement has reached its ultimate strength at 4% drift level. This will be further
investigated in FEM analysis described in Chapter 5.
Main Crack
Figure 4-2: Location and extent of main cracking after last cycle (North side beam)

94
Beam Spanning direction
Figure 4-3: Main crack in flange slab top surface (North side beam)
4.2.1.4 Flexural cracking in the ribbed beam
The first flexural cracking in the beam surface was observed at a nominal specimen drift
ratio of 1.2 %. The width of the crack at this stage was very small and it was around 0.1
mm. As expected the first crack formed at the bottom of the rib beam column connection.
As the specimen drift was increased, these flexural cracks propagated away from the beam
column connection. The type of cracking observed in the rib beam was quite normal.
However, it was observed that the extent of cracking along the length of the beam had
spread nearly 3/4 length of the span. Widths of these cracks were uniform compared with
cracks found on the top surface of the slab.

95
The bottom flexural crack at beam column interface gradually extended and joined the
existing crack at the bottom level of the flange slab. As illustrated in Figure 4-4, some
concrete crushing and spalling was seen at the rib beam-column interface, as a result of
opening and closing of the crack. The concrete crushing near rib beam-column interface
started at a drift level of 3.0 %.
Concrete crushing & spalling
Figure 4-4: Concrete spalling at beam-column interface
4.2.1.5 Flexural cracking in columns
Figure 4-1 shows the location and extent of cracking in upper column. The first crack
appeared at a drift level of about 1.2 %. The width of the crack at this stage was very
small, around 0.1 mm. The crack extended across the full face of the column and had a
depth of about 30 mm when originally observed. As the specimen drift level increased, the
crack width also increased. However, there were no new cracks formed even at higher
drift levels.

96
There was no cracking in the lower column. However, diagonal cracking was observed
within the beam-column joint region as shown in Figure 4-4. Two of these cracks
extended in to the lower column at a drift level of about 3.0 %.
4.2.2 Measured behaviour
4.2.2.1 Hysteretic response
The subassembly was tested to a maximum of 4 % nominal drift ratio. The hysteretic
response of subassemblage was plotted as actuator load versus actuator displacement. The
recorded response requires two types of corrections. The corrections are related to the
reaction frame and the first correction was made to account for the movement due to the
flexibility of the reaction frame. Flexibility of the frame was significantly reduced by the
use of cross bracings. The recorded hysteretic response could be corrected for the above
effect by recording the hysteretic response of the reaction frame. However, this
measurement was not taken during the test due to the unavailability of measurement
channels in the data acquisition system and the correction was done using the hysteretic
relation obtained from a mathematical relation developed by Stehle (2002) for the same
frame.
The second type of correction to be made was to account for the slip in bolts and pins. The
pins at the top and bottom of the column were required to join the column to the test frame
and actuator respectively. Since there was a clearance of about 2 mm between the pin and
the hole, a pin slip was expected. A horizontal discontinuity was observed in the hysteretic
results during the reversal in loading direction as can be seen in Figure 4-5. A slip
correction of 2 mm was applied at this point to smoothen the curve as the loading direction
changed (Figure 4-5). This correction was done manually to all half cycle displacement

97
readings. The fully corrected hysteretic response of the subassemblage is shown in Figure
4-6. The equivalent full-scale prototype hysteretic response can be obtained by
multiplying the recorded load by a factor of 4 and the recorded displacement by a factor
of 2.
-25
-20
-15
-10
-5
0
5
10
15
20
25
-10 -8 -6 -4 -2 0 2 4 6 8 10
Displacement (mm)
Act
uato
r L
oad
(kN
)
2 mm slip
2 mm slip
Figure 4-5: Hysteretic response showing pin slip in subassemblage
−100
−80
−60
−40
−20
0
20
40
60
80
100
−100 −75 −50 −25 0 25 50 75 100
Load (kN)
Displacement (mm)
0.8-1.2% Drift 2.0-4.0% Drift
Figure 4-6: Fully corrected hysteretic response

98
The test subassembly exhibited good displacement capacity with no degradation of overall
lateral strength up to 3 % drift. It was observed that in the positive load cycles the
maximum actuator load was achieved in cycle 8 with 3 % drift ratio. However, in negative
load cycles it was achieved in cycle 6 with 2.0% drift ratio. The secant stiffnesses of the
specimen at the end of the test and at 3% drift were 29 % and 56 % of the original
respectively. Degradation of stiffness was mainly associated with flexural cracking,
reinforcement yielding and slippage of beam column bars through the joint. As can be
seen from the low “fatness” of the hysteretic response (Figure 4-6), the system as a whole
seems to have little energy absorption capacity. Damage is characterised by two
parameters, energy and ductility. Energy is used to measure the performance, assuming
ductility is similar.
4.2.2.2 Strain gauge readings
Strain gauge readings were recorded continuously during the test, except when the
actuator loading was paused, such as at peak of each load cycle for checking of cracks, etc.
All the data were recorded on a computer via a data logger. The selected strains versus
load plots are presented within the body of the thesis for discussion purposes. Other strain
plots are given in Appendix-E.
♦ Beam top longitudinal reinforcement
Figure 4-7 shows the strain history of a top main reinforcement bar at the north column
face. As can be seen, the yielding occurred at a load of 75 kN, during the cycle 6 (2.0 %
drift). The strain increases under positive moment to 3000 microstrain at the maximum 4%
nominal drift. Under the negative moment loading, a tensile strain of 4000 microstrain was
attained at 4% drift level. At low drift, no slip was observed and small cyclic tension and

99
compression was recorded. However, in cycle 3 (1.0 % drift), strain did not increase in
compression when the load reversed direction, rather remained constant in “compression”
region, indicating the onset of bond deterioration. The occurrence of tensile strain under a
positive moment (for beam top reinforcement) also indicates the presence of bar slip.
Gauge BTG4
-2000
0
2000
4000
6000
8000
10000
12000
14000
-100 -50 0 50 100
Actuator Load ( kN )
Stra
in (
mic
ostr
ain
)
Yield Strain
BTG4
Gauge BTG4
-2000
0
2000
4000
6000
8000
10000
12000
14000
-100 -50 0 50 100
Actuator Load ( kN )
Stra
in (
mic
ostr
ain
)
Yield Strain
Gauge BTG4
-2000
0
2000
4000
6000
8000
10000
12000
14000
-100 -50 0 50 100
Actuator Load ( kN )
Stra
in (
mic
ostr
ain
)
Yield StrainYield Strain
BTG4
Figure 4-7: Strain history of a top beam bar at north column face (East corner)
The strain history of other top main reinforcement on the north column face is shown in
Figure 4-8. The reinforcement yielding occurred during cycle 6 (2.0 % drift) as per the
previous strain plot. During the same cycle (cycle 6), strain was increased from 2000 to
13000 microstrain. Under the negative moment loading, a maximum tensile strain of
13700 microstrain was attained at 2.5% drift level (cycle 7). The tensile strain was
gradually reduced at subsequent cycles and finally at cycle 9 (4 % drifts level) the strain
was reduced to 12000 microstrain. The maximum strain values observed in this strain
gauge (BTG2) was about three times higher than the maximum recorded in gauge BTG4.

100
One would expect the same strain history from both gauges, as they were located
symmetrically on the same column face. The difference in strain behaviour depicted in
Figure 4-7 and Figure 4-8 could be due to number of reasons such as: (1) Proximity of
strain gauge to cracks leading to a higher strain value. (2) Slip of bar and hence relief of
strain (3) The strain gauge located at the local yielding region of the bar, hence higher
strain gauge reading. This difference in strain behaviour was observed from the test, as
cracking on flange top surface near gauge BTG2 was higher than the other half of north
beam.
Gauge BTG2
-2000
0
2000
4000
6000
8000
10000
12000
14000
-100 -50 0 50 100
Actuator Load ( kN )
Stra
in (
mic
ostr
ain
)
Yield Strain
BTG2
Figure 4-8: Strain history of a top beam bar at north column face (West corner)
♦ Beam bottom longitudinal reinforcement
Figure 4-9 shows the strain history of the bottom main reinforcement at the north side
beam. The maximum strain recorded was well below the yield strain. A similar strain plot
was obtained for south side beam bottom bar as well, indicating that strain gauges were

101
not located in a critical region. Both plots show the gradual increase in strain with
increasing drift ratio.
Gauge BBG2
-1000
0
1000
2000
3000
4000
5000
6000
-100 -50 0 50 100
Actuator Load ( kN )
Stra
in (m
icos
trai
n)
Yield Strain
BBG2
Figure 4-9: Strain history of the beam bottom main bar (North side)
♦ Column strains
Figure 4-10 shows the strain history of strain gauge in a southeast corner (SEC2) bottom
column bar. A tensile strain of 1000 microstrain, which is well below the yield, was
developed at the maximum 4 % nominal drift. Southwest corner top column strain gauge
(SWC1) recorded the maximum strain reading of 1800 microstrain. Similar low and high
maximum strain readings were observed for other bottom and top gauges respectively.
This difference in strain behaviour was observed from the test, as slight cracking on upper
column was seen while no cracking was observed on the lower column.

102
Gauge SEC2
-1000
0
1000
2000
3000
4000
5000
6000
-100 -50 0 50 100
Actuator Load ( kN )
Stra
in (
mic
ostr
ain
)
Yield Strain
SEC2
Figure 4-10: Strain history of strain gauge in a southeast corner bottom column bar
4.2.2.3 Displacement transducer readings
As described in Chapter 3, displacement transducers located on the specimen close to the
joint were used to calculate the curvature of the section in regions of expected plastic
hinging. Figure 4-11 and Figure 4-12 show the moment curvature plots of north and south
beam respectively. Curvature of each beam was calculated using the readings obtained
from transducers located in top and bottom of each beam. The bending moments of beam
at the column face were calculated based on the recorded actuator force.
These north and south beam moment curvature plots show some difference in behaviour.
This may be due to the fact that the transducer readings are measured over a finite length.
Many cracks can occur within that distance, giving an average value for that finite length.
The cracking observed on either side of the column was not symmetrical during the test,
hence a significant variation of curvature can be expected.

103
-100
-75
-50
-25
0
25
50
75
100
-40 -20 0 20 40 60
Beam curvature (rad/m)
Bending moment (kNm)
Figure 4-11: Bending moment versus beam curvature (North)
-100
-75
-50
-25
0
25
50
75
100
-40 -20 0 20 40 60
Beam curvature (rad/m)
Bending moment (kNm)
Figure 4-12: Bending moment versus beam curvature (South)
4.2.2.4 Load cell values
Figure 4-13 shows the variation of column axial force during the test. As mentioned earlier
in section 3.4.1 this prestressing force was applied using four prestressing strands. The
prestressing force in strands remained constant at approximately 400 kN. The force only

104
varied by as little as 4%. Therefore, it is reasonable to assume that the column
compression force remained constant at 400 kN during the test.
300
350
400
450
-100 -50 0 50 100
Actuator Load (kN)
Column axial load (kN)
Figure 4-13: Column prestressing force versus Actuator load
4.2.3 Performance assessment
4.2.3.1 Strength behaviour
As seen from Figure 4-6, first subassembly test exhibited good displacement capacity with
no degradation of overall lateral strength up to 3 % drift limit. It was observed that in the
positive load cycles the maximum actuator load was achieved in cycle 8 with 3 % drift
ratio. However, in negative load cycles it was achieved in cycle 6 with 2.0% drift ratio. As
seen from Figure 4-11 and Figure 4-12, both north and south beams reached the maximum
negative and positive bending moments at cycle 8 (drift 3.0%) and cycle 6 (drift 2.0%)
respectively.
The attained strengths of various components of the subassemblage were calculated from
the hysteretic response. The theoretical capacities of subassembly members were

105
calculated using the measured material properties. The experimentally attained actions are
compared to the theoretical capacities and are given in Table 4-1. The experimentally
attained column moments were determined by multiplying the column shear with the
column height. The shear force at the top and bottom columns was same as actuator force.
It should be noted that the columns did not yield and therefore did not reach their ultimate
capacities. Beam failed due to inadequate development length of top reinforcement.
Therefore experimental and theoretical values can be expected to show large difference.
The beam moments were determined by moment-curvature hysteretic response shown in
Figure 4-11 and Figure 4-12. The beams yielded in both positive and negative directions.
Both the positive and negative beam moments reached approximately 115% and 60% of
capacity. The lower negative moment reached is due to the premature failure at the main
top reinforcement curtailment point. The shear value attained was much below the
capacity, mainly due to the fact that the rib beam has a very high shear capacity and the
dominance of flexural failure.

106
Table 4-1: Comparison of attained actions and theoretical capacities
Design parameter Units Experimentally
attained actions
Actual
theoretical
capacity
Experimental /
Theoretical
Bottom column2
-Moment Capacity
-Shear capacity
kNm
kN
70
85
124
148
0.56
0.57
Top column3
-Moment Capacity
-Shear capacity
kNm
kN
53
85
121
143
0.44
0.59
Beam (at column face)
-Negative moment capacity
-Positive moment capacity
-Negative shear capacity
- Positive shear capacity
kNm
kNm
kN
kN
77
67
34
29
134
58
128
109
0.57
1.15
0.26
0.27
4.2.3.2 Stiffness behaviour
The degradation of stiffness can be seen from the applied actuator load versus
displacement plot (Figure 4-6). The average stiffness of the specimen is calculated by
2 Column axial load taken as 400 kN- for calculations see Appendix-C 3 Column axial load taken as 345 kN- for calculations see Appendix-C

107
finding the slope of the line joining peak-to-peak points of the hysteretic loops. This
method was recommended by Durrani and Wight (1985). The specimen experienced loss
of stiffness as the drift ratio increased. This is due to the concrete cracking, yielding of
reinforcement and the pull out of the beam longitudinal reinforcement from the joint.
♦ Comparison of stiffness degradation
The stiffness degradation of the Corcon subassemblage was compared with the results of a
similar subassembly test reported by Durrani and Wight (1987). As mentioned in section
2.7.2 this test series consisted of three interior beam-to-column sub-assemblages to study
the effect of the presence of a floor slab on the behaviour of beam-column connections
during an earthquake. The overall size and cross sectional details of all three specimens
were same. A typical column height of 2248 mm and beam length of 2496 mm were used
in all specimens. The typical member cross sections were; Main “T” Beam – 419x279 mm
with 100 mm thick and 1003 mm wide slab, Transverse Beam-381x279 mm, column-
362x362 mm. The three specimens were tested with different joint shear stress and
different amount of joint transverse reinforcement. The design of frame members was
based on the ACI 318-77 Building code. The length of the beams and height of the
columns represented one half of the span and the storey height, respectively, which is
similar to Corcon test specimen.
The hysteresis loops of both systems were used to determine the stiffness degradation. The
average peak-to-peak stiffness degradation of the specimens is illustrated in Figure 4-14.
For each specimen the stiffness is shown as a percentage of the initial stiffness. As
reported by Durrani and Wight (1985), different levels of joint shear stress and joint
confinement reinforcement have very little effect on the stiffness degradation of the

108
specimen. They noted that the loss of average peak-to-peak stiffness at the end of the
seventh cycle (4% drift) was approximately the same magnitude for all three specimens in
spite of the different level of confinement and joint shear stress. Corcon beam showed
sudden drop in stiffness at its last cycle (9th cycle), which is clearly due to the main crack
development near the top reinforcement curtailment point at the end of cycle 8 (3.0%
drift). The average peak-peak stiffness of the Corcon specimen at the end of the last cycle
(4% drift) and at 3% drift was 29 % and 56 % of the original stiffness respectively.
However, Corcon specimen showed comparatively good performance up to the 3.0 % drift
level.
0
20
40
60
80
100
120
1.0 1.5 2.0 2.5 3.0 3.5 4.0Rel. Storey Drift (%)
Stiff
ness
Deg
rada
tion
(%)
Specimen 1 (D&W)
Specimen 2 (D&W)
Specimen 3 (D&W)
Corcon S1
Figure 4-14: Stiffness degradation of Corcon and other specimens
4.2.3.3 Energy dissipation
The hysteretic response of the specimen provides a measure of the energy dissipated by
the subassemblage during the test. The energy dissipated through damage in the specimen
during a particular cycle is equivalent to the area enclosed by the corresponding loop. For

109
this specimen, the hysteretic loops were thin which indicate low level of energy
dissipation. The energy dissipated by the specimen and the equivalent viscous damping
ratio (heq) for the loading cycles is presented in Table 4-2. As described earlier in section
3.4.2, the recorded nominal drift ratio was adjusted to account for pin slip at connections.
The corrected hysteretic response was used to calculate the viscous damping.
Table 4-2: Energy dissipation and equivalent damping ratio
Cycle
number
Nominal
drift ratio
(%)
Corrected
drift ratio
(%)
Energy dissipated
in half cycle
(joules)
Equivalent
viscous damping
ratio (%)
1 0.4 0.41 34.62 8.174
2 0.8 0.83 145.45 7.19
3 1.0 1.04 254.56 7.47
4 1.2 1.23 350.61 8.30
5 1.6 1.62 560.96 8.05
6 2.0 2.03 897.96 9.58
7 2.5 2.49 1093.76 9.25
8 3.0 3.03 1596.06 10.39
9 4.0 3.47 1591.60 9.57
4 At 0.4 % drift, frame slip interferes too much so that a reliable calculation cannot be made.

110
A desirable behaviour for a beam-column subassemblage under cyclic loading implies
sufficient amount of energy dissipation without a substantial loss of strength and stiffness.
As can be seen from Table 4-2, there is a gradual increase in heq, indicating that a higher
level of energy being dissipated as the drift level increased. The sudden increase in heq in
cycle 6 (2% drift) was due to the first yielding of beam reinforcement. The above
behaviour is clearly seen from the drift ratio versus equivalent damping ratio plot shown in
Figure 4-15. Generally, the equivalent viscous damping ratio corresponds well with first
yielding of reinforcement, repeated yielding, initiation of cracks and widening existing
cracks. A maximum equivalent damping ratio of 10.4% is calculated. This value was
obtained at cycle 8 (3% drift) and at the last cycle, the equivalent viscous damping ratio
was again reduced. This may represent a severe loss of strength after the main cracking
observed at the end of cycle 8.
0.00
2.00
4.00
6.00
8.00
10.00
12.00
0.00 0.50 1.00 1.50 2.00 2.50 3.00 3.50 4.00
Corrected specimen drift ratio (%)
Equi
vale
nt v
isco
us
dam
ping
ratio
for c
ycle
(%)
Figure 4-15: Drift ratio versus equivalent viscous damping ratio

111
4.2.3.4 Ductility and displacement capacity
The displacement ductility factor of the specimen may be determined using the method
presented in Chapter 2, as shown below:
The displacement ductilityy∆
∆= maxµ ,
Where max∆ = Maximum displacement, y∆ = yield displacement
Since the hysteretic response of the structural components may not have a well-defined
yield point, it is usually difficult to determine the displacement at yield. However, it was
revealed from various plots such as hysteretic response of strain gauges and hysteretic
response of north and south beam moment curvature, that yielding started at cycle 6 (2%
drift). The ultimate maximum displacement of the subassemblage’s hysteretic response
could be taken as the maximum applied displacement at last cycle (4% drift). The
displacement corresponding to this drift level could be taken as the subassemblage’s
maximum displacement due to severe cracking and high strength degradation at this level.
Hence, a maximum displacement ductility ratio equal to 2 (ratio between 4% drift and 2%
drift) can be calculated. This displacement ductility ratio is quite adequate for expected
level of seismicity in Australia.

112
4.3 2nd interior specimen
4.3.1 Observed behaviour
4.3.1.1 General
As described earlier in section 3.7, the first test specimen was retrofitted with CFRP. This
involved a major rectification of the specimen with cracks wider than 0.3 mm repaired
using epoxy injection in addition to CFRP.
The specimen appeared to perform very well under lateral deformations up to 4% drift
level. The damage that was observed appeared to be very much moderate compared to the
first specimen. As for the first specimen, there were no signs of cracks due to secondary
effects such as torsion in the specimen.
4.3.1.2 Types and formation of cracks
All cracks were numbered according to the cycle number in which they were first seen, as
for the first specimen. However, there is a greater possibility that some of the cracks may
have formed in an earlier cycle but were too fine to be detected. This issue is more critical
in this test specimen, as a large area of top flange and rib beam in the joint area were
covered with CFRP. However, all the possible cracks were recorded as in the previous
specimen. Cracks formed under positive loading were marked in red, while those formed
under negative loading were marked in blue. Figure 4-16 illustrates the cracks found in the
specimen after completing all loading cycles. This gives a clear picture of the overall
cracking pattern of the specimen. It should be noted that only cracks that are visible out
side the central joint area are shown, as cracking in the cental portion of the rib beam was
covered with CFRP.

113
C4-0
.1
C70.2
C4-0
.1
C7-0
.3
C4-0.
2
C6-0
.1
East Elevation
NS
C70.3
N S
C93.0
-
N STop View
C70.3
N S
C7- 0
.2
C6- 0
.2 C60.2
C60.3
C9-3
.0
C4- 0
.2
C4-0
.2
C4- 0
.1
C6- 0
.1
C7 0.3
West Elevation
Figure 4-16: Sketch of cracks found in the repaired specimen

114
4.3.1.3 Flexural cracking in the flange slab.
The first flexural crack in the top surface of the beam was observed running across the
beam column intersection at a nominal specimen drift ratio of 1.6 %. The width of the
crack at this stage was very small and varied from around 0.1 to 0.2 mm along the length
of the crack. All the cracks formed were almost perpendicular to the beam spanning
direction as in the previous test. The cracking in the longitudinal direction, crushing or
spalling of concrete in flange slab were not seen.
A sudden widening of cracks was not observed as in the first specimen. The number of
cracks in the top flange at the end of the last cycle was considerably low compared to the
damaged observed in the first specimen. The gradual widening of cracks with increased
drift levels was observed. This was a significant difference when compared to the
performance of the first specimen. The main crack observed at the drift level of 3.0 % was
less than 1 mm in width compared to more than 2 mm in the first specimen. Other cracks
formed at this stage were relatively very small. This main crack formed on top of the
flange slab extended across the full width of the slab as in the previous specimen and its
location coincided with the location of the previous main crack. The cracking may have
occurred at the same location due to the broken existing reinforcement and termination of
main bars within the slab. During the last cycle with the nominal drift ratio of 4 %, the
same crack widened to 3 mm and closed during the loading reversal. The main crack in the
flange slab top surface at the end of the test is shown in Figure 4-17. As seen in Figure
4-17, the main crack was limited only to the flange slab depth and had not penetrated in to
the web area as happened in the first specimen.

115
Main Crack
Rectification done for the 1st specimen main crack.
Figure 4-17: Location and extent of main cracking after last cycle (North side beam)
4.3.1.4 Flexural cracking in the ribbed beam.
The first flexural cracking in the beam surface was observed at a nominal specimen drift
ratio of 1.0 %. The first crack formed at the bottom of the rib beam column interface
similar to the first specimen. As the specimen drift was increased, flexural cracking
propagated away from the beam column interface. However, the number of cracks
observed was less compared to the first test.
As shown in Figure 4-18, the bolted steel plates at the bottom of the rib beam, which were
provided to prevent CFRP delamination, were seen bending outward due to the outward
force generated by CFRP. Due to the stiffness inadequacy of the steel flat plate provided,
the CFRP layer near the joint area was delaminated from the built up chamfer as the drift
level increased and finally at the drift level of 4% a severe cracking was observed as
shown in Figure 4-19. This was mainly resulted due to the outward force from the CFRP
and the high compressive force in the rib beam, near beam column interface.

116
Outward bending of steel plate
Figure 4-18: Part of rib beam (north side)
Cracking above the chamfer area
Figure 4-19: Cracking near the built up chamfer area

117
4.3.1.5 Flexural cracking in columns
The upper and lower columns of the subassembly were not rectified, as cracks on these
columns were less than 0.3mm. It was observed during the second test that same cracks
that formed earlier widened and no new cracks formed. However, the cracks observed in
the top column were wider than the first test and were around 0.25 mm. There was no
cracking in the lower column as in the first test.
4.3.2 Measured behaviour
4.3.2.1 Hysteretic response
The hysteretic response of the second test was recorded as was done for the first test. The
recorded response required two types of corrections similar to the first test. Displacement
corrections were done following a similar procedure as in the first test (see section
4.2.2.1). The fully corrected hysteretic response of the subassemblage is shown in Figure
4-20. The subassembly was tested to a maximum nominal drift ratio of 4 %. It should be
noted that last cycle (4.0% drift) in the negative loading direction was not done due to the
inadequate space between the external prestressing supporting steel frame and cross
bracings. The equivalent full-scale hysteretic response can be obtained by multiplying the
recorded load by a factor of 4 and the recorded displacement by a factor of 2.

118
-125
-100
-75
-50
-25
0
25
50
75
100
125
-100 -75 -50 -25 0 25 50 75 100
Load (kN)
0.8 -1.2% Drift
2.0-4.0% Drift
Displacement (mm)
Figure 4-20: Fully corrected hysteretic response (second test)
Similar to the first specimen, the corrected hysteresis response shows that the system as a
whole has relatively low energy absorption. However, compared with the first specimen
the second specimen has absorbed 25-35% higher energy (see Tables 4.2 and 4.4). Test
subassembly exhibited good displacement capacity with no degradation of overall lateral
strength up to the last cycle (4 % drift). A higher maximum strength than for the first
specimen was attained due to the CFRP strips provided beyond the reinforcement
curtailment point of the first specimen.
It is clear that the adopted CFRP system has proven to be an effective technique to
repair/strengthen the test specimen. Compared to the original, the retrofitted specimen has
increased its lateral load resistance by 26% at peak load. At large displacements, the load
was still increasing with positive stiffness, though with a stiffness lower than that of initial
value. The degradation in stiffness is attributed to flexural cracking and loss of anchorage
of both the beam reinforcement and the CFRP system.

119
4.3.2.2 Photogrammetry-based measurement
As described in Chapter 3, photogrammetry-based measurements enabled both global and
local deformation of the test specimen to be followed during the testing. Figures 4-21 to
4-24 show the deformation of first row of photo-sensitive targets on the flange slab, for the
load cycles from 1.2 % to 4.0 % drift. Figures 4-21 and 4-22 show the vertical and
horizontal components of the movement of each target during the north side displacement
of the actuator. Similar plots shown in Figures 4-23 and 4-24 give the vertical and
horizontal movement of same target points during the south movement of the actuator.
-8
-6
-4
-2
0
2
4
6
-3000 -2000 -1000 0 1000 2000 3000
1.2% Drift 1.6% Drift
2.0% Drift 2.5% Drift
3.0% Drift 4.0% Drift
Distance from column center (mm)
Deformation (mm)
Figure 4-21: Vertical deformation of the beam (North displacement of actuator)
-3
-2.5
-2
-1.5
-1
-0.5
0
0.5
1
1.5
-3000 -2000 -1000 0 1000 2000 3000
1.2% Drift 1.6% Drift
2.0% Drift 2.5% Drift
3.0% Drift 4.0% Drift
Distance from column center (mm)
Deformation (mm)
Max. Crack width = 2.26 mm
Figure 4-22: Horizontal deformation of the beam (North displacement of actuator)

120
The vertical deformation plots give a clear picture of the beam vertical deformation at the
end of each load cycle and the horizontal deformation plots give the axial deformation of
the beam flange.
The axial deformation along the beam flange slab could be used to locate the cracking in
between photo-sensitive target points. As shown in Figure 4-22 the cracking during last
cycle (4% drift) has increased to 2.26 mm. This matches perfectly with the crack width
observed (3 mm) during the 4.0 % drift cycle. The slight variation of observed crack width
and the value obtained from the graph, may be due to the change in location of measured
point and the target location. These plots will be compared with the results obtained from
finite element modelling in Chapter 5.
-6
-5
-4
-3
-2
-1
0
1
2
3
-3000 -2000 -1000 0 1000 2000 3000
1.2% Drift 1.6% Drift
2.0% Drift 2.5% Drift
3.0% Drift
Distance from column center (mm)
Deformation (mm)
Figure 4-23: Vertical deformation of the beam (south displacement of actuator)
-1.5
-1.25
-1
-0.75
-0.5
-0.25
0
0.25
0.5
-3000 -2000 -1000 0 1000 2000 3000
1.2% Drift 1.6% Drift
2.0% Drift 2.5% Drift
3.0% Drift
Distance from column center (mm)
Deformation (mm)
Figure 4-24: Horizontal deformation of the beam (South displacement of actuator)

121
4.3.2.3 Strain gauge readings on reinforcement
Strain gauge readings were recorded in a similar manner as for the first specimen. The
same strain plots presented for the first specimen was selected for the second test as well,
in order to provide direct comparison. In addition, the results from selected strain gauges
on CFRP are presented within the body of the thesis for discussion purposes.
♦ Beam top longitudinal reinforcement
Figure 4-25 shows the strain history of a top main reinforcement bar at the north column
face. The maximum strain recorded at the end of 3 % drift level was 1400 microstrain,
compared to the strain level reached in the first test of 3900 microstrain. Similarly, in the
second test reinforcement yielding occurred during the last cycle (4 % drift), whereas in
the first test reinforcement yielding occurred during cycle 6 (2.0 % drift). It is very clear
from the plot that the bar was strained to lower values than recorded strain in the first test.
The reason for this is due to the contribution of well-anchored CFRP as flexural
reinforcement in the negative moment area.

122
Gauge BTG4
-1000
0
1000
2000
3000
4000
5000
-150 -100 -50 0 50 100 150
Actuator Load (kN)
Stra
in (M
icro
Str
ain)
Yield Strain
BTG4
Figure 4-25: Strain history of a top beam bar at north column face (East corner)
The strain history of other top main reinforcement on the north column face is shown in
Figure 4-26. The reinforcement yielding occurred during the last cycle (4.0 % drift) as per
the previous strain plot. The maximum strain recorded at the end of 3 % drift level was
1360 microstrain, which is consistent with the strain level observed in the other main top
bar (1400 microstrain). However, in the first test, the strains found were not compatible for
the bars located symmetrically on the same column face. This could happen in an area
where the cracking is very high.

123
Gauge BTG2
-1000
0
1000
2000
3000
4000
5000
-150 -100 -50 0 50 100 150
Actuator Load (kN)
Stra
in (M
icro
Str
ain)
Yield Strain
BTG2
Figure 4-26: Strain history of a top beam bar at north column face (West corner)
Figures 4-27 and 4-28 show the strain history of gauges located at CFRP top strips at the
north-east and north-west respectively. The maximum strain recorded at the end of 4 %
drift level was 2600 microstrain and 2300 microstrain respectively, which are well below
the designed maximum strain of 4900 microstrain. It should be noted that the sudden
increase in strain observed in the strain gauges BTG2 and BTG4 (gauges located at top
main reinforcement bars on north side) was not observed in CFRP strain gauges.
Figures 4-29 and 4-30 show the strain history of CFRP top strips at 1000 mm away from
the column centre on east and west side respectively. The very high strain increase
observed in above strain plots are similar to the strain increases observed in BTG2 and
BTG4 (gauges located at top main reinforcement bars on north side). The main cracking
recorded in north beam coincide with the above strain gauge location. Therefore higher
strain reading can be expected due to the proximity of the strain gauge to cracks.

124
Gauge CG2
-1000
0
1000
2000
3000
4000
5000
-150 -100 -50 0 50 100 150
Actuator Load (kN)
Stra
in (M
icro
Str
ain)
NSCG2
Gauge CG2
-1000
0
1000
2000
3000
4000
5000
-150 -100 -50 0 50 100 150
Actuator Load (kN)
Stra
in (M
icro
Str
ain)
NSCG2
NS NSCG2
Figure 4-27: Strain history of top CFRP at north column face (East corner)
Gauge CG10
-2000
-1000
0
1000
2000
3000
4000
5000
-150 -100 -50 0 50 100 150
Actuator Load (kN)
Stra
in (M
icro
Str
ain)
NS
CG10
Gauge CG10
-2000
-1000
0
1000
2000
3000
4000
5000
-150 -100 -50 0 50 100 150
Actuator Load (kN)
Stra
in (M
icro
Str
ain)
NS
CG10
NS
CG10
Figure 4-28: Strain history of top CFRP at north column face (West corner)

125
Gauge CG1
-1000
0
1000
2000
3000
4000
5000
-150 -100 -50 0 50 100 150
Actuator Load (kN)
Stra
in (M
icro
Str
ain)
NSCG1
Gauge CG1
-1000
0
1000
2000
3000
4000
5000
-150 -100 -50 0 50 100 150
Actuator Load (kN)
Stra
in (M
icro
Str
ain)
NSCG1
NSCG1
Figure 4-29: Strain history of a top CFRP at 1.0 m away from column (East side)
Gauge CG9
-1000
0
1000
2000
3000
4000
5000
-150 -100 -50 0 50 100 150
Actuator Load (kN)
Stra
in (M
icro
Str
ain)
NS
CG9
Gauge CG9
-1000
0
1000
2000
3000
4000
5000
-150 -100 -50 0 50 100 150
Actuator Load (kN)
Stra
in (M
icro
Str
ain)
NS NS
CG9
Figure 4-30: Strain history of a top CFRP at 1.0 m away from column (West side)

126
♦ Beam bottom longitudinal reinforcement
Figure 4-31 shows the strain history of the bottom main reinforcement of the north side
beam. The maximum strain recorded was well below the yield strain as in the first test,
indicating that this strain gauge reading is not influenced by the CFRP used in the bottom
beam-column joint area for strengthening. A similar strain plot was obtained for south side
beam bottom bar as well. Both plots show the gradual increase in strain with increasing
drift ratio. It was noted that the strain increase was only 16 % for the 60% increase in drift
level from 2.5 % to 4.0%.
Gauge BBG2
-1000
0
1000
2000
3000
4000
5000
-150 -100 -50 0 50 100 150
Actuator Load (kN)
Stra
in (M
icro
Str
ain)
Yield Strain
BBG2
Figure 4-31: Strain history of the beam bottom main bar (North side)
Figures 4-32 and 4-33 show the strain history of CFRP north beam bottom strips on west
side at 600 mm and 200 mm away from the column centre respectively. The strain
recorded in CFRP was in the same order as in reinforcement. The gauge CG13 (Figure
4-32) shows good bond behaviour during cyclic loading. However, gauge CG14 (Figure

127
4-33) shows very poor bond behaviour after 2.5 % drift level. This is due to the
delamination of CFRP strips on both sides of the beam near the beam-column joint.
Gauge CG13
-1000
-500
0
500
1000
1500
-150 -100 -50 0 50 100 150
Actuator Load (kN)
Stra
in (M
icro
Str
ain)
NSCG13
Gauge CG13
-1000
-500
0
500
1000
1500
-150 -100 -50 0 50 100 150
Actuator Load (kN)
Stra
in (M
icro
Str
ain)
NSCG13
NSCG13
Figure 4-32: Strain history of north beam bottom CFRP at 600 mm away from column (West side)

128
Gauge C14
-500
0
500
1000
1500
-150 -100 -50 0 50 100 150
Actuator Load (kN)
Stra
in (M
icro
Str
ain)
NSCG14
Gauge C14
-500
0
500
1000
1500
-150 -100 -50 0 50 100 150
Actuator Load (kN)
Stra
in (M
icro
Str
ain)
NSCG14
NSCG14
Figure 4-33: Strain history of north beam bottom CFRP at 200 mm away from column (West side)
♦ Column strains
Figure 4-34 shows the strain history of gauge SEC2 located in a southeast corner bottom
column bar. A tensile strain of 1500 microstrain, which is well below the yield, was
developed at the maximum 4 % nominal drift. Figure 4-35 shows the strain history of
SWC1 located in a Southwest corner column top bar. Gauge SWC1 recorded a maximum
strain reading of 2300 microstrain compared to strain observed in the first test of 1800
microstrain. Similar low and high maximum strain readings were observed for other
bottom and top gauges respectively. This difference in strain behaviour was observed in
the first test as well, as slight cracking on upper column was seen while no cracking was
observed on the lower column.
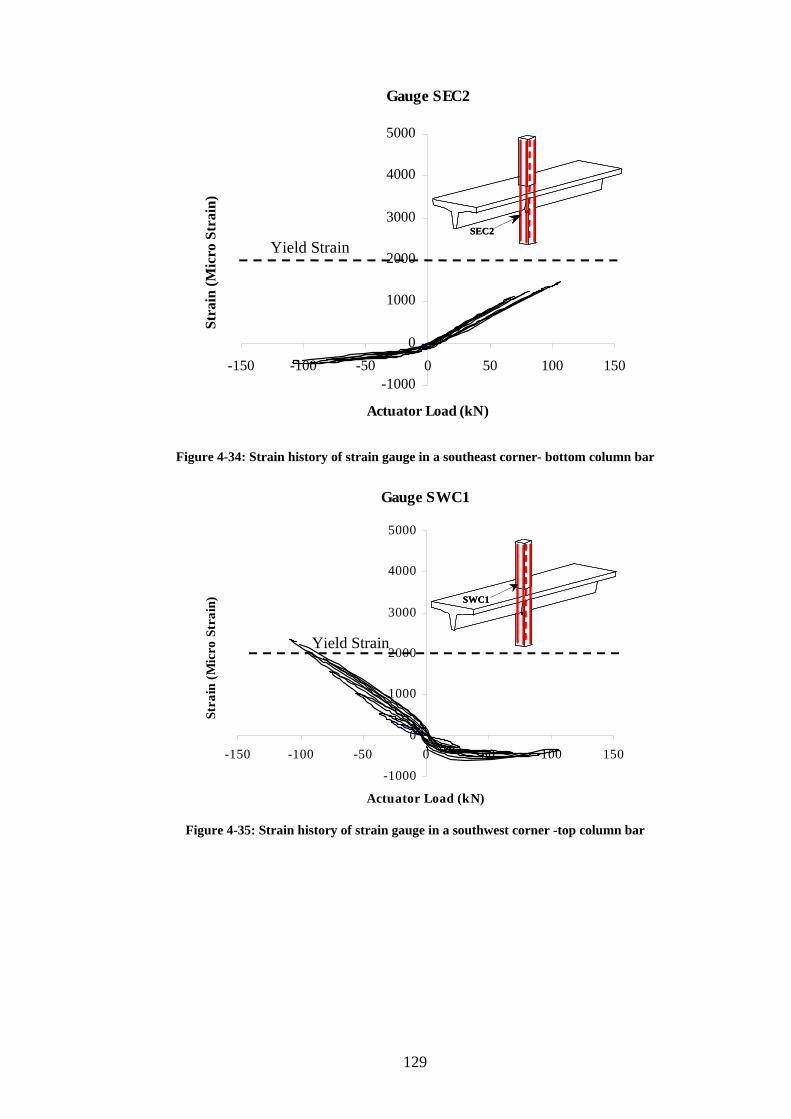
129
Gauge SEC2
-1000
0
1000
2000
3000
4000
5000
-150 -100 -50 0 50 100 150
Actuator Load (kN)
Stra
in (M
icro
Str
ain)
Yield StrainSEC2
Gauge SEC2
-1000
0
1000
2000
3000
4000
5000
-150 -100 -50 0 50 100 150
Actuator Load (kN)
Stra
in (M
icro
Str
ain)
Yield StrainSEC2SEC2
Figure 4-34: Strain history of strain gauge in a southeast corner- bottom column bar
Gauge SWC1
-1000
0
1000
2000
3000
4000
5000
-150 -100 -50 0 50 100 150
Actuator Load (kN)
Stra
in (M
icro
Str
ain) SWC1
Yield Strain
Gauge SWC1
-1000
0
1000
2000
3000
4000
5000
-150 -100 -50 0 50 100 150
Actuator Load (kN)
Stra
in (M
icro
Str
ain) SWC1SWC1
Yield Strain
Figure 4-35: Strain history of strain gauge in a southwest corner -top column bar

130
4.3.2.4 Displacement transducer readings
As for the first specimen, displacement transducers were used to measure beam curvature
near the joint. Figures 4-36 and 4-37 show the moment curvature plots of north and south
beam respectively. The bending moment and curvature of each beam were calculated
following the same procedure used in the first test (section 4.2.2.3).
There is no significant difference between north and south beam moment curvature plots
compared to the large difference observed in the first test. This may be due to the less
cracking observed in the second test compared to the first test in the beam-column
interface area. Both moment-curvature plots do not show any degradation of moment
capacity.
-125
-100
-75
-50
-25
0
25
50
75
100
125
-40 -20 0 20 40
Beam Curvature (rad/m)
Bend
ing
Mom
ent (
kNm
)
Figure 4-36: Bending moment versus beam curvature (North)

131
-125
-100
-75
-50
-25
0
25
50
75
100
125
-40 -20 0 20 40
Beam Curvature (rad/m)
Bend
ing
Mom
ent (
kNm
)
Figure 4-37: Bending moment versus beam curvature (South)
4.3.2.5 Load cell values
Figure 4-38 shows the total column axial force variation during the test. It can be seen
from the plot that the prestressing force in strands remained fairly constant at
approximately 400 kN. The axial force varied by 7% compared with the 4 % variation
observed in the first test.

132
300
325
350
375
400
425
450
-150 -100 -50 0 50 100 150
Actuator Load (kN)
Col
umn
axia
l loa
d (k
N)
Figure 4-38: Column prestressing force versus Actuator load
4.3.3 Performance assessment
4.3.3.1 Strength behaviour
As observed in Figure 4-37, first subassembly test exhibited good displacement capacity
with no degradation of overall lateral strength up to 4 % drift limit. The attained strengths
of various components of the second subassemblage are calculated from the hysteretic
response as for the first specimen. The theoretical capacities of beams were calculated
using the CFRP strips used to retrofit the specimen and ignoring the contribution due to
reinforcement.
The experimentally attained actions are compared to the theoretical capacities in Table
4-3. The experimentally attained column moments were determined by multiplying the
column shear with the column length similar to the first test. The shear force at the top and
bottom columns was same as actuator force. It should be noted that the upper column just

133
yielded and lower column did not yield. This is due to the shorter clear height of the lower
column.
The beam moments were calculated using the reactions in the vertical links at the beam-
ends. The beams were yielded in both positive and negative moments. Both the positive
and negative beam moments reached approximately 60% and 50% of ultimate capacity.
The maximum capacity was not reached due to the fact that the test was carried out only
up to the maximum lateral displacement capacity (± 75 mm. i.e. 4% drift) of the actuator.
It should be noted that, even at 4 % drift level the load was still increasing at a lower rate
than that of lower drift values. Similar to the first test, the shear value attained was much
below the capacity, mainly due to the fact that the rib beam has a very high shear capacity.

134
Table 4-3: Comparison of attained actions and theoretical capacities (2nd Test)
Design parameter Units Experimentally
attained actions
Actual
theoretical
capacity
Experimental /
Theoretical
Bottom column5
-Moment Capacity
-Shear capacity
kNm
kN
86 (70)
104 (85)
124
148
0.69 (0.56)
0.70 (0.57)
Top column6
-Moment Capacity
-Shear capacity
kNm
kN
65 (53)
104 (85)
121
143
0.54 (0.44)
0.73 (0.59)
Beam (at column face)
-Negative moment capacity
-Positive moment capacity
-Negative shear capacity
- Positive shear capacity
kNm
kNm
kN
kN
105 (77)
71 (67)
46 (34)
31 (29)
200
118
128
109
0.53 (0.57)
0.60 (1.15)
0.36 (0.26)
0.28 (0.27)
4.3.3.2 Stiffness behaviour
The degradation of stiffness can be seen from the applied actuator load versus
displacement plots (Figure 4-20). The average stiffness of the second test was calculated
5 Column axial load taken as 400 kN 6 Column axial load taken as 345 kN ( ) Values from first test

135
similar to the first test. The specimen experienced loss of stiffness as drift ratio increased.
However, the rate of stiffness degradation was low compared to the first test. This is due
to the less cracking observed in the second test. Other main reason for above behaviour is
due to both reinforcement and CFRP not being stressed to their yielding level.
The second test specimen did not show a sudden drop in stiffness up to the last cycle (4 %
drift), rather stiffness degradation was gradual. This improved behaviour was due to the
provision of top CFRP strips well beyond the original reinforcement curtailment point,
thus avoiding excessive cracking. The average peak-peak stiffness of the second test
specimen at the end of the last cycle (4% drift) and at 3% drift was 87 % and 78 % of the
original stiffness respectively.
4.3.3.3 Energy dissipation
The energy dissipation of the second test specimen was calculated similar to the first test
specimen. As for the first specimen, thin hysteretic loops were observed, indicating the
low level of energy absorption. The energy dissipated by the specimen and the equivalent
viscous damping ratios (heq) for the loading cycles are presented in Table 4-4. Compared
with the equivalent viscous damping ratio values obtained for the first test, the second test
shows relatively lower values, indicating that the overall damage is less than the first
specimen.

136
Table 4-4: Energy dissipation and equivalent damping ratio (2nd Test)
Cycle
number
Nominal
drift ratio
(%)
Corrected
drift ratio (%)
Energy dissipated in
half cycle (joules)
Equivalent viscous
damping ratio (%)
1 0.8 0.76 116.98 (145.45) 10.067 (7.19)
2 1.2 1.11 190.82 (350.61) 9.12 (8.30)
3 1.6 1.6 378.31 (560.96) 7.87 (8.05)
4 2.0 2.03 601.66 (897.96) 7.63 (9.58)
5 2.5 2.49 883.40 (1093.76) 7.66 (9.25)
6 3.0 3.03 1291.30 (1596.06) 8.14 (10.39)
7 4.0 3.95 2155.56 (1591.60) 8.87 (9.57)
4.3.3.4 Ductility and displacement capacity
As explained previously for the first specimen (section 4.2.3.4), it is usually difficult to
determine the displacement at yield. The main top reinforcement did not yield until a
nominal drift of 4 %. The second specimen did not reach the ultimate displacement, as the
test had to be terminated at 4% drift when the actuator reached its maximum capacity. At
4% drift level, the specimen exhibited no strength degradation. In fact, the strength of the
specimen was still increasing. Hence, the ductility or maximum displacement cannot be
expressed as in the first specimen.
7 At 0.4 % drift, frame slip interferes too much so that a reliable calculation cannot be made. ( ) Values from first test

137
4.4 Summary
The results of various observations related to the first and second test specimens were
presented in this chapter. Different types of cracking observed in beam and column during
the testing presented in detail. The measured behaviour of the test specimen such as
hysteretic response of subassemblage, strain gauge readings of beam and column
reinforcement, displacement transducers and load cells were presented in graphical form.
A performance assessment was carried out in relation to strength, stiffness behaviour,
degradation, energy dissipation, ductility and displacement capacity etc. The
experimentally achieved member capacities were compared with the theoretical values for
both test specimens.


138
Chapter 5
ANALYTICAL WORK
5.1 Introduction
This chapter presents the analytical component of this investigation. The finite element
analysis was used to investigate the performance of beam-column subassemblages. The
finite element modelling of the subassemblage was performed using Program ANSYS 8.0
(ANSYS, 2003). The test results were used to calibrate the initial finite element model.
Another finite element model was developed to test the performance of a similar
subassemblage with improved reinforcement detailing to overcome deficiencies identified
in the first test.
A time history analysis of prototype frame was performed using program RUAUMOKO
(Carr, 1998). Program RUAUMOKO is developed to carryout analysis of structures
subjected to earthquake and other dynamic excitations taking into account both material
and geometric non-linearity.
5.2 Finite element analysis
Program ANSYS is capable of handling dedicated numerical models for the non-linear
response of concrete under static and dynamic loading. Eight-node solid brick elements
(Solid 65) were used to model the concrete. These elements include a smeared crack
analogy for cracking in tension zones and a plasticity algorithm to account for the
possibility of concrete crushing in compression regions. Internal reinforcement was

139
modelled using 3-D spar elements (Link 8) and these elements allow the elastic-plastic
response of the reinforcing bars.
5.2.1 Element types
5.2.1.1 Reinforce concrete
The solid element (Solid 65) has eight nodes with three degrees of freedom at each node
and translations in the nodal x, y, and z directions. The element is capable of plastic
deformation, cracking in three orthogonal directions, and crushing. The geometry and
node locations for this element type are shown in Figure 5-1.
Figure 5-1: Solid65 – 3-D reinforced concrete solid (ANSYS 2003)
The geometry and node locations for Link 8 element used to model the steel reinforcement
are shown in Figure 5-2. Two nodes are required for this element. Each node has three
degrees of freedom, translations in the nodal x, y, and z directions. The element is also
capable of plastic deformation.

140
Figure 5-2: Link 8 – 3-D spar (ANSYS 2003)
5.2.2 Steel plates
An eight-node solid element, Solid45, was used for the steel plates at the top and bottom
end of column supports. The element is defined with eight nodes having three degrees of
freedom at each node and translations in the nodal x, y, and z directions. The geometry
and node locations for this element type are shown in Figure 5-3. A 50 mm thick steel
plate, modelled using Solid45 elements, was added at the support locations in order to
avoid stress concentration problems and to prevent localized crushing of concrete elements
near the supporting points and load application locations. This provided a more even stress
distribution over the support area.

141
Figure 5-3: Solid45 – 3-D solid (ANSYS 2003)
5.3 Material properties
5.3.1 Concrete
A nonlinear elasticity model was adopted for concrete. This nonlinear elasticity model is
based on the concept of variable moduli and matches well with several available test data.
For normal strength concrete, a stress-strain model as shown in Figure 5-4 was suggested
by Vecchio and Collins (1986). However, this ideal stress-strain curve was not used in the
finite element material model, as the negative slope portion leads to convergence
problems. In this study, the negative slope was ignored and the stress-strain relation shown
in Figure 5-5 was used for the material model in ANSYS.

142
0
5
10
15
20
25
30
35
40
45
0 0.0005 0.001 0.0015 0.002 0.0025 0.003
Strain
Stre
ss (M
Pa)
Figure 5-4: Stress-strain curve for 40 MPa concrete (Vecchio and Collins, 1986)
0
5
10
15
20
25
30
35
40
45
0 0.0005 0.001 0.0015 0.002 0.0025 0.003
Strain
Stre
ss (M
Pa)
Figure 5-5: Simplified compressive stress-strain curve for concrete used in FE model

143
5.3.1.1 FEM Input Data
For concrete, ANSYS requires input data for material properties as follows:
Elastic modulus (Ec= 27,897 MPa used in this analysis)
Ultimate uniaxial compressive strength (f’c=40.6 MPa)
Ultimate uniaxial tensile strength (modulus of rupture, fr=2.55 MPa)
Poisson’s ratio (ν=0.2)
Shear transfer coefficient (βt)
Compressive uniaxial stress-strain relationship for concrete.
The elastic modulus of concrete was calculated by using the slope of the tangent to the
stress-strain curve through the zero stress and strain point. The ultimate uniaxial
compressive strength of concrete was taken from the mean value of cylinder test results.
The tensile strength of concrete was assumed to be equal to the value given in the
Australian concrete structures code (AS-3600, 2001). This formula is given in Equation
5-1.
cr ff '4.0= Equation 5-1
The shear transfer coefficient for open cracks, βt, represents the conditions at the crack
face. The value of βt ranges from 0.0 to 1.0, with 0.0 representing a smooth crack
(complete loss of shear transfer) and 1.0 representing a rough crack (no loss of shear
transfer) (ANSYS, 2003). The value of βt used in many finite element studies of
reinforced concrete structures, however, varied between 0.05 and 0.25 (Bangash, 1989;
Hemmaty, 1998; Huyse et al., 1994). A number of comparative analytical studies have
been attempted by Kachlakev et al. (2001) to evaluate the influence of shear transfer
coefficient. They used finite element models of reinforced concrete beams and bridge
decks with βt values within the range 0.05-0.25 and encountered convergence problems at

144
low loads with βt values less than 0.2. Therefore, a shear transfer coefficient of 0.2 has
been used. However, in a recent study, Stehle (2002) recommended to use a shear transfer
coefficient of 0.125. Therefore, for this study, both shear transfer coefficients of 0.125 and
0.2 were used to derive the theoretical load-displacement relationship for comparison with
experimental results.
For closed cracks, the shear transfer coefficient assumed by both researchers (Kachlakev
et al., 2001; Stehle, 2002) was found to be equal to 1.0. This represents the shear stiffness
reduction in the model, set to zero. In the analysis crack closure was not expected, since
the specimen was loaded from crack free initial state to ultimate load monotonously.
5.3.1.2 Reinforcement
Steel reinforcement stress-strain curve for the finite element model was based on the
actual stress-stain curve obtained from tensile tests. The actual stress-strain curve for the
reinforcement is shown in Figure 5-6. However, this stress-strain curve was modified to
improve the convergence of finite element model by removing the negative slope portion
of the curve. Also the zero slope portion after yielding was slightly modified to a mild
positive slope. Figure 5-7 shows the stress-strain relationship used in this study.
Material properties for the steel reinforcement model are as follows:
Elastic modulus- Es = 200,000 MPa, Yield stress- fy = 450 MPa, Poisson’s ratio- ν=0.3.

145
0
100
200
300
400
500
600
0 0.02 0.04 0.06 0.08 0.1 0.12 0.14 0.16 0.18 0.2 0.22
Strain
Stre
ss (M
Pa)
Figure 5-6: Stress-strain curve for steel (obtained from testing reinforcement)
0
100
200
300
400
500
600
0 0.02 0.04 0.06 0.08 0.1 0.12 0.14 0.16 0.18 0.2 0.22
Strain
Stre
ss (M
Pa)
Figure 5-7: Modified stress-strain curve for steel (adopted in ANSYS model)
5.3.1.3 Geometry and finite mesh
The test subassemblage was modelled in ANSYS taking the advantage of symmetry across
the width of the flange beam and column. This plane of symmetry was represented using

146
relevant constraints in the finite element node points. This approach reduced
computational time and computer disk space requirements significantly.
The beam and column mesh was selected such that the node points of the solid elements
coincided with the actual reinforcement locations. Additional node points were provided
by sub dividing the mesh, so that a reasonable mesh density was obtained in the joint
regions with the recommended aspect ratio of elements.
In the finite element model, solid elements (Solid45) were used to model the steel plates.
Nodes of these solid elements were connected to those of adjacent concrete solid elements
(solid 65) in order to satisfy the perfect bond assumption. Link 8 elements were employed
to represent the steel reinforcement, referred to here as link elements. Ideally, the bond
strength between the concrete and steel reinforcement should be considered. However, in
this study, perfect bond between materials was assumed due to the limitations in ANSYS.
To provide a perfect bond, the link element for the steel reinforcing was connected
between nodes of each adjacent concrete solid element, so the two materials shared the
same nodes. Figure 5-8 illustrates the element connectivity.
Figure 5-9 shows the finite element model used to simulate the first test. It should be noted
that main reinforcement and shear ligatures in rib beam and column were precisely located
as per the actual first test subassembly. Steel reinforcement for the half beam model was
entered into the model as half the actual area. The finite element model had exactly 7067
total numbers of elements, consisting of 5480 solid 65 elements, 1542 link 8 elements and
35 solid 45 elements.

147
Concrete solid element (Solid 65)
Link element (Link 8) Solid element (Solid 45)
(a) (b)
Figure 5-8: Element connectivity: (a) concrete solid and link elements; (b) concrete solid and steel solid element
Mesh R/FBar # 01, 02, 03
Main Top R/F
Main bottom R/F(Link 8)
Column R/F (Link 8)
Column & Rib beam shear links (link 8)
Steel plate (Solid 45)
Concrete (Solid 65)
Figure 5-9: Finite element mesh used (selected concrete elements removed to illustrate internal reinforcement)

148
5.3.1.4 Boundary conditions and loading
The boundary conditions were exactly simulated as in the test set up shown in Figure 3-20.
Horizontal and vertical restraints, representing a pin connection were applied at the top of
the column. At the end of rib beams, only vertical restraints were provided to simulate the
roller support conditions used in the test. Figures 5-10 and 5-11 show the restraints used in
the finite element model at beam-ends and column top end respectively. Figure 5-10 also
shows an additional reinforcement mesh provided at the end of beam face. This was
provided to prevent any localized crushing of concrete elements near the supporting
points.
Restraints at beam end
Restraints to maintain plane of symmetry
R/F mesh provided at beam support face
Figure 5-10: Rib beam end restraints used in FE model

149
Restraints at column top end
Restraints to maintain plane of symmetry
Figure 5-11: Column top end restraints used in FE model
A constant axial load of 200 kN (half of total column load due to symmetry) was applied
to bottom end of the column. The application of gravity loading (1.2G+0.4Q) to the finite
element model was slightly modified to reduce the number of loading steps, thus reducing
the number of analysis stages. The self-weight of the beam was not applied to the beam as
a uniformly distributed load, instead it was applied as a prescribed vertical downward
displacement (1.7 mm) at each beam support. This created similar negative bending
moments as shown in Figure 3-23. The program RESPONSE-2000 (Bentz and Collins,
2000) was used to calculate the amount of displacement required to create the adopted
bending moment in the test. More details are given in Appendix D.
The horizontal displacement at the column bottom end was applied in a slowly increasing
monotonic manner, with results recorded every one-millimetre lateral displacement. The
loading was applied in one-millimetre increments up to 75 mm. It was found that after

150
several unsuccessful solution runs, the application of lateral load in very small steps is
important to obtain the full load-deformation curve without convergence problems.
5.3.2 Non-linear solution
In nonlinear analysis, the total load applied to a finite element model is divided into a
series of load increments called load steps. At the completion of each incremental solution,
the stiffness matrix of the model is adjusted to reflect nonlinear changes in structural
stiffness before proceeding to the next load increment. The ANSYS program (ANSYS
2003) uses Newton-Raphson equilibrium iterations for updating the model stiffness.
Newton-Raphson equilibrium iterations provide convergence at the end of each load
increment within tolerance limits. In this study, for the reinforced concrete solid elements,
convergence criteria were based on force and displacement, and the convergence tolerance
limits were initially selected by the ANSYS program. It was found that convergence of
solutions for the models was difficult to achieve due to the nonlinear behaviour of
reinforced concrete. Therefore, the convergence tolerance limits were increased to a
maximum of 5 times the default tolerance limits (0.5% for force checking and 5% for
displacement checking) in order to obtain convergence of the solutions.
5.3.2.1 Calibration
As mentioned earlier in section 5.3.1.1, the finite element model required calibration with
respect to the shear transfer coefficient across open cracks. For the calibration process, two
values (0.125 and 0.2) were used for the shear transfer coefficient. The results of the finite
element pushover analysis are compared to the back-bone curve of the hysteresis of the
tested subassemblage, in Figure 5-12. A shear transfer coefficient of 0.2 appears to be the
best fit.

151
0
20
40
60
80
100
0 10 20 30 40 50 60 70 80
Displacement (mm)
Loa
d (k
N)
Test-1 results0.125 Shear0.2 Shear
Figure 5-12: Load versus displacement-1st test specimen test results and FE results
A plot showing extent of cracking is shown in Figure 5-13. This is at a displacement of 65
mm (3.42 % drift). As described below, the crack patterns observed in testing and finite
element analysis matched reasonably well.
Plane of Symmetry
Half column width
Location of main cracks
Main top reinforcement curtailed at 1000 mm from column center
(a)
(b)
Figure 5-13: Smeared cracks formed parallel to vertical dashed lines at 65 mm displacement (3.42 % drift)- (a) Top view of full beam, (b) Enlarged part

152
As mentioned in section 2.5.3, in ANSYS a cracking sign represented by a circle appears
when the principal tensile stress exceeds the ultimate tensile strength of concrete. The
cracking sign appears perpendicular to the direction of the principal stress. The red circles
at each element centroid in the figure have their plane aligned with the plane of cracking.
Hence, what appears to be a dashed line is in fact a row of circles with a plane (i.e. plane
of cracking) perpendicular to the plane of beam top surface, indicating flexural cracking.
The yellow dashed line shown in Figure 5-13 is the location of main cracks appeared in
the first test (see Figures 4-2 and 4-3). It should be noted that these main cracks could be
identified among other smeared cracks, by having well defined straight red dashed lines.
For a concrete structure subjected to uniaxial compression, cracks propagate primarily
parallel to the direction of the applied compressive load, since the cracks resulting from
tensile strains develop due to Poisson’s effect. The red circles on right hand side of the
column (Figure 5-13) appeared perpendicular to the principal tensile strains in the upward
direction at integration points in the concrete elements near the right hand side of column,
where high concentration of compressive stresses occur. These will be referred to as
splitting cracks. These types of cracks were not seen during the test, as these cracks are
formed parallel to the concrete surface. These cracks lead to crushing of concrete at very
high compressive stress. Figure 5-14 shows the compressive stress vector flow within the
whole subassembly and the red arrows show the direction of compressive stress flow in
the rib beam and the flange slab. Figure 5-15 shows the compressive stress concentration
near the column.

153
Figure 5-14: Compressive stress vectors flow at 65 mm displacement
Column
Figure 5-15: Compressive stresses direction in the flange slab at 65 mm displacement
Figure 5-16 shows the deformation pattern of first subassembly model at 65 mm lateral
displacement. It is very clear from the deformation pattern that the negative hinging of
beam has shifted away from column face and coincides with the beam top main

154
reinforcement curtailment point. This behaviour was observed during the testing as well.
Figures 5-17 and 5-18 show the stress and strain distribution respectively. These
distributions help to identify the hinging locations.
Hinging near R/F curtailment location
Hinging near column face
Figure 5-16: Deformation of subassembly at 65 mm displacement- 1st specimen
Hinge Location at top bar curtailment point
High compressive stress locations
Figure 5-17: Longitudinal stress distribution of subassembly at 65 mm displacement-1st FE model

155
High strain point
Figure 5-18: 3rd principal strain distribution of subassembly at 65 mm displacement
Finite element analysis results were used to obtain detail information on concrete and
reinforcement stress variation in different areas of the subassembly. Figure 5-19 illustrates
horizontal and vertical deformation of the rib beam obtained from the finite element
model. During the first test, this type of continuous deformation was not monitored due to
the complexity of instrumentation and the cost involvement. However FEM can be used to
predict such detail information without considerable effort. As can be seen from Figure 5-
19, horizontal deformation exhibits sudden changes at 2 locations. This type of
deformation cannot happen without severe cracking. The location and the crack width
obtained from the finite element model are quite similar to the main crack observed during
the test. As illustrated in Figure 5-13, the smeared crack prediction is consistent with
discrete flexural cracking predicted by horizontal deformation graph. The deformation
graph (Figure 5-19) shows the maximum vertical deformation of the specimen which

156
represents the possible plastic hinge location. This matches very well with the
experimental observations.
-10
0
10
20
30
40
50
-2500 -2000 -1500 -1000 -500 0 500 1000 1500 2000 2500
Deformation (mm)
Distance from column center (mm)
Vertical
Horizontal
∆Crack = 6.8 mm
∆Crack = 1.9 mm
Top R/F cut off point
Figure 5-19: Deformation along the beam at 65 mm displacement-1st FEM results
The reinforcement stress variation along the beam is plotted in Figure 5-20. The finite
element model predicts a peak stress of 639 MPa in one of the mesh reinforcement bars.
Material testing shows that mesh steel used in the subassembly has an ultimate strength of
684MPa. As reported in section 4.2.1.3, during the last cycle (75 mm displacement) of the
test, a snapping sound came as a result of breaking internal mesh reinforcement. This
shows that the mesh steel has reached its ultimate strength. FEM analysis could not
achieve a converged solution beyond the 65 mm displacement. It could be expected that if
the FEM analysis was able to run up to 75 mm displacement, similar stress levels would
be obtained.

157
-100
0
100
200
300
400
500
600
700
-2500 -2000 -1500 -1000 -500 0 500 1000 1500 2000 2500
Distance from column center (mm)
R/F
stre
ss (M
Pa) Main Top R/F
Mesh R/F # 01
Mesh R/F # 02
Mesh R/F # 03
Peak stress= 639 MPa
Figure 5-20: Variation of reinforcement stresses along the beam at 65 mm displacement
- 1st FEM results
Figures 5-21 and 5-22 show the stress distribution of top and bottom main reinforcement
along the beam length at lateral displacements of 19, 38, 57 mm and 65 mm, which
correspond to drift ratios of 1%, 2%, 3% and 3.42 %. It can be seen from the plots that the
bottom bar reached the yield stress at 1% drift level, whereas the top bar started yielding
only at 3 % drift.
Figure 5-23 shows the stress variation of longitudinal mesh reinforcement at 19 mm
displacement. It can be seen from the plot that the mesh bars have started yielding just
after the main reinforcement curtailment location. Referring to Figure 5-21, the main top
reinforcement has reached only about 250 MPa stress level at 19 mm displacement. This is
a clear indication of inadequacy of main top reinforcement length (i.e. curtailment of bars
too close to the joint) provided in the first test subassemblage.

158
-500
50100150200250300350400450500
-1500 -1000 -500 0 500 1000 1500
Distance from column center (mm)
R/F
stre
ss (M
Pa)
65 mm displacement
57 mm displacement
38 mm displacement
19 mm displacement
Peak stress= 459 MPa
Figure 5-21: Variation of top main reinforcement stresses along the beam at different displacements
- 1st FEM results
-300
-200
-100
0
100
200
300
400
500
600
-3000 -2000 -1000 0 1000 2000 3000
Distance from column center (mm)
R/F
stre
ss (M
Pa)
65 mm displacement
57 mm displacement
38 mm displacement
19 mm displacement
Peak stress= 521 MPa
Figure 5-22: Variation of bottom main reinforcement stresses along the beam at different
displacements-1st FEM results
-100
0
100
200
300
400
500
-2500 -2000 -1500 -1000 -500 0 500 1000 1500 2000 2500
Distance from column center (mm)
Mes
h R
/F st
ress
(MPa
)
Mesh R/F # 01
Mesh R/F # 02
Mesh R/F # 03
Peak stress= 459 MPa
Figure 5-23: Variation of mesh reinforcement stresses along the beam at 19 mm displacement
-1st FEM results

159
5.4 The second finite element model
By modifying the first finite element model the second model was created. This model
was developed to assess the influence of further improvements to detailing. The only
modification made was extending the length of main top reinforcement bar to 1600 mm
from 1000 mm. This modification was based on the observations made during the test
program. It was very clear from the first test that the inadequate length of main top bar
was the reason for the main cracking and subsequent failure. In the second test with the
retrofitted specimen, the extension of CFRP layer on the top flange beyond the curtailment
point of the top bar, led to a significant improvement in the performance.
Further to the above, the Australian code (AS-3600, 2001) recommendation for beams was
considered. According to the clause 8.1.8.6 of AS 3600 (i.e. Deemed to comply
arrangement of flexural reinforcement) the reinforcement curtailment length was
calculated. For this calculation the span length of 9600 mm was considered, as this was the
greater span of the first interior support of the prototype structure. The length of bar
required from the column centre was 3130 mm and the half of this length was rounded to
1600 mm considering the scale factor for test specimen.
The second FE model analysis was performed using the same shear transfer factor (i.e.
0.2), which gave the best match with the test results. The boundary conditions and the load
steps were same as in the first FE model. Figure 5-24 shows the results of the second finite
element pushover analysis. The results are compared to the back-bone curve of the
hysteresis of the first test and the results of the first FE model. It should be noted that the
results of the second FE model cannot be directly compared with the results of the

160
retrofitted specimen. The finite element modelling of CFRP retrofitted specimen was
considered to be beyond the scope of this masters project.
0
20
40
60
80
100
0 10 20 30 40 50 60 70 80
Displacement (mm)
Loa
d (k
N)
Test1 results
Main top bar L=1000 mmMain top bar L=1600 mm
Figure 5-24: Load versus displacement-1st test specimen test results and FE model 1 &2 results
Figure 5-25 shows the deformation pattern obtained from the second FE model at 65 mm
lateral displacement. The second FE model solution converged up to a lateral displacement
of 70 mm. However the results are compared at the maximum displacement obtained in
the first FE model (i.e. 65 mm displacement). The hinging location could not be clearly
identified by the deformation. The vertical deformation of the beam shown in Figure 5-26
was used to identify the hinge location.

161
Hinging near column face
Hinging near column face
Figure 5-25: Deformation of subassembly at 65 mm displacement- 2nd FE model
-10
0
10
20
30
40
50
-2500 -2000 -1500 -1000 -500 0 500 1000 1500 2000 2500
Deformation (mm)
Distance from column center (mm)
Vertical
Horizontal
∆Crack = 1.1 mm
∆Crack = 4.1 mm Top R/F cut off point
Figure 5-26: Deformation along the beam at 65 mm displacement- 2nd FE model
It can be seen from the axial deformation plot shown in Figure 5-26 that the prediction of
cracking at beam top reinforcement curtailment point has reduced significantly. The
cracking near the column face has increased as expected due to the formation of a hinge
close to the joint. The vertical and horizontal deformations from photogrammetry
measurements were also consistent with the FE predictions. However, as mentioned
previously these results cannot be compared directly.
Figures 5-27 and 5-28 show the longitudinal stress and strain distributions of the second
subassemblage at 65 mm lateral displacement. It should be noted that the strain contour

162
range in Figure 5-28 was set equal to that in Figure 5-18. Thus it is possible to compare
the locations of high strain regions in the FE models. The high stress and strain
concentrations were observed only at the column face. High stress region was not seen
near the reinforcement curtailment point, as observed in the first FE model.
Hinge Location at column face
High compressive stress locations
Figure 5-27: Longitudinal stress distribution of subassembly at 65 mm displacement-2nd FE model

163
Figure 5-28: 3rd principal strain distribution of subassembly at 65 mm displacement-2nd FE model
The stress variation along the beam of main top and mesh reinforcement is plotted in
Figure 5-29. The finite element model predicts a peak stress of 511 MPa in one of the
mesh reinforcement bars. This is a stress reduction of 20 % compared to the reinforcement
stresses predicted by the first FE model. However, this highest stress recorded location
was not matching with the first FE model location. The stress increase in mesh
reinforcement near the main top bar curtailment point was around 450 MPa, which is
acceptable at a very large lateral displacement of 65 mm (3.4 % lateral displacement
level). Therefore, the provided length of top bar in second FE model is considered to be
adequate.

164
Distance from column centre (mm)-100
0
100
200
300
400
500
600
-2500 -2000 -1500 -1000 -500 0 500 1000 1500 2000 2500
R/F
stre
ss (M
Pa) Main top R/F
Mesh R/F # 01Mesh R/F # 02Mesh R/F # 03
Peak stress= 511 MPa
Distance from column centre (mm)-100
0
100
200
300
400
500
600
-2500 -2000 -1500 -1000 -500 0 500 1000 1500 2000 2500
R/F
stre
ss (M
Pa) Main top R/F
Mesh R/F # 01Mesh R/F # 02Mesh R/F # 03
Peak stress= 511 MPa
Figure 5-29: Variation of reinforcement stresses along the beam at 65 mm displacement
- 2nd FEM results
Figures 5-30 and 5-31 show the stress distribution of top and bottom main reinforcement
along the beam length at lateral displacements of 19, 38, 57 and 65 mm respectively. It can
be seen that the bottom bar had reached a higher stress level compared to the stress in the
first FE model. This indicates that main top bar length provided is adequate to resist the
bending moments at each displacement level. The bottom bar stress development with the
lateral displacement level has not changed significantly compared to the first FE model.
However, a slight reduction of maximum stress (from 521 to 509 MPa) was noted. This
reduction in stress must be due to the higher beam stiffness compared to the column in
second FE model due to lesser cracking, resulting in a reduction of beam rotation and
lower reinforcement stresses and strains.

165
Distance from column centre (mm)-100
0
100
200
300
400
500
600
-2000 -1500 -1000 -500 0 500 1000 1500 2000
R/F
stre
ss (M
Pa) 19 mm displacement
38 mm displacement57 mm displacement65 mm displacement
Peak stress= 484 MPa
Distance from column centre (mm)-100
0
100
200
300
400
500
600
-2000 -1500 -1000 -500 0 500 1000 1500 2000
R/F
stre
ss (M
Pa) 19 mm displacement
38 mm displacement57 mm displacement65 mm displacement
Peak stress= 484 MPa
Figure 5-30: Variation of top main reinforcement stresses along the beam at 65 mm displacement
- 2nd FEM results
Distance from column centre (mm)-400
-300
-200
-100
0
100
200
300
400
500
600
-3000 -2000 -1000 0 1000 2000 3000R/F
stre
ss (M
Pa)
19 mm displacement38 mm displacement57 mm displacement65 mm displacement
Peak stress= 509 MPa
Distance from column centre (mm)-400
-300
-200
-100
0
100
200
300
400
500
600
-3000 -2000 -1000 0 1000 2000 3000R/F
stre
ss (M
Pa)
19 mm displacement38 mm displacement57 mm displacement65 mm displacement
Peak stress= 509 MPa
Figure 5-31: Variation of bottom main reinforcement stresses along the beam at different
displacements- 2nd FEM results
Figures 5-32 and 5-33 illustrate the stress variation of longitudinal mesh reinforcement at
19 mm and 38 mm lateral displacement level respectively. It can be seen from the plot that
the mesh bars have high stress peaks along the beam length in negative bending moment
area. However, these high stress peaks seen at low drift levels gradually reduced as the
drift level increased. This indicates that at higher drift levels flange slab reinforcement
contributes more for resisting lateral loading.

166
Distance from column centre (mm)-100
0
100
200
300
400
500
-2500 -2000 -1500 -1000 -500 0 500 1000 1500 2000 2500
R/F
stre
ss (M
Pa) Main top R/F
Mesh R/F # 01
Mesh R/F # 02
Mesh R/F # 03
Peak stress= 395 MPa
Distance from column centre (mm)-100
0
100
200
300
400
500
-2500 -2000 -1500 -1000 -500 0 500 1000 1500 2000 2500
R/F
stre
ss (M
Pa) Main top R/F
Mesh R/F # 01
Mesh R/F # 02
Mesh R/F # 03
Peak stress= 395 MPa
Figure 5-32: Variation of mesh reinforcement stresses along the beam at 19 mm displacement
-2nd FEM results
Distance from column centre (mm)-100
0
100
200
300
400
500
-2500 -2000 -1500 -1000 -500 0 500 1000 1500 2000 2500
R/F
stre
ss (M
Pa) Main top-R/F
Mesh R/F # 01Mesh R/F # 02Mesh R/F # 03
Peak stress= 461 MPa
Distance from column centre (mm)-100
0
100
200
300
400
500
-2500 -2000 -1500 -1000 -500 0 500 1000 1500 2000 2500
R/F
stre
ss (M
Pa) Main top-R/F
Mesh R/F # 01Mesh R/F # 02Mesh R/F # 03
Peak stress= 461 MPa
Figure 5-33: Variation of mesh reinforcement stresses along the beam at 38 mm displacement
-2nd FEM results
5.5 Time history analysis
A time history analysis of model frame was performed using the program RUAUMOKO
(Carr, 1998), which is designed to carryout the analysis of structures subjected to
earthquake and other dynamic excitations taking into account both material and geometric
non linearity (P-Delta effects). The models used in this study were non-degrading beam-
column yield interaction surface for columns and modified TAKEDA (Takeda et al.,

167
1970) hysteresis for the beams. These models are shown in Figures 5-34 and 5-35. Elastic
damping is modelled using Rayleigh initial stiffness damping of 5% in modes 1 & 4.
Figure 5-34: Modified Takeda Degrading Stiffness Hysteresis Rule [After (Carr, 1998)]
Figure 5-35: Concrete Beam-Column Yield Interaction Surface [After (Carr, 1998)]
Moment curvature and column interaction diagrams were developed using reinforced
concrete sectional analysis program RESPONSE 2000 (Bentz and Collins, 2000). More
details are given in Appendix-D. As described in section 2.2.2.1, cracked stiffness of the
frame elements were estimated using the method specified by Priestley (1998b).
It is very important to evaluate member properties for the dynamic analysis. The New
Zealand building code (SANZ, 1995) recommends a value for beam stiffness of Ie=0.4Ig
for rectangular sections, and Ie=0.35Ig for T-beam sections. As highlighted by Priestley,

168
the beam stiffness depends strongly on reinforcement content; therefore the use of above
recommendation may lead to a significant error in calculating building period and drift
level.
For the analysis, the prototype beam members were modelled by using four-hinge beam
members, which allows for two plastic hinges within the span of the member in addition to
the two hinges at its ends. This beam element was recommended (Carr, 1998) to model
gravity dominated beams where under seismic loading in one direction yielding occurs at
one end hinge and at the interior hinge near the other end of the beam while under
reversed loading yielding occurs at the other two hinges.
The prototype frame beam members were modelled by using inelastic beam-column
elements, which take into account the interaction of axial load and bending moment on
strength. The calculation of relevant parameters for time history analysis is presented in
Appendix D.
The time-history analyses were conducted with an ensemble of earthquake records. These
records were obtained from COSMOS Virtual Data Centre and European Strong Motion
data Base (COSMOS, 2004). The records were selected on the criteria that they had been
corrected, were on rock or soft soil and were within the range of Richter magnitude-
epicentral distance combinations used by Stehle (2002). An arbitrary classification is
applied to the groups, with categories of low (1) to extreme (6) seismicity as shown in
Table 5-1. More details of how these earthquakes were selected, are given by Stehle
(2002)
The maximum inter-storey drift ratios of the time-history analyses using earthquake
ensemble are plotted in Figure 5-36, grouped according to the seismic classification of low

169
to extreme seismicity. Of most interest is the maximum inter-storey drift ratio as this best
assesses damage. The prototype structure was designed for low seismicity (earthquake
category 1), less than 0.5 interstorey drift level expected. For this level of drift, there will
be no damage as observed in test results. For the high level seismicity (category between 4
and 5), less than 4 % interstorey drift is encountered. Hence the structure should be able to
withstand these earthquakes without significant structural damage as observed from the
second FE modelling results with modified reinforcement detail. Also as observed in the
experimental program, CFRP retrofitted beams can resist these earthquakes without
significant damage.

170
Table 5-1:Definition of earthquake categories
Note: Only EQ’s chosen which have: -vertical and horizontal record -corrected record
Epicentral distance (km) Soil Type: Rock 10-30 30-70 70-120 120-500
Richter Magnitude 4.5-5.5 1 - - - 5.5-6.5 2 1 - - 6.5-7.5 3 2 1 - 7.5-8.5 4 3 2 1
Epicentral distance (km) Soil Type: Soft soil
10-30 30-70 70-120 120-500 Richter Magnitude 4.5-5.5 2 - - - 5.5-6.5 4 2 - - 6.5-7.5 6 4 2 - 7.5-8.5 - 6 4 2
0
0.5
1
1.5
2
2.5
3
3.5
4
4.5
1 2 3 4 5 6
Earthquake Category
Dri
ft R
atio
(%)
Time-history resultsAverage plus 2 standard deviations
Figure 5-36: Peak interstorey drift ratio versus earthquake category
Earthquake Category Seismicity 1 Low 2 Moderate 3 High 4 Very High 6 Extreme

171
5.6 Summary
The finite element analysis was used to investigate the performance of beam-column
subassemblage. Program ANSYS was used to model concrete and reinforcements of test
specimen using solid and link elements. The load displacement curve of the first test
specimen was used to calibrate the finite element model. The crack patterns and plastic
hinge location observed in testing and finite element analysis matched reasonably well.
The reinforcement stress prediction clearly indicated inadequacy of main top
reinforcement length. The calibrated FEM was modified to assess the influence of
improved reinforcement detail. Time history an analysis of prototype structure for various
intensities of earthquakes was used to determine the maximum inter-storey drift ratios.

172
Chapter 6
Conclusions and Recommendations
6.1 Conclusions from experimental studies
Two interior Rib beam-column subassemblages were tested in the experimental program.
The first test specimen showed inadequate performance under lateral cyclic loading. The
second test specimen, after the CFRP rectification, behaved very well compared to the first
specimen. The second specimen showed no sign of overall strength degradation even up to
a 4.0% drift ratio.
The deficiencies observed in the first test specimen, which was detailed according to
current non-seismic detailing requirements specified in Australian codes (AS-1170.4,
1993; AS-3600, 2001) were as follows:
• The inadequate length of the main top reinforcement has led to severe cracking of
flange slab, which was detrimental to the overall performance. Hence this type of
crack development should be avoided as it may trigger a flexure-shear failure
mechanism and lead to catastrophic failure.
• Excessive yielding and slippage of the bottom reinforcement at beam column
interface.
• Slight crushing of concrete at bottom of rib beam-column interface, indicating that rib
width is inadequate to transfer compressive force at higher drift levels.
The most severe of the above deficiencies was considered to be the occurrence of a wide
flexural crack at the curtailment point of the main top reinforcement. This particular crack

173
initiated at a drift ratio of approximately 2% and grew to a width in the order of 5mm at a
drift ratio of 3.0%. Such a wide cracks is of concern as it is associated with very large
local strains in mesh reinforcement in the flange slab, which could result in fracture, and
may lead to even complete failure of the member.
The second test was performed with the CFRP retrofitted specimen. The CFRP repair was
done to avoid failure observed in the first test. The inadequate length of the top bar was
properly addressed in the second test specimen by continuing CFRP strips, 600 mm
beyond the first curtailment point.
The second specimen performed very well under test conditions, with a higher ultimate
strength than achieved for the first specimen. It should be noted that much better
performance could be expected if the improved reinforcement detailing was used in a new
subassembly. However, following conclusions can be made from the second test:
• Second test has demonstrated the effectiveness of CFRP as a viable repair or
strengthening system. The technique used here could be used to rectify existing
structures with detailing deficiencies.
• Reference to the time-history analyses, the revised detailing is suitable to withstand
very large earthquakes without significant structural damage.
6.2 Finite element analysis
Finite element analysis was conducted and reported in Chapter 5 to investigate the
performance of ribbed beam-column connections. The first finite element analysis model
(FEM) was developed to compare the experimental results of the first test subassemblage.
Second finite element model results were used to evaluate the performance of the
improved detailing used. The only modification made was extending the length of main

174
top reinforcement bar to 1600 mm from 1000 mm. The shear transfer coefficient was
calibrated with the first finite element model. Once it is calibrated finite element
modelling procedure can be used to obtain more information compared to conventional
type laboratory tests. Also it is expensive to perform many laboratory tests.
6.3 Design recommendations
The design recommendations are developed from the limited test data and analytical
results. The recommendations are drawn as follows:
• The design of rib beam for negative and positive bending moment shall be carried out
in a similar way to the method presented in the Australian code (AS3600, 2001) for
normal T-beams. A specimen calculation is presented in Appendix-A of this thesis.
• The effective flange width for flexural calculations and stiffness calculations shall be
taken as shown in Figure 2.2 of Chapter 2.
• The negative reinforcement requirement over the supports shall be determined
ignoring the slab reinforcement for the gravity load case (1.25 G+ 1.5 Q). However
total area of reinforcement shall be considered for the earthquake load combination
case (1.0G+0.4Q+EQ).
• The top reinforcement should be curtailed as per the Australian code deemed to satisfy
requirement (i.e. As per clause 8.1.8.6 of AS 3600). If the structure or loading is not
satisfying the requirements of the above clause, the theoretical curtailment point
should be determined using the theoretical bending moment diagram. The actual
curtailment point must be determined with a further extension equal to beam depth, as
per the normal design practice.

175
• Shear links should be provided as per the Australian Code (AS-3600, 2001)
requirements for beams. Further investigation is required to consider 10 % shear
enhancement provided in other codes for rib slabs. The shape of shear-link shall be
similar to type-3 (see Figure 2-14 of Chapter 2) with open top.
• The bottom rib width should be increased to 100 mm from 75 mm to prevent concrete
crushing at the column and beam interface (see Figure 4-4). The bottom rib width
should be increased more than 100 mm to keep the minimum cover requirement of
AS 3600 to satisfy the extreme exposure classification.
6.4 Recommendations for further work
Further testing and analytical work are required to investigate the shear behaviour of the
rib slab system. The minimum rib width required to prevent crushing near the beam
column interface is needed to be studied. Only one beam size was used in this test
program. Further tests should be conducted with different beam sizes to confirm the
observations reported in this thesis.
6.4.1 Influence of flange slab reinforcement
The main influence of the slab on the inelastic behaviour of flange-beams was the
contribution of slab reinforcement to the top tensile steel area. This was discussed in
Chapter 2. A Similar behaviour has been observed in rib beam-column subassemblage
testing conducted by others (Chapter 2). However the contribution to negative moment
capacity from slab reinforcement is normally ignored in gravity load design. The finite
element analysis shows clearly the slab mesh contribution even at low drift levels. It was
also seen that slab reinforcement stress variation across the width was marginal. This
effect will increase the downward (negative) moment capacity due to slab reinforcement,

176
and cause more energy dissipation per cycle. However, this increase imposed higher
compression in the bottom compression zone, and higher shear force acting in the
downward direction. These increased compression and shear forces could cause early
buckling of bottom bars and increase the amount of shear degradation. These factors
should be considered in the analysis and design of the critical regions near beam-column
connections. However more work is required to develop design rules.
6.4.2 Amount of bottom reinforcement
If full deformational reversals are expected to occur in the beam critical regions near the
column connections, to improve energy dissipation capacity, it was recommended by past
researchers that the bottom (positive moment) steel to be at least 75 percent of the top
(negative moment) steel (Chapter 2). However this recommendation has been given for
T beams with full moment reversal situations. In the test assemblage only 40 % of top
steel area (including slab steel area) was provided for the bottom steel as per the critical
bending moment envelope. This issue needs further research before the relevant detailing
rules are incorporated in the Corcon slab system.
6.4.3 Shear reinforcement
The design of shear links in rib beam was done as per the Australian Code (AS-3600,
2001) requirement. However, 10% shear enhancement provided in other codes (ACI-318,
1999; BS-8110, 1995; SANZ, 1982) for rib slabs was not considered as the shear
reinforcement in Corcon rib slab system was not designed considering the rib spacing
limitation specified in the above codes. Buckling of bottom bars or deficiency in shear
capacity of the beam was not seen during the testing. Therefore, shear link provision in

177
Australian code (AS-3600, 2001) is sufficient. However further reduction in shear links is
possible. More work is required to develop these design rules.

178
BIBLIOGRAPHY
Abdollahi, A. (1996). "Numerical Strategies in the Application of the FEM to RC
Structures-1." Computers & Structures, Vol. 58, No. 6, pp1171-1182.
Abdouka, K. (2003). The Seismic Performance of Reinforced Concrete Wide Band
Beam Frames: Exterior Connections, PhD Thesis,. Melbourne, The
University of Melbourne, Australia.
ACI-318 (2002). Building Code Requirements for Structural Concrete (ACI-318M-99)
and Commentary (ACI-318RM-99), American Concrete Institute,
Farmington Hills, Mich.
Ahmad, D. J. and Wight, J. K. (1985). "Behaviour of Interior Beam-to-Column
Connections under Earthquake -Type Loading." ACI Structural Journal,
May-June 1985, pp343-349.
Ahmad, D. J. and Wight, J.K. (1987). "Earthquake Resistance of Reinforced Concrete
Interior Connections including a Floor Slab." ACI Structural Journal,
September-October 1987.
ANSYS (2003). ANSYS v 8.0, Swanson Analysis System, U.S.
AS1170.0 (2002). Structural design actions, Part 0: General principals, Standard
Association of Australia, Sydney, Australia.
AS1170.1 (2002). Structural design actions, Part 1: Permanent, Imposed and other
actions, Standard Association of Australia, Sydney, Australia.
AS1170.2 (2002). Structural design actions, Part 2: Wind loads, Standard Association
of Australia, Sydney, Australia.
AS1170.4 (1993). Minimum Design Loads on Structures, Part 4: Earthquake loads,
Standard Association of Australia, Sydney, Australia.
AS3600 (2001). Concrete Structures, Standard Association of Australia, Sydney,
Australia.
ATC40 (1996). Seismic evaluation and retrofit of concrete buildings. Applied
Technology Council Report no ATC-40, Redwood City, California: ATC. A

179
practical account of the seismic evaluation approaches including the
pushover analysis.
Bangash, M. Y. H. (1989). "Concrete and Concrete Structures: Numerical Modelling
and Applications." Elsevier Science Publishers Ltd., London, England.
Barbosa, A. F. and Ribeiro, G. O. (1998). Analysis of reinforced Concrete Structures
Using Ansys Nonlinear Concrete Model.
Bentz, E. C. and Collins, M. P. (2000). RESPONSE-2000 Reinforced Concrete
Sectional Analysis Program Manual.
Bommer, J.J., Elnashai, A.S. , Chlimintzas, G.O. and Lee, D. (1988). Review and
development of response spectra for displacement-based seismic design.
Research report no ESEE-98/3, Engineering Seismology and Earthquake
Engineering Section, Imperial College, London.
BS8110 (1997). Structural use of concrete, Part 1: Code of practice for design and
construction, British Standard Institute, London.
Carr, A. J. (1994). "Dynamic Analysis of Structures." Bulletin, New Zealand National
Society for Earthquake Engineering, Vol. 27, No 2, June, pp129-146.
Carr, A. J. (1998). RUAUMOKO User Manual, University of Canterbury.
Chopra, A. K. (1995). Dynamics of structures: theory and applications to earthquake
engineering. Englewood Cliffs, New Jersey: Prentice Hall.
Ciampi, V., Eligehausen, R., Bertero, V. and Popov, E. (1982). Analytical Model for
Concrete Anchorages of Reinforced Bars Under Generalised Excitations,
EERC Report No. UCA/EERC-82/83, University of California, Berkeley,
Nov., 103 pp.
Cook, R. D., Malkus, D. S., Plesha, M. E. and Witt, R. J. (2002). Concepts and
applications of finite element analysis, fourth ed. John Wiley & Sons, New York, 2002.
COSMOS (2004). Virtual Data Centre and European Strong Motion data Base,
http://db.cosmos-eq.org/scripts/default.plx, http://www.isesd.cv.ic.ac.uk/.
Dragh, P. et al (2000). "Tradition with Cost Savings." Concrete Engineering
International (March/April).
Hemmaty, Y. (1998). Modelling of the Shear Force Transferred Between Cracks in
Reinforced and Fibre Reinforced Concrete Structures,. Proceedings of the
ANSYS Conference, Vol. 1, Pittsburgh, Pennsylvania.

180
Huyse, L., Hemmaty, Y. and L.Vandewalle (1994). Finite Element Modelling of Fibre
Reinforced Concrete Beams. Proceedings of the ANSYS Conference, Vol. 2,,
Pittsburgh, Pennsylvania.
Kachlakev, D., T. Miller, Yim, S. and Chansawat, K. (2001). Finite Element Modelling
of Reinforced Concrete Structures Strengthened with FRP Laminates, Civil
and Environmental Engineering Department, California Polytechnic State
University, San Luis Obispo.
Kitayama, K., Otani, S. and Aoyama, H. (1991). Development of Design Criteria for
RC Interior Beam-Column Joint. pp97-123, American Concrete Institute,
SP123.
Mander, J. B., Priestley, M. J. N. and Park, R. (1988). "Theoretical Stress-Strain Model
for Confined Concrete." Journal of Structural Engineering, Vol. 114, No. 8,
Augest 1998.
MBrace (2002). Composite strengthening system, Engineering design guidelines, New
York., Watson Bowman Acme Corp.
Miranda, E. (1996). "Assessment of the seismic vulnerability of existing buildings."
Proceedings 11th World Conference on Earthquake Engineering, Acapulco,
Mexico, 1996. Paper no 513. New York: Elsevier Science.
NZS4203 (1992). "Code of Practice for General Structural Design and Design Loading
for Buildings, Standards New Zealand, New Zealand."
Pantazopoulou, S. J. and French, C. W. (2001). "Slab participation in Practical
Earthquake Design of Reinforced Concrete Frames." ACI Structural Journal,
Vol. 98, No 4, July-August.
Park, R. (1988). Ductility Evaluation from Laboratory and Analytical Testing-State of
the Art Report, 9th World Conference on Earthquake Engineering, Tokyo-
Kyoto, Japan, pp605-616.
Park, R. (1992). "Capacity design of ductile RC building structures for earthquake
resistance." The Structural Engineer, Vol. 70, No.16, Aug., pp 279-288.
Paulay, T. (1988). "Seismic Behaviour of Beam-Column Joints in Reinforced Concrete
Space Frames-State of Art Report." 9th World Conference on Earthquake
Engineering, Tokyo-Kyoto, Japan, pp557-568.

181
Paulay, T. and Priestley, M.J.N (1992). Seismic design of reinforced concrete and
masonry buildings. USA, John Wiley & Sons, Inc.
Priestley, M. J. N. (1998b). "Brief Comments on Elastic Flexibility of Reinforced
Concrete Frames and Significance to Seismic Design." Bulletin, New
Zealand National Society for Earthquake Engineering, Vol. 31, No 4,
December 1998, pp246-259. Vol. 31(No.4): 246-259.
Priestley, M. J. N. (2000). Performance based seismic design. Proc. 12th World
Conference of Earthquake Engineering, Auckland, 2000, Keynote paper no.
2831.
Priestley, M. J. N. and MacRac, G. A. (1996). "Seismic Tests of Precast Beam-to-
Column Joint Subassembalages with unbonded Tendons." PCI Journal 41(1):
64-80.
Priestley, M. J. N. and Kowalaky, M.J. (2000). "Direct Displacement-Based seismic
Design of Concrete Buildings." Bulletin, New Zealand National Society for
Earthquake Engineering, Vol. 33, No 4, December, pp421-444.
Priestley, M. J. N. and Kowalsky, M.J. (1998a). "Aspects of Drift and Ductility of
Cantilever Structural Walls." Bulletin, New Zealand National Society for
Earthquake Engineering, Vol. 31, No 2, June, pp73-85.
Priestley, M.J.N. (1997). "Displacement-based seismic assessment of reinforced
concrete buildings." Journal of Earthquake Engineering 1(1): 157-192.
Quintero-Febres, C. G. and Wight, J. K. (1997). "Investigation on the Seismic
Behaviour of RC Interior Wide Beam-Column Connections." The University
of Michigan, USA, UMCEE 97-15.
Rizkalla, S (2003). "Design recommendations for the use of FRP for reinforcement and
strengthening of concrete structures." Prog. Struct. Engng. Mater. 2003.5.
Saaticioglu, M. and Bruneau, M. (1993). "Performance of Structures during the 1992
Erzincan Earthquake." Canadian Journal of Civil Engineering, Vol. 20, No.
2, pp305-325.
Sanders, P. T. (1995). "Design and Detailing for Seismic Resistance- An Australian
perspective in Earthquake- Earthquake resistant design for reinforced
concrete structures." Steel Reinforcement Institute of Australia, pp 33-41.

182
SANZ (1995). NZS3101:Part 1&2: 1982- Concrete Structures Standard, Standards New
Zealand, Wellington [2 Vols: Code & commentary].


Appendix-A
A-1
Design of Prototype frame structure Design information
Design parameter
Value
Gravity
Superimposed dead load
Live load
Ultimate wind velocity
Region
Terrain category
Topographic multiplier
Shielding multiplier
Importance multiplier (for wind)
Earthquake acceleration coefficient
Site factor
Structural response modification factor
Importance factor (for earthquakes)
9.81 m/s2
1.5 kPa
4.0 kPa
50 m/s
A
2
1.0
1.0
1.0
0.11g
1.0
4.0
1.0
Calculation of Loading on beam Beam self-weight = 0.733x 24 = 17.59 kN/m Slab self-weight = 0.17 x 24x3.6 = 14.69 kN/m Super imposed dead load = 1.5 x 6.0 = 9.00 kN/m Total Dead Load = 41.28 kN/m Imposed Live Load = 4.0 x 6.0 = 24.00 kN/m

Appendix-A
A-2
Calculation of equivalent earthquake load on Proto type frame The factored load per floor (1.0 G+ 0.4 Q+ EQ)- Load Case Gg = (41.28 + 0.4 x 24) x (2x8.4+4x9.6) = 2808.576 kN/ floor/frame Standards Australia (AS1170.4, 1993) Method
The equivalent base shear force is given by: V = I[(CS)/Rf]Gg
This should be within the limits of V> 0.01Gg and V < I[(2.5a)/Rf]Gg
Where,
I = Occupancy important factor either 1.0 or 1.25
C = Earthquake design coefficient given by (1.25a)/ T2/3 where T is the natural
period of the structure.
S = Site factor which is taken as:
Rf = Structural response factor which is taken as:
a = Acceleration coefficient depends on the geographical location and a map
of Australia has been given to select the appropriate value of a.
Structure natural period T= h/46 = (4.2+3x3.4)/46 = 0.313 sec Earthquake design coefficient C = (1.25a)/ T2/3= 1.25x0.11/0.3132/3= 0.298 Calculate CS= 0.298 x1.0 = 0.298 > (2.5a)= 2.5x0.11=0.275 The equivalent base shear force V < I[(2.5a)/Rf]Gg
V=1.0x(2.5x0.11)x (2806.6x4)/4 = 772.36 kN > (0.01Gg)=0.01x(2806.6x4)= 112.3
kN
Therefore, the equivalent base shear force V= 772.36 kN

Appendix-A
A-3
Vertical distribution of horizontal earthquake forces (As per cl. 6.3 of AS 1170.4) 14.4x772.36/(14.4+11+7.6+4.2)=299 kN 11.0x772.36/(14.4+11+7.6+4.2)=229 kN 7.60x772.36/(14.4+11+7.6+4.2)=158 kN 4.20x772.36/(14.4+11+7.6+4.2)=87 kN
Earthquake loads at floor levels

Appendix-A
A-4
DATABuilding
basic wind speed (V u ) = 50 m/s Breadth (b) = 52 mRegion = A Depth (d) = 36 m
Terrain Category = 2.0 Height (h) = 14.4 mShielding muiltiplier (M s ) = 1.0
Topographical muiltiplier (M t ) = 1.0Structure Importance muiltiplier (M i ) = 1.0
Wind Direction = Assume West wind
Cl. 3.2 Gust wind Speed (V z ) = V u M (z,cat) M s M t M i
T. 3.2.5.1 M (z, cat) = 1.044V z = 52.2 m/s
Cl. 3.3 Dynamic Wind Pressure (q z ) = 0.6V z2 x 10 -3 kPa
q z = 1.63 kPa
Cl. 3.4.1.2 Force on Windward Wall (F ) = Sum (p z )A z
p z = (p e - p i )Cl. 3.4.2 p e = (C p,e )K a K l K p q z
T. 3.4.3.1(A) (C p,e ) = 0.7 for h < 25m & qz = qh
Cl. 3.4.4 K a = 1.0Cl. 3.4.5 K l = 1.0Cl. 3.4.6 K p = 1.0
p e = 1.14 kPa
Cl. 3.4.7 p i = (C p,i ) q z
T. 3.4.7 (C p,i ) = -0.30 or 0.0 for All condition 3p i = -0.49 kPa
or 0 kPa
p z = 1.63 kPa or 1.14 kPa
Therefore, Total force on the frame (F)
Cl. 3.4.1.2 F (max) = 9.78 kN/m
16.6 kN
33.3 kN
33.3 kN
37.2 kN

Appendix-A
A-5
DESIGN FOR BENDING
Compressive strain εu 0.003:=
γ 0.85 0.007 fc 28−( )−:= γ 0.762= 0.65 γ≤ 0.85≤ α 0.85:=
Effective Depth of Compression Block '"d o" is obtained from C c+Cs=T
Initial Guess do 134.185:=
Neutral Axis depth dndo
γ:= dn 176.1= mm
Width of the rib at a depth "do": bo dobt b−( )
dw⋅ b+:= bo 198.922= mm
Distance to C.G. of Compression concrete area "x"
x0.5 b⋅ do
2⋅ do2 bo b−( )
3⋅+
⎡⎢⎣
⎤⎥⎦
0.5 b bo+( )⋅ do⋅:= x 70.228= mm
Lever arm distance z dst x−:= z 759.8= mm
BEAM DESIGN [AS3600- Normal Strength Concrete]
PROJECT : CORCON PROTOTYPE FRAME BEAM
BEAM : RIB BEAM 894 mm deep
DESIGN DATA
fc 40.6= MPa
fsy 448= MPa Es 200000:= MPa
D 894:= mm dsc 60:= mm
b 150:= mm dst 830:= mm
Ast 2512:= mm2 dw 576:= mm
Asc 1256:= mm2 bt 360:= mm

Appendix-A
A-6
Cs Asc σsc⋅dn dsc−( )
dn⋅ 10 3−⋅:= Cs 327.6= kN
Tensile steel force T Ast σst⋅ 10 3−⋅:= T 1125.4= kN
Out of balance force Fout Cc Cs+ T−:= Fout 10= kN
do root 0.5 α⋅ fc⋅ do⋅ 2 b⋅ dobt b−( )
dw⋅+
⎡⎢⎣
⎤⎥⎦
⋅ σscdo α dsc⋅−( ) Asc⋅
do⋅+ σst Ast⋅− do,
⎡⎢⎣
⎤⎥⎦
:=
Change the initial guess do until Fout close to zero do 135.329= mm
Moment Capacity Mu Cs dst dsc−( )⋅ Cc z⋅+⎡⎣ ⎤⎦ 10 3−⋅:= Mu 866.1= kNm
φ 0.8:= φ Mu⋅ 692.9= kNm
Therefore, Negative Moment Capcity of Prototype Beam φ Mu⋅ 692.9= kNm
Check yield Assumptions
Yeild strain of steel εsyfsy
Es:= εsy 0.0022=
Strain in the tensile steel εst εudst dn−
dn⋅:= εst 0.0111=
Strain in the compressive steelεsc εu
dn dsc−
dn⋅:= εsc 0.002=
Steel stress σst if εst εsy< Es εst⋅, fsy,( ):=
σsc if εsc εsy< Es εsc⋅, fsy,( ):=
Steel stress is corrected for sign :
σst if εst 0 εst+< εsy> fsy−, σst,( ):= σst 448= MPa
σsc if εst 0 εst+< εsy> fsy−, σsc,( ):= σsc 395.6= MPa
Concrete Compressive Force kNCc α fc⋅ do⋅b bo+( ) 10 3−⋅
2⋅:= Cc 807.9=
Compressive steel force

Appendix-A
A-7
mm2 dw 576:= mm Ag 453 103⋅:= mm2
Asc 1256:= mm2 N 0:= Asv 226:= mm2
Design for Shear
(a) Calculation of Vuc
β1 1.1 1.6do
1000−
⎛⎜⎝
⎞⎠
⋅:= β1 0.847=
β2 1N
3.5Ag−:= For members with tensile axial force
β2 1N
14 Ag⋅+:= For members with Compressive axial force
β2 1=
β3 1:= (As there is no Concentrated load near the support )
bv 0.5 b bt+( )⋅:=
Vuc β1 β2⋅ β3⋅ bv⋅ do⋅Ast fc⋅
bv do⋅
⎛⎜⎝
⎞
⎠
13
10 3−⋅:= Vuc 140.5= kN
BEAM DESIGN [AS3600- Normal Strength Concrete]
PROJECT : CORCON PROTOTYPE BEAM
BEAM : RIB BEAM 894 mm deep
DESIGN DATA
fc 40.6= MPa
fsy 448= MPa Es 200000:= MPa fsyf 345= MPa
D 894:= mm dsc 60:= mm bt 360:= mm
b 150:= mm do 830:= mm s 200:= mm
Ast 2512:=

Appendix-A
A-8
kNφ Vu⋅ 454.1=Therefore Shear Strengthφ 0.7:=
kNVu 648.7=Vu Vuc Vus+:=
Vus 508.139=VusAsv
sfsyf⋅ do⋅ cot θvr( )⋅ 10 3−⋅:=
(c) Calculation of φVu when stirrups are at yield
θvr θvπ
180⋅:=
degθv 32.5=θv 30 15Asv Asvmin−
Asvmax Asvmin−
⎛⎜⎝
⎞
⎠⋅+:=
mm2Asvmax 1.1 103×=Asvmax bv
sfsyf⋅ 0.2 fc⋅
Vuc 103⋅
bv do⋅−
⎛⎜⎝
⎞
⎠:=
mm2Asvmin 51.739=Asvmin 0.35 bv⋅s
fsyf⋅:=
bv s⋅
fsyf147.826=
(b) Calculation of θv

Appendix-A
A-9
Cc 562.688=Cc 0.85 fc⋅ γ⋅ b⋅ dn⋅ 10 3−⋅:=Concrete Compressive Force
εsc 0.0158−=εsc εudn dsc−
dn⋅:=Strain in the compressive steel
εst 0.2425=εst εudst dn−
dn⋅:=Strain in the tensile steel
εsy 0.0022=εsyfsy
Es:=Yeild strain of steel
Check yield Assumptions
ku 0.012=kudn
dst:=
mmz 830.1=
kNmφ Mu⋅ 373.7=Design Bending strength (Positive)
φ 0.8:=
kNmMu 467.1=Mu fsy Asc⋅ dst dsc−( )⋅ 0.85 fc⋅ b⋅ γ⋅ dn⋅ z⋅+⎡⎣ ⎤⎦ 10 6−⋅:=Moment Capacity
kNT 562.688=T Ast fsy⋅ 10 3−⋅:=Tensile steel force
kNCs 0=Cs Asc fsy⋅ 10 3−⋅:=Compressive steel force
kN
dst 834:=mmb 2100:=
mmdsc 64:=mmD 894:=
MPaEs 200000:=MPafsy 448=
MPafc 40.6=
DESIGN DATA
BEAM : Corcon 894 mm deep
PROJECT : CORCON PROTOTYPE BEAM
BEAM DESIGN [AS3600- Normal Strength Concrete]
z dst 0.5 γ⋅ dn⋅−:=Lever arm distance
mmdn 10.2=dn fsy Ast Asc−( )⋅1
0.85fc b⋅ γ⋅⎛⎜⎝
⎞⎠
⋅:=Neutral axis depth
0.65 γ≤ 0.85≤γ 0.762=γ 0.85 0.007 fc 28−( )−:=Stress block parameter
εu 0.003:=Compressive strain
DESIGN FOR BENDING ( Positive )
mm2Asc 0:=
mm2Ast 1256:=
mm

Appendix-B
B-1

Appendix-B
B-2

Appendix-B
B-3

Appendix-B
B-4

Appendix-B
B-5

Appendix-B
B-6
Bending Moment diagram

Appendix-B
B-7
Shear force diagram

Appendix-B
B-8
Axial force diagram

Appendix-B
B-9
Bending Moment diagram

Appendix-B
B-10
Shear force diagram

Appendix-B
B-11
Axial force diagram

Appendix-C
C-1
mm
Es 200000:= MPa
CALCULATIONS
εsyfsy
Es:= εsy 0.0022=Compressive strain εu 0.003:=
Stress block parameter γ 0.85 0.007 fc 28−( )−:= γ 0.714= 0.65 γ≤ 0.85≤
Choose trial neutral axis dn 89.375:=
Stain in each layer of steel :
εs1εu
dndn ds1−( )⋅:= εs1 0.0019= σs1 if εs1 εsy< Es εs1⋅, fsy,( ):=
εs2εu
dndn ds2−( )⋅:= εs2 0.0002−= σs2 if εs2 εsy< Es εs2⋅, fsy,( ):=
εs3εu
dndn ds3−( )⋅:= εs3 0.0022−= σs3 if εs3 εsy< Es εs3⋅, fsy,( ):=
εs4εu
dndn ds4−( )⋅:= εs4 0.0043−= σs4 if εs4 εsy< Es εs4⋅, fsy,( ):=
COLUMN DESIGN [AS3600- Normal Strength Concrete]
PROJECT : Corcon Test 1
COLUMN : Lower column
DESIGN DATA
fc 47.4= MPa As1 800:= mm2 ds1 34:= mm
fsy 442= MPa As2 400:= mm2 ds2 94.1:= mm
D 250:= mm As3 400:= mm2 ds3 154.2:= mm
b 250:= mm As4 800:= mm2 ds4 216:=

Appendix-C
C-2
Fs3 174.1−= kN
Fs4 σs4 As4⋅ 10 3−⋅:= Fs4 353.6−= kN
Concrete and steel forcesare summed to give Nu Nu Cc Fs1+ Fs2+ Fs3+ Fs4+:= Nu 400= kN
The eccentricity of Nu,dN is given by taking moment about top compressive fibre :
dNCc 0.5 γ⋅ dn⋅( )⋅ Fs1 ds1⋅+ Fs2 ds2⋅+ Fs3 ds3⋅+ Fs4 ds4⋅+⎡⎣ ⎤⎦
Nu:= dN 184.5−= mm
Nuo 0.85 fc⋅ b⋅ D⋅ fsy As1 As2+ As3+ As4+( )⋅+⎡⎣ ⎤⎦ 10 3−⋅:= Nuo 3578.9= kN
Plastic Centroid dq
dq1
Nuo0.85 fc⋅ b⋅ D⋅( ) 0.5⋅ D⋅ fsy As1 ds1⋅ As2 ds2⋅+ As3 ds3⋅+ As4 ds4⋅+( )⋅+⎡⎣ ⎤⎦⋅ 10 3−⋅:= dq 124.916= mm
Summing moments of forces about the plactic centroid :
Mu Cc dq 0.5 γ⋅ dn⋅−( )⋅ Fs1 dq ds1−( )⋅+ Fs2 dq ds2−( )⋅+ Fs3 dq ds3−( )⋅+Fs4 dq ds4−( )⋅+
...⎡⎢⎣
⎤⎥⎦
10 3−⋅:= Mu 123.7= kNm
Steel stress is corrected for sign :
σs1 if εs1 0 εs1+< εsy> fsy−, σs1,( ):= σs1 371.7= MPa
σs4 if εs2 0 εs2+< εsy> fsy−, σs2,( ):= σs2 31.7−= MPa
σs3 if εs3 0 εs3+< εsy> fsy−, σs3,( ):= σs3 435.2−= MPa
σs4 if εs4 0 εs4+< εsy> fsy−, σs4,( ):= σs4 442−= MPa
Concrete Compressive Force Cc 0.85 fc⋅ γ⋅ b⋅ dn⋅ 10 3−⋅:= Cc 642.9= kN
Forces in each layers of steel : Fs1 σs1 As1⋅ 10 3−⋅:= Fs1 297.4= kN
Fs2 σs2 As2⋅ 10 3−⋅:= Fs2 12.7−= kN
Fs3 σs3 As3⋅ 10 3−⋅:=

Appendix-C
C-3
σs3 442−=σs3 if εs3 0 εs3+< εsy> fsy−, σs3,( ):=
MPaσs2 62.6−=σs4 if εs2 0 εs2+< εsy> fsy−, σs2,( ):=
MPaσs1 360.6=σs1 if εs1 0 εs1+< εsy> fsy−, σs1,( ):=
Steel stress is corrected for sign :
σs4 if εs4 εsy< Es εs4⋅, fsy,( ):=εs4 0.0046−=εs4εu
dndn ds4−( )⋅:=
σs3 if εs3 εsy< Es εs3⋅, fsy,( ):=εs3 0.0024−=εs3εu
dndn ds3−( )⋅:=
σs2 if εs2 εsy< Es εs2⋅, fsy,( ):=εs2 0.0003−=εs2εu
dndn ds2−( )⋅:=
σs1 if εs1 εsy< Es εs1⋅, fsy,( ):=εs1 0.0018=
kNFs4 353.6−=Fs4 σs4 As4⋅ 10 3−⋅:=
kNFs3 176.8−=Fs3 σs3 As3⋅ 10 3−⋅:=
kNFs2 25−=Fs2 σs2 As2⋅ 10 3−⋅:=
kNFs1 288.5=Fs1 σs1 As1⋅ 10 3−⋅:=Forces in each layers of steel :
kNCc 613=Cc 0.85 fc⋅ γ⋅ b⋅ dn⋅ 10 3−⋅:=Concrete Compressive Force
MPaσs4 442−=σs4 if εs4 0 εs4+< εsy> fsy−, σs4,( ):=
MPa
mmds3 154.2:=mm2As3 400:=mmD 250:=
mmds2 94.1:=mm2As2 400:=MPafsy 442=
mmds1 34:=mm2As1 800:=MPafc 47.4=
DESIGN DATA
COLUMN : Upper column
εs1εu
dndn ds1−( )⋅:=
Stain in each layer of steel :
dn 85.21:=Choose trial neutral axis
0.65 γ≤ 0.85≤γ 0.714=γ 0.85 0.007 fc 28−( )−:=Stress block parameter
εu 0.003:=Compressive strain εsy 0.0022=εsyfsy
Es:=
CALCULATIONS
MPaEs 200000:=
mmds4 216:=mm2As4 800:=mmb 250:=

Appendix-C
C-4
kNmMu 120.8=Mu Cc dq 0.5 γ⋅ dn⋅−( )⋅ Fs1 dq ds1−( )⋅+ Fs2 dq ds2−( )⋅+ Fs3 dq ds3−( )⋅+
Fs4 dq ds4−( )⋅+...⎡
⎢⎣
⎤⎥⎦
10 3−⋅:=
Summing moments of forces about the plactic centroid :
mmdq 124.916=dq1
Nuo0.85 fc⋅ b⋅ D⋅( ) 0.5⋅ D⋅ fsy As1 ds1⋅ As2 ds2⋅+ As3 ds3⋅+ As4 ds4⋅+( )⋅+⎡⎣ ⎤⎦⋅ 10 3−⋅:=
Plastic Centroid d q
kNNuo 3578.9=Nuo 0.85 fc⋅ b⋅ D⋅ fsy As1 As2+ As3+ As4+( )⋅+⎡⎣ ⎤⎦ 10 3−⋅:=
mmdN 224.1−=dNCc 0.5 γ⋅ dn⋅( )⋅ Fs1 ds1⋅+ Fs2 ds2⋅+ Fs3 ds3⋅+ Fs4 ds4⋅+⎡⎣ ⎤⎦
Nu:=
The eccentricity of Nu,dN is given by taking moment about top compressive fibre :
kNNu 346=Nu Cc Fs1+ Fs2+ Fs3+ Fs4+:=
Concrete and steel forcesare summed to give Nu

Appendix-C
C-5
Ast 800:= mm2 dsc 34:= mm Asv 56:= mm2
Asc 800:= mm2 N 346:= kN
Design for Shear
(a) Calculation of Vuc
β1 1.1 1.6do
1000−
⎛⎜⎝
⎞⎠
⋅:= β1 1.522=
β2 1N 103⋅
14 Ag⋅+:= For members with Compressive axial force
β2 1.395=
β3 1:= (As there is no Concentrated load near the support )
bv 0.5 b bt+( )⋅:=
Vuc β1 β2⋅ β3⋅ bv⋅ do⋅Ast fc⋅
bv do⋅
⎛⎜⎝
⎞
⎠
13
10 3−⋅:= Vuc 102= kN
BEAM DESIGN [AS3600- Normal Strength Concrete]
PROJECT : Corcon Test 1
BEAM : 250x250 Column
DESIGN DATA
fc 47.4= MPa
fsy 442= MPa Es 200000:= MPa fsyf 345= MPa
D 250:= mm do 216:= mm s 175:= mm
b 250:= mm bt 250:= mm Ag 62500:= mm2

Appendix-C
C-6
kNφ Vu⋅ 100.1=Therefore Shear Strengthφ 0.7:=
kNVu 143=Vu Vuc Vus+:=
Vus 40.989=VusAsv
sfsyf⋅ do⋅ cot θvr( )⋅ 10 3−⋅:=
(c) Calculation of φVu when stirrups are at yield
θvr θvπ
180⋅:=
degθv 30.2=θv 30 15Asv Asvmin−
Asvmax Asvmin−
⎛⎜⎝
⎞
⎠⋅+:=
mm2Asvmax 962.7=Asvmax bv
sfsyf⋅ 0.2 fc⋅
Vuc 103⋅
bv do⋅−
⎛⎜⎝
⎞
⎠:=
mm2Asvmin 44.384=Asvmin 0.35 bv⋅s
fsyf⋅:=
mm2Asv 56=
(b) Calculation of θv

Appendix-D
D-1
Calculation of prescribed deformation required to creating the hogging bending moment as per the Fig.3-23.
Corcon 300 mm Rib Beam
Upul Perera 2003/2/27
All dimensions in millimetresClear cover to transverse reinforcement = 22 mm
Inertia (mm4) x 106
Area (mm2) x 103
yt (mm)
yb (mm)
St (mm3) x 103
Sb (mm3) x 103
184.3
1883.6
340
107
5545.8
17543.4
191.6
2079.7
339
108
6140.6
19199.5
Gross Conc. Trans (n=7.17)
Geometric Properties
Crack Spacing
Loading (N,M,V + dN,dM,dV)
2 x dist + 0.1 db /ρ
0.0 , 0.0 , 0.0 + 0.0 , 0.01 , 1.0
1200
75
447
1 - 20 MM
6 MM @ 200 mm
2 - 207 - 7 MM
Concrete
εc' = 2.10 mm/m
fc' = 40.0 MPa
a = 19 mmft = 1.97 MPa (auto)
Rebar
εs = 180.0 mm/m
fu = 550 MPa
Links, fy= 250Long, fy= 450
She
ar F
orce
(kN
)
Maximum Deflection (mm)
Load-Max Deflection
0.09.0
18.027.036.045.054.0
0.0 3.0 6.0 9.0 12.0 15.0
1.7 mm

Appendix-D
D-2
RUAUMOKO INPUT FILE Four STOREY FRAME – Time History Analysis * 15 seconds of excitation with a time-step of 0.01 seconds 2 0 1 0 0 0 2 0 0 ! Control parameters PDelta Included 35 52 5 4 1 4 9.81 5.0 5.0 0.02 72 1.0 ! Structure parameters 0 10 10 0 1 10 0.7 0.1 ! Output parameters 0 0 0.05 ! Iteration parameters NODES 1 1 0.0 0.00 1 1 1 ! Level 0 - Ground Level 2 8.4 0.00 1 1 1 3 18.0 0.00 1 1 1 4 27.6 0.00 1 1 1 5 37.2 0.00 1 1 1 6 46.8 0.00 1 1 1 7 55.2 0.00 1 1 1 8 0.0 4.20 0 0 0 9 0 0 ! Level 1 9 8.4 4.20 0 0 0 10 0 0 10 18.0 4.20 0 0 0 11 0 0 11 27.6 4.20 0 0 0 12 0 0 12 37.2 4.20 0 0 0 13 0 0 13 46.8 4.20 0 0 0 14 0 0 14 55.2 4.20 0 0 0 0 0 0 15 0.0 7.60 0 0 0 16 0 0 ! Level 2 16 8.4 7.60 0 0 0 17 0 0 17 18.0 7.60 0 0 0 18 0 0 18 27.6 7.60 0 0 0 19 0 0 19 37.2 7.60 0 0 0 20 0 0 20 46.8 7.60 0 0 0 21 0 0 21 55.2 7.60 0 0 0 0 0 0 22 0.0 11.00 0 0 0 23 0 0 ! Level 3 23 8.4 11.00 0 0 0 24 0 0 24 18.0 11.00 0 0 0 25 0 0 25 27.6 11.00 0 0 0 26 0 0 26 37.2 11.00 0 0 0 27 0 0 27 46.8 11.00 0 0 0 28 0 0 28 55.2 11.00 0 0 0 0 0 0 29 0.0 14.40 0 0 0 30 0 0 ! Level 4 30 8.4 14.40 0 0 0 31 0 0 31 18.0 14.40 0 0 0 32 0 0 32 27.6 14.40 0 0 0 33 0 0 33 37.2 14.40 0 0 0 34 0 0 34 46.8 14.40 0 0 0 35 0 0 35 55.2 14.40 0 0 0 0 0 0

Appendix-D
D-3
ELEMENTS 1 1 1 1 8 1 8 ! Column Line 1 2 2 8 15 8 15 3 5 15 22 4 5 22 29 5 1 2 9 ! Column Line 2 6 2 9 16 7 5 16 23 8 5 23 30 9 1 3 10 ! Column Line 3 10 2 10 17 11 5 17 24 12 5 24 31 13 1 4 11 4 11 ! Column Line 4 14 2 11 18 11 18 15 5 18 25 16 5 25 32 17 1 5 12 ! Column Line 5 18 2 12 19 19 5 19 26 20 5 26 33 21 1 6 13 ! Column Line 6 22 2 13 20 23 5 20 27 24 5 27 34 25 1 7 14 7 14 ! Column Line 7 26 2 14 21 27 5 21 28 28 5 28 35 29 3 8 9 8 9 ! Level 1 Beam 30 4 9 10 31 4 10 11 32 4 11 12 33 4 12 13 34 3 13 14 35 3 15 16 15 16 ! Level 2 Beam 36 4 16 17 37 4 17 18 38 4 18 19 39 4 19 20 40 3 20 21 41 3 22 23 22 23 ! Level 3 Beam 42 4 23 24 43 4 24 25 44 4 25 26 45 4 26 27

Appendix-D
D-4
46 3 27 28 47 3 29 30 29 30 ! Level 4 Beam 48 4 30 31 49 4 31 32 50 4 32 33 51 4 33 34 52 3 34 35 34 35 PROPS 1 FRAME ! Ground floor Columns 2 0 0 2 0 0 3.198E7 1.33E7 0.25 0.25 0.002447 0.0 0.000 0.492 0.02 0.02 .25 .25 -15862.0 -9517.0 754.0 977.0 1136.0 1013.0 9148.0 0 2 FRAME ! All Columns above 1st Floor 2 0 0 2 0 0 3.198E7 1.33E7 0.25 0.25 0.002447 0.0 0.492 0.492 0.02 0.02 .25 .25 -15862.0 -9517.0 754.0 977.0 1136.0 1013.0 9148.0 0 3 FRAME ! All 8.4 m span Beams 1 0 1 4 0 0 3.198E7 1.33E7 0.474 0.4100 0.005039 0.0 0.25 0.25 0.00458 0.00458 .447 .447 -299.2 -299.2 -213.7 213.7 2379.0 -3.1e4 400.0 -1119.0 400.0 -1119.0 0.5 0.6 1 2 4 FRAME ! All 9.6 m span Beams 1 0 1 4 0 0 3.198E7 1.33E7 0.474 0.4100 0.005039 0.0 0.25 0.25 0.00458 0.00458 .447 .447 -391.0 -391.0 -244.0 244.0 2379.0 -3.1e4 400.0 -1119.0 400.0 -1119.0 0.5 0.6 1 2 5 FRAME ! All Columns above 1st Floor 2 0 0 2 0 0 3.198E7 1.33E7 0.25 0.25 0.00188 0.0 0.492 0.492 0.02 0.02 .25 .25 -13355.0 -8013.0 680.0 847.0 913.0 735.0 5827.0 0 WEIGHTS ! Weights not included in member self-weight 1 0.0 0.0 0.0 ! Level 0 - Ground Level 2 0.0 0.0 0.0 3 0.0 0.0 0.0 4 0.0 0.0 0.0

Appendix-D
D-5
5 0.0 0.0 0.0 6 0.0 0.0 0.0 7 0.0 0.0 0.0 8 214.0 214.0 000.0 ! Level 1 - Ground Level 9 458.0 458.0 000.0 10 488.0 488.0 000.0 11 488.0 488.0 000.0 12 488.0 488.0 000.0 13 458.0 458.0 000.0 14 214.0 214.0 000.0 15 214.0 214.0 000.0 ! Level 2 - Ground Level 16 458.0 458.0 000.0 17 488.0 488.0 000.0 18 488.0 488.0 000.0 19 488.0 488.0 000.0 20 458.0 458.0 000.0 21 214.0 214.0 000.0 22 214.0 214.0 000.0 ! Level 3 - Ground Level 23 458.0 458.0 000.0 24 488.0 488.0 000.0 25 488.0 488.0 000.0 26 488.0 488.0 000.0 27 458.0 458.0 000.0 28 214.0 214.0 000.0 29 214.0 214.0 000.0 ! Level 4 - Ground Level 30 458.0 458.0 000.0 31 488.0 488.0 000.0 32 488.0 488.0 000.0 33 488.0 488.0 000.0 34 458.0 458.0 000.0 35 214.0 214.0 000.0 LOADS ! Loads not in member initial conditions ! i.e. transverse walls etc, columns 1 0.0 00.0 0.0 ! Level 0 - Ground Level 2 0.0 00.0 0.0 3 0.0 00.0 0.0 4 0.0 00.0 0.0 5 0.0 00.0 0.0 6 0.0 00.0 0.0 7 0.0 00.0 0.0 !Level 1 8 0.0 00.0 0.0 9 0.0 00.0 0.0 10 0.0 00.0 0.0 11 0.0 00.0 0.0 12 0.0 00.0 0.0 13 0.0 00.0 0.0

Appendix-D
D-6
14 0.0 00.0 0.0 15 0.0 00.0 0.0 ! Level 2 16 0.0 00.0 0.0 17 0.0 00.0 0.0 18 0.0 00.0 0.0 19 0.0 00.0 0.0 20 0.0 00.0 0.0 21 0.0 00.0 0.0 22 0.0 00.0 0.0 ! Level 3 23 0.0 00.0 0.0 24 0.0 00.0 0.0 25 0.0 00.0 0.0 26 0.0 00.0 0.0 27 0.0 00.0 0.0 28 0.0 00.0 0.0 29 0.0 00.0 0.0 ! Level 4 30 0.0 00.0 0.0 31 0.0 00.0 0.0 32 0.0 00.0 0.0 33 0.0 00.0 0.0 34 0.0 00.0 0.0 35 0.0 00.0 0.0 EQUAKE 3 1 0.01 9.81 0 0 0 1 ! Free Format

Appendix-D
D-7
The input data for program RESPONSE 2000 to obtain the moment curvature and column interaction diagrams to calculate the input parameters for time history analysis.
Corcon Beam Full Scale
Upul Perera 2003/2/27
All dimensions in millimetresClear cover to transverse reinforcement = 44 mm
Inertia (mm4) x 106
Area (mm2) x 103
yt (mm)
yb (mm)
St (mm3) x 103
Sb (mm3) x 103
733.5
30135.4
215
679
140304.9
44368.0
758.9
32760.1
217
677
151201.4
48366.2
Gross Conc. Trans (n=7.17)
Geometric Properties
Crack Spacing
Loading (N,M,V + dN,dM,dV)
2 x dist + 0.1 db /ρ
0.0 , 0.0 , 0.0 + 0.0 , 2.4 , 1.0
150
2400
894
2 - 36 MM7 - 14 MM
12 MM @ 200 mm
1 - 36 MM
Concrete
εc' = 2.10 mm/m
fc' = 40.0 MPa
a = 20 mmft = 1.97 MPa (auto)
Rebar
εs = 100.0 mm/m
fu = 675 MPa
Links, fy= 250Long, fy= 450
Column Full Scale
Upul Perera 2003/3/6
All dimensions in millimetresClear cover to transverse reinforcement = 64 mm
Inertia (mm4) x 106
Area (mm2) x 103
yt (mm)
yb (mm)
St (mm3) x 103
Sb (mm3) x 103
250.0
5208.3
250
250
20833.3
20833.3
325.3
6438.8
250
250
25755.3
25755.3
Gross Conc. Trans (n=7.17)
Geometric Properties
Crack Spacing
Loading (N,M,V + dN,dM,dV)
2 x dist + 0.1 db /ρ
0.0 , 0.0 , 0.0 + 0.0 , 0.95 , 1.0
500
500
4 - 36 MM
12 MM @ 175 mm
2 layers of 2 - 36 MM12 MM @ 175 mm
4 - 36 MM
Concrete
εc' = 2.10 mm/m
fc' = 40.0 MPa
a = 20 mmft = 1.97 MPa (auto)
Rebar
εs = 100.0 mm/m
fu = 675 MPa
Trans, fy= 250Long, fy= 450

Minerva Access is the Institutional Repository of The University of Melbourne
Author/s:Perera, U.
Title:Seismic performance of concrete beam-slab-column systems constructed with a re-usablesheet metal formwork system
Date:2007
Citation:Perera, U. (2007). Seismic performance of concrete beam-slab-column systemsconstructed with a re-usable sheet metal formwork system. Masters Research thesis,Faculty of Engineering, Civil and Environmental Engineering, The University of Melbourne.
Publication Status:Unpublished
Persistent Link:http://hdl.handle.net/11343/35155
Terms and Conditions:Terms and Conditions: Copyright in works deposited in Minerva Access is retained by thecopyright owner. The work may not be altered without permission from the copyright owner.Readers may only download, print and save electronic copies of whole works for their ownpersonal non-commercial use. Any use that exceeds these limits requires permission fromthe copyright owner. Attribution is essential when quoting or paraphrasing from these works.
Copyright © 2022 FDOKUMEN