
Characterizing possible failure modes in physics-informed ...
Upload
khangminh22Category
view
0download
0
Important Notice
This copy may be used only for the purposes of research and
private study, and any use of the copy for a purpose other than research or private study may require the authorization of the copyright owner of the work in
question. Responsibility regarding questions of copyright that may arise in the use of this copy is
assumed by the recipient.

THE UNIVERSITY OF CALGARY
Seismic interpretation of two possible meteorite impact craters: White
Valley, Saskatchewan and Purple Springs, Alberta
by
Hans-Henrik Westbroek
A THESIS SUBMITTED TO THE FACULTY OF GRADUATE STUDIES IN PARTIAL
FULFILLMENT OF THE REQUIREMENTS FOR THE DEGREE OF
MASTER OF SCIENCE
DEPARTMENT OF GEOLOGY AND GEOPHYSICS
CALGARY, ALBERTA
DECEMBER, 1997
© Hans-Henrik Westbroek 1997

There is something fascinating about science. One gets such wholesalereturns of conjecture on such a trifling investment of fact. Mark Twain
END OF THE CRETACEOUS?
D. D
avis
New Quebec Crater, Canada
B. R
ober
tson
Wolfe Creek Crater, Australia
V.L
. Sha
rpto
n
Meteor Crater, U.S.A
D.J
. Rod
dy
Clearwater Lakes Craters, Canada
NA
SA
Manicouagan Crater, Canada
NA
SA

ii
THE UNIVERSITY OF CALGARY
FACULTY OF GRADUATE STUDIES
The undersigned certify that they have read, and recommended to the Faculty of Graduate
Studies for acceptance, a thesis entitled “Seismic interpretation of two possible meteorite
impact craters: White Valley, Saskatchewan and Purple Springs, Alberta” submitted by
Hans-Henrik Westbroek in partial fulfillment of the requirements for the degree of Master
of Science.
Supervisor, Dr. Robert R. Stewart, Department of Geology and Geophysics
Dr. Don C. Lawton, Department of Geology and Geophysics
Dr. Fred Cook, Department of Geology and Geophysics
Dr. Eugene F. Milone, Department of Physics
Date

iii
Abstract
High-velocity impact events have played a major role in the formation of the Solar System,
including the Earth. The terrestrial record of impact structures shows over 150 examples,
most of which are on the surface. This work uses the seismic reflection method to analyse
sub-surface structures as possible meteorite impacts. I investigate two structures of
possible meteorite impact origin: White Valley, Saskatchewan, and Purple Springs,
Alberta. The impact hypothesis is evaluated by comparing structure geometry as seen on
seismic reflection images with models (i.e., scaling criteria) derived from other known
structures, laboratory experiments and numerical modelling.
The White Valley structure is most likely explained as a complex meteorite impact structure.
It is some 7.5 km in diameter, with a nearly 2 km central uplift and is characterized by a
terraced rim, a downdropped trough, and an uplifted center. The structure extends to a
depth of 1300 m but the trough of the crater itself is only 100 to 220 m deep based on
seismic data and scaling relationships. Structural uplift is estimated at 620 m, in good
agreement with the scaling results. The gravity anomaly over the structure is consistent
with the complex impact crater model. The structure is between about 55 and 60 Ma old.
The Purple Springs structure is also reasonably well described by scaling criteria for a
complex impact crater. It is elliptical in nature, about 4 km long and 3 km wide. The
structure is apparent in some 780 m of rock extending from the Mississippian to the
Devonian Elk Point Group and is about 320 Ma old. The Mississippian shows about 180
m of downdrop into the structure in excellent agreement with scaling criteria. The rim of
the structure is characterized by listric normal rim faults delineating terraces which drop to a
relatively flat central plain. The lack of a prominant central uplift suggests post-impact
processes may have substantially altered the structure to its current form.

iv
Acknowledgements
This thesis represents the culmination of work which, as is often the case with such
endeavours, could never have been completed without the assistance of many people. I
would like to thank my supervisor, Rob Stewart, for his guidance throughout the course of
this research and in particular, for giving me encouragement at the times when self
motivation failed me. I would also like to thank Don Lawton for his time in discussing
these structures and for sharing his work on the Eagle Butte impact crater with me.
For additional insight into the formation and character of these amazing structures, I would
like to thank Richard Grieve and Alan Hildebrand, both of the Geological Survey of
Canada, for many useful and insightful discussions.
Without appropriate data these projects would not be possible so I would like to thank
Mark Resources Inc. and Enron Oil Ltd. of Calgary for their generous donation of the
White Valley seismic data. Andy St. Onge was particularly helpful by helping me acquire
the data and sharing his knowledge of the structure. Similarly, Norcen Resources Ltd. and
Amoco Canada gave me the use of the Purple Springs dataset. I would like to thank Brad
Nazar, from Norcen, for bringing the structure to my attention, and Wes Bader, also from
Norcen, for his donation of time for many discussions we had about the structure and the
geology of the area.
My thanks, also, to Henry Bland and Darren Foltinek of the CREWES Project at The
University of Calgary for their technical support and many last minute miracles prior to
(i.e., the night before) many important deadlines.

v
For generous financial support, I would like to thank the CREWES Project sponsors and
the National Science and Engineering Research Council of Canada.
To my office mates, Chris Collom (Ph.D. Paleontology), Dave Thomas (M.Sc.
Hydrogeology) and Andrew McRae (Ph.D. Paleontology), thanks for putting up with a
“squiggle reader” and realizing that geophysics really is the more superior of the three
disciplines. Finally, to Lynn Gillies, who patiently waited for me to get “that damn thesis”
done, and to the many new friends I’ve made over the last few years: thanks so much for
the great memories. It’s been one heck of a ride.

vi
Dedication
This thesis is dedicated to the memory of Hendrik Westbroek, my
mentor, my teacher, my friend and my father. It is also dedicated to
Marijke, Wido, Reinout and Jiska, for their love and support
throughout this endeavour.

vii
Table of Contents
Approval Page...... . . . . . . . . . . . . . . . . . . . . . . . . . . . . . . . . . . . . . . . . . . . . . . . . . . . . . . . . . . . . . . . . . . . . . . . . . . . . . . . . . . ii
Abstract..... . . . . . . . . . . . . . . . . . . . . . . . . . . . . . . . . . . . . . . . . . . . . . . . . . . . . . . . . . . . . . . . . . . . . . . . . . . . . . . . . . . . . . . . . . . .iii
Acknowledgements...... . . . . . . . . . . . . . . . . . . . . . . . . . . . . . . . . . . . . . . . . . . . . . . . . . . . . . . . . . . . . . . . . . . . . . . . . . . . .iv
Dedication...... . . . . . . . . . . . . . . . . . . . . . . . . . . . . . . . . . . . . . . . . . . . . . . . . . . . . . . . . . . . . . . . . . . . . . . . . . . . . . . . . . . . . . . .vi
Table of Contents...... . . . . . . . . . . . . . . . . . . . . . . . . . . . . . . . . . . . . . . . . . . . . . . . . . . . . . . . . . . . . . . . . . . . . . . . . . . . . .vii
List of Tables...... . . . . . . . . . . . . . . . . . . . . . . . . . . . . . . . . . . . . . . . . . . . . . . . . . . . . . . . . . . . . . . . . . . . . . . . . . . . . . . . . . . . x
List of Figures...... . . . . . . . . . . . . . . . . . . . . . . . . . . . . . . . . . . . . . . . . . . . . . . . . . . . . . . . . . . . . . . . . . . . . . . . . . . . . . . . . . .xi
CHAPTER ONE - INTRODUCTION . . . . . . . . . . . . . . . . . . . . . . . . . . . . . . . . . . . . . . . . . . . . . . . . . . . . . . 1
1 . 1 BACKGROUND. . . . . . . . . . . . . . . . . . . . . . . . . . . . . . . . . . . . . . . . . . . . . . . . . . . . . . . . . . . . . . . . . . . . . . . . 1
1 . 2 IMPACT MECHANICS . . . . . . . . . . . . . . . . . . . . . . . . . . . . . . . . . . . . . . . . . . . . . . . . . . . . . . . . . . . . . . 3
1.2.1 Contact and Compression Stage..... . . . . . . . . . . . . . . . . . . . . . . . . . . . . . . . . . . . . . . . . . . . . . 4
1.2.2 Excavation Stage..... . . . . . . . . . . . . . . . . . . . . . . . . . . . . . . . . . . . . . . . . . . . . . . . . . . . . . . . . . . . . . . 6
1.2.3 Modification Stage..... . . . . . . . . . . . . . . . . . . . . . . . . . . . . . . . . . . . . . . . . . . . . . . . . . . . . . . . . . . . . 8
1 . 3 ECONOMIC POTENTIAL . . . . . . . . . . . . . . . . . . . . . . . . . . . . . . . . . . . . . . . . . . . . . . . . . . . . . . . . .12
1.3.1 Progenetic Deposits.... . . . . . . . . . . . . . . . . . . . . . . . . . . . . . . . . . . . . . . . . . . . . . . . . . . . . . . . . . . .13
1.3.2 Syngenetic Deposits.... . . . . . . . . . . . . . . . . . . . . . . . . . . . . . . . . . . . . . . . . . . . . . . . . . . . . . . . . . .14
1.3.3 Epigenetic Deposits.... . . . . . . . . . . . . . . . . . . . . . . . . . . . . . . . . . . . . . . . . . . . . . . . . . . . . . . . . . . .15
1.3.3.1Hydrothermal Ores. . . . . . . . . . . . . . . . . . . . . . . . . . . . . . . . . . . . . . . . . . . . . . . . . . . . . . . . . .15
1.3.3.2Chemical Sediments. . . . . . . . . . . . . . . . . . . . . . . . . . . . . . . . . . . . . . . . . . . . . . . . . . . . . . . . .16
1.3.3.3Water Resources. . . . . . . . . . . . . . . . . . . . . . . . . . . . . . . . . . . . . . . . . . . . . . . . . . . . . . . . . . . . .16
1.3.3.4Placer Deposits. . . . . . . . . . . . . . . . . . . . . . . . . . . . . . . . . . . . . . . . . . . . . . . . . . . . . . . . . . . . . .16
1.3.3.5Oil Shales. . . . . . . . . . . . . . . . . . . . . . . . . . . . . . . . . . . . . . . . . . . . . . . . . . . . . . . . . . . . . . . . . . . . .16
1.3.3.6Hydrocarbon Accumulations. . . . . . . . . . . . . . . . . . . . . . . . . . . . . . . . . . . . . . . . . . . . . . .17
1 . 4 SEISMIC EXAMPLES OF TERRESTRIAL CRATERS . . . . . . . . . . . . . . . . . .17
1.4.1 The Manson Impact Crater.... . . . . . . . . . . . . . . . . . . . . . . . . . . . . . . . . . . . . . . . . . . . . . . . . . . .18
1.4.2 The Sudbury Impact Crater.... . . . . . . . . . . . . . . . . . . . . . . . . . . . . . . . . . . . . . . . . . . . . . . . . . .18
1.4.3 The Montagnais Impact Crater.... . . . . . . . . . . . . . . . . . . . . . . . . . . . . . . . . . . . . . . . . . . . . . . .19
1.4.4 The Mjølnir Impact Crater.... . . . . . . . . . . . . . . . . . . . . . . . . . . . . . . . . . . . . . . . . . . . . . . . . . . . .19
1.4.5 The Haughton Impact Crater.... . . . . . . . . . . . . . . . . . . . . . . . . . . . . . . . . . . . . . . . . . . . . . . . . .20
1.4.6 The Red Wing Creek Impact Crater.... . . . . . . . . . . . . . . . . . . . . . . . . . . . . . . . . . . . . . . . . .20
1.4.7 The Eagle Butte Impact Crater.... . . . . . . . . . . . . . . . . . . . . . . . . . . . . . . . . . . . . . . . . . . . . . . .21
1.4.8 The James River Structure..... . . . . . . . . . . . . . . . . . . . . . . . . . . . . . . . . . . . . . . . . . . . . . . . . . .21

viii
1.4.9 The Viewfield Structure..... . . . . . . . . . . . . . . . . . . . . . . . . . . . . . . . . . . . . . . . . . . . . . . . . . . . . .21
1.4.10The Hartney Structure..... . . . . . . . . . . . . . . . . . . . . . . . . . . . . . . . . . . . . . . . . . . . . . . . . . . . . . . .22
CHAPTER TWO - SCALING RELATIONSHIPS AND RESERVOIR
POTENTIAL . . . . . . . . . . . . . . . . . . . . . . . . . . . . . . . . . . . . . . . . . . . . . . . . . . . . . . . . . . .43
2 . 1 SCALING RELATIONSHIPS . . . . . . . . . . . . . . . . . . . . . . . . . . . . . . . . . . . . . . . . . . . . . . . . . . . .43
2.1.1 Transient Crater Scaling..... . . . . . . . . . . . . . . . . . . . . . . . . . . . . . . . . . . . . . . . . . . . . . . . . . . . . .44
2.1.2 Simple Crater Scaling..... . . . . . . . . . . . . . . . . . . . . . . . . . . . . . . . . . . . . . . . . . . . . . . . . . . . . . . . .46
2.1.3 Complex Crater Scaling..... . . . . . . . . . . . . . . . . . . . . . . . . . . . . . . . . . . . . . . . . . . . . . . . . . . . . .48
2 . 2 RESERVOIR POTENTIAL . . . . . . . . . . . . . . . . . . . . . . . . . . . . . . . . . . . . . . . . . . . . . . . . . . . . . . . .50
2 . 3 CONCLUSIONS . . . . . . . . . . . . . . . . . . . . . . . . . . . . . . . . . . . . . . . . . . . . . . . . . . . . . . . . . . . . . . . . . . . . . .55
CHAPTER THREE - THE WHITE VALLEY STRUCTURE . . . . . . . . . . . . . . . . . . . . .62
3 . 1 GEOLOGICAL SETTING . . . . . . . . . . . . . . . . . . . . . . . . . . . . . . . . . . . . . . . . . . . . . . . . . . . . . . . . . .62
3.1.1 Regional Geology..... . . . . . . . . . . . . . . . . . . . . . . . . . . . . . . . . . . . . . . . . . . . . . . . . . . . . . . . . . . . .62
3.1.2 Geological Well Control... . . . . . . . . . . . . . . . . . . . . . . . . . . . . . . . . . . . . . . . . . . . . . . . . . . . . . . .63
3 . 2 GEOPHYSICAL CHARACTERISTICS . . . . . . . . . . . . . . . . . . . . . . . . . . . . . . . . . . . . . . .64
3.2.1 Well Log Data..... . . . . . . . . . . . . . . . . . . . . . . . . . . . . . . . . . . . . . . . . . . . . . . . . . . . . . . . . . . . . . . . .65
3.2.2 Well Log to Seismic Data Correlations..... . . . . . . . . . . . . . . . . . . . . . . . . . . . . . . . . . . . .66
3.2.3 Seismic Data Interpretation..... . . . . . . . . . . . . . . . . . . . . . . . . . . . . . . . . . . . . . . . . . . . . . . . . . .68
3.2.3.1Horizon Description. . . . . . . . . . . . . . . . . . . . . . . . . . . . . . . . . . . . . . . . . . . . . . . . . . . . . . . . .69
3.2.3.2Time Structure. . . . . . . . . . . . . . . . . . . . . . . . . . . . . . . . . . . . . . . . . . . . . . . . . . . . . . . . . . . . . . .70
3.2.3.3Gravity Anomaly. . . . . . . . . . . . . . . . . . . . . . . . . . . . . . . . . . . . . . . . . . . . . . . . . . . . . . . . . . . .70
3.2.3.4General Morphology. . . . . . . . . . . . . . . . . . . . . . . . . . . . . . . . . . . . . . . . . . . . . . . . . . . . . . . .74
3 . 3 DISCUSSION. . . . . . . . . . . . . . . . . . . . . . . . . . . . . . . . . . . . . . . . . . . . . . . . . . . . . . . . . . . . . . . . . . . . . . . . . .75
3.3.1 Kimberlite Origin.... . . . . . . . . . . . . . . . . . . . . . . . . . . . . . . . . . . . . . . . . . . . . . . . . . . . . . . . . . . . . . .75
3.3.2 Meteorite Impact Origin.... . . . . . . . . . . . . . . . . . . . . . . . . . . . . . . . . . . . . . . . . . . . . . . . . . . . . . .78
3 . 4 CONCLUSIONS . . . . . . . . . . . . . . . . . . . . . . . . . . . . . . . . . . . . . . . . . . . . . . . . . . . . . . . . . . . . . . . . . . . . . .81
CHAPTER FOUR - THE PURPLE SPRINGS STRUCTURE . . . . . . . . . . . . . . . . . 100
4 . 1 GEOLOGICAL SETTING . . . . . . . . . . . . . . . . . . . . . . . . . . . . . . . . . . . . . . . . . . . . . . . . . . . . . . . . 100
4.1.1 Well Control... . . . . . . . . . . . . . . . . . . . . . . . . . . . . . . . . . . . . . . . . . . . . . . . . . . . . . . . . . . . . . . . . . . 101
4 . 2 GEOPHYSICAL CHARACTERISTICS . . . . . . . . . . . . . . . . . . . . . . . . . . . . . . . . . . . . . 102
4.2.1 Well Log to Seismic Data Correlations.... . . . . . . . . . . . . . . . . . . . . . . . . . . . . . . . . . . . 103

ix
4.2.2 Seismic Data Interpretation..... . . . . . . . . . . . . . . . . . . . . . . . . . . . . . . . . . . . . . . . . . . . . . . . . 104
4.2.2.1Horizon Description. . . . . . . . . . . . . . . . . . . . . . . . . . . . . . . . . . . . . . . . . . . . . . . . . . . . . . . 105
4.2.2.2Time Structure. . . . . . . . . . . . . . . . . . . . . . . . . . . . . . . . . . . . . . . . . . . . . . . . . . . . . . . . . . . . . 107
4.2.2.3General Morphology. . . . . . . . . . . . . . . . . . . . . . . . . . . . . . . . . . . . . . . . . . . . . . . . . . . . . . 108
4 . 3 DISCUSSION. . . . . . . . . . . . . . . . . . . . . . . . . . . . . . . . . . . . . . . . . . . . . . . . . . . . . . . . . . . . . . . . . . . . . . . . 110
4.3.1 Meteorite Impact Origin.... . . . . . . . . . . . . . . . . . . . . . . . . . . . . . . . . . . . . . . . . . . . . . . . . . . . . 110
4.3.2 Dissolution Phenomena..... . . . . . . . . . . . . . . . . . . . . . . . . . . . . . . . . . . . . . . . . . . . . . . . . . . . 113
4 . 4 CONCLUSIONS . . . . . . . . . . . . . . . . . . . . . . . . . . . . . . . . . . . . . . . . . . . . . . . . . . . . . . . . . . . . . . . . . . . . 115
CHAPTER FIVE - CONCLUSIONS . . . . . . . . . . . . . . . . . . . . . . . . . . . . . . . . . . . . . . . . . . . . . . . . . . . . 132
5 . 1 INTRODUCTION . . . . . . . . . . . . . . . . . . . . . . . . . . . . . . . . . . . . . . . . . . . . . . . . . . . . . . . . . . . . . . . . . . . 132
5 . 2 THE WHITE VALLEY STRUCTURE . . . . . . . . . . . . . . . . . . . . . . . . . . . . . . . . . . . . . . . 133
5 . 3 THE PURPLE SPRINGS STRUCTURE. . . . . . . . . . . . . . . . . . . . . . . . . . . . . . . . . . . . 135
5 . 4 GENERAL COMMENTS AND FUTURE WORK . . . . . . . . . . . . . . . . . . . . . . . . 137
REFERENCES. . . . . . . . . . . . . . . . . . . . . . . . . . . . . . . . . . . . . . . . . . . . . . . . . . . . . . . . . . . . . . . . . . . . . . . . . . . . . . . . . 139

x
List of Tables
Table 2.1 - Structural association of hydrocarbon accumulations.... . . . . . . . . . . . . . . . . . . . . . . . . .52
Table 3.1 - Survey acquisition parameters for White Valley.... . . . . . . . . . . . . . . . . . . . . . . . . . . . . . . .64
Table 3.2 - Basic processing flow for White Valley..... . . . . . . . . . . . . . . . . . . . . . . . . . . . . . . . . . . . . . . .65
Table 3.3 - Summary of measured and scaling equation results... . . . . . . . . . . . . . . . . . . . . . . . . . . . .81
Table 4.1 - Survey acquisition parameters for Purple Springs.... . . . . . . . . . . . . . . . . . . . . . . . . . . . 103
Table 4.2 - Basic processing flow for Purple Springs.... . . . . . . . . . . . . . . . . . . . . . . . . . . . . . . . . . . . . 104
Table 4.3 - Summary of measured and scaling equation results... . . . . . . . . . . . . . . . . . . . . . . . . . . 112

xi
List of Figures
Figure 1.1 -World map of impact structures..... . . . . . . . . . . . . . . . . . . . . . . . . . . . . . . . . . . . . . . . . . . . . . . .24
Figure 1.2 -Contact and compression stage..... . . . . . . . . . . . . . . . . . . . . . . . . . . . . . . . . . . . . . . . . . . . . . . . .25
Figure 1.3 -Energy partitioning during an impact event... . . . . . . . . . . . . . . . . . . . . . . . . . . . . . . . . . . . .26
Figure 1.4 -Near surface interference zone at an impact site.... . . . . . . . . . . . . . . . . . . . . . . . . . . . . . .27
Figure 1.5 -Excavation flowfield.... . . . . . . . . . . . . . . . . . . . . . . . . . . . . . . . . . . . . . . . . . . . . . . . . . . . . . . . . . . . . .28
Figure 1.6 -Simple and complex crater morphologies..... . . . . . . . . . . . . . . . . . . . . . . . . . . . . . . . . . . . .29
Figure 1.7 -Crater depth vs. rim diameter and the onset of the transition diameter. . . . . . . . .30
Figure 1.8 -Log-log plot of crater diameter vs. gravitational acceleration... . . . . . . . . . . . . . . . .31
Figure 1.9 -The Manson impact crater.... . . . . . . . . . . . . . . . . . . . . . . . . . . . . . . . . . . . . . . . . . . . . . . . . . . . . . . .32
Figure 1.10 -The Sudbury impact crater.... . . . . . . . . . . . . . . . . . . . . . . . . . . . . . . . . . . . . . . . . . . . . . . . . . . . .33
Figure 1.11 -The Montagnais impact crater.... . . . . . . . . . . . . . . . . . . . . . . . . . . . . . . . . . . . . . . . . . . . . . . . . .34
Figure 1.12 -The Mjølnir impact crater.... . . . . . . . . . . . . . . . . . . . . . . . . . . . . . . . . . . . . . . . . . . . . . . . . . . . . . .35
Figure 1.13 -The Haughton impact crater.... . . . . . . . . . . . . . . . . . . . . . . . . . . . . . . . . . . . . . . . . . . . . . . . . . . .36
Figure 1.14 -The Red Wing Creek impact crater.... . . . . . . . . . . . . . . . . . . . . . . . . . . . . . . . . . . . . . . . . . . .37
Figure 1.15 -The James River structure..... . . . . . . . . . . . . . . . . . . . . . . . . . . . . . . . . . . . . . . . . . . . . . . . . . . . .38
Figure 1.16 -Dip-azimuth map from the James River structure.... . . . . . . . . . . . . . . . . . . . . . . . . . .39
Figure 1.17 -The Viewfield structure..... . . . . . . . . . . . . . . . . . . . . . . . . . . . . . . . . . . . . . . . . . . . . . . . . . . . . . . .40
Figure 1.18 -The Hartney structure..... . . . . . . . . . . . . . . . . . . . . . . . . . . . . . . . . . . . . . . . . . . . . . . . . . . . . . . . . .41
Figure 1.19 -Time structure map over the Hartney structure.... . . . . . . . . . . . . . . . . . . . . . . . . . . . . .42
Figure 2.1 -Crater dimensions used in scaling criteria.... . . . . . . . . . . . . . . . . . . . . . . . . . . . . . . . . . . . . .57
Figure 2.2 - Avak structure map showing gas field locations.... . . . . . . . . . . . . . . . . . . . . . . . . . . . . . .58
Figure 2.3 -Steen River well map showing exploration targets.... . . . . . . . . . . . . . . . . . . . . . . . . . . .59
Figure 2.4 -Eagle Butte well map showing exploration targets.... . . . . . . . . . . . . . . . . . . . . . . . . . . .60
Figure 2.5 -Viewfield well map showing exploration targets.... . . . . . . . . . . . . . . . . . . . . . . . . . . . . .61
Figure 3.1 - Generalized stratigraphy of SW Saskatchewan..... . . . . . . . . . . . . . . . . . . . . . . . . . . . . . .83
Figure 3.2 -Aerial photograph over the White Valley structure.... . . . . . . . . . . . . . . . . . . . . . . . . . . .84
Figure 3.3 -Base map of the White Valley area..... . . . . . . . . . . . . . . . . . . . . . . . . . . . . . . . . . . . . . . . . . . . .85
Figure 3.4 - Shallow repeated zone in 07-07-010-23W3..... . . . . . . . . . . . . . . . . . . . . . . . . . . . . . . . . . .86
Figure 3.5 -Middle repeated zone in 07-07-010-23W3..... . . . . . . . . . . . . . . . . . . . . . . . . . . . . . . . . . . .87
Figure 3.6 -Deepest repeated section in 07-07-010-23W3..... . . . . . . . . . . . . . . . . . . . . . . . . . . . . . . .88
Figure 3.7 -Comparison of edited 07-07 velocity log and regional velocity trend.. . . . . . . . .89

xii
Figure 3.8 - Correlation of 01-04-010-22W3 to seismic data.... . . . . . . . . . . . . . . . . . . . . . . . . . . . . . .90
Figure 3.9 - Correlation of 04-01-011-24W3 to seismic data.... . . . . . . . . . . . . . . . . . . . . . . . . . . . . . .91
Figure 3.10 - Correlation of 07-07-010-23W3 to seismic data.... . . . . . . . . . . . . . . . . . . . . . . . . . . .92
Figure 3.11 -Interpretation of seismic line WV-017..... . . . . . . . . . . . . . . . . . . . . . . . . . . . . . . . . . . . . . .93
Figure 3.12 -Interpretation of seismic line WV-021..... . . . . . . . . . . . . . . . . . . . . . . . . . . . . . . . . . . . . . .94
Figure 3.13 -Interpretation of seismic lines WV-011 and WV-016.... . . . . . . . . . . . . . . . . . . . . . .95
Figure 3.14 -Time structure map of the Belly River reflector... . . . . . . . . . . . . . . . . . . . . . . . . . . . . .96
Figure 3.15 -Bouguer gravity profile over the White Valley structure.... . . . . . . . . . . . . . . . . . .97
Figure 3.16 -Schematic of a kimberlite pipe..... . . . . . . . . . . . . . . . . . . . . . . . . . . . . . . . . . . . . . . . . . . . . . . .98
Figure 3.17 -Diatreme implacement as modelled by fluidization experiments... . . . . . . . . . . .99
Figure 4.1 - Base map of the Purple Springs area..... . . . . . . . . . . . . . . . . . . . . . . . . . . . . . . . . . . . . . . . . 117
Figure 4.2 -Generalized stratigraphy of southern Alberta.... . . . . . . . . . . . . . . . . . . . . . . . . . . . . . . . 118
Figure 4.3 - Cross section through the four wells (Datum = Sea Level).. . . . . . . . . . . . . . . . . . 119
Figure 4.4 - Correlation of 01-36-009-13W4 to seismic data.... . . . . . . . . . . . . . . . . . . . . . . . . . . . . 120
Figure 4.5 - Correlation of 06-04-011-14W4 to seismic data.... . . . . . . . . . . . . . . . . . . . . . . . . . . . . 121
Figure 4.6 - Correlation of 08-31-010-14W4 to seismic data.... . . . . . . . . . . . . . . . . . . . . . . . . . . . . 122
Figure 4.7 - Correlation of 04-32-010-14W4 to seismic data.... . . . . . . . . . . . . . . . . . . . . . . . . . . . . 123
Figure 4.8 -Seismic line ties..... . . . . . . . . . . . . . . . . . . . . . . . . . . . . . . . . . . . . . . . . . . . . . . . . . . . . . . . . . . . . . . . . 124
Figure 4.9 -Seismic line DBRR-1..... . . . . . . . . . . . . . . . . . . . . . . . . . . . . . . . . . . . . . . . . . . . . . . . . . . . . . . . . . 125
Figure 4.10 -Seismic line DBRR-2..... . . . . . . . . . . . . . . . . . . . . . . . . . . . . . . . . . . . . . . . . . . . . . . . . . . . . . . . 126
Figure 4.11 -Seismic line DBRR-3..... . . . . . . . . . . . . . . . . . . . . . . . . . . . . . . . . . . . . . . . . . . . . . . . . . . . . . . . 127
Figure 4.12 -Interpretation of seismic line DBRR-1..... . . . . . . . . . . . . . . . . . . . . . . . . . . . . . . . . . . . . 128
Figure 4.13 -Interpretation of seismic line DBRR-2..... . . . . . . . . . . . . . . . . . . . . . . . . . . . . . . . . . . . . 129
Figure 4.14 -Interpretation of seismic line DBRR-3..... . . . . . . . . . . . . . . . . . . . . . . . . . . . . . . . . . . . . 130
Figure 4.15 - Schematic of the Purple Springs structure.... . . . . . . . . . . . . . . . . . . . . . . . . . . . . . . . . 131

1
CHAPTER 1 - INTRODUCTION
1.1 BACKGROUND
Collisions between astronomical bodies have been an integral process in the formation of
the Solar System. It is likely that the planets formed through accretionary processes in the
early solar nebula when relative bolide velocities were lower, preventing catastrophic
collisions and allowing for the formation of the Sun and planets. Separation of
components by density in the solar accretionary disk resulted in fractionation of planetary
constituents; thus the inner terrestrial planets (Mercury, Venus, Earth and Mars) formed
largely by the accretion of solid bodies while the outer planets (Jupiter, Saturn, Uranus and
Neptune) have a greater gaseous component, although solid inner cores are believed to
exist (Ruzmaikina et al., 1989; Wetherill, 1989).
In Earth’s early history, bombardment of its surface was a major geological process.
Evidence of this bombardment actually stems from observations of the Moon where a lack
of geological and atmospheric processes have lessened erosion of impact craters. It seems
highly unlikely that while the Moon was being impacted by objects, the Earth was left
immune, especially when one considers Earth’s larger mass and cross-section and thus its
greater capacity to attract bolides. Over the course of Earth’s history, however, more
interplanetary debris has been effectively removed by the gravitational attraction of the
planets, reducing current rates of impact for Earth to approximately 10-5yr-1 for 0.5 km
diameter Earth-crossing objects (Wetherill and Shoemaker, 1982).

2Meteorites are thought to originate mainly from the asteroid belt, the ring of debris between
the orbits of Jupiter and Mars, which marks the transition from the inner terrestrial planets
to the giant planets beyond. The belt might have been the location where another planet
formed had it not been for the prior formation of Jupiter and its resulting tidal effects in the
region which prevent the asteroids from accreting into a planet (Wetherill, 1989). These
perturbations, as well as interbelt collisions, can cause asteroids to be redirected along new
trajectories which take them toward the Sun. In doing so, these asteroids have the potential
for crossing Earth’s orbit and colliding with it at high velocity.
Comets also pose a potential threat to Earth. Comets are thought to originate from two
regions: the Oort cloud far outside the Solar System (possibly some 20000 to 100000
astronomical units (AU) from the Sun - one AU is the average distance between Earth and
the Sun, or approximately 150 million kilometres), and the Kuiper Belt just beyond the
orbit of Neptune (Levy, 1994). About 10% of comets which enter the Solar System have
the potential to collide with Earth. Of these, 2% are long-period comets - those with
parabolic orbits - and thus show large orbital velocities. Some investigators believe that
cometary impacts may account for a substantial portion of terrestrial craters and that they
may have brought water to the Earth’s surface, critical to the development of life
(Weissman, 1982). Some asteroids are believed to be the degassed remnants of comets.
The recent collision of Shoemaker-Levy 9 with Jupiter in 1994, its fragments only some
1.5 km in diameter, demonstrates that the potential for collisions is real and that the damage
done by such a collision would be catastrophic on Earth.
Over 150 craters have been discovered on Earth (Figure 1.1) composed largely of two
basic forms: the relatively small simple crater (<2-4 km diameter) and the larger complex
craters (Grieve, 1991; Pilkington and Grieve, 1992; Hodge, 1994). Some, such as the
structures found at Vredefort, South Africa; Manicouagan, Quebec; Chicxulub, Mexico;

3and Sudbury, Ontario may even be of the still larger multi-ring form. Impacts of this size
are thought to disrupt surface processes enough to cause mass extinctions although this
topic remains controversial (Tappan, 1982; Hildebrand et al., 1991). Regardless of their
final morphology, these craters are the result of immense impact energy and the interactions
between the projectile, the resulting shock wave and the target rocks. These interactions
may have been instrumental in extinction events (Hildebrand et al., 1991) and can lead to
the redistribution, formation and/or the concentration of various economically important
mineral and hydrocarbon deposits (Masaitis, 1989). Historically, about 23% of known
impacts are associated with economic deposits (Grieve and Masaitis, 1994).
1.2 IMPACT MECHANICS
Impact craters are the result of highly energetic collisions between meteoroids and Earth.
The energy is due to the immense approach velocity of the meteoroid. The minimum
approach velocity for an object striking Earth is Earth’s escape velocity or 11.2 km/s (this
corresponds to the velocity attained by an object which is at rest with respect to Earth at
large distances from the Earth), while the maximum approach velocity of some 83 km/s
results from a combination of Earth’s escape velocity, heliocentric orbital velocity, and the
object’s velocity when it is just bound to the Sun at a distance of one AU from the Sun.
However, an average impact velocity of about 20 km/s is reasonable. Thus a 500 m wide
spherical asteroid is, in terms of energy, roughly equivalent to some 3.1x10²⁰ J. By
comparison, the atomic bomb dropped on Hiroshima was equivalent to some 6.3x10¹³ J .
However, the analogy that a hypervelocity impact is equivalent to an explosion is not
entirely correct. Instead, I will summarize this phenomenon from the point of view of three
formative stages: the contact and compression stage, the excavation stage and the
modification stage and how they impinge on the final crater form. These stages are
discussed separately but may occur simultaneously with one stage beginning before the
previous stage ends. They generally form a continuous process of crater formation. The

4stages as they are presented here are largely a simplification of the work in Melosh (1989).
1.2.1 Contact and Compression Stage
Although the most likely incident angle for a meteorite striking the Earth’s surface is 45˚
(Shoemaker, 1962), a vertically incident projectile is considered here for simplicity.
Obliquity of the impact has the result of decreasing the energy coupling to the target and
reducing the vertical component of the projectile’s velocity. These types of impacts are
important because they can lead to asymmetry in the final crater form. For example, the
Manson impact structure in Iowa, U.S.A., shows a central uplift which is offset from the
structure’s geometric centre. This is thought to be due to the low incident angle of impact,
estimated at 20-30˚ from the horizontal (Shultz and Anderson, 1996). Impacts below 10˚
will leave highly elliptical craters such as the structures associated with the Rio Cuarto
crater field in north-central Argentina (Hodge, 1994; Melosh, 1989). Obliquity also plays
an important role in the distribution of ejecta deposits. These phenomena have been seen
with regard to Venusian craters where ejecta deposit patterns are linked to the incident angle
and direction of impact (Schaber et al., 1992; Schultz, 1992). Nonetheless, most
laboratory and numerical modelling experiments focus on vertical impacts and, for this
stage, most of the basic characteristics are adequately represented by this model.
This stage begins when the leading edge of the projectile first strikes the surface of the
target. The initial contact immediately forms a shock wave which propagates into the target
as well as back into the projectile. The trailing edge of the projectile continues at its initial
velocity. This stage is characterized by its short duration which is on the order of
τ ≈Dp
vpsin θ ,(1-1)
where τ is the time for this stage, Dp is the projectile diameter, vp is the projectile velocity

5and θ is the incident angle measured from the horizontal. Shock pressures may reach 50-
100 GPa causing mineralogical phase changes and overcoming the material strength of the
projectile causing it to flow hydrodynamically (Melosh, 1989; Grieve, 1991). The
geometry at the contact between the projectile and the target surface is essentially a sphere
striking a flat plate. Oblique convergence of the spherical surface results as the projectile
continues to penetrate into the target. This creates a torus of extreme high pressure at the
interface which leads to jetting of melted and vaporized material (Figure 1.2). Jet velocities
can exceed the initial velocity of the projectile and thus jetted material may be ejected
permanently from the planet. Jetting has been observed in laboratory experiments at
velocities as low as 6 km/s.
The shock wave reaches the rear of the projectile and is reflected back towards the target as
a strong rarefaction event. It is this rapid unloading that leads to surface spalling, melting
and vaporization if the initial shock pressure is high enough. This rarefaction event travels
faster than the shock wave because the projectile and target rocks through which it
propagates are still under compression. It eventually overtakes and weakens the shock
front. By the time of projectile unloading, the shock wave is propagating into the target as
a hemisphere, isolated from the impact site by the rarefaction event. The projectile and
some target rock have been largely vaporized by the unloading of the rarefaction event and
the vapor plume expands back into the cavity. Contact, compression and final unloading of
the projectile is largely completed within one projectile volume. At this point, the
projectile’s kinetic energy has been converted to internal energy of the projectile, the vapor
cloud and target rocks (Melosh, 1989). For most impacts, the projectile is completely
vaporized and melted during this stage, although this varies depending on the dynamics of
the impact and the physical properties of the projectile.

61.2.2 Excavation Stage
The excavation stage is dominated by two processes: 1) the attenuation of the shock wave
to a plastic wave and then an elastic wave and 2) the development of the excavation flow
field and large scale movement of material (Melosh, 1989). The rate at which the shock
wave weakens to an elastic wave determines the amount of melted or vaporized target
material created. This rate decreases quickly such that melting and vaporization of target
material usually occurs within 3-4 projectile diameters of the impact site with the mass of
melt roughly equal to ten times the mass of vapor (Melosh, 1989). The projectile’s kinetic
energy is converted largely into internal energy of the projectile, the target and the vapor via
the shock wave. Figure 1.3 summarizes the energy partitioning which takes place between
the projectile and the target rocks. After the contact and compression stage, most of the
projectile’s kinetic energy manifests itself as internal energy of the target rocks.
Vapor expansion continues during the excavation stage. In a vacuum, the vapor cloud
reduces to an expanding hemisphere traveling at tremendous velocities. A mean gas
velocity of 10 km/s is possible for a 20 to 30 km/s impact (Melosh, 1989). The expanding
gas can overcome solid ejecta and even crush or melt ejecta due to aerodynamic stress. In
the presence of an atmosphere, the vapor plume rises, forming an expanding torus similar
to the classic mushroom cloud effect produced by nuclear detonations. If the vapor cloud
never equilibrates with the ambient atmosphere (in terms of vapor cloud pressure and
temperature) then atmospheric blow-out is possible whereby the plume continues through
the top of the atmosphere and into the relative vacuum beyond. This process has the
potential to deposit fine solid and liquid material into the upper atmosphere and likely
explains the deposition of tektites hundreds or even thousands of kilometres from the
impact site.

7The near surface adjacent to the expanding cavity is often termed the interference zone for it
is here that the shock wave and rarefaction wave interact to produce reduced maximum
pressures (Figure 1.4). The rarefaction event causes spalling along the surface, ejecting
material at velocities which can exceed the escape velocity and are usually on the order of
half the projectile velocity. These large spall velocities are essentially the result of the
particle velocity doubling rule at a free surface. The particle velocity at the free surface is
the sum of the particle velocity for the shock wave and the particle velocity of the
rarefaction wave. Tensile fragmentation can continue to great depths resulting in a great
deal of target rock brecciation (Melosh, 1989).
Perhaps the most important aspect of cratering mechanics, in terms of final gross
morphology, is the initiation of the excavation flow field. The flow field itself is a result of
the difference in particle velocities of the shock wave and rarefaction wave. It stems from
the thermodynamics of the shock and rarefaction events. Shock is an irreversible process;
it conserves mass, energy, and momentum but not entropy. Rarefaction is reversible in
that it conserves mass, energy, momentum and entropy; it is also adiabatic (i.e. it conserves
heat). The difference in entropy manifests itself as heat and a residual particle velocity.
Anything which enhances the irreversibility of the shock process, such as porosity
crushing, phase changes and plastic deformation, increases the residual particle velocity
(Melosh, 1989).
The geometry of the flow field is much like that in the case of groundwater flow under a
head gradient (Figure 1.5). Material flows through streamtubes defined by isobars. The
velocity of this material slows as it moves through the divergent streamtubes until it leaves
the surface at the same velocity as the material which preceded it in the same tube. Drag on
the material from adjacent streamtubes, gravity and internal deformation all conspire to
decrease the ejection velocity from deeper streamtubes, further from the impact site.

8Eventually, the ejection velocity in a streamtube falls to zero thus defining the rim of the
transient crater (Melosh, 1989). Material in still deeper streamtubes plastically deform and
may raise the surface around the transient crater rim. The maximum depth obtained by the
transient crater occurs when material in the axial streamtube stops moving. The diameter of
the crater continues to grow resulting in the paraboloid shape of the transient crater. Depth-
to-diameter ratios for the transient crater approximate 1/3. The ejected material generally
comes from a depth only 1/3 to 1/2 the transient crater depth while the rest is displaced
(Melosh, 1989). The excavation stage is essentially complete when subsurface motion
ceases. It takes considerably longer than the contact and compression stage and is on the
order of:
τ ≈
Dat
g
12
,(1-2)
where τ is the time for excavating a transient crater of diameter Dat, and g is the acceleration
due to gravity.
1.2.3 Modification Stage
As its name implies, the transient crater is short-lived and modification begins to reshape it
to a more gravitationally stable form. Ejecta set in motion during excavation and spalling
may still be in motion during this stage. The result of the modification stage are two
morphological forms of craters: simple and complex (Figure 1.6).
Simple craters are bowl-shaped, likened to a parabola of rotation (Melosh, 1989).
Slumping of the transient crater walls leaves a lens of brecciated rock in the bottom of the
crater also with a paraboloid shape. The final rims are left standing at near the angle of
repose which is usually around 30˚ and also gravity independent (Melosh, 1989). Because
of the slumping, the transient crater diameter widens to the final, post-modification

9diameter, resulting in lower depth-to-diameter ratios. The breccia lens itself tends toward a
particular stratification. The bottom is lined by melt rocks which are not displaced from the
transient crater bottom by the excavation flow field. Melt rock on the walls of the transient
crater are subject to shear as the transient crater grows. This results in some mixing of the
melt rock with the brecciated material. Thus, immediately above the melt rock, primarily
brecciated rock slides from the walls followed by the mixed melt rock and brecciated rock
nearest the transient crater walls (Grieve et al., 1977). Slumping can occur at relatively
high speeds (several 10s of m/s) and may cause mounding of slumped material near the
center of the crater. This has been found at terrestrial craters such as Meteor Crater in
Arizona. This phenomenon should not be confused with actual structural uplift that is
observed in complex craters where material from beneath the transient crater is brought to
surface.
Complex craters form after a specific transition diameter is reached by the transient crater
(Figure 1.7). The onset of this transition diameter is often abrupt but varies under different
gravitational fields and target rock types. In general, the transition diameter follows an
inverse gravity dependence (Figure 1.8). For Earth, the simple to complex crater
transitional diameter is about 2-4 km and is dependent on target rock properties (Pilkington
and Grieve, 1992; Grieve and Pilkington, 1996). Nonetheless, transient craters which go
on to become complex craters have similar aspect ratios as those which become simple
craters. The final depth-to-diameter ratios for complex craters, after the modification stage
is complete, is much smaller than that for simple craters (see Chapter 2). Central peaks
demonstrate stratigraphic uplift comparable to transient crater depth. Study of complex
craters has revealed that collapse of the transient crater incorporates a particular volume of
material beyond the actual transient crater in which the strength of the target rocks range
from zero at the transient crater to nominal. Croft (1981) names this volume the strength
crater. The rim of the complex crater represents the point where the materials within the

10strength crater have reached the tensile strength of the target rocks. The actual mechanics
of central peak formation remains controversial and is the subject of ongoing research.
Some postulated reasons for its occurrence, some of which have been successfully argued
against, include layering, elastic rebound, vapor scouring, and gravitational slumping
accompanied by pseudo-hydrodynamic flow (Melosh, 1989).
Layering in target rocks likely affects crater morphology, although there is currently a lack
of understanding on this aspect of cratering mechanics. Laboratory experiments of impacts
into a weak layer overlying a strong one suggests that morphology is sensitive to thickness
of the weak layer and the relative strength differences between the layers. These
morphological differences in simple lunar craters, which ranged from central mounds of
unexcavated material, to flat floors when excavation is not powerful enough to remove the
strong layer, to benches in the sides of the crater when the strong layer begins to be
excavated, were used to successfully predict the regolith (unlithified material on the lunar
surface) thickness (Melosh, 1989). However, these effects are restricted to transient crater
diameters less than that required for complex craters.
Elastic rebound of the rocks at the bottom of the transient crater might produce some uplift,
however, this fails to answer why uplifts do not form in simple craters where presumably
elastic rebound should also occur. Deformation of rocks beneath the transient crater is
plastic and is unlikely to result in a great deal of rebound in any event. Nonetheless,
current evidence is inconclusive on the role elastic rebound might play in generating a
central uplift.
Gas scouring occurs in explosive events when expanding gases leave an erosional remnant
in the center of the crater. Such craters show no evidence of structural uplift and hence can
not explain the central peak in complex craters.

11
It is therefore suspected that uplift is primarily a result of gravitational collapse, plastic
deformation, and possibly the pseudo-hydrodynamic response of target rocks beneath the
center of the transient crater. Melosh (1989) proposes that the debris beneath and adjacent
to transient craters behaves much like a fluid due to their being subject to violent shaking
and alternating, localized compression and rarefaction events. This allows for localized
failure throughout the debris mass, where the rarefaction event overcomes the overburden
stress, resulting in a net motion (Melosh, 1989). The driving force of these pressure
fluctuations might be long-lived, random noise which is present after the main shock event.
The dynamics of this process is beyond the scope of this paper, but the reader is referred to
Melosh (1989) and references therein for further discussion on this topic. In short,
regardless of the true mechanics, the transient crater collapses while its bottom is uplifted -
this is known from direct study of impact craters. A secondary collapse of the central peak
likely occurs before the final complex morphology is reached (Grieve and Pesonen, 1992).
Thus, the final result of transient crater modification is, in general, two crater
morphologies. The simple crater is characterized by a brecciated lens of material in the
bottom of the true crater caused by slumping of the transient crater walls. It is generally
composed of highly brecciated and melted rocks with most of the shocked rock (~90%)
remaining in the autochthonous zone beneath the breccia lens (Grieve and Pesonen, 1992).
In contrast, the complex crater contains a central area where rocks from great depth have
been structurally uplifted primarily by gravitational collapse of the transient crater. There is
little melted debris in the central uplift and large scale fracturing dominates over brecciation.
Listric, normal rim faults develop during collapse and terraces often form along the crater
perimeter. Between the rim and central uplift, an annular moat is filled with brecciated
debris which has a similar composition to the brecciated lens of simple craters.

12
1.3 ECONOMIC POTENTIAL
Impact craters on Earth have been linked to economic deposits of various materials due to a
variety of impact-related processes. While materials in the vicinity of impact craters have
been exploited for many decades, only recently has an inventory been made on the
revenues generated by this exploitation. Historically, about 35 of the 150 known terrestrial
impact craters, have been associated with economic deposits. Currently 17 (about 11%)
are being actively exploited. The estimated annual revenues from these deposits are over
$12 billion (Grieve and Masaitis, 1994). This estimate is based largely on North American
deposits (annual revenues ≈ $5 billion) and the gold and uranium ores of the Vredefort
structure in South Africa, (annual revenues ≈ $7 billion) and does not include revenues
generated from the extraction of building materials (e.g., cement and lime products at Ries,
Germany ≈ $70 million per year) or from the generation of hydroelectric power (e.g. 4000
GWh/a from the reservoir at Manicouagan, Quebec ≈ $200 million per year).
In general, the economic potential for an impact crater relies on intensive and extensive
factors (Masaitis, 1989). Intensive factors include the energy of the impact, the
paleogeography at the time of impact and any endogenic processes which are triggered by
the impact itself. Extensive factors include the composition of the target rocks, impactite
and breccia, as well as the structure of geological formations at the impact site. However,
deposits of materials formed in or around impact craters are divided among three categories:
progenetic, syngenetic and epigenetic deposits (Masaitis, 1989). Progenetic deposits are
those which originated strictly by endogenic, geological processes. In these cases, the
impact has had the effect of redistributing the deposit allowing it to be more economically
exploited. Syngenetic deposits are those which originate during or shortly after an impact
event. Theses types of deposits are generally attributed to the direct deposition of energy
into the target rocks causing mineralogical and physical phase changes. Epigenetic deposits

13are formed after the impact and are generally attributed to hydrothermal alteration,
formation of enclosed basins with isolated sedimentation, or the flow of fluids into
structural traps associated with the crater. Grieve and Masaitis (1994) outline these types
of deposits in detail and give specific examples of the more economically significant, a
summary of which follows.
1.3.1 Progenetic Deposits
Deposits of this type include ores of iron, uranium and gold, and to a lesser extent, silica,
ilmenite and bauxite. There are currently 7 craters associated with progenetic deposits of
which the Vredefort structure in South Africa is the most spectacular. While many shock
metamorphic features have been found at the site, its genesis remains controversial
(Nicolaysen and Reimold, 1990; Grieve and Masaitis, 1994). Some 100 km southwest of
Johannesburg, the 2 Ga old feature is estimated at 140 km wide with an original diameter
of 300 km (Hodge, 1994). It is the site of the most extensive gold deposits in the world,
having produced half the world’s total gold output (40500 metric tons) worth some $50
billion (Grieve and Masaitis, 1994). Associated with the gold ore are 136500 metric tons
of uranium with an estimated value of $4 billion. Mining of these two ores currently
results in annual revenues of $7 billion. Preservation of these deposits is attributed to
structural lowering of the deposits within the annular ring adjacent to the central uplift,
protecting them from the estimated 8 km of erosion which has taken place in the area
(Grieve and Masaitis, 1994). The gold fields occur on the proximal and distal edges of the
annular ring with respect to the central uplift and occur largely in the northwestern quadrant
of the structure (Myers et al., 1990). Both the gold (found in fluvial fans or fan deltas
structurally controlled by faults) and uranium (in the form of detrital uraninite) are derived
from Archean granites and are thought to have been partially redistributed or remobilized by
the impact event.

14
Carswell, Saskatchewan, is about 130 km south of Uranium City, and is the site of another
progenetic deposit of uranium ore. The structure has a post-erosional diameter of 39 km
and is about 115 Ma old (Hodge, 1994). The ores are thought to be a result of
hydrothermal activity about 1.1 Ga ago. Two kilometres of structural uplift associated with
the center of the structure, brought these deposits nearer to the surface allowing for easier
exploitation. An estimated 46500 metric tons of uranium ore (perhaps a billion dollars
worth) reside in the deposit (Grieve and Masaitis, 1994).
1.3.2 Syngenetic deposits
Copper-nickel ores, Platinum group metals (PGMs), impact diamonds and glass are
associated with deposits formed during or shortly after an impact event. While impact
diamonds are not currently exploited, they are mentioned here because of their interesting
physical characteristics. Impact diamonds, formed from the phase transformation of
graphite or crystallized from coal, are harder and more physically resistive than normal
diamonds formed at depth, possibly making them useful for industrial applications (Grieve
and Masaitis, 1994). They are irregularly distributed in minor amounts, usually associated
with melt dikes and suevite. Shock pressures over 30 GPa are required for impact
diamonds to form, a value easily reached during meteorite impact events (Melosh, 1989).
They have been found at several impact craters including Ries (Germany), Kara (Russia),
Puchezh-Katunki (Russia), Ternovka (Russia), Zapadnaya (Ukraine) and others (Grieve
and Masaitis, 1994; Hodge, 1994).
The most important syngenetic deposits occur at the Sudbury structure in Ontario. The
Sudbury structure, of which the ore-bearing Sudbury Igneous Complex (SIC) is but one
part, is an elliptical structure some 15000 km2 in area with major axis trending NE-SW. It
is estimated to have had an original diameter of 200-250 km with NW-SE shortening

15caused by the Penokean orogeny shortly after the impact event (1.85 Ga). Inside the
structure, the SIC contains rich Cu-Ni and PGM deposits. Extraction of the 15 million tons
of nickel and copper has resulted in annual average revenues of $2 billion over the last five
years (Grieve and Masaitis, 1994; Hodge, 1994). The ore bodies are generally located
along the basal edge or below the SIC, which represents the impact melt sheet in a current
interpretation (Grieve and Masaitis, 1994). This interpretation deviates from previous ones
in that it suggests that the metals were crustal in origin and that the variable composition of
the impact melt was due to the variety of lithologies that were incorporated into the melt.
Thus the SIC did not require magmatic sources (either triggered by the impact or purely
endogenic) to reach a composition conducive to the formation of the ore bodies.
1.3.3 Epigenetic Deposit
Epigenetic deposits are the most common form associated with impact craters and include
hydrothermal ores, chemical sediments, fresh water, oil shales and hydrocarbons.
1.3.3.1 Hydrothermal Ores
Hydrothermal ores are partially syngenetic in nature as they usually require a
thermal driving force which can be attributed directly to the impact itself. Because of the
immense deposition of heat into the target rocks by the impacting bolide and low thermal
diffusivity of the rocks (κ≈10-6 m2/s), deeply buried melt in the breccia lens may take
thousands of years to cool (on the order of H2/κ for apparent crater depth H), forming a
long-term thermal reservoir. It is possible that early bombardment of Earth may have
contributed significantly to the surface’s thermal budget as well as contributed significantly
to hydrothermal systems (Melosh, 1989). Pb, Zn and Ag are common ores of this type
found at the Siljan (Sweden), Crooked Creek (U.S.A.), Serpent Mound (U.S.A.) and
Decaturville (U.S.A.) structures which have been mined. At Sudbury, the basal Vermillion
member of the Onwatin formation lies above the suevite layer (Onaping formation) and is

16estimated to contain 6 million tons of 4.4% Zn, 1.4% Cu, 1.2% Pb as well as some gold
and arsenic. Unfortunately, the fine-grained texture of the deposit makes current attempts
at recovery impossible (Grieve and Masaitis, 1994).
1.3.3.2 Chemical Sediments
Chemical sediments and evaporites form in the isolated basins created by water-
filled impact craters occurring in warmer climates. Anhydrite, gypsum, lignite, bentonite,
various carbonates, bicarbonates and chlorides are currently being exploited at Lonar, India
and Saltpan, South Africa although it is unclear what revenues this activity generates
(Grieve and Masaitis, 1994).
1.3.3.3 Water Resources
As well as providing a surface catchment basin, structural and lithologic changes in
the subsurface caused by the processes of impact cratering can affect groundwater quality
and enhance aquifer characteristics. Such a case exists at the 35 km wide Manson crater in
the U.S.A. where unusually soft groundwater was discovered when the Manson city well
was drilled. This later was found to be because of crystalline rocks that had been
structurally raised in the central uplift (Hodge, 1994).
1.3.3.4 Placer Deposits
A particular deposit associated with terrestrial craters are placers formed by Earth’s
erosional processes. Moldavite tektite placers (used for jewelry) as well as placer
diamonds have been found. Placer deposits are often distal to the impact site such as the
placer diamonds from Popigay, Russia which are found 150 km distant (Grieve and
Masaitis, 1994).
1.3.3.5 Oil Shales
The impact craters at Boltysh (25 km wide, 88 Ma), Obolon (15 km wide, 215 Ma)
and Rotmistrovka (2.7 km wide, 140 Ma), all in the Ukraine, contain oil shales equal to
some 90 million barrels of unmatured oil. Boltysh alone contains 4.5 billion metric tons of
oil shale in a 400-500 m thick productive sequence which lies over the trough and central

17uplift (Grieve and Masaitis, 1994). Evidently, these impact craters formed isolated basins
in which algae and plant activity thrived, providing the biogenic mass for development of
the oil shales.
1.3.3.6 Hydrocarbon Accumulations
The structural facies associated with impact craters makes them potential traps for
migrating hydrocarbons. Analogous to the development of oil shales, impact craters can
result in the formation of source rocks as well (Castaño et al., 1995). Thus, hydrocarbon
reservoirs of this nature do not necessarily have to develop in traditional basin-type
regions. The Ames structure in Oklahoma is one of the most prolific hydrocarbon
producers of all impact craters and an example of a crater providing both the isolated basin
in which the source rocks formed as well as the structural traps in which the hydrocarbons
accumulated. The simple Newporte crater in North Dakota is a similar case where source
oil shales are localized in the crater. In general meteorite impact craters can provide unique,
localized, structural traps and enhanced reservoir rock characteristics due to brecciation and
fracturing of target rocks as well as displacement of large, competant blocks of rock during
the modification stage of crater formation. The structures become prospective when they
lie in the path of migrating hydrocarbons. The estimated total reserves of hydrocarbon
deposits, largely from four impact structures (Ames, Red Wing Creek, Avak, and
Viewfield) include some 140 million barrels of oil and nearly 200 billion cubic feet of gas.
The structural association of these deposits are discussed in more detail in Chapter 2.
1.4 SEISMIC EXAMPLES OF TERRESTRIAL CRATERS
The primary goal of this work is to investigate the usefulness of seismic reflection data as a
tool for recognizing buried meteorite impact craters. Specifically, two seismic
interpretation case studies (the structures at White Valley, Saskatchewan and Purple
Springs, Alberta) are studied in detail in Chapters 3 and 4. However, it is useful to review
other structures in the literature, both proven and possible impact craters, which have been

18studied using seismic methods. The following is a brief summary of the seismic
interpretations of a few of these structures.
1.4.1 The Manson Impact Crater
The Manson structure is located in northwest Iowa and is the largest known impact crater in
the U.S.A. It has been extensively studied (e.g., Koeberl and Anderson, 1996 and
references therein). Investigation of the site by seismic reflection methods does not appear
extensive; the bulk of the work is petrologic and geochemical in nature. Nonetheless, some
seismic work has been recently completed in the last few years with the acquisition of high-
resolution vibrator data (Kieswetter et al., 1996 and references therein). High-resolution
vibrator seismic data were acquired along a radial line which primarily images the terraced
rim on the eastern portion of the structure (Figure 1.9). The final interpretation based on
seismic data and deep well data shows terracing of the rim towards the crater center with a
distinct thickening of sediments in the center of the terraces, an area also characterized by
an overturned sequence (Figure 1.9). Only a short portion of the annular trough is imaged
in the western extremity of the seismic line.
1.4.2 The Sudbury Impact Crater
The Sudbury structure has already been described as the site of the world’s richest copper-
nickel deposits. Although its history is complex, the discovery of several shock
metamorphic effects leave little doubt that a large meteorite impact was involved in its
genesis (Grieve et al., 1991). In fact, some interpretations suggest that no endogenic
processes are required at all to produce the structure and resulting ore bodies (Grieve and
Masaitis, 1994). Despite apparent post-impact deformation, the main crater basin, thought
to have contained much of the impact melt, can still be seismically imaged (Figure 1.10).
While details of the crater structure are not imaged, and may no longer be present, the high-
resolution Lithoprobe seismic line does show the main crater basin and its relation to

19structural elements associated with the Penokean orogeny (Wu et al., 1994).
1.4.3 The Montagnais Impact Crater
The Montagnais structure, also a proven impact crater, is unique in that it was the first
submarine impact crater found (Jansa et al., 1989). Approximately 200 km south of
Halifax, Nova Scotia, it lies on the edge of the Scotian shelf in about 110 m of water. Melt
rocks, breccia and shock-induced features all point to an impact origin. The structure itself
is 45 km wide and extends to a depth of 2.7 km beneath 500 m of Tertiary and Quaternary
marine sediments (Jansa et al., 1989). The central uplift region is extensive; its diameter is
11.5 km wide with a central basin 3.5 km wide composed largely of basement rocks. Such
“peak-ring” structures are common on other planetary surfaces (Melosh, 1989) and are
thought to be a normal progression from the smaller central peak structures to the enormous
multi-ring structures (e.g. Vredefort, South Africa, Chicxulub, Mexico, and Manicouagan,
Quebec are suspected of being terrestrial multi-ring craters). The interpreted seismic data
(Figure 1.11) shows some 1250 m of structural uplift. Another 552 m of breccia overlies
the central uplift. This draping of breccia over the central uplift is an unusual feature of
Montagnais; Jansa et al. (1989) suggest it may be a particular result of marine impact
processes.
1.4.4 The Mjølnir Impact Crater
The Mjølnir structure is located in the central Barents Sea to the north of Scandinavia and
Russia in 350-400 m of water. It has only recently been identified as a meteorite impact
crater by the discovery of shock metamorphic features and an iridium anomaly (Dypvik et
al., 1996). Disrupting some 3.6 km of Mesozoic sediment, the structure is 40 km in
diameter showing many of the morphological features of a complex crater including an
annular moat and central uplift (Figure 1.12). Study of what is interpreted to be the ejecta
deposits suggests an age of impact in the late Jurassic to Early Cretaceous (Dypvik et al.,

201996). This feature is also somewhat unique as it represents only the fourth proven
submarine impact crater (Montagnais, Nova Scotia; Chicxulub, Mexico; and Chesapeake
Bay, Virginia are the other three structures).
1.4.5 The Haughton Impact Crater
Seismic reflection imaging was used to delineate the western flank of the Haughton impact
crater (Hajnal et al., 1988). The structure is located in the Canadian Arctic on Devon Island
just north of Baffin Island (75˚22´N, 89˚41´W). The structure is 20 km in diameter and
relatively young at 21 Ma., but it disrupts the entire 1700 m sequence of gently westward
dipping Paleozoic rocks plus some crystalline basement (Hajnal et al., 1988; Hodge,
1994). The radial seismic line (Figure 1.13) shows many of the terraces delineated by
normal faults along the rim. These faults appear to be listric - slowly curving towards the
center of the structure - and transecting most of the Paleozoic. Listric rim faults are
characteristic of many complex impact craters.
1.4.6 The Red Wing Creek Impact Crater
The Red Wing Creek structure is another important buried structure in terms of
hydrocarbon accumulation (see Chapter 2). It is located in west-central North Dakota
(47˚36´N, 103˚33´W) is 9 km in diameter and about 200 Ma old (Hodge, 1994). The
unmigrated seismic data (Figure 1.14) clearly shows a raised rim, followed by a syncline,
before the 3 km wide central uplift is reached (Brenan et al., 1975). The syncline and rim
are again encountered further along the line past the uplift. The large “bowtie” features
seen beneath the troughs are classic artifacts seen on stacked seismic data from the
scattering of energy off the dipping sides of synclines. Migrating the seismic data with the
correct velocities would minimize this effect and help to image the structure more clearly.
Note also the pull-up seen along the Ow horizon. This is characteristic of many complex
craters in sedimentary settings where the maximum depth of the structure does not reach

21basement (see the White Valley structure in Chapter 3).
1.4.7 The Eagle Butte Impact Crater
The Eagle Butte impact crater is located in southeastern Alberta. It is a complex crater about
18 km in diameter with structural uplift at its core of some 250-300 m (Sawatzky, 1976).
Its impact origin has been proved by the discovery of shatter cones at the surface (Lawton
et al., 1993; Hodge, 1994). An area of active hydrocarbon exploration, it has been
extensively covered by seismic acquisition lines and the structure has been drilled in a
number of localities. To date, a few gas accumulations have been found associated with
the structure.
1.4.8 The James River Structure
James River is a structural anomaly consistent with complex crater morphology seen on 3-
D seismic data (Figure 1.15). Buried nearly 4 km deep and truncated by an erosional
unconformity at the top of the Cambrian, it is imaged clearly along the Cambrian A reflector
as a nearly 5 km wide circular structure with an annular moat and central uplift (Isaac and
Stewart, 1993). Figure 1.16 illustrates a dip-azimuth map of the structure which highlights
the annular trough and terracing along the crater walls. Of particular exploration interest,
these terraces that occur along the walls of complex craters result in large blocks of
competent rock being displaced and forming structural traps. Such a case exists at the gas
fields of the Avak structure mentioned earlier.
1.4.9 The Viewfield Structure
This structure is located in southeastern Saskatchewan and is important for its structural
influence on hydrocarbon deposits in the area (see Chapter 2). Hydrocarbon accumulations
are predominantly from the rim of the structure (Isaac and Stewart, 1993). The circular
structure is about 2.4 km wide and appears to have the morphology of a simple crater

22(Figure 1.17). The structural history is a complex one with interpretations invoking both a
meteorite impact as well as salt dissolution (Sawatzky, 1972). Sawatzky (1972) suggests,
though, that the structural deformation created initially by an impact controlled subsequent
dissolution events. The seismic data for the Jurassic or Triassic aged structure shows the
typical synclinal cross-section of simple craters including a raised rim (Figure 1.17). The
Jurassic horizon may even show infill at the center of the structure perhaps due to post-
impact sedimentation. Nonetheless, the lack of evidence for shock metamorphism has
prevented this structure from being accepted as being the result of a meteorite impact.
1.4.10 The Hartney Structure
The Hartney structure is located in southwest Manitoba (approx. 49˚N, 100˚30´W) and
was discovered as a result of hydrocarbon exploration (Anderson, 1980). The structure is
about 8 km in diameter. Seismic data acquired over the anomaly shows structural
disruption from the Winnipeg shales (Ordovician in age) to the Lower Cretaceous
Blairmore formation (Figure 1.18). Although the diameter of the structure falls within the
regime for complex morphology, it appears that the center of the structure is a structural
low surrounded by a ring anticline and subsequent syncline (see Winnipeg shale horizon,
Figure 1.19). While “peak-ring” morphologies are possible, this structure is probably too
small for such development. On the other hand, near the center of the anomaly, drilling
results have shown structurally uplifted Devonian strata and a complete absence of
Mississippian strata (Anderson, 1980). Conversion to depth was accomplished by a
velocity model based on interval velocities from well data. This resulted in the Winnipeg
shale structure map showing a central uplifted high (Figure 1.19). Perhaps the apparent
low in the Winnipeg shale was due to a velocity anomaly. The structure apparently fits
some of the morphological constraints of a complex meteorite impact crater, (e.g. a central
uplift region) although they may not be as obvious as in many of the previous examples.
This structure is a good example of how difficult it can be to make suppositions on genesis

23based on morphology alone. Furthermore, a lack of shock metamorphism leaves this
structure classified as a possible impact crater only.

24
Fig. 1.1 World map showing the distribution of currently known meteoriteimpact craters. Data courtesy of the Geological Survey of Canada.

25
50 km
2
2
277
10
810
17
50 km
33100
170
170
100
33
300230
100 100
170 170
170
50 km
60180
60180
300420
30042
0 540540
50 km
7 7
20
20
20
33
60
a) Projectile just after contact with surface. Jettingoccurs at interface.
b) Shock wave propagation into target andback into projectile.
c)Final unloading of projectile.
d) Beginning of excavation stage.
Fig. 1.2. Schematic representation of the contact and compression stagebased on numerical modelling. Depicted are the deformation of theprojectile and the resulting pressure field in GPa. Note the changing scalein each diagram (from O’Keefe and Ahrens, 1975; Melosh, 1989).

26
0 10 20 30 40 50
1.0
0.75
0.50
0.25
0
Normalized time after impact
Fra
ctio
n of
ene
rgy
Internal energy of target
Kinetic energy of target
Kinetic energy of projectile
Internal energy of projectile
Contact and Compression Stage
Fig. 1.3 Graph of energy versus time for an impact event. Initially, theprojectile contains 100% of the available energy as kinetic energy (at t=0).This is then quickly partitioned between the kinetic and internal energy ofthe target rocks (light grey) and residual kinetic and internal energy of theprojectile (dark grey) in the event any of the projectile survives the impact(from Melosh, 1989).

27
- ADirect Shock,Pfree
Pmax
Pmin
Pfree
Pmax
Pmin
Pmax
Pmin
A
B
C
- G - ARarefaction,
Resultant Pressure
- B
- G - B
- C
- G - C
time
time
time
Pre
ssur
eP
ress
ure
Pre
ssur
e
InterferenceZone
Surface
EquivalentShock Origin
*
*
*
A
B
C
G
IMPACT
Fig. 1.4 Schematic depiction of the near surface interference zone at animpact site. The pressure-vs.-time graphs show the shock pressure andrarefaction pressure at subsurface points A,B, and C, respectively. Notethat the rarefaction event is a result of the reflection of the shock wave off ofthe surface at G. The resultant pressure is shown in the graphs by the greyline (from Melosh, 1989).

28
VAPOR
ISOBARS
MELT
FAST EJECTA
EJECTA CURTAIN
SLOW EJECTA
STREAMTUBES
AXIALSTREAMTUBE
Fig. 1.5 Depiction of the excavation flowfield as a series of isobarsintersected at right-angles to the streamtubes. It is through the streamtubesthat the target material flows. Where this material breaks the surface, ejectais ballistically thrown from the impact site (from Melosh, 1989).

29
??
?
?
?
??
?? Area of seismic
imaging interest.
Annular Trough
Brecciated rock showingpossible shock metamorphiceffects, impact melt andfall-back ejecta.
Ejecta blanket consistingof finely crushed target rocksand overturned beds nearcrater rim.
?
?
?
Ejecta BlanketBreccia Lens
Bowl-shaped Depression
Ejecta Blanket
Central Uplift
Terraced RimBreccia Lens
?
Fig. 1.6 Schematic diagrams of simple (top) and complex (bottom) crater morphologies.

30
Fig. 1.7 Log-log plot of crater depth versus rim-crest diameter for lunar craters. A transition diameter ofapproximately 15 km is given by the inflection in the linear trend of the graph (from Melosh, 1989).
Transition Point
Cra
ter
Dep
th (
km)
Rim-crest Diameter (km)0.1 1.0 10
0.01
0.1
1.0
10
100 500
Upland crater, n=74Mare crater, n=138

31
Fig. 1.8 Log-log plot of transition crater diameter versus gravitationalacceleration for three of the terrestrial planets and the Moon. As thegravitational field increases, the transition diameter decreases, displaying aninverse relationship between the two variables (from Melosh, 1989).

32
Fig. 1.9 The seismic data (top) and interpretation (bottom) over the eastern rim of the Manson impact structure in Iowa, U.S.A. Notethat the seismic data extends only from CDPs 100 to 700 while the interpretation includes the full line (from Kieswetter et al., 1996).

33
Fig. 1.10 The interpreted Lithoprobe seismic line over the Sudbury impact structure showing its relationship togeological formations and structures associated with the Penokean orogeny (from Wu et al., 1994).

34
Fig. 1.11 The seismic data (top) and interpretation (bottom) from the Montagnais structure. It was thefirst submarine impact discovered (from Jansa et al., 1989).

35
Two-way Time (ms)
Fig. 1.12 The Mjølnir impact crater interpreted from the seismic data (top)and on a time structure map (bottom) of the UB reflector (from Dypvik etal., 1996).
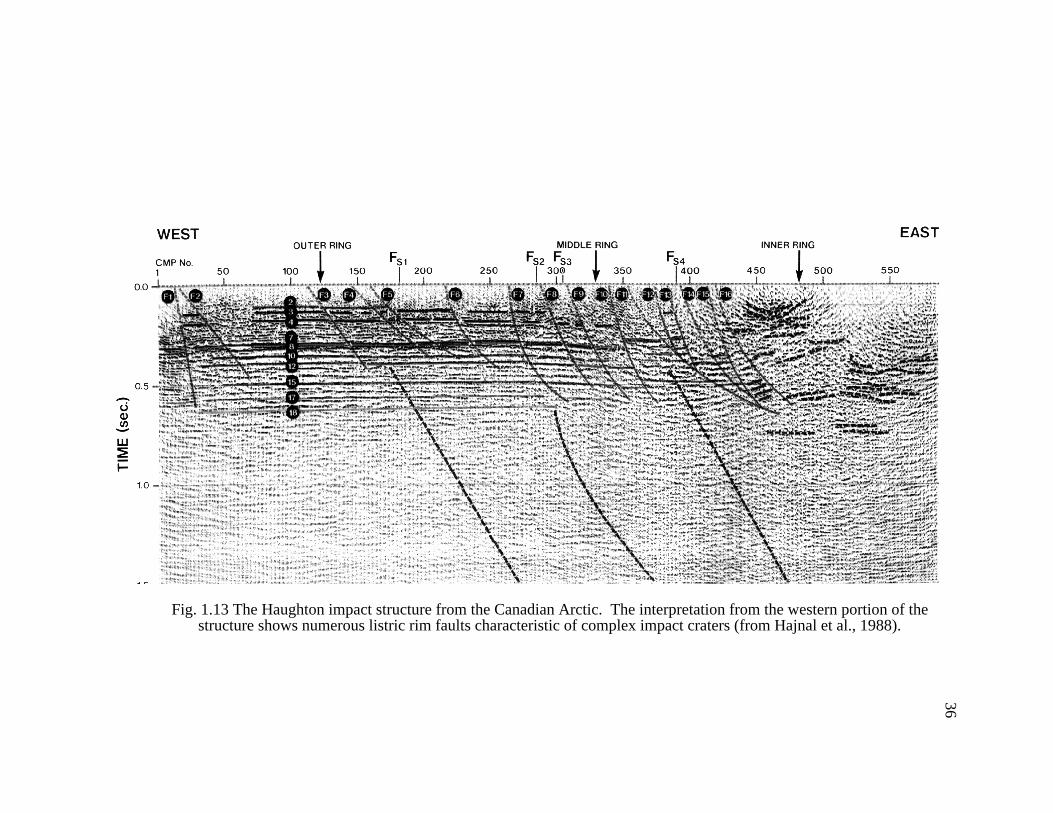
36
Fig. 1.13 The Haughton impact structure from the Canadian Arctic. The interpretation from the western portion of thestructure shows numerous listric rim faults characteristic of complex impact craters (from Hajnal et al., 1988).

37
Fig. 1.14 A seismic structure stack over the 9 km wide Red Wing Creek impact structure. The morphology ofthe structure is apparent at the Jp reflector level (from Brenen et al., 1975).

38
1700
1800
1900
2000
2100
2200
2300
2400
40 60 80 100 120 140 160 18067 61 54 48 42 36 30 23
LinesTraces
NW SE1 km
Cambrian A
Precambrian
Top Cambrian
Mannville
Tim
e (m
s)
Fig. 1.15 A radial seismic section from the James River 3-D dataset. Note that the Top Cambrian reflector representsan erosional unconformity. The original diameter of the crater may have been 7 km (from Isaac and Stewart, 1993).

39
0
180
360
Illumination Angle(deg. from North)
1 km
Terrace
N
Fig. 1.16 The dip-azimuth map from the James River structure at the Cambrian A reflector. The largeterraced blocks which make up the rim, can lead to structural traps (from Isaac and Stewart, 1993).

40
Fig. 1.17 Interpretation of the seismic data over the simple Viewfieldstructure in southeastern Saskatchewan. Within the structure, at the JURreflector, the seismic data appears to show possible infill of the crater (fromSawatsky, 1972).

41
Fig. 1.18 A migrated seismic line over the Hartney structure. The apparent low in the center of the structure atthe Winnipeg Shale is apparently due to a velocity anomaly above the central peak (from Anderson, 1980).

42
Fig. 1.19 The structure map of the Winnipeg Shale horizon after conversionof the seismic data to depth. The map shows a central peak within thestructure after depth conversion. The contour interval is 100 feet (fromAnderson, 1980).

43
CHAPTER 2 - SCALING RELATIONSHIPS ANDRESERVOIR POTENTIAL
2.1 SCALING RELATIONSHIPS
Morphometry, the analysis of crater form based on laboratory experimentation, numerical
modeling and actual impact structures, provides quantitative relationships between crater
geometry and the nature of the impacting bollide (Grieve and Pilkington, 1996; Melosh,
1989). These relationships include estimates of the melt rock volume produced by high-
velocity impact (Grieve and Cintala, 1992) as well as expressions for crater depth-to-
diameter ratios. In the case of buried impact craters on Earth, which can only be examined
remotely by geophysical means, these criteria are useful in examining the dimensions of the
structure under investigation. Presumably, if the structural dimensions adhere to those
which are predicted by scaling, then the structure itself is more likely to be an impact crater.
On the other hand, if the structure does not exhibit dimensions which are predicted by
scaling criteria then the impact hypothesis for its origin is less likely. This is a particularly
useful exercise in the event that the structure has been imaged by seismic data which has the
greatest potential to show the best structural detail.
It is my intention here to introduce and summarize scaling criteria in a manner such that
they become useful when used in interpreting seismic data over structures suspected of
having an impact origin. Thus I will focus on those scaling criteria relating to the size and
shape of the crater and related phenomena. I’ve attempted to emphasize recent formulations
of these criteria assuming that these are based on the latest available data, both experimental
and observed without delving into theoretical implications. Note also that these

44relationships are based on fresh, or reconstructed craters and therefore do not take erosion
or other post-impact deformation into account.
2.1.1 Transient Crater Scaling
The transient crater is completely formed at the end of the excavation stage of crater
development (see Chapter 1, section 1.2.2). As its name implies, it quickly changes in size
and shape, largely under the influence of gravity, until it finds a more long-lived, relatively
stable form - either the final simple morphology or the complex morphology (see Chapter
1, Figure 1.6). It has been postulated that the shape of the transient crater may be
represented by a parabola of revolution such that:
z = 4
Ht
Dt
2r2,
(2-1)
where z is the vertical distance from a point on the crater wall, to the crater floor, Ht is the
depth of crater, Dt is the rim diameter and r is the distance from the center of the crater to
the point at which z is measured (Melosh, 1989). Thus, 0 ≤ z ≤ Ht and 0 ≤ r ≤ Dt/2 for any
given transient crater (Figure 2.1). The volume of such a crater can then be calculated to be
Vt =
πDt
2Ht
8,
(2-2)
where Vt is the transient crater volume, Dt is the transient crater rim diameter, and Ht is the
transient crater depth. Melosh (1989) also suggests that the transient crater’s rim height can
be determined from
δ =
Ht
40Dt
r
3
,(2-3)
where δ is the rim height of the transient crater, Ht is the depth of the transient crater, Dt is
the diameter of the transient crater and r is the rim radius from the vertical axis of symmetry
(i.e., r ≥ Dt./2). This equation is based on the equivalence of the rim’s volume above the

45pre-impact surface with the crater’s volume beneath the pre-impact surface and thus does
not allow for bulking and mixing of ejecta due to its own impact with surface material
(Figure 2.1).
Work by Schmidt and Housen (1987) showed that the transient crater diameter is a function
of the projectile characteristics. For saturated sand targets, they found empirically that
πr = 0.8π2-0.22 , (2-4)
where πr ≡ rtc(ρt/m)0.33 (where rtc, ρt, and m are the radius of the crater, the density of the
target and the mass of the projectile, respectively), a dimensionless ratio essentially equal to
the ratio of transient crater radius to projectile radius (Melosh, 1989), and π2 ≡ 3.22grp/vp2
(where g, rp and vp are the acceleration due to gravity, the radius of the projectile and the
velocity of the projectile, respectively), a dimensionless ratio, sometimes referred to as the
gravity-scaled size of the crater, which is approximately equal to the inverse of the Froude
number (F = v2/2gr), which itself relates inertial stresses to gravitational stresses (Melosh,
1989). All the above values are expressed in cgs units. πr and π2 are results of a form of
dimensional analysis known as pi-group scaling. Note that the use of π here does not
relate to the common use of π as the ratio between a circle’s circmference and radius. The
details of this scaling method are beyond the scope of this work and are formally treated in
Schmidt and Housen (1987) and references therein. However, the essential idea is that the
physically relevant variables are grouped into dimensionless parameters (the π-parameters
such as πr and π2 mentioned above). The relationship between one π-parameter on another
is tested experimentally holding all but the variable of interest constant. This in turn,
results in relationships as expressed in Equation 2-4. As noted, the above result stems
from the work by Schmidt and Housen (1987), who also tentatively suggest that Equation
2-4 is a best-estimate for impact into rock.

46Taking the values for πr and π2 and substituting them into Equation 2-4, we get
rtc(ρt/m)0.33 = 0.8(3.22grp/vp2) -0.22
rtc = 0.62(ρt/m)-0.33(grp/vp2) -0.22. (2-5a)
Assuming the projectile can be estimated as a sphere with density, ρp, and mass, m =
4/3πr3ρp, and noting that rtc =1/2Dtc where Dtc is the transient crater diameter and rp = 1/2
Dp, where Dp is the projectile dimeter, then Equation 2-5a can be simplified to
Dtc = 1.16(ρp/ρtr)0.33Dp
0.78vp0.44g-0.22, (2-5b)
where Dtc is the diameter of the transient crater, ρp is the density of the projectile, ρtr is the
density of the target rocks, Dp is the diameter of the projectile, vp is the velocity of the
projectile and g is the acceleration due to gravity, all in cgs units (Grieve and Cintala 1992).
Grieve and Cintala (1992) use this formulation of Schmidt and Housen’s (1987) result to
calculate transient crater dimensions in their study of impact melt volumes with some
success. In the sections to follow, relationships between transient crater dimensions and
those for simple and complex craters are introduced. By using Equation 2-5b, it will be
possible to relate final crater diameters to the size of the projectile that made them.
By conservation of volume, it has been estimated that for transient craters which undergo
modification to the simple final morphology, depth-to-diameter ratios are about 1/3. A
similar ratio is found for transient craters which evolve into the complex final form when
the total depth of excavation is examined (Melosh, 1989). Thus,
Ht
Dt
=13
,(2-6)

47where Ht = the depth of the transient crater and Dt = diameter of the transient crater,
regardless of final crater form. However, depth-to-diameter ratios for simple and complex
craters, after modification of the transient crater, are quite different.
2.1.2 Simple Crater Scaling
Modification of small transient craters is dominated by simple gravity slumping of the
transient crater’s walls into the depression, forming a breccia lens. Study of these types of
craters has resulted in a series of scaling criteria between various dimensions of the crater
(Figure 2.2), some of which follow.
The velocity with which the slumping occurs can be approximated as a free-fall along a
frictionless slope. Thus
vs ≈ (2gHt)0.5, (2-7)
where vs = velocity of the slide along the transient crater, g = acceleration due to gravity
and Ht = depth of the transient crater in metres (Melosh, 1989). The result of the sliding is
to widen the diameter of the final crater such that
D = 1.19Dt, (2-8)
where D = the rim diameter of the simple crater and Dt = the transient crater diameter
(Melosh, 1989). As the transient crater fills with the slumped material, the relative depth of
the crater decreases as the diameter increases. This reduces the depth-to-diameter ratio such
that
HD
=15
,(2-9)
where H = the depth of the crater and D = rim diameter (Melosh, 1989). The depth of the
crater and the thickness of the breccia lens are approximately related by
H ≈ 2Hb, (2-10)

48where H = the depth of the crater and Hb = thickness of the breccia lens as defined in
Figure 2.2 (Melosh, 1989). This is perhaps overly simplified as Grieve and Pilkington
(1996) found that
Hgs = 0.13D1.06 (2-11)
and
Hgs + Hb = 0.28D1.02, (2-12)
where Hgs is the depth of the crater measured from the original ground surface (see Figure
2.2), Hb is thickness of the breccia lens and D is the rim diameter, all in kilometres.
However, these equations are only based on seven good terrestrial examples and, in any
case, approximate Equation 2-10. Slumping also incorporates part of the rim of the
transient crater into the breccia lens. Pike (1977) found that the final rim height is related to
the crater diameter for simple lunar craters such that
hr = 0.036D1.014, (2-13)
where hr is the height of the rim from the pre-impact surface and D is the rim diameter both
in metres. This result is in remarkable agreement with the estimate of Equation 2-3.
2.1.3 Complex Crater Scaling
Larger transient craters undergo greater modification to form the complex morphology.
Study of these types of craters has also attempted to relate the geometric dimensions of
these craters into a series of scaling criteria.
Experimental and observational data obtained with regards to the maximum excavation
within complex craters suggests that
Dt ≈ 0.6D, (2-14)
where D = rim diameter and Dt = transient crater diameter (Melosh, 1989). However,
work by Croft (1985) showed that a power law relation seemed to fit the spectrum of

49available data better. Using several transient crater reconstruction techniques, the diameter
can be expressed as
Dt = Dtr0.15±0.04D0.85±0.04, (2-15)
where Dt = diameter of the transient crater, Dtr = transition diameter for simple to complex
craters and D = rim diameter, all in kilometres. This is an improvement over Equation 2-14
in that it attempts to incorporate differences in target rock type as reflected by the transition
diameter variable.
Grieve and Pesonen (1992) evaluated five terrestrial structures and found that
H = 0.12D0.30, (2-16)
where H is the apparent crater depth, D is the rim diameter, in kilometres, for sedimentary
target rocks and
H = 0.15D0.43, (2-17)
where H = apparent crater depth, D = rim diameter, in kilometres, for crystalline target
rocks. However, being based on only a few examples, there is a great deal of uncertainty
associated with these relationships. Nonetheless, they follow the same form as the
relationship on the Moon which Pike (1977a) showed was of the form H ∝ D0.3. They also
indicate that complex craters in sedimentary target rocks are shallower than those for in
crystalline target rocks (Grieve and Pesonen, 1992).
Similarly, Grieve and Pilkington (1996) evaluated 24 complex craters and found that the
structural uplift showed a power law relationship to rim diameter such that
SU = 0.086D1.03, (2-18)
where SU is the structural uplift, defined here to mean the vertical displacement of
lowermost strata now exposed at surface, D is the rim diameter, all in kilometres. Thus
complex craters should show structural uplifts, to a first approximation, of about 1/10 their

50rim diameter. There is no indication whether or not there is a dependence on target rock
type.
Almost before the transient crater has formed completely, structural uplift of its bottom
begins, ultimately rising and then settling to form the central peak (Melosh, 1989; Grieve
and Pesonen, 1992). The size of the central peak can be determined by
Dcp = (0.22±0.03)D, (2-19)
where Dcp is the diameter of central peak and D is the rim diameter (Pike, 1985; Melosh,
1989) although there is a great deal of scatter in this relationship. This calculation also sets
a basic lower bound on the size of the transient crater.
The above relationships form a framework with which buried structures, imaged only on
seismic data, and suspected of an impact origin, can be studied. They are meant as an
interpretive guide rather than a quick yes-or-no answer to the impact origin hypothesis.
This process is attempted for the two case studies presented in Chapters 3 and 4.
2.2 RESERVOIR POTENTIAL
Before presenting the details of the above mentioned case studies, it seems prudent to
demonstrate that meteorite impact structures have exploration potential in terms of
hydrocarbon resources. Since impact craters apparently appear randomly over the Earth’s
surface, a fortuitous encounter during general exploration activity usually precedes any
kind of detailed investigation. Since the impact event itself does not induce the formation
of hydrocarbons (i.e., hydrocarbon accumulations are epigenetic deposits), the value of
these structures becomes apparent only if they lie across hydrocarbon migration pathways
or form basins in which post-impact sedimentation gives rise to hydrocarbon generation
(e.g., the Ames structure). Thus, as is the case with all hydrocarbon exploration activity,

51an understanding of the regional geological setting is important in establishing the
likelihood of an impact crater having hydrocarbons trapped within it. As there are few
examples of impact craters which are associated with hydrocarbons, this analysis is largely
qualitative in terms of locating prospective parts of an impact crater. Because of the
number of variables involved in determining whether or not a particular structure is
prospective, and the uniqueness of each structure on a small scale, a strict exploration
strategy of these features is likely impossible to implement except in the most general of
terms. We can investigate this potential by first looking at current relationships between a
few of these structures and the associated hydrocarbon exploration or exploitation activity.
Table 2-1 describes nine structures and their associated hydrocarbon accumulations as well
as the basic structural facies in which the discoveries were made.
As mentioned in Chapter 1, the Ames structure, one of the most prolific hydrocarbon
producers, is a case in which the structure provided both the isolated basin in which source
rock formed, as well as the structural trapping mechanisms for hydrocarbon accumulations.
Total reserves at Ames are estimated at 50 million barrels of oil and some 60 billion cubic
feet of gas (Isaac and Stewart, 1993; Grieve and Masaitis, 1994; Kuykendall and Johnson,
1995). While the first discovery came from karsted rim dolomites, the largest deposits are
found in the granite-dolomite breccia of the central uplift and brecciated granite in the floor
of the crater, the transient crater having excavated to basement. Over 100 wells have been
drilled on the structure of which 52 produce oil and 1 produces gas. The original discovery
well rated at 3440 MCF of gas and 300 bbl of oil per day. However, the Gregory 1-20
well, drilled on the flank of the central uplift, is the most productive oil well with 80 m of
granite-dolomite pay, a drill stem test of 1300 barrels of oil per day and a primary recovery
of more than 10 million barrels.

52
The 9 km wide, 200 Ma old Red Wing Creek structure in North Dakota is another complex
crater in which production is primarily from brecciated Mississippian rocks in the central
uplift. The petroleum source rocks in this case are not local to the structure. There is
nearly 500 m of net pay from Mississippian strata which have been repeated by thrusting in
the central uplift region. Higher porosity and permeability values are a result of impact
induced fracturing and brecciation resulting in flow rates of 1000 barrels per day for a
single well (Pickard, 1994). Cumulative production is more than 12.7 million barrels of oil
Structure Diameter andMorphology
Age HydrocarbonAccumulation
StructuralAssociation
Ames, Ok 14 km - C 450 Ma • 50 MMbbl oil• 20-60 BCFG• source rock controlled by
structure
• karsted rimdolomites
• brecciated granite-dolomites of thecentral uplift andcrater floor
Red WingCreek, N.D.
9 km - C 200 Ma • 40-70 MMbbl oilrecoverable
• 100 BCFG recoverable• 12.7 MMbbl oil and 16.2
BCFG total production• provided trap to migrating
hydrocarbons
• faultedMississippianreservoir in centraluplift
Avak, Al 12 km - C 3-100 Ma • 37 BCFG reserves• provided trap to migrating
hydrocarbons
• listric rim faultswhich formstructural traps incompetent blocks
Marquez, Tx 22 km - C 58 Ma • some gas production ?Newporte,
N.D.3.2 - S 500 Ma • oil shows in Cambrian-
Ordovician sands• highly fractured
basementCalvin, Mi. 6.2 km - C Late
Ordovician• 600 MMbbl oil reserves• 500,000 bbl oil since 1978
?
Steen, AB 22 km - C 95 Ma • 600 bbl per day • rim complexViewfield, SK 2.4 km - S Triassic-
Jurassic• 400 bbl per day• 20 MMbbl recoverable oil• formed trap to migrating
hydrocarbons
• Mississippiancarbonate breccia
• Mississippian inthe rim
Tookoonooka, Australia
55 km - C ? • forms shadow zone tomigrating hydrocarbonsfrom Eromanga Basin
• potential for rimtraps
Table 2.1 Structures associated with hydrocarbon accumulation. Simple and complexcrater morphology is denoted by an “S” and “C” respectively. (Sources: Isaac andStewart, 1993; Grieve and Masaitis, 1994; Hodge, 1994; Buthman, 1995; Milstein,1995).

53and 16.2 billion cubic feet of gas while recoverable reserves are estimated at 70 million
barrels of oil and 100 billion cubic feet of gas (Grieve and Masaitis, 1994; Pickard, 1994).
The Avak structure, located on the north coast of Alaska, shows three associated gas fields
(Figure 2.2). These fields are primarily contained between the outer rim structure and the
inner trough of the crater. In this particular case, it is believed that the structure may have
disrupted already existing gas accumulations within the Barrow High, a west-east trending
anticline (Kirschner et al., 1992). Whether or not the current accumulations are less than
those which were already in place prior to the impact is unknown, nonetheless, the
reservoirs are now structurally controlled by the shallower, listric, normal faults along the
rim which juxtapose Jurassic reservoir rock against a Cretaceous seal updip. Currently the
South and East Barrow fields are in production with estimated reserves of some 37 BCF of
gas (Grieve and Masaitis, 1994).
Figure 2.3 shows a recent well map over the Steen River structure in northern Alberta.
Currently an active area of exploration, the terraced rim and central uplift of the structure
have been the major targets. Drilling has been more successful on the rim of the structure
with four oil wells producing over 600 bbl per day (Isaac and Stewart, 1993) from the Keg
River and Muskeg formations of the Lower Devonian. The land position also gives clues
to the strategy for exploration of the structure as land currently held by exploration
companies and land currently for sale is shown in grey, and covers most of the rim and
central uplift of the structure. Similarly, Figures 2.4 and 2.5 show current well maps over
the Eagle Butte structure, in southern Alberta, and the Viewfield structure, in southeastern
Saskatchewan, respectively. Drilling over the Eagle Butte structure is largely confined to
the flanks of the central uplift and the 18 km diameter rim (particularly the southeastern
edge), where some gas accumulations are apparent. The structure itself disrupts most of

54the 1200 m thick clastic part of the section as well as the carbonates of the Mississippian
making it a likely exploration target (Lawton et al., 1993). Current accumulations are from
the Cretaceous Second White Speckled Shale and Bow Island formations. The Viewfield
structure (Figure 2.5) at only 2.4 km in diameter is thought to be a simple impact crater.
The structure is Triassic to Jurassic in age but disrupts prospective Mississippian
carbonates (see Figure 1.17). The infill of the structure effectively forms a stratigraphic
seal against which oil has migrated and been trapped within the Mississippian. No
hydrocarbons have been discovered within the center of the structure. Current reserves are
estimated at 20 MMbbl of oil (Isaac and Stewart, 1993).
These examples provide a general frame work from which exploration may be more
effective. Impact craters have the potential to be associated with hydrocarbons only when
they lie in the path of migrating hydrocarbons. In particular, their geometric relationship
with regional dip will indicate how migrating hydrocarbons will encounter the structure and
their morphology will determine the type of trapping mechanism. In settings where the
impact structure crosscuts the regional strata in such a fashion that the crater lies parallel to
the regional geology, migrating hydrocarbons will encounter the structure laterally, and will
likely be trapped along the listric rim faults of the structure. For complex craters, this
scenario usually results in the central uplift being somewhat isolated from the regional
setting by the trough and the rim faults. The rim faults can effectively prevent fluids from
migrating to the interior of the structure. However, in the event that the impact occurs in
dipping strata, the migrating fluids may reach the central peak directly from beneath the
structure. In this case, faulting is usually directed up towards the uplift allowing for
migration into the center of the structure. Similarly for simple craters, a normal setting with
respect to regional geology will likely result in trapping along the rim of the structure,
provided it is infilled with relatively less permeable material. There is no direct evidence

55whether the breccia lens might be suitable as a reservoir. It likely has enhanced porosity
and permeability and may become prospective if a suitably impermeable cap rock is
present. The exception to these generalizations occurs in the case where the source rock is
internal to the structure, as in the Ames crater. In this case, both the rim and the central
uplift are within range for migrating fluids, depending on the infill geology of the structure
and regional influences are less important.
Impact structures may be indirectly involved in the trapping of hydrocarbons by controlling
the formation of subsequent structures shallower in the stratigraphic section. The impact
site may experience long-lived hydrothermal activity enhanced by the high temperature and
fracturing imparted to the target rocks during the impact. Such an environment may be
conducive to hydrothermal alteration of rocks or dissolution. The fractures associated with
the structure may provide conduits for dissolving brines long after the impact has been
buried at depth.
2.3 CONCLUSIONS
The scaling criteria introduced in Section 2.1 are meant to provide a framework in which to
help interpret suspected meteorite impact craters which are imaged on seismic data. Rather
than a definitive answer to the impact origin hypothesis for a structure, the equations
represent a means of testing the hypothesis either to help lend credence to it or to help
dismiss it from possibility. Such analysis is limited by the quality of the seismic image, as
well as the inherent assumptions behind the scaling criteria used. This analysis is attempted
for the two case studies in Chapters 3 and 4.
The concepts introduced in Section 2.2 oversimplifies the situation of exploring for
hydrocarbons in and around meteorite impact craters. Each structure will probably have its

56own particular set of unique reservoir properties depending on size of the crater, regional
geological setting, post-impact infill, depth of burial, level of erosion, the hydrogeological
regime within and surrounding the crater, and post-impact deformation. Nonetheless,
current exploration activity around these structures suggests that the rim is likely to hold
promise for structural trapping of hydrocarbons, regardless of crater morphology. The
central portion of the crater is generally more isolated from the regional geological setting
but may become prospective in the event the impact occurs in dipping strata. In the case of
complex craters, the flanks of the central uplift are more prospective as they often
demonstrate repeated stratigraphy due to thrusting of rock units during the modification
stage of crater formation. In some instances, when the hydrocarbon source rock resides
internally to the structure itself, accumulations can occur in both the rim and central uplift of
the structure. In the case of simple craters in dipping strata, the breccia lens may become
prospective if a suitably impermeable infill is present, however, as simple craters are, by
definition, smaller than complex craters, they are more likely to be removed by erosion,
thus making them poorly represented in the total crater population.
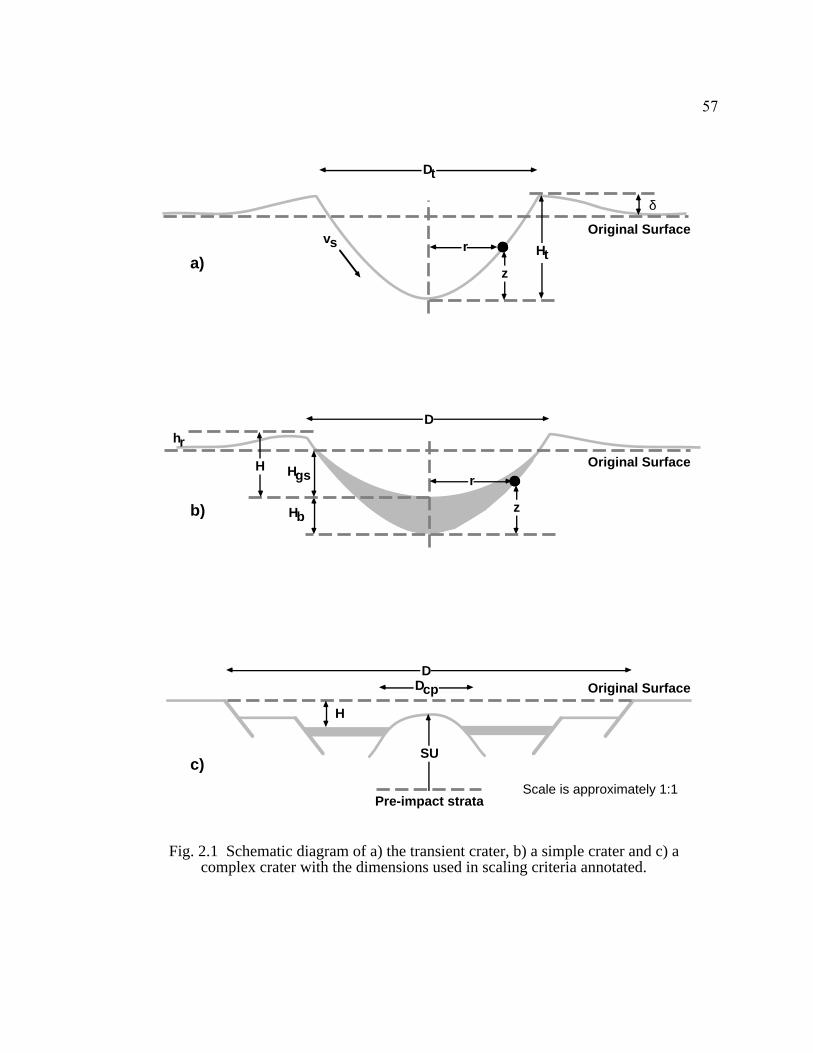
57
Dt
r Ht
δ
vs
z
r
Hb
Dhr
HgsH
D
SU
H
Dcp
a)
b)
c)
Fig. 2.1 Schematic diagram of a) the transient crater, b) a simple crater and c) acomplex crater with the dimensions used in scaling criteria annotated.
z
Scale is approximately 1:1
Original Surface
Original Surface
Original Surface
Pre-impact strata

58
Sha
llow
nor
mal
faul
ts
Inte
rmed
iate
nor
mal
faul
ts
Dee
p no
rmal
faul
ts
KE
Y
Con
tour
s in
feet
Fig.
2.2
Str
uctu
re m
ap o
ver
the
Ava
k cr
ater
sho
win
g th
e th
ree
asso
ciat
ed g
as f
ield
s lo
cate
d be
twee
n th
esh
allo
wes
t rim
fau
lts a
nd th
ose
at in
term
edia
te d
epth
(fr
om K
irsc
hner
et a
l., 1
992)
.

59
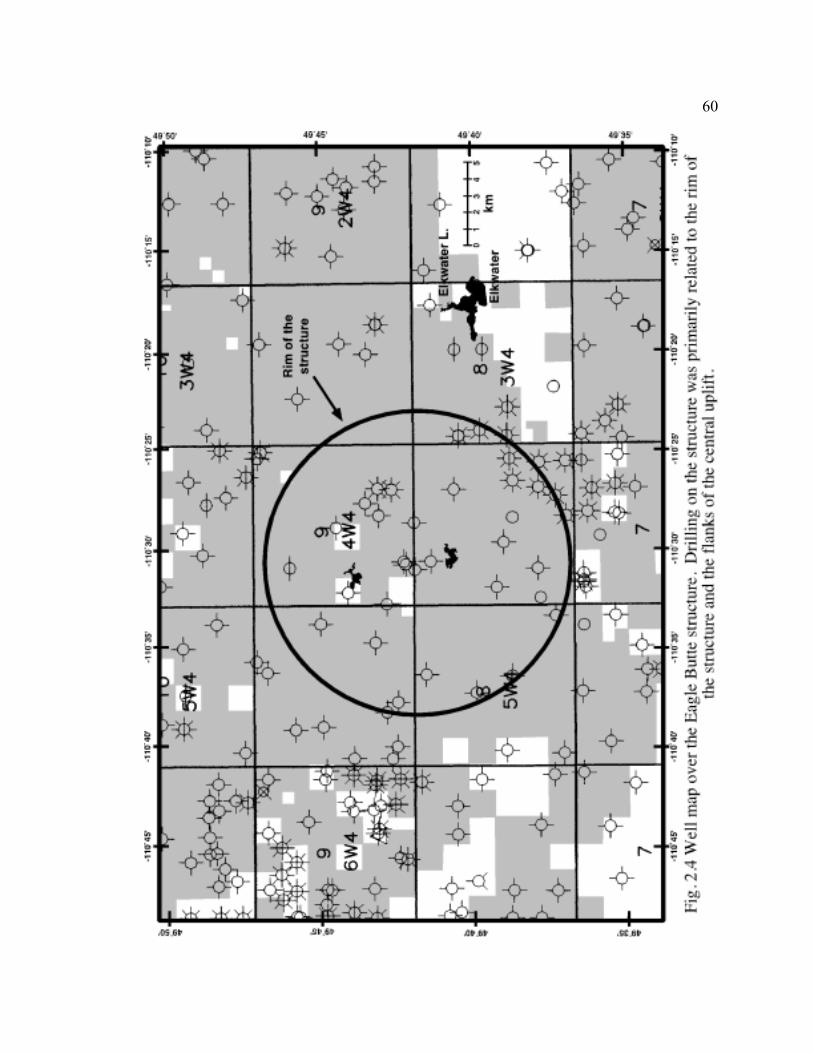
60

61

62
CHAPTER 3 - THE WHITE VALLEYSTRUCTURE
3.1 GEOLOGICAL SETTING
3.1.1 Regional Geology
The White Valley structure, also known as the Maple Creek structure, is located in the
Cypress Hills area of southwestern Saskatchewan (49˚48´00´´N, 109˚06´30´´W). The
structure lies within a valley on the north side of the Cypress Hills which rise about 1200m
above the regional plains and surround the structure to the west, east, and south (Furnival,
1946, Gent et al., 1992). The generalized stratigraphic chart of this region is shown in
Figure 3.1. Initial geological mapping in this area showed that the regional stratigraphy of
the Cypress Hills consisted mostly of gently southeast dipping strata composed of Tertiary
and Upper Cretaceous sediments from the uppermost Cypress Hills formation to the
Bearpaw formation. The plains north of the Cypress Hills are covered by glacial drift of
varying thickness which is underlain by the Bearpaw Formation (Furnival, 1946, Gent et
al., 1992). However, near the White Valley structure Furnival (1946) described these
near-surface strata as having high dip angles, slickensides, and complex folds that indicated
much more intense deformation then is typical of the area. Furnival (1946a) also concluded
that the strikes and dips indicated that the structure was much more irregular than other
structures in the area and that the available outcrops were insufficient to permit any definite
conclusions regarding the character or origin of the deformation. Well-preserved repeated
sections of the Eastend and Bearpaw formations about 1 km west of the test-holes, are
tilted toward the structure and become younger to the east (Gent et al., 1992).

63Field work conducted by Dr. Art Sweet of the Geological Survey of Canada uncovered
evidence for deformation in the Ravenscrag Formation within a fresh road cut near the rim
of the structure (Sweet, pers. comm., 1997). Shallower formations are largely
unconsolidated gravels and no structure within these could be seen (Sweet, pers. comm.,
1997). This suggests the structure formed after early Ravenscrag time (< 60 Ma ago). It
should be noted, however, that such shallow deformation has been observed elsewhere in
the Cypress Hills and has been attributed to the thrusting action of ice during the
Pleistocene (Christiansen and Whitaker, 1976; Sweet, pers. comm., 1997). The amount of
erosion is unknown so it is possible that the structure occurred at a paleo-surface higher in
elevation, resulting in an even younger age for the structure. Aerial photography of the
area shows an arcuate ridge which projects to a circle approximately 7.5 km in diameter
closely matching the projected diameter of the structure from seismic data (Section 3.2.3)
and also suggests that the structure is quite recently formed (Figure 3.2).
3.1.2 Geological Well Control
Geological well control comes primarily from the 07-07-010-23W3 well, drilled near the
center of the structure, and two shallow test wells (01-07-010-23W3 and 16-06-010-
23W3) also drilled near the apparent center of the structure. Disruption of the stratigraphic
column occurs to a depth of about 1300 m as indicated from drilling. The oldest strata
involved appear to be Mississippian in age. The target of the 07-07-010-23W3 well,
drilled near the center of the structure, was the oil-bearing carbonate Birdbear Formation of
the Late Devonian. It was dry and abandoned, but indicated that the Mississippian and
Birdbear formations occurred at regional depths. Structures found in core samples from
the two shallow test-holes include boudinage-like and ball structures along surfaces, as
well as intense brecciation, microfaults and slickensides giving evidence for shearing and
plastic deformation (Gent et al., 1992). Gent et al. (1992) also noted that the Bearpaw

64Formation is entirely absent from 16-06 with older sediments from the Belly River and Lea
Park formations in its position.
3.2 GEOPHYSICAL CHARACTERISTICS
The structure was discovered during hydrocarbon exploration in the area and is evident on
four 2-D seismic lines, a base map of which is shown in Figure 3.3. Lines WV-017 and
WV-021 best demonstrate the overall morphology of the structure as they pass close to its
center. WV-011 and WV-016, being non-radial to the feature show the complexity of the
rim and the likely problem of out-of-plane effects. Tables 3.1 and 3.2 briefly summarize
the acquisition and processing of the data to final migrated stack. A gravity profile,
acquired by Saskatchewan Energy and Mines and the University of Saskatchewan, trends
N-S over the center of the structure along seismic line WV-017 (Gent et al., 1992) and is
discussed in Section 3.2.3.3.
In addition to the seismic and gravity data, data from three wells in the area were used to
aid in correlation of horizons to reflectors and to identify evidence for structural
deformation via differences in well log signature. These included 07-07-010-23W3 which
was drilled near the structure’s core, and 01-04-010-22W3 and 04-01-011-24W3 which
Table 3.1 Survey acquisition parameters.
ACQUISITION PARAMETERSSource • Vibroseis: 4 vibs over 50 m
• Frequency: 8 sweeps, 10-90 Hz
• Interval: 125 mReceiver • Interval: 25 m
• Geometry: 9 inline pergroup
Shot-Receiver Geometry • 2D split spread• offset range of 100 m to
1575 m• 3 W-E lines, 1 N-S line
Sample Rate • 2 ms
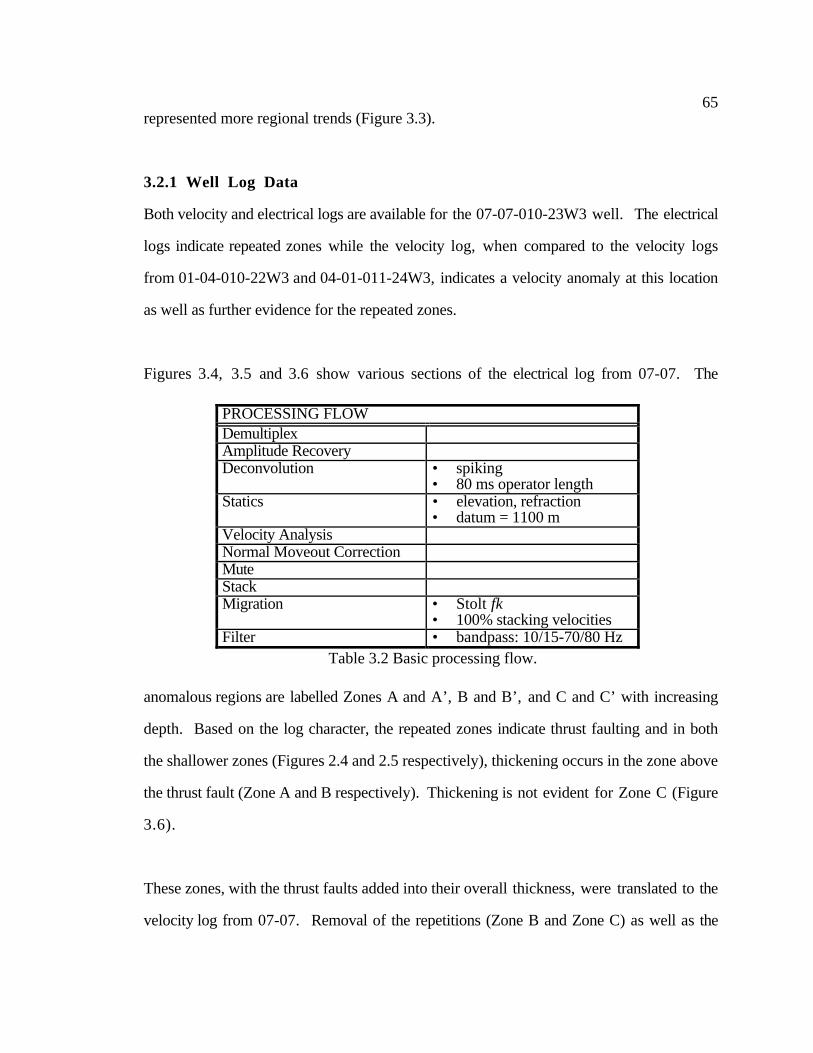
65represented more regional trends (Figure 3.3).
3.2.1 Well Log Data
Both velocity and electrical logs are available for the 07-07-010-23W3 well. The electrical
logs indicate repeated zones while the velocity log, when compared to the velocity logs
from 01-04-010-22W3 and 04-01-011-24W3, indicates a velocity anomaly at this location
as well as further evidence for the repeated zones.
Figures 3.4, 3.5 and 3.6 show various sections of the electrical log from 07-07. The
anomalous regions are labelled Zones A and A’, B and B’, and C and C’ with increasing
depth. Based on the log character, the repeated zones indicate thrust faulting and in both
the shallower zones (Figures 2.4 and 2.5 respectively), thickening occurs in the zone above
the thrust fault (Zone A and B respectively). Thickening is not evident for Zone C (Figure
3.6).
These zones, with the thrust faults added into their overall thickness, were translated to the
velocity log from 07-07. Removal of the repetitions (Zone B and Zone C) as well as the
PROCESSING FLOWDemultiplexAmplitude RecoveryDeconvolution • spiking
• 80 ms operator lengthStatics • elevation, refraction
• datum = 1100 mVelocity AnalysisNormal Moveout CorrectionMuteStackMigration • Stolt fk
• 100% stacking velocitiesFilter • bandpass: 10/15-70/80 Hz
Table 3.2 Basic processing flow.
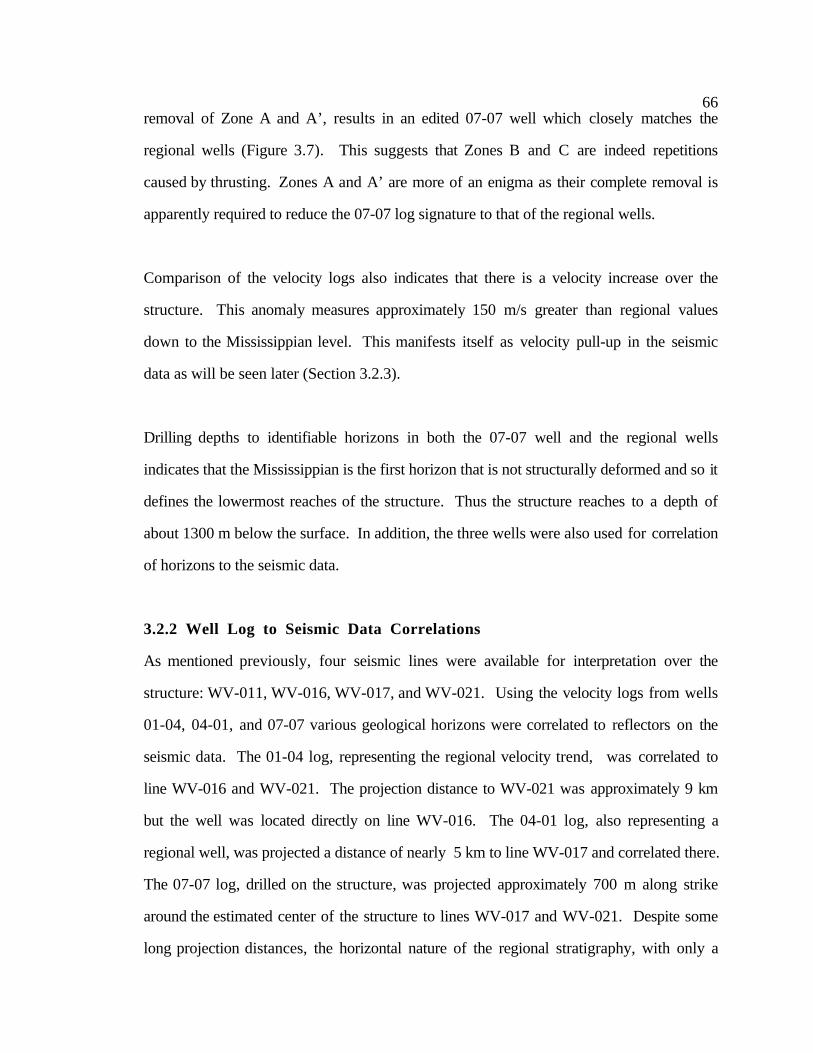
66removal of Zone A and A’, results in an edited 07-07 well which closely matches the
regional wells (Figure 3.7). This suggests that Zones B and C are indeed repetitions
caused by thrusting. Zones A and A’ are more of an enigma as their complete removal is
apparently required to reduce the 07-07 log signature to that of the regional wells.
Comparison of the velocity logs also indicates that there is a velocity increase over the
structure. This anomaly measures approximately 150 m/s greater than regional values
down to the Mississippian level. This manifests itself as velocity pull-up in the seismic
data as will be seen later (Section 3.2.3).
Drilling depths to identifiable horizons in both the 07-07 well and the regional wells
indicates that the Mississippian is the first horizon that is not structurally deformed and so it
defines the lowermost reaches of the structure. Thus the structure reaches to a depth of
about 1300 m below the surface. In addition, the three wells were also used for correlation
of horizons to the seismic data.
3.2.2 Well Log to Seismic Data Correlations
As mentioned previously, four seismic lines were available for interpretation over the
structure: WV-011, WV-016, WV-017, and WV-021. Using the velocity logs from wells
01-04, 04-01, and 07-07 various geological horizons were correlated to reflectors on the
seismic data. The 01-04 log, representing the regional velocity trend, was correlated to
line WV-016 and WV-021. The projection distance to WV-021 was approximately 9 km
but the well was located directly on line WV-016. The 04-01 log, also representing a
regional well, was projected a distance of nearly 5 km to line WV-017 and correlated there.
The 07-07 log, drilled on the structure, was projected approximately 700 m along strike
around the estimated center of the structure to lines WV-017 and WV-021. Despite some
long projection distances, the horizontal nature of the regional stratigraphy, with only a

67very slight regional dip to the southeast, allowed for reasonable correlations of seven
horizons including the Belly River (BLYRIV), the Milk River (MILKR), an A-horizon
(HOR-A), bottom of the Second White Speckled Shale (BSWSPK), the Mannville
(MANN), the Mississippian (MISS) and the Birdbear Formation (BRDBR). Also shown
on the well correlations are a B-horizon (HOR-B) and the Viking Formation (VIK). These
latter two were used to help in the comparison of the regional well logs to the 07-07 well
log as discussed in the previous section but were not correlated to the seismic data as they
did not prove to be very coherent reflectors.
Data from wells 01-04, 04-01 and 07-07 are shown in Figures 3.8, 3.9 and 3.10
respectively, which display each of the velocity logs, the corresponding zero-offset
synthetic seismograms (based on a 30 Hz zero-phase Ricker wavelet) and the tie to the
seismic data. Note that a velocity increase is represented by a trough (reverse polarity).
The horizon lines (gray) mark the tops of the formations and are shown in dashes where
the correlation is less clear.
The 07-07 well correlation was a particularly difficult one (Figure 3.10). Note that the 07-
07 well was used to correlate reflectors deeper than MILKR since shallower reflections
could not be seen clearly on the seismic data. Also labelled on the 07-07 well correlation
are the repeated zones mentioned previously. However, none of the repeated zones were
evidenced in the seismic data from lines WV-017 and WV-021 to which the well was
correlated. Apparently, the structure is complex enough, and perhaps asymmetric enough,
that even the relatively small 700 m projection distance for the well log is too far for reliable
correlation of these thrust structures. The strength of the correlations for events shallower
than VIK actually hinges on the character and continuity of these reflectors from the
regional correlations to within the structure itself. The continuity of these reflectors is quite
good and their character fairly definitive in making these correlations.

68
3.2.3 Seismic Data Interpretation
Once the basic correlations from the wells to the seismic was performed it was possible to
concentrate on the seismic lines themselves. Comparison of lines WV-017 and WV-021
demonstrated a static time shift of 60 ms at their tie point. The time shift is probably due to
different processing flows used by the two processing contractors involved. Nonetheless,
it was not difficult to correlate horizons between the two lines.
Figures 3.11 and 3.12 show the uninterpreted and interpreted migrated sections of lines
WV-017 and WV-021 respectively. Figure 3.13 shows the portions of lines WV-011 and
WV-016 used in the interpretation. Using an average velocity value of 2500 m/s to the
MISS based on well data, the sections were scaled and plotted such that there is nearly a
one-to-one correspondence between the time axis in seconds and depth in kilometres
resulting in nearly no vertical exaggeration. Horizon markers are shown in solid dark lines
while faults are indicated by dashed lines with arrows depicting relative movement. The
projected well locations, line ties and major morphological features are also labeled. All
four lines, being 2-D, likely suffer from side scatter interference off of structures outside
the plane of the lines. This is likely a greater problem with lines WV-011 and WV-016 as
they lie tangential to the core of the structure. These areas probably experienced more rock
movement across the plane of the seismic sections complicating their interpretation.
Labelled on the interpretations of WV-017 and WV-021 are some morphological
characteristics based on the hypothesis that the structure was formed by a meteorite impact.
These include the rim, the trough of the structure, and the central uplift which is depicted as
the region with no coherent reflectors, all of which are indicative of a complex crater. The
validity of this model will be discussed in Section 3.3 along with other possibilities.

693.2.3.1 Horizon Description
The BLYRIV horizon is the shallowest correlateable reflector in the sequence.
There is also some suggestion of coherent reflectors shallower in the sections but the data
quality is poor here. Disruption of the BLYRIV horizon by listric normal faults is apparent
as the rim of the structure is encountered. These faults form terraces from the outer rim to
the trough which is located at about CDP 641 and 941 on line WV-017 (Figure 3.11) and
CDP 271 and 571 on line WV-021 (Figure 3.12). The trough appears on both sides of the
structure’s core on both WV-017 and WV-021 suggesting that it surrounds the entire core.
At depth, and closer to the center of the structure, these listric faults delineate large
competent blocks of rocks which have been thrusted and rotated upwards toward the
surface and into the structure’s core. The flanks of the central, disrupted zone shows
evidence of further normal faulting away from the core. The formation then becomes
uncorrelateable across the structure’s center where complete disruption of the subsurface
has resulted in chaotic, scattered reflections.
The MILKR, HOR-A, BSWSPK and the MANN horizons represent good regional
markers which, by their deformation in the structured area, help to delineate the trajectory
of the major faults seen in the Belly River horizon mentioned above. As can be seen on
lines WV-017 and WV-021 (Figures 3.11 and 3.12), the listric rim faults penetrate to
substantial depth and delineate the outer-most extent of the structure. The MANN horizon
is disrupted by rim faults on all four lines and shows evidence of being thrusted on line
WV-017 (CDP 770, 1.2s; Figure 3.11) as well as normally faulted in graben-type
structures (e.g., line WV-016, CDP 1350, 1.2s; Figure 3.13). As with the BLYRIV, these
horizons also become uncorrelateable through the most disrupted portion of the structure’s
core.

70The MISS and BRDBR horizons also represent regional reflectors which underlie the
deepest portion of the central uplift. Both of these horizons occur at shale-carbonate
interfaces with a corresponding velocity contrast of about 3000 m/s. On line WV-017
(Figure 3.11) the Mannville is also more continuous beneath the central uplift indicating
that structural deformation becomes shallower further from the center of the structure
giving it a bowl shape in three dimensions. Both the MISS and BRDBR reflectors are
coherent except for some slight normal faulting of the MISS apparent on line WV-021
(Figure 3.12).
3.2.3.2 Time Structure
Both the Mississippian and Birdbear horizons show about 55 ms of two-way time
structure relative to their regional positions (Figures 3.11 and 3.12). In both cases, and for
both formations, the time structure takes the form of pull-up beneath the central uplift
region. The 150 m/s velocity anomaly over the structure that was mentioned previously in
Section 3.2.1 is enough to account for this velocity pull-up in the lower horizons. Reasons
for this velocity increase over the structure will be examined in Section 3.3.
The circular nature of the structure becomes clearer once the 2-D lines are combined to
create a 3-D time-surface map. This was accomplished for the Belly River horizon by
digitizing it on each line, assigning a surface location from the base map and then gridding
the data. The resulting interpolated time structure map is shown in Figure 3.14. This
diagram would have been aided by a denser dataset but the circular shape and general
morphology of the crater can still be seen.
3.2.3.3 Gravity Anomaly
A gravity profile was acquired over the White Valley structure by Saskatchewan
Energy and Mines and the University of Saskatchewan primarily over the central part of the

71structure (see Figure 3.3 for its location). The resulting Bouguer gravity profile is
illustrated in Figure 3.15. The profile indicates a 2.75 mgal anomaly over the center of the
structure and is bilaterally symmetric. The profile can be modelled as the result of a density
anomaly beneath the surface which I assume here to be a sphere or vertical cylinder for
simplicity. The gravity anomaly associated with a spherical anomaly stems from the
gravity anomaly of a point mass which, in general, is expressed by
∆gr = Gmr2 ,
(3-1)
where ∆gr is the gravitational attraction in the direction of the mass at a distance r from the
mass. G is the gravitational constant defined to be 6.67x10⁻¹¹ m3kg-1s-2. However, when
gravity measurements are being taken at the surface, only the vertical component of the
gravity is measured. Thus the measured gravity anomaly is
∆g = Gmr2 cosθ,
(3-2)
where θ is the angle between the vertical component and total gravity vector. If we let z be
the vertical distance to the point mass and x be the horizontal distance to the point mass,
then cosθ = z/r and r2 = (x2+z2)1/2 which by substitution into Equation 3-2 gives
∆g = Gmz x2 + z2 –32.
(3-3)
However, we are primarily interested in the maximum gravity anomaly which occurs
directly over the anomaly where x = 0. Thus the maximum gravity anomaly is given by
∆gmax = Gmz2 ,
(3-4)
in agreement with Equation 3-1. Equation 3-4 is the maximum gravity anomaly of a
spherical mass beneath the surface where z represents the vertical distance to the center of
the excess mass, m. This excess mass (which is negative for a mass deficiency), can be
calculated from

72 m = 4
3πrm3 ∆ρ,
(3-5)
for a spherical anomaly. Substituting Equation 3-5 into Equation 3-4 and solving for ∆ρ
gives
∆ρsph =3∆gmaxz
2
4Gπrm3 ,
(3-6)
where ∆ρsph is the required density anomaly to produce a maximum gravity anomaly,
∆gmax, for a spherical body with its center at a depth, z, and radius, rm.
Similarly, Dobrin (1976) gives a maximum gravity anomaly of
∆gmax = 2πG∆ρ h – rm + h2 + rm
2 ,(3-7)
for a vertical cylinder of height, h, and radius, rm . Rearranging Equation 3-7 to solve for
∆ρ gives
∆ρcyl =∆gmax
2πG h – rm + h2 + rm2
,
(3-8)
where ∆ρcyl is the vertical cylinder density anomaly which gives rise to ∆gmax. We see
from Equations 3-6 and 3-8 that only ∆gmax is a known quantity from the actual gravity
survey. However, the values for z, rm and h can be estimated by the following.
For the spherical model, the seismic data show that the chaotic portion of the structure over
which the gravity survey was performed has a radius of approximately 1000 m (Figure
3.11). The vertical distance to the center of the anomalous zone, z, can be estimated from
the gravity anomaly half-width, x1/2. The half-width is defined as the horizontal
displacement from the point at which the maximum gravity anomaly occurs to the point at

73which the gravity anomaly reaches half its maximum value (Kearey and Brooks, 1991).
Thus at x = x1/2, ∆g = ∆gmax/2 (Figure 3.15). Substituting these values into Equations 3-3
and 3-4 and solving for z gives
z = 1.3048x1/2. (3-9)
From the gravity survey (Figure 3.15), the half-width is estimated to be 750 m giving an
estimated depth to the anomaly’s center of nearly 980 m using Equation 3-9. Therefore,
using z = 980 m, rm = 1000 m, and ∆gmax = 2.75x10⁻⁵ m/s2 in Equation 3-6 gives a density
anomaly of 94.5 kg/m3 for a spherical anomaly.
In the case of the vertical cylinder model, I take the depth of the structure, 1300 m, to be
the height, h. As with the spherical model, the seismic data show the radius of the chaotic
portion of the structure to be about 1000 m which I use as an estimate for the radius of the
vertical cylinder. Similarly, the gravity anomaly is taken from the gravity survey giving
∆gmax = 2.75x10⁻⁵ m/s2. Using these values in Equation 3-8 gives a density anomaly of
33.8 kg/m3 for a vertical cylinder which outcrops at surface.
The measured density logs in the 07-07 and 04-01 wells give an average difference in the
density of about -50 kg/m3 representative of an overall decrease in density over the
structure. The disparity between the modelled results and the well data is probably because
the gravity survey does not extend beyond the rim of the structure. The positive anomaly is
the result of density differences between the trough and the central chaotic portion of the
structure whereas the wells sample the regional geology and the central portion of the
structure. Combining these two datasets suggests that while there is a density decrease
over the structure compared to regionally, the greatest density decrease occurs within the
trough zone of the structure which shows a negative anomaly as compared to the center of

74the structure. The fact that the estimated depth to the center of the anomalous zone is
deeper than half the total depth of the White Valley structure suggests that more of the
excess mass lies near the bottom of the structure or that the structure is buried by post-
impact sediments which do not contribute to the gravity anomaly.
3.2.3.4 General Morphology
From the interpreted seismic lines, some general morphological characteristics can
be identified. The question of structural symmetry is one which must be viewed carefully
as the degree of symmetry may give clues to the structure’s origin. Recall from the time-
structure map (Figure 3.15) that the gross morphology appears to be largely circular with a
raised central core. These features are consistent with the seismic data in Figures 3.11 and
3.12. The circular shape of the structure is, to some extent, also suggested by the erosional
remnant ridge which leaves an arcuate imprint on local drainage patterns seen on the air
photo (Figure 3.2). Thus we might feel that the structure is quite symmetric. However, on
a smaller scale, we see on the seismic data that the expected symmetry (bilateral in the case
of seismic lines which lie diametrically over the structure) breaks down. For example, a
unique feature seen on line WV-021 is the portion of heavily rotated beds near the central
core approximately located from CDPs 241-301 at about 0.8-1.1 s (Figure 3.12). This
region of the subsurface appears to have suffered greater rotational deformation than
corresponding areas on the other side of the central uplift and on line WV-017 (Figure
3.11). While the structure might be considered bilaterally symmetric in that the rim and
trough of the structure occurs on either side of its core, which in itself can be divided
symmetrically in the middle, some internal structures like these rotated beds occur on one
side of the structure only. Recall also that the repeated zones of the 07-07 well log do not
correlate to the seismic data of lines WV-017 and WV-021 again indicating a degree of
asymmetry even over relatively small projection distances. So the structure, while

75symmetric on a large scale in terms of very general morphology, appears to be asymmetric
when looked at on a smaller scale.
More quantitatively, we can obtain structural dimensions from the seismic data. At the
BLYRIV horizon, the rim of the structure measures about 6.3 km in diameter. Projecting
the most distal rim faults to the surface suggests a greater rim diameter of some 7.5 km,
more in line with that which is estimated from the aerial photograph (Figure 3.2). At the
BLYRIV horizon, the annular trough measures about 4 km in diameter and the central uplift
is about 2.6 km wide. Projecting these features to surface leaves the trough at about 4 km
in diameter but decreases the diameter of the core of the structure to about 2 km. The
maximum depth of the chaotic portion of the structure appears to be about 1.3 km as this is
the depth to the Mississippian, which was penetrated by drilling in the 07-07 well at
regional levels.
3.3 DISCUSSION
After compiling the various geophysical and geological data, we must try to combine these
into a coherent whole in order to explain the possible origin of the structure. When first
investigated, the structure was thought to be the result of glacial thrusting (Christiansen and
Whitaker, 1976). However, subsequent work by Gent (1992) dismisses this concept and
instead suggests that a kimberlite model is more likely. Explorationsists from Mark
Resources Inc. and Enron Oil Ltd. suggested a meteorite impact model for the structure to
which Gent et al. (1992) allude. I will look again at these two models in detail and argue
that the kimberlite concept is less likely and generally inconsistent with the seismic data.
3.3.1 Kimberlite Origin
Kimberlites form by the rapid rise of lithospheric or asthenospheric magma to the surface
with ascent rates on the order of 10-30 km/hr (Eggler, 1989). Explosive release of gases

76and fluids sometimes accompanies this magma rise resulting in the so-called explosion pipe
(Milashev, 1988). For my purposes here, I will only consider those pipes that break the
surface, leaving an identifiable surface structure. I also consider the gross morphology of
such a pipe as these features are more likely to be identifiable on seismic data.
The general morphology of explosion pipes is that of an inverted cone, tapering with depth.
In detail, several morphological subclasses have been identified based largely on surface
expression (e.g., oval, elliptical, etc.) although these haven’t been generally excepted
(Hawthorne, 1975; Milashev, 1988). Figure 3.16 depicts a general model for a typical
kimberlite. Major structural features include a simple crater at surface surrounded by a
raised rim of tuff material, while at depth, field studies have indicated that the sides of the
pipe dip steeply at angles of 80-85˚ regardless of country rock type (Hawthorne, 1975;
Milashev, 1988). The pipe tends to be filled with tuffs near the surface, followed by
explosion breccias and then massive kimberlite at depth. Included in this general matrix are
large blocks of wall rock although they are usually restricted to the tuffs and breccias closer
to surface (Hawthorne, 1975; Milashev, 1988). Milashev (1988) also suggests that for
most pipes, their roots penetrate to about 2 km of depth.
Most of the major structural features associated with explosion pipes have been modelled in
fluidization experiments. Woolsey et al. (1975) describe a series of such experiments and
the resulting surface and subsurface structural components associated with the “pipes” they
create. Along with the major features noted above, their experiments indicate that formerly
horizontal strata are tilted toward the main pipe (Figure 3.17). However, field
measurements have shown that some of the country rocks very close to large pipes (usually
within a few 10s of meters) may be tilted away from the pipe (Milahev, 1988). Fracturing
around the pipe is common close to the pipe except for radial fracturing which may extend

77for several pipe radii. Total vertical displacements caused by the fracturing is usually less
that a few tens of meters and is usually downward from regional levels (Milashev, 1988).
It is possible to contrast many of these features with the morphology of the White Valley
structure. First and foremost, the large size of the structure, with a projected diameter of
7.5 km, is much greater than expected for kimberlite pipes which usually reach a maximum
diameter of about one kilometre (Milashev, 1988). The general form of the White Valley
structure is that of the rim-trough-uplift configuration which is bilaterally symmetric in
cross section about the central vertical axis - typical of a complex crater configuration.
Explosion pipes demonstrate a bowl-shaped crater at surface - typical of the simple crater
configuration. This is even largely true of multiple generation kimberlites which exhibit
more than one occurrence of volcanic activity (Milashev, 1988). The cone shape of
explosion pipes have flanks which dip at 80-85˚ whereas the core of the White Valley
structure is more bowl-shaped with flanks dipping at perhaps 50-60˚. At White Valley,
vertical displacements of horizons within the central core are approximately 450-620 m
above regional levels and the well data shows evidence of major thrust faulting episodes
during the formation of the structure. These displacements are difficult to explain within
the context of the kimberlite model where regional stratigraphy is usually tilted toward the
pipe. It is also difficult to reconcile thrust faulting with the explosion pipe model. Beds
along the flanks of the White Valley structure’s core throughout the depth of the structure,
are all dipping away from the core to a distance of some 500 m. This attitude reverses itself
through the trough. For kimberlites, this phenomenon, when it does occur, is thought to
be a near surface effect that occurs within a few tens of meters from the pipe.
These differences in gross morphology make it difficult to reconcile the seismic data over
the White Valley structure to the kimberlite model. The lack of any kimberlitic material in
any of the wells makes this concept even less likely.

78
3.3.2 Meteorite Impact Origin
The overall morphology of the structure appears to fit that of a complex impact crater with
all the major features imaged in the seismic profiles including normal rim faults stepping
down to an annular trough and a central, seismically incoherent zone of uplift (Westbroek
et al., 1996). In detail, the repeated sections identified in the log signatures of the 07-07
well as Zones B and C are interpreted as thrusted sections of rock - evidence of the
structural deformation taking place during the modification stage of the cratering process.
Slumping of the transient crater’s walls and uplift of the transient crater’s bottom may result
in a compressional stress regime at the center of the structure, causing rock units to be
thrust on top of one another. This phenomenon has been identified at proven meteorite
impact structures such as Eagle Butte (Sawatzky, 1972; Lawton et al., 1993) and Avak
(Kirshner et al., 1992). This compression may also be responsible for the velocity increase
seen in the 07-07 log as it reduced impact-induced porosity. However, the rotation of
higher velocity rock units into the region of uplift and perhaps later cementation of fractures
contributed to the overall average velocity increase in the central uplift region.
As noted in Section 3.2.1, the complete removal of Zone A and A’ is necessary to reduce
the 07-07 log signature to the regional wells. This may simply be representative of the
chaotic nature of the crater’s structure so close to the central uplift or perhaps again
indicative of post-uplift slumping and interfingering of material along the sides of the uplift.
This is illustrated in the interpretation by normal faulting along the flanks of the central peak
at the BLYRIV level.
Asymmetry seen in the seismic data with respect to the fault patterns and structural
deformation of rocks is not easily explained as little experimental work has been done
regarding high-velocity impact in layered media. However, heterogeneities and anisotropic

79rock properties in target rocks cause them to react uniquely, particularly to the modification
stage of crater formation, and likely contribute to asymmetry in the final crater morphology.
The direction and angle of impact also affects crater symmetry with the central uplift
becoming skewed in the direction from which the impacting bolide came. Even
atmospheric effects can lead to alterations in surface crater symmetry although deeper crater
structures are unlikely to be affected. Such atmospheric phenomena are apparent in the
asymmetric surface morphologies and ejecta deposits of Venusian craters (Schaber et al.,
1992, Schultz, 1992) and can give clues to the incident direction of the meteorite. Steeper,
more numerous rim faults toward the north may be indicative of the downrange edge of the
structure. However, the current quantity of seismic and well data and a lack of observable
ejecta deposits make it difficult to ascertain the direction of the impacting bolide in the case
of White Valley.
Although not studied in detail, the gravity survey indicates a 2.75 mgal positive anomaly
above the structure. The gravity profile itself shows symmetry similar to the overall
morphology of the structure. Grieve and Pilkington (1992) site several examples of impact
structures which indicate a residual negative gravity anomaly followed by a more positive
anomaly over the central uplift. For example, Gosses Bluff, Australia has a -5.5 mgal
anomaly with a central peak anomaly of -3.5 mgal, a difference of 2 mgal. Similarly,
Upheaval Dome, U.S.A., has a 3 mgal anomaly over the central peak (Grieve and
Pilkington, 1992). The survey performed at White Valley covers only a portion of the
trough and the central peak of the structure. When modelled as a spherical or vertical
cylinder anomaly, the data suggest a density increase through the center of the structure of
some 30 to 100 kg/m3. Combined with the density comparison between the regional 04-01
and the 07-07 well which shows a 50 kg/m3 decrease between the regional terrane and the
central uplift, a profile becomes evident for which the structure demonstrates an overall
density decrease compared to regional values with a density increase through the central

80peak. This gives rise to a similar gravity profile as described in Pilkington and Grieve
(1992). It is not known what the regional gravity was at the survey site, nonetheless, a
2.75 mgal anomaly over the central peak of an impact structure is not unusual. This may
be due to the rotation of deeper, relatively competent blocks of rock (and hence of
somewhat greater density) into the central peak, compression of rocks through the central
uplift as compared to extension of rocks through the trough during transient crater
modification, and possibly post-impact alteration of the rock making up the central uplift.
More detailed modelling of the gravity data would be required in order to better constrain
the interpretation of this dataset.
Using morphometric measurements from the White Valley structure and the scaling criteria
introduced in Chapter 2, it is possible to see how well this particular structure scales to
known impact craters. From Equation 2-16 and using the 7.5 km projected diameter, the
depth of the crater should be some 220 m. Due to the poor quality of the shallow portion
of the seismic sections as well as possible erosion of the structure, the true crater surface is
unknown, and thus its depth can not be determined. However, downdrop within the
trough at the BLYRIV horizon indicates that the depth of the crater should be greater than
100 m. Structural uplift is calculated from Equation 2-18 to be 685 m. Since the BLYRIV
horizon is no longer imaged across the central peak, and is no longer present in the 16-06
well, the data indicate a structural uplift of more than 450 m. If the MILKR is projected to
the surface, then some 620 m of structural uplift occurred, closer to the value predicted by
scaling. The most controversial calculation is that pertaining to the transient crater
diameter. Equations 2-14 and 2-15 give a range of 4.5 km and 6.85 km, respectively, for
the diameter of the transient crater. This gives a corresponding range in the transient crater
depth (using Equation 2-6) of about 1500 to 2300 m. Considering that the seismic data
indicate a total depth of 1300 m for the structure, an even deeper transient crater must either
indicate some 200 to 1000 m of erosion to accommodate the transient crater size, or

81alternatively, the scaling criteria are not suitable for this calculation. The central peak
diameter can be estimated from Equation 2-19 and gives a range of 1.6 to 1.9 km. As
measured from seismic data, the central peak appears to be about 2 km when the structure
is projected to the surface, in reasonable agreement with the calculated estimate. Erosion
and post uplift slumping of the central core might account for the measured value being at
the high end of the calculated range. These measurements and scaling calculations are
summarized in Table 3.3.
3.4 CONCLUSIONS
The structure at White Valley in southeastern Saskatchewan, does not appear to conform to
the morphology expected for a kimberlite pipe. It’s large size, complex crater morphology,
structurally uplifted core, and extensive terraced rim are all difficult to reconcile with the
kimberlite pipe model.
Without petrological evidence of shock metamorphic features in the target rocks, the impact
origin of this feature can not be proven. Nonetheless, the structural anomaly seen on the 2-
D White Valley seismic data shows many of the morphological characteristics of a complex
impact crater. It has a circular rim, an annular ring synform and a raised central uplift
which in turn, shows evidence of possible slumping along its flanks. The structure’s
profile is evidenced in the topography of the area and indicates a rim crest diameter of about
7.5 km. The ring synform has an outer diameter of about 4 km while the central uplift is
Dimension Measured Result Scaling EquationsDepth >100 m 220 m
Structural Uplift 620 m 685 mCentral Peak Diameter 2 km 1.6-1.9 km
Transient Crater Diameter N/A 4.5-6.85 kmTransient Crater Depth ≤ 1300 m 1500-2300 m
Table 3.3 Comparison of measured dimensions and results from thescaling equations for the White Valley structure. Values are based on a rimdiameter of 7.5 km.

82about 2 km wide when projected to the surface. The amount of structure decreases with
increasing depth to a maximum of about 1300 m. Pull-up of the predominantly coherent
horizons beneath the central uplift appears to be partially due to a 150 m/s velocity anomaly
between regional values and the central uplift. Most of the disturbed zone involves the
clastic portion of the sedimentary column. The best age determination from the current data
indicates the impact occurred less than about 60 Ma ago. Although most of the scaling
criteria pertaining to the final geometry of the structure fit the available data well, the
greatest discrepancy occurs when scaling criteria are applied to estimate the size of the
transient crater. The calculated transient crater, based on the rim diameter of the structure
projected to the surface, does not fit the seismic data well unless a great deal of post-impact
erosion is invoked. This discrepancy may reflect an actual erosional component to the
post-impact history of the structure or an inherent inadequacy with the chosen scaling
criteria. It seems more likely that the transient crater had a depth less then the total depth of
the structure, perhaps some 600 to 700 m. The scaling equations were based on laboratory
experiments in saturated sand which may not reflect the response of the lithified, stratified,
clastic, target rocks present at White Valley. The gravity data indicates an anomaly profile
consistent with an impact crater. Modelled as a sphere or vertical cylinder, the anomaly
suggests a 30 to 100 kg/m3 density increase through the central uplift compared to the
trough whille well data indicates an overall density decrease between regional rocks and the
central uplift of some 50 kg/m3. Although simplistic, these models seem to indicate that the
gravity anomaly can be related to a typical density anomaly in the subsurface caused during
crater formation. Combining this interpretation more rigorously with other geophysical
data and the regional geological model may lead to a better understanding of the structural
elements of the crater and whether or not the scaling criteria, particularly those which
attempt to bridge the gap between the modification stage and the excavation stage, are
appropriate for describing the morphometry of the structure. Nonetheless, based on the
seismic data used in this interpretation, an impact origin is favoured.

83
PERIOD FORMATION LITH.
Tertiary
Jurassic
Triassic
Mississippian
Late
Early
Late
Mid.
Late
Mid.
Cre
tace
ous
Dev
onia
n
Elk Pt. GP
Manitoba GP
Duperow
Three Forks GP
Lodge Pole
Mission Canyon
Charles
Watrous
Gravelbourg
Sas
katc
hew
an G
P
Shaunavan
Vanguard
Mannville GP
Colorado GP
Milk River
Belly River
Bearpaw
Eastend
Ravenscrag
Battle/Whitemud
Shale
Sandstonesand
Shales
Carbonate
Sandstone
Shale
Shale
Shale
Carbonate
BirdBear
*
*
*
*
*
*
*
Fig. 3.1 Generalized stratigraphy of southeastern Saskatchewan. TheBirdbear formation (grey) was the target of the 07-07 well. The asterixesdenote oil-bearing formations (from AGAT Laboratories, 1988a).
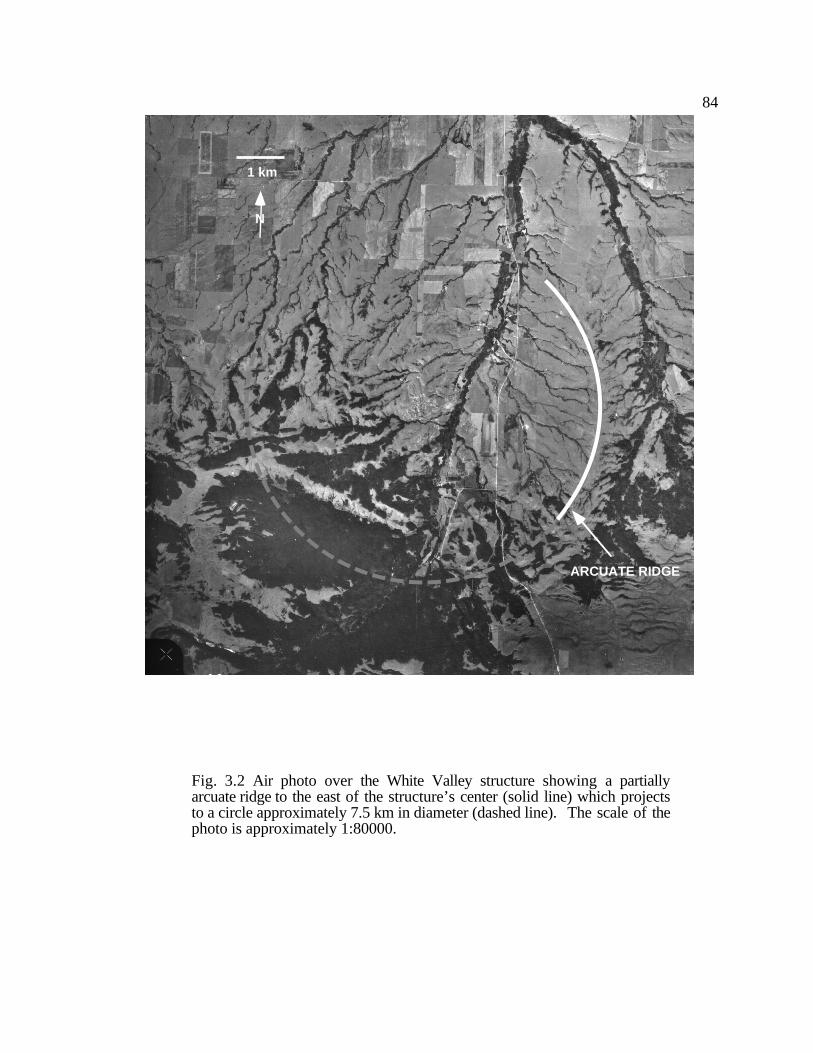
84
1 km
N
ARCUATE RIDGE
Fig. 3.2 Air photo over the White Valley structure showing a partiallyarcuate ridge to the east of the structure’s center (solid line) which projectsto a circle approximately 7.5 km in diameter (dashed line). The scale of thephoto is approximately 1:80000.

85
1-4
7-7
4-11 6
36 31
1 6
36 31
1 6
36
1
36
1
36
6
31
1
36
6
31
1023W3
1022W3
922W39
23W3
49 o50'49 o45'
-108o55'-109o00'-109o05'-109o10'
49o 4
5'49
o 50'
-109o00' -108o55'-109o05'-109o10'
0 1 2 3 4km
well locationseismic line
shallow test well
N
.
.Calgary
Edmonton
ALBERTA
..
Regina
Saskatoon
SASK.
*U.S.A.
White Valley Study Area*
Edge of Structure(at BLYRIV horizon)
WV-011
WV-021
WV-016
WV
-017
1-7
16-6
5-5
Note: The gravity survey follows seismicline WV-017 over the structure.
Fig. 3.3 Base map of the White Valley study area showing the seismic linesand the 07-07 well. The regional 01-04 and 04-01 wells are to the southeastand northwest of the base map respectively. The outline of the structure isdepicted and is located at approximately 49˚48´00´´N, 109˚06´30´´W.

86
350
400
450
500
07-07-010-23W3Electrical Logs
SP CILD
Dep
th (
m)
Zone A
Zone A'
THRUST FAULT ?
Fig. 3.4 The shallow portion of the electrical log from the 07-07 well. ZoneA´ and its repeat, Zone A are indicated. Whether or not this represents atrue repeated zone divided by a detachment (the thrust fault) or an entirezone of allocthonous material from the top of Zone A to the bottom of ZoneA´ is discussed in the text.

87
600
650
700
750
800
07-07-010-23W3Electrical Logs
SP CILD
Dep
th (
m) Zone B
Zone B'
THRUST FAULT
Fig. 3.5 The middle portion of the electrical log from the 07-07 well. ZoneB´ and its repeat, Zone B, are indicated along with the thrust fault separatingthe two.

88
800
850
900
950
1000
ZONE C
ZONE C'
THRUST FAULT
07-07-010-23W3Electrical Logs
SP CILD
Dep
th (
m)
Fig. 3.6 The deepest portion of the electrical log from well 07-07. Zone Cand its repeat are shown with the detachment between them.

89
Zone A
Zone A'
Zone C'
Zone C
Zone B
Zone B'
04-01-011-24W3Velocity Log
MILKR
BSWSPK
MANN
VIK
HOR-B
HOR-A
MISS
BSWSPK
MANN
MISS
VIK
HOR-B
HOR-A
MILKR
Velocity Log
EDIT OF07-07-010-23W3
01-04-011-24W3Velocity Log
DATUM
07-07-010-23W3Velocity Log
Fig 3.7 Comparison of the 07-07 velocity log and the regional 01-04 and 04-01 velocity log after removal ofZones A, A', B, and C. The edited 07-07 log has a signature very similar to the regional well logs.

90
0.3
0.4
0.5
0.6
0.7
0.8
0.9
1.0
1.1
1.2
1.3
1.4
Tim
e (s)
WV-021Seismic
WV-016Seismic
Velocity(x1000 m/s)
WELL 01-04-010-22W3
Dep
th (
m b
elow
KB
)
2.0 3.0 4.0 5.0 6.0 7.0
0.0
0.1
0.2
0.3
0.4
0.5
0.6
0.7
0.8
0.9
1.0
1.1
200
400
600
800
1000
1200
1400
MISS
MANN
BSWSPK
HOR-A
MILKR
BLYRIV
0.3
0.4
0.5
0.6
0.7
0.8
0.9
1.0
1.1
1.2
1.3
VIK
HOR-B
(KB @ 1084 m amsl)Synthetic
(Ricker wavelet30 Hz)
Fig. 3.8 Correlation of the 01-04 sonic log and the zero-offset syntheticseismogram with the seismic from WV-021 and WV-016. Note that thedata are reverse polarity.

91
400
600
800
1000
1200
200
2.0 3.0 4.0 5.0 6.0 7.0
0.0
0.1
0.2
0.3
0.4
0.5
0.6
0.7
0.8
Velocity(x1000 m/s)
WELL 04-01-011-24W3
Dep
th (
m b
elow
KB
)
0.6
0.7
0.8
0.9
1.0
1.1
1.2
1.3
1.4
Tim
e (s)
MILKR
BSWSPK
MANN
MISS
VIK
HOR-B
HOR-A
(KB @ 865 m amsl)
WV-017Seismic
Synthetic(Ricker wavelet
30 Hz)
Fig. 3.9 Correlation of the 04-01 sonic log and the zero-offset syntheticseismogram with the seismic from WV-017. Note that the data are reversepolarity.

92
0.5
0.6
0.7
0.8
0.9
1.0
1.1
1.2
1.3
1.4
WV-021Seismic
(along arc)
400
600
800
1000
1200
1400
1600
2.0 3.0 4.0 5.0 6.0 7.0
0.0
0.1
0.2
0.3
0.4
0.5
0.6
0.7
0.8
0.9
Velocity(x1000 m/s)
WELL 07-07-010-23W3
Dep
th (
m b
elow
KB
)
0.5
0.6
0.7
0.8
0.9
1.0
1.1
1.2
1.3
1.4
BSWSPK
MANN
MISS
BRDBR
Tim
e (s)
Zone C'
VIK
HOR-B
Zone C
HOR-AZone B
Zone B'
MILKR
(KB @ 946 m amsl)WV-017Seismic
(along arc)
Synthetic(Ricker wavelet
30 Hz)
Zone A
Zone A'
Fig. 3.10 Correlation of the 07-07 sonic log and the zero-offset syntheticseismogram with the seismic from WV-017 and WV-021. Note that thedata are reverse polarity.

93
0
0.4
0.6
0.8
1.0
1.2
1.4
Tw
o-w
ay T
ime
(s)
0.2
BLYRIV
MILKR
HOR-ABSWSPK
MISS
BRDBR
991 891 791 691 591 491CDP
TROUGH TROUGH
RIMTERRACE
CENTRALUPLIFT
RIMTERRACE
MANN
07-07-010-23W3
0
0.2
0.4
0.6
0.8
1.0
1.2
1.4
Tw
o-w
ay T
ime
(s)
991 891 791 691 591 491CDP TTTWV-016 WV-011WV-021
Fig. 3.11 Seismic line WV-017 (top) with the interpretation (bottom). The terraced rim,trough and central uplift are imaged by the seismic data.
S N
1 km

94
0
0.2
0.4
0.6
0.8
1.0
1.2
1.4
07-07-010-23W3
621 521 421 321 221 121CDP TWV-017
0
0.2
0.4
0.6
0.8
1.0
1.2
1.4
Tw
o-w
ay T
ime
(s)
MISS
BLYRIV
MILKR
HOR-ABSWSPK
MANN
BRDBR
W E
621 521 421 321 221 121CDP
TROUGHTROUGH
RIMTERRACECENTRAL
UPLIFT
RIMTERRACE
Fig. 3.12 Seismic line WV-021 (top) and the proposed interpretation (bottom).
Tw
o-w
ay T
ime
(s)
1 km

95
CDPWV-011 WV-016
CDP0
0.2
0.4
0.6
0.8
1.0
1.2
1.4
Tw
o-w
ay T
ime
(s)
931 1401 13010
0.2
0.4
0.6
0.8
1.0
1.2
1.4
TWV-017
1031TWV-017
0
0.2
0.4
0.6
0.8
1.0
1.2
1.4
CDP 1031 931 CDP 1401 13010
0.2
0.4
0.6
0.8
1.0
1.2
1.4
Tw
o-w
ay T
ime
(s)
W E W E
MISS
BLYRIV
MILKR
HOR-ABSWSPK
MANN
BRDBRMISS
BLYRIV
MILKR
HOR-ABSWSPK
MANN
BRDBR
TROUGH
RIMTERRACERIM
TERRACETROUGH
Fig. 3.13 Shown are the portions of lines WV-011 (left) and WV-016 (right) used in the interpretation. The interpretationsof the seismic data (bottom) showed many graben-like structures probably indicative of out-of-plane movement.
1 km

96
WV-17
WV-16
WV-21
WV-11
Trough
Structure'score
0 1.0 3.0 4.0 5.0 6.0 7.0 8.0 9.0 10.02.00
1.0
2.0
3.0
4.0
5.0
6.0
7.0
8.0
9.0
10.0
Dis
tanc
e (k
m)
Distance (km)
300 350 400 450 500 550 600
Time (ms)
Fig. 3.14 Time structure map of the Belly River horizon (BLYRIV) asinterpolated from the seismic lines. The gridding and interpolation wouldhave benefited from a denser dataset, however, the trough still appears tosurround the structure's raised core.

97
Bouguer Gravity Profile
0 1 2 3 427
28
29
30
31
Distance (km)
Bou
guer
Gra
vity
(m
gals
)
gmax
gmax
2
x1/2
Fig. 3.15 Bouguer gravity anomaly over the White Valley structure. Theprofile shows a positive anomaly of about 3 mgal over the center of thestructure (from Gent et al., 1992).

98
Tuft Ring
Maar
Crater
Diatreme
Root
0.5
0.0
1.0
1.5
2.0
2.5
Sill
KIMBERLITEFACIES
DEPTH(km)
500 m
PhanerozoicRocks
PreCambrianRocks
Fig. 3.16 Schematic drawing of a kimberlite pipe (from Hawthorne,1975; Belisle, 1995).

99
b
1
a
AB
d
3
4 5
c
C
2
Fig. 3.17 Series of photographs from fluidization experiments used tomodel diatreme implacement (from Woolsey et al., 1975). The followingfeatures can be seen: a) formation of two conduits (A and B) upliftingsurface sediments; b) near-conduit normal block faulting (1); c) cohesiveblocks sliding into growing primary conduit (2), secondary conduit isinactive (C); d) formation of rim (3), and downwarping of sedimentsadjacent to conduit (4 and 5).

100
CHAPTER 4 - THE PURPLE SPRINGSSTRUCTURE
4.1 GEOLOGICAL SETTING
The Purple Springs structure is located at 49˚52´30´´N, 111˚52´00´´W in southcentral
Alberta (Figure 4.1). The generalized stratigraphy is shown in Figure 4.2. Most Devonian
and Mississippian strata dip northwest or west in the area. Slight deviations from this trend
occur as the area was subjected to a series of transgressive and regressive events in lower
Devonian time which subsequently became inundated and then reemerged (Meijer Drees,
1994; Oldale and Munday, 1994; Richards et al. 1994; Switzer et al. 1994). The Purple
Springs area is east of the eastern margin of the main Mesozoic-Tertiary deformation front
and thus is relatively undisturbed. Devonian and Mississippian strata are primarily
carbonates with a few regional shale formations (e.g., Ireton, Calmar, Exshaw and Banff)
and evaporites confined primarily to the Wabamun (up to 60% anhydrite), Nisku and
Beaverhill Lake formations. Total evaporite thickness is probably less than 50-100 m
(Halbertsma, 1994; Switzer et al., 1994). The Devonian Prairie Evaporite formation has its
western depositional limit to the east of Purple Springs, although some localized
occurrences have been found in southern Alberta (Gorrel and Alderman, 1968; Meijer
Drees, 1994). Generally, the evaporite sequences become thicker to the north where
extensive shallow, inland seas existed during this time (Oliver and Cowper, 1983;
Anderson et al., 1988; Anderson, 1988; Anderson and Brown, 1991).

1014.1.1 Well Control
Most wells in this area target the clastic portion of the section with fewer Mississippian
penetrations at the Purple Springs location. For this interpretation, four wells were used to
construct a stratigraphic cross section over the structure (Figure 4.1); these included 06-04-
011-14W4, 01-36-009-13W4, 08-31-010-14W4 and 04-32-010-14W4. These wells were
chosen primarily for their location as 08-31 and 04-32 were on the structure, 06-04 was
adjacent to the structure, and 01-36 was distal from the structure. Three of these wells
(01-36, 08-31 and 06-04) were also used because they penetrated to the Devonian strata of
the Elk Point Group; the 04-32 well, situated over the structure, penetrated to the
Mississippian only.
Nine horizons were chosen for correlation purposes including the Second White Speckled
Shale (SWSPK), Bow Island (BOWISL), Mannville (MANN), an A-horizon (HOR-A),
the Rierdon formation (RIERDN), the Sawtooth formation (SAWTH), the Mississippian
(MISS), the Wabamun formation (WAB), and the Elk Point Group (ELKPT). I found that
these horizons correlated reasonably well to continuous seismic reflectors as well as
provided good delineation of the structure. Figures 4.3 shows the cross section through
the four wells depicting the velocity logs, plotted in depth, and their corresponding horizon
picks. The 06-04 and 01-36 well logs represent more regional trends while the 08-31 and
04-32 wells are located directly over the structure. The cross section indicates several
interesting features.
The MISS is situated 180 m deeper within the structure than regional with both shallower
and deeper formations demonstrating a similar trend albeit smaller in amplitude (compare
06-04 with 08-31 in Figure 4.3). The WAB is 30 m lower than regional and the ELKPT is
26 m lower. Moving shallower in the section, the SAWTH and RIERDN show some 130

102m and 75 m of lowering, respectively, while the MANN and BOWISL are both about 40 m
below regional levels. The SWSPK is 20 m below regional levels. The 04-32 well, when
compared with 06-04, illustrates a similar trend in the horizons on-structure and regional
placement.
In both 08-31 and 04-32, the MISS is characterized by an apparently anomalous lithology
layer (gray zone in Figure 4.3). The lithology log from 08-31 indicates about 2 m of salt
and anhydrite while the 04-32 logs indicate a 55 m washout of a similarly low density
material (≈2.1 g/cm3) at the SAWTH-MISS contact. The velocity of this material is about
5000 m/s which is somewhat high for salt - more typically around 4600 m/s - and thus may
indicate another rock type. Nonetheless, the result is a strong impedance contrast which
manifests itself as an amplitude anomaly on the seismic data and is probably why the 04-32
well was drilled.
It is apparent that the WAB horizon deepens by some 50 m into the structure (compare 06-
04 with 08-31, Figure 4.3). Further into the structure, the attitude of the WAB horizon
becomes unclear although it is possible that it shallows by perhaps 65 m at 04-32. This is
indicated by the lower dashed line in Figure 4.3.
Further, the cross section indicates thickening of early Mesozoic sediments within the
structure, particularly at the SAWTH and RIERDN (which thicken on the order of 50-55
m) and, to a lesser extent, at the MANN horizons. The 01-36 well indicates an overall
apparent dip to the northwest of less than a degree, consistent with regional trends.
4.2 GEOPHYSICAL CHARACTERISTICS
Seismic lines DBRR-1, DBRR-2 and DBRR-3, acquired during the course of oil and gas

103exploration, all pass completely over the structure and gave initial evidence that the feature
was somewhat circular and fairly extensive in area and in depth. These data were donated
by Norcen Resources Ltd. and Amoco Canada Ltd. for this work. Tables 4.1 and 4.2
summarize the acquisition and processing parameters to migrated stack. The four wells
discussed in Section 4.1.1 were used for correlation purposes.
4.2.1 Well Log to Seismic Data Correlations
Sonic logs were available for all four wells while only a few had density logs available. So
sonic logs alone were used to make zero-offset synthetic seismograms with which to
correlate the seismic data. In all cases, a 35 Hz, zero-phase, Ricker wavelet was used to
produce the synthetic seismograms. Figures 4.4, 4.5, 4.6 and 4.7 show the velocity logs
of 01-36, 06-04, 08-31 and 04-32, respectively, their corresponding synthetic
seismograms, and their correlations to the seismic lines.
The 01-36 log, corresponding to the regional velocity trend, was correlated to seismic lines
DBRR-1 and DBRR-2 over a distance of nearly 20 km, but the horizontal regional
stratigraphy allowed for confident correlations. The 06-04 velocity log was correlated to
Table 4.1 Survey acquisition parameters.
ACQUISITION PARAMETERS
Source ¥ Dynamite, single hole¥ 0.5 kg at 18 m¥ Interval: 68 m
Receiver ¥ Interval: 17 m¥ Geometry: 9 inline per
group (at 4 m)Shot-Receiver Geometry ¥ 2D split spread
¥ offset range of 17m to 810m
¥ 2 W-E lines, 1 N-S lineSample Rate ¥ 2 ms

104
DBRR-3 over a distance of about 400 m. The 08-31 log was projected to all three lines,
about 330 m to DBRR-1 and nearly 2 km to both DBRR-2 and DBRR-3. Lastly, the 04-32
velocity log and synthetic were correlated to all three lines over distances of 830 m to
DBRR-1, 500 m to DBRR-2, and 660 m to DBRR-3. In all cases, good correlations were
found between the synthetic seismograms and the seismic data (see Figures 4.4, 4.5, 4.6
and 4.7).
4.2.2 Seismic Data Interpretation
The three lines tied together very well with respect to all the horizons giving added
confidence in the horizon picks and the well ties (Figure 4.8). Figures 4.9, 4.10 and 4.11
show the uninterpreted seismic data from lines DBRR-1, DBRR-2 and DBRR-3,
respectively, with the location of the well ties and line ties annotated on each. Similarly,
Figures 4.12, 4.13 and 4.14 show the interpreted versions.
All three seismic lines passed completely over the structure and helped to delineate its areal
extent. In plan view, it appears slightly elliptical in shape (Figure 4.1) with a maximum
Table 4.2 Basic processing flow.
PROCESSING FLOWDemultiplex • with trace editingAmplitude RecoveryDeconvolution • min phase spiking
• 100 ms operator lengthStatics • elevation, refraction
• datum = 762 mVelocity AnalysisNormal Moveout CorrectionResidual Statics • 450-1300 ms windowMuteTrim Statics • 390-1300 ms windowStackFilter • bandpass: 13/48-70/96
Hz/dBMigration • finite difference

105diameter of some 4 km. In section, the seismic data show the structure to dominate the
carbonates of the Mississippian and Devonian with less structure occuring in the clastic
portion of the section. In addition to the nine horizons discussed in Section 4.1.1, a tenth
horizon was used to help delineate the structure and was simply labeled HOR-B. It lies
between the WAB and ELKPT horizons. The seismic lines were received in their final
migrated form and were not reprocessed. However, there are indications that the data are
of questionable quality. The near-surface reflectors shallower than the SWSPK (the
shallowest horizon correlated) abruptly show poor continuity compared to the reflectors
deeper than the SWSPK. On the other hand, the reflectors within the time zone containing
the structure appear quite coherent and there is little evidence of migration operator artifacts.
The seismic data were therefore deemed of sufficient quality to proceed directly with the
interpretation.
4.2.2.1 Horizon Description
Beginning with the shallow part of the section, the SWSPK is the first reflector
correlated to the seismic data. It shows little structure except for normal faulting in the
extreme western portion of lines DBRR-1 and DBRR-2 (Figures 4.12 and 4.13) as well as
the extreme northern and southern portions of DBRR-3. The deeper BOWISL and MANN
horizons continue this trend but also exhibit graben-type faulting on DBRR-3 (see CDP
651, 0.55 s, Figure 4.14) and an east-dipping normal fault on the eastern portion of lines
DBRR-1 and DBRR-2.
All the deeper horizons, except for the ELKPT, show structural deformation near the rim of
the structure in the form of normal faulting. These faults dip into the center of the structure
and are interpreted as being listric. They delineate terraces along the rim which step down
into the structure. Near the rim of the structure, both the SAWTH and RIERDN become

106difficult to interpret and are denoted by dashed lines (Figures 4.12, 4.13 and 4.14). HOR-
A is a regional marker which appears in the structure and is shallower than the SAWTH
and RIERDN horizons. As it was possible to interpret this horizon with more confidence
over the rim of the structure, it was used to guide the RIERDN and SAWTH horizons from
their location in the structure to their positions regionally. Within the structure, the MISS
horizon is also delineated by a dashed line. This is to stress the anomalous lithology that
the well logs from 08-31 and 04-32 indicated. It is unclear what the true lateral extent of
this lithology might be but there is possible evidence for it in both 08-31 and 04-32 and, in
both cases, it appears to correlate to a relatively flat, coherent reflector on the seismic data.
It was therefore interpreted to be equivalent to the top of the MISS horizon. Beneath the
MISS, the WAB horizon also steps down into the structure. However, reflections within
the core of the structure become completely incoherent. In fact the HOR-B horizon is only
visible outside the structure. As it reaches the structure’s side, it breaks up and is therefore
only helpful in delineating the lateral extent of the structure at this depth (e.g. CDP 760, 0.9
s, Figure 4.12).
The ELKPT horizon was the deepest correlated reflector. Although it appears to be largely
unaffected by faulting, line DBRR-3 does show some minor offsets in the ELKPT towards
the southern end of the structure (CDP 601-551, 1.0 s, Figure 4.14). It is unclear whether
or not this is a primary structure associated with the main deformation of shallower
horizons or whether this is indicative of basement control. Recall also that the cross section
(Figure 4.3) indicated the ELKPT was 26 m deeper than regional levels. This displacement
is not readily apparent on the seismic data as a distinct reflector break and may be due to the
lack of vertical resolution at this depth. The dominant frequency of the seismic data at this
level is only about 20 Hz. The compressional wave velocity of the Devonian carbonates is
about 5750 m/s (based on 06-04 velocity log, Figure 4.5) and thus the corresponding

107vertical resolution is only some 70 m based on 1/4 of the dominant wavelength (Yilmaz,
1987). Thus any fault at this depth would have to exhibit a vertical displacement of at least
70 m before the foot wall and hanging wall could be imaged as separate reflections on the
seismic data. However, displacements at or below this resolution threshold value may still
manifest themselves as amplitude anomalies but this effect is also not evident at the ELKPT
horizon. Of course, there is also no indication that the 26 m of structure has to occur in a
single displacement or that it is laterally extensive enough to even be imaged on the seismic
lines to which the wells are projected. It could easily occur as a series of smaller faults
between 06-04 and 08-31.
4.2.2.2 Time Structure
Many of the horizons identified above show time structure. For the most part, the
time structure shows a similar trend as that indicated by the cross section through the four
control wells (Figure 4.3, Section 4.1.1). The MISS demonstrates the greatest time
structure into the feature at some 110 ms of two-way travel time below regional levels.
Horizons both shallower and deeper than the MISS show less time structure. Greater time
structure may exist in the core of the feature but due to a lack of well control in this region
and poor reflector coherency, though, it remains uninterpretable beneath the MISS (e.g.,
CDP 401-551, 0.85-0.95s, Figure 4.14).
Generally, the time structure is exaggerated by velocity affects as well, particularly beneath
the feature. With thickening of the clastic horizons into the depression, higher velocity
carbonates are essentially replaced by lower velocity clastics. Thus a velocity push-down
is likely to contribute to the total time structure that is seen on the seismic data. For
example, the ELKPT horizon shows a total time structure of some 45 ms of two-way travel
time below regional levels. From the well control, it is known that some of this time

108structure is due to an actual 26 m of ELKPT structure. This corresponds to about 9 ms of
two way travel time (based on the carbonate rock’s average P-wave velocity of 6000 m/s
from the 08-31 well log). Thus the remaining 36 ms of time structure should be due to
velocity push down. Most of this push-down is likely due to the clastic infill of the
structure. As indicated earlier, this infill has a thickness of about 180 m and a P-wave
velocity of about 3750 m/s. Juxtaposed against the Mississippian carbonates it replaces,
which show an average P-wave velocity of 5750 m/s (from the 06-04 well log), the
corresponding time effect is about 33 ms of push-down, in close agreement with the 36 ms
estimated from the ELKPT horizon time structure.
4.2.2.3 General Morphology
The structure is approximately bowl-shaped with an elliptical expression in plan
view. It appears grossly bilaterally symmetric in the seismic sections although there tends
to be a greater density of normal faulting in the western portion of lines DBRR-1 and
DBRR-2 and in the southern portion of line DBRR-3 (Figures 4.12, 4.13 and 4.14).
These listric rim faults delineate terraces which step down into the structure towards its
core, which is comprised primarily of chaotic reflections. The structure appears to disrupt
primarily the Devonian and Mississippian carbonates down to the ELKPT horizon but it is
possible that deeper structural deformation exists. Within the structure there is clastic infill
above the apparently downdropped MISS horizon. The structure affects strata shallower
than the MISS, manifested largely as thickening of clastic sediments, which dominates
horizons shallower than HOR-A, as well as a combination of thickening and normal
faulting in clastic horizons from HOR-A to the SAWTH. The ELKPT horizon shows time
structure in addition to actual downdrop, believed to be a velocity push-down effect.

109It is possible to estimate the geometric dimensions of the structure quantitatively by
combining all the data described previously as well as the appropriate velocity information,
and the horizontal trace scale. In plan view, the structure appears slightly elliptical with a
major axis diameter of nearly 4 km and a minor axis diameter of nearly 3 km at the MISS
horizon (Figure 4.1). The structure’s total depth of disruption is estimated to include the
MISS to ELKPT horizons - a thickness of some 750 m regionally. The structure of the
MISS horizon from regional to its deeper location in the feature is estimated at 180 m.
Thus, the maximum thickness of the clastic infill is also 180 m. The thickness of the
remaining portion of the structure, primarily characterized by a lack of reflector coherency,
is about 596 m (this includes the 26 m displacement of the ELKPT). The seismic data
indicate about 200 ms of two-way time thickness for the structure’s core (MISS to ELKPT)
with an approximate carbonate rock P-wave velocity of about 6000 m/s (from 08-31). This
corresponds to a thickness of 600 m, in good agreement with the well data.
Infilling of the structure over time has resulted in thickening of the clastic sediments within
and above the structure. 160 m of additional Mesozoic sediment is present above the MISS
within the structure compared to regional levels. This results in 20 m of structure still
present at the SWSPK level. The thickening decreases with decreasing depth, amounting
to about 50 m for the SAWTH-MISS interval, 55 m for the RIERDN-SAWTH interval, 35
m for the MANN-RIERDN interval, no apparent thickening of the BOWISL-MANN
interval and about 20 m for the SWSPK-BOWISL interval.
The rim faults show downward vertical displacements up to about 90 m and the terraces are
some 200-250 m wide. A schematic summary of these estimated dimensions can be seen
in Figure 4.15.

1104.3 DISCUSSION
The initial interpretation of a meteorite impact origin hinged largely on a stratigraphic cross
section made over the feature which suggested a simple crater morphology at the
Mississippian level. I will look again at this hypothesis in more detail and, with the aid of
the scaling criteria introduced in Chapter 2, show that the structure is not a simple crater,
but appears to satisfy some of the scaling requirements for a complex impact crater
reasonably well. I will also look briefly at other possible explanations for the origin of this
feature.
4.3.1 Meteorite Impact Origin
The Purple Springs structure is similar to a simple meteorite impact crater. It is bowl-
shaped with a chaotic core and an elliptical plan - all characteristics of such an impact
structure. However, there are some key differences in morphology between this structure
and typical simple impact craters. For example, simple craters are not characterized by
normal faulting and terracing along the rim as is evident from the seismic data at the MISS
horizon. Furthermore, simple craters have depth-to-diameter ratios of about 1/5, whereas
the Purple Springs structure demonstrates a ratio of about 1/20 indicating it is much
shallower than typical simple craters.
A rim diameter of about 1.4 km is calculated (Eq. 2-11) based on the 180 m apparent depth
of the structure and this is about three times smaller than the rim diameter apparent in the
seismic data. Similarly, if the chaotic portion of the structure were a breccia lens as in
simple craters, then the ratio of crater depth-to-breccia lens thickness should be about 2
(Eq. 2-10). However, the Purple Springs structure has a ratio of about 1/3. This disparity
may be due to erosion of the original impact surface thus making the crater shallower
relative to the breccia lens thickness. However, if the breccia lens were left largely

111uneroded, then its 596 m thickness implies a simple crater depth of nearly 1.2 km (by
Equation 2-10) which in turn, corresponds to an expected rim diameter of about 8 km
(using Equation 2-11). This is clearly beyond the crater diameter transition zone for
simple-to-complex morphologies on Earth and hence, a simple morphology is unlikely for
such a large crater.
Interpretation of the geophysical data indicates listric normal faulting and terraces along the
rim. These are morphological characteristics more likely associated with complex craters,
and certainly the nearly 4 km rim diameter falls within the complex crater range. Craters
greater than 2 km in diameter, located in sedimentary target rocks, are expected to be of the
complex form due to their decreased strength relative to crystalline rocks. With a rim
diameter of 4 km, the anticipated crater depth, using Equation 2-16, is about 182 m, in
excellent agreement with that measured from the seismic data. However, complex crater
modification also tells of the formation of a structurally uplifted central peak which
generally forms abruptly after the transition diameter is surpassed. By Equation 2-18, this
uplift should be on the order of some 360 m for a 4 km complex crater, with a diameter of
some 760 to 1000 m (Eq. 2-19). The data at Purple Springs give no indication that such a
structurally uplifted central peak is present. Furthermore, the transient crater diameter is
caluclated to be 3.6 km with a corresponding transient crater depth of about 1.2 km (Eq. 2-
15). The full thickness of the Mississippian-Devonian interval is only 750 m, implying
erosion of the Mississippian of some 450 m just to accommodate the size of the transient
crater. If structural uplift, the increase in rim diameter associated with “raising” the current
event horizon (the MISS), and the added evidence of Mississippian-Devonian carbonates in
the center of the structure is considered, then even greater erosion of the post-impact
surface is implied. These measurements and scaling results are summarized in Table 4.3.
Recall also that these scaling criteria, used in the White Valley case study presented in

112
Chapter 3 to connect the post-impact morphology to the transient crater size, did not appear
adequate. It is also possible that the impact itself was atypical thus making the scaling
criteria inappropriate. For example, the elongate shape of the structure may be due to a
fairly oblique impact.
Fragmentation of the projectile will also alter the crater morphology producing shallower
and flatter than expected simple craters (Shultz and Gault, 1985). While the Purple Springs
structure is shallower than typical simple craters, the region corresponding to the breccia
lens is much too thick. Alternatively, fragmentation leads to the formation of crater fields -
an elliptical area in which several impacts occur - sometimes leaving only one major
depression (Passey and Melosh, 1980). However, this also does not appear to be the case
at Purple Springs. Possible fragmentation also fails to explain the rim terracing at Purple
Springs as far as it being a possible simple crater goes. It is not apparent whether
fragmentation events significantly alter complex crater morphology since the result of
fragmented projectile impacts becomes less important with increasing meteorite size
(Melosh, 1989).
Another possible explanation is that the carbonate rocks into which the impact occurred,
behave uniquely enough during crater formation as to be poorly represented by the scaling
criteria. The strength of the carbonates may be great enough that the transition diameter is
Table 4.3 Comparison of measured dimensions and results from thescaling equations for the White Valley structure. Values are based ona rim diameter of 4 km and complex crater scaling equations. The datado not include any estimates for possible erosion.
Dimension Measured Result Scaling EquationsDepth 180 m 182 m
Structural Uplift none 360 mCentral Peak Diameter none 760-1000 m
Transient Crater Diameter N/A 3.27-3.86 kmTransient Crater Depth ≤ 750 m 1200 m

113greater than for impacts in purely clastic sedimentary rocks. The Purple Springs structure
may therefore be closer to the transition diameter. It may therefore be representative of a
structure at the onset of complex crater development, having properties of both
morphological end members. For the moment, these ideas are speculative and require
greater investigation to be substantiated.
4.3.2 Dissolution Phenomena
The extensive deposition of salts in the Western Canada Sedimentary Basin and the
prominence with which many structures can be attributed to dissolution phenomena (the
leaching of salt and subsequent collapse of overburden), led to the idea that dissolution may
have played a role in the formation of the Purple Springs structure. However, in reviewing
these types of structures, it would appear that the dissolution hypothesis alone can not
account for all the characteristics of the Purple Springs feature.
Although the base of the Purple Springs structure is coincident with the base of the
Devonian, where the deepest salt-bearing formations are found, the total evaporite
thickness is less than 100 m and is primarily anhydrite - salt probably makes up less than
1/3 to 1/2 of this thickness (Gorrel and Alderman, 1968; Halbertsma, 1994; Switzer et al.,
1994; Meijer Drees, 1994). Thus the 180 m structure on the Mississippian appears to
require an anomalously thick salt sequence that has no precedent in the immediate area.
Alternatively, leaching of other evaporites other than salt (such as the anhydrite) as well as
leaching of carbonates would have had to accompany salt dissolution to allow for the 180
m of structure. However, it is unknown how significant dissolution of these other rock
types might be. Sub-aereal exposure occurred in the Carboniferous and may have led to
karsting and subsequent collapse. However, the disrupted zone at Purple Springs extends
114to the Elk Point Group, indicating that any dissolution-initiated collapse likely included
dissolution at that horizon.
Salt collapse features have the potential to disrupt thick sections of stratigraphy but their
surface expression is usually small in area. For example, Crater Lake in southeastern
Saskatchewan is only 244 m in diameter and is the surface expression of a breccia-filled
collapse chimney that extends 914 m below the surface (Gendzwill and Hajnal, 1971).
Similarly, the Wink Sink, a 110 m diameter collapse structure in Kansas, is the surface
expression of a collapse chimney that rises some 500 m from a dissolution channel in
Permian salts (Baumgardner et al., 1982). Interestingly, in the Crater Lake case,
Gendzwill and Hajnal (1972) suggest that the dissolution of only 38 m of salt was followed
by stoping of the cavern roof which led to a cavern height of some 114 m prior to
wholesale block faulting to the surface. They also note that the initial solution cavity
appears circular as opposed to linear as is typical for these features. A similar mechanism
is described by Terzaghi (1970) as a possible reason for the Sandwich brinefield collapse
structure near Windsor, Ontario. Thus it is conceivable that the total vertical displacement
at Purple Springs may be a result of salt dissolution as well as stoping and leaching of
country rock and possible compaction of the collapse breccias by an increasing overburden
load during Mesozoic and Cenozoic deposition. However, the 4 km diameter span of such
a structure appears unlikely as the overlying rocks making up the roof of the cavity
probably could not support the overburden weight to allow for such a large solution cavity.
This mechanism also fails to explain the normal faulting associated with the rim of the
Purple Springs structure, although this may be a normal consequence of such large-scale
collapse. The seismic data do not appear to image an elongate trough into which collapse
might have taken place. It must also be presumed, therefore, that the solution cavity was
essentially circular, similar to the Crater Lake example. Possible basement faulting,

115indirectly indicated by structure on the Elk Point horizon may have been the conduit for the
required brines. Dissolution, then, while not singularly able to explain the Purple Springs
structure, still may have played a role in its formation. Perhaps a more likely scenario is
that dissolution altered what was initially a meteorite impact crater. This may partially
explain the lack of a prominent central peak which, due to the fractured nature of the core,
may have been preferrentially eroded by dissolution and surface erosion processes.
Nonetheless, scaling criteria indicate some 360 m of expected structural uplift, half of
which would have had to have been removed to result in the current morphometry.
4.4 CONCLUSIONS
In summary the Purple Springs structure is an enigmatic, slightly elliptical depression in
Mississippian and Devonian carbonates characterized by normal faulting at the rim, which
delineate terraced blocks downdropped into the center of the structure. The maximum
vertical displacement of this 4 km diameter feature is about 180 m below regional levels at
the MISS horizon. Infilling of this basin began at Jurassic time evidenced by thickening
and draping of clastic sediments. Total thickening of the clastics amounts to 160 m,
leaving 20 m of structural downdrop on the shallowest correlated reflector (SWSPK).
Fracturing associated with the main structure crosscuts the deepest of these clastic horizons
(SAWTH and RIERDN) with some more minor fracturing of the shallower horizons. This
suggests that the formation of the Purple Springs structure occurred primarily at
Mississippian time but further deformation took place through to at least the end of the
Early Cretaceous.
Two hypotheses for the origin of the structure are presented. The first, based on initial
industry interpretations of the structure, suggests a meteorite impact origin. The second,
based on the prevalence of dissolution features in the Western Canadian Sedimentary

116Basin, suggests that dissolution resulted in the feature or played a role in its genesis. The
proposal that the Purple Springs structure is the result of dissolution phenomena is not
satisfactory. The major problem with this mechanism is the lack of any analogous features
in southern Alberta that show the same magnitude of deformation over such a large area.
The dissolution hypothesis also requires a combination of an anomalously thick evaporite
deposit and leaching of carbonates to accommodate the structural downdrop, although
compaction of collapse breccia might account for some of this structure. None of these
processes have analogs in the area for such a large structure. The meteorite impact theory
is still favorable based simply on the lack of evidence for any endogenic processes in the
area that could create such a large structure. However, this theory is also not perfectly
aligned with the evidence currently at hand. Scaling criteria indicate the structure is not a
simple crater but is more likely of the complex form. The seismic data indicate a terraced
rim and the apparent depth of the structure matches that which is predicted from scaling.
The lack of any obvious structural uplift, predicted to be 360 m is not easily explained,
however. Possible post-impact, differential erosion and dissolution may have reduced the
size of the central peak. Basement faulting can also not be ruled out as a possible
contributor to the structure. It should also be noted that some impact conditions such as
oblique impacts (which are expected to be the norm) are not well understood, and when
one considers that not all known terrestrial impact craters are “typical”, further results from
high-velocity impact research may shed new light on this hypothesis. Sharpton (1994), for
example, showed evidence for unusually deep complex impact craters on Venus. Perhaps
impacts in stratigraphic targets on Earth are not properly represented by the current scaling
criteria either. Nonetheless, the impact theory remains one of the more likely explanations
for the origin of this structure.

117
6-4
1-36
1 6
1 61 66
36
36 31
36 31 36 31
1 6
36 31
1 6
31
-111o50' -111o45' -111o40'
-111o55' -111o50' -111o45' -111o40'
49o 5
0' 49 o50'
1014W4
1013W4
DBRR-1
DBRR-2
DB
RR
-3
4-32
Edge ofStructure
8-31
0 1 2 3 4km
well locationseismic lineN
.
.Calgary
Edmonton
ALBERTA
U.S.A.
B.C.
*
Purple Springs Study Area*
Fig. 4.1 Base map of the Purple Springs area including the seismic lines, wellcontrol points and edge of the structure, based on the Mississippian horizon.

118
Sha
le/S
ST
Car
b/S
hale
PERIOD FORMATION LITH.
Tertiary
Jurassic
Mississippian
Late
Early
Late
Mid.Elk Pt. GP
LodgePole
MissionCanyon
Mannville GP
Colorado GP
Milk River
Belly River
Bear Paw
Eastend
/Ravenscrag
Battle/Whitemud
Sandstone
Sandstonesand
Shales
Carbonate
Shale/SST
Shale
Shale
Carbonate
*
Gravelbourg
Shaunavon
VanguardSwift
Rierdon
SawtoothEarly
Late
Mt. Head
Turner Valley
Shunda
Pekisko
Banff
Exshaw Bakken
WabamunCalamar
Nisku
Ireton
Leduc
Cooking Lake
BeaverhillLake
MildredSwanHills
*
*
*
**
*
*
*
Porc.Hills
*
Elli
s G
P
Cre
tace
ous
Dev
onia
n
Fig. 4.2 Generalized stratigraphy of the Purple Springs area.Shading indicates salt-bearing formations and asterixes (*) indicatehydrocarbon-bearing formations (from AGAT Laboratories, 1988).

119
06-04 08-31 04-32 01-3620 km0.6 km2.4 km
HOR-A RIERDN SAWTH
STRUCTURE REGIONALREGIONAL
MISS
WAB
ELKPT
SWSPK
BOWISL
RIERDN/SAWTH
MANN
?
DATUM
??
0
-100
-200
-300
-400
-500
-600
-700
-800
-900
100
200
300
Dep
th (
mas
l)
Fig. 4.3 Structural cross section using the velocity logs of the four wells. The wells are datumed on average sea level.The horizons are marked based on the log signatures and the well-to-seismic and seismic-to-seismic correlations.
WAB
ELKPT

120
1.0 4.0 7.0
0.0
0.1
0.2
0.3
0.4
0.5
0.6
0.7
0.8
500
750
1000
1250
1500
1750
2000
0.3
0.4
0.5
0.6
0.8
0.9
1.0
1.1
DBRR-2Seismic
Velocity(x1000 m/s)
WELL 01-36-009-13W4
DBRR-1Seismic
Synthetic(Ricker wavelet
35 Hz)
SWSPK
BOWISL
MANN
MISS
WAB
ELKPT
RIERDNSAWTH
HOR-A
Dep
th (
m b
elow
KB
)
Tim
e (s)
KB = 816.6 m
Fig. 4.4 Correlation of the sonic log and zero offset synthetic from the 01-36 well to the seismic data. The data are shown normal polarity such that apeak corresponds to an impedance increase.

121
0.0
0.1
0.2
0.3
0.4
0.5
0.6
0.7
0.8
500
750
1000
1250
1500
1750
250
1.0 4.0 7.0
Velocity(x1000 m/s)
WELL 06-04-011-14W4
DBRR-3Seismic
Synthetic(Ricker wavelet
35 Hz)
SWSPK
BOWISL
MANN
MISS
WAB
ELKPT
RIERDN/SAWTHHOR-A
Dep
th (
m b
elow
KB
)
Tim
e (s)
Fig 4.5 Correlation of the sonic log and zero offset synthetic from 06-04 to theseismic data from the end of line DBRR-3. The data are normal polarity.
0.3
0.4
0.5
0.6
0.7
0.8
0.9
1.0
KB = 791.5 m

122
0.5
0.6
0.7
0.8
0.9
1.0
DBRR-1Seismic
0.5
0.6
0.7
0.8
0.9
1.0
DBRR-2Seismic
DBRR-3Seismic
0.2
0.3
0.4
0.5
0.6
0.7
750
1000
1250
1500
1750
0.5
0.6
0.7
0.8
0.9
1.0
Tim
e (s)
Dep
th (
m b
elow
KB
)
BOWISL
MANN
RIERDNSAWTH
ELKPT
MISS
WAB
1.0 4.0 7.0
Velocity(x1000 m/s)
WELL 08-31-010-14W4
HOR-A
Synthetic(Ricker wavelet
35 Hz)
Fig. 4.6 Correlation of the sonic log and zero offset synthetic from 08-31 to all three seismic lines. Thedata are normal polarity.
KB = 795.2 mSWSPK

123
0.1
0.2
0.3
0.4
0.5
0.6
1.0 4.0 7.0
Velocity(x1000 m/s)
WELL 04-32-010-14W4
0.3
0.4
0.5
0.6
0.7
0.8
0.9
DBRR-2Seismic
DBRR-1Seismic
DBRR-3Seismic
Tim
e (s)D
epth
(m
bel
ow K
B)
Fig. 4.7 Correlation of the sonic log and zero offset synthetic from 04-32 to all three seismiclines. The data are normal polarity. Note the salt occurence at approximately 1100 m depth.
500
750
1000
1250
SWSPK
BOWISL
MANN
RIERDN
SAWTHMISS
HOR-A
Synthetic(Ricker wavelet
35 Hz)
KB = 793.2 m

124
0.2
0.3
0.4
0.5
0.6
0.7
0.8
0.9
1.0
1.1
DBRR-1
0.2
0.3
0.4
0.5
0.6
0.7
0.8
0.9
1.0
1.1
DBRR-2
0.2
0.3
0.4
0.5
0.6
0.7
0.8
0.9
1.0
1.1
DBRR-3
0.2
0.3
0.4
0.5
0.6
0.7
0.8
0.9
1.0
1.1
DBRR-3
SWSPK
BOWISL
MANN
ELKPT
WAB
MISSSAWTH
HOR-A RIERDN
Line Tie betweenDBRR-1 and DBRR-3
Line Tie betweenDBRR-2 and DBRR-3
Tim
e (s
) Tim
e (s)
Fig. 4.8 Line ties from DBRR-3 to DBRR-1 (left) and DBRR-2 (right).
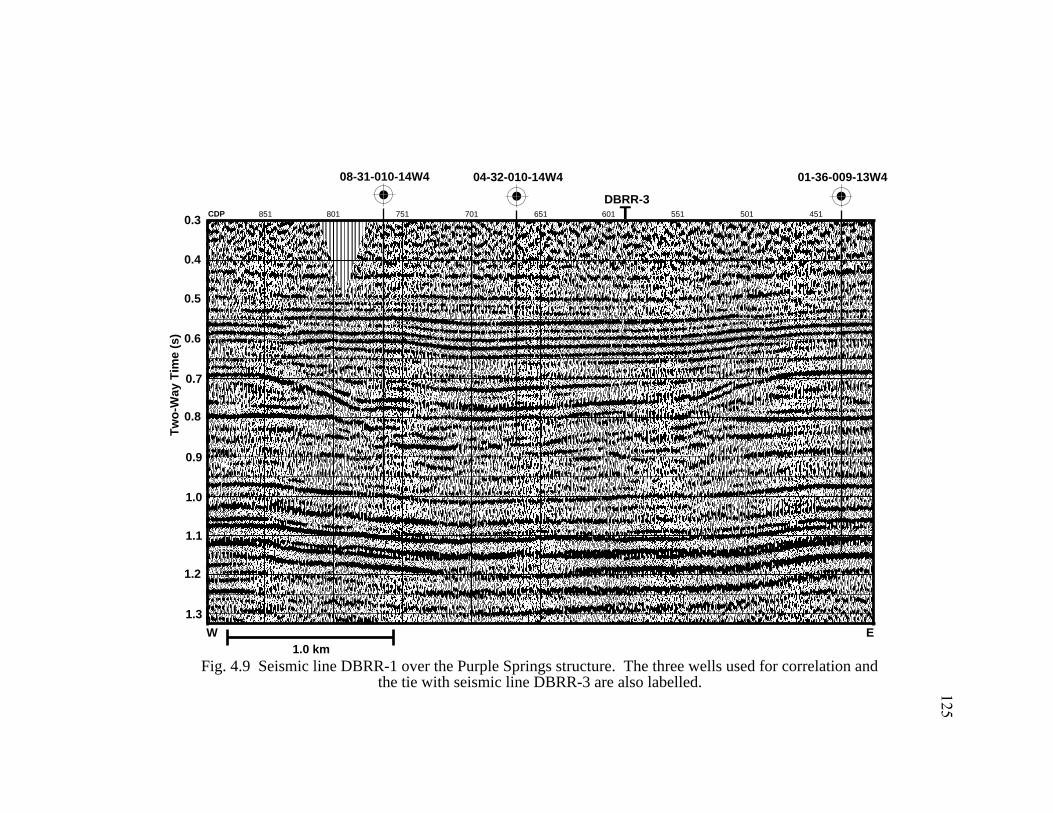
125
08-31-010-14W4 04-32-010-14W4 01-36-009-13W4
Fig. 4.9 Seismic line DBRR-1 over the Purple Springs structure. The three wells used for correlation andthe tie with seismic line DBRR-3 are also labelled.
1.0
1.1
1.2
1.3
0.3
0.4
0.5
0.6
0.7
0.8
0.9
Tw
o-W
ay T
ime
(s)
851 801 751 701 651 601 551 501 451CDP
W E1.0 km
TDBRR-3

126
1.0
1.1
1.2
1.3
0.3
0.4
0.5
0.6
0.7
0.8
0.9
Tw
o-W
ay T
ime
(s)
851 801 751 701 651 601 551 501 451CDP 901
08-31-010-14W4 04-32-010-14W4 01-36-009-13W4
W E1.0 km
TDBRR-3
Fig. 4.10 Portion of seismic line DBRR-2 over the Purple Springs structure. Annotated above are thethree wells used for correlation and the tie with line DBRR-3.

127
1.0
1.1
1.2
1.3
0.3
0.4
0.5
0.6
0.7
0.8
0.9
Tw
o-W
ay T
ime
(s)
251 301 351 401 451 501 551 601 651 701CDP 751
08-31-010-14W4 04-32-010-14W406-04-011-14W4
T T
N S1.0 km
Fig. 4.11 Seismic line DBRR-3 over the Purple Springs structure. The three wells used for correlationand the tie with seismic lines DBRR-1 and DBRR-2 are also shown.
DBRR-2DBRR-1

128
1.0
1.1
1.2
1.3
0.4
0.5
0.6
0.7
0.8
0.9
Tw
o-W
ay T
ime
(s)
851 801 751 701 651 601 551 501 451CDP
W E1.0 km
08-31-010-14W4 04-32-010-14W4 01-36-009-13W4
TDBRR-3
Fig. 4.12 Interpretation of seismic line DBRR-1. The structure appears to be bowl-shaped with rimfaulting and a chaotic core denoted by "?".
0.3
?
?? ?
?
SWSPK
BOWISL
HOR-A
SAWTHRIERDN
MISS
MANN
WAB
HOR-B
ELKPT
HOR-AMISS
MISSWAB
HOR-B
ELKPT

129
1.0
1.1
1.2
1.3
0.3
0.4
0.5
0.6
0.7
0.8
0.9
Tw
o-W
ay T
ime
(s)
W E1.0 km
?
? ??
? ?
Fig. 4.13 Interpretation of seismic line DBRR-2. Parralleling line DBRR-1, which lies to the north, theinterpreted structure appears similar.
851 801 751 701 651 601 551 501 451CDP 901
08-31-010-14W4 04-32-010-14W4 01-36-009-13W4
TDBRR-3
MISS
SWSPK
BOWISL
MANN
WAB
HOR-B
ELKPT
HOR-A
SAWTHRIERDN
HOR-A
WAB
HOR-B
ELKPT
MISS

130
1.0
1.1
1.2
1.3
0.3
0.4
0.5
0.6
0.7
0.8
0.9
Tw
o-W
ay T
ime
(s)
N S1.0 km
?
?
?
?
? ?
? ?
HOR-ARIERDN
SWSPK
BOWISL
MISS
MANN
WAB
ELKPT
HOR-B
Fig. 4.14 Interpretation of seismic line DBRR-3. This line shows possible faulting at the ELKPT horizon.It is unclear what causal association these faults may have to the structure.
HOR-A
251 301 351 401 451 501 551 601 651 701CDP 751
08-31-010-14W4 04-32-010-14W406-04-011-14W4
TDBRR-1
TDBRR-2
MISSWAB
ELKPT
HOR-B
MISS
SAWTH

131
ELKPT
Fig. 4.15 Schematic representation of the Purple Springs structure showing relevant dimensions as measuredfrom the seismic and well data. Diagram is not to scale and all measurements are in meters.
SWSPK
BOWISL
MANN
MISS
MISS
WAB55
65
3000-4000
165
125
145
125
125
13010
5 RIERDN
SAWTH
596
750
180
26
RegionalThickness
(m)AnomalousThickness
(m)
<100

132
CHAPTER 5 - CONCLUSIONS
5.1 INTRODUCTION
The purpose of this work was to study the use of reflection seismic data as a tool to help
recognize an impact origin for subsurface structures. Currently, the only accepted method
of determining such an origin without direct evidence of the meteorite itself or its
characteristic geochemical signature in target rocks, is through the discovery of shock
metamorphic affects in the target rocks, whether they manifest themselves as shatter cones,
high-pressure mineralogical phases or shock lamellae in minerals. In the case of surface
features on land, these data can be relatively easy to gather, particularly if rocks outcrop in
the area, and the crater itself has a topographic expression. However, in the cases where
the features are buried beneath the surface, or occur beneath the oceans, this type of
conclusive data can be extremely difficult or expensive to obtain. Often, these features are
located indirectly by an anomalous geophysical measurement and sometimes explored
further by drilling in the quest for resources. In the case of the oil and gas industry, by far
the most important exploration tool is the reflection seismic technique. In this work, I
study two enigmatic structures of unknown origin, both of which are imaged on reflection
seismic profiles. One, at White Valley, Saskatchewan appears similar to a complex impact
crater, and the other, near Purple Springs, Alberta, was originally interpreted to be a simple
impact crater. Both are major structural features of possible meteorite impact origin,
however, as noted above, without definitive evidence of shock metamorphism, neither of
these structures can be proven to be of impact origin. The hope is that by careful study of
their seismic character, the impact hypothesis can be more readily substantiated or refuted.

133
5.2 THE WHITE VALLEY STRUCTURE
Interpretation of this structure, based on seismic reflection data and available well control,
leads to the following specific conclusions. The feature is an obvious structural anomaly
on seismic data as it disrupts an otherwise normal stratigraphic sequence apparently from
near surface to a depth of some 1300 m. The Mississippian appears to be the deepest
horizon affected by the structure with only some minor faulting and velocity pull-up
apparent on the seismic profiles. The topography of the area, as seen on aerial
photographs, shows what appears to be an erosional remnant ridge, arcuate in form, that
can be extended to a circle with a diameter of 7.5 km. The structure itself is imaged
primarily in horizons deeper than the Belly River formation, but extrapolation of its lateral
limits to the surface gives a similar diameter for the structure. The rim of the White Valley
structure is characterized by listric normal faults which delineate separate terraces which, in
turn, step down towards an annular trough about 4 km in diameter. The core of the
structure, some 2 km in diameter, demonstrates stratigraphic uplift of some 450-620 m and
is characterized by incoherent reflections. The flanks of this central peak show evidence of
slumping. Repeated sections apparent in logs from the 07-07 well, drilled on the flanks of
the central core, indicate thrusted rock units deeper in the structure as well as possible
interfingering of material, although these repeats do not appear to be imaged on the seismic
profiles. A gravity survey over the trough and central peak of the feature, coincident with
seismic line WV-017, demonstrated a positive anomaly of nearly 3 mgal over the center of
the structure. This profile is also bilaterally symmetric and is coincident with the general
morphology of the structure as imaged in the seismic data. Using two simple models (a
sphere and vertical cylinder), the anomaly can be explained by a realistic density anomaly
of some 30 to 100 kg/m3 over the central portion of the structure. However, the well data

134indicates a nearly 50 kg/m3 density decrease over the center of the structure when compared
to regional values.
Two possible origins for this structure were investigated. The first suggested that the
structure was a kimberlite pipe and had been previously cited as a mechanism of origin in
the literature. The kimberlite model was initially proposed largely due to the inverted cone
shape of the central core of the structure and that the gravity anomaly could be modelled as
a complex form of such a structure. However, a more detailed look at the physical
characteristics of kimberlite pipes indicated deficiencies with this model. Kimberlites do
not show extensive terraced rim structures such as is present at White Valley and are not
expected to be greater than 1 km in diameter. The sides of the core of the structure dip at
about 50-60˚, not the typical 80-85˚ noted for kimberlite pipes. Kimberlites also fail to
show any structural uplift; horizons are usually tilted down toward the main pipe with little
or no terracing. Coupled with the lack of any kimberlitic material in the 07-07 well, this
model becomes even less plausible.
The second theory suggested a meteorite impact origin for the structure. The general
morphology of the structure fits well with the predicted features from the model for a
complex impact crater formed by high-velocity impact. The terraced rim, annular trough
and central peak showing stratigraphic uplift are all commensurate with the impact
hypothesis. The gravity data seems to indicate an overall negative anomaly over the
structure with the central peak demonstrating a positive anomaly relative to the trough.
This is not unusual based on other terrestrial examples of impact craters, however, more
detailed modelling of the gravity response would help to constrain the gravity data better.
The calculated transient crater, based on the rim diameter of the structure projected to the
surface, does not fit the seismic data well unless some 200 to 1000 m of post-impact

135erosion is invoked. This discrepancy may reflect an actual erosional component to the
post-impact history of the structure or an inherent inadequacy with the chosen scaling
criteria. Most other scaling criteria pertaining to the final geometry of the crater agree well
with the seismic data. Thus, the meteorite impact hypothesis is favoured over the
kimberlite model for the origin of this structure.
5.3 THE PURPLE SPRINGS STRUCTURE
The specific results of this interpretation, based on seismic data and well control can be
summarized as follows. The regional geological setting is that of a fairly typical succession
throughout the stratigraphic column from Paleozoic carbonates into Mesozoic and Cenozoic
clastics. The paleogeography of this location was one of an emergent upland during the
Lower Devonian with subsequent transgression-regression events in response to relative
sea level changes and/or orogenic episodes. Most of the structural deformation occurred to
the west of the Purple Springs area and this particular location would have been near the
coastline of inland seas that generally stretched from northwestern Alberta and northeastern
British Columbia into southern Saskatchewan, Manitoba and the mid-western United
States. The structure itself is an elliptical depression with a maximum diameter of nearly 4
km and a minimum diameter of some 3 km. The structure disrupts primarily Mississippian
and Devonian carbonate rocks with minor, simpler structure occurring shallower in the
section. The deepest Devonian carbonates of the Elk Point Group are downdropped 26 m
beneath the structure. Maximum vertical displacement occurs at the Mississippian horizon
which is 180 m below regional levels at the center of the structure. The core of the
structure, nearly 600 m thick, is characterized by incoherent reflections and is laterally
delineated by normal faults at the rim of the structure. Terraces, with maximum vertical
displacements of some 90 m, are imaged along the rim and step down into the structure.
The structure is infilled with clastic sediments primarily Jurassic in age although thickening

136of formations occurs up into the Cretaceous as well. The deepest clastic formations show
the greatest thickening of some 50-55 m with shallower formations showing less
thickening. Nonetheless, the shallowest correlated horizon, the Second White Speckled
Shale formation, shows 20 m of structure indicating that the total thickening of sediments
shallower than the Mississippian compensates for 160 m. Normal faulting, also more
apparent in the lower clastics but continuing in some cases to the Second White Speckled
Shale formation, indicates that structural deformation continued after the main
Mississippian event. This may have been caused by processes within the Mississippian-
Devonian portion of the structure in combination with increased overburden loading and
compression during Mesozoic deposition.
Two hypotheses are put forward to explain the structure’s origin. The first, based on
original industry interpretations, is that the structure is the remnant simple crater left by a
high-velocity impact. However, the application of scaling criteria and morphological
considerations suggests the Purple Springs structure is more likely a complex impact crater.
The structure does not compare favourably to a typical simple impact crater due to the
presence of rim terraces, its large diameter compared to the simple-to-complex transition
diameter expected for sedimentary rocks, the large thickness of the apparent breccia lens
relative to its shallow depth, and its elliptical shape in plan view. However, it does not
compare perfectly to typical complex craters mainly because of the lack of structural uplift
in the center of the structure and the greater depth of the transient crater than the allowable
stratigraphic thickness regionally. It is thought that post-impact processes altered the
structure substantially to its current form.
The second hypothesis proposed the structure was the result of dissolution phenomena.
Unfortunately, this hypothesis, while possibly able to explain the amount of vertical

137structure, does not seem to justify a dissolution collapse feature covering such a large area.
There appears to be no analogous structure of similar dimensions that has been attributed
solely to dissolution. Nonetheless, dissolution may have played a role in deforming the
original impact structure perhaps leading to preferential removal of the central uplift. The
question of basement reactivation as a possible contributor to the formation of the structure
is also still open since there is presently a lack of basement control to definitively say to
what extent such structure exists. If such basement faulting was present, it may have
provided a conduit for the brines required for dissolution. Further work is required to
substantiate or refute these alternative hypotheses, but the impact theory remains the most
likely.
5.4 GENERAL COMMENTS AND FUTURE WORK
In the course of interpreting the structures at White Valley, Saskatchewan and Purple
Springs, Alberta, a number of general comments can be made about the difficulties
encountered in trying to determine an impact origin for a structure based on seismic
reflection data.
It appears that complex craters, being more distinct in their morphology are less likely to be
confused with other endogenically produced structures. The White Valley structure, which
seems to fit scaling criteria reasonably well, and lacks evidence for other endogenic
mechanisms of origin, is likely a meteorite impact feature. On the other hand, the Purple
Springs structure, which was originally interpreted to be a simple impact crater fits the
scaling criteria for a complex impact crater better. Some problems with this analysis,
however, suggests that endogenic processes contributed to the current form of the
structure. An understanding of the expected geometrical relationships of crater morphology
was therefore critical for this interpretation.
138
Definitive interpretations hinge a great deal on the level of preservation of the structure.
Better preservation of the original impact structure will result in a better comparison with
the models proposed by the scaling criteria. How other geological processes (e.g.,
dissolution, surface erosion, basement fault reactivation, tectonic movement) might affect
these geometric relationships is important for correctly assessing the geometry of a given
structure as seen on seismic data.
There are several endeavours which might help to further the usefulness of seismic data in
the interpretation of impact structures and aid in our understanding of how they form.
Searching for more examples of seismic data over these structures adds to the database of
known structures and would help to refine scaling criteria for terrestrial craters.
Palinspastic reconstruction of complex craters to their pre-modified state would help to
define the size of the transient crater and may shed light on the mechanics of central uplift
generation and rim faulting. For both case studies, a fairly typical processing runstream
was used to produce a final migrated stack from which the interpretations were done.
Seismic modelling of impact structures may help to understand imaging problems
associated with processing of these seismic data such as velocity issues, the
appropriateness of time migration versus depth migration, and the possible problems of
side scatter energy contaminating 2-D seismic datasets. In the acquisition of seismic data,
we have already seen that 3-D seismic data gives superior images of crater morphologies
whereby individual blocks of rock can be seen displaced from their pre-impact positions
(refer to the James River structure, Chapter 1, Figure 1.16). However, 2-D datasets,
acquired diametrically across the structure, reducing side-scatter noise are still useful.
Finally, incorporating other datasets into the interpretation, such as gravity and
aeromagnetic data, as well as geological information, both regionally and locally to the

139structure, can only help to constrain the interpretation further, giving this unique hypothesis
of structure origin more impact.

140REFERENCES
AGAT Laboratories, 1988, Table of formations of Alberta: AGAT Laboratories, Calgary.
AGAT Laboratories, 1988a, Table of formations of Saskatchewan: AGAT Laboratories,Calgary.
Anderson, C.E., 1980, A seismic reflection study of a probable astrobleme near Hartney,Manitoba: Can. Jour. Expl. Geophys., 16, 7-18.
Anderson, N.L. and Brown, R.J., 1991, A seismic analysis of Black Creek and Wabamunsalt collapse features, Western Canadian Sedimentary Basin: Geophysics, 56, 618-627.
Anderson, N.L., 1988, Devonian salts and hydrocarbon traps: A Petrel Robertson shortcourse, 65p.
Anderson, N.L., Brown, R.J., and Hinds, R.C., 1988, Geophysical aspects of Wabamunsalt distribution in southern Alberta: Can. Jour. Expl. Geophys., 24, 166-178.
Baumgardner, R.W., Hoadley, A.D., and Goldstein, A.G., 1982, Formation of the WinkSink, a salt dissolution and collapse feature, Winkler County, Texas: Bureau of EconomicGeology, The University of Texas at Austin, Report of Investigations No. 114, 38p.
Belisle, J., 1995, 3C-3D seismic survey over high-angle intrusives: A physical modellingstudy: CREWES Project Research Report, 7, Chapter 2, 1-3.
Brenen, R.L., Peterson, B.L., and Smith, H.J., 1975, The origin of the Red Wing Creekstructure: McKenzie County, North Dakota: Earth Sci. Bull., 8, 1-41.
Buthman, D.B., 1995, Global hydrocarbon potential of impact structures: Ames structureand similar features, Expanded Abstracts, 5.
Castaño, J.R., Clement, J.H. and Sharpton, V.L., 1995, Source rock potential of impactcraters: Ames structure and similar features, Norman, OK, Expanded Abstracts, 6.
Christiansen, E.A. and Whitaker, S.H., 1976, Glacial thrusting of drift and bedrock: inLegget, R.F., Ed., Glacial till, Roy. Soc. Can., Special Publication No. 12, 121-130.
Croft, S.K., 1981, The excavation stage of basin formation: A qualitative model: inSchultz, P.H. and Merrill, R.B., Eds., Multi-ring basins, Pergamon Press, 207-225.
Croft, S.K., 1985, The scaling of complex craters: Proc. Lunar Planet. Sci. Conf., 15th,828-842.
Dobrin, M.B., 1976, Introduction to geophysical prospecting – 3rd ed., McGraw-Hill,Inc., London, 630p.
Dypvik, H. et al., 1996, Mjølnir structure: An impact crater in the Barents Sea: Geology,24, 779-782.
Eggler, D.H., 1989, Kimberlites: How do they form?: in Ross et al., Eds., Kimberlitesand related rocks, Volume 1: Their composition, occurrence, origin and emplacement,Geol. Soc. Am., Spec. Publ. No. 14, 489-504.

141
Furnival, G.M., 1946, Cypress Lake West of Third Meridian Saskatchewan: Can. Dept.Min. Res. Map 784A, scale 1:253440.
Furnival, G.M., 1946a, Cypress Lake map-area, Saskatchewan: Geological SurveyMemoir 242, 161p.
Gendzwill, D.J. and Hajnal, Z., 1971, Seismic investigations of the Crater Lake collapsestructure in southeastern Saskatchewan: Can. Jour. Earth Sci., 8, 1514-1524.
Gent, M.R., 1992, Diamonds and precious gems of the Phanerozoic Basin, Saskatchewan:Preliminary investigations, Saskatchewan Geological Survey, Sask. Energy and Mines,Open File Rep. 92-2, 67p.
Gent, M.R., Kreis, L.K., and Gendzwill, D., 1992, The Maple Creek Structure,southwestern Saskatchewan; in Summary of investigations 1992, SaskatchewanGeological Survey, Sask. Energy and Mines, Misc. Rep. 92-4, 204-208.
Gorrel, H.A. and Alderman, G.R., 1968, Elk Point Group saline basins of Alberta,Saskatchewan, and Manitoba, Canada: Geol. Soc. Am., Special Paper 88, 291-317.
Grieve, R.A.F., 1991, Terrestrial impact: The record in the rocks: Meteoritics, 26, 175-194.
Grieve, R.A.F. and Cintala, M.J., 1992, An analysis of differential impact melt-craterscaling and implications for the terrestrial impact record: Meteoritics, 27, 526-538.
Grieve, R.A.F. and Masaitis, V.L., 1994, The economic potential of terrestrial impactcraters: Internat. Geol. Rev., 36, 105-151.
Grieve, R.A.F. and Pesonen, L.J., 1992, The terrestrial impact cratering record:Tectonophysics, 216, 1-30.
Grieve, R.A.F. and Pilkington, M., 1996, The signature of terrestrial impacts: Jour.Australian Geol. and Geophys., 16, 399-420.
Grieve, R.A.F., Dence, M.R., and Robertson, P.B., 1977, Cratering processes: Asinterpreted from the occurrence of impact melts: in Roddy, D.J., Pepin, R.O. and Merrill,R.B., Eds., Impact and explosion cratering, Pergamon Press,791-814.
Grieve, R.A.F., Stoffler, D., and Deutsch, A., 1991, The Sudbury structure:Controversial or misunderstood?: Jour. Geophys. Res., 96, 22753-22764.
Hajnal, Z., Scott, D., and Robertson, P.B., 1988, Reflection study of the Haughtonimpact crater: Jour. Geophys. Res., 90, 11930-11942.
Halbertsma, H.L., 1994, Devonian Wabamun Group of the Western Canada SedimentaryBasin: in Mossop, G.D. and Shetsen, I., (comps.), Geological atlas of the Western CanadaSedimentary Basin, Can. Soc. Petro. Geol. and Alberta Research Council, 203-220.
Hawthorne, J.B., 1975, Model of a kimberlite pipe: in Ahrens, T.J. et al., Eds., Physicsand chemistry of the Earth, 9, Pergamon Press, 1-16.

142Hildebrand, A.R.S. et al., 1991, Chicxulub crater: a possible Cretaceous/Tertiaryboundary impact crater on the Yucatan Peninsula, Mexico: Geology, 19, 867-871.
Hodge, P., 1994, Meteorite craters and impact structures of the Earth: CambridgeUniversity Press, 124p.
Isaac, J.H. and Stewart, R.R., 1993, 3-D seismic expression of a cryptoexplosionstructure: Can. Jour. Expl. Geophys., 29, 429-439.
Jansa, L.F. et al., 1989, Montagnais: A submarine impact structure on the Scotian shelf,eastern Canada: Geol. Soc. Am. Bull., 101, 450-463.
Kearey, P. and Brooks, M., 1991, An introduction to geophysical exploration – 2nd ed.,Blackwell Scientific Publishing, Oxford, 254p.
Kieswetter, D., Black, R., and Steeples, D., 1996, Structure of the terrace terrane,Manson impact structure, Iowa, interpreted from high-resolution, seismic reflection data:Geo. Soc. Am., Special Paper 302, 105-113.
Kirschner , C.E., Grantz, A., and Mullen, M.W., 1992, Impact origin of the Avakstructure, Arctic Alaska, and genesis of the Barrow gas field: Amer. Assoc. Petrol. Geol.Bull., 76, 651-679.
Koeberl, C. and Anderson, R.R., Eds., 1996, The Manson impact structure, Iowa:Anatomy of an impact crater: Geol. Soc. Am., Special Paper 302, 468p.
Kuykendall, M.D. and Johnson, C.L., Reservoir characteristics of a complex impactcrater: “Ames crater”, Northern Shelf, Anadarko Basin: Ames structure and similarfeatures, Expanded Abstracts, 21.
Lawton, D.C., Stewart, R.R., and Gault, R., 1993, The geophysical expression of theEagle Butte impact structure: Presented 19th Ann. Nat. Mtg., Can. Geophys. Un., Banff,Alberta.
Levy, D., 1994, The quest for comets: An explosive trail of beauty and danger: AvonBooks, city, 282p.
Masaitis, V.L., 1989, The economic geology of impact craters: Internat. Geol. Rev., 31,922-933.
Meijer Drees, N.C., 1994, Devonian Elk Point Group of the Western Canada SedimentaryBasin: in Mossop, G.D. and Shetsen, I., (comps.), Geological atlas of the Western CanadaSedimentary Basin, Can. Soc. Petro. Geol. and Alberta Research Council, 129-147.
Melosh, H.J., 1989, Impact cratering: A geologic process: Oxford University Press, NewYork, 245p.
Milashev, V.A., 1986, Explosion pipes: Springer-Verlag, 249p.
Milstein, R.L., 1995, The Calvin impact structure, Cass County, Michigan: Identificationand analysis of a subsurface Ordovician astrobleme: Ames structures and similar features,Expanded Abstracts, 37.

143Myers, R.E., McCarthy, T.S., and Stanistreet, I.G., 1990, A tectono-sedimentaryreconstruction of the development and evolution of the Witwatersrand Basin, withparticular emphasis on the Central Rand Group: South African Jour. Geol., 93, 180-201.
Nicolaysen, L.O. and Reimold, W.U., Eds., 1990, Cryptoexplosions and catastrophes inthe geological record, with a special focus on the Vredefort structure: Tectonophysics,171, 303-335.
O’Keefe, J.D. and Ahrens, T.J., 1975, Shock effects from a large impact on the moon:Proc. Lunar Planet. Sci. Conf., 6, 2831-2844.
Oldale, H.S. and Munday, R.J., 1994, Devonian Beaverhill Lake Group of the WesternCanada Sedimentary Basin: in Mossop, G.D. and Shetsen, I., (comps.), Geological atlasof the Western Canada Sedimentary Basin, Can. Soc. Petro. Geol. and Alberta ResearchCouncil, 149-163.
Oliver, T.A. and Cowper, N.W., 1983, Wabamun salt removal and shale compactioneffects, Rumsey area, Alberta: Bull. Can. Petro. Geol., 31, 161-168.
Passey, Q.R. and Melosh, H.J., 1980, Effects of atmospheric breakup on crater fieldformation: Icarus, 42, 211-233.
Pickard, C.F., 1994, Twenty years of production from an impact structure, Red WingCreek field, McKenzie County, North Dakota: AAPG Ann. Convention, ExtendedAbstracts, 234.
Pike, R.J., 1977, Size dependence in the shape of fresh craters on the moon: in Roddy,D.J., Pepin, R.O. and Merrill, R.B., Eds., Impact and explosion cratering, PergamonPress, 489-510.
Pike, R.J., 1977a, Apparent depth/diameter relation for lunar craters: Proc. Lunar Sci.Conf., 8, 3427-3436.
Pike, R.J., 1985, Some morphologic systematics of complex impact structures:Meteoritics, 20, 49-68.
Pilkington, M. and Grieve, R.A.F., 1992, The geophysical signature of terrestrial impactcraters: Reviews of Geophysics, 30, 161-181.
Richards, B.C. et al., 1994, Carboniferous strata of the Western Canada SedimentaryBasin: in Mossop, G.D. and Shetsen, I., (comps.), Geological atlas of the Western CanadaSedimentary Basin, Can. Soc. Petro. Geol. and Alberta Research Council, 221-250.
Ruzimaikina, T.V., Safronov, V.S., and Weidenschilling, S.J., 1989, Radial mixing ofmaterial in the asteroidal zone: in Binzel, R.P., Gehrels, T., and Matthews, M.S., Eds.,Asteroids II, The University of Arizona Press, 681-700.
Sawatzky, H.B., 1972, Viewfield - A producing fossil crater?: Jour. Can. Soc. Expl.Geophys., 8, 22-40.
Sawatzky, H.B., 1976, Two probable Late Cretaceous astroblemes in western Canada —Eagle Butte, Alberta and Dumas, Saskatchewan: Geophysics, 41, 1261-1271.

144Schaber , G.G. et al., 1992, Geology and distribution of impact craters on Venus: Whatare they telling us?: Jour. Geophys. Res., 97, 13251-13301.
Schmidt, R.M. and Housen, K.R., 1987, Some recent advances in scaling of impact andexplosion cratering: Inter. Jour. Impact Eng., 5, 543-560.
Sharpton, V.L., 1994, Evidence from Magellan for unexpectedly deep complex craters onVenus: in Dressler, B.O., Grieve, R.A.F., Sharpton, V.L., Eds., Large meteorite impactsand planetary evolution: Geol. Soc. Am., Special Paper 293, 19-28.
Shoemaker, E.M., 1962, Interpretation of lunar craters: in Kopal, Z., Ed., Physics andastronomy of the moon: Academic Press, 283-359.
Shoemaker, E.M., 1977, Why study impact craters?: in Roddy, D.J., Pepin, R.O. andMerrill, R.B., Eds., Impact and explosion cratering, Pergamon Press, 1-10.
Shultz, P.H., 1992, Atmospheric effects on ejecta emplacement and crater formation onVenus from Magellan: Jour. Geophys. Res., 97, 16183-16248.
Shultz, P.H. and Anderson, R.R., 1996, Asymmetry of the Manson impact structure:Evidence for angle and direction: in Koeberl, C. and Anderson, R.R., Eds., The Mansonimpact structure, Iowa: Anatomy of an impact crater: Geol. Soc. Am., Special Paper 302,397-417.
Shultz, P.H. and Gault, D.E., 1985, Clustered impacts: Experiments and implications: J .Geophys. Res., 90, 3701-3732.
Switzer, S.B. et al., 1994, Devonian Woodbend-Winterburn Group strata of the WesternCanada Sedimentary Basin: in Mossop, G.D. and Shetsen, I., (comps.), Geological atlasof the Western Canada Sedimentary Basin, Can. Soc. Petro. Geol. and Alberta ResearchCouncil, 165-202.
Tappan, H., 1982, Extinction or survival: selectivity and causes of Phanerozoic crises: inSilver, L.T., and Schultz, P.H., Eds., Geological implications of impacts of largeasteroids and comets on the earth:Geol. Soc. Am., Special Paper 190, 265-276.
Terzaghi, R.D., 1970, Brinefield subsidence at Windsor, Ontario: in Rau, J.L. andDellwig, L.F., Eds., Third Symposium on Salt, The Northern Ohio Geological SocietyInc., 298-307.
Weissman, P., 1982, Terrestrial impact rates for long and short-period comets: in Silver,L.T., and Schultz, P.H., Eds., Geological implications of impacts of large asteroids andcomets on the earth: Geol. Soc. Am., Special Paper 190, 15-24.
Westbroek, H.-H., Stewart, R.R., and Lawton, D.C., 1996, Seismic description ofsubsurface meteorite impact craters: 58th Ann. Con. Tech. Ex., Euro. Assoc. Geosci.Eng., Expanded Abstracts, 2, A016.
Wetherill, G.W., 1989, Origin of the asteroid belt: in Binzel, R.P., Gehrels, T., andMatthews, M.S., Eds., Asteroids II, The University of Arizona Press, 661-680.
Wetherill, G.W. and Shoemaker, E.M., 1982, Collision of astronomically observablebodies with the Earth: in Silver, L.T., and Schultz, P.H., Eds., Geological implications of

145impacts of large asteroids and comets on the earth: Geol. Soc. Am., Special Paper 190, 1-13.
Woolsey, T.S., McCallum, M.E., and Schumm, S.A., 1975, Modeling of diatremeimplacement by fluidization: in Ahrens, L.H., et al., Eds., Physics and chemistry of theearth, 9, Pergamon Press, 32-42.
Wu, J., Milkereit, B., and Boerner, D., 1994, Timing constraints of deformation historyof the Sudbury impact structure: Can. Jour. Earth Sci., 31, 1654-1660.
Yilmaz, O., 1987, Seismic data processing, Investigations in geophysics, 2, Soc. Expl.Geophys., 526p.
Copyright © 2022 FDOKUMEN