seeta shah - AUHF
23
A COLLABORATIVE APPROACH TO TRANSFORMING AFFORDABLE HOUSING IN KENYA SEETA SHAH Senior Affordable Housing Specialist, FSD Kenya 2 NOVEMBER 2020
-
Upload
khangminh22 -
Category
Documents
-
view
1 -
download
0
Transcript of seeta shah - AUHF

A COLLABORATIVE APPROACH TO TRANSFORMING AFFORDABLE HOUSING IN KENYA
SEETA SHAHSenior Affordable Housing Specialist, FSD Kenya
2 NOVEMBER 2020

1.0 Kenyan Market positives
• Kenya has ALL THE necessary value chain components to unlock the delivery of affordable housing
• Deep demand, used to paying for water and electricity (although segmentation not well understood)
• Availability of land (cost is amortized over higher densities)
• Availability of building materials (albeit pricey)
• Developer experience (albeit small volumes)
• Government priority program can assist unlock bureaucratic blockages
• Strong regulatory environment in place for housing investment including:• Clear and equitable landlord and tenant laws
• Clear mortgage laws (albeit slow processes)
• Well developed REIT legislation for income and development REITs
• New regulations to allow pension contributors to withdraw up to 40% for housing
• Deep capital markets• Banking sector: KES 4.3 trillion
• Pension industry: KES 1.2 trillion: SACCOs: KES 0.5 trillion
• Diaspora remittances: KES 280 billion annually
2
However, prevailing situation of slow, small projects at high cost - caught in a “Chicken and Egg” cycle

Construction / developer financing
Land assembly /
acquisition / planning
Title / tenure
Infrastructure
ConstructionExtension
Renovation
Finance moment
Finance moment
Finance moment
Finance moment
Finance moment
Municipal land and infrastructure financing
End-user financing (mortgage / housing microfinance / personal) and savings
Offtake: Sales & rental
Maintenance
& ongoing improvements
Finance moment
Finance moment
Investors / creditors: private equity, pension funds, insurance companies, development finance institutions, wholesale debt, etc.
Municipal or community financing
Capital Markets
National or municipal tax
baseNational or municipal tax base
Public sector agencies / banks / pension funds / non-bank financial institutions / guarantors / developers / rental housing institutions / etc.
Ho
usi
ng
del
iver
y va
lue
chai
n
(fo
rmal
& in
form
al)
Fin
ance
inst
rum
ents
Fun
din
g in
stru
men
ts
Guarantees or insurance Private sector financing
* N
ote
: d
iffe
ren
t m
arke
t se
gmen
ts w
ill e
nga
ge in
dif
fere
nt
ho
usi
ng
pro
cess
es in
volv
ing
dif
fere
nt
valu
e ch
ain
s an
d d
iffe
ren
t fi
nan
ce m
om
ents
–th
is d
iagr
am is
pu
rely
illu
stra
tive
.
Demand-side subsidies
Supply-side subsidies
2.0 “Housing Value chain is long and complex”
Social and economic
infrastructure / planning
Source: CAHF’s Housing Finance Value Chain
Therefore, requires
• Appropriate regulatory support and finance at each step
• Shift in focus away from delivering units, to supporting the transformation of the ecosystem.

3.0 Four key sub-markets
Engaging with the four key Kenyan sub-markets:
IncrementalRuralPeri-urban
Informal SettlementsUrban
Small landlordUrban
FormalUrban
Key Features:
Incremental: Estimated size: 9 million householdsTypical HH Income range: < KES 50,000/monthTypical tenure: Ownership
Informal Settlements: Estimated size: 1,6 million householdsTypical HH Income range: <KES 30,000/monthTypical tenure: rental, absentee landlordism
Small landlord:Estimated size: 1,1 million HHTypical Income range: KES 30,000 - 75,000Typical tenure: Rental
Formal: Estimated size: 360 000 householdsTypical Income range: >KES 75,000Typical tenure: Owner (30%), Rental (70% - enters rental pool inefficiently)

iBUILD Platform
Housing Economic Value Chain analysis: CAHF (with World Bank support)Kn
ow
led
ge
Pla
tfo
rms
Inve
stm
ents
/ In
terv
enti
on
s
Low
er in
com
e -
--
--
--
--
--
--
--
--
--
--
--
--H
igh
er in
com
e
PAHF : CDC, Shelter Afrique, IFC*
KISIP : Informal Settlements improvement*
Acorn Senior Debt: Guarantco, DFID, IFC,
Helios*
Land Registry digitization GoK
Public Land Database
GoK
SUED/ IFC municipal and County support*
SUED / IFC municipal support *
Pangea Sankalp Accelerator HFHI *
Kenya AHP: NHDF and
Boma Yangu
House Construction
ExtensionRenovation
Land assembly / acquisition
Infrastructure
Social and economic
infrastructure / Planning
Offtake: Sales,
transfer & rental
Maintenance & ongoing
improvements
Title / tenure
NAMSIP: bulk infrastructure (WB)
Shelter Afrique and Commercial Bank lending
Microbuild for Incremental housing: HFHI, Letshego
KWFT *
KENSUP Informal Settlements upgrading:
UNHabitat*
Railway Housing: WB*
REALL developer construction financing
This pictorial illustrates the existing and
proposed DFI and state-supported
Interventions, laid out by Value Chain
component
5
Case studies: Karibu Homes / Kenya’s AHP / Role of SACCOs / Housing Finance Kenya: CAHF
Data Audit for Kenya: CAHF (with Reall support)
Landscape of Housing Investment in Kenya; Annual Yearbook profile
Existing interventions

4.0 INCREMENTAL HOUSING INTERVENTIONS
6
Value chain failures for Incremental: • Poor quality, long time to deliver• Poor, disjointed supply value chains• Poor land title rights for securitization
The KWFT Nyumba Smart program: Investment size: $80m, 80,000 borrowers, 99% repayment rate Investors: KWFT, Terwiliger Centre and Mastercard provided Technical Assistance.
1. Group lending for small loan sizes (<$5,000), registered collateral (>$,5000)• Encourage several cycles e.g roofing, flooring, lighting, one room at a time
2. Added value through supplier relationships (e.g. water tank supplier, will deliver and install)
3. High interest rates accepted by borrowers, but longer term, more affordable finance would of course improve affordability• Loan Size: $50 - $10,000. Average: $650• Loan Term 60 months. Average 18 months• Interest rate: 24% flat, 2% application, 2.25% insurance
4. KWFT is a shareholder of KMRC
Opportunities: • Deeper demand segmentation and preferences• Link lending with online platform like IBUILD to reduce leakage / promote efficiencies• Deeper value chain support for house delivery itself: building technologies, plan approvals, contractors
Incremental
5.0 INFORMAL SETTLEMENTS INTERVENTIONS
KENSUP
(Kenya Slum
Upgrading
Programme)
K-SUP
(Korogocho Slum
Upgrading Programme)
KISIP
(Kenya Informal Settlements
Improvement Programme)
NYS
(National Youth
Service)
Nairobi Railway Relocation
Action Plan
Launch year 2004 2006 2011 2012 2013
Program Scale
National, Pilot in Kibera Single settlement (Korogocho) National: 15 largest municapilities Kibera, Mathare, Korogocho, Mukuru
Single settlement: Kibear
Approach Full upgrading Minimum intervention – gradual improvement and mobilize community
Physical Improvement (Minimum Infrastructure Package)
Infrastructure improvement (road widening, water and sanitation and solid waste management)
Comprehensive upgrading
Estimated impact
<500 housing units Enabled housing investment in slums like Huruma through AMT
Flooding reduced in immediate area, but program stalled due to corruption
Approx 10,000 housing units (self contained 12 x 12 foot studios)
Coordinating Agencies (Lead first)
Ministry of Housing ( City Council of Nairobi, Ministry of Lands
Ministry of Local Government City Council of Nairobi Ministry of Lands UN-HABITAT
Ministry of Housing Ministry of Finance City Council of Nairobi Ministry of Lands Water Services Board
Ministry of Devolution and Planning
Kenya Railways Authority
Donors
Government of Kenya UN-HABITAT Swedish Development Agency (SIDA)
Government of Kenya Government of Italy
World Bank AFD Swedish Development Agency (SIDA) The Government of Kenya.
Government of Kenya The World Bank
Cost CAPITAL AND COORDINATING AGENCIES COST UNKNOWN, LIKELY TO BE VERY HIGH PER HOUSING UNIT BUILT
Evaluation
Long decanting timeframe Highly aspirational units (self contained), Ground + 5 stories Beneficiaries largely not original inhabitants as financial affordability to high
Displays political clout of ‘structure owners’. All Structure owners’ rights upheld, only 10% of tenants’ rights upheld
Completed mapping of 5 zones, created 40,000 jobs for youth initially. Program stalled due to lack of land rights and corruption.
Housing and businesses relocated exactly where they were originally, which is a big plus. Small management issues and maintenance issues.
Informal Settlements
Value chain failures for informal settlements:
• Extremely poor quality• Contested land rights• Government / DFI
initiatives to date often lead to displacement or take very long to deliver

Railway Housing: Kibera, Mukuru
8Informal Settlements
KENSUP: Kibera
Key Takeaways
• No displacement, mixed use• Up to 10,000 units• Actual subsidy unclear: peppercorn rent• Evaluate alternative typologies – communal
toilets, showers, kitchen
Key Takeaways
• High displacement, slow and limited delivery (500 units over 15 years)
• Actual subsidy unclear
Opportunities:• Emphasis on infrastructure provision rather than unit delivery• Rental vs owner occupation more financially sustainable and can reach the millions required• Integrate long term management
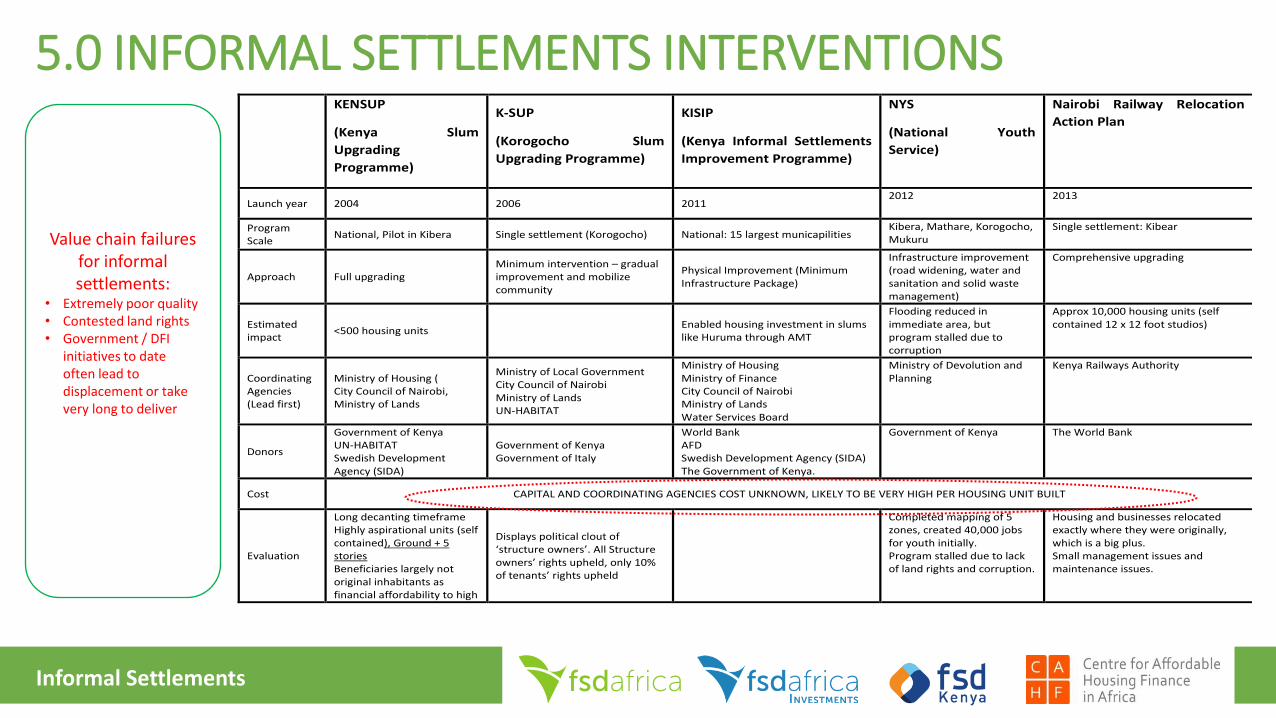
6.0 Small Landlord: affordability plus attractive yields
Elm Tower, Along Thika Road35 x 1 bedroom unit, 37 sqm, Rent 14,00012 x 2 bedroom measuring 59 sqm rent 18,000Land Size 0.2 acres Land Cost: 28 million Dev Cost: 90 millionAnnual Rent Potential: 9 millionOccupancy: 98%Annual Expenses: 0.8 millionGross Yield: 10.3%Net Yield: 9.2%
9Small landlord sub-market
Value chain failures for Small landlord:• Lack of scale, limited
amenities • Variable compliance for
housing delivery• Pressures on municipality
infrastructure due to poor municipal projections and planning
• Highly financeable but limited underwriting standards for product quality and compliance. Asset quality not suitable for capital markets
11 units financed by Tier 2 Bank, Ongata Rongai
20 units financed by Large SaccoOngata Rongai

6.2 Small landlord interventions
10
The Microbuild Fund :
Investment size: $120 millionExpected leverage: $1 billionEquity Investors: Habitat for Humanity International, Omidyar Network, DFC (previously OPIC). Fund Manager Triple Jump
1. Debt and Technical Assistance to financial intermediaries2. Mainly hard currency, only 9% invested in Africa3. Letshego to promote small landlordism in peri-urban locations. Loan terms:
o Promote rental asset creation as a business loano Loan size: $10,000 - $100,000 (Average: $30,000)o Loan Term: 72 months, Interest rate: 14% flat o Security: registered collateralo Letshego’s own funding constraints: e.g. 3 year loan at 15% from Triple
Jump, but is able to blend sources to provide this product. o Understand cost of financing and currency risk from Triple Jump to Letshego
is challenging for Letshego after building in risk and operating margins
Opportunity to expand this product with TA – build greener and more resilient housingIntegrate with tools for rental management, developing credit history as a step towards economic empowerement
Small landlord sub-market
Pu
blic
/
Pri
vate
Tota
l
Pro
ject
s
Co
mp
lete
d
un
its
On
goin
g
un
its
Acc
ess
ed
cap
ital
mar
kets
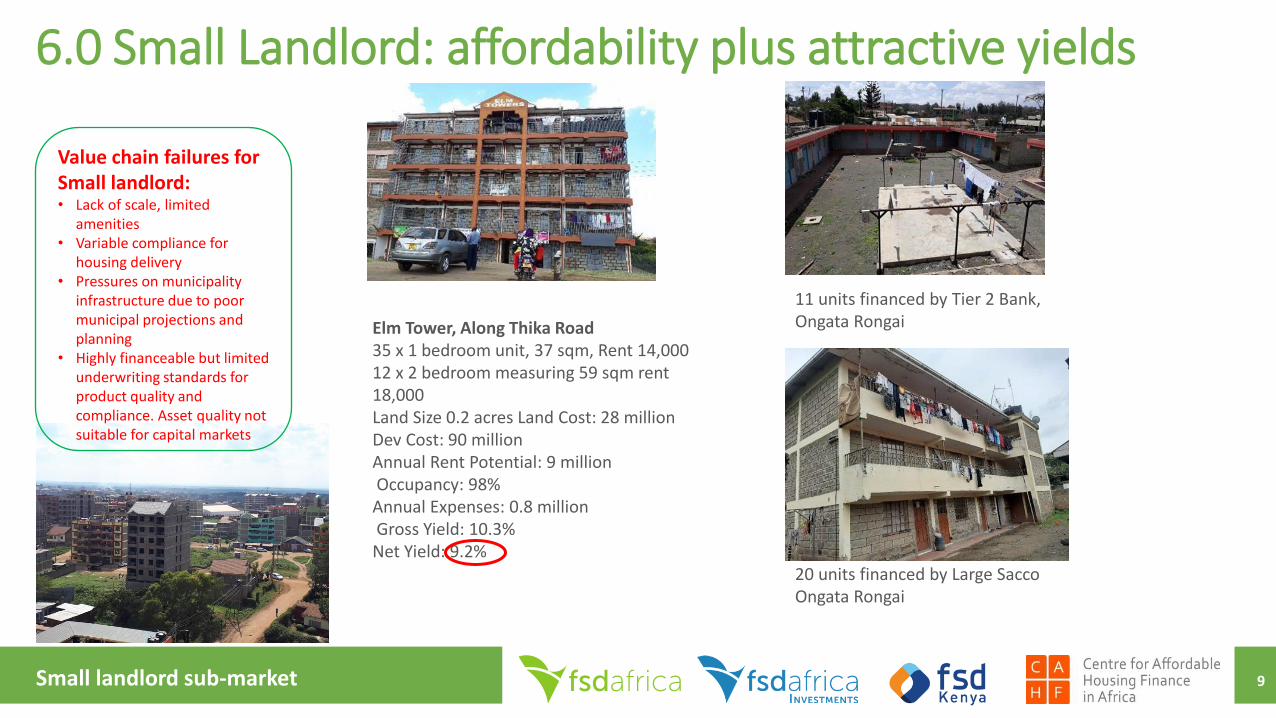
Actis Private 2 159 624 YES
Acorn Private 1,500 5,000 YES
AMS Properties Private 10 655 10,162 NO
Britam Private - - YES
Centum Private 5 100 802 YES
CITICC Private - - NO
Cytonn Private 7 100 2,805 YES
Erdemann Private 11 3,998 3,913 NO
Fusion Capital Private 4 363 53 NO
Housing Finance historical Public 15,000 YES
Housing Finance recent Private 10 2,000 960 YES
Kaydee Private 1 - 1,400 NO
NHC historical Public 16,500 NO
NHC recent Public 8 159 319 NO
Trident Private 6 109 430 NO
Unity Private 1 400 1,200 NO
Chigwell Private 3 393 250 NO
Everest Park Private 2 440 - NO
Green Park Private 3 593 - NO
Greenspan Private 1 700 260 NO
Heri Homes Private 10 517 709 NO
Karibu Homes Private 2 575 1,200 NO
Lifestyle Homes Private 4 520 - NO
MOAD Private 1 - 300 NO
Suraya Private 18 1,810 579 NO
Riruta Gardens Private 1 1,500 NO
TSAVO Private 5 160 870 NO
Zamara Private 1 259 - NO
LARGE DEV WITH INTERNATIONAL BACKING
LOCAL DEVELOPERS: TOTAL PROJECT SIZE 100 UNITS PLUS
Pu
blic
/ P
riva
te
Tota
l Pro
ject
s
Co
mp
lete
d
un
its
On
goin
g u
nit
s
Acc
ess
ed
cap
ital
mar
kets
BANDA Private 18 77 1,895 NO
Mahiga Private 12 69 491 NO
Natureville Private 3 63 500 NO
NACHU Private 20 1,456 1,457 NO
Mwalimu National Sacco Private 1 800 0 NO
Stima Investment Coop Private 2 416 1,434 NO
Safaricom Inv Coop Private 6 554 331 NO
Urithi Cooperative Private 10 622 989 NO
KUSCCO Private NO
Amref SACCO Private NO
Mhasibu Sacco Private NO
Kencom Sacco Private NO
Kamuthi Housing Cooperative Private NO
Airport Housing Cooperative Private NO
LOCAL DEVELOPERS: TOTAL PROJECT SIZE 50 - 100 UNITS
SACCOS AND HOUSING COOPERATIVES
7.0 FORMAL housing: What is scale in the Kenyan context?
11Source: Study funded by AfD and Proparco
Value chain failures for formal housing:
• Long time to deliver and high costs• Hardly any developer has delivered
more than 1,000 units since inception
• Funded primarily by cash deposits –shifts risk onto buyers
• Difficulty exit due to land registry challenges
• Mortgage / Rent x 2• Anecdotally only 30% of buyers are
owner occupiers, with 70% renting their units out – leading to inefficient entry into the rental market
• Limited long term in design and management

NACHUApex Housing Co-op
Mwalimu SACCO Kisaju Housing
SurayaFourways Junction
Greenspan HousingEstate
Karibu HomesRiverview Development, Athi RiverSee http://housingfinanceafrica.org/app/uploads/Final-Karibu-Homes-Case-Study-13-web.pdf
• Affordable, decent quality but remote
• Delivered 1,500 units in 20 years• Typical 2 BR starter, Size 20 sqm• Sale price KES 1.15m (KES 57k p
sm)• Obtained concessional
construction + end user finance
• Remote, large project of 875 units
• Completed 2019, only 20 units occupied as of Feb 2020
• 1 – 4 BR units, Sizes 48 – 130 sqm
• Sale Price: KES 3 – 10m ( KES 65kpm)
• Suraya delivered an excellent masterplanned mixed typology estate at Fourways which was very affordable upon launch, and has achieved such great capital appreciation that it now competes with Westlands.
• 500 units delivered • Suraya in distress due to failed JVs
and struggle to access infrastructure at large Encasaproject
• Well located, mixed income, mixed use
• Delivered 700 housing units (mainly mortgage buyers) and shopping mall
• Developer could not recover investment in bulk infrastructure serving neighbouring parcels
• Exited mall to Fahari IREIT• 3 BR, 90sqm apartments prices
started at KES 4m, rose to KES 6.5 million
• Award winning master planned estate that planned to cross subsidize to ensure affordability. Original business plan was to deliver 1,200 units in five years. After ten years, they have built only 700 units, of which only about 500 units have been sold.
• Lack of transport and water infrastructure undermined delivery and sales.
• Faced serious challenges in balancing the service charge budget as (a) the developer is holding onto units for much longer than expected; (b) occupiers are stretched financially (high transport and other costs); (c ) investors buy units that then remain empty; and (d) unforeseen additional costs such as the borehole.
Key takeaway:Challenges in scale and collecting end user instalments. Need to support specialized offtake vehicles.
Key takeaway:SACCOs struggle to deliver housing projects, better demand segmentation data and project positioning required
Key Takeaway:Poorly designed JVS and municipality incapacity undermines developer growth
Key takeaway:Full project timeframe 10 years. Less than 100 units per year – tie developer incentives to housing affordability, not speed
Key takeaway:Municipal capacity constraints undermined timeframes which then put the project at risk of a changing economic context. Obtaining construction financing was difficult. Household affordability undermined by transport costs given land choice.
What about the Kenyan track record in affordable housing?Value chain blockages undermine affordable housing delivery: all types of private sector struggling to deliver housing
12Private / SACCO challenges

Search for Cheapest 2 BR formally delivered apartment is disappointing
13Formal supply challenges
ZONE LOCATION DEVELOPER PROJECT NAME UNIT TYPES SIZE
(SQM)
CASH PRICE CASH PRICE
PSM
MTG PMT
CURRENT
RENT RENT
PSM
SERVICE
CHARGE
EST
YIELD
MTG/
NET RENT
CURRENT
MTG PMT
KMRC
MTG /
NET RENT
WITH
KMRC A B C D E F G H J K
1 Athi River Karibu Riverview 2 BR 55 3,560,000 64,727 42,190 18,000 327 3,000 4% 2.81 22,645 1.51
2 Kitengela Mwalimu Kisaju Park 2 BR 56 3,900,000 69,643 46,219 23,000 411 3,000 5% 2.31 24,808 1.24
3 Ongata R. Erungu 2 BR 90 4,500,000 50,000 53,330 15,000 167 3,000 2% 4.44 28,625 2.39
4 Utawala Evergreen 2 BR 73 3,900,000 53,425 46,219 25,000 342 3,000 5% 2.10 24,808 1.13
5 Kiambu Heri Kitisuru Spur 2 BR 85 6,800,000 80,000 80,588 40,000 471 3,000 5% 2.18 43,255 1.17
6 Kahawa West Imani Imani Court 2 BR 76 6,000,000 78,947 71,107 30,000 395 3,000 4% 2.63 38,166 1.41
7 Dagoretti Heri Kikuyu 2 BR 73 5,500,000 75,342 65,181 30,000 411 3,000 4% 2.41 34,986 1.30
8 Ruaka Safaricom Ruaka Ridge 2 BR 102 7,000,000 68,627 82,958 40,000 392 3,000 5% 2.24 44,527 1.20
2 Isinya NACHU Lenana 2 room starter 20 1,100,000 55,000 13,036 10,000 500 3,000 6% 1.86 6,997 1.00
3 Kajiado NACHU Tausi 2 room starter 20 1,150,000 57,500 13,629 12,000 600 3,000 7% 1.51 7,315 0.81
Average 65,321 5% 2.45 1.32
Current mortgage metrics: 20 year term, 10% deposit, 15% interest rate. KMRC mortgage metrics: 25 year term, 10% deposit, 7% interest rate
• Cannot find a 2 BR delivered in the market, that meets government’s offtake offered price of KES 50,000 per sqm
• Poor yields (<5%), high mortgage / rent instalment at >2, which will be brought down by KMRC eligible buyers.

Park Rd: State Land Jeevanjee: Nairobi County Land Stoni Athi, for sale Stoni Athi, Rental
• High density masterplan: 1,370 units• 230 units delivered (Almost 3 years after launch).• Only project delivered under EPC+F (developer provides
Engineering, procurement, construction and financing). Anecdotally understand delivered at a loss.
• Ground + 5 without lift – (appears to have market acceptance and hence policy should be changed to allow this).
• 1,800 units launched• 70% affordable units: KES 1.5m for 1 BR, KES 2.5
for 2 BR, KES 3.5 m for 3 BR)• 30% market units: KES 6.5 m 2BR, KES 8.5 m 3BR
• Unknown developer track record, construction financing risk born by individual buyers
• Less than 16,500 units delivered since inception before independence. Was more active till 1990s, with projects around the country, but then relatively inactive.
• New delivery missing affordability: 400 townhouses in KES 8 – 12 million price range in Athi River
• Delivered using Expanded Polysterene Technology
• Bedsitter, 1 BR, 2 BR units rental at KES 9,000 – 16,500/= per month
• Limited competitiveness due to distance from main road
Key takeaway:• AHP requirement for private sector to deliver at KES
50,000 psm with own land and financing appears unfeasible.
• Lack of clarity on public sector land contribution framework
• Lack of long term maintenance and management integration into design
Key takeaway:• Financed by buyer instalments during
construction – undermines affordability• Affordable units all sold, despite requirement for
construction financing instalments• Key supply gap of units less than KES 3 million, • Lack of clarity on public sector land contribution
framework• Difficult for private developers to ‘cross
subsidize’ for urban fringe land which is not at premium location
Key takeaway:• Alternative EPS technology not
providing cost savings
Key takeaway:• Lack of integration of green
space, communal facilities, masterplanning in effort to gain affordability
High Profile AHP Projects National Housing Corporation Projects
14
What about the Kenyan track record in affordable housing?Value chain blockages undermine affordable housing delivery: the public sector also struggles to deliver housing
AHP / Public Sector challenges
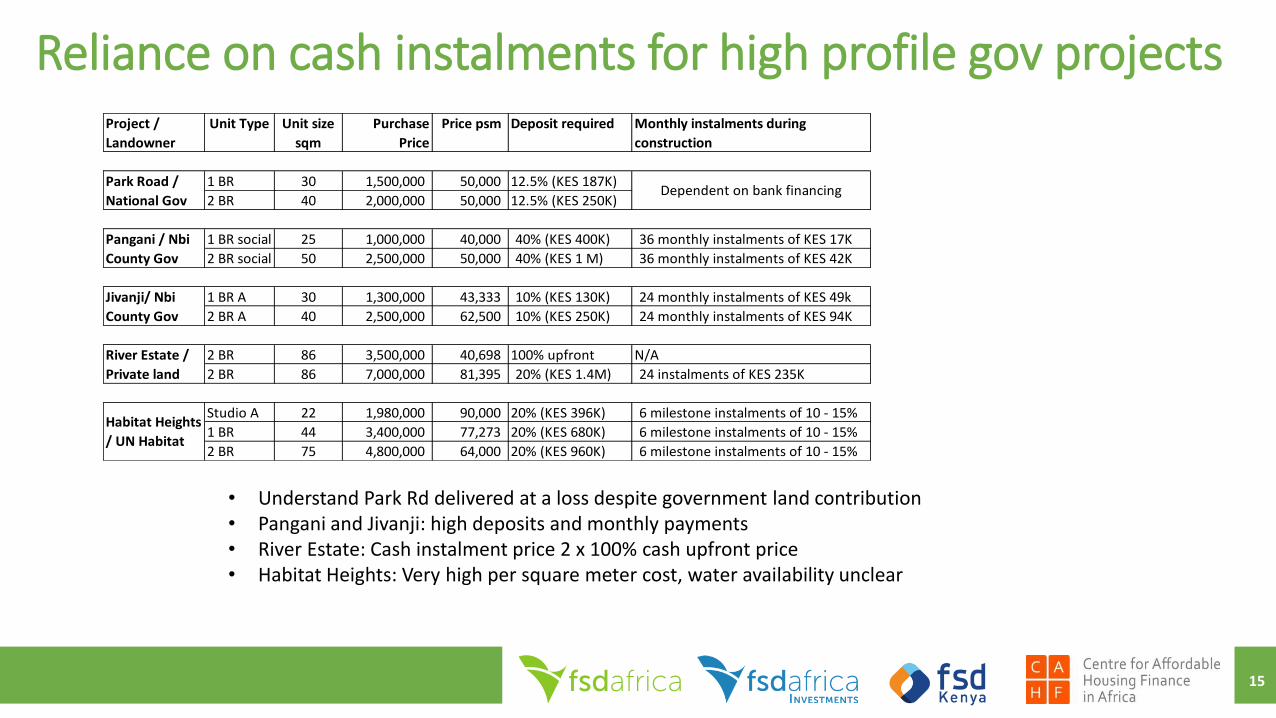
Reliance on cash instalments for high profile gov projectsProject /
Landowner
Unit Type Unit size
sqm
Purchase
Price
Price psm Deposit required Monthly instalments during
construction
1 BR 30 1,500,000 50,000 12.5% (KES 187K)
2 BR 40 2,000,000 50,000 12.5% (KES 250K)
1 BR social 25 1,000,000 40,000 40% (KES 400K) 36 monthly instalments of KES 17K
2 BR social 50 2,500,000 50,000 40% (KES 1 M) 36 monthly instalments of KES 42K
1 BR A 30 1,300,000 43,333 10% (KES 130K) 24 monthly instalments of KES 49k
2 BR A 40 2,500,000 62,500 10% (KES 250K) 24 monthly instalments of KES 94K
2 BR 86 3,500,000 40,698 100% upfront N/A
2 BR 86 7,000,000 81,395 20% (KES 1.4M) 24 instalments of KES 235K
Studio A 22 1,980,000 90,000 20% (KES 396K) 6 milestone instalments of 10 - 15%
1 BR 44 3,400,000 77,273 20% (KES 680K) 6 milestone instalments of 10 - 15%
2 BR 75 4,800,000 64,000 20% (KES 960K) 6 milestone instalments of 10 - 15%
Pangani / Nbi
County Gov
Jivanji/ Nbi
County Gov
River Estate /
Private land
Habitat Heights
/ UN Habitat
Dependent on bank financingPark Road /
National Gov
• Understand Park Rd delivered at a loss despite government land contribution• Pangani and Jivanji: high deposits and monthly payments• River Estate: Cash instalment price 2 x 100% cash upfront price• Habitat Heights: Very high per square meter cost, water availability unclear
15

Pan African Housing Fund - Phatisa
AfDB investment in Kenya Police Housing
IFC CITICC Partnership Shelter Afrique
Reall
• $42m fund closed in 2014 • Delivered only 1,000 of
expected 3,500 units in Kenya, Zambia and Rwanda
• Invested in police housing with great challenges
• Decided not to invest in supply again!
• Heavily promoting KMRC including a Partial Credit Guarantee, as feel this is a safer route to assisting housing delivery
• IFC launched a $300 m equity fund in 2015 with goal of delivering 30,000 units in partnership with CITICC across Africa. The expectation was that CITICC would work with local developers and build Africa’s developer capacity.
• Housing units delivered: Nil.
• 2019 delivery: 3,800 houses across Africa (likely to be cumulative delivery over some years)
• REALL’s targeted efforts to empower delivery for bottom 40% have failed to scale in Africa compared to Asia.
• In Kenya, REALL partners (e.g. NACHU) delivered 1,971 homes to 2019.
• In Nigeria, REALL partner delivered 212 homes to 2019 including Africa’s cheapest house, the Millard Fuller House, but struggling with scale. Offtake for Phase 1 was to Family Homes Fund, but units still unoccupied.
Key takeaway:Institutional capital requires stronger developers AND local fund managers / TAKenya strongest market of 3 geographies
Key takeaway:Need local market intelligence to deliver intended results
Key takeaway:Misalignment of incentives and risk/reward sharing that led to lack of delivery under the partnership.
Key takeaway:Need to build lending capacity and credible developers in the formal sector
Key takeaway: • Need offtake options for delivery
(subsidized KMRC will help)• Market transparency on what formal
market can deliver for owner occupation to bottom 40% in desired locations.
DFIs investments have had less impact than targetted
16
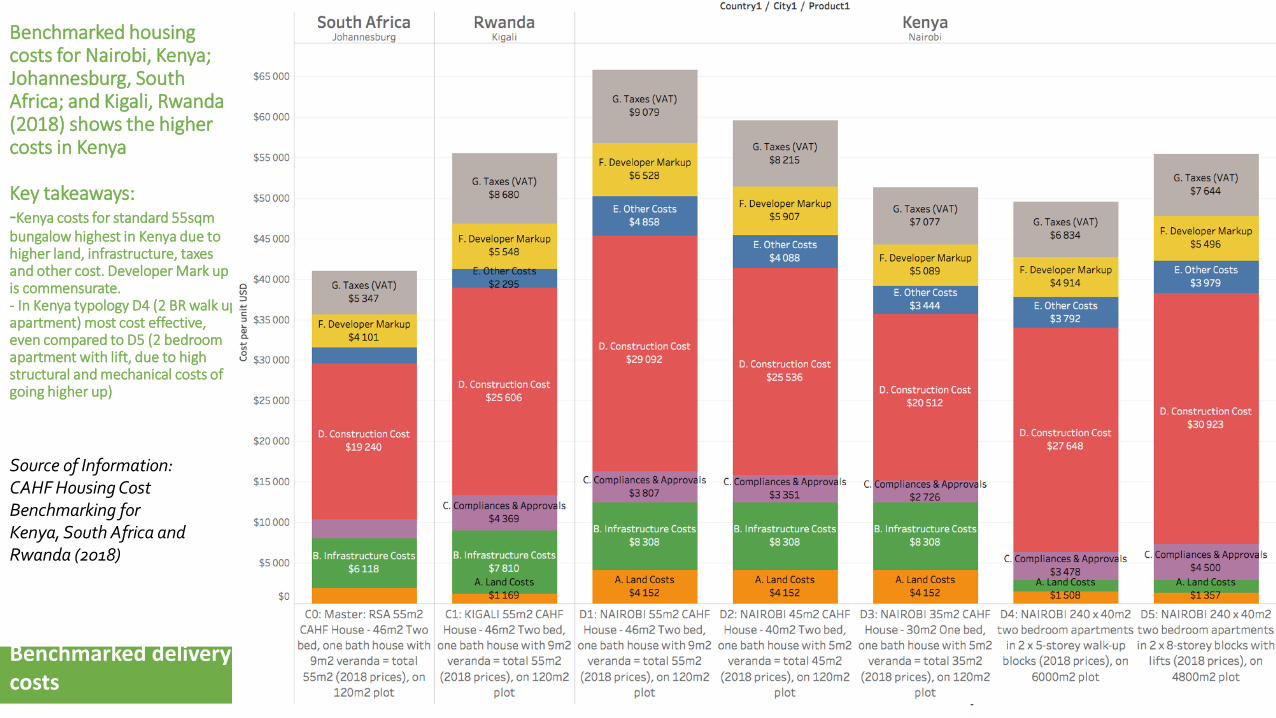
Benchmarked housing costs for Nairobi, Kenya; Johannesburg, South Africa; and Kigali, Rwanda (2018) shows the higher costs in Kenya
Key takeaways:-Kenya costs for standard 55sqm bungalow highest in Kenya due to higher land, infrastructure, taxes and other cost. Developer Mark up is commensurate.- In Kenya typology D4 (2 BR walk up apartment) most cost effective, even compared to D5 (2 bedroom apartment with lift, due to high structural and mechanical costs of going higher up)
Source of Information: CAHF Housing Cost Benchmarking for Kenya, South Africa and Rwanda (2018)
Benchmarked delivery costs

Curious cost savings of single storey houses by small developers
Description Factor KSH per m2 Explanation
Base construction cost for small developers
KSH 20,000 Input resulting in average sale price per m2 of KSH 35,000
Structure 25% KSH 25,000 Additional steel, etc., for building high rise versus single storey
Labour 5% KSH 26,250 Pay all regulatory dues on labour (NSSF, NHIF, PAYE)
Margin 20% KSH 31,500 Add profit margin for contractor
KSH 31,500 Resulting cost per buildable m2 from contractor to large developer
Area adjustment 15% KSH 36,225 Circulation space of apartments (corridors, staircases) is an additional cost factored onto sellable space
VAT 16% KSH 42,021 16% VAT is an additional tax on final contractor price
Corresponding construction
cost for Large Developers
KSH 42,021 Input resulting average sale price per m2 of KSH 65,000
Dev A Dev B
This comparative analysis shows the very different supply costs and frameworks faced by informal / small scale developers versus formal / large scale developers.
It also shows the importance of single storey solutions due to lower construction costs, smaller phasing and high capital efficiency.
FORMAL / LARGE SCALE
Strengths:Higher compliance (infrastructure, taxation, employment, building code)ConstraintsHigher opportunity cost of capital
OpportunitiesMore quickly develop product suitable for capital marketsShare designs and delivery costingShare management and legal frameworks and costings
INFORMAL / SMALL SCALE
Strengths:Lower cost baseLower opportunity cost of capitalConstraintsLack of capital to pursue larger projects
OpportunitiesPositioning larger projectsPromoting compliance, green features, innovations, communities, resilience
18Different supply constraints
Refer Case Study 15
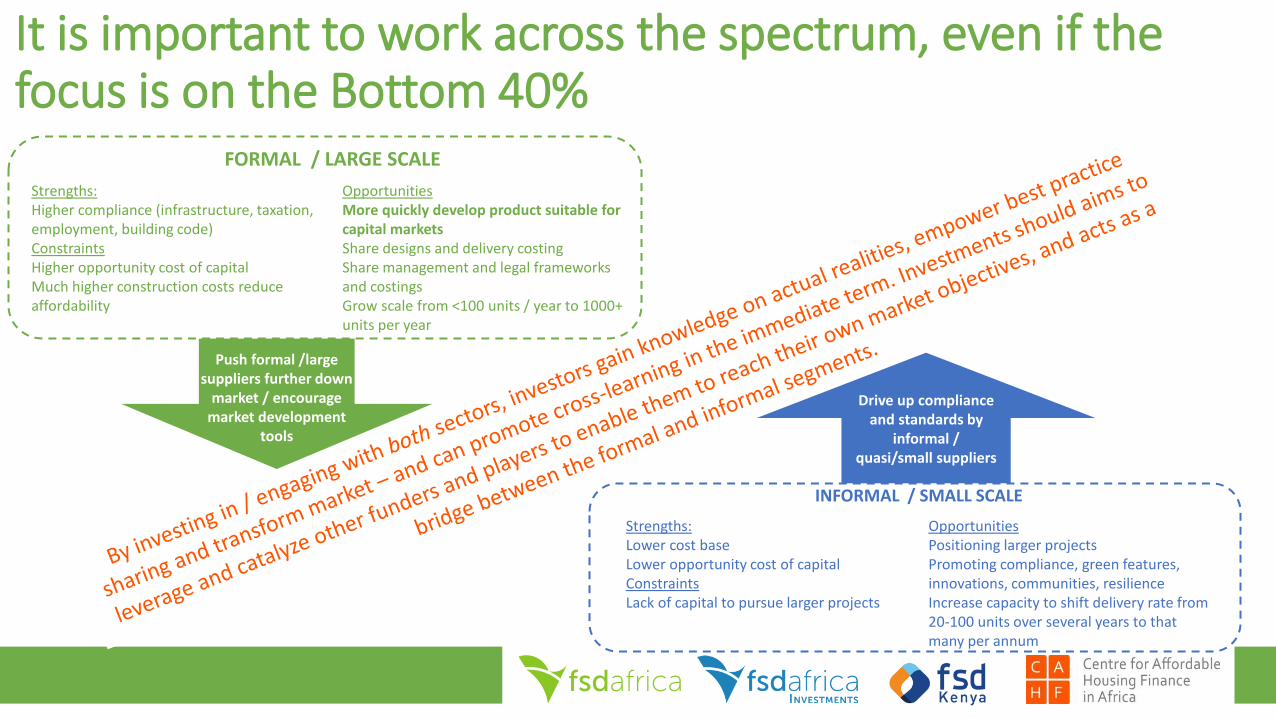
It is important to work across the spectrum, even if the focus is on the Bottom 40%
Drive up compliance and standards by
informal / quasi/small suppliers
FORMAL / LARGE SCALE
Strengths:Higher compliance (infrastructure, taxation, employment, building code)ConstraintsHigher opportunity cost of capitalMuch higher construction costs reduce affordability
OpportunitiesMore quickly develop product suitable for capital marketsShare designs and delivery costingShare management and legal frameworks and costingsGrow scale from <100 units / year to 1000+ units per year
INFORMAL / SMALL SCALE
Strengths:Lower cost baseLower opportunity cost of capitalConstraintsLack of capital to pursue larger projects
OpportunitiesPositioning larger projectsPromoting compliance, green features, innovations, communities, resilienceIncrease capacity to shift delivery rate from 20-100 units over several years to that many per annum
Push formal /large suppliers further down
market / encourage market development
tools
20
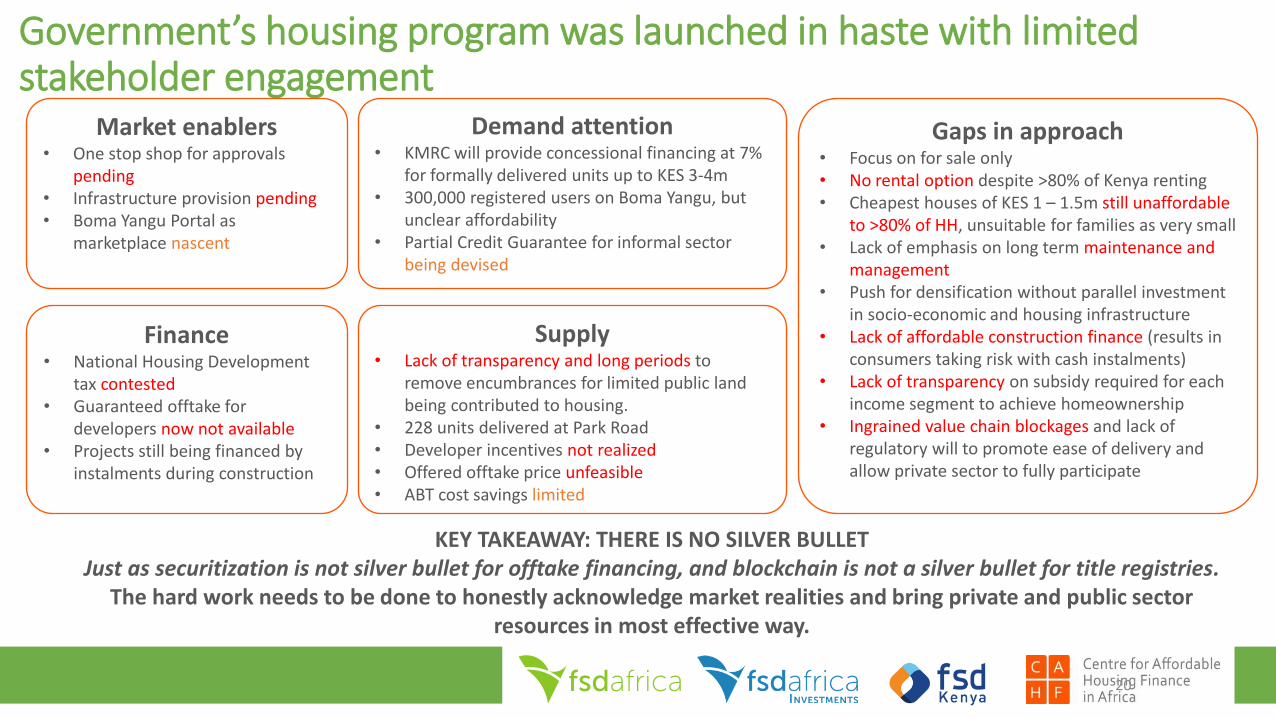
Government’s housing program was launched in haste with limited stakeholder engagement
Market enablers• One stop shop for approvals
pending• Infrastructure provision pending• Boma Yangu Portal as
marketplace nascent
Finance• National Housing Development
tax contested• Guaranteed offtake for
developers now not available• Projects still being financed by
instalments during construction
Demand attention• KMRC will provide concessional financing at 7%
for formally delivered units up to KES 3-4m• 300,000 registered users on Boma Yangu, but
unclear affordability• Partial Credit Guarantee for informal sector
being devised
Supply• Lack of transparency and long periods to
remove encumbrances for limited public land being contributed to housing.
• 228 units delivered at Park Road• Developer incentives not realized• Offered offtake price unfeasible• ABT cost savings limited
Gaps in approach• Focus on for sale only• No rental option despite >80% of Kenya renting • Cheapest houses of KES 1 – 1.5m still unaffordable
to >80% of HH, unsuitable for families as very small• Lack of emphasis on long term maintenance and
management• Push for densification without parallel investment
in socio-economic and housing infrastructure• Lack of affordable construction finance (results in
consumers taking risk with cash instalments)• Lack of transparency on subsidy required for each
income segment to achieve homeownership• Ingrained value chain blockages and lack of
regulatory will to promote ease of delivery and allow private sector to fully participate
KEY TAKEAWAY: THERE IS NO SILVER BULLETJust as securitization is not silver bullet for offtake financing, and blockchain is not a silver bullet for title registries.
The hard work needs to be done to honestly acknowledge market realities and bring private and public sector resources in most effective way.

Kenya’s Housing Affordability (extract from WB CAHF study)
Household Income
US$/month (PPP)
2.0-m2.0-m4.0-m 4.0-m
Households (No.)
KES105 k / $2 000 pm
KES53 k / $1 000 pm
KES26 k / $500 pm
KES13 k / $250 pm
1.0-m1.0-m
Households
(Rural)
Households
(Urban)
319 000
319 000
1.1 m
2.5 m
2.9 m
1.2 m
346 000
456 000
802 000
774 000
522 000
150 000
KES158 k+ /$3 000+ pm 11.4%
14.9%
26.3%
25.4%
17.1%
4.9%
3.8%
3.8%
13.3%
29.6%
34.5%
14.8%
KES42 m / $58 000
KES26 m / $38 500
KES13 m / $19 200
KES6.6 m / $9 600
KES3.3 m / $4 800
Affordability
(Mortgage)
PPP$: KES (2018) = 52.642
Rural
= 73%8.3-m households
Urban
= 27%3.1-m households
Source of Information: CGIDD, CAHF Mortgage Affordability Calculator and own modelling. http://housingfinanceafrica.org/documents/assessing-kenyas-affordable-housing-market/
KES 480k/$ 4800
KES 960k/$ 9600
KES 1.9m / $19 200
KES 3.6m/ $38 500
KES 5.8m/$58 000
21

Kenya needs $45 – 90 billion investment over the next 20 years • This is beyond the capacity of any single investor / player, or
group of investors or players. • By overcoming siloed, competitive thinking and using the
force of all stakeholders capital and capacity, to influence market transformation via collaboration
A (very) rough calculation: Existing deficit 2 000 000 housing unitsAnnual requirement over 20 years + 7 000 000 housing units (350 000 units pa)Total housing need over 20 years = 9 000 000 housing units
Assume average house cost: $ 5 000 or $ 10 000 Total investment required USD 45 000 000 000 USD 90 000 000 000
What does the housing sector really need from finance?1. Patient blended finance products
2. Deep regulatory support
3. Mechanisms for local currency capital
4. Market development and investment support
• Raising the bar on housing quality :
‘Lifecycle’ costs, incentive to invest in green features, tested cashflows support exit to local institutional capital
• Promoting demand side affordability:
Aggregating demand drives efficiencies which stimulates scale, increasing competition and reducing cost, while highlighting and targeting under-served markets

Financial sector development
Attention to finance value chain structure & functioning
Funding instruments & frameworks
Financial instruments & frameworks
Housing sector development
Attention to housing value
chain structure & functioning
Housing/ housing finance sector knowledge &
advocacy frameworks
Investment Capital
Attention to investment opportunity to establish precedent & catalyse
market development
Local market engagementAttention to local
value chain systems
Promote enabling environment,
market information, appropriate
financial solutions in Kenya
Market transformation
• Local intervention experience provides lessons & detailed approaches to inform further practice in Kenya and elsewhere: explicit focus on the detail – successes and challenges
• Value chain attention on stimulating the enabling environment
• DFI, regional, international networks• Comparative data & experience
• Local intervention• Creating demonstration
& precedent• Drawing on local
networks, local data & experience
• Establishing track records
FSDAiCDC
Reall
GuarantCo
FSDA
DFCProparco
AfD
FSD Kenya
UN Habitat
InfraCo
SUED
AfDB
IFCSIDA
World Bank
CAHF
KMRC
DFID
EU
EIB
Local Banks
Pension Funds
SACCOs
Capital Markets
Shelter Afrique
EADB
Local governments
National governments
KEPSA, KAM, KPDA
Akiba Mashinani Trust, SDI
Habitat for Humanity
Cities Alliance
Contribution to the long view, broader market enablement and sector development
Collaborative Working Group