See Content - Bangladesh Institute of Planners
646
-
Upload
khangminh22 -
Category
Documents
-
view
0 -
download
0
Transcript of See Content - Bangladesh Institute of Planners


ICURP-2019 Organizing Committee
Dr. A K M Abul Kalam Convenor, ICURP-2019 President, BIP
Dr. Akter Mahmud General Rapporteur, ICURP 2019 Vice - President, BIP
Mohammad Fazle Reza Vice - President, BIP
Dr. Adil Mohammed Khan General Secretary, BIP
Mohammed Hamidul Hasan Member Secretary, ICURP-2019 Executive Board Member, BIP
http://www.bip.org.bd/SharingFiles/journal_book/upload_content/ICURP-2019.pdf
Paper Review Committee Dr. Musleh Uddin Hasan Dr. Afsana Haque Dr. Akter Mahmud Dr. Adil Mohammed Khan
Dr. Anisha Noori Kakon Dr. Kazi Saiful Islam Dr. Md. Mustafa Saroar Md. Esraz ul Zannat
ICURP-2019 Associates Md. Yousuf Jamil Farhin Binte Islam Audri Sarwar Hossain Masuma Parvin Joty
Tanvir Ahmed Sadia Nowrin Sushmee Halima Akter Happy Maruf Hasan Jubair
Ariful Islam Rana Imtiaz Uddin Fahmida Afrin Sithi Md. Jawadul Kabir Shoudh
Fahim Ahmed Mondol Yeasin Khandokar Samia Islam Sara Md. Abdul Mannan
Sanjida Akbar Nishat Prottoy Roy Abdul Ahad Nafis Tahmid Tazwar Samin
Lisun Asib Khan Anannya Tahsin
Cover Page, Design and Illustrations J A M Mostahidul Alam Atif Ibne Zoha Sreezon Sudipta Roy Mohammed Hamidul Hasan
Proceedings of 1st International Conference on Urban and Regional Planning ICURP-2019
Dhaka, October 5-6, 2019 Planning for Sustainable Cities and Communities
Editors: Dr. A K M Abul Kalam, Dr. Akter Mahmud, Dr. Adil Mohammed Khan © Bangladesh Institute of Planners – BIP 2019
Produced and Published by – Bangladesh Institute of Planners – BIP ISBN: 978-984-34-7970-9

INTRODUCTION 1st International Conference on Urban and Regional Planning -2019 (ICURP 2019)
In accordance to the very essence of the SDGs to ‘Leave No one Behind’, the Government of Bangladesh has been instrumental in carrying out the task of SDGs implementation by engaging with various stakeholders. By maintaining the successes of the MDGs, Bangladesh became one of the forerunners in embracing the targets and goals of SDGs for implementation through five year plans and ADP. In support and upholding the spirit of Goal-11 of SDG, BIP selected the theme “Planning for Sustainable Cities and Communities” for ICURP 2019.
Main objective of this conference was to bring together the leading academic, researchers, scholars, prominent national and International NGO representatives and decision-makers working in Urban and Regional Planning around the world in a platform to exchange their research works, new ideas, share knowledge and explore recent developments of this field. The ICURP-2019 shows the potential to be an outstanding international platform for participants to share their knowledge and expertise in future as well. Young participants and students get a unique chance to get acquainted with new and advanced topics of Urban and Regional Planning that will help them advance their careers, their respective organizations, and the overall Planning community.
ICURP 2019 program was inaugurated by the Honorable Minister of Local Government, Rural Development and Cooperatives Mr. Md. Tajul Islam PM. In his speech as chief guest of the occasion he emphasized on protection of agricultural land, proper utilization of every inch of land, urgently preparation of upazila master plan and implementation of master plan in whole over the country.
ICURP-2019 provides an excellent forum for sharing knowledge and discussions on wide variety fields of Urban and Regional Planning. The conference consists of four sessions.
Under the Session-1 Urban Planning and Management, delegates present 16 research papers in two days. This session mainly focuses the core issues of urban planning and management tools for urban functionality and livability. This session covers the issues like; role and functionality of public spaces in community and city scale, better management of community solid waste, efficient distribution of urban facilities. This session also focuses on the use of GIS and remote sensing technology for analyzing land cover as tool for master planning and designing cities in a holistic sustainable and smarter way.
Session 2: Housing - Community Planning – Environmental Management-Sustainable Cities and Settlements covers a wider range of issues staring from housing and shelter to community planning and environmental management to sustainable cities. Under this session delegates present 17 research papers in two days. This session mainly focuses risks and vulnerability of communities, enhancing the livability of communities and the cities, transformation of old areas of the city, quality public spaces, conservation and protection of environmental benefits for the people.
In Session 3: Transport – Infrastructure – Urban Economy and Governance, delegates present 14 research papers in two days. This session mainly focuses on the transport planning, infrastructure development, connecting the cities and towns with the peripheral areas, street design, Street
Dr. Akter Mahmud General Rapporteur ICURP 2019 Vice-President, BIP
“BIP is proud to arrange ICURP 2019 in Dhaka city which is considered as 13th largest urban agglomeration of the Earth. In addition to the vast rural areas, Bangladesh has 12 city corporations and 328 municipalities. We, the member of Bangladesh Institute of Planners, have a profound responsibility to make plan, develop and change the cities and communities more inclusive, livable and sustainable. Government of Bangladesh is committed to maintain the success of the MDGs and obligated to implement SDGs. Cities and municipalities of Bangladesh have crucial role in implementing the 17 goals of Sustainable Development Goals. ICURP is a platform to exercise the planning dialogue for the better cities and communities.”

users’ perspectives, open transport data for smart use by the stakeholders etc. It also focuses on integration of transportation, connectivity and mobility of all living in a city.
In Session 4: Regional and Rural Planning – Disaster Management – Climate Change, delegates present 16 research papers in two days. Discussion of this session covers disaster and risk management, the issues beyond the urban affairs meaning the planning in rural and regional level. It focuses dynamics rural-urban linkages, use of modern equipment in agricultural production and rural development, disaster preparedness, use of ICT in building vulnerability assessment etc.
After the ICURP conference, our member met in a congress which was our first and foremost a meeting place of planning professionals working in academia, public and private sector for cities and regions as well as for local and international consultancies and other institutions. This congress in Dhaka intended to be an event where planners, developers, politicians and NGOs meet and discuss the future of urban planning and resilience of agglomerations of Bangladesh.
I am thankful to my colleagues of BIP board members, the general members of the organization and the volunteers who took responsibilities in various stages of the event to make this international conference happen. Without much rely on the event management, our members carried out lot of efforts enthusiastically to make it successful. I must mention few names; Planner Mohammed Hamidul Hasan and Planner Dr. Adil Mohamed Khan who steer the whole process from the behind.
I also thank our partners of the two days conference who have been our partner organizations in the last couple of years in various occasions related to the urban planning and management. I must appreciate the efforts and contribution of International Society of City and Regional Planners (ISOCARP), Save the Children, United Nations Development Programme (UNDP) and BRAC-Urban Development wing. Without their gracious support this even wouldn’t have got that much of accomplishment.
How can I forget to offer my gratitude to the paper reviewers for their quality time, paper presenters, session chairs and discussants? We are indebted to these knowledgeable and conversant experts who spare their invaluable time and heighten outcome of the conference.
With Regards,
Dr. Akter Mahmud

MESSAGE
Diversity of papers, contents, ideas and area of research, above all, the interest surrounding this conference was highly appriciable. The conference attracted more than two hundred entries of abstracts including a handful number of international researchers and eventually 64 papers were selected for presentation in the conference on a competitive basis. The 8 sessions in two-day conference on four major themes attracted the audience for an interactive communication and participation. The participants included the governmental and non-governmental delegates, academia, and young researchers in the fields of urban, regional and rural planning and as well as in many other broadly related topics of conference themes. One important purpose of the conference was to encourage broad participation to open the planning issues to a larger cross-section of enthusiasts from relevant disciplines and profession interested in planning and planned development of Bangladesh. I believe the conference has been successful in this respect, and I would like to extend my warm felicitation and thanks to the authors and paper presenters of the ICURP-2019. I would also like to thank the members of BIP’s 13th Executive Board Members for their valuable efforts and cooperation to materialize the objectives of organizing this major event. I would like to convey my wholehearted thanks and gratitude to Mr. Mohammed Hamidul Hasan for his enthusiasm about organizing this conference. I appreciate his cordial attachment with ISOCARP, which helped earn the endorsement of the conference by ISOCARP. He worked tirelessly to ensure success of the ICURP-2019. The conference was important and timely in the context of Bangladesh. The planning practice and profession is relatively new in Bangladesh compared with the global context. Bangladesh is advancing faster to achieve higher status in development, which necessitates sharing and disseminating ideas and experiences on planning practices in the country to create favorable environment for planned development.
BIP looked forward to exchanging the participants’ knowledge, ideas and experiences on the best planning practices among the relevant audiences, especially the policy makers. The participation of Honorable Minister of the Ministry of Local Government, Rural Development and Cooperatives, the Government of the People’s Republic of Bangladesh, Mr. Tajul Islam, MP (Member of Parliament) as chief guest in the inaugural session of the ICURP and Honorable Mayor of Dhaka North City Corporation (DNCC) in the concluding session fulfilled our aspirations of sharing the conference issues with the policy makers and practitioners. The presence of some other distinguished individuals in different sessions of the conference made it very enlightening in terms of deliberation of the conference themes. We are grateful to all of these very important persons. The session chairs, rapporteurs, volunteers and event management persons greatly contributed in their roles to make the conference a success. The sponsors’ cordial support has been important to the success of this conference. The Bangladesh Institute of Planners is grateful to all them.
With Regards,
Dr. A K M Abul Kalam
Dr. A K M Abul Kalam Convenor, ICURP 2019 President, BIP
It gives me great pleasure to write this short note on the first International Conference on Urban and Regional Planning - 2019 (ICURP-2019) organized by Bangladesh Institute of Planners (BIP) in partnership with BRAC, UNDP and Save the Children with endorsement by International Society of City and Regional Planners (ISOCARP) in Dhaka on 5-6 October, 2019. The conference has been participated by planners and other professionals and researchers. It was encouraging that a large number young researchers presented papers in the conference, which indicates that these young talented participants are enthusiastic in contributing to the future planned development of Bangladesh.
MESSAGE
The Conference has been arranged in four different but inter-related sessions – Urban Planning and Management; Housing, Community Planning, Environmental Management, Sustainable cities and Settlements; Transport, Infrastructure and Services, Urban Economy and Governance; Regional and Rural Planning, Disaster Management and Climate Change – and every session has highlighted different urban, regional and rural development planning and management issues that bears immense importance in the ever changing spectrum of development and sustainability challenges in new millennium.
Cities, towns and villages in Bangladesh are yet to practice planning in a substantial way. We need to move a long way on the path of making these places planned to benefit in future development. We have a more or less even geographical distribution of cities, towns and rural settlements. We have some major cities including mega city Dhaka, district administrative headquarters, upazila (municipalities) administrative headquarters, and union headquarters, which can be the backbones to address the planning issues. Besides, Development Authorities, City Corporations and Paurashavas (small towns) spread all over the country. So, we have a great network of local authorities, most of which are democratically administered representing their respective communities. We can use these opportunities to plan our country for sustainable and planned development.
Bangladesh Institute of Planners - BIP believe that the knowledge and intellect that have been shared in International Conference on Urban and Regional Planning will pave a path for our ultimate goal of making cities as well as settlements more planned and sustainable for generations to come. We wish to continue our endeavors in future to promote planning for the betterment of society, environment and people.
With Regards,
Dr. Adil Mohammed Khan
Dr. Adil Mohammed Khan General Secretary, BIP
It is an immense pleasure for Bangladesh Institute of Planners to organize International Conference on Urban and Regional Planning (ICURP). This was indeed a great opportunity that we had been able to gather in this occasion of ICURP to share our ideas and experiences on the theme of the conference - “Planning for Sustainable Cities and Communities”. This theme is pertinent to Goal 11 of Sustainable Development Goals (SDG) which emphasizes that sustainable development cannot be achieved without significantly transforming the way we build and manage our urban space as well as our communities.

Urban Planning, Development and Management
Sixteen papers under the theme “Urban Planning, Development and Management” were presented in two days under “Session-1”. Central discussion points of each paper are written in very brief:
1. Fazle Rabbi Ashik and others assesses the spatial accessibility of urban facilities in Dhaka North City Corporation area over the time. This research paper finds more spatial inequity regarding accessibility to urban facilities at present than the previous time due to the increasing trend in area coverage of higher-spatial-accessibility cluster over time. At disaggregate level, the spatial equity of secondary school, park, and hospital regarding spatial accessibility to that respective facility is promoted over the time. While opposite result has been found in case of primary school, college, and playground.
2. Muktadir Rashid and Abdullah-Al-Zunayeed conduct their research on mapping the pattern of location shift, identifying the influence of socioeconomic characteristics of slum dwellers on their location shift and understanding the reasons influencing shifting pattern in the context of Dhaka. They identify the reasons of shift behind it. Their research suggests that Public and private organizations should work together to undertake on-site slum upgrade program to improve physical conditions of slums, create home-based employment opportunities and provide training for skill improvement of the slum dwellers to improve the shelter security of the dwellers.
3. Nigar Sultana and Mahfuzur Rahman investigate the quality of surface water of surrounding river system in wet and dry seasons and develop GIS based water quality zoning maps and identify suitable portion of river for water treatment plant (TP). This paper comes up with the result that will help planners, decision makers and water supply authority to establish treatment plant strategically. It will ensure cost effective decision making in locating TP, land cover change and water sustainability in the long-run.
4. Shibu Prashad Bosu and Amanat Ullah analyze the existing urban flood scenario of Barisal city using hydrology tools on data DEM (Digital Elevation Model) and find the reasons of water logging in the city. This research demonstrates that solid waste management can be an effective tool to reduce urban flood risk and to remain successful it requires continuous commitment and engagement from the city authority and society.
5. TasnimTabassum and others measure the accessibility of children of different income group to the educational and recreational facilities of Dhaka City. This study finds out proximity and individual component of accessibility of all groups has positive correlation for educational facilities. But for recreational, relation is strong with cost and distance for lower and travel time for middle group.
6. Md. Kamal Hosen and others investigate the impact of Setback, Floor Area Ratio, and Maximum Ground Coverage rules on the circulation of wind flow on urban built environment. The outcome of this research can provide guidelines to ensure proper wind circulation and comfort within the urban areas that can be integrated with the respective policy and urban planning guidelines.
7. Tanvir Hossain and Joy Biswas study on the location of filling stations in Dhaka City Corporation against the physical planning standards set by Bangladesh Petroleum Corporation, their effect on traffic flow and how this problems can be solved by improving their service facilities. This paper stresses on the enforcement of standards and regulations set by the authority.
8. Saba Tabassum presents how the public space can provide improve quality of life, health and social advantages for the communities that cover land and water bodies dedicated to entertainment, beautiful magnificence and preservation. This study investigates individuals’ feelings about their quality of life with respect to their living standards including their perception about visiting Ramna Park in their day to day lifestyle.
9. Paper of Salit Chakma and Musarrat Zaman examines the relationship between impervious surface change and Land Surface Temperature (LST) change in Dhaka Metropolitan Development Plan (DMDP) area. It also shows the impact of built-up areas on the urban life using the images of 1989, 1999, 2009 and 2019 collected by Thematic Mapper and Operational Land Imager of Landsat missions and the years with maintaining seasonal variation.
10. Nazmul Ahsan Tonoy and others analyze three town centre; Baze Shilinda, Chhoto Bongram and Lalithar of Rajshahi City and later propose an integrated detail plan to reimagine urban spaces within the three town centers by following the master plan, detail area plan, land use and urban design guidelines to develop a sustainable town center ensuring integration of multiple functions
11. Paper of Faiza Bushra and others assesses the people relative risk exposure to PM 2.5 in Khulna City. The study reveals that the population of working age group who has more exposure to the air pollution possesses Chronic Allergy, Influenza, Kidney Diseases, and Tuberculosis risk by the exposure of particulate matters.
12. Paper of Nafisa Anjum and Shilpi Roy aims to assess the ability of the public spaces to play proper roles and functions towards sustainability in urban neighborhoods in 3 planned residential area of Khulna city. This paper suggests that we need to have better recognition and understanding about public spaces and the transformation of potential urban spaces to public spaces through accommodating social inclusiveness, economic functionalities, and urban greens

13. Tushar Kanti Roy and others take an effort to establish solid management issue as an eco-neighborhood component for Nirala R/A of Khulna city comparing with Christianshavan city of Copenhagen. At the end, they come up with suggestions increasing SWM workers of KCC, recycling of biodegradable waste as compost, proper implementation of privatization programme as per city master plan etc to improve the SWM situation of Nirala Residential area in Khulna.
14. Anik Gouala and Nandita Banik examine the physical fabric of Khatunganj, one of the oldest commercial hubs in the country. This research comes up with design solution with land use plan and redevelopment strategies to regenerate this commercially significant area of Chattogram.
15. Srishti Roy Chowdhury and others examine the utility and safety facilities in large scale kutcha bazars in Dhaka city and try to understand the level of services of these facilities from both buyers & sellers perspective. According to this study, existing condition of the kutcha bazars in Dhaka is not satisfactory.
16. Torit Charaborty and others utilize machine learning algorithms such as support vector machine (SVM), k- nearest neighbor, deep neural network, and decision tree for land cover classification from multispectral satellite data. Result of this research indicates that DNN has better ability in classification of low-resolution satellite data than other machine learning algorithms which has the scope to use in different stages of urban planning and management.
- Dr. Akter Mahmud
General Rapporteur

Ashik, F.R., Mim, S.A., Neema, M.N. Spatial equity of urban facilities
1
Research Paper
A SPATIAL ACCESSIBILITY BASED APPROACH FOR THE ASSESSMENT OF SPATIAL EQUITY OF URBAN FACILITIES
OVER TIME
Fajle Rabbi Ashik1, Sadia Alam Mim2, and Meher Nigar Neema3
1,2Graduate Student, Department of Urban and Regional Planning, Bangladesh University of Engineering and Technology (BUET), Dhaka, Bangladesh.
3Professor, Department of Urban and Regional Planning, Bangladesh University of Engineering and Technology (BUET), Dhaka, Bangladesh.
Corresponding author’s E-mail: [email protected]
Abstract
Adequate, easy, and equitable access to urban facilities is a fundamental human right. To ensure adequate access to urban facilities over time, it is a goal of paramount importance to urban planners to assess spatial equity of such facilities. Thus, this study attempts to measure an integrated spatial accessibility measurement framework that contributes to the evaluation of geographic variation of spatial accessibility to urban facilities, and seeks to assess spatial equity of urban facilities over time through examining whether and to what degree spatial accessibility has been changed over that time period. This study measures integrated spatial accessibility index for urban facilities based on 2SFCA method incorporating a GIS based methodological framework and Dhaka City Corporation) DCC area as an empirical case. Both global and local spatial autocorrelation techniques are used to assess the change in spatial accessibility of urban facilities over time. Findings demonstrate that spatial accessibility to facilities has moderately increased over the time period (2005 to 2018). However, the increasing standard deviation and coefficient of variation of spatial accessibility index values mean a higher spatial variation of accessibility to facilities over the time period indicating spatial inequity. Overall at aggregate level, there is more spatial inequity regarding accessibility to urban facilities in 2018 due to the increasing trend in area coverage of higher-spatial-accessibility cluster over time. At disaggregate level, the spatial equity of secondary school, park, and hospital regarding spatial accessibility to that respective facility is promoted over the time. While opposite result has been found in case of primary school, college, and playground. Therefore, research findings of this study could be a useful reference to help urban planners to analyze, investigate, and adjust the distribution of urban facilities in a more equitable manner.
Keywords
Spatial accessibility; spatial equity; 2SFCA; global and local spatial autocorrelation techniques.
1. Introduction Spatial equity of urban facilities based on accessibility has been widely used in literature during the last few decades. It is important to examine the level of equity of urban facilities to enhance the quality of life and promote social sustainability. It also helps to evaluate the current allocation policies regarding urban facility provision. Using this measure, urban

Ashik, F.R., Mim, S.A., Neema, M.N. Spatial equity of urban facilities
2
planners can analyze to whether and to what degree urban facilities’ distribution has been changed over time, and thus, assess the spatial equity of urban facilities over time.
However, due to rapid urbanization, increasing population pressure, shortage of urban facilities and transportation facilities, access to urban facilities can be changed over time. It is important to know how geographic distribution of these factors changes over time which contributes to examine spatiotemporal pattern of accessibility of urban facilities and provides information whether urban residents of different time periods are treated equitably in terms of access.
A comprehensive literature review conducted for this study reveals that there is no study that attempts to assess spatial equity in the distribution of urban facilities in Dhaka. A number of studies that investigated the spatial distribution of urban facilities in Dhaka, mainly emphasized on disparity or concentration of public services based on only number of such facilities (Jahan & Oda, 1999; Islam, Shahin & Riyadh, 2011; Nourin, Nazneen & Tahmid, 2015). Several researchers explored a new integrated spatial equity index considering the spatial aspect of accessibility (gravity measure) and a number of urban facilities (Tsou, Hung & Chang, 2005; Liao, Sheng & Tsou, 2009; Rahman & Neema 2015). Unfortunately, no studies so far examined whether and to what degree accessibility has been changed over time and thus explored the change in spatial equity over time. Therefore, this study seeks to explore the change in spatial equity of urban facilities over time through examining whether or to what degree spatial accessibility has been changed over the time period.
2. Methodology 2.1 Study area
A case study area with availability of urban facilities is regarded as desirable. During the last four decades, Bangladesh has observed rapid growth in its urban population while 33.8% of national urban population inhabit in Dhaka Mega City in 2011. Dhaka City Corporation area (DCC) is accounted for 49.3% of the total urban population of Dhaka (BBS, 2011). In DCC area, the high rate of urbanization increases the demand for facilities while there are severe shortages in the provision of facilities (Rahman & Oda, 1999). The distributive inequity and increasing demand for urban facilities are aggravating access of urban populations to such facilities. Therefore, decision has been taken to select DCC Area as study area.
2.2 Measuring an integrated spatial accessibility index for urban facilities Most of the spatial accessibility indices developed so far have been established following the concept of traditional gravity model. These models measured accessibility on a particular geographic area (i.e. district, sub-district) considering supply of facilities (number of facilities on that geographical area) and travel impedance. One of the disadvantages of these indices is that they have a lack of consideration to the demand of facilities. These models assume that people residing within a particular geographic area, have only access to urban facilities located on that geographic boundary. Through this assumption, these models are not considered the interaction of residents across geographic boundaries. Whereas, in reality, spatial access to urban facilities depends, upon the supply of facilities within a geographic boundary as well as the supply of such facilities in neighboring communities, and the travel distance or time that users are willing to cover to reach such facilities (Wing and Reynolds, 1988; Kleinman and Makuc, 1983). Therefore, this study will measure spatial accessibility

Ashik, F.R., Mim, S.A., Neema, M.N. Spatial equity of urban facilities
3
considering: 1) supply of facilities; 2) demand for facilities; 3) the travel distance or time that users are willing to cover to reach such facilities; 4) the interaction of residents across geographic boundaries. To acknowledge such considerations, this study will measure spatial accessibility index based on the framework developed by Ashik, et al., (2019) which is developed from 2SFCA method.
Step 1. Calculate supply to demand ratio: For each k type of facility located at j, search all population locations (l) that are within a threshold travel distance (do) or from location (j), calculate travel distance between facility location j and population locations (l) and compute
the supply-to-demand or facility-to-population ratio, for k type facility within that distance.
Here, Pl is the population of location l whose centroid falls within the travel distance of j (dlj ≤ d0), Sj is the service capacity of facility k at location j. G (dlj, do) is the Gaussian or travel impedance function, depending on distance d between facility and population capturing the distance decay of access to the k type facility at location j.
Here, is the travel distance of k type facility at location j from the centroid of population
point l, and is the threshold travel distance.
Step 2. Calculate spatial accessibility: For each population location i, search all k type facility locations (j) that are within the threshold travel distance (do) from location i and sum up the
facility-to-population ratios, , at these locations:
Here, represents the spatial accessibility to k type facility at resident location i. is the travel distance between population centroid, i and location of k type of facility, j.
Step 3. Calculate integrated spatial accessibility: After calculating for each type of
facilities, calculate integrated spatial accessibility, through weighted summation of all at population location i to all types of facilities.

Ashik, F.R., Mim, S.A., Neema, M.N. Spatial equity of urban facilities
4
Here, represents the integrated spatial accessibility at resident location i. Higher value of
indicates a better spatial accessibility to urban facilities at resident location i. is the score of preferences for k type of facilities.
This method can be applied to measure accessibility of different types of urban facilities (Primary school, Secondary school, College, Playground, Park, Hospital) using smaller geographic units (Ward).
2.3 Analysing spatiotemporal pattern of accessibility over time To analyze spatiotemporal pattern of integrated spatial accessibility index for public facilities over the time period, spatial accessibility index has to be estimated at least for two time periods. This study has estimated spatial accessibility index for two time periods (2005 and 2018). After the calculation of the index for both time periods following the methodology described in section 2.2, summary statistics (mean, standard deviation, coefficient of variation, maximum, and minimum) has been determined to analyze overall change in spatial accessibility over the time period. The coefficient of variation (CV) is defined as the ratio of the standard deviation to the mean. It shows the extent of variability in relation to the mean of the population. To map the spatial extents of variation of spatial accessibility index value over the time period, Box-map has been produced using Geoda Environment. Using ArcGIS Spatial Statistics tools, both global spatial autocorrelation trend (Moran’s I) and local spatial clusters (Getis-Ord Gi* or Hot spot analysis) has been measured for the two time periods. Local Moran’s I identifies the pattern of accessibility (clustering or dispersed or random). Getis-Ord Gi* indicates whether accessibility with high values or accessibility with low values tend to cluster in a specified location. Accessibility index value has been used as inputs to estimate both global spatial pattern Spatial autocorrelation analysis (Moran’s I) can generate a HTML file if required. Hot spot analysis has been conducted for both time periods.
3. Results and discussions Table 3-1: Summary statistics for integrated spatial accessibility index values of urban facilities for two time periods
Summary statistics Mean Standard deviation
Coefficient of variation
(percentage)
Maximum Minimum
Estimated value (2018) 0.052 0.054 103.8 0.333 0.001 Estimated value (2005) 0.037 0.038 102.7 0.19 0 Change over the time period (Percentage)
40.54 42.11 - - -
(Source: Author, 2018)
Table 3-1 shows summary statistics for integrated spatial accessibility index values of urban facilities for both time periods. It is quite evident that on average, spatial accessibility index scores has moderately increased with a statistically significant mean difference over the time period (t= 3.706, p =.000). The increasing standard deviation and coefficient of variation of spatial accessibility index values mean a higher spatial variation or inequality in accessibility

Ashik, F.R., Mim, S.A., Neema, M.N. Spatial equity of urban facilities
5
to urban facilities over the time period and thus, infers spatial equity of urban facilities is demoted over time.
In Figures 3-1 and 3-2, geographical distribution of integrated spatial accessibility index is visualized for two time periods by means of a box map. Box maps (Figures 3-1 and 3-2) show for both time period periphery area has disadvantageous access while better spatial
Figure 3-2: Spatial extents of spatial accessibility to public facilities in 2005 (Source: Author, 2018)
Figure 3-1: Spatial extents of spatial accessibility to public facilities in 2018 (Source: Author, 2018)
Ashik, F.R., Mim, S.A., Neema, M.N. Spatial equity of urban facilities
6
accessibility index values are concentrated in central and central-southern part of the study area. This evidence is also consistent with the result of correlation coefficient. The result of Spearmen correlation coefficient demonstrates that there is a strong positive relation of accessibility index values between the two time periods (correlation coefficient .835; p=.000). The areas which are spatially disadvantaged in 2005, have also disadvantageous access to urban facilities in 2018 and vice-versa. It infers that there is no policy to achieve an equitable distribution of urban facilities in terms of equal access of urban residents to such facilities.
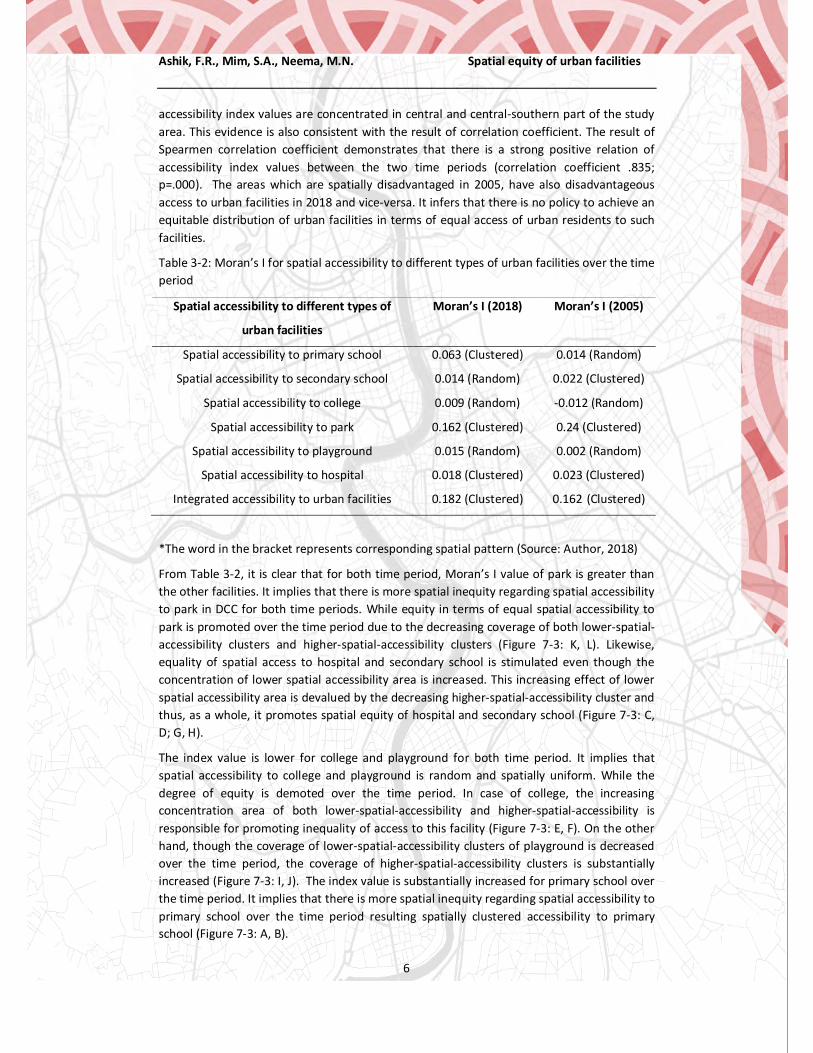
Table 3-2: Moran’s I for spatial accessibility to different types of urban facilities over the time period
Spatial accessibility to different types of
urban facilities
Moran’s I (2018) Moran’s I (2005)
Spatial accessibility to primary school 0.063 (Clustered) 0.014 (Random)
Spatial accessibility to secondary school 0.014 (Random) 0.022 (Clustered)
Spatial accessibility to college 0.009 (Random) -0.012 (Random)
Spatial accessibility to park 0.162 (Clustered) 0.24 (Clustered)
Spatial accessibility to playground 0.015 (Random) 0.002 (Random)
Spatial accessibility to hospital 0.018 (Clustered) 0.023 (Clustered)
Integrated accessibility to urban facilities 0.182 (Clustered) 0.162 (Clustered)
*The word in the bracket represents corresponding spatial pattern (Source: Author, 2018)
From Table 3-2, it is clear that for both time period, Moran’s I value of park is greater than the other facilities. It implies that there is more spatial inequity regarding spatial accessibility to park in DCC for both time periods. While equity in terms of equal spatial accessibility to park is promoted over the time period due to the decreasing coverage of both lower-spatial-accessibility clusters and higher-spatial-accessibility clusters (Figure 7-3: K, L). Likewise, equality of spatial access to hospital and secondary school is stimulated even though the concentration of lower spatial accessibility area is increased. This increasing effect of lower spatial accessibility area is devalued by the decreasing higher-spatial-accessibility cluster and thus, as a whole, it promotes spatial equity of hospital and secondary school (Figure 7-3: C, D; G, H).
The index value is lower for college and playground for both time period. It implies that spatial accessibility to college and playground is random and spatially uniform. While the degree of equity is demoted over the time period. In case of college, the increasing concentration area of both lower-spatial-accessibility and higher-spatial-accessibility is responsible for promoting inequality of access to this facility (Figure 7-3: E, F). On the other hand, though the coverage of lower-spatial-accessibility clusters of playground is decreased over the time period, the coverage of higher-spatial-accessibility clusters is substantially increased (Figure 7-3: I, J). The index value is substantially increased for primary school over the time period. It implies that there is more spatial inequity regarding spatial accessibility to primary school over the time period resulting spatially clustered accessibility to primary school (Figure 7-3: A, B).

Ashik, F.R., Mim, S.A., Neema, M.N. Spatial equity of urban facilities
7
Figure 3-4: Percentages of areas within hot spots and cold spots for spatial accessibility to urban facilities (Author, 2018)
However, the spatial pattern of integrated spatial accessibility to all types of urban facilities is clustered for both time period while the degree of clustering or inequity is increased a little bit over the time period (Table 3-2). That means at aggregate level, spatial equity of urban facilities is marginalized over the time regarding spatial accessibility to such facilities (on the basis of horizontal equity). From Figure 3-3 M and N, it is clear that in aggregate level, considering all the selected facilities higher-spatial-accessibility cluster is moving to the north over the time. While in 2005 south-eastern part of DCC is on higher-spatial-accessibility cluster which is no longer on this cluster in 2018. Considering cold spots, one ward located western part of DCC is on the lower-spatial-accessibility cluster in 2005 while this area is no longer on this cluster in 2018. From Figure 3-4, percentage of area in higher-spatial-accessibility cluster has increased from 30.6 percent (2005) to 32 percent (2018). It means more areas are in higher-spatial-accessibility cluster in 2018. While the percentage of area in lower-spatial-accessibility cluster has decreased from 27 percent (2005) to 26 percent (2018). It means few areas are in lower-spatial-accessibility cluster in 2018. The higher increase in the area coverage of hot spots compared to the cold spots causes the increasing trend of Moran’s I value for integrated spatial accessibility (Table 3-2). It indicates aggregately spatial inequity of urban facilities is promoted over time.
A B

Ashik, F.R., Mim, S.A., Neema, M.N. Spatial equity of urban facilities
8
C D
E F

Ashik, F.R., Mim, S.A., Neema, M.N. Spatial equity of urban facilities
9
G H
I J

Ashik, F.R., Mim, S.A., Neema, M.N. Spatial equity of urban facilities
10
Figure 3-3: Spatial extents of hot spots, cold spots and no clustering areas of spatial accessibility index for primary school (A; B); secondary school (C; D); college (E; F); hospital (G; H); playground (I; J); park (k; L); urban facilities (M;N) (Source: Author, 2018)
K L
M N

Ashik, F.R., Mim, S.A., Neema, M.N. Spatial equity of urban facilities
11
4. Conclusion The spatial equity of urban facility planning has become a critical issue in many developing countries. This study explores the change in spatial equity of urban facilities over time through examining whether or to what degree spatial accessibility has been changed over the time period. Through the investigation, this study shows how spatial accessibility to urban facilities has changed over time. Spatial accessibility to urban facilities has moderately increased with a higher variation over the time period. There is more spatial inequity regarding spatial accessibility to primary school, college, and playground in 2018 while the degree of inequity regarding spatial accessibility to secondary school, park, and hospital has reduced over the time period. Overall at aggregate level, there is more spatial inequity regarding accessibility to urban facilities in 2018. However, future research can assess intergenerational equity of urban facilities by incorporating different time periods with a longer time span.
5. References Ashik, Mim, Neema, (2019). Measuring an Integrated Spatial Accessibility Index for Urban
Facilities in DCC area. International Conference on Engineering Research and Practice (iCERP2019), Dhaka, Bangladesh, 19-22 January 2019; STAMCA: Sydney, Australia, 2019
BBS. (2011). District Statistics: Dhaka 2011. Bangladesh Bureau of Statistics, Statistics and
Informatics Division, Ministry of Planning, Government of the People’s Republic of
Bangladesh.
Rahman, Neema (2015) “A GIS Based Integrated Approach to Measure the Spatial Equity of Community Facilities of Bangladesh” AIMS Geosciences, Vol. 1 No.1.
Jahan, Oda (1999) “Distribution of Public Facilities in Dhaka, Bangladesh: A Spatial Analysis.”
Nourin, Nazneen, Tahmid (2015) “Education and health facilities of Dhaka City Corporation area: a study of spatial distribution of the facilities (BURP thesis)”. Urban and Regional Planning, Bangladesh University of Engineering and Technolgy, Dhaka, Bangladesh.
Islam, Shahin, Riyadh (2011) “Schools of Dhaka City: a study from spatial planning perspective (BURP thesis)”. Urban and Regional Planning, Bangladesh University of Engineering and Technology, Dhaka, Bangladesh.
Tsou, Hung, Chang (2005) “An accessibility-based integrated measureof relative spatial equity in urban public facilities” Cities, Vol. 22 No. 6.
Liao, Chang, Tsou (2009) “Explore the spatial equity of urban public facility allocation based on sustainable development viewpoint”. 14th international conference on urban planning and regional development in the information society. Sitges, Spain.
Wing, Reynolds (1988) “The availability of physician services: a geographic analysis” Health Services Research, Vol. 23.
Kleinman, Makuc, (1983). “Travel for ambulatory medical care”Medical Care, Vol. 21 No. 5.

Chowdhury, M. M. R, & Zunayeed, A. A. Location Shift by Slum Dwellers
12
Research Paper
LOCATION SHIFT BY SLUM DWELLERS Evidence from Slums of Dhaka North and South City Corporation
MOHAMMAD MUKTADIR RASHID CHOWDHURY, Assistant Manager, MGH; Bangladesh Abdullah- Al- Zunayeed, BURP, BUET; Bangladesh
Abstract
Across the rapidly urbanizing cities in the world, people living in the slums are more likely to shift their location for a variety of reasons: intention of living near to workplace, the occurrence of hazards, secured tenure, etc. Dhaka is one of the fastest-growing mega cities with 37.4% population living in different slums. The present research is aimed at mapping the pattern of location shift, identifying the influence of socioeconomic characteristics of slum dwellers on their location shift and understanding the reasons influencing shifting pattern in the context of Dhaka. A questionnaire survey has been carried out in 400 households from 54 slums which have been selected through stratified sampling. The study finds that 65% of the total respondents have changed their location. From origin to entry points of Dhaka city slum areas on two different time frame (before 2010 and after 2010) has been mapped to figure out the location shift behavior of the respondents. Noticeably, respondents of DNCC shift locations more frequently than that of DSCC area. Rickshaw puller, garment workers and day labors have been found to shift their locations more frequently to reside near their workplace, for less house rent and to dwell at a better structure. About 6% of respondents have changed their location due to fire hazard. The research suggests that Government and non-government organizations should work together to undertake on-site slum upgrade program to improve physical conditions of slums, create home-based employment opportunities and provide training for skill improvement of the slum dwellers.
Keywords
Slum Dwellers, Location Shift.
1. Introduction 1.1. Background of the research Every year a huge number of low income people are coming to Dhaka city for betterment of their livelihoods. Most of these people who relocate to the cities to earn their livelihood, take shelter in unhealthy and densely populated slums. About 37.4% of the population of Dhaka are slum dwellers, and during 2002-2025, the number is expected to grow with a shocking annual average rate of 2.72 (Ahmed and Rahman, 2014). According to Slum and

Chowdhury, M. M. R, & Zunayeed, A. A. Location Shift by Slum Dwellers
13
Floating Population Census 2014, about 1,062,284 people are living in slums in Dhaka Division. Among them, Dhaka North City Corporation and Dhaka South City Corporation have correspondingly 499,019 and 147,056 slum dwellers and the number of slums are 1,639 and 1,755 respectively (BBS, 2015). Generally slum populations hold a tendency to move from one slum to another. It has been seen in different slums that occurrence of this location shift is a common phenomenon (Owusu, Agyei and Lund, 2008). In most of the cases the motive behind this shift is to find a better place than the preceding one and to live near to their working place. So, slums located beside different industrial areas fascinate the people to move there (Beguy, Bocquier and Zulu, 2010). It may be also happened that slum people are forcefully evicted to move from slums. (Shiree-DSK, 2012; The Guardian, 2012; Cityscope, 2015). The study has been selected to study the socio-economic condition of the slum dwellers, trace the location shift pattern of slum dwellers and analyse the reasons behind these movements. There are limited researches on tracing the location shift of slum dwellers in different slums all over the world but none of those studies were conceptualized to find out the reasons behind the location shift of slum dwellers. In our context, no study has been conducted to trace the location shift of slum dwellers.
1.2. Methodology of the Research In order to fulfil the objectives of the study, Dhaka North City Corporation (DNCC) and Dhaka South City Corporation (DSCC) area have been selected. There are 55 wards in DSCC and 36 wards in DNCC area. (BBS, 2015). The slums of the study area have been identified from Slum and Floating Population Census, 2014 (BBS, 2015). DNCC and DSCC area have correspondingly 1639 and 1755 slums (BBS, 2015). These slums have been categorized into six types based on their household size. Based on these categories the number of households have been calculated from Slum and Floating Population Census, 2014 (BBS, 2015). Stratified sampling method has been used to find out the number of households that need to be surveyed. An assumption has been followed to survey at least 10 households from the slums having greater than 50 households and at least 5 households from the slums having 50 or less than 50 households. Following the assumption the numbers of slums that need to be surveyed have been found. Table 01 shows the sample selection procedure.
Table No. 01: Sample Selection process
Categories of slums based on
the number of households
Number of household Household selection
through stratified sampling
Number of slums selected
DNCC DSCC Total DNCC DSCC Total DNCC DSCC Total <50 22,894 25,529 48,423 52 58 110 10 12 22
50-200 21,441 6,628 28,069 49 15 64 5 2 7 200-400 13,047 3,140 16,187 30 7 37 3 1 4 400-600 22,265 436 22,701 51 1 52 5 1 6 600-800 6,924 2,026 8,950 16 5 20 2 1 3
Above 800 48,769 2,832 51,601 111 6 117 11 1 12 Total 135340 40,591 175,931 309 92 400 36 18 54

Chowdhury, M. M. R, & Zunayeed, A. A. Location Shift by Slum Dwellers
14
400 households have been selected from 175931 households through stratified sampling. Among them, 308 households will be surveyed from DNCC and 92 households will be surveyed from DSCC. In order to conduct survey in these households, 36 slums have been selected from DNCC and 18 slums have been selected from DSCC. The location of these slums has been selected hypothetically in such a way that they can represent the study area properly. Number of slums and number of households have been kept in mind during the selection of a slum from particular ward. For collecting primary data, a questionnaire has been formed after conducting reconnaissance survey. After forming the questionnaire, household survey have been done in the selected slums in both DNCC and DSCC area to collect the information about the socio-economic condition of slum dwellers, location shift pattern and the reasons behind their location shifts.
2. Socio-economic condition of the slum dwellers 2.1. Demographic information of the respondents Acknowledgement of the first objective of the research leads to the Identification of the socio-economic conditions of slum dwellers. Professions of male and female respondents and educational status of them have been plotted against 4 different age groups to find out the correlations.
Table No. 02: Distribution of the respondents according to their profession and educational status over different age group.
Profession and Educational Status of the Respondents
Age Group Total
20-29 30-39 40-49 > 50
Profession of the Male Respondent
s
Rickshaw Puller 8 11 6 4 29 Day Labour 5 7 5 2 19 Driver 9 10 4 2 25 Small Businessman 3 1 2 2 8 Shopkeepers 1 5 2 2 10 Unemployed 1 1 1 6 9
Total 27 35 20 18 100
Profession of the
Female Respondent
s
Garments Worker 18 10 0 0 28 Day Labour 11 12 3 1 27 Housemaid 4 9 9 8 30 Housewife 3 2 3 5 13 Others(Small Businesses) 2 0 0 0 2
Total 38 33 15 14 100
Educational Status
Illiterate 8 17 10 9 44 Primary 17 11 3 2 33 Secondary 2 0 0 0 2 Others (Madrasa,Maktab etc.) 1 6 6 8 21
Total 28 34 19 19 100 (NB: Values provided in the cells are measured in percentage)
Chowdhury, M. M. R, & Zunayeed, A. A. Location Shift by Slum Dwellers
15
Majority percentage residents in slum areas are aged from 20 to 39 years. About 44% of the respondents are illiterate in slum areas. Male respondents have been seen to engage in different profession. Among them Rickshaw Pullers and Drivers (about 54%) hold the majority percentages whereas female respondents have been seen to engage more in garments and house maid services (about 58%). Unemployment rate has been seen to increase with the increase in age. People aged above 50 hold the highest unemployment magnitude than other aged group people.
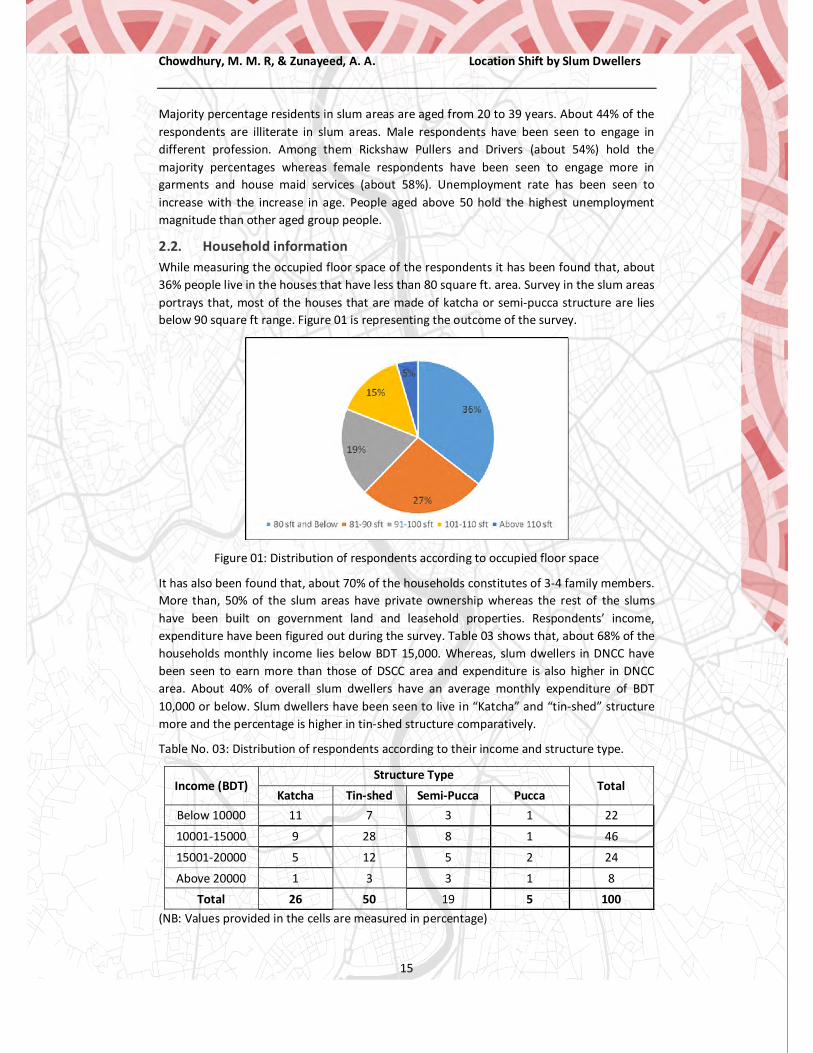
2.2. Household information While measuring the occupied floor space of the respondents it has been found that, about 36% people live in the houses that have less than 80 square ft. area. Survey in the slum areas portrays that, most of the houses that are made of katcha or semi-pucca structure are lies below 90 square ft range. Figure 01 is representing the outcome of the survey.
Figure 01: Distribution of respondents according to occupied floor space
It has also been found that, about 70% of the households constitutes of 3-4 family members. More than, 50% of the slum areas have private ownership whereas the rest of the slums have been built on government land and leasehold properties. Respondents’ income, expenditure have been figured out during the survey. Table 03 shows that, about 68% of the households monthly income lies below BDT 15,000. Whereas, slum dwellers in DNCC have been seen to earn more than those of DSCC area and expenditure is also higher in DNCC area. About 40% of overall slum dwellers have an average monthly expenditure of BDT 10,000 or below. Slum dwellers have been seen to live in “Katcha” and “tin-shed” structure more and the percentage is higher in tin-shed structure comparatively.
Table No. 03: Distribution of respondents according to their income and structure type.
Income (BDT) Structure Type
Total Katcha Tin-shed Semi-Pucca Pucca
Below 10000 11 7 3 1 22
10001-15000 9 28 8 1 46
15001-20000 5 12 5 2 24
Above 20000 1 3 3 1 8 Total 26 50 19 5 100
(NB: Values provided in the cells are measured in percentage)

Chowdhury, M. M. R, & Zunayeed, A. A. Location Shift by Slum Dwellers
16
3. Location shift analysis of slum dwellers 3.1. Existence of location shift in the study area The study methodology has been regulated with keeping an assumption that the slum dwellers shift their location from one slum to another slum. When the respondents have been asked about the location shift, around 65% respondents have shifted their locations. About 6% of them have shifted their locations for third time after arriving to Dhaka. Location shifting tendency is found to be higher amongst the slum dwellers of DNCC rather than DSCC. In DNCC, the slum dwellers of large slums (having households greater than 800) have shifted their locations mostly while the picture is totally different in DSCC. Slum dwellers of small slums (having households less than 50) have shifted their locations mostly. To analyse the pattern of location shift behaviour of the respondents, slum dwellers who have migrated after 2000 have been taken into consideration. Table 04 portrays the location shift behaviour of the respondents arrived in Dhaka in two different timeline.
Table No. 04: Distribution of the respondents according to the arrival time and number of location shift in DNCC and DSCC area.
Number of location shift
Frequency of respondents in DNCC area (%)
Frequency of respondents in DSCC area (%)
Total Arrived in
(2000-2010) Arrived
after 2010 Arrived in
(2000-2010) Arrived
after 2010 0 (No location
shift) 10 11 2 5 28
1 15 6 2 4 27 2 22 7 8 2 39 3 3 2 1 0 6
Total 50 25 13 12 100 (NB: Values provided in the cells are measured in percentage)
Three types of location shift have been identified: intra ward location shift, inter ward location shift and intra slum location shift. Among them, inter ward location shift is higher for both of the timeline and both of the areas and it covers 65% of the total location shifts. Respondents aged between 20 and 39 have been seen to change their location mostly. In case of the profession, it has been found that, Day Labours, Drivers, Rickshaw Pullers, Garment Workers and Housemaids have shifted their locations more frequently than respondents from other profession.
3.2. Location shift process of the respondents After migrating from different parts of the country due to various reasons the respondents have been seen to choose slums in DNCC and DSCC areas. The study finds that, the respondents in DNCC area have been located mostly in Uttara, Mirpur and Mohammadpur area after migration and respondents in DSCC area have been located mostly in Kamrangir Char and Jatrabari Area. So these five locations are the entry hub for slum dwellers. Majority of the respondents who have been located in DNCC area have been arrived from Tangail, Mymensingh, Sherpur, Netrokona, Rangpur, Bogura etc. which concludes that, the respondents from northern part of the country are locating mostly in DNCC area.

Chowdhury, M. M. R, & Zunayeed, A. A. Location Shift by Slum Dwellers
17
Figure 02: Distribution of respondents (arrived in DNCC between 2000-2010) according to their first location (left) and final location (right)
Figure 03: Distribution of respondents (arrived in DSCC between 2000-2010) according to their first location (left) and final location (right)

Chowdhury, M. M. R, & Zunayeed, A. A. Location Shift by Slum Dwellers
18
Whereas, respondents from southern part of the country, Barishal, Bhola, Khulna, Satkhira etc. have been seen to migrate to DSCC area slums. After entering into the Dhaka city, slum dwellers tend to shift their location in a frequent manner. The pattern has been mapped for both of the time period, those who have entered into Dhaka between 2000 and 2010 and those who have entered into Dhaka after 2010. The scenario for the first type of arrival time has been shown in figure 02 and figure 03. Based on the percentage of residing in different slums five categorization have been formulated. It has been traced that, whether they have shifted their location between different wards in DNCC and DSCC areas. The study found that, respondents arrived between 2000 and 2010 have been seen to locate in Mirpur 1 and Mohammadpur area mostly and after shifting their locations for the final time they have been seen to locate in slums in Pallabi, Bashan Tek or Karail Slum. So, there is a flow of migrating from northern parts of the country to Mirpur, Mohammadpur and after entering into Dhaka the flow continues to Pallabi, Bashan tek or Banani. Whereas, in DSCC area, the respondents after entering into Dhaka have been seen to locate in Kamrangir Char, Hazaribagh and Jatrabari area. After shifting their locations for the final time they have been seen to locate for northern side of Hazaribagh, Khilgaon, Sabujbagh areas.
4. Identifying reasons behind location shift of slum dwellers 4.1. Reasons behind location shift The reasons behind the locational shift behaviour of the respondents have been found out to fulfil the third objective of the research. In both DNCC and DSCC, less house rent is the prime factor in shifting locations. Figure 04 depicts the scenario of the reasons of location shift. They also prefer the locations closer to their work place. As the income rises of the slum dwellers, they try to avail better types of structures for example: from Katcha types of structures to tin-shed or semi-pucca structure houses. So, they shift their locations and try to reside on those slums where they can easily get access to these facilities.
Figure 04: Distribution of respondents according to the reasons of location shift in DSCC & DNCC Area

Chowdhury, M. M. R, & Zunayeed, A. A. Location Shift by Slum Dwellers
19
The most alarming factors are eviction and fire hazard. Slum dwellers are forcefully evicted from slums without prior notices. Like the scenario has drawn our attention in different national dailies for so many times, it has also come into light during our survey. Dhaka city slum areas have seen so many devastating fire hazards in last few years. As a result, the slum dwellers, with no other place to move, shift their location into other slums.
Respondents of slums having households greater than 800 are more unstable in a particular location. In some big slums like karail, Sattala Basti etc., respondents tend to shift internally within slums. Less house rent, fire hazards, eviction, tendency to live with relatives are the prime factors in shifting locations internally. It has been also found in the survey that, some particulars migrant at post rice harvesting period come to Dhaka to pull rickshaw, or engage in construction work. When the rice harvesting period arrives they go back to the villages. These people also seem to shift their location based on the opportunity they get.
Slum dwellers of different profession have different prime reasons in shifting their location. Garments workers, day labours and drivers tends to shift mostly because of closer distance to workplace. Whereas, Rickshaw puller, Housemaids and respondents from other professions prioritize less house rent when shifting their locations. Table no. 05 portrays the scenario. Correlation with profession with reasons behind shifting locations in DNCC areas has been focused on the table. The scenario is identical to the DSCC area slums also.
Table No. 05: Distribution of respondents (%) according to profession and reasons of location shift in DNCC
Professions Skilled job
Closer distance to work place
Better types
of structures
Less house rent
Evictions
Fire hazard Others Total
Garment worker 0 4 2 3 1 1 1 12
Rickshaw puller 1 6 2 7 1 1 2 20
Day labour 1 7 3 6 1 2 2 22 Housemaid
and Housewife
0 1 4 2 1 1 1 10
Shopkeeper 0 1 1 3 0 0 1 6 Driver 1 6 3 5 1 1 3 20 Small
Businessman 0 1 1 2 0 0 1 5
Others 0 1 2 1 0 0 1 5 Total 3 27 18 29 5 6 12 100
(NB: Values provided in the cells are measured in percentage)
Chowdhury, M. M. R, & Zunayeed, A. A. Location Shift by Slum Dwellers
20
5. Major findings and Conclusions 5.1. Major Findings of the study The study finds the trace of location shift of slum dwellers and various reasons acting effective behind the location shift. The other major findings of the research are given below:
About 64% slum dwellers are aged between 30 and 39 and 44% of total respondents are illiterate.
The male respondents usually more engaged in rickshaw puller, driver and day labour profession where the female respondents are more engaged as a garment worker or a housemaid.
Female respondents have been seen to work side by side with man in different construction works as a day labour.
About 63% slum dwellers have been seen to live in a houses which occupied less than 90 square ft.
Majority of household’s monthly income lies between BDT 10,000 and 15,000. About 49.3% of the slums are located in private land and 31.3% of the slums are
located in government land. More than 76% slum dwellers live miserably in Katcha & Tin-shed structues. It has been found that, 65% of the total respondents have changed their location for
shifting into a better one or they are forced to move from slums. Slums dwellers of the following profession like Day Labour, Drivers, Rickshaw
Pullers, Garment Workers and Housemaids have been seen to shift their locations mostly.
Uttara, Mirpur, Mohammadpur, Kamrangir Char and Jatrabari are five areas acting as an entry point for people migrating from different parts of the country.
Two major patterns have been identified. Migration from northern part of the county to Uttara, Mirpur and Mohammadpur which will eventually lead to Pallabi, Bhashan Tek and Banani. The other major flow is migration from southern part of the country to Jatrabari, Kamrangir Char and which will eventually lead to Hazaribagh, Khilgaon etc. areas.
Location shift percentage is higher in DNCC areas (around 75%) than DSCC areas. Three types of location shift have been found from the study. Those are Intra slum
location shift, intra ward location shift and inter ward location shift. Day labours, drivers, garments workers and rickshaw pullers have been seen to
change their location more than other profession. In DNCC, the respondents are more likely to change their location for less house
rent, better type of structure and closer distance to work place which is also identical to DSCC areas.
Around 6% of the respondents shift their location in DNCC for eviction and 6% of the respondents for different fire hazard occurred in different slums. While in DSCC, 5% of the respondents have been evicted from the slum areas.
5.2. Conclusion The study shows that, slum dwellers changing their location because they don’t get enough services that is needed to fulfil their basic requirements of living. The government can take
Chowdhury, M. M. R, & Zunayeed, A. A. Location Shift by Slum Dwellers
21
different plan and programs like, On-site upgrading, Land Readjustment, Rehabilitation program etc. to relocate the slum people and provide them better housing facility. The affordability and accessibility of slum dwellers to that type’s plans and programs must be checked. The government should incorporate these policies and programs in national level plan like master plan and national budget by creating environment for participation of different civil societies and local slum people. Wherever, slums have to be relocated, care should be taken to see that the slum dwellers are not in any way became disadvantaged. Inability to do such will result in disarray as the slum population is increasing day by day. Moreover in developing countries, this low income people are the major impetus for economic and other developments. But they are not stable at one location which impedes to use the potentiality of this huge number of people properly. So, if the reasons of location shift can be identified as to whether they are willingly shifting their location or being forced to move out, the concerned authority or government can take necessary steps to control the location shift to better their lives.
6. References Ahmed, Saleh; and Rahman, Khan Rubayet (2014). Demystifying the Rhetorics of Slums in
Dhaka: A Critical Review on the Spatial Manifestation of Urban Poverty Available from:http://www.bip.org.bd/SharingFiles/journal_book/20140622155640.pdf Accessed on: 26th October, 2019
Bangladesh Bureau of Statistics (2015). Census of Slum Areas and Floating People 2014. Retrieved from: http://www.bbs.gov.bd/PageWebMenuContent.aspx?Menukey=423 Accessed on: 25th October, 2019.
Beguy, Donatien; Bocquier, Philippe; Zulu, Eliya Msiyaphazi (2010). Circular migration patterns and determinants in Nairobi slum settlements. Demographic research volume 23, article 20, pages 549-586. DOI:10.4054/DemRes.2010.23.20. Accessed on 8th October, 2019.
Citiscope (2015, November 13). After a painful eviction, Bangladesh slum dwellers start over with a 99-year lease. Retrieved From: http://citiscope.org/story/2015/after-painful-eviction-bangladesh-slum-dwellers-start-over-99-year-lease Accessed on: 26th October, 2019.
Owusu, George; Agyei-Mensah, Samuel; Lund, Ragnhild. (2008). Slums of hope and slums of despair: Mobility and livelihoods in Nima, Accra. Norsk Geografisk Tidsskrift - Norwegian Journal of Geography, 62:3, 180-190, DOI: 10.1080/00291950802335798. Accessed on: 20th October, 2019.
Shiree-DSK (2012). Moving Backwards: Korail Slum Eviction. Retrieved from: https://assets.publishing.service.gov.uk/media/57a08a9aed915d622c0007f7/Korail-Eviction-Report.pdfAccessed on: 8th October, 2019.
The Guardian (2012, April 11). Dhaka slum dwellers live under threat of eviction. Retrieved From: https://www.theguardian.com/global-development/2012/apr/11/dhaka-bangladesh-slum-dwellers-eviction . Accessed on: 26th October, 2019.

Sultana, N and Rahman, M. M GIS based Surface Water Quality Index (SWQI) Zoning of Dhaka River System
22
Research Paper
GIS based Surface Water Quality Index (SWQI) Zoning of Dhaka River System
Nigar SULTANA, student; Bangladesh Md. Mafizur Rahman, Professor; Bangladesh
Dhaka, the capital of Bangladesh is the fastest growing mega-city of the world and expending toward its periphery with higher population density. This increasing population extracts groundwater to meet their demand. Studies found that 80% water demand of the city has been supplied from groundwater and caused water table decline 2 m/yr since 1985. On the contrary, Dhaka is blessed by abundant surface water. Dhaka Water Supply and Sewerage Authority (DWASA) has been planning to shift groundwater dependency to surface water. As the surface water is the next target to water supply source, this study will investigate the quality of surface water of surrounding river system in wet and dry seasons. The aim of the study to evaluate the water quality of surrounding rivers of Dhaka, develop GIS based water quality zoning maps and identify suitable portion of river for water treatment plant (TP) based on water quality Index (WQI). Dhaka is surrounded by rivers- Tongi khal at the north, Buriganga at the south, Balu at the east and Turag at the west. The study has collected data of 15 sampling locations around four rivers during 2016-17 from a report of Department of Environment (DoE). It covers both physical and chemical parameters. The study has used weighted arithmetic index as SWQI and GIS application for analysis. It will help planners, decision makers and water supply authority to establish treatment plant strategically. It will ensure cost effective decision making in locating TP, land cover change and water sustainability in the long-run.
Keywords
Dhaka Water Supply and Sewerage Authority (DWASA), Treatment plant, Surface Water Quality Index (SWQI), Geographic Information System (GIS), and Sustainability.
1. Introduction1 1.1. Introduction 1.1 Dhaka, the capital of Bangladesh is the fastest growing mega-city of the world. It accommodates more than 10.3 million population in 2018 (World population review, 2018) and has expand its size about 17.88 times since 1951 (Islam et al., 2013). This large population demands potable water and the demand is increasing day by day. The sources of water are groundwater, surface water and rainwater. Whereas 80% of water demands of domestic, industrial and commercial is abstracted from groundwater source (Dhaka Water Supply & Sewerage Authority (DWASA, 2005) which may be trade to renewable resource up to its recharge level. The ground water table has lowered at the rate of 2 m per year since 1985 (Akther, Ahmed and Rasheed, 2009). Dhaka is blessed by abundant surface water from its arterial rivers. Dhaka is mainly surrounded by four rivers Tongi khal in the north, Buriganga in the south, Balu in the east and Turag at the west. Master plan of DWASA has emphasized the shift the dependency of ground water to surface water. A number of surface water treatment plants has been proposed surrounding the rivers of Dhaka. The water quality has degraded due to indiscriminate use of water and effluent discharge.

Sultana, N and Rahman, M. M GIS based Surface Water Quality Index (SWQI) Zoning of Dhaka River System
23
As the surface water is the next target of supply source for the densely populated Dhaka, it is the high to study the quality of water of surrounding rivers. Therefore, this study will investigate the extant of surface water quality of the surrounding rivers for two seasons. Water directly affect life, as it is involving in local use, industrial use, fish habitat and life style, irrigation and the aquifer of ground water (Muyen, Rashedujjaman and Rahman, 2016). The study has collected data of 15 stations around four rivers during 2015 and 2019 from Department of environment report. It covers both physical and chemical parameters. To simplify data set water quality index for the stations has been calculated using GIS and the map of the water quality index has digitized for visual presentation. GIS summarizes large amount of data and convey easy interpretation for resource manager and policy makers (Singh, Tiwari, Panigary and Mahato, 2013).
1.2. Literature review 1.2 Water quality depends on the physical, chemical and biological condition of water. Presence of chemicals are not the crisis; the percentage of presence is the major concern now-a-days. Industrialization, urbanization and injustice use of water in all fields are polluting the sources of water. The availability of potable water and ecology will be threatened if the present rate of pollution persists (Uddin et al 2014; pg- 294). There is no fixed number of water quality parameter which justify the water quality of different sources. In the mid-twentieth, Horton selected 10 most commonly measured water quality variables including dissolved oxygen (DO), pH, coliforms, specific conductance, alkalinity, and chloride (Bharti and Katyal, 2011; pg-155).
Water Quality Index is defined as the composite influence of individual water quality parameters to determine conditions of water quality for human consumption (Tiwari et. al., 1985; WHO, 1993) and to gain knowledge about principles and basic concepts of water and related issues. WQI is the effective information on the quality of water to the concerned citizens and policy makers (Ramakrishnaiah et al., 2009). Finally, WQI simplifies huge water quality data into simple terms (e.g., excellent, good, bad, etc.) for reporting (Bordalo et al. 2006). The review studies on water quality indices found different corners of world used different water quality indices based on the comparison of the water quality parameters to regulatory standards (Abbasi, 2002; Khan et al., 2003). Different uses have different parameters and acceptable ranges of amount present (Rajkumar and Sneha, 2012). Such as- US National Sanitation Foundation Water Quality Index (NSFWQI). Nine water quality parameters such as temperature, pH, turbidity, coliform, dissolved oxygen, biochemical oxygen demand, total phosphates, nitrates and total solids was proposed initially. This method has been widely accepted in European, African and Asian countries (Singh, et al, 2013; pg 1595). Canadian Council of Ministers of the Environment Water Quality Index (CCME WQI) was developed by Canadian jurisdictions for both management and the public. Oregon Water Quality Index (OWQI) used Delphi method to fix parameter.
Rajkumar and Sneha, 2012 and Singh et. al, 2013 reviewed different types of water quality indices and suggested to use GIS as a tool to accesses water quality. GIS shows spatial distribution for various pollutants across river which is very useful for policy makers, responsible authorities and planners to take preventive measures.

Sultana, N and Rahman, M. M GIS based Surface Water Quality Index (SWQI) Zoning of Dhaka River System
24
2. Methodology 2 2.1. Study Area 2.1 Dhaka Water Supply Authority (DWASA) is facing increasing demand of water and found that the current groundwater abstraction exceeds the recharge rate. This extraction of water causes lowering of the ground water table which already reached at around 68-70 m. However, Dhaka is surrounded by surface water by its peripheral rivers and constantly polluted by municipal and industrial untreated wastewaters discharge. the surface water along these peripheral rivers is known to be highly polluted due to municipal and industrial untreated wastewaters that are discharged (Subramanian, 2004; Kamal et al., 1999; Mahbub, 2011; pp-41).
The study area covers four peripheral rivers Tongi Canal, partial reach of the Turag (from the Confluence of Turag and Tongi Canal to the confluence of Turag and Buriganga Rivers), the Balu River and Buriganga.. Figure 1 shows the study area and its sampling point locations.
Figure 1: Study Area (River system of Dhaka)
2.2. Mothodology 2.2 Data on 15 locations in the rivers has been collected. Physio-chemical parameter like Depth (m), Temperature (0C), pH, EC(µS/cm), TDS (mg/L), Turbidity (NTU), Alkalinity, Iron (mg/L), Ammonia (mg/L), Nitrate (mg/L), Sulfate (mg/L) and Chloride (mg/L) have been considered. All information has been gathered from the published report of DoE (Department of Environment). “Surface and ground water quality report 2016” is the provider of data source. Graphical representation for biological parameter is out of interpretable, so the parameters are limited to physical and chemical quality in this study. The study emphasizes on dry season (January) when the water quality is on the worst condition and wet season (September) when the rivers are full of uninterrupted water flow.
Water Quality Index (WQI) is calculated using the following Weighted Arithmetic Index formula proposed by Horton 1965 and later developed by Brown et al. (1970); Cude (2001).

Sultana, N and Rahman, M. M GIS based Surface Water Quality Index (SWQI) Zoning of Dhaka River System
25
WQI = ΣQiWi
Where,
Qi (water quality rating) = 100 × (Va-Vi)/ (Vs-Vi);
Va= actual value present in the water sample;
Vi= ideal value (0 for all parameters except pH and DO which are 7.0 and 14.6 mg-1 respectively) and Vs= Standard value.
Wi (Unit weight) = K/Sn
K (constant) =1/ (1/Vs1+1/Vs2+1/Vs3+1/Vs4+………+1/Vsn) and
Sn= ‘n’ number of standard value (Kumar & Singh 2006).
GIS tool has been used to represent different parameter along the river network. The sampling locations were captured as latitude / longitude data. The Spatial Analyst Tool in the GIS software was employed for interpretation of data. Inverse Distance Weighting (IDW) Interpolation has been used to generate zoning maps.
Rahman studied on water quality (DO, BOD, COD, NH3-N, NO3-N and PO4) in peripheral rivers of Dhaka city for optimal relocation of water intake point and found that water quality at the existing intake location exceeds permissible levels for all WQ parameters except NO3-N. Upstream of Lakhya River was identified as the ideal point for relocation of the intake point. Tahmina et. al, (2018) accessed the of Surface Water Quality of the Turag River based on parameter Temperature, pH, Salinity, TDS, TA, EC, TH, Chloride content, Free CO2, DO, Nitrate and Sulfate. The study used weighted arithmetic method to find water quality index. The study concluded that the river water was excessively polluted due to discharge of industrial effluents, sewage wastages, agricultural and city run-off and anthropogenic activities.
Muyen et, al. (2016) conducted a study on the water quality based on the physio-chemical parameters of old Brahmaputra River in Mymensingh district. They used water quality index (WQI) derived by the Department of Environment (DoE) Malaysia and found that water is suitable for irrigation purpose. Uddin et, al. (2014) examined parameters including Temperature, pH, EC, TDS, DO, BOD, COD, Nitrate (NO2- and NO3-), Ammonia, Sulphates, Chlorides, and Calcium of five sampling points of Jamuna river in 2012-2013 during both dry and wet season. The value of parameters of water only supported the irrigation purposes comparing the standards of EQS guideline, ADB, and the guideline of Department of Environment (DoE) in Bangladesh.
3. Discussion and Result 3 3.1. Dry Season 3.1 The literature of the study shows different countries used various parameters and acceptable range of chemical for specific usage. This study has tried to follow the standard constituent of pollutant in Department of Environment (DoE) in Bangladesh and WHO. Though direct use of drinking water from ground water accept different range of parameters values than untreated surface water. Water remains most polluted during dry season as the

Sultana, N and Rahman, M. M GIS based Surface Water Quality Index (SWQI) Zoning of Dhaka River System
26
river flow decreases. The following table shows that all parameters exceed the standard expect TDS, Alkalinity and Nitrate.
Table 1: Generalize information of Dataset for Dry season with Standards
Dry Season Wet Season Desire Values
Parameter Range Averag
e
Stand
dev
Range Average
Stand dev
BD
Stand
WHO
Depth 3.5-16.8 7.38 4.88 3.6-17.3 9.3 3.7
Temp 20.3-24.1 22.73 0.88 27.3-31.1 29.5 1.5 30.5
pH 7.44-7.88 7.65 0.12 6.38- 7.86 7.1 0.6 6.5-8.5 6.5-
8.5
EC 593-1086 851.75 123.24 129.3 - 507 297.0 129.2 300
TDS 301-560 444.31 65.13 45.7 - 224 128.1 62.3 1000 1000
Turbidity 17.78-
57.2
35.29 13.40 9.53 - 59 22.0 10.7 10 5
Alkalinity 39-79 51.50 11.23 50 - 115 79.7 19.4 500 100
Iron .01-.33 0.15 0.11 0.05 - 2.61 0.6 0.7 .3-1 0.3
Ammonia 3-19.3 9.87 5.44 0.09 - 18.5 5.2 5.5
Nitrate .5 - 4.5 2.08 1.09 0.2 - 15 2.9 3.8 .1 50
Sulfate 34-94 64.25 19.47 7--38 24.2 13.5 400 250
Chloride 80-740 347.50 249.52 110 - 480 299.4 86.7 150-600 250
The Maps show that Tongi khal and Balu rivers are the most polluted rivers. Concentration of TDS, Ammonia, EC, Iron, and chloride is more in this portion of river network. All parameters remain medium concentration in Buriganga River. The presence of iron, chloride, ammonia, and alkalinity is within acceptable level in Turag.
Figure 2: Spatial Distribution Map (a-d) of Surface Water Quality Parameters in Dry Season

Sultana, N and Rahman, M. M GIS based Surface Water Quality Index (SWQI) Zoning of Dhaka River System
27
3.2. Wet Season 3.2 Alkalinity is more than the desire level. The average values in other parameters like- pH, EC, TDS, Turbidity, Ammonia, Nitrate, Sulfate, and Chloride has decreased. The value of iron has exceeded in tongi khal which nearly contains 2.61 mg/L and 1.26 mg/L. the value of alkalinity is more in Burganga River which reads above 100. The concentration of Ammonia also increases in Buriganga River near Mirpur Bridge. Same scenario is observed for the concentration of Sulfate. Water of Buriganga is more acidic in rainy season. The acidic water may come from the surround industry or domestic usages. It represents the presence of faecal matter from latrine. In present study Ammonia concentration of sample water ranges from 3 to19.38 ppm in dry season and 0.09 - 18.5 ppm in wet season, this is very high in respect to standard value.
Water quality index shows that the water of Tongi khal and Buriganga near chadnighat is more polluted than any other portion. Only water of Turag river is in good condition. The WQI value varies from 33 to 100. People can use this water for irrigation and domestic purpose.
Figure 3: Spatial Distribution Map (e-l) of Surface Water Quality Parameters in Dry Season

Sultana, N and Rahman, M. M GIS based Surface Water Quality Index (SWQI) Zoning of Dhaka River System
28
3.3. Major Findings 3.3 Tongi khal and Balu are the most polluted rivers on the basis of individual parameters Value. Water quality index value shows Buriganga is the most polluted river of Dhaka river network. The concentration of Iron and Ammonia shows the higher value in Burganga river. Nature of surrounding land uses has influencd water quality of river. Higher concentration of Ammonia in the river water indicates the river water stands by which creates more bacteria and organic pollutants. The water of Buriganga is acidic in Rainy Season. Industrial water is mainly responsible for this water quality. They discharge water without treatment. So, the artery of Dhaka turns into Vein.
This water is not suitable for public water supply, not suitable for recreational purpose, has limited potential for aquaculture but suitable for irrigation after treatment. River water is constantly being used for washing cloths and utensils, discharging of industrial wastage, sewage and storm water, boating, fishing, open defecation and religious ritual activities. All
Figure 4: Spatial Distribution Map of Surface Water Quality Parameters in Wet Season
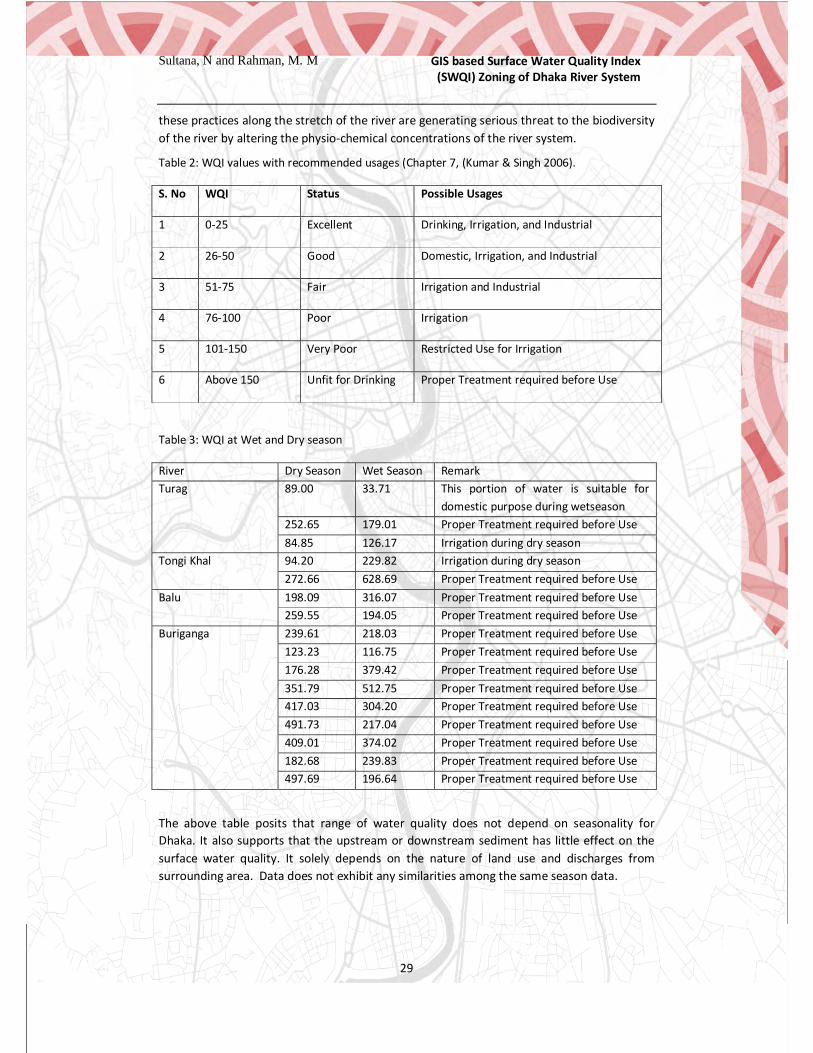
Sultana, N and Rahman, M. M GIS based Surface Water Quality Index (SWQI) Zoning of Dhaka River System
29
these practices along the stretch of the river are generating serious threat to the biodiversity of the river by altering the physio-chemical concentrations of the river system.
Table 2: WQI values with recommended usages (Chapter 7, (Kumar & Singh 2006).
S. No WQI Status Possible Usages
1 0-25 Excellent Drinking, Irrigation, and Industrial
2 26-50 Good Domestic, Irrigation, and Industrial
3 51-75 Fair Irrigation and Industrial
4 76-100 Poor Irrigation
5 101-150 Very Poor Restricted Use for Irrigation
6 Above 150 Unfit for Drinking Proper Treatment required before Use
Table 3: WQI at Wet and Dry season
River Dry Season Wet Season Remark Turag 89.00 33.71 This portion of water is suitable for
domestic purpose during wetseason 252.65 179.01 Proper Treatment required before Use 84.85 126.17 Irrigation during dry season
Tongi Khal 94.20 229.82 Irrigation during dry season 272.66 628.69 Proper Treatment required before Use
Balu 198.09 316.07 Proper Treatment required before Use 259.55 194.05 Proper Treatment required before Use
Buriganga 239.61 218.03 Proper Treatment required before Use 123.23 116.75 Proper Treatment required before Use 176.28 379.42 Proper Treatment required before Use 351.79 512.75 Proper Treatment required before Use 417.03 304.20 Proper Treatment required before Use 491.73 217.04 Proper Treatment required before Use 409.01 374.02 Proper Treatment required before Use 182.68 239.83 Proper Treatment required before Use 497.69 196.64 Proper Treatment required before Use
The above table posits that range of water quality does not depend on seasonality for Dhaka. It also supports that the upstream or downstream sediment has little effect on the surface water quality. It solely depends on the nature of land use and discharges from surrounding area. Data does not exhibit any similarities among the same season data.

Sultana, N and Rahman, M. M GIS based Surface Water Quality Index (SWQI) Zoning of Dhaka River System
30
3.4. Conclusion 3.4 The water condition of Dhaka river system is on treat for life and aquatic animals. The concentration of Iron and Ammonia is at alarming rate. The responsible authority, Department of Environment should regulate the water use around the river network. The treatment plant at Pagla and its surrounding area is polluted also. The Government should control the industrial discharge and domestic wastage. The untreated industrial discharge also has the acidic influence on the river water. All the industries discharge and withdrawal of water should be checked to ensure water security. River water is unsuitable for any direct use. Extensive treatment along with the land use control of river network can ensure good quality of water.
4. References Akther, H., Ahmed, M.S. and Rasheed, K.B.S., (2010). “Spatial and temporal analysis of groundwater level fluctuation in Dhaka City”, Bangladesh. Asian Journal of Earth Sciences, 3(4), pp.222-230.
DWASA. 2005. Master plan of Dhaka. Dhaka, Bangladesh.
Aktar, P.; Moonajilin, M.S. (2017) “Assessment of Water Quality Status of Turag River Due to Industrial Effluent.”, Int. J. Eng. Inf. Syst. 2017, 1, 105–118.
DoE, 2017. Ground and surface water quality report 2016. Dhaka, Bangladesh
Ewaid, Salam, H., and Salwan, A. A., (2017.) "Water quality index for Al-Gharraf river, southern Iraq." The Egyptian Journal of Aquatic Research 43.2 (2017): 117-122.
Akther, H. Ahmed M.S. and Rasheed, K.B.S. (2009), “Spatial and Temporal Analysis of Groundwater Level Fluctuation in Dhaka City, Bangladesh.” Asian Journal of Earth Sciences, 2: 49-57.
Islam, N., Shafi, S. A., Mathur, O. P., and Samanta, D. (2013). “Sustainable Urbanization in Bangladesh: Delving intothe Urbanization-Growth-Poverty Interlinkages”, SANEI Working Paper Series No. 13-05, South Asia Network of Economic Research Institutes, Dhaka.
Katyal, D. and Bharti, N (2011). “Water quality indices used for surface water vulnerability assessment”, International journal of environmental sciences, 2(1).
Munna, G. M., Kibriya, N. A., Nury, A. H., Islam, S., & Rahman, H. (2015). Spatial distribution analysis and mapping of groundwater quality parameters for the Sylhet City Corporation (SCC) area using GIS. Hydrology, 3(1), 1-10.
Muyen, Z., Rashedujjaman, M., & Rahman, M. S. (2016). Assessment of water quality index: a case study in Old Brahmaputra river of Mymensingh District in Bangladesh. Progressive Agriculture, 27(3), 355-361.
Rahman, S., & Hossain, F. (2008). Spatial assessment of water quality in peripheral rivers of Dhaka City for optimal relocation of water intake point. Water Resources Management, 22(3), 377-391.
Sultana, N and Rahman, M. M GIS based Surface Water Quality Index (SWQI) Zoning of Dhaka River System
31
Rahman, A. K. M. L.; Islam, M.; Hossain, M. Z. and Ahsan, M. A. (2012). “Study of the seasonal variations in Turag river water quality parameters”, African Journal of Pure and Applied Chememistry, 6(10): 144-148.
Raikar, R. V., & Sneha, M. K. (2012). “Water quality analysis of Bhadravathi taluk using GIS–a case study”, International Journal of Environmental Sciences, 2(4), 2443-2453.
Ramakrishnaiah, C.R., Sadashivaiah, C. and Ranganna, G.,(2009). “Assessment of water quality index for the groundwater in Tumkur Taluk, Karnataka State, India.” Journal of Chemistry, 6(2), pp.523-530.
Singh, P. K., Tiwari, A. K., Panigarhy, B. P., & Mahato, M. K. (2013). “Water quality indices used for water resources vulnerability assessment using GIS technique: a review.” Int J Earth Sci Eng, 6(6-1), 1594-1600.
Kumar, R., & Singh, R. N. (2006). Municipal water and waste water treatment. The Energy and Resources Institute (TERI).
World population review. (2018). Dhaka Population 2018. Retrieve from http://worldpopulationreview.com/world-cities/dhaka-population/, on 30 December, 2018.
Uddin, M. N., Alam, M. S., Mobin, M. N., & Miah, M. A. (2014). An Assessment of the River water quality parameters: A case of Jamuna River. Journal of Environmental Science and Natural Resources, 7(1), 249-256.
Zakari, A., Philippe, N. N., Harlin, E. N., Larissa, M. J., Alain, L. T. S., Ball, R. O., & Chandra, R. (1995). “Spatial distribution analysis of groundwater quality index using GIS: A case study of Ranchi Municipal Corporation (RMC) area”. Journal of Applied Sciences, 14(19), 757-771

Bosu, S. P Ullah, N. A. M Amanat
Role of Integrated Communal Solid Waste Management as A Response to Urban
Flood Risk
32
Case Study Paper
Role of Integrated Communal Solid Waste Management as a Response to Urban Flood Risk
A Case Study on Barisal City
Shibu Prashad Bosu, Assoc. Prof., Khulna University; Bangladesh Noor-A-MD. Amanat Ullah, GIS Analyst, Bose and Partners; Bangladesh
Abstract
Cities all over the Bangladesh are now facing problems arising due to the failure of integrating proper solid waste management in urban planning and management. However, poor solid waste management can contribute to the impact of urban flooding by blocking drainage, increasing debris and harboring disease vectors specially after heavy rainfall during monsoon in tropical cities. Numerous Studies on the literature and analysis of case study (both from the literature and from examples collected in the preparation of detail area plan of Barisal city) confirm that solid waste management is an emerging issue in flood risk management practice. This Study contains a GIS based analysis on existing urban flood scenario of Barisal city using hydrology tools on data DEM (Digital Elevation Model) collected from mater plan of Barisal city prepared by Urban Development Department. Existing drainage masterplan and its inefficiency to reduce urban flood has also been analyzed in this study. This study approaches to improve solid waste management included large municipal programs and community based solid waste management approaches (CBSWM). 3R (Refuse, Reuse, Recycle) approach has been analyzed with the context of Barisal city along with its feasibility and impediments. It has seen to be important that the appropriate solid waste management is adopted as part of a wide integrated flood management program. The research demonstrates that solid waste management can be an effective tool to reduce urban flood risk but, in order to remain successful, it requires that sufficient commitment and engagement can be mobilized in the long term
Keywords
Solid Waste Management, Tropical City, Urban Flash Flood, Urban Planning and Design
1. Introduction 1.1 Background of The Study
Barisal is one of the major divisional cities of Bangladesh. In spite of carrying a significant contribution on the national economy and development, the city has often been a case failure to draw attention of the policy makers to solve its problems. Solid waste management is an enduring problem in developed and developing countries and has become a major issue in flood risk management (Rahman, 2005) for various reasons. Unplanned of solid waste frequently leads to blockages in drainage and watercourses (Muñoz-Cadena et al., 2012), (Bras et al., 2009), which effectively reduces their capacity of storage and ceding resulting in flooding (World Bank, 2012), (Stevens, 2012). Flood waste and other debris moving along with flood waters can be devastating for properties and lead to higher flood losses (Lamond, 2008), (Brown, Milke and Seville, 2011). Disposal of waste
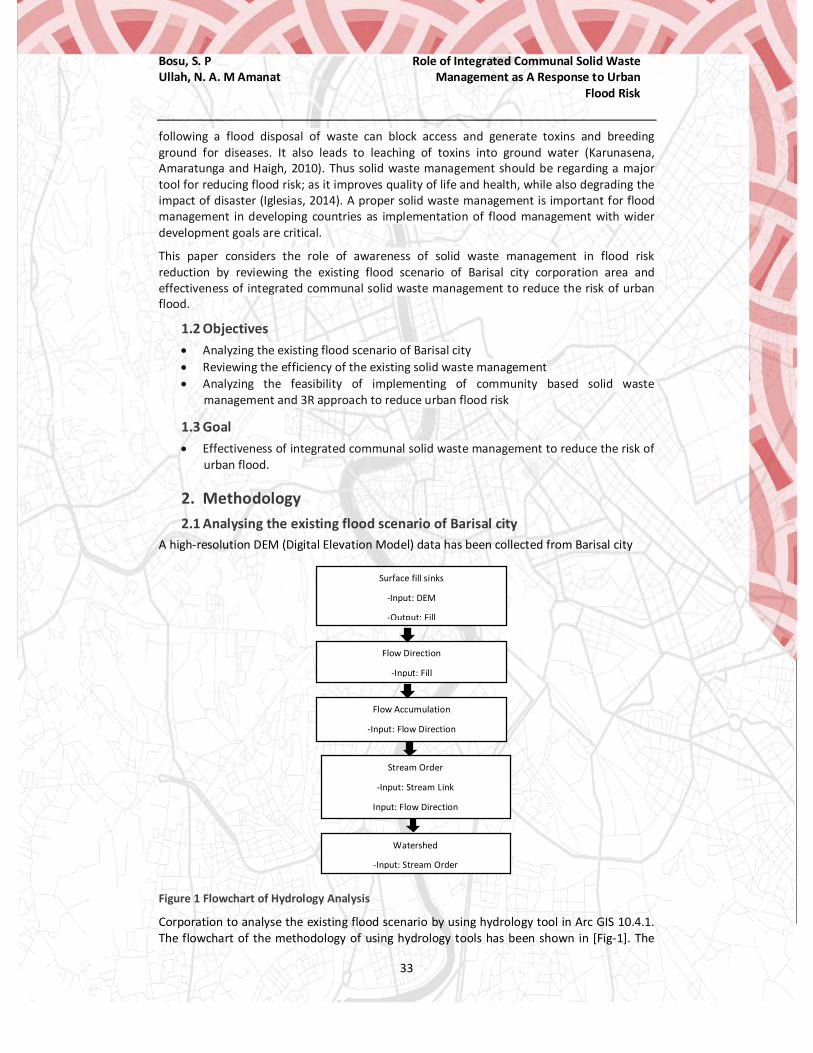
Bosu, S. P Ullah, N. A. M Amanat
Role of Integrated Communal Solid Waste Management as A Response to Urban
Flood Risk
33
following a flood disposal of waste can block access and generate toxins and breeding ground for diseases. It also leads to leaching of toxins into ground water (Karunasena, Amaratunga and Haigh, 2010). Thus solid waste management should be regarding a major tool for reducing flood risk; as it improves quality of life and health, while also degrading the impact of disaster (Iglesias, 2014). A proper solid waste management is important for flood management in developing countries as implementation of flood management with wider development goals are critical.
This paper considers the role of awareness of solid waste management in flood risk reduction by reviewing the existing flood scenario of Barisal city corporation area and effectiveness of integrated communal solid waste management to reduce the risk of urban flood.
1.2 Objectives Analyzing the existing flood scenario of Barisal city Reviewing the efficiency of the existing solid waste management Analyzing the feasibility of implementing of community based solid waste
management and 3R approach to reduce urban flood risk
1.3 Goal Effectiveness of integrated communal solid waste management to reduce the risk of
urban flood.
2. Methodology 2.1 Analysing the existing flood scenario of Barisal city
A high-resolution DEM (Digital Elevation Model) data has been collected from Barisal city
Figure 1 Flowchart of Hydrology Analysis
Corporation to analyse the existing flood scenario by using hydrology tool in Arc GIS 10.4.1. The flowchart of the methodology of using hydrology tools has been shown in [Fig-1]. The
Watershed
-Input: Stream Order
Stream Order
-Input: Stream Link
Input: Flow Direction
Flow Accumulation
-Input: Flow Direction
Flow Direction
-Input: Fill
Surface fill sinks
-Input: DEM
-Output: Fill

Bosu, S. P Ullah, N. A. M Amanat
Role of Integrated Communal Solid Waste Management as A Response to Urban
Flood Risk
34
direction of current is analysed by the topographical information. Hollow of the DEM in which current grid direction mesh flowed out was removed by using fill and flow direction. Flow accumulation is used to create the accumulation flowing quantity grid from which the number of meshes (accumulation flowing quantity) flowed from the current direction grid into each mesh. The accumulation flowing quantity of the water is analysed from the accumulation flowing quantity grid. Stream order is used to execute watershed analysis. Watershed analysis is done to estimate the flooded area of Barisal city corporation.
2.2 Reviewing the efficiency of the existing solid waste management The existing solid waste management system is reviewed by analysing the masterplan of Barisal city corporation and various literatures to discuss the collection, treatment and dumping procedure of solid wastages. Existing drainage layout and their width and depth are reviewed by the attributes of the vector data collected from Barisal city corporation to measure if it is sufficient to not have an impact in increasing urban flood risk. Locations of the dumping site and their relevance are analysed by suitability analysis in Arc GIS 10.4.1.
2.3 Analysing the feasibility of implementing of community based solid waste management and 3R approach to reduce urban flood risk
Relevant literatures are reviewed in the context of developing countries for the two chosen approaches to analyse the feasibility of implementing of community based solid waste management and 3R approach to reduce urban flood risk.
3. Study Area Profile Name of the Area: Barisal City Corporation
Geographic Location: 22°38'-22°45' North to 90°18'-90°23' South
Population: 3,28,278
Area: 58 sq. km
Figure 2 Study Area Map

Bosu, S. P Ullah, N. A. M Amanat
Role of Integrated Communal Solid Waste Management as A Response to Urban
Flood Risk
35
4. Results 4.1 Vulnerable Wards for Flooding
Fig-3 shows the direction value of current direction. Fig-4 shows the visual flow direction. To calculate flow accumulation for getting stream order raster value was picked equal to or greater than 500 which is shown in Fig-6.
Figure 4 Flow Direction
Stream orders are classified into four considering the surface run off 0.45m, 0.9m, 1.8m and 3.6m as according to the study of Barisal City Corporation the recorded elevation of urban flood is 0.45m-3.6m. in the time of recording average rainfall +150mm (Fig-5).
Source Worldweatheronline.com
Figure 5 Rainfall Data of Barisal
Figure 3 Direction Value of Current Direction
1=East.2=Southeast,4=South,8=Southwest,16=West,32=Northwest,64=North,128=Northeast

Bosu, S. P Ullah, N. A. M Amanat
Role of Integrated Communal Solid Waste Management as A Response to Urban
Flood Risk
36
Figure 6 Stream Order & Watershed
The existing drainage system is inefficient as catchment area of runoff water in rainy season which results in urban flooding. And eventually by watershed analysis it has been found that ward no-1,2,3,4,27,28,29,30 are vulnerable to flood in the existing scenario. (Fig-6)
4.2 Existing Solid Waste Management is Not Efficient and Responsible for Increasing Urban Flood Risk
4.2.1 Present Legislation Barisal City Corporation is functioning on the basis of Dhaka Municipal Corporation Ordinance XL 1983. The relevant sections for removal, collection and disposal of refuse collection are as follows-
78 (I) The Corporation shall make adequate arrangement for removal of refuse from all public streets, public latrines, drains and all buildings and land vested in the corporation and for the collection and proper disposal of such refuse.
78(2) the occupiers of all buildings and lands within the corporation shall be responsible for removal of refuse from such buildings and lands subject to the general control and supervision of the corporation.
78 (3) the corporation may cause public-dustbin or other suitable receptacles to be provided at suitable places and where such dustbin or receptacles are provided, the corporation may, by public notice, require that all refuse accumulating in any premises or land shall be deposited by the owner or occupier of such premises of land in such dustbins or receptacles.
78(4) all refuse removed and collected by the staff of corporation or under their control and supervision and refuse deposited in the dustbin and other receptacles provided by the corporation shall be the property of corporation.
The ordinance has no specific clause or section for industrial, hazardous or clinical waste storage, handling, collection, transportation and disposal either by DCC or privately. Necessary by laws has not yet been promulgated on "Standard" of refuse quality and details of punishment of any offence detected by DCC mobile court.
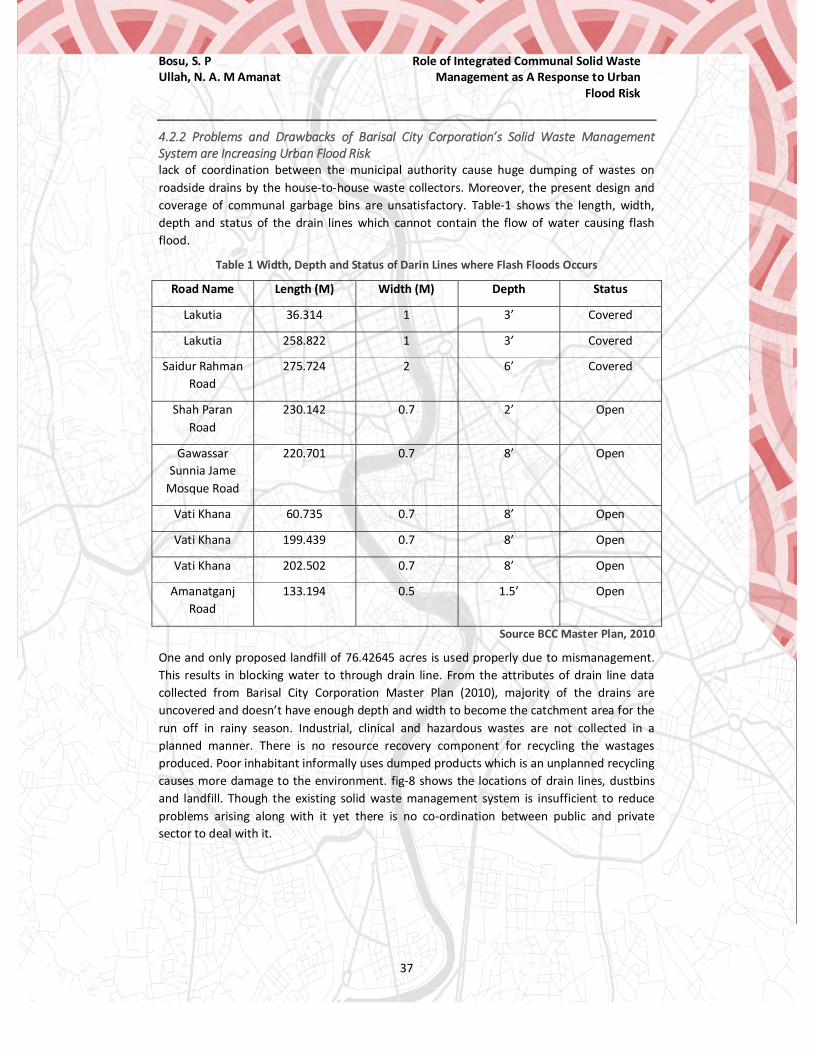
Bosu, S. P Ullah, N. A. M Amanat
Role of Integrated Communal Solid Waste Management as A Response to Urban
Flood Risk
37
4.2.2 Problems and Drawbacks of Barisal City Corporation’s Solid Waste Management System are Increasing Urban Flood Risk lack of coordination between the municipal authority cause huge dumping of wastes on roadside drains by the house-to-house waste collectors. Moreover, the present design and coverage of communal garbage bins are unsatisfactory. Table-1 shows the length, width, depth and status of the drain lines which cannot contain the flow of water causing flash flood.
Table 1 Width, Depth and Status of Darin Lines where Flash Floods Occurs
Road Name Length (M) Width (M) Depth Status
Lakutia 36.314 1 3’ Covered
Lakutia 258.822 1 3’ Covered
Saidur Rahman Road
275.724 2 6’ Covered
Shah Paran Road
230.142 0.7 2’ Open
Gawassar Sunnia Jame
Mosque Road
220.701 0.7 8’ Open
Vati Khana 60.735 0.7 8’ Open
Vati Khana 199.439 0.7 8’ Open
Vati Khana 202.502 0.7 8’ Open
Amanatganj Road
133.194 0.5 1.5’ Open
Source BCC Master Plan, 2010
One and only proposed landfill of 76.42645 acres is used properly due to mismanagement. This results in blocking water to through drain line. From the attributes of drain line data collected from Barisal City Corporation Master Plan (2010), majority of the drains are uncovered and doesn’t have enough depth and width to become the catchment area for the run off in rainy season. Industrial, clinical and hazardous wastes are not collected in a planned manner. There is no resource recovery component for recycling the wastages produced. Poor inhabitant informally uses dumped products which is an unplanned recycling causes more damage to the environment. fig-8 shows the locations of drain lines, dustbins and landfill. Though the existing solid waste management system is insufficient to reduce problems arising along with it yet there is no co-ordination between public and private sector to deal with it.
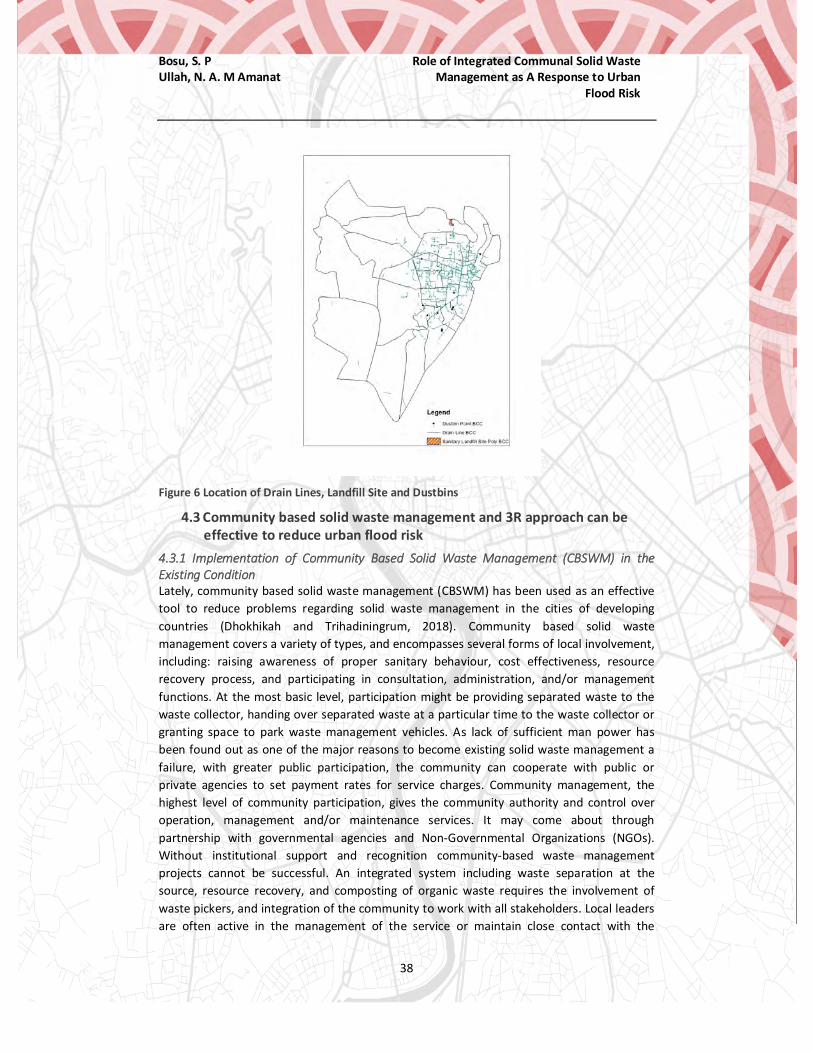
Bosu, S. P Ullah, N. A. M Amanat
Role of Integrated Communal Solid Waste Management as A Response to Urban
Flood Risk
38
Figure 6 Location of Drain Lines, Landfill Site and Dustbins
4.3 Community based solid waste management and 3R approach can be effective to reduce urban flood risk
4.3.1 Implementation of Community Based Solid Waste Management (CBSWM) in the Existing Condition Lately, community based solid waste management (CBSWM) has been used as an effective tool to reduce problems regarding solid waste management in the cities of developing countries (Dhokhikah and Trihadiningrum, 2018). Community based solid waste management covers a variety of types, and encompasses several forms of local involvement, including: raising awareness of proper sanitary behaviour, cost effectiveness, resource recovery process, and participating in consultation, administration, and/or management functions. At the most basic level, participation might be providing separated waste to the waste collector, handing over separated waste at a particular time to the waste collector or granting space to park waste management vehicles. As lack of sufficient man power has been found out as one of the major reasons to become existing solid waste management a failure, with greater public participation, the community can cooperate with public or private agencies to set payment rates for service charges. Community management, the highest level of community participation, gives the community authority and control over operation, management and/or maintenance services. It may come about through partnership with governmental agencies and Non-Governmental Organizations (NGOs). Without institutional support and recognition community-based waste management projects cannot be successful. An integrated system including waste separation at the source, resource recovery, and composting of organic waste requires the involvement of waste pickers, and integration of the community to work with all stakeholders. Local leaders are often active in the management of the service or maintain close contact with the

Bosu, S. P Ullah, N. A. M Amanat
Role of Integrated Communal Solid Waste Management as A Response to Urban
Flood Risk
39
municipality or community management agency. Women and teens can play crucial roles, such as initiators, managers, operators, political activists, educators, and watchdogs for the community. Some issues can also be addressed by CBSWM such as the following social and management problems; low participation of households, management problems, operational problems, financial difficulties and, lack of municipal cooperation (Rigasa, Badamasi and Galadimawa, 2016). So, to say, Implementation of community based solid waste management will not only bring good for the solid waste management it will also bring a greater good to the society.
4.3.2 Implementation of 3R (Reuse, Refuse, Recycle) Approach in the Existing Condition In the recent years, 3R (Reduce, Reuse, Recycle) approach, replication of good practices and educational campaigns have been promoting the values of integrated waste management and resource consumption. Having no formal source segregation and with minimum public participation in Barisal city, all the waste ends up in one common container or in an open backyard. Resource recovery and recycling usually takes place in all components of the system predominantly by the informal sector "waste pickers" or by the solid waste management staff themselves for extra income (Rahman, 2005). In Barisal the informal sector is responsible for recycling about 4 to 15% of the total solid waste generated (Enayetullah, Sinha and Khan, 2005). Recycling Pattern of solid waste in Barisal city has been shown in fig-9.
Figure 7 Recycle pattern of Barisal City (Rahman, 2005)
Waste Material Shops/Dealer
Industries/Remoulding Factories
Market
Users households/ Industries/ Institutions etc.
Final Dumping Sites
Bins/Communal Collection Places
Final Disposal
Residuals
Empty Beverage Contaiuners
Direct Sell
Street Hawkers
Scavengers
Scavengers
Municipal Workers

Bosu, S. P Ullah, N. A. M Amanat
Role of Integrated Communal Solid Waste Management as A Response to Urban
Flood Risk
40
The composition of solid waste will play a significant role in determining and designing an appropriate technology for treatment and allocating the space needed for treatment facilities. Physical composition of waste in residential and commercial areas are given in the Table-2.
Table 2 Physical Composition of Waste in Residential and Commercial Areas
Constituents Residential Area (% by dry wt.)
Commercial Area (% by dry wt.)
Food Waste 84.37 79.49
Paper 5.68 9.22
Plastic 1.94 1.48
Cloths 1.83 1.59
Glass Metal and etc. 6.38 10.22
Source (Rahman, 2005)
Technology applications for thermal recovery (direct combustion of waste to recover heat) and fuel recovery (RDF and PDF production from waste) may not be feasible due to uncertainty in their efficiency both in terms of cost and environmental factors. Table-3 present the status and technology gaps in 3R implementation in Barisal city. Here, formal and Informal denote the presence of regulations, laws and rules to govern an activity, Strong and Weak represent the level and scale of a particular activity. Considering the health risks and the resource conservation, these providing technologies or at least some formal registration and support from the governments is vital. It is undeniable that major focus should be paid to the 3R technologies associated with MSW sorting, pulverization and composting (Visvanathan, 2015).
Table 3 Status and technology gaps in 3R implementation in Barisal City
Technology
Thermal recovery
Fuel Recovery
Material Recovery
Sorting
Pulverizing
Composting Incineration
Collection
Status Formal but Weak
Formal but Weak
Formal but Weak
Informal but Strong
Formal but Weak
Formal, Strong
Informal, Weak
Informal, Weak
5. Conclusion and Recommendations An overview of the current practices of waste management indicates that-
Existing Solid Waste Management is not sufficient to reduce the urban flood risk in Barisal city
Very little instances of promoting formal, 3R-based solutions for waste crisis exist Specific policies are needed to emphasize the need of 3R Technology transfer and policy reformulation are essential to promote 3Rs

Bosu, S. P Ullah, N. A. M Amanat
Role of Integrated Communal Solid Waste Management as A Response to Urban
Flood Risk
41
Creating linkages between the recycling zones of communities is indispensable Cooperative and concerted efforts between and within communities are the need of
the hour to promote a 3R-based economy
References Bras, A. et al. (2009) ‘Problems and current practices of solid waste management in Port-au-Prince (Haiti)’, Waste Management, 29(11), pp. 2907–2909. doi: 10.1016/j.wasman.2009.07.015.
Brown, C., Milke, M. and Seville, E. (2011) ‘Disaster Waste Management : a Review Article’.
Dhokhikah, Y. and Trihadiningrum, Y. (2018) ‘Solid waste management in Asian developing countries : Challenges and opportunities Solid Waste Management in Asian Developing Countries : Challenges and Opportunities’, (January).
Enayetullah, I., Sinha, a. H. M. M. and Khan, S. S. A. (2005) ‘Urban Solid Waste Management Scenario of Bangladesh: Problem and Prospects’, Waste Concern, p. 18.
Iglesias, G. R. (2014) ‘Mainstreaming disaster risk reduction and enhancing response’, (February).
Karunasena, G., Amaratunga, R. and Haigh, R. (2010) ‘Waste management strategies during post disaster phase: A case of Sri Lanka’, CIB World Building Congress 2010 Building a Better World 1013 May. Available at: http://usir.salford.ac.uk/9756/.
Lamond, J. E. (2008) ‘THE IMPACT OF FLOODING ON THE VALUE OF by’, (June).
Muñoz-Cadena, C. E. et al. (2012) ‘An approach to litter generation and littering practices in a Mexico City neighborhood’, Sustainability, 4(8), pp. 1733–1754. doi: 10.3390/su4081733.
Rahman, S. M. S. (2005) A Study on Solid Waste Management of Barisal City Corporation.
Rigasa, Y. A., Badamasi, A. G. and Galadimawa, N. (2016) ‘Community based solid waste management strategy : a case study of Kaduna metropolis’, 210, pp. 761–772. doi: 10.2495/SDP160641.
Stevens, M. (2012) ‘Cities and Flooding: A Guide to Integrated Urban Flood Risk Management for the 21st Century by Abhas Jha, Robin Bloch, Jessica Lamond, and other contributors’, Journal of Regional Science, 52(5), pp. 885–887. doi: 10.1111/jors.12006_6.
Visvanathan, C. (2015) ‘3R PRACTICES FOR MUNICIPAL SOLID WASTE MANAGEMENT IN ASIA’, (April).
World Bank (2012) ‘Flood risk management and urban resilience workshop (English)’. Available at: http://documents.worldbank.org/curated/en/371581468234873338/Flood-risk-management-and-urban-resilience-workshop.

Tabassum, Tasnim; Hossain, Shakowat; Hafiz, Roxana
Children’s Accessibility to Educational and Recreational Facility
42
Research Paper
Measuring Accessibility to Educational and Recreational Facilities by the Children of Different Income Earning
Families of Dhaka Tasnim Tabassum, Student, Department of Urban and Regional Planning, Bangladesh
University of Engineering and Technology; Bangladesh Shakowat Hossain, Student, Department of Urban and Regional Planning, Bangladesh
University of Engineering and Technology; Bangladesh Roxana Hafiz, Professor, Department of Urban and Regional Planning, Bangladesh University
of Engineering and Technology; Bangladesh
Abstract
Dhaka city is constantly attracting people where ensuring necessary facilities for them has become intricate challenge for authority and urban planners as well. Future leader of nation, the children require educational and recreational facilities to empower their mind and character. A growing body of concerned research has showed inadequate presence of these facilities but very few have represented the accessibility based on socio-economic differences. The study illuminates present scenario of accessibility of children to educational and recreational facilities of Dhaka city of different income earning groups. As we know, accessibility is not only having the facility available in the area and only a path to reach, the term is associated with participation, easiness and level of association. This is why four components of accessibility- land use, travel, temporal and individual- have been analysed after collecting primary data from questionnaire survey. Finally, gravity measurement technique has been used to identify ultimate scenario. General impression is that lower income earning families are most deprived one because of expense limitation. However, the study discovers diversified scenario; middle income earning families have poor accessibility than lower income earning families. Study finds out proximity and individual component of accessibility of all groups has positive correlation for educational facilities. But for recreational, relation is strong with cost and distance for lower and travel time for middle group. The study also investigates different issues related with frequency of participation and finds out accessibility differs significantly based on socio-economic differences.
Keywords
Accessibility, Children, Educational, Recreational, Income-groups
1. Introduction Children cover 37% of the total population and the number is increasing day by day (BBS, 2015). This body of population not only requires but also have right of proper access to two most important facilities, educational and recreational. National Children Policy 2011 recognising all the rights, states policies to ensure these facilities. However, unequal allocations of facilities limit certain people to gain access to basic facilities even after relentless struggle. Children of lower income earning family have only 40% primary and 6% secondary education (Khan, 2014). Dhanmondi, conventionally known high income earning area, has 84% literacy rate and 61% school attendance while Kamrangir Char, area of mostly low income earning families, has 57% literacy rate and 37% school attendance (BBS, 2015).
Tabassum, Tasnim; Hossain, Shakowat; Hafiz, Roxana
Children’s Accessibility to Educational and Recreational Facility
43
26% slum has access to at least one government school and 27% have NGO operated school in Dhaka city. However, 47% slum has no access to school for education. Though the rates of achievements in literacy and number of educational facilities are higher, it is limited to higher and middle income group (Hossain, 2014). On the other hand, Dhaka has 54 registered parks (Neema et al., 2014). Different findings suggest recreational facilities are insufficient in number and space, let alone ensuring proper accessibility. All the concerned body have surely made point that all children are not getting educational and recreational facilities properly. However, if we want to make sure that the city administrations will not be overwhelmed in their abilities to provide adequate services, we must have comprehensive idea about present accessibility scenario of children based on socio-economic differences. There are significant knowledge gap in this criteria. Number of facilities illustrates one side only. This research aims to focus not on the provided number of facility, rather to focus on how accessible provided facilities are to the children of different income earning families of Dhaka.
Accessibility represents the ease of reaching to a facility by a person, often defined by transportation, land use system and satisfaction. It includes person’s need, opportunity available and capacity to achieve both physically and economically (Church and Marston, 2003). Thus, planners will be able to learn children’s travel pattern, behaviour pattern, attitude towards provided facility in relation with three income earning family’s needs. Therefore, will help efficient distribution and allocation of the facilities and alleviate inequality.
2. Methodology 2.1. Site and Facility Selection Study areas have been selected based on socio-economic characteristics of people live there. Research paper of Kamruzzaman & Ogura (2008) has assisted in this case. Based on different research, Gulshan, Mohammadpur and Mirpur from DNCC and Dhanmondi, Ramna and Lalbagh from DSCC have been selected as higher, middle and lower income earning family living area respectively. The study aimed to find accessibility to the facilities that should be provided by city authority. Study includes pre-school, primary, secondary and college for education. For recreation, common outdoor recreational activity places have been considered such as open space, park and playground.
2.2. Defining Different Income Earning Families The study has utilized the occupied housing floor space for categorizing higher, middle and lower income earning groups after reviewing previous research and with the help of Dr. Nurul Islam Nazem, Professor of the department of Geography and Environment, University of Dhaka as Key Informant Interviewee. The study selects lower income earning family having housing floor space less than 300 sq. ft., middle income earning as 300 to 1300 sq. ft. and higher income earning as more than 1300 sq. ft.
2.3. Data Collection and Accessibility Measurement Technique Sample survey at 90% confidence level and 5% confidence interval was done. 275 respondents were randomly questioned face to face with prepared questionnaire (modified after 40 pilot surveys) from selected six areas. There are several techniques, but based on

Tabassum, Tasnim; Hossain, Shakowat; Hafiz, Roxana
Children’s Accessibility to Educational and Recreational Facility
44
available information and present perspective authors has analysed through four components of accessibility. Travel Impedance Measure and Cumulative Opportunity Measure have been discussed but final illustration was drawn with Gravity Measure Technique. Opportunities are selected based on literature review and pilot survey. For educational facility ten opportunities are educational service, toilet, drinking water, cafeteria, playground, transport, library, computer amenity, extra-curricular activities, seating arrangement for guardian. For recreational facility four opportunities are service of recreation, toilet, drinking water and seating arrangement.
Where,
Aik = Accessibility of person i to activity k
Ojk = the number of opportunities for activity k at location j.
dij = the distance, travel time, or other measure of effort separating i and j.
Mik = [ j I dij, < Sik), the set of activity locations considered accessible.
β = Empirical constant, generally assumed 2
Ideal accessibility for educational and recreational facility is 15.6 and 6.25 as standard distance should be ½ mile and respective opportunity is 10 and 4.
3. Result and Discussion 3.1. Accessibility to Educational Facility The study finds out high income earning families are careful with children age and starting formal school. 75% of them started pre-school at the age of four, while it is six for both middle and lower. Only 9% lower earning families’ children have pre-school. Participation of all male and female children in primary, secondary school and college is 100% for both higher and middle but it is not same for lower. 35% lower group did not get admitted into any educational institution. Their male children (73%) participate more than female (52%). Reasons of these differences are found out by analysing four components of accessibility.
Travel and Individual Component
When it comes to travel distance, only 14% all the children can access facility within standard distance (1/2 mile). This advantage is biggest for lower group (9.7%). Only 2.2% higher and middle have this accessibility. Even higher and middle group accept the challenge to travel 12 km or more for better school (Table 1). This choice invites several complications, high travel cost (120-160 BDT), time (90 minutes), and companion. It reduces the value of utility achieved, as opportunity cost of time lose is much higher. Study shows close association between higher distance and higher journey problems and resulting less regularity. All groups have their maximum percentage (Higher 28.3%, middle 34.8% and lower 35.5%) for travel distance between one to three km. Transport facility by institution is accessible to only higher (4.1%) and middle (3%) group. For safety purpose and to avoid

Tabassum, Tasnim; Hossain, Shakowat; Hafiz, Roxana
Children’s Accessibility to Educational and Recreational Facility
45
complication in journey time these two groups rely on guardian and car and rickshaw mode. 55% higher and 75% middle income earners are dissatisfied with overall travel pattern.
Figure 1: Travel distance covered by different groups
Table 1: Travel behaviour of different income earning groups (Distance in kilometre)
Group Mean Distance Highest Distance Popular Journey Mode Popular Companion
High 5.7 14 Car (56%) Guardian
Middle 5 12 Rickshaw (47%) Guardian
Lower 2.6 7 Walk (41%) Friend
The percentage is higher as they have to travel more distance with more inconvenient mode with more travel time and also they have to rely on guardian. Cross tabulation shows satisfaction is more for car and rickshaw, low for bus for them. All these cause less accessibility by Travel Impedance Measure for them. Lower income earning group are more satisfied with travel pattern have better accessibility. Actually, they have less opportunity for school choosing. They prefer nearer (55%) and economical (74%) while saying yes to any school, which may fall in lower rank but it is accessible to them based on capacity, travel and mobility pattern. For higher (56%) and middle (54%) prefer best school. Only 26% of middle group thinks about distance. Their school location choice depends on house rent or maintenance cost, guardian’s work place, chance to get admission beside school preference. Travel components are thus linked with individual component as travel pattern is related with individual’s facility choice and satisfaction. Study shows, for overall scenario, lower income earning groups (49%) are most satisfied although they have regrets that they are unable to send children to better ranking institutions. Then comes higher (29%) and at last middle (18%). Correlation analysis shows why even after having better school two upper groups are dissatisfied. Satisfaction is related with travel pattern. Relation is negatively strong for higher (with distance -.5, time -.58) and middle (with distance -.4, time -.8).
Land Use Component
Here comes the availability of options for all groups to choose institutions and opportunity or services that institutions provided. To analyse this component Cumulative Opportunity Measure of Accessibility has been used. There are many options available for higher and middle but lower income earning groups have few according to their convenience. English medium schools are mostly situated in Dhanmondi ,Gulshan and Mohammadpur. Lower income earning families hardly have opportunity to admit here for higher tuition fees. Also opportunity or services provided by the institutions are poor for them. 21.7% higher income
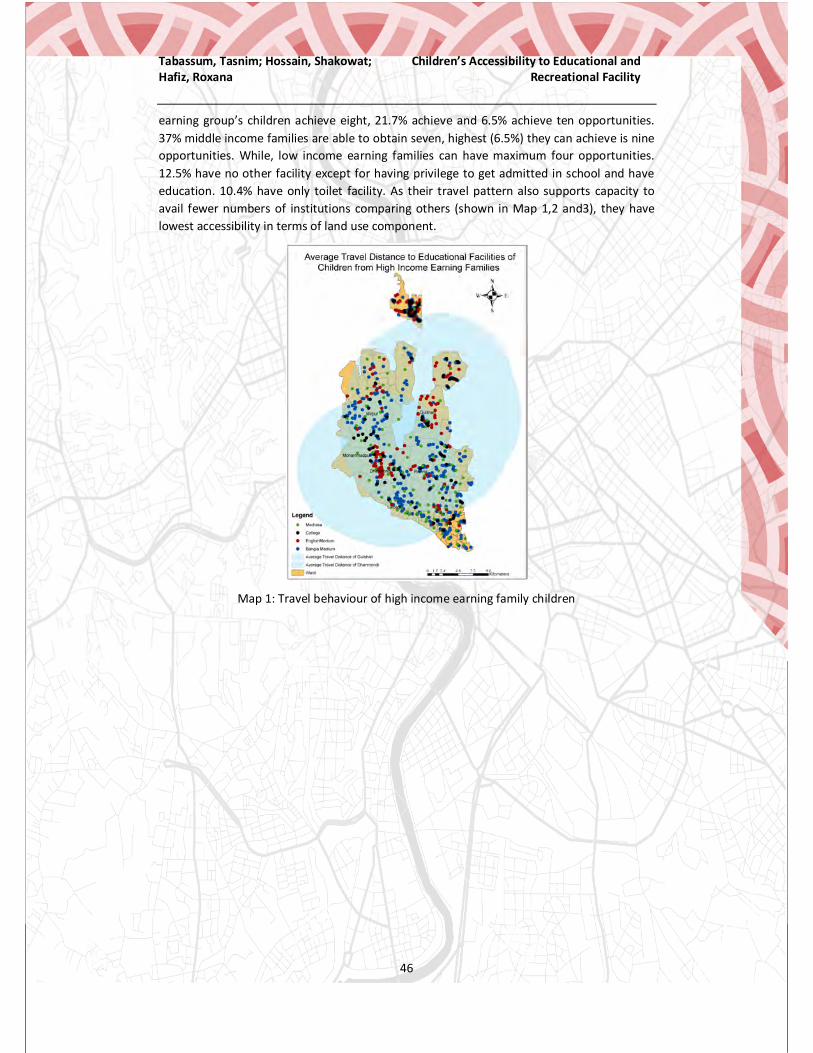
Tabassum, Tasnim; Hossain, Shakowat; Hafiz, Roxana
Children’s Accessibility to Educational and Recreational Facility
46
earning group’s children achieve eight, 21.7% achieve and 6.5% achieve ten opportunities. 37% middle income families are able to obtain seven, highest (6.5%) they can achieve is nine opportunities. While, low income earning families can have maximum four opportunities. 12.5% have no other facility except for having privilege to get admitted in school and have education. 10.4% have only toilet facility. As their travel pattern also supports capacity to avail fewer numbers of institutions comparing others (shown in Map 1,2 and3), they have lowest accessibility in terms of land use component.
Map 1: Travel behaviour of high income earning family children

Tabassum, Tasnim; Hossain, Shakowat; Hafiz, Roxana
Children’s Accessibility to Educational and Recreational Facility
47
Map 2: Travel behaviour of middle group Map 3: Travel behaviour of lower group
Temporal Component
Temporal component, frequency of use, is related with previous components. From survey, it is shown regularity is least in lower (15%). Even middle group’s children (48%) are more regular than higher (37%) group. Apart from having fewer opportunities to be attracted for school and better service, poor people engage their children to household and economic activities. In this case, they think it would be better, if the school is after sunset. Higher and middle income earning families complains whenever they learn about possibilities of traffic jam for special occasion on city; they have to avoid school if it is not exam day. As guardians need to reach their workplace after dropping children, which takes more time.
Gravity Measure of Accessibility
Different component illustrates accessibility varies based on socio-economic character. However gravity measure put quantitative expression that children of middle income earning families are having least accessibility. Ascending order based on average accessibility is middle (1.6), lower (2.12) and higher (3.01). Only, 2.2% middle, 4.2% lower and 8.8% higher group have privilege to have ideal accessibility (15.6). Even, circumstance is so concerning that 87% middle, 81% lower and 80% higher income earning groups are unable to purchase accessibility more than their respective average unit.

Tabassum, Tasnim; Hossain, Shakowat; Hafiz, Roxana
Children’s Accessibility to Educational and Recreational Facility
48
Figure 2: Percentage distribution at different groups who have educational accessibility level greater than 15.6
3.2. Accessibility to Recreational Facility 51.4% children have responded positively that they have playgrounds, open spaces, parks or playing space within walking distance or in front of building or in roof top. But only 31% participate. The percentage decreases from higher to lower income groups.
Travel and Individual Component
Participation to recreational facility is directly linked with travel distance as correlation coefficient is -.7, implying greater distance decreases participation. As we know, about 50% do not have within walking distance, they are unable to participate. Their participation comes down to weekly. Maximum travels one to three km (10% higher and middle, 12% lower income earning group). We are familiar with the fact of insufficient number of facilities. However, the percentage is little bit high for lower as they hardly care about designated open place. It is noteworthy, they make vacant place as playground. On the other hand, 18% higher and 4% middle income earning groups travel 12 km for park and lake. This percentage also incorporates those who attend club playground and designated place for sports. Middle and low income earning people complains with sorrow in heart that even after having playground nearby they are unable to have sufficient space as different organizations booked those spaces for their own members to learn sports. 28% higher, 20% middle and 2% lower income earning families' children travel with guardian. 40% children go by themselves or with friend from lower income. In contrast, percentage for high and middle for this category is limited within 10.2%. Travel impedance measure suggests accessibility surely is influenced by distance but more by travel companion for present circumstances. Discrimination is more severe for female for this reason. Significant association has been found between gender and travel companion. 77% middle, 67% high and 89% lower income earning families’ female children do not go to playground. However, all children of upper two groups are unmarried. Among these 89% children of lower group, 30% are married who have no time for recreation. So, middle income earners are least deprived because of environment and safety. Also relationship between satisfaction and travel component shows that satisfaction decreases with higher travel distance, time and cost. Table 3 shows that satisfaction is affected by travel pattern most for middle income group.

Tabassum, Tasnim; Hossain, Shakowat; Hafiz, Roxana
Children’s Accessibility to Educational and Recreational Facility
49
Different Groups Correlation Coefficient of Satisfaction with
Travel Distance Travel Time Travel Cost
Higher -.41 -.42 -.44
Middle -.46 -.5 -.68
Lower -.62 -.49 -.6
Land Use and Temporal Component
We are familiar with the fact that available recreational facilities are insufficient. As very few have advantage to avail within walking distance, parents, even children do not get interest. Map 7 shows Lalbagh is most fortunate in this case. However, high Income earners admitted that once a month they would travel up to 31 km for amusement park which is much larger than lower (12km, two times a year). Middle income earners also travel 32 km but they would only travel for twice a year or once a year. Cumulative opportunity measure suggests middle income earners are most deprived. Travel behavior is illustrated on Map 4, 5 and 6 in relation with provided facilities. For recreational facilities, study found interdependence of land use and temporal component. It is analyzed with correlation that there is a strong relation between frequency and travel distance (-.7) and time (-.6). The relation is strongest for middle (-.76).Surprisingly, even after having few numbers of open spaces available, middle income earners are less participative as they become tired after long journey from educational institution. It becomes evening and parents feel complete unsafe. All the year, they have pressure, so their park participation also decreases. This is not same for lower, as they can play beside the road and have less pressure. Same goes for higher as most of them have facility in roof top.
Map 4: Travel behavior of higher group Map 5: Travel behavior of middle group

Tabassum, Tasnim; Hossain, Shakowat; Hafiz, Roxana
Children’s Accessibility to Educational and Recreational Facility
50
Map 6: Travel behavior of middle group Map 7: ½ mile buffer of existing playgrounds
Gravity Measure of Accessibility
Gravity model shows children of middle income earning families have less average accessibility (.24) to playground than lower (.64) and higher (1.05). 2.2% of middle, which is greater than lower (2.1%) but lower than higher (6.5%), has accessibility higher than ideal accessibility. 33.2% higher income group and 14.3% middle income group have access with four opportunities. 66.7% of lower income earning family goes to parks and open spaces which provide only two opportunities. Yet, the distance crossed by middle income earners are higher as result accessibility is least for them.
Figure 3: Percentage distribution of different groups who have recreational accessibility level greater than 6.25

Tabassum, Tasnim; Hossain, Shakowat; Hafiz, Roxana
Children’s Accessibility to Educational and Recreational Facility
51
4. Conclusion Educational and recreational facilities add land value. The reason is residents of those areas have greater access to these facilities. Now days, the population of children in Dhaka is increasing rapidly but study has enlightened that very few of them are having accessibility. This is not only because facilities are in insufficient number but also services that should have been provided by them are insufficient. No doubt low income earners are deprived of educational facility. This is because of they have little facilities near to their home. The cross tabulation analysis has shown that 75% lower income earning families’ children who go to school are highly satisfied if they are able to walk to institution. On contrary, middle income earner’s choice of institutions according to their capacity is not accessible at positive rate. The public transport, bus, is cost efficient but the environment is dreadful for children. Many schools and colleges are situated in such location where rickshaw cannot avail directly as city authority has put restriction. High income earners are only having advantage because of their ability to use car to soothe journey time. As a result, the circumstance is hard to access for middle group. If institution provides transport facility, journey time problems, companion dependence decreases and regularity increase. Study also finds out for some cases, walk able journey are done by rickshaw or car as footpath are not comfortable for children.
Study shows accessibility to playground is more dependent on number of facilities within walking distance. Many open spaces are booked by different organizations and also some are restricted for all types of children. Although Shahbagh Shishu Park was available to handicapped children for Wednesday, many could not attend as it is weekday. However, an interesting side has been enlightened that accessibility to recreational facility is related with educational facilities location and study pressure.
Although the assumption is that only lower income earning families face difficulties to avail educational and recreational facilities, higher and middle income earning families also need to struggle reaching to these facilities. In different components of accessibility, different groups are facing obstacles to achieve access at different ratio. The quantitative measure suggests middle income earning families’ children are underprivileged but measurements are necessary for low and high income earners too. Specially, lower income earners accessibility is linked with child labor and marriage. Finding shows 93% of lower income group have access to schools with no playground. Also only 12% higher, 7% middle and 3% lower income groups have access to educational facilities that provide opportunity to take part in sports and extra-curricular activities without any extra pressure and cost. All these opportunities are the reason to attract children more and to prepare them for future with better physical and mental capacities. Yet, they are deprived from these. There are so many factors are interlinked that measure for single factor will not change the scenario. To change travel pattern, companion dependence has to be addressed, to address this safety and good environment has to be ensured, to ensure these strict policies and transport facility is to be provided, which is dependent on their acceptance and travel behavior and last but not least opportunities provided. Travel pattern, behavior pattern, need and capacity findings of this study should be instructive for enhancing better access to educational and recreational facility.

Tabassum, Tasnim; Hossain, Shakowat; Hafiz, Roxana
Children’s Accessibility to Educational and Recreational Facility
52
5. References BBS (2015) ‘Population and Housing Census 2011, Community Report, Zila: Dhaka’ Statistics
and Informatics Divisions. Ministry of Planning. Available from http://www.bbs.gov.bd/PageWebMenuContent.aspx?MenuKey=337 [Accessed 30 August 2016]
Church, Richard; Marston, James (2003) “Measuring Accessibility for People with a Disability” Journal of Geography, Vol. 35: 84-96. Available from https://onlinelibrary.wiley.com/doi/abs/10.1111/j.1538-4632.2003.tb01102.x [Accessed 20 February 2017]
Hossain, Basharat (2014) “Do the Slum Dwellers Enjoy the Basic Constitutional and Economical Rights as a Citizen of Bangladesh” Global Disclosure of Economics and Business, Vol. 3: 2305- 9168. Available from https://www.semanticscholar.org/paper/Do-the-Slum-Dwellers-Enjoy-the-Basic-Constitutional-Hossain/81717c608eafa9cafed11ffc09025b1b5444234d [Accessed 26 March 2017]
Kamruzzaman, Mohammad; Ogura, Nobuyuki (2008) “Housing for the Middle Income Groupin Dhaka, Bangladesh” Journal of Architecture and Planning, Vol. 73: 947-954. Available from https://www.jstage.jst.go.jp/article/aija/73/627/73_627_947/_pdf [Accessed 26 March 2017]
Khan, Madiha (2014) “Education and Health Status of Child Workers of Dhaka City” Global Disclosure of Economics and Business, Vol. 3 No. 2: 16-23. Available from http://publicationslist.org/data/gdeb/ref-5/GDEB_6.2.pdf [Accessed 12 July 2017]
Neema, Meher Nigar; Hossain, Md Rifat; Haque, Antora Mohsena & Farhan (2014) “Multi-Criteria Evaluation of Quality of Existing Urban Parks in Dhaka City-Towards Achieving Livable City” International Journal of Environment, Vol. 3 No. 3: 1-15.

Hosen, Md. Kamal Islam, Kazi Saiful, Dr. Eng. Chakraborty, Torit
Simulating the Impact of Setback, FAR and MGC Rules on Urban Living Environment: An Airflow Modelling Perspective
53
Simulating the Impact of Setback, Floor Area Ratio (FAR) and Maximum Ground Coverage (MGC) Rules on Urban Living Environment: An Airflow Modelling Perspective
1. Md. Kamal HOSEN, Graduate Student, Urban and Rural Planning Discipline, Khulna University, Bangladesh
2. Kazi Saiful ISLAM, Dr. Eng. , Professor and Head, Urban and Rural Planning Discipline, Khulna University, Bangladesh
3. Torit CHAKRABORTY, Graduated, Urban and Rural Planning Discipline, Khulna University, Bangladesh
Abstract Bangladesh is one of the most densely populated country in the world where 36.5 % of the total population lived in urban areas in 2018 and will increase to 50% in the next four decades. This rapid growth of urban population is not only caused to increase population density but also tends to slapdash development by both high compactness and increasing vertical density. Due to the imbalanced distribution of urban density with space, urban areas are becoming threatened for proper circulation of wind flow. So, in this research, a planned residential area in Khulna city was selected to investigate the impact of Setback, Floor Area Ratio, and Maximum Ground Coverage rules on the circulation of wind flow. The impact of setback, FAR and MGC rules were evaluated by using a Reynolds Averaged Navier-Stokes (RANS) based Realizable k-epsilon turbulence model of CFD simulations at four different urban configurations which represent the 3D model based on aforementioned rules. The simulations were performed applying the conditional factors including fixed wind speed (3.5 m/s), wind direction (south to north) and temperature (307K) of the pre-monsoon period (March to June) of the study area. The simulated results showed that the distributions of the velocity field are almost constant for all configurations by increasing MGC with a fixed FAR and setback. The outcome of this research can provide guidelines to ensure proper wind circulation and comfort within the urban areas that can be integrated with the respective policy and urban planning guidelines.
Keywords Airflow Modelling, Computational Fluid Dynamics (CFD), Floor Area Ratio (FAR), Maximum Ground Coverage (MGC), Setback
1. Introduction The world is rapidly being urbanized. Almost half of the world population are living in urban areas in 2008 (Dewan & Corner, 2013) and it will be increased 72 % by 2050. Currently, 36.5% population of Bangladesh lives in urban areas, of which more than half of the populations are agglomerated in only four cities – Dhaka, Khulna, Chittagong and Rajshahi. It is forecasted that it will be reached at 75% by 2050 (UN 2012).
Due to the space constraints and rapid urbanizations, cities tend to haphazard development with high physical intensity that makes challenging to ensure a better healthy living

Hosen, Md. Kamal Islam, Kazi Saiful, Dr. Eng. Chakraborty, Torit
Simulating the Impact of Setback, FAR and MGC Rules on Urban Living Environment: An Airflow Modelling Perspective
54
environment in urban areas (Khan & Mahmud, 2008). Because high physical intensity is triggered to ensure sustainability by limiting access to source of renewable energy – sunlight and wind (Antrop, 2006). On the other hands, reducing physical compactness tends to extend urban boundaries because of massive urban population that is threatened to the decline of agro-lands. Due to the complex dynamics of urban development, globally it tends to find out a way of balancing urban space and physical compactness. Floor Area Ratio (FAR), Setback and Maximum Ground Coverage (MGC) are the prime indicators in this context (Alexander et al., 1988; Debnath, 2014). FAR is the measurement of a building’s floor area in relation to the size of the lot/parcel that the building is located on (Li & Miao, 2014). It is an effective way to calculate the bulk or mass of building volume on a development site (Alexander et al., 1988), and is often used in conjunction with other development standards such as building heights, maximum ground coverage, setback and plot area to reassure a community’s desired arrangement and form of development. It can be used to either limit the intensity of land use to lessen the environmental impacts of development (Gao et al., 2006) or to control the mass and scale of development. The high value of FAR indicates greater building volume caused to reduce the potential of solar energy of buildings by changing wind pattern and dipping solar availability. To avoid the limitation of FAR, this study goes to justify the effectiveness of FAR with MGC and setback in the context of airflow. Globally, Computational Fluids Dynamics (CFD) methods are widely used to solve wind environmental problems in the respective fields (Blocken et al., 2012).
CFD equations are time-dependent which numerically solve the fluid-flow equations (Faria, 2012; Ramponi, 2014), in which flow variables have to be computed at several points in time (Safer et al., 2005; Vernay et al. 2014). The fluid-flow equations of Reynolds-averaged Navier–Stokes (RANS) based models are averaged over time which results in steady-state equations that are easier to solve (Vernay et al. 2014). Standard k-epsilon, RNG k-epsilon, and realizable k-epsilon models are examples of RANS based models. Additionally, two transport equations are also employed in these models as a turbulent property of the flow (Murakami et al., 1992). The turbulent kinetic energy (k) and turbulent dissipation rate (e) are exemplified as a new transport variable in the standard k-epsilon model. Though RANS approach have several limitations reported by Murakami et al., 1992; Franke et al., 2007; Yoshie et al., 2007; Tominaga et al., 2008, but in the consideration of cost and time, it is vastly used in the field of flow simulations (Yoshie et al., 2007; Ramponi, 2014) and sometimes have revealed very good performance in a complex study (Stathopoulos & Baskaran, 1996; Blocken & Persoon, 2009; Blocken et al., 2012; Janssen et al., 2013). CFD methods have ascertained a lot of uncertainties like (i) presence of complex phenomena related to environmental modeling (ii) geometrical structures etc. (Vernay et al., 2014). To minimize the relevant uncertainties, several sets of best practice guidelines (BPG) have been established (Franke et al., 2007).
The objective of the present paper is to investigate the impact of FAR, setback and MGC on the urban living environment performed by CFD (RANS based realizable k-epsilon turbulence model with two transported variable turbulent kinetic energy (k) and turbulent dissipation rate (e)). The outcome of this research can provide guidelines to ensure proper wind circulation and comfort within the urban areas that can be integrated with the respective policy and urban planning guidelines.
2. Methodology This study is divided into two parts. In the first part, a 3D was created which is further used in CFD wind flow simulation to assess the impact of FAR, setback and MGC at second parts.

Hosen, Md. Kamal Islam, Kazi Saiful, Dr. Eng. Chakraborty, Torit
Simulating the Impact of Setback, FAR and MGC Rules on Urban Living Environment: An Airflow Modelling Perspective
55
2.1 Physical model This research is going to perform by selected 11 plot of Nirala Residential Area, Khulna (Fig. 01). The plot data was collected from Khulna Development Authority (KDA). It was processed and finally, used to generate the 3D model with the application of FAR, Setback & MGC rules of Dhaka Imarat Nirman Bidhimala, 2008. There were four 3D models creating at four different conditions. The demarcation of the study area with the applicable setback and MGC rule was shown in Fig. 01 and Table 01 and finally, the generated 3D is shown in fig. 02.
Table 01: Application rule at different urban configurations
Perspective View Top View Perspective View Top View
Model 01 Model 02
Plot Size
(sq.m)
Constant Model 01
Model 02
Model 03
Model 04
FAR Front Setback
Back Setback
Side Setback MGC MGC
5% Decrease
MGC
10% Decrease
MGC 191.92 3.35 1.50 1 1
With
out
Max
imum
Gro
und
Cove
rage
65 60 55 198.01 3.35 1.50 1 1 65 60 55 255.00 3.50 1.50 1.50 1 62.5 57.5 52.5 259.24 3.50 1.50 1.50 1 62.5 57.5 52.5 259.81 3.50 1.50 1.50 1 62.5 57.5 52.5 266.66 3.50 1.50 1.50 1 62.5 57.5 52.5 308.43 3.50 1.50 2 1.25 62.5 57.5 52.5 324.08 3.50 1.50 2 1.25 62.5 57.5 52.5 328.31 3.50 1.50 2 1.25 62.5 57.5 52.5 328.41 3.50 1.50 2 1.25 62.5 57.5 52.5 338.85 3.75 1.50 2 1.25 60 55 50
Figure 01: Demarcation of Study Area with

Hosen, Md. Kamal Islam, Kazi Saiful, Dr. Eng. Chakraborty, Torit
Simulating the Impact of Setback, FAR and MGC Rules on Urban Living Environment: An Airflow Modelling Perspective
56
Perspective View Top View Perspective View Top View
Model 03 Model 04 Figure 02: 3D Model
2.2 CFD Air Flow Model In this study, the 3D steady RANS equations were solved with the realizable k-ε turbulence model. The realizable k-ε turbulence model was chosen because of its generally good performance especially for wind flow around buildings (Franke et al., 2004). Pressure-velocity coupling was taken care of by the SIMPLE algorithm, pressure interpolation was standard and second-order discretization schemes were used for both the convection terms and the viscous terms of the governing equations. This algorithm was developed by Patankar based on a predictor-corrector approach (Patankar, 1980). The simulation results are statistically performed by selecting 10 points of various location that is shown in figure 02. Then, the selected 10 points are categorized into three groups (Group A, B & C) based on similarity. The first Group A is formed by combining three points (point 1, 2 & 3) which are located on the road surface. The second Group B is formed by combining point 4, 5 & 6 which is parallel to air channel. The third Group C is formed by combining point 7, 8, 9 & 10 which is perpendicular to the air channel. In Fig. 03 shows the demarcation of point location.
3. Numerical Simulation The numerical simulation was performed in this research by the following process - 3.1 Governing Equations CFD work on the basis of numerical codes to solve imposed fluid problems. These codes make using the laws of physics, derived from basic conservation and transport principles. The Navier Stokes system is the basis for solving analytically incompressible Newtonian flows by approximation. The governing equations are: The mass and conservation continuity equation describes the interaction of
orthogonal velocity components, enforcing the mass balance; The three Reynolds-averaged Navier-Stokes (RANS) equations for conservation of
mass, energy, and momentum; and Further transport equations for pollutant concentration
The tensor formulation of the equation for the conservation of mass, momentum, and energy is given below -
Figure 03: Velocity Assessment Point

Hosen, Md. Kamal Islam, Kazi Saiful, Dr. Eng. Chakraborty, Torit
Simulating the Impact of Setback, FAR and MGC Rules on Urban Living Environment: An Airflow Modelling Perspective
57
Where,
Ui = the mean velocity component in Xi- direction Uj = velocity component in Xj-direction Xi = the co-ordinate (for i=1, 2, 3, Xi corresponds to three perpendicular axes) Xj = the co-ordinate (for j=1, 2, 3, Xj corresponds to three perpendicular axes) ρ = air density P = pressure µeff = µ+µt effective viscosity; µt-turbulent Viscosity and µ−laminar viscosity cp = specific heat β = thermal expansion coefficient of air T∞ = temperature of a reference point T = temperature; gi = gravity acceleration in i-direction
3.2 Model of Turbulence Shih et al. (1995) were developed in the realizable k-ε model. The turbulent viscosity model was adopted for all the CFD simulations with RANS based Realizable k-ε Model. The solver method assigns properties to cells, faces and grid points that compose an unstructured grid constrained in a finite volume, allowing data exchange between neighbor cells. Conservation equations for mass and continuity were applied for all flows, being added to energy equations when the problem involves heat changes or fluid compression. The turbulent kinetic energy ‘k’ and its rate of dissipation ‘ε’ are the basic components for the equation of turbulent viscosity. Further transport equations were added for calculating fluctuating velocity fields of turbulent flows, where eddies of small-scale and high frequency make the calculation of momentum, energy, and concentration transport difficult to be closed.
3.3 Near-wall Treatment The two-layer model was used in this study for building airflow studies, where air velocities are low. It was subdivided by the domain of viscosity-affected region and a fully turbulent region.
3.4 Boundary Conditions There are three kinds of boundary conditions like air inlet, outlet and wall boundary conditions were used in this study. The inlet condition includes the dimensions described above and flows characteristics. In the leftmost (upwind) side (y-z plane) of the domain, an inlet condition was applied. The inlet wind speed of 3.5 m/s with constant temperature 307K had been chosen as representing the average wind and temperature conditions of the pre-monsoon period (March to June) in the study region. The turbulent inlet quantities k and ε were derived from empirical correlations depending on turbulent intensity i, turbulence
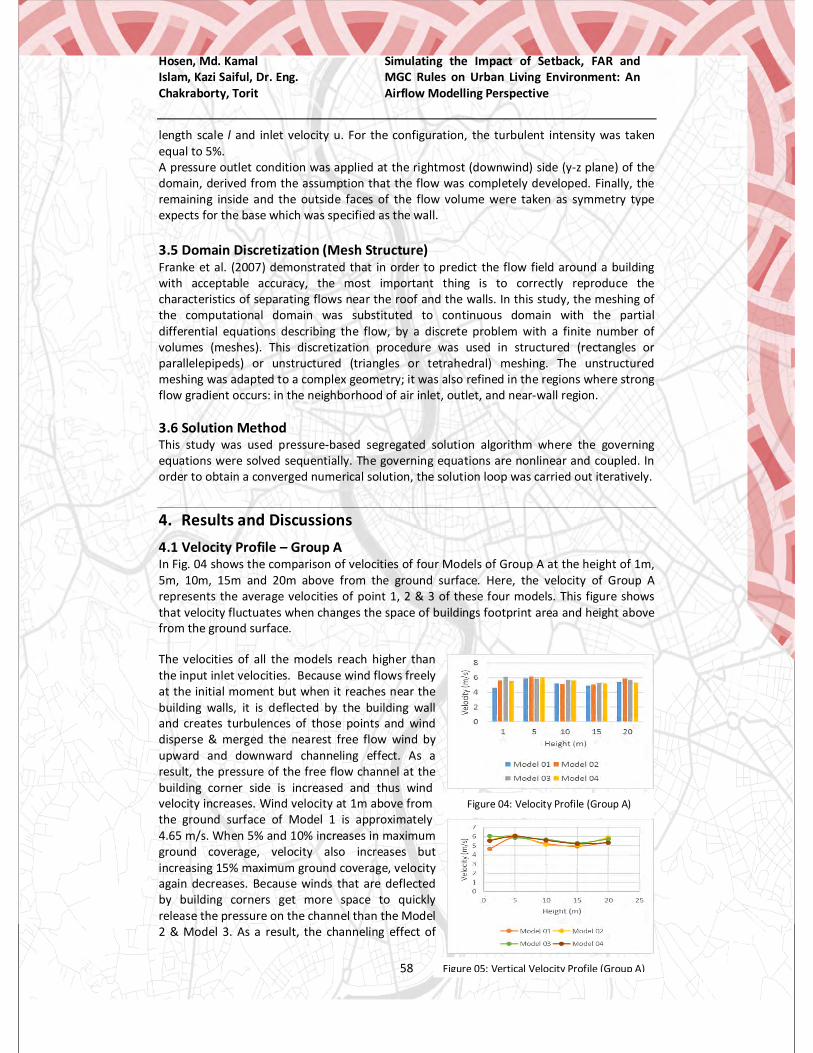
Hosen, Md. Kamal Islam, Kazi Saiful, Dr. Eng. Chakraborty, Torit
Simulating the Impact of Setback, FAR and MGC Rules on Urban Living Environment: An Airflow Modelling Perspective
58
length scale l and inlet velocity u. For the configuration, the turbulent intensity was taken equal to 5%. A pressure outlet condition was applied at the rightmost (downwind) side (y-z plane) of the domain, derived from the assumption that the flow was completely developed. Finally, the remaining inside and the outside faces of the flow volume were taken as symmetry type expects for the base which was specified as the wall.
3.5 Domain Discretization (Mesh Structure) Franke et al. (2007) demonstrated that in order to predict the flow field around a building with acceptable accuracy, the most important thing is to correctly reproduce the characteristics of separating flows near the roof and the walls. In this study, the meshing of the computational domain was substituted to continuous domain with the partial differential equations describing the flow, by a discrete problem with a finite number of volumes (meshes). This discretization procedure was used in structured (rectangles or parallelepipeds) or unstructured (triangles or tetrahedral) meshing. The unstructured meshing was adapted to a complex geometry; it was also refined in the regions where strong flow gradient occurs: in the neighborhood of air inlet, outlet, and near-wall region.
3.6 Solution Method This study was used pressure-based segregated solution algorithm where the governing equations were solved sequentially. The governing equations are nonlinear and coupled. In order to obtain a converged numerical solution, the solution loop was carried out iteratively.
4. Results and Discussions 4.1 Velocity Profile – Group A In Fig. 04 shows the comparison of velocities of four Models of Group A at the height of 1m, 5m, 10m, 15m and 20m above from the ground surface. Here, the velocity of Group A represents the average velocities of point 1, 2 & 3 of these four models. This figure shows that velocity fluctuates when changes the space of buildings footprint area and height above from the ground surface.
The velocities of all the models reach higher than the input inlet velocities. Because wind flows freely at the initial moment but when it reaches near the building walls, it is deflected by the building wall and creates turbulences of those points and wind disperse & merged the nearest free flow wind by upward and downward channeling effect. As a result, the pressure of the free flow channel at the building corner side is increased and thus wind velocity increases. Wind velocity at 1m above from the ground surface of Model 1 is approximately 4.65 m/s. When 5% and 10% increases in maximum ground coverage, velocity also increases but increasing 15% maximum ground coverage, velocity again decreases. Because winds that are deflected by building corners get more space to quickly release the pressure on the channel than the Model 2 & Model 3. As a result, the channeling effect of
Figure 04: Velocity Profile (Group A)
Figure 05: Vertical Velocity Profile (Group A)

Hosen, Md. Kamal Islam, Kazi Saiful, Dr. Eng. Chakraborty, Torit
Simulating the Impact of Setback, FAR and MGC Rules on Urban Living Environment: An Airflow Modelling Perspective
59
Model 4 is weaker than Model 1, Model 2 & Model 3. Wind velocity at 5m above from the ground surface of all models remain almost constant because of upward and downward channeling effect. When the vertical height of the point location is increased from the ground surface wind velocity tends to reduce (10m & 15m) because of increasing vertical distance weaker channeling effect happens. In this case, Model 2 & Model 3 wind velocity is high compared to Model 1 & Model 2. Because the wind pressure of the free flow channel is more prominent in Model 1 & Model 2. Wind velocity again increases at 20m above from the ground surface because the height of the buildings on the east part of the roadside is below 20m. Thus again channeling effect is prominent. On the other hand, figure 05 shows that wind velocities are slight changes with the change in vertical height of all models. At lower levels (1m), weaker channeling effect occurs and it gradually reduces by increasing vertical height. At a certain height, wind velocity again reduces because of increasing the effect of downward distance.
4.2 Velocity Profile – Group B In Fig. 06 shows the comparison of velocities of four Models of Group B at the height of 1m, 5m, 10m, 15m and 20m above from the ground surface. Here, the velocity of Group B represents the average velocities of point 4, point 5 & point 6 of these four models. These points are located in the space between two buildings. Here, velocities fluctuate by changing the space between two buildings. Velocities at 1m above from the ground surface show that Model 1 wind velocity reaches less than 3.5 m/s but gradually 5%, 10% & 15% increasing maximum ground coverage of Model 2, Model 3 and Model 4, a massive change in wind velocities. This result indicates that velocity and space are strongly related. The same scenario shows at 5m & 10m above from the ground surface but velocity reduces of all models comparing to 1m height. In Model 1, velocity reaches 3m/s that is unexpected. Wind velocity at 15m above from the ground surface reaches below 3. 0 m/s at both Model 1 & Model 2 that is unpredicted. But wind velocity at 20m above of Model 1 & Model 2 is reached greater than 4.0 m/s but in Model 3 & Model 4 it reaches below 3.0 m/s. Because, Model 1 & Model 2 buildings height below 20m. In figure 07 shows the vertical changes in wind velocities of all models. Overall, Model 4 is better for airflow environment.
4.3 Velocity Profile – Group C In Fig. 08 shows the comparison of velocities of four Models of Group C at the height of 1m, 5m, 10m, 15m and 20m above from the ground surface. Here, the velocity of Group C represents the average velocities of point 7, point 8, point 9 & point 10. These points are perpendicularly located in the wind directions. Here, space between the
Figure 06: Velocity Profile (Group B)
Figure 07: Vertical Velocity Profile (Group B)
Figure 08: Velocity Profile (Group C)

Hosen, Md. Kamal Islam, Kazi Saiful, Dr. Eng. Chakraborty, Torit
Simulating the Impact of Setback, FAR and MGC Rules on Urban Living Environment: An Airflow Modelling Perspective
60
two buildings is constant for all models. The velocity of Model 1 is high at 1m, 5m & 10m above from the ground surface comparing Model 2, Model 3 and Model 4. This result indicates that by increasing maximum ground coverage, it negatively impacted wind velocities of those points. Wind velocity at 15m above is again increased. At 20m above wind velocity is high because building heights are below 20m at Model 1 & Model 2, whereas building height of Model 3 & Model 4 is greater than 20m that influenced to reduce velocities. In Fig. 09 shows the vertical changes of wind velocities.
As this points perpendicular to wind direction, so the wind cannot directly reach this point through the channel and ultimately lowest wind velocity appears. This situation indicates that to reach enough velocity of this point increasing maximum ground coverage is not a solution. Moreover, it is necessary to change
building orientation for sufficient wind velocities. The overall velocity and temperature profiles were shown in figure 10. Model 01 Model 02 Model 03 Model 04
Heig
ht (1
m)
Heig
ht (5
m)
Hei
ght (
110m
)
Heig
ht (1
5m)
Figure 09: Vertical Velocity Profile (Group C)
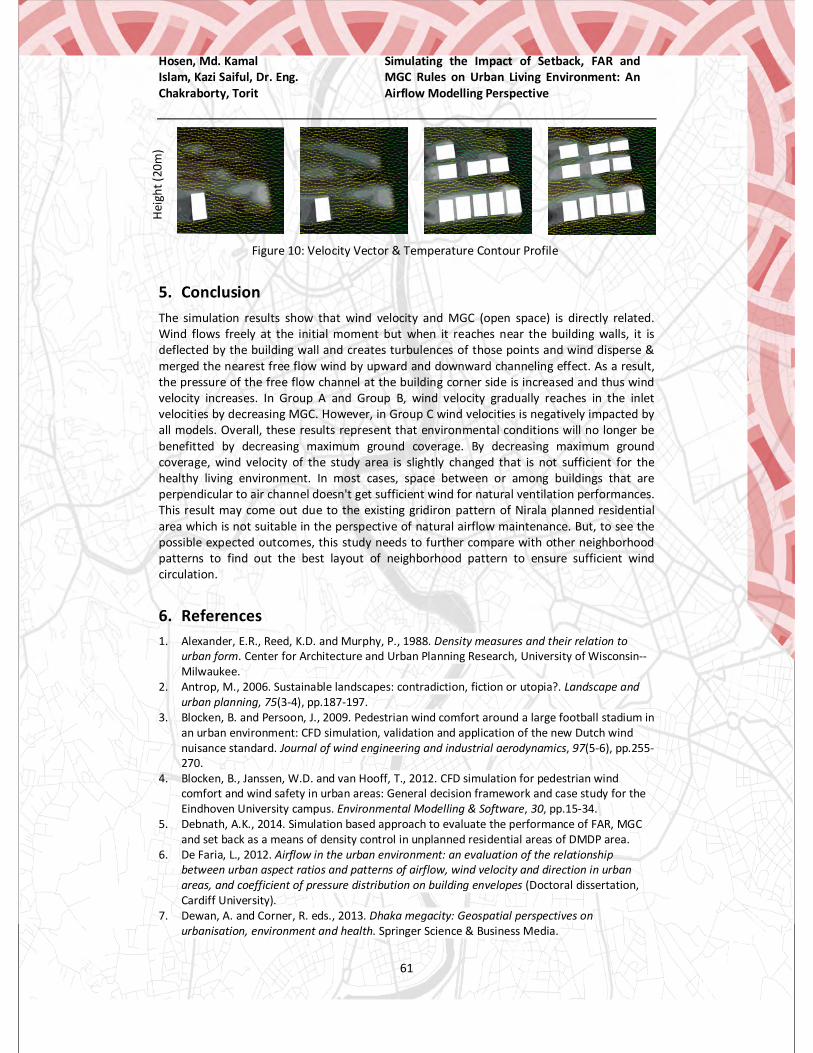
Hosen, Md. Kamal Islam, Kazi Saiful, Dr. Eng. Chakraborty, Torit
Simulating the Impact of Setback, FAR and MGC Rules on Urban Living Environment: An Airflow Modelling Perspective
61
Heig
ht (2
0m)
Figure 10: Velocity Vector & Temperature Contour Profile
5. Conclusion The simulation results show that wind velocity and MGC (open space) is directly related. Wind flows freely at the initial moment but when it reaches near the building walls, it is deflected by the building wall and creates turbulences of those points and wind disperse & merged the nearest free flow wind by upward and downward channeling effect. As a result, the pressure of the free flow channel at the building corner side is increased and thus wind velocity increases. In Group A and Group B, wind velocity gradually reaches in the inlet velocities by decreasing MGC. However, in Group C wind velocities is negatively impacted by all models. Overall, these results represent that environmental conditions will no longer be benefitted by decreasing maximum ground coverage. By decreasing maximum ground coverage, wind velocity of the study area is slightly changed that is not sufficient for the healthy living environment. In most cases, space between or among buildings that are perpendicular to air channel doesn't get sufficient wind for natural ventilation performances. This result may come out due to the existing gridiron pattern of Nirala planned residential area which is not suitable in the perspective of natural airflow maintenance. But, to see the possible expected outcomes, this study needs to further compare with other neighborhood patterns to find out the best layout of neighborhood pattern to ensure sufficient wind circulation.
6. References 1. Alexander, E.R., Reed, K.D. and Murphy, P., 1988. Density measures and their relation to
urban form. Center for Architecture and Urban Planning Research, University of Wisconsin--Milwaukee.
2. Antrop, M., 2006. Sustainable landscapes: contradiction, fiction or utopia?. Landscape and urban planning, 75(3-4), pp.187-197.
3. Blocken, B. and Persoon, J., 2009. Pedestrian wind comfort around a large football stadium in an urban environment: CFD simulation, validation and application of the new Dutch wind nuisance standard. Journal of wind engineering and industrial aerodynamics, 97(5-6), pp.255-270.
4. Blocken, B., Janssen, W.D. and van Hooff, T., 2012. CFD simulation for pedestrian wind comfort and wind safety in urban areas: General decision framework and case study for the Eindhoven University campus. Environmental Modelling & Software, 30, pp.15-34.
5. Debnath, A.K., 2014. Simulation based approach to evaluate the performance of FAR, MGC and set back as a means of density control in unplanned residential areas of DMDP area.
6. De Faria, L., 2012. Airflow in the urban environment: an evaluation of the relationship between urban aspect ratios and patterns of airflow, wind velocity and direction in urban areas, and coefficient of pressure distribution on building envelopes (Doctoral dissertation, Cardiff University).
7. Dewan, A. and Corner, R. eds., 2013. Dhaka megacity: Geospatial perspectives on urbanisation, environment and health. Springer Science & Business Media.

Hosen, Md. Kamal Islam, Kazi Saiful, Dr. Eng. Chakraborty, Torit
Simulating the Impact of Setback, FAR and MGC Rules on Urban Living Environment: An Airflow Modelling Perspective
62
8. Franke, J. ed., 2007. Best practice guideline for the CFD simulation of flows in the urban environment. Meteorological Inst..
9. Franke, J., Hellsten, A., Schlunzen, H. and Carissimo, B., 2007. The COST Action 732: Best Practice Guideline for the CFD Simulation of Flows in the Urban Environment. University of Hamburg, Hamburg, Germany.
10. Gao, X., Asami, Y. and Katsumata, W., 2006. Evaluating land-use restrictions concerning the floor area ratio of lots. Environment and Planning C: Government and Policy, 24(4), pp.515-532.
11. Janssen, W.D., Blocken, B. and van Hooff, T., 2013. Pedestrian wind comfort around buildings: Comparison of wind comfort criteria based on whole-flow field data for a complex case study. Building and Environment, 59, pp.547-562.
12. Khan, A. and Mahmud, A., 2008. FAR as a development control tool: A new growth management technique for Dhaka City. Jahangirnagar Plan. Rev, 6, pp.49-56.
13. Li, X. and Miao, L., 2014, October. The Study on Spatial Distribution of Floor Area Ratio Based-on Kriging——The Case of Wuhan City. In International Conference on Geo-Informatics in Resource Management and Sustainable Ecosystem (pp. 538-547). Springer, Berlin, Heidelberg.
14. Miao, Y., Liu, S., Chen, B., Zhang, B., Wang, S. and Li, S., 2013. Simulating urban flow and dispersion in Beijing by coupling a CFD model with the WRF model. Advances in atmospheric sciences, 30(6), pp.1663-1678.
15. Murakami, S., Mochida, A., Hayashi, Y. and Sakamoto, S., 1992. Numerical study on velocity-pressure field and wind forces for bluff bodies by κ-ϵ, ASM and LES. Journal of Wind Engineering and Industrial Aerodynamics, 44(1-3), pp.2841-2852.
16. RAMPONI, R., 2014. Computational modeling of urban wind flow and natural ventilation potential of buildings (Doctoral dissertation, Italy).
17. Patankar, S.V., 1980. Numerical Heat Transfer and Fluid Flow (Series in Computation and Physical Processes in Mechanics and Thermal Sciences).
18. Safer, N., Woloszyn, M. and Roux, J.J., 2005. Three-dimensional simulation with a CFD tool of the airflow phenomena in single floor double-skin facade equipped with a venetian blind. Solar Energy, 79(2), pp.193-203.
19. Shih, T.H., Liou, W.W., Shabbir, A., Yang, Z. and Zhu, J., 1995. A new k-ϵ eddy viscosity model for high reynolds number turbulent flows. Computers & Fluids, 24(3), pp.227-238.
20. Stathopoulos, T. and Baskaran, B.A., 1996. Computer simulation of wind environmental conditions around buildings. Engineering structures, 18(11), pp.876-885.
21. Tominaga, Y., Mochida, A., Yoshie, R., Kataoka, H., Nozu, T., Yoshikawa, M. and Shirasawa, T., 2008. AIJ guidelines for practical applications of CFD to pedestrian wind environment around buildings. Journal of wind engineering and industrial aerodynamics, 96(10-11), pp.1749-1761.
22. Vernay, D.G., Raphael, B. and Smith, I.F., 2014. Augmenting simulations of airflow around buildings using field measurements. Advanced Engineering Informatics, 28(4), pp.412-424.
23. Yoshie, R., Mochida, A., Tominaga, Y., Kataoka, H., Harimoto, K., Nozu, T. and Shirasawa, T., 2007. Cooperative project for CFD prediction of pedestrian wind environment in the Architectural Institute of Japan. Journal of wind engineering and industrial aerodynamics, 95(9-11), pp.1551-1578.
24. Esa.un.org. 2018. [online] Available at: https://esa.un.org/unpd/wpp/publications/Files/WPP2012_HIGHLIGHTS.pdf [Accessed 22 Sep. 2018].

Hossain, Biswas A study on distribution and locational effects Of fuel stations
63
Research Paper A STUDY ON DISTRIBUTION AND LOCATIONAL EFFECTS
OF FUEL STATIONS ON TRAFFIC FLOW IN DHAKA CITY CORPORATION AREAS
Tanvir Hossain, Assistant Town Planner, Eastern Housing Limited., Bangladesh Joy Biswas, Assistant Urban Planner, Sheltech (Pvt.) Ltd., Bangladesh
Abstract This study analyzed the location of filling stations in Dhaka City Corporation against the physical planning standards set by Bangladesh Petroleum Corporation (BPC 2014), their effect on traffic flow and how this problem can be solved by improving their service facilities. The findings revealed that there are 185 filling stations (Rupantarito Prakritik Gas Company Limited, 2016) located along the 29 roads in the Dhaka City Corporation area, of which 52.30% of the filling stations are located on the major road and about 42.70% on the minor roads. Among them Mirpur road has the highest percentage of filling station (15.43%) followed by DIT road (8.57%), Dhaka Aricha Highway (6.86%) and Jatrabari Road (7.43%) respectively. The result revealed that (33.33%) did not meet the criteria of 4m minimum distance from road. Equally 81% of the filling stations met the minimum distance of 100 meter from the bus station. However only one fifth (20%) of the total stations followed the standard 1km distance from each other at the same side of the road and rest of the 80% violated the rule. Although the rule stated in the BPC implies that the fuel stations must not lower the traffic flow of the adjacent roads. But 48% of the stations traffic flow is lowered by the stations and the rest 52% is unchanged. The research recommends that regulatory agencies need to look into the issues, take appropriate measures and should (in future) ensure that sites met the minimum standards were given permission to do the business.
Keywords Traffic flow, Regulatory agencies, Physical planning
1 Background A Petrol Station, also known as Filling Station, Gas Station, Fuelling Station, or Service Station is a facility which sells fuel and lubricants for motor vehicles, the most common fuel sold is petrol and kerosene. Filling Station, Petrol station, gas station or petroleum outlet is defined as any land, building or equipment used for the sale or supply of petrol or oil for motor vehicles.
Fuel station is an important sub-category of urban service facilities. It is a unique land use as people visit it for specific purpose with a very short time period (5-10 minute) and everybody visits it with car. The increase of urban population and the growth of the number of cars and other vehicle generate various kinds of demands, one of which is fuel. Harrison (1999) noted that a considerable number of cars fuel is wasted due to the long urban paths and unnecessary trips. This work, therefore seeks to identify the issues, particularly problems related to transport, due to location of filling stations. 1.1 Aim The study is aimed at analysing the location of fuel stations in Dhaka City Corporation areas and assessing their effect on traffic flow. 1.2 Objectives
To study the spatial distribution of fuel stations in both city corporations of Dhaka. To identify the effects of fuel stations on traffic flow along the adjacent road.

Hossain, Biswas A study on distribution and locational effects Of fuel stations
64
To study the site characteristics and service performance of fuel stations and its relationship with the effects of traffic flow.
1.3 Planning Implication of the study The higher concentration of petrol filling stations in Dhaka city, most especially in the city centre has resulted in problem in like traffic congestion, pollution, fire and explosion. 1.4 Scope of the study This research focuses on the location analysis of filling stations in Dhaka mega city, which consist of two city corporation (North and South). Location, distributions and patterns of the filling stations were determined by the study; and effects on traffic flow of the fuel stations have been examined. 1.5 Limitations of the study
The study was conducted only on the city corporation area (north and South) of Dhaka city.
Volume data were surveyed only on the peak hour of fuel stations but not with the peak hour of adjacent road.
Due to lack of latest technology, spot speed has been measured manually. 2. Regulations and standards regarding fuel stations in home
Location Related Location of filling station should not hamper the movement of vehicle. Location of filling station should maintain the safe distance from slope of roads,
nodes and bridges. Distance related Distance from bus station: 100m Distance apart: 1. Kilometer (same side of the road) 2. kilometer (opposite side of the road) Drive way width entry exit: 4m Setback of pump from pavement edge: 3m Frontage width: 30m
3. Methodology The methodology is the general research strategy that outlines the way in which research is to be undertaken and, among other things, identifies the methods to be used in it. The methodological steps of this study is described blow-
1. Literature Review on intersection performance improvement related studies 2. Selection of Study Route 3. Fixation of the sample size 4. Reconnaissance survey 5. Understanding the Theoretical Framework 6. Volume Survey 7. Speed Survey 8. Physical feature survey 9. Data analysis
To analyze the impact on traffic flow relation between traffic flow and traffic volume, delay etc will be determined. After calculating arrival time and departure time in the fuel station queuing theory will be applied to determine the delay time. Utilization of service pump has also been analyzed. Calculation of utilization has been done by following the below steps: If the average time it takes a server to service a request is Ts, then it follows that the average rate of service (if the server has an infinite supply of requests to work on) would be: µ=1/Ts. The utilization of the system, which is the ratio between the rate of arrivals (λ) and the rate of service is: ρ= λ/µ 4. Study area profile Dhaka is the capital and largest city of Bangladesh. It is one of the world's most populated cities, with a population of 17 million people in the Greater Dhaka Area.
Major arterial Road: Major arterial roads that are expected to carry large volumes of traffic.

Hossain, Biswas A study on distribution and locational effects Of fuel stations
65
Minor roads Minor roads are the collector roads or distributor roads that collect traffic from local roads and distribute it to arterials.
5. Data Analysis and Interpretation This chapter presents the analysis and discusses the major findings of the research to achieve the first objective (spatial distribution of fuel stations in both city corporations of Dhaka) stated at the first chapter. 5.1 Inventory of Filling Stations by Road The findings revealed that there exists one hundred and eighty-five (185) filling stations (Rupantarito Prakritik Gas Company Limited, 2016) in Dhaka City Corporation area. These filling stations are located along twenty-nine (29) roads of the Dhaka City Corporation area.
It was discovered that 52.30% of the filling stations are located on the major road, about 42.70% on the minor roads (figure 5.2).
It was found out that although Mirpur road have the highest number of filling stations, minor roads like Kamlapur way topped in relation to density per km (figure 5.3). But there exists no rule in BPC (2014) about density. So, density should be taken into consideration to ensure proper distribution of fuel stations according to road width.
Figure 5.1: percentage of fuel stations according to the road
Figure 5.2: Percentage of Fuel Stations According to Road Type
Source: Field survey 2017
Source: Field survey 2017

Hossain, Biswas A study on distribution and locational effects Of fuel stations
66
Figure 5.3: Density of Filling Stations per Road in Dhaka City
One major reason for that is most drivers fuel their vehicle when moving out of the city. More than 50% of the stations are located on exit side from Dhaka City (figure 5.4 to 5.8). 5.2 Pattern of Distribution of Filling Stations in Dhaka City Filling station business is governed by many factors among which are accessibility, market, government policy and so on. There are many methods of pattern identification; nearest neighbor analysis is one of them The Average Nearest Neighbor tool measures the distance between each feature centroid and its nearest neighbor's centroid location. If the index (average nearest neighbor ratio) is less than 1, the pattern exhibits clustering. If the index is greater than 1, the trend is toward dispersion. In case of our study the summary, table looks like this:
Table 5.2: Summary table of result of average nearest neighbor method Average Nearest Neighbor Summary Observed Mean Distance 299.765923
Expected Mean Distance 524.217360
Nearest Neighbor Ratio 0.571835 z-score: -9.410850 p-value: 0.000000 The results of the analyses revealed that the pattern of distribution is perfectly clustered because the nearest neighbor index (Rn) value is less than 1 and Z-value is -9.410850, less than -1.96.The reason for clustered distribution of the filling stations in the area may be linked to the fact that filling stations are located mainly on the road side and it is found that they mostly tend to concentrate on the highways and major roads, typical of their distribution in Dhaka city corporation area. 5.3 Factors Influencing the Distribution of Filling Stations in Dhaka City The result of the interview that was conducted to the manager of the existing side revealed the following as factors the operators consider in selecting site to build a filling station: 1. Traffic Flow 2. Exit Roads 3. Convenience 5.3.1 Distance from Road Edge According to the physical planning Standards set by BPC (2014) Procedure guide for grant of approvals to construct and operate of a petrol products retail outlet, the distance from the road to filling station pump should not be less than 4m. The result revealed that (33.33%) did not meet the criteria of 4m minimum distance from road.
Source: Field survey 2017

Hossain, Biswas A study on distribution and locational effects Of fuel stations
67
5.3.2 Distance between the Filling Stations in the same side of the road Distances between stations in the area were determined in Google Map using Measure distance tool. The finding revealed that only one fifth (20%) of the total stations followed the standard and rest of the 80% violated the rule (figure 5.12).
5.3.3 Distance from the Bus station The findings revealed that majority of the stations meet this standard (figure 5.13). Only few of the station (19%) could not meet the criteria.
5.3.4 Distance from the Intersection: From the analysis in the next chapter it is clearly seen that the fuel stations more close to the intersection has more effect on the traffic flow. So. A specific standard must be set to minimize locational effect of fuel stations on the traffic flow. 6. Data Analysis and Interpretation on “Effects of Fuel Stations on Traffic Flow” The result is presented and discussed under two sub-headings that include: effect of fuel stations on traffic flow and spot speed
Figure 5.11: Filling Station and 4m Standard Distance from Road
Figure 5.12: Distance between the filling stations in the same side of the road
Figure 5.13: Distance of fuel stations from the bus station
Source: Field survey 2017
Source: Field survey 2017
Source: Field survey 2017

Hossain, Biswas A study on distribution and locational effects Of fuel stations
68
6.1 Effects of fuel stations on traffic flow To analyse locational effect on traffic flow of fuel stations, 27 fuel stations out of 185 fuel stations was surveyed. Effect on fuel stations has been showed by two indicators: 6.2. Effects of fuel stations on Level of Service (LOS) This decreases the level of service of the adjacent road of the fuel station. From figure (figure 6.2) it is seen that 48% of the fuel stations level of service is hampered by the queue that is occurring by the pump. The rest 52% will have no effect.
Figure 6.2: Percentage of change of fuel stations level of service along with the road width change
6.3 Characteristics of fuel stations making no impact on level of service From the table (6.1) it is found that fuel stations on Mirpur road and Jatrabari road do not affect the level of service of their respective adjacent road. One of the major reasons behind this is “Mirpur road” has the highest average road width of all (figure 6.3). Even though some portion of the road is captured by the queue, still the remaining road width is sufficient to support the current traffic volume.
Figure 6.3: Average road width of fuel stations adjacent road
In case of jatrabari road, the fuel stations don’t have any impact on level of service of their adjacent road because of jatrabari flyover. Most of the vehicles pass through the jatrabari flyover. As a result, the traffic volume of adjacent road is very low. Also, there exists no queue so full of the road width of the adjacent road is used by the passing vehicles.

Hossain, Biswas A study on distribution and locational effects Of fuel stations
69
6.4 Characteristics of fuel stations making change in level of service There are two main reasons behind the LOS change in these roads.
Location near the node The surrounding public institutions
Table 6.2: List of fuel stations with unchanged level of service Road name Name of fuel
stations LOS (Using full width) g full width)
LOS (Using effective width)
Shatrastermor Akij cng filling B D Moghbazar
Jamuna Auto Center CNG Re-Fulling Station
B D
Anudip CNG Filling Station
B E
Malibag G-gas Petrol Pump B E The worst effect on level of service of adjacent road is observed on Jamuna Auto Center CNG Re-Fulling Station (B to D), Anudip CNG Filling Station (B to E), G-gas Petrol Pump (B to E), Shanto CNG Gas Station (B to D). Among them Jamuna Auto Center CNG Re-Fulling Station, Anudip CNG Filling Station,G-gas Petrol Pump is situated near to the node of busy roads. 6.5 Effect of fuel stations on spot speed It is clearly stated in the guidelines regarding establishment of fuel station that the speed of the vehicles moving in the adjacent road of the fuel stations must not hamper its speed. But from our analysis it is clearly visible that majority of the fuel stations hamper the speed of the vehicles of the adjacent roads. It is clearly visible from the graph (figure 6.8)
Figure 6.8: Comparison of spot speed before and after the station
From the figure, it is visible that, the spot speed vehicles decrease in front of filling station. The reason is the large queue length of vehicles outside the filling station 7. Data Analysis and Interpretation on “Site Characteristics and Service Performance Of Fuel Stations” This chapter presents the analysis and discusses the major findings of the research, to achieve the third objective (site characteristics and service performance of fuel stations) stated at the first chapter. 7.1 Site characteristics

Hossain, Biswas A study on distribution and locational effects Of fuel stations
70
The adjacent land use of the fuel stations was measured to account it with the planning regulations. The study revealed that most of the filling stations (54.17%) were close to the educational institutions such as school, college, universities.
7.2 Utilization ratio of the filling stations Utilization is the ratio of arrival rate and service time. It represents whether a filling station is underutilized or properly utilized. Table (Appendix 5) shows the utilization of the filling stations of Dhaka City Corporation.
Figure 7.2: Percentage of filling stations according to the category of utilization ratio
If utilization ratio is categorized into four quartiles, it is seen that most number of fuel stations (86%) lies below 75% utilization ratio. The utilization rate of these filling stations can be improved by:
Increasing and improving number of nozzle Better management system Improving the payment system.
7.3 Increase of nozzle All the filling stations have the capacity of providing service in both sides. But only 56% stations provide services by both sides and 44% stations provide one side of the nozzle.
Figure 7.1: Site characteristics of filling station Source: Field survey 2017
Source: Field survey 2017
Source: Field survey 2017 Figure 7.3 service provided by the side of nozzle

Hossain, Biswas A study on distribution and locational effects Of fuel stations
71
So, the improvement of the 44% nozzles can be done to improve the service performance of the filling stations. All the filling station should provide service from both side of the pump to improve the service performance. 7.4 Optimum use of existing nozzles The following figure shows the number of pump that each station has and the number of that providing services. In most of the stations, all the pumps are not being used. In maximum cases, they are using 3 or 4 pumps to provide services.
Figure 7.4 Number of pump servicing
Most of the filling stations do not use all the nozzle available there. By increasing the use of more nozzle, they can lower the service time and improve the service performance of the filling station. 7.5 Better management system Without management of entrance and exit of vehicles in the filling station, it is not possible to improve utilization rate. 7.6 Improvement of payment system Cash payment system of filling stations is one of the reasons of large queue length of the vehicle outside of filling station. Most of the filling stations follow the cash payment system manually to the counter or manually but within pump. 8. Reflection on Major Findings This research analyzed the location and effect on traffic flow of the filling stations in Dhaka City and subjected the location to the physical planning standards put in place by the regulatory agency, BPC (2014) The research findings revealed that:
Mirpur road which has the highest percentage of station (15.43%) followed by Dit road(8.57%) and Dhaka Aricha Highway(6.86%), Jatrabari Road(7.43%) respectively, these four roads account for more than one-third of the filling stations in the area (representing36%).
52.30% of the filling stations are located on the major road and about 42.70% on the secondary or minor roads.
The result revealed that (33.33%) did not meet the criteria of 4m minimum distance from road. These stations include mainly minor roads such as Dhaka aricha highway, outer circular road, jatra bari road etc.
Only one fifth (20%) of the total stations followed the standard 1km distance from each other at the same side of the road and rest of the 80% violated the rule.
48% of the stations traffic flow is affected by the stations and the rest 52% is not. Mirpur road and Jatrabari road doesn’t affect the level of service of their respective
adjacent road.
Source: Field survey 2017
Hossain, Biswas A study on distribution and locational effects Of fuel stations
72
The worst effect on level of service of adjacent road is observed on Jamuna Auto Center CNG Re-Fulling Station (B to D) , Anudip CNG Filling Station( B to E), G-gas Petrol Pump (B to E), Shanto CNG Gas Station( B to D) as they are situated near to the node of busy roads.
Only 56% stations provide services in both side and 44% stations provide service by one side of the pump.
Delay in departure rate is quite high due to cash payment system as there is no digital card system to pay the cash. The payment is done manually to the counter or manually within the pump.
9. Recommendations The BPC should make it compulsory for the filling station operators when submitting their EIA report to include the geographic location of the site. Discrepancies were observed as regard the compliance with standards, as such regulatory agencies need to look into the issue, take appropriate measures and should (in future) ensured that only sites met the minimum standards were given permission to do the business. Filling stations are mostly located on some roads as found by the study, hence the need to give priority for the roads with less number of filling stations when given license to operators.
10. Conclusion This study revealed that the establishment and location of these service stations in various parts of the study area is going on without due regard to planning criteria, safety and environmental considerations. Service stations in the area were often built with little or no compliance to planning regulation, lack of the implementation of standards and recommended practice the failure of which affects traffic flow directly or indirectly. These therefore remain a source of concern to all, but little is being done to improve the scenario. There is a need for plans and actions to tackle the situation for today and the future.
References
Rupantarito Prakritik Gas Company Limited. (2016). Retrieved on August 28, 2016, from http://www.rpgcl.org.bd/exp_act.php?ltype=exp_fillstation
Harrison R. (1999). Understanding our environment, Royal Society Chemistry, UK, page-444
Bangladesh petroleum corporation: News (2014) Available at: http://www.bpc.gov.bd/cir_n_pol.php (Accessed: 3 September 2016).

Tabassum, Saba Role of Public Parks in Maintaining Quality of Life in Dhaka City
73
Research Paper / Case Study Paper
ROLE OF PUBLIC PARKS IN MAINTAINING QUALITY OF LIFE IN DHAKA CITY: RAMNA PARK AS A MODEL
Saba Tabassum, Department of Disaster and Human Security Management, Bangladesh University of Professionals, Dhaka- 1216; Bangladesh
Abstract
Public parks can be characterized as un-built lands inside the city which gives natural, health and social advantages for the communities that cover land and water bodies dedicated to entertainment, beautiful magnificence and preservation. For maintaining good quality of life these are important for the purpose of different public functions, recreational and leisure activities of the urban dwellers. This study focused on six factors (Regularity & Mobility of the visitors in the park, Environmental Quality, Personal Security & Safety, their Subjective well-being (work & life balance), Social Connection and Health Status). Questionnaire was based on Spanish version of EUROHIS-QOL-8 (overall QoL, general health, energy, daily life activities, self-esteem, relationships, finances, and household) and 5-point Likert Scaling this paper sought to explore how public parks as a model Ramna Park can maintain Quality of Life (QoL). This study investigates individuals’ feelings about their quality of life with respect to their living standards including their perception about visiting Ramna Park in their day to day lifestyle.
Keyword
Role of Public Parks, Quality of Life, Ramna Park
Chapter 1:
1.1 Introduction Public parks are basic component of urban life because of their structure and multi
usefulness, can assume an excellent part in the essentialness and nature of urban life. Public
Parks are not just utilized as dynamic recreational and relaxation zones for its subjects, yet in
addition a critical impetus for group improvement and upgrade. Urban parks are
characterized as delineated open space regions, for the most part dominated by vegetation
and water, and by and large held for public use. Urban parks are for the most part bigger,
however can likewise have the state of littler 'pocket parks'. Urban parks are generally
locally characterized (by experts) as 'parks' (Konijnendijk et al., 2013). These spaces in the
city act like its lungs and assume a basic part in supporting the biological and ecological
framework. In the dense urban zones like Dhaka, even Small Parks (less than one acre in

Tabassum, Saba Role of Public Parks in Maintaining Quality of Life in Dhaka City
74
size) can contribute a considerable measure to enhance ecological quality of city life
(Tabassum, 2018). Parks have for some time been perceived as real supporters of the
physical and aesthetic quality of urban neighbourhoods. Be that as it may, another, more
extensive perspective of parks has as of late been developing. In the current decades, over
half of the total population possesses urban zones, making the urban condition the most
widely recognized territory for man (Walker, 2004). Broadly urban sprawl area, rapid and
unplanned urbanization, tremendous business improvement, alongside populace weight like
Dhaka, the general city condition gets crumbled step by step. Today city neglects to give
green and sound condition to its occupants. Besides this, Ramna Park is superior in safety
and security and landscape design (Neema et al., 2014).
The expression "Quality of Life" has been utilized overwhelmingly crosswise over numerous
orders, going from natural and well-being sciences to sociologies (Wolch, Byrne & Newell,
2014).This is because of its mind-boggling nature grasping differing components that impact
human business (Afroz, 2009).From the area of well-being sciences, matters of future,
mental prosperity, pervasiveness of sicknesses, self-awareness, access to medicinal services
and their association with QoL have likewise emphatically been accentuated (Bakas et al.,
2012).These contrasting viewpoints show the degree to which personal satisfaction can be
affected by various factors. In any case, it is fundamental to guarantee great personal
satisfaction (Quality of Life) in urban territories, giving foundation, administrations and a
solid situation, with great obligation (Ernstson, 2012). Quality of life makes the city more
alluring and attractive to live and contribute (Quintas and Curado, 2009).
As per Bangladesh Population and Housing Census 2011, only Dhaka city accounts around
38% of the aggregate urban population of Bangladesh and it obliges more than 1, 25, 17,361
individuals inside its 1463.60 sq km zone and achieving the rank of 25th with regards to most
astounding population density on the planet.In Dhaka urban greenery, park greenery or
tree-secured spaces constitutes under 15% of the city scene. The picture of past Dhaka is not
derived from its solid parts like building, streets and so forth it is substantially more
profound and more liquid.In the densely assembled urban zones, Small Parks supplement
the Public Parks framework, because of their size, they prevalently serve contiguous
building.
Therefore, this study only focuses on the Ramna Park at the heart of the Dhaka City. This
study investigates how public parks in Dhaka City assumes an indispensable part in keeping
Tabassum, Saba Role of Public Parks in Maintaining Quality of Life in Dhaka City
75
up Quality of Life and how Parks can influence the physical and mental wellness in the
meantime.
1.2 Literature Review An unpublished study open spaces reported that the quality of parks is more concern to its
users than its quantity (Morphet, 1989). Building on (Eriksson, 1994) model, Felce and Perry
(1995) further conceptualized quality of life not to have a hierarchical approach but rather to
result from dynamic interaction between objective life conditions, subjective feelings of
wellbeing, and personal values and aspirations. These three elements are capable of
changing independently due to external influences such as peers, material inheritance, age
and maturation, employment, and other social, economic, and political variables.
Department of the Environment Transport & Regions (2000) studied several schemes aimed
to raise standards in public parks which includes: A healthy, safe and secure, clean and well-
maintained park, it’s conservation and heritage, it’s community involvement, their
marketing and management.
Furthermore, Ventegodt, Merrick & Andersen et al., (2003) conceptualized quality of life as a
range running from subjective to target measurements, with existential components put in
the center to associate both the subjective and target aspects. The existential components in
this setting speak to the profundity of one's life. With reference to this model, "wellbeing"
and "objective factors, (for example, social standards)" are shallow in nature since they are
at the external edges of the model and manage a person's restricted capacity to adjust to a
given culture, while "satisfaction with life" and "fulfilment of needs" components are
worried about the more profound parts of one's life. "Happiness" and "realization of life
potential" envelop a man's most profound presence and nature as an individual, with the
"meaning in life" and "biological order" segments managing one's deepest being. People
with a greater connection to natural environments have been shown to be happier (Nisbet,
Zelenski 2009).
Studies showed health benefits for well-being which reduces obesity, stress, self-perceived
health, better mental health, stroke mortality and quality of life (Hussain ei al., 2010). Other
variables that determined health related park use and activities were for example distance
to facilities and amenities, general quality, park size and total tree canopy, species richness,
time spent and frequency of visits to the park. There were also several studies suggesting a
particular importance for ethnic minorities and immigrants as well as for adolescents (Cohen
et al., 2007). Discoveries are bolstered in the hypothetical model proposed by (Koramaz,

Tabassum, Saba Role of Public Parks in Maintaining Quality of Life in Dhaka City
76
2017) in which the cooperation amongst subjective and target individual and natural
attributes apparent by people related with urban parks, social connections, wellbeing, and
physical movement add to their QoL. It is a valuable asset to directing coordinated
intercessions by experts, organizers, and clients to enhance their quality and
administrations.
Konijnendijk et al., (2013) studied about the scientific evidence for different benefits of
urban parks. A study clarifies the significance of urban parks and portrays the arrangement
of open green space in urban areas around the globe, and also the degree to which Dhaka
needs such spaces. It additionally offers a meaning of parks—incorporates playgrounds
(Efroymson & Hossain, 2015). Neema et al., (2014) reported about the qualitative and
quantitative evaluation to the quality of some major parks of Dhaka city with respect to
environmental quality, landscape quality, safety and security quality and aesthetic quality.
Another report deals with the open spaces in the context of Dhaka city, their potentialities
and in some cases the reason of failure to work as a potential urban open space using space
syntax (Ahmed, 2008). Another study investigates the efficiency and utilization of urban
green space especially parks of Dhaka city (Ummeh & Toshio, n.d). Mridha (2015)
investigated on people’s feelings about life with respect to their own living standards and life
experiences, including their understanding and satisfaction with housing and the
neighbourhood environment.
1.3 Objectives To evaluate the role of Ramna Park that maintaining Quality of Life
To explore the factors that influencing the well-being of the users close to Ramna
Park.
1.4 Limitations of the Study The study has been conducted in a limited timeframe.
Questionnaire survey was done with a limited respondent.
Chapter 2:
2.1 Data & Method To better understand the perceptions of quality of life regarding Ramna Parks, the basic
research design was conducted into two data collection methods. Data and information
were taken basically from field survey, Questionnaire survey, interview from local people

Tabassum, Saba Role of Public Parks in Maintaining Quality of Life in Dhaka City
77
(visitors) and some secondary data like Google Scholar database (journal articles, newspaper
articles, books and reports) were used too.
2.2 Study Design Data from the Ramna Park questionnaire Survey were used to assess community members
to know their own perception whether the park is playing any role to maintain quality of life.
We have designed our study within 3 perspectives- Social Science, Health Science and
Environmental Science Perspectives (Mensah, Perera & Roji, 2016). The questionnaire
included Spanish version of EUROHIS-QOL-8 items (overall QoL, general health, energy, daily
life activities, self-esteem, relationships, finances, and household) to assess QoL (Camarago,
Ramirez & Fermino, 2017). In addition, there are some factors that are focused on to
measure the quality of life- Regularity & Mobility of the visitors in the park, Environmental
Quality, Personal Security & Safety, their Subjective well-being (work & life balance), Social
Connection and Health Status.
2.3 Data Collection The questionnaire is a key tool for broadening participation and validating the input received
from other opportunities. For the searching of subjective and objective well-being of life, the
respondents were face-to-face interviewed and provided the form of three paged
questionnaire. A questionnaire survey was carried out on 15 people chosen at random aged
from 18 to 65 years who are physically and psychologically sound. People from different
socio-economic factors like age group, economic class, literacy, occupations and genders
were selected as respondents. Park was visited twice on a random weekdayand a public
holiday. The author interviewed them and each interview took 15-20 minutes. The
observation periods were conducted from 7.00 am to 12.00pm and 4.00pm to 5.30 pm.
Some questions were included with 5-point Likert type scale (very good, good, medium, bad,
very bad) to rank their own perception.
In that study area, sample size is mainly characterized by different aspects with different
time zones. In the early morning, visitors come particularly for exercise and they are
concerned with their fitness with in the age of 35 to 65 years. In the noon and afternoon,
people are more concerned about their leisure activities and freshness within the age of 18
to 50. And in the evening all types of people were found doing their chores.
Questions from the survey that were relevant to their quality of life, how it is connected to
public parks especially Ramna Park, how a park can play a vital role in maintaining quality of
life, are they even concern about their quality of life were investigated. The answers of these
questions were based on their own perspectives, thoughts and beliefs.

Tabassum, Saba Role of Public Parks in Maintaining Quality of Life in Dhaka City
78
Chapter 3:
3.1 Study Area Profile Ramna Park is a large park and recreation area situated at the heart of Dhaka, the capital city
of Bangladesh. This park is one of the most beautiful areas in Dhaka with lots of trees and a
lake near its corner. It is situated in Ramna thana and in 1949 Ramna Lake was made. Ramna
Park now protects an area of 68.50 acres (277200 sq. meter), of which the lake covers 8.76
acres (35000 sq. meter). Ramna is at 23.7417°N 90.4083°E. Institute of Engineering (IEB) is in
the south-east of Ramna Lake. Shishu Park is situated in the southwest. Maximum portion of
the park is in the north-west part. Its width varies from 9-94m to some points and the lake is
812m long. (Razzak, Muntasir & Chowdhury, 2012). Walkways inside park have been
widened and five new gates built for entry from different sides. The park features many
beautiful and modern venues for relaxation which is maintained by the Public Works
Department (PWD) of Bangladesh.
3.2 Area Map
Figure 1: Map of Ramna Park within redline

Tabassum, Saba Role of Public Parks in Maintaining Quality of Life in Dhaka City
79
Chapter 4:
4.1 Data Analysis
Figure 2: Role of Ramna Park for users
Among the respondents, 53% of them preferred to visit the park for leisure activity, another
20% of them preferred for health issues like diabetes or high pressure that can be minimized
after coming to this park. 7% of them are concerned about their fitness and they choose
Ramna Park for exercise in their day to day lifestyle.
Figure 3: Ranking of this park maintaining QoL for users
In this case, majorities of them ranked Ramna Park for maintaining good QoL. In addition,
none of them ranked very bad or bad as maintaining QoL either.
[PERCENTAGE]
[PERCENTAGE]
[PERCENTAGE]
[PERCENTAGE]
[PERCENTAGE]
Role of Ramna Park for users
Exercise
Health issues
Leisure activity
Sports
Others
[PERCENTAGE]
[PERCENTAGE]
[PERCENTAGE]
Ranking of this park maintaining QoL for users
Very bad
Bad
Moderate
Good
Very good

Tabassum, Saba Role of Public Parks in Maintaining Quality of Life in Dhaka City
80
4.2 Findings
Most of the park users who come in morning are aged people. The middle-aged people like
to come to this park at noon and after. If we talk about the regularity and mobility of the
park users, we will see that the aged people are regular and good in number. Most of them
usually come here by walking a distance of 5-7 Kilometres. Most of the people are satisfied
with the infrastructural condition of the park but some claimed that the park is not under
good maintenance.
If we talk about the environmental quality of this park that is helping to maintain the people
quality of life is quite satisfactory. The users said that the trees should in good care so they
may grow well. The air quality is fresh enough for maintaining a healthy time. The overall
security system is moderate as there are some problems of hawker disturbance here. Other
than that, the park users feel safe to have their leisure time here. The quality of life of the
park users are well than before. They have said that they can feel the overall improvement
after using the park and the improvement is really very positive. Lastly, if we want to see the
health status of the park users, the analyses will indicate you that they can overcome their
physical and mental stress while they come here and if there is chance, they may be adding
the habit of walking to their daily routine. Because of the overall advantages, the park users
have mentioned that this park is helping them to maintain their quality of life and this kind
of parks should be more so that all the people can come and enjoy the beauty of the
environments.
Chapter 5:
5.1 Recommendations Need proper maintenance for benches, cleanliness the environment, water quality,
garbage disposal so that more people can find it convenient for their refreshments.
Security systems should be increased so that hawkers’ disturbance become less.
Input more active security cameras
Activities of park should be increased for both children and adults.
5.2 Conclusion
Situated in the core of Dhaka, nearby the exquisite Dhaka Club, Ramna Park covers a
territory of almost seventy sections of land, including a lake, arranged patio nurseries,
pathways and zones for amusement and unwinding. Ramna Park's fascination contained its
being a desert spring of sorts in the urban aridity of Dhaka. Users come here to appreciate
natural air and endeavour to upgrade their emotional wellness. Aside from this, keeping up

Tabassum, Saba Role of Public Parks in Maintaining Quality of Life in Dhaka City
81
QoL can be identified with utilizing parks in light of the fact that there are a few variables
which prompts keep up a sound and healthy lifestyle. Notwithstanding, support of stop is
likewise assuming a huge part that users will go to the recreation centre all the time.
Cooperating with nature may in this way be vital for survival, as well as for human Quality of
Life.
6. References
Afroz, R., 2009, Sustainable open space planning and the informal sector: a case study of
Dhaka, Bangladesh. HKU Theses Online (HKUTO).
Ahmed, A., 2008. Child's play and recreation in Dhaka City, Bangladesh.
Bakas, T., McLennon, S.M., Carpenter, J.S., Buelow, J.M., Otte, J.L., Hanna, K.M., Ellett, M.L.,
Hadler, K.A. and Welch, J.L., 2012, Systematic review of health-related quality of life
models. Health and quality of life outcomes, 10(1), p.134.
Camargo, D.M., Ramírez, P.C. and Fermino, R.C., 2017, Individual and Environmental
Correlates to Quality of Life in Park Users in Colombia. International journal of
environmental research and public health, 14(10), p.1250.
Cohen, D.A., Mckenzie, T.L., Sehgal, A., Williamson, S., Golinelli, D., Lurie, N., 2007,
Contribution of public parks to physical activity. American Journal of Public Health
97, 509-514.
Department of the Environment, T.T.R., 2000, Building a Better Quality of Life–A Strategy for
More Sustainable Construction.
Efroymson, D. and Hossain, M., 2015, Improving conditions for walking: research and action
in Dhaka, Bangladesh. Journeys, 13, pp.49-58.
Eriksson, M. and Lindström, B., 2007, Antonovsky’s sense of coherence scale and its relation
with quality of life: a systematic review. Journal of Epidemiology & Community
Health, 61(11), pp.938-944.
Ernstson, H., 2012, The social production of ecosystem services: A framework for studying
environmental justice and ecological complexity in urbanised landscapes. Landscape
and Urban Planning, 109(1), 7-17.
http://dx.doi.org/10.1016/j.landurbplan.2012.10.005
Felce, D. and Perry, J., 1995, Quality of life: Its definition and measurement. Research in
developmental disabilities, 16(1), pp.51-74.
Hussain, G., Nadeem, M., Younis, A., Riaz, A., Khan, M.A. and Naveed, S., 2010, Impact of
public parks on human life: A case study. Pakistan Journal of Agricultural
Science, 47(3), pp.225-230.
Tabassum, Saba Role of Public Parks in Maintaining Quality of Life in Dhaka City
82
Konijnendijk, C.C., Annerstedt, M., Nielsen, A.B. and Maruthaveeran, S., 2013, Benefits of
urban parks. A systematic review. A Report for IFPRA. Copenhagen & Alnarp.
Koramaz, E.K. and Türkoğlu, H., 2017, Measuring and understanding urban parks’
contribution to Quality of Life in Istanbul. Social Indicators Research, pp.1-17.
Mensah, C.A., Andres, L., Perera, U. and Roji, A., 2016, Enhancing quality of life through the
lens of green spaces: A systematic review approach. International Journal of
Wellbeing, 6(1).
Morphet, J., 1989, Unpublished study by Birmingham University for Department of the
Environment.
Mridha, M., 2015, Quality of life: case study of Dhaka, Bangladesh. WIT Transactions on
Ecology and the Environment, 193, pp.663-675.
Neema, M.N., Hossain, M.R., Haque, A.M. and Farhan, M.H.M., 2014, Multi-Criteria
Evaluation of Quality of Exisiting Urban Parks in Dhaka City-Towards Achieving
Livable City. International Journal of Environment, 3(3), pp.1-15.
Nisbet, E.K., Zelenski, J.M. and Murphy, S.A., 2009, The nature relatedness scale: Linking
individuals' connection with nature to environmental concern and
behavior. Environment and Behavior, 41(5), pp.715-740.
Quintas, A.V. and Curado, M.J., 2009, The Contribution of Urban Green Areas to The Quality
of Life. City Futures in a Globalising World, pp.4-6.
Razzak, N.R.B., Muntasir, S.Y. and Chowdhury, S.U.B.R.A.T.A., 2012, Pollution scenario of
Dhaka City Lakes: a case study of Dhanmondi and Ramna Lakes. Global Engineers
and Technologists Review, 2, pp.1-6.
Tabassum, S., 2018, Environmental Response of Small Urban Parks in Context of Dhaka City,
In Journal of Physics: Conference Series (Vol. 953, No. 1, p. 012038). IOP Publishing.
Ummeh, S. and Toshio, K., Classification of Urban Parks and their Regional Characteristics in
Dhaka City, Bangladesh.
Ventegodt, S., Merrick, J. and Andersen, N.J., 2003, Quality of life theory I. The IQOL theory:
an integrative theory of the global quality of life concept. The Scientific World
Journal, 3, pp.1030-1040.
Walker, C., 2004, The public value of urban parks. Urban Institute.
Wolch, J.R., Byrne, J. and Newell, J.P., 2014, Urban green space, public health, and
environmental justice: The challenge of making cities ‘just green
enough’. Landscape and Urban Planning, 125, pp.234-244.

Chakma, S. and Zaman, M. Assessing the Impact of Built-Up Areas on Land Surface Temperatures in Dhaka City
83
Research Paper on
Assessing the Impact of Built-up Areas on Land Surface Temperatures in Dhaka City
1Salit Chakma, Lecturer, Department of Disaster and Human Security Management, Bangladesh University of Professionals; Bangladesh
2Musarrat Zaman, Lecturer, Department of Disaster and Human Security Management, Bangladesh University of Professionals; Bangladesh
Abstract
Urban and rural areas are usually demarcated and recognized by a prominent climatic characteristic – heat, be that of air temperature or surface temperature. In addition, urban areas contain meteorological parameters of higher spatial variation. Through studying temperature of urban and surrounding area, a comprehension of sustainability of urban development, urban community, neighboring/peripheral wetland and vegetation, greenness can be made. Dhaka, capital of Bangladesh, is seeing extensive structural development since 1990’s and in parts it became intensive in recent years with both completed and ongoing constructions of multiple flyovers, elevated expressway and Mass Rapid Transit (MRT). Therefore, to understand how healthy the urban development of Dhaka is, this research aims to define the relationship between impervious surface change and Land Surface Temperature (LST) change in Dhaka Metropolitan Development Plan (DMDP) area. This research further aims to incorporate another factor, Greeness into the study to understand how LST is altering. The study uses images collected by Thematic Mapper and Operational Land Imager of Landsat missions and the years of 1989, 1999, 2009 and 2019 with maintaining seasonal variation. Expansion of Surface Urban Heat Islands are found to be prominent in the recent years.
Keywords
Surface Urban Heat Island (SUHI); wetland; Dhaka; Landsat
1. Introduction With the rapid expansion of urban areas and built-up lands, changes are occurred in the natural landscape as well as urban micro-climate. A large number of paved roads, buildings and other infrastructures take the place of green space, vegetation and wet land. These consequences lead to the formation of urban heat islands (UHI). It is basically an environmental phenomenon whereby urban regions experience warmer temperatures than their rural surroundings (Montavez et al., 2000; Rizwan et al., 2008). Land Surface Temperature (LST) is a key indicator of UHI, which is defined as the average temperature of an element of the exact surface of the Earth, calculated from measured radiance (Norman & Becker, 1995). There are several researches on heat impact in urban built up areas, which show the exponential increase of its effects over past decades (Delami et al., 2018). Characteristics of urban heat island (UHI), its effects and causes were investigated by Guiling et al. (2008) and the results showed that Land Surface Temperature (LST) over urban areas were by 10.83 % higher than those over rural area,and the Normalized Difference

Chakma, S. and Zaman, M. Assessing the Impact of Built-Up Areas on Land Surface Temperatures in Dhaka City
84
Vegetation Index (NDVI) and albedo over urban area were by 62 % and 18.75 % less than those over rural area, respectively. More studies have found strong correlation between surface temperatures with NDVI over different Land Use and Land Cover (LULC) classes (Mallick et al., 2008; Kaplan et al., 2018). It is alarming that, UHI causes a notable number of adverse impacts on human life and environment including increased energy consumption and demand in urban areas; initiation of high moisture in air thus initiating storm/precipitation/lightening in and nearby of urban areas (Bornstein and Lin, 2000; Dixon and Mote, 2003); its contribution to heat-related health issues that might lead to mortality (Hondula et al., 2015) and ultimately significant contribution to global warming and climate change (EPA, 2016) with abrupt temperature rise, erratic rainfall, degrading air quality, calamities like flood, water logging, disease outbreak, and water scarcity (Mayer et al., 2003; Ifatimehin et al., 2010; Hossain, 2008; Atkinson, 2002; Dewan & Yamaguchi, 2009). As one of the rapid on growing cities, Dhaka, the capital city of Bangladesh is facing major threats of UHI due to its over population and high density. The development trend of Dhaka is deliberately shifting vertical direction to cope with the extensive population pressure. Consequently, of the unplanned urbanization process several high-rise buildings are being constructed as part of fast-growing development trend. Increase of impervious surfaces are causing increase of heat and growth of urban heat islands throughout the city. Not to mention, on growing construction projects are causing cutting down of urban trees and that are resulting in further increase of heat that is further alarming from public health stance. Even though the average temperature of Dhaka city has been increasing moderately over the last 30 years, it has seen a sharp increase since 2006. A notable study of Roy (2012) was done regarding the impacts of urban development on the land cover are (LCA) and LST in Dhaka Metropolitan Area (DMA). His analysis showed that category of built-up is grown up to 23.18% in constant growth rate and it was changed from the categories of water bodies and vegetation land cover during the period of 1989 to 2010 in DMA area thus, the changing of LST is directly correlated with LC transition and the amount of vegetation (NDVI) is negatively correlated with LST (Roy, 2012). In recent years, there has been a decreasing trend of seasonal rainfall during monsoon and winter in Dhaka City, while the instances of erratic and excessive rainfall have increased to a great extent. It has also given rise to storms or precipitation events, energy demand and heat related mortality (Rabbani, 2010). Therefore, it is important to know the reasons behind UHI effect and understand the spatial distribution of the heat in urban areas of Dhaka identifying the possible mitigating factors will help the authority reach towards clement urban weather so that those can be addressed accordingly through appropriate policy interventions. This research aims to define the relationship between Land Use Land Cover (LULC) change and LST change with respect to UHI effect in Dhaka Metropolitan Development Plan (DMDP) area. It has utilized Landsat satellite images to examine the relationship between urban development and Urban Heat Island (UHI). UHI maps are derived from Land Surface Temperature (LST) map. The main purposes of this paper is to assess impact of impervious surface on Land Surface Temperature (LST) of Dhaka.
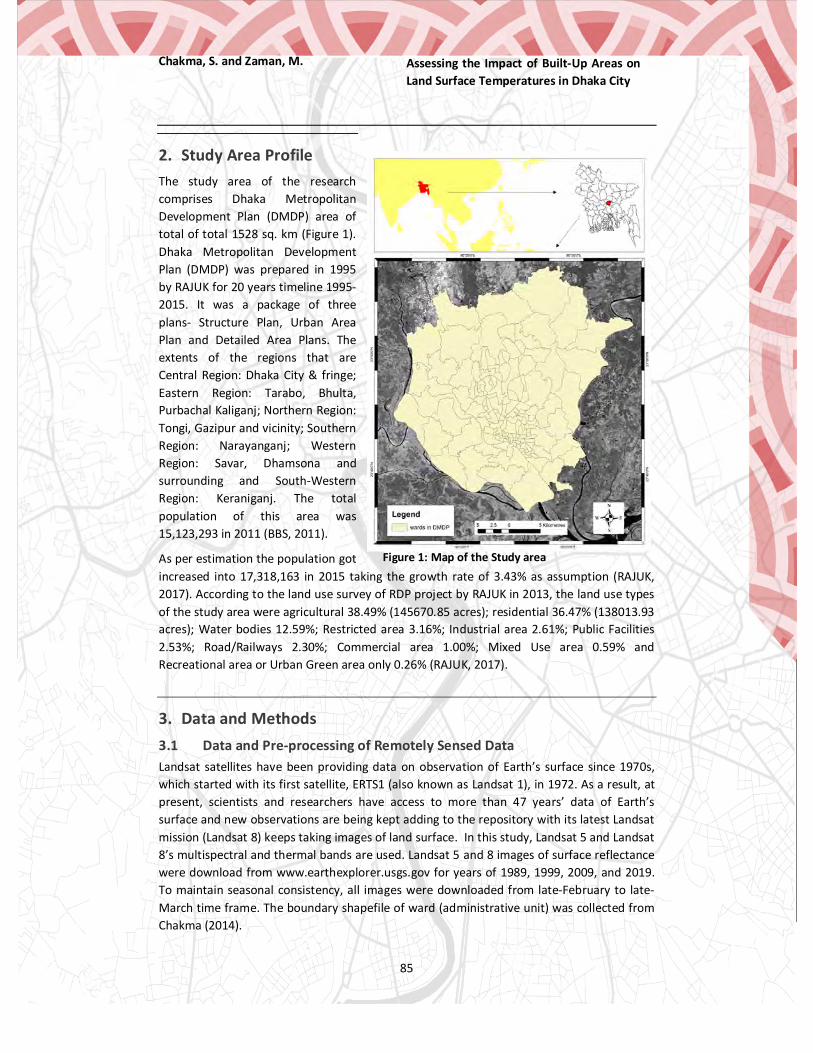
Chakma, S. and Zaman, M. Assessing the Impact of Built-Up Areas on Land Surface Temperatures in Dhaka City
85
2. Study Area Profile The study area of the research comprises Dhaka Metropolitan Development Plan (DMDP) area of total of total 1528 sq. km (Figure 1). Dhaka Metropolitan Development Plan (DMDP) was prepared in 1995 by RAJUK for 20 years timeline 1995-2015. It was a package of three plans- Structure Plan, Urban Area Plan and Detailed Area Plans. The extents of the regions that are Central Region: Dhaka City & fringe; Eastern Region: Tarabo, Bhulta, Purbachal Kaliganj; Northern Region: Tongi, Gazipur and vicinity; Southern Region: Narayanganj; Western Region: Savar, Dhamsona and surrounding and South-Western Region: Keraniganj. The total population of this area was 15,123,293 in 2011 (BBS, 2011).
As per estimation the population got increased into 17,318,163 in 2015 taking the growth rate of 3.43% as assumption (RAJUK, 2017). According to the land use survey of RDP project by RAJUK in 2013, the land use types of the study area were agricultural 38.49% (145670.85 acres); residential 36.47% (138013.93 acres); Water bodies 12.59%; Restricted area 3.16%; Industrial area 2.61%; Public Facilities 2.53%; Road/Railways 2.30%; Commercial area 1.00%; Mixed Use area 0.59% and Recreational area or Urban Green area only 0.26% (RAJUK, 2017).
3. Data and Methods 3.1 Data and Pre-processing of Remotely Sensed Data Landsat satellites have been providing data on observation of Earth’s surface since 1970s, which started with its first satellite, ERTS1 (also known as Landsat 1), in 1972. As a result, at present, scientists and researchers have access to more than 47 years’ data of Earth’s surface and new observations are being kept adding to the repository with its latest Landsat mission (Landsat 8) keeps taking images of land surface. In this study, Landsat 5 and Landsat 8’s multispectral and thermal bands are used. Landsat 5 and 8 images of surface reflectance were download from www.earthexplorer.usgs.gov for years of 1989, 1999, 2009, and 2019. To maintain seasonal consistency, all images were downloaded from late-February to late-March time frame. The boundary shapefile of ward (administrative unit) was collected from Chakma (2014).
Figure 1: Map of the Study area

Chakma, S. and Zaman, M. Assessing the Impact of Built-Up Areas on Land Surface Temperatures in Dhaka City
86
Table 1. Landsat scenes used in the study
ID Sensor Date Time LT05_L1TP_137043_19890325_20170204_01_T1 TM 25 March 1989 03:53 LT05_L1TP_137044_19890325_20170204_01_T1 25 March 1989 03:53 LT05_L1TP_137043_19990321_20161218_01_T1 TM 21 March 1999 04:03 LT05_L1TP_137044_19990321_20161218_01_T1 21 March 1999 04:03 LT05_L1TP_137043_20090228_20161029_01_T1 TM 28 February 2009 04:10 LT05_L1TP_137044_20090228_20161027_01_T1 28 February 2009 04:11 LC08_L1TP_137043_20190328_20190404_01_T1 OLI, TIRS 28 March 2019 04:23 LC08_L1TP_137044_20190328_20190404_01_T1 OLI, TIRS 28 March 2019 04:24
Since the bands (of surface reflectance level data), except thermal bands, comes with preprocessed and depict surface reflectance, no preprocessing was necessary. The thermal bands were however subjects to preprocessing – the scenes come with digital number (DN) values. Following equation is needed for convert DN values to radiance (NASA, n.d.) –
(1)
The equation 1 can be also expressed as (Chander and Markham, 2003),
(2)
Where,
= Spectral radiance at the sensor’s aperture in (Watts/(m² * sr * μm))
= Rescaled gain in (Watts/(m² * sr * μm))/DN
= Rescaled bias in (Watts/(m² * sr * μm))
= Quantized calibrated pixel value in DN
= Spectral radiance scaled to QCALMIN in (Watts/(m² * sr * μm))
= Spectral radiance scaled to QCALMAX in (Watts/(m² * sr * μm))
= Minimum quantized calibrated pixel value
= Maximum quantized calibrated pixel value
The spectral radiance needs to be further converted to at-satellite temperature of the viewed Earth-Atmosphere system, also known as Top of Atmosphere (TOA) brightness temperature, a more physically useful variable. The variable to calculate at Kelvin (K) scale.
Brightness temperature at Kelvin scale can be calculated using following equation (Barsi et al., 2014; NASA, n.d.).
(3)
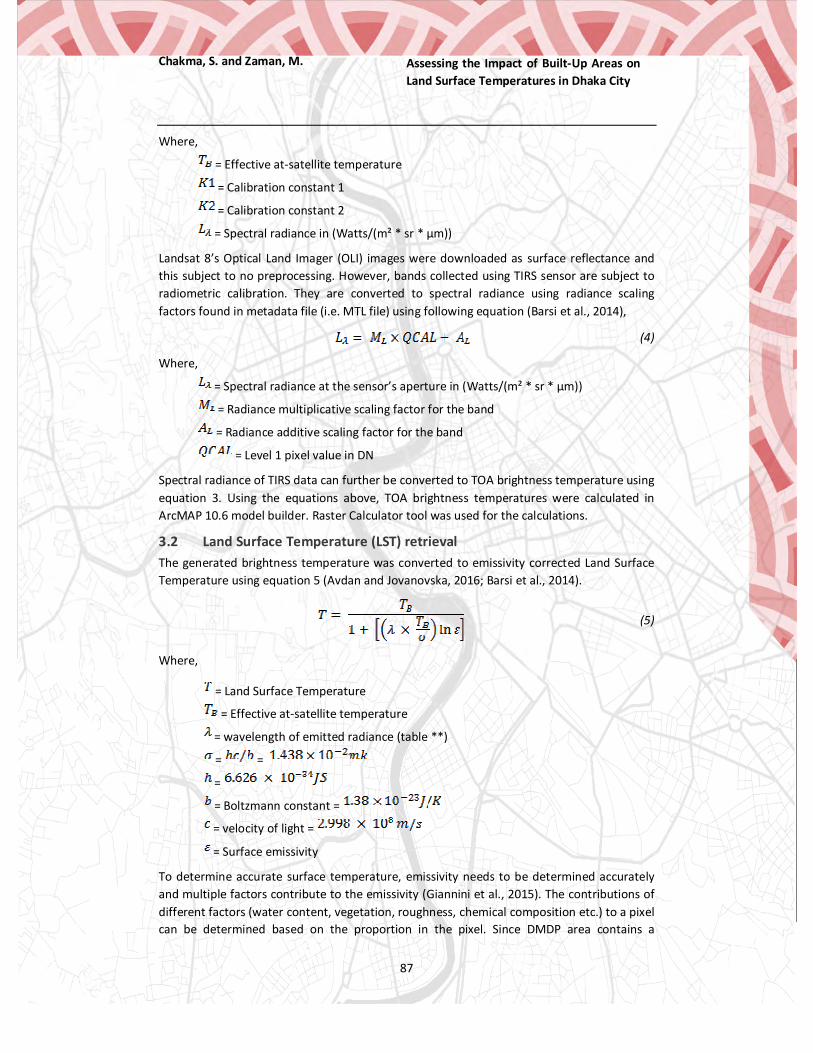
Chakma, S. and Zaman, M. Assessing the Impact of Built-Up Areas on Land Surface Temperatures in Dhaka City
87
Where,
= Effective at-satellite temperature
= Calibration constant 1
= Calibration constant 2
= Spectral radiance in (Watts/(m² * sr * μm))
Landsat 8’s Optical Land Imager (OLI) images were downloaded as surface reflectance and this subject to no preprocessing. However, bands collected using TIRS sensor are subject to radiometric calibration. They are converted to spectral radiance using radiance scaling factors found in metadata file (i.e. MTL file) using following equation (Barsi et al., 2014),
(4)
Where,
= Spectral radiance at the sensor’s aperture in (Watts/(m² * sr * μm))
= Radiance multiplicative scaling factor for the band
= Radiance additive scaling factor for the band
= Level 1 pixel value in DN
Spectral radiance of TIRS data can further be converted to TOA brightness temperature using equation 3. Using the equations above, TOA brightness temperatures were calculated in ArcMAP 10.6 model builder. Raster Calculator tool was used for the calculations.
3.2 Land Surface Temperature (LST) retrieval The generated brightness temperature was converted to emissivity corrected Land Surface Temperature using equation 5 (Avdan and Jovanovska, 2016; Barsi et al., 2014).
(5)
Where,
= Land Surface Temperature
= Effective at-satellite temperature
= wavelength of emitted radiance (table **)
= =
=
= Boltzmann constant =
= velocity of light =
= Surface emissivity
To determine accurate surface temperature, emissivity needs to be determined accurately and multiple factors contribute to the emissivity (Giannini et al., 2015). The contributions of different factors (water content, vegetation, roughness, chemical composition etc.) to a pixel can be determined based on the proportion in the pixel. Since DMDP area contains a
Chakma, S. and Zaman, M. Assessing the Impact of Built-Up Areas on Land Surface Temperatures in Dhaka City
88
heterogenous surface, impervious surface, waterbodies, vegetation covered areas and no field measurements are collected or published by any organization this study used following methods to estimate LST, which was followed by researchers in past and proved to be consistent (Avdan and Jovanovska, 2016; Giannini et al., 2015; Jiménez-Muñoz et al., 2006; Sobrino et al., 2004). According to Sobrino et al. (2004), emissivity can be estimated using proportion of vegetation, also known as fractional vegetation cover, (equation 6).
(6)
Equation 6 considers emissivity of vegetation as 0.986 (i.e. = 0.985+0.005) (Sobrino and Raissouni, 2000).The fractional vegetation cover can be retrieved by using Normalized Difference Vegetation Index (NDVI), as proposed by Carlson and Ripley (1997) (Equation 7). NDVI is a normalized difference of near infrared band (NIR) and red band (RED).
(7)
Where,
= NDVI values of full vegetation cover and bare soil respectively
Finally, LST can be calculated in degree Celsius by subtracting the Kelvin-Celsius difference,
(8)
Using equation 5-8 LST of different years were calculated in model builder. Meanwhile NDVI and Normalized Difference Build-up Index (NDBI) were also calculated in model builder. Since area of DMDP covers two scenes of Landsat data, the resultant LST, NDVI and NDBI were subject of mosaicking and then clipped to the boundary of DMDP. To note, NDBI is a normalized difference of shortwave infrared 1 (SWIR1) and near infrared bands (NIR).
NDBI often overestimates built-up areas by categorising bare land in its positive values. Roy (2012, p. 14) had found built-up area to be within 0.15-0.3 of NDBI for DMP area in his thesis. However, employing such value range in this study resulted in built-up area to be underestimated. To overcome this limitation, another approach was taken - Zha et al. (2003) categorised positive NDVI values as 1 and rest as 0, and positive NDBI values as 1 and rest as 0, then combined them to map built-up area automatically. On the other hand, NDVI has a limitation of classifying exposed wet soil as vegetation. Therefore, in this study a Boolean AND operator was used between positive NDBI and positive NDVI values that are less than 0.2 (equation 9). However, this method underestimates built-up areas in recent year of 2009 and 2019’s images, which is discernible since AND Boolean operator is a least risk-taking operator.
(9)
In figure 2, a part of the model used is given to depict the process of the study. The figure contains only the methods used for 1989’s images. However, the processes (i.e model) was replicated with following year’s images. Model given in figure 2 has three main process, calculation of LST, calculation of Fractional Vegetation Cover from NDVI and calculation of NDBI.

Chakma, S. and Zaman, M. Assessing the Impact of Built-Up Areas on Land Surface Temperatures in Dhaka City
89
Figure 3. Land Surface Temperature of 4 years – 1989, 1999, 2009, and 2019.
Figure 2. Partial of Model, only for year of 1989, used in the study.
4 Results and Discussion
Land Surface Temperature (LST) The year of 1989 shows increased temperature in western region (figure 3), which is a result of exposed land on the banks of the rivers and other waterbodies. Since the area suffered from severe flooding a year earlier, vegetation died out and increased of barren lands influenced in increase of LST. LST map of 1999 also shows higher LST values because of similar reason. 1998 the region faced another severe flooding and thus increase of barren land causing rise of LST. Also, the images depict LST of a certain day and certain time, therefore, multiple factor could influence LST. Time of image taken is another factor to consider – images of 1989 and 1999 are taken earlier than images of 2009 and 2019 in diurnal epoch (table 1). On the other hand, image of 2009 was taken on 28 February whence other images were taken in late March. In February the weather is still colder and drier than the month of March and weaker sunlight causes less energy in solar radiance. Furthermore, February has shorter diurnal length than March, hence less exposure to solar radiance. The factors (e.g. time of exposure to direct solar radiance, prior rainfall, wind speed and flow direction) influencing LST on respective day (the day of data collection by

Chakma, S. and Zaman, M. Assessing the Impact of Built-Up Areas on Land Surface Temperatures in Dhaka City
90
Figure 4. Impervious and Sandy surface retrieved using Boolean AND operation.
Figure 5. Mean LST at ward (and union) level.
satellite) is unknown. Thus explanation of their role, which is significant, cannot be made in this study.
The Surface Urban Heat Islands (SUHI) are visible in 2009 and LST difference between impervious and non-impervious surface is significant. After a decade, in 2019, the difference seems to be decreasing and the expansions of SUHI is clearly visible. Even with the mean LST distribution based on ward boundary reveals that higher mean LST values are to be found in wards of Dhaka Metropolitan Area (DMA) boundary for all four years (figure 5). However, in more recent years the mean LST in wards/unions adjacent to city areas are on rise – meaning surface of suburbs are getting warmer than previous epoch.
Boolean AND operator is a risk-adverse operator which takes minimum risks in making output, causing underestimation at the output level (Bell et al., 2007). The results of the Boolean AND (figure 4) between NDBI and NDVI is a new approach to map impervious surfaces automatically and is subject to further scrutiny. However, considering the approach is almost entirely based on multiple indices, i.e. spectral band ratio, indices that do not require accuracy assessment and widely accepted in remote sensing community; this study left out the possible accuracy assessment from scope of study. The resultant images are binary images with a class (with value of 1) mapping impervious and sandy surfaces and another class (with value of 0) mapping rest surfaces. The impervious and sandy surfaces are found with higher LST than their surroundings, supporting the idea of LST is higher at built-up areas (Corner et al., 2014).
5 Conclusion This study attempted to illustrate change patterns of LST in DMDP area. In addition to past researches this study contributes to existing body of knowledge by incorporating larger spatial extent of area under investigation, thus, finds missing patterns which were not considered in past researches, and application of new method is made which was not practised for this region in past to delineate impervious and sandy surfaces. The model prepared in this study can be used by anyone to automatically calculate LST and map impervious and sandy surface with a hard-rule, i.e. Boolean logic.

Chakma, S. and Zaman, M. Assessing the Impact of Built-Up Areas on Land Surface Temperatures in Dhaka City
91
6 Acknowledgement This study contains partial result of an existing ongoing project funded by Bangladesh University of Professionals.
7 References Atkinson, B. Wilson (2002) “Numerical modeling of urban heat-island intensity”, Boundary-Layer
Meteorology, Vol. 109 No. 3 (December) pp. 285–310 Avdan, Ugur; Jovanovska, Gordana (2016) “Algorithm for Automated Mapping of Land Surface
Temperature Using LANDSAT 8 Satellite Data”, Journal of Sensors, Vol. 2016 pp. 1-8 Barsi, Julia A.; Schott, John R.; Hook, Simon J.; Raqueno, Nina G.; Markham, Brian L.; Radocinski,
Robert G. (2014) “Landsat-8 Thermal Infrared Sensor (TIRS) Vicarious Radiometric Calibration”, Remote Sensing, Vol. 6 No. 11 pp. 11607-11626 (November)
Bell, Nathaniel; Schuurman, Nadine; Hayes, Michael V. (2007) “Using GIS-based methods of multicriteria analysis to construct socio-economic deprivation indices”, International Journal of Health Geographics, Vol. 6 No. 17 (May)
Bornstein, Robert; Lin, Qinglu (2000) “Urban heat islands and summertime convective thunderstorms in Atlanta: three case studies” Atmospheric Environment, Vol. 34 pp. 507–516.
Carlson, Toby N.; Ripley, David A. (1997) “On the relation between NDVI, fractional vegetation cover, and leaf area index”. Remote Sensing of Environment, Vol. 62 No. 3 pp. 241−252
Chander, Gyanesh; Markham, Brian L. (2003) “Revised Landsat-5 TM radiometric calibration procedures and post calibration dynamic ranges” IEEE Transactions on Geoscience and Remote Sensing, Vol. 41 No.11 (November).
Chakma, Salit (2014) “Analysis of Urban Suitability” In Dhaka Megacity: Urbanization, Environment and Health, ed. A. M. Dewan and R. J. Corner, pp.147 – 162, Heidelberg: Springer. DOI. https://doi.org/10.1007/978-94-007-6735-5_5
Corner, Robert J.; Dewan, Ashraf M.; Chakma, Salit (2014) “Monitoring and Prediction of Land-Use and Land-Cover (LULC) Change” In Dhaka Megacity: Urbanization, Environment and Health, ed. A. M. Dewan and R. J. Corner, pp. 75 – 97, Heidelberg: Springer. DOI. https://doi.org/10.1007/978-94-007-6735-5_5
Delami, Kaveh; Kamruzzaman, M.; Liu, Yan (2018) “Urban heat island effect: A systematic review of spatio-temporal factors, data, methods, and mitigation measures” International Journal of Applied Earth Observation, Vol. 67 pp. 30-42.
Dewan, M. Ashraf; Yamaguchi, Yashushi (2009) “Land use and land cover change in greater Dhaka, Bangladesh: using remote sensing to promote sustainable urbanization” Applied Geography, Vol. 29 No.3 pp. 390-401.
Dixon, P.Grady; Mote, L. Thomas (2003) “Patterns and causes of Atlanta’s urban heat island-initiated precipitation” Journal of Applied Meteorology, Vol. 42 pp. 1273–1284.
EPA (2016) “Heat Island Impacts”, United States Environmental Protection Agency, available from: http://www.epa.gov/hiri/impacts/index.htm.
Giannini, M. B.; Beilfiore, O. R.; Parente, C. Santamaria, R (2015) “Land Surface Temperature from Landsat 5 TM images: comparison of different methods using airborne thermal data”, Journal of Engineering Science and Technology Review, Vol. 8 No. 3 pp. 83-90 (October).
Guiling, Wang; Weimei, Jiang; and Ming, Wei (2008) “An Assessment of Urban Heat Island Effect using Remote Sensing Data” Marine Science Bulletin, Vol. 10 No. 2 pp. 14-24.
Chakma, S. and Zaman, M. Assessing the Impact of Built-Up Areas on Land Surface Temperatures in Dhaka City
92
Hondula, M. David; Georgescu, Matei; and Balling, C. Robert (2014) “Challenges associated with projecting urbanization-induced heat-related mortality”, Science of the Total Environment, Vol. 490 pp. 538–544.
Hossain, Shahadat (2008) “Rapid urban growth and poverty in Dhaka city. Bangladesh”, e-Journal of Sociology, Vol. 5 No. 1.
Ifatimehin, O. Oluseyi; Ishaya, Sunday; Fanan, Ujoh (2010) “An analysis of temperature variations using remote sensing approach in Lokoja area, Nigeria” Production Agricultural and Technology, Vol. 6 No.2 pp. 35-44.
Jiménez-Muñoz, Juan C.; Sobrino, José A.; Gillespie, Alan; Sabol, Donald; Gustafson, William T. (2006) “Improved land surface emissivities over agricultural areas using ASTER NDVI”, Remote Sensing of Environment, Vol. 103 pp. 474-487 (April)
Kaplan, G. Jovanovska; Avdan, Ugur; Avdan, Z. Yigit (2018) “Urban Heat Island Analysis Using the Landsat 8 Satellite Data: A Case Study in Skopje, Macedonia” 2nd International Electronic Conference on Remote Sensing, available from: https://sciforum.net/conference/ecrs-2.
Mallick, J., Kant, Y. and Bharath, B.D. (2008). Estimation of land surface temperature over Delhi using Landsat-& ETM+. J. Ind. Geophys. Union. 12, (3), 131-140.
Mayer, H., Matzarakis, A. and Iziomon, M.G. (2003) “Spatio-temporal variability of moisture conditions within the urban canopy layer”, Theoretical and Applied Climatology, Vol. 76 pp. 165-179.
Montavez, J.P., Rodriguez, A. and Jiménez, J.I. (2000) “A Study of the Urban Heat Island of Granada” International Journal of Climatology, Vol. 20 pp.899 – 911
NASA (n.d.) “Landsat Science Data User Handbook”, NASA Goddard Space and Flight Center. Norman, M. John; Becker, Francois (1995) “Agricultural and Forest Meteorology terminology in
thermal infrared remote sensing of natural surfaces” Agricultural and Forest Meteorology, Vol. 77 pp.153-166
Rabbani, Golam; Rahman, Atiq; Islam, Nazria (2010) “Resilient Cities: Cities and Adaptation to Climate Change. Proceedings of the Global Forum 2010” In: Local Sustainability 1, Chapter: Building Resilience to Climate Change in Asian Cities, Springer, 401-409.
RAJUK (2017), “Draft Dhaka Structure Plan 2016-2035”, available from: http://www.rajukdhaka.gov.bd/rajuk/image/slideshow/Dhaka_Structural_Plan.html
Rizwan, M. Ahmed; Dennis, Y.C. Leung; Chunho, Liu (2008) “A review on the generation, determination and mitigation of Urban Heat Island”, Journal of Environmental Sciences, Vol. 20 No. 1 pp. 120-128.
Roy, D. Raja (2012) “Gis-Based Spatial Simulation of Impacts of Urban Development on Changing Both Land Cover Area and Land Surface Temperature in Dhaka City”, Department of Urban and Regional Planning, Bangladesh University of Engineering Technology [Thesis]
Sobrino, J. A.; Raissouni, N. (2000). “Toward remote sensing methods for land cover dynamic monitoring: Application to Morocco”. International Journal of Remote Sensing, Vol. 21 No. 2 pp. 353−366 (November) DOI. h ps://doi.org/10.1080/014311600210876
Sobrino, Jose´ A.; Jime´nez-Mun˜oz, Juan C.; Paolini, Leonardo (2004) “Land surface temperature retrieval from LANDSAT TM 5”, Remote Sensing of Environment, Vol. 90 pp. 434–440 (February) DOI. https://doi.org/10.1016/j.rse.2004.02.003
Zha, Y.; Gao, J.; Ni, S. (2003) “Use of normalized difference built-up index in automatically mapping urban areas from TM imagery”, International Journal of Remote Sensing, Vol. 24 No. 3 pp. 583-594 (October) DOI. 10.1080/01431160210144570

Noyon, E.K.. Nazir, N.B. Tonoy, N.A
ACCOMPLISHMENT OF URBANIST CULTURE AND MAKE APPROACH TO A COMPACT CITY: A MULTIDIMENSIONAL
SCHEME FOR THREE TOWN CENTERS OF RAJSHAHI
93
Research Paper
ACCOMPLISHMENT OF URBANIST CULTURE AND MAKE APPROACH TO A COMPACT CITY
A MULTIDIMENSIONAL SCHEME FOR THREE TOWN CENTERS OF RAJSHAHI
Md. Emon Kabir Noyon1, Master of Urban and Regional Planning, Department of Urban and Regional Planning, Bangladesh University of Engineering and Technology, Dhaka,
Bangladesh. Nusrat Benta Nazir2, Bachelor of Urban and Regional Planning, Department of Urban and
Regional Planning, Rajshahi University of Engineering and Technology, Rajshahi, Bangladesh. Nazmul Ahsan Tonoy2*, Bachelor of Urban and Regional Planning, Department of Urban and Regional Planning, Rajshahi University of Engineering and Technology, Rajshahi, Bangladesh.
Abstract
Town centers with unique characteristics – historic buildings, mom-and-pop businesses, unusual traditions tend to be more valued by residents (and visitors) than more predictable town centers. When it comes to downtowns, serendipity and individuality can translate into a strong sense of community. Rajshahi, the oldest division of Bangladesh itself a metropolitan area that consists of some unmarked town centers like Shaheb Bazar, New Market etc. As the Rajshahi is one of the most fast-growing cities, it needs some sustainable town center with the integration of administrative, residential, commercial, industrial, and other activities. For this circumstance Rajshahi Development Authority proposed three town centers in their master plan in Baze Shilinda, Chhoto Bongram & Lalithar. The aim of the study is to propose an integrated detail plan to reimagine urban spaces within the three town centers by following the master plan, detail area plan, land use, and urban design guidelines to develop a sustainable town center ensuring integration of multiple functions. A suitable design scheme has been prepared considering environmental sustainability, culture, existing function, community desire establishing meaningful connectivity among three town center both in terms of function, accessibility and community services by using Arc GIS 10.1 and AutoCAD 2012. The proposed town center design will fulfil the need of a fast growing sustainable community which ensure the use of multiple functions. The study can be a guideline for RDA for future town center development as the design ensures proper sustainability and uniqueness.
Keywords
Sustainable, Community, Connectivity, Implement, Serendipity.
1. Introduction 1.1. Background The Town Centre is an area in need of visioning to direct other future developments. It is the focal point of economics, business, public gathering, and cultural activities. A successful town center promotes the development of the city. A Town Center generally serves as the heart of a community. Ideally, it serves several functions. It is a marketplace where goods and services can be obtained. It serves as the center of government, housing both administrative and functional activities. It provides both passive and active recreational

Noyon, E.K.. Nazir, N.B. Tonoy, N.A
ACCOMPLISHMENT OF URBANIST CULTURE AND MAKE APPROACH TO A COMPACT CITY: A MULTIDIMENSIONAL
SCHEME FOR THREE TOWN CENTERS OF RAJSHAHI
94
opportunities. It serves as an institutional center with places of worship and other gathering places for civic or fraternal organizations. Traditionally, housing is also a component of a Town Center, either above commercial space or adjacent to it. It also provides health and educational facility. Finally, these functions are integrated in a manner that facilitates social interaction. The importance of healthy vibrant town centers has been highlighted in recent years in certain locations due to the visible effects of vacant shops and a perception among some that their towns are not providing them withal the services they want or need, with a negative impact on their quality of life. Town center and those who operate in and manage them, are having to adapt to changing circumstances as global issues impact on local conditions. Similarly, local authorities are also having to adapt to rapid changes in the fiscal climate and increasingly challenging budgetary constraints. As with any change process, it is important to be able to measure where we are, monitor progress, learn from others and realistically compare and measure performances. Perhaps one of the most widely recognized roles of a town centre is shopping. Retailing is one of the most important economic sectors. High streets and town centers could be thought of as living ecosystems where retail alone may not be the only factor affecting their performance as an attractive place in which to live, work, play, visit and shop. Commercial and business development opportunities accompanied by the mix of land uses permitted in the Town Center can result in different types of land uses and land-use intensities that are often adjacent or in close proximity to each other. Therefore, it is the intention that development will not fragment existing positive street patterns. Structures will complement existing buildings, community character, and uses by employing appropriate orientations or setbacks, and/or adequate screening. Successfully reinforcing a pattern of mixed use or mixed-intensity development in the TC will require sensitivity to and mitigation of off-site impacts. Development of retail shopping centers as well as individual commercial and business sites present opportunities that can benefit the community through improved visual appearance and better access and circulation, and promote economic vitality through improved sales and property values.
The study was undertaken for the development of a “Town Centre” in Rajshahi city. The selected areas are “Baze Shilinda”, “Chhoto Bongram” and “Lalithar”. There are some reasons behind the formation of another town center in Rajshahi city. Day by day the population of Rajshahi city is increasing for this the existing town center (Shaheb Bazar) cannot fulfil the demand of the people and also cannot equally provide all facilities to the surroundings area. It is very tough for a single town centre to cover the entire Rajshahi city with utility services. So, people have to suffer a lot. Traffic jam also increases inside the town center. Beside it is not properly planned. So, developing a new town center is the demand of time to reduce those problems.
1.2. Objective of the study Objectives are based on the issues identified in the public input process. They have been categorized according to implementation. Issues can be addressed through a change in zoning or economic developments are located in Land Use, development patterns have been addressed under Community design and circulation issues are addressed under Transportation. Our objective is to:
• To design a sustainable town center by ensuring easy accessibility of the community facilities and services.

Noyon, E.K.. Nazir, N.B. Tonoy, N.A
ACCOMPLISHMENT OF URBANIST CULTURE AND MAKE APPROACH TO A COMPACT CITY: A MULTIDIMENSIONAL
SCHEME FOR THREE TOWN CENTERS OF RAJSHAHI
95
• To develop the Town Centre as multiple use district with a primary focus on commercial activity.
2. Study Area Profile 2.1. Location of Proposed Town Center on Baze Shilinda The city of Rajshahi is the divisional headquarters of Rajshahi division as well as the administrative district that bears its name and is one of the six metropolitan cities of Bangladesh. Often referred to as Silk City and Education City, Rajshahi is located at 24.40°N 88.50°E and is situated on the northern banks of the river Padma. It consists of nine Upazilas, 14 Pourasavas and seventy-one unions. Paba is one of the upazila of Rajshahi . Paba Upazila (Rajshahi district) area 280.42 sq. km, located in between 24°18' and 24°31' north latitudes and in between 88°28' and 88°43' east longitudes. It is bounded by mohanpur and tanore upazilas on the north, west bengal state of India and charghat upazila on the south, puthia and durgapur (Rajshahi) upazilas on the east, godagari upazila on the west. The area selected for town Centre development is a part of paba upazila the name of the proposed town center area is Baze Shilinda. It is situated 3.4 km from “Rajshahi Railway Station”, 1.1 km from “Rajshahi Divisional Stadium”, 6.9 km from “Shah Makhdum Airport”, Rajshahi, 3.7 km from “Saheb Bazar”, 2.8 km from “New Market “, 1.8 km from “Bornali Mor” and 1.6 km from “Rajshahi medical college”, Rajshahi.
2.2. Location of Proposed Town Center on Chhoto Bongram It is a part of PABA upazila. It is located in SPZ 4. The name of the proposed town centre area is Choto Bongram. It is situated 3.0 km from “Rajshahi Railway Station”, 3.4 km from “Rajshahi Divisional Stadium”, 7.6 km from “Shah Makhdum Airport”, Rajshahi, and 4.1 km from “Saheb Bazar”.
2.3. Location of Proposed Town Center on Lalithar The concern area is remote distance from Rajshahi city. The area is located north from Vadra and east from Aam-chattar. The concern area also has covered Asrafer mor, Kharkhori, Boyalia etc. It is situated 5.9 km from “Rajshahi Railway Station”, 5.8 km from “Zero Point”, 3.9 km from “Rajshahi University”, and 5 km from “Rajshahi University of Engineering & Technology”.
Figure 1 Study Area Profile

Noyon, E.K.. Nazir, N.B. Tonoy, N.A
ACCOMPLISHMENT OF URBANIST CULTURE AND MAKE APPROACH TO A COMPACT CITY: A MULTIDIMENSIONAL
SCHEME FOR THREE TOWN CENTERS OF RAJSHAHI
96
3. Literature Review According to Bournemouth Town Centre Development Design Guide, it seeks to recognize and celebrate the best of old and new in the heart of the town and learn lessons from some of the less successful buildings. High quality, innovative design is welcomed in Bournemouth. The Guide’s purpose is not to stifle change but to help manage the town’s evolution by promoting coherent streets, high quality, sustainable buildings and a recognizable sense of place. This document reflects guidance set out in the National Planning Policy Framework (NPPF) which places great emphasis on the importance of good design: “Good design is a key aspect of sustainable development, is invisible from good planning, and should contribute positively to making places better for people.” According to Chorley Town center Master plan Opportunity and delivery, reinforcement of the retail offer ensuring that the town center remains resilient and supportive particularly to the independent retail sector. Allied to retail, deliver opportunities for new businesses to set up and prosper in the food/ drink sector, the arts sector and community uses. This will add ‘richness’ to the town centre offer.
Key changes in an evolved Town Centre Composition: 1. Leisure activities with more restaurants, food-to-go outlets and community spaces
opening in vacant units. 2. Support of e-retail channel with click and collect points and safe drop boxes for
customers to collect their online orders as well as satellite stores opening for customers to make online purchases.
3. Secondary and tertiary space will also be converted into residential space as is it of less use to retailers and other businesses due to the low levels of footfall in these areas.
According to Kwainana Town Centre Master Plan and Design Guidelines, the purposes of the study development in the area between Sulphur and Challenger Avenues (previously known as the “Town Centre” but designated here as the “Civic Marketplace”) is controlled by Town Planning Scheme No. 3 which was adopted in 1998. In the decade since this scheme was prepared, market conditions in and around Kwainana have changed dramatically and the demand for new housing is putting pressure on DHW to release land in the Challenger neighbourhood. At the same time, planning for new schools by DET and TAFE in the Education Precinct underscores the importance of clear connections between the commercial core and surrounding community service and residential areas. The “town centre” therefore was redefined to include the Education Precinct and Challenger Neighbourhood, and an up-dated consolidated concept plan was prepared to coordinate the development of all three sub-areas. The design principles of this overall conceptual plan are outlined in the next section of this manual, while the design guidelines presented in the following sections offer further detail on implementation of the plan. Their purpose is to provide direction for individual projects to ensure that together, they achieve the intended qualities of the overall plan. These guidelines have been prepared to help property owners and their design consultants develop improvement plans that are consistent with the community’s vision for the future of the Kwinana Town Centre. They are also intended to assist in the review of plans by both the Councillors and the staff responsible for approving plans and issuing the required development permits. Chisham Avenue Gilmore Avenue Meares.
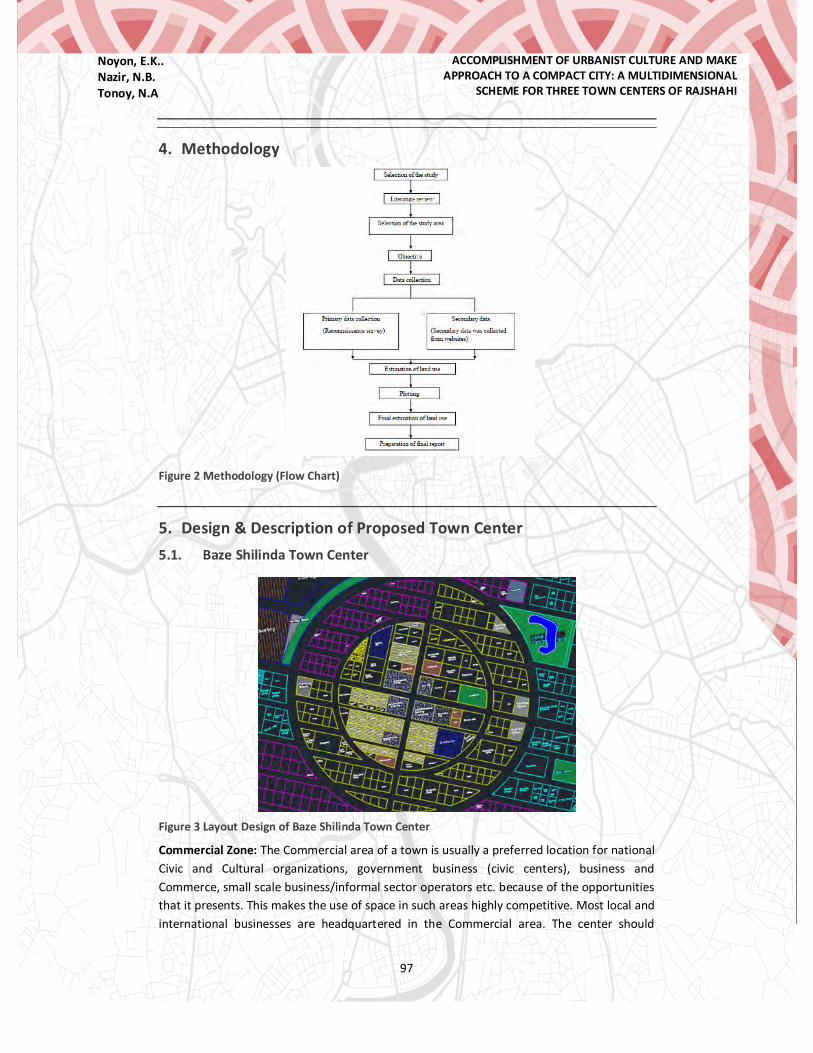
Noyon, E.K.. Nazir, N.B. Tonoy, N.A
ACCOMPLISHMENT OF URBANIST CULTURE AND MAKE APPROACH TO A COMPACT CITY: A MULTIDIMENSIONAL
SCHEME FOR THREE TOWN CENTERS OF RAJSHAHI
97
4. Methodology
Figure 2 Methodology (Flow Chart)
5. Design & Description of Proposed Town Center 5.1. Baze Shilinda Town Center
Figure 3 Layout Design of Baze Shilinda Town Center
Commercial Zone: The Commercial area of a town is usually a preferred location for national Civic and Cultural organizations, government business (civic centers), business and Commerce, small scale business/informal sector operators etc. because of the opportunities that it presents. This makes the use of space in such areas highly competitive. Most local and international businesses are headquartered in the Commercial area. The center should

Noyon, E.K.. Nazir, N.B. Tonoy, N.A
ACCOMPLISHMENT OF URBANIST CULTURE AND MAKE APPROACH TO A COMPACT CITY: A MULTIDIMENSIONAL
SCHEME FOR THREE TOWN CENTERS OF RAJSHAHI
98
provide examples of the best architectural and urban design practices. The intent is to achieve such intensive civic and cultural, commercial and business activities in the Commercial zone. The location of the commercial zone is at the center of the selected area. It is very general that the commercial areas become always the middle of a town center as there the road connectivity is very good. All kinds of administrative building locate at the center of the town. In this proposed town center no vehicles are allowed to entry into the commercial area as well as the core area. This restriction has been given to reduce the traffic jam at the commercial area. Four parking space have been provided at all the entry way of the commercial area so that people parked their vehicles at a specific place. Then they come to the commercial area by foot.
Residential Zone: Residential Zone is very important part of a town center. The people who work in the main core area or industrial area generally try to live at the center. As because of saving their time and travel cost. Beside the owner of various office or rich people prefer to live here.
Three type of housing has been provided in this proposed town center. They are Lower class residence has been placed beside the industrial zone as they get some extra advantage like they can save travel cost. Beside in this design, the residence cost has been kept under their economic condition. A buffer has been created between the low-class residence and industrial zone so that the industrial noise or any kind of pollution does not hamper their life. Middle Class Residence where there have been proposed a cul-de-sac pattern to break the monotony mood and the traditional road patter used in Bangladesh. 4 katha plot has been provided here. The red color indicates the middle-class residence. High Class Residence for the high-class people luxurious buildings has been provided. All kinds of facilities have been provided here. Cul-de-sac road pattern has been also seen here. Plot size is large here 6 katha and occupied land per family is also high. Industrial Zone: Land included in an Industrial zone is intended to accommodate a wide a range of industrial and related development including manufacturing, food processing, assembly of machinery, and heavy equipment. Industrial zones will be located in strategic locations close to major roads and infrastructure to ensure that services are provided to a high standard and reliability. •North-west corner of the town center •Located in corner so that industry cannot affect center •Buffer is created that can divide industrial area from other land uses •Well connectivity to outside and within the town center.
Mixed used Zone: Mixed used zone is very important for a town center. It serves various kinds of activities and facilities. All kinds of shop and recreational center locate in this zone. About 16.94-acre (13%) area of total area is mixed used zone.
Open Space: The study team proposed enough open space for providing relaxation and freshness for town center resident. The amount of open space in town center is 4.11 acre. This is 3% of total area.

Noyon, E.K.. Nazir, N.B. Tonoy, N.A
ACCOMPLISHMENT OF URBANIST CULTURE AND MAKE APPROACH TO A COMPACT CITY: A MULTIDIMENSIONAL
SCHEME FOR THREE TOWN CENTERS OF RAJSHAHI
99
Urban Deferred Zone: The area which is reserved for the further expansion of the town is considered as urban deferred. Study team proposed some urban deferred area. Total area of urban deferred is 6.83 acre. This is 5 % of total land. The green colour indicates the urban deferred area.
5.2. Chhoto Bongram Town Center
Figure 4 Layout Design of Chhoto Bongram Town Center
Residential Zone: A residential area is a land use in which housing predominates, as opposed to industrial and commercial areas. Housing may vary significantly between, and through, residential areas. Residential zoning usually includes a smaller FAR (floor area ratio) than business, commercial or industrial/manufacturing zoning. The area may be large or small. Facilities like dwellings, hostels including working women and gents’ hostels, old age homes, orphanages, places of public worship, schools offering higher primary school courses, public libraries, post offices and telegraph offices, distressed women center are prohibited in residential zone. Grocery shops are permitted in residential zone. The study team classified residential zone into two categories: 1) Area for private apartment 2) Area for public housing 3 katha, 4 katha, 5 katha plot are provided only for residential purpose. There are also some mixed-use plots (residential as well as commercial) at mixed use zone. Maximum building height is 3 stores in height. Commercial zone: It indicates an area allowed for only for commercial activities like retail stores and offices. Commercial activity within cities includes the buying and selling of goods and services in retail businesses, wholesale buying and selling, financial establishments, and a wide variety of uses that are broadly classified as "business". A commercial area is real estate intended for use by for-profit businesses, such as office complexes, shopping malls, service stations and restaurants. In this study area, commercial area includes commercial office area or bank, Business and retail shopping, Hotel area, Business exhibition center, Nursery, Medical store. It has a total area of 48.72 acres, which is 35.03% of total area.

Noyon, E.K.. Nazir, N.B. Tonoy, N.A
ACCOMPLISHMENT OF URBANIST CULTURE AND MAKE APPROACH TO A COMPACT CITY: A MULTIDIMENSIONAL
SCHEME FOR THREE TOWN CENTERS OF RAJSHAHI
100
Civic Zone: Land included in community services zone is intended to accommodate public services such as educational, culture and religions facilities and government use not included in a Government Business Zone. Other uses included in a community services zone are institutional facilities such as prisons, etc. Land included in this Zone is intended for use for emergency services facilities, hospitals and other such facilities. In this study, civic has a total area of 30.395 acres, which is 22.73% of study area. Facilities that can be permitted and prohibited in a civic zone: Cultural facilities Educational facilities, Religious facilities, Exhibition and display facilities, Conference and sports facilities, Institutional facilities, Emergency services facilities, Civil emergency facilities, Hospital, Fire Station, Recreational facilities, post office. Industrial development, Hotel, Major commercial development is prohibited in civic zone.
Open Space: Urban areas of protected or conserved land on which development is indefinitely set aside is known as urban open space. Public space areas are left open for the use of the public, such as plaza, park, courtyard, green way. It is open public access and open public recreation. In this study open space sub-divided into: 1) Park, 4 acres; 2) Residential open space/ play lot/ green ways, 1.2 acres 3) Urban deferred, 3.53 acres. There are two play lot of 16 katha and 12 katha for residents at private residential area. And there are two play lot, green space of 16 katha each and 10 katha respectively for residents at public residential area. The study has a total area of 2.1 acres mixed use zone, which is 1.48% of the study area. Land use of mixed-use zone is intended for residential and commercial development. Industrial development is strongly prohibited in this zone.
5.3. Lalithar Town Center
Figure 5 Layout Design of Lalithar Town Center

Noyon, E.K.. Nazir, N.B. Tonoy, N.A
ACCOMPLISHMENT OF URBANIST CULTURE AND MAKE APPROACH TO A COMPACT CITY: A MULTIDIMENSIONAL
SCHEME FOR THREE TOWN CENTERS OF RAJSHAHI
101
Commercial Zone: The commercial area is provided at North-East portion ensuring good accessibility from each portion. The area encourages the provision of large-scale retail and services for whole area. Development is intended to be pedestrian oriented and compatible with the scale of surrounding areas. The purpose of this area is to provide for convenience commercial and personal service uses, which are intended to serve the day to day needs for residents within whole area. Permitted uses: 1. Convenience retail stores 2. Health services 3. Personal service shop 4. Professional, financial an Office support services 30 acres’ land was used to prepare a design for commercial area. The area is located alongside the main primary road. Approximately 6 katha along the main road was used for commercial purposes. Some important infrastructure i s added to this area for public usages. There are two police boxes at the two edges of the main road, a clinic, a shopping mall, a convention center, two restaurants, a bank and one supper shop. The main road is wide so that there will be enough accessibility. Residential Zone: 3 types of plots (3 Katha, 5 Katha, 6 Katha) have been proposed for residential area. Mixed use plot is also proposed. At South-east portion, near to Padma residential area is for high class people. Mainly the high-class people of Rajshahi city live in this area. That’s why the south-east portion is selected as high-class residential area. At the south-west portion, middle class residential area has been proposed. 4 katha plots have been provided here. Utility and civic facilities are provided to ensure resident’s satisfaction. At the south west portion, middle class residential area has been proposed. 4 katha plots have been provided here. Utility and civic facilities are provided to ensure resident’s satisfaction. Educational Zone: There h a v e provision of a secondary school and 3primary school. To maintain 10-12 min. walking distance from their home, the primary schools are provided in three different areas near to the residential area. Secondary schools are provided in the south-east and north-west corner of the site to make it equidistance from every portion. Considering the same family numbers, if there is one high school going children from each family, each secondary school will allocate nearby 600 students.
6. Conclusion Town center planning deals with a level of planning greater than household size but smaller than that of a city. In this report three town center unit has been proposed at Baze Shilinda Chutto Bongram and Lalithar Area. It has been designed in such a way so that it can be a distinct physical unit. The main objectives of this design are to keep residents safe, healthy, comfortable. Besides the town centers are designed such way so that there is a relationship between this three town center with the old town center of Rajshahi City. This town center design can make a valuable contribution towards the creation of activity and community spirit and general social and physical development.

Noyon, E.K.. Nazir, N.B. Tonoy, N.A
ACCOMPLISHMENT OF URBANIST CULTURE AND MAKE APPROACH TO A COMPACT CITY: A MULTIDIMENSIONAL
SCHEME FOR THREE TOWN CENTERS OF RAJSHAHI
102
7. Acknowledgement Special thanks to some of our friends including Abdullah-Al-Faisal, Iftekhar Alam Siam, Al Amin Jewel, Nabil Muhtasim, Md. Saifullah, Golam Rasul, Shajibul Haque, Umma Roman, Md. Al Imran, Nishita Chowdhury, Nishat Akter Jui, Kamrul Hasan Kanon and Ataur Rahman.
8. References 1. Bournemouth Town Centre Development Design Guide. 2. Kwainana Town Centre Master Plan and Design Guidelines 3. Geographic Information. In Wikipedia. Retrieved 10 October, 2019, from
https://en.wikipedia.org/wiki/Rajshahi

Bushra, F., Sikder, S., Roy, T. Assessment of Relative Risk Exposure to PM2.5 in Khulna City
103
Research Paper / Case Study Paper
ASSESMENT OF RELATIVE RISK EXPOSURE TO PM2.5 IN KHULNA CITY
Faiza Bushra, Department of Urban and Regional Planning, Khulna University of Engineering
& Technology, Khulna, Bangladesh Shuvra Sikder, Lecturer; Department of Urban and Regional Planning, Khulna University of
Engineering & Technology, Khulna, Bangladesh Tusar Kanti Roy, Associate Professor, Department of Urban and Regional Planning, Khulna
University of Engineering & Technology, Khulna, Bangladesh
Abstract The unexpected secretion of particulate matters and its mass concentration in the air have an assured impact on public health. This paper is aimed at an assessment of urban respiratory health conditions resulted from atmospheric PM2.5 in Khulna city. For this purpose, the Relative Risk method has been performed which is principally referred to calculating the exposure rate. Another significant fact is that the meteorological factors like temperature, humidity, wind pressure, precipitation, etc. provoke the rises of toxic particulates especially in winter months rather than monsoon and pre-monsoon. So, the data collection process is designed considering three months of the winter - October, November, and December. This research work comprehends some results which are very prominently indicating adverse respiratory health disorders of local people. Based on traffic exposure the people who are exposed to traffic are more affected by various primary and secondary respiratory diseases. The ratio of Relative Risks indicates that the age group of 31-45 years is the most affected one and the group of 17-30 years is at the most risk and it also indicates that the Chronic Allergy, Influenza, Kidney Diseases, and Tuberculosis risk is increased by the exposure of particulate matters. However, this study as an initial step towards a pollution-free world will help further researches on regarding issue through creating new scopes as well as paths.
Keywords Air Pollution, Particulate Matter, Relative Risk, Respiratory Health, Exposure
1. Introduction 1.1. Background
Air pollution has become a significant phenomenon in both developing and developed countries because of the rapid expansion of the city, population growth, traffic growth, industrialization and especially deforestation. Air pollution has been affiliated with increased risk of mortality and morbidity worldwide as it has been directly affected the public health, living organisms, vegetation, water, soil and buildings (Biglari, et al., 2017, Kuklinska, Wolska, & Namiesnik, 2015). Aside some disagreements to the level of pollution, a link have been established between respiratory diseases and particulate pollutants (Dockery & Pope III , 1994). The respiratory diseases are increasing rapidly worldwide since Suspended Particulate Matter has been implicated as the cause of 4.2 million deaths in 2015 and it was ranked as 6th on the list of 10 most hazardous factors contributing to global disability-adjusted life-years (Wu, et al., 2017). About 10 million people in Bangladesh have been suffering from Asthma, concern of extensive exposure of air pollution, rose from 7 million in 2002 (Akif et al., 2018).

Bushra, F., Sikder, S., Roy, T. Assessment of Relative Risk Exposure to PM2.5 in Khulna City
104
Particulate pollutants are referred as one of the major global issues due to the toxic composition resulting in adverse health impacts (Panda & Nagendra, 2017). Atmospheric particles originate from a wide variety of natural and anthropogenic sources. Primary particles are directly ejaculated in the form of liquids or solids derived from sources including biomass burning, volcanic eruptions, incomplete combustion of fossil fuels, wind-driven or traffic-related suspension of road, soil, and mineral dust, sea salt, and biological materials (Pöschl, 2005). The particulate matters are generally categorized in three substances – coarse, fine and ultrafine (Wu, et al., 2017). The fine substances PM2.5 are those particulate matter with 2.5 micrometres or less in diameter while the coarse substances PM10 are of 10 micrometres or less in diameter (Whiteman, Hoch, Horel, & Charland, 2014). As the diameter of PM is insignificant to notice, they enter to the respiratory very easily and undetectably which cause various types of health hazard including short term and long term effects.
The aim of this study is to determine the effects of PM on urban respiratory health through exploring Relative Risk (RR) factor of Khulna city people. As a consequence of rapid urbanization that has brought pollution from diesel engines, coal-fired power plants and industrial emissions has steadily worsen the air quality in the many megacities such as Dhaka, New Delhi, Seoul, Beijing and many other cities of this Asian continent (Rim, Gall, Kim, & Bae, 2017). In Bangladesh it is seen that, during winter an extensive number of people are suffering from respiratory diseases due to air pollutants including particulate matters, Carbon Monoxide (CO), Led (Pb), Nitrogen Oxides (NOx), Sulphur Oxides (SOx), Ozone (O3) (Department of Environment, 2018).
The scope of this study has emerges explore of urban health induced by the existence of Particulate Matter particularly PM2.5. In various study it has been exposed that a moderate number of people are suffering from various types of respiratory disease worldwide because of the rapid generation of particulate matter. This study bears the conception of examining the condition of particulate matter in the atmosphere and the situation of affected people. By better understanding the timing and magnitude of the mortality response to stressful weather and pollution events we can improve our ability to provide useful forecasts of stressful weather and pollution conditions to susceptible populations, allowing hospitals to better manage their resources, and permitting emergency planners to better anticipate the population’s demand for services. Assessing the present condition of the PM2.5 a severe rate of exposure has been noticed among the people reside on the study area which caused them a severe health hazard. For this instance several worldwide recommendations for reducing PM concentration and ensuring an enhanced health might be considered. By understanding the findings and results from the analysis some recommendations can be proposed which might be proven feasible and significant for the further enhancement of this research work.
1.2. Study Area and Period Khulna is the third largest city in Bangladesh and categorized as “Extremely
Unhealthy” (402) after Dhaka (556) on the basis of air pollution according to the list of the US Air Quality Index (AQI) (Siddique, 2018). Khulna City Corporation has 31 wards and among them Ward no 31 is selected as the study area because of the persistency of extensive number of various types of industries which have chance of becoming a potential source of particulate matter.
Bangladesh has an alarming rate of declination of air quality over the past years which has worsen significantly during the winter season especially in late of October, November and December. Following to the list of the US Air Quality Index (AQI), for winter 2018 Dhaka has topped for having the worst air pollution in the world (Siddique, 2018). In this Asian continent, particulate matter is more appeared in the air during winter because of the natural dust storm, dry weather, burning of excess coals, diesel engines and other fuel. In China, average daily deaths is more in the winter season (>300) (November to March) rather

Bushra, F., Sikder, S., Roy, T. Assessment of Relative Risk Exposure to PM2.5 in Khulna City
105
than other seasons (April to October) (<299). The concentration of PM2.5 is also extensive during winter proportionate to other season (Fang, et al., 2017). A study in Santiago, Chili also indicates during wintertime the mortality rates and pollution levels rises to peak (Grass & Cane, 2007).
2. Method 2.1. Determining PM2.5 24hr. Concentration (µg /m3)
In various study it has been exposed that a moderate number of people are suffering from various types of respiratory disease worldwide because of the rapid generation of particulate matter. In order to identify the effect of PM2.5 on urban respiratory health of the study area and create a backdrop for the relative risk assessment, PM2.5 -24hr Concentration (µg /m3) of ward 31 has been recorded for December using “Air Quality Monitor” (model HHTP21) instrument of OMEGA ENGINEERING, INC. Those data has been collected from some selected points of ward 31 based on the presence of various industries such as cement industries, saw mills, shipyard industries, husk wood mills etc. and has been represented in a spatial and temporal variation map. This map has been prepared by using ArcGIS 10.5 software after projecting those values and its classification based on the Air Quality Indicator.
2.2. Relative Risk Calculation In order to become acquainted about the effect of particulate matter on the
respiratory health, data from all cases should be collected and in that condition the cases are referred as population. The sample size for the finite population of ward 31 can be determined by using the following equations
i.
ii. Where, s= Sample size for infinity population, z=z score based on Confidence Level
(1.960, for Confidence Level= 95%), p= Population Proportion (Assumed 50%), Me= Margin of Error (Generally considered 5%).
In order to determine the effect of particulate matter on respiratory health of the people of the study area a social survey must be executed to obtain the information of the inhabitant of Ward 31. In the social survey some basic questions containing the information about their age, occupation, suffering from any diseases and types (respiratory or non-respiratory) and most importantly are they exposed to traffic exposure or not (within roadside buffer or outside of roadside buffer) as per their residence or workplace. Apart from some limitations these data could exhibit a correlation between the PM2.5 concentration and its health impact. From the collected primary data set an equation has been developed for determining the Relative Risk Ratio, RR. The formula is,
Relative Risk, RR= Where, a= the affected population exposed to the risk, b= the unaffected population
exposed to the risk, c= the affected population not exposed to the risk, d= the unaffected population not exposed to the risk. The RR value have some interpretations; if RR=1 it indicates that the exposure does not affect the vulnerable group. When it refers to RR≤1, the

Bushra, F., Sikder, S., Roy, T. Assessment of Relative Risk Exposure to PM2.5 in Khulna City
106
risk of the vulnerable group is decreased by the exposure. RR≥1 i.e. he risks of the vulnerable group is increased by the exposure.
2.3. Secondary Data Collection Different organizational data are required also for an effective research work for
both data validation and data analysis. In this research work, Khulna Medical College and Hospital and Department of Environment (DoE) is the prime organization from where the patient’s records and monthly air quality monitoring report (for month October, November and December) has been collected for both data analysis and validation. A number of doctors and staff from Khulna Medical College and Hospital, Suhrawardy Medical College and Hospital, National Institute of ENT and Bangladesh Medical College and Hospitals have provided their valuable knowledge in order to pursue this study.
3. Result 3.1. Spatial and Temporal Map
PM2.5 has an adverse effect on the urban respiratory health which has been narrated through various statistical and trend analysis over months of October, November and December. The PM2.5 24 hr. concentration (µg /m3) has been collected and represented to observe the present condition of Air Quality of ward 31, Khulna. According to increasing PM2.5 24 hr. concentration (µg /m3) of Ward 31 for October, November and December, it can be stated that there is a possibility of occurring severe risk on urban respiratory health of the people during winter time.
Figure 1- Spatial and Temporal Variation Map of PM2.5 -24hr concentration (µg /m3)
3.2. Cohort Analysis (Age group-Occupation) The effect of particulate matter on respiratory health of the study area also has
been described here with possible explanation through the assessment of cohort group analysis, exposure rate assessment ant relative risk ratio. For this particular study a 100 meter buffer from the roadside has been considered (Salam, Islam, & Gilliland, 2008). A various number of respiratory diseases are also found in this study which have been categorised as primary and secondary respiratory diseases with consulting with some
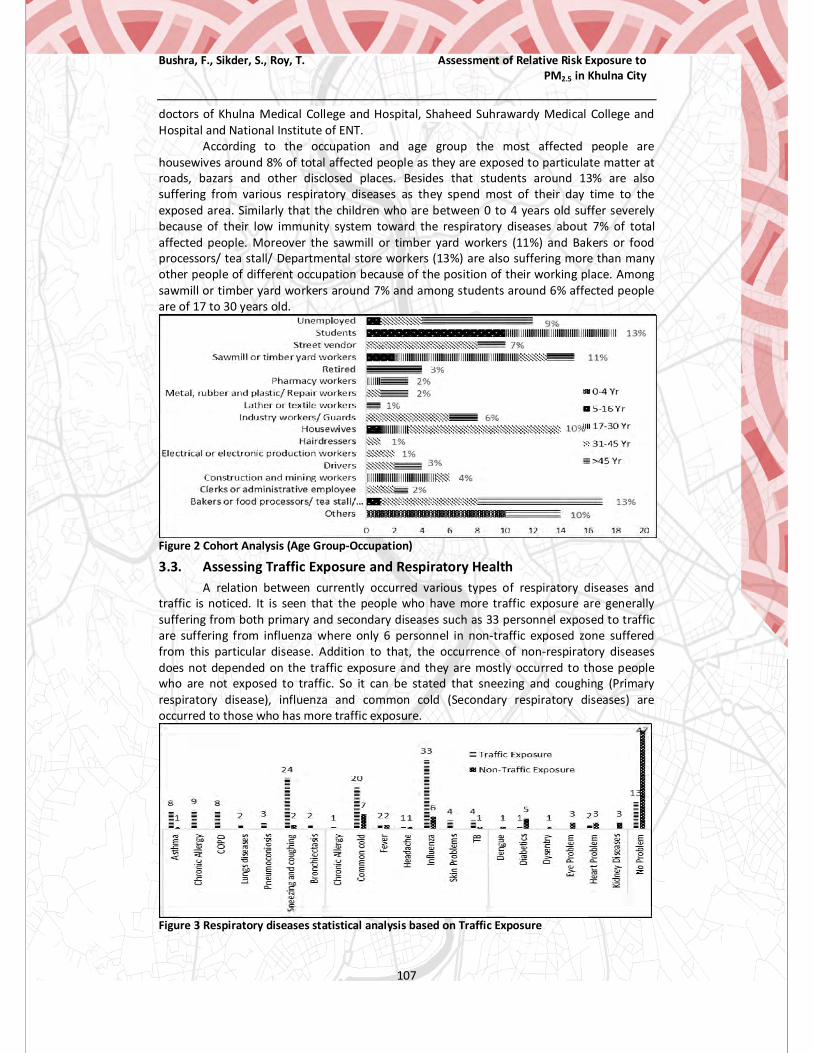
Bushra, F., Sikder, S., Roy, T. Assessment of Relative Risk Exposure to PM2.5 in Khulna City
107
doctors of Khulna Medical College and Hospital, Shaheed Suhrawardy Medical College and Hospital and National Institute of ENT.
According to the occupation and age group the most affected people are housewives around 8% of total affected people as they are exposed to particulate matter at roads, bazars and other disclosed places. Besides that students around 13% are also suffering from various respiratory diseases as they spend most of their day time to the exposed area. Similarly that the children who are between 0 to 4 years old suffer severely because of their low immunity system toward the respiratory diseases about 7% of total affected people. Moreover the sawmill or timber yard workers (11%) and Bakers or food processors/ tea stall/ Departmental store workers (13%) are also suffering more than many other people of different occupation because of the position of their working place. Among sawmill or timber yard workers around 7% and among students around 6% affected people are of 17 to 30 years old.
Figure 2 Cohort Analysis (Age Group-Occupation)
3.3. Assessing Traffic Exposure and Respiratory Health A relation between currently occurred various types of respiratory diseases and
traffic is noticed. It is seen that the people who have more traffic exposure are generally suffering from both primary and secondary diseases such as 33 personnel exposed to traffic are suffering from influenza where only 6 personnel in non-traffic exposed zone suffered from this particular disease. Addition to that, the occurrence of non-respiratory diseases does not depended on the traffic exposure and they are mostly occurred to those people who are not exposed to traffic. So it can be stated that sneezing and coughing (Primary respiratory disease), influenza and common cold (Secondary respiratory diseases) are occurred to those who has more traffic exposure.
Figure 3 Respiratory diseases statistical analysis based on Traffic Exposure

Bushra, F., Sikder, S., Roy, T. Assessment of Relative Risk Exposure to PM2.5 in Khulna City
108
From the Roadside and non-roadside buffer area observation it is seen that people who are within roadside buffer are more affected than people outside that buffer. People between 31 to 45 years old are mostly affected groups among the others because of various professions and their presence inside the roadside buffer. According to the male female ratio it is noticed that most of the roadside affected people are male and the female personnel are basically affected by non-roadside particulate matter. The reason behind that is most of the male personnel spends their most of the day time inside the roadside buffer. Though female personnel spend their time outside the roadside buffer but they are exposed to various inside particulate matter source and this is also a main reason behind housewives most sufferings.
Figure 4 Affected people demography (Age-Gender-Roadside buffer)
3.4. Relative Risk Ratio assessment Though the people of all age group have a higher Relative Risk Ratio (RR) but people
of 17-30 years contains highest RR. The higher RR (>1) indicates that the risk of the vulnerable group increases by the exposure. The reason behind the highest RR of 17-30 years age group is they tends to spend their most of the time in school or coaching inside the exposed zone. Though most affected personnel are found between 31-45 years in the study area but the 17-30 years personnel are in more vulnerable condition than other age group people. Table 1 Age group Relative Risk Calculation
Age Group (Year)
Roadside Non-roadside
Affected (a)
Unaffected (b)
Total (a+b)
Affected (c)
Unaffected (d)
Total (c+d)
0-4 7 1 8 3 4 7 2.042 5-16 12 2 14 3 14 17 4.857 17-30 23 8 31 2 22 24 8.903 31-45 41 6 47 5 23 28 4.885 >45 36 1 37 3 4 7 2.270
If a relative risk ratio is observed between the different diseases found among the people of study area it is noticed that Sneezing and coughing has the highest RR indicating that more people exposed to particulate matter the more people of different age group becomes vulnerable for this particular disease rather than people who are less exposed to particulate matter. Moreover most of the diseases except Fever, Headache, Kidney Diseases and TB (Tuberculosis), also have higher RR (>1). Though Bronchiectasis, COPD and Lung Diseases also have effect on people due to exposure, because of some reasons in study area it indicates a complicated result in RR calculation.

Bushra, F., Sikder, S., Roy, T. Assessment of Relative Risk Exposure to PM2.5 in Khulna City
109
Table 2 Diseases based Relative Risk Calculation
Health Outcome Primary
Secondary Composition
Affected Population
RR RR expression
Remarks
Asthma P 29 2.866 RR≥1 If RR=1,The exposure does not
affect the vulnerable group
If RR≤1, The risk of the vulnerable group is less increased by
the exposure
If RR≥1, The risk of the vulnerable group
is increased by the exposure
Bronchiectasis P 4 - - Chronic Allergy P 23 6.269 RR≥1 Common cold S 12 1.194 RR≥1
COPD P 8 - - Fever S 2 0.597 RR≤1
Headache S 2 0.597 RR≤1 Influenza S 8 4.179 RR≥1
Kidney Diseases S 3 0 RR≤1 Lungs diseases S 3 - -
Pneumoconiosis P 5 2.388 RR≥1 Skin Problems S 1 - -
Sneezing, coughing P 41 11.642 RR≥1 TB P 1 0 RR≤1
4. Discussion and Conclusion 4.1. Discussion
With the concentration of PM2.5-24hr concentration (µg /m3) a spatial temporal variation map has been created which indicates a seasonal variation in this particular analysis. According to the age-occupation cohort it can be stated that occupation and age group has an important role towards the urban respiratory health based on the PM exposure. The most affected occupations are generally either roadside residence or spend most of their time inside the exposure buffer such as students, baker or food processors/ tea stall/ Departmental store, sawmill or timber yard workers, housewives and children under years old. There is a significant relation between PM2.5 exposure and urban respiratory health is also noticed. Most of people affected by various respiratory diseases are inhaling particulate matter for a long time of their life. A gender based analysis indicates that male persons are more affected than female personnel which is an explanation that male personnel are spending more time in exposed area due to occupational reasons rather than female personnel causing more harm to urban respiratory health to different age group people.
The relative risk is a ratio indicating the probability of an event occurring in the exposed group versus the probability of the event occurring in the non-exposed group. Based on RR the most vulnerable age group people are found which indicates that the exposed people of 17-30 years are more vulnerable than non-exposed people of 17-30 years as they exposed person spend a huge amount of time inhaling the harmful particulate matter along with various pollutants. Discussing about the diseases those who are exposed to this PM are more tends to affected by sneezing-coughing, chronic allergy, influenza, asthma, pneumoconiosis and common cold rather than people who are not exposed.
4.2. Conclusion This research is about to determine the effects of PM2.5, a pollutant particle, on
respiratory health of Khulna city people. For this purpose, a study on previous case study on different countries has been done. By following those studies the methodology has been prepared. This project may be proven as an initial step for providing better understanding the timing and magnitude of the mortality response to stressful weather and pollution

Bushra, F., Sikder, S., Roy, T. Assessment of Relative Risk Exposure to PM2.5 in Khulna City
110
events, assisting to identify PM control measures and convenience in adopting Public Health Policy. A harmonized linkage has been made between PM2.5 concentration and urban respiratory health with a view to cohort analysis and relative risk calculation.
5. References Akif, M., Khan, B., Shoumik, N., Mithila, R., Rahman, N. and Shafa, S. (2018). Respiratory
diseases skyrocketing in Bangladesh. The Daily Star. [online] Available at: https://www.thedailystar.net/health/respiratory-diseases-skyrocketing-bangladesh-1565779 [Accessed 24 Sep. 2018].
Biglari, H., Geravandi, S., Mohammadi, M.J., Porazmey, E.J., Chuturkova, R.Z., Khaniabadi, Y.O., Goudarzi, G., Mahboubi, M., Mohammadi, B. and Yari, A.R., 2017. Relationship between air particulate matter and meteorological parameters. Fresenius Environmental Bulletin, 26(6), pp.4047-4056
Department of Environment (2018). Monthly Air Quality Monitoring Report. Reporting Month: December, 2018. [online] Khulna: Department of Environment, p.12. Available at: http://case.doe.gov.bd/images/reports_publications/monthly_reports/monthly%20report_december-18.pdf [Accessed 2 Feb. 2019].
Dockery, D.W. and Pope, C.A., 1994. Acute respiratory effects of particulate air pollution. Annual review of public health, 15(1), pp.107-132.
Fang, X., Fang, B., Wang, C., Xia, T., Matteo, B., Fang, F., & Cao, Y. (2017). Relationship between fine particulate matter, weather condition and daily non-accidental mortality in Shanghai, China: A Bayesian approach. Plos one, 12(11).
Grass, D. and Cane, M., 2008. The effects of weather and air pollution on cardiovascular and respiratory mortality in Santiago, Chile, during the winters of 1988–1996. International Journal of Climatology: A Journal of the Royal Meteorological Society, 28(8), pp.1113-1126.
Kuklinska, K., Wolska, L. and Namiesnik, J., 2015. Air quality policy in the US and the EU–a review. Atmospheric Pollution Research, 6(1), pp.129-137.
Rim, D., Gall, E.T., Kim, J.B. and Bae, G.N., 2017. Particulate matter in urban nursery schools: A case study of Seoul, Korea during winter months. Building and Environment, 119, pp.1-10.
Panda, S. and Nagendra, S.S., 2018. Chemical and morphological characterization of respirable suspended particulate matter (PM10) and associated heath risk at a critically polluted industrial cluster. Atmospheric Pollution Research, 9(5), pp.791-803.
Pöschl, U., 2005. Atmospheric aerosols: composition, transformation, climate and health effects. Angewandte Chemie International Edition, 44(46), pp.7520-7540.
Salam, M.T., Islam, T. and Gilliland, F.D., 2008. Recent evidence for adverse effects of residential proximity to traffic sources on asthma. Current opinion in pulmonary medicine, 14(1), pp.3-8.
Siddique, A. (2018). Bangladesh grapples with polluted air. Dhaka Tribune. [online] Available at: https://www.dhakatribune.com/opinion/special/2018/02/03/bangladesh-grapples-polluted-air/ [Accessed 2 Feb. 2019].
Whiteman, C.D., Hoch, S.W., Horel, J.D. and Charland, A., 2014. Relationship between particulate air pollution and meteorological variables in Utah's Salt Lake Valley. Atmospheric Environment, 94, pp.742-753.
Wu, J.Z., Ge, D.D., Zhou, L.F., Hou, L.Y., Zhou, Y. and Li, Q.Y., 2018. Effects of particulate matter on allergic respiratory diseases. Chronic diseases and translational medicine, 4(2), pp.95-102.

Anjum, N. & Roy, S. Roles and Functions of Public Spaces in the Residential Neighbourhoods of Khulna City
111
Research Paper
Roles and Functions of Public Spaces in the Planned Residential Neighbourhoods of Khulna City
Nafisa Anjum, Research Assistant, GCRF Centre for Sustainable, Healthy and Learning Cities and Neighbourhoods (SHLC), Bangladesh
Dr. Shilpi ROY, Assistant Professor, Urban and Rural Planning Discipline, Khulna University; Bangladesh
Abstract
Because of the ever-increasing importance of the public spaces from the global aspects and its contribution to sustainable, inclusive and healthy cities, the dynamics of public spaces are much essential to understand. Despite the inevitable role of public spaces towards the sustainable urban neighbourhood, the developing counties often poorly realize the importance of public spaces. Bangladesh is no exception of that due to the ever-increased pressure of urbanization and poor realization towards sustainable urban neighbourhoods. In response to the undervalued public spaces in Bangladesh, this study aims to assess the ability of the public spaces to play proper roles and functions towards sustainable urban neighbourhoods in Khulna city. Khalishpur residential area, Nirala residential area and Sonadanga residential area (phase II) are selected as the study neighbourhoods for this study. Following the mixed-method approach, walk-through analysis, behaviour analysis, accessibility analysis, and questionnaire survey are employed to identify roles and functions of the public spaces from social, physical and psychological dimension from the perspectives of sustainability. Findings show that except social dimension to improve the social mix, available public spaces hardly contribute to neighbourhood sustainability from the aspect of physical and psychological dimension. Poor accessibility in terms of residential coverage, absence of economic activities, negligible contribution to the environmental health, weak reflections of community attachment affects the neighbourhood sustainability. Through greater realization about public spaces and transformation of potential urban spaces to public spaces through accommodating social inclusiveness, economic functionalities, and urban greens, it is possible to contribute towards neighbourhood sustainability.
Keywords
Public Spaces, Neighbourhoods, Social Sustainability, Economic Sustainability, Environmental Sustainability
1. Introduction Urbanisation has a profound contribution to economic growth and development of cities in Bangladesh. However, the rapid and uneven urbanisation has been liable for several urban issues in the major cities impeding sustainability of the cities and neighbourhoods. In the process of urban transformation within the hegemony of neo-liberalism, neighbourhoods are losing their spaces for social interaction; as Jacobs (1958) feared this loss would

Anjum, N. & Roy, S. Roles and Functions of Public Spaces in the Residential Neighbourhoods of Khulna City
112
contribute to segregation within urban neighbourhoods. Consequently, the sustainability and livabilityof the neighbourhoods in large cities are at risk. The sustainability movement has urged for high-density urban living, where the significance of public space is paramount (Habitat, 2015). The Sustainable Development Agenda 2030 highlights safe, inclusive and accessible public space development to achieve safe, inclusive, resilient, and sustainable cities. SDG 11.7 urges to promote public spaces as a vital tool of the sustainable urban neighbourhood as a means of sustaining the “social inclusion”, “civic identity”, and the “quality of life” (Habitat, 2014). Developed countries throughout the world have already undertaken different initiatives to encourage the development and conservation of public spaces to accomplish SDGs agenda, whereas the developing countries are still far behind to acknowledge the importance of public spaces. Studies revealed that without streets, there are no recognisable public spaces in the developing counties (Jalaladdini and Otkay, 2012). Bangladesh being a developing country, is no exception to that. Very recently, the planning experts and the city development authorities of the major cities of Bangladesh have concentrated on developing public spaces. For instance, in the capital city of Bangladesh, Hatir jheel is a regenerated as a public space. Another project has taken to revitalise 26 open spaces, parks and playgrounds in Dhaka as public spaces in response to limited recreational facilities and community spaces (The Daily Star, 2019), yet the importance of public spaces in the secondary cities remain undervalued.
Khulna, being a secondary city, the city authority poorly realises the role of the public spaces in the urban neighbourhoods. Although the KDA emphasised parks and open spaces development, in order to keep pace with urbanisation and to manage the pressure of growing population, the standard of open spaces in the master plan is diminishing day by day. For instance, in Khulna Master Plan 1961, 4 acres of open spaces were recommended for per 1000 population, which is reduced to 2 acres in the master plan of 2001 (KDA, 2002). Due to poor recognition of the broader types of public spaces, the city master plans highlight open spaces and park development irrespective of conceptualising these spaces as public spaces and therefore, mostly failed to contribute to the broader aspect of the sustainability, even in the planned residential urban neighbourhoods. Because of the ever-increasing importance of the public spaces and its contribution towards sustainable, inclusive and healthy cities and neighbourhoods, the roles and functions of the public spaces is much essential to understand. Therefore, this study aims to assess the ability of the public spaces to play proper roles and functions towards sustainable urban neighbourhoods in Khulna city.
2. Conceptualizing Roles and Functions of Public Spaces Public spaces carry distinct meanings those are closely related to public (Low and Smith, 2006). In general, any publicly owned space, which is beyond private domain is considered as public space. Woolley (2003) defined any physical space as public space regardless its ownership and possession. The comprehensive definition of public spaces by Carmona, de Magalhães and Hammond (2008) includes all parts of built and natural environment those offer open access to the public; even the private spaces with unrestricted access are regarded as public space. In a dominant number of literatures quality of public spaces also received great significance as the defining criteria. According to these literatures, a successful public space should have the qualities of access and linkage, usage and activities,
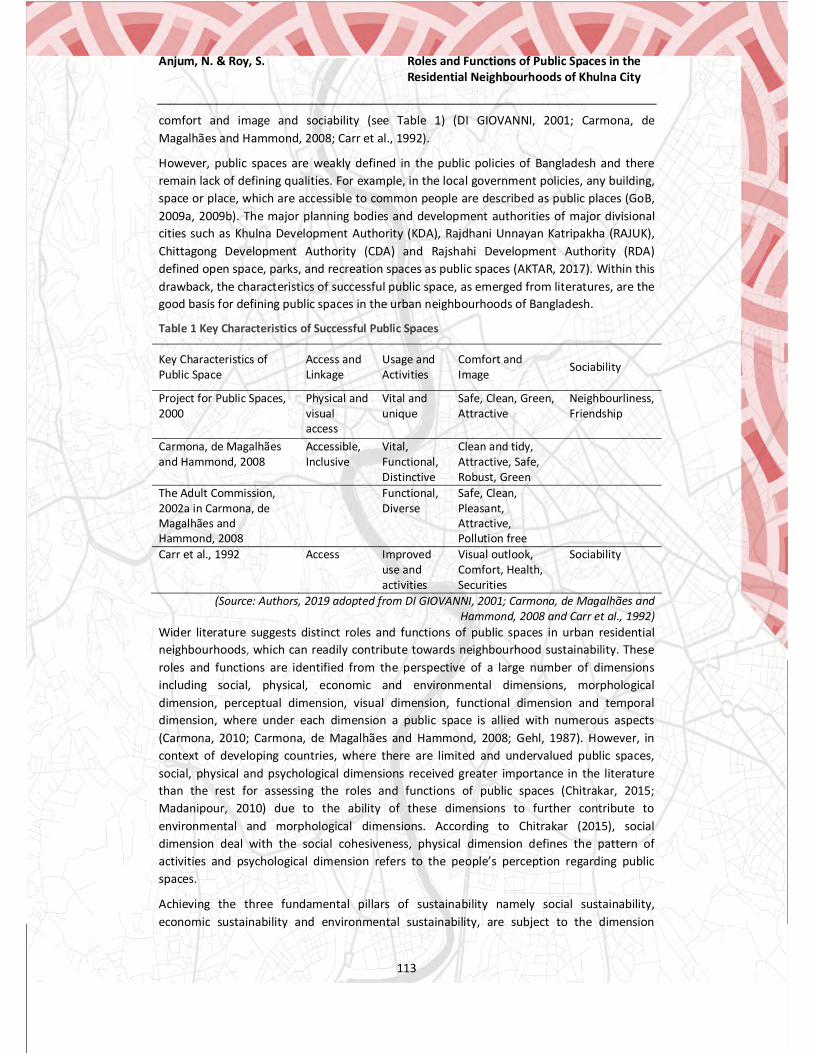
Anjum, N. & Roy, S. Roles and Functions of Public Spaces in the Residential Neighbourhoods of Khulna City
113
comfort and image and sociability (see Table 1) (DI GIOVANNI, 2001; Carmona, de Magalhães and Hammond, 2008; Carr et al., 1992).
However, public spaces are weakly defined in the public policies of Bangladesh and there remain lack of defining qualities. For example, in the local government policies, any building, space or place, which are accessible to common people are described as public places (GoB, 2009a, 2009b). The major planning bodies and development authorities of major divisional cities such as Khulna Development Authority (KDA), Rajdhani Unnayan Katripakha (RAJUK), Chittagong Development Authority (CDA) and Rajshahi Development Authority (RDA) defined open space, parks, and recreation spaces as public spaces (AKTAR, 2017). Within this drawback, the characteristics of successful public space, as emerged from literatures, are the good basis for defining public spaces in the urban neighbourhoods of Bangladesh.
Table 1 Key Characteristics of Successful Public Spaces
Key Characteristics of Public Space
Access and Linkage
Usage and Activities
Comfort and Image Sociability
Project for Public Spaces, 2000
Physical and visual access
Vital and unique
Safe, Clean, Green, Attractive
Neighbourliness, Friendship
Carmona, de Magalhães and Hammond, 2008
Accessible, Inclusive
Vital, Functional, Distinctive
Clean and tidy, Attractive, Safe, Robust, Green
The Adult Commission, 2002a in Carmona, de Magalhães and Hammond, 2008
Functional, Diverse
Safe, Clean, Pleasant, Attractive, Pollution free
Carr et al., 1992 Access Improved use and activities
Visual outlook, Comfort, Health, Securities
Sociability
(Source: Authors, 2019 adopted from DI GIOVANNI, 2001; Carmona, de Magalhães and Hammond, 2008 and Carr et al., 1992)
Wider literature suggests distinct roles and functions of public spaces in urban residential neighbourhoods, which can readily contribute towards neighbourhood sustainability. These roles and functions are identified from the perspective of a large number of dimensions including social, physical, economic and environmental dimensions, morphological dimension, perceptual dimension, visual dimension, functional dimension and temporal dimension, where under each dimension a public space is allied with numerous aspects (Carmona, 2010; Carmona, de Magalhães and Hammond, 2008; Gehl, 1987). However, in context of developing countries, where there are limited and undervalued public spaces, social, physical and psychological dimensions received greater importance in the literature than the rest for assessing the roles and functions of public spaces (Chitrakar, 2015; Madanipour, 2010) due to the ability of these dimensions to further contribute to environmental and morphological dimensions. According to Chitrakar (2015), social dimension deal with the social cohesiveness, physical dimension defines the pattern of activities and psychological dimension refers to the people’s perception regarding public spaces.
Achieving the three fundamental pillars of sustainability namely social sustainability, economic sustainability and environmental sustainability, are subject to the dimension

Anjum, N. & Roy, S. Roles and Functions of Public Spaces in the Residential Neighbourhoods of Khulna City
114
specific roles and functions of the public spaces (Choguill, 2008; Jozsa and Brown, 2005). For example, in order to foster social sustainability, public spaces in urban neighbourhoods would require facilitating social mix. Physical dimension if assure accessibility to and within the public spaces and recreational facilities in the public spaces those are able to facilitate social mix will support social sustainability (Carmona, 2010; Gehl, 1987). Likewise, users’ perception is much needed to understand the contribution of the public spaces towards different aspects of sustainability. Therefore, assessment of the contribution of public spaces towards sustainability of urban residential neighbourhoods require greater recognition of the roles and functions of public spaces from social, physical and psychological dimensions (see Table 2).
Table 2 Roles and Functions of Public Spaces from the aspects of Sustainability
Roles and Functions from
Social Sustainability Economic Sustainability
Environmental Sustainability
Social Dimension Social mix Physical Dimension
Accessibility, Recreational facilities to facilitate social mix
Economic structure
Psychological Dimension
User’s perception regarding community pride and safety
User’s perception regarding economic opportunities
User’s perception on environmental health
(Adopted from Chitrakar, 2015; Carmona, 2010; Josza and Brown, 2005)
3. Methodology and the Study Neighbourhoods Residential neighbourhoods in all the major cities of Bangladesh have developed predominantly in an organic way in the hand of people. In the face of rapid urban transformation and weak development control practices, these areas may fail to embrace varieties of public spaces with desired qualities necessary to allow these spaces can perform their roles and functions and contribute to sustainability. In contrast, ideally, planned residential neighbourhoods should be to free from these drawbacks. Design of urban neighbourhoods in Bangladesh is influenced by several factors, some of which include dominating development paradigm, national standards, good practices, and target group, availability of resources. Neighbourhoods designed and implemented in different periods can offer profound insights concerning the significance of public spaces as a fundamental element of planned residential neighbourhoods in urban policy and development decisions of Bangladesh. Consequently, three planned residential areas (R/A) in Khulna, which was developed for the middle-income people, namely Khalispur R/A, Nirala R/A and Sonadanga R/A (phase II) are considered as the study neighbourhoods. Among the study areas, Khalishpur is the oldest and largest planned R/A (developed in 1962), Nirala R/A was developed in 1980-81, and Sonadanga R/A (phase II) is the most contemporary neighbourhood developed in 1993-94.
This study is mostly qualitative, but quantitative tools are used to validate and quantify the qualitative findings. Therefore, following the mixed-method approach, several tools including walk-through analysis, behaviour analysis, accessibility analysis, and questionnaire survey are employed to identify the roles and functions of the public spaces in the light of

Anjum, N. & Roy, S. Roles and Functions of Public Spaces in the Residential Neighbourhoods of Khulna City
115
social, physical and psychological dimensions of sustainability. The sample size for the questionnaire survey is determined by the use of the following equation:
,,where, Population size, N= 301 (N is determined through user volume survey conducted in the public spaces at peak hour of a holiday); p (50% distribution) = 0.5 and q (50% distribution)= 0.5; e
(margin of error) = 10 % of ‘p’ = 0.05 and Z (confidence level) = 1.44 at 85% confidence level.
The sample size n =159 is further distributed as per the user volume ratio of the study neighbourhoods. Hence, the sample size for Khalishpur R/A, Nirala R/A and Sonadanga R/A (phase II) are respectively 72, 57 and 30.
4. Roles and Functions of the Public Spaces The findings of the walk-through analysis (2019) suggest that there are four types of public spaces in the three study neighbourhoods those demonstrate the characteristics of the successful public spaces (see Table 1); and these types include streets with footpaths, parks and playgrounds, open spaces and informal commercial activity centres. However, except Khalishpur R/A, the other two neighbourhoods fail to embrace all these types. Streets with footpaths in Sonadanga R/A (phase II) as hardly demonstrate the characteristics of the successful public spaces remain unable to be recognised as public spaces.
Area coverage of the public spaces indicates the share of public spaces in all the three study neighbourhoods remains significantly low. Although all the four types of public spaces exist in the Khalishpur R/A, these spaces cover only 16.77% urban space of the neighbourhood. Whereas, in Nirala R/A public space are identified in the form of streets with footpaths, park and informal commercial activity centres covering 11.92% of the neighbourhood. On the contrary, Sonadanga R/A (phase II) has only a neighbourhood park as public space, which consumes 10.82% of the neighbourhood area (Walk-through Analysis, 2019). Limited types and availability of the public spaces in the study neighbourhoods are responsible for poor performance of the roles and functions of the public spaces. The following sub-sections present the potentials of the public spaces to contribute towards sustainability.
4.1. Social Dimension towards Social Sustainability
Social sustainability from the perspectives of social dimension is measured through the pattern, and extent of social mix irrespective of age, gender and income group facilitated through public spaces. The extent of social mix varies across types of public spaces as well as neighbourhoods. Findings of behaviour analysis (2019) show that parks and playgrounds in all the study neighbourhoods facilitate the greatest extent of the social mix through recreational facilities. Informal commercial activity centres are the next significant type enabling social mix through commercial trading. Findings of the Questionnaire Survey (2019) reassure these results. According to the majority of the users’ (48%) irrespective of all study neighbourhoods’, parks and playgrounds accommodate the highest range of social mix followed by commercial activity centres (29%), among the existing level of social mix.
Several factors are related to the social mix in the public spaces of the study neighbourhoods. Recreational facilities and informal commercial activities are facilitating social mix in the public spaces of Khalishpur R/A and Nirala R/A, whereas Sonadanga R/A

Anjum, N. & Roy, S. Roles and Functions of Public Spaces in the Residential Neighbourhoods of Khulna City
116
(phase II) only accommodates recreational facilities to support social mix (Figure 1). Along with these aspects, the social mix is also closely interrelated with time. It is observed through behaviour analysis tool that social mix is prominent in the afternoon in the form of recreational activities and in morning and evening through commercial trading and social meeting. However, due to lack of proper facilities like lighting, and poor maintenance of the public spaces, the functionalities of the public spaces remain sluggish in the off-peak hour.
Figure 1 Behavior Analysis Map at the Public Spaces of Khalishpur R/A, Nirala R/A and Sonadanga (phase II) R/A
Based on the gender and age group, the pattern and the extent of the social mix also vary widely. For instance, there is limited evidence of inter-gender social mix, particularly in Khalishpur R/A, as the public spaces are designed without considering any gender-sensitive aspects to welcome the female residents of the neighbourhoods. However, the condition of inter-gender social mix in Nirala R/A and Sonadanga R/A (phase II) are relatively better. The social mix among different social classes is also limited. As the residents of the planned neighbourhoods mostly belong to the same income group, the public spaces hardly welcome the low-income groups residing in the surrounding neighbourhoods. Eventually, the limited extent of social mix hardly offers social sustainability.
4.2. Physical Dimension towards Social and Economic Sustainability
Ideally, physical dimension of the public spaces contributes to social and economic sustainability. Social sustainability can be ensured through the provision of better accessibility to the public spaces and availability of the recreational facilities to facilitate social mix. Whereas, economic sustainability is measured by the extent and the availability of commercial activities surrounding the public spaces that can contribute to the economic wellbeing of the neighbourhoods.
Public spaces are poorly contributing to social sustainability in Khalishpur R/A and Sonadanga R/A (phase II) as p connectivity to the residential structures are limiting the opportunities of social mix within these neighbourhoods. In Khalishpur R/A radial road pattern, lack of footpaths alongside the roads, deficient public space network with limited road connectivity and small share of residential coverage limits the social access of the community people. Likewise, public space of Sonadanga R/A (phase II) also offer poor social sustainability as there are hardly any distinguishable public space network in this area. Although the blocked pattern road of this neighbourhood provides easy access, lack of footpaths discourages community people to visit the public spaces (Figure 2). In contrast, in Nirala R/A due to a connected route network within relatively small spatial entity, major share of public spaces is within 1-minute walking distance from the residential structure. This accordingly, provides easy access to the public spaces. Moreover, lack of cleanliness of the roads, limited footpath connectivity and absence of footpath shading discourage the
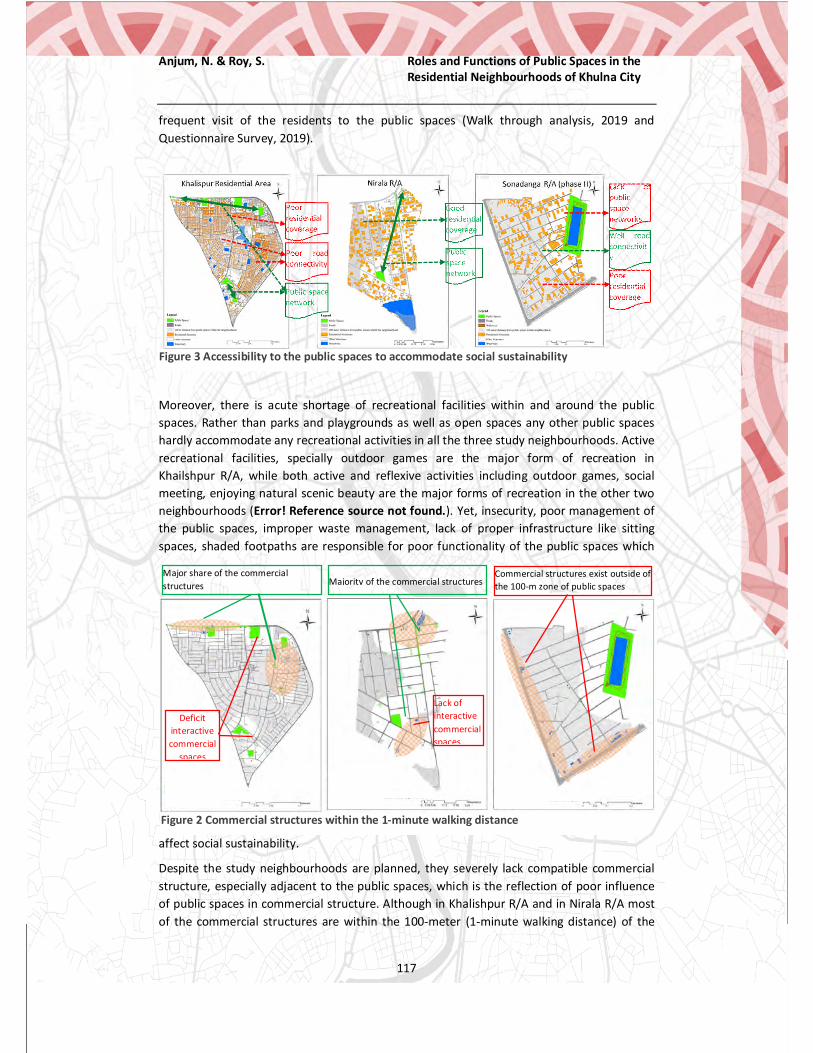
Anjum, N. & Roy, S. Roles and Functions of Public Spaces in the Residential Neighbourhoods of Khulna City
117
frequent visit of the residents to the public spaces (Walk through analysis, 2019 and Questionnaire Survey, 2019).
Moreover, there is acute shortage of recreational facilities within and around the public spaces. Rather than parks and playgrounds as well as open spaces any other public spaces hardly accommodate any recreational activities in all the three study neighbourhoods. Active recreational facilities, specially outdoor games are the major form of recreation in Khailshpur R/A, while both active and reflexive activities including outdoor games, social meeting, enjoying natural scenic beauty are the major forms of recreation in the other two neighbourhoods (Error! Reference source not found.). Yet, insecurity, poor management of the public spaces, improper waste management, lack of proper infrastructure like sitting spaces, shaded footpaths are responsible for poor functionality of the public spaces which
affect social sustainability.
Despite the study neighbourhoods are planned, they severely lack compatible commercial structure, especially adjacent to the public spaces, which is the reflection of poor influence of public spaces in commercial structure. Although in Khalishpur R/A and in Nirala R/A most of the commercial structures are within the 100-meter (1-minute walking distance) of the
Figure 2 Commercial structures within the 1-minute walking distance
Figure 3 Accessibility to the public spaces to accommodate social sustainability
Major share of the commercial structures
Deficit interactive commercial
spaces
Majority of the commercial structures
Lack of interactive commercial spaces
Commercial structures exist outside of the 100-m zone of public spaces

Anjum, N. & Roy, S. Roles and Functions of Public Spaces in the Residential Neighbourhoods of Khulna City
118
public space, only a limited share of the structures is interactive or compatible with the residential needs or public spaces. In Khalishpur R/A and in Nirala R/A, only 0.09% and 0.81% of the total neighbourhood spaces are dedicated as commercial spaces within the closet walking distance of the public spaces respectively. The situation of Sonadanga R/A (phase II) is comparatively worse, as this neighbourhood not only lacks the informal commercial activities, but also the basic formal commercial activities are located outside the 100-meter buffer zone of the public spaces, which is the evidence of poor economic sustainability.
4.3. Psychological Dimension towards Social, Economic and Environmental
Sustainability
Psychological dimension of public spaces aims to identify user’s perception, that in the long run contributes to improve social sustainability through ensuring safety and community pride, economic sustainability by identifying local economic condition and environmental sustainability by improving environmental health of the neighbourhoods (Chitrakar, 2015).
Safety issue is identified as one of the major hindrances to achieve social sustainability, which vary widely across gender, time and types of the public spaces. While the male feels safe, majority of the female feel unsafe throughout the public spaces mostly due to the fear of harassment and terrorism (Questionnaire Survey, 2019). Moreover, the majority of the respondents irrespective of gender and age feel safe in the streets with footpaths throughout the day, while safety perception in other types of public spaces varies with time (Figure 4). Damaged roads, and poor lighting facilities are the key reasons highlighted by the users that affect their sense of safety in the public spaces of the study neighbourhoods.
Satisfactory level of community pride because of the quality of public spaces in Nirala R/A and Sonadanga R/A (phase II) contributes to better social sustainability. Yet, the users of Khalishpur R/A are neither attached nor satisfied with the quality of public spaces within their neighbourhood. In compare to male users (6.29%, 10 male), female users (22.64%, 36 female) mostly feel detached to the public spaces, which impede social sustainability.
Likewise, the physical dimension, psychological dimension hardly contributes to economic sustainability. Most of the respondents of the study neighbourhoods (72.22% of Khalishpur R/A, 21.05% of Nirala R/A and 70.00% of Sonadanga R/A) have responded that public spaces don’t have any role in creating economic opportunities. The situation of Khalishpur R/A is
Figure 4 Percentage of the respondents about safety at different time

Anjum, N. & Roy, S. Roles and Functions of Public Spaces in the Residential Neighbourhoods of Khulna City
119
more outrageous, where 25% of the respondents have responded that public spaces guzzle spaces unnecessarily, which causes economic decline (Questionnaire Survey, 2019). The respondents of the other two neighbourhoods have responded that economic prosperity comes spontaneously, which apparently point out the poor economic sustainability.
Only a small share of respondents (22.27% of Khalishpur R/A, 22.81% of Nirala R/A and 40% of Sonadanga R/A) has believe that public spaces are contributing to improved environmental health. According to the respondents’ environmental health varies widely with the typologies of public spaces. Majority of the respondents (on an average 55% of all neighbourhood) perceive that only parks and playgrounds contribute to environmental health promotion, while the other typologies hardly have any roles towards environmental improvements. Walk-through analysis (2019) shows lack of greenery in streets and open spaces, carbon emission from adjacent vehicular roads and p waste management (see Figure 5) limit the contribution of public spaces towards environmental sustainability.
5. Conclusions Public spaces are fundamental attributes of creating sustainable neighbourhoods. Nevertheless, planned residential neighbourhoods in a major city, Khulna are deprived of quality public spaces. Internationally acclaimed good examples of varieties of public spaces those are supportive for residential neighbourhoods are absent in most of these areas. Furthermore, the key considerations necessary for making the existing public spaces successful are overlooked in the design of these neighbourhoods and management mechanism. Consequently, existing public spaces lack essential characters necessary to enable social mix, accessibility, recreational facilities, economic sufficiency, perception of safety and community pride, improved environmental health and therefore, failing to contribute to social, economic and environmental sustainability. These neighbourhoods still have potential spaces; careful nurture of these spaces can result in vibrant public spaces within the limit of existing spatial boundaries. Regenerative regeneration of the existing public spaces can be a revolutionary initiative towards neighbourhood sustainability in the resource-deprived cities like Khulna. The policymakers, development authorities and planning practitioners would require greater awareness of the value of neighbourhood-planning and significance of public spaces in creating sustainable neighbourhoods.
6. Reference AKTAR, SHAMIMA (2017) Urban Public Space: A Case from Developing Country (Master’s
Thesis), Blekinge Institute of Technology, 371 79 Karlskrona, Sweden.
Figure 5 Poor waste management, improper management and deficit public bins respectively in Khalishpur R/A, Nirala R/A and Sonadanga R/A (phase II) affecting environmental health

Anjum, N. & Roy, S. Roles and Functions of Public Spaces in the Residential Neighbourhoods of Khulna City
120
Carmona, Matthew (2010) "Contemporary public space, part two: classification." Journal of urban design, Vol. 15 No. 2 (May).
Carmona, Matthew; Claudio De Magalhaes; Leo Hammond (2008) Public space: the management dimension, Routledge.
Carr, Stephen; Mark, Francis; Leanne, G. Rivlin; Andrew M. Stone (1992) Public space, Cambridge University Press.
Chitrakar, Rajjan Man (2015) Transformation of public space in contemporary urban neighbourhoods of Kathmandu Valley, Nepal: An investigation of changing provision, use and meaning, Doctoral dissertation, Queensland: Queensland University of Technology.
Choguill, Charles L (2008) "Developing sustainable neighbourhoods." Habitat International, Vol. 32 No. 1 (March).
DI GIOVANNI, Andrea (2001) How to Turn a Place Around. A Handbook for Creating Successful Public Spaces, New York: Project for Public Spaces.
Gehl, Jan (1987) Life between Buildings: Using Public Space, New York: Reinhold.
GoB (Government of Bangladesh) (2009a) The Local Government (Pausrashava) Act, 2009, Dhaka: Government of the People’s Republic of Bangladesh.
GoB (Government of Bangladesh) (2009b. The Local Government (City Corporation) Act, 2009, Dhaka: Government of the People’s Republic of Bangladesh.
Habitat, UN (2014) A new strategy of sustainable neighbourhood planning: Five principles. Nairobi, Kenya: United Nations Human Settlements Programme (UN-Habitat).
Habitat, UN (2015) Global public space toolkit: From global principles to local policies and practice. Nairobi: United Nations Human Settlements Programme (UN-Habitat).
Jacobs, Jane (1958) Downtown is for People. The exploding metropolis, Fortune.
Jalaladdini, Siavash; Derya Oktay (2012) "Urban public spaces and vitality: a socio-spatial analysis in the streets of Cypriot towns", Procedia-Social and Behavioral Sciences, Vol. 35 (January).
Jozsa, Alex; Brown, David (2005) Neighborhood sustainability indicators report on a best practice workshop, School of Urban Planning, Montreal: McGill University.
KDA (2002) Structure Plan, Master Plan and Detailed Area Plan (2001-2020) for Khulna City: Volume III Master Plan, Khulna: Khulna Development Authority (KDA).
Low, Setha; Smith, Neil, eds. (2013) The politics of public space. New York: Routledge.
Madanipour, Ali. (2010) “Whose Public Space?”, International Case Studies in Urban Design and Development, Vol. 237 (January).
The Daily Star (2019) DNCC to revamp 26 parks and playgrounds. Retrieved from https://www.thedailystar.net/city/news/dncc-revamp-26-parks-and-playgrounds-1696315 [Accessed in 6th May 2019].
Woolley, Helen (2003) Urban open spaces, London: Taylor & Francis.

Roy, T.K., Ekram, K. M. M., Hossain, M. T. and Sahriar, M. R.
Assessment of Solid Waste Management as an Eco-neighbourhood Component in
Khulna City
121
ASSESSMENT OF SOLID WASTE MANAGEMENT AS AN ECO-NEIGHBORHOOD COMPONENT IN KHULNA CITY
Tusar Kanti Roy1, K. M. Mohiuddin Ekram2, Md. Tanvir Hossain3, Md. Rashid Sahriar3
1Associate Professor, Department of URP, KUET, Khulna 9203, Bangladesh 2Lecturer, Department of URP, KUET, Khulna 9203, Bangladesh
3Undergraduate Student, Department of URP, KUET, Khulna 9203, Bangladesh
Abstract
Solid Waste Management (SWM) is regarded as one of the important components of an eco-neighbourhood. Khulna City, Bangladesh produces around 600 tons of solid waste per day, of which 400 tons are collected by the Khulna City Corporation (KCC). The remaining 200 tons of waste cause environmental degradation to Khulna City. Only 7.2% waste is recycled. This research evaluates the performance of the existing SWM system as an eco-friendly component of Nirala, a planned residential area of Khulna city. Nirala has a population of 3000 in its 67.31 acre area. Using Life Cycle Inventory (LCI), a comparative analysis of SWM system is shown between Nirala and an eco-neighbourhood of Copenhagen, named Christianshavn. Christianshavn covers an area of 848 acre with a population of 10,140. The waste recycling rate by the Municipality of Copenhagen is almost 60% and they are aiming to upgrade it to 70% by 2024. Only 2% residential waste of Copenhagen is destined to landfill sites, where it is more than 65% in Khulna. On the basis of SWM system, the composite score of Nirala for being eco-friendly is 2.25 times less than Christianshavn. By applying TOPSIS method, low level of community participation is found to be the reason behind the deplorable condition of SWM in Nirala. The study concludes with a few viable suggestions, such as permanent the job for master role SWM workers of KCC, recycling of biodegradable waste as compost, proper implementation of privatization program as per city master plan, which may be beneficial to encourage stakeholders to work towards further improvement of the present system.
Keywords
Eco-Neighbourhood, SWM, Eco-friendly component, LCI, TOPSIS
1. Introduction Solid Waste Management (SWM) is described as the systematic and hygienic collection, treatment and disposal of discarded solid material (Nathanson, 2019). Due to fast urbanization, population growth and enhanced lifestyle, there has been an enormous increase in the quantity of waste, where poor waste management method and absence of adequate technology can lead to various environmental pollutions (R. Ahsan, 2009). Eco neighbourhood is defined as an integrated neighbourhood with priority given to the protection and use of natural resources, green technology, green and recycling practices aimed at preserving the environment, improving public health, safety and the welfare of urban residents (Tam & Karimipour, 2018). SWM is one of the components of eco-neighbourhood. The living condition of a neighbourhood relies on the quality of its surrounding environment. Because of uncollected household wastes on the roads, drains,

Roy, T.K., Ekram, K. M. M., Hossain, M. T. and Sahriar, M. R.
Assessment of Solid Waste Management as an Eco-neighbourhood Component in
Khulna City
122
empty plots or water bodies, the neighbourhood will experience the severe health danger which is particularly severe during the rainy season (World Bank, 2000). Nirala is a planned neighbourhood in Khulna city. In Khulna city almost 600 tons of solid waste is generated per day (The Daily Star, 2018) whereas around 6 tons of solid waste is generated per day in Nirala. Nirala Janokalyan Somity (Nirala Public Welfare Society) collects wastes from door to door and transfers to Secondary Transfer Station (STS) which is close to Nirala. On the other hand, the Christianshavn, an eco-neighbourhood of Copenhagen municipality, Denmark generates almost 11.16 tons of waste per day (Statistics Denmark, 2014). Waste is segregated at household and disposed in the waste bin according to the types. The city of Copenhagen collects waste from bins twice a week. The integrated solid waste management of Copenhagen is well known around the world. So, Christianshavn is considered as a standard for comparing the performance of SWM of Nirala.
The efficiency of daily waste collection and disposal in Khulna city is only 60 percent of the total daily generated volume (Roy et al., 2018). The STSs are not properly located which is a threat to city people (Haque, 2005). Khulna city has 1.5 million inhabitants where the 3MW power plant can be set up from daily generated waste (Salequzzaman & Iqbal, 2005). In terms of availability of landfill sites, generated solid waste will be a burden for the Khulna city where community-based small-scale compost plants can save 15 acres of land per year (Adhikary & Islam, 2015).
2. Objectives and Methodology 2.1. Objectives: The objectives of the study are: i) To explore the existing scenario of Solid Waste Management (SWM) system of Nirala, Khulna and Christianshavn, Copenhagen as two neighbourhoods; and ii) To assess the performance of existing SWM system of Nirala in comparison with Christianshavn, an eco-neighbourhood.
2.2. Methodology 2.2.1 Selection of Study Area Nirala, a planned neighbourhood of Khulna City, Bangladesh and Christianshavn, an eco-neighbourhood of Copenhagen City, Denmark have been considered as study area of this research. Nirala is situated in the southern part of Khulna city having a population of 3,000. It has an area of 67.31 acres (Roy & Ferdous, 2016). Christianshavn has an area of 848 acres of land with a population of 10140 (World Population Review, 2019).
2.2.2 Collection and Analysis of Primary and Secondary Data: Primary data on waste generation, storage, collection, transportation, recycling and other treatment of waste like composting or producing energy from it, landfilling or disposal of waste about Nirala are collected through a household questionnaire survey. A questionnaire survey of a total of 100 households (18% household of Nirala) is conducted. For Christianshavn, most of the data are collected from the secondary sources like Government website of Denmark. Some information on SWM of Copenhagen is collected over telephonic interview and email with the help of a correspondent in Copenhagen.
The existing scenario of SWM system of Nirala and Christianshavn is analysed through a Life Cycle Inventory (LCI) approach, which is an important stage of Life Cycle Analysis (LCA) (McDougall & White, 2001; ISO 14040, 2006; Othman & Noor Ezlin, 2015). The approach evaluates the two neighbourhoods in terms of SWM as an eco-neighbourhood component. The comparison has described the management aspects of wastes such as waste generation

Roy, T.K., Ekram, K. M. M., Hossain, M. T. and Sahriar, M. R.
Assessment of Solid Waste Management as an Eco-neighbourhood Component in
Khulna City
123
and collection per day, collection system, responsible authority, recycle and composting initiatives, per capita generated waste, NGOs and other authorities’ involvedness, public willingness, transport system, number of trips per day, landfill site etc. All the other processes or steps of LCA are not considered under the study.
TOPSIS (Technique for Order Preference by Similarity to Ideal Solution) is a functional and helpful technique used to rank and select the number of identified external alternatives by evaluating distance and enables decision makers to organize, evaluate and compare issues and rank alternatives (Shih, et al., 2007). Thus, TOPSIS model is an efficient instrument for problem analysis and will provide fresh insights into sustainable municipal solid waste management system planning (Saraei, et al., 2016). First of all, a Multi Criteria Decision Making (MCDM) matrix is constructed from the obtained data. Then the decision matrix is normalized. Next the weighted normalized decision matrix is calculated. These weights are determined by a decision maker. After that the positive-ideal and negative-ideal solution are determined and the separation of each alternative from the ideal solution is calculated. Finally, the relative closeness to ideal solution and rank of the preference order are calculated (Jahanshahloo, et al., 2009). Using TOPSIS method, this study tries to identify the component that is mostly responsible for the deplorable condition of the SWM system of Nirala.
3. Findings and Analysis 3.1. Life Cycle Inventory Analysis of Solid Wastes 3.1.1 Waste Generation Scenario Waste generation depends on the economic condition of the household and their consumption pattern (Shekdar, 2009; Sufian & Bala, 2006).
Table 1 reveals that about 70% of the wastes generated in Nirala are organic in nature (Kitchen waste, food waste etc.) compared to other types of waste. On the other hand, Christianshavn generates more recyclable waste (Paper, plastic, metal, glass etc.) in proportion to organic waste which is around 53.6%.
Table 1: Waste Generation Scenario of Nirala and Christianshavn
Waste Generated per day
Nirala* Christianshavn* Amount (ton) Percentage (%) Amount (ton) Percentage (%)
Organic matter 4.20 70.00 2.92 26.20 Paper 0.68 11.30 2.52 22.60 Plastic 0.28 4.70 0.47 4.20
Textile & wood 0.14 2.30 0.55 4.90 Metal 0.10 1.70 0.78 7.00 Glass 0.07 1.10 1.66 14.90 Other 0.53 8.90 2.25 20.20 Total 6.00 100 11.16 100
Source: *Alamgir & Ahsan, 2007; **European Commission, 2014; **Statistics Denmark, 2014 & *Field Survey, 2019
3.1.2 Waste Handling Scenario at Household Level There is a huge difference in waste handling scenario at household levels between the two neighbourhoods-Nirala and Christianshavn. It is almost completely inverse scenario of each other. No source segregation is practiced in Nirala but 100% households of Christianshavn
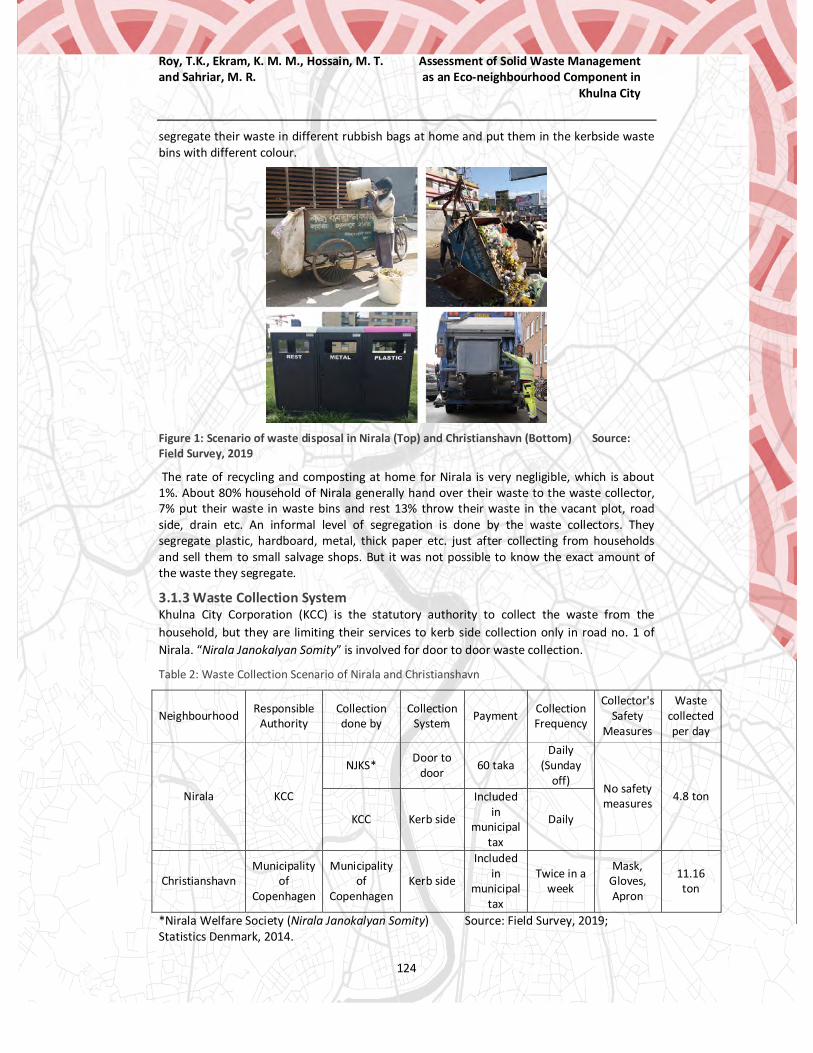
Roy, T.K., Ekram, K. M. M., Hossain, M. T. and Sahriar, M. R.
Assessment of Solid Waste Management as an Eco-neighbourhood Component in
Khulna City
124
segregate their waste in different rubbish bags at home and put them in the kerbside waste bins with different colour.
Figure 1: Scenario of waste disposal in Nirala (Top) and Christianshavn (Bottom) Source: Field Survey, 2019
The rate of recycling and composting at home for Nirala is very negligible, which is about 1%. About 80% household of Nirala generally hand over their waste to the waste collector, 7% put their waste in waste bins and rest 13% throw their waste in the vacant plot, road side, drain etc. An informal level of segregation is done by the waste collectors. They segregate plastic, hardboard, metal, thick paper etc. just after collecting from households and sell them to small salvage shops. But it was not possible to know the exact amount of the waste they segregate.
3.1.3 Waste Collection System Khulna City Corporation (KCC) is the statutory authority to collect the waste from the household, but they are limiting their services to kerb side collection only in road no. 1 of Nirala. “Nirala Janokalyan Somity” is involved for door to door waste collection.
Table 2: Waste Collection Scenario of Nirala and Christianshavn
Neighbourhood Responsible Authority
Collection done by
Collection System Payment Collection
Frequency
Collector's Safety
Measures
Waste collected per day
Nirala KCC
NJKS* Door to door 60 taka
Daily (Sunday
off) No safety measures 4.8 ton
KCC Kerb side
Included in
municipal tax
Daily
Christianshavn Municipality
of Copenhagen
Municipality of
Copenhagen Kerb side
Included in
municipal tax
Twice in a week
Mask, Gloves, Apron
11.16 ton
*Nirala Welfare Society (Nirala Janokalyan Somity) Source: Field Survey, 2019; Statistics Denmark, 2014.
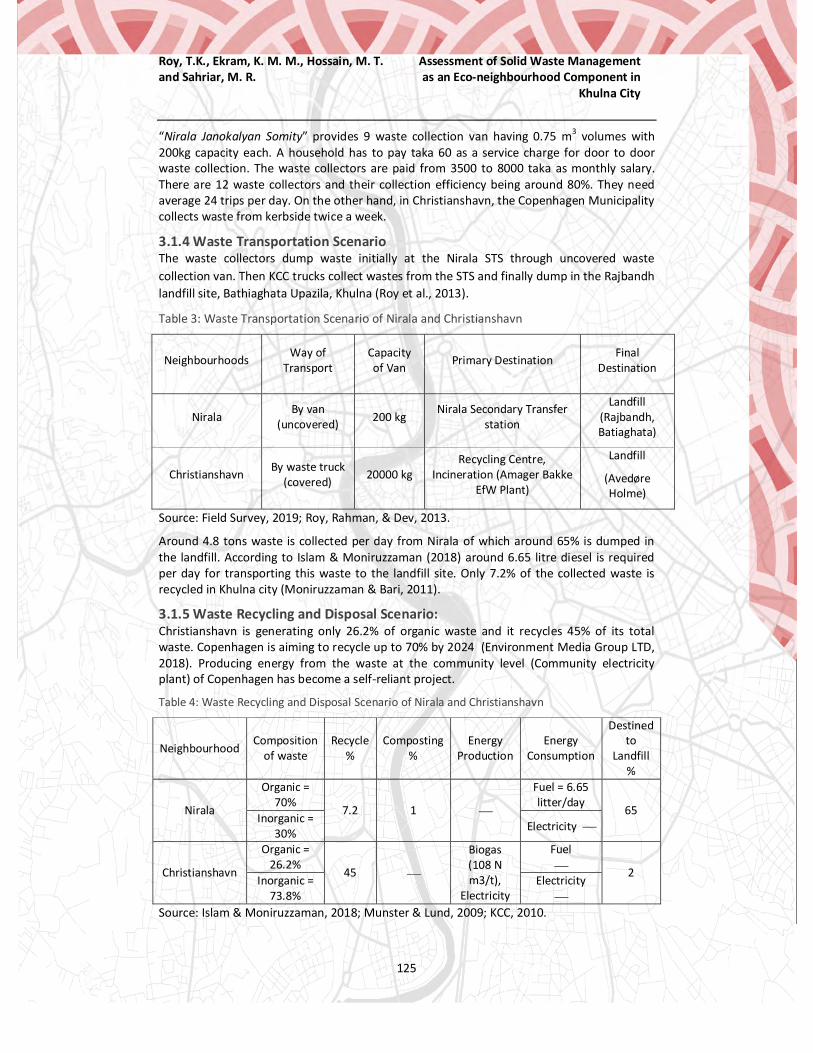
Roy, T.K., Ekram, K. M. M., Hossain, M. T. and Sahriar, M. R.
Assessment of Solid Waste Management as an Eco-neighbourhood Component in
Khulna City
125
“Nirala Janokalyan Somity” provides 9 waste collection van having 0.75 m3 volumes with 200kg capacity each. A household has to pay taka 60 as a service charge for door to door waste collection. The waste collectors are paid from 3500 to 8000 taka as monthly salary. There are 12 waste collectors and their collection efficiency being around 80%. They need average 24 trips per day. On the other hand, in Christianshavn, the Copenhagen Municipality collects waste from kerbside twice a week.
3.1.4 Waste Transportation Scenario The waste collectors dump waste initially at the Nirala STS through uncovered waste collection van. Then KCC trucks collect wastes from the STS and finally dump in the Rajbandh landfill site, Bathiaghata Upazila, Khulna (Roy et al., 2013).
Table 3: Waste Transportation Scenario of Nirala and Christianshavn
Neighbourhoods Way of Transport
Capacity of Van Primary Destination Final
Destination
Nirala By van
(uncovered) 200 kg Nirala Secondary Transfer
station
Landfill (Rajbandh, Batiaghata)
Christianshavn By waste truck (covered) 20000 kg
Recycling Centre, Incineration (Amager Bakke
EfW Plant)
Landfill
(Avedøre Holme)
Source: Field Survey, 2019; Roy, Rahman, & Dev, 2013.
Around 4.8 tons waste is collected per day from Nirala of which around 65% is dumped in the landfill. According to Islam & Moniruzzaman (2018) around 6.65 litre diesel is required per day for transporting this waste to the landfill site. Only 7.2% of the collected waste is recycled in Khulna city (Moniruzzaman & Bari, 2011).
3.1.5 Waste Recycling and Disposal Scenario: Christianshavn is generating only 26.2% of organic waste and it recycles 45% of its total waste. Copenhagen is aiming to recycle up to 70% by 2024 (Environment Media Group LTD, 2018). Producing energy from the waste at the community level (Community electricity plant) of Copenhagen has become a self-reliant project.
Table 4: Waste Recycling and Disposal Scenario of Nirala and Christianshavn
Neighbourhood Composition
of waste Recycle
% Composting
% Energy
Production Energy
Consumption
Destined to
Landfill %
Nirala
Organic = 70%
7.2 1
Fuel = 6.65 litter/day
65 Inorganic =
30% Electricity
Christianshavn
Organic = 26.2%
45
Biogas (108 N m3/t),
Electricity
Fuel 2
Inorganic = 73.8%
Electricity
Source: Islam & Moniruzzaman, 2018; Munster & Lund, 2009; KCC, 2010.
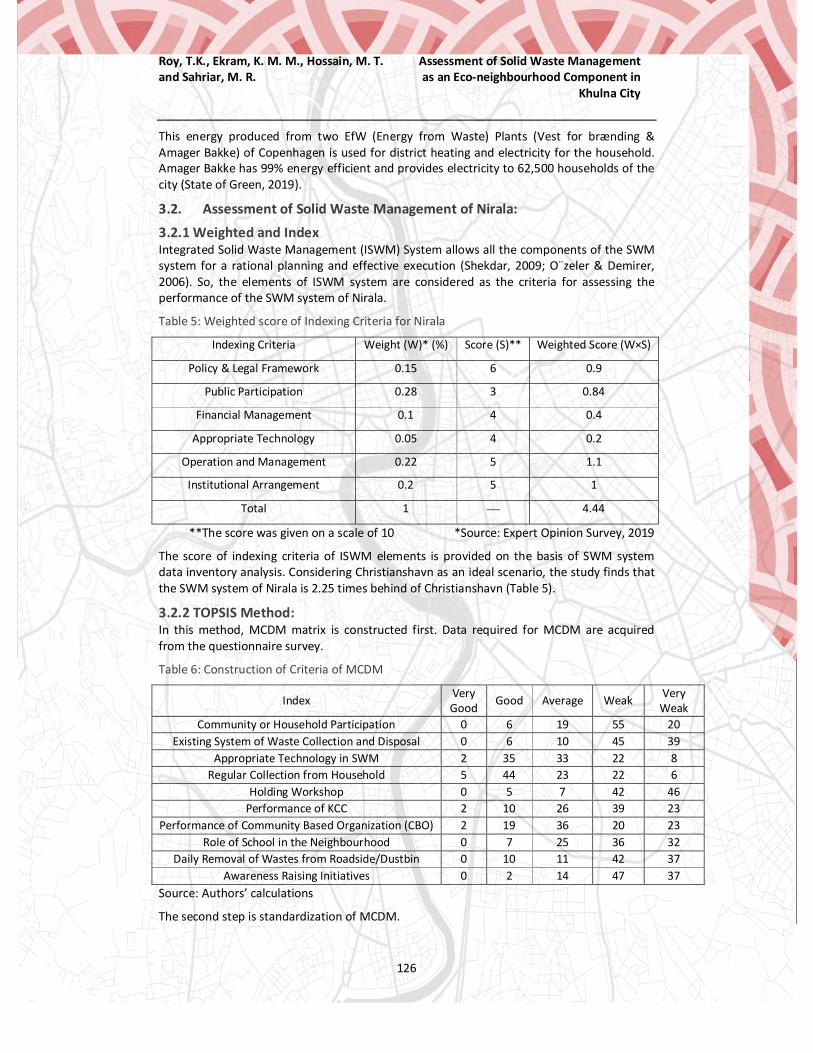
Roy, T.K., Ekram, K. M. M., Hossain, M. T. and Sahriar, M. R.
Assessment of Solid Waste Management as an Eco-neighbourhood Component in
Khulna City
126
This energy produced from two EfW (Energy from Waste) Plants (Vest for brænding & Amager Bakke) of Copenhagen is used for district heating and electricity for the household. Amager Bakke has 99% energy efficient and provides electricity to 62,500 households of the city (State of Green, 2019).
3.2. Assessment of Solid Waste Management of Nirala: 3.2.1 Weighted and Index Integrated Solid Waste Management (ISWM) System allows all the components of the SWM system for a rational planning and effective execution (Shekdar, 2009; O¨zeler & Demirer, 2006). So, the elements of ISWM system are considered as the criteria for assessing the performance of the SWM system of Nirala.
Table 5: Weighted score of Indexing Criteria for Nirala
Indexing Criteria Weight (W)* (%) Score (S)** Weighted Score (W×S)
Policy & Legal Framework 0.15 6 0.9
Public Participation 0.28 3 0.84
Financial Management 0.1 4 0.4
Appropriate Technology 0.05 4 0.2
Operation and Management 0.22 5 1.1
Institutional Arrangement 0.2 5 1
Total 1 4.44
**The score was given on a scale of 10 *Source: Expert Opinion Survey, 2019
The score of indexing criteria of ISWM elements is provided on the basis of SWM system data inventory analysis. Considering Christianshavn as an ideal scenario, the study finds that the SWM system of Nirala is 2.25 times behind of Christianshavn (Table 5).
3.2.2 TOPSIS Method: In this method, MCDM matrix is constructed first. Data required for MCDM are acquired from the questionnaire survey.
Table 6: Construction of Criteria of MCDM
Index Very Good Good Average Weak Very
Weak Community or Household Participation 0 6 19 55 20
Existing System of Waste Collection and Disposal 0 6 10 45 39 Appropriate Technology in SWM 2 35 33 22 8
Regular Collection from Household 5 44 23 22 6 Holding Workshop 0 5 7 42 46
Performance of KCC 2 10 26 39 23 Performance of Community Based Organization (CBO) 2 19 36 20 23
Role of School in the Neighbourhood 0 7 25 36 32 Daily Removal of Wastes from Roadside/Dustbin 0 10 11 42 37
Awareness Raising Initiatives 0 2 14 47 37 Source: Authors’ calculations
The second step is standardization of MCDM.
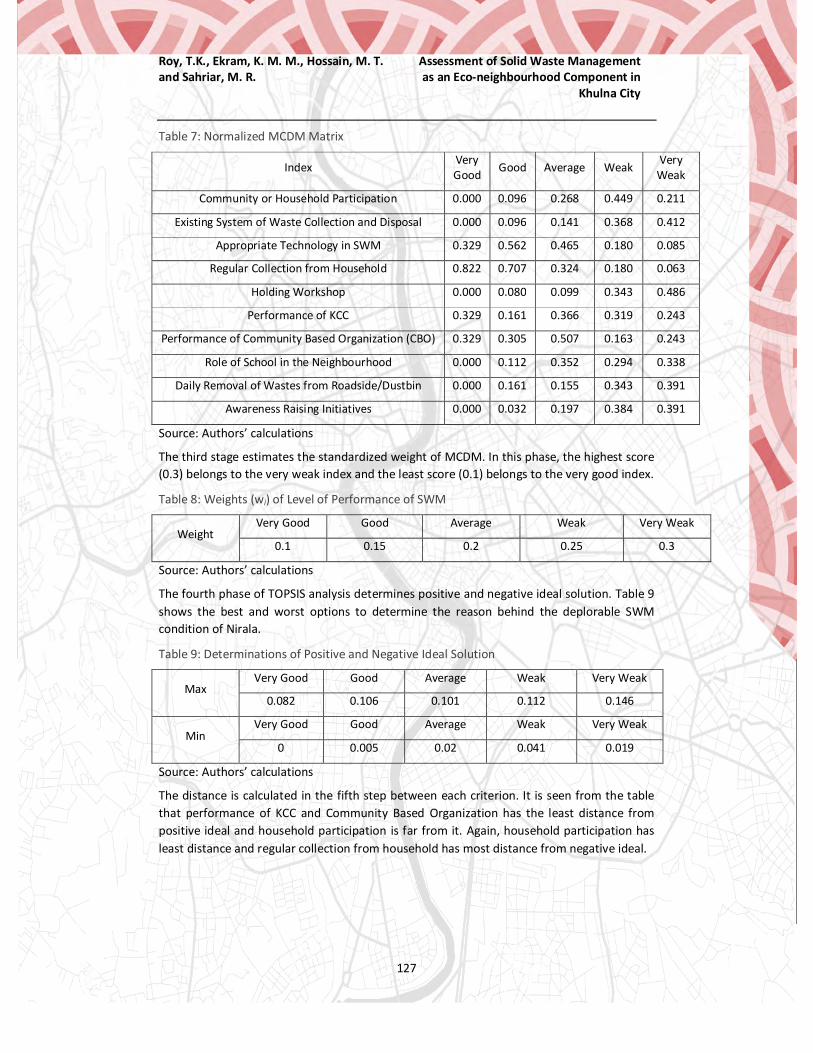
Roy, T.K., Ekram, K. M. M., Hossain, M. T. and Sahriar, M. R.
Assessment of Solid Waste Management as an Eco-neighbourhood Component in
Khulna City
127
Table 7: Normalized MCDM Matrix
Index Very Good Good Average Weak Very
Weak
Community or Household Participation 0.000 0.096 0.268 0.449 0.211
Existing System of Waste Collection and Disposal 0.000 0.096 0.141 0.368 0.412
Appropriate Technology in SWM 0.329 0.562 0.465 0.180 0.085
Regular Collection from Household 0.822 0.707 0.324 0.180 0.063
Holding Workshop 0.000 0.080 0.099 0.343 0.486
Performance of KCC 0.329 0.161 0.366 0.319 0.243
Performance of Community Based Organization (CBO) 0.329 0.305 0.507 0.163 0.243
Role of School in the Neighbourhood 0.000 0.112 0.352 0.294 0.338
Daily Removal of Wastes from Roadside/Dustbin 0.000 0.161 0.155 0.343 0.391
Awareness Raising Initiatives 0.000 0.032 0.197 0.384 0.391
Source: Authors’ calculations
The third stage estimates the standardized weight of MCDM. In this phase, the highest score (0.3) belongs to the very weak index and the least score (0.1) belongs to the very good index.
Table 8: Weights (wi) of Level of Performance of SWM
Weight Very Good Good Average Weak Very Weak
0.1 0.15 0.2 0.25 0.3
Source: Authors’ calculations
The fourth phase of TOPSIS analysis determines positive and negative ideal solution. Table 9 shows the best and worst options to determine the reason behind the deplorable SWM condition of Nirala.
Table 9: Determinations of Positive and Negative Ideal Solution
Max Very Good Good Average Weak Very Weak
0.082 0.106 0.101 0.112 0.146
Min Very Good Good Average Weak Very Weak
0 0.005 0.02 0.041 0.019
Source: Authors’ calculations
The distance is calculated in the fifth step between each criterion. It is seen from the table that performance of KCC and Community Based Organization has the least distance from positive ideal and household participation is far from it. Again, household participation has least distance and regular collection from household has most distance from negative ideal.

Roy, T.K., Ekram, K. M. M., Hossain, M. T. and Sahriar, M. R.
Assessment of Solid Waste Management as an Eco-neighbourhood Component in
Khulna City
128
Table 10: Calculating the Size of Separation
Index
Community or Household Participation 0.156 0.091
Existing System of Waste Collection and Disposal 0.146 0.117
Appropriate Technology in SWM 0.148 0.113
Regular Collection from Household 0.148 0.138
Holding Workshop 0.151 0.135
Performance of KCC 0.128 0.093
Performance of Community Based Organization (CBO) 0.128 0.111
Role of School in the Neighbourhood 0.138 0.103
Daily Removal of Wastes from Roadside/Dustbin 0.141 0.110
Awareness Raising Initiatives 0.148 0.114
Source: Authors’ calculations
The sixth phase calculates the comparative proximity to the ideal solution. Based on the sixth step, the index ranking in descending order is displayed in the seventh phase. It is found that low level of household participation is mostly responsible for the deplorable condition of SWM in Nirala.
Table 11: Calculate the Relative Proximity to Ideal Point and Ranking in Descending Order
Index Rj Rank
Community or Household Participation 0.631 1
Performance of KCC 0.578 2
Role of School in the Neighbourhood 0.574 3
Appropriate Technology in SWM 0.568 4
Awareness Raising Initiatives 0.564 5
Daily Removal of Wastes from Roadside/Dustbin 0.561 6
Existing System of Waste Collection and Disposal 0.555 7
Performance of Community Based Organization (CBO) 0.536 8
Holding Workshop 0.529 9
Regular Collection from Household 0.518 10
Source: Authors’ calculations
The role of KCC in managing solid wastes of Nirala is not up to the mark. KCC is not very much involved in its SWM functions. Nirala Janokalyan Somity is involved in waste collection from households and waste disposal. Besides, different programs are arranged to increase household participation and understanding. As they provide SWM services, it reduces the realization of the existence of KCC in waste management. Otherwise, the performance of KCC could be the main reason for the deplorable condition of SWM.

Roy, T.K., Ekram, K. M. M., Hossain, M. T. and Sahriar, M. R.
Assessment of Solid Waste Management as an Eco-neighbourhood Component in
Khulna City
129
4. Conclusion and Recommendation 4.1. Conclusion: Low level of community participation acts as one of the major reasons for poor solid waste management scenario in the Nirala. People are so conscious about the negative impacts of the improper SWM system. "Nirala Janokalyan Somity" covers almost 80% of the household and the rest of the household are not eager to be involved with such door to door waste collection system. They dispose wastes in the vacant plots, road sides and drains which create adverse effect to the surrounding environment and deteriorates the aesthetic beauty. The people in Christianshavn are conscious about the household waste management and they segregate their waste at home and dispose into separate waste bins. Household waste segregation and disposal is in the education curriculum in Denmark, which is absent in Bangladesh.
4.2. Recommendation: Following are the recommendations for improving the SWM system of Nirala:
1. There is a lack of budget for the operation of SWM both for KCC and CBO (Nirala Janokalyan Somity). As a result, there is a shortage of manpower and equipment. That is why it is not possible to collect and dispose wastes from every household. Government should take steps to increase budget for waste management of KCC and KCC should help CBO with budget for the management of solid waste. Besides, if the job of the master roll staff is made permanent, then the efficiency of waste management will be more effective.
2. In Bangladesh, there is no provision of teaching about solid waste management in a school level curriculum. SWM issues should be included in the educational curriculum of Bangladesh so that children can grow up with proper knowledge on waste management.
3. As per city Master Plan (KDA, 2002), privatization program, including NGO & CBO should be promoted which will include management with resource recovery options.
5. Acknowledgements: We wish to express our deepest thanks to Md. Lokman Hossain, Research Assistant, CHR Technology, Copenhagen and Nirala Janokalyan Somity, Nirala, Khulna for providing data and information and for their assistance and interest in this study.
6. References Adhikary, D. & Islam, M. S., 2015. Feasibility Analysis of Eco-Friendly Municipal Waste
Management in Khulna City. Rajshahi.
Alamgir, M. & Ahsan, A., 2007. MUNICIPAL SOLID WASTE AND RECOVERY POTENTIAL: BANGLADESH PERSPECTIVE. Journal of Environmental Health Science and Engineering, 4(2), pp. 67-76.
City of Copenhagen, 2014. Resource Management Plan 2018, Copenhagen.
Roy, T.K., Ekram, K. M. M., Hossain, M. T. and Sahriar, M. R.
Assessment of Solid Waste Management as an Eco-neighbourhood Component in
Khulna City
130
Environment Media Group LTD, 2018. News. Available at: https://www.letsrecycle.com/news/latest-news/copenhagen-waste-wonderful/
European Commission, 2014. Capital factsheet on separate collection, Denmark: Copenhagen Resource Institute.
Haque, M. A., 2005. Site Suitability Analysis for Solid Waste Disposal Using GIS: A Case Study on KCC area, Khulna: Khulna University.
Islam, M. S. & Moniruzzaman, S. M., 2018. INVESTIGATION ON QUANTITY OF MUNICIPAL SOLID WASTE TRANSPORTATION OF KHULNA CITY CORPORATION IN BANGLADESH. Khulna.
ISO 14040, 2006. Environmental management — Life cycle assessment — Principles and framework, Geneva: International Organization for Standardization.
Jahanshahloo, G. R., Lotfi, F. H. & Davoodi, A. R., 2009. Extension of TOPSIS for decision-making problems with interval data: Interval efficiency. Mathematical and Computer Modelling, Volume 49, pp. 1137–1142.
KCC, 2010. Khulna City Corporation. Available at: http://www.khulnacity.org/ [Accessed 2019].
KDA, 2002. Municipal Service. In: Structure Plan, Master Plan and Detailed Area Plan (2001-2020) for Khulna City. Khulna: Khulna Development Authority.
McDougall, F. R. & White, P. R., 2001. Integrated Solid Waste Management: a Life Cycle Inventory. 2nd ed. Oxford: Blackwell Science.
Munster, M. & Lund, H., 2009. Use of waste for heat, electricity and transport—Challenges when performing energy system analysis. Energy, pp. 636–644.
Nathanson, J. A., 2019. Solid-waste management. Available at: https://www.britannica.com/technology/solid-waste-management [Accessed 2019].
O¨zeler, D. & Demirer, G., 2006. Life cycle assesment of municipal solid waste management methods: Ankara case study. Environment International, Volume 32, pp. 405-411.
Othman, N. & Noor Ezlin, A., 2015. Integrated solid waste management: A life cycle assessment. Journal of Engineering and Applied Sciences, Volume 10.
R. Ahsan, A. K. I. S. S., 2009. Municipal Waste Management Mechanism for Khulna City: A Practice for Better Environment. Khulna.
Roy, T. K. et al., 2018. Prospect of Climate Mitigration by Integrated Solid Waste Management: A Case Study of Khulna City, Bangladesh. In: Waste Management and Resource Efficiency. Singapore: Springer, pp. 361-371.
Roy, T. K., Ferdous, A. & Huq., S., 2016. Building Setback Scenario in Different Sized Plots of Planned Residential Area: A Case Study on Nirala Residential Area of Khulna City, Bangladesh. Dhaka, 1st Bangladesh Planning Research Conference (BPRC).
Roy, T. K., Rahman, S. & Dev, P. K., 2013. Compost Fertilizer from Municipal Solid Wastes and its Application in Urban Agro-forestry Nurseries: A Case Study on Khulna City. Journal of Bangladesh Institute of Planners, Volume 6, pp. 191-199.
Roy, T.K., Ekram, K. M. M., Hossain, M. T. and Sahriar, M. R.
Assessment of Solid Waste Management as an Eco-neighbourhood Component in
Khulna City
131
Salequzzaman, M. & Iqbal, A., 2005. Contexts and Prospects of Renewable Energy Resources in KCC Area : A Case Study of Waste to Electricity from Existing Solid Waste, Khulna: PREGA Training Workshop.
Saraei, M. H., Jamshidi, Z. & Ahangari, N., 2016. Prioritization of Management Indexes of Municipal Solid Waste in Line with Sustainable Development (Case Study: City of Bokan). The Scientific-Research Quarterly Journal of Urban Economics and Management, Volume 4, pp. 1-17.
Shekdar, A. V., 2009. Sustainable solid waste management: An integrated approach for Asian countries. Waste Management, Volume 29, pp. 1438-1448.
Shih, H. S., Shyur, H. J. & Lee, E. S., 2007. An extension of TOPSIS for group decision making. Mathematical and Computer Modelling, Volume 45, pp. 801–813.
State of Green, 2019. State of the Art Waste to Energy Plant Copenhill. Available at: https://stateofgreen.com/en/partners/babcock-wilcox-volund/solutions/waste-to energy-plant-copenhill-amager-bakke-copenhagen-denmark/
Statistics Denmark, 2014. WASTE GENERATION BY INDUSTRY AND WASTE CATEGORY. Available at: https://www.statbank.dk/AFFALD01 [Accessed 2019].
Sufian, M. & Bala, B., 2006. Modelling of electrical energy recovery from urban solid waste system: The case of Dhaka city. Renewable Energy, Volume 31, pp. 1573–1580.
Tam, V. W. & Karimipour, H., 2018. Green neighbourhood: Review on the international assessment systems. pp. 689-699.
The Daily Star, 2018. Khulna city marred by uncollected waste. Available at: https://www.thedailystar.net/city/news/khulna-city-marred-uncollected-waste-1655896 [Accessed August 2019].
World Bank, 2000. Pilot Project on Solid Waste Management in Khulna City: A Community Organization and Management, Khulna.
World Population Review, 2019. Population of Cities in Denmark (2019). Available at: http://worldpopulationreview.com/countries/denmark-population/cities/ [Accessed 2019].
Gouala , A Banik , N
Regeneration Strategy of Oldest Commercial Hub of Bangladesh
132
Research Paper / Case Study Paper
Regeneration Strategy of Oldest Commercial Hub of Bangladesh: Land Use Development across
Khatunganj, Chattogram Anik Gouala, Department of Architecture, CUET; Bangladesh
Nandita Banik, Department of Architecture, CUET; Bangladesh
Abstract
Urban Regeneration can be defined as land use development in urban areas. It involves rezoning of a given area to low density (family house) to high density (mixed use or commercial) development. It also includes infrastructure development that can support the zoning. Rapid urbanization is currently a challenge for any developing country. Due to unplanned urbanization, urban areas of Chattogram city are under growing various problems. Khatunganj is a 150 years old commercial hub and was once Bangladesh’s largest wholesale market for essential commodities. It spanned a huge area across the Chaktai canal and Karnaphuli River in Chattogram, mostly occupied by commercial and mixed use buildings. But khatungonj is losing it’s functionality because of unplanned development in certain years, congested buildings, narrow road,, water logging and drainage problem. This paper provides redevelopment strategy in this commercial hub of Chattogram with proper urban planning. The proposals and recommendations which are provided in this paper could be considered while redeveloping the land use plan for Khatunganj
Keywords
Urban regeneration, Land use, Commercial Hub, Unplanned development, Strategy
1. Introduction Redevelopment refers to the regulation and physical placement of land uses and structures by proper planning. According to Redevelopment handbook, A guide to rebuilding new jersey’s communities; Redevelopment is defined as a process rebuild or restore an area in an measurable state of decline, disinvestment or abandonment. An underutilized or distressed area can be transformed into an economically significant and productive part of the community .According to Bentley (1985), the public edge of the building is one essential factor. He argues that commercial activities benefit from the interaction with the public realm .They should be located on the ground floor and there should be no set back so that they could take advantage of movement on the street. Moudon (1986) suggested that existing urban structure is used in a perspective way as a designing element and rules can be selected from the existing built environment and used as the basis for the design of new buildings. Delahm (1990) suggests the physical and visual contact between commercial space and adjacent side walk, preservation the existing grid and reinforcing small blocks.
Gouala , A Banik , N
Regeneration Strategy of Oldest Commercial Hub of Bangladesh
133
2. Methodology Methodology means the procedure which the study is accomplished. It is the combination of some necessary steps to fulfil the study. A methodology has been selected for the regeneration strategy of Khatunganj area. Design strategies are based on these key features described below :
Determine the study area Field Survey Disclosed the existing condition Identification of problems Literature review Data collection Data analysis Questionnaire Proposals
2.1. Determination of the study area One area is selected for urban regeneration. Khatunganj under Chattogram Metropolitan area (DPZ 03).
2.2. Field Survey Field surveys were conducted to collect information on 27 June, 9 July, 14 July, 8 August 2019 onwards.
2.3. Disclosed the existing condition On field survey disclosed the existing situation in the whole area. Existing vulnerable condition must be located. It defines which area has to be reformed.
2.4. Identification of problems This study conducts some discussion on the problems of this area. They are:
Land use pattern Socio economic condition Living condition Government development programs in this area Storm water discharge and drainage condition Existing Pedestrian pathway
2.5. Literature review Literature reviews on land use development have been conducted from previous research works, articles and newspapers.
2.6. Data Collection Various data has been collected in regard to the study. Existing area plan from Chittagong Development Authority (CDA), Drainage data from Chattogram Wasa , Mouja map and Khatian from AC land Office ,Chattogram have been collected . Some secondary data are collected from research work, papers and projects.

Gouala , A Banik , N
Regeneration Strategy of Oldest Commercial Hub of Bangladesh
134
2.7. Data analysis : After collecting all data and information analysing of data is conducted. Existing conditions were judged, problems were identified. Comparing the existing data proposals are given.
2.8. Questionnaire To conduct the study a questionnaire is prepared in a systematic way. It helps to collect information from occupied people in this area. The questionnaire covered the following criteria:
General information about occupied people Information about wholesale business Proposals on Chaktai canal Demands and their proposals on this area
2.9. Proposals The proposals which are described on the study:
Land use pattern Drainage maintenance Storm water discharge Canal development Waterfront design Community Space Transportation Management
3. Existing conditions Existing condition of Khatunganj is measured under some functional points.
Land use Drainage Heritage building Pedestrian pathway Road condition Chaktai canal
3.1. Land use Khatunganj Spanned over a huge area across Chaktai canal and Karnaphuli river. The existing land use pattern is mostly commercial. As the lands are private property here, the lands are occupied by the traders and shoppers of essential commodities. There are specific zones for same type of commodities (Rice, pulse, onion, ginger, sugar, edible, oil).The both sides of the chaktai canal are government property which are now grabbed by local people. In this figure red colour denotes commercial zones, yellow denotes residential zones, orange denotes mixed use buildings.

Gouala , A Banik , N
Regeneration Strategy of Oldest Commercial Hub of Bangladesh
135
Figure 1 : Existing land use

Gouala , A Banik , N
Regeneration Strategy of Oldest Commercial Hub of Bangladesh
136
3.2. Drainage The drainage system of this area is insufficient comparing to the land use pattern. There is no drainage system for storm water as well as waste disposal. As a result Khatunganj faces water logging problems and faces huge losses every year. Though a few drains are available, they are always logged by wastes. The common drainage section in the area is 1’ × 1.5’ .
3.3. Heritage building As Khatunganj was established in 18th century, this area houses a number of building of heritage value and worthy of conservation. As a whole Khatunganj performs as a heritage district. The buildings are mostly Bengal adoption of colonial period. The building can be divided into colonial (partially), Pakistan period and modern (60-80’s architectural style).
Figure 2 : Heritage buildings constructed on 1920 ,1950, 1975 (From left to right )
3.4. Pedestrian pathway Khatunganj area has only one main road of 30 ft width. There are no defined pedestrian walkway .Labourers and residents of adjacent area face great difficulty in communicating.
3.5. Road condition As a lacking of proper truck terminal or drop off areas, Loading unloading of goods for the roadside warehouse and yard take place on the road creating traffic congestion .It also slows down the productivity of the commercial hub.
Figure : Exisiting road conditon
3.6. Chaktai canal As the geography of Chattogram city is placed over a hilly topography where west side has sea and Karnaphuli river , Chaktai canal could be performed a downstream water flow .Currently used as open sewer, Chaktai canal was one of the major canal creating transportation and trading opportunities in port city Chattogram. The canal was 200 feet width near 1960’s but because of gradually waste disposal, sedimentation, waste disposal and land grabbing, its width shrank to merely 40 feet. Khatunganj commercial are was developed alongside the canal to properly utilize its facilities. Because of the shrinkage of Chaktai canal water transport network is dilapidated as well as storm water cannot be
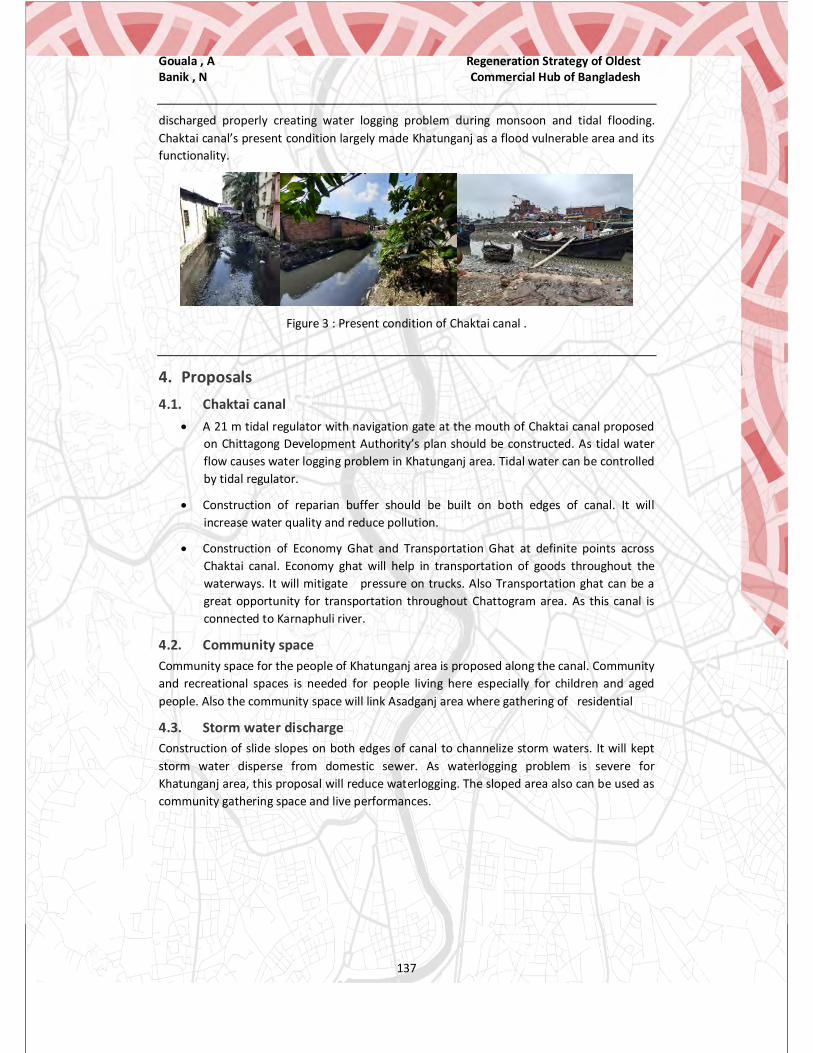
Gouala , A Banik , N
Regeneration Strategy of Oldest Commercial Hub of Bangladesh
137
discharged properly creating water logging problem during monsoon and tidal flooding. Chaktai canal’s present condition largely made Khatunganj as a flood vulnerable area and its functionality.
Figure 3 : Present condition of Chaktai canal .
4. Proposals 4.1. Chaktai canal
A 21 m tidal regulator with navigation gate at the mouth of Chaktai canal proposed on Chittagong Development Authority’s plan should be constructed. As tidal water flow causes water logging problem in Khatunganj area. Tidal water can be controlled by tidal regulator.
Construction of reparian buffer should be built on both edges of canal. It will increase water quality and reduce pollution.
Construction of Economy Ghat and Transportation Ghat at definite points across Chaktai canal. Economy ghat will help in transportation of goods throughout the waterways. It will mitigate pressure on trucks. Also Transportation ghat can be a great opportunity for transportation throughout Chattogram area. As this canal is connected to Karnaphuli river.
4.2. Community space Community space for the people of Khatunganj area is proposed along the canal. Community and recreational spaces is needed for people living here especially for children and aged people. Also the community space will link Asadganj area where gathering of residential
4.3. Storm water discharge Construction of slide slopes on both edges of canal to channelize storm waters. It will kept storm water disperse from domestic sewer. As waterlogging problem is severe for Khatunganj area, this proposal will reduce waterlogging. The sloped area also can be used as community gathering space and live performances.

Gouala , A Banik , N
Regeneration Strategy of Oldest Commercial Hub of Bangladesh
138
Figure 4 : Left - Ghat position ( Red – Transportation ghat, Yellow-Economic ghat)
Right- Section of Khatunganj proposed area
4.4. Eateries Eateries for labourers and drivers are proposed in some definite areas. As labourers work here from morning till 10 pm at night. Also drivers drive their vehicles for loading and unloading goods. They need some common eating spaces.
4.5. Commercial complex It is proposed to build some commercial complex in some definite spaces. In some spaces in Khatunganj there are some tin shaded building and hazardous building used as shops. They should be relocated collectively in some spaces (pictured in figure ). In Commercial complex there will be two categories of buildings. Category A combination of van loading unloading yard, shops, warehouse , restaurant and banks. Category B combination of shops, warehouse and Women facilities like Prayer room, Changing room, Wash zone, Breast feeding corner. This commercial spaces will provide facilities and create working environment for women who work here.
Category A Category B
Figure 5 : Proposed Commercial Complex
5. Conclusion The proposals of land use development will help to regain the lost glory of Khatunganj area. Also it will improve peoples’ living condition and commercial activities. Necessary steps should be taken by concerned authorities to implement the above recommendations. It is

Gouala , A Banik , N
Regeneration Strategy of Oldest Commercial Hub of Bangladesh
139
expected that the proposals will provide some useful ideas for future redevelopment and increase commerce in Khatunganj.
6. References Chittagong Development Authority CDA , Chittagong master plan map for Chattogram ,
Bangladesh Delafons, John (1990) Aesthetic control , a report on methods used in the USA to control the design of buildings , UC Berkeley
Moudon , Anne Vernez (1986) Built for Change : Neighbourhood architecture in San Francisco , San Francisco : The MIT Press
Bently ,Ian (1985) Responsive Environments : A manual for designers , Oxford , Architectural Press
Miller , Bryon (2006) “Castells’ the City and the Grassroots : 1983 and Today “ ,International Journal of Urban and Regional Research, Vol.30.1 No. 207-11 (March)
Ashraf , M. Ali ; Chowdhury , Md . Shariful Alam “Drainage Planning in the Cities of Bangladesh : Case Study of Drainage and Water Logging in Chaktai Commercial area, Bangladesh” , Journal of Bangladesh Institute of Planners, Vol.2 P.49-60 (December)
Mamun , Md Mustiafiz Al , “Improve Urban Waterways Management in Chattogram city” , newspaper article on the Daily Observer dated 21 July, 2018

Roy Chowdhury, Srishti; Tarannom, Rehnoma; Farid, Nafisa
Assessment of Utility and Safety Facilities of Large-Scale Kutcha Bazars in Dhaka City
140
Case Study Paper
Assessment of Utility and Safety Facilities of Large-Scale Kutcha Bazars in Dhaka City
Srishti Roy Chowdhury1, Rehnoma Tarannom2, Nafisa Farid3, Tahmid Tazwar Samin4, Ahmed Mushfiq Faiaj5, Tasnim Feroze6 & Uttama Barua7
1, 2, 3, 4, 5 Undergraduate Student, Department of URP, BUET; Bangladesh 6, 7 Lecturer, Department of URP, BUET; Bangladesh
Abstract
Kutcha Bazar is a market place where people gather to buy and sell agricultural goods, poultry, fish etc. necessary for daily life. Due to its use kutcha bazar is a very important place specially in city areas. In these markets, especially large scale kutcha bazar, provision of utility and safety facilities are important to facilitate both buyers and sellers. Considering the importance, this study aims to explore existing utility and safety facilities in large scale kutcha bazars in Dhaka city and to understand level of services of these facilities from both buyers & seller’s perspective. For the purpose of this study six large scale kutcha bazars in Dhaka city were selected as study area and data were collected from buyers and sellers through questionnaire survey. Additionally, key informant interviews were carried out with members from management organizations of these kutcha bazars. As no research work has been done previously on this topic, it can facilitate further research on this topic. Existing condition of the kutcha bazars in Dhaka is not satisfactory.
Keywords
Kutcha bazar, utility facilities, safety facilities, level of service, occupational health safety
1. Introduction Kutcha bazar is defined as a place where people sell and purchase different types of commodities to fulfill daily needs, especially the food items like vegetables, fish, meat, fruits etc. and other grocery items (Akhter, Das & Rahman, 2001). In Dhaka, Kutcha Bazars are unorganized and unhygienic (Tuli & Islam, 2014). Both locational and hierarchical distributions of market places in Dhaka city are unplanned and haphazard. They are also overcrowded and compact. This study investigates existing condition and level of service of utility and safety facilities of the large-scale kutcha bazars of Dhaka city. Large scale kutcha bazars can be defined as a place where whole sellers receive a large quantity of products from the manufactures and distribute the products to the retailers in a large quantity at wholesale price. Utility facilities mean privately, publicly or co-operatively owned system of producing and distributing essential public facilities such as electricity, gas, water supply, sewerage, waste management etc. (Electronic Code of Federal Regulations, 2000). Safety facilities mean public protection and welfare which is mainly provided by the government (US Legal, n.d.) such as safety from natural hazards storms, rainfall, fire explosion etc. In past, many bazars have faced this problem. For example- Karwan bazar and Khilkhet bazar

Roy Chowdhury, Srishti; Tarannom, Rehnoma; Farid, Nafisa
Assessment of Utility and Safety Facilities of Large-Scale Kutcha Bazars in Dhaka City
141
fire explosion (Rabbi, 2017). Mainly vegetables and fishes are adulterated which must be prevented to ensure health safety of the consumers (Huq, 2017). Wholesale markets contributed 14.3% to Bangladesh’s GDP in FY 2010/11 (BBS, 2011). Level of service is the measurement of the satisfaction level of the respondents regarding utility and safety facilities provided in the bazar. Level of service of a facility is the ratio of the facility required according to the users to the facility actually available. Level of service can be measured both qualitatively and quantitatively. Qualitative measures reveal existing condition of a facility. Example: satisfaction level of the users for toilet facilities. Quantitative measures disclose the number or quantity of the facility. Example: number of male, female and common toilets (Raju & Bhuyan, 2015). Several studies have been carried out on kutcha bazars in Bangladesh. Samina Mazumder Tuli and Nazmul Islam (2014) worked on Dhaka kitchen markets. An idea about the facilities which should be provided or improved can be generated from this study. They proposed a design considering all the requirements that needed to be provided or improved. Ahmed, Biswas and Chakrovarty (2014) worked on consumer behaviour. They found that shopper or consumer behaviour depends on characteristics, physical conditions and facilities of a market. Sayed Sarwer Hussain and David Leishman (2013) studied retail market growth focusing on structure and variations of urban and rural markets. Uday Shankar Das (2001, 2004) studied on unauthorized kutcha bazars in Dhaka city. This study focused on some interrelated dimensions of accessibility, existing problems of the kutcha bazars and recommended some solutions. Physical condition and quality of the unauthorized kutcha bazars are very poor. None of these studies focused on assessing utility and safety facilities of large-scale kutcha bazars in Dhaka. In this background, this study aims to explore existing condition and assess level of service of utility and safety facilities of large-scale kutcha bazars.
2. Study Area Profile To fulfil the objectives of the study six large scale kutcha bazar have been selected. Table -1: Study Area
Source: (Field Survey, 2018)
DSCC
Name of the Bazar
Ward no
Location Total shop
Banalata Bazar
18 New market
290
Moulavi Bazar
31 Chawk Bazar
680
Shyam Bazar
43, 47
Lalkuthi, Sadarghat, Sutrapur
380
DN
CC
Karwan Bazar
26 Tejgaon 462
Rayer Bzar
15 Hazaribag 149
Town Hall Bazar
31 Mohamma-dpur
361
Figure 1: Location of Bazar Source: (Wasim and Nine, 2017)

Roy Chowdhury, Srishti; Tarannom, Rehnoma; Farid, Nafisa
Assessment of Utility and Safety Facilities of Large-Scale Kutcha Bazars in Dhaka City
142
3. Methodology Six large scale kutcha bazars from South and Dhaka North City Corporations were selected. To carry out the survey, a co-ordination schema was prepared incorporating necessary variables chosen according to the objectives. Water, electricity, gas, sewage, sanitation and waste management facilities were chosen as utilities. Natural hazard, fire safety, security and health were chosen as safety facilities. Both social and physical survey were carried out for data collection. For physical survey, a checklist was prepared and information was collected through Key Informant Interview (KII). Again, for social survey, a questionnaire was prepared and questionnaire survey was conducted to collect data from both buyers and sellers. Respondents were chosen randomly for questionnaire survey. Secondary data such as the location of the bazars, area, adjacent land use, ward no etc. were collected from google map, google earth etc. To organize data for further analysis, three excel databases (checklist database, seller database and buyer database) were prepared. Both qualitative data and quantitative data were analysed using Microsoft excel.
3.1. Scoring Method In this research, scoring method has been used for measuring satisfaction level of the respondents to investigate the quality of facilities of different bazars. To measure the satisfaction level of both buyers and sellers, weightage from 1 to 5 were assigned as mentioned: weight 5 for highly satisfied, weight 4 for moderately satisfied, weight 3 for satisfied, weight 2 for not satisfied and weight 1 is for not satisfied at all. Scores were calculated by multiplying the corresponding weights with percentage of the respondents responded to different satisfaction levels. Higher score represents more satisfaction level and vice versa. For each of the utility and safety facilities, total score was calculated in a scale of 5, and overall score for every bazar have been calculated out of 35. And in overall facilities condition of bazars have been calculated out of 30.
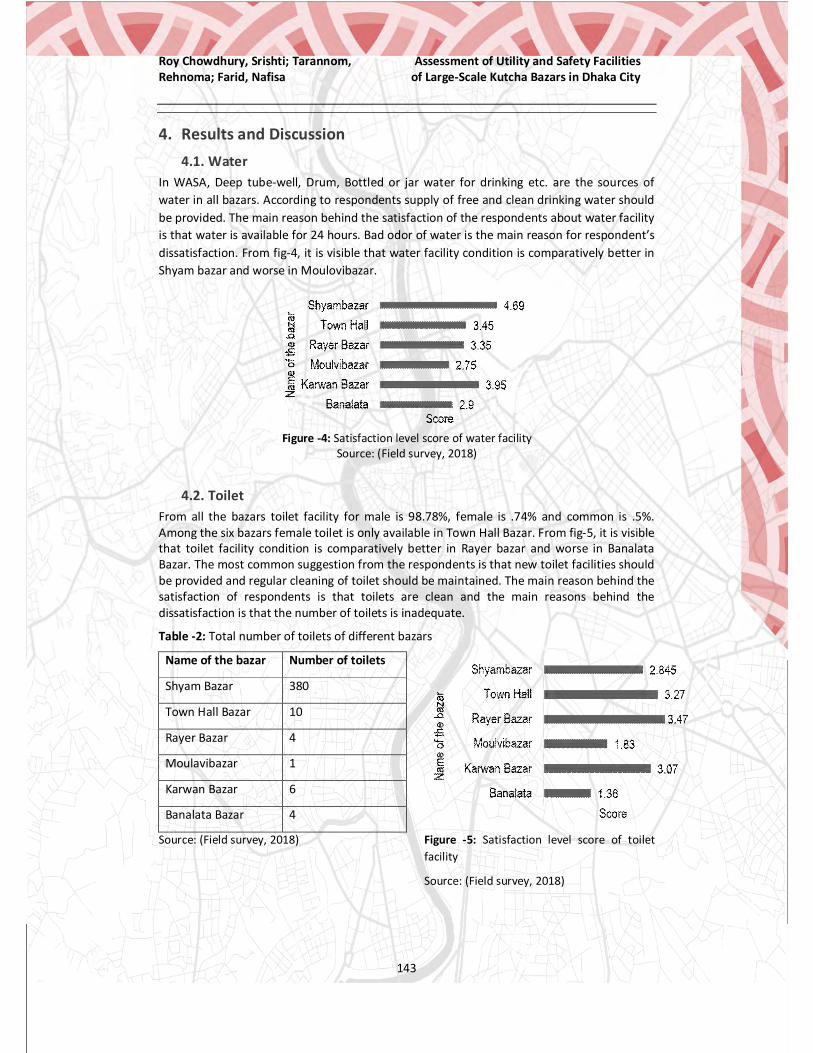
Roy Chowdhury, Srishti; Tarannom, Rehnoma; Farid, Nafisa
Assessment of Utility and Safety Facilities of Large-Scale Kutcha Bazars in Dhaka City
143
4. Results and Discussion 4.1. Water
In WASA, Deep tube-well, Drum, Bottled or jar water for drinking etc. are the sources of water in all bazars. According to respondents supply of free and clean drinking water should be provided. The main reason behind the satisfaction of the respondents about water facility is that water is available for 24 hours. Bad odor of water is the main reason for respondent’s dissatisfaction. From fig-4, it is visible that water facility condition is comparatively better in Shyam bazar and worse in Moulovibazar.
Figure -4: Satisfaction level score of water facility
Source: (Field survey, 2018)
4.2. Toilet From all the bazars toilet facility for male is 98.78%, female is .74% and common is .5%. Among the six bazars female toilet is only available in Town Hall Bazar. From fig-5, it is visible that toilet facility condition is comparatively better in Rayer bazar and worse in Banalata Bazar. The most common suggestion from the respondents is that new toilet facilities should be provided and regular cleaning of toilet should be maintained. The main reason behind the satisfaction of respondents is that toilets are clean and the main reasons behind the dissatisfaction is that the number of toilets is inadequate.
Table -2: Total number of toilets of different bazars
Name of the bazar Number of toilets
Shyam Bazar 380
Town Hall Bazar 10
Rayer Bazar 4
Moulavibazar 1
Karwan Bazar 6
Banalata Bazar 4
Source: (Field survey, 2018) Figure -5: Satisfaction level score of toilet facility
Source: (Field survey, 2018)

Roy Chowdhury, Srishti; Tarannom, Rehnoma; Farid, Nafisa
Assessment of Utility and Safety Facilities of Large-Scale Kutcha Bazars in Dhaka City
144
4.3. Gas Gas is not used in all the study area. Only gas cylinders are used in Banalata and Town Hall bazar but they have to pay high cost for the cylinder.
4.4. Drainage In Banalata and Shyam bazar there is both open and covered drain. In Karwan and Rayer bazar, the drains are covered and in Moulovi and Town Hall bazar, the drains are open. The most common suggestion from the respondents is that the drains should be cleaned regularly. From fig-6, it is visible that drainage facility condition is comparatively better in Shyam bazar and worse in Banalata Bazar. The main reason behind the satisfaction of the respondent is that drains are cleaned regularly and also the main reason behind the dissatisfaction is that drains are clogged and uncleaned in some bazars.
Figure -6: Satisfaction level score of Drainage facility
Source: (Field survey, 2018)
4.5. Electricity The main source of electricity in all bazars is DESA. Mostly used (84%) alternative source of electricity is generator. The most given suggestions from the respondents is that government should take proper steps to supply adequate electricity. From fig-7, it is visible that electricity facility condition is comparatively better in Karwan bazar and worse in Moulovibazar. The main reason behind the satisfaction of the respondents is the 24 hours supply of electricity or rare load shedding.
Figure -7: Satisfaction level score of Electricity facility
Source: (Field survey, 2018)
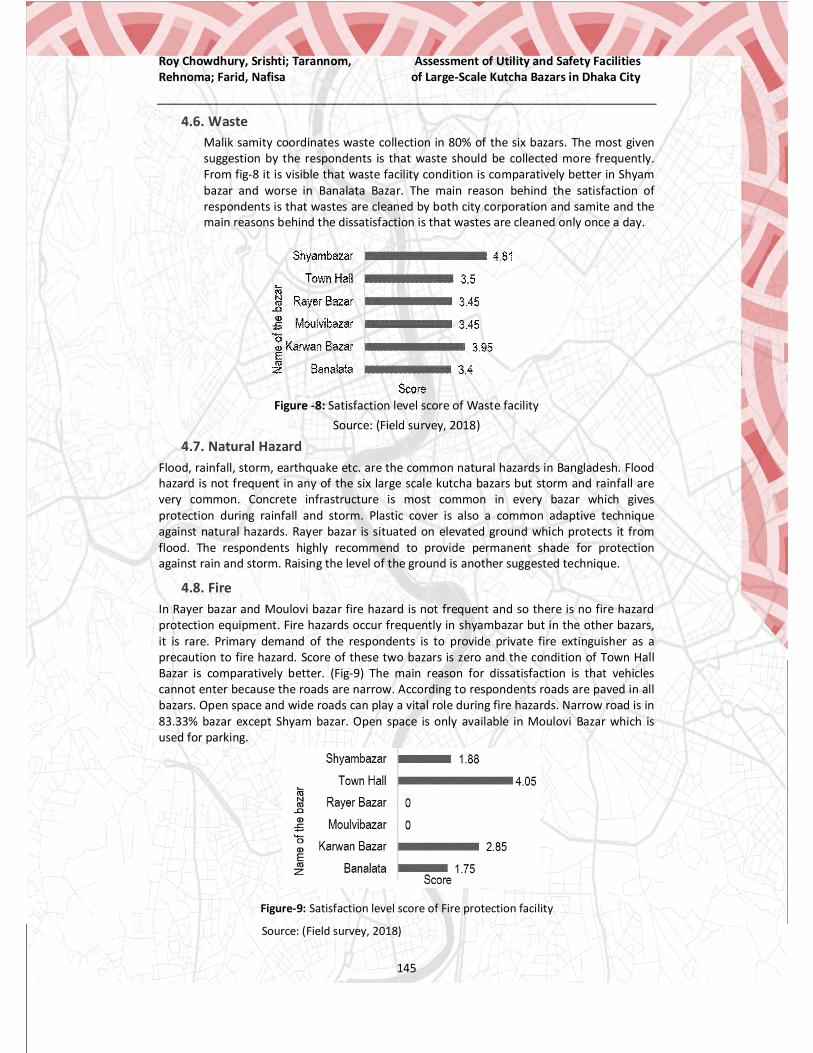
Roy Chowdhury, Srishti; Tarannom, Rehnoma; Farid, Nafisa
Assessment of Utility and Safety Facilities of Large-Scale Kutcha Bazars in Dhaka City
145
4.6. Waste Malik samity coordinates waste collection in 80% of the six bazars. The most given suggestion by the respondents is that waste should be collected more frequently. From fig-8 it is visible that waste facility condition is comparatively better in Shyam bazar and worse in Banalata Bazar. The main reason behind the satisfaction of respondents is that wastes are cleaned by both city corporation and samite and the main reasons behind the dissatisfaction is that wastes are cleaned only once a day.
Figure -8: Satisfaction level score of Waste facility Source: (Field survey, 2018)
4.7. Natural Hazard Flood, rainfall, storm, earthquake etc. are the common natural hazards in Bangladesh. Flood hazard is not frequent in any of the six large scale kutcha bazars but storm and rainfall are very common. Concrete infrastructure is most common in every bazar which gives protection during rainfall and storm. Plastic cover is also a common adaptive technique against natural hazards. Rayer bazar is situated on elevated ground which protects it from flood. The respondents highly recommend to provide permanent shade for protection against rain and storm. Raising the level of the ground is another suggested technique.
4.8. Fire In Rayer bazar and Moulovi bazar fire hazard is not frequent and so there is no fire hazard protection equipment. Fire hazards occur frequently in shyambazar but in the other bazars, it is rare. Primary demand of the respondents is to provide private fire extinguisher as a precaution to fire hazard. Score of these two bazars is zero and the condition of Town Hall Bazar is comparatively better. (Fig-9) The main reason for dissatisfaction is that vehicles cannot enter because the roads are narrow. According to respondents roads are paved in all bazars. Open space and wide roads can play a vital role during fire hazards. Narrow road is in 83.33% bazar except Shyam bazar. Open space is only available in Moulovi Bazar which is used for parking.
Figure-9: Satisfaction level score of Fire protection facility
Source: (Field survey, 2018)

Roy Chowdhury, Srishti; Tarannom, Rehnoma; Farid, Nafisa
Assessment of Utility and Safety Facilities of Large-Scale Kutcha Bazars in Dhaka City
146
4.9. Security Different types of crime occur in bazars such as theft, drug addict intruders, pick pocketing, extortion, harassment by transgender, gambling etc. The most given suggestion by the respondent is that more guards are required for security purpose. Overall security facility condition is satisfactory. From fig-10, it is visible that security facility condition is comparatively better in Town hall bazar and worse in Moulovi Bazar. The main reasons behind the satisfaction of the security system are that there are enough guards available and most of the bazars have CCTV there and the main reason behind the dissatisfaction is that guards and samity are inactive. Most of the buyer didn’t face any crime.
Figure -10: Satisfaction level score of Security facility
Source: (Field survey, 2018)
Table-3: Reasons behind satisfaction and dissatisfaction of utility facilities
Source: (Field survey, 2018)
Utility Facilities Reasons
Water Reason of satisfaction 24 hours availability of water
Reason of dissatisfaction Water is not drinkable
Toilet Reason of satisfaction Toilets are clean
Reason of dissatisfaction Inadequate number of toilets
Drainage Reason of satisfaction There is no water logging
Reason of dissatisfaction Unclean and clogged drains
Electricity Reason of satisfaction 24 hours availability of electricity
Reason of dissatisfaction Unavailability of alternative source of electricity
Waste Reason of satisfaction Waste are cleaned by both city corporation and malik samitee
Reason of dissatisfaction Waste are cleaned once a day
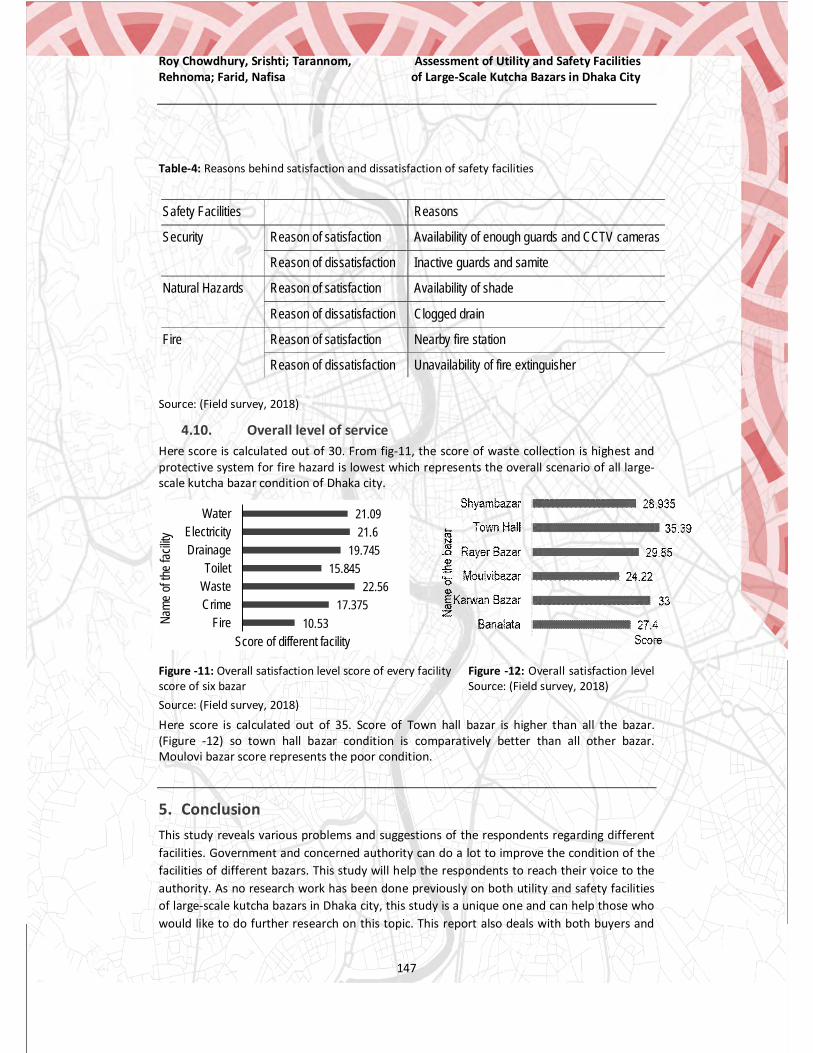
Roy Chowdhury, Srishti; Tarannom, Rehnoma; Farid, Nafisa
Assessment of Utility and Safety Facilities of Large-Scale Kutcha Bazars in Dhaka City
147
Table-4: Reasons behind satisfaction and dissatisfaction of safety facilities
Source: (Field survey, 2018)
4.10. Overall level of service Here score is calculated out of 30. From fig-11, the score of waste collection is highest and protective system for fire hazard is lowest which represents the overall scenario of all large-scale kutcha bazar condition of Dhaka city.
10.5317.375
22.5615.845
19.74521.621.09
FireCrimeWasteToilet
DrainageElectricity
Water
Score of different facility
Name
of th
e fac
ility
Figure -11: Overall satisfaction level score of every facility Figure -12: Overall satisfaction level score of six bazar Source: (Field survey, 2018) Source: (Field survey, 2018) Here score is calculated out of 35. Score of Town hall bazar is higher than all the bazar. (Figure -12) so town hall bazar condition is comparatively better than all other bazar. Moulovi bazar score represents the poor condition.
5. Conclusion This study reveals various problems and suggestions of the respondents regarding different facilities. Government and concerned authority can do a lot to improve the condition of the facilities of different bazars. This study will help the respondents to reach their voice to the authority. As no research work has been done previously on both utility and safety facilities of large-scale kutcha bazars in Dhaka city, this study is a unique one and can help those who would like to do further research on this topic. This report also deals with both buyers and
Safety Facilities Reasons
Security Reason of satisfaction Availability of enough guards and CCTV cameras
Reason of dissatisfaction Inactive guards and samite
Natural Hazards Reason of satisfaction Availability of shade
Reason of dissatisfaction Clogged drain
Fire Reason of satisfaction Nearby fire station
Reason of dissatisfaction Unavailability of fire extinguisher
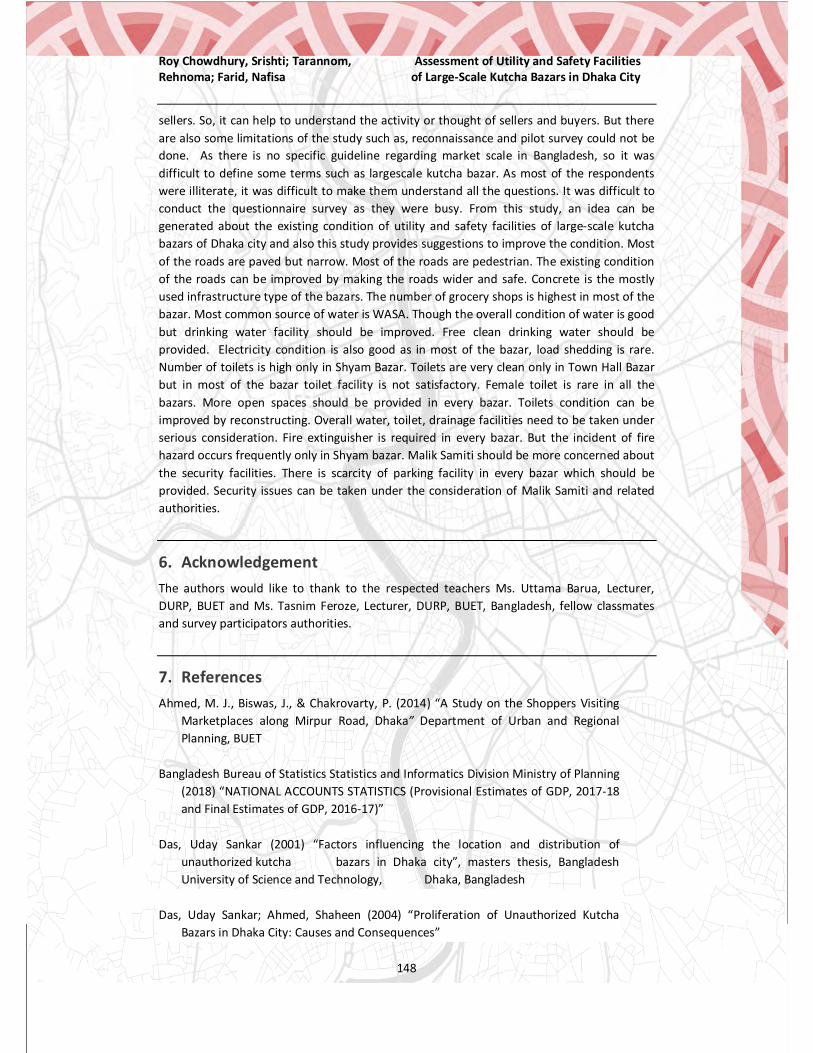
Roy Chowdhury, Srishti; Tarannom, Rehnoma; Farid, Nafisa
Assessment of Utility and Safety Facilities of Large-Scale Kutcha Bazars in Dhaka City
148
sellers. So, it can help to understand the activity or thought of sellers and buyers. But there are also some limitations of the study such as, reconnaissance and pilot survey could not be done. As there is no specific guideline regarding market scale in Bangladesh, so it was difficult to define some terms such as largescale kutcha bazar. As most of the respondents were illiterate, it was difficult to make them understand all the questions. It was difficult to conduct the questionnaire survey as they were busy. From this study, an idea can be generated about the existing condition of utility and safety facilities of large-scale kutcha bazars of Dhaka city and also this study provides suggestions to improve the condition. Most of the roads are paved but narrow. Most of the roads are pedestrian. The existing condition of the roads can be improved by making the roads wider and safe. Concrete is the mostly used infrastructure type of the bazars. The number of grocery shops is highest in most of the bazar. Most common source of water is WASA. Though the overall condition of water is good but drinking water facility should be improved. Free clean drinking water should be provided. Electricity condition is also good as in most of the bazar, load shedding is rare. Number of toilets is high only in Shyam Bazar. Toilets are very clean only in Town Hall Bazar but in most of the bazar toilet facility is not satisfactory. Female toilet is rare in all the bazars. More open spaces should be provided in every bazar. Toilets condition can be improved by reconstructing. Overall water, toilet, drainage facilities need to be taken under serious consideration. Fire extinguisher is required in every bazar. But the incident of fire hazard occurs frequently only in Shyam bazar. Malik Samiti should be more concerned about the security facilities. There is scarcity of parking facility in every bazar which should be provided. Security issues can be taken under the consideration of Malik Samiti and related authorities.
6. Acknowledgement The authors would like to thank to the respected teachers Ms. Uttama Barua, Lecturer, DURP, BUET and Ms. Tasnim Feroze, Lecturer, DURP, BUET, Bangladesh, fellow classmates and survey participators authorities.
7. References Ahmed, M. J., Biswas, J., & Chakrovarty, P. (2014) “A Study on the Shoppers Visiting
Marketplaces along Mirpur Road, Dhaka” Department of Urban and Regional Planning, BUET
Bangladesh Bureau of Statistics Statistics and Informatics Division Ministry of Planning
(2018) “NATIONAL ACCOUNTS STATISTICS (Provisional Estimates of GDP, 2017-18 and Final Estimates of GDP, 2016-17)”
Das, Uday Sankar (2001) “Factors influencing the location and distribution of
unauthorized kutcha bazars in Dhaka city”, masters thesis, Bangladesh University of Science and Technology, Dhaka, Bangladesh
Das, Uday Sankar; Ahmed, Shaheen (2004) “Proliferation of Unauthorized Kutcha
Bazars in Dhaka City: Causes and Consequences”
Roy Chowdhury, Srishti; Tarannom, Rehnoma; Farid, Nafisa
Assessment of Utility and Safety Facilities of Large-Scale Kutcha Bazars in Dhaka City
149
Electronic Code of Federal Regulations (2000) “Title 24 - Housing and Urban
Development”
Hussain, Sayed Sarwer; Leishman, David (2013) “ASSESSMENTS OF COMMODITY AND TRADE ISSUES MADE BY USDA STAFF AND NOT NECESSARILY STATEMENTS OF OFFICIAL U.S. GOVERNMENT POLICY”, Global Agricultural Information Network, BG3014
Huq, Zubair (2017) “Prevent food adulteration”, The Daily Star, daily newspaper,
https://www.thedailystar.net/letters/prevent-food-adulteration-1375891
Rabbi, Arifur Rahman (2017) “Fire Breaks Out at Khilkhet Modhopara Bazar in Dhaka”, Dhaka Tribune, online paper published at 28th February, 2017, https://www.dhakatribune.com/bangladesh/dhaka/2017/02/28/fire-khilkhet-modhopara-dhaka
Raju, Sangani Naga; Bhuyan, Prasanta Kumar (2015) “Qualitative and quantitative
estimation of pedestrian level of service at signalized intersection”, masters thesis, Department of Civil Engineering National Institute of Technology Rourkela-769008.
Tuli, Samina Mazumder; Islam, Nazmul (2014). “Analysis on design approach of
wholesale market In Dhaka City”, European Scientific Journal March 2014 edition, vol.10, No.9 (March)
USLegal, Public Safety Law and Legal Definition, Oregon Revised Statutes
Wasim, Jaher; Nine, AKM Hasan Julker (2017) “P RESENT OUTLOOK OF SUSTAINABLE
SOLID WASTE MANAGEMENT: A CASE STUDY OF DHAKA” Proceedings of the WasteSafe 2017 – 5th International Conference on Solid Waste Management in South Asian Countries 25-27 February 2017, Khulna, Bangladesh.
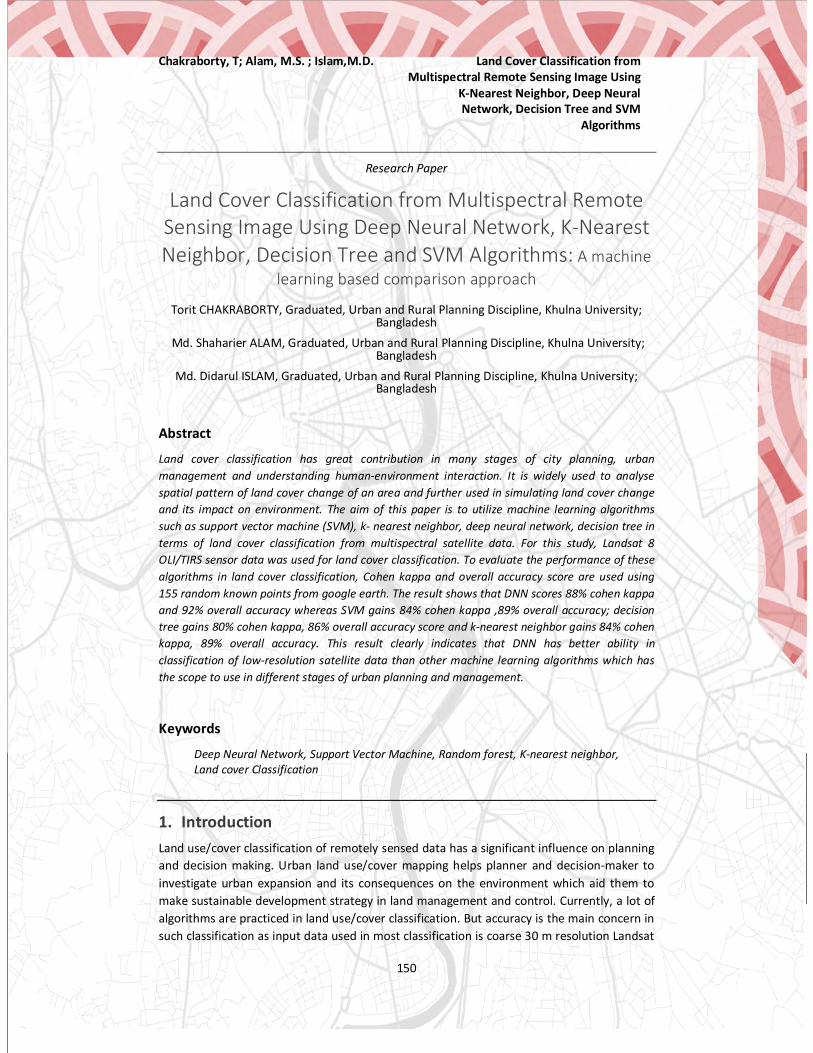
Chakraborty, T; Alam, M.S. ; Islam,M.D. Land Cover Classification from Multispectral Remote Sensing Image Using
K-Nearest Neighbor, Deep Neural Network, Decision Tree and SVM
Algorithms
150
Research Paper
Land Cover Classification from Multispectral Remote Sensing Image Using Deep Neural Network, K-Nearest Neighbor, Decision Tree and SVM Algorithms: A machine
learning based comparison approach
Torit CHAKRABORTY, Graduated, Urban and Rural Planning Discipline, Khulna University; Bangladesh
Md. Shaharier ALAM, Graduated, Urban and Rural Planning Discipline, Khulna University; Bangladesh
Md. Didarul ISLAM, Graduated, Urban and Rural Planning Discipline, Khulna University; Bangladesh
Abstract
Land cover classification has great contribution in many stages of city planning, urban management and understanding human-environment interaction. It is widely used to analyse spatial pattern of land cover change of an area and further used in simulating land cover change and its impact on environment. The aim of this paper is to utilize machine learning algorithms such as support vector machine (SVM), k- nearest neighbor, deep neural network, decision tree in terms of land cover classification from multispectral satellite data. For this study, Landsat 8 OLI/TIRS sensor data was used for land cover classification. To evaluate the performance of these algorithms in land cover classification, Cohen kappa and overall accuracy score are used using 155 random known points from google earth. The result shows that DNN scores 88% cohen kappa and 92% overall accuracy whereas SVM gains 84% cohen kappa ,89% overall accuracy; decision tree gains 80% cohen kappa, 86% overall accuracy score and k-nearest neighbor gains 84% cohen kappa, 89% overall accuracy. This result clearly indicates that DNN has better ability in classification of low-resolution satellite data than other machine learning algorithms which has the scope to use in different stages of urban planning and management.
Keywords
Deep Neural Network, Support Vector Machine, Random forest, K-nearest neighbor, Land cover Classification
1. Introduction Land use/cover classification of remotely sensed data has a significant influence on planning and decision making. Urban land use/cover mapping helps planner and decision-maker to investigate urban expansion and its consequences on the environment which aid them to make sustainable development strategy in land management and control. Currently, a lot of algorithms are practiced in land use/cover classification. But accuracy is the main concern in such classification as input data used in most classification is coarse 30 m resolution Landsat

Chakraborty, T; Alam, M.S. ; Islam,M.D. Land Cover Classification from Multispectral Remote Sensing Image Using
K-Nearest Neighbor, Deep Neural Network, Decision Tree and SVM
Algorithms
151
TM or OLI/TIRS data. So, only a few of these algorithms can address better accuracy in terms of this coarse resolution data. There are some popular algorithms for land cover classification such as support vector machine (SVM) (Thai, L., et al., 2012; Ustuner, M., et al., 2015), decision tree (Punia, M., et al., 2011; Torma, M., 2013), k-nearest neighbor (Samaniego, L., & Schulz, K., 2009) artificial neural network (ANN) (Yuan, H., et al., 2009) etc. SVM actually a non-parametric classifier which was first proposed by Vapnik and Chervonenkis (Vapnik, N., and Chervonenkis, A., 1971). SVM has been successfully used for remote sensing data classification. An SVM aims to fit an optimal separating hyperplane or set of hyperplanes in a high or infinite-dimensional space, to locate the optimal boundaries between classes. Linearly separable classes can be used to train SVM. The main limitation of the SVM approach in the application of classification lies in the choice of the kernel and another is speed and size, both in training and testing (Burges, C., J., C., 1998). K-nearest neighbor is also a non-parametric method mostly used in classification and regression (Altman, N., S., 1992). In classification, K closest training samples used as input in feature class where output is also class that classified by a majority vote of its neighbors., the most common class among its k nearest neighbor attached as assigned object.The background principle is to find the closest training(predefined) sample based on distance and predict the level of that. The main limitation of this algorithm is to determine the value of parameter K (number of nearest neighbors). Besides, which type of distance to use and which attribute to use to produce the best results are not clear in this algorithm. Decision tree also a non-parametric supervised learning method used for classification and regression which performance is massively investigated in machine learning and data mining (Quinlan, 1986). In decision analysis, a decision tree can be used to visually and explicitly represent decision and decision making. Actually, decision tree is a schematic, tree-shaped diagram used to determine a course of action or show a statistical probability (Staff, 2017). The tree is structured to show how and why one choice may lead to the next, with the use of the branches indicating each option is mutually exclusive (Staff, 2017). The limitation of the decision tree is extremely overfitting in training data and a slight change in data can result in a drastically different tree.
In the 1940s, Warren McCulloch and Walter Pitts showed that networks of artificial neurons could, in principle, compute any arithmetic or logical function (Hagan et al. 2014). After that, the practical application of artificial neural networks along with the concept of perception network and associated learning came. (Hagan et al. 2014). It is also known as single-layer perceptron network. This network could solve only linearly separable problems. In 1980s, the discovery of the backpropagation algorithm for training multilayer perceptron networks overcomes these limitations. Artificial neural network (ANN) is mainly a parallel operating system of many functions which is determined or controlled by its network structure, connection strength, and nodes (Cheng, 2003). These networks are intended to mimic the way humans solve problems through a series of repeated observations between neurons and synapses within the brain (Thakkudan, 2008). Each time data is feedforward and then backpropagated iteratively through the network (known as a cycle) error is reduced (Pijanowski et al, 2005). Application of Neural Network is simple form mathematical point of view. Because the input data sets are randomly weighted for input nods and readjust the recalculated weight according to error and thus minimize error automatically.

Chakraborty, T; Alam, M.S. ; Islam,M.D. Land Cover Classification from Multispectral Remote Sensing Image Using
K-Nearest Neighbor, Deep Neural Network, Decision Tree and SVM
Algorithms
152
Feed-forward network:
a=⨍ ( ) …………………………………………………..(1)
Activation Function:
⨍(x)= ………………………………………………………(2)
Adjust weight through backpropagation algorithms:
W(n+1) =W(n)+ƞ[d(n)-y(n)]x(n) ……………………………………………………………..(3)
The most popular neural network is multilayer perceptron neural network consisting input layer, hidden layer, and output layer. The input (X) variables are feed-forwarded through the node where it is multiplied by the random weight (W) and then added to bias (b). Then all are summed in summing node that is known as net input and it is forward through activation function which turns the net input into binary value 0 and 1 or multiple categories. The output (yn) is subtracted from desired or target output (dn) which is known as error correction. According to error, the weight is readjusted through backpropagation algorithms. This process is repeated until error minimized.
Actually, there are two types of multilayer perceptron neural network. These are a) Non-deep feedforward neural network and b) Deep neural network. Currently, deep neural network (DNN) is a popular term in image classification, facial recognition, and others. Simple non-deep neural network uses a single hidden layer but a deep neural network uses multiple hidden layers. The deep neural network also uses the same feedforward backpropagation algorithm like non-deep feedforward neural network. The advantage of using deep neural network over non-deep feedforward neural network is that it has the ability to address complex non-linearity. The main limitation of the deep neural network is overfitting and underfitting on training data. Srivastava, et al., (2014) proposed a method dropout of nodes in the hidden layer which shows significant improvement of the performance of DNN in training and validation.
2. Materials and Methods 2.1. Study area The study area selected for this research is Khulna city and its surrounding area, located in Khulna district of Bangladesh which is the third-largest city of Bangladesh and located in the southwestern part of the country. The city is important for the country’s economy due to its strategic location. Because it is located close to the second largest seaport of Bangladesh namely Mongla seaport and gateway of the world’s largest tract of mangrove forest, the Sundarbans. Besides, it is one of the key hubs of shrimp processing and export of Bangladesh and has a strong industrial and commercial base.

Chakraborty, T; Alam, M.S. ; Islam,M.D. Land Cover Classification from Multispectral Remote Sensing Image Using
K-Nearest Neighbor, Deep Neural Network, Decision Tree and SVM
Algorithms
153
Figure 1: Study area
2.2. Data acquisition In this research, Landsat TM sensor data was used for land cover classification. The study area lies in a single path and row of Landsat image (path 137, row 44). The cloud-free Landsat TM data of 2011 was downloaded from USGS earth explorer. The data was acquired for the dry season in between November to January to avoid unwanted seasonal variation which may affect the classification.
2.3. Image Processing After downloading from the USGS Earth Explorer, the raw file was processed to further use. To get the multispectral image of 2011, all the layers were combined by using layer stacking function in ERDAS Imagine software. Then the area of interest was collected from multispectral image data and subset. Data of all seven bands were used in training samples as input in DNN, SVM, KNN, Decision tree. A total of 5652 pixels were collected for four class namely 1) Agriculture & vacant 2) Built-up 3) Wetland and 4) River & Waterbody. So, for 7 bands, total 5652×7 pixels matrix generated which was input matrix for training and total 139769 pixels (139769×7 matrix for 7 bands) would be used for classification.

Chakraborty, T; Alam, M.S. ; Islam,M.D. Land Cover Classification from Multispectral Remote Sensing Image Using
K-Nearest Neighbor, Deep Neural Network, Decision Tree and SVM
Algorithms
154
2.4. Data Preparation for Classifiers In this research, the land cover classification was conducted using multiple software in different stages. According to the machine learning approach, for image classification, the classifiers need training data to classify the whole data based on the extensive learning from the training datasets. So, training samples were extracted from the image using ArcGIS 10.5 software. Image dataset is 8 bits, so all input pixel’s value lies between range 0-255. These pixels values are normalized to 0-1 using equation-
X= (x - x.min) / (x.max – x.min) ……………………………………..… (4)
The target pixels values were 4 class, so it was converted to binary category class using One Hot Encoding. This binary category class was used in the network as a target variable. The network architecture was used in training was 1 input layer, 2 hidden layers with 60 nodes and 120 nodes and 2 dropout layers where 20% nodes were dropped and 1 output layer with 4 nodes. Rectified linear unit (RELU) was used as the activation function in the hidden layer which has an advantage in vanishing gradient problem in neural network and SoftMax activation function used in output layer for the multiclass problem in output. All the machine learning algorithms (DNN, SVM, Decision-Tree, KNN) were performed to classify using Anaconda Python environment.
2.5. Validation Techniques To validate model performance three validation techniques Cohen kappa (Shao et al.2012), overall accuracy (Roy et al. 2015) and precision score were used. Cohen kappa measures the inter-rater agreement of category items. The equation of Cohen kappa is-
K=(Po-Pe)/(1-Pe) ………………………………………………………….…… (5)
Where, Po = relative observed agreement among raters and Pe = the hypothetical probability of chance agreement. The kappa values 1 represent the complete agreement between two raters Overall accuracy is the sum of correctly predicted samples divided by a total number of test samples. Equation of overall accuracy is -
Overall accuracy= o / n ………………………………………………………. (6)
Where, o = number of correctly predicted samples observed and n = total number of test samples.
The precision score is the ratio of tp/(tp + fp) ……………………….(7)
where tP is the number of true positives and fp is the number of false positive. Precision score 1 indicates completely precise prediction and 0 indicate there is no precision.

Chakraborty, T; Alam, M.S. ; Islam,M.D. Land Cover Classification from Multispectral Remote Sensing Image Using
K-Nearest Neighbor, Deep Neural Network, Decision Tree and SVM
Algorithms
155
3. Analysis and Results Input data was divided into 300 small batches and run through the network with 50 epochs. Each epoch means one forward pass and one backward pass of all batches through the network. After completing the training stage, model accuracy goes up to 98.37% and model error goes down to 6.4%.
Then the original dataset 139769×7 pixels matrix run through this trained network and the model output was the classified image which was reshaped to the shape of the actual area of interest. Later this array was converted to tiff file format and exported. To compare this model performance with support vector machine (SVM), decision tree and k-nearest neighbor same sample data run though these algorithms for training and same original dataset run through these trained models and similarly exported the classified output to tiff file format. To validate these model’s accuracy, 155 random points generated on the classified images which contain classified information. These points were then observed with the actual ground scenario of google earth historical imagery 2011. Then observed truth value of these points were collected and stored in a shapefile format. Later these 155 points observed truth values and class values were analyses using cohen kappa statistics, overall accuracy, and precision score. The below tables show error matrix, cohen kappa score, overall accuracy and the precision score of classified image for DNN, SVM, decision tree and k-nearest neighbor algorithm.
Table 1. Error matrix for DNN:
Error matrix Observed Total
Clas
sifie
d
DNN Wetland River Built up Agriculture & Vacant Wetland 30 0 1 2 33
River 0 47 9 0 56 Built up 1 0 57 0 58
Agriculture & Vacant
0 0 0 8 8
Total
31 47 67 10 155
Figure 2. a) model accuracy b) model error (loss) in total 50 epochs

Chakraborty, T; Alam, M.S. ; Islam,M.D. Land Cover Classification from Multispectral Remote Sensing Image Using
K-Nearest Neighbor, Deep Neural Network, Decision Tree and SVM
Algorithms
156
Table 2. Error matrix for SVM:
Table 3. Error matrix for Decision Tree:
Table 4. Error matrix for K-nearest neighbor:
Table 5. Validation results of classification algorithms
Validation Method DNN SVM K-nearest neighbor
Decision tree
Cohen Kappa (%) 88 84 84 80
Overall Accuracy (%) 92 89 89 86
Precision Score (%) 93 90 90 88
Error matrix Observed Total
Clas
sifie
d
SVM Wetland River Built up Agriculture & Vacant Wetland 30 2 1 3 36
River 0 42 7 0 49 Built up 1 3 59 0 63
Agriculture & Vacant
0 0 0 7 7
Total
31 47 67 10 155
Error matrix Observed Total
Clas
sifie
d
Decision Tree Wetland River Built up Agriculture & Vacant Wetland 30 3 4 2 39
River 0 35 2 0 37 Built up 1 9 61 0 71
Agriculture & Vacant
0 0 0 8 8
Total
31 47 67 10 155
Error matrix Observed
Total
Clas
sifie
d
K-nearest neighbor
Wetland River Built up Agriculture & Vacant
Wetland 27 0 1 3 31 River 1 44 6 0 51
Built up 3 3 60 0 66 Agriculture &
Vacant 0 0 0 7 7
Total
31 47 67 10 155
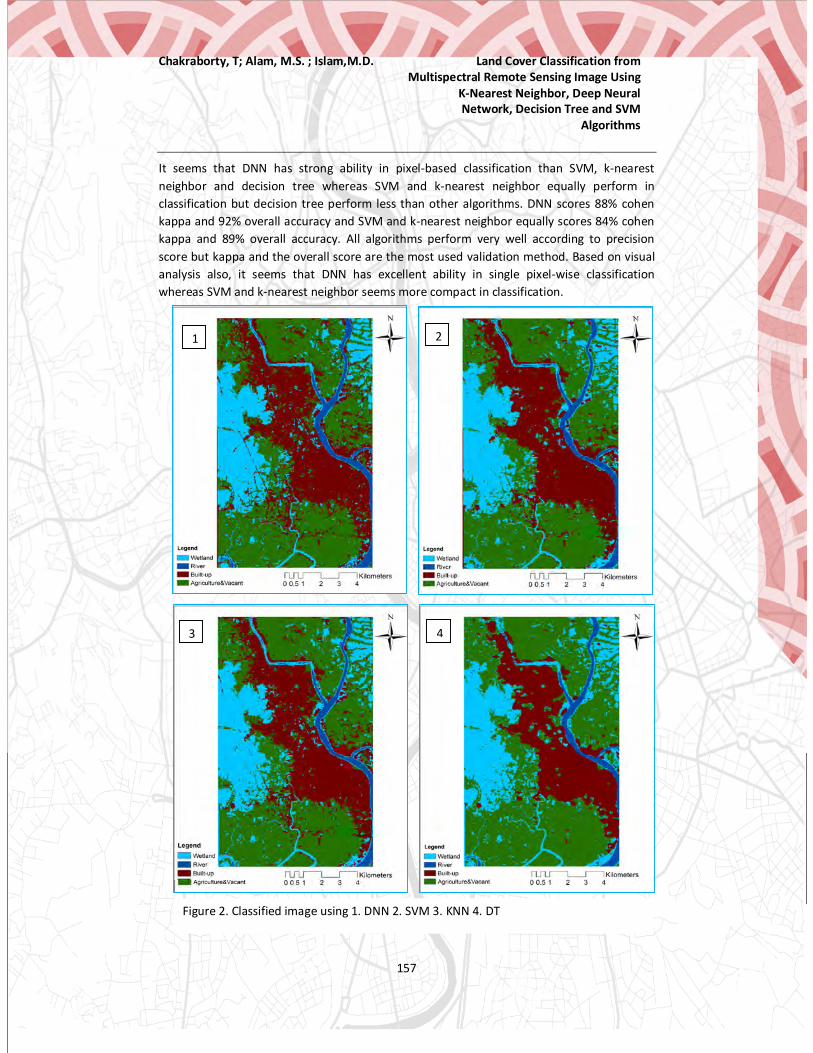
Chakraborty, T; Alam, M.S. ; Islam,M.D. Land Cover Classification from Multispectral Remote Sensing Image Using
K-Nearest Neighbor, Deep Neural Network, Decision Tree and SVM
Algorithms
157
It seems that DNN has strong ability in pixel-based classification than SVM, k-nearest neighbor and decision tree whereas SVM and k-nearest neighbor equally perform in classification but decision tree perform less than other algorithms. DNN scores 88% cohen kappa and 92% overall accuracy and SVM and k-nearest neighbor equally scores 84% cohen kappa and 89% overall accuracy. All algorithms perform very well according to precision score but kappa and the overall score are the most used validation method. Based on visual analysis also, it seems that DNN has excellent ability in single pixel-wise classification whereas SVM and k-nearest neighbor seems more compact in classification.
Figure 2. Classified image using 1. DNN 2. SVM 3. KNN 4. DT
1 2
43

Chakraborty, T; Alam, M.S. ; Islam,M.D. Land Cover Classification from Multispectral Remote Sensing Image Using
K-Nearest Neighbor, Deep Neural Network, Decision Tree and SVM
Algorithms
158
4. Conclusion In this paper, DNN applied in low resolution 30 m satellite image classification and the result is compared with other image classification algorithms such as SVM, k-nearest neighbor, and decision tree. Based on a statistical analysis of results, it can be concluded that DNN can be a better alternative method for image classification especially for low-resolution satellite image classification where it performs better than other methods. DNN has some limitation including overfitting on training data and parameterization. To combat overfitting 20% nodes in hidden layers dropped which make the network not to read 20% nodes weights in weight readjustment in the time of forward pass and backward pass. This way network will fight for overfitting. For the parameterization, trial and error method was used to set parameters. If these parameters properly set and other minor limitation can overcome, DNN can be a powerful algorithm for machine learning and land use/cover classification. So, this algorithm can be used to classify land cover from satellite image by which it can be a tremendous support for working further on land cover change, land-use modeling, land cover prediction, urban planning and management, etc.
5. References Thai, L., Hai, T. and Thuy, N. (2012). Image Classification using Support Vector Machine and
Artificial Neural Network. International Journal of Information Technology and Computer Science, 4(5), pp.32-38.
Ustuner, M., Sanli, F.B. and Dixon, B., 2015. Application of support vector machines for landuse classification using high-resolution RapidEye images: a sensitivity analysis. European Journal of Remote Sensing, 48(1), pp.403-422.
Punia, M., Joshi, P.K. and Porwal, M.C., 2011. Decision tree classification of land use land cover for Delhi, India using IRS-P6 AWiFS data. Expert systems with Applications, 38(5), pp.5577-5583.
Törmä, M., 2013. Land cover classification of FINNISH LAPLAND using decision tree classification algorithm. The photogrammetric Journal of Finland, 23(2).
Demuth, H.B., Beale, M.H., De Jess, O. and Hagan, M.T., 2014. Neural network design. Martin Hagan.
Thekkudan, T.F., 2008. Calibration of an Artificial Neural Network for Predicting Development in Montgomery County, Virginia: 1992-2001 (Doctoral dissertation, Virginia Tech).
Cheng, J., 2003. Modelling spatial and temporal urban growth. Utrecht University.

Chakraborty, T; Alam, M.S. ; Islam,M.D. Land Cover Classification from Multispectral Remote Sensing Image Using
K-Nearest Neighbor, Deep Neural Network, Decision Tree and SVM
Algorithms
159
Pijanowski, B.C., Pithadia, S., Shellito, B.A. and Alexandridis, K., 2005. Calibrating a neural network‐based urban change model for two metropolitan areas of the Upper Midwest of the United States. International Journal of Geographical Information Science, 19(2), pp.197-215.
Yuan, H., Van Der Wiele, C. and Khorram, S., 2009. An automated artificial neural network system for land use/land cover classification from Landsat TM imagery. Remote Sensing, 1(3), pp.243-265.
Vapnik, V.N. and Chervonenkis, A.Y., 2015. On the uniform convergence of relative frequencies of events to their probabilities. In Measures of complexity (pp. 11-30). Springer, Cham.
Altman, N.S., 1992. An introduction to kernel and nearest-neighbor nonparametric regression. The American Statistician, 46(3), pp.175-185.
Quinlan, J.R., 1986. Induction of decision trees. Machine learning, 1(1), pp.81-106.
Staff, I.,2017. Decision Tree. Investopedia. Retrieved 7 November 2017, from http://www.investopedia.com/terms/d/decision-tree.asp
Srivastava, N., Hinton, G., Krizhevsky, A., Sutskever, I. and Salakhutdinov, R., 2014. Dropout: a simple way to prevent neural networks from overfitting. The journal of machine learning research, 15(1), pp.1929-1958.
Samaniego, L. and Schulz, K., 2009. Supervised classification of agricultural land cover using a modified k-NN technique (MNN) and Landsat remote sensing imagery. Remote Sensing, 1(4), pp.875-895.
Burges, C.J., 1998. A tutorial on support vector machines for pattern recognition. Data mining and knowledge discovery, 2(2), pp.121-167.
Shao, Y. and Lunetta, R.S., 2012. Comparison of support vector machine, neural network, and CART algorithms for the land-cover classification using limited training data points. ISPRS Journal of Photogrammetry and Remote Sensing, 70, pp.78-87.
Roy, S., Farzana, K., Papia, M. and Hasan, M., 2015. Monitoring and prediction of land use/land cover change using the integration of Markov chain model and cellular automation in the Southeastern Tertiary Hilly Area of Bangladesh. Int. J. Sci. Basic Appl. Res, 24, pp.125-148.

Housing and Community planning - Environmental management -Sustainable Cities and Settlements
Eighteen papers under the theme “Housing and Community Planning- Environmental Management- Sustainable Cities and Settlement” were presented in two days in “Session-2”. A very brief substance of each paper is given in the bellow:
1. Presentation by Md. Ataher Ali Lipu and Mohiuddin Ekram investigates the spatial variations of water quality in the water distribution network of Khulna WASA. Various parameters of physical and chemical parameters were test to know the water quality and spatial variations. This paper recommends providing standard quality water in the distribution network, and installation of low cost treatment plants in the outlet of household distribution.
2. The paper, by Rashe Dun Nabi and others, presents a comprehensive environmental impact assessment of the potential impacts associated with the 3D Seismic Survey which will be carried by Bangladesh Petroleum Exploration & Production Company Ltd. (BAPEX) at Semutang Gas Field (250 sq km). This study recommends a mitigation plan to reduce the potential negative impacts for this 3D Seismic survey.
3. Researcher Md. Nazmul Haque and Md. Burhan Uddin Riyadh present the current status and analysis of future forecasting of community household waste generation scenario of Khulna City Corporation. Further following scientific models and GIS techniques, authors determine the suitable locations for the waste dumping.
4. Paper of Abdulla - Al Kafy and others shows a mechanism of effective environmental management by using GIS and RS to maintain sustainable ecosystem and biodiversity in Cumilla city. This study estimates the different Land Use/Land Cover indexes to measure the environmental condition in CCC area and thus provides a solution for better environmental planning and management.
5. Fawzia Farzana presents a global and local picture how neoliberal policies have shaped the housing provision system worldwide where private market has been considered the absolute provider of housing for all income groups. Her study also shows the impacts of neoliberal policies on housing provision in Dhaka that ultimately resulted in acute housing affordability crisis for limited income households.
6. Prottusha Mondol and others explore the possibility of corporatisation of Faecal Sludge Management (FSM) in Khulna city and recognize it as a solution to the current failures and poor service management by the municipalities. This paper emphasizes converting FSM into a profitable business entity approximating the private sector model of incorporation within the context of public ownership.

7. Abdulla – Al Kafy and others study to find out the satisfaction level (SL) of different RA of Rajshahi city based on the resident’s perception of living in those areas. Researchers measure the satisfaction level by studying the physical environment, social environment and community facilities of the residential areas.
8. Aftabun Nahar and others present their paper that finds out the trend of agricultural land transformation in Harian union, Paba, Rajshahi. Research was conducted through PRA and focus group discussion with the people of the study area. This paper reveals return from the agricultural activities in compare to brick kiln and fisheries force them to transform their land use which will affect food security and environment soon.
9. Abdullah Al Faisal and others present a paper that assesses the extent of water and land degradation due to human settlements at Modhumoti Model Town using Geographic Information System (GIS) and Remote Sensing (RS) approaches. It also shows the process of encroachment on wetland and captures the consequence of law violence.
10. Be-Nozir Shah Shovon and Mithila Senjuti present a comparative study on household savings of residences living in Planned and unplanned residential area of Khulna city. This paper shows that income and house rent are much higher in planned area than that of unplanned area but average propensity to savings of unplanned area is quiet close to planned area though their income level is lower than planned area dwellers.
11. R. Mahmood and others present their paper that assesses the existing housing condition of two rural areas Rajshahi and Natore of Bangladesh and its trend of changing the settlement pattern. Participatory Rural Appraisal (PRA) tools i.e. focus group discussion, transect walk and direct observation, key informant Interview etc were used to know about the housing condition and changes in the settlement pattern of study area.
12. Md. Abdul Fattah and others identify the different types of land uses, their change directions and change flow and then to evaluate the mixed land use development at Nirala, in Khulna City. They use satellite images and GIS tools to know the the site and Land Use Change (LUC) and LUC direction.
13. The Paper of Sharmin Nahar and Anisha Noori Kakon examines the physical environment of Uttara-Sector 13 on basis of land use, FAR, maximum ground coverage, setbacks, building height, community facilities, and road width etc. Later, the analyzed data has been compared with the provisions of Dhaka Metropolitan Building Construction Rules, 2008.

14. The Paper of Navira Azmi and others assesses the risk perception of people living in Mohammadpur thana area of Dhaka city. It focuses the risk elements and the perception of the urban people to combat hazards in their locality. It finds possible ways to manage probable urban hazards by identifying vulnerable constructions and available services nearby and proposes some recommendations to reduce existing vulnerabilities and increased preparedness.
15. The Paper of Md. Muntasir Mamun and others examines the possible effects of revitalization of Dhaka old central jail after being shift from present location. It finds that conversion of the old central jail into a public space will expedite a possibility of opening up a congested area which will require possible ways to guide new developments and community facilities through urban regeneration.
16. Mainuddin Patwary and others examine the “ecosystem services” value of Khulna city to understand the urban-environment interactions which are important for urban sustainability. Paper advocates that quantification and integration of ecosystem services in the planning process are essential to promote sustainable development of cities. It can be achieved through enforcement of proper land use regulations and land use plan.
17. Paper of Iqbal Habib and others explores a new mechanism for providing affordable housing for the low income people of Dhaka city as it is concern issue of National Housing Policy.With an empirical exercise, It analyzes the feasibility and prospects of affordable and sustainable housing for the people of informal settlements for the amount of rent they currently pay.
18. Faysal Kabir Shuvo and Md. Rabiul Awal identify Urban Green Spaces (UGS) as a great health and wellbeing resource for the ageing population of city. Aiming to promote UGS, they explore the health potentials of UGS with their barriers and opportunities in Dhaka city. This paper suggests that investment on revitalizing, renovating and redeveloping neighbourhood parks and playgrounds can return better public health benefits and reduce a huge amount of medical costs for the ageing population.
- Dr. Akter Mahmud
General Rapporteur

Lipu A. A. and Ekram K. M. M. Assessing the Spatial Variations of Supplied Drinking Water Quality of Khulna WASA, Bangladesh
160
Research Paper / Case Study Paper
Assessing the Spatial Variations of Supplied Drinking Water Quality of Khulna WASA, Bangladesh
Md. Ataher Ali Lipu1, Khondaker Mohammed Mohiuddin Ekram2
1Graduate Student, Department of Urban and Regional Planning, Khulna University of Engineering & Technology, Khulna-9203, Bangladesh.
2Lecturer, Department of Urban and Regional Planning, Khulna University of Engineering & Technology, Khulna-9203. Bangladesh.
Abstract
Khulna city dwellers are suffering from scarcity of safe drinking water. To overcome this crisis, KWASA is suppling water to Khulna city through a water distribution network. The purpose of this study was to investigate the spatial variations of water quality in the water distribution network of Khulna Water Supply & Sewerage Authority (KWASA). Samples were collected from 14 predetermined sample points of KWASA water distribution network in six selected wards of KCC. Various physical and chemical parameters like pH, Color, Turbidity, Chloride, Iron, TS, TDS, Alkalinity, Hardness, FC and TC have been tested in the laboratory. Geographic Information System (GIS) based supplied water quality mapping in the form of visually variation maps was developed to delineate spatial distribution in physicochemical and microbial characteristics of supplied water samples. Also, Water Quality Index (WQI) was calculated to identify the suitability of the samples. The spatial distribution map shows that the concentration of the water quality parameters in the household distribution outlets was higher than the production source. According to WHO standard, the WQI values of the samples were found in unsafe condition and unsuitable for drinking. And according to BDS guideline, two samples were found in good WQI values and quantity of microbial contamination was 0 nos/100 mL and they were safe for drinking. So, 85.71% samples are unsuitable for drinking including domestic use. The paper recommends providing standard quality water in the distribution network, and installation of low cost treatment plants in the outlet of household distribution.
Keywords
Water Quality, KWASA, Supplied Water, Spatial Variation, WQI values.
1. Introduction Water is one of the most significant ingredients of the physical environment. Drinking water quality is closely associated with human health, and providing safe drinking water is one of important elements to build human physiology and man’s continued existence depends very much on its availability. A man cannot survive without water. This fact indicates why water is regarded as most essential elements of human life (Etim, Odoh, Itodo, Umoh, & Lawal, 2013). Nations and Individuals face a wide range of water problems around the world. In

Lipu A. A. and Ekram K. M. M. Assessing the Spatial Variations of Supplied Drinking Water Quality of Khulna WASA, Bangladesh
161
2000, an assessment published by the World Health Organization (WHO) suggests that 1.1 billion people around the world have lacked access to the improved water supply. According to the World Health Organization (WHO), 89% of the world population consumes drinking water from improved drinking water sources. Improved drinking water sources include piped treated water connections, public standpipes and protected dug wells (Alam, Dafadar, Sultana, & Rahman, 2017). In developing countries, water supplies have been focused on quantity at the expense of quality and insure improvement in quality management of chemicals and microorganism content (Barrow, 2005). It is recognized that drinking water quality is directly impacted by natural and human activities (Kwame, 2011). In Bangladesh Ground Water (GW) is the main source for drinking and other uses. Numerous water quality problems exist in GW systems in Bangladesh, especially in its south-western coastal belt (Adhikary & Elahi, 2012). However, the southwest coastal belt of the country is facing enormous challenges in meeting the rising fresh water demand due to limited water supply from the available Ground Water (GW) and Surface Water (SW) sources as they are affected by the salinity and other water quality problems (Elahi & Hossain, 2011). Numerous water quality problems exist in GW systems in Bangladesh, especially in its south-western coastal belt (Semenza, Roberts, Henderson, Bogan, & Rubin, 1998). Khulna is one of the densely populated urban areas with a population of about 1.5 million in Khulna City Corporation (KCC) area which has been suffering from inadequate supply of drinking water often associated with water quality problems too (Chowdhury, 2013). In Khulna except some locations, the water is not suitable for drinking. The competency of groundwater for drinking varies from place to place with depth but shallow water is totally unsuitable for drinking (Alam, Rocky, Tarakki, Aftab, & Quamruzzaman, 2015). KWASA, established in March, 2008, supplies water from deep tube wells without water treatment through its limited distribution network system of 268 km length to the city dwellers and is able to meet 47.5% of the total demand for water of the city. The existing water supply system of Khulna city is totally being depended on groundwater sources. As this water travel through a distribution system a variety of physical, chemical and biological transformations can occur (Lahlou, 2002). Improved drinking water sources include piped treated water connections, public standpipes and protected dug wells (Alam, Dafadar, Sultana, & Rahman, 2017). So, it is important that the quality of drinking water should be checked at a regular time interval because due to use of contaminated drinking water, the human population suffers from various water borne diseases (Sagar, Chavan, Patil, Shinde, & Kekane, 2015). Drinking water is defined as the term of acceptable quality in terms of its physical, chemical, bacteriological and acceptability parameters so that it can be safely used for drinking and cooking (WHO, 2006; ECR, 1997). Polluted water contains significant levels of pollutants, when drinking water quality remain at levels above WHO certified standards and cause significant problem when it is taken by humans (Cunningham, 1999). For the open accessibility of surface water, they easily receive various materials from different types of sources which negatively impact on the quality of drinking water (Kwame, 2011). In the water supply network, the possible contamination point source is leaking pipes, unauthorized connection and lack of maintenance of domestic storage and distribution system (Fahmida, Lemon, Islam, & Kader, 2013). Some main causes of non-point source are urban runoff, construction sites and waste disposal (Buchholz, 1993). Land disposal of sewage sludge, illegal dumping of septic tank,

Lipu A. A. and Ekram K. M. M. Assessing the Spatial Variations of Supplied Drinking Water Quality of Khulna WASA, Bangladesh
162
improper toxic waste disposal and runoff contributed to surface and ground water contamination with chemicals and microorganisms (Pye & Patrick, 1983). Khulna city dwellers are not suffering from inadequate water supply but also are posed to serious threat due to scarcity of safe water (Fahmida, Lemon, Islam, & Kader, 2013). The purpose of this study was to investigate the spatial variations of water quality in the water distribution network of Khulna Water Supply & Sewerage Authority (KWASA).
2. Materials and Methods 2.1. Study Area
Khulna City Corporation is an expanding centre of south-western Bangladesh. The city along with its surrounding is bounded by the longitude 89°28'-89°37' east and latitude 22°46'-22°58' north and its elevation is 1 to 2 m above mean sea level. Khulna region faces safe drinking water. To fulfil the crisis of drinking water Khulna Water Supply and Sewerage Authority (KWASA) is supplying water to the city through distribution network from the source of groundwater (Fahmida, Lemon, Islam, & Kader, 2013). KCC have 31 wards, out of them 6 wards were selected which are ward no 18, 19, 20, 24, 25 and 26. All of them are connected to KWASA distribution network. All of the water sources, water distribution network used as a main source of water supply in the ward no 18, 19,20, 24, 25 and 26 are 51.18%, 2.82%, 20.33%, 72.23%, 35.61% and 38.69% (Islam & Ali, 2016).
2.2. Methods Sample Collection: Plastic bottles of 500 millilitre capacity were used for collecting samples. Each bottle was washed with distilled water. The bottles were then preserved in a clean place. The bottles were filled leaving no air space, and then the bottle was sealed to prevent any leakage (Zuthi, Biswas, & Bahar, 2009). Labelling is very essential for testing of samples. The test result is influenced by time. Samples were collected from the selected area.
Figure 1: Study Area Map
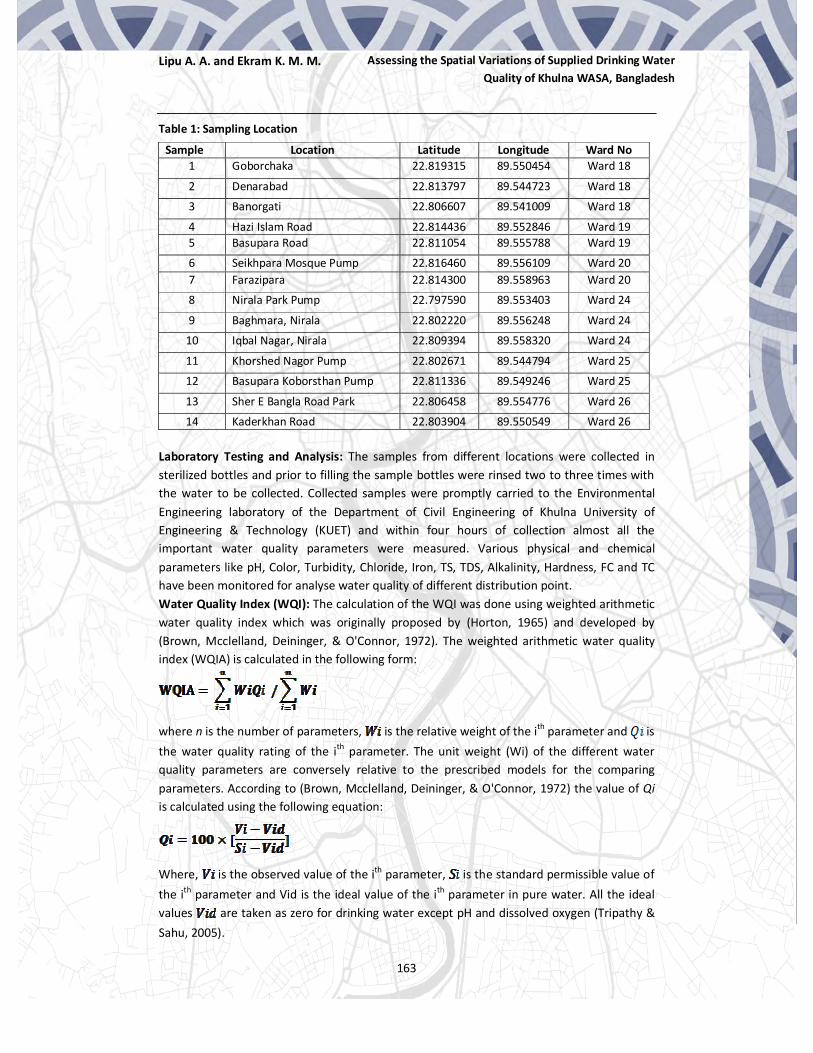
Lipu A. A. and Ekram K. M. M. Assessing the Spatial Variations of Supplied Drinking Water Quality of Khulna WASA, Bangladesh
163
Table 1: Sampling Location
Laboratory Testing and Analysis: The samples from different locations were collected in sterilized bottles and prior to filling the sample bottles were rinsed two to three times with the water to be collected. Collected samples were promptly carried to the Environmental Engineering laboratory of the Department of Civil Engineering of Khulna University of Engineering & Technology (KUET) and within four hours of collection almost all the important water quality parameters were measured. Various physical and chemical parameters like pH, Color, Turbidity, Chloride, Iron, TS, TDS, Alkalinity, Hardness, FC and TC have been monitored for analyse water quality of different distribution point. Water Quality Index (WQI): The calculation of the WQI was done using weighted arithmetic water quality index which was originally proposed by (Horton, 1965) and developed by (Brown, Mcclelland, Deininger, & O'Connor, 1972). The weighted arithmetic water quality index (WQIA) is calculated in the following form:
where n is the number of parameters, is the relative weight of the ith parameter and is the water quality rating of the ith parameter. The unit weight (Wi) of the different water quality parameters are conversely relative to the prescribed models for the comparing parameters. According to (Brown, Mcclelland, Deininger, & O'Connor, 1972) the value of Qi is calculated using the following equation:
Where, is the observed value of the ith parameter, is the standard permissible value of the ith parameter and Vid is the ideal value of the ith parameter in pure water. All the ideal values are taken as zero for drinking water except pH and dissolved oxygen (Tripathy & Sahu, 2005).
Sample Location Latitude Longitude Ward No 1 Goborchaka 22.819315 89.550454 Ward 18
2 Denarabad 22.813797 89.544723 Ward 18
3 Banorgati 22.806607 89.541009 Ward 18
4 Hazi Islam Road 22.814436 89.552846 Ward 19 5 Basupara Road 22.811054 89.555788 Ward 19
6 Seikhpara Mosque Pump 22.816460 89.556109 Ward 20 7 Farazipara 22.814300 89.558963 Ward 20
8 Nirala Park Pump 22.797590 89.553403 Ward 24
9 Baghmara, Nirala 22.802220 89.556248 Ward 24
10 Iqbal Nagar, Nirala 22.809394 89.558320 Ward 24
11 Khorshed Nagor Pump 22.802671 89.544794 Ward 25
12 Basupara Koborsthan Pump 22.811336 89.549246 Ward 25
13 Sher E Bangla Road Park 22.806458 89.554776 Ward 26
14 Kaderkhan Road 22.803904 89.550549 Ward 26
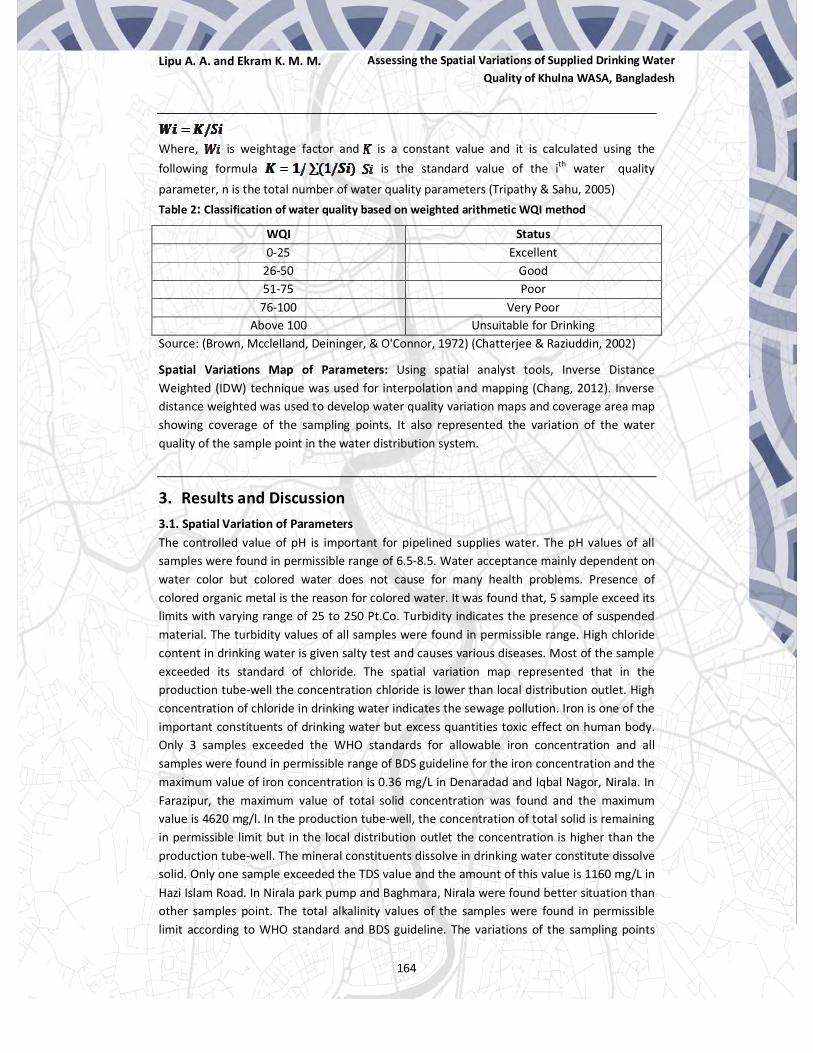
Lipu A. A. and Ekram K. M. M. Assessing the Spatial Variations of Supplied Drinking Water Quality of Khulna WASA, Bangladesh
164
Where, is weightage factor and is a constant value and it is calculated using the following formula is the standard value of the ith water quality parameter, n is the total number of water quality parameters (Tripathy & Sahu, 2005) Table 2: Classification of water quality based on weighted arithmetic WQI method
WQI Status 0-25 Excellent
26-50 Good 51-75 Poor
76-100 Very Poor Above 100 Unsuitable for Drinking
Source: (Brown, Mcclelland, Deininger, & O'Connor, 1972) (Chatterjee & Raziuddin, 2002)
Spatial Variations Map of Parameters: Using spatial analyst tools, Inverse Distance Weighted (IDW) technique was used for interpolation and mapping (Chang, 2012). Inverse distance weighted was used to develop water quality variation maps and coverage area map showing coverage of the sampling points. It also represented the variation of the water quality of the sample point in the water distribution system.
3. Results and Discussion 3.1. Spatial Variation of Parameters The controlled value of pH is important for pipelined supplies water. The pH values of all samples were found in permissible range of 6.5-8.5. Water acceptance mainly dependent on water color but colored water does not cause for many health problems. Presence of colored organic metal is the reason for colored water. It was found that, 5 sample exceed its limits with varying range of 25 to 250 Pt.Co. Turbidity indicates the presence of suspended material. The turbidity values of all samples were found in permissible range. High chloride content in drinking water is given salty test and causes various diseases. Most of the sample exceeded its standard of chloride. The spatial variation map represented that in the production tube-well the concentration chloride is lower than local distribution outlet. High concentration of chloride in drinking water indicates the sewage pollution. Iron is one of the important constituents of drinking water but excess quantities toxic effect on human body. Only 3 samples exceeded the WHO standards for allowable iron concentration and all samples were found in permissible range of BDS guideline for the iron concentration and the maximum value of iron concentration is 0.36 mg/L in Denaradad and Iqbal Nagor, Nirala. In Farazipur, the maximum value of total solid concentration was found and the maximum value is 4620 mg/l. In the production tube-well, the concentration of total solid is remaining in permissible limit but in the local distribution outlet the concentration is higher than the production tube-well. The mineral constituents dissolve in drinking water constitute dissolve solid. Only one sample exceeded the TDS value and the amount of this value is 1160 mg/L in Hazi Islam Road. In Nirala park pump and Baghmara, Nirala were found better situation than other samples point. The total alkalinity values of the samples were found in permissible limit according to WHO standard and BDS guideline. The variations of the sampling points

Lipu A. A. and Ekram K. M. M. Assessing the Spatial Variations of Supplied Drinking Water Quality of Khulna WASA, Bangladesh
165
Figure 2: Spatial variation of pH Figure 3: Spatial variation of Color
Figure 5: Spatial variation of Iron
Figure 8: Spatial variation of TDS Figure 9: Spatial variation of Hardness
Figure 6: Spatial variation of Chloride Figure 7: Spatial variation of TS
were not remarkable and it stand in acceptance range. Hardness in water is caused by the presence of carbonates and bicarbonates of calcium and magnesium. The total hardness values of the sample were found in permissible limit according to WHO standard and BDS guideline. The maximum value of hardness was found 486.2 mg/L in Banorgati school pump. Fecal coliform is the indicator of microbial contamination of Escherichia coli and Total coliform indicates the microbial contamination of the drinking water. Only two samples were found in permissible limit. Another 12 samples were not suitable for drinking. In the local distribution outlet, the concentration of microbial contamination is higher than the main production pump. The microbiological contamination in the distribution network might happen for the cross contamination of leaking pipe, unauthorized connections, lacking of proper waste disposal etc.
Figure 2: Spatial variation of Turbidity

Lipu A. A. and Ekram K. M. M. Assessing the Spatial Variations of Supplied Drinking Water Quality of Khulna WASA, Bangladesh
166
Figure 10: Spatial variation of Alkalinity
Figure 11: Spatial variation of FC
Figure 12: Spatial variation of TC
3.2. Water Quality Index (WQI) Table 3: Status of water quality based on WQI Values
Sample WQI Value (WHO, 2006)
Status WQI Value (BDS, 1997)
Status
1 110.11 Unsuitable for Drinking 88.34 Very Poor 2 136.08 Unsuitable for Drinking 105.11 Unsuitable for Drinking 3 63.99 Poor 40.27 Good 4 77.19 Very Poor 46.09 Good 5 59.97 Poor 37.05 Good 6 56.99 Poor 35.31 Good 7 66.86 Poor 41.84 Good 8 96.86 Very Poor 59.07 Poor 9 72.70 Poor 45.1 Good
10 115.00 Unsuitable for Drinking 72.54 Poor 11 57.56 Poor 39.14 Good 12 44.52 Good 33.63 Good 13 59.22 Poor 44.71 Good 14 105.69 Unsuitable for Drinking 75.62 Very Poor
Table 4: Coliform counts in different samples
Sample No. 1 2 3 4 5 6 7 8 9 10 11 12 13 14 FC (Nos/100 mL) 64 32 14 8 6 0 8 4 10 2 0 5 4 11 TC (Nos/100 mL) 74 40 24 12 38 0 20 10 20 6 0 12 8 32 According to WHO standard, the WQI values of the samples were found in unsafe condition. Only one sample was found within acceptable range. But according to WHO standard the water must be free from microbial contamination. Water samples from Seikhpara Mosque Pump and Khorshed Nagor Pump were found free from microbial contamination but their

Lipu A. A. and Ekram K. M. M. Assessing the Spatial Variations of Supplied Drinking Water Quality of Khulna WASA, Bangladesh
167
Figure 13: Spatial variation of WQI value (WHO, 2006)
Figure 13: Spatial variation of WQI value (BDS, 1997)
WQI values indicated that they are in poor condition. So, all the sample are unsuitable for drinking. And according to BDS guideline, In Seikhpara Mosque Pump and Khorshed Nagor Pump samples were found in good WQI values and quantity of microbial contamination was 0 nos/100 mL and they are safe for drinking. 3.3. Spatial Variation of WQI value
According to spatial variation of WQI values (WHO, 2006), it was found that in the production tube-well of the study area the water remains fairly acceptable compared to that in the local distribution outlet. Only one sample which was collected from Bosupara Koborsthan pump had a good WQI value. According to spatial variation of WQI values (BDS, 1997), it was found majority of the area is in the good condition with respect to the water quality. Of all of the samples, only one which was collected from Denarabad, was found unsuitable condition and in Goborchaka and Kaderkhan Road the water was found in very poor condition. In Seikhpara Mosque Pump and Khorshed Nagor Pump samples were found in good WQI values and quantity of microbial contamination was 0 nos/100 mL and they are safe for drinking. 3.4. Comparisons of Water Samples with Recommended Standard Quality Table 5: Comparison of water samples with water quality standards Sl. No
Parameter
Water Quality Standard Min Max Mean % of samples exceeding Water Quality
WHO (2006) BDS (1997) WHO (2006)
BDS (1997)
1 pH 6.5-8.5 6.5-8.5 7.0 7.9 7.36 0 0 2 Color 15 Pt.Co 15 Pt.Co 0 210 46.07 35.71 35.71 3 Turbidity 5 NTU 10 NTU 0.7 1.83 1.33 0 0 4 Chloride 250 mg/L 150-600 mg/L 235 740 496.07 92.86 28.57 5 Iron 0.3 mg/L 0.3-1.0 mg/L 0.12 0.36 0.24 28.57 0 6 TS 1000 mg/L 1000 mg/L 430 4620 949.29 21.43 21.43 7 TDS 1000 mg/L 1000 mg/L 370 1060 615.71 7.14 7.14 8 Alkalinity 250 mg/L 500 mg/L 200 230 215 0 0 9 Hardness 500 mg/L 200-500 mg/L 222.24 486.2 348.05 0 0 10 FC 0 Nos/100mL 0 Nos/100mL 0 64 12 85.71 85.71 11 TC 0 Nos/100mL 0 Nos/100mL 0 74 21.14 85.71 85.71
3.5 Summary and Recommendation The drinking water quality is seriously contaminated in distribution system because of breaking in the completeness of the pipe work. Contamination is increased for the leaking pipes, unauthorized water connection at the road side, lack of proper community dustbin and domestic storage and absence of treatment plant for insuring the standard water

Lipu A. A. and Ekram K. M. M. Assessing the Spatial Variations of Supplied Drinking Water Quality of Khulna WASA, Bangladesh
168
quality. Protecting the sources of water is necessary, so the water intake should be built in the water sources to protect drinking water from man-made waste and biological process which contaminate the water. To control the growth of microorganisms, disinfectant residuals should be used in the water distribution systems. Water tanks and treatment plant should be built beside water collection source and the water should be supplied to the household through supply pipelines after ensuring the standard water quality by treatment. Low-cost treatment plants should be installed in the outlet of household distribution for this purpose.
4. Conclusions Khulna WASA is suppling water to Khulna city through a water distribution network, to overcome the scarcity of safe drinking water. This study has exhibited the utility of GIS with analytical data to access and mapping of supplied water of KWASA of selected wards in Khulna City area. The spatial distribution map of pH, Color, Turbidity, Chloride, Iron, TS, TDS, Alkalinity, Hardness, FC and TC shows that, the water of the distribution network has not meet the standard of the chemical and microbial quality except pH, turbidity, iron, alkalinity and hardness. It also shows that the concentration of the water quality parameters in the household distribution outlets was higher than the production pump. The water quality decreased with the increasing distance from production pump of the water. According to WHO standards and BDS guidelines, 35.71 % of the samples exceeded the color limit, 85.71% of the samples exceeded the FC and TC standard limit. 92.86% of samples exceeded the WHO standard of chloride and 28.57% of samples exceeded the BDS chloride standard limit. The WQI values and microbial contamination indicated that 85.71% samples area is unsuitable for drinking and domestic use.
For the unavailability of laboratory facilities, only 14 samples were collected to cover the study area. In IDW, exceeding sample points provide noteworthy spatial distribution. It can be considered for further study to expand the quantity of sample points in applying IDW.
Acknowledgement The authors are highly grateful to the Department of Civil Engineering, Khulna University of Engineering & Technology, Khulna, Bangladesh and Khulna WASA, Bangladesh for spread out all sorts of supports.
5. References Adhikary, S. K., Elahi, M. M. A. & Hossain, A. M. I., 2012. Assessment of shallow groundwater
quality from six wards of Khulna City Corporation, Bangladesh. Int. Journal of Applied Sciences and Engineering Research, Volume 1, pp. 488-498.
Alam, M. B. et al., 2015. Groundwater and Surface Water Quality Assessment for Irrigation and Drinking Purposes of Khulna District, South-Western, Bangladesh. International Journal of Scientific & Engineering Research, 6(2), pp. 470-477.

Lipu A. A. and Ekram K. M. M. Assessing the Spatial Variations of Supplied Drinking Water Quality of Khulna WASA, Bangladesh
169
Alam, M. F. et al., 2017. Physico-Chemical Analysis of the Bottled Drinking Water available in the Dhaka City of Bangladesh. Journal of Materials and Environmental Sciences, Volume 8(6), pp. 2076-2083.
Barrow, G. W. S., 2005. Robert Bruce and the community of the Realm of Scotland. 4th ed. s.l.:Edinburgh: Edinburgh University Press.
Brown, R. M., Mcclelland, N. I., Deininger & O'Connor, M. F., 1972. Water Quality Index-Crashing, the Psychological Barrier. s.l., s.n., pp. 787-794.
Buchholz, A. R., 1993. Principles of Environmental Management. 2nd ed. s.l.:The greening of Business.
Chang, K. T., 2012. Introduction to Geographic Information Systems. New York: McGraw-Hill.
Chatterjee, C. & Raziuddin, M., 2002. Determination of water quality index of a degraded river in Asanol Industrial area, Raniganj, Burdwan, West Bengal Nature. Environment and Pollution Technology, Volume 1, pp. 181-189.
Chowdhury, A. S., 2013. An Assessment of Water Quality and Quantity for Khulna City Water Supply System, Khulna: s.n.
Cunningham, S., 1999. Environmental Science; A Global concern. 5th ed. USA: The McGraw-Hill Companies.
ECR, 1997. Environmental Conservation Rules. s.l.:Ministry of Environment and Forest, Government of Bangladesh.
Elahi, M. M. A. & Hossain, A. M. I., 2011. Assessment of spatial and temporal variations of water quality in the coastal areas, Khulna: B.Sc. Engg. Thesis, Department of Civil Engineering, Khulna University of Engineering & Technology,.
Etim, E. et al., 2013. Water Quality Index for the Assessment of Water Quality from Different Sources in the Niger Delta Region of Nigeria. Frontiers in Science, pp. 89-95.
Fahmida, K., Lemon, H. R. M., Islam, S. M. & Kader, A. M., 2013. Assessment of Supplied Water Quality of Khulna WASA of Bangladesh, Khulna: International Conference on Mechanical, Industrial and Materials Engineering 2013 (ICMIME2013).
Horton, R. K., 1965. An Index Number for Rating Water Quality. Journal of Water Pollution Control Federation, pp. 300-306.
Islam, T. & Ali, A., 2016. Assessment of Water Supply Networks for Khulna City, Khulna: ResearchGate.
Kwame, M. M., 2011. Assessment of Drinking water Quality in EHI Community in the Ketu-North District of the Volta Region of Ghana., Volta Region: s.n.
Lahlou, Z. M., 2002. Water quality in distribution systems, West Virginia: Tech Brief. A national drinking water clearing house fact sheet, West Virginia University.
Pye, V. & Patrick, R., 1983. Ground water contamination in the United States. s.l.:Science 221.
Sagar, S. et al., 2015. Physico-chemical parameters for testing of water. International Journal of Chemical Studies, 3(4), pp. 24-28.

Lipu A. A. and Ekram K. M. M. Assessing the Spatial Variations of Supplied Drinking Water Quality of Khulna WASA, Bangladesh
170
Semenza, J. et al., 1998. Water distribution system and diarrheal disease transmission: a case study in Uzbekistan. American Journal of Tropical Medicine and Hygiene, Volume 59, pp. 941-946.
Tripathy, J. K. & Sahu, K. C., 2005. Seasonal hydrochemistry of groundwater in the barrier-spit system of Chilika lagoon. Journal of Environmental Hydrology, Volume 12, pp. 1-9.
UNCED, 1992. Protection of the Quality and Supply of Freshwater Resources: Application of Integrated Approaches to the Development, Management and Use of Water Resources, s.l.: The United Nations Conference on Environment and Development.
WHO, 2006. Guidelines for Drinking Water Quality, Geneva, Switzerland: World Health Organization.
Zuthi, M. F. R., Biswas, M. & Bahar, M. N., 2009. Assessment of Supply Water Quality in the Chittagong City. ARPN Journal of Engineering and Applied Sciences, 4(3), pp. 73-80.

Nabi, RD; Mollah, TR; Muhib, MN & Islam, MS.
Comprehensive EIA and Sustainable Mitigation Measures associated with 3D Seismic Survey
171
Research Paper
Comprehensive Environmental Impact Assessment and Sustainable Mitigation Measures associated with 3D
Seismic Survey Md. Rashe Dun Nabi, Environmental Specialist, Bangladesh;
Md. Tanveer Rahman Mollah, GIS Manager, Bangladesh; Md. Nashif Muhibullah, Jr. Environmental Specialist, Bangladesh &
Mohammad Shariful Islam, Jr. GIS Specialist, Bangladesh Abstract
This paper presents a comprehensive environmental impact assessment of the potential impacts associated with the 3D Seismic Survey. Bangladesh Petroleum Exploration & Production Company Ltd. (BAPEX) plan to carry out 3D Seismic survey at Semutang Gas Field (250 square km.). The 3D seismic operation involves short-term and long-term direct, indirect, and cumulative impacts on the natural environment. The study has used a systematic and risk-based approach to quantify the significance of identified potential impacts. It also detects and develops specific mitigation measure to address each possible effect. This study was based on primary data generated during the study period, secondary data from various sources and information from field visits. Several field visits were carried out to the project location with a view to detailed physical survey of the surrounding area. Geographical Information Systems (GIS) was used as a specialized analysis and presentation tool. Before commencing field investigations, spatial analysis of satellite imagery was used to identify immediate administrative areas and other boundaries/constraints to being considered for both the environmental and social assessments. The collection of primary data had conducted during March 2019. The physical environment parameters surveyed were air quality, noise level, surface water & groundwater quality. This dataset was then used to predict the likely impacts.
This study has identified that there is a potential for significant adverse environmental impacts because of the project. However, the study has also determined that if comprehensive and effective management and mitigation measures had implemented as proposed, the potential negative impacts should be reduced to a non-significant level. Moreover, the project will create employment opportunities of approximately 400 to 500 local unskilled people for a period of between 3 and 6 months. In summary, extensive and in-depth research to date has indicated that the proposed project could proceed without significant impact on the environment, given that all appropriate mitigations had implemented.
Keywords
Environmental Impact Assessment (EIA), 3D Seismic Survey, Geographic Information System (GIS), Mitigation measures.

Nabi, RD; Mollah, TR; Muhib, MN & Islam, MS.
Comprehensive EIA and Sustainable Mitigation Measures associated with 3D Seismic Survey
172
1. Introduction A 3D seismic survey is comprised of the generation of acoustic pulses from a seismic source on or just beneath the ground surface (in a shot hole), and the subsequent measurement of the acoustic waves reflected off the boundaries between different rock strata utilizing specialized recording devices (geophones) situated at various positions on the ground surface. The survey process involves four primary operations: planning, positioning, drilling, and recording. Each section involves different environmental and social impacts. The potential adverse impacts exists as a result of 3D Seismic survey activities include: vehicles movement to transport crews to and from the project area and field camps; extensive movements of personnel while laying receiver cables throughout the site; two 4-stroke engines will be used to power the drill and water pump; physical drilling operations (21m) at about 16,800 point; the use of explosives; the establishment of field camps (1200 number of person) and use of generators to provide electricity to field camps. The overall objective of this study is to identify significant potential adverse impacts occurring as a result of these activities and suggest suitable measures to mitigate or avoid the possible adverse consequences determined so that the project is developed in an environmentally sound and sustainable manner.
1.1. Project Location 3D Seismic survey area is located at Semutang gas field in PSC Block 15 and covers Fatikchari Upazila of Chittagong District and Manikchhari, Lakshmichhari & Ramgarh Upazila of Khagrachari District. The total project area is 250 sq. km (Figure 1).

Nabi, RD; Mollah, TR; Muhib, MN & Islam, MS.
Comprehensive EIA and Sustainable Mitigation Measures associated with 3D Seismic Survey
173
Figure 1: Location of the study area along with biophysical sample location
1.2. Methodology The Stepwise activities are detailed below:
Screening and Scoping Exercise
As the first step, project screening and scoping exercise were undertaken to identify the parameters needed to be considered for the study and to outline the activities for collecting data on each parameter.
Baseline Data Collection
The detail baseline data collection, monitoring and analysis for environmental parameters were completed during March 2019. The physical environment parameters surveyed were air quality, noise level, surface water & groundwater quality. The sampling was conducted primarily within the project corridor at locations reflecting representative land use conditions and population densities. Secondary data was also collected from different government departments, local bodies and through literature surveys etc.
Impact Assessment and Mitigation Measures
Analysis of the baseline results and incremental impacts of the 3D seismic survey were assessed following the Bangladesh national guideline for air, water and noise emissions; standards stipulated in the Environmental Conservation Rules (ECR),1997.

Nabi, RD; Mollah, TR; Muhib, MN & Islam, MS.
Comprehensive EIA and Sustainable Mitigation Measures associated with 3D Seismic Survey
174
The impact assessment involved the prediction and evaluation of impact from the proposed project in different phases, including site preparation, construction and operation phase, decommissioning of the project and included consideration of mitigation measures towards the same.
2. Results and Discussion To establish a comprehensive database on the biophysical baseline conditions existing within the study area, the study team has compiled and assessed local and regional primary and secondary data from reports and field visits. This includes information on parameters such as surface and groundwater, air quality, meteorology, noise and terrestrial and aquatic ecosystems.
2.1. Meteorology and Climate Bangladesh is divided into seven climatic sub-zones based on differences in a range of factors including rainfall, temperature, evapotranspiration and local seasonality (Rashid, 1991). According to the climatic sub-regions of Bangladesh, the study area is located in North-Eastern region and is characterized by very high rainfall, particularly between the months of June and October (rainy season); The average annual rainfall from 2014 to 2018 of the study area was approximately 3132 mm (BMD, 2018), with about 88% of the mean annual rainfall occurring during the period from May to October, and 36% during June – July.
2.2. Land Use A land-use map was developed to identify the land classification within the Project corridor and presented in figure 2. Unlike the general floodplain area of Bangladesh, the land typically undulating hills covered by forests and agricultural areas. Almost half of the study area (46%) is hilly area comprising mainly of tea and rubber plantations. The resident’s covers 38%, agricultural land covers 13%, water bodies 2% and the rest is by other uses.

Nabi, RD; Mollah, TR; Muhib, MN & Islam, MS.
Comprehensive EIA and Sustainable Mitigation Measures associated with 3D Seismic Survey
175
Figure 2: Land use map of the study area
2.3. Air Quality Ambient air quality measurements were carried out during March 2019 at four specific locations within the Project corridor (Figure 1). The air quality data was collected using the Environmental Perimeter Air Sampler (EPAS) (model haz-Scanner) of Environmental Devices Corporation (EDC), USA.
Figure 3: Air Quality in the Study Area, March, 2019.
The test results (Figure 3) show that the local ambient air quality condition meets the national standard, DoE (1997) and air quality in the Project area can be stated as in good condition.
AQ01 AQ02 AQ03 AQ04
O3 11.12 12.13 12.01 14.35
PM10 28.3 26.81 23.96 22.76
PM2.5 11.64 11.23 11.06 10.07
NO 6.82 8.95 6.72 7.95
NO2 5.2 7.33 4.9 6.33
SO2 11.93 6.49 11.64 9.38
051015202530
051015202530
Uni
ts in
µg/
m3
Uni
ts in
µg/
m3
Air Quality Test Results

Nabi, RD; Mollah, TR; Muhib, MN & Islam, MS.
Comprehensive EIA and Sustainable Mitigation Measures associated with 3D Seismic Survey
176
2.4. Noise level Noise level measurements were carried out by using a Lutron’s Sound Level Meter (SL-4033SD) at the known sensitive receptors in dBA (Silent, Residential, Mixed and Commercial land-use area). These data were used to develop noise contour map by using GIS interpolation method and compared with the amended Schedule 4, 2006, of (Noise Level Measurement Standard) Environmental Conservation Rules, 1997, DoE.
The current general noise level within the study area varies from 38 dBA to 44 dBA in hilly area (silent area), 49 dB to 58 dBA in the residential area and 60 dBA to 70 dBA in the commercial area (Figure 4). The noise measurements were relatively high in commercial area of the Project corridor, exceeding the DoE standard, due to the movement of heavy vehicular traffic and human activities. The remainder fell within DoE noise standards.
Figure 4: Exiting Noise level (in dBA) Contour map of the Study area
2.5. Surface and Groundwater The project area is covered with different kinds of freshwater bodies like rivers, many more stream, beels, ponds and ditches. However, during the field visit and literature review, no protected wetlands were found in the project corridor.
Surface and groundwater samples were collected from four specific locations (figure 1) in plastic and amber sampling bottles and stored according to standard methods and analyzed at an ISO 14000-certified laboratory (Department of Public Health & engineering, DPHE). The concentration levels of all the parameters for surface water

Nabi, RD; Mollah, TR; Muhib, MN & Islam, MS.
Comprehensive EIA and Sustainable Mitigation Measures associated with 3D Seismic Survey
177
(Table 1) were within the acceptable limit set by the DoE, 1997. The water quality results indicate that water quality condition is suitable for fisheries, irrigation and agricultural use.
Table 1: Surface water Quality in the Project Area, March 2019
SL No.
ID Results BOD Mg/L
COD Mg/L
DO Mg/L
pH Temp oC
TDS Mg/L
TSS Mg/L
Turbidity NTU
01 SW 1 1 4 6.97 7.5 27.1 62 6 4.2 02 SW 2 1 4 6.90 7.5 27 140 6 1.5 03 SW 3 1 4 6.40 7.4 26.9 74 11 5.3 04 SW 4 1 4 6.92 7.8 26.8 81 15 2.9 ECR,1997* 10 - 5.0 6.5-8.5 20-30 1000 - 10 Source: Field Sample and Laboratory Analysis by DPHE
*Bangladesh Environmental Conservation Rules (ECR), 1997, Schedule -3 (Standards for Inland Surface water)
Groundwater
The groundwater analysis (Table 2) reveals that all the parameters are within the standard value of ECR, 1997 and it can be assumed that the groundwater quality is satisfactory for drinking in the study area. It is drinkable without treatment.
Table 2: Groundwater Quality in the Project Area, March 2019
Sample ID Results As Mg/L
Fe Mg/L
Mg Mg/L
pH Phosphate Mg/L
Temp oC
GW 01 0.001 0.28 0.03 7.4 2.89 26.2
GW 02 0.001 0.58 0.03 8.2 61.6 26.7
GW 03 0.008 0.16 0.04 8.1 7.9 26.5
GW 04 0.001 0.24 0.33 8.0 1.72 26.6 ECR,1997* 0.05 0.3 -1.0 0.1 6.5 to 8.5 - -
Source: Field Sample and Laboratory Analysis by DPHE
*Bangladesh Environmental Conservation Rules (ECR), 1997, Schedule -3 (Standards for Drinking water)
2.6. Biological Environment An ecological survey was conducted during March 2019 in the project area to determine the extent, species composition and the condition of existing vegetation, wildlife, threatened and protected flora and fauna, and important habitat for local migratory species by visual survey, key informant interview and consultation with local people. The 3D seismic survey area falls on CHT Hills & the CHTS (Zone 9a) bio-ecological zone, IUCN (2002). There is no environmental critical area (ECA) inside the proposed 3D seismic survey area. Ecology of the selected project is highly disturbed due to traffic movement, industrial set up, commercial activities and anthropogenic pressure. The significant biological habitats present within the project area are tea gardens, cultivated land,

Nabi, RD; Mollah, TR; Muhib, MN & Islam, MS.
Comprehensive EIA and Sustainable Mitigation Measures associated with 3D Seismic Survey
178
homestead vegetation, roadside vegetation, exotic plantation and natural and secondary forests.
In total, 135 wildlife species (about 15% of the Bangladesh total) occur in the Project corridor, of which ten species are amphibians, 20 species of reptiles, 83 species of birds and 22 species are mammals.
2.7. Identification of Potential impact Surface Water & Groundwater
The potential exists for impacts on the local hydrology as the proposed source, and receiver lines will cross several natural water bodies and streams. These streams and rivers may be affected by disturbance and sedimentation during survey operations if appropriate mitigation strategies are not implemented, SMEC (2009). Drilling operations have the potential to cause sediment movement and escape from the discrete drilling areas if not managed appropriately, EQMS (2018). This has the potential to cause adverse effects upon the water quality of nearby water bodies, both within and adjacent to the survey area. The explosives (Power gel) used during shooting operations have the potential to have an adverse effect on local sources of groundwater. Due to the density of people within each field camp there is the potential for surface and groundwater to be affected from sanitary waste. If toilet pits are dug in inappropriate locations and the sanitary waste is not treated correctly, there is a possibility that water sources used by neighboring villages may be affected.
Noise
The potential noise impact are assessed in the context of sensitive receptors include residential area, business, public services (school) and places of cultural or religious significance. Field camp electricity generators are likely to be one of the most significant noise emitters during survey operations and have the potential to impact nearby residents, especially if the generators are in use for long periods. Using a Honda 5500 (Va) industrial generator, 74 dBA are emitted (at a distance of 7 meters), SMEC (2009). During shot hole drilling, the motor for the drill/water pump will be a source of noise approximately 60-80 dBA, EQMS (2018). This drilling operation requires about 15 minutes at a time to operate and may cause discomfort to humans and animals and possible temporary hearing impairment to anyone in the immediate vicinity. During the shooting operations, the explosives are detonated 21 meters underground. When the charge is activated the audible noise levels at the surface are within 50-75 dBA, although this would last only for a short period (less than 1 second per event), EQMS (2018). Therefore, it is not expected to constitute a significant potential impact.
Air Quality
During the survey operations, the principle potential air quality impacts are likely to arise from dust generated by vehicle movements, vehicle and generator carbon dioxide

Nabi, RD; Mollah, TR; Muhib, MN & Islam, MS.
Comprehensive EIA and Sustainable Mitigation Measures associated with 3D Seismic Survey
179
emissions and dust generated during field camp operations. While some soil will be disturbed during the drilling operations, water is used as a lubricant during this process, so dust is not likely to be generated, SMEC (2009).
Biodiversity
The study areas are largely comprised of tea and rubber plantations (30%), settlements (26%) and agricultural land (24%). The study areas are considered to be highly modified landscapes and the species found within them are mostly not endemic to the area. The presence of humans is also high in many of these areas as plantation and cultivation activities and harvesting practices are labor-intensive. In this situation, it is unlikely that these habitat types would support a diverse range of wildlife. Thus they are not considered to be significant from a biodiversity perspective. Drilling operations are likely to generate a significant amount of noise. It is anticipated that these elevated noise levels would deter animals and birds from entering the surrounding area, potentially disrupting their standard patterns of behaviour. Damage to a small amount of local land cover vegetation is likely to occur as a result of the establishment of field camp. Excavation of shot holes as well as the detonation of explosive may potentially impact fauna mainly invertebrates living within the soil profile.
Waste
The generation of waste products during survey operations is likely to be one of the most significant potential impacts of the project, SMEC (2009) & HCL (2014). The improper disposal of wastes has the potential to cause environmental harm through the contamination of surface and groundwater, soils, and the atmosphere. Improper handling, storage and disposal of wastes may also pose a health and safety risk to project personnel and the local community.
3. Conclusion and Recommendation 3.1. Conclusion This study has identified the significant potential adverse impacts occurring as a result of 3D seismic survey include: emissions of a small amount of carbon dioxide when driving vehicles and using engines powered by fossil fuels; the noise generated during the drilling and shooting processes and the impacts of these may have upon wildlife and the inherent nature of field camps means there are several potentially unavoidable adverse impacts. The generation of waste products is of high concern as is the level of noise generated during peak camp activities. While these potential impacts are unavoidable, the recommended mitigation measures will be mitigated to the point where the potential consequences are considered to be negligible. In summary, the proposed 3D seismic project can be implemented without significant impact on the environment, given that all recommendation for appropriate mitigations is implemented.

Nabi, RD; Mollah, TR; Muhib, MN & Islam, MS.
Comprehensive EIA and Sustainable Mitigation Measures associated with 3D Seismic Survey
180
3.2. Recommendations for Sustainable Mitigation Measures The key biophysical and environmental issues related to this project, and their recommended sustainable mitigations measures to avoid or mitigate the potential adverse impacts are outlined in below Table 3:
Table 3: Recommendation for Sustainable Mitigation Measures
Issue Potential Impact Sustainable Mitigation Measures
Surface Water and Groundwater
Conduct of activities in the proximity of waterways; Conduct of activities in
areas of high groundwater flow.
Sedimentation of local waterways;
Pollution of local waterways through the accidental release of hazardous waste;
Contamination of groundwater resources.
All field operations are to be conducted during the dry season;
Seismic lines shall be located at least 100 meters from existing groundwater wells;
No liquid waste is to be discharged into the local area or streams encountered during operations;
Containment of sanitary waste should be correctly disposed of.
Noise
Noise from drilling shot holes;
Noise from detonation;
Project vehicle noise;
Noise from field camps;
Noise from other associated project activities.
Disruption to breeding and foraging ecology of primates and birds.
Potential disruption to species diversity of the local area;
Disturbance of local residents and/or businesses;
Potential health and safety impacts on project staff and local residents.
All operations within the forest to be restricted to between 9:00AM and half an hour prior to sunset;
Independent staff to monitor the day-to-day location of critical fauna and to alter each day’s work plan accordingly;
Use of acoustic hoods and mufflers on all project pumps and machinery within the forest;
All staff to wear hearing protection during operation of noisy equipment;
Crew sizes to be restricted;
Field camps to be sensitively located and laid out and noise curfews enforced.
Air Quality
Emissions of carbon dioxide and nitrogen oxides from vehicles and generators;
Potential increases in greenhouse gases in the atmosphere;
Local and regional air quality
Regular weekly maintenance of project vehicles to reduce particulate emissions;
Reducing travel distances and fuel consumption where possible;

Nabi, RD; Mollah, TR; Muhib, MN & Islam, MS.
Comprehensive EIA and Sustainable Mitigation Measures associated with 3D Seismic Survey
181
Issue Potential Impact Sustainable Mitigation Measures
reductions with subsequent biological health degradation ;
All generator use kept to a minimum.
Biodiversity
Operations occurring within the forested area which is home to a number of threatened species;
Operations occurring in natural environments that are economically important;
Generation of noise in and around forested areas;
Disruption to breeding and foraging ecology of primates and birds;
Damage to productive lands;
Loss of species diversity in forested and non-forested areas;
Increased risk of invasive species invasion.
All operations within the forest to be restricted to between 9:00AM and half an hour prior to sunset;
Independent staff to monitor the day-to-day location of critical fauna and to alter each day’s work plan accordingly;
Use of acoustic hoods and mufflers on all project pumps and machinery within the forest;
Crew sizes to be restricted;
Maintain foot and vehicular traffic at minimum possible level;
No field camps to be located within the forested area.
Waste
Delivery of project outcomes will generate a variety of types of waste;
Potential for contamination of local soils;
Potential for sedimentation of local waterways;
Possible for harm to be caused to local residents;
All project waste to be deposited in central locations for reuse or recycling where possible;
All waste generated in the field to be collected immediately and transported back to field camps for correct disposal or recycling;
All sanitary waste to be correctly disposed of according to locally available treatment options;
Nabi, RD; Mollah, TR; Muhib, MN & Islam, MS.
Comprehensive EIA and Sustainable Mitigation Measures associated with 3D Seismic Survey
182
4. References ECR (1997) “The Environmental Conservation Rules 1997 (Schedule 2- Air Quality Standards,
Schedule 3- Water Quality Standards & Schedule 4-Noise Level Standards)”, Department of Environment, Ministry of Environment and Forest, Govt. of the people’s republic of Bangladesh.
IUCN (2002)” Bio-ecological zones of Bangladesh”, International Union for Conservation of Nature, Dhaka, Bangladesh.
SMEC (2009) ’’Environmental Impact Assessment (EIA) for 3D Seismic Survey of Chevron’ at Moulavi bazar Gas Field”, Mountain Engineering Corporation (SMEC) Pty Limited, Dhaka (May).
HCL (2014) ‘’Environmental Impact Assessment of 3DSeismic Project of BAPEX at Sunetro, Srikail, Sundalpur, Narsingdi, Habiganj and Shahbazapur structure’’, House of Consultant Limited, Dhaka (November).
EQMS (2018) “Environmental Impact Assessment of Rupkalpa-9: 2D Seismic Project Exploration Block-8 and 11 at Kishoreganj, Narsingdi, Gazipur, Tangail, Jamalpur, Sherpur, Mymensingh, Netrokona and Sunumganj District under BAPEX”, EQMS Consulting Limited, Dhaka (August).

Haque, M.N. & Riyadh, B.U. FORECASTING MODEL OF COMMUNITY HOUSEHOLD WASTE GENERATION
183
Research Paper
Current Status and Forecasting Model of Community Household Waste Generation
A Case Study on Khulna City Corporation (KCC), Khulna, Bangladesh Md. Nazmul Haque, Lecturer, Department of Urban and Regional Planning, Khulna University
of Engineering & Technology, Khulna; Bangladesh. Md. Burhan Uddin Riyadh, Undergraduate Student, Department of Urban and Regional
Planning, Khulna University of Engineering & Technology, Khulna; Bangladesh.
Abstract
The research is introduced with the objective of determining and analysing the household waste generation, then forecasting the future model showing the waste scenario of Khulna City Corporation. To accomplish the research, three issues are considered, such as, determining the capacity and service area of the dumping stations for each ward, present waste generation amount and the involvement of local authority in household waste collection. The data that are required for the research are collected from both field survey and secondary data sources for GIS based analysis of waste dumping and collection point. The suitable location for the waste dumping unit for each ward are determined using GIS based suitability analysis. Before suitability analysis the weighted score for each criterion that are considered are determined by AHP (Analytical Hierarchy Process). The criterions are DEM of KCC, structural land use of KCC, road network of KCC, waterbodies of KCC area. For future forecasting, SPSS analysis also bring to the action from primary data that are collected from the field survey. However, these studies are mostly based on the inherent forecasting approaches, cannot predict the amount of waste correctly. Based on the criterion, spatial analysis shows that the vacant land of ward 6 & 9 (Partial Nobinogor) and ward 14 (Partial Sonadanga) are formal areas introducing a better approach to waste collection – self- controlled and collection system. Another finding relied on forecasting technique that will minimize the adverse effect of generated waste in an effective way.
Keywords
Household waste, Eco-friendly Environment, Waste management, Forecast.
1. Introduction The objective of the research is to determine the quantity of household waste generated and the future condition (Forecasting model & Spatial analysis) of KCC. Khulna is the third largest metropolitan city in Bangladesh and a centre with intensive commercial and industrial activities. Rapid urbanization and increased migration of people from rural and coastal areas has put tremendous pressure on its existing solid waste management (Ahsan et al.,2015). Growth of population, increasing urbanization, rising standards of living due to technological innovations have contributed to an increase both in the quantity and variety of solid wastes, it may damage the healthy environment, spreading odour, make the site unpleasing to see and seriously, it is increasing as the population is increasing day by day and the use of different materials is also increasing so that the unused portions is now at the top (Ahsan et al., 2005). The importance of solid waste management is increasing day by day as it is an asset for producing energy, clearing environment, maintaining balance ecosystem which is already adopted in developed countries Globally, the estimated quantity of solid

Haque, M.N. & Riyadh, B.U. FORECASTING MODEL OF COMMUNITY HOUSEHOLD WASTE GENERATION
184
wastes expected to be generated annually by the year 2025 is about 19 billion tons (Yoshizawa et al., 2004). The estimation of household solid waste generation and com- position are the basis for the optimal planning, design and operation of the functional elements associated with the management (Tchobanoglous et al., 1993). In Khulna City, piles of garbage accumulated everyday cause enormous public health and environmental hazards. The rapid growth of Khulna City and increased migration of rural and coastal population affected by natural calamities are the driving forces behind unplanned expansion of city and deteriorating environmental condition. The results of unplanned expansion of city in the form of slums have further stretched the problems of MSW management. Composting of organic wastes and medical waste management in Khulna City were studied (Ahsan et al., 2015), (Ahsan et al., 2012).
The ecological footprint (0.088 ha/capita) was calculated to develop a sustainable waste management system by considering its existing solid waste characteristics (Rahman et al., 2008). Ward No 24 faces lack of waste dumping area with its increasing urbanized wastes since it has only an ultimate disposal site (UDS), i.e. open dumping site beside the road. Therefore, it is important to find out some other sites. Several suitable and a most suitable UDS has been found by the multi-criteria evaluation method integrated with the Geographical Information System (GIS) approach so that it has satisfied all the criteria adopted for highly suitable sites for HSW (Household Service Worker) disposal (Haque et al., 2017), (Rahman et al., 2008). The paper describes the amount and composition of HSW generated daily in Khulna City from various sources such as residential, commercial and institutional.
2. Literature Review Waste as the term implies is any solid, liquid or gaseous substances or materials which being a scrap or being super flows, refuse or reject, is disposed of or required to be disposed as unwanted (Adewole et al., 2009). According to The United Kingdom’s Environmental Protection Act 1990, waste includes any substance or article, which requires to be disposed of as being broken, worn out, contaminated or otherwise spoiled. Waste can be divided into different categories like recyclable general waste, non-recyclable general waste, household waste, hazardous waste etc. Waste can be segregated as bio degradable waste and non-bio degradable waste. Bio degradable waste includes organic waste like kitchen waste, vegetable waste, paper etc. Non-bio degradable wastes are segregated into recyclable (plastics, glass, metal etc.), toxic waste (paints, chemicals, blubs etc.) and C-soiled (hospital waste such as cloth with blood and other body fluids) (Rahman et al., 2008).
Waste management involves the collection, transportation, processing, recycling or disposal and monitoring of waste materials. It relates to refused materials produced by human activity, and is generally undertaken to reduce their effect on health, environment or aesthetics. Waste management is also carried out to recover resources from it. This has brought awareness to people that the solution lies in using waste as a resource rather than to be destroyed (Colon et al.,2006). Waste management involves the use of solid, liquid, gaseous or radioactive substances with different methods and fields of expertise for each of these. It concerned with the generation, on-site storage, collection, transfer, transportation, processing and recovery, and ultimate disposal of solid wastes (Vasisth, 2011).
In Asian developing countries, waste cycles through collection, transport and final disposal. In Jakarta only 70% waste was collected. The collection service in developing countries was

Haque, M.N. & Riyadh, B.U. FORECASTING MODEL OF COMMUNITY HOUSEHOLD WASTE GENERATION
185
conducted door-to door, such as in Jakarta (Pasang et al., 2007). The other difficulty in transportation of waste are the aging of waste transport vehicles and the condition of streets, weakness in organization structures and collection method (Tin et al., 1995). The methods for final waste treatment and disposal in developing Southeast Asian countries were commonly open dumping, landfill and others. These proportions were open dumping (more than 50%), landfill (10-30%), incineration (2-5%), and composting (less than 15%). The final disposal method is generally open dumped landfill Programme, 2004. Composting is one of the treatments for solid waste, which more suitable than other treatment (Agamuthu et al., 2007). The most composition of waste in those countries is decomposable organic, which has high moisture content. The constraints of composting in Asian developing countries included high cost in operation and maintenance, and weak in maintenance and operation of facilities, incomplete separation of non-compostable materials. Besides, as well as higher cost of compost compare to commercial fertilizers, also affect the implementation of composting UNEP Programme, 2004.
In March 2005 JICA developed a case study on solid waste management of Dhaka city. The objective of that study were to formulate master plan concerning solid waste management in Dhaka City with the target year of 2015 and to develop capabilities and management skills of the DCC personnel through the technology transfer during the course of the Study (JICA, 2005).
3. Materials and Methods 3.1. Study Area Khulna City Corporation (KCC), one of the largest city of Bangladesh, is selected as the study area (Figure 1), consisting of 31 wards. The study area occupies an area of about 13504.309 acres (54.65 km2) in total. It is located between 22045’30’’ and 22054’30’’ north latitude and between 89029’ and 89035’30’’ east longitude. the area has about 1078000 populations with a density of 67,994 per square kilometre. The area has total of 66257 holdings and a total of 356.64 km roads to connect these (Department of Engineering and Planning, KCC, 2019).
3.2. Methodology The study area was selected by the help of some previous study and talking to the people. Availability of waste dumping station was mainly considered in the time of site selection. The study site was also selected based on the requirement of the data for the analysis. KCC has been selected as study area because of relatively having more available data of the area.
The primary data has been collected though the field survey and 297 households were interviewed with the help of questionnaires. Questionnaire measured household existing solid waste practices as well as individual knowledge, concerns, willingness to participate on solid waste. The secondary data has been very useful for this research. The secondary data was collected from the various sources. Firstly, studies which involved the consultation of reports, articles, documents and Case studies. Some map was collected or prepared from various sources (KCC, LGED, and KDA).
For forecasting a model, a SPSS analysis was performed to form up a linear regression model to forecast about the population and waste generation. In this regard, population and solid waste generation data of previous three years were collected (Table 1). Then using linear

Haque, M.N. & Riyadh, B.U. FORECASTING MODEL OF COMMUNITY HOUSEHOLD WASTE GENERATION
186
regression formula (Y= aX+b, where Y= population and X= Year) the value of constant a and b were determined to formulate the equation for forecasting. After that, the consistency was checked by determining the value of r. Then, the final waste generation amount predicted by multiplying the per day/capita waste generation with the forecasted population.
Table 1: Population and waste generation per day of KCC
Year Population Waste Generated (Tons)
2010 976000 440
2015 1078000 485
2019 1080676 486
(Source: Ahmed et al., 2017)
For locating the spatial location of waste dumping station ArcGIS 10.5.1 was used here. By selecting the attribute data from the data source study area was mapped. Suitable area was selected by interpolating selected criterion.
The analysis is performed using secondary data to determine the suitable location for waste. For the provincial investigation auxiliary information were required to continue. GIS information of DEM (Digital Elevation Model) of KCC, structural land use of KCC, road network of KCC, waterbodies of KCC area were expected to lead the examination of basic locales. The data was collected from the authentic source lead by the author for appropriate investigation.
Figure 1: Land Use of Study Area (KCC), Author 2019
Study Map

Haque, M.N. & Riyadh, B.U. FORECASTING MODEL OF COMMUNITY HOUSEHOLD WASTE GENERATION
187
After collecting the information, the data were plotted in GIS as shape files for four different criterions. Here it is to say DEM data would be in raster format, creating from contour points (RL values) while the other data were as vector format.
Then the vector shapes that are created for each criterion are interpolated using Euclidean Distance tool and the slope of the raster data is determined. Then from the created all raster data set, for each criterion, the data sets are reclassified into three classes using Reclassify tool. The value limits of reclassified raster (Table 2) indicate the comment and different of the criterion as per the expert opinion and also based on GIS break values.
Table 2: Reclassify Values for Different Criterion
Criterion Reclassify Values Suitability
01 DEM (Digital Elevation Model) of KCC
Low 0-1.163 m Most suitable
Medium 1.163-5.812m Moderately
High 5.812-42.348m Not suitable
02 Structural land use of KCC
Far 463-1125 m Most suitable
Near 463-145 m Moderately
Nearest 0-145 m Not suitable
03 Road network of KCC Far 182-605 cm Most suitable
Near 56-182 cm Moderately
Nearest 0-56 cm Not suitable
04 Waterbodies of KCC Far 297-824 cm Most suitable
Near 126-297 cm Moderately
Nearest 0-126 cm Not suitable
(Source: Expert Opinion Survey, 2019)
At the same time the weightage for the criterions at the scale of 100, are determined by AHP (Analytical Hierarchy Process). The weightage values were also checked by the experts. The determined weightage values or influence are as shows in Table 3.
Table 3: Weighted Values or Influence
Criterions Influence (%)
01 DEM (Digital Elevation Model) of KCC 60
02 Structural land use of KCC 14
03 Road network of KCC 14
04 Waterbodies of KCC 12
(Source: AHP & Expert Opinion Survey, 2019)
Then using the Weighted Overlay tool, the overlay of the criterions was done from the influence by AHP and expert opinions. Then the suitable location is determined from the overlaid raster data set.

Haque, M.N. & Riyadh, B.U. FORECASTING MODEL OF COMMUNITY HOUSEHOLD WASTE GENERATION
188
4. Results and Discussion 4.1. Current Status
In KCC door to door waste collection facilities is being provided by Local Association. Waste collection is generally collected in two shift. At first 9.00 am to 12:00 pm and from 2:00 pm to 5:00 pm (Figure 3). After collection collected waste are dumped into road side dumping zone (Figure 2). In almost every home in study area storage of waste is done in one way or the other. Storage containers like plastic buckets are kept in the kitchen plastic bags are kept at the back yard in order to store waste. Waste is collected every day from every house. But some time it is not collected every day and it is also found that from few houses wastes were not collected for 2 or 3 day.
Solid Waste Generation
In study area families are categorized into three different types on the basis of income level. Among these three families middle income level family produces higher amounts of waste (0.57) where the higher income family produces 0.54 kg solid waste per day.
Figure 2: Open dumping of Waste after collection, Field Survey 2019
Figure 3: Waste Collection Vehicle, Field Survey 2019
Figure 4: Waste Generation with respect to Income level (kg/family/day), Field Survey 2019

Haque, M.N. & Riyadh, B.U. FORECASTING MODEL OF COMMUNITY HOUSEHOLD WASTE GENERATION
189
4.2. Forecasted Waste Generation Model From the calculation it is found that in 2040 forecasted household waste generation is near about 493 tons per day.
Equation for population forecast, Y=536*X-1176
Here, a = 536, b = - 1176, X = Year= 2020, 2025, 2030, 2035, 2040 and Y= Population
it is seen that the value of r (= 0.779) is nearer to 1 which indicates the model has strongly positive correlation. If the increase occurs in X the value of Y will also increase.
Table 4: Forecasted waste amount for different year
Year Population Forecasted( Y) Forecasted Waste (Tons/ day)
Y*0.0004508
2010 976000 440
2015 1078000 485
2020 (2019) 1080676 486
2025 1083353 488
2030 1086031 490
2035 1088709 491
2040 1091387 493
(Source: Ahmed et al, 2017 and Authors calculation, 2019)
At the time of forecasted Waste generation income range was considered as same as present time. Besides, the amount of wastages generating per day/capita is 0.0004508 ton (Field Survey, 2019). According to the forecasting waste generation will 1.12 times in year 2040 in comparison with 2010 waste generation of 440 tons.
Figure 5: Forecasted waste amount for different year, Author 2019
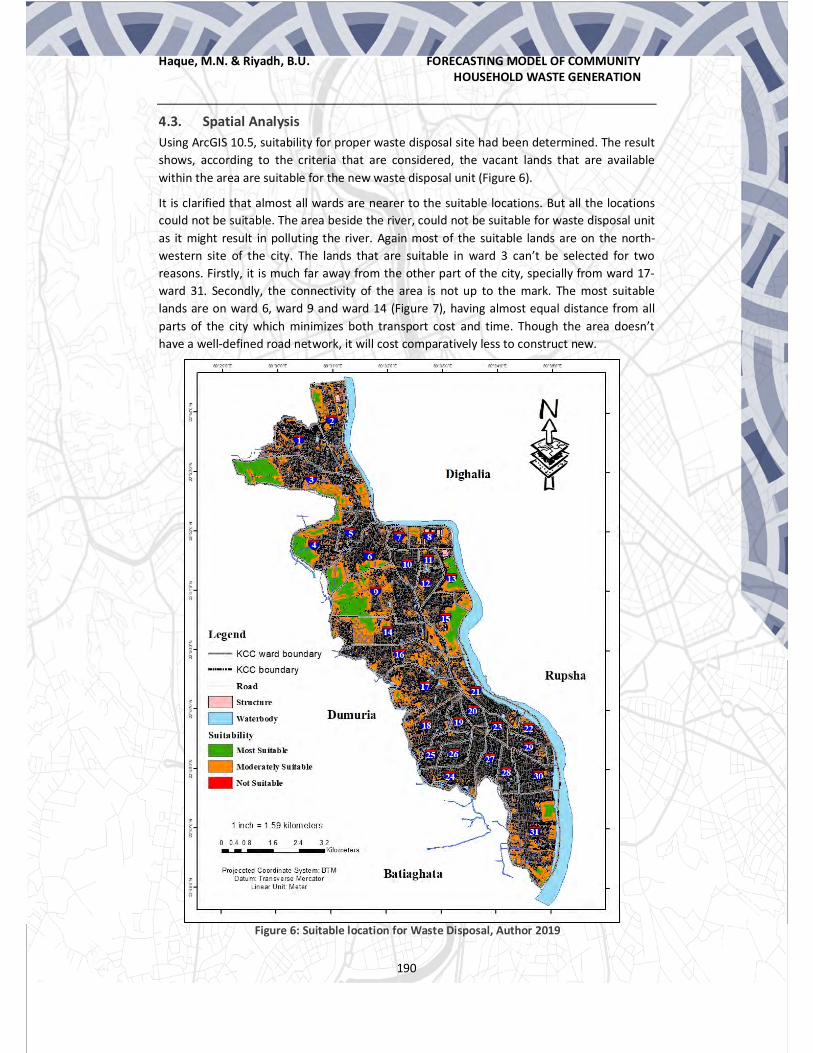
Haque, M.N. & Riyadh, B.U. FORECASTING MODEL OF COMMUNITY HOUSEHOLD WASTE GENERATION
190
4.3. Spatial Analysis Using ArcGIS 10.5, suitability for proper waste disposal site had been determined. The result shows, according to the criteria that are considered, the vacant lands that are available within the area are suitable for the new waste disposal unit (Figure 6).
It is clarified that almost all wards are nearer to the suitable locations. But all the locations could not be suitable. The area beside the river, could not be suitable for waste disposal unit as it might result in polluting the river. Again most of the suitable lands are on the north-western site of the city. The lands that are suitable in ward 3 can’t be selected for two reasons. Firstly, it is much far away from the other part of the city, specially from ward 17-ward 31. Secondly, the connectivity of the area is not up to the mark. The most suitable lands are on ward 6, ward 9 and ward 14 (Figure 7), having almost equal distance from all parts of the city which minimizes both transport cost and time. Though the area doesn’t have a well-defined road network, it will cost comparatively less to construct new.
Figure 6: Suitable location for Waste Disposal, Author 2019

Haque, M.N. & Riyadh, B.U. FORECASTING MODEL OF COMMUNITY HOUSEHOLD WASTE GENERATION
191
5. Conclusion Population growth in Khulna city is now at an alarming rate. With the increase of population, the generation of waste is also increasing at a large level. The variation of waste generation greatly depends on the education level, income level, house type, waste generation. It is found that the segregation practise is not well seen in the whole study at the initial level of waste generation and also waste pickers do not have any different designated place to dump different waste in separate space. If there is some selected area for selected wastes the waste pickers as well as the stakeholders have the chance to introduce the source segregated system. Which may help to make the environment clean and healthy as well as better management with the motivation of the household persons? The inclusion of NGOs, small enterprises and willingness of authority can pave the way to make the city liveable and environmentally silent.
Again the possible solution of waste dumping zone suggests that if the selected location (ward 6,9,14) are frequently used to manage the wastes showing in the suitability map it would be more convenient. In future the vacant place will not be vacant so now it is the time to plan a better life. The marked zone may use as new dumping zone to manage the upcoming waste generation of huge wastes from the increasing number of people.
Here the simple linear regression is used to estimate the population in Khulna city. However, multiple linear regression analysis with other significant variables (e.g., economic growth of population, no of members in family etc.) could bring more accurate forecast of waste generation.
Suitable Location
Figure 7: Suitable Place for Waste Disposal, Author 2019

Haque, M.N. & Riyadh, B.U. FORECASTING MODEL OF COMMUNITY HOUSEHOLD WASTE GENERATION
192
6. References Adewole, Taiwo and Associates (2009) “Waste management towards sustainable
development in Nigeria: A case study of Lagos state”, International NGO Journal Vol. 4 (4), pp. 173-179, (April)
Agamuthu, Paul; Fauziah, Shah Hossain; Khidzir,Khondokar Mohammod; and Aiza, Noorazamimah (2007), “Sustainable Waste Management - Asian Perspectives” , International Conference on Sustainable Solid Waste Management pp: 15-26, Chennai, India ( September).
Ahsan, Amimul; Alamgir, Muhammed; Imteaz, Monzur; Shams, Shahriar; Rowshon, Md Kamal; Aziz, Mohammad Gulzarul; Idrus, Syazwani (2015) “Municipal solid waste generation, composition and management: Issues and challenges. A case study”, Environment Protection Engineering, pp. 41(3):43-59, (January)
Ahsan, Aminul; Daud, Nik; Islam, Rafizul; Alamgir, Muhammad; Imteaz, Monzur (2012) “Role of NGOs and CBOs in waste management”, Iranian journal of public health vol. 27 pp. 41 (6)
Ahmed, Md. Ashik; and Moniruzzaman, S. M. (2018) “A study on plastic waste recycling process in Khulna city”, 4th International Conference on Civil Engineering for Sustainable Development, Khulna, Bangladesh (February)
Colon, M.; Fawcett, B. (2006) “Community-based Household Waste Management: Lessons Learnt from EXNORA’s „Zero Waste Management Scheme in Two South Indian Cities”, Habitat International, in press (Elsevier Publication)
Haque, Md. Nazmul; Khan, Md. Mehedi Hasan; Chakraborty, Tanmoy (2017) “A GIS based suitability analysis for waste dumping zone – to improve the present condition of the community: a case study on ward 24 (nirala), Khulna city, Bangladesh”, 5th International Conference on Solid Waste Management in South Asian Countries, Khulna, Bangladesh(February).
JICA, (2005) “The study on the solid waste management in Dhaka City”, Clean Dhaka Master Plan (March 2005), The People’s Republic of Bangladesh, Volume 1: Summary, Dhaka City Corporation.
Pasang, H; Moore, GA; Sitorus, G (2007) “Neighbourhood-based waste management: A solution for solid waste problems in Jakarta, Indonesia”, Waste Management Vol. 27 (12) pp: 1924-1938
Rahman, M.M.; Sultana, Kotha Rani; Hoque, M.A. (2008) “Suitable sites for urban solid waste disposal using GIS approach in Khulna City, Bangladesh”, AGRIS since Vol. 45 pp. 11
Tchobanoglous, Gant; Theisen, Hen; Vigil, Sen (1993) “Integrated solid waste management: engineering principles and management issues”, New York. McGraw Hill Inc.
Tin, Aung May; wise, Donald L.; su, Wei-Han; Reutergardh, Lars; lee, Seong-Key (1995), “Cos-benefit analysis of the municipal solid waste collection system in Yangon, Myanmar”, Conservation and Recycling Vol. 14 pp: 103-131, (August)
UNEP (United Nations Environment Programme), (2004) State of Waste Management in South East Asia.
Vasisth, Kumar (2011) Waste Management pp: 4-7, New Delhi: Maxford books Yoshizawa, S.; Tanaka, M.; and Shekdar, A.V. (2004) “Global Trends in Waste Generation. In:
Recycling, Waste Treatment and Clean Technology”, TMS Mineral, Metals and Materials Publishers, 1541-1552.
Kafy,AA; Faisal,AA; Sikdar,MS;Hasan.MM; Ahmmed,R
Using GIS and RS Techniques in Environmental Management
193
Research Paper
Using Geographic Information System and Remote Sensing Techniques in Environmental Management: A
case study in Cumilla City Corporation
Abdulla - Al Kafy, GIS Analyst, Rajshahi Development Authority; Bangladesh Abdullah-Al-Faisal, Research Consultant, Center for Environmental and Geographic
Information Services (CEGIS); Bangladesh Md. Soumik Sikdar, Graduate student, Department of Urban & Regional Planning, Chittagong
University of Engineering & Technology (CUET), Chittagong, Bangladesh Md. Maruf Hasan, Undergraduate Student; Rajshahi University of Engineering &
Technology(RUET), Bangladesh Razu Ahmmed, Undergraduate Student; Rajshahi University of Engineering &
Technology(RUET), Bangladesh
Abstract Geographic Information System (GIS) and Remote sensing (RS) play a crucial role in land use/land cover (LULC) estimation, environmental planning and management. Effective management of the environment plays a crucial role in maintaining a sustainable ecosystem and biodiversity. Cumilla City Corporation (CCC), located in the southern region of Bangladesh, faces rapid urban growth and as a result, massive LULC conversation takes place, which creates a negative impact on the environment. The aim of this study is to estimates the different LULC indexes such as Normalized Difference Vegetation Index (NDVI), Normalized Difference Water Index (NDWI), Normalized Difference Built-up Index (NDBI) and Normalized Difference Bare Soil Index (NDBSI) to measure the environmental condition in CCC area. NDVI and NDWI value give an estimation of the proportion of vegetation and water bodies while NDBI and NDBSI indicate the ratio of built-up area and bare land in the study area. Three Landsat satellite images (Landsat 4–5 TM for 1998 & 2008, and Landsat OLI for 2018) were used to estimate the different LULC indexes using GIS and RS techniques. All the indexes were calculated using Near-Infrared, Short Wave Infrared, Red, Green, and Blue bands. The result suggests that rapid and moderate increase in NDBI and NDBSI value, and a significant decrease in NDVI and NDWI value, respectively. The built-up area replaces almost 21% of vegetation land and 3% of water bodies in the last 20 years. The study provides an appropriate solution in decision making for making cities sustainable and environmental friendly using GIS and RS technologies. Keywords LULC, Landsat Images, Environmental management, Cumilla City Corporation (CCC)
1. Introduction: The use of remotely-sensed data has been widespread in natural resource mapping as well as environmental processes modelling, managing and monitoring in recent years (Ahmed, 2018, Weng and Larson, 2005, Wu et al., 2000). Remotely sensed data is now frequently available from different sensors of various platforms with a wide range of spatiotemporal, radiometric and spectral resolutions which can be applied in multiple fields (Melesse et al., 2007). It has become a great source of data as a scene cover larger area with a lot of spectral information (Faisal and Khan, 2018). Besides, maximum remote sensing works have been

Kafy,AA; Faisal,AA; Sikdar,MS;Hasan.MM; Ahmmed,R
Using GIS and RS Techniques in Environmental Management
194
focused on environmental management issues over the past decades with the advancement of availability of high-resolution images (Melesse et al., 2007). The urban landscape is a component of the environment which characteristically a complex mixture of roads, buildings, parking lots, garden, cemetery, soil, water, and so on. To create the spatial complexity of ecological systems, each urban surface exhibits a unique thermal, radiative and moisture properties, and relates to their surrounding site environment (Oke, 1982). For better understanding of the dynamics of patterns, processes and interaction in heterogeneous landscapes, ability to accurately enumerate the spatial pattern of the landscape and its temporal changes is obvious(Wu et al., 2000). For identifying the dynamic changes, it is necessary (1) to define the components by having a standardized method, and (2) to conduct a map in repetitive and consistent ways and so the model of urban morphology could be globally developed and monitored (Ridd, 1995). Furthermore, to identify the dynamic urban morphology, some mathematical indices have been invented which are globally accepted and widely used (Gandhi et al., 2015, Mishra and Prasad, 2015, Yengoh et al., 2015). Hence, there are many vegetation indices for detecting the worth condition of vegetation cover, vegetation structure and leaf distribution using satellite images (Zhao et al., 2014). The most popular and widely applied vegetation index is termed as Normalized Difference Vegetation Index (NDVI) which is relied on the red and near-infrared band combination (Gascon et al., 2016). Additionally, in the assessment of water resources, the monitoring of water bodies extraction has become a necessary task. To do so, Normalized difference water index (NDWI) is an index that was developed by McFeeters to delineate the water features using satellite images (McFeeters, 1996). Generally, to describe water features while reducing the appearance of vegetation and soil features, the NDWI uses near-infrared (NIR) and middle infrared (MIR) radiation (Gao, 1996, McFeeters, 1996). Moreover, urbanization is one of the most critical land cover change factors as it increases the loss of agricultural lands by converting it to urban areas (Morawitz et al., 2006, Pu et al., 2006). Information on the urban built-up area is needed to detect land use/land cover changes (LULC) (Singh et al., 2017). For detecting dynamics of urban built-up area, Normalized Difference Built-up Index (NDBI) index is widely used (Zha et al., 2003). Normalized Difference Bare Soil Index (NDBSI) is a useful index which is built by Zhao & Chen (2005) for distinguishing bare-soil from similarly built-up and vegetation using satellite images. The index relies on a strong reflection of TIR radiation and near-total absorption of middle infrared (MIR) wavelengths by bare-soil (Chen et al., 2006; Morawitz et al., 2006). In this study, using a combined approach of Remote Sensing and GIS technologies, four different necessary environmental components such as vegetation, waterbody, built-up land and bare soil are monitored, and their extent of changes are evaluated. Thus, the study can give a complete environmental profile to manage ecological components and ensure environment sustainability in Cumilla City Corporation area.
2. Materials and Methods 2.1. Study area Cumilla district is bounded by Brahmanbaria District in north, by Feni and Noakhali Districts in south, by Narayanganj District, Munshiganj and by Chandpur Districts in west and Tripura State of India in the east. It lies between 23°02' and 23°48' north latitudes and between 90°38' and 91°22' eastern longitudes. The total area of the district is 3146.30 Km2 (1214.79

Kafy,AA; Faisal,AA; Sikdar,MS;Hasan.MM; Ahmmed,R
Using GIS and RS Techniques in Environmental Management
195
sq. miles) with an estimated population of 5387288 people (Statistics, 2011, Kafy and Ferdous, 2018). Cumilla City Corporation was established on the 10th of July 2011 (Statistics, 2011). The Cumilla City Corporation is situated on the bank of Gumti River. The city is also known as the hub of road communication of the eastern part of Bangladesh. The Cumilla City Corporation area has not uniform topographical features. The location of Cumilla City Corporation area is shown in Figure 1. The area experiences mixed type of topography. Also, the land of the area is not flat rather undulated. The elevation of city’s area varies from 9.29 m to 16.58 m (Corporation, 2017). The city corporation area includes hilly tracks with brown, light brown and dark brown granular sandy silts or clayey silts. The soil condition of the city is very acidic and hard. Also, soaking condition of soil is ranged from very high to moderately good. Besides, the area has a condition of high to medium risk of flash floods and erosions (Department, 2014).
Figure 1 Location map of the Cumilla City Corporation
2.2. Methodology In order to identify the environmental changes of the study area, three Landsat satellite images (Landsat 4–5 TM for 1998 & 2008, and Landsat OLI for 2018) were used. Environmental assessment can be done by analysing different indices such as NDVI, NDWI, NDBI and NDBSI using satellite images. As mentioned earlier, Landsat images are used to determine the index in different periods. The sequential methods of determining the value of indices are given as follows. 2.2.1 Determination of Normalized Difference Vegetation Index (NDVI): The calculation procedure of NDVI is based on the red band and near-infrared (NIR) bands. According to Gascon et al., 2016 and Yengoh et al.,2015 the formula of calculating NDVI is given as below equation (1) (Gascon et al., 2016, Yengoh et al., 2015).
(1)

Kafy,AA; Faisal,AA; Sikdar,MS;Hasan.MM; Ahmmed,R
Using GIS and RS Techniques in Environmental Management
196
For Landsat (4-5) images, band 3 and band 4 are the RED and NIR bands, respectively. Additionally, in the case of Landsat 8 images, band 4 and band 5 are RED and NIR bands, respectively. 2.2.2 Determination of Normalized Difference Water Index (NDWI): NDWI relies on near-infrared (NIR) and Short-wave Infrared (SWIR) bands. The formula of delineating water features while reducing the appearance of vegetation and soil features in terms as NDWI is given as equation (2) (Abutaleb et al., 2015).
(2)
For Landsat (4-5) images, band 4 and band 5 are the NIR and SWIR bands, respectively. Also, in the case of Landsat 8 images, band 5 and band 6 are the NIR and SWIR bands, respectively. 2.2.3 Determination of Normalized Difference Built-up Index (NDBI): For determining the built-up scenario of an area NDBI is used. It also relies on near-infrared (NIR), and Short-wave Infrared (SWIR) bands as same as NDWI but equation is different. The formula of retrieving NDBI is given as the following equation (3) (Rouse Jr et al., 1974).
(3)
In the case of Landsat (4-5) images, band 4 and band 5 are the NIR and SWIR bands, respectively. In, addition, for Landsat 8 images, band 5 and band 6 are the NIR and SWIR bands, respectively. 2.2.3 Determination of Normalized Difference Bareness Index (NDBSI): NDBSI is a function of Red, Blue, near-infrared (NIR) and Short-wave Infrared (SWIR) bands to delineate bare soil from environmental morphology. The following equation (4) describes the formula for determining NDBSI (Mfondoum et al., 2016).
(4)
In the case of Landsat (4-5) images, band 1, band 3, band 4 and band 5 are the Blue, Red, NIR and SWIR, respectively. Also, for Landsat 8 images, band 2, band 4, band 5 and band 6 are the Blue, Red, NIR and SWIR, respectively.

Kafy,AA; Faisal,AA; Sikdar,MS;Hasan.MM; Ahmmed,R
Using GIS and RS Techniques in Environmental Management
197
3. Result and discussion 3.1. Normalized difference vegetation index (NDVI)
Figure 2 NDVI distribution of study area in different year
Based on the radiation absorption by the red spectral area chlorophyll and reflectance of it near the spectral area of infrared, the variation of NDVI values are observed. The similarity of the vegetation in an area is represented by the values of NDVI which is confined between -1 to +1. A higher value represents dense vegetation, and the lower value represents lower or no vegetation. Visually it can be said that a remarkable decrease in vegetation area eventuated in 2018 comparing to 1998 & 2018. Dense vegetation was observed in 2008.
3.2. Normalized difference vegetation index (NDWI) Mapping of water bodies can be performed using NDWI based on spectral band green and near-infrared by which turbidity variations, as well as vegetation in the water and vice versa, can be visualised. Similar to NDVI its values also vary from -1 to +1. Values adjacent to +1 represents waterbody and -1 as well as near to it represents dry land. From visual representation it is obtained a gradual reduction of waterbody took place from 1998 to 2018. The area containing water is found higher in 1998 and lower in 2018.

Kafy,AA; Faisal,AA; Sikdar,MS;Hasan.MM; Ahmmed,R
Using GIS and RS Techniques in Environmental Management
198
Figure 3 NDWI distribution of study area in different year
3.3. Normalized difference bare soil index (NDBSI) Bare soil accommodated area can be derived performing NDBSI which use spectral band red, blue, middle infrared and near-infrared to determine its value. Values close to -1 represents the bare soil land areas, and +1 represents the others landscape elements such as forest, waterbody, cropland etc. form the visual representation it can be said that there is a decrease of land covered with bare soil in 2018 compared to the year 1998 & 2008.

Kafy,AA; Faisal,AA; Sikdar,MS;Hasan.MM; Ahmmed,R
Using GIS and RS Techniques in Environmental Management
199
Figure 4 NDBSI distribution of study area in different year
3.4. Normalized difference built-up index (NDBI)
Figure 5 NDBI distribution of study area in different year
The use of NDBI in majorly in human settlement along with few essentials of land areas such as roads, dams, canals etc. mapping. Spectral band middle infrared and near-infrared is used for deriving the value of NDBI. Values close to +1 represents the land areas which have covered with buildings and -1 represents the other natural elements of environments such as forest, waterbody, cropland etc. In contrast with NDVI and NDWI, an increase of built-up
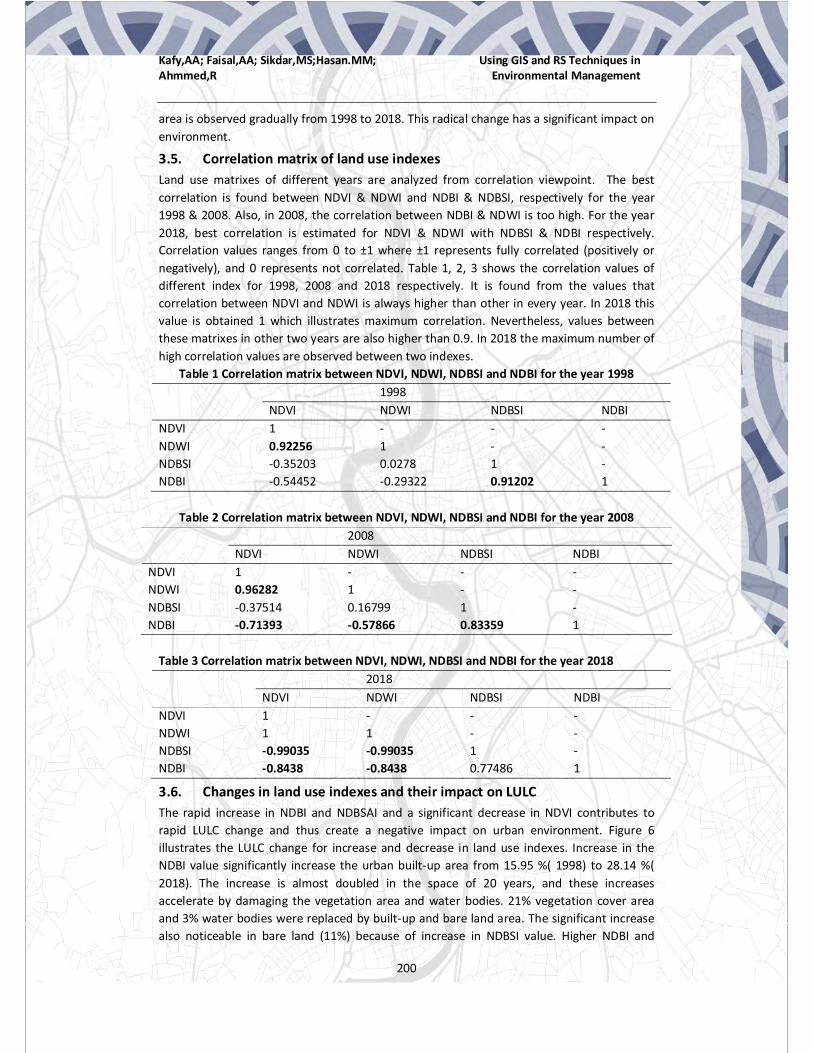
Kafy,AA; Faisal,AA; Sikdar,MS;Hasan.MM; Ahmmed,R
Using GIS and RS Techniques in Environmental Management
200
area is observed gradually from 1998 to 2018. This radical change has a significant impact on environment.
3.5. Correlation matrix of land use indexes Land use matrixes of different years are analyzed from correlation viewpoint. The best correlation is found between NDVI & NDWI and NDBI & NDBSI, respectively for the year 1998 & 2008. Also, in 2008, the correlation between NDBI & NDWI is too high. For the year 2018, best correlation is estimated for NDVI & NDWI with NDBSI & NDBI respectively. Correlation values ranges from 0 to ±1 where ±1 represents fully correlated (positively or negatively), and 0 represents not correlated. Table 1, 2, 3 shows the correlation values of different index for 1998, 2008 and 2018 respectively. It is found from the values that correlation between NDVI and NDWI is always higher than other in every year. In 2018 this value is obtained 1 which illustrates maximum correlation. Nevertheless, values between these matrixes in other two years are also higher than 0.9. In 2018 the maximum number of high correlation values are observed between two indexes.
Table 1 Correlation matrix between NDVI, NDWI, NDBSI and NDBI for the year 1998 1998
NDVI NDWI NDBSI NDBI NDVI 1 - - - NDWI 0.92256 1 - - NDBSI -0.35203 0.0278 1 - NDBI -0.54452 -0.29322 0.91202 1
Table 2 Correlation matrix between NDVI, NDWI, NDBSI and NDBI for the year 2008 2008
NDVI NDWI NDBSI NDBI NDVI 1 - - - NDWI 0.96282 1 - - NDBSI -0.37514 0.16799 1 - NDBI -0.71393 -0.57866 0.83359 1
Table 3 Correlation matrix between NDVI, NDWI, NDBSI and NDBI for the year 2018
2018 NDVI NDWI NDBSI NDBI
NDVI 1 - - - NDWI 1 1 - - NDBSI -0.99035 -0.99035 1 - NDBI -0.8438 -0.8438 0.77486 1
3.6. Changes in land use indexes and their impact on LULC The rapid increase in NDBI and NDBSAI and a significant decrease in NDVI contributes to rapid LULC change and thus create a negative impact on urban environment. Figure 6 illustrates the LULC change for increase and decrease in land use indexes. Increase in the NDBI value significantly increase the urban built-up area from 15.95 %( 1998) to 28.14 %( 2018). The increase is almost doubled in the space of 20 years, and these increases accelerate by damaging the vegetation area and water bodies. 21% vegetation cover area and 3% water bodies were replaced by built-up and bare land area. The significant increase also noticeable in bare land (11%) because of increase in NDBSI value. Higher NDBI and

Kafy,AA; Faisal,AA; Sikdar,MS;Hasan.MM; Ahmmed,R
Using GIS and RS Techniques in Environmental Management
201
NDBSI reduce green space in the study area and will create ecological imbalance and environmental problems in Cumilla city corporation area in the near future.
Figure 6 LULC change in the study area due to the increase and decrease in land use indexes
4. Conclusion This paper investigated the changes in land use indexes (NDVI, NDWI, NDBI and NDBSI) and identified the impacts of those changes in the urban environment using GIS and RS techniques. A strong positive correlation was found in NDVI & NDWI and NDBI & NDBSI. A strong negative correlation was noticed between NDBI & NDVI and NDBSI & NDWI because of rapid replacement of vegetation cover and water bodies by speedy built-up and bare land expansion. Later those bare land converted to urban built-up area. With the help of those land-use indexes, these study also estimate the LULC change in Cumilla city corporation area to identify the impacts on urban environment. The LULC change indicates that urban built-up area was almost doubled and the urban expansion mainly replaced the vegetation cover area. Using Landsat-45TM and Landsat 8 OLI images, this study successfully demonstrates that NDVI is an accurate indicator of vegetation cover where NDBI indicates rapid urban growth. The study provides an appropriate solution in decision making and helps urban planners, engineers and environmentalist for building cities ecologically sustainable and environmental friendly using GIS and RS technologies.
5. References Abutaleb, K., Ngie, A., Darwish, A., Ahmed, M., Arafat, S. & Ahmed, F. 2015. Assessment Of
Urban Heat Island Using Remotely Sensed Imagery Over Greater Cairo, Egypt. Advances In Remote Sensing, 4, 35.
Kafy,AA; Faisal,AA; Sikdar,MS;Hasan.MM; Ahmmed,R
Using GIS and RS Techniques in Environmental Management
202
Ahmed, S. 2018. Assessment Of Urban Heat Islands And Impact Of Climate Change On Socioeconomic Over Suez Governorate Using Remote Sensing And Gis Techniques. The Egyptian Journal Of Remote Sensing And Space Science, 21, 15-25.
Chen, X.-L., Zhao, H.-M., Li, P.-X. & Yin, Z.-Y. 2006. Remote Sensing Image-Based Analysis Of The Relationship Between Urban Heat Island And Land Use/Cover Changes. Remote Sensing Of Environment, 104, 133-146.
Comilla City Corporation, 2017. Updated Infrastructure Development Plan . Local Government Engineering Department, 2014. The Project For Developing Inclusive City
Governance For City Corporation. In: Agency, J. I. C. (Ed.). Faisal, A. & Khan, H. 2018. Application Of Gis And Remote Sensing In Disaster Management:
A Critical Review Of Flood Management. International Conference On Disaster Risk Mitigation.
Gandhi, G. M., Parthiban, S., Thummalu, N. & Christy, A. 2015. Ndvi: Vegetation Change Detection Using Remote Sensing And Gis–A Case Study Of Vellore District. Procedia Computer Science, 57, 1199-1210.
Gao, B.-C. 1996. Ndwi—A Normalized Difference Water Index For Remote Sensing Of Vegetation Liquid Water From Space. Remote Sensing Of Environment, 58, 257-266.
Gascon, M., Cirach, M., Martínez, D., Dadvand, P., Valentín, A., Plasència, A. & Nieuwenhuijsen, M. J. 2016. Normalized Difference Vegetation Index (Ndvi) As A Marker Of Surrounding Greenness In Epidemiological Studies: The Case Of Barcelona City. Urban Forestry & Urban Greening, 19, 88-94.
Kafy, A. A. & Ferdous, L. Pond Filling Locations Identification Using Landsat-8 Images In Comilla District, Bangladesh. 1st National Conference On Water Resources Engineering (Ncwre 2018), 2018 Cuet, Chittagong, Bangladesh.
Mcfeeters, S. K. 1996. The Use Of The Normalized Difference Water Index (Ndwi) In The Delineation Of Open Water Features. International Journal Of Remote Sensing, 17, 1425-1432.
Melesse, A., Weng, Q., Thenkabail, P. & Senay, G. 2007. Remote Sensing Sensors And Applications In Environmental Resources Mapping And Modelling. Sensors, 7, 3209-3241.
Mfondoum, A. H. N., Etouna, J., Nongsi, B. K., Moto, F. A. M. & Deussieu, F. N. 2016. Assessment Of Land Degradation Status And Its Impact In Arid And Semi-Arid Areas By Correlating Spectral And Principal Component Analysis Neo-Bands. Cloud Publications, International Journal Of Advanced Remote Sensing And Gis, 5, 1539-1560.
Mishra, K. & Prasad, P. 2015. Automatic Extraction Of Water Bodies From Landsat Imagery Using Perceptron Model. Journal Of Computational Environmental Sciences, 2015.
Morawitz, D. F., Blewett, T. M., Cohen, A. & Alberti, M. 2006. Using Ndvi To Assess Vegetative Land Cover Change In Central Puget Sound. Environmental Monitoring And Assessment, 114, 85-106.
Oke, T. R. 1982. The Energetic Basis Of The Urban Heat Island. Quarterly Journal Of The Royal Meteorological Society, 108, 1-24.
Pu, R., Gong, P., Michishita, R. & Sasagawa, T. 2006. Assessment Of Multi-Resolution And Multi-Sensor Data For Urban Surface Temperature Retrieval. Remote Sensing Of Environment, 104, 211-225.
Ridd, M. K. 1995. Exploring A Vis (Vegetation-Impervious Surface-Soil) Model For Urban Ecosystem Analysis Through Remote Sensing: Comparative Anatomy For Cities. International Journal Of Remote Sensing, 16, 2165-2185.
Rouse Jr, J. W., Haas, R. H., Schell, J. A. & Deering, D. W. 1974. Monitoring Vegetation Systems In The Great Plains With Erts.

Kafy,AA; Faisal,AA; Sikdar,MS;Hasan.MM; Ahmmed,R
Using GIS and RS Techniques in Environmental Management
203
Singh, P., Kikon, N. & Verma, P. 2017. Impact Of Land Use Change And Urbanization On Urban Heat Island In Lucknow City, Central India. A Remote Sensing Based Estimate. Sustainable Cities And Society, 32, 100-114.
Bangladesh Burue of Statistics,2011. Statistical Yearbook of Bangladesh. Statistics Division, Ministry Of Planning, Dhaka, Government Of The People’s Republic Of Bangladesh.
Weng, Q. & Larson, R. C. 2005. Satellite Remote Sensing Of Urban Heat Islands: Current Practice And Prospects. Geo-Spatial Technologies In Urban Environments. Springer.
Wu, J., Jelinski, D. E., Luck, M. & Tueller, P. T. 2000. Multiscale Analysis Of Landscape Heterogeneity: Scale Variance And Pattern Metrics. Geographic Information Sciences, 6, 6-19.
Yengoh, G. T., Dent, D., Olsson, L., Tengberg, A. E. & Tucker Iii, C. J. 2015. Use Of The Normalized Difference Vegetation Index (Ndvi) To Assess Land Degradation At Multiple Scales: Current Status, Future Trends, And Practical Considerations, Springer.
Zha, Y., Gao, J. & Ni, S. 2003. Use Of Normalized Difference Built-Up Index In Automatically Mapping Urban Areas From Tm Imagery. International Journal Of Remote Sensing, 24, 583-594.
Zhao, L., Lee, X., Smith, R. B. & Oleson, K. 2014. Strong Contributions Of Local Background Climate To Urban Heat Islands. Nature, 511, 216.

Farzana, Fawzia Neoliberalism and housing crisis in Dhaka
204
Research Paper
NEOLIBERALISM AND HOUSING AFFORDABILITY CRISIS IN THE CAPITAL DHAKA
FAWZIA FARZANA, PhD Student, Department of Geography and Environment, University of Dhaka; Bangladesh
Abstract
The rise of neoliberalism originated from the crisis of Keynesian welfare states in the United States and England in the 1970s. To solve the problem of declining profitability in the Fordist mass production industries, and because of rising government deficits, policies were enacted aiming to “extend market discipline, competition, and commodification throughout all sectors of society”. The commodification of housing, as well as the increased use of housing as an investment asset placed in a globalized financial market, has profoundly affected the enjoyment of the right to adequate housing across the world. The neoliberal policies have shaped the housing provision system worldwide where private market has been considered the absolute provider of housing for all income groups according to demand but not need. From the literatures the most prominent characteristics of neoliberal housing market have been identified which are 1. Homeownership focused housing provision to uphold asset base welfare system; 2. Unlocking land values and new geographies of the cities; and 3. Affordability crisis
Thatcherism and Reaganism in the 1980s aggressively implemented neoliberal reforms and gradually influenced most countries in the world. Neoliberalism introduced in Third World countries through structural adjustments and fiscal austerity programs. Bangladesh is one of the first nations in the South Asian region which accepted the SAP reform packages of IMF as early as the 1980s. The study has analysed the impacts of neoliberal policies on housing provision in Dhaka according to identified three prominent neoliberal housing market characteristics that ultimately resulted in acute housing affordability crisis for limited income households. The findings are based on secondary and grey materials, which have been analysed and validated by key personnel interviews. The findings will have some policy implications to tackle the housing affordability crisis of Dhaka.
Keywords
Bangladesh, Privatization, Asset based welfare, Gentrification
1. Introduction Briefly, the intellectual roots of neoliberalism can be traced back to the post-war writings of Friedrich Hayek and Milton Friedman. It gained widespread prominence during the late 1970s and early 1980s as a political strategy to deal with the sustained global recession of the preceding decade resulted from the crisis of Keynesian welfare states in the United States and England. Harvey (2005) refers to neoliberalism as ‘in the first instance a theory of political economic practices that proposes that human wellbeing can best be advanced by

Farzana, Fawzia Neoliberalism and housing crisis in Dhaka
205
liberating individual entrepreneurial freedoms and skills within an institutional framework characterized by private property rights, free markets and free trade’.
Thatcherism and Reaganism in the 1980s aggressively implemented neoliberal reforms and gradually influenced most countries in the world including many Third World countries through Structural Adjustment Programs (SAP) with the help of international neoliberal agents (Brenner and Theodore 2002). Bangladesh is one of the first nations in the South Asian region which accepted the SAP reform packages as early as the 1980s.
Neoliberalism emerged with opening up of market which emphasized on tapping the private sector wealth for housing provision. Accounts of this neo-liberal housing policy refer to privatization, increased rents, reduced subsidy, deregulation of private housing and mortgage lending and weakening of planning controls for new and existing housing have profoundly affected the enjoyment of the right to adequate housing across the world. (Wang et al, 2012).
This paper is targeted at identifying the relation between neoliberalism and housing affordability crisis in Dhaka by analysing the political economic transformation of Bangladesh towards neoliberalism. To develop the conceptual framework, next section discusses the identified characteristics of neoliberal housing market from literatures on both central and peripheral countries of the world. Section 3 and 4 will discuss the adaptation of neoliberal political economic policies in Bangladesh and the impact of such policies on housing provision of the capital Dhaka are presented in section 4. The impacts are identified from secondary and grey materials and validated by key personnel interviews1.
2. Neoliberalism and Housing: International perspective Since the late 70s housing was no more considered as social good rather the role of housing in economic development was emphasized with encouraging a formal housing market as the absolute provider of housing for all income groups according to demand but not need. Neoliberalism has evolved and influenced housing though in slightly different ways in both developed and developing countries and the states where government regulations strictly controlled the neoliberal transformation of housing provision, the East Asian developmental states (Brenner and Theodore 2002; Peck and Tickell 2002; Gough 2002; Harvey, 2005). From the literatures the influences can be organized under the three most prominent characteristics: homeownership, unlocking land values and new geographies of cities and the affordability crisis (see Fig 1). Next sections discuss the influences with reference to different categories of world cities.
2.1. Homeownership In recent decades, the notion of an ‘asset-based’ or ‘property-based’ welfare system has become increasingly central to debates on the restructuring of western welfare states (Ronald 2008; Rolnik, 2013; Watson 2009). The principle underlying to this approach is that, rather than relying on state-managed social welfare, individuals accept greater responsibility for their own welfare needs by investing in financial products and property assets which augment in value over time. These can, at least in theory, later be tapped to supplement consumption and welfare needs when income is reduced, for example, in retirement.
In developed countries like UK and Netherlands public rented housing were sold to individuals through different mechanisms. To encourage homeownership liberalization of
1 Key personnel include housing experts, developers and professionals from state agencies (RAJUK and NHA). The name and designation has not been provided here due to page limitation.

Farzana, Fawzia Neoliberalism and housing crisis in Dhaka
206
rent control and financing of homeownership have also been initiated in to speed up neoliberal housing market (Rolnik, 2013). However, the asset-based welfare system constituted a division in interests between two parts of the population, one that had secured access to asset-based welfare who have an interest in the continued increase in house prices and the other seeking access who have pressured governments to improve the affordability of home purchase (Watson 2009; Ronald 2008). The research on Australia revealed that after-housing-costs poverty rates for non-home-owning older households are notably high. An important conclusion is that greater dependency on home ownership and housing wealth in welfare provision reinforce rather than compensate for existing inequalities (Stebbing and Spies-Butcher, 2010). Globalization has affected Asian developmental states since the 1980s and since Economic Crisis in the late 1990s, the neoliberal ideology intruded into through IMF and World Bank economic rescue packages (Hundt, 2015). The percentage of homeownership among urban residents in 2010 indicates pervasive housing commodification and privatization in China (Fulong Wu, 2015). The government waived the land charge for affordable housing and established mortgage market which ultimately favoured the high-income households only (Wang et al., 2012). However, the state control did compel the work-units (employers) in buying housing from the market and then allocating them as in-kind benefits (Logan et al., 2009). In case of Japan, to encourage homeownership, the state launched a series of new loan systems like stem loan system with lower repayments during first five years, two generational loan system, and supplementary loan system. According to Lee et al. (2003), public intervention in the housing arena in Western countries is usually geared toward decommodification, whereas in Asia the tendency is for the promotion of homeownership, in which the state behaves like a private developer.
In case of developing nations, the neoliberal policy recommended ownership as the best housing tenure option but targeted at increasing homeownership however it transferred the responsibility of housing provision from public sector to the private market. As a result both the state and private developers moved away from the unprofitable low income segment of the housing market. Hence the bottom 60 to 70 percent of urban population were the losers and had no other option rather than to accommodate themselves in informal housing or in formal rental accommodations (Songsore et al., 2004; Chakrabarti, 2001; Deshpande, 2004).
2.2. Unlocking land values and new geographies of the cities The logic of building cities according with the dynamics of global capitalism has given rise to what is known as neoliberal urbanism: a form of urbanism subordinated to the dictates of capital. The growth of the big modern cities gives the land in certain areas an artificially and immensely increasing value; the buildings erected on these areas depress this value and initiates gentrification where displacement of working group occurs (Smith, 2002).
Gentrification across the western countries happened due to the penetration by global finance (Smith, 2002). Harvey’s (2004) notion of “accumulation through dispossession” provides a powerful account of the role of urban regeneration and gentrification that helps to illuminate the social, political and economic effects of such policies on city dwellers. Examples of dispossession (though less brutal and more legalistic) can be found in the United States through the abuse of rights of eminent domain to displace long-term residents in favour of higher order land uses such as condominiums and box stores (Harvey, 2004).
The degree of state intervention in the gentrification process is much higher in East Asia (Lee et al. 2003). In case of developmental states, gentrification resulted from state-led redevelopment projects. However, in recent years, the traditional ‘market-based’ form of gentrification in Western countries has emerged in developmental states too (Shin, 2009; Wong, 2006).

Farzana, Fawzia Neoliberalism and housing crisis in Dhaka
207
According to Harvey (2005), where cities were not governed by liberal urban policy during much of the twentieth century, the trajectory of change has been different, yet the embrace of a broadly conceived gentrification of old centres as a competitive urban strategy in the global market leads in a similar direction. The big cities of third world countries like India, Ghana, Kenya, Nigeria or Zimbabwe all forcefully evicted residents as a result of neoliberal urbanism that provoke regeneration through gentrification to make them the destinations of choice for global investments (Smith, 2002; CHORE, 2006; Afenah, 2009).
Figure 1 Impacts of Neoliberalism on Housing provision Source: Adapted from Hervey, 2005; Fulong, 2005; Hodkinson, 2012; Brenner and Theodore, 2002; Rolnik, 2013
2.1. Affordability crisis Asset-based welfare system, gentrification induced by unlocking of land values, increasing importance of cities for global capital accumulation, the increasing centrality of real-estate development in the new urban economy have resulted in housing affordability crisis in global cities. Though it was argued that general national incomes would grow due to the new neoliberal macroeconomic policies and more people will be able to afford housing supplied by the market, the things never happened in that way. Urban housing markets have become elitist arenas where low income inhabitants have been threatened in their “right to the city” (Kadi and Ronald 2014; Rolnik, 2013).
Neoliberal schemes in UK like Right-to-buy scheme for selling out of council housing, Buy-to-let mortgage scheme or get-rich-quick scheme through tax rebate for land lords are the direct and major causes of the lack of affordable housing today. Urban ‘regeneration’ policies in UK continue to provide expensive accommodation ‘choices’ whilst bulldozing affordable housing (Hodkinson, 2012; Dorling, 2014).
In the developmental states, when the planned economy phase (1950-1977) ended, real estate sector witnessed the similar asset price appreciation like in cities of developed world only with a few exceptions where state interventions helped the low income households by the provision of affordable housing (Shin, 2009; Wong, 2006).
Change in Housing Policies
Change in political and Economic Ideas
Neoliberalism Neoliberal Housing Policies
Asset-based welfare (more owner-occupation)
Changes in subsidies
Selling of public rental housing
Less accessible/affordable housing
Public sector: less state investment and intervention
Private sector: more volatile and expensive
World Bank market enabling Prescriptions
Liberalization of mortgage market
Withdrawal of State Interventions
Unlocking Land Values
Privatization of public housing
Liberalization of rent controls
Gentrification by huge investment on land by
RE market

Farzana, Fawzia Neoliberalism and housing crisis in Dhaka
208
The affordability crisis is most acute in developing countries because of increased income inequalities resulted from neoliberal policies as well as due to super expensive land and housing properties and unaffordable mortgage finances resulted by the tendency on relying wholly on market forces of demand and supply and leaving housing to private initiatives (Deshpande, 2004; Harvey, 2005).
3. Evolution of neoliberalism in Bangladesh Bangladesh is one of the first nations in the South Asian region which accepted the SAP reform packages as early as the 1980s. The 1980s began with decline of credit availability by the development financing institutions (DFIs), deterioration of external aid climate and sloth in domestic resource mobilization. All these adverse factors led to serious macroeconomic imbalances. Against this backdrop New Industrial Policy (NIP) was announced in 1982 and policy reforms for stabilization and structural adjustment were initiated by the government along the guidelines of the World Bank and the IMF. Structural adjustment in Bangladesh started with the IMF in December 1980 on Extended Fund Facilities followed by Structural Adjustment Facilities and Enhanced Structural Adjustment Facility throughout the consecutive two decades.
The implementation of the SAP has been followed by massive privatization. The government’s focus on private sector development was supported by the deregulation of the economy as the regime followed a disinvestments programme for which the disinvestments board was set up and direction was made to Development Financial Institutions (DFIs) to offer financial support to private entrepreneurs (Quadir, 2000). Most state owned enterprises were sold to businessmen for ‘give-away’ prices in a very non-transparent manner under the subsidized credits provided to the buyers from public fund. As a result, a ‘symbiotic relationship’ developed between the government and the business. As a result, though the SAP policy packages strongly believed that rapid disinvestment would eventually boost the overall production of the disinvested units, in reality, the production performance of disinvested units has not been found to be encouraging (Sobhan, 1991). Instead, the implementation of reform measures was accompanied by the heightening of the trend in wealth accumulation by the business elite close to the regime through misappropriation of public resources (Quadir, 2002; Nuruzzaman, 2004; Abdullah, 1991).
After the removal of autocratic regime (1982-1990), the democratically elected government began their journey with the expressed commitment to carry out the reform programmes, prescribed by the IDA and IMF according to the conditionalities attached under the Extended Structural Adjustment Facility (Bhattacharya, 2004).
The election win of the AL witnessed a major break with the past as it abandoned its socialist economic policy to officially embrace a commitment to a free market economy, liberalisation as well as privatisation which were in consistent with the development partners’ so far prescribed economic development strategy for the country. It found expression in the Fifth Five Year Plan (1997-2002).
According to Harvey (2005), the widening gap between rhetoric and realization of neoliberalism has spawned a swath of oppositional movements worldwide which came together at the World Social Forum formed in 2001. Such oppositional movements along with some outstanding events and recession in the world economy set the Millennium Development Goals for the year 2015. The sustainable Development Goals for the year 2031 replaced MDGs in 2016. The prime targets of these goals are to reduce the inequalities which have been accentuated through accumulation by dispossession and to attain environmental sustainability which is at threat due to practices of neoliberal economic

Farzana, Fawzia Neoliberalism and housing crisis in Dhaka
209
activities with increasing importance for the role of NGOs and civil society as development partner. In Bangladesh, the most important change was to replace the national development plan (Five Year Plan) by adopting a Poverty Reduction Strategy Paper (PRSP) since 2001 with good governance reform measures which are also in line with the market enabling paradigm (Siddiqui, 1996). The present Government decided to switch back to the five year plan mechanism from 2010-11. With the targets of transforming to the first stages of a middle income economy by the end of 2021, a Perspective plan (2010-2021) has been prepared. Specific strategies and the task of implementation in the Perspective plan are to be articulated through the two five-year plans: Sixth Five Year Plan (2011-2015) and the Seventh Five Year Plan (2016-2020).
3.1. Neoliberal Dhaka: the Mega city resulted from uneven geographical development
One of the themes of neoliberalism that Harvey explores is the phenomenon of uneven spatial development which results in extreme inequality between regions (Harvey, 2005). In case of Bangladesh, the one and only epicentre of economic power and activity is the capital Dhaka. As the result of globalization and neoliberalism, from virtually a zero base in 1980, by 2005 there were around 3,500 active firms in the garments sector employing about 2 million people in Dhaka. Dhaka was the main site of this progress, as, owing to its long-term regional primacy, it offered already developed infrastructural and logistical conditions that favoured the establishment of industries (World Bank, 2005).
Since the 1980s, residential and administrative buildings, cinemas, shopping centres, cultural and financial institutions were built at a breath-taking pace in Dhaka. The needed decentralization programmes failed, and the discrepancy between Dhaka and other urban and rural areas with their precarious socioeconomic situation, was further aggravated (Bertuzzo 2014). Due to pro privatization policies, private schools, universities, clinics, hospitals, diagnostic centres mushroomed in Bangladesh; most of which are centred in the capital Dhaka. A total of 200,939 (151,814 male and 49,152 female) students were studying in several disciplines in 51 private universities in 2009. Along with students, these private universities also have created huge numbers of job opportunities (Kabir, 2012). In context of health service, the contrast of Dhaka with other major cities of country can be realized by the fact that the population per bed is 4174 in secondary and other tertiary care hospitals in Dhaka division while in Chattogram and Khulna Divisions the figure is 8054 and 7300 respectively. Moreover, the establishment of international or semi-international standard Hospitals like, Apollo Hospital, United Hospital, Square Hospital, Lab Aid also have contributed to make Dhaka the only destination of most of the internal migrants. In Dhaka, only 16.4% are urban residents by birth meaning that remaining 83.6% are migrants (BBS, 2011). With immigration as a direct consequence of unbalanced growth, its population grew from 1 to 10 million within three decades and now after almost five decades it has become around 20 million.
4. Neoliberalism and housing provision in the capital Dhaka Neoliberal reforms have profound implications in the housing sector of Dhaka in the similar ways as the other prominent cities of the world with some atypical characteristics specific to this mega city which are discussed in following sections.
4.1. Homeownership As discussed in section 2, under neoliberalism, homeownership-based approach to welfare was encouraged by selling out of public rental housing; removal of rent controls to

Farzana, Fawzia Neoliberalism and housing crisis in Dhaka
210
encourage homeownership; strategies of making home loans available through financial deregulations; and encouraging private housing market to increase supply of housing.
An interesting ingredient in the Third Five Year plan (1985-1990), when SAPs were initiated in Bangladesh, is the transfer of at least a proportion of the government-owned housing stock to private ownership. The advantages of this step are seen as encouragement of private investment, reduction in government maintenance costs, recycling of housing funds (thus allowing government to provide investments in other areas). Nearly 12,000 houses which were rented out by government at rates well below market values had been suggested to be sold during the Third Five Year Plan period (Choguill, 1993).
The first concrete step towards adopting a neo-liberal housing strategy was the preparation of the National Housing Policy (NHP) in 1993. After the adoption of neoliberal housing strategies, the concept of cooperative housing in the first five year plan was abandoned, public rental housing for government employees was less emphasized2. All the strategies in housing sector were directly or indirectly related to increase the individual ownership of property which goes with the asset based approach to welfare adopted under neoliberalism (Key Personnel Interview, 2018).
Premises Rent Control Act 1991 was developed to safeguard the interests of tenants in, however in reality its application is almost non-existent (BIGD, 2017) which indicates the intention of the state that matches with worldwide neoliberal approaches to encourage homeownership by dismantling rent ceilings (Key Personnel Interview, 2018).
Under the neoliberal housing strategies, there was a continued emphasis on deepening the housing finance market. The enactment of the Financial Institutions Act 1993 opened the door for private housing finance companies to boost up housing market. There are now 23 private companies that extend housing finance in Bangladesh. Bangladesh introduced the value-added tax (VAT) for the purpose of expanding its tax support while as trade linearization policy the maximum import tariff rate was reduced from 250 percent to only 45 percent. Such policy reforms encouraged the emergence of real estate developers to supply luxurious apartments using imported construction materials in the absence of local industries of construction materials (Sen & Tisdell 2004).
Private housing market also got momentum due to policy reforms in other economic sectors. Economic success of the entrepreneurs in the RMG and other sectors had created an effective demand for homeownership in Dhaka. According to Mainuddin (2000), there was the need of 20,000 better housing units for the RMG middle and high ranking managers.
In Bangladesh, to acquire ownership of more than one housing units is a popular way to secure long-term income as a social pension program is still absent in here (Bertuzzo, 2014). Hence the supply from the market is accumulated by high income group that constitute an insignificant share of population. During the mid-1990s, the share of owner occupied houses was 31.9 percent (ADB, 2001) whereas within two decades it has reduced to 18.5 by the year of 2011 despite the strategies taken to increase homeownership (BBS, 2011).
4.2. Unlocking land value and new geographies of the city The urban renewal and redevelopment affecting Dhaka like many other cities favour a very small portion of urban population. The city in short span of time has transformed, the 2 Most of the rental apartments for govt. employees as for example in Motijheel, Azimpur or Baily road Officer’s Colonies were developed in provincial capital Dhaka during Pakistan period. Though public rental housing contributed only 8% of total housing need of this group, such initiatives were further deprioritized when the Second Five Year Plan (1980-1985) mentions that “unjustified construction of staff housing should be stopped given the resource constraints and other pressing needs”. And the Fifth Five Year Plan envisions not on rental housing rather on construction of flats for sale on hire-purchase basis for govt. employees.

Farzana, Fawzia Neoliberalism and housing crisis in Dhaka
211
landscape now dominated by new developments and an array of real-estate advertisements offering lucrative land and housing deals dot the city majority of which are of high-end real-estate for the powerful and affluent classes (Key Personnel Interview).
Under the new wave of privatization a significant number of private schools, universities and hospitals have been established where the rich and affluent only have the access. This privatization of urban space discriminates the urban poor who are forced to move to the urban peripheries. There have been numerous incidents of squatter demolitions and evictions in the last three decades. Beautification projects in the city have also marginalized poor communities from the city. The government initiated Hatirjheel project has displaced huge number of poor people to the new urban peripheries. The project has appreciated the land price of surrounding areas and initiated more private sector gentrification. Poor people used to live in and around the area over the decades have been displaced and moved out to other places especially the peripheries of the city (Hossain, 2013).
Particularly since the 1990s, housing programmes lost their attractiveness for the state. The task is thus transferred to the private real-estate sector with neoliberal strategy to unlock land value through market activities. In spite of the clear northwards expansion of the city, the residential areas within the city have not lost their attractiveness for real-estate business for gentrification. The owners of residential premises increasingly allow the development of high rise buildings on their plots in exchange for ownership of three or more new flats – a popular way to secure long-term income (Bertuzzo, 2014). Unregulated real estate activities causing exponential price hike of land and gentrification have evolved new commercial characteristics of these areas accessible only by high income people (Farzana, 2017).
4.3. Affordability crisis The right to adequate housing has been compromised by the market-based reforms and the structural reconfigurations that neoliberalism has entailed. Neoliberalism increases the income and wealth inequalities through ‘accumulation by dispossession’ where rich people accumulate capital dispossessing the poor (Harvey, 2004). Increasing income inequalities affects housing affordability by reducing the capacity of the majority of prime city dwellers.
The global city Dhaka is positioned as the costliest among similar cities in the sub-continent, even costlier than many developed countries' cities such as Montreal. Dhaka was ranked 71 in the global cost of living compared to New Delhi at 128, Kathmandu at 125, and Karachi at 132 among 133 cities (Economic Intelligence Unit Limited 2015). Inequalities in income and wealth distribution are rising at alarming rate in Bangladesh especially in Dhaka. According to recent estimates by the Centre for Policy Dialogue (CPD), wealth inequality in terms of Gini coefficient stands at a staggering 74.00, whereas the Gini coefficient for income inequality is 48.00 in Dhaka (The Daily Star, May, 2018).
In respect of housing wealth inequality, around 70 per cent of native households could not afford to own houses in Dhaka. They live either in rented houses, government quarters or informal houses (BIGD, 2017). Affordability crisis exist in respect of owning or renting a decent home in Dhaka for the majority of its population. According to the Consumers Association of Bangladesh (CAB), rental cost increased more than overall living costs by average 1.7 percent in the last five years. According to a survey conducted in 2007 by the same organization, house rent in Dhaka increased by 250 percent in last 17 years (1990 to 2007).
In respect of homeownership affordability, the extremely expensive land and housing property in Dhaka have made homeownership absolutely unaffordable for most of its population (Key Personnel Interview, 2018). The emergence of neoliberal real estate market in early 90s resulted in exponential price hike of land and apartments. Land prices appear to be comparable to those in suburban New York, whereas the average income of Dhaka

Farzana, Fawzia Neoliberalism and housing crisis in Dhaka
212
residents is a hundred times lower. Average land price in Dhaka increased by 625.1% within two decades since 1990. And the average price of apartments increased by 173.9% within the same timeframe (REHAB, 2012). Commodification of housing which implies that not need but demand would be the key for housing production and consumption under the free market operations and the ever increasing migration to Dhaka along with the increasing income inequalities which always leave an affluent group with unlimited demand have consequently exerted an upward pressure on the price of land and apartment units and on housing affordability crisis in Dhaka city.
5. Conclusion The paper has discussed the ways of adoption of neoliberal policies in Bangladesh and how neoliberalization and globalization have turned Dhaka into a mega city with the burden of mismatching between ever increasing population and city services including housing provision. Neoliberal reforms in housing sector of Dhaka are the non-existence of the application of any rent controls, deepening of the housing finance market and economic reforms to encourage real estate developers. Despite the reform policies, the housing of Dhaka has become unaffordable for majority of its population due to increased income inequalities as well as for the unanticipated price appreciation of real estate properties.
6. References Abdullah, A. (ed.) (1991), Modernization at Bay: Structure and Change in Bangladesh, Dhaka:
University Press Limited. ADB, (2001), Urban Indicators for Managing Cities, ed. Westfall, M. S. and de Villa, V. A., ISBN
971-561-312-8 Afenah, A. (2009), Conceptualizing the Effects of Neoliberal Urban Policies on Housing
Rights: An Analysis of The Attempted Unlawful Forced Eviction of An Informal Settlement in Accra, Ghana, DPU Working Paper No. 139, UCL, London. ISSN 1474-3280
BBS (2011), Bangladesh Population Census 2011. Bangladesh Bureau of Statistics, Dhaka, Bangladesh.
Bertuzzo, Elisa. (2014), During the Urban Revolution- conjuncture on the streets of Dhaka, in: Stanek, L. et al. (eds) Urban Revolution Now, pp.49-70, Ashgate.
Bhattacharya, D. (2004), ‘State of the Bangladesh Economy in FY2003: A Macroeconomic Overview’, in CPD, Revisiting Foreign Aid: A Review of Bangladesh’s Development 2003, Dhaka: CPD and UPL, pp. 1-38.
BIGD, 2017. The State of Cities 2017: Housing in Dhaka. BRAC Institute of Governance and Development, BRAC University, Dhaka
Brenner, N. and N. Theodore (2002) “Cities and the geographies of ‘Actually Existing Neoliberalism’”, Antipode, 33(3), pp. 349–379.
Chakrabarti, D. P.G.(2001), “Urban crisis in India: New initiatives for sustainable cities”, Development in Practice, 11(2-3): 260-272, DOI: 10.1080/09614520120056397
Choguill, Charles, L. (1993), “Housing Policy Trends in Bangladesh: Meeting the Needs of a Low-income population”, Cities, Volume 10, Issue 4, November, Pages 326-336
COHRE, (2006), Government Obligation on Forced Evictions, http://www.cohre.org/view_page.php?page_id=101#article153
Deshpande, S (2004) Slums of Mumbai: crying for bottoms-up approach. In Mumbai City Development Strategies (eds.), pp. 13–44. , Mumbai.
Dorling, D. (2014), All That is Solid: The Great Housing Disaster (London: Allen Lane)

Farzana, Fawzia Neoliberalism and housing crisis in Dhaka
213
Farzana, F., (2016) “Dhaka: An Example of Landuse Succession where Market Forces Supersede Planning Regulations”, JAHANGIRNAGAR UNIVERSITY PLANNING REVIEW, Vol. 14, June, pp. 1-16. ISSN 1728-4198.
Fulong Wu (2015) “Commodification and housing market cycles in Chinese cities”, International Journal of Housing Policy, 15:1, 6-26, DOI: 10.1080/14616718.2014.925255
Gough, J. (2002) ‘Neoliberalism and socialisation in the contemporary city: opposites, complements and instabilities’, in N. Brenner and N. Theodore (eds) Spaces of Neoliberalism: Urban Restructuring in North America and Western Europe, pp. 58–79. Oxford: Blackwell.
Harvey, D. (2005) A short history of neoliberalism. Oxford University Press, Oxford. Harvey, D. (2004) “The 'new' imperialism: accumulation by dispossession”, Socialist
Register 40: 63-87. Hodkinson, S. (2012) “The new urban enclosures”, CITY 16 (5): 500-518. Hossain, S. (2013) “Migration, Urbanization and Poverty in Dhaka, Bangladesh”, the journal
of the Asiatic society of Bangladesh (humanities), 58(2): 369-382 Hundt, D., (2015) “Neoliberalism, the Developmental State and Civil Society in Korea”, Asian
Studies Review, 39(3): 466-482, DOI: 10.1080/10357823.2015.1052339 Kabir, A. H. (2012), “Neoliberal Hegemony and the Ideological Transformation of Higher
Education in Bangladesh”, Critical Literacy: Theories and Practice, 6(2): 2-15 Kadi, Justin, and Richard Ronald (2014) “Market-Based Housing Reforms and the ‘right to the
City’: The Variegated Experiences of New York, Amsterdam and Tokyo.” International Journal of Housing Policy 14 (3): 268–92. doi:10.1080/14616718.2014.928098.
Lee, J., Forrest, R., and Tam, W.K. (2003) Home-ownership in East and South East Asia: market, state and institutions. Pp. 20–45 in Forrest, R., and Lee, J. (eds) Housing and Social Change: east-west perspectives. London: Routledge.
Logan, J., Fang, Y., & Zhang, Z. (2009) “ Access to housing in urban China”, International Journal of Urban and Regional Research, 33(4), 914-935.
Mainuddin, K. (2000), Case of the Garment Industry of Dhaka, Bangladesh, Urban Partnership Background Series 6, World Bank.
Nuruzzaman, M. (2004), “Neoliberal Economic Reforms, the Rich and the Poor in Bangladesh”, Journal of Contemporary Asia, 34(1): 33-54
Peck, J. and Tickell, A. (2002) Neoliberalizing space, in N. Brenner and N. Theodore (eds) Spaces of Neoliberalism: Urban Restructuring in Western Europe and North America, pp. 33–57. Oxford: Blackwell.
Quadir, F. (2000) “The Political Economy of Pro-market Reforms in Bangladesh: regime consolidation through economic liberalization”, Contemporary South Asia, 9(2), 197-212.
REHAB (2012) A Comprehensive Study on The Real Estate Sector of Bangladesh, Real Estate and Housing Association of Bangladesh, Dhaka, Bangladesh.
Rolnik, Raquel. (2013) “Late Neoliberalism: The Financialization of Homeownership and Housing Rights.” International Journal of Urban and Regional Research 37 (3): 1058–66. doi:10.1111/1468-2427.12062.
Ronald, R. (2008) The Ideology of Home Ownership: Homeowner Societies and the Role of Housing. Basingstoke: Palgrave Macmillan.
Sen, R.K. & Tisdell, C.(Eds) (2004) Economic Globalization: Social Conflicts, Labor and Environmental Issues, Edward Elger Publishing Limited: Cheltenham, UK.
Shin, HB (2009), “Property-based redevelopment and gentrification: The case of Seoul”, Geoforum 40(5): 906–917.
Siddiqui, K. (1996), Towards Good Governance in Bangladesh: Fifty Unpleasant Essays, Dhaka: University Press Limited.

Farzana, Fawzia Neoliberalism and housing crisis in Dhaka
214
Smith, N. (2002), “New Urbanism: Gentrification as Global Urban Strategy, Antipode, 34(3):427-450.
Sobhan, R. (1991), The Decade and Stagnation: The State of the Bangladesh Economy in 1980s. Dhaka: UPL.
Songsore J., McGranahan, G., Kjellen, M., (2004),Tenure, Housing and Environmental Management among families in the Greater Accra Metropolitan Area (ACCRA) of Ghana, Research Review Supplement. Vol. 15, pp. 69 – 83.
Stebbing, A. and Spies-Butcher, B. (2010), “Universal Welfare by Other Means? Social Tax Expenditures and the Australian Dual Welfare State”, Journal of Social Policy, 39(4): 585-606.
The Daily Star, (2018), why Bangladesh’s inequality is likely to rise, May, 12. Wang, Ya Ping; Shao, Lei; Murie, Alan, & Cheng, Jianhua (2012) “The Maturation of the Neo-
liberal Housing Market in Urban China”, Housing Studies, 27:3, 343-359, DOI: 10.1080/02673037.2012.651106
Watson, M. (2009). ‘Planning for the future of asset-based welfare? New Labour, Financialized economic agency and the housing market.’ Planning, Practice and Research 24 (1): 41-56. DOI: http://dx.doi.org/10.1080/02697450902742148.
Wong, T-C. (2006), Revitalizing Singapore’s Central City through Gentrification: The Role of Waterfront Housing, Urban Policy and Research, 24(2): 181-199
World Bank (2005). End of MFA Quotas: Key Issues and Strategic Options for Bangladesh Readymade Garment Industry, The World Bank Poverty Reduction and Economic Management Unit: Dhaka.

Reya, P.M.; Rahman, S.A. & Haque, M. Scope of Corporatisation in Faecal Sludge Management
215
Research Paper
Scope of Corporatisation in Faecal Sludge Management of Khulna City
Khulna City: An Opportunity of Efficient and Profitable Faecal Sludge Management through Corporatisation
Prottusha Mondal Reya, Khulna University; Bangladesh Sheikh Ashikur Rahman, Khulna University; Bangladesh
Masharul Haque, Khulna University; Bangladesh
Abstract
Globally, it is accepted that the faecal sludge management (FSM) is one of the most crucial problems of urban planning in the developing world nowadays. This paper focuses on finding out the scope of corporatisation of FSM in Khulna city as a solution to the current failures and poor service management by the municipalities. It emphasizes converting FSM into a profitable business entity approximating the private sector model of incorporation within the context of public ownership. A mixed method design entailing qualitative and quantitative data was used and data were collected from 100 participants by means of questionnaires and from 15 participants through Key Informant Interviews. The majority of the respondents identified no clear assignment of responsibilities, low priorities on Khulna City Corporation’s agenda and Slow and lengthy approval process as the main FSM service delivery challenges faced by municipalities. Though the citizens have willingness to pay more for better service, the local authorities are unable to deliver in this circumstance. The city depends on a non-sewered FSM system where 384169 households generate around 892051 m3 faecal sludge in a year. As a result it would be very costly to propose a new sewerage system for the whole city. But if it was possible to reinvent the existing system as a business entity where problems related to public sector enterprise could be altered through the private sector business principles, it could be an efficient service sector as well as a business sector with an estimated annual market size of $6.9 million.
Keywords
Corporatisation, Faecal Sludge, Business, Service Delivery, Environment
1. Introduction Importance of good sanitation is indisputable because it is a crucial stepping stone to better health of the city dwellers (WHO/UNICEF 2014). Globally, the great majority of urban dwellers rely for their sanitation on non-sewered systems generating significant public health and environmental risks (Peal et al. 2014). In order to reduce or eliminate potential risks and impacts it is an utmost necessary to manage FS effectively.
In Bangladesh, conventional sewerage system is absent in all urban areas except Dhaka where only 25 percent of the population is served by a sewer network (GOB 2011). All other urban areas use onsite options like septic tank emptying, pit emptying or none at all. At present, there is hardly any formal or environmentally sound faecal sludge collection and

Reya, P.M.; Rahman, S.A. & Haque, M. Scope of Corporatisation in Faecal Sludge Management
216
disposal system in Bangladesh. A root cause for lack of effective FSM services is that there is no clear assignment of responsibilities with regard to FSM among the utility service providers (e.g., WASAs), Local Government Institutions (LGIs), and City Development Authorities in large cities (Rahman et al. 2016).
In Khulna, regulation and control of sanitation is contemplated by the Khulna City Corporation (KCC) (Kabir & Salauddin 2014), but this is currently inadequate to protect human health or the environment. Due to the low priorities on authorities’ agenda, inadequate legal and regulatory basis, not considering urban planning as an integrated approach for improving the environment, inappropriate emptying equipment’s, manual, non-mechanized emptying by private sweepers, limited or no accessibility for cleaners to septic tanks or pits, poor service management by the municipality (Slow and lengthy approval process etc.), non-functionality of non-emptied septic tanks (Chowdhury and Kone 2012) existing faecal sludge management system in the city fails to serve the city dwellers properly. The city requires urgent improvements to its existing faecal sludge management.
There are five vacutugs having 21000L/ trip capacity available in the city corporation to provide faecal sludge emptying service for the city. Though KCC is not a profit initiating organization, it is possible to use the five vacutugs in an extremely profitable business entity. Lack of proper management and unskilled manpower has prevented the city corporation to do so.
Corporatisation is a scheme for approximating the private sector model of incorporation within the context of public ownership (Flanagan 2008). It has been used to create market-friendly public sector cultures and ideologies and also to create more opportunities of profitability (Mannan 2009). As Khulna city extensively depends on non-sewered system for FSM it will be very costly to propose new sewerage service system for the whole city. But if it is possible to reinvent the existing system as a business entity where problems related to public sector enterprise can be altered through the private sector business principles and managed as an efficient private company, the faecal sludge management will be an efficient business sector for both the private and public entity. Therefore, corporatisation can be deemed as an effective tool to manage the faecal sludge efficiently and create an environmentally sound Khulna city.
2. Literature Review
2.1 Faecal Sludge Faecal sludge is described as sludge of variable consistency collected from on-site sanitation systems, such as latrines, non-sewered public toilets, septic tanks and aqua privies (Nkansah 2009). Hemkendreis et al. (2014) also defined faecal sludge as the general term for the undigested or partially digested slurry or solid that results from the storage or treatment of blackwater or excreta. In actual fact, any solid or settled content that comes from pit latrines and septic tanks is referred to as faecal sludge (SHW-Guide 2015). Faecal Sludge refers to all liquid and semi-solid contents that accumulate in onsite-sanitation facilities. 2.2 Faecal Sludge Management Service Chain The faecal sludge management components are specifically the storage, emptying, collection and transport, treatment and enduse or disposal of the faecal sludge. FSM service chain starts from the household users who built the toilet facilities to store the sludge. When the
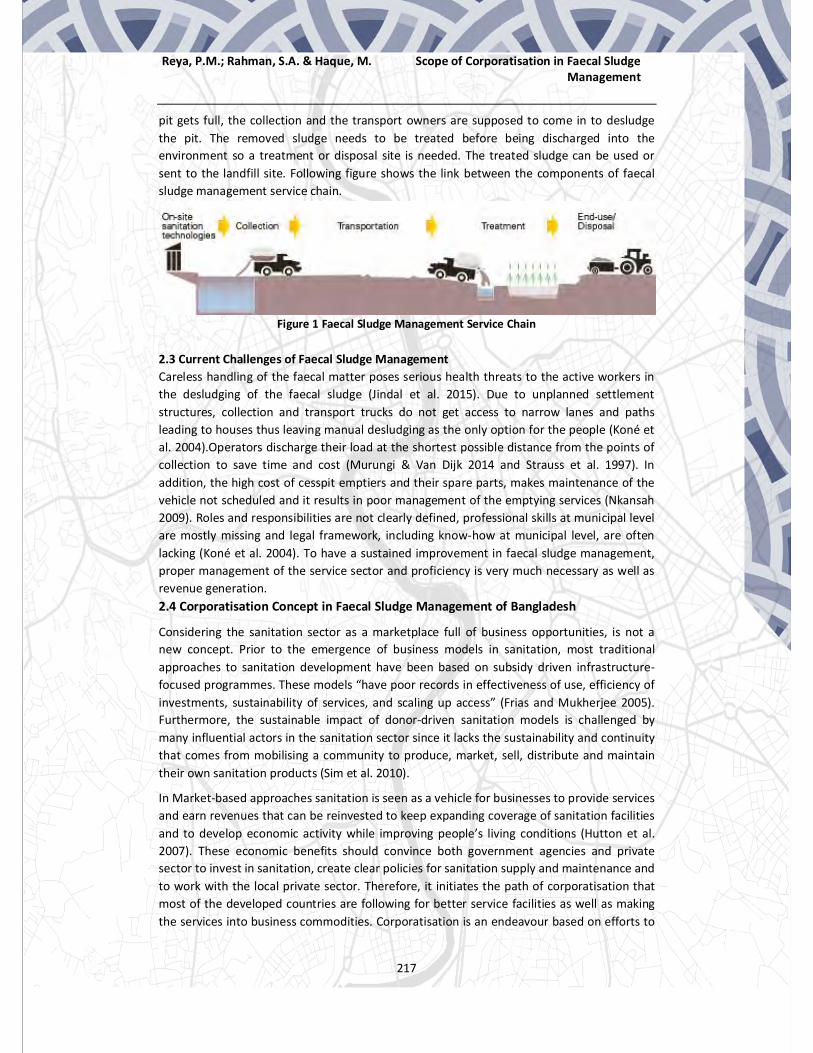
Reya, P.M.; Rahman, S.A. & Haque, M. Scope of Corporatisation in Faecal Sludge Management
217
pit gets full, the collection and the transport owners are supposed to come in to desludge the pit. The removed sludge needs to be treated before being discharged into the environment so a treatment or disposal site is needed. The treated sludge can be used or sent to the landfill site. Following figure shows the link between the components of faecal sludge management service chain.
Figure 1 Faecal Sludge Management Service Chain
2.3 Current Challenges of Faecal Sludge Management Careless handling of the faecal matter poses serious health threats to the active workers in the desludging of the faecal sludge (Jindal et al. 2015). Due to unplanned settlement structures, collection and transport trucks do not get access to narrow lanes and paths leading to houses thus leaving manual desludging as the only option for the people (Koné et al. 2004).Operators discharge their load at the shortest possible distance from the points of collection to save time and cost (Murungi & Van Dijk 2014 and Strauss et al. 1997). In addition, the high cost of cesspit emptiers and their spare parts, makes maintenance of the vehicle not scheduled and it results in poor management of the emptying services (Nkansah 2009). Roles and responsibilities are not clearly defined, professional skills at municipal level are mostly missing and legal framework, including know-how at municipal level, are often lacking (Koné et al. 2004). To have a sustained improvement in faecal sludge management, proper management of the service sector and proficiency is very much necessary as well as revenue generation. 2.4 Corporatisation Concept in Faecal Sludge Management of Bangladesh
Considering the sanitation sector as a marketplace full of business opportunities, is not a new concept. Prior to the emergence of business models in sanitation, most traditional approaches to sanitation development have been based on subsidy driven infrastructure-focused programmes. These models “have poor records in effectiveness of use, efficiency of investments, sustainability of services, and scaling up access” (Frias and Mukherjee 2005). Furthermore, the sustainable impact of donor-driven sanitation models is challenged by many influential actors in the sanitation sector since it lacks the sustainability and continuity that comes from mobilising a community to produce, market, sell, distribute and maintain their own sanitation products (Sim et al. 2010).
In Market-based approaches sanitation is seen as a vehicle for businesses to provide services and earn revenues that can be reinvested to keep expanding coverage of sanitation facilities and to develop economic activity while improving people’s living conditions (Hutton et al. 2007). These economic benefits should convince both government agencies and private sector to invest in sanitation, create clear policies for sanitation supply and maintenance and to work with the local private sector. Therefore, it initiates the path of corporatisation that most of the developed countries are following for better service facilities as well as making the services into business commodities. Corporatisation is an endeavour based on efforts to

Reya, P.M.; Rahman, S.A. & Haque, M. Scope of Corporatisation in Faecal Sludge Management
218
mimic the structure and efficiency of private corporations while assuring social objectives through public ownership.
3. Methodology Under this section, research methodology that was followed to conduct the research has been described. The methodology includes study area selection, sampling method, data collection and analysis procedure.
3.1. Study area Khulna is the third largest metropolitan city of Bangladesh. Total city corporation area is 45.65 square km serves about 1.5 million in total 31 wards with 66,257 holdings (KCC 2017). In Khulna city on an average, about 61.2% households possess septic tanks while 31.6% pits (Kabir and Salauddin 2014). There is a vast opportunity of using these households under a business entity. Moreover, absence of sewerage system in the city provides prospect for running a new efficient business that will be economically viable and environmentally soothing for the city. Two types of settlements: Planned and unplanned residential areas were selected to identify the scope of corporatisation in the city. To conduct this research Nirala Residential area and Baghmara area in ward no 24 were selected as the representatives of planned and unplanned areas.
3.2. Sampling Method To conduct the research at first stratified sampling was selected to divide the residential area of the city into two strata as planned and unplanned. Afterwards the sample was selected based on the purposive sampling method. Mainly the house owners were surveyed for the accuracy of data but in few cases the data was collected from the tenant also. 100 houses were surveyed in this research based on a closed questionnaire. The questionnaire was mainly focused on the service they are relied on at present, their satisfaction on the existing service, current problems they have faced in emptying their septic tanks and how they will accept the corporatisation of the service system. Finally 15 Key Informant Interviews were conducted from KCC, SNV and sweeper community to find out the loop holes of the system and how corporatisation can fit into this system to improve the service facilities as well as ensuring the business proficiency.
3.3. Data Collection and Analysis The research was conducted using mix method approach because both types of data (qualitative and quantitative) were to be collected and analysed in this research. Qualitative data were gathered from Key Informant Interviews (KII) with the stakeholders of KCC, SNV and sweepers related to faecal sludge management. KCC is the governmental service operating organization in the city that’s why they were one of the most important stakeholders for this research. Three conservancy department personnel’s were interviewed. SNV is delineating research on business opportunities in this sector and also provide financial support to KCC for better service operation. Two scholars of SNV were interviewed. Then again Sweepers make up the private sector which provides service to the city dwellers. There are so many difficulties they face to provide their service efficiently. But to find out how corporatisation can benefit them 10 KII were conducted.

Reya, P.M.; Rahman, S.A. & Haque, M. Scope of Corporatisation in Faecal Sludge Management
219
Quantitative data were collected by a questionnaire survey mainly on 100 household owners by preparing a closed questionnaire in the study area. The questionnaire was prepared based on selected indicators from the literature review to find out the business scope, market size, profitability of the business.
All the collected data were analysed using cross tabulation to create the relation between two variables, narrative analysis were used to narrate the information received from KII and descriptive statistics were used to present data and finally inferential statistics were used to infer from the allocated data.
4. Results and Discussions This section of the paper interprets the output and findings of the research and reveals elaborately the gaps and barriers of the existing service systems and how corporatisation can fit into the systems as overcoming those pitfalls. 4.1 Current Loop Holes and Satisfaction Level of the Existing Service Systems
There are two types of servicing system at present available in Khulna city. Mechanical Vacutugs services provided by the city corporation and manual services provided by the private sweepers. Another mechanical service was provided in the city by CDC (Community Development Committee) Vacutug service which is now closed due to difficulties with the vacutugs. The main task was to to identify the current gaps and barriers in the current mechanical and manual service as well as to find out whether the city dwellers are satisfied with the current system or not.
From the analysis it was apparent that 24% dwellers of the study area received the service from the City Corporation, 72% received services from the manual private sweepers. 4% of the dwellers never emptied their septic tank even if they were built 10-15 years ago. The Key Informant Interview data also supported the fact that people were more eager to use the manual service than the city corporation service. Both key informants and City dwellers
Dissatisfied
Haven’t Been Emptied Fully Satisfied Moderately Satisfied
Emptying Satisfaction
Mechanical by City Corporation
Manual by Sweeper Haven’t Been Emptied
Figure 2 Septic Tank Emptied Method and Its Satisfaction

Reya, P.M.; Rahman, S.A. & Haque, M. Scope of Corporatisation in Faecal Sludge Management
220
indicated that the critical application procedure of the City Corporation and delay in performing the service (most likely after 72 hours) are the main reason that majority did not select city corporation service. Often the households went through overflow and emergency situations before service from KCC arrived. The both survey results indicated that the vacutugs service could not fully clean the containment as people went for the emptying service after at least 5-10 years and the sludge became hard and difficult to remove. The data also showed that both service users are dissatisfied with the existing faecal sludge management service. Among 24% dwellers that chose mechanical service only 2% were fully satisfied, 4% were moderately satisfied and 18% were totally dissatisfied with the service system. When it came to manual service which corresponds to 72% of dwellers, only 8% were fully satisfied, 11% were moderately satisfied and 53% were dissatisfied. Within total dissatisfaction 25.4% are lying within mechanical vacutug service and 74.6% are lying within manual sweeper service. 4.2 Main Reasons of Failure
There were so many reasons the city dwellers mentioned for their dissatisfaction. Among them some of the main reasons were identified. People admitted that unsatisfactory cleaning as the main reasons for dissatisfaction with the current service system which scores 39% in this research. According to the city dwellers both City Corporation and sweeper provided cleaning services were unsatisfactory. In case of sweepers they often just partially cleaned the septic tank and claimed that it is fully cleaned. They could get away with this as no one was there to inspect their work. In case of city corporation service, the dwellers mentioned that the drivers and helpers of vacutugs were not transparent about the process. Around 31% dwellers thought that the apathy of organization was another big issue in respect of KCC service. They stated that after submitting applications KCC rarely bothered. Sometimes they came after 3/4 days to empty the septic tank or pit. Sometimes they showed excuses such as technical problems of the vacutugs etc. but the sweepers were available anytime they called them. These points completely go against with KCC service.
Haven’t Been Emptied
Lack of Efficient Manpower
Negative Impact on
Environment
Apathy of Organization
Unsatisfactory Cleaning
Figure 3 Reasons of Dissatisfaction of Existing Service System
Freq
uenc
y

Reya, P.M.; Rahman, S.A. & Haque, M. Scope of Corporatisation in Faecal Sludge Management
221
39% think the manpower efficiency of the entire cleaning service should be improved and 10% think the sweeper provided service pollutes the environment. The residents told that they are ready to pay more for better service which the existing service system cannot provide.
The Key Informant also stated that mainly there are many obstacles that City Corporation face to manage the faecal sludge sector. They have many other important issues to focus on which limits their efficiency. Their main focus lies on the solid waste department. This initiates the apathy of organization reasons of dissatisfaction of emptying obtained from the questionnaire survey. They also stated that as people are not aware that they have to empty their containment once a year and they wait for it to overflow. At this stage the mechanical service is not efficient in cleaning the hard sludge. They also mentioned that the city corporation vacutugs could not enter through road <10 feet. This identified one of their limitations to provide service everywhere. On the other side the sweepers also cheat dwellers as the dwellers are reluctant to inspect their containment cleaning. Later this translates to unsatisfactory cleaning. Some other reasons were identified from the interview such as social class, health hazard of the sweepers, nonfulfillment of wages of the sweepers etc.
Finally it could be inferred from the data that no clear assignment of responsibilities, low priorities on Khulna City Corporation’s agenda, Slow and lengthy approval process are the main FSM service delivery challenges faced by municipalities. This generates poor services for the city people. Majority dwellers show interest on paying more for efficient service.
4.3 City Dwellers Suggestions about Better Service
Most of the dwellers have suggested that another special wing of Government or KCC could be operated for efficient service in this sector. There is KWASA for specially water and sanitation services in Khulna city but they focus only on water supply services in the city. There is a vision of KWASA that there will be a sewerage network covering 70% area of the city but it is a long time till then. The general people seemed reluctant to trust in KWASA and they wanted another service provider. They suggested a solid waste management service which is given by the private sector but maintained by KCC. They were really positive about this type of service which is similar to WZPDCL in the power distribution service of the city. This way they could have a fixed sector and place where they could get better service provision and could also complain about the inefficiency of the service as well. They deemed this as an effective way for the betterment of the service.
4.4 Feedback on Corporatisation
The city dwellers indirectly suggested corporatisation of the service which developed countries now have adopted in most of the basic utility services. When the dwellers were asked to give feedback on corporatisation, 86% dwellers responded positivity and 14% people gave negative response. This indicates the possibility and scope of corporatisation in Khulna city.
From KII the sweepers along with the government officials and the researchers were also positive about corporatising the sector to supply efficient service. The sweepers mentioned that there were so many obstacles and health hazards they had to face to provide the service. There were no certainty about their work and they felt lacking of equipment’s necessary to complete the service efficiently. If there would be a private company to employ

Reya, P.M.; Rahman, S.A. & Haque, M. Scope of Corporatisation in Faecal Sludge Management
222
them and utilize their efficiency it would be very much helpful for delivering the service efficiently as well as for the betterment of their life.
Figure 4 Public Feedbacks on Corporatisation
5. Conclusion The main theme of corporatisation is to create a profitable business entity while delivering efficient service. The third largest city of the country depends on a non-sewered FSM system where 384169 households generate around 892051m3 of faecal sludge a year. The city corporation has two vacutugs of 2000L, two vacutugs of 5000L and one 7000L vacutug which has an average income of TK 823/m³. At this rate manual emptying can be profitable as well. As people are happy to pay the amount of money that city corporation have fixed for this specific service, it can be used to estimate the market size of the service which can tell whether corporatisation can be profitable in this city. Considering the average rate/m³ fixed by the city corporation the estimated market size for the business is $6.9 million per year. As it would be very costly to propose a new sewerage system for the whole city, corporatisation could produce a business entity generating a high amount of revenue from the onsite sanitation system. The business will also employ the efficient manpower in this sector like sweepers, harijans to provide better service that will improve the social status of them. One of the big issues of initiating business on a service sector is the investment. But if the sector will be corporatized than the investment will be allocated from the private sector. This also encourages the corporatisation of the service. On the other hand majority of the city dwellers believe that corporatisation can bring them better FSM service. Thus Combination of public sector priorities and private sector business principals can ensure efficient service as well as profitability. Though there may have some issues to initiate corporatisation and some challenges may arise due to corporatization of

Reya, P.M.; Rahman, S.A. & Haque, M. Scope of Corporatisation in Faecal Sludge Management
223
the sector but if all the principals of corporatisation will be maintained carefully then it may create an efficient FSM service for the city.
6. Acknowledgement
The authors’ are very grateful to Prof. Dr. Shamim Mahabubul Haque for generating research idea on this sector and helping in every possible way. The authors’ gratitude also goes to KCC conservancy department and SNV researchers for their help.
7. References Chowdhry, S. and Kone, D., 2012. Business analysis of fecal sludge management: Emptying
and transportation services in Africa and Asia. Seattle: The Bill & Melinda Gates Foundation.
Frias, J. and Mukherjee, N., 2005. Harnessing market power for rural sanitation. Water and Sanitation Program (WSP) Field Note (Feb.), Jakarta, Indonesia.
GOB (2011) Sector Development Plan (2011-25) of Water Supply and Sanitation, Local government Division, Government of Bangladesh.
Hemkendreis, B., Henseler, M. and Güdel, K. (2014). Faecal Sludge Management (FSM) Sandec Training Tool 1.0 – Module 5: pp. 1–35.
Hutton, E.K. and Hassan, E.S., 2007. Late vs early clamping of the umbilical cord in full-term neonates: systematic review and meta-analysis of controlled trials. Jama, 297(11), pp.1241-1252.
Jindal, A.K., Pandya, K. and Khan, I.D., 2015. Antimicrobial resistance: A public health challenge. medical journal armed forces india, 71(2), pp.178-181.
Kabir, A. and Salauddin, M., 2014. A Baseline Study to Assess Faecal Sludge Management of Residential Premises in Selected Southern Cities of Bangladesh. SNV Netherlands Development Organisation.
KCC (2017). “Basic Statistics of Khulna City Corporation”, Official website of KCC. (www.khulnacity.org/Content/index /About_KCC) (Accessed 10 July 2017).
Koné, D. and Strauss, M., 2004, September. Low-cost options for treating faecal sludges (FS) in developing countries–Challenges and performance. In 9th International IWA Specialist Group Conference on Wetlands Systems for Water Pollution Control and to the 6th International IWA Specialist Group Conference on Waste Stabilisation Ponds, Avignon, France (Vol. 27).
Mannan, I.F.F.A.T. and McDonald, D., 2009. Corporatizing Dhaka Water Supply and Sewerage Authority, Bangladesh.
Murungi, C. and van Dijk, M.P., 2014. Emptying, Transportation and Disposal of feacal sludge in informal settlements of Kampala Uganda: the economics of sanitation. Habitat International, 42, pp.69-75.
Nkansah, A., 2009. Management of FS in the urban areas of low-income countries: a case of Tamale, Ghana (Doctoral dissertation, Loughborough University).

Reya, P.M.; Rahman, S.A. & Haque, M. Scope of Corporatisation in Faecal Sludge Management
224
Peal, A., Evans, B., Blackett, I., Hawkins, P. and Heymans, C., 2014. Fecal sludge management: a comparative analysis of 12 cities. Journal of Water, Sanitation and Hygiene for Development, 4(4), pp.563-575.
Rahman, M.M., Ali, M.A., Choudhury, M.R., Rahman, M.A., Redwan, A.M., Noor, N.F. and Aminul, I.S., 2016. Fecal sludge management (FSM) scenario in urban areas of Bangladesh. In The 6th South Asian conference on sanitation (SACOSAN-VI). Dhaka, Bangladesh.
SHW-Guide. (2015). Worldbank Group (http://water.worldbank.org/shw-resource-guide/glossary#F (Accessed May, 18 2018).
Sim, J., Groeber, K. and Greenlee, T., 2010. Making a business of sanitation: Establishing a world trade hub for the poor. Sustainable Sanitation Practice, 10(5), pp.25-29.
Strauss, M., Larmie, S.A. and Heinss, U., 1997. Treatment of sludges from on-site sanitation-Low-cost options. Water Science and Technology, 35(6), p.129.
WHO/UNICEF Joint Water Supply and Sanitation Monitoring Programme, 2014. Progress on drinking water and sanitation: 2014 Update. World Health Organization.

Kafy,AA; Rahman,MN;Rakib,AA; Arpi,S; Faisal,AA Assessing Satisfaction Level of Urban Residential Area
225
Research Paper
Assessing Satisfaction Level of Urban Residential Area: A Comparative Study Based on Resident’s Perception in
Rajshahi City, Bangladesh
Abdulla - Al Kafy, GIS Analyst, Rajshahi Development Authority; Bangladesh Md. Naimur Rahman, Undergraduate Student; Department of Urban & Regional Planning, Rajshahi University of Engineering & Technology(RUET), Bangladesh
Abdullah Al Rakib, Undergraduate Student; Department of Urban & Regional Planning, Rajshahi University of Engineering &Technology (RUET), Bangladesh.
Sudipto Arpi,Undergraduate Student; Department of Urban & Regional Planning, Rajshahi University of Engineering &Technology (RUET), Bangladesh.
Abdullah-Al-Faisal, Research Consultant, Center for Environmental and Geographic Information Services (CEGIS); Bangladesh
Abstract
Rapid urban growth is taking place all over the world, and if the current trends of growth continue, more than 50% of the population of Bangladesh will live in urban areas by the year 2030. For ensuring sustainable and planned urban growth in city areas, residential area (RA) development projects play an important part. A well designed RA is a grouping of both varied and compatible land uses, such as housing, recreation and commercial centres all within one place. For ensuring the orderly development of Rajshahi City, Rajshahi Development Authority implemented residential projects like Padma, Parizat, Chayanir, Chandrima and Mohananda Residential Area. The aim of this study to find out the satisfaction level (SL) of different RA based on the resident’s perception of living in those areas. The SL was estimated on the basis of physical environment (air & water quality, noise pollution, temperature in winter and summer, road condition, transport availability), neighbourhood environment (water, electricity & gas supply, drainage & sewerage system, solid waste management, educational, commercial, medical & recreational facilities and local security) and social environment (privacy, religious conflict, community activities and mastan& prostitute problem). The data collected from primary and secondary sources. Total of 250 samples was collected with 95 % confidence level and 5% confidence interval. The result suggests that Padma RA is comparatively better than other RA. The entrance road is narrow in Padma, Chayanir andChandrima RA. Sewerage and drainage system alone with gas connectivity are the other common problems. The study helps urban planners to identify useful facilities which make the RA more user satisfactory. Keywords
Urban growth, Residential area, Satisfaction Level, Rajshahi.
1. Introduction Globally, more than 50% of the population lives in urban metropolitan areas (McGee, 1971, Habitat, 2016). The metropolitan population worldwide will grow to 6 billion by 2045. Cities produce more than 80% of global GDP, and if urbanisation can be managed inclusively, it will increase worldwide productivity and allowing innovation and new ideas to emerge (Rana,

Kafy,AA; Rahman,MN;Rakib,AA; Arpi,S; Faisal,AA Assessing Satisfaction Level of Urban Residential Area
226
2011, Habitat, 2016, Rahman, 2019). To manage orderly urban growth, effective land-use planning (LUP) initiative need to be taken (Kötter, 2019, Yadav, 2006). The process of LUP consists of two main functions, one is development plan (DP), and another one is development Control (DC) (Grimmond, 2007, Kötter, 2019, Weeraratne, 2016, Clayton Anthony and Radcliffe Nicholas, 1996, Werkman, 1996). DP refers to the strategic measurable goals that a city authority plans to meet and helps to cope with the changing situation in urban area due to rapid and unplanned urbanisation (Kaiser et al., 1995, Godschalk, 2004). DC restrict physical development planning in specific zones of the city to ensure orderly development of urban settlements for sustainable urban development (Xiang and Clarke, 2003, Werkman, 1996, Godschalk, 2004). One of the critical approaches in the DP is to take a significant number of planned residential area projects (Kaiser et al., 1995, Jones, 2013, Kötter, 2019). The successful implementation of these residential projects helps to reduce residential problems of the city and ensure orderly growth of the city. Bangladesh is facing rapid urbanisation through rapid population growth since independence in 1971. More than 25% of people of Bangladesh currently lives in urban areas, and the current trend will lead more than 50% of population in urban areas by 2030. To reduce the haphazard and unplanned growth and ensure sustainable development of Rajshahi city, Rajshahi Development Authority (RDA) has already implemented several residential projects like Padma, Chandrima, Chayanir, Mohananda and Parizat Residential Area. For ensuring sustainable environment and make the development of Rajshahi city more inclusive, better quality of residential environment needs to be maintained. Utility services like drinking water supply, sanitation, sewerage, waste disposal, drainage, electricity, and gas connection for cooking are essential physical infrastructure for maintaining environmental quality. Also, a well-designed residential area is a grouping of both varied and compatible land uses, such as housing, recreation and commercial centres all within one place. However, the tremendous population pressure and lack of proper management sometimes create difficulties for the people leaving in residential areas. Several studies discuss the satisfaction level of people based on various urban facilities and the overall quality of the environment. Ali et al., (2014) determine the satisfaction level of people and environment based on urban conveniences and environmental quality Bandarban municipality area (Ali et al., 2014). In another study Majumder et al. (2007) produce environmental quality maps of 41 wards of to show the spatial pattern of urban environmental quality for Chittagong Metropolitan City (Majumder et al., 2007). Both of this study use public opinion to determine the satisfaction level of people. No investigation was conducted to determine the satisfaction level of urban residential areas of Rajshahi City. Previous studies mainly related with the topic of urban form, urban environment and socio-economic condition of the slum dwellers (Kashem et al., 2009, Jamil and Panday, 2012, Rahman et al., 2010, Kafy et al., 2018a). Thus, the present study will help to provide a significant output to the city authority for successful development of residential projects in Rajshahi City. The study aims to identify the satisfaction level of different residential area (Padma, Parizat, Chayanir, Chandrima and Mohananda) of Rajshahi city based on resident’s perception living in those areas. The level of satisfaction determines based on physical, neighbourhood and social environment present in each residential area. This study also provides some useful recommendations to make the residential acres more living and environmental friendly as well as sustainable in the near future.

Kafy,AA; Rahman,MN;Rakib,AA; Arpi,S; Faisal,AA Assessing Satisfaction Level of Urban Residential Area
227
2. Materials and Methods 2.1. Study area profile Rajshahi City is the divisional headquarter of Rajshahi division as well as the administrative district and is one of the four metropolitan cities of Bangladesh. Often referred to as Silk City and Education City, Rajshahi is located on the bank of the Padma River in the western boundary of the country. The City Corporation consists of 30 wards and has an area of 48 Km2. Currently, it has an estimated population of around 449,657 people and growing at a rate of 1.25% annually (Clemett et al., 2006, Kafy et al., 2018b). For ensuring the orderly development of Rajshahi City, Rajshahi Development Authority implemented residential projects like Padma, Parizat, Chayanir, Chandrima and Mohananda Residential Area (Figure 1).
Figure 1 Land use of Rajshahi City Corporation and location of the residential areas
2.2. Data Collection and processing In the current study, primary data were collected at the household level from the different residential area for the resident’s perception of urban residential quality considering 47 environmental variables. For the primary sources of information, 474 households were surveyed with the help of a structural questionnaire prepared based on three environmental variables in the different residential area.
Table 1 Population and collected a sample from the different residential area
Residential area Number of Plots Population Confidence level Confidence Interval sample collected Padma Residential 565 28250
95
10
96 Parizat Residential 56 2800 93
Chayanir Residential 224 11200 95 Chandrima Residential 400 20000 96
Mohananda Residential 97 4850 94 Total 1342 67100 474
The larger the sample size, the more accurate the answers which genuinely reflect the population. Sample size estimation was performed using the sample size calculator

Kafy,AA; Rahman,MN;Rakib,AA; Arpi,S; Faisal,AA Assessing Satisfaction Level of Urban Residential Area
228
(https://www.surveysystem.com/sscalc.htm). This Sample size calculator determines how many people need to interview to get the best results that reflect the target population. The samples were selected at 95% confidence level and 10% confidence interval by taking random samples from 67100 populations in five different residential areas (Table 1). The collected data were processed and analysed with the help of required computer software such as Microsoft Excel and Statistical Package for Social Science (SPSS) and. The statistical data was presented in the tabular and graphical form to make it easy and understandable.
2.3. Estimation of Index of Satisfaction The level of satisfaction and dissatisfaction of the different residential area based on environmental variables was estimated using the following satisfaction index developed by Hall, Yen and Tan (1975)
ௌܫ = ிೄ ிವே
(1) IS = Satisfaction Index. FS = Number of Satisfied Respondents. FD= Number of Dissatisfied Respondents. N = Total Number of Respondents. In the Satisfaction Index (SI) IS= +1 represents the highest level of satisfaction and IS= -1, meaning the highest level of dissatisfaction. The above SI was used by Hossain, 1995, Hasan, 1999, Rahman, 2010, Majumder, 2007, and Ali, 2014 to determine the respondent SI of various income groups and urban environmental quality (Majumder et al., 2007, Ali et al., 2014, Hossain, 1995, Hasan, 1999, Aown and Meer, 2018, Rahman et al., 2010).
3. Result and discussion 3.1. Socioeconomic and demographic characteristics of the respondent Generally, characteristics such as age, gender, education level, income, marital status and employment type etc. are being considered as socio-demographic characteristics and was asked in all kinds of surveys. Socio-demographics not only represents the actual scenario but also demonstrate the environmental status of an area. The percentage of the male respondent (52%) is slightly higher than the female respondent (48%) and where 58% people are married, and 42% of the respondents are unmarried. Age group was divided into three categories between 15-65 years, older than 65 years and others. A higher percentage (69%) of the respondents are between 15-65 years. Among all the respondents, 65% of them are engaged in earning activity, whereas 35% of them are either unemployed, housewife or retired. Respondent socio-economic ability and purchasing capability were reflected with the status of income. Income level of the respondents is one of the leading indicators to define the capabilities of receiving each facility provided by urban areas. Higher class and middle-class people were lived in residential area but some lower-income group people (guards, construction worker etc.) also live in those areas. Almost 18% people individual income is 26K-30K and maximum family income (22.2%) is more than 50K.In this study, authors categorised the family income of the respondent into three groups. Income less than 20K is lower-income group. Income within 21K-50K is middle-income group and income more than 50K is high-income group. From the household survey, this study identified that maximum people were involved with service (39%) and local business (23%) activities. Only a few

Kafy,AA; Rahman,MN;Rakib,AA; Arpi,S; Faisal,AA Assessing Satisfaction Level of Urban Residential Area
229
respondents (2% and 4%) were engaged with worker and other service activity. From the respondent, 16% respondents are housewife and student.
3.2. Residential area wise Monthly individual and family income Residents of the selected residential area were mainly higher and middle-income group. Figure-2 and 3 represent the monthly individual and family income of the different residential area in Rajshahi City. The individual income of 9% respondent in Mohananda residential area is less than 10K, followed by Mohananda residential area (8%). The highest percentage of individual income(≥50K) respondent was found in Parizat residential area (12%) followed by 10% in Mohananda residential area. From all the residential area 23% respondent individual income(26K-30K) was found Chayanir residential area followed by 20% in Parizat residential area, 17% in Chandrima residential area and 16% in Padma residential area.
Figure 2 Individual income of respondent in the different residential area
The family income of 5% respondent in Padma residential area is less than 20K, followed by Parizat residential area (4%). The highest percentage of family income (≥50K) respondent was found in Padma residential area (29%) followed by 27% in Mohananda residential area. From all the residential area 29% respondent family income(≥50K) was found Padma residential area followed by 20%(41K-50K) in Parizat and Chayanir residential area respectively.
Figure 3 Family income of respondent in the different residential area

Kafy,AA; Rahman,MN;Rakib,AA; Arpi,S; Faisal,AA Assessing Satisfaction Level of Urban Residential Area
230
3.3. Work status of the respondent in the various residential area Figure 4 illustrates the residential area wise working statues of the respondent. The maximum number of respondent working as a service holder (45%) lives in Chayanir residential area followed by 40% in Chandrima residential area, 35% in Mohananda residential area and 30% in Padma and Parizat residential area respectively. 25% respondent in Padma and Chayanir residential area engaged with local business activities followed by the maximum student (25%) lives in Parizat residential area. The lowest percentage of working groups were found in different residential areas were 5% of homemaker in Chandrima residential area and 5% of worker in Chayanir and Padma residential area.
Figure 4 Work status of the respondent in the different residential area
3.4. Estimating Satisfaction level of the various residential area 3.4.1 Satisfaction level of Physical Environment
In Physical environment, 17 variables were considered for residential satisfaction level (Table 2). The only temperature in summer consists of negative value (-0.05) of SI in all the residential areas. Unbalanced topographic condition, a massive number of heat island, geographical location is the main reason behind this extreme heat in those areas. Noise outside (0.20) holds the second position according to the ranking of satisfaction index. The ongoing construction work creates noise around those residential areas and is now a dissatisfactory issue for all the residents. Waterlogging and water quality placed third (0.25) and fourth (0.29) position respectively in satisfaction index. Water quality is poor in all the residential areas as the water contains too much iron and unhealthy particles with it.
Table 2 Ranking of the physical environmental variables
Physical Environment Variables Satisfaction Index (S.I) Ranking of Satisfaction Noise inside (Human noise, radio, TV) 1.00 17
Airflow 0.96 16 Quality of air (smell) 0.96 15 Tree within the area 0.96 14
Presence of water bodies 0.96 13 Number of garden/parks/open spaces. 0.93 12
Traffic jam 0.89 11 Temperature (winter) 0.85 10
Earthquake 0.85 9 Transport availability 0.71 8
Quality of air (dust particles/SPM) 0.67 7

Kafy,AA; Rahman,MN;Rakib,AA; Arpi,S; Faisal,AA Assessing Satisfaction Level of Urban Residential Area
231
Transport service system 0.67 6 Street condition (with, construction) 0.62 5
Water quality 0.29 4 Water logging 0.25 3
Noise outside (traffic/loud speaker etc) 0.20 2 Temperature summer -0.05 1
Though WASA supplies it, the water quality remains all the same. Street condition, transport service system, transport availability, quality of air had a moderate positive value in satisfaction index. Whereas poorly constructed roads in Chayanir, Mahananda and Chandrima Residential Area is a concern for the residents as the roads were not properly designed. Also, no public transport was available in most of the areas. Residents have to cover a significant amount of distance to get transport service (auto-rickshaw and easy bikes). Noise inside, airflow, quality of air, tree within the area, presence of water bodies, number of garden/parks/open spaces, traffic jam have higher positive values in the SI. Greeneries can be seen all around the residential areas like trees, nurseries and vast open fields. There was a little number of ponds and small lakes, but the numbers are satisfactory according to the residents there. Noise inside has the highest value (1.00) and the highest rank (17) in the satisfaction index. 3.4.2 Satisfaction level of Neighbourhood Environment In the neighbourhood environment, 22 variables were considered for residential satisfaction level (Table 3). The neighbourhood environment demonstrates a perfect scenario for all the residential area and no variable show negative value in satisfaction index. Drainage system holds the lowest rank having the lowermost positive value (0.51) in satisfaction index. Lack of drainage connectivity and narrow width of the drain affect the drainage system and create water logging problem in the city. Utility services like water supply, gas supply, electricity supply, sewerage system consist moderate value (0.56) in satisfaction index.
Table 3 Ranking of the Neighbourhood environmental variables
Neighbourhood Environment Variables Satisfaction Index (S.I) Ranking of Satisfaction Educational facilities 0.96 22
Business facilities 0.93 21 Sanitation 0.91 20
Housing condition (Rant, Quality) 0.89 19 Religious places (Mosque/Temple) 0.89 18
Health care & Medical services 0.85 17 Graveyards 0.85 16
Banking facilities 0.85 15 Solid waste Management (Garbage) 0.75 14
Cyber cafe (Internet & e-mail) 0.75 13 Telephone services 0.71 12
Shopping centre 0.71 11 Recreational facilities 0.60 10
Parking facilities 0.60 9 Employment facilities 0.60 8
Local security, law & order 0.60 7 Water supply 0.56 6
Health care & medical services, graveyards, banking facilities have demonstrated highest SI(0.85) compare with solid waste management (garbage), cyber cafe (internet & e-mail), telephone services, shopping centre, recreational facilities, parking facilities, employment

Kafy,AA; Rahman,MN;Rakib,AA; Arpi,S; Faisal,AA Assessing Satisfaction Level of Urban Residential Area
232
facilities, local security, law & order which SI varies from (0.75-0.60). The presence of Barind medical college and hospital near Chandrima, Padma and Mohananda residential area make the healthcare facility excellent in those areas.Parking facility is excellent, and on-street parking was strictly prohibited in those residential areas. Educational facilities consist the highest positive value (0.96), and that’s why received highest satisfaction rank from all the neighbourhood environment variables. 3.4.3 Satisfaction level of Social Environment
Connectivity between different people and the presence of community feeling within the neighbours was excellent in various residential areas (Table 4). Mastan problem shows the lowest value of satisfaction (0.60) and ranked lowest in the satisfaction ranking. Mastan problem mainly happened in Padma, Chandrima and Mohananda residential area. Also hijacking and eve-teasing were noticeable in smaller number. Expect these issue; other variables have highest positive value (1.00). No religious conflict was seen in those residential areas. According to the satisfaction index, the highest value of satisfaction is +1, and the lowest value is –1. With respect to the satisfaction index, the respondent opinion on physical, neighbourhood and social environmental variables are much satisfied (for physical environment this value is 0.343, neighbourhood environment 0.420 and social environment 0.789) as shown in Table 5.
Table 4 Ranking of the social-environmental variables
Neighbourhood Social Variables Satisfaction Index (S.I) Ranking of Satisfaction Community feeling. 1.00 8
Connectivity of people 1.00 7 Privacy 1.00 6
Community activities 1.00 5 Prostitute problem 1.00 4 Religious conflict 1.00 3
Nude poster problem 0.98 2 Mastan problem 0.60 1
Table 5 Overall Satisfaction Index and ranking of Environmental variables
Number of Respondents Variables Satisfied Acceptable Dissatisfied Total Satisfaction Index Ranking Physical 2495 1310 885 4690 0.343 1
Neighbourhood 3415 1780 865 6060 0.420 2 Social 1805 345 60 2210 0.789 3
3.4.6 Satisfaction level of different residential areas Table 6 and Figure 5 represent the satisfied, dissatisfied respondent and raking of the residential areas based on the SI estimated from different environmental variables. The highest number of the satisfied respondent was found in Padma residential area, where 65% of respondents are satisfied, and 10% respondents are dissatisfied.

Kafy,AA; Rahman,MN;Rakib,AA; Arpi,S; Faisal,AA Assessing Satisfaction Level of Urban Residential Area
233
Table 6 SI and ranking of different residential areas based on physical, neighbourhood and social environment
Number of Respondent in percentage (%) Residential Area Satisfied
Respondents (%) Acceptable respondents (%) Dissatisfied
Respondents (%) Padma Residential 65 25 10 Parizat Residential 45 20 35
Chayanir Residential 53 26 21 Chandrima Residential 62 19 19
Mohananda Residential 57 22 21 In the second-highest place occupied by Chandrima residential area where 62% respondents are satisfied, and 19% respondents are dissatisfied. Based on the satisfied respondent. Third, fourth and fifth place was occupied by Mohananda (satisfied respondents 57% and dissatisfied Respondent 21 %), Chayanir (satisfied respondents 53% and dissatisfied Respondent 21 %) and Parizat (satisfied respondents 45% and dissatisfied Respondent 35 %) residential area respectively.Based on people perceptions collected from all the residential area, Padma Residential received the highest rank (5) because of excellent physical, neighbourhood and social environment. Padma residential area was the oldest residential area in Rajshahi city, and it's well equipped with all the necessary utility facilitates. As the highest value of ranking indicates higher satisfaction, the lower ranking was estimated for Mohananda residential area (1) based on people perceptions. Mohananda, along with Chandrima (2) and Chayanir (3) residential area was estimated lower rank because these areas were newly constructed and deprived of some essential utility facilities (Figure 5).
Figure 5 Ranking of different residential area based on the satisfaction index
4. Conclusion Rapid urbanisation creates difficulties for the urban areas and generates pressure on essential utility services and environment. A sustainable urban residential environment depends on the quality of infrastructure and proper management environmental variables. According to the people perception collected from different residential area of Rajshahi City Corporation, maximum people were satisfied with their surrounding environment. If the city authority looks after few problems in the residential areas, these areas will help to maintain sustainable and inclusive urbanization in future. Improve in the drainage and sewerage system will reduce the water loggings of residential areas in heavy rainy days. Gas
Kafy,AA; Rahman,MN;Rakib,AA; Arpi,S; Faisal,AA Assessing Satisfaction Level of Urban Residential Area
234
connectivity will enrich the quality of utility facilities in those areas. More security needs to ensure fullycrime-free residential areas. Appropriate governmental planning and initiatives, political commitments and collaboration with NGOs will help to reduce the urban residential areas problems and create inclusive ways for making the cities more environmentally friendly.
5. References Ali, K. M. B., Molla, M. H. & Faisal, M. M. 2014. Urban Socio-Economic And Environmental
Condition Of Hill Tracts Bangladesh: A Case Study In Bandarban Municipality. IOSR Journal Of Humanities And Social Science, 19, 36-44.
Aown, N. H. A. & Meer, H. A. 2018. New Urbanism And The City Planning (Implications Of The Application Of The New Urbanism Principles On The Land Uses In Al-Karkh In Baghdad City). Kne Engineering, 149-166.
Clayton Anthony, M. & Radcliffe Nicholas, J. 1996. Sustainability: A Systems Approach. Earthscan: London, United Kingdom.
Clemett, A., Amin, M. M., Ara, S. & Akan, M. M. R. 2006. Background Information For Rajshahi City, Bangladesh. Waspa Asia Project Report, 2, 1-29.
Godschalk, D. R. 2004. Land Use Planning Challenges: Coping With Conflicts In Visions Of Sustainable Development And Livable Communities. Journal Of The American Planning Association, 70, 5-13.
Grimmond, S. U. E. 2007. Urbanization And Global Environmental Change: Local Effects Of Urban Warming. Geographical Journal, 173, 83-88.
Habitat, U. N. 2016. Urbanization And Development: Emerging Futures. World Cities Report, 3, 4-51.
Hasan, S. M. 1999. Urban Environmental Quality A Case Study Of Sylhet City. Unpublished Master’s Thesis, Department Of Geography, University Of Dhaka, Dhaka.
Hossain, S. 1995. Quality Of Urban Environment Assessment: A Quantitative Analysis Of Dhaka Municipal Area. Unpublished Master’s Thesis, Department Of Geography Of Dhaka, Dhaka.
Jamil, I. & Panday, P. 2012. Inter-Organizational Coordination And Corruption In Urban Policy Implementation In Bangladesh: A Case Of Rajshahi City Corporation. International Journal Of Public Administration, 35, 352-366.
Jones, C. E. 2013. Strategic Environmental Assessment And Land Use Planning: An International Evaluation, Earthscan.
Kafy, A.-A., Islam, N., Sharmin, S., Mahzabin, F., Arafat, M. & Roy, S. 2018a. Integration Of Multiple Uses To Create A Central Place For The Community: An Approach Towards A Sustainable Town Centre Development At Baze Shilinda, Rajshahi. Trends In Civil Engineering And Its Architecture, 2, 265-272.
Kafy, A. A., Ferdous, L., Faisal, A. A., Khan, H. A. H. & Sheel, P. K. Exploring The Association Of Surface Water Body Change And Rapid Urbanization In Rajshahi City Corporation (Rcc) Area Using Rs And Gis. 1st National Conference On Water Resources Engineering (Ncwre 2018), 2018 2018b Chittagong.
Kaiser, E. J., Godschalk, D. R. & Chapin, F. S. 1995. Urban Land Use Planning, University Of Illinois Press Urbana, Il.
Kashem, M. S. B., Chowdhury, T. A., Majumder, J. & Rahman, M. A. 2009. Quantifying Urban Form: A Case Study Of Rajshahi City. Journal Of Bangladesh Institute Of Planners, 2, 39-48.
Kötter, T. 2019. Urban Development. The Bonn Handbook Of Globality. Springer. Majumder, A. K., Hossain, M. E., Islam, M. N. & Sarwar, M. I. 2007. Urban Environmental Quality
Mapping: A Perception Study On Chittagong Metropolitan City. Kathmandu University Journal Of Science, Engineering And Technology, 3, 35-48.
Mcgee, T. G. 1971. The Urbanization Process In The Third World, London: G. Bell And Sons, Ltd.

Kafy,AA; Rahman,MN;Rakib,AA; Arpi,S; Faisal,AA Assessing Satisfaction Level of Urban Residential Area
235
Rahman, M., Islam, R. & Rahman, M. 2010. Antenatal Care Seeking Behaviour Among Slum Mothers: A Study Of Rajshahi City Corporation, Bangladesh. Sultan Qaboos University Medical Journal, 10, 50.
Rahman, S. 2019. The Nexus Between Urbanization, Energy Demand And Healthcare In Bangladesh. Journal Of Social Economics Research, 6, 13-19.
Rana, M. M. P. 2011. Urbanization And Sustainability: Challenges And Strategies For Sustainable Urban Development In Bangladesh. Environment, Development And Sustainability, 13, 237-256.
Weeraratne, B. 2016. Re-Defining Urban Areas In Sri Lanka. Working Paper Series. Werkman, A. J. 1996. Regulation Theory And Development Planning: The Case Of Southern
Pinetown, Kwazulu-Natal. Xiang, W.-N. & Clarke, K. C. 2003. The Use Of Scenarios In Land-Use Planning. Environment And
Planning B: Planning And Design, 30, 885-909. Yadav, K. P. 2006. Infrastructure Development & Economic Planning, Sarup & Sons.

Author(s) Surname, Initials Main title (shortened if necessary)
236
Research Paper
IDENTIFICATION THE TREND OF AGRICULTURAL LAND TRANSFORMATION USING PRA TOOLS: A CASE STUDY OF
RAJSHAHI
Aftabun Nahar*, Bachelor of Urban and Regional Planning,Rajshahi University of Engineering and Technology, Bangladesh.
Imzamam Ul Khan Shuvo,Bachelor of Urban and Regional Planning,Rajshahi University of Engineering and Technology, Bangladesh.
Habibur Rahman,Bachelor of Urban and Regional Planning,Rajshahi University of Engineering and Technology, Bangladesh.
Md. Mostafizur Rahman, Assistant Professor, Department of Urban & Regional Planning, Rajshahi University of Engineering and Technology, Rajshahi, Bangladesh.
Anutosh Das, Lecturer, Department of Urban & Regional Planning, Rajshahi University of Engineering and Technology, Rajshahi, Bangladesh.
Abstract
Predominantly, the economy of Bangladesh depends on agriculture. But, nowadays agriculture land is converting into other uses of land. The main reasons behind it are population growth, high production cost, benefit is low, farmers are not getting fair price etc. The study focuses on to find out the trend of agricultural land transformation in Harian union, Paba, Rajshahi. Agricultural land transformation now becomes severe in Harian Union.The trend of this transformation can be shown using secondary data and GIS software. But, this study based on primary data and trend analysis is shown using PRA tools such as social map, resource map, trend analysis etc. Data are collected through focus group discussion with the people of the study area. It provides more accurate information. Villagers are asked to compare present uses to the previous uses, and finally trend analysis diagram is prepared. For better realization, the map and diagram are digitized using software such as GIS, Illustrator and Publisher etc. This study shows that the agricultural land is transformed into pond and brick kilns. Benefit is lower in Agricultural activity than fisheries and construction of brick kilns. As a result, the owner of land is supposed to excavate pond for fisheries. Moreover, the brick kilns are built in agricultural land because of getting raw materials from the excavation. It also affects the environment and livelihood of marginal farmers. This study will help to take steps or regulation on land-uses and may provide a base for further study.
Keywords
Focus group discussion, Trend analysis, Pond excavation, Construction of brick kilns
1. Introduction Agricultural land transformation becomesa common issue in Bangladesh.Bangladesh has always been an agrarian country where over 50% of the population is still dependent on crop agriculture (BBS, 2008). Rajshahi is one the largest populated districts in Bangladesh. To meet the requirement of increased peoples, infrastructures are developed in rapid way. Fast growing rate of infrastructures causes losses of agricultural land. Rajshahi is losing 0.47%
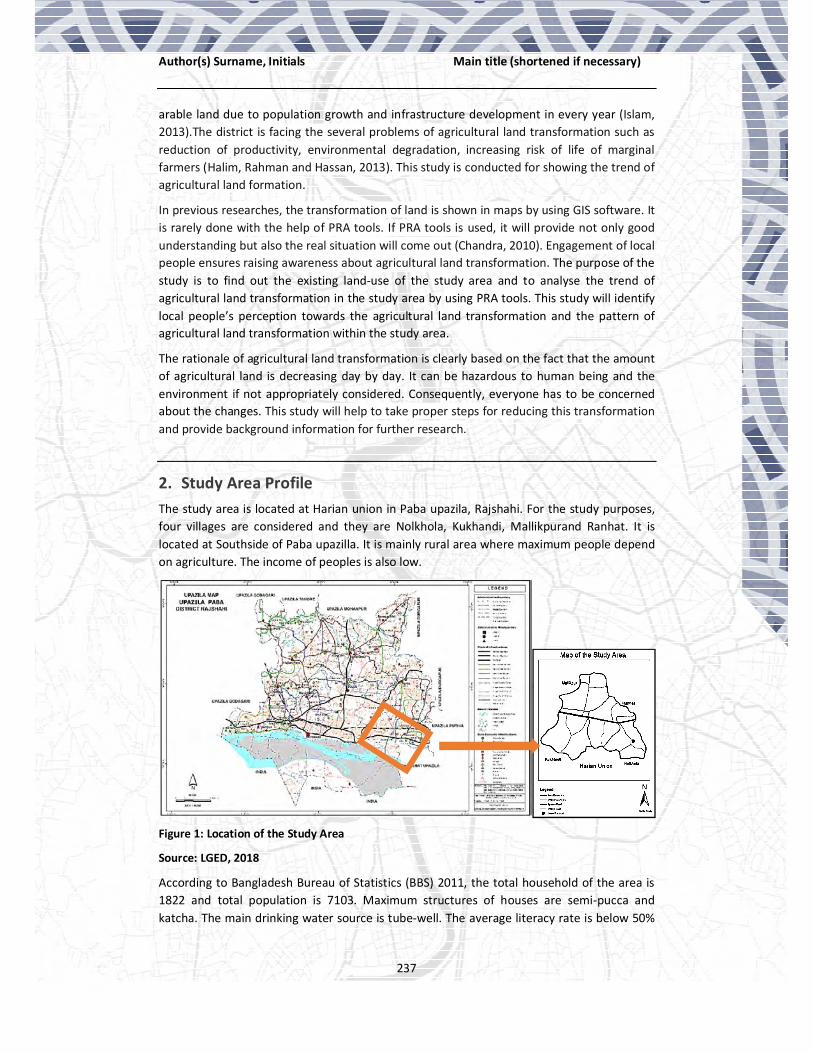
Author(s) Surname, Initials Main title (shortened if necessary)
237
arable land due to population growth and infrastructure development in every year (Islam, 2013).The district is facing the several problems of agricultural land transformation such as reduction of productivity, environmental degradation, increasing risk of life of marginal farmers (Halim, Rahman and Hassan, 2013). This study is conducted for showing the trend of agricultural land formation.
In previous researches, the transformation of land is shown in maps by using GIS software. It is rarely done with the help of PRA tools. If PRA tools is used, it will provide not only good understanding but also the real situation will come out (Chandra, 2010). Engagement of local people ensures raising awareness about agricultural land transformation. The purpose of the study is to find out the existing land-use of the study area and to analyse the trend of agricultural land transformation in the study area by using PRA tools. This study will identify local people’s perception towards the agricultural land transformation and the pattern of agricultural land transformation within the study area.
The rationale of agricultural land transformation is clearly based on the fact that the amount of agricultural land is decreasing day by day. It can be hazardous to human being and the environment if not appropriately considered. Consequently, everyone has to be concerned about the changes. This study will help to take proper steps for reducing this transformation and provide background information for further research.
2. Study Area Profile The study area is located at Harian union in Paba upazila, Rajshahi. For the study purposes, four villages are considered and they are Nolkhola, Kukhandi, Mallikpurand Ranhat. It is located at Southside of Paba upazilla. It is mainly rural area where maximum people depend on agriculture. The income of peoples is also low.
Figure 1: Location of the Study Area
Source: LGED, 2018
According to Bangladesh Bureau of Statistics (BBS) 2011, the total household of the area is 1822 and total population is 7103. Maximum structures of houses are semi-pucca and katcha. The main drinking water source is tube-well. The average literacy rate is below 50%
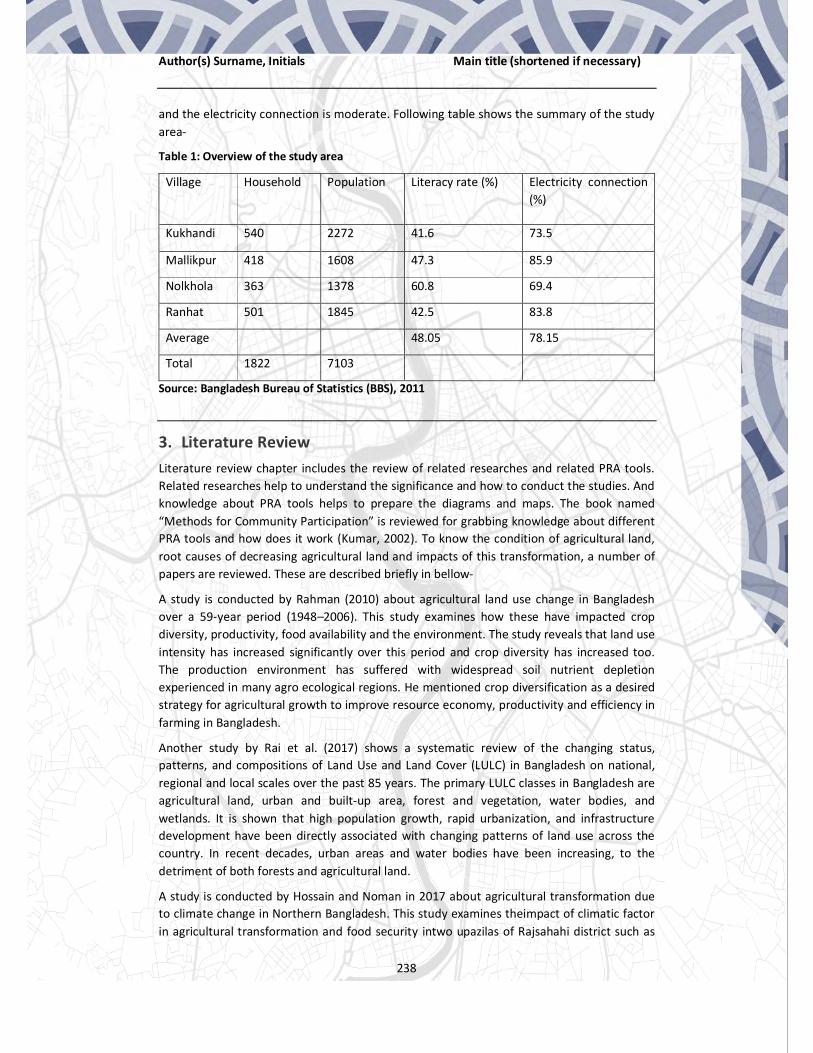
Author(s) Surname, Initials Main title (shortened if necessary)
238
and the electricity connection is moderate. Following table shows the summary of the study area-
Table 1: Overview of the study area
Village Household Population Literacy rate (%) Electricity connection (%)
Kukhandi 540 2272 41.6 73.5
Mallikpur 418 1608 47.3 85.9
Nolkhola 363 1378 60.8 69.4
Ranhat 501 1845 42.5 83.8
Average 48.05 78.15
Total 1822 7103
Source: Bangladesh Bureau of Statistics (BBS), 2011
3. Literature Review Literature review chapter includes the review of related researches and related PRA tools. Related researches help to understand the significance and how to conduct the studies. And knowledge about PRA tools helps to prepare the diagrams and maps. The book named “Methods for Community Participation” is reviewed for grabbing knowledge about different PRA tools and how does it work (Kumar, 2002). To know the condition of agricultural land, root causes of decreasing agricultural land and impacts of this transformation, a number of papers are reviewed. These are described briefly in bellow-
A study is conducted by Rahman (2010) about agricultural land use change in Bangladesh over a 59‐year period (1948–2006). This study examines how these have impacted crop diversity, productivity, food availability and the environment. The study reveals that land use intensity has increased significantly over this period and crop diversity has increased too. The production environment has suffered with widespread soil nutrient depletion experienced in many agro ecological regions. He mentioned crop diversification as a desired strategy for agricultural growth to improve resource economy, productivity and efficiency in farming in Bangladesh.
Another study by Rai et al. (2017) shows a systematic review of the changing status, patterns, and compositions of Land Use and Land Cover (LULC) in Bangladesh on national, regional and local scales over the past 85 years. The primary LULC classes in Bangladesh are agricultural land, urban and built-up area, forest and vegetation, water bodies, and wetlands. It is shown that high population growth, rapid urbanization, and infrastructure development have been directly associated with changing patterns of land use across the country. In recent decades, urban areas and water bodies have been increasing, to the detriment of both forests and agricultural land.
A study is conducted by Hossain and Noman in 2017 about agricultural transformation due to climate change in Northern Bangladesh. This study examines theimpact of climatic factor in agricultural transformation and food security intwo upazilas of Rajsahahi district such as

Author(s) Surname, Initials Main title (shortened if necessary)
239
Godagari and Puthia. It reveals that rice cultivation land istransformed into guava and mango orchard. As a result, rice cultivation isreduced that will reduce food production. This study concludes that the rate oftransformation of guava is higher in Godagari than Puthia and rate oftransformation of mango is higher in puthia than in Godagari and they claimed that transformation is going to affect the food security situationsboth positively and negatively. From the literature review it is proved that agricultural land is converting other land-uses and it will affects the overall economy of Bangladesh.
4. Methodology The major problems and issues were identified by reviewing existing policies, plan, programs, reports etc. which helped to materialize researcher’s concept about the study and formulate goals and objectives of the study. Literatures are reviewed in two times for this study such as for project identification and for objectives fixation. After finalizing goals and objectives a comprehensive literature review was conducted to understand the condition of the land transformation by reviewing relevant reports, journals, and international cases which helped to develop conceptual frame work of the study.Then the best possible study area have been selected in the Rajshahi for the study purpose. For the study the whole statistical analysis has been basically based on primary data. The whole study was conducted using various tools of Participatory rural Appraisal (PRA) method by involving the local residents, which helped obtaining information about that locality. The relevant secondary data for the study was collected from union parishan of Harian.
Aftabun Nahar, Md. Habibur Rahman & Imzamam Ul Khan Shuvo were the facilitators and 12 peoples were participated in focus group discussion. To get an overview of physical and social characteristics of the area, many PRA tools are used such as social map, resource map, etc. Community people mapped their community including information on boundary, road, housing status, health complex, primary school, high school, college, mosque, rural market, important landmarks, ponds, light industry, brick factory, poultry farm, garden and cultivated land etc. To cross check the information recorded on the social and resource map transect walk was used. Moreover, trend analysis is also used to show the actual condition. Trend analysis is based on the idea that what has happened in the past gives the researcher an idea of what will happen in the future.The collected data is processed with the author’s choice and interpreted the inner meaning of the data. After that, the findings are written. The result will reflect the study to the readers.
5. Existing Land-uses of the Study Area 5.1. Existing condition To find out the existing condition of the study area, social map is prepared (shown in figure 2). It is used to show the relative location of households and the distribution of different types of people together with the social structure and institutions of the area.The villager’s occupation can be categorized in four major activity and they are farmer, marginal farmer, day labour, watchman (Pond and Poultry farm). Some other work activity also found and they are rickshaw puller, small businessman, service holder etc. Most of the peoples in these area are related to diversify working activity.

Author(s) Surname, Initials Main title (shortened if necessary)
240
The community consists of four village named Mallikpur, Kukhandi, Ranhat and Nolkhola. The map nearly depicts highway road (Khorkhori Bypass), village road, school, college, house, poultry farm, brick kiln, community clinic, mosque, temple, union parishad etc. of the villages. In addition, using different symbols gives clear sign of social condition of the villages. In study area, there are three types of house. These are pucca, semi pucca, and katcha. Though maximum people in this area are farmers but their housing condition is better because they have opportunities to take loan from different NGOs. Eight active NGOs are found there. Maximum houses are semi pucca. Pucca house is less than semi pucca and katcha houses. Maximum pucca houses are situated near the road side and katcha houses are situated in the back side.
Figure 2: Social Map of the Study Area
Source: FGD, 2018
Facilitators: Aftabun Nahar, Habibur Rahman, Imzama Ul Khan; Participants: Billal Hossain, Fokrul Ahmed, Samsu Sarkar, Rahmotara.
Four educational institutions are present in this area. One primary school, one secondary school and one college are located in Kukhandi and another primary school located in
Not to scale
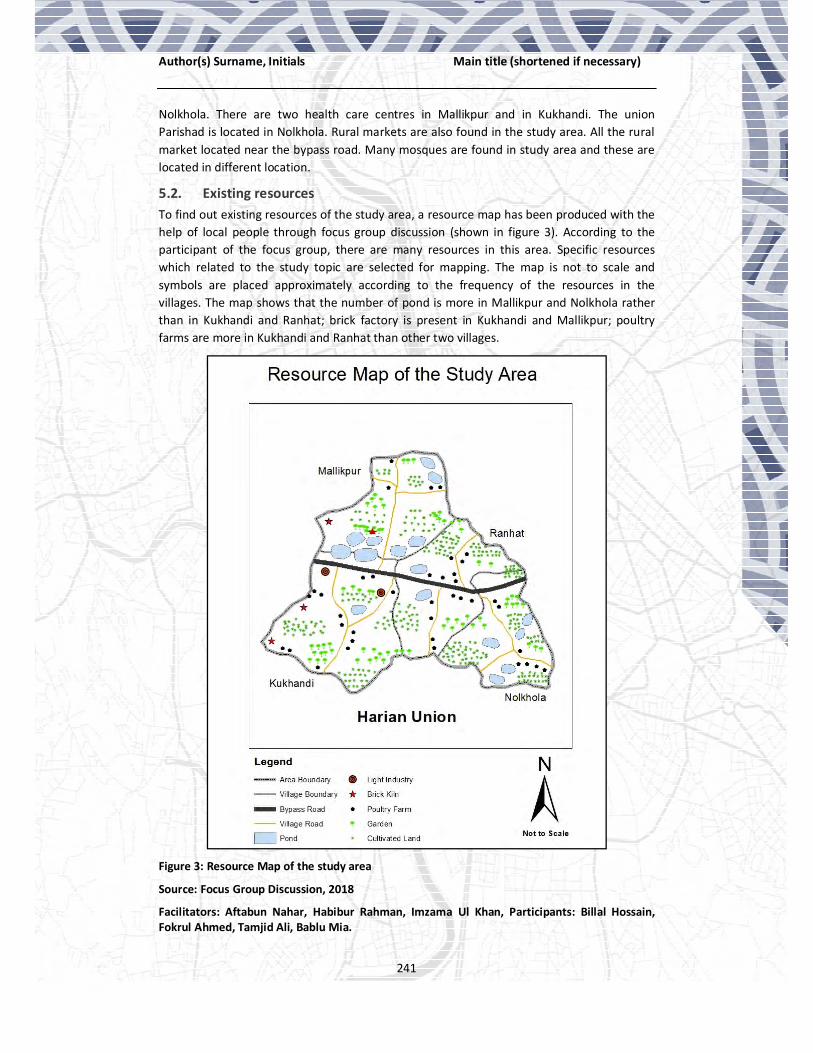
Author(s) Surname, Initials Main title (shortened if necessary)
241
Nolkhola. There are two health care centres in Mallikpur and in Kukhandi. The union Parishad is located in Nolkhola. Rural markets are also found in the study area. All the rural market located near the bypass road. Many mosques are found in study area and these are located in different location.
5.2. Existing resources To find out existing resources of the study area, a resource map has been produced with the help of local people through focus group discussion (shown in figure 3). According to the participant of the focus group, there are many resources in this area. Specific resources which related to the study topic are selected for mapping. The map is not to scale and symbols are placed approximately according to the frequency of the resources in the villages. The map shows that the number of pond is more in Mallikpur and Nolkhola rather than in Kukhandi and Ranhat; brick factory is present in Kukhandi and Mallikpur; poultry farms are more in Kukhandi and Ranhat than other two villages.
Figure 3: Resource Map of the study area
Source: Focus Group Discussion, 2018
Facilitators: Aftabun Nahar, Habibur Rahman, Imzama Ul Khan, Participants: Billal Hossain, Fokrul Ahmed, Tamjid Ali, Bablu Mia.

Author(s) Surname, Initials Main title (shortened if necessary)
242
The existing resources of the study area are cultivated land, garden (fruit), pond, poultry farm, brick factory, light industry, main road etc. In the study area, about 70% areas are cultivable. Different types of crops are produced such as paddy, mustard, wheat, lentils, onion, pumpkin, cucumber, calabash, sugarcane, lady’s finger, etc. Fruit production is another resource. Different types of fruits are produced in the study area. The main fruits are mango, guava, banana and papaya. Moreover, some big farmers are interested to produce unique and good priced fruits such as strawberry, dragon, orange (malta) etc.
The ponds are definitely important resources. It helps to keep ecological cycle active. About 15% of the study area is pond. Maximum ponds are excavated for fisheries that effect agricultural production and also the life of marginal farmers. The main fishes are rui, katla, telapia, pangas, boyal, mrigel, silver etc. The another resource of this area is poultry farm. The peoples of the area are moving to poultry farm business due to high profit. Mainly, the farms are built in the middle space of two or three houses.
Brick factory is the other source of income. But it has also negative impact on environment and fruit production. Mainly, the ponds are being excavated and the soil is the raw materials of the brick. As a result, the number of brick factory is increasing. Moreover, there are two light industry in the study area such as metal and chemical fertilizer industry. Both are located in Kukhandi.
6. The Trend of Agricultural Land Transformation According to the community peoples, the cultivated land is transformed to other uses in the study area. The existing condition also shows the evidence. Mainly, the agricultural land is converted into Homestead, Brick kiln, Garden (fruit), Pond, Poultry, farm and other infrastructure such as school, road, shops etc.
Collected data from union parishad also indicates that the agricultural land is converted to other land-uses. The following table 2 describes it clearly.
Table 2: Changes in Land Uses of the Study Area
Land use 2010 2017
Cultivable land 558 ha 83% 496 ha 73%
Pond 54 ha 8% 84 ha 12.5%
Physical infrastructure
50 ha 7.5% 72 ha 11%
Garden (fruit) 10 ha 1.5% 20 ha 3.5%
Total 672 ha 672 ha
Source: Union Parishad, 2018
There are huge changes in agricultural land transformation. Agricultural land is converted into ponds and brick kiln greatly. Brick kiln holds the maximum percentages in change in physical infrastructure. Among these changes, the number of Brick kiln and the number of pond is increasing at alarming rate. Data from union parishad shows that the number of brick kiln is increased from 4 to 8 in four year’s difference (table 3).
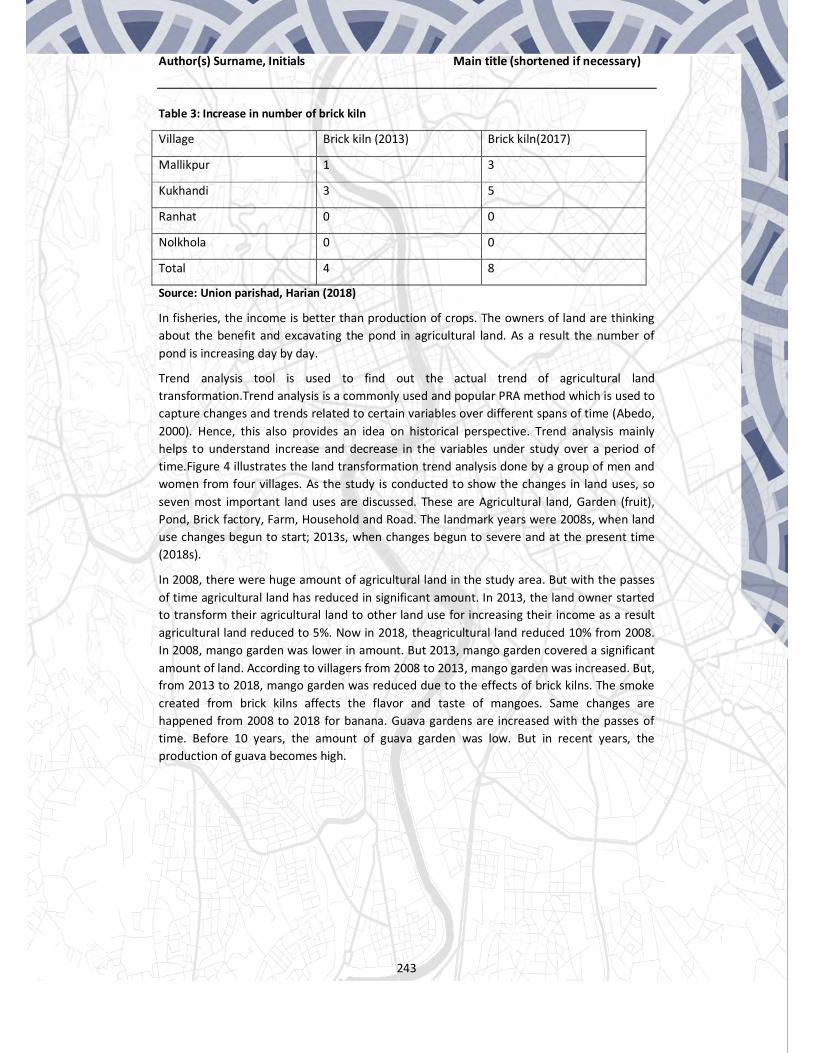
Author(s) Surname, Initials Main title (shortened if necessary)
243
Table 3: Increase in number of brick kiln
Village Brick kiln (2013) Brick kiln(2017)
Mallikpur 1 3
Kukhandi 3 5
Ranhat 0 0
Nolkhola 0 0
Total 4 8
Source: Union parishad, Harian (2018)
In fisheries, the income is better than production of crops. The owners of land are thinking about the benefit and excavating the pond in agricultural land. As a result the number of pond is increasing day by day.
Trend analysis tool is used to find out the actual trend of agricultural land transformation.Trend analysis is a commonly used and popular PRA method which is used to capture changes and trends related to certain variables over different spans of time (Abedo, 2000). Hence, this also provides an idea on historical perspective. Trend analysis mainly helps to understand increase and decrease in the variables under study over a period of time.Figure 4 illustrates the land transformation trend analysis done by a group of men and women from four villages. As the study is conducted to show the changes in land uses, so seven most important land uses are discussed. These are Agricultural land, Garden (fruit), Pond, Brick factory, Farm, Household and Road. The landmark years were 2008s, when land use changes begun to start; 2013s, when changes begun to severe and at the present time (2018s).
In 2008, there were huge amount of agricultural land in the study area. But with the passes of time agricultural land has reduced in significant amount. In 2013, the land owner started to transform their agricultural land to other land use for increasing their income as a result agricultural land reduced to 5%. Now in 2018, theagricultural land reduced 10% from 2008. In 2008, mango garden was lower in amount. But 2013, mango garden covered a significant amount of land. According to villagers from 2008 to 2013, mango garden was increased. But, from 2013 to 2018, mango garden was reduced due to the effects of brick kilns. The smoke created from brick kilns affects the flavor and taste of mangoes. Same changes are happened from 2008 to 2018 for banana. Guava gardens are increased with the passes of time. Before 10 years, the amount of guava garden was low. But in recent years, the production of guava becomes high.

Author(s) Surname, Initials Main title (shortened if necessary)
244
Figure 4: Trend Analysis
Source: Focus Group Discussion, 2018
Facilitators: Aftabun Nahar, Habibur Rahman, Imzama Ul Khan, Participants: Haldar, Monsur Ali, Josna Begum, Emdadul Hoq.
During the study period, it was found that pond has increased in significant amount. In 2008, the number of pond was less. From 2008 to 2013, pond started to increase. At present, agricultural land converted into pond. Brick factory is also increasing in the study area with the passes of time. In 2008, number of brick factory was less and it covered very less amount of land. But from 2013 to 2018 the number of brick factory is increased due to easy availability of soil. Figure 4 shows that a significant expansion of household has occurred during the study period. The household is increased double in number. It indicates that the transformation of agricultural land is increasing with the increasing amount population. Farms are also increasing rapidly with the passes of time. In 2008, there was no farm in the

Author(s) Surname, Initials Main title (shortened if necessary)
245
study area. But in 2018, farms cover a huge amount of land. But, in the study period, no significant changeis found in land covered road construction.
7. Conclusion
The study reveals that the landuse changes from agriculture to other use and significant change of agricultural land has occurred in last few year in this area. According to participant of villages most of the agricultural land converted to pond, fruit garden, brick factory and farm during the study period. That has a resulting effect on the change of livelihood pattern of the small farmer in this area. At the same time, some households have no parcel of agricultural land due to land use change, then they start to find income generating activities all over the year. Agricultural land transformation also leads the environmental degradation. Since the study is based on a particular small community within Harian union, spatial variation may occur within the different community based perceptions. But, the study reflects the overall condition of agricultural land transformation of Harian union. Moreover, the study suggests to implement regulation and policies for stopping conversion of agricultural land.
8. References
Hossain, M.D and Noman, A.N.K (2017)“Climate Change, Agricultural Transformation and Food security in Northern Bangladesh”. [Online]Available from http://beabd.org/site/images/pdf/new17/47.pdf. [22/05/2018]
Rai, R., Zhang, Y., Paudel, B., Li, S. and Khanal, N.R (2017)“A Synthesis of Studies on Land Use and Land CoverDynamics during 1930–2015 in Bangladesh”. Journal of sustainability, doi: 10.3390/su9101866.
Rahman,S (2010) “Six decades of agricultural land use change in Bangladesh: Effects on crop diversity, productivity, food availability and the environment, 1948-2006”. Singapore journal of Tropical Geography, doi: 10.1111/j.1467-9493.2010.00394.x
Kumar, S (2002)METHODS FOR COMMUNITY PARTICIPATION: A Complete Guide for Practitioners. New Delhi: Vistaar Publications.
Halim, M.A, Rahman, M.M and Hassan, M.Z (2013) “Agricultural Land Conversion in the Sub-Urban Area: A CaseStudy of Rajshahi Metropolitan City”. Journal of Life Earth Science, Vol. 8, PP. 21-30, ISSN 1990-4827.
BBS 2011, Population Census, Community Report-Rajshahi, Bangladesh Bureau of Statistics, Government of the People's Republic of Bangladesh
BBS 2008, Population Census, Community Report-Rajshahi, Bangladesh Bureau of Statistics, Government of the People's Republic of Bangladesh.
Chandra, G (2010) “Participatory rural Appraisal”. Issues and Tools for Social Science Research in Inland Fisheries, Central Inland Fisheries Research Institute, pp. 286-302.
Abedo, S (2000) “Training Manual on Participatory Rural Apprisal” [Online] https://www.fsnnetwork.org/training-manual-participatory-rural-apprisal [25/06/2018]
Isalm, M. R (2013)“Causes and consequences of Agricultural land losses of Rajshahi District, Bangladesh”. IOSR Journal Of Environmental Science, Vol. 5, No. 6, pp. 58-65.

Author(s) Surname, Initials Main title (shortened if necessary)
246

Faisal, AA; Hossain, MA; Haque, S; Shaunak, MF; Kafy, AA
Remote Sensing Approach in Wetland and Land Degradation Assessment
247
Research Paper
REMOTE SENSING APPROACH IN WETLAND AND LAND DEGRADATION ASSESSMENT: A SCENARIO OF
MODHUMOTI MODEL TOWN, SAVAR, BANGLADESH Save Wetlands, Remove Modhumoti Model Town
Abdullah-Al-FAISAL, Department of Urban & Regional Planning, Rajshahi University of Engineering & Technology, Rajshahi-6204; Bangladesh
Muhammad Arif HOSSAIN, Department of Urban & Regional Planning, Rajshahi University of Engineering & Technology, Rajshahi-6204; Bangladesh
Shajibul HAQUE, Department of Urban & Regional Planning, Rajshahi University of Engineering & Technology, Rajshahi-6204; Bangladesh
Mir Fahim SHAUNAK, Junior Specialist, Remote Sensing Division, Center for Environmental Geographic Information Services, Dhaka-1212, Bangladesh
Abdulla - Al KAFY, GIS Analyst, Rajshahi Development Authority; Bangladesh
Abstract
Due to rapid urbanization, people destroy core environmental elements such as water, land for habitation purpose without thinking about adverse environmental consequences. Modhumoti Model Town is such type of housing project which is situated at a river zone. Bangladesh Environmental Lawyers Association (Bela) filed a writ against the project and after three times (in 2004, 2005 and 2013) assembling the case, the High Court declared the project was illegal and should restore the wetland. Overruling the law, the development procedure is still constant which destroys the natural wetland and its surroundings. The study aims to assess the extent of water and land degradation due to human settlements using Geographic Information System (GIS) and Remote Sensing (RS) approaches. Modhumoti Model Town is selected as the study area which is situated at Amin Bazar, Savar. Landsat TM 4-5 and OLI 8 have been used to calculate several indices such as Normalized Difference Vegetation Index (NDVI), Soil Adjusted Vegetation Index (SAVI), Normalized Difference Built-up Index (NDBI) and Normalize Difference Water Index (NDWI) in the year of 1998, 2004, 2010, 2014 and 2019 before and after verdicts. Results indicate that NDVI, SAVI, NDWI were decreasing where NDBI was increasing sequentially. Now, both semi-pucca and pucca settlements are around 240 in amount and the project area completely blocks the free flow of water from river. Furthermore, the analysis captures the consequence of law violence and shows that imposing verdict is not enough to protect the environment if it would not be strictly maintained.
Keywords
Environmental consequences, Writ, Overruling laws, GIS, RS
1. Introduction Dhaka city was planned for l0 lakh people in 1959 (Hossain and Akther, 2011), whereas the population of Dhaka Metropolitan Area (DMP) is about 8906039 (Statistics, 2011). The population of Dhaka grows at an estimated rate of 4.2% per year, one of the highest among

Faisal, AA; Hossain, MA; Haque, S; Shaunak, MF; Kafy, AA
Remote Sensing Approach in Wetland and Land Degradation Assessment
248
Asian cities (McGee, 2006). The continuing growth reflects ongoing migration from the rural areas to the Dhaka urban region, which is accounted for 60% of the city's growth in the 1960s and the 1970s.In recent times, the city's population has also grown with the expansion of city boundaries. The process added more than a million people in the town in the 1980s (McGee, 2006). According to the Economic Review, Dhaka will become the home of 25 million people by the year 2025 (Davis, 2006, McGee, 2006). People are filling the low lying areas to meet the demands of land for residential, commercial, industrial and so on (Kafy, 2018, Kafy et al., 2018). According to local news, around 49 housing projects without approval have been identified which are inside the flood flow zones by covering about 9,241 acres of land in Dhaka. Landfilling events are going on even after the enactments of the "Wetland Conservation Act, 2000". In Dhaka, yearly loss of wetland during 1989-1999 was 1.23 %, whereas, during 1999-2003, the damage was 5.67 %. Dhaka is still left with 19.3 % of wetland. If the current rate of loss of wetland continues, by the year 2037 all temporary wetlands of Dhaka will disappear (Zaman et al., 2010). Remote sensing is a great medium of analysing environmental consequences. It has become a great source of data as a scene cover a larger area with a lot of spectral information (Kafy et al., 2019, Faisal and Khan, 2018). Moreover, to assess the environmental degradation rate and its extent, some environmental indices has been developed. Hence, there are many vegetation indices for detecting worth condition of vegetation cover, vegetation structure and leaf distribution using satellite images (Yengoh et al., 2015). The most popular and universally applied vegetation index is named as Normalized Difference Vegetation Index (NDVI). NDVI relies on the red and near-infrared band combination (Gascon et al., 2016). Additionally, In the assessment of water resources, the monitoring of water bodies extraction has become a necessary task. In order to do so, Normalized difference water index (NDWI) is an index that was developed by McFeeters to delineate the water features using satellite images (Gao, 1996, McFeeters, 1996). Generally, to delineate water features while reducing the appearance of vegetation and soil features, the NDWI uses near-infrared (NIR) and middle infrared (MIR) radiation (Gao, 1996). Moreover, urbanization is one of the most critical land cover change factors as it increases the loss of agricultural lands by converting it to urban areas (Davis, 2006, McGee, 2006). Information on urban built-up area is needed to detect land use/land cover changes (LULC) (Singh et al., 2017). For detecting dynamics of urban built-up area, Normalized Difference Built-up Index (NDBI) index is widely used (Kafy et al., 2018, Gascon et al., 2016). Basically, the method named NDBI was introduced to evaluate urban zones from Landsat images (Verbeiren et al., 2008). Besides, Soil Adjusted Vegetation Index (SAVI) another important method used to minimize soil brightness influences from spectral vegetation using near-infrared and red wavelengths (Gilabert et al., 2002). In this research, the study team identifies the adverse environmental effects of Modhumoti model town, Amin Bazar, Savar, Dhaka through combining GIS and Remote sensing technologies. The study team quantifies vegetation, measures the volume of changes water body, and differentiates urban zones measures the soil brightness influences through NDVI, NDWI, NDBI and SAVI method. Combining all of these methods, the study team finds out the overall environmental impact assessment because of Modhumoti Model Town.
2. Study Area Profile Modhumoti model town is situated in Dhaka-Aricha highway, amin bazar, Savar, Dhaka. The coordinate location of Modhumoti model town is 90°18'2.878"E and 23°47'12.302"N. This
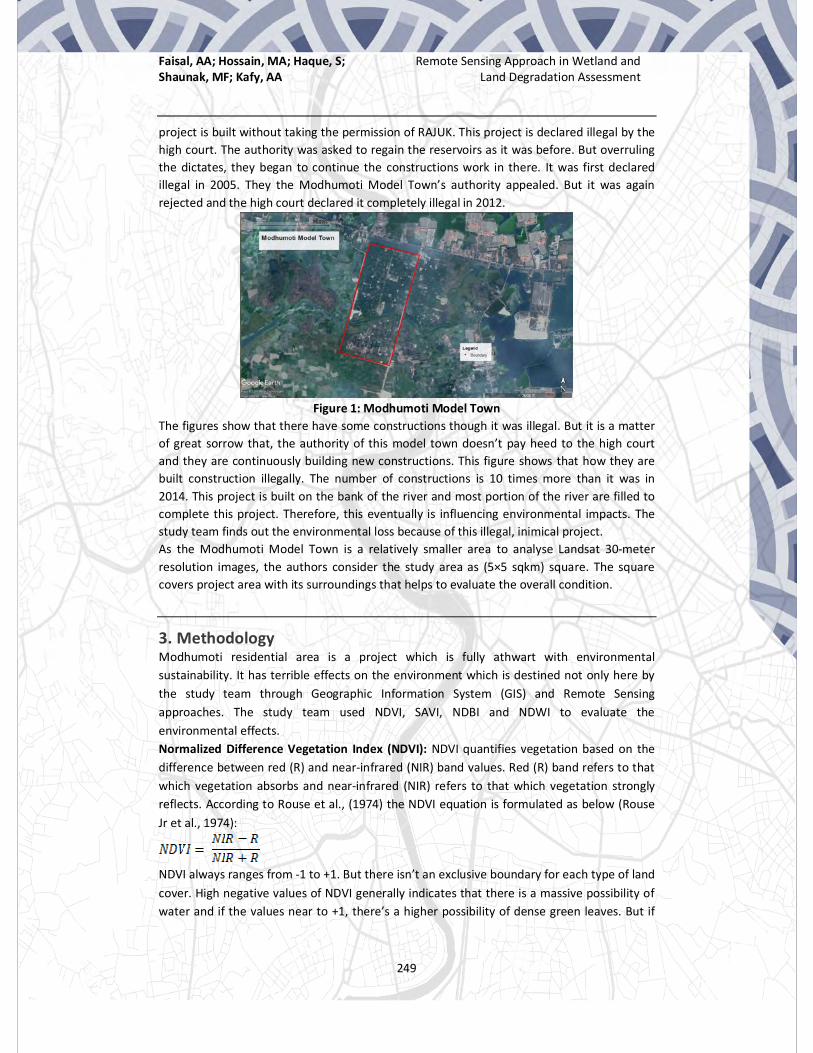
Faisal, AA; Hossain, MA; Haque, S; Shaunak, MF; Kafy, AA
Remote Sensing Approach in Wetland and Land Degradation Assessment
249
project is built without taking the permission of RAJUK. This project is declared illegal by the high court. The authority was asked to regain the reservoirs as it was before. But overruling the dictates, they began to continue the constructions work in there. It was first declared illegal in 2005. They the Modhumoti Model Town’s authority appealed. But it was again rejected and the high court declared it completely illegal in 2012.
Figure 1: Modhumoti Model Town
The figures show that there have some constructions though it was illegal. But it is a matter of great sorrow that, the authority of this model town doesn’t pay heed to the high court and they are continuously building new constructions. This figure shows that how they are built construction illegally. The number of constructions is 10 times more than it was in 2014. This project is built on the bank of the river and most portion of the river are filled to complete this project. Therefore, this eventually is influencing environmental impacts. The study team finds out the environmental loss because of this illegal, inimical project. As the Modhumoti Model Town is a relatively smaller area to analyse Landsat 30-meter resolution images, the authors consider the study area as (5×5 sqkm) square. The square covers project area with its surroundings that helps to evaluate the overall condition.
3. Methodology Modhumoti residential area is a project which is fully athwart with environmental sustainability. It has terrible effects on the environment which is destined not only here by the study team through Geographic Information System (GIS) and Remote Sensing approaches. The study team used NDVI, SAVI, NDBI and NDWI to evaluate the environmental effects. Normalized Difference Vegetation Index (NDVI): NDVI quantifies vegetation based on the difference between red (R) and near-infrared (NIR) band values. Red (R) band refers to that which vegetation absorbs and near-infrared (NIR) refers to that which vegetation strongly reflects. According to Rouse et al., (1974) the NDVI equation is formulated as below (Rouse Jr et al., 1974):
NDVI always ranges from -1 to +1. But there isn’t an exclusive boundary for each type of land cover. High negative values of NDVI generally indicates that there is a massive possibility of water and if the values near to +1, there’s a higher possibility of dense green leaves. But if

Faisal, AA; Hossain, MA; Haque, S; Shaunak, MF; Kafy, AA
Remote Sensing Approach in Wetland and Land Degradation Assessment
250
the NDVI is close to zero, it indicates that there aren’t green leaves and it might be an urbanized area. Soil Adjusted Vegetation Index (SAVI): In which areas the vegetative cover is low (i.e., < 40%) and the soil surface is manifested, the reflectance of light in the red and near-infrared spectra can influence vegetation index values. The SAVI was established as a adjustment of the NDVI to correct for the influence of soil brightness when vegetative cover is low.SAVI calculation is based on the difference between R and NIR values with a soil brightness correction factor (L) defined as 0.5 to accommodate most land cover types.
Normalized Difference Built-up Index (NDBI): NDBI is a process to convert satellite imagery into a land cover map. It was introduced to extract urban zones from Landsat images (Verbeiren et al., 2008). For Landsat TM or ETM images, the calculation of NDBI is expressed below:
For Landsat 8 images, the calculation of NDBI is expressed below:
Normalize Difference Water Index (NDWI): NDWI index is the most appropriate used method for water body mapping. It is developed to depict open water features and enhance their presence in remotely-sensed digital imagery. The index uses the green and near Infra-red bands of remote sensing images. According to Mishra et al., (2015) the calculation of NDWI can be formulated below (Mishra and Prasad, 2015):
4. Results and discussions The Modhumoti Model Town is a growing and illegal construction site which destroys the whole ecological system of the riverine area. Several environmental indices indicate the extent of environmental changes in the area. The Metro Makers and Developer Limited company is the owner of the town which developed a housing project by filling in 550 acres of wetlands. The wetland was identified as floodplain in the master plan of 1997. On August 2004, Bela filed a writ petition as public interest litigation against the project to the high court. The project did contradict with the Environmental Conservation Act, Town Improvement Act and Rajuk (Rajdhani Unnayan Kartipakkha) rules. The Bela challenged the legality of the project by addressing the laws. In the petition, Bela addressed that the natural characters of the area will be destroyed if the project continues. Also, to remain free flow of the water of the city, Bela appalled to the apex court to pass the necessary orders. The high court continued the project's development work after primary hearing. On July 27, 2005, the high court declared that the Modhumoti Model Town project is unauthorised, illegal and against public interest. The court also rejected a writ filed by the owner Metro Makers. But high court also declared that interest of the purchasers is

Faisal, AA; Hossain, MA; Haque, S; Shaunak, MF; Kafy, AA
Remote Sensing Approach in Wetland and Land Degradation Assessment
251
protected. In 2006, Bela, Metro Makers Ltd, plot purchasers and Rajuk did file 5 separate leave to appeal petition against separate portion of the high court verdict with supreme court. Metro Makers and plot purchasers appealed by addressing a lot of investment for the plots and projects. Rajuk appealed for declaring the project as illegal. On March 19, 2009, the Supreme Court upheld the high court verdict. But the court allowed the company, plot purchasers and Rajuk to move regular appeals before it against the high court verdict. On August 7, 2012, the Appellate Division upheld the high court’s decision and allowed the appeal of Bela. The court also dismissed Metro Makers, plot purchasers appeals and disposed of the appeal of Rajuk as well. Finally, on July 11, 2013, the Appellate Division of the apex court released the full text of its 159-page verdict. The verdict was directed to Modhumoti Model Town owner Metro Makers and Developer Limited and the verdict was to restore within six months the wetland in Bilamalia and Bailarpur moujas of Savar where it had developed the project. Above discussion indicates several timelines which have direct linkage with writ, appeal and verdict. Therefore, several year’s images have been chosen for evaluating action after effects. The timeline of the images shows 1-year after-effects from different actions. These years are 1998 (indicates initial stages), 2004 (indicates the situation of filing writ petition), 2010 (One year after effect after court verdict), 2014 (one year later effect after final verdict) and 2019 (to evaluate the present situation). As the project was running, and the natural riverbed was destroyed so that the area has been experienced a huge environmental change. Environmental indices do help to assess the environmental changes universally. The following sections evaluate the environmental consequences of the area by evaluating environmental indices and additional analysis. 4.1 Assessment of water body: The model town project was established by filling up the surface water body of a river. In previous, the river had a free flow of water towards the project area. The project area blocks the river channel and interrupts the free flow of water by causing flood, waterlogging and environmental degradation as well. NWDI was used to evaluate the overall water assessment. Figure 2 indicates the NDWI values of the project and surrounding area. The hierarchy of colour red to blue indicates low to high surface water availability. In 1998, the maximum NDWI value was 0.71 which shows higher surface water availability. The maximum NDWI value drops drastically in 2004 as 0.55. The project area was filled by sand and had experienced loss of water body. Most importantly, it destroyed the flowing channel. In 2010, the area still faces loss of water availability as the project verdict was hanging. After the final verdict, the area had experienced highest level of water losses as the maximum NDWI value was 0.31. Now, in 2019, the maximum NDWI value shows as 0.35 which is a little higher than 2014 but not enough at all. The whole NDWI value indicates that the surface water availability and its flow direction are completely destroyed and the water system is not restored even after verdict also. The loss water system of the area can be visualized by the following figure 3. The figure indicates extent of water body available indefinite time interval. The hierarchy from blue to red indicates the water body found in 1998 to 2019, sequentially. The figure indicates that the area losses around 5.34 km2 from 1998 to 2014. Unfortunately, in 2019, the water body has fallen around 2.23 km2 from 10.54 km2. The area is a small area but has great impact and significant loss in last 21 years. The project area is indicated as ‘Main-boundary’ in the figure.
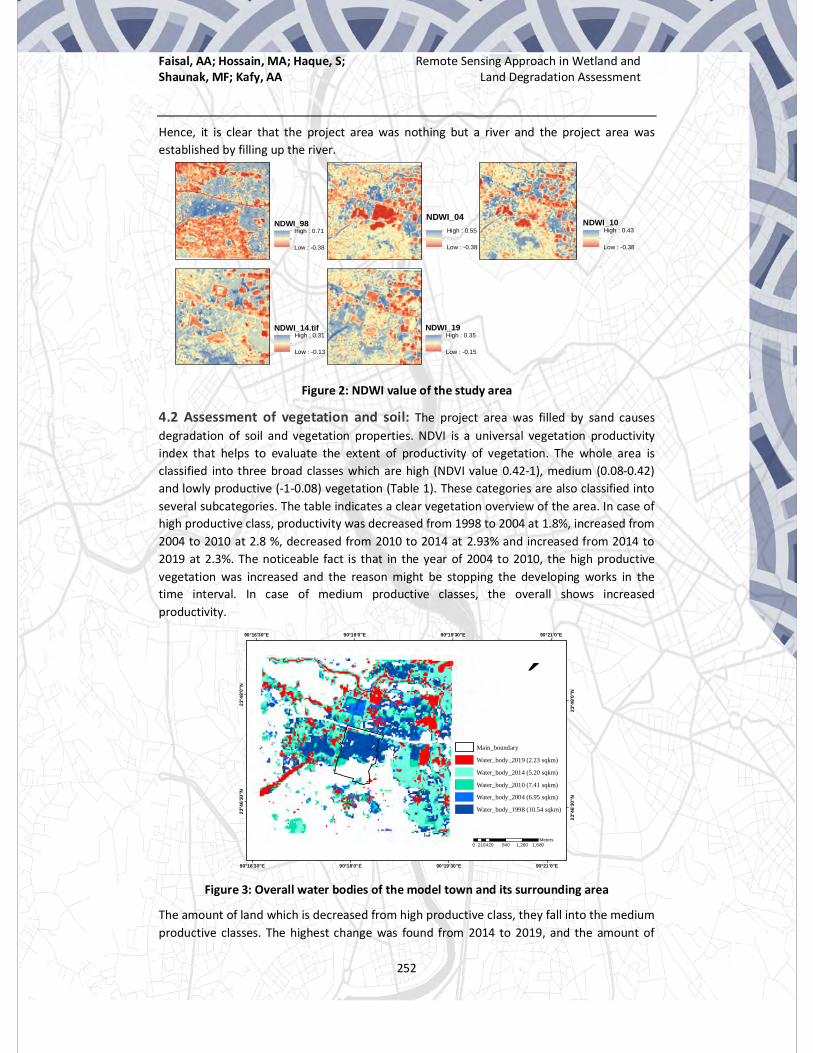
Faisal, AA; Hossain, MA; Haque, S; Shaunak, MF; Kafy, AA
Remote Sensing Approach in Wetland and Land Degradation Assessment
252
Hence, it is clear that the project area was nothing but a river and the project area was established by filling up the river.
NDWI_98High : 0.71
Low : -0.38
NDWI_04High : 0.55
Low : -0.38
NDWI_10High : 0.43
Low : -0.38
NDWI_14.tifHigh : 0.31
Low : -0.13
NDWI_19High : 0.35
Low : -0.15
Figure 2: NDWI value of the study area
4.2 Assessment of vegetation and soil: The project area was filled by sand causes degradation of soil and vegetation properties. NDVI is a universal vegetation productivity index that helps to evaluate the extent of productivity of vegetation. The whole area is classified into three broad classes which are high (NDVI value 0.42-1), medium (0.08-0.42) and lowly productive (-1-0.08) vegetation (Table 1). These categories are also classified into several subcategories. The table indicates a clear vegetation overview of the area. In case of high productive class, productivity was decreased from 1998 to 2004 at 1.8%, increased from 2004 to 2010 at 2.8 %, decreased from 2010 to 2014 at 2.93% and increased from 2014 to 2019 at 2.3%. The noticeable fact is that in the year of 2004 to 2010, the high productive vegetation was increased and the reason might be stopping the developing works in the time interval. In case of medium productive classes, the overall shows increased productivity.
90°21'0"E
90°21'0"E
90°19'30"E
90°19'30"E
90°18'0"E
90°18'0"E
90°16'30"E
90°16'30"E
23°4
8'0"
N
23°4
8'0"
N
23°4
6'30
"N
23°4
6'30
"N
Main_boundary
Water_body_2019 (2.23 sqkm)
Water_body_2014 (5.20 sqkm)
Water_body_2010 (7.41 sqkm)
Water_body_2004 (6.95 sqkm)
Water_body_1998 (10.54 sqkm)
´
0 420 840 1,260 1,680210Meters
Figure 3: Overall water bodies of the model town and its surrounding area
The amount of land which is decreased from high productive class, they fall into the medium productive classes. The highest change was found from 2014 to 2019, and the amount of

Faisal, AA; Hossain, MA; Haque, S; Shaunak, MF; Kafy, AA
Remote Sensing Approach in Wetland and Land Degradation Assessment
253
change increasing change is around 28.24%. Moreover, in case of lowly productive class, all the class shows that NDVI values were decreased all the time and that means, overall vegetation impact was not well. The significant change shows from 2014 to 2019 and that is around 30.6% of lowly productive land was decreased. That means, the NDVI values are gone towards -1 which indicates increase of impervious layers. Table1: Overall change in vegetation productivity coverage in percentage and km2.
Furthermore, to estimate the vegetation index more accurately SAVI index has been to correct for the influence of soil brightness when the vegetative cover is low. Also, due to increase of built-up area as well as impervious surfaces over time, NDBI index helps will correlate the overall environmental condition of the area. Figure 4 shows environmental indices over different time period. Every image value indicates degradation of vegetation and up-gradation of hardscapes. In the meantime, the correlation coefficient indicates the extent of influence for one factor to another (Table 2). In the case of 1998, the correlation coefficient indicates that the 1-unit change of NDVI depends on 0.91-unit change of NDBI, negatively. Here intercept value for NDVI with NDBI is 0.004. Besides, NDVI has a positive relation with SAVI and the correlation coefficient value is 1.49. That means the 1-unit change of NDVI depends on 1.49-unit change of SAVI, positively. Both SAVI and NDBI are negatively correlated and the correlation coefficient is -1.63. That means the 1-unit change of NDBI depends on 1.63-unit change of SAVI, negatively. Hence, built-up areas increase by reducing vegetation covers of the study area. Similarly, all the correlation coefficients from different timeline show more or less similar result which is built-up area takes over vegetation lands. This analysis also shows that impervious surface that means built-up area, road, housing and so on are increasing continuously which adversely affects vegetations. As government declared to restrain the previous environmental condition such as free flow of water through the area, enough green spaces by demolishing built structures but the developing of making structures is continuous. Even after the final verdict, the housing project is still live and some influential person overran the site illegally. Figure 5 indicates number of structures in four different timelines.
Change in area coverage in percentage and km2
From 1998 to 2004 From 2004 to 2010 From 2010 to 2014 From 2014 to 2019
Vegetation Productivity Classes NDVI Values Percentage
Area (km2) Percentage
Area (km2) Percentage
Area (km2) Percentage
Area (km2)
High Productive
0.97-1 0.54-0.97 -0.048 -0.011 0.004 0.001 -0.004 -0.001
0.42-0.54 -1.749 -0.394 2.775 0.626 -2.927 -0.660 2.328 0.525 0.42-1 -1.797 -0.405 2.779 0.626 -2.931 -0.661 2.328 0.525
Medium Productive
0.34-0.42 -1.334 -0.301 5.969 1.346 -9.415 -2.122 21.491 -2.122 0.29-0.34 1.354 0.305 3.574 0.806 -6.856 -1.545 17.314 -1.545 0.24-0.29 2.280 0.514 3.841 0.866 -2.727 -0.615 9.172 -0.615 0.16-0.24 5.722 1.290 2.040 0.460 12.950 2.919 -8.330 2.919 0.08-0.16 6.529 1.472 -1.031 -0.232 13.234 2.983 -11.412 2.983 0.08-0.42 14.552 3.280 14.393 3.245 7.186 1.619 28.235 1.619
Lowly Productive 0-0.08 5.415 1.220 -0.196 -0.044 8.706 1.962 -18.508 1.962
-1 -18.170 -4.096 -16.976 -3.826 -12.961 -2.921 -12.055 -2.921 -1 - .08 -12.755 -2.876 -17.172 -3.870 -4.255 -0.959 -30.563 -0.959

Faisal, AA; Hossain, MA; Haque, S; Shaunak, MF; Kafy, AA
Remote Sensing Approach in Wetland and Land Degradation Assessment
254
(a)
NDVI_98High : 0.62
Low : -0.43
NDVI_10High : 0.54
Low : -0.26
NDVI_14High : 0.35
Low : -0.05
NDVI_19High : 0.48
Low : -0.06
NDVI_04High : 0.45
Low : -0.24(b) (c) (d) (e)(a)
NDVI_10High : 0.54
Low : -0.26
NDVI_14High : 0.35
Low : -0.05
NDVI_19.tifHigh : 0.48
Low : -0.06
NDVI_04High : 0.45
Low : -0.24(b) (c) (d) (e)
(f)
NDBI_98High : 0.38
Low : -0.71
NDBI_10High : 0.38
Low : -0.43
NDBI_14High : 0.13
Low : -0.31
NDBI_19High : 0.15
Low : -0.35
NDBI_04High : 0.38
Low : -0.55(g) (h) (i) (j)
SAVI_10High : 0.81
Low : -0.39
SAVI_14High : 0.53
Low : -0.08
SAVI_19High : 0.73
Low : -0.08
SAVI_04High : 0.67
Low : -0.35
SAVI_98High : 0.93
Low : -0.64
(k) (l) (m) (n) (o) Figure 4: Environmental indices (a) NDVI in 1998, (b) NDVI in 2004, (c) NDVI in 2010, (d) NDVI in 2014, (e) NDVI in 2019, (f) NDBI in 1998, (g) NDBI in 2004, (h) NDBI in 2010, (i) NDBI in 2014, (j) NDBI in 2019, (k) SAVI in 1998, (l) SAVI in 2004, (m) SAVI in 2010, (n) SAVI in 2014 and (o) SAVI in 2019 Table 2: Correlation coefficient among NDVI, SAVI and NDBI of the study area
In 2004, structures were started building and the increasing number was continuous even after verdict also. In present years, the total number of semi-pucca and pucca structures are around 240. The graph represents continuous building of structures. The noticeable fact is
1998 NDVI NDBI SAVI
2004 NDVI NDBI SAVI
2010 NDVI NDBI SAVI NDVI 1
NDVI 1
NDVI 1
NDBI -0.9128 1
NDBI -1.247 1
NDBI -1.0035 1
SAVI 1.4927 -1.6264 1
SAVI 1.5007 -1.2025 1
SAVI 1.4963 -1.4903 1
2014 NDVI NDBI SAVI
2019 NDVI NDBI SAVI NDVI 1
NDVI 1
NDBI -0.9774 1
NDBI -0.9795 1 SAVI 1.4988 -1.5314 1
SAVI 1.498 -1.5281 1
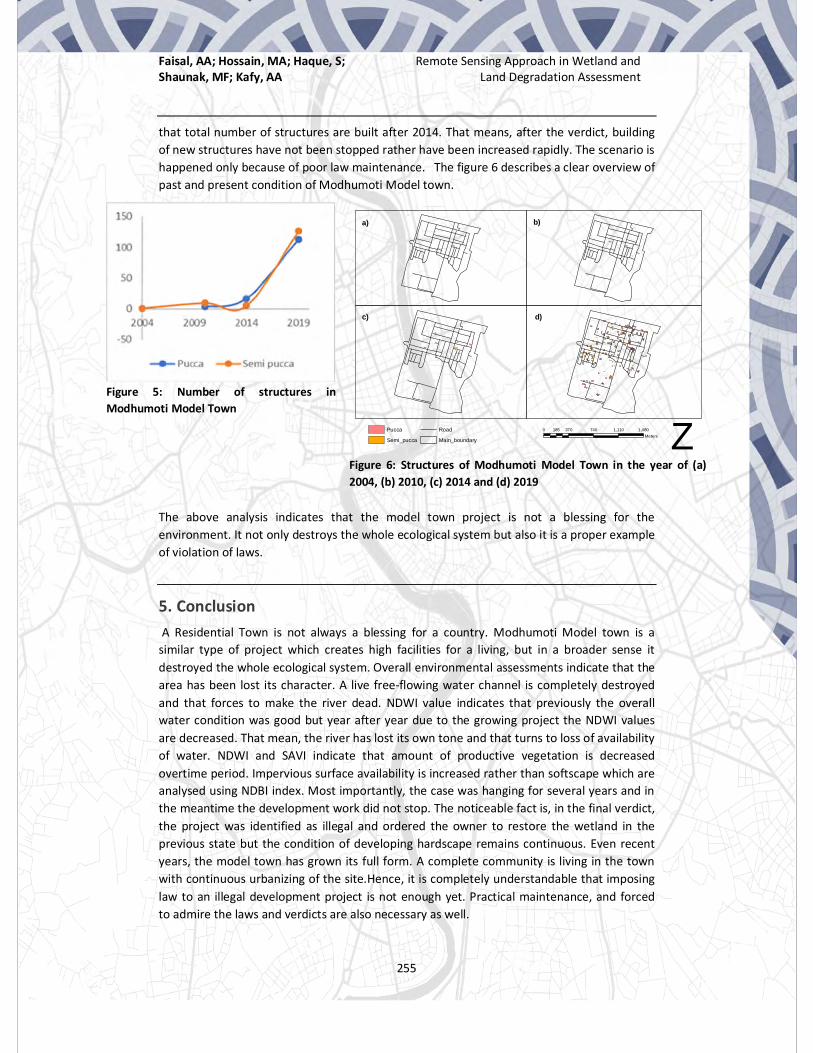
Faisal, AA; Hossain, MA; Haque, S; Shaunak, MF; Kafy, AA
Remote Sensing Approach in Wetland and Land Degradation Assessment
255
that total number of structures are built after 2014. That means, after the verdict, building of new structures have not been stopped rather have been increased rapidly. The scenario is happened only because of poor law maintenance. The figure 6 describes a clear overview of past and present condition of Modhumoti Model town.
Figure 5: Number of structures in Modhumoti Model Town
a) b)
d)c)
Z0 370 740 1,110 1,480185Meters
Pucca
Semi_pucca
Road
Main_boundary
Figure 6: Structures of Modhumoti Model Town in the year of (a) 2004, (b) 2010, (c) 2014 and (d) 2019
The above analysis indicates that the model town project is not a blessing for the environment. It not only destroys the whole ecological system but also it is a proper example of violation of laws.
5. Conclusion A Residential Town is not always a blessing for a country. Modhumoti Model town is a similar type of project which creates high facilities for a living, but in a broader sense it destroyed the whole ecological system. Overall environmental assessments indicate that the area has been lost its character. A live free-flowing water channel is completely destroyed and that forces to make the river dead. NDWI value indicates that previously the overall water condition was good but year after year due to the growing project the NDWI values are decreased. That mean, the river has lost its own tone and that turns to loss of availability of water. NDWI and SAVI indicate that amount of productive vegetation is decreased overtime period. Impervious surface availability is increased rather than softscape which are analysed using NDBI index. Most importantly, the case was hanging for several years and in the meantime the development work did not stop. The noticeable fact is, in the final verdict, the project was identified as illegal and ordered the owner to restore the wetland in the previous state but the condition of developing hardscape remains continuous. Even recent years, the model town has grown its full form. A complete community is living in the town with continuous urbanizing of the site.Hence, it is completely understandable that imposing law to an illegal development project is not enough yet. Practical maintenance, and forced to admire the laws and verdicts are also necessary as well.

Faisal, AA; Hossain, MA; Haque, S; Shaunak, MF; Kafy, AA
Remote Sensing Approach in Wetland and Land Degradation Assessment
256
Acknowledgement: The authors would like to acknowledge CEGIS for giving an opportunity to work with this interesting topic in the internship period.
References
Davis, M. 2006. Planet Of Slums. New Perspectives Quarterly, 23, 6-11. Faisal, A. & Khan, H. 2018. Application Of Gis And Remote Sensing In Disaster Management: A
Critical Review Of Flood Management. International Conference On Disaster Risk Mitigation.
Gao, B.-C. 1996. Ndwi—A Normalized Difference Water Index For Remote Sensing Of Vegetation Liquid Water From Space. Remote Sensing Of Environment, 58, 257-266.
Gascon, M., Cirach, M., Martínez, D., Dadvand, P., Valentín, A., Plasència, A. & Nieuwenhuijsen, M. J. 2016. Normalized Difference Vegetation Index (Ndvi) As A Marker Of Surrounding Greenness In Epidemiological Studies: The Case Of Barcelona City. Urban Forestry & Urban Greening, 19, 88-94.
Gilabert, M. A., González-Piqueras, J., Garcıa-Haro, F. J. & Meliá, J. 2002. A Generalized Soil-Adjusted Vegetation Index. Remote Sensing Of Environment, 82, 303-310.
Hossain, N. S. M. & Akther, F. 2011. Impacts Of Private Residential Land Development Projects In The Flood Flow Zones Of Dmdp Area: Case Study Of Tetuljhora Union. Journal Of Bangladesh Institute Of Planners, 4, 57-70.
Kafy, A.-A. 2018. Importance Of Surface Water Bodies For Sustainable Cities: A Case Study Of Rajshahi City Corporation. Bangladesh Institute Of Planners (Bip).
Kafy, A.-A., Islam, M., Khan, A. R., Ferdous, L. & Mamun, M. 2018. Identifying Most Influential Land Use Parameters Contributing Reduction Of Surface Water Bodies In Rajshahi City, Bangladesh: A Remote Sensing Approach.
Kafy, A., Hossain, M., Prince, A. A. N., Kawshar, M., Shamim , M. A., Das, P. & Noyon, M. E. K. Estimation Of Land Use Change To Identify Urban Heat Island Effect On Climate Change: A Remote Sensing Based Approach. International Conference On Climate Change (Iccc-2019), 2019 Dhaka, Bangladesh. University Of Dhaka.
Mcfeeters, S. K. 1996. The Use Of The Normalized Difference Water Index (Ndwi) In The Delineation Of Open Water Features. International Journal Of Remote Sensing, 17, 1425-1432.
Mcgee, T. 2006. Urbanization Takes On New Dimensions In Asia's Population Giants. Population Reference Bureau. Web: Http://En. Wikipedia. Org/Wiki/Dhaka. Retrieved, 09-27.
Mishra, K. & Prasad, P. 2015. Automatic Extraction Of Water Bodies From Landsat Imagery Using Perceptron Model. Journal Of Computational Environmental Sciences, 2015.
Rouse Jr, J. W., Haas, R. H., Schell, J. A. & Deering, D. W. 1974. Monitoring Vegetation Systems In The Great Plains With Erts.
Singh, P., Kikon, N. & Verma, P. 2017. Impact Of Land Use Change And Urbanization On Urban Heat Island In Lucknow City, Central India. A Remote Sensing Based Estimate. Sustainable Cities And Society, 32, 100-114.
Statistics, B. B. O. 2011. Statistical Yearbook Of Bangladesh. Statistics Division, Ministry Of Planning, Dhaka, Government Of The People’s Republic Of Bangladesh.
Verbeiren, S., Eerens, H., Piccard, I., Bauwens, I. & Van Orshoven, J. 2008. Sub-Pixel Classification Of Spot-Vegetation Time Series For The Assessment Of Regional Crop Areas In Belgium. International Journal Of Applied Earth Observation And Geoinformation, 10, 486-497.
Yengoh, G. T., Dent, D., Olsson, L., Tengberg, A. E. & Tucker Iii, C. J. 2015. Use Of The Normalized Difference Vegetation Index (Ndvi) To Assess Land Degradation At Multiple Scales: Current Status, Future Trends, And Practical Considerations, Springer.
Zaman, A. K. M. H., Alam, K. M. T. & Islam, M. J. 2010. Urbanization In Bangladesh: Present Status And Policy Implications. Asa Univ. Rev, 4.

Shovon,B.S. Senjuti,M.I.
Household Savings in Planned and Unplanned Residential Area
257
Research Paper / Case Study Paper
Household Savings in Planned and Unplanned Residential Area: A Comparative Study in Khulna City
Md.Be-Nozir Shah Shovon, Planner &Development Specialist; Bangladesh Mithila Islam Senjuti, Planner& Individual consultant; Bangladesh
Abstract
This study measures household savings by keeping into consideration the factors of income, expenditure, dependency ratio and age. Household savings is not only dependent on income. Expenditure also plays a significant role on it. Planned and Unplanned area is two different types of area in a city. For getting information, 30 representative samples are taken from planned area and simultaneously 30 samples taken from unplanned area. Higher income group generally lives in planned area, whereas mixed group lives in unplanned area. Living expenditure also varies due to location context. From the field survey, it is found that that income generating opportunity is available in unplanned area. Mixed group attracted for this reason. On the contrary, monitoring from Government sector is regular in planned area. So as a logical outcome, homogeneous income group dwells there. From the field survey it is outlined that income and house rent are much greater in planned area than that of unplanned area. But average propensity to save of unplanned area is quiet close to planned area though their income level is lower than planned area dwellers. House rent is much more negatively related in planned area than that of unplanned area.
Keywords
Planned residential area, Unplanned residential area, Savings
1. Introduction 1.1 Background of the Study
Cities are the manmade geographical entities. Because of booming rate of population and rapid urbanization, number of city dwellers increased than before. Cities internal area can be divided from different aspects (Tacoli, 1998a). From the aspects of planning there are planned area and unplanned area. Because of agglomeration, different walk of people with different social status gathered in a city. From the ancient time man have fascination in saving. In ancient time they stored food but now a day’s money is being saved as because of future sustainability. First step of saving decision comes from HH Level. In a fundamental sense, one's saving is a sacrifice of current consumption that will allow for an increase in future consumption (Gedela, 2012). Household saving is usually the largest component of domestic savings in developing countries, especially the lower income, predominantly agricultural LDCs. This contrasts with the much greater importance of corporate saving in developed countries. The ability, willingness, and opportunity of households to save over time can therefore significantly influence the rate and sustainability of capital accumulation and economic growth in developing countries (Bautista and Lamberte, 1990).

Shovon,B.S. Senjuti,M.I.
Household Savings in Planned and Unplanned Residential Area
258
In planned area generally homogeneous people lived together and in unplanned area heterogeneous people are living together. Planned residential area is developed for human being with living facilities. It includes the house and the environment such as the physical and social infrastructure (Nagasa, 2005).Unplanned residential area are consisted with different land use like- residential area, commercial area and so on. So dwellers cannot get easily get different sort of public service facility and amenities in their door step. On the contrary, planned area dwellers get more availability in different public service facility and amenity like- hospital, community center, shopping center, dustbin, police box, park, bank, post office, fire brigade, primary school,high school, college, kancha bazaar, bus stand, library, employment center than unplanned area dwellers (Hiraskar,1998).
Occupation type, income variation as well as individual characteristics of urbanites are also may be the key factor in saving behavior. Expenditure also varies due to location (Gedela, 2012). This study conducted a inter area comparison between planned and unplanned area. Side by side this study conducted a intra area comparison in planned and unplanned area by occupation, income, land owner status and etc. In a gross statement this study measured HH savings of planned and unplanned area by keeping into consideration the factors of income, expenditure, dependency ratio and age.
1.2 Statement of the Problem
In planned and unplanned area same type of occupant lives but their income varied because their salary scale is different. Unplanned area’s citizen led different life style than planned area.
The household living in planned area and households living in unplanned area can lead different life status. In this paper, the author tries to show the saving behavior between these two entities. The author thinks that there are difference between two group saving behavior.
1.3 Objective of the Study
Objective of this research is to compare the saving behavior of households living in planned and unplanned area. There are three aspects of this study:
I. To make a comparison on savings in planned and unplanned area dwellers.
II. To find out the determinants of household savings in planned and unplanned area.
1.4 Scope of the Study
• In the field of urban and rural planning there are so many research on planned and unplanned area service facility, planning consideration and other issues but location wise savings of urbanites is a completely new issues addressed in this research
• In the field of Economics there also conducted research on saving behavior but this research will conduct a complete different work like- inter area comparison. In precise comparison of saving behavior of dwellers living in planned area and unplanned area. It will also conduct an intra area comparison by occupation, income, family size etc.

Shovon,B.S. Senjuti,M.I.
Household Savings in Planned and Unplanned Residential Area
259
1.5 Limitations of the Study
Due to time constraint, it was very hard to author to go to study area several times.
During data collection people are uninterested to expose real income, saving related information
The author has collected data from primary source with questionnaire survey. In several times author cannot collect data directly from HH head. So, it is difficult to collect actual data on income and savings also.
2. Methodology 2.1Study Area Selection:
For this study planned and unplanned area are to be delineated first. According to KDA Master Plan 2001, planned residential areas are selected. Rest of the residential is the unplanned residential area. For the sake of this study two areas (one from planned and other from unplanned) will be selected by random basis. Two areas are - 1. Sonadanga 2. Tootpara have been selected for this study.
2.2 Map of the Study Area
Figure 1 Map of the study area
2.3 Sample size and Sampling Technique:
Samples are taken from planned area and also from unplanned area. From planned area 30 samples are taken and from unplanned area 30 samples are taken. So, total sample number is 60. Simple random sampling is used here. Homogeneity of the sample is considered for the sake of the study.

Shovon,B.S. Senjuti,M.I.
Household Savings in Planned and Unplanned Residential Area
260
2.4 Conceptual Framework:
Figure 2: Observation at a Glance
From the figure 2total procedure of the study showed in a blink. Firstly, planned and unplanned area are identified from the master plan of Khulna city, then in random basis two area are selected namely: Sonadanga and Tutpara. Savings are compared in between these two area by considering age of the head of the HH head, education, dependency ratio, income and housing expenditure. Different tools ike hypothesis test, APS, MPS are used for making comparison.
3. HH Savings Comparison Subheading 3.1 Comparison of savings between Planned and Unplanned Area Average saving in planned area is higher than unplanned area. Figure 6.1 depicts that average saving in planned area is 10,000 BDT and in unplanned area is 2,500 BDT.
Figure 3: Comparison of Saving

Shovon,B.S. Senjuti,M.I.
Household Savings in Planned and Unplanned Residential Area
261
3.1.1 Hypothesis Testing for Planned and Unplanned area dwellers
• Null Hypothesis= H0: b1 = 0. When there is no statistically significant difference in
saving between HHs living in planned area and HHs living in unplanned area .
• Alternative Hypothesis= Ha: b1 ≠ 0. When there is statistically significant difference
in saving between HHs living in planned area and HHs living in unplanned area .
Variable Observation Mean Value Standard Error Income Planned Area 30 10000 7356 Unplanned area 30 2500 3179 Difference - 7500** 4177
N.B.: t Stat = 2.42; ***p<0.01, **P<0.05, *p<0.1 Table 1: t-test for Savings in planned and unplanned area dwellers Table 1 depict that it is well seen that planned area’s households save 10000 BDT per month. Mean difference between their savings amount is 7500 BDT which is statistically significant at 5 percent level of significance. This statement is correct for 95 cases out of 100 cases. Savings of planned area’s household and unplanned area households are not same. Planned area’s household saves more than unplanned area.
3.2 Comparison of Average Propensity to Save Table 2 denotes that sum of the planned area’s people income is 1414000 BDT and sum of the savings is 299500 BDT. APS for the panned area is 0.211.
Table 2: Comparison of APS Sum of the unplanned area’s people income is 845500 BDT and sum of the savings is 93000 BDT. APS for the panned area is 0.109. APS for the study area is 0.173.
3.3 Comparison of Marginal Propensity to Save Every increase in the income per BDT savings of the study area increases 30 paisa for the study area. Value of R Square is 0.64. Which means 64 percent of the total variation in saving is explained by explanatory variable.
Area Income Savings APS
Planned 1414000 299500
0.21181047
Unplanned 845500 93000 0.10999409 Total 2259500 392500 0.173711

Shovon,B.S. Senjuti,M.I.
Household Savings in Planned and Unplanned Residential Area
262
Table 3: Marginal Propensity to Save for the Study Area
In planned area every increase in the income per BDT savings of the study area increases 32 paisa. Equation for planned area is Y=8539+32X.
Table 4: Marginal Propensity to Save for the both planned and unplanned area
In unplanned area every increase in the income per BDT savings of the study area increases 32 paisa. Equation for planned area is Y=556+12X .
3.4 Savings Model in the Planned and Unplanned Area Savings model of the planned and unplanned area are showing in three steps. Firstly, descriptive statistics of the independent variable are showed. Then correlation among independent variable is portrayed and lastly, regression model are visualized. 3.4.1 Descriptive Statistics of Independent Variable It can be clearly understandable from table 6.5 that average age of the household head is 43.28 year. Average year of schooling is 14.78. Average income is 37658 BDT.
Variable Coefficient Std. Error t-value
Study Area
R Square 0.643
Adjusted R Square 0.636
Constant 4801.745839 1237.638 3.87977
`Income 0.305662 0.029504 10.22443
Variable Coefficient Std. Error t-value Planned
R Square 0.698737 Adjusted R Square 0.687977
Constant 8539.91 2417.88 3.53198
`Income 0.392997 0.048767 8.058659
Unplanned R Square 0.62716 Adjusted R Square 0.60313
Constant 556.014 1103.006 0.50409
`Income 0.129723 0.035157 3.689805

Shovon,B.S. Senjuti,M.I.
Household Savings in Planned and Unplanned Residential Area
263
Variable Minimum Maximum Mean Std. Deviation Age 24 70 43.28 11.51 Year of Schooling 5 16 14.78 2.04 Wealth 0 1 0.42 0.50 Total Income 5000 90,000 37658 17556 Dependency Ratio 0.5 0.8 0.698 0.09 Housing Rent 0 15000 5303 5468
Table.5: Descriptive Statistics of the Independent Variable Another important variable is housing expenditure. Average expenditure on housing is 5303 BDT.
3.4.2 Correlation among independent variable Before running regression model it is necessary to identify the correlation between independent variables which are less co-relative with each other-are to be taken to develop the model. Then it can be found that assumption is true or false. If the variables are less co-relative then it indicates that they have little or no impact on each other. They are independent in nature. Correlation matrix also indicates the problem of multicollinearity. Table 6 depicts the correlation among independent variable where no value is equal or above 0.80.
Table 6: Correlation among independent variable From the table 6 there are two types of relationship among independent variable: Positive Relationship: Age and income, income and year of schooling, household owner and income, household owner and age, household owner and year of schooling. Negative Relationship: Dependency ratio and income, dependency ratio and year of schooling, house rent and age, house rent and dependency ratio 3.4.3 Determinants of Savings in planned and unplanned area From the table 7 it is found that in study area when income increases one BDT saving increases 29 paisa. Increase of year of schooling one year saving increases 104 BDT. Negative relation exists between dependency ratio and saving. In case of increasing in dependency ratio by one unit then saving is decreased by 19,558 BDT. In case of house rent when, house rent increase by one BDT, saving decreases by 08 paisa.
Income Age Year of
Schooling HH
Owner Dependency
ratio House rent
Income 1.00 Age 0.31 1.00
Year of Schooling 0.45 0.14 1.00 HH Owner 0.12 0.29 0.07 1.00
Dependency ratio -0.06 0.07 -0.13 0.12 1.00 House rent 0.18 -0.22 0.26 -0.73 -0.15 1.00
Coefficients Standard Error t Stat Intercept 11166.95 5197.392 5.59 Income 0.292785 0.032165 5.73*** Age 126.39423 43.12555 2.02** Year of Schooling 104.443 279.3496 4.51***

Shovon,B.S. Senjuti,M.I.
Household Savings in Planned and Unplanned Residential Area
264
N.B.: Standard errors in parentheses ***p<0.01, **p<0.05, *p<0.1 Table 7: Model for the study area R square is 0.75 which means means 75 percent of the total variation in saving is explained by explanatory variables.
N.B.: Standard errors in parentheses ***p<0.01, **p<0.05, *p<0.1
Table 8: Model for the Planned Area From the table 8 it is found that in study area when income increases one BDT saving increases 31 paisa. Increasing of year of schooling by one year saving increases by 348 BDT. Negative relation exists between dependency ratio and saving. In case of dependency ratio’s one unit increasing can decrease saving by 15,022 BDT. In case of house rent when, house rent increase by one BDT, saving decreases by 54 paisa.
Coefficients Standard Error t Stat
Intercept 1736.69 4774.924 6.57 Income 0.071407 0.04016 5.23*** Age 120.9684 42.07569 2.01** Year of Schooling 307.71 196.7084 4.31*** HH Owner 6916.182 2291.523 0.52 Dependency ratio -11049 5465.104 -5.51***
House rent -
0.24299 0.410454 -5.43*** R Square 0.649695 Adjusted R Square 0.538234
N.B.: Standard errors in parentheses ***p<0.01, **p<0.05, *p<0.1 Table.9: Model for the Unplanned Area
From the table 9 it is found that in study area when income increases one BDT saving increases 07 paisa. Increase of year of schooling one year saving increases 307 BDT. Negative relation exists between dependency ratio and saving. If dependency ratio is increased by one unit then saving will be decreased by 11049 BDT. In case of house rent when, house rent increase by one BDT, saving decreases by 24 paisa.
HH Owner 981.7142 2015.26 0.55 Dependency ratio -19558.3 4889.3 -5.81*** Houserent -0.78263 0.191118 -5.63*** R Square 0.759975 Adjusted R Square 0.727664
Coefficients Standard Error t Stat Intercept 15167.04 26325.92 5.57 Income 0.317589 0.053543 5.93*** Age 133.1427 63.59316 2.03** Year of Schooling 348.418 1629.992 4.81*** HH Owner 2748.634 6664.242 0.54 Dependency ratio -15022.2 6931.757 -5.81*** House rent -0.545 0.502078 -5.63*** R Square 0.822842 Adjusted R Square 0.766473

Shovon,B.S. Senjuti,M.I.
Household Savings in Planned and Unplanned Residential Area
265
3.4.4 Comparison about independent variables of Savings Model Income: This independent variable is statistically significant at 1 percent level of
significance. This statement is true for 99 cases out of 100 cases. In unplanned area when income increases by one BDT saving increases by 07 paisa but in planned area it is 31 paisa.
Age: This independent variable is statistically significant at 5 percent level of significance. This statement is true for 95 cases out of 100 cases. Increase of age by one year saving increases by 307 120.96 BDT in unplanned area but in planned area it is increased by 133.14 BDT.
Year of Schooling: This independent variable is statistically significant at 1 percent level of significance. This statement is true for 99 cases out of 100 cases. In unplanned area increase of year of schooling by one year savings increases by 307.71 BDT but in planned area it is 348.41 BDT.
HH Owner: This independent variable is not statistically significant at 10 percent level of significance. This statement is not even true for 90 cases out of 100 cases. Owner of unplanned area saves more than planned area. It’s a most peculiar finding.
Dependency Ratio: This independent variable is statistically significant at 1 percent level of significance. This statement is true for 99 cases out of 100 cases. In Unplanned area dependency ratio increases by one unit savings decreases by 11049 BDT but in planned area it is 15022.2 BDT.
House Rent: This independent variable is statistically significant at 1 percent level of significance. This statement is true for 99 cases out of 100 cases. In Unplanned area house rent increases by one BDT savings decreases by 24 paisa. In planned area house rent increases by one BDT savings deceases by 54 paisa.
3.5 Conclusion
From the above all discussions, facts and figures it is easily understood that on side by side behind the scene scenario is not same. Where income difference is huge in between two area but APS is quiet same. But MPS is not similar. Even intensity of various factors of saving is different. Like, in planned area due to increase of income, age, and year of schooling saving rate also increase than the unplanned areas. But due to excessive house rent there is more negative relation exists between house rent and saving in planned area than unplanned area. In case of dependency ratio things are alike the above finding because of the excessive expenditure in planned area than unplanned.
4. References Bautista, R.M. and Lamberte, M.B. (1990). Comparative saving behavior of rural and
urban households in the Philippines, Philippine Institute for Development Studies.
BBS(2011). ‘Statistical Year Book of Bangladesh 1974’, Bangladesh Bureau of Statistics (BBS), Ministry of Planning, Government of the People’s Republic of Bangladesh, Dhaka.
Shovon,B.S. Senjuti,M.I.
Household Savings in Planned and Unplanned Residential Area
266
BBS(2011). ‘Statistical Year Book of Bangladesh 2011’, Bangladesh Bureau of Statistics (BBS), Ministry of Planning, Government of the People’s Republic of Bangladesh, Dhaka.
Collins, S.M. (1991). ‘Saving behavior in ten developing countries’, in National saving and economic performance, University of Chicago Press, pp. 349-376.
Douglass, M. (1998). A Research on Savings in Rural and Tribal Households: an Agenda for Policy Research with Reference to Indonesia, Third World Planning Review, 20(1), p.1.
Gedela, D.S.P.R. (2012). Determinants of Saving Behaviour in Rural and Tribal Households (An Empirical analysis of Visakhapatnam District), 2(3).
Gujarati, D. N. (1995). Basic Econometrics. New York: McGraw Hill, Inc. 3rd Edition
Handinott, J.T. (2005). Motivations for Commuting: an Assessment and a Value-Expectancy Research Model. Journal of Regional Science, 35(2), pp. 200-205.
Hiraskar, G.K. (1998).An Introduction to Town and Country Planning (An Example from India), 5(4).
Islam, R. (2004). The Nexus of Economic Growth, Employment and Poverty Reduction:an Empirical Analysis, Recovery and Reconstruction Department, International Labour Office.
KCC (2003). ‘Yearly report of KCC ’, Local Government Department(LGD), Ministry of Local Government, Government of the People’s Republic of Bangladesh,Dhaka
KCC (2013). ‘Map of Khulna 2013’, Local Government Department(LGD), Ministry of Local Government, Government of the People’s Republic of Bangladesh,Dhaka
Mahjabeen, R. (2008). Microfinancing in Bangladesh: Impact on Households, Consumption and Welfare, Journal of policy modeling, 30(6), pp. 1083-1092
Nagasa, A. (2005). Planned Development: Livable city for the dwellers, MTID, (89). Ratcliffe, J. (1981). Introduction to Town and Country Planning Hutchinson, Planning and
Development, 2.
Tacoli, C. (1998a). Rural-Urban Interactions: a Guide to the Literature, Environment and Urbanization, 1.
Waheed, S. (1996). Household Savings in Rural Pakistan, Unpublished Faculty of Agricultural Sciences, Georg-August-Universität Göttingen ,Germany.
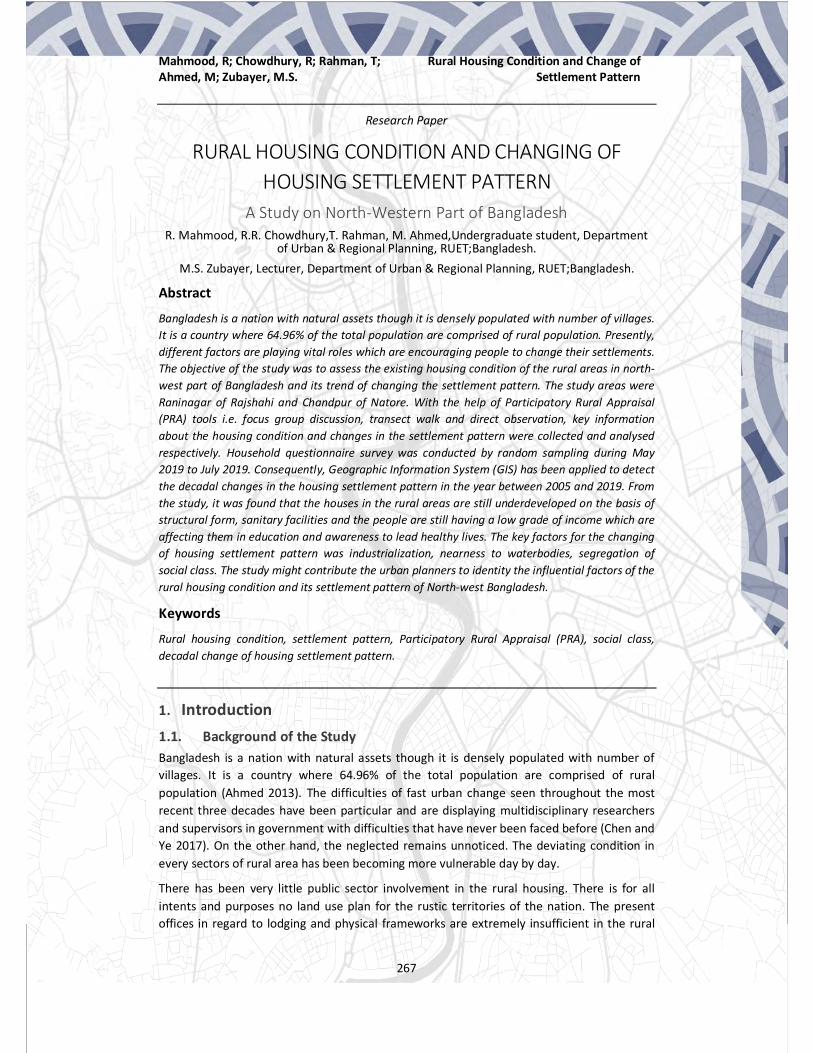
Mahmood, R; Chowdhury, R; Rahman, T; Ahmed, M; Zubayer, M.S.
Rural Housing Condition and Change of Settlement Pattern
267
Research Paper
RURAL HOUSING CONDITION AND CHANGING OF HOUSING SETTLEMENT PATTERN
A Study on North-Western Part of Bangladesh R. Mahmood, R.R. Chowdhury,T. Rahman, M. Ahmed,Undergraduate student, Department
of Urban & Regional Planning, RUET;Bangladesh. M.S. Zubayer, Lecturer, Department of Urban & Regional Planning, RUET;Bangladesh.
Abstract
Bangladesh is a nation with natural assets though it is densely populated with number of villages. It is a country where 64.96% of the total population are comprised of rural population. Presently, different factors are playing vital roles which are encouraging people to change their settlements. The objective of the study was to assess the existing housing condition of the rural areas in north-west part of Bangladesh and its trend of changing the settlement pattern. The study areas were Raninagar of Rajshahi and Chandpur of Natore. With the help of Participatory Rural Appraisal (PRA) tools i.e. focus group discussion, transect walk and direct observation, key information about the housing condition and changes in the settlement pattern were collected and analysed respectively. Household questionnaire survey was conducted by random sampling during May 2019 to July 2019. Consequently, Geographic Information System (GIS) has been applied to detect the decadal changes in the housing settlement pattern in the year between 2005 and 2019. From the study, it was found that the houses in the rural areas are still underdeveloped on the basis of structural form, sanitary facilities and the people are still having a low grade of income which are affecting them in education and awareness to lead healthy lives. The key factors for the changing of housing settlement pattern was industrialization, nearness to waterbodies, segregation of social class. The study might contribute the urban planners to identity the influential factors of the rural housing condition and its settlement pattern of North-west Bangladesh.
Keywords
Rural housing condition, settlement pattern, Participatory Rural Appraisal (PRA), social class, decadal change of housing settlement pattern.
1. Introduction
1.1. Background of the Study Bangladesh is a nation with natural assets though it is densely populated with number of villages. It is a country where 64.96% of the total population are comprised of rural population (Ahmed 2013). The difficulties of fast urban change seen throughout the most recent three decades have been particular and are displaying multidisciplinary researchers and supervisors in government with difficulties that have never been faced before (Chen and Ye 2017). On the other hand, the neglected remains unnoticed. The deviating condition in every sectors of rural area has been becoming more vulnerable day by day.
There has been very little public sector involvement in the rural housing. There is for all intents and purposes no land use plan for the rustic territories of the nation. The present offices in regard to lodging and physical frameworks are extremely insufficient in the rural

Mahmood, R; Chowdhury, R; Rahman, T; Ahmed, M; Zubayer, M.S.
Rural Housing Condition and Change of Settlement Pattern
268
Map 1: Map of the Study Area (Source: Author’s Preparation, 2019)
areas of Bangladesh. Because of the subsistent nature of the economy, 85% of the dwelling units in the rural areas are in the form of shelter, which do not provide protection from wind, rain and flood (GOB 1998).
Basically, housing condition describes the condition of the rural space and with the help of settlement pattern growth prediction in the future decades can be done. With the increase of family members, households are expanding their homesteads in horizontal way that gradually decreasing agricultural lands in rural area (Rahman and Manprasert 2006).
Many relevant studies have been conducted to identify the housing conditions and settlement pattern by using Geographic information system (GIS) and remote sensing perspective. The study circulates around the powerful factors that cause changes in rural housing and also the settlement pattern of rural area people. Basically, rural area’s housing is different from the urban area due to their income, culture and material availability which creates vulnerable condition for them in some cases. Moreover, settlement pattern also changes according to their culture, habitants, population density and so on. Statistical data analysis was done with association of statistical package for social science (SPSS) to identify the correlation of the factors which influences rural housing and settlement pattern. The settlement system in rural regions is being shaped by various forces.
The objectives of the study were specified as-
To illustrate the housing condition of the study areas.
To identify the trend of changing housing settlement pattern over time and the influencing factors for shifting towards a different settlement pattern with the change of time.
1.2. Study Area:

Mahmood, R; Chowdhury, R; Rahman, T; Ahmed, M; Zubayer, M.S.
Rural Housing Condition and Change of Settlement Pattern
269
0%
50%
100%
Raninagar Chandpur
6.67 13.5626.6742.37
66.67 44.04
Percentage of Housing Type of rural areas of North-west Bangladesh
Katcha Semi-pucca Pucca
Figure 1: Percentage of Dwelling Types (Source: Field Survey, 2019)
The study areas are chosen as Raninagar, Rajshahi and Chandpur, Natore. The study areas are chosen by analysing the satellite images of the areas with the change of time and based on the probable factors of changes in housing settlement pattern. Chandpur is located within upazilla of NatoreSadar situated beside Puthia, Rajshahi. The Study area is situated beside Dhaka-Rajshahi highway.The total land area of the study area is about 60 acres with the population of 6000. The other study area was Raninagar, Rajshahi. Raninagar area of Rajshahi is about 19 KM west of Rajshahi district situated beside the Rajshahi-Chapainawabganj highway. The study area is surrounded by raninagar and bijoynagar bazar. The total land area of the study area is about 50 acres with a population of 7000.
2. Methodology and Study materials After selecting study topic and objective, previous works related to the topic had been reviewed to find out best wayfor data collection and then analysis the collect data to get the optimum result. Two types of data from both primary and secondary sources are collected for this study. Primary sources are including questionnaire survey, interview, direct observation and mapping. The most crucial part of such an interview is to develop a rapport with the community; this is most often established by listening to the people talk about their problem rather than suggesting solutions. Direct observation of all major activities to just walk around in the community. The settlement pattern both in year 2001, 2011 and 2019 have been prepared using GIS. Secondary data were collected from Population and housing census 2011 and BBS data Related journals and articles, Website articles. Data analysis was done by qualitative as well as quantitative survey based on questionnaire survey and transect walk throughout the survey area. Data were analyzed by SPSS Software. Then the collected data were analysed to different variable. The study found statistical frequency, graph and correlation between different variable. The study principally based on some PRA techniques, i.e. focus group discussion, resource mapping and transect walk.
3. Results and Discussions 3.1. Analysis on Dwelling Type:
From the above figure, it can be seen that, a very minor percentage of the houses are pucca the houses are mostly semi-pucca. But the notable part is that, a greater percentage of the
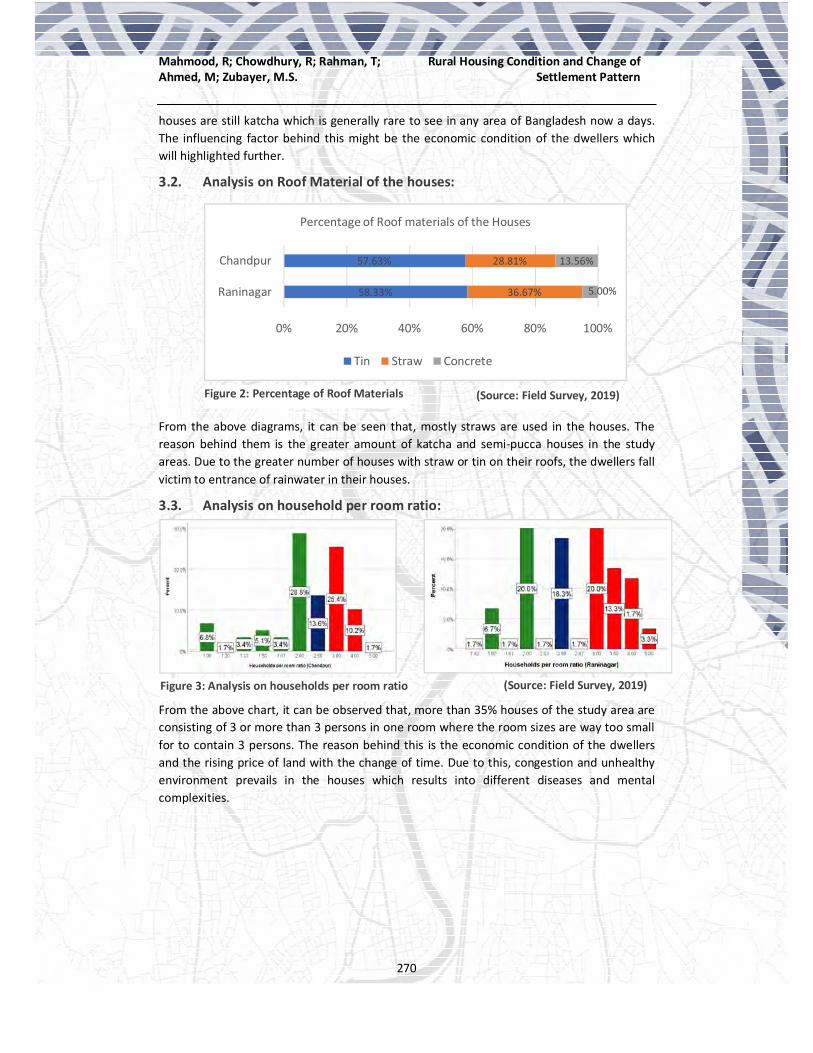
Mahmood, R; Chowdhury, R; Rahman, T; Ahmed, M; Zubayer, M.S.
Rural Housing Condition and Change of Settlement Pattern
270
58.33%
57.63%
36.67%
28.81%
5.00%
13.56%
0% 20% 40% 60% 80% 100%
Raninagar
Chandpur
Percentage of Roof materials of the Houses
Tin Straw Concrete
Figure 2: Percentage of Roof Materials (Source: Field Survey, 2019)
houses are still katcha which is generally rare to see in any area of Bangladesh now a days. The influencing factor behind this might be the economic condition of the dwellers which will highlighted further.
3.2. Analysis on Roof Material of the houses:
From the above diagrams, it can be seen that, mostly straws are used in the houses. The reason behind them is the greater amount of katcha and semi-pucca houses in the study areas. Due to the greater number of houses with straw or tin on their roofs, the dwellers fall victim to entrance of rainwater in their houses.
3.3. Analysis on household per room ratio:
From the above chart, it can be observed that, more than 35% houses of the study area are consisting of 3 or more than 3 persons in one room where the room sizes are way too small for to contain 3 persons. The reason behind this is the economic condition of the dwellers and the rising price of land with the change of time. Due to this, congestion and unhealthy environment prevails in the houses which results into different diseases and mental complexities.
Figure 3: Analysis on households per room ratio (Source: Field Survey, 2019)

Mahmood, R; Chowdhury, R; Rahman, T; Ahmed, M; Zubayer, M.S.
Rural Housing Condition and Change of Settlement Pattern
271
18.33%
[VALUE]
11.67%
18.33%11.67%
16.67%
8.33%
15.00%
Types of occupation in Raninagar, Rajshahi.
Farmer Fishermen Rickshaw pullerAuto driver Businessman Day labor
35000
90000
200000
2500065000
100000
0
50000
100000
150000
200000
250000
2003 2013 2019
Pric
e (B
DT)
Year
Change of Land Price with time (Per Decimal)
Chandpur Raninagar Linear (Chandpur) Linear (Raninagar)
Figure 5: Change of Land price of the Study Areas (Source: Field Survey, 2019)
3.4. Types of Occupation in the Study Areas:
From the diagrams shown above, it can be easily evaluated the reason behind the poor housing condition of the people of the study areas. The greater percentage of the occupants are factory workers, farmers, day labours, auto drivers. All of these occupations render a very low amount of income which is not enough to serve minimum 4 persons in of a family. This is an influencing factor which is unable to cope up with the rising price of land of the study areas.
3.5. Analysis on change of Land price: Besides, land price plays a vital role in the condition of housing of any region. From the above chart, it was observed that most of the people are rendering services of very low income. So, they cannot afford to buy land at high prices for their houses. The change of land price and its impact is shown below:
From the above charts, it can be ascertained that, keeping the exceptions aside, the land price has been increasing at a high rate but from the analysis done about the occupations of the people of the study areas, the occupations are mainly providing low amount of salary. So, with the increasing rate of land price, the people are unable of cope up with the
15.25%
8.47%
10.17%
5.08%
3.39%
[VALUE]
10.17%
3.39%
Types of occupation in Chandpur, Natore.
Farmer Rickshawpuller AutodriverBusinessman Teacher Factory worker
Figure 4: Types of Occupation of the people (Source: Field Survey, 2019)

Mahmood, R; Chowdhury, R; Rahman, T; Ahmed, M; Zubayer, M.S.
Rural Housing Condition and Change of Settlement Pattern
272
acquisition of sufficient land for their families. This is resulting the congestion of households in rooms, unhealthy condition of the houses and low-quality materials used in the houses which are mentioned above.
3.6. Relative study between monthly income, educational qualifications and structure types of the dwellings: A notable part of the study was despite of earning a good amount of money which is generally sufficient to fulfil the demand of construction of houses better than katcha houses, the people are not aware of upgrading their housing condition. The influencing factor behind this might be their educational qualifications. The relative study below will show the justification of the determining the probable factor behind the unawareness of the people.
Table 1: Relative analysis of Income, Education and Type of Structure (Raninagar, Rajshahi)
Income (BDT) * Education * Type of structure Cross tabulation
Type of structure Education
Primary SSC HSC Undergraduate
Katcha Income (BDT)
5000-10,000 62.5% 37.5%
10,000-15,000 70.0% 30.0%
Semi-pucca
Income (BDT)
15,000-20,000 45.0% 40.0% 5.0%
20,000-25,000 80.0% 20%
Pucca Income (BDT)
15,000-20,000 50.0% 50.0%
20,000-25,000 100.0%
The table shows that, people with income more than TK. 10000 are still living in katcha houses where they can easily afford a better house. The reason behind is the lack of education which shows about 70% of the people have acquired primary education. The same scenario has been observed in another study area of Natore which is shown below:
Table 2: Relative analysis of Income, Education and Type of Structure (Chandpur, Natore)
Income (BDT) * Education * Type of structure Cross tabulation
Type of structure Education
Primary SSC HSC Undergraduate
Katcha Income (BDT) 10,000-15,000 16.7% 33.3% 50.0% 0.0%
20,000-25,000 100.0% 0.0% 0.0% 0.0%
Semi-pucca Income (BDT) 15,000-20,000 0.0% 50.0% 50.0% 0.0%
25,000-35,000 0.0% 0.0% 0.0% 100.0%
From the table above, it is also seen that people who can afford better houses than katcha house are not aware of upgrading them. Besides, people who are educated to acquire the required awareness about upgrading the standard of living are not actually upgrading themselves because of the lesser tendency to invest money for upgrading houses than investing it for earning more money.

Mahmood, R; Chowdhury, R; Rahman, T; Ahmed, M; Zubayer, M.S.
Rural Housing Condition and Change of Settlement Pattern
273
(Source: Author’s Preparation, 2019)Map2&3: Settlement pattern of Chandpur, Natore in 2001 (Left) and 2019 (Right)
Settlement Pattern of Chandpur in 2001
3.7. The trend of changing settlement pattern in the study areas: From the utilization of different tools of participatory rural appraisal (PRA), the trend of changing the settlement pattern of the study areas has been detected and constructed with the help of Geographic Information System (GIS) which is shown below:
3.8. Change of Settlement Pattern in Chandpur, Natore: After a thorough analysis of the study area with the help of participatory rural appraisal tools, the information obtained about the settlement pattern in Chandpur, Natore were put together into Geographic Information System (GIS) to obtain much clearer image of the settlements and the trend of change of settlement with time. The images below will help to understand the decadal changes in settlement pattern in the study area.
From the figure shown above, it can be seen that, in 2001, the settlement was mainly focusing the access road of the study area. The number of habitats at that time was also less and from the correspondents, it was known that the people were mainly farmers and they used to build their houses near their farmlands. But after the major industrialization occurred within the time period of 2012-2014, many factories were built around the study area which were Pran Ltd., Kishwan Agro Products Ltd., Gold Cosmetics Ltd. Due to this, many families sold their lands to the factories and started living in the study area. After that, the number of habitats started to increase and the settlement was focusing on the access road and nearness to the industries. This was mainly the influencing factor behind the changing of settlement pattern. The present scenario of roadway condition is shown below:
Settlement Pattern of Chandpur in 2019

Mahmood, R; Chowdhury, R; Rahman, T; Ahmed, M; Zubayer, M.S.
Rural Housing Condition and Change of Settlement Pattern
274
Table 3: Present roadway condition in front of houses in Chandpur, Natore.
It was notable that, most of the roads were built by pitch and they were in good condition. So, it was general issue that the people were more interested in building their settlements near the roads. The roads have been constructed with these good materials in the period of 2012-2013 which was known from the correspondents. Before that, the roads were mainly katcha and brick-built. But the water logging problem was not an issue at that time because of availability of much greeneries. So, the people were eager to build their houses near the roads.
Besides, the farmers built their habitats near their farmlands in the peripheral regions of the study area to acquire the nearness to their farmlands.
So, the main factors behind the changing of settlement pattern were industrialization of 2012-2014, nearness to main access road of the area and the nearness to the farmlands.
3.9. Change of Settlement pattern in Raninagar, Rajshahi. The decadal changes of the previous study area mainly focused on the changes brought by the industrialization within the time period of 2012-2014. But the area of Raninagar was detected with much lesser changes due to the absence of such impactful issue like industrialization but from the satellite images observed within the time period of 2000 to 2019, it was much clearer that the settlements grew up surrounding the water bodies which are still existing. And with the help of participatory rural appraisal (PRA) tools, more information was gathered about the changes of settlement pattern, influencing factors of these decadal changes and the present scenario of housing. The raster data map of the study area below will show much clearer images of the discussions and findings about the changes in settlement pattern in Raninagar, Rajshahi.
Roadway Condition Good Average Bad Very bad
Roadway Type
Katcha 36.8% 52.6% 10.5% 0%
Brick 27.3% 22.7% 40.9% 9.1% Pitch 66.7% 33.3% 0% 0%

Mahmood, R; Chowdhury, R; Rahman, T; Ahmed, M; Zubayer, M.S.
Rural Housing Condition and Change of Settlement Pattern
275
(Source: Author’s Preparation, 2019)Map 6: Topographic Map of Raninagar, Rajshahi
Map 4& 5: Settlement pattern of Raninagar, Rajshahi in 2001 (Left) and 2011 (Right)
Settlement Pattern of Raninagar in 2019
(Source: Author’s Preparation, 2019)
Settlement Pattern of Raninagar in 2001
The settlement started to grow after the flood of 1989 in Rajshahi. At that time, the main focus of the settlement pattern was nearness to waterbodies. In the study area, there were number of waterbodies which are still prevailing were influential factors behind the settlement pattern. Day by day, the number of habitats were increasing and the settlement pattern were not confined within the factor of nearness to waterbodies. Class segregation occurred with the change of time and occupation and the settlement pattern was changing accordingly.The comparatively low-income people started living surrounding an elevated area at the north-west corner of the study area. The contour map of the study area is shown below which will be helpful to understand this issue.

Mahmood, R; Chowdhury, R; Rahman, T; Ahmed, M; Zubayer, M.S.
Rural Housing Condition and Change of Settlement Pattern
276
From the above map, it can be seen that, the red marked area has a high elevation than the whole region. Surrounding that high elevated area, 50 families have been living for more than 15 years. All the houses are katcha and the people are within the low-income class.
Gradually, the settlement around the water bodies were found to be of the people to middle-income class since, the water bodies are not usable for common people so that the low-income people could earn money by fishing.
Afterwards, the green spaces were decreasing with the increase of habitats. Form the map of 2019, it can be seen that, there are fewer green spaces than the previous years and the settlement increased with the development of a pucca road on 2011. The present roadway condition of the study area is shown below:
Table 4: Present Roadway Condition in Raninagar, Rajshahi.
From the above table, it can be seen that, most of the roads in front of the houses were pucca and they were in good condition. There was no problem of water logging in the study area which was reported by the correspondents. This was the influential factor behind the changing of settlement pattern after 2011.So, the influential factors behind the changing pattern of the settlement in Raninagar, Rajshahi were nearness to water bodies, segregation of class and nearness to well-developed access road.
3.10. Conclusion The study mainly focused on the present housing condition of the rural people of north-west Bangladesh and the flow of changes brought into their housing with time, settlement pattern of their housing and trend of change of their settlement pattern with e timeline of about 20 years with an interval of about 10 years. The vulnerable condition of their housing is still prevailing with congestion among households, unhealthy environment owing to their lack of education and low-income employment. In spite of industrialization, the rural people are not really able to change the standard of their lives due to low wages paid to the worker and despite of presence of a good number of water bodies and farmland in the site, the people are not able to utilize the resources due to the domination of upper-middle class people of the rural area. So, with changes brought into the site, settlement pattern has changed but the condition of housing has not really changed much due to poor socio-economic condition of the people of the study areas. Segregation of class has been still prevailing in the rural areas of north-west Bangladesh and due to this, the integration of
income class and upgradation of the standard of lives has not been possible yet. Besides, reduction of green spaces due to increase of houses detected from the decadal change of settlement pattern is alarming for Bangladesh. Rural areas are now the hope of balancing ecology due to the impact of urbanization in Bangladesh. It is saddening if the green spaces of the rural areas reduce. The rural people must be brought into importance so that migration to urban areas does not become much frequent. Deforestation should be
Roadway Condition
Very good Good Average Bad Very bad
Roadway Type Katcha 0% 11.1% 33.3% 44.4% 11.1% Brick 0% 26.3% 57.9% 15.8% 0%
Pitch 14.3% 71.4% 14.3% 0% 0%

Mahmood, R; Chowdhury, R; Rahman, T; Ahmed, M; Zubayer, M.S.
Rural Housing Condition and Change of Settlement Pattern
277
minimized by proper planning of housing within the rural areas. The upgradation of educational facilities provided to the rural people should continue and spread all over rural Bangladesh. The study can be helpful for the planners for future scopes of development of the rural areas of Bangladesh. By this, Bangladesh can be developed into a country with less migration to urban areas by the increase of living standard of the rural people.
4. References Ahmed, Khandakar (2008) Low Income housing: Multidimensional research perspectives,
Dhaka, Bangladesh, Grameen Trust.
Ahmed, Zobayer (2013) “Horizontal Expansion of Housing in Rural Areas of Bangladesh: Does Population Growth Matter?”, Developing Country Studies, Vol 3 (August).
Chen, Mingxing; Ye, Chao (2014) “Differences in Pattern and Driving Forces between Urban and Rural Settlements in the Coastal Region of Ningbo, China”, Sustainability, Vol. 6 No. 2 (April).
Government of Bangladesh –GOB (1998) The Fifth Five Year Plan: 1997-2002, Dhaka, Planning Commission, Ministry of Planning.
Jamini, Davood; Jamshidi, Alireza; Ebrahimi, Mohamad (2014) "Review and Assessment of Factors Influencing Villagers' Satisfaction with Rural Housing”, Journal of Research and Rural Planning, Vol. 3.
Rahman, Mohammad; Manprasert, Siddhart (2006) “Landlessness and its Impact on Economic Development: A Case Study on Bangladesh”, Journal of Social Sciences, Vol. 2 No. 2 (July).

Fattah, M.A.; Morshed, S.R. and Haque, M.N.
CHARACTERISTICS OF CURRENT LAND USE PATTERN OF URBAN AREA
278
Research Paper
CHARACTERISTICS OF CURRENT LAND USE PATTERN OF URBAN AREA
A Case Study on Ward 24 (Nirala), Khulna City Corporation (KCC), Khulna, Bangladesh
Md. Abdul Fattah, Undergraduate Student, Department of Urban and Regional Planning, Khulna University of Engineering & Technology, Khulna; Bangladesh.
Syed RiadMorshed, Undergraduate Student, Department of Urban and Regional Planning, Khulna University of Engineering & Technology, Khulna; Bangladesh.
Md. Nazmul Haque, Lecturer, Department of Urban and Regional Planning, Khulna University of Engineering & Technology, Khulna; Bangladesh.
Abstract
Mixed land use development is most important and key principle of sustainable development. It has a great impact on economy, environment and the health of the built environment. The objective of the research is to identify the different types of land use and their change direction and change flow. Then to evaluate the mixed land use development at Nirala, KCC Ward No-24 in Khulna City. Several field surveys were conducted emphasizing on the land use type for this research and also collected primary and secondary data for generating accurate result. Satellite images and GIS based secondary analysis helped to know the overall view of the site and Land Use Change (LUC) and LUC direction. Three core indices (i) Mixed Use Index, (ii) Entropy Index (iii) Herfindahl-Hirschman Index (HHI) are explored to evaluate the mixed-use development and the mixed land use condition of the area. The outcome of the study shows that the Entropy Index is 0.2529 is that the poor mixed-use condition and Mixed-Use Index suggested Nirala as a highly residential area rather than commercial and industrial. Another finding, which is based on satellite image from 2002 to 2018 showing the land use type and changing direction. LUCs flow indicates the negatively proportional pay rise of the build-up area (57% to 69%) with respect to vegetation (18% to 17%), and vacant space (11% to 4 %) at Nirala. Though the increment of the buildup area indicates development, but unplanned excessive growth impacts environment.
Keywords
Land use change, Sustainable development, Built Environment, Diversity.
1. Introduction This research is conducted to identify the different types of land use with the change direction flow and to evaluate themixed land use at Nirala, KCC Ward No. 24 in Khulna City.Land use indicates the uses of land cover by human being for their different purposes like residential, industrial, agricultural, commercial, mining, grazing and many other purposes to fulfil their needs for improving living standard and life more comfortable.Land use change defines the conversion of land cover and land use type like agricultural to

Fattah, M.A.; Morshed, S.R. and Haque, M.N.
CHARACTERISTICS OF CURRENT LAND USE PATTERN OF URBAN AREA
279
residential area, vacant land to residential area, waterbody to built-up area etc. or modifying the landscape physically, chemically or biologically by human being for fulfilling their different needs(Kelly, et al., 2016).
Land use change (LUC) mostly occurred locally, regionally and globally in the whole world over the last few decades and will go on in the future. Land Use Change or transform of land functions in an unplanned manner has impacts on environment, temperature, biodiversity, eco-system, groundwater level etc. Thesocioeconomic condition also changes with the change of land use type. Growth of build-up area in planned way defines development of any area (Bahadure & Kothakar,2012).
Mixed use development is a process or a form of urban development to make human living standards easier and healthier where different land use type like residential, commercial, industrial, institutional and cultural uses are combined together in a manner that they are physically and functionally integrated and also where pedestrian connections are provided (Cervero,1996). As the world is developing day by day, the significance of mixed-use development increasing day by day. It indicates the proper socioeconomic and green sustainable development of an area and increases the working opportunity in the area and also reduces traffic problems, air pollution by providing smart solutions in transportation. It also promotes effective and efficient use of land and infrastructure to represent “Smart Growth” and increase revenues. It preserves and improves traditional centers of the village(Cervero, 1996).
The outcome of the research shows different types of land use and most of the LUC direction of Nirala towards build-up area. Land use change trend indicates the negatively proportional pay rise of the build-up area (57% to 69%) with respect to vegetation (18% to 17%), and vacant space (11% to 4 %) at Nirala. The Entropy Index value 0.2529 and Herfindahl- Hirschman Index value 7899 describes poor mixed-use condition. The Mixed-Use Index suggests Nirala as a highly residential area rather than any other use.
2. Literature Review Use of land for different purposes like residential, commercial, agricultural, industrialetc. and so many other purposes and to conduct different activity on the land by human being is defined as land use (Kelly, et al., 2016). Land use change is the conversion of land use type like agricultural to build up area, vegetation to residential, vacant space to residential area, waterbody to build-up area etc. by human being. It directly and indirectly impacts on environment and causes environmental, socioeconomic, biological change in the area.
Mixed-use development is a way of urban development by creating physical and functional relationship between residential, commercial, administrative, institutional and industrial uses of land that encourages high quality design of an urban area to promote the effective use of land and infrastructure (Cervero, 1996). This type of urban development can be introduced as a single building (skyscraper), complex of building, a city block (governmental zoning regulations), or wholeneighbourhoods by a private developer, governmental agency (Rabianski & Clements, 2007). Two types of mixed use development (i) Horizontal mixed use development in the horizontal direction using more land and (ii) Vertical mixed use development in vertical direction using less land to developmet (Herndon & Drummond, 2011). Mixed use development increase the efficiency of land by providing necessary

Fattah, M.A.; Morshed, S.R. and Haque, M.N.
CHARACTERISTICS OF CURRENT LAND USE PATTERN OF URBAN AREA
280
facilities in the area. It promotes sustainable development by reducing car dependacy through providing safe and walkable negibourhoods.
For identifying the land use type Supervised image classification in ERDAS IMAGINE helped to identify these selected land use type and, GIS based secondary analysis and Land Use Change Trend Analysis was conducted to evaluate land use change direction and change flow.
There are some methods that is followed to calculate the amount of mixed land use development of an area. These are Entropy Indexing Method, Shanon Index, Mixed Use Index and Herfindahl- Hirschman Index(Haque, et al., 2018). These are calculated from different types of land use area and their percentage. Among these method, Entropy Index is mostly used and accepted method for calculating the mixed land-use.
3. Methods and Materials 3.1 Study Area Khulna is the 3rd largest city and the 2nd port entry of Bangladesh has been developed largely in an unplanned manner with the population of 232633 in KCC area (Source: BBS 2011) The area of Khulna City Corporation is 14.30 sq. miles and divided into 31 wards. With the passage of time, the land use pattern of Khulna is changing every year. The study area Nirala, KCC Ward No 24 which is shown in Figure 1 was selected due to its gradual development and it included all classes of people. Some necessary information about the area is presented in Table 1.
Table 1: Study area at a glance
Ward No 24
Total Area 392.7 acres
Population 37889
Population density 97 person per acres
Maximum land coverage Residential
(Source: BBS 2011)
3.2 Methodology The study area was selected by reading some available reading materials and based on the requirement of the data of the analysis. The gradual development in this area which is also a reason for selecting the area. The study area was selected to see the land use change trend and changing direction and to measure the present mixed land use development condition at Nirala.Other papers most important and meaningful factors were selected and given priority to analysis the data.
Several field survey and reconnaissance survey has been conducted to collect the data like structure type, existing land use, road pattern etc. of the area. The secondary preliminary survey and BBS data helped to collect the initial information about the area. Some data was also collected from KCC, KDA, and LGED. Satellite image was collected from USGS to analyse and evaluate the land use change using ERDAS IMAGINE 2014 for supervised image

Fattah, M.A.; Morshed, S.R. and Haque, M.N.
CHARACTERISTICS OF CURRENT LAND USE PATTERN OF URBAN AREA
281
classification and GIS based analysis. GIS based secondary analysis helped to determine the land use change trend and change direction.
Figure 1Study Area, Nirala KCC Ward No. 24 (Author, 2019)
The three indices, Entropy Index, Mixed-use Index and Herfindahl-Hirschman Index was used for evaluating the mixed land use.
퐸푛푡푟표푝푦 퐼푛푑푒푥 = −( )
………………………………..…. (1)
Here,
A= (b1/a)*ln(b1/a) + (b2/a)*ln(b2/a) + (b3/a)*ln(b3/a) + (b4/a)*ln(b4/a) + (b5/a)*ln(b5/a) + (b6/a)*ln(b6/a) +_(b7/a)*ln(b7/a)
a = total acre of land for all six land uses present in buffer b1-b6 measure areas of land use for b1= Residential, b2= Commercial, b3=Industrial,
b4= Educational, b5=Recreational, b6= Amenities, b7= Transportation. N= number of seven land uses with area >0 (Barbara & Yamada, 2009).
According to Mixed Use Index, land uses are categorized into three types. In this Index, Mixed Use is defined as the combination of Housing, Working and Amenities. Functional balance established among the rudimentary uses. It is mainly described as MUI= Housing: Working: Amenities and if the value is equally distributed then it is called totally mixed Use is available otherwise it is not(Barbara, et al., 2009).
Herfindahl-Hirschman Index is basically based on the percentage of land use in the study area.
퐻퐻퐼 = 훴 푃푗2 ……………………………………. (2)
Where, Pj = Percentage of individual land use.

Fattah, M.A.; Morshed, S.R. and Haque, M.N.
CHARACTERISTICS OF CURRENT LAND USE PATTERN OF URBAN AREA
282
If the value of HHI is closer to the 0 it indicates there exists mixed use and if it is closer to 10,000 it indicates there remains no mixed use(Manaugh & Kreider, 2013).
4. Result and Discussion To evaluate the LUC trend and identify the LUC direction, through GIS based analysis some tools were used and to assume the mixed-use, some indexing method from some published scholars has been used.
4.1 Land use change and direction analysis Five land use type namely agricultural land, build-up land, vacant land, vegetation, waterbody was selected on the basis of authors design to measure the land coverage and land use change. Supervised image classification in ERDAS IMAGINE helped to identify these selected land use type in year 2002, 2010 and 2018. GIS based secondary analysis helped to measure the land use change in these years that is shown in Figure 2.
Figure 2 Changes of land use type at Nirala, Khulna for the period 2002-2018, (Author, 2019)
Figure 3 Land use changed flow from the year 2002 to 2018
Figure 2 and Figure 3 shows the land use change trend and the gradual increasement of build-up land (57% to 69%) to provide land for housing and employment for gradually increased populationwith the decrement of agricultural land (9% to 8%), vacant land (11% to 4 %), vegetation (18% to 17%), waterbody (4% to 2%) from the year 2002 to 2018. The increment of build-up area had influence in the decrement of other land use type. Figure 3 shows the build-up area has gained the most top point where vacant land in the most
[VALUE]%
[VALUE]%
[VALUE]%
[VALUE]%
[VALUE]%[VALUE]%
[VALUE]%
[VALUE]%
[VALUE]%
[VALUE]%
[VALUE]%
[VALUE]%
[VALUE]% [VALUE]% [VALUE]%0
20
40
60
80
Agricultural Land Build up Vacant Land Vegetation Waterbody
Land
use
are
a pe
rcen
tage
Year 2002 Year 2010 Year 2018

Fattah, M.A.; Morshed, S.R. and Haque, M.N.
CHARACTERISTICS OF CURRENT LAND USE PATTERN OF URBAN AREA
283
vulnerable point in 2018 because of massive construction on vacant land to fulfil the human needs for more housing and amenities. Four types of land use such as vacant land, agricultural, vegetation, and waterbody has been selected that are seen to mostly changing. GIS based secondary analysis shows the land use change direction and conversion of these land use types from the year 2002 to 20012 at Nirala.
Figure 4Land use change direction (A)Waterbody, (B)Vegetation, (C) Vacant Land, (D) Agricultural Land at Nirala, KCC Ward No. 24, Khulna from 2002 to 2018, (Author, 2019)
In Figure 4 it is shown that the change direction of these four types of land uses mostly directed to the build-up area and it describes the development progression in Nirala. The conversion of vegetation is seen mostly (54.56 acres)and then vacant land (43.09%) during this time period of 2002 to 2018. As the population increases, the demand for land for housing and employment is increasing. But the land is limited and people choose vegetation and vacant land because development on it costs less than in waterbody. The gradual increase of the conversion rate of these land use changes will vitally play a negative impact on the environment in the future at Nirala.

Fattah, M.A.; Morshed, S.R. and Haque, M.N.
CHARACTERISTICS OF CURRENT LAND USE PATTERN OF URBAN AREA
284
From the analysis, it is found that the build-up area increased by 48.42 acres in the study area by the year 2002 to 2018 which influenced to decrease agricultural land, vegetation, vacant land, and waterbody. People built infrastructure on these types of land and converted into build-up area. The percentage of the conversion of this land use type into build-up area is shown in Figure 5 where vegetation got the highest percentage and waterbody lowest. This indicates a rapid decrease of greeneries at the study area.
Figure 5 The conversion of different land use to build up area from 2002 to 2018, (Author, 2019)
4.2 Entropy Index Land-use was classified into seven categories according to the authors choice. Thepercentage of present land use at Niralais shown in Figure 6 which shows that residential purpose holds the lion share of current land use pattern.Though mix land use ensures a combination of different land use type like residential, commercial, working area, service area but Figure 6 shows the percentage of amenities, transportation, commercial, recreational area in Nirala is very poor. Here the land cover has been changed by emphasizing on only one type (residential) of land use. The entropy index was calculated for two different year, 2012 and 2018 from the equation described in methodology are showed in Table 2.

Fattah, M.A.; Morshed, S.R. and Haque, M.N.
CHARACTERISTICS OF CURRENT LAND USE PATTERN OF URBAN AREA
285
Figure 6 Different land use type scenario in 2018 Source: Field Survey, 2018
Table 2: Comparative mixed land use of year 2012 and 2018
Landuse 2012 2018
Area (acres) Percentage Area (acres) Percentage
Residential 85.03 90.88 % 84.35 88.88 %
Commercial 3.70 3.96 % 3.52 3.71 %
Industrial 0.35 0.38 % 0.35 0.37 %
Educational 2.59 2.76 % 2.56 2.70 %
Recreational 0.02 0.02 % 0.08 0.08 %
Amenities 1.67 1.79 % 3.90 4.11 %
Transportation 0.20 0.22 % 0.15 0.16 %
Total 93.57 100 % 94.90 100 %
Source: Field survey, 2018 and KCC
For 2012,
A= -0.421923554
퐸푛푡푟표푝푦 퐼푛푑푒푥 = −퐴/ln (푁)
= −−0.421923554
ln(7)
= 0.216825815
For 2018,
A= -0.49220038
퐸푛푡푟표푝푦 퐼푛푑푒푥 = −퐴/ln (푁)
= −−0.49220038
ln(7)
= 0.25294096
Table 2 shows that the maximum land coverage of the study area is residential and the other land use types are poorly defined. Research says that the value of entropy index lies
[CATEGORY NAME]
[PERCENTAGE]
Commercial4%
Industrial0%
Educational3%
Recreational0%
Amenities4% Transportation
0% Residential
Commercial
Industrial
Educational
Recreational
Amenities
Transportation

Fattah, M.A.; Morshed, S.R. and Haque, M.N.
CHARACTERISTICS OF CURRENT LAND USE PATTERN OF URBAN AREA
286
between 0 to 1 and the value close to 0 indicates no mixed land use. From the analysis, the result is 0.25294096 which indicates there are no mixed land use in KCC Ward no 24. Though the amount of the residential area decreased in the year 2018, but the Mixed Land Use Index value increased due to the increasement of Amenities area and Recreational areas. Overall, Table 2 also shows a very little mixed land use change in the study area from 2012 to 2018. This happened due to the increasement of amenities or service area from 1.79% to 4.11% which indicates that the people of the study area now get more facilities in their walking distance in the area than before.
4.3 Mixed Use Index For calculating mixed use index, land uses are classified into three categories such as housing, amenities and working. The proper distribution of these categories indicates the mixed land use of an area.
Table 3: Mixed Use Index Calculated Result
Category Area (acres) in Year 2018
Housing 84.35
Work 4.05
Amenities 6.50
Total 94.90
Source: Field survey, 2018
From table 3 it is seen that these three types of land uses are not equally distributed in the study area and most of the land is used for residential purposes. The result shows that KCC Ward 24 is a highly residential area.
4.4 Herfindahl-Hirschman Index Categorized seven land use area percentage were used to calculate mixed land use in Herfindahl- Hirschman Indexing method.
HHI= (88.88)2 + (3.71)2 + (0.37)2 + (2.70)2 + (0.80)2 + (4.11)2 + (0.16)2
= 7899.41
The value of HHI closer to 10,000 indicates poor mixed land use condition, so the calculated HHI value 7899.41 which is closer to 10,000 indicates no mixed land use in the study area.
Table 4: Mixed land use index check list
Index Name Value Limit Value Remarks
Entropy Index 0-1 0.2529 Poor
Herfindahl-Hirschman 0-10000 7899 Poor
Mixed-use Index No Limit 89: 4: 7 Poor
Source: Field survey, 2018
The table 4 describing Nirala as a highly residential area rather than commercial and industrial and the poor condition of mixed land use which indicates there is absence of mixed land use at Nirala, KCC Ward No. 24, Khulna.

Fattah, M.A.; Morshed, S.R. and Haque, M.N.
CHARACTERISTICS OF CURRENT LAND USE PATTERN OF URBAN AREA
287
5. Conclusion From the analysis above, it can be concluded that land use changes mostly occurred due to rise of built-up area and it is degrading environment by reducing the amount of vegetation and vacant land. The trend flow indicates that the build-up area is increasing at a constant rate, which indicates the development, but the result of mixed land use indexes indicates the poor mixed land use condition that means the development is not going well in a planned way. The unplanned massive change of land use type towards the build-up area can cause a threat to human life. Mixed use development integrates housing, residential, commercial, transportation in a planned way by reducing distance and spreading sustainable development. For this it is becoming favoured means of development and redevelopment. This type of research gives and enriches knowledge to the people about the components which involved with their use and be demanding that those components work well together initially and as well as in future.
6. References Ana, Popovici Elena; Grigorescu, Ines; Kucsicsa, Gheorghe; Mitrica, Bianca (2018) "Past and future
land use/cover flows related to agricultural lands in romania. An assessment using clue-s model and corine land cover database" Carpathian journal of earth and environmental sciences, August 2018, August, Vol. 13 (August).
Bahadure, Sarika; Kothakar, Rajashree (2012) "Social Sutanability and Mixed Land USe, Case Study of Neighborhoods in Nagpur, India", Bonfring International Journal of Indutrial Engineering and Management Science , Vol. 2 No. 4 (December).
Barbara, Brown B; Yamanda, Ikuhu; Smith, Ken; Zick, Cathleen D; Jones, Lori (2009) "Mixed land use and walkability: Variations in land use measures and relationships with BMI, overweight, and obesity", Vol. 1 (December).
Cervero, Robert (1996) "Mixed Land-uses and Commuting: Evidence from the American Housing Survey", Elsevier Science Ltd, Vol. 30, No. 1 pp. 361-377 (October).
Haque, Nazmul Md; Rahman, Mahinur; Islam, Raisul Md. (2018) "Evaluating the presence of mixed use development by using various tools at ‘‘bashupara’’ area in khulna, bangladesh", Chittagong, Southern University Bangladesh (SUB), Chittagong, Bangladesh (January).
Herndon, Joshua; Drummond, William (2011) "Mixed-Use Development in Theory and Practice: Learning from Atlanta’s Mixed Experiences", (May).
Kelly, Alice LK; Kigen, Charles K; Agevi, Humphrey; Mwendwa, Kaleb A (2016) "Trends in land use and land cover changes; drivers and impacts on Kakamega forest block" Masinde Muliro University of Science and Technology, No. 05 (October).
Manaugh, Kevin; Kreider, Tylor (2013) "What is mixed use? Presenting an interaction method for measuring land use mix", The journal of transport and land use, Vol. 6 No. 1.
Rabianski, Josep S; Clements, J Sherwood (2007) "Mixed-Use Development: A Review of Professional Literature", The National Association of Industrial and Office Properties Research Foundation, (November).
Nahar, S.; Kakon, A.N. Comparison of physical environment of planned RA with provisions of DMBCR’08
288
Research Paper
Comparison of Physical Environment of Planned Residential Area with the Provisions of Dhaka
Metropolitan Building Construction Rules, 2008
Sharmin NAHAR, Master’s Student, Dept. of U.R.P., Jahangirnagar University; Bangladesh Anisha Noori KAKON, Associate Professor, Dept. of U.R.P., Jahangirnagar University;
Bangladesh
Abstract
Dhaka, the capital city of Bangladesh known as a densely populated city and a large amount of land in Dhaka city use as the residential purposes. As Building Construction Rules play an important role in planning and development, in recent years the Government of Bangladesh has provide Dhaka Metropolitan Building Construction Rules, 2008. This study is about a comparative analysis of the Dhaka Metropolitan Building Construction Rules, 2008 with the physical environment of planned residential area. As Dhaka Metropolitan Building Construction rules, 2008 has established in 2008, Uttara Sector 13 has been considered as study area, because this study area is in a recent development project of RAJUK named Uttara Residential Model Town (2nd phase) and its second phase is developed in recent years. For the detailed analysis some plots were identified which has been constructed after 2008. In this study the existing physical environment (land use, FAR, maximum ground coverage, setbacks, building height, community facilities, and road width) of Uttara sector 13 has been find out through checklist. The analysed data has been compared with the provisions of Dhaka Metropolitan Building Construction Rules, 2008. On the basis of the findings there has been recommended some guidelines to improve the physical environment. Though Uttara sector 13 is a planned residential area, it does not follow all the provisions of Dhaka Metropolitan Building Construction Rules, 2008 properly, for example the maximum ground coverage, building height, road width, and setbacks of buildings are not followed by the standards.
Keywords
Residential Area, Building Construction Rules, Floor Area Ratio (FAR), Setback, Maximum Ground Coverage (MGC)
1. Introduction Residential areas in Dhaka city are developed in planned and unplanned way. Residential environment is part of the built environment and it is interrelated with all the other functions (for example, other than residential, commercial, recreational, transportation, industrial and so on) and accordingly with the neighbouring functional areas and naturally all the infrastructure achieving the city. There are three interrelated characteristics of residential environments (Visser, Van Dam and Hooimeijer, 2008). These are- Physical, Social and Functional.

Nahar, S.; Kakon, A.N. Comparison of physical environment of planned RA with provisions of DMBCR’08
289
If a neighbourhood has a good physical environment, then the social and functional environment become good. These physical characteristics are directly influenced by the planning regulations. In case of Dhaka, the improper implementation of the planning regulations makes the physical environment of a residential area less functional and socially unattractive. If a neighborhood maintain the planning rules properly, then the neighborhood becomes more attractive and good for living. Today residential environment is a serious urban issue of any city. So, the Building construction rules have the important role in town planning. There are a number of Building Construction (BC) laws in Bangladesh to guide building construction in a guided way. Many of the builders even after taking the approval of concerned authority do not follow the guidelines properly. To keep a healthy and sound living environment within residential area proper application of BC Rules is a prime requirement. This study is for following the provisions of Dhaka Metropolitan Building Construction rules, 2008 in Uttara Sector 13 which is under Uttara Residential Model Town (2nd phase) developed by RAJUK in Dhaka city. Dhaka is a diverse city located in central Bangladesh with a huge population about 18.237 million. Dhaka is the most populated city in Bangladesh, and it is also one of the most populated cities in the world, with a density of 23,234 people per square kilometre within a total area of 300 square kilometres. Dhaka is a strong contributor to the population growth as here rural migration accounted for 60% population. While this growth needs to slow down by that time, Dhaka continues to show steady growth, with estimates placing the 2020 population at almost 21 million. It means by 2030 it may need to accommodate approximately 27.3 million residents. There are different agencies and authorities who are working for regulation and control over the design and construction of housing its location, necessary infrastructure, services and social facilities essential for housing areas to control this huge population. Several housing projects have been completed to ensure the physical environment of planned neighbourhoods. Uttara Residential Model Town project is very popular among those housing projects. It was called as Dhaka North Satellite Township but was changed to Uttara Residential Model Town by Dhaka Improvement Trust (DIT, presently RAJUK) in 1980.
This study shows the comparison of physical residential environment (FAR, Setback, ground coverage, Road width) of sector 13 with the provisions of Dhaka Metropolitan Building Construction Rules, 2008.
2. Objectives and Methodology 2.1. Objectives of the Study The main objective of the study is to compare and analyse the present scenario with the provisions of Dhaka Metropolitan Building Construction Rules 2008 and to propose some guidelines based on the findings of the study for improving physical residential environment of the study area.
2.2. Methodology Uttara sector 13 which is under Uttara Residential Model Town of Dhaka city has been selected as the sample area for this study as Dhaka Metropolitan Building Construction rules, 2008 has established in 2008 and this study area is a part of recent development project of RAJUK named Uttara Residential Model Town (2nd phase) and most of the buildings have been constructed in recent years. Therefore, Uttara sector 13 is selected as it is a planned

Nahar, S.; Kakon, A.N. Comparison of physical environment of planned RA with provisions of DMBCR’08
290
residential area to study the scenario of application of Dhaka Metropolitan Building Construction Rules, 2008 in this area.
282 plots have been identified which are constructed in the period of 0-10 year, and after 2008-2018 there has been constructed only 257 residential buildings. The buildings have been identified through the Screening method after completing the survey by checklist in the study area.
After collecting the data, they were analysed through ArcGIS, Microsoft Excel and SPSS for mapping, data tabulation and data analysis. Finally, the data were compared with the provision of Dhaka Metropolitan Building Construction rules, 2008.
3. Comparison with the provisions of Dhaka Metropolitan Building Construction Rules, 2008
Dhaka Metropolitan Building Construction Rules, 2008 published on May 29, 2008 as the Bangladesh Gazette by the Ministry of Housing of Govt. of Bangladesh. Dhaka Metropolitan Building Construction Rules 2008 basically came into action in the year 2006, later there were some corrections in the code which now is in practice from 2008. The Dhaka Metropolitan Building Construction Rules 2008 outdated the earlier set of rules issued in 1996 for the Dhaka Metropolitan Area and provided more authority to RAJUK in the following way;
• Clear‐cut responsibility to monitor the development of the city,
• Spread out the responsibilities to various actors,
• Spelled out responsibilities of building designers, structural engineers, site supervisors and their penalties etc.
One of the most significant improvements is the introduction of Floor Area Ratio (FAR). To manage the growth of the city it provides rules of building coverage area, allowable floor space and relation among building height ‐ road width and plot size.
In this study the main concern is about some provisions of Dhaka Metropolitan Building Construction Rules, 2008 that can determine the amount of safety of residential buildings in the study area. The provisions considered here are-Road width, Setback, Floor Area Ratio, Maximum Ground Coverage.
Standard of Physical Environment for the selected parameters referred in Dhaka Metropolitan Building Construction Rules, 2008 has been showing in Table 1.
Plot Area (Sq. m)
Road Width-m
Setback-Front-m
Setback-Rear-m
Setback-Sides-m
FAR MGC %
>=134 6 1.5 1 0.8 3.15 67.5
134-201 6 1.5 1 1 3.35 65
201-268 6 1.5 1.5 1 3.5 62.5
268-335 6 1.5 2 1.25 3.5 62.5

Nahar, S.; Kakon, A.N. Comparison of physical environment of planned RA with provisions of DMBCR’08
291
Table 1 Standards of the parameters in Dhaka Metropolitan Building Construction Rules, 2008
3.1. Study Area The success of any study depends upon the selection of a represent study area. Uttara sector 13 which is under Uttara Residential Model Town of Dhaka city has been selected as the sample area for this study as Dhaka Metropolitan Building Construction rules, 2008 has established in 2008 and this study area is a part of recent development project of RAJUK named Uttara Residential Model Town (2nd phase) and most of the buildings have been constructed in recent years. Therefore, Uttara sector 13 is selected as it is a planned residential area to study the scenario of application of Dhaka Metropolitan Building Construction Rules, 2008 in this area.
Uttara Model Town or simply Uttara is a northern Thana and a suburb of Dhaka, the capital of Bangladesh. The city consists of two city corporations including Dhaka North city corporation and Dhaka South city corporation. Uttara Sector 7 is situated in the northern part of Dhaka city. It is in Zone 10 of Ward 01 in Dhaka North City Corporation. Located in between 23°87’10” and 23°52’16” North latitudes and in between 90°38’73”and 90°23‘49” East longitudes.
3.2. Scenario of Land use In Uttara sector 13 maximum land of the study area are used as a residential purpose. So, the area can be considered as a pure residential area. The building which has at least 3 kinds of uses, those are considered as pure mixed-use plot. Some commercial plots are also situated there. There are also Institutional, community facilities, education and research, health facilities and others land use in Uttara sector 13. Figure 1 shows the land use diversity in the study area.
Plot Area (Sq. m)
Road Width-m
Setback-Front-m
Setback-Rear-m
Setback-Sides-m
FAR MGC %
335-402 6 1.5 2 1.25 3.75 60
402-459 6 1.5 2 1.25 3.75 60
459-536 6 1.5 2 1.25 4 57.5
536-603 6 1.5 2 1.25 4 57.5
603-670 6 1.5 2 1.25 4.25 55
670-804 69 1.5 2 1.25 4.5 55
804-938 9 1.5 2 1.25 4.75 52.5
938-1072 9 1.5 2 1.25 5 52.5
1072-1206 9 1.5 2 1.25 5.25 50
1206-1340 9 1.5 2 1.25 5.25 50
<=1340 12 1.5 2 1.25 5.5 50
Any 18 1.5 3 3 6 50

Nahar, S.; Kakon, A.N. Comparison of physical environment of planned RA with provisions of DMBCR’08
292
Figure 1 Land use map of Uttara sector 13
Among the land use the residential use is the highest which is 54.64%. And the lowest land use purpose is health facilities which is 0.48%. Community facilities covered 3.96%, mixed use buildings cover 8.80%. Commercial use is 4.04%, Road use is 6.21%. In this figure it shows that about 7.51% land is under construction and 11.95% land is vacant.
3.3. Scenario of Floor Area ratio All the buildings maintained the Floor Area Ratio in Uttara sector 13. Among 257 buildings only one building did not follow the provision. As Uttara sector 13 is a planned residential area, people tried to maintain the FAR when constructing their buildings for residential and mixed-use purpose.
3.4. Scenario of maximum ground coverage Maximum ground coverage of Uttara sector 13 has been compared and it is clear that, only 13% plots maintained the provision of maximum ground coverage and a huge percentage 87% of plots did not follow the provision though these buildings were constructed after establishing the Dhaka Metropolitan Building Construction Rules, 2008.
3.5. Scenario of Road Width In Uttara Sector 13, the grid iron pattern of road has been followed. Most of the roads are metaled and there is provision of footpath. RAJUK developed the roads in this area. Dhaka North City Corporation (DNCC) is responsible for the maintenance and management of road network. There has been found 4.5m, 6 m, 7.5 m and 25 m road width in Uttara sector 13. Garib e Newaj Avenue, Sonargaon Jonopath, Gausul Azam Avenue and Shah Mukhdhum Avenue are serves as the major distributor roads and the width of these roads has been found 25m. There are 21 access roads and their widths are 4.5m, 6m and 7.5 m.

Nahar, S.; Kakon, A.N. Comparison of physical environment of planned RA with provisions of DMBCR’08
293
Figure 2 Road Width map of Uttara sector 13 (Source: DNCC, 2018; modified by author)
In Dhaka Metropolitan Building Construction Rules, 2008 the width of road in front of plots had been defined for different plot size (for example, 6m road width is for 3 Katha plot). In this case it has been identified that 70% plots of Uttara sector 13 abides the provision of road width, the rest of 30% plots did not follow the provision.
3.6. Scenario of Setbacks In Dhaka Metropolitan Building Construction Rules, 2008 the setback for different sized plots has been defined.
Figure 3 Setback distance meaning

Nahar, S.; Kakon, A.N. Comparison of physical environment of planned RA with provisions of DMBCR’08
294
From the compared data the Table 2 shows that 18.19%, 10.12% and 16.34% plots follow the front, rear and sides setback rules respectively. Rest of the plots do not follow the setback rules. The table also shows the number of plots abiding and not abiding the setback rules. And the figure 2 describes how should be the setback on the basis of road and building.
Setback Abiding the Provision
Yes No
Setback front 47 (18.19%) 210 (81.71%)
Setback Rear 26 (10.12%) 231 (89.12%)
Setback Sides 42 (16.34%) 215 (83.66%)
Table 2 Abiding of Setback (Front, Rear & Sides) Provision (Source: Field survey, 2018)
4. Major Findings The findings of the study are-
Setback condition of Uttara sector 13 is very poor. Nearly 90% buildings don’t follow the setback rules of Dhaka Metropolitan Building Construction Rules, 2008.
Maximum building has been considered the Floor Area Ratio.
Though the road width is predefined, some roads did not maintain the provision.
There has been found a common tendency of violating the provisions of Dhaka Metropolitan Building Construction Rules, 2008.
5. Guidelines Based on the Findings Uttara residential model town is a planned residential housing project of RAJUK. As there is so many lacking of setbacks, ground coverage, building height, etc. while construction of residential buildings in this area, there need to be monitored by RAJUK for its improvement of physical improvement. Some guidelines based on the findings of the study are included here.
5.1. Manpower Development Supervision of construction is hardly done by the authorized section of RAJUK. Shortage of manpower in RAJUK to supervise the Building Construction process is one of the major factors. RAJUK needs to allocate skilled labour force who will able to supervise the construction work and monitoring.
5.2. Development of Appropriate Database RAJUK’s planning permission process should be simpler and more transparent. Adequate database, cross checking of data, frequent field supervision, provision of accountability, provision of strong penalty in case of default etc. should be regularized and compulsorily.
Nahar, S.; Kakon, A.N. Comparison of physical environment of planned RA with provisions of DMBCR’08
295
5.3. Creating Awareness about Dhaka Metropolitan Building Construction Rules, 2008 In many of the cases it can be seen that people do not know about the DMBCR, 2008. As a result, many of the house owners do not bother to take permission from the concerned authorities. This is mainly due to the improper use of the Act. Government does not often come forward to publicize the Act. The Authorities concerned (RAJUK) should take necessary programs, like arrangement of seminar and symposium to create awareness among the people about Dhaka Metropolitan Building Construction Rules, 2008.
5.4. Implementation of Law Dhaka Metropolitan Building Construction Rules had been introduced in 2008 but in most of the cases people are not interested to follow the provisions of this Rule. This has become a common tendency among the general people and even among the lawmakers. From the literature review it has been found that people also do not bother to take permission or approval due to lack of information provided by the concerned authority or lack of punitive against the rule’s violators of rules. The concerned authority should enforce the law so that it becomes effective.
5.5. Necessary Measures to Manage Corruption Corruption also hampers proper application of the process of provisions in a residential area like Uttara sector 13. The higher Authority (Chairman) of RAJUK needs to look into the matter seriously so that the Provisions of Dhaka Metropolitan Building Construction Rules, 2008 is maintained. Manpower of the Authorized Section should also be increased for better function.
5.6. Community Participation It needs to ensure community participation for the planned residential building construction with maintaining the Provisions of Dhaka Metropolitan Building Construction Rules, 2008 so that the physical environment of the residential area can be improved in a proper way. Government and various Development authorities who take the responsibility to Construct the residential buildings can increase the awareness of the community peoples by doing various seminars, meetings and workshops so that they can gather information about Dhaka Metropolitan Building Construction Rules, 2008 and can understand about the necessity of a community organization to deal with this issue.
5.7. Encouraging people to obey the Setback Rules As the building tax is very high in Bangladesh people do not want to follow the Setback rules. They think the high tax can be forgotten if they use maximum area of the plot. So, Overall building tax could be reduced to encourage people to follow setback rules.
6. Conclusion The development rules are the major controlling element that shapes our physical environment. Residential physical environment needs to be built in under the regulations of Dhaka Metropolitan building Construction Rules, 2008 as it is an important Building Construction Rules in Bangladesh. In the study area, maximum buildings are built without following the provisions of DMBCR, 2008. There is no proper use of FAR, Set-back, Building
Nahar, S.; Kakon, A.N. Comparison of physical environment of planned RA with provisions of DMBCR’08
296
Height, Road width and others indicators of DMBCR, 2008. Due to high price of land and the developers profit maximization, the built form usually takes the shape of the site after following the prevailing FAR and Set Back Rules. The Set Back Rules, Floor Area Ratio and Building Height restrictions along with the developers most commonly generate the built form in the residential areas. 86% or more of the buildings not maintained the actual standard of Set Back Rules in Uttara Residential Model Town (Sector 13). On the other hand, maximum buildings have maintained the FAR Standard from the provisions. If the violation goes in this way, it will create a lot of problems in the near future. The authority should be sincerer and should take immediate steps for the proper application of the Maximum Ground Coverage. Along with this, each of the building owners should become aware about the provisions and follow these appropriately during the construction of buildings. Authority has the responsibility to make them able to understand the consequences and impacts of violation. Adequate implementation of DMBCR, 2008 that can guide the development as per the plan. Lack of law enforcement and corruption of the authority is rendering the city inhabitable for the city dwellers. There is no other alternative than maintaining the planning standards and managing the planned growth to make the city habitable. Success of any law depends on its proper implementation (Mahmud, 2007). So, the implication of Dhaka Metropolitan Building Construction Rules, 2008 depends on inspection, supervision, monitoring and obviously public participation. The Authorized section of RAJUK should be sincere enough and should take immediate steps for the proper application of the provisions of Dhaka Metropolitan Building Construction Rules, 2008 in Uttara Sector 13. Along with this each of the building owners should become aware about this Building Construction Rules and should follow it during building construction. Authority has the responsibility to make them able to understand the consequences of violation of the provisions. It is expected that this research would help to alert the concern authorities as well as residential building owners to follow Dhaka Metropolitan Building Construction rules, 2008 and thus to ensure Uttara sector 13 as a planned and healthy living residential area.
7. References Dhaka Metropolitan Development Plan, Vol. I: Dhaka Structure Plan (1995-2015).
Dhaka Mohanagar Imarat Nirman Bidhimala (DMINB) 2008.
Hafiz, K. 2000. Building Construction and Control. Dhaka: Rajdhani Unnayan Kartipakhkha, Dhaka.
Herndon, J.D., 2011. Mixed-Use Development in Theory and Practice: Learning from Atlanta's Mixed Experiences.
Kibria, D.G., 2005. Application of Building Construction Rules on Residential Building (Doctoral dissertation, BANGLADESH UNIVERSITY OF ENGINEERING AND TECHNOLOGY).
Mahmud, M.A., 2007. Corruption in plan permission process in RAJUK: A study of violations and proposals. Transparency International Bangladesh, Dhaka.
Roy, T.K., Ferdous, A. and Huq, S., Building Setback Scenario in Different Sized Plots of Planned Residential Area: A Case Study on Nirala Residential Area of Khulna City, Bangladesh.

Nahar, S.; Kakon, A.N. Comparison of physical environment of planned RA with provisions of DMBCR’08
297
Shafi, S.A., 2010. National Building Code and its implementation. Round Table Discussion on Implementation of National Building Code.
Visser, P., Van Dam, F. and Hooimeijer, P., 2008. Residential environment and spatial variation in house prices in the Netherlands. Tijdschrift voor economische en sociale geografie, 99(3), pp.348-360.
Azmi, N; Abrar, MM and Rahman, MM DRR Perception and Vulnerability of Urban People: A study on Mohammadpur Thana
298
Research Paper
DISASTER RISK PERCEPTION AND VULNERABILITY OF URBAN PEOPLE: A STUDY OF MOHAMMADPUR THANA,
DHAKA, BANGLADESH
Navira Azmi1, Student, Dept. of Disaster & Human Security Management, Bangladesh University of Professionals; Dhaka, Bangladesh
Md. Mahbubul Abrar2, Student, Dept. of Disaster & Human Security Management, Bangladesh University of Professionals; Dhaka, Bangladesh
MdMostafizur Rahman3, Assistant Professor, Dept. of Disaster & Human Security Management, Bangladesh University of Professionals; Dhaka, Bangladesh
Abstract
Dhaka is the 7th largest populous and one of the most densely populated cities in the world (World Population Review, 2019). More than 20 million people live in this city and the number is increasing gradually. Mohammadpur Thana is one of the most populous areas of Dhaka North City Corporation consisting the five particular wards. This area is being used for multipurpose and mostly residence for thousands of people. Being a multipurpose area and zone for different activities that is enhancing the risk factors and exposure of the people living and have access there for different purposes. Without enough capacities and strategies to avert any adverse situation people are sensitive and at high risk of being affected. Moreover, the newly build residential and commercial infrastructures are enhancing the risk factors. The study is focused on the actual condition and risk perception assessment of the urban people through assessing the people living in the selected area to identify the factors influencing vulnerability. Besides, it helps to recognize the risk elements and the perception of the urban people to combat hazards in their locality. It also focuses on the possible ways to manage probable urban hazards by identifying vulnerable constructions and available services nearby. The findings of the study have the knowledge, information, awareness and vulnerability among the urban people and in the end it has provided some recommendations to reduce existing vulnerabilities and increased preparedness.
Keywords Risk Perception, Vulnerability, Urban Community, Preparedness
1. Introduction Hazards have been frequent due to the climate change. Exposure has increased faster than the vulnerability has decreased. Vulnerability is a condition which increase the susceptibility of an individual, a community, assets or systems to the impacts of hazards which is determined by physical, social, economic and environmental factors (UNDRR, 2017). The

Azmi, N; Abrar, MM and Rahman, MM DRR Perception and Vulnerability of Urban People: A study on Mohammadpur Thana
299
relative potential for “physical harm and social disruption to subpopulations of societies and their larger subsystems based on socioeconomic status, age, gender, race and ethnicity, family structure, residential location and other demographic variables” (Cutter 2003 and NRC 2006). Disaster risk is the interaction of hazards with all those socio-economic factors, and the community’s risk perceptions are also very important to understand their vulnerability. There is strong correlation between disaster risk perception and vulnerability. In some urban fire hazard it was depicted that people are causing casualty, injury and dying much more due to panic and low preparedness but not because of the hazard. There is a global trend of urbanization with development is taking place where people are living in marginal and vulnerable areas within cities and towns (Cutter et al., 2008). Chowdhury (2017) defines urban area as formation of an environment in order to serve the population within a confined geographical area in a set of infrastructure with support provided through interrelated government services. Prior to an in-depth look on the issues of urban hazard, it is important to have a distinctive understanding on the terms related to disaster risk reduction, which includes hazard, vulnerability, risk and disaster (Chowdhury, 2017). Low adaptive capacity in the context of development, overexploitation of resources of urban ecosystems, with the increase extent and frequency of climatic occasions make the cities of the developing world gradually vulnerable (Reckien, 2011). Therefore, it has become obligatory to find out such notions for urban hazards. Understanding the perception of people towards hazards is one way to take necessary steps in taking preparedness and awareness measures.
The soul of Bangladesh, capital and central city Dhaka is highly vulnerable to the hazards and disasters due to high density of population, unplanned infrastructure and poor economic condition, poor emergency preparation and recovery capability (Rahman, et al., 2011). Rapid and unplanned urbanization, overpopulation etc. are the factors, mixing with unawareness about sudden onset of hazards and response that have made the life of city dwellers more risky and vulnerable towards hazards. Now it has become burning issue and it is high-time to resolve. Mohammadpur, an important Thana in Dhaka North City Corporation, has been selected as the study area. This place is considered as one of the focal points of Dhaka city and accumulation of old or high-rise residential and commercial buildings with huge population.
This study discusses the concept of disaster risk, vulnerability to disaster, and community’s disaster risk perception in an urban context. It answers the research problem statement that is to find the perceptions of people in Dhaka city about disaster risk, particularly the vulnerability and in extended phase it implies people’s preparedness with the prediction of future disaster as well. The findings include the perceptions of urban people in case of different hazards they may face. It follows a systematic study. First, an overview of the literature germane to issues of vulnerability, risk, and disaster preparedness in an urban setting. Second, the mixed methods, particularly the qualitative method, used in this research, including descriptions of the data collection methods and secondary data sources have been detailed. Finally, the findings and some recommendations have been discussed.

Azmi, N; Abrar, MM and Rahman, MM DRR Perception and Vulnerability of Urban People: A study on Mohammadpur Thana
300
2. Materials and Methods 2.1. Methodology
Mixed method, particularly qualitative method, was employed to assess the risk perception and emerging vulnerability in Mohammadpur Thana communities. It is important to understand that the assessing perception gradually drops down from macro to the micro level to understand the impact on individuals and community closely. Identification of natural or human-made hazards, vulnerabilities and their perception provides the probable risk or preparedness to the individual, community cum a whole society.
2.2. Research Design
To better understand the perceptions of risk and vulnerability in the Mohammadpur Thana communities, information were collected by using several qualitative research tools such as field survey, both open and close-ended questionnaire survey, face to face interview with the local people, focused group discussion. General research design can be observed in the following flowchart:
Figure 1 Research design flowchart
2.3. Survey Procedure and Respondents
Questionnaire were prepared based on the main goal of this research which was to assess risk perception and vulnerability in urban community, here we considered Mohammadpur Thana communities. Questions were considered relevant to natural hazards, disasters and their preparedness and information level.
2.4. Data Collection
Field survey was conducted in November, 2018. The questionnaire survey was relevant to understand perceptions of the urban people who faced or not faced any hazard and disaster and also perceptions of their risks toward any particular hazard or disaster. This survey was totally based on their pre-disaster perception and their level of awareness.
Problem Identification
Study Objective
FormulationLiterature
ReviewField and
Questionnaire Survey
Data CollectionData Anlysis
and Interpretation
Result Analysis and DiscussionDocumentation

Azmi, N; Abrar, MM and Rahman, MM DRR Perception and Vulnerability of Urban People: A study on Mohammadpur Thana
301
2.4. Sampling
Purposive sampling was considered in this study. From the total population of the area sample has been taken by the following procedures:
The accessible population were selected first. A sampling frame was produced consisting local, middle aged, well off and literate
people. A sub-sample from every kind of people was selected.
This study mainly conducted survey following qualitative method where sample size is not mandatory to fix, and survey with the community was conducted till the saturation of the data. However, we also considered the sample size to maintain the accuracy of the information. Sample was considered from 5 different wards of Mohammadpur Thana. People from different socio-economic factors like age group, economic class, religions, literacy, occupations and genders were selected as respondents. The required sample size scale with Margin of Error 0.05% in 95% confidence level requires at least 384 people out of every 100,000 people or more than 100,000 according to The Research Advisors (2006). we took 50 people among 384 people as a subsample. The reason of selection of subsample was data saturation which means all the data after 50 sample was almost similar. The people we selected as sub sample who are fully able to answer all of the questions of our questionnaire as all of them are physically and psychologically sound. Therefore, this 50 people are quite good enough representatives for the total 384 samples and completes the survey requirement.
3. Results and Discussions 3.1. Results
The capacity of local residents to communicate, cooperate, and prepare for emergencies (Flint and Brennan, 2007) also influences vulnerability levels of individuals and their communities. This study, with the main aim to assess the communities’ perception of major factors responsible for disaster risk and thereby measuring their vulnerability, was conducted following three qualitative methods mainly – Focus Group Discussion (FGD), Field Survey with the questionnaire, observation and interview, and the discussion with the existing available secondary information.
3.1.1. Focus Group Discussion (FGD)
A focus group discussion (FGD) is a process when a group of participants is guided by a moderator (or group facilitator) who introduces topics for discussion and helps the group to participate in a active and natural discussion amongst themselves (Mishra, L., 2016).
The FGD was conducted in the Katasur slum to find out their perception and idea about disasters focusing mainly on fire hazard that occurred twice in their slum. There were two groups made of 6 people of different ages and genders (2 old Men and Women, 2 Adult Men and Women and 2 Children male and female). They didn’t have personal experience of the first fire incidents in their slum, occurred about 7 years ago. However, they had experienced of the massive fire hazard about 4 years ago and a female child died in that hazard. They had experienced extensive damages during that fire incident, one of the women in the group

Azmi, N; Abrar, MM and Rahman, MM DRR Perception and Vulnerability of Urban People: A study on Mohammadpur Thana
302
mentioned that she had fracture in her leg while she was trying to run out from her house. Therefore, they still fear about any kind of fire hazard rather other hazards. There is a small lake flown through the slum, that causes water flow towards that place but not water logging as the lake is cleaned every year by the people of City Corporation. But still the condition of the lake we encountered was not good at all rather too much filth and dirt is there that is causing environmental degradation, health hazards, biological hazards etc. Since they had experience of fire incidents, they considered fire risk as top rank in the list with other urban disaster risk. However, they still have other urban disaster risk such as earthquake, disease etc. which we have encountered during the discussion. They don’t have those urban disaster risk perception and thereby highly vulnerable.
3.1.2. Field Survey
The result of the field survey is divided into 3 perspectives, on the basis of their experience, knowledge and information. These three perspectives are undermining their perception over the disaster risk factors and preparedness for it.
3.1.2.1 Community’s Experience
After early 1980s the development measures started in the selected area. This area has both strong soil structure and newly made land after covering wet zones. Among major disasters, some of the fire incidents back in 2010 and 2016 of Katasur Slum, Japan Garden City in 2008 and some small scale fire breakout in some garments were in both printing and air media. Apart from that, the flood of 1988 had covered the 50% of Mohammadpur Thana area very badly. But after the establishment of the Beribadh Dam, the flood problem of this area has been resolved. Among the respondents, more than half of them didn’t have experience any major disaster in their living time in that area. About 22% of total respondents, experienced disasters according to the field survey and most of them were not severe.
Figure 2 Respondents Informed about Major Disasters
3.1.2.2. Community’s Knowledge
Disaster management relies on communities’ knowledge or local population as they are the first available sources to handle disasters. Knowledge of community in terms of their disaster experience and perception of risk in disaster preparedness, mitigation and prevention in overall disaster planning strategies is vital (Paton, 2007). The results of another study indicate that experience and risk perception showed strong correlation. Education influence risk perception of communities’ knowledge (Khan, Johar and Baba, 2017).
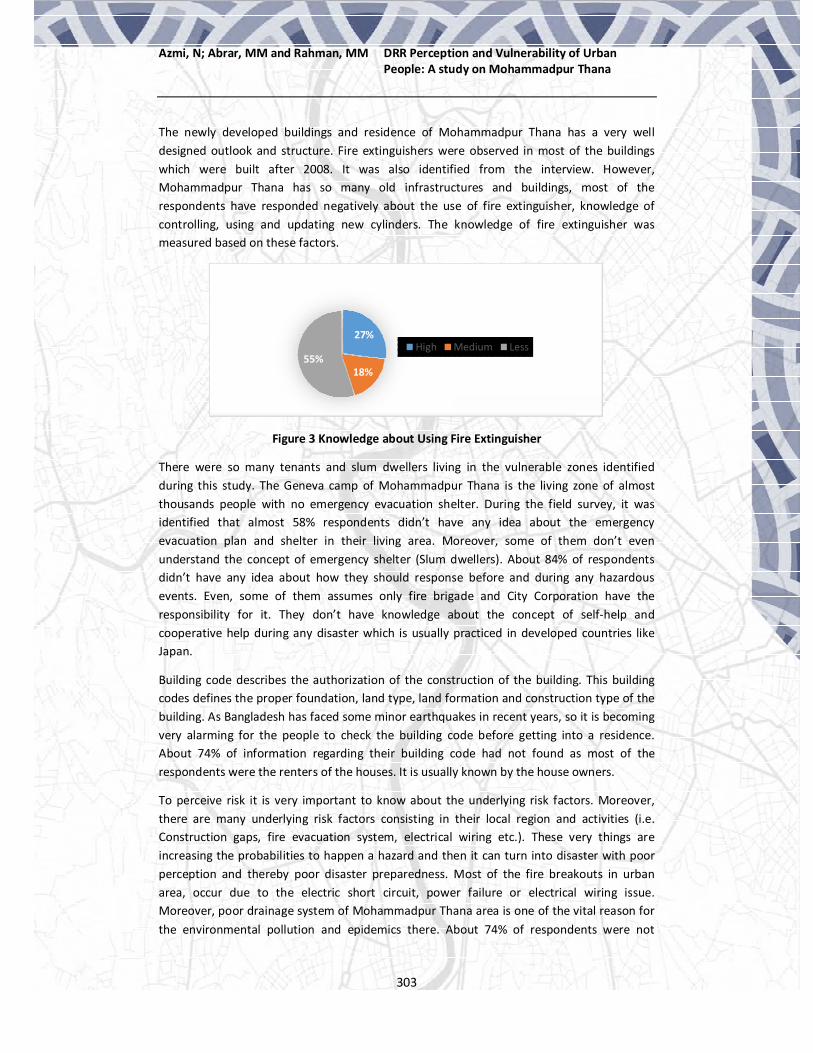
Azmi, N; Abrar, MM and Rahman, MM DRR Perception and Vulnerability of Urban People: A study on Mohammadpur Thana
303
The newly developed buildings and residence of Mohammadpur Thana has a very well designed outlook and structure. Fire extinguishers were observed in most of the buildings which were built after 2008. It was also identified from the interview. However, Mohammadpur Thana has so many old infrastructures and buildings, most of the respondents have responded negatively about the use of fire extinguisher, knowledge of controlling, using and updating new cylinders. The knowledge of fire extinguisher was measured based on these factors.
Figure 3 Knowledge about Using Fire Extinguisher
There were so many tenants and slum dwellers living in the vulnerable zones identified during this study. The Geneva camp of Mohammadpur Thana is the living zone of almost thousands people with no emergency evacuation shelter. During the field survey, it was identified that almost 58% respondents didn’t have any idea about the emergency evacuation plan and shelter in their living area. Moreover, some of them don’t even understand the concept of emergency shelter (Slum dwellers). About 84% of respondents didn’t have any idea about how they should response before and during any hazardous events. Even, some of them assumes only fire brigade and City Corporation have the responsibility for it. They don’t have knowledge about the concept of self-help and cooperative help during any disaster which is usually practiced in developed countries like Japan.
Building code describes the authorization of the construction of the building. This building codes defines the proper foundation, land type, land formation and construction type of the building. As Bangladesh has faced some minor earthquakes in recent years, so it is becoming very alarming for the people to check the building code before getting into a residence. About 74% of information regarding their building code had not found as most of the respondents were the renters of the houses. It is usually known by the house owners.
To perceive risk it is very important to know about the underlying risk factors. Moreover, there are many underlying risk factors consisting in their local region and activities (i.e. Construction gaps, fire evacuation system, electrical wiring etc.). These very things are increasing the probabilities to happen a hazard and then it can turn into disaster with poor perception and thereby poor disaster preparedness. Most of the fire breakouts in urban area, occur due to the electric short circuit, power failure or electrical wiring issue. Moreover, poor drainage system of Mohammadpur Thana area is one of the vital reason for the environmental pollution and epidemics there. About 74% of respondents were not
27%
18%55%
High Medium Less

Azmi, N; Abrar, MM and Rahman, MM DRR Perception and Vulnerability of Urban People: A study on Mohammadpur Thana
304
aware of the disaster risk factors in their area which is very alarming. The rest of the respondents have a few idea and most of them came to know about it for their self-interest or willingness. It shows poor perception of the disaster risk factors in the selected area, which also indicates very high vulnerability for the frequent and common urban disasters. Rest 26% respondents consider following factors as risk factors that increasing their vulnerability:
Figure 4 Risk Factors Enhancing Vulnerability from Community’s Perception
3.1.2.3. Information
Information is any set of datum that provides the answer to a question of some kind that determines uncertainty. Experts on risk perception (Miceli et al. 2007) have indicated that perceptions of risk along with concern about hazards may lead to forms of individual protective behaviors such as monitoring or keeping information about weather alerts. It is important to use relevant information and knowledge of disasters by communities to help protect them from future disasters, particularly through creating social networks and structures to help them prepare and cope with hazards (Yamamura, 2010). Wachinger et al., (2013) identified four categories of factors that determine risk perception: (a) risk factors, such as the perceived likelihood and frequency of an incident; (b) informational factors, e.g. the source and level of information; (c) personal factors, for example age, gender, profession and personal disaster experience; and (d) contextual factors, like family status, vulnerability indices and area of residence. In the sector of information, the first things come which is the medium of knowing about the factors or risks and then their perception about those risk factors which are enhancing their vulnerability.
Most of the respondents responded about the medium of their disaster knowledge is mostly Mass media, more specifically people responded about respectively Television, Newspaper and Facebook (social media). Responders also shown eager to know more about hazards and disasters.
Poor Evacuation
20%
Building Construction
25%[CATEGORY
NAME][PERCENTAGE
]
Land Formation
15%
Power Supply25%
Flamable Materials
5%

Azmi, N; Abrar, MM and Rahman, MM DRR Perception and Vulnerability of Urban People: A study on Mohammadpur Thana
305
Figure 5 Medium of Knowing Disaster Risk
3.1.2.4. Public Apathy
It was identified that some respondents even understand the severe consequence after any hazardous events without considering any proper actions. They don’t care about the disaster risk factors which lead to the vulnerable conditions. Even though this study didn’t consider all the factors to measure vulnerability, disaster risk perception can relate all those factors. It can become difficult to integrate disaster risk reduction in the policy, planning, development without proper understanding at the community level. If the community don’t perceive and care the importance of disaster risk reduction, those policy becomes difficult to implement.
3.2. Discussion People’s perception is important to determine vulnerability and preparedness level of people. Restricted access to resources needed to face disasters can constrain communities’ capacity to mitigate the effects of disasters and to recover from them when they do occur (Miller, 2013). Therefore, understanding of perception of risk is essential to set priorities for the management of disaster (Adelekan and Asiyanbi, 2016). By psychological strength, awareness, knowledge or just idea how people fall victim or fight against hazard is a matter of concern. Peoples’ awareness and concern also can change policies and practices, laws and their amendment, regulations and their implementation, plans and their improvements. Though vulnerability and risk perception are not very new terms in risk analysis, but risk perception assessment has turned in a new knowledge paradigm. In spite of having multiple underlying risk factors some of the respondents have respond negatively, when they have been asked to participate in rescue operation. But it is a very good point that, about 80% of the total respondents, respond positively when they were being asked about participating in voluntary rescue operations. Most of them are young and youth of the society.
The following findings were identified about the risk perception and the vulnerability of urban people have led to some major findings which make this study necessary and valuable:
People consider risk and feel vulnerable when event occurs or when it is explained to them. Risk bothers them only when they are getting to know about it.
After any low damage causing hazard like water logging, minor earthquakes and fire hazard experience, watching, hearing or speculation make most people stressed but do not make people traumatized.
52%
28%
12%
8%
Mass Media
Social Media
Preparedness Programs
Others
0% 10% 20% 30% 40% 50% 60%
Medium of Knowing Disaster Risk

Azmi, N; Abrar, MM and Rahman, MM DRR Perception and Vulnerability of Urban People: A study on Mohammadpur Thana
306
There is no existence of emergency evacuation shelter in the local area to accommodate people during emergencies.
People are vulnerable due to poor knowledge, information and awareness about risks, risk factors and disaster risk reduction approaches.
Even some people knows the severe consequence of any hazardous events, they are not found to consider the disaster risk factors in their regular life.
The final outcome is residents have willingness to know more about how they should take precautionary measures to reduce vulnerability and participation in drills, trainings and preparedness activities.
4. Recommendation and Conclusion 4.1. Recommendation
The risk perception of the community of Mohammadpur Thana is alarming and should be taken it into consideration to reduce vulnerability as much as possible. Keeping that in mind, there are some recommendations provided to overcome from the current risk factors and attain sustainability and resiliency:
Mainstreaming disaster risk reduction in the local policy, legislation, planning and development. A technical group can be formed with the members from different sectors for the advocacy of whole process.
Proper implementation of policies and plans and keeping under surveillance.
Introducing multi-hazards early warning system from the technical group can give faith to the community.
Establishment of emergency evacuation shelter with proper evacuation route.
Introduce preparedness and awareness raising programs and activities, training and trials at different schools and commercial offices, where community engagement is must. Yearly disaster preparedness observance can be introduced where the whole community will be participants. It can be the process to integrate disaster preparedness into the culture of community.
Engagement of civil society and every minimal person in a society in disaster preparedness plans and activities of urban area.
Arranging trainings and workshops with relevant information for the non-victims and unexperienced people of disasters.
Psychological counselling for the victims so that they do not panic and create unnecessary chaos during disaster and have safe evacuation training.
Community planning and collaboration for disaster risk reduction.
4.2. Conclusion
Disaster risk is enhancing each and every day in our country with the development of cities and increasing population. The purpose of this study is to examine how risk perception is influenced urban disasters, preparedness and also how disasters influence individuals to
Azmi, N; Abrar, MM and Rahman, MM DRR Perception and Vulnerability of Urban People: A study on Mohammadpur Thana
307
take physical and psychological preparation. Knowledge and awareness of hazards may increase or decrease hazard consequences. The results of this study may provide policymakers with some insights as to how to take hazard characteristics and victims’ characteristics into account in their risk communication campaign. In general, there are perhaps more personal mitigation actions that one can take to avoid losses in the case of a fire hazard or an earthquake or any types of urban hazards. Though it’s been said for a long time that urban disasters are unpredictable, but it is possible to mitigate urban disasters if we take enough precautions. This disasters can be perceived easily if we are aware of the risk factors around us. To combat disasters and to bounce back strongly it is very important to distinguish the risk factors and mitigate them.
5. References Adelekan, I. O., &Asiyanbi, A. P. (2016). Flood risk perception in flood-affected communities
in Lagos. Nigeria. Natural Hazards, 80(1) pp. 445-469.
Chowdhury, P. (2017). A Qualitative Study of Disaster Preparedness in Dhaka, Bangladesh. Combating Urban Hazard. Faculty of Social Sciences, Lund University.
Cutter, S. et al. (2003) Social Vulnerability to Environmental Hazards. Social Science Quarterly, 84(2): 242-261.
Flint, C. G. and BrennanM. A. (2007). Rural Communities and Disasters: Research from the Southern United States. Southern Rural Sociology 22(2), pp. 1–5.
Khan, M., Johar, F. and Baba, A. (2017). Disaster Management Risk Perception of Local Communities. JurnalKemanusiaan, 26(1), pp.87-94.
Miceli, Renato, Igor Sotgiu, and Michele Settanni. 2007. Disaster Preparedness and Perception of Flood Risk: A Study in an Alpine Valley in Italy.Journal of Environmental Psychology 28(2), pp. 164–73.
National Research Council of the National Academies (2006). Facing Hazards and Disasters: Understanding Human Dimensions. Washington, DC: The National Academic Press.
Paton, D. (2007). Preparing for natural hazards: the role of community trust. Disaster Prevention and Management: An International Journal, 16(3) pp. 370-379.
Paul, B. and Bhuiyan, R. (2010). Urban Earthquake Hazard: Perceived Seismic Risk and preparedness in Dhaka City, Bangladesh. Disasters, 34(2), pp. 337-59
Reckien, D. and Martinez-Fernandez, C. (2011). Why Do Cities Shrink? European Planning Studies, 19(8), pp.1375-1397.
UNDRR.org. (2017). Terminology UNISDR. [online] Available at: https://www.unisdr.org/we/inform/terminology [Accessed 19 Dec. 2018].
Wachinger, G., Renn, O, Begg, C. and Kuhlicke, C. (2013). The risk perception paradox-Implications for governance and communication of natural hazards. Risk Analysis. 33(6), pp. 1049−1065.
Yamamura, E. (2010). Effects of interactions among social capital, income and learning from experiences of natural disasters: a case study from Japan. Regional Studies, 44(8), pp. 1019-1032.

Mamun, M. M., Akter, T., Chowdhury, M. M. R., Sadmani, M. I., Akther, Dr. M. S., Islam, Dr. I., Hossain, Ms. D.
Effects of Revitalization of Dhaka Central Jail
308
Effects of Revitalization of Dhaka Central Jail: Aspirations of
Local Old Dhaka People in Regeneration of Surrounding Areas Md. Muntasir Mamun, Research Assistant, Detailed Area Plan (DAP), Rajdhani Unnayan
Kartripakkha (RAJUK), Dhaka, Bangladesh.
Tamanna Akter, Junior Urban Planner, Development Design Consultants Limited, Dhaka, Bangladesh
Mohammad Muktadir Rashid Chowdhury, Assistant Manager, MGH Group, Karwan Bazar, Dhaka, Bangladesh
Md. Israq Sadmani, Junior Urban Planner, Development Design Consultants Limited, Dhaka, Bangladesh
Dr. Mohammad Shakil Akther, Professor, Bangladesh University of Engineering and Technology (BUET), Dhaka, Bangladesh.
Dr. I. Islam, Professor, Bangladesh University of Engineering and Technology (BUET), Dhaka, Bangladesh.
Ms. D. Hossain, Assistant Professor, Bangladesh University of Engineering and Technology (BUET), Dhaka, Bangladesh
Abstract
Dhaka Central Jail, the largest jail in Bangladesh, covered a total area of 36.76 acres which had been shifted to Keraniganj. This shifting has made the jail abandoned which had been proposed to be revitalized as public space which will have an impact on the surrounding areas. An urban regeneration plan is, therefore, mandatory to guide this change in neighboring areas of old central jail. The aspirations of local residents must be addressed in the planning of the area to preserve the urban fabric of old Dhaka. The purpose of this study is to support a regeneration plan ensuring the participation of local people of Showarighat-Chawkbazar area. In this regard, the methodology of this study incorporates data collection (primary and secondary), data analysis, and findings. Primary data collection was conducted by using Participatory Rural Appraisal (PRA) tool. Different PRA techniques, e.g. social map, resource map, transect walk, pair-wise matrix, cause-effect diagram, SWOT analysis, dream map were used to collect data. The study finds that the area is primarily a wholesale and retail business hub with different transport agencies. Moreover, the area is bestowed with many inconveniences like narrow road, traffic congestion, unwanted land use e.g. small scale chemical industries and warehouses, waterlogging and lack of public spaces. The study also finds that conversion of the old central jail into a public space will create effects on the characteristics of surrounding area and will require possible ways to guide new developments and community facilities through urban regeneration.
Keywords: PRA, regeneration, community participation, central jail, old Dhaka.

Mamun, M. M., Akter, T., Chowdhury, M. M. R., Sadmani, M. I., Akther, Dr. M. S., Islam, Dr. I., Hossain, Ms. D.
Effects of Revitalization of Dhaka Central Jail
309
1. Introduction Dhaka Central Jail was the largest jail in Bangladesh, located in Nazimuddin Road of old Dhaka. It was a fort during pre-Mughal period which was built by Ibrahim Khan. Later in 1638, Islam Khan rebuilt the fort containing a palace, a court and a mint inside the fort. Most of the important public services were carried out there (Banu et. al., 2015). In the early 19th century, the fort was renovated, and converted into a jail; the Kotowali Police station was also co-located here until 1836. From the records from 1833 it is known that the capacity of the jail at that time was 800 inmates however the jail had an average of 526 inmates every day. The Dhaka jail was converted into the central jail for East Bengal (Mamoon, 1993). During Anti-British Movement, many activists were held at this prison. Also in Pakistan Period, especially during the Language Movement of 1952, the 6 Point Movement, and the Bangladesh Liberation War it was used to house criminals as well as political prisoners. In recent years, War Criminals are captivated at the Central Jail and a few of them are sentenced to death and hanged till death in the Jail premises (Mamoon, 1993). Few years ago the central jail was planned to shift to Rajendrapur, Keraniganj and it was shifted on July, 2018 and the space of old central jail has been proposed to transform into public space such as- children’s park, convention center, community center, swimming pool, gymnasium, modern shopping mall and parking place (Daily Star, 2016). The alteration of land use of central jail into public space is expected to bring positive impact on surrounding areas (Song et. al., 2016). Regeneration and redevelopment of these areas are expected to occur which can bring improvement into the economic, physical, social and environmental condition of the area by a mixture of demolition, construction and refurbishment of dwellings having regard to urban design guidelines. (Said et. al., 2014) It is also required to ensure that the change in surrounding land use reflects the hope and aspirations of local community. In this regard, local peoples’ participation in planning is required for the fulfillment of people’s demand and expectation (Mwiru, 2015). Community participation also plays in promoting sustainable physical planning in developing countries because people feel the sense of belonging and they recognize the benefits of their involvement (Ahenkan et. al., 2011). This research aimed to identify the expectations and aspirations of local residents regarding the regeneration and redevelopment of the surrounding areas of old central jail. The study also focused on the identification of the problems of the locality through the discussion with the local inhabitants and the suggestions provided by them will be accumulated in order to identify a way forward to it. Urban regeneration is an approach to improve the socio-economic, physical and environmental aspects of an area (Alpopi et al., 2013). Urban regeneration is one of the effective solutions for revitalization of deprived urban areas through a set of actions i.e. rehabilitation of historic areas, improvement of living conditions and redevelopment of public spaces (McDonald et al., 2009). Roberts (2000) defined urban regeneration as a response to the opportunities and challenges to solve urban problems prompted from urban degeneration in a particular place of a city and urban regeneration opportunities will act as a tool to improve the quality of life as well as to preserve the fabric of old Dhaka (Said et. al., 2014). A sustainable urban regeneration plan will need to address the demand and expectations of local community (Ahenkan et. al., 2011 and Mwiru, 2015). So, this paper has
Mamun, M. M., Akter, T., Chowdhury, M. M. R., Sadmani, M. I., Akther, Dr. M. S., Islam, Dr. I., Hossain, Ms. D.
Effects of Revitalization of Dhaka Central Jail
310
aimed to provide an insight on the expectations and aspirations of local residents of Showarighat-Chawkbazar area about the regeneration and redevelopment of the surrounding areas of old central jail.
2. Research objectives The study has been carried out with the following objectives:
To find out the physical and socio-economic characteristics of the surrounding areas of Dhaka central jail.
To explore the opportunities of redevelopment of the area considering the vision of local people and ensuring their participation in the redevelopment process.
3. Methodology of the Research To conduct the research, both primary and secondary data was collected. For instance, map of old Dhaka was collected from the Detailed Area Plan (DAP) 2006 for study purpose and different types of PRA techniques was used which is briefly discussed below.
1.1. Data Collection Primary data collection includes detailed site survey which was carried out for the study. Study area was surveyed and demarked on the map.
a) Participatory Rapid Appraisal (PRA) Participatory Rapid Appraisal (PRA) is a tool or set of methods that enable individuals to share and assess their local knowledge and to act accordingly (Chambers, 1994 and Kumar, 2002), without any outsider influence in the process (World Bank, 1994; Alam et. al., 2012). It encourages local participation in planning and represents the stakeholders’ desire and targets (Madon et. al., 2018). At present, PRA technique is being used for various purposes like education, and disaster management commonly in both urban and rural areas (Kumar, 2002).
b) Social Map Social mapping is the graphical representation of social and physical features of an area i.e. income pattern, school, college, hospital, mosque, graveyard, waste disposal point etc. (Kumar, 2002; Kathirvel et. al., 2012)
c) Resource Map Resource map is used mainly PRA methods, which focuses on the natural resources in the locality and depicts land, hills, rivers, fields, vegetation, etc. Resource map reflects people’s perception on their own community in terms of natural resources. (Kumar, 2002; Crane et. al., 2003).
d) Transact Work Transect walk is another PRA method which is used to explore the spatial dimensions of people’s realities used for natural resource management. It provides a cross-sectional representation by observing, asking, listening, seeking opportunities and recognizing the challenges in the areas for improvements (Kumar, 2002).

Mamun, M. M., Akter, T., Chowdhury, M. M. R., Sadmani, M. I., Akther, Dr. M. S., Islam, Dr. I., Hossain, Ms. D.
Effects of Revitalization of Dhaka Central Jail
311
Secondary data collection includes map of old Dhaka which was collected from the Detailed Area Plan (DAP) 2006, Rajdhani Unnayan Kartripakkha (RAJUK).
4. Study Area Profile The Showarighat area is situated at the south direction of Central Jail along the Gabtali-Sadarghat road and Buriganga River flows in the south of the study area. Mouluvibazar and Rahmatganj are situated in the east and west of the study area respectively. Chawkbazar is located on the northern bank of river Buriganga at Old Dhaka. The areas are under the jurisdiction of Dhaka South City Corporation (DSCC). An embankment was constructed in 1980s along the Buriganga River of Showarighat area which is now known as Shadarghat-Gabtoli Road. These areas are vulnerable to fire hazards, several fire accidents outburst in Chawkbazar which led to renovation and reconstruction of the area (Huq, 2016). The socio-cultural characteristics of these areas have also undergone through significant changes. Population densities have risen exponentially, and new settlements are constructing buildings without following any rules and regulations (Islam et. al., n.d). The major land use of the study area are mixed, whereas commercial use is prominent along Chawk Circular Road. In most cases, ground floors of mixed use buildings are used for commercial purpose and upper floors are used for residential purpose. Several transport agencies are found near the Gabtali-Sadarghat road. There is a provision of high rise buildings in Chawkbazar area which is the residence of high income group. The residences of middle income group are usually mixed use buildings which are old and structurally vulnerable. Low income people live near the Buriganga River in Katcha or Semi-pucca structures. Four schools, one college, one madrasa, two hospitals, one ward commissioner office, five community organizations and 12 mosques are found in this area.
5. Problem Analysis of the Study Area Through the participation of local stakeholders (i.e. businessmen, government representatives, political leaders and residents) the problem analysis of the Showarighat and Chawkbazar area were done. In this purpose the pair-wise matrix and problem tree tools of community participation were used.
1.2. Identification of the Problem The representatives of the area were asked about the physical planning related problems of Showarighat. They listed the problems through open discussion and arguments. The major problems of the area narrowed are mentioned in Table 1. At first people were made aware about the physical planning related problems in prior to their discussion and arguments.
1.3. Problem prioritization The local inhabitants listed nine problems related to physical planning. These nine problems are ranked using the pair-wise matrix tool (Table 1). From the pair-wise matrix, four highly frequented problems were identified and their cause-effect diagram were prepared.
Table 1: Pair-wise Matrix of Problem Prioritization

Mamun, M. M., Akter, T., Chowdhury, M. M. R., Sadmani, M. I., Akther, Dr. M. S., Islam, Dr. I., Hossain, Ms. D.
Effects of Revitalization of Dhaka Central Jail
312
Wat
er lo
ggin
g (W
L)
Nar
row
road
(N
R)
Unc
over
ed
drai
nage
(UD)
Scar
city
of
wat
er (S
oW)
Lack
of o
pen
spac
e (L
oOS)
Cong
este
d bu
ildin
g (C
B)
Unu
sual
mix
of
land
use
(U
MoL
U)
Lack
of
com
mun
ity
faci
litie
s (L
oCF)
La
ck o
f was
te
disp
osal
syst
em
(LoW
DS)
Tota
l cou
nt
Rank
WL WL WL SoW WL WL WL WL WL 7 2
NR NR SoW NR NR NR NR NR 6 3
UD SoW UD UD UMoLU UD UD 4 5
SoW SoW SoW SoW SoW SoW 8 1
LoOS LoOS LoOS LoOS LoOS 5 4
CB UMoLU LoCF CB 1 8
UMoLD UMoLU LoWDS 3 6
LoCE LoWDS 0 9
LoWDS 2 7
Total 1 2 3 4 5 6 7 8 36 36
1.4. Analysis of causes and effects Local respondents have demarked Scarcity of water, water logging and narrow roads as major
problems of the area. The causes and the effects of the problems have been described using problem tree diagram shown below:

Mamun, M. M., Akter, T., Chowdhury, M. M. R., Sadmani, M. I., Akther, Dr. M. S., Islam, Dr. I., Hossain, Ms. D.
Effects of Revitalization of Dhaka Central Jail
313
Figure 8: Cause-effect diagram
6. Findings and Discussion 7.1 SWOT analysis of the study area
To distinguish the potential impacts of redevelopment of this study area, SWOT analysis of the Showarighat area were done. As the central jail is now unoccupied, government is discerning about planning this land by maintaining the traditional reflection of old Dhaka. The factors that will facilitate the development process and it outcomes in the surrounding area and the factors that will become a threat for development process can be inspected through the SWOT analysis of the area.
a) Strength Most land owners were interested about land accumulation and development. Government intervention for accumulation of land owners through compensation. Transport agencies are willing to relocate their business along Sadarghat-Gabtoli
road which will facilitate their business and contribute in normal traffic flow in Showarighat area.
Industry owners (leather, plastic and chemical etc.) are interested to shift their factories to a well-planned industrial zone with utility and waste treatment facilities provided by government.
The illegally occupied khas land near Sadarghat-Gabtoli Road can be acquired for land redevelopment.
The structurally vulnerable buildings can be acquired for redevelopment.

Mamun, M. M., Akter, T., Chowdhury, M. M. R., Sadmani, M. I., Akther, Dr. M. S., Islam, Dr. I., Hossain, Ms. D.
Effects of Revitalization of Dhaka Central Jail
314
b) Weakness: Some land owners showed reluctance in land redevelopment because of their
ancestral attachment. A number of buildings were constructed after 1990s which may be the reason of
their disagreement. Utility service lines lie under the roads are in haphazard condition. Along with the
land development and accumulation, the service of utility connectivity may also be hindered.
c) Opportunity The redevelopment will provide opportunity to expand the commercial activity of
the adjacent areas. Redevelopment of central jail can increase the land value of adjacent areas. Sadarghat-Gabtoli road may facilitate the freight movement if the transport
agencies and industries shifted along the road. d) Threat
Land use change of the adjacent areas need to be monitored whether it is conforming to the central jail redevelopment or not.
If land acquisitions of the adjacent areas are not done properly, the area will be congested again which will increase their problem rather solving it.
7.2 Expectation of Local Community, Businessman, Industrialist & Transport Agencies:
The local respondents (local inhabitants, businessman, transport agencies and industrialists) have proposed some tentative solutions for the problems from their perspective. They suggested for overhead water reservoir and proper water distribution system to overcome water scarcity problem. Proposal of dedicated solid waste collection for the industries were given by the industrial owners with their financial help. Local respondents opposed the land acquisition for road widening. Instead, proper management of existing roads and controlling freight movement have been proposed. Local participants have demarked the necessity of separate sewerage and water supply lines, widening of existing drains and covered by the slabs. They also demanded for an active and passive open space in central jail area and proper maintenance of existing open space.
7.3 Major Findings i. Showarighat area is one of the leading wholesale business hubs of old Dhaka. There
is lot of wholesale activities of pulse, rubber and plastic products, small scale chemical products like perfume and cosmetic products, footwear and fish.
ii. Because of wholesale activities, transport agencies have flourished in this area. iii. Roads networks of this region bn are very narrow with respect to traffic volume.
Heavy traffic congestion is regular occurrence accompanied with freight movement. iv. The landowners of the areas adjacent to central jail from Chak circular road to Choto
Katra are interested in land redevelopment by the private sector. v. There are a lot of Khas land parcel along the Gabtoli-Sadarghat road which can be
easily brought under redevelopment scheme.
Mamun, M. M., Akter, T., Chowdhury, M. M. R., Sadmani, M. I., Akther, Dr. M. S., Islam, Dr. I., Hossain, Ms. D.
Effects of Revitalization of Dhaka Central Jail
315
vi. Local inhabitants want to see central jail as active open space and place of social cohesion.
vii. The transport agencies should be relocated along the Gabtoli-Sadarghat road to avoid the movement of heavy vehicles in the area. This will reduce the traffic congestion.
7.4 Proposals for Redevelopment Plan Considering the opinion of different stakeholders, the following proposal are given for redevelopment in Showarighat area:
i. The area extended from Chawk circular road to Choto Katra will have to bring under land development scheme. Private land development sector will play a major role in implementation under the intervention of Government.
ii. Freight movement will be prohibited in the study area. Transport agencies will be relocated beside the Gabtoli-Sadarghat road by acquiring the khas land which are illegally occupied.
iii. Overhead water reservoir and proper water distribution system will be installed in Showarighat for abating the water related problems in the area. WASA authority will be informed for additional help regarding this.
iv. For solving water logging, switch gate will be installed in the embankment so that the surface runoff can be passed through the embankment.
v. The roads paved from Showarighat to Bara Katra will be elevated. All the roads in the Chawk circular road to Choto Katra will be widened with installing traffic sign, road markings, median and well-designed footpath.
vi. Central jail will be redeveloped as an active open space and community cohesion. The development in the surrounding area (Chawk circular road to Choto Katra) should be checked properly for compatible development with central jail. Building election levation of the buildings should be maintained to get the view of the open space.
vii. Industries like Chemical, Leather, Plastic industries should be abolished from the area. Considering other study areas and industry owner certain place should be designed for industrial hub far away from residential zone.
viii. The place of historical interests should be preserved and existing uses of these places will be altered. Vulnerable buildings will be reconstructed by keeping the historical accent.
ix. Existing open space of the area will be brought under the planning scheme. The open spaces will be redesigned aesthetically.
7. Conclusion Revitalizing of Dhaka Central Jail as a public place or other is certainly going to bring about vast change in the adjacent areas. The surrounding area is an area with essence of old Dhaka with mixed land use, congested buildings, narrow roads, historical buildings, wholesale activities, small scale industrial activities, new trend of apartment buildings. Any type of

Mamun, M. M., Akter, T., Chowdhury, M. M. R., Sadmani, M. I., Akther, Dr. M. S., Islam, Dr. I., Hossain, Ms. D.
Effects of Revitalization of Dhaka Central Jail
316
development will bring significant change in this equilibrium state. So, there should be an action plan in an emergency basis for this area to control and guide the future development compatible with the revitalization of Dhaka Central Jail and spirit of old Dhaka. This research finds out the prospect of redevelopment in the surrounding areas compatible with the revitalization of Central Jail ensuring public participation.
8. References Ahenkan, A., Boon, E., Bawole, J., (2011). Stakeholder participation in community
development projects: an analysis of the quadripartite model of the International Centre for Enterprise and Sustainable Development (ICED) in Ghana. Retrieved from: http://ec.europa.eu/ech o/files/evaluation/watsan2005/ annex_files / WEDC/es/ES12CD.pdf on May 5, 2017
Alam, A., & Ihsan, S. (2012). Role of Participatory Rural Appraisal in Community Development (A Case Study of Barani Area Development Project in Agriculture, Live Stock and Forestry Development in Kohat). International Journal of Academic Research in Business and Social Sciences, 2(8), 25.
Alpopi, C. and Manole, C., 2013. Integrated urban regeneration–solution for cities revitalize. Procedia Economics and Finance, 6, pp.178-185.
Banu, S., Rahman, M. T., Uddin, M. K. M., Khatun, R., Khan, M. S. R., Rahman, M. M., & Heffelfinger, J. D. (2015). Effect of active case finding on prevalence and transmission of pulmonary tuberculosis in Dhaka Central Jail, Bangladesh. PloS one, 10(5), e0124976.
Bozóki, S., Fülöp, J., & Poesz, A. (2011). On pairwise comparison matrices that can be made consistent by the modification of a few elements.Central European Journal of Operations Research, 19(2), 157-175.
Chambers, R. (1994). The origins and practice of participatory rural appraisal. World development, 22(7), 953-969.
Chambers, R. (2011). Shaping the past: people’s maps, models and diagrams in local historical analysis and planning.
City Planning and Community Investment Department, (2009). Community Plan Preparation Manual. Retrieved from: https://www.sandiego.gov/sites/default/files/legacy/planning/genplan/pdf/generalplan/cityofsandiegocppm.pdf
Crane, K., & Skinner, B. (2003). Community resource mapping: A strategy for promoting successful transition for youth with disabilities. Information Brief: Addressing Trends and Developments in Secondary Education and Transition, 2(1).
Gretzky, W. (2010). Strategic planning and SWOT analysis.
Huq, R. N. (2016). Assessing architect's role in seismic evaluation and risk mitigation (Doctoral dissertation, BRAC University).

Mamun, M. M., Akter, T., Chowdhury, M. M. R., Sadmani, M. I., Akther, Dr. M. S., Islam, Dr. I., Hossain, Ms. D.
Effects of Revitalization of Dhaka Central Jail
317
Inter Co-operation. (2010). Community Based Risk Reduction Planning Tool. Retrieved From: https://assets.helvetas.ch/downloads/community_20based_20disaster_20risk_20reduction_20__202010.pdf on May 5, 2017.
Islam, K. A., Hossain, M. R., Chowdhury, T. J., & Halim, M. A. (n.d.). Accessibility of emergency rescue vehicle in the road network of Old Dhaka, Bangladesh.
Kathirvel, S., Jeyashree, K., & Patro, B. K. (2012). Social mapping: a potential teaching tool in public health. Medical teacher, 34(7), e529-e531.
Ling, R. S. J. (2011). The PRA tools for qualitative rural tourism research. Systems Engineering Procedia, 1, 392-398.
Madon, S., Malecela, M. N., Mashoto, K., Donohue, R., Mubyazi, G., & Michael, E. (2018). The role of community participation for sustainable integrated neglected tropical diseases and water, sanitation and hygiene intervention programs: A pilot project in Tanzania. Social Science & Medicine, 202, 28-37.
Mamoon, M. (1993). Dhaka: Smriti Bismritir Nogori. Ononna Publication, Dhaka Google Scholar.
McDonald, S., Malys, N. and Maliene, V., 2009. Urban regeneration for sustainable communities: A case study. Technological and Economic Development of Economy, 15(1), pp.49-59.
Mwiru, M. (2015). The Importance of community participation in development projects at local level: a case of Dodoma municipal council (Doctoral dissertation, Mzumbe University).
Roberts, P., 2000. The evolution, definition and purpose of urban regeneration. Urban regeneration, pp.9-36.
Robinson‐Pant, A. (1996). PRA: a new literacy? Journal of International Development: The Journal of the Development Studies Association, 8(4), 531-551.
Said, S. Y., Zubir, S. S., & Rahmat, M. N. (2014). Measuring physical changes in an urban regeneration scheme. WIT Transactions on Ecology and the Environment, 191, 1165-1174. 2. http://njplanning.org/wp-content/uploads/RED-Policy-Guide2.2.12.pdf
Song, X., Chang, K. T., Yang, L., & Scheffran, J. (2016). Change in Environmental Benefits of Urban Land Use and Its Drivers in Chinese Cities, 2000-2010.International journal of environmental research and public health,13(6), 535
The Daily Star (2016). Shifting of Central Jail. Retrieved From: http://www.thedailystar.net/editorial/shifting-the-central-jail-1207294 on June 8, 2017.
UN-Habitat (2009). Planning Sustainable Cities: Global Report on Human Settlements 2009, London.
William. A. The Town of Hameln: The Urban Regeneration of the 'Old Town' Retrieved From: http://www.eukn.eu/fileadmin/Lib/files/DE/2010/08_Hameln_EN.pdf on May 5, 2017

Patwary, Muhammad Mainuddin; Ashraf, Sadia; Shuvo, Faysal kabir
An assessment of ecosystem services value of Khulna city, Bangladesh: Implications for
urban sustainability.
318
Research Paper
AN ASSESSMENT OF ECOSYSTEM SERVICES VALUE OF
KHULNA CITY, BANGLADESH: IMPLICATIONS FOR
URBAN SUSTAINABILITY
1Muhammad Mainuddin PATWARY, MS in Environmental Science, Khulna University; Bangladesh
2Sadia ASHRAF, MS in Environmental Science, Khulna University; Bangladesh; 3Faysal Kabir SHUVO, Phd Candidate, Population Wellbeing and Environment Research lab,
University of Wollongong, Australia
Abstract
The concept of ‘ecosystem services’ is increasingly used for understanding the urban-environment interactions which are vital for urban sustainability. However, the dimensions of urban ecosystem services are substantially neglected in urban planning and management. Hence, quantification and integration of ecosystem services in the planning process are essential to promote sustainable development of cities. In this context, this study aims to determine the ecosystem services value (ESV) by taking Khulna City (Bangladesh) as a case city. ESVs were estimated mainly by combining Landsat image using land use land cover (LULC) datasets of the year 2019 with their corresponding global value coefficients developed earlier by Costanza et al 1997. The overall accuracy of land use map was 87% with corresponding kappa coefficients of 86%. A coefficient of sensitivity was analyzed by using an elasticity indicator to determine the effect of manipulation on the estimated values. Results revealed that settlements were identified as dominant land cover occupied by 71% of the total area. About 13.27% of the area is under vegetation, whereas agriculture holds about 8.82% of the land. The total ecosystem services value was estimated equivalent to US$ 4.88 million. Approximately 99% of the total service value was attributable to vegetation and water body. Water regulation and water supply were the two largest service functions, contributing about 64% of the total service value. The results suggest that future land use policy could be targeted to promote sustainable urban development of Bangladesh.
Keywords
Urban ecosystem services, sustainability, ESV, LULC, Bangladesh
Patwary, Muhammad Mainuddin; Ashraf, Sadia; Shuvo, Faysal kabir
An assessment of ecosystem services value of Khulna city, Bangladesh: Implications for
urban sustainability.
319
1. Introduction Ecosystems provide us multiple benefits that are crucial for human survival, health and well-being (Costanza et al., 1997, 2014). Globally, urbanization has been considered as one of the main driver of land use land cover changes, resulting in irreversible impacts on natural ecosystem. It is estimated that urban areas will expand by around 200% and approximately 5 billion people will be living in cities at the end of the 2030 (Fragkias et al., 2013). The rapid growth of urbanization causes pressure on natural resources and high demand for ecosystem services, which combined can lead to critical environmental degradation, such as water crisis, air pollution, microclimatic alteration and collapse of natural resources (Seto et al., 2011). Urban ES provide fundamental contributions to the wellbeing of population and their benefits are linked to many of the most pressing challenges for cities, from climate change adaptation and mitigation to citizens’ health. The provision of urban ES mainly depends on the strategic decision of land use allocation during planning process (Cortinovis & Geneletti, 2018). Therefore, the incorporation of ES in urban plans is considered an indicator of their quality and capacity to put in place strategic actions towards more sustainable and resilient cities (Frantzeskaki et al., 2016).
The research on the identification and valuation of ecosystems services has been gained increasing focus worldwide (Balvanera et al., 2012). Internationally, ecosystem service valuation has been widely linked to policies for improved natural resource management, which promote conservation and at the same time foster human well-being (Pandeya et al., 2016). There have been many studies on quantification of ecosystem services available in literature. Krueter et al. (2001) estimated temporal changes in ecosystem services values in the San Antonio area of Texas, USA. Tianghong et al. (2010) identified variations in ecosystem service values in response to shifts in land use in Shenzen. Long et al. (2014) estimated ecosystem service value of Tianjin Binhai New development area of China. Wang et al. (2018) assessed the ecosystem service value of land use change on Hengduan mountain region of China. Khan et al. (2014) identified the relation between natural disaster and land use changes of southwest coastal Bangladesh.
Our study focused on Khulna City, a fast-growing industrial city in southwest coastal region of Bangladesh. The city has experienced dramatic changes in land use in recent decades as a result of urban sprawl and a policy of returning vegetation and cropland to construction lands (Hassan, 2017). These complex land use changes are likely to significantly affect ecosystem services and functions. Very little is known about ecosystem services in urban area and no study has been done so far in quantification of ecosystem service value of Khulna city. This paper presents the first quantitative assessment of ecosystem services in this city. Therefore, the present study used land use based valuation technique to identify current land use practices and to determine their ecosystem service values. This approach involves determining individual land use pattern and then estimate total ecosystem service value by using their global value coefficients. This study also carried out sensitivity analysis to explore the robustness of the results by 50% adjustment of value coefficients.
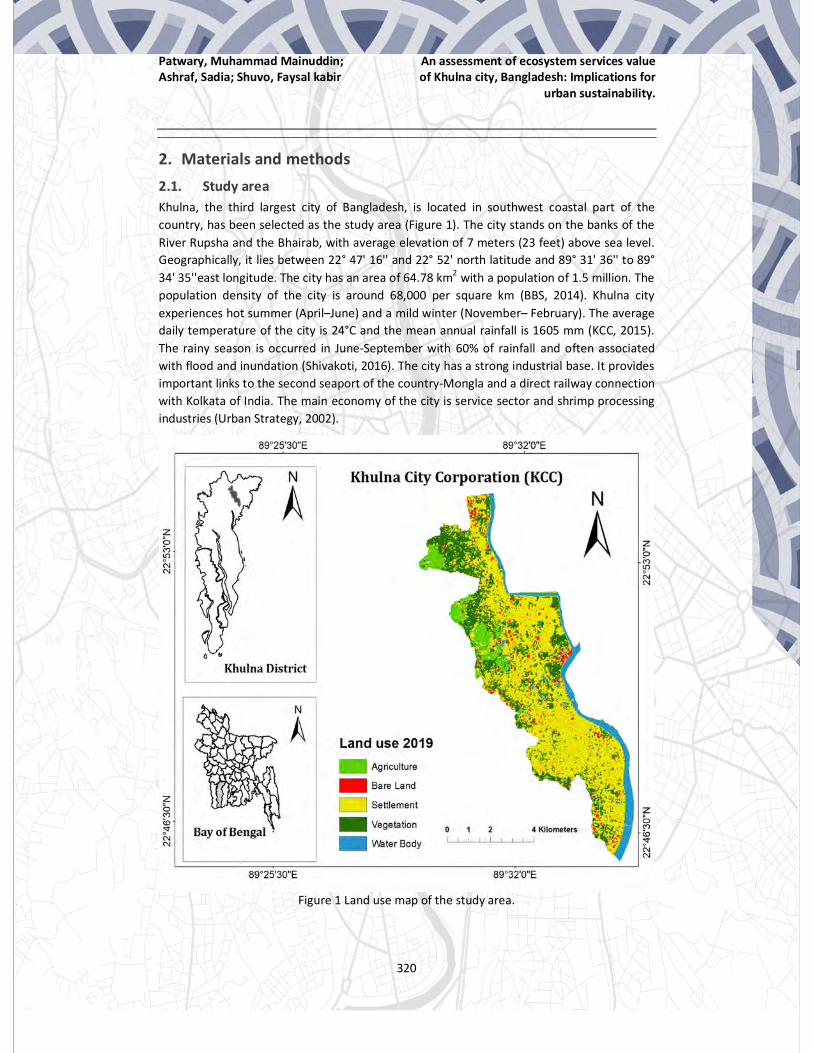
Patwary, Muhammad Mainuddin; Ashraf, Sadia; Shuvo, Faysal kabir
An assessment of ecosystem services value of Khulna city, Bangladesh: Implications for
urban sustainability.
320
2. Materials and methods 2.1. Study area Khulna, the third largest city of Bangladesh, is located in southwest coastal part of the country, has been selected as the study area (Figure 1). The city stands on the banks of the River Rupsha and the Bhairab, with average elevation of 7 meters (23 feet) above sea level. Geographically, it lies between 22° 47' 16'' and 22° 52' north latitude and 89° 31' 36'' to 89° 34' 35''east longitude. The city has an area of 64.78 km2 with a population of 1.5 million. The population density of the city is around 68,000 per square km (BBS, 2014). Khulna city experiences hot summer (April–June) and a mild winter (November– February). The average daily temperature of the city is 24°C and the mean annual rainfall is 1605 mm (KCC, 2015). The rainy season is occurred in June-September with 60% of rainfall and often associated with flood and inundation (Shivakoti, 2016). The city has a strong industrial base. It provides important links to the second seaport of the country-Mongla and a direct railway connection with Kolkata of India. The main economy of the city is service sector and shrimp processing industries (Urban Strategy, 2002).
Figure 1 Land use map of the study area.
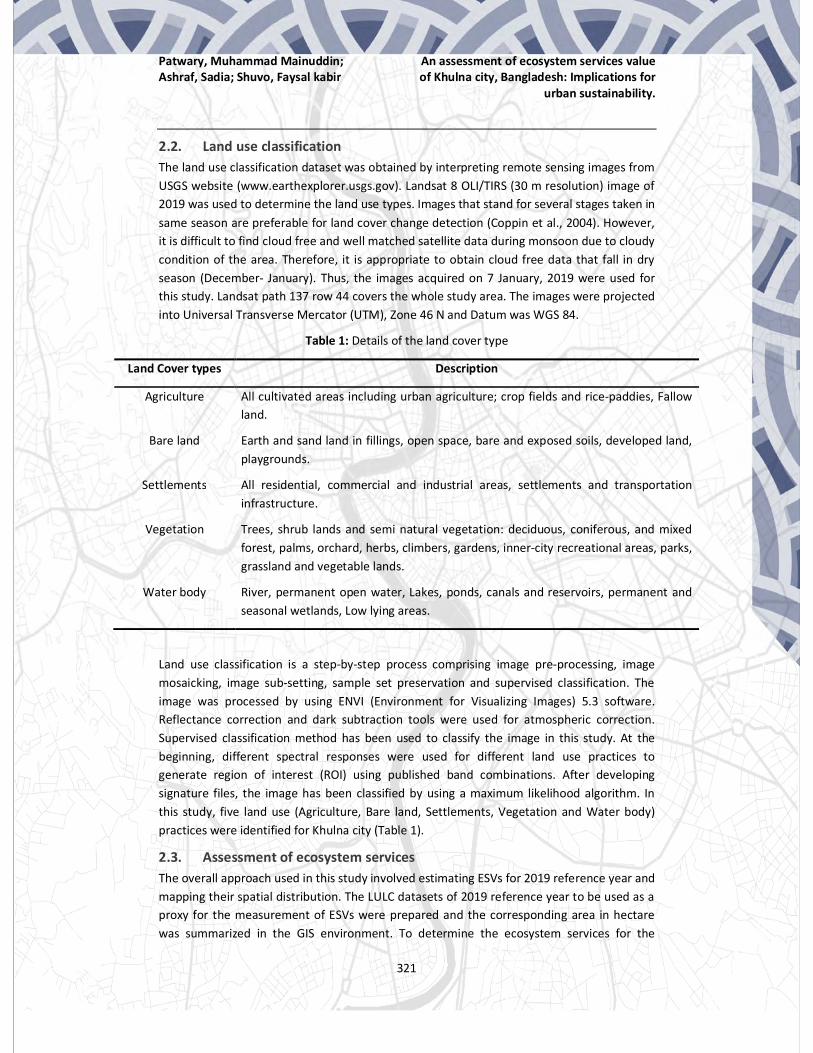
Patwary, Muhammad Mainuddin; Ashraf, Sadia; Shuvo, Faysal kabir
An assessment of ecosystem services value of Khulna city, Bangladesh: Implications for
urban sustainability.
321
2.2. Land use classification The land use classification dataset was obtained by interpreting remote sensing images from USGS website (www.earthexplorer.usgs.gov). Landsat 8 OLI/TIRS (30 m resolution) image of 2019 was used to determine the land use types. Images that stand for several stages taken in same season are preferable for land cover change detection (Coppin et al., 2004). However, it is difficult to find cloud free and well matched satellite data during monsoon due to cloudy condition of the area. Therefore, it is appropriate to obtain cloud free data that fall in dry season (December- January). Thus, the images acquired on 7 January, 2019 were used for this study. Landsat path 137 row 44 covers the whole study area. The images were projected into Universal Transverse Mercator (UTM), Zone 46 N and Datum was WGS 84.
Table 1: Details of the land cover type
Land Cover types Description
Agriculture All cultivated areas including urban agriculture; crop fields and rice-paddies, Fallow land.
Bare land Earth and sand land in fillings, open space, bare and exposed soils, developed land, playgrounds.
Settlements All residential, commercial and industrial areas, settlements and transportation infrastructure.
Vegetation Trees, shrub lands and semi natural vegetation: deciduous, coniferous, and mixed forest, palms, orchard, herbs, climbers, gardens, inner-city recreational areas, parks, grassland and vegetable lands.
Water body River, permanent open water, Lakes, ponds, canals and reservoirs, permanent and seasonal wetlands, Low lying areas.
Land use classification is a step-by-step process comprising image pre-processing, image mosaicking, image sub-setting, sample set preservation and supervised classification. The image was processed by using ENVI (Environment for Visualizing Images) 5.3 software. Reflectance correction and dark subtraction tools were used for atmospheric correction. Supervised classification method has been used to classify the image in this study. At the beginning, different spectral responses were used for different land use practices to generate region of interest (ROI) using published band combinations. After developing signature files, the image has been classified by using a maximum likelihood algorithm. In this study, five land use (Agriculture, Bare land, Settlements, Vegetation and Water body) practices were identified for Khulna city (Table 1).
2.3. Assessment of ecosystem services The overall approach used in this study involved estimating ESVs for 2019 reference year and mapping their spatial distribution. The LULC datasets of 2019 reference year to be used as a proxy for the measurement of ESVs were prepared and the corresponding area in hectare was summarized in the GIS environment. To determine the ecosystem services for the
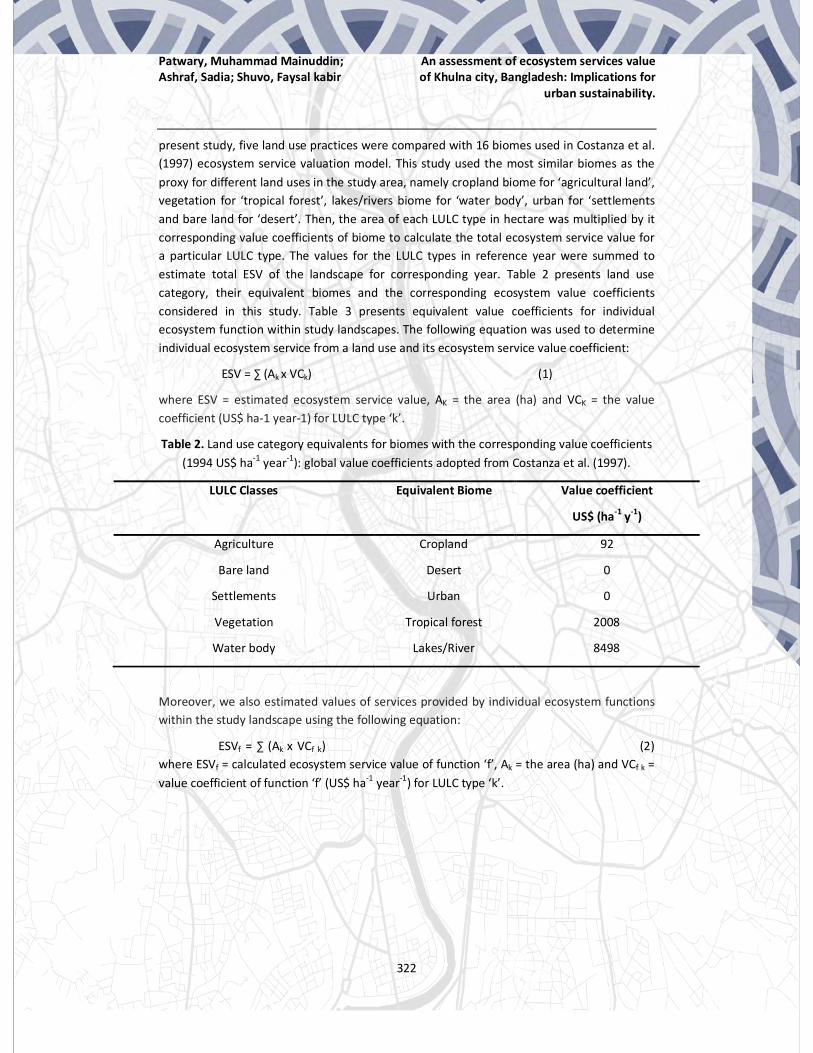
Patwary, Muhammad Mainuddin; Ashraf, Sadia; Shuvo, Faysal kabir
An assessment of ecosystem services value of Khulna city, Bangladesh: Implications for
urban sustainability.
322
present study, five land use practices were compared with 16 biomes used in Costanza et al. (1997) ecosystem service valuation model. This study used the most similar biomes as the proxy for different land uses in the study area, namely cropland biome for ‘agricultural land’, vegetation for ‘tropical forest’, lakes/rivers biome for ‘water body’, urban for ‘settlements and bare land for ‘desert’. Then, the area of each LULC type in hectare was multiplied by it corresponding value coefficients of biome to calculate the total ecosystem service value for a particular LULC type. The values for the LULC types in reference year were summed to estimate total ESV of the landscape for corresponding year. Table 2 presents land use category, their equivalent biomes and the corresponding ecosystem value coefficients considered in this study. Table 3 presents equivalent value coefficients for individual ecosystem function within study landscapes. The following equation was used to determine individual ecosystem service from a land use and its ecosystem service value coefficient:
ESV = ∑ (Ak x VCk) (1)
where ESV = estimated ecosystem service value, AK = the area (ha) and VCK = the value coefficient (US$ ha-1 year-1) for LULC type ‘k’.
Table 2. Land use category equivalents for biomes with the corresponding value coefficients (1994 US$ ha-1 year-1): global value coefficients adopted from Costanza et al. (1997).
LULC Classes Equivalent Biome Value coefficient
US$ (ha-1 y-1)
Agriculture Cropland 92
Bare land Desert 0
Settlements Urban 0
Vegetation Tropical forest 2008
Water body Lakes/River 8498
Moreover, we also estimated values of services provided by individual ecosystem functions within the study landscape using the following equation:
ESVf = ∑ (Ak x VCf k) (2) where ESVf = calculated ecosystem service value of function ‘f’, Ak = the area (ha) and VCf k = value coefficient of function ‘f’ (US$ ha-1 year-1) for LULC type ‘k’.

Patwary, Muhammad Mainuddin; Ashraf, Sadia; Shuvo, Faysal kabir
An assessment of ecosystem services value of Khulna city, Bangladesh: Implications for
urban sustainability.
323
Table 3. Equivalent value coefficient (US $ ha-1 y-1) for ecosystem service functions of each LULC type adapted from Costanza et al (1997).
Ecosystem service function Biome
CP DS UR TF LR
Provisioning Food production 54 0 0 32 41
Water supply 0 0 0 8 2,117
Raw material 0 0 0 315 0
Genetic resources 0 0 0 41 0
Regulating Water regulation 0 0 0 6 5,445
Waste treatment 0 0 0 87 665
Erosion control 0 0 0 245 0
Climate regulation 0 0 0 223 0
Biological control 24 0 0 0 0
Gas regulation 0 0 0 0 0
Disturbance regulation 0 0 0 5 0
Supporting Nutrient cycling 0 0 0 922 0
Pollination 14 0 0 0 0
Soil formation 0 0 0 10 0
Habitat 0 0 0 0 0
Cultural Recreation 0 0 0 112 0
Cultural 0 0 0 2 230
CP, DS, UR, TF, LR refers to Cropland, Desert, Urban, Tropical forest, Lakes/River
2.4 Coefficient of sensitivity (CS)
Since the biome used in this study as proxy for different land use practices are not perfect matches in every cases, sensitivity analysis is needed to determine the percentage change in ESV for a given percentage change in the value coefficient. The ecosystem value coefficients for each of agriculture, vegetation, water body, bare land, and settlements were adjusted by ± 50%. In each analysis, we calculated a coefficient of sensitivity (CS) using the standard economic concept of elasticity, as follows (Kreuter et al., 2001):
CS=
ESVj – ESVi /ESVi
VC jk – VCik / VCik

Patwary, Muhammad Mainuddin; Ashraf, Sadia; Shuvo, Faysal kabir
An assessment of ecosystem services value of Khulna city, Bangladesh: Implications for
urban sustainability.
324
where i and j represents the initial and adjusted value respectively, k represents land use type. Coefficient of sensitivity (CS) represents the ratio of percentage change in estimated total ecosystem service value (ESV) and percentage change in the adjusted valuation coefficient (VC). If the ratio is less than one, it indicates the estimation of ES is inelastic and robust, and if the ratio is greater than one that indicates the estimation is elastic.
3. Results 3.1. Estimated ecosystem services value Figure 1 illustrates the five land use practices in the Khulna City of Bangladesh. In 2019, settlements comprised the largest land cover proportion (71%) in the study area. The next common type of land uses were vegetation and agricultural land, accounting for around 13.27% and 8.82% respectively. Water bodies accounted for less than 6% of total area. Bare land areas accounted for 1.26%, and were the least common land use type (Table 4). The accuracy assessment of land use classification of year 2019 that was done by using Google Earth images and was measured by developing a confusion matrix, which indicate the overall accuracy of 87% with kappa coefficient of 86%.
Table 4: Results of land use cover, ecosystem services value and their coefficient of sensitivity
LULC Classes Area (ha) % of total Ecosystem service coefficient
US$ (ha-1 y-1)
Ecosystem services value
(million $)
Percentage contribution
(%)
Coefficient of sensitivity
Agriculture 571.35 8.82 92 0.05 1.02 0.01
Bare land 81.62 1.26 0 0 0 -
Settlements 4599.38 71 0 0 0 -
Vegetation 859.63 13.27 2008 1.72 35.25 0.02
Water body 366.07 5.65 8498 3.11 63.73 0.04
Total 6478 100 4.88 100
The ecosystem service values were estimated in the study landscape for the year 2019 (Table 4 & Figure 2). In general, the total ESVs of the whole study landscape were about US$ 4.88 million in 2019, when globally adapted coefficients were used. The study found that about 99% (US$ 4.82 million) of total ESVs comprised of water body and vegetation, with water body accounted for about US$ 3.11 million (63.61%) and vegetation accounted for about US$ 1.72 million (35.25%). Agricultural land shared small proportion, i.e. about US$ 0.05 million (1.02%) of the total ESVs. Settlements and bare land shared no proportion of the total ESVs. Table 4 summarizes the area covered by different land use practices, their contribution towards the total ecosystem services and coefficient of sensitivity.

Patwary, Muhammad Mainuddin; Ashraf, Sadia; Shuvo, Faysal kabir
An assessment of ecosystem services value of Khulna city, Bangladesh: Implications for
urban sustainability.
325
Figure 2 Spatial distribution of ecosystem service values (US$/ha/year) in the study landscape in the reference years
The coefficient of sensitivity (CS) was less than one in all cases indicating that the total ecosystem service values estimated in the study landscape were relatively inelastic (low sensitive) with respect to the value coefficients (Table 4). The relatively low values of CS i.e. agriculture (0.01), reflect the fact that the LULC area and/or the corresponding value coefficients are relatively small. CS for vegetation and water body was the highest because of the highest service value coefficient and relatively big area, which were 2nd and 4th biggest areas among the five LULC types. This results also indicates that the estimation of ecosystem service values were robust despite the value coefficient uncertainties.
3.2. Estimated services of individual ecosystem functions This study also quantified the contributions of each ecosystem functions to the overall ESV in Khulna city (Table 5). In total, regulatory services contributed to more than half (about 59.5%) of ESVs, followed by provision (about 24.44%), supporting (about 12.5%), and cultural services (about 3.46%). Breaking down the total ESV for 2019, the most important components were water regulation, water supply, nutrient cycling, waste treatment and raw materials. These ecosystem service functions respectively contribute 46.21%, 18.04%, 12.19%, 6.78% and 4.16% of the total ESVs.

Patwary, Muhammad Mainuddin; Ashraf, Sadia; Shuvo, Faysal kabir
An assessment of ecosystem services value of Khulna city, Bangladesh: Implications for
urban sustainability.
326
Table 5: Estimated values for different ecosystem functions (ESVf) in Khulna city for in 2019.
Ecosystem service function ESV (x 106 USD) % Contribution
Provisioning Food production 0.07 1.7
Water supply 0.78 18.04
Raw material 0.18 4.16
Genetic resources 0.02 0.54
Regulating Water regulation 1.99 46.21
Waste treatment 0.29 6.78
Erosion control 0.13 3.24
Climate regulation 0.18 2.95
Biological control 0.01 0.32
Gas regulation 0 0
Disturbance regulation 0.002 0.06
Supporting Nutrient cycling 0.52 12.19
Pollination 0.007 0.18
Soil formation 0.005 0.13
Habitat 0 0
Cultural Recreation 0.06 1.48
Cultural 0.08 1.98
Total 4.88 100
5. Discussion This study used the datasets derived from remotely sensed imagery as a proxy measurement with their corresponding value coefficients determined by Costanza et al. (1997) to provide information regarding of ESVs in Khulna City. The study was the first of its kind that contributes to the evolving study of ecosystem service science by providing landscape level status of ESVs from the region where datasets are limited. Currently, proxy data is widely used in the estimation of ecosystem service values and their changes. The reason of using global data set of ES value coefficients along with the land use data gives scope to eliminate the cost of ground data collection and thus provide quick and reliable information for similar data poor area (Costanza et al., 2014; Wang et al., 2014).

Patwary, Muhammad Mainuddin; Ashraf, Sadia; Shuvo, Faysal kabir
An assessment of ecosystem services value of Khulna city, Bangladesh: Implications for
urban sustainability.
327
Khulna city has experienced rapid land use change in past three decades. This change is reportedly related to fast growing settlements area by converting water body, vegetation and agricultural lands (Hassan, 2017). However, ecosystem services value based on land use pattern are not well addressed in existing literatures, despite its immense importance for natural resources management in this region. Therefore, this study was an effort to reveal the current land use pattern and associated ecosystem service values by using freely available Landsat data. Our study reveals that vegetation and water body are important for providing significant ecosystem services in Khulna city. Our study further revealed that the contribution of individual ecosystem functions showed variation throughout the study period. In terms of specific ecosystem service functions such as water regulation, water supply, nutrient cycling, waste treatment and raw materials were among the highest contributors of the total ESVs from the category of regulating, provisioning and supporting services. However, the value of food production services is found low during the study periods, which is mainly due to dramatic decrease of croplands.
Urban development is a comprehensive development system including economy, society, culture and environment. However, urbanization pattern of Bangladesh emphasizes more on the expansion of the scale. As a result, large scale of vegetation, agricultural land and water body has been encroached by construction land since reform and opening up that leads to tremendous decreases of the land with high ESV. The urban planning of Khulna city needs to strengthen the integration of regional ecological resources, to provide robust ecological support for building ecological city. The future development of Khulna city should pay more attention to its ecological environment protection at the same time. Ecological city planning should adhere to the principle of ecological priority, and properly handle the relationship between the urban construction and ecological environment protection, strengthen the protection of rivers, wetlands, and effectively protect the ecological sensitive areas, such as lakes, wetlands and plantation. To improve the quality of ecological environment, feasible measures are aggressively constructing forest park, landscape ecological corridors, and urban public green space (Long et al. 2014). Therefore, more attentions should be paid to increasing the total ESV in implementing the urban planning, to build Khulna as an ecological livable city full of harmony between human and nature, with a coordinated symbiosis system of river, tree, lake and field.
6. Conclusion Understanding the value of ecosystem services is of immense importance to initiatives promoting balanced and sustainable use of terrestrial ecosystems, as it underpins the choices about reinstating productive and sustainable food production, balanced against the wider ecological benefits. The ecosystem services value of Khulna city was found US$ 4.88 million. Settlement is the dominant land use of this area covering 71% of total city contributes no ecosystem services value. While vegetation and water body comprises only 19% of total land use cover contributes almost 99% of the total ecosystem service value. Therefore, promoting plantation and conserving wetland area could secure more ecosystem services in Khulna city area. It is fundamental to meet the demand of construction land for

Patwary, Muhammad Mainuddin; Ashraf, Sadia; Shuvo, Faysal kabir
An assessment of ecosystem services value of Khulna city, Bangladesh: Implications for
urban sustainability.
328
socio-economic development, meanwhile protecting ecosystem services function and maintaining its stability; only in this way can the new developing area of Bangladesh realize the sustainable use of ecological resources in the process of rapid urbanization, as well as the integration of economic, social and ecological benefits.
7. References Balvanera, Patricia; Uriarte, María; Almeida-Leñero, Lucía; Altesor, Alice; DeClerck, Fabrice;
Gardner, Toby; Hall, Jefferson; Lara, Antonio; Laterra, Pedro; Pen˜ a-Claros, Marielos; Mato, Dalva M. Silva; Vogl, Adrian L.; Romero-Duque, Luz Piedad; Arreola, Luis Felipe; Caro-Borrero, Angela Piedad; Gallego, Federico; Jain, Meha; Little, Christian; Xavier, Rafael de Oliveira; Paruelo, José M.; Peinado, Jesús Emilio; Poorter, Lourens; Ascarrunz, Nataly; Correa, Francisco; Cunha-Santino, Marcela B.; Herna´ndez-Sa´nchez, Amabel; Vallejos, María (2012) "Ecosystem services research in Latin America: The state of the art." Ecosystem Services, Vol. 2 No. 56-70 (December).
Bangladesh Bureau of Statistics (BBS) (2014) “District Statistics 2013 Khulna”. Bangladesh.
Coppin, Pol; Jonckheere, Inge; Nackaerts, Kristiaan; Muys, Bart; Lambin, Eric (2010) "Review ArticleDigital change detection methods in ecosystem monitoring: a review." International journal of remote sensing, Vol. 25 No. 1565-1596 (May).
Cortinovis, Chiara; Geneletti, Davide (2018) "Ecosystem services in urban plans: What is there, and what is still needed for better decisions." Land use policy, Vol. 70 No. 298-312 (January).
Costanza, Robert; d'Arge, Ralph; De Groot, Rudolf; Farber, Stephen; Grasso, Monica; Hannon, Bruce; Limburg, Karin; Naeem, Shahid ; O'Neill, Robert V. ; Paruelo, Jose; Raskin, Robert G.; Sutton, Paul; Belt, Marjan van den (1997) "The value of the world's ecosystem services and natural capital." Nature Vol. 387, No. 253-260 (May).
Costanza, Robert; de Groot, Rudolf; Sutton, Paul; Van der Ploeg, Sander; Anderson, Sharolyn J.; Kubiszewski, Ida; Farber, Stephen; Turner, R. Kerry (2014) "Changes in the global value of ecosystem services." Global environmental change Vol. 26 No. 152-158 (May).
Fragkias, Michail; Güneralp, Burak; Seto, Karen C.; Goodness, Julie (2013) Urbanization, biodiversity and ecosystem services: Challenges and opportunities, New York, London, Springer, Dordrecht.
Frantzeskaki, Niki N.; Kabisch, Nadja N.; McPhearson, Timon T. (2016) "Advancing urban environmental governance: Understanding theories, practices and processes shaping urban sustainability and resilience." Environmental Science & Policy, Vol. 62 No. 1-6 (January).
Hardoy, Jorge; Satterthwaite, David (1983) “ISOCARP: Exchange of ideas”, Cities, The International Journal of Urban Policy and Planning, Vol. 1 No. 1 (August).

Patwary, Muhammad Mainuddin; Ashraf, Sadia; Shuvo, Faysal kabir
An assessment of ecosystem services value of Khulna city, Bangladesh: Implications for
urban sustainability.
329
Hassan, Mohammad Mehedy (2017) “Monitoring land use/land cover change, urban growth dynamics and landscape pattern analysis in five fastest urbanized cities in Bangladesh.” Remote Sensing Applications: Society and Environment, Vol. 7 No. 69-83 (August).
Khan, Md Modasser Hossain; Bryceson, Ian; Kolivras, Korine N.; Faruque, Fazlay; Rahman, M. Mokhlesur; Haque, Ubydul (2015) "Natural disasters and land-use/land-cover change in the southwest coastal areas of Bangladesh." Regional Environmental Change, Vol. 15 No. 241-250 (February).
Khulna City Corporation (KCC) (2015) “Khulna City Corporation Annual Report” KCC, Khulna.
Kreuter, Urs P; Harris, Heather G.; Matlock, Marty D.; Lacey, Ronald E. (2001) "Change in ecosystem service values in the San Antonio area, Texas." Ecological economics, Vol. 39 No. 333-346 (December).
Long, Hualou; Liu, Yongqiang; Hou, Xuegang; Li, Tingting; Li, Yurui (2014) "Effects of land use transitions due to rapid urbanization on ecosystem services: Implications for urban planning in the new developing area of China." Habitat International, Vol. 44 No. 536-544 (October).
Pandeya, Bhopal; Buytaert, Wuter; Zulkafli, Zed; Karpouzoglou, Timon; Mao, Feng; Hannah, David M. (2016) "A comparative analysis of ecosystem services valuation approaches for application at the local scale and in data scarce regions." Ecosystem Services, Vol. 22 No. 250-259 (December).
Seto, Karen C; Fragkias, Michail; Güneralp, Burak; Reilly, Michael K. (2011) "A meta-analysis of global urban land expansion." PloS one, Vol. 6, No. 8 (August).
Shivakoti, Binaya Raj (2016) Groundwater Environment in Asian Cities, Japan, Institute for Global Environmental Strategies (IGES).
Tianhong, Li; Wenkai, Li; Zhenghan, Qian (2010) “Variations in ecosystem service value in response to land use changes in Shenzhen.” Ecological economics, Vol. 69 No. 1427-1435 (May).
Urban Strategy (2002) “Structure Plan, Master Plan and Detailed Area plan (2001-2020) for Khulna City”, Volume I, AQUA-SHELTECH CONSORTIUM, Khulna Development Authority, Ministry of Housing and Public Works, Government of the people's Republic of Bangladesh.
Wang, Yahui; Dai, Erfu; Yin, Le; Ma. Liang (2018) "Land use/land cover change and the effects on ecosystem services in the Hengduan Mountain region, China." Ecosystem services, Vol. 34 No. 55-67 (December).
Wang, Yan; Gao, Jixi; Wang, Jinsheng; Qiu, Jie (2014) "Value assessment of ecosystem services in nature reserves in Ningxia, China: A response to ecological restoration." PloS One, Vol. 9 No. 2 (February).

Habib, I; Aftab, N; Alam, T. Affordable & Sustainable Urban Housing Prospect
330
Research Paper
Affordable & Sustainable Urban Housing Prospect
Iqbal Habib, Architect, Bangladesh Nabila Aftab, Architect, Bangladesh
Toufiqul Alam, Urban Planner, Bangladesh
Abstract
Housing finance in Bangladesh is monopolized by people in the high-income brackets where the mortgage lending system bypasses the needs of the urban poor. Both public and private sector provides housing in the city but the Government can meet only 7% of the total housing demand, whereas private sector entertains the bulk of 93% and a significant percentage (55%) of the private sector housing is supplied by the informal sector (individual developer). However, all of the private sector housing is not affordable by the urban middle or poor economic class. These groups of people are most resilient in the society and are the major driving force of the country’s economy. This has also discouraged investors to investing in development project/schemes for them. Studies show regardless of the deprived living conditions, slum dwellers pay a higher rent than the residents of formal housing sectors. This has led to initiate a research to analyse and explore the feasibility and prospects of affordable and sustainable housing for the informal settlements for the amount of rent they currently pay. This paper is in light of the United Nation’s 2030 Agenda for Sustainable Development goals, particularly Goal 11: Make cities and human settlements inclusive, safe, resilient and sustainable. This paper focuses on the affordability and feasibility of informal housing issues as a concern of social housing policy of Dhaka City.
Keywords
Affordable, Inclusive, Housing, Design, Strategy
1. Background Bangladesh is a developing country with an approximate urban population of 57 million people, of which over 20.5 million resides in Dhaka alone (world population review, 2019). Studies show, out of the housing delivery system in Dhaka, formal legal settlements comprise only 40%. More than 5 million are living in slums and squatters for non-inclusive policy. Slums are defined as settlements with a minimum of 10 households or a mess unit with a minimum of 25 members having predominantly feeble housing, excessive population density, crowded rooms, inadequate environmental services, especially water and sanitation, meagre socio-economic status and lack of security of tenure. The non-inclusive policy for housing initiatives in Dhaka drive this large number of people into vulnerable state and force them to live a substandard life only intensifying social class distribution of this city (Islam, Mahbub, & Nazem, 2009).

Habib, I; Aftab, N; Alam, T. Affordable & Sustainable Urban Housing Prospect
331
People living in these settlements are faced with inadequate supply of urban facilities such as water, electricity, garbage disposal, sanitation, sewerage, and fuel for cooking as well as degraded social and physical environment. Security of their tenure ship is captured by
vulnerability to eviction. Nevertheless, through collective efforts the slum dwellers have been trying to improve their living conditions in many slums of Dhaka. For example, residents of Karail Basti have taken initiatives to gain access to electricity and water illegally and they have succeeded. Yet they are suffering from financial crisis because they ended up paying higher than the functioning public or public-private services, which is not a sustainable solution (Pongratz and Teschner, 2016).
The continuous deprivation of the urban poor to attain the basic urban facilities has led to the realization of affordable and sustainable urban housing prospect. With the mission of fulfilment of social obligation by extending support to low-income group in achieving a desired living standard, this research has been developed to propose a socially sustainable, economically viable infrastructure of housing compound for the RMG workers as a case study.
2. Current Scenario and Findings of Affordable Housing in Dhaka In a rapidly growing city like Dhaka, housing comes up as a major problem. The genesis of the problem remains in the fact that the development of housing and related infrastructure can’t cope with the growth of population. Government’s lone effort in terms of resources, capabilities and initiatives is not adequate to resolve the ever-increasing housing problem. As a result, the gap between housing demand and supply becomes wider. Also, studies show about 65% of the Dhaka’s population is due to migration. Both public and private sector provides housing in the city but the Government can meet only 7% of the total housing demand, whereas private sector entertains the bulk of 93% and a significant percentage (55%) of the private sector housing is supplied by the informal sector (individual developer).
Figure 1: Karail Slum, Area: 90 acre, 945 persons per acre, Total population: 85,000 source- CUS UPPRS. Image source: Vitti Sthapati Brindo Ltd.

Habib, I; Aftab, N; Alam, T. Affordable & Sustainable Urban Housing Prospect
332
However, most of the private sector housing is not affordable by the urban poor. About 3.5 million low income people are living in 4000 slums and squatters in Dhaka city. There are also about 52,000 floating people in the mega city without having any shelter. Both, public and private sectors are playing apathetic role in addressing the housing needs of the low-income city dwellers.
Despite recommendations in several plans and reports, no plausible measures were evolved by the public sector housing agencies to provide adequate housing to the urban poor, so housing need of a large section of the urban dwellers remains unfulfilled (Rajuk, 2014).
Through intensive research on the living pattern and existing housing rent it is seen that slum dwellers are paying almost double to that of dwellers living in formal dwellings. These people are paying individually for basic amenities such as water, electricity, gas however they are always in the threat of eviction and also have no collateral. The chart below shows the current housing rent analysis (field survey, 2017) in the slum areas around Dhaka City for family and mess type dwelling units.
Figure 3 shows an average of 44 taka per square feet per month per person is the rent for a four people sharing mess type dwelling of 408 square feet. Figure 5 indicates that a 168 square feet family dwelling unit costs 47 taka per square feet per month per family. Both dwelling unit types have shared toilet and shared kitchen facilities with unhygienic condition, poor sanitation, lack of ventilation and proper services. On the other hand, the average rent of formal housing sectors around the city’s residential area such as Dhanmondi with proper luxuries and facilities is 23.50 taka per square feet per month, which is almost half of the amount paid by slum dwellers. This inflation in rent makes housing for low income group a cause for social concern.
Figure 2: Existing condition of slum dwellers. Multipurpose use of each dwelling unit (left), Space for leisure activities within circulation or building setback (right). Image source: Vitti Sthapati Brindo Ltd.
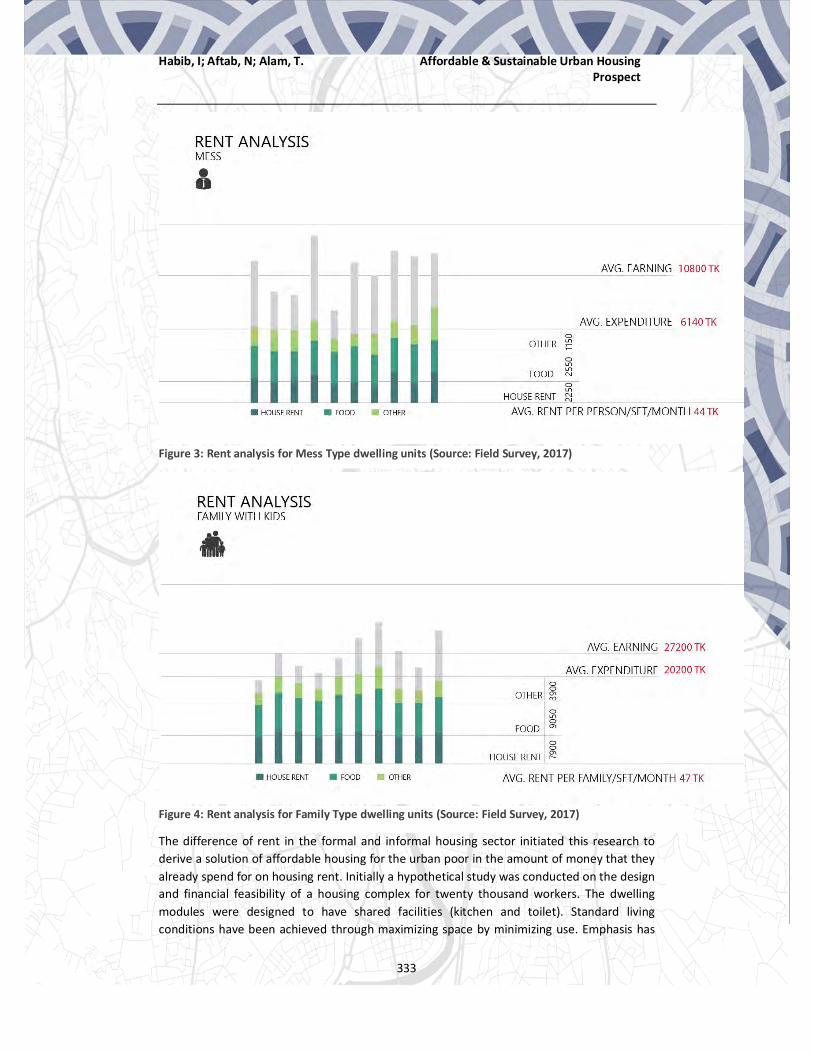
Habib, I; Aftab, N; Alam, T. Affordable & Sustainable Urban Housing Prospect
333
The difference of rent in the formal and informal housing sector initiated this research to derive a solution of affordable housing for the urban poor in the amount of money that they already spend for on housing rent. Initially a hypothetical study was conducted on the design and financial feasibility of a housing complex for twenty thousand workers. The dwelling modules were designed to have shared facilities (kitchen and toilet). Standard living conditions have been achieved through maximizing space by minimizing use. Emphasis has
Figure 3: Rent analysis for Mess Type dwelling units (Source: Field Survey, 2017)
Figure 4: Rent analysis for Family Type dwelling units (Source: Field Survey, 2017)

Habib, I; Aftab, N; Alam, T. Affordable & Sustainable Urban Housing Prospect
334
been given to providing natural lighting and ventilation. Shared facilities and use to natural ventilation and lighting has been a major factor in making the project financially feasible. Also, selection and use of material was done carefully to minimize cost. The financial feasibility analysis included land price, construction cost, cash flow, project revenue, operating expenses and interest rate. This hypothetical project is estimated to have its capital returned within 15 years of project initiation, provided that the Government gives the loan at LIBOR1 rate.
3. Sustainable Strategies to Affordable Housing A sustainable building is holistic, convenient with its whole life in mind. The effectiveness of its environmental design qualities as well as its environmental impacts, can be examined during the design stages. Now a days, sustainable building design is 6 dimensional where traditional 2D drawings become intelligent 3D virtual models, time is the 4th dimension, life time cost of our decisions is the 5th. In a 6D model, the as built project information would become available to the owner to enable sustainable operation of the building. Innovate with the available tools to create sustainable environments- design in six dimensions (Heywood, 2015). Again, Economy-Equity- Environment (three Es) are the three pillars of sustainability. A good design is always seeking to protect and enhance the environment along with social inclusiveness and economic affordability (Heywood, 2015).
1 LIBOR (or ICE LIBOR) is the world’s most widely-used benchmark for short-term interest rates. It serves as the primary indicator for the average rate at which banks that contribute to the determination of LIBOR may obtain short-term loans in the London interbank market. Currently there are 11 to 18 contributor banks for five major currencies (US$, EUR, GBP, JPY, CHF), giving rates for seven different maturities. (Investopedia , 2017).
Figure 5: Environmentally Sustainable Strategies for Affordable Housing. Image source: Vitti Sthapati Brindo Ltd.
RAIN WATER HARVESTING
ENVIRONMENTALLY SUSTAINABLE STRATEGIES

Habib, I; Aftab, N; Alam, T. Affordable & Sustainable Urban Housing Prospect
335
4. Creative and Feasible Solution to Affordable Housing Through constant advocacy and research “Shuborno Prangon” is one of our ideas perceived as a real case of affordable housing initiative. It is an RMG worker’s housing for a leading ready-made garment manufacturer inside Dhaka Metropolitan Area. Similar to the hypothetical study, this housing complex is also designed around shared common area (kitchen and toilet) and emphasis is given to the empathetic co-existence of the dwellers. The project rationality was based on the financial feasibility and a creative solution for social housing. The project was governed by a tight budget as only 17.84 crore taka loan was approved by the Government at an interest rate of 3.89% per annum and the rest had to be invested by the investor. The success of the project was based on the financial feasibility; it was targeted to make the project feasible within ten years of project initiation.
Figure 6 shows the detail rent data per square feet per month as well as the development area and project value. The rent analysis of the project shows the estimated rent would be more than 3.02 crore annually. This rent calculation was done from the above-mentioned rent analysis survey. It shows that per square feet rent per month per family and dorm occupant is 22 BDT. This amount is substantially low from what was found during the survey. The rent data is formulated in accordance to the dwelling units and the proposed total built area. The rent data alone shows that it is possible to provide desirable living units for the amount a dweller pays in a slum or squatters
Figure 6: Data Analysis of Proposed Rent, Area and Project Value
Figure 7: Proposed Dwelling unit details. Dorm unit (left) and Family unit (right). Image source: Vitti Sthapati Brindo Ltd.
PROJECT VALUE: BDT 31.61 CRORE
Total annual Rent 3.02 Crore

Habib, I; Aftab, N; Alam, T. Affordable & Sustainable Urban Housing Prospect
336
Suborno Prangon is an approximately 32 crore project which 1200 occupants. The complex is on 1.72-acre land with housing, primary school, community health care, community shopping and multipurpose hall facilities. The complex is a repetition of a structural module derived from the dwelling units. There are two types of units, family and dorm units. Each housing units has an area of 619 square feet with two double room living space and a shared kitchen and toilet for family units and two four people sharing rooms with common toilet for dorm modules. All modules are designed for natural light and ventilation and are accessed from the social corridor (social gathering space). Figure 7 shows the design of the modules.
Figure 9: Per Floor Unit allocation in Proposed Shuborno Prangon
Figure 8: Household Member Distributions. Requirement (Left) and Proposed Shuborno Prangon (Right)

Habib, I; Aftab, N; Alam, T. Affordable & Sustainable Urban Housing Prospect
337
Further detail analysis is done on cash flow and loan mobilization for financial feasibility of the project. Below, Figure 10, illustrates the loan statement for the project, clearly indicating the loan moratorium for three years and the accumulated interest with the first three years.
Further, Figure 11, shows the detail debt calculation of the project and clearly indicates that the investor would be under zero debt from year 9 onwards. This debt calculation is not only done on project revenue (rent of housing units) but also includes operation cost (Utility charges 5%, maintenance and repairs 2%, plus 7% and management fee 2.5%) as the project would need regular maintenance as well as a management team, and vacancy and collection loss (5% of PGR2), if all units are not rented out or if dwellers fail to pay rent in due time. The debt depreciation starts from year three, when part of the project is targeted to be ready for 2 PGR- Potential Gross Rent
Figure 10: Loan Statement for Proposed Shuborno Prangon
Figure 11: Debt calculation of the project.

Habib, I; Aftab, N; Alam, T. Affordable & Sustainable Urban Housing Prospect
338
renting. The data clearly confirms the investors return of investment in 10 years including interest while the tenants procure ownership of their dwelling unit. Hence the dwelling unit can be collateral for the urban poor.
5. Conclusion In a rapidly growing city like Dhaka, housing is a major problem. The origin of the problem remains in the fact that the development of housing and related infrastructure cannot cope
Figure 12: Conceptual views of Proposed Shuborno Prangon. From top left Bird’s eye view of the complex, Entry to the complex, Internal courtyard I, Internal courtyard II, Primary school and multipurpose hall courtyard. Image source: Vitti Sthapati Brindo Ltd.

Habib, I; Aftab, N; Alam, T. Affordable & Sustainable Urban Housing Prospect
339
with the growth of population. Government alone is struggling with the effort in terms of resources, capabilities and initiatives which is not adequate to resolve the ever-increasing housing problem.
Housing is the most immediate need for the migrants in the city. As most migrants belong to the disadvantaged group of the society, they live in low cost dilapidated and shanty houses. Prejudiced by their social and financial vulnerability, investors are rarely interested to invest in housing for this social class, projecting loss in return of investment. Therefore, with no prospect of investors, no capital and no proper policy for this social class, they are trapped within this cycle of poverty. However, studies indicate people living in slums and squatters pay almost twice the amount of rent per square feet than people living in formal housing sectors. Also, the above research provides evidence that it is financially feasible to invest in social housing as the return of investment is certain with certain period of time.
The lack of inclusive housing policies is the major cause of the rise of slum dwellers in the city. This research is dedicated to encourage private investors to invest in social housing. Additional to the case study of housing scheme shown in this research, there can be other initiatives like a) Public- Private Partnership b) housing Finance through Block Chain Technology; taken as solution of affordable housing. It is hoped to create a positive climate for investment in housing by the individual developers and commercial housing companies.
6. References Investopedia, 2017. Libor. [Online] Available at: http://www.investopedia.com/terms/l/libor.asp [Accessed 03 03 2017].
World Population Review, 2019 [Online]
Available at: http://worldpopulationreview.com/countries/bangladesh-population/ [Accessed 05 09 2019].
Islam, Nazrul; Mahbub, AQM & Nazem, Nurul Islam (2009) Urban slums of Bangladesh. [Online] Available at: http://www.thedailystar.net/news-detail-93293 [Accessed 01 03 2017].
Islam, Nazrul; Shafi, Salma A & Moniruzzaman, Mohammad (2017) A Comprehensive Housing Development Program. [Online] Available at: http://archive.thedailystar.net/newDesign/cached-news-details-94295.html [Accessed 01 03 2017].
Pongratz, Kathrin Golda & Teschner, Klaus (2016) Trialog 124/125. A Journal for Planning and Building in a Global Context, Volume 1-2, pp. 47-49.
Heywood, Hew (2015) 101 Rules of Thumb for Sustainable building and Cities, England, RIBA Enterprise.
Rajuk, 2014. Affordable Housing for All. In: Draft Dhaka Structure Plan 2016-2035. Dhaka: Rajuk, pp. 117-132.

Shuvo, F.K., Islam, M.M., Awal, R. Promoting urban green spaces (UGS) for healthy and active ageing
340
Case Study Paper
PROMOTING URBAN GREEN SPACES (UGS) FOR HEALTHY AND ACTIVE AGEING:
An investigation of the barriers and opportunities in Dhaka city
Faysal Kabir Shuvo, PhD candidate, PowerLab, University of Wollongong, Australia.1 Mohammad Mazharul Islam, Deputy General Manager, Eastern Housing Limited, Bangladesh Planner Md. Rabiul Awal, GIS Expert, Eastern Housing Limited, Bangladesh
Abstract
There is evidence of different health and wellbeing benefits of using urban green spaces (UGS) such as parks. Therefore, UGS can be a great health and wellbeing resource for the ageing population especially for Bangladesh, which is experiencing a growing prevalence of non-communicable diseases. However, most of this evidence came from the western and developed country contexts. There is a substantial lack of research on the health importance of UGS from the low and middle-income country (LMIC) contexts. In this backdrop, this research aimed to explore the health potentials of UGS along with the barriers and opportunities to its promotion in megacity Dhaka. 202 matured and adult users of UGS (defined as ageing) from 10 sample parks from both of the city corporations were selected through the stratified random sampling procedure and interviewed through a structured questionnaire. In addition, a socio-economic implication of UGS distribution was analyzed objectively. Although the socioeconomically disadvantaged people living outskirts of Dhaka city seemed to have better access to a higher amount of UGS, the interview based results found socio-economically well-off population are the major users of UGS. For the ageing users of UGS, accessibility remains a major concern as significant (26%) portion of ageing travel from far (> 15 min). In general, a strong motivation was found among the ageing people for using UGS and the perceived quality was the major determinant of using. The findings suggest that investment on revitalizing, renovating and redeveloping neighbourhood parks and playgrounds can return better public health benefits and reduce a huge amount of medical costs for the ageing population.
Keywords
ageing population, urban green space, socio-economic, health and wellbeing, planning
1. Background 1.1. Healthy and active ageing The proportion of the population aged 60 and over will be above 30% in both high-income countries (HICs) as well as several of the low and middle-income countries (LMICs) by 2050 (United Nations, 2013, World Health Organization, 2017). This ongoing shift has become more evident over time. Population ageing
1 Corresponding author, email: [email protected]

Shuvo, F.K., Islam, M.M., Awal, R. Promoting urban green spaces (UGS) for healthy and active ageing
341
is often framed in negative terms by raising concerns about health services and welfare provision, as well as potential impacts on economic growth (Lloyd-Sherlock et al., 2012). This can have unintended consequences, such as the stigmatisation of ageing, social exclusion and isolation of seniors (Singh, 2015, Van Regenmortel et al., 2016). In contrast, if assessed positively, the longer lives of the population bring greater opportunity for society through numerous contributions by older persons to socioeconomic development (World Health Organization, 2017, World Health Organization, 2007). Older persons support the family as well as the whole community, by providing (often unpaid) childcare, or by being mentors and volunteers. Therefore, increasing active and socially inclusive longevity should be viewed as a major opportunity to keep people healthy and prevent disability for as long as possible. The promotion of healthy and active ageing needs appropriate strategies to deter the loss of functionality of the ageing population. The challenge of formulating strategies is not vested in the health sector but in multiple sectors, including urban planning (O'Brien, 2014, Van Hoof et al., 2018). In particular, a supportive environment could help the ageing population in multiple ways when their functional decline is persistent (World Health Organization, 2017). Hence, enabling opportunities for healthier, more healthy and active ageing ought to be a key multidisciplinary agenda in order to avoid many of the unexpected scenarios that policymakers forecast. 1.2. Role of urban green spaces (UGS) on healthy and active ageing A large amount of research supports that long-term health and wellbeing of the ageing population can be modified through the planning and design of the built environment (Boudiny, 2013, Van Cauwenberg et al., 2017). For example, a park within the neighbourhood can moderate the engagement of older persons at different levels of physical activities. Its design can determine whether it is a resource or barrier to participation and exercise (World Health Organization, 2017, Cairncross, 2016). Engaging in regular physical activities can actually reduce type 2 diabetes risk in persons at high risk more than the use of metformin, the standard medicine used to modify blood glucose levels (Diabetes Prevention Program Research Group, 2002, Tuomilehto et al., 2001). However, a recent study found a combined effect of metformin and physical exercise may give a better result for the patients with impaired glucose tolerance (Viskochil et al., 2017). In addition, the beneficial effect of UGS was found on the research of obesity or overweight (Astell-Burt et al., 2014), cardiovascular diseases (Maas et al., 2009), birth and pregnancy outcomes (Dadvand et al., 2012), mental health (including general mental health , psychological well-being (Hartig, 2008, Feng and Astell-Burt, 2017) and so on. The conceptual pathways through which UGS exert influences on health outcomes are ‘restoration’ (e.g., alleviating stress), ‘instoration’ (e.g., increasing physical activity), and ‘mitigation’ (e.g., reducing exposure to air pollution) (Markevych et al., 2017).

Shuvo, F.K., Islam, M.M., Awal, R. Promoting urban green spaces (UGS) for healthy and active ageing
342
1.3. Research problem and aim Interests in the beneficial effects of UGS on older adults is steadily growing amid a higher pace of urbanisation and the demographic transition around the world. However, three is a major limitation with the evidence mentioned above. Almost each of these studies referred the developed and high-income country (HIC) contexts, whereas low and middle-income countries (LMICs) are substantially underrepresented. This limitation is a problem because LMICs differ with HICs from different aspects, such as pattern of urbanization and urban governance, epidemiologic and demographic transition, inner-city dynamics and so on. The problem with the evidence was the main motivation of this research. In this research, we have attempted to fill the gap by designing a pilot study in Dhaka, Bangladesh. As per the classification of countries by the United Nations (2017), Bangladesh is an LMIC. Therefore, the aim of this pilot study was to assess the perception of older adult population living in Dhaka city about the health benefits of UGS and the potentials and barriers of UGS as a public health resource.
2. Methodology 2.1. Data source In this study UGSs are defined as the unbuilt urban spaces that are covered with some sort of vegetation and recreational amenities and that the public can access easily, such as parks, playground (Schipperijn et al., 2010, Kabisch et al., 2016). For this pilot study, data were collected by interviewing older adult people who were using the sample parks and playground in Dhaka city. A total of two-hundred two (202) ‘ageing’ green space users from 10 parks were interviewed through a structured questionnaire. The number of users to be interviewed was determined based on the relative size of the green spaces. The sample of green spaces (parks) was selected through a stratified sampling procedure. Wards from both Dhaka North and South city corporations were stratified according to the quartile of a composite socioeconomic index, named socio-economic profile for disadvantaged (SEPD) of Dhaka city. SEPD was developed mainly by using the principal component analysis and a structured procedure that was used in constructing other socioeconomic indexes such as socioeconomic index for areas (SEIFA) in Australia (Australian Bureau of Statistics, 2011). The methodology and validation of the SEPD are beyond the scope of this paper scope.
Two parks or public open space were randomly selected from each SEPD quartile through a random number generator. To maximize the coverage of Dhaka city is represented, two popular UGS (Chandrima Udyan and Ramna Park) were selected. Figure 2 shows the location of the sample parks in the Dhaka city along

Shuvo, F.K., Islam, M.M., Awal, R. Promoting urban green spaces (UGS) for healthy and active ageing
343
with the size and number of users surveyed in parenthesis. The collection of data was conducted over a week in the month of June in 2017. The users of parks and playground (elderly) users were asked about the frequency of UGS use, accessibility and health conditions. To maintain the anonymity of the respondents, personal information (e.g. name, age, address) of the respondent was not asked. Written consent was taken from the participants after informing them about the potential usage of the responses that included publication in scientific journals.
Figure 2: Sample green spaces and number of users surveyed

Shuvo, F.K., Islam, M.M., Awal, R. Promoting urban green spaces (UGS) for healthy and active ageing
344
2.2. Statistical analysis
After cleaning the data, key outcomes such as motivation and reasons for using UGS, perceived characteristics and potential areas of improvements were summarized by the number of respondents. Chi-square test was used to test whether the responses to the relevant questions varied between gender and education level.
3. Result and findings 3.1. Characteristics of the respondents
A total of 202 users were interviewed, who according to the data collectors were matured and adult. Table 1 is showing the descriptive statistics of the study results.
Table 1: Descriptive statistics of the variables under analysis
Variables Male Female Total Sample green spaces 10 Sample size of users 59.40% (120) 40.60% (82) 202 Education status PhD 5 (4.2%) 0 5 (2.5%) Masters 29 (24.2%) 3 (3.7%) 32 (15.8%) Bachelors 47 (18.3%) 15 (39.2%) 62 (30.7%) HSC 24 (28%) 23 (20%) 47 (23.3%) SSC 6 (5.0%) 27 (32.9%) 33 (16.3%) No education 5 (4.2%) 7 (8.5%) 12 (5.9%) No response 4 (3.3%) 7 (8.5%) 11 (5.4%) Employment status Government job 19 (15.8%) 7 (8.5%) 26 (12.9%) Private job 36 (30.0%) 8 (9.8%) 44 (21.8%) Business 43 (35.8%) 2 (2.4%) 45 (22.3%) Retired 11 (9.2%) 3 (3.7%) 14 (6.9%) Unemployed 11 (9.2%) 0 11 (5.4%) Home maker 0 61 (74.4%) 61 (30.2%)

Shuvo, F.K., Islam, M.M., Awal, R. Promoting urban green spaces (UGS) for healthy and active ageing
345
3.2. Opportunities and barriers for healthy and active ageing through the promotion of UGS
Based on the data analysis some of the key opportunities and barriers are summarized here:
i. Socioeconomic differences in UGS accessibility
This study finds that socio-economically well-off population are the major users of the green space, which reflect the findings of another study of Nilufar (2009). This finding offers to formulate policies that can promote low-income population to use green spaces for positive ageing. However, most of the female green space users are high school graduate and housewife, which means professional women are less exposed to the green spaces. Future studies should investigate the reason behind such trend.
ii. Accessing the UGS
Though the majority of the respondents visit parks or playground within their neighbourhood, a significant (26%) portion of ageing users lacks access (=travel time > 15 min) to a nearer green space (figure 2). The area within 10-15 minute travel distance was considered as a neighbourhood (Wood et al., 2017). The above result can be explained by the findings of why people use a particular green space. This study finds that the majority of the ageing people use green spaces because they do not have any other option. The quality and ambient environment have almost zero influence on them to motivate the use of green space.
Figure 2: Travel distance to green space measured by travel time

Shuvo, F.K., Islam, M.M., Awal, R. Promoting urban green spaces (UGS) for healthy and active ageing
346
iii. Important feature of UGS
The walkway was found to be the major feature in the parks and playground that attracted the majority of visitors to use green space. It is because adult people visit nearest UGS mainly for walking purposes. However, considering the result in another way, this is a limitation because the existing UGS in Dhaka likely to in short of other amenities that could be supportive of healthy ageing.
iv. Health status and motivation
Most of the green space users have been facing multiple chronic and non-communicable diseases. Diabetes was found to be the major leading disease among the sample population, which is comparatively higher among females. This trend matches the secondary data on the leading factor of deaths in Bangladesh. However, Almost all of the users agreed that green spaces have a positive impact on health, though 75% of the users are already having health issues. The study finds that majority of the ageing population is using green space on doctors’ advice. These findings contradict with the previous finding of Nilufar (2009) that found physical exercise and leisure as the main reason for green space usage. This study finds physical exercise as the second major reason. Thus, promotion of UGS could be considered as an effective preventive measure to tackle chronic diseases for the adult population in Dhaka.
v. Gender perspective
Chi-square test shows that responses to most of the questions significantly differ by the sex group except for travel distance, disease prevalence, the specific reason for choosing the green space for a visit and attractive green features. These findings indicate that the opinions about these variables do no vary between male and female. Thus, investment in the development and revitalization of UGS can be expected to give return on public health benefits.
4. Discussion
The strong and potential links between urban planning and population health are largely unnoticed by both planners and health specialists, though these two fields have a common root. Previously the link between cities as objects of planning and design, and governance and health problems related to infectious and communicable diseases seemed obvious. Now, after a century focus of urban planning has embarked on the health and well-being of the urban population in the high and developed country contexts. Ironically, this linkage is still substantially absent in a country like Bangladesh. Findings in this study may able to help ‘self-management’ of diabetes and other chronic diseases and
Shuvo, F.K., Islam, M.M., Awal, R. Promoting urban green spaces (UGS) for healthy and active ageing
347
reduce health-related expenditure. Diabetes is found as the leading single chronic disease among the ageing population in our study, which agrees with the global prevalence of this chronic disease (http://www.healthdata.org/bangladesh). A number of studies found that diabetes cause comorbidity of other chronic diseases (Long and Dagogo‐Jack, 2011, Struijs et al., 2006, Katon, 2008). Our study found that a higher number of females using green spaces are housewives. This situation might be regarded as ‘self-management’ of chronic diseases for them to reduce the medical cost of the household. Prevention of chronic and non-communicable disease needs measures beyond medical solution only. Green space planning should promote this ‘self-management’ of chronic diseases through effective strategies so that more ageing population get attracted to neighbourhood green spaces.
However, Lack of green space options is a major urban planning issue, which also caused a significant percentage of the population to travel for more than 20 minutes. Since our research only interviewed who were using green space, given the findings on the green space features, it is very likely that a major portion of the ageing population does not use green space. Thus, accessibility is the key factor for the green spaces to be utilized for positive health and well-being outcome. Level of accessibility does have a different meaning for different group and sex of population. Given the high competition of land use priority within the city corporation area, supplying more parks and playground likely to be a very tough job. As environmental improvement is associated with environmental gentrification (Rupprecht and Byrne, 2018, Curran and Hamilton, 2012), researcher in the developed country contexts proposed ‘just green enough’ policy (Wolch et al., 2014, Haffner, 2015). This policy put emphasize on developing small and pocket parks (e.g. Shyamoli shishu park). Potential green space visitors often have to travel to the nearest green space through unpleasant, unsafe local road. The footpaths may have been broken or non-usable, busy interactions, etc. Thus, as a short-term remedy to increase the accessibility of the existing green spaces, adequate and safe footpath should be installed and maintained. This footpath should be friendly for the disable and slow walking elderly people. With better public participation and politically consensus approach to a new urban planning tool can help to create more green spaces within Dhaka city. Redevelopment of the congested part of the city is such a tool. The ongoing ‘Detailed Area Plan (2016-35)’ is trying to implement a redevelopment plan through land readjustment tool.
5. Conclusion
Shuvo, F.K., Islam, M.M., Awal, R. Promoting urban green spaces (UGS) for healthy and active ageing
348
Multiple health benefits of urban green spaces were reported by the researchers around the work. Though this study shows opportunities and motivation of green space users, Bangladesh understandably is far behind realizing the beneficial impacts of UGS. Especially, the exact health and wellbeing benefits of using parks and playground for the older adult population are not well known among the policymakers in Bangladesh. Based on this pilot study findings, we can hypothesize that proper planning and management of urban green space in the cities of LMICs like Bangladesh can substantially prevent many of the chronic health issues and reduce household medical costs.
Reference
ASTELL-BURT, T., FENG, X. & KOLT, G. S. 2014. Greener neighborhoods, slimmer people? Evidence from 246,920 Australians. Int J Obes (Lond), 38, 156-9.
AUSTRALIAN BUREAU OF STATISTICS 2011. Socio-Economic Indexes for Areas (SEIFA). Canberra: Australian Bureau of Statistics.
BOUDINY, K. 2013. ‘Active ageing’: from empty rhetoric to effective policy tool. Ageing & Society, 33, 1077-1098.
CAIRNCROSS, L. 2016. Active ageing and the built environment. Housing Learning and Improvement Network.
CURRAN, W. & HAMILTON, T. 2012. Just green enough: contesting environmental gentrification in Greenpoint, Brooklyn. Local Environment, 17, 1027-1042.
DADVAND, P., SUNYER, J., BASAGANA, X., BALLESTER, F., LERTXUNDI, A., FERNANDEZ-SOMOANO, A., ESTARLICH, M., GARCIA-ESTEBAN, R., MENDEZ, M. A. & NIEUWENHUIJSEN, M. J. 2012. Surrounding greenness and pregnancy outcomes in four Spanish birth cohorts. Environ Health Perspect, 120, 1481-7.
DIABETES PREVENTION PROGRAM RESEARCH GROUP 2002. Reduction in the incidence of type 2 diabetes with lifestyle intervention or metformin. N Engl j Med, 2002, 393-403.
FENG, X. & ASTELL-BURT, T. 2017. The relationship between neighbourhood green space and child mental wellbeing depends upon whom you ask: Multilevel evidence from 3083 children aged 12–13 years. International journal of environmental research and public health, 14, 235.
HAFFNER, J. 2015. The dangers of eco-gentrification: what’s the best way to make a city greener. The Guardian, 6.
HARTIG, T. 2008. Green space, psychological restoration, and health inequality. Lancet, 372, 1614-5.
KABISCH, N., STROHBACH, M., HAASE, D. & KRONENBERG, J. 2016. Urban green space availability in European cities. Ecological Indicators, 70, 586-596.
KATON, W. J. 2008. The comorbidity of diabetes mellitus and depression. The American journal of medicine, 121, S8-S15.
LLOYD-SHERLOCK, P., MCKEE, M., EBRAHIM, S., GORMAN, M., GREENGROSS, S., PRINCE, M., PRUCHNO, R., GUTMAN, G., KIRKWOOD, T., O'NEILL, D., FERRUCCI, L., KRITCHEVSKY, S. B. & VELLAS, B. 2012. Population ageing and health. Lancet, 379, 1295-6.
LONG, A. N. & DAGOGO‐JACK, S. 2011. Comorbidities of diabetes and hypertension: mechanisms and approach to target organ protection. The Journal of Clinical Hypertension, 13, 244-251.
MAAS, J., VERHEIJ, R. A., DE VRIES, S., SPREEUWENBERG, P., SCHELLEVIS, F. G. & GROENEWEGEN, P. P. 2009. Morbidity is related to a green living environment. Journal of Epidemiology and Community Health, 63, 967-973.
MARKEVYCH, I., SCHOIERER, J., HARTIG, T., CHUDNOVSKY, A., HYSTAD, P., DZHAMBOV, A. M., DE VRIES, S., TRIGUERO-MAS, M., BRAUER, M. & NIEUWENHUIJSEN, M. J. 2017. Exploring
Shuvo, F.K., Islam, M.M., Awal, R. Promoting urban green spaces (UGS) for healthy and active ageing
349
pathways linking greenspace to health: Theoretical and methodological guidance. Environmental research, 158, 301-317.
NILUFAR, F. 2009. Urban life and use of Public Space: Study of responsive Public Open Spaces for Supporting Urban life in Dhaka City. unpublished research report, Bangladesh University of Engineering and Technology, Dhaka.
O'BRIEN, E. 2014. Planning for population ageing: Ensuring enabling and supportive physical-social environments – Local infrastructure challenges. Planning Theory & Practice, 15, 220-234.
RUPPRECHT, C. D. D. & BYRNE, J. A. 2018. Informal Urban Green Space as Anti-Gentrification Strategy? Just Green Enough, 209-226.
SCHIPPERIJN, J., STIGSDOTTER, U. K., RANDRUP, T. B. & TROELSEN, J. 2010. Influences on the use of urban green space – A case study in Odense, Denmark. Urban Forestry & Urban Greening, 9, 25-32.
SINGH, S. D. 2015. Loneliness, depression and sociability in old age. The International Journal of Indian Psychology, Volume 2, Issue 2, No. 2, 73.
STRUIJS, J. N., BAAN, C. A., SCHELLEVIS, F. G., WESTERT, G. P. & VAN DEN BOS, G. A. 2006. Comorbidity in patients with diabetes mellitus: impact on medical health care utilization. BMC health services research, 6, 84.
TUOMILEHTO, J., LINDSTROM, J., ERIKSSON, J. G., VALLE, T. T., HAMALAINEN, H., ILANNE-PARIKKA, P., KEINANEN-KIUKAANNIEMI, S., LAAKSO, M., LOUHERANTA, A., RASTAS, M., SALMINEN, V., UUSITUPA, M., AUNOLA, S., CEPAITIS, Z., MOLTCHANOV, V., HAKUMAKI, M., MANNELIN, M., MARTIKKALA, V., SUNDVALL, J. & GR, F. D. P. S. 2001. Prevention of type 2 diabetes mellitus by changes in lifestyle among subjects with impaired glucose tolerance. New England Journal of Medicine, 344, 1343-1350.
UNITED NATIONS 2013. World population ageing 2013, UN. UNITED NATIONS 2017. World Economic Situation and Prospects 2017. In: NATIONS, U. (ed.).
New York. VAN CAUWENBERG, J., NATHAN, A., BARNETT, A., BARNETT, D. W. & CERIN, E. 2017.
Relationships between neighbourhood physical environmental attributes and older adults’ leisure-time physical activity: a systematic review and meta-analysis. Sports Medicine, 1-26.
VAN HOOF, J., KAZAK, J. K., PEREK-BIALAS, J. M. & PEEK, S. T. M. 2018. The Challenges of Urban Ageing: Making Cities Age-Friendly in Europe. Int J Environ Res Public Health, 15, 2473.
VAN REGENMORTEL, S., DE DONDER, L., DURY, S., SMETCOREN, A.-S., DE WITTE, N. & VERTÉ, D. 2016. Social Exclusion in Later Life: A Systematic Review of the Literature. Journal of Population Ageing, 1-30.
VISKOCHIL, R., MALIN, S. K., BLANKENSHIP, J. M. & BRAUN, B. 2017. Exercise training and metformin, but not exercise training alone, decreases insulin production and increases insulin clearance in adults with prediabetes. Journal of applied physiology (Bethesda, Md. : 1985), 123, 243-248.
WOLCH, J. R., BYRNE, J. & NEWELL, J. P. 2014. Urban green space, public health, and environmental justice: The challenge of making cities ‘just green enough’. Landscape and Urban Planning, 125, 234-244.
WOOD, L., HOOPER, P., FOSTER, S. & BULL, F. 2017. Public green spaces and positive mental health–investigating the relationship between access, quantity and types of parks and mental wellbeing. Health & Place, 48, 63-71.
WORLD HEALTH ORGANIZATION 2007. Global age-friendly cities: A guide, World Health Organization.
WORLD HEALTH ORGANIZATION 2017. Global strategy and action plan on ageing and health (2016–2020). 2016.

Urban Services and Facilities - Transport and Infrastructures - Economy and Governance
Fourteen papers under a wide theme named “Urban Services and Facilities- Transport and Infrastructure- Economy and Governance” were presented in two days under “Session-3”. Short glimpse of those papers are as follows:
1. Nur Nabi Alam and Ahsanul Kabir work on polycentric structure of urbanism, their street network, circulation for the sustainability of Khulna city. Researcher reveal the main problems of the city centre including the congestion spot, demand and supply availability of footpath, the impact of land uses on the existing roads etc. Finally, the researchers suggest how to improve the functionality of the business centres.
2. In their research paper, Nazmul Huda and Mahbuba Ahsan uses multinomial logistic model to look into people’s behavior of transportation mode choice with the basic components which makes up their choice. This study uses the various factors like; age, gender, distance, cost for traveling, etc. in the model to find out how these variables influence their mode choices.
3. Paper of Lamiya Mubashira Khan assesses the operational characteristics of road segment and congestions in some of the major intersections of Khulna city. By conducting various survey and studies, researcher calculated Level of service (LOS), Speed performance index (SPI) and Road segment congestion index (RSCI) to assess the state and performance of the roads and intersections.
4. Md. Rakibul Hasan Himal and others explore how the inter-district bus terminals of Dhaka functions currently and who are responsible for the management of the terminals. This study examines “In and Out flow” of buses and passengers, role of stakeholders and their hierarchy and relationship in managing of the terminal activities. Finally, proposes recommendations to resolve the functional and managerial issue of bus terminals.
5. Paper of Tamanna Akter and Shahrior Pervaz shows the prevalence, causes and the characteristics of motorcycle accidents and casualties in Dhaka city area. With the evidence and analysis they recommended some measures for the improvements of motorcycle operation and the safety of motorcycle riders in the Dhaka metropolitan city.
6. Nazmul Ahsan studies the accessibility of existing bus stops and then determines optimal locations of bus stops in Dhaka Metropolitan Area (DMA). He conducts survey and assessments to evaluate the accessibility of bus stops and then categorizes hem into four classes: excellent, good, moderate and poor. To ensure an adequate coverage and quick accessibility to the bus stops by all users, this paper makes plan for improvement.

7. Taufiquzzaman Pranto proposes an online platform where travel behavior data will be stored and updated regularly. Public and private office/institute gets the access and utilizes online data. He opines that it will help the public and private offices to adjust their office schedule which will help in optimum utilization of public transportation of the city.
8. Paper of Md. Israq Sadmani and Md. Muntasir Mamun conducts a comparative analysis among the markets focusing on these characteristics in the light of the standards set by Food and Agricultural Organization (FAO) and exploring the supply-distribution system of these markets. Policy interventions regarding the space arrangements, location and infrastructure facilities of these wholesale kitchen markets will help to improve the performance of this system.
9. Urban local governments facing enormous pressure of financial resource management and accountability in maintenance of roads and infrastructure. In this context Asif Khan and Md Mizanur Rahman proposes a Road Management System (RMS), is a systematic approach of inventory, which will keep record the condition of road network chronologically. Using this system, Local Government can easily take decision of repair and maintenance of roads.
10. Md. Awual Baksh, Sharmin Akter make an attempt to find out the factors affecting trip generation Baneshwar area of Rajshahi city. This paper provides important information related to the trip generation characteristics of the Baneshwar growth centre and thereby researchers find land use attributes are highly correlated to the trip generation.
11. Tanzid Hossain and others examine the walking related built environment factors and the relationship between the built environment and young adult walking in Uttara neighborhood. The research concludes that increase of street and footpath width, promotion of safety measures and development of traffic factors increase the walking ability of the young adult within a neighborhood.
12. This paper of Sanjida Bintey ALi and Mehedi Hasan explores the gender issue in budgeting and planning process at local level and women’s participation in it. This research identifies the strategies and operational approaches to strengthen gender responsive planning and budgeting. They propose an environment to enable key stakeholders to accelerate their efforts to ensure that gender sensitive planning and budgeting at the local level.
13. Kashfia Tabassum and others attempt to analyze the existing scenario of three accident-prone intersections of Dhaka city- Sonargaon-Panthapath, Jatrabari, and ShaplaChattar and redesign the intersections to ensure pedestrian safety. They propose plans considering their land use, traffic flow, surroundings and the available standards to improve the road safety of the intersections.
14. Abdulla - Al Kafy and others evaluate the land use and natural resources for future sustainable ecotourism site development in Rajshahi city using Geographic information system (GIS). This study selected five criteria and four GIS-based layers in determining the areas that are best suited for ecotourism development. Result of the study will help in future development of tourism facilities and management by environmentalist and planners working in local, central governments and non-governmental organizations.
- Dr. Akter Mahmud
General Rapporteur
Alam1 , Kabir2 City Centre Sustainability
350
Street network, Circulation and Road inventory for City Centre Sustainability
Nur Nabi Alam, Masters Student, Urban and Rural Planning Discipline, Khulna University, Bangladesh
Ahsanul Kabir, PHD; Professor, Urban and Rural Planning Discipline, Khulna University, Khulna, Bangladesh
Abstract
Due to the polycentric structure of Urbanism, the activities are dispersed from the central business district to the various business districts in a large city. These business districts grow as a function of land use interaction and transport infrastructure. Various developing countries of the world are implying this notion of Polycentrism from socioeconomic requirements in order to decentralize economic activities, increase mobility and reducing traffic congestion from the CBD. The advantages of the growth of these business districts are; they disperse employment closer to the population and they induce some traffic away from the central business district. These centres promote sustainable (balanced development), economic competitiveness and social cohesion. But various problems like traffic congestion, poor public transport and pedestrian access negatively affect functionality of these centres. In this research; taking Rupsha Traffic More (More is a bengali Word, the term is used to describe Intersection), Royal More, Moilapota More and Shib Bari More as study area, the researcher tends to explore the road circulation pattern, public transportation route, land use type and major problems of the business centres. The researcher has used field survey, personal experience and key informant surveys in collecting information and also reviewed literatures of high impact journals. The researcher has used photos, maps, tables to analyse information. The research has revealed the main problems of the city centre including the congestion spot, demand and supply availability of footpath, the impact of land uses on the existing roads etc. Finally, the researcher will suggest how to improve the functionality of the business centres. This research will help policy makers in undertaking development interventions.
Keywords
Polycentrism , Central Business District, Sustainable Development
1. Introduction Like other big cities of the world, the notion of polycentrism is apparent in Khulna. The CBD of Khulna city is known as Dakbangla. There are other business centres in Khulna city,for example: Rupsha Traffic more, Royal More, Shibbari More etc. The functionality of these business centres depends on transportation routes. For example: Due to close proximity from the river named Rupsha, the Rupsha Traffic More has developed as a wholesale marketplace and Royal More has developed as a commercial area due to its location and establishment of various educational institutions. But various crucial problems like: development blurs beside the streets, traffic congestion, in effective utilizations of urban space; disrupt circulation and communication of these business centres from the adjacent areas. The urban design elements are so poorly planned and implemented that they fail to ensure proper channelization of the pedestrian and vehicular traffic. The construction works are conducted in the rainy season which creates water logging within the street. As a result

Alam1 , Kabir2 City Centre Sustainability
351
the vehicles face mechanical damage and the sufferings of the people are worth to be mentioned. There are very few designated parking spaces for the shopping centres, the commercial buildings and educational institutions who attracts major traffic. Besides the number of illegally registered light vehicles like- Easy-bikes and Mohendra have increased so much that they have started to create traffic congestion within these business districts. There are very few designated parking spaces for these vehicles. It is a common scenario in the Shib bari and Royal More that the buses are parked on the main street which reduce effective carriageway width and induces traffic congestion. This illegal parking is also responsible for road accidents as the pedestrians have visual obstacles to see the vehicles coming from the opposite of buses. The objective of this research is to focus on business centres of Khulna city and then explore the circulation pattern, connectivity and major problems of this business district. This research will help the authorities to understand the current problems and prospects and will also help to formulate policies in order to develop the functionality and attractiveness of these business centres.
2. Theoretical Perspectives of Polycentrism From passage of time, the focus of urban policies has changed. They tend to represent urban areas as attractive commodities. From then, the concept Polycentrism has gained popularity (Säynjäjoki et al.,2014). Scholars have defined polycentrism from different point of view. (Kruger and Buckingham,2012) have explained Polycentrism from economic point of view . In their research, they discussed on the increasing economic prospects of developing business centres. On the other hand, (Rousseu,2009) described Polycentrism as middle income people centric development. He opined that, it will work as opportunity for them to increase their socio-economic condition. Rice (2009) has defined business centres having concentration of high order service activities which includes retailing, office and other municipal functions. In his study, he described the evolution of business centres by giving examples of two world cities like- London and Cape town. London adopted the polycentric development by the nineteenth century by separating the shopping area from the main city. Activities requiring less centrality like- court houses and libraries, were relocated towards the edge of the city. Similiarly in Cape town, the CBD was flanked by industrial parks in the southern suburbs of Claremont and Rondebosch. (Rice, 2009). Scholars put less emphasis on the problems which can be emerged due to the fast development of business centres and how cities can cope with those. But, In this research, the researcher has described the accessibility and existing problems of business centres in the context of fast developing cities like-Khulna. Researcher believed that, through problem identification and taking necessary steps, the functionality of business centres can be enhanced.
3. Methodology There has been previous research on the main CBD of Khulna city which is Dakbangla. But less research on the other business centres of Khulna city like-Rupsha Traffic More,Royal More, Shib Bari More,Moilapota More, Boira College More whose significance has been increasing. Among them, in this study the researcher has conducted study on Rupsha Traffic More,Royal More and Shib Bari More due to his easy accessibility, time and manpower

Alam1 , Kabir2 City Centre Sustainability
352
constrains. The researcher finds inadequate walking space in the footpath as one of the main reasons of traffic congestion in business centres. To explore the scenario of the existing condition of the footpath researcher used field survey which include video recording. Researcher has coined the term pedestrian demand supply analysis where demand is how many persons are using the footpath of business centres of Royal More, Shib Bari More and Rupsha More in an hour and the existing width of footpath is the supply. the number of pedestrian per hour has been collected through 5 min video recording during peak hour ( Morning and Evening). Then it is converted into hour. And the supply data like footpath width, pedestrian facilities has also been collected through visual observation and interviewing. Then analysis has been done manually. Besides, researchers conducted 03 group discussions involving 5/6 study participants in each discussion. The study participants were mainly the residents of Royal More, Shib Bari More and Rupsha More area. Researcher discussed on the existing problems and the solutions for increasing the performance of the business centres with the study participants. In addition to that, researchers experience as resident of Khulna city helped him to explore the issues and guide the whole research.
4. Road Circulation Pattern of the business centres The functional importance of business centres depend on their land use characteristics. For example- Shib Bari More and Royal More has more commercial land uses while Rupsha Traffic More has more retail land uses.
Figure 1: Google Map of Business Centres
Rupsha Traffic More is connected with Royal More through primary road named Khan Jahan Ali road, and Royal More is connected with Moilapota and Shib Bari through KDA Avenue

Alam1 , Kabir2 City Centre Sustainability
353
Road. Rupsha More has connectivity with secondary roads like-Azizur Rahman Road,Gagon Babu road, Tootpara Central Road. Royal More has connectivity with secondary roads like-Yusuf Row road,Baitipara Road, Taltola Road. Shib Bari More has connectivity with secondary roads like-Goborchaka Road, Sheikhpara Road and with another primary road named Majid Sarani road.
5. Public Transportation and Non-Motorized Transportation route within business centres
Public Buses operate through the Khan Jahan Ali Road and Upper Jessore Road connecting Rupsha Ghat with Doulotpur .Other public transportation modes like-Easy Bike operates through all the main roads, whereas Mohendra operate through the Khan Jahan Ali road and Upper Jessore Road.
Figure 2: Bus Route Map of Khulna city
Non motorized transport like-Rickshaws operate through all primary and secondary roads around business centres. Pedestrian facilities are not adequate, but still people prefer walking for commuting shorter distances. A brief overview of pedestrian demand-supply analysis is given in the following table-

Alam1 , Kabir2 City Centre Sustainability
354
Table 1: Pedestrian Demand-Supply analysis
Business Center Footpath Total Demand
(person/per hour)
Footpath Width
(Supply)
Rupsha More
Rupsha Ghat-Satkhira
Ghosh Dairy
300 3’
Rupsha Ghat-Sandha
Bazar
600 6’
Shib Bari More
Infront Agrani Bank 660 5’
Infront US Bangla 480 4’
Infront KDA office 300 5’
Royal More
Infront Castle Salam 828 3’
Infront Royal Hotel 276 4’
(Field Survey, 2017)
From the (Table-1) it can be said that the footpath width of these business centres are not consistent with the pedestrian demand. These two footpaths have more demand due to increasing commercial and educational land uses.But unfortunately, these footpaths are narrow and most often pedestrians have to walk on the main roads which increases the possibility of road accident.
6. Attractive Features of the business centres The authority has taken various steps to enhance the beautification of Royal More, Moilapota More and Shib Bari More. Variuos sculptures and Fountains were built on the intersections of Royal More, Shib Bari More and Moilapota More to increase the attractiveness. Moreover, the lighting system of Shib Bari More has been improved to ensure security. The traffic personnel are involved in controlling the traffic flow in the Shib Bari More, but it is absent in other intersections. There are also pedestrian precincts on Shib Bari More and Royal More. Medians are also designed with beautiful landscapes to increase the attractiveness.
7. Major Problems of the business centres 7.1 Rupsha More
The Sandha Bazar is situated beside the footpath in the Rupsha Traffic More. As a result, the pedestrians face obstacles using the footpath. They also have to endure odors while using footpaths. Moreover the footpaths are encroached by various illegal temporary shops,
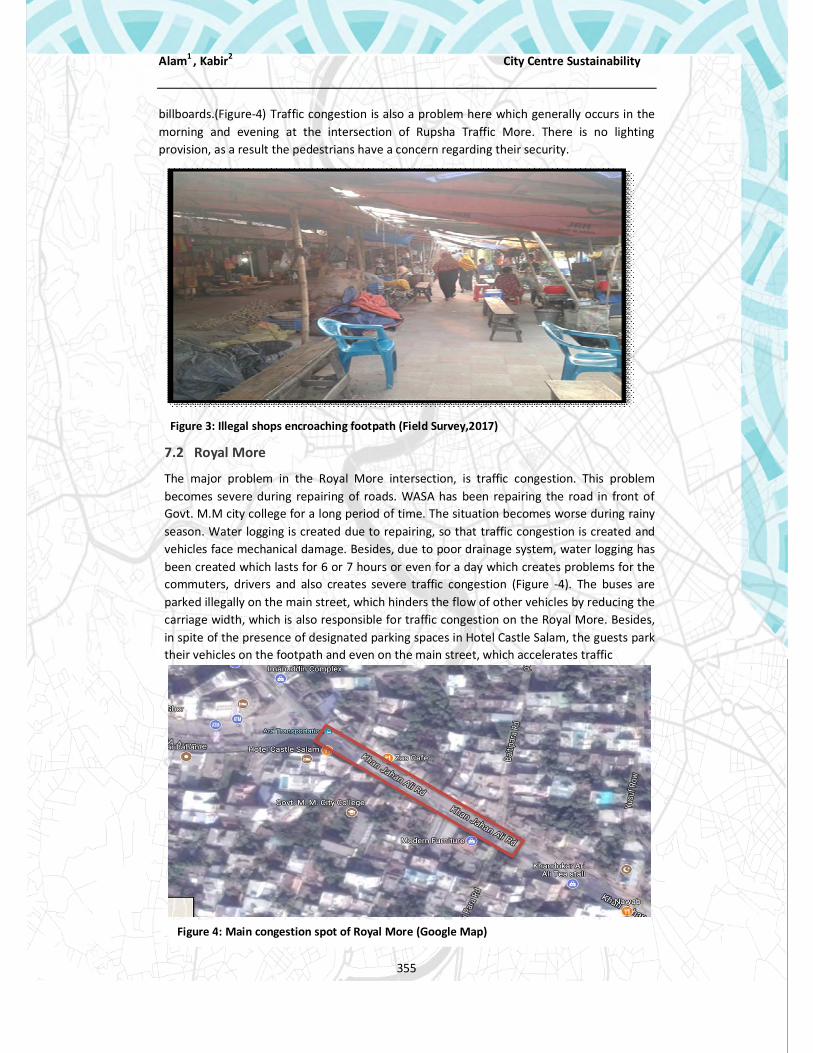
Alam1 , Kabir2 City Centre Sustainability
355
billboards.(Figure-4) Traffic congestion is also a problem here which generally occurs in the morning and evening at the intersection of Rupsha Traffic More. There is no lighting provision, as a result the pedestrians have a concern regarding their security.
Figure 3: Illegal shops encroaching footpath (Field Survey,2017)
7.2 Royal More
The major problem in the Royal More intersection, is traffic congestion. This problem becomes severe during repairing of roads. WASA has been repairing the road in front of Govt. M.M city college for a long period of time. The situation becomes worse during rainy season. Water logging is created due to repairing, so that traffic congestion is created and vehicles face mechanical damage. Besides, due to poor drainage system, water logging has been created which lasts for 6 or 7 hours or even for a day which creates problems for the commuters, drivers and also creates severe traffic congestion (Figure -4). The buses are parked illegally on the main street, which hinders the flow of other vehicles by reducing the carriage width, which is also responsible for traffic congestion on the Royal More. Besides, in spite of the presence of designated parking spaces in Hotel Castle Salam, the guests park their vehicles on the footpath and even on the main street, which accelerates traffic
Figure 4: Main congestion spot of Royal More (Google Map)

Alam1 , Kabir2 City Centre Sustainability
356
congestion problem. Moreover, the footpaths are illegally occupied by the shops which creates obstacles for the pedestrians. The footpaths are damaged on certain locations which can turn out to be lethal in future. The roads are damaged further, due to poor maintenance. As a result frequent road accident occurs mainly on the Khan Jahan Ali road.
Figure 5: Traffic Congestion in Royal More (Field Survey,2017)
7.3 Shib bari More
The traffic congestion problem is not that much severe in Shib Bari More like-Royal More or Moilapota. But sometimes congestion occurs infront of US-Bangla Airline office due to illegal parking of Easy Bikes and Mohendra.(Figure:6). Sometimes buses also illegally park on the main street which creates visual obstruction for both the drivers of other vehicles and pedestrians.(Figure-7). Due to lack of perception about the approaching vehicle on the other side of the parked bus ; the pedestrians and easy bikes often have to face accidents. Moreover, the footpaths are illegally encroached by shops and pedestrians have no other way than use the main street.
Figure 6: Traffic Congestion Spot in Shib Bari More (Google Map)

Alam1 , Kabir2 City Centre Sustainability
357
The footpath in front of KDA office is quite dark, which increases the possibility of robbery. Also, there is no footpath in front of the under constructed railway station. The garbage are dumped on the street and pedestrians have to use main road which is very risky. The roads are also damaged in certain locations which increases the possibility of road accident.
Figure 7: Traffic Congestion Spot in Shib Bari More (Field Survey,2017)
8. Recommendations 8.1. Rupsha More
This temporary bazar is to be relocated into notun bazar. Illegal shops have to be evicted and a new place has to be allocated for them. Good lighting system is to be introduced Parking on the street has to be banned. There is no footpath infront of Singer Plus Showroom. Footpath with proper amenities
and landscapes should have to be constructed there.
8.2 Royal More
The authorities should take necessary steps by prohibiting illegal parking on the footpath and also on the main street by the buses. Inside Sonadanga Bus Terminal, there are enough spaces for parking, so the buses do not need to park on the main streets of Royal More. Besides the authorities should take necessary actions against Hotel Castle Salam for overlooking the problems created by their guests parking on the footpath
The authorities should be aware of the sufferings of the people and complete their necessary works timely.
The footpaths should be repaired and designed with proper amenities and landscapes for pedestrians. Parking on the footpath has to be banned. The authorities have to take steps against the shop keepers who block pedestrian spaces by keeping billboards, construction materials on the footpath
Waterlogging is one of the main problems of Royal More and it’s surrounding areas which negatively affect the accessibility. So drainage facilities have to be improved.

Alam1 , Kabir2 City Centre Sustainability
358
As traffic congestions and number of vehicle has been increasing; pedestrians are finding it difficult to cross the roads. So over bridges should be constructed for the convenience of the pedestrians.
8.3 Shib Bari More
It is a matter of regret that, there is no lighting provision in front of the building of planning authority of Khulna (KDA). Proper lighting has to be ensured considering the security of the pedestrians
The authorities should consider constructing a over bridge for the convenience of the pedestrians.
Illegal shops in front of Zia Hall has to be evicted. Illegal Parking by buses on the main street has to be banned. The authorities should consider constructing a easy bike and Mohendra stand to reduce
traffic congestion.
9. Conclusion In this paper, the researcher has explored certain issues .The business centres have good connectivity with primary and secondary roads. But, Public Bus does not serve all the business centres along it’s route. Meanwhile , most of the surrounding land uses around business centres; are commercially mixed. The main problems of the business centres are traffic congestion, poor maintenance of the roads, damaged footpath, illegal parking on the main road and encroached footpath by various illegal shops. The economy and growth of Khulna city will depend on the effective functionality of the business centres. As land value is high in these business centres, more mixed land uses should be promoted in order to attract more diversified land uses. The authorities will have to realize the importance of these business centres and take steps to improve the accessibility and beautification of the business centres.
10. References Holden, Erling, & Norland, Ingrid T. (2005). “Three challenges for the compact city as a
sustainable urban form: Household consumption of energy and transport in eight residential areas in the greater Oslo region”. Urban Studies, Volume-42
Han, S.S., 2005. “Global city making in Singapore: a real estate perspective.” Progress in Planning ,Volume- 64 (August)
Han, S. S., 2010. “Managing motorization in sustainable transport planning: the Singapore experience”. Journal of Transport Geography, Volume- 18 (March)
Krueger, Rob., & Buckingham, Susan. (2012). “Towards a ‘consensual’ urban politics? Creative planning, urban sustainability and regional development.” International Journal of Urban and Regional Research, Volume-36
Lubna,Jerin; Aman, Ainul Hasan; Morshed ,Monjur; Islam, Ariful; “Cohesive City and Urban Informality: Battery-bikes in Khulna City”, Equality in the City:Making cities Socially Cohesive

Alam1 , Kabir2 City Centre Sustainability
359
Rousseau, Max. (2009). “Re-imaging the city centre for the middle classes: Regeneration, gentrification and symbolic policies in ‘Loser cities’. International Journal of Urban and Regional Research, Volume-33.(September)
Rice,G.A.,2009. Central Business District. Elsevier
Shi,Beixiang; Yang,Junyan;2015.” Scale, distribution, and pattern of mixed land use in central districts”, Habitat International,Volume.46 (April)
Säynäjoki, Eeva-Sofia, Inkeri, Ville, Heinonen, Jukka. and Junnila, Seppo (2014). “How central business district developments facilitate environmental sustainability – A multiple case study in Finland”. Cities, 41.
Song, Yan., & Knaap, Gerrit-Jan. (2004).” Measuring the effects of mixed land uses on housing values”. Regional Science and Urban Economics, Volume-34
Van der Waals, Jochem. (2000). “The compact city and the environment: A review”. Journal for Economy and Social Geography, Volume-91
Huda, Nazmul; Ahsan, Mahbuba Factors Influencing Transportation Choice
360
Research Paper
Factors Influencing Transportation Mode Choice of Low Income People of Khulna City
Nazmul HUDA, KUET, Bangladesh Mahbuba AHSAN, KUET, Bangladesh
Abstract
With the advancement of technology and rapid urbanization, nowadays, day to day transportation has become more important than ever. Being the 3rd largest city of Bangladesh, Khulna plays a vital role in the transportation sector having different modes of transport available. Considering the socio-economic condition of the city is crucial for transportation planning and policy making. The modes of transport are sometimes more expensive for the low-income group than they can afford. So, it can be inferred that they often seek the alternative choices of modes than regular. This, in turn, can influence quite a lot in the demand for transportation and broadly in the urban transportation sector. This study uses the multinomial logistic model to look into people’s behavior of transportation mode choice with the basic components which makes up their choice. Different factors which play a vital role in this type of choice are selected then analyzed through this model to find out their relationship with the made choices and the factors. Age, gender, distance, cost for traveling, etc. variables were used in the model to find out how these variables influence their mode choices. The overall accuracy of 69% and higher for the more popular modes signifies that this study can have an impact in deciding which modes are in need of more supply or restriction. Also, economic viability for each mode can be reassessed and implemented in greater transportation planning.
Keywords
Transportation Planning, Mode Choice Behaviour, Low-Income People, Multinomial Logistics Model
1. Introduction The role of transportation in society is remarkable as it has effects on mobility, economic growth, governance, land use and quality of life. Transportation makes people to change their tendency to live like a roaming creature to ones living in permanent settlement. Transportation has a substantial influence on political characteristics of society, enabling large areas to be governed from one place and fostering representative government of large nations (Levinson, 2008). Travellers apply their own spatial, transportation, built environment and network related knowledge each time they make any travel related decisions. This decisions then include their ownership of vehicles, travel priority etc. Decision making also is constrained by many factors such as safety issue, comfort etc. (Li, 2016). The pattern of mode choice behaviour indicates the preference of travellers influenced by different indicators such as, age, gender, income, occupation etc. (Chee W. L., 2013).

Huda, Nazmul; Ahsan, Mahbuba Factors Influencing Transportation Choice
361
Travelers are also influenced by travelling patterns, demographics, government policies and strategies, built environment, and personal choice and behaviour towards different types of mode (Saneinejad, 2010). Income is one of the major indicators for mode choice behavior in a developing country like Bangladesh. Income, fare, travel distance are the major factors effecting mode choice behaviour of the travellers (Li, 2016). Projecting and evaluating the demand of intercity transportation of a metropolitan city like Khulna has become pivotal requirement (Miskeen, 2013). Models are used to estimate parameters which are required to understand future demand. For forecasting the market share of commuters or passengers in different types of mode, travel behaviour of passengers is need to be understood (Li, 2016). Perceiving the characteristics of intercity travel pattern and mode choice behavior of passengers are the prerequisites of planning process of transport sector (Miskeen, 2013). Khulna is the third largest city in Bangladesh having a total population of around 1.8 million. In comparison to other cities in Bangladesh the variety in the use of transportation modes in Khulna is comparatively low in number. Khulna City Corporation consists of 31 wards. This study aimed at finding out how the mode choice varies for low income people with the change of comfort level, cost, trip length, time of the day, and availability of vehicles, safety and security with the help of preparing a multinomial logit model. This model will help transport planning perspective based on indicators concerned with travel behavior of passengers.
2. Literature Review Different studies conducted on mode choice preference provided the basis to carry on this study. Demographic and social indicators were the most significant factors in most of them. Satiennam et al. (Satiennam, 2011) and Thamizh Arasan and Vedagiri (Arasan, 2011) have interpreted from their study that females have a higher probability of shifting to public transport. Alvinsyah, Soehodho and Nainggolan’s study (Soehodho, 2005) reached to the conclusion that males seem to be more interested in driving than taking public transport. Morikawa et al. (Morikawa, 2003) conducted a study which found the result that car or motorcycles are more preferable to male travelers than women in the cities of Japan, except for some locality. Nurdden, Rahmat and Ismail (Nurdden, 2007) also found that female travelers prefer public transport in Malaysia. In Taiwan, Chang and Wu (Chee W. L., 2010) discovered male prefer driving than female in case of elderly too. Age is also an important factor to mode choice behaviour. A positive concluding relationship between traveller’s age and their probability to use public transport was established (Ismail, 2011) and it was showed that age and likelihood of using public transport have a strong relationship. Nurdden, Rahmat and Ismail (Nurdden, 2007) found that the elderly were ready to shift to public transport if the safety and quality is ensured in public transport. Diaz (Diaz, 2011) concluded that in Manila and Busuanga Island in Philippines, higher income people are less concerned about the variations of the fare in different modes. Abuhamoud, Rahmat and Ismail (Ismail, 2011) found that the use of cars is dependent on number of family members, vehicle ownership and income. A study was conducted in Netherlands using multinomial logit model to evaluate the impacts of mode choice behavior of the passengers. Liu et al. also used multinomial logit models to explore the impacts of weather conditions on passenger mode choice behavior in a study. Another study was conducted by Al-Ahmadi, in Saudi Arabia, 2006, using the same model and this study concluded with the decision that in

Huda, Nazmul; Ahsan, Mahbuba Factors Influencing Transportation Choice
362
Saudi Arabia, journey time, income, number of household members, car ownership etc. are the important factors for mode choice behavior (Assi, 2018).
Jessore City is a growing economic centre in the south western part of Bangladesh. The rate of motorization is rising faster in other parts of Bangladesh. Jessore is till these days, dependent on non-motorized transports for transportation sector. It was found that people tend to select the mode based on the factors: fare and comfort. Rickshaws are mostly preferred when the passengers want a convenient trip with reasonable fare. The low and mid-low income people in Jessore prefer bicycle because of its low maintenance cost. Walkers are also enjoying trips especially for short distance (Ahmad, 2010).
2.1. Traveller Characteristics Influencing Mode Choices A traveller makes a few decision beforehand his travel. Like, the destination, travel time and the mode via which the travel will take place. Among this decisions the decision of mode is very important as it affect the overall transportation scenario and economy of travelling. Different socio economic factors, personal choice, geographical reasons might contribute to that decision. It has been found that the factors influencing the decisions are, age, income, travel time, travel cost etc. Also family size and education level of traveler plays a big role in choosing the mode (Nicolau & Mas, 2005). Trip facilities travel comfort, travel time and accessibility is also regarded as the influential decision making factor (Ben-Akiva & Bowman, 2001). Income plays the most important role for mode choice, thus people of different income group can’t really put into a same equation rather different model for different economic group should be prepared (Train & McFadden, 1978). Vehicle ownership is possible for high income group and their consideration for other factors except comfort are very low (Ling & Ning, 2016). Purpose of the trip plays a big role here as for business and work punctuality and availability is the highest priority where leisure or pastime activities based travel requires more comfort.
2.2. Transport Mode Characteristics In Khulna, Mahindra, easy bike, rickshaw, bus, van etc. are used as transport mode. According to the statistics of BBS 2011, the number of registered rickshaw, van and easy bike are 10707, 3995 and 942. The unregistered number of these are 1711, 9545 and 497. In Khulna City Corporation, the average fare per km of rickshaw, van and easy bike are 10, 6 and 5 (BBS, 2013). For travelling small distance, van, rickshaw and easy bikes are used whereas for long distance, Mahindra and bus are used. The speed of bus and Mahindra are faster than easy bike, rickshaw and van.
3. Materials & Methodology Data collected in this study was obtained from all over Khulna City. The data collected in this study are all from primary sources as there have been very little information available regarding transportation mode choice and behavioural studies in Khulna. The factors which are related and influence the decision of mode choice has been noted down from different sources like KDA, KCC, focus group discussion and key informant survey. Then there was a query for the available data regarding those factors. For the missing data and also for update version of the data a questionnaire has been developed. The sampling method was based on a primary reconnaissance survey which indicated where the most trips are generated. Then the survey was done in those places in suitable time which are mostly working hours. In case

Huda, Nazmul; Ahsan, Mahbuba Factors Influencing Transportation Choice
363
of age, people from all age group who make their own travel decision has been interviewed. From the data then different analyses has been done. Total of 30 collectors collected response from 20 respondents each. Out of total 600 responses, 450 has been included in the model calibration process and the rest in model validation process. Time of the day and time of the week were different to ensure that the mode choice is not biased to individual day or time. In order to ensure that each respond is correct, people who were travelling right then in any of the modes were surveyed only. When each respondent got off from a particular vehicle he/she was then surveyed. People in Khulna and our target group understand only one language which is Bangla but the for the researchers and surveyors betterment the questionnaire was prepared in English. Responses were collected from the respondents and recorded by the surveyor so the respondent didn’t need to interfere with any writing. People have been told at the first place that their choice of mode selection and what makes them choose a certain mode is the main goal of this study. They have been also said that if any problem persists in any type of mode then they have to be more open about it so the problems of one mode can be identified. Before the main survey a pilot survey was conducted this included questionnaires from previous studies like this from around the world. It has been assumed that not all the questions are valid in any geographical context. So, questions were expected to get removed or modified from the questionnaire. Stratified random sampling technique has been used in this case to select the sample size. Khulna is a southern district of Bangladesh and the town itself is located a bit in southern region. So, people from northern part daily commute to the city. Starting from Fultola, a place 20 kilometres north from Khulna was the northern most places where they survey took place. Then gradually at almost all major stops in this 20 kilometres straight road and inside the city at various locations the survey has been performed.
The questions asked in the survey all relate to the fact how their decision modifies or what are the underlying conditions. The questionnaires asked basic question for every respondents like, name, age, gender. Though very basic questions but later it was found that these basic things plays the most important role for mode choice related decision making. After the basic questions a bit personal information like income, occupation was asked. These factors are also very important in decision making. Then questions about trips were asked. After each individual had finished a trip the start point, end point, duration, comfort level, other available types of transport has been questioned. After that travel related more questions have been asked such as, if the individual likes to shift mode in a journey, how long individual has to walk to get one transport. Problems associated with the journey have been also asked. These questions included about the low availability of certain modes, security issues, poor road condition, higher travel expense or high waiting time have been considered. The questionnaires also accepted any suggestion regarding the transportation system which is stated preference category response.
The responses have been each coded into dummy variables as our research technique was to perform the analysis by performing a multinomial regression analysis which can be performed if the dependent variable is categorical variable. So, the choice of mode being categorical variable this regression technique has been adopted. IBM SPSS 23 Statistical Analysis software has been used to conduct the analysis. This logistics regression finds out the probability of choosing one mode with respect to another individually. For each parameter and for each choice probabilities are calculated which then are formed into a linear equation for each mode.
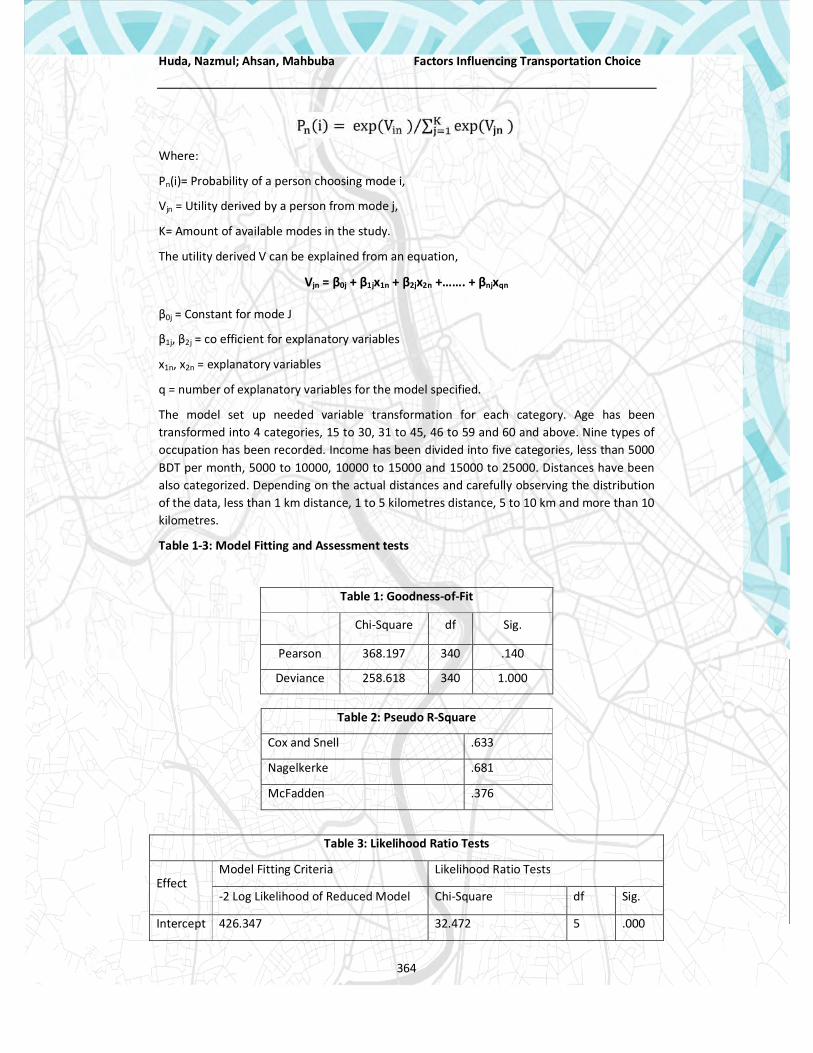
Huda, Nazmul; Ahsan, Mahbuba Factors Influencing Transportation Choice
364
Where:
Pn(i)= Probability of a person choosing mode i,
Vjn = Utility derived by a person from mode j,
K= Amount of available modes in the study.
The utility derived V can be explained from an equation,
Vjn = β0j + β1jx1n + β2jx2n +……. + βnjxqn
β0j = Constant for mode J
β1j, β2j = co efficient for explanatory variables
x1n, x2n = explanatory variables
q = number of explanatory variables for the model specified.
The model set up needed variable transformation for each category. Age has been transformed into 4 categories, 15 to 30, 31 to 45, 46 to 59 and 60 and above. Nine types of occupation has been recorded. Income has been divided into five categories, less than 5000 BDT per month, 5000 to 10000, 10000 to 15000 and 15000 to 25000. Distances have been also categorized. Depending on the actual distances and carefully observing the distribution of the data, less than 1 km distance, 1 to 5 kilometres distance, 5 to 10 km and more than 10 kilometres.
Table 1-3: Model Fitting and Assessment tests
Table 1: Goodness-of-Fit
Chi-Square df Sig.
Pearson 368.197 340 .140
Deviance 258.618 340 1.000
Table 2: Pseudo R-Square
Cox and Snell .633
Nagelkerke .681
McFadden .376
Table 3: Likelihood Ratio Tests
Effect Model Fitting Criteria Likelihood Ratio Tests
-2 Log Likelihood of Reduced Model Chi-Square df Sig.
Intercept 426.347 32.472 5 .000

Huda, Nazmul; Ahsan, Mahbuba Factors Influencing Transportation Choice
365
The data required for the models were of three types. Which are socio economic variables, service quality variables and trip details. There are a mix of qualitative data and quantitative data. The assumed and surveyed data do not fully reflect on the model as many factors which are considered to be meaningful in decision making does not have any statistical significance. Thus due to the lack of goodness of fit or impractical relationship those version of the models have been rejected. In order to accept the model as a fit model there need to be adequate significance value in ‘Model fitting information’ in SPSS. The value there was satisfactory. Pseudo R square test and likelihood ratio test both come as conclusive and thus the model is properly fit.
4. Data Analysis & Interpretation Total of 15 variables were selected initially for this study. The factors chosen were from pilot survey conducted in the city to bring out the factors associated with the local context. Out of all the variables few of them proved to be statistically fit for the analysis. All of the variables have been tested in numerous conditions and changes in base mode have been also considered. Finally, only the fittest model has been presented in the paper.
The objective of this research was to identify the behaviour of mode choice. Under which condition people tend to make a decision more was the main point of this research. In general, people in Khulna lives mostly in the town which is small and town people are financially sound. But, the research objective was to identify the behaviour among the poor people who tend to live more in the outer periphery region and the distance in around 5-20 kilometres away from the town.
Table 4: Multinomial Mode Choice Model Estimates for Low Income People of Khulna
Mode Chosen B Std. Error
Sig. Exp(B)
95% Confidence Interval for Exp(B)
Lower Bound
Upper Bound
Bus
Intercept -6.485 2.104 .002
Gender -.418 .590 .045 .658 .207 2.090
Age -.991 .328 .002 .371 .195 .706
Income -1.287 .443 .004 .276 .116 .658
Distance 3.095 .492 .000 22.077 8.423 57.863
Gender 448.166 54.291 5 .000
Age 532.253 138.378 5 .000
Income 448.986 55.112 5 .000
Distance 593.290 199.415 5 .000

Huda, Nazmul; Ahsan, Mahbuba Factors Influencing Transportation Choice
366
Rick
shaw
Intercept -.107 1.066 .090
Gender .964 .332 .004 2.623 1.368 5.028
Age -.825 .177 .000 .438 .310 .620
Income .995 .245 .000 2.704 1.673 4.371
Distance -1.449 .272 .000 .235 .138 .400
Bicy
cle
Intercept 25.784 2.173 .000
Gender -19.977 0.000 .000
Age -.589 .465 .026 .555 .223 1.381
Income -1.502 .744 .044 .223 .052 .958
Distance -2.082 .810 .010 .125 .025 .610
Mot
orcy
cle
Intercept -3.174 2.764 .051
Gender -2.461 1.092 .024 .085 .010 .725
Age -1.713 .529 .001 .180 .064 .508
Income 1.803 .746 .016 6.065 1.406 26.168
Distance .892 .451 .048 2.439 1.008 5.899
Mah
indr
a
Intercept .335 .897 .078
Gender -1.053 .300 .000 .349 .194 .628
Age -1.825 .196 .000 .161 .110 .237
Income .435 .201 .030 1.544 1.042 2.288
Distance 1.369 .213 .000 3.932 2.589 5.970
Travel cost is one of the most significant variable in choosing a specific mode yet the parameter is absent in the presented model. In previous studies it has been always found out that total travel cost negatively affects mode choice. Traveler always looks for cheaper modes but in the case of Khulna city the surveyed people of interest is daily commuter and they have some fixed preference which doesn’t really alter with anything. Another point here is the cost per mode of transportation is uniform here. So there is no variability between average cost and total cost. So, when an individual makes a choice the main reason is the average cost. The modes which have been considered in this research are, bus, rickshaw, motorcycle, Mahindra, easy bike. Mahindra being the diesel engine (three wheeler) and easy bike is electric bike having a very low speed. Bus is the cheapest mode here with per kilometre fare around 1 taka, Easy-bike and Mahindra having a fare around 2-3 taka per km and rickshaw has the highest fare of more than 10 taka per kilometres. This fare doesn’t change with time of day or week of the day as different workers’ union have made them fixed. So, the comparison with changing fare level is not possible in this context.
Huda, Nazmul; Ahsan, Mahbuba Factors Influencing Transportation Choice
367
But another economic factor which provided a very strong statistical relationship is Income level of an individual. It has been commonly known that with higher income level people will opt for more comfortable ride rather than cheap ones. Also, the cheap rides like, bus and Mahindra is congested with people so people with a little higher income level opt more to rickshaw and motorcycle. Though we stated at first that we are only considering the low income people, but tendency to have personal motor vehicle is common in the poor classes too. With income level being higher people tends to go for motor cycle first, then they opt for rickshaw and then Mahindra but bus is the most scorned vehicle even in the poorest classes. As the condition of intercity buses running in this region are awful and they carry 2-3 times more passenger than designed.
Gender here has proven to be a very key factor for mode choice. A few decisions can be taken from the analysis and everything is very meaningful here. First of all for a transportation type bus, the gender is insignificant. As from previous discussion, it was stated that bus in this region are mostly crowded by the very low income people and they commute a road which is long and costly for other means. So, the choice is not really available. Both low income male and female use this mode without any other prior thought. They do not really consider the comfort level or high waiting time. Females opt more for rickshaw in the town as it is a personal vehicle and privacy and comfort is ensured. Commuting through motorcycle for females have been seen in the town in recent days but this analysis did not find any such participant. This study finds gender a very decisive variable in the analysis so, it is necessary to consider participation of male, female, under age children to be considered in transportation planning of the city. Family can’t be treated as unit here as every member can have different opinion and preference regarding mode choice.
Age has negative signs for all the modes that means with the increasing age the probability for choosing a mode will eventually decrease. Very old people seem to have very low probability to choose Mahindra as their mode but in real field experience old people have been found to choose this mode with comfort. Young and middle age people have been found to ride motorcycle as this scenario is common all over the world. Everywhere it was found that young and middle age people seem to have vehicles of their own. Due to our study being limited to low income people only, only motorcycle as their private vehicle is listed.
Final and the most important variable of the study will be the distance, as from the field experience of the researchers it has been well known that, people of Khulna city and its periphery mostly decides their vehicle type on how far they are going to go. Same individual has been found to choose all type of vehicles under different criteria. The most important of that will be the distance. Distance plays a major role and it is well known to every one of them. But statistically proving that from an analysis is required for both policy making and for application of models in other area of the country. Probability of choosing bus increases most rapidly with distance as it is the fastest and cheapest mode of transport. For Mahindra, it is also positively related that means the higher the distance the more probability of going in Mahindra comparing to other modes. Easy bike also have a positive sign but the B value is very low which indicates people not tend to go after a certain distance with this vehicle. Field studies report distance under 3 kilometers is preferred for Easy bike users. Rickshaw being very slow and costly vehicle has negative relation with distance.

Huda, Nazmul; Ahsan, Mahbuba Factors Influencing Transportation Choice
368
The model stands for the modes are,
Bus = -6.485 -0.418(Gender) -0.991(Age) -1.287(Income Level) +3.095(Distance)
Rickshaw = -0.107 -0.964(Gender) -0.825(Age) +0.995(Income Level) -1.449(Distance)
Bicycle = 25.784 -19.977 (Gender) -0.589(Age) -1.502(Income Level) -2.082 (Distance)
Motorcycle = -3.174 -2.461(Gender) -0.991(Age) -1.713(Income Level) +0.892 (Distance)
Mahindra = 0.335 -1.053(Gender) -1.825 (Age) +0.435 (Income Level) +1.369(Distance)
Table 5: Multinomial Mode Choice Model Classification Accuracy Assessment
Observed
Predicted
Bus Rickshaw Bicycle Motorbike Mahindra Easy Bike
Percent Correct
Bus 11 0 0 0 12 1 45.8%
Rickshaw 0 56 0 0 9 22 64.4%
Bicycle 0 1 1 0 2 3 14.3%
Motorcycle 0 1 0 0 10 0 0.0%
Mahindra 1 8 0 0 127 36 73.8%
Easy Bike 2 19 0 0 26 144 75.4%
Overall Percentage
2.8% 17.3% .2% 0.0% 37.8% 41.9% 68.9%
All the final variables except, gender for bus and age for bicycle has been proven statistically significant at 0.95 and in few case 0.99 confidence level. The model was good fit as explained in the previous chapter and R2 value pf 0.68 means the 68% decision could be explained through the model. The classification matrix shows the classification accuracy where it is seen that Mahindra, easy bike and rickshaw have the highest accuracy of 74%, 75% and 65% respectively. These three modes are the most important ones as for our population class this is the most significant vehicles. The logit model is evaluated through chi square test and log likelihood has also been tested.
The respondents were asked about the distance of their residence from the nearest stop where they can take transport facilities. 52% of the respondents stated that their residence is very close to the stop (0-50 m). Only 1% respondents said that their house is far from the stop (more than 500 m).

Huda, Nazmul; Ahsan, Mahbuba Factors Influencing Transportation Choice
369
Figure 1: Distance from the Nearest Stop
In addition other than that of legal transport stoppages, 72% of the respondents get transport near the house and the rest do not get transport near their house. Respondents of this survey lastly were asked about their opinion on various transportation aspects. 57% of the respondents are satisfied with the current fare system. This percentage represents the acceptance of the current fare rate by the users.
5. Summaries & Conclusion This research tried to identify a model which predicts transport mode choice behaviour of low income people of Khulna city. Due to their income level they can’t afford any high cost means, like private car, reserved auto-rickshaw etc. Both revealed preference and stated preference method have been used to collect the data. Variables collected through the survey have been used to predict their choices of modes and for this analysis multinomial logistic regression model has been prepared which can better identify discrete choice behaviour. The model prepared the choice model based on the utility provided by each route. Overall 69% accuracy has been maintained with this model.
This study can be helpful in various levels. For the city it has been applied, there transport planning decision can have a new dimension and new vehicle permit can follow along the predicted mode choice of the citizens. Following this methodology, it is possible to predict with higher accuracy by increasing the sample size and survey quality. Different cities might end up differently in the choice model but also from there the underlying causes of the difference in preference can be identified. The result shows that the approach taken in this study is perfectly viable in our local context.
6. References Alila, Y., 1999. A Hierarchical Approach for the Regionalization of Precipitation in Canada.
Journal of Geophysical Research, pp. 645-655.
Bangladesh Bureau of Statistics, 2013. Final Report of Economic Census: 2013, Dhaka: Bangladesh Bureau of Statistics.

Huda, Nazmul; Ahsan, Mahbuba Factors Influencing Transportation Choice
370
Bogue, D. J. & Beale, C. L., 1945. Economic areas of the United States. New York: Free Press of Glencoe.
Botkin, D. B., 1982. Environmental Science: Earth as a Living Planet. s.l.:Wiley.
Boudeville, J. R., 1966. Problems of Regional Economic Planning. s.l.:Edinburgh University Press.
Cesario, F. J., 1973. A Generalized Trip Distribution Model. Journal of Regional Science, pp. 233-247.
Chand, M. & Puri, V., 1983. Regional Planning in India. Delhi: Allied Publishers.
Dinpashoh, Y. et al., 2004. Selection of variables for the purpose of regionalization of Iran's precipitation climate using multivariate methods. Journal of Hydrology, pp. 109-123.
Everson, L. R., 1988. Land-use change in Illinois, ASA: The influence of landscape attributes on current and historical land use. Landscape Ecology, pp. 45-61.
Fisher, J. L., 1969. Regional Planning: Determining the Public Interest. In: M. M. Hufschmidt, ed. Regional Planning Challenge and Prospects. s.l.:Praeger.
Glasson, J., Therivel, R. & Chadwick, A., 1974. An Introduction to Regional Planning. s.l.:Routledge.
Häntzschel, J., Goldberg, V. & Bernhofer, C., 2007. GIS based climate regionalisation in complex terrain for low mountain ranges. Meteorological Applications, pp. 33-42.
Isard, W., 1966. Methods of regional analysis. s.l.:Рипол Классик.
Liu, K. F.-R., Hung, M.-J., Yeh, P.-C. & Kuo, J.-Y., 2014. GIS-Based Regionalization of LCA. Journal of Geoscience and Environment Protection, pp. 1-8.
Noronha, V. T. & Goodchild, M. F., 1992. Modeling Interregional Interaction: Implications for Defining Functional Regios. Annals of the Association of American Geographers, pp. 86-102.
Pandey, G. R. & Nguyen, V.-T.-V., 1999. A comparative study of regression based methods in regional flood frequency analysis. Journal of Hydrology, pp. 92-101.
Rengasamy, S., 2011. Types of Regions & Regionalization of India. In: Regional Planning & Development. s.l.:s.n.
West, E. G., 1966. Regional Planning: Facts and Fallacy. Lloyds Bank Review, pp. 34-35.
Himal, M. R. H.; Zaman, M. Y. & Hasan. M. M. U Problems of Bus Terminals
371
Research Paper
PROBLEMS OF BUS TERMINALS IN DHAKA CITY:
FUNCTIONAL ARRANGEMENT AND MANAGERIAL
ISSUE
Md. Rakibul Hasan Himal, Department of Urban and Regional Planning, BUET; Bangladesh.
Md. Yeasin Zaman, Department of Urban and Regional Planning, BUET; Bangladesh.
Md. Musleh Uddin Hasan, Department of Urban and Regional Planning, BUET; Bangladesh.
Abstract
Bus terminal is one of the most important structural element of transportation system. In Dhaka, there are three inter district bus terminals at Gabtoli, Mohakhali and Sayedabad, serving inter district mobility to and from Dhaka. But it found that all the terminals are in poor condition both in terms of infrastructural and managements aspects. This study explores how the inter-district bus terminals of Dhaka functions currently and who are responsible for the management of the terminals. Buses and passenger flow in and outside of the terminals is studied to explore the functional arrangement. Common problems like loading and offloading of passengers on the road instead of inside the terminal, setting up ticket counter outside the terminals instead of inside them, poor condition of toilet managed by City Corporation, insufficiency of parking space, lack of entry and exit facility for passengers and absence of resting rooms for bus staffs are found in all the terminals. There is deviation in both of flow (entry and exit) of buses and terminal users (passengers, drivers and other staffs) from ideal practices. This study examines the roles of different stakeholders and their hierarchy and relationship in managing of the terminal activities. Management system is found less effective in all terminals as there is higher influence of labor union and bus owners’ associations than City Corporation in decision making process of the terminal. Whole management system of bus terminal is to be reformed to resolve the functional and managerial issue of bus terminals in Dhaka.
Keywords
Bus Terminal, Functional Arrangement, Management System, Stakeholder Analysis
1. Introduction 1.1. Background of the study Integrated transportation system as well as infrastructural development and management are important for smooth traffic functioning of a city. In Dhaka, there are three inter district bus terminals (RSTP, 2016). The bus terminals connect Dhaka to other districts though the national highways. According to PPIAF (2015), Bus terminal is a point for the starting and ending of a bus route. Buses use the point for stopping, turning or reversing and also waiting

Himal, M. R. H.; Zaman, M. Y. & Hasan. M. M. U Problems of Bus Terminals
372
before departure on their return journeys. On the other hand, bus depot is a transport system’s operating base which provides parking accommodation, servicing and maintenance facilities for vehicles, an administrative function, and facilities for staff. A fully enclosed depot is sometimes referred to as a garage (PPIAF, 2015). In Dhaka all three bus terminals are used as bus depot as well as bus terminal. Parking demand is increasing but parking space remain unchanged so that terminal. Generally the intercity terminal is located in the core of the downtown and local transit is available to give access easily (Chiara & Crosbie, 1989).
The grouping and management of resources based on similar activities or operations is called functional arrangement (Enna, 2015). In the bus terminal, grouping and management of different facilities and elements based on similar activities or operations on the sequence of process steps is considered as functional arrangement. At present, the terminals are not working properly due to lots of mismanagement and deficiencies in the functional arrangement. But there are few studies on the terminals to find out the actual scenario of management and functional system of three inter district bus terminal. Problems regarding functional arrangement and management of the terminals are needed to be found out.
1.2. Objective of the study The study has two main objectives. They are:
To study existing condition and functional arrangement of bus terminals in Dhaka city To identify the stakeholders involved and study the managerial issue related to the
problems of the bus terminals.
1.3. Scope of the study This study explores how the inter-district terminals of Dhaka functions daily and who are the responsible for the operating and managing work of the terminals. This study examines the stakeholder roles and their hierarchy in operating and managing of the terminals. The real scenario of managing process of terminal is analysed through this study. The issues of bus and terminal stuffs are raised in this study.
This study also tries to explore the reasons behind the deficiencies of functional arrangement of the terminals and lack of utilizing these facilities. Some recommendations regarding the betterment of the terminals are given in the last part of this study.
2. Literature Review A bus terminal is the point where a bus route starts or ends. This is the point where buses can stop, turn or reverse and also wait before departing on their return journeys. Passengers can board and alight from vehicles from here. According to SGArchitects(2015), there are some requirements which are the essential ingredients for planning and designing bus terminals. Three different user types for primary elements are considered regarding a bus terminal’s infrastructure development. These include passengers, terminal staff and bus staff. These elements are: ticketing and queuing, passenger waiting areas, Passenger conveniences (drinking water facilities and toilets), Passenger circulation, boarding/departing areas, facility entry, tourist information, security, including CCTV cameras, retail lease space, dormitories and lodging, cloak room etc.
According to MacArthur (1997), Stakeholders can be individuals, groups, a community or an institution and also it can be of any form, size and capacity. They are involved in the organization internally or externally. Internal Stakeholders are those individual or group that participates in the management of the organization. Primary Stakeholders are the other
Himal, M. R. H.; Zaman, M. Y. & Hasan. M. M. U Problems of Bus Terminals
373
name of internal stakeholders. (AENEAS, 2009). External Stakeholders do not participate in the day to day activities of the entity. But the actions of the organization influence them. They deal with the organization externally also have no ideas about the internal matters of the organization. It is also called secondary stakeholders (AENEAS, 2009). According to Brugha (2000), stakeholder analysis is an approach for generating knowledge about individuals or organization to understand their behaviour, intentions, inter relations and interests. It also assess the influence of stakeholders on decision-making or implementation processes.
It is necessary to establish a set of formal organizational structure, rules and norms towards provision of the terminal facility (SGArchitects, 2015). Building a stable institutional framework is required which relates to - how and who will operate the terminal, how the facility will be maintained, how revenue (for the facility’s development and maintenance) will be generated and what (if any) the business model will be (Finn & Mulley, 2011).
According to Hackenbroch & Hossain (2012), informality is an important mode of urban governance and an expression of different constellations of power. Informality is a mode of state regulation which is practiced after careful consideration of the power and influence of the population group. The state tolerates the informal activities of the powerful and also supports them through the extension of infrastructures and facilities. The same state criminalizes similar activities of other groups who are less likely to generate the power to dominate. Long term practice and stabilization of such institutional forms expand the difference between the privileged and those unable to participate to the same extent. As a result it generates an uneven spatiality of power (Yiftachel, 2009). According to Akbar & Campos (2009), bus terminals are turned over to politically connect operating companies. Control of bus terminals gives operators rent-seeking opportunities including proceeds from illicit trade and shipment of contraband goods. This type of system persists because it helps to serve the interest of powerful stakeholders. The capacity of regulatory institutions is kept weak and City Corporation doesn’t have enough manpower to take necessary actions. Coordination within City Corporation is weak and also coordination between BRTA and other agencies is also lacking.
3. Methodology The study for the designated three inter-district bus terminals includes secondary data collected from key informant interview of DCC officials and terminal authority as well as primary data collected by observation survey and focus group discussion. To find out real scenario and location of the facilities of the bus terminal, observation survey has been conducted. These bus terminals were visited to explore the condition of the facilities and to check if the functional arrangement complies with the ideal functional arrangement of bus terminal. One FGD for each terminal was conducted with the passengers of that terminal. It was conducted for cross checking the data collected from observation survey with the perception of the passengers. They were asked about why they don’t use the facilities provided by the bus terminals and condition of the facilities. Focus group discussions were conducted on last week of January, 2019
4. Study Area Profile Three designated inter-city bus terminals of Dhaka city are included in the study area which are Sayedabad bus terminal, Mohakhali bus terminal and Gabtoli bus terminal. The locations

Himal, M. R. H.; Zaman, M. Y. & Hasan. M. M. U Problems of Bus Terminals
374
of three terminals are shown in Map 1. Among these, Sayedabad bus terminal is situated to the eastern part of Dhaka City. The area of Sayedabad terminal is 40,500 Sq.m. About 2000 buses are operated from this terminal per day. These buses ply on 87 different routes. There are four major zones which include eastern, north-eastern, south-eastern and southern districts of Bangladesh from which buses arrive to and depart from the Sayedabad terminal.
On the other hand, Gabtoli bus terminal was built in 1945. It is located at Gabtoli adjacent to Dhaka- Aricha highway. These terminal buses cover mostly the northern and south-western districts of Bangladesh. The area of the present terminal is 123400 sq.m. About 2200 inter-district buses terminal are mainly operated from this terminal. These buses ply on 61 different routes. Mohakhali inter-district bus terminal is built in 1984 and is located near the Mohakhali intersection and is adjacent to the Tejgaon industrial area. The area of the present terminal is 36,400sq.m. This terminal mainly operates around 800 inter-district buses.
Map 1: Map of study area Source: Prepared by authors
Location of Inter District Bus

Himal, M. R. H.; Zaman, M. Y. & Hasan. M. M. U Problems of Bus Terminals
375
5. Existing functional arrangement of three bus terminals 5.1. Sayedabad bus terminal Effective passenger and bus flow in the bus terminal is necessary to run the functional system smoothly. Functional arrangement of Sayedabad bus terminal and flow of buses and passengers are described below;
From the Figure 1, it is seen that terminal buses mostly use Dhaka Syhlet highway to reach the entry point of the bus terminal. Usually Jonopod Mor, flyover entry point inside the terminal and in front of terminal building are the passenger drop off zone. The arriving passenger use CNG, Rickshaw or local bus to reach their destination.
These buses without passenger enter the terminal through the entry point. Then using the internal road buses are parked in the designated parking spaces inside the terminal. When it is time for another trip, these buses use the departure lane and go through any of the exit points (exit 1a or exit 1b). Some of the passengers buy ticket from inside ticket counter and buses pick them up from there. But most of the passengers buy tickets outside the terminal and passengers are loaded in Dhaka Sylhet highway or Atish Dipankar road.
5.2. Gabtoli bus terminal In Gabtoli bus terminal, since the offloading area is outside of the terminal area, passengers are alight from bus at the opposite side of the terminal on the highway. Local bus station and feeder services are available at the opposite side of the terminal and passengers can get easy access to the services and local buses and can go to their destination after being offloaded from bus. (Figure 2) According to Figure 2, after offloading passengers, buses get entry to the terminal through u turn at the Technical Mor. As terminal has only one entry point, all buses uses the entry point (Appendix E). Buses of small companies are parked in the parking area till next trip. On the other hand, buses of large companies go their companies’ workshop. After parking buses, bus stuffs go their home if they have no further trip on the same day. If there is any
Figure 1: Functional arrangement of Sayedabad bus terminal

Himal, M. R. H.; Zaman, M. Y. & Hasan. M. M. U Problems of Bus Terminals
376
need to wash or repair bus, bus staffs wash and repair bus before leaving the terminal. Some labors are also hired for purpose based on daily wages.
Passengers are loaded in the bus in the parking area. This process is done informally. Bus staffs called lineman normally guide their passengers to their specified bus. Buses exit the terminal through the first exit. The buses which are parked on the Dhaka- Aricha highway, they take passengers from the outside terminal. In this case, passengers don’t need to buy ticket. They pay their fair to the bus staffs directly in the bus.
5.3. Mohakhali bus terminal In Mohakhali bus terminal, passengers are offloaded from bus on the Tajuddin Ahmed Road and entry point of the Terminal. Local buses and feeder services are available in front of the terminal and the exit point and passengers can get easy access to the services and local buses to go to their destination after being offloaded from bus. After offloading passengers, bus get entry to the terminal entry point and park in the parking area. As terminal has only one entry point for buses, all buses uses the entry point. All buses are parked in the parking space of the terminal. Ena Bus Company use the loading bay as parking spaces. If there is any necessary to wash or repair bus, bus staffs wash and repair bus before departure. (Figure 3)
Figure 2: Functional arrangement of Gabtoli bus terminal
Figure 3: Functional arrangement of Mohakhali bus terminal

Himal, M. R. H.; Zaman, M. Y. & Hasan. M. M. U Problems of Bus Terminals
377
Through using feeder service passengers get entry (entry 1 or exit 1) into the terminal near the ticket counter area. Passengers buy ticket from the ticket counter and wait for buses in the waiting room. Passengers get information regarding arrival and departure time and availability of buses from the information center. They watch television in the waiting room to pass the waiting time. They are loaded in the exit point of the terminal with the help of bus staffs who normally guide them. Bus gets exit from the terminal through the exit point. In Mohakhali terminal, all buses take passengers from inside the terminal. But sometimes, they don’t need to buy ticket, they can pay their fair to the bus staffs directly in the bus.
5.4. Deficiencies in the functional arrangement of bus terminals As buses use the main road as drop off zone in Sayedabad bus terminal, so the buses have to wait in the road until it has finished unloading the passengers. As a result, it creates long queue on the road and occurs traffic congestion. According to the standard, offloading and loading area should be in the terminal area. But in Gabtoli terminal, offloading point is outside the terminal. Passengers are unloaded from the bus at the opposite side of the terminal on the highway and go to their destination using the feeder service. Since they have to cross the road to get into the terminal building and use the facilities, most of them don’t feel any interest to use the passenger amenities. Small company buses use the terminal premises as parking spaces. But large company buses like Hanif, Shamoly, Soudia etc have their own workshop to park their buses. So repairing and washing of the small company buses has to be undertaken in the terminal premises which turns the place into untidy and chaotic. There is no separate facility for bus staffs, terminal staffs and passengers. As no separate facility is provided for bus driver and conductor, they have to take rest inside the bus after a long journey. These hamper physical and mental health of the driver and conductor. Passengers don’t have to enter the terminal to use the waiting room and they wait in the road to hire feeder services like rickshaw, CNG, local bus, taxi to reach their destination. It also leads to passenger unsafety and inconvenience. As most of the departing passengers buy ticket from outside ticket counter, they board in buses in the road. As these facilities are far away from pick up point of buses, they don’t prefer to use those facilities.
6. Stakeholder analysis 6.1. Internal and external stakeholder of bus terminals Stakeholders of the study are categorized as internal and external stakeholder. Two City Corporations, bus owners and labour associations and terminals staffs who are involved in the management system directly are considered as internal stakeholders. On the other hand, local politicians, government organizations related with transportation sector as well as Ministry of Local Government and Rural Development and Corporation (LGRD & C) are considered as external stakeholders
6.2. Power exercising and relation among stakeholders of bus terminals Using power-influence matrix and Venn diagram help to find out how the stakeholders exercise their power and relationship among them. There are variation in power exercise and influence of stakeholders in the management system of the terminals. Variation of power as well as influence of different stakeholders in the management of bus terminals of Dhaka and relation among them are shown in the figure 4 and figure 5 which are given below;

Himal, M. R. H.; Zaman, M. Y. & Hasan. M. M. U Problems of Bus Terminals
378
7. Management issues of bus terminals 7.1. Evolution of management system of bus terminals There is a long history behind the present condition of the three inter district bus terminals of Dhaka. Management system and construction of the terminals are gradually changed and turned into informal system. This will help to find the managerial problem of bus terminals in Dhaka city. Timeline of three inter district bus terminals are given in a table below;
Figure 4: Power influence matrix
Figure 5: Venn diagram of stakeholders of bus terminal

Himal, M. R. H.; Zaman, M. Y. & Hasan. M. M. U Problems of Bus Terminals
379
7.2. Problems related to managerial issues of bus terminals Mismanagement of toll collection is one of the major problems related to managerial issue of the bus terminals. Due to shortage of staffs and unavailability of private organization for toll collection, City Corporation alone cannot collect toll properly. They have to appoint staffs informally and as a result government loss revenue. Since 1985, there is no appointment of terminal staffs due to absence of separate laws for two City Corporations. Local political influence is also responsible for the shortage of staffs. Besides parking mismanagement and absence of rest room for the terminal staffs are also major problems in all three terminals. Since bus companies uses the terminals as bus depo, small companies park their buses in the terminal area. It is unfortunate that, there is no resting room for the terminal and bus staffs. So they take rest and sleep in the bus.
8. Recommendations Required terminal staffs should be appointed as early as possible. In this case, City Corporation need to have right to give appointment of terminal staffs rather than ministry of
Time Construction Work Administrative Change
1945-84 Establishment of three Bus Terminals
1985 Appointment of Staffs for the terminals by LGRD&C
1990's Authorizing power handover to Dhaka City Corporation as well as political involvement in management control
October, 2003
Development work under DUTP project started
Management control of three bus terminals taken by Rora and Diba private organization
March, 2004
Cancellation of the contract with Rora Enterprise at Saydabad and Mohakhali Bus Terminal
2004- A court case filled by DCC against Rora Enterprise
Case still going on
June, 2004
Panama Enterprise took management control of Saydabad and Mohakahli Bus Terminal
2005 Development work finished
Appointment of city corporation officials regarding bus terminals
2007 Management control power taken by Dhaka City Corporation again from Panama and Diba enterprise
2009 Political power involved in the terminals again after regular Government obtained power
Table 1: Internal and External Stakeholders of the Study
Source: Key Informant Interview, 2019

Himal, M. R. H.; Zaman, M. Y. & Hasan. M. M. U Problems of Bus Terminals
380
LGRD&C. As well as case against Rora Enterprise need to be solved quickly and tender should be called for toll collection of the terminals. All bus companies only should use inside of terminal area for passenger loading and unloading and parking on the main road need to be stopped. Besides, government organizations have to be strict regarding giving rout permit and driving license. And lastly, political influence in the management system of bus terminal has to be stopped.
9. Conclusion Bus terminals located in the capital of Bangladesh, are important element of public transportation system of the country. But the three inter district bus terminals are not working effectively. Several managerial issues and deficiencies in functional arrangement of the terminals have been found. Facilities provided in the terminal are not utilized properly due to deficiencies in functional arrangement. Political influence, shortage of staffs create obstacle for the authority to work effectively. Relation, influence and power of the stakeholders related with the terminals need to be reformed.
10.References Akbar, S., & Campos, J. E. (2009). Operationalizing Political Economy: Political Economy:
Urban Bus Operations in Dhaka. London: GPE in Sectors. De Chiara, J. and Crosbie, M. (2001). Time-saver standards for building types. New York:
McGraw-Hill. Enna.com. (2019). Functional Arrangement - Enna.com. [online] Available at:
https://enna.com/dictionary/functional-arrangement/ [Accessed 24 Mar. 2019]. Finn, B. and Mulley, C. (2011). Urban Bus Services in Developing Countries and Countries in
Transition: A Framework for Regulatory and Institutional Developments. Journal of Public Transportation, 14(4), pp.89-107.
Hackenbroch, K. and Hossain, S. (2012). “The organised encroachment of the powerful”—Everyday practices of public space and water supply in Dhaka, Bangladesh. Planning Theory & Practice, 13(3), pp.397-420.
MacArthur, J.D. (1997).Stakeholder Roles and Stakeholder Analysis in Project Planning: A review of approaches in three agencies - World Bank, ODA and NRI. Bradford: University of Bradford, Development and Project Planning Center
Piaf.org.(2019). Bus Stations and Terminals. [online] Available at: https://ppiaf.org/sites/ppiaf.org/files/documents/toolkits/UrbanBusToolkit/assets/3/3.1/35(vii)a.html [Accessed 24 Mar. 2019].
Shakti Sustainable Energy Foundation. (2019). Bus Terminal Design Guidelines - Shakti Sustainable Energy Foundation. [online] Available at: https://shaktifoundation.in/report/bus-terminal-design-guidelines/ [Accessed 24 Mar.. 2019].
Strategic transport plan for Dhaka 2015-2035. (2016). Dhaka: Dhaka Transport Coordination Authority, Road Transport and Highways Division, Ministry of Road Transport and Bridges, Government of the Peoples Republic of Bangladesh
Yiftachel, O. (2009). Theoretical Notes On `Gray Cities': the Coming of Urban Apartheid?. Planning Theory, 8(1), pp.88-100.

Akter, Tamanna & Pervaz, Shahrior Assessing Motorcycle Accident and Injury Characteristics in Dhaka Metropolitan City
381
Research Paper / Case Study Paper
ASSESSING MOTORCYCLE ACCIDENT AND INJURY CHARACTERISTICS IN DHAKA METROPOLITAN CITY
Tamanna Akter, Masters Student, Department of Urban and Regional Planning (URP) Bangladesh University of Engineering and Technology (BUET), Dhaka-1000, Bangladesh
Shahrior Pervaz, Lecturer, Accident Research Institute (ARI) Bangladesh University of Engineering and Technology (BUET), Dhaka-1000, Bangladesh
Abstract
The increase in motorcycle accidents and consequent casualties is a growing problem for the urban dwellers of Dhaka metropolitan city. The massive raise of the number of motorcycles due to the local production, cheap price and introduction of app based ride sharing services has exacerbated the situation tremendously. This study aims to present the prevalence, causes and the characteristics of motorcycle accidents and casualties in this city area. The study analyzed police reported accident data by Microcomputer Accident Analysis Package five (MAAP5) software of Accident Research Institute (ARI) of Bangladesh University of Engineering and Technology (BUET). The GIS tools were used to demonstrate accident scenario in different Thanas of the city area. Analysis of accident data revealed that a total of 460 motorcycle accidents took place in Dhaka Metropolitan Area from 2000 to 2014 and caused casualties of 581 people during this period. About 56.45% of the victims were riders, 24.61% were passengers and rest was pedestrians. More than 50% fatalities fell into the <=30 age group, whereas about 32% and 14% were in 31-40 and 41-40 age group respectively. The number of rear end collisions was prominent (53.5%) in the study area. The study also revealed that in case of 94% accidents, helmets were not worn. GIS maps showed that both the Gulshan and Tejgaon Thana experienced highest motorcycle accidents and casualties. The study also recommended some measures for the improvements of motorcycle operation and the safety of motorcycle riders in the Dhaka metropolitan city.
Keywords
Motorcycle; Accidents; DMP; MAAP5; GIS
1. Introduction Road traffic accidents are the most frequent, unwanted and unfortunate occurrence with significant consequence of injury, fatality and property damage (Ruikar, 2013). They are responsible for about 1.35 million global death and 20-50 million injuries incurring physical and mental disability (WHO, 2018). The death rates are estimated to be increased by 2.34 million if any immediate actions are not taken (Ahsan et al., 2011). Lower and middle income countries are the most vulnerable to these accidents where more than 93% of road
Akter, Tamanna & Pervaz, Shahrior Assessing Motorcycle Accident and Injury Characteristics in Dhaka Metropolitan City
382
accidents take place (Ahmed et al., 2014). Bangladesh, a country of south Asia is facing horrendous consequences due to these accidents. The severity of road accidents in this country can be perceived by the statistical result of about 85 deaths/10,000 registered motor vehicles/year followed by the rise of vehicle numbers (Mahmud et al., 2013; Ahmed et al., 2014). World Health Organization (WHO) has estimated the annual death of about 20,000 people due to road accidents in this country (Mahmud et al., 2013). It is very alarming that, around 70% of road traffic fatalities are pedestrians, bicyclists, motorcyclists and non-motorized vehicles user in the country. Besides, motorcycle accidents and consequencecasualtiesare increasing alarmingly (Rahman, 2015). The share of motorcycle fatalities has increased up to 22% in 2017 from 3% in 1998. Study found that, Bangladesh has the highest fatality rate among Asian countries from motorcycle accidents (28.4 deaths/10,000 motorcycle per year); (Nguyen, 2013). Tremendous increase in the number of motorcycles are creating safety hazard especially in urban areas like Dhaka, the capital city of Bangladesh. Recent introduction of app-based ride sharing services also exacerbated the situation in the city. This paper aims to provide an insight on the motorcycle accidents,causality characteristics, and root causes of these accidents in Dhaka metropolitan city.
2. The Emergence of Motorcycle from Global Context
Being one of the cheapest modes of transport as well as low purchase and operational cost, motorcycles have been dominatingamong the registered vehicles all over the world. Global statistics shows around 455 million motorcycles are being usedacross the world (WHO, 2013). From 2013 to 2016, about 10% additional motorcycles were estimated to circulate in the roads globally, approximately 79% of themwere in the Asia (Nguyen, 2013).Comparing with passenger car from the safety point of view, motorcyclist’s risk of a fatal accident is 26 times greater than a passenger car per vehicle mile travel (Nguyen, 2013). Such circumstances have led to existing traffic system collapse, resulting in about 33% and 36% road traffic fatalitiesof motorcyclists in the South-East Asia and Western Pacific Region respectively (WHO,2017). Figure 1 provides an overall scenario of motorcycle accidents in South-East Asia. With rapid economic expansion, these countries especially Bangladesh, Thailand, Cambodia and Laos are experiencing challenging road traffic environment, especially in urban areas. However, the increasing number of motorcycle accidents is yet neglected in urban transportation (Kitamura et al., 2018).
3. The Growth of Motorcycle in Bangladesh
Due to the rapid economic growth, cheaper cost and availability of different local and global brands, Bangladesh has shown a rapid increase in the usage of motorcycles. Itoccupies a large share in total registered vehicles in the country.According to Bangladesh Road Transport Authority (BRTA), the registered motorcycles have grown from around 215,670 to 2050919 during the year of 1999-2017 (Figure 2), which occupies more than 54% of total registered vehicles (Rahman, 2015). The increased numbers of motorcycles eventually inclines the probability of road accident.

Akter, Tamanna & Pervaz, Shahrior Assessing Motorcycle Accident and Injury Characteristics in Dhaka Metropolitan City
383
Figure 1: No. of Deaths per 10,000 MC in Asian Countries (WHO, 2013)
Figure 2: Trend of motorcycle growth in Bangladesh (BRTA, 2017)
4. Study Area Profile Dhaka, the capital of Bangladesh is one of the densely populated and rapidly growing cities in the world (Ahmed et al., 2009). The city accommodates about 10% of national and one third of the urban population. It is under the jurisdiction of several respective agencies including Dhaka North and South City Corporations (DNCC and DSCC), Dhaka Metropolitan Area (DMA) and Dhaka Metropolitan Development Plan (DMDP) area. In this research, Dhaka Metropolitan Area has been selected as the study area comprising DNCC, DSCC and the old part of Dhaka. The study area covers 41 thanas of Dhaka Metropolitan Police Area which are the central part of the capital in terms of social and economic aspects (Ahmed et al., 2013). Road transport of these regions has a very significant role in the economic and social well-being of the city (Hoque et al., 2008). Wide varieties of vehicles were introduced and are plying across the city in order to meet these economic and social needs. According BRTA, about 32.6% of registered vehicles of the country are plying in Dhaka city. However, these vehicles and improper traffic management is creating road safety hazard day-by-day.Study showed that, about 22% of all reported accidents of Bangladesh occurred in Dhaka metropolitan city (Mahmud et al., 2014).The condition of motorcycle safety is more crucial in the city. The number of registered motorcycle has more than doubled (182.6% increase) in Dhakaover the last decade. Low-priced, easily available different brands and increased popularity of this mode over car and public transport for its easy accessibility to reach the destination are considered as the main reason behind this growth.These motorcycles contributed up to 10% of total accidents in Dhaka city (MAAP5, ARI, 2018).
28.4
11.9 11.5 11.29 8.6
4.4 4.1 2.52.1
Bang
lade
sh
Com
bodi
a
Lao
Thai
land
Indi
a
Mya
nmar
Mal
aysia
Viet
nam
Indo
nesia
Bhut
an
No.
of D
eath
s/10
000
MC
0
500
1000
1500
2000
1995 2000 2005 2010 2015 2020
Num
ber i
n th
ousa
nd
Total regiestered motorcycle

Akter, Tamanna & Pervaz, Shahrior Assessing Motorcycle Accident and Injury Characteristics in Dhaka Metropolitan City
384
5. Data Collection and Interpretation The study collected police reported road accident data from Accident Research Institute (ARI) of Bangladesh University of Engineering and Technology. The latest availabledata was extracted from MAAP5 (Micro Computer Accident Analysis Package) software of the institute. From the software, data of 460 motorcycle accidents from 2000-2014 were filtered. The same software was used to analyse the filtered data.Microsoft Excel, SPSS and ArcGIS were used for further analysis, graphical representation and mapping of collected data.
6. Analysis Results 6.1. Motorcycle Accident Scenario within the Study Area
The analysis of accident data revealed that, motorcycle riders werethe most vulnerable in the motorcycle accidents. More than 56.45% victims were the ridersfollowed by 24.61% pillionsand rest were pedestrians.Since 2000, the inclined number of motorcycle accidents and casualties are shown in the Table 1.
Table 1: MC accident scenario within the study area from 2000-2014
Year No. of MC Accidents
No. of Rider
Casualties
No. of Pillion
Casualties
No. of Pedestrian Casualties
Total Casualties
by MC Accidents
Causalities per
Accident
2000 33 25 13 4 42 1.3 2001 22 15 5 5 25 1.1 2002 27 21 5 5 31 1.1 2003 30 22 12 5 39 1.3 2004 25 16 5 9 30 1.2 2005 18 12 5 5 22 1.2 2006 29 19 6 6 31 1.1 2007 23 16 1 6 23 1.0 2008 50 34 13 11 58 1.2 2009 34 23 15 10 48 1.4 2010 35 24 19 6 49 1.4 2011 31 22 13 7 42 1.4 2012 31 19 7 11 37 1.2 2013 45 34 14 11 59 1.3 2014 27 26 10 9 45 1.7 Total 460 328 143 110 581 1.3
It is obvious from Table 1 that motorcycle accidents causedmore than one casualty per accidents. Keeping one or two pillions during ride could be one of the reasons behind this higher rate.
6.2. Accident Severity Analysis
Analysis of motorcycle accidents by severity classes showed that, 44% of the motorcycle accidents were fatal, 47% were grievous and only 9% were simple accidents (Figure 3).

Akter, Tamanna & Pervaz, Shahrior Assessing Motorcycle Accident and Injury Characteristics in Dhaka Metropolitan City
385
Figure 3: Motorcycle Accident Severity Analysis (2000-2014)
6.3. Collision Type
The most frequent collision in the study area were rearend collisions which held responsible for 53.48%accidents (Table 2). Table 2 also shows that, most rearend collisions resulted in fatal and grevious accident (24.35% and 24.57% respectively). This collision type was followed by hit pedestrians (19.57%) and head on collisions (13.26%) in the study area.
Table 2: Comparison of Motorcycle Accident with Collision Type and Human Casualties
Factors Accident Severity
Fatal Accident
Grievous Accident
Motor Collision
Simple Injury Total
Collision Type
Rear End 24.35% 24.57% 2.39% 2.17% 53.48% Hit Pedestrian 11.30% 7.83% - 0.43% 19.57%
Head On 5.00% 6.96% 0.22% 1.09% 13.26% Side Swipe 1.52% 2.39% 1.52% 0.43% 5.87% Right Angle 1.09% 2.17% - 0.22% 3.48%
Hit Parked Vehicle 0.65% 1.74% 0.22% - 2.61% Other - 1.30% 0.22% 0.22% 1.74%
Total 43.91% 46.96% 4.57% 4.57% 100%
6.4. Motorcycle Accident by Time, Day and Month
Analysis of data showed that most motorcycle accidents(63%) occurred during the daytime which might incur fromheavy traffic flow.It should be noted that 26.5% accidents took place at the night even with the presence of road light. Additionally, Figure 4 showed that the higher risk of accidents was noticed on weekends (18% of total accidents). Research inferredthat this could be the result of precarious driving behaviours in low traffic density (Flores et al., 2009). Analysis also showed significant monthly variation of accident occurrence in the study area. Results showed higher accident occurrence in March to June (39%). February (5%) and October (6%) showed lowest motorcycle accident occurrence in the study area (Figure 4).
[VALUE]
[VALUE]
[VALUE] [VALUE]
Fatal Accident Grievous AccidentMotor Collision Simple Injury Accident

Akter, Tamanna & Pervaz, Shahrior Assessing Motorcycle Accident and Injury Characteristics in Dhaka Metropolitan City
386
Figure 4: Occurrence of Motorcycle Accident on Different Time of Day
6.5. Motorcycle Accident by Junction Type, Traffic Control and Helmet Usage
In the study area, 59% of total motorcycle accidents were found in no junction area. Again, analysis found that Tee-Junction and Cross-Junctions are the vulnerable junction types forroad accidents which support other research (e.g. ROSPA, 2017). Furthermore, more than 52% motorcycle accidents occurred in the absence of traffic control. Besides, 27.8% accidents were found under the jurisdiction of traffic control system. Table 3 depicts accident severity by junction type and traffic control.
In case of motorcycle users, lack of awareness to use helmet may have significant influence on road safety issues. The helmet non-usage percentage was 94% who faced motorcycle accidents, 90.8% of them were fatal and grievous (Table 3).
6.6. Motorcycle Accident by Age and Gender Group
Analysis demonstrated that more than 50% fatalities of riders and pillions fell into the less than or equal to 30 age group whereas about 32% and 14% were in 31-40 and 41-40 age group respectively (Figure 5). These results support the findings of the other study that, road accidents are the main cause of fatality among young motorists (Ahmed et al., 2013). Furthermore, all the riders were male; the fatality was higher for male compared to female pillions and pedestrians (8:2).
18%
14.1%
14.3%13.7%
15.4%
10.2%
14.1%
Fri Sat Sun MonTues Wed Thurs
10%
5.4%
9.3%10.4%
8.9%10%
7%
9.1%8.7%
5.9%7.2%
8%
0%
2%
4%
6%
8%
10%
12%
Jan
Feb
Mar
ch Apr
May Jun
July
Aug
Sep
Oct
Nov De
c
8.5%
63.3%
26.5%
1.7%
Dawn/Dusk DayNight with Road Light Night Without Road light

Akter, Tamanna & Pervaz, Shahrior Assessing Motorcycle Accident and Injury Characteristics in Dhaka Metropolitan City
387
Table 3: Accident Severity Analysis with Junction Type, Traffic Control and Helmet Use
Factors
Accident Severity
Fatal Accident
Grievous Accident
Motor Collision
Simple Injury
Accident Total
Junction Type
Cross-Junction 4.57% 5.87% 0.65% 0.65% 11.74% Not Junction 26.96% 26.96% 2.61% 2.39% 58.91% Roundabout 1.30% 0.87% 0.22% - 2.39% Tee-Junction 8.26% 8.91% 0.65% 1.09% 18.91%
Other 3.04% 4.35% 0.43% 0.43% 8.04% Total 43.91% 46.96% 4.57% 4.57% 100%
Helmet Worn/
Not
Worn 3.70% 1.09% 0.22% 0.00% 5.00% Not Worn 39.57% 45.65% 4.35% 4.13% 93.70%
Not Available 0.65% 0.22% - 0.43% 1.30% Total 43.91% 46.96% 4.57% 4.57% 100%
`
Figure 5: Age Group Distribution of Human Casualties (2006-2014)
6.7. Factors Contributing to Motorcycle Accidents
Data analysis showed that over speeding and reckless driving were the primary and secondary responsible factors of 89.6% and 92.6% of motorcycle accidents respectively in Dhaka city (Figure 6). When compared with accident severity, over speeding and careless driving of motorcycle was held accountable for 84.7% fatal and 94% grievous accident.
7. Thana wise Reported MotorcycleAccidents in Comparison with Land Use Characteristics
Police reported accident data of the study area were plotted by using ArcGIS and shown in the Figure 7. It was found that among the41 thanas of DMP areas Gulshan thana and Tejgaon thanawere the most accident prone areas where 22 and 20 motorcycle accidents took place respectively during 2006-2014. In the Tejgaon thana, the number of injuries were high (33 casualties) compared to thenumber of accidents.When compared with land use characteristics, residential, mixed use and commercial use of of land are predominant in Gulshan thana and for Tejgaon residential use, transportation and communication networkand commercial use prevails high.
91
55
30
3
45
31
4 1
3219 14 9
10
20
40
60
80
100
<=30 31-40 41-50 51-60 >60
Rider casualtiesPillion casualtiesPedestrian casualties

Akter, Tamanna & Pervaz, Shahrior Assessing Motorcycle Accident and Injury Characteristics in Dhaka Metropolitan City
388
Figure 6: Primary and Secondary Factors of Motorcycle Accidents in the Study Area
The complex land use pattern of the study areamay attract more traffic which may contribute in the incurring road traffic incidents (Ng et al., 2001).No motorcyle accidents were reported in Kadamtali, Gendaria, Hazaribagh and others thanasin this time frame.
Figure 7: Thana wise Reported Motorcycle Accidents
8. Discussions and Conclusions This paper uses police reported accident data to depict the characteristics and magnitude of motorcycle accidents and casualties in Dhaka metropolitan city. The study revealed that, riders were the most vulnerable than pillions in the motorcycle accidents. Analysis of
89.60%
Primary Factors
Speeding Careless DrivingDriving Too Close Bad OvertakingBad Turning Pedestrian Action
92.6%
Secondary Factors
Speeding Careless DrivingPedestrian Action Road FactorVehicle Factor Other

Akter, Tamanna & Pervaz, Shahrior Assessing Motorcycle Accident and Injury Characteristics in Dhaka Metropolitan City
389
motorcycle accidents by severity classes showed that, more than 91% of the motorcycle accidents were fatal and grievous type which implies that there is less chance to survive from motorcycle accidents. The rear end collision was the predominant collision type of motorcycle accidents in the study area. Additionally it was found that, these rear end collisions resulted in higher severity due to the accidents. Again, not wearing helmet had a direct impact on accident severity. Result showed significant rate of motorcycle accidents during weekends which might be the result of precarious driving behaviours in low traffic density. Up to 59% of total motorcycle accidents were found in no junction areas where there is no traffic control and motorists can ride with higher speed. Study demonstrated that more than half of the fatalities of riders and pillions were young group. These results support the findings of the other study that road accidents are the main cause of fatality among young motorists. Study showed that over speeding and careless driving of motorcycle was held accountable for 84.7% fatal and 94% grievous accident. This over speeding and careless driving attitude is prominent among young riders. Besides, sometimes due to illegal activities, absence of helmet or valid driving license some motorcyclists are motivated to flee from police with higher speed that put them into risk. Awareness among motorcyclists and strict enforcement of traffic laws is essential in this circumstance.
Among the 41 thanas of DMP areas,Gulshan and Tejgaonthana were the most accident prone areas. Both the thana areas had mixed lane use characteristics where both residential and commercial activities were taken place. This mixed land use pattern attracted more traffic which might be the reason behind these higher accidents and casualties in these areas. Again thana areas such as Kadamtali, Gendaria, Hazaribaghwere very traffic congested areas where most of the time flow was in stop-and-go situation. This congestion often hobbled the motorcyclists to raise speed. Hence, this lower speed might be the reason behind no motorcycle accidents in these areas.
The share of motorcycle is growing as a convenient mode of transport in Dhaka metropolitan city. Besides, motorcycle accidents are also becoming an alarming issue. This study has put some insights on facts, characteristics and causes of motorcycle accidents in the city.To enhance road safety and lessen motorcycle accidents, several interventions such as design of safe road infrastructures, training programs for riders, refurbishment of traffic rules and regulations, proper helmet usage and collaboration among road safety agencies and research organizations should be established immediately.
8. Acknowledgement Authors would like to thank Accident Research Institute (ARI), BUET and Rajdhani Unnayan Kartipakkha for their support and assistance.
9. References Ahmed, I. and Ahmed, B., 2013. Urban road accidents in Dhaka, Bangladesh. In 16th
International Conference Road Safety on Four Continents. Beijing, China (RS4C 2013). 15-17 May 2013.
Ahmed, I., Ahmed, B. and Hainin, M., 2014. Road Traffic Accident Characteristics in Dhaka, Bangladesh. JurnalTeknologi, 71(3), pp.75-82.

Akter, Tamanna & Pervaz, Shahrior Assessing Motorcycle Accident and Injury Characteristics in Dhaka Metropolitan City
390
Ahsan, H.M., Raihan, M.A. and Rahman, M., 2011, December. A study on car involvement in road traffic accidents in Bangladesh. In Proceedings of 4th Annual Paper Meeting and 1st Civil Engineering Congress (pp. 22-24).
Flores, G.M.T., Gotohio, M.P.T., Paras, N.G.C. and Seva, R.R., 2009. Analysis motorcycle accidents based on environmental and personal factors. Manila: Department of Industrial Engineering De La Salle University.
Hoque, M.M., Mahmud, S.M. and Paul, S.E., 2008, May. The Cost of Road Traffic Accidents in Bangladesh. In 10th Pacific Regional Science Conference Organization (PRSCO) Summer Institute (p. 88).
Kitamura, Y., Hayashi, M. and Yagi, E., 2018. Traffic problems in Southeast Asia featuring the case of Cambodia's traffic accidents involving motorcycles. IATSS research.
Mahmud, S.M., Talukder, M.M.A., Ahmed, I. and Raihan, M.A., 2013. Road Safety Initiatives in Bangladesh. JurnalTeknologi, 65(3).
Mahmud, S.M., Ahmed, I. and Hoque, M.S., 2014. Road safety problems in Bangladesh: Achievable Target and Tangible Sustainable Actions. JurnalTeknologi, 70(4).
Ng, K.S., Hung, W.T. and Wong, W.G., 2001. Effects of urban design on road accidents in Hong Kong. WIT Transactions on The Built Environment, 52.
Nguyen, H.H., 2013. A comprehensive review of motorcycle safety situation in Asian countries. Journal of Society for Transportation and Traffic Studies (JSTS), 4(3), pp.20-29.
Rahman, M. (2015). Identification of injury patterns of hospitalized motorcyclists and development of countermeasures for their safety improvement.
ROSPA, (2017). ‘RoSPA Road Safety Research: Common Motorcycle Accident Causes’ Available at:https://www.rospa.com/rospaweb/docs/advice-services/road safety/motorcyclists/common-motorcycle-accident-causes.pdf [Accessed on 14 Apr. 2019]
Ruikar, M., 2013. National statistics of road traffic accidents in India. Journal of Orthopedics, Traumatology and Rehabilitation, 6(1), p.1.
World Health Organization. Violence, Injury Prevention and World Health Organization, 2013. Global status report on road safety 2013: supporting a decade of action. World Health Organization.
World Health Organization. (2018). Global status report on road safety 2018. World Health Organization.
World Health Organization. (2017). [ Powered two-and three-wheeler safety: a road safety manual for decision-makers and practitioners] .

Ahsan, M. N. & Neema, M. N. Bus stop accessibility and optimal locations
1st International Conference on Urban and Regional Planning, Bangladesh Bangladesh Institute of Planners
Case Study Paper
MEASURING BUS STOP ACCESSIBILITY USING GIS – A CASE OF DHAKA METROPOLITAN AREA
Muhammad Nazmul Ahsan, Senior Manager, Sheltech (Pvt.) Ltd., Dhaka, Bangladesh Dr. Meher Nigar Neema, Professor, Department of Urban and Regional Planning, BUET
Abstract
Transport network is often confronted with inaccessible bus stops representing the weak link in the system which effectively prevent the use of fixed-route bus service. So, bus stops in transportation networks should be located in smart way to ensure an adequate coverage and quick accessibility to all users. In this paper we studied the accessibility of existing bus stops and then determine optimal locations of bus stops. In this context, Dhaka Metropolitan Area (DMA) is selected as a case study area. Bus stops on some selected bus routes within DMA are identified for the study. All the analysis was conducted using Network Analyst Extension and Geoprocessing tools of ArcGIS software. Evaluating the accessibility of bus stops, they were categorized into four classes: excellent, good, moderate and poor. Analysing the existing bus stops it was found that most of the existing bus stops in the study area fall into moderate to poor category. Only a few bus stops are categorized as excellent. The outcome of this research would help the policy makers to assess the current accessibility conditions of bus stops and therefore plan the optimal locations where bus riders can avail the maximum accessibility.
Keywords
Bus stop, accessibility, coverage area.
1. Introduction Bus stops are a key link in the journey of a bus rider. The access to a bus stop can be defined by how many people can reach the bus stop, relative to its catchment area, and how easy the bus stop can be reached by different modes (Proceed Project, 2013). Access to transit stops affects passenger accessibility and represents the opportunity to use the public transport service (Foda & Osman, 2010 and Holtzclaw, 1994). The dominant mode of transportation in Dhaka is road based transport system (Ahmed, 2004; Nabi, 2010 and STP, 2005) where bus is the lone mode of mass transit. This mode plays most significant role in passenger transport having the highest share of all passenger trips among all motorized modes (Amin & Kabir, 2004). So, bus stops in Dhaka city should be designed in such a way that it could provide maximum accessibility to its users. Because these are the only locations in the whole route where people board into or alight from the bus. A well designed bus stop can ensure the bus users maximum accessibility to the bus service.
The study will reveal the technique to measure the accessibility of bus stops on existing roads which will help to understand the existing accessibility conditions of bus stops. Based on this, the research would help the policy makers to plan the optimal location of the new bus stops or to modify their locations in order to serve most users in its urban setting.
391

Ahsan, M. N. & Neema, M. N. Bus stop accessibility and optimal locations
1st International Conference on Urban and Regional Planning, Bangladesh Bangladesh Institute of Planners
2. Theoretical Framework 2.1. Bus Stop Accessibility Physical access to a transit stop is interpreted in terms of the proximity of the passenger’s origin or destination to the nearest transit stop (TCRP, 1996), which is generally achieved by walking, riding a bicycle or driving a car for a short distance (Murray & Wu 2003). Foda & Osman, 2010 interpreted the provision of bus-based transit service where accessing a bus stop is considered to be achieved mainly by walking. They considered the density of the pedestrian road in order to define the bus stop accessibility, knowing that every transit trip begins and ends with pedestrian travel. Density of pedestrian road around bus stops is an important parameter to assess accessibility in the way that it shows the amount of pedestrian roads which can be used to reach the bus stops.
Besides the road density, there are other parameters which also affect the accessibility of bus stops. One of the parameters is trip generation. Because there are locations where road density may be comparatively lower but may create large number of trips. For example, places beside a commercial place or a large shopping centre. These stops generally facilitate comparatively higher accessibility because they serve large number of people by ensuring direct access to these bus stops.
Another parameter is the population one bus stop serves. Because each bus stop has a coverage area where the stop can serves its users. Coverage area of each bus stop indicates that people resides inside that coverage area has direct access to that bus stop. People inside the coverage area can comfortably use the bus stop, because the bus stop is located within comfortable walking distance. The bigger the coverage area, the more people will have the access to that bus stop which will indicate the affluence of accessibility.
Besides these three parameters, there are also some other parameters which somewhat affect the accessibility. For example, gender, disability and safety issues. Some bus stops may be less accessible for women. For instance, if the bus stops are always crowded or buses are packed, women might prefer to use another mode to reach the destination, because these stops becomes uncomfortable to women and force to use them other mode. Similarly, people with disabilities would find less accessible or inaccessible to bus stops if there is no provision for them to board or alight buses, etc.
However, because of limitations like complexity in assessment and data related issues, three parameters are used and others are omitted in order to assess the accessibility. The parameters used in this study are:
a) Road Density, b) Population Served by Bus Stops and c) Trip Generation
All these parameters are calculated based on the coverage area of each bus stop. Coverage area is calculated based on comfortable/reasonable walking distance. Comfortable/reasonable walking distance is the distance that a person is generally found suitable or comfortable to walk in order to reach the destination. Hence, at an average walking speed of about 1.3 m/s, 5 minutes of walking is considered reasonable in urban areas, which is about 400 meter in terms of walking distance (Levinson, 1992). Most transit firms consider 400 meter as an acceptable access standard (Ammons, 2001). In ‘Transport for London, 2006’, the ideal spacing for bus stops is also specified as 400 meter. In
392

Ahsan, M. N. & Neema, M. N. Bus stop accessibility and optimal locations
1st International Conference on Urban and Regional Planning, Bangladesh Bangladesh Institute of Planners
Columbus, Ohio, it is stipulated that passengers do not exceed walking distances of 400m to transit stops in urban areas (Central Ohio Transit Authority, 1999).
In this study, coverage area is measured based on this 400 meter pedestrian road distance from a particular bus stop which is termed as Actual Pedestrian Road Length. Around a bus stop, all actual pedestrian road length together makes a network which is called Actual Pedestrian Road Network. The coverage area of bus stop, actual pedestrian road length and actual pedestrian road network are described in the subsequent sections.
Spacing between bus stops is also an important issue. Consideration should be given in improving spacing, and reviewing locations especially where interchange is an issue. Bus journey times and hence bus service may be affected by number of stops on a route.
2.2. Actual Pedestrian Road Length and Actual Pedestrian Road Network Actual pedestrian road length is the parcel of the specific length of a pedestrian road that originates from a bus stop. The length is measured from that bus stop. In a road network, the length of the parcel may be equal to the specific length or may be less (if the road ends before completing the specific length). In this research, the specific length is considered as 400 meter pedestrian road length from a bus stop. A number of actual pedestrian road lengths which originates from same bus stop create the Actual Pedestrian Road Network. Figure-1 shows Actual Pedestrian Road length and Actual Pedestrian Road Network.
2.3. Concept of Actual Bus Stop Access Coverage (Coverage Area) Coverage area of bus stop is measured from actual pedestrian road network. In this research, using the GIS network analysis functions, an approach is presented for estimating bus stop access coverage based on the Actual Pedestrian Road Network surrounding the bus stop. The idea here is to identify all the pedestrian road network links that lie within the specified maximum walking distance of the 400m access threshold, measured along the network paths around the bus stop. Joining the ends of those links creates a polygonal area, which is referred to as the “Actual Bus Stop Access Coverage” for the bus stop. This polygonal area is considered more representatives for measuring the actual access coverage of a bus stop. An illustration of actual bus stop access coverage is shown in Figure 1.
Figure 1: Actual pedestrian road length, Actual pedestrian road network and Actual bus stop access coverage
393

Ahsan, M. N. & Neema, M. N. Bus stop accessibility and optimal locations
1st International Conference on Urban and Regional Planning, Bangladesh Bangladesh Institute of Planners
Figure 2: Selected bus routes and stops in the study area
3. Study Area Dhaka Metropolitan Area (DMA) is selected as the study area. Road network within the DMA area is considered for the study. Selected bus routes, and bus stops located on the selected routes are identified from the existing road network for the analysis of the study.
3.1. Selected bus routes and stops in the study area
A number of routes within the study area are selected to conduct the study. Main reasons for selecting these routes are, almost all of the permitted buses in Dhaka city are running on those routes and these routes contain most of the fixed bus stops in Dhaka city. There are 92 bus stops identified on the selected bus routes which are used for buses moving from north to south direction (Figure 2). The accessibility study on the bus stops of selected bus routes will represent the overall accessibility scenario of the whole study area.
4. MEASURING BUS STOP ACCESSIBILITY As mentioned earlier, accessibility of each bus stop will be measured based on three criteria: Road Density, Population Served and Trip Generation.
4.1. Road density Road density is measured based on the coverage area. Total road length fall inside the coverage area of each bus stop is measured and then calculated the road density by dividing by the coverage area of that bus stop. Measurement of road density can be presented in the following formula:
Road Density =
Road density of 92 bus stops is presented in the Appendix (Table A).
4.2. Population served by bus stops However, in order to get the population served by the bus stops, the study area is divided into 97 zones. Among the zones, 90 zones have the same area and the same number of 90 wards of Dhaka City Corporation. The rest of the Dhaka Metropolitan Area (DMA) is divided into 7 zones (Figure 3). Population of 90 wards is collected from Dhaka City Corporation (DCC) for the year 2013. The rest is collected from BBS, 2011. List of population served by each bus stop is shown in the Appendix (Table B).
394

Ahsan, M. N. & Neema, M. N. Bus stop accessibility and optimal locations
1st International Conference on Urban and Regional Planning, Bangladesh Bangladesh Institute of Planners
Figure 3: Zones in the study area
Figure 4: Accessibility index of bus stops
4.3. Trip Generation Trip generation data is used in this study for the year 2009 and it is collected from DHUTS (2010) study. These numbers of trips are generated by all types of modes (i.e. walk, car, private bus, auto rickshaw, rickshaw, truck, railway, public bus and waterway). Here, 28.5% trips are made by public bus in the 90 wards of DCC area and 24.4% trips are made by public bus in the remaining of DMA area.
However, in order to attain the accessibility, trip generation (of public bus) is to be calculated for each bus stop. Therefore, coverage area of each bus stop is used to attain the trip generation (of public bus) of bus stops. The data is shown in the Appendix (Table C).
4.4. Evaluation of accessibility Data obtained from the above three parameters are stored in separate shape files through ArcGIS. Following data are stored in shape files:
a) Road Density for Bus Stop b) Population Served for Bus Stop c) Trip Generation by Public Bus for Bus Stop
Accessibility is evaluated from the data of abovementioned parameters using Geospatial tools of ArcGIS software. The procedures are described in the below.
The data obtained from the abovementioned three parameters are in different units and scale. Road Density is stored as km/km² and population & trip generation are stored as numbers. So to obtain the accessibility from these parameters, all data are needed to be converted to the same unit and scale. In this context, firstly each shape files of the parameters are converted to raster files. Next, data of each parameter is reclassified into a specific scale (10 is considered for this study). This is done by a geospatial tool ‘Reclassify’ of ArcGIS. Finally, Accessibility Index is calculated by adding up of reclassified data of three parameters and is done by another geospatial tool ‘Raster Calculator’ of ArcGIS. The Accessibility Index is shown in the Appendix (Table-D) and Figure 4.
395

Ahsan, M. N. & Neema, M. N. Bus stop accessibility and optimal locations
1st International Conference on Urban and Regional Planning, Bangladesh Bangladesh Institute of Planners
Table 4: Categorization of accessibility index
Table 5: Summary of accessibility indexes
Table 6: Excellent bus stops
The accessibility is primarily classified into 8 categories based on the evaluated accessibility index for displaying in the map and further classified into 4 categories for understanding the accessibility condition (Table 4).
5. Results and discussion Form the accessibility Index, it is found that there are only 5 out of 92 bus stops of which accessibility is high and can be categorized as ‘Excellent’ (Table 5). They have high road density serving high number of people to reach these bus stops only by walking, because they are located within a comfortable walking distance of 400m. Furthermore, these bus stops generate high number of trips which make them highly accessible to the user. On the other hand, a good number of bus stops are categorized as ‘Good’. But it is noted that 66.3% bus stops (61 out of 92 bus stops) have accessibility index 50 or less from which 25% bus stops are categorized as ‘Poor’ because of having very low accessibility (Table 5).
Excellent bus stops are shown separately in the Figure 5 & 6. Corresponding accessibility index and other data are shown in the Table 6.
From the Table 6 it is evident that the best accessible bus stop is 31 which is located in Motijheel commercial area (Figure 5). Though this bus stop serves comparatively smaller number of resident, the bus stop generates a huge amount of trips as the stop is located in the busiest commercial area of Dhaka city. Moreover, the stop has high road density which altogether makes the stop best accessible to the user.
Bus stops 8 & 45 are located in between densely populated Mohammadpur and Lalmatia area (Figure 6). Though these two stops generate comparatively less number of trips, they serve a high number of people who reside in that area. This high population along with the high road density makes the stops highly accessible (Table 6).
Bus stop 21 and 69 are located in Mirpur-1 and Mohakhali area respectively (as shown in Figure 6). Though these two stops have same accessibility index, they have different scenario. Bus stop 21 is located in Mirpur-1 which is one of the most densely populated areas in Dhaka. Though this stop generates lowest trips among the 5 excellent stops, it serves the highest number of population among all the 92 bus stops. On the other hand, bus stop 69 serves comparatively less number of residents but it generates comparatively a high number of trips. Besides, road density of the two stops is high.
Bus Stop Category
Accessibility Index
Bus Stop Category
Accessibility Index
Poor 3-6
Good 16-18
7-9 19-21
Moderate 10-12 Excellent 22-24 13-15 25-27
SN Category Range of accessibility
index Number of Stops
Value Percentage Number Percentage 1 Excellent 22 - 24 73.3 – 80.0 % 5 5.4% 2 Good 16 - 21 53.3 – 70.0 % 26 28.3% 3 Moderate 10 - 15 33.3 – 50.0 % 38 41.3% 4 Poor 3 - 9 10.0 – 30.0 % 23 25.0%
Total 92 100%
Stop ID Road Density
Population Served
Trip Generation by Public Bus
Accessibility Index
31 30.16 13540 44136 24 45 28.60 21469 17797 22 8 28.67 21327 17741 22
69 28.84 17531 22465 22 21 26.73 27732 15285 22
Average 20.84 10979 9337 - Maximum 33.81 27732 44136 -
396

Ahsan, M. N. Measuring Bus stop accessibility
1st International Conference on Urban and Regional Planning, Bangladesh Bangladesh Institute of Planners
Figure 7: Bus stops categorized as ‘Poor’
Figure 5: Bus stop categorized as ‘Excellent’ in Motijheel commercial area Figure 6: Bus stops categorized as ‘Excellent’
In contrast, there are 19 bus stops from the obtained Bus Stops which are categorized as ‘Poor’ (Table 7). Some of poor bus stops are shown in Figure 7 and data table is shown in Table 7.
It is evident from the table that some bus stops (55, 56, 60, 80, and 88) have very low road density. Having very low road quantity, the service areas of these stops are found to be very small for which they serve very little number of population. Besides, they also provide little number of trips also. All of these make the stops less accessible to users. Other stops have moderate road density but serve low number of population and generate lower trips which altogether make the stops least accessible.
Table 7: Bus stops categorized as ‘Poor’
Stop ID
Road Density
Population Served
Trip Generation by Public Bus
Accessibility Index
56 6.13 1588 445 3 55 7.37 177 42 3 58 10.35 2601 614 4 80 9.41 488 168 4 60 9.14 3057 721 5 57 12.51 2799 660 5 11 10.85 3989 941 5 88 9.61 3446 813 5 90 19.50 2429 1443 7 91 19.92 2751 1634 7 50 17.82 2672 1588 7 61 20.49 1941 806 8 41 20.57 2335 4004 8 82 19.27 4349 1618 8 92 19.37 3134 1862 8 89 17.54 2938 1746 8 59 23.37 1085 256 9 77 19.84 8258 4176 9 79 18.96 7045 2625 9
Avg 20.84 10979 9337 - Max 33.81 27732 44136 -
397

Ahsan, M. N. Measuring Bus stop accessibility
1st International Conference on Urban and Regional Planning, Bangladesh Bangladesh Institute of Planners
6. Conclusion There has been any systematic study or technique applied in Dhaka city to identify the accessibility condition of bus stops. The current practice in Dhaka city is that locations for bus stops are specified by authorized persons where they propose the location is suitable. However, bus stops selected in this way may not provide optimum accessibility, because most of the time the stops are selected based on only one parameter which is trip generation. Generally, locations of bus stops are selected where higher trips are generated. Other parameters which could affect accessibility are omitted. However, to overcome the lacking, this study has shown a way where accessibility can be assessed considering three most important parameters (Road density, trip generation and population served). Applying the technique, after accessing the accessibility of existing bus stops it is found that most of the stops are comparatively less accessible. The reason may be as one of the following: the stops are located in a place where there are fewer roads, therefore less connectivity; the stops serve comparatively fewer number of people or the stops generates fewer number of bus trips; or combination of two or more reasons. Measuring accessibility in this way not only helps to find current accessibility conditions, but also creates a scope to find the optimum locations where bus stops could have better accessibility.
The transport system of Dhaka city is mainly road based and here, bus is the only mode of mass transit. Most of the low and middle income people use buses for movement as it is comparatively cheapest mode available in the city. Notwithstanding, many middle and high income people do not use public bus because of its poor service, discomfort, safety and inaccessibility. The result is indiscriminate usage of private car which on the other hand is the foremost reason of unabated traffic jam in the city street. People generally switch the mode if they find used mode inaccessible or less accessible. So, if bus stops of Dhaka city could be made highly accessible to the people along with providing necessary services and facilities where people find them comfortable, safe and sound, then it would be possible to use public buses by all income people.
7. References Ahmed, S. (2004) “A Study of the Performance of Bus Transport Services in Some Selected
Routes of Dhaka City” MURP thesis, Department of Urban & Regional Planning, Bangladesh University of Engineering & Technology, Dhaka.
Amin, S. M. A.; Kabir M. H. (2004) “Evaluation of Bus Rapid Transit as a Mass Transit Option for Dhaka City: Case Study of Route No. 9 and 11” BURP thesis, Department of Urban & Regional Planning, Bangladesh University of Engineering & Technology, Dhaka.
Ammons, D. N. (2001) “Municipal Benchmarks: Assessing Local Performance and Establishing Community Standards” Second Edition. Sage, Thousand Oaks, CA.
BRTA (2013) “Bangladesh Road Transport Authority” Ministry of Communication, Government of the People’s Republic of Bangladesh.
DAP (2010) “Detailed Area Plan” Rajdhani Unnayan Kartripakkha (RAJUK), Dhaka-1000.
398

Ahsan, M. N. Measuring Bus stop accessibility
1st International Conference on Urban and Regional Planning, Bangladesh Bangladesh Institute of Planners
DHUTS (2010) “Dhaka Urban Transport Network Development Study” Dhaka Transport Coordination Board (DTCB), Ministry of Communications (MOC), Government of the People’s Republic of Bangladesh.
DTCA (2013) “Dhaka Transport Coordination Authority” Ministry of Communication, Government of the People’s Republic of Bangladesh.
Foda, M. A.; Osman, A. O. (2010) “Using GIS for Measuring Transit Stops Accessibility Considering Actual Pedestrian Roads Network”, Journal of Public Transportation, Vol. 13, No. 4.
Holtzclaw, J. (1994) “Using Residential Patterns and Transit to Decrease Auto Dependence and Costs”. National Resources Defense Council for California Home Energy Rating Systems. Independent Commission on Transport (ICT),1974. Changing Directions. Coronet Books, Pennsylvania, USA.
Levinson, H. S. (1992) “Urban mass transit systems” In Edwards, J. D. (ed.), Transportation Planning Handbook. Prentice Hall, New Jersey.
Murray, A. T.; Wu, X (2003) “Accessibility trade-offs in public transit planning” Journal of Geographical Systems 5(1): 93-107.
Nabi, N. (2010) “The Influence of Bus Service on the Choice of Residential Location” MURP thesis, Department of Urban & Regional Planning, Bangladesh University of Engineering & Technology, Dhaka.
Proceed Project (2013) “Accessibility of bus stops” [Online] Proceed Project, Accessed through: www.proceedproject.net, Accessed on: March, 2013
STP (2005) “Strategic Transport Plan for Dhaka” Final report, prepared by Louis Berger Group and Bangladesh Consultant Ltd., Dhaka, Bangladesh.
TCRP (1996) “Transit Cooperative Research Program Report 19, Guidelines for the Location and Design of Bus Stops” Transportation Research Board. National Academy Press. Washington, DC.
8. Appendix Table A: Road density of bus stops
Bus Stop ID
Sum of Road Length inside Coverage Area (L) in Km
Coverage Area (A) in Km²
Road Density (L/A) in Km/Km²
Bus Stop ID
Sum of Road Length inside Coverage Area (L) in Km
Coverage Area (A) in
Km²
Road Density (L/A) in Km/Km²
1 6.76 0.25 26.90 47 4.68 0.25 18.67 2 7.94 0.26 30.31 48 5.61 0.30 18.67 3 4.90 0.27 18.45 49 4.89 0.27 17.97 4 7.32 0.28 26.54 50 4.35 0.24 17.82 5 4.54 0.22 20.73 51 2.99 0.19 16.09 6 3.12 0.25 12.43 52 4.04 0.25 15.98 7 4.89 0.26 18.99 53 4.54 0.26 17.73 8 8.03 0.28 28.67 54 4.68 0.23 20.10 9 6.32 0.27 23.75 55 0.07 0.01 7.37
10 6.85 0.30 23.22 56 0.51 0.08 6.13 11 2.39 0.22 10.85 57 1.93 0.15 12.51 12 5.30 0.26 20.32 58 1.48 0.14 10.35 13 5.45 0.23 23.48 59 1.40 0.06 23.37 14 6.44 0.25 26.29 60 1.54 0.17 9.14 15 3.62 0.19 18.96 61 1.81 0.09 20.49 16 5.44 0.25 21.58 62 5.70 0.23 24.94 17 3.81 0.22 17.18 63 3.36 0.15 22.59 18 6.41 0.29 22.43 64 9.53 0.32 30.00
399

Ahsan, M. N. Measuring Bus stop accessibility
1st International Conference on Urban and Regional Planning, Bangladesh Bangladesh Institute of Planners
19 4.62 0.22 20.79 65 10.48 0.31 33.81 20 3.01 0.25 12.16 66 3.80 0.14 26.65 21 6.81 0.25 26.73 67 3.85 0.17 22.40 22 5.69 0.25 23.11 68 4.55 0.25 18.04 23 3.10 0.17 17.90 69 7.80 0.27 28.84 24 2.42 0.12 19.36 70 5.76 0.28 20.40 25 7.15 0.25 29.07 71 7.34 0.28 26.42 26 7.49 0.27 28.16 72 2.28 0.18 12.73 27 8.58 0.29 29.22 73 4.66 0.24 19.75 28 7.86 0.30 26.61 74 5.97 0.22 27.64 29 6.24 0.27 22.83 75 4.52 0.26 17.22 30 6.81 0.28 24.57 76 5.41 0.27 20.12 31 8.31 0.28 30.16 77 5.28 0.27 19.84 32 6.60 0.28 23.89 78 5.34 0.26 20.76 33 6.19 0.27 22.93 79 4.81 0.25 18.96 34 5.28 0.28 18.57 80 0.18 0.02 9.41 35 5.68 0.28 20.31 81 4.72 0.23 20.57 36 3.59 0.24 15.17 82 3.05 0.16 19.27 37 4.63 0.24 18.92 83 5.93 0.26 23.22 38 5.21 0.24 21.53 84 6.28 0.25 25.59 39 5.77 0.31 18.45 85 6.46 0.28 22.93 40 5.58 0.28 19.85 86 6.83 0.29 23.93 41 2.44 0.12 20.57 87 6.24 0.25 24.57 42 4.04 0.25 15.96 88 1.83 0.19 9.61 43 5.28 0.25 21.50 89 4.71 0.27 17.54 44 7.00 0.26 26.76 90 4.33 0.22 19.50 45 7.43 0.26 28.60 91 5.01 0.25 19.92 46 5.86 0.25 23.70 92 5.54 0.29 19.37
Table B: Population served by bus stops Bus Stop
ID Population Bus Stop
ID Population Bus Stop
ID Population Bus Stop
ID Population Bus Stop
ID Population
1 19042 20 13431 39 14147 58 2601 77 8258 2 17664 21 27732 40 15597 59 1085 78 7455 3 7302 22 22463 41 2335 60 3057 79 7045 4 13933 23 6419 42 7396 61 1941 80 488 5 12132 24 6321 43 7173 62 7276 81 6369 6 11392 25 18216 44 27676 63 1885 82 4349 7 10303 26 23549 45 21469 64 4022 83 12557 8 21327 27 21299 46 15927 65 3927 84 12055 9 19206 28 18173 47 9297 66 18589 85 13840
10 16396 29 15305 48 25766 67 10050 86 14026 11 3989 30 15490 49 21483 68 5565 87 12476 12 18100 31 13540 50 2672 69 17531 88 3446 13 6307 32 13487 51 10639 70 5590 89 2938 14 8365 33 12041 52 7046 71 11971 90 2429 15 6660 34 7769 53 8574 72 9763 91 2751 16 10602 35 3681 54 19776 73 19778 92 3134 17 11247 36 5345 55 177 74 13245 18 19180 37 9812 56 1588 75 8576 19 18084 38 14357 57 2799 76 8766
Table C: Trip generation by public bus for bus stops Bus Stop
ID Trip Generation by
Public Bus Bus
Stop ID Trip Generation
by Public Bus Bus
Stop ID Trip Generation
by Public Bus Bus Stop
ID Trip Generation by
Public Bus 1 12221 24 6557 47 13535 70 9975 2 14897 25 9500 48 17184 71 5942 3 7254 26 12720 49 15720 72 3533 4 9810 27 12973 50 1588 73 6588 5 14211 28 12403 51 14899 74 12009 6 5707 29 11269 52 13423 75 4500 7 8532 30 11395 53 11977 76 4596 8 17741 31 44136 54 16200 77 4176 9 9394 32 22098 55 42 78 3154
10 12026 33 21479 56 445 79 2625 11 941 34 14952 57 660 80 168
400

Ahsan, M. N. Measuring Bus stop accessibility
1st International Conference on Urban and Regional Planning, Bangladesh Bangladesh Institute of Planners
12 18516 35 10147 58 614 81 2373 13 12368 36 11659 59 256 82 1618 14 12231 37 13886 60 721 83 6258 15 7351 38 20635 61 806 84 6008 16 8952 39 19218 62 3343 85 6897 17 10340 40 12495 63 1512 86 6990 18 15322 41 4004 64 3226 87 6218 19 10385 42 13638 65 3150 88 813 20 7014 43 14157 66 9257 89 1746 21 15285 44 12231 67 5666 90 1443 22 13157 45 17797 68 8551 91 1634 23 7651 46 12022 69 22465 92 1862
Table D: Accessibility Index along with value of three parameters of bus stop
Bus Stop ID
Road Density
Population Served
Trip Generation of Bus
Accessibility Index
Bus Stop ID
Road Density
Population Served
Trip Generation of Bus
Accessibility Index
1 26.90 19042 12221 18 47 18.67 9297 13535 13 2 30.31 17664 14897 20 48 18.67 25766 17184 19 3 18.45 7302 7254 10 49 17.97 21483 15720 17 4 26.54 13933 9810 16 50 17.82 2672 1588 7 5 20.73 12132 14211 15 51 16.09 10639 14899 12 6 12.43 11392 5707 10 52 15.98 7046 13423 11 7 18.99 10303 8532 11 53 17.73 8574 11977 12 8 28.67 21327 17741 22 54 20.10 19776 16200 18 9 23.75 19206 9394 17 55 7.37 177 42 3
10 23.22 16396 12026 16 56 6.13 1588 445 3 11 10.85 3989 941 5 57 12.51 2799 660 5 12 20.32 18100 18516 18 58 10.35 2601 614 4 13 23.48 6307 12368 13 59 23.37 1085 256 9 14 26.29 8365 12231 14 60 9.14 3057 721 5 15 18.96 6660 7351 10 61 20.49 1941 806 8 16 21.58 10602 8952 13 62 24.94 7276 3343 11 17 17.18 11247 10340 12 63 22.59 1885 1512 8 18 22.43 19180 15322 17 64 30.00 4022 3226 12 19 20.79 18084 10385 16 65 33.81 3927 3150 13 20 12.16 13431 7014 10 66 26.65 18589 9257 18 21 26.73 27732 15285 22 67 22.40 10050 5666 12 22 23.11 22463 13157 19 68 18.04 5565 8551 9 23 17.90 6419 7651 10 69 28.84 17531 22465 22 24 19.36 6321 6557 10 70 20.40 5590 9975 11 25 29.07 18216 9500 19 71 26.42 11971 5942 15 26 28.16 23549 12720 20 72 12.73 9763 3533 8 27 29.22 21299 12973 20 73 19.75 19778 6588 15 28 26.61 18173 12403 18 74 27.64 13245 12009 16 29 22.83 15305 11269 16 75 17.22 8576 4500 11 30 24.57 15490 11395 16 76 20.12 8766 4596 12 31 30.16 13540 44136 24 77 19.84 8258 4176 9 32 23.89 13487 22098 18 78 20.76 7455 3154 10 33 22.93 12041 21479 17 79 18.96 7045 2625 9 34 18.57 7769 14952 12 80 9.41 488 168 4 35 20.31 3681 10147 11 81 20.57 6369 2373 10 36 15.17 5345 11659 9 82 19.27 4349 1618 8 37 18.92 9812 13886 13 83 23.22 12557 6258 14 38 21.53 14357 20635 17 84 25.59 12055 6008 15 39 18.45 14147 19218 16 85 22.93 13840 6897 14 40 19.85 15597 12495 14 86 23.93 14026 6990 15 41 20.57 2335 4004 8 87 24.57 12476 6218 14 42 15.96 7396 13638 11 88 9.61 3446 813 5 43 21.50 7173 14157 13 89 17.54 2938 1746 8 44 26.76 27676 12231 21 90 19.50 2429 1443 7 45 28.60 21469 17797 22 91 19.92 2751 1634 7 46 23.70 15927 12022 16 92 19.37 3134 1862 8
401

Pranto, M. T. Sustainable Solution of Transportation in Dhaka
402
Research Paper
Sustainable Solution of Transportation in Dhaka Controlling Flow Entities Using Data Science
Md Taufiquzzaman Pranto, Department of URP, BUET; Bangladesh
Abstract
Dhaka is the 9th megacity of the world according to the population in 2018. The density of population in Dhaka is higher than other 31 megacities except Mumbai among 33 megacities of the world. But in case of population growth rate Dhaka has almost 4 times growth rate than Mumbai. This alarming growth will cause ineffectiveness of any fixed entities (e.g. roads, flyovers) without proper maintenance. Even the proposed mass transport system also needs proper maintenance to utilize its impact. This study proposes to use an updatable online server system with individuals travel behaviour. To provide this behavioural data every governmental or private office/institute will have an individual account in this server. Then the online server system can recommend every office/institute to change in its schedule without minimizing the duration of work time. This scheduling will be done according to some small region specified by that central server. For greater utilization of this data, mass transport arrival and departure schedule can be determined. There will also have possibilities to connect adjacent offices/institutions in that small region to gather more people for allocating qualitative mass transports. Further, any change in the travel pattern of individual can be updated as the server system will be updatable.
Keywords
Sustainable Solution, Flow Entities, Data Science, Transportation in Dhaka
1. Introduction Imagine an ordinary busy morning of Dhaka city at the year of 2022. The Line-6 of Mass Rapid Transit (MRT) which connects Uttara and Motijheel has started its service some days ago. Muktadir is an employee on a private bank at Motijheel. He lives in Uttara with his family. Every morning he goes to office by using MRT. But now-a-days, he faces some problems in getting to the MRT at time because of huge pressure of other employees who also use the MRT. So, he decides to go to his office half an hour ago to avoid this peak hour traffic. He wishes if he could save his daily 30 minutes by starting and finishing his office 30 minutes before the present office schedule.
Dhaka, the 9th megacity of the world has population of around 20 million and a notable part of the population have daily schedule of their works (Anon., 2019). But because of similarities of arrival or departure time of many offices/organizations/institutions in a small area hazardous situation which described in the upper section can be created. This paper offers a sustainable solution in transportation that can be achieved by distributing this peak

Pranto, M. T. Sustainable Solution of Transportation in Dhaka
403
hour pressure by shifting of arrival or departure time in a small area using some specific data of every employees/workers/people having a daily schedule.
1.1. Need of Controlling Flow Entities Flow entities are the units that traverse the fixed facilities (Papacostas & Prevedouros, 1993). These include people, vehicles, container units, railroad cars, and so on. Extra pressure of these flow entities causes ineffectiveness of any kind of fixed facilities. As, average number of flow entities using specific fixed facilities can change in the short run, so it is important to maintain their movement.
1.2. Advantages of Data Science Data science is the field of study that combines informatics, computer science, mathematics, operational research and statistics to extract meaningful results from data (Weihs & Ickstadt, 2018). Data science is important for minimizing the cost, operational time and optimizing the effectiveness of any project. Another advantage of usage of data is that it can be updated with the recent data. This up gradation also affects the result and helps the decision makers to opt the correct decision.
2. Data Using Process In this technological world every decision is taken based on logic. Accurate use of data can create logic and make the decision strengthen. This report recommends the process of collecting as well as using data properly.
2.1. Data Collection It is very important to identify variables before collecting data for any type of analysis. For collecting data a predetermined authority will be allocated. The authority will collect data by online server system. Variable list for this report is following:
1. Location of the Institution: The location for any institution cannot be given arbitrarily. For the convenience of analysis and making more sustainable solution, the authority will divide Dhaka city into many small areas and determine a certain code for each small area. But the area should have a value not more than 4 square kilometer.
2. Institution ID: Every institution in the predetermined area by the authority will have a unique ID. This ID will also be used in the data submission of every institute in the online server system.
3. Origin of Individual: Origin of each and every workers under any institution will be collected. This is also cannot be given arbitrarily rather than following the authority’s predetermined small area.
4. Arrival Time: This arrival time is basically present arrival time determined by the institution.
2.2. Analysis of Collected Data In the analysis, collected data from the central server will analysed with an operational flow chart (See Figure 1). For the convenience of analysis, small area (also for Location of the institution and Origin of Individual) which is mentioned above in the data collection section

Pranto, M. T. Sustainable Solution of Transportation in Dhaka
404
Figure 1: Flow chart for Analysing Collected Data
will be coded. For example, Gulshan 1, Gulshan 2, Banani 1 etc. Then a particular area will be selected for location of institution. Let assume Gulshan 2 for example. Then, the maximum number of origin for every institution in that area will be collected for finding similarities in origin. Let assume the institutions ID with similar maximum origin area will be 1001, 1004, 1007 and 1012 for example. Now, these 4 institutions arrival time will be rescheduled with a specific time interval.
In the arrival time a 15 minutes gap will be maintained. Because within this 15 minutes traffic can move around 2 km average according to 7 km per hour traffic speed in Dhaka (Rahaman, 2019). According to this 15 minutes interval of arrival time there will be 13 arrival times in 3 hours.
2.3. Data Up gradation As there is a tendency of people to go for better institution so there is a big chance of switching of workers/members on any institution. Shifting residence from one place to another can also cause change in origin of individual. So for smooth and better
Select a particular location determined by the authority
Collect that institute code for different
particular origin location
Rescheduling institution’s arrival time by equally distributing institute for a
particular origin location
True False
Take a particular institute in that location
Find the maximum origin location for that institute
Check similarities of maximum origin with other institutes
Classify all the institute code according to
particular origin location

Pranto, M. T. Sustainable Solution of Transportation in Dhaka
405
implementation of this project there is necessity of upgrading the data continuously. In the up gradation process the small area which was determined in the first step can also be changed. The authority can take any necessary steps for this up gradation. This up gradation helps to make the proposal sustainable.
2.4. Control over Flow Entities Dhaka has a lot of public transport now in operation and some mass rapid transit projects are under construction. After rescheduling institution arrival time, it will also be possible to distribute public transport according to priority of origin. The present bus route can be redefined also by connecting maximum small origin area. For any mass rapid transit the operational cost in one trip is huge. Every mass rapid transit usually maintains a specific time interval for arrival of flow entities at any station. This data can also help the mass rapid transit authority to determine this time interval for arrival of flow entities at peak hour as well as off peak hour.
3. Scopes and Limitations This report proposes up gradation of data by the authority of central server system. So, up gradation in the variable can also be possible. Some other variables such as car ownership, weekly off can also be added for further analysis. Car ownership can help increase carpool from that small origin area. On the other hand, weekly off can also decrease traffic jam by distributing off in different days of week. In Dhaka, one of the frequent reasons for traffic jam is blocking of roads for some moments due to VIP movement. These data can also help the VIPs to move in such time when people suffer less due to their movement.
Data is a source of power. So, the authority must take necessary steps to secure it. If the workers/members of institution do not provide accurate data, then the analysis may not be efficient enough.
4. Conclusion Planning is the process of confronting future in an organized way. In this technological world connecting people in a common platform is so easy. One of the main reasons of being a worst liveable city for Dhaka is traffic congestion. It swallows a lot of important time of individual as well as damages the economy. As transport affects the environment so, effective use of it is mandatory to face global climate related issues. After all, government should take the traffic issue seriously to sustain present travel condition in Dhaka before it goes more out of control.
Pranto, M. T. Sustainable Solution of Transportation in Dhaka
406
5. References
Anon., 2019. Population of 2019. [Online] Available at: https://populationof2019.com/population-of-dhaka-2019.html [Accessed 25 Auguest 2019].
Papacostas, C. S. & Prevedouros, P., 1993. In: Transportation Engineering and Planning. s.l.:Pearson.
Rahaman, M. Z., 2019. The Daily Star. [Online] Available at: https://www.thedailystar.net/letters/news/worsening-traffic-congestion-dhaka-1749766 [Accessed 30 Auguest 2019].
Weihs, C. & Ickstadt, K., 2018. Data Science: the impact of statistics. International Journal of Data Science and Analytics, 16 February.
Sadmani, M.I. Mamun, M.M. Islam, I.
A Study on Wholesale Kitchen Markets of Dhaka City: A Comparative Analysis of the Market Arrangements and Their Supply-Distribution System
407
A Study on Wholesale Kitchen Markets of Dhaka City: A Comparative Analysis of the Market Arrangements
and Their Supply-Distribution System Md. Israq Sadmani, Junior Urban Planner, Development Design Consultants Ltd, Dhaka;
Bangladesh Md. Muntasir Mamun, Research Assistant, Rajdhani Unnayan Katripakkha, Dhaka;
Bangladesh Dr. Ishrat Islam, Professor, Department of Urban and Regional Planning, Bangladesh
University of Engineering and Technology, Dhaka; Bangladesh
Abstract
Dhaka, being one of the most densely populated cities in the world, needs about 5,000 metric tons of food products daily. A large amount of different food products are transported from different parts of the country and distributed all over the city through ten wholesale kitchen markets. This supply-distribution system mainly depends on the location context, physical condition and infrastructural capacities of these markets. This research aims at a comparative analysis among the markets focusing on these characteristics in the light of the standards set by Food and Agricultural Organization (FAO) and exploring the supply-distribution system of these markets. Required data for the study were collected through a questionnaire survey of the stakeholders of this system (wholesalers, bepari and retailers), observation survey of the markets and from different secondary sources. This study finds out that the location context of the markets meets up the standards but the physical condition, space arrangements and infrastructural capacities do not maintain the specified standards. Different products reach these markets from different parts of the country and even from abroad through different modes and steps. The retailers through different modes then take these products to local kitchen markets. Transportation costs of these products vary with respect to transportation modes. The bepari and retailers face various problems during the transportation of these products. Policy interventions regarding the space arrangements, location and infrastructure facilities of these wholesale kitchen markets will help to improve the performance of this system.
Keywords
Wholesale Kitchen Markets, Dhaka, Supply-Distribution System, Location Context, Physical Condition, FAO Standards.
1. Introduction 1.1. Background of the study
Dhaka is the most populous and growing city of Bangladesh. The population in the city corporation area is 6,970,105 (BBS, 2013). Per capita food consumption in Bangladesh is 2318 kcal/day (FAO, 2014). Average food consumption includes protein (fish and meat) 66g, rice 416g, pulse 14.3g fruits and vegetables 211g (FAO, 2014). So for 6,970,105 people total 1,800,000 tons of food is needed annually in Dhaka City Corporation area. Everyday this huge amount of food products is needed to be brought and distributed throughout the city. Wholesale kitchen market is a major component of this supply and distribution system

Sadmani, M.I. Mamun, M.M. Islam, I.
A Study on Wholesale Kitchen Markets of Dhaka City: A Comparative Analysis of the Market Arrangements and Their Supply-Distribution System
408
(Seidler, 2001). At present Dhaka city has seven wholesale markets with variety of product at different location of the city (Tuli and Islam, 2014).
A wholesale kitchen market or “kacha bazar” is a very vital function for the city as it makes the bridge between internal parts of a city and other parts of the country as well (Tuli and Islam, 2014). Supply and distribution system of these markets is important for the proper management of food system of this city. Research of Tuli and Islam (2014) identified some problems of these wholesale markets. They mainly focus on the market structures not their locational context. Food and Agriculture Organization (FAO), has a rough rule-of-thumb for the portion of the site covered by buildings, road space and parking, and drain reserves adjacent land use etc. (White and Jhon, 1991). So present physical condition and locational condition of markets should be explored and assessed in the light of these criteria. No research has been done to find out the supply and distribution system of the wholesale markets in Dhaka city.
1.2. Objective of the study This study has two main objectives. They are:
1. To study the existing locational context and physical condition of the wholesale kitchen markets of Dhaka City in the light of standards set by FAO.
2. To explore the food supply and distribution system of wholesale kitchen markets in Dhaka city.
1.3. Literature review and definitions Tuli and Islam (2014) have identified and compared six major aspects of the six wholesale markets according to FAO standards. Product wise store structure of the wholesale kitchen markets has also been discussed. All the acting characters of the market: ‘Bapary’, wholesalers, labour, waste collector, truck driver, retail seller, retail buyer, office staff and consumer can be stated as stakeholders of this function. This study is the only study about the wholesale kitchen markets of Dhaka city. White and Jhon (1991) developed a manual for the planning and design of the wholesale kitchen markets. Space requirements, land use patterns, access and circulations, parking requirements, on site facilities and structures and some other supporting facilities of a wholesale market have specifically elaborated in that manual. All these standards have been reviewed to compare the present condition of the wholesale markets of Dhaka city. Relevant studies and reports were reviewed for other secondary information. Studies related to supply and distribution chains of agricultural products have also been reviewed. According to Chopra and Meindl (2001), supply and distribution system consists of all stages involved, directly or indirectly, in fulfilling a customer request. This system includes the manufacturers, suppliers, transporters, warehouses, retailers and customers. Detailed studies about the supply and distribution system of these wholesale markets could not be found yet.
2. Methodology 2.1. Study area selection
Study area of this study is the administrative boundary of DNCC and DSCC. This study includes the wholesale kitchen markets of Dhaka North City Corporation (DNCC) and Dhaka

Sadmani, M.I. Mamun, M.M. Islam, I.
A Study on Wholesale Kitchen Markets of Dhaka City: A Comparative Analysis of the Market Arrangements and Their Supply-Distribution System
409
South City Corporation (DSCC). Among the ten wholesale kitchen markets of Dhaka, Karwan Bazar, Mohammadpur Krishi Market, Shah Ali market and BDR Market are in the DNCC area and Jatrabari, Swoari Ghat, Moulavibazar, Shyambazar, Badamtuli, Kaptan Bazar are in DSCC area.
2.2. Wholesale market selection DNCC and DSCC do not have any list where wholesale activities are done. So it was first challenge to select the wholesale kitchen markets. This has been solved through key informant interview, literature review and field checking. A preliminary list was prepared from rigorous literature review, interview of the tax officers of DNCC and DSCC and interview with the businessmen of kitchen markets. After this a preliminary field check was done to check whether the listing was correct or not. After the field check, the final list of ten wholesale kitchen markets was prepared.
2.3. Data collection After the selection of the wholesale markets, their respective malik somitys were interviewed to know the product category wise store numbers. With 90% confidence level and 5% confidence interval the sample size is 261 stores from 10 wholesale markets. These 261 stores are selected from the 10 markets using stratified sampling based on category of stores. Secondary data are collected from two sources. One is the list of kitchen markets from the DNCC and DSCC and the other is the review of literature.
2.4. Data compilation and analysis The collected data from the questionnaire survey and checklist were compiled in a SPSS.20 file for further analysis. Data collected from questionnaire survey have been analysed using different types of chart and statistical tool like frequency distribution, descriptive statistics, cross tabulation index number, ratio, binning, explore etc. of SPSS 20. To explore the routes of the supply and distribution necessary maps were prepared.
3. Findings and Discussions 3.1. Adjacent road network
It has been found that all the markets are very much adjacent (less than 500 meter) to their nearest intersection except BDR market which contradicts with the standard of FAO. Wholesale kitchen market should not be adjacent to road intersection specially a busy one. Among the markets, Jatrabari, Karwan Bazar and Shyambazar are very much close (less than 250 meter) to important and busy intersections: Jatrabari, SAARC Chattar and Sadarghat respectively.
3.2. Space arrangement Space arrangements of ten wholesale kitchen markets are analysed with respect to standards. The standard is based on annual throughput of the markets. Karwan Bazar has an annual throughput of 0.4 million tons on average. To sustain this throughput, it should have sales area of 5 acres, storage of 2 acres, Packing and grading of 10 acres, office of 0.25 acres, and support facilities of 0.5 acres. There is huge deviation from the standard. Having an annual throughput of 0.1 million tons on average Mohammadpur Krishi Market need 4.44 acres of land for proper functioning. However, it has total 3.46 acres of land. Deviation from

Sadmani, M.I. Mamun, M.M. Islam, I.
A Study on Wholesale Kitchen Markets of Dhaka City: A Comparative Analysis of the Market Arrangements and Their Supply-Distribution System
410
the standard is observed in sales area, storage and packing. Average yearly throughput of Mirpur Shah Ali Market is 0.1 million tons. This throughput requires 4.4375 acres of land. Nevertheless, currently this area is only 1.8 acres. These are no packing or grading space or other official support facilities. BDR Market has an annual throughput of 0.005 million tons. This market has lots of space and stores unused. Many stores are out of activity. Jatrabari is a busy marketplace with annual throughput of 0.4 million tons. Standard total space requirement is 17.75 acres according to annual throughput. Deviations occur in sales area, packing and grading and storage. Annual throughput of Shaymbazar market is 0.4 million tons. In Badamtuli market almost all the space are used for sales, storage and packing. Still packing and other facilities deviate in high numbers from the standards. Standards are calculated from the annual throughput of 0.05 million tons. Annual throughput of Kaptanbazar is 0.01 million tons. Space requirement is 0.44 acre. However, it has an area of 1.5 acre most of it is used in sales purpose. There are no spaces for packing, storage, or support facilities. Moulavibazar market is fragmented and it has no boundary. Stores are rented stores of multi-storeyed buildings of mixed use. Therefore, it has no such record of space arrangements.
3.3. Landuse pattern According to FAO standards, a wholesale market should have 20-30% covered area, 50-60% road space or parking and 10-20% drain reserves. It is prominent that all the kitchen markets deviated from the standard at a large scale. The largest deviation occurs in building coverage. Average building coverage deviation is 39%. This depicts that majority of land is covered by buildings. There is very little space for parking and roads. It is lowest in Kaptanbazar, Moulavibazar, Jatrabari and Shah Ali market. Average deviation in road space and open space are 23.5% and 15% respectively.
Figure 01: Landuse Pattern of the markets
3.4. Internal circulation network FAO standard says that there should be at least one entry- exit. All the markets have enough entry and exit compared to standards. As Badadamtuli is just a roadside market and it sits on both side of Gabtoli-Sadarghat road, it has no defined entry and exit. It is also same for Moulavibazar. The problem is there is no segregated incoming and outgoing. Internal road width is enough in Karwan bazaar, Mohammodpur Krishi Market, BDR Market, Jatrabari and Moulavibazar. However, in other markets especially in Shyambazar, Showarighat and Shah Ali market it is bellow standard.
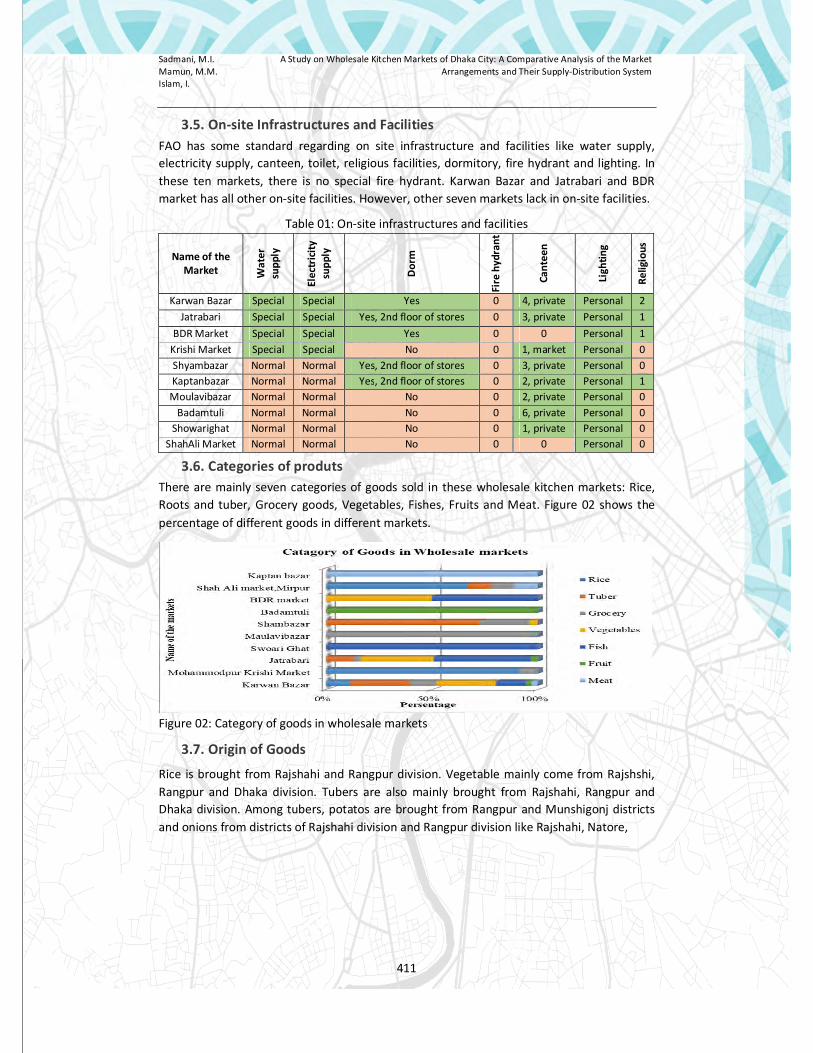
Sadmani, M.I. Mamun, M.M. Islam, I.
A Study on Wholesale Kitchen Markets of Dhaka City: A Comparative Analysis of the Market Arrangements and Their Supply-Distribution System
411
3.5. On-site Infrastructures and Facilities FAO has some standard regarding on site infrastructure and facilities like water supply, electricity supply, canteen, toilet, religious facilities, dormitory, fire hydrant and lighting. In these ten markets, there is no special fire hydrant. Karwan Bazar and Jatrabari and BDR market has all other on-site facilities. However, other seven markets lack in on-site facilities.
Table 01: On-site infrastructures and facilities
Name of the Market W
ater
su
pply
Elec
tric
ity
supp
ly
Dor
m
Fire
hyd
rant
Cant
een
Ligh
ting
Relig
ious
Karwan Bazar Special Special Yes 0 4, private Personal 2 Jatrabari Special Special Yes, 2nd floor of stores 0 3, private Personal 1
BDR Market Special Special Yes 0 0 Personal 1 Krishi Market Special Special No 0 1, market Personal 0 Shyambazar Normal Normal Yes, 2nd floor of stores 0 3, private Personal 0 Kaptanbazar Normal Normal Yes, 2nd floor of stores 0 2, private Personal 1 Moulavibazar Normal Normal No 0 2, private Personal 0
Badamtuli Normal Normal No 0 6, private Personal 0 Showarighat Normal Normal No 0 1, private Personal 0
ShahAli Market Normal Normal No 0 0 Personal 0
3.6. Categories of produts There are mainly seven categories of goods sold in these wholesale kitchen markets: Rice, Roots and tuber, Grocery goods, Vegetables, Fishes, Fruits and Meat. Figure 02 shows the percentage of different goods in different markets.
Figure 02: Category of goods in wholesale markets
3.7. Origin of Goods
Rice is brought from Rajshahi and Rangpur division. Vegetable mainly come from Rajshshi, Rangpur and Dhaka division. Tubers are also mainly brought from Rajshahi, Rangpur and Dhaka division. Among tubers, potatos are brought from Rangpur and Munshigonj districts and onions from districts of Rajshahi division and Rangpur division like Rajshahi, Natore,

Sadmani, M.I. Mamun, M.M. Islam, I.
A Study on Wholesale Kitchen Markets of Dhaka City: A Comparative Analysis of the Market Arrangements and Their Supply-Distribution System
412
Figure 03: Origin of different goods (Source: Field Survey, 2017)
Bogura, Dinajpur and Rangpur. Fruits are brought mainly from abroad and Dhaka division. Fishes are brought from districts of Dhaka division like Mymensingh, Kishoregonj, Norsingdi, Madaripur, Faridpur and Gazipur.
3.8. Mode of supply Goods are supplied to the market with varied mode of transport. Sometimes they come from their origin by single mode and sometimes by multiple modes. Mode of transport for grocery goods could not be known because there is no bepari involved. Type of mode also varies from market to market because origin of the goods varies from market to market. Mode of transport for single mode form is shown in Figure 04.
Figure 04: Mode of transport for single mode form.
For the multiple mode form the situation is different. Only Jatrabari, Badamtuli and Karwan bazaar have multiple mood form. The Table 02 shows the modes for multiple modes of these three markets
Table 02: Multiple mode type Name of the Market First mode Second Mode
Truck Launch/ship Train Pickup Truck Jatrabari 0 24% 1% 0% 25% Karwan Bazar 1% 7% 0 1% 7% Badamtuli 0 70% 10% 10% 70%
25% of Jatrabar’s product comes by multiple modes. 24% come by launch/ ship and 1% by train firstly then changes mode. Second mode for all these goods is truck. Total 80% of

Sadmani, M.I. Mamun, M.M. Islam, I.
A Study on Wholesale Kitchen Markets of Dhaka City: A Comparative Analysis of the Market Arrangements and Their Supply-Distribution System
413
Badamtuli’s goods come from abroad by multiple modes. In this 80%, 70% come by Launch/ship and the rest 10% come by train first. And then reach the market mostly by truck.
3.9. Cost of supply
Cost of supply form origin to the wholesale markets varies with the distance and type of good transported. Bepari were asked the average cost of transport per 100 kilometers of distance per tons of products carried. The result is shown in Figure 05. Average cost of transport for fruits is highest. It is because fruits are carried more carefully than other goods.
Figure 05: Average cost of Supply
3.10. Area of distribution
Karwan bazaar, Jatrabari and Shyambazar are the main three wholesale markets. Karwan bazaar being located in the center of the city, serves the most of the area of both the DNCC and DSCC area. Jatrabari and Shaymbazar are located at the boundary of the City corporation area, so they serve both the city corporation and the adjacent areas. Karwan bazaar servers Zone 01, Zone 02, northern part of Zone 4 and 5 of DSCC area and Zone 1, 2, 4 and 5 areas of DNCC.
3.11. Cost of distribution
Cost of distribution varies with the type of product. Average costs of distribution per five kilometer per ton of different goods are shown in Figure 06. Average cost of distribution is highest for fish and fruit. Fishes and fruits need special packaging and preserving during transportation. Therefore, cost is hi in these two products. Rice, vegetables, tuber, meat and grocery are almost same. These products need no special arrangements for transportation. Again, fish and fruits are mostly distributed by van and auto-rickshaw and tuber, rice, meat and grocery are distributed by pickups and van. So automatically cost rises for fish and fruits.
Figure 06: Average cost of Distribution
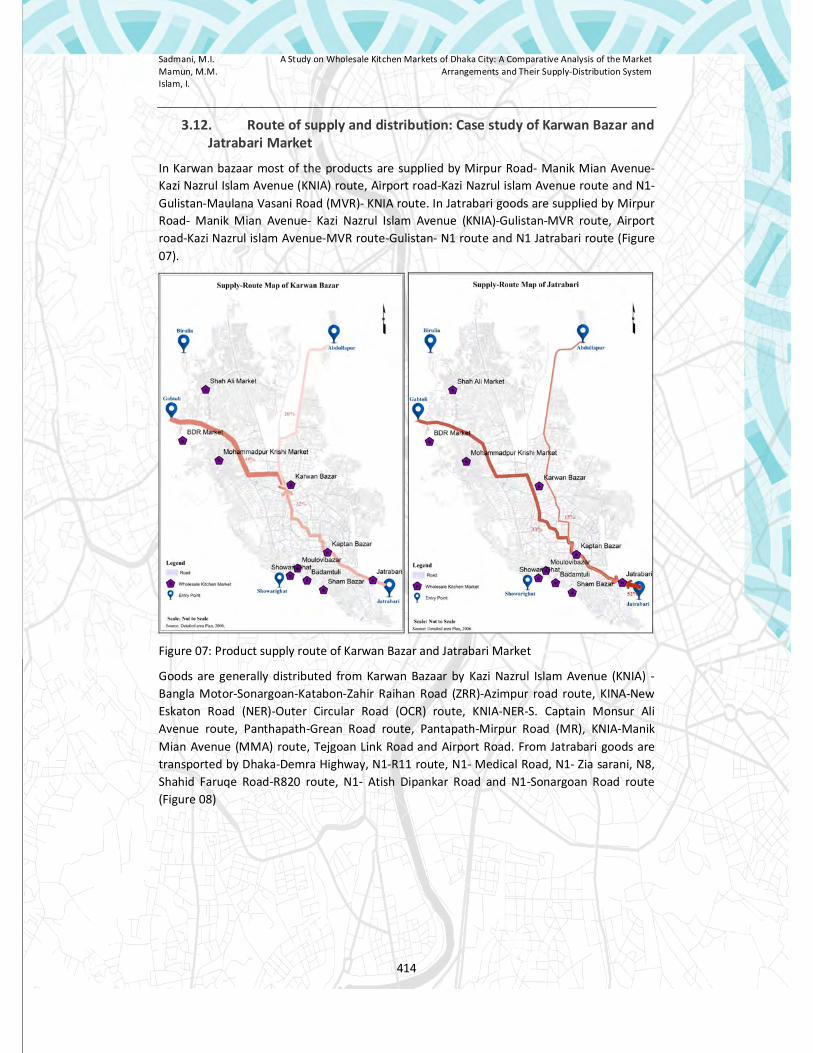
Sadmani, M.I. Mamun, M.M. Islam, I.
A Study on Wholesale Kitchen Markets of Dhaka City: A Comparative Analysis of the Market Arrangements and Their Supply-Distribution System
414
3.12. Route of supply and distribution: Case study of Karwan Bazar and Jatrabari Market
In Karwan bazaar most of the products are supplied by Mirpur Road- Manik Mian Avenue- Kazi Nazrul Islam Avenue (KNIA) route, Airport road-Kazi Nazrul islam Avenue route and N1- Gulistan-Maulana Vasani Road (MVR)- KNIA route. In Jatrabari goods are supplied by Mirpur Road- Manik Mian Avenue- Kazi Nazrul Islam Avenue (KNIA)-Gulistan-MVR route, Airport road-Kazi Nazrul islam Avenue-MVR route-Gulistan- N1 route and N1 Jatrabari route (Figure 07).
Figure 07: Product supply route of Karwan Bazar and Jatrabari Market
Goods are generally distributed from Karwan Bazaar by Kazi Nazrul Islam Avenue (KNIA) - Bangla Motor-Sonargoan-Katabon-Zahir Raihan Road (ZRR)-Azimpur road route, KINA-New Eskaton Road (NER)-Outer Circular Road (OCR) route, KNIA-NER-S. Captain Monsur Ali Avenue route, Panthapath-Grean Road route, Pantapath-Mirpur Road (MR), KNIA-Manik Mian Avenue (MMA) route, Tejgoan Link Road and Airport Road. From Jatrabari goods are transported by Dhaka-Demra Highway, N1-R11 route, N1- Medical Road, N1- Zia sarani, N8, Shahid Faruqe Road-R820 route, N1- Atish Dipankar Road and N1-Sonargoan Road route (Figure 08)

Sadmani, M.I. Mamun, M.M. Islam, I.
A Study on Wholesale Kitchen Markets of Dhaka City: A Comparative Analysis of the Market Arrangements and Their Supply-Distribution System
415
Figure 08: Product distribution routes of Karwan Bazar and Jatrabari Market
4. Recommendations Based on the major findings some general recommendations are formulated to solve the problems with location context, physical condition and supply and distribution system. These recommendations are:
1. There is no guideline for the proper planning and space arrangements of the wholesale kitchen markets of Dhaka city in none of the City Corporations. So proper policies should be formulated regarding the location, physical condition and space arrangements of the markets.
2. Space arrangement in most of the market is not up to the standard. There is enough space in the markets according to their throughput and compared to the standards. However, allocation of space in different use is not far below the standard. So space should be rearranged in the markets.
3. Karwan bazaar and Jatrabri these are the two biggest markets. However, their location is in two of the busiest intersections of the city. This creates congestion in these intersections. Market time of these two markets should be strictly fixed in between midnight and 8 am to avoid general city traffic.
4. All the markets are situated in the boundary lines of the city corporation except Karwan bazaar. In addition, Karwan bazaar serves the most portion of the city corporation area generating a huge amount of traffic inside the city. Relocation or strictly maintaining the operation time of this market should be considered. If Karwan bazaar can be shifted in the outskirts of the city corporation area, Entry of

Sadmani, M.I. Mamun, M.M. Islam, I.
A Study on Wholesale Kitchen Markets of Dhaka City: A Comparative Analysis of the Market Arrangements and Their Supply-Distribution System
416
heavy vehicles like trucks and pickups could be restricted resulting in less pressure on the city traffic.
5. References Bangladesh Bureau of Statistics (2013) District Statistics of Dhaka, Dhaka, Bangladesh Bureau
of Statistics.
Chopra, S.; Meindl, P. (2001) Supply Chain Management: Strategy, Planning, and Operations, Upper Saddle River, NJ: Prentice-Hall, Inc. Chapter 1.
Food and Agricultural Organization (2016) List of countries by food energy intake, Retrieved November 24, 2016, Retrieved from FAO: http://www.fao.org/fileadmin/templates/ess/documents/foodsecuritystatistics/Food Consuption Nutrients_en.xls.
New geography (2017) Evolving urban form: Dhaka, Accessed on 14th August 2017. http://www.newgeography.com/content/003004-evolving-urban-form-dhaka.
Reverso Dictionary (English Collins Dictionary), (2000), Accessed on 31st December 2016. http://dictionary.reverso.net/english-definition/wholesale%20market.
Seidler, E. (2001) Wholesale Market Development – FAO’s Experience, 22nd Congress of the World Union of Wholesale Markets, Durban.
Tuli, S.M., Islam, N. (2014). Analysis on design approach of wholesale kitchen market Dhaka City. European Scientific Journal, 10(9).
The Daily Star (2016). Govt to double size of Dhaka city area. Accessed on January, 2017 from:http://www.thedailystar.net/frontpage/govt-double-size-dhaka-city-area-1219972
United Nations (2016). World cities in 2016. Accessed on 14th August, 2017 http://www.un.org/en/development/desa/population/publications/pdf/urbanization/the_worlds_cities_in_2016_data_booklet.pdf.
White, Tracey, J. (1991). Market Infrastructure Planning. A Guide for Decision Makers, Rome, Food and Agriculture Organization of the United Nations.
White, Tracey, J. (1991). Wholesale Market: Planning and Design Manual, Rome, FAO (Food and Agriculture Organization).
World Economic Forum (2017). These are the world’s most crowded cities. Accessed on 14th August, 2017 from https://www.weforum.org/agenda/2017/05/these-are-the-world-s-most-crowded-cities.

Khan, A.; Rahman, M.M. RMS for a Neighbourhood
417
Research Paper
Road Management System (RMS) for a Neighbourhood Asif KHAN, Master’s Student, Dept. of U.R.P., Jahangirnagar University; Bangladesh Mohammad Mizanur RAHMAN, Assistant Professor, Dept. of U.R.P., Jahangirnagar
University; Bangladesh.
Abstract
In carrying out road maintenance functions, local governments face growing pressures arising from inadequate budgets and greater accountability, when many of the existing roads have reached the upper limits of their design life spans. Road Management System (RMS) is a systematic approach that can furnish an inclusive inventory for road network which presents the condition of the road network chronologically. It supports to predict the future road condition and set up the work with the assist of much less time and struggle. Integrating GIS with it would be more productive for planning and decision making. In this study a GIS-based RMS model has been developed for Uttara Sector-7 neighborhood through utilizing ArcGIS and Road Condition Index (RCI) tool according to ASTM D6433 standard. RCI has been calculated through entering the road condition data using SPSS 15 that had been visually accumulated and measured for each roadway for Uttara Sector 7. Among 38 existing roads of the study area 15.8% is in poor; 18.4% is in fair and rest 65.8% is in good condition and average RCI value is 78.86 which means that most of the roads is in good condition. Interviews were also conducted with experts in road maintenance with different experts and planning professionals to justify the rated factors affecting road maintenance prioritization. A guideline has been prepared from “Operation and Maintenance Plan” as recommendations that could be used for implementation of maintenance activities in the neighborhood.
Keywords
Road Management System (RMS), Geographic Information System (GIS), Local Government, Maintenance and Rehabilitation (M&R)
1. Introduction Road network is the most important infrastructure for a neighborhood as it acts like the veins of a planned neighborhood. Supervision and maintenance of these critical transportation assets can also be beneficial to obtain higher safety, convenience and cost effectiveness in the transportation sector for citizens. The road network is the most conspicuous publicly used network that is supervised and maintained by local government bodies. In 1970s, Road management systems (RMS) have been introduced and they have advanced consistently in terms of their scope, methodology, and application. According to Kulkarni and Miller (2002), these systems with the aid of evaluating the previous and contemporary practices and recognized future instructions for the key elements. According to Shahin (2005), Road Management System (RMS) is a device or systematic approach that can furnish an inclusive inventory for road network and set up the work with the assist of much less time and struggle. The system can consider the roads and discover out a suitable maintenance desires with priorities underneath the accessible funds. According to Ahmed (2013), Geographic Information System (GIS) is the scientific device which assists in the

Khan, A.; Rahman, M.M. RMS for a Neighbourhood
418
planning, implementation and managing Road Management System (RMS). GIS within RMS is used for storing, inspecting and exhibiting the road information in a color-coding like thematic maps.
There are rare studies on integrating GIS with RMS for neighborhood roadway. Implementing successful RMS for neighborhood road network desires a closer approach to this technique that is used for small cities and towns.
This research is be about feasibility of road construction and maintenance practice which can be time efficient, cost effective and sustainable in a developing country via preparing of Road management system for a neighborhood through utilizing GIS and Road Condition Index (RCI) tool. In this study, RCI was calculated through entering the Road condition data that was visually accumulated in a neighborhood for each roadway for Uttara Sector 7 by utilizing GIS.
2. Objectives and methodology 2.1. Research question and objectives For this study the research question is “How the road maintenance practice can be time efficient, cost effective and sustainable in a developing country through using RMS?”
To answer the research question, the main objective of this study is to explore the existing condition of road and prepare the Road Management System (RMS) for a neighborhood roadway using GIS.
2.2. Methodology The study area was Sector 7 of Uttara Model Town of Dhaka North city corporation was selected which has a proper road network. The existing road condition data was collected by the survey and Road Condition Index (RCI) tool according to ASTM D6433 standard was used for the study. RCI has been calculated through entering the road condition data using SPSS 15 that had been visually accumulated and measured for each roadway for Uttara Sector 7.
After that the road database of Uttara sector 7 was collected from Dhaka North City Corporation and updated according to the primary data collected form the survey. The RMS database was developed in ArcGIS 10.3. In the meantime, the questionnaire survey was done to collect the data about the most effecting factors for road maintenance prioritization that reveals that which types of roads needed to be prioritized for maintenance work.
Key Informative Interviews were also done to validate the model with the experts in the transportation and urban planning sector and their opinion to make it more understandable and workable for the local government authorities like Dhaka North City Corporation. From that a SWOT analysis was done for the validation of the model.
Based on those data analysis, those were imported and integrated in with the database to prepare US7-RMS model and the thematic mapping was done in ArcGIS 10.3 to represent the maps showing the exiting road condition and the maintenance work.
The methodology was illustrated as following showing the research methods and other aspects research ethics.

Khan, A.; Rahman, M.M. RMS for a Neighbourhood
419
Figure 1 Methodology Flowchart

Khan, A.; Rahman, M.M. RMS for a Neighbourhood
420
The full methodology was built including the research philosophy, research approach, methodological choice, research strategy, time horizon, techniques and tools and the proper procedures.
3. Existing scenario Dhaka city consists of two city corporations including Dhaka North city corporation and Dhaka South city corporation. Uttara Sector 7 is situated in the northern part of Dhaka city. It lies at 23° 52’ north latitudes and 90° 23’ longitudes with an area of 120 acres. Sector-7 is bounded by sector 9 on the north, sector 6 on the east, sector 3 on the south and a lake and sector 13 on the west. Sector-7 is bounded by Sonargaon Janapath, Rabindra Sarani and Dhaka-Mymensingh Road on northern, southern and eastern side respectively. On the western side of the sector there is Uttara Lake.
In Uttara sector, the grid iron pattern of road has been followed. Dhaka-Mymensingh Road serves as the connecting way from Uttara Sector-7 to central Dhaka city. Sonargaon Janapath Road and Rabindra Sarani 100 ft width serves as the major distributors of the Sector. Collector streets of 60 ft. width and access roads of 30 ft. width arc serving the inhabitants of the area in their daily lives. Most of the roads are metaled and there is provision of footpath. Dhaka North City Corporation (DNCC) is responsible for the maintenance and management of road network.
4. Preparation of RMS Shahin and Walther (1990) remarked that “an RMS offers a systematic, steady method for choosing maintenance and rehabilitation (M&R) needs, priorities and identifying the most beneficial time of restore with the aid of predicting future road condition”. In this research, an RMS for Uttara Model Town’s Sector-7 used to be developed on the foundation of the systematic procedure as established in figure 2. In this process, the two most important software program were utilized, these software’s are SPSS and Geographic Information System (GIS) software ArcGIS 10.3, the first one is used for storing and evaluating the RMS statistics and the 2nd one (GIS) has been used as a smart software for imparting RMS outcomes on a geographic map.
4.1. Sector-7 Road Network Definition Uttara Model Town’s Sector-7 road network consists of about 9 km length of roadway. It is properly known, for defining a road network an appropriate referencing system need to be chosen. The fundamental reason of a referencing system is to delineate one road part in the network from different sections. In the sector there is an existing systematic road numbering. Therefore, a new system has been developed for coding and numbering roads. In this study, sector’s road network is represented through the use of nodes and lines
4.2. Road Inventory and Condition Survey Uttara Sector-7’s road network consists of paved roadway. In this study, about 33,263 square meters of asphalt concrete surface have been surveyed. Firstly, inventory data gathered then road situation inspected section through section subsequently recorded in the unique form. Visual survey of the road sections used to be carried out in May 2018 to

Khan, A.; Rahman, M.M. RMS for a Neighbourhood
421
accumulate and investigate the present condition of the road network. This survey used to be performed through the usage of “Paver Asphalt Distress Manual” which was developed by using the US Army Corps of Engineers (US Army Corps of Engineers, 1997). A range of distress types used to be measured and assessed according to their severity level. Records from these measurements and assessments have been registered in the survey sheet as
4.3. Condition Evaluation and Prediction Once an inventory and condition survey completed, the recorded outcomes entered to the SPSS database, in this software program calculates the Road Condition Index (RCI) for every individual section. The RCI has been derived from the imperative score, from a mixture of the quantities of exceptional types of distress and their severity.
Branch
ID Section ID Use
Length
(m)
Width
(m)
Area
(m2) RCI
Road 1 US7-A1 Connector Road 400 9.1 3640 100
Road 3 US7-A3 Access Roadway 195.4 4.57 892.978 77
Road 6 US7-A6 Access Roadway 123.73 4.57 565.4461 89
Road 7 US7-A7 Access Roadway 233.1 4.57 1065.267 64
Road 10 US7-A10 Access Roadway 127.7 4.57 583.589 47
Table 1 Road Condition Index (RCI Values) of Uttara Sector-7
4.4. RMS and GIS Integration In this research GIS used to be utilized in the Uttara Sector-7 Road Management System to help in the preparation of an appropriate database of neighborhood paved roadways. GIS acts as a Management Information System which can be excellent described as a system to keep and deliver reliable data, in an environment friendly manner to the required planning procedure. In this study the contemporary version of GIS software program has been utilized so as to set up the database and strengthen the system. ArcGIS 10.3 which has been developed with the aid of “Environmental Systems Research Institute” (ESRI) was the fundamental GIS software program utilized to perform the required integration with RMS. The steps included georeferencing map, creating a shapefile, joining rms statistics with a shapefile, documenting and mapping.
As determined in table 2 the RCI ought to convert into a qualitative measure which displays the typical conditions of every section. It is necessary to observe that the RCI approach deals with surface prerequisites only. Surface prerequisites are regularly signing and symptoms of underlying problems, whilst in many instances feasible distresses can also properly be hidden beneath the road except inevitably indicating any visual distress signs on the surface.
Finally, the collected and calculated data were stored in a database, for this purpose SPSS was utilized. This simple database can be updated while the maintenance actions take steps, or in any essential time.

Khan, A.; Rahman, M.M. RMS for a Neighbourhood
422
Figure 3 RCI Range Map of Uttara Sector-7 (Source: DNCC 2018; Modified by author)
Thus, the RCI reports ought to be regarded for instruction and no longer conclusive information on the conditions of the road.
RCI Range Condition
71 –100 Excellent
56-70 Fair
30-55 Poor
Table 2 RCI Ranges (supported by the US Army Corps of Engineers)
5. SWOT Analysis It was don for the assessments of professionals from notable road authorities on the proposed GIS-based road maintenance administration model in order to validate the model. The KIIs had been carried out with specialists in road maintenance and GIS software who had been previously interviewed for data collection purposes.

Khan, A.; Rahman, M.M. RMS for a Neighbourhood
423
Throughout the interviews, the underlying mechanism has been completely explained. The professionals are then requested to evaluate the model through the usage of a SWOT (Strengths, Weaknesses, Opportunities, and Threats) analysis.
Figure 4 Overall SWOT Outcomes of Specialists’ Views (Source: KII Interviews 2018)
6. Major Findings and Recommendations The neighborhood road network was inspected and analysed for roadway based on the existing surface condition. Among 38 existing roads of the study area 15.8% is in poor; 18.4% is in fair and rest 65.8% is in good condition and average RCI value is 78.86 which means that most of the roads is in good condition. The poor roads are needed some immediate actions for maintenance, where the fair roads are needed the periodic maintenance.
As a conclusion from the accomplished analytical results the following findings can be drawn:
The neighborhood road network has been identified and all road sections have been inspected. Moreover, RCI computed for each individual section.
A GIS database has been created and section’s RCI value was displayed on a thematic map with different legends and symbols. Additionally, various reports and charts have been generated.
Finally, the proposed model was validated through the SWOT analysis from the professionals.
Operation and Maintenance (O&M) of property is one of the major issues of Dhaka North City Corporations in handing over sufficient offerings to its citizens. Proper operation and well-timed renovation can solely make sure positive return on a massive quantity of expenditure to accumulate DNCC’s property consisting of infrastructures, service amenities and equipment. DNCC has confronted deterioration of the bodily belongings and offerings due to fast increase in city populace which exceeds designed capability of the assets. On the
STRENGTHS
Rational, simple to use and can be effective for neighborhood roads.
GIS is an appropriate tool for network analysis.
Uses opinions of the planning community and engineering community as a basis for weighing each factor.
WEAKNESSES
Budgetary benefits are not considered. Might not be affordable due to limited
budgets. A large number of factors are used in
the model.
OPPORTUNITIES
Improvements of the model to make values consistently interpreted by each individual local road authority would enable the model to be a useful national comparison or standardization tool.
THREATS
Risk of short funding may limit the practicability of the model.
Lack of expertise in GIS technology and database management.

Khan, A.; Rahman, M.M. RMS for a Neighbourhood
424
different hand, availability of resources, manpower and their capacity, in most cases, are inadequate to control the issue. Under the circumstance, property is no longer probable to be maintained till harm to shape grows to a serious level, and its outcomes in shortening of provider life. DNCC, alternatively as most important cities, have to manage high-quality of property and offerings in order to impervious excellent of existence of metropolis dwellers. Therefore, it is regarded as a massive challenge for the DNCC to make sure suitable O&M of its property by means of setting up positive environment friendly management system.
7. Conclusion The mentioned purpose of this study was once to strengthen a GIS-based choice assist model to support the decision-making process in road renovation administration of the existing roads beneath the manipulate of local urban authorities in the Bangladesh. In thinking about the current road maintenance practices as verified through the assessment of the literature, it has been hooked up that within the various local road authorities in the Bangladesh, until currently there have been distinct techniques and principles utilized in carrying out road maintenance duties. However, local road authority (DNCC) thinks about the circumstance of road as the solely issue when planning remedies due to insufficient funding, and the precept of “worst is first” has been utilized in carrying out road maintenance. Considering the questionnaire survey and the interview future study ought to widen the survey coverage to all specific roads which includes the highway roads, while preserving the same goals and study theme. This would be of incredible advantage to acquire wider experience from specific techniques to road maintenance system.
8. References ASTM, D. (1991). ASTM D6866 - 18 Standard Test Methods for Determining the Biobased
Content of Solid, Liquid, and Gaseous Samples Using Radiocarbon Analysis. [online] Astm.org. Available at: https://www.astm.org/Standards/D6866.htm [Accessed 23 Apr. 2018].
Ahmed, B. (2013). Developing of Pavement Management System (PMS) for EMU Campus Pavement in GIS Environment. [online] I-rep.emu.edu.tr. Available at: http://i-rep.emu.edu.tr:8080/jspui/handle/11129/1582 [Accessed 19 Feb. 2018].
DNCC (2018). Dhaka North City Corporation. [online] Available at: http://www.dncc.gov.bd/ [Accessed 31 Aug. 2018].
Kulkarni, R. and Miller, R. (2002). Pavement Management Systems: Past, Present, and Future. Transportation Research Record: Journal of the Transportation Research Board, 1853(1), pp.65-71.
Shahin, M. (2019). PAVER - Pavement Management Software. [online] Paver.colostate.edu. Available at: http://paver.colostate.edu/ [Accessed 11 Jun. 2018].
Shahin, M. and Walther, J. (1990). Pavement Maintenance Management for Roads and Streets Using the PAVER system. [online] Apps.dtic.mil. Available at: https://apps.dtic.mil/docs/citations/ADA227464 [Accessed 26 Aug. 2018].

Baksh, A; Akter, S Factors relating to the trip Generation in a growth centre
425
Case Study Paper on
FACTORS RELATING TO THE TRIP GENERATION IN A GROWTH CENTRE
A Case Study of Baneshwar, Rajshahi, Bangladesh
MD. AWUAL BAKSH, DEPUTY URBAN PLANNER, TROYEE associates, Hasan Holdings, Level-12, 52/1 New Eskaton Road, Dhaka-1000, Bangladesh.
SHARMIN AKTER, Department of Urban and Regional Planning, Rajshahi University of Engineering and Technology, Rajshahi-6204, Bangladesh.
Abstract
Trip generation is the first stage of the classical 'four-stage' transport model (trip generation, distribution, modal split, and assignment). The trip generation aims at predicting and quantifying the total number of trips generated and attracted to a specific area related to various urban activities without taking into account other trip characteristics such as direction, length or duration. In other words, this stage answers the questions to "how many trips" generated at each zone based on land use, demographic and socioeconomic attributes. The Statistical model was built by using multiple linear regression analysis, which establishes a relationship between trip number and land use, demographic and socioeconomic attributes. Primary and secondary data were used to identify the factors relating to the trip generation. Primary data were collected by conducting household surveys which sample size was determined by simple random sampling method. Applying this model in the study area of Baneshwar in Rajshahi, an attempt had been made to find out the factors, which are related to trip generation. This study reveals that family size, number of employees, household income, vehicle ownership and number of students in a household as the demographic attribute and land-use intensity, characteristics of activity and location as the land use attribute are highly correlated to the trip generation. This paper provides important information related to the trip generation characteristics of the growth centre in Rajshahi district, thereby giving a vast idea about the factors affecting the trip generation towards urban land use.
Keywords
Transport modeling, trip generation and attraction, growth center, factor analysis, multiple linear regressions.
1. Introduction Transportation problems present numerous number of the constituent complex factors of urban problems. In many respects, transportation may be considered as one of the major sources of present urban problems. In this process, Engineers and Planners improve information about the impacts of implementing alternative courses of action involving transportation services such as construct new highways, change bus route, and regulate parking restrictions. Trip generation is the first phase of the classical 'four-stage' transport model (trip generation, distribution, modal split, and assignment). The purpose of this phase is to forecast the total number of trips which are generated from and attracted to each zone. Trip generation analysis provides the means for relating the number of trips in any zone to its

Baksh, A; Akter, S Factors relating to the trip Generation in a growth centre
426
land-use and socio-economic characteristics such as land-use intensity, activities and location within the urban environment. Trip generation models attempt to identify and quantify the trip ends related to various urban activities without considering other trip characteristics such as direction, length or duration (FHW A, 1975). Trip generation is defined as the decision to travel for a precise purpose. In practices, trips are often classified by different purposes to obtain better trip generation models. Based on purpose, personal trips are commonly classified into work trips, shopping trips, social trips, recreational trips, school trips, home trips, and business trips. A work trip can be defined as a trip made to a person's place of employment (Barber, 1985); the place of employment may be a public or private institution such as an industry, a hospital or a bank. A shopping trip can be defined as a trip made to any social outlet, regardless of the size of the store (or shopping Centre) and whether or not a purchase was made. Among all trip purposes, work trips used to be most numerous followed by shopping trips (Vickerman and Barmby, 1984). The attraction rate of trips depends on number and types of retail facilities, the number of employees and land use, and the production depends-on car ownership, income and population (employment characteristics) of an urban area (www.ctre.iastate.edu). The objective of the trip generation stage is to understand the reasons behind the trip making behaviour and to produce mathematical relationships to synthesize the trip making pattern based on observed trips, land use data and household characteristics (Kadiyali, 2003).
2. Literature Review An important part of the transport system planning morphology is the travel demand forecasting process. This process consists of four stages which are trip generation, trip distribution, choice modal split, and traffic assignment. A basic assumption of the travel demand forecasting process is that there is a stable relationship between transport demand and urban activity system. (B.G. Hutchinson, 1974) The merging and interaction of three disparate planning perspectives (the facility orientation of intercity highway planning, the traffic operations-oriented traffic engineering approach, and social consciousness of urban planning) produced the basic elements of the contemporary urban transportation planning process, incorporating technical analyses, widely based citizen participation, and a concern for a large variety of social, economic, and environmental impacts in addition to connectivity and accessibility.(C. S. Papacostas 2006) A study conducted by Anderson and Olander (2002) examined the practicality of using a single internal trip purpose to generate the production and attraction values for traffic analysis zones in small urban-community travel models. This work focused on the reduction of data requirements, and the complexity of the trip generation analysis. He concluded that, for modelling smaller-urban communities, there is no significant advantage in adopting multi-purpose modelling approaches, since the trip-productions and attractions for the traffic zones remained almost the same. The two most commonly used techniques of trip generation modelling have been linear regression analysis and category analysis. Both approaches have their strengths and weaknesses. In regression analysis, although there are statistical tests for the goodness of fit of the models, the assumption of linearity of each of the independent variables with the

Baksh, A; Akter, S Factors relating to the trip Generation in a growth centre
427
dependent variables is restrictive. The assumption that the number of trips is approximately continuous can be questioned when typical values for the number of trips are relatively low. The link between the number of trips and covariates in linear regression, while it may be based on hypothetical ideas about the process of trip generation, lacks a behavioural justification such as supported by the theory of random utility (e.g. Ben-Akiva and Lerman, 1985). Alternatively, in category analysis, the large sample size required to calibrate the trip rates as well as the absence of statistical tests for the overall goodness of fit of the models undermines its adequacy (see Stopher and McDonald, 1983; OrtUzar and Willumsen, 2001). Logistic regression overcomes many of the restrictive assumptions of ordinary least squares regression (Garson, 2002); in particular, the assumption of linearity between the dependent and independent variables. This technique can be used to model relationships between the response variables which are binary or categorical, with more than two categories and several explanatory variables which may be categorical or continuous. This approach has been widely used to model other travel choices such as choice of mode choice, route choice (Ortuzar, 1983; Bhat, 1995; Bhat, 1998a; Ortuzar and Willumsen, 2001) departure time choice (Bhat, 1998b; Saleh and Farrell, 2005) and other travel choices. However, not many applications in trip generation modelling have been reported (see for example Daly, 1997). Logistic regression can be used to model trip generation using binary logit models (whether or not an individual will make a trip) or multinomial logit models (probability of making 0, 1, 2 or more trips}, or probability of making infrequent, frequent, very frequent trips}, etc. This way, one can investigate the frequency of trips combined with the number of trips made by each individual or household (see Hosmer and Lemeshow, 2000 for further discussions on the applications of logistic analysis). This research investigates modelling trip generation using logistic regression analysis. Several trip generation models using linear regression, category analysis, and logistic regression analysis have been calibrated and compared. The independent variables that are most commonly considered in trip generation models are mainly socio-economic variables (individual or household attributes) as well as attraction opportunities. One of the main criticisms of trip generation models is the absence of any variables that represent the transport policies implemented in zones that affect its accessibility (e.g. public transport, pricing, and parking policies). Typically accessibility refers to the "ease" with which desired destinations may be reached and is frequently measured as a function of the available opportunities (such as employment levels and retail or non-retail square footage) moderated by some measure of impedance (such as distance, travel time or cost) (Niemeier, 1997). Previous researches that have attempted to develop trip generation models that include impacts of transport policies or accessibility are limited. For example, Hansen (1959) calibrated a trip generation (production) model with an accessibility index for each zone in the study area as a measure of the activities in other zones and a measure of travel impedance between each zone pair. Freeman (1976) developed a similar model for trip attractions. In both cases, the accessibility index was a function of opportunities and travel impedance (mainly time or cost). Leake and Huzayyin (1979) proposed a composite measure of accessibility which combined private transport and a public transport accessibility measure. Daly and colleagues (Cohn et al., 1996; Daly, 1997) introduced an accessibility measure in the logit trip generation model, which is the log sum from the mode/destination choice model. Transport policies such as road user charging and parking pricing, however, have not previously been explicitly included in a trip generation model.

Baksh, A; Akter, S Factors relating to the trip Generation in a growth centre
428
In transport modelling, 'trip' or 'journey' (both terms are used interchangeably here) is a one-way movement from a point of origin to a point of destination (OrtUzar and Willumsen, 2001). A Home-Based (HB) Trip is one where the home of the trip maker is either the origin or the destination of the trip and a Non-Home-Based (NHB) Trip is, conversely, one where neither end of the trip is the home of the traveller. Trip Generation is often defined as the total number of trips generated by households or individuals, be they HB or NHB. A Trip Production is defined as the home end of an HB trip or as the origin of an NHB trip and a Trip Attraction is normally defined as the non-home end of an HB trip or the destination of an NHB trip. Work trips and school trips are usually called compulsory (or mandatory) trips and shopping trips, social and recreational trips and some other less routine trips (such as seeing a doctor) are called discretionary (or optional) trips (OrtUzar and Willumsen, 2001). When transport policies are introduced, it would mostly impact on discretionary trips than compulsory trips. Trip generation models for different types of trips can vary either by the factors in the equations or by the value of the coefficients of the same factor. By time of day, trips are often classified into peak and off-peak period trips and the proportion of journeys by different purposes usually varies greatly with the time of day (Ortuzar and Willumsen, 200 I). The majority of trips in the AM peak are usually compulsory (Le. either to work or education) and this is not the case in the off-peak period. Trips can also be classified by type of person, as individual travel behaviour is heavily dependent on socioeconomic attributes such as income levels, car ownership and household size and structure (Ortuzar and Willumsen, 2001).
3. Methodology As a first step of conducting a trip generation model analysis, Baneshwar (growth centre of puthia Upzila) has been selected as the study area. Several relevant independent variables that influence the trip generation towards the growth centre have been identified. And the data related to the identified independent variables from each growth centre has been collected from both primary and secondary data source. Demographic data (total population, geographic area, population density) has been collected from housing census report (2011) of the Bangladesh Bureau of Statistics (BBS). Socio-economic data (family size, monthly income, vehicle ownership, and employment Status) has been collected by conducting a questionnaire survey of one hundred samples in the study area. After data collection, the characteristics of Baneshwar growth centre have been analysed. The correlation and regression analysis were done using the identified variables and the best regression model is formulated for predicting the trips attracted towards Baneshwar growth centre in Rajshahi district. Then a check for the validation of the formulated multiple regression model has been done to verify whether the formulated model is valid or not.
4. Study Area Profile The study area is selected in such a way as to satisfy the criteria of a growth centre. The definition of growth centre is not uniform throughout the world. According to ESCAP (ESCAP, 1979), Growth Centres are the centres that contribute directly to the basic needs of agricultural producers, both in respect of economic and social services.
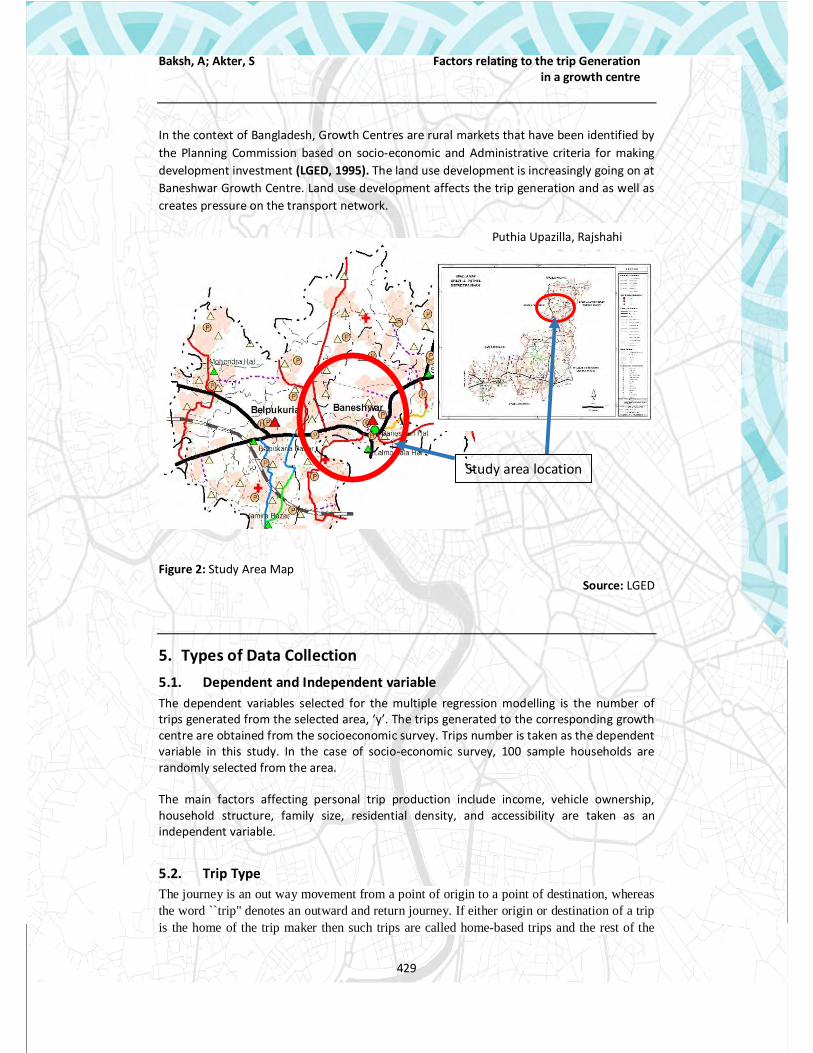
Baksh, A; Akter, S Factors relating to the trip Generation in a growth centre
429
In the context of Bangladesh, Growth Centres are rural markets that have been identified by the Planning Commission based on socio-economic and Administrative criteria for making development investment (LGED, 1995). The land use development is increasingly going on at Baneshwar Growth Centre. Land use development affects the trip generation and as well as creates pressure on the transport network.
Figure 2: Study Area Map
Source: LGED
5. Types of Data Collection 5.1. Dependent and Independent variable The dependent variables selected for the multiple regression modelling is the number of trips generated from the selected area, ‘y’. The trips generated to the corresponding growth centre are obtained from the socioeconomic survey. Trips number is taken as the dependent variable in this study. In the case of socio-economic survey, 100 sample households are randomly selected from the area. The main factors affecting personal trip production include income, vehicle ownership, household structure, family size, residential density, and accessibility are taken as an independent variable.
5.2. Trip Type The journey is an out way movement from a point of origin to a point of destination, whereas the word ``trip" denotes an outward and return journey. If either origin or destination of a trip is the home of the trip maker then such trips are called home-based trips and the rest of the
Puthia Upazilla, Rajshahi
Study area location

Baksh, A; Akter, S Factors relating to the trip Generation in a growth centre
430
trips are called non-home-based trips. Trip production is defined as all the trips of home-based or as the origin of the non-home based trips.
A.
B. Figure 3: Types of Trip
Source: Kadiyali, 2003
6. Data Analysis and Interpretation 6.1. Techniques of Trip Generation Modelling In the late 1950s and early 1960s, linear regression was the most popular method of predicting what the number of trips generated would be if one of the factors affecting trip generation changed. This approach uses trip data collected at one time to determine a functional relationship between trip generation (which are known as the 'response' or 'dependent' variable of the function) and the characteristics that exhibit a causal effect on it (which are known as the 'explanatory' or 'independent' variables of the function) utilizing the principle of least-squares, i.e. the squared sum of the residuals or deviations from the estimated line is minimized. The linear least-squares model is based on the hypothesis that there exists a linear relationship between some dependent variable and one or more independent variables. A trip generation model based on linear regression analysis predicts the number of trips by residents of the zone Y= B0 + B1X1 + B2X2+ B3X3 +B4X4 +B5X5+………………………. + BnXn
Where, Y= dependent variable representing the trip generation B0 = the constant included to represent the portion of the value of y not explained by the Independent variable Bn = coefficients X = independent variables – production (number of households, number of vehicles Population, Family size, Household income, etc.
Home Work
Home Shop
Attraction Production
Attraction
Attraction
Attraction
Production
Production
Production

Baksh, A; Akter, S Factors relating to the trip Generation in a growth centre
431
6.2. Correlation Analysis Correlation and regression analysis are related in the sense that both deal with relationships among variables. The correlation coefficient is a measure of linear association between two variables. Values of the correlation coefficient are always between -1 and +1. A correlation coefficient of +1 indicates that two variables are perfectly related in a positive linear sense, a correlation coefficient of -1 indicates that two variables are perfectly related in a negative linear sense, and a correlation coefficient of 0 indicates that there is no linear relationship between the two variables. Table 1.Correlation variables Total trip
Pearson Correlation
Total trip 1.000
Family Size 0.701
Number of employees 0.482
Vehicle ownership 0.610
Household Income 0.412
Number of students 0.704
6.3. Regression Analysis According to household survey conducted by the authors following descriptive statistics were found (See table 2). For the purpose of regression analysis, we have considered five preselected variables such as family size, number of employees, number of students, household income, and vehicle ownership. We found each family averagely generate 7.86 trip per day for their daily activities. Table 2. Descriptive Statistics Variables Mean Std. Deviation N
Total trip 7.86 1.63 100
Family Size 3.33 1.09 100
Number of employees 1.00 0.78 100
Vehicle ownership 0.80 0.66 100
Household Income 10140.00 2984.62 100
Number of students 0.83 0.698 100

Baksh, A; Akter, S Factors relating to the trip Generation in a growth centre
432
Table 3. Regression Model Summary Model
R R Square
Adjusted R square
Std. errors of the Estimation
Change statistics R square change
F change
df1
df2 Sig. F Change
1 0.840
0.706
0.64 0.97 0.706 11.51 5 24
0.00
a. Predictors: (Constant), Number of the students, Vehicle ownership, Number of employees, Household Income, Family Size b. Dependent Variable: Total trip
Coefficient of determination or R-square obtained for this model is 0.706, this shows that 70.60% of the variation in the trips is explained by the variation in family size, vehicle ownership and number of students
Adjusted R Square value takes into account the number of variables in the model and the number of observations (participants) our model is based on. This Adjusted R Square value gives the most useful measure of the success of the model. Adjusted R-value obtained is 0.645, which depend on sample size and number of the independent variable.
The standard error of the model, which is the standard deviation of residuals, indicates the degree of variation on the data about the regression line established that is, the error we would expect between the predicted and actual dependent variable. The standard error of the regression model is 0.97. This means that the expected error for trip attraction predicted is off by 0.97 trips. The error is comparatively a smaller one.
Significance F value indicates the probability that the regression output could have been obtained by chance. A small Significance of F confirms the validity of the regression output. For this model, the significance of F is nearly zero, so there is no chance that the regression output was merely a chance occurrence. This shows there is a linear relationship between all of the x variables considered together and y
Table 4. Coefficients
Model
Unstandardized Coefficients
Standardized Coefficients
t Sig. 95.0% Confidence
Interval for B
B Std. Error
Beta Lower Bound
Upper Bound
(Constant) 5.325 0.807 6.60 0.00 3.66 6.99
Family Size 0.89 0.416 0.600 2.16 0.04 0.040 1.75
Number of employee
-0.48 0.419 -0.233 -1.15 0.26 -1.348 0.38
Vehicle 0.97 0.314 0.396 3.11 0.00 0.328 1.62

Baksh, A; Akter, S Factors relating to the trip Generation in a growth centre
433
ownership 5
Household Income
-0.01 0.00 -0.267 -1.68 0.11 0.00 0.00
Number of students
0.881 0.396 0.377 2.22 0.03 0.062 1.699
Multiple Linear Regression equation
Y= 5.325 + 0.898X1 + 0.975X2 +0.881X3
Where, Y= Total trips, X1 = Family size, X2 =Vehicle Ownership, X3 = Number of Students The first term in the prediction equation (5.325) is a constant that represents the predicted criterion value when both predictors equal zero. The values of 0.898, 0.975 and 0.881 represent regression weights or regression coefficients of the selected independent variables, family size, vehicle ownership and the number of students respectively.
7. Conclusion The study developed a trip generation model for the growth centre in Rajshahi district by using multiple linear regression analysis. Similar to the related studies, this study also found that family size, vehicle ownership and the number of students are highly correlated to the trip generation. This paper provides important information related to the trip generation characteristics of the growth centre in Rajshahi district, thereby giving a vast idea about the factors affecting trip generation towards urban land use.
The main limitations of this study are the restricted number of respondents and the assumption in regression analysis. The accuracy of the regression model can be ensured by including more representative respondents from different growth centre in Rajshahi district. Since there are no comprehensive studies regarding the trip generation of the growth centre in Bangladesh, this study will help the future researcher. Also, more factors that affect trip production can be studied for further research purpose.
8. References
Hutchinson, B.G (1974) Principles of Urban Transport System Planning, Scripta Book Company.
Population and Housing Census report (2011), Bangladesh Bureau of Statistics (BBS) Papacostas, C.S; Prevedourous, P.D.(2001); “Transportation Engineering and Planning” (3rd
edition) published by Pearson Education Inc., Upper Saddle River, New Jersey 07458, U.S.A

Baksh, A; Akter, S Factors relating to the trip Generation in a growth centre
434
Williams, H.C.W.L. (1977); “On the formation of travel demand models and economic evaluation measures of user benefit”. Environment and Planning 9A. 285-344 (March)
Ortuzar, J. de D., Martinez, F.J. and Varela, F.J. (2000); “Stated preferences in modelling
accessibility”. International Planning Studies Vol 5, No 1, 65-85. (July) Anderson and Olender (2002) Journal of Urban Planning and Development, Volumes 128-129
Ortuzar, J. de D. and Williamson, L.G., (2001) “Modelling Transport”3rd ed. John Wiley & Sons, Chichester.
T Z Nakkash, (1969); “Accessibility models of trip” Issues 568-575 of Transportation Research
Record. (December, 2007(digitized))
Ben-Akiva, M.E. (1974) “Structure of passenger travel demand models”. Transportation Research record 526, 26-42
Local Government & Engineering Department. 1995. Manual for Rural Growth Center
Planning. Dhaka. Dr. L. R. Kadiyali, (2003) “Traffic and Transportation Engineering” KHANNA PUBLISHERS, 2-B,
Nath market, Nai Sarak, Delhi-110006. (India) McDonald, K.G. and Stopher, P.R. (1983) some contrary indications for the use of household
structure in trip generation analysis. Transportation Research Record 944, 92-100. Benakhiba, M.; Lerman R.(1985) Discrete choice analysis: Theory and Application to Travel
Demand, The MIT press, Asco Trade typesetting Ltd. Printed in U.S.A.
Leake, G R, Huzayyin, A (1979) ACCESSIBILITY MEASURES AND THEIR SUITABILITY FOR USE IN
IN TRIP GENERATION MODELS, volume 20, no 12 (December)
Hansen G. (1959) Accessibility and Residential Growth, Master’s Thesis, MIT (June)
FHWA (1975), “Trip Generation Analysis”, U.S., Department of Transportation, Washington, D.C., National Academy Press, 2000 (December)

Hossain, T Built Environment Factors and Walking
435
Identifying Built Environment Factors and their Relationship with Young Adult Walking
Tanzid Hossain, Masters Student, Department of URP, Jahangirnagar University; Bangladesh A.K.M Abul Kalam, Professor, Department of URP, Jahangirnagar University; Bangladesh
Mizanur Rahman, Assistant Professor Department of URP, Jahangirnagar University; Bangladesh
Sowmen Rahman, Research Assistant, University of Waikato; New Zealand Sadi Anwar Chowdhury, Assistant Maintenance Engineer; Bangladesh
Mamnunnah Jobaid, Masters Student, Department of URP, Jahangirnagar University; Bangladesh
Mahfuz Ahmed, Masters Students, Department of Environmental Science, University of Chattagram; Bangladesh
Abstract
Walking is considered as the most comfortable and equitable means of transportation because it is cheap and it needs some basic infrastructure. There is a need for greater understanding of how neighbourhood built environment influence walking behavior of the young adults. The purpose of the study is to identify the walking related built environment factors and examine the relationship between the built environment and young adult walking in Bangladesh. Data collection was conducted through a household survey on 196 young adult respondents whose age is between 18 to 29 years at Uttara in 2018. Young adult walking data on the numbers, types of trips and daily activities related to walking were obtained through a field survey. Walking and neighbourhood built environment characteristics were measured using rating of the statement on different elements of the built environment on 5-point Likert scales. There were seventeen built environment elements related to walking and these were classified according to six factors through Principal Components Analysis and Rotated Component Matrix. The association between characteristics of the built environment and the walking was assessed through linear regression analysis. The result of the analysis reveals that neighbourhood built environment features related to accessibility, pleasurability, traffic factors and safety were associated with the total amount of walking of young adults. The research concluded that the increase of street and footpath width, promotion of safety measures and development of traffic factors increase the walking ability of the young adult within the neighbourhood.
Keywords
Walking Behavior, Built Environment, Accessibility, Pleasurability, Safety.
1. Introduction Walking is the most fundamental way for human beings, not only to move, but to interact with their surroundings. The built environment for walking is the subset of the physical environment in a city that has been established to influence walking (Hirsch A. J, 2014). In the early 1990s it was found that physical inactivity was responsible for an estimated

Hossain, T Built Environment Factors and Walking
436
200,000 to 300,000 premature deaths each year in the United States (McGinnis, 1992). In 21st century obesity is considered as one of the most pressing epidemics that increase due to lack of physical activity. Walking is often the most effective, convenient way to achieve these recommended physical activity levels. According to The Institute for Health Metrics and Evaluation (IHME) of the University of Washington in 1980, 7% of adults in Bangladesh and 3% of children in Bangladesh were overweight or obese. In 2013, those rates had climbed to 17% for adults but only 4.5% for children where statistics report of 2011 shows that almost 65% adult people aged between 15-49 lives in urban area of Dhaka district. Just 4% were obese adults in Bangladesh and the obesity rates are increasing at a slower pace (The Daily Star, 2015). The obesity rate grew from 2% to 4% from 1980 to 2013 and rates in children and adolescents remained at about 1.5% (Palma, 2015). Walking ten or more blocks per day is associated with a 33% decrease of obesity (Frumkin 2001). Walkability of a person can be affected by the design of the built environment and its many features. The built environment creates a pedestrian environment that influence people to walk within the neighbourhood or discourage people to walk rather to use other transports (Gebel et al., 2007). Past studies have found significant associations between walking behavior and proximity of parks, public spaces, or commercial establishments, sidewalk condition, population density, land-use mix and neighbourhood aesthetics (Nagel et al, 2008; Saelens et al, 2003; Frank et al, 2005; Hoehner et al, 2005). There are many researches that correlates walking of people with the neighbourhood built environment but in Bangladesh this kinds of research are hardly found especially on the young adults. In Bangladesh, young adults who are aged between 18 to 30 are now increasing especially in Dhaka city. The purpose of this research is to identify the walking related built environment in the neighbourhood and examine the relationship between the built environment and young adult walking in the context of Bangladesh.
2. Literature Review Walkability is defined as the quality of a place that was a "foot-friendly” man-made, physical microenvironment; a range of useful, active destinations within walking distance (Neto. L, 2015). Walking provides accessibility benefits (Forsyth & Southworth, 2008) as well as leisure, exercise or recreation, to access services, or to travel to work (Neto, L, 2015) within a neighbourhood. Talen & Koschinsky (2013) summarized most of the research on neighbourhood and shown that a walkable neighbourhood should have an urban form that encourages pedestrian activity and minimizes environmental degradation. In the walkable neighbourhood there is an access of all kinds of people. This kind of neighbourhood influences people to walk rather to use other mode of transport. Frohnwieser et al (2013) explored in the study that age, sex and constitution had influenced on walking behavior of people. Spoon (2005) mentioned that personal and subjective factor that included distance, traffic safety, convenience, cost, valuation of time, valuation of exercise, physical condition of individual, family circumstance, habits, attitude and values as well as distance, weather, topography and infrastructure elements within the neighbourhood influenced to walk. One of the factors that contribute for people to walk more is the characteristics of the built environment (Schmid, 2006). Wang & Wen (2017) summarized much of the research on the relationship between the objectively measured built environment and active transport among adults. Residential density, land use mix, street connectivity, retail land walkability, sidewalk, and access to destinations had a convincing positive relationship with walking for
Hossain, T Built Environment Factors and Walking
437
transport except neighbourhood aesthetics were extracted among 51 articles which were reviewed in between 2005 and 2017. The built environment for walking is defined as the subset of the physical environment in a city that includes land-use patterns, transportation, and design elements for the city, has been established to influence walking (Hirsch. A. J, 2014). Alfonzo et al (2008) in the study examined the correlation of the individual built environment features and walking and tried to identify which composite characteristics of the built environment may have the greatest impact on walking. This study showed that built environment are associated with higher levels of adult walking. Urban design features related to both accessibility and safety are associated with the amount of walking that adults do in their neighbourhoods. This study showed a comparison that areas with a higher percentage of blocks with sidewalks, mixed use and public space have higher adult walking rates than those areas that have fewer of these physical design characteristics. Nagel et al (2008) in their research have explored that built environment of a neighbourhood has not played a significant role in whether adults walk but it increases the physical activities for those people who like to walk. Alfonzo (2005) established a new theory to show how to conceptually organize the various urban form variables that may affect walking. This study developed five levels of needs that are considered within the walking decision-making process. These are- feasibility, accessibility, safety, comfort, and pleasurabilty. The above discussion shows the positive and negative relation of some independent factors of built environment with walking. Density, land use mix, sidewalk, street connectivity, safety and security, socioeconomic status of people and government policy have direct relation with people in walking for transport. The positive and negative relation will correlate walkability and built environment of people in the neighbourhood.
3. Methodology of the Research Lorem Seven neighbourhoods in Uttara Residential Area were used as the setting for empirically examining the walking behavior of young adults and the neighbourhood built environment condition. Uttara Residential Model Town was selected as the study area of the research as a planned neighbourhood in Dhaka city. Various income groups of people such as lower, middle and higher income groups live in this area. It has all the facilities of a residential area including primary schools, local markets, petrol pump, mosque, tea house, public toilet, playground for children, community centre, police station, municipal office, health centre, post office, telegraph and telecom office, fire station and Public Square and park. Many few residential areas in Bangladesh are developed in this way. It is necessary to obtain a reliable and workable number of samples for the study. A total of 196 individuals was taken for collecting data from sectors-1,3,5,7,9,11 and 13 of Uttara where 28 individuals are taken from each sectors whose aged is between 18 to 29. Sample size was selected through Slovin’s Formula. The people who may be the residents of the neighbourhood were interviewed through questionnaire by following the method of Purposive Sampling. This technique was used because some issues are considered here. In questionnaire, there are many questions that are related to the opinion and observation of the residents. So, all type of people cannot understand those. To get a more balanced sample, individuals will be selected who are properly educated and can understand the core perception of the questions. The questionnaire consisted of four main parts. These are (i) individual characteristics; (ii) daily travel; (iii) walking behaviour and (iv) rate the existing features of various built environment on 5-point Likert scale. These parts were then

Hossain, T Built Environment Factors and Walking
438
categorized according to their weekly activities groups.Two types of data were collected at each neighbourhood – (I) Primary data was collected through face to face interview. The survey searched for information both about total walking hour and the level of influence of neighbourhood built environment for their walking in the neighbourhood and (II) Secondary data on built environment was collected on various reference books and journals. The data analysis was made for each respondent’s most frequent walking hours. Principal Component Analysis (PCA) was used to reduce a large set of variables to a small set that still contains most of the information in the large set. There are 17 built environment elements related to walking of people within the neighbourhood. These elements of the built environment are classified according to the following 6 factors through Principal Components Analysis. The variables of these factors are identified through Rotated Component Matrix. Table-1: Principal Component Analysis of the Built Environments’ elements
Factors Elements of Built Environment Principal Component Analysis
Initial Extraction
Street Surface and Continuity
The quality of street surface to walk 1.000 .677
The quality of footpath to walk 1.000 .773
The quality of street continuity 1.000 .752
The quality of footpath continuity 1.000 .628
Accessibility and Lighting Coverage
The quality of street width to walk 1.000 .911
The quality of footpath width to walk 1.000 .910
Existing lighting condition 1.000 .837
Traffic Factors
Traffic speed level 1.000 .826
Traffic sign level 1.000 .757
Crossing length 1.000 .770
Crossing safety 1.000 .751
Pleasurability and Traffic Flow
Quality of Litterbin 1.000 .376
Quality of roadside trees 1.000 .496
Pedestrian flow volume 1.000 .792
Vehicle flow volume 1.000 .792
Intersection Quality
Intersection Quality 1.000 .854
Safety Factors Security of the surrounding 1.000 .798
Source: Field Survey, 2018

Hossain, T Built Environment Factors and Walking
439
4. Results 4.1 Socio-Demographic Characteristic of the Residents The socio-demographic characteristics of the communities are provided in the following table- 2, based on the data from the random survey of 196 households within 7 odd sectors of Uttara residential area as a part of fieldwork research in 2018.
Table-2: Socio-demographic characteristics of the respondents
Characteristics of The Respondent
Percent of total Respondent
Characteristics The Respondent
of Percent of total Respondent
Gender Male 84% Occupation
Student 53%
Service Holder 21% Female 16% Businessman 13.8%
Education SSC 4% Housewife 7.7%
HSC 42% Shopkeeper 2%
Teacher 1%
Graduated 39%
Banker 1.5% Post Graduated
15% Doctor .5%
Marital Status
Married
32% Age 19 5.1% 24 7.7%
Unmarried
68% 20 4.1% 25 7.1%
Ownership of Vehicle
Car 1% 21 6.6% 26 21.4%
Bike 15.3% 22 4.6% 27 17.3%
Cycle 29.4% 23
4.6% 28 12.8%
Without Vehicle
54.3% 29 8.7%
Source: Field Survey, 2018
4.2 Walking hours and walking trips The following table shows the walking minute and trips of people in a week for different purposes within the neighbourhood.

Hossain, T Built Environment Factors and Walking
440
Table-3: Walking trips of people in a week
Walking
Purposes
Number of respondent
Minimum walking (Minute)
Maximum walking (Minute)
Walking Mean (Minute)
Std. Dev
Minimum Trip
Maximum Trip
Std. Dev
Transport
182 4 40 13.8 7.05 1 6 1.00
Leisure 181 4 50 19.19 10.04 1 4 .597
Eating place
125 2 15 7.85 3.70 1 3 .527
Groceries
169 1 20 7.69 4.52 1 5 .984
Business services
35 1 15 5.20 3.58 1 5 .944
Retail stores
108 1 20 5.64 3.48 1 4 1.02
Transport stops
142 2 30 12.01 7.82 1 3 .466
Green groceries
110 1 20 9.38 5.65 1 2 .416
Super market
80 4 20 9.02 4.74 1 6 .632
Parks 110 2 30 10.89 6.86 1 2 .164
Play Ground
64 1 30 13.33 9.10 1 2 .211
Open Space
23 4 20 12.13 7.93 1 1 00
Other Place
16 5 20 15.00 4.83 1 5 1.08
Source: Field Survey, 2018
From the statistical data it is explored that only 30 % and 28% young adults were satisfied and very satisfied on the existing street width. Another statistical data explored that 34% young adults were dissatisfied on the existing footpath width but 33% young adults claimed that they have highly satisfaction on the existing footpath width. It was found from the primary that more than 42% respondents were satisfied on the existing litter bin condition of Uttara, 39% respondents were satisfied on the existing traffic management and street light condition of the neighbourhood. The empirically examination of the study explored that 74% and 67% respondents believed that existing street and footpath width influenced them to walk in the neighbourhood. More than 26% respondents were not influenced to walk within the neighbourhood due to bad street as well as footpath surface and continuity in various neighbourhoods of Uttara. Almost 53% respondents were influenced to walk within the neighbourhood due to trees alongside the road. It is found from the study that more than 32 percent respondent were moderately satisfied on the surrounded security within the neighbourhood but more than 29 percent and 27 percent explained that the existing security
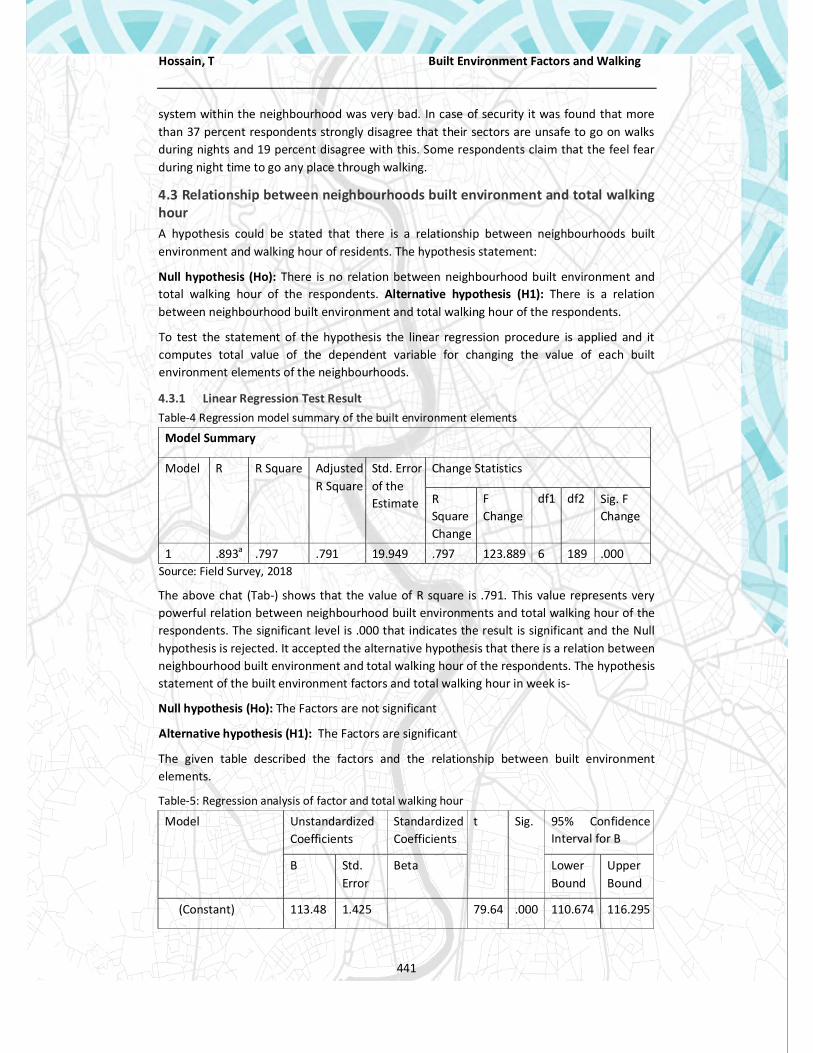
Hossain, T Built Environment Factors and Walking
441
system within the neighbourhood was very bad. In case of security it was found that more than 37 percent respondents strongly disagree that their sectors are unsafe to go on walks during nights and 19 percent disagree with this. Some respondents claim that the feel fear during night time to go any place through walking.
4.3 Relationship between neighbourhoods built environment and total walking hour A hypothesis could be stated that there is a relationship between neighbourhoods built environment and walking hour of residents. The hypothesis statement:
Null hypothesis (Ho): There is no relation between neighbourhood built environment and total walking hour of the respondents. Alternative hypothesis (H1): There is a relation between neighbourhood built environment and total walking hour of the respondents.
To test the statement of the hypothesis the linear regression procedure is applied and it computes total value of the dependent variable for changing the value of each built environment elements of the neighbourhoods.
4.3.1 Linear Regression Test Result Table-4 Regression model summary of the built environment elements
Model Summary
Model R R Square Adjusted R Square
Std. Error of the Estimate
Change Statistics
R Square Change
F Change
df1 df2 Sig. F Change
1 .893a .797 .791 19.949 .797 123.889 6 189 .000 Source: Field Survey, 2018
The above chat (Tab-) shows that the value of R square is .791. This value represents very powerful relation between neighbourhood built environments and total walking hour of the respondents. The significant level is .000 that indicates the result is significant and the Null hypothesis is rejected. It accepted the alternative hypothesis that there is a relation between neighbourhood built environment and total walking hour of the respondents. The hypothesis statement of the built environment factors and total walking hour in week is-
Null hypothesis (Ho): The Factors are not significant
Alternative hypothesis (H1): The Factors are significant
The given table described the factors and the relationship between built environment elements.
Table-5: Regression analysis of factor and total walking hour
Model Unstandardized Coefficients
Standardized Coefficients
t Sig. 95% Confidence Interval for B
B Std. Error
Beta Lower Bound
Upper Bound
(Constant) 113.48 1.425 79.64 .000 110.674 116.295

Hossain, T Built Environment Factors and Walking
442
Street Surface Continuity
and -5.178 1.429 -.119 -3.625
.000 -7.996 -2.360
Accessibility Lighting Coverage
and 37.500 1.429 .860 26.25 .000 34.682 40.317
Traffic Factors -.447 1.429 -.010 -.313 .755 -3.265 2.371
Pleasurability and Traffic Flow
7.740 1.429 .177 5.418 .000 4.922 10.558
Intersection Quality 1.008 1.429 .023 .706 .481 -1.810 3.826
Safety Factors 4.775 1.429 .109 3.342 .001 1.957 7.593
Source: Field Survey, 2018
The above table shows that the constant value of the regression is 113.48. This indicates that if the values of all factors become zero than the walking time for each person in a week will be 113.48 minute. The above figure explains that the existing worst condition of street surface and continuity increase in a unit will decrease the total walking minute (5 minute in a week) of the respondents. If the accessibility and lighting coverage increase in a unit, will increase 37minute walking time of the respondents in a weak. If the existing traffic factor increase in a unit then the result of total walking minute decrease. The increase unit of pleasurability and pedestrian flow will increase the total walking minute of the respondents. The increase of intersection quality in a unit will increase the total walking minute of the respondents. The significant level of Pleasurability, Accessibility, Traffic Factors and Safety Factors are below .05. These factors are significant in this model, so null hypothesis for these factors is rejected. The increase of safety factors in a unit will increase the 4minute walking time of the respondents. Regression Model Analysis
Figure 1: Street Surface and Continuity Model Figure 2: Accessibility and Lighting Model
Figure 3: Pleasurability and Traffic Flow Model Figure 4: Safety Model
Figure-1,2,3 and 4 explained that if Street Surface and Continuity increase in a unit then total walking minute of the respondents in a week decrease in almost 5 minutes. In figure-2, it is seen that if accessibility with lighting coverage increase in a unit then the total walking minute of the respondents increase almost 37 minutes. In figure-3 it is found that that if the

Hossain, T Built Environment Factors and Walking
443
traffic factors with pleasurability increase in a unit then the total walking minute of the respondents increases almost 7 minutes in a week. In figure-4, it is explored that if the safety factors of the respondents increase in a unit then the total walking hour of the respondents in a week increase almost 4 minutes
4. Discussion and Conclusion In summary, this study found that characteristics of the built environment- Street Surface and Continuity, Accessibility and Lighting Coverage, safety, pleasurability and traffic flow factors were independently associated with increases in the level of walking activity among young adults who favor walking. In walking within the neighbourhood traffic factors, intersection quality and comfort factor has less importance of walking among young adults. Walking is the most common form of physical activity in young adults. These finding suggest that the increase of street and footpath width, promotion of safety measures and development of street furniture increase of walking ability of the young adult within the neighbourhood. All of these measures promote a pedestrian friendly environment design that can play a significant role in encouraging more vigorous activity among moderately active young adults. However, measurements for pleasurability are limited; these include only the presence of street trees and litter bin. Connectivity measures are also limited within the neighbourhood. These elements need to include for further research and identify their impacts on young adult walking within the neighbourhood. The findings of the study have important implications for urban policies and built a pedestrian friendly neighbourhood through improving the core walking related elements for the development of the neighbourhood. This research work will help to aware the transportation planners and researchers about the walking behavior pattern of the young adult and existing problems of Uttara Residential Model Town as a case study so that they can understand the problems and the need of the walkers.
5. References Alfonzo, M. A. (2005). To walk or not to walk? The hierarchy of walking
needs. Environment and behavior, 37(6), 808-836. DOI: 10.1177/0013916504274016
Alfonzo, M., Boarnet, M.G., Day, K., Mcmillan, T. and Anderson, C.L., 2008. The relationship of neighbourhood built environment features and adult parents' walking. Journal of Urban Design, 13(1), pp.29-51. DOI: 10.1080/13574800701803456
Forsyth, A., Oakes, J.M., Schmitz, K.H. and Hearst, M., 2007. Does residential density increase walking and other physical activity? Urban Studies, 44(4), pp.679-697.
Frank, L.D. and Engelke, P.O., 2001. The built environment and human activity patterns: exploring the impacts of urban form on public health. Journal of planning literature, 16(2), pp.202-218.
Frohnwieser, A., Hopf, R. and Oberzaucher, E., 2013. Human walking behavior: the effect of pedestrian flow and personal space invasions on walking speed and direction. Human Ethology Bulletin, 28(3), pp.20-28.

Hossain, T Built Environment Factors and Walking
444
Frumkin, H., 2001. Urban Sprawl and Public Health. Public health reports., 117(3), pp.201– 217.
Gebel, K., Bauman, A., and Owen, N., 2007. Creating built environments for active living – walking: an analysis of the evidence. National Heart Foundation of Australia, Sydney.
Hirsch, J.A., 2014. Change in the Built Environment and its Association with Change in Walking and Obesity in Middle Age and Older Adults. USA (doctoral dissertation, University of Michigan, MI). Available at: http://hdl.handle.net/2027.42/107088 [Accessed 26 August 2019]
Hoehner, Christine M., Laura K. Brennan Ramirez, Michael B. Elliott, Susan L. Handy, and Ross C. Brownson. "Perceived and objective environmental measures and physical activity among urban adults." American journal of preventive medicine 28, no. 2 (2005): 105-116.
McGINNIS, J.M., 1992. The public health burden of a sedentary lifestyle. Medicine and science in sports and exercise, 24(6 Suppl), p.S196.
Nagel, C.L., Carlson, N.E., Bosworth, M. and Michael, Y.L., 2008. The relation between neighbourhood built environment and walking activity among older adults. American journal of epidemiology, 168(4), pp.461-468.
Neto, L., 2015. The walkability index. Assessing the built environment and urban design qualities at the street level using open-access omnidirectional and satellite imagery. England (dissertation, University of Manchester (the United Kingdom)).
Palma, P. (2015) ‘Obesity rising’, The Daily Star, April 01 [Online]. Available at: https://www.thedailystar.net/frontpage/obesity-rising-72797 [Accessed 26 August 2019]
Saelens, B.E., Sallis, J.F. and Frank, L.D., 2003. Environmental correlates of walking and cycling: findings from the transportation, urban design, and planning literatures. Annals of behavioral medicine, 25(2), pp.80-91.
Schmid, J., 2007. La relation entre l’environnement construit et l’activité physique sous forme de déplacements à pied (Doctoral dissertation, Université de Lausanne).
Spoon, S.C., 2005. What defines walkability: Walking behavior correlates. USA (Master’s thesis, University of North Carolina (Chapel Hill, NC)).
Talen, E. and Koschinsky, J. (2013). The Walkable Neighbourhood: A Literature Review. International Journal of Sustainable Land Use and Urban Planning, 1(1).
The Daily Star (2015) ‘Overweight and obesity soaring among Bangladeshi adult’, The Daily Star, March 08 [Online]. Available from: https://www.thedailystar.net/overweight- and-obesity-soaring-among-bangladeshi-adult-27458 [Accessed 26 August 2019]
Wang, L. and Wen, C., 2017. The relationship between the neighbourhood built environment and active transportation among adults: A systematic literature review. Urban Science, 1(3), p.29.

Ali, S.B.; Hasan, M. GM into Budgeting and Planning at Municipality level in Bangladesh
445
Research Paper on
Gender Mainstreaming into Budgeting and Planning at Municipality level in Bangladesh
Sanjida Bintey ALI, MURP Student, Department of Urban and Regional Planning, Jahangirnagar University, Savar, Dhaka-1342; Bangladesh
Mehedi Hasan, Deputy Manager, Urban Development Program, BRAC; Bangladesh
Abstract
Gender responsive planning and budgeting bring together three issues that are: gender equality, inclusive planning and financial management. GRBP argues that gender equality principles should be incorporated into all stages of the planning and budget process. Many countries have accepted gender mainstreaming as a strategy for achieving inclusiveness in all level of government. Planners across the world have increasingly begun to understand the value of inclusive planning. In this context, there has been a growing recognition that gender is a critical category of analysis and must not be overlooked by planners. Bangladesh has made significant progress in gender equality to meet the Sustainable Development Goal (SDG), Goal No-5: Gender Equality. But a number of challenges remain in different sectors and women still now face discriminations. The budgetary allocations at the local government level mostly focus on infrastructural issues rather than social issues. A major issue that underpins limited planning at the local level from a gender perspective is little awareness of and sensitization to developmental statistics and issues. The aim of this research is to explore that how the gender issue is addressed in budgeting and planning process at local level and women’s participation in it. This research will also identify strategies and operational approaches to strengthen on-going efforts in the area of GRPB. The long-term goal of the research is to enable key stakeholders at the local level to accelerate their efforts to ensure that women’s priorities are adequately reflected in planning and budgeting processes.
Keywords
Gender Equality, Gender Responsive, Gender Mainstreaming, Budgeting and Planning, Women’s Participation
1. Introduction 1.1. Background of the Study Many countries have accepted gender mainstreaming as a strategy for achieving inclusiveness in all level of government. In this context, gender responsive planning and budgeting has emerged as a critically important tool to assess and measure progress in gender mainstreaming by incorporating gender perspectives in planning and budgeting processes. GRPB not only raises awareness on the differential impacts of budget on men and women in terms of capacity building, social and economic resources, voice and agency, but also enhances accountability of governments to their budgetary and political commitments towards achieving gender equity and women empowerment. Furthermore, it emphasizes

Ali, S.B.; Hasan, M. GM into Budgeting and Planning at Municipality level in Bangladesh
446
women’s invisible work, a dimension largely ignored by conventional macroeconomic frameworks. As of today, more than 100 countries across the world have initiated GRPB, although the level of engagement and institutionalization varies greatly (Thakur & Jhamb, 2016). Bangladesh has initiated GRPB processes eight to ten years ago (Thakur & Jhamb, 2016). GRPB initiatives seek to create a direct linkage between social and economic policies through the application of a gender analysis to the formulation and implementation of government budgets. A gender analysis can also demonstrate the ways in which social institutions that are seemingly “gender neutral” do in fact bear and transmit gender biases (UN Women, 2013). Gender budget analyses can be applied to gender specific expenditures, expenditures that promote gender equity within the public service and general or mainstream expenditures.
For planning to be effective and meaningful, it must necessarily factor-in and respond to the differential needs of different sections of the population. Planners across the world have increasingly begun to understand the value of inclusive planning. In this context, there has been a growing recognition that gender is a critical category of analysis and must not be overlooked by planners. Therefore, it is important that mainstream planning processes not only identify and address the needs of women, but also draw on their knowledge and recognize how women’s contributions have changed and shaped development. The purpose of gender responsive planning and budgeting is to ensure gender-sensitive policy outcomes through a systematic and inclusive process at local government level. It also entails a set of technical processes and procedures that are necessary to achieve gender equality outcomes through well-defined indicators to measure progress towards the same (UN Women, 2013).
1.2. Problem Statement Bangladesh has made significant progress in several areas critical to gender equality (Planning Commission, 2016). The country is on track to meet the Sustainable Development Goal (SDG), Goal No-5: Gender Equality. In terms of women’s representation in decision making there has been a gradual increase. In Parliament there are 300 MPs and additional 50 seats are reserved for women (Government of Bangladesh, 2013). At the local level (union) in 2011, about 2% of the members of all union parishad were female although less than 1% of Chairmen of either the union parishads or the upazilla parishads were women (Government of Bangladesh, 2013).
Despite progress in the condition and position of women, a number of challenges remain and women often face discrimination in a number of areas. For example, violence against women is a major constraint for women’s political and economic participation, as is the non-recognition and non-valuing of most of women’s unpaid care work (Mahmud & Nazneen, 2013). In spite of tremendous progress in health, two areas interrelated areas remain very problematic: early marriage and malnutrition among women and girls. Women at both local and national level are negatively affected by the prevailing political culture and find it difficult to adjust to it and express themselves or participate fully (Nazneen et al, 2018). The budgetary allocations at the local government level often tend to focus on infrastructural issues, with limited attention to addressing social issues. A major issue that underpins limited planning at the local level from a gender perspective is little awareness of and

Ali, S.B.; Hasan, M. GM into Budgeting and Planning at Municipality level in Bangladesh
447
sensitization to developmental statistics and issues, which are important at the local level.
1.3. Significance of the Research In Bangladesh, the struggle to bring women’s voices and perspectives to the centre stage of planning has been a long-drawn one. Although many significant steps had been taken in the recent years preceding it, it is perhaps the Seventh Five Year Plan (2016-2020), which brought to forge a new thinking on this issue that the government considers women’s engagement in political and economic activities as a cross-cutting issue and one of the main drivers of transformation. It charted an exemplary shift by acknowledging women and recognizing the value of women’s roles as well as the multifaceted exclusions and discriminations faced by them. Present government is committed to attain the SDG goal of gender equity and empowering women, as well as implementing the “Convention on the Elimination of All Forms of Discrimination against Women (CEDAW)” and the “Beijing Platform for Action”. This research will be aligned with all the above agenda and it will be a key document to implement the strategies at the local government level.
This research will also identify strategies and operational approaches to strengthen on-going efforts in the area of gender responsive planning and budgeting. The long-term goal of the research is to enable key stakeholders at the local level to accelerate their efforts to ensure that women’s priorities are adequately reflected in planning and budgeting processes.
1.4. Objectives of the Study The overall objective of the research is to ensuring the practice of gender perspective at local government level and mainstreaming the gender perspective in budgeting and planning. Specific objectives of the research are:
I. To identify how the gender issue is now addressed in the planning process and annual budget of local government (Municipality Level) and
II. To find out the participation of women in local level budgeting and planning process.
2. Literature Review Parveen (2010) stated that gender responsive budgeting in health sector to ensure gender equality along with mentioning the role of national budget how it contributes on GRB issue, challenges and opportunities through analysing the variables inside and outside of the government.
Huq (2016) mentioned that he believes the state of women’s participation at Union Parishad level is vital and deserves special attention to empower them as participation and empowerment otherwise sustainable as well as participatory development cannot be ensured despite the fact that there are tremendous gaps in

Ali, S.B.; Hasan, M. GM into Budgeting and Planning at Municipality level in Bangladesh
448
balancing of gender terms in terms of governance policy both in local and national level altogether.
7th Five Year Plan (2016-2020) focused that “Bangladesh Government considers women’s engagement in political and economic activities as a cross-cutting issue and one of the main drivers of transformation.”
Sharp and Elson (2012) mentioned that GRB initiatives seek to improve the results of budgets in general, and gender equality and women’s empowerment in particular. They focused on key economic and social matters that are often overlooked or obscured in conventional budget and policy analysis, and decision making.
Akter (2015) focused on the presentation of national budget incorporating women or men, poor or rich, in terms of how benefit from public expenditures along with to find out the answer whether government expenditures contribute to promote women’s advancement through the activities of the government of all ministries, departments, divisions and agencies as well.
Mahmud and Nazneen (2014) have pointed out that the support for and various other measures taken to increase women's presence and elected bodies are themselves the result of negotiations between different social and political actors (political parties, their leadership, women within the parties, other influential party factions, women's movement, etc). What influences the action taken by the actors are: the actual and perceived interests these actors have in promoting women's representation; the context within which opportunities for promoting women's representation arises; the strength i.e. resource of these actors to negotiate and influence other actors and the gender discourses that influence actions of these actors.
3. Methodology 3.1. Research Approach Every research has its specific methods and systematic way to achieve the study objectives. This research has been designed according to the research attributes and variables following the broad objective of the study. Basically, this research followed the qualitative research approach to achieve the final output.
3.2. Selection of the Study Area For this research, Sreemangal Pourashava had selected for the study area. It is A class municipality at Moulovibazar District in Sylhet Division. Sreemangal is one of the old Pourashava in the region; it came into existence as a Thana in 1922. It was established as a Pourashava on 01st October, 1935. It became “B” class Pourashava on 1st July, 1994 and became an “A” class Pourashava on 4th February on 2002. According to 2001 population census the area of the Pourashava was 572.84 acre (excluding Extended area), and is 19418 with 10623 are male and 8795 are female. According to Sreemongal Pourashava its present population 23393 persons with 12798 are male and 10596 are female. And the physical feature survey shows the project area of Sreemongal Pourashava area is 1226.05 acres along

Ali, S.B.; Hasan, M. GM into Budgeting and Planning at Municipality level in Bangladesh
449
with 651.95 acres extended area. According to population census the male female ratio is 120: 100 (BBS, 2001).
3.3. Data Collection Method This study will collect data from both primary and secondary sources. Primary data for the study will be collected from Key Informants Interview (KII) and Focus Group Discussion (FGD). Secondary data has been collected from related books, journals and various research reports commissioned by international donor agencies and other organizations as well as local government record books.
3.4. Sampling Details Sampling Frame: Elected Mayor, 3 women councillors, female member of TLCC and
WC, Municipality Secretary
Sampling Method: Purposive Sampling
4. Findings of the Study 4.1. Budget Allocation Among the total Budget, 30% are allocated for women but in expenditure section there is no separate budget for distribution for women. According to the respondents, the budget money for the women has merged with the various expenditure sector like public health and sanitation, education and others.
4.2. Budget Disbursement The budget disbursement for women basically comes out maximum from the suggestion and decision of the standing committee for “Women and Children Welfare”. Some decisions also come from the national level, ward meeting and open budget session. Finally, the municipality disbursed the budget for women according to the priority, immediate needs and expertise suggestions.
4.3. Power Excise of Female Public Representative Three female councillors of the reserved seat have instinctive participations in the administrative work of the municipality. Female councillors played an active role to enlist the people for various social protection like widow, elderly people, physical disable people. They also work to increase the participation of women in municipality’s activities. They also handle different development skill-based training for women.
4.4. Gender Action Plan Under UGIIP project a Gender Action Plan has prepared for some selected municipalities and Sreemangal is one of them. A committee had formed to control the activities of this plan. Under the “Gender Action Plan” following activities are taken to increase the participation of women in all level-
A gender committee has formed in the musicality and the committee headed by a female councillor,
WLCC formed according to the guidelines for ensuring the female participations,
TLCC formed according to the guidelines for ensuring the female participations,

Ali, S.B.; Hasan, M. GM into Budgeting and Planning at Municipality level in Bangladesh
450
According to the Local Government Act, 2009, every standing committee had female member and disburse the responsibilities among the female councillors,
Training program arranged for female ward councillors and staffs for capacity building to establish a good governance system,
This committee will be fixed the perfect development scheme for women and include these development scheme into gender action plan to get allocation of budget.,
To increase the women’s participation, municipality arranged a meeting with the women in their locality which is known as “Uthan Boithok” and this gathering headed by the female ward councillors and they also lead the rally program of women based on the contemporary issues,
To fix up the target for UGAIP engage the female councillors and general female in different public gathering and pubic issues like public health, tax payment, waste management, disaster management etc.,
To include the women in planning and discussion meeting and ensure women’s participation in all type of service provide and maintenance activities and
To increase the women participation municipality will recruit more female staff and ensure a better workplace for women staff and ward councillors.
4.5. Development Planning Scheme Female councillors have active participation in different planning scheme. But the maximum planning scheme are basically infrastructure related and future plan is also related to the infrastructure. There is no specific gender-based planning scheme for women. But through the Gender Action Plan municipality authority try to increase the women’s participation in different level of development activities and bring out the comments, wants and thoughts of women regarding the development works.
4.6. Challenges faced by the Municipality To establish gender responsive budgeting and planning (GRPB), authority faced the financial problems mostly. Because municipalities are framing their expenditure according to the income of the municipalities. That’s why they have a little chance to keep budget disbursement for women separately. So that, the authority follows the rule of inclusiveness in case of budget expenditure. Some donor agencies give financial support to the municipalities but that’s not enough to keep pace with the development trend. But maximum respondents hope that if gender action plan run successfully it will be easy to achieve the SDG Goal No. 5: Gender Equality which ensures gender mainstreaming budgeting and planning to develop a Gender Responsive Budgeting and Planning (GPRB).
5. Conclusions Gender issues in municipality governance practice don’t get enough attention in our country. Generally, this issue is not addressed in different functions of municipality rather is addressed in serving a specific purpose. But municipality authority needs to look after this

Ali, S.B.; Hasan, M. GM into Budgeting and Planning at Municipality level in Bangladesh
451
issue in every activity in municipalities to ensure a good governance system. Gender Action Plan’s functions and activities create a positive pathway towards the women’s participation and help to develop gender responsive budgeting and planning. It also helps to gain the inclusiveness in budgeting and planning at local level and gender issues will come into the mainstream of local governance activities.
6. References Akter, T. (2015). Gender Budgeting: A tool for gender mainstreaming in Bangladesh. International
Journal of Applied Research, Vol: 1, Issue: 6, (April) [online]. Available at:http://www.allresearchjournal.com/archives/2015/vol1issue6/PartC/1-5- 08.1.pdf [Accessed 19 Jan. 2019].
Division of Local Government (2018), “Union Parishad Operational Manual”, Ministry of LGRDC, Government of Republic Bangladesh.
Government of Bangladesh, (2013) National Policy for Women's Advancement (revised 2013)
Hossain, N and Akhter, S (2011) “Gender, Power and Politics in Bangladesh: a baseline study for the Upazila Support Project (draft)”
Huq, S.M.S., (2016), Women’s Participation in Local Government: A Tool for Sustainable Development of Bangladesh, European Journal of Business and Social Sciences, Vol. 4, No. 11, (February). Available at:http://www.ejbss.com/Data/Sites/1/vol4no11february2016/ejbss-1698-16-womensparticipationinlocalgovernment.pdf, [Accessed 19 Jan. 2019].
Mahmud, S. and Nazneen, S. (2013) "Gendered Politics of Securing Inclusive Development". BIGD Working Paper”, Dhaka.
Mahmud, S. and Nazneen, S. (2014) "Gendered Politics of Securing Inclusive Development". BIGD Working Paper”, Dhaka
Nazneen S., Sultan M. and Mohammad Z., (2018), Sharique Case Study: Gender Responsive Budgeting, BIGD”, Dhaka, Bangladesh
Panday, P. K. (2008) “Representation without Participation: Quotas for Women in Bangladesh”, International Political Science Review 29.4: 489-512
Panday, P. K. (2013) "Impact Study on Women Empowerment through Effective, Transparent and Inclusive Local Governance (Sharique Case)". Report prepared for Sharique, Local Governance Programme.
Parveen, B., (2010), Gender Responsive Budgeting in Bangladesh: An Assessment of Challenges and Opportunities in Health Sector, available at: http://www.northsouth.edu/newassets/files/ppg-research/ppg-1st-3rd-batch/119_Parveen_Gender%20Budget.pdf, [Accessed 19 Jan. 2019].
Planning Commission (2016), “7th Five Year Plan (2016-2020”), Government of Peoples Republic of Bangladesh, Dhaka
Sharp, R. & Elson, D. (2012). “Improving budgets: A framework for assessing gender responsive budget initiatives”, Adelaide: University of South Australia

Tabassum, K., Esti, M. L. M., Sultana, R., Zafri, N. M., Hasan, M. M. U., Debnath, A. K., Tabassum, N.
Redesigning intersections for enhancing pedestrian safety: A study of three
accident-prone intersections of Dhaka
452
Case Study Paper
REDESIGNING INTERSECTIONS FOR ENHANCING PEDESTRIAN SAFETY: A STUDY OF THREE ACCIDENT-
PRONE INTERSECTIONS OF DHAKA Kashfia TABASSUM, Graduate, Department of Urban and Regional Planning (URP),
Bangladesh University of Engineering and Technology (BUET); Bangladesh Md. Lazim Munim ESTI, Graduate, URP, BUET; Bangladesh
Rashada SULTANA, Postgraduate student, URP, BUET; Bangladesh Safakat SIDDIKA, Graduate, URP, BUET; Bangladesh
Niaz Mahmud ZAFRI, Postgraduate student, URP, BUET; Bangladesh Md. Musleh Uddin HASAN, Associate Professor, URP, BUET; Bangladesh Anindya Kishore DEBNATH, Assistant Professor, URP, BUET; Bangladesh
Nawshin TABASSUM, Lecturer, URP, BUET; Bangladesh
Abstract
About 60% of the trips are made on foot in Dhaka city but the pedestrians are the most vulnerable group among the road users. It is identified that more than 48% of reported road accidents and 72% of reported fatalities were pedestrians in Dhaka Metropolitan City. Among them, a large percentage of pedestrian crashes occurred in the intersection area. This study attempted to analyse the existing scenario of three accident-prone intersections of Dhaka city- Sonargaon-Panthapath, Jatrabari, and Shapla Chattar and redesign the intersections to ensure pedestrian safety. For the study, geographic elements were analysed and traffic studies were conducted for both vehicles and pedestrians of the intersections. Each of the legs of the intersections was incorporated in the study to know about the actual existing traffic scenario and problems of the intersections. After that, opinions of the stakeholders were collected regarding the redesign of the intersection. It was found that the geographical condition of the intersections was very poor. Sidewalks and roadways were mainly occupied by illegal hawkers, illegal parking, ticket counters. Besides, the roundabouts and central islands were not well-designed to control the vehicular and pedestrian traffic. So, these three intersections were redesigned by considering their land use, traffic flow, surroundings and the available standards. Overall pedestrian safety is expected to improve at those intersections if the proposed design is implemented.
Keywords
Pedestrian safety, Intersection, Redesign, Stakeholder analysis, Dhaka
1. Introduction Pedestrians are the most vulnerable road user group in Dhaka city. About 60% of trips are made on foot in Dhaka city (Mahmud et al., 2006). There is 2,230 km of total roads in Dhaka and only 220 km of footpath is available. From 1998 to 2014, more than 10 thousand

Tabassum, K., Esti, M. L. M., Sultana, R., Zafri, N. M., Hasan, M. M. U., Debnath, A. K., Tabassum, N.
Redesigning intersections for enhancing pedestrian safety: A study of three
accident-prone intersections of Dhaka
453
accidents occurred in Dhaka and 4,514 pedestrians have died in those accidents. Among them, about 37% of the pedestrian crashes occurred at intersections (ARI, 2015). Lack of pedestrian facilities, faulty design, improper traffic management and haphazard traffic movement are the main reasons behind the safety problem (Zafri et al. 2019). So, it is important to ensure pedestrian safety.
Though pedestrian safety is an important issue throughout the world, very few studies have been conducted on pedestrian safety in Bangladesh. Rifaat et al. (2017) and Bhuiyan and Islam (2018) investigated the factors contributing to pedestrian crashes at the intersection in Dhaka. Pervaz et al. (2016) provided an extensive overview on pedestrian safety and facilities at the intersections of Dhaka city. Mahmud et al. (2006) and Bhuiyan (2019) focused on pedestrian movement and pedestrian safety in Dhaka by evaluating the existing problems. Although these studies provide an overview on pedestrian movement, facilities and safety problems at intersections of Dhaka, no study has been conducted on redesigning accident-prone intersections for increasing pedestrian safety to help the policy-maker to understand what factors should be considered for redesign a roundabout intersection and how those issues should be addressed at the time of redesigning the facilities of intersection for ensuring pedestrian safety. The objective of this study is to redesign accident-prone intersections of Dhaka for enhancing pedestrian safety.
2. Methodology In this study, three most vulnerable and accident-prone roundabout intersections of Dhaka city have been selected for redesigning. Those intersections are Sonargaon-Panthapath, Shapla Chattar and Jatrabari intersection. Nine, five and eleven pedestrian accidents occurred in those intersections from 2009 to 2014 respectively. To fulfill the objective, first, a good bunch of literature related to pedestrian accident and safety and design guidelines was reviewed. Then, observation survey was conducted to analyse the existing geographical condition of the intersections. After that, videography survey was conducted to collect data of traffic volume (pedestrian and vehicle), speed and modal share. Videography survey was conducted by placing two cameras at vantage points to capture every second of traffic movement at each intersection. Here, video recording of each intersection was done for about 120 minutes; where 60 minutes were taken at morning peak period (10.00 am to 12.00 noon) and rest of the recoding at evening peak period (4.00 pm to 6.00 pm) on a normal working day in a fair weather condition. Then, stakeholder surveys were conducted through questionnaire to collect the opinions of the stakeholders. Government agencies, advocacy and policy-making group, individuals and private entities, public interest group those who have their stake, power, connection and previous activities related to intersection redesign for pedestrian safety, all were surveyed. Finally, three accident-prone intersections of Dhaka city were redesigned by incorporating the findings of the literature review, existing condition analysis and stakeholder opinion.

Tabassum, K., Esti, M. L. M., Sultana, R., Zafri, N. M., Hasan, M. M. U., Debnath, A. K., Tabassum, N.
Redesigning intersections for enhancing pedestrian safety: A study of three
accident-prone intersections of Dhaka
454
3. Existing scenario analysis Existing situation analysis is essential while redesigning an intersection as it works as a base scenario and provides direction for further development. This section focuses on the geographic elements and traffic condition of the three intersections as a part of the existing scenario analysis.
3.1. Geographic Elements Pedestrian safety significantly depends on the geographical elements of an intersection. Description of different geographical elements of the three studies intersections is presented in Table 1. This table also summarizes the existing problems, shows a comparative scenario among the three intersections and provides direction for the further development of the intersection to ensure pedestrian safety.
Table 1 Geographic element of the intersections
Shapla Chattar Sonargaon-Panthapath Jatrabari Number of Legs
4 5 5 Name of Legs
Baitul Mukaram Road, Tikatuli Road, Kamlapur
Bazar Road, Fakirapul Road
Kazi Nazrul Islam Avenue, Sonargaon Road, Tejgaon Link Road, Kawran Bazar Road, Panthapath Road
Dhaka-Sylhet HWY, Dhaka- Mawa HWY, Dhaka-
Narayanganj HWY, Dhaka-Demra Highway, Shahid
Faroque Road Land Use (Considering 250 meter influential area surrounding intersection)
Commercial, mixed Mixed, commercial Commercial, residential, mixed
Footpath About 10 feet wide footpath was found in all legs. Footpath was illegally occupied by hawkers, buildings materials, parked vehicles etc.
About 7 feet wide footpath was found in all legs. The footpath was obstructed by hawkers and illegal parking on Panthapath road and Tejgaon Link Road.
About 5-8 feet wide footpath was found in all legs. Footpath was illegally occupied by hawker, fruit seller, temporary shops, garbage etc.
Presence of Foot over bridge/ Underpass A two-legged foot over bridge on the Fakirapul Road
An underpass in the Kawran Bazar Approach
Absence of foot over bridge or underpass
Crosswalk
Present in Baitul Mukaram and Tikatuli leg
Absent in approach leg of Panthapath, departure leg of Tejgaon link road and in Kawran bazar road
Absent in all approach
Lighting System Insufficient street lights on the medians and footpaths
Insufficient lighting in the underpass
Overall insufficient lighting facility
Traffic Control System Traffic signals were found but non-functional. Controlled by traffic police.
Traffic signals were found but non-functional. Controlled by traffic police.
Traffic signal was not found. Controlled by traffic police.

Tabassum, K., Esti, M. L. M., Sultana, R., Zafri, N. M., Hasan, M. M. U., Debnath, A. K., Tabassum, N.
Redesigning intersections for enhancing pedestrian safety: A study of three
accident-prone intersections of Dhaka
455
Signage Only a regulatory sign found on Baitul Mukaram Road to regulate standing of rickshaw. Pavement marking was not clear.
Traffic sign was present only in Tejgaon link road. Pavement marking was not clear.
No pavement marking or traffic sign was found.
Median Present in all legs except Kamlapur Bazar Road. Median was found inaccessible as steel barrier were construct there.
Present in all approaches
Present in all approaches but blocked by the structural elements of Mayor Hanif Flyover except on Shahid Faroque Road.
Stoppage of Different Modes Bus stop facility was available adjacent to Bangladesh Bank. Illegal bus stop facility was found near the foot over bridge.
Illegal bus stops facility was found in Karwan Bazar leg and on the intersection near Panthapath leg.
Illegal bus stops facility was found in every leg.
Carriageway Dual carriageway consisting of six lanes in each leg
Dual carriageway consisting of six-eight lanes in each leg
Dual carriageway consisting of four-six lanes in each leg
Channelization
Present on Kamlapur Bazar Road approach. Properly designed central island was found named Shapla Chattar.
Channelization was not found in any leg. Properly designed central island was found named SAARC Fountain.
Channelization was not found in any leg. A small central island was found which did not follow the proper design.
3.2 Traffic Studies Results of the traffic volume survey show that the highest number of traffic volume (vehicle and pedestrian) was found at Jatrabari intersection and the lowest was found at Sonargaon-Panthapath intersection (Table 2). Vehicular and pedestrian traffic was found the highest at Fakirapul Road leg of Shapla Chattar. Furthermore, vehicular traffic volume was found the lowest at Kamlapur Road leg. In addition, pedestrian traffic volume was found the lowest at Sonargaon Road leg. Speed of the vehicle was found high at Shapla Chattar intersection. On the other hand, it is lower in Jatrabari intersection. Speed of the vehicle was found lowest at Dhaka- Mawa HWY at Jatrabari intersection (Table 2). Besides, a high percentage of rickshaw and bus were found at Shapla Chattar and Jatrabari intersection. Percentage of the car was found the highest at Sonargaon-Panthapath intersection (Figure 1).
Figure 1 Modal share at the intersections

Tabassum, K., Esti, M. L. M., Sultana, R., Zafri, N. M., Hasan, M. M. U., Debnath, A. K., Tabassum, N.
Redesigning intersections for enhancing pedestrian safety: A study of three
accident-prone intersections of Dhaka
456
Table 2 Traffic volume (vehicle and pedestrian) and average speed of vehicles at intersections
Approach (towards intersection)
Saturation Flow
(PCU/hr)
Total Saturation
Flow (PCU/hr)
Average Speed
(kmph)
Pedestrian Flow
(ped/hr)
Total Pedestrian
Flow (ped/hr)
Shapla Chattar Fakirapul Road 2630
6555
26.32 2903
8144 Kamlapur Road 504 15.01 1543 Tikatuli Road 1768 19.64 1657
Baitul Mukarram Road 1652 16.06 2041 Sonargaon-Panthapath
Kawran Bazar Road 1266
5161
6.48 2784
7792 Tejgaon Link Road 897 7.92 1245 Kazi Nazrul Avenue 1266 25.12 1548
Sonargaon Road 725 24.48 671 Panthapath 1007 10.44 1544
Jatrabari Dhaka-Sylhet HWY 1945
7628
5.46 2634
9748
Dhaka- Mawa HWY 1049 3.81 1979 Dhaka-Narayanganj
HWY 1625 22.23 1366
Dhaka-Demra HWY 1505 6.22 2271 Shahid Faroque Road 1504 14.02 1498
4. Stakeholder Analysis
Stakeholder means all those individuals or groups who affect or are affected by a project and its activities. Understanding the opinions of stakeholders can be very helpful for designing a safe intersection. Table 3 shows the summarized opinions of the stakeholders of this study.
Table 3 Summary of stakeholder opinion about intersection redesign
Interviewed Group (Surveyed Person)
Opinion
Government Agencies
Dhaka South City Corporation (DSCC)
[Executive Engineer]
(1) Sufficient sidewalks, attractive sidewalk surface, zebra crossing, safety railing in sidewalk, proper regulation to control diagonal crossing, foot over bridge in appropriate standard should be provided. (2) Consideration of pedestrian movement, safety, air flow, water logging and lighting condition in case of giving underpass should be encouraged.
Dhaka North City Corporation (DNCC)
[Superintendent Engineer]
(1) Only providing facilities for pedestrian safety cannot solve the safety issue. (2) Relocating street hawkers is a difficult task. So, space should be demarcated for them in the sidewalk if sidewalk is wide enough.

Tabassum, K., Esti, M. L. M., Sultana, R., Zafri, N. M., Hasan, M. M. U., Debnath, A. K., Tabassum, N.
Redesigning intersections for enhancing pedestrian safety: A study of three
accident-prone intersections of Dhaka
457
Dhaka Metropolitan Police (DMP)
[Additional Deputy Commissioner (ADC)]
(1) Increasing awareness among people was advocated as the only step to improve pedestrian safety
Dhaka Transport Coordination
Authority (DTCA) [Traffic Engineer]
(1) Existing scenario evaluation was suggested as the most important issue for ensuring pedestrian safety
Beneficiaries Pedestrian (three
focus group discussion (FGD) was
conducted)
(1) Making sidewalks and roadways free from blockage, ensuring neat and clean environment of footpaths, enforcing traffic laws, making the median accessible, making the intersection signalized were suggested to improve the condition.
Driver (three focus group discussion
(FGD) was conducted)
(1) Scattered and confusing movement of the pedestrian at the time of crossing, vehicle speed, lack of general knowledge about road crossing, unconsciousness while crossing were suggested as the main reasons behind pedestrian accidents.
Public Interest Group
Work for Better Bangladesh (WBB)
[Program Manager]
(1) No foot over bridge is necessary at the intersection. (2) Enough space in the median should be provided so that the pedestrians can wait for a little during crossing the road. (3) A stop line before every zebra crossing should be provided.
Advocacy group Lecturer, Civil Engineering
Department, BUET.
(1) All red point should be provided at the intersection only for pedestrians to cross the road. (2) Public awareness among the drivers should also be encouraged.
5. Redesign of Intersection Among the three selected intersections, Jatrabari intersection is different from others as it was found as the most unplanned intersection. Recently, Mayor Hanif Flyover has been constructed over the intersection which hampered the arrangement of this intersection. So, Jatrabari intersection was designed in detail here. In contrast, the rest two intersections were found comparatively well designed. So, several strategies have been provided to make them more pedestrian friendly.
5.1 Redesign of Jatrabari Intersection Design Speed: For a multilane roundabout, maximum recommended entry design speed is 40-50 km/h whereas for urban areas, the current Indian practice is 30 km/h (Rodegerdts et al., 2010; FHWA, 2000; Kadiyali, 2013). Jatrabari intersection had a mean entry speed of around 10 km/h which is very low for the national highways. Therefore, low entry speed creates congestion in the intersection which increases the chance of crash in the intersection. So, for increasing the flow rate of vehicles, and developing the intersection harmless for pedestrian, 30 km/h has been taken as the entry design speed for Jatrabari intersection.

Tabassum, K., Esti, M. L. M., Sultana, R., Zafri, N. M., Hasan, M. M. U., Debnath, A. K., Tabassum, N.
Redesigning intersections for enhancing pedestrian safety: A study of three
accident-prone intersections of Dhaka
458
Design vehicle: For Jatrabari intersection, intermediate semi-trailer (WB-50) has been selected as the largest design vehicles because 8% of the vehicles pass through the intersection were truck and four out of the five approach roadways of this intersection were found national highways which connects the capital Dhaka with other important regions like Chittagong, Narayanganj, Sylhet etc.
Size of Inscribed Circle Diameter: For multilane roundabout, inscribed circle diameter (ICD) varies from 150 to 300 feet depending on design vehicle (Rodegerdts et al., 2010; FHWA, 2000). For redesigning the Jartabari intersection, 210 feet has been taken as the ICD. This large ICD would help to guide the traffic flow and reduce conflict points at Jatrabari intersection.
Circulatory Roadway Width: For redesigning the Jatrabari intersection, around 15 feet has been taken as the width of circulatory roadway lane and total two lanes was given in circulatory roadway for carrying vehicular traffic. Large circulatory roadway width was taken for larger design vehicles as they need more space while manoeuvring (Rodegerdts et al., 2010). A 10 feet wide truck apron has been provided for the manoeuvring of the large trucks without hampering other traffic flow.
Central Island: For redesigning Jatrabari intersection, radius of the central island has been taken 63 feet to provide guideline to the vehicles at the time of crossing the intersection. Landscaping is also encouraged in the central island.
Radius at entry-exit and entry width: Too small or too large entry radius is not recommended to design a roundabout. Generally, for a multilane roundabout intersection, radius of entry should be typically had between 65-120 feet (Rodegerdts et al., 2010; Kadiyali, 2013). For redesigning Jatrabari intersection, entry radius has been selected around 80 feet. Generally, the radius at exit is to keep 1.5 to two times higher than the radius of entry (Kadiyali, 2013). In this study, the radius of exit has been selected around 115 feet for redesigning Jatrabari intersection. Besides, width of a lane at entry has been kept from 12 to 15 feet for Jatrabari intersection in this plan.
Median: Median has also been provided in the proposed design at the entry and exit points for ensuring proper entry and exit radius. Plants which can grow without sunlight has been proposed to be planted because of inadequacy of sunlight under the flyover at the intersection.
Crosswalk: Pedestrians prefer crosswalk locations close to the roundabout to minimize crossing distance. But minimum 20 feet setback from circulatory roadway is recommended to select the location of crosswalk. Desirable setback is 45 feet (Rodegerdts et al., 2010; FHWA, 2000). In the design of the Jatrabari intersection, around 30-45 feet setback has been given between crosswalk and circulatory roadway. Crosswalks has been placed perpendicularly to the center line of the approach roadway so that pedestrian can cross the road by traveling shorter distance. Figure 2 shows existing condition and condition after redesign of Jatrabari intersection.
5.2 Redesign of Sonargaon- Panthapath Intersection Channelization for controlling speed: To separate the turning traffic, plastic cones were found in the intersection. Pedestrian had been forced to walk alongside the plastic cones at the time of crossing to reach the sidewalk. As a result, they had to walk along with heavy

Tabassum, K., Esti, M. L. M., Sultana, R., Zafri, N. M., Hasan, M. M. U., Debnath, A. K., Tabassum, N.
Redesigning intersections for enhancing pedestrian safety: A study of three
accident-prone intersections of Dhaka
459
traffic. Channelization has been encouraged in this plan by providing raised island in place of plastic cones to separate of the left turn vehicles from the straight going vehicles. Raised island should be accessible by pedestrians. This would also help to control vehicle speed as it creates large radii and also can be used as pedestrian refuge.
Smooth flow of vehicle: 10 feet wide apron has been provided around the central island so that the large vehicles like bus can easily complete the turn without striking fixed objects or other road users. Proposed plan of Sonargaon- Panthapath intersection is presented in Figure 3 (a).
5.3 Redesign of Shapla Chattar Intersection Creating facilities for at grade crossing: The existing foot over bridge had not been properly used by pedestrians. Furthermore, from inclusive planning perspective, foot over bridge is not recommended for pedestrian to cross the road. So, here, at grade crossing facilities– wide sidewalk, traffic signals, ramp, wide and accessible median, crosswalk– has been proposed to make the intersection pedestrian friendly. Proposed plan is presented in Figure 3 (b).
5.4 General Recommendations for Three Intersections Sidewalk extension: In case of all the three intersections, existing sidewalks was found narrow, full of garbage and blocked by illegal hawkers and the condition was found very poor. So, it was recommended to build a wide and pedestrian attracting sidewalk. Generally, recommended sidewalk width for high pedestrian volume is 10 feet which can carry 3,200 persons per hour (Rodegerdts et al., 2010; Kadiyali, 2013). So, 10 feet wide sidewalk has been proposed in each leg of the intersections so that it can accommodate the entire pedestrian comfortably. Sidewalk should be edged by railing so that pedestrian must be forced to use sidewalk and cannot able to go down on the carriageway wherever they wish except crosswalk location.
Ramp: Ramp should be provided to facilitate the wheelchair users. Ramps should be given at the starting and ending point of the sidewalk and crosswalk and at the intersect point of the median and crosswalk in the proposed design. The gradient of the ramp should be 1:15 for making the ramp easily traversable for the wheelchair users (Rodegerdts et al., 2010).
Pavement marking and signs: Pavement marking at the entries, exits, circulatory roadway and approach roadways is very much important for providing guidance for the pedestrians and vehicle operators. Lane line, obstruction approach marking, route direction arrows and white entrance line should be given for guiding the vehicles. Pedestrian crossing markings and yield lines should also be used at the intersections to improve pedestrians’ safety condition. Besides, proper regulatory control, advance warning and directional guidance sign should be provided at most visible locations to guide the drivers and pedestrians.
Traffic Signal: Existing signal post, mast arm pole and pedestrian signal operates, which do not work now-a-days, should be improved. In case of unsignalized and manually operated intersections, installing traffic signals with pedestrian traffic signals will help in controlling both pedestrian and vehicle traffic.
Lighting: Proper lighting system should be adopted in the intersection so that pedestrians and drivers can traverse the intersection with ease and safely.

Tabassum, K., Esti, M. L. M., Sultana, R., Zafri, N. M., Hasan, M. M. U., Debnath, A. K., Tabassum, N.
Redesigning intersections for enhancing pedestrian safety: A study of three
accident-prone intersections of Dhaka
460
5.5 Management Related Strategies Strategy 1- Parking Management: Fine system should be encouraged if anyone parks the vehicle at intersection. Designated parking space should be provided. Strategy 2- Hawker Management: Hawkers should be relocated from their current location to designated space. Hawkers should not be allowed to block the roadway or sidewalk. Strategy 3- Bus Stop Management: Bus stops should be relocated far from the entry or exit location of the intersections so that no congestion can be created at entry or exit location. Strategy 4- Waste Management: Proper waste management system should be developed to keep the sidewalk and roadways clean and attractive. Dustbin at the intersection should be relocated far from the intersection to increase pedestrian comfort and safety. Strategy 5- Awareness Raising: Awareness raising program should be arranged to educate the drivers and pedestrians about road safety and duty of drivers and pedestrians.
Figure 2 Jatrabari intersection (a) Existing condition, (b) After redesign
Figure 3 Proposed design of (a) Sonargaon- Panthapath, (b) Shapla Chattar Intersection
(a) (b)
(a) (b)

Tabassum, K., Esti, M. L. M., Sultana, R., Zafri, N. M., Hasan, M. M. U., Debnath, A. K., Tabassum, N.
Redesigning intersections for enhancing pedestrian safety: A study of three
accident-prone intersections of Dhaka
461
6. Conclusion As the pedestrian safety condition of Dhaka is not satisfactory specially at the intersections, this study aimed to redesign three intersections– Sonargaon-Panthapath, Shapla Chattar and Jatrabari intersection– of Dhaka for enhancing pedestrian safety. To fulfil the aim, first existing scenario of the intersection was analysed. Here, geographical element of intersection was investigated and traffic survey– volume survey, speed survey and modal share survey– was conducted. Then, stakeholders were surveyed to collect their opinion. Finally, the designs had been prepared by incorporating the findings of existing condition analysis and considering the opinion and needs of the stakeholders. It is expected that implementation of the designs will help in enhancing pedestrian safety at these important intersections of the city and help the policy-maker and designer to redesign other intersections.
7. References Accident Research Institute (ARI). (2015). Road Safety Facts 2013. Available at:
http://ari.buet.ac.bd/downloads/Facts%202013.pdf [Accessed 30 July. 2019].
Bhuiyan, M. and Islam, M. (2018). A Study on Pedestrian Deaths in Dhaka City Road Accidents. UIU Institutional Repository.
Bhuiyan, N. F. (2019). Enhancing Pedestrian Safety in Bangladesh. In Conference on 1st Convention of NRB Engineers, Pan Pacific Sonargaon Hotel, Dhaka, 26-27 February.
Federal Highway Administration (FHWA). (2000). Roundabouts: An informational guide(No. FHWA-RD-00-067; Project 2425). United States.
Kadiyali, L.R. (2013). Traffic engineering and transport planning. Khanna publishers.
Mahmud, S.S., Hossain, M.M., Hoque, M.S. and Hoque, M.M. (2006), August. Pedestrian Safety Problem, Existing Facilities and Required Strategies in the Context of Dhaka Metropolitan City. In International Conference on Road Safety in Developing Countries, Dhaka, Bangladesh.
Pervaz, S. and Newaz, K.M.S. (2016). Pedestrian safety at intersections in Dhaka metropolitan city. In 17th International Conference Road Safety On Five Continents (RS5C 2016), Rio de Janeiro, Brazil, 17-19 May 2016 (pp. 1-11).
Rifaat, S.M., Tay, R., Raihan, S.M., Fahim, A. and Touhidduzzaman, S.M. (2017). Vehicle-Pedestrian crashes at Intersections in Dhaka city. The Open Transportation Journal, 11(1).
Rodegerdts, L.A. (2010). Roundabouts: An informational guide(Vol. 672). Transportation Research Board.
Zafri, N.M., Rony, A.I. and Adri, N. (2019). Analysis of Pedestrian Crossing Speed and Waiting Time at Intersections in Dhaka. Infrastructures, 4(3), p.39.

Kafy,AA; Saifullah,M;Roy,S; Faisal,AA;Hasan,MM
Sustainable Ecotourism Site Development
462
Research Paper
Evaluating Land Use and Natural Resources for Sustainable Ecotourism Site Development and Its
Contribution to Urban Economy
Abdulla - Al Kafy, GIS Analyst, Rajshahi Development Authority; Bangladesh
Md. Saifullah, Graduate Student, Department of Urban & Regional Planning, Rajshahi University of Engineering & Technology (RUET), Rajshahi, Bangladesh
Sumita Roy, Masters student, Dhaka School of Economics (DScE), Constituent Institution of the University of Dhaka, Bangladesh
Abdullah-Al-Faisal, Research Consultant, Center for Environmental and Geographic Information Services (CEGIS); Bangladesh.
Mohammad Mahmudul Hasan, Graduate Student, Department of Urban & Regional Planning, Rajshahi University of Engineering & Technology (RUET), Rajshahi, Bangladesh
Abstract
The complex characteristics of tourism require effective tools to incorporate tourism development in decision making, which will help to meet the economic, social, and environmental demands of future sustainable development. There is ample opportunity to develop ecotourism in Rajshahi city and its neighbourhood that would generate both employment and income of people and foster development in the area. This study aims to evaluate the land use and natural resources for future sustainable ecotourism site development using Geographic information system (GIS). Land use/land cover (LULC) data estimated from satellite image for the year 2018 and Analytical Hierarchical Process (AHP) data collected from expert opinion was integrated with GIS to evaluate the best-suited ecotourism suitability zones. AHP is an expert opinion based approach and helps to identify the suitable ecotourism zone in Rajshahi. This study selected five criteria and four GIS-based layers in determining what areas are best suited for ecotourism development. These are physical (land use/cover), topography (elevation, slope), accessibility (proximity to open space and water bodies, distance from roads) and environmental characteristics (NDVI). The output of the study is effective for tourism facilities development, ecotourism resource utilization, and identifying the suitable ecotourism site where ecotourism could be more developed. Moreover, the results can be helpful for environmental managers and planners working in local, central governments and non-governmental organizations. These integrated approaches help to solve the complex and universal issues regarding the sustainable development of ecotourism, biodiversity conservation and improve the urban economy of any countries. Keywords:
GIS; Ecotourism; Analytical Hierarchical Process; LULC.

Kafy,AA; Saifullah,M;Roy,S; Faisal,AA;Hasan,MM
Sustainable Ecotourism Site Development
463
1. Introduction Ecotourism is increasing its attention not only as a substitute to mass tourism but also as a resource to promote a country’s economic development and environmental conservation(Tewodros, 2010, Kafy et al., 2018c). Ecotourism means a sustainable form of natural environment based tourism which combines environment and economy to minimize harmful impacts and focuses on local culture and wilderness adventures (Reza et al., 2009). Ecotourism defined by McCormick (1994) “purposeful travel to natural areas to understand the culture and natural history of the environment, taking care not to alter the integrity of the ecotourism. Ecotourism creates economic opportunities that make the conservation of natural resources beneficial to local people” (Hossen et al., 2014). Ecotourism is focused on the natural environment and relies on natural and cultural heritage (Bunruamkaew and Murayama, 2012, Kafy et al., 2018b). Compared to other consumptive economic uses, there is no doubt that ecotourism represents more friendly alternatives for economic use of natural resources (Randolph, 2004). Since the late 20th century, there has been a growing trend towards ecotourism in both the developed and developing world (Wanyonyi et al., 2016). The concept of ecotourism is now a common issue for the developed countries whereas it is still a new area for the tourism industry in Bangladesh as a ‘gold mine’ for her unparalleled bio-diversified natural habitats, wildlife and ancient heritages (Ahsan, 2008). Bangladesh has an appealing natural environment and numerous historical and cultural sites that can be used for tourism growth (Rahman et al., 2010, Rahman, 2010). Rajshahi district is decorated with a number of cultural heritage sites and land diversity full of natural resources. That is why the study aims to evaluate and monitor the natural resources used for ecotourism site selection on the land ecosystem in Rajshahi City and its neighbourhood areas. The methodology is to generate land use/land cover (LULC) map for ecotourism and present a suitable space for ecotourism development. The use of Information Technology in tourism has been an issue of growing importance during the last years (Farsari, 2016). Geographic Information System (GIS) can be used in tourism as a decision-supporting tool for sustainable tourism planning, impact assessment, visitor flow management, and tourism site selection (Rahman et al., 2010). To form the base of a decision support system for policy and decision making in sustainable tourism GIS is helpful (Wanyonyi et al., 2016, Farsari, 2016). A GIS helps to classify the Landsat Imagery to evaluate the land use and natural resource distribution and also for suitability analysis. The integration of the AHP with GIS combines decision support methodology with powerful visualisation and mapping capabilities which in turn facilitates the creation of land use suitability map (Bunruamkaewa and Murayamaa, 2011, Kafy et al., 2019). These two methods together help to define the suitable zone for ecotourism development, considering the ground information and expert opinion. Some operations can degrade natural resources due to the fast development of mass tourism, particularly when confronted with poor management and moving towards ecotourism can be a solution to this (Tewodros, 2010, Hossen et al., 2014, Wanyonyi et al., 2016). If proper steps can be taken to protect the ecotourism spots along with adequate measures to make the destinations as eco-tourist-friendly with appropriate policy to allow ecotourism, it will also improve the socio-economic condition of remote local people and Bangladesh will be able to earn a considerable amount of foreign exchange through it.

Kafy,AA; Saifullah,M;Roy,S; Faisal,AA;Hasan,MM
Sustainable Ecotourism Site Development
464
Ecotourism has a chain of impacts. It has a multiplier effect in an economy, which is very much rewarding for the growth of a country (Ahsan, 2008, Kafy et al., 2018c). Ecotourism’s is a useful tool for sustainable development, which is the main reason why developing countries adopt conservation strategies resulting in economic development. The area appropriate for ecotourism must be identified to assist in the decision-making of the concerned authorities and to conserve the environment of these attractions. This study aims to evaluate the land use and natural resources for future sustainable ecotourism site development in Rajshahi city using Geographic information system (GIS) and AHP methods and analyse how it impacts the urban economy.
2. Materials and Methods 2.1. Study area Rajshahi city is situated in the ancient Barind area. Rajshahi is the most significant metropolitan city in the northern part of Bangladesh. It lies between 24°07′ to 24°43′ north latitudes and between 88°17′ to 88°58′east longitudes (Figure 1). The total area of the Rajshahi district is 2,425.37 sq.km. Rajshahi District was bounded by Naogaon District on the north, West Bengal of India, the Padma and Kushtia District on the south, Natore District on the east and Chapainawabganj District on the west. The region consists of Barind tract, Diara and Char lands. Rajshahi Development Authority (RDA) stands on the bank of the river Padma. The total area of the RDA is 364 Km2(Kafy et al., 2018d, Clemett et al., 2006). The RDA is bounded in the east, north and west by Paba thana and in the south by the Padma river and the shape of the city is as like an inverted “T”. The maximum length along the east-west direction is about 13 km and along north-south is 8 km (Rahman, 2004, Kafy et al., 2018c).
Figure 1 Classified LULC map of Rajshahi City, 2018
Rajshahi City has many tourist attraction places which are noticeable. First of all, Padma River, which itself is a source of beauty and a favourite place for river lovers. Rajshahi is

Kafy,AA; Saifullah,M;Roy,S; Faisal,AA;Hasan,MM
Sustainable Ecotourism Site Development
465
called as the ‘City of Silk’ because of flourishing silk industry. Rajshahi starts its journey as an urban centre by driving the business of ‘Blue’ and ‘Silk’. Shaheb Bazar is the Central Business District (CBD) of the town where all traditional matters can be found. At present, a Mazar which is known as Hazrat Shah Mokhdum Ruposh (ra), is the most remarkable tourist spot of the city. Additionally, Rajshahi Collegiate School, previously known as the first modern educational institute Boalia English School, is situated in the year 1828. It is believed that the institution is the first modern institution of Bangladesh. Now, Rajshahi city has several renewed institutes such as Rajshahi University of Engineering and Technology (RUET), Rajshahi University, Rajshahi Medical College, Rajshahi College and so on. That is why the city is called the ‘City of Education’. Besides, Shahar Rakkha Badh, T-badh, I-badh, National Zoo, Varndra museum (the first museum of the country established in 1910), Zia Park, Lalon Shah Park and so on which are the most popular tourist attractive places in the city (Kafy et al., 2018c, Kafy et al., 2018a, Clemett et al., 2006, Rahman et al., 2010).
2.2. Materials and Method 2.2.1 Data Collection
Two types of data were used for this study; primary and secondary. Expert opinion and interview were one of the crucial primary data collection methods in this study. At the inauguration of the study, they were interviewed for selection of the suitability criteria. The experts were interviewed for one last time to determine the relative weight of the selected suitability criteria. For this purpose, evaluation forms were prepared. Twenty experts were interviewed for specifying the criteria weight. A various literature review was conducted in order to identify the criteria for suitability analysis for eco-tourism site.
Table 1 List of data and sources Data Scale Source
Boundary Map 1:10,000 Rajshahi Development authority, Rajshahi, Bangladesh. Land Used/Cover Map 2004 1:10,000 Rajshahi Development authority, Rajshahi, Bangladesh.
ASTER DEM (View-shed Map) 1:10,000 U.S. Geological Survey (USGS). Tourist Map 1:50,000 Bangladesh Parjatan Corporation
Natural Attraction Places Field Survey.
Protected Areas 1:10,000 Department of Land Record and Survey, Bangladesh. Location of Park Rajshahi Development Authority, Rajshahi, Bangladesh.
Road Map 1:50,000 Rajshahi Development Authority, Rajshahi, Bangladesh. Population Data 2011 Bangladesh bureau of statistics, Bangladesh
To have an overview of the various multi-criteria decision-making tools and to identify the method for suitability analysis, guidelines for land use planning of other countries etc. All the secondary data related to the recent development plan of Rajshahi district and GIS database for Rajshahi city were collected from different organizations like RDA, UDD, DDC, BBS etc. (Table 1).
2.2.2 Selection of Criteria and spatial database preparation
The criterion is a general category of information by which the site being evaluated. To find out the suitable location for ecotourism is often consider some aspects such as physical factor like LULC, topography factors like slope and elevation, accessibility factor-like

Kafy,AA; Saifullah,M;Roy,S; Faisal,AA;Hasan,MM
Sustainable Ecotourism Site Development
466
accessibility to roads and open space and environmental factors like availability of park, open space and vegetation cover. By synthesising literature reviews, local contexts, expert opinions and available data six criteria were selected for this study. Twenty expert’s opinion was undertaken for this study. Among them, eight experts ware urban planner, six experts were environmentalist, three experts were engineers, and other three experts were geographers.
Table 2 Factors and criteria in site suitability analysis for ecotourism
Factors Criteria Unit Factor Suitability Rating
High Moderate Marginal Not suitable Physical Land use/Land Cover class High Moderate Marginal Not
Topography Elevation meter 300-400 m 100-300 m > 400 m 0-100 m Slope degree 0-5o 5-25 o 25-35 o > 35 o
Accessibility Proximity to open space and water bodies
meter <500 m 500-1000 m 1000-2000 m >2000 m
Distance from roads meter <50 m 50-100 m 100-200 m >200 m Environmental NDVI Range NDVI< 0 NDVI> 0.3 0.1 <NDVI< 0.3 0 < NDVI< 0.1
The evaluation of ecotourism site development was based on the six chosen criteria demonstrate in table 2. Criteria and criteria range were selected according to experience, expert opinion, and information gathered from literature review. Table 1 is given below showing the parameters with their suitability ranges from ecotourism site development perspective. Each of the sub-parameter is divided into Four ranges: S1 (Highly suitable), S2 (Moderately Suitable) S3 (marginal Suitable), N0 (Not Suitable) on the basis of FAO framework (Çetinkaya et al., 2018, Šiljeg et al., 2019, Bunruamkaew and Murayama, 2012)and expert opinion.
2.2.3 Determining Weight Values in AHP
Once the criteria for ecotourism site analysis were fixed, the relative weights of the parameters were determined using the AHP technique. At first, individual experts’ opinions were undertaken. Experts were asked to score their preference values over the criteria using Saaty’s 1–9 ratio scale (Wind and Saaty, 1980, Saaty, 2008). Saaty’s 9-degree scale for qualitative judgment based on experiments (table 3). Many authors criticised Saaty’s this scale and some authors tried to improve this scale but still no unique scale has been suggested other than Saaty’s scale (Cengiz and Akbulak, 2009, Saaty, 2008). Besides, Saaty’s scale is simple and easy to understand. To make the pair-wise comparison between two factors or criteria under 9-degree preferences scale following table 4 was used.
Table 3 Saaty’s Scale for Pairwise Comparison
Preferences expressed in numeric variables Preferences expressed in linguistic variables 1 Equal importance 3 Moderate importance 5 Strong importance 7 Very strong importance 9 Extreme importance
2,4,6,8 Intermediate value between the two adjacent judgments

Kafy,AA; Saifullah,M;Roy,S; Faisal,AA;Hasan,MM
Sustainable Ecotourism Site Development
467
Table 4 Factor preference by expert
Criteria Importance (or preference) of one criterion over another Criteria
9 8 7 6 5 4 3 2 1 2 3 4 5 6 7 8 9
Slope √ Elevation
Table 4 shows the diagram to choose a preference level between Land-use and Physical/Geological. At first an expert fixes his stance, either both criteria are equally important or not. If they are equally important, then the value is 1. If they are not, then the expert takes his position where he prefers. For example, in Table, an expert prefers Elevation over slope. So, he takes right side positions of 1. Finally, according to 9 degree preferences scale (Table 3) he marks his actual value of preference. In this diagram, the elevation got strong importance over the slope. So, the value of 5 on the right side of 1 was highlighted. Thus pair-wise comparisons were made for all the factors.
2.2.4 Land Suitability Assessment
In this process, the land suitability map for ecotourism site has been created, based on the linear combination of each used factor’s suitability score, as shown in Equation (1). The AHP technique was used to determine the comparative significance of all the selected variables. The total suitability score “Si” for each land unit was calculated from the linear combination of suitability score obtained for each factor and criteria involved.
(1)
where “n” is the number of factors, “Wi” is the multiplication of all associated weights in the hierarchy of “ith” factor (as seen in Table 7) and “Ri” is a rating given for the defined class of the “ith” factor found on the assessed land unit. In this process, after getting experts’ opinions, the pairwise matrix was formed to calculate the relative importance of the factors and criteria involved. The calculations of the pair wise comparison matrix are given in Table 5.
2.2.5 Evaluation of Land Suitability in GIS
After finishing all the above steps, the GIS Model builder (Geo-processing tool) in ArcGIS (version 10.6.1) was used to develop a model for analysing the ecotourism site suitability based on different criteria and their weight. Initially different raster files for each parameter: Slope (degree) Elevation (m), Proximity to existing road (km), Proximity to open space and water bodies (km), and NDVI were prepared from the existing Geodatabase (. gdb) files. These raster files were then reclassified according to the suitability ranges. For calculating the suitability ranges Euclidian distance was followed. A ‘0-3’ scale was used for reclassifying suitability ranges: ‘0’ is not suitable, ‘1’ being marginally suitable area, ‘2’being moderately suitable area and ‘3’ is the highly suitable area. Finally, when all the layers were reclassified, these were overlaid following “weighted overlay method” to get the final suitability map. Based on the properties of pairwise comparison matrices, the consistency ratio index (CR) as shown in Equation (2) can be calculated. Saaty suggests that if CR is <0.10, then degree of consistency is fairly acceptable. But if it’s >0.10, then there are inconsistencies in the evaluation process, and the AHP method may not yield meaningful results.

Kafy,AA; Saifullah,M;Roy,S; Faisal,AA;Hasan,MM
Sustainable Ecotourism Site Development
468
(2)
Table 5 Establishment of the pairwise comparison matrix
Factor C1 C2 C3 C4 C5 C6 Land use/Land Cover (C1) 1 1.02 2.05 4.23 5.52 4.2
Elevation (C2) 0.19 1 2.3 0.23 1.73 2.03 Slope (C3) 1 3 1 4.57 3.1 0.63
Proximity to open space (C4) 0.18 0.49 0.22 1 0.9 5.62 Distance from roads (C5) 0.25 0.58 0.32 1.11 1 1.74
NDVI (C6) 4.75 0.23 0.32 5.06 1.56 1
3. Result and discussion 3.1. Influencing factors in ecotourism suitability. In Table 7 Factors and criteria selected for ecotourism, suitability analysis was ranked high (rank 1) to low (rank 6) to identify the most influential factors contributing to ecotourism site development. The ranking evaluated using the weighted sum approach in Arc GIS 10.6. From Table 7 it’s noticeable that LULC was the highest rank criteria with total suitability 0.32. On the other hand green open space and water/riverside places along with dense vegetation cover area placed at 2nd and 3rd rank respectively with suitability value of 0.29 and 0.27. Hardly few places have higher topography because flat topography present in Rajshahi. People also pay less attention to those places of, and these places receive lower rank with slope and elevation receive 0.20 and 0.06 suitability respectively. Road accessibility creates positive impact on eco-tourism suitability and rank 4th with 0.22 suitability value.
Table 6 Factors and criteria ranking for ecotourism site suitability analysis
Factors Criteria Weight Total Suitability Ranking
Physical Land use/Land Cover 0.46 0.32 1 Topography Elevation 0.12 0.06 6
Slope 0.1 0.20 5 Accessibility Proximity to open space and
water bodies 0.35 0.29 2
Distance from roads 0.36 0.22 4 Environmental NDVI 0.42 0.27 3
3.2. Identification of Ecotourism suitable site in Rajshahi City Figure 2 describes the suitability map for ecotourism site in Rajshahi city. Four suitability classes were used (Table 6) to describe the data in maps, namely not suitable (0.0-0.2), marginally suitable (0.2-0.4), moderately suitable (0.4-0.8) and highly suitable (0.8-1.0). The suitability map illustrates that maxima area (218.4 km2) in Rajshahi city is marginally suitable (S3) and located in outside the central part of the city. The significant amount of open space, greenery and good accessibility in those part create attraction and make those part marginally suitable for ecotourism. The area of moderately suitable (S2) is about 22%, and these are in the north-eastern and southern parts of the city. Only a few percentages (7% and 11%) of the area were classified as highly suitable (S1) and not suitable (N), respectively.

Kafy,AA; Saifullah,M;Roy,S; Faisal,AA;Hasan,MM
Sustainable Ecotourism Site Development
469
Table 7 Area coverage for ecotourism suitability classes
Area Coverage Suitability Class Score Range Km2 %
Highly suitable (S1) 0.75–1.00 25.48 7 Moderately suitable (S2) 0.50–0.75 80.08 22 Marginally suitable (S3) 0.25–0.50 218.40 60
Not suitable (N) 0.00–0.25 40.04 11 Total area 364.00 100
The high suitable ecotourism site mainly the Padma riverside places T badh, I badh, shimanto nongor and some museum-like Barandra museum and Kamrruzzamn park in Rajshahi city. If these places were equipped with more tourist attraction elements and maintain properly the local government can earn huge money and contribute to the development of local and national economy.
Figure 2 Suitability map for ecotourism in Rajshahi, Bangladesh
4. Conclusion This research represents an integrated strategy to the development of ecotourism via the identification of ecotourism sites and the formation of methods to assess the ecotourism sustainability, by adapting the characteristics of the location. This method has been proven advantageous for assistant decision-making for tourism facilities planning and ecotourism resource utilization for sustainable development. The eco-tourism suitable map prepared using weight-based approach (i.e. AHP) in the current study and is the outcome of a combination of various factors responsible for eco-tourism suitability, in which each factor has relative significance. The availability of up to date data, higher-resolution satellite

Kafy,AA; Saifullah,M;Roy,S; Faisal,AA;Hasan,MM
Sustainable Ecotourism Site Development
470
images, better base maps will assist in producing high accuracy eco-tourism suitable maps. The research outcome will help the local community, urban planner and engineers to improve the facilities in high eco-tourism suitability locations and develop strategies which will contribute to the local and national economy.
5. References Ahsan, M. N. 2008. Ecotourism In Bangladesh: A New Tool For Economic Development. J.
Socio. Res. Dev., 5, 299-304. Bunruamkaew, K. & Murayama, Y. 2012. Land Use And Natural Resources Planning For
Sustainable Ecotourism Using Gis In Surat Thani, Thailand. Sustainability, 4, 412-429. Bunruamkaewa, K. & Murayamaa, Y. 2011. Site Suitability Evaluation For Ecotourism Using
Gis & Ahp: A Case Study Of Surat Thani Province, Thailand. Procedia Social And Behavioral Sciences, 21, 269–278.
Cengiz, T. & Akbulak, C. 2009. Application Of Analytical Hierarchy Process And Geographic Information Systems In Land-Use Suitability Evaluation: A Case Study Of Dümrek Village (Çanakkale, Turkey). International Journal Of Sustainable Development & World Ecology, 16, 286-294.
Çetinkaya, C., Kabak, M., Erbaş, M. & Özceylan, E. 2018. Evaluation Of Ecotourism Sites: A Gis-Based Multi-Criteria Decision Analysis. Kybernetes, 47, 1664-1686.
Clemett, A., Amin, M. M., Ara, S. & Akan, M. M. R. 2006. Background Information For Rajshahi City, Bangladesh. Waspa Asia Project Report, 2, 1-29.
Farsari, Y. 2016. Gis-Based Support For Sustainable Tourism Planning And Policy Making. Hossen, A., Ahsan, M. F. & Kamruzzaman, M. 2014. Ecotourism Potentiality In The Dulahazra
Safari Park, Bangladesh. J. Environ. Sci. & Natural Resources, 7, 189 – 196. Kafy, A.-A., Hasan, M. M., Ferdous, L., Ali, M. R. & Uddin, M. S. 2019. Application Of Artificial
Hierarchy Process For Landslide Susceptibility Modelling In Rangamati Municipality Area, Bangladesh.
Kafy, A.-A., Islam, N., Sharmin, S., Mahzabin, F., Arafat, M. & Roy, S. 2018a. Integration Of Multiple Uses To Create A Central Place For The Community: An Approach Towards A Sustainable Town Centre Development At Baze Shilinda, Rajshahi. Trends In Civil Engineering And Its Architecture, 2, 265-272.
Kafy, A.-A., Sheel, P. K., Ali, S. & Ferdous, L. 2018b. Economic Value Determination Of A Wetland Using Contingent Valuation Method :A Case Study On Chalan Beel In Natore District, Bangladesh. 1st National Conference On Water Resources Engineering (Ncwre 2018)At: Cuet, Chittagong, Bangladesh. Chittagong.
Kafy, A. A., Ali, S., Ferdous, L. & Sheel, P. K. 2018c. Using Contingent Valuation Method To Determine Economic Value Of Padma River Wetland In Rajshahi District, Bangladesh. 1st National Conference On Water Resources Engineering (Ncwre 2018)At: Cuet, Chittagong, Bangladesh. Chittagong.
Kafy, A. A., Ferdous, L., Faisal, A. A., Khan, H. A. H. & Sheel, P. K. Exploring The Association Of Surface Water Body Change And Rapid Urbanization In Rajshahi City Corporation (Rcc) Area Using Rs And Gis. 1st National Conference On Water Resources Engineering (Ncwre 2018), 2018 2018d Chittagong.
Rahman, M. A. 2010. Application Of Gis In Ecotourism Development: A Case Study In Sundarbans, Bangladesh. Master Of Arts, Human Geography Focusing On Tourism, Mid-Sweden University.
Rahman, M. L., Hossain, S. M. N., Miti, S. S. & Kalam, D. A. K. M. A. 2010. An Overview Of Present Status And Future Prospects Of The Tourism Sector In Bangladesh. Journal Of Bangladesh Institute Of Planners, 3, 65-75.

Kafy,AA; Saifullah,M;Roy,S; Faisal,AA;Hasan,MM
Sustainable Ecotourism Site Development
471
Rahman, M. M. 2004. Surface Water Quality In Rajshahi City. The Journal Of Geo-Environment, 4, 15-22.
Randolph, J. 2004. Environmental Land Use Planning And Management, Island Press. Reza, S., Ahmed, M. & Rehunuma, M. 2009. Opportunities And Challenges Of Eco-Tourism
Marketing In Bangladesh. Saaty, T. L. 2008. Decision Making With The Analytic Hierarchy Process. International Journal
Of Services Sciences, 1, 83-98. Šiljeg, A., Cavrić, B., Šiljeg, S., Marić, I. & Barada, M. 2019. Land Suitability Zoning For
Ecotourism Planning And Development Of Dikgatlhong Dam, Botswana. Geographica Pannonica, 23, 76-86.
Tewodros, K. T. 2010. Geospatial Approach For Ecotourism Development: A Case Of Bale Mountains National Park, Ethiopia.
Wanyonyi, J. W., Imwati, A. & Boitt, M. 2016. Gis In Analysis Of Potential Sites For Ecotourism – A Case Study Of Kwale County. Iosr Journal Of Environmental Science, Toxicology And Food Technology, 10, 43-49.
Wind, Y. & Saaty, T. L. 1980. Marketing Applications Of The Analytic Hierarchy Process. Management Science, 26, 641-658.

Rural and Regional Planning, Climate Change and Disaster Management
Sixteen papers focusing on Rural and Regional Planning, Climate Change and Disaster Management were presented in two days under “Session-4”. Bullet points of those papers are as follows:
1. Md. Moklasar Rahman Litu and others assess the risk of water logging in South Agrabad area of Chattagram and its socio-economic impacts on its residences with the help of PRA tools. Study finds most vulnerable groups due to the water logging are children and office going people.
2. Study of Md Rashed Chowdhury examines two climate sensitive “hotspots” (e.g., USAPI and Bangladesh) and uses the ENSO-information for forecasting and warning with regard to local rainfall, flooding, tropical cyclones, and sea level on seasonal time scales, and then links this information to disaster preparedness planning and management.
3. The study of Akshar Tripathi and Reet Kamal Tiwari uses DInSAR (Differential Interferometric Synthetic Aperture RADAR) technique for mapping the land subsidence and deformation of Chandigarh area due to continuous lowering of water table and loss. This study makes use of Sentinel-1A microwave datasets over a year from 2018-19, for monitoring the land subsidence and finds evidence of substantial land subsidence ranging from 0.5cm-1.7cm. Due to this subsidence, the buildings in residential and industrial areas including the new airport terminal building is showing cracks, which if unchecked can lead to disastrous consequences.
4. Md. Shahadat Hossain studies the adaptive capacity of coastal women to cope with climate change induced salinity in 5 upazilas of Khulna and Shatkhira. Study reveals that women and girls in the study area are crucially suffering from lack of adaptive capacities due to their lack of access to services and they play vital role in bringing back the family in original state after any disaster.
5. Most. Asma Khatun and others study on delineation of economically potential regions in Bangladesh through competitiveness analysis. From the data of BBS and analysis the delineated four regions, namely, highly potential region, moderately high potential region, moderately low potential region and lower potential region. It will help government in resource distribution and decision making of development planning and process.
6. Jenifar Selim and others make an assessment on total forest cover of Bangladesh. Researchers use the data of BBS and apply the statistical tools to delineate the 64 districts of Bangladesh into 7 regions on the basis of the existing condition of forest lands in the country. This study will be helpful for the researchers, planners and policy makers to perform further research in forest land conservation and management.

7. This study of Tania Islam and others deals with analyzing all the 64 districts of Bangladesh on the basis intensity of agricultural production and the chemical fertilizer use. This work maps the BBS data of crop production of all districts and finds the relationship between productivity with the use of chemical fertilizer. Outcome of the study will help policy makers in decision making about agricultural food production and use of chemical fertilizer in future.
8. Paper of Anutosh Das and others tries to understand the requirement and availability of socio-economic facilities and its distribution in the optimum location in Khulna City through regional competitiveness analysis of facilities. This study deals with several services facilities as growth center, rural market, educational and healthcare facilities like high school, primary school, upazilla health complex, community clinic etc of the study area.
9. Paper of M.A.A. Murad and others studies to find out the main causes of water crisis and the impacts of this crisis on agriculture in a village of Godagari Upazila, Rajshahi. This research covers various issues like change in crop production cost, job migration and degradation of ground water level, availability of drinking water etc and the adaptation of people with the prevailing condition.
10. The research of Abdulla - Al Kafy and others observes dramatic decrease in greenery and water bodies and a significant increase in the urban built-up area that leads gradual increase of urban land surface temperature (LST) in Rajshahi city in the last few decades. This research estimates the effect of Urban Heat Island (UHI) using quantitative temporal, thermal GIS and remote sensing and techniques.
11. The study of Arifa Akhter Chowdhury and others focuses on the existing fire extinguishing system in RDA market and people’s perception regarding fire safety issue of this market. Researchers do not see any visible steps to improve its present condition this market was marked as 'most vulnerable' by Fire Service and Civil Defense authorities. Study finds that most of the buyers want improvement of the existing firefighting system of this market.
12. Paper of Anika Tabassum Sinthy and others shows the present status of agricultural technologies in 8 selected Upazillas of Bangladesh and how the government and other bodies like NGOs are working in the dissemination of technologies in this sector. This paper reveals use of agricultural technology is more and commonly used where education level of people is high.
13. Nusrat Jahan Tabassum and others conduct their study on the uses and impacts of technology in the improvement of livelihood of the people in rural area of Bangladesh. They show how the means of communication, modernization of agricultural equipment, financial facilities have brought the changes in the livelihood of rural areas of Bangladesh

14. Paper of Nishat Akter Juy deals with an analytical approach to measure the dissimilation of private banking sector in Bangladesh. Researcher measures the dissimilation of private banking sector in Bangladesh using Lorenz curve and Gini index. Her research finds significant inequality in case of private commercial banks distribution in different regions of the country.
15. Md. Aminur Rahman Sarker and others use various GIS and Remote Sensing tools and USLE Model, for estimation of soil erosion in Khulna city. Rainfall erosivity, soil erosivity, slope length and steepness of land, land cover management, and conservation supporting practice etc factors are integrated for developing the soil erosion model and predicting the soil erosion risk.
16. Paper of Md. Shaharier Alam and others assesses the fire hazard risk of residential buildings in Rajshahi City Corporation and produces map of spatial variation to fire risk. For the study, researchers use Entropy-Technique for Order Preference by Similarity to Ideal Solution (TOPSIS) integrated method for fire hazard risk assessment based on 9 most relevant factors. Outcome of the study will be helpful in deciding disaster risk sensitive land use planning interventions in future planning.
- Dr. Akter MahmudGeneral Rapporteur

Litu M.R, Mim M.S.H, Riyasat I.A, Mahid M.R, Graduate, CUET, Bangladesh
Water Logging and Its Effect on Socio-economic Condition of South Agrabad, Chattogram
472
Case Study Paper
Assessment of The Risk Due to Water Logging and Its Effect on Socio-economic Condition of South Agrabad
(Ward No. 27) With Participatory Rural Appraisal (PRA) Tools
Md. Moklasar Rahman Litu, Graduate, CUET, Bangladesh
Molla Safayet Hossan Mim, Graduate, CUET, Bangladesh
Ishteaque Ali Riyasat, Graduate, CUET, Bangladesh
Md. Mahbubur Rob Mahid Graduate, CUET, Bangladesh
Abstract
Heavy rain from the month of May to August results in water logging in many areas of Chittagong including South Agrabad as one of the most affected areas. South Agrabad is prone to water logging due to its vulnerable geographical setting, mismanagement of waste and proper drainage. This research intends to identify the social and physical vulnerability under such adverse environmental condition. Necessary data has been collected through different participatory tools which include social map, resource map, cause effect diagram, daily activity schedule, Venn diagram, spider diagram. Major findings revealed the causes of water logging as uncontrolled dumping of waste in the drain, lack of proper drainage system. Other findings are most vulnerable groups due to the water logging are children and office going people. Accordingly, some necessary recommendations on the basis of the opinion of the local people such as facilitating drainage, provision of dustbin and waste collection system, regular cleaning and widening of the drainage and also proper management have been given.
Keywords
Water Logging, PRA, Vulnerable, Problem, Disaster Management
1. Introduction Bangladesh is the darling child of Nature. It is one of those developing countries which is often faced with various types of natural disasters. About 97.1 % of its total area and 97.7 % of the total population at risk of multiple hazards (World Bank, 2005). Water logging is one of the hazards which occur frequently in different parts of our country especially in the metropolitan cities.). It has caused serious disruption to more than one million people in Bangladesh during the past two decades. It has caused large scale damages to crops, employments, livelihood and national economy (Ahmed, 2004). Due to seasonal rainfall a large part of the major cities of Bangladesh suffer from water logging due to inadequate drainage and most surprisingly, in the south western part of coastal region, people are compelled to live under water in a water logged condition for nine months in a year.

Litu M.R, Mim M.S.H, Riyasat I.A, Mahid M.R, Graduate, CUET, Bangladesh
Water Logging and Its Effect on Socio-economic Condition of South Agrabad, Chattogram
473
(Ahmed, 2005). At present, it has become an increasing problem in recent years due to natural changes in river flow; increased deposition of sediment on floodplains; and a lack of proper operation and maintenance of drainage (Awal, 2014). Water logging also causes road blocks which leads to traffic jam. A lot of urban poor people who live in slum or squatters often have to suffer due to water logging. Their houses are often damaged poorly by inundated water. Chittagong is the business capital of Bangladesh. It is the also second largest metropolitan city of Bangladesh.It is situated on the south eastern part of Bangladesh surrounded by hill tracts. Bay of Bengal is situated on the southern part of Chittagong Water logging is a common phenomenon for the port Chittagong. The frequency of this problem is on the increase during the past few decades. Excessive urbanization rate and poor condition of city drainage system makes the city paralyzed during erotic rainfall. In 2012, more two million people of this city have been affected directly by water logging problem (The Daily Star, 2012). The problem of waterlogging has become worse as the remedial efforts of the Chittagong City Corporation and all other concerned authorities are both inadequate and ill-planned (Ahmed, 2005). The root cause of Chittagong’s severe water-logging is its chocked-up network of 16 major canals which are supposed to flush out the rain water. A large part of these canals has been encroached upon by the local influential people, causing disruption to the normal flow of water. These recent subsequent effects of water logging in many parts of the world and the magnitude of lose and impacts indicate the necessities of vulnerability assessment for making immediate response plan and for continuous management of water logging. In an economically poor county like Bangladesh, it is also important to assess the most vulnerable area for water logging to response immediately to reduce economic loss as well as for mitigation and preparedness. From this perspective, the main focus of this study is to assess the vulnerability of water logging. To do so, ward no 27 of Chittagong City Corporation area has been selected as the study area.
2. Study Area Profile South Agrabad (Ward no. 27) is located in between 22°19′28″N 91°48′42″E.It is bounded by Khulshi thana on the north, karnafuli thana and Karnafuli river on the east and on the south, kowtali thana on the west.
Figure 1: Location Map of the study area

Litu M.R, Mim M.S.H, Riyasat I.A, Mahid M.R, Graduate, CUET, Bangladesh
Water Logging and Its Effect on Socio-economic Condition of South Agrabad, Chattogram
474
3. Methodology The initial step of any research work is to select the topic. The topic of this study is selected to reduce the water logging vulnerability because it is major burning problem of the local resident of Chittagong. After selection of the topic, relevant literatures were reviewed to gather information about responsible factors that affecting the water logging vulnerability of area, different tools, their procedures, advantages and limitations by which the water logging vulnerability can be assessed. From these literatures it is clear that the PRA tools are very important for assessing water logging vulnerability in the cities for developing countries. In this step, different factors that affect the water logging vulnerability were also identified. The selected factors are drainage problem, topography, rainfall, tidal wave, Surface runoff, Construction work etc. In the next step, the goal and objectives of the study were fixed. The goal of this research work is to assessment the water logging vulnerability through using PRA tools. While conducting different participatory tools is used in each phases such as historical profiling, timeline, vulnerability mapping, seasonal calendar, dream mapping, Venn diagrams etc. Efforts have been made to have FGD sessions with economically challenged groups, low income floating people as well as with poor women in the study site. Then the analysis part is completed in where the social, environmental and economic vulnerability of water logging in south Agrabad area are analysed. The social vulnerability of water logging assessed through the pair wise ranking method, spider diagram and daily activity schedule which are done by the consultation with local people of South Agrabad area. From the social vulnerability it is also identified that which social activities, group of people are more vulnerable due to water logging. The environmental vulnerability is assessed through the seasonal diagram of PRA tools. The environmental vulnerability is also assessed which seasons are mostly vulnerable for water logging. The economic vulnerability is further assessed through the mobility and connectivity pattern & service opportunity map of South Agrabad area which is also done by the consultation with local people of South Agrabad area. Then the recovery plan is prepared through dream map of PRA tools which is prepared by local people to reduce the water logging vulnerability. Dream map actually determines how the local people want to see their locality in future where most of the people will live in the lower vulnerable area and the water logging vulnerability is reduced within that area. Then the process map of water logging vulnerability assessment and recovery is prepared where every step of vulnerability assessment and recovery is discussed briefly with responsible authority and time limit of implementation. This paper is based on the information and analysis of the findings.

Litu M.R, Mim M.S.H, Riyasat I.A, Mahid M.R, Graduate, CUET, Bangladesh
Water Logging and Its Effect on Socio-economic Condition of South Agrabad, Chattogram
475
Figure 2: Methodology flow chart
4. Result & Discussion 4.1. Socio-Economic Analysis Most of the families live in pucca houses in almost four to five storied building that are used for residential and commercial purpose. A few buildings are used for commercial purposes that are mostly shops.
Type of the Household Number of Household
Pucca 3420
Semi Pucca 1232
Katcha 12
Table 1: House-hold information of south Agrabad area
4.2. Road Condition Almost all of the roads are bituminous road and some roads are brick or concrete made that is located every front side besides residential building. Some roads have poor surface condition that become muddy and unusable in the rainy season and causes difficulties to the local people.

Litu M.R, Mim M.S.H, Riyasat I.A, Mahid M.R, Graduate, CUET, Bangladesh
Water Logging and Its Effect on Socio-economic Condition of South Agrabad, Chattogram
476
Road type Number of Roads
Bituminous road 15
Brick and Concrete made 8
Katcha 2
Total 25
Table 2: Road condition of south Agrabad area
4.3. Water Supply Condition Although it is a mostly residential area that are known as CDA Housing Society mostly used pipe water supply by CWASA and then some are used tube well water for household purpose. A few of slum area are used tube well water for their household purpose. They are the mostly affected by water borne diseases during water logging period.
Table 3: Water source
4.4. Drainage Condition There are adequate numbers of drains in the area and beside the roads to drain the water but in most places, these drains became blocked. As most of the drain cannot link with main stream water logging is occurred in this area mainly in the rainy season and tidal wave.
Table 4: Type of drainage
4.5. Social Map
In social map people focuses the mostly housing such as residential, commercial such as shop, Institutional such as school and college, Religious institution such as Mosque and other public facilities such as road. They also had given here the natural resources such as ponds, trees and low land which are located in middle of the area.
Water supply Sources Number of Sources
Pipeline Water supply 2034
Tube well 20
Total 2054
Type of Drains Number of Drains
Pucca 38
Katcha 2
Total 40
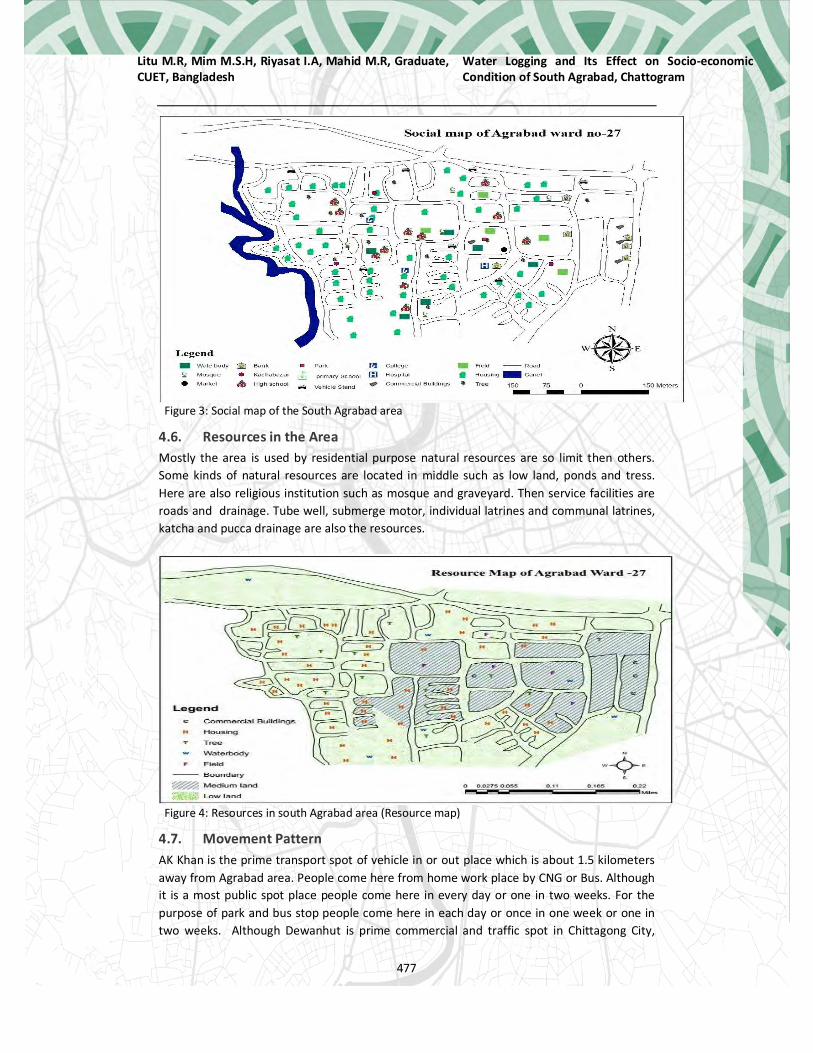
Litu M.R, Mim M.S.H, Riyasat I.A, Mahid M.R, Graduate, CUET, Bangladesh
Water Logging and Its Effect on Socio-economic Condition of South Agrabad, Chattogram
477
Figure 3: Social map of the South Agrabad area
4.6. Resources in the Area Mostly the area is used by residential purpose natural resources are so limit then others. Some kinds of natural resources are located in middle such as low land, ponds and tress. Here are also religious institution such as mosque and graveyard. Then service facilities are roads and drainage. Tube well, submerge motor, individual latrines and communal latrines, katcha and pucca drainage are also the resources.
Figure 4: Resources in south Agrabad area (Resource map)
4.7. Movement Pattern AK Khan is the prime transport spot of vehicle in or out place which is about 1.5 kilometers away from Agrabad area. People come here from home work place by CNG or Bus. Although it is a most public spot place people come here in every day or one in two weeks. For the purpose of park and bus stop people come here in each day or once in one week or one in two weeks. Although Dewanhut is prime commercial and traffic spot in Chittagong City,

Litu M.R, Mim M.S.H, Riyasat I.A, Mahid M.R, Graduate, CUET, Bangladesh
Water Logging and Its Effect on Socio-economic Condition of South Agrabad, Chattogram
478
people come here for different purpose. It is mostly 1 km away from Agrabad area. People come here from Agrabad by walking or by riding rickshaw. Although it is the most Job curriculum place, tempo stand, commercial or Educational purpose people come here in every day in each. GEC is one of the commercial hubs in Chittagong city which is located 5km away from the Agrabad area. People normally visit this for job or business purpose. People normally go there through Bus or CNG. (figure 6)
Figure 5: Seasonal Diagram
Figure 6: Mobility map
F i gure 5.8: Seasonal

Litu M.R, Mim M.S.H, Riyasat I.A, Mahid M.R, Graduate, CUET, Bangladesh
Water Logging and Its Effect on Socio-economic Condition of South Agrabad, Chattogram
479
Figure 7: Pairwise ranking
Figure 8: Vulnerablity Map
5. Recommendation The main dream of the inhabitants of ward 27, south Agrabad is to be saved from waterlogging incidents in rainy season and afterwards. To make this come to reality they believe re-excavating Mahesh khal is the key.Also, the branches of the canal right along the ward boundary should be enlarged and cleared off the wastage materials that have congested it. Similarly, some drainage width and functionality has been demanded to be improved in their dream map. To watch over the drainage maintenance and waste disposal system so that no waste is disposed in the canal or canal branches there should be an active committee. Waste disposal van/dustbin/collecting car should be in adequate positions all over the ward. illegal settlement to be removed off from the canal bank too as they contribute to the congestion in the canal at high scale. It is one of the most important

Litu M.R, Mim M.S.H, Riyasat I.A, Mahid M.R, Graduate, CUET, Bangladesh
Water Logging and Its Effect on Socio-economic Condition of South Agrabad, Chattogram
480
desires of the inhabitants that the CMOSH(hospital), Mohilla College and other schools are well protected from the waterlogging as they are very important institutions for them. Some roads’ condition damaged by waterlogging is expected to be improve with better quality of road materials.
Figure 10: Dream map
6. Conclusion Water logging is the consequence of unplanned urban development. Due to rapid urbanization with unplanned construction, most of the storm water drainage have been encroached, filled up, diverted and caused obstruction to the smooth flow of water to the out fall rivers, creating severe water-logging every year during monsoon incurring huge loss in terms of adverse social, physical, economic loss. Projects should be designed by considering both hydro-geophysical and social context of the study area. Coping strategies should be implemented at the household level supported by local institutions. Therefore, adequate macro political blessing is needed in the whole process, because resource allocation is extremely important in all the planning and implementation phase where political parties can intervene with their administrative hats. Local people should be actively involved in the overall process of planning and implementation of local projects. Local people must have some strong and recognized platform to delivery their point of view to other institutions. Therefore, coordinated development actions from the part of Government and NGOs are necessary which must reflect local people’s voice.
7. References ADPC. (2006). Community-based disaster risk management for local authorities.
Aditi Nandini Saha, (2014) Water logging in Chittagong, Bangladesh. Retrieved from http://www.adpc.net/igo/contents/iPrepare/iprepare-news_id.asp?ipid=236.

Litu M.R, Mim M.S.H, Riyasat I.A, Mahid M.R, Graduate, CUET, Bangladesh
Water Logging and Its Effect on Socio-economic Condition of South Agrabad, Chattogram
481
Awal, M.A. (2014) Water logging in southwestern coastal region of Bangladesh: local adaptation and policy options. Science Postprint1
Disaster assessment portal. (2008). Technique used in disaster risk assessment. Retrieved from http://www.disasterassessment.org/section.asp?id=20
Financial express. (2012, August 29). Water logging; more than a problem. Dhaka, Bangladesh.
Hoque, M. M., Abdullah, & Khan, M. S. (1996). Storm surge flooding in Chittagong city and associated risks. International Conference on Destructive Water: Water-Caused Natural Disasters, their Abatement and Control (p. 115). California: IAHS.
Huq, S. and Alam, M. 2003. Flood Management and Vulnerability of Dhaka City. Bangladesh Center of Advance Studies (BCAS). Dhaka
Humanitarian exchange magazine (2007, July 4). Working with vulnerable communities to assess and reduce disaster risk. Issue 38. Retrieved from
http://www.odihpn.org/humanitarian-exchange-magazine/issue-38/working-withvulnerablecommunities-to-assess-and-reduce-disaster-risk.
International Federation of Red Cross and Red Crescent Societies (IFRCRCS). (2015). Vulnerability and Capacity Assessment (VCA). Retrieved from www.ifrc.org/en/whatwedo/disaster-management/preparing-for-disaster.
Papry & Ahmed. (2015) Drainage Condition in Water Logged Areas of Central Part in Chittagong City Corporation. International Journal of Engineering Science Invention, 4(1), PP.24-29.
The Daily Star. (2012, June 25). Rain causes water logging in chittagong city. Chittagong. Retrieved from http:/www.the daily star.net/beta2/news/rain-causes-water logging-inctgcity.
Towhid, K. G. (2004). Causes and Effects of Water Logging in Dhaka City, Bangladesh.
Stockholm, Sweden: TRITA-LWR Master Thesis, Royal Institute of Technology. UNISDR. (2007, August 2007). Terminology. Retrieved September 12, 2014

Chowdhury, Md R Climate Disaster Preparedness
482
Research Paper
THE USE OF ENSO-RELATED CLIMATE INFORMATION IN DISASTER PREPAREDNESS
Experience from the Pacific Islands and Bangladesh
Md Rashed CHOWDHURY Pacific ENSO Applications Climate Center, University of Hawaii at Manoa; USA
Abstract
The basin-wide rainfall, run-off, sea level, and tropical cyclones in the El Niño-Southern Oscillation (ENSO)-sensitive U.S.-Affiliated Pacific Islands (USAPI) and Bangladesh have recently undergone considerable changes. These changes resulted in more frequent tropical cyclones, severe water shortages (e.g., drought) during the lean periods and excessive water (e.g., flooding) during the monsoon season. While the climate-sensitive sectors in the USAPI and Bangladesh are already stressed, the current trend of changing rainfall and other climatic factors poses a major threat for disaster preparedness planning in these two regions. This study synthesizes the use of ENSO-based climate forecasts, warnings, and response systems for disasters preparedness. The objective is to visit two climate sensitive “hotspots” (e.g., USAPI and Bangladesh) and examine the use of ENSO-information for forecasting and warning with regard to local rainfall, flooding, tropical cyclones, and sea level on seasonal time scales, and then link these information to disaster preparedness planning and management.
Keywords
ENSO, climate, disaster preparedness, Pacific Islands, Bangladesh.
1. Introduction Tropical climate variability is heavily influenced by the ENSO climate cycle (Bjerknes, 1966; Ropelewski and Halpert, 1987; Chu and Chen, 2005). As a result, the Pacific Island communities are highly vulnerable to climate variability and change. Studies reveal that ENSO events significantly influence the overall development of the U.S.-Affiliated Pacific Islands (USAPI). Low sea level (and less rainfall) during the El Niño events and high sea level (and excessive rainfall) during the La Niña events are the primary causes for this influence. Therefore, advance information on seasonal sea level and rainfall variability has a significant impact on the overall development of these islands. Similarly, the climate of Bangladesh has a particularly strong relationship to ENSO extremes with El Niño to dry and La Niña to wet events (Chowdhury, 2003). Therefore, knowing ENSO conditions ahead of time would provide substantial opportunities for early warnings on climate extremes in the USAPI and Bangladesh with far-reaching economic ramifications (also see Schroeder et al., 2012).
The global climate model experiment indicates that much of the atmospheric response to ENSO is associated with changes in SSTs in the Pacific Ocean. Therefore, based on SSTs in the tropical Pacific Ocean, the prime objective of this study is to develop ‘seasonal climate

Chowdhury, Md R Climate Disaster Preparedness
483
forecasting schemes’ for disaster management in the USAPI and Bangladesh by using local climate data (i.e., sea level, rainfall, flooding, and tropical cyclone).
1.1. Overview of ENSO The El Niño/La Niña-Southern Oscillation (ENSO) is of central importance for prediction purposes because of its global nature, strong signal, interannual time scale, and inherent lag relationships. El Niño is caused by major warming of the equatorial waters in the Pacific Ocean. In this case, the anomaly of the sea surface temperatures (SSTs) in the tropical Pacific increases (+0.5 to +1.5°C in the Niño 3.4 area) from its long-term average. On the other hand, La Niña is caused by major cooling of the same equatorial waters in which case the anomaly of the SSTs in the tropical Pacific decreases (-0.5 to -1.5°C in the Niño 3.4 area) from its long-term average. It is clear from Figure 1 (top) that El Niño is caused by warming (purple to red shading) of the equatorial waters. La Niña, on the other hand, is caused by major cooling (light to darker blue shading) of the same equatorial waters (Fig. 1, bottom). Note that the ENSO-related discussion in this paper is limited to SST anomalies in the Niño 3.4 area, which is the conventional ENSO area and bounded by 5°S–5°N, 170°–120°W.
Figure 1. Anomaly of average SST (°C) during three major El Niño (1982, 1997, and 2015) (top) and three major La Niña (1975, 1988, and1998) (bottom) events. The physical locations of Bangladesh and the USAPI are shown. The Niño 3.4 region is denoted by a heavy black rectangle in the top panel.
The Southern Oscillation (“SO” in ENSO) represents the atmospheric component of the cycle in which lower (higher) than normal sea level pressure occurs near Tahiti and higher (lower) sea level pressure occurs in Australia during El Niño (La Niña) conditions.

Chowdhury, Md R Climate Disaster Preparedness
484
El Niño events (event and year is synonymously used in this paper) occur every three to seven years and may last for many months, causing significant economic and atmospheric consequences worldwide. During the past fifty years, ten of these major El Niño (La Niña) events have been recorded, the worst of which occurred in 1997–98 (1998–99). The recent 2015–16 El Niño is also a major event. Some of the El Niño events persisted more than one year.
These El Niño/La Niña events are associated with consistent climate anomalies (e.g., shifts in temperature and precipitation patterns) throughout the globe. Therefore, these events are treated as important components of the climate system as they impact weather on a global scale. A detailed discussion on ENSO is beyond the scope of this study but is available elsewhere in the literature (see Clarke, 2008; McPhaden et al., 2006; Freund et al., 2019, and references).
2. Understanding ENSO, Weather and Climate Scale The difficulty in understanding ENSO, weather, and climate arises from the time scales (Fig. 2). While weather can be observed and measured in seconds, minutes, and hours, global climate generally spans 30+ years or longer.
Figure 2. Weather and climate scale.
(Adapted from https://www.pacificclimatefutures.net/en/help/climate-projections/understanding-climate-variability-and-change/.)
Weather refers to short-term variability in rain, wind, snow, dryness, humidity, temperature, and other conditions such as fog (Fig. 2). It is difficult to predict weather beyond three or four weeks. Climate variability, on the other hand, refers to changes in weather over months, seasons, and years. The variability results from natural, large-scale, physical features such as temperature, pressure, and winds, and interactions between the ocean, atmosphere, and land. Monsoons (wet and dry seasons) and other longer-term patterns including ENSO (El Niño and La Niña) are part of this ongoing variability. The Pacific Decadal Oscillation (PDO) is another longer-term pattern of climate variability. While ENSO and PDO have similar spatial footprints, they behave differently over time. PDO is most visible in the North Pacific/North American sector with secondary signatures in the tropics. The opposite (stronger effects in the tropics) is true for ENSO.

Chowdhury, Md R Climate Disaster Preparedness
485
Different from variability, climate change refers to changes over time affecting physical processes in the climate system. Human activities such as greenhouse gas (GHG) emissions, urbanization, and loss of natural areas affect climate, climate variability, and weather patterns. The effects include changes to the components that affect climate and weather, and also exposure, vulnerabilities, and risks associated with weather and other hazards.
3. Methodology A source of predictable, accessible climate data [e.g., sea level deviation (SL) in the USAPI, flood affected area (FAA) in Bangladesh] and its relation to large-scale oceanic variability, as predicted by ENSO, has been identified. For SST data, the extended reconstructed SST dataset (http://iridl.ldeo.columbia.edu/SOURCES/.NOAA/.NCDC/.ERSST/.version4/.sst/) has been used. Flood data was provided by the Bangladesh Water Development Board (http://www.ffwc.gov.bd/). The ENSO state for each season is defined according to the Oceanic Niño Index (ONI). This is calculated using SST anomalies based on the 1981–2010 normal, in the geographical box defined by Niño 3.4 region. Five major El Niño/La Niña events were classified based on spatial patterns of the SST anomaly.
During the first stage, composite analyses of seasonal variations of SST for five major El Niño/La Niña events with sea level for USAPI and flood-affected areas for Bangladesh were done. The next stage comprised of correlation analyses between these climate indicators (e.g., sea level and flood area) and tropical Pacific SSTs. Finally, Canonical Correlation Analysis (CCA) was used to develop an operational forecasting scheme for seasonal sea level variability in the USAPI, and exploratory models for estimating the FAA in Bangladesh were constructed using multiple regression analyses.
4. ENSO, Sea level, and Flooding in the USAPI Region The USAPI region is sparsely located in between 18°N–18°S and 120°E–170°W. The region is composed of the Territory of Guam, Commonwealth of the Northern Marianas Islands, Republic of Palau, Republic of the Marshall Islands (RMI) (Majuro and Kwajalein), Federated States of Micronesia (FSM), and American Samoa (see Fig. 1 for general locations). They are situated near the center of the major variations in atmospheric and oceanic circulation associated with the ENSO. These variations appear in sea level patterns, seasonal rainfall, and tropical cyclone (TC) genesis (TC: not discussed further in this section; see Lander, 1994).
Previous studies by Chowdhury et al. (2007a, 2007b) revealed that the sea level variations in the USAPI region are sensitive to the ENSO-cycle, with low sea level during El Niño and high sea level during La Niña events. The occurrence of these dangerously high or low water levels and associated inundation and erosion problems are just some of the extremely important costal disaster management issues for the USAPI region. The situation is further complicated when lower than normal rainfall (drought) is seen during an El Niño year and higher than normal rainfall (flooding) is seen during a La Niña year. For example, the strongest El Niño events in 1997–98 and 2015–16 resulted in water rationing due to drought in the Marshall Islands (Fig. 3 left) and the La Niña events in 2007–08 and 2016–17 caused inundations and resulted roads and infrastructure damage in many places in RMI (Fig. 3 right) and FSM. As a result, there is a high demand for ENSO-based seasonal sea level and

Chowdhury, Md R Climate Disaster Preparedness
486
rainfall forecasts that can define thresholds of various temporal ranges from season-to-annual time-scale.
Figure 3. (Left) El Niño-low rainfall-induced drought in Majuro. People lined up to receive rationed water once every fourteen days during 1997–98. (Right) La Niña-wind-induced high tides and flooding in Majuro during 2018–19.
4.1. Seasonal Sea Level Forecasts Based on the nature and strength of possible teleconnections between variations in sea level and ENSO events (e.g., SSTs), an operational CCA statistical model was developed by the Pacific ENSO Applications Climate (PEAC) Center to capture the seasonal sea level variability at lead times of one to three seasons (i.e., three to nine months) in advance (Chowdhury et al., 2007b; Chowdhury et al., 2014; Chowdhury and Chu, 2015 and references). The results of the CCA cross-validation skills are presented in Fig. 4. Note that forecasts are thought to be of useful skill if the CCA cross-validation value is greater than 0.3. Skill levels greater than 0.4 and 0.5 are considered moderate and good, while skill levels greater than 0.6 are strong.
0.3
0.5
0.7
0.9
0 1 2 3 0 1 2 3 0 1 2 3 0 1 2 3
JFM AMJ JAS ONDTarget Seasons
CCA
Cros
s Va
lidat
ion
skill
Guam Marshalls A Samoa
Figure 4. CCA cross-validation hindcast skills for Guam, Marshalls, and American Samoa. Note that 0, 1, 2, 3 represent zero, one, two, and three seasons lead-time, which is the time interval between the end of the initial period and the beginning of the forecast period, respectively. For example, JFM-0, 1, 2, and 3 means ‘sea level’ of target season JFM based on SSTs of previous OND, JAS, AMJ, and JFM (JFM: January-February-March; AMJ: April-May-June; JAS: July-August-September; and OND: October-November-December).

Chowdhury, Md R Climate Disaster Preparedness
487
Based on this operational CCA model, the real-time forecasts for seasonal sea level variations (i.e., anomalies with respect to the climatology) are published on the official website of the PEAC Center (https://www.weather.gov/peac/sealevel) for planning and decision options regarding meteorological disaster management in the USAPI.
4.2. Seasonal Rainfall Forecasts Recent research emphasized the intensification of ENSO-driven rainfall in the Pacific (Collins et al., 2011, Murphy et al., 2014 and references). The risk of major rainfall disruption has already increased in the USAPI region and remains elevated for the reminder of the 21st century (Power et al., 2017). Figure 5 provides an island-wide perspective of seasonal rainfall variations during conventional El Niño (left) and La Niña (right) years.
Figure 5. Seasonal rainfall variations during El Niño (left) and La Niña (right) years (1966–2017). Note that DJF, MAM, JJA and SON indicate winter, spring, summer and fall, respectively, for all Islands except American Samoa, where DJF and JJA are austral summer and winter. (0): year of onset of El Niño/La Niña (dotted line); (+1): the year following El Niño/La Niña (heavy solid line) (reproduced from Chowdhury and Chu, 2019).
Currently, a probabilistic outlook on seasonal rainfall forecasts is prepared based on relationships between the state of ENSO and rainfall in the USAPI. Outputs from six globally skillful dynamical and two statistical models are consulted for these interpretations. One of the statistical models is PEAC’s in-house product (PEAC-CCA), which is the latest addition to the list (also see Yu et al., 1997). Finally, a composite of subjective and objective assessments is assembled to present the seasonal rainfall outlook in tercile format, expressing probabilities of below-normal, near-normal, and above-normal rainfall occurrence with respect to the long-term mean.
4.3. Results and Discussions The ENSO-based seasonal sea level and rainfall forecasts provide tailored, understandable technical information and products to support planning and disaster management in climate-sensitive sectors such as water resources, fisheries and aquaculture, agriculture, emergency management, health, utilities, and coastal zones. This forecasting scheme is currently fully instrumental for hazards management and coastal disaster preparedness planning purposes in the USAPI region (see Schroeder et al., 2012). This information also enhances local governance capacity to successfully address emergency management activities, as seen in Majuro where water was rationed and also imported from the U.S. during extreme drought caused by El Nino in 1997–98 and 2015–16. This information also

Chowdhury, Md R Climate Disaster Preparedness
488
empowered underrepresented groups in atmospheric sciences. Hence this disaster management model can be applied to other similar ENSO-sensitive regions/countries such as Bangladesh.
5. ENSO, Rainfall, Flooding, and Tropical Cyclones in Bangladesh Bangladesh occupies an area of about 145,000 sq. km between latitudes 20°-30′N and 26°-45′N, and longitudes 88°-0′E and 92°-45′E (see Fig. 1). Climate variability and change in Bangladesh are highly sensitive to ENSO (see Chowdhury, 2003; Chowdhury and Ward, 2004; Chowdhury and Ward, 2007c and references). Chowdhury and Ndiaye (2017) provided an improved perspective on the ENSO-climate relationship in Bangladesh with many climate indicators such as temperature, rainfall, sea level, floods, forest fires, tropical cyclones, and lightning (Chowdhury and Ndiaye, 2017 and references). However, the following discussion is limited to the three most important disaster preparedness indicators in Bangladesh: rainfall, flooding, and tropical cyclones.
5.1. ENSO, Rainfall, and Seasonal Flooding The average SST anomalies for the five strongest La Niña/El Niño years are shown in Fig. 6. Figures 6(a)–(c) show major cooling (blue or dark shading) of the equatorial waters in the Niño 3.4 area of the Pacific Ocean, which is a sign of La Niña. This means that during the stage of significantly lower than normal SST, Bangladesh receives more rainfall and high flows in the Ganges and Brahmaputra Rivers. This, in turn, severely floods Bangladesh, as it is the lowest riparian country in these basins. For example, the highest flood years are 1955, 1974, 1987, 1988, 1998, 2004, 2007, 2017, and 2019. Of these, all are La Niña years except 1987, 2004, and 2019, which are moderate El Niño years. It is therefore important to note that Bangladesh is also flooded during some of the moderate El Niño years. An improved perspective for flooding during a moderate El Niño year is available elsewhere (http://epaper.thefinancialexpress.com.bd/?archiev=yes&arch_date=02-08-2019#).
Figure 6. SST anomalies (°C) for five strong La Niña years (a–c) and five strong El Niño years (d–f). Variations in rainfall and flows in the Ganges and Brahmaputra are shown in left, middle, and right panels (modified from Chowdhury, 2003).

Chowdhury, Md R Climate Disaster Preparedness
489
In contrast, during an El Niño year, Figs. 6(d)–(f) show major warming (red/yellow shading) of the equatorial waters in the Pacific Ocean. This means that during significantly higher-than-normal SST, Bangladesh receives less rainfall and low flows in the Ganges and Brahmaputra Rivers, which, in turn, cause drought inside Bangladesh. For example, the driest years recorded, so far, are 1977–78, 1982–83, 1986, 1990–92, 1994, 1997, and 2015–16, which are all El Niño years.
5.2. ENSO and Tropical Cyclone The variability of tropical cyclones (TCs) is also influenced by ENSO activities. Since 1960, the chronology of tropical cyclones shows that most of the major cyclones that hit Bangladesh in different periods were during either an El Niño or La Niña event, or a transitioning period from one to the other (Table 1). For example, 54 severe cyclonic storms formed during El Niño and 77 during La Niña in the past 100 years (Wahiduzzaman et al., 2012). It is also important to note that compared to 1950–80, the number of El Niño/La Niña years has increased considerably during 1981–2009 (Wenju et al., 2014; Guojian et al., 2017). This trend is likely to continue with more frequent El Niño/La Niña events, which may increase both the frequency and intensity of extreme cyclones in Bangladesh.
Table 1: Chronology of Tropical Cyclone and El Niño/La Niña Events (1960–2016)
Occurrences of Tropical Cyclones in Bangladesh ENSO State
May 22, 2016: Tropical Cyclone Roanu; 80–90 km/hr with gusts to nearly 110, killed 21 and displaced half a million residents
Strong El Niño to ENSO-neutral/La Niña
May 27, 2009: Tropical Cyclone Aila (TC); 110 km/hr; 339 fatalities La Niña to ENSO-neutral
April 14–15, 2009: Cyclonic Storm Bijli; 90 km/hr, four fatalities La Niña to ENSO-neutral
November 15, 2007: Cyclone Sidr; 215-km/hr, 5-10,000 fatalities La Niña
November 29–30, 1997: 224 km/hr Strong El Niño
April 29–30, 1991: 225 km/hr; 150,000 fatalities El Niño
May 24–25, 1985: severe cyclone hit Chittagong, 12,000 fatalities La Niña to El Niño
November 12, 1970: 222 km/hr, 3–6 m surge, 0.5-1.2 M fatalities La Niña
May 28–29, 1963: cyclonic storm hit Chittagong, 12,000 fatalities El Niño
5.3. Seasonal Climate Forecast Potentials for Bangladesh Forecasts of the FAAs using the leading principal components (PCs) of SST were made, which provided good skill with a lead-time of a season or so. The multiple regression results were skillful. This is an encouraging because it suggests that linkages with SST can be successfully recovered in a physical model of the climate system in Bangladesh (Chowdhury and Ward, 2007c). Therefore, a seasonal flood prediction scheme is achievable in Bangladesh using the unusually warm or cold SSTs (e.g., ENSO signal) in parts of the tropics. This predictability can be enhanced with information available from monitoring the downstream stream-flows, which are generated mainly from upstream rainfall conditions.
5.4. Results and Discussions The study revealed that Bangladesh’s climate has particularly a strong relation with ENSO extremes, strong El Niño results in dry or drought conditions and a strong La Niña to wet or
Chowdhury, Md R Climate Disaster Preparedness
490
flooding. Knowing ENSO conditions ahead of time (skillful ENSO information is currently available 3–6 months in advance) would provide substantial opportunities to provide early warnings of climate extremes (e.g., floods and droughts) for disaster preparedness in Bangladesh.
6. Conclusions Both the USAPI and Bangladesh are severely affected by climate change. However, whilst the long-term decadal variations in the climate are increasingly understood to exist, the ability to predict such changes in an operational disaster management context for USAPI and Bangladesh is somewhat difficult. In contrast the ENSO’s interannual time-scale variability and impacts are found to be more effective for developing an immediate response plan for adaptations.
Scientific advances have led to the ability to generate skillful ENSO forecasts, and substantial progress has been made in understanding regional impacts of the ENSO cycle. As an immediate response, ENSO-based seasonal climate forecasts can play an important role to help meet some of the climate disaster challenges. The USAPI experience is encouraging and Bangladesh can benefit from this experience, which can offer an environmentally friendly, non-structural, and cost-effective decision option for disaster management in Bangladesh.
Disclaimer: Dr. Rashed Chowdhury ([email protected]) works on the critical issues of weather, climate and society. The views expressed herein are of the author and do not reflect the views of PEAC, JIMAR, or the University of Hawaii.
7. References Bjerknes, J. A. (1966) “Possible response of the atmospheric Hadley circulation to equatorial
anomalies of ocean temperature”, Tellus, Vol. 18, 820-829. Chu, P-S., Chen, H. (2005) “Interannual and interdecadal rainfall variations in the Hawaiian
Island”, Journal of Climate, Vol. 18, 4796-4813. Chowdhury, M.R. (2003) “The El Niño-Southern Oscillation (ENSO) and seasonal flooding:
Bangladesh”, Theoretical and Applied Climatology, Vol. 76, 105-124. Chowdhury, M. R.; Chu, P.-S. (2019) “A study of the changing climate in the U.S-affiliated
Pacific Islands using observations and CMIP5 Model Output”, Metrological Applications, Wiley, doi: 10.1002/met.1781.
Chowdhury, M. R.; Chu, P.-S. (2015) “Sea level forecast and early warning application—Expanding cooperation in the South Pacific”, Bulletin of the American Meteorological Society, Vol. 96, 3,381–386.
Chowdhury, M. R.; Ndiaye, O. (2017) Climate change and variability impacts on the forests of Bangladesh: A diagnostic discussion based on CMIP5 GCMs and ENSO. International Journal of Climatology, Vol. 37, 4768-4782, doi: 10.1002/joc.5120.
Chowdhury, M. R.; Ward, N. (2007c) “Seasonal flooding in Bangladesh—variability and predictability”, Hydrological Processes, Vol. 21, No. 3, 335–347.
Chowdhury, M.R.; Ward, N. (2004) “Hydro-meteorological variability in the greater Ganges-Brahmaputra-Meghna basins”, International Journal of Climatology, Vol. 24, No. 12, 1495–1508.

Chowdhury, Md R Climate Disaster Preparedness
491
Chowdhury, M. R., P.-S. Chu, and C. Guard, 2014: An improved sea level forecasting scheme for hazards management in the U.S.-affiliated Pacific Islands. International Journal of Climatology, Vol. 34, 2320–2329.
Chowdhury, M. R.; Chu, P.-S.; Schroeder, T. (2007a) “ENSO and seasonal sea level variability—A diagnostic discussion for the U.S.-affiliated Pacific Islands”, Theoretical and Applied Climatology, Vol. 88, 213–224.
Chowdhury, M. R.; Chu, P.-S.; Schroeder, T.; Colasacco, N. (2007b) “Seasonal sea-level forecasts by canonical correlation analysis – an operational scheme for the U.S-affiliated Pacific Islands (USAPI)”, International Journal of Climatology, Vol. 27, 1389–1402.
Clarke, A. J. (2008) An Introduction to the Dynamics of El Niño & the Southern Oscillation, MA, USA, Academic Press.
Collins, D.; Sen Gupta, A.; Power, S. (2011) “Observed climate variability and trends”, Cambers, G.; Hennessy, K.; Power, S. (eds.) Climate Change in the Pacific: Scientific Assessment and New Research: Regional Overview, Vol. 1, CSIRO, 51–77.
Freund, M. B.; Benjamin, J. H.; David, J. K.; Helen, V. M.; Nerilie, J. A.; Dietmar, D. (2019) “Higher frequency of Central Pacific El Niño events in recent decades relative to past centuries”, Nature Geoscience (https://doi.org/10.1038/s41561-019-0353-3).
Guojian, W.; Coauthors (2017) “Continued increase of extreme El Niño frequency long after 1.5°C warming stabilization”, Nature Climate Change, Vol. 7, No. 8, 568–572, doi: 10.1038/nclimate3351.
Lander, M. A.; (1994) “An Exploratory Analysis of the Relationship between Tropical Storm Formation in the western North Pacific and ENSO”, Mon. Wea. Rev., Vol. 122, No. 4, 636-651.
McPhaden, M. J.; Zebiak, S. E.; Glantz, M. H. (2006) “ENSO as an integrating concept in Earth science”, Science, Vol. 314, 1740–1745.
Murphy, B. F.; Power, S. B.; McGree, S. (2014) “The varied impacts of El Niño-Southern Oscillation on Pacific island climates”, Journal of Climate, Vol. 27, 4015–4036, doi: http://dx.doi.org/10.1175/JCLI-D-13-00130.1.
Power, S. B.; Coauthors (2017) “Humans have already increased the risk of major disruptions to Pacific rainfall”, Nature Communications, Vol. 8, No. 14368, 1–7, doi: 10.1038/ncomms14368
Ropelewski, C. F.; Halpert, M. S. (1987) “Global and regional scale precipitation patterns associated with the El Niño–Southern Oscillation”, Monthly Weather Review, Vol. 115, 1606–1626.
Schroeder, T. A.; Chowdhury M. R.; Coauthors (2012) “The role of the Pacific ENSO Applications Center in reducing vulnerability to climate hazards”, Bulletin of the American Meteorological Society, Vol. 93, 1003–1015.
Wahiduzzaman, M.; Quadir, D.; Das, C.S. (2012) ENSO and Hazards in Bangladesh: Impact of ENSO on Tropical Cyclones and Floods of Bangladesh, LAP LAMBERT Academic Publishing, pp 120.
Wenju, C.; Coauthors (2014) “Increasing frequency of extreme El Niño events due to greenhouse warming”, Nature Climate Change, Vol. 4, 111–116.
Yu, Z.-P.; Chu, P.-S.; Schroeder, T. (1997) “Predictive skills of seasonal to annual rainfall variations in the U. S. affiliated Pacific islands: Canonical correlation analysis and multivariate principal component regression approaches”, Journal of Climate, Vol. 10, 2586–2599.

Tripathi A. and Tiwari RK SPACEBORNE C-BAND DInSAR BASED URBAN SUBSIDENCE MAPPING OF
CHANDIGARH AREA
492
Research Paper
SPACEBORNE C-BAND DInSAR BASED URBAN SUBSIDENCE MAPPING OF CHANDIGARH AREA
Akshar Tripathi *1 and Reet Kamal Tiwari2 1Department of Civil Engineering, Indian Institute of Technology Ropar, Rupnagar, Punjab,
India, [email protected] 2Department of Civil Engineering, Indian Institute of Technology Ropar, Rupnagar, Punjab,
India, [email protected]
Abstract
Land subsidence is usually defined as the loss in elevation of surface as compared to the surroundings. This is mainly a downward movement of Land surface features, where little or no horizontal movement comes into picture. Of the various techniques used world over, DInSAR (Differential Interferometric Synthetic Aperture RADAR) technique has proved to be the most versatile and robust for land subsidence and deformation mapping. It combines the all-weather data availability of microwave or SAR (Synthetic Aperture RADAR) remote sensing and the pixel by pixel precise deformation information due to same acquisition geometry in repeat pass. With ground water being the major source of water for all domestic and nearby industrial set-ups in Chandigarh and surroundings, and drastic decrease in rainfall over the years (only 496.4mm in 2016), there is an acute pressure on underground aquifers. This is leading to continuous lowering of water table and loss in piezometric pressure which is leading to subsidence of land features. This study makes use of Sentinel-1A microwave datasets over a year from 2018-19, for monitoring the land subsidence. It was found that there has been substantial land subsidence ranging from 0.5cm-1.7cm. Due to this subsidence, the buildings in residential and industrial areas including the new airport terminal building is showing cracks, which if unchecked can lead to disastrous consequences. Hence, a continuous monitoring is necessary.
Keywords
Land Subsidence, Differential Interferometric Synthetic Aperture RADAR, Microwave remote sensing, piezometric pressure loss
1. Introduction With the increase in human population there has been a proportionate and at places an exponential increase in urbanisation (Akshar Tripathi, Sandeep Maithani, 2018). The rising urbanisation is posing a threat to the agricultural lands nearby leading to land fragmentation(Naab, 2013). The decrease in area under agriculture is one such case of resource depletion where there is a threat to food security which is a burning issue world over and predominantly in the case of developing countries(S. K. Akshar Tripathi, 2019). With the increased demand for food, many new agricultural techniques were put into use
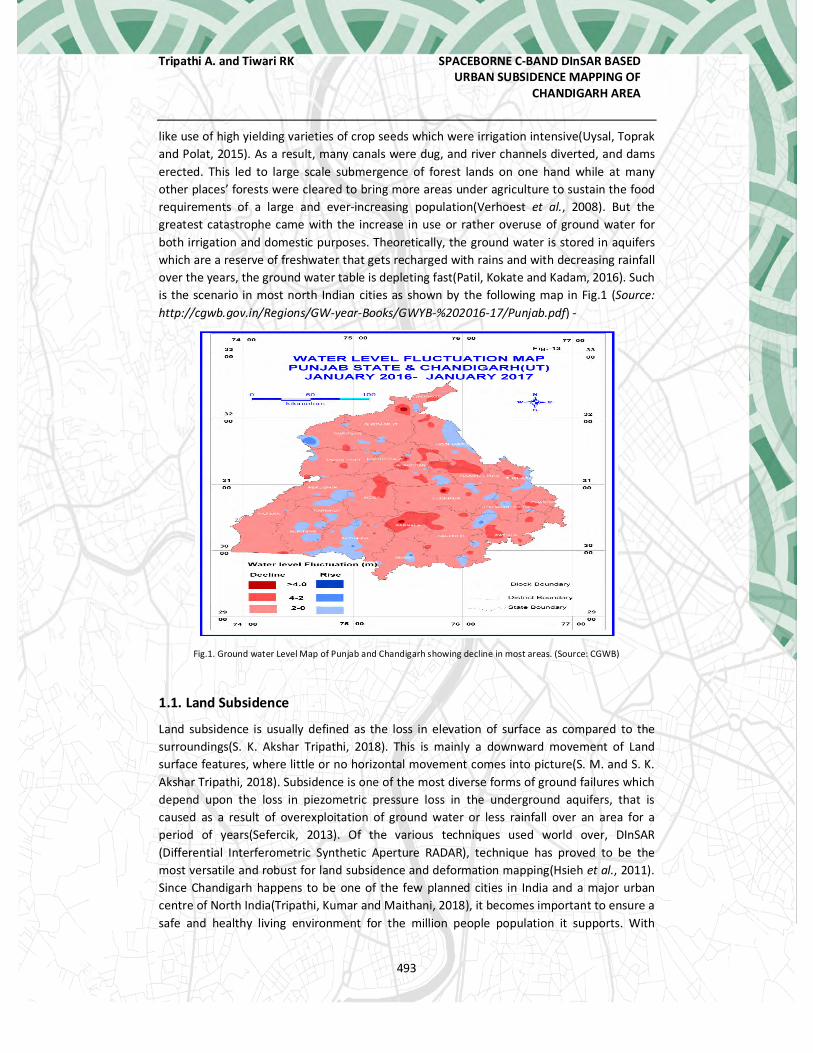
Tripathi A. and Tiwari RK SPACEBORNE C-BAND DInSAR BASED URBAN SUBSIDENCE MAPPING OF
CHANDIGARH AREA
493
like use of high yielding varieties of crop seeds which were irrigation intensive(Uysal, Toprak and Polat, 2015). As a result, many canals were dug, and river channels diverted, and dams erected. This led to large scale submergence of forest lands on one hand while at many other places’ forests were cleared to bring more areas under agriculture to sustain the food requirements of a large and ever-increasing population(Verhoest et al., 2008). But the greatest catastrophe came with the increase in use or rather overuse of ground water for both irrigation and domestic purposes. Theoretically, the ground water is stored in aquifers which are a reserve of freshwater that gets recharged with rains and with decreasing rainfall over the years, the ground water table is depleting fast(Patil, Kokate and Kadam, 2016). Such is the scenario in most north Indian cities as shown by the following map in Fig.1 (Source: http://cgwb.gov.in/Regions/GW-year-Books/GWYB-%202016-17/Punjab.pdf) -
Fig.1. Ground water Level Map of Punjab and Chandigarh showing decline in most areas. (Source: CGWB)
1.1. Land Subsidence
Land subsidence is usually defined as the loss in elevation of surface as compared to the surroundings(S. K. Akshar Tripathi, 2018). This is mainly a downward movement of Land surface features, where little or no horizontal movement comes into picture(S. M. and S. K. Akshar Tripathi, 2018). Subsidence is one of the most diverse forms of ground failures which depend upon the loss in piezometric pressure loss in the underground aquifers, that is caused as a result of overexploitation of ground water or less rainfall over an area for a period of years(Sefercik, 2013). Of the various techniques used world over, DInSAR (Differential Interferometric Synthetic Aperture RADAR), technique has proved to be the most versatile and robust for land subsidence and deformation mapping(Hsieh et al., 2011). Since Chandigarh happens to be one of the few planned cities in India and a major urban centre of North India(Tripathi, Kumar and Maithani, 2018), it becomes important to ensure a safe and healthy living environment for the million people population it supports. With

Tripathi A. and Tiwari RK SPACEBORNE C-BAND DInSAR BASED URBAN SUBSIDENCE MAPPING OF
CHANDIGARH AREA
494
ground water being the major source of water for all domestic and nearby industrial set-ups in Panchkula, and drastic decrease in rainfall over the years (only 496.4mm in 2016), there is an acute pressure on underground aquifers.
This is leading to continuous lowering of water table and loss in piezometric pressure which is leading to subsidence of land features.
1.2 SAR Interferometry
SAR interferometry involves acquisition by two RADAR antennae on the same platform or with same satellite in repeated orbits at different times(R. K. T. Akshar Tripathi, 2019). SAR data was collected for the same area, with same SAR geometry. This study utilizes a pair of interferometric Sentinel-1 SAR data. The information derived from these interferometric data is also used to measure several geophysical quantities, such as topography, deformations (volcanoes, earthquakes, ice fields), glacier flows, ocean currents and vegetation properties. Prime focus of present study is to evaluate the potential of C-Band SAR interferometry for Urban Subsidence mapping.
2. Study Area and Datasets 2.1 Study Area The study area chosen for this study is Chandigarh tri-city which comprises of the Union Territory of Chandigarh, Mohali of Punjab and Panchkula of Haryana, in India. Chandigarh happens to be the first planned city of independent India. It was designed on Iron-grid pattern by the French architect, Le Corbusier. A marvel of modern planning and architecture, Chandigarh today stands as an example of planning not only in India but also for the entire South Asia and the world. The following Liss IV imagery from Indian Remote Sensing Satellite- Reosurcesat-2 showing the study area is as follows-
Fig.2. LiSS IV Optical Image showing the Chandigarh Tri-city

Tripathi A. and Tiwari RK SPACEBORNE C-BAND DInSAR BASED URBAN SUBSIDENCE MAPPING OF
CHANDIGARH AREA
495
2.2 Datasets Time series datasets of C-Band dual PolSAR datasets of Sentinel -1 A satellite over a period of one year from January 2018 to January 2019, Single Look Complex were taken for the study. A total of 12 datasets were co-registered, one from each month over the time period of one-year.
3. Methodology Both the datasets were splitted in order to locate the study area of Chandigarh in the correct IW product or region of interest tile. This was followed by radiometric calibration to remove any radiometric errors arising due to enhanced or supressed target interacted backscatter. This was followed by deburst of the dataset since the data in Sentinel -1A is acquired in burst or scan mode(Akshar Tripathi, Shashi Kumar, 2018). It was carefully made sure that the data selected was of same acquiring geometry with same row and path number and ascending pass(Wang et al., 2010). Thereafter, the two pre-processed datasets were co-registered together with root mean square error of 0.05. this was followed by interferometric processing. The detailed methodology flow chart is as follows, Fig.3-
Fig.3. Methodology Flow Chart
3.1 Interferogram Formation An interferogram is formed by the multiplication of the master image of the co-registered image product with the complex conjugate of itself. The difference in phase in the backscatter RADAR wave is due to displacement and in this case subsidence that has occurred in the time span of a year. Based on the phase variation, the subsidence is studied. The formula for phase is as follows(S. M. and S. K. Akshar Tripathi, 2018)-
ϕ 1= 4πR/λ (1)
ϕ 2= R+ΔR /λ (2)
ϕ2-ϕ1= Interferometric phase difference = =4π (ΔR)/λ (3)

Tripathi A. and Tiwari RK SPACEBORNE C-BAND DInSAR BASED URBAN SUBSIDENCE MAPPING OF
CHANDIGARH AREA
496
where, R represents target distance and ϕ is phase variation. When the phase bands are regularly spaced then this represents flat earth while when there is even a slightest movement of target feature, then this represents a highly irregular phase appearance. To further enhance the topographic phase, the phase filtering and flattening is needed. Here, modified Goldstein phase filter was used. The filtered phase was then corrected for terrain to correlate it further with the ground and geographic projection. The final interferogram is as follows, as shown in Fig.4-
Fig.4. Interferogram showing phase variations
3.2 Coherence Map
Proper interference between two waves is possible only when two waves are coherent. Coherence is shown by persistent scatterers like built-up features(Chen, Lasaponara and Masini, 2017). This is shown when waves have a constant phase difference even if their initial amplitudes and initial values of phase are different. Coherence formula for two waves E1 and E2 are given by the following formula-
γ= (4)
where γ denotes assemblage average wherein averaging of values is done as many times in the same set of sample data. Good coherence means a better elevation and topographic displacement information extraction(Dore et al., 2013). The coherence map for Chandigarh is shown as follows, Fig.5, wherein built-up features which act as persistent scatterers show high values of coherence close to 1-

Tripathi A. and Tiwari RK SPACEBORNE C-BAND DInSAR BASED URBAN SUBSIDENCE MAPPING OF
CHANDIGARH AREA
497
Fig.5. Coherence map overlay on Google Earth
3.3 Phase Unwrapping
Since the interferometric phase wraps itself to 0 every time it encounters a 2π phase cycle to establish a relation between topographic phase and height, it becomes necessary to unwrap the phase(Patel, Srivastava and Navalgund, 2009; Chen et al., 2016; Delgado Blasco, Verstraeten and Hanssen, 2017). This is achieved by integration of phase difference with neighbouring pixel values. Highest value at 2π gives crest value of amplitude, termed as highest value of ambiguity of amplitude, denoted as Ha in the following formula(Confuorto et al., 2016)-
Ha=λRsinθ/Bn (5)
The unwrapped phase map is shown as follows, as shown in Fig. 6-
Fig.6. Unwrapped Phase Map

Tripathi A. and Tiwari RK SPACEBORNE C-BAND DInSAR BASED URBAN SUBSIDENCE MAPPING OF
CHANDIGARH AREA
498
4. Results and Discussion After the phase unwrapping, the areas with low coherence and having coherence values less than 0.54 were masked out. This was done to remove dynamic features like vegetation which show a low coherence. Only permanent scattering features showing high coherence values were left. During ground truth validation, it was observed that local people reported buildings developing cracks. This could be due to land subsidence as found out in the vertical displacement cum subsidence map. The subsidence could be due to many reasons, however the continuous lowering of water table in aquifers leading to loss in piezometric pressure could be one of them. The formula for subsidence is as follows(Tapete et al., 2013)-
Land subsidence = (6)
Where, ϕunw is unwrapped phase, λ is wavelength, and θ is angle of incidence. The vertical displacement map overlay on google earth is as follows, as shown in Fig.7 below-
Fig.7. Vertical Displacement Map overlay on Google Earth

Tripathi A. and Tiwari RK SPACEBORNE C-BAND DInSAR BASED URBAN SUBSIDENCE MAPPING OF
CHANDIGARH AREA
499
5. Conclusion C-band DInSAR Remote Sensing has a great potential in Urban Subsidence Mapping as a Non-Evasive tool. It was found that there has been substantial land subsidence ranging from 0.5cm-1.7cm. To further validate this result, the buildings in residential and industrial areas including the new airport terminal building need to be surveyed in detail to find out the effects of subsidence in their structure. Hence, a continuous monitoring is necessary. This can be easily and efficiently done with microwave remote sensing, as shown by this study, and timely maintenance measures can be suggested. Further, the results can also be validated with other technologies such as LiDAR.
6. Acknowledgements This work was supported by the Department of Civil Engineering, Indian Institute of Technology – IIT Ropar, India; the European Space Agency (ESA) and SNAP Team.
References Akshar Tripathi, Sandeep Maithani, S. K. (2018) ‘Minimization of the Ambiguity of Merging of
Urban Builtup and Fallow land Features by Generating “ C2 ” Covariance Matrix using Spaceborne Bistatic Dual Pol SAR Data’, (March). doi: 10.1109/RAIT.2018.8389058.
Akshar Tripathi, Shashi Kumar, S. M. (2018) ‘Minimization of the Ambiguity of Merging of Urban Builtup and Fallow land Features by Generating “ C2 ” Covariance Matrix using Spaceborne Bistatic Dual Pol SAR Data’, 2018 4th International Conference on Recent Advances in Information Technology (RAIT). IEEE, pp. 1–4. doi: 10.1109/RAIT.2018.8389058.
Akshar Tripathi, R. K. T. (2019) ‘UTILIZATION OF SPACEBORNE C-BAND SAR DATA FOR ANALYSIS OF FLOOD UTILIZATION OF SPACEBORNE C-BAND SAR DATA FOR ANALYSIS OF FLOOD’, (August), pp. 2–6. doi: 10.5194/isprs-archives-XLII-3-W6-521-2019.
Akshar Tripathi, S. K. (2018) ‘SAR INTERFEROMMETRY BASED DISPLACEMENT MAPPING OF CULTURAL SAR INTERFEROMETRY BASED DISPLACEMENT MAPPING OF CULTURAL’, (October 2017).
Akshar Tripathi, S. K. (2019) ‘Effect of Phase Filtering on Interferometry based Displacement Analysis of Cultural Heritage Sites’, in 2018 5th IEEE Uttar Pradesh Section International Conference on Electrical, Electronics and Computer Engineering (UPCON). IEEE, pp. 1–5. doi: 10.1109/UPCON.2018.8597027.
Akshar Tripathi, S. M. and S. K. (2018) ‘X-band persistent SAR interferometry for surface subsidence detection in Rudrapur City, India’, SPIE DIGITAL LIBRARY, SPIEDigita.
Chen, F. et al. (2016) ‘Multi-frequency satellite radar imaging of cultural heritage: the case studies of the Yumen Frontier Pass and Niya ruins in the Western Regions of the Silk Road Corridor’, International Journal of Digital Earth. Key Laboratory of Digital Earth Science, Institute of Remote Sensing and Digital Earth, Chinese Academy of Sciences, Haidian District, Beijing, China: Taylor and Francis Ltd., 9(12), pp. 1224–1241. doi: 10.1080/17538947.2016.1181213.
Chen, F., Lasaponara, R. and Masini, N. (2017) ‘An overview of satellite synthetic aperture radar remote sensing in archaeology: From site detection to monitoring’, Journal of Cultural Heritage. Key Laboratory of Digital Earth Science, Institute of Remote Sensing and Digital

Tripathi A. and Tiwari RK SPACEBORNE C-BAND DInSAR BASED URBAN SUBSIDENCE MAPPING OF
CHANDIGARH AREA
500
Earth, Chinese Academy of Sciences, No. 9 Dengzhuang South Road, Haidian District, Beijing, China: Elsevier Masson SAS, 23, pp. 5–11. doi: 10.1016/j.culher.2015.05.003.
Confuorto, P. et al. (2016) ‘Implementation of DInSAR methods for the monitoring of the archaeological site of Hera Lacinia in Crotone (Southern Italy)’, Rendiconti Online Societa Geologica Italiana. Department of Earth, Environment and Resources Sciences, Federico II University of Napoli, Italy: Societa Geologica Italiana, 41, pp. 231–234. doi: 10.3301/ROL.2016.136.
Delgado Blasco, J. M., Verstraeten, G. and Hanssen, R. F. (2017) ‘Detecting modern desert to urban transitions from space in the surroundings of the Giza World Heritage site and Greater Cairo’, Journal of Cultural Heritage. Department of Geoscience and Remote Sensing, Delft University of Technology, Stevinweg 1, 2628CN, Delft, P.O. Box 5048, GA Delft, Netherlands: Elsevier Masson SAS, 23, pp. 71–78. doi: 10.1016/j.culher.2016.10.014.
Dore, N. et al. (2013) ‘New research in polarimetric sar technique for archaeological purposes using ALOS PALSAR data’, Archaeological Prospection. University of Rome ‘Sapienza’, Geodesy and Geomatics Division - Department of Civil Constructional and Environmental Engineering, Faculty of Civil and Industrial Engineering, via Eudossiana, 18, Rome, 00184, Italy, 20(2), pp. 79–87. doi: 10.1002/arp.1446.
Hsieh, C. S. et al. (2011) ‘Using differential SAR interferometry to map land subsidence: A case study in the Pingtung Plain of SW Taiwan’, Natural Hazards, 58(3), pp. 1311–1332. doi: 10.1007/s11069-011-9734-7.
Naab, F. Z. (2013) ‘Urbanisation and its impact on agricultural lands in growing cities in developing countries: a case study of tamale in ghana’, 2(2), pp. 256–287.
Patel, P., Srivastava, H. S. and Navalgund, R. R. (2009) ‘Use of synthetic aperture radar polarimetry to characterize wetland targets of Keoladeo National Park, Bharatpur, India’, Current Science. Space Applications Centre, Indian Space Research Organization, Satellite Road, Ahmedabad 380 015, India, 97(4), pp. 529–537. Available at: https://www.scopus.com/inward/record.uri?eid=2-s2.0-71849116132&partnerID=40&md5=f5e7d6c4f52c1405d8daff9316ab67f7.
Patil, S., Kokate, A. R. and Kadam, D. D. (2016) ‘Precision Agriculture : A Survey’, International Journal of Science and Research (IJSR), 5(8), pp. 2013–2016.
Sefercik, U. G. (2013) ‘Productivity of terraSAR-X 3D data in urban areas: A case study in trento’, European Journal of Remote Sensing, 46(1), pp. 597–612. doi: 10.5721/EuJRS20134635.
Tapete, D. et al. (2013) ‘Prospection and monitoring of the archaeological heritage of nasca, Peru, with ENVISAT ASAR’, Archaeological Prospection. Institute for the Conservation and Valorization of Cultural Heritage, National Research Council, Via Madonna del Piano 10, Florence, I-50019, Italy, 20(2), pp. 133–147. doi: 10.1002/arp.1449.
Tripathi, A., Kumar, S. and Maithani, S. (2018) ‘Spaceborne bistatic polarimetrie SAR for scattering analysis and classification of man-made and natural features’, in 2018 3rd International Conference on Microwave and Photonics, ICMAP 2018. doi: 10.1109/ICMAP.2018.8354494.
Uysal, M., Toprak, A. S. and Polat, N. (2015) DEM generation with UAV Photogrammetry and accuracy analysis in Sahitler hill, Measurement. doi: 10.1016/j.measurement.2015.06.010.
Verhoest, N. E. C. et al. (2008) ‘On the Soil Roughness Parameterization Problem in Soil Moisture Retrieval of Bare Surfaces from Synthetic Aperture Radar’, pp. 4213–4248. doi: 10.3390/s8074213.

Tripathi A. and Tiwari RK SPACEBORNE C-BAND DInSAR BASED URBAN SUBSIDENCE MAPPING OF
CHANDIGARH AREA
501
Wang, K. et al. (2010) ‘Review from the Perspective of Remote Sensing Specialists’, MDPI Sensors, (Vi), pp. 9647–9667. doi: 10.3390/s101109647.

Hossain S., Hamid T., & Tarin M.A, Approach Towards Understanding the Adaptive Capacities of Coastal Women to Cope with Climate Change Induced Salinity
500
Research Paper / Case Study Paper
APPROACH TOWARDS UNDERSTANDING THE ADAPTIVE CAPACITIES OF COASTAL WOMEN TO COPE WITH
CLIMATE CHANGE INDUCED SALINITY Md. Shahadat Hossain, Environment & Water Specialist, O.CREEDS,
Taspiya Hamid, Junior Hydro-geologist, O.CREEDS, Maria Abdullah Tarin, Assistant Research Officer, O.CREEDS,
Abstract
Bangladesh is mostly susceptible to climate change due to its geological and hydrological setting. Climate change has increased the frequency and intensity of natural hazards like cyclones, storm surges and sea- level rise which are accelerating saltwater intrusion into fresh water sources in coastal areas of Bangladesh. The intensified climate change induced salinity intrusion into coastal areas has adverse impact on life and livelihood of coastal community especially on women and girls. Satkhira and Khulna are mostly vulnerable to climate change induced salinity intrusion. Five upazilas of these two districts have been sampled for the study. The study aims at assessing current salinity situation in these two districts, understanding the vulnerabilities of coastal women and girls, and recommending approaches towards enhancing their adaptive capacities to combat salinity intrusion. Both primary and secondary data sources are used in the study. An extensive field survey has been done for Face to Face (F2F) interview, Focus Group Discussion (FGD) and Key Informant Interview (KII) to collect both qualitative and quantitative primary data. Total 3000 households are sampled for quantitative survey and the qualitative survey sample size is 15. Literature review of relevant documents has been done to collect the required secondary data. Study found that women and girls in the study area are crucially suffering from lack of adaptive capacities due to their lack of access to services. Women play vital role in bringing back the family in original state after any disaster. So their inclusion in key decision making and their access to market is essential for the overall development of community resilience. Problems specific adaptation plans must be initiated locally and the capacities of women and girls should be strengthened in line so that they can adapt to climate change induced salinity.
Theme: Climate Change
Keywords: Climate change; natural hazards; adaptation; vulnerability; resilience
1.1. Introduction 1.1 Background Climate change, manifesting in the form of intensified cyclones, storm surges, and sea-level rise (SLR), is accelerating saltwater intrusion into the fresh water resources of the coastal belt of Bangladesh. Climate change-induced soil and water salinity is projected to adversely impact freshwater dependent agricultural livelihoods (leading to loss of productivity or livelihoods) as well as the availability and quality of drinking water in the vulnerable coastal communities. Climate change impacts are not gender-neutral and many of the consequences of climate-induced impacts are more severe for women, and other socio-economically marginalized groups, given their specific livelihood circumstances, their socio-political isolation perpetuated by unequal power dynamics, and related information asymmetry and constraint in decision making processes (Alam et al., 2008; Ahmed et al., 2006a).

Hossain S., Hamid T., & Tarin M.A, Approach Towards Understanding the Adaptive Capacities of Coastal Women to Cope with Climate Change Induced Salinity
501
Building the resilience and adaptive capacity of vulnerable, extreme poor women and girls, and their communities, in the most climate change affected areas of south-western Bangladesh is an essential investment to support the basic socioeconomic human rights of beneficiaries, in regards to a sustainable supply of potable water in the face of rising sea level and increasing salinity. Developing women-led water management committees and empowering women to manage their water supply, will also create positive social changes in regards to gender dynamics, social mobility and women’s unpaid time burden, which exacerbate vulnerability to climate change in the target districts. Targeted support of climate resilient livelihoods, will not only alleviate climate-induced vulnerability in the coastal communities of Bangladesh but will also further empower women to have greater skills, knowledge, decision-making power and access to assets, contributing to transformative social change.
The community-based approach in planning and managing climate-resilient water supply targets the highly vulnerable, specifically women and girls. Furthermore, given the crucial role that women play in water security and household level resilience, and their socio-economic marginalization, the climate change-induced threat to agricultural livelihoods and drinking water security of the affected coastal communities disproportionately affects women and girls. It is crucial to strengthen the adaptive capacities of coastal communities, especially women, to cope with impacts of climate change-induced salinity on their livelihoods and water security. In relative terms, women importantly lack access to productive resources, as well as decision-making power, and this has impacts on their health, food security and safety. The constraints in access to natural resources, and additional socio-cultural barriers limiting participation and movement outside the household sphere, is worsened by phenomena such as flooding, drought and erratic rainfall. These constraints cause women to have to work much harder to secure food and water, and generate additional income through livelihoods which, in turn, diminishes their ability to advance out of poverty, particularly when they have, for example, lost their land due to the impacts of flooding during cyclone events (Dankelman, 2010).
In this regard, a baseline study undertook for understanding the adaptive capacities of coastal women to cope with climate change induced salinity in implementing and managing resilient livelihoods and drinking water solutions for the vulnerable communities in the Southwestern coastal districts of Khulna and Satkhira.
2. Research Design The National Adaptation Program of Action (NAPA),prepared by the Ministry of Environment and Forest of the Bangladesh government, has identified that the coastal people of Bangladesh are more vulnerable than the population in other areas of the country (MoEF 2005).The study has been designed to provide a comprehensive picture of the target beneficiaries and other relevant stakeholders in respect of documenting the pre-intervention data of the adaptive capacities of coastal communities, especially women, to cope with climate change induced salinity’. Hence, to capture data on the present situation relevant to project interventions both qualitative and quantitative methods of data analysing will be adopted. For successful completion of the study, two sources of data - primary and secondary, will be required. The main source of primary data will be the sample Household

Hossain S., Hamid T., & Tarin M.A, Approach Towards Understanding the Adaptive Capacities of Coastal Women to Cope with Climate Change Induced Salinity
502
survey by using Face-to-Face Interview, which will be covered under quantitative approach. This study also suggests for considering qualitative approach under which it will conducted Focus Group Discussions (FGDs) and Key Informant Interviews (KIIs).
2.1. Study Area Dacope Upazila is located in between 21° 43' 14.506" N and 22° 39' 2.581" N latitudes and in between 89° 24' 13.050" E and 89° 38' 18.603" E longitudes. It is bounded by Mongla Upazila in the east, Rampal, Batiaghata and Paikgachha Upazilas in the north and Koyra Upazila in the southwest.
Koyra Upazila is located in between 21° 41' 25.560" N and 22° 31' 19.616" N latitudes and in between 89° 14' 31.337" E and 89° 31' 58.494" E longitudes. It is bounded by Dacope Upazila in the northeast, Paikgachha Upazila in the north, Assasuni Upazila in the northwest and Shyamnagar Upazila in the southwest.
Paikgachha Upazila is located in between 22° 27' 50.829" N and 22° 43' 5.535" N latitudes and in between 89° 14' 9.323" E and 89° 27' 54.355" E longitudes. It is bounded by Batiaghata Upazila in the northeast, Dumuria Upazila in the north, Tala Upazila in the northwest, Assasuni Upazila in the southwest and Koyra and Dacope Upazilas in the south.
Assasuni Upazila is located in between 22° 20' 25.723" N and 22° 39' 15.823" N latitudes and in between 89° 2' 53.371" E and 89° 17' 18.584" E longitudes. It is bounded by Paikgachha Upazila in the northeast, Tala Upazila in the north, Satkhira Sadar and Debhata Upazilas in the northwest, Kaliganj Upazila in the southwest, Shyamnagar Upazila in the south and Koyra Upazila in the southeast.
Shyamnagar Upazila is located in between 21° 39' 1.880" N and 22° 24' 13.201" N latitudes and in between 88° 59' 47.739" E and 89° 22' 34.926" E longitudes. It is bounded by Koyra Upazila in the northeast, Assasuni and Kaliganj Upazilas in the north.
2.2. Survey Designing and Sampling 2.2.1 Quantitative Survey Process
Total sample size for conducting the baseline survey is 3000 with a two times allocation in the treatment areas comparing with the controlled areas. It means the sample size for the treatment areas is 2000 and it is 1000 of the controlled area. The survey will take a total of 40 wards within 39 unions under the treatment and control ratio of the baseline survey is 2:1. Therefore, 20 wards under 20 unions will cover under the control sample area. In an ideal scenario, control samples should be collected in the same manner the treatment sample is collected. The number of HH/ward will increase if the number of matched wards is smaller. The control wards need to be selected purposely to best match the similar climate risk exposure. Under each of the ward, a total of 50 households choose for interview under the quantitative survey.

Hossain S., Hamid T., & Tarin M.A, Approach Towards Understanding the Adaptive Capacities of Coastal Women to Cope with Climate Change Induced Salinity
503
Figure 1: Survey locations with surveyed data
Table 1: Approach of study
Sample size Instrument and methods
Treatment Area Controlled Area
2000 1000
Focused group discussion
Key Informant Interview (KII)
Questionnaire Survey
3. Understanding Coping Method 3.1. Socio-economic condition of the households related with coping method From the baseline study of the existing conditions in local communities, disasters have disproportionate effects on certain populations, particularly those of low socioeconomic status and other marginalized groups. Women’s livelihoods were deemed vulnerable due to a lack of diversity of livelihoods; reduced options for on-farm livelihoods; cultural barriers in employment in the industry sector; poor capacity to enter into skilled service sectors; domestic responsibility; lack of incentives for skilled jobs; and sole responsibility of child care. Land use changes due to salinity significantly impact women’s livelihood options due to fewer on-farm and postharvest employment opportunities. The overall reduction in livelihood options in coastal regions has also led to the increased migration of men to find work and this also greatly increases women’s burden of unpaid and undervalued household work. This study’s prime concern is to understand the adaptive strategies coping methods of coastal women’s due to climate change induced salinity. However, in order to vividly depict

Hossain S., Hamid T., & Tarin M.A, Approach Towards Understanding the Adaptive Capacities of Coastal Women to Cope with Climate Change Induced Salinity
504
the picture of diversified coping methods of a community, especially women, it is necessary to understand a community’s perception and know how people respond to the different hazards occurring around them. The analysis diagrams of socio-economic condition of the households selected for the questionnaire survey are given below:
Figure 2: Access to social assistance during emergency period (Early warning System)
Figure 3: Gender of the respondent
Figure 4: Type of Household structure
Figure 5: Educational Qualification of the Respondent
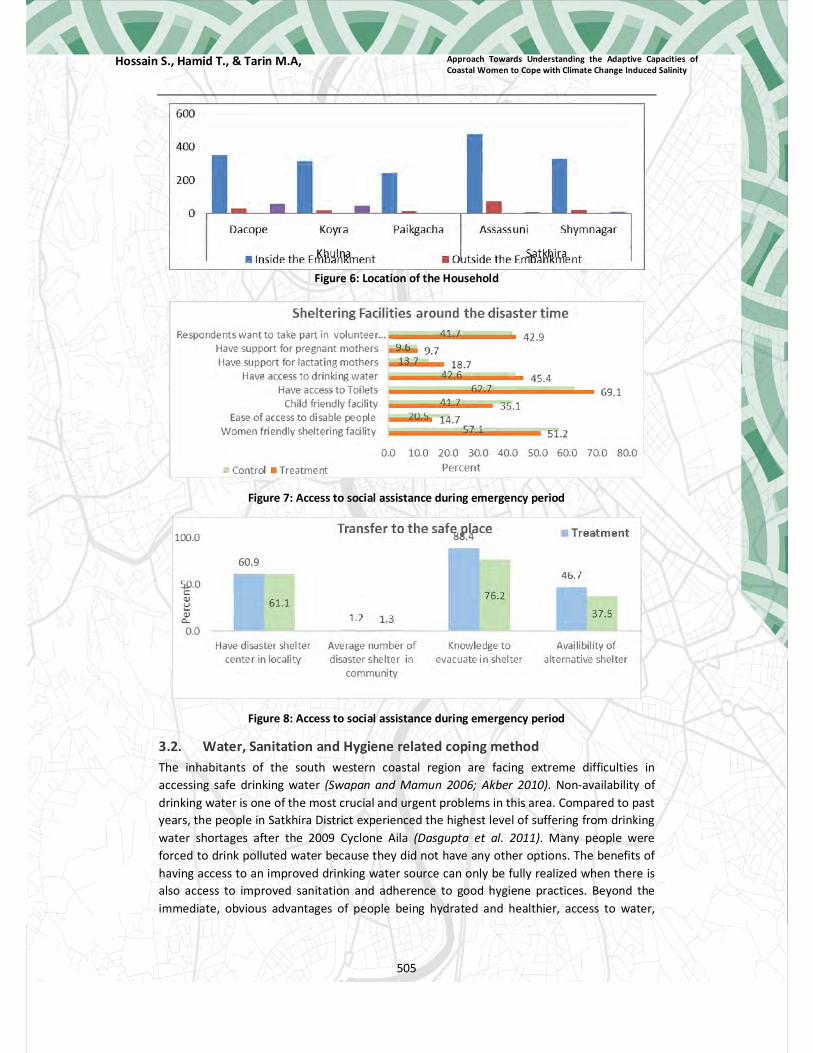
Hossain S., Hamid T., & Tarin M.A, Approach Towards Understanding the Adaptive Capacities of Coastal Women to Cope with Climate Change Induced Salinity
505
Figure 6: Location of the Household
Figure 7: Access to social assistance during emergency period
Figure 8: Access to social assistance during emergency period
3.2. Water, Sanitation and Hygiene related coping method The inhabitants of the south western coastal region are facing extreme difficulties in accessing safe drinking water (Swapan and Mamun 2006; Akber 2010). Non-availability of drinking water is one of the most crucial and urgent problems in this area. Compared to past years, the people in Satkhira District experienced the highest level of suffering from drinking water shortages after the 2009 Cyclone Aila (Dasgupta et al. 2011). Many people were forced to drink polluted water because they did not have any other options. The benefits of having access to an improved drinking water source can only be fully realized when there is also access to improved sanitation and adherence to good hygiene practices. Beyond the immediate, obvious advantages of people being hydrated and healthier, access to water,
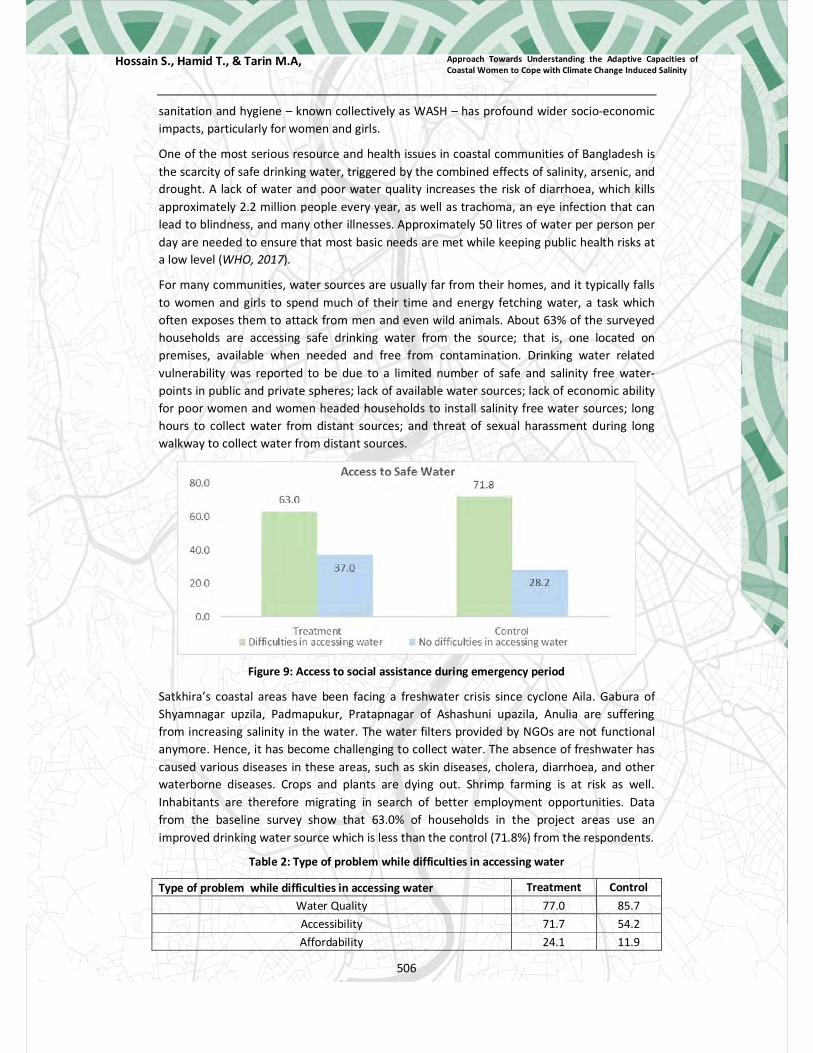
Hossain S., Hamid T., & Tarin M.A, Approach Towards Understanding the Adaptive Capacities of Coastal Women to Cope with Climate Change Induced Salinity
506
sanitation and hygiene – known collectively as WASH – has profound wider socio-economic impacts, particularly for women and girls.
One of the most serious resource and health issues in coastal communities of Bangladesh is the scarcity of safe drinking water, triggered by the combined effects of salinity, arsenic, and drought. A lack of water and poor water quality increases the risk of diarrhoea, which kills approximately 2.2 million people every year, as well as trachoma, an eye infection that can lead to blindness, and many other illnesses. Approximately 50 litres of water per person per day are needed to ensure that most basic needs are met while keeping public health risks at a low level (WHO, 2017).
For many communities, water sources are usually far from their homes, and it typically falls to women and girls to spend much of their time and energy fetching water, a task which often exposes them to attack from men and even wild animals. About 63% of the surveyed households are accessing safe drinking water from the source; that is, one located on premises, available when needed and free from contamination. Drinking water related vulnerability was reported to be due to a limited number of safe and salinity free water-points in public and private spheres; lack of available water sources; lack of economic ability for poor women and women headed households to install salinity free water sources; long hours to collect water from distant sources; and threat of sexual harassment during long walkway to collect water from distant sources.
Figure 9: Access to social assistance during emergency period
Satkhira’s coastal areas have been facing a freshwater crisis since cyclone Aila. Gabura of Shyamnagar upzila, Padmapukur, Pratapnagar of Ashashuni upazila, Anulia are suffering from increasing salinity in the water. The water filters provided by NGOs are not functional anymore. Hence, it has become challenging to collect water. The absence of freshwater has caused various diseases in these areas, such as skin diseases, cholera, diarrhoea, and other waterborne diseases. Crops and plants are dying out. Shrimp farming is at risk as well. Inhabitants are therefore migrating in search of better employment opportunities. Data from the baseline survey show that 63.0% of households in the project areas use an improved drinking water source which is less than the control (71.8%) from the respondents.
Table 2: Type of problem while difficulties in accessing water
Type of problem while difficulties in accessing water Treatment Control Water Quality 77.0 85.7 Accessibility 71.7 54.2 Affordability 24.1 11.9
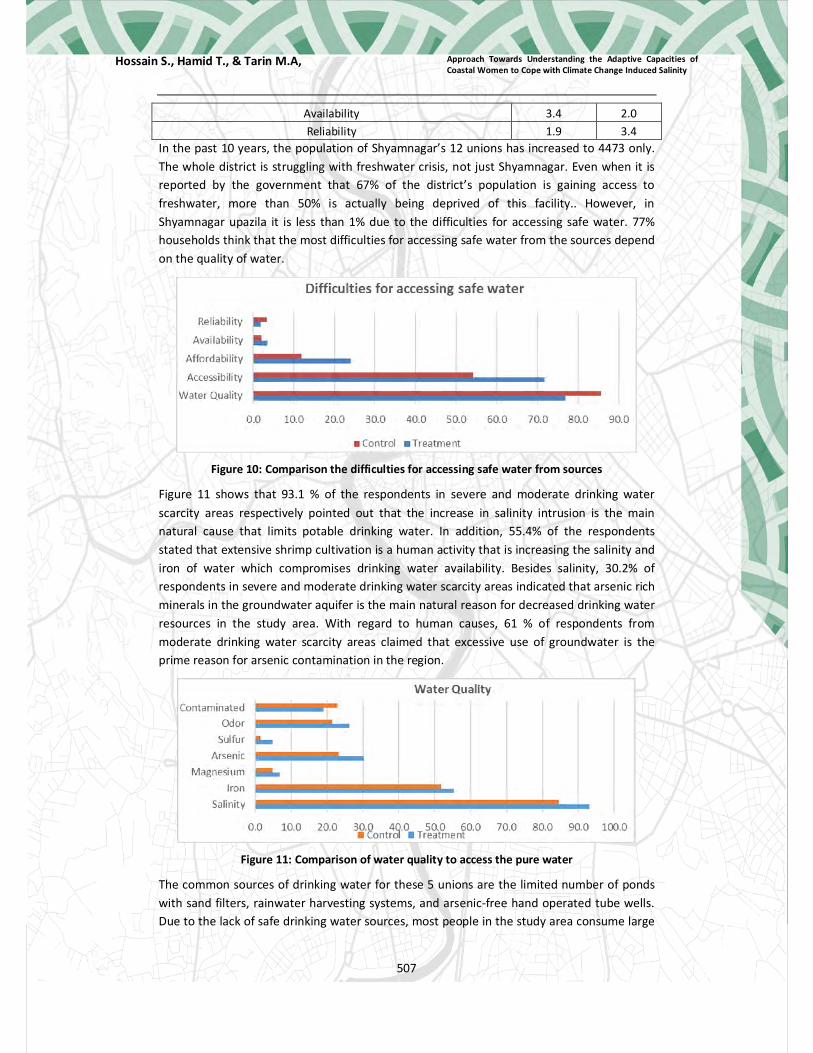
Hossain S., Hamid T., & Tarin M.A, Approach Towards Understanding the Adaptive Capacities of Coastal Women to Cope with Climate Change Induced Salinity
507
Availability 3.4 2.0 Reliability 1.9 3.4
In the past 10 years, the population of Shyamnagar’s 12 unions has increased to 4473 only. The whole district is struggling with freshwater crisis, not just Shyamnagar. Even when it is reported by the government that 67% of the district’s population is gaining access to freshwater, more than 50% is actually being deprived of this facility.. However, in Shyamnagar upazila it is less than 1% due to the difficulties for accessing safe water. 77% households think that the most difficulties for accessing safe water from the sources depend on the quality of water.
Figure 10: Comparison the difficulties for accessing safe water from sources
Figure 11 shows that 93.1 % of the respondents in severe and moderate drinking water scarcity areas respectively pointed out that the increase in salinity intrusion is the main natural cause that limits potable drinking water. In addition, 55.4% of the respondents stated that extensive shrimp cultivation is a human activity that is increasing the salinity and iron of water which compromises drinking water availability. Besides salinity, 30.2% of respondents in severe and moderate drinking water scarcity areas indicated that arsenic rich minerals in the groundwater aquifer is the main natural reason for decreased drinking water resources in the study area. With regard to human causes, 61 % of respondents from moderate drinking water scarcity areas claimed that excessive use of groundwater is the prime reason for arsenic contamination in the region.
Figure 11: Comparison of water quality to access the pure water
The common sources of drinking water for these 5 unions are the limited number of ponds with sand filters, rainwater harvesting systems, and arsenic-free hand operated tube wells. Due to the lack of safe drinking water sources, most people in the study area consume large

Hossain S., Hamid T., & Tarin M.A, Approach Towards Understanding the Adaptive Capacities of Coastal Women to Cope with Climate Change Induced Salinity
508
quantities of saline and arsenic contaminated water. About 49.2 % people are drinking water from Tube Well and almost 36.8% people is using rain water for drinking purposes.
Figure 12: Water sources during normal time
The study reveals that 100% of the respondents in both severe and moderate scarcity areas stated that water scarcity has substantial impacts on their daily activities through disturbances to domestic work, health problems, social conflicts, and hardship for women as women walk from one village to another to fetch water. For common practice usually they collect water from nearby Tube well or ponds but when it will be an emergency condition 48.4% people will collect water from tube well and 39.5% people use rainwater. Here the control is higher than the treatment respondents.
Figure 13: Pure water sources during emergency time
Many respondents in this study reported water-related various challenges. In particular, respondents often mentioned the presence of arsenic, iron, or salt contamination in the water. In these 5 union study area, the survey data indicate that 70.0 % of all households have accessible drinking water where main source impacted by salinity. 39.0% respondents think that the main source of water impacted by salinity due to cyclones. But the control people are higher than the treatment respondents. 45.8 % respondents from control respondents.

Hossain S., Hamid T., & Tarin M.A, Approach Towards Understanding the Adaptive Capacities of Coastal Women to Cope with Climate Change Induced Salinity
509
Figure 14: Access to social assistance during emergency period
Figure 15: Access to social assistance during emergency period
Figure 16: Access to social assistance during emergency period
Overall, 33.5% of the respondents in the project areas can obtain drinking water in less than 30 minutes. Almost more than 80% households in this 5 unions are can obtain drinking water in less than 60 minutes because nearly all households have no either a shallow (88.7 percent) or deep (10.3 percent) tube well on or near the household.
According to the previous studies, if people in rural places can reach a source of water and get back within 30 minutes, most of them fetch at least enough drinking water to satisfy their basic needs for direct ingestion, cooking, and hygiene. When the round trip takes more than 30 minutes, people typically haul less water than they need to meet their basic daily requirements.
Overall, 41.2% of the respondents in the study areas can obtain drinking water in less than 500-meter distance. Almost more than 80% respondents in these 5 unions are can obtain drinking water in less than 2 kilometres because nearly there are no pure drinking water sources to collect. Only 13.2 % of households practiced recommended water treatment technologies, which include chlorination, filtration through a water filter and pond sand filter, boiling, and solar disinfection.

Hossain S., Hamid T., & Tarin M.A, Approach Towards Understanding the Adaptive Capacities of Coastal Women to Cope with Climate Change Induced Salinity
510
Figure 17: Access to social assistance during emergency period
Figure 18: Access to social assistance during emergency period
Figure 19: Access to social assistance during emergency period
Figure 20: Access to social assistance during emergency period

Hossain S., Hamid T., & Tarin M.A, Approach Towards Understanding the Adaptive Capacities of Coastal Women to Cope with Climate Change Induced Salinity
511
Figure 21: Access to social assistance during emergency period
4. Conclusion It is advised that understanding a community’s unique perceptions and assessments of their adaptive and proactive capacities is important in creating successful coastal hazard management programs. This paper has tried to analysis adaptive strategies of women's about coastal hazards, their vulnerabilities to these hazards, and the methods they need to employ for coping with a variety of hazards. Climate-change induced migration has also meant that income from women’s productive labour becomes critical for families’ survival, and also creates a situation where women are often forced to provide labour at any cost to supplement household income. This is equally true for adolescent girls, forced to marry early and discontinue their education in order to supplement household income. Furthermore, increasing salinity has also led to a decline in the production of assets under their control, such as cattle and paddy.
A number of socio-economic and locational factors are enhancing their vulnerabilities though they are relentlessly struggling to minimize their vulnerabilities by undertaking various coping methods. It is necessary to build a bridge between the efforts taken at the community level and development organizations. Rather than segregated efforts, integration is needed to manage coastal hazards and facilitate a community’s coping. It is also important to note that in different aspects of life community coping varies with the variation of the hazard. Moreover, climate resilient livelihoods, focusing on women, for enhanced adaptive capacities of coastal agricultural communities with gender-responsive access to year-round, safe and reliable climate-resilient drinking water solutions. The study suggests to strengthen institutional capacities knowledge and learning for climate-risk informed management of livelihoods and drinking water security.

Hossain S., Hamid T., & Tarin M.A, Approach Towards Understanding the Adaptive Capacities of Coastal Women to Cope with Climate Change Induced Salinity
512
5. References Ahmed, A. K., & Chowdhury, E.H. (2006b). Study on livelihood systems assessment,
vulnerable groups profiling and livelihood adaptation to climate hazard and long term climate change in drought prone areas of NW Bangladesh. FAO, CEGIS.
Alam, K., Fatema, N., & Ahmed, W. B. (2008). Gender, climate change and human security in Bangladesh. Dhaka
Dankelman, I. ed., 2010. Gender and climate change: An introduction. Routledge.
Dasgupta, S., Laplante, B., Murray, S. and Wheeler, D., 2011. Exposure of developing countries to sea-level rise and storm surges. Climatic Change, 106(4), pp.567-579.
Swapan, S.S.A., and Md. M. Mamun. 2006. In search of safe drinking water: In the context of climate change and salinity. Satkhira, Bangladesh: Uttaran and Water Committee.
Khatun, A.,Akter, S.,Das, A.,Zubayer, S. Regional economic competitiveness analysis
513
Research paper
DELINEATION OF ECONOMICALLY POTENTIAL REGIONS THROUGH ECONOMIC COMPETITIVENESS ANALYSIS
MOST. ASMA KHATUN,dept. of Urban and Regional Planning; Bangladesh SHARMIN AKTER,dept. of Urban and Regional Planning, RUET;Bangladesh ANUTOSH DAS, dept. of Urban and Regional Planning, RUET, Bangladesh
MD SAKIB ZUBAYER, dept. of Urban and Regional Planning, RUET, Bangladesh
Abstract
Economic potentiality of a country is a key indicator of regional economic and other kinds of development. And economic competitiveness is a measure of economic potentiality of regions. This competitiveness is measured by the productivity that allows a nation to support high wages, a strong currency and attractive returns to capital, and with them a high standard of living. This paper aims to present economic potential zone which would be helpful to understand economic situation at different location of the country and plan accordingly. To fulfill the aim, objective is to prepare an economic potentiality map of Bangladesh and to interpret it. In this study the regional competitiveness analysis has been done with the five indicators of economic competency using BBS data of sixty four districts of Bangladesh. Composite weighted index method has been used to show the actual condition of each region to compete with the other regions. Based on the analysis, full Bangladesh has been divided into four regions of highly potential region, moderately high potential region, moderately low potential region and lower potential region. By analyzing the regional competitiveness it will be helpful for the government and foreign agencies for the further investment decision making process, and will be helpful to the govt. in development planning and decision making process.
Keywords
Economic competitiveness, Economic potential regions, Weighted index method, Development planning, Decision making.
1. Introduction Competitiveness and cohesion have become popular goals in the lexicon of city development. (I. Turko et al., 2007) Regional competitiveness is synonymous with regional productivity (Porter, 1990, 2002). A region’s competitiveness and the efficacy of policies to enhance competitiveness may be influenced by the region’s industrial structure and legacy. (R.M. Dudensing, 2008). Some of the difficulties associated with the concept of competitiveness become apparent when trying to define and measure it empirically (I. Turko et al., 2007). This focus on competitiveness has not just been a macroeconomic phenomenon, however. It has also assumed key significance at the regional, urban and local scale. (M. Kitson et al., 2004)
Bangladesh has come a long since the dark days of early part of liberation, when the country did not have sufficient fund for the development of the country. For the time being, the economy has been flourishing. As per the Global finance Magazine report, Bangladesh has an international reserve of USD31.8 billion (2016) and its gross domestic product (GDP) is USD 246.2 billion. The GDP per capita value is USD 1508 (2017) and the annual growth rate of the GDP is 6.9% (2017). (A. Rahman, 2018)

Khatun, A.,Akter, S.,Das, A.,Zubayer, S. Regional economic competitiveness analysis
514
The growth rate of the economy and the potentiality of the economic growth is not confined at any point of Bangladesh (Glasson, 1974). The factors of the economic growth rate as well as the regional economic potentiality is spread all over the areas of the Bangladesh. For example, a recent study conducted by WB, 2010 shows the industry, manufacturing share GDP, % of person engaged in the industrial sector, % of person engaged at service sector has been gradually increased between 2000-2010. But % of agricultural share, person engaged in the agricultural sector and share of total GDP has been decreased gradually. (Sources: World Bank World Development Indicators 2010, Asian Development Bank. 2010).Another study shows that at 1991 more than 40% people lived under the poverty level and now according to World Bank it is less than 14%. That means over 42 million people has been pulled out of the extreme poverty. (A. Rahman, 2018)
As the economic development of Bangladesh is growing fast, the agricultural and other development is also growing very fast. But there have either a little or don’t have any specific research regarding the factors influencing the regional economic competitiveness.Regional economic competitiveness refers to the ability of a region to compete effectively and to prosper in the global economy(local planning handbook, 2015).Thus economic competitiveness of a region indicating to potentiality of the region to grow economically based on the available economic resources. This competitiveness in regions’ economy can be shown through comparing the factors influencing economic development of the region.
This study focuses on some particular factors havinggreat influence on the regional economic development resulting to economic competitiveness of the regions as well as economic potentiality. Four factors have been chosen to show the regional economic competitiveness which are 1. Number of industry, 2. Number of growth center, 3. Number of economically active labor force and 4. The rate of inter district migration. These four factors have great influence on regional economic competitiveness. This study aims to divide Bangladesh into 4 regions according to their potentiality so that it may help the researchers and the policymakers for their future interest.
2. Literature review
Region means a large tract of land; a country; a more or less defined portion of earth’s surface, as distinguished by certain natural features, climatic conditions, a special fauna, and flora or the like. (Biswas CJ, Biswas KJ, 2014).and regionalization refers to the process of delineation of the region. In the process of regionalization, formal regionalization and functional regionalization are two common types of regionalization. Formal regionalization refers to the uniform or homogeneous areas on the basis of some selected criteria’s where functional regionalization refers to the functional homogeneity. (J. Glasson, 1974)
The competitiveness of a region depends not only on some factors but also on character, its actors and their development and relations between the actors in and also outside the region. The competitiveness of regions is an issue not just of academic interest and debate, but also of increasing policy deliberation and action. (M. Kitson et al., 2004) There are many factors, which have positive influence on the regions competitiveness and also there are some with inhibiting effect. One of the study conducted by S. Ruchinksa, R. Ruchinksa, 2007, they focused on what is competition of regions and their aim was to determine what presents the competitiveness of a region and to specify factors of it. But they didn’t focused any particular region those are affect by the factors. But this study gives a broad idea regarding the influencing factors of regional economic potentiality and competitiveness. Besides it gives us clear idea about what makes the region more or less competitive. The standard (common) concept of competitiveness has been partly developed in order to serve as a widely accepted theoretical definition, which can be measured and also be used by economic development. (I. LENGYEL, 2004). The delineation
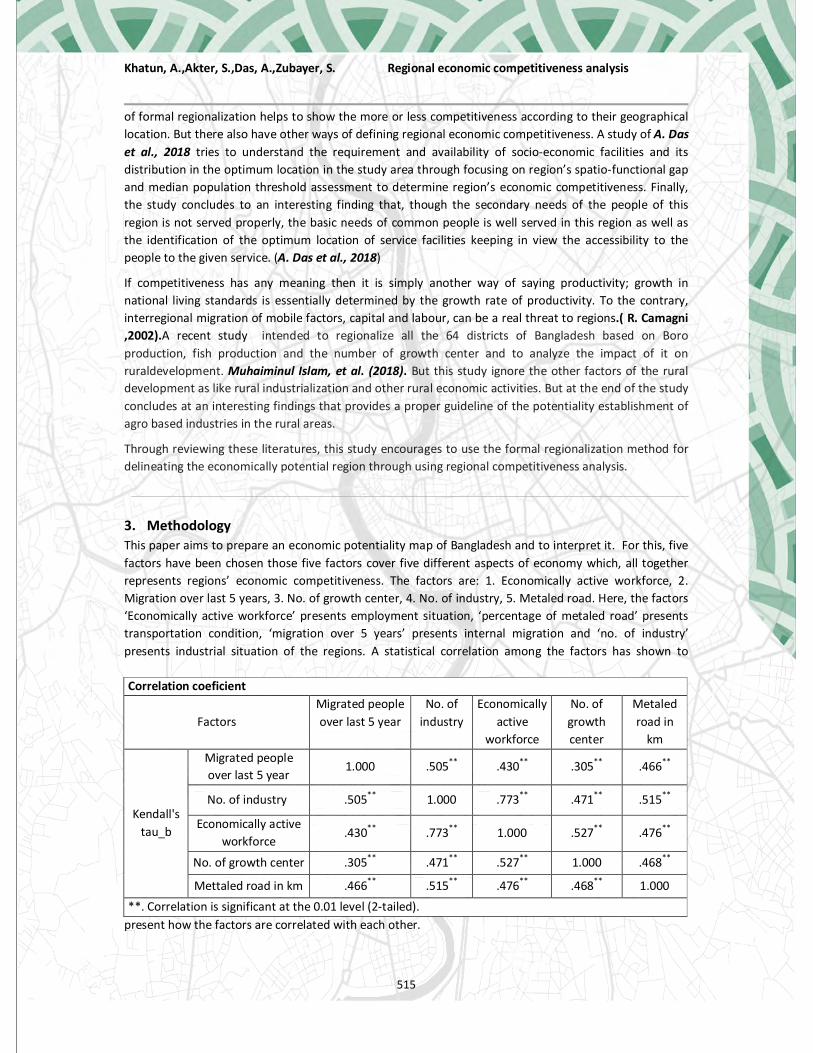
Khatun, A.,Akter, S.,Das, A.,Zubayer, S. Regional economic competitiveness analysis
515
of formal regionalization helps to show the more or less competitiveness according to their geographical location. But there also have other ways of defining regional economic competitiveness. A study of A. Das et al., 2018 tries to understand the requirement and availability of socio-economic facilities and its distribution in the optimum location in the study area through focusing on region’s spatio-functional gap and median population threshold assessment to determine region’s economic competitiveness. Finally, the study concludes to an interesting finding that, though the secondary needs of the people of this region is not served properly, the basic needs of common people is well served in this region as well as the identification of the optimum location of service facilities keeping in view the accessibility to the people to the given service. (A. Das et al., 2018)
If competitiveness has any meaning then it is simply another way of saying productivity; growth in national living standards is essentially determined by the growth rate of productivity. To the contrary, interregional migration of mobile factors, capital and labour, can be a real threat to regions.( R. Camagni ,2002).A recent study intended to regionalize all the 64 districts of Bangladesh based on Boro production, fish production and the number of growth center and to analyze the impact of it on ruraldevelopment. Muhaiminul Islam, et al. (2018). But this study ignore the other factors of the rural development as like rural industrialization and other rural economic activities. But at the end of the study concludes at an interesting findings that provides a proper guideline of the potentiality establishment of agro based industries in the rural areas.
Through reviewing these literatures, this study encourages to use the formal regionalization method for delineating the economically potential region through using regional competitiveness analysis.
3. Methodology This paper aims to prepare an economic potentiality map of Bangladesh and to interpret it. For this, five factors have been chosen those five factors cover five different aspects of economy which, all together represents regions’ economic competitiveness. The factors are: 1. Economically active workforce, 2. Migration over last 5 years, 3. No. of growth center, 4. No. of industry, 5. Metaled road. Here, the factors ‘Economically active workforce’ presents employment situation, ‘percentage of metaled road’ presents transportation condition, ‘migration over 5 years’ presents internal migration and ‘no. of industry’ presents industrial situation of the regions. A statistical correlation among the factors has shown to
present how the factors are correlated with each other.
Correlation coeficient
Factors Migrated people over last 5 year
No. of industry
Economically active
workforce
No. of growth center
Metaled road in
km
Kendall's tau_b
Migrated people over last 5 year
1.000 .505** .430** .305** .466**
No. of industry .505** 1.000 .773** .471** .515**
Economically active workforce
.430** .773** 1.000 .527** .476**
No. of growth center .305** .471** .527** 1.000 .468**
Mettaled road in km .466** .515** .476** .468** 1.000 **. Correlation is significant at the 0.01 level (2-tailed).

Khatun, A.,Akter, S.,Das, A.,Zubayer, S. Regional economic competitiveness analysis
516
The table shows that the factors are correlated and acting in the positive direction presenting relationship among the factors. Correlation among the factors represents the validation of the factors chosen. Its value differs from -1 to +1. The sign presents positive and negative relation. The greater the value, the stronger the relation.
For this reason, selecting these 5 correlated factors and using data of 64 districts, the study conducted formal regionalization to get the output. The delineation of formal regions involves the grouping together of local units which have similar characteristics according to certain clearly defined criteria but may differ significantly from units outside the region on the basis of chosen criteria. In this process, resultant region will never be perfectly homogeneous but must be homogeneous with these criteria.
Weighted index method has been chosen for formal regionalization because of being simplest form and a number of factors being used. Five factors being used at this regionalization method which are no of industry, no of growth center, no of economically active labor force, no. of internal migration and length of metaled road are denoted by 푥 ,푥 ,푥 ,푥 ,푥 respectively. The weighted index formula is given below:
푊 =log(푥 ) ∗ 푤 + log(푥 ) ∗ 푤 + log(푥 ) ∗ 푤 + log(푥 ) ∗ 푤 + log(푥 ) ∗ 푤
푤 + 푤 +푤 +푤 + 푤
To neutralize the effect of unit of each factor, log of the factors are used. 푤 ,푤 ,푤 ,푤 푎푛푑 푤 are the weighted values calculated for each variables in the following way;
푤 =푚푒푎푛 표푓 log (푥)
푠푡푎푛푑푎푟푑 푑푒푣푖푎푡푖표푛 표푓 log (푥)
Later on through the weighted index formula 푊 is calculated for each of the districts. Since all the factors are positively correlated, thus the higher the value, more economically potential area is. After this W is classified in SPSS software using three different methods and these are: 1. Arithmetic mean method, 2. Equal class interval method and 3. Mean standard deviation method.
There is an equation of finding probable no. of class; 2 = 푁. k= no. of class required and N= no. of total districts=64. Here we found k=6. Then using 3 methods histograms are produced and the most suited one is selected for map making.Skewness of histogramis a measure of symmetry of the probability distribution of a real valued random variable about its’ mean and kurtosis is the measure of tailedness of the probability distribution. A comparative study on basis of skewness value and graph of histogram is made to find out the appropriate one for map making of the output.
Figure 1 Histogram in Mean standard deviation method.
Figure 2 Histogram in Arithmetic mean method.
Figure 3 histogram in Equal class interval method.

Khatun, A.,Akter, S.,Das, A.,Zubayer, S. Regional economic competitiveness analysis
517
Skewness value in ‘Mean standard deviation method’ is .371. In this method, the skewness value indicates index distribution is more in right side about the mean and the curve is normally distributed.
In ‘Arithmetic mean method’skewness value is -.226. it refers that, index distribution is negatively skewed and index distribution is more in negative side.
In case of ‘Equal class interval method’ value of skewness is .222. Index distribution is more in positive side. Comparing this three methods, any of the Equal class interval method and arithmetic mean method can be better representable. The histogram of ‘Equal class interval method’ shows fine distribution of datas. Thus, ‘Equal class interval method’ is come out as the more appropriate one and chosen.‘Equal class interval method’ is shortly described below. Equal class interval method:
X= ; where, B=Highest value; A= lowest value; X=number of class required
Using this distribution, later on,economic potentiality map is generated and interpreted with respect to present economic situation and resources & flaws of the regions.
4. Results & discussion: Economic competitiveness of regions represents the overall picture of the potentiality and attractiveness of the region to grow economically. How vibrant a region from economic perspective is, can be well represent by formal regionalization of the country.After going through formal regionalization with these factors and using equal class interval method, a map is generated and later on grouped into four regions for better presentation and interpretation of map. First two classes are grouped into lower economic potential regions, second two classes grouped into moderately lower economic potential regions, 5th class is presented as moderately high economic potential region and the 6th class as highly economic potential region. Thus, the map given presents low economic potential region to highly economic potential region by a range of color from yellow to Blue. The table presents which districts belongs to which regions.
Table: districts belong to different regions
Region Range Total number of district
Name of the district
Highly economic potential region
≥4.00 2 Dhaka, Chittagong
Moderately high economic potential region
3.81-4.00 8 Dinajpur, Bogura, Sirajganj, sylhet, Comilla, Gazipur, Kishoreganj, Tangail

Khatun, A.,Akter, S.,Das, A.,Zubayer, S. Regional economic competitiveness analysis
518
Moderately loweconomic potential region
3.40-3.80 37 Thakurgaon, Nilphamari, kurigram, rangpur, gaibandha, sherpur, jamalpur,joypurhat, naogaon,nawabganj,rajshahi, natore, sirajganj,pabna, kusthia, jessor, jheinadh, Khulna, Bagherhat,Gopalganj,feni, noakhali, chandpur, faridpur,narsingdi, bhramonbria, habiganj,moulvybazar,sunamganj, netrokona, cox’s bazar, Barisal, potuakhali, sariatpur, lakshmipur,Narayanganj,
Low economic potential region
≤3.40 17 Panchagarh, Lalmonirhat, Meherpur, Pirojpur, Chuadanga,Manikganj,Rajabri, Magura, Narail, Satkhira, Bhola,Jhalokathi, Borguna, khagrachari, rangamati, bandarban
22.67% area of Bangladesh falls in low economic potentiality regions, 57.01% falls in moderately low economic potential region, 15.75% falls in moderately high economic potential region and the rest 4.57% belongs to high economic potential region. To explain why the output is like that way, regions with locations, i.e; the map is presented and interpreted.
4.1 Higher economic potential region:
Among all 64 districts only 2 districts of Bangladesh shows the higher economic potentiality. These two districts are Dhaka and Chittagong.
Dhaka city is showing the topmost economic potentiality. One of the reason could be that Dhaka is the only one mega city of Bangladesh and it has higher internal migration rate over the years. Total number of migrated people over 5 years is 1768974 in the Dhaka city (BBS, 2011) which is much higher than the other divisional cities of Bangladesh. For these reasons total number of economically active labor force is also high in the Dhaka city. As of its secondary consequence the number of growth center, and quality of accessibility increases.
Alongside Chittagong is the city with second best potentiality of Bangladesh. As the Chittagong city is situated at the coastal region and the area has a great impact on the export sector of Bangladesh so the area also has a great contribution on the countries increasing GDP. And because of these export sectors,
Figure 4 economic potentiality map of Bangladesh

Khatun, A.,Akter, S.,Das, A.,Zubayer, S. Regional economic competitiveness analysis
519
total number of internal migrated people increases and as a consequence employment rate and number of economically active labor force also increases.
A recent study conducted by S.S. Ahmed and M, Ahmed,2017 shows that Economic opportunities are concentrated in the largest four cities of Bangladesh which are the concentrated urban areas in Bangladesh. Major industrial activities and auxiliary business services are concentrated in the largest cities. Dhaka alone account for 80% of the garments industries. Workers employment density in Dhaka City Corporation is above 60% higher than in Chittagong City Corporation. Employment density of workers per sq. km in Dhaka was 4241 which was 2835 in Chittagong in 2009 (WB-2012).
4.2 Moderately higher economic potential region:
Only 15.75% region of the total area belongs to moderately higher economic potential region. Among them Sylhet, BoguraandDinajpur region is more significant than the other regions.
Sylhet is situated at the north east border region of Bangladesh. As a moderately higher economic potential region sylhet is significant because the other areas alongside the Sylhet belongs to moderately lower potential region.The area has a moderately higher rate of migrated people, moderately high amount of growth center, higher rate of economically active workforce, and higher length of metaled road facilities. Besides these factor as the area has a higher potentiality regarding the tourism facilities and growing tea sector, so the area belongs to moderately higher potential region.
Dinajpur is an area with moderately higher potentiality. This area is situated at the North West region of the Bangladesh. The area is famous for production of rice. The area has a moderate in-migration rate. Because of higher crop productivity rate, the number of agro based industry, total number of growth center and total number of locally active labor force is relatively high in this area. At a recent study, the range of cropping intensity was recorded 206-249% whereas the maximum value was found for Khansama of Dinajpurand minimum for Boda of Panchagarh district. (B J Shirazy et al., 2017)
In Bogura, although the area is surrounded by other moderately lower regions but itself it belongs to the moderately higher potential region. The total length of the metaled road is 566.11 km (BBS, 2011) that is almost at the highest category of metaled road. Because of the higher accessibility the area has the higher potentiality of different industries and higher amount of growth center. The area has 77 growth center that is also significant (BBS 2011). Also having the good accessibility with the other significant districts as like as good accessibility with the rangpur, dinajpur, Rajshahi encourage the growth the industries and also encourage in migration.
4.3 Moderately lower economic potential region:
Most of the districts are located in this region. The total number of the districts are 37. Rajshahi, the divisional city belongs to this group. Compare to other divisional cities, it’s number of industrialization, growth center and percentage of metaled road is less, thus the picture is like that way.
4.4 Lower economic potential region:
Within the region 22.67% (17 districts) belongs to lower potential region. Among them the lowest value of the potentiality belongs to Bandarban (w=3.06). After Bandarban the 2nd and 3rd lowest values (w=3.22, w=3.25) are shown in Rangamati and khagrachari. It is significant that all of these 3 districts are parallel to the Chittagong district which is highly potential area. All of thses 3 areas have lower potentiality because of having limited number of growth centers and limited number of industries. The underlying reason behind this consequence is that these areas are mainly hilly areas and only the Chittagong district is in flat land. And so all the developments has been concentratedin the city.

Khatun, A.,Akter, S.,Das, A.,Zubayer, S. Regional economic competitiveness analysis
520
Another most significant district is manikganj. Manikganj, being situated near the Dhaka city, it is one of the lowest potential region in Bangladesh which is because of existence of the junction of five rivers in the district. These are the Padma,the Kaliganga, the Jamuna, the Dhaleshwari and the Ichamati (Wikipidea, 2019). Due to river erosion, every year a large number of households and infrastructures losses in the course of the river. And as of its secondary consequence, the economy of the area break down very badly.Since 1993, the Padma has devoured at least 39 villages on its both banks, mostly in Naria of Shariatpur on the other side of Munshiganj. “In last one month, more than 600 families became homeless as 300 houses of BoroBahadurpur, ChhotoBahadurpur and Degirchar villages of Gopinathpur union were washed away said Abdul Kuddus, chairman of Gopinathpur Union Parishad. (The daily Star, September 28, 2018)
Although the surrounding areas ofMadaripur belongs to moderately low potential areas, Madaripur itself belongs to lower potential region. Although it has moderate number of internal migrated people and industrial structure, it has lower number of growth center and lower length of metaled road. So it belongs to lower potential region.
4.5 Geographic influence over the economic potentiality of regions:
Bangladesh is probably the most flood prone country in the world, and some authors are arguing it is the most disaster prone nation in the world (Cutter, 1996, Zaman, 1999). Among natural disasters in Bangladesh, flood is the preeminent one. Every year a large portion of the country becomes flooded due to heavy rainfall and spilling water from the major rivers. Bangladesh is well known as 'land of rivers' and there are about 230 rivers network within the country including 54 international rivers flowing across the country and finally reach to the Bay of Bengal. It is observed that each year's highest flood record has been broken by the subsequent years and, simultaneously, damage from floods has been surpassed by the following year's damage.
Netrokona, Noakhali,Manikganj, (belong to moderately low economic potential region);pirojpur,Rajbari, rajshahi,pabna, ,Shirajgonj, Shunamganj, Shariatpur, faridpur, Kurigram, Jamalpur, (belong to low economic potential region); Sylhet, Tangail (belong to moderately high economic potential region) are flood vulnerable districts of Bangladesh (BBS census survey 2011& flood zone data FFWC, DWDB, 1998)
If one closely looks into the map, geographic influence over the regions’ economic potentiality became clearly visible. By laying out the river lines over economic potentiality map of Bangladesh, a new map is generated and presented below.
Figure 6 River map of Bangladesh Figure 5 River map V/s economic potentiality map

Khatun, A.,Akter, S.,Das, A.,Zubayer, S. Regional economic competitiveness analysis
521
The red mark on the economic potentiality map presents river lines and the sky color pointing to hilly area of Chittagong division. Mostly The riverside regions belong to either‘low economic potential region’or ‘moderately low economic potential region’.
Although Mankganj, Rajbari, Narail, Magura, madaripur areas has a close proximity to the Dhaka city, these areas has been defined as lower economic potential region and all of those areas has agreat influence of river erosion & monsoon flooding(rivers: Gorai-Madhumati, chitra, nabaganga, bhairab, kumar, dhaleshwri, Padma, etc). For this purpose the economy of these areas can not flourish much with respect to other areas. Again nature of all rivers are not aggressive and destructive.
Riverside Munshiganj, Narayanganj, Narsingdi districts belong to ‘moderately low economic potential regions’ and kishoreganj belongs to ‘moderately high economic potential regions’(rivers: Meghna, shitalakshya, ichamoti).Rajshahi being divisional city, it belongs to moderately low economic potential regions’ (Padma river).
Again, coastal regions (pirojpur, satkhira, Jhalakathi, Borguna, Bhola, Bagerhat) belongs to either low economic potential region or moderately low economic potential regions. This is due to their geographic location, lack behind economic possibilities.
Hilly areas of Chittagong devision (Bandorban, Rangamati and Khagrachari) belongs to low economic potential areas. This is because of the nature of land unfriendly to flourish economically. On the other hand hills of sylhet having more flat hilltops compare to Chittagong area is more friendly to develop economically. This district belongs to moderately high economic potential region.
5. CONCLUSION
Delineation of region based on economic potentiality presents areas requiring attention for economic planning & decision making and at the same time provides a guideline of that planning based on situation and resources available. A proper planning not only cure problems but also increases quality and standard. This paper will assist in proper economic planning and provide base for further economic studies. Here, Economic potentiality is measured by composite weighted value of five correlated factors covering almost all sectors that act behind economic growth of regions where there are a number of major and minor factors. There is scope to incorporate other indicators that may lead to different output. Through scrutinizing geographic influence over economic sector (partially discussed in this paper) will better interpret the regions’ economic situation. Again economic studies can be made from functional aspects in different economic potential regions.
Khatun, A.,Akter, S.,Das, A.,Zubayer, S. Regional economic competitiveness analysis
522
6. References:
Glasson, J. (1975) An Introduction to Regional Planning, Fitzroy Square, London: Hutchinson & Co Ltd.
Local planning handbook. [Online] Saint Paul: metropolitan council. Available from: https://metrocouncil.org/Handbook/Files/Resources/Fact-Sheet/ECONOMIC-COMPETITIVENESS/Regional-Economic-Competitiveness.aspx
Statistics and Information Division (2011) District statistics-2011.Bangladesh Bureau of Statistics. [Online]Available from: http://203.112.218.65:8008/PageWebMenuContent.aspx?MenuKey=246
Statistics and Information Division (2011) Population and housing census 2011: Socio economic and demographic report. Bangladesh Bureau of Statistics. National series, volume-4. [Online] available from: http://bbs.dhaka.gov.bd/sites/default/files/files/bbs.dhaka.gov.bd/law_policy/6ed6b42c_2015_11e7_8f57_286ed488c766/Socio-Economic%20and%20demographic%20Report%202012.pdf
Das, A., Zinia, F. A. &Zubayer, S. (2018) Regional Competitiveness Analysis: A Prime Focus on Region's Spatio- Functional Gap and Median Population Threshold Assessment.
Shirazy, B. J. (2017) crops and cropping system in Dinajpur.
Statistics and Information Division (2013) Preliminary report on Economic census 2013. Bangladesh bureau of statistics. Available from: http://bbs.portal.gov.bd/sites/default/files/files/bbs.portal.gov.bd/page/f2661853_b857_49c5_8761_e1641e3aec9b/Pre_Report_Econo_Cen_13.pdf
Kitson, M., Martin, R. &Tyler,R. (2004) “Regional Competitiveness: An Elusive yet Key Concept?”, Regional studies, 38 (9), 991–999 (November) [online]. Available from: https://www.tandfonline.com/doi/pdf/10.1080/0034340042000320816?needAccess=true
Camagni, R. (2002), On the Concept of Territorial Competitiveness: Sound or Misleading?, in Urban Studies, 39, (13), 2395-2411.
Lengyel, I. (2004); The pyramid model: Enhancing regional competitiveness in Hungary, 54 (3), 323-342 (March)
https://en.mwikipedia.org/wiki/district_profile; Retrived at 07 July, 2019
The Daily Star, September 28, 2018. Available fromhttps://www.thedailystar.net/country/news/300-houses-lost-padma-1639897
Ruchinksa, S., Ruchinksa, R. (2007) “Factors of regional competitiveness” In: 2nd Central European Conference in Regional Science – CERS, 2007. Available from: https://www.researchgate.net/publication/228452752_Factors_of_regional_competitiveness
Selim, Dev, Jenifar, Tanmoy Assessment of Total Forest land of Bangladesh
523
Research Paper
Assessment of Total Forest Land of Bangladesh
Jenifar Selim, Tanmoy Dev, Undergraduate student, Department of Urban and Regional Planning, Rajshahi University of Engineering and Technology (RUET), Rajshahi-6204,
Bangladesh,
Anutosh Das, Md. Sakib Zubayer Assistant Professor and Lecturer, Department of Urban & Regional Planning, Rajshahi University of Engineering & Technology (RUET), Bangladesh,
Abstract The forest land is one of the vital natural resources of Bangladesh as it contributes largely to balance the ecosystem and the environment as well. Also, the forestry sector accounts for about 3% of the country’s gross domestic product (GDP) and 2% of the labour force which indicates that this sector needs special attention. The objective of the study is to delineate the 64 districts of Bangladesh into 7 regions on the basis of the existing condition of forest lands in Bangladesh. To meet this objective formal regionalization has been performed using five important factors such as: amount of reserved forest land, amount of notified under Forest Act 4 & 6, amount of protected forest land, amount of acquired forest land and amount of vested forest land are selected for weighting each district. The required data were collected from Bangladesh Bureau of Statistics (BBS). Equal Class Interval Method is selected for determining class interval and therefore seven classes are formed with seven potential regions. Skewness defines how the data are distributed in the class and value of skewness is the indicator of forming the class range. Composite index method is used to measure the weight of each district and levels of regions are subjected with respect to the value of weight. Not only the amount of dense forest is low but also the amount of total forest land in Bangladesh is very low. The study may help the researchers, urban planners and policy makers to perform further research in forest land conservation and management.
Keywords Formal regionalization, Equal Class Interval Method, Composite index method, Forest land conservation and management.
1. Introduction
Forest land means those ecosystems that have a tree crown density (crown closure percentage) of 10% or more and are stocked with trees capable of producing timber or other wood products. This includes land from which trees have been removed to less than 10%, but which have not been developed for other uses.
Regionalization is the process where different regions are delineated on the basis of different criteria and the availability of data (Glasson, 1974). Regionalization can be delineated by formal region and functional region. The delineation of formal regions involves the grouping together of local units which have similar characteristics according to certain clearly defined criteria. And the delineation of functional regions involves the grouping together of local units which displays a considerable degree of interdependence (Glasson, 1974).

Selim, Dev, Jenifar, Tanmoy Assessment of Total Forest land of Bangladesh
524
In this study, the regional structure of forest land in different districts is analyzed using the composite index method by using certain criteria. By using this method, it can be easily determined that which districts are very potential and which districts are less potential. The main objective of the study is to delineate the 64 districts of Bangladesh into 7 regions on the basis of total forest land of Bangladesh. Bangladesh Bureau of Statistics (BBS) is the main source of data where five factors are selected for assessing the total forest land.
2. Literature Review The amount of forest land of Bangladesh is very low. Though a country should have at least 25% forest coverage to meet the ecological balance. The total area of forest land in Bangladesh is 11.2% (ADB, 2016).
In a conference of Forest land in Chittagong, Bangladesh Forest Research Institute said that the amount of forest land in Bangladesh has come down to 7 – 9 % (Forest Land Workshop, 2018).
The forest ecosystem in Bangladesh has been severely damaged by the destructive anthropogenic and natural impacts coupled with overexploitation of forest resources [1].
Between 1990 and 2015, Bangladesh annually lost 2600 hectares of primary forest (FAO, 2015) Primary forest land gradually decreased from 1.494 million hectares in 1990 to 1.429 million hectares in 2015. Thus annual rate of deforestation in Bangladesh was 0.2% during 1990- 2015 (FAO, 2015). According to Dipak Chakraborty, director of Local Government, Chittagong, It is the rural population which is protecting the forest resources in the country. Coastal forestation has a great role to play since it shields us from natural calamities like cyclones. Not so long but recently people are leaning towards agroforestry. We should emphasize on social forestry for a country like Bangladesh to face the climate change impacts. Out of 64 districts, 32 districts have no state owned forest at all (BBS, 2016). Being a developing country like Bangladesh, Indonesia is also facing the high deforestation rate. According to one of their research, weakness in public control, political less awareness, over populations are the main reasons for their high deforestation rate (Tessa Toumbourou).
According to Dr.Saxena, Tenurial issues in forestry in India, The deforestation problem can be solved if there is change in ownership of forest land. Only in the control of government, the deforestation rate can be minimized and forest land can be protected.
Regionalization is the process where different regions are delineated on the basis of different criteria and the availability of data (Glasson, 1974). Regionalization can be delineated by formal region and functional region. The delineation of formal regions involves the grouping together of local units which have similar characteristics according to certain clearly defined criteria. And the delineation of functional regions involves the grouping together of local units which displays a considerable degree of interdependence (Glasson, 1974).
Selim, Dev, Jenifar, Tanmoy Assessment of Total Forest land of Bangladesh
525
These studies will help us to regionalize the 64 districts of Bangladesh according to their total forest land. Also the situation of deforestation in Bangladesh and other developing countries. It will also help us to find out the main reasons behind this.
Also the policies and recommendations of other countries will help us to enrich our forest land and decrease the rate of deforestation.
3. Methodology In the case of formal region delineation, several techniques have actually been used to delineate formal region. Among these, the Factor Analysis Method is a more spectacular approach to regionalization process. The study discusses, Factor Analysis Method with five factors affecting forest land under control
As mentioned above, five factors are chosen to regionalize the whole Bangladesh under some categories with definite potentiality index. Bangladesh has 64 districts and these districts contain different potentialities. Among 64 districts we have gotten data of 35 districts in Statistical Year Book of Bangladesh – 2011. They are:
(i) Amount of reserved forest land (sq. kilo meter) (ii) Amount of notified under Forest Act 4&6 (sq. kilo meter) (iii) Amount of protected forest land (sq. kilo meter) (iv) Amount of acquired forest land (sq. kilo meter) (v) Amount of vested forest land (sq. kilo meter)
To make the calculation more perfect we need a unit-less method. So, to make the variable unit-less, logarithm method is used.
The value of W of each district indicates the weight of districts with respect to its influencing factors.
Now to determine the suitable class interval we will follow three methods. The methods are : Equal Class Interval Method, Mean Standard Deviation Method and Arithmetic Mean Method.
Then we will categorize the districts according to their score and identify their situation.
After following the three methods, according to the skewness which will be near to 0 and normal distribution curve we have selected “Equal Class Interval Method” for the classification.
Equal Class Interval Method: In equal class interval method, class interval (x) is calculated by following formula,
Class interval, X = Highest Value - Lowest value Number of class

Selim, Dev, Jenifar, Tanmoy Assessment of Total Forest land of Bangladesh
526
Figure 1 : Histogram of Equal Class Interval Method. (Source : Prepared by author,2019).
Table 1 : Statistical output of Equal Class Interval Method
N Valid 35 Missing 0
Mean 4.54 Median 4.00 Mode 4 Std. Deviation 1.521 Skewness .047 Std. Error of Skewness .398 Kurtosis -1.034 Std. Error of Kurtosis .778
(Source : Prepared by author,2019)
For the assessment of total forest land after evaluating all the class interval method, only the Equal class interval method is suitable as it shows a normal distribution curve and the value of skewness is near 0. Here, for better representation, the number of class is selected as the value 6. Highest and lowest value of the study is 4.4822 and 0.4768. The value of class interval is 0.6676 under 6 classes. In this analysis, Class interval is formulated by this method.
So, the class interval of Equal Class Distribution is represented by the following table :
Table 2 : Class name with class interval for forest land
Class Name Class Range Class Number Non Forest but vegetate land 0 0 Scrub Forest 0.4769 – 1.1448 1 Moderately Open Forest 1.1449 – 1.8128 2 Open Forest 1.8129 – 2.4808 3 Moderately Dense Forest 2.4809 – 3.1488 4 Dense Forest 3.1489 – 3.8168 5 Very Dense Forest 3.8169 – 4.4822 6
(Source : Prepared by author,2019)

Selim, Dev, Jenifar, Tanmoy Assessment of Total Forest land of Bangladesh
527
4. Result and Discussion According to the classification level we have delineated the regions into some categories and
Found out the reasons behind their being into the classes.
The final output of the forest land analysis is to delineate the region under some categories. All districts are subdivided into seven regions. These categories are selected with respect to the value of "W". Class range, class name, percentage and districts under each class are shown by the following table :
Table 3 : Regionalization based on forest land under control in Bangladesh
Class range Class name Percentage Districts
0 Non Forest but vegetate land
46.15% Panchagar, Gaibandha, Joupurhat, Bogra, Rajshahi, Sirajgonj, Natore, Nawabgonj, Pabna, Khulna, Meherpur, Manikgonj, Rajbari,Magura, Jhenaidah, Chou Danga, Munshigonj, Faridpur, Chandpur, Shariatpur, Madaripur, Narail, Gopalgonj, Jessore, Barisal, Jhalkathi, Pirojpur, Kishoregonj, Narsingdi, Brahmanbaria, Naray Angonj.
0.4769 – 1.1448 Scrub Forest 4.62% Nilphamari, Lalmonirhat, Kurigram
1.1449 – 1.8128 Moderately Open Forest
9.23% Pirojpur, Lakshmipur, Comilla, Dhaka,
Jamalpur, Naogaon

Selim, Dev, Jenifar, Tanmoy Assessment of Total Forest land of Bangladesh
528
1.8129 – 2.4808 Open Forest 9.23% Shatkhira, Bagerhat, Khulna, Thakurgaon, Rongpur, Netrakona, Feni, Noakhali
2.4809 – 3.1488 Moderately Dense Forest
9.23% Dinajpur, Sherpur, Sunamganj, Hobiganj,
Gazipur, Barguna
3.1489 – 3.8168 Dense Forest 10.77% Nasirabad, Sylhet, Moulovibazar, Khagrachari, Bandorban, Bhola, Patuakhali.
3.8169 – 4.4822 Very Dense
Forest
4.62% Tangail, Chittagong, Parbattya Chattagram, Cox’s Bazar.
(Source : Prepared by author,2019)
The table shows that among 64 districts 46.15% which is almost half of the districts are non forest land but only have vegetated land. That means there is no forest land and it is the worst case for any country. The districts of this region are : Panchagar, Gaibandha, Joupurhat, Bogra, Rajshahi, Sirajgonj, Natore, Nawabgonj, Pabna, Khulna, Meherpur, Manikgonj, Rajbari,Magura, Jhenaidah, Chuadanga, Munshigonj, Faridpur, Chandpur, Shariatpur, Madaripur, Narail, Gopalgonj, Jessore, Barisal, Jhalkathi, Pirojpur, Kishoregonj, Narsingdi, Brahmanbaria, Naray Angonj. The main reason behind this is pressure on land to serve the over population and people are not concerned for the importance of forest land.
Among 64 districts only 35 districts have forest lands under control. Around 4.62% districts have scrub forest, 9.23% districts have moderately open forest, 9.23% districts have open forest, 9.23% have moderately dense forest.
Only 10.77% districts have dense forest only and the districts of this region are : Nasirabad, Sylhet, Moulovibazar, Khagrachari, Bandorban, Bhola, Patuakhali. In this regions the land on pressure is less and forests are naturally created. People mainly use this for “Tourist spot”.
4.62% districts have very dense forest and the districts are : Tangail, Chittagong, Parbattya Chattagram, Cox’s Bazar. The main reasons are, the regions are coastal part and the pressure on land is less. Also most of the forests are naturally created.
So, we can say that the amount of moderately dense and dense forest is too less for Bangladesh.

Selim, Dev, Jenifar, Tanmoy Assessment of Total Forest land of Bangladesh
529
The amount of total forest land in Bangladesh is not less because of natural condition or location. Because of the geographical location, Bangladesh is a gifted or blessed place to have a vast forest land. The main reasons behind the decreasing number of forest land are: deforestation, over population, pressure on land, climatic change and its impact, natural calamities because of environment pollution and so on. The forestry sector accounts for about 3% of the country’s gross domestic product (GDP) and 2% of the labour force which indicates that this sector needs special attention.
Figure 2 : Regionalization on the basis of forest land. (source : Prepared by author, 2019)

Selim, Dev, Jenifar, Tanmoy Assessment of Total Forest land of Bangladesh
530
5.0 Conclusion
As regionalization is the process of delineating regions under some categories so, the study indicates some regions of high and low potential for forest land. It is clear that not only the amount of dense forest is low but also the amount of total forest land in Bangladesh is very low.
Forestry sector can make a great contribute on our GDP as Bangladesh has the potentiality or natural blessing to have a great forest land.
In this situation, we can clearly say that as the condition of forest land under control is very poor so the government and the respective authority should take necessary steps and create public awareness to protect the forest lands and stop deforestation.
So for future research, one can also consider the impact of forest land on the weather condition. Also they can consider the factors like deforestation, natural calamities and other factors for the further research.
References MM Rahman, MR Motiur, Z Guogang, KS Islam. A review of the present threats to
tropical moist deciduous Sal (Shorea robusta) forest ecosystem of central Bangladesh. Trop Conserv Sci, 3(1): 90-102. URL: www.tropicalconservationscience.org
BBS. Bangladesh Bureau of Statistics. Retrieved from: http://www.bbs.gov.bd/
Dr.Saxena, Tenurial issues in forestry in India,2014.
(available at :http://planningcommission.nic.in/reports/articles/ncsxna/ar_forestry1.htm )
Sustainable forest resource management, The Daily Star,2017. (available at :
https://www.thedailystar.net/environment-and-climate-action/sustainable-forest-resource-management-1367131 )
FAO. 2010. Global Forest Resources Assessment 2010. Rome (available at www.fao.org/forestry/fra/fra2010/en/ ).
FAO. 2013. FAO Yearbook of Forest Products 2009–2013. Rome (available at www.fao.org/3/a-i4746m.pdf).
FAO. 2014. State of the World’s Forests 2014. Enhancing the socioeconomic benefits from forests. Rome (available at www.fao.org/forestry/sofo/en/).
FAO. Country Reports. Rome,2015 (available at : http://www.fao.org/forest-resources-assessment/current-assessment/%20country-reports/en/
Islam, Jinnahtul & Wagner, Thomas & Xie, Y & Mahboob, M. Golam. (2011). Tropical deforestation in Bangladesh and global warming.
Agrawal, A & Ostrom, E. (2001) ‘Collective Action, Property Rights, and Decentralization in Resource Use in India and Nepal’, Politics and Society, 29(4): 485-514.
Austin, K., Alisjahbana, T.D., Boediono, R., Budianto, B.E., Purba, C., Indrarto, G.B., Pohman, E., Putraditama, & A., Stolle, F. (2014). ‘Indonesia’s Forest Moratorium: Impacts and Next Steps’, Washington DC, World Resources Institute.

Islam, T.; Rahman, F.; Das, A.; Zubayer, S. Relation between Intensity of Agricultural Production and the Use of Chemical Fertilizer
531
Research Paper
REGIONALIZATION OF BANGLADESH BASED ON THE RELATION BETWEEN INTENSITY OF
AGRICULTURAL PRODUCTION AND THE USE OF CHEMICAL FERTILIZER
Tania Islam, Undergraduate Student, Department of Urban &Regional Planning,
Rajshahi University of Engineering & Technology; Bangladesh Farhan Rahman, Undergraduate Student, Department of Urban &Regional Planning,
Rajshahi University of Engineering & Technology; Bangladesh Anutosh Das, Assistant Professor, Department of Urban &Regional Planning,
Rajshahi University of Engineering & Technology; Bangladesh Md.Sakib Zubayer, Lecturer, Department of Urban &Regional Planning, Rajshahi
University of Engineering & Technology; Bangladesh
Abstract
Agriculture is one of the largest producing sectors of economy since it comprises about 14.2% of the country's GDP. Fertilizer is a chemical or natural substance added to soil or land to enhance its fruitfulness and help in increasing production. The aim of the study is to divide all the 64 districts of Bangladesh on the basis intensity of agricultural production and the chemical fertilizer use. Only the cereal crops have been considered as agricultural production. The study will find out if the highly productive areas are depended on chemical fertilizer or not by comparing the both maps produced from the regionalization according to agricultural production and chemical fertilizer use. Rajshahi, Kurigram, Cox’s Bazar, Sylhet, Narshingdi districts have been found as exceptional region where agricultural cereal crops production is not proportional to the amount of chemical fertilizer use which has diversified reasons. In this context, Formal region has been delineated using Composite Index Method for fertilizer use, five factors such as (UREA, TSP, MP, DAP, Others) and for agricultural production such as (Aus, Aman, Boro, Potato, Rape and Mustard) have been considered for regionalization. Data collected from Bangladesh Bureau of Statistics (BBS) has been analysed and presented in maps prepared with ArcGIS (version 10.2.2). This study may help the policy makers for further research on increasing the capacity of agricultural food production and maintenance of chemical fertilizer use in future.
Key words
BBS, Chemical Fertilizer, Cereal crops, Formal Regionalization, Composite Index.
1. Introduction In South Asia, Bangladesh holds the second position in cereal production, fourth in rice and fish production. It has favourable climate for the production of variety of crops. Per capita cultivable land in the country is about 0.2 acres, which is one of the lowest in the world (SHED, 2012). However, production of rice is solely based on fertilizer subsidies by the government. Farmers use fertilizer depending on availability during the cropping season,

Islam, T.; Rahman, F.; Das, A.; Zubayer, S. Relation between Intensity of Agricultural Production and the Use of Chemical Fertilizer
532
fertilizer price, fertilizer dealer motivation & promotion, assumptions and traditional practices in a locality. The identification of the study to improvement of agricultural production through increasing fertilizer use as well as establishment of agricultural development policy and program. Agricultural regionalization can help to achieve the goal of regional self-sufficiency by proper utilization of agricultural potentials and local resources and infrastructure if proper agricultural development policy & program is undertaken (Singh, J. and Dhilon, S.S. 2004).
BLGG AgroXpertus is an international company located in Wageningen, the Netherlands, it provides soil and plant based fertilizer recommendation by analysing soil test results. Rather recently (< 10 years), BLGG AgroXpertus is doing soil tests in different continents such as Asia, Africa, South America and Australia. However, this company offers recommendation mainly based on information originated from European research. According to the Ministry of Agriculture, Bangladesh has a yearly demand of approximately 5 million tons of fertilizer, where 2.7 million tons are urea and the rest are non–urea fertilizers. Due to the capacity limitation of existing warehouse, every year around 0.25 million tons urea fertilizer is left in the open air, causing huge loss to the state coffer because of wastage and quality deterioration of a large amount of urea fertilizer (The Daily Sun, 2017). Regionalization is the process of delineating regions. (Glasson, 1974).There are two ways for formal region delineation; the composite Index Method is used as there are five factors considered (Glasson, 1974). By using this method 64 districts of Bangladesh have been classified into 5 categories. Those categories are divided based on the relation between intensity of Agricultural Production and the use of Chemical Fertilizer.
To analyses the agriculture production five common cereal crops (Rice: Aus, Aman, Boro, Potato, Rape and mustard) and chemical fertilizer (TSP, UREA, MP, DAP, others) have been selected as these are most common and their data is available in 64 districts. The objective of the study is to delineate regions basis of the relation between intensity of Agricultural Production and the Use of Chemical Fertilizer.
2. Literature Review This research is based on several published literatures (journal papers, book), newspapers, and reports from different governmental and non-governmental organizations. .This research study underlines the needs to search more literatures about the actual situation of different nutrient status, social, cultural and environmental situation in Bangladesh. The fertilizer recommendation facility at farmer level based on laboratory soil test analytical data is still inadequate. While the farmers of Bangladesh have realized the importance and benefits of fertilizer recommendation during crop cultivation because the natural soil fertility of Bangladesh is reducing rapidly hampering crop productivity and yield apart from environmental degradation. In Bangladesh, most of the demand for fertilizers is fulfilled by imports. Recently Bangladesh Chemical Industries Corporation (BCIC) has signed an agreement with Saudi Arabia Basic Industries Corporation (SABIC) to buy 0.5 million metric tons of urea fertilizer in 2017. This will also open the door for concessions to supply DAP fertilizer to Bangladeshi market (The Financial Express, 2017). In these circumstances, increase of balanced and or recommended fertilizer uses by soil testing for farmers with support of SRDI and Dept. of Extension, Bangladesh, could contribute in resource use efficiency and more economic return from cultivated crops. There are several saline affected districts in Bangladesh such as Satkhira, Khulna, pirojpur, Barguna, Patuakhali, Noakhali and Cox’s Bazar; these areas are relatively flat and suffer inundation by saline water to different degrees. Agricultural production constraints due to salinity, i.e., soil and water salinity, high
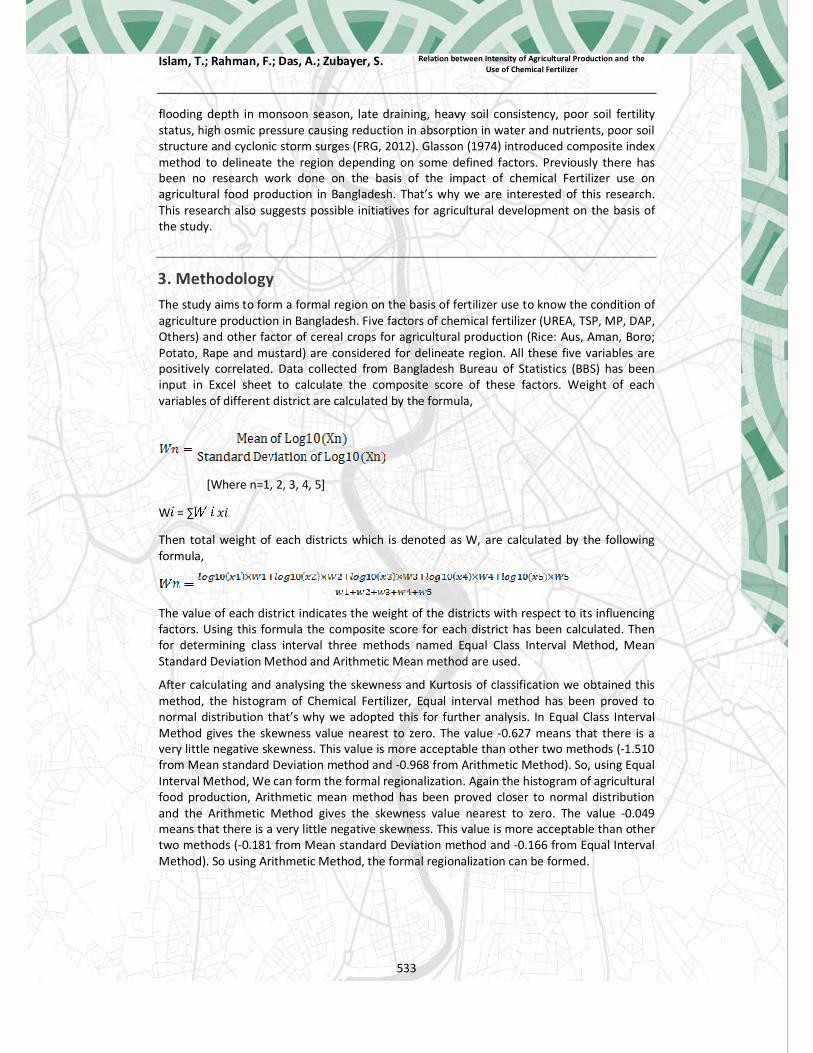
Islam, T.; Rahman, F.; Das, A.; Zubayer, S. Relation between Intensity of Agricultural Production and the Use of Chemical Fertilizer
533
flooding depth in monsoon season, late draining, heavy soil consistency, poor soil fertility status, high osmic pressure causing reduction in absorption in water and nutrients, poor soil structure and cyclonic storm surges (FRG, 2012). Glasson (1974) introduced composite index method to delineate the region depending on some defined factors. Previously there has been no research work done on the basis of the impact of chemical Fertilizer use on agricultural food production in Bangladesh. That’s why we are interested of this research. This research also suggests possible initiatives for agricultural development on the basis of the study.
3. Methodology The study aims to form a formal region on the basis of fertilizer use to know the condition of agriculture production in Bangladesh. Five factors of chemical fertilizer (UREA, TSP, MP, DAP, Others) and other factor of cereal crops for agricultural production (Rice: Aus, Aman, Boro; Potato, Rape and mustard) are considered for delineate region. All these five variables are positively correlated. Data collected from Bangladesh Bureau of Statistics (BBS) has been input in Excel sheet to calculate the composite score of these factors. Weight of each variables of different district are calculated by the formula,
[Where n=1, 2, 3, 4, 5]
W = ∑ ݔ
Then total weight of each districts which is denoted as W, are calculated by the following formula,
The value of each district indicates the weight of the districts with respect to its influencing factors. Using this formula the composite score for each district has been calculated. Then for determining class interval three methods named Equal Class Interval Method, Mean Standard Deviation Method and Arithmetic Mean method are used.
After calculating and analysing the skewness and Kurtosis of classification we obtained this method, the histogram of Chemical Fertilizer, Equal interval method has been proved to normal distribution that’s why we adopted this for further analysis. In Equal Class Interval Method gives the skewness value nearest to zero. The value -0.627 means that there is a very little negative skewness. This value is more acceptable than other two methods (-1.510 from Mean standard Deviation method and -0.968 from Arithmetic Method). So, using Equal Interval Method, We can form the formal regionalization. Again the histogram of agricultural food production, Arithmetic mean method has been proved closer to normal distribution and the Arithmetic Method gives the skewness value nearest to zero. The value -0.049 means that there is a very little negative skewness. This value is more acceptable than other two methods (-0.181 from Mean standard Deviation method and -0.166 from Equal Interval Method). So using Arithmetic Method, the formal regionalization can be formed.

Islam, T.; Rahman, F.; Das, A.; Zubayer, S. Relation between Intensity of Agricultural Production and the Use of Chemical Fertilizer
534
4. Result and Discussion Total 64 districts of Bangladesh were divided into four agricultural region in this study on the basis of combined chemical fertilizer index and composite score. The considered five classes have been grouped as Very low use, Low use, Moderate use, High use and Extreme use regions. Table 1 shows a detailing of the agricultural regions.
Table 1: Districts in different attributes in Chemical Fertilizer
(Source: Authors’ Preparation, 2019) The map illustrates in Figure 1:
Range of Composite
Score
Attribute Frequency District Name
2.85-3.22 Very low use
3 Rangamati, Jhenadah, Barguna
3.23-3.60 Low use 3 Khulna, Barisal, Munshiganj 3.61-3.98 Moderate
use 22 Dinajpur, Gaibandha, Bogra, Nator, Meherpur,
Magura, Rajbari, Shariatpur, Chadpur, Potuakhali,Bogra, Bhola, Nohakhali, Sunamganj, Sylhet,Kishorganj,Narsindi,Pirojpur,Satkhira, Bandarban, Sherpur, Narayanganj,
3.99-4.46 High use 25 Panchagar,Thakurgaonn,Nilphamari,Lalmonirhat, Kurigram,Joypurhat,Jamalpur,Mymensing,Netrak ona,Gazipur,Pabna,Kustia,Rajshahi,Nawabganj, Chuadanga,Gopalganj,Manikganj,Dhaka,Comilla, Feni,Khagrachari,Chittagonj,Cox’s Bazar,Habiganj,Maulivbazar
4.37-4.75 Extreme use
11 Rangpur,Naogaon,Sirajganj,Tangail,Brahanbaria, Lakhsimipur,Faridpur Narail,Jessore,jhalokathi, Bagherhat,

Islam, T.; Rahman, F.; Das, A.; Zubayer, S. Relation between Intensity of Agricultural Production and the Use of Chemical Fertilizer
535
(Source: Authors’ Preparation, 2019)
Figure 1: Chemical fertilizer use Map in Bangladesh Table 2: Agricultural Regionalization Based on Productivity for Bangladesh Range of Composite Score
Attribute Frequency District Name
3.89-4.29 Low productive
5 Barisal,Barguna,Jhenaidah,Narsingdi,Rangamati
4.30-5.11 Moderately low productive
23 Panchagarh, Nilphamari,Dinajpur,Gaibandha,Meherpur, Natore,Mymensingh,Sunamganj,Habiganj,Maulovibazar, Magura,Rajbari,Manikganj,Dhaka,Narayanganj,Gopalganj ,Madaripur,Shariatpur,Khulna,Patuakhali,Noakhali,Feni, Bandarban
5.12-6.34 Moderately High productive
26 Thakurgaon,Lalmonirhat,Rangpur,Chapainawabganj, Joypurhat,Bogra,Chuadanga,Kushtia,Pabna,Shirajganj, Jamalpur,Sherpur,Gazipur,Kishoreganj,Netrakona,Jessore, Satkhira,Bagerhat,Pirojpur,Munshiganj,Chandpur,Comilla, Lakshmipur,Bhola,Khagrachari,Chittagong
6.35-7.98 Highly productive
10 Kurigram,Sylhet,Naogaon,Rajshahi
Tangail,Brahamanbaria,Faridpur,Narail,Jhalokati,Cox’s Bazar The map illustrates in figure 2.

Islam, T.; Rahman, F.; Das, A.; Zubayer, S. Relation between Intensity of Agricultural Production and the Use of Chemical Fertilizer
536
(Source: Authors’ Preparation, 2019)
Figure 2: Agricultural Productivity Map for Bangladesh based on cereal crops production
Regionalization map of Bangladesh under categories of two sector; Chemical fertilizer and agricultural cereal crops production are merged and is presented as following with different colours and Symbol.

Islam, T.; Rahman, F.; Das, A.; Zubayer, S. Relation between Intensity of Agricultural Production and the Use of Chemical Fertilizer
537
(Source: Authors’ Preparation, 2019)
Figure 3 Map of Relation between intensity of Agricultural cereal crops Production and the Use of Chemical Fertilizer.
The subcategories from both sector is presented on table.
Table 3: Districts in Different attributes in Agricultural cereal crops Production on the basis of chemical fertilizer use
Attribute Frequency District Name
High Fertilizer Use and Highly Productive
42 Panchagarh,Nilphamari,Mymensingh,Habiganj, Maulovibazar,Dhaka,Manikganj,Gopalganj,Feni, Thakurgaon,Lalmonirhat,Joypurhat,Nawabganj,Jamalpur,Netrakona,Chuadanga,Kushtia,Pabna,Gazipur,Comilla,Khagrachari,Chittagong, Bogra,Sherpur, Kishoreganj,Chandpur,Satkhira,Pirojpur,Bhola Dinajpur,Gaibandha,Natore,Meherpur,Sunamganj, Narayanganj,Rajbari,Magura,Madaripur,Noakhali, Shariatpur,Patuakhali,Bandarban

Islam, T.; Rahman, F.; Das, A.; Zubayer, S. Relation between Intensity of Agricultural Production and the Use of Chemical Fertilizer
538
High Fertilizer Use but low Production
5 Rajshahi,Kurigram,Cox’s Bazar, Sylhet,Narshingdi
Moderate Fertilizer Use and Highly Productive
5 Jessore,Bagerhat,Lakshmipur,Sirajganj,Rangpur
Moderate Fertilizer Use and low Productive
6 Jhalikathi,Narail,Faridpur,Brahamanbaria,Tangail, Naogaon
Low Fertilizer use but High Production
2 Khulna, Munshiganj
Very Low Fertilizer Use and low Production
4 Rangamati,Borguna,Jhenaidah, Barisal
We are particularly focusing the highlighted districts in the above table.
Highly Productive Region Panchagarh,Nilphamari,Mymensingh,Habiganj,Maulovibazar,Dhaka,Manikganj,Gopalganj,Feni,Thakurgaon,Lalmonirhat,Joypurhat,Nawabganj,Jamalpur,Netrakona,Chuadanga,Kushtia,Pabna,Gazipur,Comilla,Khagrachari,Chittagong,Bogra,Sherpur,Kishoreganj,Chandpur,Satkhira,Pirojpur,BholaDinajpur,Gaibandha,Natore,Meherpur,Sunamganj,NarayanganjRajbari,Magura,Madaripur,Noakhali,Shariatpur,Patuakhali,Bandarban Districts are highly productive regions for agricultural production as being high fertilizer use. Due to high agricultural productivity of the districts of the country has always received a priority for expenditure on agricultural sector of the government. Districts like Dhaka, Comilla, and Dinajpur which are divisional headquarters. They have better infrastructure and communication system for agricultural improvement (LGED, 2013). For this, they have higher level of production. High productivity of Naogaon, Dinajpur, can also be attributed by presence of rice mill encouraging farmer’s rice production (The Daily Star, 2011). Kushtia and Thagurgaon has also potentiality for Rice production. Low Productive Region Around 4% districts are in low productive region. Rangamati, Borguna, Jhenaidah, and Barisal these districts are low productive region as fertilizer use is low. Rangamati is hilly area which is unsuitable for agricultural production (LGED, 2013) High Fertilizer Use but low Productive Region From the analysis we can see that Rajshahi, Kurigram, Cox’s Bazar, Sylhet, and Narshingdi are low productive region for agricultural production in spite of using high chemical fertilizer. In Cox’s Bazar Rice: Aus, Aman, Boro; Potato, Rape and mustard are equally low production proportionally comparatively other districts though the amount of fertilizer use is high. There may be other reason behind this, as this districts is near to sea level and soil fertility is not as good for good production as saline soil is present there. In this region excess amount of saline soil is present. Due to closeness to Bay of Bengal, this district is the worst victim of

Islam, T.; Rahman, F.; Das, A.; Zubayer, S. Relation between Intensity of Agricultural Production and the Use of Chemical Fertilizer
539
the hurricane, typhoon, cyclone etc. For these kind of natural disasters local agriculture have a negative impact .Another reason for low productivity in this region is low expenditure in the agriculture sector of Government (World Bank, 2013).In Rajshahi region the organic matter status of soil is very low <1.0%., Nur Muhammad Mondal, Joint Director (Fertilizer) of BADC, said soil fertility in the region has gradually been decreasing with intensified crop production, high-yielding crop varieties and an over dependency on chemical inputs. During the last couple of decades, food grain production as considerably increased due to substantial intensification of cropping, introduction of high yielding varieties and expansion of irrigated area and use of chemical fertilizers. Nur Muhammad added that integrated nutrient management has become an urgent need for sustaining crop productivity and improvement of soil fertility through overcoming the constraints in the region (Green Watch news).As Sylhet has dominancy of hilly topography, crop production is relatively low than other districts. Among the seven haor districts under consideration, in the haor areas of Sunamgonj, Kishoregonj, Sylhet and Hobigonj, rice is not grown in Aus season. (DAE, 2007). Area coverage under different crops by season in the haor areas rice (Aus, Aman, Boro) production rate is average low than other haor areas. That’s why though being high fertilizer use, production rate is low in this region (DAE, 2007). Kurigram is flood prone area, farmer can’t not harvest properly because of flood. Maximum agricultural land become flooded during heavy rain. That’s why the average agriculture food production is low though being use of high chemical fertilizer. Low Fertilizer use but highly productive region Khulna, Munshiganj are the best for production though being use low fertilizer. Munshiganj alone produce about 34 percent of the country’s potato, according to the Agriculture Extension Department (AED) of the district. Potato production is the factor behind highest production of this region. Another districts highly productive but low fertilizer use is Khulna. Khulna consists of both saline and non-saline ecosystem. Agriculture of this region is mainly dominated by rice and fish. In Khulna most of the area about 63% is covered by exclusive rice-based cropping pattern. (BBS, 2014-15). In spite of being prone to salinity intrusion and natural disaster, they have high level of production. It is because the characteristics of this district Ganges Tidal Flood Plain Agro ecological zone which provide higher level of fertility due to alluvial characteristics of land which is suitable for agricultural production (Quddus, M.A. 2009).
5. Conclusion From the research it is clear that all districts are not equally well off. The main reasons behind inequality are the lack of fertility of land, topographic variation, inadequate infrastructure facility like fertilizer warehouse etc. Due to uneven distribution of crop production, crucial result is dependency of the low productive districts on the higher productive districts. Agriculture plays a key role in the overall economic performance of Bangladesh not only in terms of its contribution to GDP but also as a major source of foreign exchange earnings and in providing employment to a large segment of the population, particularly the poor. From analysis we can see that 40% area is good for agriculture production under high fertilizer use and 4% districts are low for agriculture production with 8% high fertilizer use. Exceptional districts are also seen in different condition. In our research we can see that some districts are low for agriculture production though high fertilizer use and some districts are best for production with low fertilizer use. There may be reason for soil, weather and other factor. But we didn’t go so far in our research. So there remains a great scope for further research. Fertilizers play an essential role in increasing crop yields, although, fertilizer marketing and distribution system are weakly organized. The crisis is more emphasized due to the time impressibility of fertilizer application. Fertilizer factory

Islam, T.; Rahman, F.; Das, A.; Zubayer, S. Relation between Intensity of Agricultural Production and the Use of Chemical Fertilizer
540
at every Upazila level can meet up the total demands of fertilizer throughout the country. In these circumstances, increase of balanced and or recommended fertilizer uses could contribute in resource use efficiency and more economic return from cultivated crops. Information in this research would be helpful to serve as an intermediate between intensity of fertilizer use and agriculture production.
6. Reference Annonomous. (2012), Fertilizer recommendation guide, Bangladesh Agricultural Research
Council AgroXpertus. B, (2014), BLGG AGROXPERTUS, from- http://blgg.agroxpertus.nl/ Basak. J. K, (2010), Future fertilizer demand for sustaining rice production in Bangladesh Department of Agricultural Extension, (2007), Field Crops Wing,
Khamarbari,Farmgate,Dhaka, Department of Agricultural Extension FRG, (2012), Fertilizer Recommendation Guide, Bangladesh Agriculture Research Council, pp
275, Farmgate,Dhaka Glasson. J, (1975), An Introduction to Regional Planning, London, Hutchinson and Co Ltd LGED, (2013), http://www.lged.gov.bd/Default.aspx accessed on 29-10-2013 (2011), Population and Housing Census, Dhaka: Bangladesh Bureau of Statistics Quddus. M. A, (2009), Crop Production Growth in Different Agro-Ecological Zones of
Banglad1esh, Vol: 7(2), pp: 351-360, Journal of Agricultural University Singh. J, Dhilon. S.S, (2004), Agricultural Geography, India: Tata McGraw-Hill Education Society for Environment and human Development, (2012), Bangladesh: Land, Forest and
Forest People, from- http://www.sehd.org/publications/adivasis-andforests/29-bangladesh-land-forestand-forest-people.
The Financial Express Bangladesh, (2017), from- www.thefinancialexpress-bd.com/2017/03/08/63786/Bangladesh,-SaudiArabia-sign-agreement-to-buy-urea-fertilizer.
The Daily Sun, (2017), retrieved from- www.dailysun.com/printversion/details/215525/Govt-to-set-up-13-buffer-fertiliser-warehouses-
The Daily Star, (2011), from http://archive.thedailystar.net/newDesign/news-details.php?nid=206220 accessed on 30-10-2013.
World Bank, (2018), Poverty Assessment in Bangladesh: Creating Opportunities and Bridging East-West Divide, from http://siteresources.worldbank.org/BANGLADESHEXTN/Resources/2957591240185591585/ BanglaPD.pdf accessed on 28-10-2013.

Das, A; Salan, M S A; Zubayer, M S Regional Competitiveness Analysis
541
Research Paper
Regional Competitiveness Analysis: A Prime Focus on Region’s Spatio-Functional Gap and Median
Population Threshold Assessment
Anutosh Das, Assistant Professor, Dept. of URP, RUET, Rajshahi, Bangladesh
Md. Shakil Ar Salan, Graduate, Dept. of URP, RUET, Rajshahi, Bangladesh Md. Sakib Zubayer, Lecturer, Dept. of URP, RUET, Rajshahi, Bangladesh
Abstract
Counter-balancing the spatio-functional gaps of service facilities is considered to be the foremost task of Regional Planning. The functional gap analysis and median population threshold helps to identify and analyze the adequacy or inadequacy of the services within each complementary region. Therefore, this particular research tries to understand the requirement and availability of socio-economic facilities and its distribution in the optimum location in the study area through the analysis of functional gap and median population threshold. This study deals with several services facilities as growth center, rural market, educational and healthcare facilities like high school, primary school, upazilla health complex, community clinic and so on. As an overall finding the study reveals that, service facilities like community clinic, growth center requires a very small population to be supported whereas facilities like police station, healthcare center do not demand such a high population to be existed. The main reason behind that can be facility like community clinic is of major importance for the people and it is a basic need in comparing to the other supplementary services like police station. In regards of functional gap, the service facilities are inadequate in almost all of the unions and upazillas of Khulna district. Finally, the study concludes to an interesting finding that, though the secondary needs of the people of this region is not served properly, the basic needs of common people is well served in this region.
Keywords
Regional Competitiveness, Functional Gap, Median Threshold Population, Service Facilities, Optimum Location.
1. Introduction Bangladesh is a densely populated country of the world. The country is experiencing a high pace of urbanization, though the rate of urbanization is uneven throughout the regions or districts of the country. The long-term convergence in per capita income between national and sub-national regions is increasing (Huang and Leung, 2009). Competitiveness exists in all of the regions of Bangladesh in respect of investment, infrastructure, resource, Institutions, Macroeconomic stability, Health and primary education, Higher education and training, Goods market efficiency, Labour market efficiency etc. as a consequence of this uneven urbanization (Ara and Rahman, 2014).

Das, A; Salan, M S A; Zubayer, M S Regional Competitiveness Analysis
542
In case of economic policy making both at the national and regional level, the enhancement of competitiveness is a popular target (Bekes, 2015). Regional competitiveness is often defined as the derivation of macroeconomic competitiveness. It can also be defined as the ability of offering an attractive and sustainable environment for firms and residents to live and work (Bekes, 2015). The Global Economic Forum (GEF) defines competitiveness as “the set of institutions, policies, and factors that determine the level of productivity of a country” (Ara and Rahman, 2014). The characteristics of a region which is competitive are more debated by the concept than the literature. The key determinants of regional competitiveness are productive capital, human capital, infrastructure, technological readiness, market size, innovation, the competitiveness of firms and the interaction among these factors (Ara and Rahman, 2014; Bekes, 2015). Private investment in a particular region or the infrastructural development of a particular region can affect the regional competitiveness (Bekes, 2015). The strength of export base of a particular region also affects its regional competitiveness (Gardiner, Martin and Tyler, 2004).
There are several measures of regional competitiveness. Functional gap analysis and the assessment of median threshold population are the prime focus of regional competitiveness analysis in this study. Functional gap analysis describes the differences between required and actual service facilities (Chron, 2013). It aims to identify gaps in various types of functions and determines whether the gaps are critical or whether the users of that activity can accommodate them (Santini, Marco, Boitani, Maiorano, and Rondinini, 2014). The method of analyzing the gaps includes identifying the magnitude and the direction of the gap. If the direction of the gap is positive, the existing facility exceeds requirements or vice-versa (Chron, 2013). The population threshold is the minimum population required to support a service facility. Threshold population for different service facilities varies widely (Glasson, 1978). The frequency of use of different services has a vital influence on the threshold population for that specific service activity. If the population of a region falls below the threshold population for a specific service activity, the activity will run at a loss and will face closure in the long run. In the meantime, if the population increases above the threshold, the activity will increase its profit (Glasson, 1978).
The study aims to analyse the regional competitiveness through the assessment of median population threshold and analysis of functional gap for different service facilities of different upazilla of Khulna district. The study provides insight about the comparative functional gap and median threshold population for various facilities and services which ultimately depicts the competitiveness of different regions of Khulna district.
2. Operational Procedure and Data Foremost objectives of this study are to determine the median population threshold for different service activities of the study area and to analyze the functional gap between the existing and required number of different service facilities of the study area. Secondary database on different service activities (Khulna district) is collected from Bangladesh Bureau of Statistics (BBS, 2011).
The study commences with the collection of union wise database of area, population, existing number of different service facilities of Khulna district. This study deals with several

Das, A; Salan, M S A; Zubayer, M S Regional Competitiveness Analysis
543
services facilities of different unions of Khulna district namely growth center, rural market, police station, upazilla health complex, family welfare center, Post office, community clinic, madrasa, mosque, bank branch, high school, primary school and College. The population levels are selected on the basis of the accuracy and the precision of the study is required. Equal interval class interval method is used for the categorization of population level. In the next step the median threshold populations for different service facilities are determined. The intersecting point of two different equation representing “number of union with college absent at this and greater level” and “number of union with college present at this and smaller level” represent the threshold population of an particular service activity. The median threshold population of an service activity is determined using the following formula (Jahan and Oda, n.d).
The horizontal co-ordinate for a specific service activity, [1]
Median population threshold = [2] Where, a= Vertical intercept of equation representing number of union with College absent at this and greater level. b = Slope of equation representing number of union with College absent at this and greater level. c = Vertical intercept of equation representing number of union with College present at this and smaller level. d = Slope of equation representing number of union with College present at this and smaller level. m= Midpoint of first population level. k= Equal interval between midpoints of population levels. Afterward the functional gap for different service facilities of different unions is analyzed. For functional gap analysis a rule of thumb is used in this study. The derived fractional number of required service facility for a union is always rounded to its nearest upper value. In this stage at first the required number of service facilities in each of union is determined. It is obtained by dividing the total population of a union by the threshold population of different service facilities attained in the previous stage of calculation. Then the derived required number of service facilities for a union is subtracted from the existing number of different facilities at that specific union. The calculated figure indicates the magnitude of the functional gap and the positive or negative sign indicates the direction of functional gap for that particular facility. If the direction of the gap is positive, the existing facility exceeds requirements or vice-versa. Finally, the database analyzed the overall scenario of Khulna district in respect of different service facilities is represented on the basis of the output derived from functional gap analysis.
3. Data Analysis and Interpretation The facilities for which the calculated horizontal co-ordinate values are found negative (calculated from equation-1), have been omitted from further analysis of median threshold population or functional gap analysis. The underlying reason is that the median threshold population for these facilities will also be negative and negative population does not have any kind of real implication. For this reason, service facilities like rural market, high school, mosque, primary school and post office are omitted from further analysis (Table 1).
Here, Midpoint of first population level= 15000 and equal interval between midpoints of population levels =2000

Das, A; Salan, M S A; Zubayer, M S Regional Competitiveness Analysis
544
Table-1: Calculation of horizontal co-ordinate for a specific service activity
Source: Researcher calculation
Figure 1: Calculation of median population threshold for (a) community clinic (b) growth center
(c) madrasa (d) family welfare center (e) college (f) upazilla health complex and (g) police station Figure 1 shows the calculation of median threshold population for different facilities and services which result a positive horizontal coordinate value. The linear regression between No. of union with facility absent at this and greater level (AG) and No. of union with facility present at this and smaller level (PS) shows the value of coefficient of determination (R2) which is about 0.80 or more, which means that the proportion of the variance in the dependent variable explained by the independent variable is about 80% or more.
Service facilities a b c d x
Rural Market 22.9 2.821 4.272 -0.213 -6.14 Growth Centre 12.89 1.769 23.07 -1.524 3.09 Police station 0 0 54.33 -3.634 14.95
upazilla health complex 40.99 -2.757 0.683 0.826 11.25
Family Welfare Centre 12.41 0.973 36.64 -2.352 7.29 High school 21.05 2.654 6.257 -0.453 -4.76
Post Office 22.05 2.732 4.897 -0.348 -5.57
Community clinic 14.61 1.977 19.14 -1.277 1.39 Madrasa 6.845 2.036 19.25 -1.387 3.62
Mosque 14.8 2.818 5.242 -0.399 -2.97 Primary School 21.86 2.963 1.419 -0.105 -6.66
College 6.051 1.125 33.87 -2.365 7.97
(f) (e) (d)
(b) (c)
(g)
(a)

Das, A; Salan, M S A; Zubayer, M S Regional Competitiveness Analysis
545
Figure 2: Ranking of median threshold population for different service facilities
Figure 2 depicts that, service facilities like police station, upazilla health complex requires higher threshold population to be supported. On the contrary, growth center, community clinic requires small threshold population to be supported (Figure 2). The main reason behind that can the facility like community clinic is of major importance for the people and it is a basic need in comparing to the services like police station. For this reason, the frequency of these types of service facility like police station is too much less in relation to the health care facilities
Figure- 3: Ranking of different upazilla of Khulna district on the basis of population. From the analysis it is found that “Koira upazilla” is the largest upazilla of Khulna district in terms of population (Figure 3). On the other hand, “Dumuria upazilla” is the largest one in terms of geographical area (Figure 4). The relationship among population, area of different upazilla of Khulna district and existing condition of service facilities and functional gaps are analyzed below.

Das, A; Salan, M S A; Zubayer, M S Regional Competitiveness Analysis
546
Figure- 4: Ranking of different upazilla of Khulna district on the basis of area.
Figure 5: Existing number of different facilities according to different Upazilla.
From the above analysis it is found that the different service facilities exist in quite large number in Dumuria and Paikgacha upazilla than all other upazillas of Khulna district. Dumuria upazilla is the largest upazilla, Paikgacha is the second one among all upazillas in Khulna district in terms of geographical area. On the other hand facilities do not exist in large number in upazilla like Koira , Dacope which are the large one in terms of population (Figure 5). So it can be said that the existing number of service facility largely depend on the area of an upazilla rather than the population of it.

Das, A; Salan, M S A; Zubayer, M S Regional Competitiveness Analysis
547
Figure 6: Upazilla wise functional gap of different service facilities.
Figure 6 depicts that almost all the service facilities in different upazilla of Khulna district is inadequate as the functional gaps are negative for almost all of the service facilities. Functional gaps of different service facilities are calculated from the difference between the existence and required number of facilities. Among the different kinds of facilities, the shortage of facilities like growth center, college etc. is acute. As a result, the total economy and higher education of this region is hardly hampered due to the inadequacy of these facilities. On the other hand, the service facilities like family welfare center, madrasa etc. are in quite adequate quantity. So, the healthcare facility and primary education is not yet hampered in this region. Again, the shortage of different facilities is acute in Paikgacha and Dumuria upazilla althouth the existing numbers are quite satisfactory. These are two outsized upazilla of Khulna district in term of geographical area. On the other hand, the problems are less acute in case of Koira and Dacope upazilla which are two large upazilla of Khulna district in terms of population. One of the main reasons behind this is that the total population of an upazilla is considered while calculating required service facility for an area but the area is not considered. But in reality, the geographical area of a region is an important factor in determining the required number of service facilities for that specific region. The main service facilities which are inadequate in different unions of Dumuria and Paikgacha upazilla are identified below:
-10
-8
-6-4
-2
0
24
6
8
10Fu
nctio
nal g
ap
Different upazilla of "Khulna" district
Functional gap of different service facilities of different upazilla of "Khulna" district
Growth centre
Police satation
Upazilla HealthcomplexFamily welfarecentreCommunity clinic
Madrasa
College

Das, A; Salan, M S A; Zubayer, M S Regional Competitiveness Analysis
548
Figure 7: Union wise functional gap of different service facilities of Dumuria Upazilla.
Figure 8: Union wise functional gap of different service facilities of Paikgacha Upazilla.
The analysis shows that there is variation in functional gap of different service facilities of different unions in Khulna district. Moreover, service facilities are not evenly distributed in different unions of an upazilla. In Dumuria upazilla, the most required facilities are growth center and college. This scenario is same for the Paikgacha upazilla where there is also acute lack of facilities like growth center and college (Figure 7 & 8). So, it can be said that here is an overall inadequacy of these two facilities in almost all union of Khulna district.

Das, A; Salan, M S A; Zubayer, M S Regional Competitiveness Analysis
549
4. Major Findings and Conclusion Median population threshold is highly dependent on the type of service facility. For example, whether, it is a primary need of people like healthcare facility or not. Service facilities like growth center, community clinic requires a very small population to be supported whereas facilities like police station, healthcare center do not demand such a high population to be existed. The frequency of these types of service facility like police station is too much less in relation to the health care facilities. In regards functional gap between the existing and required number of different service facilities, the service facilities are inadequate in almost all of the unions and upazilla of Khulna district. The inadequacy of growth center and college is acute. Due to the shortage of these facilities the total economy as well as the higher education is hampered. On the other hand, the service facilities like family welfare center, madrasa etc. are in quite adequate quantity. So finally, it can be said that though the secondary needs of the people of this region is not served properly, the basic needs of common people are well served in this region.
5. References Ara, D. L. A., & Rahman, M. M. (2014). The Competitiveness and Future Challenges of
Bangladesh in International Trade, 2. Retrieved from: https://www.researchgate.net/publication/237812220_The_Competitiveness_and_Future_Ch llenges_of_Bangladesh_in_International_Trade
BBS (2011). Area, Households, Population, Density by Residence and Community Report-
Khulna, Bangladesh Bureau of Statistics, Government of the People’s Republic of Bangladesh.
Bekes, G. (2015). Measuring regional competitiveness: A survey of approaches, measurement
and data. Institute of Economics, Centre for Economic and Regional Studies, Hungarian Academy of Sciences, pp. 5-13.
Chron. (2013). Functional Gap Analysis. Retrieved from: http://smallbusiness. chron.com/
functional-gap-analysis-41841.html assessed on 30 October, 2014. Jahan, S. & Oda, T.(n.d.). Distribution of Public Facilities in Dhaka, Bangladesh: A Spatial
Analysis. Retrieved from: http://www2.kobe-u.ac.jp/~oda/Jahan&Oda.pdf accessed on October 30,2014.
Gardiner, B., Martin, R., & Tyler, P. (2004). Competitiveness, Productivity and Economic
Growth across the European Regions. Regional Studies Association’s Regional Productivity Forum Seminar, London, 3.
Glasson, J. (1978). An Introduction To Regional Planning: Concepts, Theory And Practice,
Hutchinson & Co. Ltd, 3 Fitzory Square, London. Santini, L., Marco, M. D., Boitani, L., Maiorano, L., & Rondinini, C. (2014). Incorporating
spatial population structure in gap analysis reveals inequitable assessments of species protection. Journal of conservation biography, 20, pp. 698.

Murad, M.A.A.; Hossain, M.M.; Jahan, T.; Tahasin, A.; Zubayer, M.S.
Irrigation Water Crisis and Changes in Agricultural Practice in Barind Area
550
Research Paper
Irrigation Water Crisis and Changes in Agricultural Practice in Barind Area A Study in Godagari Upazila
M.A.A. Murad, M.M. Hossain, T. Jahan, A. Tahasin, Undergraduate student, Department of Urban & Regional Planning, RUET;Bangladesh.
M.S. Zubayer, Lecturer, Department of Urban & Regional Planning, RUET;Bangladesh.
Abstract
Bangladesh is a country of agricultural economy. Most of the people of this country directly or indirectly dependent on agriculture. Irrigation is a must in cultivation of any agricultural product. But nowadays the irrigation water crisis is a big problem in North-West region of Bangladesh. Mostly the Barind area is facing the problem of water crisis for irrigation purpose as the farmers don’t have much sources of water. The objective of the study was to find out the main causes of water crisis and the impacts of this crisis on agriculture. A village from the Godagari Upazila was selected for the study where agriculture is the major occupation. The study was conducted through snowball sampling method and collected data by questionnaire survey. There are also several tools of Participatory Rural Appraisal (PRA) method e.g. Focused group discussion (FGD), Seasonal Calendar, Timeline (Historical mapping), Resource Map and some secondary data had been used for the data collection and analysis purposes. The study found that there is a practice of using underground water for every purpose in the particular area. The study also covered various issues like change in crop production cost, job migration and degradation of ground water level, Adaptation of people with their condition etc. Moreover, the study had also analyzed about the drinking water for the people of the area. This study might be helpful to develop rural-agricultural scenario in future.
Keywords
Irrigation, Crisis, Seasonal calendar, Timeline, Deep well, Ground water level.
1. Introduction and Study area profile 1.1.1 Background: Bangladesh is one of the most densely populated country in the world. Most of the population directly or indirectly depends on agriculture. Agricultural land is decreasing in an alarming rate. In recent time the agricultural sector of the country is facing many obstacles especially for the climate change. Water scarcity is one of the major problems for agriculture. In recent time the dependency on ground water is increasing immensely for the agricultural purpose. In Barind area of Rajshahi the water level is falling lower day by day. Especially Mohanpur, Baghmara, Tanore and Godagari the water level of these area is very much lower than other surrounding area (M. Aziz et al. 2015). People of the area are facing the scarcity of water for drinking and agricultural purpose. The rainfall is the main source of ground water recharge. But the rainfall of the area is decreasing over the time for climate change. The mean annual rainfall of Rajshahi is 1625 mm which is much

Murad, M.A.A.; Hossain, M.M.; Jahan, T.; Tahasin, A.; Zubayer, M.S.
Irrigation Water Crisis and Changes in Agricultural Practice in Barind Area
551
lower than the national average of 2550 mm (M. Aziz et al. 2015). The quality of drinking water is also poor in these area. Most of the people of these area could not manage the safe water for drinking in the drought season.
The people of the Barind area nowadays developed their several policies to overcome this water crisis in agriculture as well as in their daily lives. There is a visible change in the sources of irrigation water in this area. The process of adaptation with the climatic condition is developed time to time.
The people of Degram village of the Mahanpur Union, fully depend on ground water for their drinking purpose and the ground water level is getting very lower in the drought season. There is only a single source of water serving every sector of the village. However, using ground water for agriculture and daily life it reduces the crisis of water, but the effect might take place as long term effect in reality.
1.1.2 Objectives: To find out the principle causes of water crisis in the study area
To find out the changes in crop production
To analyze the impact of water crisis on crop production
1.1.3 Scope of the study: The study was done through the PRA tools and the questionnaire survey. The study contains the irrigation system analysis, drinking water source, adaptation with drought by the villagers, migration of the farmers etc related to the village agriculture.
1.1.4 Limitations of the study: The study covers a small portion of the Barind area. There was a shortage of time and man power to conduct the study for the whole region.
1.2 Study area profile: Degram is a village from the Mohanpur Union of Godagari Upazila. The people of the village mostly work as farmer in their fields for their livelihood. The whole population of the village and their settlements totally depend on the deep well and the ground water sources. However there are several surface water sources are seen throughout the whole village, the water usage is restricted.
Figure 1 Study area map Source: Google earth, 2019

Murad, M.A.A.; Hossain, M.M.; Jahan, T.; Tahasin, A.; Zubayer, M.S.
Irrigation Water Crisis and Changes in Agricultural Practice in Barind Area
552
2. Methodology After analysing the rural problem of North West part of Bangladesh, the topic and objective were selected and then many related articles, journals, books and online document had been reviewed for the study in order to understanding the process and working methods. For this study both primary and secondary data are collected through questionnaire survey, interview and physical observation. Again, there are also some PRA tools (Focus Group Discussion, Seasonal calendar and Resource map) have been used to gather the primary data. The population of the study area was about 60000. From this population, the primary data were collected through the snowball sampling method. Then the farmers were interviewed and several information was collected about the water sources, irrigation process and their condition of irrigation and cultivation. Surface water condition and ground water distribution are observed by roaming the village. There are also some secondary data about rainfall and temperature has been used for the study. Finally the data were processed and analysed by the Microsoft Excel and SPSS software.
3. Analysis and findings 3.1. Analysis: 3.1.1 Climatic condition and water problem
Figure 2 Temperature data (Left) and rainfall data (Right)
Source: World Weather Online, 2019
From these data charts, it is visible that the temperature and the rainfall pattern has been changed over years. These almost 9 year data of Godagari can describe the whole climatic condition. Here, the annual average temperature is increasing consistently and the rainfall is decreasing almost in the same pattern. As a result there is a water crisis generating from these phenomenon. The ground water is not recharged as the rainfall is not sufficient, again the temperature is also very high. So, the ground water level is getting lower and surface water loses its real existence in almost every season.
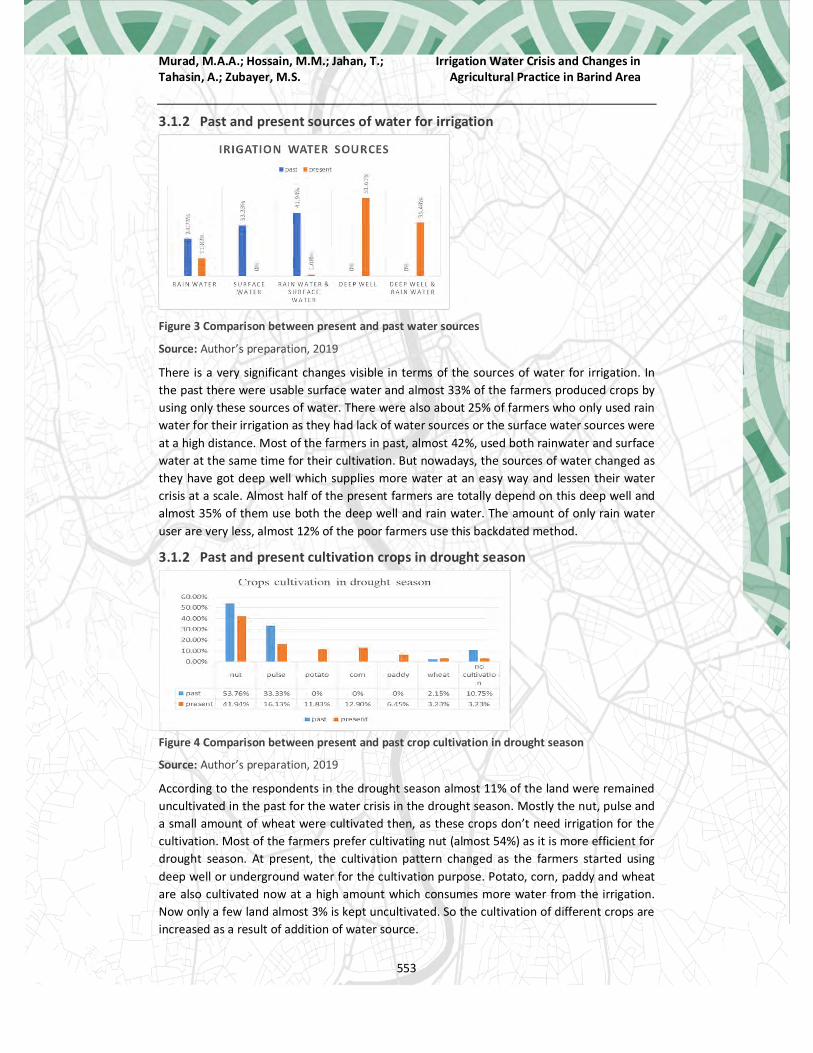
Murad, M.A.A.; Hossain, M.M.; Jahan, T.; Tahasin, A.; Zubayer, M.S.
Irrigation Water Crisis and Changes in Agricultural Practice in Barind Area
553
3.1.2 Past and present sources of water for irrigation
Figure 3 Comparison between present and past water sources
Source: Author’s preparation, 2019
There is a very significant changes visible in terms of the sources of water for irrigation. In the past there were usable surface water and almost 33% of the farmers produced crops by using only these sources of water. There were also about 25% of farmers who only used rain water for their irrigation as they had lack of water sources or the surface water sources were at a high distance. Most of the farmers in past, almost 42%, used both rainwater and surface water at the same time for their cultivation. But nowadays, the sources of water changed as they have got deep well which supplies more water at an easy way and lessen their water crisis at a scale. Almost half of the present farmers are totally depend on this deep well and almost 35% of them use both the deep well and rain water. The amount of only rain water user are very less, almost 12% of the poor farmers use this backdated method.
3.1.2 Past and present cultivation crops in drought season
Figure 4 Comparison between present and past crop cultivation in drought season
Source: Author’s preparation, 2019
According to the respondents in the drought season almost 11% of the land were remained uncultivated in the past for the water crisis in the drought season. Mostly the nut, pulse and a small amount of wheat were cultivated then, as these crops don’t need irrigation for the cultivation. Most of the farmers prefer cultivating nut (almost 54%) as it is more efficient for drought season. At present, the cultivation pattern changed as the farmers started using deep well or underground water for the cultivation purpose. Potato, corn, paddy and wheat are also cultivated now at a high amount which consumes more water from the irrigation. Now only a few land almost 3% is kept uncultivated. So the cultivation of different crops are increased as a result of addition of water source.

Murad, M.A.A.; Hossain, M.M.; Jahan, T.; Tahasin, A.; Zubayer, M.S.
Irrigation Water Crisis and Changes in Agricultural Practice in Barind Area
554
3.1.3 Past and present cultivation in one year
Figure 5 Comparison between present and past cultivation
Source: Author’s preparation, 2019
Here the comparison charts shows the present and past cultivation in a particular agricultural land. In the past, most of the lands were able to be cultivated once or twice in a year. Almost 86% of the lands were cultivated only once as there were no such source of water except rain water. Almost 14% of the land were able to be cultivated twice in a year which had the access of surface water only. But nowadays, most of the land are cultivated twice in a year (approximately 90% of the lands). However 3 times cultivation of land was not possible in the past, it happens nowadays as a result of using deep well water for irrigation.
3.1.4 Job migration
Figure 6 Job migration from agriculture to others in time period
Source: Author’s preparation, 2019
Seasonal migration is so common affair in the agriculture. Most of the migrants do migration from agricultural to non-agricultural activities like auto driving, day labouring, live-stock business or many other similar activities. Most of the farmers, almost half of the respondents, do seasonal migration for almost for 3-4 month. Very few farmers, almost 11% do seasonal migration for 1-2 month in any particular year. Mostly 20% of the farmers do seasonal migration for 5-6 month. Again, there are about 18% of the respondents who changed their job permanently. These permanent changes are the result of water crisis and financial problems.

Murad, M.A.A.; Hossain, M.M.; Jahan, T.; Tahasin, A.; Zubayer, M.S.
Irrigation Water Crisis and Changes in Agricultural Practice in Barind Area
555
3.1.5 The cultivated crops before migration
Figure 7 percentage of crops cultivated before job migration
Source: Author’s preparation, 2019
There are various crops were cultivated in past. When the farmers don’t get their benefits from the cultivation most of them quit their agricultural jobs and find another way for their betterment to the financial status. Here the chart shows the cultivated crops of the migrants before their migration. Here about 65% of the farmers gave responses that they had cultivated paddy in the past before migration. Again, almost 30% of them were involved in wheat cultivation. Rest almost 6% cultivated different other crops before their migration. So, from the chart we can understand that most of the farmers who had switched their jobs from agricultural to non-agricultural jobs were farmers of wheat and paddy mainly. These two crops are most water consuming crops according to their responses also. That means these crops are also costly for cultivation in the context of irrigation water supply.
3.1.6 The reasons behind the migration
Figure 8 Reasons of migration
Source: Author’s preparation, 2019
Both permanent and seasonal migration are seen in the particular region every year. The farmers are migrating in different other suitable jobs for their betterment. There are several reasons behind every job migration. The given chart shows different reasons behind the job migration of the respondent farmers. Here almost 25% of them are migrated in the off

Murad, M.A.A.; Hossain, M.M.; Jahan, T.; Tahasin, A.; Zubayer, M.S.
Irrigation Water Crisis and Changes in Agricultural Practice in Barind Area
556
season when they do not need to work in their crop fields. A high amount of farmers do migration to earn extra income as side business or to make another source of income for their financial improvement. This rate is about 38% of the respondents. There are also some farmers who does migration to earn more profit from agricultural as well as from non-agricultural activities. About 23% of them are falling in migration in order to earn a greater profit from agricultural activities like livestock business or the fertilizer-medicine business. However their reasons are different from each other but the main goal of their every reason is to get financial improvement in terms of earnings.
3.1.7 Change in living standard by job migration
Figure 9 changes in living standard with migration
Source: Author’s preparation, 2019
Here the change of the farmers’ living standard is shown after migration. Mostly 80% of the permanent migrated farmer’s living standard has been improved where about 65% of the seasonal migrated farmers’ living standard has been improved. In seasonal migration most of their living standard decreased significantly. Finally it could be seen that more seasonal migrants have similar living standard than the permanent migrants.
3.2. Findings The study was done in the village called Degram, which is in the Mohanpur Union and Godagari Upazila. The village is situated in the Barind region. In the village most of the people are in agriculture-based profession. However, the needs of agriculture are increasing day by day; the irrigation water is in a great crisis. There is a crisis of drinking water also in this particular village.
Farmers of this village generally used surface water and rain water for their cultivation purposes in the past. But now the surface water is unavailable for the general peoples as they are getting used for tender and fishing purposes by the government or other organizations. At present, the whole community is dependent on the deep well for their irrigation water for their fields.

Murad, M.A.A.; Hossain, M.M.; Jahan, T.; Tahasin, A.; Zubayer, M.S.
Irrigation Water Crisis and Changes in Agricultural Practice in Barind Area
557
Figure 10 Deep well
Source: Field survey, 2019
An old farmer of the village named Serajul Islam told, “The ground is fully dependent on the deep well water. Before the fields could cultivate only once in a year where after the placing of the deep well the fields are cultivating twice in a year.” Again, in order to cultivate a land, there is a huge need of water from the source. Here, the source is the ground water and the people are using a huge amount of water from the ground water source not only for irrigation but also for drinking. Several poles indicate the flow of water throughout the field.
The ground water level is falling as a result of the excessive use of deep well. So, the general tube wells are now unable to pump water from the ground water source. As a result, the use of deep tube well for drinking purpose is increasing by the people who can afford the cost. For the other poor people, the government has placed a water tank collecting water from the deep well and reserves for the drinking purposes.
Figure 11 Drinking water tank
Source: Field survey, 2019
The water from the tank is then served to the people by several tap placement throughout the whole village. Then, the villagers use the water for their daily purposes as household activities, bathing, drinking etc.
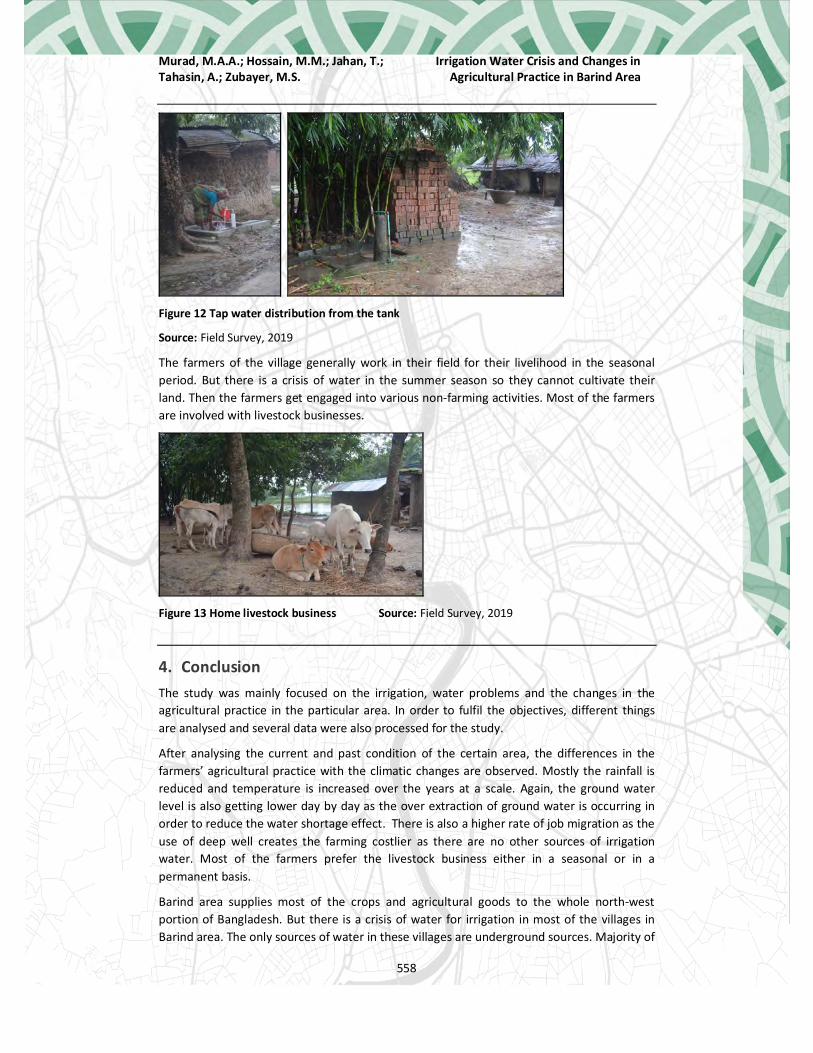
Murad, M.A.A.; Hossain, M.M.; Jahan, T.; Tahasin, A.; Zubayer, M.S.
Irrigation Water Crisis and Changes in Agricultural Practice in Barind Area
558
Figure 12 Tap water distribution from the tank
Source: Field Survey, 2019
The farmers of the village generally work in their field for their livelihood in the seasonal period. But there is a crisis of water in the summer season so they cannot cultivate their land. Then the farmers get engaged into various non-farming activities. Most of the farmers are involved with livestock businesses.
Figure 13 Home livestock business Source: Field Survey, 2019
4. Conclusion The study was mainly focused on the irrigation, water problems and the changes in the agricultural practice in the particular area. In order to fulfil the objectives, different things are analysed and several data were also processed for the study.
After analysing the current and past condition of the certain area, the differences in the farmers’ agricultural practice with the climatic changes are observed. Mostly the rainfall is reduced and temperature is increased over the years at a scale. Again, the ground water level is also getting lower day by day as the over extraction of ground water is occurring in order to reduce the water shortage effect. There is also a higher rate of job migration as the use of deep well creates the farming costlier as there are no other sources of irrigation water. Most of the farmers prefer the livestock business either in a seasonal or in a permanent basis.
Barind area supplies most of the crops and agricultural goods to the whole north-west portion of Bangladesh. But there is a crisis of water for irrigation in most of the villages in Barind area. The only sources of water in these villages are underground sources. Majority of

Murad, M.A.A.; Hossain, M.M.; Jahan, T.; Tahasin, A.; Zubayer, M.S.
Irrigation Water Crisis and Changes in Agricultural Practice in Barind Area
559
the underground water sources fails to pump water in the drought season. In order to overcome this situation the people from this region started using deep wells for their daily and agricultural use which increases the cost in production. However the use of deep well it increases the amount of crop production in short term but it creates a long term effect in the ground water level.
5. References Aziz, M., Majumder, M., Kabir, M., Hossain, M., Rahman, N., Rahman, F. and Hosen, S 2015
‘Groundwater Depletion with Expansion of Irrigation in Barind Tract: A Case Study of Rajshahi District of Bangladesh’, International Journal of Geology, Agriculture and Environmental Sciences, vol. 3, no. 1, Available at: https://www.researchgate.net/publication/282749334_Groundwater_Depletion_with_Expansion_of_Irrigation_in_Barind_Tract_A_Case_Study_of_Rajshahi_District_of_Bangladesh [Accessed 20 Aug. 2019].
Shahid, S 2010 ‘Impact of climate change on irrigation water demand of dry season Boro rice in northwest Bangladesh’, Climatic Change, vol. 105, no. 3-4, pp.433-453. Available at: https://link.springer.com/article/10.1007/s10584-010-9895-5.
Rashid, M, Islam, M, Islam and M 2013 ‘Causes of Acute Water Scarcity in the Barind Tract, Bangladesh’, International Journal of Economic and Environment Geology, vol. 4, no. 1, pp. 5-14, Available at: https://www.researchgate.net/publication/289505282 [20 August 2019]
Raihan, M, Sarker and M, Miah 2017 ‘SHORTAGE OF WATER IN TEESTA RIVER BASIN AND ITS IMPACT ON CROP PRODUCTION IN NORTHERN BANGLADESH’, SAARC Journal of Agriculture, vol. 15, no. 2, pp. 113- 123, Available at: http://dx.doi.org/10.3329/sja.v15i2.35163 [11 July 2019]
WorldWeatherOnline.com. (2019). World Weather Online. [online] Available at: https://www.worldweatheronline.com/godagari-weather-averages/bd.aspx [Accessed 20 Aug. 2019].

Kafy,AA; Hasan,MM; Faisal,AA; Nipun, MWH; Noman,AA
Estimation of Urban Heat Islands Effect and Its Impact On Climate Change
560
Research Paper
Estimation of Urban Heat Islands Effect and Its Impact on Climate Change: A Remote Sensing and GIS-Based
Approach in Rajshahi District.
Abdulla - Al Kafy, GIS Analyst, Rajshahi Development Authority; Bangladesh Mohammad Mahmudul Hasan, Graduate Student, Department of Urban & Regional
Planning, Rajshahi University of Engineering & Technology (RUET), Rajshahi, Bangladesh Abdullah-Al-Faisal, Research Consultant, Center for Environmental and Geographic
Information Services (CEGIS); Bangladesh Muhammad Waresl Hassan Nipun, Assistant Urban Planner, Rajshahi Development
Authority; Bangladesh Abdullah Al Noman, Assistant program officer; UCEP Bangladesh
Abstract In all cities around the world, the urban land surface temperature (LST) is increasing gradually. The dramatic increase in LST leads to climate change, which creates a more extended and serious urban heat island (UHI) effect. In the last few decades, massive land use/land cover (LULC) transition leads to higher LST in the city space of Rajshahi City. The dramatic decrease in greenery and water bodies and a significant increase in the urban built-up area influence UHI in Rajshahi city. This study estimates the effect of UHI using quantitative temporal, thermal GIS and remote sensing and techniques. Series of Landsat TM/OLI and ASTER images of Rajshahi collected in summer season were used to explore the variation in LST from 1998 to 2018 as well as LULC change. Also, the correlation between LST, NDBI and NDVI for the mentioned date is estimated, and the correlation coefficient is generated. The UHI effect was quantitatively defined using urban thermal field variance index (UTFVI). Results of the study indicate that there are increases in the overall LST between years 1998 and 2018. UHI phenomenon represents that total of 37.36% of the area in the study region estimated higher LST in the space of 20 years. Also, the distribution of UTFVI predominantly related to the expansion of urban built-up area during the study period. The hot spot of lower UTFVI was found in vegetation land where higher UTFVI were mainly found in the built-up areas. These higher hot spot areas are the most vulnerable to UHI effect. The findings will help the concerned authority to prepare a suitable strategy to reduce the UHI effect and improve the climate change scenario of the cities. Keywords Climate Change, Land use/Land cover, Land Surface Temperature, Urban Heat Island, Rajshahi District.
1. Introduction: Climate is the most dominating factors that affect a person not only psychologically and physiologically but also hamper life behaviour and economic activities. In the case of indoors and outdoors, the climate impacts the comfort of the person significantly (Priyadarsini, 2012, Ogashawara and Bastos, 2012b). Human Settlements, as well as rapid urbanization, has significant impact on climate change. Industrial activity, road traffic, impervious pavements and so on affect significantly on atmospheric composition near urban agglomerations (Gallo
Kafy,AA; Hasan,MM; Faisal,AA; Nipun, MWH; Noman,AA
Estimation of Urban Heat Islands Effect and Its Impact On Climate Change
561
et al., 1993a, Rizwan et al., 2008, Fu and Weng, 2018). In large and very populated cities, urban smog events are common characteristics where artificial cover and emitted energy are responsible for the climatic changes and actions. Therefore, Urban Heat Island (UHI) effect is the most often and common analysed phenomenon related to cites (Streutker, 2003, Poumadere et al., 2005, Gallo and Owen, 1999). A UHI is defined as the temperature, which is warmer than its surroundings. The higher the urbanization, the higher impervious cover on surface, causes UHI effect. Natural cooling effect system has been demolished due to replacement of natural land cover with concrete, infrastructure and industrial activities, meanwhile, tall buildings and narrow streets which help to heat the air trapped between them and increases UHI effect (Speth, 2005, Poumadere et al., 2005, Weng et al., 2004). Many studies indicate that UHI has more and more severe impacts on human living environment (Weng, 2002, Weng et al., 2004, Yang et al., 2012, Ogashawara and Bastos, 2012b). Estimation indicates that more than 70% people of the world’s population will live in urban areas in the next 30 years (Gallo et al., 1993b, Gaur et al., 2018, Godschalk, 2004). As a result, according to Intergovernmental Panel on Climate Change (IPCC), the global average surface temperature will be increased around 1.4-5.8 °C by 2100 and the atmospheric carbon dioxide concentration could be twice compared to the amount of pre-industrial concentration (Rasul et al., 2015, Kafy et al., 2019a, Gaur et al., 2018, Streutker, 2002, Zhao et al., 2014). That is why the study of UHI is compulsory to manage the environment whereas remote sensing-based approach could be a better way to analyse it. Urban Heat Island is broadly categorized into sectors such as atmospheric UHI and Surface UHI (Ogashawara and Bastos, 2012b, Randolph, 2004). This case study explores only surface UHI. The surface UHI can be measured with the help of satellite thermal remote sensing data (Poumadere et al., 2005, Streutker, 2003, Chen et al., 2006). Hence, satellite remote sensing provides a way to retrieve Land Surface Temperature (LST) by investigating thermal data. As UHI has significant dependency on LST therefore, many researchers suggest to use remote sensing data for examining most appropriate assessment of UHI (Gallo et al., 1993b, He et al., 2007, Hart and Sailor, 2009, Lai and Cheng, 2010, Bahi et al., 2016, Gaur et al., 2018, Fu and Weng, 2018, Kafy et al., 2019a). The relation between land surface temperature changes with land use/land cover (LULC) change is investigated by many studies (Wang et al., 2010, Fabrizi et al., 2010). The comparative study between LST and LULC change allows researchers to investigate the link between UHI effect and LULC change (Fabrizi et al., 2010). There are several different types of LULC indices that have been introduced to investigate the correlation between LST and LULC changes. The commonly used indices are Normalized Difference Vegetation Index (NDVI), Normalized Difference Built-up Index (NDBI), Normalized Difference Water Index (NDWI), and Normalized Difference Bareness Index (NDBaI) strongly correlate with LST (Chen et al., 2006, Liu and Zhang, 2011, Zhi-hao et al., 2011, Abutaleb et al., 2015) The study aims to demonstrate the UHI effect by retrieving LST and LULC change indices and analysing the affecting interconnectivity among them. In case of inter-correlation, the authors analyse the correlation among LST, NDVI and NDBI which are directly incorporated with the UHI. Hence, Landsat images provide sufficient spatial and temporal resolution to investigate the changes in LULC and LST at city scale (Hart and Sailor, 2009, Roth et al., 1989, Streutker, 2003, Ahmed, 2018). Therefore, the authors considered Landsat imageries to investigate the analysis. Thus, this study utilizes Landsat images to study LST and UHI impacts in Rajshahi City area.

Kafy,AA; Hasan,MM; Faisal,AA; Nipun, MWH; Noman,AA
Estimation of Urban Heat Islands Effect and Its Impact On Climate Change
562
2. Materials and methods 2.1. Study area profile The Rajshahi district is located in the north-west region of Bangladesh between 24°12′ to 24°42′ N latitude and 88°15′ to 88°50′ E longitude (Figure 1). Topographically, the area of Rajshahi district is almost flat with a surface elevation varies from 1 to 18 m. The area of Rajshahi district is about 2428 km2, and it consists of 9 Upazilas, 4 thanas, 13 Municipalities and 147 Wards. Rajshahi District predominately a tropical wet and dry climate region. The average temperature is 22-25°C and rainfall is about 1448 mm. Total land of the study area is 2422 Km2, where agriculture, infrastructures and others constitute 394986.32 ha, 117615.42 ha and 63829.56 ha, respectively (Rajshahi Development Authority, 2008, Clemett et al., 2006, Statistics, 2013, Kafy et al., 2018). Historically Rajshahi district is known as rural agrarian community. However, after the construction of Jamuna Bridge and industrialisation, this area is significantly experiencing rapid urbanization. The rapid urbanization remarkably changed the intensity of winter and summer season during the last couple of years which is detrimental to environment, livelihood and agricultural production of this district (Kafy et al., 2019b).
Figure 1 Location map of the study area
2.2. Methodology 2.2.1 Derivation of land surface temperature The LST is estimated from the Digital Number (DN) values of the thermal bands (Bands 10 in Landsat 8 TIRS and Band 6 in Landsat 5 TM). At first step, spectral radiances (Lλ) of the Landsat 8 TIRS and Landsat 5 TM bands can be calculated by using the Eq. (1) and (2), respectively (Pal and Ziaul, 2017). The LST in Degree Celsius can be obtained from Lλ by using the Eq. 3 (Weng et al., 2004, Ahmed, 2018).
(1)
(2)

Kafy,AA; Hasan,MM; Faisal,AA; Nipun, MWH; Noman,AA
Estimation of Urban Heat Islands Effect and Its Impact On Climate Change
563
(3)
Where ML (0.0003342) is band-specific multiplicative rescaling factor, and AL (0.1) is a band-specific additive rescaling factor. The values for Landsat TM, Lmax and Lmin are available in the satellite header file (metadata). λ (11.5 µm) is the wavelength of emitted radiance in meters. = 1.438×10⁻² mK (where h indicates Plank’s constant which is equal to 6.626×10⁻³⁴ Js, c indicates the velocity of light, which is equivalent to 2.998×10⁸
ms-2 and is the Boltzmann constant (5.67×10⁻⁸ Wm2k-4 = 1.38 ×10⁻²³ JK-1). is the land surface emissivity which is ranged between 0.97 and 0.99.
(4)
In equation 4, is the satellite brightness temperature (Hart and Sailor, 2009, Rasul et al., 2015, Gaur et al., 2018, Kafy et al., 2019a), K1 and K2 are constants of band-specific thermal conversions in metadata (Landsat-5 TM: K1 is 607.7 and K2 is 1260.6 and Landsat 8 TIRS: K1 is 774.9 and K2 is 1321.07). 2.2.2 Retrieving of urban heat island (UHI): To compare the LST of three different years, a normalisation procedure was performed in equation 5 to estimate UHI (Abutaleb et al., 2015):
(5)
Here, UHI means urban heat island, LSTm represents the mean temperature of the land surface temperature, SD means standard deviation of temperature. Finally, UHI effect is described performing urban thermal field variance index (UTFVI). It can be calculated as the following equation (Liu and Zhang, 2011, Zhang et al., 2006, Ahmed, 2018):
(6)
Considering six different ecological indices suggested by (Ahmed, 2018, Zhi-hao et al., 2011, Chen et al., 2006) UTFVI was divided into six levels.
Table 1 Threshold values of UTFVI
UHI Phenomenon UTFVI Ecological Evaluation Index None Low <0 Excellent Weak 0 – 0.005 Good
Middle Moderate 0.005 – 0.01 Normal Strong 0.01 – 0.015 Bad
Stronger High 0.015 – 0.02 Worse Strongest >0.02 Worst
2.2.3 Classification and retrieving of LULC The land-use types were divided into four broad categories which are water bodies, built-up areas, vegetation cover and bare land. The training areas are determined, and the maximum likelihood supervised classification (MLSC) algorithm was used for the image classification. The accuracy assessment of land use classification (overall accuracy, Kappa coefficient, and accuracy validation) was applied. The detail MLSC method was described in the previous study (Kafy et al., 2019b, Kafy et al., 2018) . For accuracy assessment, randomly 350 points were selected for evaluating each classified map using Google Earth images.

Kafy,AA; Hasan,MM; Faisal,AA; Nipun, MWH; Noman,AA
Estimation of Urban Heat Islands Effect and Its Impact On Climate Change
564
3 Result and Discussion 3.2 LULC change analysis In this present scenario urbanization is the most vital and active forces that derive LULC cover changes and impact climate warming (Mosammam et al., 2017, Hu, 2007). Four local factors (Waterbody, build-up, vegetation, bare soil) have been generated to carry out the objective of the study area. Figure 2 retrieved LULC of the study area. From this figure, it can be easily perceived that a large number of water bodies disappear in 2008 and 2018 from the year 1998 which transform into either vegetation or build-up area. A significant portion of bare soil (alluvion) also appears in 2018 that was remain in water body (river) in 1998. Decreasing vegetation cover and increase in concrete impervious surface modifies thermal process in urban regions, thus creating 2oC to 4oC warmer regimes than rural areas (Ogashawara and Bastos, 2012a, Pal and Ziaul, 2017).
Figure 2 Classified LULC types of the study area
Form Table 2 it easily emphasised that the vegetation area was 50.8% in 1998 and in 2008 it changes about 3.9 % and in 2018 it’s about 4.03% to other LULC types. This reduction generates extra 6oC mean temperature (see figure 2) at build-up area as urban area expansion. From the table below it can clearly perceive the condition of bare soil LULC type. In 2008 this type of LULC decreased to 0.5 % and transformed towards either vegetation or build-up area. Again in 2018 this type of LULC increased to 4%. It means the alluvion condition on the bank of Mighty Padma
Table 2 Percentage of Area under different LULC in different periods. Area (Km2)
Name 1998 2008 Changes in % (2008-1998) 2018 Changes in % (2018-2008) Water Body 301.9 272.3 -1.2 269.2 -0.13
Build Up Area 178.2 316.9 5.7 320.1 0.13 Vegetation 1232.5 1137.2 -3.9 1039.5 -4.03
Bare Soil 709.8 696.2 -0.5 793.8 4.03
1998 2008
2018

Kafy,AA; Hasan,MM; Faisal,AA; Nipun, MWH; Noman,AA
Estimation of Urban Heat Islands Effect and Its Impact On Climate Change
565
3.3 LST distribution in the study area Figure 3 and 4 indicate a spatial pattern and area distribution of LST in three phases, e.g. 1998, 2008 and 2018. In all maps, bright reddish tone highlights higher temperature and bluish tone low LST. These spatial patterns of LST concentration and temporal shift LST pattern highlights rapid change of LULC classes.
Figure 3 LST distribution in the study area
Usually, LST was confined within the range of 17–250 C during 1998, 18-330 C during 2008 and 26-420 C during 2018. Out of total area (2428 km2), 40.28% area represents temperature from 28 - 300 C in 1998 followed by 44.05% area in 2008. Core urban area is sensitive to high temperature. From 1998 to 2018 the temperature was heaved up to, and 37.63% area was faced 37-390 C temperature in the year 2018. This growth is entirely arithmetic, but more realistic temperature growth calculated using spatial average indicates that about 170 C LST has increased since 1998–2018. The northeastern part of the study area exhibits lowering in temperature due to higher vegetation and agricultural land whereas the southwestern part exhibits the rise in LST due to rapid urban expansion and declining of water bodies as well as vegetation cover.
Figure 4 Area wise LST distribution
2018
1998 2008

Kafy,AA; Hasan,MM; Faisal,AA; Nipun, MWH; Noman,AA
Estimation of Urban Heat Islands Effect and Its Impact On Climate Change
566
3.4 LULC change and its association with LST distribution Statistical analysis was conducted in order to estimate the association between LST and LULC. Using a lot of different methods, many authors documented this association (Ahmed, 2018, Pal and Ziaul, 2017). Figure 5 represents the LULC wise LST distribution for 1998,2008 and 2018. From the figure it was found that urban core area with dominant built-up land experienced 240C in 1998, 330C in 2008, and 410C LST in 2018 respectively. Also, high LST recorded 240C, 310C and 400C for bare soil in three different years. Associate with the built-up area and bare land other two land use (water bodies and vegetation & agricultural land) recorded the lowest temperature ranging from < 190C - <330C. The minimum temperature recorded for water bodies (190C,21 0C and 300C) followed by vegetation & agricultural land (210C,23 0C and 330C) in three different years. Following that, the maximum temperature recorded for the year 1998 in bare land (240C) and 2008 and 2018 in built-up areas (330C & 410C).
Figure 5: LST distribution for each LULC types for 1998, 2008 and 2018.
3.5 UHI effect estimation: The present research was paid attention to the ecological evaluation phenomenon that is influenced through the UHI. To retrieve the UHI effect, Urban Thermal Field Variance Index (UTFVI) was performed (Figure 6). As much of terrain in Rajshahi district is agricultural land to orchard especially mango, litchi and betel leaf. Less than 20% terrain was brought out under development. Most of the remaining undeveloped parcels were either vegetation or bare soil. Therefore, during 1998 UTFVI shows excellent ecological evaluation index. Only 30% land shows worst index. Due to scatter and leapfrog development in Rajshahi district, the urban expansion occurred to southeast side of the district during 2018. This concentrate and haphazard urban development lead beyond the control and to the demoted eco-environment situation with worst evaluation index. During 2018 the upper side of Rajshahi district shows excellent evaluation index due to the implementation of several projects by Barind Multipurpose Development Authority (BMDA). From 1996 to 2006 BMDA implemented eco-system management project, under which 5.55 lakhs afforestation, 43 excavation of pond, 16.50 Km canal excavation, 11 cross dam construction, 430 mini ditch excavation, 9 eco-village establishment, and 1 mini eco-park establishment has been initiated. The output has come into visible in 2018 (BMDA, 2006).

Kafy,AA; Hasan,MM; Faisal,AA; Nipun, MWH; Noman,AA
Estimation of Urban Heat Islands Effect and Its Impact On Climate Change
567
Figure 6 The UTFVI classification map of ecological evaluation in Rajshahi District
4 Conclusion Based on the Landsat images of 1998, 2008, and 2018, we examined the trend of LULC and LST changes and fluctuation of UHI in Rajshahi district, Bangladesh. From the results, it was found that the built-up area was increased from 1998 to 2018 about 165 km2, where 188 km2 vegetation areas were lost. LST shows a rapidly growing trend in city areas, while in regions occupied by water bodies and vegetation shows a decreasing trend. In the last 20 years, LST was increased about 170 C, and 37.63% area was faced 37-390 C temperature in the year 2018. Important to mention is that rapid urbanization is the crucial driving process of LULC and LST changes and subsequent rise of UTFVI.54% of the study area was faced high UTFVI effect in 2018 which is only 30% and 45% in 1998 and 2008 respectively. Without implementing a radical decentralisation strategy, it is difficult to prevent the rise of UTFVI. A massive increase in UHI can damage the human health and components of the ecosystem. The local government, urban planners and environmental engineers of Rajshahi can consider the rapid urban growth and the formation of UHI based on the results in this study. The results also give the updated and improved understanding for the urban planners in developing an inclusive climate resilience policy to make a city more sustainable.
5 References Abutaleb, K., Ngie, A., Darwish, A., Ahmed, M., Arafat, S. & Ahmed, F. 2015. Assessment Of Urban
Heat Island Using Remotely Sensed Imagery Over Greater Cairo, Egypt. Advances In Remote Sensing, 4, 35.
Ahmed, S. 2018. Assessment Of Urban Heat Islands And Impact Of Climate Change On Socioeconomic Over Suez Governorate Using Remote Sensing And Gis Techniques. The Egyptian Journal Of Remote Sensing And Space Science, 21, 15-25.
Bahi, H., Rhinane, H., Bensalmia, A., Fehrenbach, U. & Scherer, D. 2016. Effects Of Urbanization And Seasonal Cycle On The Surface Urban Heat Island Patterns In The Coastal Growing Cities: A Case Study Of Casablanca, Morocco. Remote Sensing, 8, 829.
2008

Kafy,AA; Hasan,MM; Faisal,AA; Nipun, MWH; Noman,AA
Estimation of Urban Heat Islands Effect and Its Impact On Climate Change
568
Barind Multipurpose Development Authority 2006. Projects Performed By The BMDA. Chen, X.-L., Zhao, H.-M., Li, P.-X. & Yin, Z.-Y. 2006. Remote Sensing Image-Based Analysis Of The
Relationship Between Urban Heat Island And Land Use/Cover Changes. Remote Sensing Of Environment, 104, 133-146.
Clemett, A., Amin, M. M., Ara, S. & Akan, M. M. R. 2006. Background Information For Rajshahi City, Bangladesh. Waspa Asia Project Report 2.
Fabrizi, R., Bonafoni, S. & Biondi, R. 2010. Satellite And Ground-Based Sensors For The Urban Heat Island Analysis In The City Of Rome. Remote Sensing, 2, 1400-1415.
Fu, P. & Weng, Q. 2018. Responses Of Urban Heat Island In Atlanta To Different Land-Use Scenarios. Theoretical And Applied Climatology, 133, 123-135.
Gallo, K., Mcnab, A., Karl, T. R., Brown, J., Hood, J. & Tarpley, J. 1993a. The Use Of A Vegetation Index For Assessment Of The Urban Heat Island Effect. Remote Sensing, 14, 2223-2230.
Gallo, K. P. & Owen, T. W. 1999. Satellite-Based Adjustments For The Urban Heat Island Temperature Bias. Journal Of Applied Meteorology, 38, 806-813.
Gallo, K. P., Tarpley, J. D., Mcnab, A. L. & Karl, T. R. 1993b. Assessment Of Urban Heat Islands: A Satellite Perspective. Asymetric Change Of Daily Temperature Range.
Gaur, A., Eichenbaum, M. K. & Simonovic, S. P. 2018. Analysis And Modelling Of Surface Urban Heat Island In 20 Canadian Cities Under Climate And Land-Cover Change. Journal Of Environmental Management, 206, 145-157.
Godschalk, D. R. 2004. Land Use Planning Challenges: Coping With Conflicts In Visions Of Sustainable Development And Livable Communities. Journal Of The American Planning Association, 70, 5-13.
Hart, M. A. & Sailor, D. J. 2009. Quantifying The Influence Of Land-Use And Surface Characteristics On Spatial Variability In The Urban Heat Island. Theoretical And Applied Climatology, 95, 397-406.
He, J., Liu, J., Zhuang, D., Zhang, W. & Liu, M. 2007. Assessing The Effect Of Land Use/Land Cover Change On The Change Of Urban Heat Island Intensity. Theoretical And Applied Climatology, 90, 217-226.
Hu, Z. 2007. Using Ndvi Differencing And Temporal Logic To Enhance Isodata Classification In Urban Environments. Giscience & Remote Sensing, 44, 48-67.
Kafy, A., Hossain, M., Prince, A. A. N., Kawshar, M., Shamim , M. A., Das, P. & Noyon, M. E. K. Estimation Of Land Use Change To Identify Urban Heat Island Effect On Climate Change: A Remote Sensing Based Approach. International Conference On Climate Change (Iccc-2019), 2019a Dhaka, Bangladesh. University Of Dhaka.
Kafy, A. A., Faisal, A. A., Khan, H. A. H. & Sheel, P. K. Exploring The Association Of Surface Water Body Change And Rapid Urbanization In Rajshahi City Corporation (Rcc) Area Using Rs And Gis. 1st National Conference On Water Resources Engineering (Ncwre 2018), 2018 2018 Chittagong, Bangladesh. Chittagong University Of Engineering & Technology 203-207.
Kafy, A. A., Islam, M., Ferdous, L., Khan, A. R. & Hossain, M. M. 2019b. Identifying Most Influential Land Use Parameters Contributing Reduction Of Surface Water Bodies In Rajshahi City, Bangladesh: A Remote Sensing Approach. Remote Sensing Of Land, 2, 87-95.
Lai, L.-W. & Cheng, W.-L. 2010. 0> Urban Heat Island And Air Pollution—An Emerging Role For Hospital Respiratory Admissions In An Urban Area. Journal Of Environmental Health, 72, 32-36.
Liu, L. & Zhang, Y. 2011. Urban Heat Island Analysis Using The Landsat Tm Data And Aster Data: A Case Study In Hong Kong. Remote Sensing, 3, 1535-1552.
Mosammam, H. M., Nia, J. T., Khani, H., Teymouri, A. & Kazemi, M. 2017. Monitoring Land Use Change And Measuring Urban Sprawl Based On Its Spatial Forms: The Case Of Qom City. The Egyptian Journal Of Remote Sensing And Space Science, 20, 103-116.
Ogashawara, I. & Bastos, V. 2012a. A Quantitative Approach For Analyzing The Relationship Between Urban Heat Islands And Land Cover. Remote Sensing, 4, 3596-3618.

Kafy,AA; Hasan,MM; Faisal,AA; Nipun, MWH; Noman,AA
Estimation of Urban Heat Islands Effect and Its Impact On Climate Change
569
Ogashawara, I. & Bastos, V. D. S. B. 2012b. A Quantitative Approach For Analyzing The Relationship Between Urban Heat Islands And Land Cover. Remote Sensing, 4, 3596-3618.
Pal, S. & Ziaul, S. 2017. Detection Of Land Use And Land Cover Change And Land Surface Temperature In English Bazar Urban Centre. The Egyptian Journal Of Remote Sensing And Space Science, 20, 125-145.
Poumadere, M., Mays, C., Le Mer, S. & Blong, R. 2005. The 2003 Heat Wave In France: Dangerous Climate Change Here And Now. Risk Analysis: An International Journal, 25, 1483-1494.
Priyadarsini, R. 2012. Urban Heat Island And Its Impact On Building Energy Consumption. Advances In Building Energy Research. Routledge.
Rajshahi Development Authority, 2008. Working Paper On Existning Landuse , Demographic And Transport (Revised),. In: Development Design Consultants Limited 47, M. C. A., Dhaka-1212 (Ed.). Government Of The People’s Republic Of Bangladesh Ministry Of Housing And Public Works.
Randolph, J. 2004. Environmental Land Use Planning And Management, Island Press. Rasul, A., Balzter, H. & Smith, C. 2015. Spatial Variation Of The Daytime Surface Urban Cool Island
During The Dry Season In Erbil, Iraqi Kurdistan, From Landsat 8. Urban Climate, 14, 176-186.
Rizwan, A. M., Dennis, L. Y. & Chunho, L. 2008. A Review On The Generation, Determination And Mitigation Of Urban Heat Island. Journal Of Environmental Sciences, 20, 120-128.
Roth, M., Oke, T. & Emery, W. 1989. Satellite-Derived Urban Heat Islands From Three Coastal Cities And The Utilization Of Such Data In Urban Climatology. International Journal Of Remote Sensing, 10, 1699-1720.
Speth, J. G. 2005. Global Environmental Challenges: Transitions To A Sustainable World, Orient Blackswan.
Bangladesh Burue of Statistics 2013. District Statistics 2011 ,Rajshahi. In: Division, S. A. I. (Ed.). Ministry Of Planning Government Of The People's Republic Of Bangladesh
Streutker, D. R. 2002. A Remote Sensing Study Of The Urban Heat Island Of Houston, Texas. International Journal Of Remote Sensing, 23, 2595-2608. Streutker, D. R. 2003. Satellite-Measured Growth Of The Urban Heat Island Of Houston, Texas.
Remote Sensing Of Environment, 85, 282-289. Wang, L., Hu, H., Zheng, X., Deng, J. & Ning, G. Study On Lucc Based On Vector Date Source Using
The Ca_Markov Model: A Case Study Of Changping District, Beijing, China. Multimedia Technology (Icmt), 2010 International Conference On, 2010. Ieee, 1-4.
Weng, Q. 2002. Land Use Change Analysis In The Zhujiang Delta Of China Using Satellite Remote Sensing, Gis And Stochastic Modelling. Journal Of Environmental Management, 64, 273-284.
Weng, Q., Lu, D. & Schubring, J. 2004. Estimation Of Land Surface Temperature–Vegetation Abundance Relationship For Urban Heat Island Studies. Remote Sensing Of Environment, 89, 467-483.
Yang, X., Zheng, X.-Q. & Lv, L.-N. 2012. A Spatiotemporal Model Of Land Use Change Based On Ant Colony Optimization, Markov Chain And Cellular Automata. Ecological Modelling, 233, 11-19.
Zhang, Y., Yu, T., Gu, X., Zhang, Y. & Chen, L. 2006. Land Surface Temperature Retrieval From Cbers-02 Irmss Thermal Infrared Data And Its Applications In Quantitative Analysis Of Urban Heat Island Effect. Journal Of Remote Sensing-Beijing-, 10, 789.
Zhao, L., Lee, X., Smith, R. B. & Oleson, K. 2014. Strong Contributions Of Local Background Climate To Urban Heat Islands. Nature, 511, 216.
Zhi-Hao, Q., Wen-Juan, L., Ming-Hua, Z., Karnieli, A. & Berliner, P. 2011. Estimating Of The Essential Atmospheric Parameters Of Mono-Window Algorithm For Land Surface Temperature Retrieval From Landsat Tm 6. Remote Sensing For Land & Resources, 15, 37-43.

Kafy,AA; Hasan,MM; Faisal,AA; Nipun, MWH; Noman,AA
Estimation of Urban Heat Islands Effect and Its Impact On Climate Change
570
Research Paper
Are They Really Safe? An Analysis of the Existing Fire Extinguishing System in RDA Market and People’s Perception
Regarding This Arifa Akhter Chowdhury, Undergraduate student, Dept. of URP, RUET, Rajshahi, Bangladesh
Tanzila Khatun, Undergraduate student, Dept. of URP, RUET, Rajshahi, Bangladesh
Sanjida Kawsary, Undergraduate student, Dept. of URP, RUET, Rajshahi, Bangladesh
Bishal Guha , Undergraduate student, Dept. of URP, RUET, Rajshahi, Bangladesh
Mahfuzur Rahman Sakib, Undergraduate student, Dept. of URP, RUET, Rajshahi, Bangladesh
Nazia Hossain, Assistant Professor, Dept. of URP, RUET, Rajshahi, Bangladesh Md. Sakib Zubayer, Lecturer, Dept. of URP, RUET, Rajshahi, Bangladesh
Abstract RDA market, the most influential shopping mall of Rajshahi city is situated at Shaheb Bazar (Central Business District of Rajshahi) in Rajshahi. In spite of being marked as 'most vulnerable' to fire risk incidents by Fire Service and Civil Defense authorities, no step has been taken to improve its present condition. This study focuses on the existing fire extinguishing system in RDA market and people’s perception regarding this. More specifically, people’s perception includes the awareness level of people, possible economic loss, life loss, the most vulnerable group, the causes of people’s preference for RDA market, people’s willingness to pay for improvement and maintenance of existing fire extinguishing system. In this study the primary data has been collected from a field survey in which the sample size (65 sellers and 68 buyers) has been determined by the Quota sampling method having the confidence level of 90%. Secondary data has been collected from RDA, journals, newspaper. The data has been explained by statistical analysis. This study reveals that about 71% sellers prefer auto fire extinguisher in the market. It also finds out 49 % and 38% sellers are willing to contribute BDT 107(20% of total cost) and BDT 64(30% of total cost) respectively for minimum improvement and maintenance. Most of the buyers want improvement of the existing fire extinguishing system and direction indicator image of rescue for their safety. Depending on the reliable data from this study, further improvement and research can be possible.
Keywords Vulnerable, Fire extinguishing system, RDA,BDT.

Kafy,AA; Hasan,MM; Faisal,AA; Nipun, MWH; Noman,AA
Estimation of Urban Heat Islands Effect and Its Impact On Climate Change
571
1.IntroductionFire hazards have been a very common phenomenon in Bangladesh. Around 2,50,000 fire incidents took
place in Bangladesh from January 1, 1997 to December 31, 2018(Jahangir 2019).Recently Rajshahi Development Authority market(RDA) has been marked as most vulnerable to fire risk by Fire Service & Self Defence.(Daily star,2019).But no step has been taken to improve its present condition.
RDA market, the most influential shopping mall of Rajshahi city is situated at Shaheb Bazar (Central Business District of Rajshahi) in Rajshahi. A three storied building along with a new constructed building covers an area of 2.18 acre. There are many other shops, restaurants, shopping mall etc. surrounding it. If any fire hazard take place in this shopping mall, the surroundings will also be damaged. That’s why the study has been conducted to achieve the existing condition of this fire risk area for its improvement.
The current research focuses on the existing fire extinguishing system & people’s perception regarding this. Here people’s perception includes the awareness level of people, possible economic loss, life loss, the most vulnerable group, the causes of people’s preference for RDA market, people’s willingness to contribute for improvement and maintenance of the existing fire extinguishing system.
2.Methodology In this study the primary data has been collected from field survey & physical survey conducted in RDA market. And the secondary data has been collected from Rajshahi Development Authority., newspapers, journals, different websites.
Two target group (seller, buyer) has been selected for the study. The sample size (65 sellers,68 buyers) has been determined by Quota sampling method having the confidence level of 90%. We have collected data by making individual questionnaires for sellers and buyers. Finally, data has been analysed by statistical analysis.
3.Results & Discussion
3.1. Existing Condition:
RDA market consists of two three storied buildings. The old one with a large entrance is unplanned and it was designed to have two storeys but later additional floors were added (Daily Star,2019). There is no such fire extinguishing system (Auto fire extinguisher, Sprinkler system, water reservoir, fire hydrant, emergency exit etc.) listed in ‘Ogni Nirbapon Bidhi O Nitimala 2014’ in RDA market except 42 manual fire extinguishers. The existence of fire extinguishers along with shops’ materials (based on combustibility) in different floors of this market are given below:
Most of the shops in the ground floor are cloth and plastic shops (A type combustible material) indicated by red and blue colour respectively in figure 3.1(a). In the right side of the entrance there are some cosmetic (B type combustible material) shops which are indicated by pink colour. This floor includes 9 fire extinguishers.

Kafy,AA; Hasan,MM; Faisal,AA; Nipun, MWH; Noman,AA
Estimation of Urban Heat Islands Effect and Its Impact On Climate Change
572
Figure 3.1(a): Ground floor Source: Author survey,2019
The 1st floor includes cloth and plastic shops (A type combustible material) in figure 3.1(b). This floor also includes some ceramic (non-combustible material) shops and cosmetic shops (B type combustible material) at the right corner. There are 21 fire extinguishers in this floor.
Figure 3.1(b):1st Floor Source: Physical survey,2019
Most of the tailors are in the 2nd floor where both electronic machinaries & cloth( C & A type combustible mateial) exist in figure 3.1(c).But there are only 12 fire extinguishers.The 3rd floor is under construction.
Figure 3.1(c):2nd floor Source: Physical survey,2019

Kafy,AA; Hasan,MM; Faisal,AA; Nipun, MWH; Noman,AA
Estimation of Urban Heat Islands Effect and Its Impact On Climate Change
573
Figure3.2(a):Buyers' frequency of visiting
29%
26%
41%
4%
No alternative
It's near home
Figure 3.2(b):Causes of people preference of visiting
53%28%
19%
Sellers' Prefecence for Keeping Shop in RDA Market
No better option
Earn a good profit
Figure 3.1(d):New building in backside Source: Author’s survey,2019
The new bulilding in Figure 3.1(d) is comparetively planned structure.But the extinguishing system is very miserable.Most of the shops in the 1st and 2nd floor which are cloths ,cosmetics shops etc.And the 3rd floor shops are not running yet.There are no fire extinguisher in the whole building.
3.2.People preference for RDA market
.
Source:field survey
The findings show that the majority (46%) of the buyers visit RDA market weekly to purchase their necessary commodities (Figure 3.2.a)From figure 3.2(b),it is noted that most of the buyers visit RDA market because commodities are available at a reasonable price.29% buyers respond that they visit this place because there is no alternative for them.26% buyer visit this place as it’s near their home. All these findings indicate the importance of RDA market.
53% sellers consider that there can be no better option than RDA market, the most influential market in Rajshahi as their preference.28% & 19% considered earning a good profit & attachment with this shop as their causes for preference respectively. Having shop in RDA market for a long time is the cause of their attachment.
Figure 8
Figure 3.2(c):Seller’s Preference
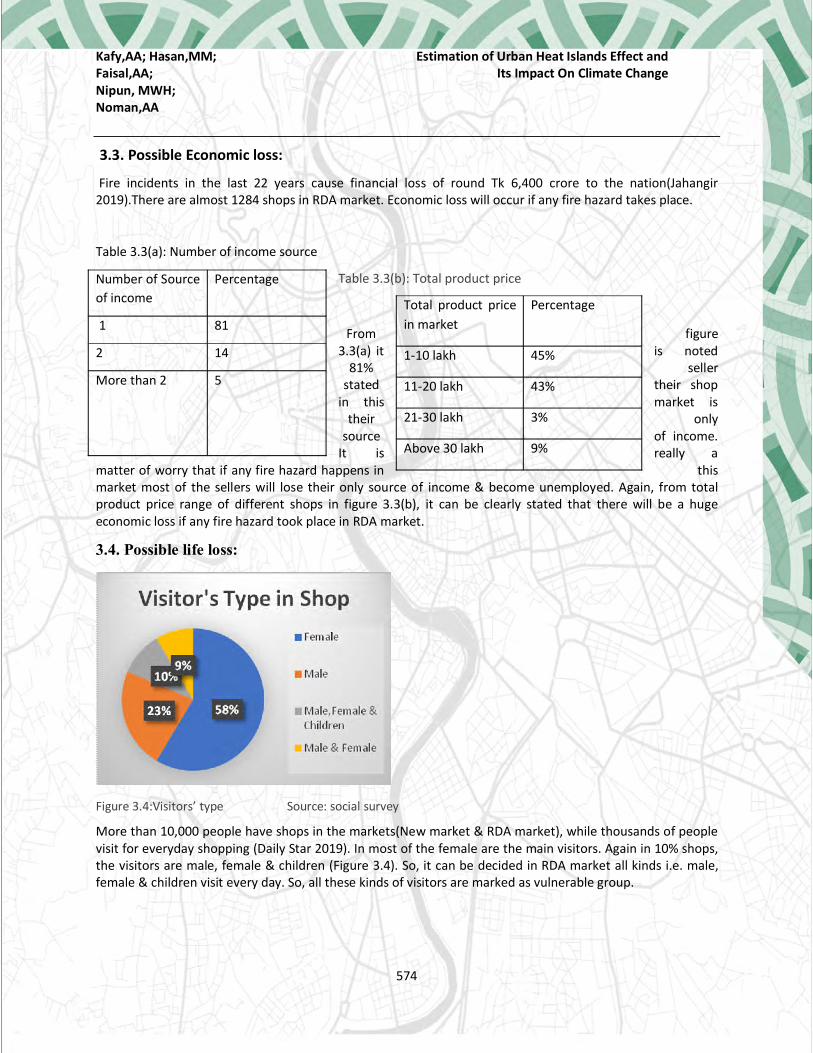
Kafy,AA; Hasan,MM; Faisal,AA; Nipun, MWH; Noman,AA
Estimation of Urban Heat Islands Effect and Its Impact On Climate Change
574
3.3. Possible Economic loss:
Fire incidents in the last 22 years cause financial loss of round Tk 6,400 crore to the nation(Jahangir 2019).There are almost 1284 shops in RDA market. Economic loss will occur if any fire hazard takes place.
Table 3.3(a): Number of income source
Table 3.3(b): Total product price
From figure 3.3(a) it is noted
81% seller stated their shop
in this market is their only
source of income.It is really a
matter of worry that if any fire hazard happens in this market most of the sellers will lose their only source of income & become unemployed. Again, from total product price range of different shops in figure 3.3(b), it can be clearly stated that there will be a huge economic loss if any fire hazard took place in RDA market.
3.4. Possible life loss:
Figure 3.4:Visitors’ type Source: social survey
More than 10,000 people have shops in the markets(New market & RDA market), while thousands of people visit for everyday shopping (Daily Star 2019). In most of the female are the main visitors. Again in 10% shops,the visitors are male, female & children (Figure 3.4). So, it can be decided in RDA market all kinds i.e. male, female & children visit every day. So, all these kinds of visitors are marked as vulnerable group.
Number of Source of income
Percentage
1 81
2 14
More than 2 5
Total product price in market
Percentage
1-10 lakh 45%
11-20 lakh 43%
21-30 lakh 3%
Above 30 lakh 9%
Kafy,AA; Hasan,MM; Faisal,AA; Nipun, MWH; Noman,AA
Estimation of Urban Heat Islands Effect and Its Impact On Climate Change
575
3.5. People’s level of awareness
Human behaviour has been recognized as a factor in the loss of life in fires for many years. (EMPLOYEE FIRE AND LIFE SAFETY: Developing a Preparedness Plan and Conducting Emergency Evacuation Drills 2019). So, people awareness along with proper steps during fire incident can stop fire hazard & reduce damage. This section will analyse people’s preparedness for fire incident.
Table 4.5(a): Having knowledge on operating fire extinguisher
Operating Fire Extinguisher Buyer (%) Seller (%)
Yes 15 23
No 85 77
Source: Social Survey
A 2002 UK study performed by FETA (Fire Extinguishing Trades Association) and IFEDA (Independent Fire Engineering and Distributors Association) reviewed 2100 fire incidents and reveals, in 80% of the cases a portable fire extinguisher successfully supressed the fire and the fire department didn’t need to attend in 75 % cases.( Report on a Survey into Portable Fire Extinguishers and their use in the United Kingdom and other member countries of Eurofeu 2003)
There are 42 fire extinguishers available in RDA market. When a fire breaks out, one can easily put out it by using extinguisher. But figure 3.5(a) shows that majority of the sellers (77%) & buyers (85%) don’t know how to operate fire extinguisher. That means if any fire breaks out in this market, they won’t be able to use these fire extinguishers to put out fire. It’s because they along with authority are callous.
Table 3.5(b): Having contact no. of fire service
When fire break out anywhere, it is must to inform fire service. It is seen 52 % buyer & 41% sellers have contact number in Figure :3.5(b). Others don’t even think to keep this number as they don’t give know its necessity.
Table 3.5(c): Receive fire rescue training
Receive fire rescue training Seller (%) Buyer (%)
Never 86 82
1 time 12 13
2 time 0 0
More than 2 time 2 5
Source: Social Survey
Having Contact Number of Fire service
Buyer (%) Seller (%)
Yes 52 41
No 48 59
Kafy,AA; Hasan,MM; Faisal,AA; Nipun, MWH; Noman,AA
Estimation of Urban Heat Islands Effect and Its Impact On Climate Change
576
Individuals participated in drills and received training in emergency, response & react faster and with better decision making than those without training (EMPLOYEE FIRE AND LIFE SAFETY: Developing a Preparedness Plan and Conducting Emergency Evacuation Drills 2019). Because of this fast & easy react they can easily escape from incident & extinguish fire. But it’s frightening that 86 % sellers & 82 % buyers didn’t receive any training in figure 3.5(c). It’s because proving training from concerned authority is not a trend in Bangladesh. It shows the people callousness also.
Table 3.5(d): To do in smoke
In smoke, to do Seller (%) Buyer (%)
Crawl towards the nearest exit holding breath as much as possible
23 25
Run anywhere to exit 42 54
Rush to the roof 35 21
Source: Social Survey
Recent official statistics by the fire and rescue service in the United Kingdom in January 2015 (DCLG, 2015) revealed that the major cause of death and injury in 2013/14 fires in the UK was because of toxic smokeinhalation (Alarifi et al. 2016). If anyone is confined to smoke during a fire accident, he should get down & crawl towards the exit taking short breath to escape as smoke will rise to a ceiling level first. From figure 3.5(d) it is seen; 23% sellers & 25 % buyers consider this. It is quite hard to accept that that 35% sellers & 21 % buyers consider to rush to the roof which is another cause of people dying in fire accidents. Because they think smoke will not reach upstairs. It shows their poor awareness level. Again, in most cases it is seen, the victims die in the roof-stairs because of smoke inhalation as the doors remains closed. Again, most of the people prefer to run anywhere to exit which will also dangerous as it will create a haphazard situation in that time.
Table 3.5(e): To do on fire
On fire, to do Seller (%) Buyer (%)
Stop, drop & roll 57 59
Run anywhere to exit 17 15
Search for water 26 26
Source: Social Survey
Accidents can’t be controlled. But a person having the primary knowledge can save himself. A victim caught on fire must have to stop, drop & roll on the floor to put out fire. From figure 3.5(e), it is seen, 57% sellers & 59% buyers consider the correct opinion. But 26% sellers along with 26 % buyers & 17% sellers along with 15 % buyers would search for water & run anywhere to exit respectively if they caught on fire which would be

Kafy,AA; Hasan,MM; Faisal,AA; Nipun, MWH; Noman,AA
Estimation of Urban Heat Islands Effect and Its Impact On Climate Change
577
life threatening. Searching water to put out fire or run away can only increase fire instead of putting it out. It shows their lack of knowledge and awareness.
Figure 3.6(a). Sellers Demand:
The finding reveals that 71% sellers rank auto fire extinguisher as number 1 in the market in case of improvement.38% ranked training as number 2 ,41% ranked drill as number 3,38% %ranked underground reservoir as number 4 & finally 38% ranked manual fire extinguisher as number 5 for the implementation. In figure 3.6(a)

Kafy,AA; Hasan,MM; Faisal,AA; Nipun, MWH; Noman,AA
Estimation of Urban Heat Islands Effect and Its Impact On Climate Change
578
Figure 3.6 (b) : Buyers' demand Source: Social survey
In figure 3.6(b),55 % buyers prefer both improvement of the existing fire extinguishing system & direction indicator image of rescue for their personal safety. They believe improved fire extinguishing system would extinguish fire when they will escape following the direction indicator image of nearest exit.
3.7. Buyer’s desire to contribute for the improvement of the existing fire extinguishing system:
According to ‘Ogni Nirbapon o Bidhimala ,2014’ ,there must be at least 1 fire extinguisher in 550 sq. ft area = 51.096 m2.The total area of RDA market = 2.18 acre = 8822.146 m2 .The area of 2 ground floor =1 unit of two building of this market without its front open space ( 8822.146 – 300 ) m2 = 8522.146 m2. Again, there are total 6 floors (3 in each building)=3 units in the market=8522.146. So,total extinguisher needed for 1 unit ( 8522.146 / 51.096 ) = 167. So,total extinguisher needed for this area 167*3=501.Again, there are about 42 fire extinguishers available or already exist in the market. So, the new amount of fire extinguishers to be planted (501 – 42) = 459. According to current rate, 5 kg extinguisher in BDT cost is about 1500.So, the total cost of the extinguishers is BDT ( 459*1500) = BDT 688500.Now,People can contribute only up to (20-30)% of the total cost of total government expenditure. So, when 20% contribution from people is required then cost per shopkeeper will be = (688500*20%)/1284 =BDT 107 (as total number of shops in RDA is 1284 (according to RDA),when 25% contribution from people is required then cost per shopkeeper will be = (688500*25%)/1284 = BDT 134 .Again, when 30%contribution from people is required then cost per shopkeeper will be = (688500*30%)/1284 =BDT 161
Cost for refill the fire extinguishers (Maintenance Cost): Number of Total fire extinguisher = (459+42) =501.Refill cost for 1 fire extinguisher =550 BDT. Number of total shops=1284.Total cost of 501 fire extinguisher=(501*550)BDT=275550. If each shopkeeper contributes in the 20% of the total cost, then the cost is = (275550*20/100)/1284=BDT 43 BDT.Similarly,25%=BDT 54 ,30%= BDT 64
Figure 3.7 (a): For improvement Figure 3.7(b): For maintenance
Source: Field survey
For Improvement
Percentage
BDT 0 3
BDT 107 49
BDT 134 9
BDT 161 39
For Maintenance
Percentage
BDT 0 3
BDT 43 37
BDT 54 22
BDT 64 38

Kafy,AA; Hasan,MM; Faisal,AA; Nipun, MWH; Noman,AA
Estimation of Urban Heat Islands Effect and Its Impact On Climate Change
579
it is found, 49 % sellers are willing to contribute BDT 107(20% of total cost) ,3 % sellers don’t want to contribute for minimum improvement. it is found, 38% sellers are willing to contribute BDT 64(30% of total cost) & 3% sellers don’t want to contribute for maintenance
4.Recommendation & Conclusion:This research shows the poor fire extinguishing system of RDA market in comparison to the code for minimum fire extinguishing system for shopping mall from ‘Ogni Nirbapon o Bidhimala 2014’.It also shows both the buyers & sellers want improvement in the existing fire extinguishing system in RDA market. So the authority should take proper steps to improve the existing fire extinguishing system to avoid huge life loss along with economic loss in RDA market. Again, a lot of people visit & do business in this fire risk marked area every day. But the study reveals most of the buyers & sellers are callous & don’t know what to do in most of the emergency cases. The sellers of this market should be trained properly & fire drill must be arranged in this market. The people of Rajshahi must be trained individually to prevent fire hazard by Fire Service & Self-Defence. Spreading awareness among the people regarding fire safety should be the first priority. The results would have been more reliable if the respondents were dealt with more patience taking long time. There might have some limitations in this research data due to sampling & data collection. Most of the sellers & buyers didn’t want to respond properly. Nevertheless, the study has some important findings. The inspiration of this study comes from the desire to see RDA market as a safe place & to see people selling & buying safely instead of dying in fire hazards. Based on the results of this study further improvement of the existing fire extinguishing system can be possible by realizing the importance of RDA market from people’s perspective. It can also be helpful to work on the improvement at the lacking point of people awareness.
References
EMPLOYEE FIRE AND LIFE SAFETY: Developing a Preparedness Plan and Conducting Emergency Evacuation Drills , National Fire Protection Association, viewed 1 September 2019 from https://www.nfpa.org/-/media/Files/Public-Education/By-topic/Occupancies/Evacuation.ashx?la=en
Jahangir,A.R.,2019,’Fire incidents in Bangladesh triple in 22 years’, UNB, viewed 1 September 2019 from https://unb.com.bd/category/Special/fire-incidents-in-bangladesh-triple-in-22-years/13435
Alarifi, A.A.S., Phylaktou, H.N.,Andrews G.E.,2016, ‘What Kills People in a Fire? Heat or Smoke? ‘,) In: 9th SSC Proceedings. The 9th Saudi Students Conference, 13-14 Feb 2016, Birmingham, UK. . (In Press)
Ogni Nirbapon o Bidhimala 2014
Report on a Survey into Portable Fire Extinguishers and their use in the United Kingdom and other member countries of Eurofeu ,FETA & IFEDA,viewed 1 September 2019 from https://ifeda.org/wp-content/uploads/2015/07/IFEDA-portable-fire-extinguisher-survey-results.pdf
Tabassum.A, Hasan.M.U, Adri.N, Tabassum.N
Diffusion of Agricultural Technology
580
Research Paper
DIFFUSION OF AGRICULTURAL TECHNOLOGY IN BANGLADESH
A Case Study of Different Upazillas
Anika Tabassum Sinthy, Undergraduate Student, Department of Urban and Regional Planning, Bangladesh University of Engineering and Technology, Dhaka; Bangladesh
Dr. Musleh Uddin Hasan, Professor, Department of Urban and Regional Planning, Bangladesh University of Engineering and Technology, Dhaka; Bangladesh
Dr. Neelopal Adri, Assistant Professor, Department of Urban and Regional Planning, Bangladesh University of Engineering and Technology, Dhaka; Bangladesh
Ms. Nawshin Tabassum, Lecturer, Department of Urban and Regional Planning, Bangladesh University of Engineering and Technology, Dhaka; Bangladesh
Abstract
Agriculture is the driving force in Bangladesh economy. Being a developing country, the agriculture sector of Bangladesh lacks in terms of technological advancements compared to the developed countries although it has a huge amount of labor force. This paper is focused to show the present status of agricultural technologies in 8 selected Upazillas of Bangladesh and how the government and other bodies like NGOs are working in the dissemination of technologies. It also discusses some policies and strategies about agricultural diffusion as mentioned in the National Agricultural Extension Policy 2012 and tries to make a connection with the present scenario and the suggested policies. For the study, 276 household surveys, 22 key informant interviews have been carried out in 27 villages of 8 Upazillas of Bangladesh. Major findings show that E-Agriculture or agricultural technology is more commonly used in Panchbibi, Pirganj, Ghior, Feni, Noakhali where education level of people is high. Emphasis on farm mechanization has been made more in Panchbibi and Saghata where more people are employed in agricultural occupation than other areas. This study will be useful as it can initiate further in depth studies to find out the reasons why technology is disseminated more in one region and less in some other regions. Also the present review of agriculture technology is an attempt to identify the strength and weakness of the country.
Keywords
agriculture, technology, policy, diffusion
1. Introduction 1.1. Background Agriculture constitutes the major source of livelihood in Bangladesh. Rural population in Bangladesh was reported at 64.96 % in 2016, according to the World Bank collection of development indicators, compiled from officially recognized sources. Agriculture contributes 13.1% of the total GDP in Bangladesh in 2017 down from about more than one-half in the early 1970s (BER, 2009) due to increased contribution of the garment sector and employs 30.07% of the labour force (World Bank, 2017). Continued agricultural development is

Tabassum.A, Hasan.M.U, Adri.N, Tabassum.N
Diffusion of Agricultural Technology
581
therefore considered to be crucial in alleviating poverty and increasing the population's standard of living. Consequently, the main thrust of domestic policies over the previous four decades has been to transform agriculture through fast technological progress in order to keep pace with the growing population (Rahman,1999). This resulted in extensive diffusion of 'Green Revolution' technology with associated assistance in providing contemporary inputs such as chemical fertilizers, pesticides, irrigation equipment, institutional credit, product procurement, storage and marketing infrastructure (Rahman, 2002).
Despite having many issues and limitations, Bangladesh agriculture has accomplished significant structural modifications. There has been a quiet agricultural revolution that continues to evolve in reaction to natural disasters, socio-political changes, population growth, urbanization, modern technology in agriculture and new possibilities in the rural non-agricultural industry, market and trade liberalization and a significant reduction in public sector involvement in agriculture. There is a growing trend in Bangladesh's diversification and intensification of agriculture (Kashem, 2010).
This paper aims to show the existing scenario of agricultural technologies in some rural areas of Bangladesh and the role of the government in its diffusion. The objective is to identify some common technological practices used by those people in agriculture in those areas currently, and the technological support provided by the government and other agencies to them. It also tries to show the Upazillas where policies suggested by the National Agricultural Extension Policy 2012 are being implemented to some extent through different projects of government and NGOs.
Based on the questionnaire survey, data about common technologies used in agriculture, ponds and livestock by people were collected and the benefits and problems of those technologies faced by the users were also collected from the survey. From the key informant interviews, the role of government in providing support for the rural people in the different Upazillas were studied. Finally, an attempt has been made to compare the present scenario of agricultural technology diffusion in the Upazillas with the National Agricultural Extension Policy 2012 of Bangladesh.
1.2. Scopes and Limitations of the Study Scopes of the study include finding solutions for the present technological problems related with agriculture which have been identified in this study. More research can be carried out to see the successes and failures of the projects undertaken by government and modifying them accordingly for the best outcome.
The study has a few limitations. The household data collected were from rural people irrespective of their occupation. A better analysis could have been done with a data sample of people only from agricultural occupation. The data collected from the key informant interview could be made more enriched if more professionals related to agriculture, fisheries and livestock could have been interviewed from every Upazilla to know more detailed information.
1.3. Methodology Literature review from journal articles and papers was done on topics related to diffusion of technology in rural areas. A questionnaire survey for the topic “A Study on Impact of Technology Diffusion on Rural Livelihood” was carried out by 31 students in 8 groups in 27 villages of 8 Upazillas of Bangladesh. The field survey in the rural areas was conducted in

Tabassum.A, Hasan.M.U, Adri.N, Tabassum.N
Diffusion of Agricultural Technology
582
December, 2018. The study regions were selected at random by the students according to their convenience of surveying. A total of 276 respondents were surveyed. Key informant interviews of 22 people like agriculture officer, UNO, LGED engineer and others from those upazillas have been conducted to know about technological diffusion in those areas. After data collection, the topic of the article has been finalized to focus on the technologies used in agriculture in rural areas. Necessary objectives have been chosen and information for objectives from secondary source have been collected accordingly. The survey and interviews provided the primary data for the study. For the secondary data, National Agricultural Extension Policy 1996 of Bangladesh, National Agricultural Extension Policy 2012 of Bangladesh and numerous journal papers have been studied. The necessary data were analysed using Statistical Package for Social Sciences (SPSS) and Microsoft Excel and the final report was prepared after interpretation of the data.
1.4. Related Studies Similar studies have been found in many journals and reports. In the article “Agricultural Technology: A Challenge To Way Forward Sustainable Development” by M. A. Kashem and M. A. A. Faroque, agricultural technologies that are playing the significant role in agriculture of Bangladesh have been addressed and suggestions regarding generation of modern agricultural technologies for the potential sustainable development have been made. The paper shows the evolution of modern technology that started in 1960s by the introduction of wheat varieties. After that, IR8 rice varieties integrated seed-fertilizer-irrigation and pesticide management technologies which geared the green revolution. There has been a substantial increase in agricultural infrastructure and a change from public control to liberalization. The net outcome is that the nation has gone from a persistent deficit condition to close self-reliance. It then discusses about the present status of technological development in different sectors of agriculture. It shows the uses of agro-chemical technologies such as fertilizer technologies, irrigation technologies, pesticide and drugs, and mechanical technology. It also sheds light about productivity, yield gap and agricultural budget. Finally, it suggests some major research priority areas for technology development to address the future need.
2. Data Analysis 2.1. Study Regions and Data Survey in 27 villages from 8 Upazillas of Bangladesh have been conducted to accomplish the study. The upazillas are Feni, Meghna, Ghior, Sreenagar, Noakhali, Saghata, Pirganj and Panchbibi. 276 household data have been collected from this questionnaire survey. For the key informant interview, Upazilla Nirbahi Officers (UNO), LGED Engineers, Agricultural Officers, teachers and other knowledgeable people have been interviewed. For the study, data related to ownership and uses of agricultural technology by the people surveyed have been analysed. They are discussed below:
2.2. Ownership of agricultural land across the Upazillas From the surveyed data, about 17% people had no land ownership. The remaining 83% people owned land to some extent. Majority of people (28.6%) owned land less than 0.5 acres (Figure 1). In Panchbibi, Pirganj and Saghata Upazilla, percentage of people owning land more than three acres is higher than in other Upazillas.

Tabassum.A, Hasan.M.U, Adri.N, Tabassum.N
Diffusion of Agricultural Technology
583
Figure 1: Distribution of ownership of agricultural land according to Upazillas (Source: Field Survey, 2018)
This can be explained by the interest of people in agricultural activities or lack of employment activities in other sectors as well. On the other hand, In Feni, Noakhali, Meghna and Sreenagar, most people own land less than 0.5 acres This is because of the trend of migrating to other cities or in foreign countries.
2.3. Socio-economic condition of respondents: 57.6% people are involved in agricultural activities as major occupation and 34.7% is involved in agriculture as minor occupation. It was also seen that less educated people are more involved in agriculture than more educated people (Source: Field Survey, 2018). This might be one of the reasons for using less technology in agricultural activities because of insufficient knowledge.
2.4. Technologies in Agriculture: The most common technologies used in agriculture are tractors, power tillers and irrigation pumps. 16.3% households have/use tractors and 1.1% have/use power tillers. 22.5% households have/use irrigation pumps. Types of irrigation pumps used are electric pump and petrol pump. (Source: Field Survey, 2018).
Besides cultivating land, tractors increase production and income due to increasing efficiency. Irrigation pumps are also much effective than manual ways of supplying water. Hence they decrease cost and increase income.
Avg. cost of using tractor is 1120 tk/acre (Field survey, 2018) and average duration of using tractor is 11.7 years. Service providers of tractor include BRAC besides local providers (Field survey, 2018). Avg. cost of using electric pump is 1481 tk/acre and for petrol pump is 600 tk/acre (Field survey, 2018). Average duration of using irrigation pump was 12.2 years. Irrigation pumps are mostly provided by local providers (Field survey, 2018). Irrigation pumps and tractors diffused almost in the same time range i.e. 11-12years ago. Tractors are usually personally rented while irrigation pumps are more often rented from co-operatives (Figure 2).
0% 20% 40% 60% 80% 100%
Feni SadarMeghna
GhiorSreenagar
Noakhali SadarSaghataPirganj
Panchbibi
Percentages of people owning land
Upaz
illa
Less than 0.5 acre 0.5 to 1 acre 1 to 2 acre 2 to 3 acre More than 3 acre

Tabassum.A, Hasan.M.U, Adri.N, Tabassum.N
Diffusion of Agricultural Technology
584
Figure 2 Distribution of users according to sources of tractor and irrigation pump
Before diffusion of tractors, cows were as previous techniques and deep well, swallow pump and traditional irrigation processes were employed before irrigation pump. Hence, tractors and pumps made agriculture much easier (Field survey, 2018).
2.5. Technologies in ponds and livestock: About 12% people own ponds while 66.5% people own livestock in surveyed areas (Field Survey, 2018). The most common technologies used in ponds are chemicals and fertilizers. In livestock, chicken coup, cowsheds are the most common uses. Figure 3 shows the frequency of types of technology used in ponds and livestock:
Figure 3 Types of technology in ponds and livestock in surveyed upazillas
3. Roles played by the government in technology diffusion in agriculture of rural areas:
The contribution of government and different NGOs in the technological diffusion and development of agriculture have been studied. These data have been collected from the key informant interviews in the 8 Upazillas. They are summarized as follows:

Tabassum.A, Hasan.M.U, Adri.N, Tabassum.N
Diffusion of Agricultural Technology
585
3.1. Feni Rural development projects ongoing in Feni include Ektee Bari Ektee Khamar, app-based services to farmers, agriculture and farm-based machines, seed spreader projects, water quality checks to the farmers (Mamun, 2018). The LGED department also helps the NGOs considerably in various ways such as providing agricultural training, fishing training etc. (Barua, 2018). Social services, female participation etc. are being developed by the government and NGOs. Loans are also provided by NGOs but no improvement has taken place in the lives of farmers (Shikdar,2018).
3.2. Meghna The upazilla office provides farmers different types of quality seeds in free of cost (Khatun,2018). There are almost 10/12 NGOs at the upazilla such as ASA, Grameen Bank, CCDA, PAGE, SSS, Sonar Bangla Sangstha, etc. which works mainly for landless farmers and female employment. They are providing loan to the farmers to grow food and make a way to run their livelihood (Khatun, 2018).
3.3. Ghior A number of NGOs like BRAC, Proshika, Grameen Bank etc. provide free seeds, training and credit facilities to women and poor rural farmers by collaborating with government to create employment opportunities through poultry, farming etc. (Rakhi, 2018). The government has also taken a project “Ekti Bari Ekti Khamar” to improve the financial condition of rural people. Credit facilities, training facilities are provided to farmers and rural people on earning different skills for income generating activities (Rakhi, 2018). Three android apps have been introduced and also phone communication is provided to the farmers to contact with the Agriculture Office to fight the disease of crops and other necessary information. Tablet phones are used for training the farmers (Hossain, 2018) The government is providing subsidy on seeds and fertilizers in Robi season for wheat and loan for spice production is given. 2000 farmers producing corn are given free seeds for cultivating one bigha agricultural land. Training is provided in every three months to farmers about the use of non-urea fertilizers (Hossain, 2018).
3.4. Sreenagar The Agricultural office has developed a new type of vermin compost that is largely used by the farmers. They are also working on tissue culture and trying to come up with a new type of banana tree seed (Islam, 2018). NGOs provide small credits to the farmers. Though the upazilla agriculture department has some programs, but there are no initiatives of the NGOs to teach these farmers about modern technological advancements to increase production (Islam, 2018).
3.5. Saghata There are 11 NGOs working for the betterment of the people like SKS, Udayan, BRAC, ASHA. These NGOs provide training to the rural people specially to the rural women about using different technologies in animal husbandry and agriculture. Thus the NGOs are developing the working skill of the people of this area (Ghosh, 2018)
3.6. Pirganj The Upazilla agriculture office provides online support for the mass people which is easily accessible. For this, farmers from any place of the Upazilla can contact with them without

Tabassum.A, Hasan.M.U, Adri.N, Tabassum.N
Diffusion of Agricultural Technology
586
coming to the office (Ghosh, 2018). They also send audit team to the field who visit the farmers directly, try to figure out their problems and give them the proper solution. They also provide subsidy to the farmers for buying fertilizers and pesticides (Ghosh, 2018).
3.7. Panchbibi The Upazilla agriculture office offers online support for mass people. The audit team visits the cultivating lands regularly and discuss with the farmers at large about all of their problems, queries and give them instant solution. In case of any confusion or expert advice, they connect them with the Online Help Desk through mobile phone or Internet to solve their problems (Paul, 2018). Sometimes, experts also accompany the audit team while field visit and instruct the farmers about the techniques of scientific cultivation like using tractors, power tillers, irrigation pumps, etc. correctly for better harvest (Paul, 2018).
3.8. Noakhali The District Fisheries Office works to disseminate improved aquaculture technologies through training and demonstration and e-Extension service (Hossen, 2018). It facilitates arrangement for institutional credit for fish and shrimp farmers, fishers and fish traders and entrepreneurs and introducing newer technology for fish breeding, fish growth and fish feeder etc. (Hossen, 2018).
4. Bridging between the present status of technologies and the National Agricultural Extension Policy, 2012
In 1996, the Ministry of Government prepared the National Agricultural Extension Policy (NAEP) in line with the agricultural policies and priorities outlined in the Fifteen Year Perspective Plan, 1995-2010. NAEP's primary objective was to encourage the numerous partners and organizations within the domestic agricultural extension scheme to provide efficient and effective services that complement and strengthen each other in an attempt to improve agricultural effectiveness and productivity in Bangladesh (NAEP, 2012). In 2012, the NAEP 1996 has been updated for future uses and is known as National Agricultural Extension Policy, 2012.
Among the several key constraints in agriculture sector of Bangladesh as identified in NAEP 2012, inefficient use and inadequacy of irrigation water and slow mechanization in agriculture has been mentioned which are related to the topic of this article. As already seen from the previous discussions in data analysis, the use of irrigation pumps, tractors, power tillers are in very less percentage which reflects the scenario of the constraints identified in the NAEP 2012.
The strategic approaches suggested by NAEP 2012 includes:
1. Promoting e-Agriculture: Innovative use of ICT will be promoted at all possible phases of the agricultural production cycle.
2. Innovative Improvements for e-Agriculture: Utilization of ICT in electronic and versatile based systems, the preparation of digitized information bases and the information management systems at upazilla, regional and national level, portable based instant messages and voice messages for early cautioning on nuisance and malady episode, catastrophic events for dissemination of critical information are stated.

Tabassum.A, Hasan.M.U, Adri.N, Tabassum.N
Diffusion of Agricultural Technology
587
3. Strengthening Supply of Quality Seeds and Other Inputs: Production, processing, conservation and distribution of quality HYV plants (plants, cattle, fishing, etc.), prompt accessibility of fertilizers, organic cultivation, low use of pesticides with greater emphasis on the use of IMP techniques (gender pheromones and associated techniques), effective management of irrigation water and Alternate Wetting and Drying (AWD) water system framework (e.g., covered pipe, sub-surface water system, pukka nala and so on) are mentioned.
4. Mainstreaming Women in Agriculture: Developing women farmers' organizations, encouraging females to develop small and medium-sized enterprises in agri-business, building trust to raise voice by organizing women farmers' grass root level, generating gender consciousness in both females and male farmers are mentioned.
5. Thrust on Farm Mechanization: Projects need to be facilitated by mechanizing various crop manufacturing activities such as tillage, seeding, fertilization, weeding, herbicide spraying, harvesting and threshing, with 25% subsidy cost for farmers to buy various farm machinery.
6. Efficient and Effective Dissemination of Technology: Changes in behaviour, skills and understanding of farmers and their communities will be improved by a "one-day training program based on the need for a single subject" incorporating the danger of farmers adopting new techniques through adaptation testing and demonstration.
7. Credit and Insurance: Through group savings, the farmers ' organisations (FOs) should link upazilla and district-level with the financial institutions and banks to facilitate the extension agent. Crop insurance may be implemented for farmers as a result of damage to their crops by sudden catastrophe.
4.1. Major Findings From the key informant interviews, projects and activities carried out government and NGOs associated with technological diffusion in agriculture sector in the 8 Upazillas have been identified. The table 1 below summarizes information about where such activities matching with the approaches suggested by NAEP 2012 have been implemented.
Table 1: Activities under NAEP carried out in different Upazillas
Approaches suggested NAEP Upazillas
Promoting e-Agriculture Panchbibi, Pirganj, Ghior, Feni, Noakhali
Innovative Improvements for e-Agriculture Panchbibi, Pirganj, Ghior, Feni
Strengthening Supply of Quality Seeds and Other Inputs
Feni, Meghna, Sreenagar, Noakhali
Mainstreaming Women in Agriculture Feni, Meghna, Ghior, Saghata
Thrust on Farm Mechanization Panchbibi, Saghata
Efficient and Effective Dissemination of Technology
Feni, Ghior, Saghata, Sreenagar, Panchbibi, Noakhali
Credit and Insurance Feni, Meghna, Ghior, Sreenagar, Noakhali
(Source: Field survey, 2018 and NAEP 2012)

Tabassum.A, Hasan.M.U, Adri.N, Tabassum.N
Diffusion of Agricultural Technology
588
In Meghna, Saghata and Sreenagar, use of E-agriculture is not seen to that extent. It is also seen that the education level of people is low compared to other Upazillas (Figure 4).
Figure 4: Upazila-wise education level in surveyed upazillas (Source: Field Survey, 2018)
It can be said that lack of education or sufficient knowledge acts as a constraint in case of disseminating technological advancement. 54.6% of the female population are housewives (Source: Field Survey,2018). This is a large number of the total population. This shows the ineffectiveness or failure of the working bodies like government or NGOs despite undertaking many programs and projects to bring rural women in the labour force. Moreover, social and religious beliefs may act as some of the reasons for rural women to stay at home. More effective programs need to be undertaken to encourage women to be employed in agricultural sector as mentioned in the National Agricultural Extension Policy 2012. In Panchbibi, Pirganj and Saghata where more agricultural land is owned by people and main occupation of most people is agriculture, effective programs by either government or NGOs for strengthening supply of quality seeds to farmers are not seen. Programs for mainstreaming women in agricultural activities are not seen in Panchbibi, Pirganj, Sreenagar and Noakhali. Thrust for farm mechanization is seen at present in Saghata and Panchbibi only according to the summary Table 1. This might be because other Upazillas have already adopted the existing common technologies related to farm machineries, so no new programs are needed at that high extent to introduce those with farmers.
4.2. Conclusion The present review of agriculture technology is an attempt to identify the strength and weakness of the selected Upazilas of the country. In the modern era where technology is dominating every sector of life, diffusion of technology in rural agriculture is of crucial importance. To cope up with the increasing demand of food for the huge population of Bangladesh and to alleviate poverty by creating employment for people, use of technology is now one of the most needed solutions. If the study on present status of agriculture can be carried out in all the Upazilas along with studying the socio-economic condition of the farmers, it will provide the scope of understanding the main reasons or the constraints behind insufficient spread of technological use. It will also show the gap between the real life scenario of different projects or programs undertaken by government or NGOs for rural development and the suggested approaches as mentioned in the National Agricultural Policy 2012. Thus further works can be carried out such as modifying the programs or policies to

Tabassum.A, Hasan.M.U, Adri.N, Tabassum.N
Diffusion of Agricultural Technology
589
ensure maximum dissemination of technology in the agriculture sector and meet the challenge of food security and sustainable development of Bangladesh.
5. References BER 2009. Bangladesh Economic Review, Department of Finance, Ministry of Finance.
Bangladesh. pp.83-85
Rahman.S (1999) Environmental impacts of modern agricultural technology diffusion in Bangladesh: an analysis of farmers’ perceptions and their determinants
Rahman, S., (2002) Technological change and food production sustainability in Bangladesh agriculture. Asian Profile 30, 233–246.
M. A. Kashem and M. A. A. Faroque (2010) Agricultural Technology: A Challenge To Way Forward Sustainable Development
Mamun. M (2018) Upazilla Nirbahi Officer, Feni Sadar (Key Informant Interview on December 2018)
The World Bank Data (2017) retrieved from https://data.worldbank.org/country/bangladesh on 09.02.19
National Agricultural Extension (Policy 2012) Ministry of Agriculture, Government of the People’s Republic of Bangladesh
Barua. A.K (2108) Upazila Engineer, Feni Sadar (Key Informant Interview on December 2018)
Shahab Uddin Ahmed Shikdar (2018) Polli Unnayan Officer, Feni Sadar (Key Informant Interview on December 2018)
Khatun.S (2018) Upazila Agriculture officer, Meghna Upazilla (Key Informant Interview on December 2018)
Rakhi.M.S (2018) Upazilla Nirbahi Officer, Ghior Upazilla (Key Informant Interview on December 2018)
Hossain. S.K.B Upazila Krishi Officer, Ghior Upazilla (Key Informant Interview on December 2018)
Islam.A(2018) Assistant Agriculture Officer, Sreenagar (Key Informant Interview on December 2018)
Ghosh.U.K (2018) Upazila Nirbahi Officer, Saghata Upazilla (Key Informant Interview on December 2018)
Ghosh.S.C (2018) Upazila Agriculture Officer, Pirganj Upazilla(Key Informant Interview on December 2018)
Paul.K.P (2018) Upazila Agriculture Officer. Panchbibi Upazilla (Key Informant Interview on December 2018)
Hossen.M.M (2018) District Fisheries Officer, Noakhali District (Key Informant Interview on December 2018)

Tabassum, N, T Technological Impact on Income Generation: A Way to Make Sustainable
Livelihood for Rural People
590
Research Paper
Technological Impact on Income Generation: A way to Make Sustainable Livelihood for Rural People
Nusrat Jahan Tabassum, Bangladesh University of Engineering and Technology, BUET; Bangladesh
Ms. Nawshin Tabassum, Lecturer, Department of Urban and Regional Planning, BUET; Bangladesh
Dr. Neelopal Adri, Assistant Professor, Department of Urban and Regional Planning, BUET; Bangladesh
Dr. Md. Musleh Uddin Hasan, Associate Professor, Department of Urban and Regional Planning, BUET; Bangladesh
Abstract
Bangladesh is the most densely populated country having a large number of villages. Villages are the main center of economic growth as Bangladesh is the agrarian country. Most of the village people are involved in agriculture. But they are deprived of modern technology in agricultural sector as well as other sector. Employment opportunity in villages are absent in other sector because of absence of skill of technology. On the contrary, agriculture sector has vulnerability issue like seasonality problem and so most of the time they are unemployed. It tends to villagers to migrate in big cities and abroad. Migrated people sent remittances and technology based instruments from that place. It emphasizes the importance of learning and using modern technology. So, people of different upazila are now learned that opens a new scope of income generating activity. Remittances also helps to buy different product for agricultural production like power tiller, irrigation pump etc. and input (seeds, fertilizers and pesticides). Bkash is used for collecting money. In that way, the demand for bkash is increased which motivated the villagers to grab this employment opportunity. Communication is also an important things for business, education, job, agriculture, hospital service etc. Mobile and computer are contributing a great help for this particular things. It can be said that technology is provided a great help for increasing income. It also improve the livelihood assets (human, physical, social, financial, and natural) of villagers and make a strategies to achieve a goal for making a sustainable rural livelihood.
Keywords
Rural Livelihood, Technology, Sustainable, Remittances, Bkash
1. Background of the Study 1.1. Introduction 1.1 Bangladesh is a small south Asian country with dense population but surrounded by natural beauty. It has 64 district of 492 upazilas. Upazila is the second lowest tier of regional administration in Bangladesh. This administrative structure system of devolution was introduced by formal military ruler and President of Bangladesh, Lieutenant General Hossain Mohammad Ershad to strengthen local government. Village is the smallest territorial and
Tabassum, N, T Technological Impact on Income Generation: A Way to Make Sustainable
Livelihood for Rural People
591
social unit for administrative and representative purpose. Villages of Bangladesh are not in well condition and well connected with city. They are deprived of technological advancement and modern facility after the independence rather than city. Technology is the use of scientific knowledge for practical purposes in the industry or daily activity. In rural area, agriculture is the main occupation. According to World Bank employment in agricultural sector is also declining from 69.51 to 37.65 on 2018 but 75% of population directly and indirectly depend on agriculture in Bangladesh (Sheheli, 2012). Though they are still involved in agricultural sector but do not know about the advanced agricultural instruments and its use. Introduction of new technologies on farming practices have given tremendous benefits to resourceful on one hand while the small land farmer deprived of such benefit on the other hand. Income generating technology that are mainly used in rural area are power tiller, Bkash, mobile and computer. This technology has impact on different sector like power tiller in agricultural sector, computer in education sector, bkash on mobile banking and mobile for business and communication purpose. Migration is also the common scenario in different region that also influenced directly and indirectly to the use of technology. Though farming is an important factor of rural economy, rural area are also contain a wide range of other economic activity. So, rural people are now engaged in diverse and multiple activities to improve their livelihoods by maximizing income generating activities both farming and non-farming activities and minimizing the vulnerability and risk.
In this study 8 upazila (Feni Sadar, Meghna, Ghior, Sreenagar, Noakhali Sadar, Saghata, Pirganj, Panchbibi) is selected among 492 upazilas of Bangladesh to know the socio-economic condition and technological adaptation. FGD and key informants provide the technology related information which provides the acute differences in upazilas. It is stated that technology related activities are changed in the upazila through the helps of upazila headquarters and NGO. But still some people are deprived of this facility. As they are lower middle and lower income people and upazila headquarters are also not in well facilitated from others upazila. Most of the rural area people are migrated which brings lots of new technology for the purpose of communication. In that case, they know how to use but are not aware of the benefit and impact on income generation. Villagers who are known the fact is very little amount and not countable for most of the villages. Villages which are well connected with technology used this to change their daily livelihood pattern through improve financial and human resources like- improved agricultural production, mobile banking shop, computer training shop etc. Technology related activity and its impact on income generation creates gaps between villages. It is the great concern to improve the villagers’ livelihood pattern to involve them diverse activities along with agriculture. So, this paper is focused on how to impose technology and contribute it to income generation for changing their livelihood pattern in a sustainable way.
2. Literature Review and Methodology 2 2.1. Literature Review 2.1 A literature study is conducting a research study that is considered the most important factor in the study. Literature study helps to strengthen the background knowledge of the study. It helps the researcher to keep his work going in right direction. Livelihood is the combination of the capabilities and resources people have (including social, human, natural,

Tabassum, N, T Technological Impact on Income Generation: A Way to Make Sustainable
Livelihood for Rural People
592
financial and material assets) and the activities they undertake in order to make a living by attaining a goal and aspiration. Livelihood are ways of keeping one self meaningfully by occupying ones’ endowments (human and material). It helps to generate adequate resources to meet the requirements in a sustainable manner. Sustainable livelihood create a livelihood that empower individuals to earn money to provide basic needs such as food, clothing and shelter. A livelihood is sustainable when people cope up and recover from shocks and crisis (e.g. seasonal, environmental and economic). It can maintain and enhance their capability and resources both now and in future. Sustainable livelihood approaches puts the people at the centre of development work. It attempts to understand the socio-economic development and resource management. The development alternatives (DA) approach encompasses activities that help economically disadvantage members of society to meet their daily needs in a dignified manner, locally appropriate and environmentally sustainable.
Lucas (1997) indicated that human capital (education, skills, knowledge and health) determines access to economic opportunities. Individual with better education and skills has long been seen as a key determinants of migration as advantage in labour market. De Haan (2000) found an inverse relationship between land and livestock ownership, migration. Although migration is not appropriate for the households who had no own land, migration is seen in the poorest people. Migrants from two sites in Bangladesh are less likely to be from landless household and it is varied according to locality. International migrants are mainly from better off households in terms of landholding. Knox et al. (1998) has debated on green revolution centred on large landholdings (natural capital). In order to permit technology adaptation, policy emphasis has been given to expanding agricultural production (financial capital) and roads or transportation (physical capital). Human capital (knowledge and skill) is also need to properly make use of many new technologies. It is also recognized that social capital can facilitate adoption of technologies which operates on large spatial scale. In that case, collective operation is needed to coordinate the actions of individuals for common investment.
Sharma (2004) stated that development of social infrastructure for the components of human capital like education, skill and training is crucial. It is needed to employing rural people with paying special attention by encouraging self-employment through provision of micro-credit. Financial inclusion is also an important elements for economic development along with poverty reduction. Mobile banking refers to collectively set of application that enable people to use their mobile phone to manipulate the bank account, store value, transfer funds, insurance policy. The mobile financial services has direct and indirect impact on both customers and agents to improve their socio-economic condition. Many successful cases of MFS in developing countries (Philippines, South Africa and Kenya) suggest that it creates employment opportunity. 95% respondents believe that mobile banking created a new income opportunity and also improve the socio-economic condition and financial inclusion in rural area of Bangladesh (Sheheli, 2012).
2.2. Methodology 2.2 The study is related to technology based activity on income generation. For accomplishing the study, objectives were formulated to guide it. Objectives for the study are to study the socio-economic condition of upazila and analysis the impact of income generating technology on sustainable rural livelihood planning. At first a reconnaissance survey is done

Tabassum, N, T Technological Impact on Income Generation: A Way to Make Sustainable
Livelihood for Rural People
593
in villages. After that objectives are refreshed and prepared a questionnaire. Then 276 household survey of villages of 8 upazila is done. Focused group discussion (FGD) and Key Informants survey is also conducted in Bazars and Upazila headquarters. They are important informer as they provide the overall village information about new technology related projects and impact of technology on income generation. It is very helpful to know the technological adaptation among villagers and their livelihood pattern.
3. Study Area Profile 3 Bangladesh has 64 district in which 8 districts are selected. They are apart from each other and has different lifestyle, culture and activities. Feni sadar, Noakhali sadar is located in south-eastern; Panchbibi, Pirganj, Saghata is in North-western and Ghior, Sreenagar, Meghna is in north-eastern part of Bangladesh. 276 household survey is conducted of 28 villages. People are mostly local (81.5%) and migrated (16.7%). Noakhali sadar has the highest surveyor and lowest in Sreenagar. Most of them are Muslim household head.
3.1. Livelihood Pattern of Upazila 3.1 Livelihood refers to a meaning of living. It is an outcome of how and why people transform the environment to meet the needs through technology, labor, power, knowledge and social relation. So, the socio-economic condition of the people is related to sustainable livelihood. Villagers are surveyed mainly 15 to 40 years age and few of them are old age (14%). Rural household people monthly income is around 20,001-30,000 of upazila. They are mostly middle group of people except few rural. People of higher income group (above 40,000) is seen in Noakhali sadar of Chattogram division. Noakhali sadar, Pirganj, Panchbibi upazila has no lower income (below 10,000) group people. In that case, Noakhali sadar upazila people are not involved in agricultural occupation. They are worked in business and most of them are migrated in big city (internal migration). On the contrary, the people of Feni sadar, Meghna and Sreenagar upazila is mostly migrated in abroad. Other villagers are involved in agricultural occupation. The people of Saghata upazila are more involved in agriculture that is around 37.8%. Non-firm activity is also seen among upazilas and they are business, professionals and many more. Business is present almost each upazila that is less in Panchbibi upazila.
Legend Surveyed upazila
Pirganj
Panchbibi
Saghata
Ghior
Sreenagar Meghna
Feni Sadar
Noakhali Sadar
Figure 1 Map of Surveyed Upazila of Bangladesh

Tabassum, N, T Technological Impact on Income Generation: A Way to Make Sustainable
Livelihood for Rural People
594
4. Income and employment generation through income generating activities in rural areas 4
Technology has great impact on income generation. Technology is being changed the livelihood pattern (financial assets) by involving them other non-firm activity. Income generating technology has been created great impact on Agricultural sector, Mobile banking and opened an employment opportunity. These two sector are related to each other.
4.1. Agricultural Sector 4.1 Bangladesh is the mainly agricultural based country. Most of the rural people are dependent on agricultural for living. Income generating activities on rural livelihoods of agricultural sector has impact on human, social, physical, financial, food security. In Kawad project of India, it can be seen that overall livelihood status was increased from 22.67% to 60.50% after undertaking income generating activities. Subsequently, there was a percentage decrease in overall low and medium income respondents form overall livelihood status category and has a positive status of 1% significant level. In this project frequency of visiting, selling, producing, working are helped to mitigate the livelihood status. Bkash is also an amazing instrument that helps in the agricultural sector (Biradar, 2008). It helps to farmers for purchasing agricultural ingredients like-seed, fertilizer, pesticides and machine in timely without physical visit. Farmers can sell their products in perfect price through direct communicate to urban side buyers.
4.2. Mobile Banking 4.2 A cross country study investigated that MFS has positive impact on financial inclusion, economic growth and income distribution. It is found that MFS has increased up to 20% in Pakistan and 5% in Malaysia financial inclusion. In Bangladesh, GDP growth can be increased up to 2-3% by 2020 due to MFS. Bangladesh has high degree of positive relation between Bkash that generating employment opportunity for rural people and has also been changed the socio-economic condition. Rural people have tendency to migrate abroad for better living condition and so remittances come from them. It is known that Bangladesh is the 8Th largest recipient of international remittances in the world which is one of the largest contributors of economy. 75% people of rural area feel that Bkash is the easiest way to collect remittances though large amount of money cannot send and cash out due to the policy of Bangladesh bank. Bkash also play a momentous role to develop the socio-economic condition of rural people as well as rural women by improving financial capability. Now, women have access to collect remittances or salary from the husband who are far from them. Women is used this money to maintain her family and savings, invest in cattle or in small business or in farming. Thus, women become self-sufficient and maintain a standard of living condition through technological impact of Bkash (Russel, 2018). It is also created a bridge for helping the rural disadvantageous people who have no knowledge about formal and informal banking. It provides help to eradicate the poverty by mobile financial services. It increase the mobility of money and financial productivity of seasonal workers and businessman.
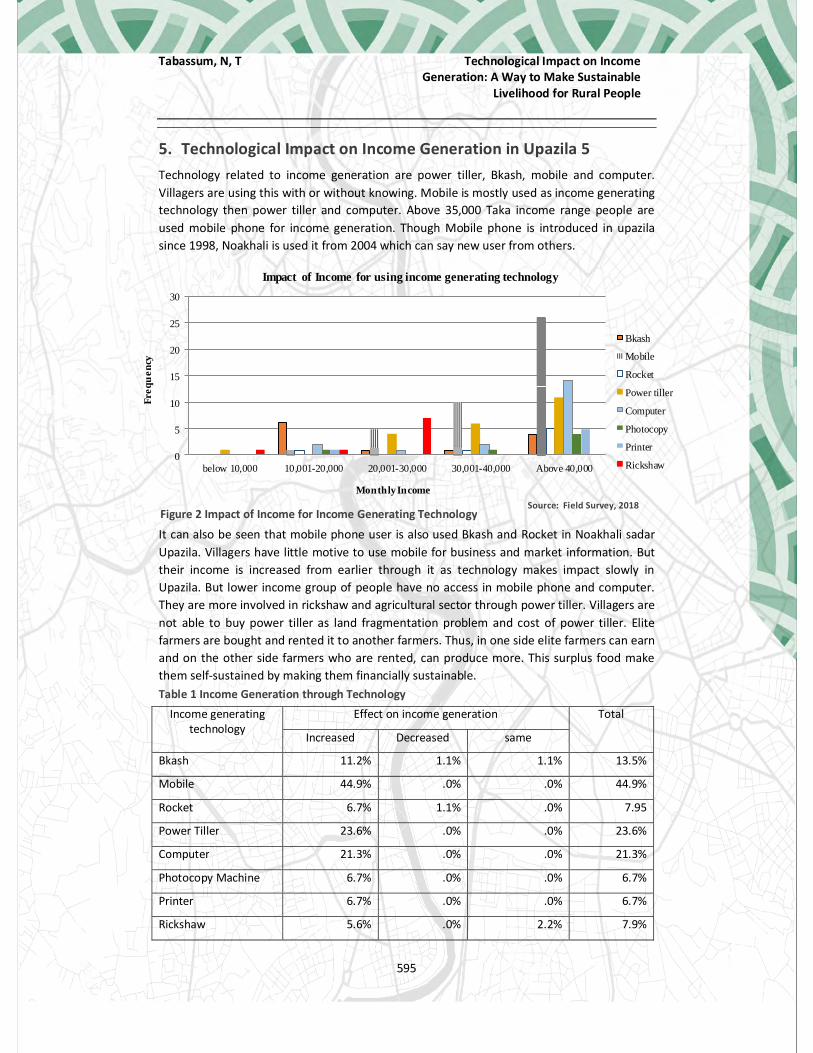
Tabassum, N, T Technological Impact on Income Generation: A Way to Make Sustainable
Livelihood for Rural People
595
0
5
10
15
20
25
30
below 10,000 10,001-20,000 20,001-30,000 30,001-40,000 Above 40,000
Freq
uenc
y
Monthly Income
Impact of Income for using income generating technology
Bkash
Mobile
Rocket
Power tiller
Computer
Photocopy
Printer
Rickshaw
5. Technological Impact on Income Generation in Upazila 5 Technology related to income generation are power tiller, Bkash, mobile and computer. Villagers are using this with or without knowing. Mobile is mostly used as income generating technology then power tiller and computer. Above 35,000 Taka income range people are used mobile phone for income generation. Though Mobile phone is introduced in upazila since 1998, Noakhali is used it from 2004 which can say new user from others.
It can also be seen that mobile phone user is also used Bkash and Rocket in Noakhali sadar Upazila. Villagers have little motive to use mobile for business and market information. But their income is increased from earlier through it as technology makes impact slowly in Upazila. But lower income group of people have no access in mobile phone and computer. They are more involved in rickshaw and agricultural sector through power tiller. Villagers are not able to buy power tiller as land fragmentation problem and cost of power tiller. Elite farmers are bought and rented it to another farmers. Thus, in one side elite farmers can earn and on the other side farmers who are rented, can produce more. This surplus food make them self-sustained by making them financially sustainable.
Income generating technology
Effect on income generation Total
Increased Decreased same
Bkash 11.2% 1.1% 1.1% 13.5%
Mobile 44.9% .0% .0% 44.9%
Rocket 6.7% 1.1% .0% 7.95
Power Tiller 23.6% .0% .0% 23.6%
Computer 21.3% .0% .0% 21.3%
Photocopy Machine 6.7% .0% .0% 6.7%
Printer 6.7% .0% .0% 6.7%
Rickshaw 5.6% .0% 2.2% 7.9%
Figure 2 Impact of Income for Income Generating Technology Source: Field Survey, 2018
Table 1 Income Generation through Technology

Tabassum, N, T Technological Impact on Income Generation: A Way to Make Sustainable
Livelihood for Rural People
596
44.9% 44.2%
70.6%
31.3%22.6%
12.80%
.0%
20.0%
40.0%
60.0%
80.0%
InadequateKnowledge
NetworkProblem
Load Shedding TechnologyCost
Maintenance PersonalSecurity
Per
cen
tage
s
ProblemsProblem Using Technology
Using of computer is very rare in villages of Upazila. Surveyed data provided that Feni sadar upazila is started of using computer since 2000 and rest of the Upazila from 2008. During 2011, people of Noakhali upazila have computer. Noakhali sadar has preferences to use computer as it has few undergraduate students which studies in Noakhali Science and Technology University. The main purpose of computer user is for education and then social networking, communicating and browsing. In that case, new income generation (typing, printer, and cyber-cafe) sector is opened which help to divert them from agro based occupation. Computer is helped them to develop their skill and earn. So, technology has impact on income generation by making them financially sustainable (livelihood assets) that also helped to remove poverty from villages.
6. Problem of Using Technology 6 Technology is the most important factor in daily life activity. It has brought things more closely and changed the livelihood pattern. Technology related problems are in general due to inadequate knowledge, network problem, load shedding, cost of technology, maintenance and personal security. Technology cost is higher that people of low income cannot afford.
As villagers have lack of education they are not able to enjoy the facility. Most of the villages have no access of broadband connection, they only have mobile operator internet network. It is not provided well services in each village of Upazila and so it creates a problem in education and also shop (cybershop, computer training center) that depends on it. Security is also a problem because some villagers are betrayed by Bkash agency. So, villagers have lost their faith on technology and prefer banking system. Problems of technology are dependent on each other. If one circle is faced any obstacle other is also hampered for earning income and affected the livelihood that depends on it.
7. Major Findings of Study Area 7 Rural area has some features that need to address for planning a sustainable rural livelihood. Some key findings are given below:
Figure 2 Problems due to Technology Source: Field Survey, 2018

Tabassum, N, T Technological Impact on Income Generation: A Way to Make Sustainable
Livelihood for Rural People
597
Noakhali Sadar and Feni sadar upazila has the more tendency to use technology as a income generating activity.
Saghata upazila has used quite less technology to increase their income level.
Migration is high among villages of Upazila (Feni, Meghna, Sreenagar)
Mobile phone, computer and power tiller is mostly used income generating technology in villages.
Income generating technology increases income from previous. It means that income generating technology has scope to increase income.
8. Ways for Making Sustainable Rural Livelihood 8
The sustainable livelihood framework is an effort to conceptualize the livelihood. It helps to capture the complexities of livelihood, and the constraints &opportunities. These constrains and opportunities are shaped by numerous factor that is from national, international level to livelihood assets. The vulnerability context is an important factor to make the livelihood sustainable as it has a direct impact on the poor people present and future earnings. It includes trends (national or international economic trends, changes in available technology, political systems), shocks (illness or death, conflict, weather) and seasonality (prices of product, production cycles and so on). It also consider the five assets which poor people need to sustain an adequate income to live. After accomplishing the assets, vulnerability context and transforming structures, rural poor people are able to determine their livelihood
Figure 2 Sustainable Rural Livelihood: A framework for Analysis
Source: Scoones, 1998

Tabassum, N, T Technological Impact on Income Generation: A Way to Make Sustainable
Livelihood for Rural People
598
outcomes by making livelihood strategies. Then it will provide more secure and increased well-being (Scoones, 1998).
People of rural area of Bangladesh is achieved a sustainable livelihood by maintaining a livelihood framework. The way to make a sustainable livelihood through income generating technology are given below:
Upazila needs to ensure information center that provide necessary new technology related information to the poor rural people.
Education facility need to be improved to remove the illiteracy rate. Rural farmers education facility need to be ensure for their agricultural purpose. In that case, they are able to adopt with technology for using and make a surplus product.
Mobile banking related information need to be provided so that villagers are not betrayed by agencies.
Growth center has to be well facilitated with technological instruments, modern agricultural products like-seeds, fertilizer, pesticides etc., mobile service facility, computer facility etc.
Information and communication center have to establish to create employment opportunity for the new generation. It can generate income as well as skill to work non-firm activity.
Mobile phone has many benefits that is not known by many people. It need to promote among villagers. For that growth center, bazars and social gathering places can be a first priority as many people come there at a time. Villagers are able to know the benefits of it (business, food selling, price of products, buying products etc.) and they are inspired to use it. Thus, it generates income for both the donor and recipient as it has direct and indirect benefit.
Broadband connection system need to ensure in village of upazila. It is useful for both student, businessman, farmers and local shop that is related to mobile, computer. It will also help to generate income and change the livelihood pattern.
In agricultural sector, upazila agriculture officer have to organize a training program for providing the information of new agricultural instruments.
Power tiller, irrigation pump are costly for lower middle income farmers. NGO or cooperative organization provide this facility to the farmers for harvesting.
Training need to be imposed in villages of upazila to develop the skill of mobile banking, new agricultural instrument, computer and internet facility. Many human capital is needed to promote the training facility and so both trainer and consumer can earned.
All the facility to sustain rural livelihood, transportation or communication facility have to improve for providing the access to meet the consumer demand. Like- if anyone booked for agricultural instruments in online, provider need to provide it in his/her house. If there has no well-connected road, delivery of the products will not be possible. It is an emergence need for fulfill the demand both physically and virtually.

Tabassum, N, T Technological Impact on Income Generation: A Way to Make Sustainable
Livelihood for Rural People
599
After taking this initiative, people of rural areas have acquired human capital, financial or economic capital, physical capital, social capital and natural capital.
9. Conclusion 9 Bangladesh is mainly an agricultural base country. Upazilas of Bangladesh are lagged behind in terms of technology, education and other facility that is necessary for sustainable livelihood. Agricultural sector is important for the economy of Bangladesh. Mobile banking, mobile and computer are also important things for daily activities. These technology are interrelated with each other. So, this technology have to work with each other to give a better outcome. Income generating technology creates opportunity to earn but it has also some problem. This problem need to be mitigated by upgrading the facility and make a way for sustaining a rural livelihood. In that case, rural people make contribution to increase GDP of Bangladesh and also can reduce poverty as well as prepared skilled manpower. Thus, diverse occupation is opened through technology which can change the pattern of village along with reducing migration.
10.Reference Biradar, B, Manjunath, L, & Yadav V.S. (2011). ‘A study on impact of income generating
activities on sustainable rural livelihoods of Kawad project beneficiaries’, Agriculture Update, Vol. 6 (November).
De Haan, Arjan (2000). Migrants, Livelihoods and Rights: The relevance of migration in development policies, London, Department of International Development.
Knox, P. (1998). Property rights, collective actions and technologies for natural resources management- A conceptual framework. Available at: http://www.capri.cgian.org/pdf/capriowl.pdf (Accessed: 8 February 2019).
Lucas, H. (1997). International Migration in Developing Countries, Available at: https://www.un.org/en/development/desa/population/migration/publications/migrationreport/docs/MigrationReport2017_Highlights.pdf (Accessed: 8 February 2019).
Russel, A. H. & Hossain, M.S. (2017). Picture of the socio-economic development of rural people of Bangladesh through mobile financial services- a study on bkash, European Journal of Business and Management, Vol. 9, No. 36.
Sharma, E. A. S. (2004). Is Rural economy breaking down?-Farmers suicide at Andhra Pradesh, Economic & Political Weekly, Vol.39, No.28 (July).
Sheheli, S. (2012). Improving livelihood of rural women through income generating activities in Bangladesh, Available at: https://edoc.hu-berlin.de/bitstream/handle/18452/17240/sheheli.pdf?sequence=1 (Accessed: 8 February 2019).
Scoones, I. (1998). Sustainable Rural Livelihoods-A Framework for Analysis, Available at: https://www.researchgate.net/publication/270588972_Sustainable_Rural_LivelihoodA_Framework_for_Analysis_IDS_Working_Paper_72 (Accessed: 8 February 2019).

Juy, N.A., Akter, A., Das, A., Zubayer, S. An Analytical Approach to Measure the Dissimilation of Private Banking Sector in
Bangladesh
600
Research Paper
An Analytical Approach to Measure the Dissimilation of Private Banking Sector in Bangladesh
1*Nishat Akter Juy, 1Afrina Akter, 2Anutosh Das, 2Sakib Zubayer
1 Graduate Student, Department of Urban & Regional Planning, Rajshahi University of Engineering & Technology (RUET), Kazla, Rajshahi-6204, Bangladesh.
2 Lecturer, Department of Urban & Regional Planning, Rajshahi University of Engineering & Technology (RUET), Kazla, Rajshahi-6204, Bangladesh.
Abstract
Banking sector play an important role to uphold the industrial as well as business activity of region. It generates national capitals, increase productivity, provide financial support to the people and overall accrete the economic growth of a country. During the period of 1972 to 1982, expansion of banking activity was in favour of rural areas where bank operate under a regime of rigid government control and central bank regulations. After that, Govt. focus on decentralization and privatization of banks. Thus, private financial institution started to establish throughout the country. The study considers the no of private financial institution as an indicator of economic growth of a district, where private financial institution includes number of private commercial bank branch, number of foreign bank branch and insurance company. The aim of the study is to measure the dissimilation of private banking sector in Bangladesh using Lorenz curve and Gini index. There is significant inequality in case of private commercial banks distribution, whereas inequality of foreign banks is absurd. But compare to private commercial banks and foreign bank, the distribution of insurance company throughout is quite good. In case of private commercial bank Gini index is 79.53% and insurance company represent a value of 26.50%. Finally, the study recognizes the backward districts needs more attention to gear up its economic growth. Further to the study, will help to guide regional planning to reduce overall dissimilation of private banking sector throughout the country.
Keywords
Private banking sector, Inequalities, Lorenz curve, Gini Index
1. Introduction The expansion Banking is an important sector that plays a great role in the economy of Bangladesh. The financial establishment of Bangladesh is mixed one that comprises of nationalized bank, private bank, commercial bank, foreign bank, specialized bank and insurance company (Dias, 2019). These all are engaged to motivate the economic growth of Bangladesh. Commercial bank dominates the financial sector of Bangladesh (Khatun, 2018). Its help to increase in capital formation of the national economy. This bank provide capital, technical assistance etc. to the businessman according to their need which tends to trade development and foreign trade also. It provides transfer of money which tends to economic growth. It increases the production capabilities of the economy by reinforcing capital

Juy, N.A., Akter, A., Das, A., Zubayer, S. An Analytical Approach to Measure the Dissimilation of Private Banking Sector in
Bangladesh
601
formation and labour division. It also provides development of transport, assistance to govt., increase in employment, and increase in savings. It provides long, medium and short-term loan in agriculture to farmers (Money Matters, 2013). This study comprises commercial bank, insurance company and foreign bank as private commercial bank. One thing is that, the govt. bank has the liability to establish equally across the country to serve its nation equally. It’s one kind of responsibility of govt. to support its people by providing financial facilities whereas the private banks are profit motive and do good to the economy. So, it also necessary establish its function across the country (Rouf, n.d.,). That’s why the private commercial bank is being selected to find out its distribution distinction. Insurance company served Bangladesh economy by increasing national capital, reducing hindrance and risk, providing financial support to the people, promote economic growth as well as play vital role in the industrial development of Bangladesh.
As commercial banks are of a great association for stabilizing of country’s economy so it is essential to identify the distribution of these bank all over the country to know how it serves its clients and is it sufficient for them (Rouf, n.d.,). All the data are inputted from the Bangladesh Bureau of Statistics (BBS) 2011 and the study topic is selected based on the data availability in the BBS 2011.
This study objective is to measure the unequal distribution of commercial bank against the government bank across the country. This study will help to find out the backward regions which lag behind the sufficient commercial bank. It will help for further research of equal distribution of commercial bank and related studies.
2. Literature Review According to Z. Xiaobo and K. Ravi in the study “Which Regional Inequality? The Evolution of Rural–Urban and Inland–Coastal Inequality in China from 1983 to 1995” include that, in China, assessment of the evolution of the relative contributions of rural– urban and inland– coastal gaps to overall regional inequality is based on a decomposition methodology and generalized entropy. Thus Hu Angang (1996) warned that further increases in regional inconsistencies may lead to China’s dissolution. Former Yugoslavia Xue (1997, p. 46) noted that further expansions of the differences may generate serious social and political problems, generate nationalist conflicts and negatively influence China’s economic and social stability. Its main conclusion is that the greater affluence of rural-to-urban migration within countryside, compared to the institutional and other difficulties of migrating from inland to coastal countryside, provides a partial explanation for this phenomenon.
In the study “Rawls’ fairness, income distribution and alarming level of Gini coefficient” (2017) authors showed that, small number of Gini index help to make peaceful world but radical changes due to instability makes alarming level of Gini index. Next they calculate the alarming levels from three years that is, 1995, 2000, and 2005, using statistical decision theory. The findings suggest that the alarming levels are larger than 0.5. Again, Gini coefficients of year 1990 no longer follow normal distribution at the 5% significance level. The alarming level they proposed only for the free market system, which ensures the free competition and equal opportunity.

Juy, N.A., Akter, A., Das, A., Zubayer, S. An Analytical Approach to Measure the Dissimilation of Private Banking Sector in
Bangladesh
602
Another study “INEQUALITIES FOR THE GINI COEFFICIENT OF COMPOSITE POPULATIONS” includes the income inequality calculation through Gini coefficient and its different types of situation when and how to use Gini coefficient in different situations (Zagier, 1982).
3. Methodology To conduct the study total bank and total commercial bank of Bangladesh is being selected that total bank is stood in X axis and total commercial bank is stood in Y axis. Dissimilation in banking sector is measured through Lorenz curve and Gini coefficient.
The Lorenz curve is a graphical illustration that represents any type of distributional inequality. This can be used for showing any kind of unequal distribution of assets, income or related. This paper use Lorenz curve for showing unequal distribution of Bangladesh banking sectors (Inequality Measures, 2018). For this purpose, graph includes cumulative percentage of total commercial bank against cumulative percentage of corresponding total bank (ranked in increasing size). To the magnitude that drop below the straight diagonal line designated the extent of unequal distribution of commercial bank in Bangladesh banking sector.
The Gini coefficient is another comprehensive measure that uses Lorenz curve for its calculation. It is the most commonly used for measurement of unequal distribution. The Gini coefficient is a number between 0 and 1, where 0 resembles to perfect equality and 1 resembles to perfect inequality. It is expressed in percentage form, and is equal to the Gini coefficient multiplied by 100. It is implied that the Gini coefficient of one country is 0.4 means that may confront the risk of overall social instability.
To order up the cumulative value of total bank and total private commercial bank Locational Quotient is being used. Locational Quotient is the ratio of total number of private commercial banks (Y) and total banks (X). That is,
This is why to descending arrangement of X and Y value for formulation of Lorenz curve.
In this study, the calculation of Gini coefficient is shown below:
Figure 1 Gini coefficient and Lorenz curve

Juy, N.A., Akter, A., Das, A., Zubayer, S. An Analytical Approach to Measure the Dissimilation of Private Banking Sector in
Bangladesh
603
That means, the area of ACD that is yellow colour in figure is deducted from the area of ABC, then it is divided by the Area of ABC. Hence, Value of Gini index is being bring about.
4. Result and Discussion With the common data set, four different Gini co-efficient has been calculated to understand the dissimilation of banking sector in Bangladesh. First of all, we consider the overall inequality in banking sector for 64 districts.
Figure 2 Gini Coefficient based on Lorenz curve
The above figure represents the Lorenz curve, where X is the sum of total no. of nationalized bank branch, total no. of private bank branch, total no of specialized and other co-operative bank, total no. insurance company, total no of foreign bank; Y is the sum of total private commercial bank branch, total no. of insurance company and total no. of foreign bank. The area between perfect distribution line and Lorenz curve represent the overall inequality. Gini-coefficient index has been calculated according to the below figure at 8th interval.
= (5000-4342.824)/5000
= 0.1315
= 13.15 %
The extent of Gini index is 13.15% that’s mean, the inequality of private commercial banking sector in respect with total banking and insurance establishment is 13.15%.
Lorenz curve shows that, Gopalganj district is the lowest in position for private bank establishment whereas Bogra is in the highest. The distinction may be from different sectors. From the BBS 2011 it is found that, total number of private bank in Gopalganj is 19 and in Bogra is 1551. It clarifies more financial and economic activity, more development in Bogra than Gopalganj. In Bogra, total bank, insurance and financial institution establishment is 590,

Juy, N.A., Akter, A., Das, A., Zubayer, S. An Analytical Approach to Measure the Dissimilation of Private Banking Sector in
Bangladesh
604
real estate and renting establishment is 1617, public administration and defence establishment is 545, manufacturing establishment is 17479 whereas in Gopalganj 213, 190, 162, 2784 respectively (BBS 2011). It solely explains the strong dissimilation between these two districts. Hence, Bogra becoming the higher in position than Gopalganj.
0.65 2.447.31
15.2423.29
34.24
49.43
62.6
100
0
20
40
60
80
100
120
0 20 40 60 80 100 120
Cum
ulat
ive
Y%
Cumulative X%
Figure 3 Lorenz Curve by 8th Interval for Area Calculation
13.15% inequality in banking sector can be described by the asset distribution chart stated below.
Figure 4 Percentage of Asset Distribution by districts
In this chart, the districts are categorizing into five class according to the locational quotient i.e., Y/X, listed in a descending ordered. First 20% district explain only 9.36% of the total bank and insurance establishment, whereas last thirteen district describes majority of the asset i.e., 32.37% of X. The commercial banking activity is higher as well.
Table 1 Asset distribution of Districts
Class District 1st 20% district Gopalganj, Rangamati, Khagrachari, Narail, Bandarban, Natore, Barguna,
Chuadanga, Netrokona, Panchagarh, Patuakhali, Rajshahi, Meherpur
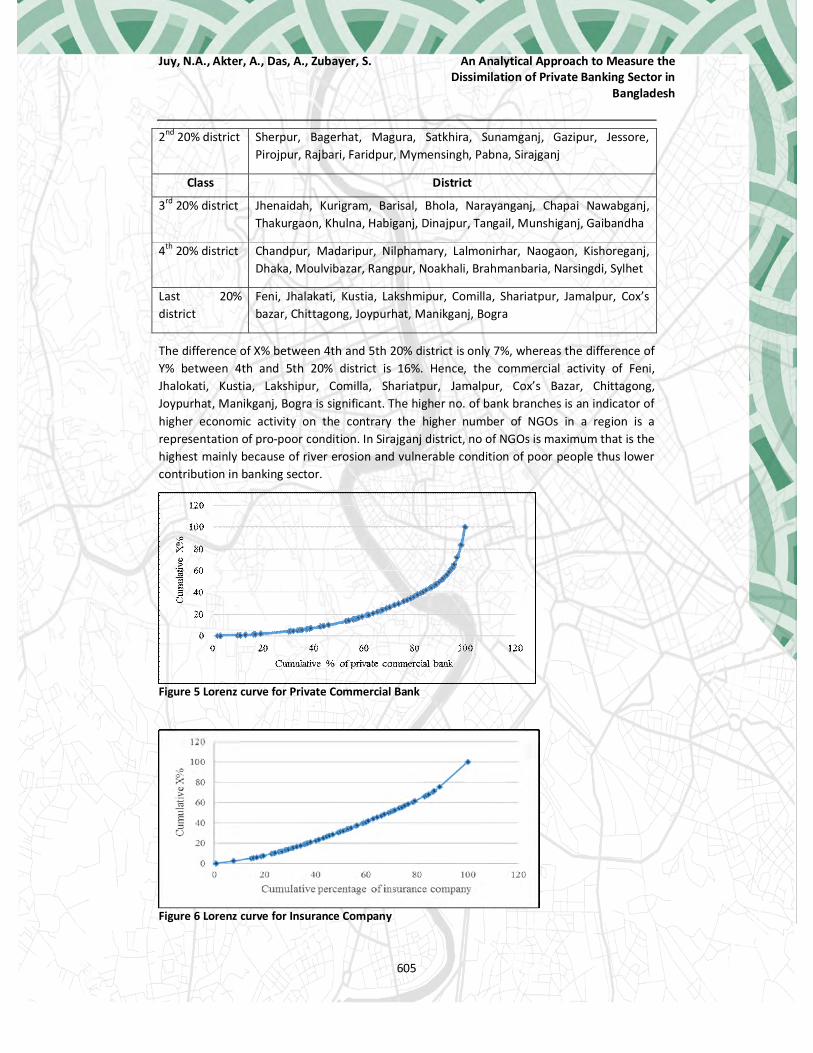
Juy, N.A., Akter, A., Das, A., Zubayer, S. An Analytical Approach to Measure the Dissimilation of Private Banking Sector in
Bangladesh
605
2nd 20% district Sherpur, Bagerhat, Magura, Satkhira, Sunamganj, Gazipur, Jessore, Pirojpur, Rajbari, Faridpur, Mymensingh, Pabna, Sirajganj
Class District
3rd 20% district Jhenaidah, Kurigram, Barisal, Bhola, Narayanganj, Chapai Nawabganj, Thakurgaon, Khulna, Habiganj, Dinajpur, Tangail, Munshiganj, Gaibandha
4th 20% district Chandpur, Madaripur, Nilphamary, Lalmonirhar, Naogaon, Kishoreganj, Dhaka, Moulvibazar, Rangpur, Noakhali, Brahmanbaria, Narsingdi, Sylhet
Last 20% district
Feni, Jhalakati, Kustia, Lakshmipur, Comilla, Shariatpur, Jamalpur, Cox’s bazar, Chittagong, Joypurhat, Manikganj, Bogra
The difference of X% between 4th and 5th 20% district is only 7%, whereas the difference of Y% between 4th and 5th 20% district is 16%. Hence, the commercial activity of Feni, Jhalokati, Kustia, Lakshipur, Comilla, Shariatpur, Jamalpur, Cox’s Bazar, Chittagong, Joypurhat, Manikganj, Bogra is significant. The higher no. of bank branches is an indicator of higher economic activity on the contrary the higher number of NGOs in a region is a representation of pro-poor condition. In Sirajganj district, no of NGOs is maximum that is the highest mainly because of river erosion and vulnerable condition of poor people thus lower contribution in banking sector.
Figure 5 Lorenz curve for Private Commercial Bank
Figure 6 Lorenz curve for Insurance Company
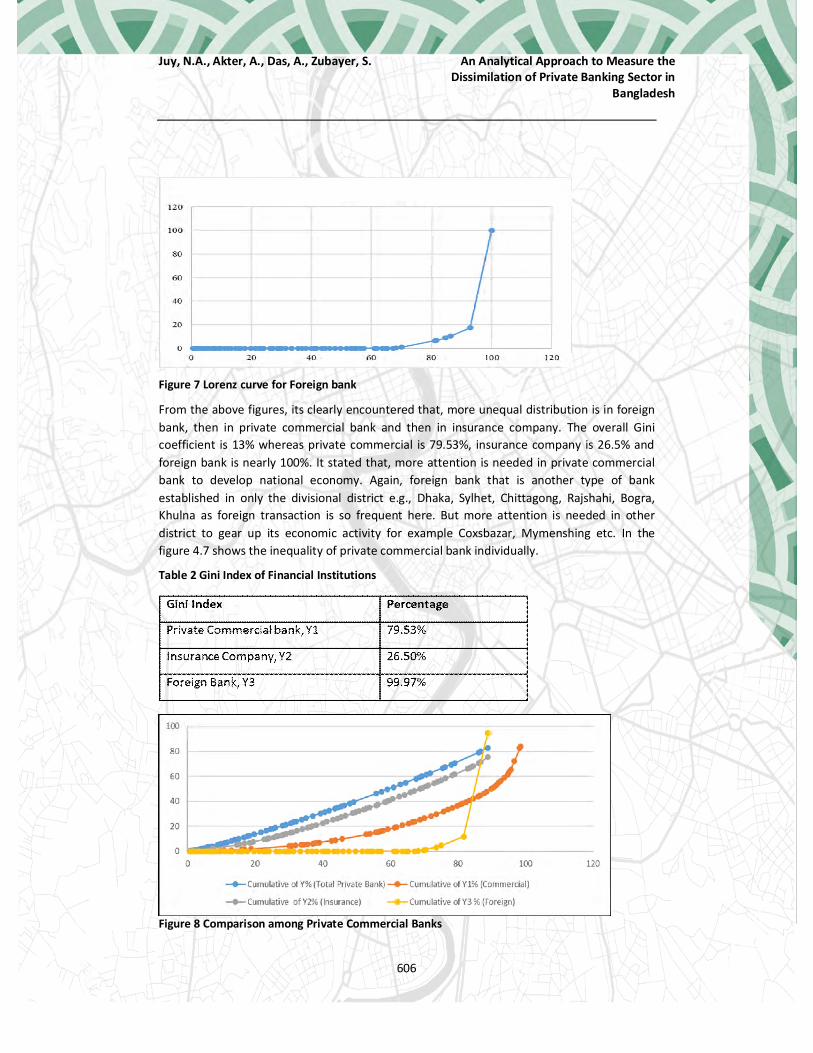
Juy, N.A., Akter, A., Das, A., Zubayer, S. An Analytical Approach to Measure the Dissimilation of Private Banking Sector in
Bangladesh
606
Figure 7 Lorenz curve for Foreign bank
From the above figures, its clearly encountered that, more unequal distribution is in foreign bank, then in private commercial bank and then in insurance company. The overall Gini coefficient is 13% whereas private commercial is 79.53%, insurance company is 26.5% and foreign bank is nearly 100%. It stated that, more attention is needed in private commercial bank to develop national economy. Again, foreign bank that is another type of bank established in only the divisional district e.g., Dhaka, Sylhet, Chittagong, Rajshahi, Bogra, Khulna as foreign transaction is so frequent here. But more attention is needed in other district to gear up its economic activity for example Coxsbazar, Mymenshing etc. In the figure 4.7 shows the inequality of private commercial bank individually.
Table 2 Gini Index of Financial Institutions
Figure 8 Comparison among Private Commercial Banks

Juy, N.A., Akter, A., Das, A., Zubayer, S. An Analytical Approach to Measure the Dissimilation of Private Banking Sector in
Bangladesh
607
5. Conclusion The study deals with the dissimilation of banking sectors of Bangladesh. This study uses the Lorenz curve and Gini coefficient to find out the inequality of commercial bank of Bangladesh. The overall Gini coefficient is 13.15%. The commercial bank includes private commercial bank, insurance company and foreign bank. Private commercial banks contribution is the highest then the insurance company. If the locational quotient is arranging descending, then it will be found that last 40% district hold the maximum assets and that is 68%. Bogra being the top and Gopalganj being the bottom in position. More attention is needed to the lower positional districts to develop the growth and service facilities throughout the country.
6. References BBS (Bangladesh Bureau of Statistics), District Statistics 2011. Ministry of Planning,
Government of the Peoples Republic of Bangladesh. Dias, Norman. (2019). REPORT ON - UNITED COMMERCIAL BANK LTD. BANGLADESH.
Retrieved from : https://www.academia.edu/8242044/REPORT_ON_-_UNITED_COMMERCIAL_BANK_LTD._BANGLADESH
Role of Commercial Banks in Economic Development of Country, (2013) Accessed from https://accountlearning.com on 15 September 2018.
Inequality Measures, (2018) Accessed from https://www.econweb.com on 15 September 2018.
Rauf. A, (n.d.,). Private Bank and its Contribution to Develop the Industry in Bangladesh
Khatun. F. (2019). Banking Sector in Bangladesh: Moving from Diagnosis to Action. Centre for Policy Dialogue (CPD). Dhaka.
Kanbur. R, (1999). Which Regional Inequality? The Evolution of Rural–Urban and Inland–
Coastal Inequality in China from 1983 to 19951, Journal of Comparative Economics 27, ID jcec.1999.1612, Pg. 686–701, retrieved from http://www.idealibrary.com
Tao. Y et. all, (2017) Rawls’ fairness, income distribution and alarming level of Gini
coefficient, retrieved from http://www.economics-ejournal.org/economics/discussionpapers/2017-67
Zagier. D, (1982), INEQUALITIES FOR THE GINI COEFFICIENT OF COMPOSITE POPULATIONS, Journal
of Mathematical Economics 12, pg. 103-118. North Holland.
Sarker,M.A.R; Zannat, M.E.U. ESTIMATION OF SOIL EROSION BY USING USLE MODEL USING GISAND REMOTE SENSING TECHNIQUES
608
Research Paper
ESTIMATION OF SOIL EROSION BY USING USLE MODEL USING GIS AND REMOTE SENSING TECHNIQUES
A Case Study of Khulna City
Md. Aminur Rahman Sarker, Graduate Student, Institute of Water and Flood Management, Bangladesh University of Engineering & Technology, Dhaka; Bangladesh.
Md. Esraz-Ul-Zannat, Assistant Professor, Department of Urban and Regional Planning, Khulna University of Engineering & Technology, Khulna; Bangladesh.
Abstract
Soil erosion is a common phenomenon which occurred all over the world by climatic or environmental activities. Bangladesh is not beyond the exceptional specially Khulna Region. Khulna is the third largest city of Bangladesh which has a higher possibility of soil erosion because of the dynamic condition of the coastal region for that erosion and sedimentation taking place at a different rate. By integration of various GIS and Remote Sensing tools and USLE Model, the spatial distribution of soil erosion in Khulna City is aimed at this paper. The USLE Model usually depends on rainfall erosivity factor, soil erosivity factor, slope length and steepness factor, land cover management factor, and conservation supporting practice factor. Those factors are integrated for developing the soil erosion model and predicting the soil erosion risk. The model predicted that soil erosion mainly depended on the slope length so that the higher the slope length is then soil erosion occurred in proportionally high. Then the model final output of soil erosivity was classified into five different classes depending upon the severity of the erosion. It was found a significant relationship between soil erosion and sediment yield. When crop management factor is absent then soil erosion susceptibility showed potential erodible land over the study area so that mitigation measures could be implied by the decision makers. This study approach has positive impacts to identify the most vulnerable group and financial, infrastructural and organizational support can be provided through policy level implication by associated departments.
Keywords
Sedimentation, Sediment Yield, Soil Erosion Susceptibility, Spatial Distribution
1.0 Introduction Soil erosion is a common phenomenon that occurred all over the world and Bangladesh is not beyond the exception. Several causes identified by researchers and several governments or non-government organizations which mostly indicates the climatic or environmental activities enhanced by man-made activities. But there are no constant rates of soil erosion which can be occurred by natural or geological effects (Bera, 2017). An average rate of 30 to 40 푡 ℎ푎 푦푒푎푟 soil erosion occurred in Asia, South America, and Africa and an average rate of 17 푡 ℎ푎 푦푒푎푟 for the United States of America and Europe found in a review of the costs of soil erosion (Pimentel, et al., 1995). As Bangladesh lying in the active monsoon and cyclone basin (ADB, 2016), 19.76% of total disaster damage occurred from 2009 to 2015 due to costal/ river erosion (BBS, 2015). So as for Bangladesh mainly faced the river bank/ costal erosion time to time in various places. For consequence huge amount of land loss, population migration and landlessness materialized by riverbank erosion (Rabbi, et al., 2013). Khulna is the third largest city of Bangladesh (The World Bank, 2007)which has higher possibility of soil erosion because of the dynamic condition of the coastal regions for that erosion and sedimentation taking place at a different rate (Brammer, 2014). Also, the high rate of average yearly rain falls about 1736 mm (BBS, 2017) and the soil
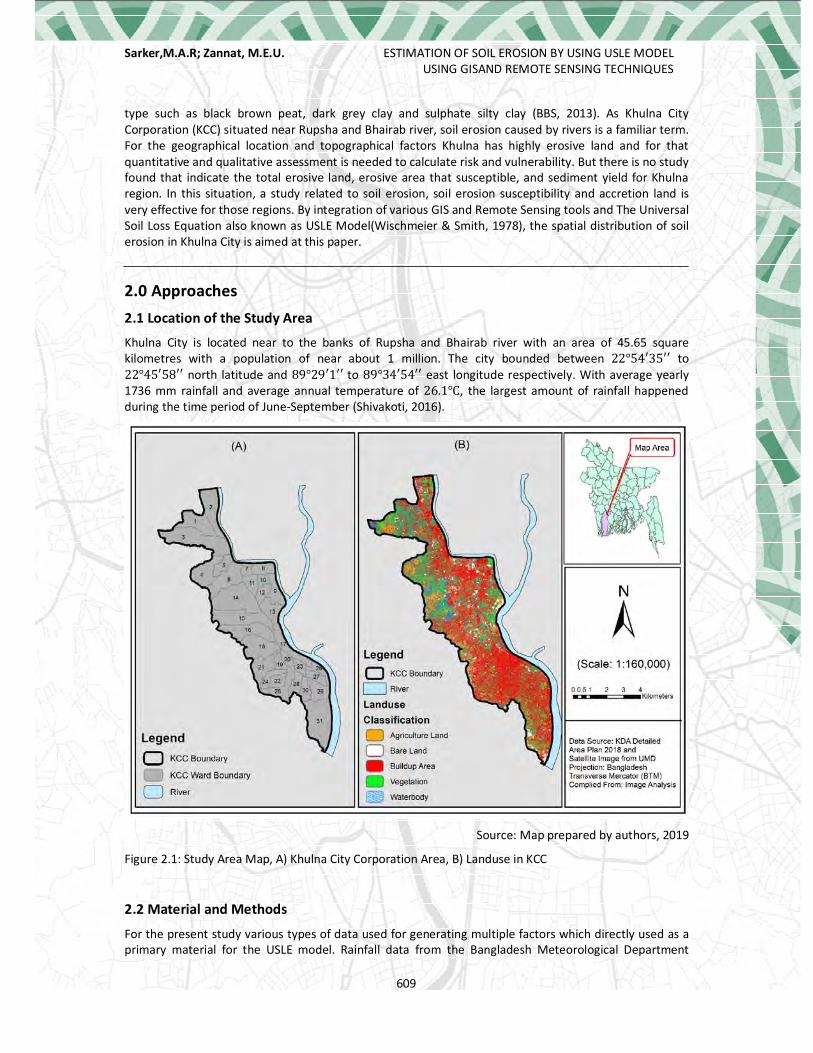
Sarker,M.A.R; Zannat, M.E.U. ESTIMATION OF SOIL EROSION BY USING USLE MODEL USING GISAND REMOTE SENSING TECHNIQUES
609
type such as black brown peat, dark grey clay and sulphate silty clay (BBS, 2013). As Khulna City Corporation (KCC) situated near Rupsha and Bhairab river, soil erosion caused by rivers is a familiar term. For the geographical location and topographical factors Khulna has highly erosive land and for that quantitative and qualitative assessment is needed to calculate risk and vulnerability. But there is no study found that indicate the total erosive land, erosive area that susceptible, and sediment yield for Khulna region. In this situation, a study related to soil erosion, soil erosion susceptibility and accretion land is very effective for those regions. By integration of various GIS and Remote Sensing tools and The Universal Soil Loss Equation also known as USLE Model(Wischmeier & Smith, 1978), the spatial distribution of soil erosion in Khulna City is aimed at this paper.
2.0 Approaches 2.1 Location of the Study Area
Khulna City is located near to the banks of Rupsha and Bhairab river with an area of 45.65 square kilometres with a population of near about 1 million. The city bounded between 22°54′35′′ to 22°45′58′′ north latitude and 89°29′1′′ to 89°34′54′′ east longitude respectively. With average yearly 1736 mm rainfall and average annual temperature of 26.1℃, the largest amount of rainfall happened during the time period of June-September (Shivakoti, 2016).
Source: Map prepared by authors, 2019
Figure 2.1: Study Area Map, A) Khulna City Corporation Area, B) Landuse in KCC
2.2 Material and Methods
For the present study various types of data used for generating multiple factors which directly used as a primary material for the USLE model. Rainfall data from the Bangladesh Meteorological Department

Sarker,M.A.R; Zannat, M.E.U. ESTIMATION OF SOIL EROSION BY USING USLE MODEL USING GISAND REMOTE SENSING TECHNIQUES
610
(BMD) which helps to generate rainfall erosivity factor. Harmonized World Soil Database (HWSD) version 1.2 used to collect soil information about the study area. A high resolution of DEM (1 m) of Khulna City Coproration (KCC) which collected from the office of KCC, used as a primary material for the generation of L facor and S factor respectively. High resolution of satellite image which downloaded through Global Maps Downloader for calculating landuse and land cover of the study area and also used for generating C factor and P factor respectively. Overall those factors used for estimating of soil loss in the study area by using the Universal Soil Loss Equation (USLE) model.
2.3 Universal Soil Loss Equation (USLE) Model
The Universal Soil Loss Equation Model developed by two reserachers Wischmeier and Smith in 1978, generally formed with a very simple multiplication equation as below:
퐴 = 푅 ×퐾 × 퐿 × 퐶 × 푃 (1)
Where, A = the computed mean annual soil loss (푡 ℎ푎 푦 ), R = rainfall erosivity factor (푀퐽 푚푚 ℎ푎 ℎ 푦 ), K = soil erodibilty factor (푡 ℎ푎 ℎ ℎ푎 푀퐽 푚푚 ), L = slope length factor (unitless), S = slope steepness factor (unitless), C = cover and management factor (unitless), and P = support practice factor (unitless).
Mainly USLE model was developed in the United States of America at the farm plot scale for arable land since it was used for estimating soil loss in many other countries with a varity of scales (Benavidez, et al., 2018). Overall this empirical model accounts for rill and interrill erosion but it does count huge soil loss like as gullies or landslides (Thorne, et al., 1985).
Figure 2.2: Methodological flow chart for the preparation of soil loss assessment map
2.3.1 Rainfall Erosivity (R) Factor
Modified Fourier Index (Arnoldus, 1980) used for estimating of rainfall erosivity index based on monthly rainfall data collected from Bangladesh Meteorological Department (BMD). This index is used to estimate rainfall using equation (3) for this study.
푀퐹퐼 = (푃푚푃
)
(2)
푅 = 1.735 ∗ 10( . . )
(3)

Sarker,M.A.R; Zannat, M.E.U. ESTIMATION OF SOIL EROSION BY USING USLE MODEL USING GISAND REMOTE SENSING TECHNIQUES
611
Where, Pm = monthly rainfall data (mm), P = annual rainfall data (mm), F = modified fourier index (MFI), and R = rainfall erosivity in 푀퐽 푚푚 ℎ푎 ℎ 푦 .
Monthly precipitation data of Khulna BMD station from the year 1948 to 2017 was used for calculating the rainfall erosivity factor and found a significant relationship between monthly precipitation in mm and rainfall erosivity factor. From the regression analysis, this relation stands with 푟 = 0.6626 which satisfied by a significance test (two-tailed test) with 99% confidence level (P value < 0.01). Finally, the mean R factor was inserted into GIS platform and was interpolated spatially using the inverse distance weighted (IDW) tool.
2.3.2 Soil Erodibility (K) Factor
Soil susceptibility to erosion depends on soil slopes varies form different soil properties that represent the K factor (Renard, et al., 1997). As much as the higher the K factor values then the soil is higher susceptible to soil erosion (Adornado, et al., 2009). For the present study Harmonized World Soil Database (HWSD) version, 1.2 used as the primary materials for calculating the K factor. Two different types of soil found in the study area according to HWSD. Haplic Greyzems and Lithic Leptosols were major soil type where the percentages of clay, silt, sand, and organic matters from these soil types used to calculate by using Proposed Alternative Soil Erodibilty Factor (ERFAC) equation 4.
퐸퐹푅퐴퐶 = 0.32(%푠푖푙푡
%푐푙푎푦 + %푠푎푛푑) (4)
Then with these results, spatial distribution of the K factor computed under a GIS environment.
2.3.3Slope Length and Slope Steepness (LS) Factor
Slope length L factor and slope steepness S factor combined called a topographic factor. By using the index equation given by Moore and Burch (1986), it can be easily calculated soil loss occurring for the topographic influences.
LS = (Flow accumula on * cell value) .
m *((sin 푠푙표푝푒/0.0896) . ∗ 1.4) (5)
The final product is a unitless topographic factor which claculated from the DEM by using flow accumulation tool and slope tool in a GIS environment.
2.3.4Cover and Management (C) Factor
Effects of vegetation, management, and erosion control on soil represents by the cover management factor as it is refects the effects of cropping and management practices over the soil and its sensibility towards soil erosion. C factor can be calculated through the normalized difference vegetation index (NDVI) in a satellite image of the study area. Various researcher approaches various technique to generalize this fcator. Land use and land cover pattern detection would be helpful in this case.
Table 2.1: C factors for general types of land cover compiled from various sources
Land Use and Land Cover C Factor Resrearchers/Author/ Source
Agriculture land 0.34 (Devatha, et al., 2015)
Buildup Area/ Urban 0.5 (Biswal, 2015)
Waterbodies 1 (Biswal, 2015)
Bare Land 1 (Dymond, 2010)
Vegetation 0.001 (Morgan, 2004)
2.3.5Support Practice (P) Factor

Sarker,M.A.R; Zannat, M.E.U. ESTIMATION OF SOIL EROSION BY USING USLE MODEL USING GISAND REMOTE SENSING TECHNIQUES
612
Soil loss with a specific supporting practice factor to cultivation is called support practice (P) factor. The P factor value ranges between 0 to 1 where the higher as much the value assign then that area is remarked as no supporting practice found. Assuming no support practice is denoted as the P factor value will be assigned as 1. The lower the value assigned then that particular soil having sufficient supporting practice.
3.0 Results and Discussion With 0.6606 푟 value, rainfall erosivity factor (R factor) for Khulna city range between 1219.67 푀퐽 푚푚 ℎ푎 ℎ 푦 to 920.258 푀퐽 푚푚 ℎ푎 ℎ 푦 . Upper north-west and north region of Khulna city having higher R factor value whereas the overall city had moderate values. According to HWSD, there were two types of soil found in the city such as Haplic Greyzems and Lithic Leptosols and there corresponding soil erodibilty factor (K factor) values were 0.375652 푡 ℎ푎 ℎ ℎ푎 푀퐽 푚푚 and 0.164848 푡 ℎ푎 ℎ ℎ푎 푀퐽 푚푚 respectively. Upper KCC area facing higher soil erodibily than the lower KCC area according to the values of K factor. The topographic factor which represented by the two topological factors slope length factor (L factor) and slope steepness factor (S factor) respectively were adjoined together and the value of that factor for the KCC area ranges between 0 to 23.4814. The higher LS factor reflects the higher potentiality that produced overland flow velocities and exposure to higher soil erosion. For calculating of cover and management factor (C factor) land use and land cover detection were followed through and implying various C factor values that already developed by various authors according to the impacts of soil cover was used. Mainly five types of land cover shown in the landuse map and their corresponding C factor values were shown in table 2.1. Assuming there was no support practice in the study area so that the support practice factor (P factor) would be denoted as 1.
For USLE model analysis, all these factors multiply together by the raster calculator tool in GIS environment to find out the average annual soil erosion (A = R K L S C P). The final result of annual average soil erosion ranges between 0 to 230.006 푡 ℎ푎 푦 and that result equally distributed over the study area with 5 consecutive classes which denoted the intensity of soil erosion occurred. Finally, the result is shown on table 3.1. Most of the study area having negligible erosion level and less than one percentage area had extreme level of erosion. As most of the study area covered with buildup area so that soil erosion directly affect on these.
Table 3.1: Classification of Different Soil Erosion Intensity
Soil Loss Classes (푡 ℎ푎 푦 ) Erosion Intensity/ Level Percentage
<46 Negligible Erosion 69.88%
46 - 92 Low Erosion 21.89%
92 - 138 Medium Erosion 6.0%
138 - 184 High Erosion 1.39%
>184 Extreme Erosion 0.84%
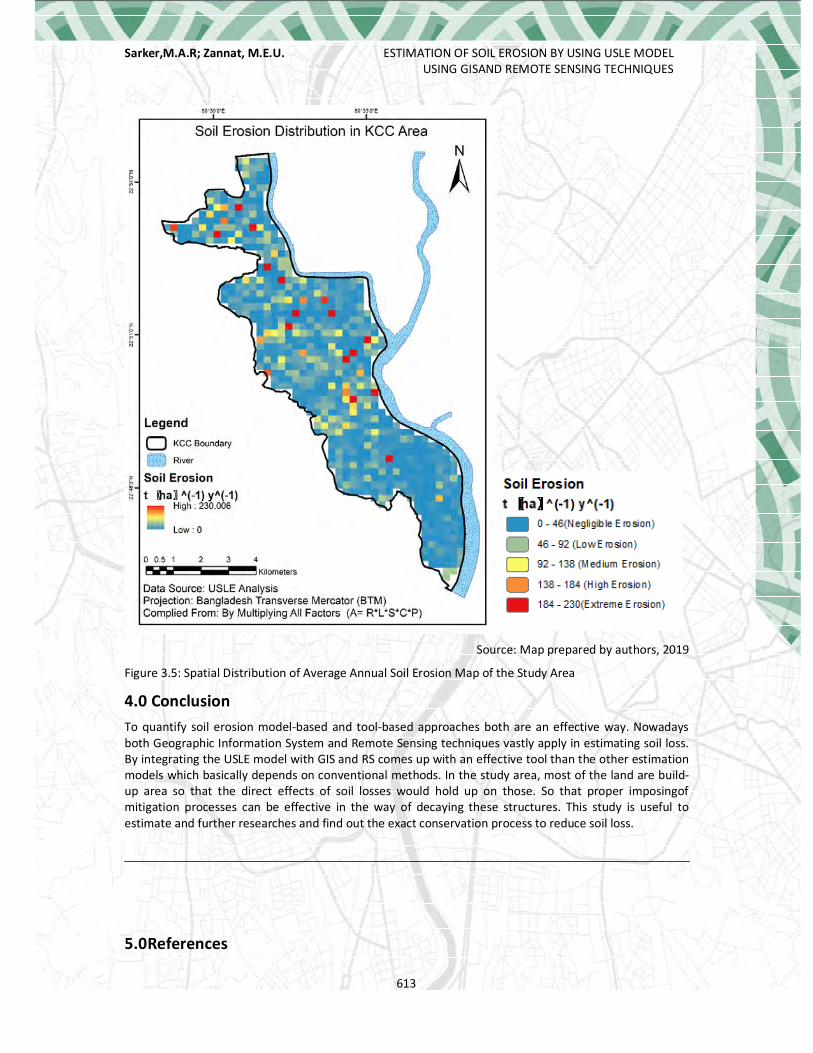
Sarker,M.A.R; Zannat, M.E.U. ESTIMATION OF SOIL EROSION BY USING USLE MODEL USING GISAND REMOTE SENSING TECHNIQUES
613
Source: Map prepared by authors, 2019
Figure 3.5: Spatial Distribution of Average Annual Soil Erosion Map of the Study Area
4.0 Conclusion To quantify soil erosion model-based and tool-based approaches both are an effective way. Nowadays both Geographic Information System and Remote Sensing techniques vastly apply in estimating soil loss. By integrating the USLE model with GIS and RS comes up with an effective tool than the other estimation models which basically depends on conventional methods. In the study area, most of the land are build-up area so that the direct effects of soil losses would hold up on those. So that proper imposingof mitigation processes can be effective in the way of decaying these structures. This study is useful to estimate and further researches and find out the exact conservation process to reduce soil loss.
5.0References

Sarker,M.A.R; Zannat, M.E.U. ESTIMATION OF SOIL EROSION BY USING USLE MODEL USING GISAND REMOTE SENSING TECHNIQUES
614
A. Bera, “Estimation of Soil loss by USLE Model using GIS and Remote Sensing techniques: A case study of Muhuri River Basin, Tripura, India,” Eurasian Journal of Soil Science, vol. 6, no. 3, pp. 206 - 215, January 2017.
D. Pimentel, C. Harvey, . P. Resosudarmo, . K. Sinclair, D. Kurz, M. Kurz, S. Crist, L. Shpritz, L. Fitton, R. Saffouri and R. Blair, “Environmental and Economic Costs of Soil Erosion and Conservation Benefits,” Science, vol. 267, no. 5201, p. 1117–1123, February 1995.
ADB, “Disaster Risk Financing in Bangladesh,” Asian Development Bank, Mandaluyong City, Philippines, 2016.
BBS, “Bangladesh Disaster-related Statistics: Climate Change and Natural Disaster Perspectives,” Bangladesh Bureau of Statistics, 2015.
H. Rabbi, A. Saifullah, M. S. Sheikh, M. Sarker and A. C. Bhowmick, “Recent Study on River Bank Erosion and Its Impacts on Land Displaced People in Sirajgonj Riverine Area of Bangladesh,” International Journal of Applied Environmental Sciences, vol. 2, no. 2, pp. 36-43, June 2013.
The World Bank, “Bangladesh: Strategy for Sustained Growth,” The World Bank, Dhaka, 2007.
H. Brammer, “Bangladesh’s dynamic coastal regions and sea-level rise,” Climate Risk Management, vol. 1, pp. 51-62, 2014.
BBS, “Bangladesh Statistics,” Bangladesh Bureau of Statistics, 2017.
BBS, “District Statistics: Khulna,” Bangladesh Bureau of Statistics, 2013.
W. H. Wischmeier and D. D. Smith, Predicting Rainfall Erosion Losses: A Guide to Conservation Planning. Agriculture Handbook No. 537, 537 ed., Science and Education Administration, U.S. Department of Agriculture, 1978.
B. R. Shivakoti, CHAPTER 7: Groundwater Environment in Khulna, Bangladesh, Japan: Institute for Global Environmental Strategies (IGES), 2016.
R. Benavidez, B. Jackson, D. Maxwell and K. Norton, “A review of the (Revised) Universal Soil Loss Equation ((R)USLE): with a view to increasing its global applicability and improving soil loss estimates,” Hydrology and Earth System Sciences, vol. 22, p. 6059–6086, November 2018.
C. R. Thorne, L. Zevenbergen, E. H. Grissinger and J. B. Murphey, “Calculator programe and nomograph for on-site predictions of ephemeral gully erosion,” Department of Civil Engineering, Colorado State University, Colorado, 1985.
H. M. J. Arnoldus, “An approximation of the rainfall factor in the Universal Soil Loss Equation,” pp. 127-132, 1980.
K. Renard, G. Foster, G. Weesies, D. McCool and D. Yoder, Predicting soil erosion by water: a guide to conservation planning with the Revised Universal Soil Loss Equation (RUSLE), Agricultural Handbook No. 703 ed., Washington, DC (USA): Agricultural Research Service, 1997.
H. A. Adornado, M. Yoshida and H. Apolinares, “Erosion Vulnerability Assessment in REINA, Quezon Province, Philippines with Raster-based Tool Built within GIS Environment,” J. Agric. Res., vol. 18, no. 1, pp. 24-31, January 2009.
I. Moore and G. Burch, “Physical basis of the length-slope factor in the Universal Soil Loss Equation,” Soil Science Society of America Journal, vol. 50, p. 1294–1298, September 1986.
C. P. Devatha, V. Deshpande and M. Renukaprasad, “Estimation of soil loss using USLE model for Kulhan Watershed, Chattisgarh - A case study,” Aquatic Procedia, vol. 4, pp. 1429-1436, December 2015.
S. K. Biswal, “MATHEMATICAL MODEL FOR FLOW AND SEDIMENT YIELD ESTIMATION ON TEL RIVER BASIN OF INDIA,” DEPARMENT OF CIVIL ENGINEERING, NATIONAL INSTITUTE OF TECHNOLOGY , Rourkela, India, 2015.

Sarker,M.A.R; Zannat, M.E.U. ESTIMATION OF SOIL EROSION BY USING USLE MODEL USING GISAND REMOTE SENSING TECHNIQUES
615
J. R. Dymond, “Soil erosion in New Zealand is a net sink of CO2,” Earth Surface Processes and Landforms, vol. 35, pp. 1763-1772, December 2010.
R. P. C. Morgan, Soil Erosion and Conservation, 3 ed., Wiley-Blackwell, 2004.

Alam,M.S;Chakraborty,T.;Noyon,M.E.K, Hosen, M.K, Haque,S.M.
FIRE HAZARD RISK ASSESSMENT OF RESIDENTIAL BUILDINGS OF RAJSHAHI CITY
CORPORATION
616
Research Paper
GIS BASED FIRE HAZARD RISK ASSESSMENT OF RESIDENTIAL BUILDINGS OF RAJSHAHI CITY
CORPORATION USING ENTROPY-TOPSIS INTEGRATED APPROACH
Md. Shaharier ALAM, Urban and Rural Planning Discipline; Khulna University, Bangladesh Torit CHAKRABORTY, Urban and Rural Planning Discipline; Khulna University, Bangladesh
Md. Emon Kabir NOYON, Graduate Student, Bangladesh University of Engineering Technology, Bangladesh
Md. Kamal Hosen, Urban and Rural Planning Discipline, Khulna University, Bangladesh Shamim Mahabubul Haque, Professor, Urban and Rural Planning Discipline; Khulna
University, Bangladesh
Abstract
Fire Hazard has become a regular phenomenon in the densely populated cities of Bangladesh due to haphazard urban development, high building density, unplanned city growth etc. The cities of Bangladesh have experience around terrifying 16000 fire incidents and 1590 death in the last ten year. The city of Rajshahi, one of the oldest municipalities of the country, is also prone to fire hazard and many factors such as- unplanned building construction, existence of many old buildings, slum and squatter settlement, presence of potential industrial fire source, narrow road width, pond filling etc. This research aims to assess the fire hazard risk of residential buildings of Rajshahi City Corporation and mapping the spatial variation of fire risk to identify proper planning interventions. This study used Entropy-Technique for Order Preference by Similarity to Ideal Solution (TOPSIS) integrated method for fire hazard risk assessment based on 9 most relevant factors including proximity to road, distance to water body, distance from fire station, distance from fuel station, distance to hospital, space between adjacent structure, building storey, distance to high voltage electric pole, distance to gas pipeline. From the fire hazard risk score calculated from above mentioned method and factors, ward wise fire risk mapping of Rajshahi City Corporation is done using ArcGIS software. The result shows that only 2.72% of residential buildings of Rajshahi city have low level of fire risk whereas 54.64% of residential building falls in high level of fire risk. About 42.64% of residential building is marked as moderate fire risky in Rajshahi city.This result expected to be helpful in deciding disaster risk sensitive land use planning interventions of Rajshahi City.
Keywords
Fire hazard, Entropy, TOPSIS, GIS, and Residential Buildings
1. Introduction While many natural hazards and forest fire are drawing attention of global leaders, policy makers and disaster risk managers due to their magnitude, frequency, scope, intensity;

Alam,M.S;Chakraborty,T.;Noyon,M.E.K, Hosen, M.K, Haque,S.M.
FIRE HAZARD RISK ASSESSMENT OF RESIDENTIAL BUILDINGS OF RAJSHAHI CITY
CORPORATION
617
urban fire hazard is continuously being marginalized all over the world. But urban fire hazard has become a regular phenomenon in developing and under developed countries of Asia Pacific and many recent horrifying fire blazes in this region grabs global attention. It is estimated that over 95% of fire deaths and burn injuries are in low- and middle-income countries (WHO, 2018). Bangladesh, a middle income country of south Asia, has become a hotspot of urban fire incident and the country have experienced around 16000 fire incidents have occurred in slums, squatter settlements, garment factories, manufacturing industries etc. in the last ten years (2008-2018) which killed at least 1600 people (Dhaka Tribune, 2019). According to world fire statistics, Bangladesh is in 2nd trend in fire incident frequency and in 3rd trend fire death (CTIF, 2019). At the extreme, a 2014 garment factory fire in Bangladesh resulted in 1,127 deaths and stands as one of the deadliest industrial fires in modern history. A massive fire swept through the heart 400 year oldest part of Dhaka city in February ends up killing at least 78 people (BBC, 2019). Fire hazard has become a recurring tragedy for Bangladesh and many similar fire incident ravages every day in some part of the country.
With the flow of urbanization, the city of Rajshahi is growing at a very fast rate which also leads the city towards haphazard urban development and disaster risk. The city has established itself as a significant market town and already turned into a trade centre feeding the locality as well as Dhaka City (CDMP, 2014). As Rajshahi city is one of four oldest municipality of the country, most of the neighbourhoods in this city are very old, unplanned and so does the building in it. Moreover, due to mass migration of peoples to Rajshahi from many neighbouring district, many new densely populated settlements have constructed in a haphazard and unplanned way where people have less access to basic urban services. Majority of these migrating people belong to rural background having modest knowledge on awareness of fire hazards, fire preventive measures and fire resistant construction (Tomar et al. 2018). Existence of many fire inducing factors such as- poor settlement planning, lack of implementation of BNBC building code, earthquake induced fire risk, existence of flammable materials in building construction, existence of many old buildings, slum and squatter settlement, presence of potential industrial fire source, narrow road width, pond filling, inappropriate use of electricity, gas, fuel and overloaded electrical installations are increasing the fire risk of Rajshahi city in every passing moment. Therefore, there is an urgent need to develop a fire risk assessment system for Rajshahi city and determine the fire risk of corresponding buildings of the city. This study aims to develop a Geographic Information System (GIS) based fire risk assessment index to assess the fire risk of residential buildings of Rajshahi City Corporation.
Numerous techniques have been proposed by researchers to assess fire risk. The most commonly used approaches of fire risk assessment at building level includes- survey studies and interview, statistical analysis, multi criteria decision making approach etc. Tian Y.M.et al. (2004) endeavoured to combine the statistical probability method with the fuzzy comprehensive evaluation method to assess fire risk of high-rise civil buildings. Zhang L. N. et al.(2015). broadly assessed the fire risk situation of high-rise civil buildings by using C-means clustering model. Rahman et al.(2015) assessed fire risk of Dhaka city using a AHP based index based approach. FangZh. et al. (2015) used Analytical Hierarchy Process (AHP) to evaluate the risk of fire accidents in shopping malls. Alam and Baroi(2003) attempted to develop a GIS based fire hazard assessment system to categorize the fire risk

Alam,M.S;Chakraborty,T.;Noyon,M.E.K, Hosen, M.K, Haque,S.M.
FIRE HAZARD RISK ASSESSMENT OF RESIDENTIAL BUILDINGS OF RAJSHAHI CITY
CORPORATION
618
of Dhaka city. Hanea et al.(2010) used quantitative and qualitative analysis of the expert and non-expert opinion in fire risk in buildings. Chhetri and Kayastha(2015) used Analytic Hierarchy Process (AHP) Model on Fire Potential Zonation Mapping in Kathmandu Metropolitan City, Nepal. Liu et al.(2017) applied entropy weighted method to assess fire risk of large scale commercial building. For the above literature review, it is observed that most of the studies of fire risk assessment used different multi-criteria decision making approach to assess fire risk at building level. This study will also use multi-criteria decision making method to assess fire hazard risk of residential building stock of Rajshahi City Corporation. Analytical hierarchy process is one of the most used MCDM approach to assess fire risk because of its simplicity and rationality (Alam and Mondal, 2018). But AHP requires expert judgement to determine weights of any criteria which can be biased and misleading as human emotion are obscure (Karthikeyan et al, 2016).To circumvent this issue, entropy method, which mainly worked based on mathematical calculation and free from use of judgement, is used to weight the fire vulnerability factors in this study. This study aims to examine and estimate residential building specific fire risk of Rajshahi city Corporation using a hybrid approach of Entropy and Technique for Order Preference by Similarity to Ideal Solution method(TOPSIS) models and ranks the residential building into three levels (low, moderate, high) fire risk category. Geographic Information System (GIS) is used to analyse and mapping of the fire risk factors of Rajshahi City Corporation. This study is expected to be helpful in fire hazard categorization and risk assessment of Rajshahi city to ensure a safe, sustainable and fire hazard resiliency of the city.
2. Methodology 2.1. Selection of Study Area 2.2. Rajshahi City Corporation (RCC), located on the bank of Padma River in the west boundary of the country, is renowned for economy, trade, and commerce and administrative importance. Rajshahi Municipality was one of the first municipalities in Bangladesh, established in 1876. In 1991, the Municipality has upgraded to Rajshahi City Corporation. The City Corporation consists of 30 wards and has an area of 96.69 sq. km.(CDMP,2014). Recently, it has an estimated population of around 449,657 people and growing at the rate of 1.25% annually (BBS, 2011). In this study, Rajshahi City Corporation (RCC) is selected as study area to assess fire risk. The spatial distribution of selected residential buildings of Rajshahi city is shown in figure 1.

Alam,M.S;Chakraborty,T.;Noyon,M.E.K, Hosen, M.K, Haque,S.M.
FIRE HAZARD RISK ASSESSMENT OF RESIDENTIAL BUILDINGS OF RAJSHAHI CITY
CORPORATION
619
Figure 1 Map of Rajshahi City Corporation
2.3. Sample Size Selection The primary focus of this study is to assess the fire risk of residential buildings of Rajshahi City Corporation using a GIS based indexing method. According to the database of Comprehensive Disaster Management Plan, the total number of residential building located in Rajshahi City is.88326. It is a time and resource consuming task to assess fire risk of each and every building of Rajshahi city. In this study, a sample of 8511 residential buildings have been selected by ArcGIS based random sampling procedure using solvins formula (Slovin,1960) considering 1% margin of error to assess fire risk of Rajshahi city.
2.4. Selection of Fire Vulnerability Factors This study endeavours to assess the fire risk of residential building stock of Rajshahi city using GIS based Entropy-TOPSIS integrated approach. To develop this fire risk index using Entropy-TOPSIS integrated approach, nine most important and influential fire vulnerability factors are selected in this study. The factors are- distance from fire station(Rahman et al.2017, Alam an Haque,2018), Space between adjacent building (Yan, Zhang and He,2014; Rahman et al.2017, Alam and Haque 2017), distance to fuel station (Chhetri and Kayastha, 2015; Rahman et al.2015), distance to road(Rahman et al.2017; Yagoub and Jalil,2014), distance to hospital(Yagoub and Jalil,2014, Sen et al.2011), distance to high voltage electric pole(Rahman et al.2017, Rahman et al.2015), distance to gas pipe line(Khatsü,2005), distance to water body (Maniruzzaman and Haque,2007) and building strorey(Rahman et al.,2015).

Alam,M.S;Chakraborty,T.;Noyon,M.E.K, Hosen, M.K, Haque,S.M.
FIRE HAZARD RISK ASSESSMENT OF RESIDENTIAL BUILDINGS OF RAJSHAHI CITY
CORPORATION
620
2.5. Methods 2.5.1. Entropy Method To determine the weight of factors, different subjective fixed weight methods are widely used such as the Delphi method, expert survey method, the analytic hierarchy process method (AHP), etc. But using these above mentioned methods may lead to deviations of indexes’ weights due to subjective factors (Li et al.2011). To circumvent these man-made disturbances, entropy method is used in this study as it is an objective method of allocation weights depending on the decision matrix without affecting the preference of the decision maker (Zeleny 1982). The steps of entropy calculation are shown as follows;
a) The evaluations ij (i = 1, m) (j = 1, n) are taken as normalized as a fraction of the sum iij Σ to the original assessments of each criterion j.
aij=∑ .∑ for m > 1 and i=1, 2, …, m; and j=1, 2, …, n. (1)
b) Entropy (Ej) is calculated. Ej=[
( )]∑ [푎푖푗{ln(푎푖푗)}](2)
where m = number of alternatives in the matrix standardized assessments and ij =Criteria or standardized attributes.
c) Diversity criterion (Dj) is calculated. Dj=1-Ej (3)
d) The normalized weight of each criterion (Wj) is calculated.
Wj=∑
(4)
2.5.2. Technique for Order Preference by Similarity to Ideal Solution(TOPSIS) models TOPSIS is one of the renowned multi criteria decision-making (MCDM) methods, which chose alternatives, based on distance from positive and negative ideal point. The basic concept of TOPSIS is the chosen Alternative should have the shortest distance from the ideal solution and the farthest from the negative-ideal solution. TOPSIS model follows five major steps.
a) Construct normalized decision matrix using Equation (5) where Kij score of option i with respect to criterion j.
Normalized Score, rij=√∑ (5)
b) Construct the weighted normalized decision matrix using Equation (6) where wj is weights (calculated from equation 4) for each criteria
Vij= wij× rij(6)
c) Identify the Positive and Negative Ideal Solution. The positive ideal (A+) and the negative ideal (A') solutions are defined according to the weighted decision matrix via Equations (7) and (8) below
A+ ={V1+. V2
+, V3+…………..Vn
+} (7)
Where Vj+={max(Vij) if j€J, min(Vij) if j €J’}

Alam,M.S;Chakraborty,T.;Noyon,M.E.K, Hosen, M.K, Haque,S.M.
FIRE HAZARD RISK ASSESSMENT OF RESIDENTIAL BUILDINGS OF RAJSHAHI CITY
CORPORATION
621
A’={ V1’, V2’,V3’……..Vn’} (8)
Where Vj’={min(Vij) if j€J, max(Vij) if j €J’}
d) Calculate the separation distance of each alternative from the positive ideal and negative ideal solution (Equations (9) and (10)).
S+= ∑ where, i= 1……m (9)
S-= ∑ where, i= 1……m (10)
Here Si+ is the distance from the ith alternative from the positive ideal point for the
jth feature and Si−is the distance between the ith alternative and the negative ideal
point for the jth feature.
e) Measure the relative closeness of each location to the ideal solution using Equation (11).
Closeness, Ci= (11)
Ci is a value between 0 and 1 and when the value is closer to 1, that alternative is closer to the ideal condition. In this study, the closeness of alternative value is to 1, the more vulnerable those limits are and the closer they are to 0, the less vulnerability these limits will have.
The negative and positive ideal point for each factors of fire risk along with its respective weight is shown in Table 1.
Table 1. Weight, Positive and negative ideal point of nine fire risk factors
Fire Risk Factors Relation with Fire Risk
Weight (calculated from Entropy)
Positive Ideal Point
Negative Ideal Point
Distance From Fire Station Proportionate 0.1156 0.000014 0.002666 Space Between Adjacent Building
Disproportionate 0.1088 0.000001 0.004171
Distance To Fuel Station Disproportionate 0.1144 0.000011 0.002905
Distance To Road Proportionate 0.1047 0.015312 0.000001 Distance To Hospital Proportionate 0.1138 0.007439 0.000001 Distance To High Voltage Electric Pole
Disproportionate 0.1115 0.000001 0.012930
Distance To Gas Pipe Line Disproportionate 0.1039 0.000001 0.009145
Distance To Water Body Proportionate 0.1116 0.006674 0.000001
Building Strorey Proportionate 0.1157 0.004752 0.000792
2.6. Data Source The data of 9 fire hazard risk factors of Rajshahi city are collected from the physical database of Comprehensive Disaster Management Programme (CDMP)-II of the Ministry of Disaster Management and Relief and Urban Development Directorate (UDD), Ministry of Housing and Public Works.
(Vj+- Vij)2
(Vj+- Vij)2
S- + S+

Alam,M.S;Chakraborty,T.;Noyon,M.E.K, Hosen, M.K, Haque,S.M.
FIRE HAZARD RISK ASSESSMENT OF RESIDENTIAL BUILDINGS OF RAJSHAHI CITY
CORPORATION
622
2.7. Data Analysis and Vulnerability Maps Preparation This study essayed to assess the fire hazard risk of 8511 randomly selected buildings of Rajshahi city using a GIS based indexing approach considering nine most influential factors of fire hazard. The index was developed using two most renowned MCDM method viz. Entropy method and TOPSIS method. To develop an index and analyse fire hazard risk, ArcGIS software has been used in this research paper. Firstly, 8511 residential buildings of Rajshahi City Corporation has been selected using random sampling technique in ArcGIS environment. Then a network dataset has been defined based on the road network database of CDMP-II to assess proximity of buildings from different influential factors. Employing network analysis tool in ArcGIS environment, the distance of each residential buildings from nearest hospital, fire station, water body has been calculated to develop an index for fire risk calculation. The distance other influential factors of fire hazard including space between adjacent structure, distance to petrol pump, high voltage electric pole, gas pipe line from each residential buildings of Rajshahi city is also calculated using ‘near’ tool in ArcGIS software. Using Entropy-TOPSIS integrated fire risk assessment index method, the fire risk score of each building is calculated and classified into three risk category using natural break classification in GIS environment.
3. Result and Discussion Based on the analysis in ArcGIS environment using Entropy-TOPSIS integrated index based approach, the fire risk score of residential building of Rajshahi city has been calculated and classified into three risk category viz. high, moderate and low risk level. From the analysis, it is found that only 2.72% (232 building) of residential buildings of Rajshahi city j has low level of fire risk whereas 54.64% (4651 building) of residential building fall in high level of fire risk. About 42 %( 3628 building) of residential building is marked as moderate fire risky in Rajshahi city. The spatial variation of fire hazard risk of residential buildings of Rajshahi city is shown in Figure 2.

Alam,M.S;Chakraborty,T.;Noyon,M.E.K, Hosen, M.K, Haque,S.M.
FIRE HAZARD RISK ASSESSMENT OF RESIDENTIAL BUILDINGS OF RAJSHAHI CITY
CORPORATION
623
Figure 2. Spatial variation of fire hazard risk in residential buildings of Rajshahi City Corporation
In this study, the ward wise spatial variation of fire risk of residential buildings is also analysed to find out fire risk hotspot of Rajshahi city for identifying appropriate fire risk interventions and mitigation strategies. According to the analysis, ward no 14, 27, 15, 3, 26 respectively has highest number of high fire risky residential buildings and ward no 29, 6, 7,20,8 has low number of high risky building in Rajshahi city. In addition, ward no 3, 24, 19,28,5 respectively has high concentration of moderate fire hazard risky building in Rajshahi city. On the contrary, ward no 12, 22, 21,23,9,13,15,16 has low concentration of moderate risky residential buildings in Rajshahi city corporation. According to the analysis of 8511 random selected residential buildings, 21 out of 30 wards has no residential building that has low fire risk in Rajshahi city. The ward wise distribution of fire risky residential buildings in Rajshahi is shown in Figure 3.
Figure 3. Ward wise distribution of fire hazard risk in Rajshahi City Corporation
0100200300400500600700
1 2 3 4 5 6 7 8 9 101112131415161718192021222324252627282930
Num
ber o
f Bui
ldin
g
RCC Ward number
Low Risk Moderate Risk High Risk

Alam,M.S;Chakraborty,T.;Noyon,M.E.K, Hosen, M.K, Haque,S.M.
FIRE HAZARD RISK ASSESSMENT OF RESIDENTIAL BUILDINGS OF RAJSHAHI CITY
CORPORATION
624
4. Conclusion Understanding the scale, intensity, frequency and probability, exposure of fire hazard of residential buildings of an urban area is of paramount importance for developing an integrated emergency preparedness response system and mitigation strategies. This study endeavours to assess the fire hazard risk of residential buildings of Rajshahi city using Entropy-TOPSIS integrated approach and the result shows that most of the buildings of Rajshahi city fall in high and moderate fire risk category which is very alarming for the urban dwellers of Rajshahi city. This study used only nine proximity factors of fire hazard to assess fire risk and future studies may include more factors from many other dimensions of fire hazard including socio-economic, physical, awareness etc. This study only considers residential landuse and excludes other occupancy types of a building which could be included in further research for accurate result. Excluding all the shortcomings, this study introduced a GIS based hybrid indexing approach combining two MCDM methods and shows a practical and effective result which is expected to be helpful in deciding proper planning interventions for Rajshahi city.
5. References Tomar, S., Kaur, A., Sarma, K., &Dangi, H. K. 2018 .Fire Risk Assessment and Fire Hazard Zonation
Mapping using GIS in South-West Division of Delhi, IAETSD Journal For Advanced Research In Applied Science,5(3).
Slovin, E. 1960.Slovin's formula for sampling technique.Retrieved on January 24, 2019. Akashah, FaridWajdi; BAAKI, Timothy Kurannen; LEE, ShingPeng. 2017. Fire Risk Assessment of
Low Cost High Rise Residential Buildings in Kuala Lumpur: A Case Study. Journal of Design and Built Environment.
Tian Y. M., Liu M., 2004. Probabilistic Fuzzy Comprehensive Evaluation Method for Fire Risk of High-rise Buildings, Journal of Chinese Society for Safety Science 14, p. 99
Zhang L. N., Zhang Q, An J., 2015. High-rise Civil Building Fire Risk Comprehensive Assessment System, Journal of Safety and Environment 15, p. 20
Fang Zh., Chen J. J., Xie T., 2015. Fire Risk Assessment of Shopping Mall Based on Cluster Analysis and AHP, Journal of Northeastern University 36, p. 442.
Alam, M.J.B. and Baroi, G.N., 2004. Fire hazard categorization and risk assessment for Dhaka city in GIS framework. J. Civ. Eng.(IEB), 32(1), pp.35-45.
Hanea, D.M., Jagtman, H.M., Van Alphen, L.L.M.M. and Ale, B.J., 2010. Quantitative and qualitative analysis of the expert and non-expert opinion in fire risk in buildings. Reliability Engineering & System Safety, 95(7), pp.729-741.
Zeleny, M. 1982 .Multiple Criteria Decision Making.New York, McGraw Hill. BBS. 2011. Population & Housing Census 2011: Community Series, Bangladesh Bureau of
Statistics CDMP.2014. Scenario based Earthquake Contingency Plan of Rajshahi City Corporation Area,
Comprehensive Disaster Management Program, Ministry of Disaster Management and Relief Government of the People’s Republic of Bangladesh.
Alam, M.S. and Mondal, M., 2019. Assessment of sanitation service quality in urban slums of Khulna city based on SERVQUAL and AHP model: A case study of railway slum, Khulna, Bangladesh. Journal of Urban Management, 8(1), pp.20-27.

Alam,M.S;Chakraborty,T.;Noyon,M.E.K, Hosen, M.K, Haque,S.M.
FIRE HAZARD RISK ASSESSMENT OF RESIDENTIAL BUILDINGS OF RAJSHAHI CITY
CORPORATION
625
Karthikeyan, R., Venkatesan, K.G.S. and Chandrasekar, A., 2016. A comparison of strengths and weaknesses for analytical hierarchy process. Journal of Chemical and Pharmaceutical Sciences, 9(3), pp.12-15.
Rahman, M.M., Aktar, S. And Ashikuzzaman, M.,.2017.Multi-Hazard Vulnerability Assessment Of An Urban Area: A Case Study On Ward 34 Of Dhaka South City Corporation. J. Asiat. Soc. Bangladesh, Sci. 43(2): 181-195,
Yan, F.Y., Zhang, Q. and He, Z.N., 2015.Assessment of Fire Risk in Central Business District-Taking Yujiapu of Tianjin City as Example. In Proceedings of the 5th International Asia Conference on Industrial Engineering and Management Innovation (IEMI2014) (pp. 171-176). Atlantis Press, Paris.
Chhetri, S., &Kayastha, P. 2015. Manifestation of an analytic hierarchy process (AHP) model on fire potential zonation mapping in Kathmandu Metropolitan City, Nepal. ISPRS International Journal of Geo-Information, 4(1), 400-417.
Alam, M. S., & Haque, S. M. 2017. Assessing Spatial Variability of Earthquake Vulnerability of the Residential Neighborhoods of Mymensingh Town and Their Implications in City Planning and Management. In International Conference on Disaster Risk Mitigation.
Yagoub, M.M. and Jalil, A.M., 2014. Urban Fire Risk Assessment Using GIS: Case Study on Sharjah, UAE. International Geoinformatics Research and Development Journal, 5 (3), pp.1-8.
Şen, A., Önden, I., Gökgöza,T. &Şen, C., 2011. A GIS approach to fire station location selection .Retrieved fromhttp//www.isprs.org/proceedings/2011/Gi4DM/.../OP80.pdf. Istanbul: Yildiz Technical University
Khatsü, P., 2005. Urban Multi-Hazard Risk Analysis Using GIS and Remote Sensing: A Case Study of a Part of Kohima Town, India.
Maniruzzaman, K.M. and Haque, Q., 2007. Fire hazard in Dhaka City: A case study of the service area of Mohammadpur fire station. Urbanization in Bangladesh: Patterns, Issues and Approaches to Planning; Jahan, S., Maniruzzaman, KM, Eds, pp.96-104.
Li, X., Wang, K., Liu, L., Xin, J., Yang, H. and Gao, C., 2011. Application of the entropy weight and TOPSIS method in safety evaluation of coal mines. Procedia Engineering, 26, pp.2085-2091.
Alam, M.S. and Haque, S.M., 2018. Assessment of urban physical seismic vulnerability using the combination of AHP and TOPSIS models: A case study of residential neighborhoods of Mymensingh city, Bangladesh. Journal of Geoscience and Environment Protection, 6(02), p.165.
Dhaka Tribune .2019.. 16,000 fire incidents in 10 years. [online] Available at: https://www.dhakatribune.com/bangladesh/dhaka/2019/03/28/16-000-fire-incidents-in-10-years
WHO .2018. Global Health Estimates 2016: Estimated deaths by cause and region, 2000-2016, Disease burden and mortality estimates: CAUSE-SPECIFIC MORTALITY, 2000–2016. Available at: https://www.who.int/healthinfo/global_burden_disease/estimates/en/
CTIF.2019.World Fire Statistics, Center of Fire Statistics of CTIF- International Association of Fire and Rescue Services, Issue no 24. Retrieve from https://www.ctif.org/news/world-fire-statistics-issue-no-24-2019
BBC.2019. Bangladesh fire: Blaze kills dozens in Dhaka historic district. Available at https://www.bbc.com/news/world-asia-47314098