Security Analysis and Portfolio Management - ACE College
300
Security Analysis and Portfolio Management MBA Second Year (Financial Management) Paper No. 2.6 School of Distance Education Bharathiar University, Coimbatore - 641 046
-
Upload
khangminh22 -
Category
Documents
-
view
1 -
download
0
Transcript of Security Analysis and Portfolio Management - ACE College
Security Analysisand Portfolio Management
MBA Second Year(Financial Management)
Paper No. 2.6
School of Distance EducationBharathiar University, Coimbatore - 641 046

Author: Sudhindra Bhat
Copyright © 2008, Bharathiar UniversityAll Rights Reserved
Produced and Printedby
EXCEL BOOKS PRIVATE LIMITEDA-45, Naraina, Phase-I,
New Delhi-110028for
SCHOOL OF DISTANCE EDUCATIONBharathiar UniversityCoimbatore-641046

Page No.
UNIT I
Lesson 1 Investment 7
Lesson 2 Speculation Investment Avenues in India 15
UNIT II
Lesson 3 Risk and Return 53
Lesson 4 Measurement and Significance of Beta 106
UNIT III
Lesson 5 Security Valuation 117
Lesson 6 Equity Shares Valuation 138
UNIT IV
Lesson 7 Fundamental Analysis 1: Economic Analysis 157
Lesson 8 Fundamental Analysis 2: Industry Analysis 171
Lesson 9 Fundamental Analysis 3: Company Analysis 186
Lesson 10 Technical Analysis 205
UNIT V
Lesson 11 Portfolio Selection 241
Lesson 12 Performance Evaluation of Portfolio 258
Lesson 13 Portfolio Revision 272
Lesson 14 Capital Asset Pricing Model 284
Model Question Paper 305
CONTENTS
SECURITY ANALYSIS AND PORTFOLIO MANAGEMENT
SYLLABUS
UNIT I
Investment-Meaning and process of Investment Management - Speculation InvestmentAvenues in India.
UNIT II
Risk and Return - Historical and Expected return - Measurement - Risk and itsmeasurement - Systematic and Unsystematic risk - Types - Measurement and significanceof Beta.
UNIT III
Security Valuation - Bond, Equity and preference share valuation - Yield to maturity-Bond value theorems
UNIT IV
Fundamental and Technical Analysis - Economy, Industry and Company analysis - Toolsfor technical analysis.
UNIT V
Portfolio Selection, performance evaluation and portfolio revision- Formula plans. - CapitalAsset Pricing Model (CAPM)

UNIT I


LESSON
1INVESTMENT
CONTENTS
1.0 Aims and Objectives
1.1 Introduction
1.1.1 Types of Investments
1.2 Process of Investment Management
1.2.1 Process
1.2.2 Investment Managers and Portfolio Structures
1.2.3 Asset Allocation
1.2.4 Long-term Returns
1.2.5 Diversification
1.2.6 Investment Styles
1.2.7 Performance Measurement
1.3 Common Mistakes/Errors in Investment Management
1.3.1 Some Points to be considered for taking Successful Investment Decisions
1.4 Let us Sum up
1.5 Lesson End Activity
1.6 Keywords
1.7 Questions for Discussion
1.8 Suggested Readings
1.0 AIMS AND OBJECTIVES
After studying this lesson, you will be able to:
l Know about meaning and different types of investment
l Understand the process of investment management
1.1 INTRODUCTION
Investment or investing is a term with several closely-related meanings in businessmanagement, finance and economics, related to saving or deferring consumption. Anasset is usually purchased, or equivalently a deposit is made in a bank, in hopes of gettinga future return or interest from it. The word originates in the Latin "vestis", meaning
8Security Analysis andPortfolio Management
garment, and refers to the act of putting things (money or other claims to resources) intoothers' pockets. The basic meaning of the term being an asset held to have some recurringor capital gains. It is an asset that is expected to give returns without any work on theasset per se.
1.1.1 Types of Investments
The term "investment" is used differently in economics and in finance. Economists referto a real investment (such as a machine or a house), while financial economists refer toa financial asset, such as money that is put into a bank or the market, which may then beused to buy a real asset.
In business management the investment decision (also known as capital budgeting) isone of the fundamental decisions of business management: managers determine theassets that the business enterprise obtains. These assets may be physical (such as buildingsor machinery), intangible (such as patents, software, goodwill), or financial. The managermust assess whether the net present value of the investment to the enterprise is positive;the net present value is calculated using the enterprise's marginal cost of capital.
A business might invest with the goal of making profit. These are marketable securitiesor passive investment. It might also invest with the goal of controlling or influencing theoperation of the second company, the investee. These are called intercorporate,long-term and strategic investments. Hence, a company can have none, some or totalcontrol over the investee's strategic, operating, investing and financing decisions. Onecan control a company by owning over 50% ownership, or have the ability to elect amajority of the Board of Directors.
In economics, investment is the production per unit time of goods which are not consumedbut are to be used for future production. Examples include tangibles (such as building arailroad or factory) and intangibles (such as a year of schooling or on-the-job training).In measures of national income and output, gross investment I is also a component ofGross Domestic Product (GDP), given in the formula GDP = C + I + G + NX, where Cis consumption, G is government spending, and NX is net exports. Thus investment iseverything that remains of production after consumption, government spending, andexports are subtracted I is divided into non-residential investment (such as factories) andresidential investment (new houses). Net investment deducts depreciation from grossinvestment. It is the value of the net increase in the capital stock per year.
Investment, as production over a period of time ("per year"), is not capital. The timedimension of investment makes it a flow. By contrast, capital is a stock, that is, anaccumulation measurable at a point in time (say December 31st).
Investment is often modeled as a function of Income and Interest rates, given by therelation I = f (Y, r). An increase in income encourages higher investment, whereas ahigher interest rate may discourage investment as it becomes more costly to borrowmoney. Even if a firm chooses to use its own funds in an investment, the interest raterepresents an opportunity cost of investing those funds rather than loaning them out forinterest.
In finance, investment = cost of capital, like buying securities or other monetary or paper(financial) assets in the money markets or capital markets, or in fairly liquid real assets,such as gold, real estate, or collectibles. Valuation is the method for assessing whether apotential investment is worth its price. Returns on investments will follow the risk-returnspectrum.

9Investment
Types of financial investments include: shares, other equity investment, and bonds(including bonds denominated in foreign currencies). These financial assets are thenexpected to provide income or positive future cash flows, and may increase or decreasein value giving the investor capital gains or losses.
Trades in contingent claims or derivative securities do not necessarily have future positiveexpected cash flows, and so are not considered assets, or strictly speaking, securities orinvestments. Nevertheless, since their cash flows are closely related to (or derived from)those of specific securities, they are often studied as or treated as investments.
Investments are often made indirectly through intermediaries, such as banks, mutualfunds, pension funds, insurance companies, collective investment schemes, and investmentclubs. Though their legal and procedural details differ, an intermediary generally makesan investment using money from many individuals, each of whom receives a claim onthe intermediary.
In personal finance, money is used to purchase shares, put in a collective investmentscheme or used to buy any asset where there is an element of capital risk is deemed aninvestment. Saving within personal finance refers to money put aside, normally on aregular basis. This distinction is important, as investment risk can cause a capital losswhen an investment is realized, unlike saving(s) where the more limited risk is cashdevaluing due to inflation.
In many instances the terms saving and investment are used interchangeably, whichconfuses this distinction. For example many deposit accounts are labeled as investmentaccounts by banks for marketing purposes. Whether an asset is a saving(s) or aninvestment depends on where the money is invested: if it is cash then it is savings, if itsvalue can fluctuate then it is investment.
In real estate, investment is money used to purchase property for the sole purpose ofholding or leasing for income and where there is an element of capital risk. Unlike othereconomic or financial investment, real estate is purchased. The seller is also called aVendor and normally the purchaser is called a Buyer.
In residential real estate investment, the property is purchased as other people's houses.In many cases the Buyer does not have the full purchase price for a property and mustengage a lender such as a Bank, Finance company or Private Lender. Herein the lenderis the investor as only the lender stands to gain returns from it. Different countries havetheir individual normal lending levels, but usually they will fall into the range of 70-90% ofthe purchase price. Against other types of real estate, residential real estate is the leastrisky.
Check Your Progress 1
Fill in the blanks:
1. In economics, investment is the production per unit time of _____________.
2. The time dimension _____________ makes it a flow.
3. _____________ is a function of income and interest rates.
4. In real estate, investment is _____________ used to purchase property.
10Security Analysis andPortfolio Management
1.2 PROCESS OF INVESTMENT MANAGEMENT
The process of investment management is the professional management of varioussecurities (shares, bonds etc.) assets (e.g. real estate), to meet specified investmentgoals for the benefit of the investors. Investors may be institutions (insurance companies,pension funds, corporations etc.) or private investors (both directly via investment contractsand more commonly via collective investment schemes e.g. mutual funds) .
The term asset management is often used to refer to the investment management ofcollective investments, whilst the more generic fund management may refer to all formsof institutional investment as well as investment management for private investors.Investment managers who specialize in advisory or discretionary management on behalfof (normally wealthy) private investors may often refer to their services as wealthmanagement or portfolio management often within the context of so-called "privatebanking".
The provision of investment management includes elements of financial analysis, assetselection, stock selection, plan implementation and ongoing monitoring of investments.Investment management is a large and important global industry in its own right responsiblefor caretaking of trillions of dollars, euro, pounds and yen. Coming under the remit offinancial services many of the world's largest companies are at least in part investmentmanagers and employ millions of staff and create billions in revenue.
Fund manager (or investment advisor) refers to both a firm that provides investmentmanagement services and an individual(s) who directs "fund management" decisions.
1.2.1 Process
In the process of Investment management, the 3-P's (Philosophy, Process and People)are often used to describe the reasons which the managers keep in mind while takinginvestment management decisions.
l "Philosophy" refers to the over-arching beliefs of the investment organization. Forexample: (i) Does the manager buy growth or value shares (and why)? (ii) Doeshe believe in market timing (and on what evidence)? (iii) Does he rely on externalresearch or does he employ a team of researchers? It is helpful if any and all ofsuch fundamental beliefs are supported by proof-statements.
l "Process" refers to the way in which the overall philosophy is implemented. Forexample: (i) Which universe of assets is explored before particular assets are chosenas suitable investments? (ii) How does the manager decide what to buy and when?(iii) How does the manager decide what to sell and when? (iv) Who takes thedecisions and are they taken by committee? (v) What controls are in place toensure that a rogue fund (one very different from others and from what is intended)cannot arise?
l "People" refers to the staff, especially the fund managers. The questions are, Whoare they? How are they selected? How old are they? Who reports to whom? Howdeep is the team (and do all the members understand the philosophy and processthey are supposed to be using)? And most important of all, How long has the teambeen working together? This last question is vital because whatever performancerecord was presented at the outset of the relationship with the client may or maynot relate to (have been produced by) a team that is still in place. If the team haschanged greatly (high staff turnover or changes to the team), then arguably theperformance record is completely unrelated to the existing team (of fund managers).
11Investment
1.2.2 Investment Managers and Portfolio Structures
At the heart of the investment management industry are the managers who invest anddivest client investments.
A certified company investment advisor should conduct an assessment of each client'sindividual needs and risk profile. The advisor then recommends appropriate investments.
1.2.3 Asset Allocation
The different asset classes and the exercise of allocating funds among these assets (andamong individual securities within each asset class) is what investment managementfirms are paid for. Asset classes exhibit different market dynamics, and different interactioneffects; thus, the allocation of monies among asset classes will have a significant effecton the performance of the fund. Some research suggested that allocation among assetclasses have more predictive power than the choice of individual holdings in determiningportfolio return. Arguably, the skill of a successful investment manager resides inconstructing the asset allocation, and separately the individual holdings, so as to outperformcertain benchmarks (e.g., the peer group of competing funds, bond and stock indices).
1.2.4 Long-term Returns
It is important to look at the evidence on the long-term returns to different assets, and toholding period returns (the returns that accrue on average over different lengths ofinvestment). For example, over very long holding periods (e.g. 10+ years) in most countries,equities have generated higher returns than bonds, and bonds have generated higherreturns than cash. According to financial theory, this is because equities are riskier (morevolatile) than bonds which are themselves more risky than cash.
1.2.5 Diversification
Against the background of the asset allocation, fund managers consider the degree ofdiversification that makes sense for a given client (given its risk preferences) and constructa list of planned holdings accordingly. The list will indicate what percentage of the fundshould be invested in each particular stock or bond. The theory of portfolio diversificationwas originated by Markowitz and effective diversification requires management of thecorrelation between the asset returns and the liability returns, issues internal to the portfolio(individual holdings volatility), and cross-correlations between the returns.
1.2.6 Investment Styles
Investment Style selection depends upon risk appetite and return expectation. There area range of different styles of fund management that the institution can implement. Forexample, growth, value, market neutral, small capitalisation, indexed, etc. Each of theseapproaches has its distinctive features, adherents and, in any particular financialenvironment, distinctive risk characteristics. For example, there is evidence that growthstyles (buying rapidly growing earnings) are especially effective when the companiesable to generate such growth are scarce; conversely, when such growth is plentiful, thenthere is evidence that value styles tend to outperform the indices particularly successfully.
1.2.7 Performance Measurement
Fund performance is the acid test of fund management, and in the institutional contextaccurate measurement is a necessity. For that purpose, institutions measure theperformance of each fund (and usually for internal purposes components of each fund)

12Security Analysis andPortfolio Management
under their management, and performance is also measured by external firms thatspecialize in performance measurement.
1.3 COMMON MISTAKES/ERRORS IN INVESTMENTMANAGEMENT
It may be helpful to be aware of some common mistakes people make when approachingfinancial planning:
1. Don’t set measurable financial goals.
2. Make a financial decision without understanding its effect on other financial issues.
3. Confuse financial planning with investing.
4. Neglect to reevaluate their financial plan periodically.
5. Think that financial planning is only for the wealthy.
6. Think that financial planning is for the time when they get older.
7. Think that financial planning is the same as retirement planning.
8. Wait until a monetary crisis to begin financial planning.
9. Expect unrealistic returns on investments.
10. Think that using a financial planner means losing control.
11. Believe that financial planning is primarily tax planning.
Check Your Progress 2
Indicate whether the following statements are true or false:
1. A certified company investment advisor should conduct an assessment ofeach client's individual needs and risk profile.
2. Investment Style selection depends upon risk appetite and return expectation.
3. The process of investment management is the professional management ofvarious securities (shares, bonds etc) assets (e.g. real estate), to meet specifiedinvestment goals for the benefit of the investors.
4. The provision of investment management includes elements of financialanalysis, asset selection, stock selection, plan implementation and ongoingmonitoring of investments.
5. Investments are often made indirectly through intermediaries, such as banks,mutual funds, pension funds, insurance companies, collective investmentschemes, and investment clubs.
1.3.1 Some Points to be considered for taking Successful Investment Decisions
A Selected list of Proverbs of Stock Markets
l “Don’t invest your money on the advice of a poor man.” Spain
l “A steady job and a mutual fund is still the best defence against social security.”Right on the Web
l “When buying and selling are controlled by legislation, the first thing to be boughtand sold are legislators.” P. J. O’Rourke

13Investment
l “Whoever controls the volume of money in any country is the absolute master ofall industry and commerce.” President James A. Garfield
l “That some should be rich shows that others may become rich, and hence is justencouragement to industry and enterprise.” Abraham Lincoln
l “That’s the American way. If little kids don’t aspire to make money like I did, whatthe hell good is this country?” Lee Iacocca
l “When it is a question of money, everyone is of the same religion.”Voltaire
l “I’d like to live like a poor man with lots of money.” Pablo Picasso
l “If you make money your god, it will plague you like the devil.”Henry Fielding
l “A banker warned the British poet Robert Graves that one could not grow richwriting poetry. He replied that if there was no money in poetry, there was certainlyno poetry in money, and so it was all even.” Robert Graves
l “A liberal is a man who is willing to spend somebody else’s money.”Carter Glass
1.4 LET US SUM UP
A good Investment Management's services focus on independent discretionary andadvisory investment management as well as comprehensive financial advice, includinginheritance tax and protection planning.
The Investment Strategy Group provides asset allocation services, a range of hand-selected investment products as well as comprehensive research and advice on multi-manager investing.
The Investment Strategy Group also advises on a number of asset classes and products,including equity funds, hedge funds, actual property and property funds, bond funds andtax shelter investments.
1.5 LESSON END ACTIVITY
Prepare a note on investment and the process of investment management.
1.6 KEYWORDS
Investment: Investment or investing is a term with several closely-related meanings inbusiness management, finance and economics, related to saving or deferring consumption.
Financial Management: A study of decisions, including financial, investment = cost ofcapital, like buying securities or other monetary or paper (financial) assets in the moneymarkets or capital markets, or in fairly liquid real assets, such as gold, real estate, orcollectibles, etc.
Asset Management: The term asset management is often used to refer to the investmentmanagement of collective investments,
Fund Performance: Fund performance is the acid test of fund management, and in theinstitutional context accurate measurement is a necessity.
Process of Investment Management: It is the professional management of varioussecurities (shares, bonds etc.) assets (e.g. real estate), to meet specified investmentgoals for the benefit of the investors.

14Security Analysis andPortfolio Management
1.7 QUESTIONS FOR DISCUSSION
1. What do you understand by the term investment?
2. What are different types of investment?
3. Define the process of investment.
4. What should be the steps involved in advising about the process of investmentmanagement?
5. What precautions and care should a finance manager take while taking decisionson investment matters?
Check Your Progress: Model Answers
CYP 1
1. Goods 2. Investment 3. Investment 4. Money
CYP 2
1. True 2. True 3. True 4. True 5. True
1.8 SUGGESTED READINGS
Sudhindra Bhat, Security Analysis and Portfolio Management, Excel Books, New Delhi.
Kevin, S., Security Analysis and Portfolio Management, Prentice-Hall of India.
Prasanna Chandra, Investment Analysis and Portfolio Management, Second Edition, Tata McGrawHill.
Punithavathy Pandian, Security Analysis and Portfolio Management, Vikas.
V. K. Bhalla, Investment Management.
A. Davis, Investors in a Changing Economy, Prentice-Hall, 1968.
Williamson, J. Peter, Investments: New Analytic Techniques, London, Longman, 1970.
Cottle, CC., and Whitman, W.T., Investment Timing: The Formula Plan Approach, McGraw Hill.
LESSON
2SPECULATION INVESTMENT AVENUES IN INDIA
CONTENTS
2.0 Aims and Objectives
2.1 Introduction
2.2 Investment Alternatives/Investment Avenues
2.2.1 Investment Attributes
2.3 Equity Shares
2.3.1 Advantages and Disadvantages of Equity Shares
2.3.2 Money Market Securities
2.3.3 Advantages of Going Public
2.3.4 Disadvantages
2.4 Hybrid Instruments
2.5 Investment Instruments of the Money Market
2.5.1 New Instruments Introduced
2.5.2 Issuers
2.5.3 Money Market Mutual Funds
2.6 Non-security Form of Investment
2.7 UNITS
2.7.1 Unit-linked Insurance Plan (1971)
2.7.2 Reinvestment Plan (1966)
2.7.3 Children Gift Growth Fund, 1986 (Interest 12.5% p.a.)
2.8 Social Security Funds
2.8.1 National Savings Scheme - VIII Series
2.8.2 10 Years Social Security Certificates
2.8.3 Kisan Vikas Patras
2.8.4 Indira Vikas Patras
2.8.5 National Savings Certificates (VIII Issue)
2.8.6 Twelve-Year National Savings Annuity Certificates
2.9 Post Office Time Deposit
2.10 Fixed Income Investments
Contd....

16Security Analysis andPortfolio Management
2.11 Government Securities
2.11.1 Treasury Bills
2.11.2 Invest in Government Securities
2.11.3 Advantages and Disadvantages of Investing in Gilts
2.12 Deposit with Companies
2.13 Bullion/Gold, Silver, Platinum
2.13.1 Gold
2.13.2 Silver/Platinum
2.14 Real Estate Investment
2.14.1 Advantages
2.14.2 Disadvantages
2.15 New Avenues for Investment
2.15.1 ULIP
2.15.2 New Insurance Policies
2.15.3 Art
2.16 Let us Sum up
2.17 Lesson End Activity
2.18 Keywords
2.19 Questions for Discussion
2.20 Suggested Readings
2.0 AIMS AND OBJECTIVES
After studying this lesson you should be able to:
l Explain the advantages and disadvantages of equity shares
l Learn about the investment instruments of the money market
l Know about different speculation investment avenues in India
2.1 INTRODUCTION
In India, the household sector’s investment in non-security forms constitutes a majorportion of its total investment in financial assets. A large number of non-security formsof financial assets are available to investors. Non-security forms of investment includeall those investments that are not quoted in any stock market and are not freely marketable.These include: corporate deposits, bank deposits, post office deposits, national savingsand other small saving certificates—and schemes, insurance policies and provident funds.Another investment avenue is the investment in physical assets such as gold, silver,diamonds, real estate etc.
17Speculation Investment
Avenues in India
2.2 INVESTMENT ALTERNATIVES/INVESTMENT AVENUES
Two basic investment avenues are:
(i) Financial assets
(ii) Physical assets (real assets)
(iii) Investment in financial assets consists of:
(a) Securitized (i.e., security forms of) investments
(b) Non-securitized investments.
The term 'securities' is used in the broadest sense, consisting of those papers that arequoted and are transferable. Under Section 2(h) of the Securities Contract (Regulation)Act, 1956 (SCRA) 'securities' include:
(i) Shares, scrips, stocks, bonds, debentures, debenture stock or other marketablesecurities of alike nature in or of any incorporated company or other body corporate.
(ii) Government securities.
(iii) Such other instruments as may be declared by the Central Government to besecurities, and
(iv) Rights or interest in securities.
Therefore, in the above context, security forms of investments include equity shares,preference shares, debentures, government bonds, units of UTI and other mutual funds,and equity shares and bonds of Public Sector Undertakings (PSUs).
Non-security forms of investment include all those investments, which are not quoted inany stock market and are not freely marketable, viz., bank deposits, corporate deposits,post office deposits, national savings and other small savings certificates and schemes,provident funds, and insurance policies. The above investments are essentially forms ofsavings and should be treated as such. In India, nearly 33% of the household savings gointo such savings schemes as Post office savings schemes, life insurance, providentfunds, etc.
Another popular investment avenue is the investment in physical assets such as gold,silver, diamonds, real estate, antiques etc. Indian investors have always considered physicalassets to be attractive investments and, particularly for hedging against inflation. Indiahas a very long tradition in arts and crafts in jewellery, made of gold/silver and preciousstones. Moreover, it has been observed that in times of high inflation, investors moveaway from financial assets into physical assets more particularly, real estate.
2.2.1 Investment Attributes
Some of the main investment attributes which envelope the investment decision are:
(a) Risk and return
(b) Liquidity of the investment
(c) Tax advantages
(d) Convenience
We have already covered risk and return in the proceeding section. We shall now look atthe other attributes.

18Security Analysis andPortfolio Management
Liquidity of the investment is largely a function of its marketability. An investment ishighly marketable if it can be bought/sold quickly without a loss or with a very minimumloss which is possible, again, only if the prices do not fluctuate widely. Further, marketabilityexists when the cost of transactions is low. Empirical evidence suggests that shares ofsmall companies suffer from lack of liquidity, perhaps, on account of infrequent trading.In the case of non-security forms of investments, liquidity is not dependent on the physicalmarketability of the asset, because they are not transferable, but on their acceptability ascollateral for borrowing.
The next important attribute is the tax advantage or tax shelter the investment enjoys.Many non-security forms of investment are attractive, despite their low rate of return,only because of the tax benefits they provide. The tax shelters are:
(i) Initial tax shelter: This is the tax benefit the investor gets when he makes theinvestment for the first time. Usually, many of the investments in non-securityforms like contribution to Provident Fund, purchase of NSC etc. are eligible forinitial tax shelter under Section 88 of the Income Tax Act.
(ii) On-going tax shelters: These are the tax benefits available for the interest ordividends earned on investments already made. These tax benefits are generallyavailable under Sections 10 and SOL of the Income Tax Act.
(iii) Terminal tax shelters: These tax reliefs are available when the investment madein the past are liquidated or realized.
Finally, convenience is an important attribute of investment decision-making. Conveniencerefers to the procedural ease when the investment is made and also the ease with whichthe day-to-day management of the investment can be done. For instance, buying of aNational Saving Certificate (VIII issue) may require only filling of a form initially.Thereafter, there is no need for the investor to manage the investment. On the otherhand, in the case of equity shares, the investor will be required to analyze differentshares, time the entry by technical analysis and place an order to buy. Thereafter, heneeds to continuously track the price behaviour of the stock and also track the performanceof the company so that he can quickly exit from the scrip if need be. From the point ofview of convenience, the two ends of the spectrum are occupied by the equity shares onone end, which is the point of least convenience, and the bank deposits on the other end,which is the point of extreme convenience. Other investments require close attentionfrom the investors, and the returns justify the time spent.
Investments that represent evidence of debt, ownership of a business or the legal right toacquirer sell an ownership interest in business are called securities. Two of the mostcommon types of securities are bonds and shares. Another way of classifying securities,divided further into two main groups:
l Government obligations and
l Bonds and stock of corporations
There are four major ways of classifying the above mentioned securities:
l Short-term Money Market Securities
l Bonds Issued by Corporations
l Equity Shares
l Hybrid Instruments
19Speculation Investment
Avenues in India
Different types of investment avenues in financial assets, their characteristics and theirrisk-return features are described below:
2.3 EQUITY SHARES
Equity shares represent equity capital, which is the ownership capital because equityshareholders collectively own the company. The ownership of equity shares or stocksconfers upon the shareholders the benefits of such ownership, which is a residuary claimon the profits and assets of the company after the claims of others have been satisfied.The shareholders are the last category of those with claims on the company to receiveany of its earnings and if the company is dissolved, the last to receive any assets. Equityshareholders also enjoy the right to control the company through the board of directorsand have the right to vote on 1 every resolution placed before the general body. Yetanother right enjoyed by the equity shareholders is the pre-emptive right that obliges thecompany to give the existing equity shareholders the first opportunity to purchase,proportionately, additional equity shares called the ‘right shares’.
Equity shares are the first security to be issued by a corporation and, in the event ofbankruptcy, the last to be retired. Equity shares, also called common stock, represent ashare in the ownership of a firm; they have the lowest-priority claim on earnings andassets of all securities issued.
Equity shares, however, possess an unlimited potential for dividend payments and priceappreciation. In contrast, bonds and preference shares have a contract for fixed interestor dividend payments that equity shares do not have. A share certificate states the numberof shares, their par value, the certificate number, distinctive numbers and the name ofowner of the certificate.
Common stockholders or shareholders elect the board of directors and vote on majorissues that affect the corporation because they are the owners of the corporation.
Par Value: It is the face value of a share of the stock. Companies are allowed to fix apar value; the minimum being Re. 1 per share.
Book Value: The book value is calculated by adding reserves to the equity capital of thecompany, multiplied by the face value and divided by the equity capital of the company.Book and market values might be equal on the day the stock in a new corporation isissued, but after that, it appears that only coincidence will ever make them equal at anygiven moment.
Stock Price Quotations: If you pick up any of the financial newspapers, they carry thequotations of the last day's trading on the major stock exchanges, including NationalStock Exchange (NSE), Bombay Stock Exchange (BSE), etc. They normally carry open,high, low, close prices along with volumes of shares traded as well as the previous 52-week (1 year) high-low prices for each stock. The prices mentioned are for one share ofthe company.
Preferred Stock: Sandwiched between bondholders and common stockholders, preferredstocks have an assured dividend and assume less risk than that borne by commonstockholders. They hardly have any voting rights in the corporation as compared to thecommon stockholders.
There are two types of companies:
1. Publicly held companies, and
2. Private companies.

20Security Analysis andPortfolio Management
Private companies are owned by the promoters (a small group of shareholders) whilethe publicly held ones have shareholding by the ordinary investors too. There are severaladvantages and disadvantages associated with going public:
Equity shares can be classified in different ways but we will use the terminology of‘Investors.’ However, it should be noted that the lines of demarcation between the classesare not clear and such a classification is not mutually exclusive.
Blue Chips (also called Stalwarts): These are stocks of high quality financially strongcompanies, which are usually the leaders in their industry. They are stable and maturecompanies. They pay good dividends regularly and the market price of the shares doesnot fluctuate widely. Examples are stocks of Colgate, Pond's, Hindustan Lever, TELCO,Mafatlal Industries etc.
Growth Stocks: Growth stocks are companies whose earnings per share are growingfaster than the economy and at a rate higher than that of an average firm in the sameindustry. Often, the earnings are ploughed back with a view to use them for financinggrowth. They invest in research and development and diversify with an aggressivemarketing policy. They are evidenced by high and strong EPS. Examples are ITC, Dr.Reddy's, Bajaj Auto, Spartek, ITW Signode, etc. The high growth stocks are often called'glamour stocks' or 'high flyers.' If such companies can sustain their growth, they becomeemerging blue chips. Many of such emerging blue chips are in the hi-tech industries,particularly in the information technology segment. Notable examples of such shares areInfosys Technologies, Satyam Computers etc.
Income Stocks: A company that pays a large dividend relative to the market price iscalled an income stock. They are also called defensive stocks. Usually, income stocksare not growth stocks and vice versa. Drug, food and public utility industry shares areregarded as income stocks, and their prices are not as volatile as those of growth stocks.
Cyclical Stocks: Cyclical stocks are companies whose earnings fluctuate with the businesscycle. They are affected by economic and trade cycles like boom, recession, recovery,etc. Cyclical stocks generally belong to infrastructure or capital goods industries such asgeneral engineering, auto, cement, paper, construction, steel, sugar etc. Their performanceis good in the boom period but plunges in times of recession. Their share prices also riseand fall in tandem with the trade cycles.
Discount Stocks: Discount stocks are those, which are quoted or valued below theirface values. These are the shares of sick units. Discount shares are different fromunder-valued or under-priced shares. Under-priced or under-valued shares are those,which have all the potential to become growth stocks; have very good future but somehowthe market is yet to price the shares correctly. Discount shares are also different fromthe ‘turnaround’ shares.
Turnaround Stocks: Turnaround stocks are those that are not really doing well in thesense that their market price is well below the intrinsic value, mainly because the companyis going through a bad patch but is on the way to recovery with signs of turning aroundthe corner in the new future. Turnaround stocks may resemble discount stocks andtherefore require a very careful analysis and a keen eye to spot them. Turnaround stockscan fetch very attractive returns to the investors. Turning around a sick company can bedone either with the help of the Board for Industrial and Financial Reconstruction (BIFR)or through the efforts of the management - by shedding losing products, financialrestructuring, offering attractive voluntary retirement schemes to the employees, etc.For example, Parry in the 80s, Tata Tea (Tata Finlay), SPIC, Mukand Iron and Steel etc.,are some examples of turnaround companies. Sometimes, a dynamic management takingover the company may turn around a sick company.
21Speculation Investment
Avenues in India
Advantages of Investing in Equity Shares:
(i) Capital appreciation: The stock price reflects the underlying fundamentals. Capitalgains offer certain tax advantages.
(ii) Dividend payout: Companies can pay higher dividends and provide current cashflows to the investor.
(iii) Bonus shares: Enhance liquidity and ensure capital gains.
(iv) Rights shares: Shareholders may get additional shares for less than market price.If the investor does not want to invest in that company he can sell his rights in themarket.
(v) Liquidity: Saleability and exit options are ensured in the case of actively tradedstocks.
(vi) Security for pledging: Capital appreciation of equity shares makes them goodsecurities for borrowing from the financial institutions and banks.
Check Your Progress 1
1. Equity shares represent equity capital, which is the ownership capital becauseequity _____________ collectively own the company.
2. Equity shares are the first to be issued by a _____________ and, in theevent of bankruptcy, the last to be retired.
3. Par value is the face value of a share of the _____________ .
4. Terminal tax shelters, tax reliefs are available when the investment made inthe past are liquidated or _____________ .
2.3.1 Advantages and Disadvantages of Equity Shares
Advantages
l Equity shares do not entail fixed charges. If the company does not generate theearnings, it does not have to pay equity share dividends. This is very much incontrast to interest on debt, which must be paid regardless of the level of earnings.
l Equity shares have no fixed maturity date – it is permanent capital that does nothave to be “paid back”.
l Since equity shares provide a cushion against losses to the firm's creditors, the saleof equity shares increases the creditworthiness of the firm.
l Equity shares can, at times, be sold more easily than debt. They appeal to certaininvestor groups because (1) they typically carry a higher expected return than dopreferred stock or debt, (2) provide investors with a better hedge against inflationthan bonds, and (3) returns from capital gains on equity shares are not equityshares and not taxed at a lower rate.
Disadvantages
l The sale of equity shares extends voting rights, or even control, to the additionalnew shareowners who are brought into the company. For this reason, small firms,whose owner-managers may be unwilling to share control, often avoid additionalequity financing.
l The use of debt enables the firm to acquire funds at a fixed cost, whereas the useof equity shares means more share in the firm's net profits.
22Security Analysis andPortfolio Management
l The costs of underwriting and selling equity shares are usually higher than thecosts of underwriting and selling preferred shares or debt.
l The sale of the new equity shares may be perceived by investors as a negativesignal and hence may cause the share price to fall.
2.3.2 Money Market Securities
Highly liquid debt securities that have short-term maturity periods and involve little or norisk of default are known as money market securities. All money market securities aredebts that mature within 364 days or less. Money market securities are frequently issuedinstead of longer-term debt securities in order to avoid long and costly formalities.
Money market securities pay continuously fluctuating rate of interest that overssomewhere between the rate of inflation and the rate paid by the long-term debtinstruments.
Money market securities typically pay interest to their investors, as a discount from theirface (or maturity) values. Indian Government Treasury Bills, for instance, with a facevalue of Rs. 1 cr. and a maturity of 90 days can be sold for Rs. 97 lacs, when issued bythe Treasury Department. The buyer can either hold the security for 90 days or sell it inthe active secondary market before it matures. Upon maturity, whosoever owns theT-bill can redeem it for its face value of Rs. 1 cr. The Rs. 3 lac difference between thediscounted purchase price of Rs. 97 lac and the maturity value of Rs. 1 cr. is the interestpaid to the T-bill's investor (or series of investors).
Certificates of Deposit (CD): One of the money market securities, CD's were innovatedby Citibank, New York in 1961. A CD is a receipt from a commercial bank for a depositof Rs. 10 lakh or more, with certain provisions attached. One of the provisions is that thedeposit will not be withdrawn from the bank before a specific maturity date.
Banker's Acceptances: Securities that are written when a bank inserts itself betweenthe borrower and the investor and accepts the responsibility for paying the loan, therebyshielding the investor from the risk of default.
Commercial Paper (CP): Refers to the short term promissory notes issued by“blue-chip” corporations - large, old, safe, well known, national companies like TISCO,ONGC, SAIL, etc. The maturities vary from 5 to 270 days, and the denominations arefor Rs. 10 lakh or more - usually more. These notes are backed only by the high creditratings of the issuing corporations.
Bonds Issued by Corporations
A bond is a marketable legal contract that promises to pay its investors a stated rate ofinterest and to repay the principal amount at the maturity date. Bonds differ according totheir provisions for repayment, security pledged and other technical aspects. Bonds arethe senior securities of a corporation in the respect that in the case of bankruptcy of thecorporation, the law requires that the bondholders should be paid off before their stockinvestors.
A legal agreement, called a trust deed or in dentures, is drawn between the bondholdersand the corporation. Every bond issued under it has, the same right and protection;however, bonds of the same issue may mature at different dates and carry differentinterest rates. Trust deed is a complicated legal document containing restrictions, pledgesand promises. The trustee, usually a large bank or a financial institution, ensures that theissuing corporation keeps its promises and conforms to the terms and conditions of thecontract. The trustee is the watchdog guarding the bondholder's interests.

23Speculation Investment
Avenues in India
Term Loans are long-term debt contracts under which a borrower agrees to make aseries of interest and principal payments on the specific dates to the lender. While this istrue for bonds too, term loans differ in one significant aspect: they are generally sold toone or a consortium of lenders, especially financial institutions and banks, while bonds(term debentures used interchangeably) are typically offered to the public. Anothersignificant difference is that the loan is repaid in monthly/ quarterly/ half yearly/ annualinstallments, which also include the interest accrued for the specified period. In bonds,however, repayment is usually made by one lump-sum payment although interest may bepaid at periodic intervals.
Interest Payments: Bond interest is usually paid semi-annually, though annual paymentsare also popular. The method of payment depends on whether the bond is a registered orcoupon bond. The interest on registered bonds is paid to the holder by cheque. Couponbonds have a series of attached coupons that are clipped off at the appropriate times andsent through banking channels for collection of the interest.
Coupon Rate: The coupon rate is the stipulated interest rate to be paid on the face valueof a bond. It represents a fixed annual rupee amount that is paid as long as the debtor issolvent. The coupon rate is fixed after the issuing corporation's investment banker hasweighed the risk of default, the credit standing of the issuer, the convertibility options, theinvestment position of the industry, the security backing of the bond and the appropriatemarket rate of interest for the firm's industry, size, and class of risk. The goal is to picka coupon rate that is just high enough to attract investors.
Yield to Maturity: Riskier bonds must pay higher yield-to-maturity (YTM) to attractinvestors. The YTM is more significant than the coupon rate to bond investors. If thebond is selling at a discount, its market price is below its face value. In this case thebond's YTM exceeds its coupon rate. If it is selling at a premium, the market price of thebond is above its face value and the coupon rate is higher that the YTM.
Maturities vary widely: Bonds are sometimes grouped by the length of time until maturitythat existed on the date the bond was first issued. Money market securities mature in364 days or less. Short-term bonds are any bonds maturing within about 1 to 5 years.They are common in industrial financing and may be secured and unsecured. Medium-term bonds mature between 5 to 10 years and long-term bonds are the ones who have amaturity life of more than 10 years.
There are various types of bonds:
Bearer Bonds: If the coupon interest may be paid to whoever holds the bond, the bondsare called bearer bonds. Unlike registered bonds, the ownership of bearer bonds may betransferred by simply handling them over, like cash.
Deep Discount Bonds: Like money market securities, these bonds are issued at adiscount to their face values. Long-term bonds with maturities exceed 10 years, and bluechip corporations or financial institutions normally issue these bonds.
Non-Convertible Debentures: NCDs are medium-term bonds issued by corporations,with maturity periods varying between 5 to 8 years. They are normally secured and haveto be credit-rated by one of the credit rating agencies if the maturity period exceeds 18months.
Secured Premium Notes (SPNs): SPNs are medium-term bonds issued by corporationsand mature between 3 to 8 years. Their distinctive feature is the flexibility they offer inyielding returns either in the form of premium or interest payments, depending on holder'spreferences.
24Security Analysis andPortfolio Management
Call Provision: A call provision may be included in the trust deed. This provision allowsboth the issuing corporation and the investor to call or redeem the bonds at a specifiedamount before the maturity date. The issuing corporation will use the provision if theinterest rates fall substantially below the specified coupon rates.
Sinking Fund: It is a provision that requires the corporation to set aside a fixed amounteach year towards the orderly retirement of the issue.
Credit Rating: It is approved credit rating by agencies, which is mandatory beforecorporations are allowed to issue bonds or debentures. Rating reflects the probability ofthe corporations going into default. The higher the bond's rating, the lower the risk ofdefault and the lower the interest rate.
Refunding Analysis: It is performed by the issuer to determine: (1) whether it is currentlyprofitable to call an outstanding debt issue, and (2) whether it might be even more profitableto delay the call until some time in the future; for example, in a scenario where interestrates are rising steadily.
Advantages and Disadvantages of Long-Term Debt Financing
From the issuer's viewpoint, the major advantages are as follows:
l The cost of debt is independent of earnings, so debt-holders do not participate ifprofits soar. There is, however, a flip side to this - even if profits fall, the debt-holders must still be paid their interest.
l Because of tax effects, the risk-adjusted component cost of debt is lower than thatof common stock.
l The owners of the corporation do not have to share control.
The major disadvantages are as follows:
l Since debt service (interest plus scheduled principal repayments) is a fixed charge,a reduction in revenues may result in insufficient cash flow to meet debt servicerequirements. This can lead to bankruptcy.
l Financial leverage increases the firm's risk exposure, hence the cost of both debtand equity also rise accordingly.
l Debt normally has a fixed maturity; hence the firm has to repay the principal on afixed date. It cannot be deferred.
l In a long-term contractual relationship, it is necessary for the indenture provisionsto be much more stringent than in a short-term credit agreement. Thus, the firmwill be subject to more restrictions than if it had borrowed on a short-term basis orhad issued equity shares.
l There is a limit to the amount of funds that can be raised at a 'reasonable' rate.Widely accepted lending standards dictate that the debt ratio should not exceedcertain limits, and when debt goes beyond these limits, its costs become exorbitant.
Some recent innovations in long-term financing include floating rate debt, whose interestpayments fluctuate with changes in the general level of interest rates; junk bonds (junkFDs in India), which are high-yield instruments used by firms that are poor credit risks.
A firm's long-term financing decisions are influenced by its target capital structure, thematurity of assets, current and projected interest rates levels, the firm's current andprojected financial conditions, and the suitability of its assets for use as collateral.
25Speculation Investment
Avenues in India
2.3.3 Advantages of Going Public
Permits Diversification: As a company grows and becomes more valuable, its foundersoften have most of their wealth tied up in the company. By selling some of their stock ina public offering, they can diversify their holdings, thereby reducing the risk element oftheir personal portfolios.
Increases liquidity: The stock of a closely held firm is non-liquid; it has no ready market.If one of the owners wants to sell some shares to raise cash, it is hard to find a readybuyer, and even if a buyer is located, there is no established price on which to base thetransaction. These problems do not exist with publicly held company.
Facilitates raising new corporate cash: If a privately held company wants to raisecash by a sale of new stock, it must either go to its existing owners, who may not haveany money or not want to put any more eggs in this particular basket, or to shop aroundelsewhere for wealthy investors. However, it is usually quite difficult to get outsiders toput money into a closely held company, because if the outsiders do not have votingcontrol, insider stock holders/managers can put them to severe disadvantages.
Discover and establish a value for the firm: As the book value is not the real value,such value put forth by any one entity will merely reflect his personal opinion. The bestway is to get the valuation of the business done by the market valuation. This will reflectthe collective opinion of all the persons who are participating in the market. The book-building system in vogue for the purpose provides a reliable, workable mechanism forsuch fixation of a company's share price.
2.3.4 Disadvantages
Cost of Reporting: A publicly owned company must file quarterly, semi-annual andannual reports with stock exchanges on which it is listed. These reports can be costly,especially for small firms.
Disclosure: The management may not like the idea of reporting operating data becausesuch data will then be available to competitors. Similarly, the owners of the companymay not want people to know their net worth, and since a publicly owned company mustdisclose the number of shares owned by its officers, directors and major shareholders, itis easy enough for anyone to multiply shares held by price per share to estimate thevalue of an insider's investment.
Self-Dealings: The owners/managers of closely held companies have many opportunitiesfor various types of questionable but legal self-dealings, including the payment of highsalaries, nepotism, personal transactions with the business (such as a leasing arrangement),and not-truly-necessary fringe benefits. Such insider dealings, which are often designedto minimize taxes, are much harder to arrange if a company is publicly owned.
Inactive market/low price: If the firm is small, and if its shares are not frequentlytraded, its stock will not really be liquid, and the market price may not be representativeof the stock's true value. Security analysts and stockbrokers simply will not follow thestock, because there will just not be sufficient trading activity to generate enough salescommissions to cover the cost of following the stock.
Control: Because of the dramatic increase in tender offers, proxy fights, and institutionalinvestor activism, the mangers of publicly owned firms who do not have voting controlmust be concerned about maintaining control. Further, there is pressure on such managersto repeatedly generate higher profits every year, even when it might be in the shareholders'best long-term interests to adopt a strategy that sacrifices short-term earnings in favourof higher earnings in future years. Moreover, this relentless pressure to keep giving

26Security Analysis andPortfolio Management
higher returns can force managers to adopt questionable practices that can one dayseverely damage the company's reputation.
There are five different ways of offering equity shares: public issues, right issues,preferential allotments, and international offerings like GDRs/ADRs.
(i) Public Issues could be the first or the subsequent issues by the company to thegeneral investor who may not be an existing shareholder in the company. Thevalue of the shares held by existing shareholders could fluctuate depending uponthe price at which the shares are offered to potential shareholders.
(ii) Right Issue is issued to the existing shareholders as a matter of pre-emptive right,in certain ratio relative to the existing holdings in the company. If the shareholderssubscribe to their rights or sell the rights entitlement in the market, the value of theshares held by them does not change. The value changes only if the shares offeredas a right are not subscribed to.
(iii) Preferential Allotments are just like public issues, with two major differences:One, the shares are offered at prices practically at par with market prices, unlikepublic issues, where the issue is usually below market prices. Two, the offer isspecifically targeted at a select group of individuals, whether promoters or theinstitutional investors.
(iv) Global Depository Receipts (GDRs) and American Depository Receipts (ADRs)issues are the same as public issues, the only difference being that the issue isoffered to international investors (including FIIs) at or around market prices prevailingin the domestic markets.
(v) Bonus Issue is an issue in which free shares are given to the existing shareholdersin a predetermined ratio. No cash exchange takes place, and value of the sharesheld by the shareholders does not change.
2.4 HYBRID INSTRUMENTS
A warrant is a long-term call option issued along with a bond or on a stand-alone basis.Warrants are generally detachable from the bond, and they trade separately. Whenwarrants are exercised, the firms receive additional equity capital and the original bondsremain outstanding. Warrants are ‘sweeteners’ that are used to make the underlyingdebt or preferred share issue more attractive to investors.
Fully Convertible Debentures (FCDs) are bonds issued by corporations which areconvertible into common stock not too far in to the future. In order to avoid the creditrating process, these bonds are normally converted into common stock in less than 18months with 6, 12 and 18 months being the normal converse periods. Rate of conversionis usually decided at the time of the issue but a price band can also be specified.
Partly convertible debentures are a combination of non-convertible debentures and fullyconvertible debentures.
Optionally convertible debentures provide an option to the debenture holder, to convertor not to convert. They usually carry an interest rate that they keep on paying if theinvestor decides not to convert these into equity shares because the market price of theshares is less than the conversion price.
Foreign Currency Convertible Bonds (FCCBs) are exactly like optionally convertibledebentures with the difference that these are offered only to overseas investors.
27Speculation Investment
Avenues in India
2.5 INVESTMENT INSTRUMENTS OFTHE MONEY MARKET
A money market is a mechanism that makes it possible for borrowers and lenders tocome together. Essentially it refers to a market for short-term funds. It meets the short-term requirements of the borrowers and provides liquidity of cash to the lenders.
A money market is the market in which short-term funds are borrowed and lent. Themoney market does not deal in cash or money but in trade bills, promissory notes andgovernment papers, which are drawn for short periods. These short-term bills are knownas near money.
The major short-term credit instruments dealt with in a money market include:
l Trade Bills: These are bills exchange arising out of bona fide commercialtransactions. They include both inland bills and foreign bills.
l Bankers' Acceptances: These are bills of exchange accepted by commercialbanks on behalf of their customers. The fact that a bank of repute accepts a billincreases its creditworthiness, which, in turn, means that it can easily be discounted.
l Treasury Bills: These are promissory notes of short-term maturity issued by thegovernment to meet its short-term financial needs.
l Short-dated Government Securities: These are securities issued by thegovernment for short periods. Long-term government securities that are nearingmaturity are also sometimes included in this category.
l Commercial Papers: These are short-term credit instruments dealt with in theIndian money market. They refer to promissory notes issued by certain well-knownbusiness houses to the specialized institutions known as ‘commercial paper houses’.Their maturity period ranges between 90 to 180 days.
l Hundis: These are short-term credit instruments dealt with in the Indian moneymarket. They refer to indigenous bills of exchange drawn in vernacular languagesand under various circumstances.
2.5.1 New Instruments Introduced
l Zero Coupon Bonds (ZCBs)
l Non-Convertible Debentures (NCBs)
l Zero Interest Fully Convertible Debentures
l Equity Shares with Detachable Warrants
l Fully Convertible Cumulative Preference Shares
l Preference Shares with Warrants
l Fully Convertible Bonds with Interest
l Floating Rate Notes or Debentures
l Naked Debentures
l Debentures or Equity with Loyalty Coupons
l Discount Bonds
l Deep Discount Bonds
28Security Analysis andPortfolio Management
2.5.2 Issuers
l Government of India and other sovereign bodies
l Banks and development financial institutions
l Public sector undertakings
l Private sector companies
l Government or quasi-government owned non-corporate entities
2.5.3 Money Market Mutual Funds
l In April 1992, the Government of India announced the setting up of money marketmutual funds with the purpose of bringing money market instruments within thereach of individuals. Only commercial banks and public sector financial institutionsare permitted to set up MMMFs.
l In 1995, the RBI permitted private sector institutions to set up MMMFs.
Check Your Progress 2
Fill in the blanks:
1. A money market is a mechanism that makes it possible for borrowers andlenders to _____________ .
2. A money market is a market where short-term funds are borrowed and_____________ .
3. Trade bills include both inland bills and _____________ .
4. The money market does not deal in cash or money but in trade bills, promissorynotes and _____________ .
2.6 NON-SECURITY FORM OF INVESTMENT
In India, the household sector's investment in non-security forms constitutes a majorproportion of its total investment in financial assets. One of the basic channels of influenceof financial development on growth is the saving rate. The primary mode through whichthis occurs is financial savings and in particular, intermediated financial savings. In fact,a distinction should be made between the determinants of the capacity to save and thewillingness to save. While the capacity to save is dependent on the level and growth ofper capita income, the willingness to save is influenced by a number of financial variables,such as, rate of interest and financial deepening. However, the effect of interest rate onsaving in developing economies is not clear, partly because of the presence of eitheradministered interest rates or some rigidities in the working of interest rate mechanism.After all, a change in interest rate could cause a variation in the portfolio composition ofthe household sector's saving without perceptible impact on the total quantum of saving.Financial deepening, on the other hand, is capable of increasing the total quantum ofsaving.

29Speculation Investment
Avenues in India
Table 2.1: Trends in Gross Domestic Saving
(as percentage of GDP at current market prices)
S.No. Item 1990-91
to
1994-95
1995-96
to
2000-03
2003-2004
to
2006-07
1 2 3 4
1. Household sector (a + b) 14.1 17. 2 18.6
(a) Financial Saving 6.7 8.4 10.6
(b) Saving in Physical Assets 7.4 8.8 8.0
2. Private Corporate Sector 1.6 2.4 4.1
3. Public Sector 3.7 2.0 1.2
4. Gross Domestic Saving (1+2+3) 19.4 21.6 23.9
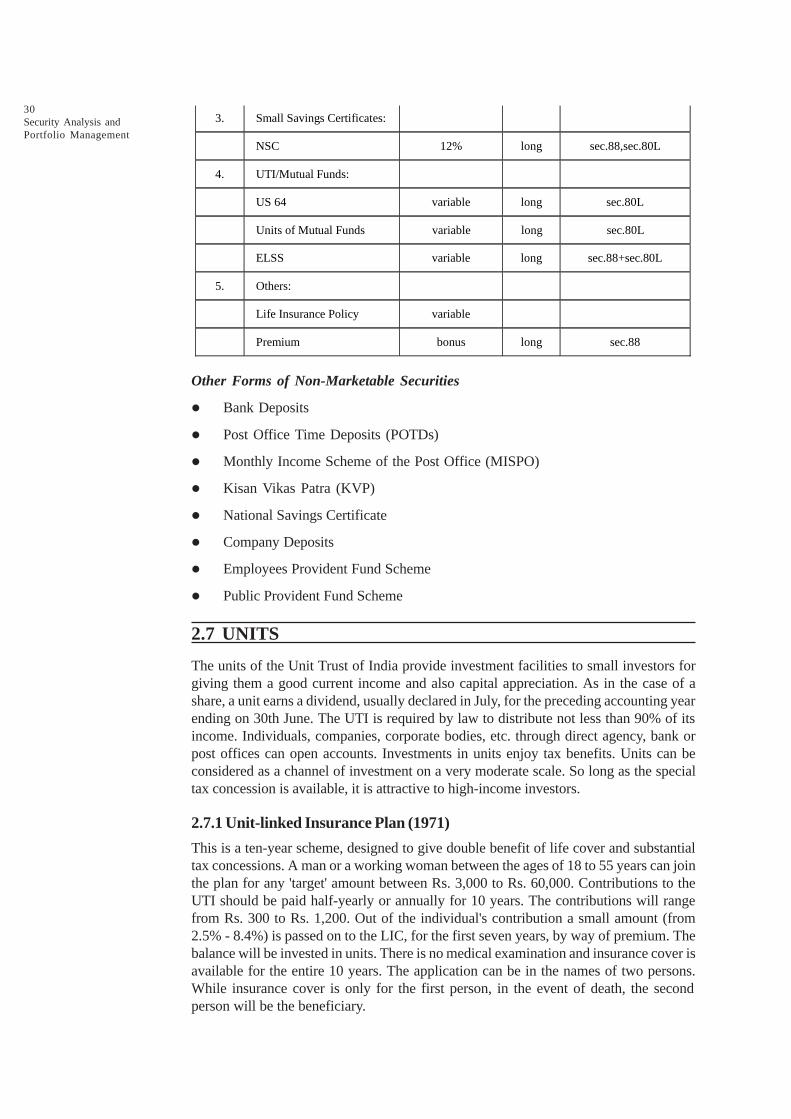
There are a large number of non-security forms of financial assets that are available toinvestors in India. As stated earlier, these are more in the nature of savings of individualsand households, particularly for the benefit of small savers. These investments are guidedmore by conveniences safety and tax benefits rather than a strong desire to earn a veryattractive rate of return. Most of the investments are illiquid but are generally acceptedas good collateral for borrowing from banks. The following table describes the mainfeatures of these investments.
Table 2.2: Non-Security Forms of Investment Avenues
S. No.
Name of Investment
Rate of interest
per annum
Term
Income tax deduction
1. Bank Deposits:
Savings bank a/c 5% short u/s 80L
Fixed/Recurring deposites 9-12% medium u/s 80L
2. Post Office Schemes:
P.O.Savings bank 5.5% short tax free
Public Provident fund
12%
Long
sec.88 rebate + int.tax
free
Recurring deposites 11% long sec.80L
Time deposites 9-11% long sec.80L
Monthly income scheme 13% sec.80L
NSS 11% Long sec.88 rebate + sec.80L
Contd....
30Security Analysis andPortfolio Management
3. Small Savings Certificates:
NSC 12% long sec.88,sec.80L
4. UTI/Mutual Funds:
US 64 variable long sec.80L
Units of Mutual Funds variable long sec.80L
ELSS variable long sec.88+sec.80L
5. Others:
Life Insurance Policy variable
Premium bonus long sec.88
Other Forms of Non-Marketable Securities
l Bank Deposits
l Post Office Time Deposits (POTDs)
l Monthly Income Scheme of the Post Office (MISPO)
l Kisan Vikas Patra (KVP)
l National Savings Certificate
l Company Deposits
l Employees Provident Fund Scheme
l Public Provident Fund Scheme
2.7 UNITS
The units of the Unit Trust of India provide investment facilities to small investors forgiving them a good current income and also capital appreciation. As in the case of ashare, a unit earns a dividend, usually declared in July, for the preceding accounting yearending on 30th June. The UTI is required by law to distribute not less than 90% of itsincome. Individuals, companies, corporate bodies, etc. through direct agency, bank orpost offices can open accounts. Investments in units enjoy tax benefits. Units can beconsidered as a channel of investment on a very moderate scale. So long as the specialtax concession is available, it is attractive to high-income investors.
2.7.1 Unit-linked Insurance Plan (1971)
This is a ten-year scheme, designed to give double benefit of life cover and substantialtax concessions. A man or a working woman between the ages of 18 to 55 years can jointhe plan for any 'target' amount between Rs. 3,000 to Rs. 60,000. Contributions to theUTI should be paid half-yearly or annually for 10 years. The contributions will rangefrom Rs. 300 to Rs. 1,200. Out of the individual's contribution a small amount (from2.5% - 8.4%) is passed on to the LIC, for the first seven years, by way of premium. Thebalance will be invested in units. There is no medical examination and insurance cover isavailable for the entire 10 years. The application can be in the names of two persons.While insurance cover is only for the first person, in the event of death, the secondperson will be the beneficiary.

31Speculation Investment
Avenues in India
2.7.2 Reinvestment Plan (1966)
This plan provided for automatic reinvestment of dividend income at the special offerprice prevailing in July every year. Suppose a person had 1,000 units, the dividend is90 paise per unit and the special sale price is Rs. 11.50 per unit (par value Rs. 10) thenthe investor would automatically be credited with 78.26 units (Rs. 900/11.5).
2.7.3 Children Gift Growth Fund, 1986 (Interest 12.5% p.a.)
Under this plan, any minor child below the age of 15 can be gifted with 50 units andupwards in multiples of 10. The dividend income is reinvested every year, at the specialprice prevailing in July, until the child reaches the age of 21 years (optional up to 18 yearsfor girls). Bonus dividend is paid every five years and the amount in gifted multipliesrises to about 12 times (excluding bonus and dividend) in 21 years.
2.8 SOCIAL SECURITY FUNDS
Household sector savings in the form of social security funds, which include savings ininsurance and in provident and pension funds, constitute the second major category offinancial savings next only to deposits.
Household sector savings in the form of insurance comprise of the life funds of LifeInsurance Corporation of India (LIC), Postal Insurance, State Insurance Fund and CentralGovernment Group Insurance Funds.
Various National Savings Schemes have been introduced from time to time to mobilisepublic savings for financing the economic development plans. These schemes havebeen very popular in view of tax benefits enjoyed by them. Unlike commercial bankschemes, these schemes are uniform all over the country. Again, the interest is paid oncompleted years, no payment being admissible for broken periods of a year. Prematureencashment is discouraged. Some of the schemes are offered through the State Bank ofIndia/nationalised banks. The national savings certificates sold through the SBI aredesignated as "Bank Series". Unlike commercial banks schemes, nomination facility isavailable for all the National Savings Schemes. Accounts can also be transferred fromone post office to another. Further, many of these savings certificates can be pledged assecurity, towards loan guarantee.
2.8.1 National Savings Scheme - VIII Series
This is a tax saving scheme in the sense that the amounts deposited under it are exemptfrom tax.
Under this scheme, no withdrawal is permitted in the first three years. Thereafter, thedepositor can withdraw once in a year and the amount shall not exceed the balance atthe end of the 4th preceding financial year. Another attractive feature in this scheme isthat the amount payable to nominee or legal heirs is totally tax-free.
2.8.2 10 Years Social Security Certificates
Persons in the age group of 18-45 years can purchase these certificates. The minimuminvestment amount is Rs. 500. The maturity period of these instruments is 10 years andthe rate of interest is 11.3% p.a. compounded annually. These certificates can be encashedpie-mature after three years from the date of issue. In case of the death of the certificateholder before expiry of two years from the date of issue due to non-natural causes(excepting suicide), the legal heir/nominee is entitled to receive an amount equal to3 times the face value of the certificates.
32Security Analysis andPortfolio Management
2.8.3 Kisan Vikas Patras
Such instruments are available at post offices and can be obtained in denominations ofRs. 1,000, Rs. 5,000 and Rs. 1,0000. The maturity period here is around 7 to 8 butpremature encashment is possible. The interest payable on Kisan Vikas Patras iscompounded annually but is taxable.
2.8.4 Indira Vikas Patras
These instruments are available at post offices and can be purchased by any person.Minimum investment in Indira Vikas Patras is Rs. 100. and there is no maximum limit.These are available in the maturity denominations of Rs. 200, 500, 1000 and Rs. 5000and the investor has to pay half the face value. The initial amount is doubled in around7 to 8 years and these patras cannot be encashed prematurely.
The interest on Indira Vikas Patras is compounded annually, is payable on maturity onlyand is taxable. These instruments are like bearer bonds and hence have to be carefullypreserved.
2.8.5 National Savings Certificates (VIII Issue)
Such certificates are available in denominations of Rs. 100, 500, 1000, 5000 andRs. 10,000. The interest on it is compounded half-yearly. Premature encashment is notgenerally possible. The National Savings Certificates can be purchased from the postoffice, can be pledged as security for loan and provide nomination facility.
2.8.6 Twelve-Year National Savings Annuity Certificates
This provides for a retirement plan. The rate of interest is the same as in NSC II Issue,though the manner of payment of interest is different. The annuity certificates are availableonly in higher denominations of Rs. 3,200 and Rs. 6,400. The deposit amount can bemade either in lump sum or in periodic installments, spread over a period of two years.From the 61st month onwards, the depositor starts receiving a monthly annuity (Rs. 50for a certificate of Rs. 3,200. and Rs. 100. for a certificate of Rs. 6,400) for seven years,at the end of which the holder gets Rs. 4,320 and Rs. 8,640 respectively. These figuresare calculated with old rate of 10.25%.
In case of any default in payment of installment, either the period is extended by oneyear, till the installments have been paid, or the defaulter installments are paid in a lumpsum along with simple interest at 12% per annum. The amount deposited is also, refunded,if required during the period of deferment with simple interest 5% per annum. Thepayments received in respect of these certificates are liable to income tax.
2.9 POST OFFICE TIME DEPOSIT
(i) Post-Office Savings Bank: Withdrawal from the account is by cheques and thereis no restriction on withdrawals, unlike in a commercial bank. Accounts havingminimum balance of Rs. 200 during April-September and October-March qualifyfor six monthly prize draws in the next January and July. The interest is tax-freeand is ½% more than that offered on savings bank account by commercial banks.
(ii) Post Office Recurring Deposit: The scheme covers free life insurance coverafter receiving contributions for 24 months on account of denomination of Rs. 5,Rs. 10, Rs. 15 or Rs. 20. In the event of death of the depositor after a minimumperiod of two years, from the date of opening the account, the heir or nominee willget the full maturity value of the account provided the depositor's age was between
33Speculation Investment
Avenues in India
8 and 53 years and there have been no withdrawals or defaults during the first twoyears and the account remains current at the time of death.
2.10 FIXED INCOME INVESTMENTS
Fixed income securities consist of government securities, corporate securities and PSUbonds. Securities issued by the Central Government, State Governments, semi-government authorities, autonomous institutions like part trusts, electricity boards, publicsector financial institutions and other public sector units are broadly known as gilt-edgedsecurities. Gilt-edged securities include treasury bills and dated securities.
Treasury bills are the short-term securities issued by the Central Government havingmaturity periods of 91, 182 and 364 days. Of late, the government commonly issues the91 and 364 days Treasury bills. Typically, the Treasury bills do not carry any coupon ratebut are sold at a discount. The difference between the face value and the discountedvalue constitutes the income to the investor. The discount rates on Treasury bills are lowand hence the rates of return offered by the bills are not very attractive. Most of thebuyers of Treasury bills are banks who purchase them to satisfy their liquidity requirements.Other buyers include institutional investors and provident funds. Individual investor interestin Treasury bills is almost nil. Treasury bills are the safest and hence their return is low.The Central Government also issues Ad hoc Treasury bills to meet its short-term resourcerequirements. These bills are taken up by the RBI and hence are not available to otherbuyers. The Finance Minister, in his 1995 budget speech, announced that governmentborrowing from the RBI through Ad-hoc Treasury bills would be gradually stopped.
Dated government securities have a maturity period longer than one year and carry afixed coupon rate. Interest is generally paid semi-annually through encashable coupons.These securities may be issued at par or below par but are redeemed at par. The datedsecurities are either in the form of promissory notes or in the form of stock certificates.While the government promissory notes are negotiable freely by a simple endorsement,the stock certificates are transferable only through transfer deed, copies of which shouldbe filed with the RBI. The RBI will make appropriate entries in its books and issue anew certificate to the transferee. The secondary market for Government securities isvery narrow and the major individual investor interest in these securities is again verylow on account of largeness of the size of each transaction. The rates of return on datedgovernment securities are higher than those on treasury bills and the only risks are therisk of unexpected inflation and the interest rate risk.
Semi-government dated securities are those issued by government undertakings andguaranteed by the Central/State Governments. These are promissory notes and aresimilar to the government-dated securities in all respects. They carry a slightly higherrate of interest than dated government securities. The risks involved in these securitiesare the risk of unexpected inflation, interest rate of risk and a possible default risk.
Corporate securities, excluding equity shares, consist of Debentures and CommercialPaper (CP). The latter is more like a Treasury bill (no coupon rate and issued at adiscount to the face value) and is raised by the corporate to meet their working capitalneeds. Transactions in CP are limited to a small set of players like banks and financialinstitutions. Common investors are not interest in CP.
Corporate entities desirous of issuing CPs should have a minimum net worth ofRs. 5 crores and should get the CP credit rates. Further, the company should be a listedcompany and should maintain a current ratio of 1.33 : 1. The CPs can be issued for aterm of 3 to 6 months and should be of a minimum size of Rs. 50 lakhs. The CPs shouldbe issued in trading lots of Rs.5 lakhs each.

34Security Analysis andPortfolio Management
Corporate Debentures are the promissory notes issued by the companies in the privatesector. These debentures have a maturity period of 7 to 10 years. They carry a fixedcoupon rate and may be issued at par or below par. They may be redeemed at a par orabove par. Debentures are issued to the investing public subject to the conditions laiddown in the agreement, between the company and the debenture holders, called theindenture. A public trustee is appointed to ensure that the interests of the debenture-holders are not compromised by the corporates. However, in case the debentures areprivately placed, an indenture is not created and no trustee is appointed. Prior to 1991,the interest rates of corporate debentures were regulated with a ceiling on coupon ratesof 12.5% for the convertible debentures and 14% for the non-convertible debentures. InJuly 1991, the government removed all restriction on interest rates. Debentures can beclassified as follows:
(I) On the basis of security: secured debentures and unsecured debentures. Unsecureddebentures, called naked debentures, are not permitted to be issued by thecorporates. Secured debentures carry a fixed or floating charge on the assets ofthe corporate.
(II) On the basis of transferability: registered or unregistered debentures. Registereddebentures can be transferred only through a transfer deed, which has to beregistered with the company and stamp duty is payable at the transfer. Stamp dutyvaries from state to state. Unregistered debentures are bearer bonds, which canbe freely transferred by a mere endorsement. There is no need for a transfer deedand hence no stamp duty. However, unregistered debentures are not issued becauseof many practical problems.
(III) On the basis of redeem ability: redeemable and unredeemable debentures.Redeemable debentures are those repayable after a fixed maturity period or byannual installments. The unredeemable debentures are those that are not redeemedtill the company is liquidated. At present, they are not issued by the corporates.
(IV) On the basis of convertibility: convertible and non-convertible debentures.Convertible debentures are in turn classified into two types - fully convertible andpartly convertible debentures. Fully convertible debentures are converted into equityshares on a specified date or dates at a specified price. The conversion ratio,conversion price and the period when conversion option could be exercised areindicated in the offer document. Conversion of debentures into equity shares isoptional to the investor, but not compulsory. Partly convertible debentures havetwo portions - the convertible portion and the non-convertible portion. While theconvertible portion is convertible into equity shares at the option of the investor, thenon-convertible portion carries fixed interest and is redeemable after the maturityperiod. The non-convertible portion is called khokha, traded in the secondary marketlike any other non-convertible debentures. Non-Convertible Debentures (NCD),on the other hand, do not carry any option for conversion into equity shares. TheseNCD generally carry a coupon rate of 14-17% and a much higher effective currentyield. NCDs are traded in the secondary market at a discount because of whichthe effective yield will be higher than the coupon rates. For example, if NCD of aface value of Rs. 100 carrying coupon rate of 15% is traded at Rs. 80 in thesecondary market, the nominal interest for one year will be Rs. 15. If an investorbuys the NCD in the market at Rs. 80, his current yield will be:
Nominal interest 150.1875 i.e., 18.75
Current price 80= =

35Speculation Investment
Avenues in India
The corporate debentures are affected by such risk factors as the inflation risk, interestrate risk and default risk. They are also subject to certain degree of liquidity risk. In spiteof several attractive features of debentures, the secondary market in corporate debentureshas remained out of bounds for individual investors. At present the institutional investorsdominate the market, but of late, it is becoming broad-based with the commencement oftrading in corporate debentures in the National Stock Exchange and the OTCEI. Anotherinteresting feature that is emerging is to attach ‘Equity Warrants’ as sweeteners to theNCDs at the time of issue. These warrants can be converted into equity shares at apredetermined time and pre-set price. Some corporate entities have started innovativepractices in designing debt instruments; most prominent among them are the 'Zero CouponBonds', 'Zero Coupon Convertible Bonds and 'Deep Discount Bonds'. Zero CouponBond is a debenture without any coupon rate and is issued at a discount to the facevalue. After the maturity period, the face value of the instrument is paid to the investor.These bonds take care of re-investment risk because the interest earned is deemed to bereinvested. When the zero coupon bonds come with the option of conversion into equityshares they are called the Zero Coupon Convertible Bonds. Deep discount bonds, forexample, the bond issued by the IDBI in 1992, are similar to zero coupon bonds exceptthat they have a very long maturity period such as 15 to 25 years.
Sometimes, debentures are issued by the corporates with a call option embedded intothem. Such debentures can be called for redemption by the corporate at a specifiedprice before the maturity date.
The prices of bonds change to reflect interest rate movements. For example, if there isan increase in interest rates, the current yield can remain constant only if the marketprice of the debentures goes down. In case, interest rates were to decline, the marketvalues of the securities appreciate, so that the investor would continue to obtain currentyield. This leads to capital gains or loss even on debt securities, as prices move up ordown in relation to changes in interest rates. Hence, the concept of Yield-to-Maturitytakes into account not only current yield, but also capital appreciation on the residual lifeof security.
Advantages of Fixed Income Securities
1. Source of relatively safe regular income.
2. Legally binding agreement to pay interest and principal.
3. Generally secured by the assets of the issuing company.
4. If a fund is created for redeeming the bonds, like Debenture Redemption Fund,there is an assurance of timely repayment of interest and principal.
5. Bonds that can be converted into equity shares have built-in potential for capitalgains.
6. Comparatively less volatile in price fluctuation.
7. Many bonds issued by the government, public sector companies and other companiesare eligible for tax concessions.
8. Act as better collateral for borrowing purposes.
9. The degree of risk involved can be evaluated by independent professional ratingagencies before the issue. Hence the investor can ascertain whether the investmentis sale or not. Periodical review by the rating agency affords investor protection.

36Security Analysis andPortfolio Management
2.11 GOVERNMENT SECURITIES
Government securities (G-secs) or gilts are sovereign securities, which are issued by theReserve Bank of India (RBI) on behalf of the Government of India (GOI). The GOIuses these funds to meet its expenditure commitments.
2.11.1 Treasury Bills
Treasury bills are short-term money market instruments, which are issued by the RBI onbehalf of the GOI. The GOI uses these funds to meet its short-term financial requirementsof the government. The salient features on T-Bills are:
l These are zero coupon bonds, which are issued at discount to face value and areredeemed at par.
l No tax is deducted at source and there is minimal default risk.
l The maximum tenure of these securities is one year.
Different types of Government Securities
Following are the different types of government securities:
(a) Dated Securities: These securities generally carry a fixed coupon (interest) rateand have a fixed maturity period. e.g. an 11.40% GOI 2008 G-sec. In this case,11.40% is the coupon rate and it is maturing in the year 2008. The salient featuresof dated securities are:
v These are issued at the face value.
v The rate of interest and tenure of the security is fixed at the time of issuanceand does not change till maturity.
v The interest payment is made on half yearly rest.
v On maturity the security is redeemed at face value.
(b) Zero coupon bonds: These securities are issued at a discount to the face valueand redeemed at par i.e. they are issued at below face value and redeemed at facevalue. The salient features of zero coupon bonds are:
v The tenure of these securities is fixed.
v No interest is paid on these securities.
v The return on these securities is a function of time and the discount to facevalue.
(c) Partly paid stock: In these securities, the payment of principal is made in installmentsover a given period of time. The salient features of Partly Paid Stock are:
v These types of securities are issued at face value and the principal amount ispaid in installments over a period of time.
v The rate of interest and tenure of the security is fixed at the time of issuanceand does not change till maturity.
v The interest payment is made on half yearly rest.
v These are redeemed at par on maturity.

37Speculation Investment
Avenues in India
(d) Floating rate bonds: These types of securities have a variable interest rate, whichis calculated as a fixed percentage over a benchmark rate. The interest rate onthese securities changes in sync with the benchmark rate. The salient features ofFloating Rate Bonds are:
v These are issued at the face value.
v The interest rate is fixed as a percentage over a predefined benchmark rate.The benchmark rate may be a bank rate, Treasury bill rate etc.
v The interest payment is made on half yearly rests.
v The security is redeemed at par on maturity, which is fixed.
(e) Capital indexed bonds: These securities carry an interest rate, which is calculatedas a fixed percentage over the wholesale price index. The salient features of CapitalIndexed Bonds are:
v These securities are issued at face value.
v The interest rate changes according to the change in the wholesale priceindex, as the interest rate is fixed as a percentage over the wholesale priceindex.
v The maturity of these securities is fixed and the interest is payable on halfyearly rates.
v The principal redemption is linked to the wholesale price index.
2.11.2 Invest in Government Securities
Entities registered in India including banks, financial institutions, primary dealers, partnershipfirms, institutions, mutual funds, Foreign Institutional Investors (FIIs), State Governments,provident funds, trusts, research organizations, Nepal Rashtra Bank and individuals caninvest in government securities.
2.11.3 Advantages and Disadvantages of Investing in Gilts
Advantages
1. The main advantage of investing in G-secs is that there is a minimal default risk, asthe instrument is issued by the GOI.
2. G-secs, especially dated securities, offer investors the opportunity to invest in verylong-term debt (at times with maturity over 20 years), which is usually not availablefrom the private sector.
3. Although some issues of G-secs tend to be illiquid, there is adequate liquidity inmost other issues. In fact, buying and selling from/to a primary dealer can takecare of the liquidity risk.
Disadvantages
The main disadvantage of investing in G-secs is the same as in the case of investing inany other debt instrument i.e. possibility of higher interest rates and inflation. Whilehigher interest rates will lead to erosion in value of the bond, a rise in inflation will eat intothe real return (though this can be taken care of by buying capital indexed bonds, forexample).

38Security Analysis andPortfolio Management
Tax benefits by investing in gilts
There is no tax deducted at source and the investor can avail tax benefit u/s 80L i.e.Rs. 3,000/-.
Minimum amount for investing in gilts
The minimum amount for investing in gilts varies depending on the primary dealer. Forexample, in case of IDBI Capital markets, which are primary dealers, the minimumamount for investing in gilts is Rs 10,000.
Hold these instruments in a demat form
The Reserve Bank of India maintains a Subsidiary General Ledger (SGL) Account forholding and trading gilts and treasury bills in dematerialised form. Banks and primarydealers are allowed to open SGL accounts with RBI. These primary dealers in turn arepermitted to offer the facility of Constituent SGL account to other non-bank clients tohold these securities in a demat form.
What are Gilt accounts?
Accounts maintained by investors with the primary dealers for holding their governmentsecurities and Treasury bills in the demat form are know as gilt accounts. The salientfeatures of gilt accounts are:
l It is like a bank, which debits or credits the holders account on withdrawal ordeposit of the money. Similarly in a gilt account the holder's account is debited orcredited on the sale or purchase of the securities.
l The account holder receives a statement at periodic intervals showing the balanceof securities in his account.
l All the securities are maintained in demat mode, which can be converted intophysical mode whenever required by the gilt account holder.
Commonly used terms
Coupon rate: Every government security carries a coupon rate also called interest rate,which is fixed. e.g. 12.00% GOI 2008, where 12.00% is the coupon rate payable on theface value, which matures in the year 2008.
Face value: The par value of the security (the issue price may be at a discount or apremium to the par value).
Current price: As these G-secs are traded in the secondary market, the price of theseG-secs fluctuates according to the demand/supply in the market for that security. Thecurrent price is the prevailing price in the secondary market.
Wholesale price index: A wholesale price index is an index of prices of selectcommodities. The percentage in the index reflects the inflation/deflation.
Primary dealer: Primary dealer is an intermediary who buys and sells governmentsecurities and treasury bills. He is authorised by the RBI.
Secondary market: Like the stock market where stocks are traded there is a secondarymarket where the debt instruments like gilts, bonds and treasury bills can be bought andsold.
Yield: Yield is the actual return on the investments. There are different types of yields:
l Coupon yield: Coupon yield is the fixed interest rate on a government security orbond e.g. 12.00% GOI 2008, where 12.00% is the coupon yield. This yield does notreflect the change in the interest rate, inflation rate or any other economic factor.
39Speculation Investment
Avenues in India
l Current yield: Current yield is the return on the government security or bonddepending on its purchase price. For example, an investor 'A' purchases 12.00%GOI 2008 at Rs 100 and an other investor 'B' purchases the same instrument at Rs110. The current yield of investor 'A' will be 12.00%. The current yield of investor'B' will be 10.91% .
l Yield-to-Maturity (YTM): Yield-to-maturity is the discount rate that equates presentvalue of all the cash inflows to the cost price of the government security or bond.This is actually the Internal Rate of Return (IRR) of the government security orbond.
Check Your Progress 3
1. _____________ bills are short-term money market instruments, which areissued by RBI on behalf of GOI.
2. _____________ securities generally carry a fixed coupan (interest) rateand have a fixed maturity period.
3. Capital indexed bonds carry an interest rate, which is calculated as a fixedpercentage over the wholesale _____________ .
4. The interest rate changes according to the change in wholesale_____________ .
2.12 DEPOSIT WITH COMPANIES
These deposits are accepted by the companies under relevant government regulations.But these regulations do not mean any great safety to the depositor. The interest rates(ranging from 6 -12%) are quite attractive but there is no tax exemption on interestearned. The interest income is subject to tax deduction at source, at the rates in forceunder Section 194-A of the Income Tax Act.
While investing in reputed companies may be safe to a great extent, an investor must bedoubly cautious while investing in less reputed companies, particularly private limitedcompanies who may misguide the public by advertising a return of 66.67% for a depositof three years. In fact, there are not many companies in which the public can deposittheir money without anxiety.
In company deposits, the element of risk is the real problem as these deposits areunsecured loans. Of course, companies are required to fulfill certain norms such asdeposits for a period of 3-6 months should not exceed 10% of the aggregate paid upshare capital and free reserves of the company. According to Section 58-A and 58-B ofCompanies Amendment Act of 1974 and the Companies (Acceptance of Deposits) Rules1975 as amended in April 1979, a company has to reveal certain required informationwhile inviting deposits from the public. An investor should go through that informationvery carefully.
2.13 BULLION/GOLD, SILVER, PLATINUM
From times immemorial gold and silver have constituted important media for investmentfrom the points of view of both capital appreciation and liquidity. But these preciousmetals do not yield any current return. In fact, there is a cost, even if modest, in holdingbullion, capital appreciation could also be on some equity shares besides a current return.
40Security Analysis andPortfolio Management
2.13.1 Gold
The monthly average price of gold in the Mumbai market recorded a sharp rise ofRs. 9,200 per 10 grams in March 2007 as compared to 27 years ago. Presently, investmenton gold (not in jewellery) is a good investment.
The rally in gold prices during the second half of 2006-07 in the national and internationalmarkets could be largely attributed to supply-demand imbalances. On the supply side, adeceleration in gold production in major gold producing countries and a virtual stoppageof sale of official gold holding by central banks reduced the supply in the market. On thedemand side, investors' disappointment with global equity markets and apprehensionregarding future inflation following the Federal Reserve's lowering of the short-termlending rate led to a sharp increase in demand for the yellow metal.
2.13.2 Silver/Platinum
Silver prices in the domestic market in Mumbai fluctuated in a narrow range duringApril-December 2006, but soared during January through early April 2007. It increasedthereafter and this trend continued till May 2007. Silver and Platinum became majorinvestment avenues in our country.
2.14 REAL ESTATE INVESTMENT
Real estate has historically been useful in a portfolio for both income and capital gains.Home ownership, in itself, is a form of equity investment, as is the ownership of a secondor vacation home, since these properties generally appreciate in value. Other types ofreal estate, such as residential and commercial rental property, can create income streamsas well as potential long-term capital gains.
Real estate investments can be made directly, with a purchase in your own name orthrough investments in limited partnerships, mutual funds, or Real Estate InvestmentTrusts (REIT). REIT is a company organized to invest in real estate. Shares are generallytraded in the organized exchanges.
Also, there are many kinds of investments. Some are very speculative while others aremore conservative. The major classifications are:
l Residential house
l Sources of housing finance
l Features of housing loans
l Guidelines for buying a flat
l Commercial property
l Agricultural land
l Suburban land
l Time share in a holiday resort
l Unimproved land
l Improved real estate
l New and used residential property
l Vacation homes
l Low income housing

41Speculation Investment
Avenues in India
l Certified historic rehab structures
l Other income-producing real estate such as office buildings, shopping centres andindustrial or commercial properties
l Mortgages such as through certificates packaged and sold through entities.
2.14.1 Advantages
1. The potential for high return in real estate exists due, in part to the frequent use offinancial leverage. Financial leverage is the use of borrowed funds, as in a long-term mortgage, to try to increase the rate of return that can be earned on theinvestment. When the cost of borrowing is less than what can be earned on theinvestment, it is considered 'favourable' leverage, but when the reverse is true, it isconsidered 'unfavourable' leverage.
2. There are potential tax advantages in real estate, as well. First, for personal useresidential property, there is the opportunity to deduct interest paid (first and secondhomes, within limitations) There may also be a deduction for property taxes. If theproperty is income producing, other expenses may be deductible as well, such asdepreciation, insurance, and repairs. Also, real estate can be traded or exchangedfor similar kind of property on a tax-free basis. And lastly, if the sale of investmentreal estate results in a profit, the gain is normally a capital gain. (Note: real estateinvestment was dealt a blow under the Tax Reform Act of 1986, and the relatedrules are somewhat complex, as it relates to passive business activities, so your taxadviser should be consulted concerning any tax implications for your specificsituation.)
3. Some consider real estate a good hedge against inflation.
4. Good quality carefully selected income property will generally produce a positivecash flow.
5. As a real estate owner, you may be in a position to take your gains from real estatethrough refinancing the property without having to sell the property, therein triggeringa taxable capital gain. Real estate is advantageous in this respect, because goodquality properties can be used to secure mortgage loans up to a relatively highpercentage of current value.
2.14.2 Disadvantages
1. There is generally limited marketability in real estate (depending on the nature andlocation of the property).
2. There is also a lack of liquidity, in that there is no guarantee that the property canbe disposed of at its original value, especially if it must be done within a short periodof time.
3. A relatively large initial investment often is required to buy real estate.
4. If ownership in investment property is held directly by the investor, there are many“hands-on” management duties that must be performed.
5. Real estate is often considered high risk because it is fixed in location and character.It is particularly vulnerable to economic fluctuations such as interest rate changesand/or recession.
6. The Tax Reform Act of 1986 eliminated many of the previously-available taxadvantages relating to real estate.
42Security Analysis andPortfolio Management
2.15 NEW AVENUES FOR INVESTMENT
2.15.1 ULIP
Take charge of your returns with ULIP
Unit-linked plans have gained popularity in a very short time and they seem to shine incomparison with traditional endowment product from insurers and ELSS schemes frommutual funds. But are they really as good as they claim to be and are there any downsidesin investing in ULIPs? This is something investors are eager to know. Unit-LinkedInsurance Plan (ULIP) is a life insurance solution that provides the benefits of protectionthe benefits of protection and flexibility in investment. It is prime facie an insurancepolicy. The investment is denoted as units and is represented by the value that it hasattained, called Net Asset Value (NAV). The policy value at any time varies accordingto the value of the underlying assets at the time. IRDA in its recent pronouncement has,however, fixed the minimum sum assured for ULIPs.
Freedom to Choose
Normally in an insurance policy like endowment policies, returns accrue to you in theform of bonuses declared by the insurer form out of the profits earned on investmentsmade on your behalf by the insurers. You had no choice over where your insurer willinvest on your behalf. ULIPs let you take change and decide which class of investmentsyour money should go; whether to invest in equity, debt and so on rests with you. If youwant totally risk-free return, you can choose an investment option of 100% debt securities.Conversely, if you are totally comfortable with risk, you can choose a 100 percent equitypotion. Various options with differing equity and debt mix are also available. This givesyou greater control over your investments and you can choose the one which best suitsyour risk-taking ability. A thumb rule followed in the field of investment for asset allocationbetween equity and debt is that the equity exposure should be 100 less the age of theinvestor.
You can switch from one portion to another, subject to some limitations. For example, ifyou are invested in a 70% equity and 30% debt option you can feel bullish, or to 100&debt if your view on equity markets is bearish. Most insurance offer some switches ayear for free. Thereafter, you will have to pay a switching fee. Others may not changea switching fee but apply a spread between buy and sell quotes of NAVs .
Risks
The sense of empowerment comes with a price. The price is the ability to predict thefuture performance of the stock and debt markets. The purpose of investing in ULIPswill defeated if the returns you get is lower than the bonuses received on an ELSSscheme. So you will have to acquire sufficient expertise over risk-return on these assetclasses or get sound advice from experts. Principally, you need to understand that exposureto equity investment is not without risk and that risk is being borne by you.
Factors to Evaluate
Cost is a major factor in case of ULIPs. Typically, all the costs are frontloaded and itcould be as high as 25% in the first two years as the insurance companies recover allthe costs of the policy in the beginning itself. The costs even out and are comparable toa mutual fund investment only in the long term. Consistency of a performance qualityof the promoters of the insurance company and their track record in insurance arethe factors to consider before deciding on a ULIP. If you are committed to investing for

43Speculation Investment
Avenues in India
the long-term and are comfortable with the risk that comes with unit-linked products,you can look at this class of investment.
2.15.2 New Insurance Policies
Mix and Match based on Need
Investments in life insurance have always been an important part of everyone's investmentplanning exercise. It is important that people buy insurance keeping both their long-termfinancial goals and their tax planning in mind. The insurance sector has come into thelimelight since the last few years after the government opened it for private players, whobrought in a lot of innovative products, thereby increasing competition and aggressivemarketing in this sector. This is good for investors as they have more options/variety ofinvesting their money.
Every insurance product has its own positives and negatives. Investors should carefullyweigh the pros and cons before making an investment decision. Diversification andbuilding a portfolio of multiple products is one way to deal with this confusing situation.First of all, investors need a little bit of understanding of various insurance products(categories) available in the market and the positive and negatives of those products.
Endowment Plans
These are traditional insurance plans that provide insurance covers as well as givesreturn on maturity. These plans invest most of their corpus in corporate bonds, G-secsand money market instruments. They provide a safe/guaranteed return in the range of4-7%. Child plans and money-back plans are variants of endowment plans. Such planspurport to give the individual either a certain sum at regular intervals (in case of money-back plans) or as a lump sum on maturity.
Term Plans
Term insurance is a basic pure insurance plan. The premium in this plan covers the riskelement (mortality charges), sales and administration expenses. That is why the premiumcharged in term insurance plans is much lower then in endowment plans. The premiumcharged in term insurance does not have any savings element and hence the individualdoes not receive any maturity benefit. A term plan should form a part of every individual'sinvestment plan and provide more risk coverage for small investment. Individuals withyounger age (more responsibilities) can opt for more coverage by buying more termpolicies and as their risk component reduces with time, they can slowly drop some partof term policies. A term plan should be part of every individual’s insurance portfolio.
Unit-linked Plans
Unit-Linked Insurance Plans (ULIP) have been in the limelight from last few moths asthe stock market is presently soaring. A ULIP is linked to a mutual fund with a life coveradded to it. They invest the corpus in market-linked instruments like stocks, corporatebonds and government securities (G-secs) etc. Investing in the stock is the basic differencebetween ULIPs and traditional insurance plans. Although stock markets give betterreturns in a long period of time as compared to other investment option, they bring in acertain degree of risk of losing the money. Investments in ULIPs should be related to theindividual's appetite for risk. Individuals who can task higher risk (younger investors)could consider buying ULIPs with a higher equity component. ULIP should also be partof every insurance portfolio. The percentage can vary based on the individual's riskappetite.

44Security Analysis andPortfolio Management
Investors should look for building an insurance portfolio, which maximizes their returnsand also offers the required risk cover to them. Investors should make a proper evaluationof their needs and then carefully build a life insurance portfolio. They should analyse thefacts and their needs carefully before making investment decision.
Invest in Gold without Buying it
Gold mutual funds offer investor a new, innovative relatively cost-efficient and secureway to access the gold market. Gold units are intended to offer investors a mean ofparticipating in the gold bullion market without the necessity of taking physical deliveryof gold. Investors can buy and sell their interest through the trading of a security on aregulated stock exchange.
The Securities and Exchange Board of India had permitted introduction of gold exchangetraded fund scheme by mutual funds in 2006. These schemes are permitted to investprimarily in gold and gold-related instruments, i.e. specified instruments having gold asunderlying.
GTF scheme means a mutual fund scheme that invests primarily in gold or gold-relatedinstruments.
The assets of the scheme are gold or gold-related instruments kept in the custody of abank, which is registered as a custodian with SEBI.
A GTF scheme is subject to these investment restrictions:
l The initial issue expenses should not exceed 6% of the fund raised under thatscheme.
l The fund of the scheme should be invested only in gold or gold-related instrumentsin accordance with its investment objective, except to the extent necessary to meetthe liquidity requirements for honouring repurchase or redemption, as disclosed inthe offer documents.
l Pending deployment of funds as mentioned above the mutual fund may invest inshort-term deposit of scheduled commercial banks.
The Net Asset Value (NAV) of units under the scheme is calculated by dividing themarket or fair value of the scheme's investments and current assets, minus currentliabilities and provisions, by the number of units outstanding under the scheme on thevaluation date.
The NAV is calculated up to four decimals. For a GETF, the limit applicable to equityscheme is applicable. So there are no indices catering to the gold selector/security linkedto gold. Currently, GTF is benchmarked against the price of gold.
SEBI has recently specified the methodology for valuation of gold by the Gaffs. Thegold had by a GTF is valued at the AM fixing price of London Bullion Market Association(LBMA) in US dollar per troy ounce for gold having a fineness of 995.0 parts perthousand.
The valuation is subject to:
l Adjustment for conversion to metric measures as per standard conversion rates.
l Adjustment for conversion of US dollars into Indian rupees as per the RBI referencerate declared by the Foreign Exchange Dealers Association of India (FEDAI).

45Speculation Investment
Avenues in India
l Addition for transportation and other charges that may be normally incurred inbringing gold from London to the place where it is actually stored on behalf of themutual fund, and national customer duty and other applicable taxes and levies thatmay be normally incurred to bring the gold from London.
Also, it has been specified that where the gold held by a GTF scheme has a greaterfinance, the relevant LBMA price of AM fixing will be taken as the reference price. Incase the gold required by the fund is not in the forms of standard bars, it will be convertedinto standard bars, which comply with the good delivery norms of the LBMA thereaftervalued as per the above guidelines.
The introduction of gold funds is intended to lower of many barriers like access, custody,and truncation costs. A GTF will represent gold as the underlying security, which will betraded at the exchange. Investment through this mode is efficient, cost-effective andconvenient. Investors get instruments to invest and thereby reduce their risks whileincreasing their returns.
Check Your Progress 4
State true and false for the following statements:
1. Equity shares do not represent equity capital.
2. Cyclical stocks are companies whose earnings fluctuate with the businesscycle.
3. Discount stocks are companies which are quoted or valved below their facevalue.
4. A company that pays a large dividend relative to the market price is called anincome stock.
5. The stocks which are not doing well in the sense that their market price iswell below the intrinsic value, are called Turnaround stocks.
2.15.3 Art
Investing in arts – Cashing in on the Future
As art is increasingly being seen as lucrative avenue for investments, a large number ofpeople have started buying art as a part of their investment portfolio. The Indian artmarket is doing extremely well internationally and there has been a marked increase inthe number of foreign buyers.
However, there are various factors that govern the pricing of a work of art in the primaryand the secondary markets. According to experts "Investment in art does not have theease of liquidity that stocks and shares have. You cannot take it to the market and tradein it immediately. Just as real estate is a long-term investment opportunity, art is an evenlonger term investment option". It is still a good investment option to add to one's portfolio,apart from conventional assets such as stocks, gold and real estate.
It is estimated that currently the art market is growing at around 30% per annum. However,many artists' works have appreciated at 200% as well. We advise investors to beginwith an amount of approximately Rs. 20 lakhs to be able to buy a good collection of workthat comprise a judicious mix of established and upcoming artists. An amount of Rs. 1-21lakhs is an optimal sum to buy art for its decorative value, which may eventually turn inthe long run. However the percentage of risk is always higher when buying upcoming orlesser-known artists.
46Security Analysis andPortfolio Management
The ET art index provides a quantitative of price trends and is computed on the basis ofthe average square inch rate of works of art of India's leading 51 contemporary artists.Manjit Bawa, M.F. Husain, F.N. Souza, Tyeb Mehta, V.S. Gaitonde, Akbar Padamsee,Ganesh Pyne, Paristosh Sen and Raja Ravi Verma are some of the well-known artistslisted in this category. Investing in any one of these artists is a safe option. However,their prices are already beyond the range of many small investors.
The mid-segment bracket comprises work of artists who are fairly established and couldpossibly be in a rice range of Rs. 5-15 lakhs for an average-sized work. These are thenext group of artists who are most likely to hit the top league in the near future.The under Rs. 3 lakhs category would comprise works by promising artists who are inthe process of getting established and are beginning to make a name for themselves.Remember, investing in this group carries the highest risk, but returns can also bespectacular in the long-term provided the artist sustains himself and the Indian art marketcontinues to grow at the present rate. Prices mentioned are indicative and depend on thesize and the medium of the work of art.
A few points for investors to remember:
1. Do a through assessment of the artists past performance and price trends.
2. Always buy from reputed dealer or art gallery.
3. The gallery price of an artist is much lower than his auction rates.
4. Make sure you get a provenance certificate (a letter of authenticity) from theseller.
5. Take good care of your work of art you have purchased. Prices are directly relatedto the condition of the artwork. For instance, keep away from direct sunlight, focusedlight and dampness.
When reselling your work of art, remember, there are gallery commissions, current priceof the artist and tax implications, which will affect the profit margin.
2.16 LET US SUM UP
Non-security forms of investment include all those investments that are not quoted inany stock market and are not freely marketable viz., bank deposits, corporate deposits,post office deposits, national savings and other small savings certificates and schemes,provident funds and insurance policies. The above investments are essentially forms ofsavings and should be treated as such. In India nearly 33% of the household savings gointo such savings schemes as post office savings schemes, life insurance, providentfunds etc.
Another popular investment avenue is the investment in physical assets such as gold,silver, diamonds, real estate, antiques etc. Indian investors have always considered thephysical assets to be attractive investments and particularly, for hedging against inflation,India has a very long tradition in arts and crafts in jewellery, made of gold/silver andprecious stones. Moreover, it has been observed that in times of high inflation, investorsmove away from financial assets into physical assets more particularly, real estate.
The bewildering range of investment alternatives fall into two broad categories. Theseare financial assets and real assets.
A good portion of the financial assets of individual investors is held in the form of non-marketable financial assets such as bank deposits.

47Speculation Investment
Avenues in India
Debt instruments that have a maturity of less than one year at the time of issue arecalled money market instruments. Bonds or debentures represent long-term debtinstruments.
Preference shares represent a hybrid security. Equity shares represent ownership capital.
A mutual fund represents a vehicle for collective investment. Mutual fund schemes arebroadly classified as equity schemes, balanced schemes, and debt schemes. Endowmentassurance policies, money-back policy, whole life policy, unit linked plan, and term policyare popular life insurance policies in India. As a category, real estate is an attractiveinvestment proposition.
Precious objects are items that are generally small in size but highly valuable in monetaryterms.
2.17 LESSON END ACTIVITY
Suppose you are a financial advisor of a reputed company; how would you provideinformation to the management about different speculation investment avenues in India.
2.18 KEYWORDS
Capital appreciation: The stock price reflects the underlying fundamentals. Capitalgains offer certain tax advantages.
Dividend payout: Companies can pay higher dividends and provide current cash flowsto the investor.
Bonus shares: Enhance liquidity and ensure capital gains
Rights shares: Shareholders may get additional shares for less than market price. If theinvestor does not want to invest in that company he can sell his rights in the market.
Liquidity: Saleability and exit options are ensured in the case of actively traded stocks.
Security for pledging: Capital appreciation of equity shares makes them good securitiesfor borrowing from the financial institutions and banks.
Coupon rate: Every government security carries a coupon rate also called interest rate,which is fixed. e.g. 12.00% GOI 2008, where 12.00% is the coupon rate payable on theface value, which matures in the year 2008.
Face value: The par value of the security (the issue price may be at a discount or apremium to the par value).
Current price: As these G-secs are traded in the secondary market, the price of theseG-secs fluctuates according to the demand/supply in the market for that security.The current price is the prevailing price in the secondary market.
Wholesale price index: A wholesale price index is an index of prices of selectedcommodities. The percentage in the index reflects the inflation/deflation.
Primary dealer: Primary dealer is an intermediary who buys and sells governmentsecurities and treasury bills. He is authorised by the RBI.
Secondary market: Like the stock market where stocks are traded there is a secondarymarket where the debt instruments like gilts, bonds and treasury bills can be bought andsold.

48Security Analysis andPortfolio Management
l Bankers' Acceptances: These are bills of exchange accepted by commercialbanks on behalf of their customers. The fact that a bank of repute accepts a billincreases its creditworthiness, which, in turn, means that it can easily be discounted.
l Treasury Bills: These are promissory notes of short-term maturity issued by thegovernment to meet its short-term financial needs.
l Short-dated Government Securities: These are securities issued by thegovernment for short periods. Long-term government securities that are nearingmaturity are also sometimes included in this category.
l Commercial Papers: These are short-term credit instruments dealt with in theIndian money market. They refer to promissory notes issued by certain well-knownbusiness houses to the specialized institutions known as 'commercial paper houses'.Their maturity period ranges between 90 to 180 days.
l Hundis: These are short-term credit instruments dealt with in the Indian moneymarket. They refer to indigenous bills of exchange drawn in vernacular languagesand under various circumstances.
2.19 QUESTIONS FOR DISCUSSION
1. Discuss the various saving schemes promoted by post office, which are presentlyavailable to investors.
2. Should an investor commit his funds in bullion? What are the advantages anddisadvantages of such an investment?
3. Discuss the role of social security funds in the mobilizing financial savings.
4. Why should you invest on money market instruments? What are the different moneymarket instruments? Explain in detail.
5. Why should an investor include non-security forms of investment in his portfolio.
Check Your Progress: Model Answers
CYP 1
1. shareholders 2.corporation 3. stock 4. realized
CYP 2
1. come together 2.lent 3. foreign bills 4. government papers
CYP 3
1. treasury 2. dated 3.price-index 4. price-index
CYP 4
1. F 2. T 3. T 4. T 5. T
2.20 SUGGESTED READINGS
Sudhindra Bhat, Security Analysis and Portfolio Management, Excel Books, Delhi.
Kevin, S., Security Analysis and Portfolio Management, Printice Hall of India.
Prasanna Chandra, Investment Analysis and Portfolio Management, Second Edition, Tata McGrawHill.

49Speculation Investment
Avenues in India
Punithavathy Pandian, Securities Analysis and Portfolio management, Vikas.
Investment Management, V. K. Bhalla.
A. Davis, Investors in a Changing Economy, Printice -Hall, 1968.
Williamson, J. Peter, Investments: New Analytic Techniques, London, Longman, 1970.
Cottle, CC., and Whitman, W.T., Investment Timing: The Formula Plan Approach, McGraw Hill.

UNIT II


LESSON
3RISK AND RETURN
CONTENTS
3.0 Aims and Objectives
3.1 Introduction
3.1.1 Financial Analysis
3.1.2 Economic Analysis
3.1.3 Capital Market Analysis
3.1.4 Comparative Selection of Securities
3.1.5 Investment Decision-making
3.2 Risk Defined
3.2.1 Types of Investment Risk
3.3 Measurement of Risk
3.3.1 Volatility
3.3.2 Standard Deviation
3.3.3 Probability Distributions
3.3.4 Beta
3.4 Risk and Expected Return
3.5 Risk-return Relationship
3.6 Portfolio and Security Returns
3.6.1 Risk
3.7 Return and Risk of Portfolio
3.7.1 Return of Portfolio (Two Assets)
3.7.2 Risk of Portfolio (Two Assets)
3.7.3 Risk and Return of Portfolio (three assets)
3.7.4 Optimal Portfolio (Two Assets)
3.8 Portfolio Diversification and Risk
3.9 Benefits of Diversification
3.9.1 Utility Function and Risk Taking
3.10 When Diversification does not Help
3.10.1 Perfectly Positively Correlated Returns
3.11 Let us Sum up
3.12 Lesson End Activity
3.13 Keywords
3.14 Questions for Discussion
3.15 Suggested Readings
5 4Security Analysis andPortfolio Management
3.0 AIMS AND OBJECTIVES
After studying this lesson, you should be able to:
l Understand historical and expected return
l Know about risk measurement
l Learn about systematic and unsystematic risk
l Have knowledge about different types of risk
3.1 INTRODUCTION
Unlike natural science and like medicine, law and economics, investing lies somewherebetween an art and a science. Certain aspects of investing lend themselves to a scientificapproach. The creation of computer skills has accelerated the use of scientific methods.
However, corporations are managed by people and therefore open to problems associatedwith their faulty judgments. Moreover, the corporations operate in a highly dynamic andcompetitive environment, and many operate both nationally and internationally. As aresult, the judgment factor still dominates investment decisions.
Whether investing will ever be classified as a science is doubtful, but research, trainingand experience have developed investing into a discipline. Discipline means a structured,consistent and orderly process without rigidity in either concept or methods.
3.1.1 Financial Analysis
Financial analysis is the informative and predictive function in investing. It providesinformation about the past and present, and it quantifies expectations for the future.Capital budgeting decisions, corporate financial polices, and informed selections ofsecurities for investment are all products of financial analysis. Analytical resourcesmobilized for these purposes include economic, capital market, sector and specific securityanalyses.
3.1.2 Economic Analysis
Economic analysis provides both near-term and longer-term projections for the totaleconomy in terms of the nation's output of goods and services, inflation, profits, monetaryand fiscal policy, and productivity. It, thus, provides the foundation for capital market,sector, industry and company estimates of the future.
3.1.3 Capital Market Analysis
Capital market analysis examines the industries and securities of individual companiesprimarily to develop value and return expectations for securities and thus to distinguishover-priced securities from under-priced ones.
Between capital market analysis and security analysis, incorporating some characteristicsof each is sector analysis. Broader than industry and company analysis, sector analysismay be viewed as a bridge between capital market context; sectors consist of majorgroupings of stocks (i.e. according to economic sector, growth rate, or cyclically inearnings) that either cut across or combine several industries.
5 5Risk and Return
3.1.4 Comparative Selection of Securities
Selection among alternative investment opportunities requires appraisal of securities sothat their relative attractiveness in terms of return and risk can be judged at any time.This purpose can be accomplished only if consistent analytical procedures are employedand industry and company forecasts are based on an internally consistent set of economicand capital market projections.
If Hindalco is considered for purchase, it must be considered more attractive than Nalco,Indian Aluminium, or other issues with comparable investment characteristics. Thus,isolated analysis and evaluation of an individual security are impractical and inappropriate.One security cannot be effectively appraised apart from other securities, or apart fromthe general investment climate.
Consistency and comparability are so important that they should be the twin goals of theinvestment analysis process. Consistency applies to data for an individual company acrosstime, whereas comparability seeks valid data on companies for each time period. Withoutconsistency and comparability, the investor cannot exercise sound judgment in identifyinginstances of overvaluation and under-valuation.
3.1.5 Investment Decision-making
Investment decision-making can best be viewed as an integrated process to which securityanalysis makes its unique contribution. Portfolio management requires the consistentapplication of economic, capital market and sector analysis to the definition of objectivesand the measurement of performance. Security analysis serves the investment decision-maker by identifying the fairly priced or under-priced securities that are most likely toproduce the desired results.
Investment policies and asset allocation strategies are developed based on the followingobjectives:
l To earn a sufficient “real” rate of return and maintain the purchasing power of itsassets adjusted for inflation in perpetuity.
l To control portfolio risk and volatility in order to provide as much year-to-yearspending stability as possible and still meet.
3.2 RISK DEFINED
Risk can be defined as the probability that the expected return from the security will notmaterialize. Every investment involves uncertainties that make future investment returnsrisk-prone. Uncertainties could be due to the political, economic and industry factors.
Risk could be systematic in future depending upon its source. Systematic risk is for themarket as a whole, while unsystematic risk is specific to an industry or the companyindividually. The first three risk factors discussed below are systematic in nature and therest are unsystematic. Political risk could be categorised depending on whether it affectsthe market as whole, or just a particular industry.
3.2.1 Types of Investment Risk
Modern investment analysis categorizes the traditional sources of risk causing variabilityin returns into two general types: those that are pervasive in nature, such as market riskor interest rate risk, and those that are specific to a particular security issue, such asbusiness or financial risk. Therefore, we must consider these two categories of total
5 6Security Analysis andPortfolio Management
risk. The following discussion introduces these terms. Dividing total risk into its twocomponents, a general (market) component and a specific (issuer) component, we havesystematic risk and non-systematic risk, which are additive:
Total risk = General risk + Specific risk
= Market risk + Issuer risk
= Systematic risk + Non-systematic risk
Systematic Risk: An investor can construct a diversified portfolio and eliminate part ofthe total risk, the diversifiable or non-market part. What is left is the non- diversifiableportion or the market risk. Variability in a security's total returns that is directly associatedwith overall movements in the general market or economy is called systematic (market)risk.
Virtually all securities have some systematic risk, whether bonds or stocks, becausesystematic risk directly encompasses interest rate, market, and inflation risks. The investorcannot escape this part of the risk because no matter how well he or she diversifies, therisk of the overall market cannot be avoided. If the stock market declines sharply, moststocks will be adversely affected; if it rises strongly, as in the last few months of 1982,most stocks will appreciate in value. These movements occur regardless of what anysingle investor does. Clearly, market risk is critical to all investors.
Non-systematic Risk: The variability in a security's total returns not related to overallmarket variability is called the non- systematic (non-market) risk. This risk is unique to aparticular security and is associated with such factors as business and financial risk aswell as liquidity risk. Although all securities tend to have some non-systematic risk, it isgenerally connected with common stocks.
Remember the difference: Systematic (market) risk is attributable to broad macrofactors affecting all securities. Non-systematic (non-market) risk is attributable to factorsunique to a security. Different types systematic and unsystematic risk are explained asunder:
1. Market Risk: The variability in a security's returns resulting from fluctuations inthe aggregate market is known as market risk. All securities are exposed to marketrisk including recessions, wars, structural changes in the economy, tax law changesand even changes in consumer preferences. Market risk is sometimes usedsynonymously with systematic risk.
2. Interest Rate Risk: The variability in a security's return resulting from changes inthe level of interest rates is referred to as interest rate risk. Such changes generallyaffect securities inversely; that is, other things being equal, security prices moveinversely to interest rates. The reason for this movement is tied up with the valuationof securities. Interest rate risk affects bonds more directly than common stocksand is a major risk that all bondholders face. As interest rates change, bond priceschange in the opposite direction.
3. Purchasing Power Risk: A factor affecting all securities is purchasing powerrisk, also known as inflation risk. This is the possibility that the purchasing power ofinvested dollars will decline. With uncertain inflation, the real (inflation-adjusted)return involves risk even if the nominal return is safe (e.g., a Treasury bond). Thisrisk is related to interest rate risk, since interest rates generally rise as inflationincreases, because lenders demand additional inflation premiums to compensatefor the loss of purchasing power.
5 7Risk and Return
4. Regulation Risk: Some investments can be relatively attractive to other investmentsbecause of certain regulations or tax laws that give them an advantage of somekind. Municipal bonds, for example, pay interest that is exempt from local, stateand federal taxation. As a result of that special tax exemption, municipals can pricebonds to yield a lower interest rate since the net after-tax yield may still make themattractive to investors. The risk of a regulatory change that could adversely affectthe stature of an investment is a real danger. In 1987, tax law changes dramaticallylessened the attractiveness of many existing limited partnerships that relied uponspecial tax considerations as part of their total return. Prices for many limitedpartnerships tumbled when investors were left with different securities, in effect,than what they originally bargained for. To make matters worse, there was noextensive secondary market for these illiquid securities and many investors foundthemselves unable to sell those securities at anything but 'firesale' prices if at all.
5. Business Risk: The risk of doing business in a particular industry or environmentis called business risk. For example, as one of the largest steel producers, U.S.Steel faces unique problems. Similarly, General Motors faces unique problems as aresult of such developments as the global oil situation and Japanese imports.
6. Reinvestment Risk: The YTM calculation assumes that the investor reinvests allcoupons received from a bond at a rate equal to the computed YTM on that bond,thereby earning interest on interest over the life of the bond at the computed YTMrate. In effect, this calculation assumes that the reinvestment rate is the yield tomaturity.
If the investor spends the coupons, or reinvests them at a rate different from theassumed reinvestment rate of 10%, the realized yield that will actually be earned atthe termination of the investment in the bond will differ from the promised YTM.And, in fact, coupons almost always will be reinvested at rates higher or lower thanthe computed YTM, resulting in a realized yield that differs from the promisedyield. This gives rise to reinvestment rate risk. This interest-on-interest conceptsignificantly affects the potential total dollar return. Its exact impact is a function ofcoupon and time to maturity, with reinvestment becoming more important as eithercoupon or time to maturity, or both, rise. Specifically:
(a) Holding everything else constant, the longer the maturity of a bond, the greaterthe reinvestment risks.
(b) Holding everything else constant, the higher the coupon rate, the greater thedependence of the total dollar returns from the bond on the reinvestment ofthe coupon payments.
Let’s look at realized yields under different assumed reinvestment rates for a 10%non-callable 20-year bond purchased at face value. If the reinvestment rate exactlyequals the YTM of 10%, the investor would realize a 10% compound return whenthe bond is held to maturity, with $4,040 of the total dollar return from the bondattributable to interest on interest. At a 12% reinvestment rate, the investor wouldrealize an 11.14% compound return, with almost 75% of the total return comingfrom interest-on-interest ($5,738/$7,738). With no reinvestment of coupons (spendingthem as received), the investor would achieve only a 5.57% return. In all cases, thebond is held to maturity.
Clearly, the reinvestment portion of the YTM concept is critical. In fact, for long-term bonds the interest-on-interest component of the total realized yield may accountfor more than three-fourths of the bond's total dollar return.
5 8Security Analysis andPortfolio Management
7. Bull-Bear Market Risk: This risk arises from the variability in the market returnsresulting from alternating bull and bear market forces. When security index risesfairly consistently from a low point, called a trough, over a period of time, thisupward trend is called a bull market. The bull market ends when the market indexreaches a peak and starts a downward trend. The period during which the marketdeclines to the next trough is called a bear market.
8. Management Risk: Management, all said and done, is made up of people who aremortal, fallible and capable of making a mistake or a poor decision. Errors made bythe management can harm those who invested in their firms. Forecasting errors isdifficult work and may not be worth the effort and, as a result, imparts a needlesslysceptical outlook.
An agent-principal relationship exists when the shareholder owners delegate theday-to-day decision-making authority to managers who are hired employees ratherthan substantial owners. This theory suggests that owners will work harder tomaximize the value of the company than employees will. Various researches in thefield indicate that investors can reduce their losses to difficult-to-analyse managementerrors by buying shares in those corporations in which the executives have significantequity investments.
9. Default Risk: It is that portion of an investment's total risk that results from changesin the financial integrity of the investment. For example, when a company thatissues securities moves either further away from bankruptcy or closer to it, thesechanges in the firm's financial integrity will be reflected in the market price of itssecurities. The variability of return that investors experience, as a result of changesin the credit worthiness of a firm in which they invested, is their default risk.
Almost all the losses suffered by investors as a result of default risk are not theresult of actual defaults and/or bankruptcies. Investor losses from default risk usuallyresult from security prices falling as the financial integrity of a corporation'sweakness - market prices of the troubled firm's securities will already have declinedto near zero. However, this is not always the case - 'creative' accounting practicesin firms like Enron, WorldCom, Arthur Anderson and Computer Associates maymaintain quoted prices of stock even as the company's net worth gets completelyeroded. Thus, the bankruptcy losses would be only a small part of the total lossesresulting from the process of financial deterioration.
10. International Risk: International risk can include both country risk and exchangerate risk.
Exchange Rate Risk: All investors who invest internationally in today's increasinglyglobal investment arena face the prospect of uncertainty in the returns after theyconvert the foreign gains back to their own currency. Unlike the past, when mostUS investors ignored international investing alternatives, investors today mustrecognize and understand exchange rate risk, which can be defined as the variabilityin returns on securities caused by currency fluctuations. Exchange rate risk issometimes called currency risk.
For example, a US investor who buys a German stock denominated in marks(German currency), must ultimately convert the returns from this stock back todollars. If the exchange rate has moved against the investor, losses from theseexchange rate movements can partially or totally negate the original return earned.Obviously, US investors who invest only in US stocks on US markets do not facethis risk, but in today's global environment where investors increasingly consideralternatives from other countries, this factor has become important. Currency risk

5 9Risk and Return
affects international mutual funds, global mutual funds, closed-end single countryfunds, American Depository Receipts, foreign stocks, and foreign bonds.
Country Risk: Country risk, also referred to as political risk, is an important riskfor investors today. With more investors investing internationally, both directly andindirectly, the political, and therefore economic stability and viability of a country'seconomy need to be considered. The United States has the lowest country risk,and other countries can be judged on a relative basis using the United States as abenchmark. Examples of countries that needed careful monitoring in the 1990sbecause of country risk included the former Soviet Union and Yugoslavia, China,Hong Kong, and South Africa.
Liquidity Risk: Liquidity risk is the risk associated with the particular secondarymarket in which a security trades. An investment that can be bought or sold quicklyand without significant price concession is considered liquid. The more uncertaintyabout the time element and the price concession, the greater the liquidity risk. ATreasury bill has little or no liquidity risk, whereas a small OTC stock may havesubstantial liquidity risk.
Liquid Assets Risk: It is that portion of an asset's total variability of return whichresults from price discounts given or sales concessions paid in order to sell theasset without delay. Perfectly liquid assets are highly marketable and suffer noliquidation costs. Illiquid assets are not readily marketable and suffer no liquidationcosts. Either price discounts must be given or sales commissions must be paid, orthe seller must incur both the costs, in order to find a new investor for an illiquidasset. The more illiquid the asset is, the larger the price discounts or the commissionsthat must be paid to dispose of the assets.
Political Risk: It arises from the exploitation of a politically weak group for thebenefit of a politically strong group, with the efforts of various groups to improvetheir relative positions increasing the variability of return from the affected assets.Regardless of whether the changes that cause political risk are sought by politicalor by economic interests, the resulting variability of return is called political risk, ifit is accomplished through legislative, judicial or administrative branches of thegovernment.
Domestic political risk arises from changes in environmental regulations, zoningrequirements, fees, licenses, and most frequently, taxes. Taxes could be both directand indirect. Some types of securities and certain categories of investors enjoy aprivileged tax status.
International political risk takes the form of expropriation of non-residents' assets,foreign exchange controls that won't let foreign investors withdraw their funds,disadvantageous tax and tariff treatments, requirements that non-residents investorsgive partial ownership to local residents, and un-reimbursed destruction of foreign-owned assets by hostile residents of the foreign country.
Industry Risk: An industry may be viewed as group of companies that competewith each other to market a homogeneous product. Industry risk is that portion ofan investment's total variability of return caused by events that affect the productsand firms that make up an industry. For example, commodity prices going up ordown will affect all the commodity producers, though not equally.
The stage of the industry's life cycle, international tariffs and/or quotas on theproducts produced by an industry, product/industry related taxes (e.g. cigarettes),industry-wide labour union problems, environmental restrictions, raw material
6 0Security Analysis andPortfolio Management
availability, and similar factors interact with and affect all the firms in an industrysimultaneously. As a result of these common features, the prices of the securitiesissued by the competing firms tend to rise and fall together.
These risk factors do not make up an exhaustive list, but are merely representative ofthe major classifications involved. All the uncertainties taken together make up the totalrisk, or the total variability of return.
Check Your Progress 1
1. International risk can include both country risk and _____________ risk.
2. _____________ risk is that portion of an investment’s total risk that resultsfrom changes in the financial integrity of investment.
3. Exchange rate risk is sometimes called _____________ risk.
4. Market risk is sometimes used synonymously with _____________ risk.
3.3 MEASUREMENT OF RISK
3.3.1 Volatility
Of all the ways to describe risk, the simplest and possibly most accurate is “the uncertaintyof a future outcome.” The anticipated return for some future period is known as theexpected return. The actual return over some past period is known as the realized return.The simple fact that dominates investing is that the realized return on an asset with anyrisk attached to it may be different from what was expected. Volatility may be describedas the range of movement (or price fluctuation) from the expected level of return. Forexample, the more a stock goes up and down in price, the more volatile that stock is.Because wide price swings create more uncertainty of an eventual outcome, increasedvolatility can be equated with increased risk. Being able to measure and determine thepast volatility of a security is important in that it provides some insight into the riskinessof that security as an investment.
3.3.2 Standard Deviation
Investors and analysts should be at least somewhat familiar with the study of probabilitydistributions. Since the return an investor will earn from investing is not known, it mustbe estimated. An investor may expect the TR (total return) on a particular security to be10% for the coming year, but in truth this is only a "point estimate."
3.3.3 Probability Distributions
To deal with the uncertainty of returns, investors need to think explicitly about a security’sdistribution of probable TRs. In other words, investors need to keep in mind that, althoughthey may expect a security to return 10%, for example, this is only a one-point estimateof the entire range of possibilities. Given that investors must deal with the uncertainfuture, a number of possible returns can, and will, occur.
In the case of a Treasury bond paying a fixed rate of interest, the interest payment willbe made with 100 per cent certainty, barring a financial collapse of the economy. Theprobability of occurrence is 1.0, because no other outcome is possible. With the possibilityof two or more outcomes, which is the norm for common stocks, each possible likelyoutcome must be considered and a probability of its occurrence assessed. The result of
6 1Risk and Return
considering these outcomes and their probabilities together is a probability distributionconsisting of the specification of the likely returns that may occur and the probabilitiesassociated with these likely returns.
Probabilities represent the likelihood of various outcomes and are typically expressed asa decimal (sometimes fractions are used). The sum of the probabilities of all possibleoutcomes must be 1.0, because they must completely describe all the (perceived) likelyoccurrences. How are these probabilities and associated outcomes obtained? In thefinal analysis, investing for some future period involves uncertainty, and therefore subjectiveestimates. Although past occurrences (frequencies) may be relied on heavily to estimatethe probabilities, the past must be modified for any changes expected in the future.Probability distributions can be either discrete or continuous. With a discrete probabilitydistribution, a probability is assigned to each possible outcome. With a continuousprobability distribution, an infinite number of possible outcomes exists. The most familiarcontinuous distribution is the normal distribution depicted by the well-known bell-shapedcurve often used in statistics. It is a two-parameter distribution in that the mean and thevariance fully describe it.
To describe the single-most likely outcome from a particular probability distribution, it isnecessary to calculate its expected value. The expected value is the average of allpossible return outcomes, where each outcome is weighted by its respective probabilityof occurrence. For investors, this can be described as the expected return.
We have mentioned that it's important for investors to be able to quantify and measurerisk. To calculate the total risk associated with the expected return, the variance orstandard deviation is used. This is a measure of the spread or dispersion in the probabilitydistribution; that is, a measurement of the dispersion of a random variable around itsmean. Without going into further details, just be aware that the larger this dispersion, thelarger the variance or standard deviation. Since variance, volatility and risk can, in thiscontext, be used synonymously, remember that the larger the standard deviation, themore uncertain the outcome.
Calculating a standard deviation using probability distributions involves making subjectiveestimates of the probabilities and the likely returns. However, we cannot avoid suchestimates because future returns are uncertain. The prices of securities are based oninvestors' expectations about the future. The relevant standard deviation in this situationis the ex ante standard deviation and not the ex post based on realized returns.
Although standard deviations based on realized returns are often used as proxies for exante standard deviations, investors should be careful to remember that the past cannotalways be extrapolated into the future without modifications. Ex post standard deviationsmay be convenient, but they are subject to errors. One important point about the estimationof standard deviation is the distinction between individual securities and portfolios. Standarddeviations for well-diversified portfolios are reasonably steady across time, and thereforehistorical calculations may be fairly reliable in projecting the future. Moving from well-diversified portfolios to individual securities, however, makes historical calculations muchless reliable. Fortunately, the number one rule of portfolio management is to diversifyand hold a portfolio of securities, and the standard deviations of well-diversified portfoliosmay be more stable.
Something very important to remember about standard deviation is that it is a measure ofthe total risk of an asset or a portfolio, including, therefore, both systematic andunsystematic risk. It captures the total variability in the asset's or portfolio's return,whatever the sources of that variability. In summary, the standard deviation of returnmeasures the total risk of one security or the total risk of a portfolio of securities.
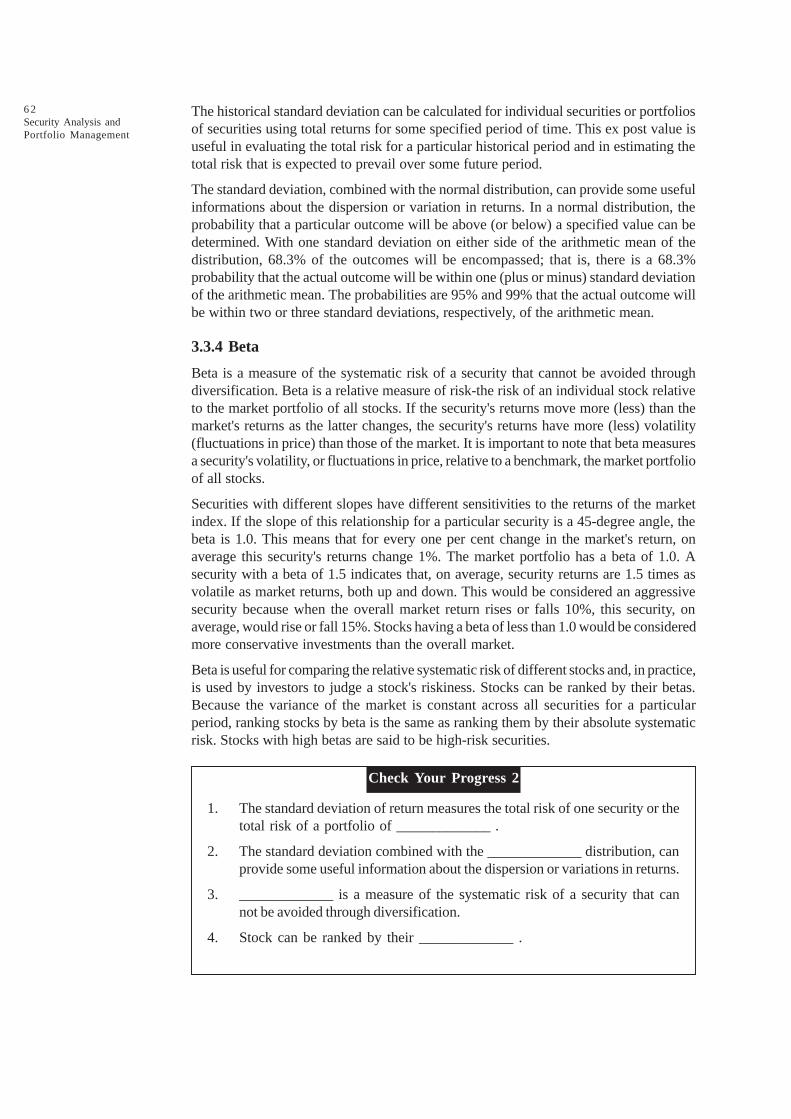
6 2Security Analysis andPortfolio Management
The historical standard deviation can be calculated for individual securities or portfoliosof securities using total returns for some specified period of time. This ex post value isuseful in evaluating the total risk for a particular historical period and in estimating thetotal risk that is expected to prevail over some future period.
The standard deviation, combined with the normal distribution, can provide some usefulinformations about the dispersion or variation in returns. In a normal distribution, theprobability that a particular outcome will be above (or below) a specified value can bedetermined. With one standard deviation on either side of the arithmetic mean of thedistribution, 68.3% of the outcomes will be encompassed; that is, there is a 68.3%probability that the actual outcome will be within one (plus or minus) standard deviationof the arithmetic mean. The probabilities are 95% and 99% that the actual outcome willbe within two or three standard deviations, respectively, of the arithmetic mean.
3.3.4 Beta
Beta is a measure of the systematic risk of a security that cannot be avoided throughdiversification. Beta is a relative measure of risk-the risk of an individual stock relativeto the market portfolio of all stocks. If the security's returns move more (less) than themarket's returns as the latter changes, the security's returns have more (less) volatility(fluctuations in price) than those of the market. It is important to note that beta measuresa security's volatility, or fluctuations in price, relative to a benchmark, the market portfolioof all stocks.
Securities with different slopes have different sensitivities to the returns of the marketindex. If the slope of this relationship for a particular security is a 45-degree angle, thebeta is 1.0. This means that for every one per cent change in the market's return, onaverage this security's returns change 1%. The market portfolio has a beta of 1.0. Asecurity with a beta of 1.5 indicates that, on average, security returns are 1.5 times asvolatile as market returns, both up and down. This would be considered an aggressivesecurity because when the overall market return rises or falls 10%, this security, onaverage, would rise or fall 15%. Stocks having a beta of less than 1.0 would be consideredmore conservative investments than the overall market.
Beta is useful for comparing the relative systematic risk of different stocks and, in practice,is used by investors to judge a stock's riskiness. Stocks can be ranked by their betas.Because the variance of the market is constant across all securities for a particularperiod, ranking stocks by beta is the same as ranking them by their absolute systematicrisk. Stocks with high betas are said to be high-risk securities.
Check Your Progress 2
1. The standard deviation of return measures the total risk of one security or thetotal risk of a portfolio of _____________ .
2. The standard deviation combined with the _____________ distribution, canprovide some useful information about the dispersion or variations in returns.
3. _____________ is a measure of the systematic risk of a security that cannot be avoided through diversification.
4. Stock can be ranked by their _____________ .

6 3Risk and Return3.4 RISK AND EXPECTED RETURN
Risk and expected return are the two key determinants of an investment decision. Risk,in simple terms, is associated with the variability of the rates of return from an investment;how much do individual outcomes deviate from the expected value? Statistically, risk ismeasured by any one of the measures of dispersion such as co-efficient of range, variance,standard deviation etc.
The risk involved in investment depends on various factors such as:
(i) The length of the maturity period - longer maturity periods impart greater risk toinvestments.
(ii) The credit-worthiness of the issuer of securities - the ability of the borrower tomake periodical interest payments and pay back the principal amount will impartsafety to the investment and this reduces risk.
(iii) The nature of the instrument or security also determines the risk. Generally,government securities and fixed deposits with banks tend to be riskless or leastrisky; corporate debt instruments like debentures tend to be riskier than governmentbonds and ownership instruments like equity shares tend to be the riskiest. Therelative ranking of instruments by risk is once again connected to the safety of theinvestment.
(iv) Equity shares are considered to be the most risky investment on account of thevariability of the rates of returns and also because the residual risk of bankruptcyhas to be borne by the equity holders.
(v) The liquidity of an investment also determines the risk involved in that investment.Liquidity of an asset refers to its quick saleability without a loss or with a minimumof loss.
(vi) In addition to the aforesaid factors, there are also various others such as theeconomic, industry and firm specific factors that affect the risk an investment. Adetailed analysis of these risk factors will be taken up in the next chapter.
Another major factor determining the investment decision is the rate of return expectedby the investor. The rate of return expected by the investor consists of the yield andcapital appreciation.
Before we look at the methods of computing the rate of return from an investment, it isnecessary to understand the concept of the return on investment. We have noted earlierthat an investment is a postponed consumption. Postponement of consumption issynonymous with the concept of 'time preference for money'. Other things remainingthe same, individuals prefer current consumption to future consumption. Therefore, inorder to induce individuals to postpone current consumption they have to be paid certaincompensation, which is the time preference for consumption. The compensation paidshould be a positive real rate of return. The real rate of return is generally equal to therate of return expected by an investor from a risk-free capital asset assuming a worldwithout inflation. However, in real life, inflation is a common feature of a capitalisteconomy. If the investor is not compensated for the effects of inflation, the real rate ofreturn may turn out to be either zero or negative. Therefore, the investors, generally, addexpected inflation rate to the real rate of return to arrive at the nominal rate of return.
For example, assume that the present value of an investment is Rs. 100; the investorexpects a real time rate of 3% per annum and the expected inflation rate is 3% perannum. If the investor were to receive only the real time rate, he would get back Rs. 103
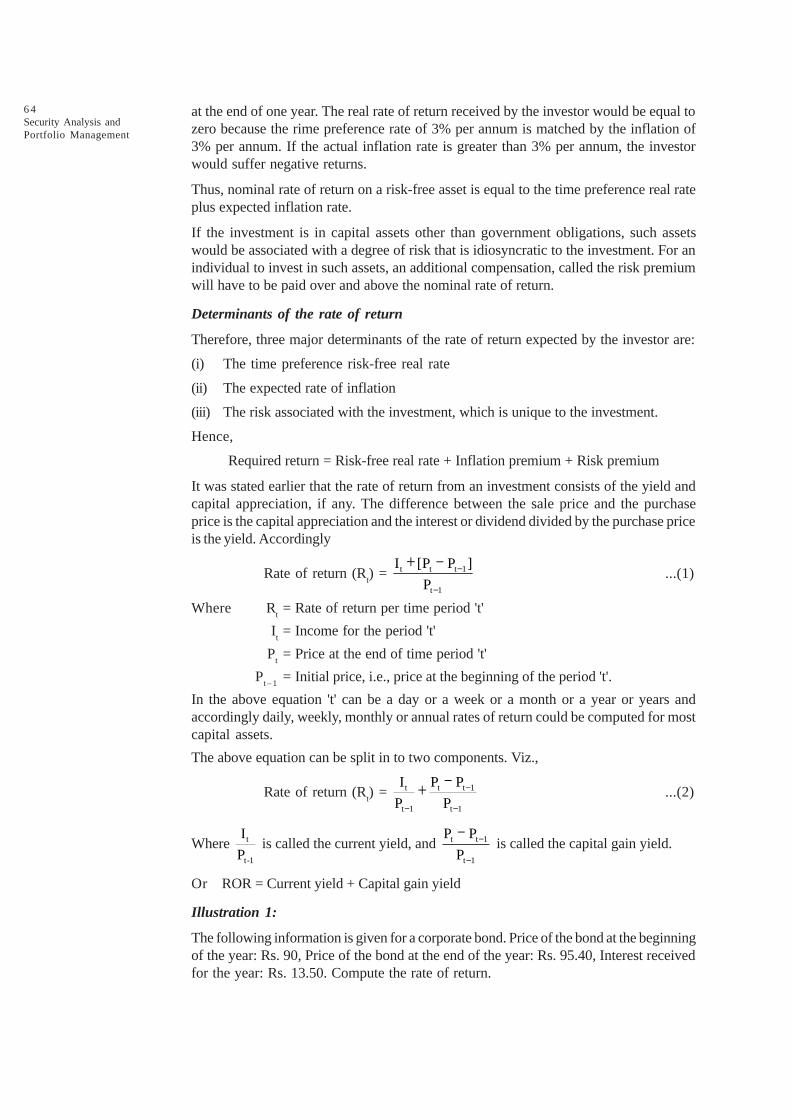
6 4Security Analysis andPortfolio Management
at the end of one year. The real rate of return received by the investor would be equal tozero because the rime preference rate of 3% per annum is matched by the inflation of3% per annum. If the actual inflation rate is greater than 3% per annum, the investorwould suffer negative returns.
Thus, nominal rate of return on a risk-free asset is equal to the time preference real rateplus expected inflation rate.
If the investment is in capital assets other than government obligations, such assetswould be associated with a degree of risk that is idiosyncratic to the investment. For anindividual to invest in such assets, an additional compensation, called the risk premiumwill have to be paid over and above the nominal rate of return.
Determinants of the rate of return
Therefore, three major determinants of the rate of return expected by the investor are:
(i) The time preference risk-free real rate
(ii) The expected rate of inflation
(iii) The risk associated with the investment, which is unique to the investment.
Hence,
Required return = Risk-free real rate + Inflation premium + Risk premium
It was stated earlier that the rate of return from an investment consists of the yield andcapital appreciation, if any. The difference between the sale price and the purchaseprice is the capital appreciation and the interest or dividend divided by the purchase priceis the yield. Accordingly
Rate of return (Rt) = t t t 1
t 1
I [P P ]
P-
-
+ -...(1)
Where Rt = Rate of return per time period 't'
It = Income for the period 't'
Pt = Price at the end of time period 't'
Pt – 1
= Initial price, i.e., price at the beginning of the period 't'.
In the above equation 't' can be a day or a week or a month or a year or years andaccordingly daily, weekly, monthly or annual rates of return could be computed for mostcapital assets.
The above equation can be split in to two components. Viz.,
Rate of return (Rt) = t t t 1
t 1 t 1
I P P
P P-
- -
-+ ...(2)
Where t
t-1
I
P is called the current yield, and t t 1
t 1
P P
P-
-
- is called the capital gain yield.
Or ROR = Current yield + Capital gain yield
Illustration 1:
The following information is given for a corporate bond. Price of the bond at the beginningof the year: Rs. 90, Price of the bond at the end of the year: Rs. 95.40, Interest receivedfor the year: Rs. 13.50. Compute the rate of return.

6 5Risk and Return
Solution:
The rate of return can be computed as follows:
13.50 (95.40 90)
90
+ -= 0.21 or 21% per annum
The return of 21% consists of 15% current yield and 6% capital gain yield.
There is always a direct association between the rates of return and the asset prices.Finance theory stipulates that the price of any asset is equal to the sum of the discountedcash flows, which the capital asset owner would receive. Accordingly, the current priceof any capital asset can be expected, symbolically, as
P0
= n
t nt n
t 1
E(I ) P
(1 r) (1 r)=+
+ +∑ ...(3)
Where E(Rt) = Expected income to be received in year 't'
P0 = Current price of the capital asset
Pn = Price of the asset on redemption or on liquidation
R = The rate of return investors expect given the risk inherent in thatcapital asset.
Thus, 'r' is the rate or return, which the investors require in order to invest in a capitalasset that is used to discount the expected future cash flows from that capital asset.
Illustration 2:
Mr. Amirican has purchased 100 shares of Rs. 10 each of Kinetic Ltd. in 2005 at Rs. 78per share. The company has declared a dividend @ 40% for the year 2006-07. Themarket price of share as on 1-4-2006 was Rs. 104 and on 31-3-2007 was Rs. 128.Calculate the annual return on the investment for the year 2006-07.
Dividend received for 2004 – 05 = Rs. 10 × 40/100 = Rs. 4
Solution:
Calculation of annual rate of return on investment for the year 2006-07
R = 1 1 0
0
d (P P ) 4 (128 104)0.2692 or 26.92%
P 104
+ - + -= =
3.5 RISK-RETURN RELATIONSHIP
The most fundamental tenet of finance literature is that there is a trade-off between riskand return. The risk-return relationship requires that the return on a security should becommensurate with its riskiness. If the capital markets are operationally efficient, thenall investment assets should provide a rate or return that is consistent with the risksassociated with them. The risk and return are directly variable, i.e., an investment withhigher risk should produce higher return.
The risk/return trade-off could easily be called the "ability-to-sleep-at-night test." Whilesome people can handle the equivalent of financial skydiving without batting an eye,others are terrified to climb the financial ladder without a secure harness. Deciding whatamount of risk you can take while remaining comfortable with your investments is veryimportant.

6 6Security Analysis andPortfolio Management
In the investing world, the dictionary definition of risk is the possibility that an investment'sactual return will be different than expected. Technically, this is measured in statistics bystandard deviation. Risk means you have the possibility of losing some, or even all, ofyour original investment.
Low levels of uncertainty (low risk) are associated with low potential returns. Highlevels of uncertainty (high risk) are associated with high potential returns. The risk/return trade-off is the balance between the desire for the lowest possible risk and thehighest possible return. This is demonstrated graphically in the chart below. A higherstandard deviation means a higher risk and higher possible return. The figure belowrepresents the relationship between risk and return.
Low risk Average risk High risk M
Return
Slope indicates required
Return per unit of risk
Risk-free return R(f)
Figure 3.1: Risk and Return Relationship
The slope of the Market Line indicates the return per unit of risk required by all investors.Highly risk-averse investors would have a steeper line, and vice versa. Yields on apparentlysimilar stocks may differ. Differences in price, and therefore yield, reflect the market'sassessment of the issuing company's standing and of the risk elements in the particularstocks. A high yield in relation to the market in general shows an above average riskelement.
This is shown in the figure below.
Rate of
Return Risk Market Line E(r)
Premium
Ordinary shares
Preference shares
Subordinate loan stock
Unsecured loan
Debenture with floating charge
Mortage loan
Government stock (risk-free)
O Degree of Risk
Figure 3.2: Risk Return Relationship of different Stocks
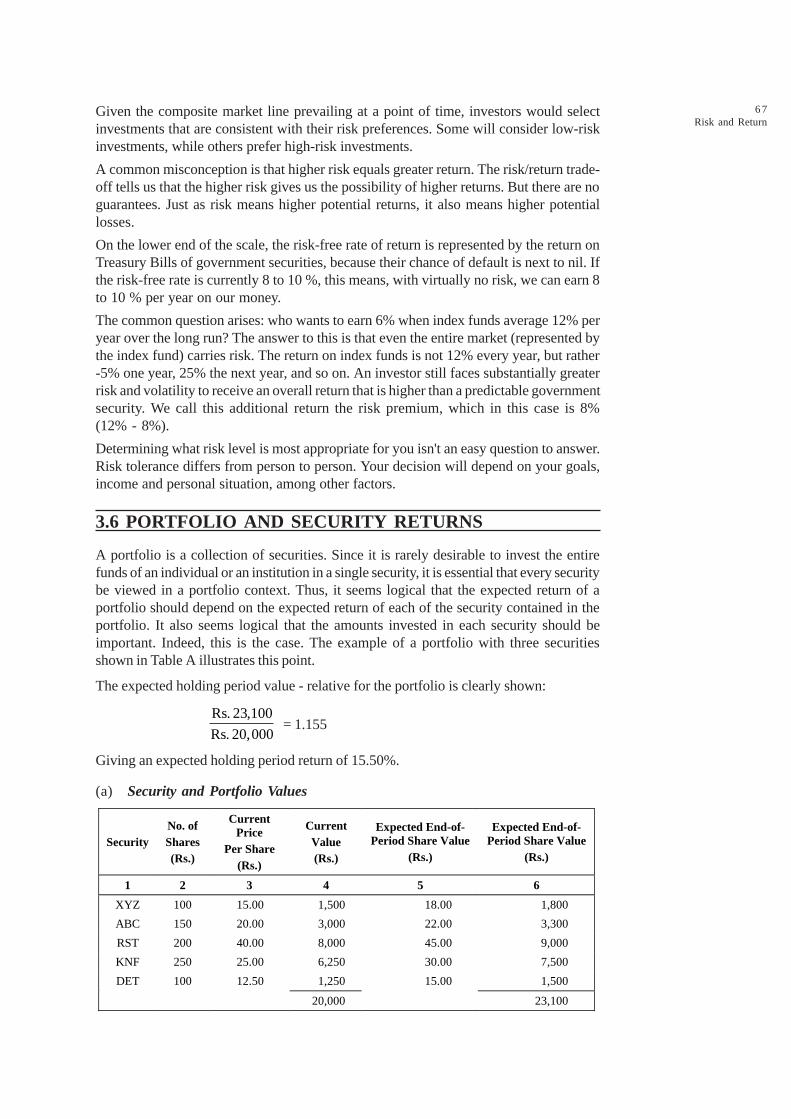
6 7Risk and Return
Given the composite market line prevailing at a point of time, investors would selectinvestments that are consistent with their risk preferences. Some will consider low-riskinvestments, while others prefer high-risk investments.
A common misconception is that higher risk equals greater return. The risk/return trade-off tells us that the higher risk gives us the possibility of higher returns. But there are noguarantees. Just as risk means higher potential returns, it also means higher potentiallosses.
On the lower end of the scale, the risk-free rate of return is represented by the return onTreasury Bills of government securities, because their chance of default is next to nil. Ifthe risk-free rate is currently 8 to 10 %, this means, with virtually no risk, we can earn 8to 10 % per year on our money.
The common question arises: who wants to earn 6% when index funds average 12% peryear over the long run? The answer to this is that even the entire market (represented bythe index fund) carries risk. The return on index funds is not 12% every year, but rather-5% one year, 25% the next year, and so on. An investor still faces substantially greaterrisk and volatility to receive an overall return that is higher than a predictable governmentsecurity. We call this additional return the risk premium, which in this case is 8%(12% - 8%).
Determining what risk level is most appropriate for you isn't an easy question to answer.Risk tolerance differs from person to person. Your decision will depend on your goals,income and personal situation, among other factors.
3.6 PORTFOLIO AND SECURITY RETURNS
A portfolio is a collection of securities. Since it is rarely desirable to invest the entirefunds of an individual or an institution in a single security, it is essential that every securitybe viewed in a portfolio context. Thus, it seems logical that the expected return of aportfolio should depend on the expected return of each of the security contained in theportfolio. It also seems logical that the amounts invested in each security should beimportant. Indeed, this is the case. The example of a portfolio with three securitiesshown in Table A illustrates this point.
The expected holding period value - relative for the portfolio is clearly shown:
Rs. 23,100
Rs. 20,000= 1.155
Giving an expected holding period return of 15.50%.
(a) Security and Portfolio Values
Security No. of Shares (Rs.)
Current Price
Per Share (Rs.)
Current Value (Rs.)
Expected End-of-Period Share Value
(Rs.)
Expected End-of-Period Share Value
(Rs.)
1 2 3 4 5 6
XYZ 100 15.00 1,500 18.00 1,800
ABC 150 20.00 3,000 22.00 3,300
RST 200 40.00 8,000 45.00 9,000
KNF 250 25.00 6,250 30.00 7,500
DET 100 12.50 1,250 15.00 1,500
20,000 23,100
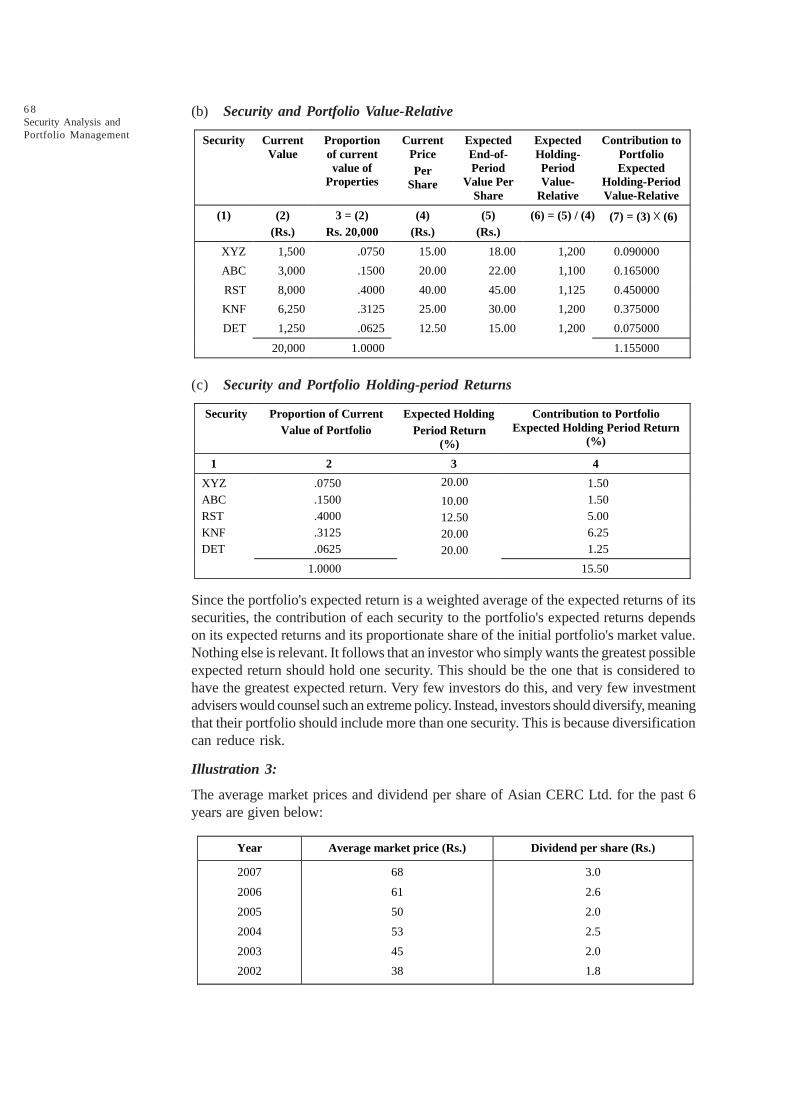
6 8Security Analysis andPortfolio Management
(b) Security and Portfolio Value-Relative
Security Current Value
Proportion of current value of
Properties
Current Price Per
Share
Expected End-of-Period
Value Per Share
Expected Holding-Period Value-
Relative
Contribution to Portfolio Expected
Holding-Period Value-Relative
(1) (2) (Rs.)
3 = (2) Rs. 20,000
(4) (Rs.)
(5) (Rs.)
(6) = (5) / (4) (7) = (3) ́ (6)
XYZ 1,500 .0750 15.00 18.00 1,200 0.090000
ABC 3,000 .1500 20.00 22.00 1,100 0.165000
RST 8,000 .4000 40.00 45.00 1,125 0.450000
KNF 6,250 .3125 25.00 30.00 1,200 0.375000
DET 1,250 .0625 12.50 15.00 1,200 0.075000
20,000 1.0000 1.155000
(c) Security and Portfolio Holding-period Returns
Security Proportion of Current Value of Portfolio
Expected Holding Period Return
(%)
Contribution to Portfolio Expected Holding Period Return
(%)
1 2 3 4
XYZ .0750 20.00 1.50 ABC .1500 10.00 1.50 RST .4000 12.50 5.00 KNF .3125 20.00 6.25 DET .0625 20.00 1.25
1.0000 15.50
Since the portfolio's expected return is a weighted average of the expected returns of itssecurities, the contribution of each security to the portfolio's expected returns dependson its expected returns and its proportionate share of the initial portfolio's market value.Nothing else is relevant. It follows that an investor who simply wants the greatest possibleexpected return should hold one security. This should be the one that is considered tohave the greatest expected return. Very few investors do this, and very few investmentadvisers would counsel such an extreme policy. Instead, investors should diversify, meaningthat their portfolio should include more than one security. This is because diversificationcan reduce risk.
Illustration 3:
The average market prices and dividend per share of Asian CERC Ltd. for the past 6years are given below:
Year Average market price (Rs.) Dividend per share (Rs.)
2007
2006
2005
2004
2003
2002
68
61
50
53
45
38
3.0
2.6
2.0
2.5
2.0
1.8

6 9Risk and Return
Solution:
Calculate the average rate of return of Asian CERC Ltd.'s shares for past 6 years.
Year Average market price per share (Rs.)
Capital gain (%)
Dividend per share (Rs.)
Dividend yield (%)
Rate of return (%)
2002 38 - 1.8 4.74 -
2003 45 18.42 2.0 4.44 22.86
2004 53 17.78 2.5 4.72 22.50
2005 50 -5.66 2.0 4.00 -1.66
2006 61 22.00 2.6 4.26 26.26
2007 68 11.48 3.0 4.41 15.89
R = 1/5 (22.86 + 22.50 – 1.66 + 26.26 + 15.89)
= 1/5(85.85) = 17.17%
3.6.1 Risk
All possible questions which the investor may ask, the most important one is concernedwith the probability of actual yield being less than zero, that is, with the probability ofloss. This is the essence of risk. A useful measure of risk should somehow take intoaccount both the probability of various possible "bad" outcomes and their associatedmagnitudes. Instead of measuring the probability of a number of different possibleoutcomes, the measure of risk should somehow estimate the extent to which the actualoutcome is likely to diverge from the expected.
Two measures are used for this purpose: the average (or mean) absolute deviation andthe standard deviation.
Illustration 4:
The rate of return of equity shares of Wipro Ltd., for past six years are given below:
Year 01 02 03 04 05 06
Rate of return (%) 12 18 -6 20 22 24
Calculate the average rate of return, standard deviation and variance.
Solution:
Calculation of Average Rate of Return (R)
R =R 12 18 6 20 22 24
15%N 6
S + - + + += =
s2 =2(R R)
N
S -
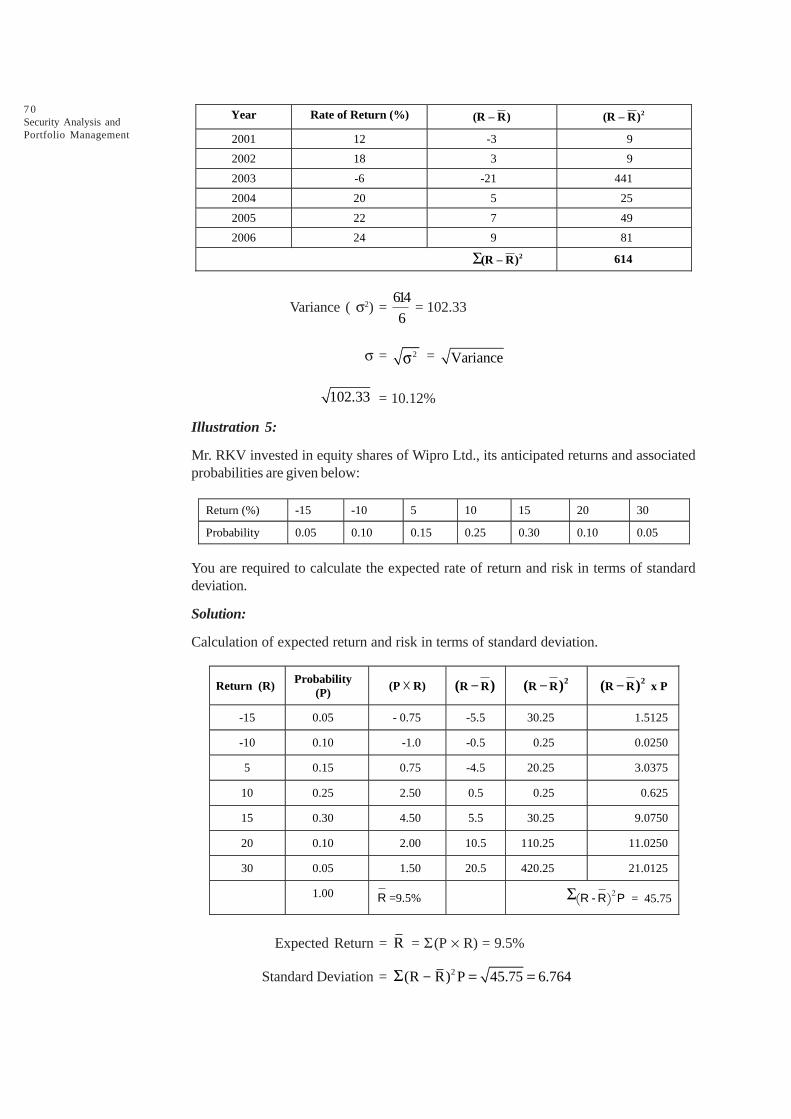
7 0Security Analysis andPortfolio Management
Year Rate of Return (%) (R – R) 2(R – R)
2001 12 -3 9
2002 18 3 9
2003 -6 -21 441
2004 20 5 25
2005 22 7 49
2006 24 9 81
S 2(R – R) 614
Variance ( s2) = 614
6 = 102.33
s = 2s = Variance
102.33 = 10.12%
Illustration 5:
Mr. RKV invested in equity shares of Wipro Ltd., its anticipated returns and associatedprobabilities are given below:
Return (%) -15 -10 5 10 15 20 30
Probability 0.05 0.10 0.15 0.25 0.30 0.10 0.05
You are required to calculate the expected rate of return and risk in terms of standarddeviation.
Solution:
Calculation of expected return and risk in terms of standard deviation.
Return (R) Probability (P)
(P ́ R) -R R( ) - 2R R( ) - 2R R( ) x P
-15 0.05 - 0.75 -5.5 30.25 1.5125
-10 0.10 -1.0 -0.5 0.25 0.0250
5 0.15 0.75 -4.5 20.25 3.0375
10 0.25 2.50 0.5 0.25 0.625
15 0.30 4.50 5.5 30.25 9.0750
20 0.10 2.00 10.5 110.25 11.0250
30 0.05 1.50 20.5 420.25 21.0125
1.00 R =9.5% 2( )S R - R P = 45.75
Expected Return = R = S (P ¥ R) = 9.5%
Standard Deviation = 2(R R) P 45.75 6.764S - = =
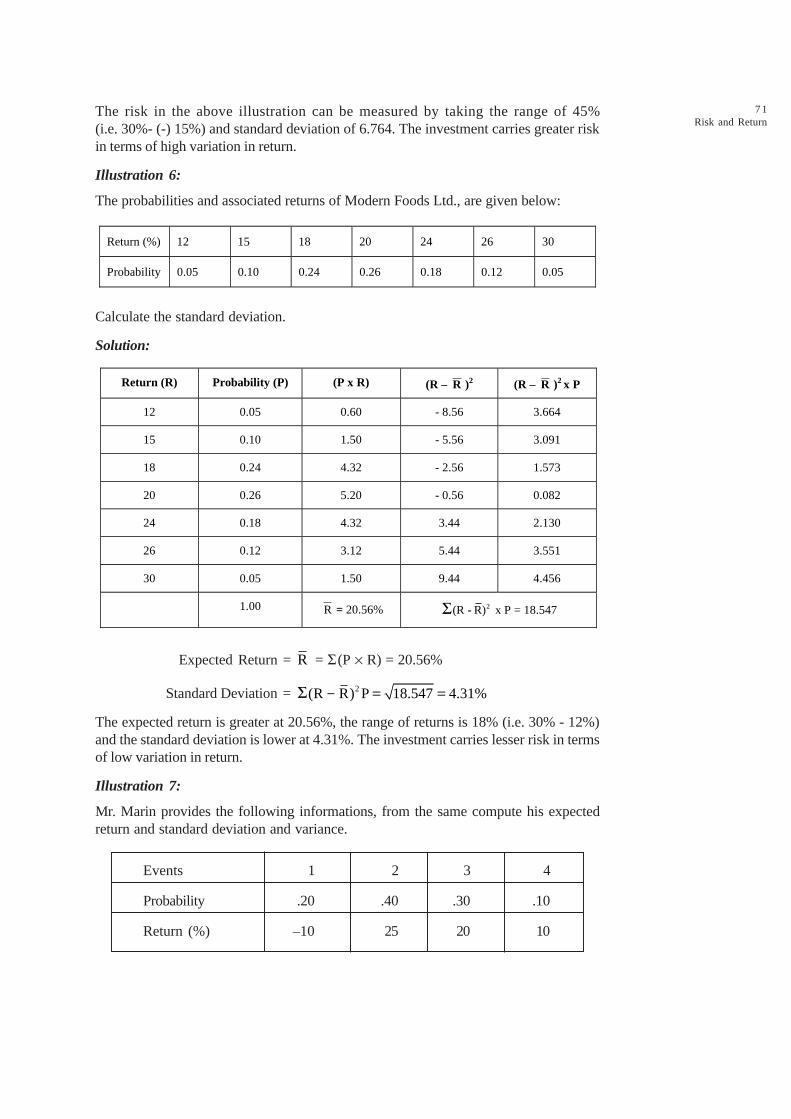
7 1Risk and Return
The risk in the above illustration can be measured by taking the range of 45%(i.e. 30%- (-) 15%) and standard deviation of 6.764. The investment carries greater riskin terms of high variation in return.
Illustration 6:
The probabilities and associated returns of Modern Foods Ltd., are given below:
Return (%) 12 15 18 20 24 26 30
Probability 0.05 0.10 0.24 0.26 0.18 0.12 0.05
Calculate the standard deviation.
Solution:
Return (R) Probability (P) (P x R) (R – R )2 (R – R )2 x P
12 0.05 0.60 - 8.56 3.664
15 0.10 1.50 - 5.56 3.091
18 0.24 4.32 - 2.56 1.573
20 0.26 5.20 - 0.56 0.082
24 0.18 4.32 3.44 2.130
26 0.12 3.12 5.44 3.551
30 0.05 1.50 9.44 4.456
1.00 R = 20.56% S 2(R - R) x P = 18.547
Expected Return = R = S (P ¥ R) = 20.56%
Standard Deviation = 2(R R) P 18.547 4.31%S - = =
The expected return is greater at 20.56%, the range of returns is 18% (i.e. 30% - 12%)and the standard deviation is lower at 4.31%. The investment carries lesser risk in termsof low variation in return.
Illustration 7:
Mr. Marin provides the following informations, from the same compute his expectedreturn and standard deviation and variance.
Events 1 2 3 4
Probability .20 .40 .30 .10
Return (%) –10 25 20 10
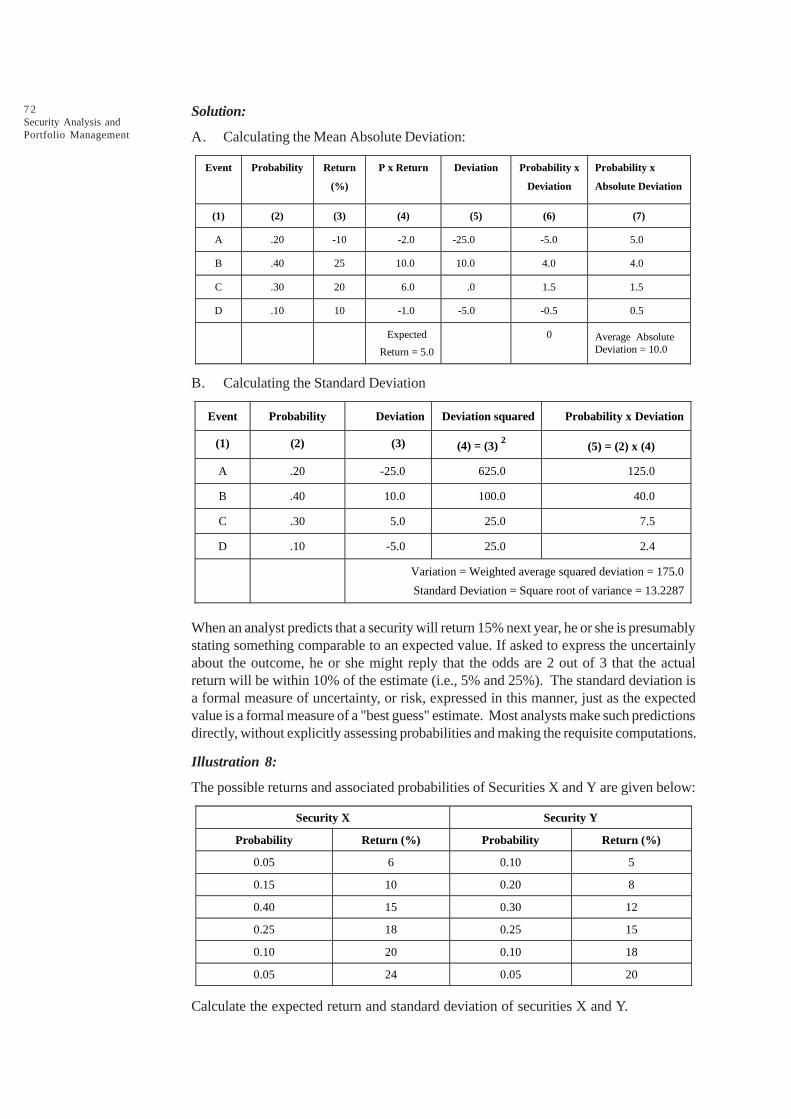
7 2Security Analysis andPortfolio Management
Solution:
A. Calculating the Mean Absolute Deviation:
Event
Probability
Return
(%)
P x Return
Deviation
Probability x
Deviation
Probability x
Absolute Deviation
(1) (2) (3) (4) (5) (6) (7)
A .20 -10 -2.0 -25.0 -5.0 5.0
B .40 25 10.0 10.0 4.0 4.0
C .30 20 6.0 .0 1.5 1.5
D .10 10 -1.0 -5.0 -0.5 0.5
Expected
Return = 5.0
0 Average Absolute Deviation = 10.0
B. Calculating the Standard Deviation
Event Probability Deviation Deviation squared Probability x Deviation
(1) (2) (3) (4) = (3) 2 (5) = (2) x (4)
A .20 -25.0 625.0 125.0
B .40 10.0 100.0 40.0
C .30 5.0 25.0 7.5
D .10 -5.0 25.0 2.4
Variation = Weighted average squared deviation = 175.0
Standard Deviation = Square root of variance = 13.2287
When an analyst predicts that a security will return 15% next year, he or she is presumablystating something comparable to an expected value. If asked to express the uncertainlyabout the outcome, he or she might reply that the odds are 2 out of 3 that the actualreturn will be within 10% of the estimate (i.e., 5% and 25%). The standard deviation isa formal measure of uncertainty, or risk, expressed in this manner, just as the expectedvalue is a formal measure of a "best guess" estimate. Most analysts make such predictionsdirectly, without explicitly assessing probabilities and making the requisite computations.
Illustration 8:
The possible returns and associated probabilities of Securities X and Y are given below:
Security X Security Y
Probability Return (%) Probability Return (%)
0.05 6 0.10 5
0.15 10 0.20 8
0.40 15 0.30 12
0.25 18 0.25 15
0.10 20 0.10 18
0.05 24 0.05 20
Calculate the expected return and standard deviation of securities X and Y.

7 3Risk and Return
Solution:
Calculation of expected return and standard deviation of Security X:
Probability (P) Return (%) (R) (P x R) (R – R) 2(R – R) P
0.05 6 0.30 - 9.5 4.5125
0.15 10 1.50 -5.5 4.5375
0.40 15 6.00 -0.5 0.1000
0.25 18 4.50 2.5 1.5625
0.10 20 2.00 4.5 2.0250
0.05 24 1.20 8.5 3.6125
1.00 R = 15.5
2(R - R) På = 16.35
Expected return of Security X(R) = 15.5%
Standard Deviation of Security X
s 2y
= 16.35
sy
= 16.35 4.04%=
Calculation of expected return and standard deviation of Security Y
Probability (P) Return (%) (R) (P x R) (R – R) 2(R – R) P
0.10 5 0.50 -7.25 5.2563
0.20 8 1.60 -4.25 3.6125
0.30 12 3.60 -0.25 0.0188
0.25 15 3.75 2.75 1.8906
0.10 18 1.80 5.75 3.3063
0.05 20 1.00 7.75 3.0031
R = 12.25 2(R–R)å P = 17.086
Expected Return SecurityY(R) = 12.25%
Standard Deviation of Security Y
s 2y
= 17.086
sy
= 17.0876 4.134%=
Analysis - Security X has higher expected return and lower level of risk as compared toSecurity Y.
3.7 RETURN AND RISK OF PORTFOLIO
3.7.1 Return of Portfolio (Two Assets)
The expected return from a portfolio of two or more securities is equal to the weightedaverage of the expected returns from the individual securities.
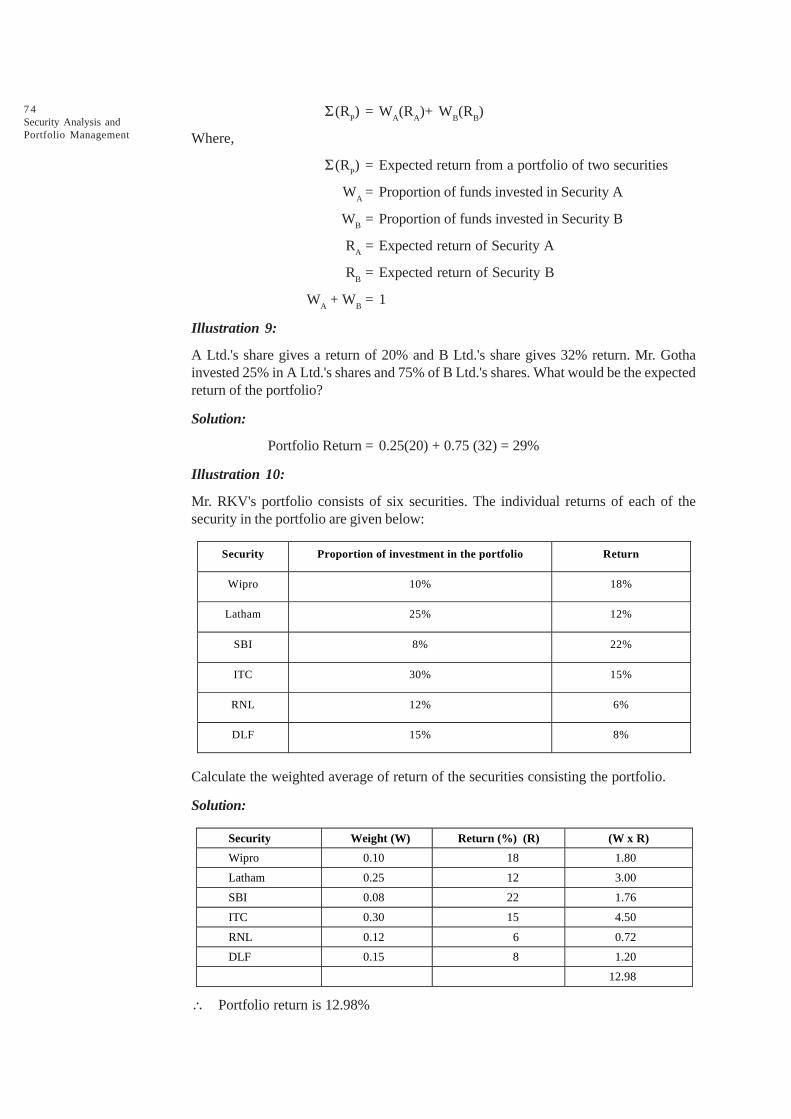
7 4Security Analysis andPortfolio Management
S (RP) = W
A(R
A)+ W
B(R
B)
Where,
S (RP) = Expected return from a portfolio of two securities
WA = Proportion of funds invested in Security A
WB = Proportion of funds invested in Security B
RA = Expected return of Security A
RB = Expected return of Security B
WA + W
B = 1
Illustration 9:
A Ltd.'s share gives a return of 20% and B Ltd.'s share gives 32% return. Mr. Gothainvested 25% in A Ltd.'s shares and 75% of B Ltd.'s shares. What would be the expectedreturn of the portfolio?
Solution:
Portfolio Return = 0.25(20) + 0.75 (32) = 29%
Illustration 10:
Mr. RKV's portfolio consists of six securities. The individual returns of each of thesecurity in the portfolio are given below:
Security Proportion of investment in the portfolio Return
Wipro 10% 18%
Latham 25% 12%
SBI 8% 22%
ITC 30% 15%
RNL 12% 6%
DLF 15% 8%
Calculate the weighted average of return of the securities consisting the portfolio.
Solution:
Security Weight (W) Return (%) (R) (W x R)
Wipro 0.10 18 1.80
Latham 0.25 12 3.00
SBI 0.08 22 1.76
ITC 0.30 15 4.50
RNL 0.12 6 0.72
DLF 0.15 8 1.20
12.98
\ Portfolio return is 12.98%
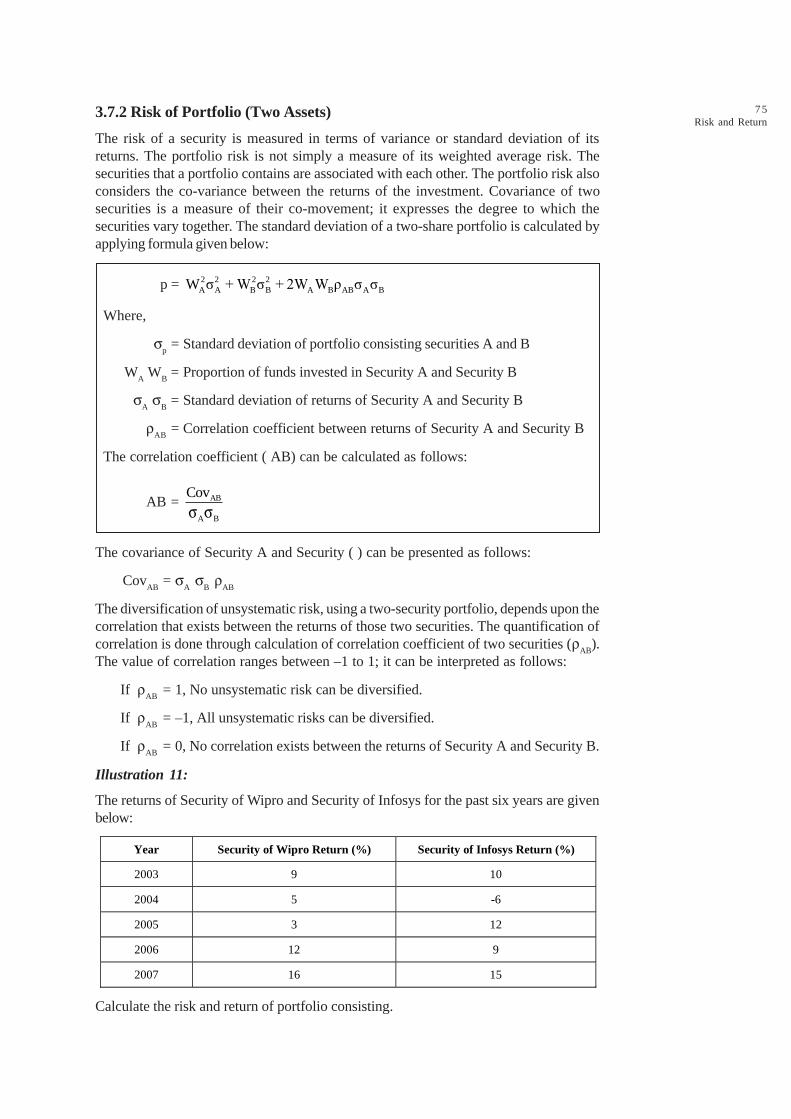
7 5Risk and Return
3.7.2 Risk of Portfolio (Two Assets)
The risk of a security is measured in terms of variance or standard deviation of itsreturns. The portfolio risk is not simply a measure of its weighted average risk. Thesecurities that a portfolio contains are associated with each other. The portfolio risk alsoconsiders the co-variance between the returns of the investment. Covariance of twosecurities is a measure of their co-movement; it expresses the degree to which thesecurities vary together. The standard deviation of a two-share portfolio is calculated byapplying formula given below:
p = 2 2 2 2A A B B A B AB A BW ó + W ó + 2W W ñ ó ó
Where,
sp = Standard deviation of portfolio consisting securities A and B
WA W
B = Proportion of funds invested in Security A and Security B
sA s
B = Standard deviation of returns of Security A and Security B
rAB
= Correlation coefficient between returns of Security A and Security B
The correlation coefficient ( AB) can be calculated as follows:
AB = AB
A B
Covs s
The covariance of Security A and Security ( ) can be presented as follows:
CovAB
= sA s
B r
AB
The diversification of unsystematic risk, using a two-security portfolio, depends upon thecorrelation that exists between the returns of those two securities. The quantification ofcorrelation is done through calculation of correlation coefficient of two securities (r
AB).
The value of correlation ranges between –1 to 1; it can be interpreted as follows:
If rAB
= 1, No unsystematic risk can be diversified.
If rAB
= –1, All unsystematic risks can be diversified.
If rAB
= 0, No correlation exists between the returns of Security A and Security B.
Illustration 11:
The returns of Security of Wipro and Security of Infosys for the past six years are givenbelow:
Year Security of Wipro Return (%) Security of Infosys Return (%)
2003 9 10
2004 5 -6
2005 3 12
2006 12 9
2007 16 15
Calculate the risk and return of portfolio consisting.

7 6Security Analysis andPortfolio Management
Solution:
Calculation of Mean Return and Standard Deviation of Security A:
Year Return (%) R (R – R) 2(R – R)
2003 9 0 0
2004 5 -4 16
2005 3 -6 36
2006 12 3 9
2007 16 7 49
45 110
Mean Return (R) = 45/5 = 9%
Standard Deviation ( sA) = 110 = 10.49%
Calculation Mean Return and Standard Deviation of Security A:
Year Return (%) (R – R) 2(R – R)
2001 10 2 4
2002 -6 14 196
2003 12 4 16
2004 9 1 1
2005 15 7 49
40 266
Mean Return (R) = 40/5 = 8%
Standard Deviation ( sB) = 266 = 16.31%
Analysis – Security A has a higher historic level of return and lower risk as compared toSecurity B. Correlation Coefficient (r
AB).
= 2 2 2 2
NÓXY - (ÓX)(ÓY)
NÓX (ÓX) NÓY ÓY- -
A’s return (%) B’s return (%)
X X2 Y Y2 XY
9 81 10 100 90
5 25 -6 36 -30
3 9 12 144 36
12 144 9 81 108
16 256 15 225 240
SX = 45 SX2 = 515 SY = 40 SY2 = 586 SXY = 444

7 7Risk and Return
= 2 2
2 2
(5×5) (45) 5×586 (40)
(5×515) (45) 5×586) (40)
- -
- -
= 2,220 1800
2575 2025 2930 1600
-- -
= 420
550 1330
= 420
23.452×36.469 =
420
855.271 = 0.491
Verification:
Calculation of Covariance of Returns of Securities A and B
Returns (%) Year
A B A A(R – R ) B B(R – R ) A A(R – R ) ´ B B(R – R )
2001 9 10 0 2 0
2002 5 -6 -4 -14 56
2003 3 12 -6 4 -24
2004 12 9 3 1 3
2005 16 15 7 7 49
CovAB = 84
rAB
= AB
A B
Cov 84= = 0.491
ó ó 10.49×16.31
CovAB
= sA s
B r
AB = 10.49 ¥ 16.31 ¥ 0.491 = 84
Return of portfolio (Rp)
= (0.80 ¥ 9) + (0.20 ¥ 8) = 7.2 + 1.6 = 8.8%
Risk of portfolio (sp)
= (0.802 ¥ 10.492) + (0.202 ¥ 16.312) + (2 ¥ 0.80 ¥ 0.20 ¥ 10.49 ¥ 16.31 ¥ 0.491)
= (0.64 ¥ 110.04) + (0.04 ¥ 266.02) + 26.88
= 70.43 + 10.64 + 26.88 = 107.95
sp
= 107.95 = 10.39%
3.7.3 Risk and Return of Portfolio (Three Assets)
Formula for calculating risk of portfolio consisting three securities
2Pó = 2 2 2 2 2 2
x x y y z z x y yz y z x z xz x zW ó + W ó + W ó + 2W W ñ ó ó + W W ñ ó ó
Where,
W1, W
2, W
3 = Proportion of amount invested in securities X, Y and Z
sx, s
y, s
z = Standard deviations of securities X, Y and Z
rxy
= Correlation coefficient between securities X and Y
ryz = Correlation coefficient between securities Y and Z
rxz = Correlation coefficient between securities X and Z
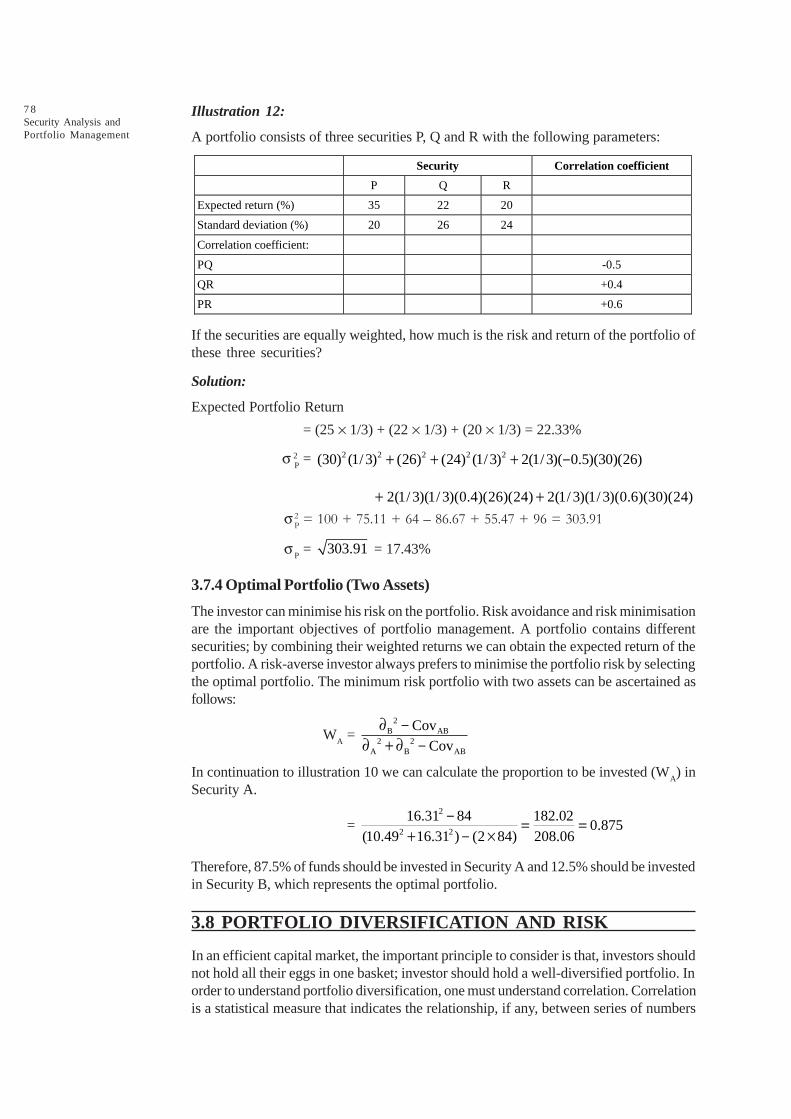
7 8Security Analysis andPortfolio Management
Illustration 12:
A portfolio consists of three securities P, Q and R with the following parameters:
Security Correlation coefficient
P Q R
Expected return (%) 35 22 20
Standard deviation (%) 20 26 24
Correlation coefficient:
PQ -0.5
QR +0.4
PR +0.6
If the securities are equally weighted, how much is the risk and return of the portfolio ofthese three securities?
Solution:
Expected Portfolio Return
= (25 ¥ 1/3) + (22 ¥ 1/3) + (20 ¥ 1/3) = 22.33%
s 2P
= 2 2 2 2 2(30) (1/3) (26) (24) (1/3) 2(1/3)( 0.5)(30)(26)+ + + -
2(1/3)(1/3)(0.4)(26)(24) 2(1/3)(1/3)(0.6)(30)(24)+ +s 2
P= 100 + 75.11 + 64 � 86.67 + 55.47 + 96 = 303.91
sP
= 303.91 = 17.43%
3.7.4 Optimal Portfolio (Two Assets)
The investor can minimise his risk on the portfolio. Risk avoidance and risk minimisationare the important objectives of portfolio management. A portfolio contains differentsecurities; by combining their weighted returns we can obtain the expected return of theportfolio. A risk-averse investor always prefers to minimise the portfolio risk by selectingthe optimal portfolio. The minimum risk portfolio with two assets can be ascertained asfollows:
WA
= 2
B AB2 2
A B AB
CovCov
¶ -¶ + ¶ -
In continuation to illustration 10 we can calculate the proportion to be invested (WA) in
Security A.
= 2
2 2
16.31 84 182.020.875
(10.49 16.31 ) (2 84) 208.06
- = =+ - ´
Therefore, 87.5% of funds should be invested in Security A and 12.5% should be investedin Security B, which represents the optimal portfolio.
3.8 PORTFOLIO DIVERSIFICATION AND RISK
In an efficient capital market, the important principle to consider is that, investors shouldnot hold all their eggs in one basket; investor should hold a well-diversified portfolio. Inorder to understand portfolio diversification, one must understand correlation. Correlationis a statistical measure that indicates the relationship, if any, between series of numbers
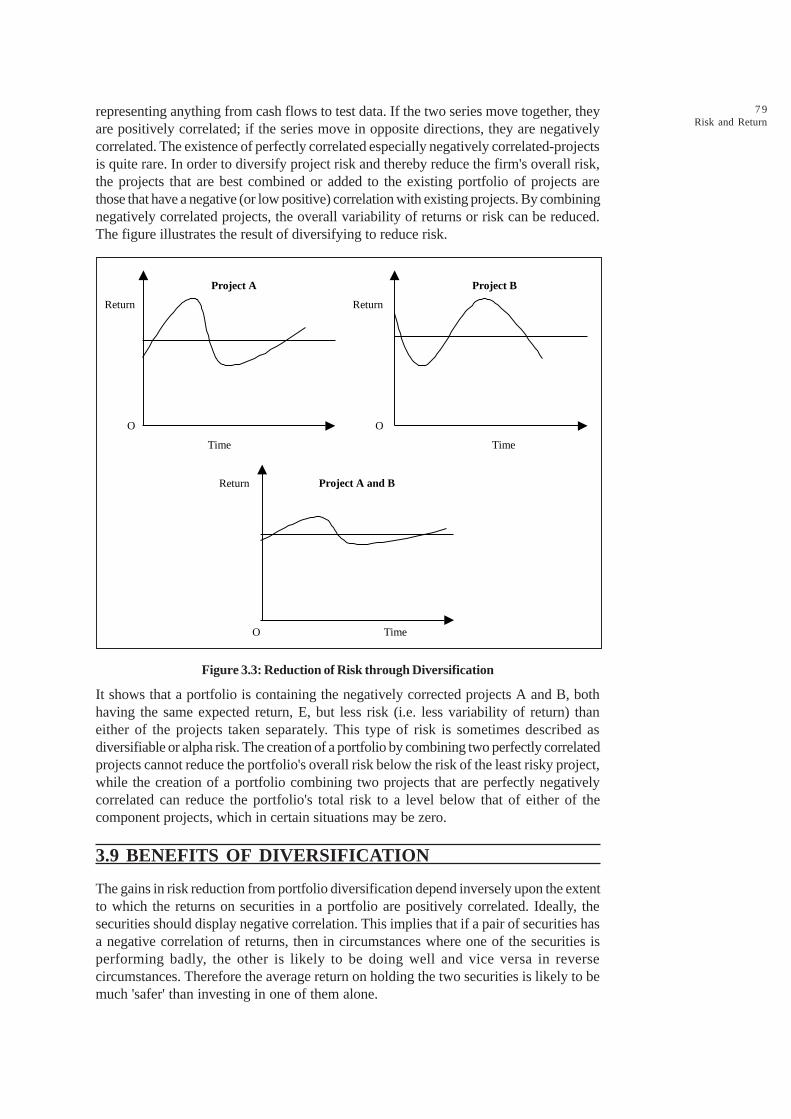
7 9Risk and Return
representing anything from cash flows to test data. If the two series move together, theyare positively correlated; if the series move in opposite directions, they are negativelycorrelated. The existence of perfectly correlated especially negatively correlated-projectsis quite rare. In order to diversify project risk and thereby reduce the firm's overall risk,the projects that are best combined or added to the existing portfolio of projects arethose that have a negative (or low positive) correlation with existing projects. By combiningnegatively correlated projects, the overall variability of returns or risk can be reduced.The figure illustrates the result of diversifying to reduce risk.
Project A Project B
Return Return
O O
Time Time
Return Project A and B
O Time
Figure 3.3: Reduction of Risk through Diversification
It shows that a portfolio is containing the negatively corrected projects A and B, bothhaving the same expected return, E, but less risk (i.e. less variability of return) thaneither of the projects taken separately. This type of risk is sometimes described asdiversifiable or alpha risk. The creation of a portfolio by combining two perfectly correlatedprojects cannot reduce the portfolio's overall risk below the risk of the least risky project,while the creation of a portfolio combining two projects that are perfectly negativelycorrelated can reduce the portfolio's total risk to a level below that of either of thecomponent projects, which in certain situations may be zero.
3.9 BENEFITS OF DIVERSIFICATION
The gains in risk reduction from portfolio diversification depend inversely upon the extentto which the returns on securities in a portfolio are positively correlated. Ideally, thesecurities should display negative correlation. This implies that if a pair of securities hasa negative correlation of returns, then in circumstances where one of the securities isperforming badly, the other is likely to be doing well and vice versa in reversecircumstances. Therefore the average return on holding the two securities is likely to bemuch 'safer' than investing in one of them alone.
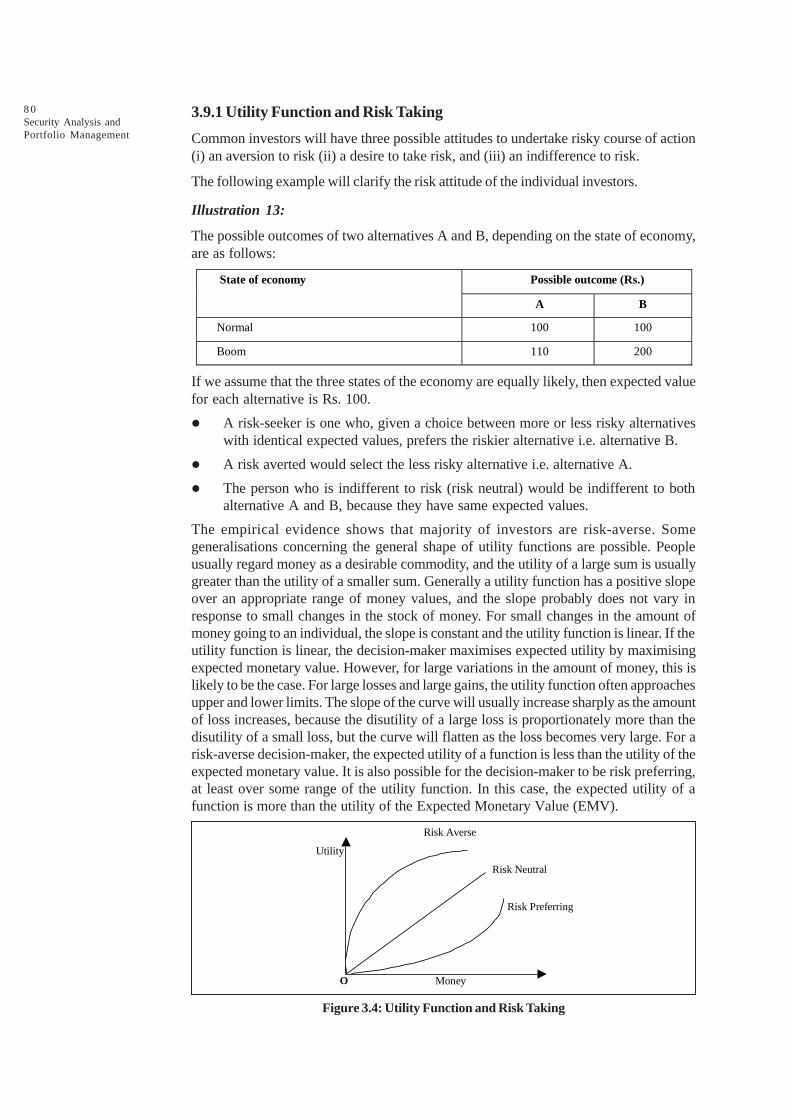
8 0Security Analysis andPortfolio Management
3.9.1 Utility Function and Risk Taking
Common investors will have three possible attitudes to undertake risky course of action(i) an aversion to risk (ii) a desire to take risk, and (iii) an indifference to risk.
The following example will clarify the risk attitude of the individual investors.
Illustration 13:
The possible outcomes of two alternatives A and B, depending on the state of economy,are as follows:
Possible outcome (Rs.) State of economy
A B
Normal 100 100
Boom 110 200
If we assume that the three states of the economy are equally likely, then expected valuefor each alternative is Rs. 100.
l A risk-seeker is one who, given a choice between more or less risky alternativeswith identical expected values, prefers the riskier alternative i.e. alternative B.
l A risk averted would select the less risky alternative i.e. alternative A.
l The person who is indifferent to risk (risk neutral) would be indifferent to bothalternative A and B, because they have same expected values.
The empirical evidence shows that majority of investors are risk-averse. Somegeneralisations concerning the general shape of utility functions are possible. Peopleusually regard money as a desirable commodity, and the utility of a large sum is usuallygreater than the utility of a smaller sum. Generally a utility function has a positive slopeover an appropriate range of money values, and the slope probably does not vary inresponse to small changes in the stock of money. For small changes in the amount ofmoney going to an individual, the slope is constant and the utility function is linear. If theutility function is linear, the decision-maker maximises expected utility by maximisingexpected monetary value. However, for large variations in the amount of money, this islikely to be the case. For large losses and large gains, the utility function often approachesupper and lower limits. The slope of the curve will usually increase sharply as the amountof loss increases, because the disutility of a large loss is proportionately more than thedisutility of a small loss, but the curve will flatten as the loss becomes very large. For arisk-averse decision-maker, the expected utility of a function is less than the utility of theexpected monetary value. It is also possible for the decision-maker to be risk preferring,at least over some range of the utility function. In this case, the expected utility of afunction is more than the utility of the Expected Monetary Value (EMV).
Risk Averse Utility
Risk Neutral
Risk Preferring
O Money
Figure 3.4: Utility Function and Risk Taking

8 1Risk and Return
Illustration 14:
Stocks A and B have the following historical returns:
Year Stock A’s Return (K A) (%) Stock A’s Return (K B) (%)
2003 -12.24 -5.00
2004 23.67 19.55
2005 35.45 44.09
2006 5.82 1.20
2007 28.30 21.16
You are required to calculate the average rate of return for each stock during the period2003 through 2007. Assume that someone held a portfolio consisting 50% of stock A and50% of stock B. What would have been the average return on the portfolio during theperiod? (You may assume that the year ended on 31st March.)
Solution:
Calculation of Average Rate of Return on Portfolio during 2003-2007:
Year Stock A’s Return (%) Stock A’s Return (%)
2003 -12.24 -5.00
2004 23.67 19.55
2005 35.45 44.09
2006 5.82 1.20
2007 28.30 21.16
81.00 81.00
Average Rate of Return 81/5 years =16.20% 81/5 years = 16.20%
Calculation of Realised Rate of Return on Portfolio during 2003-2007:
Stock A Stock B Year
Proportion Return Net return (a) Proportion Return Net return (b)
Total Net
return
(a) + (b)
2003 0.50 -12.24 -6.12 0.50 -5.00 -2.50 -8.62
2004 0.50 23.67 11.83 0.50 19.55 9.77 21.60
2005 0.50 35.45 17.72 0.50 44.09 22.04 39.76
2006 0.50 5.82 2.91 0.50 1.20 0.60 3.51
2007 0.50 28.30 14.15 0.50 21.16 10.58 24.73
81.00 40.49 81.00 80.98
Average Rate of Return = Rs. 80.98/5 = 16.20%
Illustration 15:
Type of Security Nos. Annual
Coupon (%)
Maturity
Years
Yield
(%)
Bond A (Rs.1000) 10 9 3 12
Bond B (Rs. 1000) 10 10 5 12
Preference shares C (Rs.100) 100 11 * 13*
Preference shares D (Rs.100) 100 12 * 13*

8 2Security Analysis andPortfolio Management
Dr. TKV inherited the following securities upon his uncle's death:
Likelihood of being called at a premium over par. Compute the current value of hisuncle's portfolio
Solution:
Calculation of Current value of Dr. RKV's Portfolio inherited from his uncle
Current Value (Rs.)
Bond A
(i) Interest p.a. (Rs.10,000 × 9/100) =Rs.900Compounded @ 12% p.a. for 3 years (Rs.900 × 2,402) 2,162
(ii) Current value of bonds amount received onmaturity P.V. @ 12% on 3rd year (Rs.10,000 × 0.712) 7,120
(a) 9,282Bond B
(i) Interest p.a. (Rs.10,000 x 10/100) = Rs. 1000Compounded @ 12% p.a for 5 years (Rs.1,000 × 3,605) 3,605
(ii) Current value of bonds value received onmaturity P.V @ 12% on 5th year (Rs.10,000 × 0.567) 5,670
(b) 9,275Preference shares C
Rs.100×100Nos.×11%
13%
Rs.1,100
0.13= (c) 8,462
Preference shares D (d) 9,231
Rs.100 100Nos. 11%
13%
´ ´ Rs.1,200
0.13=
Current Value of John's Portfolio (a) + (b) + (c) + (d) 36,250
Illustration 16:
Following is the data regarding six securities:
A B C D E F
Return (%) 8 8 121 4 9 8
Risk (%) (standard deviation) 4 5 12 4 5 6
(i) Which of the securities will be selected?
(ii) Assuming perfect correlation, analyse whether it is preferable to invest 75% inSecurity A and 25% in Security C.
Solution:
(i) When we make risk return analysis of different securities from A to F, we canobserve that Security A gives a return of 8% at a risk level of 4%. Simultaneously,securities B and F gives the same return of 8% as of security A, but their risk levelsare 5% and 6% respectively. Security D is giving only 4% return for the risk rate of4%. Hence, security A dominates securities B, D and F.
Securities C and E offer more return but carry higher level of risk.
Hence, securities A, C and E can be selected based on individual preferences.
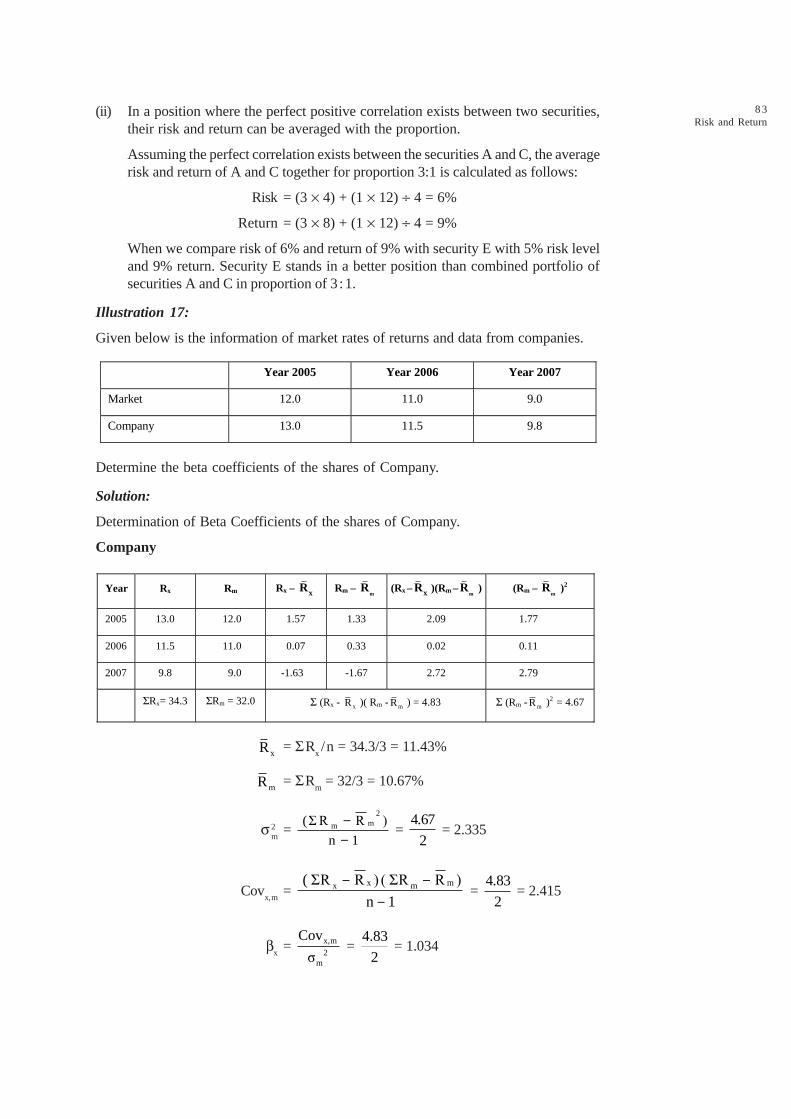
8 3Risk and Return
(ii) In a position where the perfect positive correlation exists between two securities,their risk and return can be averaged with the proportion.
Assuming the perfect correlation exists between the securities A and C, the averagerisk and return of A and C together for proportion 3:1 is calculated as follows:
Risk = (3 ¥ 4) + (1 ¥ 12) ∏ 4 = 6%
Return = (3 ¥ 8) + (1 ¥ 12) ∏ 4 = 9%
When we compare risk of 6% and return of 9% with security E with 5% risk leveland 9% return. Security E stands in a better position than combined portfolio ofsecurities A and C in proportion of 3:1.
Illustration 17:
Given below is the information of market rates of returns and data from companies.
Year 2005 Year 2006 Year 2007
Market 12.0 11.0 9.0
Company 13.0 11.5 9.8
Determine the beta coefficients of the shares of Company.
Solution:
Determination of Beta Coefficients of the shares of Company.
Company
Year Rx Rm Rx – xR Rm – m
R (Rx – xR )(Rm – mR ) (Rm –
mR )2
2005 13.0 12.0 1.57 1.33 2.09 1.77
2006 11.5 11.0 0.07 0.33 0.02 0.11
2007 9.8 9.0 -1.63 -1.67 2.72 2.79
SRx= 34.3 SRm = 32.0 S (Rx - xR )( Rm - mR ) = 4.83 S (Rm - mR )2 = 4.67
xR = SR
x/n = 34.3/3 = 11.43%
mR = SRm = 32/3 = 10.67%
s 2m
= 2
mm (Ó R R )
n 1
--
= 4.67
2 = 2.335
Covx,m
= x mx m ( ÓR R ) ( ÓR R )
n 1
- --
= 4.83
2 = 2.415
bx
= x,m
2m
Cov
ó =
4.83
2 = 1.034
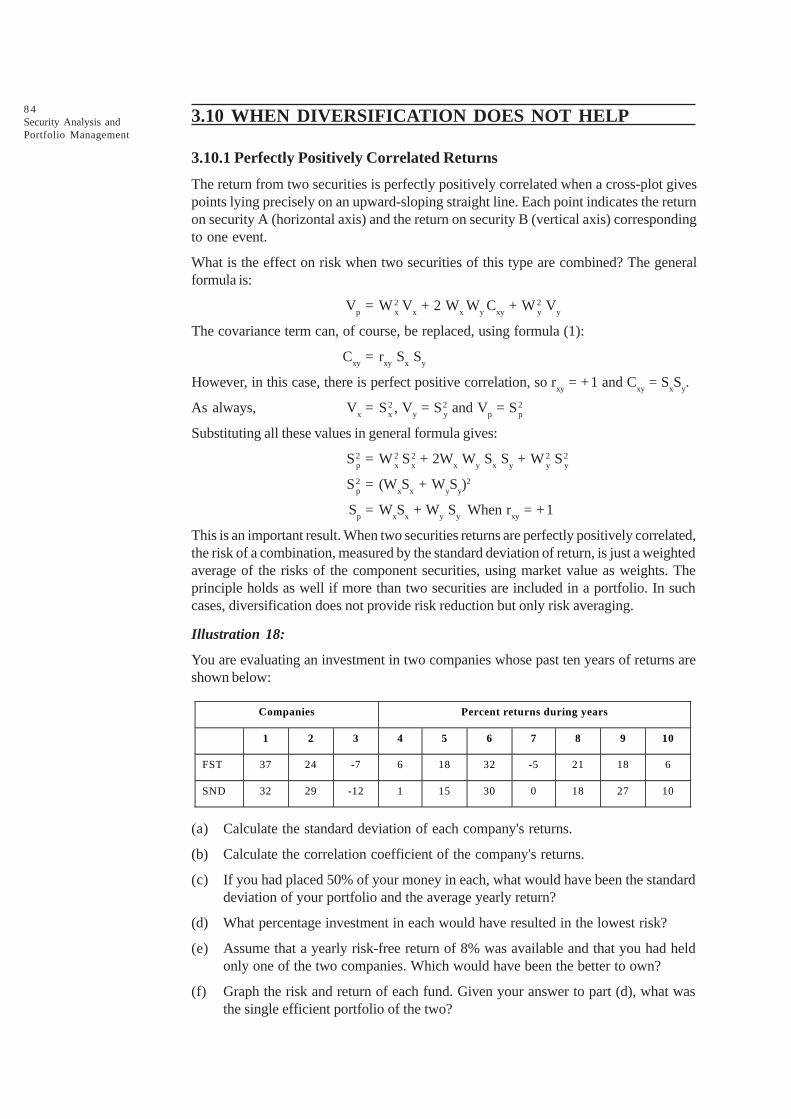
8 4Security Analysis andPortfolio Management
3.10 WHEN DIVERSIFICATION DOES NOT HELP
3.10.1 Perfectly Positively Correlated Returns
The return from two securities is perfectly positively correlated when a cross-plot givespoints lying precisely on an upward-sloping straight line. Each point indicates the returnon security A (horizontal axis) and the return on security B (vertical axis) correspondingto one event.
What is the effect on risk when two securities of this type are combined? The generalformula is:
Vp = W2
x V
x + 2 W
x W
y C
xy + W2
y V
y
The covariance term can, of course, be replaced, using formula (1):
Cxy
= rxy
Sx S
y
However, in this case, there is perfect positive correlation, so rxy
= +1 and Cxy
= SxS
y.
As always, Vx = S2
x, V
y = S2
y and V
p = S2
p
Substituting all these values in general formula gives:
S2p = W2
x S2
x + 2W
x W
y S
x S
y + W2
y S2
y
S2p = (W
xS
x + W
yS
y)2
Sp = W
xS
x + W
y S
yWhen r
xy = +1
This is an important result. When two securities returns are perfectly positively correlated,the risk of a combination, measured by the standard deviation of return, is just a weightedaverage of the risks of the component securities, using market value as weights. Theprinciple holds as well if more than two securities are included in a portfolio. In suchcases, diversification does not provide risk reduction but only risk averaging.
Illustration 18:
You are evaluating an investment in two companies whose past ten years of returns areshown below:
Companies Percent returns during years
1 2 3 4 5 6 7 8 9 10
FST 37 24 -7 6 18 32 -5 21 18 6
SND 32 29 -12 1 15 30 0 18 27 10
(a) Calculate the standard deviation of each company's returns.
(b) Calculate the correlation coefficient of the company's returns.
(c) If you had placed 50% of your money in each, what would have been the standarddeviation of your portfolio and the average yearly return?
(d) What percentage investment in each would have resulted in the lowest risk?
(e) Assume that a yearly risk-free return of 8% was available and that you had heldonly one of the two companies. Which would have been the better to own?
(f) Graph the risk and return of each fund. Given your answer to part (d), what wasthe single efficient portfolio of the two?

8 5Risk and Return
(g) Use part (f) to determine:
l How an average return of 10.8% would have been obtained.
l How an average return of 17.8% would have been obtained.
Solution:
(a) Find the average returns:
RFST
= (37 + 24 +……+ 6)/10 = 15%
RSND
= (32 + 29 +……+ 10)/10 = 15%
Next, find the SD:
sFST
2 2(37 –15) + (24 –15) +.......+ (6 –1)
10 = 14.0%
sSND
2 2(37 –15) + (24 –15) +.......+ (10 –1)
10 = 14.3%
(b) To find the covariance term:
Cov. = (37 –15)(32 –15) + (24 –15)(29 –15) +.......+ (6 –15)(10 –15)
10 = 187.4%
The correlation coefficient
r = 187.4
(14.0)(14.3) = 0.94
(c) sp = (0.5)2(14.0)2 + (0.5)2(14.3)2 + 2(0.5)(0.5)(14.0)(14.3)(0.94) = 13.9%
E(RP) = 0.5(15.0) + 0.5(15.0) = 15%
(d) Using the minimum variance equation and let W stand for FST :
WFST
= 22 1 2 1,2
2 21 2 1 2 1,2
ó � ó ó ó
ó + ó � ó ó ó
WFST
= 2
2 2
(14.3) – (14.0)(14.3)(0.94)= 6706%
(14.0) +(14.3) – 2(14.0)(14.3)(0.94)
WSND
= 32.4%
(e) This part asks which of the funds provided the greater return per unit of risk.
The risk-slope of the line:
For FST
= 15.0 – 8
14.0 = 0.5% per unit of s
For SND
= 15 – 8.0
14.3 = 0.49% per unit of s
They were very close, but FST was better.

8 6Security Analysis andPortfolio Management
(f) Both funds have identical average returns. The minimum variance portfolio ofW = 67.6 % and W = 32.4% would also have had a 15 % average return, but itsrisk would be lower than holding either company in isolation. The minimum standarddeviation was 13.9%.
(g) Using 8% as the risk-free rate and the single efficient portfolio in part (f) as theoptimal risky portfolio, the following risk/return relationship was available:
E(Rc) = R + s
cP
p
E(R ) – T
ó
æ öç ÷è ø
where sc
= (1 – WT) s
P
= 8.0% + sC
C
15.0% 8.0%
8.0%
æ ö-ç ÷+ sè ø
= 8.0% + sC [0.5036]
To earn 10.8%, invest 60% risk-free and 40% it the optimal risky portfolio:
10.8 % = 8% + (0.4)(13.9%)(0.5036)
To earn 17.8%, borrow 40% on your equity and invest it with your equity in theoptimal risky portfolio:
17.8% = 8.0% + W (13.9%)(0.5036)
= 8.0% + (1.4)(13.9)(0.5036)
Illustration 19:
K.S. Bhatt holds a well-diversified portfolio of stocks in the XYZ Group. During the lastfive years, returns on these stocks have average 20.0% per year and had a standarddeviation of 15.0%. He is satisfied with the yearly availability of his portfolio and wouldlike to reduce its risk without affecting overall returns. He approaches you for help infinding an appropriate diversification medium. After a lengthy review of alternatives,you conclude: (i) future average returns and volatility of returns on his current portfoliowill be the same as he has historically expected, (ii) to provide a quarter degree ofdiversification in his portfolio, investment could be made in stocks of the following groups:
Groups Expected Return Correlation of Returns with Group XYZ
Standard Deviation
ABC 20% +1.0 15.0%
KLM 20% -1.0 15.0%
RST 20% +0.0 15.0%
(a) If Bhatt invests 50% of his funds in ABC Group and leaves the remainder in XYZGroup, how would this affect both his expected return and his risk? Why?
(b) If Bhatt invests 50% of his funds in KLM Group and leaves the remainder in XYZGroup, how would this affect both his expected return and his risk? Why?
(c) What should he do? Indicate precise portfolio weighting.
Solution:
(a) Risk and return of ABC Portfolio are the same as those of XYZ portfolio and thecorrelation coefficient is 1.0, so there is no diversification gain.
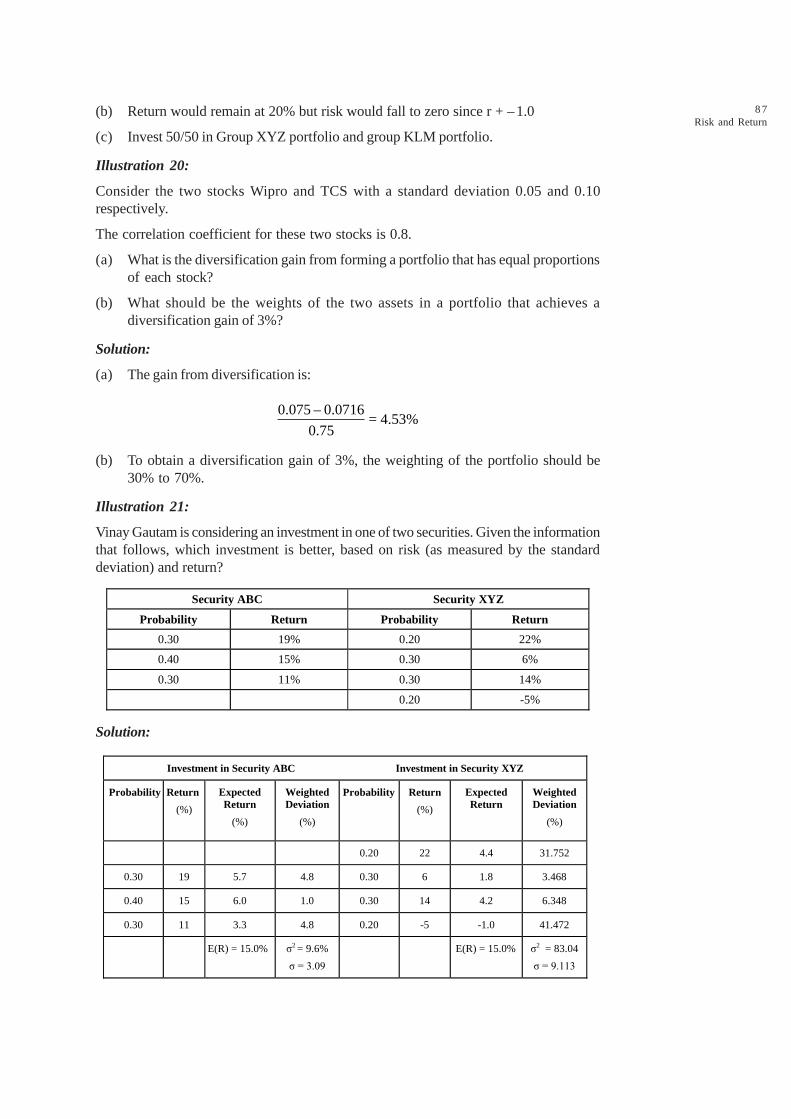
8 7Risk and Return
(b) Return would remain at 20% but risk would fall to zero since r + –1.0
(c) Invest 50/50 in Group XYZ portfolio and group KLM portfolio.
Illustration 20:
Consider the two stocks Wipro and TCS with a standard deviation 0.05 and 0.10respectively.
The correlation coefficient for these two stocks is 0.8.
(a) What is the diversification gain from forming a portfolio that has equal proportionsof each stock?
(b) What should be the weights of the two assets in a portfolio that achieves adiversification gain of 3%?
Solution:
(a) The gain from diversification is:
0.075 – 0.0716= 4.53%
0.75
(b) To obtain a diversification gain of 3%, the weighting of the portfolio should be30% to 70%.
Illustration 21:
Vinay Gautam is considering an investment in one of two securities. Given the informationthat follows, which investment is better, based on risk (as measured by the standarddeviation) and return?
Security ABC Security XYZ
Probability Return Probability Return
0.30 19% 0.20 22%
0.40 15% 0.30 6%
0.30 11% 0.30 14%
0.20 -5%
Solution:
Investment in Security ABC Investment in Security XYZ
Probability Return
(%)
Expected Return
(%)
Weighted Deviation
(%)
Probability Return
(%)
Expected Return
Weighted Deviation
(%)
0.20 22 4.4 31.752
0.30 19 5.7 4.8 0.30 6 1.8 3.468
0.40 15 6.0 1.0 0.30 14 4.2 6.348
0.30 11 3.3 4.8 0.20 -5 -1.0 41.472
E(R) = 15.0% ó2 = 9.6%
ó = 3.09
E(R) = 15.0% ó2 = 83.04
ó = 9.113
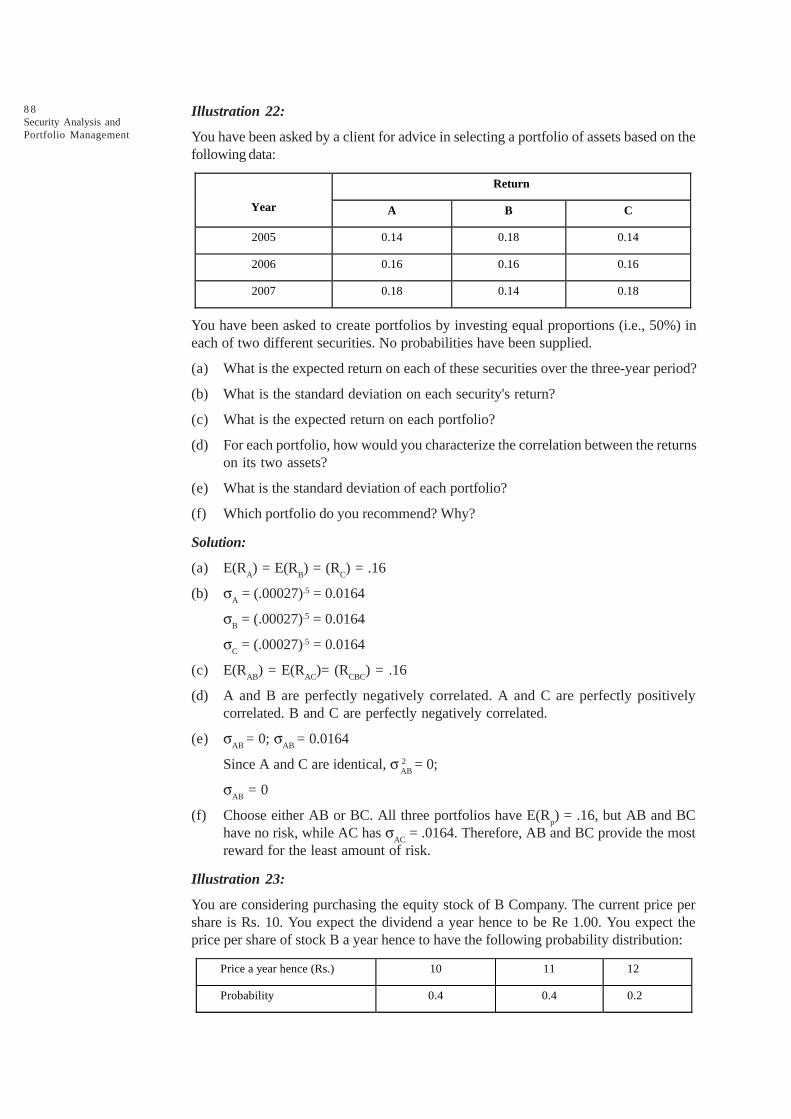
8 8Security Analysis andPortfolio Management
Illustration 22:
You have been asked by a client for advice in selecting a portfolio of assets based on thefollowing data:
Return
Year A B C
2005 0.14 0.18 0.14
2006 0.16 0.16 0.16
2007 0.18 0.14 0.18
You have been asked to create portfolios by investing equal proportions (i.e., 50%) ineach of two different securities. No probabilities have been supplied.
(a) What is the expected return on each of these securities over the three-year period?
(b) What is the standard deviation on each security's return?
(c) What is the expected return on each portfolio?
(d) For each portfolio, how would you characterize the correlation between the returnson its two assets?
(e) What is the standard deviation of each portfolio?
(f) Which portfolio do you recommend? Why?
Solution:
(a) E(RA) = E(R
B) = (R
C) = .16
(b) sA = (.00027).5 = 0.0164
sB = (.00027).5 = 0.0164
sC = (.00027).5 = 0.0164
(c) E(RAB
) = E(RAC
)= (RCBC
) = .16
(d) A and B are perfectly negatively correlated. A and C are perfectly positivelycorrelated. B and C are perfectly negatively correlated.
(e) sAB
= 0; sAB
= 0.0164
Since A and C are identical, s 2AB
= 0;
sAB
= 0
(f) Choose either AB or BC. All three portfolios have E(Rp) = .16, but AB and BC
have no risk, while AC has sAC
= .0164. Therefore, AB and BC provide the mostreward for the least amount of risk.
Illustration 23:
You are considering purchasing the equity stock of B Company. The current price pershare is Rs. 10. You expect the dividend a year hence to be Re 1.00. You expect theprice per share of stock B a year hence to have the following probability distribution:
Price a year hence (Rs.) 10 11 12
Probability 0.4 0.4 0.2

8 9Risk and Return
(a) What is the expected price per share a year?
(b) What is the probability distribution of the rate of return on B's equity stock?
Solution:
(a) Expected price per share a year hence will be:
= 0.4 ¥ Rs. 10 + 0.4 ¥ Rs. 11 + 0.2 ¥ Rs. 12 = Rs. 10.80
(b) Probability distribution of the rate of return is
Rate of return (Ri) 10% 20% 30%
Probability (pi) 0.4 0.4 0.2
Note that the rate of return is defined as:
Dividend + Terminal price
Initial price – 1
(c) The standard deviation of rate of return is: s = pi (R
i – R )2
The s of the rate of return on B's stock is calculated below:
Ri
pi
pi R
i(R
i – R ) (R
i – R )2 p
i(R
i – R )2
10 0.4 4 -8 64 25.6
20 0.4 8 2 4 1.6
30 0.2 6 12 144 28.8
R = 18% s 2p= S 1
pi(R
1 – R )2 = 56
sp= 56 = 7.48%
Illustration 24:
The stock of X Company performs well relative to other stocks during recessionaryperiods. The stocks of Y Company, on the other hand, do well during growth periods.Both the stocks are currently selling for Rs. 50 per share. The rupee returns (dividendplus price change) of these for the next year would be as follows:
Economic Condition
High Growth Low Growth Stagnation Recession
Probability 0.3 0.3 0.2 0.2
Return on Wipro stock 55 50 60 70
Return on Infosys stock 75 65 50 40
Calculate the expected return and standards deviation of:
(a) Rs. 1,000 in the equity stock of Wipro.
(b) Rs. 1,000 in the equity stocks of Infosys.
(c) Rs. 500 in the equity stock of Wipro and Rs. 500 in the equity stock of Infosys.
(d) Rs. 700 in the equity stock of Wipro and Rs. 300 in the equity of Infosys.
Which of the above four options would you choose? Why?

9 0Security Analysis andPortfolio Management
Solution:
(a) For Rs. 1,000, 20 shares of Wipro's stock can be acquired. The probability distributionof the return on 20 shares is
Economic Condition Return (Rs.) Probability
High Growth 20 × 55 = 1,100 0.3
Low Growth 20 × 50 = 1,000 0.3
Stagnation 20 × 60 = 1,200 0.2
Recession 20 × 70 = 1,400 0.2
Expected return = (1,100 ¥ 0.3) + (1,000 ¥ 0.3) + (1,200 ¥ 0.2) + (1,400 ¥ 0.2)
= 330 + 300 + 240 + 280
= Rs. 1,150
Standard deviation of the return = [(1,100 – 1,150)2 ¥ 0.3 + (1,000 – 1,150)2 ¥ 0.3+ (1,200 – 1,150)2 ¥ 0.2 + (1,400 – 1,150)2 ¥ 0.2]1/2
= Rs. 143.18
(b) For Rs. 1,000, 20 shares of Infosys's stock can be acquired. The probabilitydistribution of the return on 20 shares is:
Economic condition Return (Rs) Probability
High growth 20 × 75 = 1,500 0.3
Low growth 20 × 65 = 1,300 0.3
Stagnation 20 × 50 = 1,000 0.2
Recession 20 × 40 = 800 0.2
Expected return = (1,500 ¥ 0.3) + (1,300 ¥ 0.3) + (1,000 × 0.2) + (800 ¥ 0.2)
= Rs.1,200
Standard deviation of the return = [(1,500 – 1,200)2 ¥ .3 + (1,300 – 1,200)2 ¥ .3
+ (1,000 – 1,200)2 ¥ .2 + (800 – 1,200)2 ¥ .2]1/2 = Rs. 264.58
(c) For Rs. 500, 10 shares of Wipro's stock can be acquired; likewise for Rs. 500, 10shares of Infosys's stock can be acquired. The probability distribution of this option is:
Return (Rs) Probability
(10 ¥ 55) + (10 ¥ 75) = 1,300 0.3
(10 ¥ 50) + (10 ¥ 65) = 1,150 0.3
(10 ¥ 60) + (10 ¥ 50) = 1,100 0.2
(10 ¥ 70) + (10 ¥ 40) = 1,100 0.2
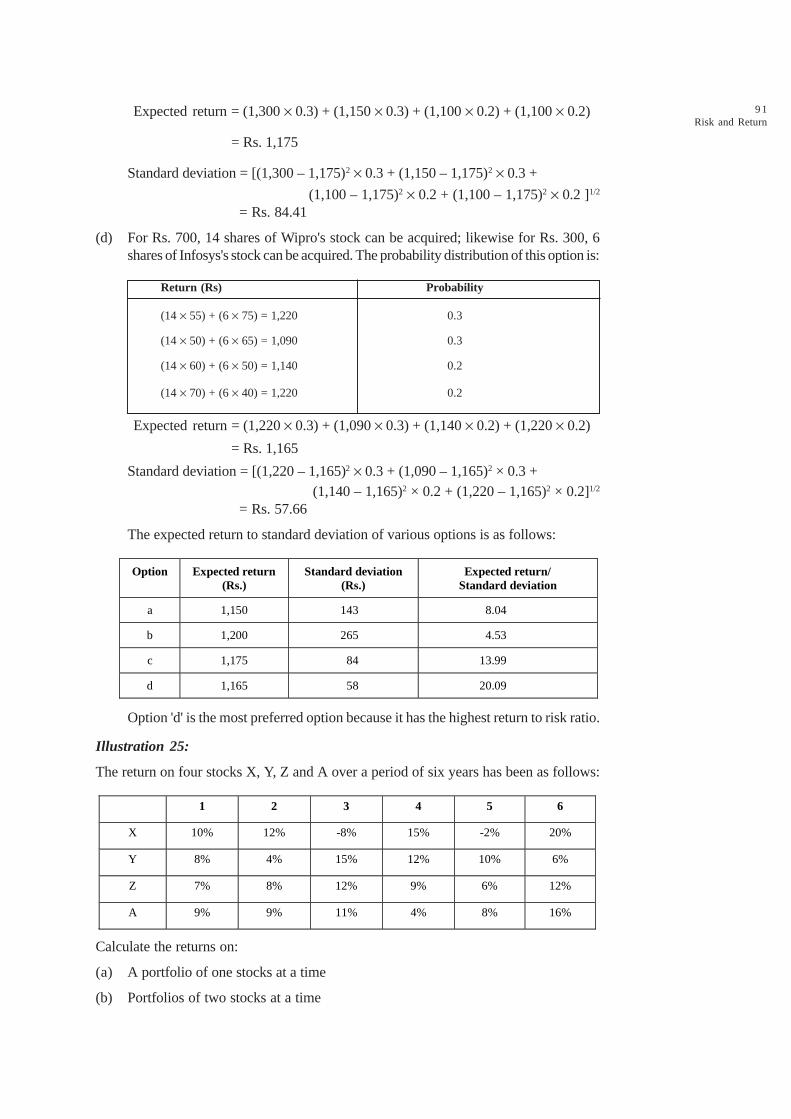
9 1Risk and Return
Expected return = (1,300 ¥ 0.3) + (1,150 ¥ 0.3) + (1,100 ¥ 0.2) + (1,100 ¥ 0.2)
= Rs. 1,175
Standard deviation = [(1,300 – 1,175)2 ¥ 0.3 + (1,150 – 1,175)2 ¥ 0.3 +
(1,100 – 1,175)2 ¥ 0.2 + (1,100 – 1,175)2 ¥ 0.2 ]1/2
= Rs. 84.41
(d) For Rs. 700, 14 shares of Wipro's stock can be acquired; likewise for Rs. 300, 6shares of Infosys's stock can be acquired. The probability distribution of this option is:
Return (Rs) Probability
(14 ¥ 55) + (6 ¥ 75) = 1,220 0.3
(14 ¥ 50) + (6 ¥ 65) = 1,090 0.3
(14 ¥ 60) + (6 ¥ 50) = 1,140 0.2
(14 ¥ 70) + (6 ¥ 40) = 1,220 0.2
Expected return = (1,220 ¥ 0.3) + (1,090 ¥ 0.3) + (1,140 ¥ 0.2) + (1,220 ¥ 0.2)
= Rs. 1,165
Standard deviation = [(1,220 – 1,165)2 ¥ 0.3 + (1,090 – 1,165)2 × 0.3 +(1,140 – 1,165)2 × 0.2 + (1,220 – 1,165)2 × 0.2]1/2
= Rs. 57.66
The expected return to standard deviation of various options is as follows:
Option Expected return (Rs.)
Standard deviation (Rs.)
Expected return/ Standard deviation
a 1,150 143 8.04
b 1,200 265 4.53
c 1,175 84 13.99
d 1,165 58 20.09
Option 'd' is the most preferred option because it has the highest return to risk ratio.
Illustration 25:
The return on four stocks X, Y, Z and A over a period of six years has been as follows:
1 2 3 4 5 6
X 10% 12% -8% 15% -2% 20%
Y 8% 4% 15% 12% 10% 6%
Z 7% 8% 12% 9% 6% 12%
A 9% 9% 11% 4% 8% 16%
Calculate the returns on:
(a) A portfolio of one stocks at a time
(b) Portfolios of two stocks at a time
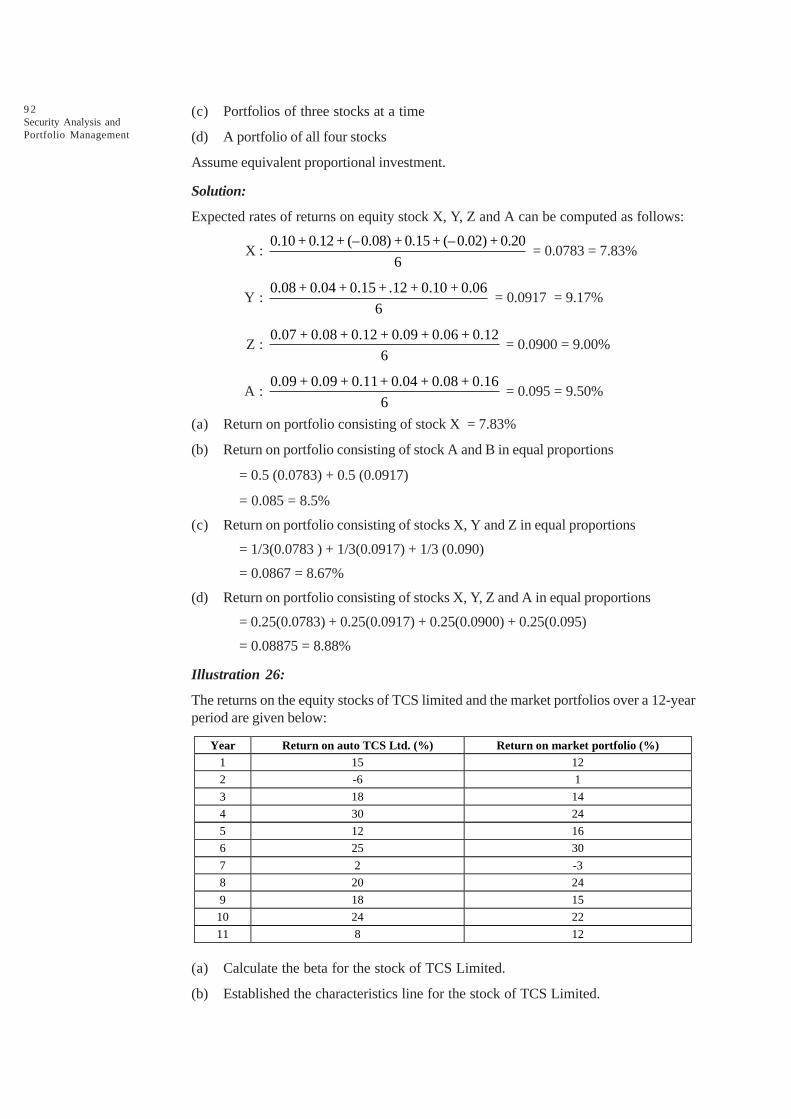
9 2Security Analysis andPortfolio Management
(c) Portfolios of three stocks at a time
(d) A portfolio of all four stocks
Assume equivalent proportional investment.
Solution:
Expected rates of returns on equity stock X, Y, Z and A can be computed as follows:
X : 0.10 + 0.12 + (–0.08) + 0.15 + (–0.02) + 0.20
6 = 0.0783 = 7.83%
Y : 0.08 + 0.04 + 0.15 + .12 + 0.10 + 0.06
6 = 0.0917 = 9.17%
Z : 0.07 + 0.08 + 0.12 + 0.09 + 0.06 + 0.12
6 = 0.0900 = 9.00%
A : 0.09 + 0.09 + 0.11 + 0.04 + 0.08 + 0.16
6 = 0.095 = 9.50%
(a) Return on portfolio consisting of stock X = 7.83%
(b) Return on portfolio consisting of stock A and B in equal proportions
= 0.5 (0.0783) + 0.5 (0.0917)
= 0.085 = 8.5%
(c) Return on portfolio consisting of stocks X, Y and Z in equal proportions
= 1/3(0.0783 ) + 1/3(0.0917) + 1/3 (0.090)
= 0.0867 = 8.67%
(d) Return on portfolio consisting of stocks X, Y, Z and A in equal proportions
= 0.25(0.0783) + 0.25(0.0917) + 0.25(0.0900) + 0.25(0.095)
= 0.08875 = 8.88%
Illustration 26:
The returns on the equity stocks of TCS limited and the market portfolios over a 12-yearperiod are given below:
Year Return on auto TCS Ltd. (%) Return on market portfolio (%) 1 15 12
2 -6 1
3 18 14
4 30 24
5 12 16
6 25 30
7 2 -3
8 20 24
9 18 15
10 24 22
11 8 12
(a) Calculate the beta for the stock of TCS Limited.
(b) Established the characteristics line for the stock of TCS Limited.
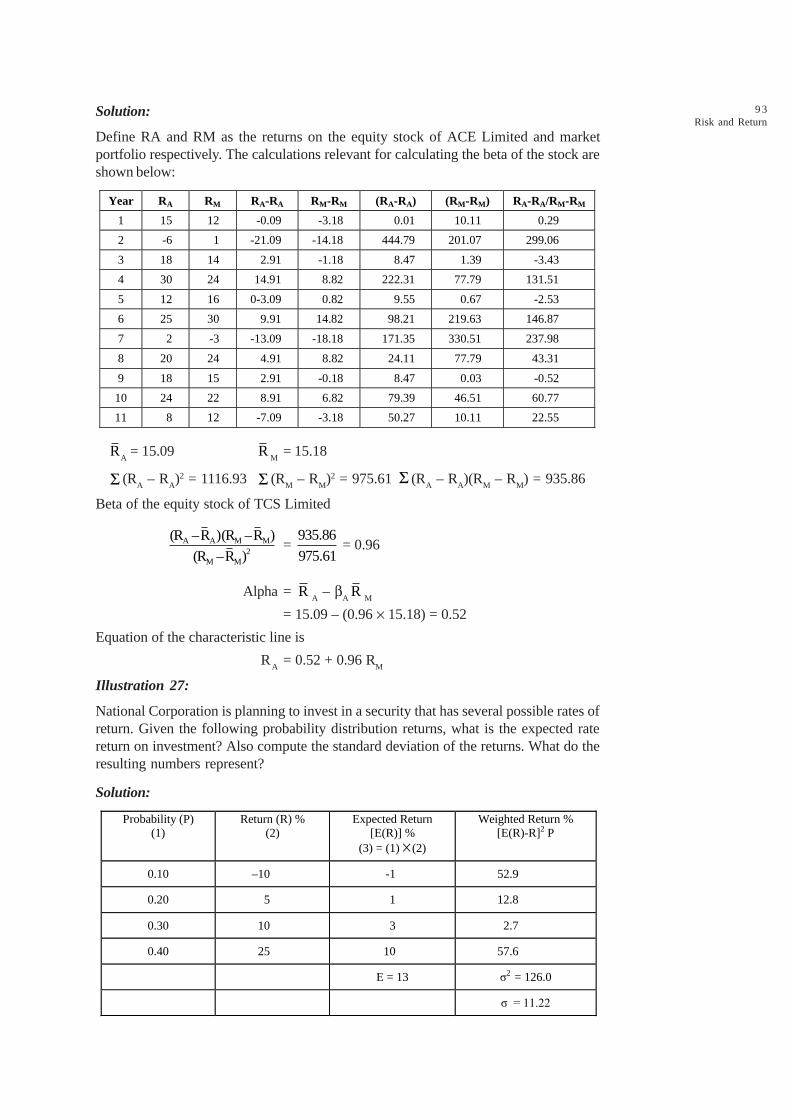
9 3Risk and Return
Solution:
Define RA and RM as the returns on the equity stock of ACE Limited and marketportfolio respectively. The calculations relevant for calculating the beta of the stock areshown below:
Year RA RM RA-RA RM-RM (RA-RA) (RM-RM) RA-RA/RM-RM
1 15 12 -0.09 -3.18 0.01 10.11 0.29
2 -6 1 -21.09 -14.18 444.79 201.07 299.06
3 18 14 2.91 -1.18 8.47 1.39 -3.43
4 30 24 14.91 8.82 222.31 77.79 131.51
5 12 16 0-3.09 0.82 9.55 0.67 -2.53
6 25 30 9.91 14.82 98.21 219.63 146.87
7 2 -3 -13.09 -18.18 171.35 330.51 237.98
8 20 24 4.91 8.82 24.11 77.79 43.31
9 18 15 2.91 -0.18 8.47 0.03 -0.52
10 24 22 8.91 6.82 79.39 46.51 60.77
11 8 12 -7.09 -3.18 50.27 10.11 22.55
RA = 15.09 R
M= 15.18
S (RA – R
A)2 = 1116.93 S (R
M – R
M)2 = 975.61 S (R
A – R
A)(R
M – R
M) = 935.86
Beta of the equity stock of TCS Limited
A A M M2
M M
(R –R )(R –R )
(R –R )=
935.86
975.61 = 0.96
Alpha = RA – b
AR
M
= 15.09 – (0.96 ¥ 15.18) = 0.52
Equation of the characteristic line is
RA
= 0.52 + 0.96 RM
Illustration 27:
National Corporation is planning to invest in a security that has several possible rates ofreturn. Given the following probability distribution returns, what is the expected ratereturn on investment? Also compute the standard deviation of the returns. What do theresulting numbers represent?
Solution:
Probability (P) (1)
Return (R) % (2)
Expected Return [E(R)] %
(3) = (1) ́ (2)
Weighted Return % [E(R)-R]2 P
0.10 –10 -1 52.9
0.20 5 1 12.8
0.30 10 3 2.7
0.40 25 10 57.6
E = 13 ó2 = 126.0
ó = 11.22
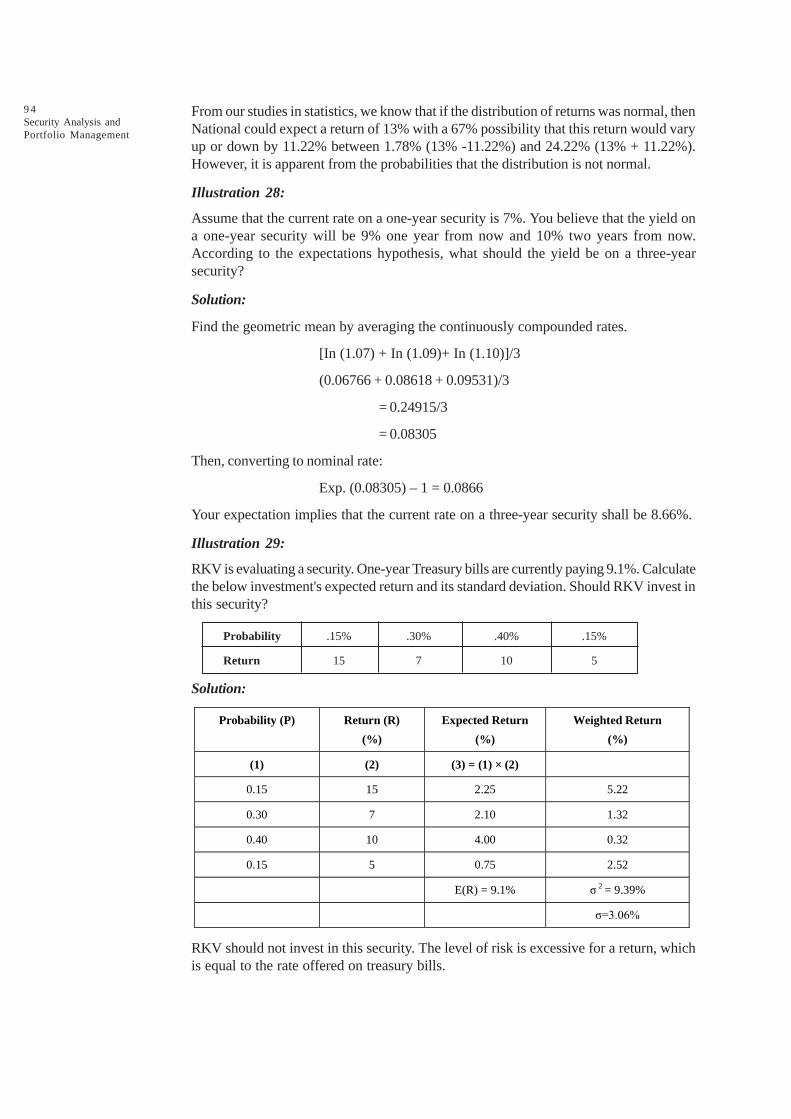
9 4Security Analysis andPortfolio Management
From our studies in statistics, we know that if the distribution of returns was normal, thenNational could expect a return of 13% with a 67% possibility that this return would varyup or down by 11.22% between 1.78% (13% -11.22%) and 24.22% (13% + 11.22%).However, it is apparent from the probabilities that the distribution is not normal.
Illustration 28:
Assume that the current rate on a one-year security is 7%. You believe that the yield ona one-year security will be 9% one year from now and 10% two years from now.According to the expectations hypothesis, what should the yield be on a three-yearsecurity?
Solution:
Find the geometric mean by averaging the continuously compounded rates.
[In (1.07) + In (1.09)+ In (1.10)]/3
(0.06766 + 0.08618 + 0.09531)/3
= 0.24915/3
= 0.08305
Then, converting to nominal rate:
Exp. (0.08305) – 1 = 0.0866
Your expectation implies that the current rate on a three-year security shall be 8.66%.
Illustration 29:
RKV is evaluating a security. One-year Treasury bills are currently paying 9.1%. Calculatethe below investment's expected return and its standard deviation. Should RKV invest inthis security?
Probability .15% .30% .40% .15%
Return 15 7 10 5
Solution:
Probability (P)
Return (R)
(%)
Expected Return
(%)
Weighted Return
(%)
(1) (2) (3) = (1) × (2)
0.15 15 2.25 5.22
0.30 7 2.10 1.32
0.40 10 4.00 0.32
0.15 5 0.75 2.52
E(R) = 9.1% ó 2 = 9.39%
ó=3.06%
RKV should not invest in this security. The level of risk is excessive for a return, whichis equal to the rate offered on treasury bills.

9 5Risk and Return
Illustration 30:
T.S. Shekhar has a portfolio of five securities. The expected rate and amount of investmentin each security is as follows:
Security A B C D E
Expected Return .14 .08 .15 .09 .12
Amount invested Rs.20,000 Rs.10,000 Rs.30,000 Rs.25,000 Rs.15,000
Compute the expected return on Shekhar's portfolio.
Solution:
The expected return on Shekhar's portfolio is:
E(Rp) = (20,000/1,00,000).14 + (10,000/1,00,000).08 + (30,000/1,00,000).15
+ (25,000/1,00,000).9 + (15,000/1,00,000).12
= .028 + .008 + .045 + .0225 + .018 = .1215
= 12.15%
Illustration 31:
T.S. Kumar holds a two-stock portfolio. Stock ABC has a standard deviation of returnsof .6 and stock XYZ has a standard deviation of .4. The correlation coefficient of thetwo stocks returns is 0.25. Kumar holds equal amounts of each stock. Compute theportfolio standard deviation for the two-stock portfolio.
Solution:
sp = 2 2 2 2.5 .6 + 2 .5 .5 .6 .4 25 + 5 .4´ ´ ´ ´ ´ ´ ´
= .09 +.03+.04
= .16 = .4
Illustration 32:
Ravi Shankar has prepared the following information regarding two investments underconsideration. Which investment should be accepted?
Security ABC Security XYZ
Probability Return
%
Probability Return
%
0.30 27 0.21 15
0.50 18 0.30 6
0.30 -2 0.40 10
- - 0.10 4
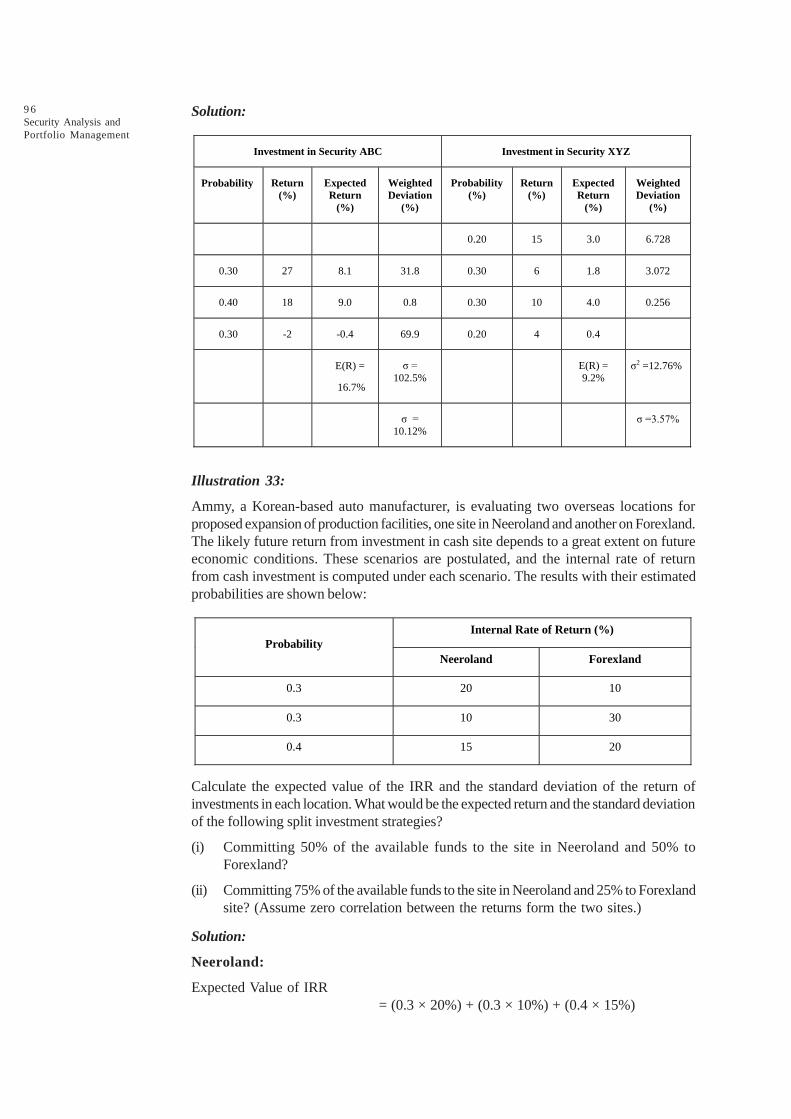
9 6Security Analysis andPortfolio Management
Solution:
Investment in Security ABC Investment in Security XYZ
Probability Return (%)
Expected Return
(%)
Weighted Deviation
(%)
Probability (%)
Return (%)
Expected Return
(%)
Weighted Deviation
(%)
0.20 15 3.0 6.728
0.30 27 8.1 31.8 0.30 6 1.8 3.072
0.40 18 9.0 0.8 0.30 10 4.0 0.256
0.30 -2 -0.4 69.9 0.20 4 0.4
E(R) =
16.7%
ó =
102.5% E(R) =
9.2% ó2 =12.76%
ó =
10.12% ó =3.57%
Illustration 33:
Ammy, a Korean-based auto manufacturer, is evaluating two overseas locations forproposed expansion of production facilities, one site in Neeroland and another on Forexland.The likely future return from investment in cash site depends to a great extent on futureeconomic conditions. These scenarios are postulated, and the internal rate of returnfrom cash investment is computed under each scenario. The results with their estimatedprobabilities are shown below:
Internal Rate of Return (%) Probability
Neeroland Forexland
0.3 20 10
0.3 10 30
0.4 15 20
Calculate the expected value of the IRR and the standard deviation of the return ofinvestments in each location. What would be the expected return and the standard deviationof the following split investment strategies?
(i) Committing 50% of the available funds to the site in Neeroland and 50% toForexland?
(ii) Committing 75% of the available funds to the site in Neeroland and 25% to Forexlandsite? (Assume zero correlation between the returns form the two sites.)
Solution:
Neeroland:
Expected Value of IRR= (0.3 × 20%) + (0.3 × 10%) + (0.4 × 15%)
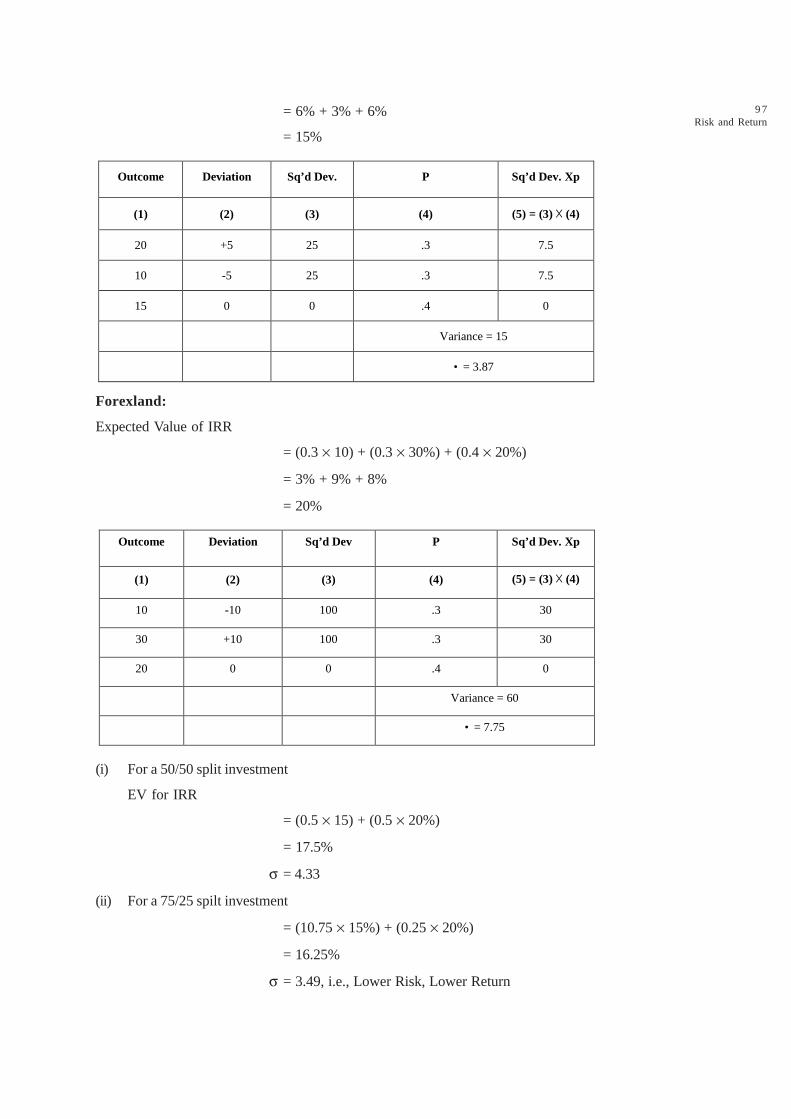
9 7Risk and Return
= 6% + 3% + 6%
= 15%
Outcome Deviation Sq’d Dev. P Sq’d Dev. Xp
(1) (2) (3) (4) (5) = (3) ́ (4)
20 +5 25 .3 7.5
10 -5 25 .3 7.5
15 0 0 .4 0
Variance = 15
• = 3.87
Forexland:
Expected Value of IRR
= (0.3 ¥ 10) + (0.3 ¥ 30%) + (0.4 ¥ 20%)
= 3% + 9% + 8%
= 20%
Outcome Deviation Sq’d Dev P Sq’d Dev. Xp
(1) (2) (3) (4) (5) = (3) ́ (4)
10 -10 100 .3 30
30 +10 100 .3 30
20 0 0 .4 0
Variance = 60
• = 7.75
(i) For a 50/50 split investment
EV for IRR
= (0.5 ¥ 15) + (0.5 ¥ 20%)
= 17.5%
s = 4.33
(ii) For a 75/25 spilt investment
= (10.75 ¥ 15%) + (0.25 ¥ 20%)
= 16.25%
s = 3.49, i.e., Lower Risk, Lower Return
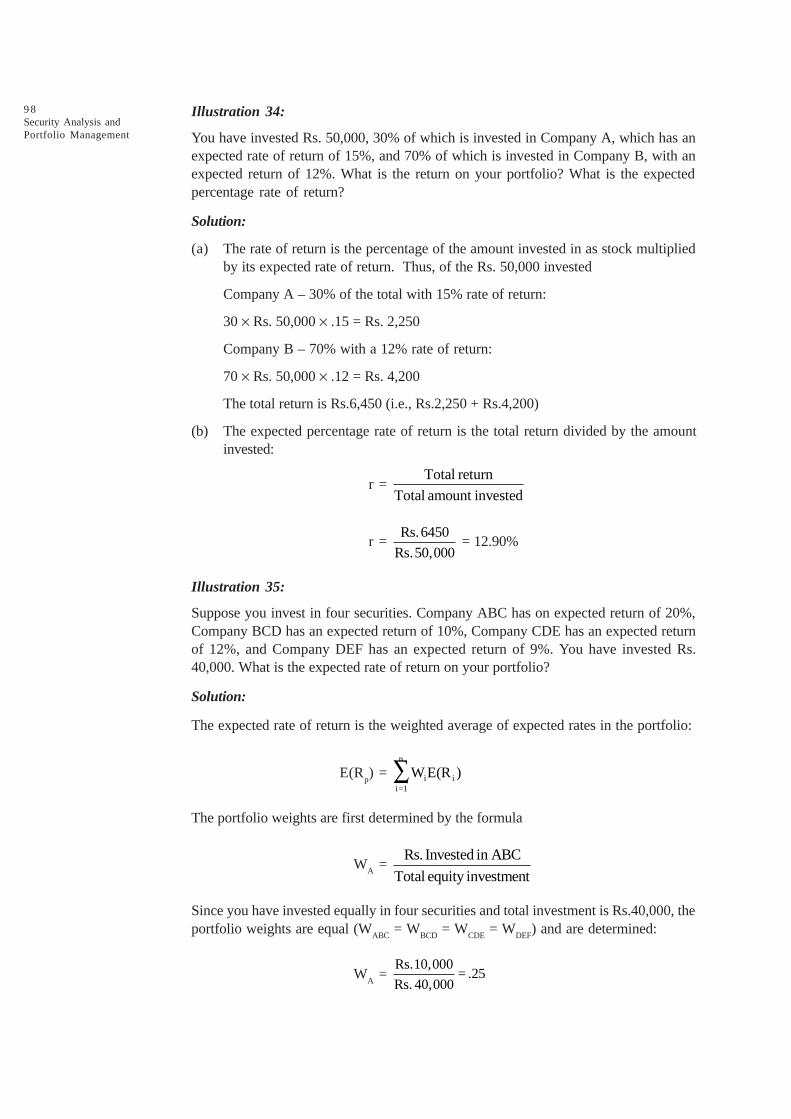
9 8Security Analysis andPortfolio Management
Illustration 34:
You have invested Rs. 50,000, 30% of which is invested in Company A, which has anexpected rate of return of 15%, and 70% of which is invested in Company B, with anexpected return of 12%. What is the return on your portfolio? What is the expectedpercentage rate of return?
Solution:
(a) The rate of return is the percentage of the amount invested in as stock multipliedby its expected rate of return. Thus, of the Rs. 50,000 invested
Company A – 30% of the total with 15% rate of return:
30 ¥ Rs. 50,000 ¥ .15 = Rs. 2,250
Company B – 70% with a 12% rate of return:
70 ¥ Rs. 50,000 ¥ .12 = Rs. 4,200
The total return is Rs.6,450 (i.e., Rs.2,250 + Rs.4,200)
(b) The expected percentage rate of return is the total return divided by the amountinvested:
r = Total return
Total amount invested
r = Rs. 6450
Rs. 50,000 = 12.90%
Illustration 35:
Suppose you invest in four securities. Company ABC has on expected return of 20%,Company BCD has an expected return of 10%, Company CDE has an expected returnof 12%, and Company DEF has an expected return of 9%. You have invested Rs.40,000. What is the expected rate of return on your portfolio?
Solution:
The expected rate of return is the weighted average of expected rates in the portfolio:
E(Rp) =
n
i ii=1
W E(R )å
The portfolio weights are first determined by the formula
WA
= Rs. Invested in ABC
Total equity investment
Since you have invested equally in four securities and total investment is Rs.40,000, theportfolio weights are equal (W
ABC = W
BCD = W
CDE = W
DEF) and are determined:
WA
= Rs.10,000
= .25Rs. 40,000
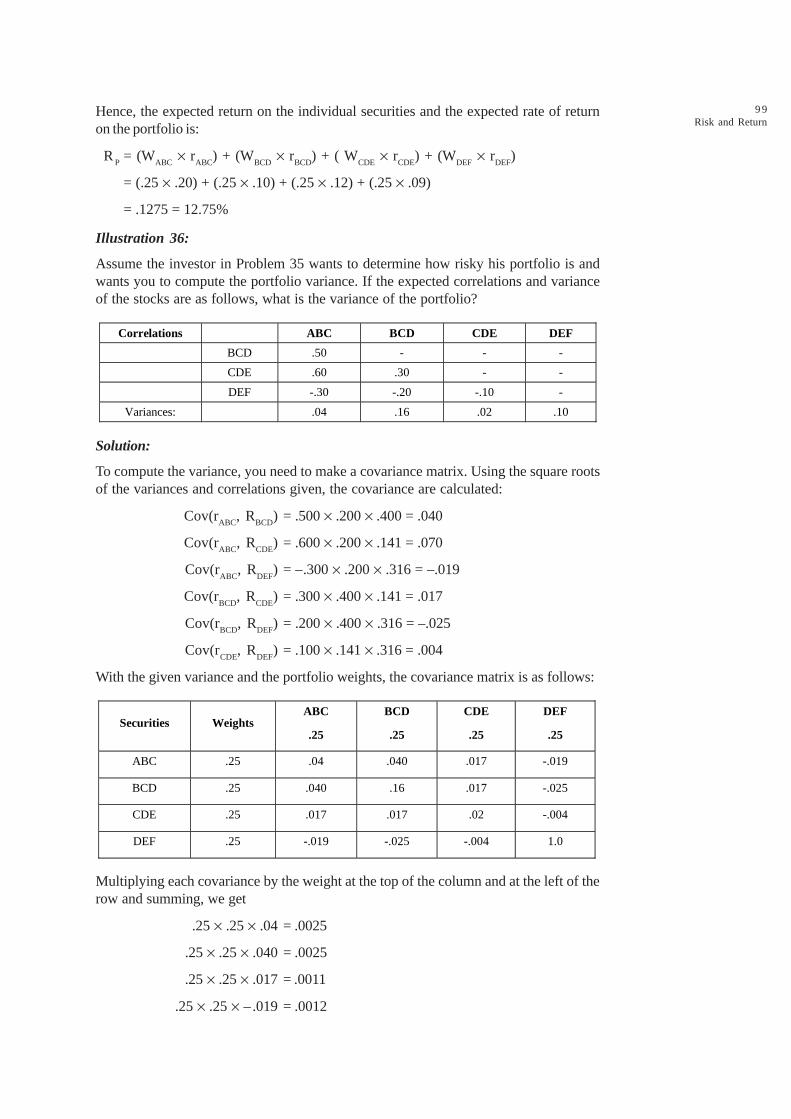
9 9Risk and Return
Hence, the expected return on the individual securities and the expected rate of returnon the portfolio is:
RP
= (WABC
¥ rABC
) + (WBCD
¥ rBCD
) + ( WCDE
¥ rCDE
) + (WDEF
¥ rDEF
)
= (.25 ¥ .20) + (.25 ¥ .10) + (.25 ¥ .12) + (.25 ¥ .09)
= .1275 = 12.75%
Illustration 36:
Assume the investor in Problem 35 wants to determine how risky his portfolio is andwants you to compute the portfolio variance. If the expected correlations and varianceof the stocks are as follows, what is the variance of the portfolio?
Correlations ABC BCD CDE DEF
BCD .50 - - -
CDE .60 .30 - -
DEF -.30 -.20 -.10 -
Variances: .04 .16 .02 .10
Solution:
To compute the variance, you need to make a covariance matrix. Using the square rootsof the variances and correlations given, the covariance are calculated:
Cov(rABC
, RBCD
) = .500 ¥ .200 ¥ .400 = .040
Cov(rABC
, RCDE
) = .600 ¥ .200 ¥ .141 = .070
Cov(rABC
, RDEF
) = –.300 ¥ .200 ¥ .316 = –.019
Cov(rBCD
, RCDE
) = .300 ¥ .400 ¥ .141 = .017
Cov(rBCD
, RDEF
) = .200 ¥ .400 ¥ .316 = –.025
Cov(rCDE
, RDEF
) = .100 ¥ .141 ¥ .316 = .004
With the given variance and the portfolio weights, the covariance matrix is as follows:
Securities Weights ABC
.25
BCD
.25
CDE
.25
DEF
.25
ABC .25 .04 .040 .017 -.019
BCD .25 .040 .16 .017 -.025
CDE .25 .017 .017 .02 -.004
DEF .25 -.019 -.025 -.004 1.0
Multiplying each covariance by the weight at the top of the column and at the left of therow and summing, we get
.25 ¥ .25 ¥ .04 = .0025
.25 ¥ .25 ¥ .040 = .0025
.25 ¥ .25 ¥ .017 = .0011
.25 ¥ .25 ¥ – .019 = .0012
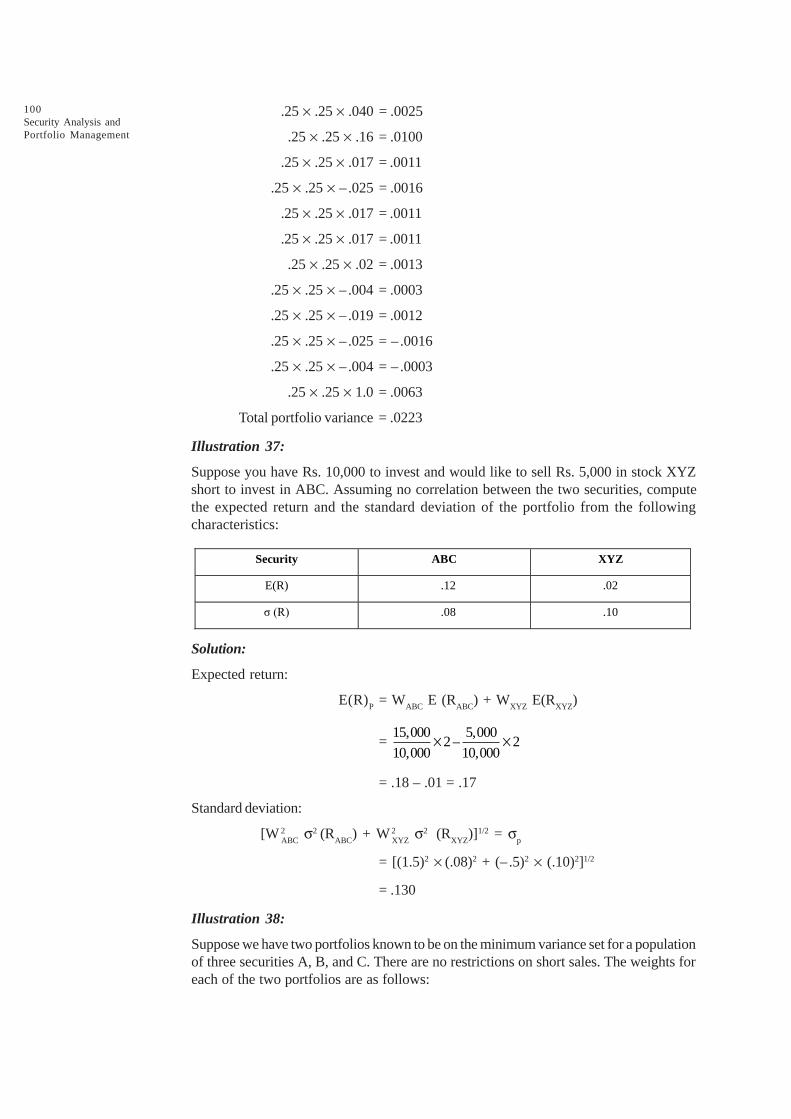
100Security Analysis andPortfolio Management
.25 ¥ .25 ¥ .040 = .0025
.25 ¥ .25 ¥ .16 = .0100
.25 ¥ .25 ¥ .017 = .0011
.25 ¥ .25 ¥ – .025 = .0016
.25 ¥ .25 ¥ .017 = .0011
.25 ¥ .25 ¥ .017 = .0011
.25 ¥ .25 ¥ .02 = .0013
.25 ¥ .25 ¥ – .004 = .0003
.25 ¥ .25 ¥ – .019 = .0012
.25 ¥ .25 ¥ – .025 = – .0016
.25 ¥ .25 ¥ – .004 = – .0003
.25 ¥ .25 ¥ 1.0 = .0063
Total portfolio variance = .0223
Illustration 37:
Suppose you have Rs. 10,000 to invest and would like to sell Rs. 5,000 in stock XYZshort to invest in ABC. Assuming no correlation between the two securities, computethe expected return and the standard deviation of the portfolio from the followingcharacteristics:
Security ABC XYZ
E(R) .12 .02
ó (R) .08 .10
Solution:
Expected return:
E(R)P
= WABC
E (RABC
) + WXYZ
E(RXYZ
)
= 15,000 5,000
2– 210,000 10,000
´ ´
= .18 – .01 = .17
Standard deviation:
[W 2ABC
s2 (RABC
) + W2XYZ
s2 (RXYZ
)]1/2 = sp
= [(1.5)2 ¥ (.08)2 + (– .5)2 ¥ (.10)2]1/2
= .130
Illustration 38:
Suppose we have two portfolios known to be on the minimum variance set for a populationof three securities A, B, and C. There are no restrictions on short sales. The weights foreach of the two portfolios are as follows:

101Risk and Return
WA WB WC
Portfolio X .24 .52 .24
Portfolio Y -.36 .72 .64
(a) What would the stock weights be for a portfolio constructed by investing Rs. 2,000
in portfolio X and Rs. 1,000 in portfolio Y?
(b) Suppose you invest Rs. 1,500 of the Rs. 3,000 in Security X. How will you allocatethe remaining Rs. 1500 between Securities X and Y to ensure that your portfolio ison the minimum variance set?
Solution:
(a) Given a Rs. 2,000 investment in portfolio X and Rs. 1,000 investment in portfolio Y,the investment committed to each security would be:
A B C Total
Portfolio X Rs.480 Rs.1040 Rs.480 Rs.2000
Portfolio Y -360 720 640 1000
Confirmed Portfolio Rs.120 Rs.1760 Rs.1120 Rs.3000
Since we are investing a total of Rs. 3,000 in the combined portfolio, the investmentposition in three securities are consistent with the following portfolio weights .
WA WB WC
Combined portfolio .04 .59 .37
(b) Since the equation for the critical line takes the following form:
WB
= a + bwA
Substituting in the values for WA and W
B from portfolio X and Y, we get
.52 = a + .24 b
.72 = a + –.36b
By solving these equations simultaneously, we can obtain the slope and the interceptof the critical line
WB
= .6 – 1/3 WA
Using this equation, we can find W for any given WA if we invest half of the funds
in security A(WA = .5), then
WB
= .6 – 1/3 (.5) = .43
Since WA + W
B + W
C = 1, we know W
C = 1 – W
A – W
B
Substituting in our value for W and W, we find
WC
= .6 – .5 – .43 = .07
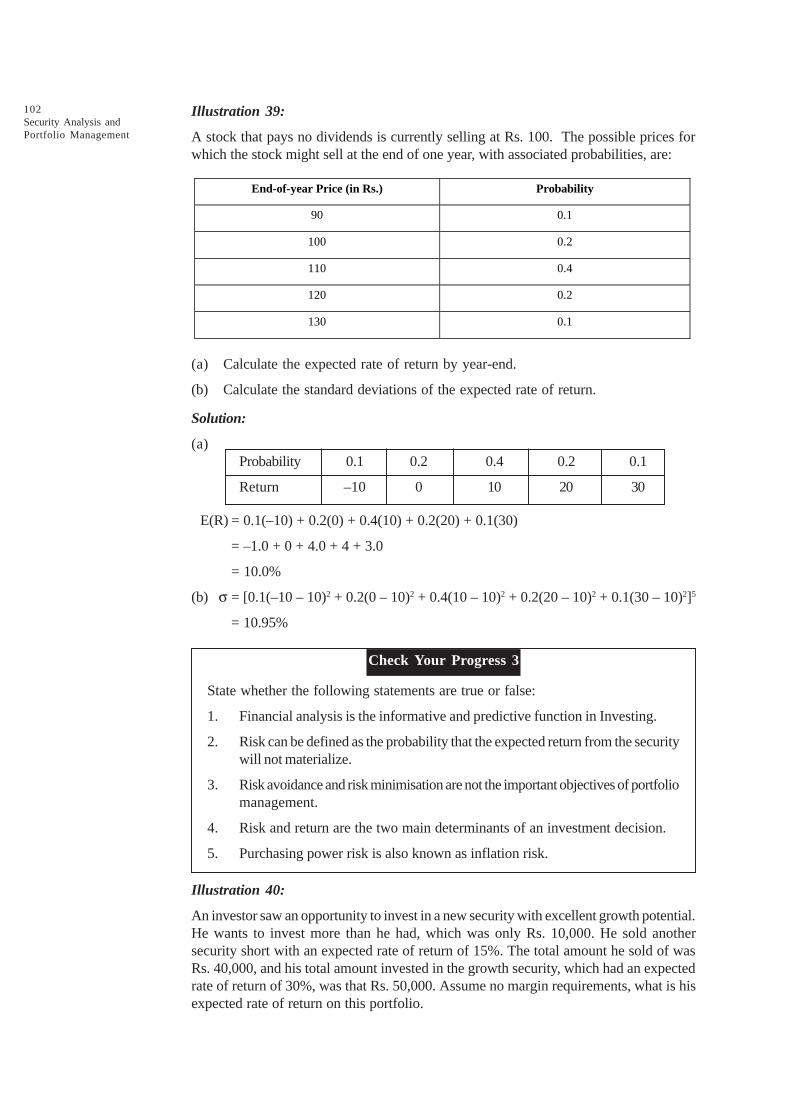
102Security Analysis andPortfolio Management
Illustration 39:
A stock that pays no dividends is currently selling at Rs. 100. The possible prices forwhich the stock might sell at the end of one year, with associated probabilities, are:
End-of-year Price (in Rs.) Probability
90 0.1
100 0.2
110 0.4
120 0.2
130 0.1
(a) Calculate the expected rate of return by year-end.
(b) Calculate the standard deviations of the expected rate of return.
Solution:
(a)Probability 0.1 0.2 0.4 0.2 0.1
Return –10 0 10 20 30
E(R) = 0.1(–10) + 0.2(0) + 0.4(10) + 0.2(20) + 0.1(30)
= –1.0 + 0 + 4.0 + 4 + 3.0
= 10.0%
(b) s = [0.1(–10 – 10)2 + 0.2(0 – 10)2 + 0.4(10 – 10)2 + 0.2(20 – 10)2 + 0.1(30 – 10)2]5
= 10.95%
Check Your Progress 3
State whether the following statements are true or false:
1. Financial analysis is the informative and predictive function in Investing.
2. Risk can be defined as the probability that the expected return from the securitywill not materialize.
3. Risk avoidance and risk minimisation are not the important objectives of portfoliomanagement.
4. Risk and return are the two main determinants of an investment decision.
5. Purchasing power risk is also known as inflation risk.
Illustration 40:
An investor saw an opportunity to invest in a new security with excellent growth potential.He wants to invest more than he had, which was only Rs. 10,000. He sold anothersecurity short with an expected rate of return of 15%. The total amount he sold of wasRs. 40,000, and his total amount invested in the growth security, which had an expectedrate of return of 30%, was that Rs. 50,000. Assume no margin requirements, what is hisexpected rate of return on this portfolio.
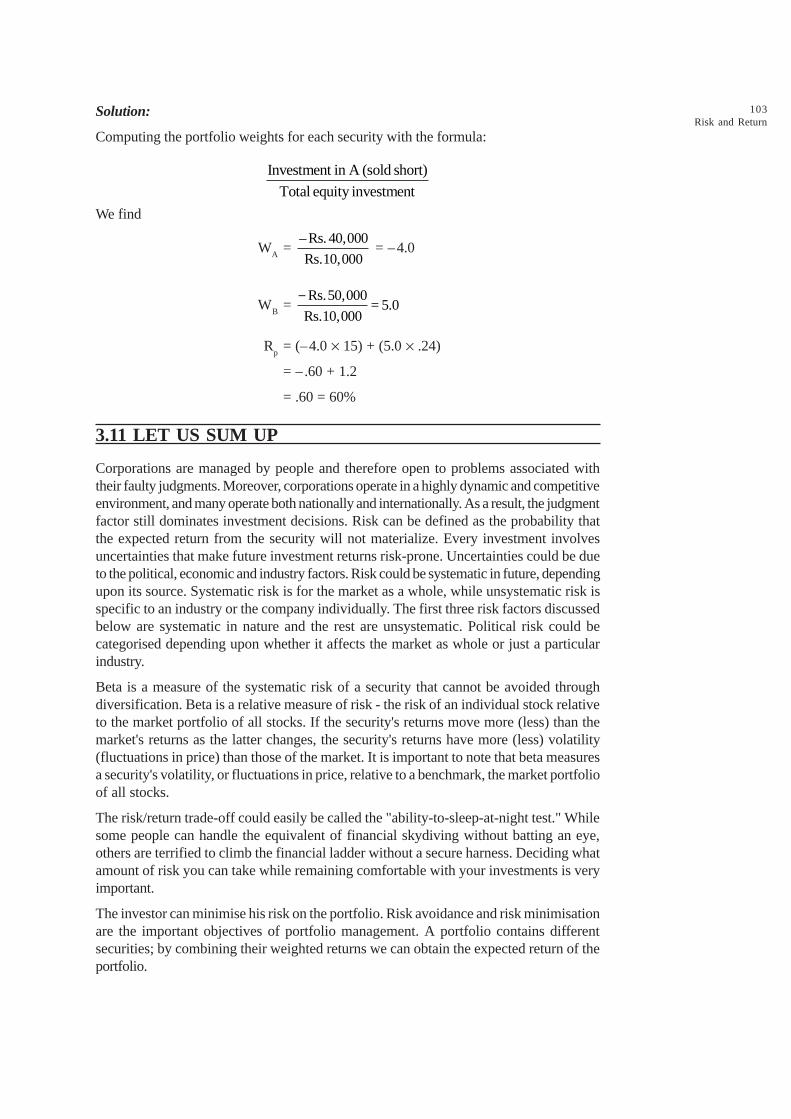
103Risk and Return
Solution:
Computing the portfolio weights for each security with the formula:
Investment in A (sold short)
Total equity investment
We find
WA
= –Rs. 40,000
Rs. 10,000 = –4.0
WB
= Rs. 50,000
= 5.0Rs. 10,000
-
Rp
= (–4.0 ¥ 15) + (5.0 ¥ .24)
= –.60 + 1.2
= .60 = 60%
3.11 LET US SUM UP
Corporations are managed by people and therefore open to problems associated withtheir faulty judgments. Moreover, corporations operate in a highly dynamic and competitiveenvironment, and many operate both nationally and internationally. As a result, the judgmentfactor still dominates investment decisions. Risk can be defined as the probability thatthe expected return from the security will not materialize. Every investment involvesuncertainties that make future investment returns risk-prone. Uncertainties could be dueto the political, economic and industry factors. Risk could be systematic in future, dependingupon its source. Systematic risk is for the market as a whole, while unsystematic risk isspecific to an industry or the company individually. The first three risk factors discussedbelow are systematic in nature and the rest are unsystematic. Political risk could becategorised depending upon whether it affects the market as whole or just a particularindustry.
Beta is a measure of the systematic risk of a security that cannot be avoided throughdiversification. Beta is a relative measure of risk - the risk of an individual stock relativeto the market portfolio of all stocks. If the security's returns move more (less) than themarket's returns as the latter changes, the security's returns have more (less) volatility(fluctuations in price) than those of the market. It is important to note that beta measuresa security's volatility, or fluctuations in price, relative to a benchmark, the market portfolioof all stocks.
The risk/return trade-off could easily be called the "ability-to-sleep-at-night test." Whilesome people can handle the equivalent of financial skydiving without batting an eye,others are terrified to climb the financial ladder without a secure harness. Deciding whatamount of risk you can take while remaining comfortable with your investments is veryimportant.
The investor can minimise his risk on the portfolio. Risk avoidance and risk minimisationare the important objectives of portfolio management. A portfolio contains differentsecurities; by combining their weighted returns we can obtain the expected return of theportfolio.
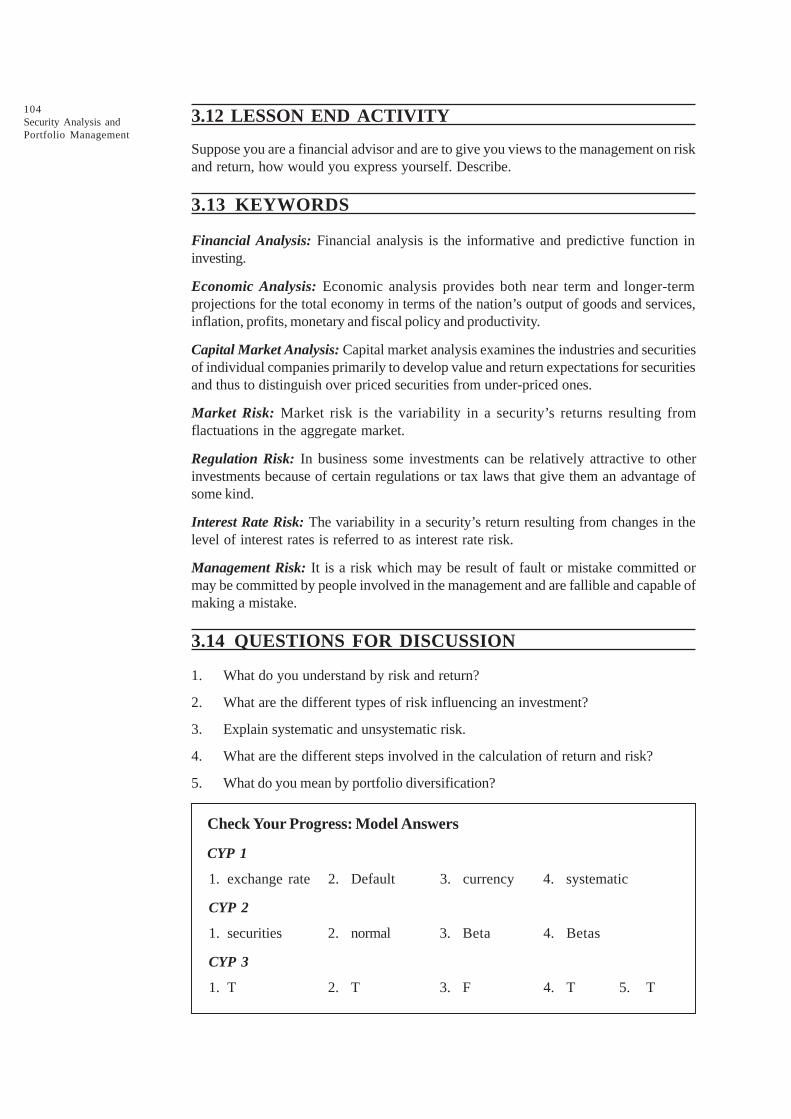
104Security Analysis andPortfolio Management
3.12 LESSON END ACTIVITY
Suppose you are a financial advisor and are to give you views to the management on riskand return, how would you express yourself. Describe.
3.13 KEYWORDS
Financial Analysis: Financial analysis is the informative and predictive function ininvesting.
Economic Analysis: Economic analysis provides both near term and longer-termprojections for the total economy in terms of the nation’s output of goods and services,inflation, profits, monetary and fiscal policy and productivity.
Capital Market Analysis: Capital market analysis examines the industries and securitiesof individual companies primarily to develop value and return expectations for securitiesand thus to distinguish over priced securities from under-priced ones.
Market Risk: Market risk is the variability in a security’s returns resulting fromflactuations in the aggregate market.
Regulation Risk: In business some investments can be relatively attractive to otherinvestments because of certain regulations or tax laws that give them an advantage ofsome kind.
Interest Rate Risk: The variability in a security’s return resulting from changes in thelevel of interest rates is referred to as interest rate risk.
Management Risk: It is a risk which may be result of fault or mistake committed ormay be committed by people involved in the management and are fallible and capable ofmaking a mistake.
3.14 QUESTIONS FOR DISCUSSION
1. What do you understand by risk and return?
2. What are the different types of risk influencing an investment?
3. Explain systematic and unsystematic risk.
4. What are the different steps involved in the calculation of return and risk?
5. What do you mean by portfolio diversification?
Check Your Progress: Model Answers
CYP 1
1. exchange rate 2. Default 3. currency 4. systematic
CYP 2
1. securities 2. normal 3. Beta 4. Betas
CYP 3
1. T 2. T 3. F 4. T 5. T

105Risk and Return3.15 SUGGESTED READINGS
Sudhindra Bhat, Security Analysis and Portfolio Management, Excel Books, Delhi.
Kevin, S., Security Analysis and Portfolio Management, Printice Hall of India.
Prasanna Chandra, Investment Analysis and Portfolio Management, Second Edition, Tata McGrawHill.
Punithavathy Pandian, Securities Analysis and Portfolio management, Vikas.
Investment Management, V. K. Bhalla.
A. Davis, Investors in a Changing Economy, Printice -Hall, 1968.
Williamson, J. Peter, Investments: New Analytic Techniques, London, Longman, 1970.
Cottle, CC., and Whitman, W.T., Investment Timing: The Formula Plan Approach, McGraw Hill.
106Security Analysis andPortfolio Management
LESSON
4MEASUREMENT AND SIGNIFICANCE OF BETA
CONTENTS
4.0 Aims and Objectives
4.1 Introduction
4.2 Definition
4.3 Beta Coefficient
4.3.1 Investing
4.3.2 Multiple Beta Model
4.4 Measurement of Beta
4.4.1 Extreme and Interesting Cases
4.5 Alpha
4.5.1 Origin of the Concept
4.5.2 Relation to Beta
4.6 Significance of Beta
4.7 Let us Sum up
4.8 Lesson End Activity
4.9 Keywords
4.10 Questions for Discussion
4.11 Suggested Readings
4.0 AIMS AND OBJECTIVES
After studying this lesson, you should be able to:
l Know about definition and measurement of Beta
l Understand the significance of Beta in relation to return
4.1 INTRODUCTION
Beta is a measure of a security's or portfolio's volatility, or systematic risk, in comparisonto the market as a whole. It is also known as "beta coefficient."
The beta coefficient, in terms of finance and investing, describes how the expectedreturn of a stock or portfolio is correlated to the return of the financial market as awhole.
107Measurement and
Significance of Beta
An asset with a beta of 0 means that its price is not at all correlated with the market; thatasset is independent. A positive beta means that the asset generally follows the market.A negative beta shows that the asset inversely follows the market; the asset generallydecreases in value if the market goes up.
Correlations are evident between companies within the same industry, or even within thesame asset class (such as equities), as was demonstrated in the Wall Street crash of1929. This correlated risk, measured by Beta, creates almost all of the risk in a diversifiedportfolio.
The beta coefficient is a key parameter in the capital asset pricing model (CAPM). Itmeasures the part of the asset's statistical variance that cannot be mitigated by thediversification provided by the portfolio of many risky assets, because it is correlatedwith the return of the other assets that are in the portfolio. Beta can be estimated forindividual companies using regression analysis against a stock market index.
Beta is calculated using regression analysis, and you can think of beta as the tendency ofa security's returns to respond to swings in the market. A beta of 1 indicates that thesecurity's price will move with the market. A beta less than 1 means that the security willbe less volatile than the market. A beta greater than 1 indicates that the security's pricewill be more volatile than the market. For example, if a stock's beta is 1.2 it's theoretically20% more volatile than the market.
Many utilities stocks have a beta of less than 1. Conversely most high-tech Nasdaq-based stocks have a beta greater than 1, offering the possibility of a higher rate of returnbut also posing more risk.
4.2 DEFINITION
The formula for the Beta of an asset within a portfolio is , where ra measures the rate of
return of the asset, rp measures the rate of return of the portfolio of which the asset is a
part and Cov (ra, r
p) is the covariance between the rates of return. In the CAPM
formulation, the portfolio is the market portfolio that contains all risky assets, and so ther
p terms in the formula are replaced by rm, the rate of return of the market.
Beta is also referred to as financial elasticity or correlated relative volatility, and can bereferred to as a measure of the sensitivity of the asset's returns to market returns, itsnon-diversifiable risk, its systematic risk or market risk. On an individual asset level,measuring beta can give clues to volatility and liquidity in the marketplace. On a portfoliolevel, measuring beta is thought to separate a manager's skill from his or her willingnessto take risk.
The beta movement should be distinguished from the actual returns of the stocks. Forexample, a sector may be performing well and may have good prospects, but the factthat its movement does not correlate well with the broader market index may decreaseits beta. However, it should not be taken as a reflection on the overall attractiveness orthe loss of it for the sector, or stock as the case may be. Beta is a measure of risk and notto be confused with the attractiveness of the investment.
4.3 BETA COEFFICIENT
The beta coefficient was born out of linear regression analysis. It is linked to a regressionanalysis of the returns of a portfolio (such as a stock index) (x-axis) in a specific periodversus the returns of an individual asset (y-axis) in a specific year. The regression line isthen called the Security Characteristic Line (SCL).

108Security Analysis andPortfolio Management
aa is called the asset’s alpha coefficient and b
a is called the asset's beta coefficient. Both
coefficients have an important role in Modern portfolio theory.
For example, in a year where the broad market or benchmark index returns 25% abovethe risk free rate, suppose two managers gain 50% above the risk free rate. Since thishigher return is theoretically possible merely by taking a leveraged position in the broadmarket to double the beta so it is exactly 2.0, we would expect a skilled portfolio managerto have built the outperforming portfolio with a beta somewhat less than 2, such that theexcess return not explained by the beta is positive. If one of the managers' portfolios hasan average beta of 3.0, and the other's has a beta of only 1.5, then the CAPM simplystates that the extra return of the first manager is not sufficient to compensate us for thatmanager's risk, whereas the second manager has done more than expected given therisk. Whether investors can expect the second manager to duplicate that performance infuture periods is of course a different question.
4.3.1 Investing
By definition, the market itself has an underlying beta of 1.0, and individual stocks areranked according to how much they deviate from the macro market (for simplicity purposes,the S&P 500 is usually used as a proxy for the market as a whole). A stock that swingsmore than the market (i.e. more volatile) over time has a beta whose absolute value isabove 1.0. If a stock moves less than the market, the absolute value of the stock's betais less than 1.0.
More specifically, a stock that has a beta of 2 follows the market in an overall decline orgrowth, but does so by a factor of 2; meaning when the market has an overall decline of3% a stock with a beta of 2 will fall 6%. (Betas can also be negative, meaning the stockmoves in the opposite direction of the market: a stock with a beta of -3 would decline 9%when the market goes up 3% and conversely would climb 9% if the market fell by 3%.)
Higher-beta stocks mean greater volatility and are therefore considered to be riskier, butare in turn supposed to provide a potential for higher returns; low-beta stocks pose lessrisk but also lower returns. In the same way a stock's beta shows its relation to marketshifts, it also is used as an indicator for required Returns on Investment (ROI). If themarket with a beta of 1 has an expected return increase of 8%, a stock with a beta of 1.5should increase return by 12%.
This expected return on equity, or equivalently, a firm's cost of equity, can be estimatedusing the Capital Asset Pricing Model (CAPM). According to the model, the expectedreturn on equity is a function of a firm's equity beta (b
E) which, in turn, is a function of
both leverage and asset risk (bA):
where:
l KE = firm's cost of equity
l RF = risk-free rate (the rate of return on a "risk free investment", e.g. U.S. Treasury
Bonds)
l RM = return on the market portfolio
because:
and
Firm Value (V) = Debt Value (D) + Equity Value (E)

109Measurement and
Significance of Beta
4.3.2 Multiple Beta Model
The Arbitrage Pricing Theory (APT) has multiple betas in its model. In contrast to theCAPM that has only one risk factor, namely the overall market, APT has multiple riskfactors. Each risk factor has a corresponding beta indicating the responsiveness of theasset being priced to that risk factor.
Check Your Progress 1
Fill in the blanks:
1. Beta is a measure of a security’s or portfolio’s volatility, or systematic risk, in_____________ to the market as a whole.
2. Beta is also known as _____________ .
3. The Arbitrage Pricing Theory (APT) has multiple _____________ in itsmodel.
4. Many gold related stocks are _____________ negative.
4.4 MEASUREMENT OF BETA
To estimate or measure Beta, one needs a list of returns for the asset and returns for theindex; these returns can be daily, weekly or any period. Next, a plot should be made, withthe index returns on the x-axis and the asset returns on the y-axis, in order to check thatthere are no serious violations of the linear regression model assumptions. The slope ofthe fitted line from the linear least-squares calculation is the estimated Beta. They-intercept is the alpha.
l There is an inconsistency between how beta is interpreted and how it is calculated.The usual explanation is that it gives the asset volatility relative to the marketvolatility. If that were the case it should simply be the ratio of these volatilities. Infact, the standard estimation uses the slope of the least squares regression line -this gives a slope which is less than the volatility ratio. Specifically it gives thevolatility ratio multiplied by the correlation of the plotted data.
4.4.1 Extreme and Interesting Cases
l Beta has no upper or lower bound, and betas as large as 3 or 4 will occur withhighly volatile stocks.
l Beta can be zero. Some zero-beta securities are risk-free, such as treasury bondsand cash. However, simply because a beta is zero does NOT mean that it is riskfree. A beta can be zero simply because the correlation between that item and themarket is zero. An example would be betting on horse racing. The correlation withthe market will be zero, but it is certainly not a risk free endeavor.
l A negative beta simply means that the stock is inversely correlated with the market.Many gold-related stocks are beta-negative.
l A negative beta might occur even when both the benchmark index and the stockunder consideration have positive returns. It is possible that lower positive returnsof the index coincide with higher positive returns of the stock, or vice versa. Theslope of the regression line, i.e. the beta, in such a case will be negative.
110Security Analysis andPortfolio Management
l Using beta as a measure of relative risk has its own limitations. Most analysisconsider only the magnitude of beta. Beta is a statistical variable and should beconsidered with its statistical significance (R square value of the regression line).Higher R square value implies higher correlation and a stronger relationship betweenreturns of the asset and benchmark index.
4.5 ALPHA
Alpha is a risk-adjusted measure of the so-called active return on an investment. It is acommon measure of assessing an active manager's performance as it is the return inexcess of a benchmark index. Note that the term "active return" refers to the return overa specified benchmark (e.g. the S&P500), whereas "excess return" refers specificallyto the return over the risk-free rate. It is a common error to confound these two terms,and the reader is cautioned to make a careful distinction between them when studying ordiscussing investments.
The difference between the fair and actually expected rates of return on a stock iscalled the stock's alpha.
The alpha coefficient (ai) is a parameter in the capital asset pricing model. In fact it is
the intercept of the Security Characteristic Line (SCL). One can prove that in an efficientmarket, the expected value of the alpha coefficient equals the return of the risk freeasset: E(a
i) = r
f.
Therefore the alpha coefficient can be used to determine whether an investment manageror firm has created economic value:
l ai < r
f: the manager or firm has destroyed value
l ai = r
f: the manager or firm has neither created nor destroyed value
l ai > r
f: the manager or firm has created value
The difference ai – r
f is called Jensen's alpha.
4.5.1 Origin of the Concept
The concept and focus on Alpha comes from an observation increasingly made duringthe middle of the twentieth century, that around 75 percent of stock investment managersdid not make as much money picking investments as someone who simply invested inevery stock in proportion to the weight it occupied in the overall market in terms ofmarket capitalization, or indexing. Many academics felt that this was due to the stockmarket being "efficient" which means that since so many people were paying attentionto the stock market all the time, the prices of stocks rapidly moved to the correct price atany one moment, and that only luck made it possible for one manager to achieve betterresults than another, before fees or taxes were considered. A belief in efficient marketsspawned the creation of market capitalization weighted index funds that seek to replicatethe performance of investing in an entire market in the weights that each of the equitysecurities comprises in the overall market. The best examples are the S&P 500 and theWilshire 5000 which approximately represent the 500 largest equities and the largest5000 securities respectively, accounting for approximately 80%+ and 99%+ of the totalmarket capitalization of the US market as a whole.
In fact, to many investors, this phenomenon created a new standard of performance thatmust be matched: an investment manager should not only avoid losing money for theclient and should make a certain amount of money, but in fact should make more money
111Measurement and
Significance of Beta
than the passive strategy of investing in everything equally (since this strategy appearedto be statistically more likely to be successful than the strategy of any one investmentmanager). The name for the additional return above the expected return of the betaadjusted return of the market is called "Alpha".
4.5.2 Relation to Beta
Besides an investment manager simply making more money than a passive strategy,there is another issue:
Although the strategy of investing in every stock appeared to perform better than75 percent of investment managers, the price of the stock market as a wholefluctuates up and down, and could be on a downward decline for many yearsbefore returning to its previous price.
The passive strategy appeared to generate the market-beating return over periods of 10years or more. This strategy may be risky for those who feel they might need to withdrawtheir money before a 10-year holding period, for example. Thus investment managerswho employ a strategy which is less likely to lose money in a particular year are oftenchosen by those investors who feel that they might need to withdraw their money sooner.The measure of the correlated volatility of an investment (or an investment manager'strack record) relative to the entire market is called beta. Note the "correlated" modifier:an investment can be twice as volatile as the total market, but if its correlation with themarket is only 0.5, its beta to the market will be 1.
Investors can use both alpha and beta to judge a manager's performance. If the managerhas had a high alpha, but also a high beta, investors might not find that acceptable,because of the chance they might have to withdraw their money when the investment isdoing poorly.
Check Your Progress 2
State whether the following statements are true or false:
1. Beta is also referred to as financial elasticity or correlated relative volatility.
2. The beta coefficient was born out of linear regression analysis.
3. Beta cannot be zero.
4. A negative beta might occur even when both the benchmark index and thestock under consideration have positive returns.
5. Beta coefficient was born out of linear regression analysis.
4.6 SIGNIFICANCE OF BETA
Bull-market betas are significantly positively related to returns and, except for somemodels in January, bear-market betas are significantly negatively related to returns. Theserelationships are not lost even after other independent variables, including size, book-to-market equity, and an earnings-price ratio, are added to the cross-sectional regressions.Book-to-market equity is an important factor in bear, but not bull, markets. Size is importantin January and in bear markets during February through December.
Fama and French's (1992) assertion that investors receive premium payments for riskassociated with the book value to market price (BE/ME) and size and not for holding

112Security Analysis andPortfolio Management
beta risk has sparked a lively debate concerning risk factors that are priced in the market.Howton and Peterson (1998) use a dual-beta model to test the Fama and Frenchconclusions. They conclude that the significant relationship between beta and returnsdepends on the use of the dual-beta model. This work, however, ignores the resultsreported by Pettengill, Sundaram, and Mathur (PSM, 1995). PSM find a significant relationbetween a constant risk beta and returns when data are segmented between up anddown markets, but do not consider the impact of size and BE/ME. The PSM marketsegmentation procedure alone provides a sufficient condition to identify a significantrelation between beta and returns in the presence of size and BE/ME. Dual marketbetas may be relevant in explaining risk and return. However, the market segmentationprocedure of PSM (1995) is the critical condition for finding a significant relationshipbetween returns and betas.
4.7 LET US SUM UP
Beta is a measure of a security's or portfolio's volatility, or systematic risk, in comparisonto the market as a whole. It is also known as "beta coefficient."
The beta coefficient, in terms of finance and investing, describes how the expectedreturn of a stock or portfolio is correlated to the return of the financial market as awhole.
The beta coefficient is a key parameter in the capital asset pricing model (CAPM). Itmeasures the part of the asset's statistical variance that cannot be mitigated by thediversification provided by the portfolio of many risky assets, because it is correlatedwith the return of the other assets that are in the portfolio. Beta can be estimated forindividual companies using regression analysis against a stock market index.
Beta is calculated using regression analysis, and you can think of beta as the tendency ofa security's returns to respond to swings in the market.
Beta is also referred to as financial elasticity or correlated relative volatility, and can bereferred to as a measure of the sensitivity of the asset's returns to market returns, itsnon-diversifiable risk, its systematic risk or market risk.
Higher-beta stocks mean greater volatility and are therefore considered to be riskier, butare in turn supposed to provide a potential for higher returns; low-beta stocks pose lessrisk but also lower returns. In the same way a stock's beta shows its relation to marketshifts, it also is used as an indicator for required returns on investment (ROI).
4.8 LESSON END ACTIVITY
Write a note on the beta coefficient and beta factor of a market portfolio.
4.9 KEYWORDS
Beta Coefficient: It describes how the expected return of a stock or portfolio is correlatedto the return of the financial market as a whole.
A Positive Beta: It A positive beta means that the asset generally follows the market.
A Negative Beta: It A negative beta shows that the asset inversely follows the market;the asset generally decreases in value if the market goes up.
CAPM: The expected return on equity, or equivalently, a firm's cost of equity, can beestimated by using the Capital Asset Pricing Model (CAPM).

113Measurement and
Significance of Beta
Cost of Equity: The cost of equity is broadly defined as the risk-weighted projectedreturn required by investors, where the return is largely unknown.
Cost of Capital: The cost of capital is often used as the discount rate, the rate at whichprojected cash flow will be discounted to give a present value or net present value.
4.10 QUESTIONS FOR DISCUSSION
1. Define Beta coefficient.
2. Define Alpha coefficient.
3. Explain the significance of Beta in relation to returns.
4. How is Beta calculated?
Check Your Progress: Model Answers
CYP 1
1. comparison 2. Beta coefficient 3.betas 4. beta
CYP 2
1. T 2. T 3. F 4. T 5. T
4.11 SUGGESTED READINGS
Sudhindra Bhat, Security Analysis and Portfolio Management, Excel Books, Delhi.
Kevin, S., Security Analysis and Portfolio Management, Printice Hall of India.
Prasanna Chandra, Investment Analysis and Portfolio Management, Second Edition, Tata McGrawHill.
Punithavathy Pandian, Securities Analysis and Portfolio management, Vikas.
Investment Management, V. K. Bhalla.
A. Davis, Investors in a Changing Economy, Printice -Hall, 1968.
Williamson, J. Peter, Investments: New Analytic Techniques, London, Longman, 1970.
Cottle, CC., and Whitman, W.T., Investment Timing: The Formula Plan Approach, McGraw Hill.

UNIT III


LESSON
5SECURITY VALUATION
CONTENTS
5.0 Aims and objectives
5.1 Introduction
5.1.1 Economy Influences
5.1.2 Industry Influences
5.2 The General Valuation Framework
5.2.1 The Basic Valuation Model
5.2.2 Value-price Relationship
5.3 Valuation of Fixed Income Securities
5.3.1 Bond Features
5.3.2 Reasons for Issuing Bonds
5.3.3 Types of Bonds
5.4 Bond Valuation
5.4.1 Estimating Returns on Fixed Income Securities
5.5 Yield-to-Maturity (YTM)
5.6 Valuation of Preference Shares
5.7 Let us Sum up
5.8 Lesson End Activity
5.9 Keywords
5.10 Questions for Discussion
5.11 Suggested Readings
5.0 AIMS AND OBJECTIVES
After studying this lesson, you should be able to understand:
l Types of Bond and Preference Shares
l Yield and Interest Rates
l Yield to Maturity
l Bond Duration and Price Volatility
l Pre-emptive Rights Preference Share Yields
118Security Analysis andPortfolio Management
l Holding Period Return
l Valuation of Fixed-income Securities
l Valuation of Preference Shares
5.1 INTRODUCTION
Implicit in all rational buy-sell transactions relating to claims, goods, and services is thequestion. Is it good or real? The investor surrenders a cost (time or money) in exchangefor promised benefits. Both cost and benefits have to face uncertainty since nothingappears certain in this world, except death and taxes. The basic valuation process,therefore, is a constant exercise in rationality with cost, benefits and uncertainty asimportant variables.
The question of the valuation process following a sequence has been widely examined inthe literature and the industry performance, in turn, is linked to performance of theeconomy and the market in general. The three sequential steps in the valuation processwould, therefore, be as follows.
1. Economy analysis
2. Industry analysis
3. Company analysis
5.1.1 Economy Influences
All firms are parts of the overall systems known as the 'general economy', which recordsups and downs. It is important to begin the valuation process with projections of the'macro economy'. What you should grasp is the vast number of influences that affect the'general economy'. A few examples may suffice for an initial view of these. Fiscal policyaffects spending both directly and through its multiplier effects. Monetary policy affectsthe supply and cost of funds available to business units. Interest rates and hence requiredrates of return are influenced by expected inflation. The exchange rates of the balancepayments position, and hence required rates of return are influenced by expected inflation.Balance of payments affects the performance of the economy. A well-informed investorwill first attempt to project the future course of the economy. Should he anticipate arecession he should get his cash back and say 'good-bye' to new investments. If thisprojection indicates conditions of boom, he should select industries most likely to benefitfrom the expected phase of prosperity.
5.1.2 Industry Influences
All industries are not influenced equally by changes in the economy nor they are affectedby busy cycles at just one single point of time. For example, in an international environmentof peace treaties and reasonably cold war, profits of defence-related industries wouldwane, as the economy is not likely to benefit from such industries, which are primarilycentered around defence and armaments. Similarly, a boom or expansion of the economyis not likely to benefit industries subject to foreign competition or marked by productobsolescence. A weak firm in a boom industry might prove more rewarding to a leaderin a weak or declining industry. Of course, the investor would continuously be through asearch process that identifies the best firms in strong industries, and narrow down hisarea of search for investment.
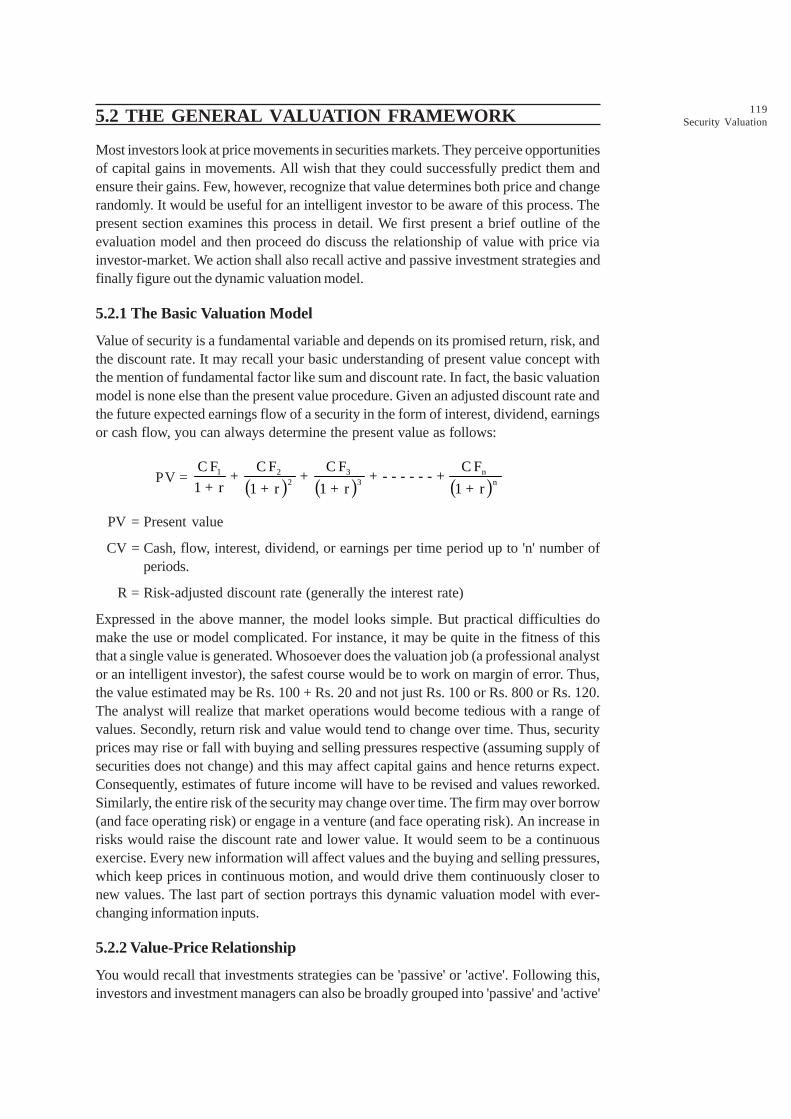
119Security Valuation5.2 THE GENERAL VALUATION FRAMEWORK
Most investors look at price movements in securities markets. They perceive opportunitiesof capital gains in movements. All wish that they could successfully predict them andensure their gains. Few, however, recognize that value determines both price and changerandomly. It would be useful for an intelligent investor to be aware of this process. Thepresent section examines this process in detail. We first present a brief outline of theevaluation model and then proceed do discuss the relationship of value with price viainvestor-market. We action shall also recall active and passive investment strategies andfinally figure out the dynamic valuation model.
5.2.1 The Basic Valuation Model
Value of security is a fundamental variable and depends on its promised return, risk, andthe discount rate. It may recall your basic understanding of present value concept withthe mention of fundamental factor like sum and discount rate. In fact, the basic valuationmodel is none else than the present value procedure. Given an adjusted discount rate andthe future expected earnings flow of a security in the form of interest, dividend, earningsor cash flow, you can always determine the present value as follows:
PV = ( ) ( ) ( )
31 2 n2 3 n
C FC F C F C F+ + + - - - - - - +
1 + r 1 + r 1 + r 1 + r
PV = Present value
CV = Cash, flow, interest, dividend, or earnings per time period up to 'n' number ofperiods.
R = Risk-adjusted discount rate (generally the interest rate)
Expressed in the above manner, the model looks simple. But practical difficulties domake the use or model complicated. For instance, it may be quite in the fitness of thisthat a single value is generated. Whosoever does the valuation job (a professional analystor an intelligent investor), the safest course would be to work on margin of error. Thus,the value estimated may be Rs. 100 + Rs. 20 and not just Rs. 100 or Rs. 800 or Rs. 120.The analyst will realize that market operations would become tedious with a range ofvalues. Secondly, return risk and value would tend to change over time. Thus, securityprices may rise or fall with buying and selling pressures respective (assuming supply ofsecurities does not change) and this may affect capital gains and hence returns expect.Consequently, estimates of future income will have to be revised and values reworked.Similarly, the entire risk of the security may change over time. The firm may over borrow(and face operating risk) or engage in a venture (and face operating risk). An increase inrisks would raise the discount rate and lower value. It would seem to be a continuousexercise. Every new information will affect values and the buying and selling pressures,which keep prices in continuous motion, and would drive them continuously closer tonew values. The last part of section portrays this dynamic valuation model with ever-changing information inputs.
5.2.2 Value-Price Relationship
You would recall that investments strategies can be 'passive' or 'active'. Following this,investors and investment managers can also be broadly grouped into 'passive' and 'active'

120Security Analysis andPortfolio Management
categories. You should note that buying and selling pressures predominantly originatewith active investors. They follow certain rules of the game, which are as follows:
Rule 1: Buy when value is more than price. This underlines the fact that shares areunder-priced and it is deemed to be a bargain to buy now and sell when prices move uptowards value.
Rule 2: Sell when value is less than price. In a situation like this, shares would beoverpriced and it would advantageous to sell them now and avoid a loss when price latermoves down to the level of the value.
Rule 3: Don’t trade when value is equal to price. This is a state when the market priceis in equilibrium and is not expected to change.
An example would be to make the operation of these rules and the consequential investoractions clear. Assume that the share of a hundred-percent-export-unit (EOU) is currentlytrading at Rs. 80 against a face value of Rs… Now, most active investors in the marketreceive news of the company having lost a valuable export contract amounting to around40 % of its expect total export sales of the coming year. They revise their estimate offuture income downward by 40 %with risk, discount rate and other things remainingunchanged. Review the present value at Rs. 48 (60% of Rs. 80). Now, this takes you toRule 2 when what you value is less than price. More appropriately, when price is morethan value. One would expect a decline in price due to an adverse net affecting thepresent value. Active investors would begin selling to avoid probable losses so the sellingpressure would be generated. Its supply of shares does not change. Such a pressurewould reduce price till such time that it nears the new present value viz., Rs. 45. Contrarily,take the case of a company whose share was trading at Rs. 20 (with a par of Rs. 10).Now, the alert and active investors receive news of the lifting of a year-long lockout andsigning of three-wage agreements quite beneficial to management much before eventhe media could know it. Other things including risk and discount rate remaining unchanged,analysts revise the estimates of the present value to Rs. 40 (Rs. 10 below the peak of thelast year when the company was working normally). You will see the case now fallingunder Rule 1. Investors would expect price to move up towards the next value of Rs. 40and would immediately start buying at or around the current price of Rs. 20. This willgenerate buying pressures and the price would increase if supplies of the scrip do notincrease at the same time.
5.3 VALUATION OF FIXED INCOME SECURITIES
A debenture is a legal document containing an acknowledgement of indebtedness by acompany. It contains a promise to pay a stated rate of interest for a defined period andthen to repay the principal at a given date of maturity.
In short, a debenture is a formal legal evidence of debt and is termed as the seniorsecurities of a company.
Unlike equity holders, the bond investor does not share in the growth of a company toany appreciable extent. Thus, although serious losses can accrue to bond holders if acompany suffers financial reverses, they cannot profit to any significant degree by aspectacular improvement in the company's position. It is a case of heads they lose andtails they cannot win. Therefore, their primary role in an investment portfolio is to providecontinuity of income under all reasonably conceivable economic conditions.
5.3.1 Bond Features
Indenture: The indenture is a long, complicated legal instrument containing the restrictions,pledges and promises of the contract. Bond indenture involves three parties. The firstparty is the debtor corporation that borrows the money, promises to pay interest, andpromises to repay the principal borrowed.

121Security Valuation
Maturities: Maturities vary widely. Bonds are usually grouped by their maturity classes.
Interest Payments: Bond interest is usually paid semi-annually, though annual paymentsare also popular. The method of payment depends upon whether the bond is a coupon(bearer) or registered bond.
Call Feature: Most modern corporate bonds are callable at the discretion of the issuer.This gives the issuing company the right to recall a bond before it reaches maturity.
5.3.2 Reasons for Issuing Bonds
To Reduce the Cost of Capital: Bonds are the cheapest source of financing.
To Widen the Sources of Funds: By issuing bonds, the corporation can attract fundsfrom individual investors and especially from those investing institutions that are reluctantor not permitted to purchase equity shares.
To Preserve Control: An increase in debt does not diminish the voting power of presentowners, since bonds ordinarily carry no voting right.
To Gain the Benefit of Leverage: The presence of debt and/or preference shares inthe company's financial structure means that it is using financial leverage. When financialleverage is used, changes in Earnings Before Interest and Tax (EBIT) translate into thelarger changes in earnings per share.
To Effect Tax Saving: Unlike dividends on equity, the interest on bonds is deductible infiguring up corporate income for tax purposes. Hence, the EPS increases if the financingis through bonds rather than with preference or equity shares.
5.3.3 Types of Bonds
Convertible and Non-Convertible Bonds: Convertible bonds can be one of the finestholdings for the investor looking for both appreciation of investment and income of bond.A convertible bond is a cross between a bond and a stock. The holder can at his option,convert the bond into a predetermined number of shares of common stock at apredetermined price.
Collateral Trust Bonds: Instead of being secured by a pledge of tangible property, asare mortgage bonds, collateral trust issues are secured by a pledge of intangibles, usuallyin the form of stocks and bonds of corporation. Collateral trust issues are, thus, securedby (1) shares, representing ownership in corporation, (2) bonds, representing the indirectpledge of assets, or a combination of both. Usually, the pledged securities are those ofother corporations.
Income Bonds: Income bonds are bonds on which the payment of interest is mandatoryonly to the extent of current earnings. If earnings are sufficient to pay only a portion ofthe interest, that portion usually is required to be paid, but if the corporation is able to paythe unearned balance out of its cash resources, it is of course free to do so.
Redeemable and Irredeemable Bonds: A redeemable debenture is a bond, which hasbeen issued for a certain period on the expiry of which its holder will be repaid theamount thereof, with or without premium. A bond without the aforesaid redemptionperiod is termed as an irredeemable debenture. These may be repaid either in the eventof the winding-up of company or the happening of certain specified uncertain or contingentevents.
Participating Bonds: Companies with poor credit positions issue participating bonds.They have a guaranteed rate of interest, but may also participate in earnings up to anadditional specified percentage.
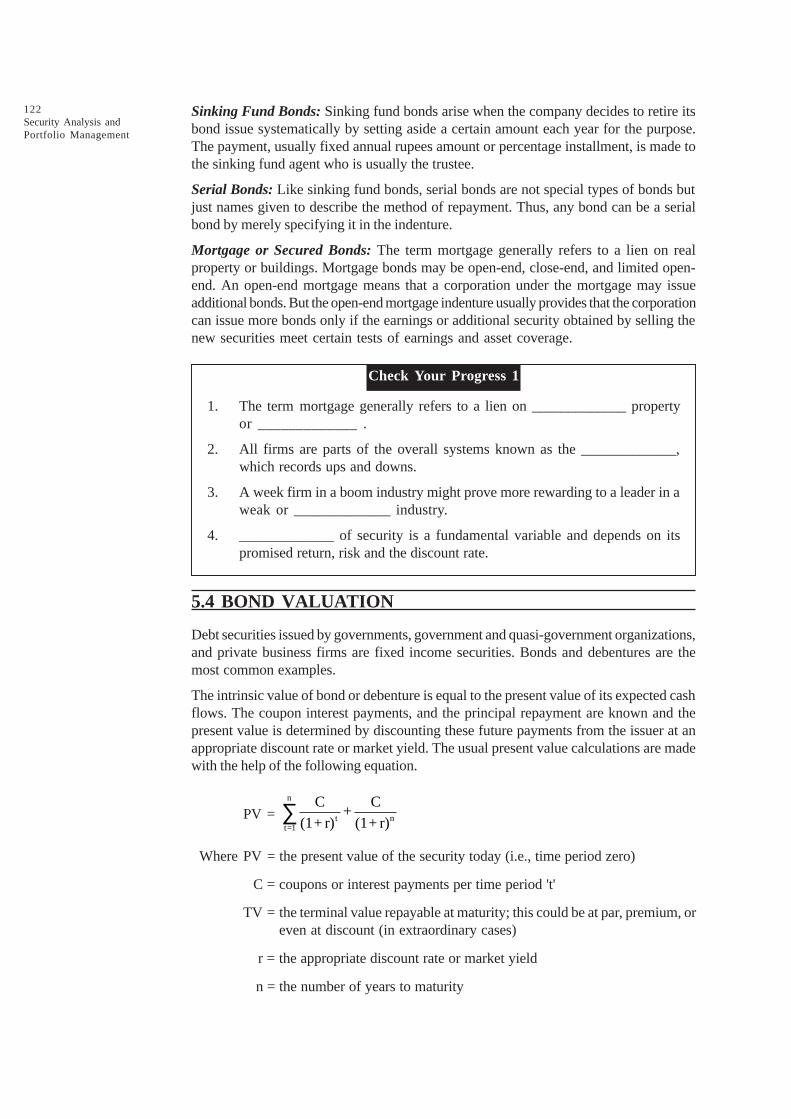
122Security Analysis andPortfolio Management
Sinking Fund Bonds: Sinking fund bonds arise when the company decides to retire itsbond issue systematically by setting aside a certain amount each year for the purpose.The payment, usually fixed annual rupees amount or percentage installment, is made tothe sinking fund agent who is usually the trustee.
Serial Bonds: Like sinking fund bonds, serial bonds are not special types of bonds butjust names given to describe the method of repayment. Thus, any bond can be a serialbond by merely specifying it in the indenture.
Mortgage or Secured Bonds: The term mortgage generally refers to a lien on realproperty or buildings. Mortgage bonds may be open-end, close-end, and limited open-end. An open-end mortgage means that a corporation under the mortgage may issueadditional bonds. But the open-end mortgage indenture usually provides that the corporationcan issue more bonds only if the earnings or additional security obtained by selling thenew securities meet certain tests of earnings and asset coverage.
Check Your Progress 1
1. The term mortgage generally refers to a lien on _____________ propertyor _____________ .
2. All firms are parts of the overall systems known as the _____________,which records ups and downs.
3. A week firm in a boom industry might prove more rewarding to a leader in aweak or _____________ industry.
4. _____________ of security is a fundamental variable and depends on itspromised return, risk and the discount rate.
5.4 BOND VALUATION
Debt securities issued by governments, government and quasi-government organizations,and private business firms are fixed income securities. Bonds and debentures are themost common examples.
The intrinsic value of bond or debenture is equal to the present value of its expected cashflows. The coupon interest payments, and the principal repayment are known and thepresent value is determined by discounting these future payments from the issuer at anappropriate discount rate or market yield. The usual present value calculations are madewith the help of the following equation.
PV =n
t nt=1
C C+
(1+ r) (1+ r)∑
Where PV = the present value of the security today (i.e., time period zero)
C = coupons or interest payments per time period 't'
TV = the terminal value repayable at maturity; this could be at par, premium, oreven at discount (in extraordinary cases)
r = the appropriate discount rate or market yield
n = the number of years to maturity

123Security Valuation
Illustration 1:
Consider a Rs. 1,000 bond issued with a maturity of five years at par to yield 10%.Interest is paid annually and the bond is newly issued.
Solution:
The value of the bond would be as follows:
PVA = 2 3 4 5
Rs. 100 Rs. 100 Rs. 100 Rs. 100 Rs. 100+ + + +
1 + .10 (1 + .10) (1 + .10) (1 + .10) (1 + .10)
= 100 ¥ .9091 + 100 ¥ .8264 + 100 ¥ .7513 + 100 ¥ .6830 + 1100 ¥ .6209
= 90.91 + 82.64 + 75.13 + 68.30 + 682.99
= 999.97 or Rs. 1000 approx.
You should recognize that the present value of the bond viz., Rs. 1,000 estimated aboveis equal to the issue price because the bond was just been sold at par of Rs. 100.
Now, consider another of Rs. 1,000 Bond B is issued ten years ago at a coupon at 6%.The bond had a maturity period of ten years and as of today, therefore, five more yearsare left for final repayment at par. The current discount rate is 10 % as before. All othercharacteristics of Bond B are identical with Bond A.
It is obvious that the present value of Bond B will not be Rs. 1,000 because investors willnot pay this price and agree to receive Rs. 60 per year as interest for the next five yearswhen Bond A with similar characteristics provides annual interest payments of Rs. 100for the five years. The present value of Bond B will be determined as:
PVA = 2 3 4 5
Rs. 60 Rs. 60 Rs. 60 Rs. 60 Rs. 60+ + + +
1 + .10 (1 + .10) (1 + .10) (1 + .10) (1 + .10)
= 60 ¥ .9091 + 60 ¥ .8264 + 60 ¥ .7513 + 60 ¥ .6830 + 1100 ¥ .6209
= 54.55 + 48.59 + 45.08 + 40.98 + 657.15
= Rs. 847.35
You will observe that the numerator of the PV equation will be given at the time ofissuance of the bond or the nature. The maturity period, timing of interest is payments,and maturity value will also be specified. What should be determined is the denominatorof the equation viz., the discount rate. You may notice that this comes with the samefeatures. In other words, it is an opportunity cost. Thus, the discount rate incorporatesthe change of interest rates and reflects the current market yield for the issue.
Should interest payments be semi-annual, the PV equation will have to be modified asfollows: divide 'Ct' both end and by multiply 'n' by 2. The resultant equation will be:
PV = 2n
t 2nt=1
ct/2 C+
(1+ r/2) (1+ r/2)åComing under semi-annual payments, the present values of Bonds A and B the aboveexamples can be solved as under
PVA
= 10
t 10t=1
Rs.50 1000+
(1.05) (1.05)å
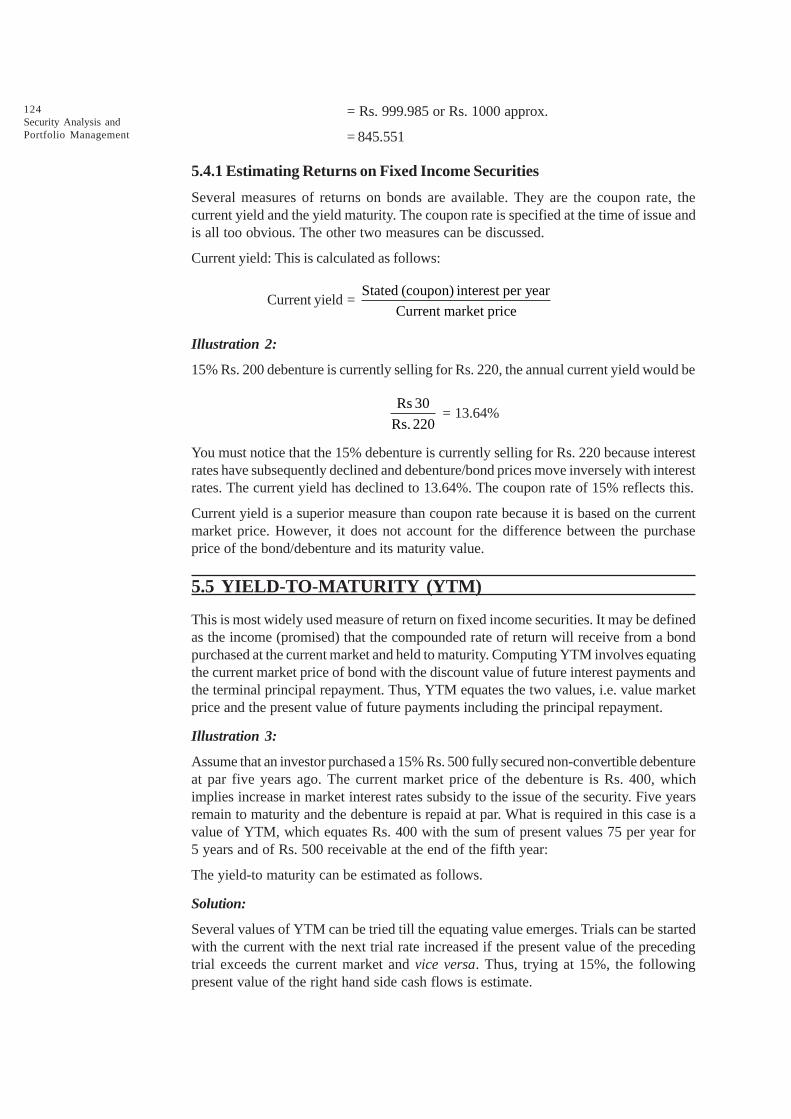
124Security Analysis andPortfolio Management
= Rs. 999.985 or Rs. 1000 approx.
= 845.551
5.4.1 Estimating Returns on Fixed Income Securities
Several measures of returns on bonds are available. They are the coupon rate, thecurrent yield and the yield maturity. The coupon rate is specified at the time of issue andis all too obvious. The other two measures can be discussed.
Current yield: This is calculated as follows:
Current yield = Stated (coupon) interest per year
Current market price
Illustration 2:
15% Rs. 200 debenture is currently selling for Rs. 220, the annual current yield would be
Rs 30
Rs. 220 = 13.64%
You must notice that the 15% debenture is currently selling for Rs. 220 because interestrates have subsequently declined and debenture/bond prices move inversely with interestrates. The current yield has declined to 13.64%. The coupon rate of 15% reflects this.
Current yield is a superior measure than coupon rate because it is based on the currentmarket price. However, it does not account for the difference between the purchaseprice of the bond/debenture and its maturity value.
5.5 YIELD-TO-MATURITY (YTM)
This is most widely used measure of return on fixed income securities. It may be definedas the income (promised) that the compounded rate of return will receive from a bondpurchased at the current market and held to maturity. Computing YTM involves equatingthe current market price of bond with the discount value of future interest payments andthe terminal principal repayment. Thus, YTM equates the two values, i.e. value marketprice and the present value of future payments including the principal repayment.
Illustration 3:
Assume that an investor purchased a 15% Rs. 500 fully secured non-convertible debentureat par five years ago. The current market price of the debenture is Rs. 400, whichimplies increase in market interest rates subsidy to the issue of the security. Five yearsremain to maturity and the debenture is repaid at par. What is required in this case is avalue of YTM, which equates Rs. 400 with the sum of present values 75 per year for5 years and of Rs. 500 receivable at the end of the fifth year:
The yield-to maturity can be estimated as follows.
Solution:
Several values of YTM can be tried till the equating value emerges. Trials can be startedwith the current with the next trial rate increased if the present value of the precedingtrial exceeds the current market and vice versa. Thus, trying at 15%, the followingpresent value of the right hand side cash flows is estimate.

125Security Valuation
PV15% = Rs. 75 per annum ¥ PVIF a.yrs.15% + Rs. 500 ¥ PVIF15%.5yrs.
= Rs. 75 ¥ 3.3522 + Rs. 500 ¥ .4972 = Rs. 251.42 + 248.60
= Rs. 500.08
Since the PV of Rs. 500.08 exceeds Rs. 400, a higher discount rate must be tried.
PV20% = Rs. 75 ¥ 2.9906 + Rs. 500 ¥ .8333
= Rs. 224.295 + Rs. 200.95
= Rs. 425.245
Even the second trial has failed to equate the two values. Hence, you can go over to thethird trial at, say
PV24% = Rs. 75 ¥ 2.7454 + Rs. 500 ¥ .3411
= Rs. 205.91 + Rs. 170.55
= Rs. 376.46
The third trial has lowered the present value to Rs. 376.46, which is less than Rs. 400.Hence, the required must lie between 20% and 24%. The estimate can be obtained byinterpolating, thus:
YTM =20% + 425.245 400.00 (24% 20%)20% + 25.245 4%
=425.245 346.46 48.785
- ´ - ´-
20% + 2.07% = 22.07%
It may be noted that YTM calculation is similar to calculating the internal rate of return.Calculators and computers made these calculations extremely easy. You may furthernote that the YTM is just a promised yield and the investor cannot earn it unless thebond/debenture is held to maturity. And if you have to hold the security till you cannot, atthe same time, sell it. Thus, there would be no trading. One significant implication ofsuch a situation is that the investor simply buys and holds and assumes all intermediatecash flows in the form of interest principal repayments to be reinvested at YTM. Inother words, the YTM concept is a compound interest concept, i.e. the investor is earninginterest-on-interest at YTM throughout the hold period till maturity. One should understandthat intermediate cash flows are not reinvested at YTM. The realized yield actuallyearned will differ from the rate. The receipts are reinvested at different rates (interestbeing receivable semi-annually).
Coupon Interest Income (Rs.)
Assumed Reinvestment (%)
Interest on Interest income (Rs.)
Total return (Rs.)
Realized Return (%)
(1) (2) (3) (4) (5)
2000
2000
2000
2000
2000
2000
2000
0
5
8
9
10
11
12
0
1370
2751
3352
4040
4830
5738
2000
3370
4751
5352
6040*
6830
7738
5.57
7.51
8.94
9.46
10.00
10.56
11.14

126Security Analysis andPortfolio Management
Notes:
Vol. 1: Coupon interest @ 10% on Rs. 1000 received for 20 years semi-annually =Rs. 50 × 40 periods = Rs. 2000 Interest on interest at the assumed reinvestmentrate for 40 per cent.
Vol. 3: Co. 1 + Col. 3 + Co.4
Vol. 4: Sum of an annuity of Rs. 50 for 40 periods at 5% semi-annual reinvestmentrate is, thus, period annuity factor = 120.80 × 50 = Rs.6040*
Vol. 5: Realized return = (Future value per rupee invested)1/N–1
Future value per rupee invested = Total return + Cost of bond
Cost of bond
The realized return is the compound return on semi-annual basis. For an annual basis,this figure must be doubled. The table above clearly demonstrates the critical nature ofthe reinvestment rate assumption of YTM. You may note that the realized return is equalto the YTM of 10% only when the reinvestment rate is 10%. At a payment rate of zero(i.e., the investor consumes away all intermediate cash flows from the bond), interest-on-interest is zero and the realized return is a low 5.57%. In contrast, at a reinvestmentrate of 12%, the interest-on-interest is Rs. 5738 (i.e. 5738/7738 = around 75% of totalreturn) and the realized return is 11.14%.
Investors must make specific assumptions about re-investment rates in order to gainideas about realized returns. Zero coupon bonds eliminate the reinvestment rate riskbecause investors know that at the time of purchase of YTM that will be realized whenthe bond is held to maturity.
Approximate YTM = n t
n
Coupon Interest + MP MP
[MP + MP]/2-
where MPn is market price at if maturity and MPt is market price (or cost) at the
beginning.
Illustration 4:
An investor is considering the purchase of the following debenture:
Maturity/3 years Coupon/11% Par/Rs. 100
(a) If the investor requires a YTM of 13% on debentures of equivalent risk and maturity,what does he believe is a fair market price?
(b) If the debenture is selling for a price of Rs.97.59, what is its promised YTM?
(c) If the investor expects the debenture to provide a final payment of Rs. 105 in year3 instead of the promised Rs. 11 (par plus coupon). Using the debenture's marketprice of Rs.97.59, what is his expected annual return? If the return on three-yearrisk-free securities is equal to 10.0 %, why might this debenture sell at a higherexpected return?
(d) Why is the expected return different from the yield-to-maturity calculated in part (b)?
(e) What is the duration of this debenture?
(f) If an investor 'X' has a horizon date of 4.0 years, why is this debenture risky toinvestor 'X'?
(g) If an investor 'Y' has a horizon date of 2.0 years, why is this debenture risky toinvestor 'Y'?
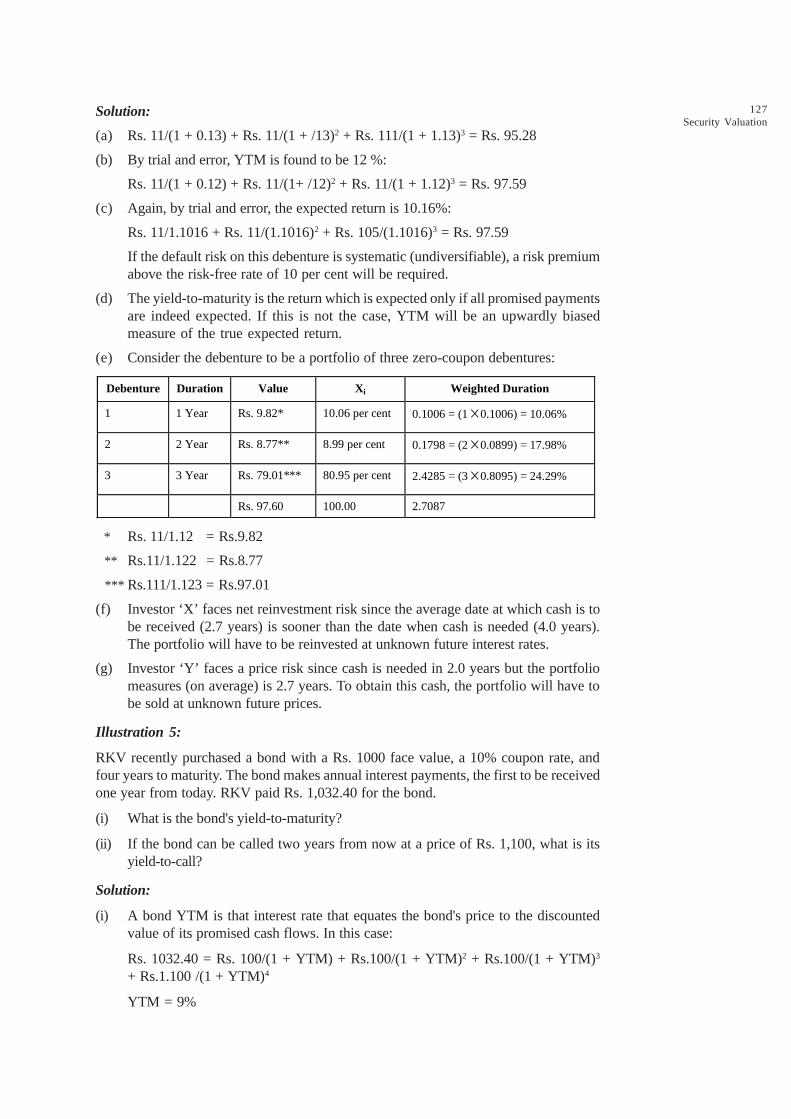
127Security Valuation
Solution:
(a) Rs. 11/(1 + 0.13) + Rs. 11/(1 + /13)2 + Rs. 111/(1 + 1.13)3 = Rs. 95.28
(b) By trial and error, YTM is found to be 12 %:
Rs. 11/(1 + 0.12) + Rs. 11/(1+ /12)2 + Rs. 11/(1 + 1.12)3 = Rs. 97.59
(c) Again, by trial and error, the expected return is 10.16%:
Rs. 11/1.1016 + Rs. 11/(1.1016)2 + Rs. 105/(1.1016)3 = Rs. 97.59
If the default risk on this debenture is systematic (undiversifiable), a risk premiumabove the risk-free rate of 10 per cent will be required.
(d) The yield-to-maturity is the return which is expected only if all promised paymentsare indeed expected. If this is not the case, YTM will be an upwardly biasedmeasure of the true expected return.
(e) Consider the debenture to be a portfolio of three zero-coupon debentures:
Debenture Duration Value Xi Weighted Duration
1 1 Year Rs. 9.82* 10.06 per cent 0.1006 = (1 ́ 0.1006) = 10.06%
2 2 Year Rs. 8.77** 8.99 per cent 0.1798 = (2 ́ 0.0899) = 17.98%
3 3 Year Rs. 79.01*** 80.95 per cent 2.4285 = (3 ́ 0.8095) = 24.29%
Rs. 97.60 100.00 2.7087
* Rs. 11/1.12 = Rs.9.82
** Rs.11/1.122 = Rs.8.77
*** Rs.111/1.123 = Rs.97.01
(f) Investor ‘X’ faces net reinvestment risk since the average date at which cash is tobe received (2.7 years) is sooner than the date when cash is needed (4.0 years).The portfolio will have to be reinvested at unknown future interest rates.
(g) Investor ‘Y’ faces a price risk since cash is needed in 2.0 years but the portfoliomeasures (on average) is 2.7 years. To obtain this cash, the portfolio will have tobe sold at unknown future prices.
Illustration 5:
RKV recently purchased a bond with a Rs. 1000 face value, a 10% coupon rate, andfour years to maturity. The bond makes annual interest payments, the first to be receivedone year from today. RKV paid Rs. 1,032.40 for the bond.
(i) What is the bond's yield-to-maturity?
(ii) If the bond can be called two years from now at a price of Rs. 1,100, what is itsyield-to-call?
Solution:
(i) A bond YTM is that interest rate that equates the bond's price to the discountedvalue of its promised cash flows. In this case:
Rs. 1032.40 = Rs. 100/(1 + YTM) + Rs.100/(1 + YTM)2 + Rs.100/(1 + YTM)3
+ Rs.1.100 /(1 + YTM)4
YTM = 9%
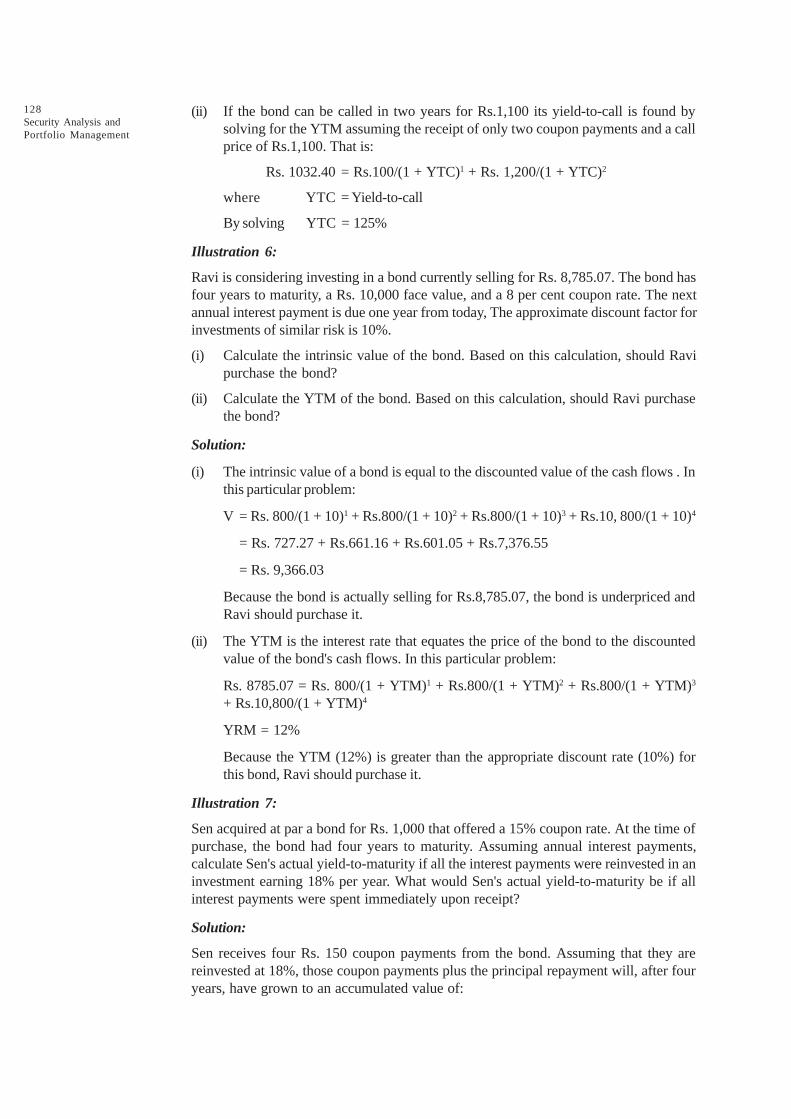
128Security Analysis andPortfolio Management
(ii) If the bond can be called in two years for Rs.1,100 its yield-to-call is found bysolving for the YTM assuming the receipt of only two coupon payments and a callprice of Rs.1,100. That is:
Rs. 1032.40 = Rs.100/(1 + YTC)1 + Rs. 1,200/(1 + YTC)2
where YTC = Yield-to-call
By solving YTC = 125%
Illustration 6:
Ravi is considering investing in a bond currently selling for Rs. 8,785.07. The bond hasfour years to maturity, a Rs. 10,000 face value, and a 8 per cent coupon rate. The nextannual interest payment is due one year from today, The approximate discount factor forinvestments of similar risk is 10%.
(i) Calculate the intrinsic value of the bond. Based on this calculation, should Ravipurchase the bond?
(ii) Calculate the YTM of the bond. Based on this calculation, should Ravi purchasethe bond?
Solution:
(i) The intrinsic value of a bond is equal to the discounted value of the cash flows . Inthis particular problem:
V = Rs. 800/(1 + 10)1 + Rs.800/(1 + 10)2 + Rs.800/(1 + 10)3 + Rs.10, 800/(1 + 10)4
= Rs. 727.27 + Rs.661.16 + Rs.601.05 + Rs.7,376.55
= Rs. 9,366.03
Because the bond is actually selling for Rs.8,785.07, the bond is underpriced andRavi should purchase it.
(ii) The YTM is the interest rate that equates the price of the bond to the discountedvalue of the bond's cash flows. In this particular problem:
Rs. 8785.07 = Rs. 800/(1 + YTM)1 + Rs.800/(1 + YTM)2 + Rs.800/(1 + YTM)3
+ Rs.10,800/(1 + YTM)4
YRM = 12%
Because the YTM (12%) is greater than the appropriate discount rate (10%) forthis bond, Ravi should purchase it.
Illustration 7:
Sen acquired at par a bond for Rs. 1,000 that offered a 15% coupon rate. At the time ofpurchase, the bond had four years to maturity. Assuming annual interest payments,calculate Sen's actual yield-to-maturity if all the interest payments were reinvested in aninvestment earning 18% per year. What would Sen's actual yield-to-maturity be if allinterest payments were spent immediately upon receipt?
Solution:
Sen receives four Rs. 150 coupon payments from the bond. Assuming that they arereinvested at 18%, those coupon payments plus the principal repayment will, after fouryears, have grown to an accumulated value of:

129Security Valuation
Ace value = Rs. 150 ¥ (1.18)3 + Rs. 150 ¥ (1.18)2 + Rs. 150 ¥ (1.18)1
+ Rs. 1,150 (1.18)0
= Rs. 246.45 + Rs. 208.86 + Rs. 177 + Rs. 1,150
= Rs. 1,782.31
As the bond had a purchase price of Rs.1,000, Sen's actual YTM over the four years is:
Actual yield = (Rs.1,782.31/Rs.1,000)1/4 = 15.54 per cent
If the coupon payments were spent immediately upon receipt, then the effectivereinvestment rate is 0%. Thus the accumulated value of the cash flow is:
Ace value = Rs. 150 ¥ (1.0)3 + Rs. 150 ¥ (1.0)2 + Rs. 150 ¥ (1.0)1 + Rs. 1,150(1.0)0
= Rs. 1600
Therefore, Sen's actual YTM over the four years is:
Actual yield = (Rs.1600/Rs.1000)1/4
= 1.1246828 = 12.47%.
Illustration 8:
From the price data that follow, compute the holding period returns:
Time S tock Price (in Rs.)
1 25
2 30
3 24
4 32
Solution:
Time Stock Price (in Rs.) Holding-Period Return
1 25
2 30 (Rs. 30/Rs. 25) - 1 = 20%
3 24 (Rs. 24/Rs. 30) - 1 = - 20%
4 32 (Rs. 32/Rs. 24) - 1 =333%
Illustration 9:
Calculate the value and duration for the following bonds:
Bond Years of Maturity Annual Interest Maturity value
Wipro 10 Rs. 80 Rs.1,000
SBI 15 Rs. 65 Rs. 1,000
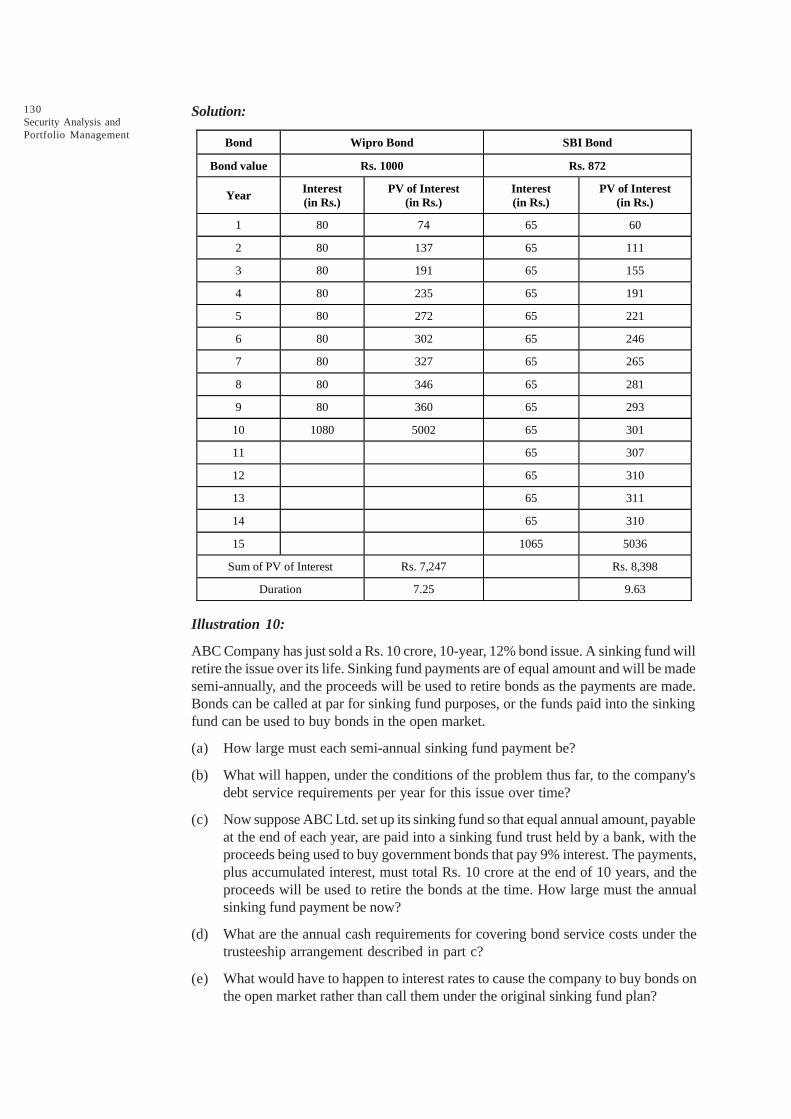
130Security Analysis andPortfolio Management
Solution:
Bond Wipro Bond SBI Bond
Bond value Rs. 1000 Rs. 872
Year Interest (in Rs.)
PV of Interest (in Rs.)
Interest (in Rs.)
PV of Interest (in Rs.)
1 80 74 65 60
2 80 137 65 111
3 80 191 65 155
4 80 235 65 191
5 80 272 65 221
6 80 302 65 246
7 80 327 65 265
8 80 346 65 281
9 80 360 65 293
10 1080 5002 65 301
11 65 307
12 65 310
13 65 311
14 65 310
15 1065 5036
Sum of PV of Interest Rs. 7,247 Rs. 8,398
Duration 7.25 9.63
Illustration 10:
ABC Company has just sold a Rs. 10 crore, 10-year, 12% bond issue. A sinking fund willretire the issue over its life. Sinking fund payments are of equal amount and will be madesemi-annually, and the proceeds will be used to retire bonds as the payments are made.Bonds can be called at par for sinking fund purposes, or the funds paid into the sinkingfund can be used to buy bonds in the open market.
(a) How large must each semi-annual sinking fund payment be?
(b) What will happen, under the conditions of the problem thus far, to the company'sdebt service requirements per year for this issue over time?
(c) Now suppose ABC Ltd. set up its sinking fund so that equal annual amount, payableat the end of each year, are paid into a sinking fund trust held by a bank, with theproceeds being used to buy government bonds that pay 9% interest. The payments,plus accumulated interest, must total Rs. 10 crore at the end of 10 years, and theproceeds will be used to retire the bonds at the time. How large must the annualsinking fund payment be now?
(d) What are the annual cash requirements for covering bond service costs under thetrusteeship arrangement described in part c?
(e) What would have to happen to interest rates to cause the company to buy bonds onthe open market rather than call them under the original sinking fund plan?
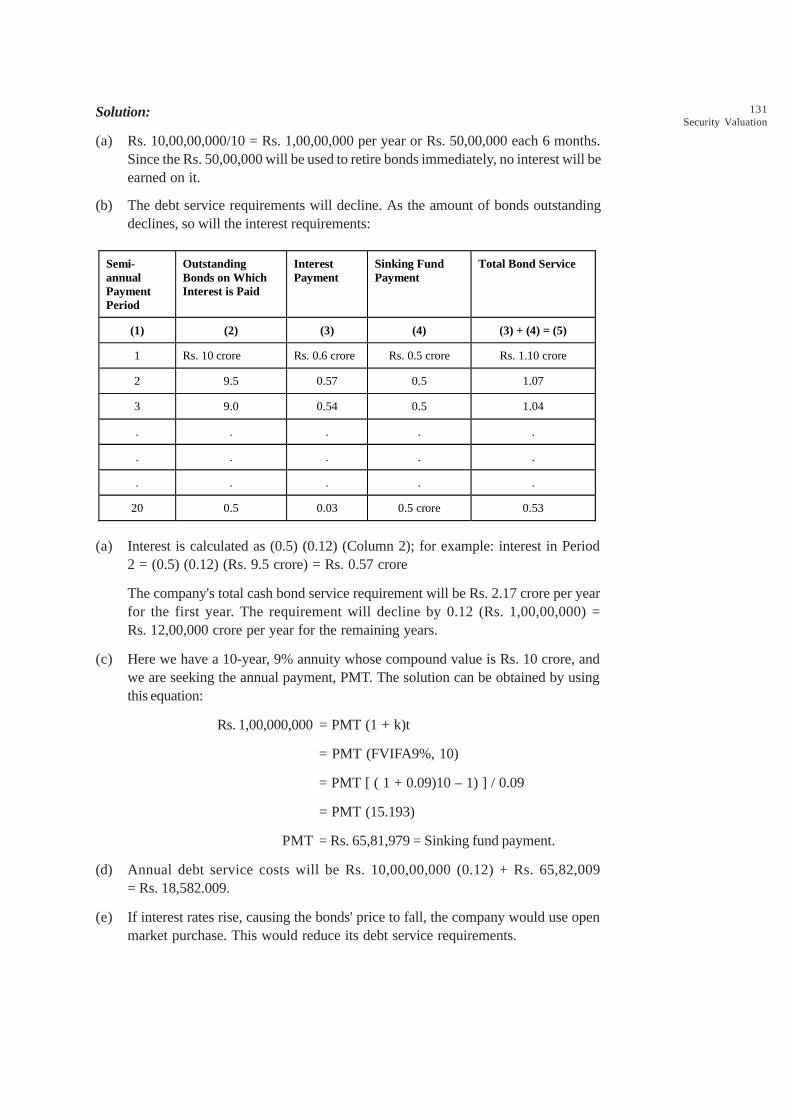
131Security Valuation
Solution:
(a) Rs. 10,00,00,000/10 = Rs. 1,00,00,000 per year or Rs. 50,00,000 each 6 months.Since the Rs. 50,00,000 will be used to retire bonds immediately, no interest will beearned on it.
(b) The debt service requirements will decline. As the amount of bonds outstandingdeclines, so will the interest requirements:
Semi-annual Payment Period
Outstanding Bonds on Which Interest is Paid
Interest Payment
Sinking Fund Payment
Total Bond Service
(1) (2) (3) (4) (3) + (4) = (5)
1 Rs. 10 crore Rs. 0.6 crore Rs. 0.5 crore Rs. 1.10 crore
2 9.5 0.57 0.5 1.07
3 9.0 0.54 0.5 1.04
. . . . .
. . . . .
. . . . .
20 0.5 0.03 0.5 crore 0.53
(a) Interest is calculated as (0.5) (0.12) (Column 2); for example: interest in Period2 = (0.5) (0.12) (Rs. 9.5 crore) = Rs. 0.57 crore
The company's total cash bond service requirement will be Rs. 2.17 crore per yearfor the first year. The requirement will decline by 0.12 (Rs. 1,00,00,000) =Rs. 12,00,000 crore per year for the remaining years.
(c) Here we have a 10-year, 9% annuity whose compound value is Rs. 10 crore, andwe are seeking the annual payment, PMT. The solution can be obtained by usingthis equation:
Rs. 1,00,000,000 = PMT (1 + k)t
= PMT (FVIFA9%, 10)
= PMT [ ( 1 + 0.09)10 – 1) ] / 0.09
= PMT (15.193)
PMT = Rs. 65,81,979 = Sinking fund payment.
(d) Annual debt service costs will be Rs. 10,00,00,000 (0.12) + Rs. 65,82,009= Rs. 18,582.009.
(e) If interest rates rise, causing the bonds' price to fall, the company would use openmarket purchase. This would reduce its debt service requirements.
132Security Analysis andPortfolio Management
Illustration 11:
What is the elasticity of a ten-year zero-coupon bond priced to yield 10%?
Solution:
Because it is a zero-coupon bond, its duration is equal to its maturity.
e1 = 10(0.10) / ( 1 + 0.10) = –0.9091
This means that for a 1% rise in interest rates (not a rise of one percentage point), theprice of the bond should fall by 0.90915%.
Check Your Progress 2
State whether the following statements are true or false:
1. A debenture is not a legal document.
2. Income bonds are bonds on which payment of interest is not mandatory onlyto the extent of current earnings.
3. Companies with poor credit do not issue participating bonds.
4. Unlike equity holders, the bonds investor does not share in the growth of acompany to any appreciable extent.
5. An increase in debt does not diminish the voting power of present owners,since bonds ordinarily carry no voting rights.
5.6 VALUATION OF PREFERENCE SHARES
Preference shares are hybrid security. They have some features of bonds and some ofequity shares. Theoretically, preference shares are considered a perpetual security butthere are convertible, callable, redeemable and other similar features, which enable issuersto terminate them within a finite time horizon. In the case of redeemable preferenceshares, legal mandates require creation of redemption sinking funds and earmarkedinvestments to ensure funds for repayments.
Preference dividends are specified like bonds. This has to be done because they rankprior to equity share for dividends. However, specification does not imply obligation,failure to comply with which may amount to default. Several preference issues arecumulative where dividends accumulate over time and equity dividends need clearanceof preference arrears first.
Preference shares are less risky than equity because their dividends are specified and allarrears must paid before equity holders get dividends. They are, however, more riskythan bonds because the latter earn priority in payment and in liquidation. Bonds are alsosecured and enjoy protection of the principal which is ordinary not available to preferenceshares. Investors' required returns on preference shares are more than those on bond,but less than on equity shares. In exceptional circumstances when preference sharesenjoy special tax-shares (like in the US, inter-corporate holdings of preference sharesget exemption on 80% of preference dividends) required return on such shares mayeven be marginally below those on bonds.
Since dividends from preference shares are assumed to be perpetual payments, theintrinsic value of shares will be estimated from the following equation valid for perpetuitiesin general

133Security ValuationV
P=
2p p
C C+ + ....................
(1 + K ) (1 + K )
Where Vp
= the value of a perpetuity today
C = the constant annual payment to be received
Kp
= the required rate of return appropriate for the perpetuity
You have only to substitute preference dividend (D) for 'C' and the appropriate requiredreturn (K
PS) for 'K
P' to obtain the following equation for valuing preference shares.
VP =
PS
D
K
You may note that 'D' is a perpetuity and is known and fixed forever. A perpetuity doesnot involve present value calculations and the equitation provides for computing any ofthe three variables viz., value of perpetuity (V), preference dividend (D) and requiredrate of return (K
PS) only if the remaining two variables are known. Thus, the value of a
preference share can be calculated if the dividend per share and the required rate ofreturn are known. Similarly, the required rate of return (or yield) can be known if thevalue of the perpetuity and dividend per share are known.
Illustration 12:
We look at the valuation process of a preference share. Consider the issue of preferenceshares of Rs. 100 each with a specified dividend of Rs. 11.5 per share. Now, if theinvestor's required rate of return corresponding to the risk-level of firm A is 10% whatwould the value today of the share be?
Solution:
VP =
Rs. 11.50= Rs. 115.00
.10
Should the required return increase (say in the wake of rising interest rates and,consequently the high opportunity costs) to 12%, value will be:
Rs. 11.50= Rs. 95.83
.12
You may note that the value changes inversely to the required rate of return.
If you are an observer of market prices, you may notice the price of any preferenceshare on any day and calculate its yield on that day using the above formula. Thus, if thecurrent market price of the preference share in question is Rs. 125.00, the required rateof return or yield can be calculated as under:
PPS PS
D Rs. 11.50V = or, Rs. 125.00 =
K K
Or
= 11.50
125.00 = 9.2%
Thus, the yield declines after issue of the shares by 'A'. May be, interest rates decline orother changed to induce the downward shift in the yield.
You can observe price shifts over various ranges of time, say weeks, months and yearsand examine the causes of shifts in yields of preference shares. These relate to'fundamental approach to 'floatation equity shares.'
134Security Analysis andPortfolio Management
Illustration 13:
What is the value of a preference share where the dividend rate is 18% on a Rs. 100 parvalue? The appropriate discount rate for a stock of this risk level is 15%.
Solution:
Vp
= (0.18 ¥ Rs. 100) / 0.15
= Rs. 18 / 0.15
= Rs. 120
Illustration 14:
The preference shares of RKV Group are selling for Rs. 47.50 per share and pay adividend of Rs. 2.35 in dividends. What is your expected rate of return if you purchasethe security at market price?
Solution:
Expected rate of return = Dividend / Market Price
= Rs. 2.35/Rs. 47.50
= 4.95%
Illustration 15:
You own 250 preference shares of ABC company which currently sells for Rs. 38.50per share and pays annual dividends of Rs. 6.50 per share.
(a) What is your expected return?
(b) If you require a 13% return, given the current price, should you sell or buy morepreference shares?
Solution:
(a) Expected return = Dividend/Market Price
= Rs. 6.50/Rs. 38.50
= 16.88%
(b) Given a 13% required rate of return, the stock is worth:
V p= Dividend/Required Rate
= Rs. 6.50/0.13
= Rs. 50.00
Because the expected rate of return (16.88%) is greater than the required rate ofreturn (13%) or because the current market price (Rs. 38.50) is less than Rs. 50.00,the stock is undervalued and it is worth buying.
Illustration 16:
Pioneer's preference shares are selling for Rs. 44 per share in the market and pay aRs. 4.40 annual dividend.
(a) What is the expected rate of return on the preference shares?
(b) If an investor's required rate of return is 12%, what is the value of a preferenceshare for that investor?
(c) Should the investor acquire the preference shares?
135Security Valuation
Solution:
(a) Expected rate of return on preference
= Rs. 4.40/Rs. 44.00
= 10%
(b) VP = Dividend/Required rate of return
= Rs. 4.40/0.12
= Rs. 36.67
(c) The investor's required rate of return (12%) is more than the expected rate ofreturn for the investment (10%). Also, the value of the preference share to theinvestor (Rs. 36.67) is less than the existing market price (Rs. 44). Therefore, theinvestor should not acquire the preference shares from the market.
Illustration 17:
Consider a share of preferred stock with a par value of Rs. 100 that pays a 12% annualdividend, or Rs. 12. If the discount rate for this share is 15%, what would the preferenceshare be worth?
Solution:
Vp
= Rs. 12/0.15
= Rs. 80
Illustration 18:
KSDB pays a Rs. 2.76 dividend on each preference share. What is the value of eachpreference share if the required rate of return of investors is 12%?
Solution:
Vp
= Rs. 2.76/0.12
= Rs. 23
5.7 LET US SUM UP
The question of the valuation process following a sequence has been examined in theliterature and the industry performance overall, in turn, is linked to performance of theeconomy and the market in general. The three sequential steps in the valuation processwould, therefore, be as follows. Economy analysis, industry analysis, company analysis
Most investors look at price movements in the securities markets. They perceiveopportunities of capital gains in these movements. All would wish that they couldsuccessfully predict these and ensure their gains. Few, however, recognize that valuedetermines price and both change randomly. It would be useful for an intelligent investorto be aware of this process. The present section examines this process in detail. We firstpresented a brief outline of the evaluation model and then proceeded do discuss therelationship of value with price via investor-market-action. We also recall active andpassive investment strategies and finally figure out the dynamic valuation model.
Debt securities issued by governments, government and quasi-government organizations,and private business firms are fixed income securities. Bonds and debentures are themost common examples. The intrinsic value of bond or debenture is equal to the present
136Security Analysis andPortfolio Management
value of its expected cash flows. The coupon interest payments, and the principalrepayment are known and the present value is determined by discounting these futurepayments from the issuer at an appropriate discount rate or market yield.
5.8 LESSON END ACTIVITY
Evaluate briefly earning of variable income securities.
5.9 KEYWORDS
Indenture: The indenture is a long, complicated legal instrument containing the restrictions,pledges and promises of the contract. Bond indenture involves three parties. The firstparty is the debtor corporation that borrows the money, promises to pay interest, andpromises to repay the principal borrowed.
Maturities: Maturities vary widely. Bonds are usually grouped by their maturity classes.
Interest Payments: Bond interest is usually paid semi-annually, though annual paymentsare also popular. The method of payment depends upon whether the bond is a coupon(bearer) or registered bond.
Call Feature: Most modern corporate bonds are callable at the discretion of the issuer.This gives the issuing company the right to recall a bond before it reaches maturity.
Income Bonds: Income bonds are bonds on which the payment of interest is mandatoryonly to the extent of current earnings.
Participating Bonds: Companies with poor credit positions issue participating bonds.They have a guaranteed rate of interest, but may also participate in earnings up to anadditional specified percentage.
Serial Bonds: Like sinking fund bonds, serial bonds are not special types of bonds butjust names given to describe the method of repayment. Thus, any bond can be a serialbond by merely specifying it in the indenture.
5.10 QUESTIONS FOR DISCUSSION
1. Write on the three-step valuation process.
2. Explain the general valuation framework.
3. Write on Value-Price Relationship.
4. Write on features of bonds and explain them in detail.
5. What are the reasons for issuing Bonds?
6. Define a bond and also explain the different types, in detail.
7. What is meant by yield-to-maturity (YTM)?
8. What comprises the appropriate discount rate for a given debenture?
9. Market interest rates and debenture prices are inversely related. Explain why.
10. What are some of the general characteristics found in preference shares?
11. Explain preference shares in detail.

137Security ValuationCheck Your Progress: Model Answers
CYP 1
1. Real, buildings 2. general economy 3.declining 4. Value
CYP 2
1. F 2. F 3. T 4. T 5. T
5.11 SUGGESTED READINGS
Sudhindra Bhat, Security Analysis and Portfolio Management, Excel Books, Delhi.
Kevin, S., Security Analysis and Portfolio Management, Printice Hall of India.
Prasanna Chandra, Investment Analysis and Portfolio Management, Second Edition, Tata McGrawHill.
Punithavathy Pandian, Securities Analysis and Portfolio management, Vikas.
Investment Management, V. K. Bhalla.
A. Davis, Investors in a Changing Economy, Printice -Hall, 1968.
Williamson, J. Peter, Investments: New Analytic Techniques, London, Longman, 1970.
Cottle, CC., and Whitman, W.T., Investment Timing: The Formula Plan Approach, McGraw Hill.
138Security Analysis andPortfolio Management
LESSON
6EQUITY SHARES VALUATION
CONTENTS
6.0 Aims and Objectives
6.1 Introduction
6.2 Active Equity Investment Styles
6.3 Share Valuation
6.4 Equity Valuation Models
6.5 Dividend Valuation Model
6.5.1 Zero-Growth Case
6.5.2 Multiple-Growth Case
6.5.3 Models based on Price Ratio Analysis
6.5.4 Considerations in Developing and Selecting Quantitative Strategies
6.6 Let us Sum up
6.7 Lesson End Activity
6.8 Keywords
6.9 Questions for Discussion
6.10 Suggested Readings
6.0 AIMS AND OBJECTIVES
After studying this lesson, you should be able to understand:
l Equity Valuation Model
l Basic Models: Zero Growth Model, Constant Growth Model, Variable Growth Model,
l Valuation Models of Cyclical Stocks
l Models based on Price Ratio Analysis
l Random Valuation Model
l Group Rotation Model
l Considerations in Developing and Selecting Quantitative Strategy

139Equity Shares Valuation6.1 INTRODUCTION
Fundamental analysis is centred on present value, which is computed as the discountedvalue of future of earnings. This poses two problems. One, it is neither specified (as inthe case of preference shares) not stated and their timing have both to be estimated in aprobabilistic viz., dividends, cash flows and earnings. The solution to the first problem isoffered by past data, which is appropriately modified for future projections. Also, doingperiod of investors on the margin (i.e., the major players in the market who influence thepricing) in the case of active strategists and 'infinity' in the case of those who follow the'buy-and-hold' strategy is the base for determining the timing of these benefits. A majormodification to past data will be premised on received growth rates of return on equities.
The second problem can also be viewed as a case of three alternatives not reallyconflicting with each other. And question is: which cash flows are appropriate in thevaluation of equity shares? Now, if you buy equities and place them all in a trust fund foryour and your heir's perpetual benefit, what cash flows will be received to fund? Theanswer is 'dividends' because this is the only cash distribution, which a company makesto that. Even though earnings per share in any year do belong to the shareholders,companies do not distribute them all. There is no doubt that investors who follow the'buy-and-sell' strategy i.e., active strategists, would sell their whenever price changesare favourable. But since a price is the present value of future dividends, investors' cashflows from equity shares as a combination of dividends and a future price at which theshares can be equivalent to the stream of all dividends to be received on the shares.
Finally, should you regard earnings as important and use them as a measure of futurebenefits? Obviously, the answer is 'yes'. All dividends are paid out of earnings. Moreover,a popular approach to valuation of equity down as P/E ratio uses earnings as its basis.Hence, earnings are important. Now if all earnings are paid dividends, they will beaccounted for as dividends. In the even of a part of earnings being retained, the effectwill be to increase future earnings and finally future dividends too. Present value analysisaccounts for earnings reinvested currently and paid later as dividends. Such a risk ofdouble counting is present as open 'earnings' are used as a measure of future benefits. Infact, the two can be properly defined in which case the two variables viz. earnings anddividends would produce the same results. You would recognize that more than onepresent value model is possible in the case of equity shares viz., earnings now (i.e.,earnings after tax plus depreciation). However, it is always correct to use dividends asthe sum of the present value equation used to estimate the intrinsic value of equityshares. The present value, which uses dividends as its variable representing the cashflow stream, is known as the dividend valuation. This model is discussed below and isfollowed by a discussion of the P/E approach to equity shares situation.
6.2 ACTIVE EQUITY INVESTMENT STYLES
The primary styles of active equity management are top-down and bottom-up. A managerwho uses a top-down equity management style begins with an assessment of the overalleconomic environment and a forecast of its near-term outlook and makes a generalasset allocation decision regarding the relative attractiveness of the various sectors ofthe financial markets (e.g., equity, bond, real estate, bullion, and cash equivalents).
The top-down manager then analyses the stock market in an attempt to identify economicsectors and industries that stand to gain or lose from the manager's economic forecast.After identifying attractive and unattractive sectors and industries, the top-down managerfinally selects a portfolio of individual stocks.

140Security Analysis andPortfolio Management
EQUITY MANAGEMENT
Active Passive
Subjective Objective
Complex rules Simple rules
Few names Many names
Appropriate weightings Precise weightings
Trading
Active Passive
Worked transactions Programme transactions
Few names Many names
Cash reserves Fully vested
Monitoring
Active Passive
Infrequent Constant
Approximate Detailed
6.3 SHARE VALUATION
Share valuation is the process of assigning a rupee value to a specific share. An idealshare valuation technique would assign an accurate value to all shares. Share valuationis a complex topic and no single valuation model can truly predict the intrinsic value of ashare. Valuation models can provide a basis to compare the relative merits of two differentshares.
Equity valuations could be classified into the following categories:
1. Earnings valuation
2. Revenues valuation
3. Cash flow valuation
4. Asset valuation
5. Yield valuation
6. Member valuation
6.4 EQUITY VALUATION MODELS
We now turn to some of the actual models of equity valuation. The purpose of thesemodels is to identify whether a stock is mispriced. Underpriced stocks need to bepurchased; overpriced stocks should be shorted. As most modern equity valuation modelsare based upon the present value theory, set forth in detail by John B. Williams in Theoryof Investment Value, the investment analyst must first turn to the present value estimationto know the intrinsic value of the equities.
141Equity Shares ValuationCheck Your Progress 1
1. _____________ valuation is the process of assigning a rupee value to aspecific share.
2. An ideal share valuation will assign an accurate value to all ___________ .
3. Fundamental analysis is centered on present value, which is computed as thediscounted value of the future of _____________ .
4. The primary styles of active equity management are top-down and_____________ .
6.5 DIVIDEND VALUATION MODEL
A difficult problem in using the dividend valuation model is the timing of cash flows fromdividends. Since equity shares have no finite measure, the investor must forecast allfuture dividends. This might imply a forecast of intently long stream of dividends. Clearly,this would be almost impossible. And therefore, in order to manage the problem,assumptions are made with regard to the future growth of the dividend of the immediatelyprevious period available at the time the investor wants to determine the intrinsic valueof his/her equity shares. The assumptions can be:
(a) Dividends do not grow in future i.e., the constant or zero growth assumption.
(b) Dividends grow at a constant rate in future, i.e., the constant assumption.
(c) Dividends grow at varying rates in the future time period i.e., multiple growthassumption.
The dividend valuation model is now discussed with these assumptions.
6.5.1 Zero-Growth Case
The growth rate of dividend D at time 't' will be known by solving for 'g' in the following
Dt= D
t – 1 (1 + g
t) ...(1)
Or,
Dt= t t
1
D – 1(1 + g )
D – 1...(2)
You can easily see that when gt = 0, 3 equation 1 will yield D
t = D
t – 1, which
means all future dividends would equal to be current dividend (i.e., the dividend ofthe immediately preceding period available as on date)
Now, the present value of dividends for an infinite future period would be
V = 0 1 22 3
D D D+ + +
1+ k (1+ k) (1+ k)¥ ...(3)
Since, D0 = D
1 = D
2 = D
3, under the zero-grown assumption, the numerator D
1 in
equation 3 is replaced D0.
You will appreciate that discounting cash flows over a very distant long futureperiod would be meaningless. Mathematics tells us that if K > 0 then the value of
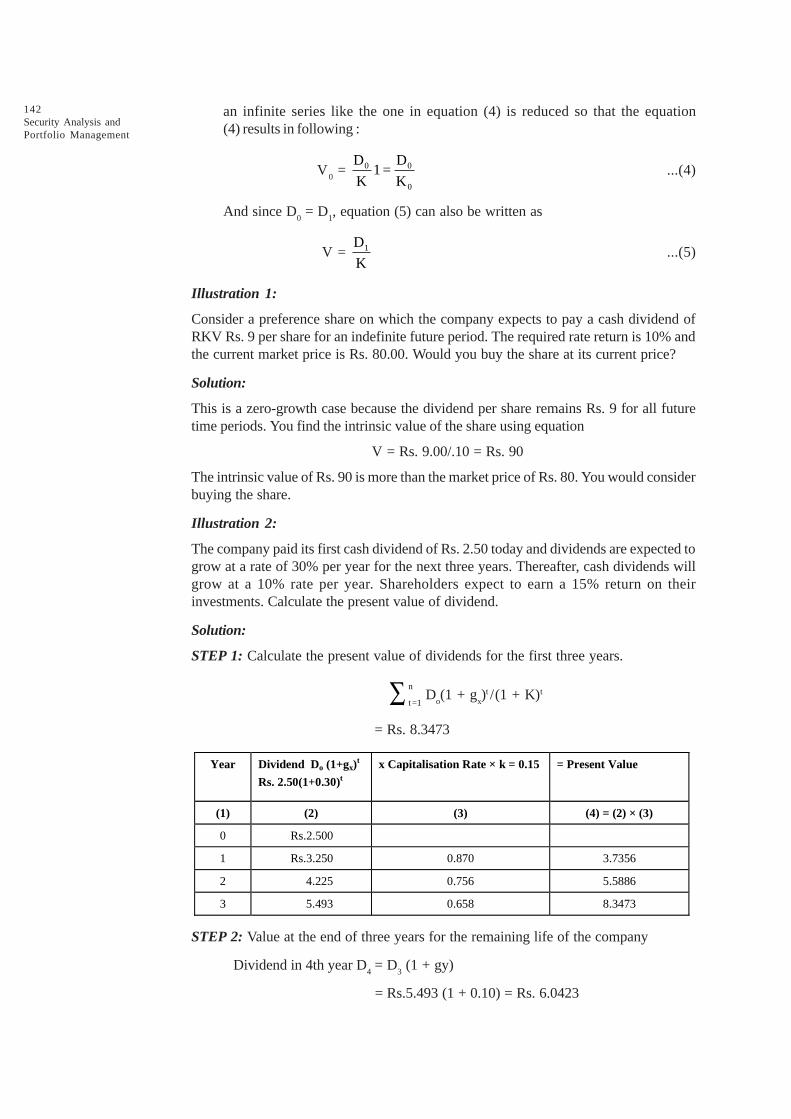
142Security Analysis andPortfolio Management
an infinite series like the one in equation (4) is reduced so that the equation(4) results in following :
V0
= 0 0
0
D D1 =
K K...(4)
And since D0 = D
1, equation (5) can also be written as
V = 1D
K...(5)
Illustration 1:
Consider a preference share on which the company expects to pay a cash dividend ofRKV Rs. 9 per share for an indefinite future period. The required rate return is 10% andthe current market price is Rs. 80.00. Would you buy the share at its current price?
Solution:
This is a zero-growth case because the dividend per share remains Rs. 9 for all futuretime periods. You find the intrinsic value of the share using equation
V = Rs. 9.00/.10 = Rs. 90
The intrinsic value of Rs. 90 is more than the market price of Rs. 80. You would considerbuying the share.
Illustration 2:
The company paid its first cash dividend of Rs. 2.50 today and dividends are expected togrow at a rate of 30% per year for the next three years. Thereafter, cash dividends willgrow at a 10% rate per year. Shareholders expect to earn a 15% return on theirinvestments. Calculate the present value of dividend.
Solution:
STEP 1: Calculate the present value of dividends for the first three years.
n
t =1å Do(1 + g
x)t /(1 + K)t
= Rs. 8.3473
Year Dividend Do (1+gx)t
Rs. 2.50(1+0.30)t
x Capitalisation Rate × k = 0.15 = Present Value
(1) (2) (3) (4) = (2) × (3)
0 Rs.2.500
1 Rs.3.250 0.870 3.7356
2 4.225 0.756 5.5886
3 5.493 0.658 8.3473
STEP 2: Value at the end of three years for the remaining life of the company
Dividend in 4th year D4 = D
3 (1 + gy)
= Rs.5.493 (1 + 0.10) = Rs. 6.0423

143Equity Shares Valuation
Value at the end of the third year
V3 = D
4/(k – gy)
V3 = 6.0423/(0.15 – 0.10)
= Rs. 120.846
STEP 3: The present value at the end of three years (V3) discounted by the required
rate of return k = 0.15
(V3) ¥ 1/(1 + k)3
= Rs. 120.846 (0.658)
= Rs. 79.516668
STEP 4: The value per share today equals the present value of dividends for the firstthree years (Step-1) plus the present value of the share price at the end of year 3(Step-3)
Step 1 Step 2
Vo =Rs.8.343 + Rs.79.516668
= Rs.87.8639668
STEP 5: Multiply the number of shares by the price per share to determine the totalvalue of the equity. If there are 10,00,000 ordinary shares the total value of the firm isRs. 8,78,63,967.
6.5.2 Multiple-Growth Case
The multiple-growth assumption has to be made in a vast number of practical situations.The infinite future period is viewed as divisible into two or more different growth segments.The investor must forecast the time to which growth would be variable and after whichonly the growth rate would show a pattern and would be constant. This would mean thatpresent value calculations will have to be spread over two phases viz., one phase wouldlast until time 'T' and other would begin after 'T' in infinity.
The present value of all dividends forecasts up to and including time 'T' VT(i)
would be
tT
T(i) tt=1
DV
(1+ K)å …(6)
The second phase present value is denoted by VT(2)
and would based on constant-growthdividend forecast after time 'T'. The position of the investor at time 'T' after which thesecond phase commences is viewed as a point in time when he is forecasting a streamof dividends for time periods T + 1, T+2, T+3 and so on, which grow at a constant rate.The second phase dividends would be
DT+1
= DT(1 + g)
DT+2
= DT+1
(1 + g) = DT(1 + g)2 …(7)
DT+3
= DT+2
(1 + g) = DT(1 + g)3
And so on. The present value of the second phase stream of dividends can, therefore, beestimated using equation (6) and at time 'T'
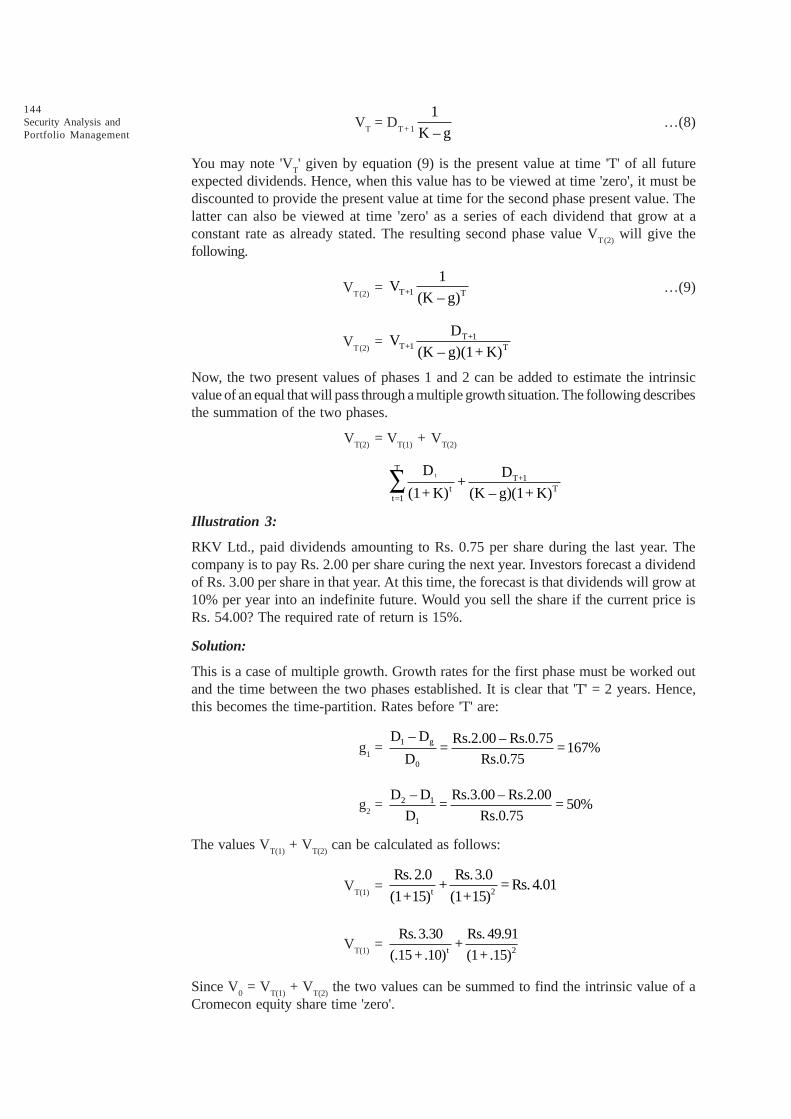
144Security Analysis andPortfolio Management
VT = D
T+ 1
1
K – g…(8)
You may note 'VT' given by equation (9) is the present value at time 'T' of all future
expected dividends. Hence, when this value has to be viewed at time 'zero', it must bediscounted to provide the present value at time for the second phase present value. Thelatter can also be viewed at time 'zero' as a series of each dividend that grow at aconstant rate as already stated. The resulting second phase value V
T(2) will give the
following.
VT(2)
= T+1 T
1V
(K – g)…(9)
VT(2)
= T+1T+1 T
DV
(K – g)(1+ K)
Now, the two present values of phases 1 and 2 can be added to estimate the intrinsicvalue of an equal that will pass through a multiple growth situation. The following describesthe summation of the two phases.
VT(2)
= VT(1)
+ VT(2)
tT
T+1t T
t=1
D D+
(1+ K) (K – g)(1+ K)åIllustration 3:
RKV Ltd., paid dividends amounting to Rs. 0.75 per share during the last year. Thecompany is to pay Rs. 2.00 per share curing the next year. Investors forecast a dividendof Rs. 3.00 per share in that year. At this time, the forecast is that dividends will grow at10% per year into an indefinite future. Would you sell the share if the current price isRs. 54.00? The required rate of return is 15%.
Solution:
This is a case of multiple growth. Growth rates for the first phase must be worked outand the time between the two phases established. It is clear that 'T' = 2 years. Hence,this becomes the time-partition. Rates before 'T' are:
g1 = 1 g
0
D – D Rs.2.00 – Rs.0.75= =167%
D Rs.0.75
g2 = 2 1
1
D – D Rs.3.00 – Rs.2.00= = 50%
D Rs.0.75
The values VT(1)
+ VT(2)
can be calculated as follows:
VT(1)
= t 2
Rs.2.0 Rs.3.0+ = Rs.4.01
(1+15) (1+15)
VT(1)
= t 2
Rs.3.30 Rs. 49.91+
(.15 +.10) (1+ .15)
Since V0 = V
T(1) + V
T(2) the two values can be summed to find the intrinsic value of a
Cromecon equity share time 'zero'.
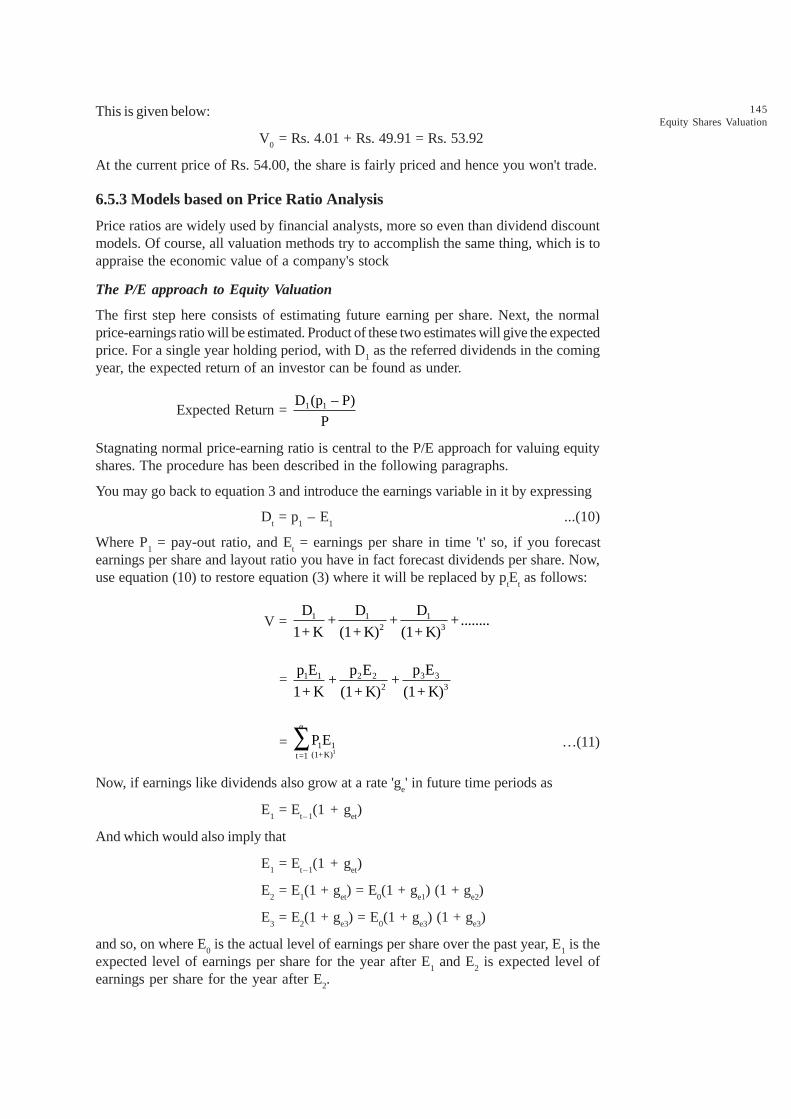
145Equity Shares Valuation
This is given below:
V0 = Rs. 4.01 + Rs. 49.91 = Rs. 53.92
At the current price of Rs. 54.00, the share is fairly priced and hence you won't trade.
6.5.3 Models based on Price Ratio Analysis
Price ratios are widely used by financial analysts, more so even than dividend discountmodels. Of course, all valuation methods try to accomplish the same thing, which is toappraise the economic value of a company's stock
The P/E approach to Equity Valuation
The first step here consists of estimating future earning per share. Next, the normalprice-earnings ratio will be estimated. Product of these two estimates will give the expectedprice. For a single year holding period, with D
1 as the referred dividends in the coming
year, the expected return of an investor can be found as under.
Expected Return = 1 1D (p – P)
P
Stagnating normal price-earning ratio is central to the P/E approach for valuing equityshares. The procedure has been described in the following paragraphs.
You may go back to equation 3 and introduce the earnings variable in it by expressing
Dt = p
1 – E
1...(10)
Where P1 = pay-out ratio, and E
t = earnings per share in time 't' so, if you forecast
earnings per share and layout ratio you have in fact forecast dividends per share. Now,use equation (10) to restore equation (3) where it will be replaced by p
tE
t as follows:
V = 1 1 12 3
D D D+ + +........
1+ K (1+ K) (1+ K)
= 3 31 1 2 22 3
p Ep E p E+ +
1+ K (1+ K) (1+ K)
=1
á
1 1(1+K)t=1
P Eå …(11)
Now, if earnings like dividends also grow at a rate 'ge' in future time periods as
E1 = E
t–1(1 + g
et)
And which would also imply that
E1 = E
t–1(1 + g
et)
E2 = E
1(1 + g
et) = E
0(1 + g
e1) (1 + g
e2)
E3 = E
2(1 + g
e3) = E
0(1 + g
e3) (1 + g
e3)
and so, on where E0 is the actual level of earnings per share over the past year, E
1 is the
expected level of earnings per share for the year after E1 and E
2 is expected level of
earnings per share for the year after E2.
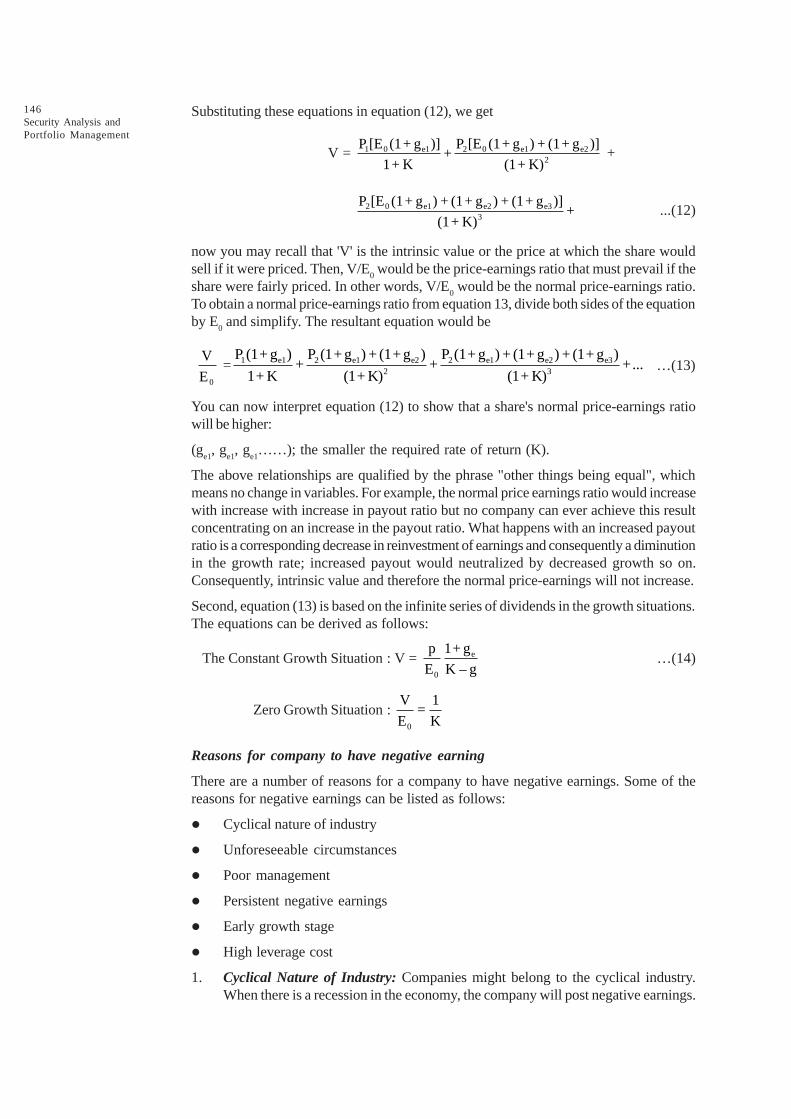
146Security Analysis andPortfolio Management
Substituting these equations in equation (12), we get
V = 1 0 e1 2 0 e1 e22
P [E (1+ g )] P [E (1+ g ) + (1+ g )]+
1+ K (1+ K) +
2 0 e1 e2 e33
P [E (1+ g ) + (1+ g ) + (1+ g )]+
(1+ K)...(12)
now you may recall that 'V' is the intrinsic value or the price at which the share wouldsell if it were priced. Then, V/E
0 would be the price-earnings ratio that must prevail if the
share were fairly priced. In other words, V/E0 would be the normal price-earnings ratio.
To obtain a normal price-earnings ratio from equation 13, divide both sides of the equationby E
0 and simplify. The resultant equation would be
0
V
E = 1 e1 2 e1 e2 2 e1 e2 e3
2 3
P (1+ g ) P (1+g ) + (1+g ) P (1+ g ) + (1+ g ) + (1+ g )+ + +...
1+ K (1+ K) (1+ K)…(13)
You can now interpret equation (12) to show that a share's normal price-earnings ratiowill be higher:
(ge1, g
e1, g
e1……); the smaller the required rate of return (K).
The above relationships are qualified by the phrase "other things being equal", whichmeans no change in variables. For example, the normal price earnings ratio would increasewith increase with increase in payout ratio but no company can ever achieve this resultconcentrating on an increase in the payout ratio. What happens with an increased payoutratio is a corresponding decrease in reinvestment of earnings and consequently a diminutionin the growth rate; increased payout would neutralized by decreased growth so on.Consequently, intrinsic value and therefore the normal price-earnings will not increase.
Second, equation (13) is based on the infinite series of dividends in the growth situations.The equations can be derived as follows:
The Constant Growth Situation : V = e
0
p 1+ g
E K – g…(14)
Zero Growth Situation : 0
V 1=
E K
Reasons for company to have negative earning
There are a number of reasons for a company to have negative earnings. Some of thereasons for negative earnings can be listed as follows:
l Cyclical nature of industry
l Unforeseeable circumstances
l Poor management
l Persistent negative earnings
l Early growth stage
l High leverage cost
1. Cyclical Nature of Industry: Companies might belong to the cyclical industry.When there is a recession in the economy, the company will post negative earnings.
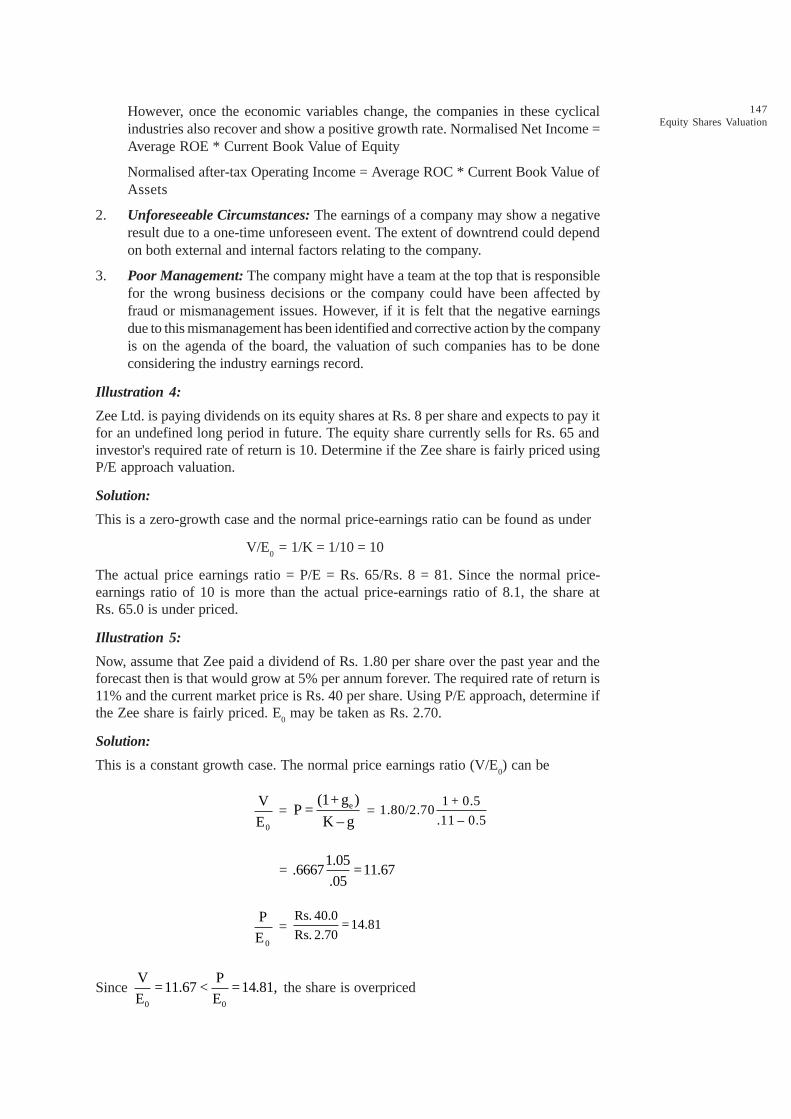
147Equity Shares Valuation
However, once the economic variables change, the companies in these cyclicalindustries also recover and show a positive growth rate. Normalised Net Income =Average ROE * Current Book Value of Equity
Normalised after-tax Operating Income = Average ROC * Current Book Value ofAssets
2. Unforeseeable Circumstances: The earnings of a company may show a negativeresult due to a one-time unforeseen event. The extent of downtrend could dependon both external and internal factors relating to the company.
3. Poor Management: The company might have a team at the top that is responsiblefor the wrong business decisions or the company could have been affected byfraud or mismanagement issues. However, if it is felt that the negative earningsdue to this mismanagement has been identified and corrective action by the companyis on the agenda of the board, the valuation of such companies has to be doneconsidering the industry earnings record.
Illustration 4:
Zee Ltd. is paying dividends on its equity shares at Rs. 8 per share and expects to pay itfor an undefined long period in future. The equity share currently sells for Rs. 65 andinvestor's required rate of return is 10. Determine if the Zee share is fairly priced usingP/E approach valuation.
Solution:
This is a zero-growth case and the normal price-earnings ratio can be found as under
V/E0 = 1/K = 1/10 = 10
The actual price earnings ratio = P/E = Rs. 65/Rs. 8 = 81. Since the normal price-earnings ratio of 10 is more than the actual price-earnings ratio of 8.1, the share atRs. 65.0 is under priced.
Illustration 5:
Now, assume that Zee paid a dividend of Rs. 1.80 per share over the past year and theforecast then is that would grow at 5% per annum forever. The required rate of return is11% and the current market price is Rs. 40 per share. Using P/E approach, determine ifthe Zee share is fairly priced. E
0 may be taken as Rs. 2.70.
Solution:
This is a constant growth case. The normal price earnings ratio (V/E0) can be
0
V
E = e(1+ g )
P =K – g
= 1 + 0.5
1.80/2.70.11 – 0.5
=1.05
.6667 =11.67.05
0
P
E =
Rs. 40.0=14.81
Rs. 2.70
Since 0 0
V P=11.67 < =14.81,
E E the share is overpriced
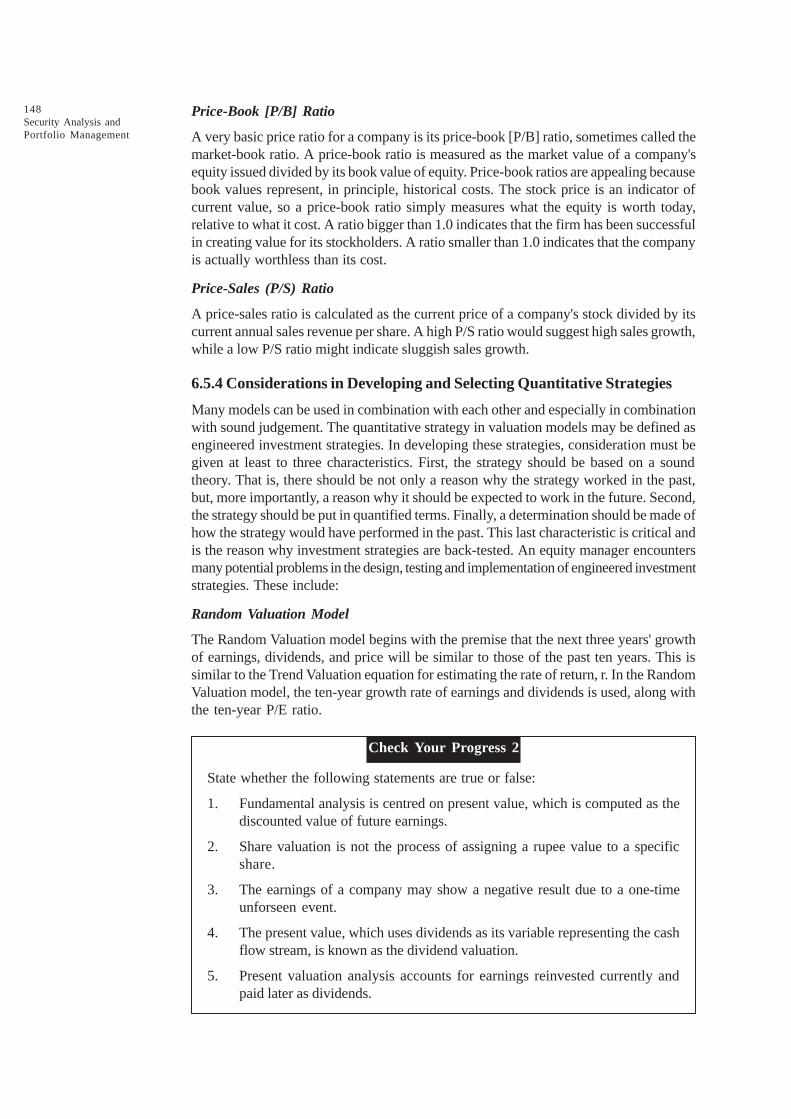
148Security Analysis andPortfolio Management
Price-Book [P/B] Ratio
A very basic price ratio for a company is its price-book [P/B] ratio, sometimes called themarket-book ratio. A price-book ratio is measured as the market value of a company'sequity issued divided by its book value of equity. Price-book ratios are appealing becausebook values represent, in principle, historical costs. The stock price is an indicator ofcurrent value, so a price-book ratio simply measures what the equity is worth today,relative to what it cost. A ratio bigger than 1.0 indicates that the firm has been successfulin creating value for its stockholders. A ratio smaller than 1.0 indicates that the companyis actually worthless than its cost.
Price-Sales (P/S) Ratio
A price-sales ratio is calculated as the current price of a company's stock divided by itscurrent annual sales revenue per share. A high P/S ratio would suggest high sales growth,while a low P/S ratio might indicate sluggish sales growth.
6.5.4 Considerations in Developing and Selecting Quantitative Strategies
Many models can be used in combination with each other and especially in combinationwith sound judgement. The quantitative strategy in valuation models may be defined asengineered investment strategies. In developing these strategies, consideration must begiven at least to three characteristics. First, the strategy should be based on a soundtheory. That is, there should be not only a reason why the strategy worked in the past,but, more importantly, a reason why it should be expected to work in the future. Second,the strategy should be put in quantified terms. Finally, a determination should be made ofhow the strategy would have performed in the past. This last characteristic is critical andis the reason why investment strategies are back-tested. An equity manager encountersmany potential problems in the design, testing and implementation of engineered investmentstrategies. These include:
Random Valuation Model
The Random Valuation model begins with the premise that the next three years' growthof earnings, dividends, and price will be similar to those of the past ten years. This issimilar to the Trend Valuation equation for estimating the rate of return, r. In the RandomValuation model, the ten-year growth rate of earnings and dividends is used, along withthe ten-year P/E ratio.
Check Your Progress 2
State whether the following statements are true or false:
1. Fundamental analysis is centred on present value, which is computed as thediscounted value of future earnings.
2. Share valuation is not the process of assigning a rupee value to a specificshare.
3. The earnings of a company may show a negative result due to a one-timeunforseen event.
4. The present value, which uses dividends as its variable representing the cashflow stream, is known as the dividend valuation.
5. Present valuation analysis accounts for earnings reinvested currently andpaid later as dividends.
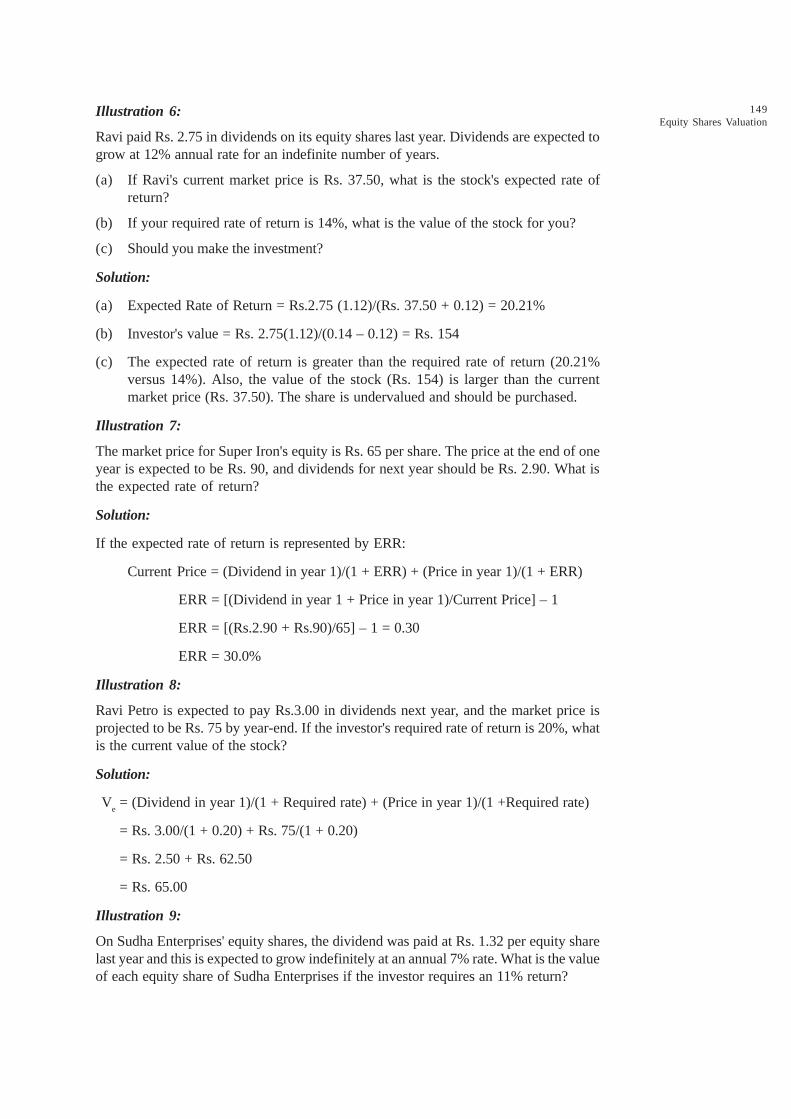
149Equity Shares Valuation
Illustration 6:
Ravi paid Rs. 2.75 in dividends on its equity shares last year. Dividends are expected togrow at 12% annual rate for an indefinite number of years.
(a) If Ravi's current market price is Rs. 37.50, what is the stock's expected rate ofreturn?
(b) If your required rate of return is 14%, what is the value of the stock for you?
(c) Should you make the investment?
Solution:
(a) Expected Rate of Return = Rs.2.75 (1.12)/(Rs. 37.50 + 0.12) = 20.21%
(b) Investor's value = Rs. 2.75(1.12)/(0.14 – 0.12) = Rs. 154
(c) The expected rate of return is greater than the required rate of return (20.21%versus 14%). Also, the value of the stock (Rs. 154) is larger than the currentmarket price (Rs. 37.50). The share is undervalued and should be purchased.
Illustration 7:
The market price for Super Iron's equity is Rs. 65 per share. The price at the end of oneyear is expected to be Rs. 90, and dividends for next year should be Rs. 2.90. What isthe expected rate of return?
Solution:
If the expected rate of return is represented by ERR:
Current Price = (Dividend in year 1)/(1 + ERR) + (Price in year 1)/(1 + ERR)
ERR = [(Dividend in year 1 + Price in year 1)/Current Price] – 1
ERR = [(Rs.2.90 + Rs.90)/65] – 1 = 0.30
ERR = 30.0%
Illustration 8:
Ravi Petro is expected to pay Rs.3.00 in dividends next year, and the market price isprojected to be Rs. 75 by year-end. If the investor's required rate of return is 20%, whatis the current value of the stock?
Solution:
Ve= (Dividend in year 1)/(1 + Required rate) + (Price in year 1)/(1 +Required rate)
= Rs. 3.00/(1 + 0.20) + Rs. 75/(1 + 0.20)
= Rs. 2.50 + Rs. 62.50
= Rs. 65.00
Illustration 9:
On Sudha Enterprises' equity shares, the dividend was paid at Rs. 1.32 per equity sharelast year and this is expected to grow indefinitely at an annual 7% rate. What is the valueof each equity share of Sudha Enterprises if the investor requires an 11% return?

150Security Analysis andPortfolio Management
Solution:
Ve= (Last year dividend{1 + Growth Rate})/(Required rate of return – Growth rate)
= Rs. 1.32 (1.07) / (0.11 – 0.07) = Rs. 35.31
Illustration 10:
An investor holds an equity share giving him an annual dividend of Rs. 30. He expects tosell the share for Rs. 300 at the end of a year. Calculate the value of the share if therequired rate of return is 10%.
Solution:
The market price of a share in the beginning of the period is equal to the present value ofthe dividends paid at the end of the period plus the market price of the share at the endof the period. Symbolically:
P0 = D
1/(1 + i) + P
1(1 + i)
OR P0 = (D
1 + P
1)/(1 + i)
where
P0 = Current price of the share
i = Required rate of return or the cost of equity
D1 = Dividend to be received at the end of the period
P1 = Market price of share at the end of the period
Substituting the values, we get:
P1 = Market price of share at the end of the period
P0 = (Rs. 30 + Rs. 300)/(1 + 0.10) = Rs. 330/1.10 = Rs. 300
Illustration 11:
Ravi equity share currently sells for Rs. 23 per share. The company's finance manageranticipates a constant growth rate of 10.5% and an end-of-year dividend of Rs. 2.50.
(a) What is the expected rate of return?
(b) If the investor requires a 17% return, should he purchase the stock?
Solution:
(a) Expected rate of return = (Dividend in year 1) / (Market Price) + Growth rate
= (Rs. 2.50 / Rs. 23.00) + 0.105
= 21.37%
(b) Ve = Rs. 2.50 / (0.17 – 0.105)
= Rs. 38.46
The value of the stock would be Rs.38.46. Thus, the expected rate of return exceeds therequired rate of return, which means that the value of the security is greater than thecurrent market price. Therefore, the investor should buy the stock.
Illustration 12:
RAJ's equity shares currently sells for Rs. 22.50 per share. The finance manager ofRAJ anticipates a constant growth rate of 12% and an end-of-year dividend of Rs. 2.50.

151Equity Shares Valuation
(a) What is your expected rate of return if you buy the stock for Rs. 25?
(b) If you require an 18% return, should you purchase the stock?
Solution:
(a) Expected rate of return: (Dividend in year 1)/(Market Price) + Growth rate
= Rs. 2.50 / Rs.25 + 0.12
= 0.22 = 22%
(b) Ve = Rs. 2.50 / (0.18 – 0.12)
= Rs. 41.67
Yes, do purchase the equity shares of RAJ.
Illustration 13:
Firms A, B and C are similar. Firm A is the most progressive and trades at a 18/1 P/Emultiple. Firm B is less progressive, is not publicly traded, and has an EPS of Rs. 1.20.Firm C is least progressive and trades at a 15/1 P/E ratio. What is the intrinsic value offirm B?
Solution:Average P/E = 16.5
Intrinsic value = 16.5 ¥ 1.20
= Rs. 19.80
Illustration 14:
Companies R, S and T are similar. Company R is privately held, and has a book value ofRs. 40 per share. Company S has a market price of Rs. 15 and a book value of Rs. 12.Company T has a market value (MV) of Rs. 82 and a book value of Rs. 62. What is apossible value for Company R?
Solution:
Ratio of book value to market value:
Company R = Rs. 40/MV – 0.78
MV = Rs. 51
Company S = Rs. 12/Rs. 15 = 0.8
Company T = Rs. 62/Rs. 82 = 0.76
Illustration 15:
Verma is a conservative investor who demands 10% interest on his fixed investment but20% from his equity investments. He has been considering the purchase of an equitythat pays Rs. 2.50 in dividends this year and whose dividends are expected to grow at10% per year for the next three years. Earnings this year are Rs. 5 per share and areexpected to grow at 20% for the next seven years. Stocks growing at this rate generallysell at 40 times earnings. What price does Verma pay for this equity?
Solution:
Using the three year valuation formula:
P0 = D(1 + g)/(1 + k) + D(1 + g)2/(1 + k)2 + D(1 + g)3/(1 + k)3
152Security Analysis andPortfolio Management
where
P3 = (E)(P/E)(1 + g)3
P3 = (Rs. 4) (40) (1 + 20%)
3 = Rs. 276.48
P0 = Rs. 2.50 (1 + 0.10)/(1 + 0.20) + Rs. 2.50 (1 + 0.10)2/(1 + 0.20)2
+ [Rs. 2.50 (1 + 0.10)3 + Rs. 276.48]/(1 + 0.20)3
Rs. 2.50/(1.20) + Rs. 3.035/(1.44) + (Rs. 3.3275 + Rs. 276.48) / (1.728)
= Rs. 2.292 + Rs. 2.107 + Rs. 161.926
= Rs. 166.32
6.6 LET US SUM UP
Fundamental analysis is centred on present value, which is computed as the discountedvalue of future earnings. This poses two problems. One, it is neither specified (as in thecase of preference shares) nor is it stated and their timings have to be both estimated ina probabilistic viz., dividends cash flows, and earnings. The solution to the first problemis offered by past data, which is appropriately modified for future projections. Also,doing period of investors on the margin (i.e., the major players in the market who influencethe pricing) in the case of active strategists and 'infinity' in the case of those who followthe 'buy-and-hold' strategy' is the base for determining the timing of these benefits. Amajor modification to past data will be premised on received growth rates of return onequities.
The valuation task is relatively straightforward in case of bond and preference share,because benefits are generally constant and reasonably certain. Equity valuation isdifferent, because the return on equity is uncertain and can change from time to time. Itis the size of the return and the degree of fluctuation (i.e. risk), which together determinethe value of a share to the investor. We have also discussed equity valuation models. Thepurpose of these models is to identify whether a stock is mispriced. Underpriced stocksneed to be purchased; overpriced stocks should be shorted. As most modern equityvaluation models are based upon the present value theory, set forth in detail by John B.Williams in Theory of Investment Value, investment analyst must turn first to the presentvalue estimation to know the intrinsic value of the equities.
6.7 LESSON END ACTIVITY
Do the risk analysis of different securities mainly with fixed income and variable income.
6.8 KEYWORDS
Fundamental Analysis: It is centred on present value, which is computed as thediscounted value of future of earnings.
Present Value Analysis: It accounts for earnings reinvested currently and paid later asdividends.
Share Valuation: It is the process of assigning a rupee value to a specific share.
Price-Book Ratio: A very basic price ratio for a company is its price-book [P/B] ratio,sometimes called the market-book ratio.

153Equity Shares Valuation
Price-Sale Ratio: A price-sales ratio is calculated as the current price of a company'sstock divided by its current annual sales revenue per share.
Random Valuation Model: It begins with the premise that the next three years' growthof earnings, dividends, and price will be similar to those of the past ten years.
6.9 QUESTIONS FOR DISCUSSION
1. Write a note on the present value of expected stream of benefits from equityshares.
2. Explain passive and active investment styles.
3. What are the differences between active equity management and passive equitymanagement?
4. What do you mean by valuation? Explain briefly different equity evaluation modules.
5. Write a short note with illustrations for the following:
(i) Dividend Valuation Model
(ii) Zero Growth Case
(iii) Constant Growth Case
(iv) Multiple Growth Case
(v) P/E Approach to Equity Valuation
(vi) Price-Book [P/B] Ratio
(vii) Random Valuation Model
Check Your Progress: Model Answers
CYP 1
1. Share 2. shares 3.earnings 4. bottom up
CYP 2
1. T 2. F 3. T 4. T 5. T
6.10 SUGGESTED READINGS
Sudhindra Bhat, Security Analysis and Portfolio Management, Excel Books, Delhi.
Kevin, S., Security Analysis and Portfolio Management, Printice Hall of India.
Prasanna Chandra, Investment Analysis and Portfolio Management, Second Edition, TataMcGraw Hill.
Punithavathy Pandian, Securities Analysis and Portfolio management, Vikas.
Investment Management, V. K. Bhalla.
A. Davis, Investors in a Changing Economy, Printice -Hall, 1968.
Williamson, J. Peter, Investments: New Analytic Techniques, London, Longman, 1970.
Cottle, CC., and Whitman, W.T., Investment Timing: The Formula Plan Approach, McGraw Hill.

UNIT IV


LESSON
7FUNDAMENTAL ANALYSIS 1:ECONOMIC ANALYSIS
CONTENTS
7.0 Aims and Objectives
7.1 Introduction
7.2 Fundamental Analysis
7.2.1 Fundamental Analysis and Efficient Market
7.2.2 Fundamental Analysis and Chemistry of Earnings
7.3 Economy - Industry - Company Analysis: A Framework
7.3.1 Economy Analysis
7.3.2 Macro Economic Analysis
7.3.3 Fiscal Policy
7.3.4 Monetary Policy
7.4 Significance of Economic Analysis
7.5 Economic Forecasting
7.5.1 Techniques
7.5.2 Anticipatory Surveys
7.6 Barometric or Indian Approach
7.6.1 Leading Indicators
7.6.2 Coincidental Indicators
7.6.3 Lagging Indicators
7.7 Money and Stock Prices
7.8 Diffusion Index
7.9 Geometric Model Building Approach
7.9.1 Future Scenario
7.10 Economy and Industry Analysis
7.11 Let us Sum up
7.12 Lesson End Activity
7.13 Keywords
7.14 Questions for Discussion
7.15 Suggested Readings
158Security Analysis andPortfolio Management
7.0 AIMS AND OBJECTIVES
After studying this lesson, you should be able to:
l Analysis of Economy
l Current State of Economy and Indicators
l Tools for Economic Analysis
l Economic Forecasting
7.1 INTRODUCTION
Investment decisions are a part of our economic life. Everybody makes such decisionsin different contexts at different times. Some are able to reap more profits through them;while others simply lose their money. Attempts should, therefore, be made to understandand know the way sound investments decision can be made in order to improve thechange of making profit through them. Thus, investment decision-making is an importantarea probing further.
Unfortunately, for long, investment decision-making was regarded only as an act. As anart it is personal subjective, it was difficult to provide a general framework with in onecould operate. Only, recently it was considered as science with the result that a body ofliterature has been developed that help us to understand the way investment decisionscan be attempted. Recognizing its art content, this body of literature works on the thinkingthat a general system framework can be suggested for those involved in investmentdecisions, who can then modify it according to their requirements. It has, therefore, beenrecognized that investment decision-making is both an art as well as a science. This isindeed an on-going process in which a decision-maker attempts to update himself regardingthe characteristics of returns of securities. These characteristics keep on changing andinvestors go on attempting to understand their impact on their decisions. The conceivableinvestment opportunities were discussed and explained in Block I. The investment decision-maker takes them into account in order to decide which securities should be bought orheld or sold by him. A very simple decision rule is applicable here: buy a security that hashighest bought, held or sold security volume and the above required per unit of risk orlowest risk per unit or return. And, sell the security, which does not satisfy the aboverequired.
The above decision rule to buy/sell securities is highly simple, but it is very difficult toapply both risk and return fashion in actual practice. This is because there are a largenumber of factors, which affect both risk and return in the real world. Thus, a securitythat had the highest return per unit of risk at one point of time and was considered to bea good buy might turn into a less attractive proposition and could be considered later onas a possible candidate for disinvestments. Such a situation might arise due to change inthe management concerned company or changes in government policy concerning theeconomy, making it less attractive.
Investment decision-making being continuous in nature should be attempted systematically.Broadly approaches are suggested in the literature. These are: fundamental analysis andtechnical analysis. In this approach, the investor attempts to look at fundamental factorsthat affect risk return characteristic of the security. While in the second approach, theinvestor tries to identify the price trends that reflect these characteristics. Technicalanalysis concentrates on demand and supply of securities and prevalent trend in shareprices mean by various market indices in the stock market.

159Fundamental Analysis 1:
Economic Analysis
7.2 FUNDAMENTAL ANALYSIS
As has been mentioned earlier, in the fundamental approach, an attempt is made toanalyze various fundamental or basic factors that affect the risk-return of the securities.The effort here is to identify those securities that one perceives as mispriced in the stockmarket. The assumption in this case is that the 'market price' of security and the price asjustified by its fundamental factors called 'intrinsic value' are different and the marketplaceprovides an opportunity for a discerning investor to detect such discrepancy. The momentsuch a description is identified, a decision to invest or disinvest is made. The decision ruleunder this approach is like this:
If the price of a security at the market place is higher than the one, which is justified bythe security fundamentals, sell that security. This is because, it is expected that themarket will sooner or later realize its mistake and price the security properly. A deal tosell this security should be based on its fundamentals; it should be both before the marketcorrect its mistake by increasing the price of security in question. The price prevailing inmarket is called "market price' (MP) and the one justified by its fundamentals is called'intrinsic value' (IV) session rules/recommendations.
(1) If IV > MP, buy the security
(2) If IV < MP, sell the security
(3) If IV > MP, no action
The fundamental factors mentioned above may relate to the economy or industry orcompany or all some of this. Thus, economy fundamentals, industry fundamentals andcompany fundamentals are considered while prizing the securities for taking investmentdecision. In fact, the economy-industry-company framework forms integral part of thisapproach. This framework can be properly utilized by making suitable adjustments in aregular context. A world of caution, though. Please remember, the use of an analyticalframework does not guarantee an actual decision. However, it does guarantee an informedand considered investment decision, which would hopefully be better as it based onrelevant and crucial information.
7.2.1 Fundamental Analysis and Efficient Market
Before elaborating in detail on the economy-industry-company framework, it is pertinentto mention that doubts are expressed about the utility of this approach in the contest ofefficient stock market set-up. Briefly, the market efficiency relates to the speed withwhich the stock market incorporates the information about the economy, industry andcompany, in the share prices, rather instantaneously. The above given view about sharemarket efficiency implies that no one would be able to make abnormal profits given sucha set-up. Some research studies in the literature also support the above view. Practitioners,however, do not agree to such conclusions of an empirical nature.
7.2.2 Fundamental Analysis and Chemistry of Earnings
The logic for fundamental analysis becomes crystal clear once we understand thechemistry of earnings and macro and macro factors which influence the future of earnings.
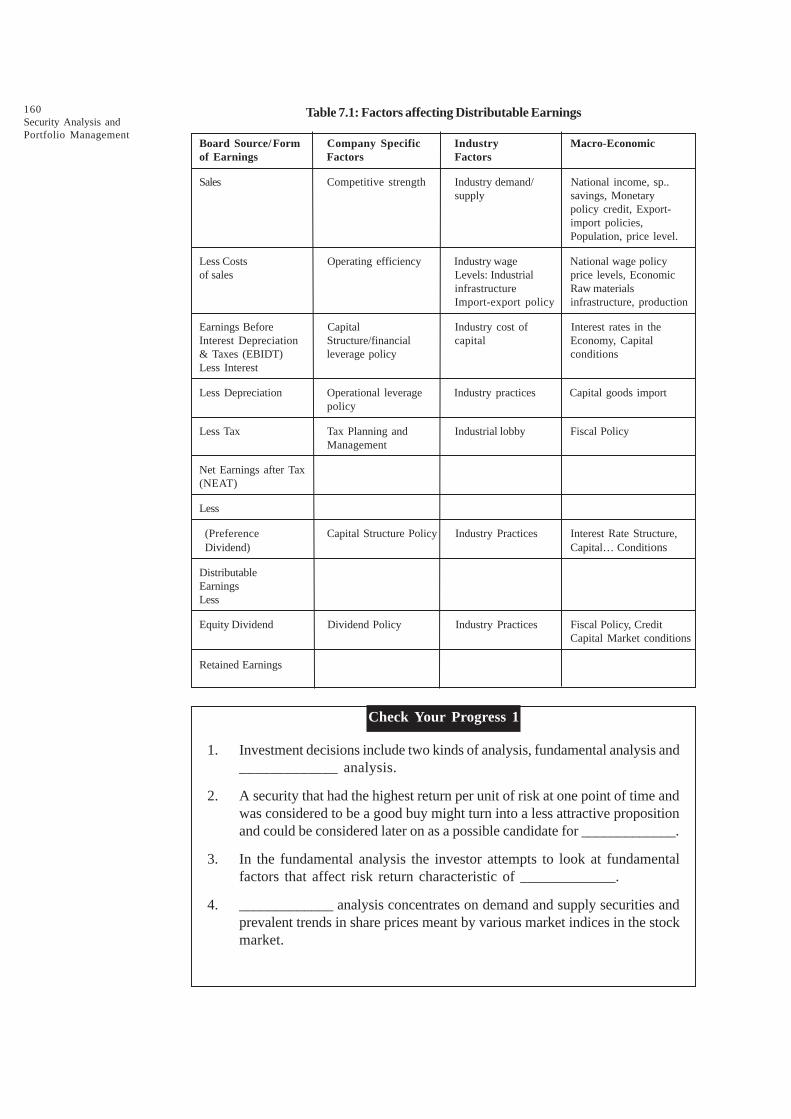
160Security Analysis andPortfolio Management
Table 7.1: Factors affecting Distributable Earnings
Board Source/Form Company Specific Industry Macro-Economicof Earnings Factors Factors
Sales Competitive strength Industry demand/ National income, sp..supply savings, Monetary
policy credit, Export-import policies,Population, price level.
Less Costs Operating efficiency Industry wage National wage policyof sales Levels: Industrial price levels, Economic
infrastructure Raw materialsImport-export policy infrastructure, production
Earnings Before Capital Industry cost of Interest rates in theInterest Depreciation Structure/financial capital Economy, Capital& Taxes (EBIDT) leverage policy conditionsLess Interest
Less Depreciation Operational leverage Industry practices Capital goods importpolicy
Less Tax Tax Planning and Industrial lobby Fiscal PolicyManagement
Net Earnings after Tax(NEAT)
Less
(Preference Capital Structure Policy Industry Practices Interest Rate Structure,Dividend) Capital… Conditions
DistributableEarningsLess
Equity Dividend Dividend Policy Industry Practices Fiscal Policy, CreditCapital Market conditions
Retained Earnings
Check Your Progress 1
1. Investment decisions include two kinds of analysis, fundamental analysis and_____________ analysis.
2. A security that had the highest return per unit of risk at one point of time andwas considered to be a good buy might turn into a less attractive propositionand could be considered later on as a possible candidate for _____________.
3. In the fundamental analysis the investor attempts to look at fundamentalfactors that affect risk return characteristic of _____________.
4. _____________ analysis concentrates on demand and supply securities andprevalent trends in share prices meant by various market indices in the stockmarket.

161Fundamental Analysis 1:
Economic Analysis
7.3 ECONOMY - INDUSTRY - COMPANY ANALYSIS:A FRAMEWORK
The analysis of economy, industry and company fundamentals as mentioned above is themain ingredient of the fundamental approach. The analyst should take into account allthe three constituents that form different but special steps in making an investmentdecision. These can be looked at as different stages in the investment decision-making.Operationally, to base the investment decision on various fundamentals, all the threestages must be taken into account.
7.3.1 Economy Analysis
In actual practice, you must have noticed that investment decisions of individuals and theinstitutions made in the economic set-up of a particular country. It becomes essential,therefore, to understand the star economy of that country at the macro level. The analysisof the state of the economy at the macro level incorporates the performance of theeconomy in the past, how it is performing in the present and how it is expected toperform in future. Also relevant in this context is to know how various sectors of theeconomy are going to grow in the future.
Economy
Industry
Company Analysis
7.3.2 Macro Economic Analysis
The analysis of the following factors indicates the trends in macro economic changesthat effect the risk and return on investments.
l Money supply
l Industrial production
l Capacity utilisation
l Unemployment
l Inflation
l Growth in GDP
l Institutional lending
l Stock prices
l Monsoons
l Productivity of factors of production

162Security Analysis andPortfolio Management
l Fiscal deficit
l Credit/Deposit ratio
l Stock of food grains and essential commodities
l Industrial wages
l Foreign trade and balance of payments position
l Status of political and economic stability
l Industrial wages
l Technological innovations
l Infrastructural facilities
l Economic and industrial policies of the government
l Debt recovery and loans outstanding
l Interest rates
l Cost of living index
l Foreign investments
l Trends in capital market
l Stage of the business cycle
l Foreign exchange reserves
In a globalised business environment, the top-down analysis of the prospects of a firmmust begin with the global economy. The global economy has a bearing on the exportprospects of the firm, the competition it faces from international competitors, and theprofitability of its overseas investors.
The government employs two broad classes of macroeconomic policies, viz. demand-side policies and supply-side policies.
Traditionally, the focus was mostly on fiscal and monetary policies, the two major toolsof demand-side economics. From the 1980s onward, however, supply-side economicshas received a lot of attention.
7.3.3 Fiscal Policy
Fiscal policy is concerned with the spending and tax initiatives of the government. It isthe most direct tool to stimulate or dampen the economy.
An increase in government spending stimulates the demand for goods and services,whereas a decrease deflates the demand for goods and services. By the same token, adecrease in tax rates increases the consumption of goods and services and an increasein tax rates decreases the consumption of goods and services.
7.3.4 Monetary Policy
Monetary policy is concerned with the manipulation of money supply in the economy.Monetary policy affects the economy mainly through its impact on interest rates.
The main tools of monetary policy are:
l Open market operation
l Bank rate
163Fundamental Analysis 1:
Economic Analysis
l Reserve requirements
l Direct credit controls
7.4 SIGNIFICANCE OF ECONOMIC ANALYSIS
Each of the sectors show sings of stagnation and degradation in the economy. This, wecan examine and understand by studying historical performance of various sectors ofthe economy in the past, their performances at present and then forming the expectationabout their performances in the future. It is through this systematic process that onewould be able to realise various relevant investment opportunities whenever these arise.Sectoral analysis, therefore, is carried out along with overall economy analysis as the rateof growth in overall economy often differs from the rate within various segments/sectors.
Rationale of the above type of analysis depends on economic considerations too. Theway people in general, their income and the way they spend these earnings would inultimate analysis decide which industry or bunch of industries would grow in the future.Such spending affects corporate profits, dividends and prices of the shares at the manywould grow in the future. A research study conducted by King (1966) reinforces theneed of economic and industry analysis in this context. According to him on an average,over half the variation in stock returns is attributed to market prices that affect all themarket indices. Over and above this, industry specific factors account for approximately10 to 15 per cent of the variation of stock returns. Thus, taken together, two-third of thevariation of stock prices/returns reported to market and industry related factors. King'sstudy, despite the limitations of its period of its publication and use of US-specific data,highlights the importance of economic and industry analyses in making investmentdecisions. To neglect this analysis while deciding where to invest would be at one's peril.
It must be clear by this now that analysis of historical performance of the economy is astarting point; albeit a portent step. But, for the analyst to decide whether to invest or not,expected future performance of the overall economy along with its various segments ismost relevant. Thus, all efforts should be made to forecast the performance of theeconomy so that the decision to invest or to disinvest the securities can be a beneficialone. Decisions can be made in the most haphazard manner. Interestingly, this calls forusing the same indicators that describe how the economy has shaped up in the past andhow it is likely to take shape in the future as compared to the current state of affairs. Ahealthy outlook about the economy goes a long way in boosting the investment climate ingeneral and investment in securities in particular.
Check Your Progress 2
1. _____________ policy is concerned with the manipulation of money supplyin the economy.
2. Monetary policy affects the economy mainly through its impact on_____________.
3. The government applies two broad classes of microeconomic policies, viz.demand-side policies and _____________ side policies.
4. _____________ policy is concerned with the spending and tax initiatives ofthe government.
164Security Analysis andPortfolio Management
7.5 ECONOMIC FORECASTING
Still, it must be properly understood at this stage that economic forecasting is a must formaking investment decision. It has been mentioned earlier too, that the fortunes of specificindustries and the firm depends upon how the economy looks like in the future, bothshort-term and long-term. Accordingly, forecasting techniques can also be divided andcategories: Short-term forecasting techniques are dealt with in detail; these terms shouldbe clearly understood. Short-term refers to a period up to three years. Sometimes, it canalso refer to a much shorter period, as a quarter or a few quarters. Intermediate periodrefers to a period of three to five years. Long-term refers to the forecast made for morethan five years. This may mean a period of ten years or more.
7.5.1 Techniques
l Economic indicators
l Diffusion index
l Surveys
l Economic Model Building
At the very outset, let it be mentioned that the central theme of economic forecasting isto forecast national some with its various components. This is because it summarizes thereceipts and expenditures of all segments of the economy, be they government, businessor households. These macro-economic accounts describe economic activities over aperiod of time. Not surprisingly, therefore, all the techniques focus on forecast nationalincome and its various components, particularly, those components that have bearing onan industry and the particular industry and the company to be analysed.
GNP is a measure to quantify national income and is the total value of the final output ofgoods and produced in the economy. It is an important indicator of the level and the rateof growth in the economy, and is of central concern to analysts for forecasting overall aswell as various components during a certain period. Following are some of the techniquesof short-term economic forecasting.
7.5.2 Anticipatory Surveys
This is very simple method through which investors can form their opinion/expectationswith respect to the future state of the economy. As is generally understood, this is asurvey of expert opinions of those prominent in the government, business, trade andindustry. Generally, it incorporates expert opinion with construction activities, plant andmachinery expenditure, level of inventory etc. that are important economic activities.Anticipatory surveys can also incorporate the opinion or future plans of consumersregarding their spending. So long as people plan and budget their expenditure and implementtheir plans accordingly, such surveys should provide valuable input, as a starting point.
Despite the valuable inputs provided by this method, care must be exercised in using theinformation obtained through this method. Precautions are needed because:
1. Survey results cannot be regarded as forecasts per se. A consensus of opinion maybe used investor in forming his own forecasts.
2. There is no guarantee that the intentions surveyed would certainly materialize. Tothis extent, they cannot rely solely on these.
Despite the above limitations, surveys are very popular in practice and used for short-term forecast of course, requires continuous monitoring.
165Fundamental Analysis 1:
Economic Analysis
7.6 BAROMETRIC OR INDIAN APPROACH
In this approach, various types of indicators are studied to find out how the economy islikely to behave in future. For meaningful interpretations, these indicators are roughlyclassified into leading, lagging and coincidental indicators.
Leading indicators: As the name suggests, these are indicators that lead the economicactivity in their outcome. That is, these are those time series data of the variables thatreach their high points as well low points in advance of the economic activity.
Lagging indicators: These are time series data of variables that lag behind in theirconsequences vis-à-vis the economy. That is, these reach their turning points aftereconomy has already reached its own.
In developed countries, data relating to various indicators are published at short intervals.For example, the Department of Commerce publishes data regarding various indicatorsin each of the following categories.
7.6.1 Leading Indicators
l Average weekly hours of manufacturing production workers
l Average weekly in initial unemployment claims
l Contacts and orders for plant and machinery
l Index of S&P 500 stock prices
l Money supply (M2)
l Change in sensitive material prices
l Change in manufacture's unfilled orders (durable goods industries)
l Index of consumer expectations.
7.6.2 Coincidental Indicators
l Index of industrial production
l Manufacturing and trade sales
l Employee on non-agricultural payrolls
l Personal income less transfer payment
7.6.3 Lagging Indicators
l Average duration of unemployment
l Ratio of manufacturing and trade inventories to sales
l Average prime rate
l Outstanding commercial and industrial loans
The above list is not exhaustive. It is only illustrative of various indicators used by investors.A word of caution will not be out of place here as forecasting based solely on leadingindicators is a hazardous business. One has to be quite careful in using them. There isalways a time lag it with result that interpretation can be erroneous, if it is not done wellin advance. Interpretation even if performed meticulously, cannot be fruitfully utilized.Further, problems with regard to their interpretation exist as well. Indicators are classifiedunder the broad category of leading indicators. Their various measures may emit
166Security Analysis andPortfolio Management
conflicting signals about the future direction of the economy; the use of diffusion indexor composite index has, thus, been suggested. This deals with the problem by combiningseveral indicators into one index in order to measure the strength or weaknesses of theproblem by combining several indicators into one index in order to measure the strengthor weaknesses of a particular kind of indicator. Care has to be exercised even in thiscase as diffusion indices are also without problems. Apart from the fact that itscomputations are difficult, it does not eliminate the varying factors in the series. Despitethese limitations, indicator approach/diffusion index can be useful tool in the armoury ofa skilful forecaster.
7.7 MONEY AND STOCK PRICES
Analysts have recognized that money supply in the economy plays a crucial part in theinvestment decision per se. The rate of change in the money supply in the economyaffects the GNP, corporate profits, interest rates and prices. Accordingly, monetaristsargue that total money supply in the economy and its rate of change has an importantinfluence the stock prices as a hedge against inflation, and in creases in stock pricessometimes.
7.8 DIFFUSION INDEX
l A diffusion index is an indicator of the extensiveness or spread of an expansion orcontraction.
l It has been developed by the National Bureau of Economic Research, USA.
l There are two main categories of diffusion index:
1. Composite or Consensus Index: It combines several indicators into onesingle measure, in order to measure the strength or weakness in the movementsof these particular time series of data.
For instance, there are ten leading indicators; out of them four are moving upand others are not. How do we interpret it?
Diffusion Index = No of members in the set in the same direction
Total no. of members in the set
In the example, diffusion index = 4/10 = 0.4
Next month, if the index moved to 0.6, it certainly is a strong confirmation ofeconomic advance.
2. Component Evaluation Index: This is a narrow type of index, one thatexamines a particular series taking into consideration its components. Itmeasures the breadth of the movement within a particular series.
7.9 GEOMETRIC MODEL BUILDING APPROACH
This is an approach to determine the precise relationship between the dependent and theindependent variables. In fact, econometrics is a discipline wherein application ofmathematics and statistical techniques is a part of economic theory. It presupposes theprecise and clear relationship between the dependent and independent variables and theonus of such well-defined relationship with its attendant assumptions rests with the analyst.
167Fundamental Analysis 1:
Economic Analysis
Thus, by geometrics, the analyst is able to forecast a variable more precisely than by anyother approach. But this derived approach would be as good as the data inputs used andassumptions made.
Static Model Building or GNP Model Building or Sectoral Analysis is frequently used inparticular in the methods discussed earlier. These use national accounting framework inmaking short-term forecasts. The various steps while using this approach are:
1. Hypothesize the total demand in the economy as measured by its total income(GNP) based on likely conditions in the country like war, peace, political instability,economic changes, level and rate of inflation etc.
2. Forecast the GNP by estimating the levels of its various components like:
v Consumption expenditure
v Private cosmetic investment
v Government purchases of goods and services
v Net exports
3. Forecasting the individual components of GNP, the analysis then adds them up toobtain a figure of the GNP.
4. The analyst compares the total of GNP and arrives at an independent estimateappropriately. The forecast of GNP is an overall forecast for internal consistency.This is done to ensure that both his total forecast and permanent forecast makesense and fit together in a reasonable manner.
5. Thus the GNP model building involves all the details described above with aconsiderable amount of judgment.
6. What has accounted for this suddenly revived economy? One likely answer isdefinitely a cut in customs and a corresponding reduction in excise, which hashelped reduce the cost structure of a number of products. This has made a numberof products cheaper in the domestic market and expanded the demand for them inthe process.
7.9.1 Future Scenario
What of the future? The scenario could emerge strongly bullish if the cut in costs inimplementing the finished product is accompanied by a cut in the import tariff for theraw materials as well. Besides, the excise component would have to be lowered as well,resulting in an expansion of demand within the economy. Once this transpires, moregoods will be sold, recession will history and if installed capacities fail to meeting thedemand, we could even have a temporary shortage in certain areas on our hands.
Given this scenario, only the obstinate would continue to be bearish. It is time perhaps, toovercome the current shorts on the Sensex and place and place all our big chips on theshares of polyesters companies. Stock polyester, Sanghi Polyster, Sanghi Polyster andHaryana Petro look cheap when viewed against projected 1993-94 earnings. With thefestive season under way, the buoyancy in yarn prices is expected to continue givinginvestors a turnaround for the first half of the current financial year.
168Security Analysis andPortfolio Management
Check Your Progress 3
State whether the following statements are true or false:
1. Monetary policy is not concerned with the money supply and interest rates.
2. Fiscal policy is concerned with the spending and tax initiatives of thegovernment.
3. GNP is a measure to quantify national income and is the total value of thefinal output of goods and services produced in the economy.
4. Anticipatory survey is a method in which investors can form their opinionwith respect to the future state of the economy.
5. Lagging indicators are time series data of variables that lag behind in theirconsequences vis-a-vis the economy.
7.10 ECONOMY AND INDUSTRY ANALYSIS
Investment decisions are a part of our economic life, made by almost everybody indifferent contexts at different times. The highly subjective nature of such decisions andthe varying results that they offer therefore, necessitate a further study and analysis intothe same.
Long regarded as an art, investment decision-making has only recently been consideredas science with an attendant body of literature being developed helping us understand itsdynamics. Investment decision-making is now accepted both as an art as well as ascience. Decision-makers attempt to update themselves on the characteristics of returnssecurities, which keep changing. Their understanding needs sustained efforts. Conceivableinvestment opportunities were discussed and explained in Block I.
Changes in the management of any particular company or changes in government policyat macro level can bring about changes in the attractiveness of certain securities. Forexample, before 1992-93, the shares of sugar industry in India did not catching the attentionof the investing public. But due to changes in the government policy towards this industryaround 1999, sugar industry shares became quite attractive. Policy changes made by thegovernment related to hike in the sugar per sold both in open market as well as throughpublic distribution system, increase in the quantity of sugar for sale in the free marketetc. played a very important role in making the shares of sugar companies attractive.There may be other factors too, that are more specific to a particular company or industry.
7.11 LET US SUM UP
A commonly advocated procedure for fundamental analysis involves a 3-step analysis:macro-economic analysis, industry analysis, and company analysis. In a globalised businessenvironment, the top-down analysis of the prospects of a firm must begin with the globaleconomy. There are two broad classes of macroeconomic policies, viz. demand sidepolicies and supply side policies. Fiscal and monetary policies are the two major tools ofdemand side economics. Fiscal policy is concerned with the spending and tax initiativesof the government. Monetary policy is concerned with money supply and interest rates.The macro-economy is the overall economic environment in which all firms operate.

169Fundamental Analysis 1:
Economic Analysis
7.12 LESSON END ACTIVITY
Study the fundamental analysis of BSE 30 companies.
7.13 KEYWORDS
Fundamental Analysis: It is an analysis of various fundamental or basic factors thataffect the risk-return of securities.
Short-term: It refers to a period upto three years.
Long-term: It refers to a period more than five years.
GNP: It is a measure to quantify national income and is the total value of the final outputof goods and services produced in the economy.
Fiscal Policy: It is concerned with the spending and tax initiatives of the government.
Monetary Policy: It is concerned with the manipulation of money supply in the economy.
7.14 QUESTIONS FOR DISCUSSION
1. Define fundamental analysis
2. What is economic forecasting?
3. Define EIC Analysis.
4. Define Diffusion Index.
5. What are the factors influencing economic analysis?
6. What are the techniques used in economic analysis?
7. Explain the barometric Indian approach.
8. Explain the geometric module building approach.
Check Your Progress: Model Answers
CYP 1
1. technical 2. disinvestments 3. security 4. Technical
CYP 2
1. Monetary 2. interest rates 3.supply 4. Fiscal
CYP 3
1. F 2. T 3. T 4. T 5. T
7.15 SUGGESTED READINGS
Sudhindra Bhat, Security Analysis and Portfolio Management, Excel Books, Delhi.
Kevin, S., Security Analysis and Portfolio Management, Printice Hall of India.
Prasanna Chandra, Investment Analysis and Portfolio Management, Second Edition, TataMcGraw Hill.

170Security Analysis andPortfolio Management
Punithavathy Pandian, Securities Analysis and Portfolio management, Vikas.
Investment Management, V. K. Bhalla.
A. Davis, Investors in a Changing Economy, Printice -Hall, 1968.
Williamson, J. Peter, Investments: New Analytic Techniques, London, Longman, 1970.
Cottle, CC., and Whitman, W.T., Investment Timing: The Formula Plan Approach, McGraw Hill.
LESSON
8FUNDAMENTAL ANALYSIS 2:ZINDUSTRY ANALYSIS
CONTENTS
8.0 Aims and Objectives
8.1 Introduction
8.2 Importance of Industry Analysis
8.3 Alternative Classification of Industries
8.4 Industry Life Cycle Analysis
8.4.1 Pioneering Stage
8.4.2 Expansion Stage
8.4.3 Stabilization Stage
8.4.4 Decay Stage
8.5 Forecasting Methods
8.5.1 Market Profile
8.5.2 Cumulative Methods
8.6 Conditions and Profitability
8.6.1 Technology and Research
8.7 Industry Analysis Factors
8.7.1 Techniques of Industry Analysis
8.8 Let us Sum up
8.9 Lesson End Activity
8.10 Keywords
8.11 Questions for Discussion
8.12 Suggested Readings
8.0 AIMS AND OBJECTIVES
After studying this lesson, you should be able to understand:
l The Concepts of Industry Analysis
l Standard Industry Classification
l The Industry Growth Cycle
172Security Analysis andPortfolio Management
l Tools for Industry Analysis
l Quantitative Industry Analysis
8.1 INTRODUCTION
After conducting an analysis of the economy and identifying the direction it is likely totake in the short, interim and long term, the analyst must look into various sectors of theeconomy in terms of various industries. An industry is a homogenous group of companies.That is, companies with similar characteristic can be divided into one industrial group.There are many bases on which grouping of companies can be done. For example,traditional classification is generally done product-wise like pharmaceuticals, cotton textile,synthetic fibre etc. Such a classification, through useful, does not help much in investmentdecision-making. Some of the useful bases for classifying industries from the investmentdecision-point of view are as follows:
1. Growth Industry: This is an industry that is expected to grow consistently and itsgrowth may exceed the average growth of the economy.
2. Cyclical Industry: In this category of the industry, the firms included are thosethat move closely with the rate of industrial growth of the economy and fluctuatecyclically as the economy fluctuates.
3. Defensive Industry: It is a grouping that includes firms, which move steadily withthe economy and less than the average decline of the economy in a cyclical downturn.
Another useful criterion to classify industries is the various stages of theirdevelopment. Different stages of their life cycle development exhibit differentcharacteristic. In fact, each development is quite unique. Grouping firms with similarcharacteristics of development help investors to properly identify different investmentopportunities in the companies. Based on the stage in the life cycle, industries areclassified as follows:
(i) Pioneering stage: This is the first stage in industrial life cycle of a newindustry. In this, technology and its products are relatively new and have notreached a stage of perfection. There is an experimental order both in productand technology. However, there is a demand for its products in the market;the profits opportunities are in plenty. This is a stage where the venturecapitalists take a lot of interest, enter the industry and sometimes organize thebusiness. At this stage, the risk commences in this industry and hence, mortalityrate is very high. If an industry withstands them, the investors would reap therewards substantially or else substantial risk of investment exists. A verypertinent example of this stage of industry in India was the leasing industry,which tried to come up during the mid-eighties. There was a mushroom growthof companies in this period. Hundreds of companies came into existence.Initially, lease rental charged by them were very high. But as competitiongrew among firms, lease rentals reduced and came down to a level where itbecame difficult for a number companies to survive. This period saw manycompanies that could not survive the onslaught of competition of those firmsthat could tolerate this onslaught of price war, could remain in the industry.The leasing industry today is much pruned down compared to the mid-eighties.
(ii) Fast growing stage: This is the second stage when the chaotic competitionand growth that is the hallmark of the first stage is more or less over. Firms
173Fundamental Analysis 2:
Industry Analysis
that could not survive this onslaught have already died. The surviving largefirms now dominate the industry. The demand of their product still growsfaster, leading to increasing amount of profits the companies can reap. Thisis a stage where companies grow rapidly. These companies provide a goodinvestment opportunity to the investors. In fact, as the firms during stage ofdevelopment grow faster, they sometimes break records in various areas, likepayment of dividend and become more and more attractive for investment.
(iii) Security and stabilization stage: The third stage where industries growroughly at the rate of the economy, develop and reach a stage of stabilization.Looked at differently, this is a stage where the ability of the industry appearsto have more or less saturated. As compared to the competitive industries, atthis stage, the industry faces the problem of what Grodinsky called "latentobsolescence" a term used to a stage where earliest signs of decline haveemerged. Investors have to be very cautions to examine those sings before itis too late.
(iv) Relative decline stage: The fourth stage of industrial life cycle developmentis the relative decline The industry has grown old. New products, newtechnologies have entered the market. Customers have new habits, styles,likes etc. The company's/industry's products are not much in demand as wasin the earliest stage. Still, it continues to exist for some more time.Consequently, the industry would grow less than the economy during the bestof the times of the economy. But as is expected, the industry's decline ismuch faster than the decline of the economy in the worst of times.
The characteristics of different stages of life cycle development of industries have anumber of implications for decisions. Investment at this stage is quite rewarding. However,for an investor looking for steady forms with risk aversion, it is suggested that he shouldin general avoid investing at this stage. But if he is still keen to invest, he should try todiversify or disperse his investment price the risk. It would be quite prudent on this partto look for companies that are in the second date i.e., fast growth. This probably explainsthe prevalent higher stock prices of the companies of this industry.
From the investment point of view, selection of the industries at the third stage ofdevelopment is quite crucial. It is the growth of the industry that is relevant and not itspast performance. There are a number of cases where the share prices of a company ina declining industry have been artificially hiked up in the market, on the basis of its goodperformance. But the fact of the matter is that a company in such an industry wouldsooner or later feel the pinch of its decline and an investor investing in such companiesexperiences a reduction in the value of his investment in due course.
Having discussed various investment implications, it may be pointed out that one shouldbe careful while classifying them. This is because the above discussion assumes that theinvestor would be able to identify the industrial life cycle. In practice, it is very difficult todetect which stage of the industry is at. Needless to say, it is only a general frameworkthat is presented above. One can spangle this analysis with suitable modifications. Inorder to strengthen the analysis further, it is essential to outline the features of the industryin detail. Due to its unique characteristic, unless the specific industry is analysed properlyand in depth with regard to these, it will be very difficult to form an opinion for profitableinvestment opportunities.
174Security Analysis andPortfolio Management
1. There is competition among domestic and foreign firms, both in the domestic andthe foreign markets. How do firms perform here?
2. Many types of products are manufactured in this industry. Are these homogenousin nature or highly heterogeneous?
3. What is the nature and prospect of demand for the industry? Are these homogenousin nature or highly heterogeneous?
4. This may also incorporate the analysis of the markets of its products, customer-wise and geographical area-wise, identifying various determinants of this type ofindustry its growth, cyclical, defensive or relative decline industry.
8.2 IMPORTANCE OF INDUSTRY ANALYSIS
Why should a security analyst carry out industry analysis?
To answer this question, logically, two arguments are presented:
(i) Firms in each different industry typically experience similar levels of risk and similarrates of return. As such, industry analysis can also be useful in knowing theinvestment-Worthiness of a firm.
(ii) Mediocre stocks in a growth industry usually outperform the best stocks in a stagnantindustry. This points out the need for knowing not only company prospects but alsoindustry prospects.
Risk-return patterns: Economic theory points out that competitive firms in an industrytry to maximize their profits by adopting fairly similar policies with respect to the following:
1. The labour-capital ratio utilized by each firm.
2. Mark ups, profit margins and selling prices.
3. Advertising and promotional programmes.
4. Research and development expenditures.
5. Protective measures of the government.
At such, they have the same risk level as well as rates of return, on an average. Empiricalevidence shown by research done by Fabozzi and Francis supports this argument.
Growth Factor: All industries do not have equally good or equally bad experiences andexpectations; their fortunes keep on changing. It implies that the past is not a goodindicator of the future - if one looks very far into the future.
This view is well supported by research. Researchers have ranked the performance ofdifferent industries over a period of one year and then ranked the performance of thesame industries over subsequent periods of years. They compared the ranking and obtainednear zero correlations. It implies that an industry that was good during one period of timecannot continue to be good in all periods.
Another observation is every industry passes through four distinct phases of the lifecycle. The stages may be termed as pioneering, expansion, stagnation and decline.Different industries may be in different stages. Consequently their prospects vary. Assuch, separate industry analysis is essential.

175Fundamental Analysis 2:
Industry Analysis
Check Your Progress 1
1. _____________ industry is an industry that is expected to grow consistentlyand its growth may exceed the average growth of the economy.
2. In the cyclical industry the firms included are those that move closely withthe rate of _____________ growth of the economy and fluctuate cyclicallyas the economy fluctuates.
3. _____________ industry is a grouping that includes firms, which movesteadily with the economy and less than the average decline of the economyin a cyclical downturn.
4. _____________ stage is the first stage in the industrial life cycle of a newindustry.
8.3 ALTERNATIVE CLASSIFICATION OF INDUSTRIES
There are different ways of classifying industrial enterprises:
(i) Classification by Reporting Agencies: In India, The Reserve Bank of India hasclassified industries into 32 groups. Stock exchanges have made a broad classificationof industry into 10 groups.
Business media have their own classification. The Economic Times classifies industryinto 10 groups and the Financial Express into 19 groups. The groups are furthersub-divided.
(ii) Classification by Business Cycle: The general classification in this framework isgrowth, cyclical, defensive and cyclical growth. Growth industries are characterizedby high rates of earnings expansion, often independent of business cycles. Theseindustries are pioneers of a major change in the state of the art i.e., innovationdiffusing concerns. The ongoing revolution in the electronics industry andcommunications equipments is an example of this kind.
Cyclical industries are closely related to business cycles. Prosperity provides consumerspurchasing power and boom to industry whereas depression adversely affects them.Consumer durables are subject to these kinds of changes.
Defensive industries are those the products of which have relatively inelastic demand.Food processing industry is an example.
Cyclical growth industries are those that are greatly influenced by technological andeconomic changes. The airline industry can be cited as an example.
8.4 INDUSTRY LIFE CYCLE ANALYSIS
We have identified various factors and questions relating to industry analysis. Now, weshall consider the frameworks within which the analysis may be carried out.
Every industry passes through different stages in its lifetime. The stages can be identifiedas follows:
l Pioneering Stage (Introduction)
l Expansion Stage (Growth)
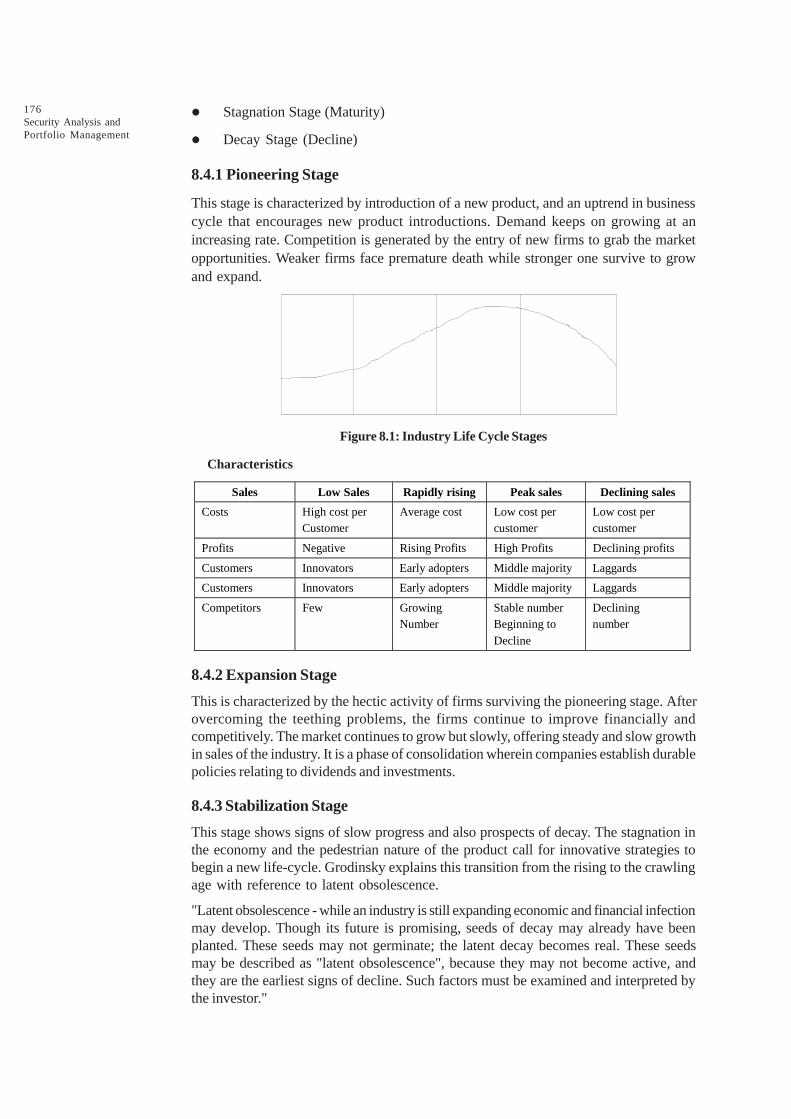
176Security Analysis andPortfolio Management
l Stagnation Stage (Maturity)
l Decay Stage (Decline)
8.4.1 Pioneering Stage
This stage is characterized by introduction of a new product, and an uptrend in businesscycle that encourages new product introductions. Demand keeps on growing at anincreasing rate. Competition is generated by the entry of new firms to grab the marketopportunities. Weaker firms face premature death while stronger one survive to growand expand.
Figure 8.1: Industry Life Cycle Stages
Characteristics
Sales Low Sales Rapidly rising Peak sales Declining sales
Costs High cost per Customer
Average cost Low cost per customer
Low cost per customer
Profits Negative Rising Profits High Profits Declining profits
Customers Innovators Early adopters Middle majority Laggards
Customers Innovators Early adopters Middle majority Laggards
Competitors Few Growing Number
Stable number Beginning to Decline
Declining number
8.4.2 Expansion Stage
This is characterized by the hectic activity of firms surviving the pioneering stage. Afterovercoming the teething problems, the firms continue to improve financially andcompetitively. The market continues to grow but slowly, offering steady and slow growthin sales of the industry. It is a phase of consolidation wherein companies establish durablepolicies relating to dividends and investments.
8.4.3 Stabilization Stage
This stage shows signs of slow progress and also prospects of decay. The stagnation inthe economy and the pedestrian nature of the product call for innovative strategies tobegin a new life-cycle. Grodinsky explains this transition from the rising to the crawlingage with reference to latent obsolescence.
"Latent obsolescence - while an industry is still expanding economic and financial infectionmay develop. Though its future is promising, seeds of decay may already have beenplanted. These seeds may not germinate; the latent decay becomes real. These seedsmay be described as "latent obsolescence", because they may not become active, andthey are the earliest signs of decline. Such factors must be examined and interpreted bythe investor."

177Fundamental Analysis 2:
Industry Analysis
Symptoms of latent obsolescence include changing social habits, high labour costs, changesin technology, stationary demand.
8.4.4 Decay Stage
An industry reaches this stage when it fails to detect the death signal and implement -proactively or reactively - appropriate strategies. Obsolescence manifests itself, effectinga decline in sales, profit, dividends and share prices.
Implications to the Investor: This approach is useful to the analyst as it gives insights,not apparent merits and demerits of investments in a given industry at a given time.What the investor has to do is.
(i) Collect relevant data to identify the industry life cycle stage
(ii) Forecast the probable life period of the stage
(iii) Decide whether to buy, hold or sell.
Figure 8.1 shows the diagrammatic presentation along with the indicators of each stage.Although the industry life cycle theory appears to be very simple, it is no so in practice.Proper identification of the life cycle stage is difficult. Temporary setbacks or upheavalsmay confuse the analyst. Further, how long the stage continues is difficult to predict.
The internal analysis can be done periodically to evaluate strengths and weaknesseseither by inside company executives or outside consultants. This can be done by using aform such as the one shown in Table 8.1. Each factor, minor or major weakness isdisplayed. Of course, not all factors are equally important for succeeding in business.Therefore, it is necessary to rate the importance of each factor - high, medium or low.When combining performance and importance levels, four possibilities emerge. Theseare illustrated in Figure 8.2.
Performance
Low High
High A. Concentrate here B. Keeping the good work
Importance Low C. Take enough care D. If overkill, divert
Figure 8.2: Importance – Performance Matrix
This analysis provides norms for management attention. For example, an industry isperforming poorly in a high priority area. It should hence concentrate here. If the industrystrategy is not addressed to this, it becomes unattractive to the investor.
Table 8.1: Strengths Weaknesses Analysis
S. No. Factor Performance Importance
Major Minor Neutral Minor Major High Medium
Marketing
1. Popularity and regard
2. Relative market share
3. Quality image
4. Service reputation

178Security Analysis andPortfolio Management
5. Distribution costs
6. Sales force
7. Market locations
Finance
1. Cost of Capital
2. Funds availability
3. Financial stability
4. Profitability
Manufacturing
1. Facilities
2. Economics of scale
3. Capacity utilization
4. Labour productivity
5. Manufacturing costs
6. Raw material availability
7. Technology of process
Human Resources
1. Leadership
2. Management capabilities
3. Worker attitudes
4. Entrepreneurial competence
5. Skill development
6. Structural flexibility
7. Adaptation
8. Industrial Relations
Check Your Progress 2
1. The Reserve Bank of India has classified industry into _____________groups.
2. Stock exchanges have made a broad classification of industry into_____________ groups.
3. The financial express has classified industry into _____________ groups.
4. Every industry passes through different stages in its lifetime. The first stageis the pioneering stage or the introduction stage, second the expansion orgrowth stage, third the stagnation or maturity stage and the fourth is_____________ or _____________ .
179Fundamental Analysis 2:
Industry Analysis
8.5 FORECASTING METHODS
The techniques for analyzing information about industry within a time framework arebriefly explained in this lesson.
8.5.1 Market Profile
A market profile consists of those endogenous characteristics that have a significantbearing on demand or the way in which it can be developed.
Its basic elements are:
l Number of establishments
l Geographical location of establishment
l Number of employees
l Value of sales
l Value added by manufacturing
l Capital expenditures
l Degree to which establishments are specialized
l Importance of their output in the national total
The trend of these elements when analysed, reveal vital information about the positionand progress of the industry. Illustratively some lead points are given here:
l A decrease in number of establishments and employment accompanied by an increasein the other elements of the profile means increased automation.
l An increase in value of sales, unaccompanied by an increase in value added andcapital expenditure signifies rising prices.
l An increase in value added without an increase in capital expenditure signifiesincrease in labour productivity.
l A fall in the share of industry in national total implies decline of industry.
8.5.2 Cumulative Methods
These are based either on market surveys or statistical measurements:
1. Surveys: Surveys are carried out by research agencies, consultants, industryassociation and the research bureau of media. These surveys generally study thecurrent facilities and demand, future demand and proposed investment, and therebythe expansion prospects vis-à-vis demand gap. Other factors like, strengths andweaknesses of the organization, environmental forces are also brought into focusto evaluate the future of the industry.
Surveys adopt the methodology of inquiry, through questionnaires and interviews.The subjects will be either manufacturer or dealers/end users.
2. Correlation and Regression analysis: Statistical methods like correlation andregression analysis can be of much help in demand measurement. The followingsteps have general application.
(i) Determine the total requirement for the type of product in question by presentcustomers in each industry classification.
This can be done by asking the customer or obtaining the estimate from thesalesmen, or by comparing with other customers of same size and class.

180Security Analysis andPortfolio Management
(ii) Correlation product requirement of customer establishments with a variableto output for which accurate published data are available. Generally,employment is the most useful variable.
The correlation can be observed by preparing a scatter or calculatingmathematically, using the formula given below:
Degree of relationship (r) =2 2 2 2
NÓ(xy) �(Óx)(Óy)
[nÓx �(Óx) ][NÓx �(Óy) ]
Where X = Number of employees
Y = Number product items
… observation
The nearer the correlate n coefficient is to +1 or – 1, the closer the relationshipof the two variables under study.
The significance of the relationship can be determined using hypothesis testingprocedure.
(iii) Apply the relationship to estimate demand. If the degree of correlation betweenpurchases of a given product by present customers and their employmentsize is considered significant, the demand estimation can be done as follows:
v Computing the average number of items purchased per employee andapplying this ratio to total employment.
v Formulating an estimating equation through regression method.
S y = Na + bS x
xSy = aSx + bSx
Where, a equals the number of products purchased when employmentis zero and b equals the amount of change in the number of productspurchased with every change in total employment.
The latter method is more accurate because it is more sensitive to theinfluence of independent variable on dependent variable.
Multiple regression analysis facilitates the study of impact of more thanone independent variable on the dependent variable.
Y = a + b x1 + c x
2 + d x
3 + e x
4 + f x
5
Where Y = Yearly sales in lakhs of rupees;
x1
= yearly sales (lagged one year) in lakhs of rupees
x2
= yearly advertising expenditure in lakhs of rupees
x3
= a dummy variable
x4
= year
x5
= disposable personal income in lakhs of current rupees
3. Time series analysis: Time series analysis consists of decomposing the originalsales series over a period of time. The elements derived are:
(a) Trend (T): It is the result of basic developments in population, capital formation,and technology. It is found by fitting a straight or curved line through past sales.
181Fundamental Analysis 2:
Industry Analysis
(b) Cycle (C): It captures the wave-like movement of sales. Many sales areaffected by swings in general economic activity, which tends to be somewhatperiodic. The cyclical component can be useful in intermediate rangeforecasting.
(c) Season (S): It refers to a consistent pattern of sales movements within theyear. The term season describes any recurrent sales pattern. The seasonalcomponent may be related to weather factors, holidays, and trade customs.The seasonal pattern provides a norm for forecasting short-range sales.
(d) Erratic Events (E): It refers to the unpredictable sales caused by unforeseenevents like strikes, riots, war scares, floods, and other disturbances.
Another time series technique is exponential smoothing. For industries with severalitems in product line, this technique is useful to produce efficient and economicalshort-run forecasts. It requires only three pieces of information.
l This period's actual sales (Qt)
l This period's smoothed sales (Qt)
l A smoothing parameter (a), where
Sales forecast for next period (Qt + 1) = Q
t + (1 – a)Q
t
The initial level of smoothed sales can simply be the average sales for the last fewperiods. The smoothing constant is derived by trial and error testing of different smoothingconstants between zero and one, to find the constant that produces the best fit of pastsales.
8.6 CONDITIONS AND PROFITABILITY
The worth of a share depends on its return, which in turn depends on the profitability ofthe company. It is interesting that growth is an essential variable but its mere presencedoes not guarantee profitability. Profitability depends upon the state of competition prevalentin the industry. Cost control measures adopted by its units and the growth in demand forits products. While conducting an analysis from the point of view of profitability, somerelevant aspects to be investigated are:
l How is the cost allocation done among various heads like raw materials, wagesand overheads? Knowledge about the distribution of costs under various heads isvery essential as this gives an idea to investors about the controllability of costs.Some industries have much higher overhead costs than others. Labour cost isanother area that requires close scrutiny. This is because finally whether labour ischeap or expensive depends on the wage level and labour productivity. Labour thatapparently look cheaper may turn out to be when its productivity is taken intoaccount.
l Price of the product of the industry
l Capacity of production-installed, used, unused etc.
l Level of capital expenditure required to maintain or increase the productive efficiencyof the industry.
Profitability is another area that calls for a thorough analysis on the part of investors. Noindustry can survive in the long run if it is not making profits. This requires thoroughinvestigation into various aspects of profitability. However, such an analysis can begin by

182Security Analysis andPortfolio Management
having a bird's eye view of the situation. In this context, ratio analysis has been foundquite useful. Some of the important often used are:
l Gross Profit Margin ratio
l Operating Profit Margin ratio
l Rate of Return on Equity
l Rate of Return on Total Capital
Ratios are not an end in themselves. But they do indicate possible areas for furtherinvestigation.
8.6.1 Technology and Research
Due to increasing competition in general, technology and research play a crucial part inthe growth and survival of a particular industry. However, technology itself is subject tochange; sometimes, very fast, and can lead obsolescence. Thus only those industries,which update themselves in the field of technology, can attain competitive advantageover others in terms of the quality, pricing of products etc.
The relevant questions to be probed further by the analyst in this respect could includethe following.
l What is the nature and type of technology used in the industry?
l Are there any expected changes in the technology in terms of offering new productsin the market to increase in sales?
l What has been the relationship of capital expenditure and the sales over time?
l Whether more capital expenditure has led to increase in sales or not?
l What has been the amount of money spent in the research and development activitiesof the firm? Did amount on the research and development in the industry relate toits redundancy or otherwise?
l What is the assessment of this industry in terms of its sales and profitability in theshort, intermediate and long run?
The impact of all these factors have to be finally translated in terms of two most crucialnumbers i.e. profitability - their level and expected rate of change during short, intermediateand long run.
Check Your Progress 3
Indicate true or false for the following statements:
1. Input output analysis helps us understand demand analysis in greater detail.
2. End use and regression analysis is the process whereby the analyst or investorattempts to dial the factor that determines the demand for the output of theindustry.
3. Season refers to a consistent pattern of sales movements within the year.
4. Trend is not the result of basic developments in population, capital formationand technology.
5. The worth of a share depends on its return, which in turn depends on theprofitability of the company.

183Fundamental Analysis 2:
Industry Analysis
8.7 INDUSTRY ANALYSIS FACTORS
The securities analyst will take into consideration the following factors into account inassessing the industry potential in making investments.
l Post-sales and earnings performance
l The government's attitude towards industry
l Labour conditions
l Competitive conditions
l Performance of the industry
l Industry share prices relative to industry earnings
l Stage of the industry life cycle
l Industry trade cycle
l Inventories build-up in the industry
l Investors' preference over the industry
l Technological innovations
8.7.1 Techniques of Industry Analysis
So far, we have discussed about various factors that are to be taken into account whileconducting industry analysis. Now, we turn our attention towards various techniquesthat help us evaluate the factors mentioned above:
l End Use and Regression Analysis: It is the process whereby the analyst orinvestor attempts to dial the factor that determines the demand for the output of theindustry. This is also known as end-use demand analysis. In this process, the investorhopes to uncover the factors that explain the demand. Some of the factors arefound to be powerful in explaining the demand for the product, like disposableincome per capital consumption, price elasticity of demand and per capital income.In order to identify the factors that affect demand, statistical techniques likeregression analysis and correlation have often been used. These help identify theimportant factors/variables. However, one should be aware of their limitations.
l Input Output Analysis: This analysis helps us understand demand analysis ingreater detail. Input of analysis is a very useful technique that reflects the flow ofgoods and services through the economy, including intermediate steps in theproduction process as the goods proceed from the raw material stage through toconsumption. This information is reflected in the input-output table that reflects thepattern of consumption at all stages, not at the final stage of consumption of finalgoods. This is done to detect any changing patterns. It might also indicate thegrowth or decline of industries.
8.8 LET US SUM UP
After conducting analysis of the economy and identifying the direction, it is likely to takein the short intermediate and long term, the analyst must look into various sectors of theeconomy in terms of various industries. An industry is a homogenous group of companies.That is, companies with the similar characteristics can be divided in to one industrialgroup. There are many bases on which grouping of companies can be done.
184Security Analysis andPortfolio Management
The securities analyst will take into consideration the following factors into account inassessing the industry potential in making investments. Post-sales and earningsperformance, the government's attitude towards industry, labour conditions and competitiveconditions are the various factors that are to be taken into account while conductingindustry analysis. Now we turn our attention to various techniques that help us evaluatethe factors mention above.
End Use and Regression Analysis: It is the process whereby the analyst or investorattempts to dial the factor that determines the demand for the output of the industry. Thisis also known as end-use demand analysis.
8.9 LESSON END ACTIVITY
Suppose you are appointed portfolio manager of ABC industries Ltd. How would youprepare on industry analysis for your company?
8.10 KEYWORDS
Time Series Analysis: Time series analysis consists of decomposing the original salesseries over a period of time.
Trend (T): It is the result of basic developments in population, capital formation, andtechnology. It is found by fitting a straight or curved line through past sales.
Cycle (C): It captures the wave-like movement of sales. Many sales are affected byswings in general economic activity, which tends to be somewhat periodic. The cyclicalcomponent can be useful in intermediate range forecasting.
Season (S): It refers to a consistent pattern of sales movements within the year. Theterm season describes any recurrent sales pattern. The seasonal component may berelated to weather factors, holidays, and trade customs. The seasonal pattern provides anorm for forecasting short-range sales.
Erratic Events (E): It refers to the unpredictable sales caused by unforeseen eventslike strikes, riots, war scares, floods, and other disturbances.
End Use and Regression Analysis: It is the process whereby the analyst or investorattempts to dial the factor that determines the demand for the output of the industry.
Input Output Analysis: This analysis helps us understand demand analysis in greaterdetail.
8.11 QUESTIONS FOR DISCUSSION
1. Why does portfolio manager do the industry analysis?
2. What are the factors influencing industry analysis?
3. Write notes on different types of industry.
4. Explain in detail the key indicators of industry analysis.

185Fundamental Analysis 2:
Industry AnalysisCheck Your Progress: Model Answers
CYP 1
1. Growth 2. industrial 3. Defensive 4. Pioneering
CYP 2
1. thirty-two 2. ten 3. nineteen 4. decay stage, decline
CYP 3
1. T 2. T 3. T 4. F 5. T
8.12 SUGGESTED READINGS
Sudhindra Bhat, Security Analysis and Portfolio Management, Excel Books, Delhi.
Kevin, S., Security Analysis and Portfolio Management, Printice Hall of India.
Prasanna Chandra, Investment Analysis and Portfolio Management, Second Edition, TataMcGraw Hill.
Punithavathy Pandian, Securities Analysis and Portfolio management, Vikas.
Investment Management, V. K. Bhalla.
A. Davis, Investors in a Changing Economy, Printice -Hall, 1968.
Williamson, J. Peter, Investments: New Analytic Techniques, London, Longman, 1970.
Cottle, CC., and Whitman, W.T., Investment Timing: The Formula Plan Approach, McGraw Hill.

186Security Analysis andPortfolio Management
LESSON
9FUNDAMENTAL ANALYSIS 3:COMPANY ANALYSIS
CONTENTS
9.0 Aims and Objectives
9.1 Introduction
9.2 Framework of Company Analysis
9.2.1 Non-financial Aspects
9.2.2 Financial Analysis
9.3 Fundamental Analyst’s Model
9.3.1 Earnings Analysis
9.3.2 Accounting Income Effect on Balance Sheet
9.3.3 Forecasting Earnings
9.4 Determining Earnings – Multiplier (P/E) Ratio
9.5 Dividend Discount Model of Valuation
9.6 Comparative P/E Approach
9.7 Growth Stocks
9.7.1 Guidelines for Investment
9.7.2 Estimation of Future Price
9.7.3 Quantitative Analysis
9.8 Forecasting Earnings per Share
9.8.1 Traditional Methods of Forecasting EPS
9.8.2 ROI Approach
9.8.3 Ratio Analysis
9.9 Let us Sum up
9.10 Lesson End Activity
9.11 Keywords
9.12 Questions for Discussion
9.13 Suggested Readings
187Fundamental Analysis 3:
Company Analysis
9.0 AIMS AND OBJECTIVES
After studying this lesson, you should be able to understand:
l Need for Company Analysis
l Estimation of Future Price
l Quantitative Analysis
l Forecasting Earning Per Share
l Traditional and Modern Methods of Forecasting EPS
l Qualitative Analysis
l Tools for Company Analysis
9.1 INTRODUCTION
We have discussed the relevance of economy and industry analysis and the manner inwhich it is conducted. In this unit, we will discuss the company level analyses. In orderto provide a proper perspective to this analysis, let us begin by discussing the way investormakes investment decisions given his goal maximization. For earning profits, investorsapply a simple and common sense decision rule of maximization. That is:
l Buy the share at a low price
l Sell the share at a high price
The above decision rule is very simple to understand, but difficult to apply in actualpractice. Huge efforts are made to operationalise it by using a proper formal and analyticalframework. To begin with, problems faced by the investor are: how to find out whetherthe price of a company’s share is high or low? What is the benchmark used to comparethe price of the share? The first question becomes easier if some benefits are agreedupon with which the prevailing market price can be compared. In this respect, fundamentalanalysis provides the investor a real benchmark in terms of intrinsic value. This value isdependent upon industry and company fundamentals. Out of these three, company levelanalysis provides a direct link to investor’s action and his investment goal in operationalterms. This is because an investor buys the equivalent of a company and not that ofindustry and economy. This framework indeed provides him with a proper background,with which he buys the shares of a particular company. A careful examination of thecompany’s quantitative and qualitative fundamentals is, therefore, very essential. AsFischer and Jordan have aptly put it: “If the economic outlook suggests purchase at thetime, the industry analysis will aid the investor in selecting the proper industry in which toinvest. Nonetheless, when to invest and in which industry is not enough. It is also necessaryto know which companies industries should be selected.”
The real test of an analyst’s competence lies in his ability to see not only the forest butalso the trees. Superior judgment is an outcome of intelligence, synthesis and inferencedrawing. That is why, besides economic analysis and industry analysis, individual companyanalysis is important.
9.2 FRAMEWORK OF COMPANY ANALYSIS
The two major components of company analysis are:
(i) Financial (ii) Non-financial
188Security Analysis andPortfolio Management
A good analyst gives proper weightage to both these aspects and tries to make anappropriate judgment. In the process of evaluating the investment-worthiness of acompany’s securities, the analyst will be concerned with two broad categories information:(i) internal and (ii) external. Internal information consists the data and events relating tothe enterprise as publicized by it. External information comprises the reports and analysesmade by sources outside the company viz. media and research agencies.
9.2.1 Non-financial Aspects
A general impressionistic view is also important in evaluating the worth of a company forinvesting in securities. This could be obtained by gathering and analyzing informationabout companies, publicized in the media, the stock exchange directory, annual reportsand prospectus.
1. History and business of the company
2. Top management team
3. Collaboration agreements
4. Product range
5. Future plans of expansion/diversification
6. R & D
7. Market standing – competition and market share
8. Corporate social responsibility
9. Industrial relations scenario
10. Corporate image etc.
Besides these internal factors, the external environment related to the company survivaland image:
1. Statutory controls
2. Government policy
3. Industry life cycle stage
4. Business cycle stage
5. Environmentalism
6. Consumerism, etc.
9.2.2 Financial Analysis
Financial analysts interested in making investments in equality shares of a company willbe concerned with the prospects of rise in value of the firm.
Asset value vs. Earnings value
The asset value of a security is determined by estimating the liquidating value of the firm,deducting the claims of firm’s creditors and allocating the remaining net asset value ofthe firm over the outstanding shares of stock. The asset value is usually estimated byconsultation with:
(i) A specialist who appraises asset values and/or
(ii) An accountant who gives book value of the firm.
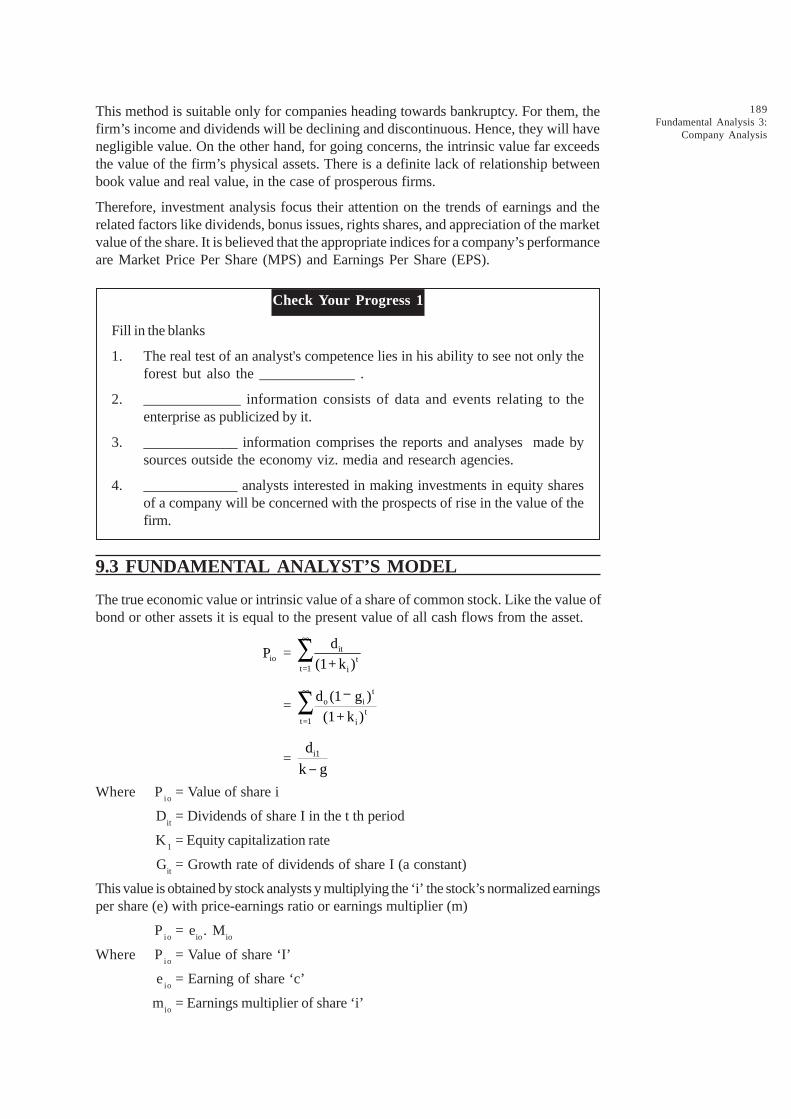
189Fundamental Analysis 3:
Company Analysis
This method is suitable only for companies heading towards bankruptcy. For them, thefirm’s income and dividends will be declining and discontinuous. Hence, they will havenegligible value. On the other hand, for going concerns, the intrinsic value far exceedsthe value of the firm’s physical assets. There is a definite lack of relationship betweenbook value and real value, in the case of prosperous firms.
Therefore, investment analysis focus their attention on the trends of earnings and therelated factors like dividends, bonus issues, rights shares, and appreciation of the marketvalue of the share. It is believed that the appropriate indices for a company’s performanceare Market Price Per Share (MPS) and Earnings Per Share (EPS).
Check Your Progress 1
Fill in the blanks
1. The real test of an analyst's competence lies in his ability to see not only theforest but also the _____________ .
2. _____________ information consists of data and events relating to theenterprise as publicized by it.
3. _____________ information comprises the reports and analyses made bysources outside the economy viz. media and research agencies.
4. _____________ analysts interested in making investments in equity sharesof a company will be concerned with the prospects of rise in the value of thefirm.
9.3 FUNDAMENTAL ANALYST’S MODEL
The true economic value or intrinsic value of a share of common stock. Like the value ofbond or other assets it is equal to the present value of all cash flows from the asset.
ioP = itt
t=1 i
d(1+ k )
¥
å
= t
o it
t=1 i
d (1 g )(1+ k )
¥ -å
= i1d
k g-Where P
io= Value of share i
Dit
= Dividends of share I in the t th period
K1
= Equity capitalization rate
Git
= Growth rate of dividends of share I (a constant)
This value is obtained by stock analysts y multiplying the ‘i’ the stock’s normalized earningsper share (e) with price-earnings ratio or earnings multiplier (m)
Pio
= eio. M
io
Where Pio
= Value of share ‘I’
eio
= Earning of share ‘c’
mio
= Earnings multiplier of share ‘i’
190Security Analysis andPortfolio Management
The ratio of dio/e
io is known as dividend payout ratio. From the above model it is obvious
that, to determine the appropriate earnings multiplier an analysis must consider thefollowing:
l The earnings of the security
l The risk of the security
l The growth rate of the dividend stream
l The duration of the expected growth and
l The dividend payout ratio
9.3.1 Earnings Analysis
As seen earlier, to value common stocks or other risky assets, the present value model isemployed.
Present value = AQ
Where t = time period
This model gives rise to two questions:
1. How does the investor measure the income from the common stocks?
2. What discount or capitalization rate should be used?
The income question is discussed here:
Income concepts: Accountants and economists have provided two different conceptsof income.
Accountant’s income is the revenue over the above all the costs incurred. Economistsdefine the income of a firm as the maximum amount, which can be consumed by theowners of the firm in any period without decreasing their future consumption opportunities.
Adjusting for economic income: Since income, which is very important is determiningthe value of a security, is vaguely reported by accountants, it is necessary to adjust ornormalize it in a consistent manner.
Fundamental analysts find it necessary to significantly alter the income statements, toobtain estimates for two reasons:
(i) The accountant has used an accounting procedure, which is inappropriate for therelevant economic transaction and/or
(ii) The accountant, perhaps under the pressure of top management, has adopted aprocedure to minimise the firm’s income taxes or window dress the firm’s financialstatements.
We will now discuss four differences in accounting procedures. These are only illustrativeof the controversy in reporting incomes.
1. Sales – Revenue Recognition Principle: Sales can be either cash sales or creditsales. Sales can be recognized as early as the date the sale order is signed. However,in the case of long-term construction contracts the sale may not be recognized untilas late as the day the cash is fully paid. Between these two extremes, the accountantmay choose a suitable time point to recognize the sales revenue in the financialstatements. He may do it either in an attempt to improve current income or becausehe has grown confident about its collectability. In the case of credit sales, companiesmay factor their accounts receivable and realize cash proceeds. One firm may
191Fundamental Analysis 3:
Company Analysis
recognize this immediately, whereas another firm may wait until the customer’sfinal cash payment is actually received.
2. Inventory: Inventory valuation is done based on two methods:
FIFO – First in, first out method
LIFO – Last in, first our method
3. Depreciation: Several depreciation methods may be used in financial statementsthat a firm to the public:
1. Straight line method
2. Sum-of-digit method
3. Double declining balance method
4. Units of production method
The second and third methods are accelerated methods of deprecation. The secondmethod may be used to accelerate depreciation during a period of rapid production.
9.3.2 Accounting Income Effect on Balance Sheet
A balance sheet is a summary of account balance carried after the appropriate closingof the books. Income statements deal with flows, whereas balance sheet deals withstocks. Since stocks are accumulations of flows, vagaries that undermine the estimatesof accounting income are cumulated in certain sheet items.
For instance, the impact of inflation should be considered to make the balance sheetitems realistic. Measures suggested are:
Assets side
1. Report marketable securities at current value.
2. Inventory should be valued at replacement cost.
3. Land and natural resources to be shown at net realizable value (current marketprice-future development, selling or interest costs.
4. Plant & machinery at replacement cost.
5. Goodwill.
6. R & D expenses.
Liabilities side
1. Debt. In future, at the time of maturity it is repaid in cheaper money units (rupees).It is a gain to shareholders.
2. Deferred taxes.
3. Retained earnings.
9.3.3 Forecasting Earnings
It is necessary to estimate a stock’s future income because the value of the share is thepresent value of its future income. This can be done by focussing on:
(a) Identification of variables which will have impact on income, and
(b) Determining the extent of change in income due to change in the identified variables,by employing appropriate method of forecasting.
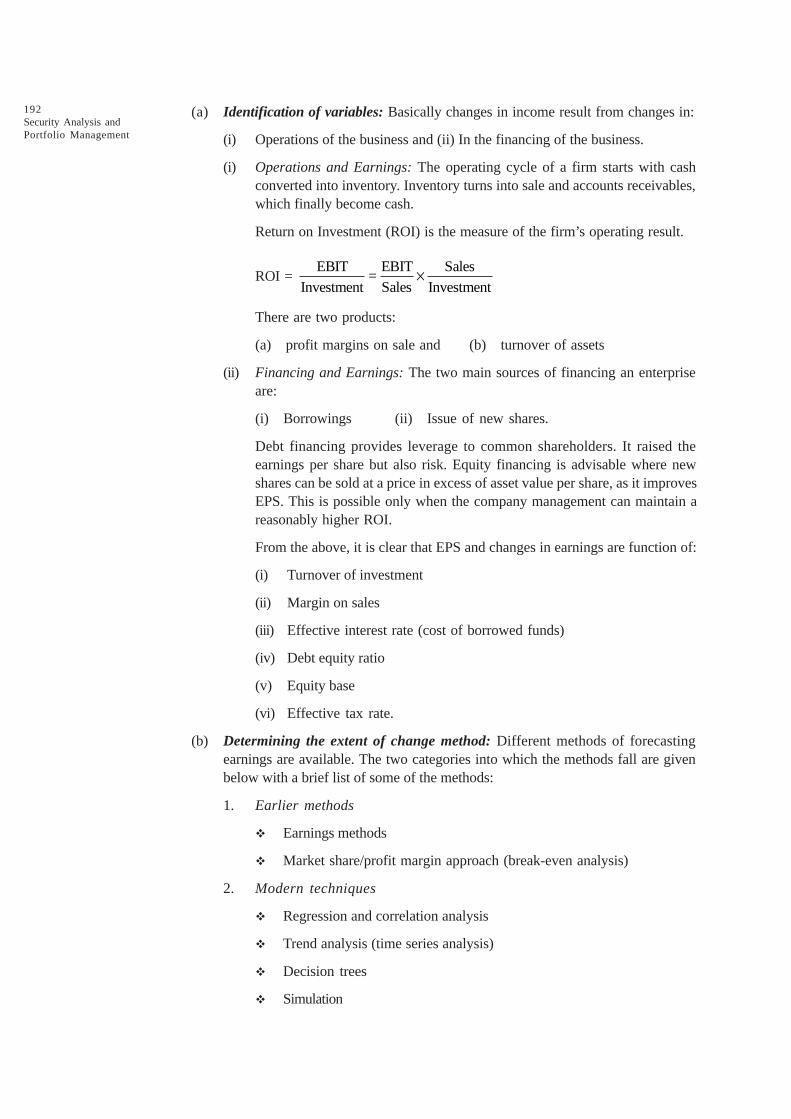
192Security Analysis andPortfolio Management
(a) Identification of variables: Basically changes in income result from changes in:
(i) Operations of the business and (ii) In the financing of the business.
(i) Operations and Earnings: The operating cycle of a firm starts with cashconverted into inventory. Inventory turns into sale and accounts receivables,which finally become cash.
Return on Investment (ROI) is the measure of the firm’s operating result.
ROI = EBIT EBIT Sales
=Investment Sales Investment
´
There are two products:
(a) profit margins on sale and (b) turnover of assets
(ii) Financing and Earnings: The two main sources of financing an enterpriseare:
(i) Borrowings (ii) Issue of new shares.
Debt financing provides leverage to common shareholders. It raised theearnings per share but also risk. Equity financing is advisable where newshares can be sold at a price in excess of asset value per share, as it improvesEPS. This is possible only when the company management can maintain areasonably higher ROI.
From the above, it is clear that EPS and changes in earnings are function of:
(i) Turnover of investment
(ii) Margin on sales
(iii) Effective interest rate (cost of borrowed funds)
(iv) Debt equity ratio
(v) Equity base
(vi) Effective tax rate.
(b) Determining the extent of change method: Different methods of forecastingearnings are available. The two categories into which the methods fall are givenbelow with a brief list of some of the methods:
1. Earlier methods
v Earnings methods
v Market share/profit margin approach (break-even analysis)
2. Modern techniques
v Regression and correlation analysis
v Trend analysis (time series analysis)
v Decision trees
v Simulation
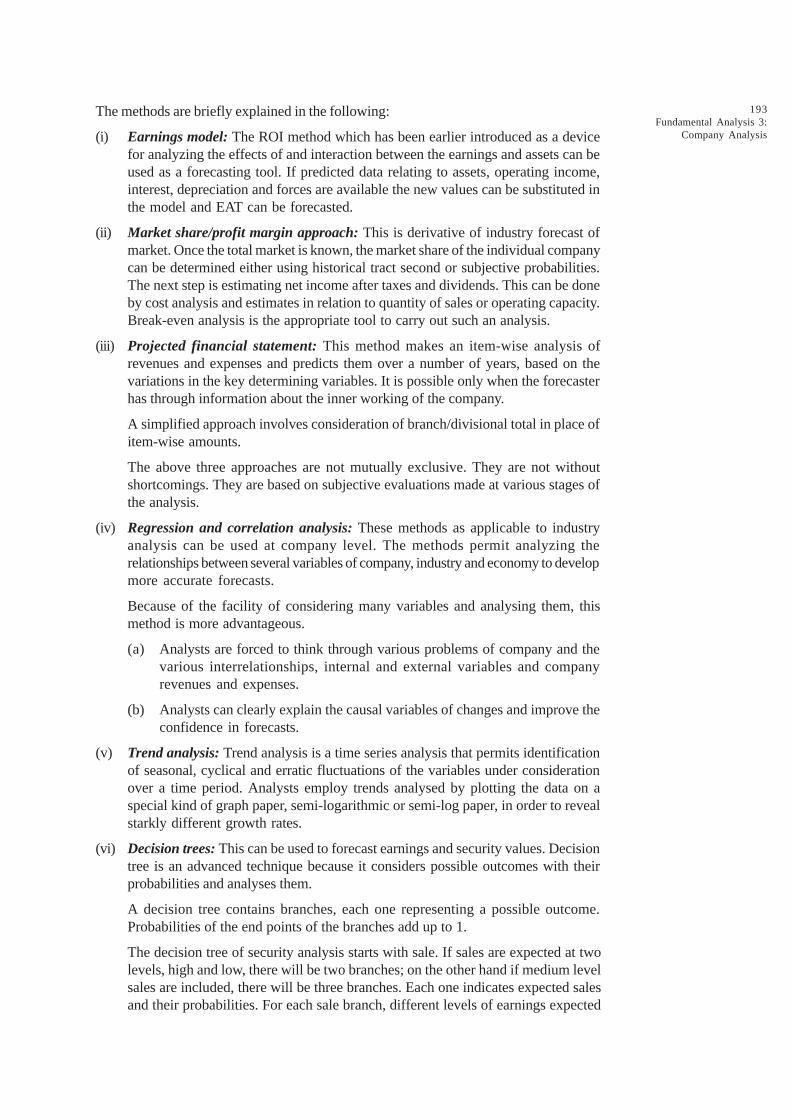
193Fundamental Analysis 3:
Company Analysis
The methods are briefly explained in the following:
(i) Earnings model: The ROI method which has been earlier introduced as a devicefor analyzing the effects of and interaction between the earnings and assets can beused as a forecasting tool. If predicted data relating to assets, operating income,interest, depreciation and forces are available the new values can be substituted inthe model and EAT can be forecasted.
(ii) Market share/profit margin approach: This is derivative of industry forecast ofmarket. Once the total market is known, the market share of the individual companycan be determined either using historical tract second or subjective probabilities.The next step is estimating net income after taxes and dividends. This can be doneby cost analysis and estimates in relation to quantity of sales or operating capacity.Break-even analysis is the appropriate tool to carry out such an analysis.
(iii) Projected financial statement: This method makes an item-wise analysis ofrevenues and expenses and predicts them over a number of years, based on thevariations in the key determining variables. It is possible only when the forecasterhas through information about the inner working of the company.
A simplified approach involves consideration of branch/divisional total in place ofitem-wise amounts.
The above three approaches are not mutually exclusive. They are not withoutshortcomings. They are based on subjective evaluations made at various stages ofthe analysis.
(iv) Regression and correlation analysis: These methods as applicable to industryanalysis can be used at company level. The methods permit analyzing therelationships between several variables of company, industry and economy to developmore accurate forecasts.
Because of the facility of considering many variables and analysing them, thismethod is more advantageous.
(a) Analysts are forced to think through various problems of company and thevarious interrelationships, internal and external variables and companyrevenues and expenses.
(b) Analysts can clearly explain the causal variables of changes and improve theconfidence in forecasts.
(v) Trend analysis: Trend analysis is a time series analysis that permits identificationof seasonal, cyclical and erratic fluctuations of the variables under considerationover a time period. Analysts employ trends analysed by plotting the data on aspecial kind of graph paper, semi-logarithmic or semi-log paper, in order to revealstarkly different growth rates.
(vi) Decision trees: This can be used to forecast earnings and security values. Decisiontree is an advanced technique because it considers possible outcomes with theirprobabilities and analyses them.
A decision tree contains branches, each one representing a possible outcome.Probabilities of the end points of the branches add up to 1.
The decision tree of security analysis starts with sale. If sales are expected at twolevels, high and low, there will be two branches; on the other hand if medium levelsales are included, there will be three branches. Each one indicates expected salesand their probabilities. For each sale branch, different levels of earnings expected
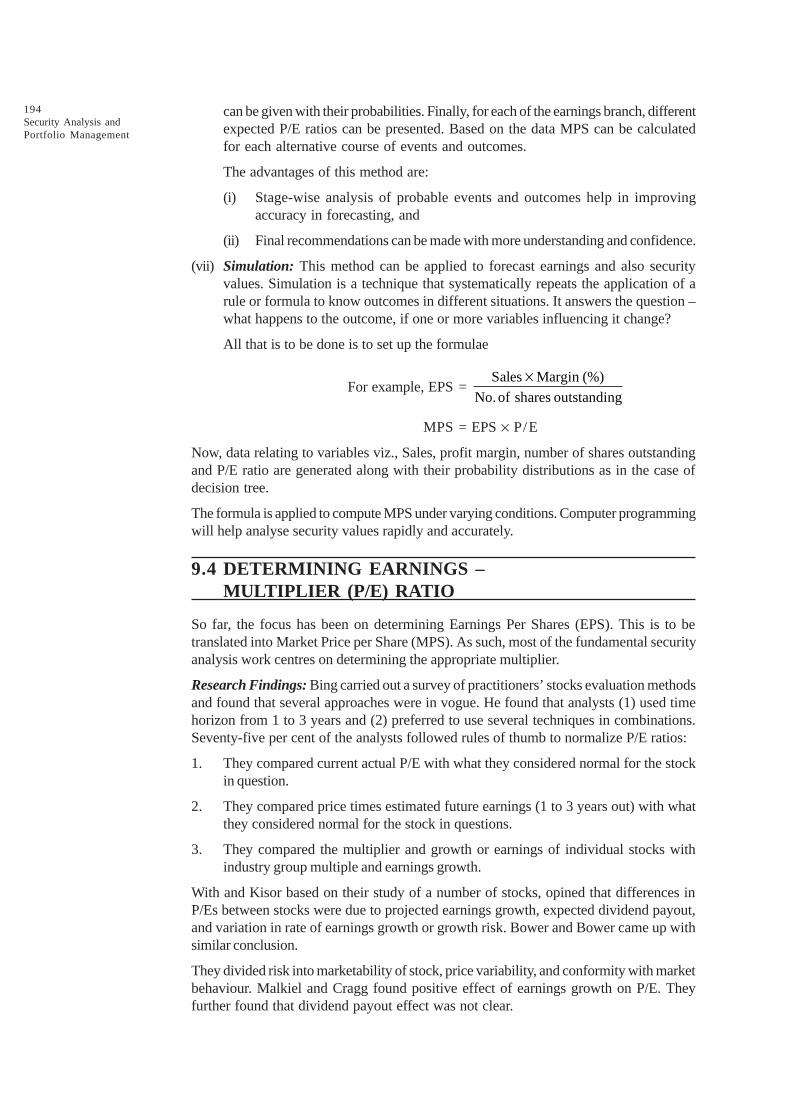
194Security Analysis andPortfolio Management
can be given with their probabilities. Finally, for each of the earnings branch, differentexpected P/E ratios can be presented. Based on the data MPS can be calculatedfor each alternative course of events and outcomes.
The advantages of this method are:
(i) Stage-wise analysis of probable events and outcomes help in improvingaccuracy in forecasting, and
(ii) Final recommendations can be made with more understanding and confidence.
(vii) Simulation: This method can be applied to forecast earnings and also securityvalues. Simulation is a technique that systematically repeats the application of arule or formula to know outcomes in different situations. It answers the question –what happens to the outcome, if one or more variables influencing it change?
All that is to be done is to set up the formulae
For example, EPS = Sales Margin (%)
No. of shares outstanding
´
MPS = EPS ¥ P/E
Now, data relating to variables viz., Sales, profit margin, number of shares outstandingand P/E ratio are generated along with their probability distributions as in the case ofdecision tree.
The formula is applied to compute MPS under varying conditions. Computer programmingwill help analyse security values rapidly and accurately.
9.4 DETERMINING EARNINGS –MULTIPLIER (P/E) RATIO
So far, the focus has been on determining Earnings Per Shares (EPS). This is to betranslated into Market Price per Share (MPS). As such, most of the fundamental securityanalysis work centres on determining the appropriate multiplier.
Research Findings: Bing carried out a survey of practitioners’ stocks evaluation methodsand found that several approaches were in vogue. He found that analysts (1) used timehorizon from 1 to 3 years and (2) preferred to use several techniques in combinations.Seventy-five per cent of the analysts followed rules of thumb to normalize P/E ratios:
1. They compared current actual P/E with what they considered normal for the stockin question.
2. They compared price times estimated future earnings (1 to 3 years out) with whatthey considered normal for the stock in questions.
3. They compared the multiplier and growth or earnings of individual stocks withindustry group multiple and earnings growth.
With and Kisor based on their study of a number of stocks, opined that differences inP/Es between stocks were due to projected earnings growth, expected dividend payout,and variation in rate of earnings growth or growth risk. Bower and Bower came up withsimilar conclusion.
They divided risk into marketability of stock, price variability, and conformity with marketbehaviour. Malkiel and Cragg found positive effect of earnings growth on P/E. Theyfurther found that dividend payout effect was not clear.
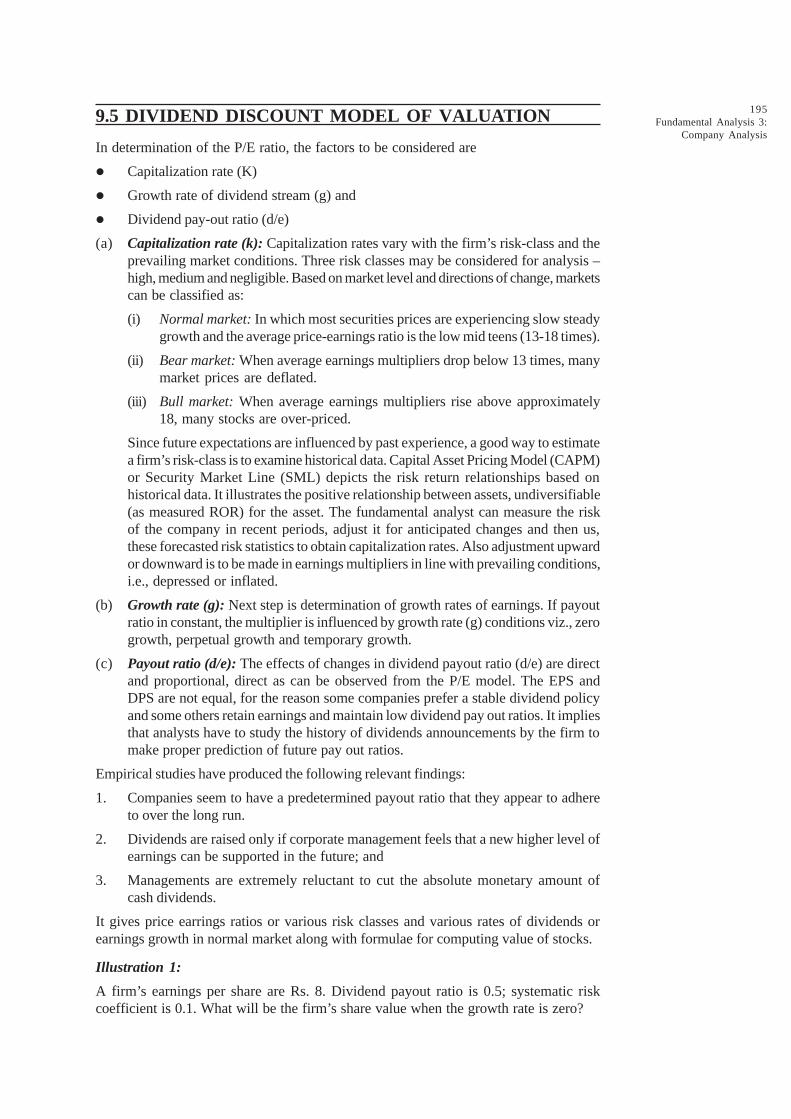
195Fundamental Analysis 3:
Company Analysis
9.5 DIVIDEND DISCOUNT MODEL OF VALUATION
In determination of the P/E ratio, the factors to be considered are
l Capitalization rate (K)
l Growth rate of dividend stream (g) and
l Dividend pay-out ratio (d/e)
(a) Capitalization rate (k): Capitalization rates vary with the firm’s risk-class and theprevailing market conditions. Three risk classes may be considered for analysis –high, medium and negligible. Based on market level and directions of change, marketscan be classified as:
(i) Normal market: In which most securities prices are experiencing slow steadygrowth and the average price-earnings ratio is the low mid teens (13-18 times).
(ii) Bear market: When average earnings multipliers drop below 13 times, manymarket prices are deflated.
(iii) Bull market: When average earnings multipliers rise above approximately18, many stocks are over-priced.
Since future expectations are influenced by past experience, a good way to estimatea firm’s risk-class is to examine historical data. Capital Asset Pricing Model (CAPM)or Security Market Line (SML) depicts the risk return relationships based onhistorical data. It illustrates the positive relationship between assets, undiversifiable(as measured ROR) for the asset. The fundamental analyst can measure the riskof the company in recent periods, adjust it for anticipated changes and then us,these forecasted risk statistics to obtain capitalization rates. Also adjustment upwardor downward is to be made in earnings multipliers in line with prevailing conditions,i.e., depressed or inflated.
(b) Growth rate (g): Next step is determination of growth rates of earnings. If payoutratio in constant, the multiplier is influenced by growth rate (g) conditions viz., zerogrowth, perpetual growth and temporary growth.
(c) Payout ratio (d/e): The effects of changes in dividend payout ratio (d/e) are directand proportional, direct as can be observed from the P/E model. The EPS andDPS are not equal, for the reason some companies prefer a stable dividend policyand some others retain earnings and maintain low dividend pay out ratios. It impliesthat analysts have to study the history of dividends announcements by the firm tomake proper prediction of future pay out ratios.
Empirical studies have produced the following relevant findings:
1. Companies seem to have a predetermined payout ratio that they appear to adhereto over the long run.
2. Dividends are raised only if corporate management feels that a new higher level ofearnings can be supported in the future; and
3. Managements are extremely reluctant to cut the absolute monetary amount ofcash dividends.
It gives price earrings ratios or various risk classes and various rates of dividends orearnings growth in normal market along with formulae for computing value of stocks.
Illustration 1:
A firm’s earnings per share are Rs. 8. Dividend payout ratio is 0.5; systematic riskcoefficient is 0.1. What will be the firm’s share value when the growth rate is zero?
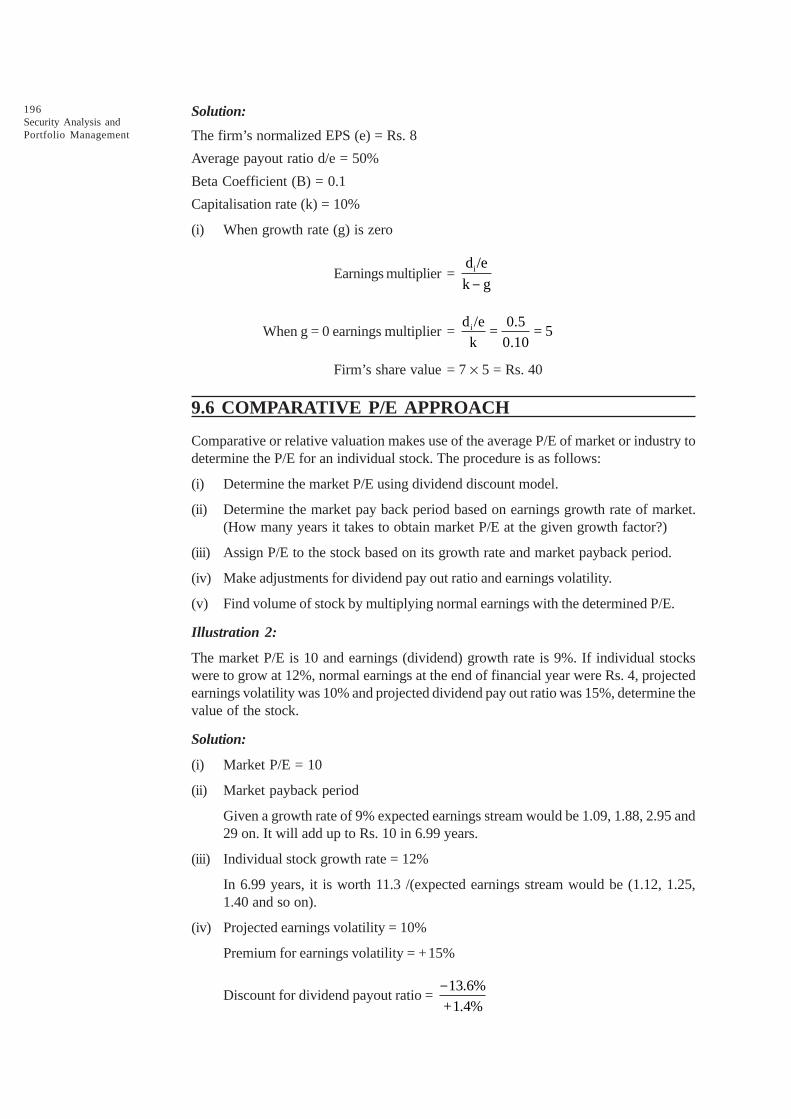
196Security Analysis andPortfolio Management
Solution:
The firm’s normalized EPS (e) = Rs. 8
Average payout ratio d/e = 50%
Beta Coefficient (B) = 0.1
Capitalisation rate (k) = 10%
(i) When growth rate (g) is zero
Earnings multiplier = id /e
k g-
When g = 0 earnings multiplier = id /e 0.5
= = 5k 0.10
Firm’s share value = 7 ¥ 5 = Rs. 40
9.6 COMPARATIVE P/E APPROACH
Comparative or relative valuation makes use of the average P/E of market or industry todetermine the P/E for an individual stock. The procedure is as follows:
(i) Determine the market P/E using dividend discount model.
(ii) Determine the market pay back period based on earnings growth rate of market.(How many years it takes to obtain market P/E at the given growth factor?)
(iii) Assign P/E to the stock based on its growth rate and market payback period.
(iv) Make adjustments for dividend pay out ratio and earnings volatility.
(v) Find volume of stock by multiplying normal earnings with the determined P/E.
Illustration 2:
The market P/E is 10 and earnings (dividend) growth rate is 9%. If individual stockswere to grow at 12%, normal earnings at the end of financial year were Rs. 4, projectedearnings volatility was 10% and projected dividend pay out ratio was 15%, determine thevalue of the stock.
Solution:
(i) Market P/E = 10
(ii) Market payback period
Given a growth rate of 9% expected earnings stream would be 1.09, 1.88, 2.95 and29 on. It will add up to Rs. 10 in 6.99 years.
(iii) Individual stock growth rate = 12%
In 6.99 years, it is worth 11.3 /(expected earnings stream would be (1.12, 1.25,1.40 and so on).
(iv) Projected earnings volatility = 10%
Premium for earnings volatility = +15%
Discount for dividend payout ratio = 13.6%
+ 1.4%
-
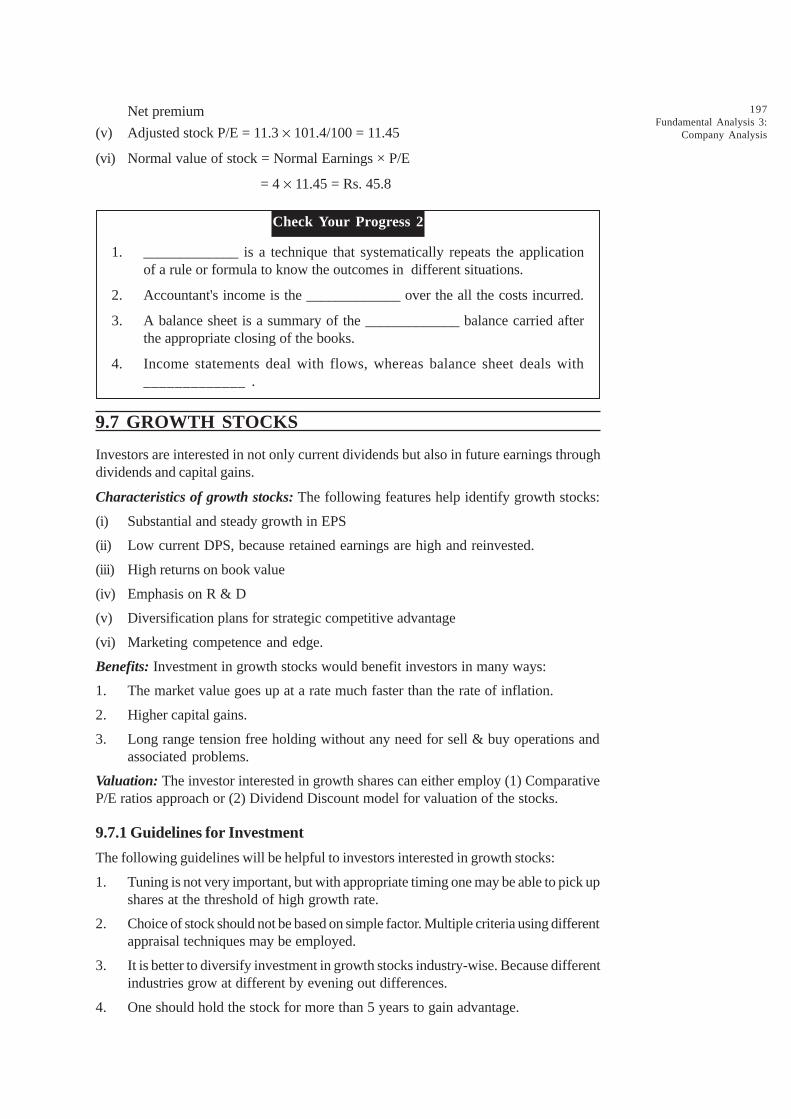
197Fundamental Analysis 3:
Company Analysis
Net premium
(v) Adjusted stock P/E = 11.3 ¥ 101.4/100 = 11.45
(vi) Normal value of stock = Normal Earnings × P/E
= 4 ¥ 11.45 = Rs. 45.8
Check Your Progress 2
1. _____________ is a technique that systematically repeats the applicationof a rule or formula to know the outcomes in different situations.
2. Accountant's income is the _____________ over the all the costs incurred.
3. A balance sheet is a summary of the _____________ balance carried afterthe appropriate closing of the books.
4. Income statements deal with flows, whereas balance sheet deals with_____________ .
9.7 GROWTH STOCKS
Investors are interested in not only current dividends but also in future earnings throughdividends and capital gains.
Characteristics of growth stocks: The following features help identify growth stocks:
(i) Substantial and steady growth in EPS
(ii) Low current DPS, because retained earnings are high and reinvested.
(iii) High returns on book value
(iv) Emphasis on R & D
(v) Diversification plans for strategic competitive advantage
(vi) Marketing competence and edge.
Benefits: Investment in growth stocks would benefit investors in many ways:
1. The market value goes up at a rate much faster than the rate of inflation.
2. Higher capital gains.
3. Long range tension free holding without any need for sell & buy operations andassociated problems.
Valuation: The investor interested in growth shares can either employ (1) ComparativeP/E ratios approach or (2) Dividend Discount model for valuation of the stocks.
9.7.1 Guidelines for Investment
The following guidelines will be helpful to investors interested in growth stocks:
1. Tuning is not very important, but with appropriate timing one may be able to pick upshares at the threshold of high growth rate.
2. Choice of stock should not be based on simple factor. Multiple criteria using differentappraisal techniques may be employed.
3. It is better to diversify investment in growth stocks industry-wise. Because differentindustries grow at different by evening out differences.
4. One should hold the stock for more than 5 years to gain advantage.

198Security Analysis andPortfolio Management
9.7.2 Estimation of Future Price
Before attempting to discuss the approach that can be adopted for company level analysis,let us about the objective of investor and how it can be quantified. It is to reiterate theproposition that an investor looks for increasing his returns from the investment. Returnsare composed of capital gains and a stream of income in the form of dividends. Assuminghe has equity shares for a period of one year (known as holding period), i.e., he sells it atthe end of the year, the total returns obtained by him would be equal to capital gains plusdividends received at the end of the year.
Where R1
= (P1 – P
1–1) + D
t
P1
= Price of the share at the end of the year
P1 – 1
= Price of the share at the beginning of the year
D1
= Dividend received at the end of the year
R1
= Return for the holding period, t
In order to calculate the return received by him on his original investment (i.e. purchaseprice), total should be divided by Pt – 1. These are expressed in percentage terms andknown as holding period yield. Thus,
HRY (%) = 1 1 1
1
(P P 1) + D
P 1
- --
The above computation is quite simple as long as the value of the variables is available.In reality, however, the investor would know the beginning price of the share (calledpurchase price) as this is the price paid to buy the shares, but the price at the end of theyear (i.e. selling price) as well as dividend income received would have to be estimated.This is where the problem lies. How to estimate the future price of the share as well asdividends? This becomes the main challenge. The series data relating to dividends paidby companies provide us useful clues in estimating the dividends likely to be declared bycompanies. There is, it seems, a dividends policy followed by most firms in general.Thus, an investor would be able to estimate dividend for the year with reasonable degreeof accuracy under normal circumstances.
It has been found the management is very conservative in increasing the amount ofdividend paid to shareholders. Managements generally do not increase the dividend unlessthis increase is sustainable in the long run. This is to avoid further cuts if need count ofdividend, in actual practice, does not form large part of the total returns of the investor.It is an important constraint, as indicated above.
Estimation of future price of the share that contributes a major portion in the total returnsof the investor is the problematic and is discussed in detail in the following section. Inorder to estimate future price of share, you may adopt two approaches, namely Quantitativeanalysis and attractive analysis. Let us elaborate each of the two approaches.
9.7.3 Quantitative Analysis
This approach helps us to provide a measure of future value of equity share based onquantitative factors. The methods commonly used under this approach are:
l Dividend discounted method, and
l Price-earnings ratio method
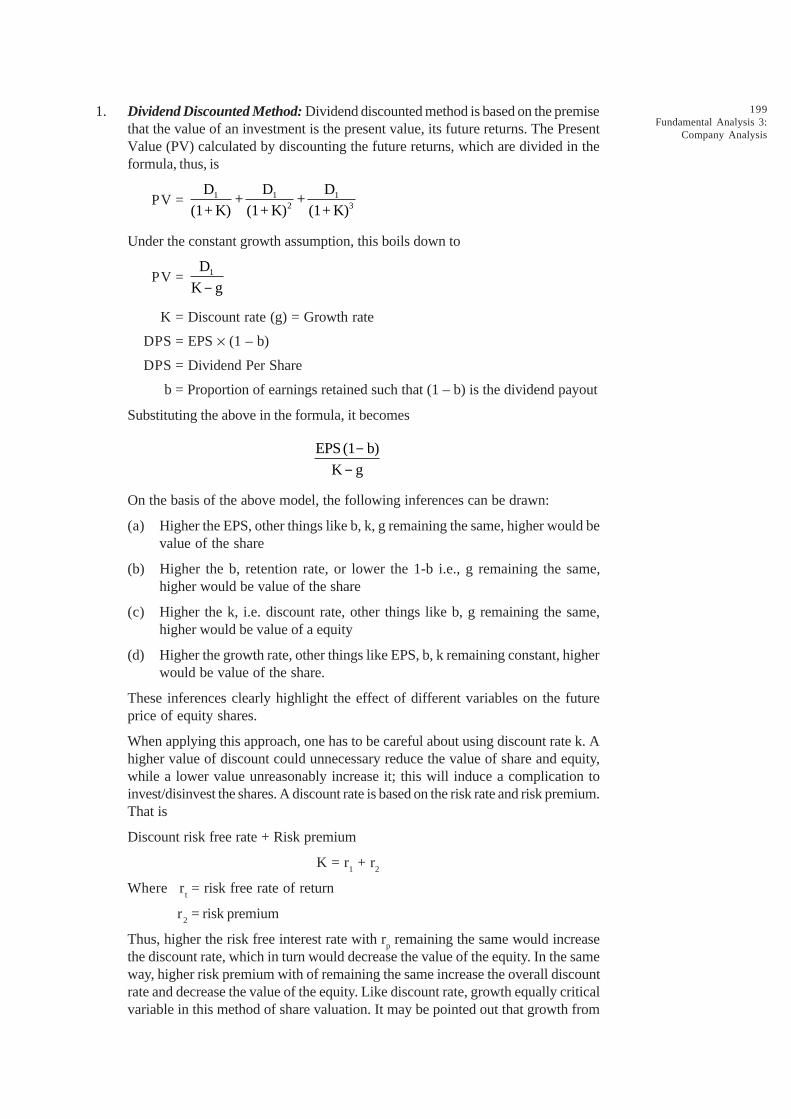
199Fundamental Analysis 3:
Company Analysis
1. Dividend Discounted Method: Dividend discounted method is based on the premisethat the value of an investment is the present value, its future returns. The PresentValue (PV) calculated by discounting the future returns, which are divided in theformula, thus, is
PV = 1 1 12 3
D D D+ +
(1+ K) (1+ K) (1+ K)
Under the constant growth assumption, this boils down to
PV = 1D
K g-
K = Discount rate (g) = Growth rate
DPS = EPS ¥ (1 – b)
DPS = Dividend Per Share
b = Proportion of earnings retained such that (1 – b) is the dividend payout
Substituting the above in the formula, it becomes
EPS (1 b)
K g
--
On the basis of the above model, the following inferences can be drawn:
(a) Higher the EPS, other things like b, k, g remaining the same, higher would bevalue of the share
(b) Higher the b, retention rate, or lower the 1-b i.e., g remaining the same,higher would be value of the share
(c) Higher the k, i.e. discount rate, other things like b, g remaining the same,higher would be value of a equity
(d) Higher the growth rate, other things like EPS, b, k remaining constant, higherwould be value of the share.
These inferences clearly highlight the effect of different variables on the futureprice of equity shares.
When applying this approach, one has to be careful about using discount rate k. Ahigher value of discount could unnecessary reduce the value of share and equity,while a lower value unreasonably increase it; this will induce a complication toinvest/disinvest the shares. A discount rate is based on the risk rate and risk premium.That is
Discount risk free rate + Risk premium
K = r1 + r
2
Where rt= risk free rate of return
r2
= risk premium
Thus, higher the risk free interest rate with rp remaining the same would increase
the discount rate, which in turn would decrease the value of the equity. In the sameway, higher risk premium with of remaining the same increase the overall discountrate and decrease the value of the equity. Like discount rate, growth equally criticalvariable in this method of share valuation. It may be pointed out that growth from

200Security Analysis andPortfolio Management
internal of it depends on the amount of earnings retained and return on equity.Thus, higher is the retention rate, highly be the value of the firm, other thingsremaining constant.
2. Price Earnings Approach: According to this method, the future price of an equityshare is calculated by multiplying the P/E ratio by the price. Thus,
P = EPS ¥ P/E ratio
The P/E ratio or multiple is an important ratio frequently used by analyst in determiningthe value of an equity share. It is frequently reported in the financial press andwidely quoted in the investment community. In India, we can gauge its popularityby looking at various financial magazines and newspapers.
This approach seems quite straight and simple. There are, however, importantproblems with respect calculation of both P/E ratio and EPS. Pertinent questionsoften asked are:
l How to calculate the P/E ratio?
l What is the normal P/E ratio?
l What determines P/E ratio?
l How to relate company P/E ratio to market P/E ratio?
The problems often confronted in calculating this ratio are: which of the earnings –past, present or future to be taken into account in the denominator of this ratio?Likewise, which price should be put in the numerator ratio? These questions needto be answered while using this method.
Indeed, both these methods are inter-related. In fact, if we divide the equation ofdividend discounted made under constant growth assumption by E
0 (Earnings per
shares), we get 0 0 0 0P /E = D /E (1 + g)
K g-Here D0 (1 + g) – D
1
Based on the above model, decision rules become:
DECISION RULES
l Higher the P/E ratio, other things remaining the same, higher would be thevalue of an equity share.
l Lower the P/E ratio, other things remaining the same, lower would be thevalue of an equity share.
Looking at the above decision rules, it is not uncommon to find that investor prefershares of companies higher P/E multiple.
You will appreciate that the usefulness of the above model lies in understanding thevarious factors determine P/E ratio is broadly determined by:
l Dividend payout
l Growth
l Risk free rate
l Business risk
l Financial risk
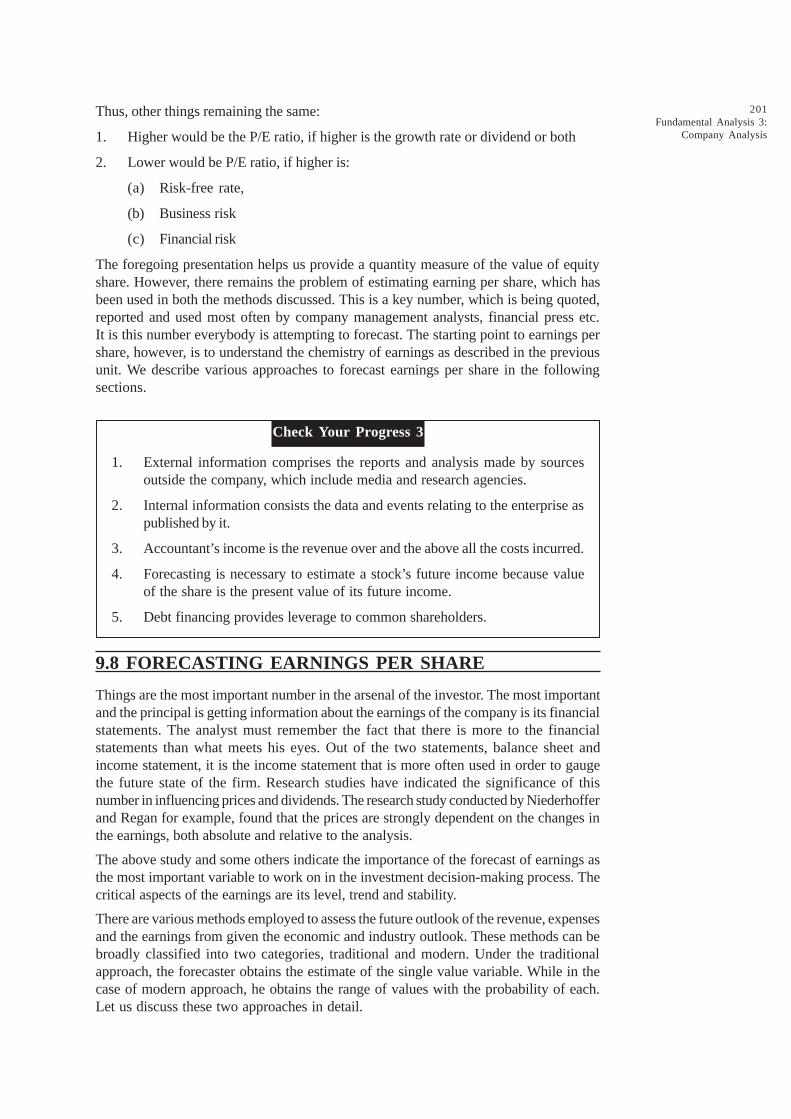
201Fundamental Analysis 3:
Company Analysis
Thus, other things remaining the same:
1. Higher would be the P/E ratio, if higher is the growth rate or dividend or both
2. Lower would be P/E ratio, if higher is:
(a) Risk-free rate,
(b) Business risk
(c) Financial risk
The foregoing presentation helps us provide a quantity measure of the value of equityshare. However, there remains the problem of estimating earning per share, which hasbeen used in both the methods discussed. This is a key number, which is being quoted,reported and used most often by company management analysts, financial press etc.It is this number everybody is attempting to forecast. The starting point to earnings pershare, however, is to understand the chemistry of earnings as described in the previousunit. We describe various approaches to forecast earnings per share in the followingsections.
Check Your Progress 3
1. External information comprises the reports and analysis made by sourcesoutside the company, which include media and research agencies.
2. Internal information consists the data and events relating to the enterprise aspublished by it.
3. Accountant’s income is the revenue over and the above all the costs incurred.
4. Forecasting is necessary to estimate a stock’s future income because valueof the share is the present value of its future income.
5. Debt financing provides leverage to common shareholders.
9.8 FORECASTING EARNINGS PER SHARE
Things are the most important number in the arsenal of the investor. The most importantand the principal is getting information about the earnings of the company is its financialstatements. The analyst must remember the fact that there is more to the financialstatements than what meets his eyes. Out of the two statements, balance sheet andincome statement, it is the income statement that is more often used in order to gaugethe future state of the firm. Research studies have indicated the significance of thisnumber in influencing prices and dividends. The research study conducted by Niederhofferand Regan for example, found that the prices are strongly dependent on the changes inthe earnings, both absolute and relative to the analysis.
The above study and some others indicate the importance of the forecast of earnings asthe most important variable to work on in the investment decision-making process. Thecritical aspects of the earnings are its level, trend and stability.
There are various methods employed to assess the future outlook of the revenue, expensesand the earnings from given the economic and industry outlook. These methods can bebroadly classified into two categories, traditional and modern. Under the traditionalapproach, the forecaster obtains the estimate of the single value variable. While in thecase of modern approach, he obtains the range of values with the probability of each.Let us discuss these two approaches in detail.
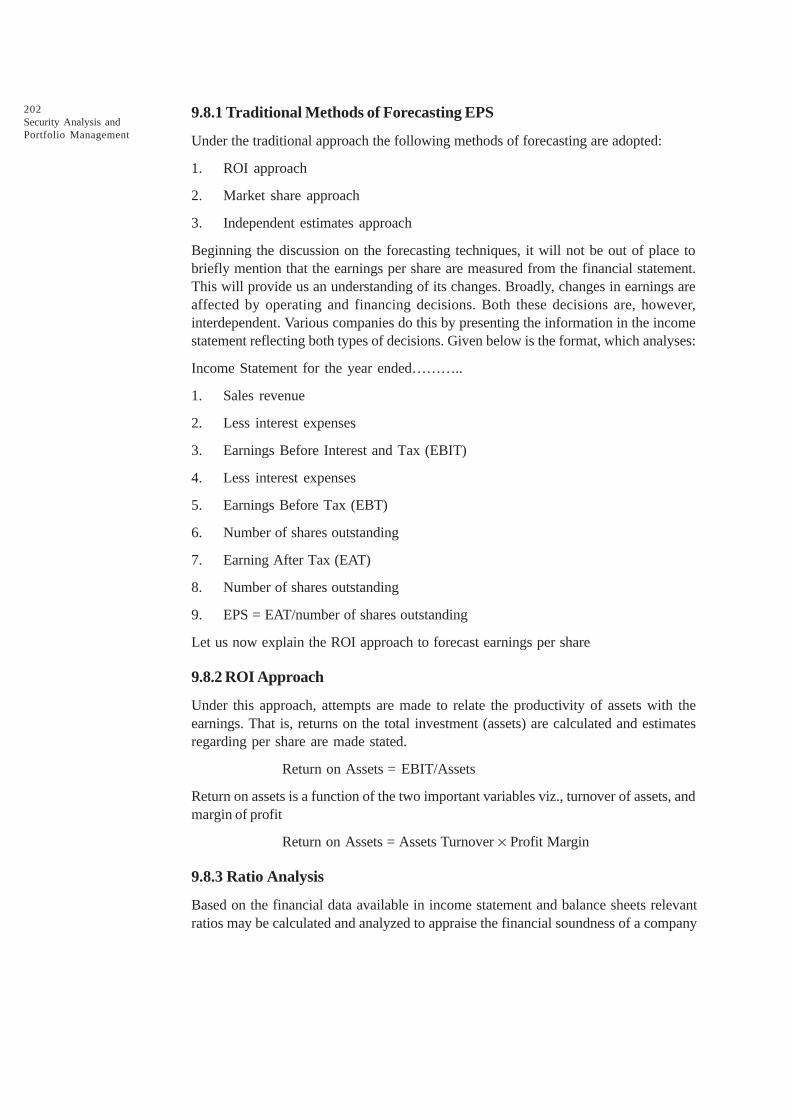
202Security Analysis andPortfolio Management
9.8.1 Traditional Methods of Forecasting EPS
Under the traditional approach the following methods of forecasting are adopted:
1. ROI approach
2. Market share approach
3. Independent estimates approach
Beginning the discussion on the forecasting techniques, it will not be out of place tobriefly mention that the earnings per share are measured from the financial statement.This will provide us an understanding of its changes. Broadly, changes in earnings areaffected by operating and financing decisions. Both these decisions are, however,interdependent. Various companies do this by presenting the information in the incomestatement reflecting both types of decisions. Given below is the format, which analyses:
Income Statement for the year ended………..
1. Sales revenue
2. Less interest expenses
3. Earnings Before Interest and Tax (EBIT)
4. Less interest expenses
5. Earnings Before Tax (EBT)
6. Number of shares outstanding
7. Earning After Tax (EAT)
8. Number of shares outstanding
9. EPS = EAT/number of shares outstanding
Let us now explain the ROI approach to forecast earnings per share
9.8.2 ROI Approach
Under this approach, attempts are made to relate the productivity of assets with theearnings. That is, returns on the total investment (assets) are calculated and estimatesregarding per share are made stated.
Return on Assets = EBIT/Assets
Return on assets is a function of the two important variables viz., turnover of assets, andmargin of profit
Return on Assets = Assets Turnover ¥ Profit Margin
9.8.3 Ratio Analysis
Based on the financial data available in income statement and balance sheets relevantratios may be calculated and analyzed to appraise the financial soundness of a company

203Fundamental Analysis 3:
Company Analysis
S. No. Indicator Ratios
A Technical Solvency Current ratio
Liquidity ratio
Net Income to Debt service ratio
B Actual Solvency Debt-equity ratio
Return on investment
Profit margin
Fixed Assets to total assets
C Profitability Gross profit margin
Net profit margin
Return on investment
Earnings per share
Dividend yield ratio
P/E ratio
D Efficiency Operating ratio
Expense ratio
Current assets turnover
Inventory turnover
Credit collection period
9.9 LET US SUM UP
Here, we have discussed in the company level analyses. For earning profits, investorsapply a simple and common sense decision rule, that is, maximization. A carefulexamination of the company quantitative and qualitative fundamentals is, therefore, veryessential. As Fischer and Jordan have aptly put it: “If the economic outlook suggestspurchase at the time, the economic analysis of the industry analysis will aid the investorselecting their proper industry in which to invest. Nonetheless, when to invest and inwhich industry is not enough. It is also necessary to know which companies industriesshould be selected”.
9.10 LESSON END ACTIVITY
“An analyst will not be able to develop a trading strategy based on adjustment to newpublic information”. Discuss.
9.11 KEYWORDS
Earnings model: The ROI method which has been earlier introduced as a device foranalyzing the effects of and interaction between the earnings and assets can be used asa forecasting tool.
Market share/profit margin approach: This is derivative of industry forecast of market.Once the total market is known, the market share of the individual company can bedetermined either using historical tract second or subjective probabilities.
Projected financial statement: This method makes an item-wise analysis of revenuesand expenses and predicts them over a number of years, based on the variations in thekey determining variables.

204Security Analysis andPortfolio Management
Regression and correlation analysis: These methods as applicable to industry analysiscan be used at company level.
Trend analysis: Trend analysis is a time series analysis that permits identification ofseasonal, cyclical and erratic fluctuations of the variables under consideration over atime period.
Decision trees: This can be used to forecast earnings and security values. Decision treeis an advanced technique because it considers possible outcomes with their probabilitiesand analyses them.
Simulation: This method can be applied to forecast earnings and also security values.Simulation is a technique that systematically repeats the application of a rule or formulato know outcomes indifferent situations.
9.12 QUESTIONS FOR DISCUSSION
1. What is the need of company analysis? Do we need the company analysis? Illustrateyour answer.
2. What is the framework of company analysis?
3. What are the two major components of company analysis?
4. Explain financial analysis.
5. What do you mean by earnings analysis?
Check Your Progress: Model Answers
CYP 1
1. trees 2. Internal 3. External 4. Financial
CYP 2
1. Simulation 2. revenue 3. account 4. stocks.
CYP 3
1. T 2. T 3. T 4. T 5. T
9.13 SUGGESTED READINGS
Sudhindra Bhat, Security Analysis and Portfolio Management, Excel Books, Delhi.
Kevin, S., Security Analysis and Portfolio Management, Prentice Hall of India.
Prasanna Chandra, Investment Analysis and Portfolio Management, Second Edition, Tata McGrawHill.
Punithavathy Pandian, Securities Analysis and Portfolio management, Vikas.
Investment Management, V. K. Bhalla.
A. Davis, Investors in a Changing Economy, Printice -Hall, 1968.
Williamson, J. Peter, Investments: New Analytic Techniques, London, Longman, 1970.
Cottle, CC., and Whitman, W.T., Investment Timing: The Formula Plan Approach, McGraw Hill.
LESSON
10TECHNICAL ANALYSIS
CONTENTS
10.0 Aims and Objectives
10.1 Introduction
10.2 What is Technical Analysis?
10.2.1 Basic Technical Assumptions
10.3 Technical vs Fundamental Analysis
10.3.1 Critics
10.3.2 Superiority of Technical Analysis
10.4 Old Puzzles and New Developments
10.4.1 Fibonacci Numbers
10.4.2 Elliott Wave Principle
10.4.3 Kondratev Wave Theory
10.4.4 Chaos Theory
10.5 Neutral Networks
10.6 Tools of Technical Analysis
10.7 Dow Theory
10.8 Criticism of Dow Theory
10.8.1 Price Indicators of Market
10.9 Types of Trend
10.9.1 Trend Lengths
10.9.2 Trendlines
10.9.3 Volume and Chart Patterns
10.9.4 Volume Precedes Price
10.10 Technical Analysis: Chart Types
10.10.1 Line Chart
10.10.2 Bar Charts
10.10.3 Candlestick Charts
10.10.4 Point - and - Figure Chart
10.10.5 Technical Analysis: Chart Patterns
10.11 Technical Analysis: Moving Averages
10.11.1 Types of Moving Averages
Contd....

206Security Analysis andPortfolio Management
10.0 AIMS AND OBJECTIVES
After studying this lesson, you should be able to understand:
l Introduction to Technical Analysis and Assumptions
l Technical Versus Fundamental Analysis
l Origins and Development of Technical Analysis
l Techniques of Technical Analysis
l Market Indicators
l Old Puzzles and New Developments: Fibonacci Numbers,
l The Dow Theory, Elliott Wave Principles; Kondratev Wave Theory
l Chaos Theory, Neutral Networks
l Tools of Technical Analysis
10.12 Exponential Moving Average (EMA)
10.12.1 Linear Weighted Average
10.12.2 Moving Average Convergence Divergence (MACD)
10.13 Major Uses of Moving Averages
10.14 Technical Analysis: Indicators and Oscillators
10.14.1 Aroon Oscillator
10.14.2 Relative Strength Index
10.15 Limitations of Charts
10.15.1 Technical Indicators
10.16 Short Interest Ratio Theory
10.16.1 Confidence Index
10.16.2 Spreads
10.16.3 Advance-Decline Ratio
10.16.4 Market Breadth Index
10.16.5 Odd-Lot Ratio
10.16.6 Insider Transactions
10.17 Criticisms of Technical Analysis
10.17.1 Future of Technical Analysis
10.18 Let us Sum up
10.19 Lesson End Activity
10.20 Keywords
10.21 Questions for Discussion
10.22 Suggested Readings
207Technical Analysis
l Charting as a Technical Tool: Types of Charts, Important Chart Patterns
l Limitation of Charts
l Limitation of Technical Analysis
l The Future of Technical Analysis
10.1 INTRODUCTION
The methods used to analyze securities and make investment decisions fall into two verybroad categories: fundamental analysis and technical analysis. Fundamental analysisinvolves analyzing the characteristics of a company in order to estimate its value. Technicalanalysis takes a completely different approach; it doesn't care one bit about the 'value' ofa company or a commodity. Technicians (sometimes called chartists) are only interestedin the price movements in the market.
The term technical analysis is used to mean fairly wide range of techniques, all based onthe concept that past information on prices and trading volume of stocks give theenlightened investor a picture of what lies ahead. It attempts to explain and forecastchanges in security prices by studying only the market data rather than informationabout a company or its prospects as is done by fundamental analyst. John Magee, whosebook Technical Analysis of Stock Trends is considered a classic for technical analysts,says:
"The technician has elected to study, not the mass of fundamentals, but certain abstractions,namely the market data alone. But this technical view provides a simplified and morecomprehensible picture of what is happening to the price of a stock. It is like a shadowor reflection in which can be seen the broad outline of the whole situation. Furthermore,it works."
The technical analysts believe that the price of a stock depends on supply and demand inthe marketplace and has little relationship to value, if any such concept even exits. Priceis governed by basic economic and psychological inputs so numerous and complex thatno individual can hope to understand and measure them correctly. The technician thinksthat the only important information to work from is the picture given by price and volumestatistics.
The technician sees the market, disregarding minor changes, moving in discernible trends,which continue for significant periods. A trend is believed to continue until there is definiteinformation of a change. The past performance of a stock can then be harnessed topredict the future. The direction of price change is as important as the relative size of thechange. With his various tools, the technician attempts to correctly catch changes intrend and take advantage of them.
10.2 WHAT IS TECHNICAL ANALYSIS?
Technical analysis is a method of evaluating securities by analyzing the statistics generatedby market activity, such as past prices and volume. Technical analysts do not attempt tomeasure a security's intrinsic value, but instead use charts and other tools to identifypatterns that can suggest future activity.
Just as there are many investment styles on the fundamental side, there are also manydifferent types of technical traders. Some rely on chart patterns, others use technicalindicators and oscillators, and most use some combination of the two. In any case,technical analysts' exclusive use of historical price and volume data is what separates
208Security Analysis andPortfolio Management
them from their fundamental counterparts. Unlike fundamental analysts, technical analystsdon't care whether a stock is undervalued - the only thing that matters is a security's pasttrading data and what information this data can provide about where the security mightmove in the future.
10.2.1 Basic Technical Assumptions
Before we embark on the actual methods themselves, let us review the basic and necessaryassumptions regarding the technical analysis:
1. The Market Discounts Everything: A major criticism of technical analysis is thatit only considers price movement, ignoring the fundamental factors of the company.However, technical analysis assumes that, at any given time, a stock's price reflectseverything that has or could affect the company - including fundamental factors.Technical analysts believe that the company's fundamentals, along with broadereconomic factors and market psychology, are all priced into the stock, removingthe need to actually consider these factors separately. This only leaves the analysisof price movement, which technical theory views as a product of the supply anddemand for a particular stock in the market.
2. Price Moves in Trends: In technical analysis, price movements are believed tofollow trends. This means that after a trend has been established, the future pricemovement is more likely to be in the same direction as the trend than to be againstit. Most technical trading strategies are based on this assumption.
3. History Tends to Repeat Itself: Another important postulate in technical analysisis that history tends to repeat itself, mainly in terms of price movement. The repetitivenature of price movements is attributed to market psychology; in other words,market participants tend to provide a consistent reaction to similar market stimuliover time. Technical analysis uses chart patterns to analyze market movementsand understand trends. Although many of these charts have been used for morethan 100 years, they are still believed to be relevant because they illustrate patternsin price movements that often repeat themselves.
Technical analysis and fundamental analysis are the two main schools of thought inthe financial markets. As we've mentioned, technical analysis looks at the pricemovement of a security and uses this data to predict its future price movements.Fundamental analysis, on the other hand, looks at economic factors, known asfundamentals. Let's get into the details of how these two approaches differ, thecriticisms against technical analysis and how technical and fundamental analysiscan be used together to analyze securities.
Check Your Progress 1
Fill in the blanks:
1. Fundamental analysis involves analyzing the characteristics of a company inorder to estimate its _____________.
2. _____________ analysis is a method of evaluating securities by analyzingthe statistics generated by the market activity, such as past prices and volume.
3. In technical analysis price movements are believed to follow ____________ .
4. A major criticism of technical analysis is that it only considers price movement,ignoring the _____________ factors of the company.
209Technical Analysis10.3 TECHNICAL VS FUNDAMENTAL ANALYSIS
With a view to making a broad comparison between technical analysis and fundamentalanalysis, let us assume that the fundamentalist is a conservative who invests for thelong-term and the technician is a trader who buys and sells for short-term profits. Actually,of course, the value of technical analysis lies between these extremes.
Fundamentalists study the cause, not the "should." They make their decisions on quality,value and depending on their specific investment goals, the yield or growth potential ofthe security. They are concerned with the basis, the corporation's financial strength,record of growth in sales and earnings, profitability, the investment acceptance and soon. They also take into account the general business and market conditions. Finally theyinterpret these data inductively to determine the current value of the stock and then toproject its future price. Fundamentalists are patient and seldom expect meaningful profitsin less than one year.
In the long run, the fundamentalist who selects quality stocks when they are undervaluedand sells them when they become fully priced will make substantial profits. But as JohnMaynard Keynes often noted, "In the long run, we'll all be dead".
Compared with long-term investors, technicians seek to keep their money working asprofitably as possible at all times. When trading, they want to score profits quickly, and ifthe stock to market does not perform as anticipated, they are willing to take a small, fastloss.
Technically-oriented investors start by checking the market action of the stock. If it isfavourable, they examine the fundamentals to be sure the company is sound and profitable.At all times, their focus is on the market, generally, on the performance of all listedstocks; specifically, on the price/volume movements of the stock they are consideringbuying. They make their decisions based on technical, not fundamental, data.
Technicians believe that (1) the stock market is rooted 15% in economics and 85% inpsychology; (2) the record of past and present performance of a stock, not necessarilyof the corporation, is the key factor; and (3) stock market dominated by institutionalinvestors, operates on the wolf pack theory of following leaders. When major moneymanagers start to buy, regardless of the reason, the price of the stock will go up. Whenthey start to sell, it will go down. All such moves are shown by technical indicators.
In more detailed terms, here are several ways the technician acts:
1. Technicians believe that behind the fundamentals are important factors: At anygiven time, some investors have gains in the stock, and some usually have losses.Those with gains want to safeguard them and if possible, build them higher, theywill hold the stocks.
Those with losses will adopt different tactics; some will cut their losses short byselling out early when the stock price begins to decline others will sell when aminor rally has moved the stock up to their cost price; and still others will hold ondoggedly until there is a turnaround.
Each of these decision points can be spotted on charts: current configuration toshow the action of the past week or so; intermediate and long-term patterns to findthe previous important price levels at which selling is likely; and interim and long-term high points from which the stock started to move down in the past.
In this method of analysis, a vital factor is volume. Volume is favourable on theupside when the number of shares traded is greater than before and on the downside
210Security Analysis andPortfolio Management
when the number of shares traded dwindles. Volume is unfavourable when volumedips as prices rise or increases when there is a decline. None of these indicators isconcerned with the fundamentals of the corporation.
2. Technicians act on the what not the why: They recognize that formations andpatterns signify changes in real value as the result of investor expectations, hopes,fears, industry developments and so on. They are not as impressed with fundamentalvalue of any security as they are with current and prospective values reflected bymarket action.
3. Technicians are not committed to a buy-and-hold policy: As long as the trend isup, they will hold a stock. This may be for months or even years. But if there is areversal, they will sell within hours of purchase. They recognize that, to achievethe greatest gains, they must never let sentiment of emotion override facts (asshown by technical indicators) and should always get out of a situation which, onavailable evidence, is no longer profitable.
4. Technicians do not separate income from capital gains: They look for totalreturns, that is, the realized price less the price paid plus dividends received. This isin sharp contrast to most long-term investors who buy a high-dividend paying stockand hold it for years, through up-and-down fluctuations. To the technicians, suchstrategy is foolish. A stock may continue to pay liberally but lose 50% of its value.If a stock is to be judged solely on its income, a non-dividend payer would have novalue at all.
5. Technicians act more quickly to make commitments and to take profits andlosses: They are not concerned with maintaining a position in any market, anyindustry or any stock. As a result, they are willing to take smaller gains in an up-market and accept quick losses in a down market. Traders/technicians want tokeep their money working at maximum efficiency.
Technicians know that there is no real value to any stock and that price reflectssupply and demand, which are governed by hundreds of factors, rational andirrational. No one can grasp and weigh them all, but to a surprising degree, themarket does so automatically.
6. Technicians recognize that the more experience one has with the technicalindicators, the more alert one becomes to pitfalls and failure of investing: Tobe rewarding, technical analysis requires attention and discipline, with quality stocksheld for the long terms. The duration can make up for timing mistakes. With technicalapproaches, the errors become clear quickly.
7. Technicians insist that the market always repeats: What has happened beforewill probably be repeated again; therefore, current movements can be used forfuture projection.
With all markets and almost all securities, there are cycles and trends which willoccur again and again. Technical analyses, especially charts, provide the best andmost convenient method of comparison.
8. Technicians believe that breakouts from previous trends are important signals:They indicate a shift in that all-important supply and demand. When confirmed,breakouts are almost always accurate signals to buy or sell.
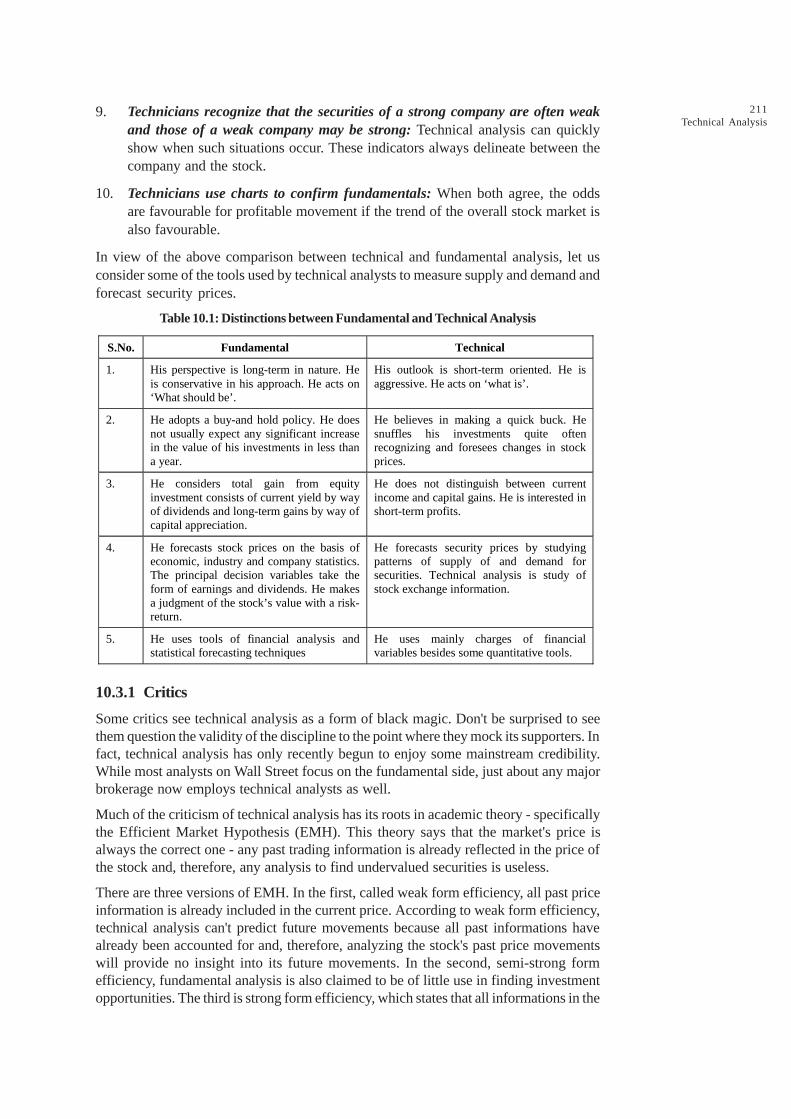
211Technical Analysis
9. Technicians recognize that the securities of a strong company are often weakand those of a weak company may be strong: Technical analysis can quicklyshow when such situations occur. These indicators always delineate between thecompany and the stock.
10. Technicians use charts to confirm fundamentals: When both agree, the oddsare favourable for profitable movement if the trend of the overall stock market isalso favourable.
In view of the above comparison between technical and fundamental analysis, let usconsider some of the tools used by technical analysts to measure supply and demand andforecast security prices.
Table 10.1: Distinctions between Fundamental and Technical Analysis
S.No. Fundamental Technical
1. His perspective is long-term in nature. He is conservative in his approach. He acts on ‘What should be’.
His outlook is short-term oriented. He is aggressive. He acts on ‘what is’.
2. He adopts a buy-and hold policy. He does not usually expect any significant increase in the value of his investments in less than a year.
He believes in making a quick buck. He snuffles his investments quite often recognizing and foresees changes in stock prices.
3. He considers total gain from equity investment consists of current yield by way of dividends and long-term gains by way of capital appreciation.
He does not distinguish between current income and capital gains. He is interested in short-term profits.
4. He forecasts stock prices on the basis of economic, industry and company statistics. The principal decision variables take the form of earnings and dividends. He makes a judgment of the stock’s value with a risk-return.
He forecasts security prices by studying patterns of supply of and demand for securities. Technical analysis is study of stock exchange information.
5. He uses tools of financial analysis and statistical forecasting techniques
He uses mainly charges of financial variables besides some quantitative tools.
10.3.1 Critics
Some critics see technical analysis as a form of black magic. Don't be surprised to seethem question the validity of the discipline to the point where they mock its supporters. Infact, technical analysis has only recently begun to enjoy some mainstream credibility.While most analysts on Wall Street focus on the fundamental side, just about any majorbrokerage now employs technical analysts as well.
Much of the criticism of technical analysis has its roots in academic theory - specificallythe Efficient Market Hypothesis (EMH). This theory says that the market's price isalways the correct one - any past trading information is already reflected in the price ofthe stock and, therefore, any analysis to find undervalued securities is useless.
There are three versions of EMH. In the first, called weak form efficiency, all past priceinformation is already included in the current price. According to weak form efficiency,technical analysis can't predict future movements because all past informations havealready been accounted for and, therefore, analyzing the stock's past price movementswill provide no insight into its future movements. In the second, semi-strong formefficiency, fundamental analysis is also claimed to be of little use in finding investmentopportunities. The third is strong form efficiency, which states that all informations in the
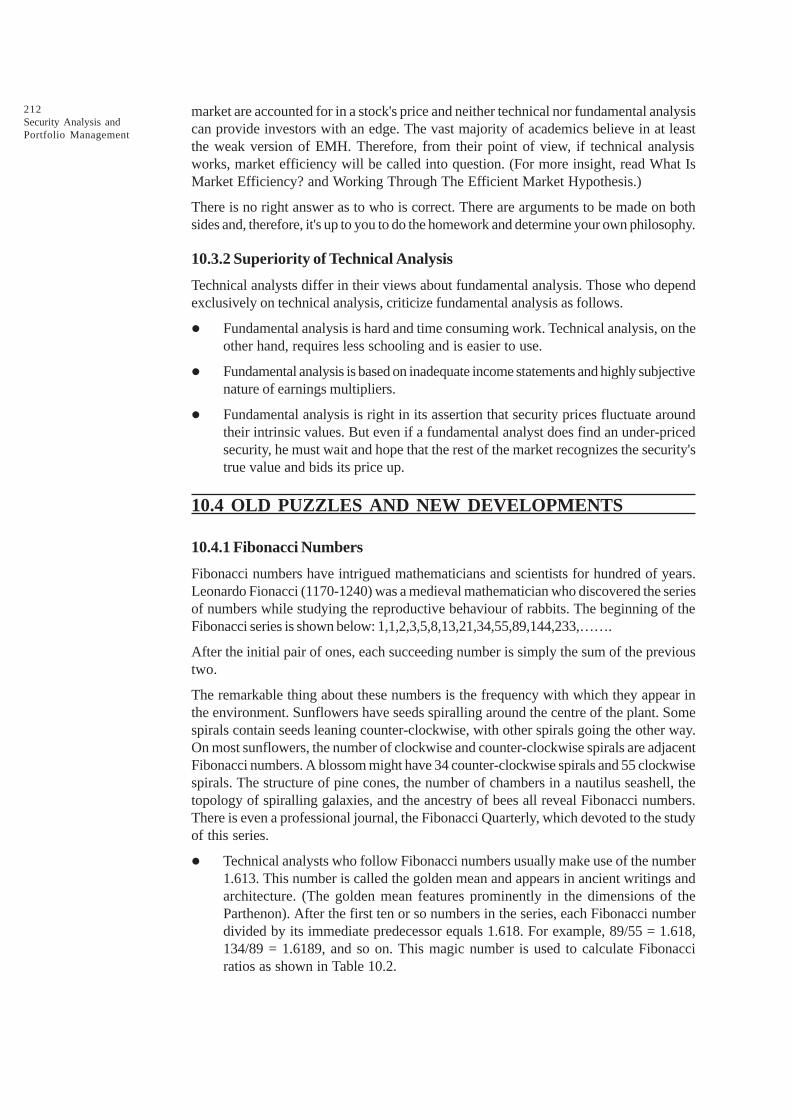
212Security Analysis andPortfolio Management
market are accounted for in a stock's price and neither technical nor fundamental analysiscan provide investors with an edge. The vast majority of academics believe in at leastthe weak version of EMH. Therefore, from their point of view, if technical analysisworks, market efficiency will be called into question. (For more insight, read What IsMarket Efficiency? and Working Through The Efficient Market Hypothesis.)
There is no right answer as to who is correct. There are arguments to be made on bothsides and, therefore, it's up to you to do the homework and determine your own philosophy.
10.3.2 Superiority of Technical Analysis
Technical analysts differ in their views about fundamental analysis. Those who dependexclusively on technical analysis, criticize fundamental analysis as follows.
l Fundamental analysis is hard and time consuming work. Technical analysis, on theother hand, requires less schooling and is easier to use.
l Fundamental analysis is based on inadequate income statements and highly subjectivenature of earnings multipliers.
l Fundamental analysis is right in its assertion that security prices fluctuate aroundtheir intrinsic values. But even if a fundamental analyst does find an under-pricedsecurity, he must wait and hope that the rest of the market recognizes the security'strue value and bids its price up.
10.4 OLD PUZZLES AND NEW DEVELOPMENTS
10.4.1 Fibonacci Numbers
Fibonacci numbers have intrigued mathematicians and scientists for hundred of years.Leonardo Fionacci (1170-1240) was a medieval mathematician who discovered the seriesof numbers while studying the reproductive behaviour of rabbits. The beginning of theFibonacci series is shown below: 1,1,2,3,5,8,13,21,34,55,89,144,233,…….
After the initial pair of ones, each succeeding number is simply the sum of the previoustwo.
The remarkable thing about these numbers is the frequency with which they appear inthe environment. Sunflowers have seeds spiralling around the centre of the plant. Somespirals contain seeds leaning counter-clockwise, with other spirals going the other way.On most sunflowers, the number of clockwise and counter-clockwise spirals are adjacentFibonacci numbers. A blossom might have 34 counter-clockwise spirals and 55 clockwisespirals. The structure of pine cones, the number of chambers in a nautilus seashell, thetopology of spiralling galaxies, and the ancestry of bees all reveal Fibonacci numbers.There is even a professional journal, the Fibonacci Quarterly, which devoted to the studyof this series.
l Technical analysts who follow Fibonacci numbers usually make use of the number1.613. This number is called the golden mean and appears in ancient writings andarchitecture. (The golden mean features prominently in the dimensions of theParthenon). After the first ten or so numbers in the series, each Fibonacci numberdivided by its immediate predecessor equals 1.618. For example, 89/55 = 1.618,134/89 = 1.6189, and so on. This magic number is used to calculate Fibonacciratios as shown in Table 10.2.
213Technical Analysis
Table 10.2: Fibonacci Ratios
0/618 1 0.618 1.000 1.618 2.618
– – ́ ́ ́ ́
1.618 1.618 1.618 1.618 1.618 1.618
0.382 0.618 1.000 1.618 2.618 4.236
l Many Fibonacci advocate in the investment business use the first two ratios, 0.382
and 0.618, to "compute retracement levels of a previous move." For instance, astock that falls from Rs. 50 to Rs. 35 (a 30% drop) will encounter resistance tofurther advances after it recoups 38.2% of its loss (that is, after it rises to Rs.40.73).
l Some technical analysts keep close-tabs on resistance and support levels as predictedby the Fibonacci ratios. Even people who do not subscribe to this business knowthat many other people do, and that when stock prices approach important Fibonaccilevels, unusual things can occur.
l A male bee (a drone) has only a mother; it comes from an unfertilized egg. Afemale bee (a queen) comes from a fertilized egg and has both a mother and afather. This means one drone has one parent, two grandparents, three great-grandparents, five great-great grandparents, and so on. The number of ancestorsat each generation is the Fibonacci series.
10.4.2 Elliott Wave Principle
One theory that attempts to develop a rationale for a long-term pattern in the stock pricemovements is the Elliott Wave Principle (EWP), established in the 1930s by R.N. Eliottand later popularized by Hamilton Bolton. The EWP states that major moves take placein five successive steps resembling tidal waves. In a major bull market, the first move isupward, the second downward, the third upward, the fourth downward and the fifth andfinal phase upward. The waves have a reverse flow in a bear market.
10.4.3 Kondratev Wave Theory
Nikolay Kondratev was a Russian economist and statistician born in 1892. He helpeddevelop the first Soviet Five-Year Plan. From 1920 to 1928 he was Director of the Studyof Business Activity at the Timiriazev Agricultural Academy. While there, he devoted hisattention to the study of Western capitalist economies. In the economies of Great Britainand the United States, he identified long-term business cycles with a period of 50-60years. He became well-known after the US market crash of 1929, which Kondratevpredicted would follow the US crash of 1870. His hypothesis of a long-term businesscycle is called the Kondratev Wave Theory.
Note that the market crash for 1987 occurred 58 years after the crash of 1929, a periodconsistent with Kondratev's theory. Some modern economists believe that Kondratev'stheory has merits. Many others believe that significant macro-economic changes, suchas floating exchange rates, the elimination of the gold standard, and the reduction ofbarriers to free trade, make the decision cycle less predictable. Still, many market analystsconsider Kondratev's work in their assessment of the stock market and its risks.

214Security Analysis andPortfolio Management
10.4.4 Chaos Theory
At recent finance conferences, a few researchers have presented papers on the chaostheory and its application to the stock market. In physics, chaos theory is growing field ofstudy examining instances in which apparently random behaviour is, in fact, quitesystematic or even deterministic. Scientists apply this theory to weather prediction,population growth estimates, and fisheries biology.
l As an example of the latter application, a given volume of ocean water, left freefrom human interference, will not necessarily reach an equilibrium population ofthe various species that inhibit it. As fishes grow, they consume the smaller fry (oftheir own or a different species) in increasing numbers. Fewer younger fishes areleft to mature; this, coupled with the natural death of the older fish, eventuallyresults in a sudden drastic reduction in fish population, causing dismay to fishermenand excitement in the local media. At the same time, it results in reduced predationand competition for food among the surviving fry, so the population begins to growdramatically, and the cycle continues. Interactions between species add complexityto the process.
l Investment analysts have sought a pattern in stock market behaviour since theorigin of the exchanges. Much remains unknown about how security prices aredetermined, and chaos theory may eventually provide some potential answers. Ifthe apparent randomness of security price changes, can be shown to be non-random,much of the theory of finance would need revision.
10.5 NEUTRAL NETWORKS
A neutral network is a trading system in which a forecasting model is trained to finddesired output from past trading data. By repeatedly cycling through the data, the neutralnetwork eventually learns the pattern that produces the desired output. If the desiredoutput remains elusive, more data is included until a pattern is found. Neutral networksmay also include a feedback mechanism whereby experience gained from past errors.
l This topic is a hot one in the investment community. National conferences havebeen organized dealing exclusively with this topic, and the trade literature publishesmany articles upon this. A problem with concept of a neutral network is that thestock market is seldom deterministic. Situations constantly change, and what mayhave been true a few years ago will not necessarily prevail tomorrow. Financialacademics are especially leery of back-tests, or research that tests a hypothesesusing past data. Mining the data will almost always result in some apparent causeand effect between past events and stock market performance. Research thattests a hypothesis using subsequent data is much more useful. An article in thepopular press describes Wall Street's response to this criticism.
l One way to get around this hazard is to build something called a genetic algorithminto your neutral network. A sexy term that currently causes Wall Street rocketscientists to swoon, genetic algorithms enable neutral nets to adapt to the futurebuy spawning schools of baby nets, each of which is sent to swim against thechanging flow of data, where only the fittest survive to take over the role of themother.
l No matter what someone's field of study, they are interested in the search for abetter mousetrap. Essentially, what all security analysts seek to do is to findimprovements in their methodology for security selection.
215Technical Analysis10.6 TOOLS OF TECHNICAL ANALYSIS
The technician must (1) identify the trend, (2) recognize when one trend comes to anend and prices set off in the opposite direction. His central problem is to distinguishbetween reversals within a trend and real changes in the trend itself. This problem ofsorting out price changes is critical, since prices do not change in a smooth, uninterruptedfashion.
The two variables concerning groups of stocks or individual stocks are:
1. Behaviour of prices, and
2. Volume of trading contributing to and influenced by changing prices.
The use of technical 'indicators' to measure the direction of overall market should precedeany technical analysis of individual stocks, because of systematic influence of the generalmarket on stock prices. In addition, some technicians feel that forecasting aggregates anmore reliable, since individual errors can be filtered out.
First, we will examine the seminal theory from which much of the substances of technicalanalysis has been developed - the Dow Theory - after which the key indicators viz.,price and volume relating to entire market and individual stock performance as shown inTable 10.3 will be examined.
Table 10.3: Tools of Technical Analysis
Category Market Indicators Market and individual stock indicators
Price indicators Dow Theory – Breadth of market indicators
o Plurality o Market breadth index o Advance –Declines o New highs and new lows o The most active list o Confidence indicator
(Disparity index)
Line, bar and point and figure charges Moving averages. Relative strength
Volume indicators New York and American Exchange volume Contrary Opinion Theories
o Short selling o Odd Lot trading
Resistance and support charts Price volume bar charts
Other indicators Mutual fund activity Credit balance theory
10.7 DOW THEORY
The Dow Theory is one of the oldest and most famous technical tools. It was originatedby Charles Dow, who founded the Dow Jones company and was the editor of The WallStreet Journal. Charles Dow passed away in 1902.
The Dow Theory was developed by W.P. Hamilton and Robert Rhea from the editorialwritten by Dow during 1900-02. Numerous writers have altered, extended and in somecases abridged the original Dow Theory. It is the basis for many other techniques usedby technical analysts.
The Dow Theory is credited with having forecast the Great Crash of 1929. On October23, 1929, The Wall Street Journal published a still famous editorial "A Twin in the Tide"
216Security Analysis andPortfolio Management
which correctly stated that the bull market was then over and a bear market had started.The horrendous market crash which followed the forecast drew much favourable attentionto the Dow Theory. Greiner and Whitecombe assert that "The Dow Theory provides atime-tested method of reading the stock market barometer."
There are many versions of this theory, but essentially it consists of three types of marketmovements: the major market trend, which can often last a year or more; a secondaryintermediate trend, which can move against the primary trend for one to several months;and minor movements lasting only for hours to a few days. The determination of themajor market trend is the most important decision for the Dow believer.
The Theory: According to Dow, "The market is always considered as having threemovements, all going at the same time. The first is the narrow movement from day-to-day. The second is the short swing running from two weeks to a month or more, the thirdis the main movement covering at least four years in duration".
These movements are called:
l Daily fluctuations (minor trends)
l Secondary movements (trends), and
l Primary trends
The primary trends are the long range cycle that carries the entire market up or down(bull or bear markets). The secondary trend acts as a restraining force on the primarytrend. It ends to correct deviations from its general boundaries. The minor trendshave little analytical value, because of their short duration and variations in amplitude.Figure 10.1 represents the Dow Theory.
The Dow Theory is built upon the assertion that measures of stock prices tend to movetogether. It employs two of the Dow Jones' averages:
(i) Dow-Jones Transportation Average (DJTA)
(ii) Dow-Jones Transportation Average (DJTA)
Bear market - If both the averages are rising
Bear market - If both the averages are falling
Uncertain - If one is rising and other is falling
Although Charles Dow believed in fundamental analysis, the Dow Theory has evolvedinto a primarily technical approach to the stock market. It asserts that stock pricesdemonstrate patterns over four to five years and these patterns are mirrored by indicesof stock prices. The Dow Theory employs two of the Dow Jones' averages, the industrialaverage and the transportation average. The utility average is generally ignored.
The Dow Theory is built upon the assertion that measures of stock prices tend to movetogether. If the Dow Jones industrial average is rising, then the transportation averageshould also be rising. Such simultaneously price movements suggest a strong bull market.Conversely, a decline in both the industrial and transportation averages, both move inopposite directions; the market is uncertain as to the direction of future stock prices.
If one of the averages starts to decline after a period of rising stock prices, then the twoare at odds. For example, the industrial average may be rising while the transportationaverage is falling. This suggests that the industries may not continue to rise but may soonbegin to fall. Hence, the market investor will use this signal to sell securities and convertto cash.
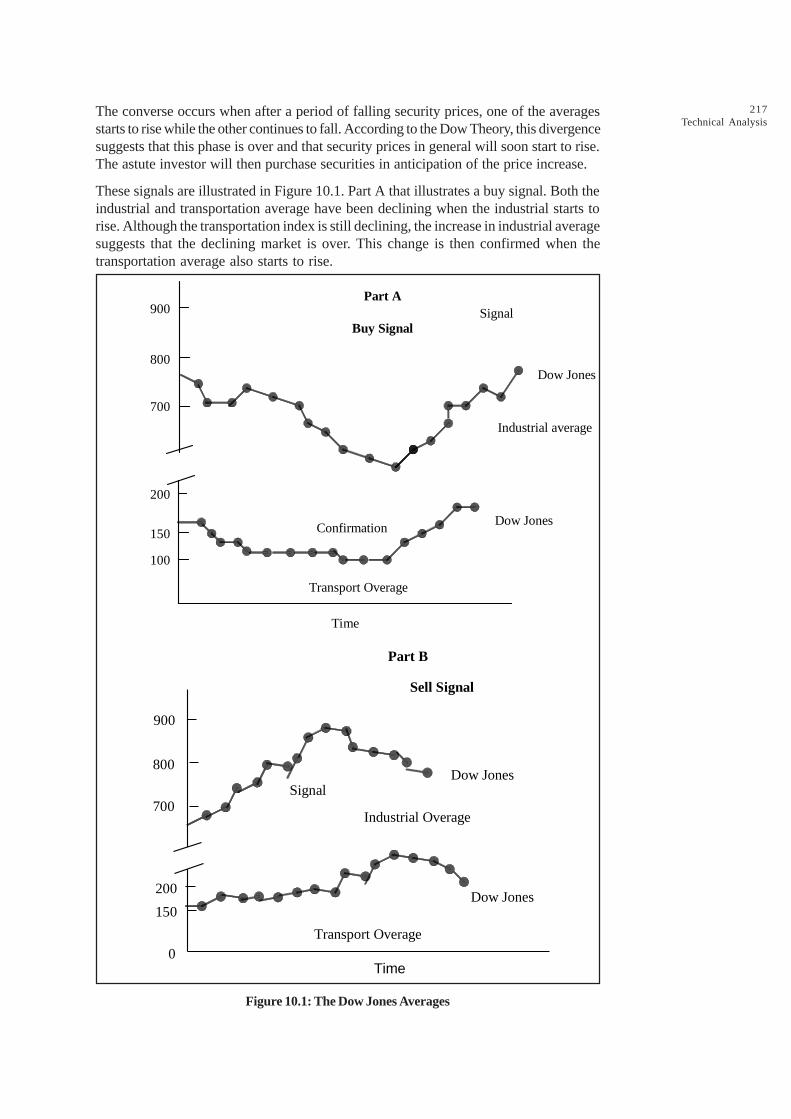
217Technical Analysis
The converse occurs when after a period of falling security prices, one of the averagesstarts to rise while the other continues to fall. According to the Dow Theory, this divergencesuggests that this phase is over and that security prices in general will soon start to rise.The astute investor will then purchase securities in anticipation of the price increase.
These signals are illustrated in Figure 10.1. Part A that illustrates a buy signal. Both theindustrial and transportation average have been declining when the industrial starts torise. Although the transportation index is still declining, the increase in industrial averagesuggests that the declining market is over. This change is then confirmed when thetransportation average also starts to rise.
Buy Signal
Time
Signal
Dow Jones
Industrial average
Confirmation Dow Jones
Transport Overage
900
800
700
200
150
100
Part A
Sell Signal
Time
800
700
200
150
0 Transport Overage
Signal Dow Jones
Industrial Overage
Dow Jones
900
Part B
Figure 10.1: The Dow Jones Averages
218Security Analysis andPortfolio Management
Check Your Progress 2
1. A _____________ network is a trading system in which a forecasting modelis trained to find desired output from past trading data.
2. _____________ analysis is based on inadequate income statements andhighly subjective nature of earnings multipliers.
3. Technically oriented investors start by checking the market action of the_____________ .
4. Technical analysts know that there is no real value to any stock and that pricereflects supply and _____________ .
10.8 CRITICISM OF DOW THEORY
Several criticisms are levelled against the Dow Theory.
1. It is not a theory but an interpretation of known data. A theory should be able toexplain why a phenomenon occurs. No attempt was made by Dow or his followersto explain why the two averages should be able to forecast future stock prices.
2. It is not acceptable in its forecast. There was considerable lag between the actualturning points and those indicated by the forecast.
3. It has poor predictive power. According to Rosenberg, the Dow Theory could notforecast the bull market which had preceded the 1929 crash. It gave bearishindication in early 1926. The 31/2 years which followed the forecast of Hamilton'seditorials for the 26-year period, from 1904 to 1929. Of the 90 recommendationsHamilton made for a change in attitude towards the market 55% were bullish, 18%bearish and 29% doubtful) only 45 were correct. Such a result an investor may getby flipping a coin.
10.8.1 Price Indicators of Market
The different price indicators which measure market movement are briefly explainedbelow:
(A) Breadth of Market: Breadth-of-market indicators are used to determine what themain body of stocks is doing. It is computed by comparing market advances ordeclines. The technician is interested in change in breadth than in absolute level.Several methods are in vogue for measuring the breadth of the market. The mostcommon ones are explained here.
The breadth-of-market statistics are obtained by using the data of stock advancesand declines. The data of advances and declines are published daily in most financialand national newspapers. Three simple methods are presented here:
(i) Plurality or Net Advances and Declines: To get net advances or declines,subtract the number of issues whose prices declined from the number ofissues whose prices advanced each day. Obtain cumulative index by addingdaily net advances and declines.

219Technical Analysis
When the index +ve, market is bullish
When the index –ve, market is bearish
(ii) Advance: Decline ratio: a simple variant to the above method is computinga ratio.
Advance - Decline ratio = no. of advances/no. of declines.
When the ratio is > 1, market is bullish
When the ratio is < 1, market is bearish
(iii) Market breadth index: This is another way of computing the advance anddeclines
Market breadth index = 2(advance declines)
Unchanged
-
The figure of each week is added to the next week. The data are then plotted toestablish the patterns of movement of advances and declines.
If both the stock index and market breadth index increase, the market is bullish.
When the stock index increases but breadth index does not, the market is bearish.
Iteratively, it can be emphasized that the technician is more interested in change inbreadth. Further indexes are used along with stock market index. Normally, breadthand stock market index will move in unison. The key signals occur where there isdivergence between the two. When they diverge, the advance decline line showsthe direction of the market.
(B) Price Indicators of Individual Stock: After the technical analysis has forecastthe probable future performance of the market, he has focussed his attention onindividual stock performance. The popular method of analyzing price changes ofindividual stocks are charts and moving averages.
10.9 TYPES OF TREND
There are three types of trend:
l Uptrends
l Downtrends
l Sideways/Horizontal Trends
As the names imply, when each successive peak and trough is higher, it's referred to asan upward trend. If the peaks and troughs are getting lower, it's a downtrend. Whenthere is little movement up or down in the peaks and troughs, it's a sideways or horizontaltrend. If you want to get really technical, you might even say that a sideways trend isactually not a trend on its own, but a lack of a well-defined trend in either direction. Inany case, the market can really only trend in these three ways: up, down or nowhere.
10.9.1 Trend Lengths
Along with these three trend directions, there are three trend classifications. A trend ofany direction can be classified as a long-term trend, intermediate trend or a short-termtrend. In terms of the stock market, a major trend is generally categorized as one lastinglonger than a year. An intermediate trend is considered to last between one and three
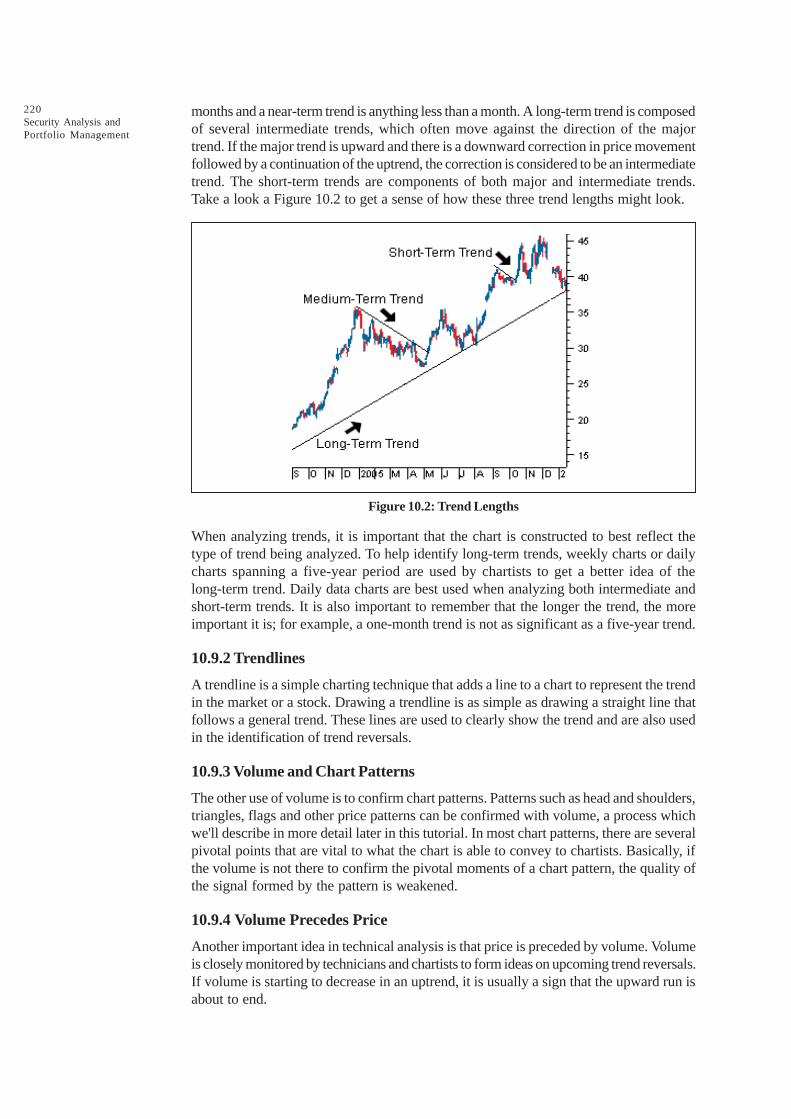
220Security Analysis andPortfolio Management
months and a near-term trend is anything less than a month. A long-term trend is composedof several intermediate trends, which often move against the direction of the majortrend. If the major trend is upward and there is a downward correction in price movementfollowed by a continuation of the uptrend, the correction is considered to be an intermediatetrend. The short-term trends are components of both major and intermediate trends.Take a look a Figure 10.2 to get a sense of how these three trend lengths might look.
Figure 10.2: Trend Lengths
When analyzing trends, it is important that the chart is constructed to best reflect thetype of trend being analyzed. To help identify long-term trends, weekly charts or dailycharts spanning a five-year period are used by chartists to get a better idea of thelong-term trend. Daily data charts are best used when analyzing both intermediate andshort-term trends. It is also important to remember that the longer the trend, the moreimportant it is; for example, a one-month trend is not as significant as a five-year trend.
10.9.2 Trendlines
A trendline is a simple charting technique that adds a line to a chart to represent the trendin the market or a stock. Drawing a trendline is as simple as drawing a straight line thatfollows a general trend. These lines are used to clearly show the trend and are also usedin the identification of trend reversals.
10.9.3 Volume and Chart Patterns
The other use of volume is to confirm chart patterns. Patterns such as head and shoulders,triangles, flags and other price patterns can be confirmed with volume, a process whichwe'll describe in more detail later in this tutorial. In most chart patterns, there are severalpivotal points that are vital to what the chart is able to convey to chartists. Basically, ifthe volume is not there to confirm the pivotal moments of a chart pattern, the quality ofthe signal formed by the pattern is weakened.
10.9.4 Volume Precedes Price
Another important idea in technical analysis is that price is preceded by volume. Volumeis closely monitored by technicians and chartists to form ideas on upcoming trend reversals.If volume is starting to decrease in an uptrend, it is usually a sign that the upward run isabout to end.
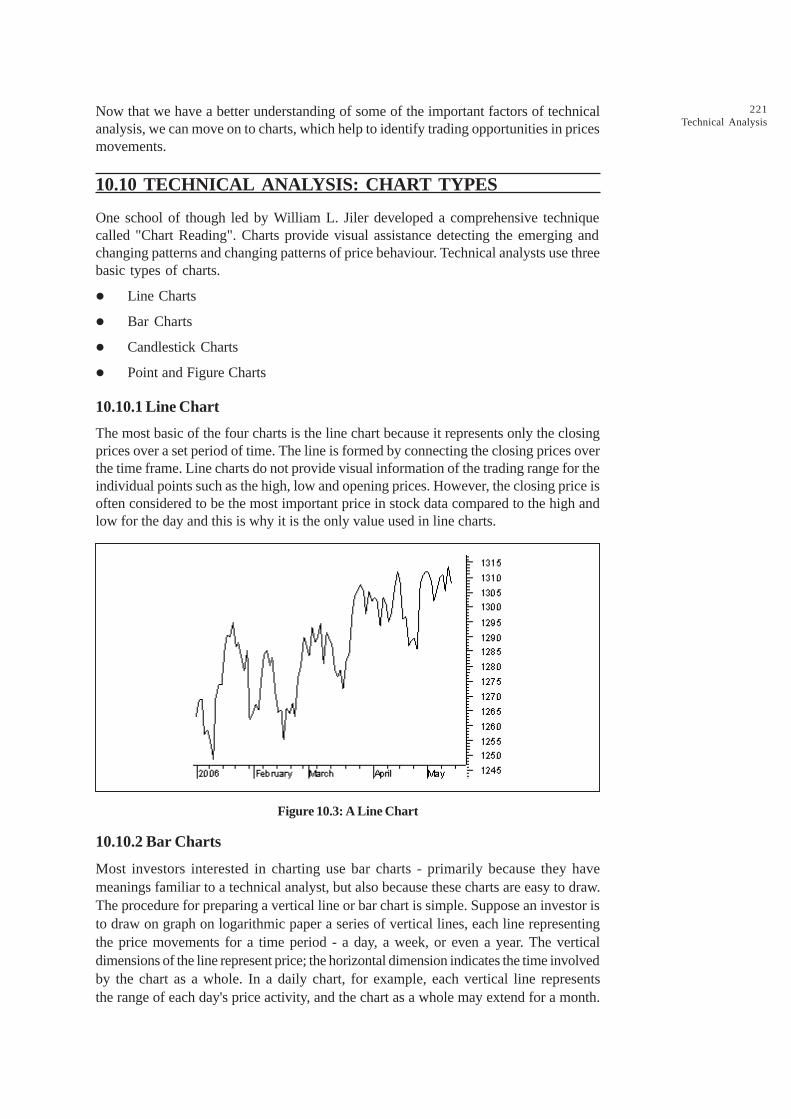
221Technical Analysis
Now that we have a better understanding of some of the important factors of technicalanalysis, we can move on to charts, which help to identify trading opportunities in pricesmovements.
10.10 TECHNICAL ANALYSIS: CHART TYPES
One school of though led by William L. Jiler developed a comprehensive techniquecalled "Chart Reading". Charts provide visual assistance detecting the emerging andchanging patterns and changing patterns of price behaviour. Technical analysts use threebasic types of charts.
l Line Charts
l Bar Charts
l Candlestick Charts
l Point and Figure Charts
10.10.1 Line Chart
The most basic of the four charts is the line chart because it represents only the closingprices over a set period of time. The line is formed by connecting the closing prices overthe time frame. Line charts do not provide visual information of the trading range for theindividual points such as the high, low and opening prices. However, the closing price isoften considered to be the most important price in stock data compared to the high andlow for the day and this is why it is the only value used in line charts.
Figure 10.3: A Line Chart
10.10.2 Bar Charts
Most investors interested in charting use bar charts - primarily because they havemeanings familiar to a technical analyst, but also because these charts are easy to draw.The procedure for preparing a vertical line or bar chart is simple. Suppose an investor isto draw on graph on logarithmic paper a series of vertical lines, each line representingthe price movements for a time period - a day, a week, or even a year. The verticaldimensions of the line represent price; the horizontal dimension indicates the time involvedby the chart as a whole. In a daily chart, for example, each vertical line representsthe range of each day's price activity, and the chart as a whole may extend for a month.
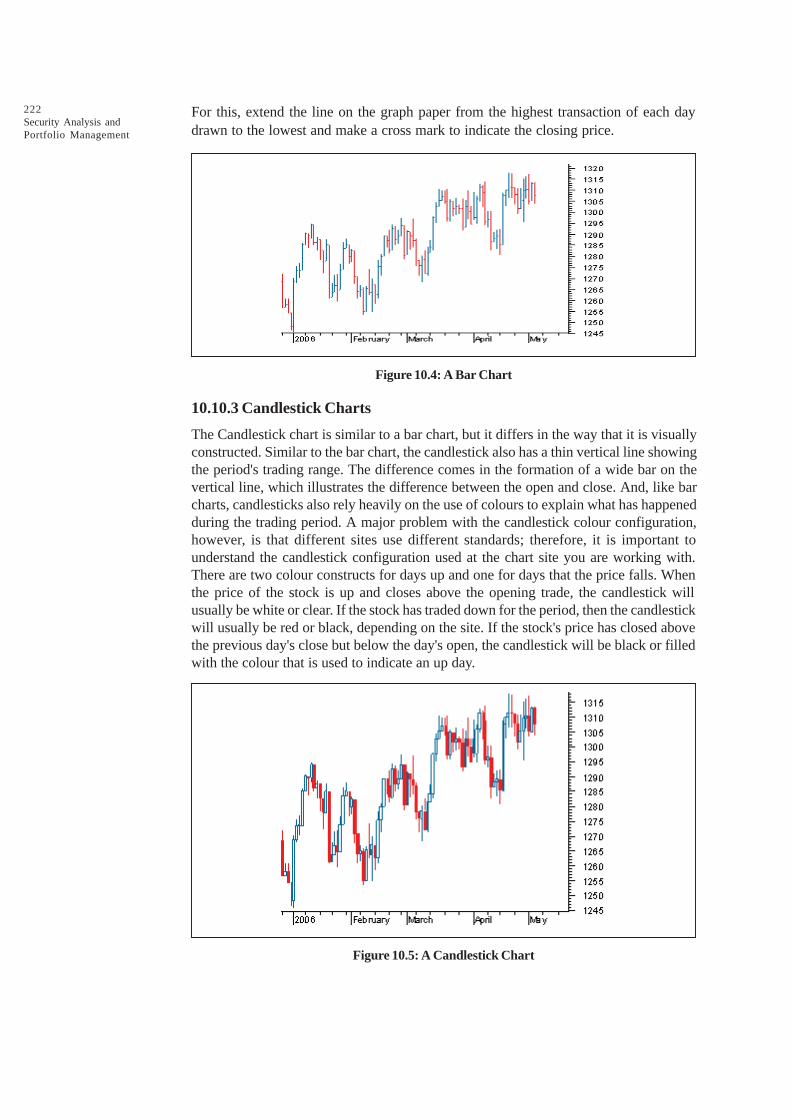
222Security Analysis andPortfolio Management
For this, extend the line on the graph paper from the highest transaction of each daydrawn to the lowest and make a cross mark to indicate the closing price.
Figure 10.4: A Bar Chart
10.10.3 Candlestick Charts
The Candlestick chart is similar to a bar chart, but it differs in the way that it is visuallyconstructed. Similar to the bar chart, the candlestick also has a thin vertical line showingthe period's trading range. The difference comes in the formation of a wide bar on thevertical line, which illustrates the difference between the open and close. And, like barcharts, candlesticks also rely heavily on the use of colours to explain what has happenedduring the trading period. A major problem with the candlestick colour configuration,however, is that different sites use different standards; therefore, it is important tounderstand the candlestick configuration used at the chart site you are working with.There are two colour constructs for days up and one for days that the price falls. Whenthe price of the stock is up and closes above the opening trade, the candlestick willusually be white or clear. If the stock has traded down for the period, then the candlestickwill usually be red or black, depending on the site. If the stock's price has closed abovethe previous day's close but below the day's open, the candlestick will be black or filledwith the colour that is used to indicate an up day.
Figure 10.5: A Candlestick Chart
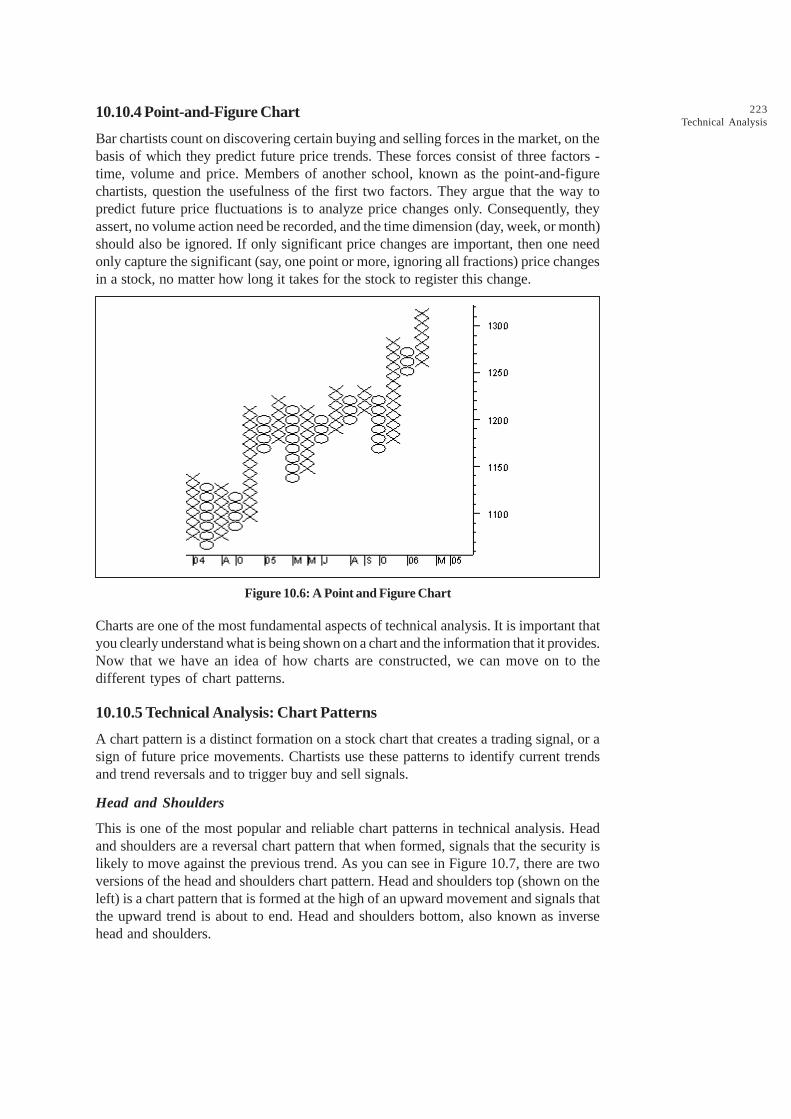
223Technical Analysis
10.10.4 Point-and-Figure Chart
Bar chartists count on discovering certain buying and selling forces in the market, on thebasis of which they predict future price trends. These forces consist of three factors -time, volume and price. Members of another school, known as the point-and-figurechartists, question the usefulness of the first two factors. They argue that the way topredict future price fluctuations is to analyze price changes only. Consequently, theyassert, no volume action need be recorded, and the time dimension (day, week, or month)should also be ignored. If only significant price changes are important, then one needonly capture the significant (say, one point or more, ignoring all fractions) price changesin a stock, no matter how long it takes for the stock to register this change.
Figure 10.6: A Point and Figure Chart
Charts are one of the most fundamental aspects of technical analysis. It is important thatyou clearly understand what is being shown on a chart and the information that it provides.Now that we have an idea of how charts are constructed, we can move on to thedifferent types of chart patterns.
10.10.5 Technical Analysis: Chart Patterns
A chart pattern is a distinct formation on a stock chart that creates a trading signal, or asign of future price movements. Chartists use these patterns to identify current trendsand trend reversals and to trigger buy and sell signals.
Head and Shoulders
This is one of the most popular and reliable chart patterns in technical analysis. Headand shoulders are a reversal chart pattern that when formed, signals that the security islikely to move against the previous trend. As you can see in Figure 10.7, there are twoversions of the head and shoulders chart pattern. Head and shoulders top (shown on theleft) is a chart pattern that is formed at the high of an upward movement and signals thatthe upward trend is about to end. Head and shoulders bottom, also known as inversehead and shoulders.
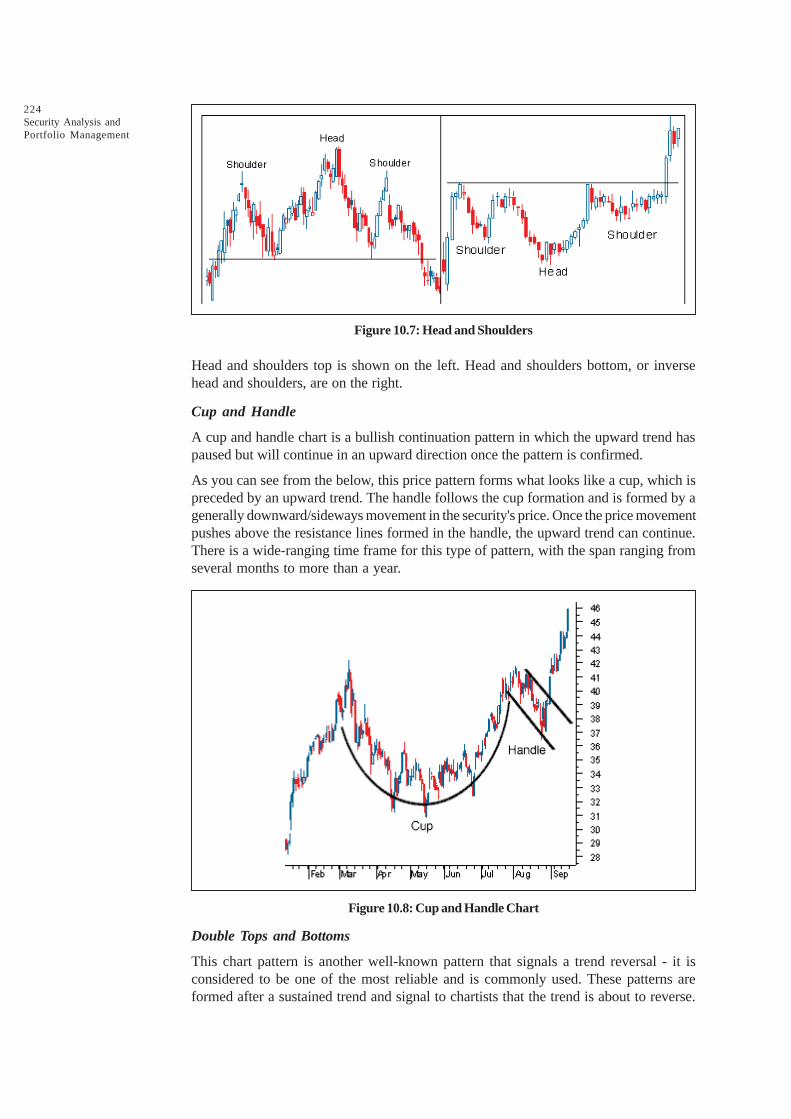
224Security Analysis andPortfolio Management
Figure 10.7: Head and Shoulders
Head and shoulders top is shown on the left. Head and shoulders bottom, or inversehead and shoulders, are on the right.
Cup and Handle
A cup and handle chart is a bullish continuation pattern in which the upward trend haspaused but will continue in an upward direction once the pattern is confirmed.
As you can see from the below, this price pattern forms what looks like a cup, which ispreceded by an upward trend. The handle follows the cup formation and is formed by agenerally downward/sideways movement in the security's price. Once the price movementpushes above the resistance lines formed in the handle, the upward trend can continue.There is a wide-ranging time frame for this type of pattern, with the span ranging fromseveral months to more than a year.
Figure 10.8: Cup and Handle Chart
Double Tops and Bottoms
This chart pattern is another well-known pattern that signals a trend reversal - it isconsidered to be one of the most reliable and is commonly used. These patterns areformed after a sustained trend and signal to chartists that the trend is about to reverse.
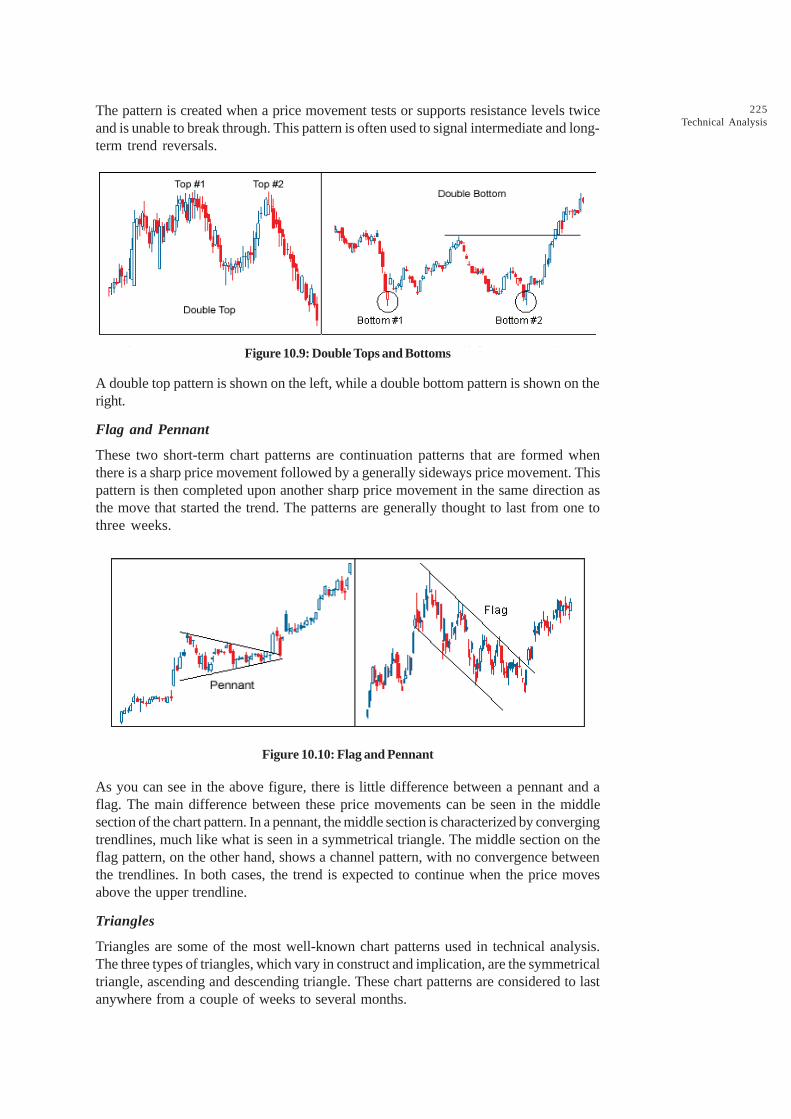
225Technical Analysis
The pattern is created when a price movement tests or supports resistance levels twiceand is unable to break through. This pattern is often used to signal intermediate and long-term trend reversals.
Figure 10.9: Double Tops and Bottoms
A double top pattern is shown on the left, while a double bottom pattern is shown on theright.
Flag and Pennant
These two short-term chart patterns are continuation patterns that are formed whenthere is a sharp price movement followed by a generally sideways price movement. Thispattern is then completed upon another sharp price movement in the same direction asthe move that started the trend. The patterns are generally thought to last from one tothree weeks.
Figure 10.10: Flag and Pennant
As you can see in the above figure, there is little difference between a pennant and aflag. The main difference between these price movements can be seen in the middlesection of the chart pattern. In a pennant, the middle section is characterized by convergingtrendlines, much like what is seen in a symmetrical triangle. The middle section on theflag pattern, on the other hand, shows a channel pattern, with no convergence betweenthe trendlines. In both cases, the trend is expected to continue when the price movesabove the upper trendline.
Triangles
Triangles are some of the most well-known chart patterns used in technical analysis.The three types of triangles, which vary in construct and implication, are the symmetricaltriangle, ascending and descending triangle. These chart patterns are considered to lastanywhere from a couple of weeks to several months.
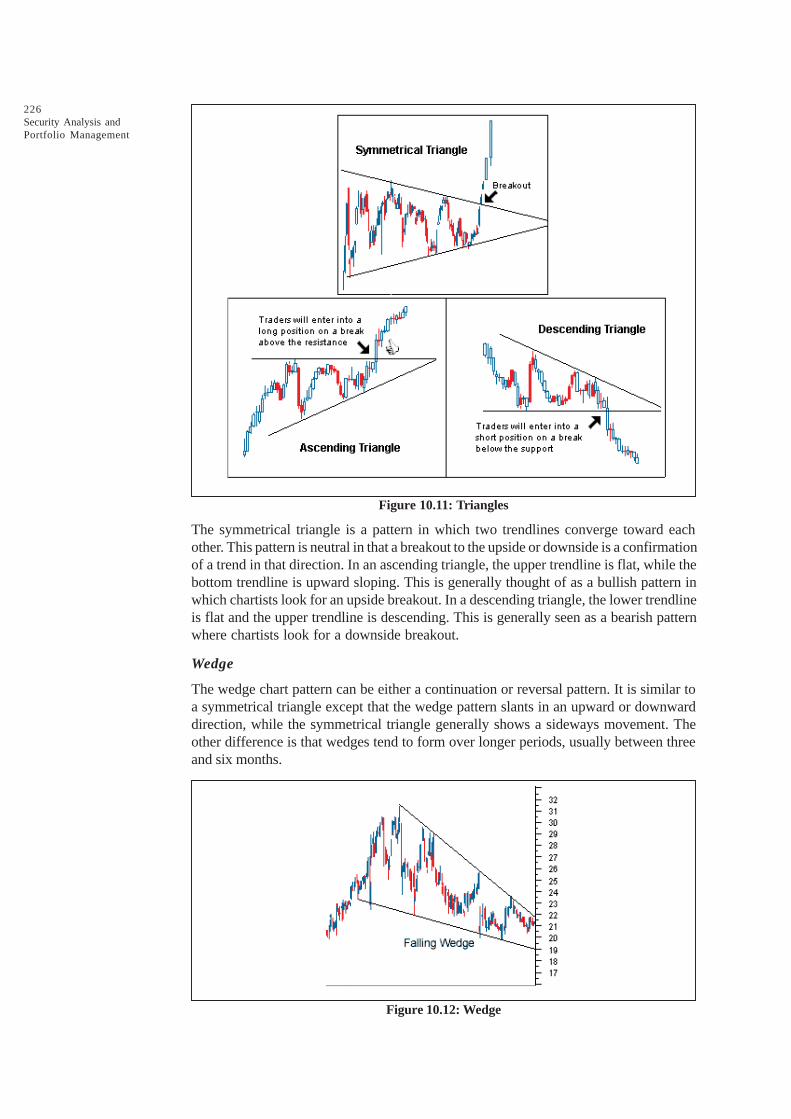
226Security Analysis andPortfolio Management
Figure 10.11: Triangles
The symmetrical triangle is a pattern in which two trendlines converge toward eachother. This pattern is neutral in that a breakout to the upside or downside is a confirmationof a trend in that direction. In an ascending triangle, the upper trendline is flat, while thebottom trendline is upward sloping. This is generally thought of as a bullish pattern inwhich chartists look for an upside breakout. In a descending triangle, the lower trendlineis flat and the upper trendline is descending. This is generally seen as a bearish patternwhere chartists look for a downside breakout.
Wedge
The wedge chart pattern can be either a continuation or reversal pattern. It is similar toa symmetrical triangle except that the wedge pattern slants in an upward or downwarddirection, while the symmetrical triangle generally shows a sideways movement. Theother difference is that wedges tend to form over longer periods, usually between threeand six months.
Figure 10.12: Wedge
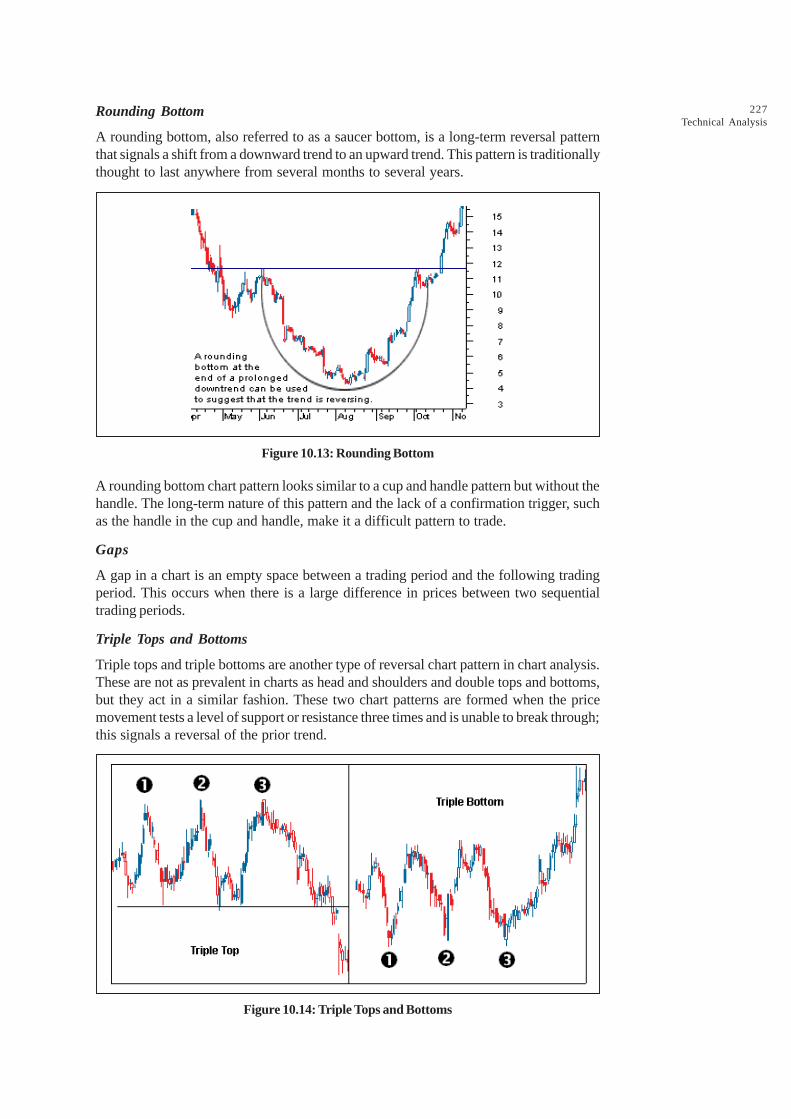
227Technical Analysis
Rounding Bottom
A rounding bottom, also referred to as a saucer bottom, is a long-term reversal patternthat signals a shift from a downward trend to an upward trend. This pattern is traditionallythought to last anywhere from several months to several years.
Figure 10.13: Rounding Bottom
A rounding bottom chart pattern looks similar to a cup and handle pattern but without thehandle. The long-term nature of this pattern and the lack of a confirmation trigger, suchas the handle in the cup and handle, make it a difficult pattern to trade.
Gaps
A gap in a chart is an empty space between a trading period and the following tradingperiod. This occurs when there is a large difference in prices between two sequentialtrading periods.
Triple Tops and Bottoms
Triple tops and triple bottoms are another type of reversal chart pattern in chart analysis.These are not as prevalent in charts as head and shoulders and double tops and bottoms,but they act in a similar fashion. These two chart patterns are formed when the pricemovement tests a level of support or resistance three times and is unable to break through;this signals a reversal of the prior trend.
Figure 10.14: Triple Tops and Bottoms
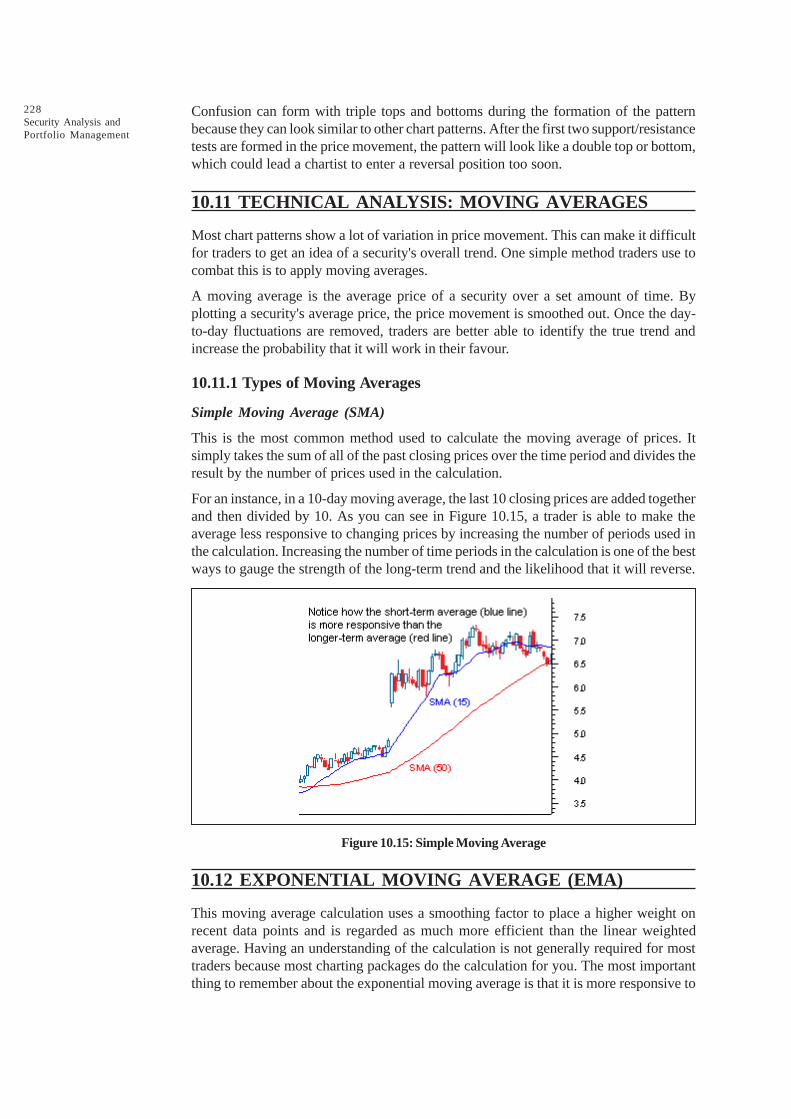
228Security Analysis andPortfolio Management
Confusion can form with triple tops and bottoms during the formation of the patternbecause they can look similar to other chart patterns. After the first two support/resistancetests are formed in the price movement, the pattern will look like a double top or bottom,which could lead a chartist to enter a reversal position too soon.
10.11 TECHNICAL ANALYSIS: MOVING AVERAGES
Most chart patterns show a lot of variation in price movement. This can make it difficultfor traders to get an idea of a security's overall trend. One simple method traders use tocombat this is to apply moving averages.
A moving average is the average price of a security over a set amount of time. Byplotting a security's average price, the price movement is smoothed out. Once the day-to-day fluctuations are removed, traders are better able to identify the true trend andincrease the probability that it will work in their favour.
10.11.1 Types of Moving Averages
Simple Moving Average (SMA)
This is the most common method used to calculate the moving average of prices. Itsimply takes the sum of all of the past closing prices over the time period and divides theresult by the number of prices used in the calculation.
For an instance, in a 10-day moving average, the last 10 closing prices are added togetherand then divided by 10. As you can see in Figure 10.15, a trader is able to make theaverage less responsive to changing prices by increasing the number of periods used inthe calculation. Increasing the number of time periods in the calculation is one of the bestways to gauge the strength of the long-term trend and the likelihood that it will reverse.
Figure 10.15: Simple Moving Average
10.12 EXPONENTIAL MOVING AVERAGE (EMA)
This moving average calculation uses a smoothing factor to place a higher weight onrecent data points and is regarded as much more efficient than the linear weightedaverage. Having an understanding of the calculation is not generally required for mosttraders because most charting packages do the calculation for you. The most importantthing to remember about the exponential moving average is that it is more responsive to

229Technical Analysis
new information relative to the simple moving average. This responsiveness is one of thekey factors of why this is the moving average of choice among many technical traders.
10.12.1 Linear Weighted Average
This moving average indicator is the least common out of the three and is used to addressthe problem of the equal weighting. The linear weighted moving average is calculated bytaking the sum of all the closing prices over a certain time period and multiplying them bythe position of the data point and then dividing by the sum of the number of periods.
For instance, in a five-day linear weighted average, today's closing price is multiplied byfive, yesterday's by four and so on, until the first day in the period range is reached.These numbers are then added together and divided by the sum of the multipliers.
10.12.2 Moving Average Convergence Divergence (MACD)
The Moving Average Convergence Divergence (MACD) is one of the most well-knownand used indicators in technical analysis. This indicator is comprised of two exponentialmoving averages, which help to measure momentum in the security. The MACD issimply the difference between these two moving averages plotted against a centreline.The centreline is the point at which the two moving averages are equal. Along with theMACD and the centreline, an exponential moving average of the MACD itself is plottedon the chart. The idea behind this momentum indicator is to measure short-term momentumcompared to the longer term momentum to help signal the current direction of momentum.
MACD = Shorter-term moving average – Longer-term moving average
When the MACD is positive, it signals that the shorter-term moving average is abovethe longer-term moving average and suggests upward momentum. The opposite holdstrue when the MACD is negative - this signals that the shorter-term is below the longerand suggest downward momentum. When the MACD line crosses over the centreline,it signals a crossing in the moving averages. The most common moving average valuesused in the calculation are the 26-day and 12-day exponential moving averages. Thesignal line is commonly created by using a nine-day exponential moving average of theMACD values. These values can be adjusted to meet the needs of the technician andthe security. For more volatile securities, shorter-term averages are used, while lessvolatile securities should have longer averages.
Another aspect to the MACD indicator that is often found on charts is the MACDhistogram. The histogram is plotted on the centreline and represented by bars. Each baris the difference between the MACD and the signal line or, in most cases, the nine-dayexponential moving average. The higher the bars are in either direction, the moremomentum behind the direction in which the bars point.
As you can see in Figure 10.16, one of the most common buy signals is generated whenthe MACD crosses above the signal line (blue dotted line), while sell signals often occurwhen the MACD crosses below the signal.

230Security Analysis andPortfolio Management
Figure 10.16: Moving Average Convergence Divergence
10.13 MAJOR USES OF MOVING AVERAGES
l Moving averages are used to identify current trends and trend reversals as well asto set up support and resistance levels.
l Moving averages can be used to quickly identify whether a security is moving in anuptrend or a downtrend depending on the direction of the moving average.
10.14TECHNICAL ANALYSIS: INDICATORS ANDOSCILLATORS
Indicators are calculations based on the price and the volume of a security that measuresuch things as money flow, trends, volatility and momentum. Indicators are used as asecondary measure to the actual price movements and add additional information to theanalysis of securities. Indicators are used in two main ways: to confirm price movementand the quality of chart patterns, and to form buy and sell signals.
There are two main types of indicators: leading and lagging. A leading indicator precedesprice movements, giving them a predictive quality, while a lagging indicator is a confirmationtool because it follows price movement. A leading indicator is thought to be the strongestduring periods of sideways or non-trending trading ranges, while the lagging indicatorsare still useful during trending periods.
10.14.1 Aroon Oscillator
An expansion of the Aroon is the Aroon oscillator, which simply plots the differencebetween the Aroon up and down lines by subtracting the two lines. This line is thenplotted between a range of -100 and 100. The centreline at zero in the oscillator isconsidered to be a major signal line determining the trend. The higher the value of theoscillator from the centreline point, the more upward strength there is in the security; thelower the oscillator's value is from the centreline, the more downward the pressure.
10.14.2 Relative Strength Index
The Relative Strength Index (RSI) is another one of the most used and well-knownmomentum indicators in technical analysis. RSI helps to signal overbought and oversold
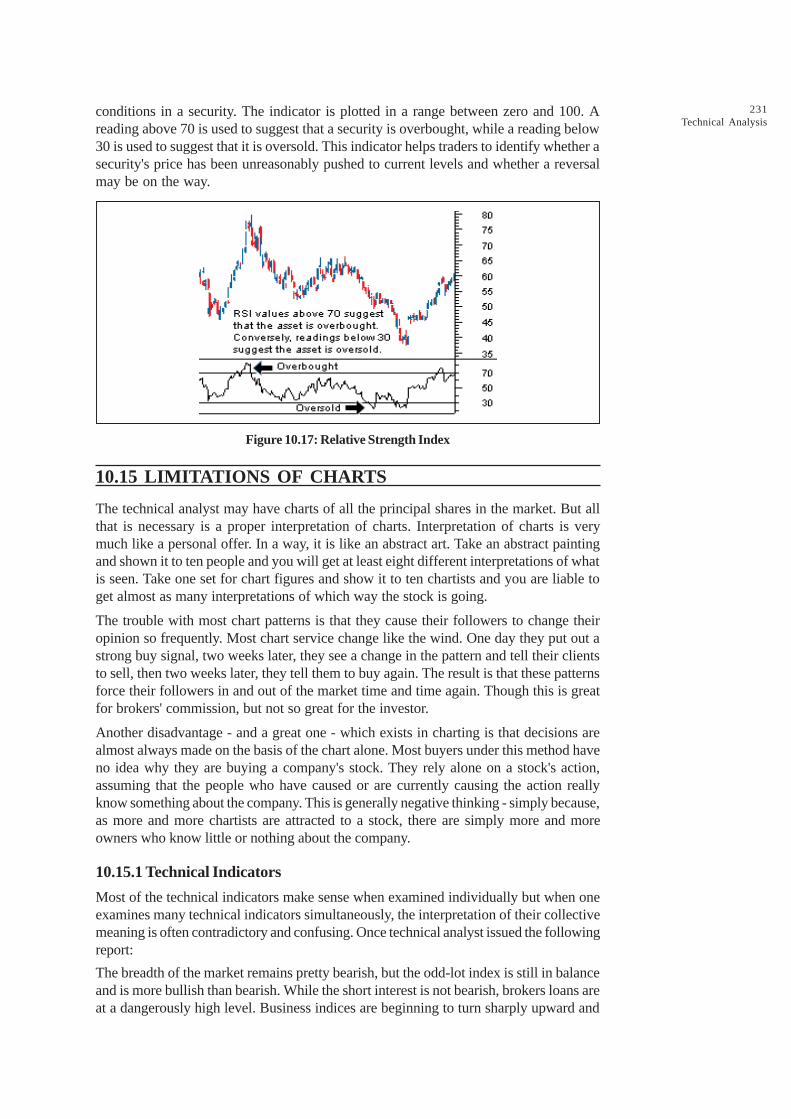
231Technical Analysis
conditions in a security. The indicator is plotted in a range between zero and 100. Areading above 70 is used to suggest that a security is overbought, while a reading below30 is used to suggest that it is oversold. This indicator helps traders to identify whether asecurity's price has been unreasonably pushed to current levels and whether a reversalmay be on the way.
Figure 10.17: Relative Strength Index
10.15 LIMITATIONS OF CHARTS
The technical analyst may have charts of all the principal shares in the market. But allthat is necessary is a proper interpretation of charts. Interpretation of charts is verymuch like a personal offer. In a way, it is like an abstract art. Take an abstract paintingand shown it to ten people and you will get at least eight different interpretations of whatis seen. Take one set for chart figures and show it to ten chartists and you are liable toget almost as many interpretations of which way the stock is going.
The trouble with most chart patterns is that they cause their followers to change theiropinion so frequently. Most chart service change like the wind. One day they put out astrong buy signal, two weeks later, they see a change in the pattern and tell their clientsto sell, then two weeks later, they tell them to buy again. The result is that these patternsforce their followers in and out of the market time and time again. Though this is greatfor brokers' commission, but not so great for the investor.
Another disadvantage - and a great one - which exists in charting is that decisions arealmost always made on the basis of the chart alone. Most buyers under this method haveno idea why they are buying a company's stock. They rely alone on a stock's action,assuming that the people who have caused or are currently causing the action reallyknow something about the company. This is generally negative thinking - simply because,as more and more chartists are attracted to a stock, there are simply more and moreowners who know little or nothing about the company.
10.15.1 Technical Indicators
Most of the technical indicators make sense when examined individually but when oneexamines many technical indicators simultaneously, the interpretation of their collectivemeaning is often contradictory and confusing. Once technical analyst issued the followingreport:
The breadth of the market remains pretty bearish, but the odd-lot index is still in balanceand is more bullish than bearish. While the short interest is not bearish, brokers loans areat a dangerously high level. Business indices are beginning to turn sharply upward and
232Security Analysis andPortfolio Management
most psychological indicators are generally uptrend. The index of 20 low-priced stocksremains in a general upward trend, but the confidence index still is in a long-termdowntrend. The Canadian gold price index is still in a downtrend, which normally impliesa higher stock market ahead. Professional and public opinion remains cautiously optimistic,which is also an indication of a higher stock market, but on a decline below 800, the DowJones Industrial averages would emit a definite sell signal.
The author of this technical report presented numerous technical indicators that collectivelyadd up to organized confusion. Some of the major technical indicators are described inthe following sections. Each indicator makes sense by itself, but interpreting all of themat the same time may yield the same type of confusion found in the passage quotedabove.
Check Your Progress 3
Fill in the blanks:
1. The _____________ analyst may have charts of all the principal shares inthe market.
2. The Moving Average Convergence Divergence (MACD) is one of the mostwell-known and used indicators in _____________ analysis.
3. A gap is an empty space between a trading period and the _____________trading period.
4. A cup and _____________ chart is a bullish continuation pattern in whichthe upward trend has paused but will continue in an upward direction oncethe pattern is confirmed.
10.16 SHORT INTEREST RATIO THEORY
The short interest ratio is derived by dividing the reported short interest or the number ofshares sold short, by the average volume for about 30 days. When short sales increaserelative to total volume, the indicator rises. A ratio above 150% is considered bullish, anda ratio below 100% is considered bearish.
The logic behind this ratio is that speculators and other investor sell stocks at high pricein anticipation of buying them back at lower prices. Thus, increasing short selling isviewed as a sign of general market weakness, and short covering (as evidenced bydecreasing short positions) as a sign of strength. An existing large short interest isconsidered a sign of strength, since the cover (buying) is yet to come; whereas anestablished slight short interest is considered a sign of weakness (more short sales are tocome).
10.16.1 Confidence Index
It is the ratio of a group of lower-grade bonds to a group of higher-grade bonds. Accordingto the theory underlying this index, when the ratio is high, investors' confidence is likewisehigh, as reflected by their purchase of relatively more of the lower-grade securities.When they buy relatively more of the higher-grade securities, this is taken as an indicationthat confidence is low, and is reflected in a low ratio.
233Technical Analysis
10.16.2 Spreads
Large spreads between yields indicate low confidence and are bearish; the market appearsto require a large compensation for business, financial and inflation risks. Small spreadsindicate high confidence and are bullish. In short, the larger the spreads, the lower theratio and the less the confidence. The smaller the spreads, the greater the ratio, indicatinggreater confidence.
10.16.3 Advance-Decline Ratio
The index-relating advance to decline is called the advance decline ratio. When advancespersistently outnumber declines, the ratio increases. A bullish condition is said to exist,and vice versa. Thus, an advance decline ratio tries to capture the market's underlyingstrength by taking into account the number of advancing and declining issues.
10.16.4 Market Breadth Index
The market breadth index is a variant of the advance decline ratio. To compute it, wetake the net difference between the number of stocks rising and the number of stocksfalling, added (or subtracted) to the previous. For example, if in a given week 600 sharesadvanced, 200 shares declined, and 200 were unchanged, the breadth would be2[(9600-200)/200]. These data are then plotted to establish the pattern of movement ofadvance and declines.
The purpose of the market breadth index is to indicate whether a confirmation of someindex has occurred. If both the stock index and the market breadth index increase, themarket is bullish; when the stock index increase but the breadth index does not, themarket is bearish.
10.16.5 Odd-Lot Ratio
Odd-lot transactions are measured by odd-lot changes in index. Odd-lots are stocktransactions of less than, say, 100 shares. The odd-lot ratio is sometimes referred to as ayardstick of uniformed sentiment or an index of contrary opinion because the odd-lottheory assumes that small buyers or sellers are not very bright especially at tops andbottoms when they need to be the brightest. The odd-lot short ratio theory assumes thatthe odd-lot short sellers are even more likely to be wrong than odd-lotters in general.This indicator relates odd-lot sales to purchases.
10.16.6 Insider Transactions
The hypothesis that insider activity may be indicative of future stock prices has receivedsome support in academic literature. Since insiders may have the best picture of how thefirm is faring, some believers of technical analysis feel that these inside transactionsoffer a clue, to future earnings, dividend and stock price performance. If the insiders areselling heavily, it is considered a bearish indicator and vice versa. Stockholders do notlike to hear that the president of a company is selling large blocks of stock of the company.Although the president's reason for selling the stock may not be related to the futuregrowth of the company, it is still considered bearish as investors figure the president,as an insider, must know something bad about the company that they, as outsiders, do notknow.
234Security Analysis andPortfolio Management
Check Your Progress 4
1. Technical analysis is a method of evaluating securities by analyzing the statisticsgenerated by market activity, such as past prices and volume.
2. Technical analysis and fundamental analysis are the two main schools ofthought in the financial markets.
3. Technical analyst does not care whether a stock is undervalued- the onlything that matters is a security’s past trading data.
4. In technical analysis, price movements are not believed to follow trends.
5. The Dow Theory was developed by W.P. Hamilton and Robert Rhea.
10.17 CRITICISMS OF TECHNICAL ANALYSIS
Despite the assertions of technical analysis, technical analysis is not a sure-fire method.The various limitations of technical were pointed but by its critics are as given under:
(i) Difficult in interpretation: Technical analysis is not as simple as it appears to be.While the charts are fascinating to look at, interpreting them correctly is verydifficult. It is always easy to interpret the charts long after the actual point of time.As such, fundamentals argue that charting techniques are no different frompalmistry.
(ii) Frequent changes: Technical analysis is not as simple as it appears to be. Whilethe charts are fascinating to look at, interpreting them correctly is very difficult. Itis always easy to interpret the charts long after the actual point of time. As such,fundamentalists argue that charting techniques are no different from palmistry.
(iii) Frequent changes: With changes in market, chart patterns keep on changing.Accordingly, technical analysts change their opinions about a particular investmentvery frequently. One day they put up a buy signal. A couple of weeks later, theysee a change pattern and put up a sell signal.
(iv) Unreliable changes: Changes in market behaviour observed and studied bytechnical analyst may not always be reliable owing to ignorance or intelligence ormanipulative tendencies of some participants.
A false piece of information or wrong judgment may result in trade at a lower thanmarket price. If the technicians fail to wait for confirmation, they incur losses.
With actively traded stocks, the prices may be the result of battle of wits and notthe intrinsic worth. In the game of making money, two knowledgeable persons mayengage in buying and selling every one hoping to make money at the expense of theothers. In this game, many may lose, if they are not cleverer and luckier.
The market prices of shares are sometimes the results of certain unhealthy practiceslike cornering and rigging of certain shares by some stock market operators.
(v) Unpredictable changes: Technicians expect changes to take place in a knownand gradual fashion.
(a) History does not repeat itself: One of the major limitations of technicalanalysis is that the entire data is based on the past. It is presumed that futureresembles the past. There is no guarantee that history repeats itself. Systemsbecome more sophisticated and people become more mature, effecting a
235Technical Analysis
different pattern of behaviour. Further, unexpected events like a change ofthe government, or a violent agitation or a natural calamity may produce adifferent pattern of behaviour. This contingency is not taken into account inmaking projections.
(b) No gradual shifts: It is presumed that shifts in supply and demand occurgradually rather than instantaneously. Since these shifts are expected tocontinue as the price gradually reacts to new or other factors the price changepattern is extrapolated to predict further price changes. However, economistsasserted that this is a wrong proposition. Their random walk theory has shakenthe conceptual foundation of technical analysis. They believe that securitiesprice changes are a series of random numbers, which occur in reaction to therandom arrival of news.
(vi) Less precise tools: The greatest limitation of technical analysis is perhaps themechanical precision it gives to the entire exercise of investment in equity shares.However, the tools are subject to errors, breakdown and misinterpretation.
(vii) False signals can occur: Technical analysis is a signalling device. Like athermometer, it may give a false indication when there is no alarm, but when thereis cause for alarm, the signal will almost invariably be flashed.
(viii) No one indicator is infallible: Technical analysis includes many approaches, mostrequiring a good deal of subjective judgment in applications. A number of testshave been conducted to obtain statistically reliable estimates of the worth of varioustechnical trading strategies. The results have been inconclusive because of differentfindings of different researchers using different procedures and different samples.
The hub of the problem as it applies to indicators is that while they may be crystal clearin definition and theory, they often break down in practice. Each one of them has atsome particular time been ineffective, out-weighed by a number of other indicators.
Because of this, technicians seldom rely upon a single indicator; they place reliance uponreinforcement provided by groups of indicators.
In conclusion, it can be said that technical analysis is essentially an imperfect scienceand an art. It helps those who have good skills, of course, not always.
10.17.1 Future of Technical Analysis
Although there is much in finance that we do not completely understand, technical analysishas been around for more than 100 years, and it is not likely to disappear from theinvestment scene anytime soon. Improved quantitative methods coupled with improvedbehavioural research will continue to generate ideas for analysts to test. The well-knownfinancial behaviourist Warner De Bont, for instance, recently reported substantial evidencethat the public expects the continuation of past price trends. That is, they are bullish inbull markets and pessimistic in bear markets.
Perhaps within a decade or more, the fragmentation of technical analysis into such awide-ranging array of increasingly complex, widely differing formulae will cause a gradualmovement away from the entire quasi-science back to some form of more fundamentalevaluation.
10.18 LET US SUM UP
The term technical analysis is used to mean a fairly wide range of techniques; all basedon the concept that past information on prices and trading volume of stocks gives theenlightened investor a picture of what lies ahead. It attempts to explain and forecast

236Security Analysis andPortfolio Management
changes in security prices by studying only the market data rather than informationabout a company or its prospects, as is done by fundamental analyst. John Magee,whose book “Technical Analysis of Stock Trends” is considered a classic for technicalanalysts, says: "The technician has elected to study, not the mass of fundamentals, butcertain abstraction, namely the market data alone.
Fundamentalists study the cause, not the 'should.' They make their decisions on quality,value and depending on their specific investment goals, the yield or growth potential ofthe security. They are concerned with the basis, the corporation's financial strength,record of growth in sales and earnings, profitability, the investment acceptance and soon. They also take into account the general business and market conditions. Finally, theyinterpret these data inductively to determine the current value of the stock and then toproject its future price. Fundamentalists are patient and seldom expect meaningful profitsin less than one year.
Some critics see technical analysis as a form of black magic. Don't be surprised to seethem question the validity of the discipline to the point where they mock its supporters. Infact, technical analysis has only recently begun to enjoy some mainstream credibility.While most analysts on Wall Street focus on the fundamental side, just about any majorbrokerage now employs technical analysts as well.
The technician must (1) identify the trend, (2) recognize when one trend comes to anend and prices set off in the opposite direction. His central problem is to distinguishbetween reversals within a trend and real changes in the trend itself. This problem ofsorting out price changes is critical since prices do not change in a smooth, uninterruptedfashion. The two variables concerning groups of stocks or individual stocks are:
1. Behaviour of prices, and
2. Volume of trading contributing to and influenced by changing prices.
One school of thought led by William L. Jiler developed a comprehensive techniquecalled "Chart Reading". Charts provide visual assistance detecting the emerging andchanging patterns and changing patterns of price behaviour. Technical analysts use threebasic types of charts. These are Line Charts, Bar Charts, Point and Figure Charts.
The trouble with most chart patterns is that they cause their followers to change theiropinion very frequently. Most chart services change like the wind. One day they put outa strong buy signal, two weeks later, they see a change in the pattern and tell their clientsto sell, then two weeks later, they tell them to buy again. The result is that these patternsforce their followers in and out of the market time and time again. This might be greatfor brokers' commission, but not so great for the investor. Most of the technical indicatorsmake sense when examined individually but when one examines many technical indicatorssimultaneously, the interpretation of their collective meaning is often contradictory andconfusing. One technical analyst issued the following report: The breadth of the marketremains pretty bearish, but the odd-lot index is still in balance and is more bullish thanbearish. While the short interest is not bearish, brokers loans are at a dangerously highlevel.
Although there is much in finance that we do not completely understand, technical analysishas been around for more than 100 years, and it is not likely to disappear from theinvestment scene anytime soon. Improved quantitative methods coupled with improvedbehavioural research will continue to generate ideas for analysts to test. The well-knownfinancial behaviourist Warner De Bont, for instance, recently reported substantial evidencethat the public expects the continuation of past price trends. That is, they are bullish inbull markets and pessimistic in bear markets.

237Technical Analysis10.19 LESSON END ACTIVITY
“We can understand the characterization of technical analysis as ‘crystal ball gazing’.”Discuss the statement.
10.20 KEYWORDS
Technical Analysis: It attempts to explain and forecast changes in security prices bystudying only the market data rather than information about a company or its prospectsas is done by fundamental analyst.
Elliot Wave Principle: It is a theory that attempts to develop a rational for a long-termpattern in the stock price movements.
Chaos Theory: It provides potential answers to how security prices are determined.
Dow Theory: According to Charles Dow, “The market is always considered as havingthree movements, all going at the same time. The first is the narrow movement fromday-to-day. The second is the short swing running from two weeks to a month or more,the third is the main movement covering at least four years in duration.”
Chart Pattern: A chart pattern is a distinct formation on a stock chart that creates atrading signal, or a sign of future price movements.
Head and Shoulders: Head and shoulders are a reversal chart pattern that when formed,signal that the security is likely to move against the previous trend.
Cup and Handle: A cup and handle chart is a bullish continuation pattern in which theupward trend has paused but will continue in an upward direction once the pattern isconfirmed.
Double Tops and Bottoms: This chart pattern signals a trend reversal. The pattern iscreated when a price movement test or supports resistance levels twice and is unable tobreak through.
Gap: A gap in a chart is an empty space between a trading period and the followingtrading period.
MACD: Moving Average Convergence Divergence (MACD) is comprised of twoexponential moving averages, which helps to measure momentum in the security.
RSI: Relative Strength Index (RSI) helps to signal overbought and oversold conditions ina security.
Confidence Index: It is the ratio of a group of lower grade bonds to a group of higher-grade bonds.
10.21 QUESTIONS FOR DISCUSSION
1. Write a brief note on technical analysis and assumptions.
2. What are the differences between technical and fundamental analysis?
3. Write on the origin and development of technical analysis.
4. What are the techniques of technical analysis?
5. What do you mean by market indicators?

238Security Analysis andPortfolio Management
Check Your Progress: Model Answers
CYP 1
1. value 2. Techanical 3.trends 4. fundamental
CYP 2
1. Neutral 2. Fundamental 3.stock 4. demand
CYP 3
1. technical 2. technical 3.following 4. handle
CYP 4
1. True 2. True 3. True 4. False 5. True
10.22 SUGGESTED READINGS
Sudhindra Bhat, Security Analysis and Portfolio Management, Excel Books, Delhi.
Kevin, S., Security Analysis and Portfolio Management, Prentice Hall of India.
Prasanna Chandra, Investment Analysis and Portfolio Management, Second Edition, Tata McGrawHill.
Punithavathy Pandian, Securities Analysis and Portfolio management, Vikas.
Investment Management, V. K. Bhalla.
A. Davis, Investors in a Changing Economy, Prentice -Hall, 1968.
Williamson, J. Peter, Investments: New Analytic Techniques, London, Longman, 1970.
Cottle, CC., and Whitman, W.T., Investment Timing: The Formula Plan Approach, McGraw Hill.

UNIT V

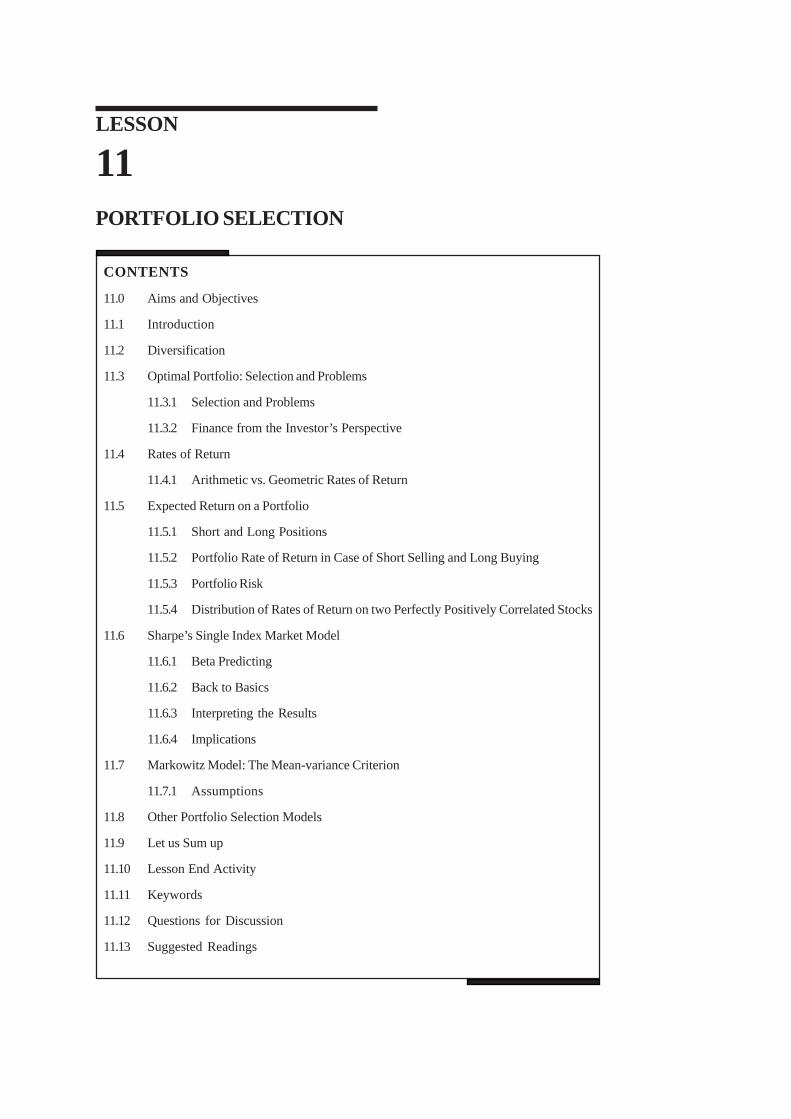
LESSON
11PORTFOLIO SELECTION
CONTENTS
11.0 Aims and Objectives
11.1 Introduction
11.2 Diversification
11.3 Optimal Portfolio: Selection and Problems
11.3.1 Selection and Problems
11.3.2 Finance from the Investor’s Perspective
11.4 Rates of Return
11.4.1 Arithmetic vs. Geometric Rates of Return
11.5 Expected Return on a Portfolio
11.5.1 Short and Long Positions
11.5.2 Portfolio Rate of Return in Case of Short Selling and Long Buying
11.5.3 Portfolio Risk
11.5.4 Distribution of Rates of Return on two Perfectly Positively Correlated Stocks
11.6 Sharpe’s Single Index Market Model
11.6.1 Beta Predicting
11.6.2 Back to Basics
11.6.3 Interpreting the Results
11.6.4 Implications
11.7 Markowitz Model: The Mean-variance Criterion
11.7.1 Assumptions
11.8 Other Portfolio Selection Models
11.9 Let us Sum up
11.10 Lesson End Activity
11.11 Keywords
11.12 Questions for Discussion
11.13 Suggested Readings
242Security Analysis andPortfolio Management
11.0 AIMS AND OBJECTIVES
After studying this lesson, you should be able to understand:
l Optimal Portfolio
l Risk and Investor Preferences
l Selecting the best Portfolio
l Simple Sharp Portfolio Optimization
l Markowitz Model: The Mean-variance Criterion
l Significance of Beta in the Portfolio
l Single Index Model
l Solved Problems
l Other Portfolio Selection Models
11.1 INTRODUCTION
The art and science of making decisions about investment mix and policy, matchinginvestments to objectives, asset allocation for individuals and institutions, and balancingrisk vs. performance. Portfolio management is all about strengths, weaknesses,opportunities and threats in the choice of debt vs. equity, domestic vs. international,growth vs. safety, and numerous other trade-offs encountered in the attempt to maximizereturn at a given appetite for risk.
11.2 DIVERSIFICATION
Diversification is a risk-management technique that mixes a wide variety of investmentswithin a portfolio in order to minimize the impact that any one security will have on theoverall performance of the portfolio. Diversification lowers the risk of your portfolio.Academics have complex formulas to demonstrate how this works, but we can explainit clearly with an example:
Suppose that you live on an island where the entire economy consists of only twocompanies: one sells umbrellas, while the other sells sunscreen. If you invest your entireportfolio in the company that sells umbrellas, you’ll have strong performance during therainy season, but poor performance when it’s sunny outside. The reverse occurs withthe sunscreen company, the alternative investment; your portfolio will be high performancewhen the sun is out, but it will tank when the clouds roll in. Chances are you’d ratherhave constant, steady returns. The solution is to invest 50% in one company and 50% inthe other. Because you have diversified your portfolio, you will get decent performanceyear round, instead of having either excellent or terrible performance depending on theseason.
There are three main practices that can help you ensure the best diversification:
1. Spread your portfolio among multiple investment vehicles such as cash, stocks,bonds, mutual funds and perhaps even some real estate.
2. Vary the risk in your securities. You’re not restricted to choosing only blue chipstocks. In fact, it would be wise to pick investments with varied risk levels; this willensure that large losses are offset by other areas.
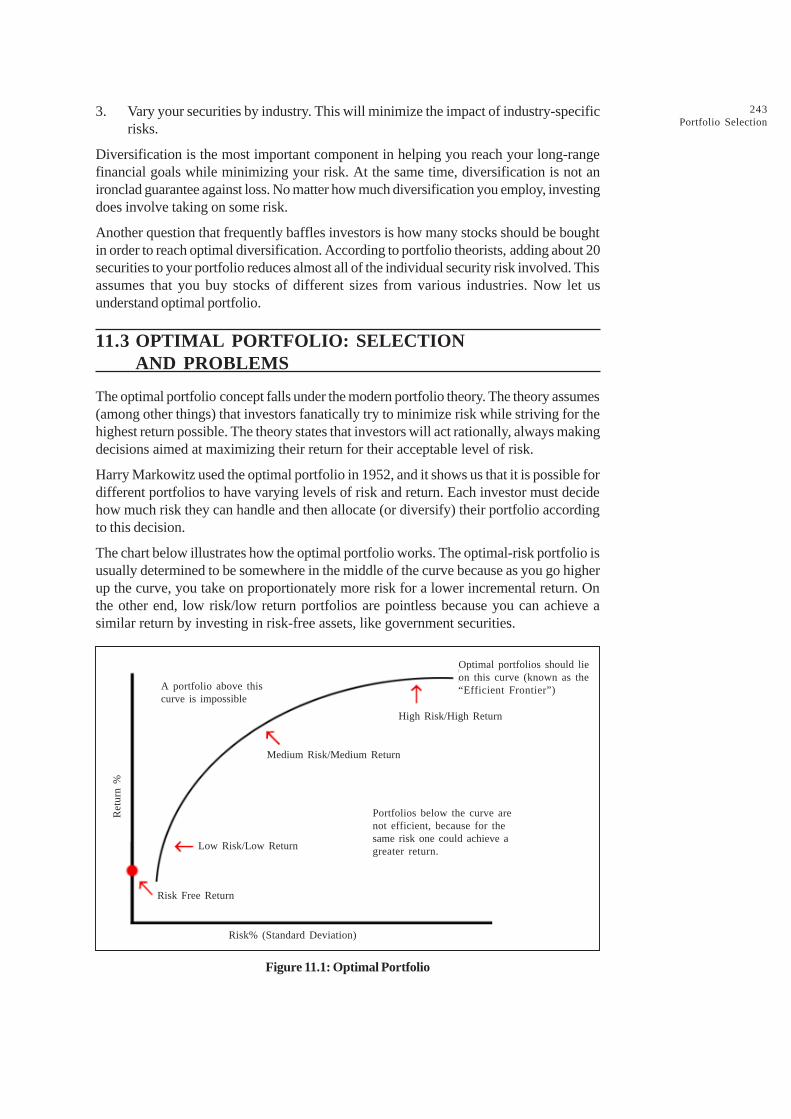
243Portfolio Selection
3. Vary your securities by industry. This will minimize the impact of industry-specificrisks.
Diversification is the most important component in helping you reach your long-rangefinancial goals while minimizing your risk. At the same time, diversification is not anironclad guarantee against loss. No matter how much diversification you employ, investingdoes involve taking on some risk.
Another question that frequently baffles investors is how many stocks should be boughtin order to reach optimal diversification. According to portfolio theorists, adding about 20securities to your portfolio reduces almost all of the individual security risk involved. Thisassumes that you buy stocks of different sizes from various industries. Now let usunderstand optimal portfolio.
11.3 OPTIMAL PORTFOLIO: SELECTIONAND PROBLEMS
The optimal portfolio concept falls under the modern portfolio theory. The theory assumes(among other things) that investors fanatically try to minimize risk while striving for thehighest return possible. The theory states that investors will act rationally, always makingdecisions aimed at maximizing their return for their acceptable level of risk.
Harry Markowitz used the optimal portfolio in 1952, and it shows us that it is possible fordifferent portfolios to have varying levels of risk and return. Each investor must decidehow much risk they can handle and then allocate (or diversify) their portfolio accordingto this decision.
The chart below illustrates how the optimal portfolio works. The optimal-risk portfolio isusually determined to be somewhere in the middle of the curve because as you go higherup the curve, you take on proportionately more risk for a lower incremental return. Onthe other end, low risk/low return portfolios are pointless because you can achieve asimilar return by investing in risk-free assets, like government securities.
Figure 11.1: Optimal Portfolio
Optimal portfolios should lieon this curve (known as the“Efficient Frontier”)
High Risk/High Return
Medium Risk/Medium Return
Low Risk/Low Return
Risk Free Return
Risk% (Standard Deviation) Copyright 2003 - investopedia.com
Re
turn
%
A portfolio above thiscurve is impossible
Portfolios below the curve arenot efficient, because for thesame risk one could achieve agreater return.
244Security Analysis andPortfolio Management
You can choose how much volatility you are willing to bear in your portfolio by pickingany other point that falls on the efficient frontier. This will give you the maximum returnfor the amount of risk you wish to accept. Optimizing your portfolio is not something youcan calculate in your head. There are computer programs that are dedicated to determiningoptimal portfolios by estimating hundreds (and sometimes thousands) of different expectedreturns for each given amount of risk
11.3.1 Selection and Problems
Suppose you find a great investment opportunity, but you lack the cash to take advantageof it. This is the classic problem of financing. The short answer is that you borrow eitherprivately from a bank, or publicly by issuing securities. Securities are nothing more thanpromises of future payment. They are initially issued through financial intermediariessuch as investment banks, which underwrite the offering and work to sell the securitiesto the public. Once they are sold, securities can often be re-sold. There is a secondarymarket for many corporate securities. If they meet certain regulatory requirements, theymay be traded through brokers on the stock exchanges, such as the NYSE, the AMEXand NASDAQ, or on options exchanges and bond trading desks.
11.3.2 Finance from the Investor’s Perspective
Most financial decisions you have addressed up to this point in the term have been fromthe perspective of the firm. Should the company undertake the construction of a newprocessing plant? Is it more profitable to replace an old boiler now, or wait? In thismodule, we will examine financial decisions from the perspective of the purchaser ofcorporate securities: shareholders and bondholders who are free to buy or sell financialassets. Investors, whether they are individuals or institutions such as pension funds,mutual funds, or college endowments, hold portfolios, that is, they hold a collection ofdifferent securities.
11.4 RATES OF RETURN
The investor return is a measure of the growth in wealth resulting from that investment.This growth measure is expressed in percentage terms to make it comparable acrosslarge and small investors. We often express the percent return over a specific timeinterval, say, one year. For instance, the purchase of a share of stock at time t, representedas P
t will yield P
t+1 in one year’s time, assuming no dividends are paid. This return is
calculated as: Rt = [P
t+1 – P
t]/P
t. Notice that this is algebraically the same as: R
t = [P
t+1/
Pt] – 1. When dividends are paid, we adjust the calculation to include the intermediate
dividend payment: Rt = [P
t+1 – P
t + D
t] /P
t. While this takes care of all the explicit
payments, there are other benefits that may derive from holding a stock, including theright to vote on corporate governance, tax treatment, rights offerings, and many otherthings. These are typically reflected in the price fluctuation of the shares.
11.4.1 Arithmetic vs. Geometric Rates of Return
There are two commonly quoted measures of average return: the geometric and thearithmetic mean. These rarely agree with each other. Consider a two period example:P
0 = $100, R
1 = –50% and R
2 = +100%. In this case, the arithmetic average is calculated
as (100 – 50)/2 = 25%, while the geometric average is calculated as: [(1 + R1)
(1 + R2)]1/2 – 1 = 0%. Well, did you make money over the two periods, or not? No, you
didn’t, so the geometric average is closer to investment experience. On the other hand,suppose R
1 and R
2 were statistically representative of future returns. Then next year,
245Portfolio Selection
you have a 50% shot at getting $200 or a 50% shot at $50. Your expected one yearreturn is (1/2)[(200/100) – 1] + (1/2)[(50/100) – 1] = 25%. Since most investors have amultiple year horizon, the geometric return is useful for evaluating how much theirinvestment will grow over the long-term. However, in many statistical models, thearithmetic rate of return is employed. For mathematical tractability, we assume a singleperiod investor horizon.
11.5 EXPECTED RETURN ON A PORTFOLIO
The Expected Return on a Portfolio is simply the weighted average – the expectedreturns of the individual securities in the given portfolio.
RP
= WA R
A + W
B R
B + .... W
n R
n
or = n
i=1
W.RåWhere R
P= Expected Rate of Return in a Portfolio
W1
= Proportion of total investment invested in VI asset
Ri= Expected Rate of return as ith Security
n = number of securities in a given portfolio
Suppose your Expected Rate of Return from Lakshmi Mills (LML) stocks is 20% duringa given holding period and the same rate of return – in case of Khandri Mills (KM) scripis, say 16% and you are interested in putting you total investment equally in both thesesecurities, then Expected Rate of Return from the Two-Asset Portfolio is
WLMC
= 0.50 RLML
= 0.20
Wxm
= 0.50 RKM
= 0.16
RP
= (WLM
) (RLML
+ (WKM
) RKM
)
= (0.50 ¥ 0.20) + (0.50 ¥ 0.16)
= 0.10 + 0.08
= 0.18or
= 18%
Suppose you are interested in including the Arvind Mills scrip too into your Portfolio, bypartly selling of your earlier investment in Khandri Mills, say about 20% of total investmentand if your Expected Rate of return from Arvind Mills is 22% during the same saidholding period, then the return from the 3-asset portfolio would be
RP
= [0.50 ¥ 0.201 + [0.30 ¥ 0,16 + [0.20 ¥ 0.221
= 0. 10 + 0,048 + 0.044
= 0.192 or 19.2%
Using the same logic the rate of return on a portfolio with assets wherein short and longpositions could also be calculated.
11.5.1 Short and Long Positions
Short-selling and long-buying are certain trading activities that active stock holders(speculators) use to perform on the list of forward securities. These practices are allowedby most stock exchanges. In India, these activities are often called badla transactions.
246Security Analysis andPortfolio Management
Basically, short selling refers to that trading activity wherein the speculator sells a ‘securitywithout currently possessing it. Similarly, the long buy refers to the contract of buying asecurity without any real intention to take the delivery of it.
11.5.2 Portfolio Rate of Return in Case of Short Selling and Long Buying
Illustration 1:
X Y is a portfolio with two assets – one with short and another with long positions. Thenthe portfolio rate of return is as follows: Proportion is – 0.50 & + 1.50 respectively andreturn stock on x is 20% and on stock y is 25%. Find out the expected return (R
p).
Solution:
Let weightages X = – 0.50
Y = + 1.50
Expected Rates of Return X = 20%
Y = 25%
Rr= W.R + W.R
Rp
= (–0.50 ¥ 0.20) + (1.50 ¥ 0.25)
= 0.275 or 27.5%
11.5.3 Portfolio Risk
Calculation of portfolio risk is not similar to weighted average of individual assets’ totalrisk. Portfolio’s risk is sometimes substantially different from individual assets risk. It isquite possible that the individual assets may be substantially risky with sizeable standarddeviations and when combined may result in a portfolio which is absolutely riskless.
Illustration 2:
The following data relates to the annual rates of returns earned from two stocks, viz., Mand W whose rates of return are perfectly negatively correlated. To make it moremeaningful, we can say that the stock M relates an agro-based industry while stock Wrelates to the construction industry.
Year Stock M Stock W
2001 40% –10%
2002 –10% 40%
2003 35% –5%
2004 –5% 35%
2005 15% 15%
Average
Return 15% 15%
Standard
Deviation 22.6% 22.6%
Solution:
Portfolio Rates of return and Risk on M and W
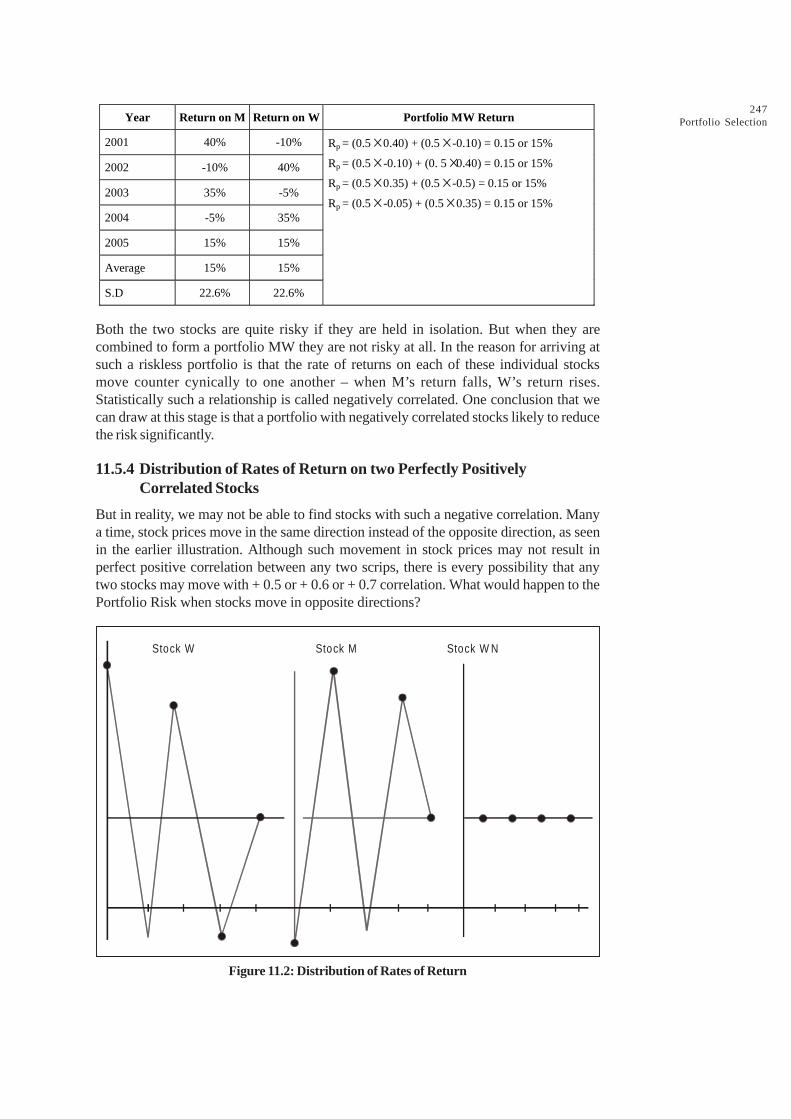
247Portfolio SelectionYear Return on M Return on W Portfolio MW Return
2001 40% -10%
2002 -10% 40%
2003 35% -5%
2004 -5% 35%
2005 15% 15%
Average 15% 15%
S.D 22.6% 22.6%
Rp = (0.5 ́ 0.40) + (0.5 ́ -0.10) = 0.15 or 15%
Rp = (0.5 ́ -0.10) + (0. 5 ́0.40) = 0.15 or 15%
Rp = (0.5 ́ 0.35) + (0.5 ́ -0.5) = 0.15 or 15%
Rp = (0.5 ́ -0.05) + (0.5 ́ 0.35) = 0.15 or 15%
Both the two stocks are quite risky if they are held in isolation. But when they arecombined to form a portfolio MW they are not risky at all. In the reason for arriving atsuch a riskless portfolio is that the rate of returns on each of these individual stocksmove counter cynically to one another – when M’s return falls, W’s return rises.Statistically such a relationship is called negatively correlated. One conclusion that wecan draw at this stage is that a portfolio with negatively correlated stocks likely to reducethe risk significantly.
11.5.4 Distribution of Rates of Return on two Perfectly PositivelyCorrelated Stocks
But in reality, we may not be able to find stocks with such a negative correlation. Manya time, stock prices move in the same direction instead of the opposite direction, as seenin the earlier illustration. Although such movement in stock prices may not result inperfect positive correlation between any two scrips, there is every possibility that anytwo stocks may move with + 0.5 or + 0.6 or + 0.7 correlation. What would happen to thePortfolio Risk when stocks move in opposite directions?
Stock W Stock M Stock W N
Figure 11.2: Distribution of Rates of Return
248Security Analysis andPortfolio Management
Illustration 3:
Following information provided to you. Compute the portfolio return
Year Stock W Stock Z
2002 40% 28%
2003 -10% 20%
2004 35% 41%
2005 -5% -7%
2006 15% 3%
Average 15% 15%
Standard Deviation 22.6% 22.6%
Solution:
The returns of above two scrips exhibit a, correlation of 0.65, indicating positive movementin stock prices of W and Z. The Average and Standard Deviation of a portfolio consistingof both these assets equally would be as follows:
Year Stock W Stock 2 Portfolio WZ
2002 40% 28% RP = (0.5 ́ 0.40) + (0.50 ́ 0.28) = 34%
2003 -10% 20% RP = (0.5 ́ -0.10) + (0.5 ́ 0.20) = 5%
2004 35% 41% RP = (0.5 ́ 0.35) + (0.5 ́ 0.41) = 38%
2005 -5% -7% RP = (0.5 ́ -0.05) + (0.5 ́ -0.07) = - 11%
2006 15% 3% RP = (0.5 ́ 0.15) + (0.5 ́ 0.03) = 9%
Average return: 15% 15% 15%
Standard deviation 22.6% 22.6% 20.6%
Check Your Progress 1
Fill in the blanks:
1. The investor _____________ is a measure of the growth in wealth resultingfrom that investment.
2. The growth measure is expressed in _____________ terms to make itcomparable across large and small investors.
3. There are two mainly quoted measures of average return: the geometric andthe _____________ mean.
4. Short selling and long - buying are certain trading activities that active stockholders (speculators) use to perform on the list of _____________ securities.
11.6 SHARPE’S SINGLE INDEX MARKET MODEL
Sharpe assumed that, for the sake of simplicity, the return on a security could be regardedas being linearly related to a single index like the market index. Theoretically, the marketindex should consist of all the securities trading on the market. However, a popular
249Portfolio Selection
average can be treated as a surrogate for the market index. The acceptance of the ideaof a market between individual securities is because any movements in securities couldbe attributed to movements in the single underlying factor being measured by the marketindex. The simplification of the Markowitz Model has come to be known as the MarketModel or Single Index Model (SIM).
In an attempt to capture the relative contribution of each stock towards portfolio risk,William Sharpe has developed a simple but elegant model called as ‘Market Model’. Hisargument is like this. We appreciate that the portfolio risk declines as the number ofstocks increases but to an extent. That part of the risk which cannot be further reducedeven when we add few more stocks into a portfolio is called systematic risk. Thatundiversifiable risk is attributed to the influence of systematic factors principally operatedat a given market.
Rit + a
i + b
mt – e
it Where
Rit
= Return on ith security during tth holding period
Rmt
= Return on a Market Index during tth holding period
a = Constant term
bmt
= Market Beta or Market Sensitivity of a given stock
Since the regression coefficient (Beta) indicates the manner in which a security’s returnchanges systematically with the changes in market, this linear line is also calledCharacteristic Line. The slope of the line is called Beta. It gained lot of popularity insecurity analysis as a measure of relative market risk. Beta is ‘one’ for such a stock,which is said to have the risk exactly equal to that of the market. On the other hand, thestock with Beta greater than one indicates the aggressiveness of the stock in the marketand less than one indicates the slow response in the price of that stock.
11.6.1 Beta Predicting
Beta, as commonly defined, represents how sensitive the return of an equity portfolio (orsecurity) is to the return of the overall market. It can be measured by regressing thehistorical returns of a portfolio (or security) against the historical returns of an index; theresulting slope of this regression line would be the historical beta. This can be useful forattributing relative performance to various sources or for explaining active risk over acertain period of time.
Portfolio managers are also very interested in what the beta of a portfolio (or security)will be in the future, or what the realized beta will be. As one might expect, predicting thevalue of beta can be a complicated process.
11.6.2 Back to Basics
Since daily returns are now widely available, it is worth asking the question: are multi-factor predicted betas better predictors of realized betas than historical betas, which usedaily returns? A related question, which probably should have been asked some timeago, is: how good are these predictors? We will try to address these questions below.
Using daily security returns, going back to the end of 1998 and Barra-predicted betas forthe same time period, we performed the following calculations for each month:
l For each security, we calculated the beta relative to the S&P 500 using the 20business days’ returns starting in that month (the realized beta).
l For each security, we obtained the Barra-predicted beta as of the beginning of thatmonth.
250Security Analysis andPortfolio Management
l Using the data points for all these securities, we performed the regression:
Realized Beta = a + b ¥ Predicted Beta + e
We repeated this calculation by substituting a historical beta (calculated using trailingdaily returns) for the predicted beta; we used trailing periods of 60, 120, 180, 240, 300,and 360 business days to calculate six different values of trailing historical betas. Wethen repeated all of these calculations using 60 business days’ returns for the calculationof the realized beta.
11.6.3 Interpreting the Results
A perfect predictor would have regression results of a = 0, b = 1, correlation = 1, andMAE = 0. While these results are far from perfect, it is important to remember that theyare for individual securities; predictions for portfolios can be expected to be far morereliable.
It is more useful to look at the results on a comparative basis. For each line, the shadedvalues of b, correlation, and MAE are the closest to ideal. We can see that all of theshaded numbers are associated with either the daily historical beta or the average of thepredicted and historical beta. While we cannot conclude from this that daily historicalbetas are significantly better predictors of realized beta than Barra-predicted betas, itcertainly raises the question of whether the Barra-betas (or any other multi-factor betas)are the best predictors.
There are a few other interesting results worth noting:
l The “b” in the regression results for the predicted betas are greater than 1. This isnot necessarily good or bad, but simply indicates that the predicted betas have lessdispersion than the realized betas. This makes intuitive sense, since the predictedbetas are based on longer-term factor relationships.
l The “b” in the regression results for the historical betas increases as the length ofthe trailing period increases. This indicates that the dispersion of historical betasdecreases as the trailing period increases, which also makes intuitive sense.
l All of the prediction results are better for the 60-day realized betas than for the20-day realized betas.
l The historical beta appears to have the largest relative advantage for trailing periodsof 240-300 days (for both the 20-day and the 60-day realized betas).
11.6.4 Implications
As mentioned previously, we should not rush to draw any hard conclusions from theseresults. A brief study such as this has its limitations, not the least of which is the fact thatit uses less than four years worth of data. However, the evidence presented abovesupports the following claim: In recent years, a simple daily historical beta has been atleast as good a predictor of short-term security betas as the predicted betas generatedby a sophisticated multi-factor equity model.
Illustration 4:
Mr. Soma owns a portfolio of two securities with the following expected returns, standarddeviations, and weights:
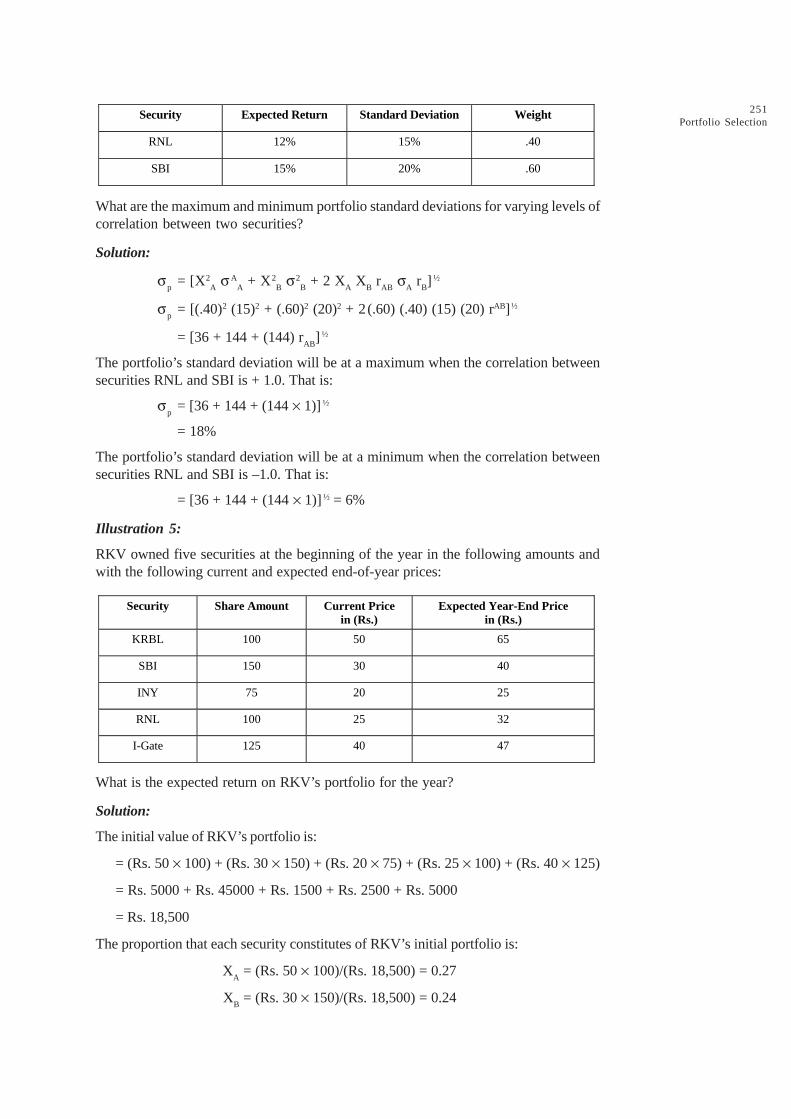
251Portfolio Selection
Security Expected Return Standard Deviation Weight
RNL 12% 15% .40
SBI 15% 20% .60
What are the maximum and minimum portfolio standard deviations for varying levels ofcorrelation between two securities?
Solution:
sp
= [X2A s A
A + X2
B s2
B + 2 X
A X
B r
AB s
A r
B] ½
sp
= [(.40)2 (15)2 + (.60)2 (20)2 + 2(.60) (.40) (15) (20) rAB] ½
= [36 + 144 + (144) rAB
] ½
The portfolio’s standard deviation will be at a maximum when the correlation betweensecurities RNL and SBI is + 1.0. That is:
sp
= [36 + 144 + (144 ¥ 1)]½
= 18%
The portfolio’s standard deviation will be at a minimum when the correlation betweensecurities RNL and SBI is –1.0. That is:
= [36 + 144 + (144 ¥ 1)]½ = 6%
Illustration 5:
RKV owned five securities at the beginning of the year in the following amounts andwith the following current and expected end-of-year prices:
Security Share Amount Current Price in (Rs.)
Expected Year-End Price in (Rs.)
KRBL 100 50 65
SBI 150 30 40
INY 75 20 25
RNL 100 25 32
I-Gate 125 40 47
What is the expected return on RKV’s portfolio for the year?
Solution:
The initial value of RKV’s portfolio is:
= (Rs. 50 ¥ 100) + (Rs. 30 ¥ 150) + (Rs. 20 ¥ 75) + (Rs. 25 ¥ 100) + (Rs. 40 ¥ 125)
= Rs. 5000 + Rs. 45000 + Rs. 1500 + Rs. 2500 + Rs. 5000
= Rs. 18,500
The proportion that each security constitutes of RKV’s initial portfolio is:
XA
= (Rs. 50 ¥ 100)/(Rs. 18,500) = 0.27
XB
= (Rs. 30 ¥ 150)/(Rs. 18,500) = 0.24
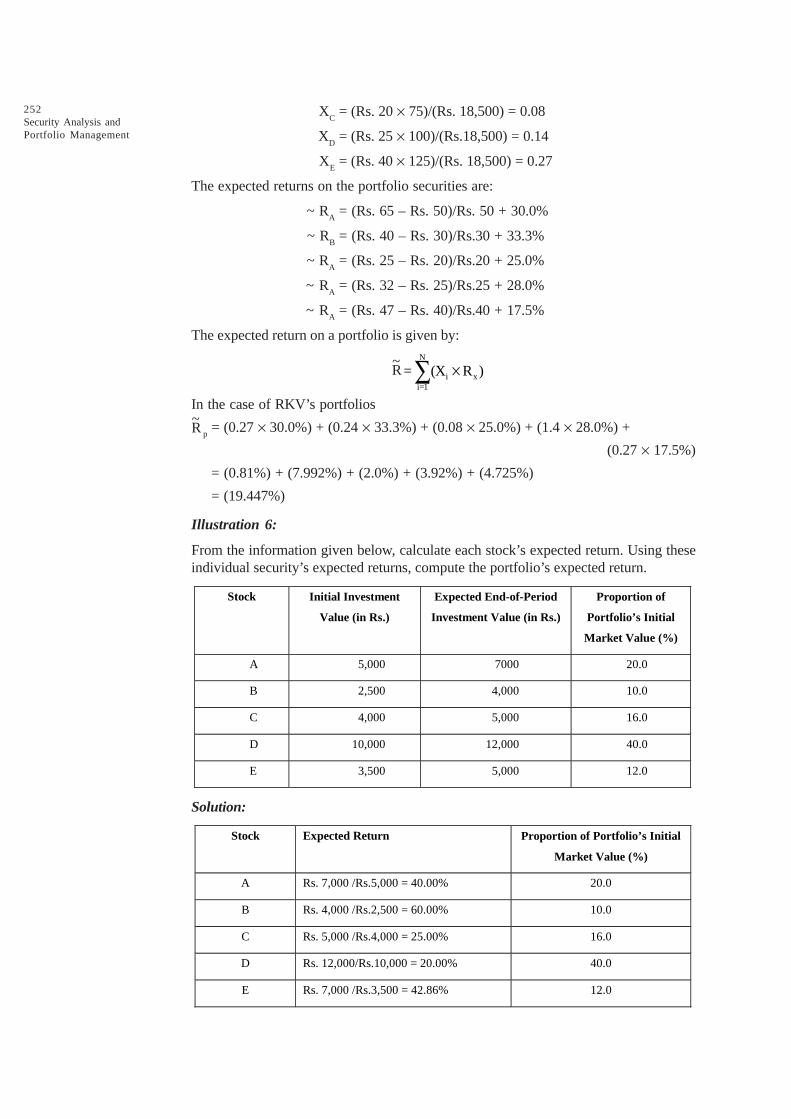
252Security Analysis andPortfolio Management
XC
= (Rs. 20 ¥ 75)/(Rs. 18,500) = 0.08
XD
= (Rs. 25 ¥ 100)/(Rs.18,500) = 0.14
XE
= (Rs. 40 ¥ 125)/(Rs. 18,500) = 0.27
The expected returns on the portfolio securities are:
~ RA
= (Rs. 65 – Rs. 50)/Rs. 50 + 30.0%
~ RB
= (Rs. 40 – Rs. 30)/Rs.30 + 33.3%
~ RA
= (Rs. 25 – Rs. 20)/Rs.20 + 25.0%
~ RA
= (Rs. 32 – Rs. 25)/Rs.25 + 28.0%
~ RA
= (Rs. 47 – Rs. 40)/Rs.40 + 17.5%
The expected return on a portfolio is given by:N
i xi=1
= (X R )´åIn the case of RKV’s portfolios
p = (0.27 ¥ 30.0%) + (0.24 ¥ 33.3%) + (0.08 ¥ 25.0%) + (1.4 ¥ 28.0%) +
(0.27 ¥ 17.5%)
= (0.81%) + (7.992%) + (2.0%) + (3.92%) + (4.725%)
= (19.447%)
Illustration 6:
From the information given below, calculate each stock’s expected return. Using theseindividual security’s expected returns, compute the portfolio’s expected return.
Stock Initial Investment
Value (in Rs.)
Expected End-of-Period
Investment Value (in Rs.)
Proportion of
Portfolio’s Initial
Market Value (%)
A 5,000 7000 20.0
B 2,500 4,000 10.0
C 4,000 5,000 16.0
D 10,000 12,000 40.0
E 3,500 5,000 12.0
Solution:
Stock Expected Return Proportion of Portfolio’s Initial
Market Value (%)
A Rs. 7,000 /Rs.5,000 = 40.00% 20.0
B Rs. 4,000 /Rs.2,500 = 60.00% 10.0
C Rs. 5,000 /Rs.4,000 = 25.00% 16.0
D Rs. 12,000/Rs.10,000 = 20.00% 40.0
E Rs. 7,000 /Rs.3,500 = 42.86% 12.0
R~
R~

253Portfolio Selection
The portfolio’s expected return is given by:
N
i xi=1
= (X R )´å
= (0.200 ¥ 40.0%) + (0.10 ¥ 60.0%) + (0.16 ¥ 25.0) +(0.40 ¥ 20.0%) + (0.14 ¥ 42.86%)
= 8 + 6 + 4 + 8 + 6.0004
= 32.000.%
11.7 MARKOWITZ MODEL: THE MEAN-VARIANCECRITERION
Dr. Harry Markowitz is credited with developing the first modern portfolio analysis modelsince the basic elements of modern portfolio theory emanate from a series of propositionsconcerning rational investor behaviour set forth by Markowitz, then of the RandCorporation, in 1952, and later in a more complete monograph sponsored by the CowlesFoundation. It was this work that has attracted everyone’s perspective regarding portfoliomanagement. Markowitz used mathematical programming and statistical analysis in orderto arrange for the optimum allocation of assets within portfolio. To reach this objective,Markowitz generated portfolios within a reward-risk context. In other words, he consideredthe variance in the expected returns from investments and their relationship to eachother in constructing portfolios. In so directing the focus, Markowitz, and others followingthe same reasoning, recognized the function of portfolio management as one ofcomposition, and not individual security selection – as it is more commonly practiced.Decisions as to individual security additions to and deletions from an existing portfolioare then predicated on the effect such a manoeuvre has on the delicate diversificationbalance. In essence, Markowtiz’s model is a theoretical framework for the analysis ofrisk return choices. Decisions are based on the concept of efficient portfolios.
A portfolio is efficient when it is expected to yield the highest return for the level of riskaccepted or, alternatively, the smallest portfolio risk for a specified level of expectedreturn. To build an efficient portfolio an expected return level is chosen, and assets aresubstituted until the portfolio combination with the smallest variance at return level isfound. As this process is repeated for other expected returns, a set of efficient portfoliosis generated.
11.7.1 Assumptions
The Markowitz model is based on several assumptions regarding investor behaviour:
(i) Investors consider each investment alternative as being represented by a probabilitydistribution of expected returns over some holding period.
(ii) Investors maximize one period’s expected utility and progress along the utility curve,which demonstrates diminishing marginal utility of wealth.
(iii) Individuals estimate risk on the basis of the variability of expected returns.
(iv) Investors base decisions solely on expected returns and variance (or standarddeviation) of returns only.
(v) For a given risk level, investors prefer high returns to lower returns. Similarly, for agiven level of expected return, investor prefer less risk to more risk.
R~

254Security Analysis andPortfolio Management
Under these assumptions, a single asset or portfolio of assets is considered to be ‘efficient’if no other asset or portfolio of assets offers higher expected return with the same (orlower) risk or lower risk with the same (or higher) expected return.
sp
= W2C s2
C + (1 – W
C) s2
E + 2 [W
C (1 – W
C) s
C s
E r
CE] ½
E(R)P
= WC E (R
C) + (1 + W
C) E(R
E)
Geographical representation of the Mean-Variance Criterion is presented in Figure 11.3,the vertical axis denoting expected return while the horizontal axis measures the standarddeviation (or variance) of the returns. Given its expected return and standard deviation,any investment option can be represented by a point on such a plane and the set of allpotential options can be enclosed by an area such as shown in Figure 11.3. The efficientfrontier, given by the arc AB, is a boundary of the attainable set. In Figure 11.3 theshaded area represents the attainable set of portfolio considerations, with their own risksand expected returns. (Two different portfolios may have the same expected return andrisk). Any point inside the shaded area is not as efficient as a corresponding point on theefficient frontier – the arc AB.
ER1
A
SD1 SD2 Standard Deviation
X3
X2
Exp
ecte
d R
etu
rn
Attainable Portfolios
(Entire Shaded Area) Efficient
Frontier
X1 B
Figure 11.3: Markowitz Efficient Frontier
Illustration 8:
The policy committee of CDME recently used reports from various security analysts todevelop inputs for the single-index model. Output derived from the single-index modelconsisted of the following efficient portfolios:
Portfolio Expected Return (ER) Standard Deviation
1 8% 3%
2 10% 6%
3 13% 8%
4 17% 13%
5 20% 18%
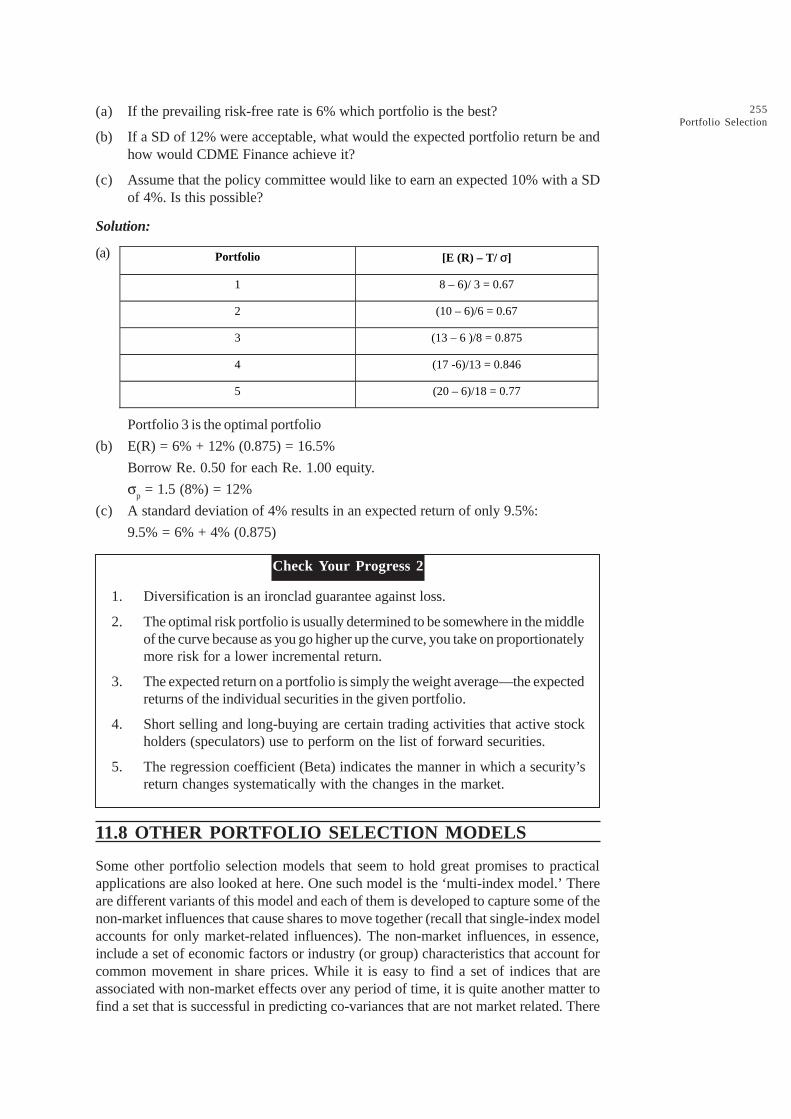
255Portfolio Selection
(a) If the prevailing risk-free rate is 6% which portfolio is the best?
(b) If a SD of 12% were acceptable, what would the expected portfolio return be andhow would CDME Finance achieve it?
(c) Assume that the policy committee would like to earn an expected 10% with a SDof 4%. Is this possible?
Solution:
(a) Portfolio [E (R) – T/ σ]
1 8 – 6)/ 3 = 0.67
2 (10 – 6)/6 = 0.67
3 (13 – 6 )/8 = 0.875
4 (17 -6)/13 = 0.846
5 (20 – 6)/18 = 0.77
Portfolio 3 is the optimal portfolio
(b) E(R) = 6% + 12% (0.875) = 16.5%
Borrow Re. 0.50 for each Re. 1.00 equity.
sp = 1.5 (8%) = 12%
(c) A standard deviation of 4% results in an expected return of only 9.5%:
9.5% = 6% + 4% (0.875)
Check Your Progress 2
1. Diversification is an ironclad guarantee against loss.
2. The optimal risk portfolio is usually determined to be somewhere in the middleof the curve because as you go higher up the curve, you take on proportionatelymore risk for a lower incremental return.
3. The expected return on a portfolio is simply the weight average—the expectedreturns of the individual securities in the given portfolio.
4. Short selling and long-buying are certain trading activities that active stockholders (speculators) use to perform on the list of forward securities.
5. The regression coefficient (Beta) indicates the manner in which a security’sreturn changes systematically with the changes in the market.
11.8 OTHER PORTFOLIO SELECTION MODELS
Some other portfolio selection models that seem to hold great promises to practicalapplications are also looked at here. One such model is the ‘multi-index model.’ Thereare different variants of this model and each of them is developed to capture some of thenon-market influences that cause shares to move together (recall that single-index modelaccounts for only market-related influences). The non-market influences, in essence,include a set of economic factors or industry (or group) characteristics that account forcommon movement in share prices. While it is easy to find a set of indices that areassociated with non-market effects over any period of time, it is quite another matter tofind a set that is successful in predicting co-variances that are not market related. There
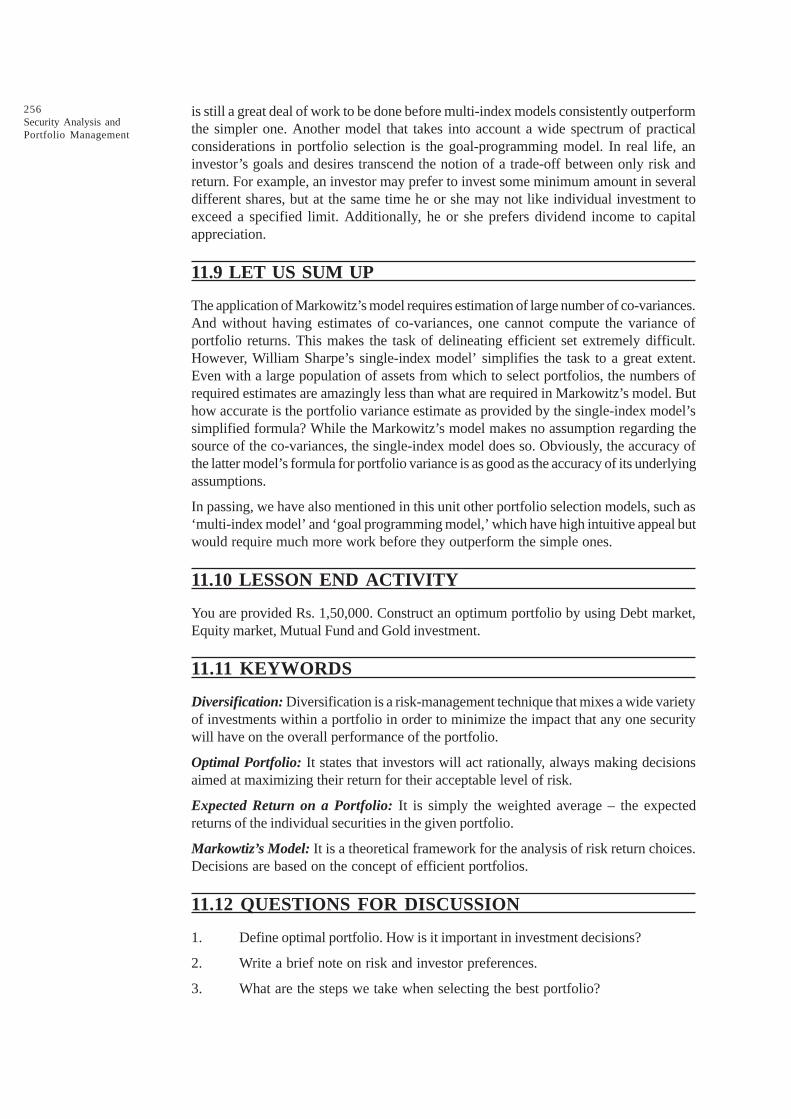
256Security Analysis andPortfolio Management
is still a great deal of work to be done before multi-index models consistently outperformthe simpler one. Another model that takes into account a wide spectrum of practicalconsiderations in portfolio selection is the goal-programming model. In real life, aninvestor’s goals and desires transcend the notion of a trade-off between only risk andreturn. For example, an investor may prefer to invest some minimum amount in severaldifferent shares, but at the same time he or she may not like individual investment toexceed a specified limit. Additionally, he or she prefers dividend income to capitalappreciation.
11.9 LET US SUM UP
The application of Markowitz’s model requires estimation of large number of co-variances.And without having estimates of co-variances, one cannot compute the variance ofportfolio returns. This makes the task of delineating efficient set extremely difficult.However, William Sharpe’s single-index model’ simplifies the task to a great extent.Even with a large population of assets from which to select portfolios, the numbers ofrequired estimates are amazingly less than what are required in Markowitz’s model. Buthow accurate is the portfolio variance estimate as provided by the single-index model’ssimplified formula? While the Markowitz’s model makes no assumption regarding thesource of the co-variances, the single-index model does so. Obviously, the accuracy ofthe latter model’s formula for portfolio variance is as good as the accuracy of its underlyingassumptions.
In passing, we have also mentioned in this unit other portfolio selection models, such as‘multi-index model’ and ‘goal programming model,’ which have high intuitive appeal butwould require much more work before they outperform the simple ones.
11.10 LESSON END ACTIVITY
You are provided Rs. 1,50,000. Construct an optimum portfolio by using Debt market,Equity market, Mutual Fund and Gold investment.
11.11 KEYWORDS
Diversification: Diversification is a risk-management technique that mixes a wide varietyof investments within a portfolio in order to minimize the impact that any one securitywill have on the overall performance of the portfolio.
Optimal Portfolio: It states that investors will act rationally, always making decisionsaimed at maximizing their return for their acceptable level of risk.
Expected Return on a Portfolio: It is simply the weighted average – the expectedreturns of the individual securities in the given portfolio.
Markowtiz’s Model: It is a theoretical framework for the analysis of risk return choices.Decisions are based on the concept of efficient portfolios.
11.12 QUESTIONS FOR DISCUSSION
1. Define optimal portfolio. How is it important in investment decisions?
2. Write a brief note on risk and investor preferences.
3. What are the steps we take when selecting the best portfolio?

257Portfolio Selection
4. Write a note on simple Sharpe portfolio optimization.
5. Explain Markowitz model – the mean-variance criterion.
Check Your Progress: Model Answers
CYP 1
1. return 2. percentage 3.arithmetic 4. forward
CYP 2
1. F 2. T 3. T 4. T 5. T
11.13 SUGGESTED READINGS
Sudhindra Bhat, Security Analysis and Portfolio Management, Excel Books, Delhi.
Kevin, S., Security Analysis and Portfolio Management, Prentice Hall of India.
Prasanna Chandra, Investment Analysis and Portfolio Management, Second Edition, Tata McGrawHill.
Punithavathy Pandian, Securities Analysis and Portfolio management, Vikas.
Investment Management, V. K. Bhalla.
A. Davis, Investors in a Changing Economy, Prentice -Hall, 1968.
Williamson, J. Peter, Investments: New Analytic Techniques, London, Longman, 1970.
Cottle, CC., and Whitman, W.T., Investment Timing: The Formula Plan Approach, McGraw Hill.
258Security Analysis andPortfolio Management
LESSON
12PERFORMANCE EVALUATION OF PORTFOLIO
CONTENTS
12.0 Aims and Objectives
12.1 Introduction
12.2 Methods of Calculating Portfolio Returns
12.2.1 Dollar-Weight Rate of Return
12.2.2 Time-weighted Rate of Return
12.2.3 Unit Value Rate of Return
12.3 Portfolio Performance and Risk Adjusted Methods
12.3.1 Risk-adjusted Returns
12.3.2 Sharpe’s Ratio
12.3.3 Treynor Portfolio Performance Measure (Aka: Reward to Volatility Ratio)
12.3.4 Jenseen’s Differential Return (On Jensen Measure)
12.3.5 Applying the Jenson Measure
12.4 Determinants of Portfolio Performance
12.4.1 Risk Taking
12.5 Market Timing
12.6 Benchmark Portfolios for Performance Evaluation
12.7 Let us Sum up
12.8 Lesson End Activity
12.9 Keywords
12.10 Questions for Discussion
12.11 Suggested Readings
12.0 AIMS AND OBJECTIVES
After studying this lesson, you should be able to understand:
l Classification of Managed Portfolio
l Advantages of Managed Portfolio
259Performance Evaluation
of Portfolio
l Methods of Computing Portfolio Return
l Components of Investment Performance
l Problems with Risk-adjusted Measures
l Benchmark Portfolios for Performance Evaluation
l Risk-adjusted Measure of Performance
l Sharpe’s Reward-to-variability Ratio
l Treynor’s Reward-to-volatility Ratio
l Treynors Versus Sharpe Measures
l Jensen's differential Return Measures
l Application of Evaluation Techniques
12.1 INTRODUCTION
Of late, mutual funds have gained popularity in India since the early 90s. Most individualinvestors find it difficult to identify and diversify their investments across different portfolios,either due to lack of adequate knowledge of investment management principles or becauseof lack of skills needed to play actively with the complex system of making quick decisionsfor proper handling of their portfolios. As a result, they are simply turning to specialisedinstitutions like mutual funds. Mutual funds in turn, with their skilled portfolio managersare promising to generate a rate of return almost similar to the size of return that marketyields on efficient portfolios. These specialised institutions are able to invest acrossdifferent industries and different securities with the available large amounts of moneyentrusted to them by investors. This facilitates the obtainment of fuller benefits ofdiversification. Further, the myriad schemes in mutual funds throw up opportunities tosuit to the varied requirements of different investors. This lesson examines theperformance of a portfolio manager in investing the funds entrusted to a mutual fund.Such an evaluation is important to an investor in different directions.
1. It enables the investor to appraise how well the portfolio manager has achieved thetargeted return.
2. It enables the investor to examine how well the manager has achieved the targetsin comparison to other mutual funds.
3. It enables the fund authorities to evaluate the performance of their investmentdecisions not only earning a specified rate of return, but return in relative terms i.e.per unit of risk.
12.2METHODS OF CALCULATINGPORTFOLIO RETURNS
Calculation of portfolio returns is almost similar to the calculation of rate of return onindividual stock. The rate of return is generally estimated for a specific holding period.The performance of a portfolio fund is evaluated on the returns generated over a timeframe,with number of sub-periods, by considering the holding periods. The calculation of portfolioreturn is relatively easy when there are no additions or withdrawals from the initialcorpus during the given phenomena.
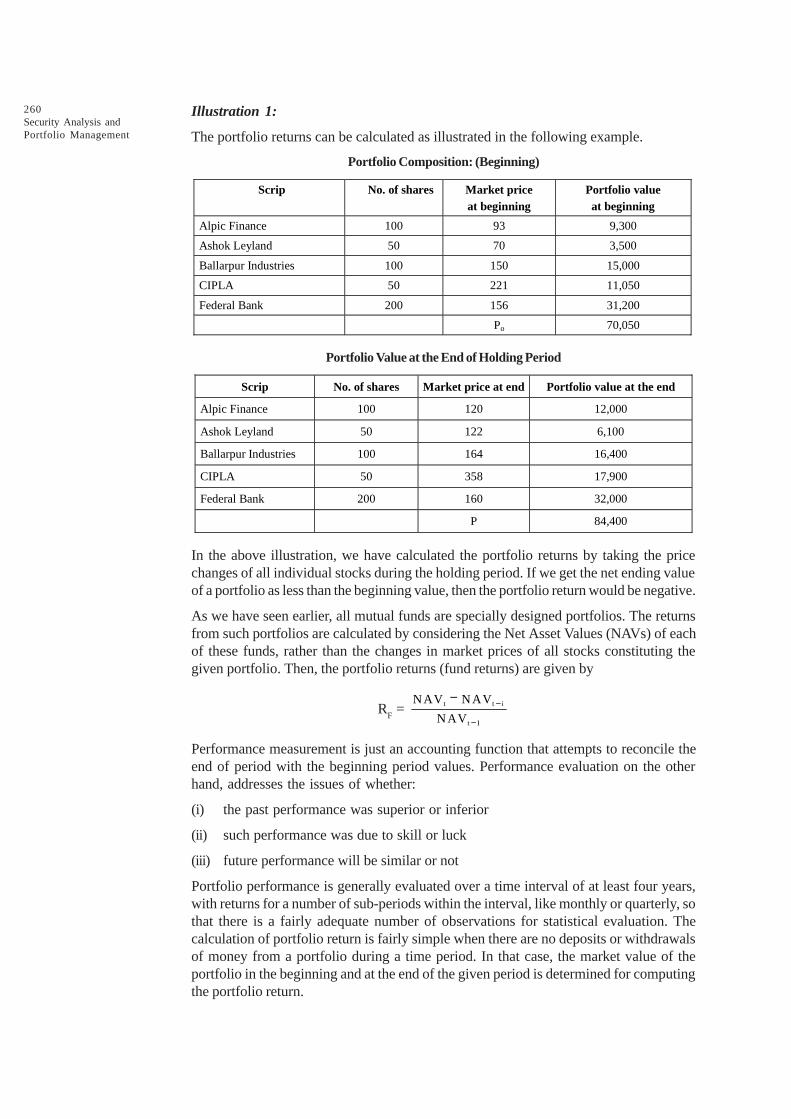
260Security Analysis andPortfolio Management
Illustration 1:
The portfolio returns can be calculated as illustrated in the following example.
Portfolio Composition: (Beginning)
Scrip No. of shares Market price at beginning
Portfolio value at beginning
Alpic Finance 100 93 9,300
Ashok Leyland 50 70 3,500
Ballarpur Industries 100 150 15,000
CIPLA 50 221 11,050
Federal Bank 200 156 31,200
Po 70,050
Portfolio Value at the End of Holding Period
Scrip No. of shares Market price at end Portfolio value at the end
Alpic Finance 100 120 12,000
Ashok Leyland 50 122 6,100
Ballarpur Industries 100 164 16,400
CIPLA 50 358 17,900
Federal Bank 200 160 32,000
P 84,400
In the above illustration, we have calculated the portfolio returns by taking the pricechanges of all individual stocks during the holding period. If we get the net ending valueof a portfolio as less than the beginning value, then the portfolio return would be negative.
As we have seen earlier, all mutual funds are specially designed portfolios. The returnsfrom such portfolios are calculated by considering the Net Asset Values (NAVs) of eachof these funds, rather than the changes in market prices of all stocks constituting thegiven portfolio. Then, the portfolio returns (fund returns) are given by
RF = t t i
t I
NAV NAV
NAV-
-
-
Performance measurement is just an accounting function that attempts to reconcile theend of period with the beginning period values. Performance evaluation on the otherhand, addresses the issues of whether:
(i) the past performance was superior or inferior
(ii) such performance was due to skill or luck
(iii) future performance will be similar or not
Portfolio performance is generally evaluated over a time interval of at least four years,with returns for a number of sub-periods within the interval, like monthly or quarterly, sothat there is a fairly adequate number of observations for statistical evaluation. Thecalculation of portfolio return is fairly simple when there are no deposits or withdrawalsof money from a portfolio during a time period. In that case, the market value of theportfolio in the beginning and at the end of the given period is determined for computingthe portfolio return.

261Performance Evaluation
of Portfolio
Illustration 2:
Step 1: Portfolio Value – Beginning
Shares No. of Shares Market Price Portfolio Value Beginning
A 50 100 5,000
B 100 70 7,000
C 200 40 8,000
D 500 60 30,000
Total (Vo) 50,000
Step 2: Portfolio Value – End
Shares No. of Shares Market Price Portfolio Value End
A 50 100 10,000
B 100 40 4,000
C 200 110 22,000
D 500 80 40,000
Total (Vo) 76,000
Step 3: Portfolio Return
= 1 0
0
V V
V
-
= 6,000 50,000
50,000
- = 52%
Performance measurement becomes different when a client adds or withdraws moneyfrom the portfolio. The percentage change in the market value of the portfolio as computedabove may not be an accurate measurement of the portfolio’s return in that case. Forexample, if the beginning value of the portfolio is Rs. 50,000 and the value at the end ofOctober is Rs. 70,000 and the client deposits Rs. 30,000 in cash in early November, thevalue at the end of the year would be Rs. 1,00,000. The portfolio return in this case willbe:
(1,00,000 – 50,000)/50,000 = 100%
However, the entire return was not due to the actions of the investment manager. Amore accurate measure would be:
(1,00,000 – 30,000) – 50,000/50,000 = 40%
In the event of a deposit or a withdrawal occurring just after the start of the period, thereturn on the portfolio should be calculated by adjusting the beginning market value ofthe portfolio. In the case of a deposit, the beginning value would be increased by thedeposit amount and in the case of withdrawal, the beginning value would be decreasedby the amount.
When deposits or withdrawals occur in the middle of the period, either the dollar-weightedreturn (rupee-weighted return) or the time-weighted return should be used. The choice
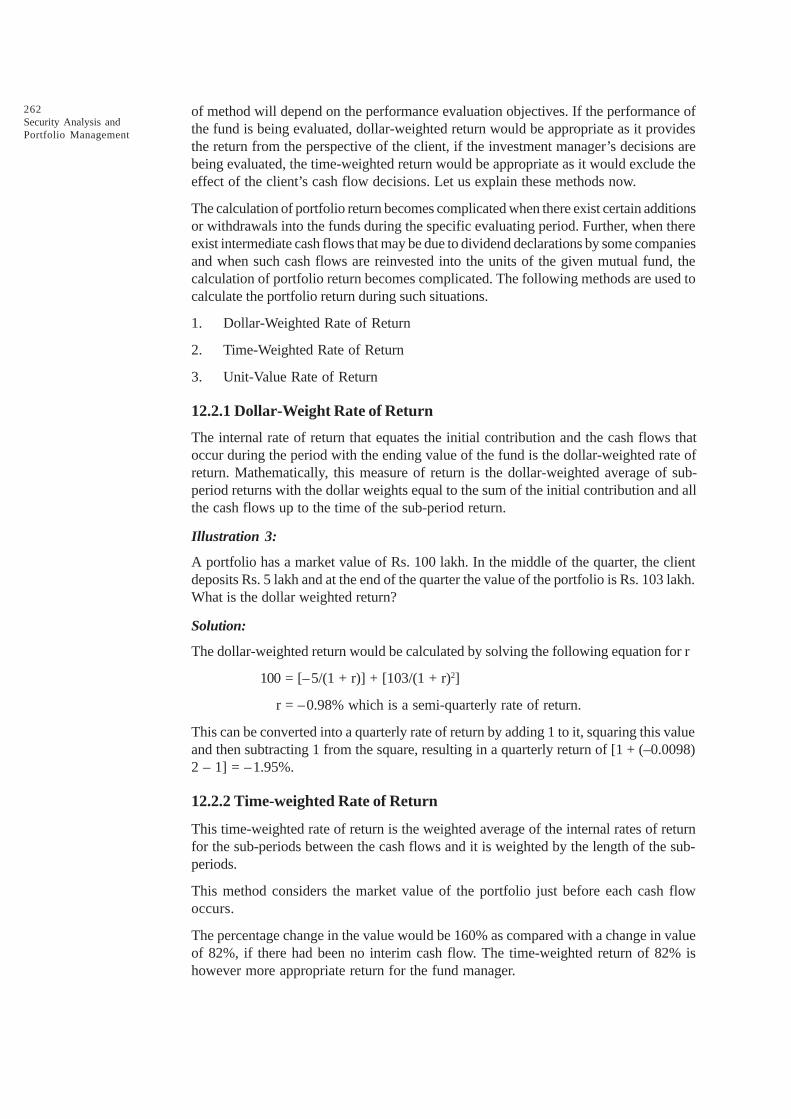
262Security Analysis andPortfolio Management
of method will depend on the performance evaluation objectives. If the performance ofthe fund is being evaluated, dollar-weighted return would be appropriate as it providesthe return from the perspective of the client, if the investment manager’s decisions arebeing evaluated, the time-weighted return would be appropriate as it would exclude theeffect of the client’s cash flow decisions. Let us explain these methods now.
The calculation of portfolio return becomes complicated when there exist certain additionsor withdrawals into the funds during the specific evaluating period. Further, when thereexist intermediate cash flows that may be due to dividend declarations by some companiesand when such cash flows are reinvested into the units of the given mutual fund, thecalculation of portfolio return becomes complicated. The following methods are used tocalculate the portfolio return during such situations.
1. Dollar-Weighted Rate of Return
2. Time-Weighted Rate of Return
3. Unit-Value Rate of Return
12.2.1 Dollar-Weight Rate of Return
The internal rate of return that equates the initial contribution and the cash flows thatoccur during the period with the ending value of the fund is the dollar-weighted rate ofreturn. Mathematically, this measure of return is the dollar-weighted average of sub-period returns with the dollar weights equal to the sum of the initial contribution and allthe cash flows up to the time of the sub-period return.
Illustration 3:
A portfolio has a market value of Rs. 100 lakh. In the middle of the quarter, the clientdeposits Rs. 5 lakh and at the end of the quarter the value of the portfolio is Rs. 103 lakh.What is the dollar weighted return?
Solution:
The dollar-weighted return would be calculated by solving the following equation for r
100 = [–5/(1 + r)] + [103/(1 + r)2]
r = –0.98% which is a semi-quarterly rate of return.
This can be converted into a quarterly rate of return by adding 1 to it, squaring this valueand then subtracting 1 from the square, resulting in a quarterly return of [1 + (–0.0098)2 – 1] = –1.95%.
12.2.2 Time-weighted Rate of Return
This time-weighted rate of return is the weighted average of the internal rates of returnfor the sub-periods between the cash flows and it is weighted by the length of the sub-periods.
This method considers the market value of the portfolio just before each cash flowoccurs.
The percentage change in the value would be 160% as compared with a change in valueof 82%, if there had been no interim cash flow. The time-weighted return of 82% ishowever more appropriate return for the fund manager.
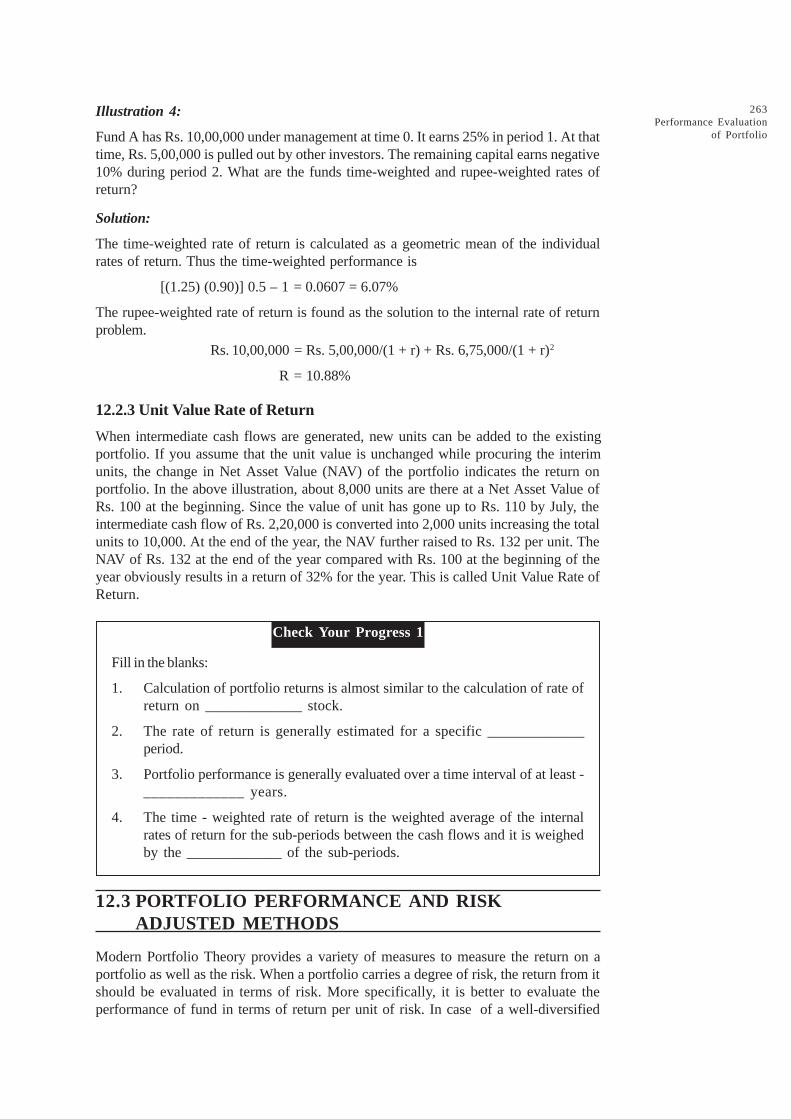
263Performance Evaluation
of Portfolio
Illustration 4:
Fund A has Rs. 10,00,000 under management at time 0. It earns 25% in period 1. At thattime, Rs. 5,00,000 is pulled out by other investors. The remaining capital earns negative10% during period 2. What are the funds time-weighted and rupee-weighted rates ofreturn?
Solution:
The time-weighted rate of return is calculated as a geometric mean of the individualrates of return. Thus the time-weighted performance is
[(1.25) (0.90)] 0.5 – 1 = 0.0607 = 6.07%
The rupee-weighted rate of return is found as the solution to the internal rate of returnproblem.
Rs. 10,00,000 = Rs. 5,00,000/(1 + r) + Rs. 6,75,000/(1 + r)2
R = 10.88%
12.2.3 Unit Value Rate of Return
When intermediate cash flows are generated, new units can be added to the existingportfolio. If you assume that the unit value is unchanged while procuring the interimunits, the change in Net Asset Value (NAV) of the portfolio indicates the return onportfolio. In the above illustration, about 8,000 units are there at a Net Asset Value ofRs. 100 at the beginning. Since the value of unit has gone up to Rs. 110 by July, theintermediate cash flow of Rs. 2,20,000 is converted into 2,000 units increasing the totalunits to 10,000. At the end of the year, the NAV further raised to Rs. 132 per unit. TheNAV of Rs. 132 at the end of the year compared with Rs. 100 at the beginning of theyear obviously results in a return of 32% for the year. This is called Unit Value Rate ofReturn.
Check Your Progress 1
Fill in the blanks:
1. Calculation of portfolio returns is almost similar to the calculation of rate ofreturn on _____________ stock.
2. The rate of return is generally estimated for a specific _____________period.
3. Portfolio performance is generally evaluated over a time interval of at least -_____________ years.
4. The time - weighted rate of return is the weighted average of the internalrates of return for the sub-periods between the cash flows and it is weighedby the _____________ of the sub-periods.
12.3 PORTFOLIO PERFORMANCE AND RISKADJUSTED METHODS
Modern Portfolio Theory provides a variety of measures to measure the return on aportfolio as well as the risk. When a portfolio carries a degree of risk, the return from itshould be evaluated in terms of risk. More specifically, it is better to evaluate theperformance of fund in terms of return per unit of risk. In case of a well-diversified
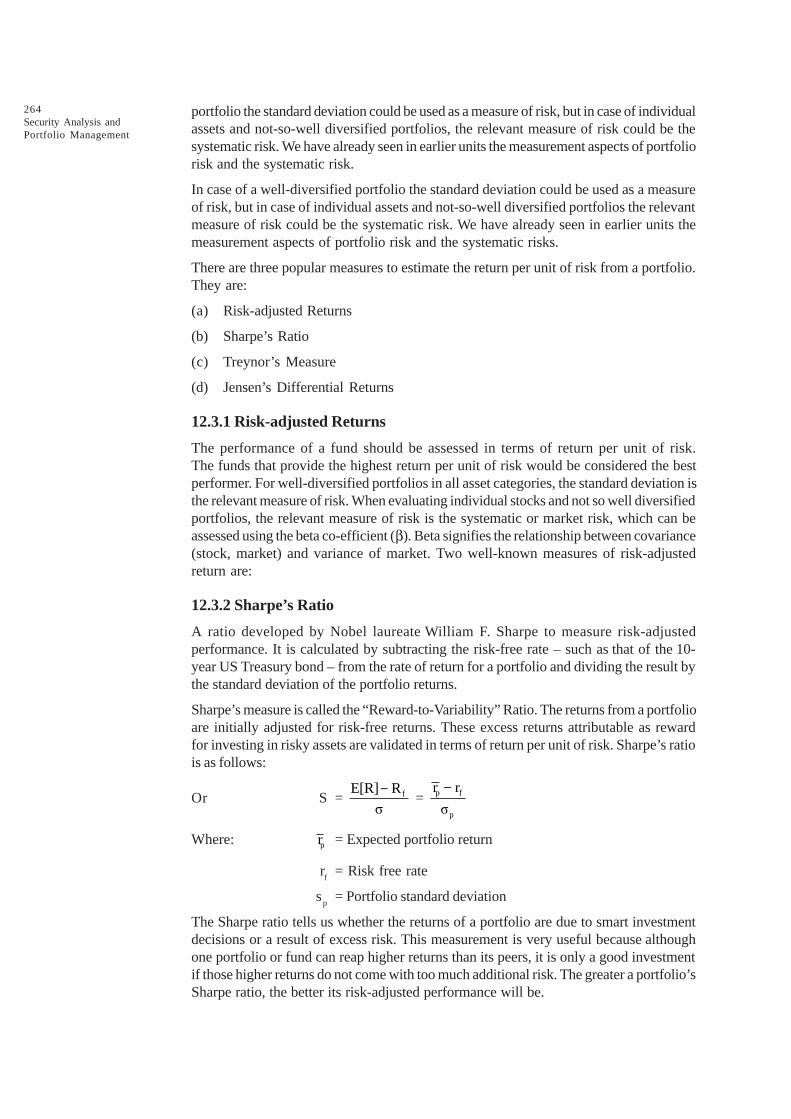
264Security Analysis andPortfolio Management
portfolio the standard deviation could be used as a measure of risk, but in case of individualassets and not-so-well diversified portfolios, the relevant measure of risk could be thesystematic risk. We have already seen in earlier units the measurement aspects of portfoliorisk and the systematic risk.
In case of a well-diversified portfolio the standard deviation could be used as a measureof risk, but in case of individual assets and not-so-well diversified portfolios the relevantmeasure of risk could be the systematic risk. We have already seen in earlier units themeasurement aspects of portfolio risk and the systematic risks.
There are three popular measures to estimate the return per unit of risk from a portfolio.They are:
(a) Risk-adjusted Returns
(b) Sharpe’s Ratio
(c) Treynor’s Measure
(d) Jensen’s Differential Returns
12.3.1 Risk-adjusted Returns
The performance of a fund should be assessed in terms of return per unit of risk.The funds that provide the highest return per unit of risk would be considered the bestperformer. For well-diversified portfolios in all asset categories, the standard deviation isthe relevant measure of risk. When evaluating individual stocks and not so well diversifiedportfolios, the relevant measure of risk is the systematic or market risk, which can beassessed using the beta co-efficient (b). Beta signifies the relationship between covariance(stock, market) and variance of market. Two well-known measures of risk-adjustedreturn are:
12.3.2 Sharpe’s Ratio
A ratio developed by Nobel laureate William F. Sharpe to measure risk-adjustedperformance. It is calculated by subtracting the risk-free rate – such as that of the 10-year US Treasury bond – from the rate of return for a portfolio and dividing the result bythe standard deviation of the portfolio returns.
Sharpe’s measure is called the “Reward-to-Variability” Ratio. The returns from a portfolioare initially adjusted for risk-free returns. These excess returns attributable as rewardfor investing in risky assets are validated in terms of return per unit of risk. Sharpe’s ratiois as follows:
Or S = fE[R] R
ó
- = p f
p
r r
ó
-
Where: pr = Expected portfolio return
rf
= Risk free rate
sp
= Portfolio standard deviation
The Sharpe ratio tells us whether the returns of a portfolio are due to smart investmentdecisions or a result of excess risk. This measurement is very useful because althoughone portfolio or fund can reap higher returns than its peers, it is only a good investmentif those higher returns do not come with too much additional risk. The greater a portfolio’sSharpe ratio, the better its risk-adjusted performance will be.

265Performance Evaluation
of Portfolio
A variation of the Sharpe ratio is the Sortino ratio, which removes the effects of upwardprice movements on standard deviation to instead measure only the return againstdownward price volatility.
Illustration 5:
Consider two portfolios A and B. On the basis of information given below, compare theperformance of portfolios A and B.
Portfolio Return I (R M) Risk-free rate (RF) Excess return (RF – RM) Portfolio risk (SD)
A 21 8 13 10
B 17 8 9 8
Solution:
A = 13/10 = 1.3
B = 9/8 = 1.125
Reward per unit of risk in case of Portfolio A is relatively higher. Hence its performanceis said to be good.
12.3.3 Treynor Portfolio Performance Measure (Aka: Reward to Volatility Ratio)
This measure was developed by Jack Treynor in 1965. Treynor (helped developedCAPM) argues that, using the characteristic line, one can determine the relationshipbetween a security and the market. Deviations from the characteristic line (unique returns)should cancel out if you have a fully diversified portfolio.
Treynor’s Composite Performance Measure: He was interested in a performancemeasure that would apply to all investors regardless of their risk preferences. He arguedthat investors would prefer a CML with a higher slope (as it would place them on ahigher utility curve). The slope of this portfolio possibility line is:
Ti = M F
1
R Râ
-
Where: R = Market Return, RFR = Risk Free return, and b1 = SD.
A larger Ti value indicates a larger slope and a better portfolio for all investors regardless
of their risk preferences. The numerator represents the risk premium and the denominatorrepresents the risk of the portfolio; thus the value, T, represents the portfolio’s return perunit of systematic risk. All risk-averse investors would want to maximize this value.
The Treynor measure only measures systematic risk – it automatically assumes anadequately diversified portfolio.
You can compare the T measures for different portfolios. The higher the T value, thebetter the portfolio performance. For instance, the T value for the market is:
Tm = m
m
R RFR
â
´
In this expression, bm = 1.
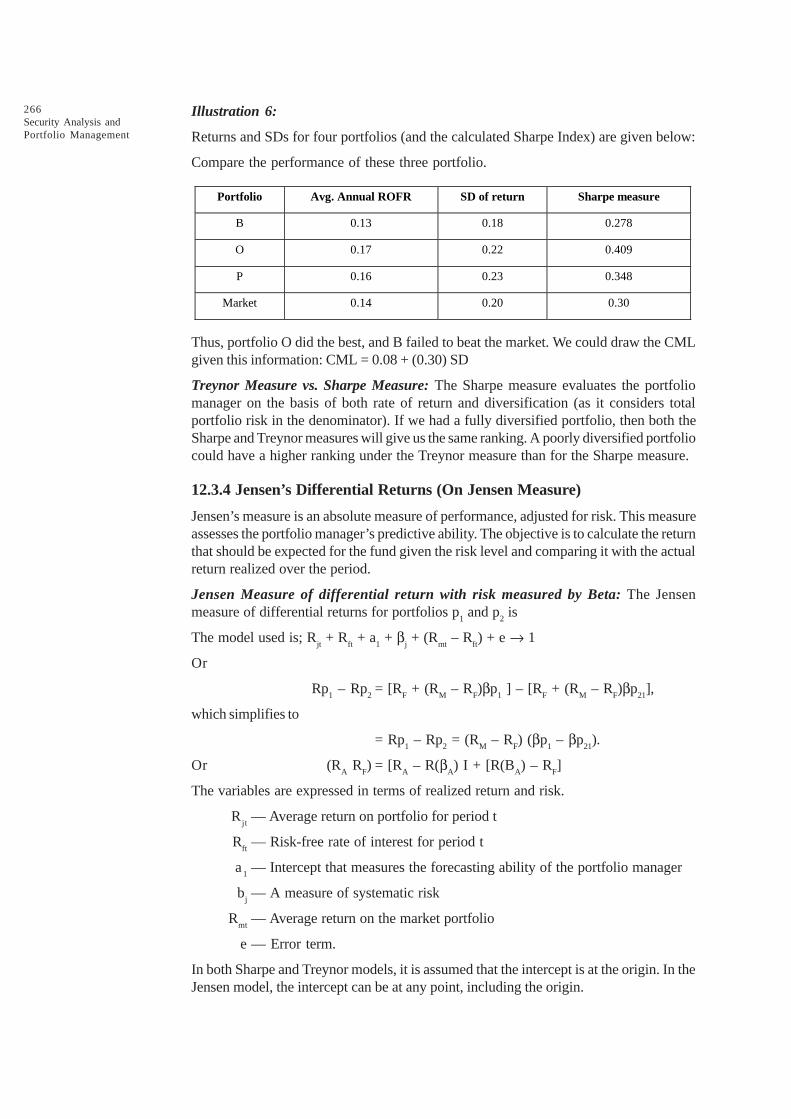
266Security Analysis andPortfolio Management
Illustration 6:
Returns and SDs for four portfolios (and the calculated Sharpe Index) are given below:
Compare the performance of these three portfolio.
Portfolio Avg. Annual ROFR SD of return Sharpe measure
B 0.13 0.18 0.278
O 0.17 0.22 0.409
P 0.16 0.23 0.348
Market 0.14 0.20 0.30
Thus, portfolio O did the best, and B failed to beat the market. We could draw the CMLgiven this information: CML = 0.08 + (0.30) SD
Treynor Measure vs. Sharpe Measure: The Sharpe measure evaluates the portfoliomanager on the basis of both rate of return and diversification (as it considers totalportfolio risk in the denominator). If we had a fully diversified portfolio, then both theSharpe and Treynor measures will give us the same ranking. A poorly diversified portfoliocould have a higher ranking under the Treynor measure than for the Sharpe measure.
12.3.4 Jensen’s Differential Returns (On Jensen Measure)
Jensen’s measure is an absolute measure of performance, adjusted for risk. This measureassesses the portfolio manager’s predictive ability. The objective is to calculate the returnthat should be expected for the fund given the risk level and comparing it with the actualreturn realized over the period.
Jensen Measure of differential return with risk measured by Beta: The Jensenmeasure of differential returns for portfolios p
1 and p
2 is
The model used is; Rjt + R
ft + a
1 + b
j + (R
mt – R
ft) + e Æ 1
Or
Rp1 – Rp
2= [R
F + (R
M – R
F)bp
1 ] – [R
F + (R
M – R
F)bp
21],
which simplifies to
= Rp1 – Rp
2 = (R
M – R
F) (bp
1 – bp
21).
Or (RA R
F) = [R
A – R(b
A) I + [R(B
A) – R
F]
The variables are expressed in terms of realized return and risk.
Rjt
— Average return on portfolio for period t
Rft
— Risk-free rate of interest for period t
a1
— Intercept that measures the forecasting ability of the portfolio manager
bj— A measure of systematic risk
Rmt
— Average return on the market portfolio
e — Error term.
In both Sharpe and Treynor models, it is assumed that the intercept is at the origin. In theJensen model, the intercept can be at any point, including the origin.
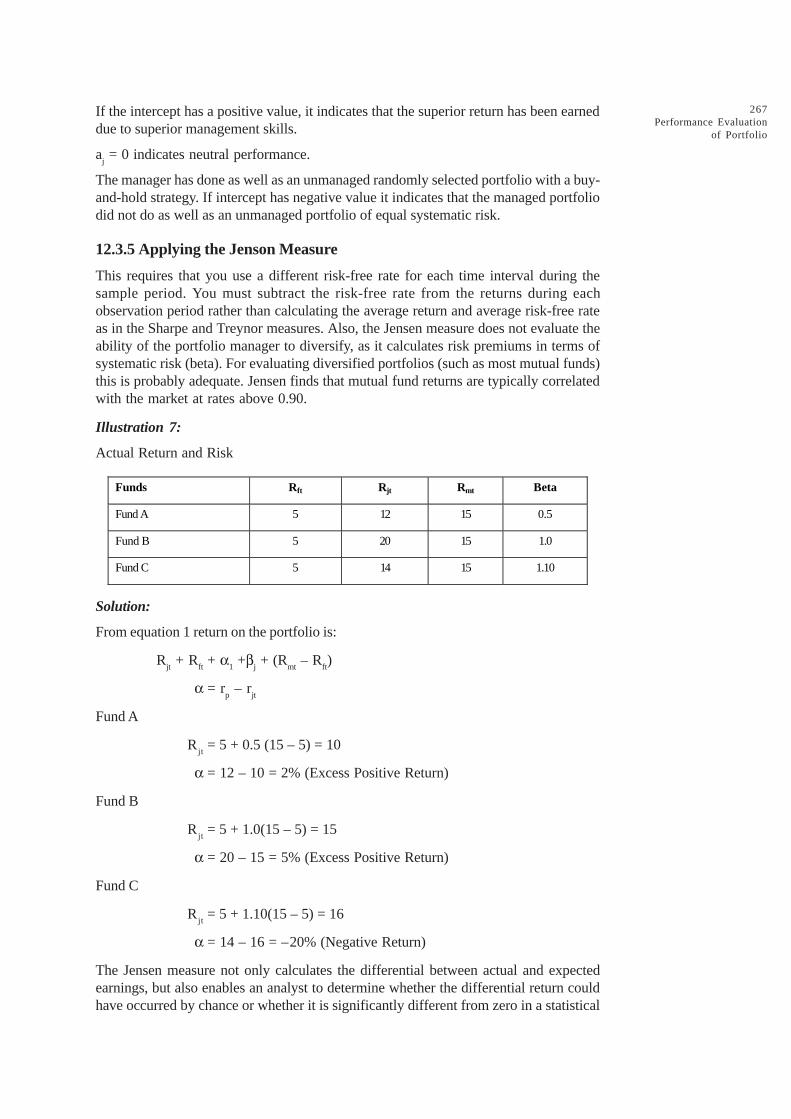
267Performance Evaluation
of Portfolio
If the intercept has a positive value, it indicates that the superior return has been earneddue to superior management skills.
aj = 0 indicates neutral performance.
The manager has done as well as an unmanaged randomly selected portfolio with a buy-and-hold strategy. If intercept has negative value it indicates that the managed portfoliodid not do as well as an unmanaged portfolio of equal systematic risk.
12.3.5 Applying the Jenson Measure
This requires that you use a different risk-free rate for each time interval during thesample period. You must subtract the risk-free rate from the returns during eachobservation period rather than calculating the average return and average risk-free rateas in the Sharpe and Treynor measures. Also, the Jensen measure does not evaluate theability of the portfolio manager to diversify, as it calculates risk premiums in terms ofsystematic risk (beta). For evaluating diversified portfolios (such as most mutual funds)this is probably adequate. Jensen finds that mutual fund returns are typically correlatedwith the market at rates above 0.90.
Illustration 7:
Actual Return and Risk
Funds Rft Rjt Rmt Beta
Fund A 5 12 15 0.5
Fund B 5 20 15 1.0
Fund C 5 14 15 1.10
Solution:
From equation 1 return on the portfolio is:
Rjt + R
ft+ a
1 +b
j + (R
mt – R
ft)
a = rp – r
jt
Fund A
Rjt
= 5 + 0.5 (15 – 5) = 10
a = 12 – 10 = 2% (Excess Positive Return)
Fund B
Rjt
= 5 + 1.0(15 – 5) = 15
a = 20 – 15 = 5% (Excess Positive Return)
Fund C
Rjt
= 5 + 1.10(15 – 5) = 16
a = 14 – 16 = –20% (Negative Return)
The Jensen measure not only calculates the differential between actual and expectedearnings, but also enables an analyst to determine whether the differential return couldhave occurred by chance or whether it is significantly different from zero in a statistical
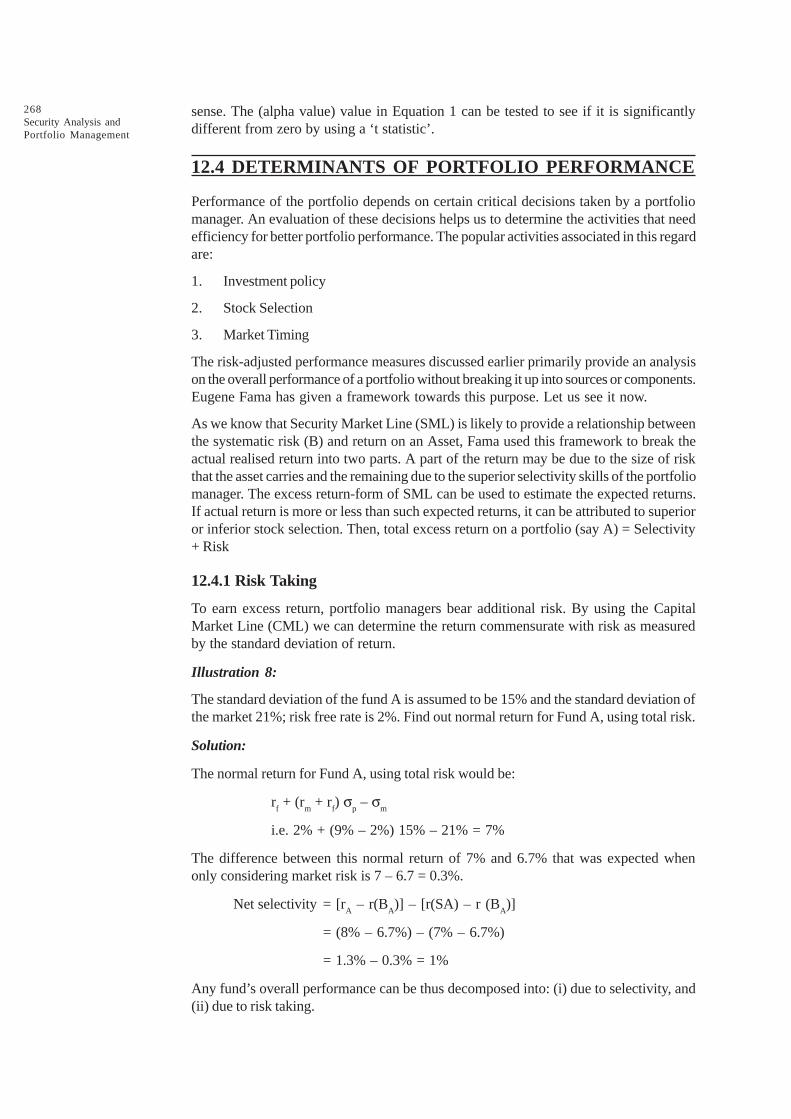
268Security Analysis andPortfolio Management
sense. The (alpha value) value in Equation 1 can be tested to see if it is significantlydifferent from zero by using a ‘t statistic’.
12.4 DETERMINANTS OF PORTFOLIO PERFORMANCE
Performance of the portfolio depends on certain critical decisions taken by a portfoliomanager. An evaluation of these decisions helps us to determine the activities that needefficiency for better portfolio performance. The popular activities associated in this regardare:
1. Investment policy
2. Stock Selection
3. Market Timing
The risk-adjusted performance measures discussed earlier primarily provide an analysison the overall performance of a portfolio without breaking it up into sources or components.Eugene Fama has given a framework towards this purpose. Let us see it now.
As we know that Security Market Line (SML) is likely to provide a relationship betweenthe systematic risk (B) and return on an Asset, Fama used this framework to break theactual realised return into two parts. A part of the return may be due to the size of riskthat the asset carries and the remaining due to the superior selectivity skills of the portfoliomanager. The excess return-form of SML can be used to estimate the expected returns.If actual return is more or less than such expected returns, it can be attributed to superioror inferior stock selection. Then, total excess return on a portfolio (say A) = Selectivity+ Risk
12.4.1 Risk Taking
To earn excess return, portfolio managers bear additional risk. By using the CapitalMarket Line (CML) we can determine the return commensurate with risk as measuredby the standard deviation of return.
Illustration 8:
The standard deviation of the fund A is assumed to be 15% and the standard deviation ofthe market 21%; risk free rate is 2%. Find out normal return for Fund A, using total risk.
Solution:
The normal return for Fund A, using total risk would be:
rf + (r
m + r
f) s
p – s
m
i.e. 2% + (9% – 2%) 15% – 21% = 7%
The difference between this normal return of 7% and 6.7% that was expected whenonly considering market risk is 7 – 6.7 = 0.3%.
Net selectivity = [rA – r(B
A)] – [r(SA) – r (B
A)]
= (8% – 6.7%) – (7% – 6.7%)
= 1.3% – 0.3% = 1%
Any fund’s overall performance can be thus decomposed into: (i) due to selectivity, and(ii) due to risk taking.

269Performance Evaluation
of Portfolio
12.5 MARKET TIMING
A portfolio manager’s performance has been seen so far in the context of stock selectionfor superior performance. Managers can also generate superior performance from aportfolio by planning the investment and disinvestment activities by shifting from stocksto bonds or bonds to stocks based on good market timing sense. Positioning of a portfoliois to be adjusted by correctly adjusting the direction of the market, either in the bull orbear phases. Managers with a forecast of a declining market can position a portfolioeither by shifting resources from stocks to bonds, or restructure the component stocks insuch a way that the beta of the equity portion of the portfolio comes down.
One way of finding the performance of a portfolio in this regard is to simply look directlyat the way the fund return behaves, relative to the return of the market. This methodcalls for calculating the returns of the portfolio and the market at different intervals andplot a scatter diagram to see the direction of relationship between these two. If a portfoliois constructed by concentrating on stock selection rather than keeping the market timingin mind, the average beta of the portfolio stands fairly constant and if we plot such aportfolio’s returns and market returns, we observe a linear relationship. On the otherhand, if a manager was able to successfully assess the market direction and reshufflethe portfolio accordingly, we would observe a situation of high portfolio betas at times ofrise in market and low portfolio beta at times of decline in the market.
Portfolio managers can also achieve superior performance by picking up high beta stocksduring a market upswing and moving out of equity, one could calculate the quarterlyreturns for a fund and for the market index like Bombay Stock Exchange’s NationalIndex of a 5-year period.
Check Your Progress 2
State whether the following statements are true or false:
1. Mutual funds have gained popularity in India since the early 90s.
2. All mutual funds are specially designed portfolio.
3. Modern portfolio theory provides the measures to measure the return on aportfolio as well as risk.
4. Benchmark portfolio is not a tool for meaningful evaluation of the performanceof a portfolio manager.
5. Performance of portfolio does not depend on certain critical decisions takenby a portfolio manager.
12.6BENCHMARK PORTFOLIOS FORPERFORMANCE EVALUATION
Benchmark portfolio is a tool for the meaningful evaluation of the performance of aportfolio manager. The more the benchmark reflects the manager’s stated style, themore accurately the performance due to a manager’s skills can be assessed. Specializedbenchmarks are called “normal portfolios.” They are specially constructed by mutualconsent of the client and the manager to reflect the client’s needs and the manager’sstyle. Some management firms develop a normal portfolio, which they can use for allclients, and some develop it separately for each type of client. When benchmarks aredesigned in advance, the portfolio manager knows what the specific objectives are and
270Security Analysis andPortfolio Management
tailors the portfolio accordingly. The benchmark should reflect the appropriate investmentuniverse in which the manager works. Without a yardstick for proper comparison, itbecomes difficult to distinguish between active management skills and random results.
Rather than using a market index like the Bombay Stock Exchange’s Sensitive Index tothe Economic Times Index, a benchmark portfolio would use a portfolio with predominantlyvalue-oriented shares for a value manager, growth-oriented shares for a growth managerand small capitalization shares for a small cap (size) manager. It is quite possible for aninvestment manager to perform better than the benchmark, though the benchmark mayitself under-perform in relation to a market index. The process of constructing a benchmarkportfolio involves:
(a) Defining the universe of stock to be used for the benchmark portfolio, and
(b) Defining the weightage of the stocks in the universe.
Performance attribution analysis, as mentioned earlier, is a means of evaluating aninvestment manager’s performance, the return and the sources of return relative to abenchmark portfolio. This analysis looks at an investment manager’s total ‘excess’ return,or ‘active management return’ (AMR) relative to its benchmark over the given period.
12.7 LET US SUM UP
We have examined the issues associated with portfolio evaluation by constructing simplemodel of NAV and Dollar-Weighted Rate of Return; methods of computing portfolioreturn viz. Value-Weighted Return and Risk-adjusted Rate of Return. We have alsodistinguished between performance measurement and performance evaluation andhighlighted the primary components of performance namely stock selection and markettiming and also the concepts and method of construction of a benchmark portfolio forcomparison and evaluation with a managed portfolio. And further, a detailed discussionis provided on risk-adjusted methods like Sharpe Treynor and Jensen’s Measures. Inaddition a focus is made on the performance determinants.
12.8 LESSON END ACTIVITY
Distinguish between time weighted and dollar weighted rate of return, Under whatperformance measurement circumstances might the dollar weighted return be preferredto the time weighted.
12.9 KEYWORDS
Differential Return: The return that should be expected for the fund given the risk leveland comparing it with the actual return realized over the period.
Dollar-Weight Rate of Return: The internal rate of return that equates the initial distributionand the cash flows that occur during the period with the ending value of the fund is thedollar-weighted rate of return.
Time-Weighted Return: It is the weighted average of the internal rates of return for thesub-periods between the cash flows and it is weighted by the length of the sub-periods.
Modern Portfolio Theory: It provides a variety of measures to measure the return on aportfolio as well as the risk.
Benchmark Portfolio: It is a tool for the meaningful evaluation of the performance of aportfolio manager.

271Performance Evaluation
of Portfolio
12.10 QUESTIONS FOR DISCUSSION
1. Explain briefly the methods of calculating portfolio returns.
2. What is dollar-weighted rate of return method?
3. Explain the time-weighted rate of return method.
4. What is unit value method? How is unit value method different from the dollar-weighted rate method?
5. What are portfolio performance and risk-adjusted methods?
6. Explain Sharpe’s Ratio, Treynor’s Measure, and Jensen’s Differential Return.
7. What are the determinants of portfolio performance?
8. Distinguish between time-weighted and dollar-weighted rate of return. Under whatperformance measurement circumstances might the dollar-weighted return bepreferred to the time-weighted one?
9. Using a recent NSE and BSE website, find the closing value of the NIFTY stockand Sensex and compare the same. Write a comment on variation, if any.
CYP 1
1. individual 2. holding 3. four 4. length.
CYP 2
1. True 2. True 3. True 4. False 5. False
12.11 SUGGESTED READINGS
Sudhindra Bhat, Security Analysis and Portfolio Management, Excel Books, Delhi.
Kevin, S., Security Analysis and Portfolio Management, Prentice Hall of India.
Prasanna Chandra, Investment Analysis and Portfolio Management, Second Edition, Tata McGrawHill.
Punithavathy Pandian, Securities Analysis and Portfolio management, Vikas.
Investment Management, V. K. Bhalla.
A. Davis, Investors in a Changing Economy, Prentice -Hall, 1968.
Williamson, J. Peter, Investments: New Analytic Techniques, London, Longman, 1970.
Cottle, CC., and Whitman, W.T., Investment Timing: The Formula Plan Approach, McGraw Hill.

272Security Analysis andPortfolio Management
LESSON
13PORTFOLIO REVISION
CONTENTS
13.0 Aim and Objectives
13.1 Introduction
13.2 Need for Portfolio Revision
13.3 Portfolio Revision Strategies
13.3.1 Portfolio Revision Practices
13.4 Constraints in Portfolio Revision
13.5 Formula Plans
13.5.1 Formula Investing
13.5.2 Basic Assumptions and Ground Rules of Formula Plan
13.5.3 Constant Dollar-Value Plan
13.5.4 Dollar Cost Averaging
13.5.5 Constant-Ratio Plan
13.5.6 Variable-Ratio Plan
13.5.7 Limitations
13.6 Let us Sum up
13.7 Lesson End Activity
13.8 Keywords
13.9 Questions for Discussion
13.10 Suggested Readings
13.0 AIM AND OBJECTIVES
After reading this chapter you should be able to understand:
l Meaning of Portfolio Revision
l Need for Portfolio Revision
l Portfolio Revision Strategies
l Portfolio Revision Practices
l Constraints in Portfolio Revision
l Formula Plans
273Portfolio Revision13.1 INTRODUCTION
In the entire process of portfolio management, portfolio revision is as important as portfoliosanalysis and selection. Keeping in mind the risk-return objectives, an investor selects amix of securities from the given investment universe. In a dynamic world of investment,it is only natural that the portfolio may not perform as desired or opportunities might ariseturning the desired into less that desired. In every such situation, a portfolio revision iswarranted. Portfolio revision involves changing the existing mix of securities. The objectiveof portfolio revision is similar to the objective of portfolio selection i.e. maximizing thereturn for a given level of risk or minimizing the risk for a given level of return. Theprocess of portfolio revision may also be similar to the process of portfolio selection.This is particularly true where active portfolio revision strategy is followed. Where passiveportfolio revision strategy is followed, use of mechanical formula plans may be made.What are these formula plans? We shall discuss these and other aspects of portfoliorevision in this unit. Let us begin by highlighting the need for portfolio revision.
13.2 NEED FOR PORTFOLIO REVISION
No plan can be perfect to the extent that it would not need revision sooner or later.Investment plans are certainly not. In the context of portfolio management, the need forrevision is ever more because the financial markets are continually changing. Thus theneed for portfolio revision might simply arise because the market witnessed some significantchanges since the creation of the portfolio. Further, the need for portfolio revision mayarise because of some investor-related factors such as (i) availability of additional wealth,(ii) change in the risk attitude and the utility function of the investor, (iii) change in theinvestment goals of the investors, and (iv) the need to liquidate a part of the portfolio toprovide funds for some alternative uses. The other valid reasons for portfolio revisionsuch as short-term price fluctuations in the market do also exist. There are, thus, numerousfactors, which may be broadly called market related and investor-related, which spellneed for portfolio revision.
13.3 PORTFOLIO REVISION STRATEGIES
As are there numerous factors motivating revision of portfolio, so are there numerousstrategies of portfolio revision. Broadly speaking, investors may, depending on theirinvestment objectives, skill and resources, follow active or passive strategies for portfoliorevision. Active strategy of portfolio revision involves a process similar to portfolio analysisand selection, which is based on an analysis of fundamental factors covering economy,industries and companies as well as technical factors. As against this, under passivestrategy some kinds of formula plans are followed for revision.
An active revision strategy seeks “beating the market by anticipating” or reacting to theperceived events or information. Passive revision strategy, on the other hand, seeks‘performing as the market.’ The followers of active revision strategy are found amongbelievers in the ‘market inefficiency’, whereas passive revision strategy is the choice ofbelievers in ‘market efficiency.’ The frequency of trading transaction, as is obvious, willbe more under active revision strategy than under passive revision strategy and so willbe the time, money and resources required for implementing active revision strategythan for passive revision strategy. In other words, active and passive revision strategiesdiffer in terms of purpose, process and cost involved. The choice between the twostrategies is certainly not very straightforward. One has to compare relevant costs andbenefits. On the face of it, active revision strategy might appear quite appealing but inactual practice, there exist a number of constraints in undertaking portfolio revision itself.
274Security Analysis andPortfolio Management
13.3.1 Portfolio Revision Practices
In the US, both active and passive portfolio revision strategies have been prevalent.Studies about portfolio revision strategies followed by US investors show that the efficientmarket hypothesis is slowly but continuously gaining believers and these converts revisetheir portfolio much less often than they were doing previously because of their risingfaith in market efficiency. Institutional investors in the US, on the other hand, haveshown a definite tendency in the recent past for active revision of their portfolios. This isreportedly motivated by their desire to achieve superior performance by frequent tradingto take advantage of their supposedly superior investment skills.
Some research studies undertaken in the US about the market timing and portfolio revisionsuggested as follows:
F. Black (1973) found that monthly and weekly revision could be rewarding strategy.Though when transactions costs were considered, the results were less impressive, butof course, still significantly positive.
H.A. Latane et al. (1974) concluded that complete portfolio revision every six monthswould have been a rewarding strategy.
Sharpe (1975) wrote: “A manager who attempts to time the market must be right roughlythree times out of four, in order to out perform the buy-and-hold portfolio. If the manageris right less often, the relative performance will be inferior because of transaction costsand the manager will often have funds in cash equivalents when they could be earningthe higher returns available from common stock.”
Institutional investors who continue to be dominant in the Indian stock market do notseem to resort to active portfolio revision mainly for statutory reasons. Another featureof their portfolio revision is that they continue to emphasize individual securities ratherthan portfolio risk-return changes.
Check Your Progress 1
Fill in the blanks:
1. Portfolio revision involves changing the existing mix of _____________ .
2. The objective of portfolio revision is similar to the objective of portfolio_____________ .
3. Active and passive revision strategies differ in terms of purpose, process,and _____________ involved.
4. A manager who attempts to time the market must be right roughly threetimes out of four, in order to outperform the buy-and- hold _____________ .
13.4 CONSTRAINTS IN PORTFOLIO REVISION
A look into the portfolio revision practices as discussed above highlight that there are anumber of constraints in portfolio revision, in general and active portfolio revision, inparticular. Let us indicate some common constraints in portfolio revision as follows:
Transaction cost: As you know, buying and selling of securities involve transactioncosts, including brokers’ fee. Frequent buying and selling for portfolio revision may pushup transaction costs beyond gainful limits.
275Portfolio Revision
Taxes: In most countries, capital gains are taxed at concessional rates. But for anyincome to qualify as capital gains, it should be earned after the lapse of a certain period.In many cases, the period is 36 months. Frequently selling portfolio revision may meanforegoing capital gains tax concessions. Higher the tax differential (between rates of taxfor income and capital gains), the higher the constraints rise. Even for tax switches,which mean that one stock is sold to establish a tax loss and a comparable security ispurchased to replace it in the investor’s portfolio, one must wait for a minimum periodafter selling a stock and before repurchasing it, to be declare the gain or loss. If the stockis repurchased before the minimum fixed period, it is considered a wash sale, and no gainor loss can be claimed for tax purposes.
Statutory Stipulation: In many countries like India, statutory stipulations have beenmade as to the percentage of investible funds that can be invested by investmentcompanies/mutual funds in the shares/debentures of a company or industry. In such asituation, the initiative to revise the portfolio is most likely to get stifled under the burdenof various stipulations. Government-owned investment companies and mutual funds arequite often called upon to support sagging markets (albeit counters) or to cool downheated markets, which put limits on the active portfolio revision by these companies.
No Single Formula: Portfolio revision is not an exact science. Even today, there doesnot exist a clear-cut answer to the overall question of whether, when and how to revisea portfolio. The entire process is fairly cumbersome and time-consuming. Investmentliterature does provide some formula plans, which we shall discuss in the following section,but they have their own assumptions and limitations.
13.5 FORMULA PLANS
13.5.1 Formula Investing
Investment technique is based on a predetermined timing or asset allocation model thateliminates emotional decisions. One type of formula investing, called dollar cost averaging,involves putting the same amount of money into a stock or mutual fund at regular intervals,so that more shares will be bought when the price is low and less when the price is high.Another formula investing method calls for shifting funds from stocks to bonds or viceversa as the stock market reaches particular price levels. If stocks rise to a particularpoint, a certain amount of the stock portfolio is sold and put in bonds. On the other hand,if stocks fall to a particular low price, money is brought out of bonds into stocks.
Somewhat similar to the constant-dollar plan is the constant-ratio formula. It is one ofthe oldest formulas in existence, having been used as long as 20 years ago. More important,it still stands up today, and is widely used, despite the drastic changes, which have takenplace in the market.
It fulfils, perhaps, better than any other formula, the basic theoretical requirements offormula investing. It permits the investor to participate to some extent in bull markets,while at the same time protecting him from serious price declines. And because it is notmarried to a fixed-dollar amount in stocks (as in the constant-dollar plan) or a ‘norm’ (asin the variable-ratio plans to be discussed in the next chapter), the method has a highdegree of flexibility. One reason for its durability and its effectiveness is that no forecastwhatsoever is made about the character of future markets, other than that they willcontinue to fluctuate, which is hardly a hazardous assumption.
Because of the clear-cut advantages of this plan, it has been widely used by institutions,such as trust, endowment and pension funds. Its first use, as will be seen later, was in acollege endowment fund. In past years, however, its popularity with some institutional
276Security Analysis andPortfolio Management
investors has waned (although others are still quite satisfied), and it has been adoptedmore and more by individuals.
Here is how it works: The total investment fund is divided into two equal portions, onehalf to be invested in stocks, the other in bonds. As the market rises, stocks are sold andbonds are bought to restore the 50-50 relationship. If the market goes down, the reverseprocedure is followed, bonds being sold and stocks bought to return to the 50-50 ratio.
13.5.2 Basic Assumptions and Ground Rules of Formula Plan
The formula plans are based on the following assumption:
l One, the stock prices move up and down in cycle.
l Two, the stock prices and the high-grade bond prices move in the opposite directions.
l Three, the investors cannot or are not inclined to forecast direction of the nextfluctuations in stock prices, which may be due to lack of skill and resources or theirbelief in market efficiency or both.
The use of formula plans call for the investor to divide his investment funds into twoportfolios, one aggressive and the other conservative or defensive. The aggressive portfoliousually consists of stocks while conservative portfolio consists of bonds. The formulaplans specify predesignated rules for the transfer of funds from that aggressive into theconservative and vice-versa such that it automatically causes the investors to sell stockswhen their prices are rising and buy stocks when their prices are falling. Let us nowdiscuss, one by one, the three formula plans.
13.5.3 Constant Dollar-Value Plan
An investment strategy designed to reduce volatility in which securities, typically mutualfunds, are purchased in fixed dollar amounts at regular intervals, regardless of whatdirection the market is moving. Thus, as prices of securities rise, fewer units are bought,and as prices fall, more units are bought also called constant dollar plan, also called dollarcost averaging.
13.5.4 Dollar Cost Averaging
Periodic investment of a fixed dollar amount, as in a particular stock or fund or in themarket as a whole, on the belief that the average value of the investment will rise overtime and that it is not possible to foresee the intermediate highs and lows.
Dollar-Cost Averaging – DCA
It is a technique of buying a fixed dollar amount of a particular investment on a regularschedule, regardless of the share price. More shares are purchased when prices arelow, and fewer shares are bought when prices are high. Also referred to as “constantdollar plan”.
Investopedia says: “Eventually, the average cost per share of the security will becomesmaller and smaller. Dollar-cost averaging lessens the risk of investing a large amount ina single investment at the wrong time. In the UK, it is known as “pound-cost averaging.”
The Constant-Dollar-Value Plan (CDVP) asserts that the dollar value (or rupee valuein Indian context) of the stock portion of the portfolio will remain constant. This inoperational terms, would mean that as the stock rises, the investor must automaticallysell some of the shares to keep the value of his aggressive portfolio constant. If, on theother hand, the prices of the stocks fall, the investors must buy additional stocks to keepthe value of the aggressive portfolio constant. By specifying that the aggressive portfolio
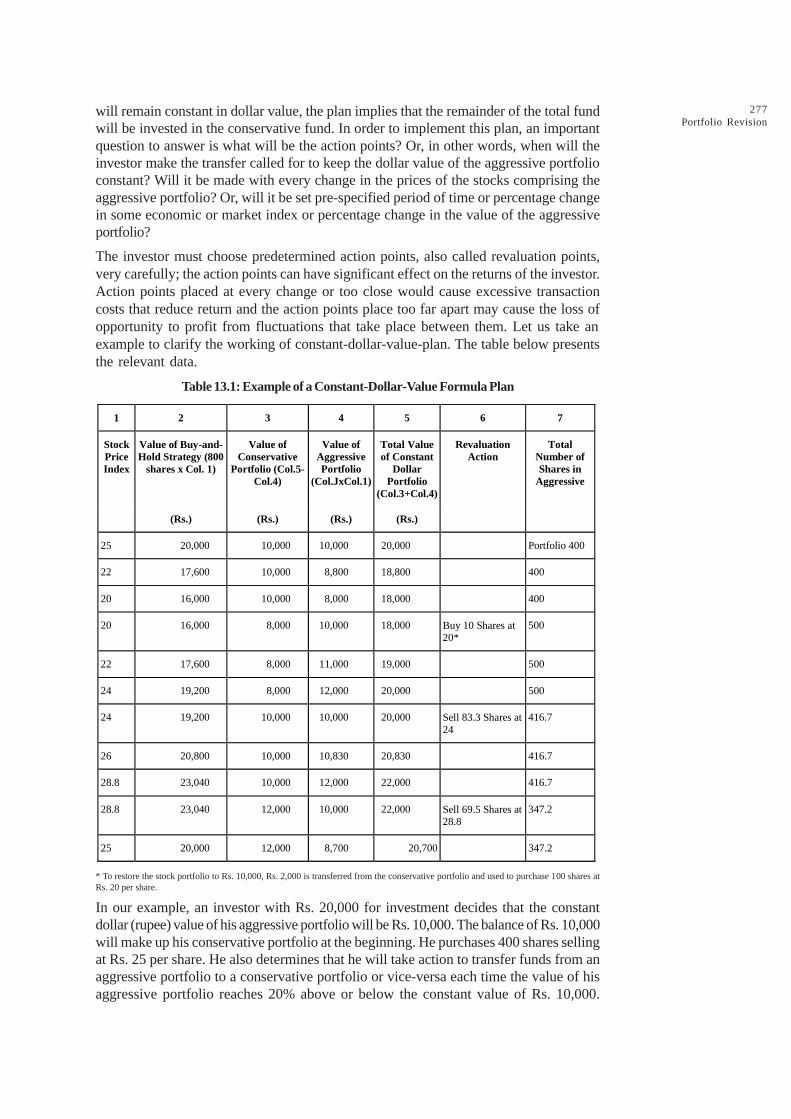
277Portfolio Revision
will remain constant in dollar value, the plan implies that the remainder of the total fundwill be invested in the conservative fund. In order to implement this plan, an importantquestion to answer is what will be the action points? Or, in other words, when will theinvestor make the transfer called for to keep the dollar value of the aggressive portfolioconstant? Will it be made with every change in the prices of the stocks comprising theaggressive portfolio? Or, will it be set pre-specified period of time or percentage changein some economic or market index or percentage change in the value of the aggressiveportfolio?
The investor must choose predetermined action points, also called revaluation points,very carefully; the action points can have significant effect on the returns of the investor.Action points placed at every change or too close would cause excessive transactioncosts that reduce return and the action points place too far apart may cause the loss ofopportunity to profit from fluctuations that take place between them. Let us take anexample to clarify the working of constant-dollar-value-plan. The table below presentsthe relevant data.
Table 13.1: Example of a Constant-Dollar-Value Formula Plan
1 2 3 4 5 6 7
Stock Price Index
Value of Buy-and-Hold Strategy (800
shares x Col. 1)
Value of Conservative
Portfolio (Col.5-Col.4)
Value of Aggressive Portfolio
(Col.JxCol.1)
Total Value of Constant
Dollar Portfolio
(Col.3+Col.4)
Revaluation Action
Total Number of Shares in
Aggressive
(Rs.) (Rs.) (Rs.) (Rs.)
25 20,000 10,000 10,000 20,000 Portfolio 400
22 17,600 10,000 8,800 18,800 400
20 16,000 10,000 8,000 18,000 400
20 16,000 8,000 10,000 18,000 Buy 10 Shares at 20*
500
22 17,600 8,000 11,000 19,000 500
24 19,200 8,000 12,000 20,000 500
24 19,200 10,000 10,000 20,000 Sell 83.3 Shares at 24
416.7
26 20,800 10,000 10,830 20,830 416.7
28.8 23,040 10,000 12,000 22,000 416.7
28.8 23,040 12,000 10,000 22,000 Sell 69.5 Shares at 28.8
347.2
25 20,000 12,000 8,700 20,700 347.2
* To restore the stock portfolio to Rs. 10,000, Rs. 2,000 is transferred from the conservative portfolio and used to purchase 100 shares atRs. 20 per share.
In our example, an investor with Rs. 20,000 for investment decides that the constantdollar (rupee) value of his aggressive portfolio will be Rs. 10,000. The balance of Rs. 10,000will make up his conservative portfolio at the beginning. He purchases 400 shares sellingat Rs. 25 per share. He also determines that he will take action to transfer funds from anaggressive portfolio to a conservative portfolio or vice-versa each time the value of hisaggressive portfolio reaches 20% above or below the constant value of Rs. 10,000.
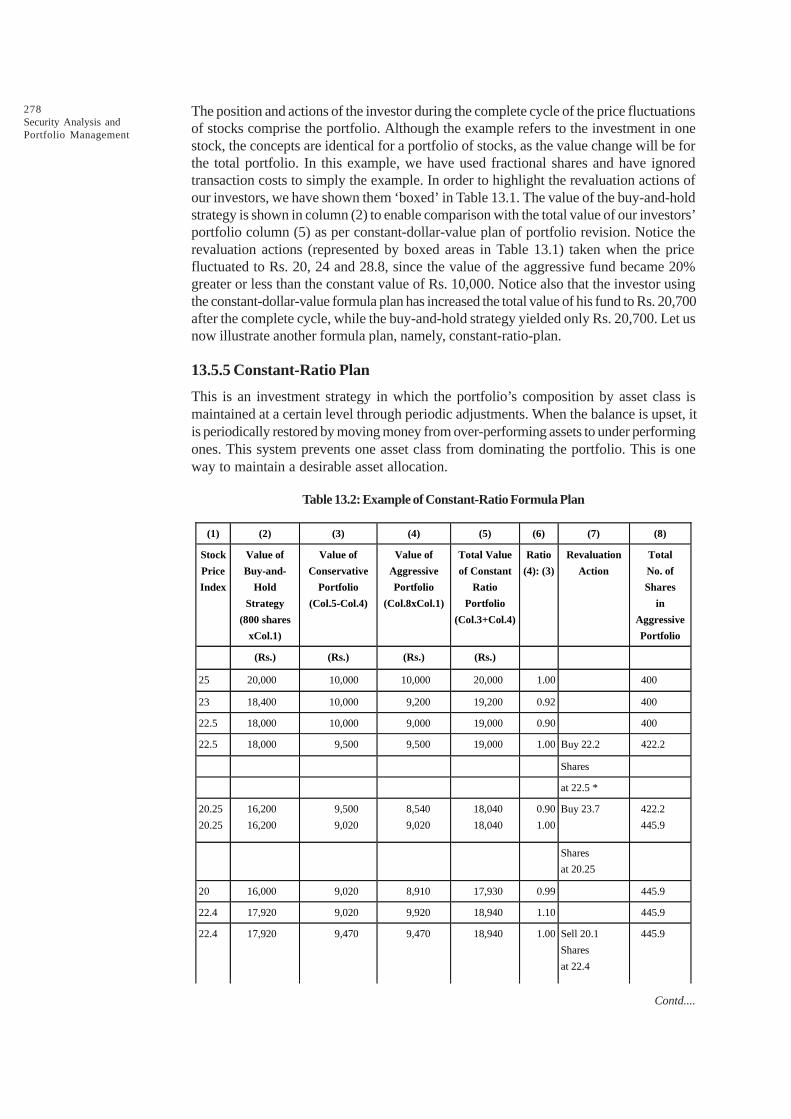
278Security Analysis andPortfolio Management
The position and actions of the investor during the complete cycle of the price fluctuationsof stocks comprise the portfolio. Although the example refers to the investment in onestock, the concepts are identical for a portfolio of stocks, as the value change will be forthe total portfolio. In this example, we have used fractional shares and have ignoredtransaction costs to simply the example. In order to highlight the revaluation actions ofour investors, we have shown them ‘boxed’ in Table 13.1. The value of the buy-and-holdstrategy is shown in column (2) to enable comparison with the total value of our investors’portfolio column (5) as per constant-dollar-value plan of portfolio revision. Notice therevaluation actions (represented by boxed areas in Table 13.1) taken when the pricefluctuated to Rs. 20, 24 and 28.8, since the value of the aggressive fund became 20%greater or less than the constant value of Rs. 10,000. Notice also that the investor usingthe constant-dollar-value formula plan has increased the total value of his fund to Rs. 20,700after the complete cycle, while the buy-and-hold strategy yielded only Rs. 20,700. Let usnow illustrate another formula plan, namely, constant-ratio-plan.
13.5.5 Constant-Ratio Plan
This is an investment strategy in which the portfolio’s composition by asset class ismaintained at a certain level through periodic adjustments. When the balance is upset, itis periodically restored by moving money from over-performing assets to under performingones. This system prevents one asset class from dominating the portfolio. This is oneway to maintain a desirable asset allocation.
Table 13.2: Example of Constant-Ratio Formula Plan
(1) (2) (3) (4) (5) (6) (7) (8)
Stock
Price
Index
Value of
Buy-and-
Hold
Strategy
(800 shares
xCol.1)
Value of
Conservative
Portfolio
(Col.5-Col.4)
Value of
Aggressive
Portfolio
(Col.8xCol.1)
Total Value
of Constant
Ratio
Portfolio
(Col.3+Col.4)
Ratio
(4): (3)
Revaluation
Action
Total
No. of
Shares
in
Aggressive
Portfolio
(Rs.) (Rs.) (Rs.) (Rs.)
25 20,000 10,000 10,000 20,000 1.00 400
23 18,400 10,000 9,200 19,200 0.92 400
22.5 18,000 10,000 9,000 19,000 0.90 400
22.5 18,000 9,500 9,500 19,000 1.00 Buy 22.2 422.2
Shares
at 22.5 *
20.25
20.25
16,200
16,200
9,500
9,020
8,540
9,020
18,040
18,040
0.90
1.00
Buy 23.7 422.2
445.9
Shares
at 20.25
20 16,000 9,020 8,910 17,930 0.99 445.9
22.4 17,920 9,020 9,920 18,940 1.10 445.9
22.4 17,920 9,470 9,470 18,940 1.00 Sell 20.1
Shares
at 22.4
445.9
Contd....

279Portfolio Revision
24.6 19,920 9,470 10,430 19,900 1.10 425.8
24.6 19,920 9,950 9,950 19,900 1.00 Sell 19.5
Shares
at 24.6
406.3
27.0 21,600 9,950 10,950 20,900 1.10 406.3
27.0 21,600 10,450 10,450 20,900 1.00 Sell 18.5
Shares
at 27.0
387.8
28.8 23,040 10,450 11,170 21,620 1.07 387.8
27.0 21,600 10,450 10,450 20,900 1.00 387.8
25 20,000 10,450 9,670 20,120 0.93 387.8
* To restore the ratio from .90 to 1.00, total value of the fund, Rs. 19,000, is simply split in two equal segments of Rs. 9,500; and Rs. 9500/
9,500 = 1.00. The Rs. 500 transferred from the conservative portfolio will buy 22.2 Shares at the prevailing price of Rs. 22.50.
The constant-ratio plan specifies that the value of the aggressive portfolio to the value ofthe conservative portfolio will be held constant at the predetermined ratio. This planautomatically forces the investor to sell stocks as their prices rise, in order to keep theratio of the value of their aggressive portfolio to the value of the conservative portfolioconstant. Likewise, the investor is forced to transfer funds from conservative portfoliosto aggressive portfolios as the price of stocks fall. We may clarify the operations of thisplan with the help of an example. For the sake of our example, the starting point andother information are the same as in the previous example. The desired ratio is 1:1. Theinitial fund of Rs. 20,000 is thus divided into equal portfolios of Rs. 10,000 each. Theaction points are predetermined at + .10 from the desired ratio of 1.00. The table shows,in boxes, the actions taken by our investor to readjust the values of the two portfolios tore-obtain the desired ratio.
You may notice that the constant-ratio plan calls for more transactions than the constant-dollar-value plan did, but the actions triggered by this plan are less aggressive. This planyielded an increase in total value at the end of the cycle compared with the total valueyielded under constant-dollar-value plan. It did, however, outperform the buy-and-holdstrategy. Let us now explain and illustrate variable-ratio plan.
13.5.6 Variable-Ratio Plan
Variable-ratio plan is a more flexible variation of constant ratio plan. Under the variableratio plan, it is provided that if the value of aggressive portfolio changes by certainpercentage or more, the initial ratio between the aggressive portfolio and conservativeportfolio will be allowed to change as per the pre-determined schedule. Some variationsof this plan provide for the ratios to vary according to economic or market indices ratherthan the value of the aggressive portfolio. Still others use moving averages of indicators.
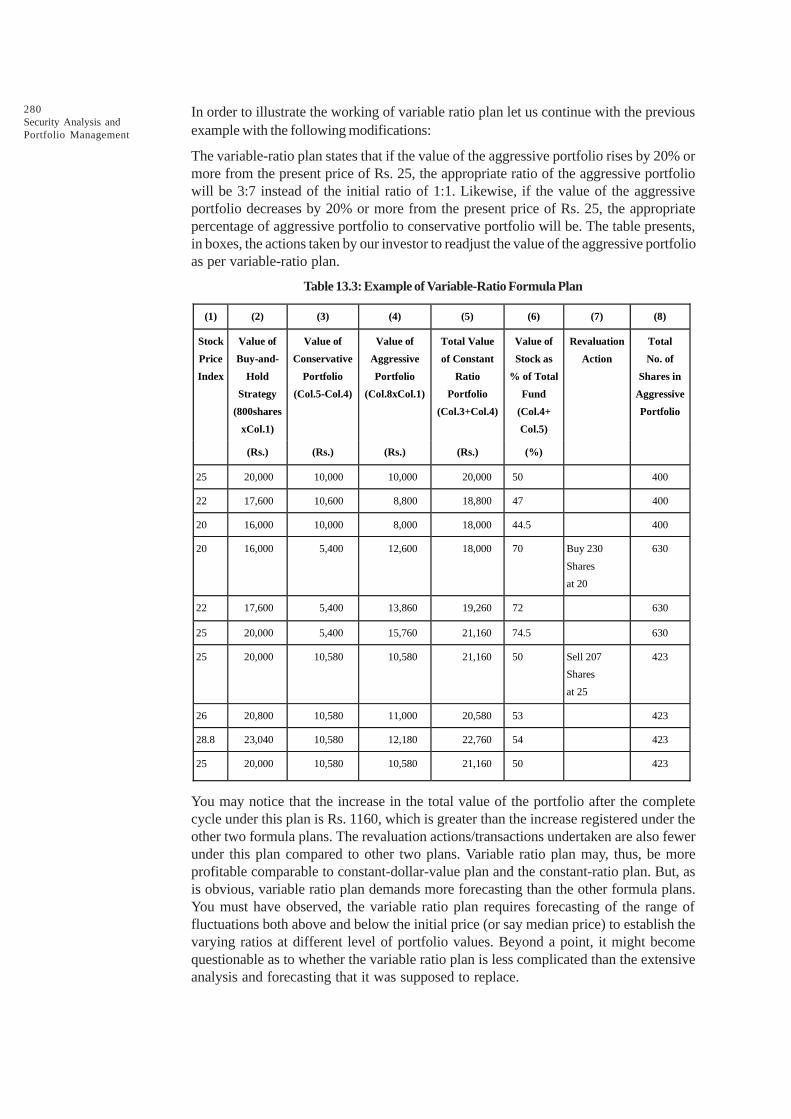
280Security Analysis andPortfolio Management
In order to illustrate the working of variable ratio plan let us continue with the previousexample with the following modifications:
The variable-ratio plan states that if the value of the aggressive portfolio rises by 20% ormore from the present price of Rs. 25, the appropriate ratio of the aggressive portfoliowill be 3:7 instead of the initial ratio of 1:1. Likewise, if the value of the aggressiveportfolio decreases by 20% or more from the present price of Rs. 25, the appropriatepercentage of aggressive portfolio to conservative portfolio will be. The table presents,in boxes, the actions taken by our investor to readjust the value of the aggressive portfolioas per variable-ratio plan.
Table 13.3: Example of Variable-Ratio Formula Plan
(1) (2) (3) (4) (5) (6) (7) (8)
Stock
Price
Index
Value of
Buy-and-
Hold
Strategy
(800shares
xCol.1)
Value of
Conservative
Portfolio
(Col.5-Col.4)
Value of
Aggressive
Portfolio
(Col.8xCol.1)
Total Value
of Constant
Ratio
Portfolio
(Col.3+Col.4)
Value of
Stock as
% of Total
Fund
(Col.4+
Col.5)
Revaluation
Action
Total
No. of
Shares in
Aggressive
Portfolio
(Rs.) (Rs.) (Rs.) (Rs.) (%)
25 20,000 10,000 10,000 20,000 50 400
22 17,600 10,600 8,800 18,800 47 400
20 16,000 10,000 8,000 18,000 44.5 400
20 16,000 5,400 12,600 18,000 70 Buy 230
Shares
at 20
630
22 17,600 5,400 13,860 19,260 72 630
25 20,000 5,400 15,760 21,160 74.5 630
25 20,000 10,580 10,580 21,160 50 Sell 207
Shares
at 25
423
26 20,800 10,580 11,000 20,580 53 423
28.8 23,040 10,580 12,180 22,760 54 423
25 20,000 10,580 10,580 21,160 50 423
You may notice that the increase in the total value of the portfolio after the completecycle under this plan is Rs. 1160, which is greater than the increase registered under theother two formula plans. The revaluation actions/transactions undertaken are also fewerunder this plan compared to other two plans. Variable ratio plan may, thus, be moreprofitable comparable to constant-dollar-value plan and the constant-ratio plan. But, asis obvious, variable ratio plan demands more forecasting than the other formula plans.You must have observed, the variable ratio plan requires forecasting of the range offluctuations both above and below the initial price (or say median price) to establish thevarying ratios at different level of portfolio values. Beyond a point, it might becomequestionable as to whether the variable ratio plan is less complicated than the extensiveanalysis and forecasting that it was supposed to replace.
281Portfolio RevisionCheck Your Progress 2
State whether the following statements are true or flase:
1. Transaction cost is the cost involved in the buying and selling of securities.
2. The problem of portfolio revision essentially boils down to timing the buyingand selling the securities.
3. Portfolio revision is required more because the financial markets are continuallychanging.
4. An active revision strategy seeks ‘beating the market by anticipating’ orreacting to the perceived events or information.
5. Mechanical portfolio revision techniques involve three formula plans: constant-
13.5.7 Limitations
Indeed, none of the formula plans are a royal road to riches. First, as an effort to providemechanical rules for portfolio revision, they make no provision for what securities shouldbe selected for investment. Second, formula plans by their nature are inflexible. Thisinflexibility makes it difficult to know if and when to adjust the plan to new conditionsemerging in the investment environment. Finally, in the absence of much faith in themarket efficiency, particularly in the developing stock markets, there may not be manyfollowers of formula plans for portfolio revision.
13.6 LET US SUM UP
The portfolio revision strategies adopted by investors can be broadly classified as ‘active’and ‘passive’ revision strategies. This unit also points out that while both ‘active’ and‘passive’ revision strategies are followed by investors and portfolio managers, “passive’strategy is followed by believers of market efficiency or those who lack portfolio analysisand selection skills and resources. Major constraints, which come in the way of portfoliorevision, are transaction costs, taxes, statutory stipulations and lack of ideal formula.This unit also discusses and illustrates three formula plans of portfolio revision, namely,constant-dollar-value plan, constant-ratio plan and variable-ratio plan. Before closing thediscussion about formula plans, it is noted that these formula plans are not a royal road toriches. They have their own limitations. The choice of portfolio revision strategy or planis, thus, no simple question. The choice will involve cost benefit analysis.
No plan can be perfect to the extent that it would not need revision sooner or later.Investment plans certainly are not. In the context of portfolio management the need forrevision is ever more because the financial markets are continually changing. Thus theneed for portfolio revision might simply arise because market witnessed some significantchanges since the creation of the portfolio. Further, the need for portfolio revision mayarise because of some investor-related factors such as (i) availability of additional wealth,(ii) change in the risk attitude and the utility function of the investor, (iii) change in theinvestment goals of the investors, and (iv) the need to liquidate a part of the portfolio toprovide funds for some alternative uses. The other valid reasons for portfolio revisionsuch as short-term price fluctuations in the market do also exist. There are, thus, numerousfactors, which may be broadly called market-related and investor-related, which spellneed for portfolio revision.

282Security Analysis andPortfolio Management
13.7 LESSON END ACTIVITY
Study on Indian Investors Bond Portfolio management strategies with special referenceto your area.
13.8 KEYWORDS
Portfolio Revision: It involves changing the existing mix of securities.
Transaction Cost: As you know, buying and selling of securities involve transactioncosts, including brokers’ fee. Frequent buying and selling for portfolio revision may pushup transaction costs beyond gainful limits.
DCA: It is a technique of buying a fixed dollar amount of a particular investment on aregular schedule, regardless of the share price. More shares are purchased when pricesare low, and fewer shares are bought when prices are high. Also referred to as “constantdollar plan”.
CDVP: The Constant-Dollar-Value Plan (CDVP) asserts that the dollar value (or rupeevalue in Indian context) of the stock portion of the portfolio will remain constant.
Variable-Ratio Plan: If the value of aggressive portfolio changes by certain percentageor more, the initial ratio between the aggressive portfolio and conservative portfolio willbe allowed to change as per the pre-determined schedule.
Constant Ratio Plan: This is an investment strategy in which the portfolio’s compositionby asset class is maintained at a certain level through periodic adjustments.
13.9 QUESTIONS FOR DISCUSSION
1. Explain portfolio revision.
2. What is the need for portfolio revision?
3. What are the portfolio revision strategies?
4. Write on portfolio revision practices.
5. Write about the constraints in portfolio revision.
6. What are the basic assumptions and ground rules of formula plans?
7. Write a short note on constant dollar-value plan.
8. What do you understand by dollar cost averaging?
Check Your Progress: Model Answers
CYP 1
1. securities 2. revision 3. cost 4. portfolio
CYP 2
1. True 2. True 3. True 4. True 5. True
13.10 SUGGESTED READINGS
Sudhindra Bhat, Security Analysis and Portfolio Management, Excel Books, Delhi.

283Portfolio Revision
Kevin, S., Security Analysis and Portfolio Management, Prentice Hall of India.
Prasanna Chandra, Investment Analysis and Portfolio Management, Second Edition, Tata McGrawHill.
Punithavathy Pandian, Securities Analysis and Portfolio management, Vikas.
Investment Management, V. K. Bhalla.
A. Davis, Investors in a Changing Economy, Prentice -Hall, 1968.
Williamson, J. Peter, Investments: New Analytic Techniques, London, Longman, 1970.
Cottle, CC., and Whitman, W.T., Investment Timing: The Formula Plan Approach, McGraw Hill.

284Security Analysis andPortfolio Management
LESSON
14CAPITAL ASSET PRICING MODEL
CONTENTS
14.0 Aim and Objectives
14.1 Introduction to CAPM
14.1.1 Assumptions of CAPM
14.1.2 Investment Implications
14.1.3 Is the CAPM true?
14.2 Portfolio Risk
14.2.1 Further Explorations of the Capital Asset Pricing Model
14.2.2 Assessing the CAPM
14.3 Security Market Line (SML)
14.3.1 Expectations vs Realizations
14.3.2 Security Market Line
14.4 Capital Market Line (CML)
14.5 Beta Factor of a Market Portfolio
14.6 Benefits and Limitations of CAPM
14.6.1 Benefits
14.6.2 CAPM is Criticised for the Following Reasons
14.7 Arbitrage Pricing Model
14.8 Arbitrage Pricing Theory (APT)
14.8.1 APT Model
14.8.2 Arbitrage and the APT
14.8.3 Arbitrage in Expectations
14.8.4 Arbitrage Mechanics
14.8.5 Relationship with the Capital Asset Pricing Model
14.9 Using the APT
14.9.1 Identifying the Factors
14.10 Modern Portfolio Theory
14.10.1 Markowitz Mean-Variance Model
14.10.2 Efficient Frontier
14.11 Let us Sum up
14.12 Lesson End Activity
14.13 Keywords
14.14 Questions for Discussion
14.15 Suggested Readings
285Capital Asset Pricing Model14.0 AIM AND OBJECTIVES
After studying this lesson, you should be able to understand:
l Concepts of Risk-free Asset, Risk-free Lending and Borrowings
l The Capital Asset Pricing Model
l Testing the Capital Asset Pricing Model
l Capital Market Line
l Security Market Line
l Empirical Evidence on the Capital Asset Pricing Model
l Arbitrage Pricing Theory
l Modern Portfolio Theory
l Mean Variance Analysis Developed by Harry Markowitz
l Assumptions of Mean Variance Analysis
l Concept of Efficient Frontier
l Capital Market Line and Identification of Market Portfolio
14.1 INTRODUCTION TO CAPM
William F. Sharpe and John Linter developed the Capital Asset Pricing Model (CAPM).The model is based on the portfolio theory developed by Harry Markowitz. The modelemphasises the risk factor in portfolio theory is a combination of two risks, systematicrisk and unsystematic risk. The model suggests that a security’s return is directly relatedto its systematic risk, which cannot be neutralised through diversification. The combinationof both types of risks stated above provides the total risk. The total variance of returns isequal to market related variance plus company’s specific variance. CAPM explains thebehaviour of security prices and provides a mechanism whereby investors could assessthe impact of a proposed security investment on the overall portfolio risk and return.CAPM suggests that the prices of securities are determined in such a way that the riskpremium or excess returns are proportional to systematic risk, which is indicated by thebeta coefficient. The model is used for analysing the risk-return implications of holdingsecurities. CAPM refers to the manner in which securities are valued in line with theiranticipated risks and returns. A risk-averse investor prefers to invest in risk-free securities.For a small investor having few securities in his portfolio, the risk is greater. To reducethe unsystematic risk, he must build up well-diversified securities in his portfolio.
The asset return depends on the amount for the asset today. The price paid must ensurethat the market portfolio’s risk/return characteristics improve when the asset is added toit. The CAPM is a model, which derives the theoretical required return (i.e. discountrate) for an asset in a market, given the risk-free rate available to investors and the riskof the market as a whole.
The CAPM is usually expressed:
E(Ri) = R
f + b
i(E(R
m) – R
f)
b (Beta), is the measure of asset sensitivity to a movement in the overall market; Beta isusually found via regression on historical data. Betas exceeding one signify more thanaverage “riskiness”; betas below one indicate lower than average.
286Security Analysis andPortfolio Management
E(Rm) – (R
f) is the market premium, the historically observed excess return of the market
over the risk-free rate.
Once the expected return, E(ri), is calculated using CAPM, the future cash flows of the
asset can be discounted to their present value using this rate to establish the correctprice for the asset. (Here again, the theory accepts in its assumptions that a parameterbased on past data can be combined with a future expectation.)
A more risky stock will have a higher beta and will be discounted at a higher rate; lesssensitive stocks will have lower betas and be discounted at a lower rate. In theory, anasset is correctly priced when its observed price is the same as its value calculated usingthe CAPM derived discount rate. If the observed price is higher than the valuation, thenthe asset is overvalued; it is undervalued for a too low price.
14.1.1 Assumptions of CAPM
Assumptions to Capital Asset Pricing Model
Because the CAPM is a theory, we must assume for argument that:
1. All assets in the world are traded.
2. All assets are infinitely divisible.
3. All investors in the world collectively hold all assets.
4. For every borrower, there is a lender.
5. There is a riskless security in the world.
6. All investors borrow and lend at the riskless rate.
7. Everyone agrees on the inputs to the Mean-STD picture.
8. Preferences are well described by simple utility functions.
9. Security distributions are normal, or at least well described by two parameters.
10. There are only two periods of time in our world.
This is a long list of requirements, and together they describe the capitalist’s ideal world.Everything may be bought and sold in perfectly liquid fractional amounts even humancapital! There is a perfect, safe haven for risk-averse investors i.e. the riskless asset.This means that everyone is an equally good credit risk! No one has any informationaladvantage in the CAPM world.
14.1.2 Investment Implications
CAPM tells us that all investors will want to hold “capital-weighted” portfolios of globalwealth. In the 1960s when the CAPM was developed, this solution looked a lot like aportfolio that was already familiar to many people: the S&P 500. The S&P 500 is acapital-weighted portfolio of most of the US’ largest stocks. At that time, the US was theworld’s largest market, and thus, it seemed to be a fair approximation to the ‘cake.’Amazingly, the answer was right under our noses – the tangency portfolio must besomething like the S&P 500 Not co-incidentally, widespread use of index funds beganabout this time. Index funds are mutual funds and/or money managers who simply matchthe performance of the S&P. Many institutions and individuals discovered the virtues ofindexing. Trading costs were minimal in this strategy: capital-weighted portfoliosautomatically adjust to changes in value when stocks grow, so that investors need notchange their weights all the time – it is a “buy-and-hold” portfolio. There was also littleevidence at the time that active portfolio management beat the S&P index – so why not?
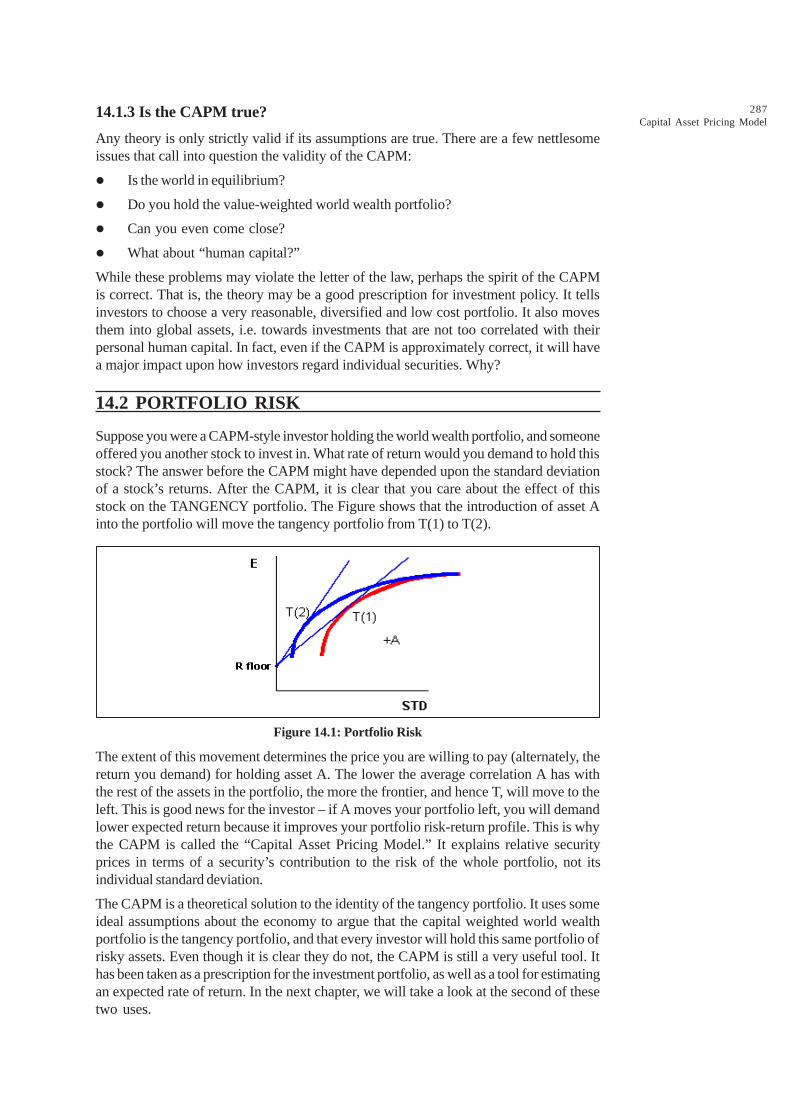
287Capital Asset Pricing Model
14.1.3 Is the CAPM true?
Any theory is only strictly valid if its assumptions are true. There are a few nettlesomeissues that call into question the validity of the CAPM:
l Is the world in equilibrium?
l Do you hold the value-weighted world wealth portfolio?
l Can you even come close?
l What about “human capital?”
While these problems may violate the letter of the law, perhaps the spirit of the CAPMis correct. That is, the theory may be a good prescription for investment policy. It tellsinvestors to choose a very reasonable, diversified and low cost portfolio. It also movesthem into global assets, i.e. towards investments that are not too correlated with theirpersonal human capital. In fact, even if the CAPM is approximately correct, it will havea major impact upon how investors regard individual securities. Why?
14.2 PORTFOLIO RISK
Suppose you were a CAPM-style investor holding the world wealth portfolio, and someoneoffered you another stock to invest in. What rate of return would you demand to hold thisstock? The answer before the CAPM might have depended upon the standard deviationof a stock’s returns. After the CAPM, it is clear that you care about the effect of thisstock on the TANGENCY portfolio. The Figure shows that the introduction of asset Ainto the portfolio will move the tangency portfolio from T(1) to T(2).
Figure 14.1: Portfolio Risk
The extent of this movement determines the price you are willing to pay (alternately, thereturn you demand) for holding asset A. The lower the average correlation A has withthe rest of the assets in the portfolio, the more the frontier, and hence T, will move to theleft. This is good news for the investor – if A moves your portfolio left, you will demandlower expected return because it improves your portfolio risk-return profile. This is whythe CAPM is called the “Capital Asset Pricing Model.” It explains relative securityprices in terms of a security’s contribution to the risk of the whole portfolio, not itsindividual standard deviation.
The CAPM is a theoretical solution to the identity of the tangency portfolio. It uses someideal assumptions about the economy to argue that the capital weighted world wealthportfolio is the tangency portfolio, and that every investor will hold this same portfolio ofrisky assets. Even though it is clear they do not, the CAPM is still a very useful tool. Ithas been taken as a prescription for the investment portfolio, as well as a tool for estimatingan expected rate of return. In the next chapter, we will take a look at the second of thesetwo uses.
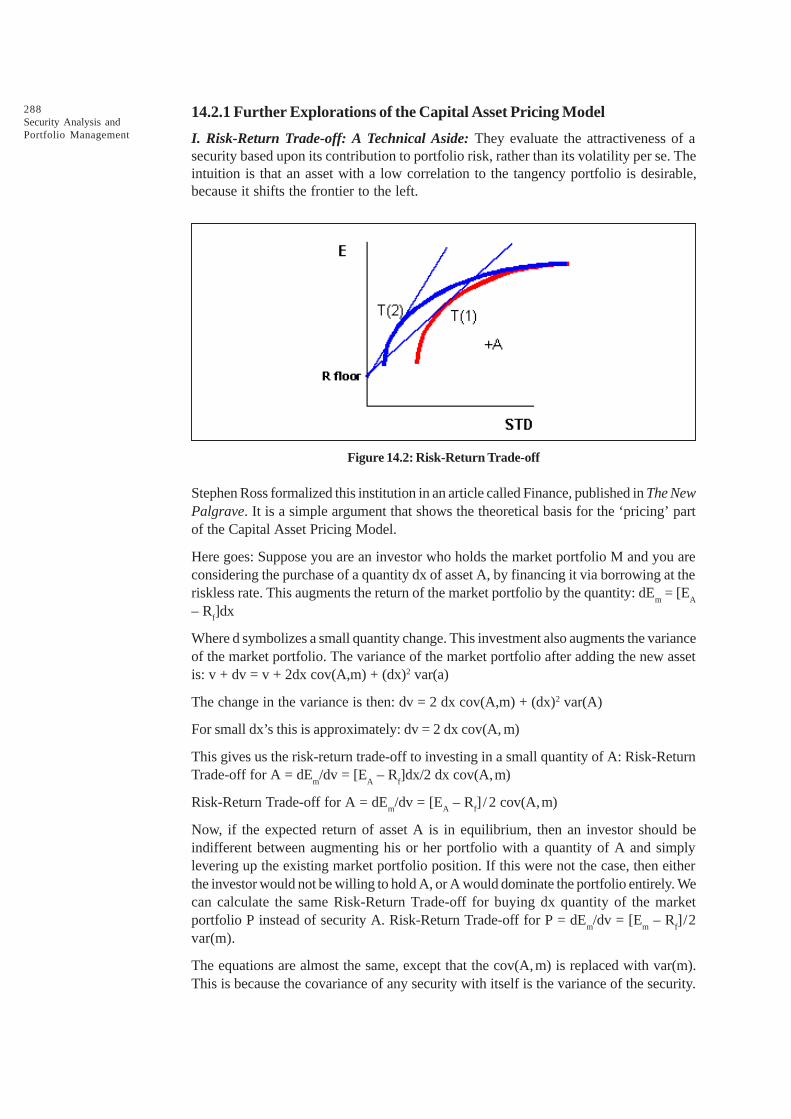
288Security Analysis andPortfolio Management
14.2.1 Further Explorations of the Capital Asset Pricing Model
I. Risk-Return Trade-off: A Technical Aside: They evaluate the attractiveness of asecurity based upon its contribution to portfolio risk, rather than its volatility per se. Theintuition is that an asset with a low correlation to the tangency portfolio is desirable,because it shifts the frontier to the left.
Figure 14.2: Risk-Return Trade-off
Stephen Ross formalized this institution in an article called Finance, published in The NewPalgrave. It is a simple argument that shows the theoretical basis for the ‘pricing’ partof the Capital Asset Pricing Model.
Here goes: Suppose you are an investor who holds the market portfolio M and you areconsidering the purchase of a quantity dx of asset A, by financing it via borrowing at theriskless rate. This augments the return of the market portfolio by the quantity: dE
m = [E
A
– Rf]dx
Where d symbolizes a small quantity change. This investment also augments the varianceof the market portfolio. The variance of the market portfolio after adding the new assetis: v + dv = v + 2dx cov(A,m) + (dx)2 var(a)
The change in the variance is then: dv = 2 dx cov(A,m) + (dx)2 var(A)
For small dx’s this is approximately: dv = 2 dx cov(A, m)
This gives us the risk-return trade-off to investing in a small quantity of A: Risk-ReturnTrade-off for A = dE
m/dv = [E
A – R
f]dx/2 dx cov(A,m)
Risk-Return Trade-off for A = dEm/dv = [E
A – R
f] / 2 cov(A,m)
Now, if the expected return of asset A is in equilibrium, then an investor should beindifferent between augmenting his or her portfolio with a quantity of A and simplylevering up the existing market portfolio position. If this were not the case, then eitherthe investor would not be willing to hold A, or A would dominate the portfolio entirely. Wecan calculate the same Risk-Return Trade-off for buying dx quantity of the marketportfolio P instead of security A. Risk-Return Trade-off for P = dE
m/dv = [E
m – R
f]/2
var(m).
The equations are almost the same, except that the cov(A,m) is replaced with var(m).This is because the covariance of any security with itself is the variance of the security.

289Capital Asset Pricing Model
These Risk-Reward Trade-offs must be equal:
[EA – R
f] /2 cov(A,m) = [E
m – R
f] /2 var(m)
Thus, [EA – R
f] = [cov(A,m)/var(m)][E
m – R
f]
The value cov(A,m)/var(m) is also known as the b of A with respect to m. b is a famousstatistic in finance. It is functionally related to the correlation and the covariance betweenthe security and the market portfolio in the following way:
b = i, mi
i, m 2m m
óóñ =
ó ó
II. A Model of Expected Returns: In the preceding example, notice that we used theexpression expected returns. That is, we found an equation that related the expectedfuture return of asset A (in excess of the riskless rate) to the expected future return ofthe market (in excess of the riskless rate). This expected return is the return that investorswill demand when asset prices are in the equilibrium described by the CAPM. For anyasset i, the CAPM argues that the appropriate rate at which to discount the cash flowsof the firm is that same rate that investors demand to include the security in their portfolio:
E[Ri] = R
f + b
i(E[R
m] – R
f)
One surprising thing about this equation is what is not in it. There is no measure of thesecurity’s own standard deviation. The CAPM says that you do not care about thevolatility of the security. You only care about its beta with respect to the market portfolio!Risk is now re-defined as the quantity of exposure the security has to fluctuations in themarket portfolio.
14.2.2 Assessing the CAPM
The CAPM is a classical model in finance. It is an equilibrium argument that, if true,answers most important investment questions. It tells us where to invest, how to investand what discount rate to use for project cash flows. Not only that, it is a disarminglysimple model. The expected return of a security depends upon a simple statistic: ß. Therelationship between risk and return is linear. Calculation of portfolio risk is trivial. At thesame time, the CAPM is revolutionary. It tells us that the variance of a project is not afactor in determining the appropriate, risk-adjusted discount rate. It turns financial researchfrom roll-up-your-sleeves fundamental analysis into a statistics problem. In short, theCAPM turned Wall Street on its head.
Check Your Progress 1
Fill in the blanks:
1. The CAPM is a _____________ model in finance.
2. CAPM tells us that all investors want to hold _____________ portfolios ofglobal wealth.
3. CAPM means _____________ .
4. The CAPM equation describes a linear relationship between risk and_____________ .
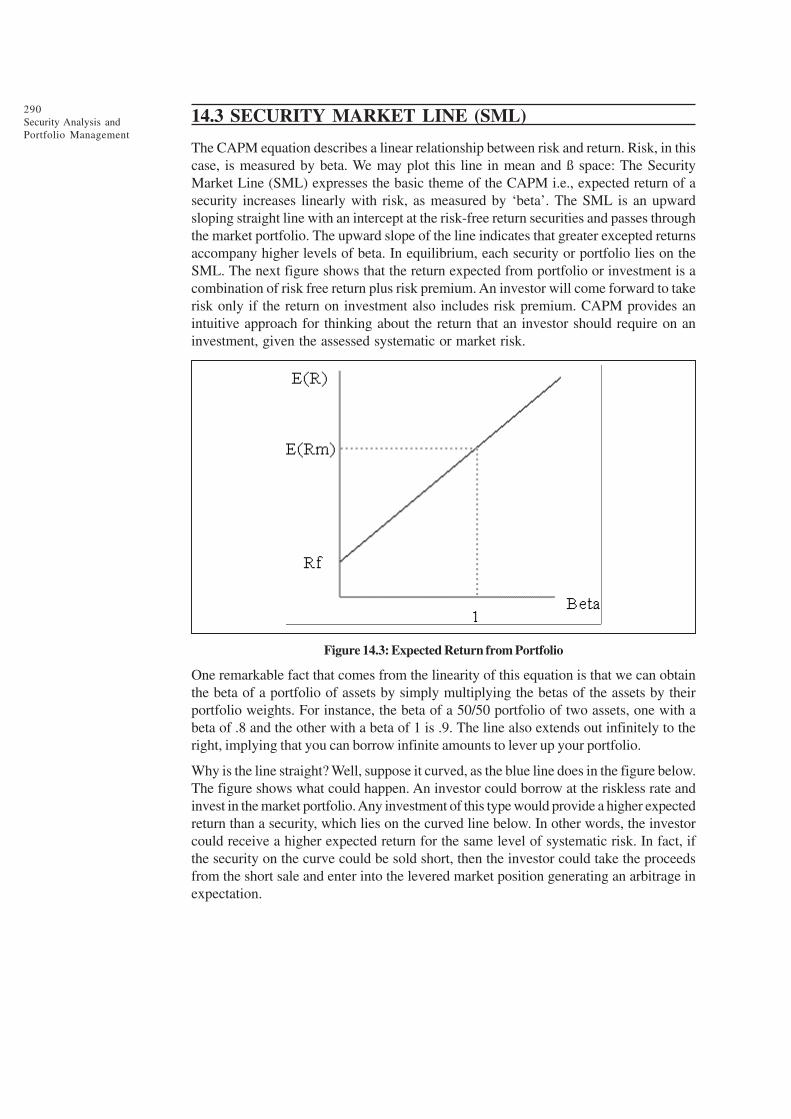
290Security Analysis andPortfolio Management
14.3 SECURITY MARKET LINE (SML)
The CAPM equation describes a linear relationship between risk and return. Risk, in thiscase, is measured by beta. We may plot this line in mean and ß space: The SecurityMarket Line (SML) expresses the basic theme of the CAPM i.e., expected return of asecurity increases linearly with risk, as measured by ‘beta’. The SML is an upwardsloping straight line with an intercept at the risk-free return securities and passes throughthe market portfolio. The upward slope of the line indicates that greater excepted returnsaccompany higher levels of beta. In equilibrium, each security or portfolio lies on theSML. The next figure shows that the return expected from portfolio or investment is acombination of risk free return plus risk premium. An investor will come forward to takerisk only if the return on investment also includes risk premium. CAPM provides anintuitive approach for thinking about the return that an investor should require on aninvestment, given the assessed systematic or market risk.
Figure 14.3: Expected Return from Portfolio
One remarkable fact that comes from the linearity of this equation is that we can obtainthe beta of a portfolio of assets by simply multiplying the betas of the assets by theirportfolio weights. For instance, the beta of a 50/50 portfolio of two assets, one with abeta of .8 and the other with a beta of 1 is .9. The line also extends out infinitely to theright, implying that you can borrow infinite amounts to lever up your portfolio.
Why is the line straight? Well, suppose it curved, as the blue line does in the figure below.The figure shows what could happen. An investor could borrow at the riskless rate andinvest in the market portfolio. Any investment of this type would provide a higher expectedreturn than a security, which lies on the curved line below. In other words, the investorcould receive a higher expected return for the same level of systematic risk. In fact, ifthe security on the curve could be sold short, then the investor could take the proceedsfrom the short sale and enter into the levered market position generating an arbitrage inexpectation.
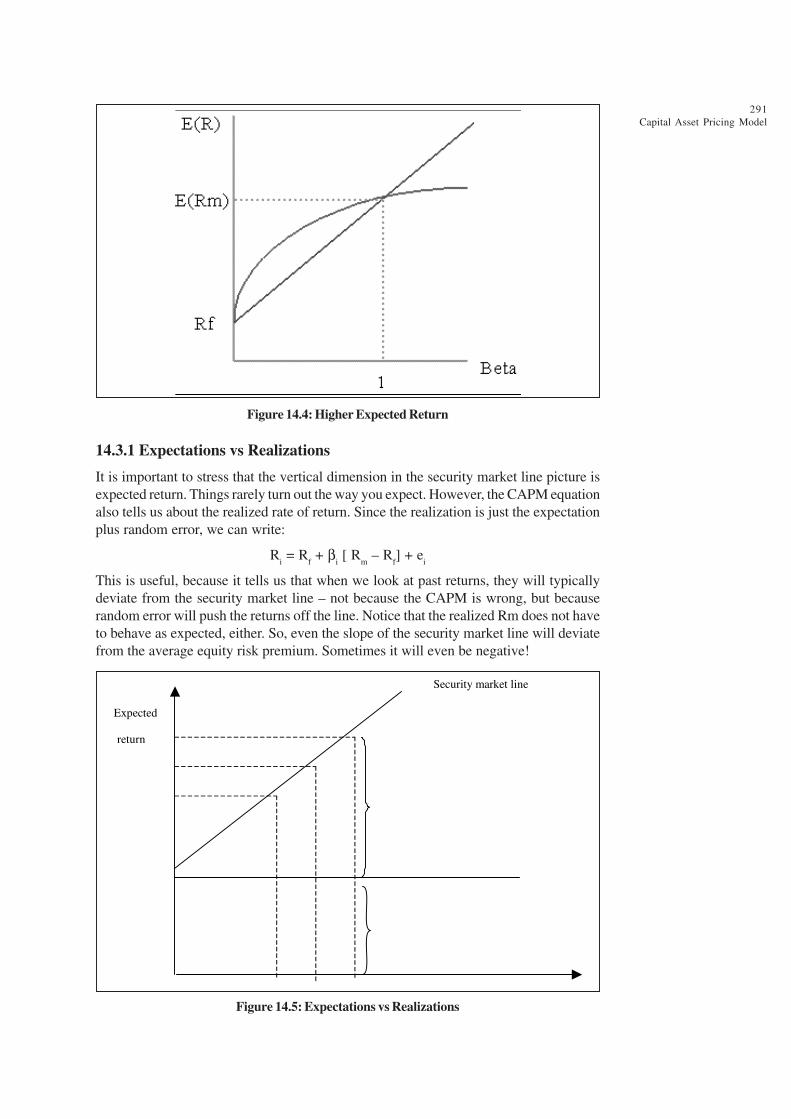
291Capital Asset Pricing Model
Figure 14.4: Higher Expected Return
14.3.1 Expectations vs Realizations
It is important to stress that the vertical dimension in the security market line picture isexpected return. Things rarely turn out the way you expect. However, the CAPM equationalso tells us about the realized rate of return. Since the realization is just the expectationplus random error, we can write:
Ri = R
f + b
i [ R
m – R
f] + e
i
This is useful, because it tells us that when we look at past returns, they will typicallydeviate from the security market line – not because the CAPM is wrong, but becauserandom error will push the returns off the line. Notice that the realized Rm does not haveto behave as expected, either. So, even the slope of the security market line will deviatefrom the average equity risk premium. Sometimes it will even be negative!
Security market line
Expected
return
Figure 14.5: Expectations vs Realizations
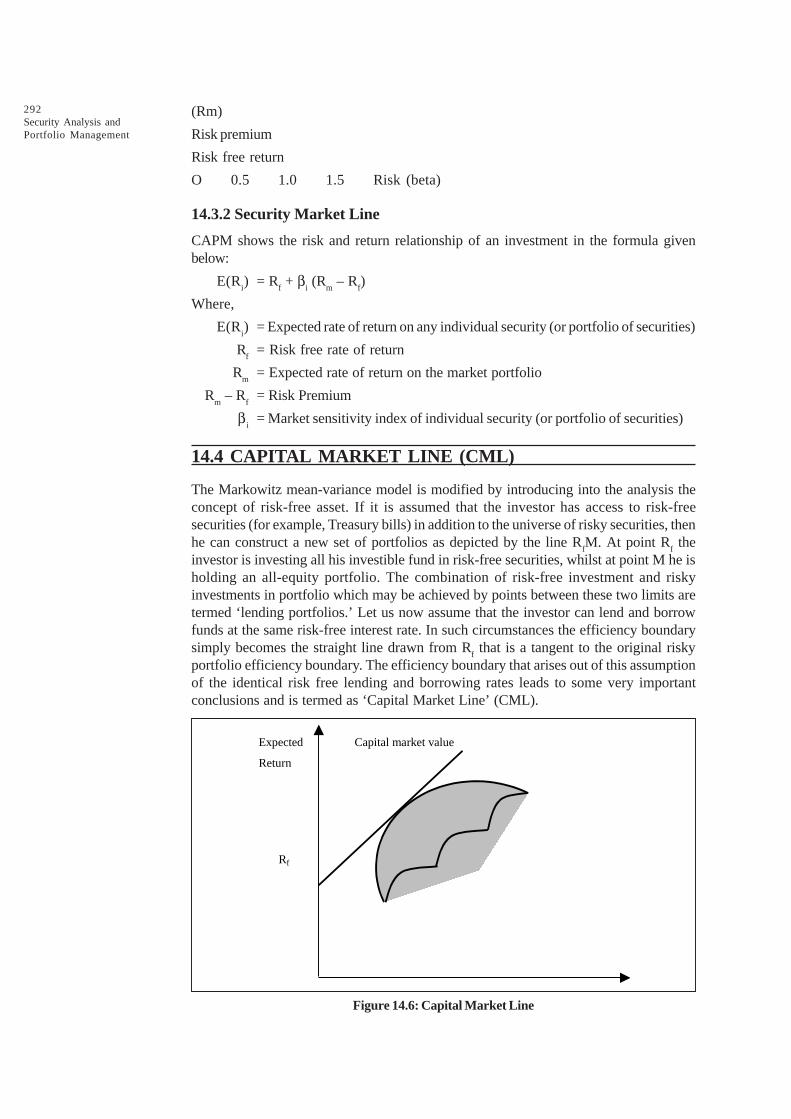
292Security Analysis andPortfolio Management
(Rm)
Risk premium
Risk free return
O 0.5 1.0 1.5 Risk (beta)
14.3.2 Security Market Line
CAPM shows the risk and return relationship of an investment in the formula givenbelow:
E(Ri) = R
f + b
i (R
m – R
f)
Where,
E(Ri) = Expected rate of return on any individual security (or portfolio of securities)
Rf
= Risk free rate of return
Rm
= Expected rate of return on the market portfolio
Rm – R
f= Risk Premium
bi
= Market sensitivity index of individual security (or portfolio of securities)
14.4 CAPITAL MARKET LINE (CML)
The Markowitz mean-variance model is modified by introducing into the analysis theconcept of risk-free asset. If it is assumed that the investor has access to risk-freesecurities (for example, Treasury bills) in addition to the universe of risky securities, thenhe can construct a new set of portfolios as depicted by the line R
fM. At point R
f the
investor is investing all his investible fund in risk-free securities, whilst at point M he isholding an all-equity portfolio. The combination of risk-free investment and riskyinvestments in portfolio which may be achieved by points between these two limits aretermed ‘lending portfolios.’ Let us now assume that the investor can lend and borrowfunds at the same risk-free interest rate. In such circumstances the efficiency boundarysimply becomes the straight line drawn from R
f that is a tangent to the original risky
portfolio efficiency boundary. The efficiency boundary that arises out of this assumptionof the identical risk free lending and borrowing rates leads to some very importantconclusions and is termed as ‘Capital Market Line’ (CML).
Expected Capital market value
Return
M
Rf
Figure 14.6: Capital Market Line
293Capital Asset Pricing Model
Illustration 1:
Dummy Ltd., an investment company, has invested in equity shares of a blue chipcompany. It’s risk-free rate of return (R
f) = 10% , Expected total return (R
m) = 16%,
Market sensitivity index (b) = 1.50, (of individual security)
Calculate the expected rate of return on the investment make in the security.
Solution:
Total expected return (Rm) = 16%
Risk free return (Rf) = 10%
Risk premium (Rm – R
f) = 6%
E(Ri) = R
f + b
i(R
m – R
f)
= 10 + 1.50(16 – 10) = 19%
14.5 BETA FACTOR OF A MARKET PORTFOLIO
If the return from the market portfolio rises or falls, we should expect a correspondingrise or fall in the return from an individual share. The amount of this corresponding riseor fall depends on the beta factor of the share. The beta factor of an investor’s portfoliois the total of the weighted average beta factors of each security in the portfolio. As themarket portfolio represents all shares on the stock market, it follows that the betacoefficient of the market portfolio must be 1, and all other betas are viewed relative tothis value. Thus, if the return from the market portfolio rise by says 2%, the coefficientwould be:
Increase in return on Investment 2%= =1
Increase in return on market portfolio 2%
CAPM indicates the expected return of a particular security in view of its systematic ormarket risk. The value of a share price is determined in relation to investment in sharesof individual companies, rather than as a portfolio.
In practice, for estimation of beta factor the following regression equation is used:
Ri= a
i + b
i R
m + e
i
Where,
Ri= Rate of return of individual security
aI= The intercept that equals the risk free rate (R
f)
bi= Beta factor of the individual security
Rm
= Market of return
eI= Random error, which reflects the diversifiable risk of individual security
Illustration 2:
Wipro provides you the following informations. Calculate the expected rate of return ofa portfolio:
Expected market return 15%
Risk-free rate of return 9%
Standard deviation of an asset 2.4%
294Security Analysis andPortfolio Management
Market Standard deviation 2.0%
Correlation co-efficient of portfolio with market 0.9
Solution:
Calculation Market Sensitivity Index (bi)
Since, market sensitivity index is not given in the problem, it is calculated by applying thefollowing formula:
bi = i
m
ó
ó = r
m
Where, bi= Market sensitivity index or Beta factor
si= Standard deviation of an asset i.e., 0.024
sm
= Market Standard deviation i.e., 0.02
rim
= Correlation coefficient of portfolio with market i.e., 0.90
bi=
0.024
0.02 ¥ 0.90 = 1.08
We can calculate the expected rate of return of a portfolio by applying capital assetpricing model:
E(Ri) = R
f + b
i(R
m – R
f)
Where,
E(Rj) = Expected rate of return of portfolio
Rf
= Risk free rate of return Le., 9%
Rm
= Expected return of market portfolio Le. 15%
bi= Beta coefficient of investment Le. 1.08
By substituting, we get
E(R.) = 9 + 1.08 (15 – 9) = 9 + 1.08(6) = 15.48 or 15.48%
14.6 BENEFITS AND LIMITATIONS OF CAPM
14.6.1 Benefits
CAPM model of portfolio management can be effectively used to:
l Investments in risky projects having real assets can be evaluated of its worth inview of expected return.
l CAPM analyses the riskiness of increasing the levels of gearing and its impact onequity shareholders returns.
l CAPM suggests the diversification of portfolio in minimisation of risk.
14.6.2 CAPM is Criticised for the Following Reasons
l In real world, assumptions of CAPM will not hold good.
l In practice, it is difficult to estimate the risk-free return, market rate of return, andrisk premium.
295Capital Asset Pricing Model
l Investors can estimate the required rate of return on a particular investment incompany’s securities.
l CAPM is a single period model while most projects are often available only aslarge indivisible projects. It is, therefore, more difficult to adjust.
14.7 ARBITRAGE PRICING MODEL
The Arbitrage Pricing Model (APM) looks very similar to the CAPM, but its origins aresignificantly different. Whereas the CAPM is a single-factor model, the APM is a multi-factor model instead of just a single beta value; there is a whole set of beta values – onefor each factor. Arbitrage Pricing Theory, out of which the APM arises, states that theexpected return on an investment is dependent upon how that investment reacts to a setof individual macro-economic factors (the degree of reaction being measured by thebetas) and the risk premium associated with each of those macro-economic factors.The APM, which was developed by Ross (1976), holds that there are four factors,which explain the risk/risk premium relationship of a particular security.
Basically, CAPM says that:
E(Ri) = R
f + b
i(R
m – R
f)
Where, l is the average risk premium = Rm – R
f
However, APM holds that:
E(Ri) = R
f + l
1b
i1 + l
2b
12 + l
3b
13 + l
4b
14
Where,
l1, l
2, l
3, and l
4 the average risk premium for each of the four factors in the model and
bi1, b
i2, b
i3 and b
i4 are measures of the sensitivity of the particular security ‘i’ to each of
the four factors.
Several factors appear to have been identified as being important (some of which, suchas inflation and money supply, industrial production and personal consumption, do haveaspects of being inter-related). In particular, researchers have identified:
l Changes in the level of industrial production in the economy
l Changes in the shape of the yield curve
l Changes in the default risk premium (i.e., changes in the return required onbonds\different perceived risks of default)
l Changes in the inflation rate
l Changes in the real interest rate
l Level of personal consumption
l Level of money supply in the economy
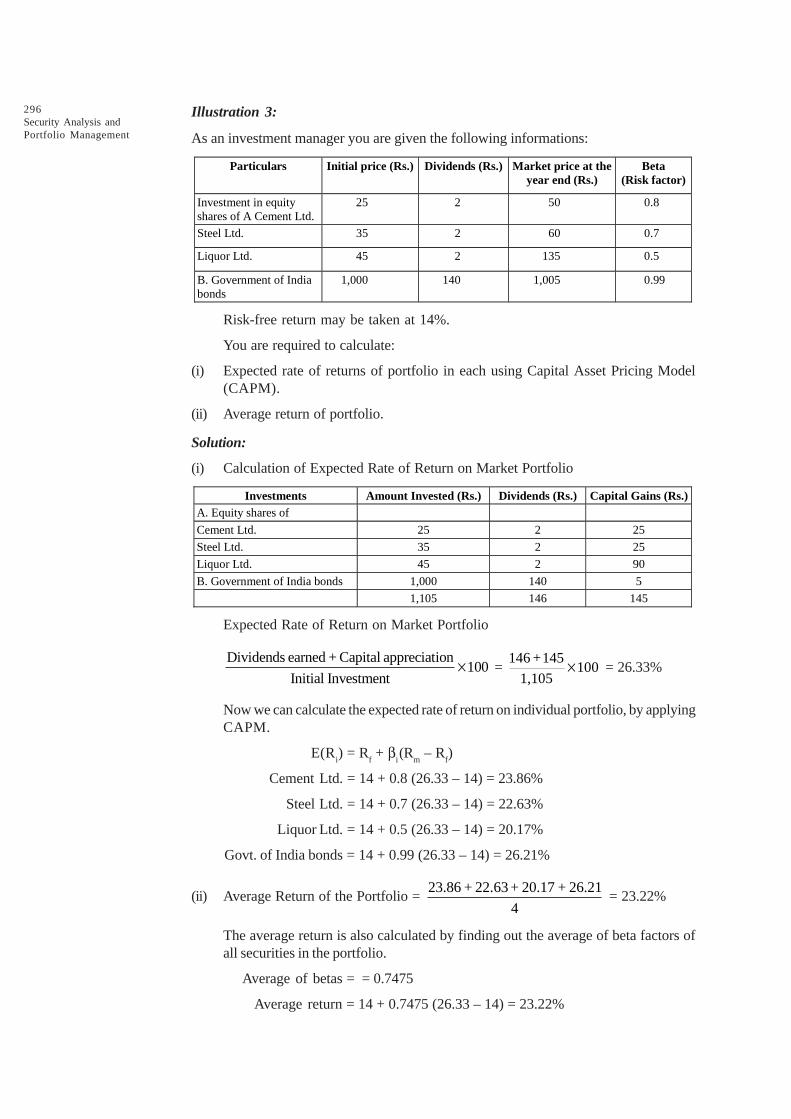
296Security Analysis andPortfolio Management
Illustration 3:
As an investment manager you are given the following informations:
Particulars Initial price (Rs.) Dividends (Rs.) Market price at the year end (Rs.)
Beta (Risk factor)
Investment in equity shares of A Cement Ltd.
25 2 50 0.8
Steel Ltd. 35 2 60 0.7
Liquor Ltd. 45 2 135 0.5
B. Government of India bonds
1,000 140 1,005 0.99
Risk-free return may be taken at 14%.
You are required to calculate:
(i) Expected rate of returns of portfolio in each using Capital Asset Pricing Model(CAPM).
(ii) Average return of portfolio.
Solution:
(i) Calculation of Expected Rate of Return on Market Portfolio
Investments Amount Invested (Rs.) Dividends (Rs.) Capital Gains (Rs.) A. Equity shares of
Cement Ltd. 25 2 25
Steel Ltd. 35 2 25
Liquor Ltd. 45 2 90
B. Government of India bonds 1,000 140 5
1,105 146 145
Expected Rate of Return on Market Portfolio
Dividends earned + Capital appreciation100
Initial Investment´ =
146 +145100
1,105´ = 26.33%
Now we can calculate the expected rate of return on individual portfolio, by applyingCAPM.
E(Ri) = R
f + b
i(R
m – R
f)
Cement Ltd. = 14 + 0.8 (26.33 – 14) = 23.86%
Steel Ltd. = 14 + 0.7 (26.33 – 14) = 22.63%
Liquor Ltd. = 14 + 0.5 (26.33 – 14) = 20.17%
Govt. of India bonds = 14 + 0.99 (26.33 – 14) = 26.21%
(ii) Average Return of the Portfolio = 23.86 + 22.63 + 20.17 + 26.21
4 = 23.22%
The average return is also calculated by finding out the average of beta factors ofall securities in the portfolio.
Average of betas = = 0.7475
Average return = 14 + 0.7475 (26.33 – 14) = 23.22%

297Capital Asset Pricing Model14.8 ARBITRAGE PRICING THEORY (APT)
Arbitrage Pricing Theory (APT) in finance is a general theory of asset pricing, whichhas become influential in the pricing of shares.
APT holds that the expected return of a financial asset can be modelled as a linearfunction of various macro-economic factors or theoretical market indices, where sensitivityto changes in each factor is represented by a factor specific beta coefficient. The model-derived rate of return will then be used to price the asset correctly – the asset priceshould equal the expected end-of-period-price discounted at the rate implied by model.If the price diverges, arbitrage should bring it back into line. The theory was initiated bythe economist Stephen Ross in 1976.
14.8.1 APT Model
If APT holds, then a risky asset can be described as satisfying the following relation:
E(rj) = r
j + b
j1RP
1 + b
j2RP
2 + ... + b
jnRP
n
rj= E(r
j) + b
j1F
1 + b
j2F
2 + ... + b
jnF
n + Œ
j
where
E(rj) is the risky asset’s expected return,
RPk is the risk premium of the factor,
rf is the Risk-free
Fk is the macroeconomic factor,
bjk is the sensitivity of the asset to factor k, also called factor loading,
and ej is the risky asset’s idiosyncratic random stock with mean zero.
14.8.2 Arbitrage and the APT
Arbitrage is the practice of taking advantage of a state of imbalance between two (orpossibly more) markets and thereby making a risk-free profit, Rational Pricing.
14.8.3 Arbitrage in Expectations
The APT describes the mechanism whereby arbitrage by investors will bring an assetthat is mispriced, according to the APT model, back into line with its expected price.Note that under true arbitrage, the investor locks-in a guaranteed payoff, whereas underAPT arbitrage as described below, the investor locks-in a positive expected payoff. TheAPT, thus, assumes “arbitrage in expectations” – i.e. that arbitrage by investors willbring asset prices back into line with the returns expected by the model portfolio theory.
14.8.4 Arbitrage Mechanics
In the APT context, arbitrage consists of trading in two assets – with at least one beingmispriced. The arbitrageur sells the asset that is relatively too expensive and uses theproceeds to buy one which is relatively too cheap.
Under the APT, an asset is mispriced if its current price diverges from the price predictedby the model. The asset price today should equal the sum of all future cash flowsdiscounted at the APT rate, where the expected return of the asset is a linear function ofvarious factors, and sensitivity to changes in each factor is represented by a factor-specific beta coefficient.
298Security Analysis andPortfolio Management
A correctly priced asset here may be in fact a synthetic asset – a portfolio consisting ofother correctly priced assets. This portfolio has the same exposure to each of themacroeconomic factors as the mispriced asset. The arbitrageur creates the portfolio byidentifying x correctly priced assets (one per factor plus one) and then weighting theassets such that portfolio beta per factor is the same as for the mispriced asset.
When the investor is long the asset and short the portfolio (or vice versa) he has createda position which has a positive expected return (the difference between asset return andportfolio return) and which has a net-zero exposure to any macroeconomic factor and is,therefore, risk free (other than for firm specific risk). The arbitrageur is thus in a positionto make a risk free profit:
Where Today’s price is too low
The implication is that at the end of the period the portfolio would have appreciated atthe rate implied by the APT, whereas the mispriced asset would have appreciated atmore than this rate. The arbitrageur could therefore:
Today: 1. Short-sell the portfolio
2. Buy the mispriced-asset with the proceeds.
At the end of the period:
1. Sell the mispriced asset
2. Use the proceeds to buy back the portfolio
3. Pocket the difference.
Where today’s price is too high
The implication is that at the end of the period the portfolio would have appreciated atthe rate implied by the APT, whereas the mispriced asset would have appreciated at lessthan this rate. The arbitrageur could therefore:
Today: 1. Short sell the mispriced-asset
2. Buy the portfolio with the proceeds
3. At the end of the period:
1. Sell the portfolio
2. Use the proceeds to buy back the mispriced-asset
3. Pocket the difference
14.8.5 Relationship with the Capital Asset Pricing Model
The APT along with the CAPM is one of two influential theories on asset pricing. TheAPT differs from the CAPM in that it is less restrictive in its assumptions. It allows foran explanatory (as opposed to statistical) model of asset returns. It assumes that eachinvestor will hold a unique portfolio with its own particular array of betas, as opposed tothe identical “market portfolio.” In some ways, the CAPM can be considered a “specialcase” of the APT in that the securities market line represents a single-factor model ofthe asset price, where Beta is exposure to changes in value of the market.
Additionally, the APT can be seen as a “supply side” model, since its beta coefficientsreflect the sensitivity of the underlying asset to economic factors. Thus, factor shockswould cause structural changes in the asset’s expected return, or in the case of stocks,in the firm’s profitability.
On the other side, the capital asset pricing model is considered a “demand side” model.Its results, although similar to those in the APT, arise from a maximization problem of
299Capital Asset Pricing Model
each investor’s utility function, and from the resulting market equilibrium (investors areconsidered to be the “consumers” of the assets).
14.9 USING THE APT
14.9.1 Identifying the Factors
As with the CAPM, the factor-specific Betas are found via a linear regression of historicalsecurity returns on the factor in question. Unlike the CAPM, the APT, however, doesnot itself reveal the identity of its priced factors – the number and nature of these factorsis likely to change over time and between economies. As a result, this issue is essentiallyempirical in nature. Several a priori guidelines as to the characteristics required of potentialfactors are, however, suggested:
1. Their impact on asset prices manifests in their unexpected movements.
2. They should represent undiversifiable influences (these are, clearly, more likely tobe macroeconomic rather than firm-specific in nature).
3. Timely and accurate information on these variables is required.
4. The relationship should be theoretically justifiable on economic grounds.
Chen, Roll and Ross identified the following macro-economic factors as significant inexplaining security returns:
l Surprises in inflation;
l Surprises in GNP as indicted by an industrial production index;
l Surprises in investor confidence due to changes in default premium in corporatebonds;
l Surprise shifts in the yield curve.
As a practical matter, indices or spot or futures market prices may be used in place ofmacro-economic factors, which are reported at low frequency (e.g. monthly) and oftenwith significant estimation errors. Market indices are sometimes derived by means offactor analysis. More direct ‘indices’ that might be used are:
l Short-term interest rates;
l The difference in long-term and short-term interest rates;
l A diversified stock index such as the S&P 500 or NYSE Composite Index;
l Oil prices
l Gold or other precious metal prices
l Currency exchange rates
Check Your Progress 2
Indicate true or false for the following statements:
1. CAPM does not explain the behaviour of security prices.
2. An investor who invests in an asset that does not improve the risk-returncharacteristics of his existing portfolio will be called a rational investor.
3. The alpha coefficient (a) gives the vertical intercept point of the regression line.
4. The ATP differs from the CAPM in that it is less restrictive in its assumptions.
5. Harry Markowitz is regarded as the father of modern portfolio theory.

300Security Analysis andPortfolio Management
14.10 MODERN PORTFOLIO THEORY
Portfolio management is concerned with efficient management of investment in thesecurities. An investment is defined as the current commitment of funds for a period inorder to derive a future flow of funds that will compensate the investing unit:
(a) For the time the funds are committed
(b) For the expected rate of inflation
(c) For the uncertainty involved in the future flow of funds
The portfolio management deals with the process of selection of securities from thenumber of opportunities available with different expected returns and carrying differentlevels of risk and the selection of securities is made with a view to provide the investorsthe maximum yield for a given level of risk or ensure minimise risk for a given level ofreturn.
14.10.1 Markowitz Mean-Variance Model
Harry Markowitz is regarded as the father of modern portfolio theory. According to him,investors are mainly concerned with two properties of an asset: risk and return, but bydiversification of portfolio it is possible to trade-off between them. The essence of histheory is that risk of an individual asset hardly matters to an investor. What really countsis the contribution it makes to the investor’s total risk. By turning his principle into auseful technique for selecting the right portfolio from a range of different assets, hedeveloped ‘Mean Variance Analysis’ in 1952. The thrust has been on balancing safety,liquidity and return depending on the taste of different investors. The portfolio selectionproblem can be divided into two stages, first finding the mean-variance efficient portfoliosand secondly selecting one such portfolio. Investors do not like risk and the greater theriskiness of returns on an investment, the greater will be the returns expected by investors.There is a trade-off between risk and return, which must be reflected in the requiredrates of return on investment opportunities. The standard deviation (or variance) ofreturn measures the total risk of an investment. It is not necessary for an investor toaccept the total risk of an individual security. Investors can and do diversify to reducerisk. As number of holdings approach larger, a good deal of total risk is removed bydiversification.
Assumptions
This model has taken into account of risks associated with investments – using varianceor standard deviation of the return. This model is based on the following assumptions:
l The return on an investment adequately summarises the outcome of the investment.
l All investors are risk-averse. For a given expected return he prefers to take minimumrisk, obviously for a given level of risk the investor prefers to get maximum expectedreturn.
l Investors are assumed to be rational in so far as they would prefer greater returnsto lesser ones given equal or smaller risk and risk averse. Risk aversion in thiscontext means merely that, as between two investments with equal expected returns,the investment with the smaller risk would be preferred.
14.10.2 Efficient Frontier
Markowitz has formulised the risk return relationship and developed the concept ofefficient frontier. For selection of a portfolio, comparison between a combination ofportfolios is essential. As a rule, a portfolio is not efficient if there is another portfolio with:
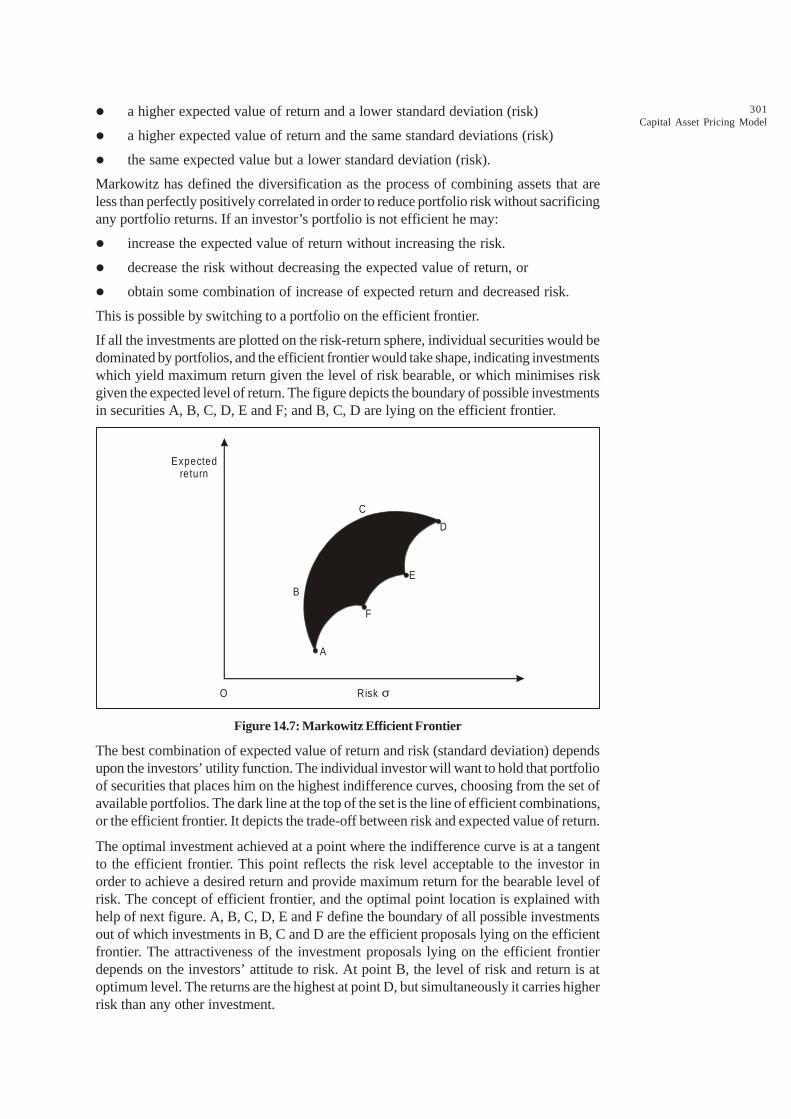
301Capital Asset Pricing Model
l a higher expected value of return and a lower standard deviation (risk)
l a higher expected value of return and the same standard deviations (risk)
l the same expected value but a lower standard deviation (risk).
Markowitz has defined the diversification as the process of combining assets that areless than perfectly positively correlated in order to reduce portfolio risk without sacrificingany portfolio returns. If an investor’s portfolio is not efficient he may:
l increase the expected value of return without increasing the risk.
l decrease the risk without decreasing the expected value of return, or
l obtain some combination of increase of expected return and decreased risk.
This is possible by switching to a portfolio on the efficient frontier.
If all the investments are plotted on the risk-return sphere, individual securities would bedominated by portfolios, and the efficient frontier would take shape, indicating investmentswhich yield maximum return given the level of risk bearable, or which minimises riskgiven the expected level of return. The figure depicts the boundary of possible investmentsin securities A, B, C, D, E and F; and B, C, D are lying on the efficient frontier.
Risk σO
Expectedreturn
C
D
E
F
A
B
Figure 14.7: Markowitz Efficient Frontier
The best combination of expected value of return and risk (standard deviation) dependsupon the investors’ utility function. The individual investor will want to hold that portfolioof securities that places him on the highest indifference curves, choosing from the set ofavailable portfolios. The dark line at the top of the set is the line of efficient combinations,or the efficient frontier. It depicts the trade-off between risk and expected value of return.
The optimal investment achieved at a point where the indifference curve is at a tangentto the efficient frontier. This point reflects the risk level acceptable to the investor inorder to achieve a desired return and provide maximum return for the bearable level ofrisk. The concept of efficient frontier, and the optimal point location is explained withhelp of next figure. A, B, C, D, E and F define the boundary of all possible investmentsout of which investments in B, C and D are the efficient proposals lying on the efficientfrontier. The attractiveness of the investment proposals lying on the efficient frontierdepends on the investors’ attitude to risk. At point B, the level of risk and return is atoptimum level. The returns are the highest at point D, but simultaneously it carries higherrisk than any other investment.

302Security Analysis andPortfolio Management
Indifference
Curves
Expected 1 2 3 4 Efficient Return frontier
•D
C
•
•E
•F
O 1 2 3 4 • A Risk σ
• B
Figure 14.8: Attainable Portfolios
The shaded area represents all attainable portfolios, that is all the combinations of riskand expected return that may be achieved with the available securities. The efficientfrontier denotes all possible efficient portfolios and any point on the frontier dominatesany point to the right of it.
14.11 LET US SUM UP
Markowitz’s great insight was that the relevant information about securities could besummarized by three measures: the mean return (taken as the arithmetic mean), thestandard deviation of the returns and the correlation with other assets’ returns.
CAPM explains the behaviour of security prices and provides a mechanism wherebyinvestors could assess the impact of a proposed security investment on the overall portfoliorisk and return. CAPM suggests that the prices of securities are determined in such away that the risk premium or excess returns are proportional to systematic risk, which isindicated by the beta coefficient. The model is used for analysing the risk-returnimplications of holding securities. CAPM refers to the way in which securities are valuedin line with their anticipated risks and returns.
14.12 LESSON END ACTIVITY
Study on the relevance of CAPM model in BSE and NSE.
14.13 KEYWORDS
CAPM: CAPM explains the behaviour of security prices and provides a mechanismwhereby investors could assess the impact of a proposed security investment on theoverall portfolio risk and return.
CML: The efficiency boundary that arises out of this assumption of the identical riskfree lending and borrowing rates leads to some very important conclusions and is termedas ‘Capital Market Line’ (CML).
303Capital Asset Pricing Model
Beta Coefficient: Beta coefficient is a measure of the volatility of stock price in relationto movement in stock index of the market, therefore, beta is the index of systematic risk.
ATP: APT holds that the expected return of a financial asset can be modelled as a linearfunction of various macro-economic factors or theoretical market indices, where sensitivityto changes in each factor is represented by a factor specific beta coefficient.
APM: Arbitrage Pricing Model is a multifactor model used instead of just a single betavalue.
14.14 QUESTIONS FOR DISCUSSION
1. Explain the benefits and limitations of CAPM.
2. Define CAPM. Write on its assumptions.
3. Write on Arbitrage Pricing Model.
4. Define Arbitrage Pricing Theory.
5. What are the differences between arbitrage and the APT?
6. Explain arbitrage mechanics.
7. As an investor, how do you use the APT?
8. Write on the modern portfolio theory.
9. Explain the Markowitz Mean-Variance Model.
10. Define the Efficient Frontier.
Check Your Progress: Model Answers
CYP 1
1. classical 2. capital -weighted 3. Capital Asset Pricing Model
4. return
CYP 2
1. F 2. F 3. F 4. T 5. T
14.15 SUGGESTED READINGS
Sudhindra Bhat, Security Analysis and Portfolio Management, Excel Books, Delhi.
Kevin, S., Security Analysis and Portfolio Management, Prentice Hall of India.
Prasanna Chandra, Investment Analysis and Portfolio Management, Second Edition, Tata McGrawHill.
Punithavathy Pandian, Securities Analysis and Portfolio management, Vikas.
Investment Management, V. K. Bhalla.
A. Davis, Investors in a Changing Economy, Prentice -Hall, 1968.
Williamson, J. Peter, Investments: New Analytic Techniques, London, Longman, 1970.
Cottle, CC., and Whitman, W.T., Investment Timing: The Formula Plan Approach, McGraw Hill.