Securities Analysis - Union Medical Healthcare (2138 HK)
34
7 Dec 2017 Securities Analysis PLEASE READ THE ANALYST CERTIFICATION AND IMPORTANT DISCLOSURES ON LAST PAGE BUY (Initiation) Target Price HK$4.76 Up/downside +31.8% Current price HK$3.61 Amy Ge Tel: (852) 3761 8778 Email: [email protected] Cyrus Ng, CFA Tel:(852) 3761 8780 Email:[email protected] China Healthcare Sector Mkt. Cap. (HK$mn) 3,541 Avg. 3mths t/o (HK$mn) 4.04 52W High/Low (HK$) Total Issued Shares (mn) 4.35/2.36 980.9 Source: Bloomberg Shareholding Structure Management 74.46% Free float 25.54% Source: Bloomberg Share performance Absolute Relative 1-mth 14.2% 13.3% 3-mth 47.3% 41.0% 6-mth 49.0% 34.3% Source: Bloomberg 12-mth price performance Source: Bloomberg Auditor: KPMG Web-site: www.umhgp.com 2.0 2.5 3.0 3.5 4.0 4.5 Nov 16 Jan 17 Mar 17May 17 Jul 17 Sep 17 Nov 17 HK$ Union Medical Healthcare (2138 HK) Top pick among HK aesthetic service providers The leading aesthetic medical service provider expanding into multiple medical fields. UMH was the largest aesthetic medical service provider in Hong Kong in terms of revenue in 2016, according to Frost & Sullivan. UMH has gradually transformed itself from a purely aesthetic medical player to a comprehensive medical service provider through self-launched services and acquisitions. It provides a broad range of services, including aesthetic medical services, traditional beauty services, dental services, physical examination services, chiropractic therapy, health management services and sales of skincare products. New medical services to bring additional growth momentum. We believe the new business divisions, including physical examination, acquired chiropractic business and dental services, could enjoy strong growth momentum from cross selling activities among the large and loyal customer base of the Company. Potential acquisitions in other medical fields such as dermatology, ophthalmology, ENT and gynecology would add additional growth momentum for the Company. Booming medical tourism to boost growth. In FY2017, revenue from PRC clients was HK$241.2mn and accounted for 25% of total revenue (vs. 14% in FY16). As of 1H FY18, revenue from PRC clients had increased to HK220.4mn and generated 35.7% of overall revenue (vs.17.7% in 1H FY17). Medical tourism has become a major growth driver for the Company. In addition, the PRC clinics will play a key role on client referral and can refer some clients to Hong Kong for services not offered by PRC clinics. The Company expected the proportion of revenue from PRC clients to increase to around 30%-40% in FY2018. We forecast 26.4% core net profit CAGR in FY17-FY20E. We forecast core net profit to grow 34.6% /23.0% /21.9% YoY in FY18/FY19/FY20E with a core NPM of 20.4% /20.1% /20.6%. Initiation coverage with TP of HK$4.76. We believe the Company would continue to strengthen its leading position in aesthetic medical industry and to grow other medical services which would complement each other. Given the robust growth, better profitability over peers and not demanding valuation (trading at 13.8x/11.2x FY18/FY19E PER), we initiate coverage on UMH with BUY rating and target price of HK$4.76, which is based on our DCF model (WACC:13.5%, terminal growth rate:3%). Our target price implies 18.2x/14.8x FY18/FY19E PER, with upside potential of 31.8%. Earnings summary (YE Mar 31) FY16A FY17A FY18E FY19E FY20E Turnover (HK$ mn) 705 965 1,256 1,563 1,861 Core net income (HK$ mn) 177 190 256 315 384 Core EPS (HK$) 0.24 0.20 0.26 0.32 0.39 Core EPS CHG (%) -1.7 -16.7 32.4 23.0 21.9 PE (x) 15.3 18.3 13.8 11.2 9.2 PB (x) 4.8 4.5 4.4 3.6 2.8 Yield (%) 5.3 5.7 5.8 2.7 3.3 ROE (%) 20.3 25.8 32.5 32.4 30.7 Net gearing (%) Net cash Net cash Net cash Net cash Net cash Source: Company, CMBIS
-
Upload
khangminh22 -
Category
Documents
-
view
0 -
download
0
Transcript of Securities Analysis - Union Medical Healthcare (2138 HK)

7 Dec 2017
Securities Analysis
PLEASE READ THE ANALYST CERTIFICATION AND IMPORTANT DISCLOSURES ON LAST PAGE
BUY (Initiation)
Target Price HK$4.76 Up/downside +31.8% Current price HK$3.61
Amy Ge Tel: (852) 3761 8778
Email: [email protected]
Cyrus Ng, CFA Tel:(852) 3761 8780
Email:[email protected]
China Healthcare Sector Mkt. Cap. (HK$mn) 3,541 Avg. 3mths t/o (HK$mn) 4.04 52W High/Low (HK$) Total Issued Shares (mn)
4.35/2.36 980.9
Source: Bloomberg
Shareholding Structure Management 74.46% Free float 25.54% Source: Bloomberg
Share performance Absolute Relative 1-mth 14.2% 13.3% 3-mth 47.3% 41.0% 6-mth 49.0% 34.3% Source: Bloomberg
12-mth price performance
Source: Bloomberg
Auditor: KPMG Web-site: www.umhgp.com
2.0
2.5
3.0
3.5
4.0
4.5
Nov 16 Jan 17 Mar 17May 17 Jul 17 Sep 17 Nov 17
HK$
Union Medical Healthcare (2138 HK)
Top pick among HK aesthetic service providers
The leading aesthetic medical service provider expanding into multiple
medical fields. UMH was the largest aesthetic medical service provider in Hong Kong in terms of revenue in 2016, according to Frost & Sullivan. UMH has gradually transformed itself from a purely aesthetic medical player to a comprehensive medical service provider through self-launched services and acquisitions. It provides a broad range of services, including aesthetic medical services, traditional beauty services, dental services, physical examination services, chiropractic therapy, health management services and sales of skincare products.
New medical services to bring additional growth momentum. We believe the new business divisions, including physical examination, acquired chiropractic business and dental services, could enjoy strong growth momentum from cross selling activities among the large and loyal customer base of the Company. Potential acquisitions in other medical fields such as dermatology, ophthalmology, ENT and gynecology would add additional growth momentum for the Company.
Booming medical tourism to boost growth. In FY2017, revenue from PRC clients was HK$241.2mn and accounted for 25% of total revenue (vs. 14% in FY16). As of 1H FY18, revenue from PRC clients had increased to HK220.4mn and generated 35.7% of overall revenue (vs.17.7% in 1H FY17). Medical tourism has become a major growth driver for the Company. In addition, the PRC clinics will play a key role on client referral and can refer some clients to Hong Kong for services not offered by PRC clinics. The Company expected the proportion of revenue from PRC clients to increase to around 30%-40% in FY2018.
We forecast 26.4% core net profit CAGR in FY17-FY20E. We forecast core net profit to grow 34.6% /23.0% /21.9% YoY in FY18/FY19/FY20E with a core NPM of 20.4% /20.1% /20.6%.
Initiation coverage with TP of HK$4.76. We believe the Company would continue to strengthen its leading position in aesthetic medical industry and to grow other medical services which would complement each other. Given the robust growth, better profitability over peers and not demanding valuation (trading at 13.8x/11.2x FY18/FY19E PER), we initiate coverage on UMH with BUY rating and target price of HK$4.76, which is based on our DCF model (WACC:13.5%, terminal growth rate:3%). Our target price implies 18.2x/14.8x FY18/FY19E PER, with upside potential of 31.8%.
Earnings summary
(YE Mar 31) FY16A FY17A FY18E FY19E FY20E
Turnover (HK$ mn) 705 965 1,256 1,563 1,861
Core net income (HK$ mn) 177 190 256 315 384
Core EPS (HK$) 0.24 0.20 0.26 0.32 0.39
Core EPS CHG (%) -1.7 -16.7 32.4 23.0 21.9
PE (x) 15.3 18.3 13.8 11.2 9.2
PB (x) 4.8 4.5 4.4 3.6 2.8
Yield (%) 5.3 5.7 5.8 2.7 3.3
ROE (%) 20.3 25.8 32.5 32.4 30.7
Net gearing (%) Net cash Net cash Net cash Net cash Net cash
Source: Company, CMBIS
7 Dec 2017
Table of content
INVESTMENT SUMMARY ............................................................................. 3
THE LARGEST AESTHETIC MEDICAL SERVICE PROVIDERS IN
HONG KONG WITH STRONG BRAND RECOGNITION ......................... 5
BECOMING A DIVERSIFIED MEDICAL SERVICE PROVIDER .......... 16
POTENTIAL M&A TO PROPEL REVENUE GROWTH ........................ 20
FINANCIALS .................................................................................................. 21
FINANCIAL STATEMENTS ........................................................................ 26
VALUATION .................................................................................................. 28
KEY INVESTMENT RISKS .......................................................................... 30
APPENDIX 1: COMPANY BACKGROUND ............................................. 32

7 Dec 2017
PLEASE READ THE ANALYST CERTIFICATION AND IMPORTANT DISCLOSURES ON LAST PAGE 3
Investment summary
The Company is the largest aesthetic medical service provider in Hong Kong in terms of
revenue in 2016, according to Frost & Sullivan. The Company provides a broad range of
services, including aesthetic medical service, dental service, physical examination,
chiropractic therapy, health management service and sales of skincare products. We believe
revenue growth of the Company will mainly be driven by 1) fast growing aesthetic medical
industry and increasing penetration; 2) the Company’s network expansion in Hong Kong and
the PRC; 3) booming medical tourism and referral programme from PRC clinics; 4) mature
cross-selling between different business segments; 5) potential M&As.
The largest aesthetic medical service provider in Hong Kong with strong
brand recognition
Surfing on the fast growing aesthetic medical industry. According to Frost & Sullivan, Hong
Kong aesthetic medical market reached HK$4.2bn in 2015 (CAGR of 12.5% in 2011-2015) and
is expected to increase to HK$8.1bn in 2020E, delivering a CAGR of 13.9% in 2016-2020E.
Growth of aesthetic medical market will be driven by1) increasing penetration, and 2) growing
expenditure per client on aesthetic services.
Network expansion in Hong Kong to add growth momentum. By far, the Company has 33
chains in Hong Kong, 2 in Macau and 3 self-operating aesthetic medical clinics in China. The
utilization rate of Hong Kong chains has reached 60%-70%. The Company planned to open
two new shops in Causeway Bay and Mongkok in 1H2018. We expect the total GFA to increase
25%/22%/19% to 200k sq ft/240k sq ft/280k sq ft in FY18E/FY19E/FY20E, with GFA in
Hong Kong to increase 21%/17%/15% to 158k sq ft /186k sq ft/214k sq ft. We believe the
expansion should help the Company in catering the increasing demand of medical aesthetic
service in Hong Kong.
Medical tourism to become a main growth driver. In FY2017, UMH’s revenue from PRC
clients was HK$241.2mn and accounted for 25% of total revenue (vs. 14% in FY16), among
which 92% (HK$222.1mn) came from medical tourists to Hong Kong and 8% (HK$19.1mn)
derived from PRC clinics. The revenue from PRC medical tourists increased from HK$90mn in
FY16 to HK$222.1mn in FY17. As per Management, medical tourism has become a major
growth driver for the Company and expects the proportion of revenue from PRC clients to
increase to 30%-40% in FY2018.
The PRC market is promising and supports referral business. According to Deloitte
research, the aesthetic medical market in China reached US$7.4bn in 2015 and is expected to
deliver a CAGR of 22.7% in 2015-2020E. UMH’s two new clinics in Shenzhen and Chongqing
are expected to commence operation in 1H2018. Management plans to establish 1-2 aesthetic
medical clinics each year in first or second tier cities in China and prefers forming JVs with
local established aesthetic medical players. In the short run, we believe the PRC clinics will
mainly contribute by referring more clients to Hong Kong and in the long run, we expect the
PRC clinics to become a major growth engine of the Company.
Developing into an one-stop medical service provider
While continuing growing its aesthetic medical business, the Company also expanded into
other medical services, such as dental services, physical examination and chiropractic services.
The Company aimed to leverage their client base and raise client spending as well as attract
new clients by offering a wide range of high quality medical services. The average contracted
sales per client were HK$24,355/HK$20,891/HK$18,491 in FY15/FY16/FY17. The ASP
7 Dec 2017
PLEASE READ THE ANALYST CERTIFICATION AND IMPORTANT DISCLOSURES ON LAST PAGE 4
decline was due to the relatively lower package price of new business when comparing to
aesthetic medical service.
Fast growing health management business. The Company established its health
management center “re:HEALTH” in May 2016. It contributed HK$51mn revenue in FY2017
with around 10 months of operation since its debut and recorded a revenue of HK$51.2mn in
1H18. We believe it was a successful attempt to launch the health management service and the
new business ramped up very quickly. The health management business will maintain a high
growth rate in the next few years, in our view, driven mainly by medical tourism from the PRC.
We expect the health management business to grow 80%/20%/20% in FY18/FY19/FY20E.
To expand dental service business in Hong Kong through acquisitions. The dental service
business delivered a strong growth with a CAGR of 31.6% in FY15-FY17. Management aimed
to enlarge the dental business scale and currently is in negotiation to acquire a dental chain
with multiple dental centers in Hong Kong, according to an announcement published on 14
Nov 2017. Given the low base and future acquisition potential, we believe the dental business
will maintain robust growth.
Potential M&As propel revenue growth.
Apart from dental services, the Company will continue to explore M&A potentials in other
medical fields, such as cardiac angiography, gastroscopy, dermatology, ophthalmology, ENT
and gynecology. We believe future M&As would broaden the type of services offered and
propel the total revenue growth. The Company had a strong cash flow of HK$333.1mn and low
gearing ratio of 13.8% in 1H18, which we believe is healthy and would support future M&As.
We forecast 26.4% core net profit CAGR in 2017-2020E
Revenue is expected to grow 30.2%/24.4%/19.1% in FY18/FY19/FY20E. Driven by 1)
aesthetic medical clinic expansions, 2) newly acquired business ramp up, and 3) increasing
medical tourism, total revenue is expected to grow 30.2%/24.4%/19.1% to HK$1,256.3mn
/HK$1,562.9mn /HK$1,860.9mn in FY18 /FY19 /FY20E with a CAGR of 24.5% in 2017-20E.
We forecast core net profit to grow 34.6%/23%/21.9% in FY18/FY19/FY20E. Supported
by revenue ramp up, effective integration and utilization improvement, we forecast core
net profit to grow 34.6%/23.0%/21.9% to HK$256mn /HK$314.8mn /HK$383.9mn in
FY18/FY19/FY20E.
Initiation coverage with BUY rating and target price of HK$4.76
We initiate coverage on UMH with BUY rating and target price of HK$4.76 based on DCF model
(WACC: 13.5%, terminal growth rate: 3%). Our target price implies 18.2x/14.8x 2018E/19E
PER, with upside potential of 31.8%.
Key investment risks 1) Highly dependent on the strength of brand image and reputation.
2) Change in clients’ behavior in utilization of prepaid packages may impact the Company’s
revenue growth.
3) Dependent on skilled and competent Registered Practitioners and may not be able to retain
and attract suitable candidates.
4) Failure to replicate the success business models in Hong Kong to the PRC.
5) The Hong Kong aesthetic medical tourism industry sector faces intense competition from
other market, including Japan and Korea.
6) Fail to identify or execute acquisition opportunities.
7 Dec 2017
PLEASE READ THE ANALYST CERTIFICATION AND IMPORTANT DISCLOSURES ON LAST PAGE 5
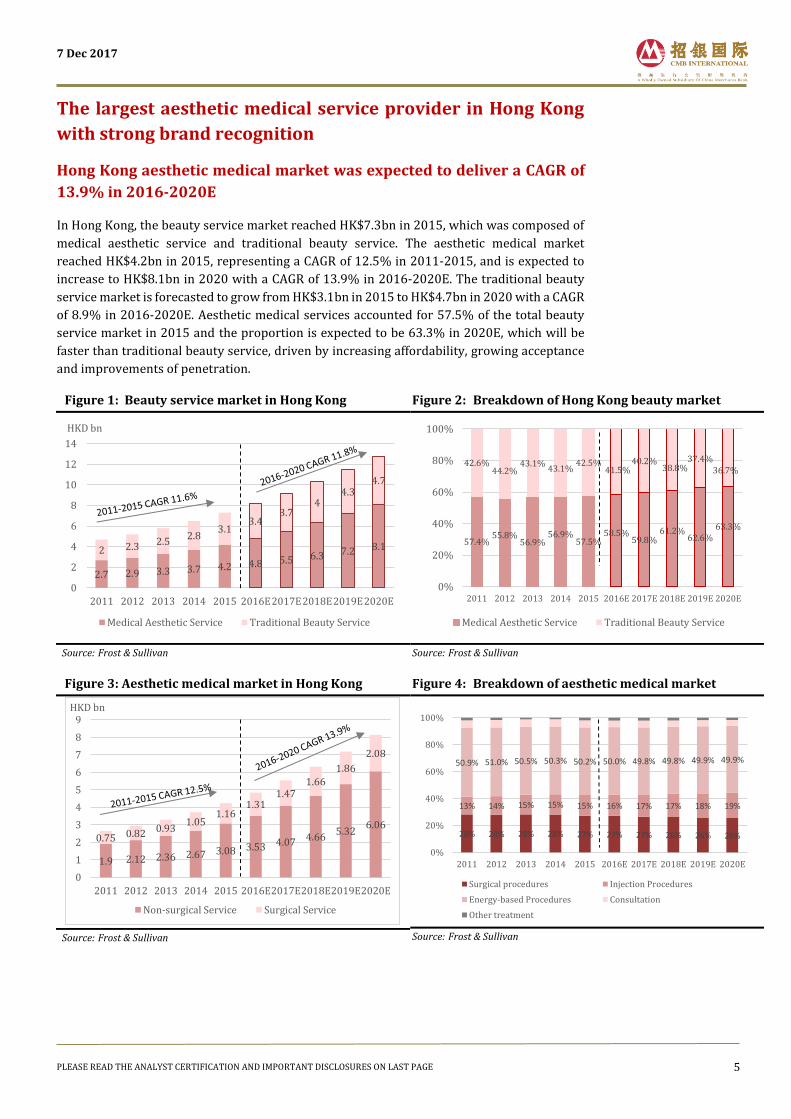
The largest aesthetic medical service provider in Hong Kong
with strong brand recognition
Hong Kong aesthetic medical market was expected to deliver a CAGR of
13.9% in 2016-2020E
In Hong Kong, the beauty service market reached HK$7.3bn in 2015, which was composed of
medical aesthetic service and traditional beauty service. The aesthetic medical market
reached HK$4.2bn in 2015, representing a CAGR of 12.5% in 2011-2015, and is expected to
increase to HK$8.1bn in 2020 with a CAGR of 13.9% in 2016-2020E. The traditional beauty
service market is forecasted to grow from HK$3.1bn in 2015 to HK$4.7bn in 2020 with a CAGR
of 8.9% in 2016-2020E. Aesthetic medical services accounted for 57.5% of the total beauty
service market in 2015 and the proportion is expected to be 63.3% in 2020E, which will be
faster than traditional beauty service, driven by increasing affordability, growing acceptance
and improvements of penetration.
Figure 1: Beauty service market in Hong Kong
Source: Frost & Sullivan
Figure 2: Breakdown of Hong Kong beauty market
Source: Frost & Sullivan
Figure 3: Aesthetic medical market in Hong Kong
Source: Frost & Sullivan
Figure 4: Breakdown of aesthetic medical market
Source: Frost & Sullivan
2.7 2.9 3.3 3.7 4.2 4.8 5.5 6.3 7.2 8.12 2.3 2.52.8
3.13.4
3.74
4.34.7
0
2
4
6
8
10
12
14
2011 2012 2013 2014 2015 2016E2017E2018E2019E2020E
HKD bn
Medical Aesthetic Service Traditional Beauty Service
57.4%55.8%
56.9%56.9%
57.5%58.5%
59.8%61.2%
62.6%63.3%
42.6%44.2%
43.1%43.1%
42.5%41.5%
40.2%38.8%
37.4%36.7%
0%
20%
40%
60%
80%
100%
2011 2012 2013 2014 2015 2016E 2017E 2018E 2019E 2020E
Medical Aesthetic Service Traditional Beauty Service
1.9 2.12 2.36 2.67 3.08 3.53 4.07 4.665.32
6.060.75 0.82 0.93
1.051.16
1.311.47
1.661.86
2.08
0
1
2
3
4
5
6
7
8
9
2011 2012 2013 2014 2015 2016E2017E2018E2019E2020E
HKD bn
Non-surgical Service Surgical Service
28% 28% 28% 28% 27% 27% 27% 26% 26% 26%
13% 14% 15% 15% 15% 16% 17% 17% 18% 19%
50.9% 51.0% 50.5% 50.3% 50.2% 50.0% 49.8% 49.8% 49.9% 49.9%
0%
20%
40%
60%
80%
100%
2011 2012 2013 2014 2015 2016E 2017E 2018E 2019E 2020E
Surgical procedures Injection Procedures
Energy-based Procedures Consultation
Other treatment
7 Dec 2017
PLEASE READ THE ANALYST CERTIFICATION AND IMPORTANT DISCLOSURES ON LAST PAGE 6
Figure 5: Comparison between traditional beauty salon and aesthetic medical center
Types Major services available Professional requirements
Pricing Client expectation
Traditional beauty salons
Spa, massage, manicure, pedicure, waxing, and energy-based procedures
Non-professional training Low to medium
Moderate aesthetic effects; generally relaxing and more frequent
Modern aesthetic medical service providers
Aesthetic surgical procedures, minimally invasive procedures, and energy-based procedures
Doctors to prescribe certain medicines; Doctors and trained therapists to perform certain procedures
Medium to high
More noticeable and longer-lasting aesthetic effects
Source: Company, CMBIS
Figure 6: Aesthetic medical service providers in Hong Kong
Category Features
Aesthetic medical departments of private hospitals Rely on the reputation of the private hospitals
Independent aesthetic medical centers Rely heavily on doctors' personal reputations
One-stop aesthetic medical service centers Doctors and Plastic Surgeons may serve in multiple centers, and the brand images of the centers help attract potential clients.
Source: Company, CMBIS
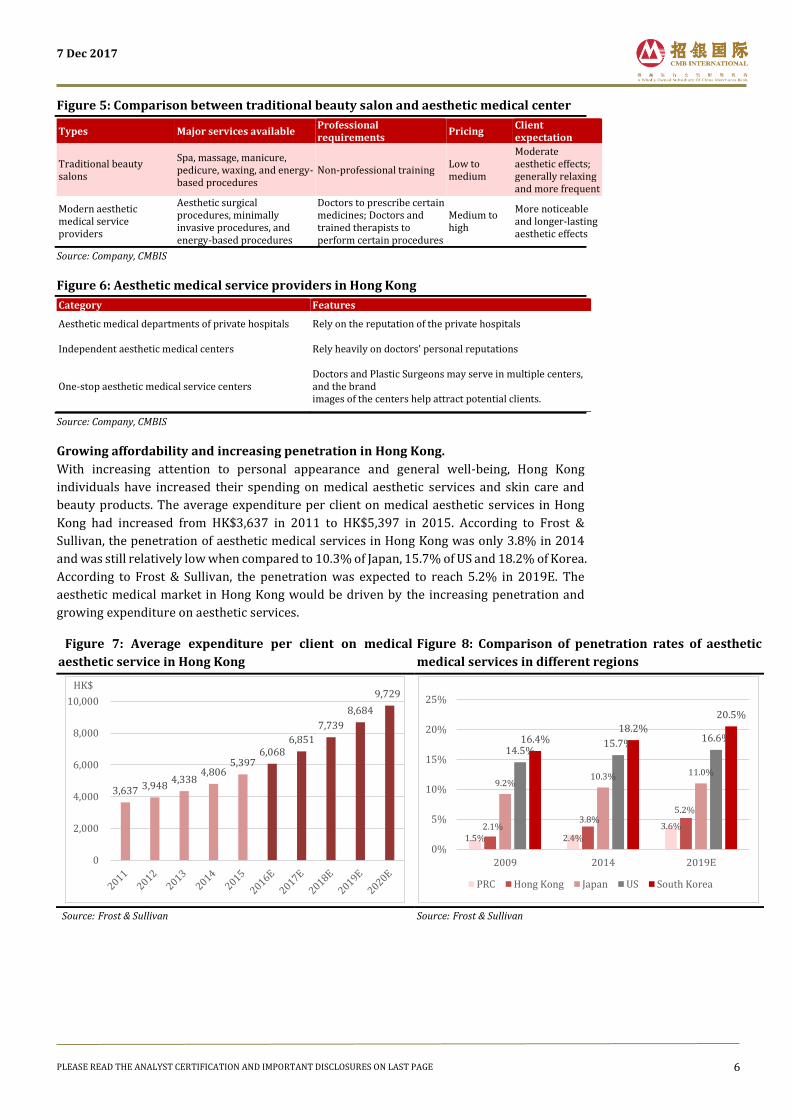
Growing affordability and increasing penetration in Hong Kong.
With increasing attention to personal appearance and general well-being, Hong Kong
individuals have increased their spending on medical aesthetic services and skin care and
beauty products. The average expenditure per client on medical aesthetic services in Hong
Kong had increased from HK$3,637 in 2011 to HK$5,397 in 2015. According to Frost &
Sullivan, the penetration of aesthetic medical services in Hong Kong was only 3.8% in 2014
and was still relatively low when compared to 10.3% of Japan, 15.7% of US and 18.2% of Korea.
According to Frost & Sullivan, the penetration was expected to reach 5.2% in 2019E. The
aesthetic medical market in Hong Kong would be driven by the increasing penetration and
growing expenditure on aesthetic services.
Figure 7: Average expenditure per client on medical
aesthetic service in Hong Kong
Source: Frost & Sullivan
Figure 8: Comparison of penetration rates of aesthetic
medical services in different regions
Source: Frost & Sullivan
3,637 3,948 4,338
4,806 5,397
6,068 6,851
7,739
8,684
9,729
0
2,000
4,000
6,000
8,000
10,000
HK$
1.5% 2.4%
3.6%2.1%3.8%
5.2%
9.2%10.3% 11.0%
14.5%15.7%
16.6%16.4%18.2%
20.5%
0%
5%
10%
15%
20%
25%
2009 2014 2019E
PRC Hong Kong Japan US South Korea
7 Dec 2017
PLEASE READ THE ANALYST CERTIFICATION AND IMPORTANT DISCLOSURES ON LAST PAGE 7
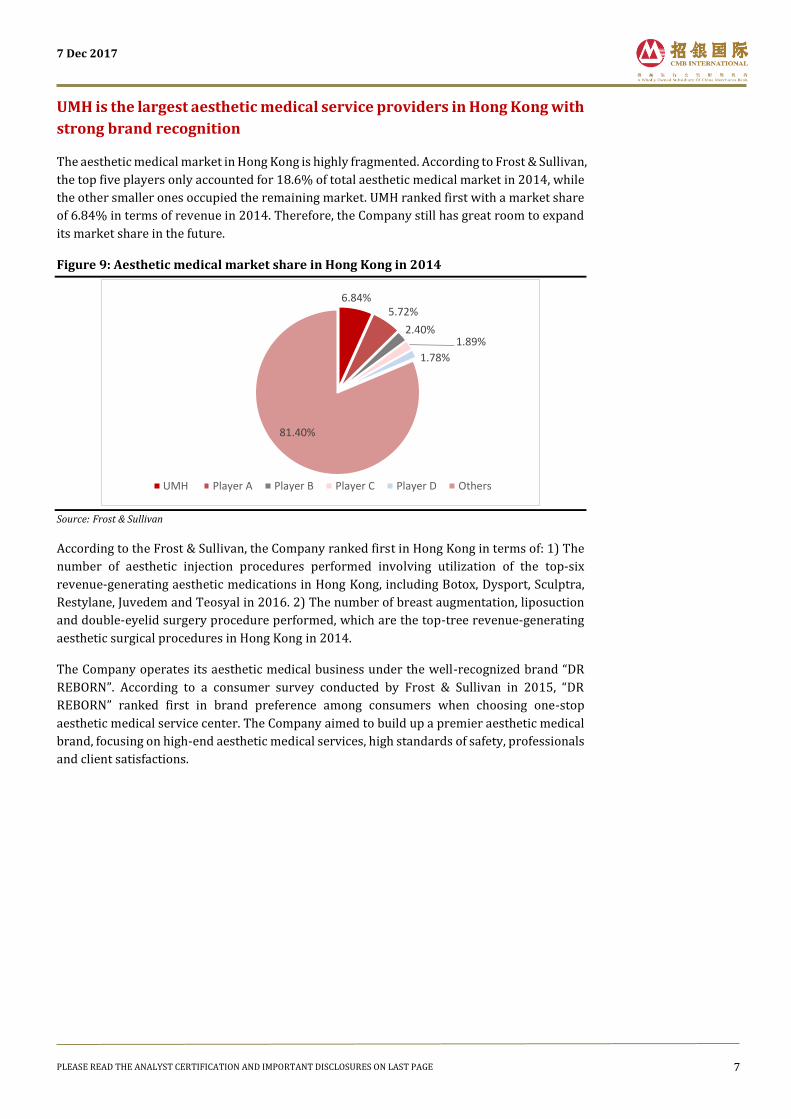
UMH is the largest aesthetic medical service providers in Hong Kong with
strong brand recognition
The aesthetic medical market in Hong Kong is highly fragmented. According to Frost & Sullivan,
the top five players only accounted for 18.6% of total aesthetic medical market in 2014, while
the other smaller ones occupied the remaining market. UMH ranked first with a market share
of 6.84% in terms of revenue in 2014. Therefore, the Company still has great room to expand
its market share in the future.
Figure 9: Aesthetic medical market share in Hong Kong in 2014
Source: Frost & Sullivan
According to the Frost & Sullivan, the Company ranked first in Hong Kong in terms of: 1) The
number of aesthetic injection procedures performed involving utilization of the top-six
revenue-generating aesthetic medications in Hong Kong, including Botox, Dysport, Sculptra,
Restylane, Juvedem and Teosyal in 2016. 2) The number of breast augmentation, liposuction
and double-eyelid surgery procedure performed, which are the top-tree revenue-generating
aesthetic surgical procedures in Hong Kong in 2014.
The Company operates its aesthetic medical business under the well-recognized brand “DR
REBORN”. According to a consumer survey conducted by Frost & Sullivan in 2015, “DR
REBORN” ranked first in brand preference among consumers when choosing one-stop
aesthetic medical service center. The Company aimed to build up a premier aesthetic medical
brand, focusing on high-end aesthetic medical services, high standards of safety, professionals
and client satisfactions.
6.84%5.72%
2.40%1.89%
1.78%
81.40%
UMH Player A Player B Player C Player D Others

7 Dec 2017
PLEASE READ THE ANALYST CERTIFICATION AND IMPORTANT DISCLOSURES ON LAST PAGE 8
Figure 10: Awards and recognition in Hong Kong
Brand Type Achievements
Botox
Botulinum Toxin A Highest Sales Achievement for Consecutive 7 Years from 2010 to 2016 within Hong Kong
Dysport
Botulinum Toxin A Highest Sales Achievement for Consecutive 9 Years from 2008 to 2016 within Hong Kong
Juvederm
Dermal Fillar Highest Sales Achievement for Consecutive 7 Years from 2010 to 2016 within Hong Kong
Restylane
Hyaluronic acid Highest Sales Achievement for Consecutive 7 Years from 2010 to 2016 within Hong Kong
Sculptra
Poly-l-lactic Acid Highest Sales Achievement for Consecutive 7 Years from 2010 to 2016 within Hong Kong
Teosyal
Hyaluronic acid Highest Sales Achievement for Consecutive 6 Years from 2011 to 2016 within Hong Kong
Source: company, CMBIS
One-stop aesthetic service provider, focusing on aesthetic medical
service, supplemented by traditional beauty service
The Company provides a broad range of aesthetic medical services and traditional beauty
services with treatments performed by doctors or trained therapists and operates it aesthetic
medical business under the well-recognized brand “DR REBORN” and some sub-brands
(“Dermagic”, “Young Aesthetics”). Aesthetic medical service is divided into surgical
procedures and non-surgical procedures. Aesthetic surgical procedures of the Company
comprise treatments of eyelid and nose related procedures, breast augmentation and
liposuction. Non-surgical procedures include minimally invasive procedures and energy-
based procedures performed by doctors,
The aesthetic surgical business accounted for 1.6% of total revenue in FY2017 and was not
expected to deliver high growth in the future, due to the limited plastic surgeon resource and
operating rooms. The minimally invasive service involves treatments of injection procedures,
such as Botulinum Toxin A, Dermal Fillers, Hyaluronic acid and Poly-L-lactic acid. The
minimally invasive business boosted by 81.7% YoY to HK$324mn in FY2017 and generated
33.6% of total revenue (Ranked first among all procedures). Revenue from energy-based
procedures performed by doctors and quasi-medical services (Energy-based procedures
performed by trained therapists) increased by 104.5% / 30.2% YoY to HK$83.2mn/
HK$96.4mn and accounted for 8.5%/10% of total revenue in FY2017.
The Company offers non-medical and non-invasive traditional beauty services, which
complement medical and quasi-medical services. Traditional beauty services include body and
facial procedures, such as Guinot Hydrafermie, Moisturizing Facials, Robolex and Aromatic
Massages. Revenue from traditional beauty increased by 169.6% YoY to HK$175.4mn and
contributed 18% of total revenue. Besides, the Company also offers skincare products,
including self-owned brands (PRODERMA LAB and Suissebeaute), which generated a revenue
of HK$61.9mn in FY2017. Furthermore, the company invested in 5 “Mulan” beauty salons and
7 Dec 2017
PLEASE READ THE ANALYST CERTIFICATION AND IMPORTANT DISCLOSURES ON LAST PAGE 9
integrated a haircare chain “Tony & Guy” in Hong Kong in Sep 2017, which would supplement
to existing beauty service business.
The market concerned about the high ratios of unutilized prepaid packages may damage the
reputation of the Company. However, the proportion of revenue recognized from unutilized
prepaid packages has declined from 35.8% in FY2016 to 8.1% of total revenue in FY2017, due
to the KPI mechanism. The Company had regarded the utilization of prepaid package as a KPI
for its client relationship managers and had taken various measures to encourage its clients
to make reservations.
Figure 11: Aesthetic service procedures
Categories Sub-categories Major procedures
Aesthetic medical service
Aesthetic surgical procedures
Eye and nose related surgery/ breast augmentation/ liposuction
Minimally invasive procedures
Injection procedures: Botulinum Toxin A / Dermal Fillers/ Hyaluronic acid/ Poly-L-lactic acid
Energy-based procedures performed by doctors
Cryolyposis/ lasers/ radio frequency/ HIFU/ intense pulsed light
Quasi-medical Energy-based procedures performed by Trained Therapists
Energy-based procedures performed by Trained Therapists
Traditional beauty
Facial Guinot Hydrafermie/ moisturising facials
Massages, other non-invasive procedures
Robolex/ aromatic massages
Sales of products Skincare, healthcare and beauty product
self-owned brands ( PRODERMA LAD, Swissline) / third party bands
Source: Company, CMBIS
Figure 12: Total revenue breakdown in FY2017
Source: Company, CMBIS
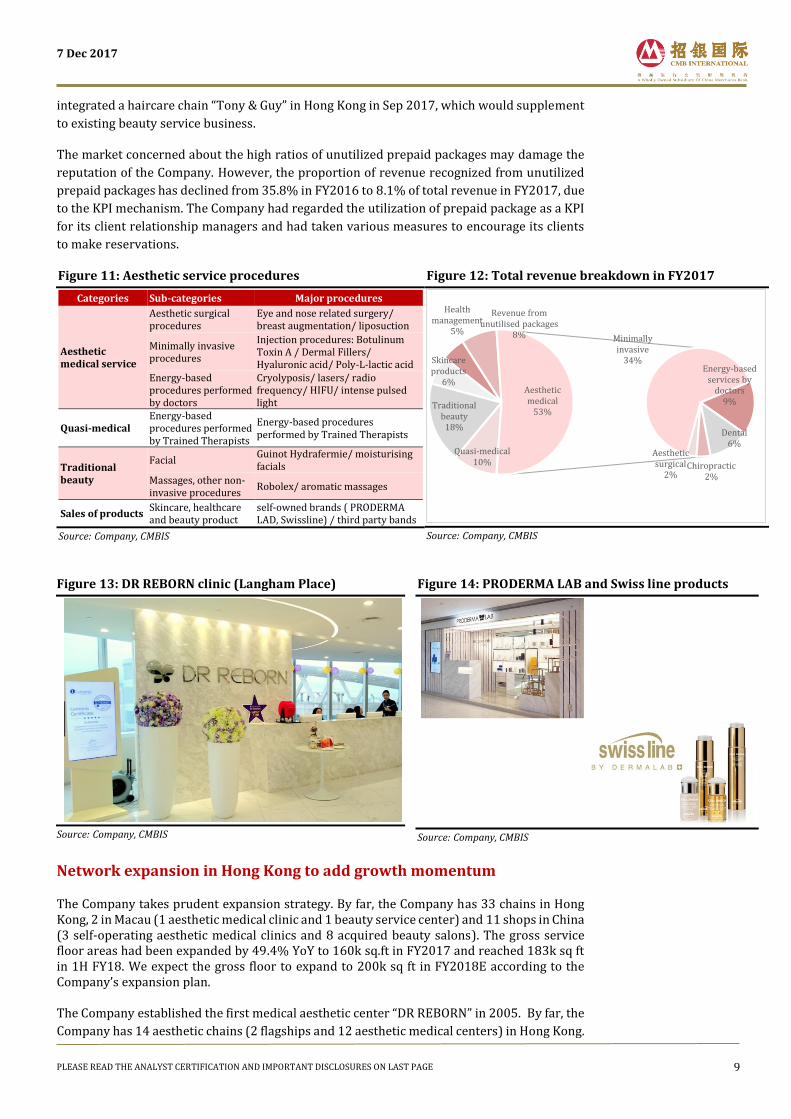
Figure 13: DR REBORN clinic (Langham Place)
Source: Company, CMBIS
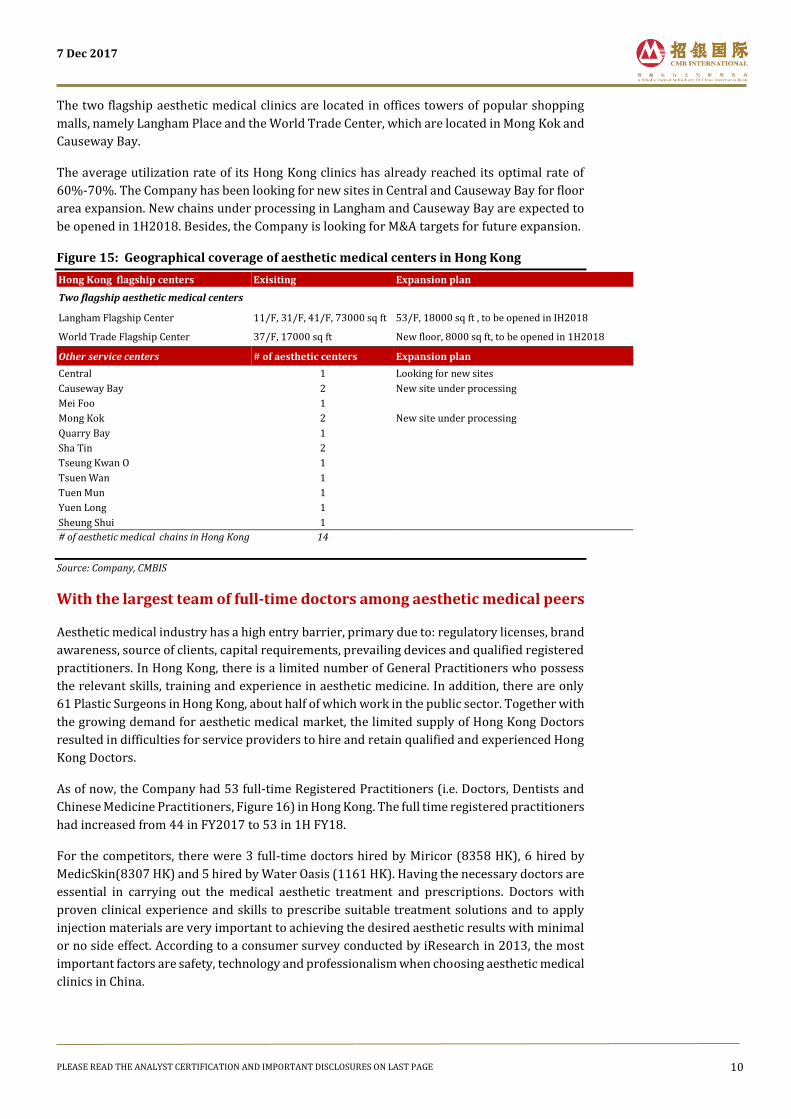
Figure 14: PRODERMA LAB and Swiss line products
Source: Company, CMBIS
Network expansion in Hong Kong to add growth momentum
The Company takes prudent expansion strategy. By far, the Company has 33 chains in Hong Kong, 2 in Macau (1 aesthetic medical clinic and 1 beauty service center) and 11 shops in China (3 self-operating aesthetic medical clinics and 8 acquired beauty salons). The gross service floor areas had been expanded by 49.4% YoY to 160k sq.ft in FY2017 and reached 183k sq ft in 1H FY18. We expect the gross floor to expand to 200k sq ft in FY2018E according to the Company’s expansion plan. The Company established the first medical aesthetic center “DR REBORN” in 2005. By far, the
Company has 14 aesthetic chains (2 flagships and 12 aesthetic medical centers) in Hong Kong.
Quasi-medical 10%
Traditional beauty
18%
Skincare products
6%
Health management
5%
Revenue from unutilised packages
8%
Aesthetic surgical
2%
Minimally invasive
34%Energy-based
services by doctors
9%
Dental 6%
Chiropractic 2%
Aesthetic medical
53%
7 Dec 2017
PLEASE READ THE ANALYST CERTIFICATION AND IMPORTANT DISCLOSURES ON LAST PAGE 10
The two flagship aesthetic medical clinics are located in offices towers of popular shopping
malls, namely Langham Place and the World Trade Center, which are located in Mong Kok and
Causeway Bay.
The average utilization rate of its Hong Kong clinics has already reached its optimal rate of
60%-70%. The Company has been looking for new sites in Central and Causeway Bay for floor
area expansion. New chains under processing in Langham and Causeway Bay are expected to
be opened in 1H2018. Besides, the Company is looking for M&A targets for future expansion.
Figure 15: Geographical coverage of aesthetic medical centers in Hong Kong
Hong Kong flagship centers Exisiting Expansion plan
Two flagship aesthetic medical centers
Langham Flagship Center 11/F, 31/F, 41/F, 73000 sq ft 53/F, 18000 sq ft , to be opened in IH2018
World Trade Flagship Center 37/F, 17000 sq ft New floor, 8000 sq ft, to be opened in 1H2018
Other service centers # of aesthetic centers Expansion plan
Central 1 Looking for new sites
Causeway Bay 2 New site under processing
Mei Foo 1
Mong Kok 2 New site under processing
Quarry Bay 1
Sha Tin 2
Tseung Kwan O 1
Tsuen Wan 1
Tuen Mun 1
Yuen Long 1
Sheung Shui 1
# of aesthetic medical chains in Hong Kong 14
Source: Company, CMBIS
With the largest team of full-time doctors among aesthetic medical peers
Aesthetic medical industry has a high entry barrier, primary due to: regulatory licenses, brand
awareness, source of clients, capital requirements, prevailing devices and qualified registered
practitioners. In Hong Kong, there is a limited number of General Practitioners who possess
the relevant skills, training and experience in aesthetic medicine. In addition, there are only
61 Plastic Surgeons in Hong Kong, about half of which work in the public sector. Together with
the growing demand for aesthetic medical market, the limited supply of Hong Kong Doctors
resulted in difficulties for service providers to hire and retain qualified and experienced Hong
Kong Doctors.
As of now, the Company had 53 full-time Registered Practitioners (i.e. Doctors, Dentists and
Chinese Medicine Practitioners, Figure 16) in Hong Kong. The full time registered practitioners
had increased from 44 in FY2017 to 53 in 1H FY18.
For the competitors, there were 3 full-time doctors hired by Miricor (8358 HK), 6 hired by
MedicSkin(8307 HK) and 5 hired by Water Oasis (1161 HK). Having the necessary doctors are
essential in carrying out the medical aesthetic treatment and prescriptions. Doctors with
proven clinical experience and skills to prescribe suitable treatment solutions and to apply
injection materials are very important to achieving the desired aesthetic results with minimal
or no side effect. According to a consumer survey conducted by iResearch in 2013, the most
important factors are safety, technology and professionalism when choosing aesthetic medical
clinics in China.
7 Dec 2017
PLEASE READ THE ANALYST CERTIFICATION AND IMPORTANT DISCLOSURES ON LAST PAGE 11
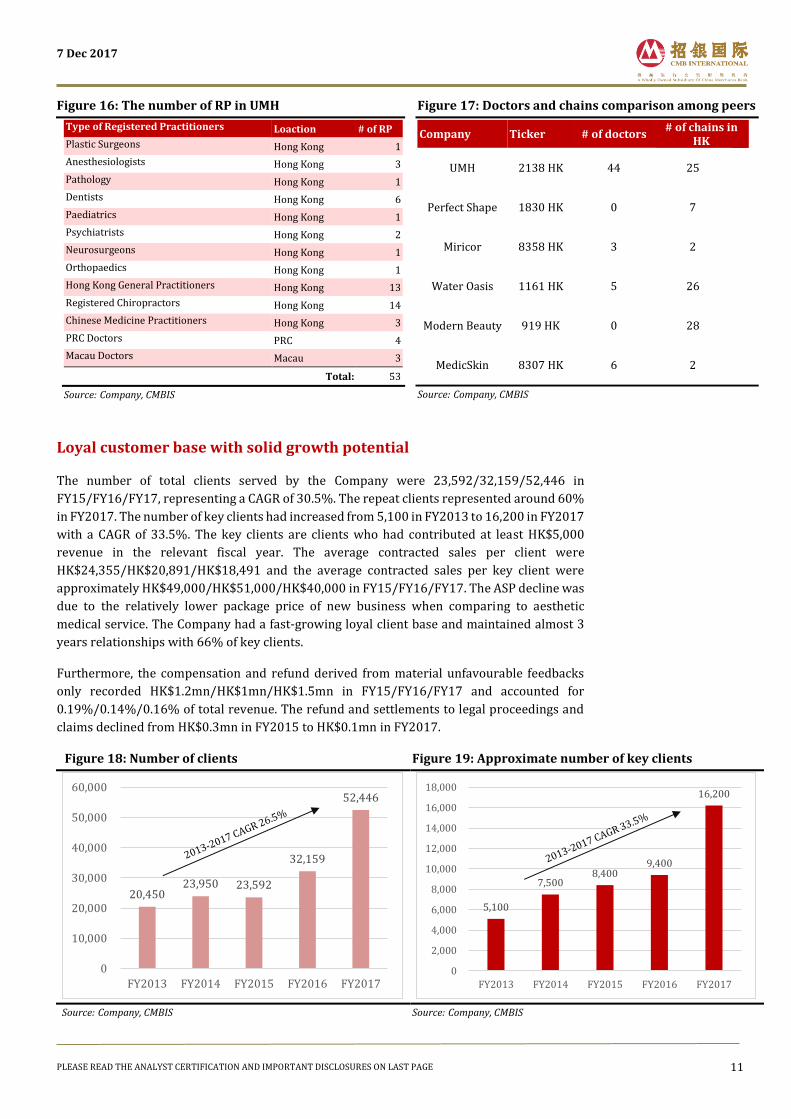
Figure 16: The number of RP in UMH
Type of Registered Practitioners Loaction # of RP
Plastic Surgeons Hong Kong 1
Anesthesiologists Hong Kong 3
Pathology Hong Kong 1
Dentists Hong Kong 6
Paediatrics Hong Kong 1
Psychiatrists Hong Kong 2
Neurosurgeons Hong Kong 1
Orthopaedics Hong Kong 1
Hong Kong General Practitioners Hong Kong 13
Registered Chiropractors Hong Kong 14
Chinese Medicine Practitioners Hong Kong 3
PRC Doctors PRC 4
Macau Doctors Macau 3
Total: 53
Source: Company, CMBIS
Figure 17: Doctors and chains comparison among peers
Company Ticker # of doctors # of chains in
HK
UMH 2138 HK 44 25
Perfect Shape 1830 HK 0 7
Miricor 8358 HK 3 2
Water Oasis 1161 HK 5 26
Modern Beauty 919 HK 0 28
MedicSkin 8307 HK 6 2
Source: Company, CMBIS
Loyal customer base with solid growth potential
The number of total clients served by the Company were 23,592/32,159/52,446 in
FY15/FY16/FY17, representing a CAGR of 30.5%. The repeat clients represented around 60%
in FY2017. The number of key clients had increased from 5,100 in FY2013 to 16,200 in FY2017
with a CAGR of 33.5%. The key clients are clients who had contributed at least HK$5,000
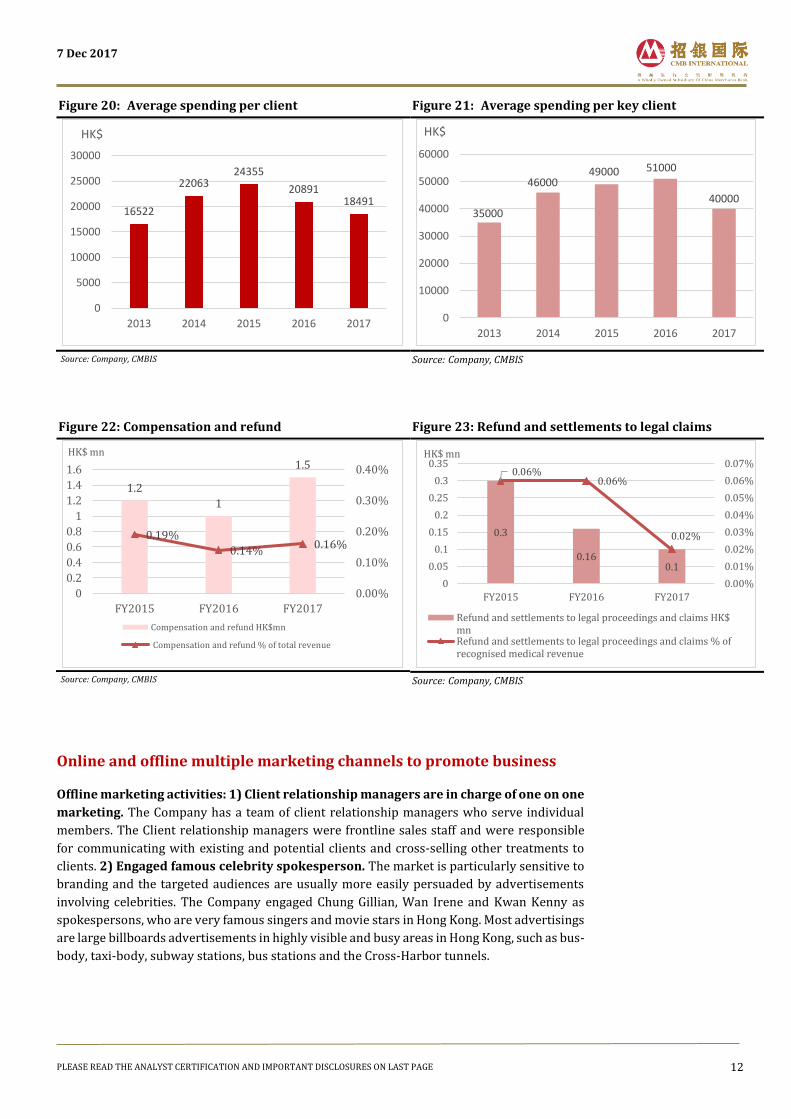
revenue in the relevant fiscal year. The average contracted sales per client were
HK$24,355/HK$20,891/HK$18,491 and the average contracted sales per key client were
approximately HK$49,000/HK$51,000/HK$40,000 in FY15/FY16/FY17. The ASP decline was
due to the relatively lower package price of new business when comparing to aesthetic
medical service. The Company had a fast-growing loyal client base and maintained almost 3
years relationships with 66% of key clients.
Furthermore, the compensation and refund derived from material unfavourable feedbacks
only recorded HK$1.2mn/HK$1mn/HK$1.5mn in FY15/FY16/FY17 and accounted for
0.19%/0.14%/0.16% of total revenue. The refund and settlements to legal proceedings and
claims declined from HK$0.3mn in FY2015 to HK$0.1mn in FY2017.
Figure 18: Number of clients
Source: Company, CMBIS
Figure 19: Approximate number of key clients
Source: Company, CMBIS
20,450 23,950 23,592
32,159
52,446
0
10,000
20,000
30,000
40,000
50,000
60,000
FY2013 FY2014 FY2015 FY2016 FY2017
5,100
7,500 8,400
9,400
16,200
0
2,000
4,000
6,000
8,000
10,000
12,000
14,000
16,000
18,000
FY2013 FY2014 FY2015 FY2016 FY2017
7 Dec 2017
PLEASE READ THE ANALYST CERTIFICATION AND IMPORTANT DISCLOSURES ON LAST PAGE 12
Figure 20: Average spending per client
Source: Company, CMBIS
Figure 21: Average spending per key client
Source: Company, CMBIS
Figure 22: Compensation and refund
Source: Company, CMBIS
Figure 23: Refund and settlements to legal claims
Source: Company, CMBIS
Online and offline multiple marketing channels to promote business
Offline marketing activities: 1) Client relationship managers are in charge of one on one
marketing. The Company has a team of client relationship managers who serve individual
members. The Client relationship managers were frontline sales staff and were responsible
for communicating with existing and potential clients and cross-selling other treatments to
clients. 2) Engaged famous celebrity spokesperson. The market is particularly sensitive to
branding and the targeted audiences are usually more easily persuaded by advertisements
involving celebrities. The Company engaged Chung Gillian, Wan Irene and Kwan Kenny as
spokespersons, who are very famous singers and movie stars in Hong Kong. Most advertisings
are large billboards advertisements in highly visible and busy areas in Hong Kong, such as bus-
body, taxi-body, subway stations, bus stations and the Cross-Harbor tunnels.
16522
2206324355
2089118491
0
5000
10000
15000
20000
25000
30000
2013 2014 2015 2016 2017
HK$
35000
4600049000 51000
40000
0
10000
20000
30000
40000
50000
60000
2013 2014 2015 2016 2017
HK$
1.2
1
1.5
0.19%
0.14%0.16%
0.00%
0.10%
0.20%
0.30%
0.40%
0
0.2
0.4
0.6
0.8
1
1.2
1.4
1.6
FY2015 FY2016 FY2017
HK$ mn
Compensation and refund HK$mn
Compensation and refund % of total revenue
0.3
0.160.1
0.06%0.06%
0.02%
0.00%
0.01%
0.02%
0.03%
0.04%
0.05%
0.06%
0.07%
0
0.05
0.1
0.15
0.2
0.25
0.3
0.35
FY2015 FY2016 FY2017
HK$ mn
Refund and settlements to legal proceedings and claims HK$mnRefund and settlements to legal proceedings and claims % ofrecognised medical revenue
7 Dec 2017
PLEASE READ THE ANALYST CERTIFICATION AND IMPORTANT DISCLOSURES ON LAST PAGE 13
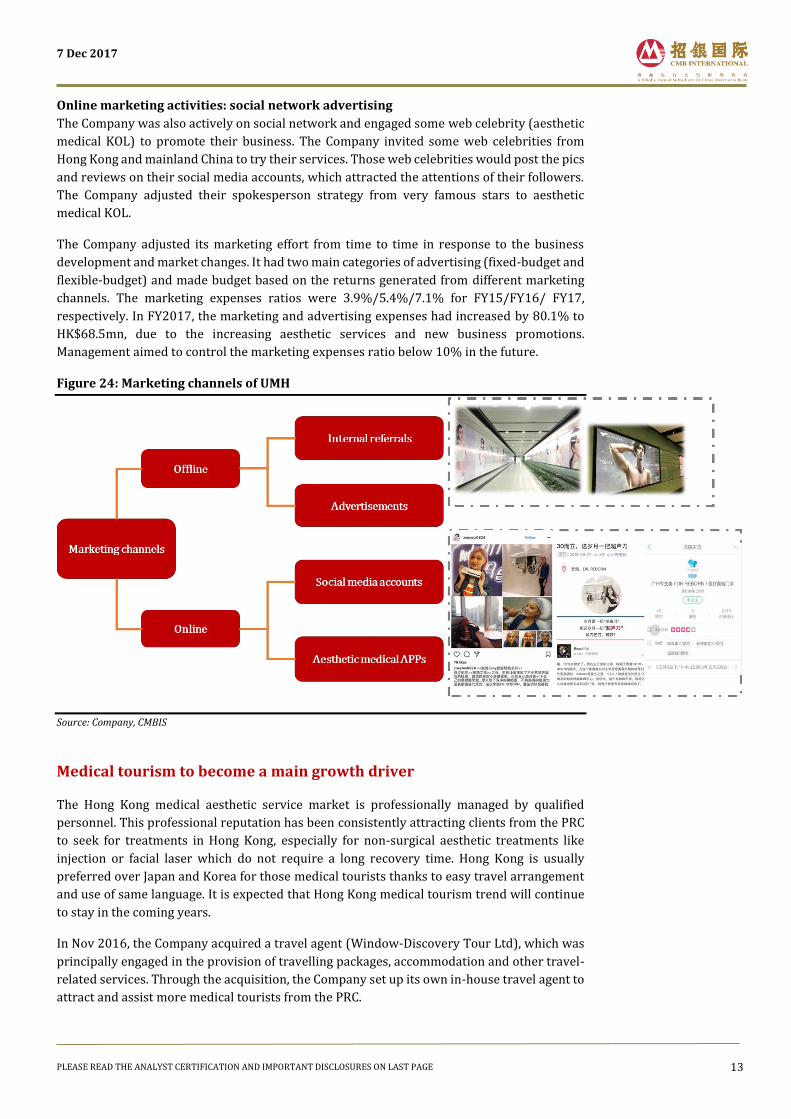
Online marketing activities: social network advertising
The Company was also actively on social network and engaged some web celebrity (aesthetic
medical KOL) to promote their business. The Company invited some web celebrities from
Hong Kong and mainland China to try their services. Those web celebrities would post the pics
and reviews on their social media accounts, which attracted the attentions of their followers.
The Company adjusted their spokesperson strategy from very famous stars to aesthetic
medical KOL.
The Company adjusted its marketing effort from time to time in response to the business
development and market changes. It had two main categories of advertising (fixed-budget and
flexible-budget) and made budget based on the returns generated from different marketing
channels. The marketing expenses ratios were 3.9%/5.4%/7.1% for FY15/FY16/ FY17,
respectively. In FY2017, the marketing and advertising expenses had increased by 80.1% to
HK$68.5mn, due to the increasing aesthetic services and new business promotions.
Management aimed to control the marketing expenses ratio below 10% in the future.
Figure 24: Marketing channels of UMH
Source: Company, CMBIS
Medical tourism to become a main growth driver
The Hong Kong medical aesthetic service market is professionally managed by qualified
personnel. This professional reputation has been consistently attracting clients from the PRC
to seek for treatments in Hong Kong, especially for non-surgical aesthetic treatments like
injection or facial laser which do not require a long recovery time. Hong Kong is usually
preferred over Japan and Korea for those medical tourists thanks to easy travel arrangement
and use of same language. It is expected that Hong Kong medical tourism trend will continue
to stay in the coming years.
In Nov 2016, the Company acquired a travel agent (Window-Discovery Tour Ltd), which was
principally engaged in the provision of travelling packages, accommodation and other travel-
related services. Through the acquisition, the Company set up its own in-house travel agent to
attract and assist more medical tourists from the PRC.
7 Dec 2017
PLEASE READ THE ANALYST CERTIFICATION AND IMPORTANT DISCLOSURES ON LAST PAGE 14
Revenue from PRC clients accounted for 9%/14%/25% of total revenue in FY15/FY16/FY17.
In FY2017, PRC clients contributed a revenue of HK$241.2mn, among which 92%
(HK$222.1mn) came from medical tourists to Hong Kong and 8% (HK$19.1mn) derived from
PRC clinics. The revenue from PRC medical tourists increased from HK$90mn in FY16 to
HK$222.1mn in FY17. As per Management, medical tourism has become a major growth driver
for the Company. In 1H FY2018, PRC clients generated a revenue of HK$220.4mn and
accounted for 35.7% of overall revenue and we expected the revenue proportion from PRC
clients to be around 30%-40% in FY2018.
Promising PRC market supports medical tourism referral
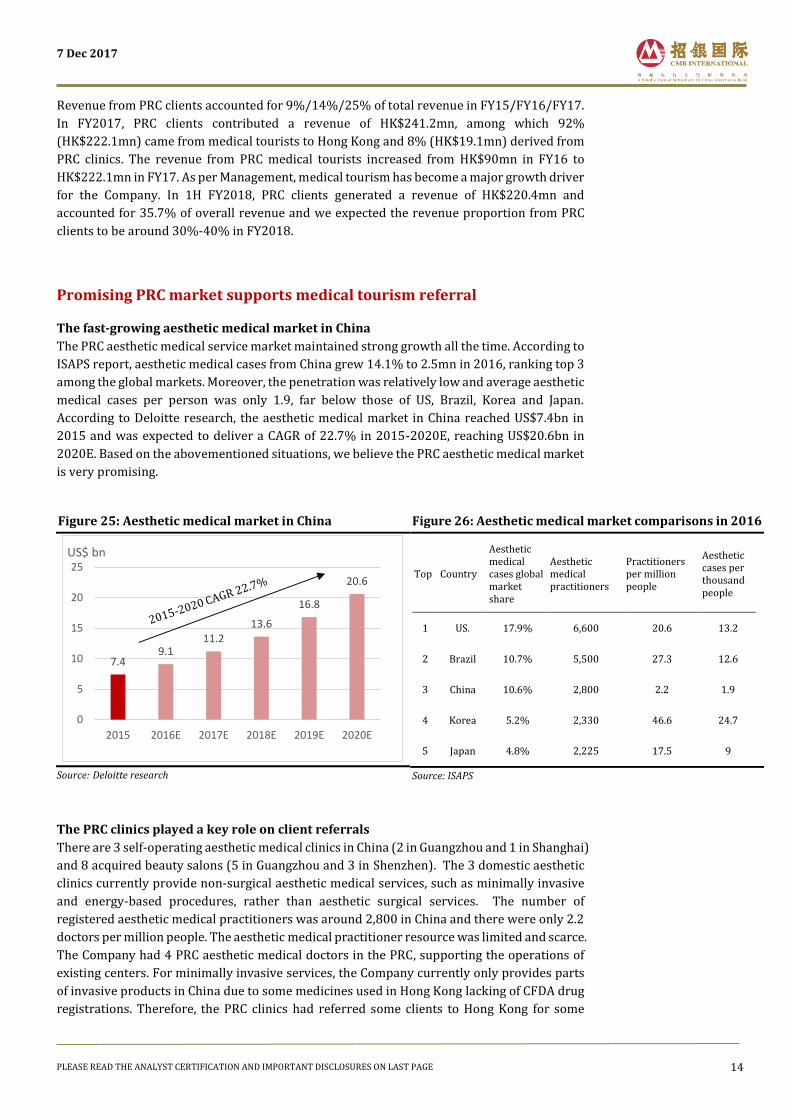
The fast-growing aesthetic medical market in China
The PRC aesthetic medical service market maintained strong growth all the time. According to
ISAPS report, aesthetic medical cases from China grew 14.1% to 2.5mn in 2016, ranking top 3
among the global markets. Moreover, the penetration was relatively low and average aesthetic
medical cases per person was only 1.9, far below those of US, Brazil, Korea and Japan.
According to Deloitte research, the aesthetic medical market in China reached US$7.4bn in
2015 and was expected to deliver a CAGR of 22.7% in 2015-2020E, reaching US$20.6bn in
2020E. Based on the abovementioned situations, we believe the PRC aesthetic medical market
is very promising.
Figure 25: Aesthetic medical market in China
Source: Deloitte research
Figure 26: Aesthetic medical market comparisons in 2016
Top Country
Aesthetic medical cases global market share
Aesthetic medical practitioners
Practitioners per million people
Aesthetic cases per thousand people
1 US. 17.9% 6,600 20.6 13.2
2 Brazil 10.7% 5,500 27.3 12.6
3 China 10.6% 2,800 2.2 1.9
4 Korea 5.2% 2,330 46.6 24.7
5 Japan 4.8% 2,225 17.5 9
Source: ISAPS
The PRC clinics played a key role on client referrals
There are 3 self-operating aesthetic medical clinics in China (2 in Guangzhou and 1 in Shanghai)
and 8 acquired beauty salons (5 in Guangzhou and 3 in Shenzhen). The 3 domestic aesthetic
clinics currently provide non-surgical aesthetic medical services, such as minimally invasive
and energy-based procedures, rather than aesthetic surgical services. The number of
registered aesthetic medical practitioners was around 2,800 in China and there were only 2.2
doctors per million people. The aesthetic medical practitioner resource was limited and scarce.
The Company had 4 PRC aesthetic medical doctors in the PRC, supporting the operations of
existing centers. For minimally invasive services, the Company currently only provides parts
of invasive products in China due to some medicines used in Hong Kong lacking of CFDA drug
registrations. Therefore, the PRC clinics had referred some clients to Hong Kong for some
7.49.1
11.213.6
16.8
20.6
0
5
10
15
20
25
2015 2016E 2017E 2018E 2019E 2020E
US$ bn
7 Dec 2017
PLEASE READ THE ANALYST CERTIFICATION AND IMPORTANT DISCLOSURES ON LAST PAGE 15
services not offered by PRC clinics. The Company also intends to establish programmes where
PRC clients would be referred to Hong Kong service centers.
Prudent aesthetic medical clinics expansion plan for the PRC market
For the PRC market, the first aesthetic medical clinic in Guangzhou was established in Jun 2015.
The capex of Guangzhou clinic was HK$3.1mn and the cashflow breakeven period was 8
months. The Company set up the second clinic in Guangzhou in Sep 2016 after the first one
had reached breakeven point. The Shanghai clinic was launched in Mar 2017. For the PRC
expansion plan, clinics in Shenzhen (self-operating) and Chongqing (JV with a local player) are
in the process of being established and will commence operation in 1H2018. According to
Management, the Company plans to establish 1-2 aesthetic medical clinics each year in first
and second tier cities in China and prefers forming JVs with local established aesthetic medical
players with customer base and licenses. Unlike other aesthetic medical players in China, the
Company takes a more careful expansion strategy. We believe, it would be an adoptable
strategy before establishing its own brand image in China.
The PRC market is very promising and supports referral business
Revenue from the PRC clinics was HK$8.9mn/HK$19mn in FY2016/FY2017, accounting
for1.3%/2% of total revenue. In the near term, the PRC clinics played a key role on client
referrals. The Company tries to leverage its brand image in the PRC, establishes a referral
programme and captures the opportunities of growing medical tourism on reliable and quality
medical service. In the long term, the Company will accelerate the domestic expansion once it
has built a well-known branding in the PRC. The Company is committed to expanding its
presence in the PRC through setting up self-owned clinics or JVs with local players.
Figure 27: Clinics in the PRC
The PRC aesthetic medical centers GFA Commence date Expansion plan
Guang Zhou
Clinic 1 Mayfolwer Plaza 4700 sq ft June 2015
Clinic 2 GT Land Spring Plaza 5000 sq ft Sep 2016
Shang Hai
Clinic 1 Shanghai Jing’ an District 5000 sq ft March 2017
Shenzhen
Clinic 1 5000 sq ft 1H2018E Under progress
Chongqing
Clinic 1 8000 sq ft 1H2018E Under progress
More tier 1&2 cities in the future
Source: Company
7 Dec 2017
PLEASE READ THE ANALYST CERTIFICATION AND IMPORTANT DISCLOSURES ON LAST PAGE 16
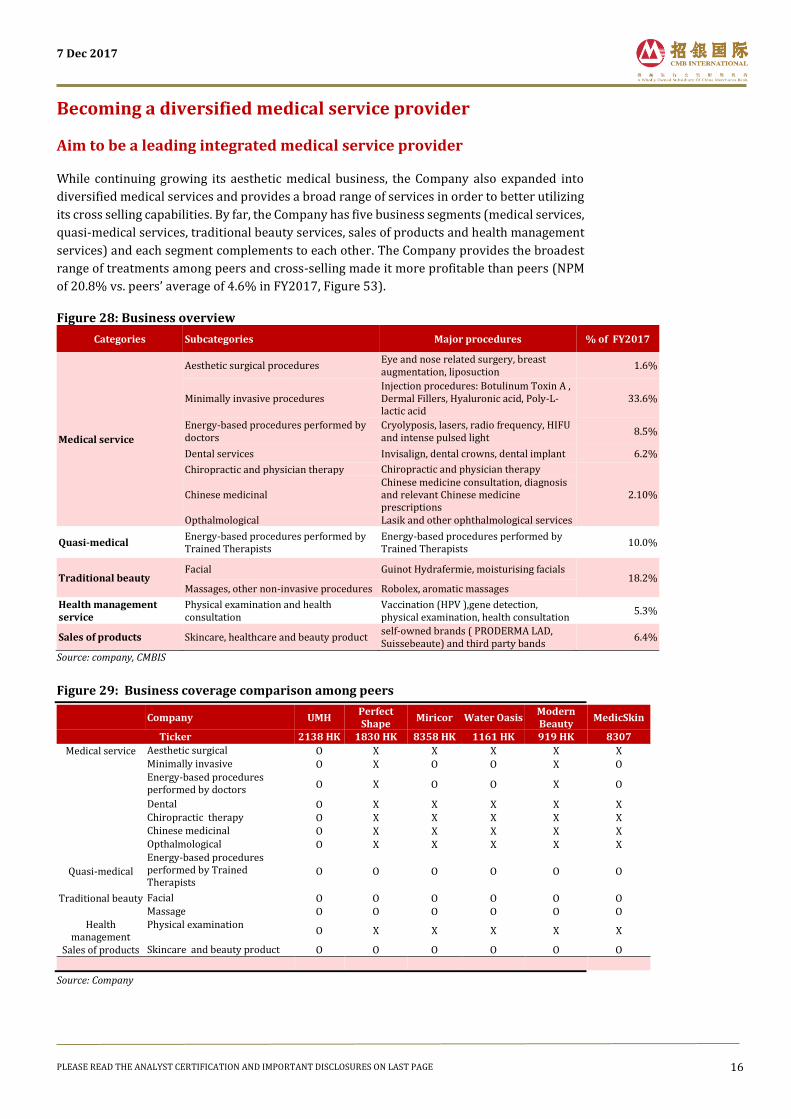
Becoming a diversified medical service provider
Aim to be a leading integrated medical service provider
While continuing growing its aesthetic medical business, the Company also expanded into
diversified medical services and provides a broad range of services in order to better utilizing
its cross selling capabilities. By far, the Company has five business segments (medical services,
quasi-medical services, traditional beauty services, sales of products and health management
services) and each segment complements to each other. The Company provides the broadest
range of treatments among peers and cross-selling made it more profitable than peers (NPM
of 20.8% vs. peers’ average of 4.6% in FY2017, Figure 53).
Figure 28: Business overview
Categories Subcategories Major procedures % of FY2017
Medical service
Aesthetic surgical procedures Eye and nose related surgery, breast augmentation, liposuction
1.6%
Minimally invasive procedures Injection procedures: Botulinum Toxin A , Dermal Fillers, Hyaluronic acid, Poly-L-lactic acid
33.6%
Energy-based procedures performed by doctors
Cryolyposis, lasers, radio frequency, HIFU and intense pulsed light
8.5%
Dental services Invisalign, dental crowns, dental implant 6.2%
Chiropractic and physician therapy Chiropractic and physician therapy
2.10% Chinese medicinal Chinese medicine consultation, diagnosis and relevant Chinese medicine prescriptions
Opthalmological Lasik and other ophthalmological services
Quasi-medical Energy-based procedures performed by Trained Therapists
Energy-based procedures performed by Trained Therapists
10.0%
Traditional beauty Facial Guinot Hydrafermie, moisturising facials
18.2% Massages, other non-invasive procedures Robolex, aromatic massages
Health management service
Physical examination and health consultation
Vaccination (HPV ),gene detection, physical examination, health consultation
5.3%
Sales of products Skincare, healthcare and beauty product self-owned brands ( PRODERMA LAD, Suissebeaute) and third party bands
6.4%
Source: company, CMBIS Figure 29: Business coverage comparison among peers
Company UMH Perfect Shape
Miricor Water Oasis Modern Beauty
MedicSkin
Ticker 2138 HK 1830 HK 8358 HK 1161 HK 919 HK 8307
Medical service Aesthetic surgical O X X X X X
Minimally invasive O X O O X O
Energy-based procedures performed by doctors O X O O X O
Dental O X X X X X Chiropractic therapy O X X X X X
Chinese medicinal O X X X X X
Opthalmological O X X X X X
Quasi-medical
Energy-based procedures performed by Trained Therapists
O O O O O O
Traditional beauty Facial O O O O O O Massage O O O O O O
Health management
Physical examination O X X X X X
Sales of products Skincare and beauty product O O O O O O
Source: Company

7 Dec 2017
PLEASE READ THE ANALYST CERTIFICATION AND IMPORTANT DISCLOSURES ON LAST PAGE 17
The Company operates it aesthetic service business under the main brand “DR REBORN”, and sub-brands (“Young Aesthetic” and “DERMAGIC”), health management under the brand “re:HEALTH”, dental services under the brand” ONE DENTAL” and chiropractic therapy under the brand “NYMG” and “SPINE Central”. The Company currently provides comprehensive medical services through multiple brands in Hong Kong. We believe it will take the advantage of its cross-selling opportunities and refer more clients to each business segment.
Figure 30: Multi-brands of Union Medical
Source: Company, CMBIS
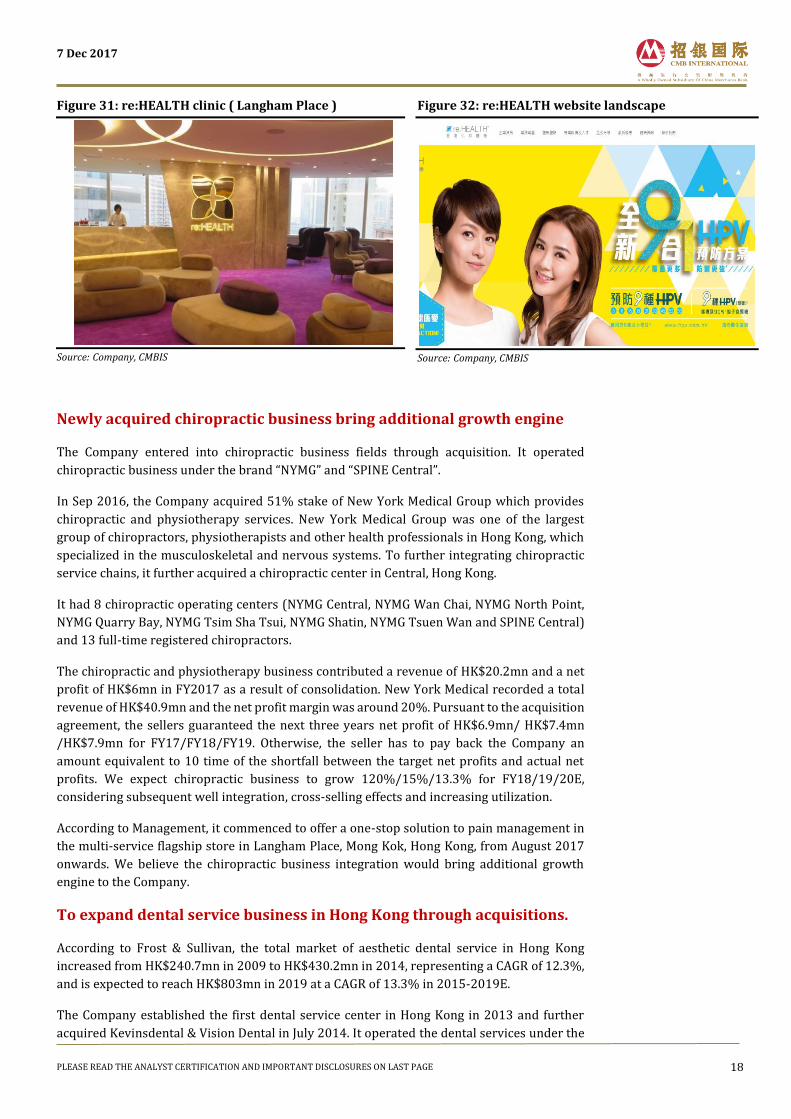
Successful launch of health management business
The Company established the health management center under the brand of “re:HEALTH” in
May 2016 and expanded its business into physical examination field. The health management
center was located in 11/F (GFA: 18,000 sq ft), Langham Place (the same building with the
flagship center), one of the most popular shopping mall with a high visitors flow and
convenient transportation. The health management center provides vaccinations (HPV), gene
detection, physical examination and health consultation. It was equipped with in-house
clinical lab and advanced medical report system (reports can be available within one hour
after test). The quick access to body check reports was efficient and attractive, attracting more
PRC medical tourists. Moreover, the Company cooperated with insurance companies in Hong
Kong, which would refer their clients to “re:HEALTH” for body check and vaccinations.
During June 2016 to May 2017, the health management business recorded a client visits of
over 5,5000, completed over 6,000 full health screening and served around 700 clients per
day. It contributed around HK$51mn to total revenue in FY2017 since launch (10 months
operation) and recorded a revenue of HK$51.2mn in 1H FY18 (vs. HK$13mn in 1H FY17). We
believe it was a very successful attempt to launch health management services and the new
business ramped up very quickly.
The expiration period of the health check pre-paid packages is 6 months and the revenue will
be recognized once the pre-paid package expired. We expect the health management sector to
maintain a high growth rate in the next few years, due to the booming PRC medical tourists.
We expect the health check business to grow 80%/20%/20% in FY18/FY19/FY20E.
7 Dec 2017
PLEASE READ THE ANALYST CERTIFICATION AND IMPORTANT DISCLOSURES ON LAST PAGE 18
Figure 31: re:HEALTH clinic ( Langham Place )
Source: Company, CMBIS
Figure 32: re:HEALTH website landscape
Source: Company, CMBIS
Newly acquired chiropractic business bring additional growth engine
The Company entered into chiropractic business fields through acquisition. It operated
chiropractic business under the brand “NYMG” and “SPINE Central”.
In Sep 2016, the Company acquired 51% stake of New York Medical Group which provides
chiropractic and physiotherapy services. New York Medical Group was one of the largest
group of chiropractors, physiotherapists and other health professionals in Hong Kong, which
specialized in the musculoskeletal and nervous systems. To further integrating chiropractic
service chains, it further acquired a chiropractic center in Central, Hong Kong.
It had 8 chiropractic operating centers (NYMG Central, NYMG Wan Chai, NYMG North Point,
NYMG Quarry Bay, NYMG Tsim Sha Tsui, NYMG Shatin, NYMG Tsuen Wan and SPINE Central)
and 13 full-time registered chiropractors.
The chiropractic and physiotherapy business contributed a revenue of HK$20.2mn and a net
profit of HK$6mn in FY2017 as a result of consolidation. New York Medical recorded a total
revenue of HK$40.9mn and the net profit margin was around 20%. Pursuant to the acquisition
agreement, the sellers guaranteed the next three years net profit of HK$6.9mn/ HK$7.4mn
/HK$7.9mn for FY17/FY18/FY19. Otherwise, the seller has to pay back the Company an
amount equivalent to 10 time of the shortfall between the target net profits and actual net
profits. We expect chiropractic business to grow 120%/15%/13.3% for FY18/19/20E,
considering subsequent well integration, cross-selling effects and increasing utilization.
According to Management, it commenced to offer a one-stop solution to pain management in
the multi-service flagship store in Langham Place, Mong Kok, Hong Kong, from August 2017
onwards. We believe the chiropractic business integration would bring additional growth
engine to the Company.
To expand dental service business in Hong Kong through acquisitions.
According to Frost & Sullivan, the total market of aesthetic dental service in Hong Kong
increased from HK$240.7mn in 2009 to HK$430.2mn in 2014, representing a CAGR of 12.3%,
and is expected to reach HK$803mn in 2019 at a CAGR of 13.3% in 2015-2019E.
The Company established the first dental service center in Hong Kong in 2013 and further
acquired Kevinsdental & Vision Dental in July 2014. It operated the dental services under the
7 Dec 2017
PLEASE READ THE ANALYST CERTIFICATION AND IMPORTANT DISCLOSURES ON LAST PAGE 19
brands “ONE DENTAL” and “ONE DENTAL PLUS”. The Company offered a full range of dental
services for both aesthetic and general dental health purposes, such as prosthetic dentistry,
orthodontics, cosmetic dentistry and dental implants. The top revenue-generating dental
services are Invisalign, dental crowning and dental implanting. Expect for routine dental
cleaning performed by dental hygienists, other services are performed by dentists.
By far, the Company had 2 dental centers and 6 full-time dentists. The 2 dental centers located
in Langham Place and World Trade Center, the same building with the two flagship aesthetic
centers. Management aimed to enlarge the scope of dental service. It is said that the Company
is in negotiation to acquire a dental chain which is principally engaged in dental services via
multiple dental centers in Hong Kong, according to the announcement published on 14 Nov
2017. The completion of the acquisition is expected to take place by 31 Dec 2017.
The dental business maintained a strong growth recent years and recorded a revenue of
HK$34.8mn/HK$41.6mn/HK$60.3mn for FY15/FY16/FY17, with a CAGR of 31.6%. Given the
low base and organic growth, we expect dental business to grow 20%/15%/15% for
FY18/FY19/FY20E.
7 Dec 2017
PLEASE READ THE ANALYST CERTIFICATION AND IMPORTANT DISCLOSURES ON LAST PAGE 20
Potential M&As to propel revenue growth
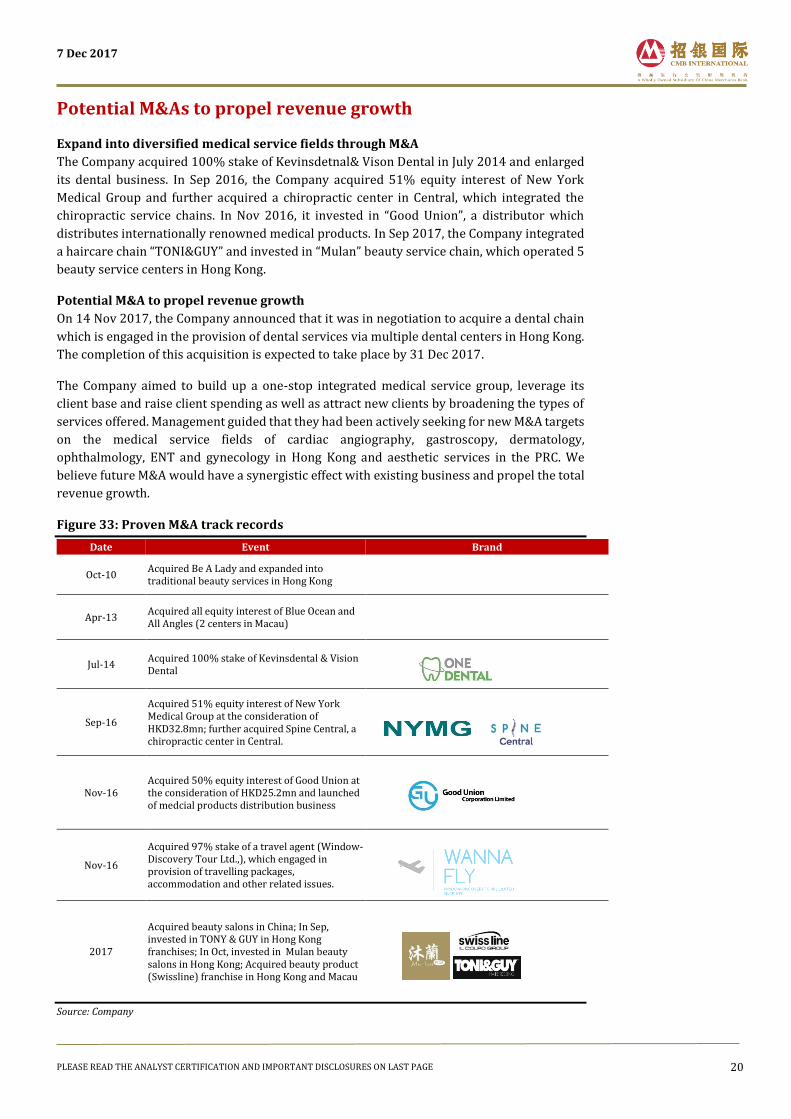
Expand into diversified medical service fields through M&A
The Company acquired 100% stake of Kevinsdetnal& Vison Dental in July 2014 and enlarged
its dental business. In Sep 2016, the Company acquired 51% equity interest of New York
Medical Group and further acquired a chiropractic center in Central, which integrated the
chiropractic service chains. In Nov 2016, it invested in “Good Union”, a distributor which
distributes internationally renowned medical products. In Sep 2017, the Company integrated
a haircare chain “TONI&GUY” and invested in “Mulan” beauty service chain, which operated 5
beauty service centers in Hong Kong.
Potential M&A to propel revenue growth
On 14 Nov 2017, the Company announced that it was in negotiation to acquire a dental chain
which is engaged in the provision of dental services via multiple dental centers in Hong Kong.
The completion of this acquisition is expected to take place by 31 Dec 2017.
The Company aimed to build up a one-stop integrated medical service group, leverage its
client base and raise client spending as well as attract new clients by broadening the types of
services offered. Management guided that they had been actively seeking for new M&A targets
on the medical service fields of cardiac angiography, gastroscopy, dermatology,
ophthalmology, ENT and gynecology in Hong Kong and aesthetic services in the PRC. We
believe future M&A would have a synergistic effect with existing business and propel the total
revenue growth.
Figure 33: Proven M&A track records
Date Event Brand
Oct-10 Acquired Be A Lady and expanded into traditional beauty services in Hong Kong
Apr-13 Acquired all equity interest of Blue Ocean and All Angles (2 centers in Macau)
Jul-14 Acquired 100% stake of Kevinsdental & Vision Dental
Sep-16
Acquired 51% equity interest of New York Medical Group at the consideration of HKD32.8mn; further acquired Spine Central, a chiropractic center in Central.
Nov-16 Acquired 50% equity interest of Good Union at the consideration of HKD25.2mn and launched of medcial products distribution business
Nov-16
Acquired 97% stake of a travel agent (Window-Discovery Tour Ltd.,), which engaged in provision of travelling packages, accommodation and other related issues.
2017
Acquired beauty salons in China; In Sep, invested in TONY & GUY in Hong Kong franchises; In Oct, invested in Mulan beauty salons in Hong Kong; Acquired beauty product (Swissline) franchise in Hong Kong and Macau
Source: Company

7 Dec 2017
PLEASE READ THE ANALYST CERTIFICATION AND IMPORTANT DISCLOSURES ON LAST PAGE 21
Financials
We forecast a core net profit CAGR of 26.4% in 2017-2020E
Historically, the Company had a higher profitability over peers. It maintained a net profit
margin and ROE above 20% for recent fiscal years with a NPM of 28.1%/21.1%/20.8%
FY15/FY16/FY17 and a ROE of 20.3%/25.4% in FY16/FY17.
We forecast a core net profit CAGR of 26.4% for the Company in 2017-2020E, driven by
revenue ramp up, effective integration and utilization improvement. We expect core net profit
to grow 34.6%/23%/21.9% to HK$256mn/HK$314.8mn /HK$383.9mn in FY18 /FY19
/FY20E respectively.
Figure 34: Core profit projections
Source: Company, CMBIS
Figure 35: Core net profit margin projections
Source: Company, CMBIS
Figure 36: ROE comparison among peers
Source: Company, CMBIS
Figure 37: Net Profit Margin comparison among peers
Source: Company, CMBIS
177.0 177.3 190.2
256.0
314.8
383.9
-
50
100
150
200
250
300
350
400
450
FY2015 FY2016 FY2017 2018E 2019E 2020E
HKD mn
28.5%
25.2%
19.7% 20.4% 20.1% 20.6%
5%
10%
15%
20%
25%
30%
35%
40%
FY2015 FY2016 FY2017 2018E 2019E 2020E
20.3%25.4%
27%
16%
10%
14%
27%
6%
5%
-1% 4%
-5%
0%
5%
10%
15%
20%
25%
30%
FY2016 FY2017
UMH (2138) Perfect Shape(1830)Water Oasis(1161) Modern Beauty (919)Medicskin(8307) Sausantong(8200)
28.1%
21.1% 20.8%
18.5%14.8%
12.1%
18.20%
22%
17.9%
-10%
0%
10%
20%
30%
FY2015 FY2016 FY2017
UMH (2138) Perfect Shape(1830)
Water Oasis(1161) Modern Beauty (919)
Medicskin(8307) Sausantong(8200)
Miricor (8358)
7 Dec 2017
PLEASE READ THE ANALYST CERTIFICATION AND IMPORTANT DISCLOSURES ON LAST PAGE 22
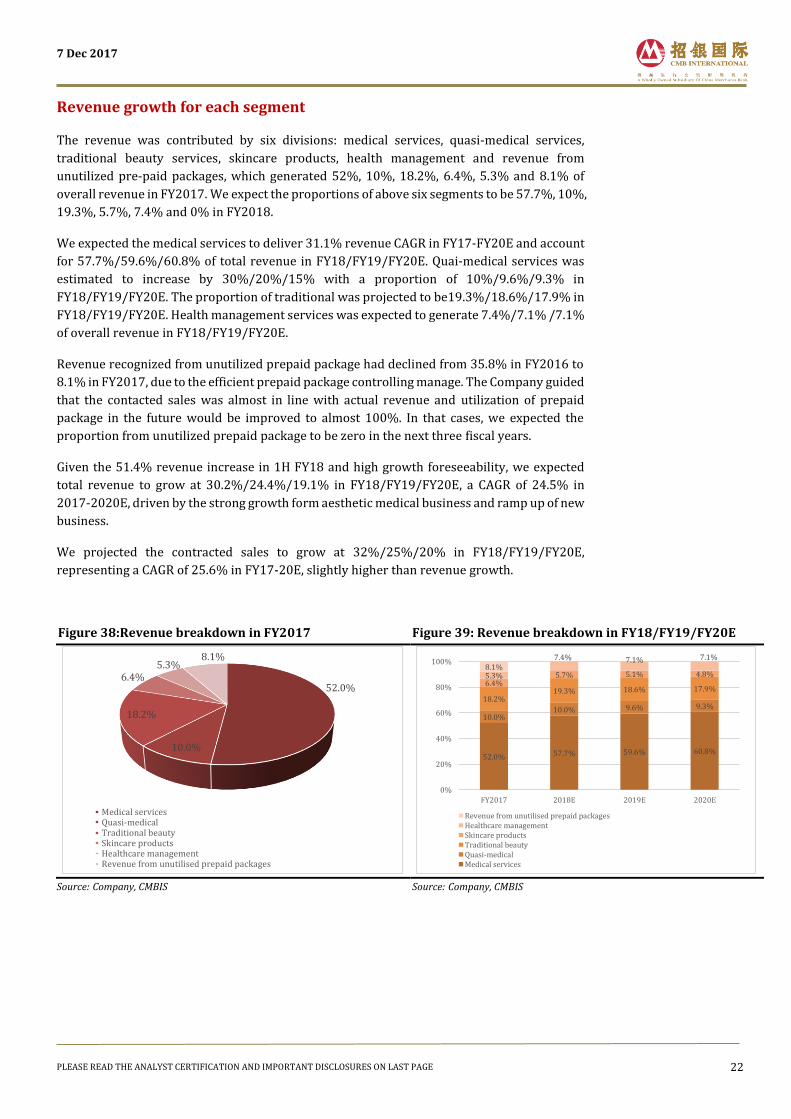
Revenue growth for each segment
The revenue was contributed by six divisions: medical services, quasi-medical services,
traditional beauty services, skincare products, health management and revenue from
unutilized pre-paid packages, which generated 52%, 10%, 18.2%, 6.4%, 5.3% and 8.1% of
overall revenue in FY2017. We expect the proportions of above six segments to be 57.7%, 10%,
19.3%, 5.7%, 7.4% and 0% in FY2018.
We expected the medical services to deliver 31.1% revenue CAGR in FY17-FY20E and account
for 57.7%/59.6%/60.8% of total revenue in FY18/FY19/FY20E. Quai-medical services was
estimated to increase by 30%/20%/15% with a proportion of 10%/9.6%/9.3% in
FY18/FY19/FY20E. The proportion of traditional was projected to be19.3%/18.6%/17.9% in
FY18/FY19/FY20E. Health management services was expected to generate 7.4%/7.1% /7.1%
of overall revenue in FY18/FY19/FY20E.
Revenue recognized from unutilized prepaid package had declined from 35.8% in FY2016 to
8.1% in FY2017, due to the efficient prepaid package controlling manage. The Company guided
that the contacted sales was almost in line with actual revenue and utilization of prepaid
package in the future would be improved to almost 100%. In that cases, we expected the
proportion from unutilized prepaid package to be zero in the next three fiscal years.
Given the 51.4% revenue increase in 1H FY18 and high growth foreseeability, we expected
total revenue to grow at 30.2%/24.4%/19.1% in FY18/FY19/FY20E, a CAGR of 24.5% in
2017-2020E, driven by the strong growth form aesthetic medical business and ramp up of new
business.
We projected the contracted sales to grow at 32%/25%/20% in FY18/FY19/FY20E,
representing a CAGR of 25.6% in FY17-20E, slightly higher than revenue growth.
Figure 38:Revenue breakdown in FY2017
Source: Company, CMBIS
Figure 39: Revenue breakdown in FY18/FY19/FY20E
Source: Company, CMBIS
52.0%
10.0%
18.2%
6.4%5.3%
8.1%
Medical servicesQuasi-medicalTraditional beautySkincare productsHealthcare managementRevenue from unutilised prepaid packages
52.0% 57.7% 59.6% 60.8%
10.0%10.0% 9.6% 9.3%
18.2%19.3% 18.6% 17.9%
6.4%5.7% 5.1% 4.8%5.3%
7.4% 7.1% 7.1%8.1%
0%
20%
40%
60%
80%
100%
FY2017 2018E 2019E 2020E
Revenue from unutilised prepaid packagesHealthcare managementSkincare productsTraditional beautyQuasi-medicalMedical services
7 Dec 2017
PLEASE READ THE ANALYST CERTIFICATION AND IMPORTANT DISCLOSURES ON LAST PAGE 23
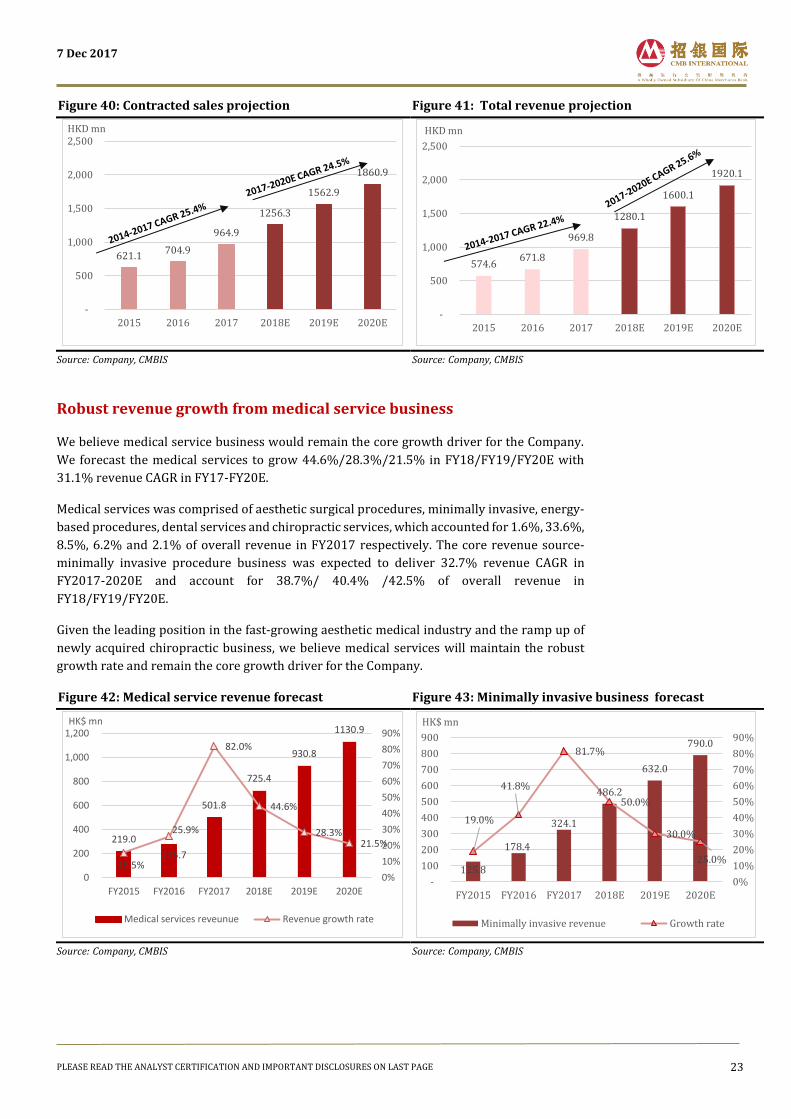
Figure 40: Contracted sales projection
Source: Company, CMBIS
Figure 41: Total revenue projection
Source: Company, CMBIS
Robust revenue growth from medical service business
We believe medical service business would remain the core growth driver for the Company.
We forecast the medical services to grow 44.6%/28.3%/21.5% in FY18/FY19/FY20E with
31.1% revenue CAGR in FY17-FY20E.
Medical services was comprised of aesthetic surgical procedures, minimally invasive, energy-
based procedures, dental services and chiropractic services, which accounted for 1.6%, 33.6%,
8.5%, 6.2% and 2.1% of overall revenue in FY2017 respectively. The core revenue source-
minimally invasive procedure business was expected to deliver 32.7% revenue CAGR in
FY2017-2020E and account for 38.7%/ 40.4% /42.5% of overall revenue in
FY18/FY19/FY20E.
Given the leading position in the fast-growing aesthetic medical industry and the ramp up of
newly acquired chiropractic business, we believe medical services will maintain the robust
growth rate and remain the core growth driver for the Company.
Figure 42: Medical service revenue forecast
Source: Company, CMBIS
Figure 43: Minimally invasive business forecast
Source: Company, CMBIS
621.1704.9
964.9
1256.3
1562.9
1860.9
-
500
1,000
1,500
2,000
2,500
2015 2016 2017 2018E 2019E 2020E
HKD mn
574.6671.8
969.8
1280.1
1600.1
1920.1
-
500
1,000
1,500
2,000
2,500
2015 2016 2017 2018E 2019E 2020E
HKD mn
219.0
275.7
501.8
725.4
930.8
1130.9
15.5%
25.9%
82.0%
44.6%
28.3%21.5%
0%
10%
20%
30%
40%
50%
60%
70%
80%
90%
0
200
400
600
800
1,000
1,200
FY2015 FY2016 FY2017 2018E 2019E 2020E
HK$ mn
Medical services reveunue Revenue growth rate
125.8
178.4
324.1
486.2
632.0
790.0
19.0%
41.8%
81.7%
50.0%
30.0%
25.0%
0%
10%
20%
30%
40%
50%
60%
70%
80%
90%
-
100
200
300
400
500
600
700
800
900
FY2015 FY2016 FY2017 2018E 2019E 2020E
HK$ mn
Minimally invasive revenue Growth rate
7 Dec 2017
PLEASE READ THE ANALYST CERTIFICATION AND IMPORTANT DISCLOSURES ON LAST PAGE 24
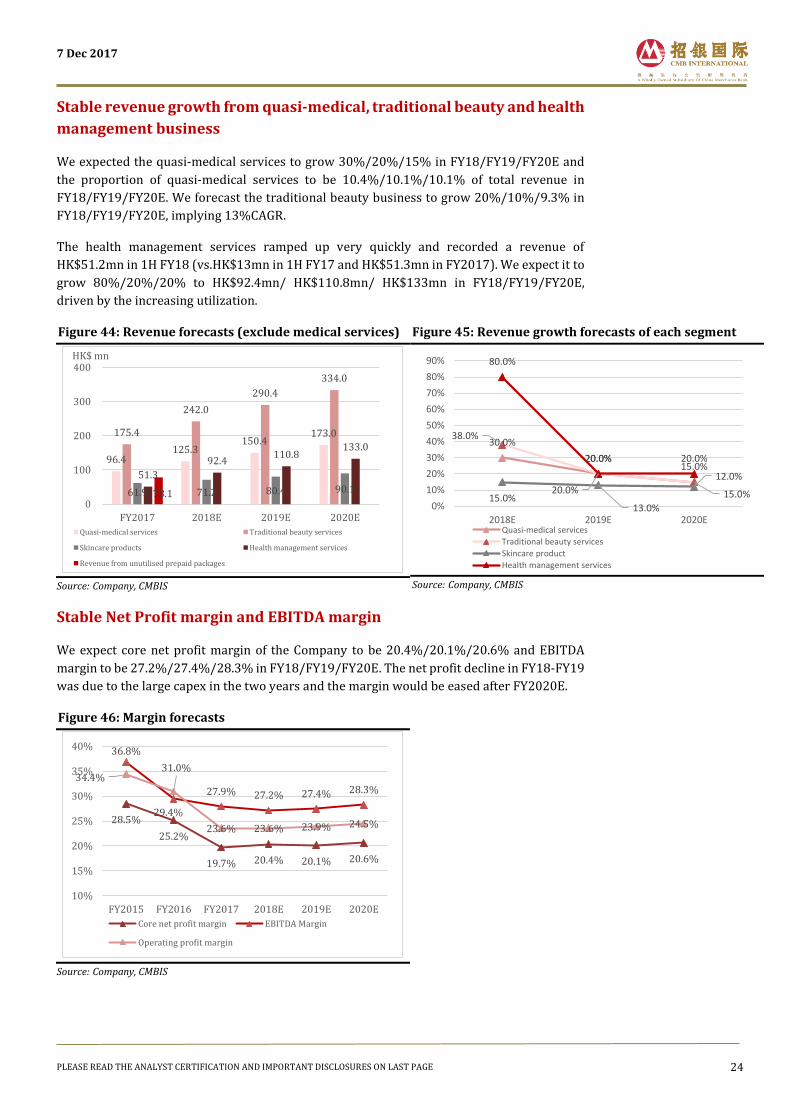
Stable revenue growth from quasi-medical, traditional beauty and health
management business
We expected the quasi-medical services to grow 30%/20%/15% in FY18/FY19/FY20E and
the proportion of quasi-medical services to be 10.4%/10.1%/10.1% of total revenue in
FY18/FY19/FY20E. We forecast the traditional beauty business to grow 20%/10%/9.3% in
FY18/FY19/FY20E, implying 13%CAGR.
The health management services ramped up very quickly and recorded a revenue of
HK$51.2mn in 1H FY18 (vs.HK$13mn in 1H FY17 and HK$51.3mn in FY2017). We expect it to
grow 80%/20%/20% to HK$92.4mn/ HK$110.8mn/ HK$133mn in FY18/FY19/FY20E,
driven by the increasing utilization.
Figure 44: Revenue forecasts (exclude medical services)
Source: Company, CMBIS
Figure 45: Revenue growth forecasts of each segment
Source: Company, CMBIS
Stable Net Profit margin and EBITDA margin
We expect core net profit margin of the Company to be 20.4%/20.1%/20.6% and EBITDA
margin to be 27.2%/27.4%/28.3% in FY18/FY19/FY20E. The net profit decline in FY18-FY19
was due to the large capex in the two years and the margin would be eased after FY2020E.
96.4125.3
150.4173.0175.4
242.0
290.4
334.0
61.9 71.2 80.4 90.1
51.3
92.4110.8
133.0
78.10
100
200
300
400
FY2017 2018E 2019E 2020E
HK$ mn
Quasi-medical services Traditional beauty services
Skincare products Health management services
Revenue from unutilised prepaid packages
30.0%
20.0%15.0%
38.0%
20.0% 15.0%15.0%13.0%
12.0%
80.0%
20.0% 20.0%
0%
10%
20%
30%
40%
50%
60%
70%
80%
90%
2018E 2019E 2020EQuasi-medical services
Traditional beauty services
Skincare product
Health management services
Figure 46: Margin forecasts
Source: Company, CMBIS
28.5%
25.2%
19.7% 20.4% 20.1% 20.6%
36.8%
29.4%
27.9% 27.2% 27.4% 28.3%34.4%
31.0%
23.6% 23.6% 23.9% 24.5%
10%
15%
20%
25%
30%
35%
40%
FY2015 FY2016 FY2017 2018E 2019E 2020E
Core net profit margin EBITDA Margin
Operating profit margin
7 Dec 2017
PLEASE READ THE ANALYST CERTIFICATION AND IMPORTANT DISCLOSURES ON LAST PAGE 25
CAPEX for new centers and future acquisitions
We forecast CAPEX of HK$234mn, HK$124mn and HK$74mn for the Company in 2018E,
2019E and 2020E. The large capex in 2018E was due to the acquisition of two properties
(Admiralty and Central, Hong Kong), launch of new centers (2 centers in Hong Kong and 2
centers in the PRC) and some acquisitions (beauty salons and haircare chains). The Company
plans to upgrade and equip the health management center with an MRI which would resulted
in a capex of HK$50mn in FY2019E.
Figure 47: CAPEX Forecast
CAPEX Forecast 2018E 2019E 2020E
Hong Kong CAPEX HK$ mn 56 56 56
Additional space (sq ft) 28000 28000 28000
CAPEX HK$/sq ft 2000 2000 2000
The PRC CAPEX HK$ mn 18 18 18
Additional space (sq ft) 12000 12000 12000
CAPEX HK$/sq ft 1500 1500 1500
Acquisition of PP&E 160 50 0
Total CAPEX HK$ mn 234 124 74
Source: CMBIS
Strong operating cash flow
The company sell services through pre-paid packages. Payments received from contracted
sales are recorded as deferred revenue and are subsequently recognized as revenue in the P&L
when services is delivered or the pre-paid packages are expired. The contracted sales is a
leading indicator of the total revenue and has been almost in line with total revenue. Given the
advance payment mechanism, the Company recorded a strong operating cash inflow of
HK$158.6mn/HK$76.2mn/HK$180.0mn in FY15/FY16/FY17. We expected the Company to
maintain the strong operating cash inflow trend with a cash inflow of HK$316mn /
HK$362.2mn / HK$441.8mn in FY18/ FY19/FY20E.
Figure 48: Operating cash flow forecasts
Source: Company, CMBIS
158.6
76.2
180.0
316.0362.2
441.8
0
100
200
300
400
500
FY2015 FY2016 FY2017 2018E 2019E 2020E
HK$ mn
7 Dec 2017
PLEASE READ THE ANALYST CERTIFICATION AND IMPORTANT DISCLOSURES ON LAST PAGE 26
Financial statements
Income statement
(#) Core net profit is calculated excluding listing expenses and share option expenses
Source: Company, CMBIS estimates
Balance sheet
Source: Company, CMBIS estimates
YE Mar 31 (HK$ mn) FY16A FY17A FY18E FY19E FY20E
Revenue 704.9 964.9 1,256.3 1,562.9 1,860.9
Medical services 275.7 501.8 725.4 930.8 1,130.9
Quasi-medical 74.1 96.4 125.3 150.4 173.0
Traditional beauty 65.0 175.4 242.0 290.4 334.0
Skincare products 38.0 61.9 71.2 80.4 90.1
Health management - 51.3 92.4 110.8 133.0
Revenue from unutilised prepaid packages 252.1 78.1 - - -
Other net income and gains 3.0 10.0 4.2 3.0 3.0
Cost of inventories (70.7) (130.5) (165.8) (206.3) (245.6)
Registered practitioner expenses (52.8) (77.5) (90.0) (114.6) (139.0)
Employee benefit expenses (192.4) (277.9) (361.8) (437.6) (502.4)
Marketing and advertising expenses (38.0) (68.5) (113.1) (140.7) (167.5)
Rental and related expenses (62.2) (88.8) (111.0) (135.9) (161.7)
Credit card and expenses (23.0) (29.7) (41.5) (51.6) (61.4)
Depreciation (24.1) (27.5) (30.3) (45.1) (60.0)
Other expenses (26.5) (47.1) (50.7) (60.5) (70.2)
Operating profit 218.3 227.5 296.4 373.6 456.1
Share of profit of associate / JV - (0.0) 3.5 3.6 3.6
Net finance income / (expenses) 1.5 4.5 9.2 8.2 9.7
Exceptional (35.4) 12.7 4.6 - -
Pre-tax profit 184.4 244.6 313.7 385.4 469.4
Profits tax (35.1) (41.1) (53.3) (65.5) (79.8)
Minority interest (0.6) (2.8) (4.3) (5.0) (5.7)
Net profit 148.7 200.7 256.0 314.8 383.9
Core net profit 177.3 190.2 256.0 314.8 383.9
EBITDA 207.6 269.3 341.2 428.8 526.1
YE Mar 31 (HK$ mn) FY16A FY17A FY18E FY19E FY20E
Non-current assets 86.5 200.8 494.4 570.4 581.6
Fixed asset 59.2 70.2 273.9 352.8 366.8
Intangible assets 1.3 35.9 78.3 71.8 65.4
Goodwill 3.4 36.7 70.0 70.0 70.0
Other non-current assets 22.7 58.1 72.2 75.7 79.4
Current assets 1,069.0 998.5 905.3 1,059.7 1,395.8
Cash 354.7 200.6 215.8 361.4 676.8
Account receivable 74.8 112.9 142.2 145.0 159.8
Inventory 17.9 19.1 24.9 30.9 36.8
Available-for-sale investments 103.5 499.7 314.7 314.7 314.7
Other current assets 518.1 166.1 207.7 207.7 207.7
Current liabilities 421.0 401.1 588.2 628.2 690.7
Borrowings - - 120.5 149.0 191.8
Trade and other payables 101.9 61.4 63.2 65.2 67.2
Deffered revenue 312.9 327.9 384.7 384.3 390.2
Other current liabilities 6.2 11.8 19.8 29.6 41.6
Non-current liabilities 3.2 8.3 8.3 8.3 8.3
Borrowings - - - - -
Deffered taxation 0.1 3.1 3.1 3.1 3.1
Other non-current liabilities 3.1 5.2 5.2 5.2 5.2
Total net assets 731.3 789.9 803.2 993.6 1,278.4
Minority interest (0.1) 11.4 15.7 20.7 26.4
Shareholders' equity 731.4 778.5 787.4 972.8 1,251.9
7 Dec 2017
PLEASE READ THE ANALYST CERTIFICATION AND IMPORTANT DISCLOSURES ON LAST PAGE 27
Cash flow summary
Source: Company, CMBIS estimates
Key ratios
Source: Company, CMBIS estimates
YE Mar 31 (HK$ mn) FY16A FY17A FY18E FY19E FY20E
EBIT 218.3 227.5 296.4 373.6 456.1
Depreciation and amortization 24.6 29.2 36.7 51.6 66.4
Change in working capital (45.9) (60.5) 23.6 (7.3) (12.9)
Income tax paid (87.6) (33.2) (45.3) (55.7) (67.8)
Interest paid (1.5) (4.5) (9.2) (8.2) (9.7)
Others (31.8) 21.5 13.8 8.2 9.7
Net cash from operating activities 76.2 180.0 316.0 362.2 441.8
Capex (28.6) (75.6) (234.0) (124.0) (74.0)
Acquisition of subsidiaries (0.7) (28.5) - - -
Net change in available-for-sale investments (76.8) (395.0) 50.7 - -
Other (498.9) 345.8 10.7 11.5 13.9
Net cash from investing activities (604.9) (153.2) (172.6) (112.5) (60.1)
Change of Debts 0.0 - 120.5 28.6 42.7
Net proceeds from shares issued 717.1 2.3 - - -
Dividend paid (60.0) (90.1) (247.1) (129.4) (104.8)
Other 96.5 (92.2) (1.5) (3.3) (4.2)
Net cash from financing activities 753.7 (180.1) (128.1) (104.2) (66.3)
Net change in cash 224.9 (153.3) 15.2 145.5 315.4
Cash at the beginning of the year 129.9 354.7 200.6 215.8 361.4
Exchange difference (0.1) (0.8) - - -
Cash at the end of the year 354.7 200.6 215.8 361.4 676.8
YE Dec 31 FY16A FY17A FY18E FY19E FY20E
Sales mix (%)
Medical services 39.1 52.0 57.7 59.6 60.8
Quasi-medical 10.5 10.0 10.0 9.6 9.3
Traditional beauty 9.2 18.2 19.3 18.6 17.9
Skincare products 5.4 6.4 5.7 5.1 4.8
Health management - 5.3 7.4 7.1 7.1
Revenue from unutilised packages 35.8 8.1 - - -
Total 100.0 100.0 100.0 100.0 100.0
Profit & loss ratios (%)
EBITDA margin 29.4 27.9 27.2 27.4 28.3
Pre-tax margin 26.2 25.3 25.0 24.7 25.2
Net margin 21.1 20.8 20.4 20.1 20.6
Core net margin 25.2 19.7 20.4 20.1 20.6
Effective tax rate 19.0 16.8 17.0 17.0 17.0
Growth (%)
Revenue 13.5 36.9 30.2 24.4 19.1
EBITDA (9.2) 29.7 26.7 25.6 22.7
Operating profit 2.3 4.2 30.3 26.1 22.1
Net profit (14.8) 35.0 27.6 23.0 21.9
Core net profit 0.2 7.2 34.6 23.0 21.9
Balance sheet ratios
Current ratio (x) 2.5 2.5 1.5 1.7 2.0
Trade receivables turnover days 14 16 17 16 17
Trade payables turnover days 24 16 16 16 17
Inventory turnover days 81 52 48 49 50
Net debt to total equity ratio (%) Net cash Net cash Net cash Net cash Net cash
Returns (%)
ROE 20.3 25.8 32.5 32.4 30.7
ROA 12.9 16.7 18.3 19.3 19.4
Per share data
EPS (HK$) 0.20 0.21 0.26 0.32 0.39
Core EPS (HK$) 0.24 0.20 0.26 0.32 0.39
DPS (HK$) 0.19 0.21 0.21 0.10 0.12
BVPS (HK$) 0.76 0.81 0.82 1.01 1.30
7 Dec 2017
PLEASE READ THE ANALYST CERTIFICATION AND IMPORTANT DISCLOSURES ON LAST PAGE 28
Valuation
Initiation coverage with BUY rating, target price: HK$4.76
We believe the Company would continue to strengthen its leading position in aesthetic
medical industry and to grow other medical service segments which complement to each other.
Supported by revenue ramp up, effective integration and utilization improvement, we forecast
the Company to deliver 26.4% core net profit CAGR in FY17-FY20E. Given the robust growth,
better profitability over peers and above 20% net profit CAGR, we initiate coverage on UMH
with BUY rating and the target price is HK$4.76, based on the DCF model (WACC:13.5%,
terminal growth rate:3%). Our target price implies 18.2x/14.8x/12.2x of FY18/FY19/FY20E
PER, with upside potential of 31.8%.
Figure 49: DCF valuation
Source: Company, CMBIS
Figure 50: Sensitivity analysis
Source: Company, CMBIS
2019E 2020E 2021E 2022E 2023E
HKD mn HKD mn HKD mn HKD mn HKD mn
Net profit 315 384 432 507 571
Depreciation and amortisation 52 66 77 86 95
Net interest after tax (7) (8) (10) (14) (16)
CAPEX (124) (74) (63) (63) (63)
Change in working capital (7) (13) (10) (9) (6)
FCF 228 355 426 508 582
Terminal value 5,726
PV of FCF 201 276 291 307 3,354
Corporate value 4,429
Debt & Preferred Stock 120
Bank deposit and pledged cash 359
Equity Value 4,668
Number of shares(mn) 981
Value per share (HK$) 4.76
Risk free rate 1.8%
Beta 1.0
Risk premium 12.7%
Cost of equity 14.5%
Cost of debt 5.0%
WACC 13.5%
Terminal growth rate 3.0%
Terminal growth / WACC
4.76 9.0% 9.5% 10.0% 13.5% 16.0% 17.0% 18.0%
1.5% 7.07 6.61 6.20 4.33 3.54 3.30 3.09
2.0% 7.47 6.95 6.50 4.46 3.62 3.36 3.14
2.5% 7.93 7.34 6.84 4.60 3.70 3.44 3.21
3.0% 8.47 7.80 7.22 4.76 3.80 3.52 3.27
3.5% 9.10 8.33 7.67 4.93 3.90 3.60 3.34
4.0% 9.87 8.95 8.19 5.12 4.01 3.69 3.42
4.5% 10.80 9.70 8.80 5.33 4.13 3.79 3.50
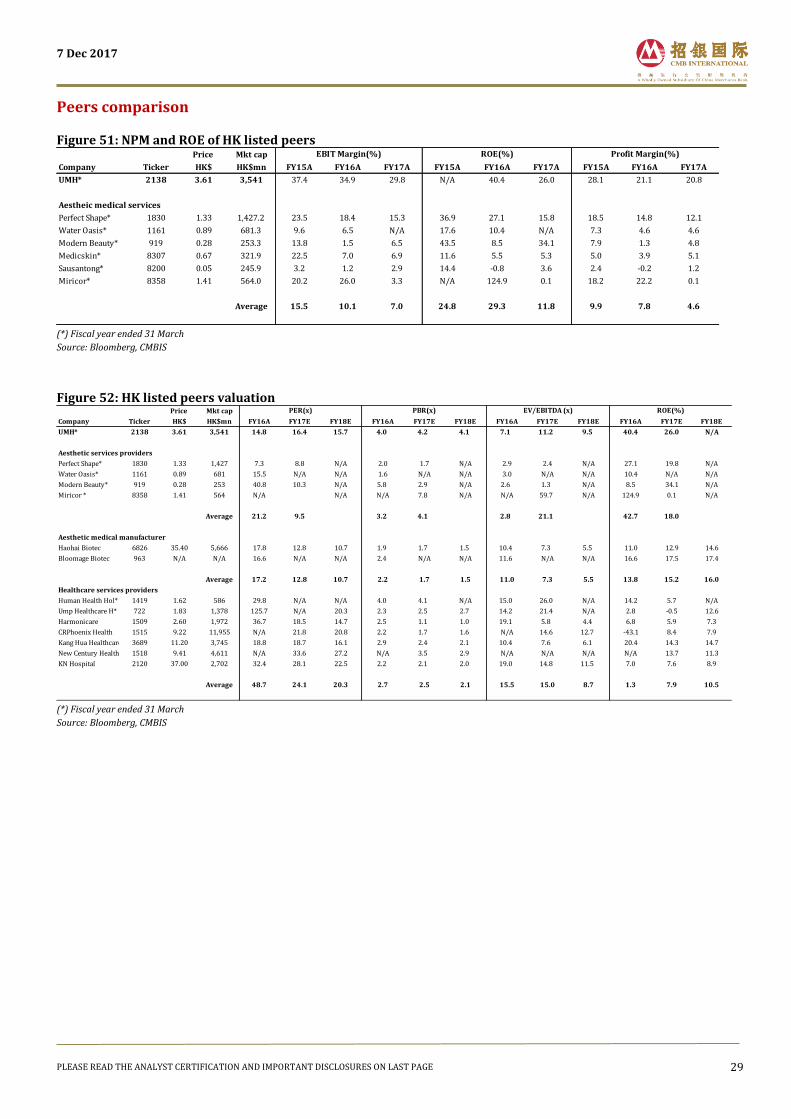
7 Dec 2017
PLEASE READ THE ANALYST CERTIFICATION AND IMPORTANT DISCLOSURES ON LAST PAGE 29
Peers comparison
Figure 51: NPM and ROE of HK listed peers
(*) Fiscal year ended 31 March
Source: Bloomberg, CMBIS
Figure 52: HK listed peers valuation
(*) Fiscal year ended 31 March
Source: Bloomberg, CMBIS
Price Mkt cap
Company Ticker HK$ HK$mn FY15A FY16A FY17A FY15A FY16A FY17A FY15A FY16A FY17A
UMH* 2138 3.61 3,541 37.4 34.9 29.8 N/A 40.4 26.0 28.1 21.1 20.8
Aestheic medical services
Perfect Shape* 1830 1.33 1,427.2 23.5 18.4 15.3 36.9 27.1 15.8 18.5 14.8 12.1
Water Oasis* 1161 0.89 681.3 9.6 6.5 N/A 17.6 10.4 N/A 7.3 4.6 4.6
Modern Beauty* 919 0.28 253.3 13.8 1.5 6.5 43.5 8.5 34.1 7.9 1.3 4.8
Medicskin* 8307 0.67 321.9 22.5 7.0 6.9 11.6 5.5 5.3 5.0 3.9 5.1
Sausantong* 8200 0.05 245.9 3.2 1.2 2.9 14.4 -0.8 3.6 2.4 -0.2 1.2
Miricor* 8358 1.41 564.0 20.2 26.0 3.3 N/A 124.9 0.1 18.2 22.2 0.1
Average 15.5 10.1 7.0 24.8 29.3 11.8 9.9 7.8 4.6
EBIT Margin(%) ROE(%) Profit Margin(%)
Price Mkt cap
Company Ticker HK$ HK$mn FY16A FY17E FY18E FY16A FY17E FY18E FY16A FY17E FY18E FY16A FY17E FY18E
UMH* 2138 3.61 3,541 14.8 16.4 15.7 4.0 4.2 4.1 7.1 11.2 9.5 40.4 26.0 N/A
Aesthetic services providers
Perfect Shape* 1830 1.33 1,427 7.3 8.8 N/A 2.0 1.7 N/A 2.9 2.4 N/A 27.1 19.8 N/A
Water Oasis* 1161 0.89 681 15.5 N/A N/A 1.6 N/A N/A 3.0 N/A N/A 10.4 N/A N/A
Modern Beauty* 919 0.28 253 40.8 10.3 N/A 5.8 2.9 N/A 2.6 1.3 N/A 8.5 34.1 N/A
Miricor * 8358 1.41 564 N/A N/A N/A 7.8 N/A N/A 59.7 N/A 124.9 0.1 N/A
Average 21.2 9.5 3.2 4.1 2.8 21.1 42.7 18.0
Aesthetic medical manufacturer
Haohai Biotec 6826 35.40 5,666 17.8 12.8 10.7 1.9 1.7 1.5 10.4 7.3 5.5 11.0 12.9 14.6
Bloomage Biotec 963 N/A N/A 16.6 N/A N/A 2.4 N/A N/A 11.6 N/A N/A 16.6 17.5 17.4
Average 17.2 12.8 10.7 2.2 1.7 1.5 11.0 7.3 5.5 13.8 15.2 16.0
Healthcare services providers
Human Health Hol* 1419 1.62 586 29.8 N/A N/A 4.0 4.1 N/A 15.0 26.0 N/A 14.2 5.7 N/A
Ump Healthcare H* 722 1.83 1,378 125.7 N/A 20.3 2.3 2.5 2.7 14.2 21.4 N/A 2.8 -0.5 12.6
Harmonicare 1509 2.60 1,972 36.7 18.5 14.7 2.5 1.1 1.0 19.1 5.8 4.4 6.8 5.9 7.3
CRPhoenix Health 1515 9.22 11,955 N/A 21.8 20.8 2.2 1.7 1.6 N/A 14.6 12.7 -43.1 8.4 7.9
Kang Hua Healthcare 3689 11.20 3,745 18.8 18.7 16.1 2.9 2.4 2.1 10.4 7.6 6.1 20.4 14.3 14.7
New Century Health 1518 9.41 4,611 N/A 33.6 27.2 N/A 3.5 2.9 N/A N/A N/A N/A 13.7 11.3
KN Hospital 2120 37.00 2,702 32.4 28.1 22.5 2.2 2.1 2.0 19.0 14.8 11.5 7.0 7.6 8.9
Average 48.7 24.1 20.3 2.7 2.5 2.1 15.5 15.0 8.7 1.3 7.9 10.5
ROE(%)PER(x) PBR(x) EV/EBITDA (x)
7 Dec 2017
PLEASE READ THE ANALYST CERTIFICATION AND IMPORTANT DISCLOSURES ON LAST PAGE 30
Key investment risks
Highly depend on the strength of brand image and reputation The Company highly depends on the brand image and reputation as a quality and reliable
aesthetic medical provider in the aesthetic medical service industry in Hong Kong, where it
conducts business. If the Company fails to maintain or if there is any damage to, such brand
image or reputation in relation to the services or products provided by the Company, the
demand for the Company’s services and products may be materially and adversely affected.
Change in the clients’ behavior in utilization of prepaid packages may impact the Company’s revenue growth. The Company sells services through prepaid packages which generally have a one-year
contractual validity period. The revenue recognized from unutilized prepaid packages
represented 37%/38.7%/8.1% of total revenue in FY15/FY16/FY17. Some of clients had a
significant portion of their prepaid packages unused upon expiry, as a result it may have a
negative impact on some of these clients’ desire to renew the services or purchase other
prepaid packages. Therefore, the changes in clients’ behavior in utilization of prepaid packages
may impact the revenue recognition and growth.
Depend on skilled and competent Registered Practitioners and may not be able to retain and attract suitable candidates. The Company’s success depends on its ability to attract and retain skilled Registered
Practitioners, including Specialists, General Practitioners, Dentists and other competent staff.
By far, the Company had 44 full-time Registered Practitioners (36 Hong Kong Doctors, 3 Macau
Doctors and 5 PRC Doctor). Most of medical services are performed by these professionals.
The ability to attract and retain them is dependent on several factors such as reputation,
financial remuneration and job satisfaction. If the Company is unable to hire or keep enough
suitable Registered Practitioners, the business and prospects may be materially and adversely
affected. The number of Registered Practitioners with the necessary experience and
qualifications is limited in the market. The Company is competing for suitable candidates with
other medical care providers. In particular, there were only 61 Plastic Surgeons in Hong Kong
listed in the relevant Specialist Register published by the Hong Kong Medical Council as at 30
October 2015. The Company may need to provide competitive terms, such as higher wages, to
attract and retain suitable Registered Practitioners and other staff, which would increase costs.
Failure to replicate the success business models in Hong Kong to the PRC The Company has a limited track record in expanding aesthetic business in the PRC. They had
opened 2 clinics in Guangzhou and 1 clinic in Shanghai. The success experience from Hong
Kong may not be readily transferable to other locations. For example, some services provided
in Hong Kong may not be conducted in the PRC market due to the drug regulatory. In addition,
the Company may have limited ability to leverage the brand image and reputation in the new
locations. Furthermore, the administrative, legal, regulatory and tax environment may differ
from those in Hong Kong and the Company may face additional expenses or difficulties in
complying with the relevant legal and administrative procedures.
The Hong Kong aesthetic medical tourism industry sector faces intense competition from other market, including Japan and Korea. According to the Frost & Sullivan Report, the growth of the Hong Kong aesthetic medical
industry has been and is expected to be partially attributed to the growth in the number of
aesthetic medical tourists, particularly those from the PRC choosing to come to Hong Kong to
receive aesthetic medical services. The Company cannot assure that aesthetic medical tourists
will continue to choose Hong Kong over other destinations, such as Japan and Korea and
cannot guarantee the number of medical tourists to increase or decline in the future.

7 Dec 2017
PLEASE READ THE ANALYST CERTIFICATION AND IMPORTANT DISCLOSURES ON LAST PAGE 31
Fail to identify or execute acquisition opportunities Despite of successful acquisition in the past years, the Company may not be able to identify
suitable targets, negotiate favorable terms for acquisitions or successfully integrate acquired
assets in the future. The future acquisitions may be difficult, time-consuming and costly to
execute and integrate. The Company may not be able to secure necessary financing for the
acquisitions. In addition, the subsequent integration of newly acquired assets and businesses
could result in a failure or no synergy effect would be produced, Acquired assets or businesses
may not generate the financial results as expected, which in turn could have a material adverse
effect on the Company’s business.

7 Dec 2017
PLEASE READ THE ANALYST CERTIFICATION AND IMPORTANT DISCLOSURES ON LAST PAGE 32
Appendix 1: Company background
The Company’s history can be traced back to November 2005 when Mr. Tang established
Union Investment to operate the first aesthetic medical center in Jordan, Hong Kong. The
Company started using the key brand “DR REBORN” in November 2006. Since inception, the
Company had grown and expanded rapidly, becoming the largest aesthetic medical service
provider in Hong Kong in terms of revenue in 2016, according to Frost & Sullivan. The
Company has been providing aesthetic medical and traditional beauty services in Hong Kong
and Macau, and has begun its expansion in the PRC. The Company has grown through
establishing aesthetic service centers as well as through strategically acquiring and
integrating beauty salons, aesthetic medical centers and other medical care business. It aims
to provide one-stop comprehensive medical care services, focusing on aesthetic medical and
beauty solutions as well as other medical disciplines (dental care, chiropractic, ENT,
dermatology, ophthalmology, etc.).
Figure 53: Key milestones
Date Event Brand
2005 Established its first aesthetic medical center in Hong Kong
2010 Acquired Be A Lady to expand into traditional beauty services in Hong Kong
2012
1) Established the first flagship aesthetic medical center in Langham Place ; 2) Launched self-owned skin care products "PRODERMA LAB"
2013
1)Established the first dental service center in Mong Kok ; 2) Established the second flagship center in World Trade Center ; 3)Acquired all equity interest of Blue Ocean and All Angles (2 Macau centers)
2014.07 Acquired dental services through Kevinsdental and Vision Dental
2016.03 Listed on the main board of HKEX
2016.05 Established the health management center "re:HEALTH", offering comprehensive personalized health management services
2016.09 Acquired 51% of New York medical Group and entered into chiropractic business fields; further acquired another chiropractic center.
2016.11 Acquired 51% of Good Union and launched the medical products distribution services; Acquired a travel agency.
2017
Launch of beauty salon service in China; In Sep, launch of hair treatment service- TONY & GUY in Hong Kong; In Oct, launch of beauty salon service ”Mulan” in Hong Kong; Acquired beauty product (Swissline) franchise in Hong Kong and Macau
Source: Company, CMBIS

7 Dec 2017
PLEASE READ THE ANALYST CERTIFICATION AND IMPORTANT DISCLOSURES ON LAST PAGE 33
Figure 54: Shareholders structure
Source: Company, CMBIS
Figure 55: Key management team members
Name Existing Position Roles Previous experiences
Eddy Tang CEO Responsible for overall business, operations and strategic planning of the Group
14+ years at 2 listed groups in the beauty industry
Gabriel Lee COO Responsible for overall business, operations and strategic planning of the Group
15+ years at Cathay Pacific
Martin Law CFO Responsible for financial management
25+ years, at ANZ/LLOYD'S/HSBC
Brian Yeung CFO Responsible for financial management
15+ years at PWC
Vam Cheng GM, Medical Dept Pharmaceutical business 21+ years at Allergan
Ben Luk CIO Responsible for information technology
13+ years at Google
Source: Company, CMBIS
7 Dec 2017
PLEASE READ THE ANALYST CERTIFICATION AND IMPORTANT DISCLOSURES ON LAST PAGE 34
Disclosures & Disclaimers
Analyst Certification The research analyst who is primary responsible for the content of this research report, in whole or in part, certifies that with respect to the securities or issuer that the analyst covered in this report: (1) all of the views expressed accurately reflect his or her personal views about the subject securities or issuer; and (2) no part of his or her compensation was, is, or will be, directly or indirectly, related to the specific views expressed by that analyst in this report. Besides, the analyst confirms that neither the analyst nor his/her associates (as defined in the code of conduct issued by The Hong Kong Securities and Futures Commission) (1) have dealt in or traded in the stock(s) covered in this research report within 30 calendar days prior to the date of issue of this report; (2) will deal in or trade in the stock(s) covered in this research report 3 business days after the date of issue of this report; (3) serve as an officer of any of the Hong Kong listed companies covered in this report; and (4) have any financial interests in the Hong Kong listed companies covered in this report.
CMBIS Ratings BUY : Stock with potential return of over 15% over next 12 months HOLD : Stock with potential return of +15% to -10% over next 12 months SELL : Stock with potential loss of over 10% over next 12 months NOT RATED : Stock is not rated by CMBIS
CMB International Securities Limited Address: 45th Floor, Champion Tower, 3 Garden Road, Central, Hong Kong, Tel: (852) 3900 0888 Fax: (852) 3900 0800
CMB International Securities Limited (“CMBIS”) is a wholly owned subsidiary of CMB International Capital Corporation Limited (a wholly owned subsidiary of China Merchants Bank)
Important Disclosures There are risks involved in transacting in any securities. The information contained in this report may not be suitable for the purposes of all investors. CMBIS does not provide individually tailored investment advice. This report has been prepared without regard to the individual investment objectives, financial position or special requirements. Past performance has no indication of future performance, and actual events may differ materially from that which is contained in the report. The value of, and returns from, any investments are uncertain and are not guaranteed and may fluctuate as a result of their dependence on the performance of underlying assets or other variable market factors. CMBIS recommends that investors should independently evaluate particular investments and strategies, and encourages investors to consult with a professional financial advisor in order to make their own investment decisions. This report or any information contained herein, have been prepared by the CMBIS, solely for the purpose of supplying information to the clients of CMBIS and/or its affiliate(s) to whom it is distributed. This report is not and should not be construed as an offer or solicitation to buy or sell any security or any interest in securities or enter into any transaction. Neither CMBIS nor any of its affiliates, shareholders, agents, consultants, directors, officers or employees shall be liable for any loss, damage or expense whatsoever, whether direct or consequential, incurred in relying on the information contained in this report. Anyone making use of the information contained in this report does so entirely at their own risk. The information and contents contained in this report are based on the analyses and interpretations of information believed to be publicly available and reliable. CMBIS has exerted every effort in its capacity to ensure, but not to guarantee, their accuracy, completeness, timeliness or correctness. CMBIS provides the information, advices and forecasts on an "AS IS" basis. The information and contents are subject to change without notice. CMBIS may issue other publications having information and/ or conclusions different from this report. These publications reflect different assumption, point-of-view and analytical methods when compiling. CMBIS may make investment decisions or take proprietary positions that are inconsistent with the recommendations or views in this report. CMBIS may have a position, make markets or act as principal or engage in transactions in securities of companies referred to in this report for itself and/or on behalf of its clients from time to time. Investors should assume that CMBIS does or seeks to have investment banking or other business relationships with the companies in this report. As a result, recipients should be aware that CMBIS may have a conflict of interest that could affect the objectivity of this report and CMBIS will not assume any responsibility in respect thereof. This report is for the use of intended recipients only and this publication, may not be reproduced, reprinted, sold, redistributed or published in whole or in part for any purpose without prior written consent of CMBIS. Additional information on recommended securities is available upon request. For recipients of this document in the United Kingdom This report has been provided only to persons (I)falling within Article 19(5) of the Financial Services and Markets Act 2000 (Financial Promotion) Order 2005 (as amended from time to time)(“The Order”) or (II) are persons falling within Article 49(2) (a) to (d) (“High Net Worth Companies, Unincorporated Associations, etc.,) of the Order, and may not be provided to any other person without the prior written consent of CMBIS. This report is intended for distribution in the United States to "major US institutional investors", as defined in Rule 15a-6 under the US, Securities Exchange Act of 1934, and may not be furnished to any other person in the United States. Each major US, institutional investor that receives a copy of this research report by its acceptance hereof represents and agrees that it shall not distribute or provide this research report to any other person.