Section 13: City of Ryder - Ward County
71
Ward County, North Dakota Hazard Mitigation Plan Section 13: City of Ryder Final DRAFT – 10.2.17 – Page 13-1 Section 13: City of Ryder: 1 Profile, HIRA, Capability Assessment, & Mitigation Strategy 2 3 Contents 4 Section 13: City of Ryder: Profile, HIRA, Capability Assessment, & Mitigation Strategy .............................. 1 5 13.1 Profile of the City of Ryder (Updated) .............................................................................................. 1 6 13.2 Requirement for Hazard Identification & Risk Assessment .............................................................. 3 7 13.3 Hazard Identification (Updated) ....................................................................................................... 3 8 13.3.1 Overview of Ryder’s Hazard History and Potential Hazards ...................................................... 3 9 13.3.2 Hazard Profiles ........................................................................................................................... 7 10 13.4 Risk Assessment (Updated) ............................................................................................................. 48 11 13.4.1 Risk Assessment Methodology ................................................................................................ 49 12 13.4.2 Risk and Vulnerability Assessment .......................................................................................... 51 13 13.5 Capability Assessment (Updated) ................................................................................................... 63 14 13.6 Mitigation Strategy (Updated) ........................................................................................................ 64 15 13.6.1 Mitigation Goals ....................................................................................................................... 64 16 13.6.2 Mitigation Actions .................................................................................................................... 65 17 18 13.1 Profile of the City of Ryder (Updated) 19 Originally known as Centerville, the City of Ryder was incorporated in 1906. The City occupies an area of 20 .34 mi², the majority of which is land. .01mi² of the area of Ryder is water. The following figure illustrates 21 the area occupied by Ryder, and its location within Ward County. 22 23
-
Upload
khangminh22 -
Category
Documents
-
view
0 -
download
0
Transcript of Section 13: City of Ryder - Ward County
Ward County, North Dakota Hazard Mitigation Plan Section 13: City of Ryder
Final DRAFT – 10.2.17 – Page 13-1
Section 13: City of Ryder: 1
Profile, HIRA, Capability Assessment, & Mitigation Strategy 2
3
Contents 4
Section 13: City of Ryder: Profile, HIRA, Capability Assessment, & Mitigation Strategy .............................. 1 5
13.1 Profile of the City of Ryder (Updated) .............................................................................................. 1 6
13.2 Requirement for Hazard Identification & Risk Assessment .............................................................. 3 7
13.3 Hazard Identification (Updated) ....................................................................................................... 3 8
13.3.1 Overview of Ryder’s Hazard History and Potential Hazards ...................................................... 3 9
13.3.2 Hazard Profiles ........................................................................................................................... 7 10
13.4 Risk Assessment (Updated) ............................................................................................................. 48 11
13.4.1 Risk Assessment Methodology ................................................................................................ 49 12
13.4.2 Risk and Vulnerability Assessment .......................................................................................... 51 13
13.5 Capability Assessment (Updated) ................................................................................................... 63 14
13.6 Mitigation Strategy (Updated) ........................................................................................................ 64 15
13.6.1 Mitigation Goals ....................................................................................................................... 64 16
13.6.2 Mitigation Actions .................................................................................................................... 65 17
18
13.1 Profile of the City of Ryder (Updated) 19
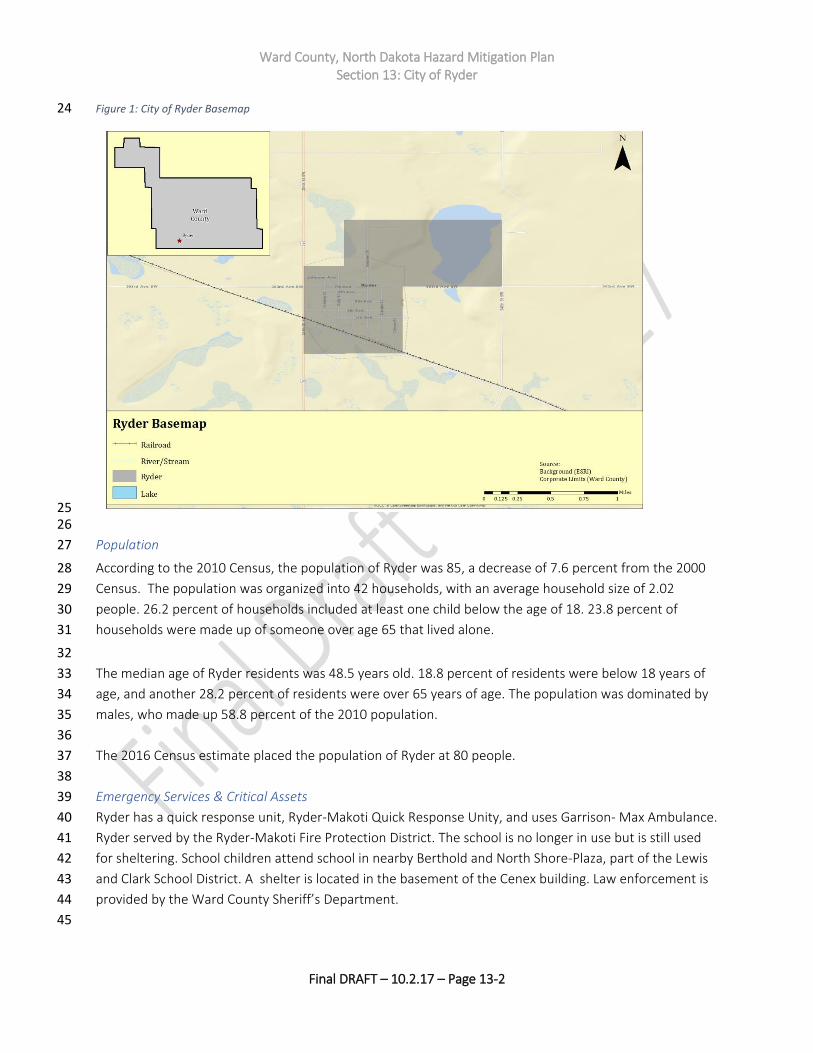
Originally known as Centerville, the City of Ryder was incorporated in 1906. The City occupies an area of 20
.34 mi², the majority of which is land. .01mi² of the area of Ryder is water. The following figure illustrates 21
the area occupied by Ryder, and its location within Ward County. 22
23
Ward County, North Dakota Hazard Mitigation Plan Section 13: City of Ryder
Final DRAFT – 10.2.17 – Page 13-2
Figure 1: City of Ryder Basemap 24
25 26
Population 27
According to the 2010 Census, the population of Ryder was 85, a decrease of 7.6 percent from the 2000 28
Census. The population was organized into 42 households, with an average household size of 2.02 29
people. 26.2 percent of households included at least one child below the age of 18. 23.8 percent of 30
households were made up of someone over age 65 that lived alone. 31
32
The median age of Ryder residents was 48.5 years old. 18.8 percent of residents were below 18 years of 33
age, and another 28.2 percent of residents were over 65 years of age. The population was dominated by 34
males, who made up 58.8 percent of the 2010 population. 35
36
The 2016 Census estimate placed the population of Ryder at 80 people. 37
38
Emergency Services & Critical Assets 39
Ryder has a quick response unit, Ryder-Makoti Quick Response Unity, and uses Garrison- Max Ambulance. 40
Ryder served by the Ryder-Makoti Fire Protection District. The school is no longer in use but is still used 41
for sheltering. School children attend school in nearby Berthold and North Shore-Plaza, part of the Lewis 42
and Clark School District. A shelter is located in the basement of the Cenex building. Law enforcement is 43
provided by the Ward County Sheriff’s Department. 44
45
Ward County, North Dakota Hazard Mitigation Plan Section 13: City of Ryder
Final DRAFT – 10.2.17 – Page 13-3
13.2 Requirement for Hazard Identification & Risk Assessment 46
Requirement §201.6(c)(2): The plan shall include a risk assessment that provides the factual basis for 47
activities proposed in the strategy to reduce losses from identified hazards. Local risk assessments must 48
provide sufficient information to enable the jurisdiction to identify and prioritize appropriate mitigation 49
actions to reduce losses from identified hazards. 50
Requirement §201.6(c)(2)(i): [The risk assessment shall include a] description of the type…location and 51
extent of all natural hazards that can affect the jurisdiction. The plan shall include information on previous 52
occurrences of hazard events and on the probability of future hazard events. 53
Requirement §201.6(c)(2)(ii): [The risk assessment shall include a] description of the jurisdiction’s 54
vulnerability to the hazards described in paragraph (c)(2)(i) of this section. This description shall include an 55
overall summary of each hazard and its impact on the community. 56
Requirement §201.6(c)(2)(ii): [The risk assessment] must also address National Flood Insurance Program 57
(NFIP) insured structures that have been repetitively damaged floods. 58
Requirement §201.6(c)(2)(ii)(A): The plan should describe vulnerability in terms of the types and numbers of 59
existing and future buildings, infrastructure, and critical facilities located in the identified hazard area. 60
Requirement §201.6(c)(2)(ii)(B): [The plan should describe vulnerability in terms of an] estimate of the 61
potential dollar losses to vulnerable structures identified in paragraph (c)(2)(ii)(A) of this section and a 62
description of the methodology used to prepare the estimate. 63
Requirement §201.6(c)(2)(ii)(C): [The plan should describe vulnerability in terms of] providing a general 64
description of land uses and development trends within the community so that mitigation options can be 65
considered in future land use decisions. 66
Requirement §201.6(c)(2)(iii): For multi-jurisdictional plans, the risk assessment must assess each 67
jurisdiction's risks where they vary from the risks facing the entire planning area. 68
69
This section addresses the specific requirements regarding hazards, risks, and vulnerabilities related to 70
the City of Ryder. 71
72
13.3 Hazard Identification (Updated) 73
In accordance with the requirements, and as part of its efforts to support and encourage hazard 74
mitigation initiatives, the Advisory Committee (the Committee) prepared this general assessment of the 75
hazards that have the potential to impact the City of Ryder. This section provides an overview of past 76
hazard events in the city and descriptions of potential hazards to the City. 77
78
13.3.1 Overview of Ryder’s Hazard History and Potential Hazards 79
Numerous federal agencies maintain a variety of records regarding losses associated with natural 80
hazards. Unfortunately, no single source is considered to offer a definitive accounting of all losses. The 81
Federal Emergency Management Agency (FEMA) maintains records on federal expenditures associated 82
with declared major disasters. The United States Army Corps of Engineers (USACE) and the Natural 83
Resources Conservation Service (NRCS) collect data on losses during the course of some of their ongoing 84
projects and studies. Additionally, the National Oceanic and Atmospheric Administration’s (NOAA) 85
National Centers for Environmental Information (NCEI, formerly NCDC) database collects and maintains 86
Ward County, North Dakota Hazard Mitigation Plan Section 13: City of Ryder
Final DRAFT – 10.2.17 – Page 13-4
data about natural hazards in summary format. The data includes occurrences, dates, injuries, deaths, 87
and costs. Many of these databases and other data collection services, including NCEI, have inherent data 88
limitations when searching for information at a scale as small as a single municipality. The best available 89
data and records were used throughout this section. 90
91
According to the NCEI database, at least nine weather-related hazard events have occurred in the City of 92
Ryder since 1950, including the following number and types of hazard events: 93
94
Hail – 5 95
Thunderstorm – 4 96
97
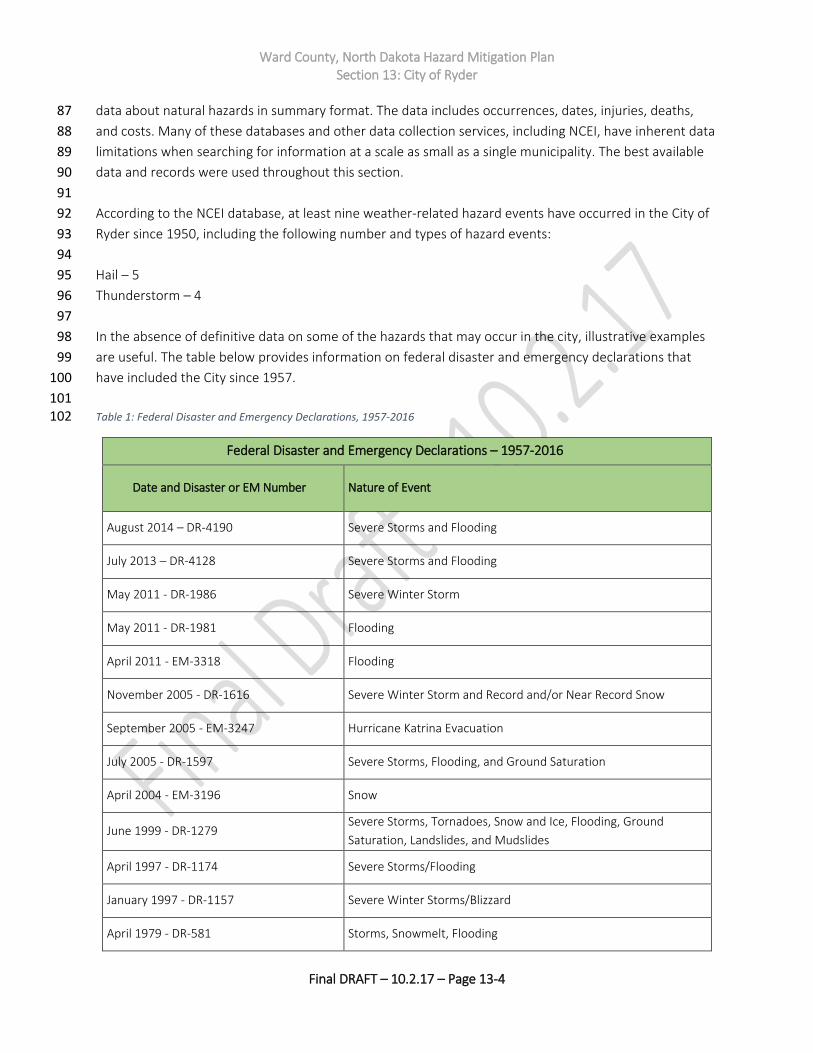
In the absence of definitive data on some of the hazards that may occur in the city, illustrative examples 98
are useful. The table below provides information on federal disaster and emergency declarations that 99
have included the City since 1957. 100
101 Table 1: Federal Disaster and Emergency Declarations, 1957-2016 102
Federal Disaster and Emergency Declarations – 1957-2016
Date and Disaster or EM Number Nature of Event
August 2014 – DR-4190 Severe Storms and Flooding
July 2013 – DR-4128 Severe Storms and Flooding
May 2011 - DR-1986 Severe Winter Storm
May 2011 - DR-1981 Flooding
April 2011 - EM-3318 Flooding
November 2005 - DR-1616 Severe Winter Storm and Record and/or Near Record Snow
September 2005 - EM-3247 Hurricane Katrina Evacuation
July 2005 - DR-1597 Severe Storms, Flooding, and Ground Saturation
April 2004 - EM-3196 Snow
June 1999 - DR-1279 Severe Storms, Tornadoes, Snow and Ice, Flooding, Ground
Saturation, Landslides, and Mudslides
April 1997 - DR-1174 Severe Storms/Flooding
January 1997 - DR-1157 Severe Winter Storms/Blizzard
April 1979 - DR-581 Storms, Snowmelt, Flooding
Ward County, North Dakota Hazard Mitigation Plan Section 13: City of Ryder
Final DRAFT – 10.2.17 – Page 13-5
Federal Disaster and Emergency Declarations – 1957-2016
Date and Disaster or EM Number Nature of Event
July 1976 - EM-3016 Drought
April 1976 - DR-501 Flooding
May 1975 - DR-469 Flooding from Rains, Snowmelt
May 1974 - DR-434 Heavy Rains, Snowmelt, Flooding
June 1972 - DR-335 Severe Storms, Flooding
June 1970 - DR-287 Severe Storms, Flooding
April 1969 - DR-256 Flooding
103
Potential Hazards to the City of Ryder 104
In the initial identification process, the Committee considered potential hazards to identify those with the 105
most chance to significantly affect the planning area. The hazards include those that have occurred in the 106
past and may occur in the future. A variety of sources were used to develop the list of hazards considered 107
by the Committee. These included national, regional, and local sources such as emergency operations 108
plans, the State of North Dakota Multi-Hazard Mitigation Plan, the 2013 Ward County Hazard Mitigation 109
Plan, FEMA’s How-To Series, websites, published documents, databases, and maps, as well as discussion 110
among the Committee members. 111
112
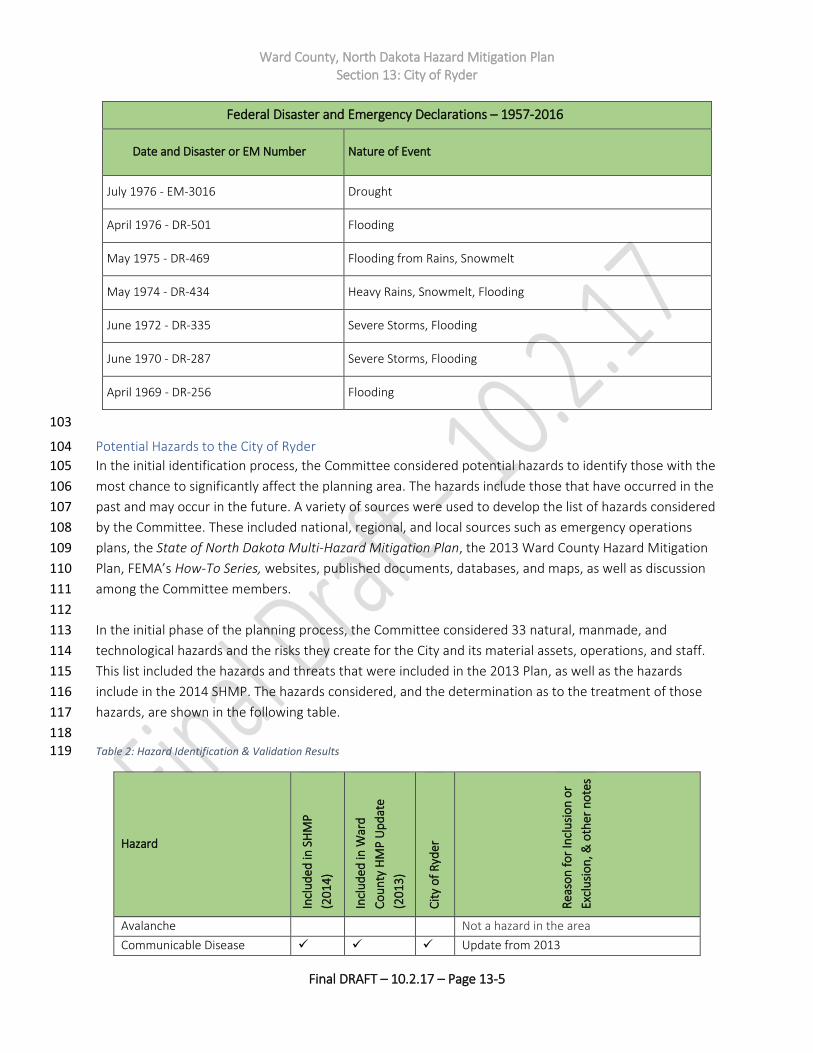
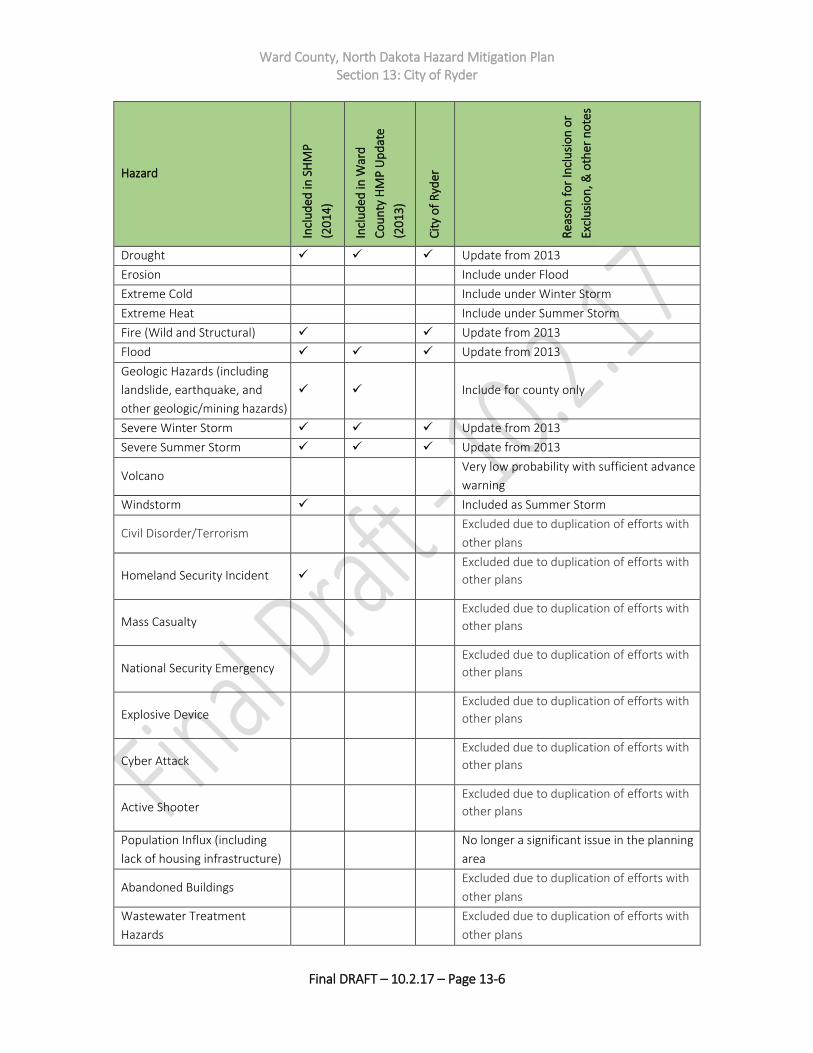
In the initial phase of the planning process, the Committee considered 33 natural, manmade, and 113
technological hazards and the risks they create for the City and its material assets, operations, and staff. 114
This list included the hazards and threats that were included in the 2013 Plan, as well as the hazards 115
include in the 2014 SHMP. The hazards considered, and the determination as to the treatment of those 116
hazards, are shown in the following table. 117
118 Table 2: Hazard Identification & Validation Results 119
Hazard
Incl
ud
ed in
SH
MP
(20
14
)
Incl
ud
ed in
War
d
Co
un
ty H
MP
Up
dat
e
(20
13
)
Cit
y o
f R
yder
Rea
son
fo
r In
clu
sio
n o
r
Excl
usi
on
, & o
ther
no
tes
Avalanche Not a hazard in the area
Communicable Disease ✓ ✓ ✓ Update from 2013
Ward County, North Dakota Hazard Mitigation Plan Section 13: City of Ryder
Final DRAFT – 10.2.17 – Page 13-6
Hazard
Incl
ud
ed in
SH
MP
(20
14
)
Incl
ud
ed in
War
d
Co
un
ty H
MP
Up
dat
e
(20
13
)
Cit
y o
f R
yder
Rea
son
fo
r In
clu
sio
n o
r
Excl
usi
on
, & o
ther
no
tes
Drought ✓ ✓ ✓ Update from 2013
Erosion Include under Flood
Extreme Cold Include under Winter Storm
Extreme Heat Include under Summer Storm
Fire (Wild and Structural) ✓ ✓ Update from 2013
Flood ✓ ✓ ✓ Update from 2013
Geologic Hazards (including
landslide, earthquake, and
other geologic/mining hazards)
✓ ✓ Include for county only
Severe Winter Storm ✓ ✓ ✓ Update from 2013
Severe Summer Storm ✓ ✓ ✓ Update from 2013
Volcano Very low probability with sufficient advance
warning
Windstorm ✓ Included as Summer Storm
Civil Disorder/Terrorism Excluded due to duplication of efforts with
other plans
Homeland Security Incident ✓ Excluded due to duplication of efforts with
other plans
Mass Casualty Excluded due to duplication of efforts with
other plans
National Security Emergency Excluded due to duplication of efforts with
other plans
Explosive Device Excluded due to duplication of efforts with
other plans
Cyber Attack Excluded due to duplication of efforts with
other plans
Active Shooter Excluded due to duplication of efforts with
other plans
Population Influx (including
lack of housing infrastructure)
No longer a significant issue in the planning
area
Abandoned Buildings Excluded due to duplication of efforts with
other plans
Wastewater Treatment
Hazards
Excluded due to duplication of efforts with
other plans
Ward County, North Dakota Hazard Mitigation Plan Section 13: City of Ryder
Final DRAFT – 10.2.17 – Page 13-7
Hazard
Incl
ud
ed in
SH
MP
(20
14
)
Incl
ud
ed in
War
d
Co
un
ty H
MP
Up
dat
e
(20
13
)
Cit
y o
f R
yder
Rea
son
fo
r In
clu
sio
n o
r
Excl
usi
on
, & o
ther
no
tes
Dam Failure ✓ Include under Flood, as applicable
Ground and Surface Water
Contamination
Excluded due to duplication of efforts with
other plans
Hazardous Material Incident
(Fixed Site and Transport) ✓ ✓ ✓ Update from 2013
Levee Failure Include under Flood, as applicable
Shortage of Critical Materials ✓ Excluded due to duplication of efforts with
other plans
Nuclear Generating Plant
Incident
Excluded due to duplication of efforts with
other plans
Transportation Accident
(including vehicular, railway,
and aircraft)
✓
Excluded due to duplication of efforts with
other plans
120
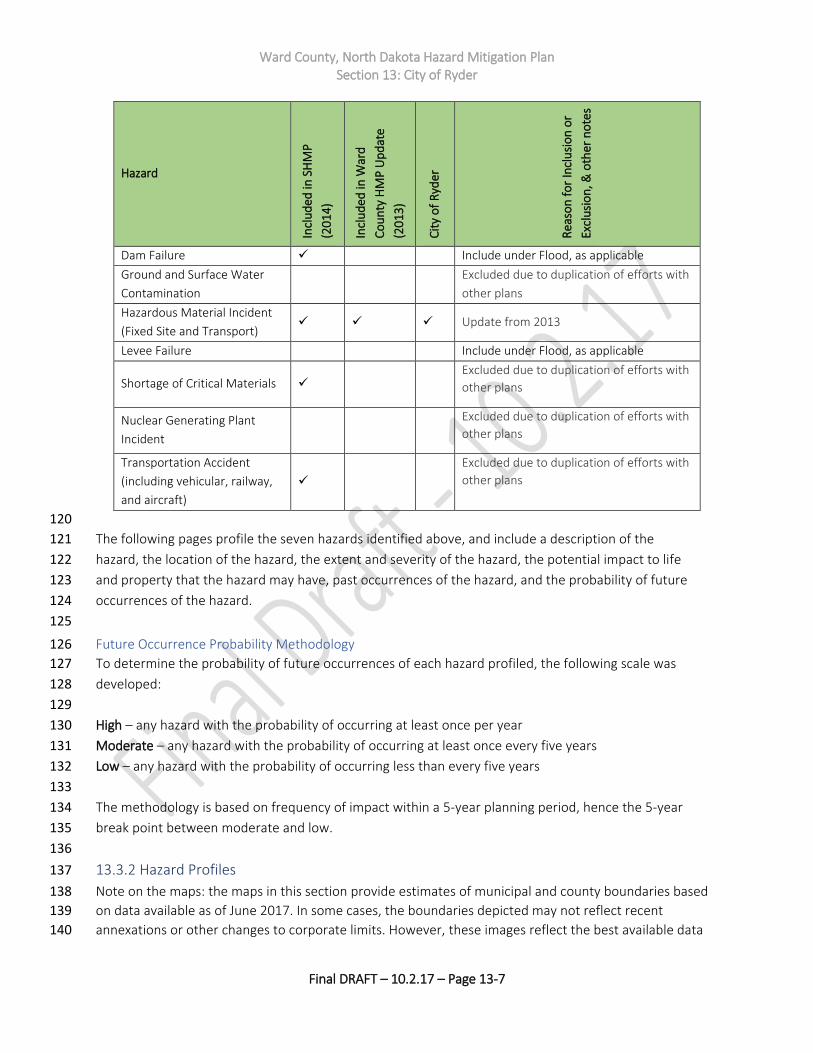
The following pages profile the seven hazards identified above, and include a description of the 121
hazard, the location of the hazard, the extent and severity of the hazard, the potential impact to life 122
and property that the hazard may have, past occurrences of the hazard, and the probability of future 123
occurrences of the hazard. 124
125
Future Occurrence Probability Methodology 126
To determine the probability of future occurrences of each hazard profiled, the following scale was 127
developed: 128
129
High – any hazard with the probability of occurring at least once per year 130
Moderate – any hazard with the probability of occurring at least once every five years 131
Low – any hazard with the probability of occurring less than every five years 132
133
The methodology is based on frequency of impact within a 5-year planning period, hence the 5-year 134
break point between moderate and low. 135
136
13.3.2 Hazard Profiles 137
Note on the maps: the maps in this section provide estimates of municipal and county boundaries based 138
on data available as of June 2017. In some cases, the boundaries depicted may not reflect recent 139
annexations or other changes to corporate limits. However, these images reflect the best available data 140
Ward County, North Dakota Hazard Mitigation Plan Section 13: City of Ryder
Final DRAFT – 10.2.17 – Page 13-8
at the time of plan development. Future updates to this plan will reflect changes to municipal and county 141
boundaries. 142
143
13.3.2.1 Communicable Disease 144
Description of the Hazard 145
Infectious pathologies are also called communicable diseases or transmissible diseases due to their 146
potential of transmission from one person or species to another by a replicating agent (as opposed to a 147
toxin). An infectious disease is a clinically evident illness resulting from the presence of pathogenic 148
microbial agents, including pathogenic viruses, pathogenic bacteria, fungi, protozoa, multi-cellular 149
parasites, and aberrant proteins known as prions. Transmission of an infectious disease may occur 150
through one or more pathways including physical contact with infected individuals. These infecting agents 151
may also be transmitted through liquids, food, body fluids, contaminated objects, airborne inhalation, or 152
through vector-borne spread. 153 154
Transmissible diseases which occur through contact with an ill person or their secretions, or objects 155
touched by them, are especially infective, and are sometimes referred to as contagious diseases. 156
Infectious (communicable) diseases which usually require a more specialized route of infection, such as 157
vector transmission, or blood or needle transmission, are usually not regarded as contagious. 158
159
The term infectivity describes the ability of an organism to enter, survive and multiply in the host, while 160
the infectiousness of a disease indicates the comparative ease with which the disease is transmitted to 161
other hosts. An infection however, is not synonymous with an infectious disease, as an infection may not 162
cause important clinical symptoms or impair host function. 163
164
Examples of communicable or infectious diseases include plague, malaria, tuberculosis, rabies, hepatitis 165
B, influenza, HIV, and measles. 166
167
Location of the Hazard 168
This hazard impacts people, rather than physical assets. Therefore, all populated areas of the City are at 169
risk from the communicable disease hazard. 170
171
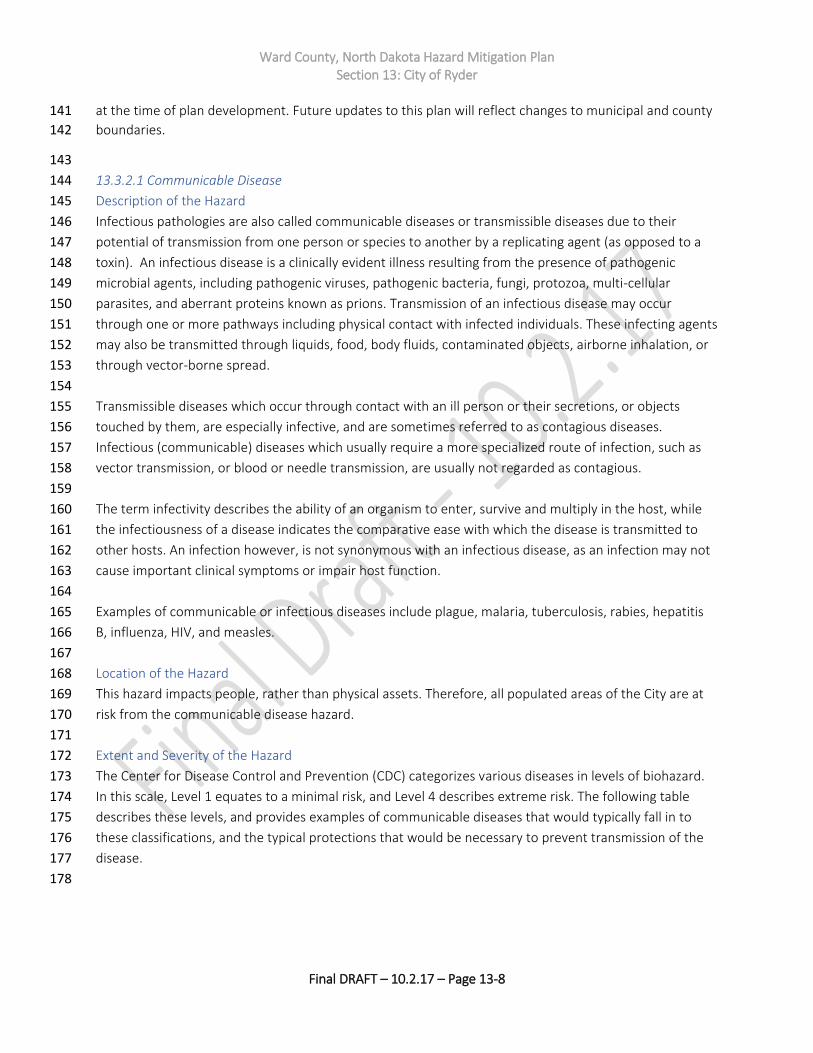
Extent and Severity of the Hazard 172
The Center for Disease Control and Prevention (CDC) categorizes various diseases in levels of biohazard. 173
In this scale, Level 1 equates to a minimal risk, and Level 4 describes extreme risk. The following table 174
describes these levels, and provides examples of communicable diseases that would typically fall in to 175
these classifications, and the typical protections that would be necessary to prevent transmission of the 176
disease. 177
178
Ward County, North Dakota Hazard Mitigation Plan Section 13: City of Ryder
Final DRAFT – 10.2.17 – Page 13-9
Table 3: Biohazard Classification Levels 179
Level Examples Typical Protection to Prevent Transmission
Biohazard Level I (BSL-I)
e. Coli Canine Hepatitis Chicken Pox
Precautions are minimal, most likely involving gloves and some sort of facial protection. Usually, contaminated materials are left in open (but separately indicated) waste receptacles. Decontamination procedures for this level are similar in most respects to modern precautions against everyday viruses (i.e.: washing one's hands with anti-bacterial soap, washing all exposed surfaces of the lab with disinfectants, etc.).
Biohazard Level II (BSL-2)
Hepatitis A, B, C Lyme disease Salmonella Mumps Measles Scrapie Dengue Fever HIV
These bacteria and viruses cause mild disease in humans, or are difficult to contract via aerosol. Routine diagnostic work with clinical specimens can be done safely at BSL-2, using BSL- 2 practices and procedures.
Biohazard Level III (BSL-3)
Anthrax West Nile Virus SARS Virus Smallpox Tuberculosis Typhus Yellow Fever Malaria
These bacteria and viruses cause severe to fatal disease in human, but vaccines or other treatments do exist to combat them. Laboratory personnel have specific training in handling pathogenic and potentially lethal agents, and are supervised by competent scientists who are experienced in working with these agents. This is considered a neutral or warm zone.
Biohazard Level IV (BSL-4)
H5N1 (Bird Flu) Dengue Hemorrhagic Fever Marburg Virus Ebola Virus Hantaviruses Lassa Fever Crimean-Congo Hemorrhagic Fever Other Hemorrhagic Diseases
These viruses and bacteria cause severe to fatal disease in humans, for which vaccines or other treatments are not available. When dealing with biological hazards at this level the use of a Hazmat suit and a self-contained oxygen supply is mandatory. The entrance and exit of a BSL-4 lab will contain multiple showers, a vacuum room, an ultraviolet light room, autonomous detection system, and other safety precautions designed to destroy all traces of the biohazard. Multiple airlocks are employed and are electronically secured to prevent both doors opening at the same time. All air and water service going to and coming from a BSL- 4 lab will undergo similar decontamination procedures to eliminate the possibility of an accidental release.
180
Potential Impact of the Hazard 181
Communicable disease outbreaks and pandemics will have the most immediate impact on life and health 182
safety. The extent of the impact will be contingent on the type of infection or contagion, the severity of 183
the outbreak, and the speed at which it is transmitted. Property and infrastructure could be affected if 184
large portions of the population were affected and unable to perform maintenance and operations tasks. 185
This would be particularly disruptive if those impacted were first responders or other essential personnel. 186
187
Ward County, North Dakota Hazard Mitigation Plan Section 13: City of Ryder
Final DRAFT – 10.2.17 – Page 13-10
Past Occurrences of the Hazard 188
In general, North Dakota has been spared the devastating outbreaks of communicable disease that have 189
impacted other areas. For example, the 1918 Spanish Flu pandemic killed an estimated 20-40 million 190
people worldwide; 675,000 of those fatalities occurred in the US. In North Dakota, this same pandemic 191
infected 6,000 people, and resulted in 2,700 fatalities – a significantly lower proportion of the population 192
than other states. 193
Communicable diseases statistics are maintained by the state at the county level, and are not generally 194
available at the municipal levels. The exception to this is when a geographically-specific outbreak occurs. 195
Based on information obtained from the North Dakota Department of Health, all available data rests at 196
the county level, and is not available for the municipal level. Therefore, this discussion will focus on 197
occurrences in the county, and will reasonable assume that some of the occurrences could have or did 198
occur in or otherwise impact the City of Ryder. 199
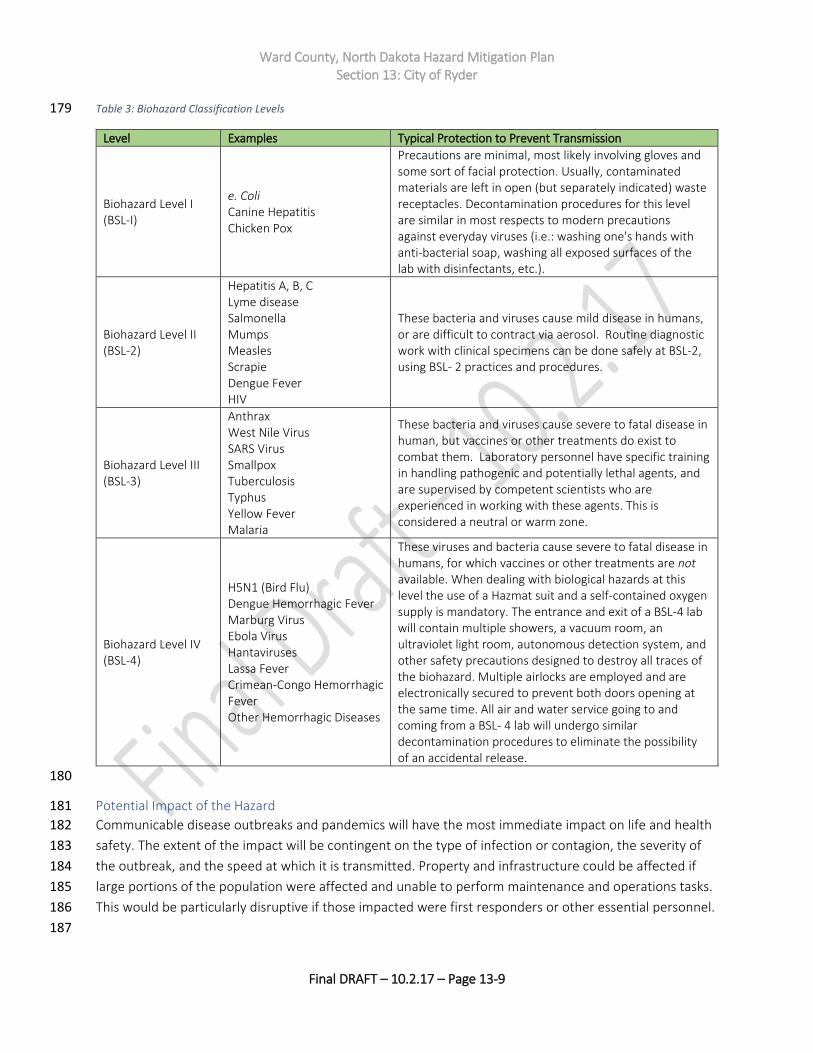
Influenza is an illness that is specifically tracked by the State Department of Health, and detailed records 200
are maintained for this illness. The table below provides updated, available information regarding 201
influenza in Ward County and the State of North Dakota since the 2007-2008 influenza season, including 202
the 2016-2017 season. 203
Table 4: Influenza Occurrences 204
Years Cases (Statewide) Cases (Ward County) Percentage of ND Cases
in Ward County
2007-2008 3,817 178 5 percent
2008-2009 1,755 115 7 percent
2009-2010 3,259 221 7 percent
2010-2011 2,089 125 6 percent
2011-2012 1,487 115 8 percent
2012-2013 4,831 307 7 percent
2013-2014 2,923 407 13 percent
2014-2015 6,443 100+ 1.5 percent (or more)
2015-2016 1,942 50+ 2 percent (or more)
2016-2017 7,507 628 8 percent
205
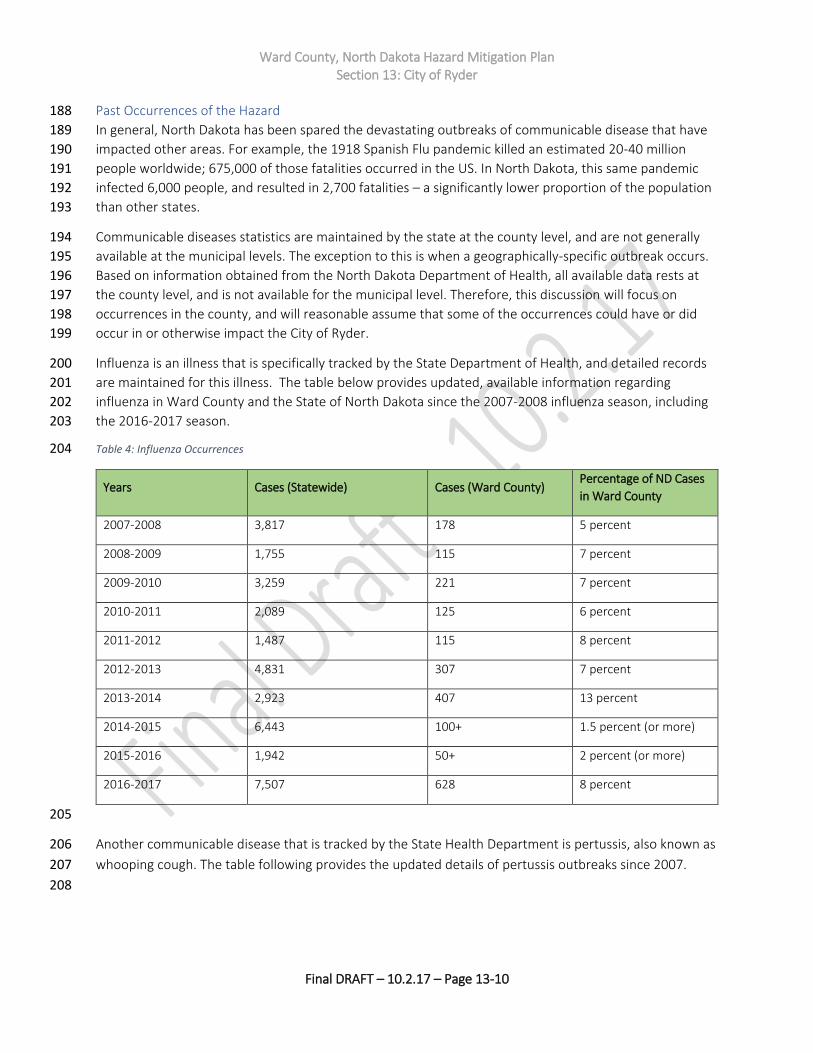
Another communicable disease that is tracked by the State Health Department is pertussis, also known as 206
whooping cough. The table following provides the updated details of pertussis outbreaks since 2007. 207
208
Ward County, North Dakota Hazard Mitigation Plan Section 13: City of Ryder
Final DRAFT – 10.2.17 – Page 13-11
Table 5: Pertussis Occurrences 209
Years Cases (Statewide) Cases (Ward County) Percentage of ND Cases
in Ward County
2007 12 1 9 percent
2008 Unavailable Unavailable NA
2009 30 0 NA
2010 58 6 11 percent
2011 70 1 2 percent
2012 215 59 28 percent
2013 87 5 5 percent
2014 51 9 17 percent
2015 44 4 9 percent
2016 44 16 36 percent
210
As is evident in the table above, occurrences of pertussis have remained fairly high in both North Dakota 211
and in Ward County. The dramatic spike in 2012 prompted the State Health Department to issue a Health 212
Advisory, which recommended that health care providers consider testing for pertussis for any patient 213
that presented possible symptoms of the disease and also recommended immunizations be administered 214
as recommended for children and infants. Fortunately, levels that high have not been seen since then. 215
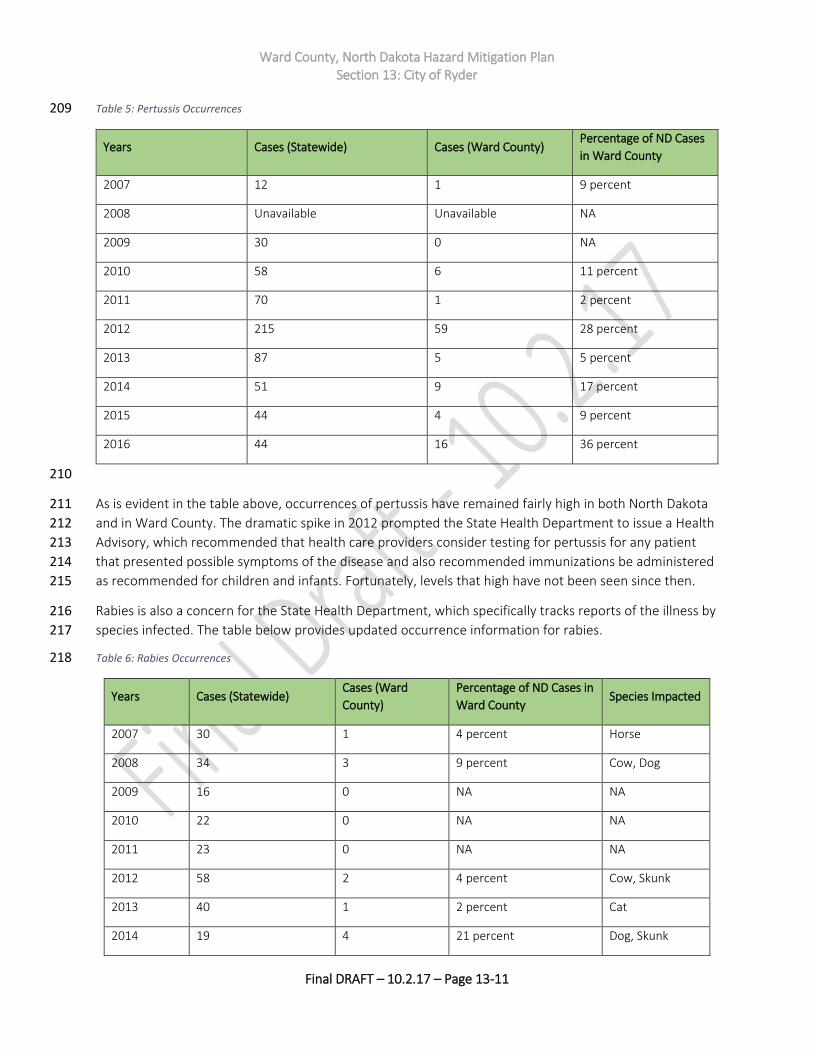
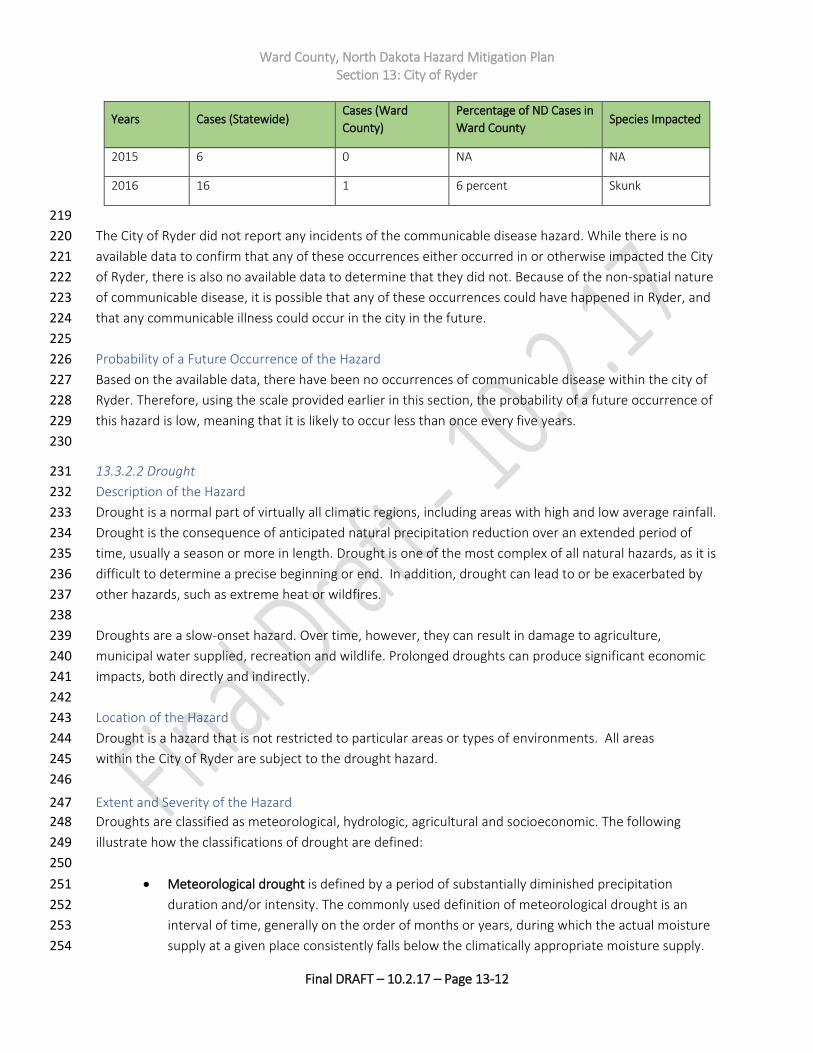
Rabies is also a concern for the State Health Department, which specifically tracks reports of the illness by 216
species infected. The table below provides updated occurrence information for rabies. 217
Table 6: Rabies Occurrences 218
Years Cases (Statewide) Cases (Ward
County)
Percentage of ND Cases in
Ward County Species Impacted
2007 30 1 4 percent Horse
2008 34 3 9 percent Cow, Dog
2009 16 0 NA NA
2010 22 0 NA NA
2011 23 0 NA NA
2012 58 2 4 percent Cow, Skunk
2013 40 1 2 percent Cat
2014 19 4 21 percent Dog, Skunk
Ward County, North Dakota Hazard Mitigation Plan Section 13: City of Ryder
Final DRAFT – 10.2.17 – Page 13-12
Years Cases (Statewide) Cases (Ward
County)
Percentage of ND Cases in
Ward County Species Impacted
2015 6 0 NA NA
2016 16 1 6 percent Skunk
219
The City of Ryder did not report any incidents of the communicable disease hazard. While there is no 220
available data to confirm that any of these occurrences either occurred in or otherwise impacted the City 221
of Ryder, there is also no available data to determine that they did not. Because of the non-spatial nature 222
of communicable disease, it is possible that any of these occurrences could have happened in Ryder, and 223
that any communicable illness could occur in the city in the future. 224
225
Probability of a Future Occurrence of the Hazard 226
Based on the available data, there have been no occurrences of communicable disease within the city of 227
Ryder. Therefore, using the scale provided earlier in this section, the probability of a future occurrence of 228
this hazard is low, meaning that it is likely to occur less than once every five years. 229
230
13.3.2.2 Drought 231
Description of the Hazard 232
Drought is a normal part of virtually all climatic regions, including areas with high and low average rainfall. 233
Drought is the consequence of anticipated natural precipitation reduction over an extended period of 234
time, usually a season or more in length. Drought is one of the most complex of all natural hazards, as it is 235
difficult to determine a precise beginning or end. In addition, drought can lead to or be exacerbated by 236
other hazards, such as extreme heat or wildfires. 237
238
Droughts are a slow-onset hazard. Over time, however, they can result in damage to agriculture, 239
municipal water supplied, recreation and wildlife. Prolonged droughts can produce significant economic 240
impacts, both directly and indirectly. 241
242
Location of the Hazard 243
Drought is a hazard that is not restricted to particular areas or types of environments. All areas 244
within the City of Ryder are subject to the drought hazard. 245
246
Extent and Severity of the Hazard 247
Droughts are classified as meteorological, hydrologic, agricultural and socioeconomic. The following 248
illustrate how the classifications of drought are defined: 249
250
• Meteorological drought is defined by a period of substantially diminished precipitation 251
duration and/or intensity. The commonly used definition of meteorological drought is an 252
interval of time, generally on the order of months or years, during which the actual moisture 253
supply at a given place consistently falls below the climatically appropriate moisture supply. 254
Ward County, North Dakota Hazard Mitigation Plan Section 13: City of Ryder
Final DRAFT – 10.2.17 – Page 13-13
• Agricultural drought occurs when there is inadequate soil moisture to meet the needs of a 255
particular crop at a particular time. Agricultural drought usually occurs after or during 256
meteorological drought, but before hydrological drought and can affect livestock and other 257
dry-land agricultural operations. 258
• Hydrological drought refers to deficiencies in surface and subsurface water supplies. It is 259
measured as stream flow, snow pack, and as lake, reservoir, and groundwater levels. There is 260
usually a delay between lack of rain or snow and less measurable water in streams, lakes, and 261
reservoirs. Therefore, hydrological measurements tend to lag behind other drought 262
indicators. 263
• Socio-economic drought occurs when physical water shortages start to affect the health, well-264
being, and quality of life of the people, or when the drought starts to affect the supply and 265
demand of an economic product. 266
267
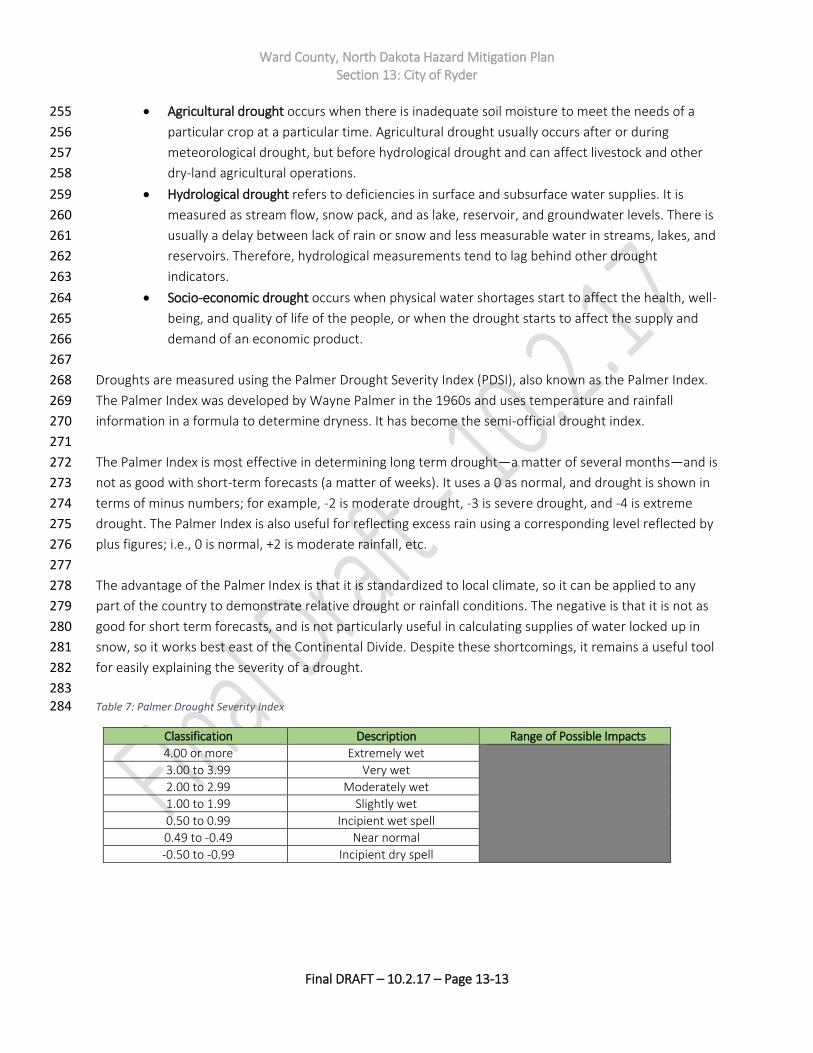
Droughts are measured using the Palmer Drought Severity Index (PDSI), also known as the Palmer Index. 268
The Palmer Index was developed by Wayne Palmer in the 1960s and uses temperature and rainfall 269
information in a formula to determine dryness. It has become the semi-official drought index. 270
271
The Palmer Index is most effective in determining long term drought—a matter of several months—and is 272
not as good with short-term forecasts (a matter of weeks). It uses a 0 as normal, and drought is shown in 273
terms of minus numbers; for example, -2 is moderate drought, -3 is severe drought, and -4 is extreme 274
drought. The Palmer Index is also useful for reflecting excess rain using a corresponding level reflected by 275
plus figures; i.e., 0 is normal, +2 is moderate rainfall, etc. 276
277
The advantage of the Palmer Index is that it is standardized to local climate, so it can be applied to any 278
part of the country to demonstrate relative drought or rainfall conditions. The negative is that it is not as 279
good for short term forecasts, and is not particularly useful in calculating supplies of water locked up in 280
snow, so it works best east of the Continental Divide. Despite these shortcomings, it remains a useful tool 281
for easily explaining the severity of a drought. 282
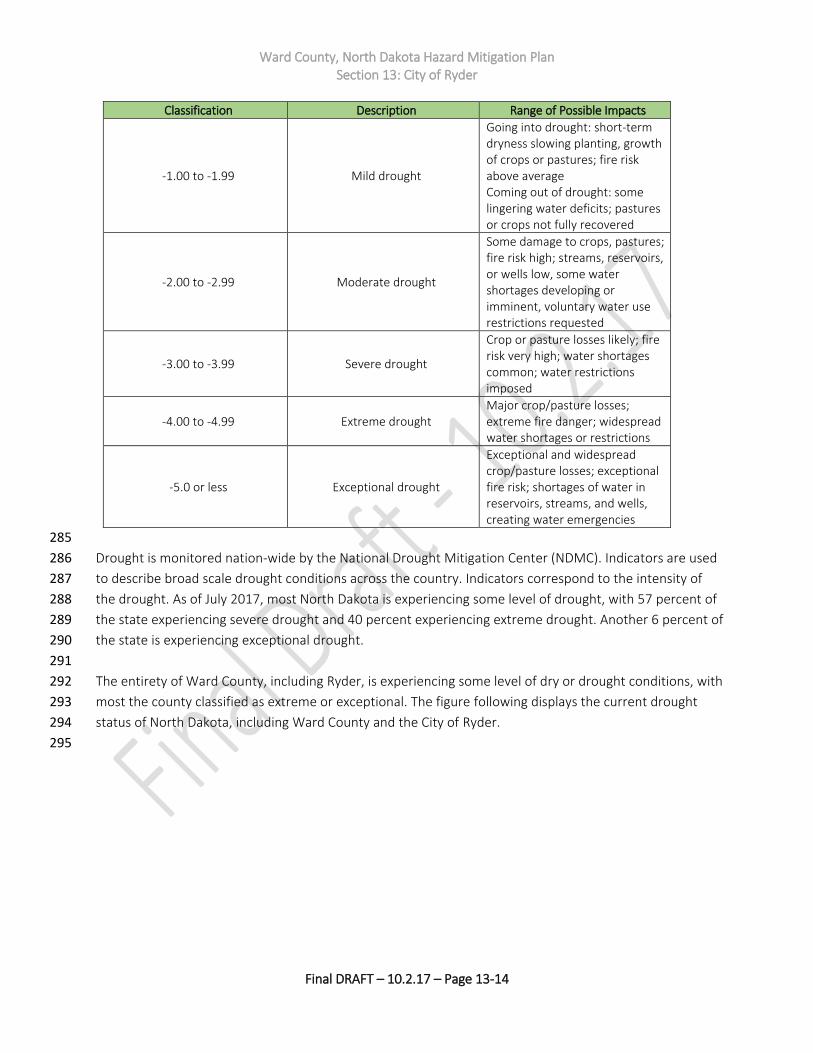
283 Table 7: Palmer Drought Severity Index 284
Classification Description Range of Possible Impacts
4.00 or more Extremely wet
3.00 to 3.99 Very wet
2.00 to 2.99 Moderately wet
1.00 to 1.99 Slightly wet
0.50 to 0.99 Incipient wet spell
0.49 to -0.49 Near normal
-0.50 to -0.99 Incipient dry spell
Ward County, North Dakota Hazard Mitigation Plan Section 13: City of Ryder
Final DRAFT – 10.2.17 – Page 13-14
Classification Description Range of Possible Impacts
-1.00 to -1.99 Mild drought
Going into drought: short-term dryness slowing planting, growth of crops or pastures; fire risk above average Coming out of drought: some lingering water deficits; pastures or crops not fully recovered
-2.00 to -2.99 Moderate drought
Some damage to crops, pastures; fire risk high; streams, reservoirs, or wells low, some water shortages developing or imminent, voluntary water use restrictions requested
-3.00 to -3.99 Severe drought
Crop or pasture losses likely; fire risk very high; water shortages common; water restrictions imposed
-4.00 to -4.99 Extreme drought Major crop/pasture losses; extreme fire danger; widespread water shortages or restrictions
-5.0 or less Exceptional drought
Exceptional and widespread crop/pasture losses; exceptional fire risk; shortages of water in reservoirs, streams, and wells, creating water emergencies
285
Drought is monitored nation-wide by the National Drought Mitigation Center (NDMC). Indicators are used 286
to describe broad scale drought conditions across the country. Indicators correspond to the intensity of 287
the drought. As of July 2017, most North Dakota is experiencing some level of drought, with 57 percent of 288
the state experiencing severe drought and 40 percent experiencing extreme drought. Another 6 percent of 289
the state is experiencing exceptional drought. 290
291
The entirety of Ward County, including Ryder, is experiencing some level of dry or drought conditions, with 292
most the county classified as extreme or exceptional. The figure following displays the current drought 293
status of North Dakota, including Ward County and the City of Ryder. 294
295

Ward County, North Dakota Hazard Mitigation Plan Section 13: City of Ryder
Final DRAFT – 10.2.17 – Page 13-15
Figure 2: Current Drought Conditions - July 2017 - North Dakota 296
297 Potential Impact of the Hazard 298
As illustrated by the preceding figure, droughts can affect a large geographic area, and can range in size 299
from a few counties to a few states. Their potential to impact wildlife and agricultural concerns can be 300
enormous. Droughts can kill crops, edible plants and wildlife habitat, and destroy grazing lands and trees. 301
Dead or dying vegetation, a normal result of drought, can then serve as a prime ignition source for 302
wildfires or grass fires. 303
304
The impacts of drought directly impact both economic and social stability in the affected area. Impacts do 305
not generally include direct structural damages, but rather focus on the impacts to living things. 306
307
Perhaps the best-known example of the impacts on life and property from drought is the Dust Bowl. The 308
phenomenon was caused by severe drought coupled with decades of poor farming and land management 309
practices. Deep plowing of the virgin topsoil of the Great Plains killed the natural grasses that normally 310
kept the soil in place and trapped moisture even during periods of drought and high winds. This led to 311
widespread crop failure throughout the Great Plains, including throughout North Dakota. 312
313
Ward County, North Dakota Hazard Mitigation Plan Section 13: City of Ryder
Final DRAFT – 10.2.17 – Page 13-16
During the Dust Bowl period, impressive drought-related research was carried out by the USDA, State 314
Agricultural Experiment Station Systems, and agricultural colleges and universities. Notable 315
accomplishments were technologies for soil erosion control, soil moisture conservation, higher yielding 316
grain varieties, improved fertilizers, and better farm management. 317
318
When drought struck again in the early 1950s, the impact was much less severe. The widespread financial 319
distress, interstate migration, and regional disruption characteristic of the Dust Bowl era were largely 320
absent. Although comparable in meteorological severity (even if not spatially uniform) the impact was 321
moderated by the trends in adjustment, as well as by improved farm prices and a healthy economy. 322
Again, attention was directed to drought adjustment and research. Strong emphasis was placed on water 323
conservation and augmentation, weather modification research, weather prediction and control, 324
groundwater recharge, irrigation and river basin development, increasing runoff, evaporation control, 325
desalination, phreatophyte control, and irrigation canal lining. 326
327
The worst drought since the Dust Bowl years affected at least 35 states – including North Dakota - during 328
the summer of 1988 and into 1989. In some areas, the lack of rainfall dated back to 1984. In 1988, rainfall 329
totals over the Midwest, Northern Plains, and the Rockies were 50-85 percent below normal. Crops and 330
livestock died and some areas became desert. To make matters worse, this event was accompanied by 331
heat waves, which were estimated to kill 4,800-17,000 people, nationwide. 332
333
North Dakotans – including those in the City of Ryder – are familiar with the impacts of drought. Given 334
the areas dependence on agriculture, a significant drought in the modern era could have equally 335
devastating consequences. Widespread crop failure, livestock death, inadequate drinking water, illness or 336
diseases from inadequate sanitation – these are potential impacts from a widespread or prolonged 337
drought. 338
339
Several secondary hazards are often associated with drought. Rural grassland fires increase because of 340
dry vegetation. Reduction in vegetation cover will expose the soil to wind, and dust storms and soil 341
erosion will occur. Because of reduction in flow, the chemical quality of river and lake water will change, 342
and the sediment transport regimes of streams will be altered. 343
344
Deterioration in water quality, in turn, results in injury and death to plants and animals. Stagnant pools 345
along river courses will provide favorable habitats for insects, particularly mosquitoes and grasshoppers. 346
Finally, with the return of the rains, the dry and unstable topsoil is vulnerable to gullying and flooding. 347
348
Past Occurrences of the Hazard 349
Information obtained from the State Hazard Mitigation Plan (SHMP) indicates that Ward County has a 350
documented history of drought. For the purposes of this Plan, the assumption is made that all 351
jurisdictions within Ward County would have experienced the hazard, including the City of Ryder. 352
353
Ward County, North Dakota Hazard Mitigation Plan Section 13: City of Ryder
Final DRAFT – 10.2.17 – Page 13-17
The following are some notable occurrences of drought in the vicinity of the planning area. This list is not 354
exhaustive, and includes only those occurrences that were notable. 355
356
• 1930s: The decade began with dry years in 1930 and 1931. By 1934, extremely dry conditions 357
were recorded over 80 percent of the US, including most of North Dakota. By the end of the 358
decade, the Great Plains were in extreme drought conditions. As rain continued to elude the 359
area, crops and livestock failed. Exposed topsoil blew away in heat-driven winds, creating dust 360
storms. According to the State Historical Society, thousands of North Dakotans lost their farms, 361
and moved either to cities or towns, while others left the state altogether. One historian cited by 362
the Society estimates that 70 percent of the state’s population required one form of public 363
assistance or another, but also notes that most North Dakotans held on, husbanding their 364
resources wherever they could. 365
• 1950s: This drought, lasting most of the decade, was one of the most severe to impact the Great 366
Plains. A pattern of low precipitation began in 1952 and continued until 1957. According to the 367
USGS, this drought was intensified by the diversion of moisture-laden air masses away from 368
drought-stricken areas by the formation of stronger-than-normal high pressure cells. Ground 369
water throughout the Great Plains declined; in some areas, this decline was measured in tens of 370
feet. Compared to other Great Plains states, North Dakota fared reasonably well during this 371
drought, though significant hardships did occur. The USGS estimated that in 1955, approximately 372
614,000 acres throughout the State were damaged by wind, resulting in significant erosion. 373
During this period, precipitation ranged from 50 percent to 75 percent of normal throughout 374
North Dakota. 375
• 1988-1992: Per a report published by the ND State Water Commission, the drought of 1988-1992 376
was the second most severe drought to occur in North Dakota since 1930. Streams throughout 377
the state had record low flows, and groundwater levels were impacted. These impacts included 378
Rice Lake, which was strongly impacted by the drought. The following figure illustrates the 379
severity of this drought, nationwide. 380
• 2006: The meteorological summer of June, July, and August 2006 turned out to be the 3rd 381
warmest and 14th driest in state history. Then-Governor John Hoeven issued a statewide 382
agricultural drought emergency declaration in response to drought conditions that continued to 383
deteriorate in southwest and south central portions of North Dakota. Drought declarations were 384
issued in Grant, Hettinger, McIntosh, Sioux and Emmons County. Per the US Drought Monitor, 385
Ward County was in the moderate to severe intensity for the 2006 drought. No deaths or injuries 386
were reported. 387
• 2012: The 2012 growing season in North Dakota was the 8th warmest and 13th driest on record. 388
By August of 2012, 87 percent of North Dakota was experiencing drought conditions. Twenty 389
counties were classified as being in severe drought. Pasture and range conditions were declining 390
across the state. This prompted Governor Jack Dalrymple to declare an agricultural emergency in 391
North Dakota; Ward County and its municipalities (including Ryder) were included in this 392
declaration. 393
394

Ward County, North Dakota Hazard Mitigation Plan Section 13: City of Ryder
Final DRAFT – 10.2.17 – Page 13-18
Figure 3: 1988 Drought 395
396 397
In 2017, Ward County and the City of Ryder were included in a USDA Farm Service Agency Drought 398
Disaster Declaration. This was also true in 2016 and 2013. This declaration means that emergency loans 399
are available to producers suffering losses in designated counties – including Ward County – and in 400
geographically contiguous counties. 401
402
Probability of a Future Occurrence of the Hazard 403
Based on the available data, drought impacts the planning area at least once every five years, at least 404
since 2000, during which there was at least five occurrences of the hazard. Using the scale provided 405
earlier in this chapter, this equates to a moderate probability of a future occurrence, as the hazard occurs 406
an average of once every four years. 407
408
13.3.2.3 Fire 409
This profile includes both structure and wildfire. 410
411
Description of the Hazard 412
Fire is the rapid oxidation of a material in the chemical process of combustion, releasing heat, light, and 413
various reaction products. Slower oxidative processes like rusting or digestion are not included by this 414
definition. The flame is the visible portion of the fire and consists of glowing hot gases. If hot enough, the 415
Ward County, North Dakota Hazard Mitigation Plan Section 13: City of Ryder
Final DRAFT – 10.2.17 – Page 13-19
gases may become ionized to produce plasma. Depending on the substances alight, and any impurities 416
outside, the color of the flame and the fire's intensity might vary. 417
418
Fire in its most common form can result in conflagration, which has the potential to cause physical 419
damage through burning. Fire is an important process that affects ecological systems across the globe. 420
The positive effects of fire include stimulating growth and maintaining various ecological systems. Fire has 421
been used by humans for cooking, generating heat, signaling, and propulsion purposes. The negative 422
effects of fire include decreased water purity, increased soil erosion, an increase in atmospheric 423
pollutants and an increased hazard to human life. 424
425
Wildfires, also known as a wild land fire, are any fire that occurs on grassland, forest or prairie, regardless 426
of ignition source, damages or benefits. Wildfires are usually a naturally-occurring phenomenon, though 427
they can be caused by human action – namely arson. A wildfire differs from other fires by its extensive 428
size, the speed at which it can spread out from its original source, its potential to change direction 429
unexpectedly, and its ability to jump gaps such as roads, rivers and fire breaks. Wildfires are characterized 430
in terms of the cause of ignition, their physical properties such as speed of propagation, the combustible 431
material present, and the effect of weather on the fire. 432
433
Structures fires are considered a man-made hazard, in that their origins often arise from human activity 434
and be fueled by dense development. (For the purposes of this hazard profile, structures fires are 435
assumed to be accidental and their consequences unintended.) 436
437
Location of the Hazard 438
While fire is a hazard that can occur anywhere, some areas are more prone to fire than others. 439
Structure fires can and do occur anywhere that a structure exists. Wildfires can occur anywhere that 440
burnable vegetation exists. 441
442
The US Forest Service has an assessment product available, called the Wildfire Hazard Potential. This 443
product provides an overview assessment of the areas within a defined area that have the potential 444
to experience wildland fire, the following figure illustrates the wildfire hazard potential for the City of 445
Ryder, as defined by the US Forest Service. According to this assessment, Ryder contains areas 446
designated as non-burnable, water, very low, low, and high potential. 447
448
Note that the areas designated as ‘non-burnable’ in the figure are predominantly either developed or 449
agricultural land, and that they are subject to other types of fire. By definition of the US Forest 450
Service, however, they are outside of the wildland fire potential area. 451
452

Ward County, North Dakota Hazard Mitigation Plan Section 13: City of Ryder
Final DRAFT – 10.2.17 – Page 13-20
Figure 4: City of Ryder Wildfire Hazard Potential 453
454
Extent and Severity of the Hazard 455
The National Fire Danger Rating System (NFDRS) is a set of computer programs and algorithms that allow 456
land management agencies to estimate fire danger for a given rating area. NFDRS characterizes fire 457
danger by evaluating the approximate upper limit of fire behavior in a fire danger rating area during a 24-458
hour period. Calculations of fire behavior are based on fuels, topography and weather. NFDRS output give 459
relative ratings of the potential growth and behavior of any wildfire. Fire danger ratings are guides for 460
initiating presuppression activities and selecting the appropriate level of initial response to a reported 461
wildfire in lieu of detailed, site- and time-specific information. 462
463
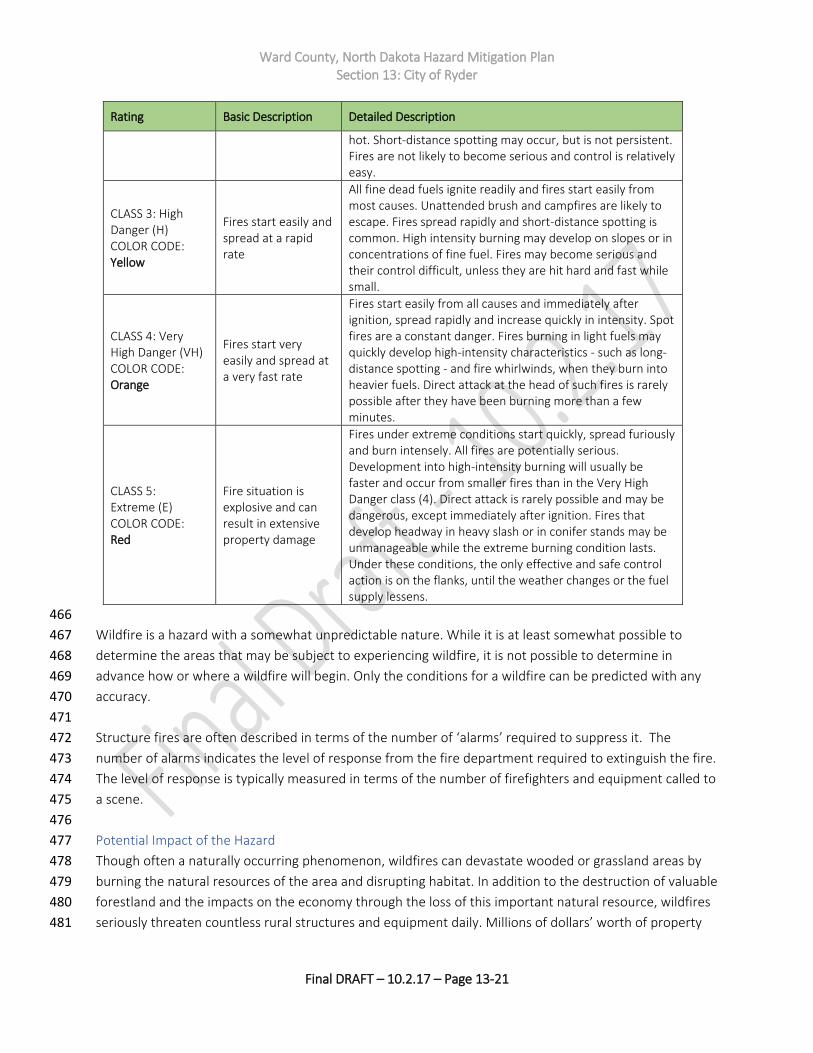
The following table details the NFDRS, from the US Forest Service’s Wildland Fire Assessment System. 464
465
Rating Basic Description Detailed Description
CLASS 1: Low Danger (L) COLOR CODE: Green
Fires not easily started
Fuels do not ignite readily from small firebrands. Fires in open or cured grassland may burn freely a few hours after rain, but wood fires spread slowly by creeping or smoldering and burn in irregular fingers. There is little danger of spotting.
CLASS 2: Moderate Danger (M) COLOR CODE: Blue
Fires start easily and spread at a moderate rate
Fires can start from most accidental causes. Fires in open cured grassland will burn briskly and spread rapidly on windy days. Woods fires spread slowly to moderately fast. The average fire is of moderate intensity, although heavy concentrations of fuel – especially draped fuel -- may burn
Ward County, North Dakota Hazard Mitigation Plan Section 13: City of Ryder
Final DRAFT – 10.2.17 – Page 13-21
Rating Basic Description Detailed Description
hot. Short-distance spotting may occur, but is not persistent. Fires are not likely to become serious and control is relatively easy.
CLASS 3: High Danger (H) COLOR CODE: Yellow
Fires start easily and spread at a rapid rate
All fine dead fuels ignite readily and fires start easily from most causes. Unattended brush and campfires are likely to escape. Fires spread rapidly and short-distance spotting is common. High intensity burning may develop on slopes or in concentrations of fine fuel. Fires may become serious and their control difficult, unless they are hit hard and fast while small.
CLASS 4: Very High Danger (VH) COLOR CODE: Orange
Fires start very easily and spread at a very fast rate
Fires start easily from all causes and immediately after ignition, spread rapidly and increase quickly in intensity. Spot fires are a constant danger. Fires burning in light fuels may quickly develop high-intensity characteristics - such as long-distance spotting - and fire whirlwinds, when they burn into heavier fuels. Direct attack at the head of such fires is rarely possible after they have been burning more than a few minutes.
CLASS 5: Extreme (E) COLOR CODE: Red
Fire situation is explosive and can result in extensive property damage
Fires under extreme conditions start quickly, spread furiously and burn intensely. All fires are potentially serious. Development into high-intensity burning will usually be faster and occur from smaller fires than in the Very High Danger class (4). Direct attack is rarely possible and may be dangerous, except immediately after ignition. Fires that develop headway in heavy slash or in conifer stands may be unmanageable while the extreme burning condition lasts. Under these conditions, the only effective and safe control action is on the flanks, until the weather changes or the fuel supply lessens.
466
Wildfire is a hazard with a somewhat unpredictable nature. While it is at least somewhat possible to 467
determine the areas that may be subject to experiencing wildfire, it is not possible to determine in 468
advance how or where a wildfire will begin. Only the conditions for a wildfire can be predicted with any 469
accuracy. 470
471
Structure fires are often described in terms of the number of ‘alarms’ required to suppress it. The 472
number of alarms indicates the level of response from the fire department required to extinguish the fire. 473
The level of response is typically measured in terms of the number of firefighters and equipment called to 474
a scene. 475
476
Potential Impact of the Hazard 477
Though often a naturally occurring phenomenon, wildfires can devastate wooded or grassland areas by 478
burning the natural resources of the area and disrupting habitat. In addition to the destruction of valuable 479
forestland and the impacts on the economy through the loss of this important natural resource, wildfires 480
seriously threaten countless rural structures and equipment daily. Millions of dollars’ worth of property 481
Ward County, North Dakota Hazard Mitigation Plan Section 13: City of Ryder
Final DRAFT – 10.2.17 – Page 13-22
and crops can be severely threatened by wildfire, but damage can be minimized by timely and effective 482
wildfire suppression. 483
484
Structure fires have the potential for similar impacts in more developed areas, where there are more 485
structures and more people in closer proximity. If not suppressed in time, fires can spread from one 486
structure to another, endangering many people. 487
488
The increasing cost of natural gas and fuel oil has caused families to utilize alternate heating methods 489
during colder months. Thus, the use of space heaters, fireplaces, and wood burning stoves has increased 490
the structure fire hazard. Portable LP (propane) gas or kerosene heaters with self-contained fuel supplies 491
can be hazardous appliances, even when used per the manufacturer’s instructions, as their open flame 492
design is a potential fire hazard. Fuel leaks can result in explosions, and vapors are a source of indoor air 493
pollution, which is unhealthy for residents of the structure. Wood burning stoves can also be a point of 494
ignition, if the stove or chimney is incorrectly installed or maintained. 495
496
Past Occurrences of the Hazard 497
Note: Ryder’s Fire Department works in conjunction with the City of Makoti, and all statistics are 498
combined for both cities. Therefore, the statistics below assume that 50 percent of the reported fires 499
occurred in each city. 500
501
Based on data obtained from the National Reporting System and from the Ryder/Ryder Fire Department, 502
the city of Ryder experienced 3.5 structure fires from January 2008 through December 2012, an average 503
of .70 structure fires per year. For this same time period, 23 wildland fires were responded to, an average 504
of 4.6 per year. 505
506
For 2013 to 2016, no additional occurrences of fire were reported, based on fire department records. 507
508
From 2008 to 2016, the City experienced a total of four fires, for an average of .5 fires per year for the 509
period of record. 510
511
Probability of a Future Occurrence of the Hazard 512
Since 2008, there have been four fires in and around the City of Ryder. This equates to an annualized 513
occurrence rate of slightly more than half a fire per year every year. Using the scale provided earlier in 514
this chapter, the probability of a future occurrence is moderate, as there is an occurrence at least once 515
every other year. 516
517
13.3.2.4 Flood 518
This profiles includes references to both the current effective Flood Insurance Rate Maps (FIRMs) and the 519
Preliminary Digital Flood Insurance Rate Maps (Preliminary DFIRMs), which are not yet effective and have 520
not yet been adopted, but are expected to be during the life cycle of this plan. 521
Ward County, North Dakota Hazard Mitigation Plan Section 13: City of Ryder
Final DRAFT – 10.2.17 – Page 13-23
Description of the Hazard 522
Floods are naturally occurring events. Excess water from snowmelt, rainfall, or dam release (controlled or 523
uncontrolled) accumulates and either overflows onto banks or backs up into adjacent floodplains. 524
525
The National Flood Insurance Program (NFIP) defines flood in the following way: 526
527
A general and temporary condition of partial or complete inundation of two or more acres of 528 normally dry land area or of two or more properties from overflow of inland or tidal waters, from 529 unusual and rapid accumulation or runoff of surface waters from any source, or from mudflow. 530
531
This hazard profile considers flooding from all relevant sources. The Committee determined that all 532
sources of flooding should be treated in the same profile, as the effect on the area was generally the 533
same, regardless of the source of origin of the flood. Flooding sources considered include: 534
535
• Snowmelt; 536
• Dam failure; and 537
• Excessive rain events. 538
539
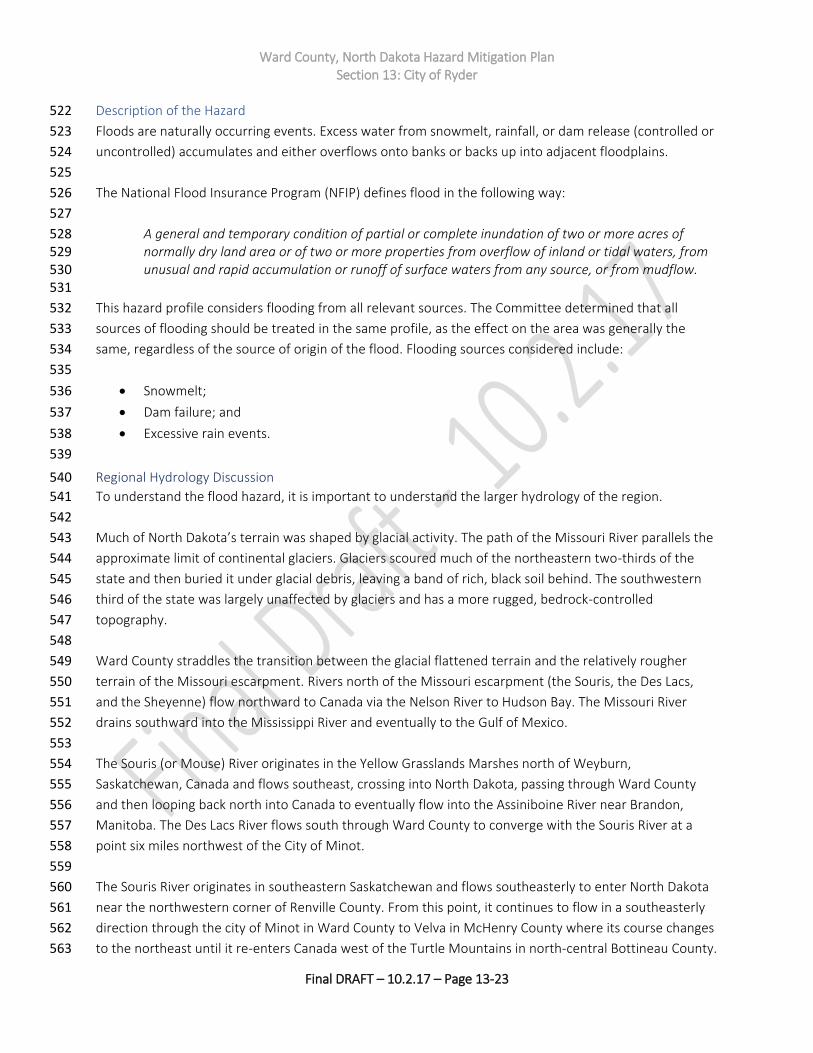
Regional Hydrology Discussion 540
To understand the flood hazard, it is important to understand the larger hydrology of the region. 541
542
Much of North Dakota’s terrain was shaped by glacial activity. The path of the Missouri River parallels the 543
approximate limit of continental glaciers. Glaciers scoured much of the northeastern two-thirds of the 544
state and then buried it under glacial debris, leaving a band of rich, black soil behind. The southwestern 545
third of the state was largely unaffected by glaciers and has a more rugged, bedrock-controlled 546
topography. 547
548
Ward County straddles the transition between the glacial flattened terrain and the relatively rougher 549
terrain of the Missouri escarpment. Rivers north of the Missouri escarpment (the Souris, the Des Lacs, 550
and the Sheyenne) flow northward to Canada via the Nelson River to Hudson Bay. The Missouri River 551
drains southward into the Mississippi River and eventually to the Gulf of Mexico. 552
553
The Souris (or Mouse) River originates in the Yellow Grasslands Marshes north of Weyburn, 554
Saskatchewan, Canada and flows southeast, crossing into North Dakota, passing through Ward County 555
and then looping back north into Canada to eventually flow into the Assiniboine River near Brandon, 556
Manitoba. The Des Lacs River flows south through Ward County to converge with the Souris River at a 557
point six miles northwest of the City of Minot. 558
559
The Souris River originates in southeastern Saskatchewan and flows southeasterly to enter North Dakota 560
near the northwestern corner of Renville County. From this point, it continues to flow in a southeasterly 561
direction through the city of Minot in Ward County to Velva in McHenry County where its course changes 562
to the northeast until it re-enters Canada west of the Turtle Mountains in north-central Bottineau County. 563
Ward County, North Dakota Hazard Mitigation Plan Section 13: City of Ryder
Final DRAFT – 10.2.17 – Page 13-24
The Souris River drains portions of Saskatchewan, Montana, North Dakota, and Manitoba. In North 564
Dakota, the area drained by the Souris is 9,112 mi². Stream length in the state is 357 river miles. 565
566
In North Dakota above Minot, the Souris River Valley is comparatively straight with a fairly constant width 567
of about one-half mile. Throughout this 64-mile reach of the river, valley walls rise sharply 100 feet or 568
more to broad, comparatively level benches. Between Minot and Verendrye, the valley displays the same 569
general characteristics; however, it is wider in places and has benches which are somewhat lower and 570
more broken. Below Verendrye, the north-side bench diminishes to low ridge and the lands toward 571
Bantry and Upham tend to merge with the valley. The channel of the Souris River follows a meandering 572
course, averaging slightly less than 100 feet wide and 15 to 25 feet deep, and meanders such that the 573
total length of the channel is approximately twice the length of the valley through which it flows. 574
575
Principle tributaries above Minot are the Des Lacs River, which enters the Souris River approximately 576
seven miles north of Minot; Moose Creek, which receives runoff from the Moose Mountains in Canada; 577
and Long Creek. Of these three streams, only the Des Lacs River, which rises just north of the US-Canada 578
boundary, enters the Souris River in North Dakota. 579
580
Other important tributaries outside the Souris River ‘Loop’ include the Wintering River, which flows 581
through southern McHenry County, and Willow Creek, which arises in the Turtle Mountains and flows in a 582
southwesterly direction to its confluence with the Souris River about eight miles east of Upham. The 583
interior of the Souris River ‘Loop’ is drained principally by a single stream system, the Deep River. 584
Principal tributaries of the Deep River are Cut Bank Creek (north), Little Deep Creek, and Cut Bank Creek 585
(south). 586
587
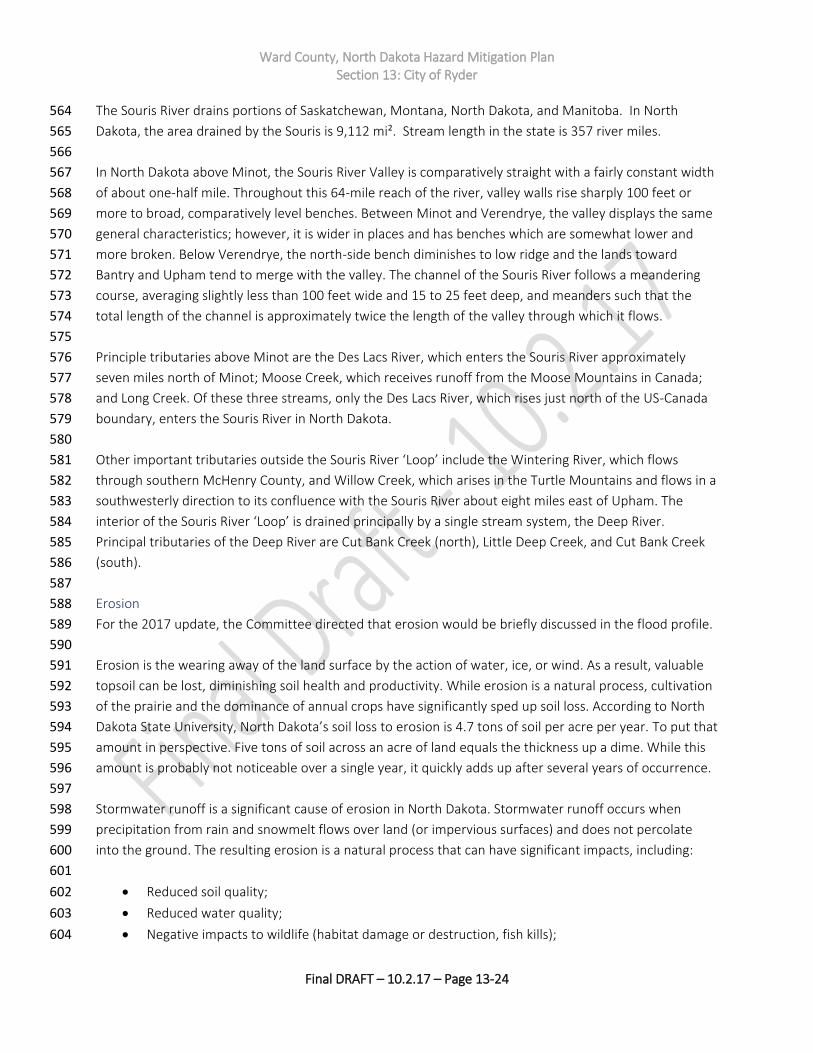
Erosion 588
For the 2017 update, the Committee directed that erosion would be briefly discussed in the flood profile. 589
590
Erosion is the wearing away of the land surface by the action of water, ice, or wind. As a result, valuable 591
topsoil can be lost, diminishing soil health and productivity. While erosion is a natural process, cultivation 592
of the prairie and the dominance of annual crops have significantly sped up soil loss. According to North 593
Dakota State University, North Dakota’s soil loss to erosion is 4.7 tons of soil per acre per year. To put that 594
amount in perspective. Five tons of soil across an acre of land equals the thickness up a dime. While this 595
amount is probably not noticeable over a single year, it quickly adds up after several years of occurrence. 596
597
Stormwater runoff is a significant cause of erosion in North Dakota. Stormwater runoff occurs when 598
precipitation from rain and snowmelt flows over land (or impervious surfaces) and does not percolate 599
into the ground. The resulting erosion is a natural process that can have significant impacts, including: 600
601
• Reduced soil quality; 602
• Reduced water quality; 603
• Negative impacts to wildlife (habitat damage or destruction, fish kills); 604
Ward County, North Dakota Hazard Mitigation Plan Section 13: City of Ryder
Final DRAFT – 10.2.17 – Page 13-25
• Negative impacts to infrastructure (siltation of waterways, clogged ditches and drains); 605
• Increases in flood intensity; and 606
• Economic impacts (higher water treatment costs, loss of soil productivity, damaged 607
infrastructure, flood damages). 608
609
While erosion is a natural function, it can lead to severe increases in the effects of flooding, as well as 610
unpredictable flood pathways. 611
612
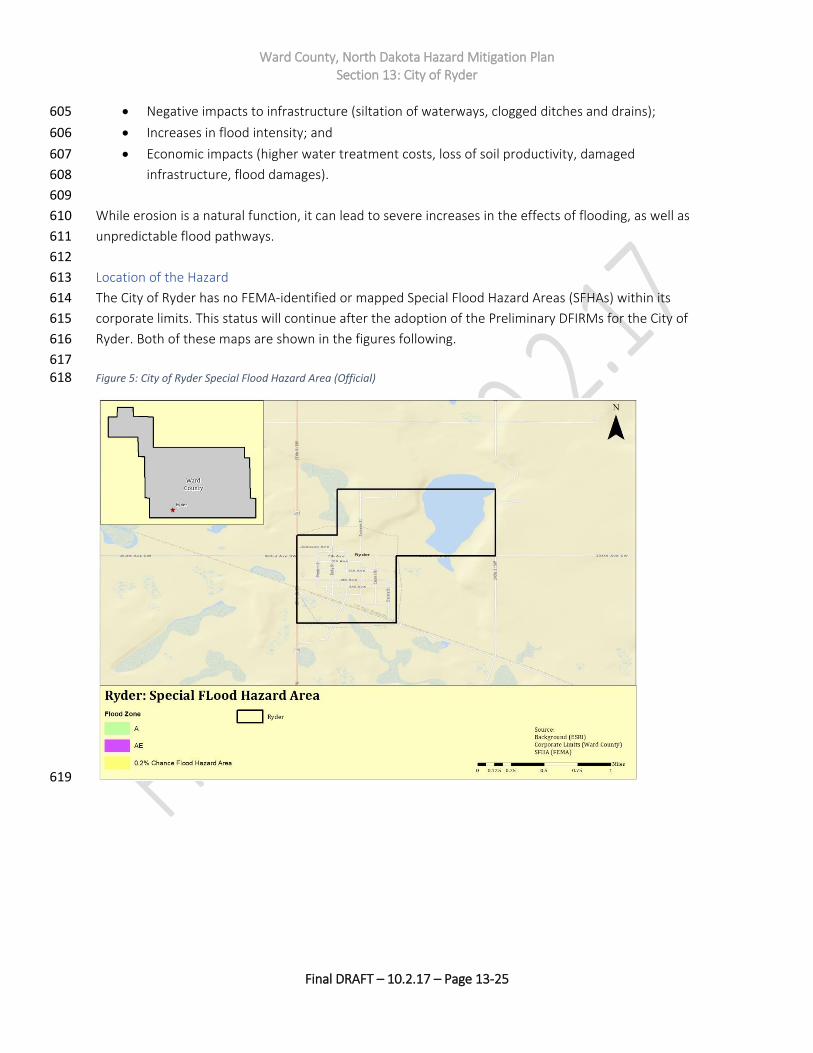
Location of the Hazard 613
The City of Ryder has no FEMA-identified or mapped Special Flood Hazard Areas (SFHAs) within its 614
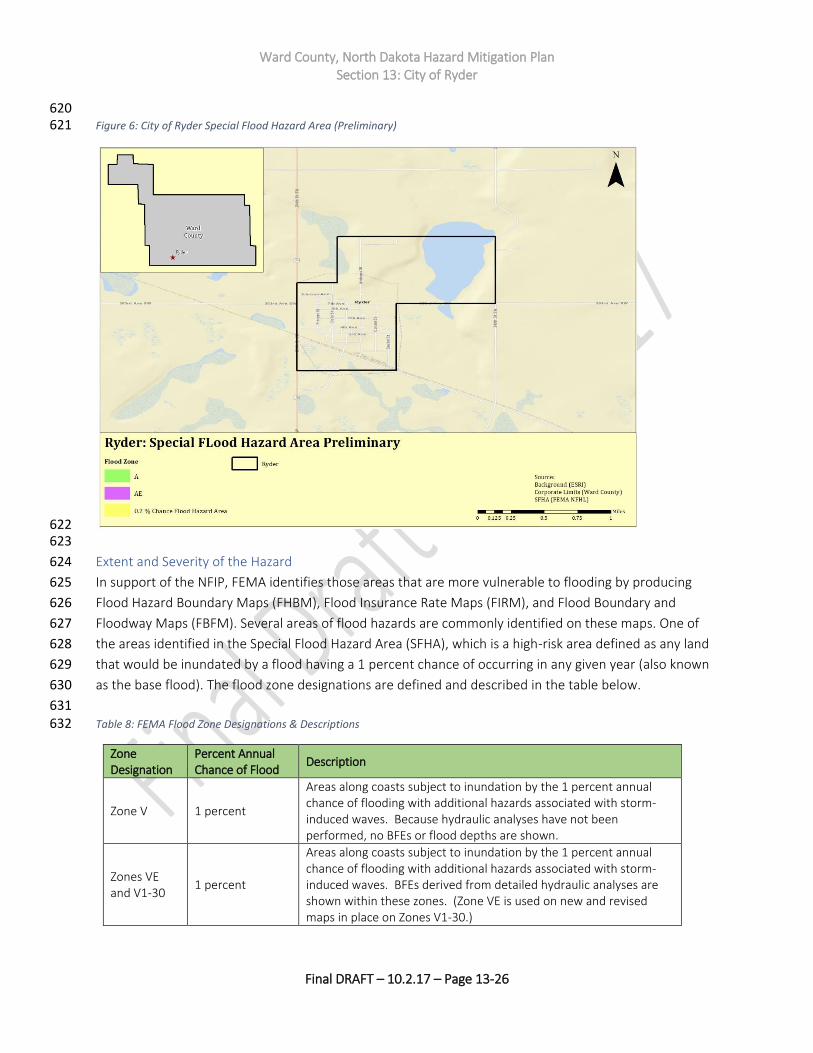
corporate limits. This status will continue after the adoption of the Preliminary DFIRMs for the City of 615
Ryder. Both of these maps are shown in the figures following. 616
617 Figure 5: City of Ryder Special Flood Hazard Area (Official) 618
619
Ward County, North Dakota Hazard Mitigation Plan Section 13: City of Ryder
Final DRAFT – 10.2.17 – Page 13-26
620 Figure 6: City of Ryder Special Flood Hazard Area (Preliminary) 621
622 623
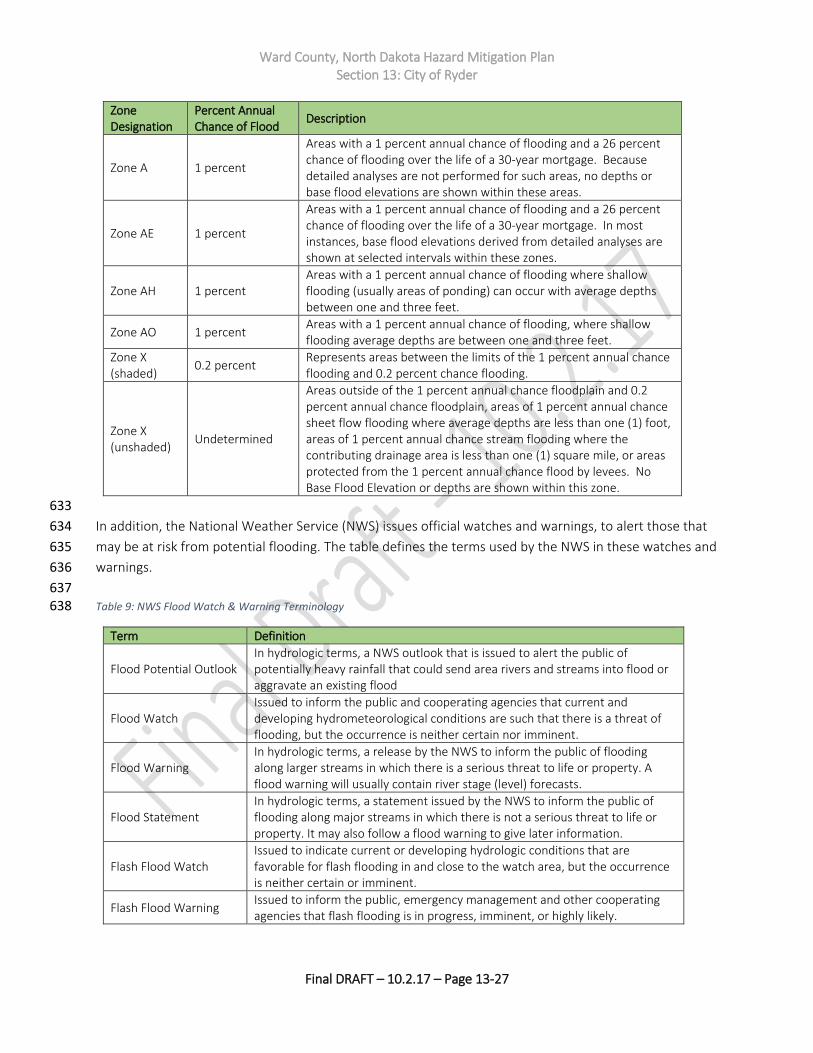
Extent and Severity of the Hazard 624
In support of the NFIP, FEMA identifies those areas that are more vulnerable to flooding by producing 625
Flood Hazard Boundary Maps (FHBM), Flood Insurance Rate Maps (FIRM), and Flood Boundary and 626
Floodway Maps (FBFM). Several areas of flood hazards are commonly identified on these maps. One of 627
the areas identified in the Special Flood Hazard Area (SFHA), which is a high-risk area defined as any land 628
that would be inundated by a flood having a 1 percent chance of occurring in any given year (also known 629
as the base flood). The flood zone designations are defined and described in the table below. 630
631 Table 8: FEMA Flood Zone Designations & Descriptions 632
Zone Designation
Percent Annual Chance of Flood
Description
Zone V 1 percent
Areas along coasts subject to inundation by the 1 percent annual chance of flooding with additional hazards associated with storm-induced waves. Because hydraulic analyses have not been performed, no BFEs or flood depths are shown.
Zones VE and V1-30
1 percent
Areas along coasts subject to inundation by the 1 percent annual chance of flooding with additional hazards associated with storm-induced waves. BFEs derived from detailed hydraulic analyses are shown within these zones. (Zone VE is used on new and revised maps in place on Zones V1-30.)
Ward County, North Dakota Hazard Mitigation Plan Section 13: City of Ryder
Final DRAFT – 10.2.17 – Page 13-27
Zone Designation
Percent Annual Chance of Flood
Description
Zone A 1 percent
Areas with a 1 percent annual chance of flooding and a 26 percent chance of flooding over the life of a 30-year mortgage. Because detailed analyses are not performed for such areas, no depths or base flood elevations are shown within these areas.
Zone AE 1 percent
Areas with a 1 percent annual chance of flooding and a 26 percent chance of flooding over the life of a 30-year mortgage. In most instances, base flood elevations derived from detailed analyses are shown at selected intervals within these zones.
Zone AH 1 percent Areas with a 1 percent annual chance of flooding where shallow flooding (usually areas of ponding) can occur with average depths between one and three feet.
Zone AO 1 percent Areas with a 1 percent annual chance of flooding, where shallow flooding average depths are between one and three feet.
Zone X (shaded)
0.2 percent Represents areas between the limits of the 1 percent annual chance flooding and 0.2 percent chance flooding.
Zone X (unshaded)
Undetermined
Areas outside of the 1 percent annual chance floodplain and 0.2 percent annual chance floodplain, areas of 1 percent annual chance sheet flow flooding where average depths are less than one (1) foot, areas of 1 percent annual chance stream flooding where the contributing drainage area is less than one (1) square mile, or areas protected from the 1 percent annual chance flood by levees. No Base Flood Elevation or depths are shown within this zone.
633
In addition, the National Weather Service (NWS) issues official watches and warnings, to alert those that 634
may be at risk from potential flooding. The table defines the terms used by the NWS in these watches and 635
warnings. 636
637 Table 9: NWS Flood Watch & Warning Terminology 638
Term Definition
Flood Potential Outlook In hydrologic terms, a NWS outlook that is issued to alert the public of potentially heavy rainfall that could send area rivers and streams into flood or aggravate an existing flood
Flood Watch Issued to inform the public and cooperating agencies that current and developing hydrometeorological conditions are such that there is a threat of flooding, but the occurrence is neither certain nor imminent.
Flood Warning In hydrologic terms, a release by the NWS to inform the public of flooding along larger streams in which there is a serious threat to life or property. A flood warning will usually contain river stage (level) forecasts.
Flood Statement In hydrologic terms, a statement issued by the NWS to inform the public of flooding along major streams in which there is not a serious threat to life or property. It may also follow a flood warning to give later information.
Flash Flood Watch Issued to indicate current or developing hydrologic conditions that are favorable for flash flooding in and close to the watch area, but the occurrence is neither certain or imminent.
Flash Flood Warning Issued to inform the public, emergency management and other cooperating agencies that flash flooding is in progress, imminent, or highly likely.

Ward County, North Dakota Hazard Mitigation Plan Section 13: City of Ryder
Final DRAFT – 10.2.17 – Page 13-28
Term Definition
Flash Flood Guidance Forecast guidance produced by the River Forecast Centers, often model output, specific to the potential for flash flooding (e.g., how much rainfall over a given area will be required to produce flash flooding).
Flash Flood Statement In hydrologic terms, a statement by the NWS which provides follow-up information on flash flood watches and warnings.
639
Ward County has a series of naturally occurring coulees that channel water towards the Souris and Des 640
Lacs Rivers. Flows of water through these coulees have measured three feet or more during localized 641
heavy rain (6-9 inches in 3 hours). This type of flooding has washed out roads, breached culverts and 642
damaged bridges. Adding to these phenomena, as the water flows down through the coulees it picks up a 643
great deal of debris and deposits it into the river, compounding the flood hazard. 644
645
Flood Control and the National Flood Insurance Program 646
North Dakota has long recognized that good floodplain management involves the utilization of a variety 647
of tools to reduce the impact of flood disasters. It is also recognized that a balance must be reached 648
between the four aspects of floodplain management which are: structural works designed to modify the 649
flood itself, regulatory functions which may reduce susceptibility to flooding, emergency preparedness 650
actions which may reduce susceptibility to flooding, and emergency preparedness actions which minimize 651
a flood’s effects during a flood event. 652
653
Flood control development had its beginning with the Flood Control Act of 1936. This act provided a basic 654
plan and an authorized program for the control of water resources. In the early 1940s, the North Dakota 655
State Water Commission cooperated with the federal agencies to plan and engineer the overall program 656
for North Dakota. 657
658
The US Army Corps of Engineers occupies one of the major roles in flood control planning and 659
construction. Two reservoirs built by the US Soil Conservation Service have contributed materially to flood 660
control by the construction of watershed projects in North Dakota. These watershed projects include 661
channel work and flood retention structures. In such projects, the Soil Conservation District has the 662
responsibility for ensuring that 50 percent of the farms above a structure are under a basic conservation 663
plan. 664
665
The Federal Disaster Protection Act of 1973 requires state and local governments to participate in the 666
National Flood Insurance Program (NFIP) as a condition to the receipt of any federal loan or grant for 667
construction projects in identified and mapped flood prone areas. 668
669
Participation in the NFIP requires communities to adopt floodplain regulations that meet NFIP objectives, 670
which are: New buildings must be protected from flooding damages that occur as a result of the 1 671
percent annual chance flood, and new development must not cause an increase in flood damages to 672
other property. 673
674
Ward County, North Dakota Hazard Mitigation Plan Section 13: City of Ryder
Final DRAFT – 10.2.17 – Page 13-29
Communities have been aided through passage, in 1981, of the state’s first Floodplain Management Act 675
which directed the State Engineer to aid local governments to reduce flood damages through sound 676
floodplain management. As a start, the state legislature provided the State Engineer with an 677
appropriation to be used in assisting communities to obtain base flood (1 percent annual chance flood) 678
elevation data. 679
680
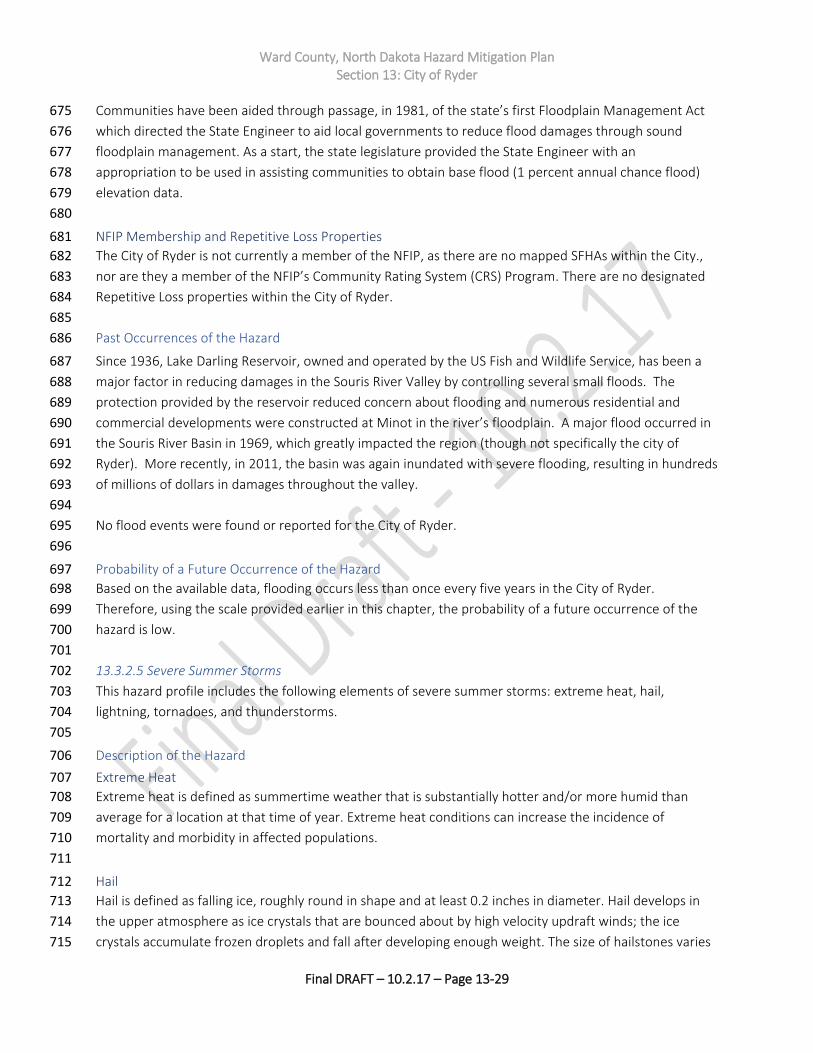
NFIP Membership and Repetitive Loss Properties 681
The City of Ryder is not currently a member of the NFIP, as there are no mapped SFHAs within the City., 682
nor are they a member of the NFIP’s Community Rating System (CRS) Program. There are no designated 683
Repetitive Loss properties within the City of Ryder. 684
685
Past Occurrences of the Hazard 686
Since 1936, Lake Darling Reservoir, owned and operated by the US Fish and Wildlife Service, has been a 687
major factor in reducing damages in the Souris River Valley by controlling several small floods. The 688
protection provided by the reservoir reduced concern about flooding and numerous residential and 689
commercial developments were constructed at Minot in the river’s floodplain. A major flood occurred in 690
the Souris River Basin in 1969, which greatly impacted the region (though not specifically the city of 691
Ryder). More recently, in 2011, the basin was again inundated with severe flooding, resulting in hundreds 692
of millions of dollars in damages throughout the valley. 693
694
No flood events were found or reported for the City of Ryder. 695
696
Probability of a Future Occurrence of the Hazard 697
Based on the available data, flooding occurs less than once every five years in the City of Ryder. 698
Therefore, using the scale provided earlier in this chapter, the probability of a future occurrence of the 699
hazard is low. 700
701
13.3.2.5 Severe Summer Storms 702
This hazard profile includes the following elements of severe summer storms: extreme heat, hail, 703
lightning, tornadoes, and thunderstorms. 704
705
Description of the Hazard 706
Extreme Heat 707
Extreme heat is defined as summertime weather that is substantially hotter and/or more humid than 708
average for a location at that time of year. Extreme heat conditions can increase the incidence of 709
mortality and morbidity in affected populations. 710
711
Hail 712
Hail is defined as falling ice, roughly round in shape and at least 0.2 inches in diameter. Hail develops in 713
the upper atmosphere as ice crystals that are bounced about by high velocity updraft winds; the ice 714
crystals accumulate frozen droplets and fall after developing enough weight. The size of hailstones varies 715

Ward County, North Dakota Hazard Mitigation Plan Section 13: City of Ryder
Final DRAFT – 10.2.17 – Page 13-30
and is a direct consequence of the severity and size of the storm that produces them – the higher the 716
temperatures at the Earth’s surface, the greater the strength of the updrafts and the amount of time 717
hailstones are suspended, the greater the size of the hailstone. 718
719
Lightning 720
Lightning is an atmospheric discharge of electricity accompanied by thunder, which typically occurs 721
during thunderstorms, and sometimes during volcanic eruptions or dust storms. In the atmospheric 722
electrical discharge, a leader of a bolt of lightning can travel at speeds of 130,000 MPH, and can reach 723
temperatures approaching 54,000°F, hot enough to fuse silica sand into glass. There are some 16 million 724
lightning storms in the world every year. 725
726
Lightning rapidly heats the air in its immediate vicinity to about 36,000°F - about three times the 727
temperature of the surface of the sun. This compresses the surrounding air and creates a supersonic 728
shock wave, which decays to an acoustic wave that is heard as thunder. 729
730
Some lightning strikes exhibit particular characteristics; scientists and the general public have given 731
names to these various types of lightning. The lightning that is most-commonly observed is streak 732
lightning. This is nothing more than the return stroke, the visible part of the lightning stroke. Most 733
lightning occurs inside a cloud and is not observed during a thunderstorm. 734
735
Tornadoes 736
The most destructive of all atmospheric phenomena, tornadoes are violently rotating columns of air. 737
These columns extend between and in contact with a cloud and the Earth’s surface. The most violent 738
tornadoes have rotational wind speeds of 250 MPH; in extreme cases, rotational wind speeds may 739
approach 300 MPH. Tornadoes are often produced by severe thunderstorms. 740
741
Thunderstorms 742
Thunderstorms are caused by an atmospheric imbalance from warm unstable air rising rapidly into the 743
atmosphere. Thunderstorms are a unique threat because of their complex nature. Multiple hazards are 744
present within a single system. Strong winds, rain, and hail can accompany large thunderstorm systems. 745
Lightning, which occurs during all thunderstorms, can strike anywhere. Generated by the buildup of 746
charged ions in a thundercloud, the discharge of a lightning bolt interacts with the best conducting object 747
or surface on the ground. The air channel of a lightning strike can reach temperatures higher than 748
50,000°F. The National Weather Service defines a severe thunderstorm as a thunderstorm that produces 749
¾ inch hail or larger in diameter and/or produces winds that equal or exceed 58 MPH. 750
751
Location of the Hazard 752
Severe summer storms are a non-spatial hazard, and can occur anywhere in the City of Ryder. 753
754
Extent and Severity of the Hazard 755
Severe summer storms have a wide range of extent and severity markers and characteristics. 756

Ward County, North Dakota Hazard Mitigation Plan Section 13: City of Ryder
Final DRAFT – 10.2.17 – Page 13-31
757
Extreme Heat 758
The National Weather Service (NWS) issues a range of watches and warnings associated with extreme 759
heat, as illustrated below: 760
761
• Excessive Heat Outlook: when the potential exists for an excessive heat event in the next 3 to 7 762
days. An outlook is used to indicate that a heat event may develop. It is intended to provide 763
information to those who need considerable lead time to prepare for the event, such as public 764
utilities, emergency management and public health officials. 765
• Excessive Heat Watch: when conditions are favorable for an excessive heat event in the next 12 to 766
48 hours. A watch is used when the risk of a heat wave has increased, but its occurrence and 767
timing is still uncertain. It is intended to provide enough lead time so those who need to set their 768
plans in motion can do so, such as established individual city excessive heat event mitigation 769
plans. 770
• Excessive Heat Warning/Advisory: when an excessive heat event is expected in the next 36 hours. 771
These products are issued when an excessive heat event is occurring, is imminent, or has a very 772
high probability of occurrence. The warning is used for conditions posing a threat to life or 773
property. An advisory is for less serious conditions that cause significant discomfort or 774
inconvenience and, if caution is not taken, could lead to a threat to life and/or property. 775
776
The NWS also developed the Heat Index (HI). The HI is sometimes referred to as the ‘apparent 777
temperature.’ The HI, given in degrees F, is a measure of how hot it really feels when relative 778
humidity (RH) is added to the actual air temperature. To find the HI, NWS uses the Heat Index Chart, 779
found in the figure below. As an example, if the air temperature is 96°F (found on the top of the 780
table) and the RH is 65 percent (found on the left of the table), the HI - or how hot it really feels - is 781
121°F. This is the intersection of the 96°F column and the 65 percent row. 782
783
Since HI values were devised for shady, light wind conditions, exposure to full sunshine can increase HI 784
values by up to 15°F. Also, strong winds, particularly with very hot, dry air, can be extremely hazardous. 785
Note the shaded zone above 105°F on the Heat Index Chart. This corresponds to a level of HI that may 786
cause increasingly severe heat disorders with continued exposure and/or physical activity. 787
788

Ward County, North Dakota Hazard Mitigation Plan Section 13: City of Ryder
Final DRAFT – 10.2.17 – Page 13-32
Figure 7: NWS Heat Index Chart 789
790 791
Recent research has shown that a heat index threshold does not fully account for a variety of factors 792
which impact health including the impact of consecutive stressful days on human health, the time of year, 793
or the location where excessive heat events occur. For example, studies indicate large urban areas are 794
particularly sensitive to heat early in the summer season. Based on this research, NOAA/NWS has 795
supported the implementation of new Heat Health Watch/Warning System (HHWS) that its forecasters 796
use as guidance in producing their daily warning and forecast products. 797
798
Hail 799
The National Oceanic and Atmospheric Administration (the parent agency for the NWS) and the 800
Tornado and Storm Research Organization (TORRO) both created Hailstorm Intensity Scales. The table 801
below provides details of these scales. 802
803
Table 10: Hailstorm Intensity Scale 804
Size Code
Intensity Category
Typical Hail Diameter
Approximate Size
Typical Damage Impacts
H0 Hard Hail Up to 0.33” Pea No damage
H1 Potentially Damaging
0.33” – 0.60”
Marble or mothball
Slight damage to plants and crops

Ward County, North Dakota Hazard Mitigation Plan Section 13: City of Ryder
Final DRAFT – 10.2.17 – Page 13-33
Size Code
Intensity Category
Typical Hail Diameter
Approximate Size
Typical Damage Impacts
H2 Potentially Damaging
0.60” – 0.80”
Dime or grape Significant damage to fruit, crops and vegetation
H3 Severe 0.80” – 1.20”
Nickel to quarter
Severe damage to fruit and crops, damage to glass and plastic structures, paint and wood scored
H4 Severe 1.20” – 1.60”
Half dollar to ping pong ball
Widespread glass damage, vehicle body damage
H5 Destructive 1.60” – 2.0” Silver dollar to golf ball
Wholesale destruction of glass, damage to tiled roofs, significant risk of injuries
H6 Destructive 2.0” – 2.4” Lime or egg Aircraft body dented, brick walls pitted
H7 Very Destructive
2.4” – 3.0” Tennis ball Severe roof damage, risk of serious injuries
H8 Very Destructive
3.0” – 3.5” Baseball to orange
Severe damage to aircraft body
H9 Super Hailstorms
3.5” – 4.0” Grapefruit
Extensive structural damage, risk of severe or fatal injuries to persons caught in the open
805
Lightning 806
The following are descriptions of various terms used to describe lightning, both scientific and common 807
usage: 808
809
• Cloud-to-Ground Lightning. This is the best known and second most common type of lightning. Of 810
all the different types of lightning, it poses the greatest threat to life and property since it strikes 811
the ground. Cloud-to-ground lightning is a lightning discharge between a cumulonimbus cloud 812
and the ground. It is initiated by a leader stroke moving down from the cloud. 813
• Bead Lightning. Bead lightning is a type of cloud-to-ground lightning which appears to break up 814
into a string of short, bright sections, which last longer than the usual discharge channel. It is 815
relatively rare. Several theories have been proposed to explain it; one is that the observer sees 816
portions of the lightning channel end on, and that these portions appear especially bright. 817
Another is that, in bead lightning, the width of the lightning channel varies; as the lightning 818
channel cools and fades, the wider sections cool more slowly and remain visible longer, appearing 819
as a string of beads. 820
• Ribbon Lightning. Ribbon lightning occurs in thunderstorms with high cross winds and multiple 821
return strokes. The wind will blow each successive return stroke slightly to one side of the 822
previous return stroke, causing a ribbon effect. 823

Ward County, North Dakota Hazard Mitigation Plan Section 13: City of Ryder
Final DRAFT – 10.2.17 – Page 13-34
• Staccato Lightning. Staccato lightning is a cloud to ground lightning strike which is a short-824
duration stroke that appears as a single very bright flash and often has considerable branching. 825
• Ground-to-Cloud Lightning. Ground-to-cloud lightning is a lightning discharge between the ground 826
and a cumulonimbus cloud initiated by an upward-moving leader stroke. It is much rarer than 827
cloud-to-ground lightning. This type of lightning forms when negatively charged ions called the 828
stepped leader rises from the ground and meets the positively charged ions in a cumulonimbus 829
cloud. Then the strike goes back to the ground as the return stroke. 830
• Cloud-to-Cloud Lightning. Lightning discharges may occur between areas of cloud without 831
contacting the ground. When it occurs between two separate clouds it is known as inter-cloud 832
lightning and when it occurs between areas of differing electric potential within a single cloud, it 833
is known as intra-cloud lightning. Intra-cloud lightning is the most frequently occurring type. 834
• Heat Lightning. Heat lightning is a common name for a lightning flash that appears to produce no 835
thunder because it occurs too far away for the thunder to be heard. The sound waves dissipate 836
before they reach the observer. 837
• Dry Lightning. Dry lightning is a term used for lightning that occurs with no precipitation at the 838
surface. This type of lightning is the most common natural cause of wildfires. Pyrocumulus clouds 839
produce lightning for the same reason that it is produced by cumulonimbus clouds. When the 840
higher levels of the atmosphere are cooler, and the surface is warmed to extreme temperatures 841
due to a wildfire, volcano, etc., convection will occur, and the convection produces lightning. 842
Therefore, fire can beget dry lightning through the development of more dry thunderstorms 843
which cause more fires. 844
845
The National Weather Service uses a Lightning Activity Level scale to indicate the frequency and character 846
of cloud-to-ground (C/G) lightning, the most common form of lightning on Earth. The scale uses a range of 847
1 – 6, with 6 being the high end of the scale. 848
849 Table 11: Lightning Activity Level 850
Lightning Activity Level Scale
Rank Cloud and Storm Development Areal Coverage
Counts C/G per 5 Minutes
Counts C/G per 15
Minutes
Average C/G per Minute
1 No Thunderstorms None None None None
2 Cumulus clouds are common but only a few reach the towering stage. A single thunderstorm must be confirmed in the rating area. The clouds mostly produce virga but light rain will occasionally reach ground. Lightning is very infrequent.
<15 percent 1-5 1-8 <1

Ward County, North Dakota Hazard Mitigation Plan Section 13: City of Ryder
Final DRAFT – 10.2.17 – Page 13-35
Lightning Activity Level Scale
Rank Cloud and Storm Development Areal Coverage
Counts C/G per 5 Minutes
Counts C/G per 15
Minutes
Average C/G per Minute
3 Cumulus clouds are common. Swelling and towering cumulus cover less than 2/10 of the sky. Thunderstorms are few, but 2 to 3 occur within the observation area. Light to moderate rain will reach the ground, and lightning is infrequent.
15 percent to 24 percent
6-10 9-15 1-2
4 Swelling cumulus and towering cumulus cover 2-3/10 of the sky. Thunderstorms are scattered but more than three must occur within the observation area. Moderate rain is commonly produced, and lightning is frequent.
25 percent to 50 percent
11-15 16-25 2-3
5 Towering cumulus and thunderstorms are numerous. They cover more than 3/10 and occasionally obscure the sky. Rain is moderate to heavy, and lightning is frequent and intense.
>50 percent >15 >25 >3
6 Dry lightning outbreak. (LAL of 3 or greater with majority of storms producing little or no rainfall.)
>15 percent None None None
851
Tornadoes 852
Tornado wind forces are measured and described according to the Enhanced Fujita Scale (EF Scale). The 853
EF Scale is largely a residential structure damage scale, which tends to have much more standardized 854
construction than commercial structures. The EF Scale considers how most structures are designed, and 855
is thought to be an accurate representation of the surface wind speeds in the most violent tornadoes. 856
The table below illustrates the EF scale. 857
858 Table 12: Enhanced Fujita Scale 859
Enhanced Fujita Category
Wind Speed (mph) Potential Damage
EF0 65-85 Light damage. Peels surface off some roofs; some damage to gutters or siding; branches broken off trees; shallow-rooted trees pushed over.
EF1 86-110 Moderate damage. Roofs severely stripped; mobile homes overturned or badly damaged; loss of exterior doors; windows and other glass broken.

Ward County, North Dakota Hazard Mitigation Plan Section 13: City of Ryder
Final DRAFT – 10.2.17 – Page 13-36
Enhanced Fujita Category
Wind Speed (mph) Potential Damage
EF2 111-135
Considerable damage. Roofs torn off well-constructed houses; foundations of frame homes shifted; mobile homes destroyed; large trees snapped or uprooted; light-object missiles generated; cars lifted off ground.
EF3 136-165
Severe damage. Entire stories of well-constructed houses destroyed; severe damage to large buildings such as shopping malls; trains overturned; trees debarked; heavy cars lifted off the ground and thrown; structures with weak foundations blown away some distance.
EF4 166-200 Devastating damage. Well-constructed houses and whole frame houses completely leveled; cars thrown and small missiles generated.
EF5 >200
Incredible damage. Strong frame houses leveled off foundations and swept away; automobile-sized missiles fly more than 100 m (109 yd); high-rise buildings have significant structural deformation; incredible phenomena will occur.
860
Thunderstorms 861
Thunderstorms affect relatively small areas. The typical thunderstorm is 15 miles in diameter and lasts an 862
average of 30 minutes. Given that Ryder is smaller than 15 miles in diameter, it is possible for the entire 863
jurisdiction to be impacted by the same thunderstorm at any given time. Despite their small size and 864
relatively short duration, all thunderstorms are potentially dangerous. Of the estimated 100,000 865
thunderstorms that occur each year in the US, about 10 percent are classified as severe by the NWS. 866
People most at risk from thunderstorms are those who are outdoors, especially under or near tall trees; 867
in or on water; or on or near hilltops. 868
869
All assets and people within the City of Ryder are at risk from the effects of severe summer storms, 870
and can expect to experience the complete range of the component hazards 871
872
Potential Impact of the Hazard 873
Extreme Heat 874
On average, more than 1,500 people in the US die each year from extreme heat. This number is greater 875
than the 30-year mean annual number of deaths due to tornadoes, hurricanes, floods and lightning 876
combined. In the 40-year period from 1936 through 1975, nearly 20,000 people were killed in the United 877
States by the effects of heat and solar radiation. In the disastrous heat wave of 1980, more than 1,250 878
people died. In the heat wave of 1995 more than 700 deaths in the Chicago, IL area were attributed to 879
this event. 880
881
Heat-related disorders generally have to do with a reduction or collapse of the body's ability to shed heat 882
by circulatory changes and sweating or a chemical (salt) imbalance caused by too much sweating. When 883
the body heats too quickly to cool itself safely, or when fluid or salt is lost through dehydration or 884
sweating, the body’s temperature rises and heat-related illness may develop. 885

Ward County, North Dakota Hazard Mitigation Plan Section 13: City of Ryder
Final DRAFT – 10.2.17 – Page 13-37
886
Studies indicate that, other things being equal, the severity of heat disorders tend to increase with age. 887
Conditions that cause heat cramps in a 17-year-old may result in heat exhaustion in a 40-year-old and 888
heat stroke in a person over 60. 889
890
Sunburn, with its ultraviolet radiation burns, can significantly impair the skin's ability to shed excess heat. 891
892
Hail 893
Hail typically impacts property by damaging structures, cars, and utilities as it falls. Dents in cars, 894
broken glass, and holes in roofs are common impacts of hail. Injuries to people from hail are less 895
common, though they can happen, as hail is a hard object falling in an unpredictable manner at a 896
fairly high rate of speed. 897
898
Lightning 899
Lightning is the leading cause of weather-related personal injuries. Perhaps because lightning is a common 900
weather phenomenon, most people do not take the associated risks of exposure to lightning as seriously 901
as they should. 902
903
Lightning is a major cause of storm related deaths in the US, out pacing hurricanes and tornados in most 904
years. A lightning strike can result in a cardiac arrest (heart stopping) at the time of the injury, although 905
some victims may appear to have a delayed death a few days later if they are resuscitated but have 906
suffered irreversible brain damage. 907
908
On average, for every person struck by lightning, 10 additional people are affected by the strike. 909
According to Storm Data, a National Weather Service publication, over the last 30 years the US has 910
averaged 58 reported lightning fatalities per year. Due to under reporting, the figures are more 911
realistically at least 70 deaths per year. Only about 10 percent of people who are struck by lightning are 912
killed, leaving 90 percent with various degrees of disability. 913
914
The table following provides statistics from the National Weather Service. Assuming a US population of 915
313 million (based on the 2010 Census estimate), the NWS has calculated the likelihood of the average 916
person being struck or killed by lightning. 917 918
Table 13: Lightning Strike Statistics 919
Odds of Becoming a Victim of Lightning
Characteristic Probability or Statistic
Number of Deaths Reported 60
Estimated Number of Deaths 70
Number of Injuries Reported 340-400
Estimated Number of Injuries 540-600
Odds of Being Struck by Lightning in a Given Year (using reported numbers)
1 in 750,000

Ward County, North Dakota Hazard Mitigation Plan Section 13: City of Ryder
Final DRAFT – 10.2.17 – Page 13-38
Odds of Becoming a Victim of Lightning
Characteristic Probability or Statistic
Odds of Being Struck by Lightning in a Given Year (using estimated numbers)
1 in 500,000
Odds of Being Struck by Lightning in Average Lifetime (80 years) 1 in 6,250
Odds of Being Affected by Someone Else Being Struck 1 in 625 920
While approximately one third of injuries occur during work, worker’s compensation companies are often 921
reluctant to acknowledge the injury or pay related medical expenses. An estimated third of injuries occur 922
during recreational or sports activities. The last third occurs in diverse situation, including injuries to those 923
inside buildings. 924
925
Those struck by lightning report a variety of affects, including: 926
927
• Personality changes, likely due to frontal lobe damage 928
• Fatigue 929
• Brain and nervous system damage 930
• Headaches 931
• Ringing in the ears 932
• Dizziness 933
• Nausea and vomiting 934
• Sleep difficulties 935
• Seizures 936
• Chronic pain 937
938
In addition to the impact lightning can have on people, lightning can have significant impact on property, 939
including utility infrastructure, such as lift stations and electrical sub-stations. Lightning is the leading 940
natural cause of wildfires, and can lead to structure fires as well. The historic structures and districts are 941
particularly vulnerable, as they are primarily wood-frame construction and are closer together than 942
modern residences. 943
944
The Lightning Protection institute, a non-profit organization dedicated to promoting lightning safety and 945
protection, conducted a study that demonstrates that: 946
947
• 32 percent of lightning strikes hit roofs and projections such as satellite dishes or chimneys; 948
• 29 percent of lightning strikes hit overhead power lines and phone lines; 949
• 29 percent of lightning strikes hit television antennas; and 950
• 10 percent of lightning-strikes hit trees near structures. 951
952
On average, lightning strikes cause 30 percent of the church fires and at least 18 percent of lumberyard 953
fires in the US annually. They also cause significant losses to more than 18,000 houses and 12,000 other 954
buildings. 955
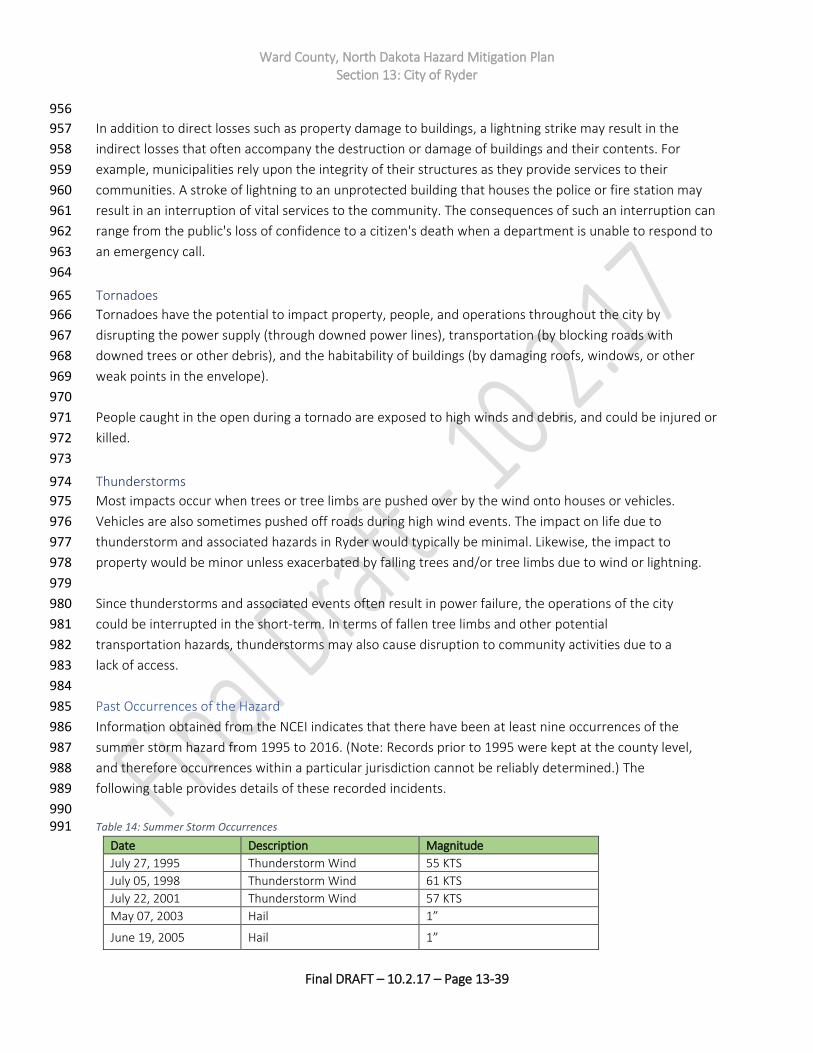
Ward County, North Dakota Hazard Mitigation Plan Section 13: City of Ryder
Final DRAFT – 10.2.17 – Page 13-39
956
In addition to direct losses such as property damage to buildings, a lightning strike may result in the 957
indirect losses that often accompany the destruction or damage of buildings and their contents. For 958
example, municipalities rely upon the integrity of their structures as they provide services to their 959
communities. A stroke of lightning to an unprotected building that houses the police or fire station may 960
result in an interruption of vital services to the community. The consequences of such an interruption can 961
range from the public's loss of confidence to a citizen's death when a department is unable to respond to 962
an emergency call. 963
964
Tornadoes 965
Tornadoes have the potential to impact property, people, and operations throughout the city by 966
disrupting the power supply (through downed power lines), transportation (by blocking roads with 967
downed trees or other debris), and the habitability of buildings (by damaging roofs, windows, or other 968
weak points in the envelope). 969
970
People caught in the open during a tornado are exposed to high winds and debris, and could be injured or 971
killed. 972
973
Thunderstorms 974
Most impacts occur when trees or tree limbs are pushed over by the wind onto houses or vehicles. 975
Vehicles are also sometimes pushed off roads during high wind events. The impact on life due to 976
thunderstorm and associated hazards in Ryder would typically be minimal. Likewise, the impact to 977
property would be minor unless exacerbated by falling trees and/or tree limbs due to wind or lightning. 978
979
Since thunderstorms and associated events often result in power failure, the operations of the city 980
could be interrupted in the short-term. In terms of fallen tree limbs and other potential 981
transportation hazards, thunderstorms may also cause disruption to community activities due to a 982
lack of access. 983
984
Past Occurrences of the Hazard 985
Information obtained from the NCEI indicates that there have been at least nine occurrences of the 986
summer storm hazard from 1995 to 2016. (Note: Records prior to 1995 were kept at the county level, 987
and therefore occurrences within a particular jurisdiction cannot be reliably determined.) The 988
following table provides details of these recorded incidents. 989
990 Table 14: Summer Storm Occurrences 991
Date Description Magnitude
July 27, 1995 Thunderstorm Wind 55 KTS
July 05, 1998 Thunderstorm Wind 61 KTS
July 22, 2001 Thunderstorm Wind 57 KTS
May 07, 2003 Hail 1”
June 19, 2005 Hail 1”
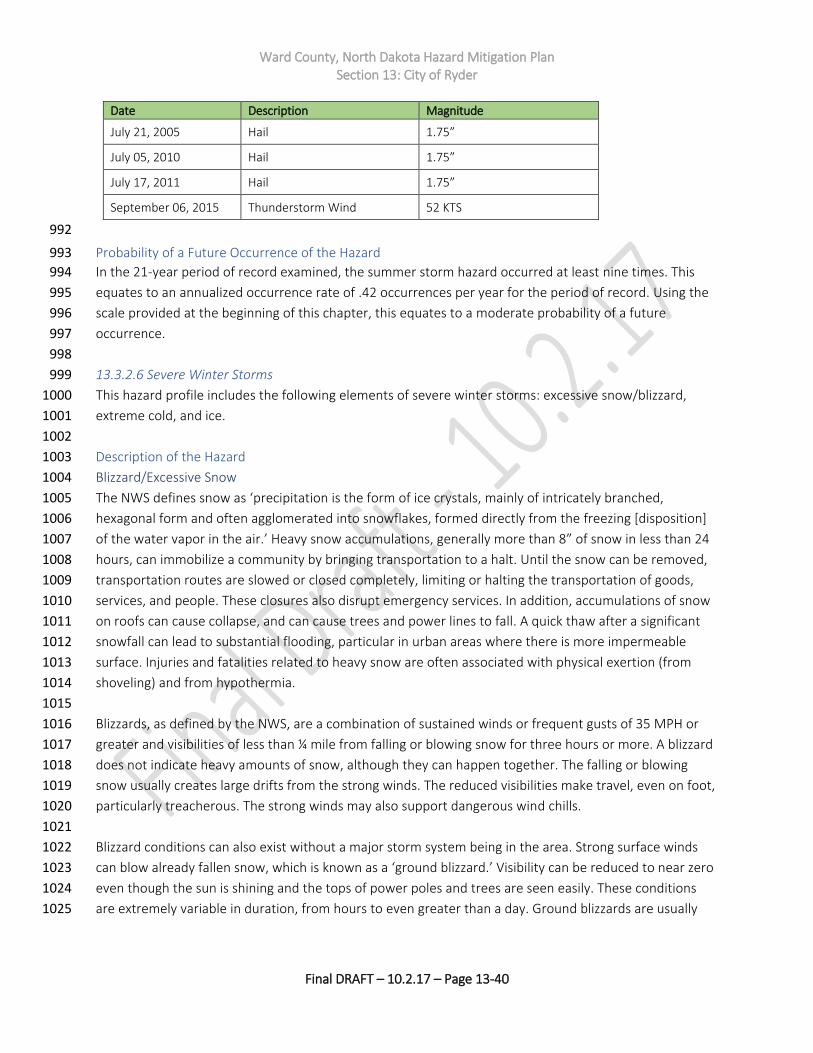
Ward County, North Dakota Hazard Mitigation Plan Section 13: City of Ryder
Final DRAFT – 10.2.17 – Page 13-40
Date Description Magnitude
July 21, 2005 Hail 1.75”
July 05, 2010 Hail 1.75”
July 17, 2011 Hail 1.75”
September 06, 2015 Thunderstorm Wind 52 KTS
992
Probability of a Future Occurrence of the Hazard 993
In the 21-year period of record examined, the summer storm hazard occurred at least nine times. This 994
equates to an annualized occurrence rate of .42 occurrences per year for the period of record. Using the 995
scale provided at the beginning of this chapter, this equates to a moderate probability of a future 996
occurrence. 997
998
13.3.2.6 Severe Winter Storms 999
This hazard profile includes the following elements of severe winter storms: excessive snow/blizzard, 1000
extreme cold, and ice. 1001
1002
Description of the Hazard 1003
Blizzard/Excessive Snow 1004
The NWS defines snow as ‘precipitation is the form of ice crystals, mainly of intricately branched, 1005
hexagonal form and often agglomerated into snowflakes, formed directly from the freezing [disposition] 1006
of the water vapor in the air.’ Heavy snow accumulations, generally more than 8” of snow in less than 24 1007
hours, can immobilize a community by bringing transportation to a halt. Until the snow can be removed, 1008
transportation routes are slowed or closed completely, limiting or halting the transportation of goods, 1009
services, and people. These closures also disrupt emergency services. In addition, accumulations of snow 1010
on roofs can cause collapse, and can cause trees and power lines to fall. A quick thaw after a significant 1011
snowfall can lead to substantial flooding, particular in urban areas where there is more impermeable 1012
surface. Injuries and fatalities related to heavy snow are often associated with physical exertion (from 1013
shoveling) and from hypothermia. 1014
1015
Blizzards, as defined by the NWS, are a combination of sustained winds or frequent gusts of 35 MPH or 1016
greater and visibilities of less than ¼ mile from falling or blowing snow for three hours or more. A blizzard 1017
does not indicate heavy amounts of snow, although they can happen together. The falling or blowing 1018
snow usually creates large drifts from the strong winds. The reduced visibilities make travel, even on foot, 1019
particularly treacherous. The strong winds may also support dangerous wind chills. 1020
1021
Blizzard conditions can also exist without a major storm system being in the area. Strong surface winds 1022
can blow already fallen snow, which is known as a ‘ground blizzard.’ Visibility can be reduced to near zero 1023
even though the sun is shining and the tops of power poles and trees are seen easily. These conditions 1024
are extremely variable in duration, from hours to even greater than a day. Ground blizzards are usually 1025

Ward County, North Dakota Hazard Mitigation Plan Section 13: City of Ryder
Final DRAFT – 10.2.17 – Page 13-41
accompanied by very cold temperatures and wind chill conditions, making them as potentially deadly as a 1026
conventional blizzard. 1027
1028
Extreme Cold 1029
What is considered an excessively cold temperature varies according to the normal climate for that 1030
region. Excessive or extreme cold can accompany severe winter weather, or it can occur without 1031
severe weather. The greatest danger from extreme cold is to people, as prolonged exposure can 1032
cause frostbite or hypothermia, and can become life-threatening. 1033
1034
Ice 1035
The NWS defines an ice storm as occasions when damaging accumulations of ice are expected during 1036
freezing rain situations. Significant accumulations of ice pull down trees and utility lines resulting in loss of 1037
power and communication. These accumulations of ice make walking and driving extremely dangerous. 1038
Significant ice accumulations are usually accumulations of ¼ ‘or greater.’ The term ‘ice storm’ is used to 1039
describe occasions when damaging accumulations of ice are expected during freezing rain situations. Ice 1040
storms can be the most damaging of winter phenomena, and are often the cause of automobile 1041
accidents, utility failures, personal injury, and death. Moreover, they significantly impact the delivery of 1042
emergency services. 1043
1044
Location of the Hazard 1045
Severe winter storms are non-spatial hazards, and can (and do) occur anywhere in the City of Ryder. 1046
1047
Extent and Severity of the Hazard 1048
Severe winter storms have a wide range of extent and severity markers and characteristics. 1049
1050
Blizzard/Excessive Snow 1051
Various intensities of snowfall are defined differently: 1052
1053
• Blizzard describes winds of 35 miles (56 kilometers) per hour or more with snow and blowing 1054
snow that reduce visibility to less than one-quarter mile (0.4 kilometer) for at least three hours. 1055
• Blowing snow describes wind-driven snow that reduces visibility. Blowing snow may be falling 1056
snow and/or snow on the ground that is picked up by the wind. 1057
• Snow squall describes a brief, intense snow shower accompanied by strong, gusty winds. 1058
Accumulation from snow squalls can be significant. 1059
• Snow shower describes snow that falls at varying intensities for short durations with little or no 1060
accumulation. 1061
1062
Extreme Cold 1063
Winter temperatures in Ryder typically range from the 20s and 30s (high) to single digits to 20s (lows.) 1064
1065

Ward County, North Dakota Hazard Mitigation Plan Section 13: City of Ryder
Final DRAFT – 10.2.17 – Page 13-42
The figure below depicts the methodology for determining wind chill, using wind speed and actual 1066
temperature. Winter storm severity is a function of wind chill and other factors, such as precipitation 1067
amount (rain, sleet, ice, and/or snow). 1068
1069 Figure 8: NWS Windchill Chart 1070
1071 1072
Ice 1073
Heavy accumulations of ice can bring down trees and topple utility poles and communication towers. Ice 1074
can disrupt communications and power for days while utility companies repair damage. Even small 1075
accumulations of ice can be severely dangerous to motorists and pedestrians. Bridges and overpasses are 1076
particularly dangerous because they freeze before other surfaces. 1077
1078
Ice forms in different ways: 1079
1080
• Sleet is rain that freezes into ice pellets before it reaches the ground. Sleet usually bounces when 1081
hitting a surface and does not stick to objects; however, it can accumulate like snow and cause 1082
roads and walkways to become hazardous. 1083
• Freezing rain is rain that falls onto a surface that has a temperature below freezing. The cold 1084
surface causes the rain to freeze so the surfaces—trees, utility wires, vehicles, and roads—1085
become glazed with ice. 1086
1087

Ward County, North Dakota Hazard Mitigation Plan Section 13: City of Ryder
Final DRAFT – 10.2.17 – Page 13-43
Potential Impact of the Hazard 1088
Severe winter weather can bring a community to a standstill by inhibiting transportation, knocking down 1089
trees and utility lines, and by causing structural collapse in buildings not designed to withstand the weight 1090
of accumulated snow. Repair and snow removal costs can be significant, and can easily surpass an entity’s 1091
annual salt and snow removal budget, often before the end of the winter weather season. Ice buildup can 1092
cause utilities to fail, and communication towers to cease functioning. Without electricity, heaters and 1093
pumps fail to work, causing water and sewer pipes to freeze or rupture. If extreme cold temperatures are 1094
combined with low snow cover, the ground’s frost level can change, creating the possibility of failure in 1095
underground infrastructure. 1096
1097
Structure fires and carbon monoxide poisoning are also possible impacts of severe winter weather, as 1098
people rely on auxiliary heating devices, such as candles, portable heaters, and fuel burning lanterns. 1099
According to NOAA observations, 20 percent of all winter deaths attributed to exposure to cold occur in 1100
the home, whereas 25 percent of all winter deaths attributed to ice and snow involve people caught in 1101
the storm. 1102
1103
Rural residents can be hit particularly hard by severe winter storms, if they do not have adequate 1104
stockpiles of food, water, and heating fuel. The livestock industry can be severely impacted by severe 1105
winter weather as well. The inability to get feed and water to livestock can quickly escalate to a critical 1106
situation, and can lead to dehydration, a major cause of livestock causalities. Cattle cannot lick enough 1107
snow to satisfy their thirst, and will die of dehydration before they succumb to cold or suffocation. 1108
1109
In addition to the threat posed to humans, severe winter storms pose a significant threat to utility 1110
production, which in turn threatens facilities and operations that rely on utilities, specifically climate 1111
stabilization. As temperature drop and stay low, increased demand for heating places a strain on the 1112
electrical grid, which can lead to temporary outages. 1113
1114
Past Occurrences of the Hazard 1115
According to the ND State Hazard Mitigation Plan (SHMP), winter in North Dakota can begin as early 1116
as September and last into May, though the bulk of winter weather occurs from mid-November until 1117
early April. On average, there are approximately 10 winter storms each year; three or four of these 1118
storms will reach severe status. North Dakota typically leads the nation in blizzard and severe winter 1119
storm frequency. 1120
1121
There is a long history of severe winter storm events, going back to when North Dakota was a 1122
territory and not a state: 1123
1124
• 1886-1887: A severe winter storm in the western part of the state put an end to open range 1125
ranching. 1126
• January 12, 1888: This storm, known as the ‘Schoolhouse Blizzard,’ swept through the entire 1127
territory in an afternoon. The day began relatively warm, around 32°F. Temperatures 1128

Ward County, North Dakota Hazard Mitigation Plan Section 13: City of Ryder
Final DRAFT – 10.2.17 – Page 13-44
reportedly dropped to -20°F in a matter of minutes, accompanied by winds so strong that 1129
people were unable to stand upright. Schools throughout the state were closed, and 1130
children sent home. Many of those children, as well as adults, became disorientated in the 1131
storm, and lost their sense of direction, eventually succumbing to hypothermia. An 1132
estimated 400 people died throughout the state, and thousands of head of cattle perished. 1133
Transportation came to a standstill, and many buildings collapsed under the weight of the 1134
snow. 1135
• March 1966: This severe storm was notable for its excessive duration. Bismarck (100 miles 1136
to the south) recorded near zero visibility for 42 consecutive hours. More than 100,000 head 1137
of livestock, and 15 people, died in the storm. 1138
• January 09, 1997: Bitter cold wind chills ranged from 40-60 below in the south and east and 1139
30-45 below in the northwest. Some schools closed for as many as nine days. A National 1140
Weather Service report indicated snow depths up to 30 inches in eastern and south central 1141
North Dakota. The state livestock industry sustained approximately $32.8 million in losses. 1142
FEMA had approximately $5 million in snow removal costs, National Guard exceeded $1.1 1143
million and the North Dakota Department of Transportation spent approximately $3.7 1144
million. All but one county in North Dakota, and 75 cities and 3 Indian Reservations issued 1145
emergency or disaster declarations. A total of seven deaths across the state were reported 1146
along with many injuries due to traffic accidents. 1147
• March 12, 1997: Approximately $15,000 in damages was reported in North Dakota. Snowfall 1148
amounts were up to 4 inches in Minot. Many of the smaller school districts cancelled school and 1149
I-94 was also closed. Roads were very icy and visibility near zero. 1150
• April 4, 1997: This blizzard was the worst of the season and brought much of the state to a 1151
complete halt. Snow accumulations were on average 1.5 to 2 inches an hour with 50 to 60 mph 1152
winds as well. The additional snow at Bismarck brought the season snowfall total to 101.4 1153
inches, which set an all-time record. An estimated 100,000 head of cattle (10 percent of the 1154
state’s herd) was lost with an estimated dollar loss across the state of over $5 M. An estimated 1155
75,000 homes in North Dakota were without power for some time over the weekend. The 1156
reported property damage was $44.7 M with 16 injuries and 2 deaths were reported statewide. 1157
• January 2004: a persistent winter storm brought up to 12 inches of snow to northwest and 1158
central North Dakota. The storm began as freezing rain before changing to snow. Winds of 15-25 1159
MPH caused considerable drifting; wind chills fell to -30°F. 1160
• October 2005: an early season blizzard in western and northern North Dakota dropped up to 22 1161
inches of heavy, wet snow, downing power lines and closing roadways, including 155 miles of I-1162
94. The National Guard rescued hundreds of stranded motorists. Damages were estimated at 1163
$22 million. 1164
• January 2010: intense storms brought blizzard conditions and 45-55 MPH winds. Many roadways 1165
and schools statewide were close due to icy conditions, near zero visibilities, and widespread 1166
power outages. An estimated $20 million in damages, primarily to electric systems, were 1167
reported in western and central North Dakota. 1168

Ward County, North Dakota Hazard Mitigation Plan Section 13: City of Ryder
Final DRAFT – 10.2.17 – Page 13-45
• April-May 2011: Prolonged period of very strong winds, freezing precipitation, and heavy snow 1169
up to 14 inches hit westerns and north central North Dakota. Some reporting stations observed 1170
wind gusts at hurricane wind speeds. The storm ultimately resulted in a federal disaster 1171
declaration. 1172
• April 2013: Strong low pressure pushed across the Rockies, slowed down over the Dakotas, then 1173
moved east. The peak of the storm occurred on Sunday when much of west and central North 1174
Dakota received heavy amounts of snow, with portions of the south central and southeast 1175
having a blizzard. A combination of favorable moisture feed and strong surface and mid-level 1176
dynamics brought historic snowfall to parts of west and central North Dakota. A moist conveyer 1177
belt extended from the eastern portions of Iowa and Illinois back northwest into North Dakota, 1178
situated along and north of an inverted surface trough stretched from southeast to northwest 1179
across South Dakota. Combined with strong diffluent flow aloft associated with the upper level 1180
low, snowfall rates approached two inches per hour across south central North Dakota on 1181
Sunday. In addition to the heavy snow, strong surface winds developed across south central 1182
North Dakota west of the Missouri River and into the James River Valley. Wind gusts to 40 MPH 1183
combined with the heavy snow resulting in a blizzard. Ward County received up to ten inches of 1184
snow. 1185
1186
The NCEI records winter storm hazards at the county level, rather than at the municipal level. Since 1996, 1187
NCEI has recorded 31 occurrences of winter storms, four occurrences of winter weather, one occurrence 1188
of ice storm, 16 occurrences of heavy snow, 33 occurrences of extreme cold, and 32 occurrences of 1189
blizzard. 1190
1191
Probability of a Future Occurrence of the Hazard 1192
Based on the data available, winter storms occur in or otherwise impact the City of Ryder at least 1193
annually. Therefore, using the scale previously provided, the probability of a future occurrence of the 1194
winter storm hazard is high. 1195
1196
13.3.2.7 Hazardous Materials Incident 1197
This hazard profiles includes three hazardous materials scenarios – highways, railways, and pipelines. 1198
1199
Description of the Hazard 1200
Hazardous materials incidents are technological (meaning non-natural hazards created or influenced by 1201
humans) events that involve large-scale accidental or intentional releases of chemical, biological, or 1202
radiological materials. These incidents may occur at fixed site locations, such as factories or storage 1203
facilities, or may occur while these materials are being transported to another location. 1204
1205
Hazardous materials come in the form of explosives, corrosive, reactive, flammable and combustible 1206
substances, toxic releases and waste materials. These substances are most often released as a result of 1207
transportation accidents or because of chemical accidents in fixed facilities. Hazardous materials in 1208
various forms can cause death, serious injury, long-lasting health effects, and damage to buildings, 1209
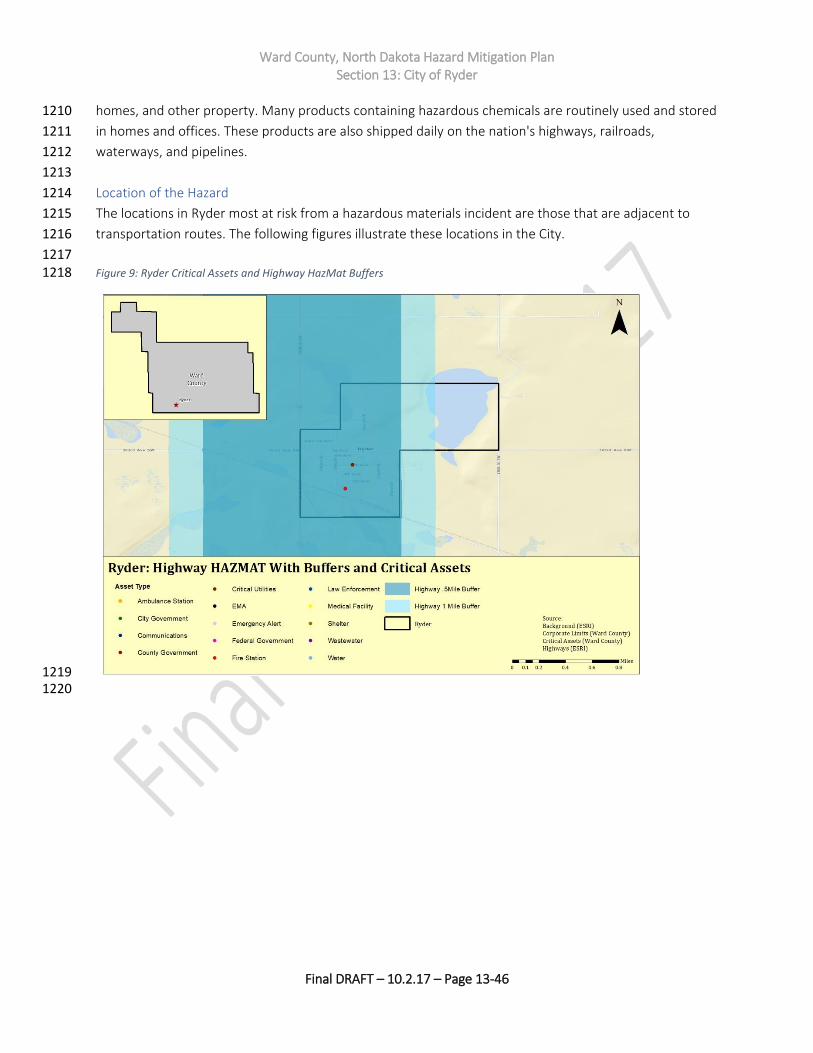
Ward County, North Dakota Hazard Mitigation Plan Section 13: City of Ryder
Final DRAFT – 10.2.17 – Page 13-46
homes, and other property. Many products containing hazardous chemicals are routinely used and stored 1210
in homes and offices. These products are also shipped daily on the nation's highways, railroads, 1211
waterways, and pipelines. 1212
1213
Location of the Hazard 1214
The locations in Ryder most at risk from a hazardous materials incident are those that are adjacent to 1215
transportation routes. The following figures illustrate these locations in the City. 1216
1217 Figure 9: Ryder Critical Assets and Highway HazMat Buffers 1218
1219 1220
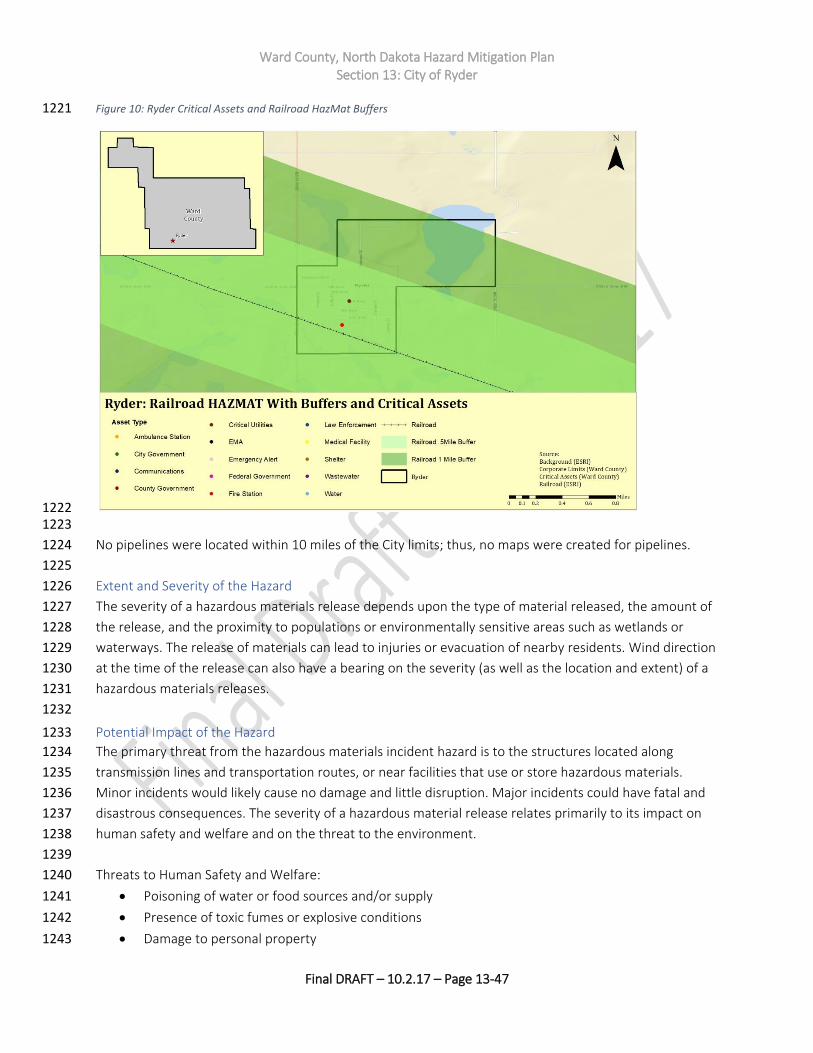
Ward County, North Dakota Hazard Mitigation Plan Section 13: City of Ryder
Final DRAFT – 10.2.17 – Page 13-47
Figure 10: Ryder Critical Assets and Railroad HazMat Buffers 1221
1222 1223
No pipelines were located within 10 miles of the City limits; thus, no maps were created for pipelines. 1224
1225
Extent and Severity of the Hazard 1226
The severity of a hazardous materials release depends upon the type of material released, the amount of 1227
the release, and the proximity to populations or environmentally sensitive areas such as wetlands or 1228
waterways. The release of materials can lead to injuries or evacuation of nearby residents. Wind direction 1229
at the time of the release can also have a bearing on the severity (as well as the location and extent) of a 1230
hazardous materials releases. 1231
1232
Potential Impact of the Hazard 1233
The primary threat from the hazardous materials incident hazard is to the structures located along 1234
transmission lines and transportation routes, or near facilities that use or store hazardous materials. 1235
Minor incidents would likely cause no damage and little disruption. Major incidents could have fatal and 1236
disastrous consequences. The severity of a hazardous material release relates primarily to its impact on 1237
human safety and welfare and on the threat to the environment. 1238
1239
Threats to Human Safety and Welfare: 1240
• Poisoning of water or food sources and/or supply 1241
• Presence of toxic fumes or explosive conditions 1242
• Damage to personal property 1243
Ward County, North Dakota Hazard Mitigation Plan Section 13: City of Ryder
Final DRAFT – 10.2.17 – Page 13-48
• Need for the evacuation of people 1244
• Interference with public or commercial transportation 1245
1246
Threats to the environment: 1247
• Injury or loss of animals or plants or habitats that are of economic or ecological importance such 1248
as; commercial, recreation, or subsistence fisheries (marine plants, crustaceans, shellfish, 1249
aquaculture facilities) or livestock 1250
• Impact to ecological reserves, forests, parks, archaeological, and cultural sites 1251
1252
In terms of property, property and people could be either directly impacted by an explosion or fire 1253
resulting from a hazardous materials release, contamination of buildings and contents, or indirectly 1254
impacted by the release of materials that necessitates evacuation and long-term abandonment of 1255
facilities. 1256
1257
Past Occurrences of the Hazard 1258
Based on Tier II reporting data obtained from the EPA, no Tier II reports from the City of Ryder have been 1259
submitted to the EPA since 1987, the year that the EPA began keeping such reports. Representatives from 1260
the City did not report any other occurrences of the hazard. 1261
1262
According to the EPA’s Tier II database, the number of releases in Ward County, by year reported, are: 1263
1264
• 2015 – 1,339 incidents that resulted in a reportable incident. 1265
• 2014 – 5,556 incidents that resulted in a reportable incident. 1266
• 2013 – 5,547 incidents that resulted in a reportable incident. 1267
• 2012 – 4.304 incidents that resulted in a reportable incident. 1268
• 2011 - 4,211 incidents that resulted in a reportable incident. 1269
• 2010 – 4,211 incidents that resulted in a reportable incident. 1270
• 2009 - 18,031 incidents that resulted in a reportable incident. 1271
• 2008 - 22,292 incidents that resulted in a reportable incident. 1272
1273
Probability of a Future Occurrence of the Hazard 1274
Based on the available data, hazardous materials incidents occur with regularity in Ward County, though 1275
not within the City of Ryder. Therefore, based on the scale provided at the beginning of this chapter, the 1276
probability of a future occurrence is low. 1277
1278
13.4 Risk Assessment (Updated) 1279
The following table provides a comparison of the risk assessment results of the 2013 plan and this 1280
update, as they relate to the City of Ryder. 1281
1282
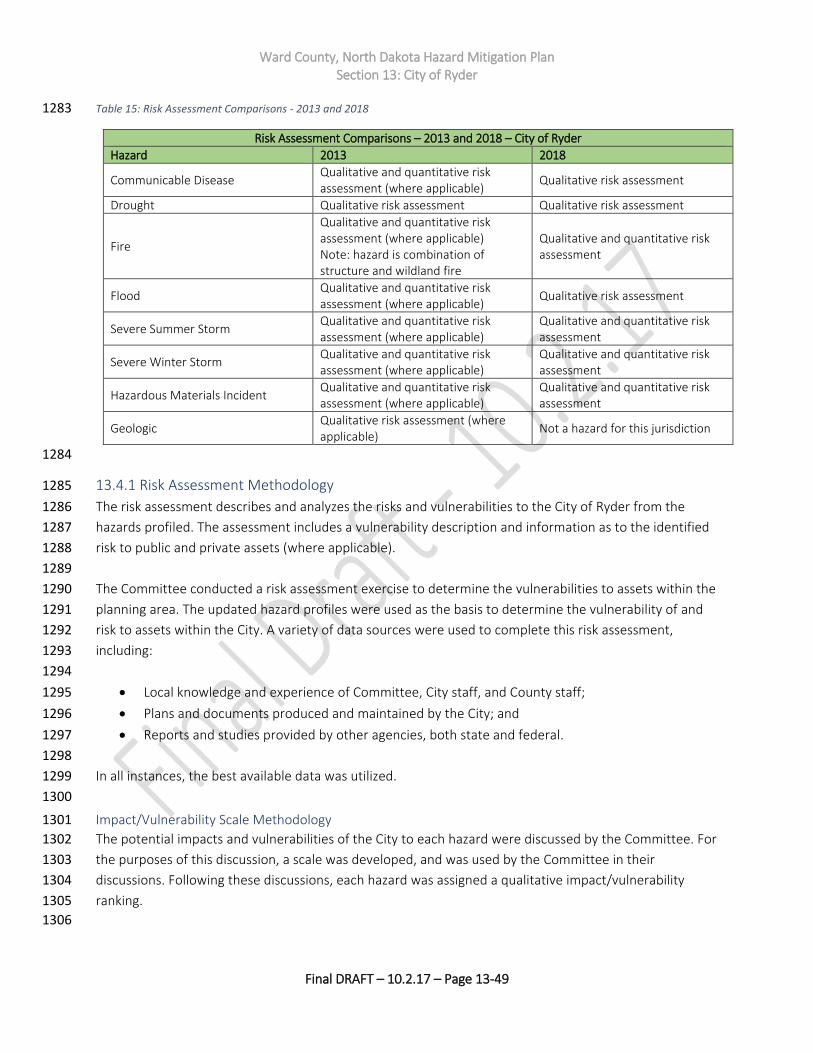
Ward County, North Dakota Hazard Mitigation Plan Section 13: City of Ryder
Final DRAFT – 10.2.17 – Page 13-49
Table 15: Risk Assessment Comparisons - 2013 and 2018 1283
Risk Assessment Comparisons – 2013 and 2018 – City of Ryder
Hazard 2013 2018
Communicable Disease Qualitative and quantitative risk assessment (where applicable)
Qualitative risk assessment
Drought Qualitative risk assessment Qualitative risk assessment
Fire
Qualitative and quantitative risk assessment (where applicable) Note: hazard is combination of structure and wildland fire
Qualitative and quantitative risk assessment
Flood Qualitative and quantitative risk assessment (where applicable)
Qualitative risk assessment
Severe Summer Storm Qualitative and quantitative risk assessment (where applicable)
Qualitative and quantitative risk assessment
Severe Winter Storm Qualitative and quantitative risk assessment (where applicable)
Qualitative and quantitative risk assessment
Hazardous Materials Incident Qualitative and quantitative risk assessment (where applicable)
Qualitative and quantitative risk assessment
Geologic Qualitative risk assessment (where applicable)
Not a hazard for this jurisdiction
1284
13.4.1 Risk Assessment Methodology 1285
The risk assessment describes and analyzes the risks and vulnerabilities to the City of Ryder from the 1286
hazards profiled. The assessment includes a vulnerability description and information as to the identified 1287
risk to public and private assets (where applicable). 1288
1289
The Committee conducted a risk assessment exercise to determine the vulnerabilities to assets within the 1290
planning area. The updated hazard profiles were used as the basis to determine the vulnerability of and 1291
risk to assets within the City. A variety of data sources were used to complete this risk assessment, 1292
including: 1293
1294
• Local knowledge and experience of Committee, City staff, and County staff; 1295
• Plans and documents produced and maintained by the City; and 1296
• Reports and studies provided by other agencies, both state and federal. 1297
1298
In all instances, the best available data was utilized. 1299
1300
Impact/Vulnerability Scale Methodology 1301
The potential impacts and vulnerabilities of the City to each hazard were discussed by the Committee. For 1302
the purposes of this discussion, a scale was developed, and was used by the Committee in their 1303
discussions. Following these discussions, each hazard was assigned a qualitative impact/vulnerability 1304
ranking. 1305
1306
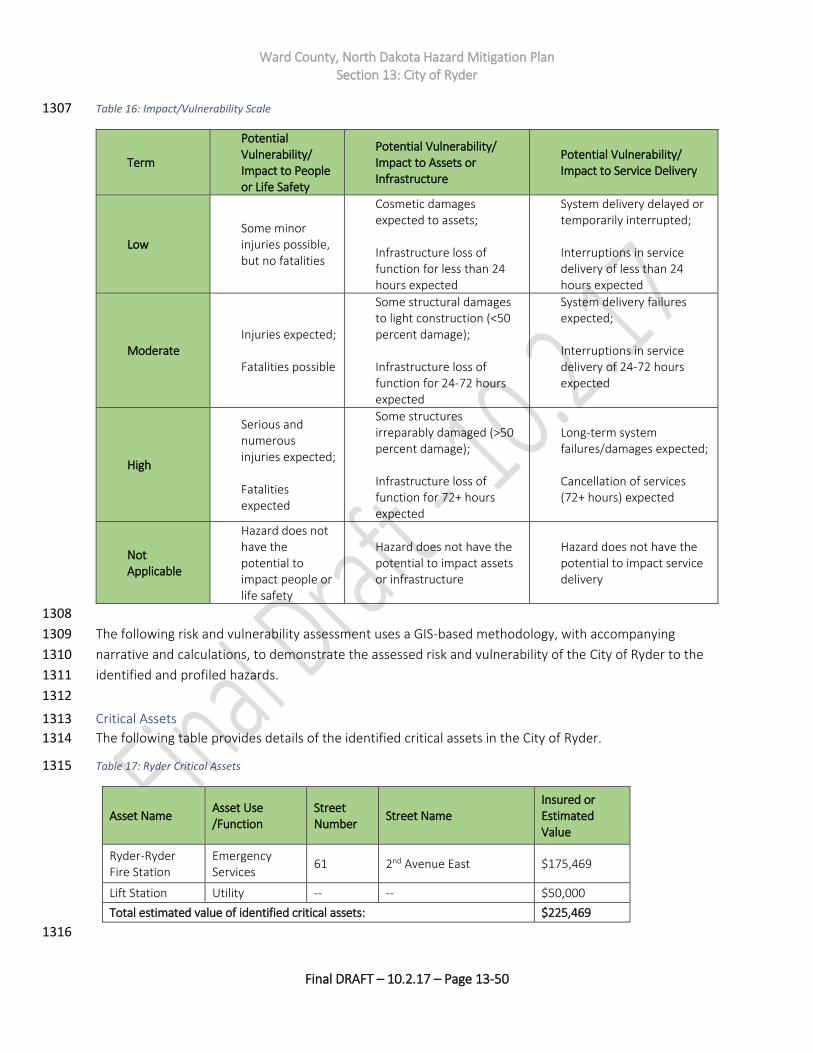
Ward County, North Dakota Hazard Mitigation Plan Section 13: City of Ryder
Final DRAFT – 10.2.17 – Page 13-50
Table 16: Impact/Vulnerability Scale 1307
Term
Potential Vulnerability/ Impact to People or Life Safety
Potential Vulnerability/ Impact to Assets or Infrastructure
Potential Vulnerability/ Impact to Service Delivery
Low Some minor injuries possible, but no fatalities
Cosmetic damages expected to assets; Infrastructure loss of function for less than 24 hours expected
System delivery delayed or temporarily interrupted; Interruptions in service delivery of less than 24 hours expected
Moderate Injuries expected; Fatalities possible
Some structural damages to light construction (<50 percent damage); Infrastructure loss of function for 24-72 hours expected
System delivery failures expected; Interruptions in service delivery of 24-72 hours expected
High
Serious and numerous injuries expected; Fatalities expected
Some structures irreparably damaged (>50 percent damage); Infrastructure loss of function for 72+ hours expected
Long-term system failures/damages expected; Cancellation of services (72+ hours) expected
Not Applicable
Hazard does not have the potential to impact people or life safety
Hazard does not have the potential to impact assets or infrastructure
Hazard does not have the potential to impact service delivery
1308
The following risk and vulnerability assessment uses a GIS-based methodology, with accompanying 1309
narrative and calculations, to demonstrate the assessed risk and vulnerability of the City of Ryder to the 1310
identified and profiled hazards. 1311
1312
Critical Assets 1313
The following table provides details of the identified critical assets in the City of Ryder. 1314
Table 17: Ryder Critical Assets 1315
Asset Name Asset Use /Function
Street Number
Street Name Insured or Estimated Value
Ryder-Ryder Fire Station
Emergency Services
61 2nd Avenue East $175,469
Lift Station Utility -- -- $50,000
Total estimated value of identified critical assets: $225,469
1316
Ward County, North Dakota Hazard Mitigation Plan Section 13: City of Ryder
Final DRAFT – 10.2.17 – Page 13-51
Note on asset values: Valuation data for assets within the City was unavailable at the time this plan 1317
update was developed. All valuations used in the following estimates of potential losses are derived 1318
from an average of available data for the same or similar types of assets from other jurisdictions. The 1319
assessment that follows is an estimate only, and may not correlate with actual occurrences of the 1320
damage caused by the hazards described. 1321
1322
Note on the maps: the maps in this section provide estimates of municipal and county boundaries based 1323
on data available as of June 2017. In some cases, the boundaries depicted may not reflect recent 1324
annexations or other changes to corporate limits. However, these images reflect the best available data 1325
at the time of plan development. Future updates to this plan will reflect changes to municipal and county 1326
boundaries. 1327
1328
13.4.2 Risk and Vulnerability Assessment 1329
1330
13.4.2.1 Communicable Disease 1331
Vulnerability to the Hazard 1332
Vulnerability to the communicable diseases hazard resides in the population of a given area. While it is 1333
possible that assets and infrastructure could be impacted by communicable disease, these impacts would 1334
come as a secondary impact to the illness of human operators and caretakers, and not as a result of the 1335
hazard itself. In general, the very young and the elderly, as well as those with underlying health conditions 1336
or who are immunocompromised, are more vulnerable to communicable disease. 1337
1338
As of the 2015 Census American Community Survey (the most recent year for which detailed estimates 1339
are available), there were 122 people residing in Ryder. Each of these persons is vulnerable to 1340
communicable disease, particularly if it is a pathogen that that individual has not been immunized 1341
against, or for which no immunization exists. Of these 122 people, 15 (12.3 percent) were under age five. 1342
13 (10.6 percent) were over age 65. This means that almost 23 percent of the population of Ryder, on 1343
average, is potentially more vulnerable to the hazard. 1344
1345
Prolonged outbreaks could result in a loss of City services, failure of infrastructure (from lack of operators 1346
or maintenance), and closure of facilities, including social centers. In extreme cases, it may be necessary 1347
to segregate or quarantine parts or all the City, to prevent the further spread of infection. 1348
1349
Qualitative Risk and Vulnerability Determination 1350
The Committee determined that the City of Ryder has some vulnerability to and risk from the hazard, as 1351
detailed in the table below. These results were averaged from all responses received. 1352
1353

Ward County, North Dakota Hazard Mitigation Plan Section 13: City of Ryder
Final DRAFT – 10.2.17 – Page 13-52
Hazard
Potential Vulnerability/ Impact to People or Life Safety
Potential Vulnerability/ Impact to Assets or Infrastructure
Potential Vulnerability/ Impact to Service Delivery
Average Vulnerability / Impact Ranking
Communicable Disease
Moderate Low Moderate Low/moderate
1354
Identified Data Limitations 1355
There is a wealth of information and data available for assessing the impacts and vulnerabilities related to 1356
communicable disease. Much of this data is limited to the state or county level, however, and does not 1357
address the municipal level. This deficit makes performing a municipal-level risk assessment difficult. 1358
1359
Data that could be developed to perform a municipal-level risk assessment for this hazard includes: 1360
1361
• Data regarding infection rates at the municipal level; 1362
• Data regarding absenteeism rates at the municipal level; and 1363
• Data regarding the costs of absenteeism at the municipal level. 1364
1365
13.4.2.2 Drought 1366
Vulnerability to the Hazard 1367
Though there are obvious vulnerabilities for people and animals that will result from a prolonged drought, 1368
the most common impacts are generally felt in the area’s economy. This is particularly true in areas 1369
whose economies depend largely on agriculture, such as the state of North Dakota. Agricultural losses 1370
from drought can be staggering, and can be in the billions of dollars. Shortages because of drought can 1371
have far-reaching consequences, given the centralized food system that currently exists in modern 1372
society. 1373
1374
As water becomes more and more precious, the value of that water will increase, resulting in issues of 1375
supply and demand. The decrease in availability of this necessary resource can result in significant 1376
societal disruption, which can worsen as the resource becomes more and more precious. 1377
1378
Ryder has not experienced any significant changes or improvements in development in the previous five 1379
years, as it relates to their water supply or delivery system, nor have they experienced significant 1380
increases or decreases to their agriculture or livestock development. The City’s overall vulnerability to 1381
drought has remained relatively unchanged since the 2013 plan. 1382
1383
Qualitative Risk and Vulnerability Determination 1384
The Committee determined that the City of Ryder has some vulnerability to and risk from the hazard, as 1385
detailed in the table below. These results were averaged from all responses received. 1386
1387
Ward County, North Dakota Hazard Mitigation Plan Section 13: City of Ryder
Final DRAFT – 10.2.17 – Page 13-53
Hazard
Potential Vulnerability/ Impact to People or Life Safety
Potential Vulnerability/ Impact to Assets or Infrastructure
Potential Vulnerability/ Impact to Service Delivery
Average Vulnerability / Impact Ranking
Drought Low Low Low Low
1388
Identified Data Limitations 1389
While both North Dakota and Ward County are clearly experiencing severe drought conditions, the risk 1390
and vulnerability of the City of Ryder is limited. As of this update, the City has not experienced water 1391
shortfalls or other impacts from the ongoing drought, and does not anticipate them in the future. 1392
Additionally, there is little to no data available to quantify the impacts of drought at the municipal level. 1393
The majority of the available data resides at the county, state, and regional level, where impacts are more 1394
apparent. Because of this limited risk, no quantitative risk assessment has been performed for this 1395
jurisdiction for this hazard. 1396
1397
Data that could be developed to perform a municipal-level risk assessment for this hazard includes: 1398
1399
• Data regarding the volume of water required to maintain municipal operations; 1400
• Data regarding projects changes in development and populations; and 1401
• Estimates of potential increases in operating costs that could result from a lack of water. 1402
1403
13.4.2.3 Fire 1404
Vulnerability to the Hazard 1405
Fire has the potential to devastate a community. All people and assets within a community are vulnerable 1406
to fire. In the City, it is assumed that there is a greater vulnerability to structure fire than to wildfire, given 1407
the very low probability of wildfire demonstrated by the USFS Wildfire Hazard Potential. 1408
1409
Fire can result in fatalities and injuries, in property damage or destruction, in the interruption of services, 1410
in transportation disruptions, and in economic losses. 1411
1412
The ability to suppress and fight a fire is contingent on having the necessary training, personnel, and 1413
equipment to bring the fire under control and to extinguish it. If one of these areas is lacking or is 1414
unavailable, the community can suffer extensive losses because of fire. 1415
1416
According to the 2015 American Community survey, there are 122 people living in the City of Ryder in 46 1417
housing units. Each of these housing units is vulnerable to fire, as is each person living in them. Ryder has 1418
a small commercial district that includes retail services, which is also vulnerable to fire. 1419
1420
Qualitative Risk and Vulnerability Determination 1421
The Committee determined that the City of Ryder has some vulnerability to and risk from the hazard, as 1422
detailed in the table below. These results were averaged from all responses received. 1423
1424
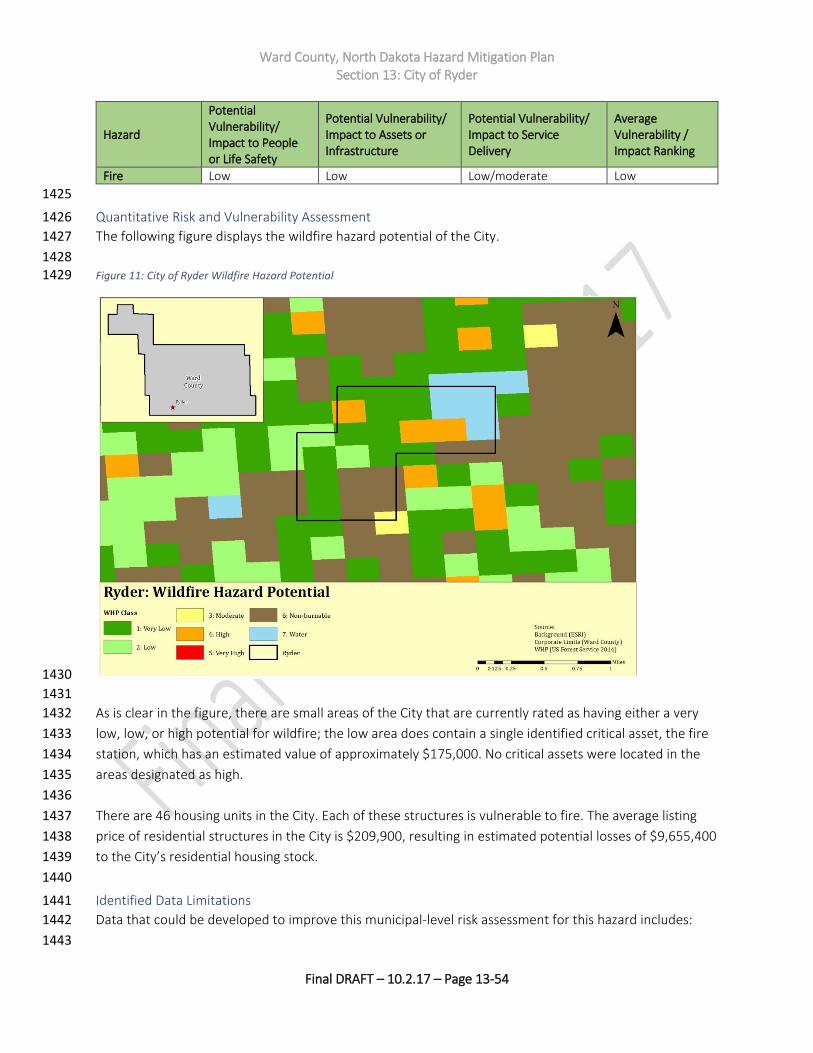
Ward County, North Dakota Hazard Mitigation Plan Section 13: City of Ryder
Final DRAFT – 10.2.17 – Page 13-54
Hazard
Potential Vulnerability/ Impact to People or Life Safety
Potential Vulnerability/ Impact to Assets or Infrastructure
Potential Vulnerability/ Impact to Service Delivery
Average Vulnerability / Impact Ranking
Fire Low Low Low/moderate Low
1425
Quantitative Risk and Vulnerability Assessment 1426
The following figure displays the wildfire hazard potential of the City. 1427
1428 Figure 11: City of Ryder Wildfire Hazard Potential 1429
1430
1431
As is clear in the figure, there are small areas of the City that are currently rated as having either a very 1432
low, low, or high potential for wildfire; the low area does contain a single identified critical asset, the fire 1433
station, which has an estimated value of approximately $175,000. No critical assets were located in the 1434
areas designated as high. 1435
1436
There are 46 housing units in the City. Each of these structures is vulnerable to fire. The average listing 1437
price of residential structures in the City is $209,900, resulting in estimated potential losses of $9,655,400 1438
to the City’s residential housing stock. 1439
1440
Identified Data Limitations 1441
Data that could be developed to improve this municipal-level risk assessment for this hazard includes: 1442
1443
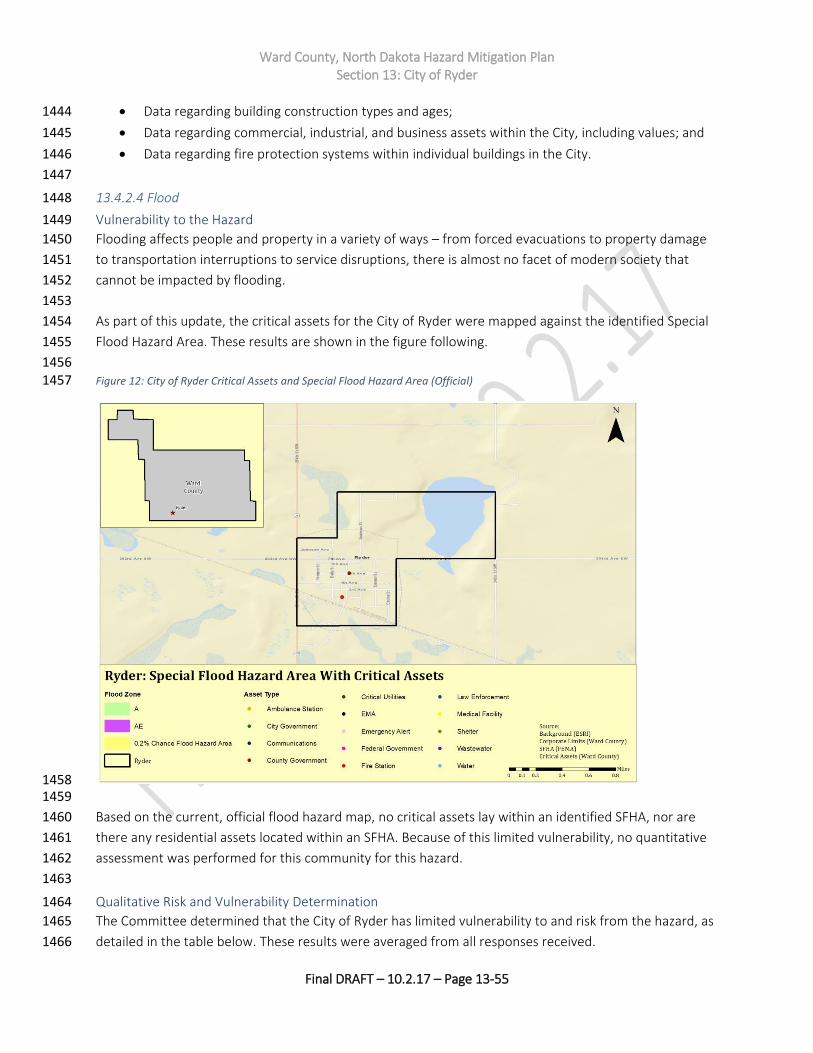
Ward County, North Dakota Hazard Mitigation Plan Section 13: City of Ryder
Final DRAFT – 10.2.17 – Page 13-55
• Data regarding building construction types and ages; 1444
• Data regarding commercial, industrial, and business assets within the City, including values; and 1445
• Data regarding fire protection systems within individual buildings in the City. 1446
1447
13.4.2.4 Flood 1448
Vulnerability to the Hazard 1449
Flooding affects people and property in a variety of ways – from forced evacuations to property damage 1450
to transportation interruptions to service disruptions, there is almost no facet of modern society that 1451
cannot be impacted by flooding. 1452
1453
As part of this update, the critical assets for the City of Ryder were mapped against the identified Special 1454
Flood Hazard Area. These results are shown in the figure following. 1455
1456 Figure 12: City of Ryder Critical Assets and Special Flood Hazard Area (Official) 1457
1458 1459
Based on the current, official flood hazard map, no critical assets lay within an identified SFHA, nor are 1460
there any residential assets located within an SFHA. Because of this limited vulnerability, no quantitative 1461
assessment was performed for this community for this hazard. 1462
1463
Qualitative Risk and Vulnerability Determination 1464
The Committee determined that the City of Ryder has limited vulnerability to and risk from the hazard, as 1465
detailed in the table below. These results were averaged from all responses received. 1466
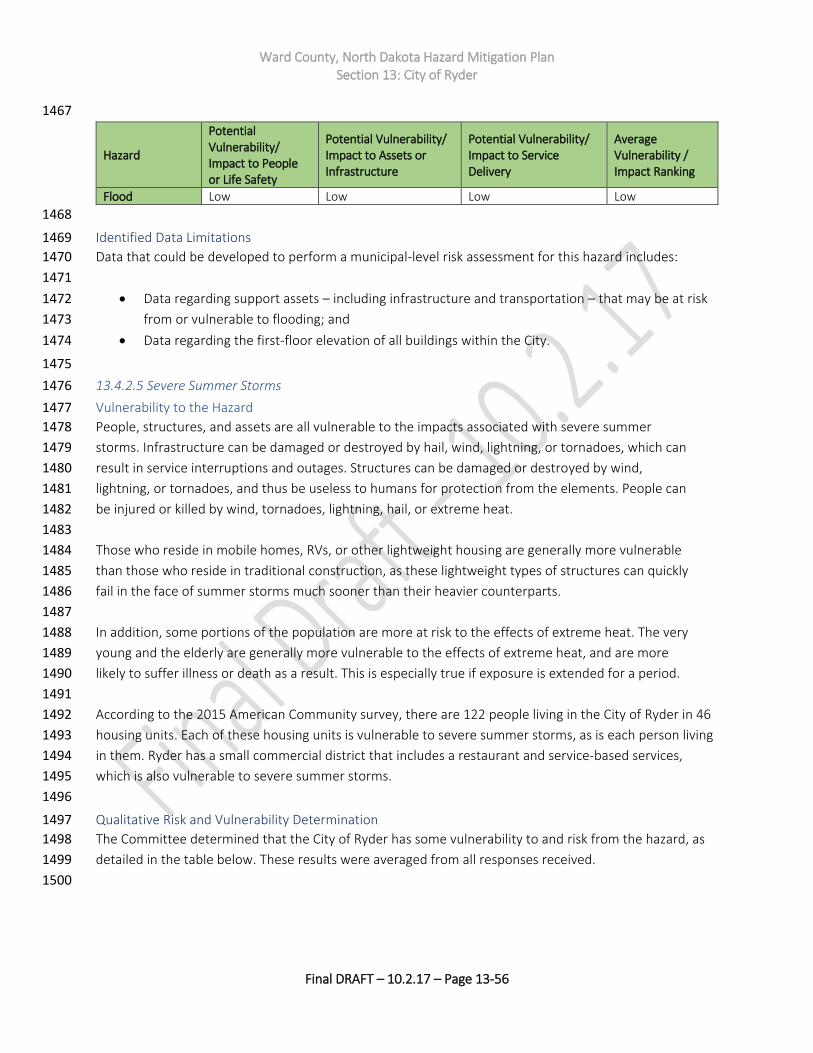
Ward County, North Dakota Hazard Mitigation Plan Section 13: City of Ryder
Final DRAFT – 10.2.17 – Page 13-56
1467
Hazard
Potential Vulnerability/ Impact to People or Life Safety
Potential Vulnerability/ Impact to Assets or Infrastructure
Potential Vulnerability/ Impact to Service Delivery
Average Vulnerability / Impact Ranking
Flood Low Low Low Low
1468
Identified Data Limitations 1469
Data that could be developed to perform a municipal-level risk assessment for this hazard includes: 1470
1471
• Data regarding support assets – including infrastructure and transportation – that may be at risk 1472
from or vulnerable to flooding; and 1473
• Data regarding the first-floor elevation of all buildings within the City. 1474
1475
13.4.2.5 Severe Summer Storms 1476
Vulnerability to the Hazard 1477
People, structures, and assets are all vulnerable to the impacts associated with severe summer 1478
storms. Infrastructure can be damaged or destroyed by hail, wind, lightning, or tornadoes, which can 1479
result in service interruptions and outages. Structures can be damaged or destroyed by wind, 1480
lightning, or tornadoes, and thus be useless to humans for protection from the elements. People can 1481
be injured or killed by wind, tornadoes, lightning, hail, or extreme heat. 1482
1483
Those who reside in mobile homes, RVs, or other lightweight housing are generally more vulnerable 1484
than those who reside in traditional construction, as these lightweight types of structures can quickly 1485
fail in the face of summer storms much sooner than their heavier counterparts. 1486
1487
In addition, some portions of the population are more at risk to the effects of extreme heat. The very 1488
young and the elderly are generally more vulnerable to the effects of extreme heat, and are more 1489
likely to suffer illness or death as a result. This is especially true if exposure is extended for a period. 1490
1491
According to the 2015 American Community survey, there are 122 people living in the City of Ryder in 46 1492
housing units. Each of these housing units is vulnerable to severe summer storms, as is each person living 1493
in them. Ryder has a small commercial district that includes a restaurant and service-based services, 1494
which is also vulnerable to severe summer storms. 1495
1496
Qualitative Risk and Vulnerability Determination 1497
The Committee determined that the City of Ryder has some vulnerability to and risk from the hazard, as 1498
detailed in the table below. These results were averaged from all responses received. 1499
1500
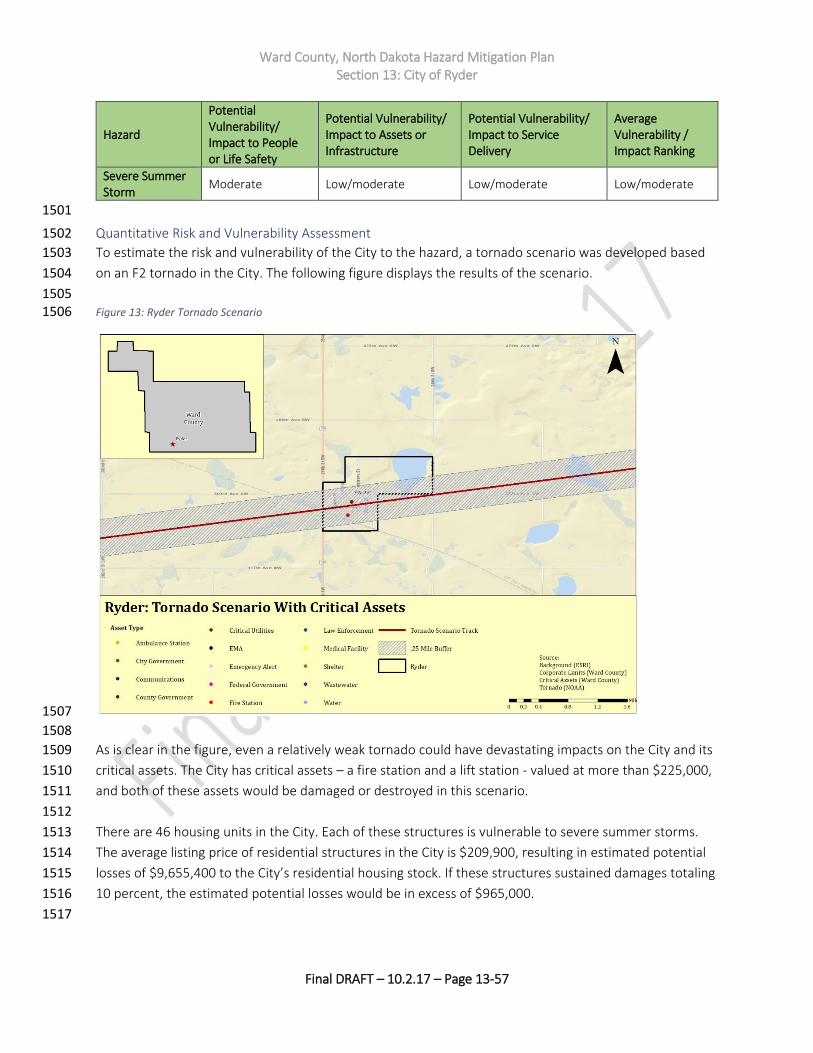
Ward County, North Dakota Hazard Mitigation Plan Section 13: City of Ryder
Final DRAFT – 10.2.17 – Page 13-57
Hazard
Potential Vulnerability/ Impact to People or Life Safety
Potential Vulnerability/ Impact to Assets or Infrastructure
Potential Vulnerability/ Impact to Service Delivery
Average Vulnerability / Impact Ranking
Severe Summer Storm
Moderate Low/moderate Low/moderate Low/moderate
1501
Quantitative Risk and Vulnerability Assessment 1502
To estimate the risk and vulnerability of the City to the hazard, a tornado scenario was developed based 1503
on an F2 tornado in the City. The following figure displays the results of the scenario. 1504
1505 Figure 13: Ryder Tornado Scenario 1506
1507
1508
As is clear in the figure, even a relatively weak tornado could have devastating impacts on the City and its 1509
critical assets. The City has critical assets – a fire station and a lift station - valued at more than $225,000, 1510
and both of these assets would be damaged or destroyed in this scenario. 1511
1512
There are 46 housing units in the City. Each of these structures is vulnerable to severe summer storms. 1513
The average listing price of residential structures in the City is $209,900, resulting in estimated potential 1514
losses of $9,655,400 to the City’s residential housing stock. If these structures sustained damages totaling 1515
10 percent, the estimated potential losses would be in excess of $965,000. 1516
1517
Ward County, North Dakota Hazard Mitigation Plan Section 13: City of Ryder
Final DRAFT – 10.2.17 – Page 13-58
Finally, each of the 122 residents of Ryder, as well as any visitors or passersby that happened to be in the 1518
area when the storm hit, are vulnerable to and at-risk from severe summer storms. Of these 122 people, 1519
15 (12.3 percent) were under age five. 13 (10.6 percent) were over age 65. This means that almost 23 1520
percent of the population of Ryder, on average, is potentially more vulnerable to the extreme heat 1521
element of the hazard, as the very young and the elderly are usually more vulnerable to extreme heat. 1522
1523
Identified Data Limitations 1524
Data that could be developed to improve this municipal-level risk assessment for this hazard includes: 1525
1526
• Data regarding building construction types and ages; 1527
• Data regarding commercial, industrial, and business assets within the City, including values; and 1528
• Data regarding the location of vulnerable populations that may require services or special 1529
attention during hazard events. 1530
1531
13.4.2.6 Severe Winter Storms 1532
Vulnerability to the Hazard 1533
People, structures, and assets are all vulnerable to the impacts associated with severe winter storms. 1534
Infrastructure can be damaged or destroyed by wind or ice, which can result in service interruptions and 1535
outages. Structures can be damaged or destroyed by wind, ice, or snow weight, and thus be useless to 1536
humans for protection from the elements. People can be injured or killed by transportation accidents 1537
(resulting from icy roadways) or extreme cold. 1538
1539
The majority of the vulnerability related to severe winter storms is related to either transportation 1540
accidents or to utility failures. Transportation accidents occur when roadways and bridges become 1541
impacted and ice over, which results in loss of vehicular control and subsequent accidents. Utility failure 1542
results in disruption to electrical service, water, and natural gas, which results in loss of heat to 1543
structures. 1544
1545
In addition, some portions of the population are more at risk to the effects of extreme cold. The very 1546
young and the elderly are generally more vulnerable to the effects of extreme cold, and are more likely to 1547
suffer illness or death as a result. This is especially true if exposure is extended for a period of time. 1548
1549
According to the 2015 American Community survey, there are 122 people living in the City of Ryder in 46 1550
housing units. Each of these housing units is vulnerable to severe winter storms, as is each person living in 1551
them. Ryder has a small commercial district that includes a restaurant and service-based businesses, 1552
which is also vulnerable to severe winter storms. 1553
1554
Qualitative Risk and Vulnerability Determination 1555
The Committee determined that the City of Ryder has some vulnerability to and risk from the hazard, as 1556
detailed in the table below. These results were averaged from all responses received. 1557
1558

Ward County, North Dakota Hazard Mitigation Plan Section 13: City of Ryder
Final DRAFT – 10.2.17 – Page 13-59
Hazard
Potential Vulnerability/ Impact to People or Life Safety
Potential Vulnerability/ Impact to Assets or Infrastructure
Potential Vulnerability/ Impact to Service Delivery
Average Vulnerability / Impact Ranking
Severe Winter Storm
Moderate Low/Moderate Moderate Low/moderate
1559
Quantitative Risk and Vulnerability Assessment 1560
The City has critical assets valued at $225,469, and these assets could be left inoperable or damaged by a 1561
severe winter storm, if the supporting utilities and/or transportation routes were obstructed or damaged 1562
by the storm. If the estimated losses were even 10 percent, this would be more than $259,000 in 1563
damages to critical assets. 1564
1565
There are 46 housing units in the City. Each of these structures is vulnerable to severe winter storms. The 1566
average listing price of residential structures in the City is $209,900, resulting in estimated potential 1567
losses of $9,655,400 to the City’s residential housing stock. If these residential structures sustain 1 1568
percent damage from a winter storm, this would result in more than $96,000 in potential losses. 1569
1570
Finally, each of the 122 residents of Ryder, as well as any visitors or passersby that happened to be in the 1571
area when the storm hit, are vulnerable to and at-risk from severe winter storms. Of these 122 people, 15 1572
(12.3 percent) were under age five. 135 (10.61 percent) were over age 65. This means that almost 23 1573
percent of the population of Ryder, on average, is potentially more vulnerable to the extreme cold 1574
element of the hazard, as the very young and the elderly are usually more vulnerable to extreme cold. 1575
1576
Identified Data Limitations 1577
Data that could be developed to improve this municipal-level risk assessment for this hazard includes: 1578
1579
• Data regarding building construction types and ages; 1580
• Data regarding commercial, industrial, and business assets within the City, including values; and 1581
• Data regarding the location of vulnerable populations that may require services or special 1582
attention during hazard events. 1583
1584
13.4.2.7 Hazardous Materials Incident 1585
Vulnerability to the Hazard 1586
Vulnerabilities to people are often significant during hazardous materials incidents. Depending on the 1587
exact material and concentration released, the health impacts to humans can be short term, long term, 1588
minor, or significant. Those in the area of the immediate release would have little or no warning prior to 1589
exposure, and would have little or no time to evacuate. Those further away may have more time to 1590
evacuate, depending on the circumstances and the conditions. 1591
1592
Vulnerabilities also exist to the environment, in particular air, water, and soil. For example, water sources 1593
can be threatened or contaminated by hazardous releases. A single release can create hazardous 1594

Ward County, North Dakota Hazard Mitigation Plan Section 13: City of Ryder
Final DRAFT – 10.2.17 – Page 13-60
conditions for an entire area or an entire watershed. Sensitive habitats can be damaged by a reduction in 1595
air, water, and soil quality, which can lead to plant and wildlife injury or death. 1596
1597
While it is possible that structural losses would occur, these are more likely to occur in the immediate 1598
area of an incident involving an explosion or fire. In many cases, the vulnerability lies in contamination 1599
and in the resulting loss of use/function prior to clean up. 1600
1601
Qualitative Risk and Vulnerability Determination 1602
The Committee determined that the City of Ryder has some vulnerability to and risk from the hazard, as 1603
detailed in the table below. These results were averaged from all responses received. 1604
1605
Hazard
Potential Vulnerability/ Impact to People or Life Safety
Potential Vulnerability/ Impact to Assets or Infrastructure
Potential Vulnerability/ Impact to Service Delivery
Average Vulnerability / Impact Ranking
Hazardous Materials Incident
Low Low Low Low
1606
Quantitative Risk and Vulnerability Assessment 1607
To estimate the risk and vulnerability of the City to the hazard, a scenario was developed for each 1608
relevant transport route. This scenario was limited to approximate locations only, and does not account 1609
for situational specifics, such as climate, time of day, or specific materials. The following figures display 1610
the results of the scenarios. 1611
1612

Ward County, North Dakota Hazard Mitigation Plan Section 13: City of Ryder
Final DRAFT – 10.2.17 – Page 13-61
Figure 14: City of Ryder Critical Assets and Highway HazMat Buffers 1613
1614 In this figure, it is clear that all critical assets in the City of Ryder lay within ½ mile of the highway, and 1615
therefore are within the ½ buffer of a hazmat incident, making them vulnerable to exposure. 1616
1617

Ward County, North Dakota Hazard Mitigation Plan Section 13: City of Ryder
Final DRAFT – 10.2.17 – Page 13-62
Figure 15: City of Ryder Critical Assets and Railroad HazMat Buffers 1618
1619 1620
In this figure, it is clear that all of the City’s critical assets lay within a half mile of the railroad, and are 1621
therefore exposed to a potential hazmat incident involving the railroad. 1622
1623
As is clear in the figures, each critical asset owned by the City is vulnerable to a hazardous materials 1624
incident involving some transportation route. The City has critical assets valued at $225,469, and both 1625
assets would be damaged or destroyed in this scenario. If the estimated losses were even 10 percent, this 1626
would be more than $22,000 in damages to critical assets. 1627
1628
There are 46 housing units in the City. Each of these structures is vulnerable to a hazardous materials 1629
incident. The average listing price of residential structures in the City is $209,900, resulting in estimated 1630
potential losses of $9,655,400 to the City’s residential housing stock. 1631
1632
Finally, each of the 122 residents of Ryder, as well as any visitors or passersby that happened to be in the 1633
area when the incident occurred, are vulnerable to and at-risk from a hazardous materials incident. 1634
1635
Identified Data Limitations 1636
Data that could be developed to improve this municipal-level risk assessment for this hazard includes: 1637
1638
• Data regarding building construction types and ages; 1639
• Data regarding commercial, industrial, and business assets within the City, including values; and 1640
Ward County, North Dakota Hazard Mitigation Plan Section 13: City of Ryder
Final DRAFT – 10.2.17 – Page 13-63
• Data regarding the location of vulnerable populations that may require services or special 1641
attention during hazard events. 1642
1643
13.5 Capability Assessment (Updated) 1644
1645
A capability assessment adds context to a mitigation plan by providing an inventory of a municipality’s 1646
programs and policies, and an analysis of its capacity to carry them out. These are essential for 1647
developing mitigation strategies and actions. 1648
1649
This capability assessment is a review of the City of Ryder’s resources to identify, review, and analyze 1650
what the city is currently doing to reduce losses, and to identify the framework that is in place for the 1651
implementation of new mitigation activities. In addition, this assessment will be useful in gauging whether 1652
the current local organizational structures and inter-jurisdictional coordination mechanisms for hazard 1653
mitigation could be improved, and how. 1654
1655
This local capability is extremely important, because the municipal officials know their own landscape 1656
best. Additionally, many of the most critical and effective hazard mitigation strategies and programs, 1657
including enforcement of floodplain management, building codes, and land-use planning, require a strong 1658
local role to achieve effective implementation. 1659
1660
This capability assessment primarily results from research and interviews with City staff. Relevant 1661
documents were reviewed related to hazard mitigation, including the State of North Dakota Hazard 1662
Mitigation Plan, as well as state and federal sources related to funding, planning, and regulatory 1663
capability. 1664
1665
For this assessment, a written questionnaire was provided to the jurisdiction, with a request that it be 1666
completed by a person or persons knowledgeable of the topics. The survey generally covered a variety of 1667
topics, including administrative and fiscal capacity, planning and zoning, floodplain management, and 1668
inter- and intra-governmental coordination. 1669
1670
The general findings of the survey were: 1671
1672
▪ Knowledge of mitigation programs and practices – City staff has little familiarity with hazard 1673
mitigation programs. Mitigation does play a role in decision-making for the City, though it is not 1674
always a driving factor in the ultimate decision. 1675
▪ Current/ongoing mitigation efforts – With the support of the County, the City is involved in the 1676
hazard mitigation plan update. 1677
▪ Intra- and inter-governmental coordination – the City does participate in intra- and 1678
intergovernmental coordination efforts, including participating in planning efforts. For example, 1679
the City has their own Emergency Operations Plan, which works in conjunction with the county’s 1680
plan. 1681
Ward County, North Dakota Hazard Mitigation Plan Section 13: City of Ryder
Final DRAFT – 10.2.17 – Page 13-64
▪ Planning – currently, the City does not have many formal plans, but rather operates on informal 1682
plan. The City does have an array of MOUs, which have worked well when activated. 1683
▪ Staff, personnel, and technical capability – as of this Plan, the City has limited capability and 1684
capacity regarding hazard mitigation, and the City has a strong partnership with Ward County, 1685
who helps when possible. 1686
1687
Like other municipalities within Ward County, Ryder relies on the framework established by the county 1688
and state government for technical assistance, and on the state and federal government for funding. 1689
1690
Conclusions and Recommendations 1691
Ryder should continue to build its capability and capacity for disaster recovery and hazard mitigation, and 1692
should continue to work with the county towards this end. 1693
1694
13.6 Mitigation Strategy (Updated) 1695
1696
Requirement §201.6(c)(3): [The plan shall include the following] a mitigation strategy that provides the 1697
jurisdiction’s blueprint for reducing the potential losses identified in the risk assessment, based on existing 1698
authorities, policies, programs, and resources, and its ability to expand on and improve these existing 1699
tools. This section shall include: 1700
Requirement §201.6(c)(3)(i): A description of mitigation goals to reduce or avoid long-term vulnerabilities 1701
to the identified hazards. 1702
Requirement §201.6(c)(3)(ii): A section that identifies and analyzes a comprehensive range of specific 1703
mitigation actions and projects being considered to reduce the effects of each hazard, with particular 1704
emphasis on new and existing buildings and infrastructure. All plans approved by FEMA after October 1, 1705
2008 must also address the jurisdiction’s participation in the NFIP, and continued compliance with NFIP 1706
requirements, as appropriate. 1707
Requirement: §201.6(c)(3)(iii): An action plan describing how the actions identified in section (c)(3)(ii) will 1708
be prioritized, implemented, and administered by the local jurisdiction. Prioritization shall include a special 1709
emphasis on the extent to which benefits are maximized according to a cost benefit review of the 1710
proposed projects and their associated costs. 1711
Requirement §201.6(c)(3)(iv): For multi-jurisdictional plans, there must be identifiable action items specific 1712
to the jurisdiction requesting FEMA approval or credit of the plan. 1713
1714
13.6.1 Mitigation Goals 1715
The table below provides the mitigation goals that guide the City’s mitigation strategy, compared to the 1716
goals of the 2013 plan. 1717
1718
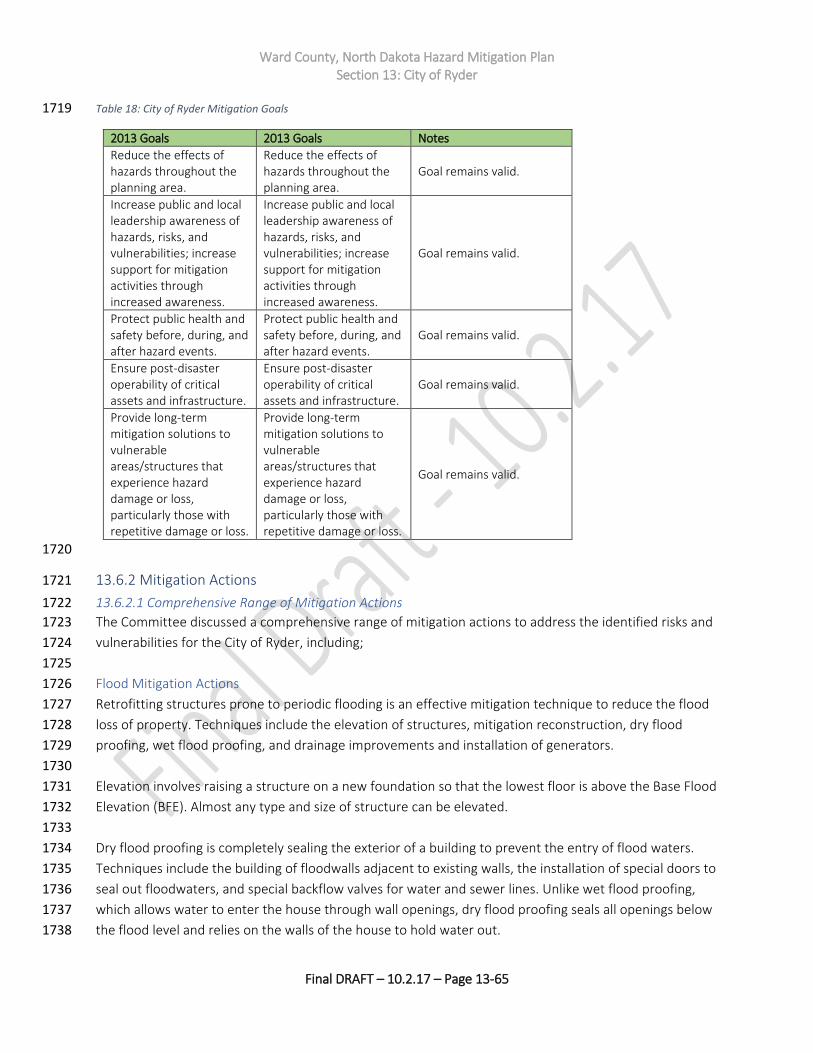
Ward County, North Dakota Hazard Mitigation Plan Section 13: City of Ryder
Final DRAFT – 10.2.17 – Page 13-65
Table 18: City of Ryder Mitigation Goals 1719
2013 Goals 2013 Goals Notes
Reduce the effects of hazards throughout the planning area.
Reduce the effects of hazards throughout the planning area.
Goal remains valid.
Increase public and local leadership awareness of hazards, risks, and vulnerabilities; increase support for mitigation activities through increased awareness.
Increase public and local leadership awareness of hazards, risks, and vulnerabilities; increase support for mitigation activities through increased awareness.
Goal remains valid.
Protect public health and safety before, during, and after hazard events.
Protect public health and safety before, during, and after hazard events.
Goal remains valid.
Ensure post-disaster operability of critical assets and infrastructure.
Ensure post-disaster operability of critical assets and infrastructure.
Goal remains valid.
Provide long-term mitigation solutions to vulnerable areas/structures that experience hazard damage or loss, particularly those with repetitive damage or loss.
Provide long-term mitigation solutions to vulnerable areas/structures that experience hazard damage or loss, particularly those with repetitive damage or loss.
Goal remains valid.
1720
13.6.2 Mitigation Actions 1721
13.6.2.1 Comprehensive Range of Mitigation Actions 1722
The Committee discussed a comprehensive range of mitigation actions to address the identified risks and 1723
vulnerabilities for the City of Ryder, including; 1724
1725
Flood Mitigation Actions 1726
Retrofitting structures prone to periodic flooding is an effective mitigation technique to reduce the flood 1727
loss of property. Techniques include the elevation of structures, mitigation reconstruction, dry flood 1728
proofing, wet flood proofing, and drainage improvements and installation of generators. 1729
1730
Elevation involves raising a structure on a new foundation so that the lowest floor is above the Base Flood 1731
Elevation (BFE). Almost any type and size of structure can be elevated. 1732
1733
Dry flood proofing is completely sealing the exterior of a building to prevent the entry of flood waters. 1734
Techniques include the building of floodwalls adjacent to existing walls, the installation of special doors to 1735
seal out floodwaters, and special backflow valves for water and sewer lines. Unlike wet flood proofing, 1736
which allows water to enter the house through wall openings, dry flood proofing seals all openings below 1737
the flood level and relies on the walls of the house to hold water out. 1738
Ward County, North Dakota Hazard Mitigation Plan Section 13: City of Ryder
Final DRAFT – 10.2.17 – Page 13-66
1739
Wet flood proofing includes measures applied to a structure that prevent or provide resistance to 1740
damage from flooding while allowing floodwaters (this includes flooding of interior spaces with clean 1741
water from city water or wells, instead of flood water) to enter the structure or area. Generally, this 1742
includes properly anchoring the structure, using flood resistant materials below the determined flood 1743
elevation, protection of mechanical and utility equipment, and use of openings or breakaway walls. Wet 1744
flood proofing includes low-cost mitigation measures such as raising air conditioners, heat pumps, and 1745
hot water heaters on platforms above the determined flood elevation. 1746
1747
Becoming a member of the NFIP and/or the CRS program can provide the community with access to flood 1748
insurance and with increased floodplain management and regulation, which will lead to a decrease in the 1749
level of risk and vulnerability faced by the community. 1750
1751
Wind Mitigation Actions 1752
Structures can be retrofitted to withstand high winds by installing shutters, roof tie-downs and other 1753
storm protection features. The exterior integrity (i.e. building envelope) is maintained by protecting the 1754
interior of the structure and providing stability against wind hazards associated with extreme winds This 1755
also improves the ability to achieve a continuous load path. These types of measures can be relatively 1756
inexpensive and simple to put in place. 1757
1758
To protect from extreme winds, safe rooms can be constructed or retrofitted into existing buildings. Safe 1759
rooms protect the lives if the people inside, providing safe haven for the duration of the storm. 1760
1761
Drought and Fire Mitigation Actions 1762
In general, communities can have little influence or impact on mitigating the impact of droughts except 1763
through ensuring adequate water supplies for normal circumstances and through implementation of 1764
water conservation measures when drought conditions are imminent. Undertaking drought impact 1765
studies, as well as searching for alternative water supplies can both set the foundation for future 1766
mitigation measures. 1767
1768
Communities can join the Firewise program, to help with education and outreach to prevent fire in the 1769
community. Maintaining defensible space, training of firefighters, and clearing of woody debris are all 1770
excellent mitigation activities for fire. 1771
1772
Early Warning Systems 1773
With sufficient warning of a hazard event, a community and its residents can take protective measures 1774
such as moving personal property, cars, and people out of harm’s way. When a threat recognition system 1775
is combined with an emergency response plan that addresses the community's hazard vulnerabilities, 1776
considerable damage can be prevented. This system must be coupled to warning the public, carrying out 1777
appropriate tasks, and coordinating the hazard response plan with operators of critical facilities. A 1778
comprehensive education and outreach program is critical to the success of early warning systems so that 1779
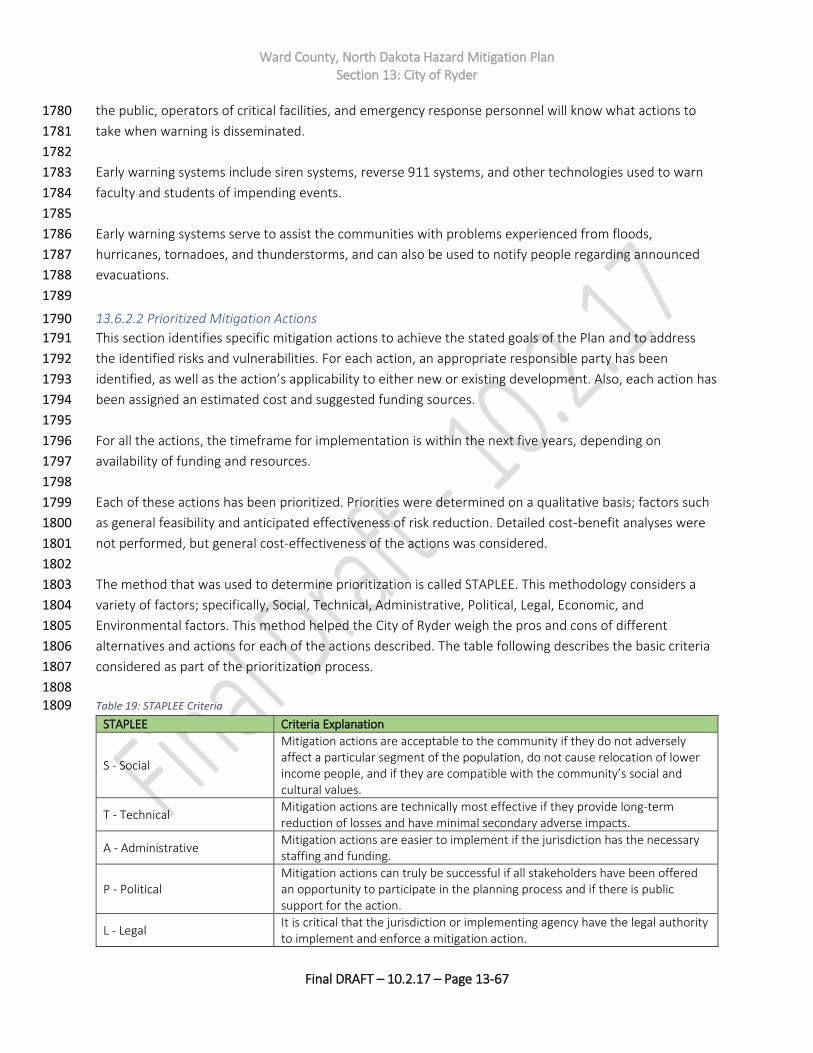
Ward County, North Dakota Hazard Mitigation Plan Section 13: City of Ryder
Final DRAFT – 10.2.17 – Page 13-67
the public, operators of critical facilities, and emergency response personnel will know what actions to 1780
take when warning is disseminated. 1781
1782
Early warning systems include siren systems, reverse 911 systems, and other technologies used to warn 1783
faculty and students of impending events. 1784
1785
Early warning systems serve to assist the communities with problems experienced from floods, 1786
hurricanes, tornadoes, and thunderstorms, and can also be used to notify people regarding announced 1787
evacuations. 1788
1789
13.6.2.2 Prioritized Mitigation Actions 1790
This section identifies specific mitigation actions to achieve the stated goals of the Plan and to address 1791
the identified risks and vulnerabilities. For each action, an appropriate responsible party has been 1792
identified, as well as the action’s applicability to either new or existing development. Also, each action has 1793
been assigned an estimated cost and suggested funding sources. 1794
1795
For all the actions, the timeframe for implementation is within the next five years, depending on 1796
availability of funding and resources. 1797
1798
Each of these actions has been prioritized. Priorities were determined on a qualitative basis; factors such 1799
as general feasibility and anticipated effectiveness of risk reduction. Detailed cost-benefit analyses were 1800
not performed, but general cost-effectiveness of the actions was considered. 1801
1802
The method that was used to determine prioritization is called STAPLEE. This methodology considers a 1803
variety of factors; specifically, Social, Technical, Administrative, Political, Legal, Economic, and 1804
Environmental factors. This method helped the City of Ryder weigh the pros and cons of different 1805
alternatives and actions for each of the actions described. The table following describes the basic criteria 1806
considered as part of the prioritization process. 1807
1808 Table 19: STAPLEE Criteria 1809
STAPLEE Criteria Explanation
S - Social
Mitigation actions are acceptable to the community if they do not adversely affect a particular segment of the population, do not cause relocation of lower income people, and if they are compatible with the community’s social and cultural values.
T - Technical Mitigation actions are technically most effective if they provide long-term reduction of losses and have minimal secondary adverse impacts.
A - Administrative Mitigation actions are easier to implement if the jurisdiction has the necessary staffing and funding.
P - Political Mitigation actions can truly be successful if all stakeholders have been offered an opportunity to participate in the planning process and if there is public support for the action.
L - Legal It is critical that the jurisdiction or implementing agency have the legal authority to implement and enforce a mitigation action.
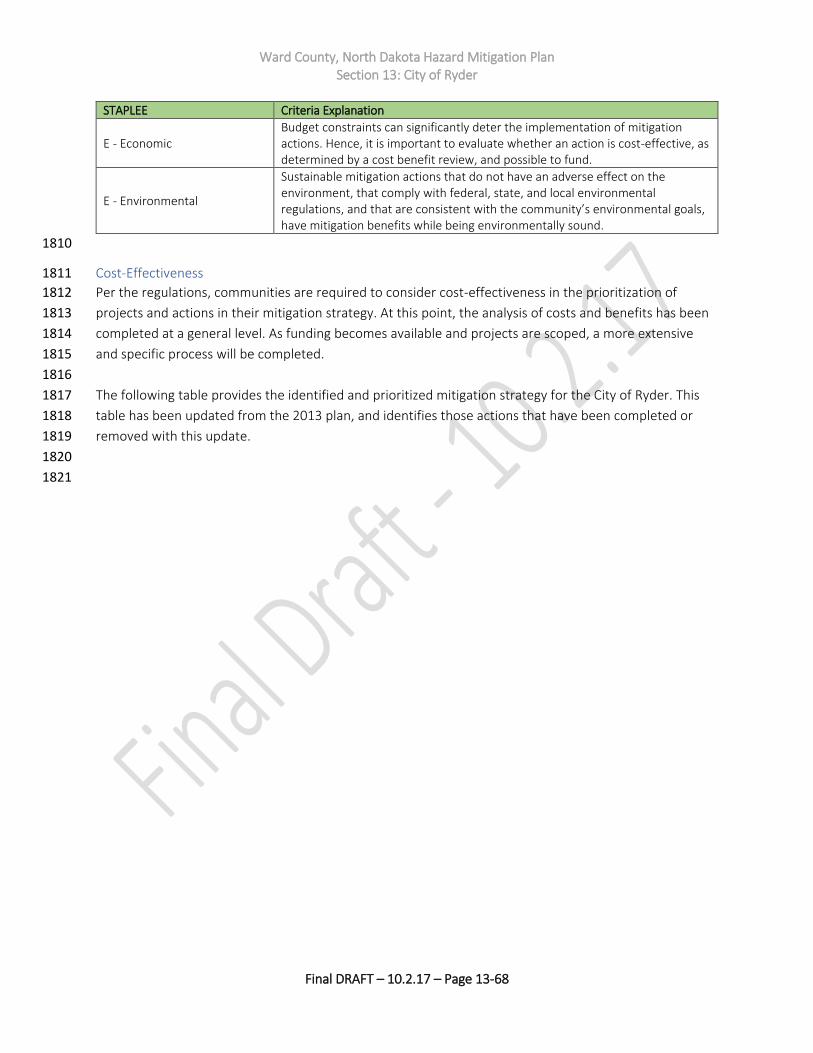
Ward County, North Dakota Hazard Mitigation Plan Section 13: City of Ryder
Final DRAFT – 10.2.17 – Page 13-68
STAPLEE Criteria Explanation
E - Economic Budget constraints can significantly deter the implementation of mitigation actions. Hence, it is important to evaluate whether an action is cost-effective, as determined by a cost benefit review, and possible to fund.
E - Environmental
Sustainable mitigation actions that do not have an adverse effect on the environment, that comply with federal, state, and local environmental regulations, and that are consistent with the community’s environmental goals, have mitigation benefits while being environmentally sound.
1810
Cost-Effectiveness 1811
Per the regulations, communities are required to consider cost-effectiveness in the prioritization of 1812
projects and actions in their mitigation strategy. At this point, the analysis of costs and benefits has been 1813
completed at a general level. As funding becomes available and projects are scoped, a more extensive 1814
and specific process will be completed. 1815
1816
The following table provides the identified and prioritized mitigation strategy for the City of Ryder. This 1817
table has been updated from the 2013 plan, and identifies those actions that have been completed or 1818
removed with this update. 1819
1820
1821
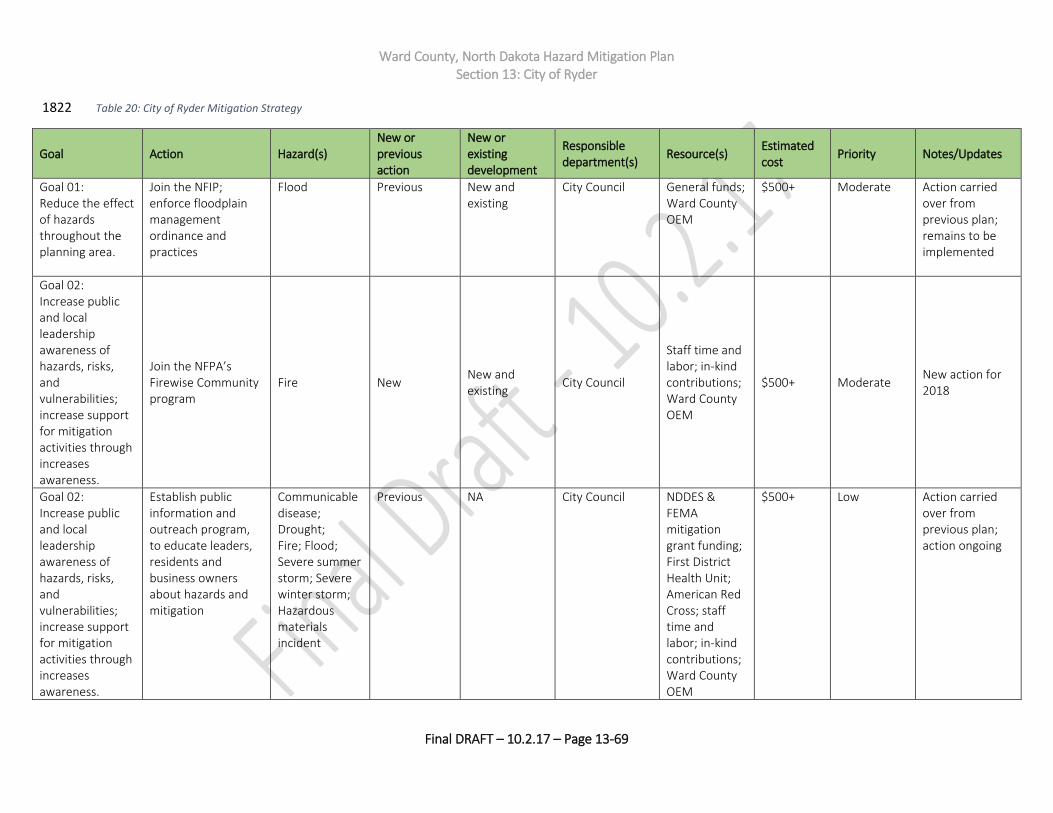
Ward County, North Dakota Hazard Mitigation Plan Section 13: City of Ryder
Final DRAFT – 10.2.17 – Page 13-69
Table 20: City of Ryder Mitigation Strategy 1822
Goal Action Hazard(s) New or previous action
New or existing development
Responsible department(s)
Resource(s) Estimated cost
Priority Notes/Updates
Goal 01: Reduce the effect of hazards throughout the planning area.
Join the NFIP; enforce floodplain management ordinance and practices
Flood Previous New and existing
City Council General funds; Ward County OEM
$500+ Moderate Action carried over from previous plan; remains to be implemented
Goal 02: Increase public and local leadership awareness of hazards, risks, and vulnerabilities; increase support for mitigation activities through increases awareness.
Join the NFPA’s Firewise Community program
Fire New New and existing
City Council
Staff time and labor; in-kind contributions; Ward County OEM
$500+ Moderate New action for 2018
Goal 02: Increase public and local leadership awareness of hazards, risks, and vulnerabilities; increase support for mitigation activities through increases awareness.
Establish public information and outreach program, to educate leaders, residents and business owners about hazards and mitigation
Communicable disease; Drought; Fire; Flood; Severe summer storm; Severe winter storm; Hazardous materials incident
Previous NA City Council NDDES & FEMA mitigation grant funding; First District Health Unit; American Red Cross; staff time and labor; in-kind contributions; Ward County OEM
$500+ Low Action carried over from previous plan; action ongoing
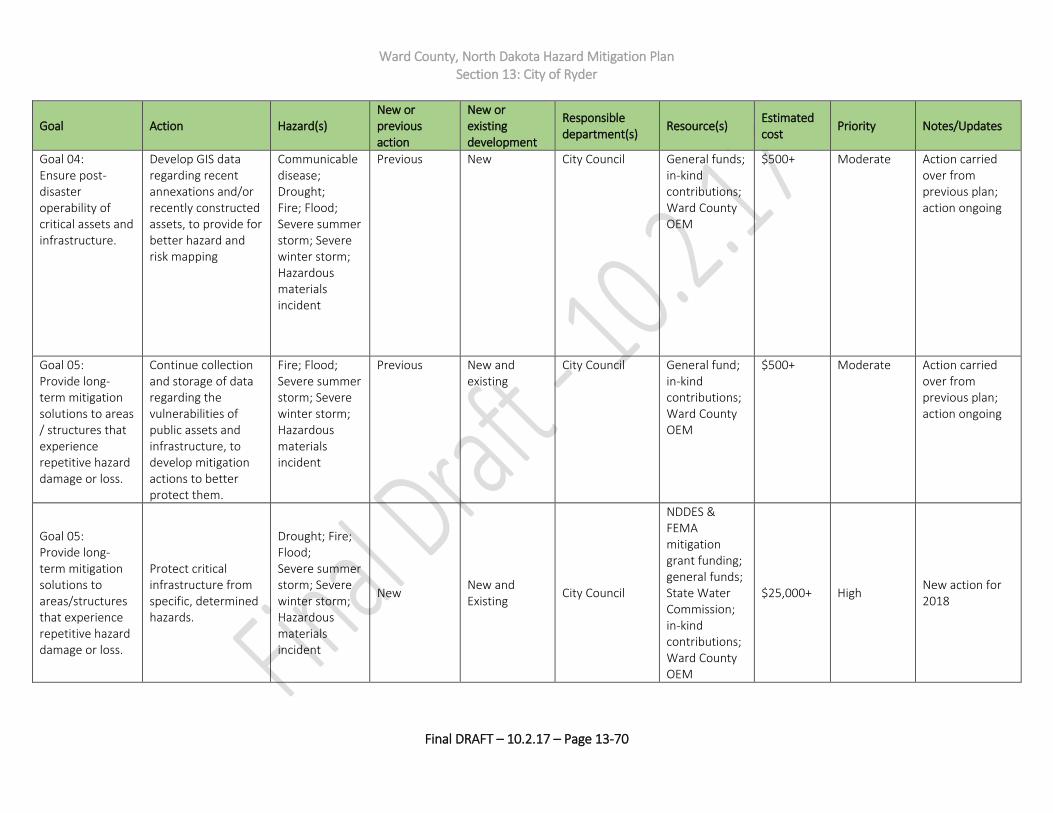
Ward County, North Dakota Hazard Mitigation Plan Section 13: City of Ryder
Final DRAFT – 10.2.17 – Page 13-70
Goal Action Hazard(s) New or previous action
New or existing development
Responsible department(s)
Resource(s) Estimated cost
Priority Notes/Updates
Goal 04: Ensure post-disaster operability of critical assets and infrastructure.
Develop GIS data regarding recent annexations and/or recently constructed assets, to provide for better hazard and risk mapping
Communicable disease; Drought; Fire; Flood; Severe summer storm; Severe winter storm; Hazardous materials incident
Previous New City Council General funds; in-kind contributions; Ward County OEM
$500+ Moderate Action carried over from previous plan; action ongoing
Goal 05: Provide long-term mitigation solutions to areas / structures that experience repetitive hazard damage or loss.
Continue collection and storage of data regarding the vulnerabilities of public assets and infrastructure, to develop mitigation actions to better protect them.
Fire; Flood; Severe summer storm; Severe winter storm; Hazardous materials incident
Previous New and existing
City Council General fund; in-kind contributions; Ward County OEM
$500+ Moderate Action carried over from previous plan; action ongoing
Goal 05: Provide long-term mitigation solutions to areas/structures that experience repetitive hazard damage or loss.
Protect critical infrastructure from specific, determined hazards.
Drought; Fire; Flood; Severe summer storm; Severe winter storm; Hazardous materials incident
New New and Existing
City Council
NDDES & FEMA mitigation grant funding; general funds; State Water Commission; in-kind contributions; Ward County OEM
$25,000+ High New action for 2018
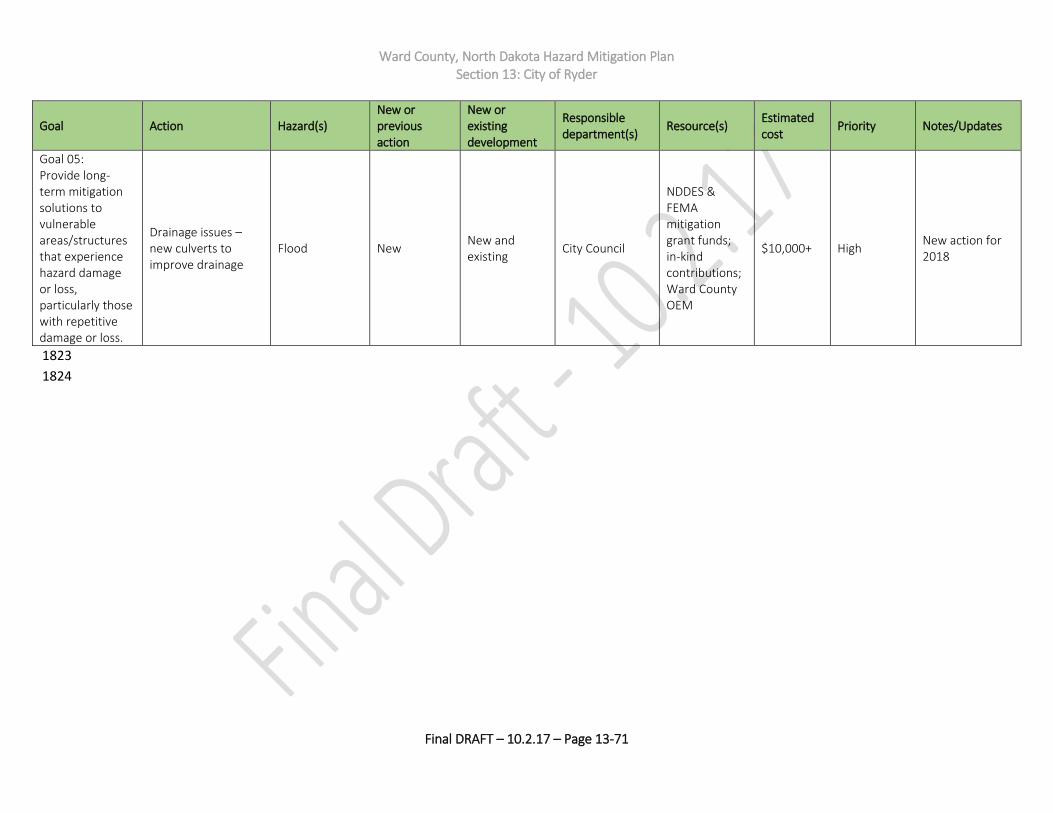
Ward County, North Dakota Hazard Mitigation Plan Section 13: City of Ryder
Final DRAFT – 10.2.17 – Page 13-71
Goal Action Hazard(s) New or previous action
New or existing development
Responsible department(s)
Resource(s) Estimated cost
Priority Notes/Updates
Goal 05: Provide long-term mitigation solutions to vulnerable areas/structures that experience hazard damage or loss, particularly those with repetitive damage or loss.
Drainage issues – new culverts to improve drainage
Flood New New and existing
City Council
NDDES & FEMA mitigation grant funds; in-kind contributions; Ward County OEM
$10,000+ High New action for 2018
1823
1824