Second Quarter FY 2022 Quarterly Update - Infineon ...
101
1 Second Quarter FY 2022 Quarterly Update Infineon Technologies AG Investor Relations
-
Upload
khangminh22 -
Category
Documents
-
view
11 -
download
0
Transcript of Second Quarter FY 2022 Quarterly Update - Infineon ...

1
Second Quarter FY 2022
Quarterly Update
Infineon Technologies AG
Investor Relations

2Copyright © Infineon Technologies AG 2022. All rights reserved.2022-05-09
FY21 revenue by product categoryFinancials
FY21 revenue by segment
Infineon at a glance
Addressing long-term high-growth trends
6,473 7,063 7,599 8,029 8,567
11,060
982 1,208 1,353 1,319 1,170 2,072
15.2%17.1% 17.8% 16.4%
13.7%
18.7%
0
3000
6000
9000
12000
FY16 FY17 FY18 FY19 FY20 FY21
Revenue Segment Result Margin
[EUR m]
~5% memory ICs
~12% RF & sensors
~28%embedded control
and connectivity
~55%power semi-
conductors
ATV IPC PSS CSS
44%
14%
29%
13%
Automotive (ATV)
Industrial Power Control (IPC)
Power & Sensor Systems (PSS)
Connected Secure Systems (CSS)
of total revenue
Decarbonization
Digitalization› CO2 saving
› Energy efficiency
› Sustainability › Productivity
› Comfort
› New use cases

3Copyright © Infineon Technologies AG 2022. All rights reserved.2022-05-09
FY99 FY01 FY03 FY05 FY07 FY09 FY11 FY13 FY15 FY17 FY19 FY21
Since 1999, Infineon has grown by more than 10% p.a.,
thereby consistently outperforming the semiconductor market
Revenue Infineon Semiconductor World Market3 (adjusted for the Infineon fiscal year ending Sep 30)
~1
,20
0
12
6,8
95
43
6,8
90
3
11
,04
82
Semiconductor World Market CAGR (FY99 – FY21): 5.8%
Revenues CAGR (FY99 – FY21): 10.6%
Profitability1
(average Segment Result Margin)
FY09 – FY11:
9.5%
Technology provider
System provider
System Integrator
Solution provider
CypressInternational RectifierStrategic consolidation Product-to-System
FY12 – FY14:
12.6%FY15 – FY17:
15.9%
[EUR m]
F18 – FY21:
16.7%
1 In FY09 Infineon’s management changed the measure it uses to assess the operating performance of its operating segments to “Segment Result”
2 Based on Infineon’s portfolio (excl. Other Operating Segments and Corporate & Eliminations) per end of FY21 | 3 Source: WSTS (World Semiconductor Trade Statistics) in EUR adjusted for fiscal year, September 2021
4Copyright © Infineon Technologies AG 2022. All rights reserved.2022-05-09
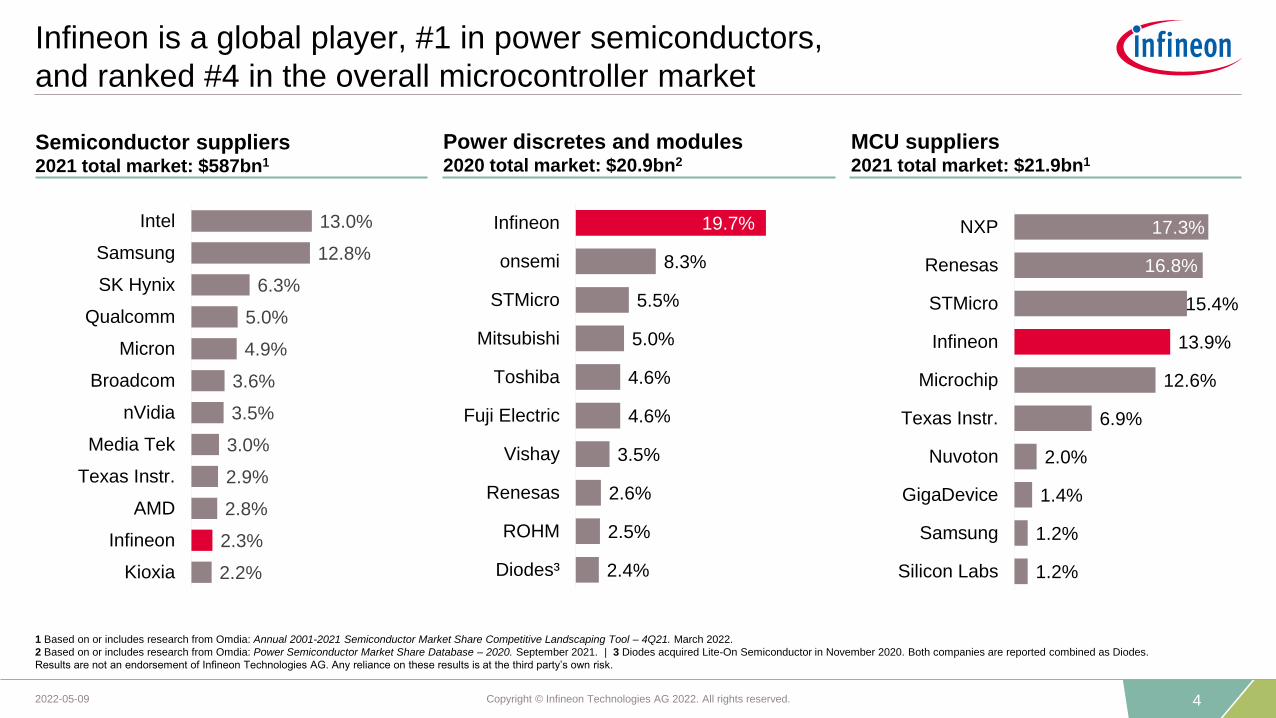
MCU suppliers2021 total market: $21.9bn1
Power discretes and modules2020 total market: $20.9bn2
Semiconductor suppliers2021 total market: $587bn1
13.0%
12.8%
6.3%
5.0%
4.9%
3.6%
3.5%
3.0%
2.9%
2.8%
2.3%
2.2%
Intel
Samsung
SK Hynix
Qualcomm
Micron
Broadcom
nVidia
Media Tek
Texas Instr.
AMD
Infineon
Kioxia
17.3%
16.8%
15.4%
13.9%
12.6%
6.9%
2.0%
1.4%
1.2%
1.2%
NXP
Renesas
STMicro
Infineon
Microchip
Texas Instr.
Nuvoton
GigaDevice
Samsung
Silicon Labs
Infineon is a global player, #1 in power semiconductors,
and ranked #4 in the overall microcontroller market
2.4%
2.5%
2.6%
3.5%
4.6%
4.6%
5.0%
5.5%
8.3%
19.7%
Diodes³
ROHM
Renesas
Vishay
Fuji Electric
Toshiba
Mitsubishi
STMicro
onsemi
Infineon
1 Based on or includes research from Omdia: Annual 2001-2021 Semiconductor Market Share Competitive Landscaping Tool – 4Q21. March 2022.
2 Based on or includes research from Omdia: Power Semiconductor Market Share Database – 2020. September 2021. | 3 Diodes acquired Lite-On Semiconductor in November 2020. Both companies are reported combined as Diodes.
Results are not an endorsement of Infineon Technologies AG. Any reliance on these results is at the third party’s own risk.

5Copyright © Infineon Technologies AG 2022. All rights reserved.2022-05-09
powertrain ICE; 8%
xEV (incl. MHEV); 7%
safety excl. ADAS; 6%
ADAS; 5%
comfort, premium; 11%
infotainment; 3%
other ATV; 4%
drives; 5%
renewables; 4%home appliances; 2%
transportation; 1%power infrastructure; 1%
other IPC; 1%
computing; 5%
communications; 1%
smartphones; 5%
consumer; 9%
industrial; 7%
other PSS; 2%
payment, identification, ticketing; 6%
industrial and consumer IoT; 7%
Well-balanced portfolio among
key trends Decarbonization and Digitalization
CSS
13%
ATV
44%
IPC
14%
PSS
29%
FY21 revenue of €11,060m by target application

6Copyright © Infineon Technologies AG 2022. All rights reserved.2022-05-09
Renault
We continue the broad presence of Infineon power semiconductors in
Automotive applications with new SiC design wins
Examples of OEMs powered by Infineon Latest CoolSiC™ design wins including new applications
Volkswagen
SAICCadillac
Mini
Nissan
German Luxury OEM
Asian OEM
Hyundai XPeng
US OEM
Chinese OEM Chinese OEM
new!new!
› Leverage huge IGBT
customer base with broadest
portfolio and full system
solution
› Seamless and cost-effective
upgrade path across entire
power range
› Latest SiC design wins
include next-generation
traction inverter and OBC
(on-board charger) at two
Chinese OEMs with a
combined triple-digit
million € volume NIO

7Copyright © Infineon Technologies AG 2022. All rights reserved.2022-05-09
Infineon offers complete power management solutions
for compute servers based on Intel’s Xeon processors
Infineon’s power management solution maximizes overall
system performance Advantages of Infineon’s System Solution
• XDP™ digital power controller: Flexibility with
software-defined architecture
enables customizations for best
performance
• OptiMOSTM Power Stage: Best-in-class efficiency &
robustness minimizes total cost of ownership (TCO).
Accurate telemetry and intelligent fault handling
maximizes system performance and reliability
• OptiMOSTM Smart IPOL: Best-in-class efficiency
and smart telemetry enables superior system
performance
Roughly 40 Infineon
components located
on the server board
are supplying energy
efficient power for
Intel Xeon CPUs
This total system solution drives superior performance and energy efficiency in data centers
8Copyright © Infineon Technologies AG 2022. All rights reserved.2022-05-09 8
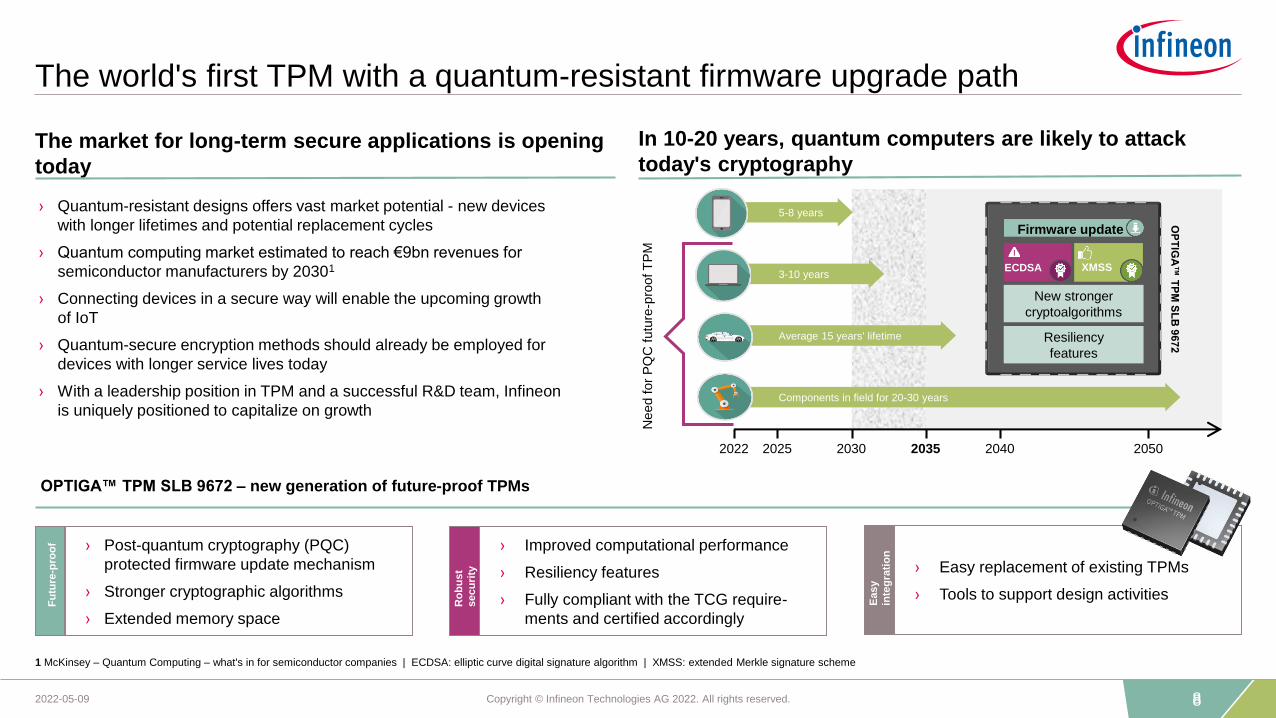
› Quantum-resistant designs offers vast market potential - new devices
with longer lifetimes and potential replacement cycles
› Quantum computing market estimated to reach €9bn revenues for
semiconductor manufacturers by 20301
› Connecting devices in a secure way will enable the upcoming growth
of IoT
› Quantum-secure encryption methods should already be employed for
devices with longer service lives today
› With a leadership position in TPM and a successful R&D team, Infineon
is uniquely positioned to capitalize on growth
20502040203520302022
Need f
or
PQ
C f
utu
re-p
roof T
PM
Components in field for 20-30 years
5-8 years
3-10 years
Average 15 years' lifetime
2025
ECDSA
Firmware update
XMSS
New stronger
cryptoalgorithms
Resiliency
features
OP
TIG
A™
TP
M S
LB
9672
Fu
ture
-pro
of › Post-quantum cryptography (PQC)
protected firmware update mechanism
› Stronger cryptographic algorithms
› Extended memory space
Ro
bu
st
secu
rity
› Improved computational performance
› Resiliency features
› Fully compliant with the TCG require-
ments and certified accordingly
Easy
inte
gra
tio
n
› Easy replacement of existing TPMs
› Tools to support design activities
OPTIGA™ TPM SLB 9672 – new generation of future-proof TPMs
The world's first TPM with a quantum-resistant firmware upgrade path
1 McKinsey – Quantum Computing – what's in for semiconductor companies | ECDSA: elliptic curve digital signature algorithm | XMSS: extended Merkle signature scheme
The market for long-term secure applications is opening
today
In 10-20 years, quantum computers are likely to attack
today's cryptography
9Copyright © Infineon Technologies AG 2022. All rights reserved.2022-05-09
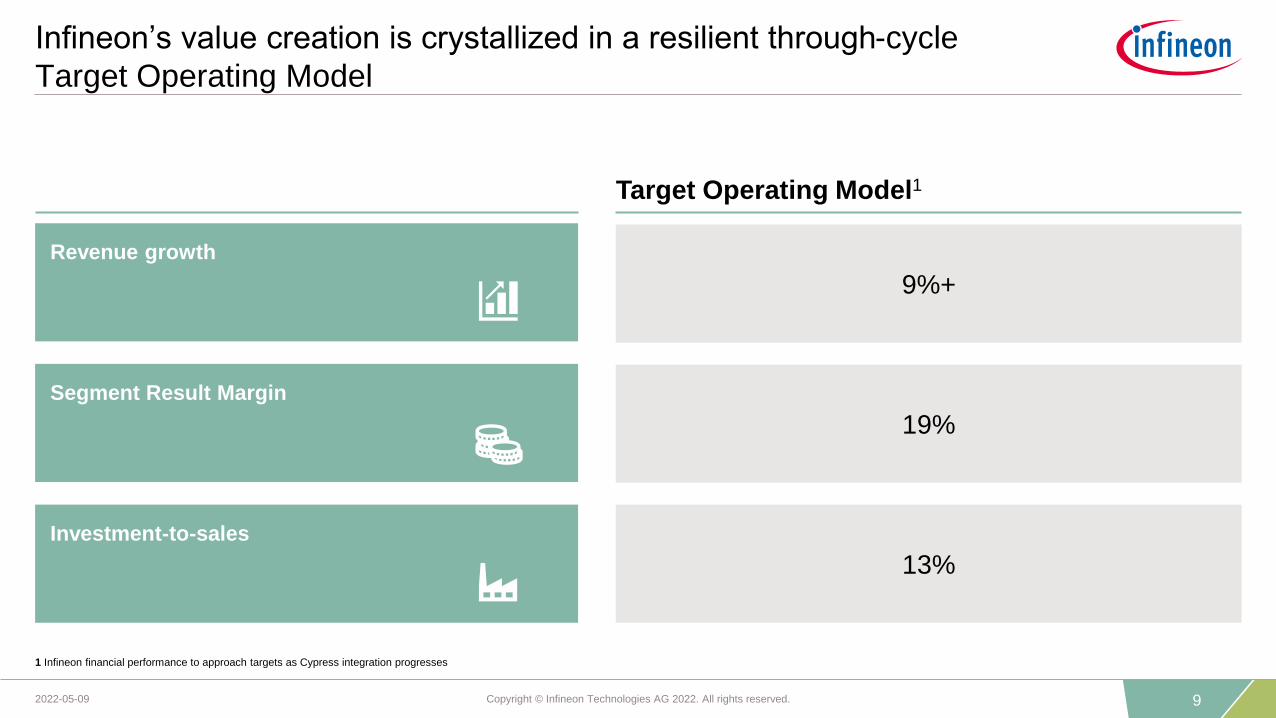
Infineon’s value creation is crystallized in a resilient through-cycle
Target Operating Model
Target Operating Model1
Investment-to-sales
13%
Segment Result Margin
19%
Revenue growth
9%+
1 Infineon financial performance to approach targets as Cypress integration progresses
10Copyright © Infineon Technologies AG 2022. All rights reserved.2022-05-09
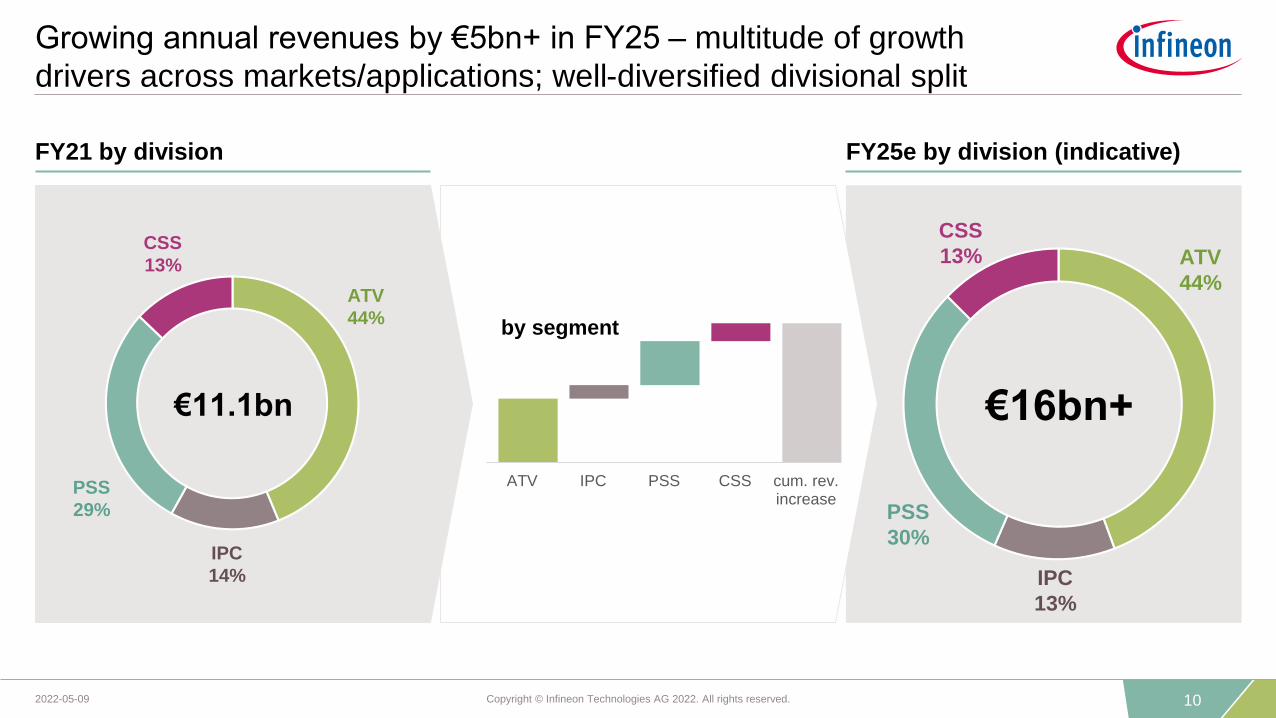
CSS
13% ATV
44%
IPC
13%
PSS
30%
€16bn+
FY25e by division (indicative)
Growing annual revenues by €5bn+ in FY25 – multitude of growth
drivers across markets/applications; well-diversified divisional split
CSS
13%
ATV
44%
IPC
14%
PSS
29%
€11.1bn
FY21 by division
ATV IPC PSS CSS cum. rev.increase
by segment

11Copyright © Infineon Technologies AG 2022. All rights reserved.2022-05-09
Assuming no pandemic, 17% Segment
Result Margin target would have been
achieved over the cycle
Key levers identified to get to the target profitability flight level –
19% Segment Result Margin over the (next) cycle
17%
19%
over the (next) cycle; illustrative
FY17 to FY21
COVID
Looking back: former TOM achieved Looking ahead: all set up to reach current TOM
› Higher value system solutions:
› P2S and Cypress revenue synergies
› Additional customer value creation
› Business mix
› Manufacturing productivity and cost control:
› 300 mm productivity
› Cypress cost synergies, SG&A scaling
› Cypress accretion for entire period
› Increased supplier (foundry)
and materials costs
› Pre-funding P2S synergies
› Pre-funding SiC/GaN roadmap
Levers for margin expansion Inhibitors to margin expansion

12Copyright © Infineon Technologies AG 2022. All rights reserved.2022-05-09
Strategic differentiation through in-house manufacturing
In-house manufacturing
› We manufacture power and sensor technologies in-house where we can gain a strategic
advantage from our leading-edge manufacturing technologies and our outstanding process
expertise
› This results in a differentiation potential in terms of cost and/or performance
› The current chip shortage highlights the strategic value of in-house manufacturing
Outsourcing
› We work with outsourcing partners where we see no or only little differentiation to optimize
our capital efficiency (CMOS and derivate technologies and standard packages)
› We cooperate with subcontractors and foundries in order to ensure adequate capacity
growth and flexibility
› Infineon‘s outsourcing share is expected to increase from ~30% in FY21 to ~40% in FY25
~30%
~40%
FY21 FY25e
Infineon’s outsourcing share

13Copyright © Infineon Technologies AG 2022. All rights reserved.2022-05-09
Investment-to-sales
Revenue growth
Basis investment in frontend, backend and other investment1
(structure, innovation, quality, maintenance, infrastructure)
~13%
~9%
Capitalization of development expenses
Capacity investment
in frontend and backend
TOM
(9%+ | 19% | 13%)
~2%
~5%
~6%
We focus our investments to those areas with highest differentiation
1 Frontend clean rooms and major office buildings are not included
› Capacity expansion for SiC and
GaN
› Further capacity expansion for
300 mm in Villach and Dresden
› Further capacity expansion for
200 mm in Kulim
› Focused insourcing from silicon
foundries
› Clean room for WBG / 300 mm and
major office buildings (slightly above
€1bn over five years)
› ~€2.4bn investments planned in
FY22
Major focus topicsSplit of investment-to-sales by category
14Copyright © Infineon Technologies AG 2022. All rights reserved.2022-05-09
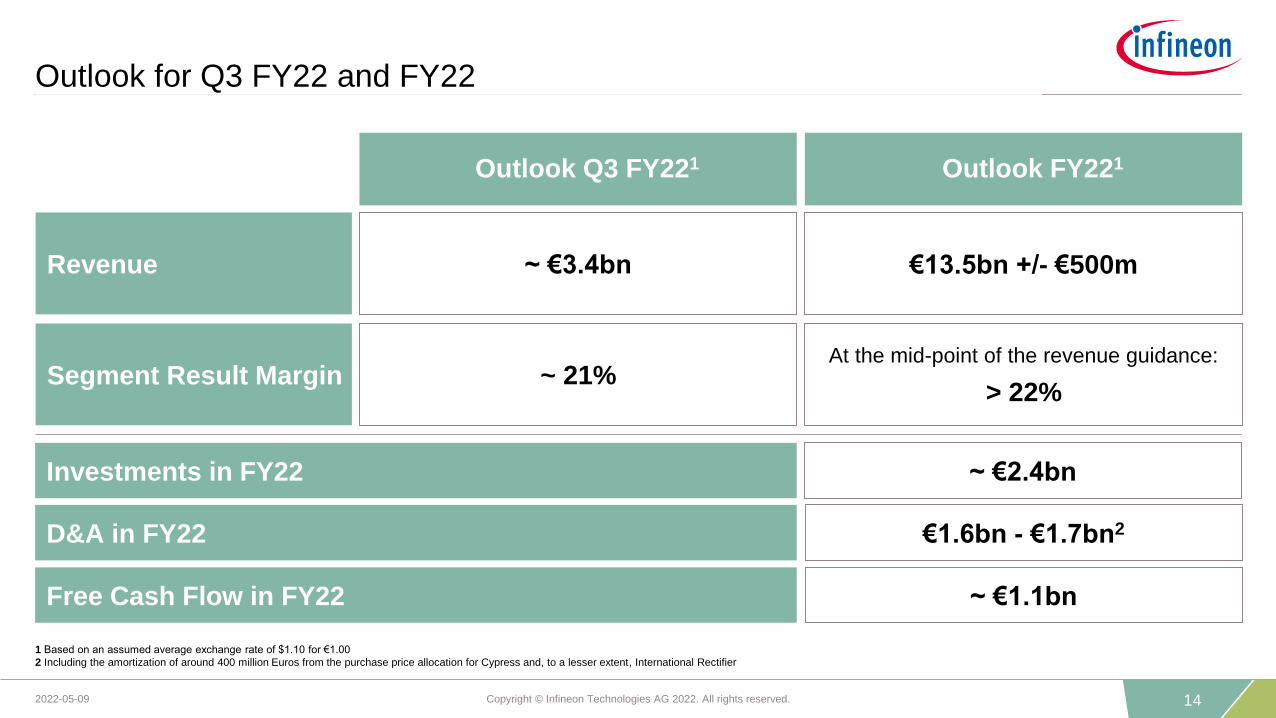
Outlook for Q3 FY22 and FY22
Segment Result Margin ~ 21%
~ €3.4bn
Investments in FY22 ~ €2.4bn
D&A in FY22 €1.6bn - €1.7bn2
Outlook FY221
€13.5bn +/- €500m
At the mid-point of the revenue guidance:
> 22%
Outlook Q3 FY221
Revenue
Free Cash Flow in FY22 ~ €1.1bn
1 Based on an assumed average exchange rate of $1.10 for €1.00
2 Including the amortization of around 400 million Euros from the purchase price allocation for Cypress and, to a lesser extent, International Rectifier

15
ESG: targets and achievements

16Copyright © Infineon Technologies AG 2022. All rights reserved.2022-05-09
Infineon is excellent in resource efficiency
We are committed to CO2 neutrality by 2030
Our CO2-saving applications are high-growth, we are part of the solution!
The ~1:33 ratio is expected to further improve in the coming years
CO2 burden1
2.2 million tons
of CO2 equivalents
CO2 savings2
72.5 million tons
of CO2 equivalents
We contribute a net CO2 reduction of more than 70 million tons
1 | 2 For explanatory notes see “ESG footnotes” in the appendix.
Net ecological benefit: CO2 emissions reduction of more than 70 million tons
Ratio ~1:33

17Copyright © Infineon Technologies AG 2022. All rights reserved.2022-05-09
1.15
0.35
CY19Base year
Target FY25 Target FY30
Infineon is excellent in resource efficiency and committed to CO2
neutrality – sustainability is in our DNA
In CY20, we used resources in our manufacturing processes much more efficiently than the global average of the
semiconductor industry:
-100%
-70%
Infineon ranks among the 10 percent most sustainable companies in the world1
67%
less waste generatedper cm² manufactured wafer
17%
less water consumedper cm² manufactured wafer
44%
less electricity consumedper cm² manufactured wafer
Net CO2 emissions in million tons of CO2 equivalents2
Infineon’s CO2 target2 by 2025 and 2030
Avoiding direct emissions and further reducing energy consumption
Purchasing green electricity with guarantees of origin
Compensate the smallest part by certificates that combine development
support and CO2 abatement
1
2
3
1 Based on the results of The Sustainability Yearbook 2022 by S&P Global in cooperation with RobecoSam | 2 Related to Scope 1 and 2 emissions

18Copyright © Infineon Technologies AG 2022. All rights reserved.2022-05-09
High-growth applications offer further additional CO2 savings potential
Net ecological benefit
increases over time
EVs: Increased sales contributed to
an average fleet emission reduction
of 14 g/km in Europe4
Wind energy: Annual installation
capacity increased over 80%1
PV energy: Annual installation
capacity increase of ~15%2
Drives: Increasing penetration of
more efficient drives3
In CY20:
1 Wood Mackenzie: Global Wind Power Market Outlook, Q2 2021. June 2021 | 2 Based on or includes content supplied by IHS Markit Climate and Sustainability Group: PV Installations Tracker, Q2 2021. June 2021
3 Based on or includes research from Omdia: Industrial Motor Control Sourcebook 2020. December 2020 | 4 CO2 emissions from new passenger cars in Europe: Car manufacturers' performance in 2020 - 08/2021

19Copyright © Infineon Technologies AG 2022. All rights reserved.2022-05-09
External recognitions confirm our engagement in contributing
to a sustainable society
Dow Jones Sustainability Index
Ethibel Sustainability Index
Excelence Europe”
ISS ESG Corporate Rating
Ecovadis
CDP
MSCI ESG
FTSE4Good Index
Euronext Vigeo Eurozone 120 Index
Euronext Vigeo Europe 120 Index
Sustainalytics
AACCC to
AAA02/2021
B climate scoring
B water scoringF to A 12/2021
99th percentile “Platinum” award 0 to 100 02/2022
83 Dow Jones Sustain-
ability™ World and Europe Index listing0 to 100 11/2021
Index member - 05/2020
B-
Prime StatusD- to A+ 01/2021
Index member - 06/2021
Indices member - 05/2021
Top ESG performer - 01/2022
Rating/Score Scale Date
20
Infineon's Wide Bandgap Strategy

21Copyright © Infineon Technologies AG 2022. All rights reserved.2022-05-09
Leveraging full potential based on the power ratings and switching
frequency required by the application
› SiC complements Si in many
applications and enables new solutions
› Targeting 650 V - 3.3 kV
› High power – high switching frequency
› Si remains the mainstream technology
› Targeting 25 V - 6.5 kV
› Suitable from low to high power
› GaN enables new horizons in power
supply applications and audio fidelity
› Targeting 80 V - 600 V
› Medium power – highest switching
frequency
Si
SiC
GaN
Comparison of technologies

22Copyright © Infineon Technologies AG 2022. All rights reserved.2022-05-09
SiC – Infineon is serving all relevant applications
AutomotivePhotovoltaic
Drives
TransportationIndustrial power
supply
EV charging
Infineon serves
> 3,000customers directly or via
distribution
Focus applications Customers

23Copyright © Infineon Technologies AG 2022. All rights reserved.2022-05-09
SiC – US$ 1 billion revenue in sight
FY20 FY21 FY22e
Automotive
Industrial
~80%
~100%
Mid-
20ies
~$1bn revenue
~$200m
› Strengthening #2 position in SiC device market
› Highest yoy growth of all peers
› Broadest portfolio fits customers’ individual needs
› Scalable portfolio allows for easy and seamless
upgrade from IGBT to SiC-based inverters
2%
7%
10%
14%
22%
40%
Mitsubishi
onsemi
Rohm
Wolfspeed
Infineon
ST Micro
1 Yole Développement: Compound Semiconductor Quarterly Market Monitor. Q1 2022
SiC revenue development
SiC power devices1
2021 total market: $1,137m

24Copyright © Infineon Technologies AG 2022. All rights reserved.2022-05-09
CoolSiC™ trench design optimized performance and reliability
Instead of exploiting full potential of performance, Infineon
turns part of this budget into much higher reliability
Infineon’s trench technology moves the boundaries
Re
liab
ility
PerformanceLow High
High
planar
Infineon trench
Gen 2Gen 1
25Copyright © Infineon Technologies AG 2022. All rights reserved.2022-05-09
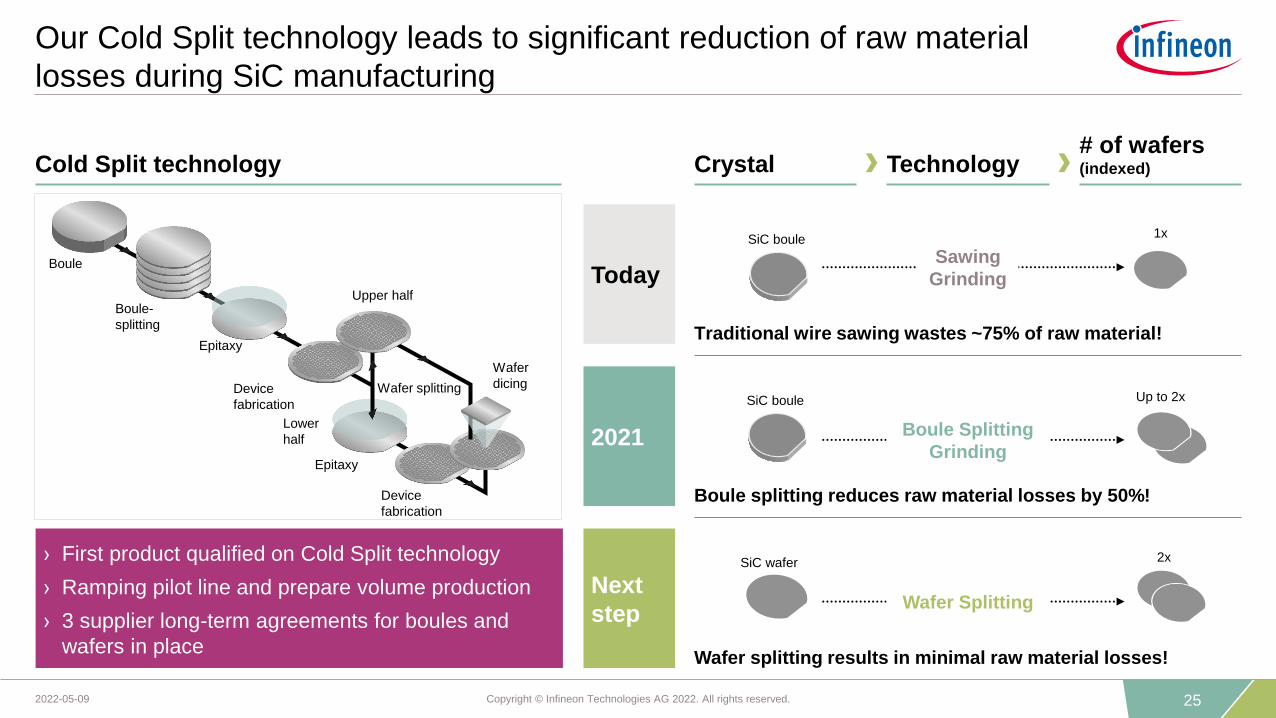
Our Cold Split technology leads to significant reduction of raw material
losses during SiC manufacturing
Boule splitting reduces raw material losses by 50%!
Traditional wire sawing wastes ~75% of raw material!
Today
2021
Next
step
Wafer splitting results in minimal raw material losses!
1x
Crystal Technology # of wafers(indexed)
Up to 2x
Sawing
Grinding
Boule Splitting
Grinding
Wafer Splitting
SiC wafer
SiC boule
SiC boule
Cold Split technology
Boule
Boule-
splitting
Epitaxy
Device
fabrication
Lower
half
Epitaxy
Device
fabrication
Upper half
Wafer splitting
Wafer
dicing
› First product qualified on Cold Split technology
› Ramping pilot line and prepare volume production
› 3 supplier long-term agreements for boules and
wafers in place
2x

26Copyright © Infineon Technologies AG 2022. All rights reserved.2022-05-09
Strong CoolSiC™ portfolio expansion: by packages and by voltages
Continuous expansion of portfolio
Broadest and best-in-class SiC portfolio
Industrial Automotive grade
CoolSiC™
Diode
CoolSiC™
MOSFET
CoolSiC™
Diode
CoolSiC™
MOSFET
Discrete Module Discrete Module Discrete
CoolSiC™ Hybrid
ModuleDiscrete DiscreteIPM
600 V
650 V
1200 V
1700 V
voltages
CoolSiC™
Hybrid
Discrete

27Copyright © Infineon Technologies AG 2022. All rights reserved.2022-05-09
Expansion of SiC and GaN capacity follows our long-term strategy
> €2bn investment to build a 3rd module at our site in Kulim
› Seize structural growth opportunities linked to electrification
› Prepare manufacturing cluster for acceleration of WBG
› Create higher resilience of WBG supply by further expanding
capacities with Kulim 3 and in Villach
› Leverage economies of scale
Rationale
Total frontend investment > €2bn
Revenue potential ~ €2bn per year
Groundbreaking January 2022
Start of construction June 2022
Ready for equipment Summer 2024
First volumes out Second half of calendar year 2024

28Copyright © Infineon Technologies AG 2022. All rights reserved.2022-05-09
GaN technology – Infineon well positioned to address key markets
53
1,125
2020 2025e
[USD m]
1 GaN power devices market Yole Développement (Yole): SiC and GaN power devices: market trends and supply chain evolutions Q2 2022
CAGR(20 – 25): 84%
> 2%more power
efficiency
10xswitching
frequency
25%higher power
density
3xless
weight
20%lower
System Cost
We combine leading-edge system and application
understanding with additional strengths:
Broad GaN IP portfolio, large R&D force and
best-in-class manufacturing landscape
Focus applications
Emerging applications
GaN market forecast1 Key values of GaN vs Si Applications
Higher power density in adapters and chargers
29Copyright © Infineon Technologies AG 2022. All rights reserved.2022-05-09
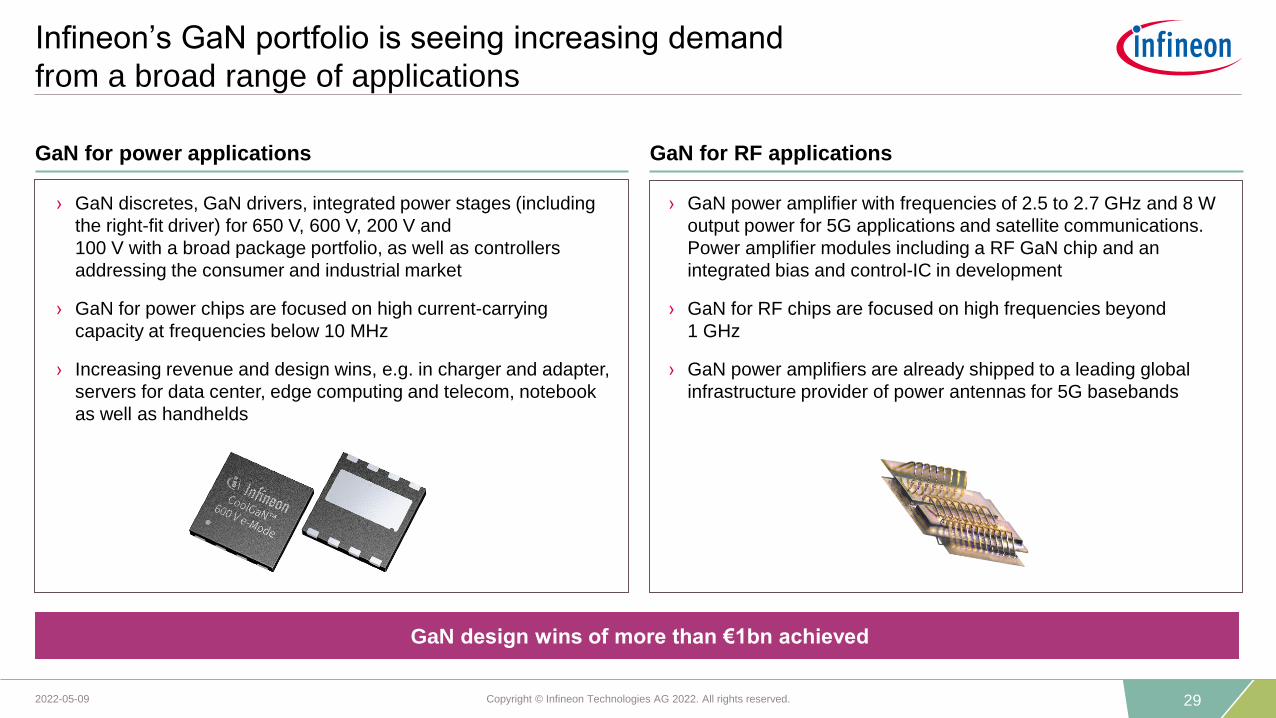
› GaN power amplifier with frequencies of 2.5 to 2.7 GHz and 8 W
output power for 5G applications and satellite communications.
Power amplifier modules including a RF GaN chip and an
integrated bias and control-IC in development
› GaN for RF chips are focused on high frequencies beyond
1 GHz
› GaN power amplifiers are already shipped to a leading global
infrastructure provider of power antennas for 5G basebands
Infineon’s GaN portfolio is seeing increasing demand
from a broad range of applications
› GaN discretes, GaN drivers, integrated power stages (including
the right-fit driver) for 650 V, 600 V, 200 V and
100 V with a broad package portfolio, as well as controllers
addressing the consumer and industrial market
› GaN for power chips are focused on high current-carrying
capacity at frequencies below 10 MHz
› Increasing revenue and design wins, e.g. in charger and adapter,
servers for data center, edge computing and telecom, notebook
as well as handhelds
GaN for power applications GaN for RF applications
GaN design wins of more than €1bn achieved

30
Automotive

31Copyright © Infineon Technologies AG 2022. All rights reserved.2022-05-09
ATV at a glance
Key customers
FY21 revenue split by product groupATV revenue and Segment Result Margin
CAGR(FY16-FY21): 12.8%[EUR m]
MCUs
sensors
power (incl. SiC)
memory ICs
2,6562,989 3,284 3,503 3,521
4,841
14%16% 14%
12%
4%
16%
-5%
5%
15%
25%
0
500
1.000
1.500
2.000
2.500
3.000
3.500
4.000
4.500
5.000
FY16 FY17 FY18 FY19 FY20 FY21
ATV revenue ATV Segment Result Margin
32Copyright © Infineon Technologies AG 2022. All rights reserved.2022-05-09
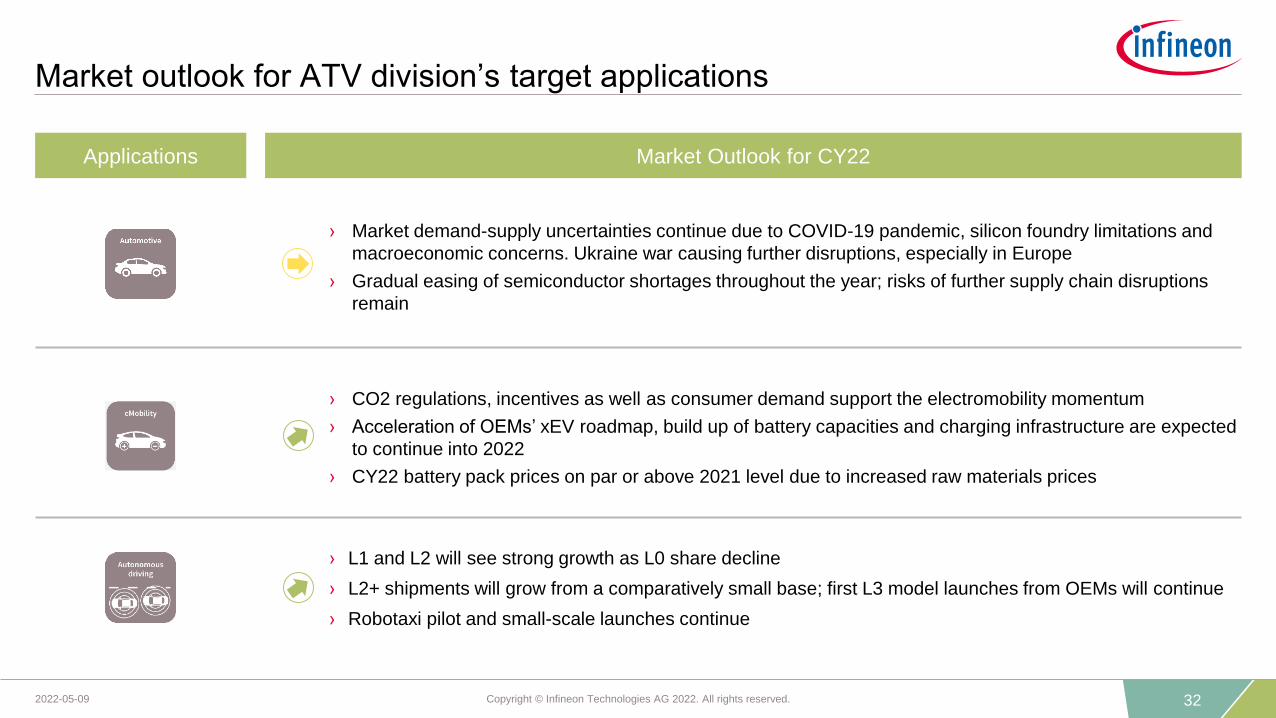
Market outlook for ATV division’s target applications
Applications Market Outlook for CY22
› CO2 regulations, incentives as well as consumer demand support the electromobility momentum
› Acceleration of OEMs’ xEV roadmap, build up of battery capacities and charging infrastructure are expected
to continue into 2022
› CY22 battery pack prices on par or above 2021 level due to increased raw materials prices
› Market demand-supply uncertainties continue due to COVID-19 pandemic, silicon foundry limitations and
macroeconomic concerns. Ukraine war causing further disruptions, especially in Europe
› Gradual easing of semiconductor shortages throughout the year; risks of further supply chain disruptions
remain
› L1 and L2 will see strong growth as L0 share decline
› L2+ shipments will grow from a comparatively small base; first L3 model launches from OEMs will continue
› Robotaxi pilot and small-scale launches continue
33Copyright © Infineon Technologies AG 2022. All rights reserved.2022-05-09
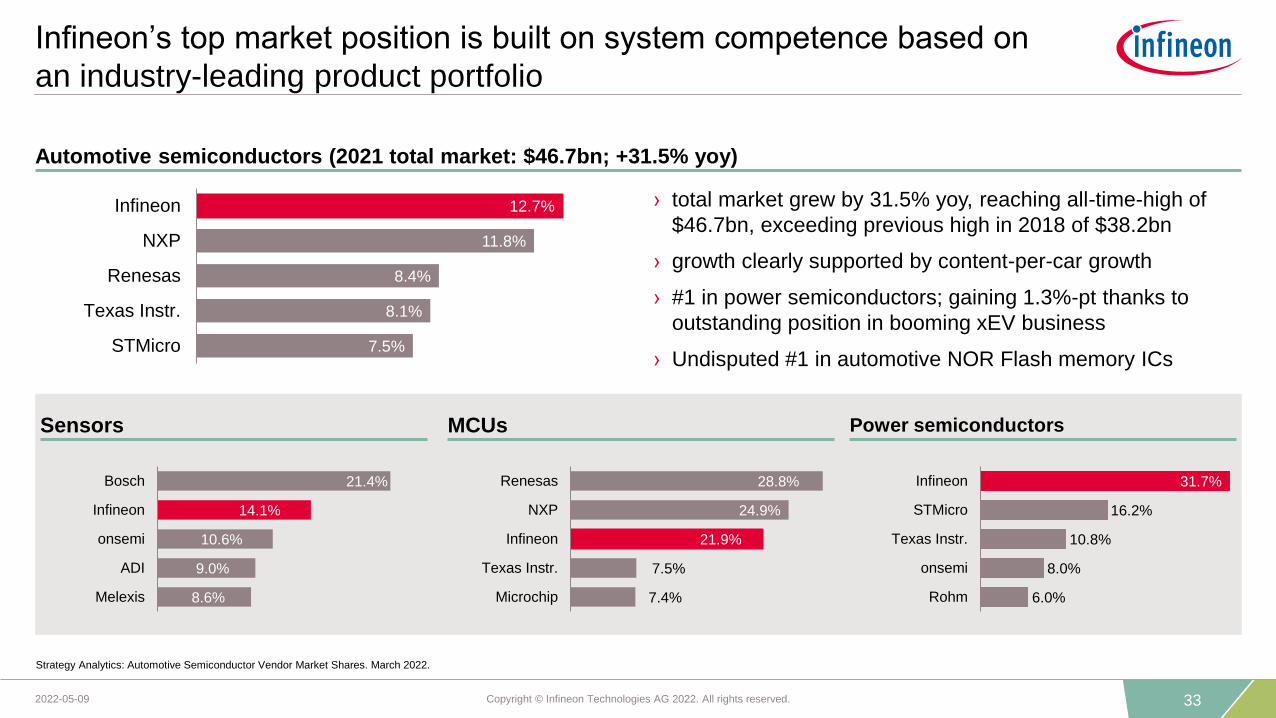
Infineon’s top market position is built on system competence based on
an industry-leading product portfolio
› total market grew by 31.5% yoy, reaching all-time-high of
$46.7bn, exceeding previous high in 2018 of $38.2bn
› growth clearly supported by content-per-car growth
› #1 in power semiconductors; gaining 1.3%-pt thanks to
outstanding position in booming xEV business
› Undisputed #1 in automotive NOR Flash memory ICs
12.7%
11.8%
8.4%
8.1%
7.5%
Infineon
NXP
Renesas
Texas Instr.
STMicro
Automotive semiconductors (2021 total market: $46.7bn; +31.5% yoy)
21.4%
14.1%
10.6%
9.0%
8.6%
Bosch
Infineon
onsemi
ADI
Melexis
Sensors
7.4%
7.5%
21.9%
24.9%
28.8%
Microchip
Texas Instr.
Infineon
NXP
Renesas
MCUs Power semiconductors
6.0%
8.0%
10.8%
16.2%
31.7%
Rohm
onsemi
Texas Instr.
STMicro
Infineon
Strategy Analytics: Automotive Semiconductor Vendor Market Shares. March 2022.

34
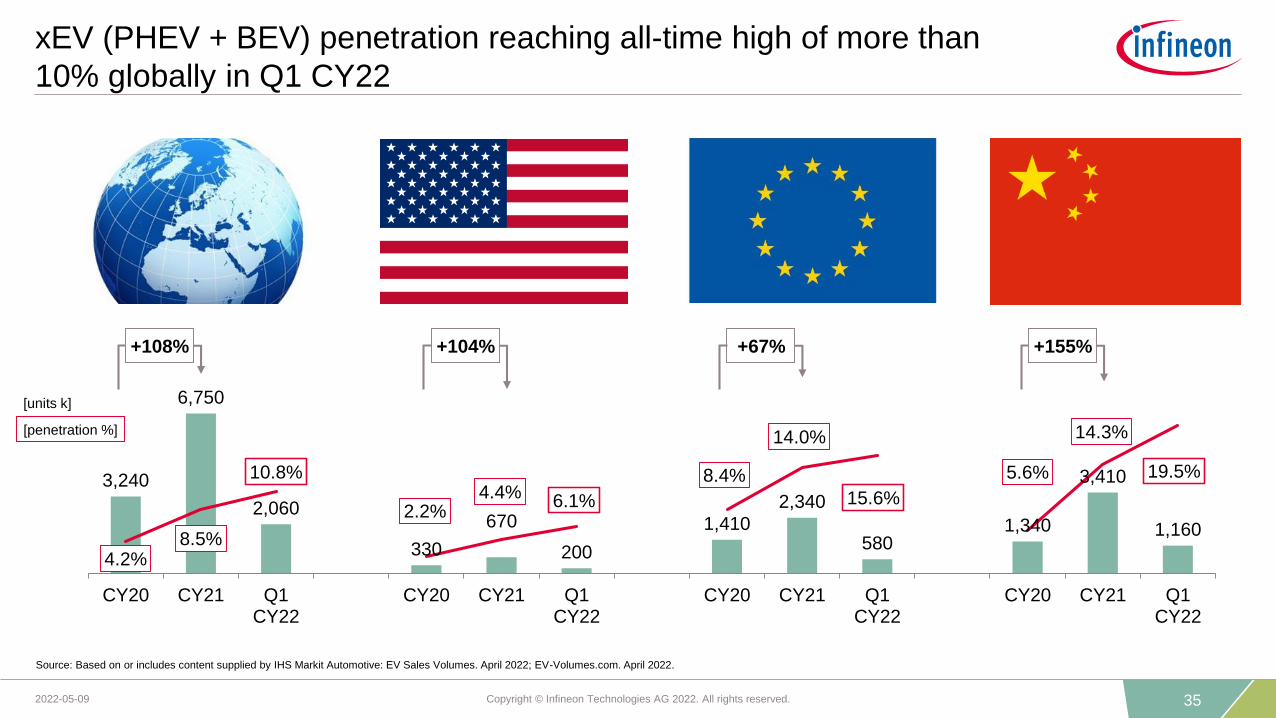
Electromobility
35Copyright © Infineon Technologies AG 2022. All rights reserved.2022-05-09
3,240
6,750
2,060
330
670
200
1,410
2,340
5801,340
3,410
1,160
4.2%8.5%
10.8%
2.2%4.4% 6.1%
8.4%
14.0%
15.6%
5.6%
14.3%
19.5%
CY20 CY21 Q1CY22
CY20 CY21 Q1CY22
CY20 CY21 Q1CY22
CY20 CY21 Q1CY22
xEV (PHEV + BEV) penetration reaching all-time high of more than
10% globally in Q1 CY22
+108% +104% +67% +155%
[units k]
Source: Based on or includes content supplied by IHS Markit Automotive: EV Sales Volumes. April 2022; EV-Volumes.com. April 2022.
[penetration %]

36Copyright © Infineon Technologies AG 2022. All rights reserved.2022-05-09
The road to emission-free cruising:
Governments and OEMs indicated when to ban the ICE
2035:
› GM: "All new vehicles will be BEV.”
› VW brand: “To end sales of ICEs in Europe.”
› VW brand: “55% of US sales fully electric.“
2039:
› BMW: “All new vehicles will be BEV.”
/ Government regulations
/ OEM statements
2025:
› Norway: no new ICE on sale.
› Mallorca: no Diesel car on sale.
› Netherlands, special zones: only electrified trucks and
delivery vehicles allowed.
› Netherlands: in major cities (Amsterdam, Rotterdam,
The Hague, Eindhoven, Tilburg), all taxis and rental
cars newly registered are to be emission-free. Other
areas in the Netherlands have until 2030.
2030:
› USA: ~40% of new vehicle sales to be BEVs.
› Japan: no ICE on the street.
› UK, Denmark, Sweden, Ireland, Netherlands: no ICE on sale.
› International Energy Agency: no new ICE car sales recommended. 60%
of global car sales to be BEV or H2.
2035:
› EU: all new cars zero-emission.
› China: public transport vehicles to be fully electrified.
› Canada: no new ICE on sales.
› California, Massachusetts, New Jersey, Thailand: no ICE on the street.
2040: Spain, cities with > 50k
inhabitants: no new ICE on sale.
2050: Spain, cities with > 50k inhabitants: no
ICE on the street.
2025:
› Lamborghini: “All new vehicles will be BEV or PHEV.”
› Mercedes: “The upcoming S class generation will be available as BEV only.
All new vehicle architectures are BEV only (no longer PHEV).
~50% of all new vehicle sales to be BEV or PHEV (vs ~25% so far).”
2030:
› VW brand: “> 70% of all new vehicles to be BEV in Europe.”
› Volvo: “All new vehicles will be BEV.”
› Ford: "All new veh. in Europe will be BEV. 40% of Ford global veh. volume to be BEV.”
› Jaguar: “No new ICEs.”
› BMW: "50% of all new vehicles to be BEV.”
2033:
› Audi: “All new vehicles will be BEV.”
2040:
› Honda: “All new vehicles will
be BEV.”
2023: Spain, cities with > 50k
inhabitants: only zero-emission
vehicles allowed.

37Copyright © Infineon Technologies AG 2022. All rights reserved.2022-05-09
~25%
~75%
The penetration of PHEV + BEV is accelerating; the incremental
content of power semis in xEV is a significant opportunity for Infineon
5
9
13
17
20
24
4
9
15
22
30
36
2020 2022e 2024e 2026e 2028e 2030e
September 2019 estimate
August 2021 estimate
1 Based on or includes content supplied by IHS Markit Automotive: Alternative Propulsion Forecast. September 2019, August 2021.
2 Strategy Analytics: Automotive Semiconductor Demand Forecast 2019 - 2028. July 2021; Infineon. “power” includes voltage regulators, ADCs and ASICs.
3 Due to missing ICE engine in BEV the weighted incremental semiconductor content for PHEV and BEV starts below the “~$490” line.
ICE MHEV FHEV PHEV,BEV
ICE non-power power
3
PHEV + BEV
OBC, DC-DC, BMS,
auxiliaries, analog
inverter
[m units]
PHEV + BEV annual car production1 2021 average xEV semi content2 Incremental power semi by application
~$600
~$490
~$890
~$950

38
Automated Driving

39Copyright © Infineon Technologies AG 2022. All rights reserved.2022-05-09
The car of the future is driving digitalization in many aspects and
Infineon provides the ingredients
software-over-the-air
› remote OS updates
› secure feature upgrades
› NOR flash memory
› security solution
digital instrument cluster
› real-time driver information
› user-specific digital content
› MCU (AURIX™, TRAVEO™ 2, PSoC™)
› NOR flash and RAM memory
› MCU (AURIX™, TRAVEO™ 2, PSoC™)
› pressure and magnetic sensors
› LED driver ICs
› automatic exterior and interior lighting
› passenger-specific automatic settings
comfort / premium
trends examples of benefitting products
infotainment and HMI
› seamless digital entertainment
› always-on, secure connectivity
› intuitive user interface (UI)
› MCU (AURIX™, TRAVEO™ 2, PSoC™)
› Wi-Fi, Bluetooth®, USB Type C
› touch controller with CapSense™
Car of the future
ADAS/AD
› object recognition
› advanced spatial sensing
› MCU (AURIX™, TRAVEO™ 2, PSoC™)
› radar sensor
› NOR flash and RAM memory
40Copyright © Infineon Technologies AG 2022. All rights reserved.2022-05-09
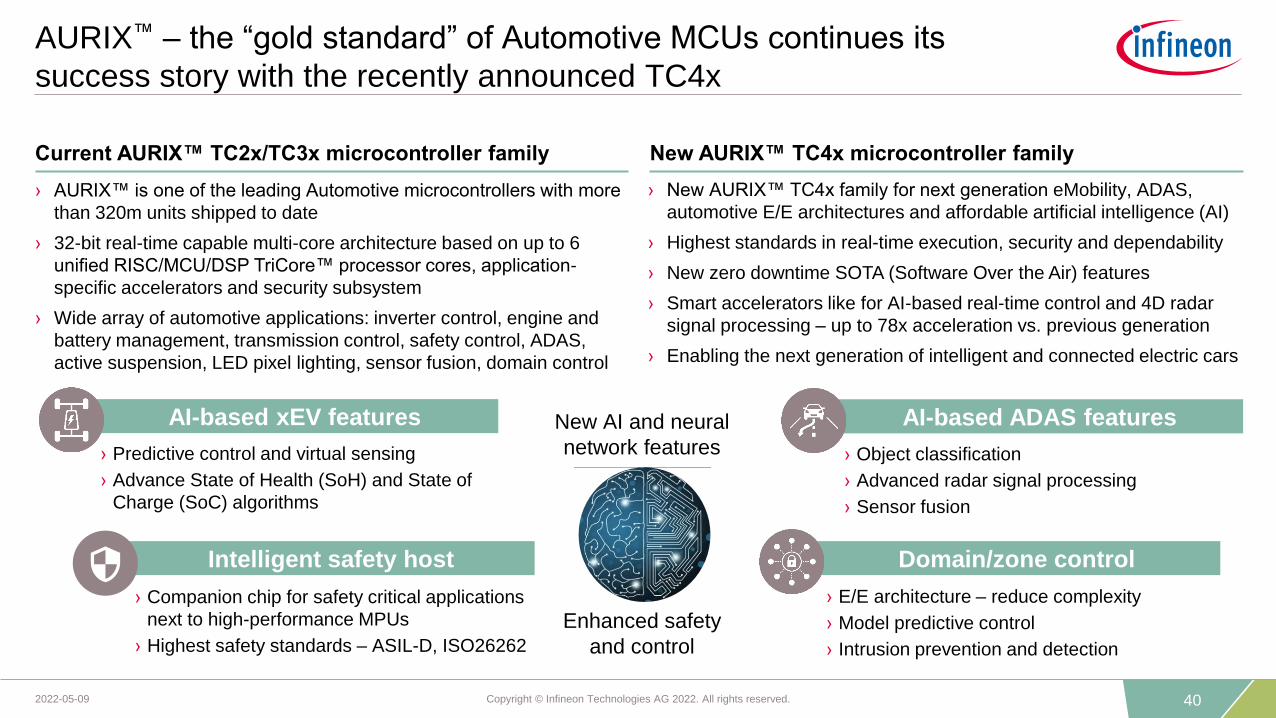
AURIX™ – the “gold standard” of Automotive MCUs continues its
success story with the recently announced TC4x
Current AURIX™ TC2x/TC3x microcontroller family New AURIX™ TC4x microcontroller family
› AURIX™ is one of the leading Automotive microcontrollers with more
than 320m units shipped to date
› 32-bit real-time capable multi-core architecture based on up to 6
unified RISC/MCU/DSP TriCore™ processor cores, application-
specific accelerators and security subsystem
› Wide array of automotive applications: inverter control, engine and
battery management, transmission control, safety control, ADAS,
active suspension, LED pixel lighting, sensor fusion, domain control
› New AURIX™ TC4x family for next generation eMobility, ADAS,
automotive E/E architectures and affordable artificial intelligence (AI)
› Highest standards in real-time execution, security and dependability
› New zero downtime SOTA (Software Over the Air) features
› Smart accelerators like for AI-based real-time control and 4D radar
signal processing – up to 78x acceleration vs. previous generation
› Enabling the next generation of intelligent and connected electric cars
New AI and neural
network features
Domain/zone control
› E/E architecture – reduce complexity
› Model predictive control
› Intrusion prevention and detection
AI-based xEV features
› Predictive control and virtual sensing
› Advance State of Health (SoH) and State of
Charge (SoC) algorithms
› Companion chip for safety critical applications
next to high-performance MPUs
› Highest safety standards – ASIL-D, ISO26262
Enhanced safety
and control
Intelligent safety host
AI-based ADAS features
› Object classification
› Advanced radar signal processing
› Sensor fusion

41Copyright © Infineon Technologies AG 2022. All rights reserved.2022-05-09
~35x AURIX™
in OEM platform
The Infineon AURIX™ MCU family has become the first-choice auto-
motive architecture for high-growth and safety-critical applications
Powertrain
› ICE engine management
› ICE transmission
› xEV motor control
Classical safety
› power steering
› braking
› airbag
ADAS/AD
› camera host control
› sensor fusion host control
› radar signal pre-processing
Domain and zone control
› drive domain
› body & convenience domain
› zone control
Infineon AURIX™ revenue development over time
~7x AURIX™
in powertrain
~7x AURIX™
in classical safety
~10x AURIX™
in ADAS/AD
~11x AURIX™
in domain and
zone control
+ + + =
Example of AURIX™ platform design-win
FY21 FY25e
CAGR: +29%
FY21 FY25e
CAGR: +15%
FY21 FY25e
CAGR: +25%
FY21 FY25e
CAGR: +61%

42
Industrial Power Control

43Copyright © Infineon Technologies AG 2022. All rights reserved.2022-05-09
IPC at a glance
FY21 revenue split by product group (indicative)IPC revenue and Segment Result Margin
CAGR(FY16-FY21): 7.5%[EUR m]
1,0721,206
1,323 1,418 1,4061,542
12%15%
19%18% 18% 18%
-5%
5%
15%
25%
0
200
400
600
800
1.000
1.200
1.400
1.600
1.800
FY16 FY17 FY18 FY19 FY20 FY21
IPC revenue IPC Segment Result Margin
Key customers
discrete IGBTs
driver ICs
IPMs
IGBT modules
SiC

44Copyright © Infineon Technologies AG 2022. All rights reserved.2022-05-09
Market outlook remains positive across most target applications;
growth rates returning to normal long term patterns
~35%
~8%
~26%
~5%
~9%
~17%
Automation
and Drives
Renewable
Energy
Generation
Transportation
Power
Infrastructure
Others
Applications(% of FY21 segment revenue)
› Growth rates remain above long-term averages after strong recovery in CY21; currently no signs of softening
› Long-term positive outlook driven by general trend of electrification in emerging applications (e.g. eMarine)
› Strong growth of xEV driving charging infrastructure; continuous installation of renewable energy generation driving energy
storage systems
› After strong growth surge in CY21, demand is softening but still driven by energy efficiency incentives for major appliances
› Analyst updates wind installations forecast to show 10% growth compared to CY21 (in GW)
› PV installations remain in double-digit growth
› Overall expectations dominated and dampened by still delayed recovery for traction in China
Market Outlook for CY22
45Copyright © Infineon Technologies AG 2022. All rights reserved.2022-05-09
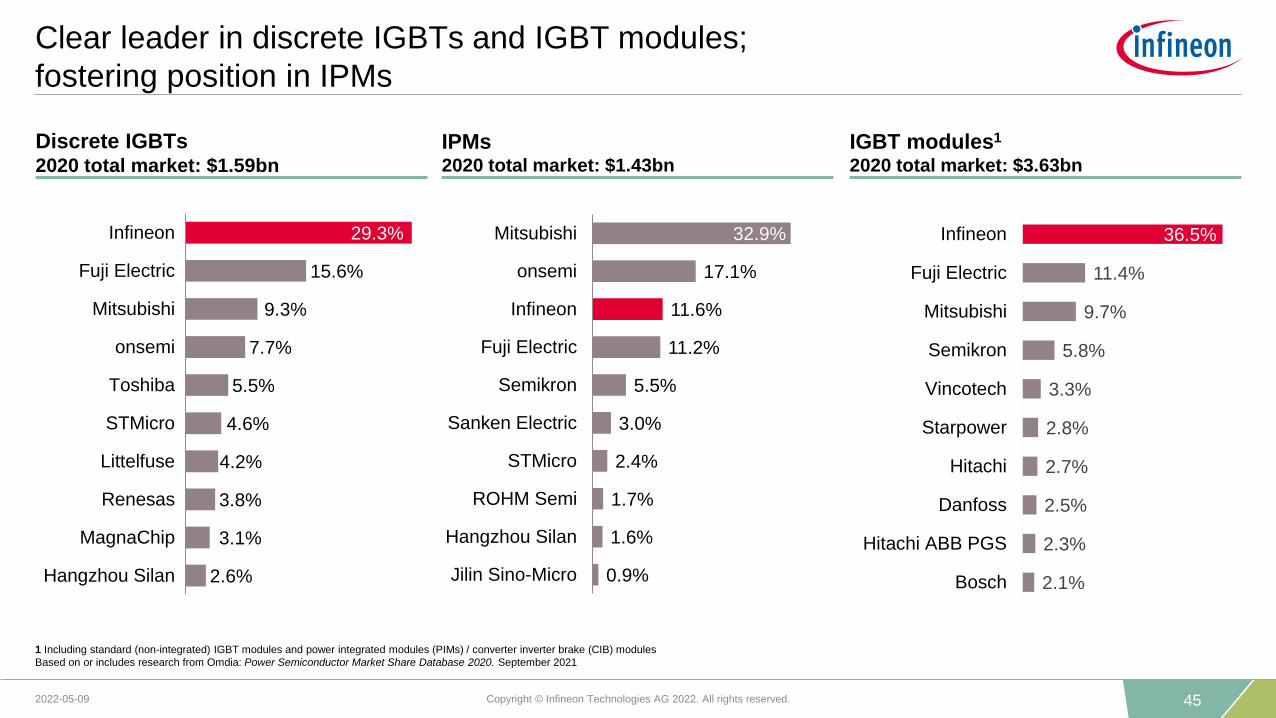
Clear leader in discrete IGBTs and IGBT modules;
fostering position in IPMs
Discrete IGBTs2020 total market: $1.59bn
0.9%
1.6%
1.7%
2.4%
3.0%
5.5%
11.2%
11.6%
17.1%
32.9%
Jilin Sino-Micro
Hangzhou Silan
ROHM Semi
STMicro
Sanken Electric
Semikron
Fuji Electric
Infineon
onsemi
Mitsubishi
2.6%
3.1%
3.8%
4.2%
4.6%
5.5%
7.7%
9.3%
15.6%
29.3%
Hangzhou Silan
MagnaChip
Renesas
Littelfuse
STMicro
Toshiba
onsemi
Mitsubishi
Fuji Electric
Infineon
IGBT modules1
2020 total market: $3.63bn
IPMs2020 total market: $1.43bn
2.1%
2.3%
2.5%
2.7%
2.8%
3.3%
5.8%
9.7%
11.4%
36.5%
Bosch
Hitachi ABB PGS
Danfoss
Hitachi
Starpower
Vincotech
Semikron
Mitsubishi
Fuji Electric
Infineon
1 Including standard (non-integrated) IGBT modules and power integrated modules (PIMs) / converter inverter brake (CIB) modules
Based on or includes research from Omdia: Power Semiconductor Market Share Database 2020. September 2021

46Copyright © Infineon Technologies AG 2022. All rights reserved.2022-05-09
Infineon provides solutions for all links in the energy conversion chain
47Copyright © Infineon Technologies AG 2022. All rights reserved.2022-05-09
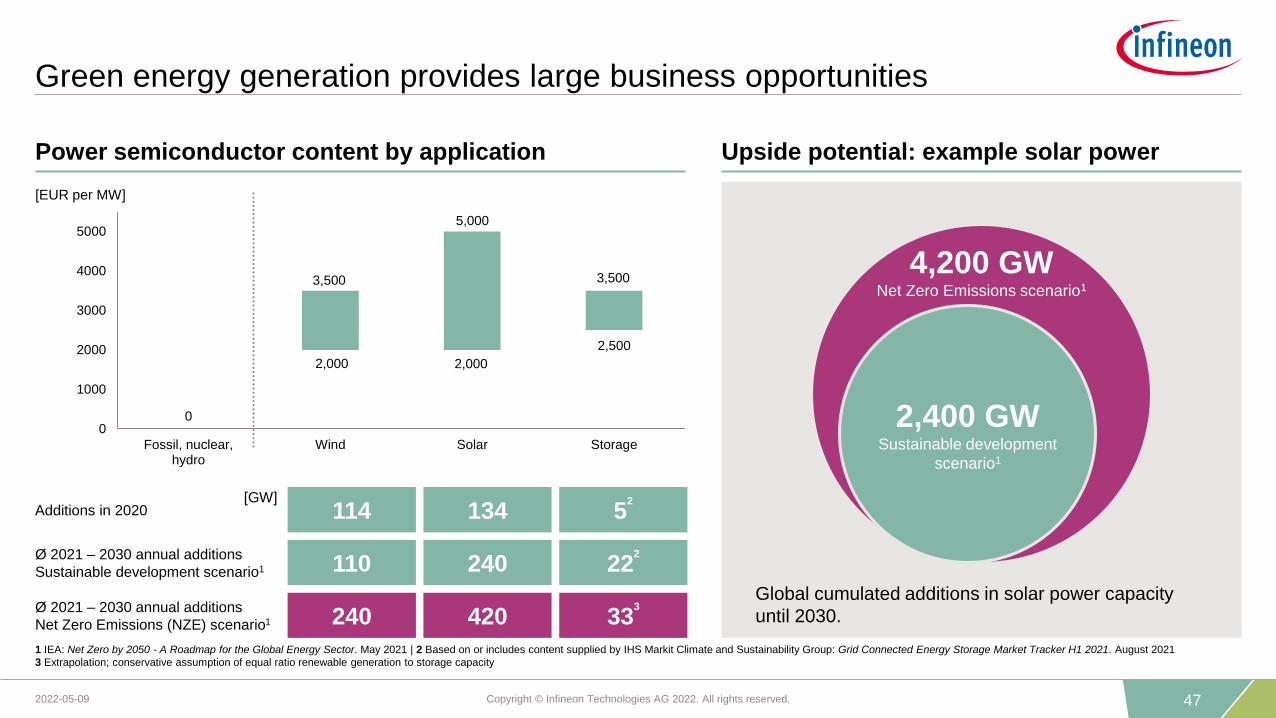
Green energy generation provides large business opportunities
2,000 2,000
2,500
0
3,500
5,000
3,500
0
1000
2000
3000
4000
5000
6000
Fossil, nuclear,hydro
Wind Solar Storage
[EUR per MW]
Additions in 2020 134 52
114
240 222
110
4,200 GWNet Zero Emissions scenario1
2,400 GWSustainable development
scenario1
Global cumulated additions in solar power capacity
until 2030.420 333
240
[GW]
Power semiconductor content by application Upside potential: example solar power
1 IEA: Net Zero by 2050 - A Roadmap for the Global Energy Sector. May 2021 | 2 Based on or includes content supplied by IHS Markit Climate and Sustainability Group: Grid Connected Energy Storage Market Tracker H1 2021. August 2021
3 Extrapolation; conservative assumption of equal ratio renewable generation to storage capacity
Ø 2021 – 2030 annual additions
Sustainable development scenario1
Ø 2021 – 2030 annual additions
Net Zero Emissions (NZE) scenario1

48Copyright © Infineon Technologies AG 2022. All rights reserved.2022-05-09
Increasing share of renewables requires stronger grid
› HVDC – High Voltage Direct Current lines
are the technology of choice to strengthen
the grid
› Converter stations are equipped with power
semiconductors
› Infineon offers highly robust, low-loss 4.5 kV
IGBT solutions
› 6.5 kV IGBT is in development and will
complement offering
4.5 kV IGBT module in IHV-B housingSource: Bundesnetzagentur
Converter stationPlanned grid expansion in
Germany
Infineon‘s 4.5 kV IGBT modules enable
HVDC lines
Source: Siemens Energy

49Copyright © Infineon Technologies AG 2022. All rights reserved.2022-05-09
Infineon will benefit from all CO2 saving measures
More renewables
installations
Further market growth
Wide bandgap
Higher value proposition
Hydrogen production
New markets
0
5.000
10.000
15.000
20.000
25.000
30.000
35.000
2017 2030 2040 2050
CO2 (Gt / year)Total savings to be achieved:
23,000 Gt via
CO2 emissions
„Transforming Energy Scenario“
(Full adoption of the Paris Climate Agreement)
10,000 Gt
Renewable energies
~50%
Energy efficiency
~30%
Fuel switch
~20%
Electricity
generation
11,500 Gt
Industry
6,900 Gt
Transport
8,600 Gt
Electricity
generation
8,200 Gt
Industry
4,900 Gt
Transport
6,200 Gt
District heat
Buildings
Others
Emissions „Transforming scenario“ Savings „Transforming scenario“
Source: IRENA, „Global Renewables Outlook 2020“
50Copyright © Infineon Technologies AG 2022. All rights reserved.2022-05-09
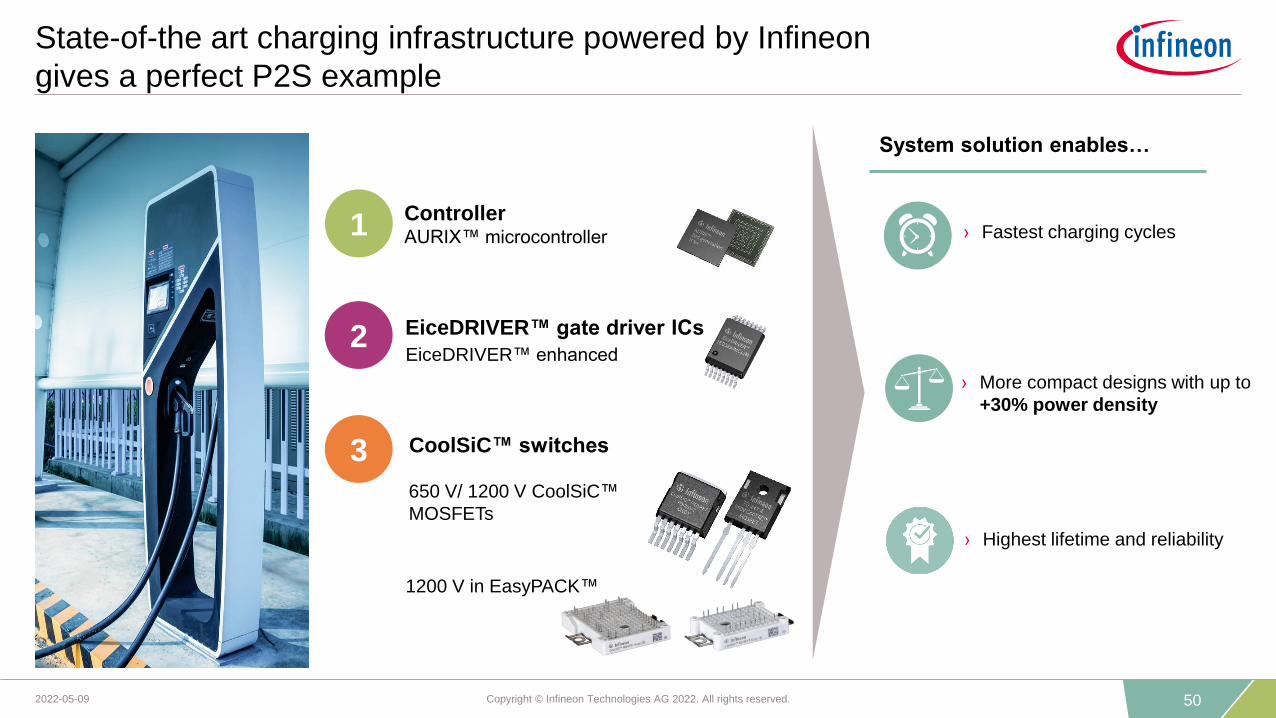
State-of-the art charging infrastructure powered by Infineon
gives a perfect P2S example
› Fastest charging cyclesControllerAURIX™ microcontroller
1200 V in EasyPACK™
CoolSiC™ switches
650 V/ 1200 V CoolSiC™
MOSFETs
EiceDRIVER™ gate driver ICs
EiceDRIVER™ enhanced
1
System solution enables…
› More compact designs with up to
+30% power density
› Highest lifetime and reliability
3
2

51Copyright © Infineon Technologies AG 2022. All rights reserved.2022-05-09
Field test of XHP™ 2 module with SiC MOSFET successfully concluded
› One year in operation transporting
passengers
› 65,000 kilometers
› 10% energy savings
› Reduction of motor noise
Product Application Outcome
XHP™ 2
SiC MOSFET
Stadtwerke München
Voice of Customer
“The project […] shows that we can not only optimize the noise levels of our vehicles but also improve
our energy efficiency. We would be very interested in this solution if these improvements could be
commercially mass-produced.” Ingo Wortmann, Head of Mobility at Stadtwerke München
Avenio Streetcar

52
Power & Sensor Systems

53Copyright © Infineon Technologies AG 2022. All rights reserved.2022-05-09
MOSFETs(incl. SiC, GaN)
power ICs
RF & sensors
other (incl. HiRel)
PSS at a glance
FY21 revenue split by product groupPSS revenue and Segment Result Margin
[EUR m]
2,041 2,148 2,318 2,445 2,560
3,268
17%20%
23% 24% 24% 25%
0%
10%
20%
30%
40%
0
500
1.000
1.500
2.000
2.500
3.000
3.500
FY16 FY17 FY18 FY19 FY20 FY21
PSS revenue PSS Segment Result Margin
Key customers
CAGR(FY16-FY21): 9.9%

54Copyright © Infineon Technologies AG 2022. All rights reserved.2022-05-09
Market outlook remains positive across most target applications but impact of
current macro environment to be further closely monitored
› Demand in renewable energy, EV and EV charging expected to be accelerated; value chain risks increasing and to be watched
› Tailwinds from US, EU and Asia stimuli packages for infrastructure / green energy initiatives support long-term growth
› Still slight positive unit growth is expected for CY22 but reduced due to demand reduction mainly in Europe and intensifying supply
constraints
› 5G cycle will continue to drive telecom equipment spending in CY22
› Consumer confidence declined due to current macro environment, implying headwinds for consumer spending
Applications(% of FY21 segment revenue)1
~20%
~25%
~5%
~17%
~24%
Computing
Communication
Smartphone
Consumer
Market Outlook for CY22
› Structural growth driven by cloud computing and to a lesser extent by enterprise servers
› Notebook PC shipments are expected to move steadily
1 does not sum up to 100% due to other applications not shown here
Industrial

55Copyright © Infineon Technologies AG 2022. All rights reserved.2022-05-09
PSS's growth is built on many applications from different sectors in
power and non-power
› data center
› enterprise server
› PC, notebook
› peripherals
› chargers and
adapters
Computing Communications IndustrialSmartphones Consumer
› power supplies
› EV on-board
charger
› charging
infrastructure
› PV inverter
› power tools
› lighting
› Industry 4.0
› aerospace
› base stations
› backhaul cellular
infrastructure
› 5G massive MIMO
› telecommunication
servers
› smartphones
› mobile devices
› wearables
› USB Type-C,
USB Type-C PD
› eBikes, eScooter
› multicopter
› gaming
› TV sets
› smart home

56
PSS – Power
57Copyright © Infineon Technologies AG 2022. All rights reserved.2022-05-09
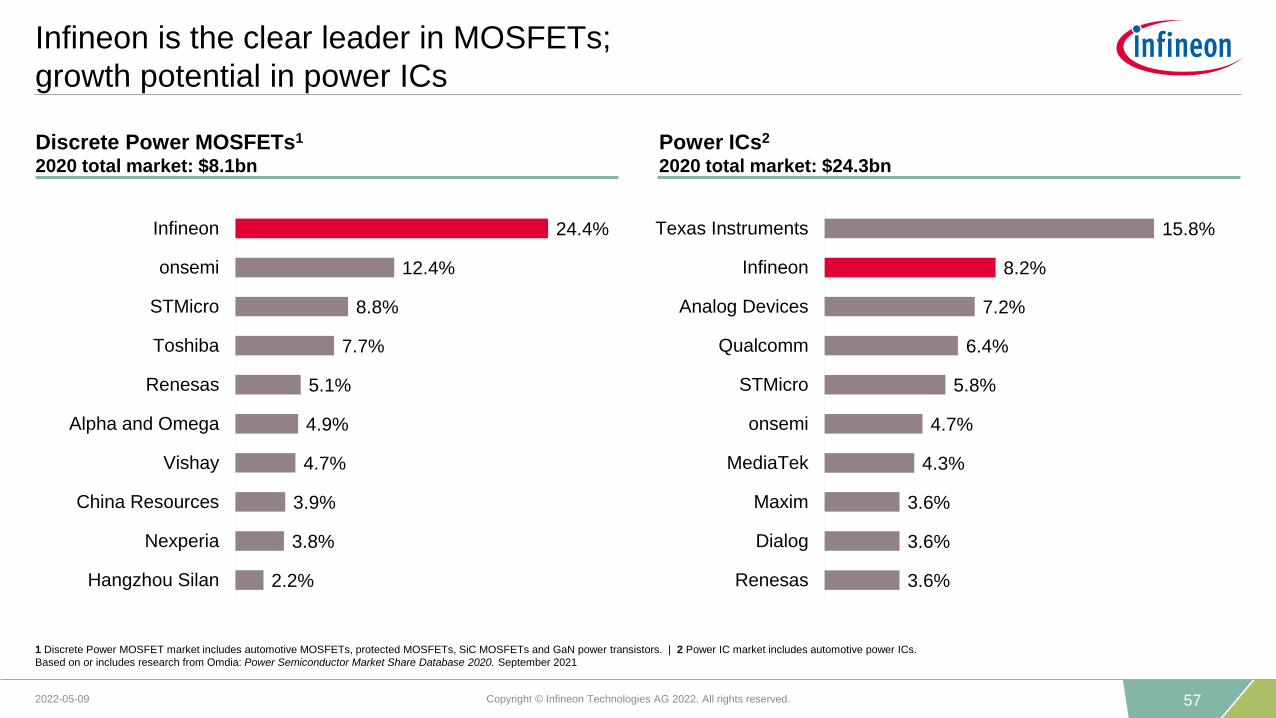
Power ICs2
2020 total market: $24.3bn
Discrete Power MOSFETs1
2020 total market: $8.1bn
Infineon is the clear leader in MOSFETs;
growth potential in power ICs
3.6%
3.6%
3.6%
4.3%
4.7%
5.8%
6.4%
7.2%
8.2%
15.8%
Renesas
Dialog
Maxim
MediaTek
onsemi
STMicro
Qualcomm
Analog Devices
Infineon
Texas Instruments
2.2%
3.8%
3.9%
4.7%
4.9%
5.1%
7.7%
8.8%
12.4%
24.4%
Hangzhou Silan
Nexperia
China Resources
Vishay
Alpha and Omega
Renesas
Toshiba
STMicro
onsemi
Infineon
1 Discrete Power MOSFET market includes automotive MOSFETs, protected MOSFETs, SiC MOSFETs and GaN power transistors. | 2 Power IC market includes automotive power ICs.
Based on or includes research from Omdia: Power Semiconductor Market Share Database 2020. September 2021
58Copyright © Infineon Technologies AG 2022. All rights reserved.2022-05-09
0
5
10
15
20
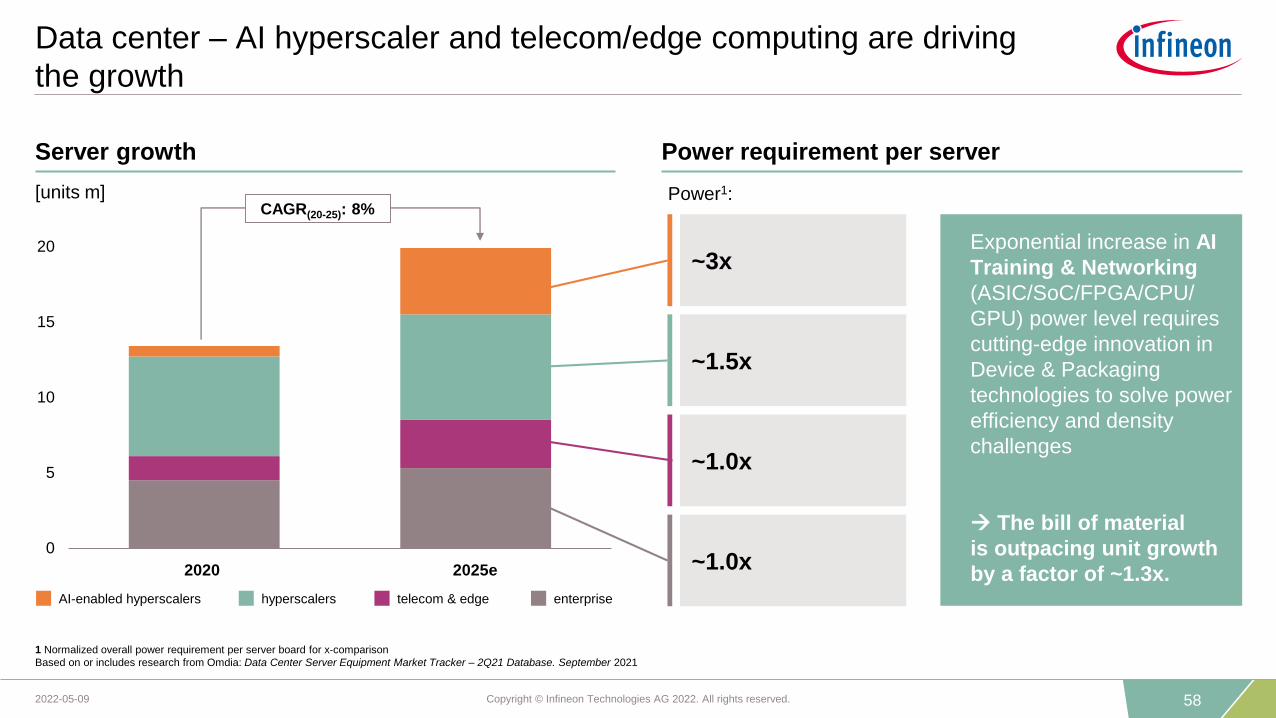
Data center – AI hyperscaler and telecom/edge computing are driving
the growth
1 Normalized overall power requirement per server board for x-comparison
Based on or includes research from Omdia: Data Center Server Equipment Market Tracker – 2Q21 Database. September 2021
CAGR(20-25): 8%
Server growth Power requirement per server
[units m]
2020 2025e
AI-enabled hyperscalers hyperscalers telecom & edge enterprise
~3x
~1.5x
~1.0x
~1.0x
Power1:
Exponential increase in AI
Training & Networking
(ASIC/SoC/FPGA/CPU/
GPU) power level requires
cutting-edge innovation in
Device & Packaging
technologies to solve power
efficiency and density
challenges
→ The bill of material
is outpacing unit growth
by a factor of ~1.3x.

59Copyright © Infineon Technologies AG 2022. All rights reserved.2022-05-09
Transition from 3G/4G to 5G drives demand in power semis for
antennas and power supplies
5G base station
Massive MIMO
DC-DC (MOSFET, ICs)
Fog Computing
AC-DC, DC-DC (MOSFET, ICs)
Base station power supply
AC-DC, DC-DC (MOSFET, ICs)
› driver #1: massive growth of data
and computing power
› driver #2: higher number of base
stations due to dense network
› driver #3: ~4x higher power semi
content per radio board: from ~$25
for MIMO antenna to ~$100 for
massive MIMO antenna array
› driver #4: fog computing data
center as a completely new market

60
PSS – RF and Sensing
61Copyright © Infineon Technologies AG 2022. All rights reserved.2022-05-09
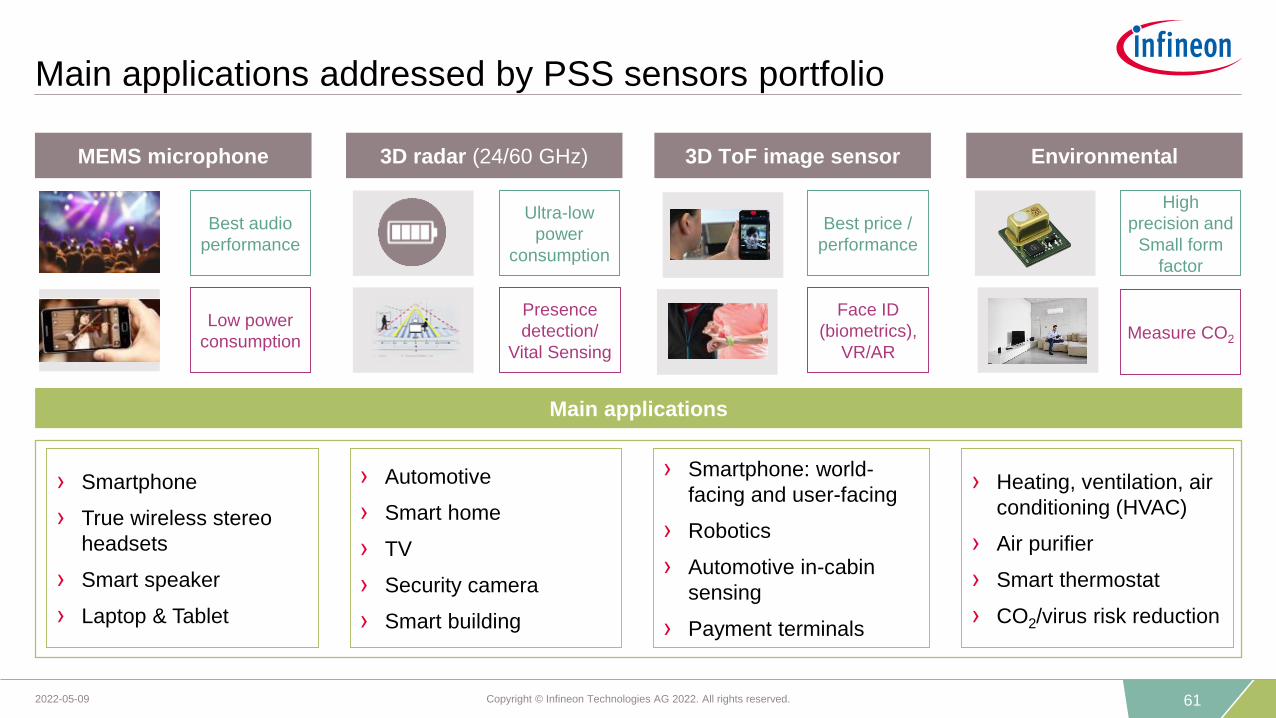
Main applications addressed by PSS sensors portfolio
Best audio
performance
Low power
consumption
MEMS microphone
› Smartphone
› True wireless stereo
headsets
› Smart speaker
› Laptop & Tablet
Main applications
High
precision and
Small form
factor
Measure CO2
Environmental
› Heating, ventilation, air
conditioning (HVAC)
› Air purifier
› Smart thermostat
› CO2/virus risk reduction
Best price /
performance
Face ID
(biometrics),
VR/AR
3D ToF image sensor
Ultra-low
power
consumption
Presence
detection/
Vital Sensing
3D radar (24/60 GHz)
› Automotive
› Smart home
› TV
› Security camera
› Smart building
› Smartphone: world-
facing and user-facing
› Robotics
› Automotive in-cabin
sensing
› Payment terminals

62Copyright © Infineon Technologies AG 2022. All rights reserved.2022-05-09
285361
456559
700
842
2021 2022 2023 2024 2025 2026
132 143237
340
470
600
2021 2022 2023 2024 2025 2026
173296
534
735
895
1048
2021 2022 2023 2024 2025 2026
Environmental sensor market*3D ToF image sensor market
Radar IC market (24 GHz and 60 GHz only)MEMS microphone market
Sensor markets targeted by PSS offer attractive growth potential
[EUR m]
Source: Infineon estimates
Source: Infineon estimates
FY
[EUR m]
FY
Source: Infineon estimates
* Infineon is addressing smart building, smart home, smart appliances, consumer IoT devices and automotive
Source: Infineon estimates
[EUR m]
1074 11501310
1433 1480 1543
2021 2022 2023 2024 2025 2026
[EUR m]
FY
FY

63Copyright © Infineon Technologies AG 2022. All rights reserved.2022-05-09
Unparalleled audio characteristics of our XENSIV™ MEMS micro-
phones made Infineon #1 in 2019 with further m/s gain in 2020
Infineon’s market share development in MEMS microphones (by units)
Based on or includes research from Omdia: MEMS Microphones Dice Market Shares 2021. July 2021
2.6%
3.5%
6.8%
38.3%
44.2%
NJRC
Omron
MEMSensing
Knowles
Infineon
2020 MEMS die market share
total market: 6.0bn units
Technological progression of Infineon XENSIV™ MEMS microphones
SNR = 62 – 65 dB(A)
Single-back plate1 Dual-back plate2
SNR = 65 – 69 dB(A)
Sealed dual-membrane3
SNR = 68 – 75 dB(A)
3.5% 5.2%8.8%
26.5%
34.7% 33.5% 35.7%
44.2%
2006 2008 2010 2012 2014 2016 2018 2020
#1 #1
64Copyright © Infineon Technologies AG 2022. All rights reserved.2022-05-09
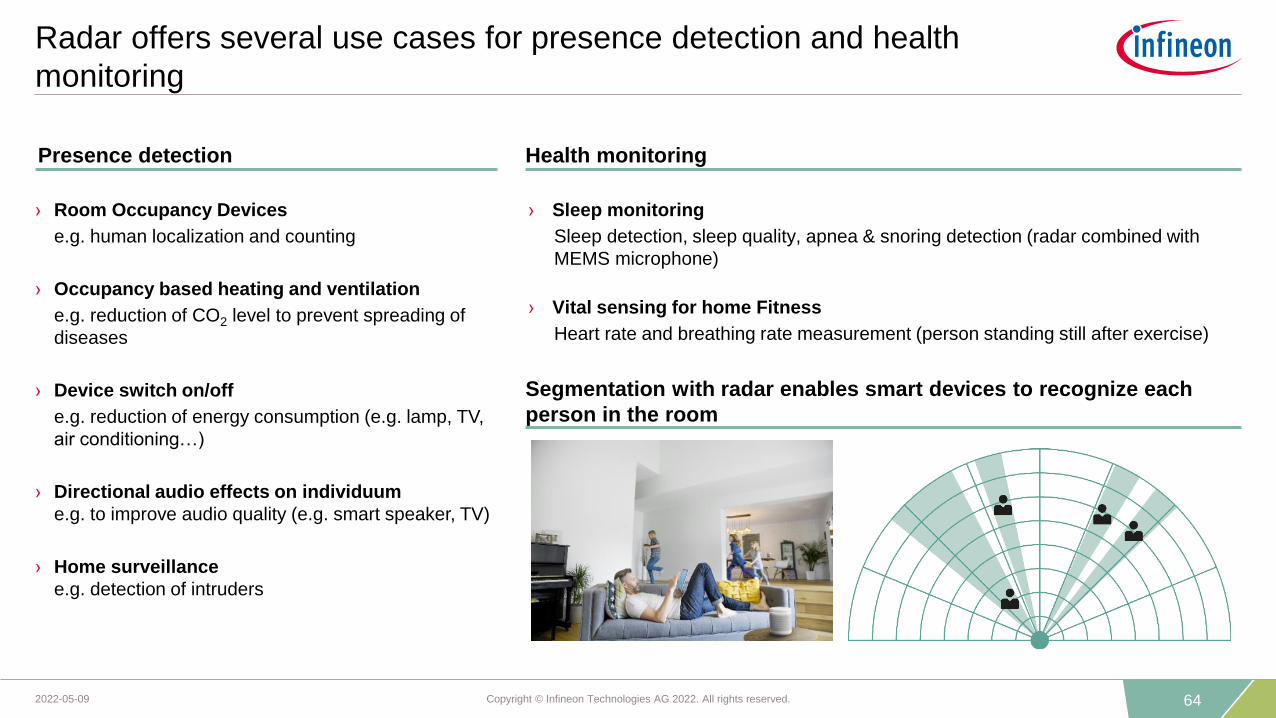
› Sleep monitoring
Sleep detection, sleep quality, apnea & snoring detection (radar combined with
MEMS microphone)
› Vital sensing for home Fitness
Heart rate and breathing rate measurement (person standing still after exercise)
Radar offers several use cases for presence detection and health
monitoring
Health monitoringPresence detection
› Room Occupancy Devices
e.g. human localization and counting
› Occupancy based heating and ventilation
e.g. reduction of CO2 level to prevent spreading of
diseases
› Device switch on/off
e.g. reduction of energy consumption (e.g. lamp, TV,
air conditioning…)
› Directional audio effects on individuum
e.g. to improve audio quality (e.g. smart speaker, TV)
› Home surveillance
e.g. detection of intruders
Segmentation with radar enables smart devices to recognize each
person in the room
65Copyright © Infineon Technologies AG 2022. All rights reserved.2022-05-09
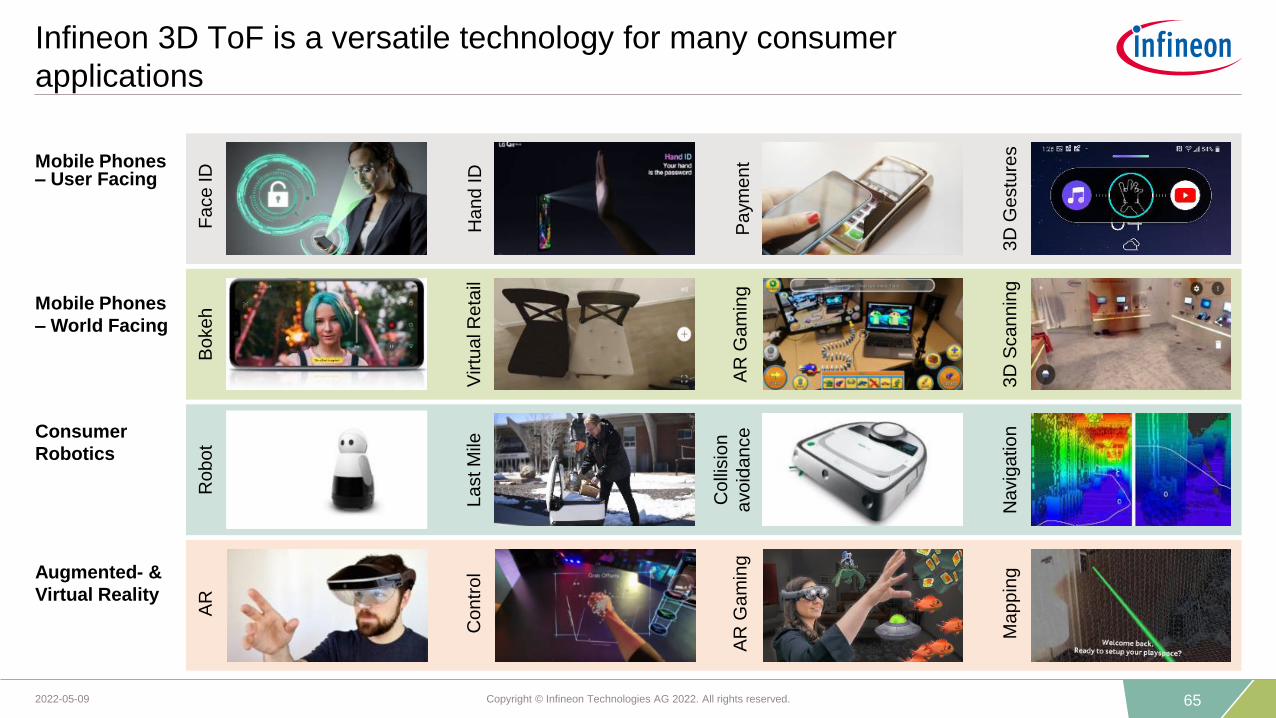
Infineon 3D ToF is a versatile technology for many consumer
applications
Mobile Phones – User Facing
Fa
ce
ID
Ha
nd
ID
Pa
ym
en
t
3D
Ge
stu
res
3D
Sca
nn
ing
AR
Ga
min
g
Bo
ke
h
Virtu
al R
eta
il
Mobile Phones
– World Facing
AR
AR
Ga
min
g
Ma
pp
ing
Co
ntr
olAugmented- &
Virtual Reality
La
st M
ile
Na
vig
atio
n
Co
llisio
n
avo
ida
nce
Ro
bo
t
Consumer
Robotics

66Copyright © Infineon Technologies AG 2022. All rights reserved.2022-05-09
Infineon XENSIV™ PAS CO2 sensor enables highly-precise CO2
measuring in an extremely small size
Photoacoustic spectroscopy (PAS) technology based on Infineon‘s high (SNR) signal-to-noise ratio MEMS microphone
XENSIVTM PAS CO2 leads to demand-oriented and energy efficient control of air conditioning systems
› Infineon XENSIV™ PAS CO2 sensor enables highly-precise, cost-effective and space saving CO2 measuring
› The technology offers an exceptionally small form factor (14 mm x 13.8 mm x 7.5 mm) that is 4x smaller and 3x lighter (2 grams)
than the typical NDIR (non-dispersive infrared) sensor, allowing for more than 75% space savings in customer systems
› The SMD package ensures compatibility with high-volume manufacturing standards, enabling cost-effective, fast assembly and
system integration
› Advanced compensation and configuration algorithms enable a plug-&-play sensor performance and fast design-to-market
XENSIVTM PAS CO2 sensor
measures the CO2 level

67Copyright © Infineon Technologies AG 2022. All rights reserved.2022-05-09
Infineon system solution addresses IoT market via combining
XENSIV™ sensors, PSoC™ 6 MCU and connectivity
› Infineon offers system solutions comprising of
sensor, MCU, connectivity and software libraries
(apps, SDKs)
› BLE functionality monolithically integrated on MCU
› IoT target applications for radar: entrance control or
presence detection for smart home and smart
building
› Radar solutions are anonymous and therefore
respecting privacy
› First orders for presence detection received from
several Asian customers
› Radar solution can perfectly
be combined with Infineon’s
XENSIV™ PAS CO2 sensor
for air quality monitoring
Key facts
Example offering: Combination of sensors, microcontrollers and
connectivity in development kit
› super compact design; smaller system sizes
› determination of person’s direction, speed, distance
› programmable; can flexibly be adapted to the target application
› higher accuracy; more precise measurements of detected objects
Advantages of radar over passive infrared
Main board with MCU +
Wi-Fi + Bluetooth combo
XENSIVTM PAS CO2
Wing Board
XENSIVTM Radar + Pressure
Wing Board

68
Connected Secure Systems

69Copyright © Infineon Technologies AG 2022. All rights reserved.2022-05-09
CSS at a glance
FY21 revenue split by product groupCSS revenue and Segment Result Margin
CAGR(FY16-FY21): 14.7%[EUR m]
703 708 664642
974
1,397
19%18%
16%12% 13% 13%
0%
10%
20%
30%
0
200
400
600
800
1.000
1.200
1.400
FY16 FY17 FY18 FY19 FY20 FY21
CSS revenue CSS Segment Result Margin
Key customers
security ICs
connectivity
MCUs

70Copyright © Infineon Technologies AG 2022. All rights reserved.2022-05-09
Positive outlook for most markets for CY22, while allocation has
varying effects on the segments with the strongest impacts on payment
Applications(% of FY21 segment revenue)
Payment,
ID,
Ticketing
Industrial
and
Consumer
IoT
Payment
Identification
Wearables
Gaming
~67%
~33%
Industrial IoT
› Supply constraints inhibit market growth, despite strong market demand for contactless payment solutions.
› Positive trend expected driven by recovery in passports issuance as well as projects roll-out for other eDocuments.
› Further growth momentum across smart home devices expected.
› Growth in wearables market is assumed to stretch in CY22 driven mainly by smart watches.
› Gaming Consoles shipments expected to show a decrease due to supply constraints.
› Market demand-supply uncertainties continue due to COVID-19 pandemic, silicon foundry limitations and macroeconomic
concerns. Ukraine war causing further disruptions, especially in Europe.
› Growth momentum in industrial segments to continue into CY22.
Market Outlook for CY22 (not considering supply constraints)
Automotive
Smart Home

71Copyright © Infineon Technologies AG 2022. All rights reserved.2022-05-09
Infineon remains top player in security ICs
Security ICs (excl. NFC controllers; excl. NFC eSE)2020 total market: $2.8bn
Security ICs (excl. NFC controllers; excl. NFC eSE)2020 by application
ABI Research: Smart Card and Embedded Security IC Technologies. October 2021
8.5%
12.7%
17.1%
20.4%
24.6%
CEC Huada
STMicro
Samsung
NXP
Infineon
(+0.1-pt)
payment; 37%
mobile communications (incl. std. SIM, SWP SIM);19%
government ID; 14%
authentification; 9%
embedded SIM; 8%
others (incl. ticketing, transportation, access control, others); 13%
72Copyright © Infineon Technologies AG 2022. All rights reserved.2022-05-09
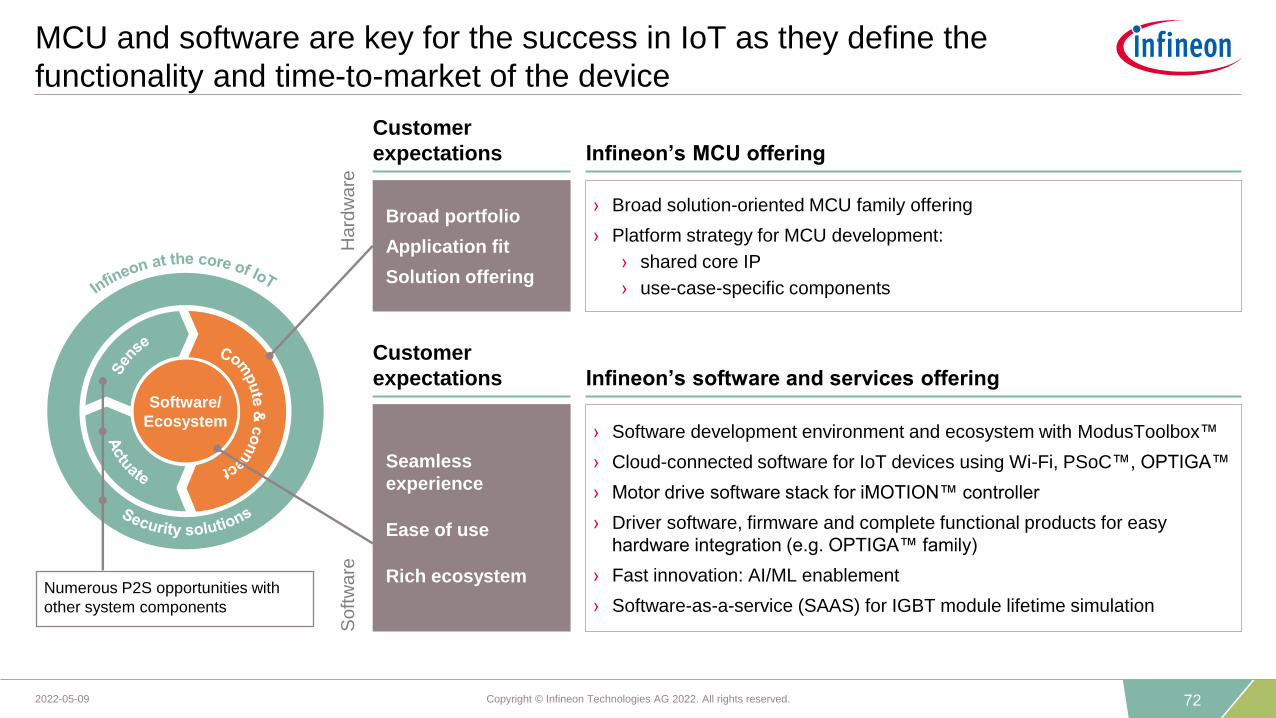
MCU and software are key for the success in IoT as they define the
functionality and time-to-market of the device
Software/
Ecosystem
Numerous P2S opportunities with
other system components
› Software development environment and ecosystem with ModusToolbox™
› Cloud-connected software for IoT devices using Wi-Fi, PSoC™, OPTIGA™
› Motor drive software stack for iMOTION™ controller
› Driver software, firmware and complete functional products for easy
hardware integration (e.g. OPTIGA™ family)
› Fast innovation: AI/ML enablement
› Software-as-a-service (SAAS) for IGBT module lifetime simulation
Seamless
experience
Ease of use
Rich ecosystem
Customer
expectations Infineon’s software and services offering
› Broad solution-oriented MCU family offering
› Platform strategy for MCU development:
› shared core IP
› use-case-specific components
Broad portfolio
Application fit
Solution offering
Customer
expectations Infineon’s MCU offering
Ha
rdw
are
So
ftw
are
73Copyright © Infineon Technologies AG 2022. All rights reserved.2022-05-09
2020 2025e
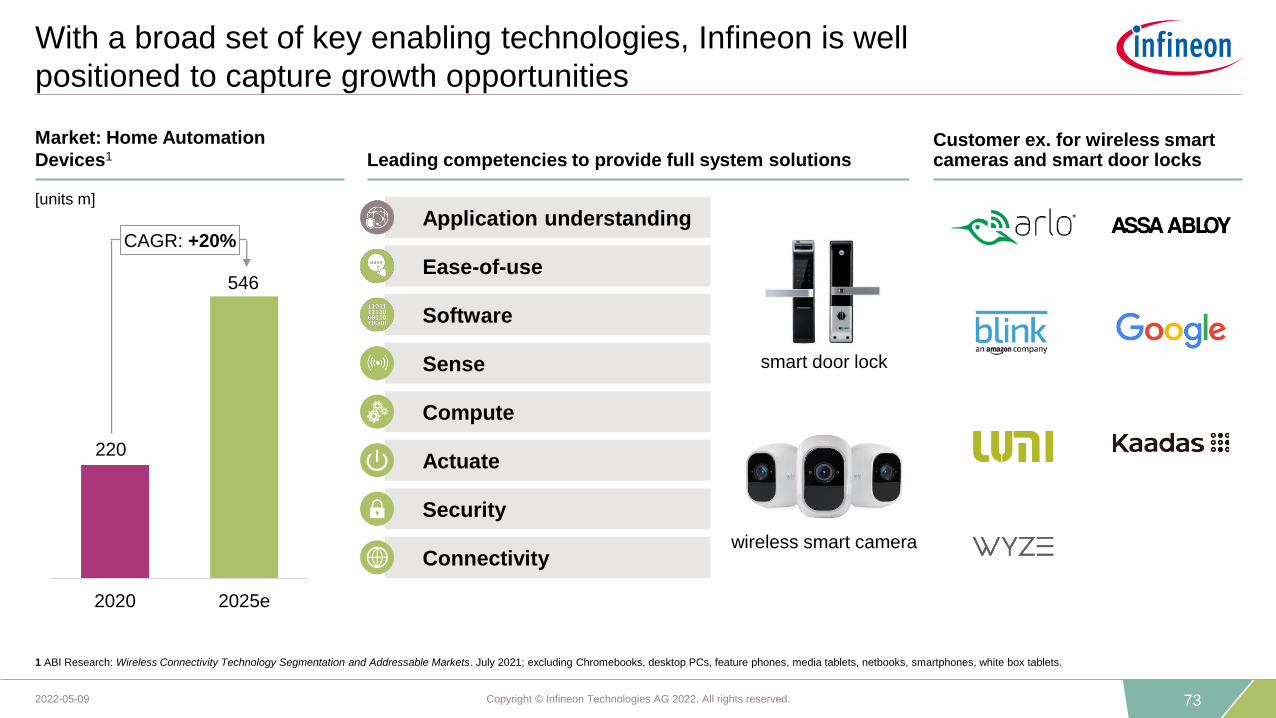
With a broad set of key enabling technologies, Infineon is well
positioned to capture growth opportunities
CAGR: +20%
wireless smart camera
smart door lock
1 ABI Research: Wireless Connectivity Technology Segmentation and Addressable Markets. July 2021; excluding Chromebooks, desktop PCs, feature phones, media tablets, netbooks, smartphones, white box tablets.
Connectivity
Sense
Compute
Actuate
Security
Application understanding
Ease-of-use
Software
Market: Home Automation
Devices1 Leading competencies to provide full system solutionsCustomer ex. for wireless smart cameras and smart door locks
[units m]
220
546

74Copyright © Infineon Technologies AG 2022. All rights reserved.2022-05-09
Infineon acts as one-stop-shop with excellent RF, sensor, connectivity,
power, memory and security solutions
1,365
898
CAGR: +9%
1 ABI Research: Wireless Connectivity Technology Segmentation and Addressable Markets. July 2021; excluding Chromebooks, desktop PCs, feature phones, media tablets, netbooks, smartphones, white box tablets.
Market: Smartwatches, Trackers & Hearables1 Acting as one-stop-shop with comprehensive solutions
Customer examples for smart watches and fitness trackers
[units m]
Connectivity
Sense
Compute
Actuate
Security
Application understanding
Ease-of-use
Software
smartwatch
fitness tracker2020 2025e

75Copyright © Infineon Technologies AG 2022. All rights reserved.2022-05-09
2020 2025e
We are driving the smart home opportunity together with market-
shaping customers
926
1,946
Frame TV
smart vacuum cleaner
CAGR: +16%
Market: Smart home1,2,3Combining our portfolio to create new use caseswith our customers
Customer examples forsmart home
[units m]
Connectivity
Sense
Compute
Actuate
Security
Application understanding
Ease-of-use
Software
1 ABI Research: Wireless Connectivity Technology Segmentation and Addressable Markets. July 2021; excluding Chromebooks, desktop PCs, feature phones, media tablets, netbooks, smartphones, white box tablets.
2 ABI Research: Smart Home Hardware Market. June 2021. | 3 Incl. Smart Appliances, Smart Lighting, Flat Panel TVs, Smart Speakers & Displays, Smoke & Air Quality Sensors, Consumer Robotics, Thermostats and others.

76Copyright © Infineon Technologies AG 2022. All rights reserved.2022-05-09
Connectivity
Wi-Fi / Bluetooth Combo
XENSIV™ Sensor
LED Drivers
Sensing
OPTIGA™
Audio
Capacitive touch
controller
HMI
Class D Audio IC
Significant synergy potential of a combined company product portfolio
Security
Connectivity
Wi-Fi / Bluetooth Combo
MEMS microphone,
radar IC
Sensing
OPTIGA™
Audio
Capacitive touch
controller
HMI
Class D Audio IC
Security
Connectivity
Wi-Fi / Bluetooth Combo
XENSIV™ Sensor
Sensing
OPTIGA™
MCU
XMC
Security
MCU
PSoC™ 6
Synergies application examples
Smart speaker Smart lighting Service robots
CSS offering Other Infineon Divisions offering

77Copyright © Infineon Technologies AG 2022. All rights reserved.2022-05-09
Cloud AI
› Public and private clouds offer scalability
and flexibility
› Growing performance demand
with higher power consumption
(ASIC/SoC/FPGA/CPU/GPU)
Edge AI is a fast developing market enabled by and calling for many of
our core competencies
Infineon:Power supply (AC-DC)
Power conversion (DC-DC)
Smart sensors with AI capabilities
Embedded control including connectivity and edge AI accelerators
Smart power, toolchain/ecosystem, deployment services
Infineon:
Cloud AI
Edge AI
› Smart subsystems offer low latency, improved privacy, higher power efficiency
› Growing solution demand for e.g. image and object recognition, autonomous material
handling, predictive maintenance, and human-machine interface
+ +
sensors neural network tinyAI
connectivity smart power
Edge AI to offer additional growth opportunities as inference workloads move to device level
Edge AI
Edge AI
Edge AI
Edge AI
Edge AI +

78Copyright © Infineon Technologies AG 2022. All rights reserved.2022-05-09
For the Industrial IoT, Edge AI enables predictive maintenance and other
use cases – playing right into our core competences
Maintenance prediction for key assets (avoidance of fixed preventive maintenance cycles)
Predictive maintenance is a significant
lever for productivity
Edge AI enhances Industrial IoT to enable predictive maintenance,
increasing production efficiency and robustness
Advantages
› Reduced downtime through optimized
maintenance
› Lower maintenance costs
› Increase transparency on device usage
Edge AI-enabled
control and field-level
devices
Products and services from Infineon enable safe, secure,
power-efficient, dependable implementation
Smart sensors
Detect and pre-process signals through AI capabilities to
recognize potential abnormal operation of equipment
Smart Actuators
Receive and implement instructions to reduce potential
impacts in production
Edge AI processing and control
Edge AI enabled MCUs to identify at-risk equipment,
repair urgency and control adaptation
Connectivity
Enable dependable communication across devices,
factory levels, cloud and secure device management
Security
Ensure secure communication and protection of critical
information

79Copyright © Infineon Technologies AG 2022. All rights reserved.2022-05-09
AIROC™ portfolio expansion to support Matter with multiprotocol
solutions including BLE and IEEE 802.15.4 low-power SoC
Examples of target applications
Smart Building Residential Lighting Commercial Lighting Access Control Door Locks
› Launching the new AIROC™ Bluetooth® Low Energy (BLE) and IEEE 802.15.4 to support Matter with
multiprotocol solutions
– Built on market-proven wireless IP technology for maximum interoperability
– Superior RF performance enables robust and reliable connectivity
– Low power consumption supports applications requiring long battery life
– Software enablement reduces development time for BLE and Matter over Thread applications
Smart Home
A proprietary, license-free home automation connectivity standard that aims to reduce fragmentation between
different vendors and achieve interoperability between smart home devices and Internet of Things platforms.
Other members include Amazon, Apple, Google, Comcast, the Zigbee Alliance, IKEA, Signify, etc.
Infineon joins Connectivity Standards Alliance – shaping the future of IoT AIROC™ CYW30739
Multi-protocol subsystem features:
› Bluetooth® v5.3 with LE 2-Mbps support
› Fully compliant IEEE 802.15.4 MAC and
PHY layers
› Best-in-class Rx sensitivity of -95.5 dBm
(BLE) and -103.5 dBm (IEEE 802.15.4)
Low power system on chip (SoC) with multi-
protocol connectivity and integrated MCU
80
Selected financial figures

81Copyright © Infineon Technologies AG 2022. All rights reserved.2022-05-09
Strong presence in all regions; well-balanced customer portfolio;
no customer represents more than 10% of total sales
Distribution
partners*EMEA (excl. Germany)
13%
Germany12%
APAC (excl. GC, Japan)
16%
GC (excl. Mainland China, Hong Kong)
9%
Mainland China, Hong Kong
29%
Japan10%
Americas11%
Revenue by sales channelFY21 revenue by region
Top-10 direct customers
other direct customers
Distribution and EMS partners
Top-10 direct customers*
EMS partners*
* in alphabetical order
82Copyright © Infineon Technologies AG 2022. All rights reserved.2022-05-09
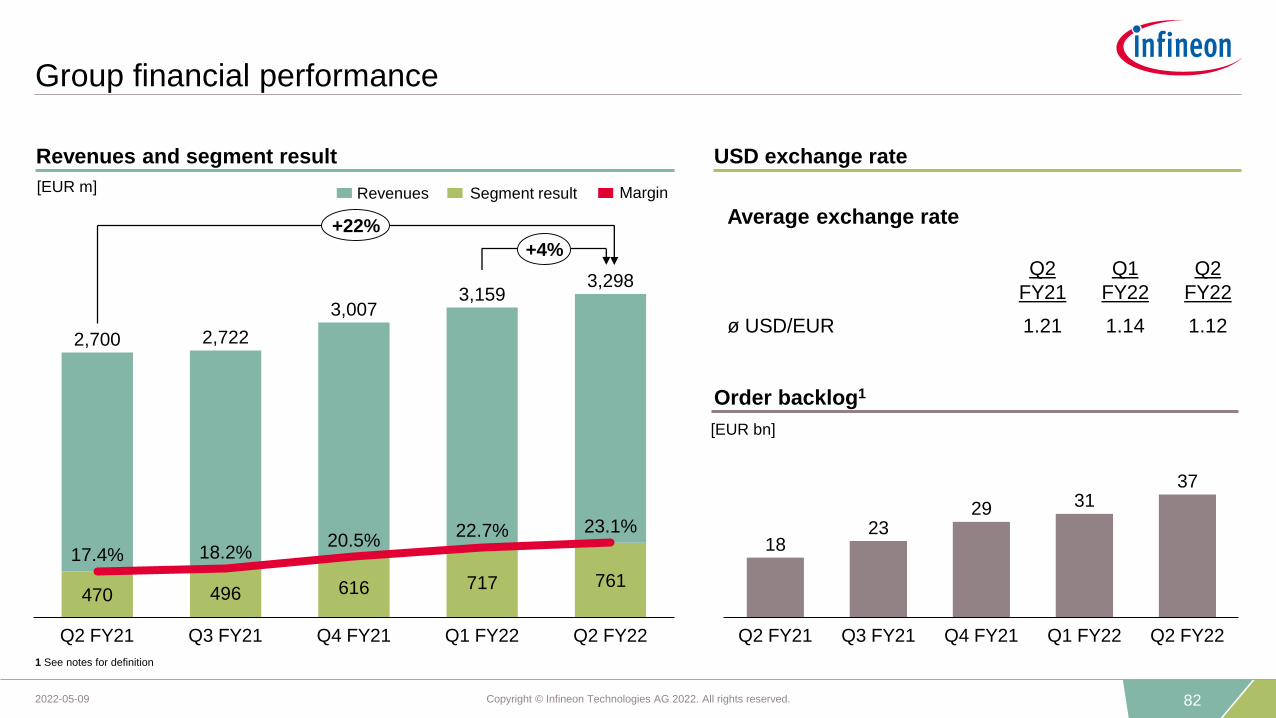
Average exchange rate
Q2
FY21
Q1
FY22
Q2
FY22
ø USD/EUR 1.21 1.14 1.12
Group financial performance
Revenues and segment result USD exchange rate
Order backlog1
MarginSegment resultRevenues[EUR m]
1 See notes for definition
470 496 616 717 761
Q1 FY22Q3 FY21
3,298
Q4 FY21
17.4% 18.2%
Q2 FY21
20.5%22.7% 23.1%
Q2 FY22
2,700 2,722
3,0073,159
+22%
+4%
1823
29 3137
Q4 FY21Q2 FY21 Q3 FY21 Q1 FY22 Q2 FY22
[EUR bn]

83Copyright © Infineon Technologies AG 2022. All rights reserved.2022-05-09
Automotive (ATV)
› Positive development supported by additional capacity availabilities, favorable pricing and a supportive US-Dollar exchange rate
› Macroeconomic and geopolitical developments continue to disrupt automotive production – the supply chain remains fragile
› ADAS and electromobility continue their strong growth trajectory – further SiC design-wins in China achieved
Q3 FY21Q2 FY21 Q2 FY22Q1 FY22Q4 FY21
1,2051,219 1,2671,390
1,491
+22%
+7%
197 199 211
261
324
18.8%16.2%
Q2 FY21
21.7%
16.5% 16.7%
Q3 FY21 Q4 FY21 Q1 FY22 Q2 FY22
Revenues Segment Result
[EUR m] [EUR m]
Margin

84Copyright © Infineon Technologies AG 2022. All rights reserved.2022-05-09
Industrial Power Control (IPC)
› Automation and drives, home appliances and power infrastructure showed particular strength in Q2
› The current business perspective remains positive:
− Decarbonization is a strong structural driver for renewable energies and the related power infrastructure
− Industrial applications benefit strongly from our differentiating SiC offering
361
412 407382
430
Q2 FY21 Q2 FY22Q3 FY21 Q1 FY22Q4 FY21
+19%
+13%
59
8272 73
93
19.9%16.3%
Q2 FY21 Q3 FY21 Q1 FY22Q4 FY21
17.7% 19.1%
Q2 FY22
21.6%
Revenues Segment Result
[EUR m] [EUR m]
MarginRevenues Segment Result
[EUR m] [EUR m]
Margin

85Copyright © Infineon Technologies AG 2022. All rights reserved.2022-05-09
Power & Sensor Systems (PSS)
› Strong demand across key applications – but: delivery capability was hampered by strict Covid containment measures in China
› Server business benefiting from industry-leading portfolio of power management solutions
› Some signs of slowdown in consumer and smartphones
787 757
945 955 925
Q1 FY22Q2 FY21 Q3 FY21 Q4 FY21 Q2 FY22
+18%
-3%
184167
276 285
237
23.4%
Q1 FY22Q4 FY21Q2 FY21
22.1%
Q3 FY21
29.8%29.2%25.6%
Q2 FY22
Revenues Segment Result
[EUR m] [EUR m]
Margin

86Copyright © Infineon Technologies AG 2022. All rights reserved.2022-05-09
Connected Secure Systems (CSS)
› Revenue and segment result improved – in particular microcontrollers for IoT applications as well as payment and identity solutions contributed
› Demand continues to outstrip supply – capacity constraints from foundries will continue to limit revenue potential
› Market momentum remains strong in key areas such like industrial IoT, smart buildings and identity
329 346386
427448
Q2 FY22Q2 FY21 Q1 FY22Q3 FY21 Q4 FY21
+36%
+5%
30
47
60
100108
Q3 FY21 Q1 FY22
9.1%
Q4 FY21
15.5%
Q2 FY21
13.6%
23.4%
Q2 FY22
24.1%
Revenues Segment Result
[EUR m] [EUR m]
Margin

87Copyright © Infineon Technologies AG 2022. All rights reserved.2022-05-09
Gross margin and Opex
Adjusted gross margin
Therein non-segment result charges
[EUR m]
Therein non-segment result charges
[EUR m]
47 5058 6064 6 6
39.3%
57
43.9%
6
41.8% 43.9%
Therein non-segment result charges
[EUR m]
[EUR m] [EUR m] [EUR m]
Gross profit R&D SG&A
7689 74 83
972
Q3
FY21
42.9%
36.0%
Q2
FY21
1,416
39.1%41.2%
Q4
FY21
41.5%
Q1
FY22
Q2
FY22
1,065
1,2381,312
341376 399 399
447
Q4
FY21
13.6%
Q2
FY22
12.6% 13.8%
Q2
FY21
12.6%
Q3
FY21
13.3%
Q1
FY22
328 342373
330369
Q3
FY21
12.1% 12.6%
Q2
FY21
Q1
FY22
Q4
FY21
12.4% 10.4% 11.2%
Q2
FY22
Gross margin as reported
Gross profit as reported R&D expenses
R&D expenses as % of revenue SG&A expenses as % of revenue
SG&A expenses
82
45.4%

88Copyright © Infineon Technologies AG 2022. All rights reserved.2022-05-09
Investments, Depreciation & Amortization and Free Cash Flow
[EUR m] [EUR m] [EUR m]
Investments Depreciation & Amortization Free Cash Flow
332285
596
408
494
Q1
FY22
Q4
FY21
Q3
FY21
Q2
FY22
Q2
FY21
368 380 397 393 405
Q2
FY21
Q3
FY21
Q4
FY21
Q1
FY22
Q2
FY22
407
477
378 378
120
Q2
FY22
Q2
FY21
Q1
FY22
Q3
FY21
Q4
FY21

89Copyright © Infineon Technologies AG 2022. All rights reserved.2022-05-09
Working Capital, in particular trade working capital components
Working capital1 Inventories
Trade receivables Trade payables
[EUR m]
[EUR m]
[EUR m]
[EUR m]
[days]
[days][days]
1 For definition please see page "Notes“
2 Along with the integration of Cypress refund liabilities to customers are presented under “other current liabilities” instead of “trade receivables”. Prior quarters’ figures were adjusted accordingly for better comparability.
945 855711 788
Q2 FY21
1,091
Q3 FY21 Q4 FY21 Q1 FY22 Q2 FY22
101 112 111 113 121
Q4 FY21Q2 FY21 Q1 FY22 Q2 FY22Q3 FY21
1,937 2,053 2,181 2,3192,540
36 33 35 31 34
1,2371,3481,483
Q2 FY21 Q3 FY21 Q4 FY21 Q1 FY22 Q2 FY22
1,4181,609
58 61 61 69 63
1,777
Q2 FY21 Q3 FY21 Q4 FY21 Q2 FY22Q1 FY22
1,273 1,277
1,569 1,682
90Copyright © Infineon Technologies AG 2022. All rights reserved.2022-05-09
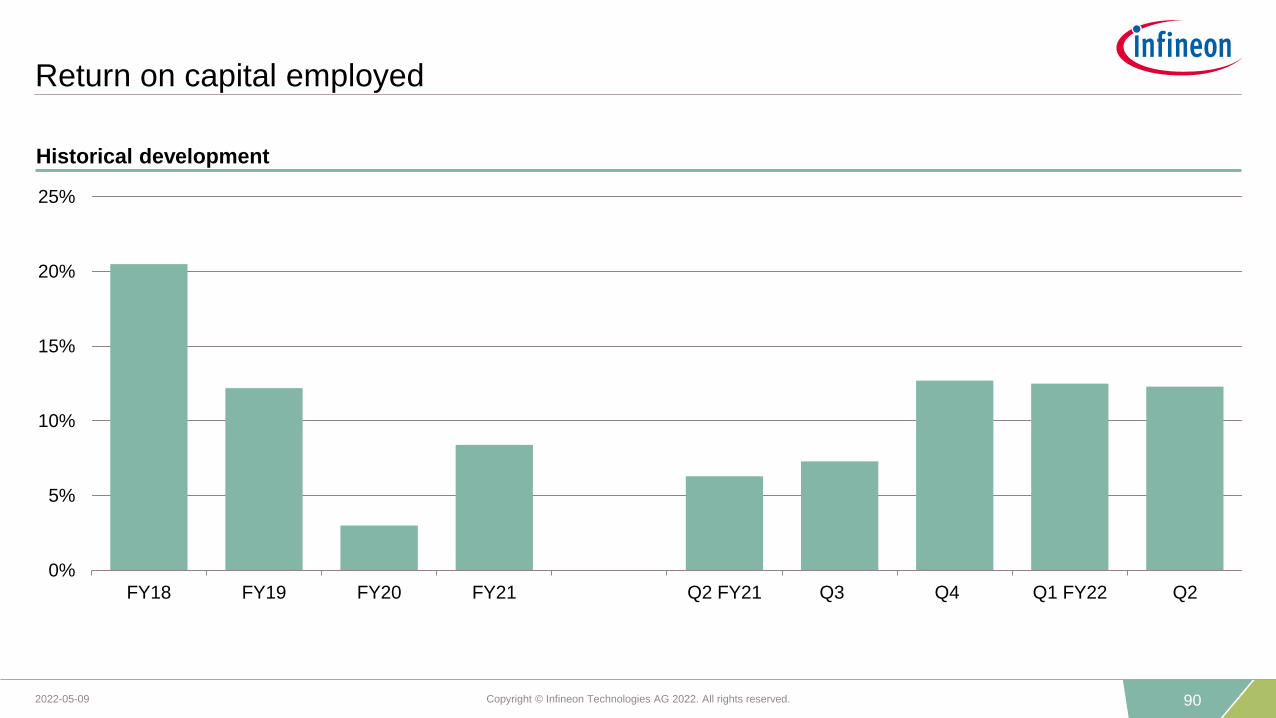
Return on capital employed
0%
5%
10%
15%
20%
25%
FY18 FY19 FY20 FY21 Q2 FY21 Q3 Q4 Q1 FY22 Q2
Historical development

91Copyright © Infineon Technologies AG 2022. All rights reserved.2022-05-09
Earnings-per-share and total cash return
15 18
36 35 3524 27
41 41 44
Q2 FY21 Q3 Q4 Q1 FY22 Q2
EPS basic
EPS adjusted
Total cash return to shareholders
[EUR m]
225248
283 305336
286
351
FY16 FY17 FY18 FY19 FY20 FY21 FY22e
dividends (payout year)
› Dividend for FY21: €0.27 per share
› Dividend payout of €351m for FY21
[EUR cent]
Development of earnings-per-share (EPS) from continuing operations

92Copyright © Infineon Technologies AG 2022. All rights reserved.2022-05-09
3,4
44
-6,8
59
3,8
63
-6,8
08
3,922
-6,585
4,284
-6,657
3,205
-5,881
-3,4
15
-2,9
45
-2,663
-2,373
-2,676Q2
FY21Q3
FY21Q4
FY21Q1
FY22Q2
FY22
Liquidity development
[EUR m]
Historical liquidity development
Gross Cash Net Cash/DebtGross Debt

93Copyright © Infineon Technologies AG 2022. All rights reserved.2022-05-09
Maturity profile
€750
€500
€750
€750€650
2022 2023 2024 2025 2026 2027 2028 2029 2030 2031 2032 2033
$350$235
[EUR m; US$ m; nominal values]
€600
Term loans (Jun 2024)
Corporate bonds under the EMTN program
(Jun 2023, Feb 2025,Jun 2026, Jun 2029,
Jun 2032)
$555
$350 $350
$350
$350$250
US PP 2016 Notes (Apr 2024, Apr 2026, Apr
2028)
Hybrid bonds1 (Jan 2025, Jan 2028)
US PP 2021 Notes (Jun 2027, Jun 2029,
Jun 2031, Jun 2033)
Maturity profile from 2022 to 2033
Graph excludes additional debt with maturities between 2022 and 2023 totaling €4.5m.
1) On 1 Oct 2019, Infineon issued a perpetual hybrid bond with two tranches: €600m with first call date in 2025 and €600m with first call date in 2028; both are accounted as equity under IFRS.
$600

94Copyright © Infineon Technologies AG 2022. All rights reserved.2022-05-09
Conservative financial policy and strict commitment to investment-
grade rating are the basis for through-cycle flexibility
1 Gross cash position is defined as cash and cash equivalents plus financial investments | 2 Gross debt is defined as short-term debt and current maturities of long-term debt plus long-term debt. EBITDA is calculated as the total of earnings from
continued operations before interest and taxes plus scheduled depreciation and amortization
Financial Policy Targets
Gross Cash1
Status Quo (LTM 31 March 2022)
Gross Debt2
€1bn + at least 10% of revenues → €2.2bn €1bn + 18% of revenues → €3.2bn
≤ 2.0x EBITDA 1.6x EBITDA
Comfortable liquidity
position
Balanced debt position
› Flexibility for financing operating activities and investments through the cycle
› Cushion for net pension liabilities and contingent liabilities
› Gross debt target temporarily exceeded for CY acquisition, but still compatible to investment-grade rating
› Public commitment to return to target level of ≤ 2.0x – achieved FY22 Q1, one year ahead of schedule, further
deleveraging steps taken
Rating Investment grade BBB stable outlook (by S&P Global)

95

96Copyright © Infineon Technologies AG 2022. All rights reserved.2022-05-09
Disclaimer
Disclaimer
This presentation contains forward-looking statements and/or assessments about the business, financial condition performance and strategy of the Infineon Group.
These statements and/or assessments are based on assumptions and management expectation resting upon currently available information and present estimates. They are subject to a
multitude of uncertainties and risks, many of which are partially or entirely beyond Infineon’s control. Infineon’s actual business development, financial condition, performance and strategy may
therefore differ materially from what is discussed in this presentation.
Beyond disclosure requirements stipulated by law, Infineon does not undertake any obligation to update forward-looking statements.
Specific disclaimer for Omdia – part of Informa Tech – reports, data and information referenced in this document:
The Omdia reports, data and information referenced herein (the “Omdia Materials – mostly former IHS Markit Technology Materials") are the copyrighted property of Informa Tech Research Ltd.
and its subsidiaries or affiliates (together "Informa Tech") and represent data, research, opinions or viewpoints published by Informa Tech, and are not representations of fact. The Omdia
Materials speak as of the original publication date thereof and not as of the date of this document. The information and opinions expressed in the Omdia Materials are subject to change without
notice and neither Informa Tech nor, as a consequence, Infineon have any duty or responsibility to update the Omdia Materials or this publication as a result. Omdia Materials are delivered on
an "as-is" and "as-available" basis. No representation or warranty, express or implied, is made as to the fairness, accuracy, completeness or correctness of the information, opinions and
conclusions contained in the Omdia Materials. To the maximum extent permitted by law, Informa Tech and its affiliates, IHS Markit and its Affiliates and their respective, officers, directors,
employees and agents, disclaim any liability (including, without limitation, any liability arising from fault or negligence) as to the accuracy or completeness or use of the Omdia Materials. Informa
Tech and/or IHS Markit will not, under any circumstance whatsoever, be liable for any trading, investment, commercial or other decisions based on or made in reliance of the Omdia Materials.
The "IHS Markit" brand and logo have been licensed for use by Informa Tech. The "IHS Markit" brand and logo and any third-party trademarks used in the IHS Markit Technology Materials are
the sole property of IHS Markit Group or their respective third-party owners.
Specific disclaimer for IHS Markit – reports, data and information referenced in this document:
The IHS Markit reports, data and information referenced herein (the "IHS Markit Materials") are the copyrighted property of IHS Markit Ltd. and its subsidiaries ("IHS Markit") and represent data,
research, opinions or viewpoints published by IHS Markit, and are not representations of fact. The IHS Markit Materials speak as of the original publication date thereof and not as of the date of
this document. The information and opinions expressed in the IHS Markit Materials are subject to change without notice and neither IHS Markit nor, as a consequence, Infineon have any duty or
responsibility to update the IHS Markit Materials or this publication. Moreover, while the IHS Markit Materials reproduced herein are from sources considered reliable, the accuracy and
completeness thereof are not warranted, nor are the opinions and analyses which are based upon it. IHS Markit and the trademarks used in the Data, if any, are trademarks of IHS Markit. Other
trademarks appearing in the IHS Markit Materials are the property of IHS Markit or their respective owners.

97Copyright © Infineon Technologies AG 2022. All rights reserved.2022-05-09
GlossaryAC alternating current
AD automated driving
ADAS advanced driver assistance system
AI artificial intelligence
AR augmented reality
ASIC application-specific integrated circuit
ASIL-D automotive safety integrity level D
BEV battery electric vehicle
BLE bluetooth low energy
BMS battery management system
CMOS complementary metal-oxide-semiconductor
CPU central processing unit
DC direct current
DSP digital signal processor
E/E electrical/electronic architecture
eSIM embedded subscriber identity module
EV electric vehicle
FHEV full hybrid electric vehicle
FPGA field programmable gate array
GaN gallium nitride
GPU graphics processing unit
HMI human machine interaction
HVAC heating, ventilation, air conditioning
IC integrated circuit
ICE internal combustion engine
IGBT insulated gate bipolar transistor
IoT internet of things
IPM intelligent power module
LED light-emitting diode
Mbps megabit per second
MCU microcontroller unit
MEMS micro electro-mechanical systems
MHEV mild hybrid electric vehicle
MIMO multiple input, multiple output
MOSFET metal-oxide silicon field-effect transistor
MPU microprocessor unit
OBC on-board charger
OEM original equipment manufacturer
P2S Infineon‘s strategic product-to-system approach
PAS photo-acoustic spectroscopy
PD power delivery
PHEV plug-in hybrid electric vehicle
PSoC programmable system-on-chip
PV photovoltaic
RAM random-access memory
RF radio frequency
RISC reduced instruction set computer
SDK software development kit
Si silicon
SiC silicon carbide
SMD surface mounted device
SNR signal-to-noise ratio
SoC system-on-chip
SOTA software over-the-air
SWP single wire protocol
ToF time-of-flight
USB universal serial bus
VR virtual reality
WBG wide band gap, specifically referring to SiC and GaN based devices
xEV all degrees of vehicle electrification (EV, HEV, PHEV)

98Copyright © Infineon Technologies AG 2022. All rights reserved.2022-05-09
Notes and ESG footnotes
Investments = 'Purchase of property, plant and equipment' + 'Purchase of intangible assets and other assets' incl. capitalization of R&D expenses
Capital Employed = 'Total assets' – 'Cash and cash equivalents' – 'Financial investments' – 'Assets classified as held for sale
– ('Total Current liabilities' – 'Short-term debt and current maturities of long-term debt' – 'Liabilities classified as held for sale')
RoCE = Operating profit from continuing operations after tax / Capital Employed
= (‘Operating profit' – ‘Financial result excluding interest result' – 'Share of profit (loss) of associates and joint ventures accounted for using the equity method'-'Income tax') / Capital
Employed
Working Capital = ('Total current assets' – 'Cash and cash equivalents' – 'Financial investment' – 'Assets classified as held for sale’)
– ('Total current liabilities' – 'Short term debt and current maturities of long-term debt' – 'Liabilities classified as held for sale')
DIO (days inventory outstanding; quarter-to-date) = ('Net Inventories' / 'Cost of goods sold') x 90
DPO (days payables outstanding; quarter-to-date) = ('Trade payables' / ['Cost of goods sold' + 'Purchase of property, plant and equipment']) x 90
DSO (days sales outstanding; quarter-to-date) = ('Trade receivables’ - ‘reimbursement obligations’)* / 'revenue' x 90
*without debtors with credit balances
Order backlog = The total amount of orders received regardless of their current status
ESG footnotes:
1) This figure takes into account manufacturing, transportation, own vehicles, travel, raw materials and consumables, chemicals, water/waste water, direct emissions, energy consumption, waste, etc. as well as direct and indirect energy-related
emissions by manufacturing service providers. It is based on data collected internally and publicly available conversion factors and relates to the 2021 fiscal year.
2) This figure is based on internally established criteria, which are described in the explanatory notes. The figure relates to the 2020 calendar year and takes into account the following application areas: automotive, LED, induction cookers, servers,
renewable energy (wind, photovoltaic) and cell phone chargers as well as drives. CO2 savings are calculated based on the potential savings generated by technologies in which semiconductors are used. The CO2 savings are allocated based on
Infineon's market share, semiconductor share, and the lifetime of the technologies concerned, based on internal and external experts' estimations. Despite the fact that carbon footprint calculations are subject to imprecision due to the complex
issues involved, the results are nevertheless clear.

99Copyright © Infineon Technologies AG 2022. All rights reserved.2022-05-09
For further reading
CMD 2021
5 October 2021
https://www.infineon.com/2021cmd
IPC Business Update Call
Dr. Peter Wawer
6 May 2021
https://www.infineon.com/2021ipccall
PSS Business Update Call
Andreas Urschitz
1 July 2021
https://www.infineon.com/2021psscall
CSS Business Update Call
Thomas Rosteck
3 March 2021
https://www.infineon.com/2021csscall
ATV Business Update Call
Peter Schiefer
5 October 2020
https://www.infineon.com/2020atvcall
Annual Report 2021https://www.infineon.com/2021annualreport
Sustainability Report 2021https://www.infineon.com/2021sustainabilityreport
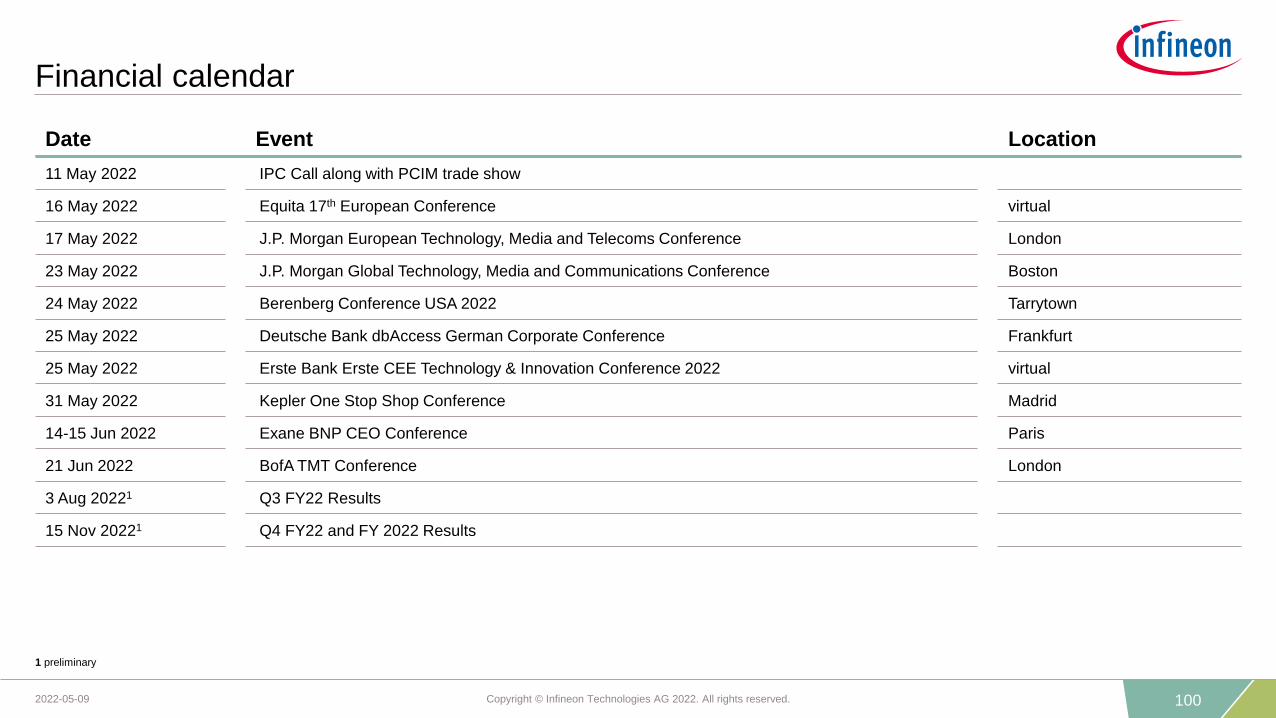
100Copyright © Infineon Technologies AG 2022. All rights reserved.2022-05-09
Financial calendar
Date Event Location
11 May 2022 IPC Call along with PCIM trade show
16 May 2022 Equita 17th European Conference virtual
17 May 2022 J.P. Morgan European Technology, Media and Telecoms Conference London
23 May 2022 J.P. Morgan Global Technology, Media and Communications Conference Boston
24 May 2022 Berenberg Conference USA 2022 Tarrytown
25 May 2022 Deutsche Bank dbAccess German Corporate Conference Frankfurt
25 May 2022 Erste Bank Erste CEE Technology & Innovation Conference 2022 virtual
31 May 2022 Kepler One Stop Shop Conference Madrid
14-15 Jun 2022 Exane BNP CEO Conference Paris
21 Jun 2022 BofA TMT Conference London
3 Aug 20221 Q3 FY22 Results
15 Nov 20221 Q4 FY22 and FY 2022 Results
1 preliminary
101Copyright © Infineon Technologies AG 2022. All rights reserved.2022-05-09
Institutional Investor Relations contacts
Alexander Foltin
Executive Vice President
Finance, Treasury & Investor Relations
+49 89 234-23766
Daniel Györy
Senior Director Investor Relations
+49 89 234-35078
Holger Schmidt
Director Investor Relations
+49 89 234-22332
Alexander Groschke
Director Investor Relations
+49 89 234-38348
Isabell Diel
Manager Investor Relations
+49 89 234-38297
Visitor address
Am Campeon 1 – 15
885579 Neubiberg
Germany