Seat comfort issues in Economy Class and their effect on long ...
122
Seat comfort issues in Economy Class and their effect on long-haul passenger satisfaction and future re-flying intentions Mona Al-Murrakshi A thesis submitted to Auckland University of Technology (AUT) in partial fulfilment of the requirements for the degree of Master of Business Faculty of Business, Economics and Law Department of Marketing Auckland, New Zealand 2021
-
Upload
khangminh22 -
Category
Documents
-
view
1 -
download
0
Transcript of Seat comfort issues in Economy Class and their effect on long ...
Seat comfort issues in Economy Class and their effect on
long-haul passenger satisfaction and future re-flying intentions
Mona Al-Murrakshi
A thesis submitted to Auckland University of Technology (AUT) in partial
fulfilment of the requirements for the degree of Master of Business
Faculty of Business, Economics and Law
Department of Marketing
Auckland, New Zealand
2021
ATTESTATION OF AUTHORSHIP
“I hereby declare that this submission is my own work and that, to the best of my
knowledge and belief, it contains no material previously published or written by another person
(except where explicitly defined in the acknowledgements), nor material which to a substantial
extent has been submitted for the award of any other degree or diploma of a university or other
institution of higher learning”
Mona Abdulrazaq Al-Murrakshi
December / 2021

ETHICS APPROVAL
Ethics Application No. 19/135 was approved by the Auckland University of Technology Ethics Committee (AUTEC) on the 2nd of May 2019.

Acknowledgements
I submit my sincere love and gratitude to Almighty God (Allah) for giving me strength,
patience and his divine support in all life aspects and especially in accomplishing this academic
research.
Greatest appreciation and thanks to my respected supervisor, Associate Professor. Kenneth
Hyde, who is a sincerely supportive person and who gave his generous time during my work
with him on my research.
Again, deep thanks for his patience with me in all the challenges I encountered in my study
journey; this research could not have been completed without his guidance and expertise.
Wholehearted gratitude is also owed to my soul friend and life partner Ahmad who has
supported me throughout my study journey and my life in New Zealand, It is impossible to
underestimate all his efforts given or his ongoing support.
Special thanks with no limits for my mother Hayam for her enduring love, prayers and ongoing
emotional support, and her tolerance for my absence since 2014. Also for her confidence that I
would achieve my Master’s degree.
My sincere prayers and love to the late king of Saudi Arabia, Abdullah bin Abdul-Aziz for his
generosity and kindness in giving us the opportunity to be a part of his external study missions
programme.
Finally, my appreciation to participants and readers for this research and to all those who co-
operated with me in this regard.
Abstract
Background. Seating is one of the major factors that can affect airline passengers’
comfort or discomfort in-flight and their behavioural re-purchase intentions. There has been a
rise in dis/comfort issues in economy class and related health problems – especially for long-
haul passengers, including individuals of tall stature and large size who may suffer most from
the shrinkage in space in aircraft economy cabins. There is a scarcity of research on the
relationship of the anthropometric measurement of airline passengers (e.g., Body Mass Index
(BMI) and seat dis/comfort, and passenger satisfaction and future flying intentions with the same
airline for long-haul flights.
Purpose. The purpose of this study is to examine elements of aircraft seat comfort and
discomfort that affect long-distance air travellers through an understanding of their experiences
in economy class and the impact of these experiences on their intentions of flying again with the
same airline. In addition, the research seeks to focus on the segment of the airline market that
has so far been ignored (that is, passengers of size), looking at their experience in-flight with
seat comfort and the impact of this on their future flying intentions.
Method. A quantitative method has been conducted with participants from the USA (N=
168), who completed an online survey assessing past experiences of seat comfort and discomfort
during a long-haul flight in the economy cabin, together with their pre-existing expectations,
their satisfaction with the flight and behavioural intentions to re-fly with the same airline.
Result. The overall result of the study shows that the seat dis/comfort experience is
predictive of passenger satisfaction; this effect is partially mediated by fulfilment of
expectations. Furthermore, fulfilment of expectations is more predictive of re-flying intentions
than is satisfaction. BMI and ethnicity functioned as moderators to the mediating effect of
fulfilment of expectation on the relationship between the seat dis/comfort experience and
passenger satisfaction. This moderation effect was greatest for passengers of higher BMI. Length
of flight, purpose of flight, gender and age did not play a moderating role. Regarding features of
the economy class seat, there were lower levels of satisfaction with the seat recline, footrest and
legroom amongst long-haul passengers.
Conclusion. The outcomes of this study can assist researchers, airline managers and
marketers when taking steps to enhance the in-flight experience for economy class travellers on
long-haul air trips, especially for customers of size.
Key words:
Aircraft seat, economy class, long-haul flight, comfort experience, behaviour intention, BMI.
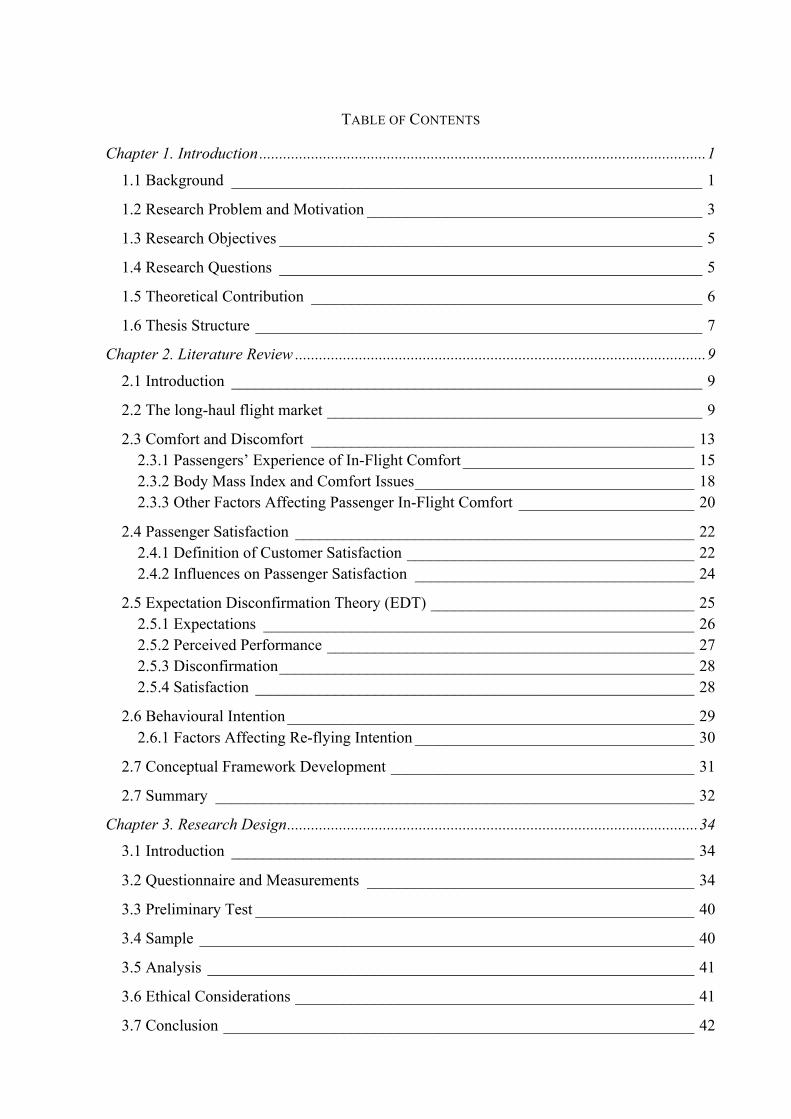
TABLE OF CONTENTS
Chapter 1. Introduction ................................................................................................................ 1
1.1 Background ___________________________________________________________ 1
1.2 Research Problem and Motivation __________________________________________ 3
1.3 Research Objectives _____________________________________________________ 5
1.4 Research Questions _____________________________________________________ 5
1.5 Theoretical Contribution _________________________________________________ 6
1.6 Thesis Structure ________________________________________________________ 7
Chapter 2. Literature Review ....................................................................................................... 9
2.1 Introduction ___________________________________________________________ 9
2.2 The long-haul flight market _______________________________________________ 9
2.3 Comfort and Discomfort ________________________________________________ 13 2.3.1 Passengers’ Experience of In-Flight Comfort _____________________________ 15 2.3.2 Body Mass Index and Comfort Issues ___________________________________ 18 2.3.3 Other Factors Affecting Passenger In-Flight Comfort ______________________ 20
2.4 Passenger Satisfaction __________________________________________________ 22 2.4.1 Definition of Customer Satisfaction ____________________________________ 22 2.4.2 Influences on Passenger Satisfaction ___________________________________ 24
2.5 Expectation Disconfirmation Theory (EDT) _________________________________ 25 2.5.1 Expectations ______________________________________________________ 26 2.5.2 Perceived Performance ______________________________________________ 27 2.5.3 Disconfirmation ____________________________________________________ 28 2.5.4 Satisfaction _______________________________________________________ 28
2.6 Behavioural Intention ___________________________________________________ 29 2.6.1 Factors Affecting Re-flying Intention ___________________________________ 30
2.7 Conceptual Framework Development ______________________________________ 31
2.7 Summary ____________________________________________________________ 32
Chapter 3. Research Design ....................................................................................................... 34
3.1 Introduction __________________________________________________________ 34
3.2 Questionnaire and Measurements _________________________________________ 34
3.3 Preliminary Test _______________________________________________________ 40
3.4 Sample ______________________________________________________________ 40
3.5 Analysis _____________________________________________________________ 41
3.6 Ethical Considerations __________________________________________________ 41
3.7 Conclusion ___________________________________________________________ 42
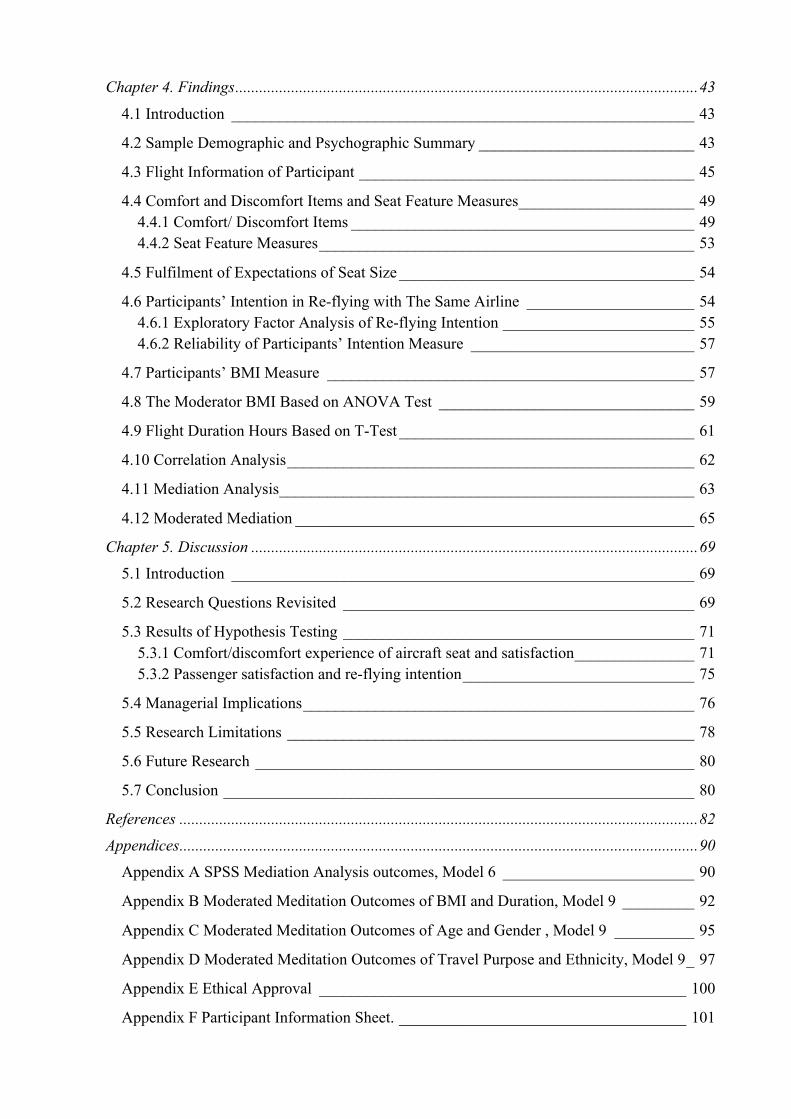
Chapter 4. Findings .................................................................................................................... 43
4.1 Introduction __________________________________________________________ 43
4.2 Sample Demographic and Psychographic Summary ___________________________ 43
4.3 Flight Information of Participant __________________________________________ 45
4.4 Comfort and Discomfort Items and Seat Feature Measures ______________________ 49 4.4.1 Comfort/ Discomfort Items ___________________________________________ 49 4.4.2 Seat Feature Measures _______________________________________________ 53
4.5 Fulfilment of Expectations of Seat Size _____________________________________ 54
4.6 Participants’ Intention in Re-flying with The Same Airline _____________________ 54 4.6.1 Exploratory Factor Analysis of Re-flying Intention ________________________ 55 4.6.2 Reliability of Participants’ Intention Measure ____________________________ 57
4.7 Participants’ BMI Measure ______________________________________________ 57
4.8 The Moderator BMI Based on ANOVA Test ________________________________ 59
4.9 Flight Duration Hours Based on T-Test _____________________________________ 61
4.10 Correlation Analysis ___________________________________________________ 62
4.11 Mediation Analysis ____________________________________________________ 63
4.12 Moderated Mediation __________________________________________________ 65
Chapter 5. Discussion ................................................................................................................ 69
5.1 Introduction __________________________________________________________ 69
5.2 Research Questions Revisited ____________________________________________ 69
5.3 Results of Hypothesis Testing ____________________________________________ 71 5.3.1 Comfort/discomfort experience of aircraft seat and satisfaction _______________ 71 5.3.2 Passenger satisfaction and re-flying intention _____________________________ 75
5.4 Managerial Implications _________________________________________________ 76
5.5 Research Limitations ___________________________________________________ 78
5.6 Future Research _______________________________________________________ 80
5.7 Conclusion ___________________________________________________________ 80
References .................................................................................................................................. 82
Appendices .................................................................................................................................. 90
Appendix A SPSS Mediation Analysis outcomes, Model 6 ________________________ 90
Appendix B Moderated Meditation Outcomes of BMI and Duration, Model 9 _________ 92
Appendix C Moderated Meditation Outcomes of Age and Gender , Model 9 __________ 95
Appendix D Moderated Meditation Outcomes of Travel Purpose and Ethnicity, Model 9 _ 97
Appendix E Ethical Approval ______________________________________________ 100
Appendix F Participant Information Sheet. ____________________________________ 101

Appendix G ____________________________________________________________ 103
The Study Questionnaire __________________________________________________ 103
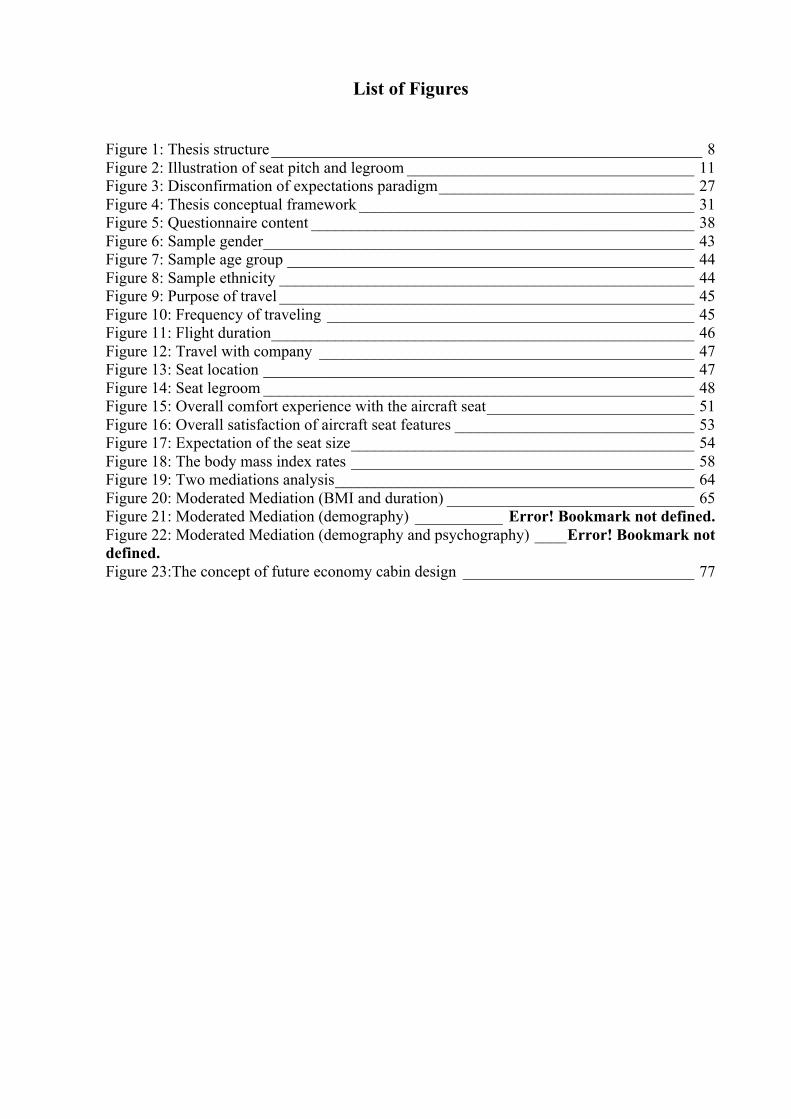
List of Figures
Figure 1: Thesis structure ______________________________________________________ 8 Figure 2: Illustration of seat pitch and legroom ____________________________________ 11 Figure 3: Disconfirmation of expectations paradigm ________________________________ 27 Figure 4: Thesis conceptual framework __________________________________________ 31 Figure 5: Questionnaire content ________________________________________________ 38 Figure 6: Sample gender ______________________________________________________ 43 Figure 7: Sample age group ___________________________________________________ 44 Figure 8: Sample ethnicity ____________________________________________________ 44 Figure 9: Purpose of travel ____________________________________________________ 45 Figure 10: Frequency of traveling ______________________________________________ 45 Figure 11: Flight duration _____________________________________________________ 46 Figure 12: Travel with company _______________________________________________ 47 Figure 13: Seat location ______________________________________________________ 47 Figure 14: Seat legroom ______________________________________________________ 48 Figure 15: Overall comfort experience with the aircraft seat __________________________ 51 Figure 16: Overall satisfaction of aircraft seat features ______________________________ 53 Figure 17: Expectation of the seat size ___________________________________________ 54 Figure 18: The body mass index rates ___________________________________________ 58 Figure 19: Two mediations analysis _____________________________________________ 64 Figure 20: Moderated Mediation (BMI and duration) _______________________________ 65 Figure 21: Moderated Mediation (demography) ___________ Error! Bookmark not defined. Figure 22: Moderated Mediation (demography and psychography) ____ Error! Bookmark not defined. Figure 23:The concept of future economy cabin design _____________________________ 77
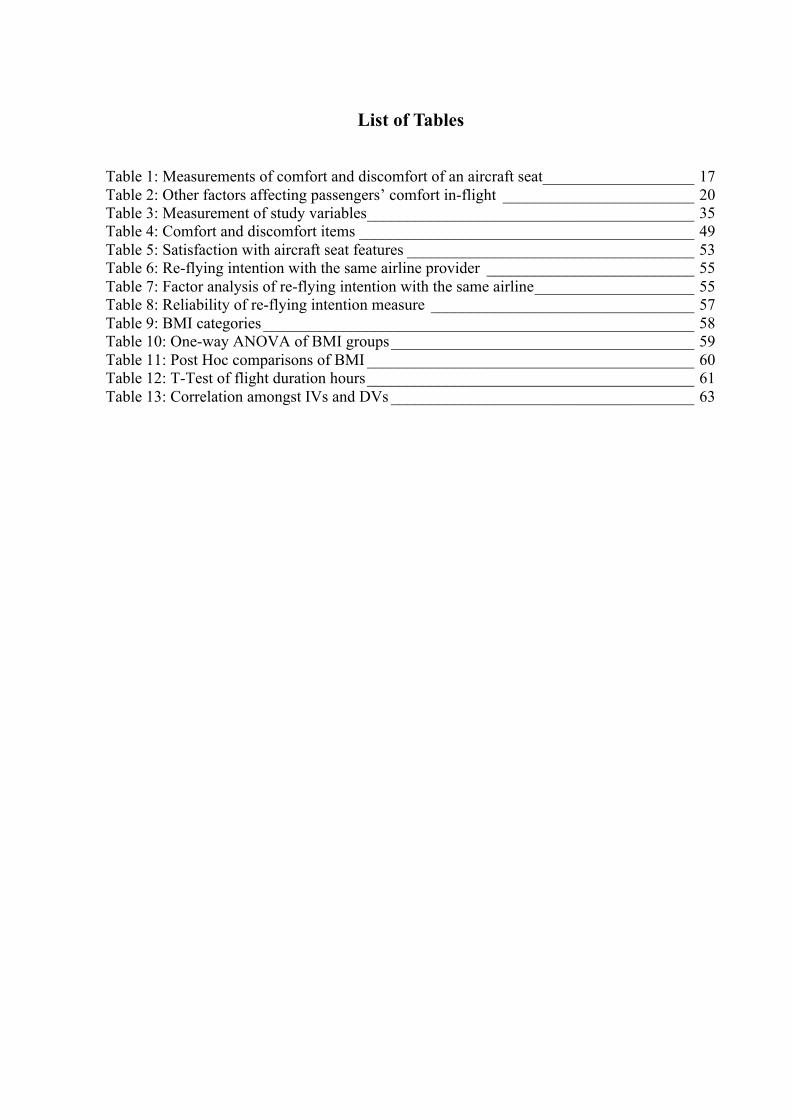
List of Tables
Table 1: Measurements of comfort and discomfort of an aircraft seat ___________________ 17 Table 2: Other factors affecting passengers’ comfort in-flight ________________________ 20 Table 3: Measurement of study variables _________________________________________ 35 Table 4: Comfort and discomfort items __________________________________________ 49 Table 5: Satisfaction with aircraft seat features ____________________________________ 53 Table 6: Re-flying intention with the same airline provider __________________________ 55 Table 7: Factor analysis of re-flying intention with the same airline ____________________ 55 Table 8: Reliability of re-flying intention measure _________________________________ 57 Table 9: BMI categories ______________________________________________________ 58 Table 10: One-way ANOVA of BMI groups ______________________________________ 59 Table 11: Post Hoc comparisons of BMI _________________________________________ 60 Table 12: T-Test of flight duration hours _________________________________________ 61 Table 13: Correlation amongst IVs and DVs ______________________________________ 63
pg. 1
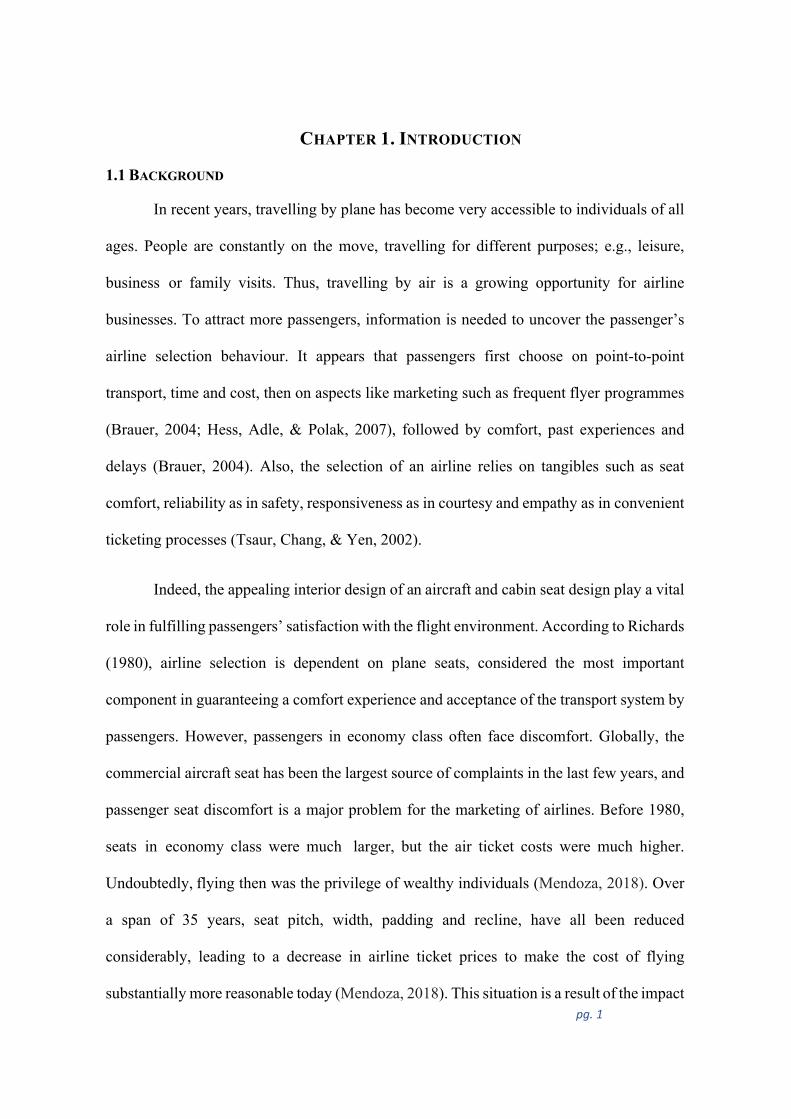
CHAPTER 1. INTRODUCTION
1.1 BACKGROUND
In recent years, travelling by plane has become very accessible to individuals of all
ages. People are constantly on the move, travelling for different purposes; e.g., leisure,
business or family visits. Thus, travelling by air is a growing opportunity for airline
businesses. To attract more passengers, information is needed to uncover the passenger’s
airline selection behaviour. It appears that passengers first choose on point-to-point
transport, time and cost, then on aspects like marketing such as frequent flyer programmes
(Brauer, 2004; Hess, Adle, & Polak, 2007), followed by comfort, past experiences and
delays (Brauer, 2004). Also, the selection of an airline relies on tangibles such as seat
comfort, reliability as in safety, responsiveness as in courtesy and empathy as in convenient
ticketing processes (Tsaur, Chang, & Yen, 2002).
Indeed, the appealing interior design of an aircraft and cabin seat design play a vital
role in fulfilling passengers’ satisfaction with the flight environment. According to Richards
(1980), airline selection is dependent on plane seats, considered the most important
component in guaranteeing a comfort experience and acceptance of the transport system by
passengers. However, passengers in economy class often face discomfort. Globally, the
commercial aircraft seat has been the largest source of complaints in the last few years, and
passenger seat discomfort is a major problem for the marketing of airlines. Before 1980,
seats in economy class were much larger, but the air ticket costs were much higher.
Undoubtedly, flying then was the privilege of wealthy individuals (Mendoza, 2018). Over
a span of 35 years, seat pitch, width, padding and recline, have all been reduced
considerably, leading to a decrease in airline ticket prices to make the cost of flying
substantially more reasonable today (Mendoza, 2018). This situation is a result of the impact
pg. 2
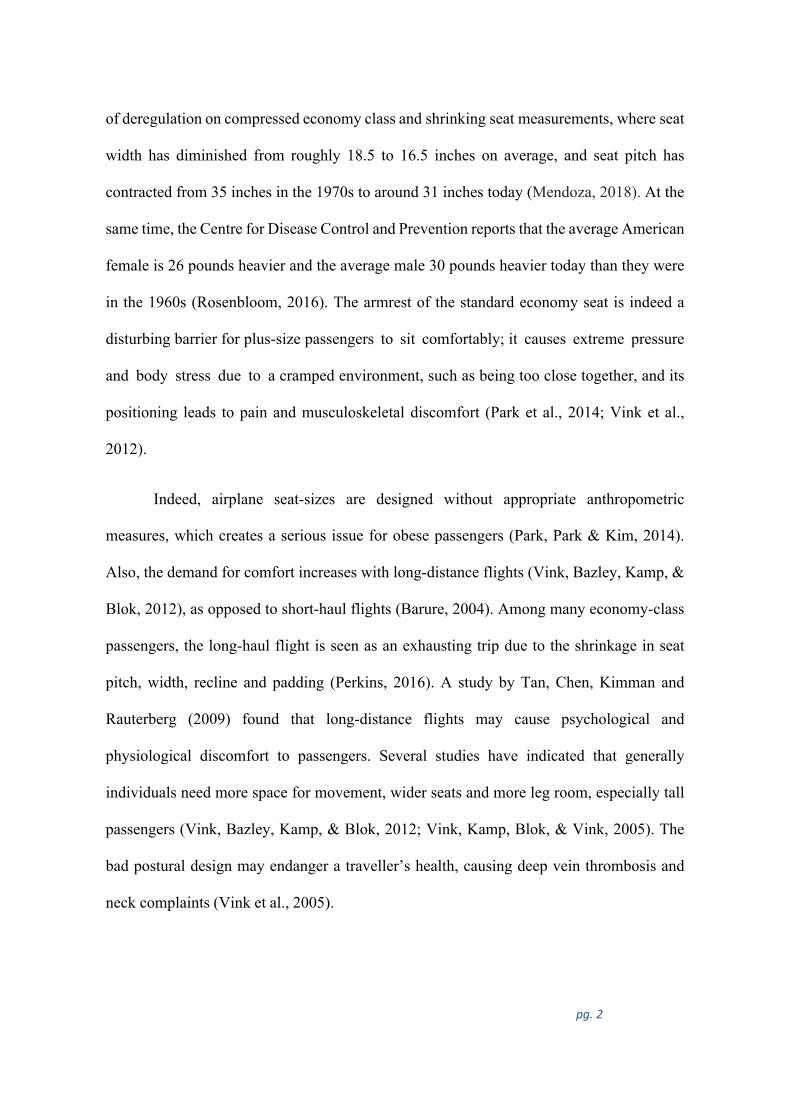
of deregulation on compressed economy class and shrinking seat measurements, where seat
width has diminished from roughly 18.5 to 16.5 inches on average, and seat pitch has
contracted from 35 inches in the 1970s to around 31 inches today (Mendoza, 2018). At the
same time, the Centre for Disease Control and Prevention reports that the average American
female is 26 pounds heavier and the average male 30 pounds heavier today than they were
in the 1960s (Rosenbloom, 2016). The armrest of the standard economy seat is indeed a
disturbing barrier for plus-size passengers to sit comfortably; it causes extreme pressure
and body stress due to a cramped environment, such as being too close together, and its
positioning leads to pain and musculoskeletal discomfort (Park et al., 2014; Vink et al.,
2012).
Indeed, airplane seat-sizes are designed without appropriate anthropometric
measures, which creates a serious issue for obese passengers (Park, Park & Kim, 2014).
Also, the demand for comfort increases with long-distance flights (Vink, Bazley, Kamp, &
Blok, 2012), as opposed to short-haul flights (Barure, 2004). Among many economy-class
passengers, the long-haul flight is seen as an exhausting trip due to the shrinkage in seat
pitch, width, recline and padding (Perkins, 2016). A study by Tan, Chen, Kimman and
Rauterberg (2009) found that long-distance flights may cause psychological and
physiological discomfort to passengers. Several studies have indicated that generally
individuals need more space for movement, wider seats and more leg room, especially tall
passengers (Vink, Bazley, Kamp, & Blok, 2012; Vink, Kamp, Blok, & Vink, 2005). The
bad postural design may endanger a traveller’s health, causing deep vein thrombosis and
neck complaints (Vink et al., 2005).
pg. 3
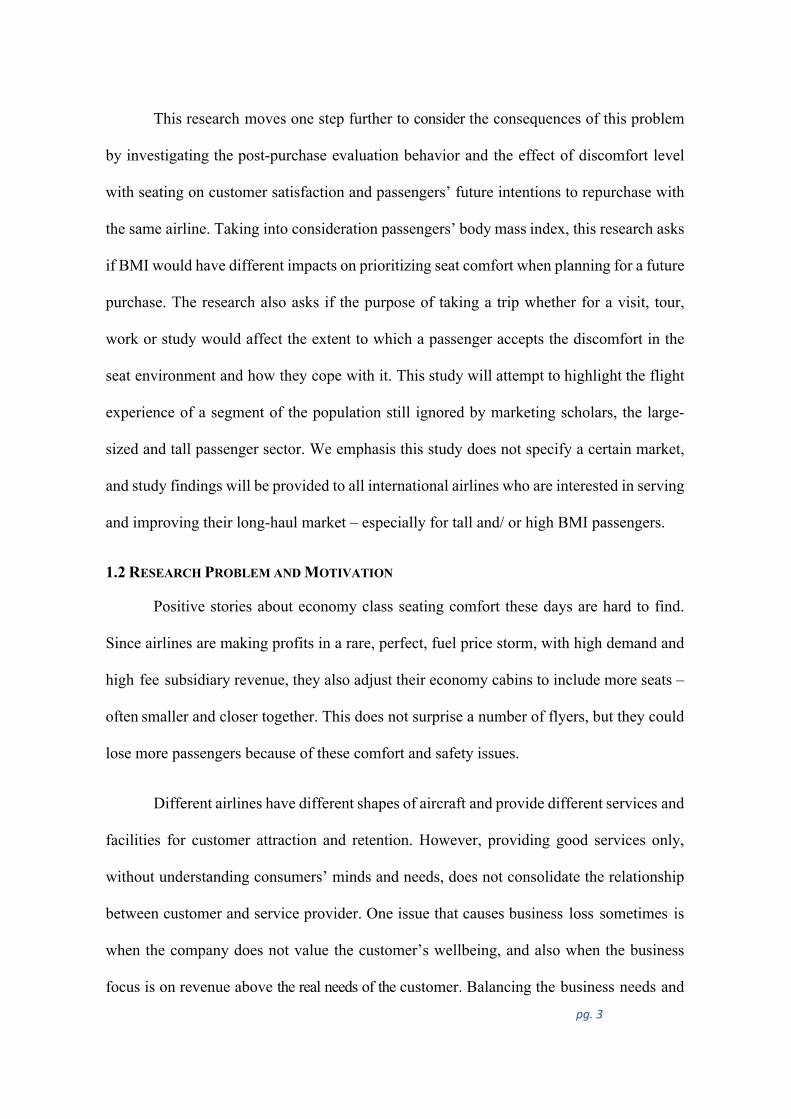
This research moves one step further to consider the consequences of this problem
by investigating the post-purchase evaluation behavior and the effect of discomfort level
with seating on customer satisfaction and passengers’ future intentions to repurchase with
the same airline. Taking into consideration passengers’ body mass index, this research asks
if BMI would have different impacts on prioritizing seat comfort when planning for a future
purchase. The research also asks if the purpose of taking a trip whether for a visit, tour,
work or study would affect the extent to which a passenger accepts the discomfort in the
seat environment and how they cope with it. This study will attempt to highlight the flight
experience of a segment of the population still ignored by marketing scholars, the large-
sized and tall passenger sector. We emphasis this study does not specify a certain market,
and study findings will be provided to all international airlines who are interested in serving
and improving their long-haul market – especially for tall and/ or high BMI passengers.
1.2 RESEARCH PROBLEM AND MOTIVATION
Positive stories about economy class seating comfort these days are hard to find.
Since airlines are making profits in a rare, perfect, fuel price storm, with high demand and
high fee subsidiary revenue, they also adjust their economy cabins to include more seats –
often smaller and closer together. This does not surprise a number of flyers, but they could
lose more passengers because of these comfort and safety issues.
Different airlines have different shapes of aircraft and provide different services and
facilities for customer attraction and retention. However, providing good services only,
without understanding consumers’ minds and needs, does not consolidate the relationship
between customer and service provider. One issue that causes business loss sometimes is
when the company does not value the customer’s wellbeing, and also when the business
focus is on revenue above the real needs of the customer. Balancing the business needs and
pg. 4
benefits with the consumer’s needs and benefits is the only way for companies to survive
and sustain themselves. Thus, the argument of this thesis underlies the concept that “a low-
ticket price” in economy class can provide passenger comfort and well-being. Since this
strategy has been used for a long time in the long-haul flight market, consumers’ minds are
programmed to the concept that money is “worth more than their comfort and wellbeing”.
How? When we compare non-large-sized passengers(A) with large-sized or tall passengers
(B), group B might have a much less satisfying experience with economy class seating.
They might still value their wellbeing and comfort more than the ticket price even if they
choose to fly economy class frequently as compared to group A. Here we could expect that
group B is less likely than group A to fly again with an airline with seats that are narrow in
width and pitch. Therefore, this study hypothesises that individuals in group B, when they take
a long-haul flight, tend to find a different airline company rather than re-fly with an airline
that provides unsatisfactory seating in economy class, and that these customers may not
recommend the airline to others because of the issue with seating that led to a unsatisfactory
experience. Segment (B) has been neglected in the airline industry. This study examines
this market segment, and the relationship of seat comfort to overall satisfaction with the
flight, and the intention to fly with the airline again.
Commercial airlines have many competitors in the marketplace willing to provide
good services and facilities to their customers to promote customer satisfaction and
retention. To reach the point of sustainability, I believe that moving from the concept of
low-price tickets for narrow seats in economy class to providing economy class seats at a
reasonable cost will benefit airlines in gaining better and sustainable revenue without
compromising service and facility expenses or consumer wellbeing and comfort.
In the current decade, because of the technology revolution, consumers can share
pg. 5
their airline stories of dissatisfaction online – particularly the issue of
comfortable/uncomfortable seating in economy class. This increases awareness among
consumers that can then affect the airline company’s image and reputation about their
ability to meet consumers’ needs and rights. Large-sized and tall passengers deserve to have
enough space to sit comfortably on flights of long duration, as this segment is much more
affected by the seating issue than other passengers in economy class.
Therefore, this study has a clear purpose and motivation for testing the hypothesis
that airplane seat comfort in economy class could affect passengers’ intention to re-fly with
the same airline, particularly for tall and large-sized passengers.
1.3 RESEARCH OBJECTIVES
This study aims to:
1. identify the effect of seating comfort/discomfort in economy class on the
satisfaction of long-haul passengers.
2. examine the impact of seating discomfort in economy on one specific segment in the
market (large-sized and tall passengers), and the effect on their satisfaction and
behavioural intentions.
3. determine whether the past experience of seat comfort by long-haul passengers in
economy class affects their future behavioural intention to re-fly with the same
airline.
1.4 RESEARCH QUESTIONS
This study sought to answer one main research question, consistent with the
research objectives outlined above.
1. To what extent does the comfort /discomfort experience of an airplane seat affect
pg. 6
passenger satisfaction and in turn affect passenger intention to re-fly with the same
airline when taking a long-haul flight?
1.1 What physical and emotional elements cause the comfort/discomfort
experience for passengers during the flight?
1.5 CONTRIBUTION
This research is anticipated to practically and theoretically contribute to the commercial
airline industry by improving the consumer’s experience in-flight – in particular, to raise the
level of comfort of the aircraft seat. Although some passengers are able to fly business or first
class with more spacious seats that fulfils their health and safety needs, this does not preclude
the necessity for a minimum standard of seat size, pitch and legroom in economy class to enhance
the level of comfort, health and safety especially for long-haul passengers, since more passengers
fly economy class due to affordability.
Also, this research will assist marketers and the commercial airline industry to understand
the need for comfort for a particular market segment - passengers with high BMI or tall stature.
This issue cannot be dismissed, as an aviation expert warns that seat pitch shrinkage to less than
30 inches is dangerous (Davies, 2017). Airlines wanting to balance passengers’ safety, health
and comfort with the need to provide a maximum number of economy seats will need to manage
an optimal balance between passenger comfort and retention to ensure profitability. The research
is expected to highlight the need for enhancing the experience for long-haul travellers in
economy class, especially for the aforementioned segment, to understand their inflight
experience and the level of influence on their expectations, satisfaction levels and future flying
intentions with the same airline with which they have experienced either seat comfort or
discomfort. Also, this study findings can add to the marketing literature on understanding
customer’s expectations and future intention as one of the interesting variables in our research
pg. 7
where the expectation was significant in affecting the long haul passengers in their intention to
re-fly again with the same airline, and this was clearly seen with passengers of high BMI.
Regarding the rare studies in the marketing field around the long haul travellers and difficulties
they face inflight, this study opens a path for marketing scholars to rich the literature with new
studies that focus on the inflight experience especially long haul travellers and issues they found
in long-distance trips. As well as to explore factors that drive long-haul passengers to choose one
airline over another.
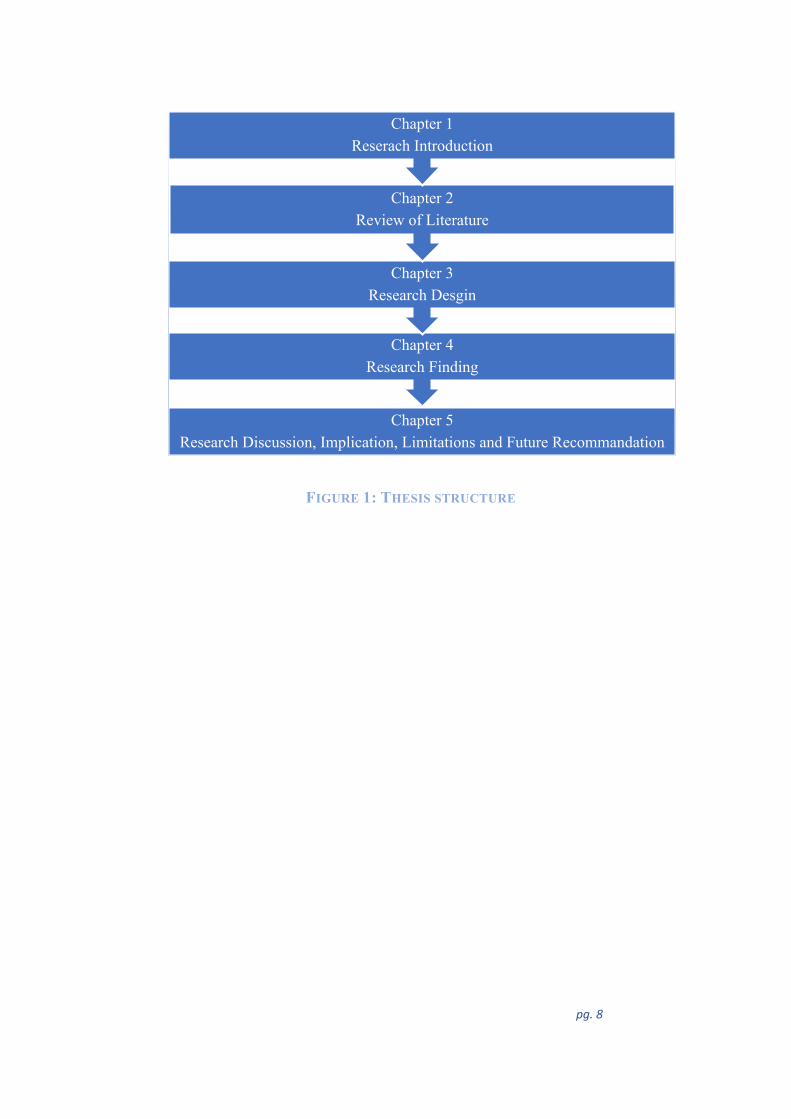
1.6 THESIS STRUCTURE
Five chapters have been added to this thesis. Chapter 1 identifies the topic, provides a
background and motivation for the study, and highlights the problems, objectives and
contributions of research. Chapter 2 presents a literature review, which looks into various issues
regarding the objectives of the thesis, including the concepts of comfort and discomfort, the long-
haul flight market, passenger satisfaction and other issues. The literature review describes
economy-class design and seat comfort, and passengers’ experience of the economy class,
comfort issues and the body mass index of passengers, influences on passenger satisfaction and
factors affecting re-flying intentions. The chapter further illustrates the development of the
conceptual framework and hypotheses for the study and concludes with the literature review
summary. The process, method and methodology used are presented and justified in Chapter 3.
Research findings and analyses are described in Chapter 4. Chapter 5 includes the research
discussions, limitations and recommendations and future directions for research.
pg. 8
FIGURE 1: THESIS STRUCTURE
Chapter 5 Research Discussion, Implication, Limitations and Future Recommandation
Chapter 4 Research Finding
Chapter 3Research Desgin
Chapter 2 Review of Literature
Chapter 1Reserach Introduction
pg. 9
CHAPTER 2. LITERATURE REVIEW 2.1 INTRODUCTION
The chapter reviews relation theories and previous investigations to gather important
knowledge related to the content topic of this study, the market of long-haul air travel and the
issue of economy seat design for long-haul travellers. The review presents a theoretical debate
on the concepts of comfort and discomfort, and explores in detail the in-flight comfort
/discomfort experience. Furthermore, the review considers the Body Mass Index – especially
large sizes and tall passengers – as one of the moderating variables that can affect the relationship
between the comfort experience and a passenger’s satisfaction level. The chapter also considers
other factors that can impact on economy passengers’ experience of long-haul air trips. These
factors can affect passenger satisfaction, all of which are discussed in the review. The
disconfirmation of expectation theory is considered to understand post-purchase behaviour and
explore further factors that potentially affect re-flying intentions.
2.2 THE LONG-HAUL FLIGHT MARKET
Long-distance air travel is a flight of over six hours (Wilkerson et al., 2010). Often, these
are non-stop flights and by large-bodied aircraft. Long-haul carriers with low costs have
expanded rapidly, entering the major international market in early 2010 (Blondel et al., 2017),
and there are multi drivers for expansion. The development of jet technology has enabled planes
to fly for longer periods without refuelling, and has also seen a maturing of medium- and short-
haul aircraft. Moreover, this technology has enabled long-haul aircraft to arrive at destinations
in less time (Blondel et al., 2017). There has been considerably higher competition between tour
operators and airlines, which has reduced travel costs for long distances (Nau & Larget, 2018),
and a greater number of people who have the opportunity to fly abroad (Training & Development
Ltd, 2000).
pg. 10
Aircraft types are divided by seating setup, capacity of passengers and technical aspects
such as wingspan, speed, engine range and engine configuration. There are two types of aircraft;
narrow-body planes with only one aisle and broad-body planes with two walking aisles (Semer-
Purzycki, 2000). The physical and psychological comfort of passengers is affected by these
aspects.
The Boeing 747, which carries around 400 passengers, was the dominant aircraft type on
long-haul flights in the 1970s and 1980s. The Boeing 747 market share in 1985 was 62 percent
higher in North Atlantic services and in Asia-Europe. The first long-haul, twin-jet Boeing 767
subsequently increased market competition, yet the Boeing 747 continued to dominate. New
generations of long-distance aircraft, Boeing 777, Airbus A330 and A340, took the leadership
between 2000 and 2005. US airlines have abandoned the 747 almost entirely, but many Asian
operators continue to operate this aircraft. Some major carriers also continue to operate 747s in
Europe (Dennis, 2005). The development of Airbus and Boeing led to the B787 and the A350,
which have advanced engines for fuel efficiency, low capacity and low operation costs (Blondel
et al., 2017). These new models of aircraft have revolutionised the long-haul market (ibid).
However, despite all the enhancement of aircraft design, there is still a question around the issue
of the comfort experience of long-haul travellers in economy class – especially in aircraft with
small seat dimensions and its effect on passengers’ future intentions to re-fly with the same
airline.
2.2.1 Economy Seat Design for Long-Haul Flights
Aircraft seats are considered to be the most significant feature ensuring the comfort of
passengers during the journey (Richards, 1980). Aggressive passenger behaviour is believed to
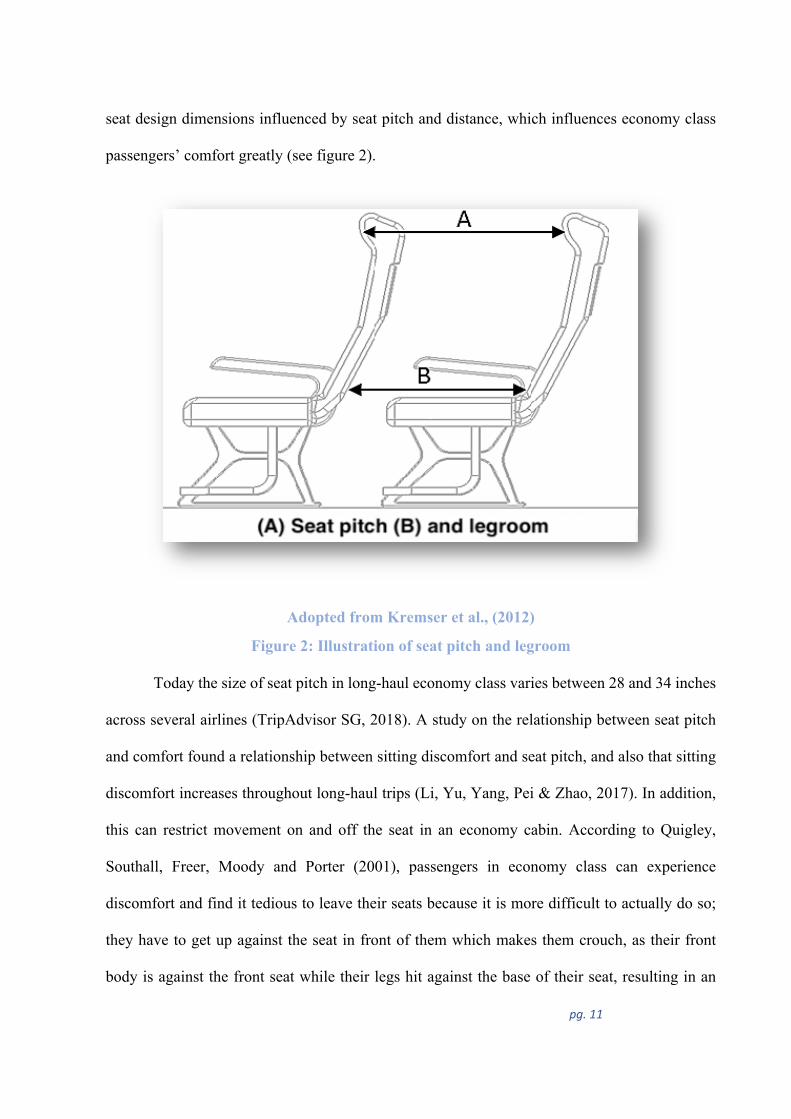
arise from excessive stress caused by seat discomfort (Tan et al., 2009). Legroom is one of the
pg. 11
seat design dimensions influenced by seat pitch and distance, which influences economy class
passengers’ comfort greatly (see figure 2).
Adopted from Kremser et al., (2012)
Figure 2: Illustration of seat pitch and legroom
Today the size of seat pitch in long-haul economy class varies between 28 and 34 inches
across several airlines (TripAdvisor SG, 2018). A study on the relationship between seat pitch
and comfort found a relationship between sitting discomfort and seat pitch, and also that sitting
discomfort increases throughout long-haul trips (Li, Yu, Yang, Pei & Zhao, 2017). In addition,
this can restrict movement on and off the seat in an economy cabin. According to Quigley,
Southall, Freer, Moody and Porter (2001), passengers in economy class can experience
discomfort and find it tedious to leave their seats because it is more difficult to actually do so;
they have to get up against the seat in front of them which makes them crouch, as their front
body is against the front seat while their legs hit against the base of their seat, resulting in an
pg. 12
uneasy body posture. Quigley et al. (2001) elaborated on this issue, stating that the movement
between seats in economy class is not only difficult for the passenger themselves but also for the
people around them, meaning that passengers are not at ease throughout their journey. Another
study concluded that one of the complaints received by passengers who travel in economy class
is that the seat pocket is designed in such a way that they have to curl their legs in order to avoid
the pocket hitting their knees (Vink et al., 2012). This becomes even more difficult when the seat
in front is in a recline position.
Moreover, it is observed that the seats in the economy class of a Boeing 737 negatively
impact on the perception of passengers regarding comfort (Anjani, Vink & Ruiter, 2018). This
is because the seat pitch ranges from 28 to 34 inches. This could result in a painful travelling
experience for taller passengers whose knees are pushed into the seat in front at all times, a
situation which can have an adverse physiological impact on passengers (Vink et al., 2018). The
average standard seat width in long-haul economy class (16.3 to 18 inches) (TripAdvisor SG,
2018), is also a critical aspect in passengers’ comfort and on their private seating zone. Roebuck
et al. (1975) concluded in a study that males have a wider upper body structure than females,
meaning that they generally have broader shoulders and elbows compared to their hips. The
width of the seat therefore becomes irrelevant to the comfort of these customers as body shape
is not factored into the design of the seats, which means that even if such males fit within the
seat’s width, their upper body usually crosses the seat boundaries and invades the space of the
passengers next to them (Molenbroek, Albin & Vink, 2017). Another recent study explores the
relationship between the comfort of air passengers and seat pitch, and other influencing factors
as anthropometric measurements, and space experience. Participants experienced economy
class, a Boeing 737 with seat pitches ranging from 28 to 30 inches and 32 to 34 inches. The result
revealed that a significant relationship between aircraft’s seat pitch and comfort in addition to
pg. 13
discomfort. Also, it was found that each pitch size for a middle seat was uncomfortable compared
to the aisle and window seat. As well as the influence of the anthropometric measurement
(dis)comfort on smaller inches of seat pitch (Anjani, Ruiter &Vink, 2020). The following study
by Anjani, Song, Hou, Ruiter, & Vink (2021) measures the passengers’ comfort feeling
regarding different seat widths composed of data from a previous study. The study recruited
passengers to sit in aircraft seats wide 17 and 18 inch in a Boeing 737 for 10 minutes. They found
that the more inches wider, the more comfort score higher. Also, it was found that passengers
with a small hip-breadth sitting in an 18-inch seat size felt more comfort. By combining the
findings of earlier study on the relationship between seat pitch and comfort, it was shown that
widening seat size is more effective on comfort than raising the seat floor area.
2.3 COMFORT AND DISCOMFORT
The words comfort and discomfort are employed in everyday language. In fact, in the
scientific literature there is debate as to whether discomfort and comfort can be deemed a single
continuum (Richards, 1980; Shackel Chidsey & Shipley, 1969), independent concepts with
dissimilar underlying influences affecting them (De Looze, Kuijt-Evers & Van Dieen, 2003;
Zhang, Helander & Drury, 1996), or whether comfort is basically the absence of discomfort
(Osbourne, Leal, Saran, Shipley & Stewart, 2014). These words are connected with diverse
factors, as comfort indicates a positive experience (Vink & Brauer, 2011), such as relaxation
(Zhang, Helander & Drury, 1996), satisfaction, ease, relief (Lewis et al., 2016) and a sense of
well-being (Richards, 1980; Kolcaba, 1991). However, discomfort is linked to a sense of fatigue,
soreness and a lack of ease caused by physical constraints in design (Hiemstra-van Mastrigt et
al., 2016; Zhang, Helander & Drury, 1996). It has been claimed that comfort means a lack of
discomfort, which implies that comfort is a neutral state in which people are unaware of any
positive or negative feelings (Osbourne et al., 2014; Shen & Vértiz, 1997).
pg. 14
Furthermore, comfort and discomfort are discussed in the literature as indicating an
interaction with each other. Lewis et al. (2016) proposed that the experience of comfort and
discomfort can be simultaneous, which means the feeling of comfort does not ensure complete
satisfaction. Similarly, a number of studies suggested that the absence of discomfort does not
always lead to comfort because different features are needed to occur for a comfort experience
(Zhang, Helander & Drury, 1996; Helander & Zhang, 1997). Another study by Helander and
Zhang (1997) claimed that experiences of high levels of discomfort can only be achieved if the
level of comfort is low and vice versa, and thus display a relationship between these two
constructs.
In addition, individuals’ concept of comfort is determined by the interior of an airplane.
In fact, scientifically, comfort illustrates a pleasant state of psychological, physiological and
physical harmony between individuals and the environment or a sense of subjective well-being
(da Silva Menegon et al., 2019). According to De Looze et al. (2003), there are many concepts
of comfort, but comfort as a subjective experience is not really under debate. It is assumed that
comfort and discomfort can be caused by reasons pertaining to a single set of pain points;
however, a general consensus is that both these concepts are subjective to the people
experiencing them (De Looze, Kuijt-Evers & Van Dieen, 2003). It is highly likely that a
problematic situation might bring discomfort to one and not to another person because the
reaction to the situation by an individual is what distinguishes their perception of the matter,
which results in the experience of comfort and discomfort (Richards, Jacobson & Kuhlthau,
1978; De Looze, Kuijt-Evers & Van Dieen, 2003). A product or an environment is not in itself
uncomfortable or comfortable, it is how individuals perceive them. The product is never
comfortable in itself but only when used by individuals to assess the level of comfort or not. The
comfort concept is complicated therefore, due an individual’s personal reaction to a product. For
pg. 15
instance, on long-distance flights, some passengers find back comfort or discomfort of greatest
importance whereas others require reduced noise or more space. Thus, to a accomplish a high
level of comfort, the level of discomfort should be low.
To address the issue of seat discomfort for passengers in economy class, inspiration can
be drawn from the examples set by Bronkhorst and Krause (2002), who designed a train interior
rated to be comfortable by over 80 percent of the passengers. They were able to achieve these
results by understanding the needs of their customers and factoring in their opinions. They also
conducted studies to understand the physical dimensions of the customers and design the seats
according to those findings. As a result, they designed an interior that provided passengers with
an easier travelling experience. Although it is assumed that implementing measures to improve
passenger comfort might be cost-intensive for airlines, by improving its passenger comfort
ratings an airline might increase its customer base by attracting new passengers to their services.
2.3.1 PASSENGERS’ EXPERIENCE OF IN-FLIGHT COMFORT
In order to acquire a better market share, airlines can improve the interior of their planes,
as studies show that one of the most important factors impacting on the choice of customers for
particular airlines is cabin environment. Environment in this case refers to the in-flight facilities
and seating comfort the interior has to offer (Bouwens, Tsay & Vink, 2017). A study conducted
on a sample of around 10,000 passengers by Vink, Bazley, Kamp and Blok (2012) claimed that
the most important factor determining the relationship between airline interior and customers
using the airline again, is the sitting comfort the passenger experiences, and that this experience
directly correlates with the leg space the airline offers to its economy-class passengers.
Guenzkofer, Sedlmeier, Sabbah and Bengler (2012) found in their study that seat pitch directly
impacts passenger leg room and is thus one of the most important variables impacting on
pg. 16
passenger comfort. Another study concluded that airlines that offer multiple entertainment
options to its passengers during the journey distract their customers from the discomfort of the
seat and thus have a relatively better travelling experience (Lewis et al., 2016).
On the other hand, studies have been conducted that suggest that seat dimensions are not
entirely responsible for the perception of the passengers regarding comfort or discomfort.
According to the research conducted by Ahmadpour, Robert and Lindgaard (2014), the
experience of the passenger is mainly dependent on the first half of their journey, meaning that
if their travelling experience starts off well then passengers do not perceive seating discomfort
and overall interior to be issues. However, if the travelling experience of the customer is not
initially pleasing, the customer would perceive every further inconvenience of the flight as a
discomfort and a problem.
The sense of discomfort increases due to movement restriction and cramped spaces for
four or more hours. Vink and Brauer (2011) reported that passenger discomfort increases during
a four-hour flight. In theory, this pattern in discomfort or comfort over time would help to
prioritise the aspects that need attention. According to Bouwens, Tsay and Vink, (2017), the
most comfortable time is after take-off and while landing at the destination, whereas stowing the
luggage and during the cruise itself flight comfort is at its lowest. This study also highlights the
fact that passengers experience positive feelings when they are about to arrive at the destination
or when taking off from one, and negative feelings during flight cruising, which means that
improving the customer’s experience while cruising can have a major impact on improving the
perception of customers regarding the overall journey. Table 1 shows several measurements used
to study the comfort and discomfort experience for air passengers adopted in applied ergonomics
studies.

pg. 17
Table 1: Measurements of comfort and discomfort of an aircraft seat
Type Measurement Reference
Performing the effect of activities and duration on the development of discomfort physically which was measured every 15 min. (Scale)
Participants sat in three types of seats in orders to evaluate whether there were differences between the seats.
(Hiemstra-van Mastrigt, Meyenborg & Hoogenhout, 2016)
Identifying whether there are differences in comfort experiences during different phases of a flight. also, identifying similarities between recalled and real time reported comfort experiences. (Scale)
Rating the comfort in the different phases of their last flight on a scale from 1–10. Additionally, a combination of a self-reporting design probe and generative interview was used to investigate the appraisal patterns of emotions in nine passengers.
(Bouwens, Tsay & Vink, 2017)
Describes passenger comfort as an experience generated by the cabin interior features. (Themes)
Characterising passengers’ perceptions in the form of eight themes and outline their particular eliciting features. Comfort is depicted as a complex construct derived by passengers’ perceptions beyond the psychological (i.e. peace of mind) and physical (i.e. physical well-being) aspects and includes perceptual (e.g. proxemics) and semantic (e.g. association) aspects.
(Ahmadpour et al., 2014)
Investigates the levels of comfort in aircraft seat which influenced by physical and psychological aspects, the object itself, and its environment and context. (Scale)
Levels measuring the comfort of aircraft seat
20 , 30, 40 (Without comfort)
50 (minimum comfort)
60 (a bit of comfort)
70 (moderate comfort)
80 (intense comfort)
90 (maximum comfort)
(da Silva Menegon, Vincenzi, Andrés Diaz Merino, Barbetta & de Andrade, 2016)
pg. 18
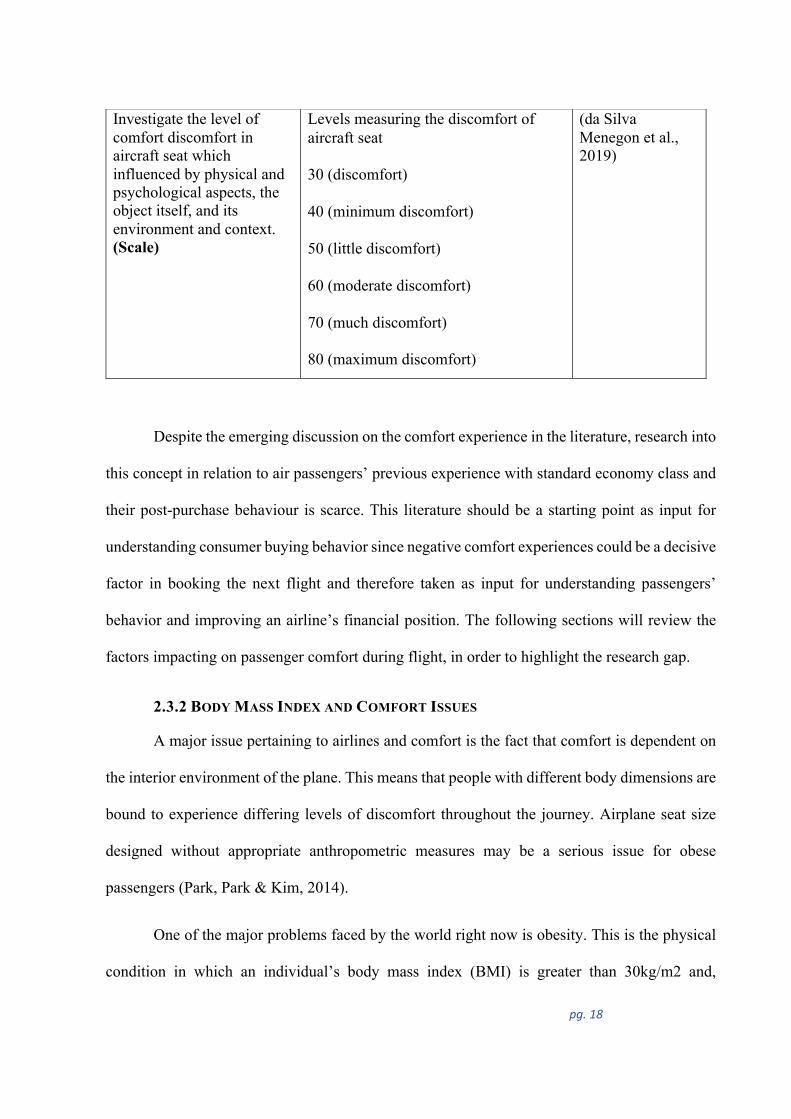
Despite the emerging discussion on the comfort experience in the literature, research into
this concept in relation to air passengers’ previous experience with standard economy class and
their post-purchase behaviour is scarce. This literature should be a starting point as input for
understanding consumer buying behavior since negative comfort experiences could be a decisive
factor in booking the next flight and therefore taken as input for understanding passengers’
behavior and improving an airline’s financial position. The following sections will review the
factors impacting on passenger comfort during flight, in order to highlight the research gap.
2.3.2 BODY MASS INDEX AND COMFORT ISSUES
A major issue pertaining to airlines and comfort is the fact that comfort is dependent on
the interior environment of the plane. This means that people with different body dimensions are
bound to experience differing levels of discomfort throughout the journey. Airplane seat size
designed without appropriate anthropometric measures may be a serious issue for obese
passengers (Park, Park & Kim, 2014).
One of the major problems faced by the world right now is obesity. This is the physical
condition in which an individual’s body mass index (BMI) is greater than 30kg/m2 and,
Investigate the level of comfort discomfort in aircraft seat which influenced by physical and psychological aspects, the object itself, and its environment and context. (Scale)
Levels measuring the discomfort of aircraft seat
30 (discomfort)
40 (minimum discomfort)
50 (little discomfort)
60 (moderate discomfort)
70 (much discomfort)
80 (maximum discomfort)
(da Silva Menegon et al., 2019)
pg. 19
according to the World Health Organization (2018), the issue is so prevalent across the globe
that, as at 2016, nearly 13 percent of the entire world population was considered to be obese.
Moreover, these numbers are alarming in Western countries like the USA where obesity rates
are greater than 20 percent and almost one-third of the population is considered obese (Sassi,
2010; Flegal, Carroll, Kit & Ogden, 2012). If the issue continues unaddressed, the number of
obese individuals is estimated to reach 1.12 billion by 2030 (Kelly, Yang, Chen, Reynolds &
He, 2008). Considering these dynamics, it is important for airlines to factor in this information
when deciding the size of seats, and to adapt seating so a greater number of passengers could be
accommodated while maintaining their comfort and ease.
Obese individuals may be denied boarding an aircraft because they do not adequately fit
into designed seats, or they may be required to purchase two seats (Park et al., 2014), which is
the controversial "customer of size" policies adopted by multiple airlines. Park et al. (2014) and
Vink et al. (2012) further state that obese passengers who manage to fit into an airline seat may
experience extreme pressure and body stress from a cramped environment, leading to pain and
musculoskeletal discomfort. An obese passenger may have difficulty egressing efficiently from
a seat in an emergency situation, jeopardizing the evacuation process which could be fatal for all
passengers (Park et al., 2014; Röggla, Moser & Röggla, 1999). Aircraft seatbelts also affect
obese passengers in terms of adjustment and fit (Park et al., 2014). Another seatbelt issue is
safety, especially for obese passengers, when passengers are required to fasten their seatbelts in
emergency situations such as landing or air turbulence (Flaherty & Lehane, 2017). In discussing
aeroplane design with large-sized participants, a qualitative study by Poria and Beal (2017)
reveals issues related to the seat, toilets and aisle width in economy class. The study referred to
the fact that the size of the aforementioned elements was not adequate enough to feel
pg. 20
comfortable. They commented that they would be happy to be issued a document that designated
their special needs.
2.3.3 OTHER FACTORS AFFECTING PASSENGER IN-FLIGHT COMFORT
Vink and van Mastrigt (2011) seek to understand how the experience of comfort is
constructed. Their study highlighted that although seat dimensions have a great impact on the
overall passenger experience, the attention of the flight crew, the services being offered by the
airline and the overall management of passengers play a vital role in determining whether a
customer would re-fly with the airline or not. This study indicated that passengers are aware of
crew attention, hygiene, legroom, noise and the seat itself, all of which are relative to the comfort
experience.
The factors that impact on the experience of the passenger may include abstract variables
that may or may not be within the control of the airline; for instance, factors like passenger
expectation, body dimensions, passenger demographics, the attitudes of other passengers and
confidence in the services of the airline. These factors heavily impact on the perceptions by
airline passengers of their experience (Richards, Jacobson & Kuhlthau, 1978; Bor, 2007; Lewis
et al., 2016).
Other factors that might have an impact on in-flight comfort include the purpose for
travel, travel companions, flight duration, who paid for the journey, cost, the aircraft and the
airline (Richards, Jacobson & Kuhlthau, 1978). An example of this could be the fact that people
travelling on shorter flights might not be bothered by many of the issues encountered by people
traveling on longer flights (Mayr, 1959). Table 2 displays more variables may influence
passengers’ comfort, comprising environmental, behavioural and object aspects.
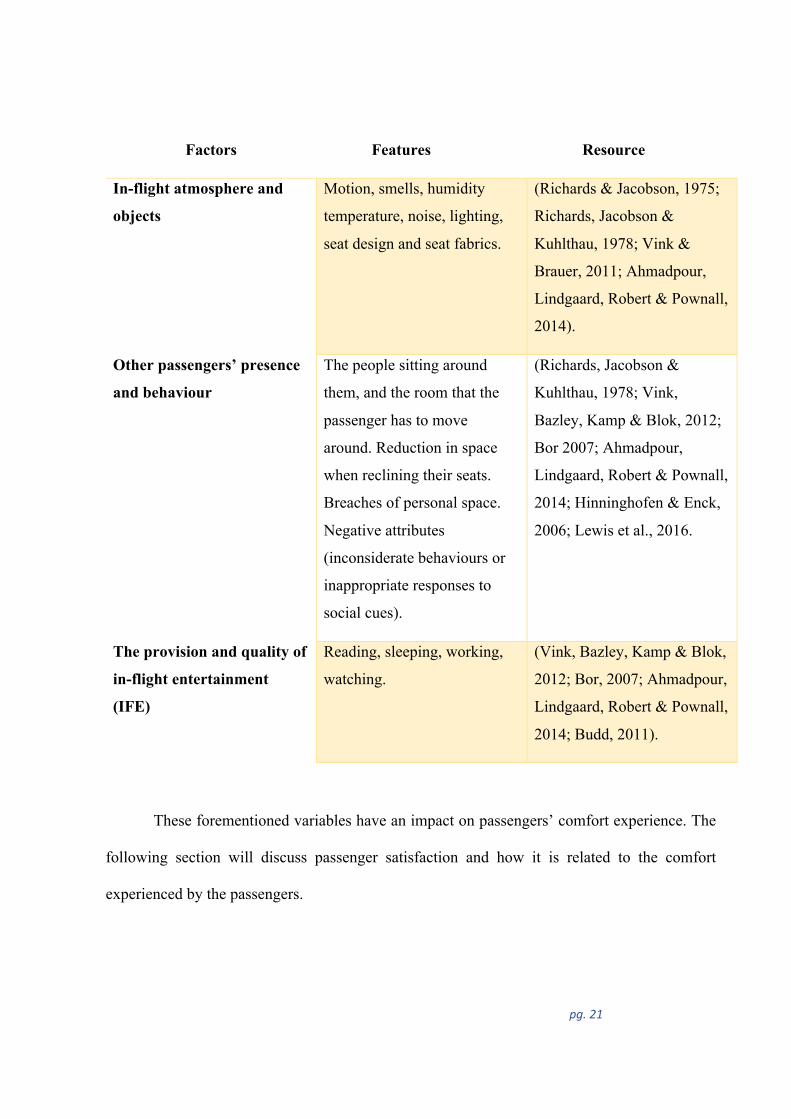
Table 2: Other factors affecting passengers’ comfort in-flight
pg. 21
Factors Features Resource
In-flight atmosphere and
objects
Motion, smells, humidity
temperature, noise, lighting,
seat design and seat fabrics.
(Richards & Jacobson, 1975;
Richards, Jacobson &
Kuhlthau, 1978; Vink &
Brauer, 2011; Ahmadpour,
Lindgaard, Robert & Pownall,
2014).
Other passengers’ presence
and behaviour
The people sitting around
them, and the room that the
passenger has to move
around. Reduction in space
when reclining their seats.
Breaches of personal space.
Negative attributes
(inconsiderate behaviours or
inappropriate responses to
social cues).
(Richards, Jacobson &
Kuhlthau, 1978; Vink,
Bazley, Kamp & Blok, 2012;
Bor 2007; Ahmadpour,
Lindgaard, Robert & Pownall,
2014; Hinninghofen & Enck,
2006; Lewis et al., 2016.
The provision and quality of
in-flight entertainment
(IFE)
Reading, sleeping, working,
watching.
(Vink, Bazley, Kamp & Blok,
2012; Bor, 2007; Ahmadpour,
Lindgaard, Robert & Pownall,
2014; Budd, 2011).
These forementioned variables have an impact on passengers’ comfort experience. The
following section will discuss passenger satisfaction and how it is related to the comfort
experienced by the passengers.
pg. 22
2.4 PASSENGER SATISFACTION
The main indicator of customer satisfaction in the services of the airline is customer
happiness. Satisfaction of the customer is considered to be of utmost importance because this
satisfaction gives rise to loyalty and ultimately means customer retention for the airline. With so
much competition in the market and so many airlines offering similar travel routes, standing out
from the competition plays a pivotal role in defining the approach of an organisation. Customers
who are satisfied tend to remain loyal to their brand of choice, and in the case of airlines
satisfaction is measured against the comfort the passenger experiences during their journey
(Anderson & Sullivan, 1993). Moreover, it is important for an airline to create and maintain the
expectations of customers. Many organisations tend to oversell their services in order to attract
larger volumes of customers; however, this tactic often backfires as customers who are
dissatisfied by the product or services of a certain brand tend not to use their services again. And
considering the fact that first impressions are equally important in the aviation industry, it might
be assumed that airlines need not oversell the experience for the passenger, and rather should
look to uphold whatever they have promised their customers (Kotler & Armstrong, 1996).
2.4.1 DEFINITION OF CUSTOMER SATISFACTION
A general understanding that prevails in the airline industry is that financial benefits can
be gained by determining the factors that make passengers switch airlines. As a result, an airline
needs to have a clear understanding of the relationship between the services they offer and overall
customer satisfaction. This relationship enables the airline to maintain their existing customer
base and not allow churn (Han & Hyun, 2015; Taylor & Baker, 1994). The sustainability of an
airline can be ensured by understanding that the budget allocated to marketing and advertising
could be reduced if the existing customer base was kept satisfied, because maintaining an
pg. 23
existing customer would definitely cost the airline less than acquiring a new customer (Han,
2013; Han, Hyun, & Kim, 2014).
Researchers are of the opinion that improvement in the quality of service directly impact
the overall satisfaction of customers and lay the foundation of their loyalty (Han et al., 2014;
Mohd-Zahari et al., 2011; Saha, 2009). On the other hand, the findings from many studies go on
to show that service quality might not prove to be the only factor influencing the decision making
of customers (Han & Ryu, 2006; Lee, Lee, & Yoo, 2000; Taylor & Baker, 1994). This is because
even if an airline improves its services, there are many other variables not within the control of
the airline that can result in an overall disappointing experience for the passenger. Although
service quality might be a good predictor of satisfaction it does not guarantee satisfaction and
therefore airlines find it difficult to commit to major financial allocations toward improving the
overall service quality and in-flight experience of the passengers (Han & Ryu, 2006; Lee, Lee &
Yoo, 2000; Taylor & Baker, 1994; Ting, 2004). Results from various studies conflict in that they
do not guarantee that the factors of satisfaction and loyalty originate from better service quality
and are therefore not convincing enough for airlines to act upon. Thus, the nature of this
correlation needs to be better understood and redefined in a way that invokes confidence in the
stakeholders of the major airlines. (Lee et al., 2000; Ryu & Han, 2010; Taylor & Baker, 1994;
Ting, 2004). It is, however, a universally accepted idea that the better services an organization
offers, the more chances they have of attracting new customers and maintaining the loyalty of
existing ones. In industries that offer services instead of products especially, it is important that
the customer is satisfied as it takes only one bad experience for customer churn (Han & Ryu,
2009).
pg. 24
2.4.2 INFLUENCES ON PASSENGER SATISFACTION
The idea of influencing a customer’s decision regarding choice of airline by providing
better quality services has been a major focus of airlines in the past two decades (Lin, 2003).
Companies want to understand the factors that enable them to avoid customer churn, and so
airlines have put in a lot of effort in order to understand the needs of their passengers (Berkman
& Gilson, 1986). According to Kendall (2007), overall satisfaction of the customer is very
important in understanding their loyalties and provides a competitive advantage over other
airlines.
The satisfaction of passengers is associated with the level of comfort the passenger
experiences; however, overall satisfaction is impacted by many factors that involve different
processes the passenger goes through during their journey. A number of studies claim that all
the processes involved in travelling that pertain to the airline in general are directly correlated to
the overall experience of customers, meaning that if the airline is able to optimise their processes
of ticket booking and collection, check-in services, waiting lounges, in-flight services and all
other stages involved in the experience of the customer, then the airline would be able to
capitalise on the potential of their existing customer base by tapping into their loyalty for the
brand (Khatib, 1998; Badr-El-deen et al., 2016; Badr- El-deen, Hasan & Fawzy, 2016). Other
dimensions important in determining the satisfaction of passengers are related to the back-office
operations of the airline. These factors basically pertain to the experience the customer has when
they are first introduced to the organisation through their website. In many cases, these first
experiences come in the form of the ticket reservations. Here, the passenger either interacts with
the airline through counter services or another ticket booking channel. The experience of the
customer at this stage also has a major impact on what they perceive about the airline. While
pg. 25
pre-flight services are of major importance, the availability of the flights and overall schedule
also impacts significantly on customer perception and their overall experience (Han, 2013).
In a study conducted by Suki (2014), the services offered by the airline are differentiated
into tangible and intangible. Tangible services are related to the overall environment and
ambiance the customer experiences during the flights. This may include the design of the plane,
the interior of the cabins, the seating arrangement of the cabin, the behaviour of the cabin crew,
and the food and other services offered by the airline. These tangible services are entirely within
the control of the airline and have a direct impact on how the customer perceives the experience.
This means that if the airline is able to improve its tangible services, the overall satisfaction of
passengers may be improved. Moreover, researchers have also concluded empathy – the
behaviour and approach of the cabin crew – can have a major impact on the perception of the
passenger. It is appropriate to apply the theory of disconfirmation of expectation to understand
consumer satisfaction and re-purchase intention.
2.5 EXPECTATION DISCONFIRMATION THEORY (EDT)
The expectation disconfirmation theory (EDT) is used to understand the post-purchase
behaviour of customers. It is imperative for airlines to understand that their customers have a lot
of options to choose from and can easily opt for a different airline in their next travel plan. In
order to keep their customers loyal to their brand, it is important that customer expectations are
properly understood, and that customers have a satisfying experience with the airline. This theory
is adopted mainly in order to understand the behaviour of customers and to pinpoint the root
cause of customer churn (Churchil & Surprenant, 1982; Spreng et al., 1996; Yoon & Kim, 2000).
It is generally assumed that the expectations and the fulfilment of those expectations are the
defining factors in the customer’s overall satisfaction. This assumption is, however, not entirely
proven and thus EDT analysis in the airline industry has provided conflicting results in the past,
pg. 26
although strong correlations have also been observed in the understanding of performance,
satisfaction and continuation of using the services from the customer’s end (Yoon & Kim, 2000).
The idea and understanding of the disconfirmation of expectations basically refers to the
correlation between the expectations the customer draws from the image and branding of the
airline and the perception they take away after the utilisation of those services (Churchill &
Surprenant, 1982).
The initial expectations of the customer play a pivotal role in defining the relationship
between the passenger and the organisation. Many airlines who overpromise on the quality of
services they offer have to backtrack from those promises if they fail to fulfil them and thus lose
the confidence the customer has put in them. The overall paradigm of the disconfirmation theory
revolves around four basic principles, which are; expectations, performance against those
expectations, disconfirmation and satisfaction. For those organisations that offer products which
are high involvement, extra effort is required to manage the expectations of customers because
the post-purchase satisfaction for such products is difficult to analyse and losing customers
because of dissatisfaction is highly likely (Churchill & Surprenant, 1982; Oliver & Beardon,
1983).
2.5.1 EXPECTATIONS
The expectations of a customer directly originate from the perceptions of the organisation
and the product image it exhibits. The relationship between customer satisfaction and the
fulfilment of expectations is very strong and thus it is imperative for every organisation,
especially airlines, to ensure that expectations about their services are not so overwhelming that
the airline would find these expectations difficult to manage (Churchill & Surprenant, 1982).
pg. 27
2.5.2 PERCEIVED PERFORMANCE
Performance is judged against the perceptions of the population, which are derived from
the expectations of customers and how they are met. If customer expectations are fulfilled then
customers perceive the performance of the airline to be satisfactory and overall customer
perception is improved (Anderson, 1973; LaBarbera & Mazursky, 1983; Cadotte et al., 1987).
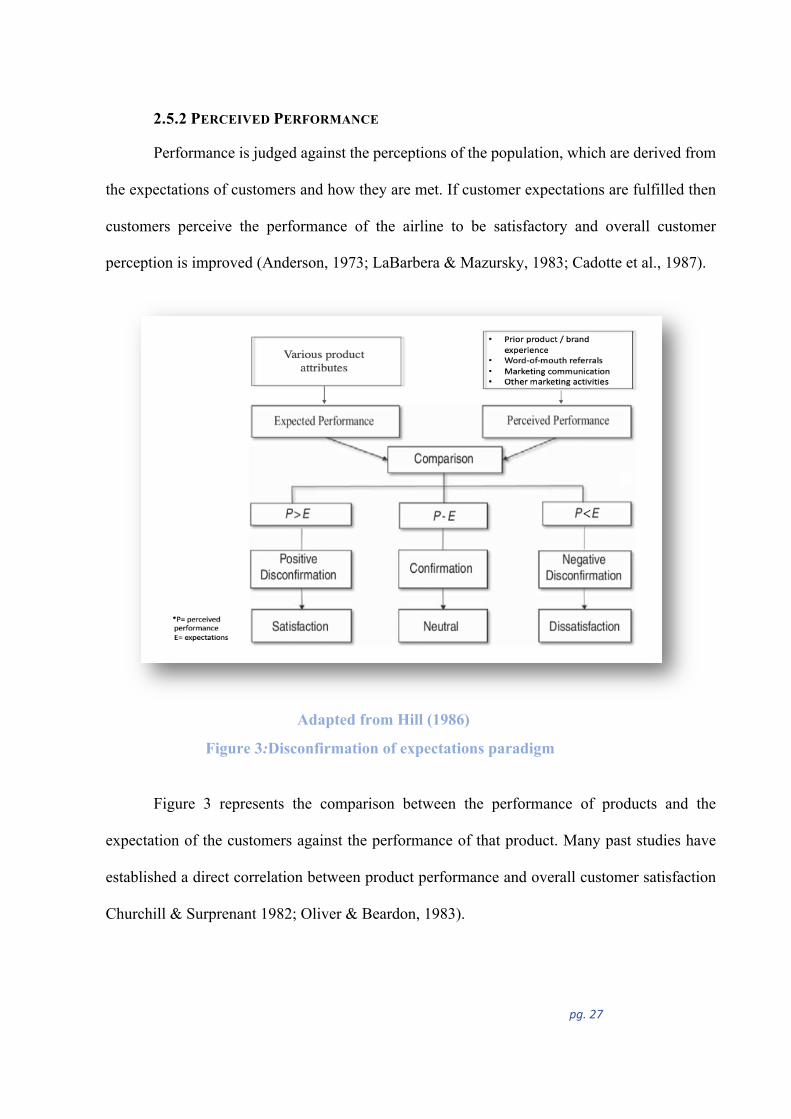
Adapted from Hill (1986)
Figure 3:Disconfirmation of expectations paradigm
Figure 3 represents the comparison between the performance of products and the
expectation of the customers against the performance of that product. Many past studies have
established a direct correlation between product performance and overall customer satisfaction
Churchill & Surprenant 1982; Oliver & Beardon, 1983).
pg. 28
2.5.3 DISCONFIRMATION
Disconfirmation basically refers to customers whose expectations were not met through
their experience of the airline (Bitner, 1990; Hill, 1986). It is imperative to understand that the
expectation of the customer may change over time as they keep on using their services. It is
observed that the idea of disconfirmation can have a great impact on the overall satisfaction of
the customer and it should be considered an entirely separate factor to predict overall customer
retention (Bitner, 1990; Hill, 1986). Enhancing satisfaction in the disconfirmation of expectation
requires revealing the psychological process that motivate satisfaction responses. Cognitively,
consumers form pre-consumption expectations, observing and comparing the performance of the
product attributes with their expectations. They form disconfirmation perceptions that merge
these perceptions with expectations and then make satisfaction judgments (Oliver 1980; Tse &
Wilton, 1988). Thus, it is believed that consumer satisfaction can be influenced immediately by
disconfirmation (Oliver,1993).
2.5.4 SATISFACTION
Satisfaction is the response of a customer to the services offered to them. These responses
need to be measured by the organisation in order to understand what the customer is feeling and
experiencing. It is imperative that the organisation knows the level of satisfaction the customer
experiences during their flight and in connection with the airline. This is because the level of
satisfaction a customer experiences is directly correlated to whether or not that customer will re-
fly with that particular airline. The entire process of EDT is employed to understand the intention
of customers to reuse the services of the organisation, meaning that the satisfaction of customers
is of utmost importance to any organisation, especially to airline businesses where the
competition is overwhelming and similar services are offered by all competitors.
pg. 29
2.6 BEHAVIOURAL INTENTION
To understand the role of EDT on behavioural intention, we should refer first to the
importance of satisfaction as an exploratory essential element in studies that have extended EDT
(Chang, Cai & Chang, 2018). Satisfaction is the link between behavioural intention and belief
variables (Wu, 2013). Moreover, Bhattacharjee (2001) reported that satisfaction is a mirror of an
individual psychological state, which is an outcome of the cognitive appraisal of disconfirmation.
As such, a high satisfaction level will lead to a rise in purchase intention. Consequently, the
satisfaction of customers is positively correlated with the re-purchase intention (Fang, Chiu &
Wang, 2011). Also, behavioural intention is directly correlated to the re-fly intention of the
customer, meaning that if the customer opts to use the services of the airline again, it can be
assumed that the passenger was satisfied with the services initially offered to them by the airline.
Another important factor that depicts a customer’s behavioural intention is the feedback
they provide. The fact that customers are willing to provide feedback means they intend to
continue to use the services of the organisation and they want improvement to avoid any further
discomfort. This feedback is a positive sign for the airline industry as they can factor in the
opinion of their customers when defining strategies and making all-around organisational
changes (Saha, 2009). In their study, Saha (2009) found that apart from providing feedback,
word of mouth is one of the most important aspects in judging the satisfaction of existing
customers and also a significant marketing tool. This is because word of mouth is more trusted
than any other form of advertisement; it costs the organisation the initial experience of the first
customer only and this effect continues with every other satisfied customer of the airline.
However, it was observed that mostly dissatisfied customers use word of mouth, to criticise the
organisation, and so instead of becoming a marketing tool for organisations word of mouth can
pg. 30
be a source of concern for an airline if their level of customer satisfaction is low (Fishbein &
Ajzen, 1975).
2.6.1 FACTORS AFFECTING RE-FLYING INTENTION
Bamford and Xystouri (2005) proposed that the aviation industry, which relies heavily
on excellent service quality, can only be enhanced and sustained through employee satisfaction
and dedication. The airlines that have been able to stay on top of the aviation game have done so
through continual excellence in service quality in everything from baggage handling and tracking
systems to basic crew and staff interaction. In fact, research shows customer tends to look at
factors such as punctuality, booking convenience and baggage handling to decide which airlines
to choose. A more in-depth analysis of consumer behaviour shows that small operational
procedures like customers looking at their luggage coming down the conveyer belts supposedly
puts them at ease and increases the overall satisfaction of their travelling experience; on the other
hand things like flights delays and service failure have a profoundly adverse impact on consumer
perception, which is passed on to and impressed upon friends and family (Bamford & Xystouri,
2005). Recurring customers who are loyal to the airline and frequently use their services are an
essential part of overall revenue, so much so that as early as the 1920s the aviation industry was
trying to incorporate value-added services such as a diverse dining menu.
Critical attention is paid to tray sizes and quality of the food. Food plays a huge role in
determining the brand perception of a particular airline in the mind of a customer and influences
their chances of re-flying. Customers compare everything from taste to freshness and ambience
when rating the services on offer. Food, however, is only the ninth most important thing that
customers take into account when selecting an airline, after scheduling, punctuality, safety,
speedy check-in, route network, comfort, price and mileage programmes.
pg. 31
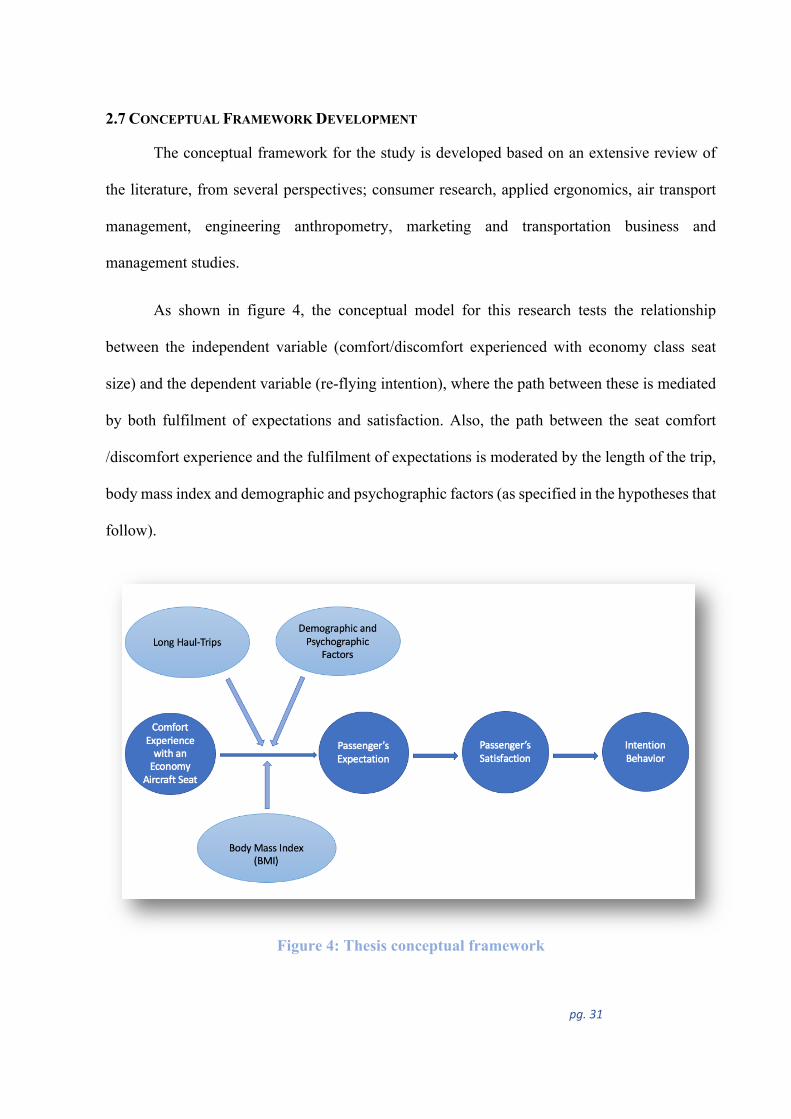
2.7 CONCEPTUAL FRAMEWORK DEVELOPMENT
The conceptual framework for the study is developed based on an extensive review of
the literature, from several perspectives; consumer research, applied ergonomics, air transport
management, engineering anthropometry, marketing and transportation business and
management studies.
As shown in figure 4, the conceptual model for this research tests the relationship
between the independent variable (comfort/discomfort experienced with economy class seat
size) and the dependent variable (re-flying intention), where the path between these is mediated
by both fulfilment of expectations and satisfaction. Also, the path between the seat comfort
/discomfort experience and the fulfilment of expectations is moderated by the length of the trip,
body mass index and demographic and psychographic factors (as specified in the hypotheses that
follow).
Figure 4: Thesis conceptual framework
pg. 32
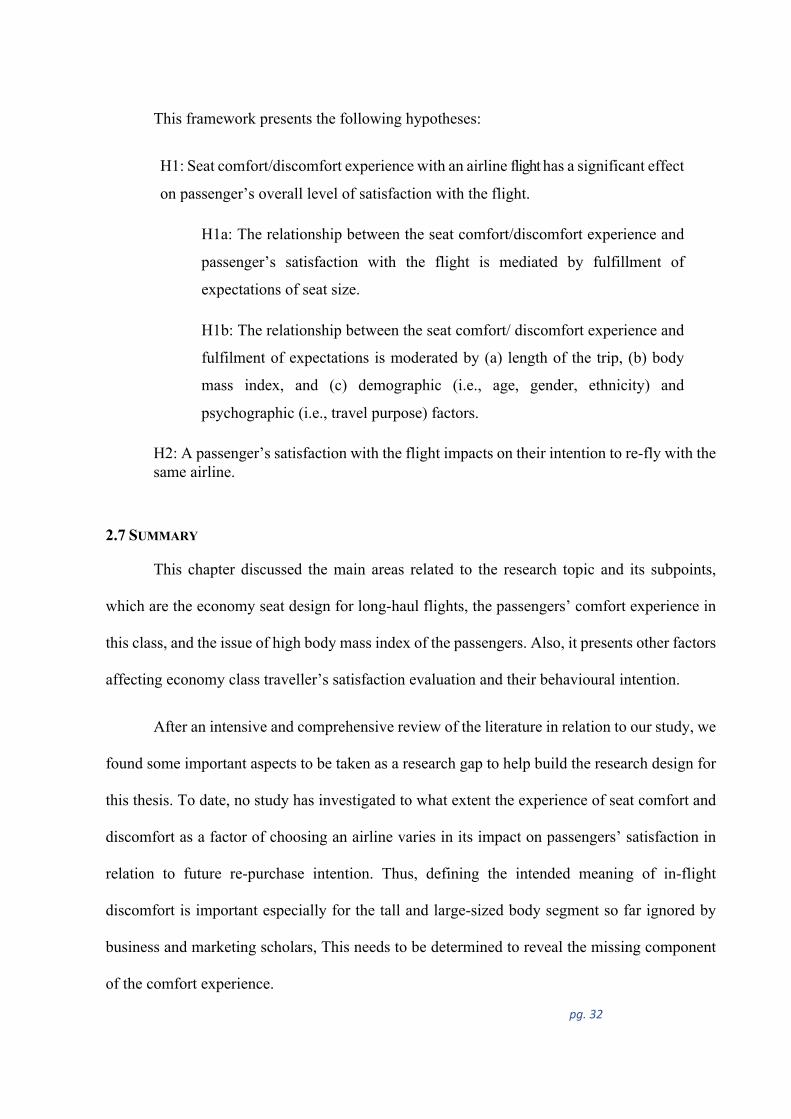
This framework presents the following hypotheses:
H1: Seat comfort/discomfort experience with an airline flight has a significant effect
on passenger’s overall level of satisfaction with the flight.
H1a: The relationship between the seat comfort/discomfort experience and
passenger’s satisfaction with the flight is mediated by fulfillment of
expectations of seat size.
H1b: The relationship between the seat comfort/ discomfort experience and
fulfilment of expectations is moderated by (a) length of the trip, (b) body
mass index, and (c) demographic (i.e., age, gender, ethnicity) and
psychographic (i.e., travel purpose) factors.
H2: A passenger’s satisfaction with the flight impacts on their intention to re-fly with the same airline.
2.7 SUMMARY
This chapter discussed the main areas related to the research topic and its subpoints,
which are the economy seat design for long-haul flights, the passengers’ comfort experience in
this class, and the issue of high body mass index of the passengers. Also, it presents other factors
affecting economy class traveller’s satisfaction evaluation and their behavioural intention.
After an intensive and comprehensive review of the literature in relation to our study, we
found some important aspects to be taken as a research gap to help build the research design for
this thesis. To date, no study has investigated to what extent the experience of seat comfort and
discomfort as a factor of choosing an airline varies in its impact on passengers’ satisfaction in
relation to future re-purchase intention. Thus, defining the intended meaning of in-flight
discomfort is important especially for the tall and large-sized body segment so far ignored by
business and marketing scholars, This needs to be determined to reveal the missing component
of the comfort experience.

pg. 33
An issue highlighted is the inadequacy of previous studies and whether passengers
remember the differences in the comfort/ discomfort experience (emotionally and physically)
from their most recent trip. In fact, passengers will form a mental image of the airline based on
internal knowledge and past experience and use that information to influence others. How? If
passengers feel that the in-flight tangible comfort (seats) and services are not good, their negative
impression will be disseminated among their circle of friends. Therefore, airline companies
should be highly conversant with these matters in order to be more internationally recognised
and competitive in the global airline market. Thus, there is a need for investigating the impact of
customer’s prior expectations and perceived performance, especially with the sitting
environment on long-haul flights in economy class that might affect passenger satisfaction, and
also might in return, affect passengers’ post-purchase intentions especially those passengers who
are tall or have a high body mass index. Airplane seats are considered to become a more
significant aspect of airline service quality perception, especially for long-distance flights. This
study will investigate the importance of seat comfort for long-haul travellers especially for tall
and large-sized passengers. Per se, this factor requires an appropriate strategic re-evaluation
because it is a neglected element in the discussion of overall passenger evaluation of aircraft
cabin services/ products and repurchasing behaviour.
The results of this research may be appreciated by passengers who suffer from the
discomfort of the seat in economy class flights. The study is based on the theory of the
disconfirmation of expectations, which assists us to understand consumer post-purchase
behaviour in the form of their satisfaction and repurchase intentions with the same airline that
has small seats, both in pitch and width.

pg. 34
CHAPTER 3. RESEARCH DESIGN
3.1 INTRODUCTION
To understand the research issue more deeply, this chapter presents detailed information
about the research methodology used to identify the importance of enhancing in-flight comfort
in economy class by finding out the effect of structure and environment of economy class seats
on the comfort level of long-haul travellers, their satisfaction level and their future intention to
re-fly with the same airline.
This chapter consists of six main parts, including the introduction, outlines for the
development of the research questionnaire, a discussion on the research approach and
justification of the selected methodology. The chapter also presents the research method, the
method justification, pre-test and measurements and the research sampling plan. Finally, there
is clarification of the statistical methods used for analysing the primary data gathered from
targeted sample and a brief conclusion.
3.2 QUESTIONNAIRE AND MEASUREMENTS
A quantitative approach (i.e., a survey) is developed in a positivism paradigm (Grant &
Giddings, 2002) for this study, to statistically measure the effect of economy class aircraft seat
comfort/discomfort on long-haul traveller satisfaction in relation to their re-flying intention (with
the same airline). Employing a quantitative method in this study has several justifications; first,
to generate the needed information from a large sample in less time and with less effort, and so
reduce the monetary cost. Second, the selection of the quantitative method is effective in
explaining the complicated situations in correlational data that provide understanding and
knowledge to the research (Zikmund, D’Alessandro, Winzar, Lowe & Babin, 2014). Moreover,
the quantitative method can present the data in the form of numbers for reaching conclusions
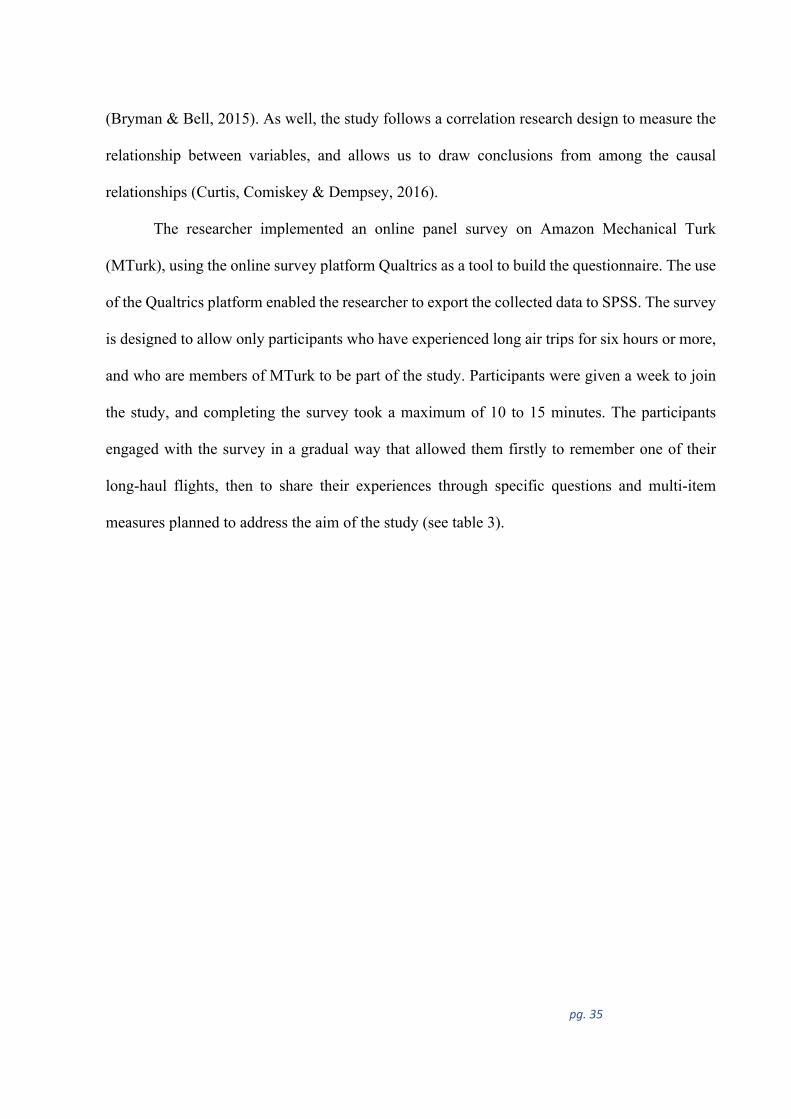
pg. 35
(Bryman & Bell, 2015). As well, the study follows a correlation research design to measure the
relationship between variables, and allows us to draw conclusions from among the causal
relationships (Curtis, Comiskey & Dempsey, 2016).
The researcher implemented an online panel survey on Amazon Mechanical Turk
(MTurk), using the online survey platform Qualtrics as a tool to build the questionnaire. The use
of the Qualtrics platform enabled the researcher to export the collected data to SPSS. The survey
is designed to allow only participants who have experienced long air trips for six hours or more,
and who are members of MTurk to be part of the study. Participants were given a week to join
the study, and completing the survey took a maximum of 10 to 15 minutes. The participants
engaged with the survey in a gradual way that allowed them firstly to remember one of their
long-haul flights, then to share their experiences through specific questions and multi-item
measures planned to address the aim of the study (see table 3).
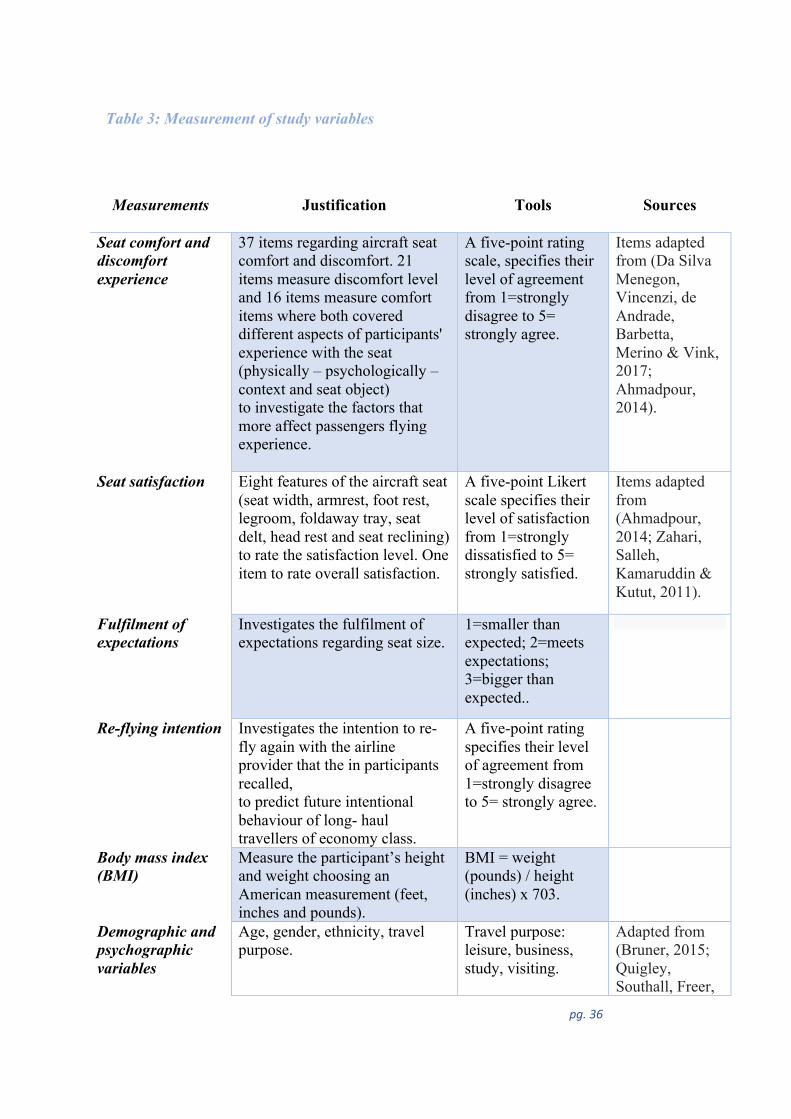
pg. 36
Table 3: Measurement of study variables
Measurements Justification Tools Sources
Seat comfort and discomfort experience
37 items regarding aircraft seat comfort and discomfort. 21 items measure discomfort level and 16 items measure comfort items where both covered different aspects of participants' experience with the seat (physically – psychologically – context and seat object) to investigate the factors that more affect passengers flying experience.
A five-point rating scale, specifies their level of agreement from 1=strongly disagree to 5= strongly agree.
Items adapted from (Da Silva Menegon, Vincenzi, de Andrade, Barbetta, Merino & Vink, 2017; Ahmadpour, 2014).
Seat satisfaction Eight features of the aircraft seat (seat width, armrest, foot rest, legroom, foldaway tray, seat delt, head rest and seat reclining) to rate the satisfaction level. One item to rate overall satisfaction.
A five-point Likert scale specifies their level of satisfaction from 1=strongly dissatisfied to 5= strongly satisfied.
Items adapted from (Ahmadpour, 2014; Zahari, Salleh, Kamaruddin & Kutut, 2011).
Fulfilment of expectations
Investigates the fulfilment of expectations regarding seat size.
1=smaller than expected; 2=meets expectations; 3=bigger than expected..
Re-flying intention Investigates the intention to re-fly again with the airline provider that the in participants recalled, to predict future intentional behaviour of long- haul travellers of economy class.
A five-point rating specifies their level of agreement from 1=strongly disagree to 5= strongly agree.
Body mass index (BMI)
Measure the participant’s height and weight choosing an American measurement (feet, inches and pounds).
BMI = weight (pounds) / height (inches) x 703.
Demographic and psychographic variables
Age, gender, ethnicity, travel purpose.
Travel purpose: leisure, business, study, visiting.
Adapted from (Bruner, 2015; Quigley, Southall, Freer,
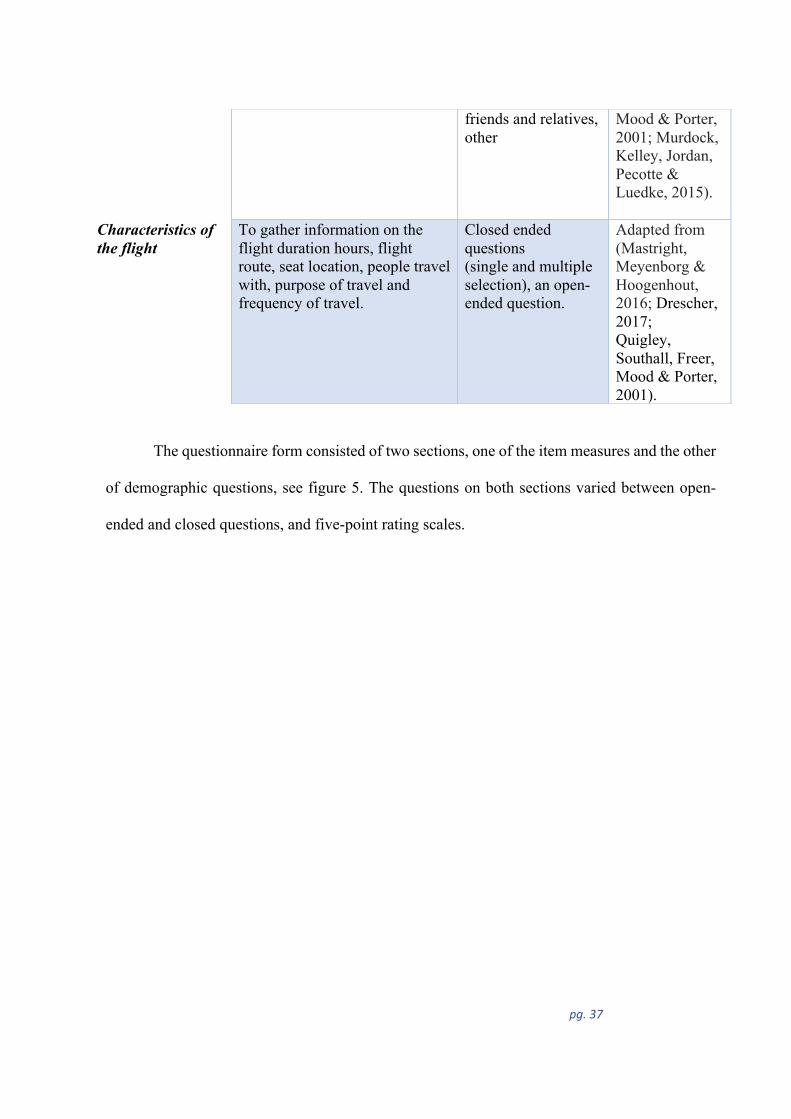
pg. 37
The questionnaire form consisted of two sections, one of the item measures and the other
of demographic questions, see figure 5. The questions on both sections varied between open-
ended and closed questions, and five-point rating scales.
friends and relatives, other
Mood & Porter, 2001; Murdock, Kelley, Jordan, Pecotte & Luedke, 2015).
Characteristics of the flight
To gather information on the flight duration hours, flight route, seat location, people travel with, purpose of travel and frequency of travel.
Closed ended questions (single and multiple selection), an open-ended question.
Adapted from (Mastright, Meyenborg & Hoogenhout, 2016; Drescher, 2017; Quigley, Southall, Freer, Mood & Porter, 2001).
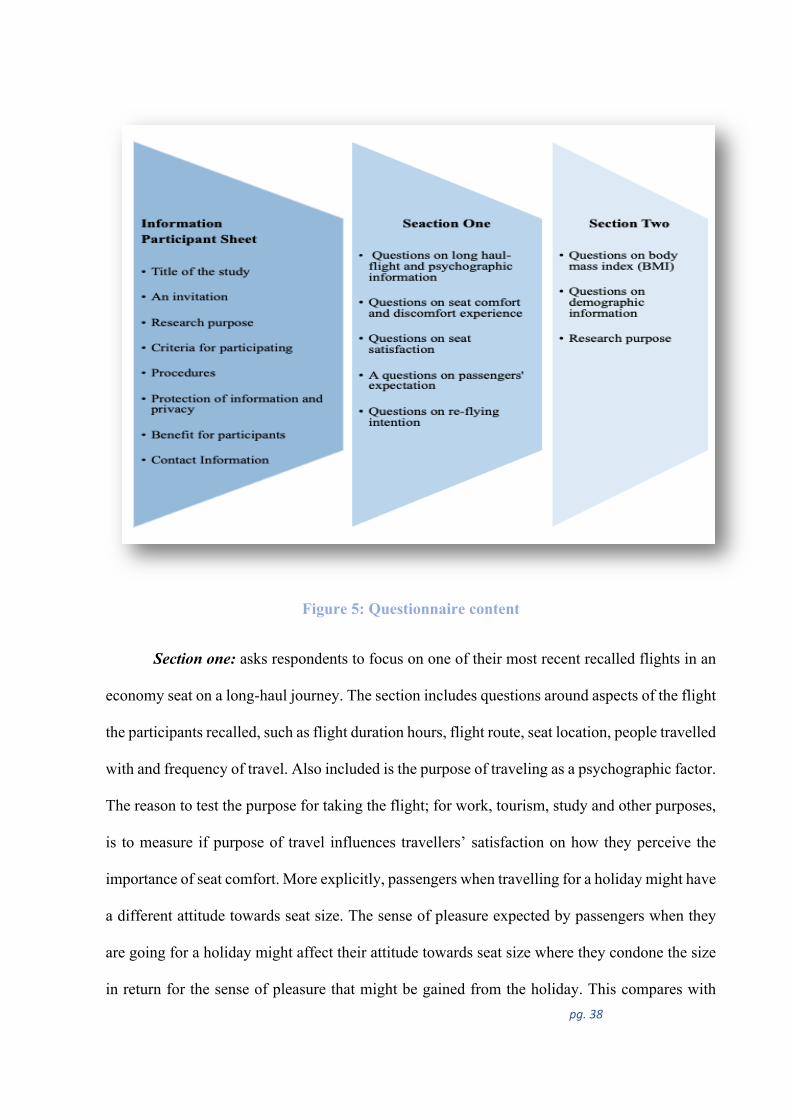
pg. 38
Figure 5: Questionnaire content
Section one: asks respondents to focus on one of their most recent recalled flights in an
economy seat on a long-haul journey. The section includes questions around aspects of the flight
the participants recalled, such as flight duration hours, flight route, seat location, people travelled
with and frequency of travel. Also included is the purpose of traveling as a psychographic factor.
The reason to test the purpose for taking the flight; for work, tourism, study and other purposes,
is to measure if purpose of travel influences travellers’ satisfaction on how they perceive the
importance of seat comfort. More explicitly, passengers when travelling for a holiday might have
a different attitude towards seat size. The sense of pleasure expected by passengers when they
are going for a holiday might affect their attitude towards seat size where they condone the size
in return for the sense of pleasure that might be gained from the holiday. This compares with
pg. 39
passengers flying for work purposes and who might want a more comfortable environment in a
long-haul air journey.
Following this is an in-depth investigation of the seat comfort and discomfort that
participants experienced; provided by 37 rating scale items concerning the emotional and
physical aspects, such as seat enjoyment and ease of stretching legs. Also tested is their overall
comfort experience. This is followed by eight items measuring their satisfaction with each of the
seat features; for instance seat width, foot rest and seat belt. Another rating scale was provided
to test their overall satisfaction with the seat features. Participants were also asked about their
prior expectation of seat size on their flight; whether it met their expectation or was smaller or
bigger than expected, in order to test the influence of prior expectation of seat size on intention
to fly again with the same airline. The last question in the section was about their intention of
flying again with the same airline provider, whether they experienced comfort or discomfort with
seat size in their long flight.
Section two: Respondents were asked for demographic information (gender, age group,
ethnicity) and their body mass index (weight and height). Since different ethnicities have
different body structures, this might affect their comfort experience with the seat and so then
affect their satisfaction in relation to re-flying with the same airline on long-haul trips. Measuring
BMI of participants is important to this study to distinguish between high BMI, > 30, overweight
size and normal weight size in relation to passengers’ comfort experience and their expectations
and satisfaction. The survey asked participants to provide their BMI in numbers using the United
States mass unit to measure height in feet and inches, and weight in pounds. This data was
calculated through SPSS.
pg. 40
3.3 PRELIMINARY TEST
The study measures underwent pre-testing before the survey was published to detect and
correct any errors that could occur when building the questionnaire and that could affect study
measurements and results. For the pilot study, the measurement scale of the items in the survey
was pre-tested on an electronic copy with five friends of the researcher, who were familiar with
the Qualtrics software programme. The pre-test was run to ensure the intelligibility of all survey
questions, estimate the required time to complete the questionnaire and evaluate the recorded
value of items before using them in the main study.
Our hypothesis comprised both dependent and independent variables, also moderators
and mediator variables.
IV = comfort/discomfort experience with an economy aircraft seat
DV = satisfaction , re-flying intention
Me = expectation, satisfaction
Mo = length of trip, body mass index (BMI), and demographic and psychographic
factors.
3.4 SAMPLE
The study recruited n=168 respondents via an internet panel survey (Amazon Mechanical
Turk) to produce a sufficient and accurate response that matched our sample plan. The selection
of participants followed a quota sampling, a tailored sample from a selected population, that has
relevance to our study. Sampling involved a two-step process; first, specifying a list of quotas
such as age group under 18 to above 60, and males and females who varied in their ethnicity and
body mass index (BMI). The second step involved collecting a sample of individuals from the
USA who meet the following selection criteria:
• passenger has travelled on economy class with more than one airline
pg. 41
• has experienced long-haul air trips
• able to recall his/her most recent long-haul air journey whether his/her inflight experience
was comfortable or not.
3.5 ANALYSIS
The result of the survey collected from the targeted sample was analysed using IBM-SPSS
statistical software. The study data was analysed with respect to:
• reliability: via Cronbach’s alpha to assess scale reliability
• frequency: to examine the distribution of key variables
• correlations: to measure the strength and direction of the relationship between four of the
key constructs of the model (comfort experience, expectation, satisfaction and intention
behaviour ).
One-way ANOVA: to identify the differences between means of three groups of our
sample BMI.
As well, the researcher applied the Hayes method to test the indirect and direct effects of
mediation and moderation effects using models 6 and 9 (Hayes, 2017). Each of these models has
different functions; model 6 was used to test the influence of indirect effect variables through
two mediators, and model 9 to test the influence variables through two moderators.
3.6 ETHICAL CONSIDERATIONS
The method of data collection required ethical approval from the Auckland University of
Technology’s Ethics Committee (AUTEC). The questionnaire did not request any sensitive or
personal information. Participation in the study was voluntary. A participant information sheet
was provided with the researcher’s contact details and that of the supervisor of the research and
AUTEC for any further concerns.
pg. 42
3.7 CONCLUSION
This chapter provided the methods and different strategies used in the study to minimise
research methodology limitations. The chapter covered mainly questionnaire development and
procedure, collection of the data and the sample. Finally, the statistical analysis tools used were
described. The following chapter presents the findings of this study on the seat
comfort/discomfort experience and how it can affect passengers’ satisfaction and re-flying
intentions.
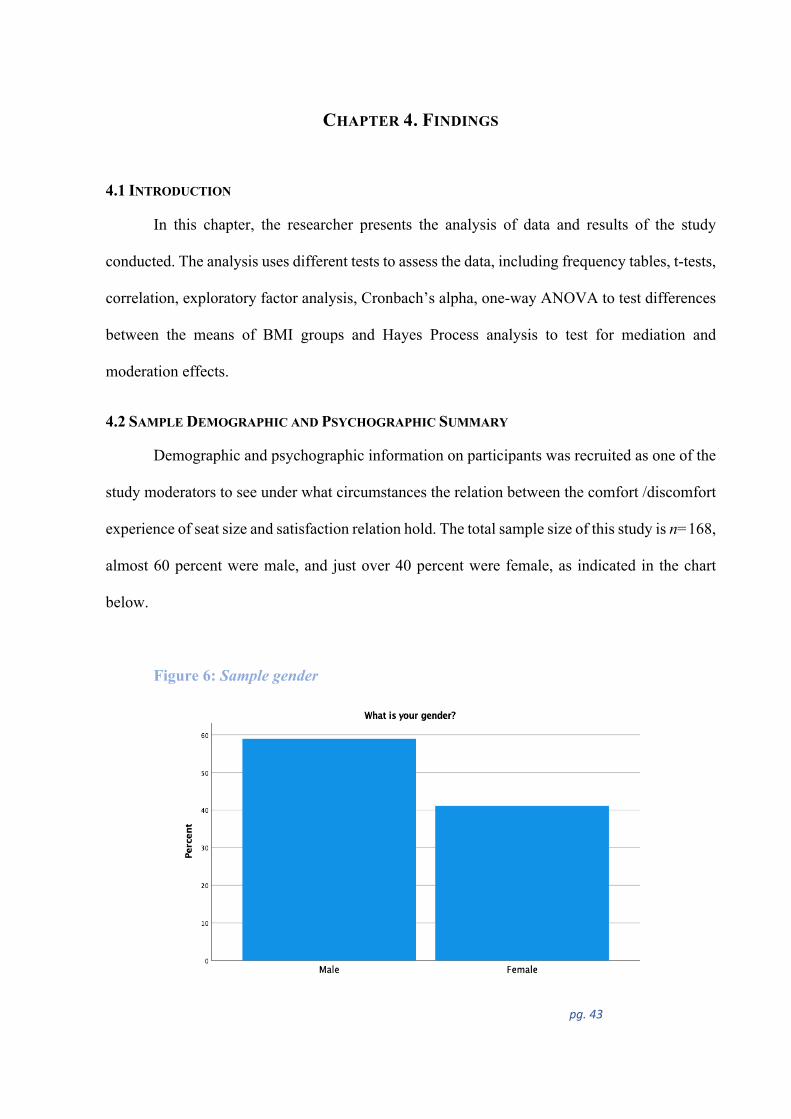
pg. 43
CHAPTER 4. FINDINGS
4.1 INTRODUCTION
In this chapter, the researcher presents the analysis of data and results of the study
conducted. The analysis uses different tests to assess the data, including frequency tables, t-tests,
correlation, exploratory factor analysis, Cronbach’s alpha, one-way ANOVA to test differences
between the means of BMI groups and Hayes Process analysis to test for mediation and
moderation effects.
4.2 SAMPLE DEMOGRAPHIC AND PSYCHOGRAPHIC SUMMARY
Demographic and psychographic information on participants was recruited as one of the
study moderators to see under what circumstances the relation between the comfort /discomfort
experience of seat size and satisfaction relation hold. The total sample size of this study is n=168,
almost 60 percent were male, and just over 40 percent were female, as indicated in the chart
below.
Figure 6: Sample gender
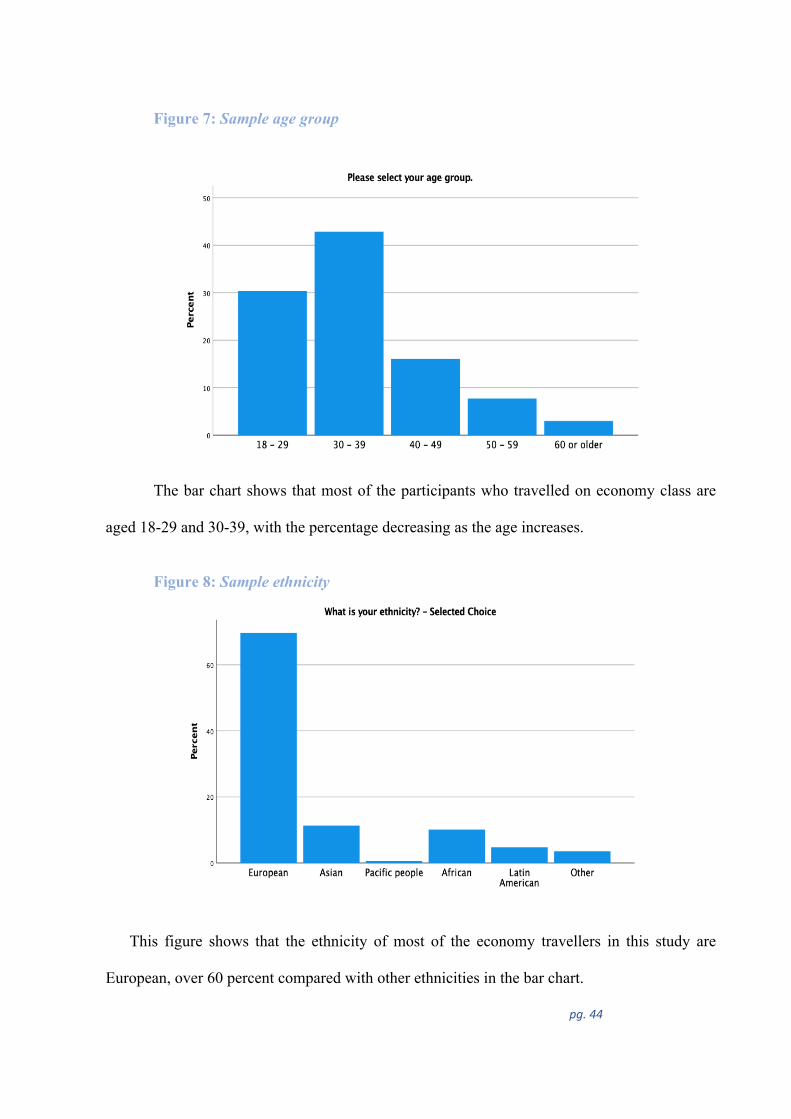
pg. 44
Figure 7: Sample age group
The bar chart shows that most of the participants who travelled on economy class are
aged 18-29 and 30-39, with the percentage decreasing as the age increases.
Figure 8: Sample ethnicity
This figure shows that the ethnicity of most of the economy travellers in this study are
European, over 60 percent compared with other ethnicities in the bar chart.
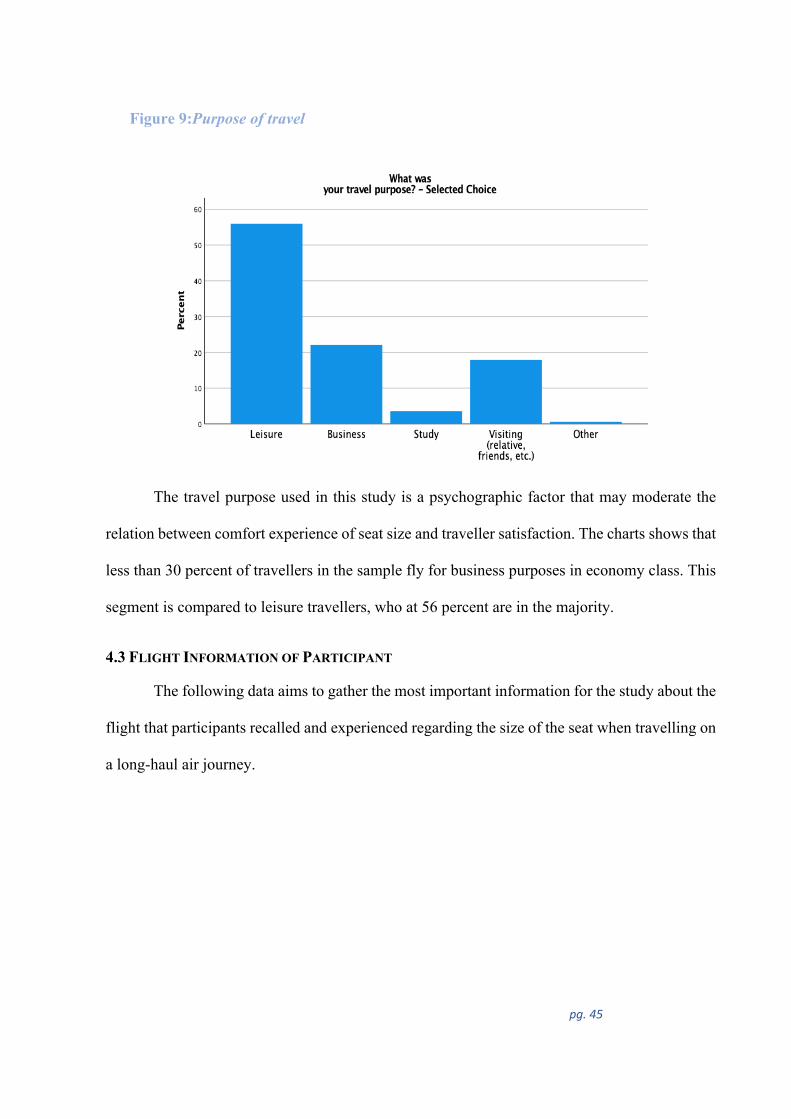
pg. 45
Figure 9:Purpose of travel
The travel purpose used in this study is a psychographic factor that may moderate the
relation between comfort experience of seat size and traveller satisfaction. The charts shows that
less than 30 percent of travellers in the sample fly for business purposes in economy class. This
segment is compared to leisure travellers, who at 56 percent are in the majority.
4.3 FLIGHT INFORMATION OF PARTICIPANT
The following data aims to gather the most important information for the study about the
flight that participants recalled and experienced regarding the size of the seat when travelling on
a long-haul air journey.
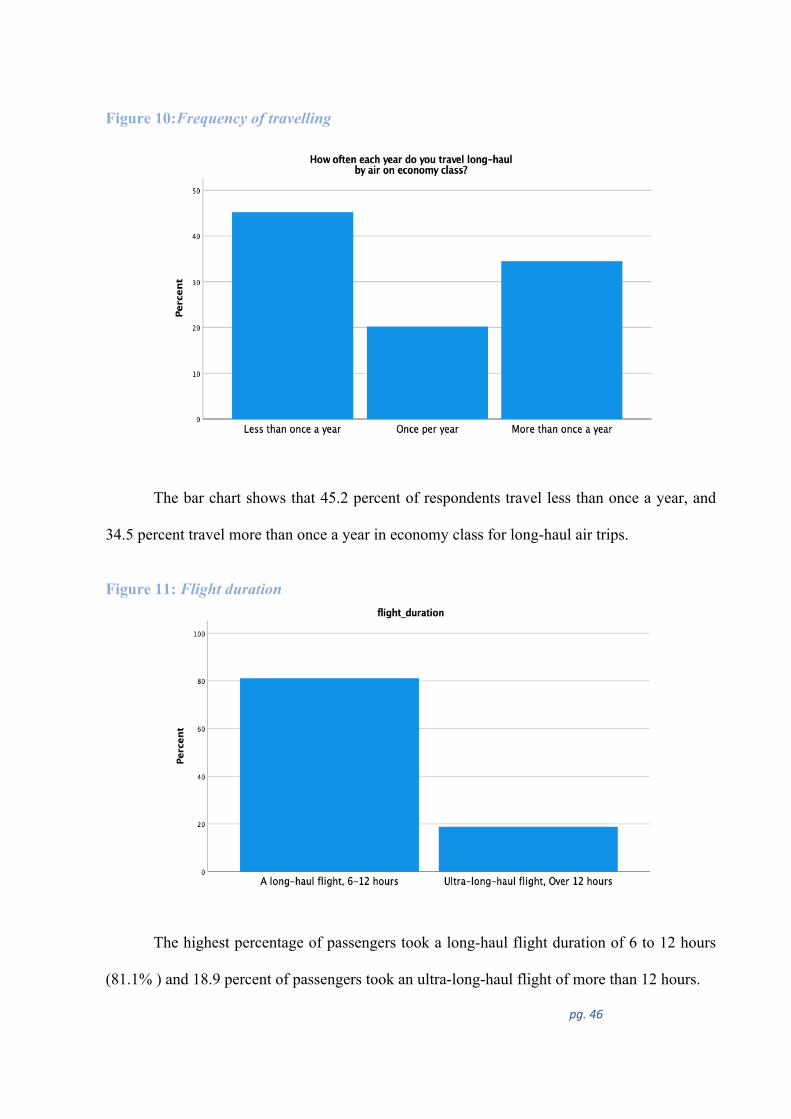
pg. 46
Figure 10:Frequency of travelling
The bar chart shows that 45.2 percent of respondents travel less than once a year, and
34.5 percent travel more than once a year in economy class for long-haul air trips.
Figure 11: Flight duration
The highest percentage of passengers took a long-haul flight duration of 6 to 12 hours
(81.1% ) and 18.9 percent of passengers took an ultra-long-haul flight of more than 12 hours.
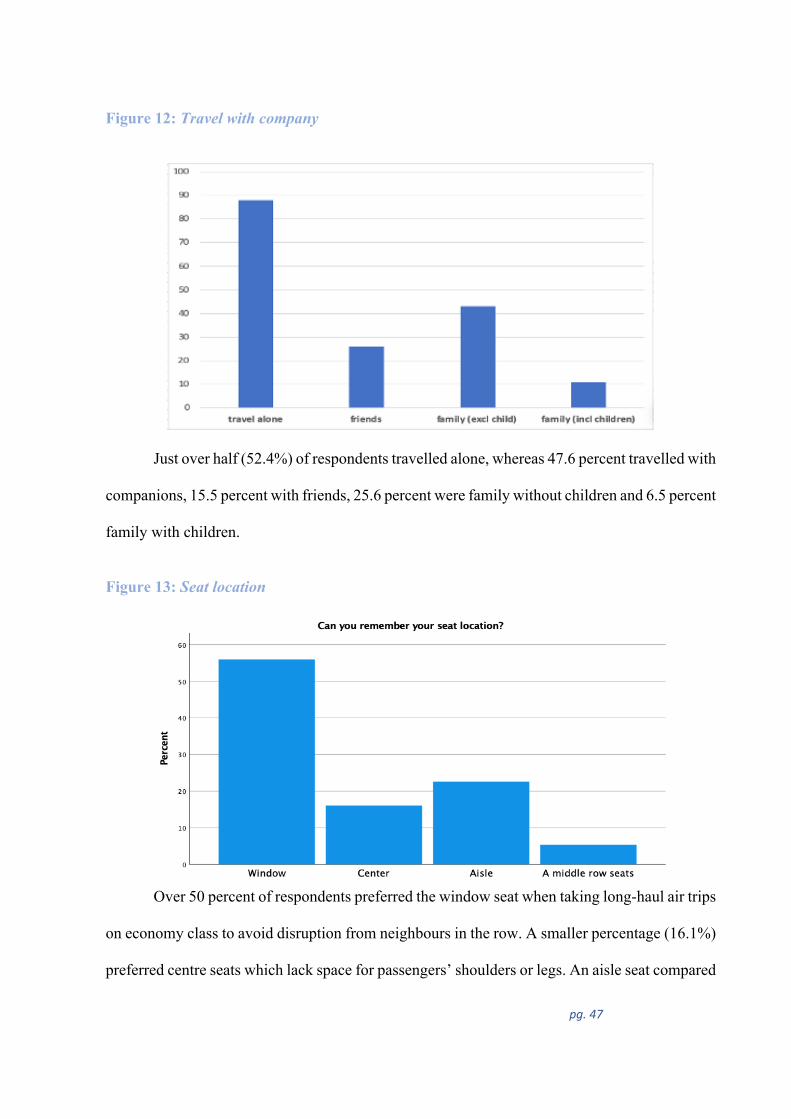
pg. 47
Figure 12: Travel with company
Just over half (52.4%) of respondents travelled alone, whereas 47.6 percent travelled with
companions, 15.5 percent with friends, 25.6 percent were family without children and 6.5 percent
family with children.
Figure 13: Seat location
Over 50 percent of respondents preferred the window seat when taking long-haul air trips
on economy class to avoid disruption from neighbours in the row. A smaller percentage (16.1%)
preferred centre seats which lack space for passengers’ shoulders or legs. An aisle seat compared
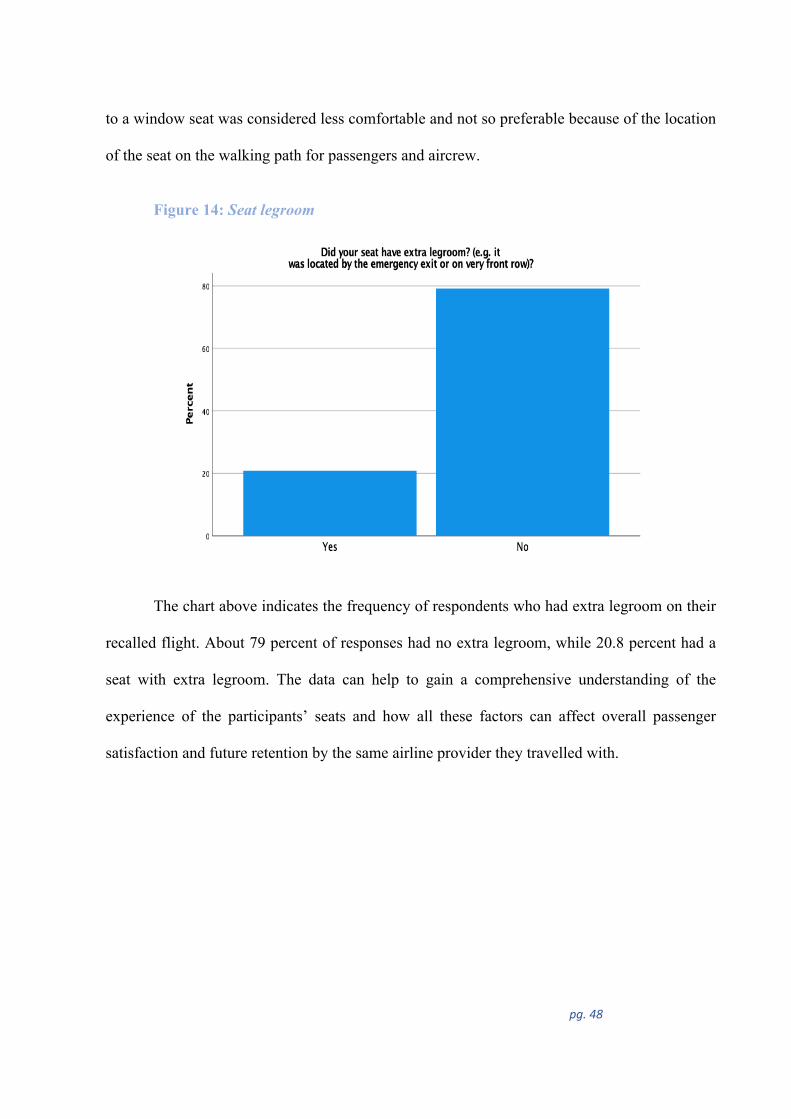
pg. 48
to a window seat was considered less comfortable and not so preferable because of the location
of the seat on the walking path for passengers and aircrew.
Figure 14: Seat legroom
The chart above indicates the frequency of respondents who had extra legroom on their
recalled flight. About 79 percent of responses had no extra legroom, while 20.8 percent had a
seat with extra legroom. The data can help to gain a comprehensive understanding of the
experience of the participants’ seats and how all these factors can affect overall passenger
satisfaction and future retention by the same airline provider they travelled with.
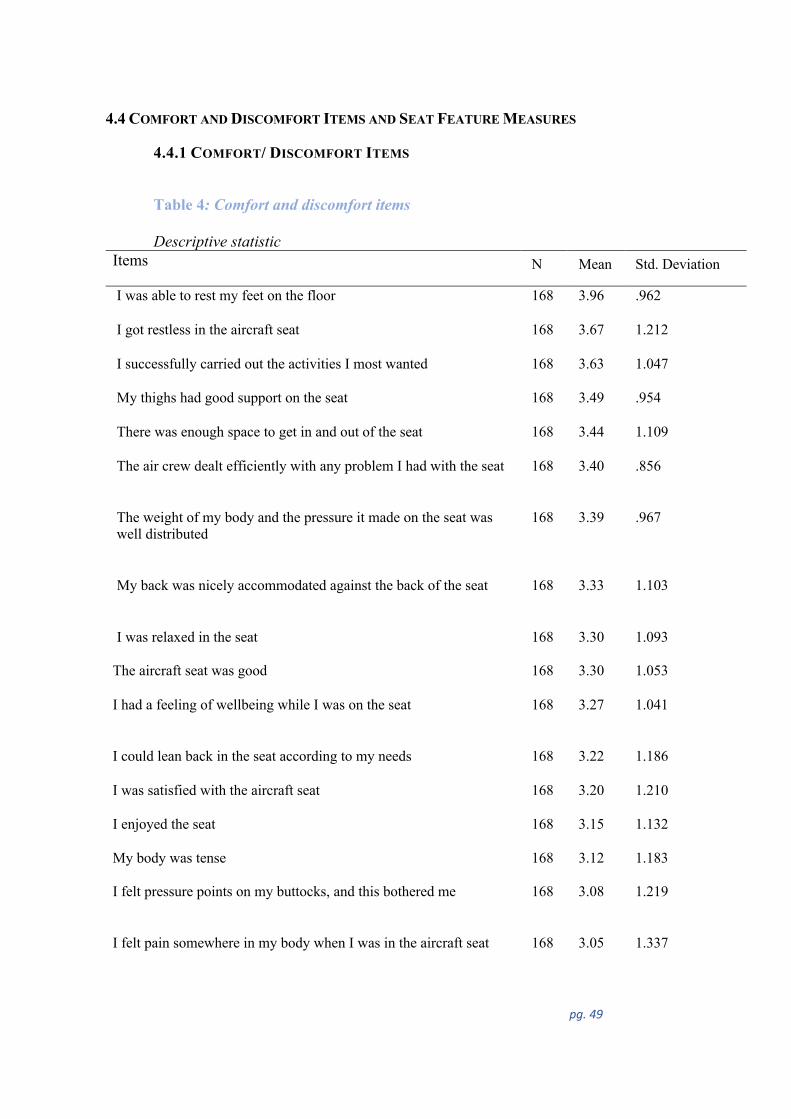
pg. 49
4.4 COMFORT AND DISCOMFORT ITEMS AND SEAT FEATURE MEASURES
4.4.1 COMFORT/ DISCOMFORT ITEMS
Table 4: Comfort and discomfort items
Descriptive statistic Items N Mean Std. Deviation
I was able to rest my feet on the floor 168 3.96 .962
I got restless in the aircraft seat 168 3.67 1.212
I successfully carried out the activities I most wanted 168 3.63 1.047
My thighs had good support on the seat 168 3.49 .954
There was enough space to get in and out of the seat 168 3.44 1.109
The air crew dealt efficiently with any problem I had with the seat 168 3.40 .856
The weight of my body and the pressure it made on the seat was well distributed
168 3.39 .967
My back was nicely accommodated against the back of the seat 168 3.33 1.103
I was relaxed in the seat 168 3.30 1.093
The aircraft seat was good 168 3.30 1.053
I had a feeling of wellbeing while I was on the seat 168 3.27 1.041
I could lean back in the seat according to my needs 168 3.22 1.186
I was satisfied with the aircraft seat 168 3.20 1.210
I enjoyed the seat 168 3.15 1.132
My body was tense 168 3.12 1.183
I felt pressure points on my buttocks, and this bothered me 168 3.08 1.219
I felt pain somewhere in my body when I was in the aircraft seat 168 3.05 1.337
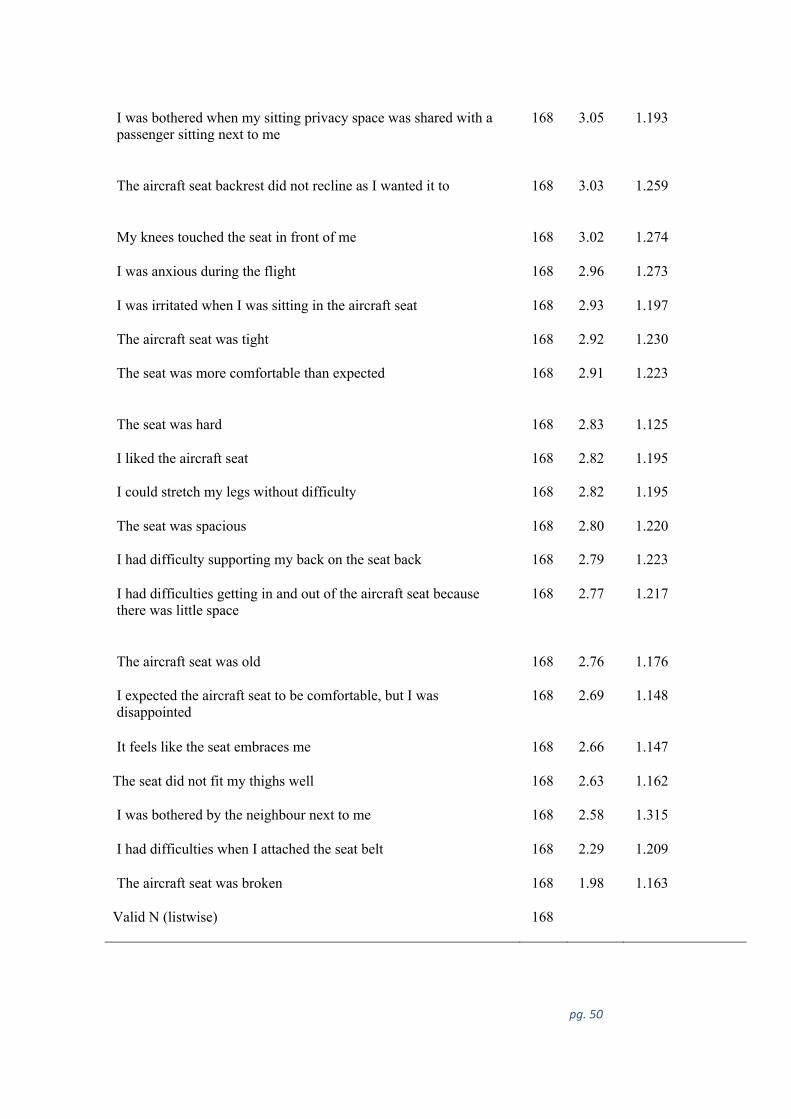
pg. 50
I was bothered when my sitting privacy space was shared with a passenger sitting next to me
168 3.05 1.193
The aircraft seat backrest did not recline as I wanted it to 168 3.03 1.259
My knees touched the seat in front of me 168 3.02 1.274
I was anxious during the flight 168 2.96 1.273
I was irritated when I was sitting in the aircraft seat 168 2.93 1.197
The aircraft seat was tight
168 2.92 1.230
The seat was more comfortable than expected 168 2.91 1.223
The seat was hard
168 2.83 1.125
I liked the aircraft seat
168 2.82 1.195
I could stretch my legs without difficulty 168 2.82 1.195
The seat was spacious
168 2.80 1.220
I had difficulty supporting my back on the seat back 168 2.79 1.223
I had difficulties getting in and out of the aircraft seat because there was little space
168 2.77 1.217
The aircraft seat was old
168 2.76 1.176
I expected the aircraft seat to be comfortable, but I was disappointed
168 2.69 1.148
It feels like the seat embraces me 168 2.66 1.147
The seat did not fit my thighs well 168 2.63 1.162
I was bothered by the neighbour next to me 168 2.58 1.315
I had difficulties when I attached the seat belt 168 2.29 1.209
The aircraft seat was broken 168 1.98 1.163
Valid N (listwise) 168
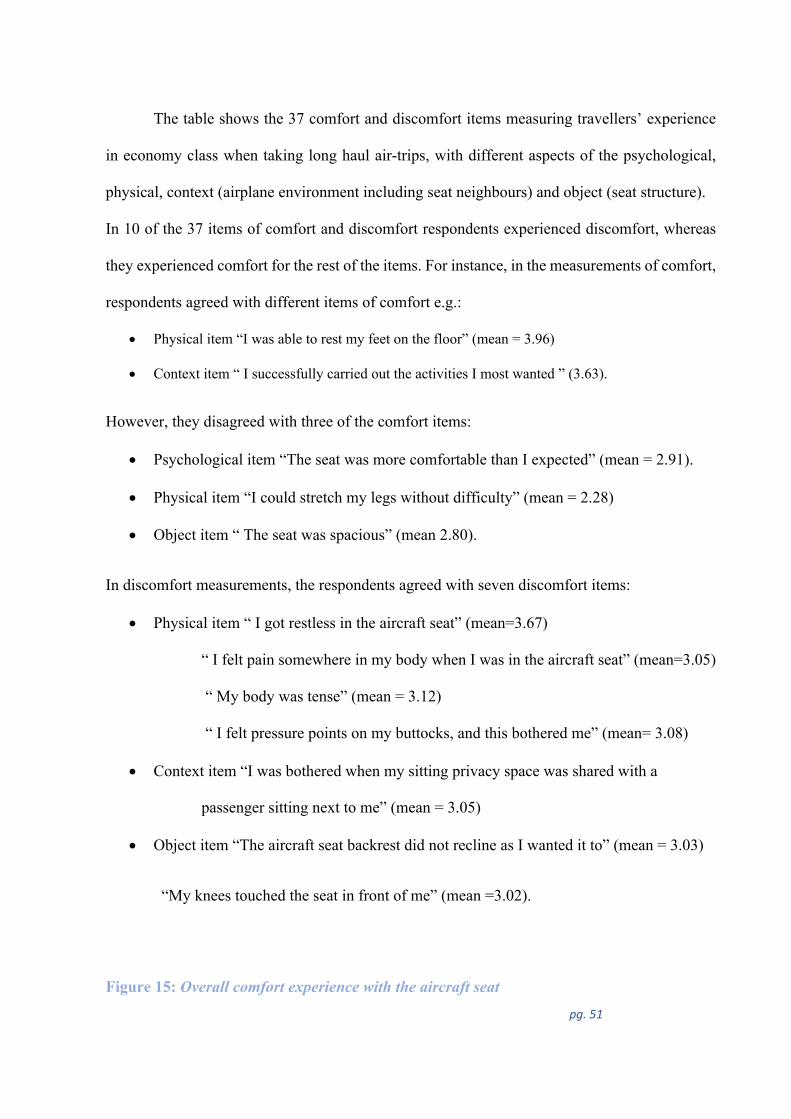
pg. 51
The table shows the 37 comfort and discomfort items measuring travellers’ experience
in economy class when taking long haul air-trips, with different aspects of the psychological,
physical, context (airplane environment including seat neighbours) and object (seat structure).
In 10 of the 37 items of comfort and discomfort respondents experienced discomfort, whereas
they experienced comfort for the rest of the items. For instance, in the measurements of comfort,
respondents agreed with different items of comfort e.g.:
• Physical item “I was able to rest my feet on the floor” (mean = 3.96)
• Context item “ I successfully carried out the activities I most wanted ” (3.63).
However, they disagreed with three of the comfort items:
• Psychological item “The seat was more comfortable than I expected” (mean = 2.91).
• Physical item “I could stretch my legs without difficulty” (mean = 2.28)
• Object item “ The seat was spacious” (mean 2.80).
In discomfort measurements, the respondents agreed with seven discomfort items:
• Physical item “ I got restless in the aircraft seat” (mean=3.67)
“ I felt pain somewhere in my body when I was in the aircraft seat” (mean=3.05)
“ My body was tense” (mean = 3.12)
“ I felt pressure points on my buttocks, and this bothered me” (mean= 3.08)
• Context item “I was bothered when my sitting privacy space was shared with a
passenger sitting next to me” (mean = 3.05)
• Object item “The aircraft seat backrest did not recline as I wanted it to” (mean = 3.03)
“My knees touched the seat in front of me” (mean =3.02).
Figure 15: Overall comfort experience with the aircraft seat
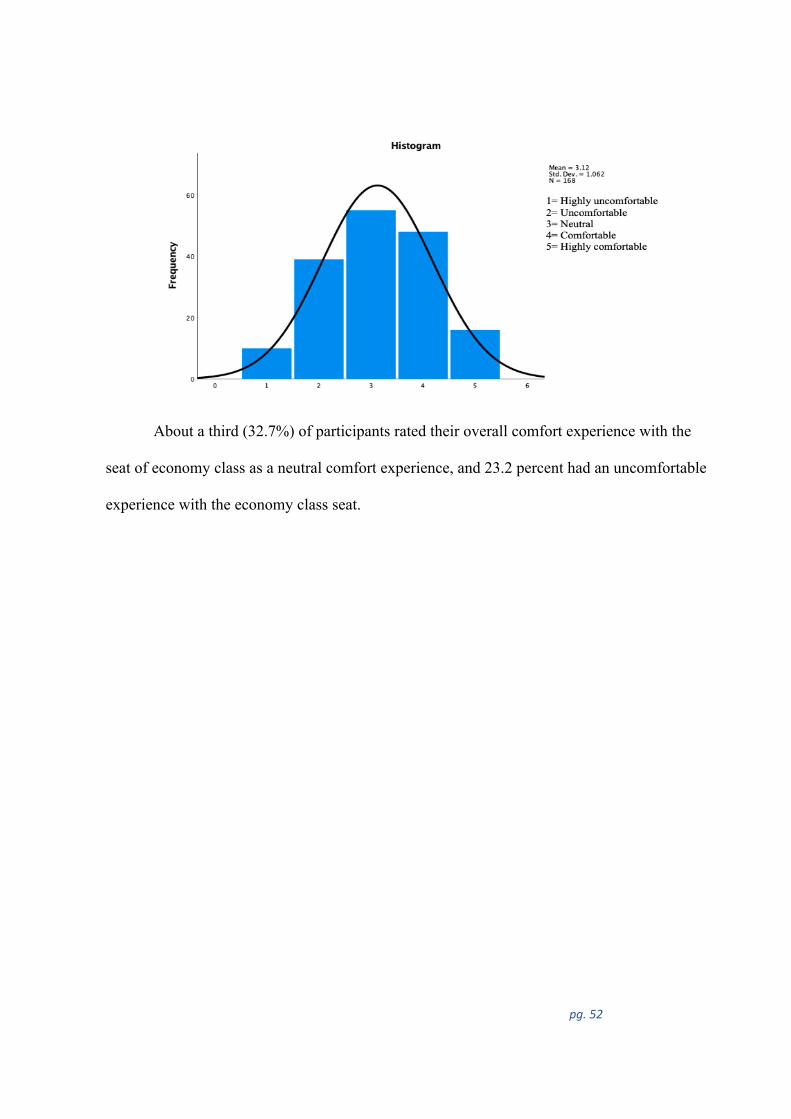
pg. 52
About a third (32.7%) of participants rated their overall comfort experience with the
seat of economy class as a neutral comfort experience, and 23.2 percent had an uncomfortable
experience with the economy class seat.
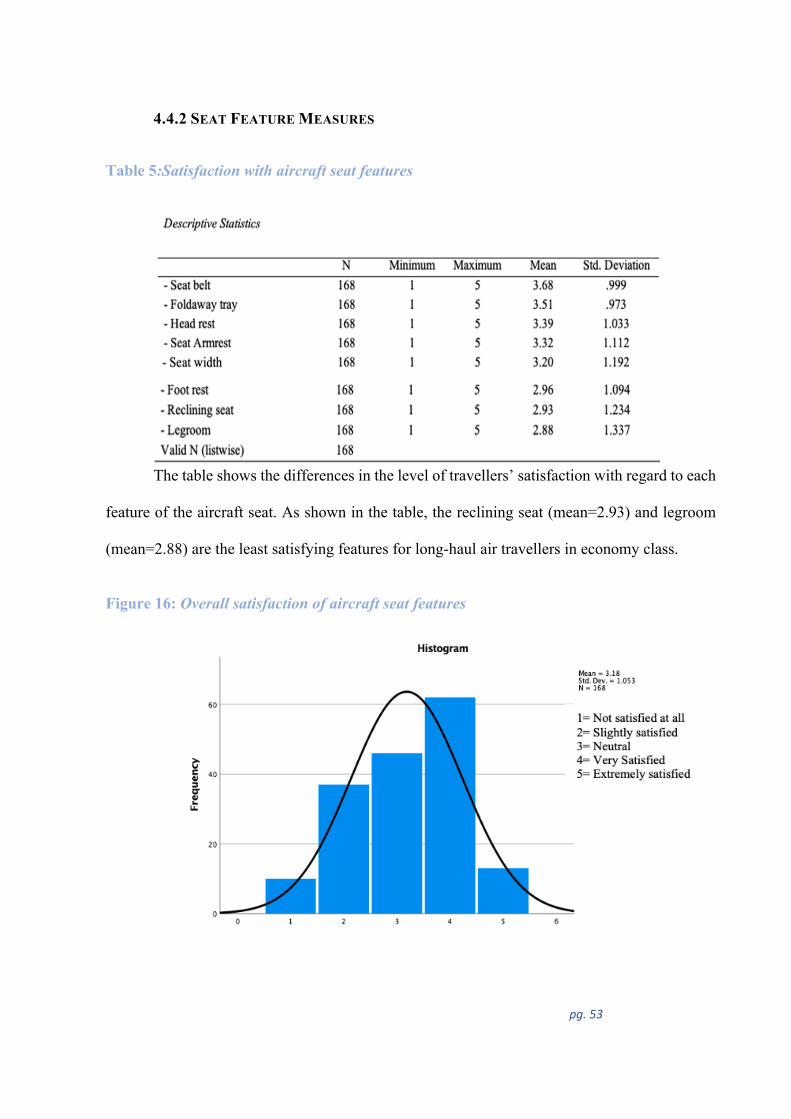
pg. 53
4.4.2 SEAT FEATURE MEASURES
Table 5:Satisfaction with aircraft seat features
The table shows the differences in the level of travellers’ satisfaction with regard to each
feature of the aircraft seat. As shown in the table, the reclining seat (mean=2.93) and legroom
(mean=2.88) are the least satisfying features for long-haul air travellers in economy class.
Figure 16: Overall satisfaction of aircraft seat features
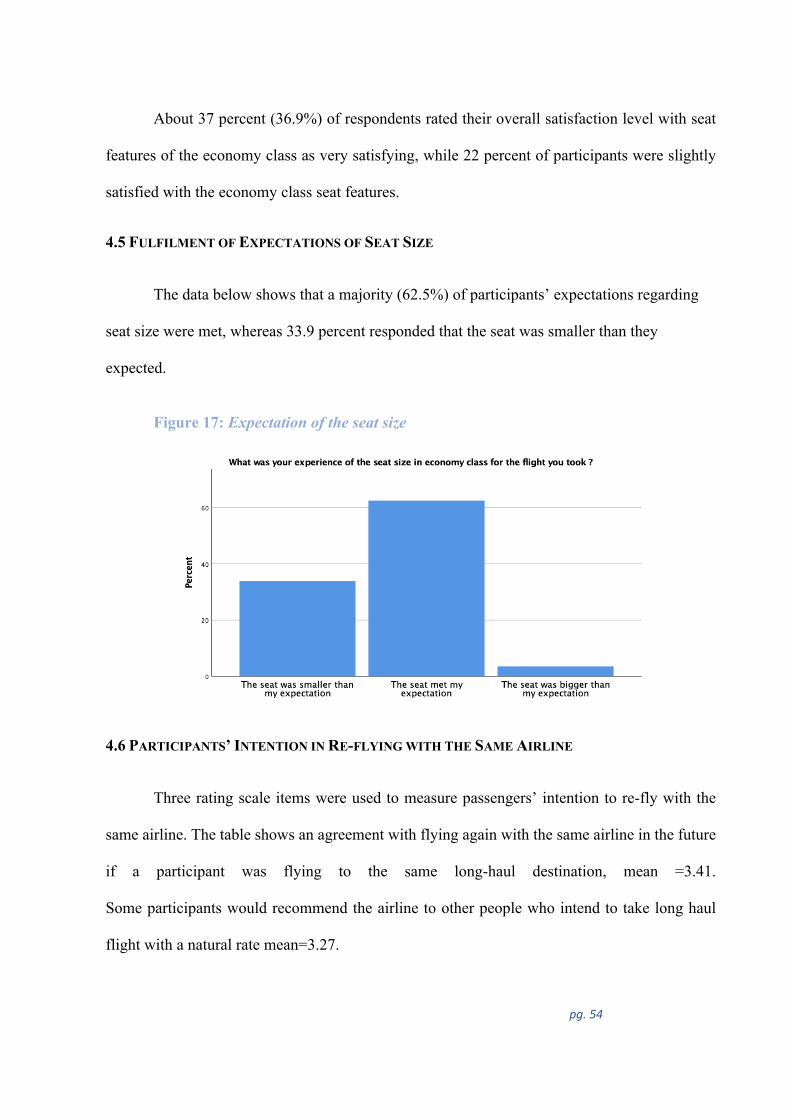
pg. 54
About 37 percent (36.9%) of respondents rated their overall satisfaction level with seat
features of the economy class as very satisfying, while 22 percent of participants were slightly
satisfied with the economy class seat features.
4.5 FULFILMENT OF EXPECTATIONS OF SEAT SIZE
The data below shows that a majority (62.5%) of participants’ expectations regarding
seat size were met, whereas 33.9 percent responded that the seat was smaller than they
expected.
Figure 17: Expectation of the seat size
4.6 PARTICIPANTS’ INTENTION IN RE-FLYING WITH THE SAME AIRLINE
Three rating scale items were used to measure passengers’ intention to re-fly with the
same airline. The table shows an agreement with flying again with the same airline in the future
if a participant was flying to the same long-haul destination, mean =3.41.
Some participants would recommend the airline to other people who intend to take long haul
flight with a natural rate mean=3.27.
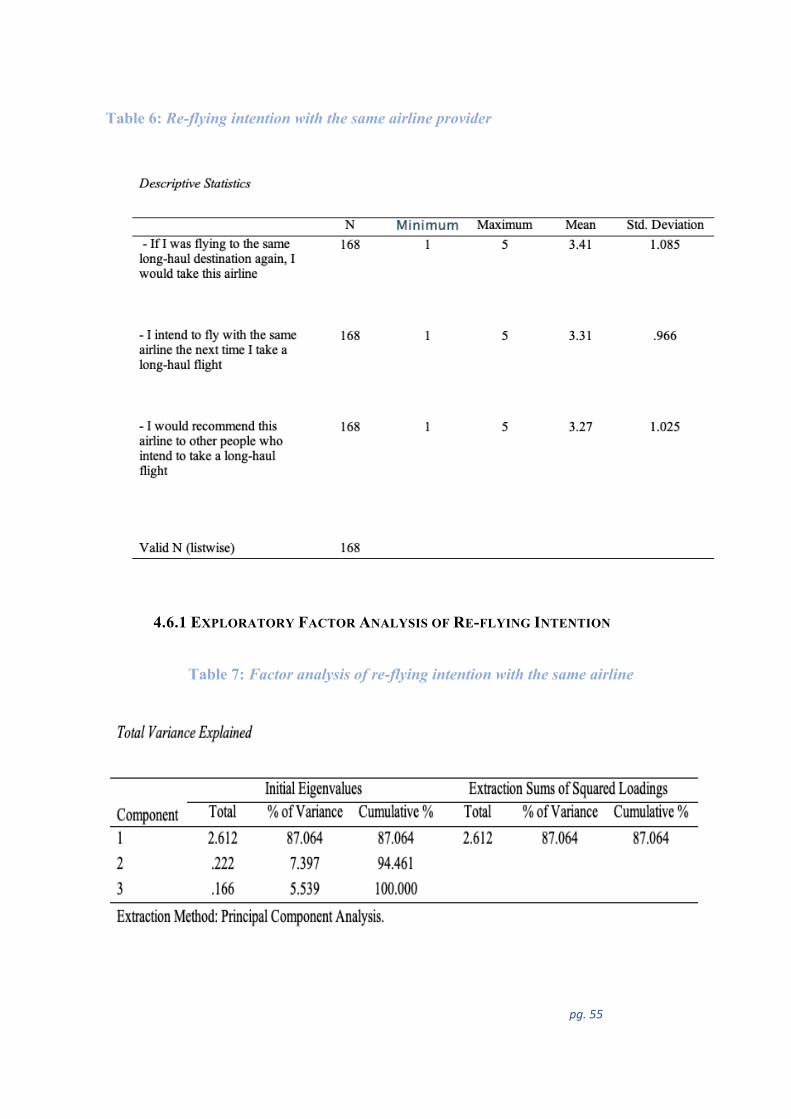
pg. 55
Table 6: Re-flying intention with the same airline provider
4.6.1 EXPLORATORY FACTOR ANALYSIS OF RE-FLYING INTENTION
Table 7: Factor analysis of re-flying intention with the same airline
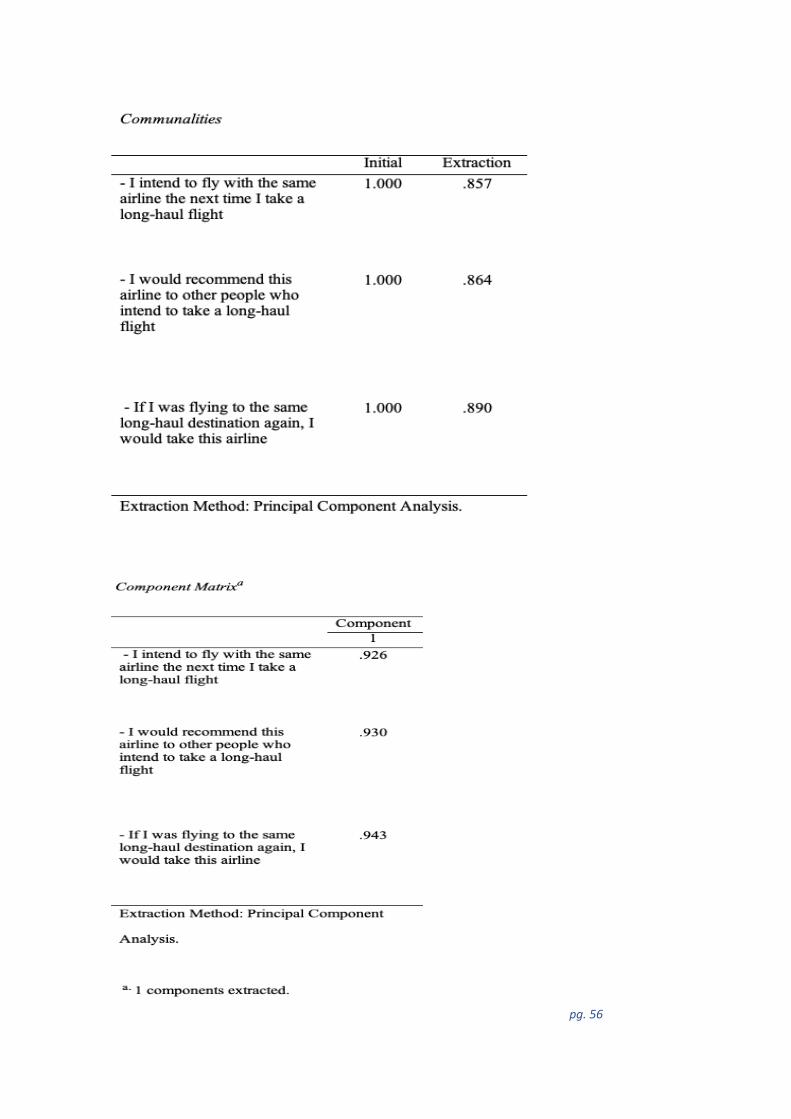
pg. 56
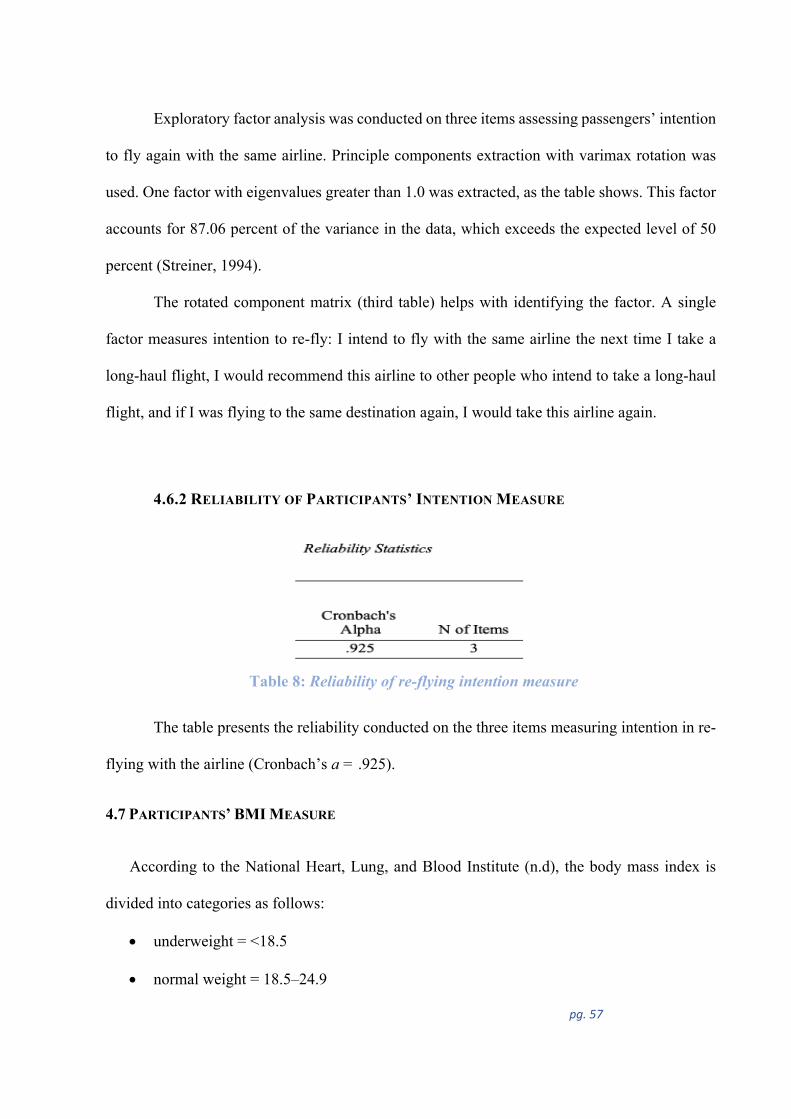
pg. 57
Exploratory factor analysis was conducted on three items assessing passengers’ intention
to fly again with the same airline. Principle components extraction with varimax rotation was
used. One factor with eigenvalues greater than 1.0 was extracted, as the table shows. This factor
accounts for 87.06 percent of the variance in the data, which exceeds the expected level of 50
percent (Streiner, 1994).
The rotated component matrix (third table) helps with identifying the factor. A single
factor measures intention to re-fly: I intend to fly with the same airline the next time I take a
long-haul flight, I would recommend this airline to other people who intend to take a long-haul
flight, and if I was flying to the same destination again, I would take this airline again.
4.6.2 RELIABILITY OF PARTICIPANTS’ INTENTION MEASURE
Table 8: Reliability of re-flying intention measure
The table presents the reliability conducted on the three items measuring intention in re-
flying with the airline (Cronbach’s a = .925).
4.7 PARTICIPANTS’ BMI MEASURE
According to the National Heart, Lung, and Blood Institute (n.d), the body mass index is
divided into categories as follows:
• underweight = <18.5
• normal weight = 18.5–24.9
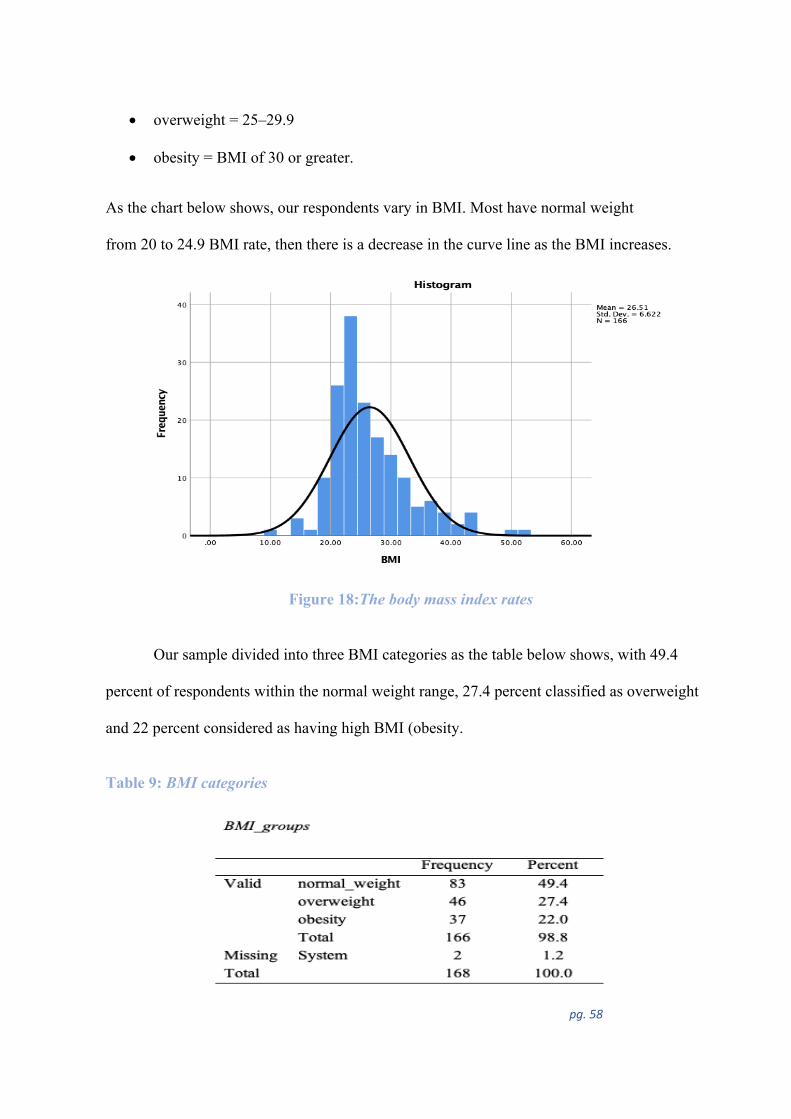
pg. 58
• overweight = 25–29.9
• obesity = BMI of 30 or greater.
As the chart below shows, our respondents vary in BMI. Most have normal weight
from 20 to 24.9 BMI rate, then there is a decrease in the curve line as the BMI increases.
Figure 18:The body mass index rates
Our sample divided into three BMI categories as the table below shows, with 49.4
percent of respondents within the normal weight range, 27.4 percent classified as overweight
and 22 percent considered as having high BMI (obesity.
Table 9: BMI categories
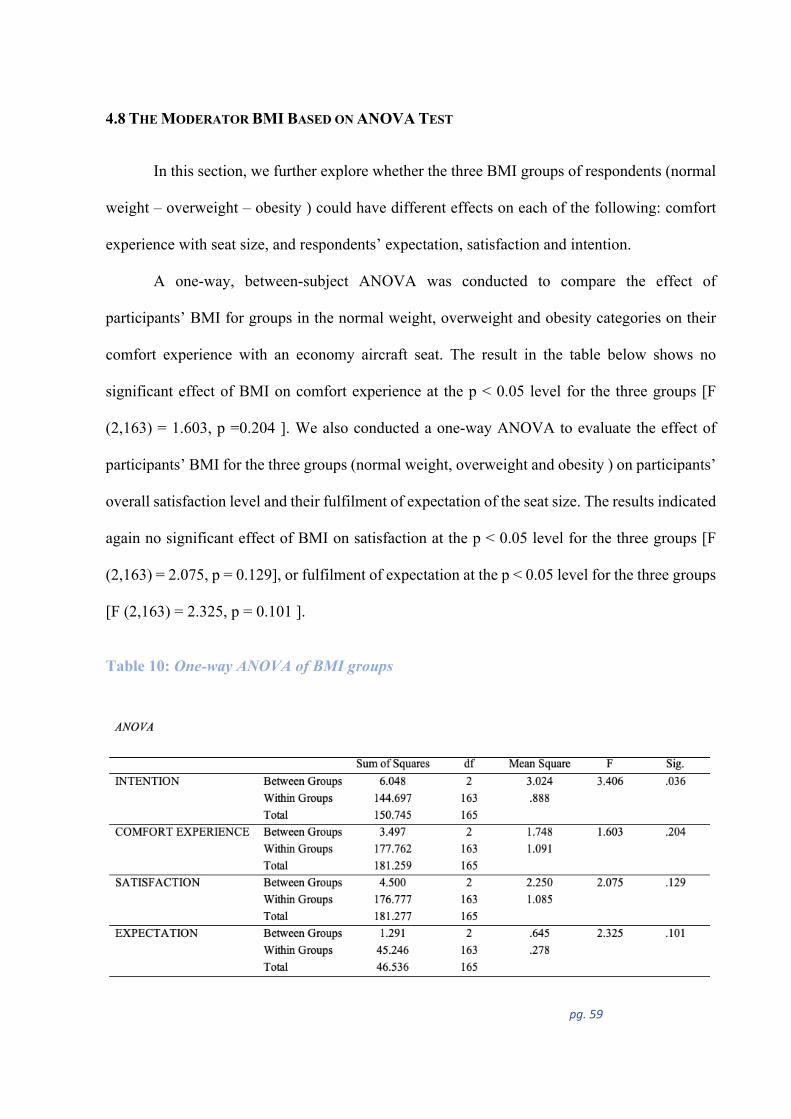
pg. 59
4.8 THE MODERATOR BMI BASED ON ANOVA TEST
In this section, we further explore whether the three BMI groups of respondents (normal
weight – overweight – obesity ) could have different effects on each of the following: comfort
experience with seat size, and respondents’ expectation, satisfaction and intention.
A one-way, between-subject ANOVA was conducted to compare the effect of
participants’ BMI for groups in the normal weight, overweight and obesity categories on their
comfort experience with an economy aircraft seat. The result in the table below shows no
significant effect of BMI on comfort experience at the p < 0.05 level for the three groups [F
(2,163) = 1.603, p =0.204 ]. We also conducted a one-way ANOVA to evaluate the effect of
participants’ BMI for the three groups (normal weight, overweight and obesity ) on participants’
overall satisfaction level and their fulfilment of expectation of the seat size. The results indicated
again no significant effect of BMI on satisfaction at the p < 0.05 level for the three groups [F
(2,163) = 2.075, p = 0.129], or fulfilment of expectation at the p < 0.05 level for the three groups
[F (2,163) = 2.325, p = 0.101 ].
Table 10: One-way ANOVA of BMI groups
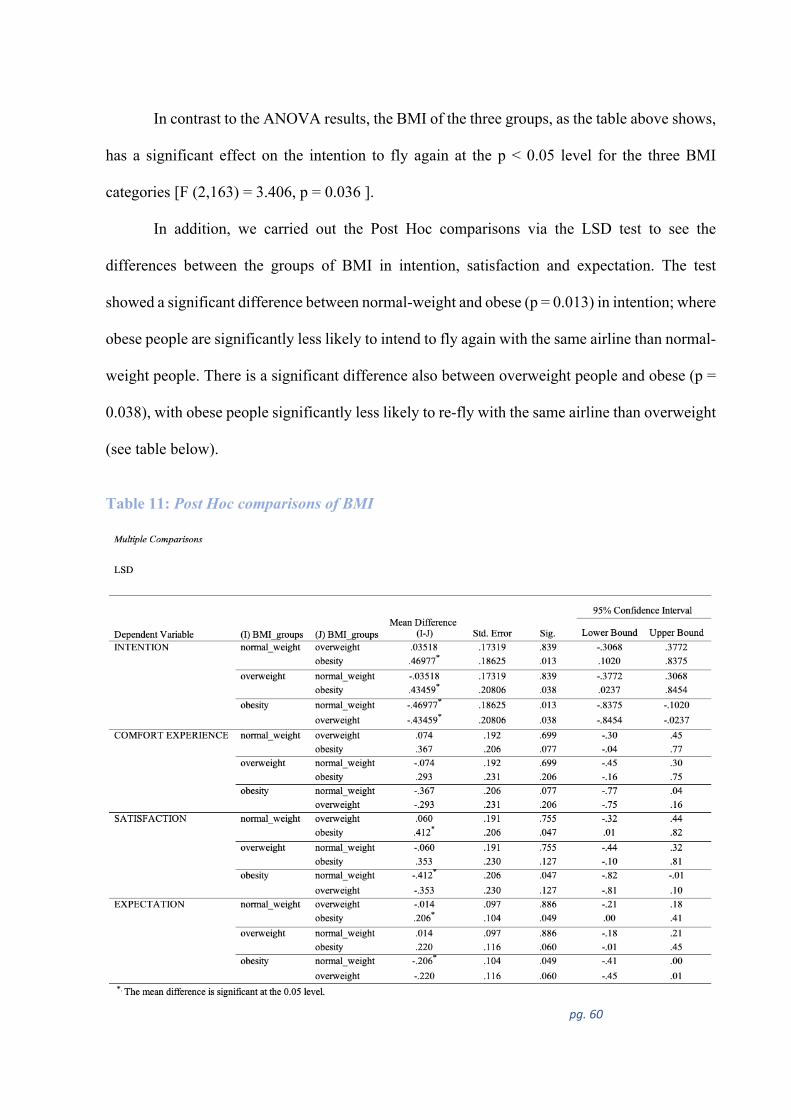
pg. 60
In contrast to the ANOVA results, the BMI of the three groups, as the table above shows,
has a significant effect on the intention to fly again at the p < 0.05 level for the three BMI
categories [F (2,163) = 3.406, p = 0.036 ].
In addition, we carried out the Post Hoc comparisons via the LSD test to see the
differences between the groups of BMI in intention, satisfaction and expectation. The test
showed a significant difference between normal-weight and obese (p = 0.013) in intention; where
obese people are significantly less likely to intend to fly again with the same airline than normal-
weight people. There is a significant difference also between overweight people and obese (p =
0.038), with obese people significantly less likely to re-fly with the same airline than overweight
(see table below).
Table 11: Post Hoc comparisons of BMI
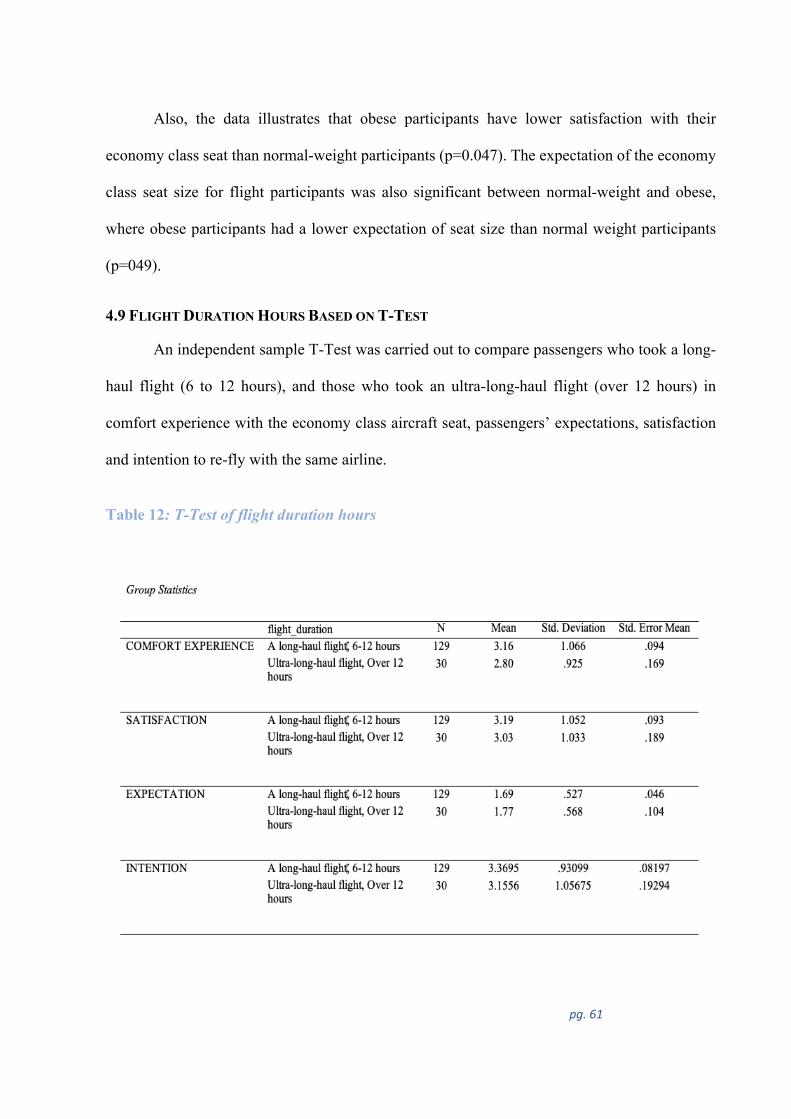
pg. 61
Also, the data illustrates that obese participants have lower satisfaction with their
economy class seat than normal-weight participants (p=0.047). The expectation of the economy
class seat size for flight participants was also significant between normal-weight and obese,
where obese participants had a lower expectation of seat size than normal weight participants
(p=049).
4.9 FLIGHT DURATION HOURS BASED ON T-TEST
An independent sample T-Test was carried out to compare passengers who took a long-
haul flight (6 to 12 hours), and those who took an ultra-long-haul flight (over 12 hours) in
comfort experience with the economy class aircraft seat, passengers’ expectations, satisfaction
and intention to re-fly with the same airline.
Table 12: T-Test of flight duration hours
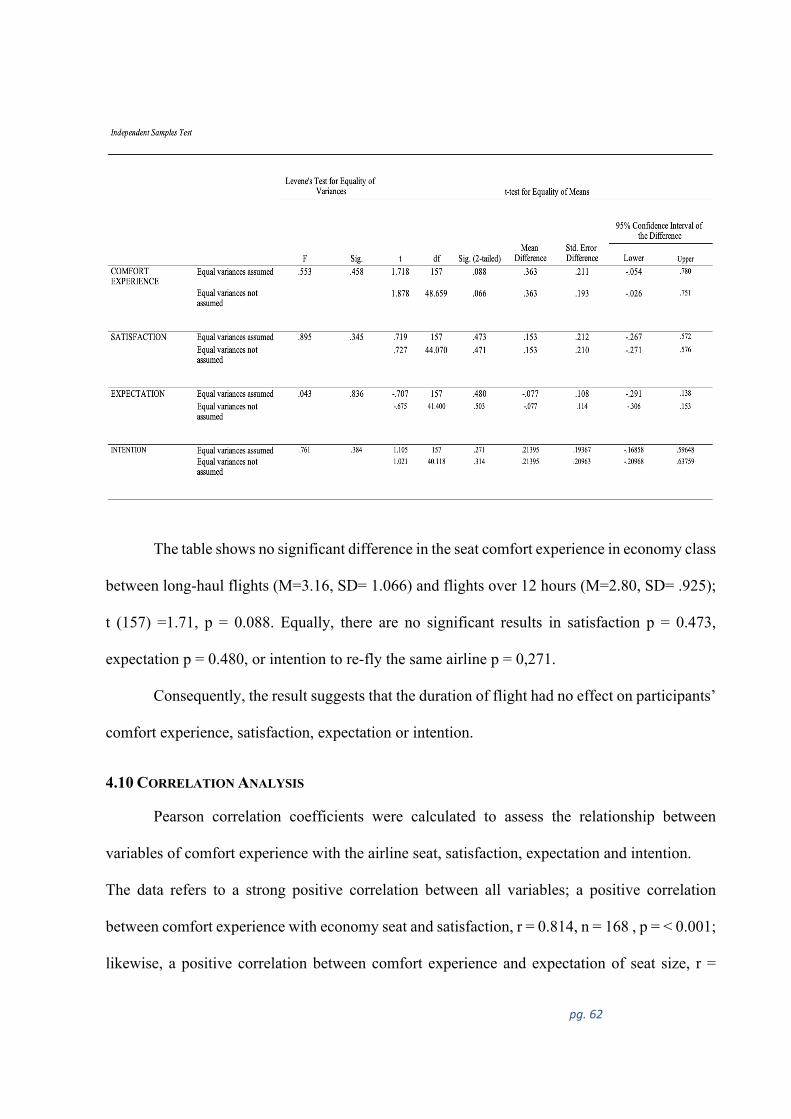
pg. 62
The table shows no significant difference in the seat comfort experience in economy class
between long-haul flights (M=3.16, SD= 1.066) and flights over 12 hours (M=2.80, SD= .925);
t (157) =1.71, p = 0.088. Equally, there are no significant results in satisfaction p = 0.473,
expectation p = 0.480, or intention to re-fly the same airline p = 0,271.
Consequently, the result suggests that the duration of flight had no effect on participants’
comfort experience, satisfaction, expectation or intention.
4.10 CORRELATION ANALYSIS
Pearson correlation coefficients were calculated to assess the relationship between
variables of comfort experience with the airline seat, satisfaction, expectation and intention.
The data refers to a strong positive correlation between all variables; a positive correlation
between comfort experience with economy seat and satisfaction, r = 0.814, n = 168 , p = < 0.001;
likewise, a positive correlation between comfort experience and expectation of seat size, r =
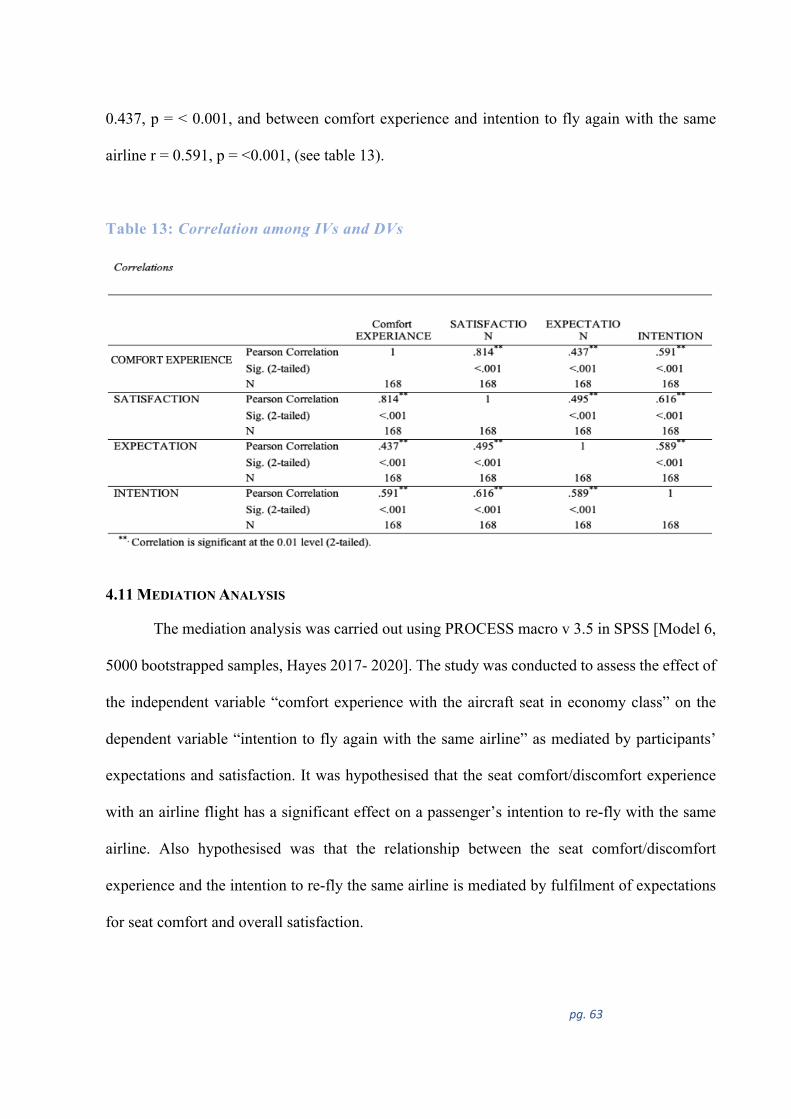
pg. 63
0.437, p = < 0.001, and between comfort experience and intention to fly again with the same
airline r = 0.591, p = <0.001, (see table 13).
Table 13: Correlation among IVs and DVs
4.11 MEDIATION ANALYSIS
The mediation analysis was carried out using PROCESS macro v 3.5 in SPSS [Model 6,
5000 bootstrapped samples, Hayes 2017- 2020]. The study was conducted to assess the effect of
the independent variable “comfort experience with the aircraft seat in economy class” on the
dependent variable “intention to fly again with the same airline” as mediated by participants’
expectations and satisfaction. It was hypothesised that the seat comfort/discomfort experience
with an airline flight has a significant effect on a passenger’s intention to re-fly with the same
airline. Also hypothesised was that the relationship between the seat comfort/discomfort
experience and the intention to re-fly the same airline is mediated by fulfilment of expectations
for seat comfort and overall satisfaction.
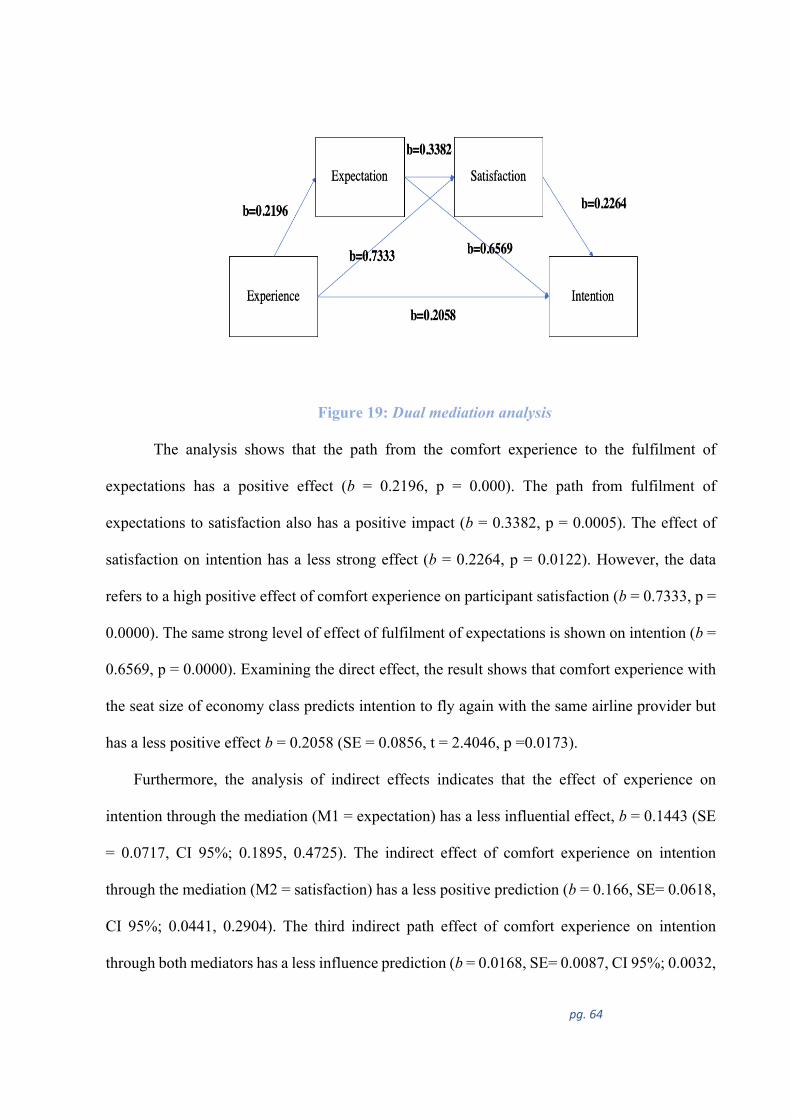
pg. 64
Figure 19: Dual mediation analysis
The analysis shows that the path from the comfort experience to the fulfilment of
expectations has a positive effect (b = 0.2196, p = 0.000). The path from fulfilment of
expectations to satisfaction also has a positive impact (b = 0.3382, p = 0.0005). The effect of
satisfaction on intention has a less strong effect (b = 0.2264, p = 0.0122). However, the data
refers to a high positive effect of comfort experience on participant satisfaction (b = 0.7333, p =
0.0000). The same strong level of effect of fulfilment of expectations is shown on intention (b =
0.6569, p = 0.0000). Examining the direct effect, the result shows that comfort experience with
the seat size of economy class predicts intention to fly again with the same airline provider but
has a less positive effect b = 0.2058 (SE = 0.0856, t = 2.4046, p =0.0173).
Furthermore, the analysis of indirect effects indicates that the effect of experience on
intention through the mediation (M1 = expectation) has a less influential effect, b = 0.1443 (SE
= 0.0717, CI 95%; 0.1895, 0.4725). The indirect effect of comfort experience on intention
through the mediation (M2 = satisfaction) has a less positive prediction (b = 0.166, SE= 0.0618,
CI 95%; 0.0441, 0.2904). The third indirect path effect of comfort experience on intention
through both mediators has a less influence prediction (b = 0.0168, SE= 0.0087, CI 95%; 0.0032,
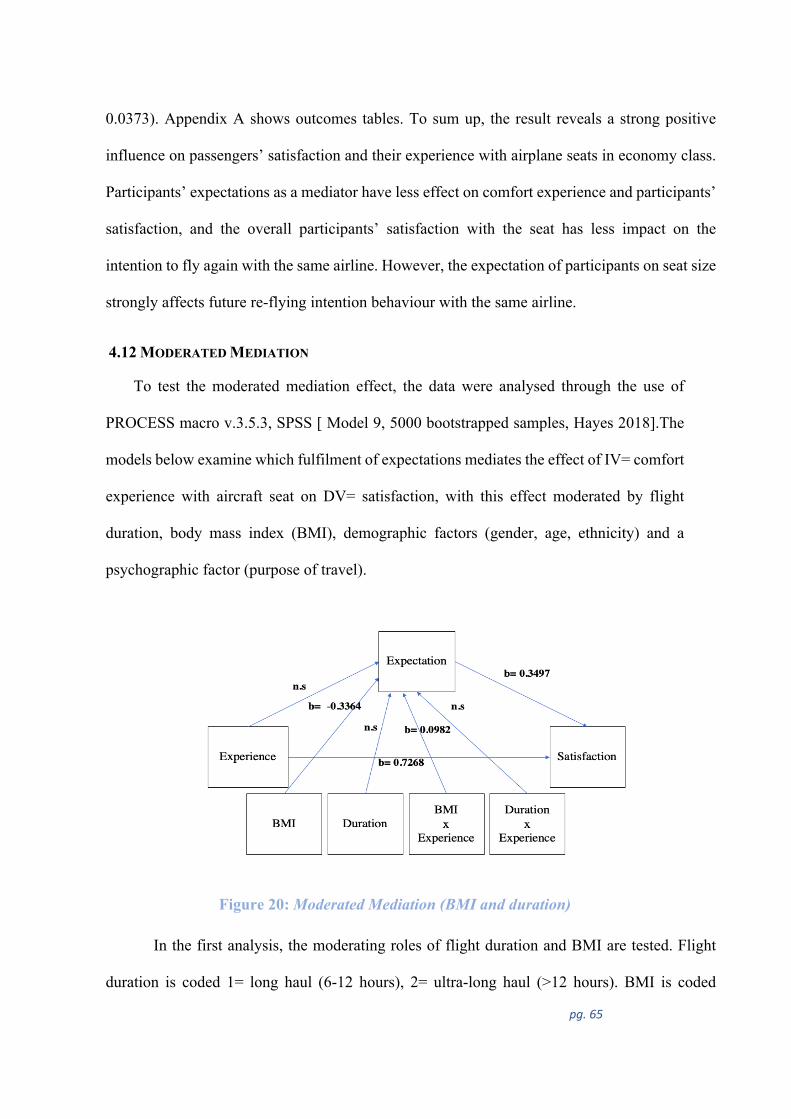
pg. 65
0.0373). Appendix A shows outcomes tables. To sum up, the result reveals a strong positive
influence on passengers’ satisfaction and their experience with airplane seats in economy class.
Participants’ expectations as a mediator have less effect on comfort experience and participants’
satisfaction, and the overall participants’ satisfaction with the seat has less impact on the
intention to fly again with the same airline. However, the expectation of participants on seat size
strongly affects future re-flying intention behaviour with the same airline.
4.12 MODERATED MEDIATION
To test the moderated mediation effect, the data were analysed through the use of
PROCESS macro v.3.5.3, SPSS [ Model 9, 5000 bootstrapped samples, Hayes 2018].The
models below examine which fulfilment of expectations mediates the effect of IV= comfort
experience with aircraft seat on DV= satisfaction, with this effect moderated by flight
duration, body mass index (BMI), demographic factors (gender, age, ethnicity) and a
psychographic factor (purpose of travel).
Figure 20: Moderated Mediation (BMI and duration)
In the first analysis, the moderating roles of flight duration and BMI are tested. Flight
duration is coded 1= long haul (6-12 hours), 2= ultra-long haul (>12 hours). BMI is coded
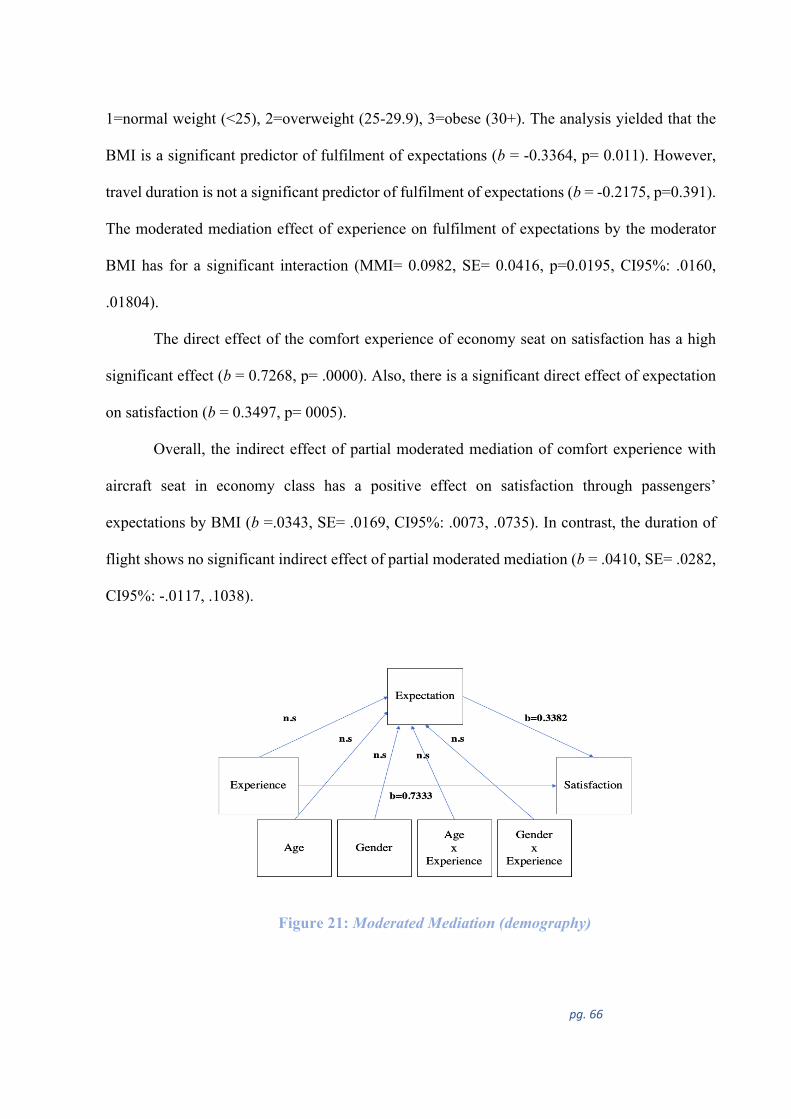
pg. 66
1=normal weight (<25), 2=overweight (25-29.9), 3=obese (30+). The analysis yielded that the
BMI is a significant predictor of fulfilment of expectations (b = -0.3364, p= 0.011). However,
travel duration is not a significant predictor of fulfilment of expectations (b = -0.2175, p=0.391).
The moderated mediation effect of experience on fulfilment of expectations by the moderator
BMI has for a significant interaction (MMI= 0.0982, SE= 0.0416, p=0.0195, CI95%: .0160,
.01804).
The direct effect of the comfort experience of economy seat on satisfaction has a high
significant effect (b = 0.7268, p= .0000). Also, there is a significant direct effect of expectation
on satisfaction (b = 0.3497, p= 0005).
Overall, the indirect effect of partial moderated mediation of comfort experience with
aircraft seat in economy class has a positive effect on satisfaction through passengers’
expectations by BMI (b =.0343, SE= .0169, CI95%: .0073, .0735). In contrast, the duration of
flight shows no significant indirect effect of partial moderated mediation (b = .0410, SE= .0282,
CI95%: -.0117, .1038).
Figure 21: Moderated Mediation (demography)

pg. 67
In the second analysis, the moderating roles of age and gender are tested. Age is coded
1=under 40 years, 2= 40+ years. The analysis demonstrated that the age is not a predictor of
fulfilment of expectations (b = -0.2132, p= 0.475). The same result with regard to gender shows
that this is also not a significant predictor of fulfilment of expectations (b = -0.0878, p=0.712).
In the interaction of the moderated mediation effect of comfort experience with aircraft seat on
fulfilment of expectations by the moderator, age has no statistical significance interaction
(MMI= 0.0895, SE= 0.0938, p= 0.3424, CI 95%: -.0957, .2747). Furthermore, there is no
significant interaction of moderated mediation of experience on expectations by gender (MMI=
.0519, SE= .0733, p= 0.4801, CI 95%: -.0929, .1966).
Figure 22:Moderated Mediation (demography and psychography)
In the third analysis, the moderating roles of travel purpose and ethnicity are tested.
Travel purpose is coded 1=non business, 2=business. Ethnicity is coded 1=European, 2=other.
The result of the model shows that travel purpose is not a predictor of fulfilment of expectations
(b = .0470, p= 0.8777). The opposite result to ethnicity indicates that it is a significant predictor
of fulfilment of expectations (b = .6841, p=0.0135). The interaction of the moderated mediation
pg. 68
effect of comfort experience with aircraft seat on expectations by the moderator ethnicity has a
significance interaction (MMI= -.02102, SE= .0799, p= .0094, CI 95%: -.3681, -.0524). A
reverse result is found in the interaction of moderated mediation of experience on expectations
through purpose of travel, that there is no statistically significant interaction (MMI= .0477, SE=
.0852, p= 0.5763, CI 95%: -.1205, .2160).
Only a negative significant indirect effect is found in a partial moderated mediation of
experience on satisfaction through expectation by ethnicity (b = .-.0711, Se= .0324, CI 95%: -
.1395, -.0128); however, no significant indices were found by purpose of travel (b = .0161,
SE= .0307, CI 95%: -.0363, .0854).
To sum up, the results of the three partial moderated mediation models illustrated above
revealed that passengers’ expectations mediate the effect of comfort experience with aircraft seat
on satisfaction when moderated by ethnicity and BMI.
pg. 69
CHAPTER 5. DISCUSSION
5.1 INTRODUCTION
In this chapter, the findings of the fourth chapter will be discussed and provide the
conclusions of the study as to whether the outcomes support the research hypotheses and have
consistency with the literature review results. The chapter will outline the research aim and the
overall research questions, consider managerial implications, limitations of the study and future
research suggestions.
5.2 RESEARCH QUESTIONS REVISITED
The lack of positive stories about the comfort of airplane seats in the economy cabin and
flying long hours in a seat with limited width and pitch is one of the reasons for this study. The
research aims to explore the effect of the economy seat experience on long-haul passenger
satisfaction rates.
More specifiically, the study examines the impact of seat comfort/discomfort on
satisfaction and the re-flying intention of a particular segment, notably passengers who are tall
and/or who have a high BMI. The study planned to examine whether passengers’ prior
expectations of seat size would affect their intention to fly again with the same airline. These
objectives are consistent with the main research question:
1. To what extent does the comfort /discomfort experience of an airplane seat affect
passenger satisfaction and in turn affect passenger intention to re-fly with the same
airline when taking a long-haul flight?
The mediation analysis (Figure 19) shows a strong effect of aircraft seat dis/comfort experience
on the satisfaction level of economy passengers on long-haul flights. However, although a
pg. 70
passenger’s satisfaction level predicts a re-flying intention with the same airline this prediction
is not strong. Without a doubt, customer satisfaction is a company’s most important intangible
asset, and satisfied customers are more likely to return and repurchase. According to Anderson
(1996), customer satisfaction in particular has been shown to have a measurable impact on fewer
customer defections. However, purchase intention is frequently used by academic researchers as
an indicator for purchasing behaviour (Morwitz, Steckel & Gupta, 2007). Repurchase intentions
are by far the most often used measure of consumer loyalty in businesses (Morgan & Rego,
2006). Thus, in our study, the predictor of passenger re-flying intention with the same airline
was expectation of seat size, which was stronger than satisfaction in predicting repurchase
intention.
1.1 What physical and emotional elements cause the comfort/discomfort
experience for passengers during flight?
We investigated the comfort experience with the airline seat in greater depth using a research
sub-question to see if the structure of the seat, and/or physical and emotional aspects impacted
on passengers’ comfort or discomfort. Thirty-seven items were employed to investigate the
comfort and discomfort experience of respondents on these aspects. We found that some
respondents experienced discomfort more in the seat structure and in the physical rather than
emotional aspects of the seat. However, some respondents found the experience comfortable in
seat structure and the physical and emotional aspects (Table 4). The inconsistency in the result
of comfort and discomfort may be due to simultaneity, which means that the feeling of comfort
does not guarantee complete satisfaction (Lewis et al., 2016). This explanation is consistent with
those of Osbourne et al., (2014), who claimed that comfort is a neutral state, which means the
person is not aware of either negative or positive feelings.
pg. 71
5.3 RESULTS OF HYPOTHESIS TESTING
5.3.1 COMFORT/DISCOMFORT EXPERIENCE OF AIRCRAFT SEAT AND SATISFACTION
H1: Seat comfort/discomfort experience with an airline flight has a significant effect
on passenger’s overall level of satisfaction with the flight.
The first hypothesis predicted a significant effect of the comfort and discomfort
experience of aircraft seats on overall passenger satisfaction. The result has supported this
hypothesis; a strong positive relationship between the seat comfort/discomfort experience and
the overall satisfaction level was found (Figure 19). The overall comfort experience with the
economy seat had a neutral response among passengers on average.
H1a: The relationship between the seat comfort/discomfort experience and
passenger satisfaction with the flight is mediated by fulfillment of expectations for
seat size.
In addition to the above, we assumed that fulfilment of expectation for seat size mediated
the relationship between seat comfort/discomfort and passenger satisfaction. It was found that
the relationship between the seat comfort/discomfort experience and participants’ satisfaction
was mediated by participants’ expectations of seat size, but the effect was not very strong (Figure
19).
In more detail, in
Figure 17 we observed that participants have different responses regarding their
expectations; group A constituted 62.5 percent of respondents who found the seat size met their
expectations, while 33.9% of group B found the seat size was smaller than they expected. This
relationship between perceived performance and expected performance of the seat can be
pg. 72
explained by Oliver (2014) through expectation disconfirmation theory (EDT), which concerns
customer satisfaction processes. When participants compare the perceived performance of seat
size with pre-determined standards of seat size, this will result in either satisfaction or
dissatisfaction. As we see, group A perceived the performance of the seat to be in line with their
expectations, which means their expectations were confirmed. This will result in passengers who
are neutral about or likely satisfied with their experience with seat size. In comparison, group B
perceived seat performance to be below their expectations. This means a negative
disconfirmation of their expectations, resulting in passenger dissatisfaction.
H1b: The relationship between the comfort/ discomfort experience and fulfilment of
expectations is moderated by (a) length of the trip, (b) body mass index, and (c)
demographic (i.e., age, gender, ethnicity) and psychographic (i.e., travel purpose)
factors.
Moreover, we assumed that fulfilment of expectations mediates the effect of the
comfort/discomfort experience on passenger satisfaction, varying as a function of length of trip,
body mass index, and demographic and psychographic factors due to the effect of experience on
expectations. The moderated mediation analysis only partly supported this hypothesis: body
mass index and ethnicity moderate the mediation; there is no significant moderation effect due
to the length of trip, duration of the journey, purpose of travel, age or gender (Figures 20-22).
The beta value for the moderation of BMI is positive, indicating that the mediation of the
relationship between experiences and satisfaction by fulfilment of expectation is most
pronounced for travellers with the highest BMI. The length of the trip result is contrary to that
of Perkins (2016), who found long-haul flights in economy class to be exhausting for most
passengers due to the seat shrinkage in width, pitch and recline. The possible explanation for no
pg. 73
significant result of flight length as a moderator in our study is that most respondents’ records
showed they travelled less than 12 hours (Figure 11). One respondent commented that he found
himself restless after six hours; “It felt good for the six hours, then I start getting restless”. This
means some of the long-haul travellers may not be aware of level of seat comfort or discomfort
on economy class flights of less than 12 hours.
Interestingly, ethnicity and BMI as moderators have statistically significant results,
which generates a new addition to previous studies of marketing on the importance of ethnicity
and BMI for passengers who fly economy class and experience seat comfort/discomfort on long-
haul journeys. Different ethnicities have different anthropometrical characteristics that depend
on the body shape and size of a person (Goh, Dhaliwal, Welborn, Lee & Della, 2014). This study
found that the moderated mediation effect of the comfort/discomfort experience on satisfaction
through expectations by ethnicity showed that Europeans have a negative effect result compared
with other ethnicities. This means that people of European ethnicity are more affected by the
seat discomfort than other ethnicities. Therefore, the in-flight experience differs from one
ethnicity to another regarding their differences in body dimensions, which may affect their
comfort level, especially with seat size in economy class. Park, Park and Kim (2014) confirmed
there is a bond between different body dimensions and different levels of seat discomfort
throughout the journey.
Also, BMI (height and weight ) takes part in anthropometric measures when we want to
understand seat comfort/discomfort and passenger satisfaction through their expectations, and
the future intention behaviour of flying again with the same airline. Three groups with different
BMI measures (normal-weight, overweight and obese) were put through ANOVA (one-way)
using Post Hoc comparisons to note any statistical differences among the groups (Table 11).
Surprisingly, no differences were found among the three groups when experiencing aircraft seat
pg. 74
comfort. This accords with our earlier discussion about comfort, which showed that most
respondents have neutral feelings towards their seat experience. There it was reasoned that
comfort means a lack of discomfort, which implies that comfort is a neutral state in which people
are unaware of either positive or negative feelings (Osbourne et al., 2014).
Thus, the lack of discomfort does not automatically mean comfort since different features
are needed to experience comfort (Helander & Zhang, 1997). Nevertheless, it is interesting to
highlight the obese group which showed statistically significant differences from the other
groups in intention, satisfaction and expectations. The finding can be explained by EDT where
the very high BMI passengers compared perceived performance with expected performance.
Their expected performance was lower than what they perceived, leading to a negative
disconfirmation of expectations. This means that high BMI participants were dissatisfied with
the features of the aircraft seat overall. According to Park, Park & Kim (2014), seat size is seen
as a serious issue by this segment of the market (large-size passengers) because of improper
anthropometric sizing when these seats in economy class were designed; that is, it was carried
out without considering the needs of such passengers.
It is encouraging to corroborate our result with that found by Poria and Beal (2017), who
found that tall passengers with high BMI have a negative in-flight experience because of their
height. Short passengers with high BMI in comparison, had a better in-flight experience. Tall,
obese passengers have substantial difficulties during the flight when using the toilet, fitting in
the seat comfortably and smoothly and walking along the aisle without having to touch other
passengers.
So far, little attention has been paid to the issue of high BMI passengers by marketing
scholars. This study adds a new research strand that investigates the needs of this segment of the
market. Our findings provide an understanding of passengers’ experience on long-haul flights
pg. 75
with seat size and other related issues, and predictions for future intention to improve market
profitability by providing new insights for the marketing sector.
5.3.2 PASSENGER SATISFACTION AND RE-FLYING INTENTION
H2: A passenger’s satisfaction with the flight impacts intention to re-fly with the same
airline.
The results provide further support for the hypothesis that passengers’ satisfaction with
the flight affects the intention to fly again with the same airline. This effect of overall satisfaction
with aircraft seat features on intention was not strong however. What is surprising is that
passengers’ expectations were a stronger predictor than satisfaction on the behavioural intention
(Figure 19). However, several studies have shown that customer satisfaction is seen as a function
of expectation and expectancy disconfirmation. Satisfaction, in turn, impacts on attitude shifts
and buying intention (Oliver, 1980; Leeuwen, Quick & Daniel, 2002).
It is important to point out that dissatisfied responses were found in three out of eight
features of aircraft seat – legroom, recline and footrest, whereas seat width, seat belt, headrest,
armrest and foldaway tray were somewhat satisfying to respondents. These factors can affect the
levels of passenger satisfaction but not for all passengers in the stage of re-purchase intention.
Fang, Chiu and Wang (2011) claimed that consumer satisfaction is linked to the likelihood of
making another purchase. This means there is no complete satisfaction without a group of factors
that can occur to identify a clear state of high satisfaction to predict re-purchase intention or high
dissatisfaction to predict no re-purchase intention.
The behavioural intention result of respondents shows an agreement state on average in
intention to fly with the same airline the next time they take a long-haul flight. Also, if they were
flying to the same destination again, they would use this airline again. The last and lowest in the
pg. 76
mean result is that they would recommend this airline to other people who intend to take a long-
haul flight. Although, we cannot ignore the obese group who, compared to the normal and
overweight groups, indicated low intention to fly again with the same airline. Explaining the
behavioural intention through EDT, we have to mention the importance of satisfaction.
Satisfaction reflects an individual’s psychological condition, which is a result of
disconfirmation’s cognitive evaluation. In turn, a high level of satisfaction will raise the
likelihood of purchase intention (Bhattacharjee, 2001).
We concluded from this study that passengers would fly again or not with the same airline
depending on their expectations of seat size. The result revealed that expectation is stronger in
affecting repurchase intention than satisfaction, while satisfaction naturally depends on
expectation. This data must be interpreted with caution because the result of expectations in this
study could function as a stronger predictor than satisfaction for passengers who had previous
experience in economy class for long-haul flights, travelled on different airplanes, whether
narrow-body or wide-body. Therefore, pre-existing expectations with many different
experiences of aircraft seats in economy class may be a strong predictor of future intention. High
involvement services or products require business organisations, such as airlines, to provide extra
efforts in managing customers’ expectations due to the difficulties of analysing post-purchase
satisfaction for products or services they provide, and so reduce the loss of dissatisfied customers
(Oliver & Beardon, 1983; Churchill & Surprenant, 1982).
5.4 MANAGERIAL IMPLICATIONS
The findings of this study deliver new insights for marketing management, the market of
long-haul flights, and for those airlines willing to serve the market segment of obese and tall
passengers who fly economy class on long-haul flights. The managerial implications concentrate
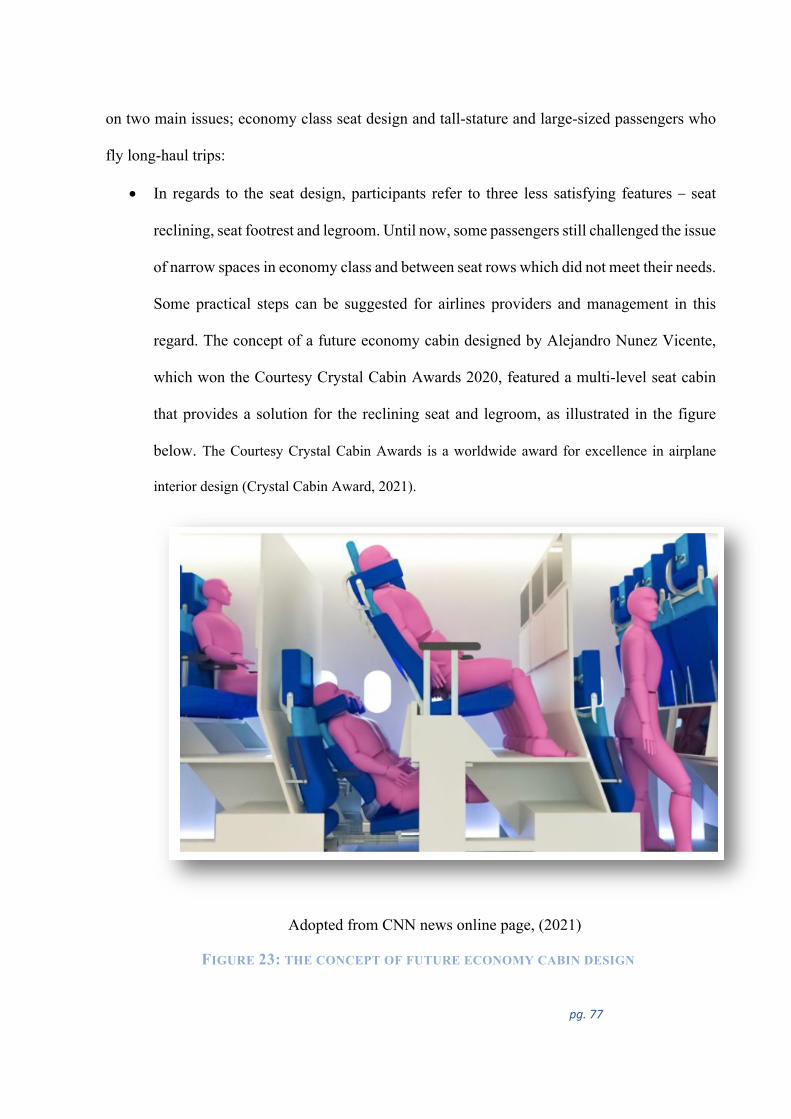
pg. 77
on two main issues; economy class seat design and tall-stature and large-sized passengers who
fly long-haul trips:
• In regards to the seat design, participants refer to three less satisfying features – seat
reclining, seat footrest and legroom. Until now, some passengers still challenged the issue
of narrow spaces in economy class and between seat rows which did not meet their needs.
Some practical steps can be suggested for airlines providers and management in this
regard. The concept of a future economy cabin designed by Alejandro Nunez Vicente,
which won the Courtesy Crystal Cabin Awards 2020, featured a multi-level seat cabin
that provides a solution for the reclining seat and legroom, as illustrated in the figure
below. The Courtesy Crystal Cabin Awards is a worldwide award for excellence in airplane
interior design (Crystal Cabin Award, 2021).
Adopted from CNN news online page, (2021)
FIGURE 23: THE CONCEPT OF FUTURE ECONOMY CABIN DESIGN
pg. 78
The concept was designed on two levels, the lower one to give the lounge experience of
the seat to stretch the legs, while the upper level for legroom allowing the passenger space
to cross their legs. The purpose of this design is to provide passengers with a more
comfortable and more appealing experience. The design also provides reclining seat
angles, adjustable neck and backrest.
• With regard to the width of seat, some of the participants revealed that the seat size was
smaller than expected. Our result shows a strong relationship between expectation and
future intention. Therefore, airline management and marketers need to pay attention to
this component in their strategies as an indicator for passengers’ future intention to re-
fly with them. It is important to highlight that marketers need to put more effort into
tracking dissatisfied customers and providing appealing offers after their flight and for
their subsequent flights given the expectations of passengers when paying for high
involvement services. Passenger expectation can be tracked through a short survey given
on the IFT screen of each seat, and linked to the system to find out if passengers had
satisfying or dissatisfying experiences in-flight. This will help reduce any loss of
potential clients as negative word-of-mouth comments could spread from dissatisfied
passengers to their social circle either on- or off-line. Another suggestion is to provide
different sizes of seats, from average to wide, which can be booked online in advance
and charged at different prices depending on the width. This suggestion accords with the
study finding that ethnicity and BMI can affect seat comfort experience and satisfaction
through a passenger’s expectation for long-haul trips.
5.5 RESEARCH LIMITATIONS
To the best of the researcher’s knowledge, this is the first study in the marketing research
field that investigates the relationship between seat dis/comfort and re-flying intention with the
pg. 79
same airline of long-haul passengers, using BMI as a measure to indicate the level of effect on
this relationship. Other moderators such as demographic and psychographic factors, and the
length of the flight for further in-flight experience investigation are also used. However, this
study has some limitations, which can be examined in future research:
• First, the sample size of high BMI passengers was small compared to the sample size of
normal-weight passengers. This means that most of the responses in this study represent
the thoughts and experiences of normal-weight rather than obese passengers. However,
the results were valid as they were verified by an appropriate methodology and a proper
analysis of data.
• Second, the study did not determine the aircraft type in which survey participants flew.
Different aircraft types may influence participants’ assessment of seat comfort. However,
Information of this type was difficult to apply to the survey however, because of the
inconvenience for participants to recall aircraft type and model number, and because it
was not easily consistent with survey strategy and purpose.
• These findings cannot be generalised to all long-haul passengers. Perceiving seat comfort
as an essential element when choosing a flight or specific airline depends on different
factors among passengers, such as state of health, financial status and other factors that
lead a passenger to choose one airline over another.
• A large population size needs to be examined in this area of the study because the issue
has a wide-ranging impact on society. In general, many people have experienced
economy class whether in short-, medium- or long-haul flights. It is not easy, however,
to reach the views of all individuals, especially those who have experienced different
airlines for many long-haul flights, to recognise the differences of seat comfort
experience from one flight to another; for example, the seats in gulf airlines (Emirates
pg. 80
and Qatar) are wider by some inches than the average seat size in the economy class of
some other airlines, such as Asian airlines. Time and cost therefore play a part in reaching
a large sample of this segment, those who have had a wide experience with different
airlines in the economy cabin on long-haul flights.
5.6 FUTURE RESEARCH
We believe that aircraft type has an influence on passengers’ evaluation of the seat
comfort experience. Each aircraft type has a different appearance, age and quality of service in
the economy cabin, and this differs from one airline to another. Further research is required to
investigate the relationship of each aircraft type to the seat comfort experience for long-haul air
passengers in order to enhance future long-haul market revenue by encouraging individuals to
take flights to new countries involving long-distance journeys.
Also, we suggest conducting qualitative research investigating in-depth other factors that
affect the in-flight comfort experience of high BMI passengers in a special, separate document
to highlight other issues related to this segment.
Comfort and discomfort are separate concepts and most studies examine them separately.
In this study they are investigated together, which has meant they needed to be interpreted with
careful consideration. For this reason we suggest studying these two concepts individually in
future research.
5.7 CONCLUSION
The aircraft seat is the key factor impacting the comfort level of passengers during an
airline flight. It is possible to develop an optimal comfort experience with the seat in economy
class by recognising the discomfort factors that influence this experience. This chapter presented
a discussion of findings and provided managerial and practical implications that can be taken
into consideration when planning marketing strategies for airlines, who are interested in serving
pg. 81
long-haul passengers in economy class with special consideration to tall and large-body size
passengers in particular.
The study findings indicted a significant relationship between aircraft seat dis/comfort
experience and the level of passenger satisfaction in relation to their re-flying intention with the
same airline. Also, passengers’ pre-existing expectations regarding seat size function as a
stronger predictor than satisfaction in measuring future re-flying intentions with the same airline.
BMI and ethnicity function as moderators between the relationship of the dis/comfort experience
of the seat in the economy cabin and the fulfilment of expectations. Length of flight, purpose of
travel, gender and age show no significant impact on passengers’ seat comfort experiences.
Future research areas were provided to extend the current work on the issue of seating comfort
for long-haul travellers in economy class.
pg. 82
REFERENCES
Ahmadpour, N., Kühne, M., Robert, J. M., & Vink, P. (2016). Attitudes towards personal and shared space during the flight. Work, 54(4), 981–987.
Ahmadpour, N., Lindgaard, G., Robert, J. M., & Pownall, B. (2014). The thematic structure of passenger comfort experience and its relationship to the context features in the aircraft cabin. Ergonomics, 57(6), 801–815.
Ahmadpour, N., Robert, J. M., & Lindgaard, G. (2014). A study of passengers’ real-time emotional responses and comfort experience during the flight using the experience sampling method. AHFE international, 14, 194–202.
Al-Medabesh, A., & Ali, M. (2014). Customer services in Saudi Arabian airlines: A case study of jazan province. Interdisciplinary Journal of Contemporary Research in Business, 5(9), 335–357.
Anderson, R. E. (1973). Consumer dissatisfaction: The effect of disconfirmed expectancy on perceived product performance. Journal of marketing research, 10 (1), 38–44.
Anjani, S., Li, W., Ruiter, I. A., & Vink, P. (2020). The effect of aircraft seat pitch on comfort. Applied Ergonomics, 88, 103132.
Anjani, S., Li, W., Vink, P., & Ruiter, I. (2018). The relationship of space experience and human anthropometric sizes in aircraft seat pitch. In Congress of the International Ergonomics Association (pp. 504–511). Springer, Cham.
Anjani, S., Song, Y., Hou, T., Ruiter, I. A., & Vink, P. (2021). The effect of 17-inch-wide and18-inch-wide airplane passenger seats on comfort. International Journal of Industrial Ergonomics, 82, 103097.
Archana, R., & Subha, M. V. (2012). A study on service quality and passenger satisfaction on Indian airlines. International Journal of Multidisciplinary Research, 2(2), 50–63.
Babin, B. J., Lee, Y. K., Kim, E. J., & Griffin, M. (2005). Modeling consumer satisfaction and word-of-mouth: restaurant patronage in Korea. Journal of Services Marketing, 19(3), 133–139.
Ball, K. (2003). Deep vein thrombosis and airline travel—The deadly duo. AORN Journal, 77(2), 346–358.
Bamford, D., & Xystouri, T. (2005). A case study of service failure and recovery within an international airline. Managing Service Quality: An International Journal, 15(3), 306–322.
Bazley, C. M. (2015). Beyond comfort in built environments. Doctoral dissertation, TU Delft, Delft University of Technology.
Bazley, C., Nugent, R., & Vink, P. (2015). Patterns of discomfort. Journal of Ergonomics, 5 (1), 2015.
Berkman, H. W., & Gilson, C. (1986). Consumer behavior: Concepts and strategies. Kent Pub. Berry, L. L. (1999). Discovering the soul of service: The nine drivers of sustainable business
success. Simon & Schuster. Bhattacherjee, A. (2001). Understanding information systems continuance: An expectation
confirmation model. MIS Quarterly, 351–370. Bitner, M. J. (1990). Evaluating service encounters: the effects of physical surroundings and
employee responses. Journal of Marketing, 54(2), 69–82. Blondel, M., Vialade, J., Iskrov, S., & Fujita, A. (2017). The ultimate battle in the
sky_reinventing the long-haul travel experience. adlittle. Retrieved [7 August 2019],
pg. 83
from www.adlittle.com/sites/default/files/viewpoints/adl_aviation_reinventing_long_ haul_flights.pdf
Bor, R. (2007). Psychological factors in airline passenger and crew behaviour: a clinical overview. Travel Medicine and Infectious Disease, 5(4), 207–216. Bouwens, J., Tsay, W. J. J., & Vink, P. (2017). The high and low comfort peaks in passengers’
flight. Work, 58(4), 579–584. Brauer, K. (2004). Convenience, comfort, and costs. Presentation at the aircraft interior
EXPO. Bronkhorst, R. E., & Krause, F. (2002). End-users help design mass transport seats (No. 2002-
01-0780). SAE Technical Paper. doi.org/10.4271/2002-01-0780 Brown, T. J., Barry, T. E., Dacin, P. A., & Gunst, R. F. (2005). Spreading the word:
Investigating antecedents of consumers’ positive word-of-mouth intentions and behaviours in a retailing context. Journal of the Academy of Marketing Science, 33(2),123–138.
Brundrett, G. (2001). Comfort and health in commercial aircraft: a literature review. The journal of the Royal Society for the Promotion of Health, 121(1), 29–37.
Budd, L. C. (2011). On being aeromobile: airline passengers and the affective experiences of flight. Journal of Transport Geography, 19(5), 1010–1016.
Bruner, I. I. (2015), Marketing scales handbook, GCBII Productions, LLC. Bujisic, M., Bogicevic, V., Yang, W., Cobanoglu, C., & Bilgihan, A. (2017). “Hobson’s
choice” service scape: consumer anxiety and enjoyment. Journal of Consumer Marketing, 34(7), 577–590. Retrieved [15 May 2019], from https://doi-org.ezproxy.aut.ac.nz/10.1108/JCM-04-2016-1776
Bryman, A., & Bell, E. (2015). Business research methods. Oxford University Press. Cadotte, E. R., Woodruff, R. B., & Jenkins, R. L. (1987). Expectations and norms in models of
consumer satisfaction. Journal of Marketing Research, 24(3), 305–314. Cambridge Training and Development Ltd. (2000). Advanced travel & tourism. Oxford
University Press. Chan, D. (2000). The development of the airline industry from 1978 to 1998–A strategic global
overview. Journal of Management Development, 19(6), 489–514. Chang, Y. C., Cai, C. M., & Chang, F. Y. (2018). The Influences of belief disconfirmation and
country image on repurchasing intention for online sportswear: empirical evidence from Taiwan. International Journal of Organizational Innovation (Online), 11(1), 1–17.
Chen, F., & Chang, Y. (2005). Examining airline service quality from a process perspective. Journal of Air Transport Management, 11(2), 79–87.
Churchill, G.A. & Surprenant, C. (1982). An investigation into the determinants of customer satisfaction. Journal of Marketing Research, 19, 491‐504.
CNN (2021). These double-decker airplane cabin concepts could be the future of flying. Retrieved [6 August 2021], from https://edition.cnn.com/travel/article/double-decker-airplane cabin-concepts-crystal-cabin-awards/index.html
Cronin Jr, J. J., & Taylor, S. A. (1992). Measuring service quality: a re-examination and extension. Journal of Marketing, 56(3), 55–68.
Crystal cabin award. (2021). General Information. Retrieved [24 August 2021], from https://www.crystal-cabin-award.com/the-award/general-information.html
Curtis, E. A., Comiskey, C., & Dempsey, O. (2016). Importance and use of correlational research. Nurse researcher, 23(6).
pg. 84
Czipura, C., & Jolly, D. R. (2007). Global airline alliances: sparking profitability for a troubled industry. Journal of Business Strategy, 28(2), 57–64.
Davidow, M. (2003). Have you heard the word? The effect of word of mouth on perceived justice, satisfaction and repurchase intentions following complaint handling. Journal of Consumer Satisfaction, Dissatisfaction and Complaining Behavior, 16(1), 67–80.
Davies, J. (2017). Scary thing about lack of leg room. NewsComAu. Retrieved [14 July 2018], from https://www.news.com.au/travel/travel-advice/health-safety/aviation-expertwarns shrinking-leg-roomcould-be-dangerous/newsstory/
De Looze, M. P., Kuijt-Evers, L. F., & Van Dieen, J. A. A. P. (2003). Sitting comfort and discomfort and the relationships with objective measures. Ergonomics, 46(10), 985–997.
Dennis, N. (2005). The development of long-haul air services from regional and secondary airports in Europe. Ideas.repec.org. Retrieved [15 August 2019], from https://ideas.repec.org/p/wiw/wiwrsa/ersa05p316.html
Dolnicar, S., Grabler, K., Grün, B., & Kulnig, A. (2011). Key drivers of airline loyalty. Tourism Management, 32(5), 1020–1026. Retrieved [7 August 2018], from doi: https://doi.org/10.1016/j.tourman.2010.08.014
El-deen, R. M. B., Hasan, S. B., & Fawzy, N. M. (2016). Customers satisfaction towards some flight reservation, scheduling and check in services: The case of Egypt air. International Journal of Heritage, Tourism, and Hospitality, 10(1/2).
El-deen, R. M. B., Hasan, S. B., & Fawzy, N. M. (2016). The effect of airport and in-flight service quality on customer satisfaction. International Journal of Heritage, Tourism, and Hospitality, 10(1/2).
Engel, J. F., Kegerreis, R. J., & Blackwell, R. D. (1969). Word-of-mouth communication by the innovator. Journal of Marketing, 33(3), 15–19.
Fang, Y. H., Chiu, C. M., & Wang, E. T. (2011). Understanding customers' satisfaction and repurchase intentions: An integration of IS success model, trust, and justice. Internet Research, 21 (4), 479–503. Retrieved [6 June 2021], from https://dwirg.zprex.out.us.nz/10.1108/10662241111158335
Fazlollahtabar, H. (2010). A subjective framework for seat comfort based on a heuristic multi criteria decision making technique and anthropometry. Applied Ergonomics, 42(1), 16–28.
Fishbein, M., & Ajzen, I. (1977). Belief, attitude, intention, and behaviour: An introduction to theory and research. Journal of Business, 5, 177– I89.
Flaherty, G. T., & Lehane, S. M. (2017). Fasten your seatbelts: preventing injury from air turbulence in travellers. Journal of Travel Medicine, 24(3).
Flegal, K. M., Carroll, M. D., Kit, B. K., & Ogden, C. L. (2012). Prevalence of obesity and trends in the distribution of body mass index among US adults, 1999–2010. Jama, 307(5), 491–497.
Fornell, C. (1992). A national customer satisfaction barometer: The Swedish experience. Journal of Marketing, 56(1), 6–21.
Goh, L. G., Dhaliwal, S. S., Welborn, T. A., Lee, A. H., & Della, P. R. (2014). Ethnicity and the association between anthropometric indices of obesity and cardiovascular risk in women: a cross-sectional study. BMJ Open, 4(5), e004702.
Grant, B. M., & Giddings, L. S. (2002). Making sense of methodologies: A paradigm framework for the novice researcher. Contemporary Nurse, 13(1), 10–28.
Han, H. (2013). Effects of in-flight ambience and space/function on air travellers’ decision to select a low-cost airline. Tourism Management, 37, 125–135.
pg. 85
Han, H., & Hyun, S. S. (2015). Customer retention in the medical tourism industry: Impact of quality, satisfaction, trust, and price reasonableness. Tourism Management, 46, 20–29.
Han, H., Hyun, S. S., & Kim, W. (2014). In-flight service performance and passenger loyalty: A cross-national (China/Korea) study of travellers using low-cost carriers. Journal of Travel & Tourism Marketing, 31(5), 589–609.
Han, H., & Ryu, K. (2006). Moderating role of personal characteristics in forming restaurant customers' behavioural intentions: An upscale restaurant setting. Journal of Hospitality & Leisure Marketing, 15(4), 25–54.
Han, H., & Ryu, K. (2009). The roles of the physical environment, price perception, and customer satisfaction in determining customer loyalty in the restaurant industry. Journal of Hospitality & Tourism Research, 33(4), 487–510.
Hayes, A. F. (2017). Introduction to mediation, moderation, and conditional process analysis: A regression-based approach. Guilford Publications.
Helander, M. G., & Zhang, L. (1997). Field studies of comfort and discomfort in sitting. Ergonomics, 40(9), 895–915.
Hess, S., Adler, T., & Polak, J. W. (2007). Modelling airport and airline choice behaviour with the use of stated preference survey data. Transportation Research Part E: Logistics and Transportation Review, 43(3), 221–233. doi:https://doi.org/10.1016/j.tre.2006.10.002
Hiemstra-van Mastrigt, S. (2015). Comfortable passenger seats: Recommendations for design and research. Repository. TU, Delft. Retrieved [11 July 2019], from http://resolver.tudelft.nl/uuid:65014a10-1d7d-4021-8afb-4bad058d1242
Hill, D. J. (1986). Satisfaction and consumer services. Advances in Consumer Research, 13(1), 311–315.
Hinninghofen, H., & Enck, P. (2006). Passenger well-being in airplanes. Autonomic Neuroscience, 129(1–2), 80–85.
Hopkins, M. S., Kruschwitz, N., Haanaes, K., Kong, M. T., Arthur, D., & Reeves, M. (2011). Sustainability: The ‘embracers’ seize advantage. MIT Sloan Management Review, 52(3), 3.
Huang, Y., & Griffin, M. J. (2014). The relative discomfort of noise and vibration: effects of stimulus duration. Ergonomics, 57(8), 1244–1255.
Hunt, H. K. (1977). Customer satisfaction/dissatisfaction–Overview of and future research directions. In H. Keith Hunt (Ed.), Conceptualization and measurement of consumer satisfaction and dissatisfaction. Marketing Science Institute.
Jones, T. O., & Sasser, W. E. (1995). Why satisfied customers defect. Harvard Business Review, 73(6), 88.
Kankaew, K. (2013). Importance-Performance Analysis in Airlines Service Quality: A Case Study of legacy Airlines in Thailand. In The International Conference on Tourism, Transport, Logistics 2013.
Kelly, T., Yang, W., Chen, C. S., Reynolds, K., & He, J. (2008). Global burden of obesity in 2005 and projections to 2030. International Journal of Obesity, 32(9), 1431–1437.
Kendall, K. D. (2008). AFMC customer satisfaction study at the Air Logistics Centers (No. AFIT/GLM/ENS/08-5). Master’s Thesis, Air Force Institution of Wright-Patterson. Retrieved [3 April 2019], from https://scholar.afit.edu/etd/2802
Khatib, F. S. (1998). An investigation of airline service quality, passenger satisfaction and loyalty: The Jordanian Airline. Doctoral dissertation, University of Sheffield.
Khuong, M. (2014). The factors affecting Vietnam airlines service quality and passenger satisfaction–A mediation analysis of service quality. International Journal of Innovation, Management and Technology, 5(5), 327–333.
pg. 86
Kiron, D., Kruschwitz, N., Haanaes, K., Reeves, M., & Goh, E. (2013). The innovation bottom line. MIT Sloan Management Review, 54(3), 1.
Kiron, D., Kruschwitz, N., Haanaes, K., & von Streng Velken, I. (2012). Sustainability nears a tipping point. MIT Sloan Management Review, 53(2), 69–74.
Kolcaba, K. Y. (1991). A taxonomic structure for the concept comfort. Image: The Journal of Nursing Scholarship, 23(4), 237–240.
Kremser, F., Guenzkofer, F., Sedlmeier, C., Sabbah, O., & Bengler, K. (2012). Aircraft seating comfort: the influence of seat pitch on passengers’ well-being. Work, 41 (Supplement 1), 4936–4942.
LaBarbera, P. A., & Mazursky, D. (1983). A longitudinal assessment of consumer satisfaction/dissatisfaction: the dynamic aspect of the cognitive process. Journal of Marketing Research, 20(4), 393–404.
Laws, E. (2005). Managing passenger satisfaction: some quality issues in airline meal service. Journal of Quality Assurance in Hospitality & Tourism, 6(1–2), 89–113.
Lee, H., Lee, Y., & Yoo, D. (2000). The determinants of perceived service quality and its relationship with satisfaction. Journal of Services Marketing, 14(3), 217–231.
Leeuwen, L., Quick, S., & Daniel, K. (2002). The sport spectator satisfaction model: A conceptual framework for understanding the satisfaction of spectators. Sport Management Review, 5(2), 99–128.
Lewis, L., Patel, H., Cobb, S., D’Cruz, M., Bues, M., Stefani, O., & Grobler, T. (2016). Distracting people from sources of discomfort in a simulated aircraft environment. Work, 54(4), 963–979.
Li, W., Yu, S., Yang, H., Pei, H., & Zhao, C. (2017). Effects of long-duration sitting with limited space on discomfort, body flexibility, and surface pressure. International Journal of Industrial Ergonomics, 58, 12–24.
Lin, C. (2003). A critical appraisal of customer satisfaction and e-commerce. Managerial Auditing Journal, 18, 202–212.
Lin, I. Y., & Worthley, R. (2012). Servicescape moderation on personality traits, emotions, satisfaction, and behaviors. International Journal of Hospitality Management, 31(1), 31–42.
Mayr, R. (1959). Comfort in railway travel. The Railway Gazette, 9, 266–269. Mazursky, D., & Geva, A. (1989). Temporal decay in satisfaction–purchase intention
relationship. Psychology & Marketing, 6(3), 211–227. Mendoza, R. L. (2018). Health risk, price efficiency, and airline seat size regulation.
International Journal of Healthcare Management, 11(2), 122–132. Molenbroek, J. F. M., Albin, T. J., & Vink, P. (2017). Thirty years of anthropometric changes
relevant to the width and depth of transportation seating spaces, present and future. Applied Ergonomics, 65, 130–138.
Morgan, N. A., & Rego, L. L. (2006). The value of different customer satisfaction and loyalty metrics in predicting business performance. Marketing science, 25(5), 426–439.
Morwitz, V. G., Steckel, J. H., & Gupta, A. (2007). When do purchase intentions predict sales?. International Journal of Forecasting, 23(3), 347–364.
Munusamy, J., Chelliah, S., & Pandian, S. (2011). Customer satisfaction delivery in airline industry in Malaysia, A case of low cost carrier. Australian Journal of Basic and Applied Sciences, 5(11), 718–723.
Murdock, S. H., Kelley, C., Jordan, J. L., Pecotte, B., & Luedke, A. (2015). Demographics: A guide to methods and data sources for media, business, and government. Routledge.
pg. 87
Namasivayam, K., & Lin, I. (2005). Accounting for temporality in service scape effects on consumers' service evaluations. Journal of Foodservice Business Research, 7(1), 5–22.
National Heart, Lung, and Blood Institute. (n.d). Calculate Your BMI – Standard BMI Calculator. Nhlbi.nih.gov. Retrieved [18, June, 2021], from https://www.nhlbi.nih.gov/health/educational/lose_wt/BMI/bmicalc.htm
Nau, J., & Larget, L. (2018). The Rise of the long-haul, low-cost carriers. Wavestone. Retrieved [29 September 2018], from
O’Hara, L., & Strugnell, C. (1997). Developments in in-flight catering. Nutrition & Food Science, 97(3), 105–106.
Oliver, R. L. (1980). A cognitive model of the antecedents and consequences of satisfaction decisions. Journal of Marketing Research, 17(4), 460–469.
Oliver, R. L. (1981). Measurement and evaluation of satisfaction processes in retail settings. Journal of Retailing, 57(3), 25.
Oliver, R. L. (1993). Cognitive, affective, and attribute bases of the satisfaction response. Journal of Consumer Research, 20(3), 418–430.
Oliver, R. L., & Bearden, W. O. (1983). The Role of Involvement in Satisfaction Processes. Advances in Consumer Research, 10(1), 250–255.
Osbourne, D.J., Leal, F., Saran, R., Shipley, P., & Stewart, T. (2014). Person-Centred Ergonomics: A Brantonian View Of Human Factors (1st ed.). CRC Press. Retrieved [6 March 2019], from https://doi.org/10.1201/9781482295207
Park, H., Park, W., & Kim, Y. (2014). Manikin families representing obese airline passengers in the US. Journal of Healthcare engineering, 5(4), 479–504.
Park, J. W., Robertson, R., & Wu, C. L. (2005). Investigating the effects of airline service quality on airline image and passengers’ future behavioural intention: Findings from Australian international air passengers. The Journal of Tourism Studies, 16(1), 2–11.
Poria, Y., & Beal, J. (2017). An Exploratory Study about Obese People’s Flight Experience. Journal of Travel Research. 56(3), 370–380. doi:10.1177/0047287516643416
Quigley, C., Southall, D., Freer, M., Moody, A., & Porter, J. M. (2001). Anthropometric study to update minimum aircraft seating standards. ICE Ergonomics, Loughborough.
Richards, L. G. (1980). On the psychology of passenger comfort. Human Factors in Transport Research. 15- 23. Retrieved [28 May 2019], from www.scopus.com
Richards, L. G., & Jacobson, I. D. (1975). Ride quality evaluation 1. Questionnaire studies of airline passenger comfort. Ergonomics, 18(2), 129–150.
Richards, L. G., Jacobson, I. D., & Kuhlthau, A. R. (1978). What the passenger contributes to passenger comfort. Applied Ergonomics, 9(3), 137–142.
Roebuck, J. A., Kroemer, K. H., & Thomson, W. G. (1975). Engineering anthropometry methods (Vol. 3). John Wiley & Sons.
Röggla, G., Moser, B., & Röggla, M. (1999). Seat space on airlines. The Lancet, 353(9163), 1532.
Rosenbloom, S. (2016). Fighting the Incredible Shrinking Airline Seat International New York Times, March 1, 2016. [Online Research Library: Questia Reader]. Retrieved [1 May 2019], from https://www.nytimes.com/2016/02/29/travel/shrinking-airline-seats.html
Ross, C. K., Frommelt, G., Hazelwood, L., & Chang, R. W. (1987). The role of expectations in patient satisfaction with medical care. Journal of health care marketing, 7(4).
Rust, R. T., & Zahorik, A. J. (1993). Customer satisfaction, customer retention, and market share. Journal of retailing, 69(2), 193–215.
Ryu, K., & Han, H. (2010). Influence of the quality of food, service, and physical environment on customer satisfaction and behavioural intention in quick-casual restaurants:
pg. 88
Moderating role of perceived price. Journal of Hospitality & Tourism Research, 34(3), 310–329.
Saha, G. C. (2009). Service quality, satisfaction, and behavioural intentions: A study of low-cost airline carriers in Thailand. Managing Service Quality: An International Journal, 19(3), 350–372.
Sassi, F. (2010). Obesity and the Economics of Prevention. OECD. Sebjan, U., Tominc, P., & Širec, K. (2017). Multiple conceptual modelling of perceived quality
of in-flight airline services. Promet-Traffic & Transportation, 29(3), 311–319. Semer-Purzycki, J. (2000). Travel vision: A practical guide for the travel, tourism, and
hospitality industry. Prentice Hall. Shackel, B., Chidsey, K. D., & Shipley, P. (1969). The assessment of chair comfort.
Ergonomics, 12(2), 269–306. Sharma, N., & Patterson, P. G. (2000). Switching costs, alternative attractiveness and
experience as moderators of relationship commitment in professional, consumer services. International Journal of Service Industry Management, 11(5), 470–490.
Shen, W., & Vértiz, A. M. (1997). Redefining seat comfort (No. 970597). SAE Technical Paper.
Stein, P. D., Beemath, A., & Olson, R. E. (2005). Obesity as a risk factor in venous thromboembolism. The American Journal of Medicine, 118(9), 978–980.
Streiner, D. (1994). Figuring Out Factors: The Use and Misuse of Factor Analysis. The Canadian Journal Of Psychiatry, 39(3), 135–140. doi: 10.1177/070674379403900303
Sivadas, E., & Baker-Prewitt, J. L. (2000). An examination of the relationship between service quality, customer satisfaction, and store loyalty. International Journal of Retail & Distribution Management, 28(2), 73–82.
Söderlund, M. (1998). Customer satisfaction and its consequences on customer behaviour revisited: The impact of different levels of satisfaction on word-of-mouth, feedback to the supplier and loyalty. International Journal of Service Industry Management, 9(2), 169–188.
Spreng, R.A., Mackenzie, S.C., & Olshavsky, R.W. (1996). A re‐examination of the determinants of consumer satisfaction. Journal of Marketing, 60, 15‐32.
Suki, N. M. (2014). Passenger satisfaction with airline service quality in Malaysia: A structural equation modeling approach. Research in Transportation Business & Management, 10, 26–32.
Suzuki, Y. (2004). The impact of airline service failures on travelers’ carrier choice: A case study of central Iowa. Transportation Journal, 26–36.
Tan, C., Chen, W., Kimman, F., & Rauterberg, G. (2009). Sleeping posture analysis of economy class aircraft seat. Symposium conducted at the meeting of the World Congress on Engineering.
Taylor, S. A., & Baker, T. L. (1994). An assessment of the relationship between service quality and customer satisfaction in the formation of consumers' purchase intentions. Journal of Retailing, 70(2), 163–178.
TripAdvisor SG (2018) Airline seat comparison charts. Retrieved [5 September 2018], from https://www.seatguru.com/charts/longhaul_economy
Tsaur, S. H., Chang, T. Y., & Yen, C. H. (2002). The evaluation of airline service quality byfuzzy MCDM. Tourism Management, 23(2), 107–115. doi:https://doi.org/10.1016/S0261-5177(01)00050-4
Tse, D.V., & Wilton, P.C. (1988). Models of consumer satisfaction formation: an extension. Journal of Marketing Research, 15, 204–12.
pg. 89
Vink, P., C. Bazley, I. Kamp, and M. Blok. 2012. Possibilities to improve the aircraft interior comfort experience Applied Ergonomics 43(2), 354–359.
Vink, P., & Brauer, K. (2011). Aircraft interior comfort and design (ergonomics design management: theory and applications). CRC Press.
Vink, P., & Hallbeck, S. (2012). Comfort and discomfort studies demonstrate the need for a new model. Applied Ergonomics, 43(2), 271–276. Retrieved [28 June 2018], from https://doiorg.ezproxy.aut.ac.nz/10.1016/j.apergo.2011.06.001
Vink, P., & van Mastrigt, S. (2011). The aircraft interior comfort experience of 10,032 passengers. Proceedings of the Human Factors and Ergonomics Society Annual Meeting 55(1), 579–583.
Vink, P., Bazley, C., Kamp, I., & Blok, M. (2012). Possibilities to improve the aircraft interior comfort experience. Applied Ergonomics, 43(2), 354–359.
Wafik, G. M., Abou-Shouk, M. A., & Hewedi, M. M. (2017). Airline Passenger Travel Cycle, Satisfaction and Loyalty: A Comparison of EgyptAir and Emirates Airlines. International Journal of Hospitality and Tourism Systems, 10(1), 1.
Wilkerson, J. T., Jacobson, M. Z., Malwitz, A., Balasubramanian, S., Wayson, R., Fleming, G., Naiman, A. D., & Lele, S. K. (2010). Analysis of emission data from global commercial aviation: 2004 and 2006. Atmospheric Chemistry and Physics, 10(13), 6391–6408.
Wilton, P. C. & Myers, H. G. (1986). Task, expectancy, and information assessment effects in information utilization processes. Journal of Consumer Research, 12, 469‐86.
Wirtz, J., & Chew, P. (2002). The effects of incentives, deal proneness, satisfaction and tie strength on word-of-mouth behaviour. International Journal of Service Industry Management, 13(2), 141–162.
World Health Organization. (2018). Obesity and overweight. Retrieved [30 October 2018], from http://www.who.int/news-room/fact-sheets/detail/obesity-and-overweight
Wu, L. (2013). The antecedents of customer satisfaction and its link to complaint intentions in online shopping: An integration of justice, technology, and trust. International Journal of Information Management, 33(1), 166–176.
Wyld, D. C., Jones, M. A., & Totten, J. W. (2005). Where is my suitcase? RFID and airline customer service. Marketing Intelligence & Planning, 23(4), 382–394.
Yoon, S. J. & Kim, J. H. (2000). An empirical validation of a loyalty model based on expectation disconfirmation. Journal of Consumer Marketing, 17(2), 120‐36.
Zahari, M., Salleh, N. K., Kamaruddin, M. S. Y., & Kutut, M. Z. (2011). In-flight meals, passengers’ level of satisfaction and re-flying intention. World Academy of Science, Engineering and Technology, 60(12), 1353–1360.
Zhang, L., Helander, M. G., & Drury, C. G. (1996). Identifying factors of comfort and discomfort in sitting. Human Factors, 38(3), 377–389.
Zikmund, W., D’Alessandro, S., Winzar, H., Lowe, B., & Babin, B. (2014). Marketing research (3rd Asia-Pacific ed.). Cengage Learning Australia.
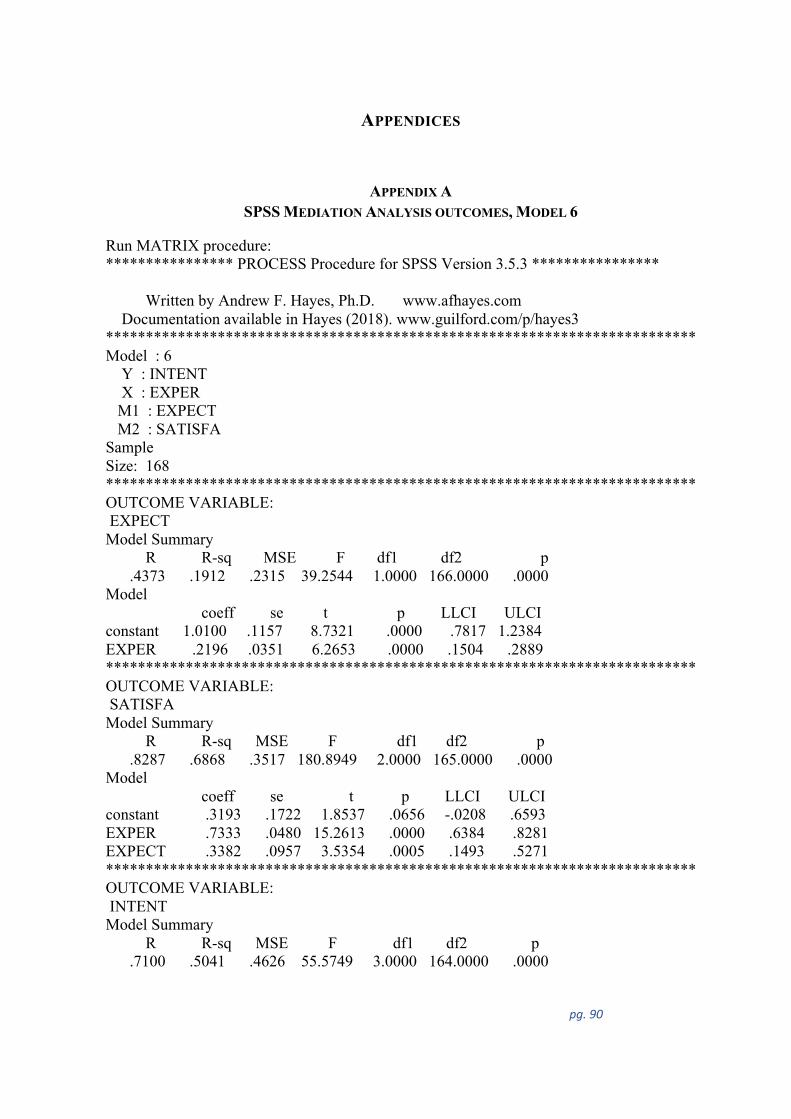
pg. 90
APPENDICES
APPENDIX A SPSS MEDIATION ANALYSIS OUTCOMES, MODEL 6
Run MATRIX procedure: **************** PROCESS Procedure for SPSS Version 3.5.3 ****************
Written by Andrew F. Hayes, Ph.D. www.afhayes.com Documentation available in Hayes (2018). www.guilford.com/p/hayes3 ************************************************************************** Model : 6 Y : INTENT X : EXPER M1 : EXPECT
M2 : SATISFA Sample Size: 168 ************************************************************************** OUTCOME VARIABLE: EXPECT Model Summary R R-sq MSE F df1 df2 p .4373 .1912 .2315 39.2544 1.0000 166.0000 .0000 Model
coeff se t p LLCI ULCI constant 1.0100 .1157 8.7321 .0000 .7817 1.2384 EXPER .2196 .0351 6.2653 .0000 .1504 .2889 ************************************************************************** OUTCOME VARIABLE: SATISFA Model Summary R R-sq MSE F df1 df2 p .8287 .6868 .3517 180.8949 2.0000 165.0000 .0000 Model
coeff se t p LLCI ULCI constant .3193 .1722 1.8537 .0656 -.0208 .6593 EXPER .7333 .0480 15.2613 .0000 .6384 .8281 EXPECT .3382 .0957 3.5354 .0005 .1493 .5271 ************************************************************************** OUTCOME VARIABLE: INTENT Model Summary R R-sq MSE F df1 df2 p .7100 .5041 .4626 55.5749 3.0000 164.0000 .0000
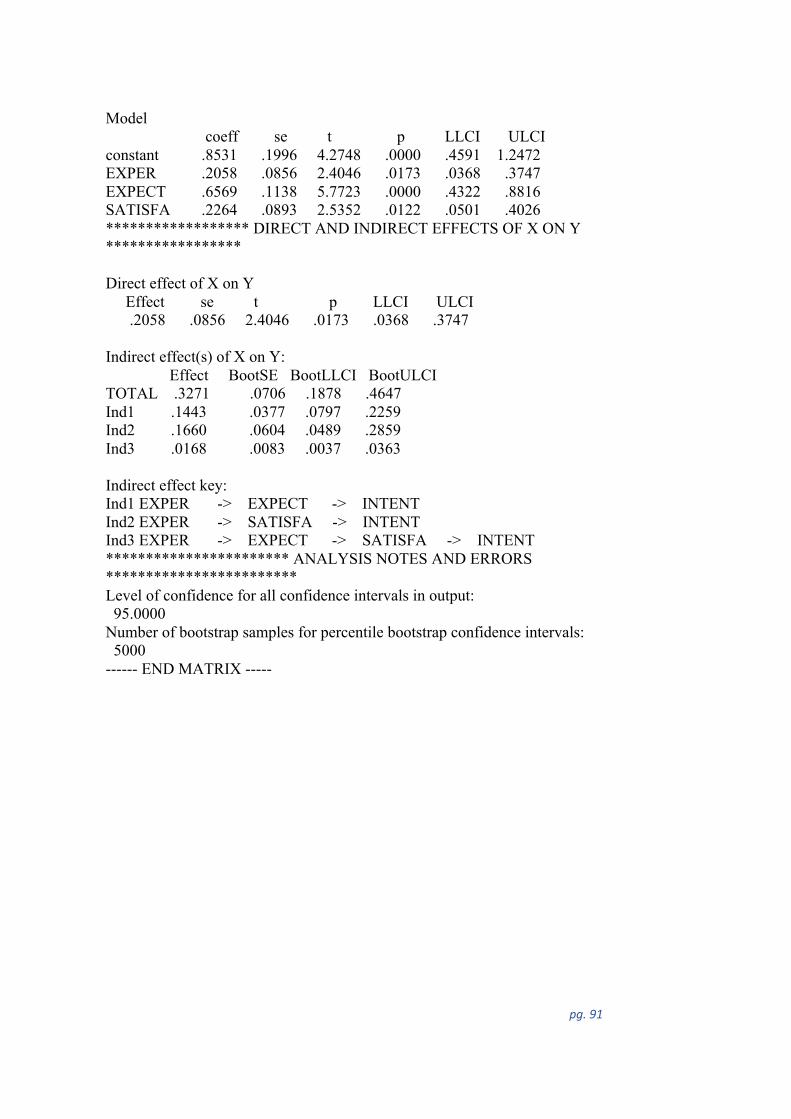
pg. 91
Model coeff se t p LLCI ULCI
constant .8531 .1996 4.2748 .0000 .4591 1.2472 EXPER .2058 .0856 2.4046 .0173 .0368 .3747 EXPECT .6569 .1138 5.7723 .0000 .4322 .8816 SATISFA .2264 .0893 2.5352 .0122 .0501 .4026 ****************** DIRECT AND INDIRECT EFFECTS OF X ON Y *****************
Direct effect of X on Y Effect se t p LLCI ULCI .2058 .0856 2.4046 .0173 .0368 .3747
Indirect effect(s) of X on Y: Effect BootSE BootLLCI BootULCI
TOTAL .3271 .0706 .1878 .4647 Ind1 .1443 .0377 .0797 .2259 Ind2 .1660 .0604 .0489 .2859 Ind3 .0168 .0083 .0037 .0363
Indirect effect key: Ind1 EXPER -> EXPECT -> INTENT Ind2 EXPER -> SATISFA -> INTENT Ind3 EXPER -> EXPECT -> SATISFA -> INTENT *********************** ANALYSIS NOTES AND ERRORS ************************ Level of confidence for all confidence intervals in output: 95.0000 Number of bootstrap samples for percentile bootstrap confidence intervals: 5000 ------ END MATRIX -----
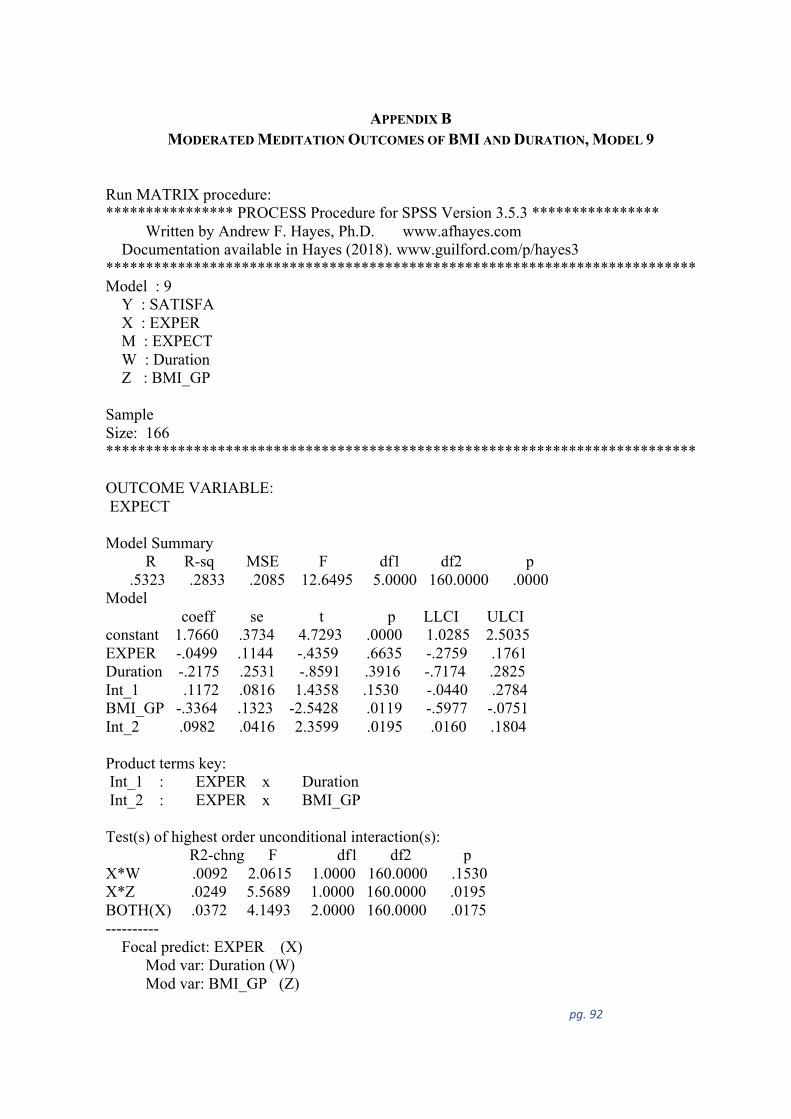
pg. 92
APPENDIX B MODERATED MEDITATION OUTCOMES OF BMI AND DURATION, MODEL 9
Run MATRIX procedure: **************** PROCESS Procedure for SPSS Version 3.5.3 **************** Written by Andrew F. Hayes, Ph.D. www.afhayes.com Documentation available in Hayes (2018). www.guilford.com/p/hayes3 ************************************************************************** Model : 9 Y : SATISFA X : EXPER M : EXPECT W : Duration Z : BMI_GP
Sample Size: 166 **************************************************************************
OUTCOME VARIABLE: EXPECT
Model Summary R R-sq MSE F df1 df2 p .5323 .2833 .2085 12.6495 5.0000 160.0000 .0000 Model
coeff se t p LLCI ULCI constant 1.7660 .3734 4.7293 .0000 1.0285 2.5035 EXPER -.0499 .1144 -.4359 .6635 -.2759 .1761 Duration -.2175 .2531 -.8591 .3916 -.7174 .2825 Int_1 .1172 .0816 1.4358 .1530 -.0440 .2784 BMI_GP -.3364 .1323 -2.5428 .0119 -.5977 -.0751Int_2 .0982 .0416 2.3599 .0195 .0160 .1804
Product terms key: Int_1 : EXPER x Duration Int_2 : EXPER x BMI_GP
Test(s) of highest order unconditional interaction(s): R2-chng F df1 df2 p
X*W .0092 2.0615 1.0000 160.0000 .1530 X*Z .0249 5.5689 1.0000 160.0000 .0195 BOTH(X) .0372 4.1493 2.0000 160.0000 .0175 ---------- Focal predict: EXPER (X) Mod var: Duration (W) Mod var: BMI_GP (Z)
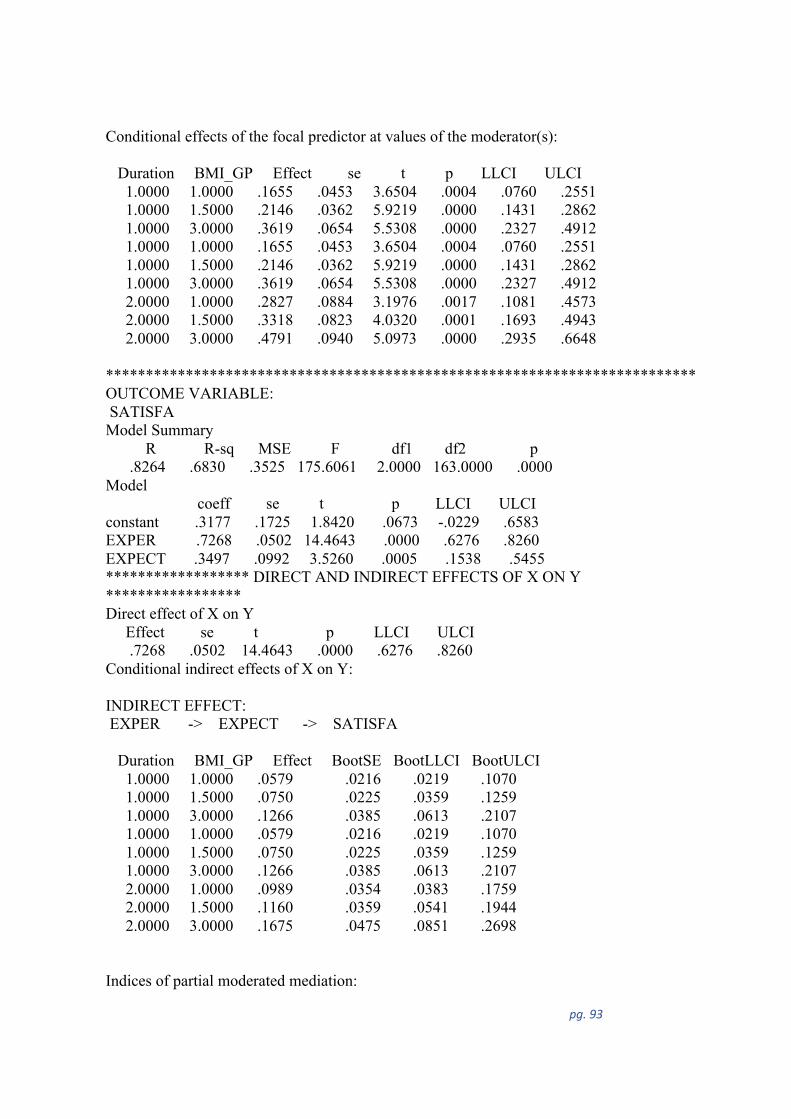
pg. 93
Conditional effects of the focal predictor at values of the moderator(s): Duration BMI_GP Effect se t p LLCI ULCI 1.0000 1.0000 .1655 .0453 3.6504 .0004 .0760 .2551 1.0000 1.5000 .2146 .0362 5.9219 .0000 .1431 .2862 1.0000 3.0000 .3619 .0654 5.5308 .0000 .2327 .4912 1.0000 1.0000 .1655 .0453 3.6504 .0004 .0760 .2551 1.0000 1.5000 .2146 .0362 5.9219 .0000 .1431 .2862 1.0000 3.0000 .3619 .0654 5.5308 .0000 .2327 .4912 2.0000 1.0000 .2827 .0884 3.1976 .0017 .1081 .4573 2.0000 1.5000 .3318 .0823 4.0320 .0001 .1693 .4943 2.0000 3.0000 .4791 .0940 5.0973 .0000 .2935 .6648 ************************************************************************** OUTCOME VARIABLE: SATISFA Model Summary R R-sq MSE F df1 df2 p .8264 .6830 .3525 175.6061 2.0000 163.0000 .0000 Model coeff se t p LLCI ULCI constant .3177 .1725 1.8420 .0673 -.0229 .6583 EXPER .7268 .0502 14.4643 .0000 .6276 .8260 EXPECT .3497 .0992 3.5260 .0005 .1538 .5455 ****************** DIRECT AND INDIRECT EFFECTS OF X ON Y ***************** Direct effect of X on Y Effect se t p LLCI ULCI .7268 .0502 14.4643 .0000 .6276 .8260 Conditional indirect effects of X on Y: INDIRECT EFFECT: EXPER -> EXPECT -> SATISFA Duration BMI_GP Effect BootSE BootLLCI BootULCI 1.0000 1.0000 .0579 .0216 .0219 .1070 1.0000 1.5000 .0750 .0225 .0359 .1259 1.0000 3.0000 .1266 .0385 .0613 .2107 1.0000 1.0000 .0579 .0216 .0219 .1070 1.0000 1.5000 .0750 .0225 .0359 .1259 1.0000 3.0000 .1266 .0385 .0613 .2107 2.0000 1.0000 .0989 .0354 .0383 .1759 2.0000 1.5000 .1160 .0359 .0541 .1944 2.0000 3.0000 .1675 .0475 .0851 .2698 Indices of partial moderated mediation:
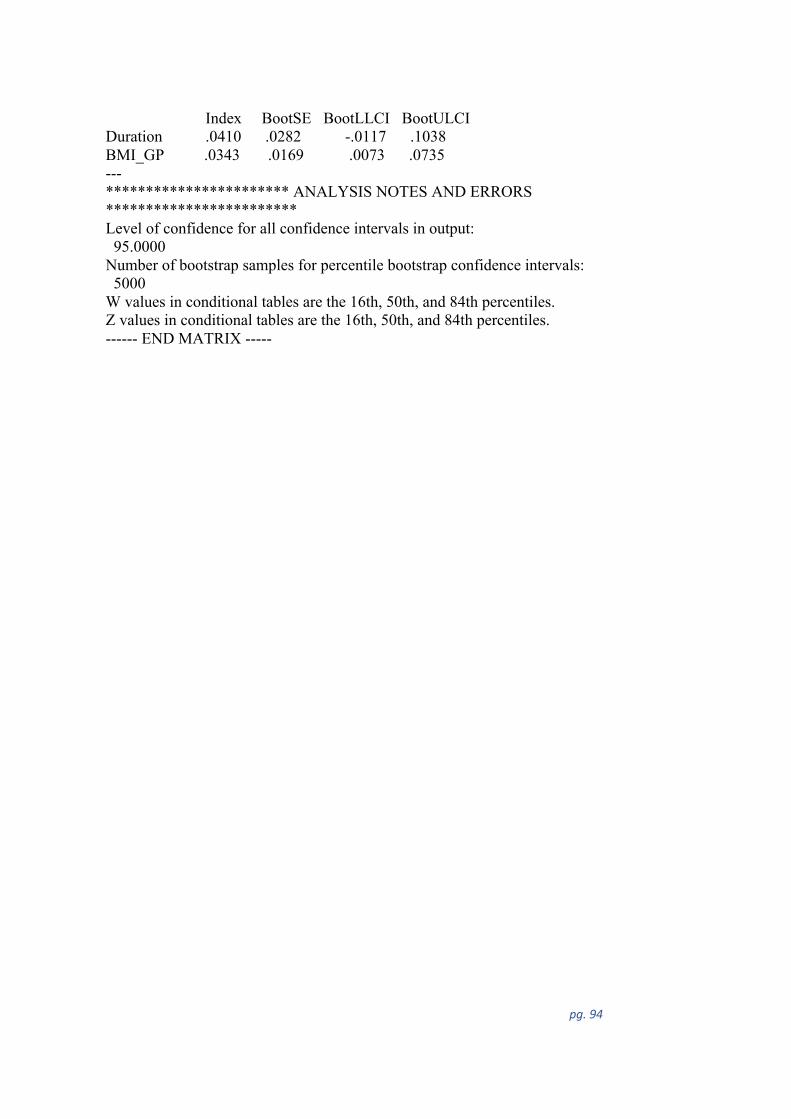
pg. 94
Index BootSE BootLLCI BootULCI Duration .0410 .0282 -.0117 .1038 BMI_GP .0343 .0169 .0073 .0735 --- *********************** ANALYSIS NOTES AND ERRORS ************************ Level of confidence for all confidence intervals in output: 95.0000 Number of bootstrap samples for percentile bootstrap confidence intervals: 5000 W values in conditional tables are the 16th, 50th, and 84th percentiles. Z values in conditional tables are the 16th, 50th, and 84th percentiles. ------ END MATRIX -----
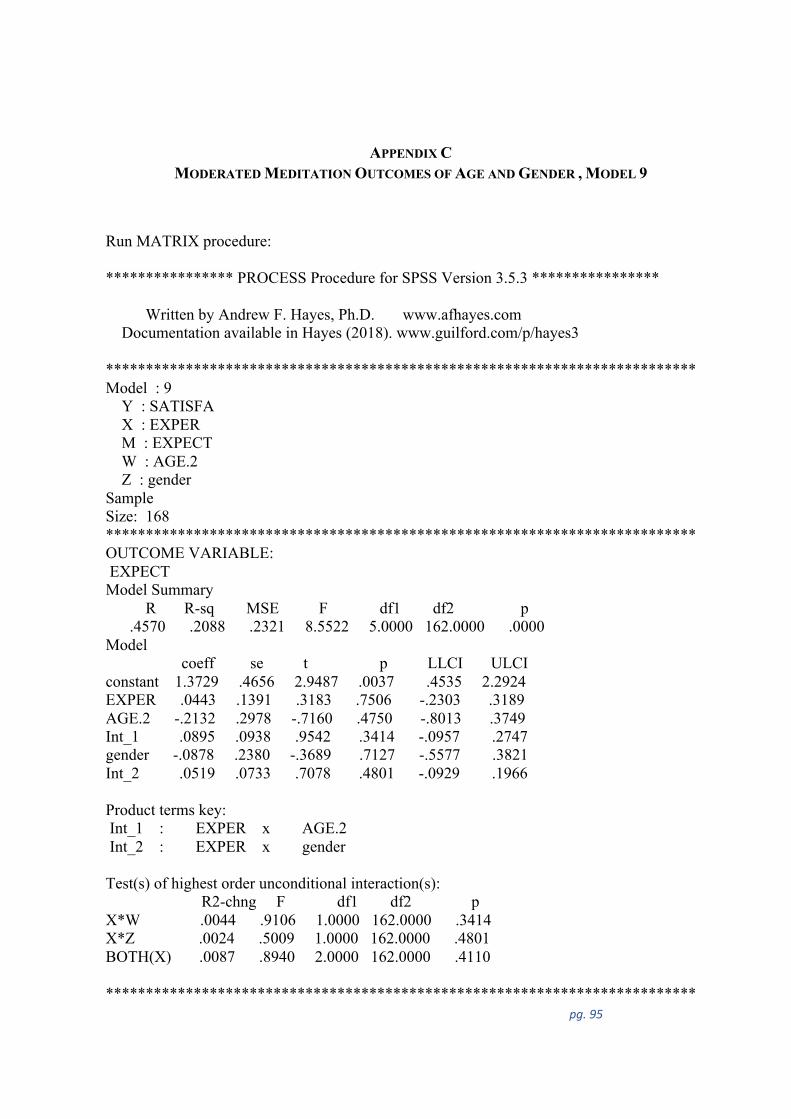
pg. 95
APPENDIX C MODERATED MEDITATION OUTCOMES OF AGE AND GENDER , MODEL 9
Run MATRIX procedure:
**************** PROCESS Procedure for SPSS Version 3.5.3 ****************
Written by Andrew F. Hayes, Ph.D. www.afhayes.com Documentation available in Hayes (2018). www.guilford.com/p/hayes3
************************************************************************** Model : 9 Y : SATISFA X : EXPER M : EXPECT W : AGE.2 Z : gender Sample Size: 168 ************************************************************************** OUTCOME VARIABLE: EXPECT Model Summary R R-sq MSE F df1 df2 p .4570 .2088 .2321 8.5522 5.0000 162.0000 .0000 Model
coeff se t p LLCI ULCI constant 1.3729 .4656 2.9487 .0037 .4535 2.2924 EXPER .0443 .1391 .3183 .7506 -.2303 .3189 AGE.2 -.2132 .2978 -.7160 .4750 -.8013 .3749 Int_1 .0895 .0938 .9542 .3414 -.0957 .2747 gender -.0878 .2380 -.3689 .7127 -.5577 .3821 Int_2 .0519 .0733 .7078 .4801 -.0929 .1966
Product terms key: Int_1 : EXPER x AGE.2 Int_2 : EXPER x gender
Test(s) of highest order unconditional interaction(s): R2-chng F df1 df2 p
X*W .0044 .9106 1.0000 162.0000 .3414 X*Z .0024 .5009 1.0000 162.0000 .4801 BOTH(X) .0087 .8940 2.0000 162.0000 .4110
**************************************************************************
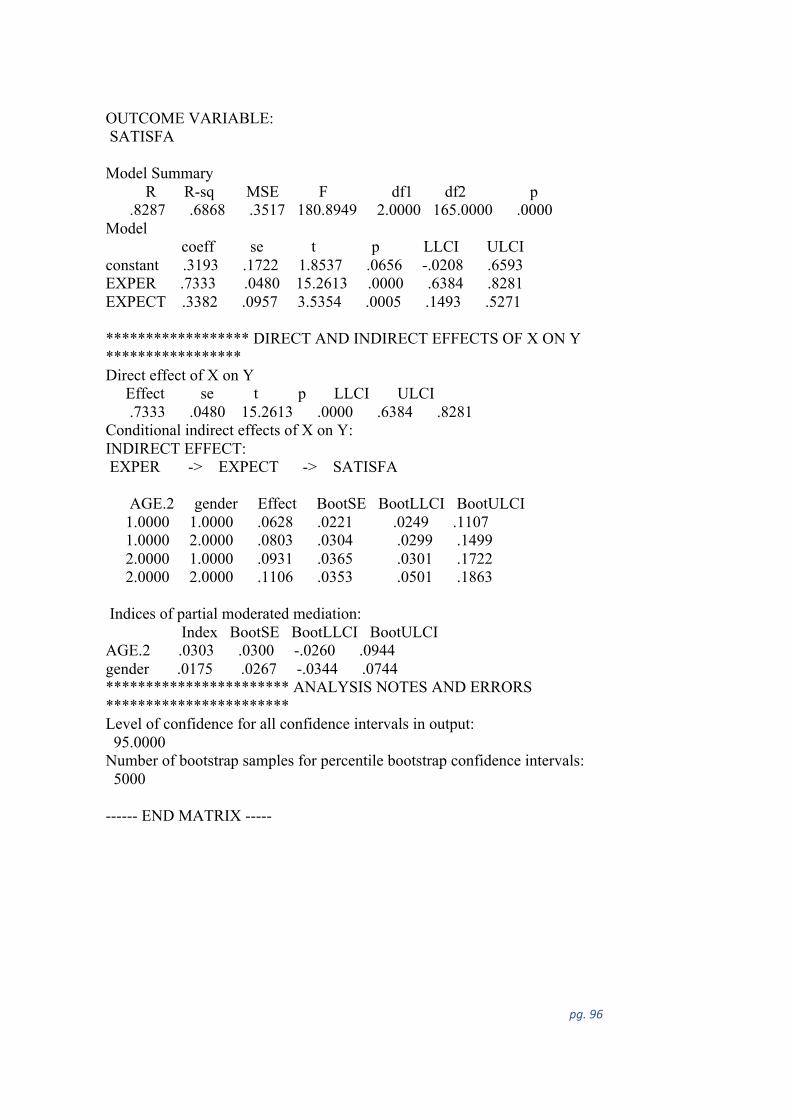
pg. 96
OUTCOME VARIABLE: SATISFA
Model Summary R R-sq MSE F df1 df2 p .8287 .6868 .3517 180.8949 2.0000 165.0000 .0000 Model
coeff se t p LLCI ULCI constant .3193 .1722 1.8537 .0656 -.0208 .6593 EXPER .7333 .0480 15.2613 .0000 .6384 .8281 EXPECT .3382 .0957 3.5354 .0005 .1493 .5271
****************** DIRECT AND INDIRECT EFFECTS OF X ON Y ***************** Direct effect of X on Y Effect se t p LLCI ULCI .7333 .0480 15.2613 .0000 .6384 .8281 Conditional indirect effects of X on Y: INDIRECT EFFECT: EXPER -> EXPECT -> SATISFA
AGE.2 gender Effect BootSE BootLLCI BootULCI 1.0000 1.0000 .0628 .0221 .0249 .1107 1.0000 2.0000 .0803 .0304 .0299 .1499 2.0000 1.0000 .0931 .0365 .0301 .1722 2.0000 2.0000 .1106 .0353 .0501 .1863
Indices of partial moderated mediation: Index BootSE BootLLCI BootULCI
AGE.2 .0303 .0300 -.0260 .0944 gender .0175 .0267 -.0344 .0744 *********************** ANALYSIS NOTES AND ERRORS *********************** Level of confidence for all confidence intervals in output: 95.0000 Number of bootstrap samples for percentile bootstrap confidence intervals: 5000
------ END MATRIX -----
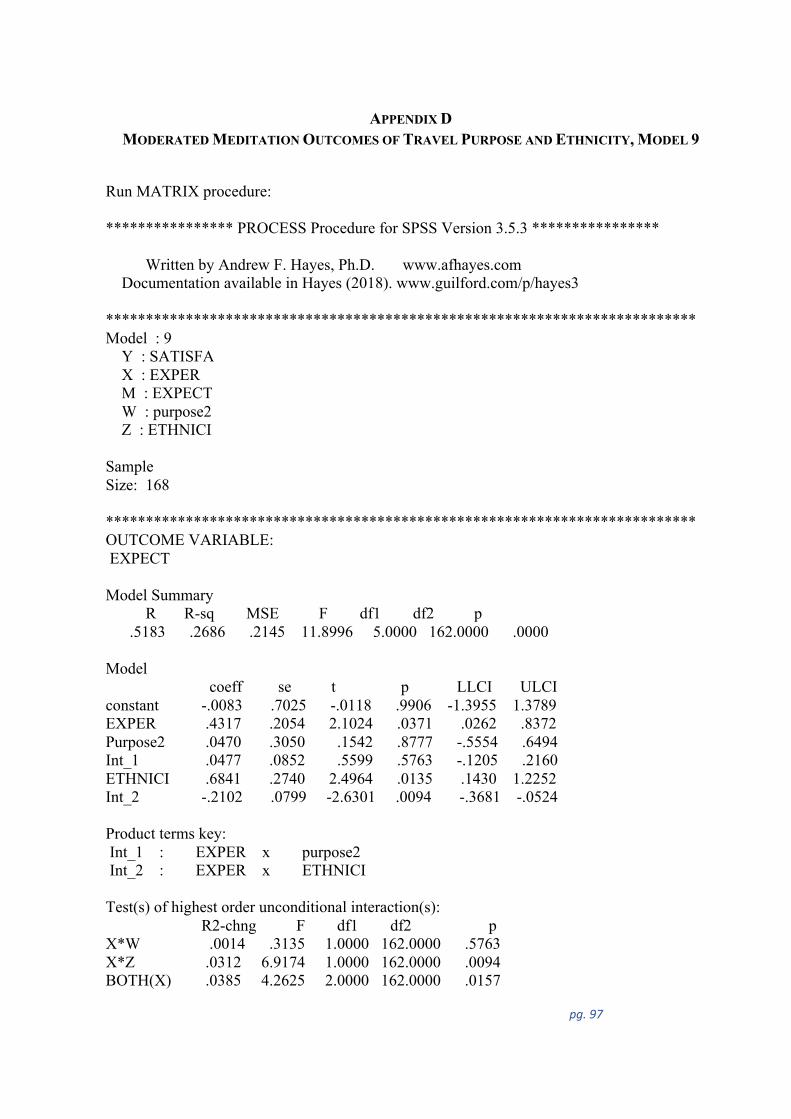
pg. 97
APPENDIX D MODERATED MEDITATION OUTCOMES OF TRAVEL PURPOSE AND ETHNICITY, MODEL 9
Run MATRIX procedure: **************** PROCESS Procedure for SPSS Version 3.5.3 **************** Written by Andrew F. Hayes, Ph.D. www.afhayes.com Documentation available in Hayes (2018). www.guilford.com/p/hayes3 ************************************************************************** Model : 9 Y : SATISFA X : EXPER M : EXPECT W : purpose2 Z : ETHNICI Sample Size: 168 ************************************************************************** OUTCOME VARIABLE: EXPECT Model Summary R R-sq MSE F df1 df2 p .5183 .2686 .2145 11.8996 5.0000 162.0000 .0000 Model coeff se t p LLCI ULCI constant -.0083 .7025 -.0118 .9906 -1.3955 1.3789 EXPER .4317 .2054 2.1024 .0371 .0262 .8372 Purpose2 .0470 .3050 .1542 .8777 -.5554 .6494 Int_1 .0477 .0852 .5599 .5763 -.1205 .2160 ETHNICI .6841 .2740 2.4964 .0135 .1430 1.2252 Int_2 -.2102 .0799 -2.6301 .0094 -.3681 -.0524 Product terms key: Int_1 : EXPER x purpose2 Int_2 : EXPER x ETHNICI Test(s) of highest order unconditional interaction(s): R2-chng F df1 df2 p X*W .0014 .3135 1.0000 162.0000 .5763 X*Z .0312 6.9174 1.0000 162.0000 .0094 BOTH(X) .0385 4.2625 2.0000 162.0000 .0157
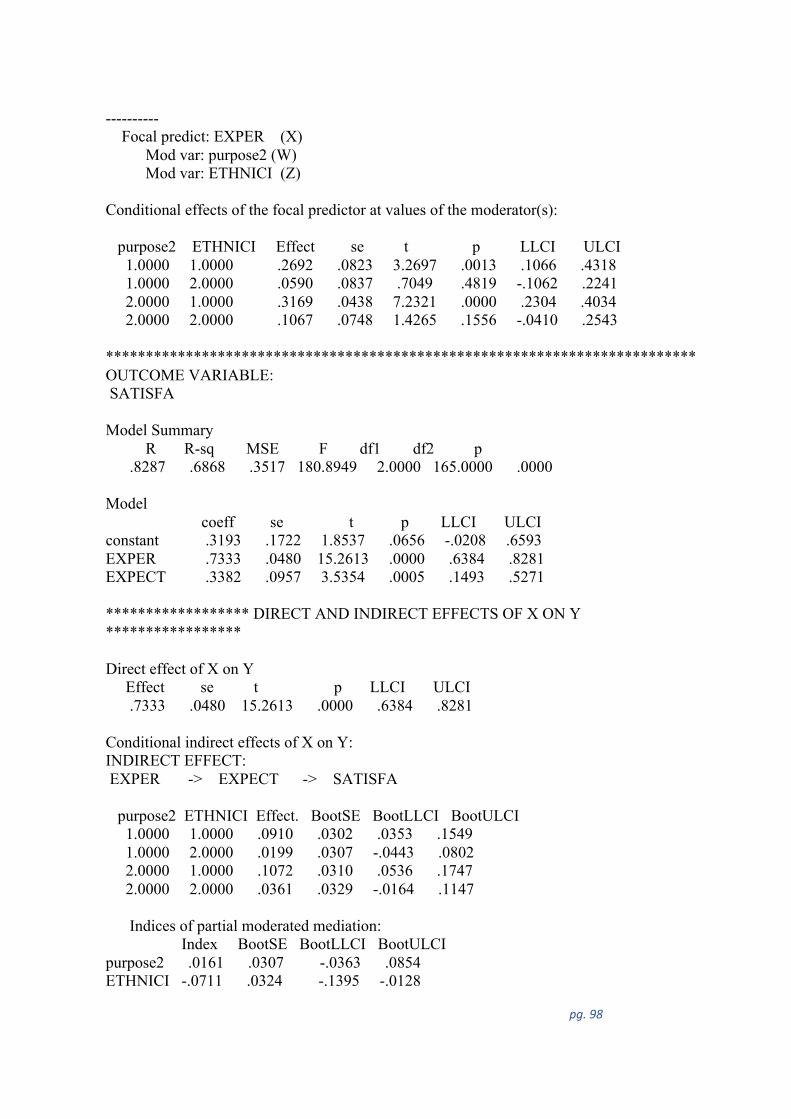
pg. 98
---------- Focal predict: EXPER (X) Mod var: purpose2 (W) Mod var: ETHNICI (Z) Conditional effects of the focal predictor at values of the moderator(s): purpose2 ETHNICI Effect se t p LLCI ULCI 1.0000 1.0000 .2692 .0823 3.2697 .0013 .1066 .4318 1.0000 2.0000 .0590 .0837 .7049 .4819 -.1062 .2241 2.0000 1.0000 .3169 .0438 7.2321 .0000 .2304 .4034 2.0000 2.0000 .1067 .0748 1.4265 .1556 -.0410 .2543 ************************************************************************** OUTCOME VARIABLE: SATISFA Model Summary R R-sq MSE F df1 df2 p .8287 .6868 .3517 180.8949 2.0000 165.0000 .0000 Model coeff se t p LLCI ULCI constant .3193 .1722 1.8537 .0656 -.0208 .6593 EXPER .7333 .0480 15.2613 .0000 .6384 .8281 EXPECT .3382 .0957 3.5354 .0005 .1493 .5271 ****************** DIRECT AND INDIRECT EFFECTS OF X ON Y ***************** Direct effect of X on Y Effect se t p LLCI ULCI .7333 .0480 15.2613 .0000 .6384 .8281 Conditional indirect effects of X on Y: INDIRECT EFFECT: EXPER -> EXPECT -> SATISFA purpose2 ETHNICI Effect. BootSE BootLLCI BootULCI 1.0000 1.0000 .0910 .0302 .0353 .1549 1.0000 2.0000 .0199 .0307 -.0443 .0802 2.0000 1.0000 .1072 .0310 .0536 .1747 2.0000 2.0000 .0361 .0329 -.0164 .1147 Indices of partial moderated mediation: Index BootSE BootLLCI BootULCI purpose2 .0161 .0307 -.0363 .0854 ETHNICI -.0711 .0324 -.1395 -.0128

pg. 99
*********************** ANALYSIS NOTES AND ERRORS ************************ Level of confidence for all confidence intervals in output: 95.0000 Number of bootstrap samples for percentile bootstrap confidence intervals: 5000 ------ END MATRIX -----
pg. 100
APPENDIX E ETHICAL APPROVAL
pg. 101
APPENDIX F PARTICIPANT INFORMATION SHEET.

pg. 102
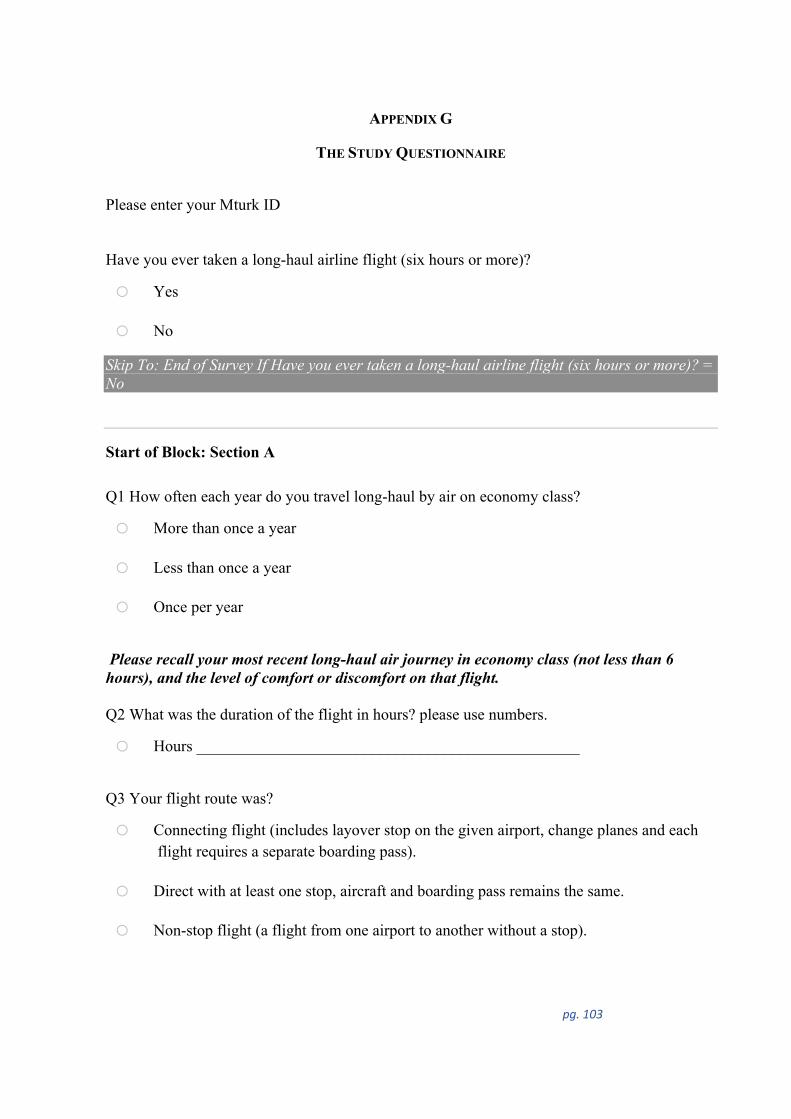
pg. 103
APPENDIX G
THE STUDY QUESTIONNAIRE
Please enter your Mturk ID
Have you ever taken a long-haul airline flight (six hours or more)?
o Yes
o No
Skip To: End of Survey If Have you ever taken a long-haul airline flight (six hours or more)? = No
Start of Block: Section A
Q1 How often each year do you travel long-haul by air on economy class?
o More than once a year
o Less than once a year
o Once per year
Please recall your most recent long-haul air journey in economy class (not less than 6 hours), and the level of comfort or discomfort on that flight.
Q2 What was the duration of the flight in hours? please use numbers.
o Hours ________________________________________________
Q3 Your flight route was?
o Connecting flight (includes layover stop on the given airport, change planes and eachflight requires a separate boarding pass).
o Direct with at least one stop, aircraft and boarding pass remains the same.
o Non-stop flight (a flight from one airport to another without a stop).
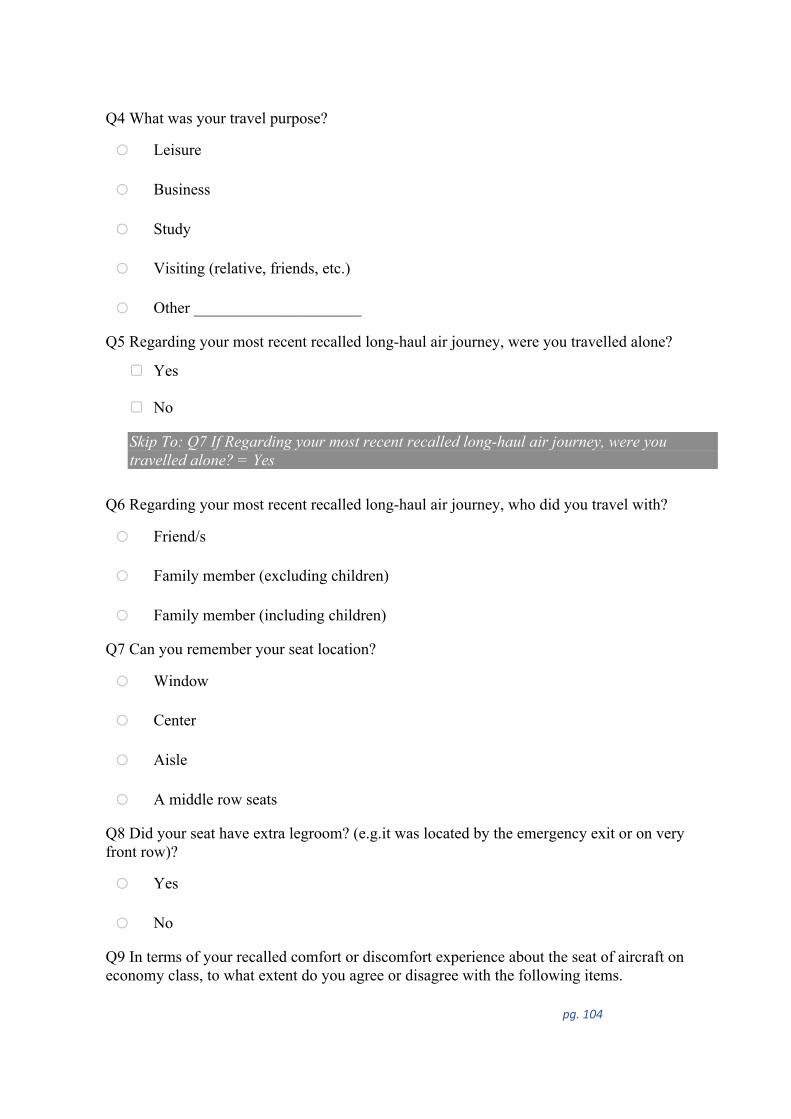
pg. 104
Q4 What was your travel purpose?
o Leisure
o Business
o Study
o Visiting (relative, friends, etc.)
o Other _____________________
Q5 Regarding your most recent recalled long-haul air journey, were you travelled alone?
▢ Yes
▢ No
Skip To: Q7 If Regarding your most recent recalled long-haul air journey, were you travelled alone? = Yes
Q6 Regarding your most recent recalled long-haul air journey, who did you travel with?
o Friend/s
o Family member (excluding children)
o Family member (including children)
Q7 Can you remember your seat location?
o Window
o Center
o Aisle
o A middle row seats
Q8 Did your seat have extra legroom? (e.g.it was located by the emergency exit or on very front row)?
o Yes
o No
Q9 In terms of your recalled comfort or discomfort experience about the seat of aircraft on economy class, to what extent do you agree or disagree with the following items.
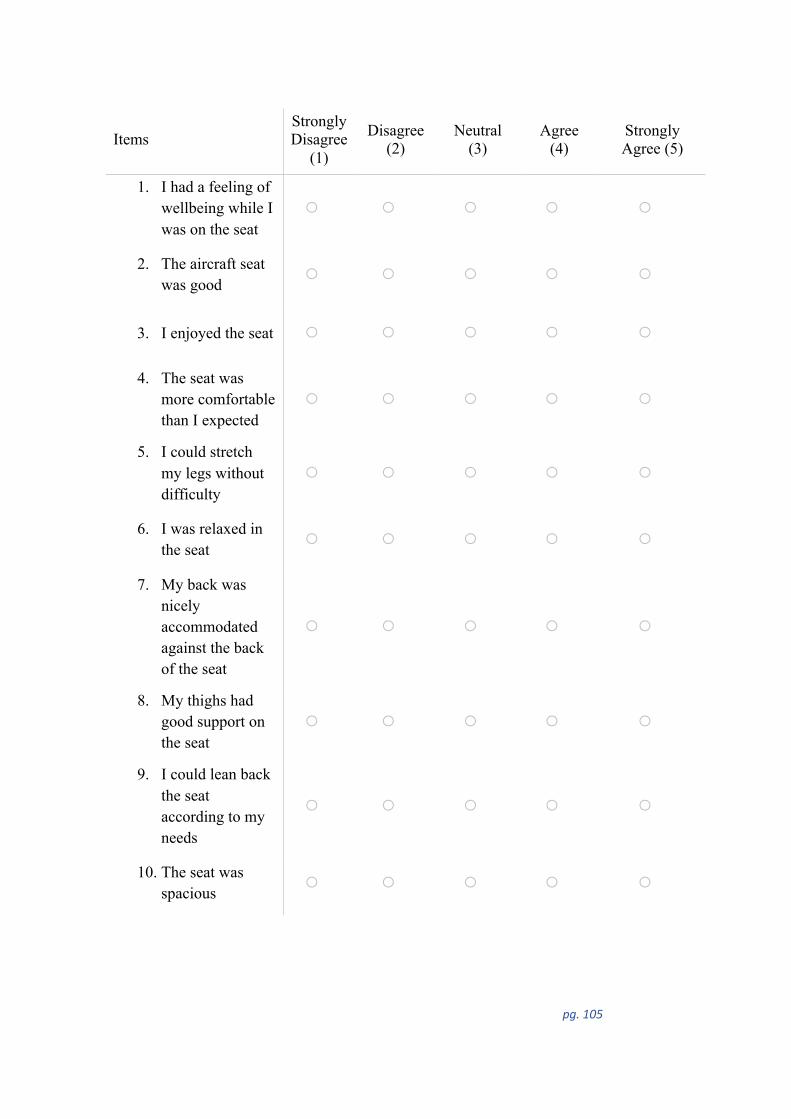
pg. 105
Items Strongly Disagree
(1)
Disagree (2)
Neutral (3)
Agree (4)
Strongly Agree (5)
1. I had a feeling ofwellbeing while Iwas on the seat
o o o o o
2. The aircraft seatwas good
o o o o o
3. I enjoyed the seat o o o o o
4. The seat wasmore comfortablethan I expected
o o o o o
5. I could stretchmy legs withoutdifficulty
o o o o o
6. I was relaxed inthe seat
o o o o o
7. My back wasnicelyaccommodatedagainst the backof the seat
o o o o o
8. My thighs hadgood support onthe seat
o o o o o
9. I could lean backthe seataccording to myneeds
o o o o o
10. The seat wasspacious
o o o o o
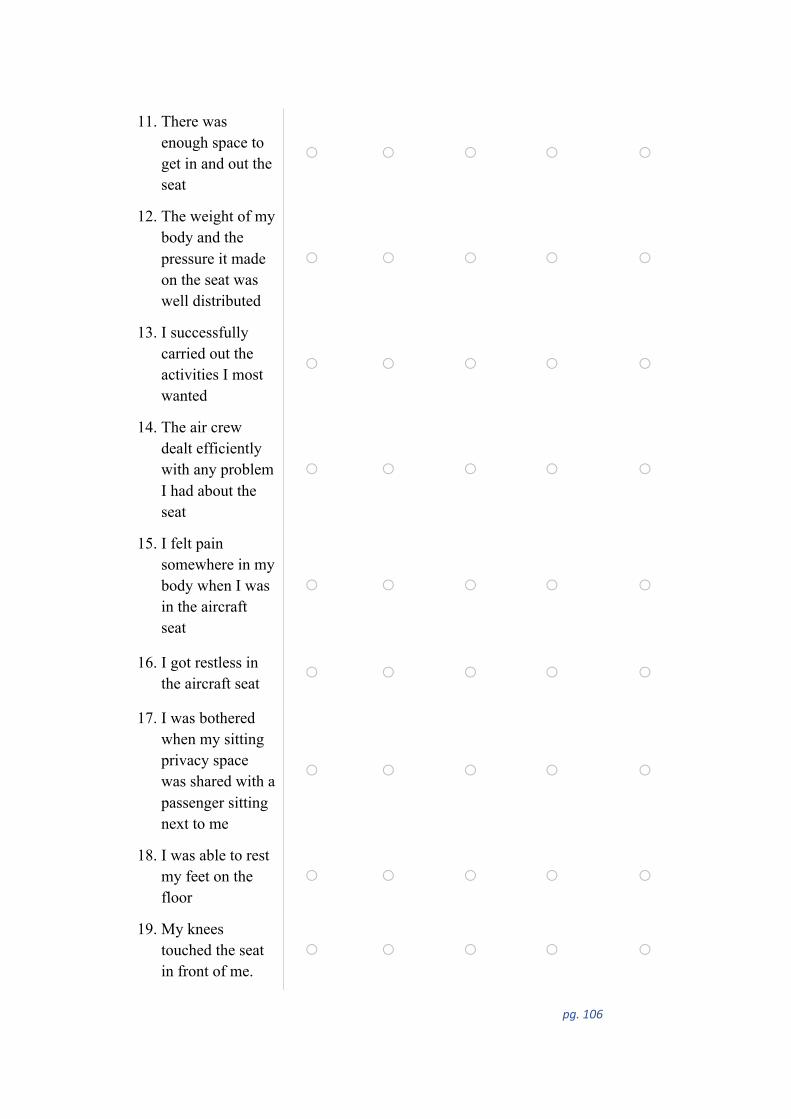
pg. 106
11. There was enough space to get in and out the seat
o o o o o
12. The weight of my body and the pressure it made on the seat was well distributed
o o o o o
13. I successfully carried out the activities I most wanted
o o o o o
14. The air crew dealt efficiently with any problem I had about the seat
o o o o o
15. I felt pain somewhere in my body when I was in the aircraft seat
o o o o o
16. I got restless in the aircraft seat
o o o o o
17. I was bothered when my sitting privacy space was shared with a passenger sitting next to me
o o o o o
18. I was able to rest my feet on the floor
o o o o o
19. My knees touched the seat in front of me.
o o o o o
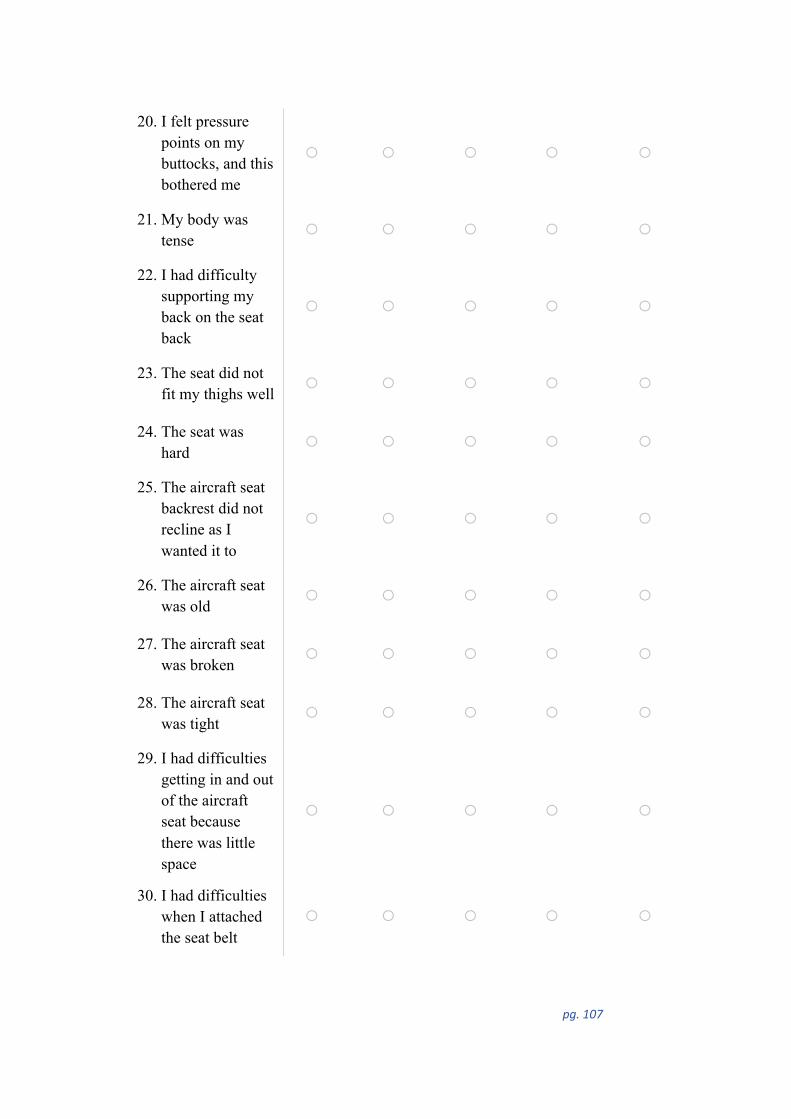
pg. 107
20. I felt pressure points on my buttocks, and this bothered me
o o o o o
21. My body was tense
o o o o o
22. I had difficulty supporting my back on the seat back
o o o o o
23. The seat did not fit my thighs well
o o o o o
24. The seat was hard
o o o o o
25. The aircraft seat backrest did not recline as I wanted it to
o o o o o
26. The aircraft seat was old
o o o o o
27. The aircraft seat was broken
o o o o o
28. The aircraft seat was tight
o o o o o
29. I had difficulties getting in and out of the aircraft seat because there was little space
o o o o o
30. I had difficulties when I attached the seat belt
o o o o o
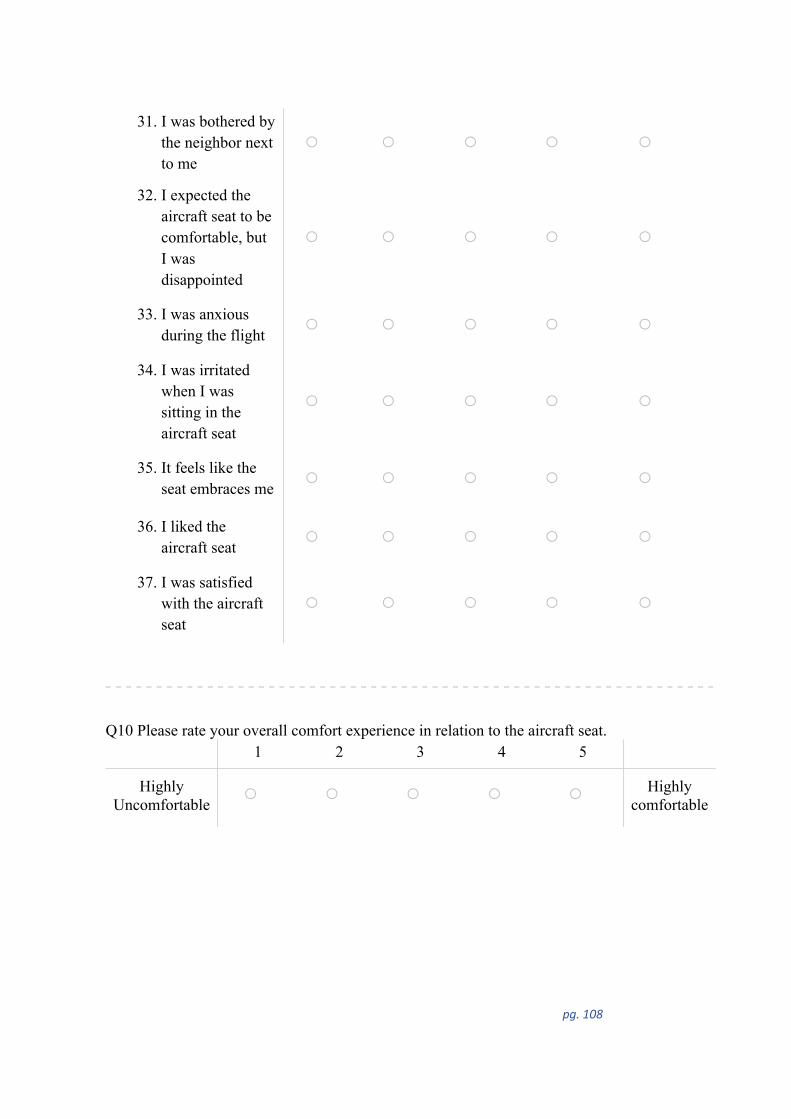
pg. 108
31. I was bothered bythe neighbor nextto me
o o o o o
32. I expected theaircraft seat to becomfortable, butI wasdisappointed
o o o o o
33. I was anxiousduring the flight
o o o o o
34. I was irritatedwhen I wassitting in theaircraft seat
o o o o o
35. It feels like theseat embraces me
o o o o o
36. I liked theaircraft seat
o o o o o
37. I was satisfiedwith the aircraftseat
o o o o o
Q10 Please rate your overall comfort experience in relation to the aircraft seat. 1 2 3 4 5
Highly Uncomfortable
o o o o o Highly comfortable
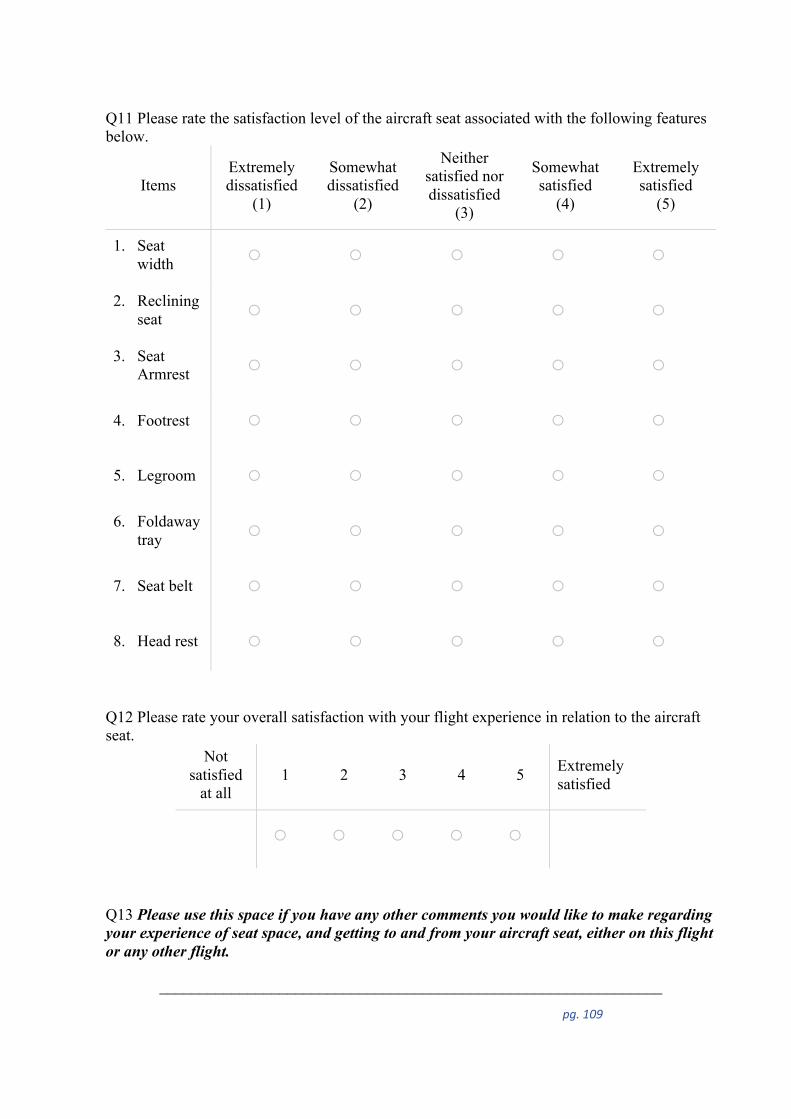
pg. 109
Q11 Please rate the satisfaction level of the aircraft seat associated with the following features below.
Items Extremely dissatisfied
(1)
Somewhat dissatisfied
(2)
Neither satisfied nor dissatisfied
(3)
Somewhat satisfied
(4)
Extremely satisfied
(5)
1. Seatwidth o o o o o
2. Recliningseat o o o o o
3. SeatArmrest o o o o o
4. Footrest o o o o o
5. Legroom o o o o o
6. Foldawaytray o o o o o
7. Seat belt o o o o o
8. Head rest o o o o o
Q12 Please rate your overall satisfaction with your flight experience in relation to the aircraft seat.
Not satisfied
at all 1 2 3 4 5 Extremely
satisfied
o o o o o
Q13 Please use this space if you have any other comments you would like to make regarding your experience of seat space, and getting to and from your aircraft seat, either on this flight or any other flight.
_______________________________________________________________
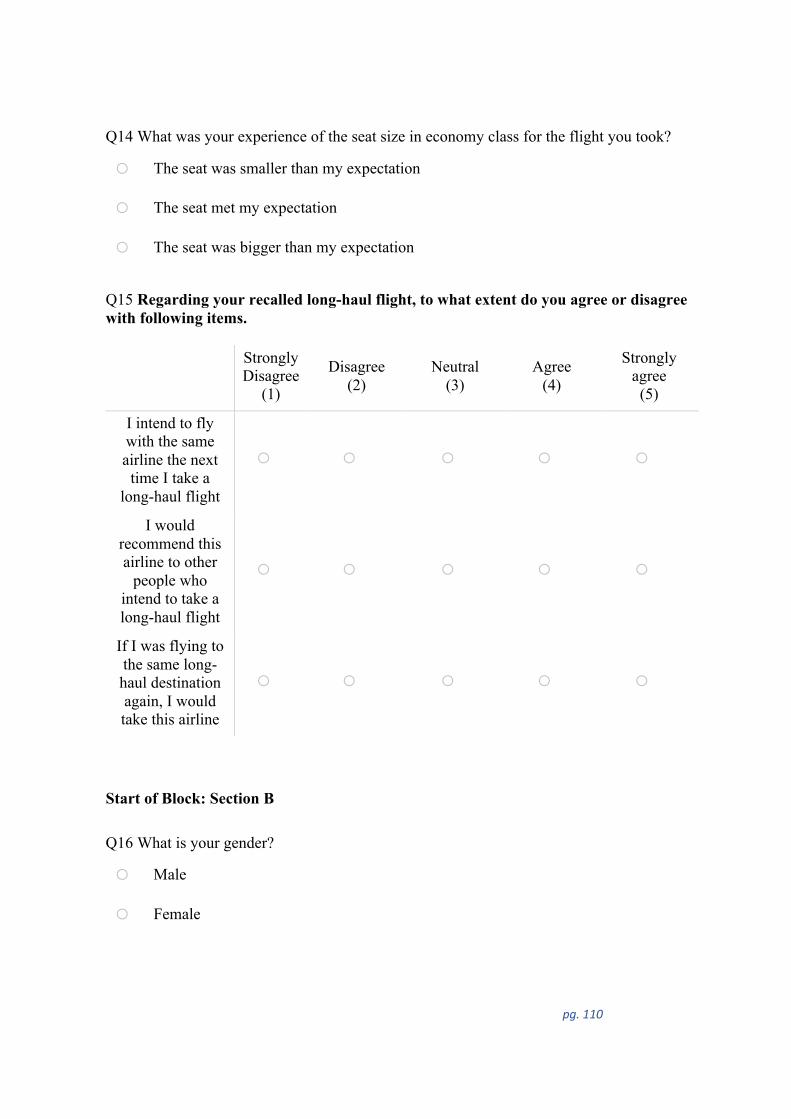
pg. 110
Q14 What was your experience of the seat size in economy class for the flight you took?
o The seat was smaller than my expectation
o The seat met my expectation
o The seat was bigger than my expectation
Q15 Regarding your recalled long-haul flight, to what extent do you agree or disagree with following items.
Strongly Disagree
(1)
Disagree (2)
Neutral (3)
Agree (4)
Strongly agree (5)
I intend to fly with the same airline the next
time I take a long-haul flight
o o o o o
I would recommend this airline to other
people who intend to take a long-haul flight
o o o o o
If I was flying to the same long-haul destination again, I would take this airline
o o o o o
Start of Block: Section B Q16 What is your gender?
o Male
o Female
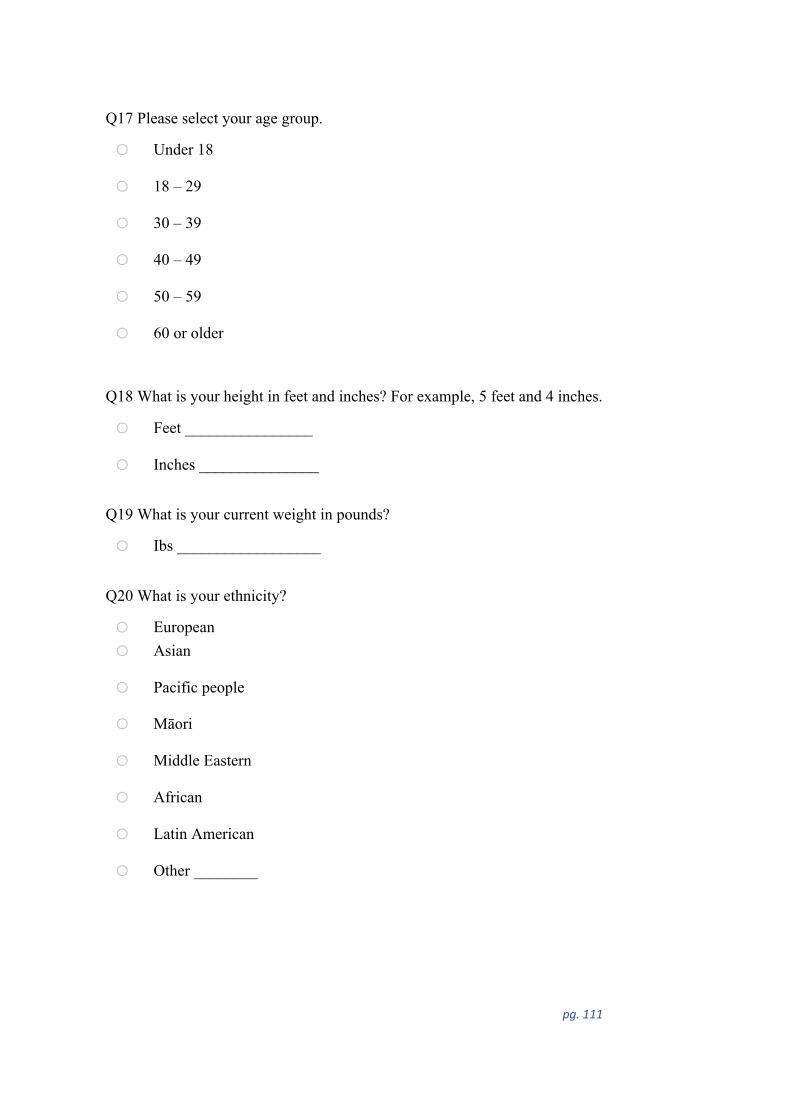
pg. 111
Q17 Please select your age group.
o Under 18
o 18 – 29
o 30 – 39
o 40 – 49
o 50 – 59
o 60 or older
Q18 What is your height in feet and inches? For example, 5 feet and 4 inches.
o Feet ________________
o Inches _______________
Q19 What is your current weight in pounds?
o Ibs __________________
Q20 What is your ethnicity?
o Europeano Asian
o Pacific people
o Māori
o Middle Eastern
o African
o Latin American
o Other ________