Seasonal Influenza Vaccine and Increased Risk of Pandemic A/H1N1‐Related Illness: First Detection...
11
Seasonal Vaccine Effect on pH1N1 Risk • CID 2010:51 (1 November) • 1017 MAJOR ARTICLE Seasonal Influenza Vaccine and Increased Risk of Pandemic A/H1N1-Related Illness: First Detection of the Association in British Columbia, Canada Naveed Z. Janjua, 1 Danuta M. Skowronski, 1 Travis S. Hottes, 1 William Osei, 3 Evan Adams, 4 Martin Petric, 1 Suzana Sabaiduc, 1 Tracy Chan, 1 Annie Mak, 1 Marcus Lem, 2 Patrick Tang, 1 David M. Patrick, 1 Gaston De Serres, 5 and David Bowering 3 1 BC Centre for Disease Control and 2 First Nations and Inuit Health, Health Canada, Vancouver, 3 Northern Health Authority, Prince George, and 4 British Columbia Ministry of Health, Victoria, British Columbia; and 5 Institut national de sante ´ publique du Que ´bec, Que ´bec, Que ´bec, Canada (See the articles by Hung et al, on pages 1007–1016, and by Liu et al, on pages 1028–1032.) Background. In April 2009, an elementary school outbreak of pandemic H1N1 (pH1N1) influenza was reported in a community in northern British Columbia, Canada—an area that includes both non-Aboriginal and Aboriginal residents living on or off a reserve. During the outbreak investigation, we explored the relationship between prior receipt of trivalent inactivated influenza vaccine (TIV) and pH1N1-related illness. Methods. A telephone survey was conducted from 15 May through 5 June 2009 among households of children attending any school in the affected community. Members of participating households where influenza-like illness (ILI) was described were then invited to submit blood samples for confirmation of pH1N1 infection by hemag- glutination inhibition and microneutralization assays. Circulation of pH1N1 was concentrated among households of the elementary school and elsewhere on-reserve to which analyses of TIV effect were thus restricted. Odds ratios (ORs) for the TIV effect on ILI were computed through logistic regression, with adjustment for age, comorbidity, household density, and Aboriginal status. The influence of within-household clustering was assessed through generalized-linear-mixed models. Results. Of 408 participants, 92 (23%) met ILI criteria: 29 (32%) of 92 persons with ILI, compared with 61 (19%) 316 persons without ILI, had received the 2008–2009 formulation of TIV. Fully adjusted ORs for 2008– 2009 TIV effect on ILI were 2.45 (95% confidence interval, 1.34–4.48) by logistic regression and 2.68 [95% confidence interval, 1.37–5.25) by generalized-linear-mixed model. Conclusions. An outbreak investigation in British Columbia during the late spring of 2009 provided the first indication of an unexpected association between receipt of TIV and pH1N1 illness. This led to 5 additional studies through the summer 2009 in Canada, each of which corroborated these initial findings. During the last week of April 2009, a laboratory-con- firmed outbreak of pandemic A/H1N1(pH1N1) influ- enza was reported in an elementary school in a rural community of northern British Columbia, Canada [1]. This school included students of Aboriginal and non- Aboriginal background drawn from the local town (population, ∼2000 persons) and surrounding 5 re- serves (population, ∼1000 persons) [1, 2]. Laboratory confirmation of the elementary school outbreak was Received 13 April 2010; accepted 21 July 2010; electronically published 1 October 2010. Reprints or correspondence: Dr Danuta M. Skowronski, Epidemiology Services, BC Centre for Disease Control, 655 W 12th Ave, Vancouver, BC Canada V5Z 4R4 ([email protected]). Clinical Infectious Diseases 2010; 51(9):1017–1027 2010 by the Infectious Diseases Society of America. All rights reserved. 1058-4838/2010/5109-0004$15.00 DOI: 10.1086/656586 made on 3 May 2009, and the school was closed the following week. Because pH1N1 was first recognized in mid-April as a novel virus, and to learn more about its characteristics, risk factors, and impact, an outbreak investigation was undertaken by public health through a school-based telephone survey conducted between 15 May and 5 June 2009 [3]. We report findings from this investigation, which revealed a first unexpected link between prior receipt of seasonal trivalent inactivated influenza vaccine (TIV) and pH1N1-related illness in Canada. METHODS Components of the Investigation Investigation included 3 components: a telephone sur- vey, laboratory surveillance for respiratory viruses, and a sero-survey of affected households.
Transcript of Seasonal Influenza Vaccine and Increased Risk of Pandemic A/H1N1‐Related Illness: First Detection...
Seasonal Vaccine Effect on pH1N1 Risk • CID 2010:51 (1 November) • 1017
M A J O R A R T I C L E
Seasonal Influenza Vaccine and Increased Riskof Pandemic A/H1N1-Related Illness: First Detectionof the Association in British Columbia, Canada
Naveed Z. Janjua,1 Danuta M. Skowronski,1 Travis S. Hottes,1 William Osei,3 Evan Adams,4 Martin Petric,1
Suzana Sabaiduc,1 Tracy Chan,1 Annie Mak,1 Marcus Lem,2 Patrick Tang,1 David M. Patrick,1 Gaston De Serres,5
and David Bowering3
1BC Centre for Disease Control and 2First Nations and Inuit Health, Health Canada, Vancouver, 3Northern Health Authority, Prince George,and 4British Columbia Ministry of Health, Victoria, British Columbia; and 5Institut national de sante publique du Quebec, Quebec, Quebec, Canada
(See the articles by Hung et al, on pages 1007–1016, and by Liu et al, on pages 1028–1032.)Background. In April 2009, an elementary school outbreak of pandemic H1N1 (pH1N1) influenza was reported
in a community in northern British Columbia, Canada—an area that includes both non-Aboriginal and Aboriginalresidents living on or off a reserve. During the outbreak investigation, we explored the relationship between priorreceipt of trivalent inactivated influenza vaccine (TIV) and pH1N1-related illness.
Methods. A telephone survey was conducted from 15 May through 5 June 2009 among households of childrenattending any school in the affected community. Members of participating households where influenza-like illness(ILI) was described were then invited to submit blood samples for confirmation of pH1N1 infection by hemag-glutination inhibition and microneutralization assays. Circulation of pH1N1 was concentrated among householdsof the elementary school and elsewhere on-reserve to which analyses of TIV effect were thus restricted. Odds ratios(ORs) for the TIV effect on ILI were computed through logistic regression, with adjustment for age, comorbidity,household density, and Aboriginal status. The influence of within-household clustering was assessed throughgeneralized-linear-mixed models.
Results. Of 408 participants, 92 (23%) met ILI criteria: 29 (32%) of 92 persons with ILI, compared with 61(19%) 316 persons without ILI, had received the 2008–2009 formulation of TIV. Fully adjusted ORs for 2008–2009 TIV effect on ILI were 2.45 (95% confidence interval, 1.34–4.48) by logistic regression and 2.68 [95%confidence interval, 1.37–5.25) by generalized-linear-mixed model.
Conclusions. An outbreak investigation in British Columbia during the late spring of 2009 provided the firstindication of an unexpected association between receipt of TIV and pH1N1 illness. This led to 5 additional studiesthrough the summer 2009 in Canada, each of which corroborated these initial findings.
During the last week of April 2009, a laboratory-con-firmed outbreak of pandemic A/H1N1(pH1N1) influ-enza was reported in an elementary school in a ruralcommunity of northern British Columbia, Canada [1].This school included students of Aboriginal and non-Aboriginal background drawn from the local town(population, !2000 persons) and surrounding 5 re-serves (population, !1000 persons) [1, 2]. Laboratoryconfirmation of the elementary school outbreak was
Received 13 April 2010; accepted 21 July 2010; electronically published 1October 2010.
Reprints or correspondence: Dr Danuta M. Skowronski, Epidemiology Services,BC Centre for Disease Control, 655 W 12th Ave, Vancouver, BC Canada V5Z 4R4([email protected]).
Clinical Infectious Diseases 2010; 51(9):1017–1027! 2010 by the Infectious Diseases Society of America. All rights reserved.1058-4838/2010/5109-0004$15.00DOI: 10.1086/656586
made on 3 May 2009, and the school was closed thefollowing week. Because pH1N1 was first recognized inmid-April as a novel virus, and to learn more about itscharacteristics, risk factors, and impact, an outbreakinvestigation was undertaken by public health througha school-based telephone survey conducted between 15May and 5 June 2009 [3]. We report findings from thisinvestigation, which revealed a first unexpected linkbetween prior receipt of seasonal trivalent inactivatedinfluenza vaccine (TIV) and pH1N1-related illness inCanada.
METHODS
Components of the InvestigationInvestigation included 3 components: a telephone sur-vey, laboratory surveillance for respiratory viruses, anda sero-survey of affected households.
1018 • CID 2010:51 (1 November) • Janjua et al
Telephone survey. After identification of the elementaryschool outbreak, the sampling frame for investigation wasbroadly inclusive of all households of students enrolled in the6 local community schools. Approximately one-half of allhouseholds in the community included at least 1 child [1].
Before initiating the telephone survey, letters were distributedvia students to households to explain the purpose of the in-vestigation. Trained interviewers then contacted households,obtained consent, and conducted telephone interviews with 1adult per household, who provided information for all house-hold members. The telephone survey was conducted between15 May and 5 June 2009. Household information included thenumber of household members and sleeping rooms, Aboriginalversus non-Aboriginal status, and whether residency was on oroff a reserve. Individual-level information included age,whether flulike symptoms were experienced and the relateddates of onset, duration of time “in bed” (in days), and dataon health care visits, comorbidity (corresponding to high-riskcategories specified by the National Advisory Committee onImmunization [4]), and receipt of 2008–2009 and/or the 2007–2008 TIV.
Laboratory surveillance for respiratory viruses. All res-piratory virus testing for this community was provided by theBC Centre for Disease Control (Vancouver, BC) Public HealthMicrobiology and Reference Laboratory (Appendix, which ap-pears only in the electronic version of the journal). Duringinitial outbreak investigation, nasal or nasopharyngeal speci-mens were collected on 29 April by public health staff from asample of students attending the affected elementary school.Thereafter, specimens were collected during the outbreak pe-riod at the clinician’s or public health official’s discretion andwere evaluated as part of routine surveillance.
Sero-survey of affected households. To validate the clinicalcase definition, community households with at least 1 memberreporting ILI were subsequently invited to provide serum sam-ples from both symptomatic and asymptomatic householdmembers. An on-site clinic was arranged during 6–8 August2009. Antibody response to pH1N1 was quantified using thehemagglutination inhibition (HI) and microneutralization(MN) assays (Appendix). An HI threshold of !40 was used todesignate seropositive versus seronegative participants, andstatus was confirmed using the MN assay [5].
Statistical AnalysisThe primary focus of analyses presented here is estimation ofthe effect of receipt of the 2008–2009 TIV on risk of developingILI during a documented pH1N1 outbreak. Symptom experi-ence since 1 April 2009 was elicited. ILI was defined at theanalysis stage as a report of fever and cough plus !1 of thefollowing symptoms during that period: headache, generalaches, sore throat, or prostration. Corresponding control sub-
jects were participants who had been symptomatic in the periodsince 1 April 2009 who did not meet the ILI case definition orwho were asymptomatic. Participants aged "6 months as of31 December 2008 were excluded at the analysis stage, becausethey would not have been eligible to receive the vaccine.
On the basis of results of serologic tests, the sensitivity, spec-ificity, and positive and negative predictive values for the ILIcase definition were explored. Odds ratios (ORs) for seasonalinfluenza vaccine effect (2008–2009 and 2007–2008) on ILIwere computed via logistic regression analysis, with adjustmentfor combinations of age, chronic conditions, Aboriginal status,and household density (calculated as the number of householdmembers/number of sleeping rooms). We also accounted forwithin-household clustering while assessing vaccine effect byusing generalized-linear-mixed models (GLMMs) for binaryoutcomes, adjusting for the same covariates [6]. Because sur-veillance data suggested that children experienced higherpH1N1 attack rates and that older adults were at lower risk [7,8], we explored vaccine effects stratified for participants aged!20 years and !50 years. We also explored the effect of TIVreceipt on pH1N1 infection defined by HI and/or MN sero-positive status.
Human Subject ConsiderationThe initial telephone survey was conducted as a public health–mandated outbreak investigation, with verbal consent providedat interview. The serologic component was reviewed and ap-proved by the Research Ethics Board of the University of BritishColumbia, and individual written consent was obtained forblood sample collection and analysis.
RESULTS
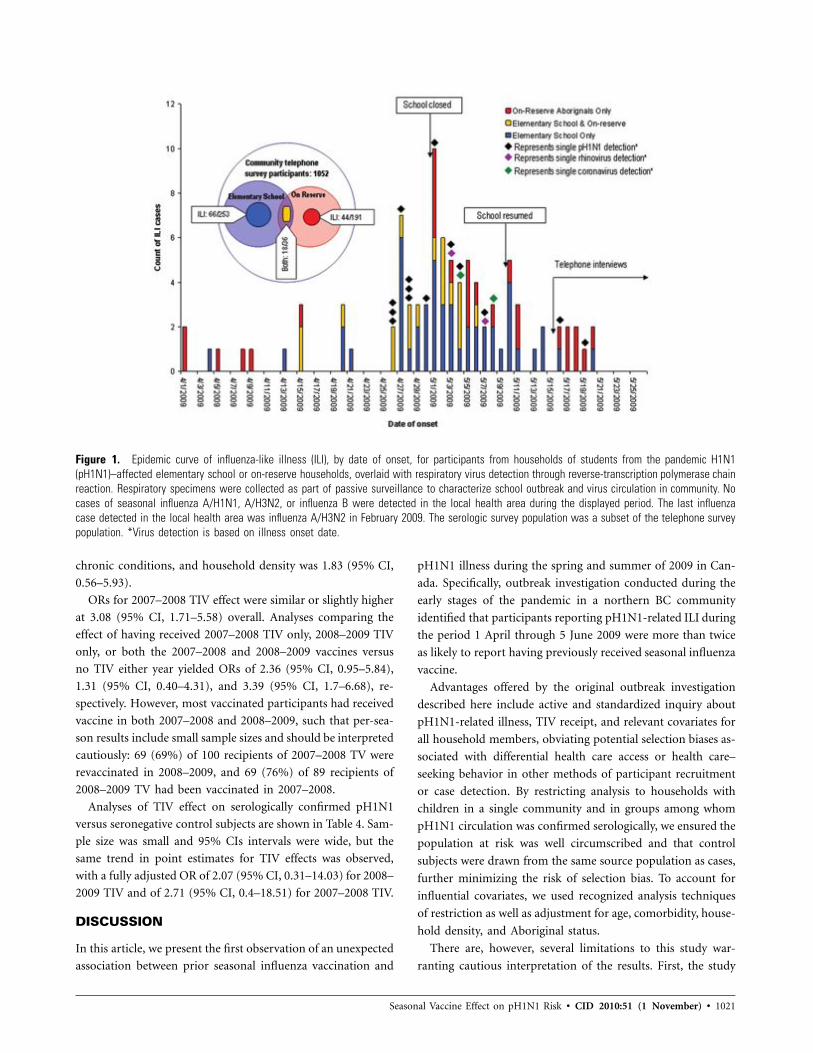
LaboratoryRespiratory specimen surveillance. Respiratory virus testingby the BC Centre for Disease Control for the local communityincluded 30 specimens collected during the period 29 Aprilthrough 5 June 2009. pH1N1 was confirmed in 14 of these 30specimens by reverse-transcription polymerase chain reaction(RT-PCR). Other respiratory viruses detected in the local com-munity during that period included coronavirus (in 2 speci-mens) and rhinovirus or enterovirus (in 2 specimens).
Of the 30 specimens submitted, 9 were from households ofthe affected elementary school that also participated in thetelephone survey; pH1N1 was detected in 6 (67%) of the 9specimens from survey participants. Five (56%) of these 9 spec-imens were from patients living on a reserve; pH1N1 was de-tected in 4 (80%) of the 5 specimens. Of note, surveillancedata indicated the last detection of seasonal influenza (A/H3N2)in the local health area was in February 2009.
Serologic test results. In total, 135 households with at least1 member with ILI identified during the community survey
Seasonal Vaccine Effect on pH1N1 Risk • CID 2010:51 (1 November) • 1019
were invited to participate in the serologic study. Ultimately,42 households contributed serologic specimens, resulting in 106individual serum samples available for analysis, including 58(54%) from households associated with the affected elementaryschool (np45) or on a reserve (np29). Details of the sero-survey participants are shown in Table A1 in the Appendix.
In total, 44 (42%) of the 106 serologic survey participantsreported ILI during the study period. Of the 106 serum samples,28 (26%) had HI titers to pH1N1 !40 (denoting seroposi-tivity), and of these, 22 (79%) were from persons who hadreported ILI. Among the 106 serologic survey participants over-all, there was strong correlation between log-transformed HIand MN titers (rp0.92). Of the 28 specimens with an HI titer!40, all but 3 had MN titers !80 and exceeding HI. Of the3 participants whose specimens yielded MN titers less than theHI titers, none reported ILI.
Of the 45 participants from the affected elementary schoolhouseholds, 14 (31%) were seropositive for pH1N1 (13 of 14persons with ILI). Of the 29 on-reserve participants, 13 (45%)were seropositive for pH1N1 (12 of 13 persons with ILI). Ofthe 48 serum samples from participants belonging to off-reservehouseholds without children in the affected elementary school,12 (25%) of 48 were seropositive for pH1N1 (8 of 12 personswith ILI).
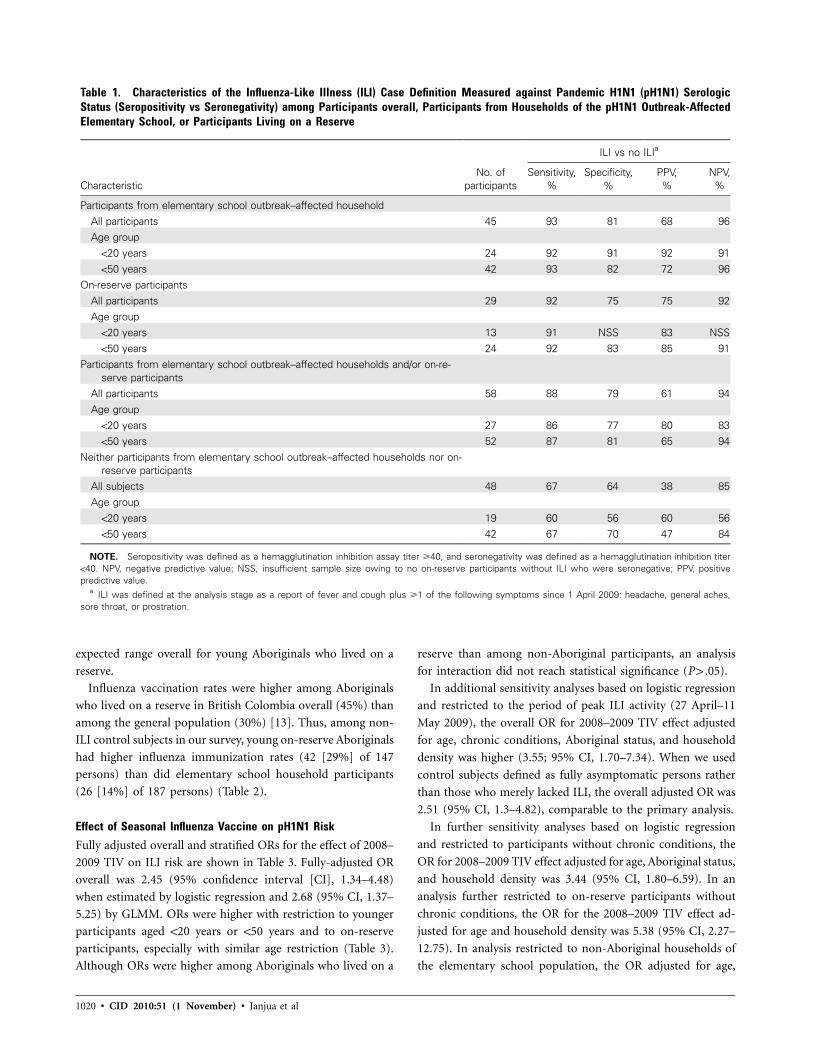
Clinical case definitions: characteristics in relation to se-rologic status. To guide analyses, we assessed the sensitivity,specificity, and positive and negative predictive values of theILI case definition in relation to HI or MN seropositive status(Table 1). Parameters were highest in combination among par-ticipants belonging to households associated with the initialelementary school outbreak or who lived on a reserve. The ILIcase definition had less value in predicting pH1N1 seropositivestatus among telephone survey participants who belonged tohouseholds other than those associated with the elementaryschool or who lived on a reserve (positive predictive value,38%, 68%, and 75%, respectively) (Table 1).
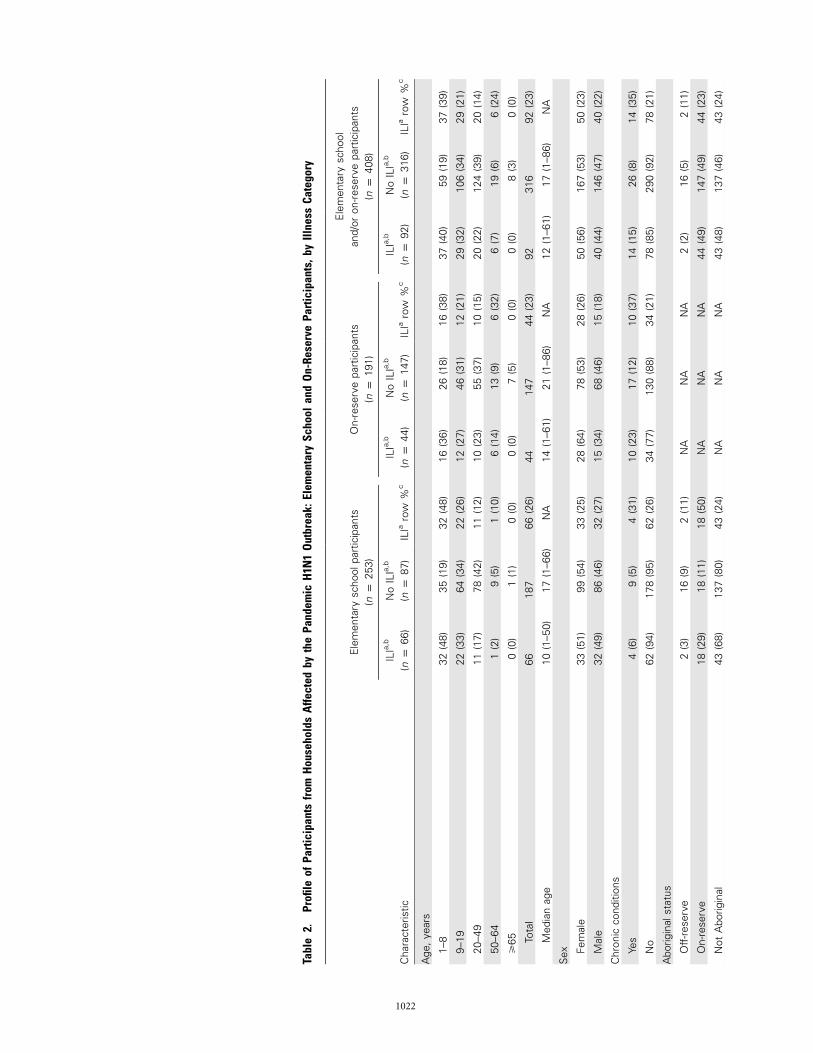
Participant CharacteristicsOverall, 266 households and 1154 individuals contributed tothe community telephone survey. Because respiratory virus sur-veillance and the follow-up serologic survey both indicatedgreatest pH1N1 circulation among the originally affected ele-mentary school and on-reserve households, we restricted anal-yses of TIV effect on ILI to those households, hereafter referredto as “elementary school” or “on-reserve” participants. Theepidemic curve of ILI, by date of onset for the elementaryschool and/or on-reserve participants, is shown in Figure 1.
Elementary school household participants. There were 118households with at least 1 child enrolled at the affected ele-mentary school. Sixty-three of these households participated inthe survey, contributing data on 271 individuals. After exclud-
ing those with unknown 2008–2009 TIV status (np17) and
unknown chronic conditions (n p1), the analysis included 253
participants associated with the elementary school. Among
these participants, 36 (15%) lived on one of the local reserves.
Overall, 153 (60%) of 253 persons were aged !20 years. There
were few older adults (11 [4%]) aged !50 years.
Of the 253 elementary school household participants, 66
(26%) reported ILI, with the rate highest among young children
(Table 2). The secondary attack rate among elementary school
households was 27% (32 of 119); after excluding on-reserve
households, the rate was 20% (19 of 94). Only 1 participant
reported travel to Mexico since mid-March 2009. The pro-
portion in the fourth quartile of household density was greater
among participants with ILI than among those without ILI
(40% vs 20%). The proportion of participants with chronic
conditions was comparable to the BC proportion overall for
children and young adults (!10%) [9]. Self-reported influen-
za immunization rates among non-ILI control subjects were
also comparable to BC rates estimated through other surveys
among children and young adults (15%–20%) in British Co-
lombia [10].
On-reserve household participants. Two hundred twenty-
four individuals who participated in the community survey
were reported as living on a surrounding reserve. After ex-
cluding individuals with unknown 2008–2009 TIV status (n
p29), unknown chronic condition (n p1), or age "6 months
on 31 December 2008 (np4), the on-reserve analysis included
191 survey participants, of whom 100 (52%) were aged !20
years and 26 (14%) were aged !50 years.
Of the 191 on-reserve participants, 44 (23%) reported having
ILI, again with the rate highest among young children (Table
2). The secondary attack rate among on-reserve households
was 24% (23 of 94). None of these participants reported travel
to Mexico since mid-March. The proportion of participants
living in households in the fourth quartile of density was greater
for on-reserve participants (39%) than for elementary school
participants (25%) and among on-reserve participants with ILI
(50%) than among those without ILI (35%). A higher pro-
portion of on-reserve participants with ILI sought medical care
(25 [57%] of 44), compared with elementary school partici-
pants (25 [38%] of 66). A comparable proportion for whom
information was available sought care "48 h after onset (3
[20%] of 15 vs 3 [19%] of 16). No participant in either pop-
ulation was prescribed antivirals, and none were hospitalized.
A higher proportion of Aboriginals in British Colombia and
Canada, compared with the general population, have at least
1 chronic condition [11, 12]. Accordingly, the proportion of
young on-reserve participants in our study with at least 1
chronic condition (27 [14%] of 191) was higher than the pro-
portion of elementary school participants and was within the
1020 • CID 2010:51 (1 November) • Janjua et al
Table 1. Characteristics of the Influenza-Like Illness (ILI) Case Definition Measured against Pandemic H1N1 (pH1N1) SerologicStatus (Seropositivity vs Seronegativity) among Participants overall, Participants from Households of the pH1N1 Outbreak-AffectedElementary School, or Participants Living on a Reserve
CharacteristicNo. of
participants
ILI vs no ILIa
Sensitivity,%
Specificity,%
PPV,%
NPV,%
Participants from elementary school outbreak–affected householdAll participants 45 93 81 68 96Age group
!20 years 24 92 91 92 91!50 years 42 93 82 72 96
On-reserve participantsAll participants 29 92 75 75 92Age group
!20 years 13 91 NSS 83 NSS!50 years 24 92 83 85 91
Participants from elementary school outbreak–affected households and/or on-re-serve participants
All participants 58 88 79 61 94Age group
!20 years 27 86 77 80 83!50 years 52 87 81 65 94
Neither participants from elementary school outbreak–affected households nor on-reserve participants
All subjects 48 67 64 38 85Age group
!20 years 19 60 56 60 56!50 years 42 67 70 47 84
NOTE. Seropositivity was defined as a hemagglutination inhibition assay titer !40, and seronegativity was defined as a hemagglutination inhibition titer!40. NPV, negative predictive value; NSS, insufficient sample size owing to no on-reserve participants without ILI who were seronegative; PPV, positivepredictive value.
a ILI was defined at the analysis stage as a report of fever and cough plus !1 of the following symptoms since 1 April 2009: headache, general aches,sore throat, or prostration.
expected range overall for young Aboriginals who lived on areserve.
Influenza vaccination rates were higher among Aboriginalswho lived on a reserve in British Colombia overall (45%) thanamong the general population (30%) [13]. Thus, among non-ILI control subjects in our survey, young on-reserve Aboriginalshad higher influenza immunization rates (42 [29%] of 147persons) than did elementary school household participants(26 [14%] of 187 persons) (Table 2).
Effect of Seasonal Influenza Vaccine on pH1N1 RiskFully adjusted overall and stratified ORs for the effect of 2008–2009 TIV on ILI risk are shown in Table 3. Fully-adjusted ORoverall was 2.45 (95% confidence interval [CI], 1.34–4.48)when estimated by logistic regression and 2.68 (95% CI, 1.37–5.25) by GLMM. ORs were higher with restriction to youngerparticipants aged !20 years or !50 years and to on-reserveparticipants, especially with similar age restriction (Table 3).Although ORs were higher among Aboriginals who lived on a
reserve than among non-Aboriginal participants, an analysisfor interaction did not reach statistical significance (P 1 .05).
In additional sensitivity analyses based on logistic regressionand restricted to the period of peak ILI activity (27 April–11May 2009), the overall OR for 2008–2009 TIV effect adjustedfor age, chronic conditions, Aboriginal status, and householddensity was higher (3.55; 95% CI, 1.70–7.34). When we usedcontrol subjects defined as fully asymptomatic persons ratherthan those who merely lacked ILI, the overall adjusted OR was2.51 (95% CI, 1.3–4.82), comparable to the primary analysis.
In further sensitivity analyses based on logistic regressionand restricted to participants without chronic conditions, theOR for 2008–2009 TIV effect adjusted for age, Aboriginal status,and household density was 3.44 (95% CI, 1.80–6.59). In ananalysis further restricted to on-reserve participants withoutchronic conditions, the OR for the 2008–2009 TIV effect ad-justed for age and household density was 5.38 (95% CI, 2.27–12.75). In analysis restricted to non-Aboriginal households ofthe elementary school population, the OR adjusted for age,
Seasonal Vaccine Effect on pH1N1 Risk • CID 2010:51 (1 November) • 1021
Figure 1. Epidemic curve of influenza-like illness (ILI), by date of onset, for participants from households of students from the pandemic H1N1(pH1N1)–affected elementary school or on-reserve households, overlaid with respiratory virus detection through reverse-transcription polymerase chainreaction. Respiratory specimens were collected as part of passive surveillance to characterize school outbreak and virus circulation in community. Nocases of seasonal influenza A/H1N1, A/H3N2, or influenza B were detected in the local health area during the displayed period. The last influenzacase detected in the local health area was influenza A/H3N2 in February 2009. The serologic survey population was a subset of the telephone surveypopulation. *Virus detection is based on illness onset date.
chronic conditions, and household density was 1.83 (95% CI,0.56–5.93).
ORs for 2007–2008 TIV effect were similar or slightly higherat 3.08 (95% CI, 1.71–5.58) overall. Analyses comparing theeffect of having received 2007–2008 TIV only, 2008–2009 TIVonly, or both the 2007–2008 and 2008–2009 vaccines versusno TIV either year yielded ORs of 2.36 (95% CI, 0.95–5.84),1.31 (95% CI, 0.40–4.31), and 3.39 (95% CI, 1.7–6.68), re-spectively. However, most vaccinated participants had receivedvaccine in both 2007–2008 and 2008–2009, such that per-sea-son results include small sample sizes and should be interpretedcautiously: 69 (69%) of 100 recipients of 2007–2008 TV wererevaccinated in 2008–2009, and 69 (76%) of 89 recipients of2008–2009 TV had been vaccinated in 2007–2008.
Analyses of TIV effect on serologically confirmed pH1N1versus seronegative control subjects are shown in Table 4. Sam-ple size was small and 95% CIs intervals were wide, but thesame trend in point estimates for TIV effects was observed,with a fully adjusted OR of 2.07 (95% CI, 0.31–14.03) for 2008–2009 TIV and of 2.71 (95% CI, 0.4–18.51) for 2007–2008 TIV.
DISCUSSION
In this article, we present the first observation of an unexpectedassociation between prior seasonal influenza vaccination and
pH1N1 illness during the spring and summer of 2009 in Can-ada. Specifically, outbreak investigation conducted during theearly stages of the pandemic in a northern BC communityidentified that participants reporting pH1N1-related ILI duringthe period 1 April through 5 June 2009 were more than twiceas likely to report having previously received seasonal influenzavaccine.
Advantages offered by the original outbreak investigationdescribed here include active and standardized inquiry aboutpH1N1-related illness, TIV receipt, and relevant covariates forall household members, obviating potential selection biases as-sociated with differential health care access or health care–seeking behavior in other methods of participant recruitmentor case detection. By restricting analysis to households withchildren in a single community and in groups among whompH1N1 circulation was confirmed serologically, we ensured thepopulation at risk was well circumscribed and that controlsubjects were drawn from the same source population as cases,further minimizing the risk of selection bias. To account forinfluential covariates, we used recognized analysis techniquesof restriction as well as adjustment for age, comorbidity, house-hold density, and Aboriginal status.
There are, however, several limitations to this study war-ranting cautious interpretation of the results. First, the study
1022
Tabl
e2.
Profi
leof
Parti
cipa
nts
from
Hous
ehol
dsAf
fect
edby
the
Pand
emic
H1N
1Ou
tbre
ak:E
lem
enta
rySc
hool
and
On-R
eser
vePa
rtici
pant
s,by
Illne
ssCa
tego
ry
Cha
ract
eris
tic
Elem
enta
rysc
hool
part
icip
ants
(np
253)
On-
rese
rve
part
icip
ants
(np
191)
Elem
enta
rysc
hool
and/
oron
-rese
rve
part
icip
ants
(np
408)
ILIa,
b
(np
66)
No
ILIa,
b
(np
87)
ILIa
row
%c
ILIa,
b
(np
44)
No
ILIa,
b
(np
147)
ILIa
row
%c
ILIa,
b
(np
92)
No
ILIa,
b
(np
316)
ILIa
row
%c
Age
,yea
rs
1–8
32(4
8)35
(19)
32(4
8)16
(36)
26(1
8)16
(38)
37(4
0)59
(19)
37(3
9)
9–19
22(3
3)64
(34)
22(2
6)12
(27)
46(3
1)12
(21)
29(3
2)10
6(3
4)29
(21)
20–4
911
(17)
78(4
2)11
(12)
10(2
3)55
(37)
10(1
5)20
(22)
124
(39)
20(1
4)
50–6
41
(2)
9(5
)1
(10)
6(1
4)13
(9)
6(3
2)6
(7)
19(6
)6
(24)
!65
0(0
)1
(1)
0(0
)0
(0)
7(5
)0
(0)
0(0
)8
(3)
0(0
)
Tota
l66
187
66(2
6)44
147
44(2
3)92
316
92(2
3)
Med
ian
age
10(1
–50)
17(1
–66)
NA
14(1
–61)
21(1
–86)
NA
12(1
–61)
17(1
–86)
NA
Sex Fe
mal
e33
(51)
99(5
4)33
(25)
28(6
4)78
(53)
28(2
6)50
(56)
167
(53)
50(2
3)
Mal
e32
(49)
86(4
6)32
(27)
15(3
4)68
(46)
15(1
8)40
(44)
146
(47)
40(2
2)
Chr
onic
cond
ition
s
Yes
4(6
)9
(5)
4(3
1)10
(23)
17(1
2)10
(37)
14(1
5)26
(8)
14(3
5)
No
62(9
4)17
8(9
5)62
(26)
34(7
7)13
0(8
8)34
(21)
78(8
5)29
0(9
2)78
(21)
Abo
rigin
alst
atus
Off-
rese
rve
2(3
)16
(9)
2(1
1)N
AN
AN
A2
(2)
16(5
)2
(11)
On-
rese
rve
18(2
9)18
(11)
18(5
0)N
AN
AN
A44
(49)
147
(49)
44(2
3)
Not
Abo
rigin
al43
(68)
137
(80)
43(2
4)N
AN
AN
A43
(48)
137
(46)
43(2
4)
1023
Hou
seho
ldde
nsity
quar
tiled
Firs
tto
third
36(6
0)13
7(8
0)36
(21)
22(5
0)95
(65)
22(1
9)57
(66)
223
(74)
57(2
0)
Four
thqu
artil
e24
(40)
34(2
0)24
(41)
22(5
0)52
(35)
22(3
0)29
(34)
77(2
6)29
(27)
Med
ical
lyat
tend
ed
Yes
25(3
8)0
(0)
NA
25(5
7)0
(0)
NA
36(3
9)0
(0)
NA
No
41(6
2)18
7(1
00)
NA
19(4
3)14
7(1
00)
NA
56(6
1)31
6(1
00)
NA
Rec
eive
d20
08–2
009
influ
enza
vacc
ine
Yes
19(2
9)26
(14)
19(4
2)24
(55)
42(2
9)24
(36)
29(3
2)61
(19)
29(3
2)
No
47(7
1)16
1(8
6)47
(23)
20(4
5)10
5(7
1)20
(16)
63(6
8)25
5(8
1)63
(20)
Rec
eive
d20
07–2
008
influ
enza
vacc
ine
Yes
24(3
6)29
(16)
24(4
5)26
(59)
46(3
1)26
(36)
34(3
8)66
(21)
34(3
4)
No
42(6
4)15
2(8
4)42
(22)
16(3
6)99
(67)
16(1
4)56
(62)
243
(79)
56(1
9)
2008
–200
9in
fluen
zava
ccin
ere
ceip
t,by
cate
gory
,n/N
(%)
Age
,yea
rs
1–8
9/32
(28)
5/35
(14)
NA
9/16
(56)
3/26
(12)
NA
10/3
7(2
7)8/
59(1
4)N
A
9–19
5/22
(23)
5/64
(8)
NA
8/12
(67)
9/46
(20)
NA
9/29
(31)
13/1
06(1
2)N
A
20–4
94/
11(3
6)13
/78
(17)
NA
3/10
(30)
18/5
5(3
3)N
A6/
20(3
0)27
/124
(22)
NA
50–6
41/
1(1
00)
2/9
(22)
NA
4/6
(67)
8/13
(62)
NA
4/6
(67)
8/19
(42)
NA
!65
0/0
(0)
1/1
(100
)N
A0
(0)
4/7
(57)
NA
0/0
(0)
5/8
(63)
NA
Chr
onic
cond
ition
s
Yes
0/4
(0)
3/9
(33)
NA
4/10
(40)
12/1
7(7
1)N
A4/
14(2
9)15
/26
(58)
NA
No
19/6
2(3
1)23
/178
(13)
NA
20/3
4(5
9)30
/130
(23)
NA
25/7
8(3
2)46
/290
(16)
NA
NO
TE.
Dat
aar
eno
.(%
)of
part
icip
ants
,unl
ess
othe
rwis
ein
dica
ted.
ILI,
influ
enza
-like
illne
ss;N
A,n
otav
aila
ble.
aIL
Iwas
defin
edat
the
anal
ysis
stag
eas
are
port
offe
ver
and
coug
hpl
us!
1of
the
follo
win
gsy
mpt
oms
sinc
e1
Apr
il20
09:h
eada
che,
gene
rala
ches
,sor
eth
roat
,or
pros
trat
ion.
bW
here
tota
lsdo
not
sum
,the
diffe
renc
eis
mis
sing
orun
know
nva
lues
.c
No.
(%)o
fpa
rtic
ipan
tsin
the
cate
gory
who
expe
rienc
edIL
I.d
Hou
seho
ldde
nsity
was
calc
ulat
edas
the
num
ber
ofho
useh
old
mem
bers
divi
ded
bynu
mbe
rof
room
sus
edfo
rsl
eepi
ngin
the
hom
e.
1024 • CID 2010:51 (1 November) • Janjua et al
Table 3. Odds Ratios for the Effect of 2008–2009 Trivalent Inactivated Influenza Vaccine on Influenza-Like Illness Riskamong Households Affected by the Pandemic H1N1 Outbreak: Elementary School and On-Reserve Participants
Covariates OverallParticipants
aged !20 yearsParticipants
aged !50 years
Elementary school householdsNo. of participants 227 136 216Covariate(s)
Unadjusted 2.50 (1.28–4.92) 3.12 (1.28–7.61) 2.56 (1.28–5.15)Agea 2.94 (1.39–6.19) 2.80 (1.12–7.01) 2.82 (1.32–6.04)Chronic conditionsb 2.50 (1.27–4.9) 3.34 (1.36–8.23) 2.57 (1.28–5.16)Aboriginalc 1.83 (0.83–4.03) 1.79 (0.58–5.48) 1.81 (0.81–4.05)Household densityd 2.15 (1.06–4.38) 2.43 (0.94–6.28) 2.25 (1.09–4.67)Age,a chronic conditionsb 2.93 (1.39–6.18) 3.03 (1.20–7.65) 2.84 (1.33–6.08)Age,a Aboriginalc 2.36 (0.99–5.66) 1.74 (0.56–5.46) 2.26 (0.94–5.46)Age,a household densityd 2.60 (1.19–5.66) 2.29 (0.88–5.97) 2.55 (1.16–5.62)Age,a chronic conditions,b Aboriginalc 2.34 (0.98–5.62) 1.81 (0.57–5.72) 2.24 (0.93–5.42)Age,a Aboriginal,c household densityd 2.45 (1.00–5.98) 1.78 (0.56–5.61) 2.37 (0.96–5.81)Age,a chronic conditions,b Aboriginal,c household densityd 2.43 (1.00–5.94) 1.85 (0.58–5.91) 2.35 (0.96–5.77)
On-reserve householdsNo. of participants 191 100 165
Covariate(s)Unadjusted 3.00 (1.50–5.99) 7.73 (2.90–20.58) 3.59 (1.68 –7.66)Agea 3.53 (1.67–7.45) 8.93 (3.15–25.28) 4.07 (1.84–9.01)Chronic conditionsb 2.76 (1.36–5.61) 8.86 (3.19–24.6) 3.34 (1.55–7.21)Household densityd 2.88 (1.43–5.79) 7.10 (2.61–19.28) 4.25 (1.84–9.84)Age,a chronic conditionsb 3.18 (1.48–6.82) 10.71 (3.55–32.28) 3.74 (1.66–8.41)Age,a household densityd 2.88 (1.43–5.79) 8.22 (2.87–23.55) 3.99 (1.79–8.91)Age,a chronic conditions,b household densityd 3.00 (1.39–6.50) 9.62 (3.13–29.52) 3.54 (1.56–8.04)
Elementary school and/or on-reserve households combinedNo. of participants 382 214 349Covariate(s)
Unadjusted 1.92 (1.14–3.24) 2.77 (1.37–5.6) 2.06 (1.18–3.60)Agea 2.29 (1.32–3.98) 2.78 (1.36–5.71) 2.29 (1.28–4.11)Chronic conditionsb 1.78 (1.04–3.03) 3.00 (1.47–6.11) 1.94 (1.10–3.41)Aboriginalc 2.12 (1.21–3.71) 3.55 (1.63–7.71) 2.25 (1.25–4.07)Household densityd 1.95 (1.15–3.31) 2.74 (1.34–5.62) 2.09 (1.19–3.69)Age,a chronic conditionsb 2.08 (1.19–3.65) 3.05 (1.47–6.35) 2.15 (1.19–3.88)Age,a Aboriginalc 2.57 (1.43–4.65) 3.68 (1.67–8.13) 2.62 (1.41–4.89)Age,a household densityd 2.32 (1.33–4.05) 2.79 (1.35–5.78) 2.34 (1.30–4.23)Age,a chronic conditions,b Aboriginalc 2.4 (1.32–4.37) 3.95 (1.77–8.85) 2.49 (1.33–4.67)Age,a Aboriginal,c household densityd 2.63 (1.45–4.77) 3.65 (1.65–8.07) 2.7 (1.44–5.04)Age,a chronic conditions,b Aboriginal,c household densityd 2.45 (1.34–4.48) 3.92 (1.75–8.79) 2.56 (1.36–4.81)
NOTE. Data are odds ratio (95% confidence interval), unless otherwise indicated. Influenza-like illness was defined at the analysis stageas a report of fever and cough plus !1 of the following symptoms since 1 April 2009: headache, general aches, sore throat, or prostration.Control subjects were those who had not experienced an influenza-like illness since 1 April 2009.
a Age categories were 1–8 years, 9–19 years, and 119 years (reference).b Chronic condition categories were yes and no (reference).c Aboriginal categories were on-reserve, off-reserve, and or Aboriginal (applied only to elementary school participants; reference).d Household density was dichotomized as first through third quartiles (reference) versus fourth quartile.
relied upon a nonspecific clinical outcome (ILI) for definingpH1N1-related illness. There are many causes of ILI, as evi-denced by other contributing viruses identified through passivesurveillance during the study period. We attempted to validatethe ILI case definition on the basis of pH1N1-seropositive
status, but participation in the serologic survey was self-se-lected, and sample size was small. Inclusion of communitieswhere there was little or no circulation of pH1N1 would leadto outcome misclassification as evidenced by the low positivepredictive value (38%) for the ILI case definition. We thus
Seasonal Vaccine Effect on pH1N1 Risk • CID 2010:51 (1 November) • 1025
Table 4. Effect of 2008–2009 and 2007–2008 Trivalent Inactivated Influenza Vaccine (TIV) on PandemicH1N1–Seropositive Status among Serologic Survey Participants Overall
Covariate
OR (95% CI)
Effect of receipt of2008–2009 TIV, with or
without receipt of2007–2008 TIV
(n p 102)
Effect of receipt of2007–2008 TIV, with or
without receipt of2008–2009 TIV
(n p 101)
Unadjusted 2.07 (0.85–5.04) 1.66 (0.68–4.02)Agea 6.01 (1.60–22.52) 7.16 (1.71–30.03)Chronic conditionsb 2.23 (0.90–5.50) 1.72 (0.70–4.19)On-reserve statusc 0.92 (0.27–3.09) 0.61 (0.17–2.13)Household densityd 1.48 (0.57–3.82) 1.19 (0.46–3.07)Age,a chronic conditionsb 6.25 (1.64–23.8) 7.42 (1.73–31.70)Age,a household densityd 2.31 (0.35–15.3) 2.94 (0.45–19.34)Age,a on-reserve statusc 4.06 (1.02–16.23) 4.91 (1.10–21.90)Age,a chronic conditions,b on-reserve statusc 2.49 (0.37–16.87) 3.11 (0.46–21.13)Age,a on-reserve status,c household densityd 1.97 (0.30–13.02) 2.57 (0.39–16.96)Age,a chronic conditions,b household density,d
on-reserve statusc 2.07 (0.31–14.03) 2.71 (0.40–18.51)
NOTE. Most vaccinated participants had received TIV in both 2007–2008 and 2008–2009. Seropositivity was definedas a hemagglutination inhibition assay titer !40
a Age categories were 1–8 years, 9–19 years, and 119 years (reference).b Chronic condition categories were yes and no (reference).c On-reserve categories were on-reserve versus others (reference).d Household density was dichotomized as first through third quartiles (reference) versus fourth quartile.
restricted analyses to households of the affected elementaryschool and on a reserve where pH1N1 circulation was morecertain. This improved the positive predictive value of the ILIcase definition in representing pH1N1-related illness (160%),although some misclassification may have still occurred. Theeffect of any persisting misclassification due to a nonspecificoutcome would be to underestimate the association betweenTIV and pH1N1 illness (ie, to drive the OR toward a null effect)[14].
A second limitation is that we relied on proxy report by 1adult for all household members. Both ILI experience and TIVhistory may have been less well known for other householdmembers. Third, the collection of TIV status after any ILI ex-perience may have introduced recall bias. If recall bias relatedto TIV receipt were operating, it would introduce misclassifi-cation (information bias) related to exposure. Ultimately, theimpact of this misclassification would depend on whether par-ticipants believed a priori that seasonal vaccine ought to havedecreased or increased the risk of ILI during the study period.The lack of an immunization registry in British Colombia pre-cluded further confirmation of immunization status.
It is noteworthy that ORs were higher among Aboriginal on-reserve participants who also had higher rates of repeat seasonalinfluenza immunization. Repeated vaccination has been hy-pothesized to block potentially cross-protective immunity oth-erwise afforded by heterotypic infection [15–17]. Higher ORs
among on-reserve Aboriginals could also reflect greater sus-ceptibility to the effects of TIV on pH1N1 risk, although ananalysis for interaction did not yield statistically significant re-sults. Some studies have reported genetic polymorphisms thatfavor Th2 skew among Canadian Aboriginals with higher ex-pression of interleukin-6 and lower production of tumor ne-crosis factor–a, interferon-g, and interleukin-10 that may berelevant to enhanced immune-mediated effects in this popu-lation [18]. Other studies have suggested that Aboriginal statusis an independent risk factor for more severe pH1N1 outcomes,but we did not specifically assess that hypothesis [19]. However,higher ORs may also reflect the methodological influences ofbias or confounding. Aboriginal populations are known to havehigher rates of both chronic conditions and influenza vacci-nation [11–13]. To address this, we adjusted for comorbidityand conducted sensitivity analyses restricted to on-reserve par-ticipants without chronic conditions, resulting in similar orhigher ORs. Despite these reassurances, neither residual con-founding nor bias can be fully ruled out. As a final limitation,the sample sizes were small and confidence intervals were widefor stratified and serologically-confirmed analyses so that thesein particular should be interpreted cautiously.
Because of limitations in study design and because they rep-resented unexpected findings, we interpreted the results of thisoutbreak investigation as a paradoxical signal of possible con-cern—thought-provoking but inconclusive and warranting fur-
1026 • CID 2010:51 (1 November) • Janjua et al
ther evaluation. Canadian investigators thus embarked on aseries of confirmatory studies using more rigorous methodsand laboratory-confirmed outcomes through the summer of2009, each of which corroborated findings from this initialoutbreak investigation. In combination, these showed 1.4–2.5-fold increased risk of medically attended, laboratory-confirmedpH1N1 illness among prior 2008–2009 TIV recipients [17]. Anadditional Canadian study using the linked Manitoba immu-nization registry and administrative databases has also shownsimilar findings of increased risk [4] (Dr Carole Beaudoin,Public Health Agency of Canada, personal communication).Thus, in Canada, 6 observational studies based on differentmethods and settings, including the current outbreak investi-gation, consistently showed increased risk of pH1N1 illnessduring the spring and summer of 2009 associated with priorreceipt of the 2008–2009 TIV [4, 17]. Conversely, studies con-ducted outside of Canada have provided inconsistent results:3 studies (from the United States and Australia) reported nulleffects [20–22], 4 (from the United States and Mexico) reportedprotective effects [23–26], and 1 other outbreak investigation(from the Untied States) reported increased risk [27].
Findings of pH1N1 risk associated with TIV—consistent inCanada but conflicting elsewhere—may have been due to meth-odological differences and/or unrecognized flaws, differencesin immunization programs or population immunity, or a spe-cific mechanistic effect of Canadian TIV. High rates of im-munization and the use of a single domestic manufacturer tosupply 175% of the TIV in Canada may have enhanced thepower within Canada to detect a vaccine-specific effect. Giventhe changed immunologic landscape following the first spring-summer pandemic wave and the mass pH1N1 vaccination cam-paign during the fall 2009, it may not be possible to furtherresolve this issue epidemiologically. Studies using animal mod-els, banked serum samples, or other in vitro experiments areneeded to further assess this association.
Acknowledgments
Financial support. BC Centre for Disease Control.Potential conflicts of interest. D.M.S. and G.D.S. have previously re-
ceived research grant funding from GlaxoSmithKline and Sanofi-Pasteurfor separate unrelated studies. All other authors: no conflicts.
References
1. BC Stats. Socio-economic profiles local health areas: maps. Victoria,British Colombia, Canada: BC Stats, 2008. http://www.bcstats.gov.bc.ca/data/sep/lha/lhamap.asp. Accessed 30 March 2010.
2. BC Stats. British Columbia Indian reserve census figures: 2006 censustotal population results. Victoria, British Colombia, Canada: BC Stats,2008. http://www.bcstats.gov.bc.ca/data/cen06/ir2006.asp. Accessed 6April 2010.
3. Novel Swine-Origin Influenza A (H1N1) Virus Investigation Team.Emergence of a novel swine-origin influenza A (H1N1) virus in hu-mans. N Engl J Med 2009; 360:2605–2615.
4. National Advisory Committee on Immunization. Statement on sea-sonal trivalent inactivated influenza vaccine (TIV) for the 2009–2010season. Can Commun Dis Rep 2009; 35(ACS-6):1–41. http://www.phac-aspc.gc.ca/publicat/ccdr-rmtc/09pdf/acs-dcc-06.pdf.
5. Committee for Proprietary Medicinal Products. Note for guidance onharmonization of requirements for influenza vaccines. London, UK:European Agency for the Evaluation of Medicinal Products, 1997.http://www.emea.europa.eu/pdfs/human/bwp/021496en.pdf. Accessed30 March 2010.
6. Molenberghs G, Verbeke G. Models for discrete longitudinal data. NewYork: Springer, 2005.
7. Donaldson LJ, Rutter PD, Ellis BM, et al. Mortality from pandemicA/H1N1 2009 influenza in England: public health surveillance study.BMJ 2009; 339:b5213.
8. Baker MG, Wilson N, Huang QS, et al. Pandemic influenza A(H1N1)vin New Zealand: the experience from April to August 2009. Euro Sur-veill 2009; 14:piip19319.
9. Statistics Canada. Canadian Community Health Survey (Cycle 3.1).Ottawa, Ontario, Canada: Statistics Canada, 2005.
10. Statistics Canada. Influenza immunization coverage by province and age2007–08. In: Table 105–0502. Health indicator profile, annual estimates,by age group and sex, Canada, provinces, territories, health regions (2007boundaries) and peer groups, occasional (1209600 series). Ottawa, On-tario, Canada: Statistics Canada, 2009. http://cansim2.statcan.gc.ca/cgi-win/cnsmcgi.pgm?LangpE&RootDirpCII/&Array_Pickp1&ArrayIdp105-0502&C2DBpPRD&ResultTemplatepCII%2FCII. Accessed 30March 2010.
11. British Columbia, Provincial Health Officer. Pathways to health andhealing: 2nd report on the health and well-being of Aboriginal peoplein British Columbia. Provincial Health Officer’s Annual Report 2007.Victoria, British Columbia, Canada: British Columbia, ProvincialHealth Officer, 2009. Available at: http://www.hls.gov.bc.ca/pho/pdf/abohlth11-var7.pdf. Accessed 30 March 2010.
12. British Columbia First Nations Health Council. Healthy children,healthy families, healthy communities: the road to wellness. BC FirstNations Regional Longitudinal Health Survey 2002/2003. West Vancouver, British Colombia, Canada: British Columbia First NationsHealth Council, 2005. http://www.fnhc.ca/pdf/RHS_2002_2003_Regional_Report.pdf. Accessed 30 March 2010.
13. Environics Research Group. 2006 First Nations and Inuit Adult Im-munization Coverage Survey (FNIICS). First Nations and Inuit HealthBranch, Health Canada (contract #H1011–060001/001/CY). Ottawa,Ontario, Canada: First Nations and Inuit Health Branch, Health Can-ada, 2006.
14. Orenstein EW, De Serres G, Haber MJ, et al. Methodologic issuesregarding the use of three observational study designs to assess influ-enza vaccine effectiveness. Int J Epidemiol 2007; 36:623–631.
15. Bodewes R, Kreijtz JHCM, Baas C, et al. Vaccination against humaninfluenza A/H3N2 virus prevents the induction of heterosubtypic im-munity against lethal infection with avian influenza A/H5N1 virus.PLoS ONE 2009; 4: e5538.
16. Bodewes R, Kreijtz JHCM, Rimmelzwaan GF. Yearly influenza vacci-nations: a double-edged sword? Lancet Infect Dis 2009; 9:784–788.
17. Skowronski DM, De Serres G, Crowcroft NS, et al. Association betweenthe 2008–09 seasonal influenza vaccine and pandemic H1N1 illnessduring spring-summer 2009: four observational studies from Canada.PLoS Med 2010; 7:e1000258.
18. Larcombe L, Rempel JD, Dembinski I, Tinckam K, Rigatto C, Nick-erson P. Differential cytokine genotype frequencies among CanadianAboriginal and Caucasian populations. Genes and Immunity 2005; 6:140–144.
19. Zarychanski R, Stuart TL, Kumar A, et al. Correlates of severe diseasein patients with 2009 pandemic influenza (H1N1) virus infection.CMAJ 2010; 182(3):257–264.
20. Garguillo P, Shay D, Katz J, et al. Effectiveness of 2008–09 trivalentinfluenza vaccine against 2009 pandemic influenza A (H1N1)—United
Seasonal Vaccine Effect on pH1N1 Risk • CID 2010:51 (1 November) • 1027
States, May-June 2009. MMWR Morb Mortal Wkly Rep 2009; 58:1241–1245.
21. Iuliano AD, Reed C, Guh A, et al. Notes from the field: outbreak of2009 pandemic influenza A (H1N1) virus at a large public universityin Delaware, April-May 2009. Clin Infect Dis 2009; 49:1811–1820.
22. Kelly H, Grant K. Interim analysis of pandemic influenza (H1N1) 2009in Australia: surveillance trends, age of infection and effectiveness ofseasonal vaccination. Euro Surveill 2009; 14:piip19288.
23. Johns MC, Eick AA, Blazes DL, Lee S-e, Perdue CL, et al. Seasonalinfluenza vaccine and protection against pandemic (H1N1) 2009–as-sociated illness among US military personnel. PLoS ONE 2010; 5(5):e10722.
24. Echevarrıa-Zuno S, Mejıa-Arangure JM, Mar-Obeso AJ, et al. Infection
and death from influenza A H1N1 virus in Mexico: a retrospectiveanalysis. Lancet 2009; 374:2072–2079.
25. Garcia-Garcia L, Valdespino-Gomez JL, Lazcano-Ponce E, et al. Partialprotection of seasonal trivalent inactivated vaccine against novel pan-demic influenza A/H1N1 2009: case-control study in Mexico City. BMJ2009; 339:b3928.
26. Lessler J, Reich NG, Cummings DA, et al. Outbreak of 2009 pandemicinfluenza A (H1N1) at a New York City school. N Engl J Med 2009;361:2628–2636.
27. Crum-Cianflone NF, Blair PJ, Faix D, et al. Clinical and epidemiologiccharacteristics of an outbreak of novel H1N1 (swine origin) influenzaA among United States military beneficiaries. Clin Infect Dis 2009; 49:1801–1810.