SEASONAL HABITAT USE OF PERSIAN GAZELLES (Gazella subgutturosa subgutturosa) BASED ON VEGETATION...
51
CHAPTER 5 SEASONAL HABITAT USE OF PERSIAN GAZELLES (Gazella subgutturosa subgutturosa) BASED ON VEGETATION PARAMETERS AT GOLESTAN NATIONAL PARK, IRAN 4.0 INTRODUCTION The Persian gazelle (Gazella subgutturosa subgutturosa) (Güldenstaedt 1780) is a sub-species of the Goitered gazelle (G. subgutturosa) in the genus Gazelle, family Bovidae and order Artiodactyla. This sub-species is distributed from eastern Turkey to Iran, Pakistan, Turkmenistan and Central Asia (Kingswood & Blank 1996). It is currently categorized as Vulnerable (VU) and if conservation efforts are not implemented for this species in the near future, this could change to the Extinction (EX) category (IUCN Red List 2013). One of the most important ecological concepts in wildlife management is habitat use, i.e., the interaction of animals with biotic and abiotic parameters in their habitat. Theories or models of habitat use strive to capture the essentials of resource allocation by an organism and its implications for fitness (Lawes & Nanni 1993). 1
-
Upload
independent -
Category
Documents
-
view
2 -
download
0
Transcript of SEASONAL HABITAT USE OF PERSIAN GAZELLES (Gazella subgutturosa subgutturosa) BASED ON VEGETATION...

CHAPTER 5
SEASONAL HABITAT USE OF PERSIAN GAZELLES (Gazella
subgutturosa subgutturosa) BASED ON VEGETATION PARAMETERS AT
GOLESTAN NATIONAL PARK, IRAN
4.0 INTRODUCTION
The Persian gazelle (Gazella subgutturosa subgutturosa)
(Güldenstaedt 1780) is a sub-species of the Goitered
gazelle (G. subgutturosa) in the genus Gazelle, family Bovidae
and order Artiodactyla. This sub-species is distributed
from eastern Turkey to Iran, Pakistan, Turkmenistan and
Central Asia (Kingswood & Blank 1996). It is currently
categorized as Vulnerable (VU) and if conservation
efforts are not implemented for this species in the near
future, this could change to the Extinction (EX) category
(IUCN Red List 2013). One of the most important
ecological concepts in wildlife management is habitat
use, i.e., the interaction of animals with biotic and
abiotic parameters in their habitat. Theories or models
of habitat use strive to capture the essentials of
resource allocation by an organism and its implications
for fitness (Lawes & Nanni 1993). 1

The distribution and abundance of ungulate
populations are affected by the availability of food,
cover, and freestanding water (Dasmann 1971), as well as
high primary production and high biodiversity (Penka et
al. 1985) because these resources provide the basic
physiological and biological requirements of the ungulate
in the habitat. Also, the agricultural fields situated
near the habitat offer very specific conditions, which
can significantly influence the habitat use of animal
species living there (Prokesova et al. 2006; Kaplan
1994). Ward and Saltz (1994) concluded that feeding
behaviour of some species of gazelle can be changed
according to
2

environmental conditions during different seasons and
years; Junsheng et al (1999) reported that the food
availability of the Mongolian gazelle showed seasonal
changes; the plant biomass was higher in spring and
summer than that in autumn and winter. Food availability
and food choice are closely related to the feeding
strategy of forage plants; together they influence the
feeding behaviour, feeding type, and even social
organization of the ruminants (Geist 1974; Jarman 1974).
Radio telemetry, track count and direct observation
are methods commonly used to measure habitat use by large
ungulates. Radio telemetry can be expensive and needs
advanced transmitters and other equipment (Weckerly &
Ricca 2000). Track counts are not useful during the fall
and winter when the weather is unstable, rain and snow
are common, and lower temperatures tend to decrease the
activity of ungulates (Mooty et al. 1984). Direct
observation is time consuming and the results are rarely
accurate (Harkonen & Heikkila 1999). Pellet-group
counting is a more effective and less expensive method of
assessing habitat use (e.g., Sutherland 1996) as it does
not rely on technology and investment to capture, radio
track, or “camera trap” animals. However, pellet group
count has some disadvantages. The identification of each
species’ track and pellet is sometimes not reliable, and
the quantification of signs may be affected by the
species, sign features, substrate quality, weather, and
3

other factors influenced by habitat conditions and
seasonality (Rabinowitz 1993).
In other studies by Collins and Urness (1981), and
Andersen et al (1992) they reported that as the
defecation rates of animals varied due to different food
sources and activities throughout the year, pellet group
count cannot be a strong model to determine habitat use.
In spite of these impediments, pellet group count has
been a common method for assessing population trends and
habitat use of wild ruminants since the 1940s (Neff 1968;
Weckerly & Ricca 2000; Palmer & Truscott 2003). With this
method, the overall animal and pellet abundance are
monitored over several months with a concentrated
recording effort (Marques et al. 2001), and habitat
attributes, such as vegetation parameters are registered
simultaneously on the same spatial scale. The habitat
utilization data can be used in the management of
ungulate populations and their habitat essentials (Hemami
et al. 2004).
The pellet group count method has been widely used
to collect data on the habitat use of large herbivores
like elk, deer and moose throughout the whole world
(Guillet et al. 1995; Härkönen & Heikkilä 1999; Palmer &
Truscott 2003). However, only a few investigations have
been conducted on gazelles (Nowzari et al. 2007; Hazeri
et al. 2009). Thus, this study attempts to identify
habitat use by the Persian gazelle, using clearance
4

transect pellet group counts to identify the quantity and
quality factors of habitats in relation to habitat use
during seasons.
4.1 MATERIALS AND METHODS
4.1.1 Study Area
The Golestan National Park (GNP), covering an area of
91859 hectares, is located to the south-east of the
Caspian Sea (55° 43' to 56° 17' E, 37° 16' to 37° 31' N).
This park has been protected since 1957 because of its
valuable natural assets, such as a verdant and virgin
forest and diverse species of flora and fauna. Due to the
geographic location of the GNP, plant coverage can be
divided into two zones: the Hirkani forest in east
Alborz, and Iran-Toorani growth. The park includes
mountainous areas in the northern and western parts, and
undulating fields and plains in the eastern part. The
maximum and minimum elevations are approximately 2411 m
and 450 m respectively.
Persian gazelles live in the steppe habitats of the
GNP, scattered throughout the northern, southern and
eastern parts of the region (Figure 4.1). The main plant
cover includes thick shrubs, evergreens and annual
5

vegetation, which mostly belong to the Iran-Toorani
elements. Artemisia spp is the main endemic species of the
local vegetation. Parts of the GNP that feature this kind
of habitat have warm, dry summers and cold winters. The
average annual precipitation is 400 mm and the average
annual temperature varies between 11.5 ° to 17.5°° C. The
absolute minimum temperature is -25 °° C and the reported
maximum is 45 °°C.
6

Figure 4.1 Location of three gazelle habitats(Mirzabylou plain, Solegerd and Lohondur areas)at Golestan National Park. The green squares arevillages and farmlands around park
The density of shrub growth forms range from sparse
to dense thickets from Mirzabailo and its surrounding
area, to the southern part of the park, to the Dasht and
Almeh valleys, to the Sulgerd Mountains and to the
northern part of the park up to Lohondor. In some cases
these growths are associated with barberry shrubs, Rosa
sp. and Tamarix. Around the Almeh valley, the density and
7

variation of vegetation are higher. Artemisia spp annual
species and steppe communities provide good cover in the
hills and valleys, giving an expanded scrubland landscape
that is a suitable habitat for the wildlife species of
the park, such as gazelle, wild sheep and goats.
Among the three gazelle habitats at the GNP, the
Mirzabailo plain was selected as the main habitat because
it had a variety of vegetation types. This allowed the
determination of gazelle habitat use through vegetation
parameters (Table 4.1 and Figure 4.1). The map of
vegetation types was established during several field
visits to the habitat, using the topographic position,
vegetation structure, and direct (Figure 4.2). All
vegetation types were located in the plain areas that
have gentle topographic variation, mostly between 1000 m
and 1300 m elevation. The area covers a minor portion of
the park, has low soil erosion, so the soils are deep to
very deep and have good development. The soils of this
area include less than 15% of gravel. The best type of
texture is loam and its derivatives like clay loam or
sandy loam that can be found in this group of soils.
In order to assess the composition of each vegetation
type, in May 2009 plant surveys by random sampling of 1 m2
plots were used based on the Daubenmire (1959) method. A
general description of the vegetation in each sampling
plot was complied by using 4 plant growth forms; shrub,
8
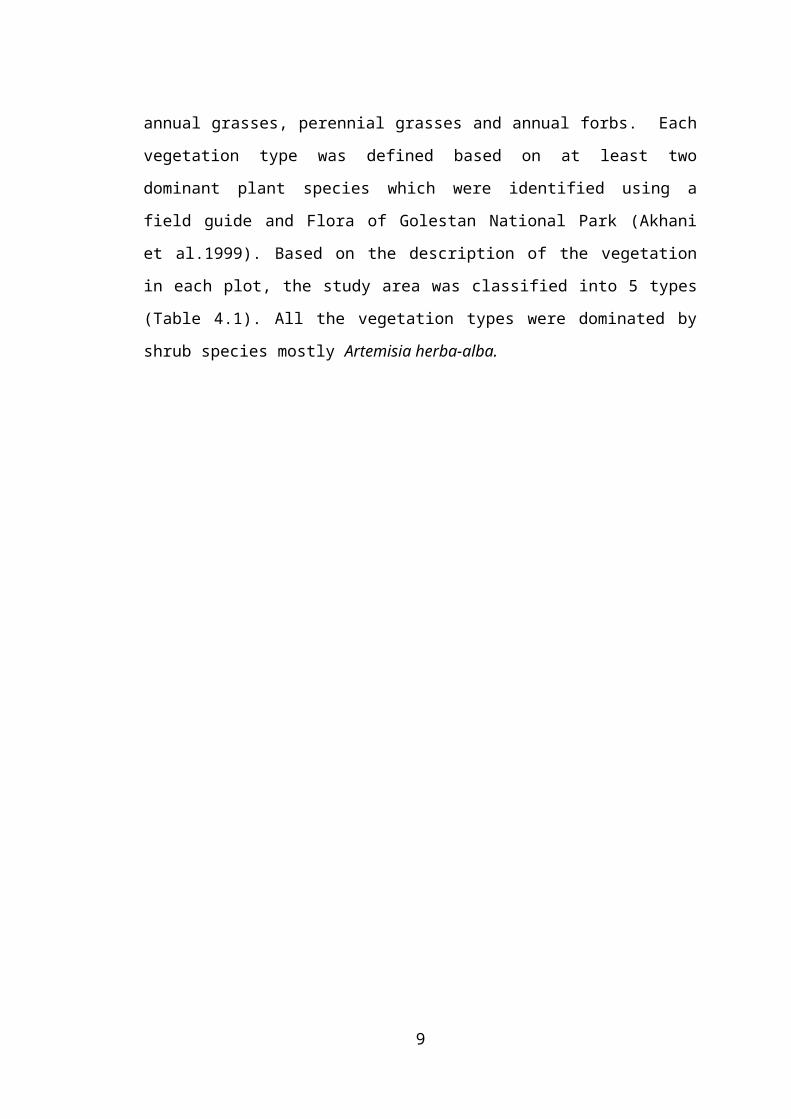
annual grasses, perennial grasses and annual forbs. Each
vegetation type was defined based on at least two
dominant plant species which were identified using a
field guide and Flora of Golestan National Park (Akhani
et al.1999). Based on the description of the vegetation
in each plot, the study area was classified into 5 types
(Table 4.1). All the vegetation types were dominated by
shrub species mostly Artemisia herba-alba.
9

Table 4.1 Total number of transects and area of eachvegetation type of gazelle habitat in the study site inGolestan National Park
Gazellehabitat Vegetation type Area
(ha)
Numberof
Transects
I. Artemisia herba-alba / Eremopyrun bonaipartis /Anabasis aphylla/ Aellenia sp.
678.68 4
II. Artemisia herba-alba / Salsola rigida
968.63 5
Mirzabailo III. Artemisia herba-alba / Salsola vermiculata / Stipa barbata / Poa bulbosa
205.00
2
3
IV. Artemisia herba-alba / Eurotia ceratoides / Stipa barbata / Poa bulbosa
865.11 4
V. Artemisia herba-alba/ Aellenia sp. / Annual forb
847.70
0
4
Sulgerd IV. Artemisia herba-alba / Eurotia ceratoides / Stipa barbata / Poa bulbosa
759.00
2
-
Lohondor IV. Artemisia herba-alba / Eurotia ceratoides / Stipa barbata / Poa bulbosa
572.96 -
10

11

Figure 4.2 Map of the Mirzabailo plain, which is themain gazelle habitat at Golestan National Park.Monitoring transects were distributedproportional to the extent of the vegetationtypes. The blue symbols show the artificial watersources.
Vegetation types III and IV in the hilly terrain at
1300 m elevation were dominated by shrubs and perennial
grasses with 48% and 39% vegetation cover, respectively.
The dominant shrub species included Artemisia herba-alba, Salsola
vermiculata and Eurotia ceratoides. Of the grasses the main
species were Stipa barbata and Poa bulbosa.
12

Vegetation types II and V were located in the middle
of the habitat between 1100 m and 1200 m elevation. Type
II was dominated by the shrubs Artemisia herba-alba and Salsola
rigida and had 29% vegetation cover, while type V was
dominated by shrubs and annual forbs with 25% total
vegetation cover. Its dominant shrub species were Artemisia
herba-alba and Aellenia sp., while the main annual forbs are
Alyssum strigosum, Astragalus spp, Tragopogon longirostris, Trigonella
arcouta and Ziziphora tenuior (for more details see Appendix 1).
Vegetation type I in the low steppe area of the
habitat was located at less than 1100 m elevation near
the intercity road from Gorgan to Mashhad, which crosses
the reserve from east to west (Figure 4.2). It generally
had no more than 17% total vegetation cover, and most of
this part of the habitat had bare ground with salty,
white soil. Shrub species such as Artemisia herba-alba, Anabasis
aphylla and Aellenia sp were dominant here, while Eremopyrun
bonaipartis was the most dominant species of grass.
4.1.2 Gazelle Pellet-Group Survey
A total of 20 transects, each 3 m x 210 m were
established between 28th - 30th May 2010 on the Mirzabilo
plain and at the same time all the accumulated pellet
groups were removed from the transects. The size of the
transects was decided based on methods successfully used
in other gazelle habitats (Nowzari et al. 2007; Hazeri et
al. 2009) and the number of transects was proportional to
13

the area of the vegetation types (Table 4.1 and Figure
4.2). Transects were distributed by stratified random
sampling. The beginning and end of each transect was
marked using the Global Positioning System (GPS). In
order to achieve greater accuracy, each transect was sub-
divided using numbered wooden pegs into of 1.5 m x 30 m
segments (Nowzari et al. 2007; Hazeri et al. 2009).
Pellet-groups were counted in each segments and were then
removed.
In spring, gazelle pellets were separated into two
age groups, adults: male-female (1-1+ years old) and
fawns: male-female (0-1 year old). The size and shape of
the pellets for each age group were categorized by local
hunters assisting us based on diagnostic features. Feld
researchers had also received training at the Zoo and in
the field. We only recorded pellet groups with more than
five individual pellets, and any pellet-group at the edge
would be counted if more than half of it lay inside the
transect (Hemami et al. 2004; Nowzari et al. 2007).
Pellet group counts and clearance were completed at
two-monthly intervals due to the low decomposition rate
of the pellet groups in arid areas (Nowzari et al. 2007).
All signs of gazelles were removed from a transect at
each site visit. Accumulated pellet-groups within
transects were counted and removed between 29th - 31st
July, 29th September - 1st October, 28th - 30th November, 28th
14
February - 1st March, 27th - 29th April . In the winter,
because of harsh weather conditions, data collection had
to be postponed by one month.
4.1.3 Vegetation Parameters
Canopy cover, density, diversity, forage production and
forage quality (crude protein) comprised the vegetation
parameters, which were significant elements of habitat
quality (Mysterud et al. 1999). These were surveyed
simultaneously and on the same spatial scale as gazelle
signs in each transect (Table 4.1).
In each 1.5m x 30m transect segment, the percentage
cover of all plant species (perennial and annual) was
visually surveyed based on Daubenmire (1959) cover
classes. The species percentage cover data was used to
calculate the diversity within the vegetation types.
At each 3 m x 30 m transect area, a 1 m2 plot was
randomly sited behind the right shoulder of the observer
to measure the species density and forage production.
This sample size is deemed adequate for sampling shrubs
and grass in the study site and in other arid and semi-
arid environments. Species density was estimated by
counting individual plants in each plot. To determine
forage production, the edible parts of the plants, around
2.5 cm above ground were harvested by manual clipping.
15

This height represents a typical standing crop that has
been grazed by the gazelle during feeding (Nowzari et al.
2007). Clipped plants were weighed (wet weight) before
drying in an oven at 70° C for at most 48 hours and then
reweighed (dry weight). The dry matter of all plant
species was determined at different seasons. The total
number of pellet-groups and the mean vegetation
parameters were then calculated for each transect.
To consider of forage quality, plant samples were
collected at different seasons from the edible part of
shrubs, grasses and forbs. The samples selected as their
presence was dominant (i.e., they were the most common
species in the gazelle habitat based on Table 4.1) and
they were the most consumed food by gazelles (based on
personal direct observation and literature review).
Sighting records of the gazelle foods along
transects were made with the aid of a telescope at
bimonthly intervals. As a gazelle’s upper jaw does not
have any incisor or canine teeth as it separates the
leaves from the stems of plants, some skin will remain on
the intact parts, so plants eaten by the gazelle can be
recognized (Nowzari et al. 2007). Thus, direct
observations in the morning and at mid-day were used as a
secondary method besides the pellet-group count method
(Holechek et al. 1982; Rominger et al. 1988; Saltz & Ward
2000; Nowzari et al. 2007).
16

Besides primary field data, information from local
guides and the results of other studies of gazelles in
other regions were also utilized to compile a list of the
gazelle food plants and their seasonal availability in
the study area. A study of the food preferences in the
Khosh Yeilagh Wildlife Refuge by Mowlavi (1978) showed
that shrubs comprised 86% of their diet, followed by
grasses (11%), and forbs 3%. Analysis of the rumen
content of a female gazelle in the Ghamishloo Wildlife
Refuge in 1992 indicated that Salsola sp. was the most
common component of the diet, followed by grasses. In
southern Iran, they feed on shrubs, grasses, and forbs in
the winter and early spring, but browsing diversifies
during the rest of the year.
A variety of shrubs and grasses were selected in the
study area; Artemisia herba-alba, Salsola rigida, Salsola vermiculata,
Erotia ceratoidea, Anabasis aphylla, Stipa barbata, Poa bulbosa, Eremopyrun
bonaris and Allysum strigosum. Plant species for chemical
analysis were selected from different parts of the
habitat with three replicates at each phenological stage.
Plant samples were washed thoroughly dried for 72 hours
at 60°° C and ground using a 1 mm screen in a Wiley mill.
Crude protein was selected as an important indicator of
forage quality and was measured using the Kjeldahl method
(AOAC 2000).
17

4.1.4 Statistical Analyses
A normality test was done on data for frequency
distribution and homogeneity of variance. For statistical
analysis, Log10 was used to transform pellet group density
and a number of vegetation variables (production and
density) and square root transformation was used for
vegetation canopy cover.
Differences in the pellet group density and the
vegetation parameters (based on variables in Tables 4.3
and 4.4; Figures 4.3, 4.4 and 4.5) between vegetation
types and seasons were analyzed using one-way analysis of
variance [ANOVA]. Species diversity between vegetation
types was estimated with the Shannon-Wiener formula
(Krebs 1989). The difference between forage quality and
quantity in each season was analysed by one-way ANOVA and
the Kruskal Wallis test, respectively (Table 4.5 and
4.6).
The matrix data of pellet groups (as dependent
variable) and the canopy cover of all plant species (as
independent variable) were set at different seasons. The
stepwise regression model (forward selection) was then
used to determine which one of the plant species was
18

significantly associated with the density of gazelle
pellet groups in each season.
4.2 RESULTS
4.2.1 Pellet Group Analysis
The mean density of pellet groups in the 630 m2 transects
was compared between the five vegetation types using one-
way ANOVA. It was found that signs of gazelle presence
were not homogeneously distributed among the five
vegetation types (P<0.05) (Figure 4.3). In spring,
vegetation type I was highly used by adult gazelles (P =
0.004, F = 6.30) and vegetation type V was highly used by
fawns (P = 0.030, F = 3.60), while vegetation types III
and IV were used less by both age groups. In mid-summer
(P=1.11, F=0.39) and the end of summer (P = 1.51, F =
0.24) no significant difference was detected in the use
pattern of all vegetation types. In fall, both vegetation
types I and II were more preferred than vegetation type
III (P = 0.005, F = 5.73). In winter vegetation type II
was consumed more than vegetation types III, IV and V (P
= 0.011, F = 4.82). The overall values of the pellet
group accumulation indicated that gazelles ranged rather
uniformly over all the vegetation types within the
habitat (Figure 4.3). But, the field results showed that
the gazelles had a higher intensity of use of vegetation
19

types I and II followed by type V (P = 0, F = 9.97).
Moreover, although we identified a significant seasonal
difference in pellet group accumulation (P = 0.04, F =
2.51), but the high pellet density in all seasons showed
that gazelles use the steppe area of the GNP throughout
the year (Figure 4.4).
20

21

Figure 4.3 Mean ± s.d of Log transformed pellet group density accumulated in differentvegetation types and seasons by pellet-group clearance transects in the gazellehabitats of Golestan National Park. (A, B, C indicate difference or similarity of theparameter across vegetation types and seasons by Tukey Test).
22
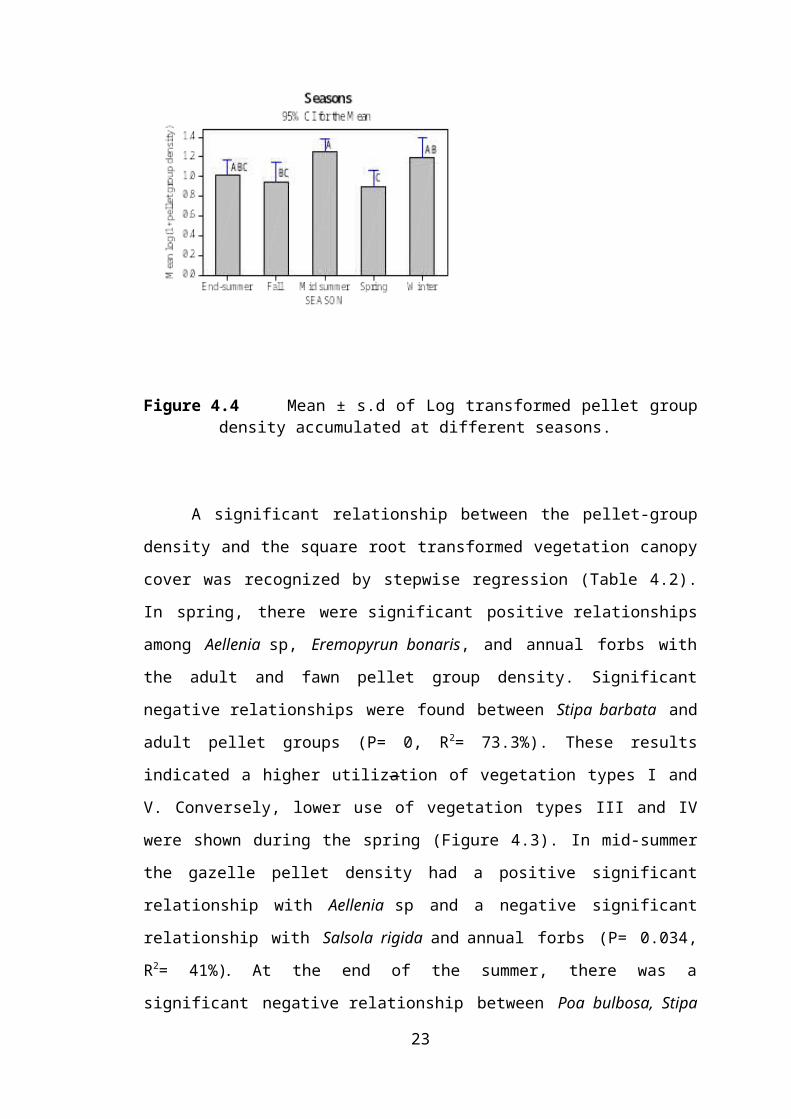
Figure 4.4 Mean ± s.d of Log transformed pellet groupdensity accumulated at different seasons.
A significant relationship between the pellet-group
density and the square root transformed vegetation canopy
cover was recognized by stepwise regression (Table 4.2).
In spring, there were significant positive relationships
among Aellenia sp, Eremopyrun bonaris, and annual forbs with
the adult and fawn pellet group density. Significant
negative relationships were found between Stipa barbata and
adult pellet groups (P= 0, R2= 73.3%). These results
indicated a higher utilization of vegetation types I and
V. Conversely, lower use of vegetation types III and IV
were shown during the spring (Figure 4.3). In mid-summer
the gazelle pellet density had a positive significant
relationship with Aellenia sp and a negative significant
relationship with Salsola rigida and annual forbs (P= 0.034,
R2= 41%). At the end of the summer, there was a
significant negative relationship between Poa bulbosa, Stipa
23
barbata and pellet group density (P = 0.004, R2 = 47.8%),
that justified the lower usage of vegetation types III
and IV. In the fall and winter a significant positive
relationship was detected between Salsola rigida and pellet
group density, while a significant negative relationship
between pellet groups and Stipa barbata and Poa bulbosa was
found (in fall P= 0.035, R2=32.7%; in winter P=0.086,
R2=33%). This verified the higher use of vegetation type
II and lower use of vegetation types III and IV in cold
seasons. Despite the fact that Artemisia herba-alba was a
dominant species throughout the area, there was no
significant relationship between pellet group density and
canopy cover of this species during the various seasons.
24
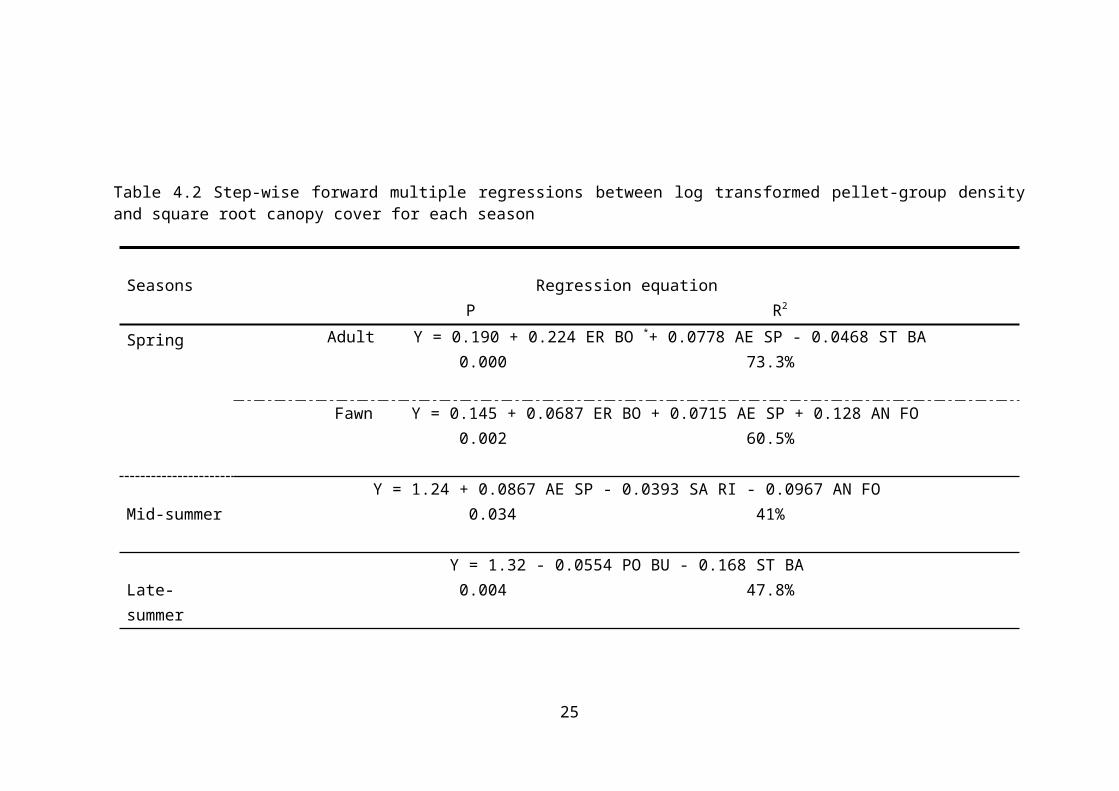
Table 4.2 Step-wise forward multiple regressions between log transformed pellet-group densityand square root canopy cover for each season
Seasons Regression equationP R2
Spring Adult Y = 0.190 + 0.224 ER BO *+ 0.0778 AE SP - 0.0468 ST BA0.000 73.3%
Fawn Y = 0.145 + 0.0687 ER BO + 0.0715 AE SP + 0.128 AN FO0.002 60.5%
Mid-summerY = 1.24 + 0.0867 AE SP - 0.0393 SA RI - 0.0967 AN FO
0.034 41%
Late-summer
Y = 1.32 - 0.0554 PO BU - 0.168 ST BA0.004 47.8%
25
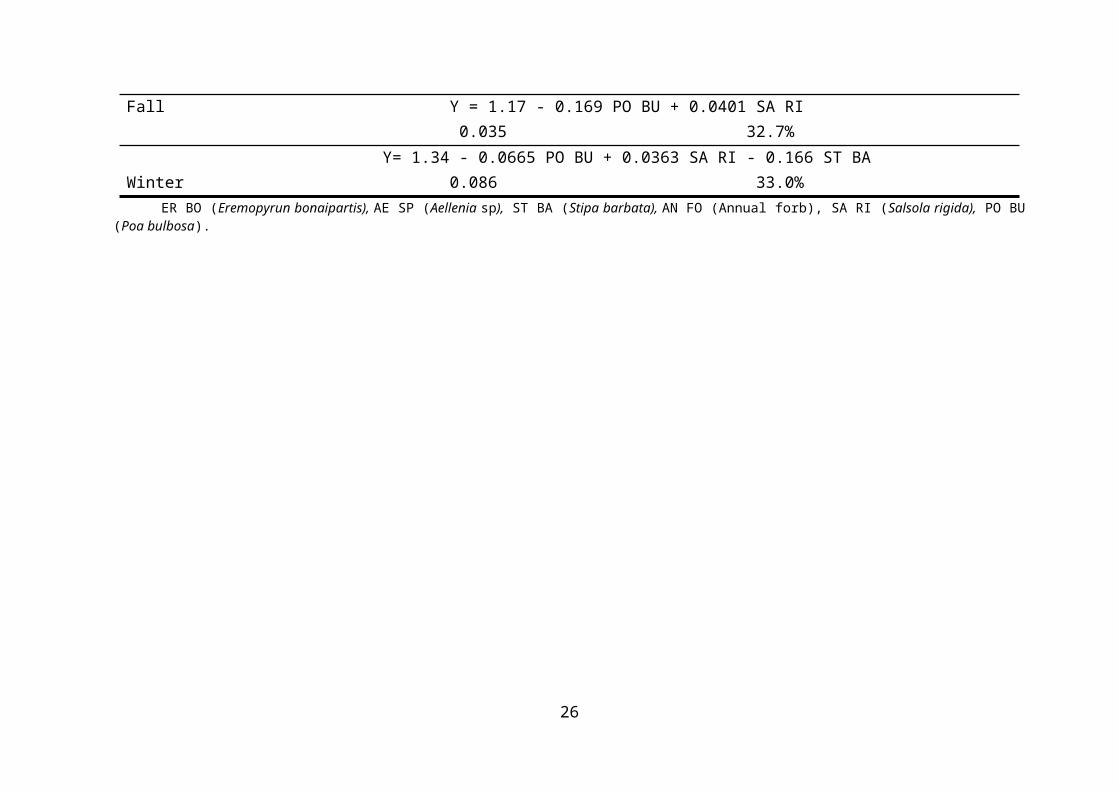
Fall Y = 1.17 - 0.169 PO BU + 0.0401 SA RI0.035 32.7%
WinterY= 1.34 - 0.0665 PO BU + 0.0363 SA RI - 0.166 ST BA
0.086 33.0%ER BO (Eremopyrun bonaipartis), AE SP (Aellenia sp), ST BA (Stipa barbata), AN FO (Annual forb), SA RI (Salsola rigida), PO BU
(Poa bulbosa).
26
4.2.2 Vegetation Parameter Evaluation
Canopy cover, diversity, density and forage production
are vegetation parameters which demonstrate significant
differences among seasons and vegetation communities
(P<0.05). As expected, the values of all vegetation
parameters were higher in the spring and mid-summer than
in other seasons (P<0.05; Table 4.3). Total forage
production, canopy cover and density were greater in
vegetation types IV, III and II than in the other
vegetation types, respectively. Moreover, a calculation
of Shannon’s diversity (H’) indicated that species
diversity was greatest (P<0.05) in vegetation type II
than in the other vegetation types (Table 4.4). Figure 6
shows the relative canopy cover of the main forage
species in each vegetation type (habitat) throughout one
year.
27
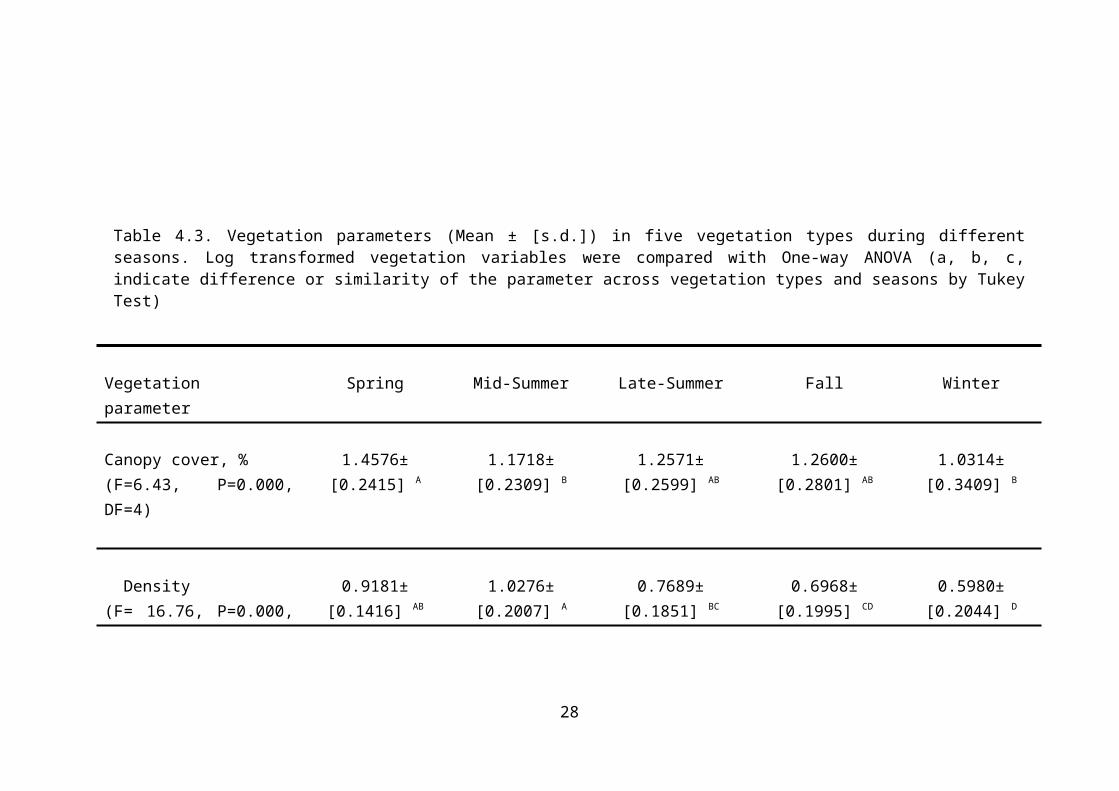
Table 4.3. Vegetation parameters (Mean ± [s.d.]) in five vegetation types during differentseasons. Log transformed vegetation variables were compared with One-way ANOVA (a, b, c,indicate difference or similarity of the parameter across vegetation types and seasons by TukeyTest)
Vegetationparameter
Spring Mid-Summer Late-Summer Fall Winter
Canopy cover, %(F=6.43, P=0.000,DF=4)
1.4576±[0.2415] A
1.1718±[0.2309] B
1.2571±[0.2599] AB
1.2600±[0.2801] AB
1.0314±[0.3409] B
Density(F= 16.76, P=0.000,
0.9181±[0.1416] AB
1.0276±[0.2007] A
0.7689±[0.1851] BC
0.6968±[0.1995] CD
0.5980±[0.2044] D
28

DF=4)
Production, gr/m2
(F= 31.67, P=0.000, DF=4 )
1.4057±[0.2638] A
1.1173±[0.1564] B
0.8290±[0.2292] CD
0.8594±[0.2876] C
0.6201±[0.2638] D
Table 4.4 ) The comparison of vegetation parameters (Mean ± [s.d.]) in five vegetationtypes/habitats. Log transformed vegetation variables were compared with One-way ANOVA (a, b, c,indicate difference or similarity of the parameter across vegetation types and seasons by TukeyTest).
Vegetationparameter
Vegetationtype IN= 40
Vegetationtype II N= 25
Vegetationtype IIIN=15
Vegetationtype IVN=20
Vegetationtype VN=35
0.9251±
29

Canopy cover, %(F=15.51, P=0.000,DF=4)
[0.3279]C 1.2661±[0.2718]AB
1.4598±[0.1403]A
1.4247±[0.1478]A
1.1507±[0.2242]B
Density(F=2.24, P=0.071,DF=4)
0.6703±[0.3398]B
0.8522±[.2211]A
0.7986±[0.0877]AB
0.8656±[0.1679]A
0.8092±[0.2523]AB
Production, gr/m2
(F=7.72, P=0.000,DF=4)
0.6757±[0.3218]C
1.0472±[0.3153]AB
1.1019±[0.3602]AB
1.1634±[0.2566]A
0.8570±[0.3437]BC
Diversity(P=0, DF=4 )
1.27C 1.15A 1.21B 1.6D 1.77E
30

31

Figure 4.5 Means ± s.d of relative canopy cover of each forage species at differentvegetation types in Golestan National Park (A, B, C indicate difference or similarityof the parameter across vegetation types and seasons by Tukey Test).
32

There were significant differences (P<0.05) in the
quantity and quality among species, season and the
species-season interaction. The results of Tables 4.5 and
4.6 show there were significant differences in the
quantity and quality among the dominant and edible plant
species in each season (P=0.00), which probably accounted
for the different use of vegetation communities by the
gazelles. In comparison to the other shrub species,
Artemisia herba-alba had a much higher production and less
crude protein while Anabasis aphylla had higher crude protein
and less production.
In spring, A. herba-alba, Salsola vermiculata and Eurotia
ceratoides have the most production while the level of crude
protein was higher in the shrubs as Anabasis aphylla and
Aellenia sp. In midsummer, S. rigida, A. herba-alba and Aellenia sp have
higher production but crude protein concentration is more
in A. aphylla and Aellenia sp. In endsummer, A. herba-alba, S. rigida and
Eurotia ceratoides have higher production amount while the
highest percentage of crude protein was accumulated in A.
aphylla and E. ceratoides. During fall and winter, A. herba-alba, S.
rigida, A. aphylla and E.ceratoides have high production rate but
crude protein was more concentrated in A. aphylla and S. rigida
(Table 4.5 and 4.6).
33

34

Table 4.5. Forage quantity [Average Rank] at differentseasons. Species forage productions in each season were
compared with Kruskal Wallis analysis.
Species Spring(P=0,DF= 10)
Mid-summer(P=0,
DF= 10)
Late-summer( P=0,DF=9)
Fall( P=0,DF=7)
Winter( P=0,DF=7)
ShrubsArtemisia.herba-alba
1 2 1 1 1
Salsola rigida 4 1 2 2 2Anabasisaphylla
9 4 6 3 4
Aellenia spp 6 3 7 7 7Eurotiaceratoides
3 10 3 4 3
Salsolavermiculata
2 5 9 8 8
GrassesPoa bulbosa 11 8 5 5 5Stipa barbata 5 7 4 6 6Eremopyrunbonaipartis
7 6 10 - -
ForbsAlyssumstrigosum
10 9 11 - -
Otherannualforbs
8 11 8 - -
---1 to 11 related to rank of speciesproduction from high to low, respectively.
35

Table 4.6 Forage crude protein (Mean ± [s.d.]) at different seasons. Percent of Crude proteinwas compared with One-way ANOVA (a, b, c, indicate difference or similarity of the proteinacross plant species by Tukey Test).
Species Spring(F= 79, P=0,
DF= 9)
Mid-summer(F=223.19, P=0,DF=
10)
Late-summer(F=43.94, P=0,
DF=9)
Fall(F=34.46, P=0,
DF=7)
Winter(F=34.46,P=0,DF=7)
Shrubs
Artemisia. herba-alba 15.98±1.40C 15.98±1.40C 12.55±0.74CD 8±0.57C 8±0.57C
Salsola rigida 17.80±0.48BC 17.80±0.48BC 14.06±0.60BC 11±0.015B 11±0.015B
Anabasis aphylla 28.60±0.13A 28.65±0.13A 22.04±2.36A 15.98±0.53A 15.98±0.53A
Aellenia spp 20.77±0. 47B 20.77±0.78B 14.34±0.08BC 8.92±0.35BC 8.92±0.35BC
Eurotia ceratoides 15.96±0.56C 15.96±0.56C 16.31±1.70B 7.83±0.17C 7.83±0.17C
Salsola vermiculata 11.89±1.48D 10.43±0.62D 7.48±0.61E 7.48±0.61C 7.48±0.61C
GrassesPoa bulbosa 17.36±0.39BC 5.77±0.61E 6.95±2.23E 6.33±2.23C 6.33±2.23C
Stipa barbata 18.33±1.27BC 9.49±1.01D 8±0.22E 8±0.22C 7.66±0.22C
Eremopyrun 11.28±1.48D 10.09±1.01D 9.44±0.17DE * *
36

bonaipartisForbsAlyssum strigosum 10.38±1.25D 9.70±0.61D 9.18±0.87DE * *other annualforbs ** 8.85±0.54D
** * *** no data available; *These species were absent during these seasons
37

4.3 DISCUSSION
4.3.1 Pellet Groups Analysis
Pellet group count was employed to consider the habitat
use of the Persian gazelle based on the vegetation
structure and nutritional content of dominant forages in
the steppe vegetation of the GNP. Nutrient content and
availability of forages have been identified as the main
parameters to determine the food selection and habitat
use patterns of ungulates . In the present study, food
quantity and quality have seasonal changes. The highest
nutritional content and forage availability were detected
in spring and the lowest levels identified during the
fall and winter. During cold seasons, nutrients and fiber
content are not as necessary for gazelles as in the
spring and summer (Sinclair 1975; Fryxell 1987). Thus,
the lack of sufficient food of high quality and quantity
would be the determinant factor in gazelle survival or
death during the cold seasons (Junsheng et al. 1999).
Gazelles are known to eat a variety of grasses,
forbs and shrubs during the different seasons (Olson et
al. 2010; Xu et al. 2012). During the calving period in
the spring, Persian gazelles feed mostly on
Chenopodiaceae, Gramineae and forbs, which comprised
38.8% to 85.1% of their diet (Karami et al. 2002;
Wenxuan et al. 2008). Moreover, in a previous study by
Vallentine (2000) as well as in this study a positive
38

relationship between the presence of these plant families
and gazelle densities was observed. In our study, annual
forbs and grasses generally had their highest production
and protein content in the spring, while their quantity
and quality factors decreased rapidly by the end of the
year and were below gazelle‘s requirements. Hence, it
seems the annual species should be selected by the
gazelle before they declined in nutrient content.
Therefore, habitat types I and V with higher abundance of
nutritional species like Aellenia sp, Eremopyrun bonaris and
annual forbs are the most suitable food sources for adult
and fawn gazelles in the spring. The presence of Annual
forbs and grasses was verified in the diet of the
goitered gazelle during spring, although they are
ubiquitous but not dominant in the gazelle habitat at the
GNP.
Summer is the driest season in the study area and
water sources and water stress condition are considered
to be a very important factor in the gazelle survey.
Despite the water sources being located in the upland
hilly terrain (type IV), even in the hot summer there was
no significant difference in the aggregation of pellet
groups in the upland areas compared to other parts of the
habitat. In another study on predicting habitat
suitability (Bagherirad et al. in press) we found that
gazelles were distributed more homogenously 10 km around
the water sources, which seemed a long distance for a
39

water-dependent species, such as the gazelle. Moreover,
in the current study, the results of step-wise forward
multiple regressions indicated significant positive
relationship between the pellet group density and the
cover of Aellenia sp, a species that was scattered but not
dominant in the study area. Therefore, a hypothesis can
be generated that in the summer there is no significant
difference in the pellet group densities among the
vegetation types due to the fact that the gazelles
searche all areas to find Aellenia sp. Our study results
indicate that Aellenia sp is the only green and hydrous
plant with 60% water content, which also has a high
production rate and protein content compared to the other
species. Moreover, in several direct observations of the
grazed plants, we found that mostly succulent species
like Aellenia sp were consumed by the gazelles during the
summer time. In agreement with these results, Williamson
and Delima (1991); Wenxuan et al (2008); Farhadinia et al
(2009) and Xu et al (2012) also reported that the
gazelles tended to obtain a considerable portion of their
water needs through the consumption of plants with high
water content. The importance of utilising succulent
plants during the dry season by gazelles has been
reported in some other studies throughout the world. For
instance, although the content of crude protein in Acacia
tortilis was low (4-5%), but the high water content (48-63%)
in this shrub species during the dry days of summer make
it the most selected by the dorcas gazelle (Grettenberger
40

1987), dama gazelle in Niger (Grettenberger & Newby
1986), and by dorcas gazelle in Israel (Baharav 1982).
Moreover, Baharav & Rosenzweig (1985) found that for
their survival during summer the dorca gazelles made more
attempt to optimize water intake rather than energy and
protein intake, which is probably similar for the
goitered gazelle in the GNP during the challenging season
by making use of succulent shrubs such as Aellenia spp.
Gazelles are territorial animals and this behaviour
is partly related to their reproductive activity. The
mating behaviour of the Persian gazelle takes place from
September through November in the study area. During the
mating season the pellet group density is similar in all
the habitat types, which is probably because the male
gazelles become more territorial and keep other males out
of their territory. Gazelles defend their territory by
leaving pellets and urine in parts of their habitat. As a
result, each area is occupied by the territorial male and
their females.
during the fall and winter generally the nutritional
quality and quantity of the forage species decreased and
were below the gazelle’s nutritional need for herbaceous
plants. In addition, annual herbaceous plants were
removed from the habitat by intensive grazing and only
the permanent species remained. During the fall the
percentage of protein in grasses was 4-5%, which is too
41

low for nutritional maintenance (the lowest acceptable
level is 7%). In shrubs the preference level drops to
only 8% in winter, thus bushes sustain more nutrition
than grasses (Kaplan 1995; Beck & Peek 2005). The
deficiency in nutritional quality is simultaneous with
mating and pregnancy in the fall, when more food with
high levels of protein and energy are needed. Thus, the
positive relationship between canopy cover of Salsola rigida
and pellet group density in the cold seasons is
significant because of the higher production and protein
content in shrubs compared to grass species such as Stipa
barbata and Poa bulbosa. Similar to livestock, the gazelle
might avoid grazing grass species because of the hard
awns and silvery silky plumes of Stipa barbata in the
seeding season, as reported by Moghaddam (1998).
It is interesting to note that, there was not any
significant relationship between the pellet group density
and canopy cover of shrubs such as Artemisia herba-alba and
Anabasis aphylla, although these browse are dominant species
with high nutritional quality rather than the herbaceous
types. Although habitat type I was used by the gazelles
during the fall and winter, there was no significant
relationship between the pellet groups and the associated
plant species by stepwise forward multiple regressions,
even with dominant species such as Artemisia herba alba and
Anabasis aphylla. However, in other studies, it has been
documented that Artemisia herba-alba is a dominant species in
42
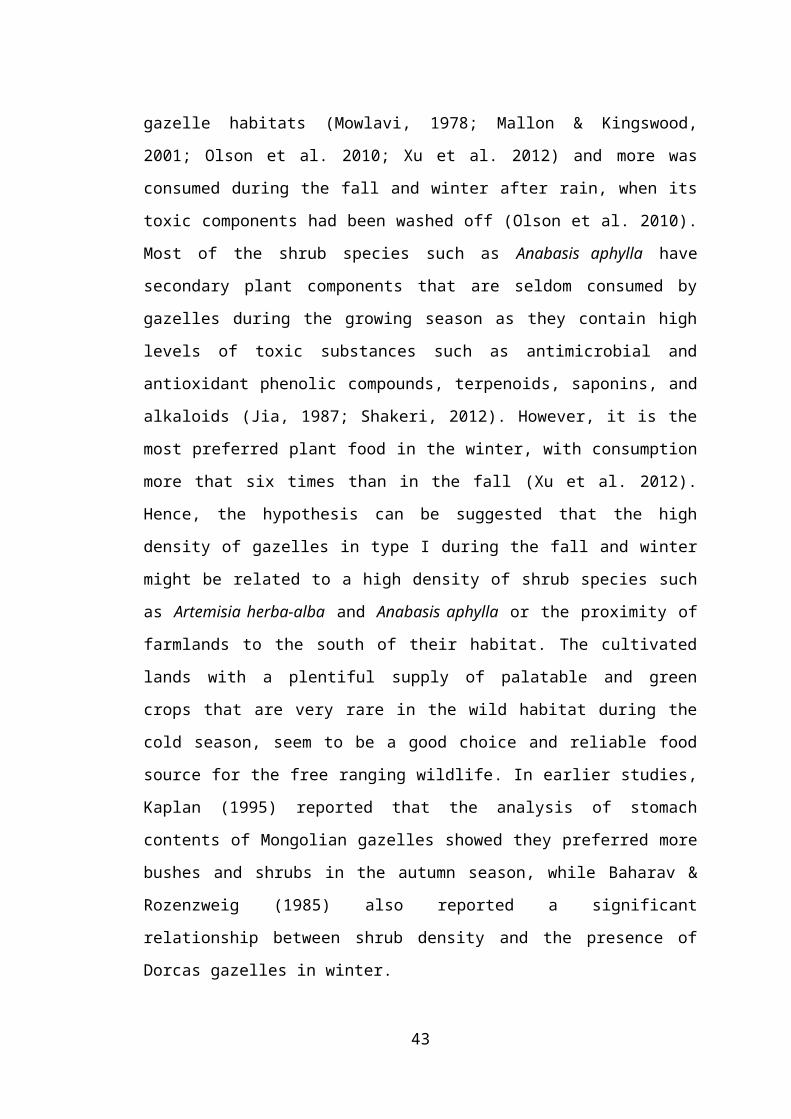
gazelle habitats (Mowlavi, 1978; Mallon & Kingswood,
2001; Olson et al. 2010; Xu et al. 2012) and more was
consumed during the fall and winter after rain, when its
toxic components had been washed off (Olson et al. 2010).
Most of the shrub species such as Anabasis aphylla have
secondary plant components that are seldom consumed by
gazelles during the growing season as they contain high
levels of toxic substances such as antimicrobial and
antioxidant phenolic compounds, terpenoids, saponins, and
alkaloids (Jia, 1987; Shakeri, 2012). However, it is the
most preferred plant food in the winter, with consumption
more that six times than in the fall (Xu et al. 2012).
Hence, the hypothesis can be suggested that the high
density of gazelles in type I during the fall and winter
might be related to a high density of shrub species such
as Artemisia herba-alba and Anabasis aphylla or the proximity of
farmlands to the south of their habitat. The cultivated
lands with a plentiful supply of palatable and green
crops that are very rare in the wild habitat during the
cold season, seem to be a good choice and reliable food
source for the free ranging wildlife. In earlier studies,
Kaplan (1995) reported that the analysis of stomach
contents of Mongolian gazelles showed they preferred more
bushes and shrubs in the autumn season, while Baharav &
Rozenzweig (1985) also reported a significant
relationship between shrub density and the presence of
Dorcas gazelles in winter.
43

The current results of habitat use surveyed over one
year indicated that although the Persian gazelles used
all vegetation types, habitats I and II were the most
favoured and habitats III and IV were the least favoured.
Types I and II were the most suitable habitats because of
the higher density of annual forbs and grasses like
Asteragalus sp, Bromus tectorum, Trigonella arcouta, and Eremopyrun
bonaipartis; and shrub species such as Artemisia herba-alba,
Anabasis aphylla, Salsola rigida Aellenia sp, as they are high
quantity and quality food sources. Additionally, the
proximity of habitat type I to agricultural activity that
apparently offered food sources with high protein content
and artificial water sources would also attract gazelles
throughout the year. Based on interviews with several
farm owners and villagers, they complained that the
gazelles encroach into farmland from fall through spring
due to the existence of palatable and green crops such as
wheat and wild alfalfa.
The lower use of habitat types III and IV might be
explained by less density of main food sources such as
annual forbs, Eremopyrun bonaipartis, Aellenia sp, Anabasis aphylla
and Salsola rigida; and the higher density of low nutritional
quality forages such as Stipa barbata and Poa bulbosa. The
protein content of Poa bulbosa falls below the minimum
maintenance requirement (7%); and the protein content of
Salsola vermiculata, the dominant species in habitat III, falls
below the minimum requirement (14%) for fawn survival, as
reported by Murphy & Coates (1966). As previously
44

discussed, the main limiting factors for the low presence
of gazelles in the upland areas were the absence of their
main food resources and the deficiency in the quality of
indicator plant species. Notably, other limiting factors
might be the uneven rocky grounds of vegetation types III
and IV and the presence of wild carnivores such as
leopards and wolves.
The habitats of gazelles at the GNP are composed of
various plant species and families. As a result of these
high resource levels small herbivores like the gazelle
would be more selective (Westoby 1974; Belovsky 1978).
Since the gazelles are small ruminant ungulates with a
relatively low daily forage consumption of around 1
kg/day (Karami et al. 2002), they may be forced to
fulfill their need for protein and energy from a low
volume of forages. Furthermore, they are also endothermic
animals with a smaller body size that requires more
metabolic energy . As their energy requirements are
relatively high and they have a low rumen volume , the
Persian gazelle has to be selective in both the quantity
and quality of its food resources. There are two theories
on food choice of ruminants. The first is by Bell (1971)
who worked with large ungulates in Africa and found that
the body weight of ruminants is an important factor in
their food habits. As opposed to large ungulates, small
ruminants are more selective and choose highly
nutritional plants. In other words, low rumen content in
45

small ruminants is an important factor for selecting
digestive plants with low fibre content such as forbs and
shrubs (Hanley 1982). The second theory was established
by Jarman (1974) whose focus was on the availability and
distribution of forages as important variables in the
feeding behaviour of ungulates. The results of our study
showed that more annual forbs and grasses were consumed
by gazelles in the spring when the former were both
abundant and nutritious. Shrub species were preferred as
the main and dominant food source in the study area
throughout the year, especially in the fall and winter,
when the annual herbaceous plants were not available.
Therefore, the findings of this study are in line with
points of view suggested by Bell and Jarman, indicating
that both availability and quality of food resources are
important in the habitat selection of small ungulates
such as the gazelle.
the high density of gazelle pellet groups
accumulated at different seasons indicated that the
steppe areas of the GNP are suitable habitats for the
Persian gazelle throughout the year. The accumulation of
different amounts of pellets during each time period
surveyed could be related to patterns of gazelle habitat
use in the study area (which cannot be determined by this
method) or a to variation in the gazelle defecation rate
or level of activity in different periods of the year. As
indicated by Nowzari et al (2007) the lowest pellet
46
densities in the gazelle habitat were recorded during the
mating season, when the male gazelles feed less but spent
more time defending their females.
Comparative results between seasons also showed that
the values of vegetation parameters were low in the
winter, but the high pellet group density during this
season was a good indication that the plains of the GNP
are a particularly suitable habitat for the gazelles
during the fall and winter seasons.
4.4 CONCLUSION
Many types of habitat may occur within a home range of an
animal, but gazelles may utilize only a few of these
available patches. Preference for certain habitat types
can be due to food preferences, diversity, presence of
toxic plants, high safety factors, water sources, cover,
or other factors. However, during the one year study of
the gazelle’s habitat parameters, it was found that they
are selective ungulates with seasonal changes in their
habitat use patterns. Overall, several direct
observations besides pellet group counts confirmed that
the gazelles focus more on habitat type II, which was
characterized by the highest species diversity, density
and canopy cover with high nutritional forage quantity
and quality. Moreover, this habitat type was located in
47

the middle of their habitat, and a safe distance from the
hilly terrain and villages. With respect to the low
population of leopards and cheetahs in the steppe
vegetation area of the GNP, it seems the gazelles are
most at risk by poachers in the adjacent villages,
especially when the gazelles graze cultivated farms from
the fall to spring. Therefore, less use of upland areas
(habitat types III and IV) seemed more related to
insufficient forage quality, which in some dominant
forage species was measured and found to be less than the
minimum requirement for the gazelles.
The importance of food diversity, nutrient quality
and quantity in habitat use by small ungulates may be
related to a response to the requirement for a wide
variety of food in order to enhance foraging performance
in small ruminants. Thus, the prominent presence of
gazelles in those habitats with higher plant quality and
greater diversity can be attributed to the quality of
feeding sites, and indicate that as selective ungulates
they have more chance to select better food in their
natural habitats. In the open plains, because of high
visibility, the risk of poaching is minimized and there
is a strong increase in the forage efficiency of
gazelles. Due to the fact there is no conflict between
feeding efficiency and the risk of poaching, the safest
places could also increase the feeding efficiency of this
48

ungulate. As a result, the gazelles only select safe
places and there is no tradeoff between these factors.
Appendix I. List of plant species in steppe habitats of
Golestan National Park, under gazelle grazing
Species Family Duration*
Growthform
Life form**
Palatability***
Aellenia sp Salsolaceae
P shrub CH III
Alyssum strigosum Brassicaceae
A Forb TH III
Anabasis aphylla Salsolaceae
P Shrub CH III
Arabis nova Brassicaceae
A Forb TH III
Artemisia sieberi Asteraceae P Shrub CH II
49

Astragalus tribuloides Fabaceae A Forb TH IIIAstragalus brividens Fabaceae A Forb TH IBromus tectorum Poaceae A Grass TH IICapsella bursa-pastoris Brassicace
aeA Forb TH III
Carex stenophylla Cyperaceae P Forb HE IIIConsolida orientalis Ranunculac
eaceA Forb TH III
Delphinium biternatum Ranunculaceace
A Forb TH III
Cousinia bakhtiarica Asteraceae P Forb HE IIIEremopyrun bonaipartis Poaceae A Grass TH IIIEromostachys boissieriana Lamiaceae P Forb HE IIIEuphorbia characias wulfenii
Euphorbiaceae
A Forb TH III
Eurotia ceratoides Salsolaceae
P Shrub CH II
Gagea reticulata Liliaceae P Forb GEO IIIJeraenium eriantum Geranniace
aA Forb TH II
Lathyrus latifolius Fabaceae A Forb TH IIIorobanche gracilis Orbancheac
eA Forb EPY III
Papaver pavonicum Papaveracea
A Forb TH III
Roemeria hybrida Papaveracea
A Forb TH III
Peganum harmala Zygophillaceae
P Forb HE III
Poa bulbosa Poaceae P Grass GEO IIRapistrum rugosum Brassicace
aeA Forb TH II
Salsola kali Salsolaceae
A Forb TH III
Salsola rigida Salsolaceae
P Shrub CH I
Salsola vermiculata Salsolaceae
P Shrub CH III
Salvia nemorosa Lamiaceae P Forb HE IIISenecio vulgaris Asteraceae A Forb TH IIStachys inflata Lamiaceae P Forb HE IIIStipa barbata Poaceae P Grass HE IITragopogon longirostris Asteraceae P Forb HE ITrigonella arcouta Fabaceae A Forb TH ITulipa wilsoniana Liliaceae P Forb GEO IIIVeronica persicum plantagina
ceaeA Forb TH III
Ziziphora tenuior Lamiaceae A Forb TH III
50

Zosimia absinthifolia Apiaceae P Forb HE IIIZygophyllum atriplicaides Zygophilla
ceaeP Bush PH III
* A: annual plant P: perennial plant
**Plant species were split into seven groups based on morphology(life form) and life span. The groups included: Phanerophyte (thesurviving buds or shoot apices are borne on shoots, which projectedinto the air), Chamaephyte (a perennial plant that sets its dormantvegetative buds just at or above the surface of the ground), Hemi-cryptophyte, Cryotophyte, Geophytes (a perennial plant that propagates byunderground bulbs or tubers or corms), Therophyte (plants completedtheir life cycle from seed to seed and died), Epiphyte (Kreps, 2001).*** Palatability class: I = high palatable; II = medium palatable;III = low-unpalatable (Bagherirad et al., 2012).
51


![Moshtagh Khorasani, Manouchehr (2009). Šamširhāye Mostaqim Irān: Dandānhāye Ejdehā [Straight Swords from Iran: Dragon's Teeth]. Translated into Persian by Ashraf Haji. Dānešmand](https://static.fdokumen.com/doc/165x107/63153d4a5cba183dbf07e6f9/moshtagh-khorasani-manouchehr-2009-samsirhaye-mostaqim-iran-dandanhaye.jpg)