Seasonal cycles in biogenic production and export in Northern Bay of Bengal sediment traps
23
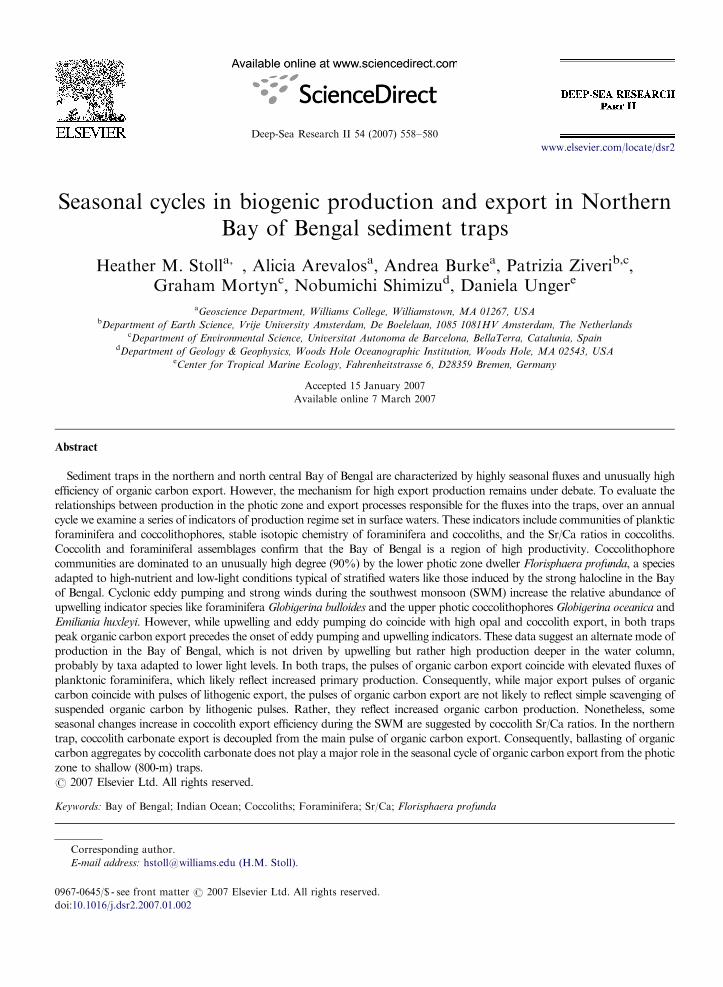
Deep-Sea Research II 54 (2007) 558–580 Seasonal cycles in biogenic production and export in Northern Bay of Bengal sediment traps Heather M. Stoll a, , Alicia Arevalos a , Andrea Burke a , Patrizia Ziveri b,c , Graham Mortyn c , Nobumichi Shimizu d , Daniela Unger e a Geoscience Department, Williams College, Williamstown, MA 01267, USA b Department of Earth Science, Vrije University Amsterdam, De Boelelaan, 1085 1081HV Amsterdam, The Netherlands c Department of Environmental Science, Universitat Autonoma de Barcelona, BellaTerra, Catalunia, Spain d Department of Geology & Geophysics, Woods Hole Oceanographic Institution, Woods Hole, MA 02543, USA e Center for Tropical Marine Ecology, Fahrenheitstrasse 6, D28359 Bremen, Germany Accepted 15 January 2007 Available online 7 March 2007 Abstract Sediment traps in the northern and north central Bay of Bengal are characterized by highly seasonal fluxes and unusually high efficiency of organic carbon export. However, the mechanism for high export production remains under debate. To evaluate the relationships between production in the photic zone and export processes responsible for the fluxes into the traps, over an annual cycle we examine a series of indicators of production regime set in surface waters. These indicators include communities of planktic foraminifera and coccolithophores, stable isotopic chemistry of foraminifera and coccoliths, and the Sr/Ca ratios in coccoliths. Coccolith and foraminiferal assemblages confirm that the Bay of Bengal is a region of high productivity. Coccolithophore communities are dominated to an unusually high degree (90%) by the lower photic zone dweller Florisphaera profunda, a species adapted to high-nutrient and low-light conditions typical of stratified waters like those induced by the strong halocline in the Bay of Bengal. Cyclonic eddy pumping and strong winds during the southwest monsoon (SWM) increase the relative abundance of upwelling indicator species like foraminifera Globigerina bulloides and the upper photic coccolithophores Globigerina oceanica and Emiliania huxleyi. However, while upwelling and eddy pumping do coincide with high opal and coccolith export, in both traps peak organic carbon export precedes the onset of eddy pumping and upwelling indicators. These data suggest an alternate mode of production in the Bay of Bengal, which is not driven by upwelling but rather high production deeper in the water column, probably by taxa adapted to lower light levels. In both traps, the pulses of organic carbon export coincide with elevated fluxes of planktonic foraminifera, which likely reflect increased primary production. Consequently, while major export pulses of organic carbon coincide with pulses of lithogenic export, the pulses of organic carbon export are not likely to reflect simple scavenging of suspended organic carbon by lithogenic pulses. Rather, they reflect increased organic carbon production. Nonetheless, some seasonal changes increase in coccolith export efficiency during the SWM are suggested by coccolith Sr/Ca ratios. In the northern trap, coccolith carbonate export is decoupled from the main pulse of organic carbon export. Consequently, ballasting of organic carbon aggregates by coccolith carbonate does not play a major role in the seasonal cycle of organic carbon export from the photic zone to shallow (800-m) traps. r 2007 Elsevier Ltd. All rights reserved. Keywords: Bay of Bengal; Indian Ocean; Coccoliths; Foraminifera; Sr/Ca; Florisphaera profunda ARTICLE IN PRESS www.elsevier.com/locate/dsr2 0967-0645/$ - see front matter r 2007 Elsevier Ltd. All rights reserved. doi:10.1016/j.dsr2.2007.01.002 Corresponding author. E-mail address: [email protected] (H.M. Stoll).
Transcript of Seasonal cycles in biogenic production and export in Northern Bay of Bengal sediment traps
ARTICLE IN PRESS
0967-0645/$ - se
doi:10.1016/j.ds
�CorrespondiE-mail addre
Deep-Sea Research II 54 (2007) 558–580
www.elsevier.com/locate/dsr2
Seasonal cycles in biogenic production and export in NorthernBay of Bengal sediment traps
Heather M. Stolla,�, Alicia Arevalosa, Andrea Burkea, Patrizia Ziverib,c,Graham Mortync, Nobumichi Shimizud, Daniela Ungere
aGeoscience Department, Williams College, Williamstown, MA 01267, USAbDepartment of Earth Science, Vrije University Amsterdam, De Boelelaan, 1085 1081HV Amsterdam, The Netherlands
cDepartment of Environmental Science, Universitat Autonoma de Barcelona, BellaTerra, Catalunia, SpaindDepartment of Geology & Geophysics, Woods Hole Oceanographic Institution, Woods Hole, MA 02543, USA
eCenter for Tropical Marine Ecology, Fahrenheitstrasse 6, D28359 Bremen, Germany
Accepted 15 January 2007
Available online 7 March 2007
Abstract
Sediment traps in the northern and north central Bay of Bengal are characterized by highly seasonal fluxes and unusually high
efficiency of organic carbon export. However, the mechanism for high export production remains under debate. To evaluate the
relationships between production in the photic zone and export processes responsible for the fluxes into the traps, over an annual
cycle we examine a series of indicators of production regime set in surface waters. These indicators include communities of planktic
foraminifera and coccolithophores, stable isotopic chemistry of foraminifera and coccoliths, and the Sr/Ca ratios in coccoliths.
Coccolith and foraminiferal assemblages confirm that the Bay of Bengal is a region of high productivity. Coccolithophore
communities are dominated to an unusually high degree (90%) by the lower photic zone dweller Florisphaera profunda, a species
adapted to high-nutrient and low-light conditions typical of stratified waters like those induced by the strong halocline in the Bay
of Bengal. Cyclonic eddy pumping and strong winds during the southwest monsoon (SWM) increase the relative abundance of
upwelling indicator species like foraminifera Globigerina bulloides and the upper photic coccolithophores Globigerina oceanica and
Emiliania huxleyi. However, while upwelling and eddy pumping do coincide with high opal and coccolith export, in both traps
peak organic carbon export precedes the onset of eddy pumping and upwelling indicators. These data suggest an alternate mode of
production in the Bay of Bengal, which is not driven by upwelling but rather high production deeper in the water column,
probably by taxa adapted to lower light levels. In both traps, the pulses of organic carbon export coincide with elevated fluxes of
planktonic foraminifera, which likely reflect increased primary production. Consequently, while major export pulses of organic
carbon coincide with pulses of lithogenic export, the pulses of organic carbon export are not likely to reflect simple scavenging of
suspended organic carbon by lithogenic pulses. Rather, they reflect increased organic carbon production. Nonetheless, some
seasonal changes increase in coccolith export efficiency during the SWM are suggested by coccolith Sr/Ca ratios. In the northern
trap, coccolith carbonate export is decoupled from the main pulse of organic carbon export. Consequently, ballasting of organic
carbon aggregates by coccolith carbonate does not play a major role in the seasonal cycle of organic carbon export from the photic
zone to shallow (800-m) traps.
r 2007 Elsevier Ltd. All rights reserved.
Keywords: Bay of Bengal; Indian Ocean; Coccoliths; Foraminifera; Sr/Ca; Florisphaera profunda
e front matter r 2007 Elsevier Ltd. All rights reserved.
r2.2007.01.002
ng author.
ss: [email protected] (H.M. Stoll).
ARTICLE IN PRESSH.M. Stoll et al. / Deep-Sea Research II 54 (2007) 558–580 559
1. Introduction
Sediment traps represent one of the main vehiclesfor quantifying fluxes of carbon from the surface tothe deep ocean and the processes responsible forexport. Recent compilations have highlighted thetight correlation of organic carbon fluxes with thoseof lithogenic materials and biogenic carbonate andopal (Francois et al., 2002; Klaas and Archer, 2002).One interpretation infers that the dense mineralsserve as ballast to increase efficiency with whichorganic carbon is exported into the deep ocean.Carbonate may serve as particularly effective ballast(Francois et al., 2002; Klaas and Archer, 2002), yetto date regressions have been carried out using totalcarbonate, whereas ballasting of organic aggregatesshould result from fine carbonate, not coarseforaminiferal carbonate, which sinks independently.An alternate interpretation suggests that the corre-lation between minerals and organic carbon arisesbecause organic carbon ‘‘glue’’ effectively scavengessuspended fine minerals from the water column(Passow and De la Rocha, 2006).
The Bay of Bengal sediment traps have thehighest transfer efficiency of organic carbon of anysediment trap studied to date (Francois et al., 2002).These traps provide an opportunity to exploremechanisms responsible for very high transferefficiencies. Satellite-based measurements of pri-mary productivity in the Bay of Bengal are muchlower than those of the highly productive ArabianSea, yet fluxes of organic carbon in sediment trapsin the Bay of Bengal are comparable in the twosettings (Prasanna Kumar et al., 2004). Recentorganic chemistry confirms that, in the Bay ofBengal, these organic carbon fluxes are of marineorigin (Unger et al., 2005). What is responsible forthe unusual high transfer efficiency in the Bay ofBengal? The Bay of Bengal is characterized byunusually high lithogenic mineral input from themajor river systems draining the Himalayan andIndo-Burman ranges, which are heavily weatheredby the high and seasonal precipitation of thesouthwest monsoon (SWM). Ittekkot et al. (1991)attributed the high efficiency to the ballastinglithogenic material provided by river sedimentdelivery, noting that highest fluxes of biogeniccomponents coincide with the summer monsoonseason of greatest terrestrial sediment flux. How-ever, the Ganges-Brahmaputra system delivers 10%of the worlds dissolved P flux to the oceans (Datta,1999), and high organic carbon fluxes also may
reflect production stimulated by high nutrientfluxes. Indeed, on annual to interannual timescales,high export of organic carbon must be compensatedby addition of new nutrients to the photic zone,potentially through eddy pumping in cyclonic gyres(Kumar and Ramesh, 2005).
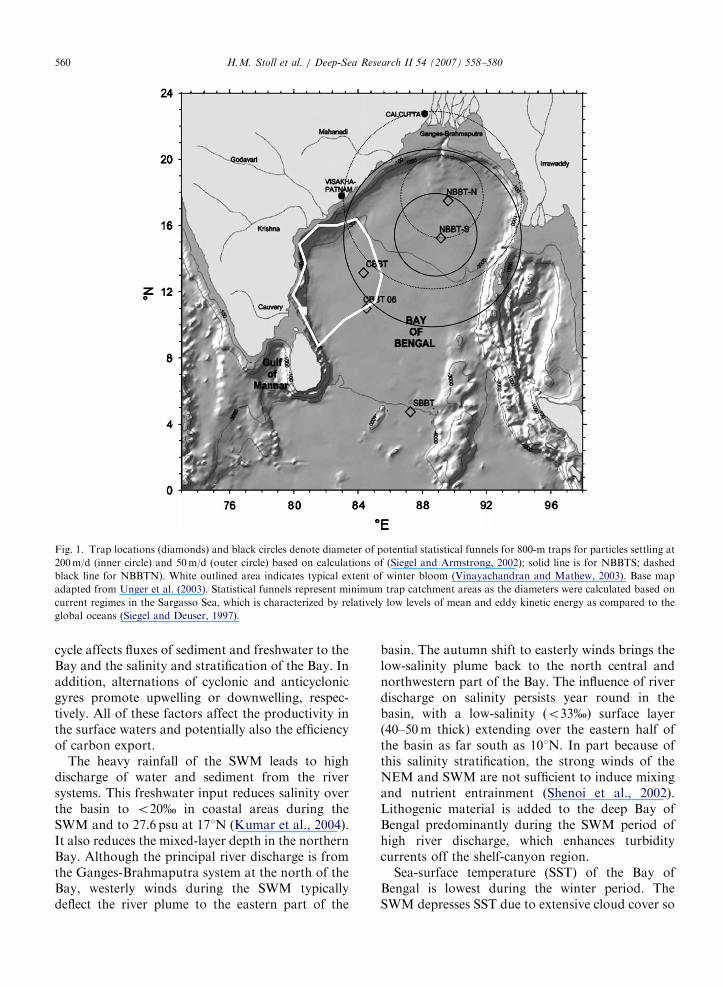
Here we examine in detail an annual cycle ofbiogenic production in sediment traps from thenorthern and north central Bay of Bengal (Fig. 1),which are characterized by highly seasonal fluxes.Over this seasonal cycle, we seek to evaluate therelationships between production in the surfacezone and export processes responsible for the fluxesinto the traps. In particular we seek to elucidatewhether elevated organic carbon fluxes are asso-ciated with indicators of higher production insurface waters or simply higher delivery of litho-genic ballast.
To this end, we compare trap fluxes with severalgeochemical and floral/faunal indicators of produc-tivity and production regime that are set in theeuphotic zone during production and, hence,independent of export process. These include thecommunities of planktic foraminifera and cocco-lithophores, which reflect the nature of productivityin the photic zone, the stable isotopic chemistry offoraminifera and coccoliths, which mark conditionsin the photic zone during production of theseorganisms, and the Sr/Ca ratios in coccoliths, whichreflect nutrient-stimulated growth rates of cocco-lithophores (Stoll and Ziveri, 2004; Rickaby et al.,2007; Stoll et al., 2007). To assess whether organiccarbon fluxes are more closely associated with finecarbonate as predicted by the ballast model, we alsoevaluate the proportion of carbonate from coarseand fine size fractions. This dataset extends previousstudies on patterns of fluxes of organic carbon,carbonate, opal, and lithogenic material to the traps(Unger et al., 2003) and characterization of for-aminiferal fluxes to the traps (Gupta et al., 1997).
2. Background
2.1. Monsoon effects on physical oceanography
The Bay of Bengal experiences a seasonal reversalof wind direction produced by the Asian monsoonsystem. A winter northeast monsoon (NEM)features moderately strong (5m/s) winds. A summerSWM features strong (14m/s) winds from thesouthwest that bring heavy rainfall over most partsof the Indian subcontinent. This seasonal monsoon
ARTICLE IN PRESS
Fig. 1. Trap locations (diamonds) and black circles denote diameter of potential statistical funnels for 800-m traps for particles settling at
200m/d (inner circle) and 50m/d (outer circle) based on calculations of (Siegel and Armstrong, 2002); solid line is for NBBTS; dashed
black line for NBBTN). White outlined area indicates typical extent of winter bloom (Vinayachandran and Mathew, 2003). Base map
adapted from Unger et al. (2003). Statistical funnels represent minimum trap catchment areas as the diameters were calculated based on
current regimes in the Sargasso Sea, which is characterized by relatively low levels of mean and eddy kinetic energy as compared to the
global oceans (Siegel and Deuser, 1997).
H.M. Stoll et al. / Deep-Sea Research II 54 (2007) 558–580560
cycle affects fluxes of sediment and freshwater to theBay and the salinity and stratification of the Bay. Inaddition, alternations of cyclonic and anticyclonicgyres promote upwelling or downwelling, respec-tively. All of these factors affect the productivity inthe surface waters and potentially also the efficiencyof carbon export.
The heavy rainfall of the SWM leads to highdischarge of water and sediment from the riversystems. This freshwater input reduces salinity overthe basin to o20% in coastal areas during theSWM and to 27.6 psu at 171N (Kumar et al., 2004).It also reduces the mixed-layer depth in the northernBay. Although the principal river discharge is fromthe Ganges-Brahmaputra system at the north of theBay, westerly winds during the SWM typicallydeflect the river plume to the eastern part of the
basin. The autumn shift to easterly winds brings thelow-salinity plume back to the north central andnorthwestern part of the Bay. The influence of riverdischarge on salinity persists year round in thebasin, with a low-salinity (o33%) surface layer(40–50m thick) extending over the eastern half ofthe basin as far south as 101N. In part because ofthis salinity stratification, the strong winds of theNEM and SWM are not sufficient to induce mixingand nutrient entrainment (Shenoi et al., 2002).Lithogenic material is added to the deep Bay ofBengal predominantly during the SWM period ofhigh river discharge, which enhances turbiditycurrents off the shelf-canyon region.
Sea-surface temperature (SST) of the Bay ofBengal is lowest during the winter period. TheSWM depresses SST due to extensive cloud cover so
ARTICLE IN PRESSH.M. Stoll et al. / Deep-Sea Research II 54 (2007) 558–580 561
that SSF is highest in May, just before the SWM,and in early October, just after the SWM. Unlikethe Arabian Sea, due to the high humidity in theregion, winter cooling in the Bay of Bengal is notsufficient to produce convective mixing of surfacewaters through negative buoyancy flux (Prasad,2004).
The monsoon reversal of wind directions estab-lishes alternate anticyclonic and cyclonic gyres(Somayajulu et al., 2003), which stimulate down-welling or eddy pumping and upwelling of nutrient-rich deeper waters, respectively. Typically, duringthe spring intermonsoon (February–April), a largeanticyclonic gyre (ACG) is set up in the central Bay(Babu et al., 2003). With the intensification of theSWM in September and October, a large cyclonicgyre develops in the north and central Bay andmigrates progressively towards the western Bay inthe winter season.
2.2. Biological production and nutrient cycling
Nutrient availability regulates production, andthe proportions of major and micronutrients caninfluence community structure and export effi-ciency. In the Bay of Bengal, the major enrichmentof phosphate and silicate from river discharge,constituting 10% of world total inorganic P (Datta,1999) and 1.5% of world total silica delivery (Sarinet al., 1989), elevates P:N and Si:N ratios an orderof magnitude higher than Redfield ratio in the upper50m (Olson et al., 1995). Overall, nitrogen is likelyto be the limiting nutrient in most of the bay sinceriver and groundwater contributions for nitrate arelesser than those of P and Si (Dowling et al., 2003;Kumar et al., 2004). There is no evidence for strongupwelling except in a narrow 40-km band offcoastal areas of the southwestern Bay (Shetye etal., 1991; Kumar et al., 2004). The bay ischaracterized by a shallow nitracline (Madhupratapet al., 2003). Kumar et al. (2004) interpret theshoaling of the nitracline towards the north duringthe SWM as evidence of river-derived nitrate duringthe SWM.
The north central Bay of Bengal is characterizedby modest (110–260mgC/m2/day) productivity,with a deep chlorophyll maximum comparable inpre-SWM and post-SWM periods and on averageslightly lower during the SWM (Madhupratap et al.,2003; Kumar et al., 2004; Kumar and Ramesh,2005). However, transient localized productivityincreases (800mgC/m2/day) have been identified
when mixed-layer depth is enhanced by Ekmanpumping in cyclones and cyclonic eddies. In thenorth central bay, establishment of a cyclonic gyreduring the late SWM may drive Ekman pumping,manifested by shoaling of the nitracline to depths of25m in thermocline oscillations (Madhupratap etal., 2003; Kumar et al., 2004). Because of the strongstratification of the upper ocean by warm and low-salinity waters (Kumar et al., 2004), these cold-coreeddies remained below the surface, with maximumchlorophyll concentrations at 25–60m. This mayexplain why during the SWM, surface and satellite-detected chlorophyll concentrations remained lowand remote-sensed SST determinations do notdetect this upwelling. Eddy pumping appears tohave an even stronger manifestation in the westernbay. In the western Bay of Bengal, intense bloomsare detected by remote-sensed chlorophyll (Vinaya-chandran and Mathew, 2003) during the NEM.While blooms are intensified by the passage ofcyclones, which augment churning of nutrient-richwaters (Sadhuram, 2004), they also occur in theabsence of cyclones due to the intense cyclonic gyrepresent in the western bay in December and January(Vinayachandran and Mathew, 2003). Some east-ward advection of nutrients is indicated by elevatedchlorophyll farther east during the bloom decay.
Measurements during the fall and pre-SWMperiods indicate that the ratio of new to totalproduction in the Bay of Bengal (f-ratio) isrelatively high (0.5) compared to the Arabian Sea(0.3) (Kumar et al., 2004), and that the f-ratio ispositively correlated with total production. This f-ratio is significantly greater than inferred for theBay from models (Francois et al., 2002). Thecommunity structure of living plankton over theseasonal cycle has not been studied. Phytoplanktonassemblages during the SWM are dominated bydiatoms (Madhupratap et al., 2003) although anycalcareous phytoplankton are unlikely to be pre-served in the un-buffered water samples collectedfor phytoplankton counts.
2.3. Sediment trap fluxes and composition
Despite the modest water-column productivityobserved during cruises, fluxes of organic carbon tosediment traps in the Bay of Bengal are very high,2.4–3.1mg/m2/day, and comparable to those in thehighly productive Arabian Sea. Lithogenic fluxesare much larger than in other tropical regions due tothe high river sediment load. Lithogenic and organic
ARTICLE IN PRESSH.M. Stoll et al. / Deep-Sea Research II 54 (2007) 558–580562
carbon fluxes are highly correlated in the northernBay of Bengal (Unger et al., 2003). Fluxes oforganic carbon, carbonate, opal, and lithogenicmaterial to shallow and deep sediment traps in thenorthern Bay of Bengal are highly seasonal, withmaximum fluxes during the SWM and pre-SWM(Ittekkot et al., 1991; Unger et al., 2003).
Due to the strong correlation of lithogenic, opal,and organic carbon fluxes in the Bay of Bengal traps,it has been difficult to ascertain whether lithogenic fluxevents reflect scavenging of suspended lithogenics bybiological production events (Unger et al., 2003),whether simultaneous riverine silica and lithogenicaddition cause both events, or whether lithogenicinput seasonally increases export efficiency (Ittekkotet al., 1991). Unlike fluxes of organic carbon andbiogenic opal, carbonate fluxes are only weakly tomoderately correlated with lithogenic fluxes.
3. Methods
3.1. Processing of trap material and CaCO3 in size
fractions
Sediment trap samples from shallow NBBTN(171270N, 891370E, 684m) and NBBTS (151320N,891130E, 731m; Fig. 1) deployment 8 (February1994–February 1995) were used in this study;sample resolution was 14 days for the first foursamples and 38 days for subsequent samples. Dried(40 1C) splits of the trap material (typically 1/16splits containing 50–100mg sediment) were resus-pended off polycarbonate filters in seawater (pHbuffered to 8.5 with NH4OH) using gentle sonica-tion. Trap material was filtered through a 300-mmnylon (Spectramesh) sieve to remove the largestplanktic foraminifera. The o300-mm fraction wasoxidized with 10mL of bleach and 10mL ofperoxide to break up aggregates (Bairbakhishet al., 2001). The bleach solution was removed byvacuum filtration onto a cellulose 0.45-mm filter,and the filter was rinsed several times in distilledwater buffered to pH 8.5. The bleached fraction wasresuspended off the filter in 2% (v/v) NH4OHsolution with gentle sonication and was sieved usinga 20-mm nylon (Spectramesh) sieve. The o20-mmcoccolith-bearing fraction was suspended in aknown volume of 2% NH4OH. The 420-mmfraction was sieved at 200 mm to recover additionalforaminifera.
A wet split of the o20 mm size fraction wasfiltered onto a 25-mm polycarbonate filter for
determination of CaCO3 0.45–20 mm and total mass0.45–20 mm. All wet splits were collected with aprecision pipette in a minimum of four aliquots(e.g., a 1000-mL split was taken as 4* 250 mL) toimprove precision by compensating for heterogene-ity in the sample suspension. The o20-mm poly-carbonate filter was placed in a 15-mL centrifugetube with 2mL of 0.5% HNO3. Mass of carbonatefrom foraminifera and other shells 20–200 mm wasquantified by suspending the 20–200 mm fraction in2% ammonia, and filtering on a 0.45-mm 47-mmcellulose filter. Calcium in a 0.25 split of this filterwas measured as described above for theo20-mmfraction of the sediments. For both, Ca wasanalyzed using flame atomic absorption spectro-metry on a Perkin Elmer AAnalyst 300 usingmatrix-match standards.
To verify yields of the above method (hereaftertermed Method 1), an alternative approach (termedMethod 2) was employed for seven replicatesamples. Filters were divided in quarters andsediment was peeled from the filters and massed.A quarter of the sediment was dissolved directly in5mL of 1% HNO3 and diluted appropriately foranalysis of Ca using flame atomic absorptionspectrometry on a Perkin Elmer AAnalyst 300using matrix-match standards. One-half of thesediment was oxidized as described above, butfollowing oxidation coarse fraction was capturedin a 200-mm nylon sieve and the o200-mm fractionwas recovered on a cellulose filter. The 4200-mmfraction was recovered on pre-weighed 0.45-mmpore polycarbonate filters, dried, and weighed. Weassume that an insignificant proportion of thelithogenic or opal fluxes are in the 4200-mm sizefraction, consistent with estimates of particle sizes inthese traps and that all mass reflects CaCO3. For theo200-mm fraction, one-quarter of the cellulose filterwas dissolved directly in 3mL of 1% HNO3, andone-quarter of the cellulose filter was immersed in8mL of 2% (v/v) NH4OH solution and sonicated toresuspend the material off the filter. One-mLaliquots of this o200-m suspension were centri-fuged to remove NH4OH and dissolved in 1mL of1% HNO3 and appropriately diluted for analysis ofCa using flame atomic absorption spectrometry.
3.2. Coccolith assemblages and fluxes
A wet split of the o20-mm size fraction wasfiltered onto a 0.45-mm cellulose nitrate filter andrinsed with buffered distilled water. A segment of
ARTICLE IN PRESSH.M. Stoll et al. / Deep-Sea Research II 54 (2007) 558–580 563
each filter was mounted in immersion oil between aslide and coverglass. Coccoliths were counted usingan Olympus polarizing light microscope at magni-fication of 1600� . For each sample, 500–1200coccoliths were counted. Coccolith fluxes werecalculated by extrapolating the counted area to theentire filter area, total sample, duration days, andtrap aperture. Coccolith fluxes were converted tomass fluxes using the shape factor method (Youngand Ziveri, 2000).
3.3. Foraminifera assemblages and fluxes and stable
isotope methods
Foraminifera were picked from the 4300 mm(Globigerinoides ruber, Globigerina bulloides) andthe 200–300 mm (Globigerinoides sacculifer, Neoglo-
boquadrina dutertrei) size fraction for counting andisotopic analyses. Stable isotopes of one individualfor the large fraction and two individuals for thesmall fraction were measured at the Vrije Universi-teit Amsterdam (VUA) using a Finnigan 252 massspectrometer, equipped with an automated carbo-nate extraction line (Kiel device). The size of theavailable sediment trap sample precluded obtaininglarger numbers of individuals from most species forreplicate analyses or evaluation of interspecimenvariability. Replicate analyses of G. bulloides forthree trap samples differed by 0.005–0.32 permil ford13C and 0.09–0.35 permil for d18O. Replicateanalyses of G. ruber for two samples differed by0.02 and 0.34 permil for d13C and 0.16 and 0.29permil for d18O. These interspecimen ranges aresmall relative to the seasonal variation amongdifferent trap samples. The reproducibility ofa routinely analysed carbonate standard (NBS 19)is better than 0.05% for d13C and 0.09% for d18O(1 SD).
Census counts for each size fraction wereperformed and converted into foraminiferal massflux by obtaining the average shell weight for thedominant species (derived from mass of 3 to 10shells) and using an average shell weight per sizefraction for the minor species.
3.4. Separation of size fractions of coccoliths for
stable isotope and Sr/Ca analysis
For stable isotope and elemental analysis, differ-ent size fractions of coccoliths were separated usingrepeated decanting (Stoll and Ziveri, 2002) andmicrofiltering (e.g., Minoletti et al., 2001; Stoll and
Bains, 2003). The smallest coccoliths were separatedusing repeated decanting (6 cm, 283min; repeatedfour times). Except during the SWM, the suspensionconsisted of Florisphaera profunda. During theSWM the suspension also contained abundantGephyrocapsa oceanica, which were subsequentlyseparated from F. profunda using a 3-mm polycar-bonate microfilter, since the G. oceanica were43 mm. From the coarser sedimented fraction ofthe decanting column, we used polycarbonatemicrofilters to extract a o5-mm fraction dominatedby G. oceanica and Umbilicosphaera sibogae, and a5–8 mm fraction dominated by Helicosphaera spp.and Calcidiscus leptoporus. Due to the low masscontribution of the 5–8 mm and G. oceanica sizefractions, insufficient material was available forchemical analysis for some trap samples, especiallyfrom NBBTN.
For Sr/Ca analyses, splits of sample were dissolvedin 0.1M acetic acid/ammonium acetate buffer anddiluted to contain appropriate Ca concentrations foratomic absorption spectroscopy (5 ppm) or induc-tively coupled plasma mass spectrometry (12 ppm).Samples were analyzed for Ca using flame atomicabsorption spectrometry (AAS; Perkin Elmer AAna-lyst 300) and for Sr using graphite furnace atomicabsorption spectrometry on the same sample dilution.No matrix modifiers (e.g., Lanthanum chloride) wereused for either analysis because La addition for Caanalyses precludes Sr determinations, and sampleoxidation and dilute acid should reduce the presenceof interfering elements (P, Al) in the dissolved sample.Replicates of many samples also were measured viaInductively Coupled Argon Plasma Spectrometry(ICP) in axial mode (Thermo Elemental model IRIS1000 DUO at Middlebury College) with precisiono1% (r.s.d). Time series trends in AAS and ICPanalyses were identical, however, absolute Sr/Caratios were typically 10% lower in the AAS analyses,likely because of some signal depression of Ca.
Stable isotopes of separated fractions weremeasured using a Finnigan 252 mass spectrometer,equipped with an automated carbonate extractionline (Kiel device). The reproducibility of a routinelyanalysed carbonate standard (NBS 19) is better than0.05% for d13C and 0.09% for d18O (1 SD).
3.5. Ion probe measurement of coccolith Sr/Ca
Coccoliths of C. leptoporus and H. carteri werepicked off glass slides using a tungsten needlemounted in a Narishige micromanipulator under a
ARTICLE IN PRESSH.M. Stoll et al. / Deep-Sea Research II 54 (2007) 558–580564
400�magnification on a Nikon Diaphot 300inverted microscope. The relatively large coccolithsof these species can be reliably identified and pickedunder 400�magnification, and previous ion probework has shown that these species give sufficientduration of high counts for precise Sr/Ca ratios. Fora limited number of samples we also attemptedanalysis of G. oceanica coccoliths. Picking andanalysis were conducted as described in Stoll andZiveri (2004), Rickaby et al. (2007), Stoll et al.(2007).
4. Results and discussion
4.1. Reproducibility in of size-fractionated carbonate
flux measurements
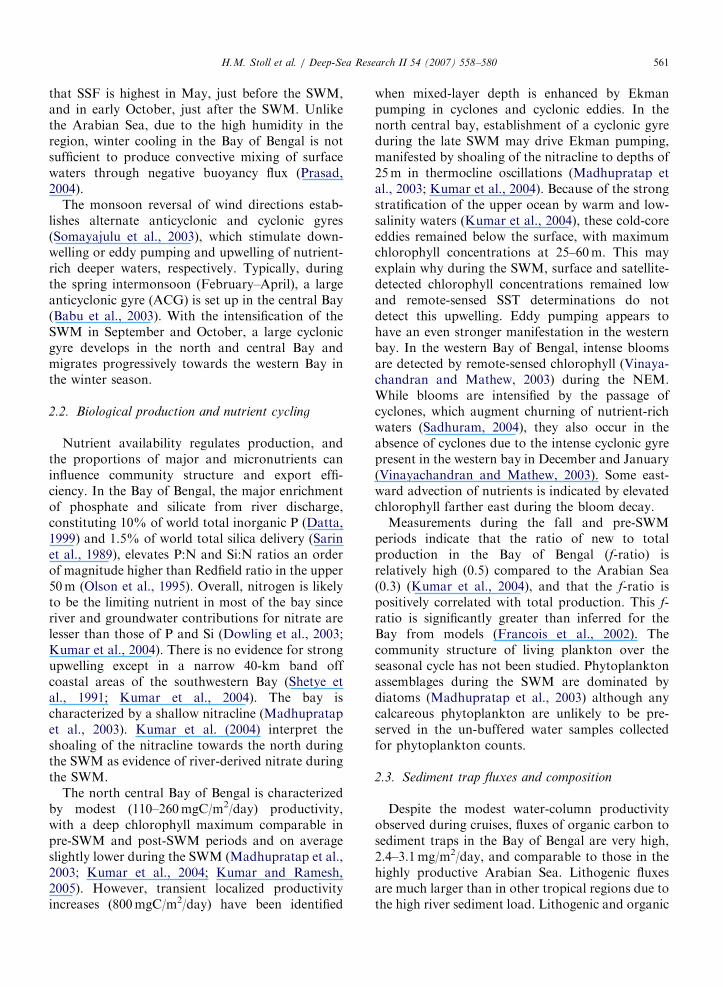
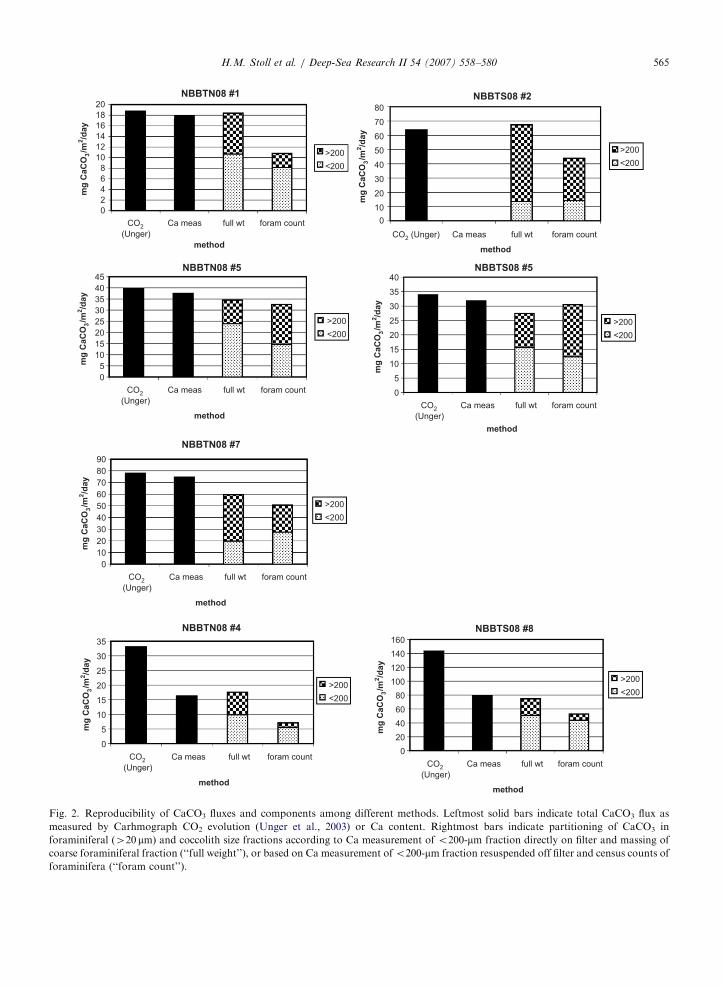
Methodology for distinguishing trap carbonatefluxes of different size fractions continues to evolve.Total CaCO3 flux for coulometry and that inferredfrom Ca concentrations in dissolutions agree towithin 5%, comparable to analytical uncertainty,for five of the seven samples analyzed (Fig. 2). Intwo of the samples, the Ca-derived CaCO3 fluxes areonly half of those reported from Carhmographcoulometry measurements. XRD analyses of one ofthese (NBBTS08 #8) show that the only carbonatephase is calcite (CaCO3), indicating that Ca shouldaccurately indicate carbonate content. Dissolutionof carbonate during post-collection sample storagecan be ruled out since the total weight of the split isconserved. These two points do coincide with higherCaCO3 contents than surrounding trap samples, butother comparably high CaCO3 contents in subse-quent trap samples have been confirmed. The CO2
analysis for these samples may have included somenon-carbonate derived CO2, which elevated con-centration. Alternatively, the distribution of CaCO3
(most likely foraminifera) is not even among thesplits (although mass is even), so if some originalsplits had more foraminifera and subsequent haveless, then the %CaCO3 could differ among differentsplits.
For those samples for which total carbonateestimates by Ca and CO2 Carmhograph are inagreement, the separation process of coarse and finecarbonate did not significantly jeopardize totalcarbonate yields, which are 80–100% of those fornonseparated samples. Yields are typically lower forsamples that were sieved before bleaching, for whichfine fraction was resuspended off the filter, and forwhich coarse CaCO3 was estimated from forami-
niferal census counts. Fine fraction yields werelower if sieving occurred before bleaching, probablybecause some fines were contained in large organicaggregates 4300 mm and were removed from thesample Bairbakhish et al. (2001). We also foundthat flux estimates were about 15% lower whenderived from material resuspended off the cellulosefilter rather than dissolved directly from the filter.
For the coarse 4200-mm fraction, CaCO3 fluxesestimated from foraminiferal census counts rangefrom 34% to 169% of the fluxes calculated fromweight of 4200-mm carbonate (Fig. 2). These datasuggest large uncertainty in CaCO3 fluxes derivedfrom foraminiferal census counts, likely because ofseasonal changes in foraminiferal weight and shellsize. Therefore, the optimal approach is oxidationof organics prior to separation of coarse and finesize fractions, measurement of fine-fraction Cadirectly from filters, and determination of coarse-fraction contribution from mass rather than censuscounts.
4.2. Carbonate export in coarse and fine fractions
Coarse carbonate from foraminifera and finecarbonate from coccoliths are expected to havedifferent effects on the ballasting of organic carbon.Production of foraminifera, heterotrophic zoo-plankton, depends on food supply. If coccolitho-phore production correlates with total primaryproduction, as suggested by some recent data(Poulton et al., 2007), then foraminiferal andcoccolith production may covary. If coccolitho-phore production does not correlate with totalprimary production, then foraminiferal and cocco-lith carbonate fluxes may not covary.
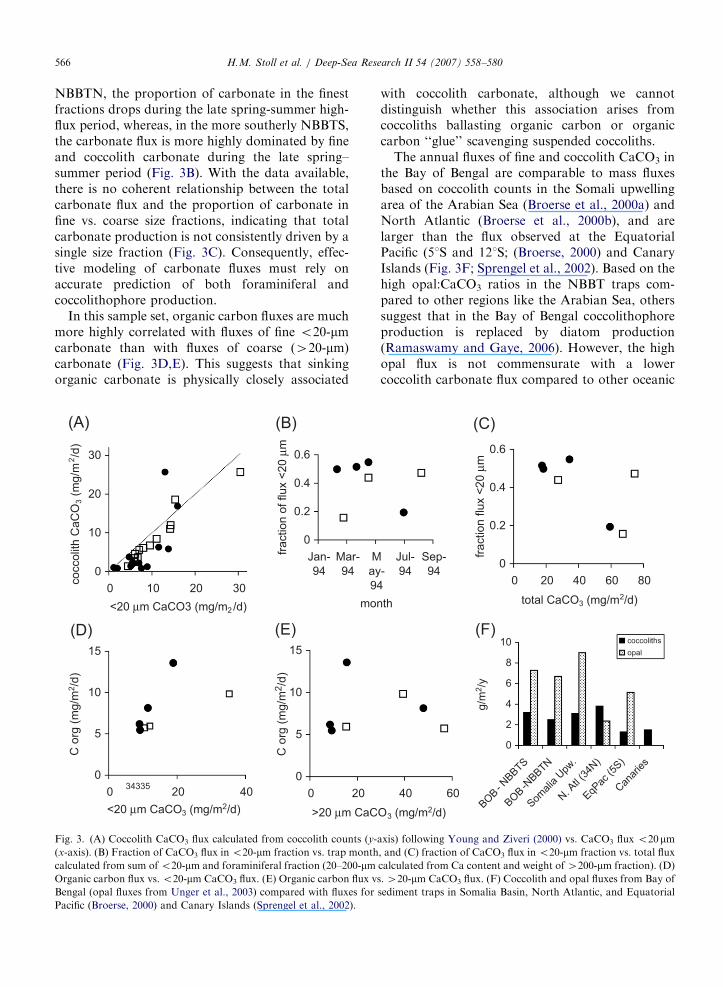
Coccolith mass flux derived from coccolith countsand Ca-based carbonate flux in the 0.45–o20 mmsize range for all data are in excellent agreement forthe NBBTS site, indicating that the fine carbonateflux is dominated by coccoliths (Fig. 3A). ForNBBTN, there is more variation in counts and Ca-based estimates, although the census-derived massflux and o20-mm carbonate flux are still highlycorrelated.
We observe seasonal variations in the contribu-tion of carbonate from the coarse vs. fine sizefraction (note here we consider results only from themore accurate weight-based determination of coarsecarbonate). Fifteen to 55% of the CaCO3 derivesfrom the o20-mm size fraction (Fig. 3B). From thislimited set, it appears that in northernmost trap
ARTICLE IN PRESS
NBBTN08 #1
0
2
4
6
8
10
12
14
16
18
20
CO2
(Unger)
Ca meas full wt foram count
method
mg
CaC
O3/m
2/d
ay
>200
<200
NBBTN08 #5
0
5
10
15
20
25
30
35
40
45
CO2
(Unger)
Ca meas full wt foram count
method
mg
CaC
O3/m
2/d
ay
>200
<200
NBBTS08 #8
0
20
40
60
80
100
120
140
160
CO2
(Unger)
Ca meas full wt foram count
method
mg
CaC
O3/m
2/d
ay
>200
<200
NBBTN08 #4
0
5
10
15
20
25
30
35
CO2
(Unger)
Ca meas full wt foram count
method
mg
CaC
O3/m
2/d
ay
>200
<200
NBBTN08 #7
0
10
20
30
40
50
60
70
80
90
CO2
(Unger)
Ca meas full wt foram count
method
mg
CaC
O3/m
2/d
ay
>200
<200
NBBTS08 #2
0
10
20
30
40
50
60
70
80
CO2 (Unger) Ca meas full wt foram count
method
mg
CaC
O3/m
2/d
ay
>200
<200
NBBTS08 #5
0
5
10
15
20
25
30
35
40
CO2
(Unger)
Ca meas full wt foram count
method
mg
CaC
O3/m
2/d
ay
>200
<200
Fig. 2. Reproducibility of CaCO3 fluxes and components among different methods. Leftmost solid bars indicate total CaCO3 flux as
measured by Carhmograph CO2 evolution (Unger et al., 2003) or Ca content. Rightmost bars indicate partitioning of CaCO3 in
foraminiferal (420 mm) and coccolith size fractions according to Ca measurement of o200-mm fraction directly on filter and massing of
coarse foraminiferal fraction (‘‘full weight’’), or based on Ca measurement ofo200-mm fraction resuspended off filter and census counts of
foraminifera (‘‘foram count’’).
H.M. Stoll et al. / Deep-Sea Research II 54 (2007) 558–580 565
ARTICLE IN PRESSH.M. Stoll et al. / Deep-Sea Research II 54 (2007) 558–580566
NBBTN, the proportion of carbonate in the finestfractions drops during the late spring-summer high-flux period, whereas, in the more southerly NBBTS,the carbonate flux is more highly dominated by fineand coccolith carbonate during the late spring–summer period (Fig. 3B). With the data available,there is no coherent relationship between the totalcarbonate flux and the proportion of carbonate infine vs. coarse size fractions, indicating that totalcarbonate production is not consistently driven by asingle size fraction (Fig. 3C). Consequently, effec-tive modeling of carbonate fluxes must rely onaccurate prediction of both foraminiferal andcoccolithophore production.
In this sample set, organic carbon fluxes are muchmore highly correlated with fluxes of fine o20-mmcarbonate than with fluxes of coarse (420-mm)carbonate (Fig. 3D,E). This suggests that sinkingorganic carbonate is physically closely associated
34335
0
0.2
0.4
0.6
Jan-
94
Mar-
94
M
ay
9
mo
fraction o
f flux <
20 μ
m
(B)
0
5
10
15
0 20 40
<20 μm CaCO3 (mg/m2/d)
C o
rg (
mg/m
2/d
)
(D)
0
5
10
15
0 20
>20 μm CaC
C o
rg (
mg/m
2/d
)
(E)
0
10
20
30
0 10 20 30
<20 μm CaCO3 (mg/m2/d)
coccolit
h C
aC
O3 (
mg
/m2/d
)
(A)
Fig. 3. (A) Coccolith CaCO3 flux calculated from coccolith counts (y-
(x-axis). (B) Fraction of CaCO3 flux in o20-mm fraction vs. trap month
calculated from sum of o20-mm and foraminiferal fraction (20–200-mmOrganic carbon flux vs. o20-mm CaCO3 flux. (E) Organic carbon flux v
Bengal (opal fluxes from Unger et al., 2003) compared with fluxes for
Pacific (Broerse, 2000) and Canary Islands (Sprengel et al., 2002).
with coccolith carbonate, although we cannotdistinguish whether this association arises fromcoccoliths ballasting organic carbon or organiccarbon ‘‘glue’’ scavenging suspended coccoliths.
The annual fluxes of fine and coccolith CaCO3 inthe Bay of Bengal are comparable to mass fluxesbased on coccolith counts in the Somali upwellingarea of the Arabian Sea (Broerse et al., 2000a) andNorth Atlantic (Broerse et al., 2000b), and arelarger than the flux observed at the EquatorialPacific (51S and 121S; (Broerse, 2000) and CanaryIslands (Fig. 3F; Sprengel et al., 2002). Based on thehigh opal:CaCO3 ratios in the NBBT traps com-pared to other regions like the Arabian Sea, otherssuggest that in the Bay of Bengal coccolithophoreproduction is replaced by diatom production(Ramaswamy and Gaye, 2006). However, the highopal flux is not commensurate with a lowercoccolith carbonate flux compared to other oceanic
0
0.2
0.4
0.6
0 20 40 60 80
total CaCO3 (mg/m2/d)
fraction flu
x <
20 μ
m
(C)
-
4
Jul-
94
Sep-
94
nth
40 60
O3 (mg/m2/d)
0
2
4
6
8
10
- NBBTS
BOB
BOB
-NBB
TN
Som
alia U
pw.
N. A
tl(3
4N)
EqP
ac(5
S)
Can
aries
g/m
2/y
coccoliths
opal
(F)
axis) following Young and Ziveri (2000) vs. CaCO3 flux o20mm, and (C) fraction of CaCO3 flux in o20-mm fraction vs. total flux
calculated from Ca content and weight of 4200-mm fraction). (D)
s. 420-mm CaCO3 flux. (F) Coccolith and opal fluxes from Bay of
sediment traps in Somalia Basin, North Atlantic, and Equatorial

ARTICLE IN PRESSH.M. Stoll et al. / Deep-Sea Research II 54 (2007) 558–580 567
regions as would be expected if coccolithophoreproduction were adversely affected by competitionwith diatoms over an annual timescale. Rather, it isthe foraminiferal carbonate flux that is depressed inthe Bay of Bengal relative to the Arabian Sea as aresult of the lower salinity in the Bay of Bengal(Conan and Brummer, 2000).
4.3. Coccolithophore and foraminiferal assemblages
and relation to export
Because different species of coccolithophore algaeand foraminifera have different ecological adapta-tions, the species composition of trap materialprovides information on the water-column condi-tions during production.
4.3.1. Foraminiferal assemblages and upwelling
indicators
Assemblages of foraminifera at NBBTN andNBBTS are dominated by Neogloboquadrina duter-
trei, Globigerina bulloides, Globigerinoides sacculifer,Neogloboquadrina pachyderma (d.), Glogigerinoides
ruber, and Globorotalia menardii. There is pro-nounced seasonal alternation in the composition ofthe assemblage. In the Northern Indian Ocean,Globigerinoides sacculifer, G. ruber, and G. conglo-
batus are inferred to represent a non-upwellingassemblage, and G. bulloides is inferred to be anindicator of upwelling and is positively correlatedwith satellite-based productivity estimates (Cayreet al., 1999). We calculate the ratio of G. bulloides/(G. sacculifer, G. ruber, and G. conglobatus) as anindicator of upwelling-driven productivity. In bothNBBTN and NBBTS, this foraminiferal upwellingindex peaks during the late SWM, just followingattainment of deepest cyclonic eddy conditions thatfavor upwelling (Figs. 4A,B,5A,B). The indicatorsdrop sharply with wind speed despite continuedcyclonic conditions.
In the Arabian Sea, a similar ratio of G. bulloides/
G. ruber also has been used as an upwellingindicator with high ratios of 20 during the upwellingSWM, 1 during the winter wind mixing and nutriententrainment, and minimal values of 0.1 during the
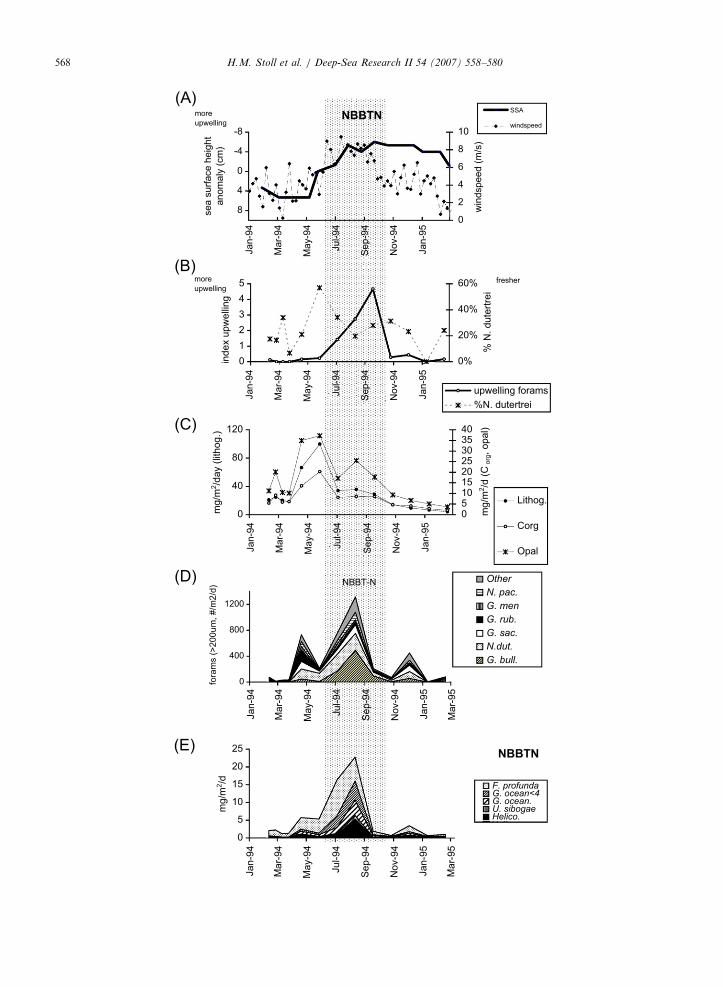
Fig. 4. Biogenic fluxes in NBBTN compared with physical forcing. (A)
(Somayajulu et al., 2003). (B) Indicators of upwelling intensity from G.
Trap fluxes of organic carbon, opal, and lithogenics (Unger et al., 2003).
pachyderma (N. pac), G. menardii (G. men.), G. ruber (G. rub.), G. saccul
Mass fluxes of coccoliths F. profunda, G.oceanica o4 mm (G. ocean o4)
Shaded interval denotes elevated upwelling indicators.
stratified intermonsoons. In NBBTN, G. bulloides/
G. ruber reaches comparable peak ratios of 14during the SWM, but during a much shorter periodthan observed in the Arabian Sea, suggesting thatpeak upwelling type situations are comparable inthe two regions. In NBBTS, the maximum G.
bulloides/G. ruber ratio is 5, suggesting less intensepeak upwelling conditions. On annual average, G.
bulloides comprises 35% of the foraminiferalassemblage in the Arabian Sea (Conan and Brum-mer) compared with 10% in the Bay of Bengal,attesting to the longer duration of upwellingconditions in the Arabian Sea.
N. dutertrei in the Bay of Bengal has beeninterpreted as an indicator of low-salinity waters(Cullen, 1981) although in sediments it can beenriched by dissolution of other more fragile speci-mens. We use %N. dutertrei as an indication ofsalinity. In sediment traps we observe similar trendsin % N. dutertrei or the proportion of N. dutertrei
among the resistant species (N. dutertrei, G.
menardii, G. tumida, P. obliquiloculata, N. pachy-
derma s.). This suggests that dissolution is not amajor influence on N. dutertrei relative abundance.Both NBBTN and NBBTS have similar averagecontributions of N. dutertrei. The % N. dutertrei
index shows a strong maximum in June in NBBTN(Fig. 4B). In NBBTS the abundance is morevariable with minima (maximum salinity) in Mayand August (Fig. 5B).
4.3.2. Coccolithophore assemblages and upwelling
indicators
Assemblages of coccolithophores in both trapsare dominated to an unusually high degree (typi-cally 90% of coccoliths and 50% of coccolith mass)by F. profunda throughout the year (Figs. 4E, 5E).F. profunda typically dwells in the deep photic zonebetween 100 and 200m (Young, 1994; Beaufortet al., 1997) and is adapted to low-light and high-nutrient conditions at the nutricline. The relativeabundance of F. profunda relative also has beenpositively correlated with water-column stratifica-tion and inversely correlated with satellite-detectedproductivity in the Equatorial Indian Ocean (Beau-
Windspeed (Unger et al. 2003), and sea-surface height anomalies
bulloides index, and salinity indicator from % N. dutertrei. (C)
(D) Fluxes of planktic foraminifera shells larger than 200mm. N.
ifer (G. sac.), N. dutertrei (N. dut), and G. bulloides (G. bull.). (E)
and G. oceanica 44 mm (G. ocean), and Helicosphaera (Helico).
ARTICLE IN PRESS
NBBT-N
0
400
800
1200
Jan-9
4
Mar-
94
May-9
4
Jul-94
Sep-9
4
No
v-9
4
Jan-9
5
Mar-
95
fo
ram
s (
>2
00
um
, #
/m2
/d)
Other
N. pac.
G. men
G. rub.
G. sac.
N.dut.
G. bull.
(D)
NBBTN
-8
-4
0
4
8
Jan-9
4
Mar-
94
May-9
4
Jul-94
Sep-9
4
Nov-9
4
Jan-9
5
sea s
urf
ace h
eig
ht
anom
aly
(cm
) 0
2
4
6
8
10
win
dspeed (
m/s
)
SSA
windspeed
more
upwelling
(A)
0
40
80
120
mg/m
2/d
ay (
lithog.)
0510152025303540
mg/m
2/d
(C
org
, opal)
Lithog.
Corg
Opal
(C)
NBBTN
0
5
10
15
20
25
Ja
n-9
4
Ma
r-94
Ma
y-9
4
Ju
l -94
Se
p-9
4
No
v-9
4
Ja
n-9
5
Ma
r -95
mg/m
2/d
F. profundaG. ocean<4G. ocean.U. sibogaeHelico.
(E)
0
1
2
3
4
5
ind
ex u
pw
elli
ng
0%
20%
40%
60%
% N
. dute
rtre
i
upwelling forams
%N. dutertrei
freshermore
upwelling
(B)
Jan-9
4
Mar-
94
May-9
4
Jul-94
Sep-9
4
Nov-9
4
Jan-9
5
Jan-9
4
Mar-
94
May-9
4
Jul-94
Sep-9
4
Nov-9
4
Jan-9
5
H.M. Stoll et al. / Deep-Sea Research II 54 (2007) 558–580568
ARTIC
LEIN
PRES
S
NB
BT
-S
0
200
400
600
Jan-
94
Mar-
94
May-
94
Jul-
94
Sep-
94
Nov-
94
Jan-
95
Mar-
95
forams (>200μm, #/m2/d)
Oth
er
N. p
ac.
G. m
en.
G. ru
b.
G. s
ac.
N. d
ut.
G. b
ull.
(D)
NB
BT
-S
0
20
40
60
Jan-94
Mar-94
May-94
Jul-94
Sep-94
Nov-94
Jan-95
mg/m2/day
0 4 8 12
mg/m2/d (Corg)
Opal
Lith
og
Corg
(C)
NB
BT
S
0 5
10
15
20
25
Jan-94
Mar-94
May-94
Jul-94
Sep-94
Nov-94
Jan-95
Mar-95
mg/m2/d
F. p
rofu
nda
G. o
cean<
4G
. ocean >
4U
. sib
ogae
E. h
ux o
verc
alc
E. h
uxle
yi
Helic
o.
Helic
o
(D)
NB
BT
S
-8-327
Jan-94
Mar-94
May-94
Jul-94
Sep-94
Nov-94
Jan-95
sea surface height
anomaly (cm)0 2 4 6 8 10
windspeed (m/s)
SS
A
win
dspeed
more
upw
ellin
g
(A)
0 1 2 3
index upwelling
0%
20%
40%
60%
%N. dutertrei
up
we
ll. fora
m
%N
. du
t.
up
we
ll. co
cco
more
upw
ellin
g
fresher
(B)
Jan-94
Mar-94
May-94
Jul-94
Sep-94
Nov-94
Jan-95
H.M
.S
toll
eta
l./
Deep
-Sea
Resea
rchII
54
(2
00
7)
55
8–
58
0569
ARTICLE IN PRESS
F
(
a
p
u
H.M. Stoll et al. / Deep-Sea Research II 54 (2007) 558–580570
fort et al., 1997). Given the low light penetration inthe Bay of Bengal due to turbidity and cloud coverduring the SWM, the high abundances of F.
profunda may reflect in particular its adaptation tolow light levels rather than productivity per se.
G. oceanica is the next most abundant species,and increases in importance during the SWM inboth NBBTS and NBBTN. G. oceanica is an upperphotic zone taxa typical of high productivityenvironments like upwelling zones (Young, 1994).The ratio of small placoliths (G. oceanica andEmiliania huxleyi) to F. profunda serves as anupwelling indicator and closely follows the forami-niferal upwelling indicator, with maxima in the lateSWM coinciding with onset of most intense cycloniceddy formation and declining with declining windspeed (Fig. 5B).
Other important coccolith taxa in the sedimenttraps include Helicophaera spp., and Umbilico-
sphaera sibogae. Notably absent from the assem-blages are upper photic zone taxa typical ofoligotrophic areas like Umbellosphaera tenuis andUmbellosphaera irregularis (Young, 1994).
4.3.3. Relationships between export and assemblage
indicators of production regime
In NBBTN, organic carbon, opal, and lithogenicfluxes peak in April–May. This coincides with apeak in % N. dutertrei, suggesting lowered salinity,but precedes the peak in upwelling indicators whichoccurs in July through September (Fig. 4B, C). Incontrast, foraminiferal and coccolith carbonatefluxes peak later, simultaneous with the upwellingindicators and coincident with a secondary peak inopal fluxes (Fig. 4D, E). The correlation of lowsalinity with high lithogenic flux suggests greateradvection of the river and sediment plume over thesediment trap sites, perhaps because during April–May of 1994 the normal wind pattern was altered,leading to a southward directed wind-stress anom-aly over the northern part of the Bay (Vinayachan-dran et al., 1999).
Could the April–May peak in opal and organiccarbon export in NBBTN result solely from anincrease in export efficiency due to lithogenicaddition, without a concomitant increase in produc-
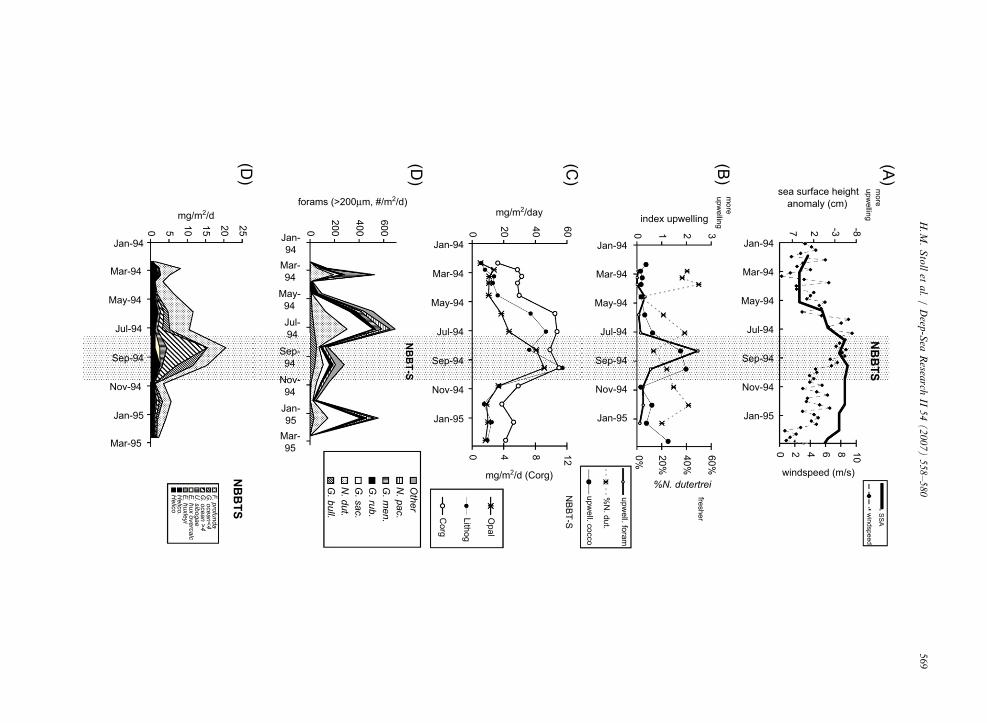
ig. 5. Biogenic fluxes in NBBTS compared with physical forcing. (A) W
Somayajulu et al., 2003). (B) Indicators of upwelling intensity from G.
nd salinity indicator from % N. dutertrei. (C) Trap fluxes of organic c
lanktic foraminifera shells larger than 200mm. (E) Mass fluxes of coccol
pwelling indicators.
tion of opal and organic carbon? Any increase inexport efficiency did not significantly affect cocco-liths, whose export increased only slightly duringthe April–May period. Because large and heavyforaminifera sink rapidly and independently, exportproduction is likely closely related to total produc-tion of foraminifera. The significant increase inforaminiferal export during the April–May periodsuggests increased food sources available for for-aminiferal production, and implies that the April–May export event is, at least in part, due to higherprimary production. An April–May peak in diatomproduction may have been triggered by addition ofsilicic acid, significantly more abundant in the riverplume than in upwelled waters. The April–Maypeak in organic carbon export may result from highdominance of phytoplankton community by dia-toms, and the efficiency of diatom-based food websat exporting carbon (Sweeney et al., 2003). Peakcoccolithophore export in June–September mayreflect a succession from diatom-dominated tococcolithophore-rich planktic communities in re-sponse to progressive silica depletion.
The data for the northernmost NBBT sitethus indicate either that eddy-pumping/upwellingis not the major forcing of primary production andexport or organic carbon, or that scavengingby pulsed addition of lithogenics is an importantexport enhancer. In either case, it is clear that inthe northernmost trap, neither coccolith carbo-nate nor total carbonate fluxes are primarilyresponsible for ballasting the main pulse of organiccarbon export, and conversely, that the export ofcoccoliths is not primarily driven by organic carbonglue.
In NBBTS, lithogenic, organic carbon, andforaminiferal fluxes reach peak values in late Maythrough early July, prior to the upwelling indicators(Fig. 5). High organic carbon and lithogenic fluxesare maintained through the period indicated byupwelling, whereas foraminiferal fluxes declineduring the upwelling period. Fluxes in opal andcoccoliths increase slightly along with lithogenic,organic carbon, and foraminifera in late Maythrough July, but reach peak fluxes in August–September simultaneous with the coccolithophore
indspeed (Unger et al., 2003), and sea-surface height anomalies
bulloides index and (G. oceanica+E. huxleyi)/F. profunda index,
arbon, opal, and lithogenics (Unger et al. 2003). (D) Fluxes of
iths. Abbreviations as in Fig. 4. Shaded interval denotes elevated
ARTICLE IN PRESSH.M. Stoll et al. / Deep-Sea Research II 54 (2007) 558–580 571
and foraminiferal upwelling indicators. The earlyrise of lithogenic fluxes coincides with an increase in% N. dutertrei, possibly indicative of lower salinityconditions, although other high abundances of N.
dutertrei are not accompanied by elevated lithogenicfluxes.
Could the late May–July peak in opal andorganic carbon export in NBBTS result solely froman increase in export efficiency of a non-diatom,non-coccolithophore dominated community due tolithogenic addition, without a concomitant increasein production of organic carbon? Peak fluxes offoraminifera during late May–July suggest thatprimary production did increase during this period.Late May–July organic carbon export must reflectproduction by non-diatom, non-coccolithophorecommunities, whereas subsequent August–Septem-ber organic carbon export reflects production ofcoccolithophores and diatoms coincident with eddypumping/upwelling. The implication of this inter-pretation is that a significant portion of organiccarbon production is unrelated to production bydiatoms and not driven by cyclonic eddy pumping.Such production unrelated to upwelling is consis-tent with increased coccolith fluxes from deepphotic coccolithophore F. profunda, but not surfacedwelling coccolithophores. Fluxes of F. profunda
correlate highly with organic carbon fluxes in thistrap. This explanation implies lower availabilityof food sources for foraminifera during the upwel-ling period, suggesting that peaks in coccolitho-phore and diatom production in August–Septemberdo not necessarily reflect peaks in overall produc-tivity.
In NBBTS, there are also significant winterpeaks in foraminiferal fluxes in March 1994 andJanuary 1995. The peak in March 1994 coincideswith an increased flux of F. profunda and a smallincrease in organic carbon flux, and increasedabundance of N. dutertrei suggestive of lowersalinities. The January 1995 event coincides witha rise in indicators of upwelling coccoliths, anda small increase in organic carbon flux. Thiswinter peak in foraminiferal and coccolith produc-tion may be related to very strong cycloniccirculation in the Western Bay of Bengal (Somaya-julu et al., 2003), which gives rise to winter bloomsin this part of this Bay (Vinayachandran andMathew, 2003). While these blooms typically lieto the west of 881E and west of the trap location,they are well within the statistical funnel of the trapand occasionally advect near the southern trap
location (Fig. 1; 600 to 41000 km wide; (Siegel andArmstrong, 2002).
Because in both trap sites major organic carbonexport, and probably major organic carbon produc-tion, precede the onset of upwelling driven by eddypumping, an alternative style of high productiondeeper in the water column is inferred for thenorthern Bay. Because turbidity and cloud coverlimit light, and the halocline precludes completeshoaling of the nitracline, production remainssubsurface. The high correlation of organic carbonexport and flux of coccoliths of deep photic F.
profunda in the southern traps supports this.Upwelling indicators such as foraminifera G.
bulloides or coccolithophore G. oceanica are prob-ably adapted to the high light levels of a typicalupwelling system where nutrients make it all theway to the surface. Therefore, in the Bay of Bengal,these upwelling indicators should not be consideredas the unique indicators of high productivity.Conversely, these data indicate that there aresettings in which high abundance of deep photiccoccolithophore F. profunda should not be inter-preted as indicative of low productivity. In this areaof limited light penetration, remote sensed chlor-ophyll concentrations also may underestimateproductivity.
4.4. Sr/Ca geochemical variations in coccoliths
Several studies suggest a relationship betweenSr/Ca ratios of coccoliths and coccolithophoreproductivity. Sr/Ca ratios in coccoliths arehigher during seasons of enhanced nutrient avail-ability and coccolith export fluxes in the Somaliabasin in Arabian Sea. Sr/Ca ratios in coccolithsare higher during periods of enhanced surfaceproduction of coccolithophores, which do notalways coincide with increased export fluxes, in theSargasso Sea (Rickaby et al., 2002; Stoll et al.,2007). Coccolith Sr/Ca ratios are also higherat higher nutrient-regulated growth rates in cultures(Rickaby et al., 2002; Stoll et al., 2007). Nutrientlimitation in coccolithophores appears totrigger carbon dumping of extracellular polysaccar-ides, which reduce the Sr/Ca ratio taken intothe calcifying vescicle and depress coccolith Sr/Caratios (Langer et al., 2006). Hence, coccolith Sr/Caratios may give an indication of the degreeof nutrient limitation of productivity of coccolitho-phores during the annual cycle in the Bay ofBengal.
ARTICLE IN PRESSH.M. Stoll et al. / Deep-Sea Research II 54 (2007) 558–580572
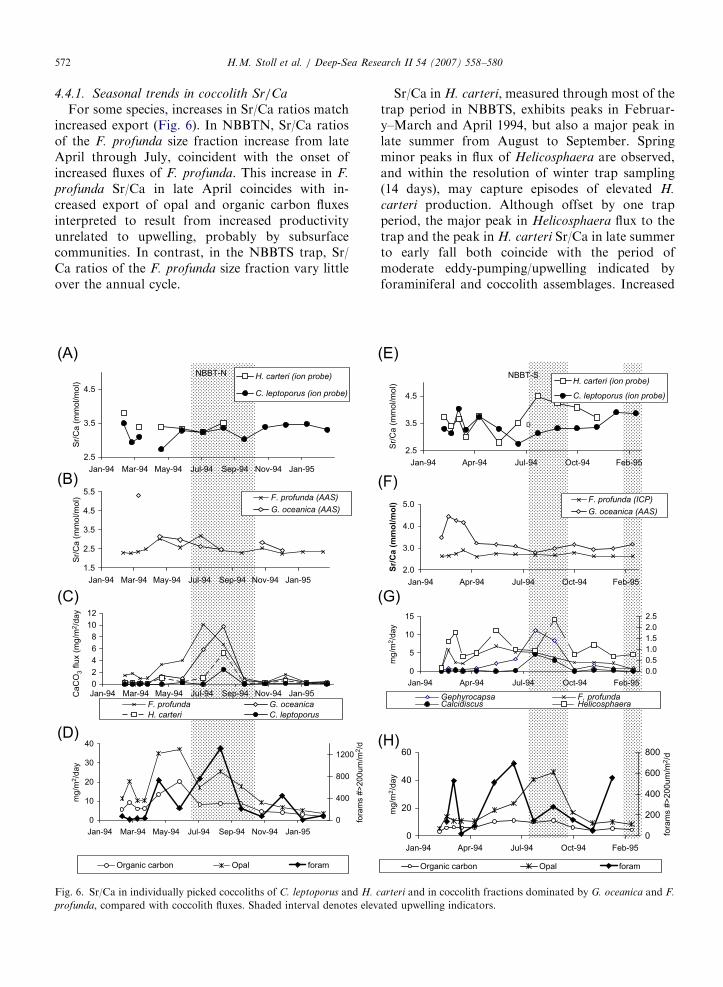
4.4.1. Seasonal trends in coccolith Sr/Ca
For some species, increases in Sr/Ca ratios matchincreased export (Fig. 6). In NBBTN, Sr/Ca ratiosof the F. profunda size fraction increase from lateApril through July, coincident with the onset ofincreased fluxes of F. profunda. This increase in F.
profunda Sr/Ca in late April coincides with in-creased export of opal and organic carbon fluxesinterpreted to result from increased productivityunrelated to upwelling, probably by subsurfacecommunities. In contrast, in the NBBTS trap, Sr/Ca ratios of the F. profunda size fraction vary littleover the annual cycle.
0
10
20
30
40
Jan-94 Mar-94 May-94 Jul-94 Sep-94 Nov-94 Jan-95
mg
/m2/d
ay
0
400
800
1200
fora
ms #
>2
00
um
/m2/d
Organic carbon Opal foram
0
2
4
6
8
10
12
Jan-94 Mar-94 May-94 Jul-94 Sep-94 Nov-94 Jan-95Ca
CO
3 f
lux (
mg
/m2/d
ay
F. profunda G. oceanica
H. carteri C. leptoporus
NBBT-N
2.5
3.5
4.5
Jan-94 Mar-94 May-94 Jul-94 Sep-94 Nov-94 Jan-95
Sr/
Ca (
mm
ol/m
ol)
H. carteri (ion probe)
C. leptoporus (ion probe)
1.5
2.5
3.5
4.5
5.5
Jan-94 Mar-94 May-94 Jul-94 Sep-94 Nov-94 Jan-95
Sr/
Ca (
mm
ol/m
ol) F. profunda (AAS)
G. oceanica (AAS)
(A)
(B)
(C)
(D)
Fig. 6. Sr/Ca in individually picked coccoliths of C. leptoporus and H. c
profunda, compared with coccolith fluxes. Shaded interval denotes elev
Sr/Ca in H. carteri, measured through most of thetrap period in NBBTS, exhibits peaks in Februar-y–March and April 1994, but also a major peak inlate summer from August to September. Springminor peaks in flux of Helicosphaera are observed,and within the resolution of winter trap sampling(14 days), may capture episodes of elevated H.
carteri production. Although offset by one trapperiod, the major peak in Helicosphaera flux to thetrap and the peak in H. carteri Sr/Ca in late summerto early fall both coincide with the period ofmoderate eddy-pumping/upwelling indicated byforaminiferal and coccolith assemblages. Increased
0
5
10
15
Jan-94 Apr-94 Jul-94 Oct-94 Feb-95
mg
/m2/d
ay
0.0
0.5
1.0
1.5
2.0
2.5
Gephyrocapsa F. profundaCalcidiscus Helicosphaera
0
20
40
60
Jan-94 Apr-94 Jul-94 Oct-94 Feb-95
mg
/m2/d
ay
0
200
400
600
800
fora
ms #
>2
00
um
/m2/d
Organic carbon Opal foram
NBBT-S
2.5
3.5
4.5
Jan-94 Apr-94 Jul-94 Oct-94 Feb-95
Sr/
Ca (
mm
ol/m
ol)
H. carteri (ion probe)
C. leptoporus (ion probe)
D
2.0
3.0
4.0
5.0
Jan-94 Apr-94 Jul-94 Oct-94 Feb-95
Sr/
Ca
(m
mo
l/m
ol)
F. profunda (ICP)
G. oceanica (AAS)
(G)
(H)
(E)
(F)
arteri and in coccolith fractions dominated by G. oceanica and F.
ated upwelling indicators.
ARTICLE IN PRESSH.M. Stoll et al. / Deep-Sea Research II 54 (2007) 558–580 573
coccolith export lags increased coccolith Sr/Ca inother sediment trap settings, probably because somecoccoliths produced in high-productivity periodsexperience enhanced setting therefore and arrive atthe traps prior to the main mass pulse. H. carteri isbelieved to inhabit middle photic zone and may bewell adapted to benefit from the shoaling of thenitracline due to modest summer eddy pumping inthe north-central Bay of Bengal.
For other species, Sr/Ca ratios show littlecorrelation to export fluxes (Fig. 6). Sr/Ca of C.
leptoporus in both traps exhibits maxima in winterseasons, a trend most pronounced in NBBTS. InNBBTS, Sr/Ca ratios of individually picked C.
leptoporus peak in winter and spring of 1994 (earlyMarch and April), and winter 1995 (Jan–Feb),synchronous with spring 1994 peaks recorded by H.
carteri. Unlike H. carteri, summer eddy pumping atNBBTS does not appear to change nutrient limita-tion of C. leptoporus. C. leptoporus inhabits upperphotic zone waters (Haidar and Thierstein, 2001)which may be less affected by the modest shoalingof the nitracline with summer eddy pumping.
Elevated Sr/Ca ratios are observed in G. oceanica
in winter 1994 (February through late March) in theNBBTS trap. An unusually high ratio for the G.
oceanica fraction occurred in early March inNBBTN, though, due to the very small amount ofG. oceanica material, we could not reconfirm thisvalue with subsequent analyses.
4.4.2. Variable export efficiency decouples coccolith
Sr/Ca and coccolith export?
Seasonal variations in export efficiency couldcontribute to the decoupling of coccolith Sr/Caratios and coccolith export for C. leptoporus and G.
oceanica. For NBBTN, given minimal seasonalvariation in coccolithophore production, a signifi-cant increase in export efficiency during theJuly–September upwelling period could producethe dominantly summer coccolith export. However,this scenario would imply low organic carbonproduction during the upwelling period because ahigh export efficiency and modest to high organiccarbon production would produce high exportfluxes of organic carbon, which are not observed.This inference of low organic carbon production isnot supported by the major peak in foraminiferalexport in July-September, which infers high primaryproduction.
For NBBTS, a significant increase in exportefficiency during August–September period of peak
opal production could explain a decoupling betweendominantly winter coccolithophore production anddominantly summer coccolith export. This scenariowould imply peak organic carbon production in lateMay–July rather than August–September, which isin close agreement with peak fluxes of foraminiferain late May–July. This scenario implies that diatomsare not the major contributor to primary produc-tion at NBBTS, but strongly influence export.
In either of these scenarios, increased exportefficiency of coccoliths would not appear to imply amajor scavenged component of coccoliths sus-pended in the water column for long periodsbecause the assemblage during inferred higherexport period differs from that during other timesof the year and, hence, must reflect recent produc-tion. Rather, coccoliths produced during the periodsof low export efficiency likely dissolve in the watercolumn.
4.4.3. Distal bloom-derived coccoliths explain winter
Sr/Ca peaks?
The arrival of small numbers of coccoliths fromdistal regions of the trap catchment area that areexperiencing higher productivity also may decouplecoccolith Sr/Ca ratios from coccolith export. In thiscase, a high fraction of the captured coccoliths maybe coming from a higher productivity regime, butthe fraction of that production that arrives in thedistal trap is small compared to subsequent fluxes ofmore proximally produced coccoliths.
High Sr/Ca coccoliths that arrive in the sedimenttrap during winter periods may derive fromproduction in the southwest bay. The southwestbay experiences cyclone-driven blooms during thewinter northeast monsoon season (Vinayachandranand Mathew, 2003) and highest total and biogenicfluxes to western bay sediment traps (CBBT inFig. 1) during the winter bloom (Unger et al., 2003).The statistical funnel of the NBBTS traps includes asignificant portion of the area of the southwest Bay,which is affected by these blooms (Fig. 1). Whilethis distal production is likely not sufficient toelevate coccolith export of all species in the NBBTS,it is possible that a high proportion of some speciesof coccoliths entering the NBBTS trap during thisseason were produced in the very high productivityregime of the southwest bay or high productivityfilaments advected into the central bay. Comparedwith the SSA of summer cyclonic regime directlyover the northern bay traps NBBTN and NBBTS,this winter event in the western Bay is more intense
ARTICLE IN PRESSH.M. Stoll et al. / Deep-Sea Research II 54 (2007) 558–580574
(Fig. 7) and features higher productivity evidencedby the satellite detection of high chlorophyll duringthe western Bay winter bloom (Vinayachandran andMathew, 2003). Consequently, coccoliths derivedfrom this bloom regime could feature Sr/Ca ratioshigher than those produced in the summer in thenorthern Bay of Bengal during maximum coccolithfluxes. Because the southwest bay bloom regimecomprises a larger part of the trap catchment ofNBBTS than NBBTN, it may have a less pro-nounced influence in the northern NBBTN. Thisinterpretation need not invoke higher export effi-ciency to explain the summer coccolith fluxes in thenorthern traps.
The existence of significant winter peaks inforaminifera flux, unlikely affected by exportefficiency, suggests that winter peaks in coccolithSr/Ca likely reflect real production events. Becauseforaminifera have a smaller statistical funnel, theymay indicate that these production events occurredproximal to the NBBTS and NBBTN traps but werenot recorded as increased flux events because of lowexport efficiency compared to summer.
4.5. Stable isotopic variations in coccoliths and
foraminifera
The oxygen isotopic composition in marine carbo-nates depends on the temperature and stable isotopiccomposition of the water in which they are pre-cipitated. In the Bay of Bengal, as elsewhere, the d18Oof seawater is positively correlated with salinity(Delaygue et al., 2001). The carbon isotopic composi-tion of marine carbonates depends on the carbonisotopic composition of dissolved inorganic carbon
-20
-15
-10
-5
0
5
10
15
20
1993 1994 1995
year
se
a s
urf
ac
e h
eig
ht
an
om
aly
(cm
)
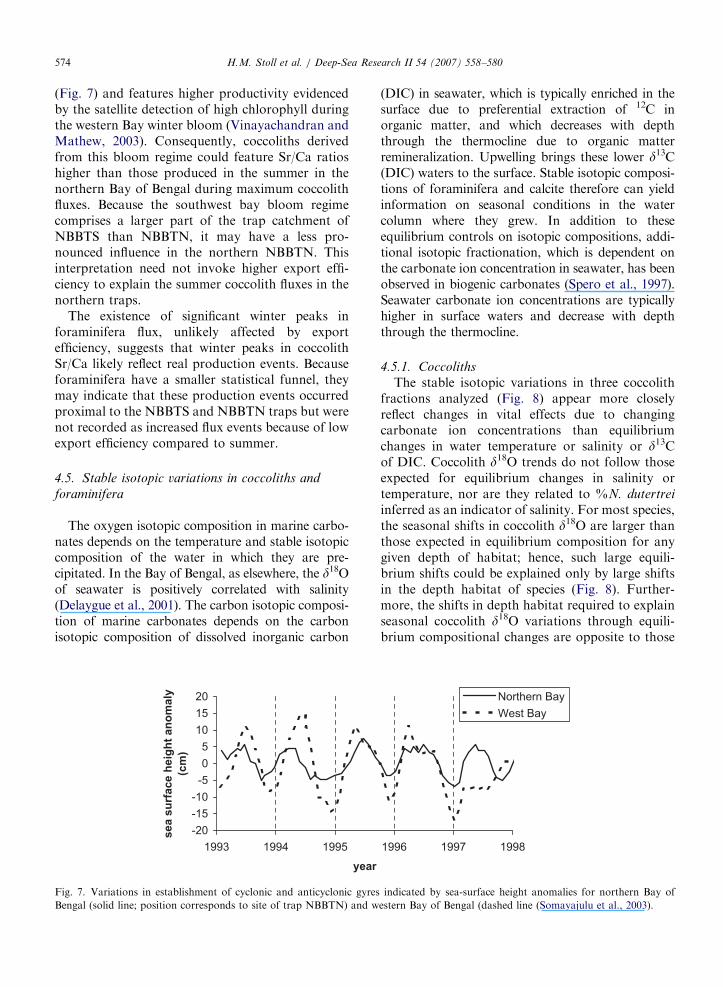
Fig. 7. Variations in establishment of cyclonic and anticyclonic gyres
Bengal (solid line; position corresponds to site of trap NBBTN) and w
(DIC) in seawater, which is typically enriched in thesurface due to preferential extraction of 12C inorganic matter, and which decreases with depththrough the thermocline due to organic matterremineralization. Upwelling brings these lower d13C(DIC) waters to the surface. Stable isotopic composi-tions of foraminifera and calcite therefore can yieldinformation on seasonal conditions in the watercolumn where they grew. In addition to theseequilibrium controls on isotopic compositions, addi-tional isotopic fractionation, which is dependent onthe carbonate ion concentration in seawater, has beenobserved in biogenic carbonates (Spero et al., 1997).Seawater carbonate ion concentrations are typicallyhigher in surface waters and decrease with depththrough the thermocline.
4.5.1. Coccoliths
The stable isotopic variations in three coccolithfractions analyzed (Fig. 8) appear more closelyreflect changes in vital effects due to changingcarbonate ion concentrations than equilibriumchanges in water temperature or salinity or d13Cof DIC. Coccolith d18O trends do not follow thoseexpected for equilibrium changes in salinity ortemperature, nor are they related to %N. dutertrei
inferred as an indicator of salinity. For most species,the seasonal shifts in coccolith d18O are larger thanthose expected in equilibrium composition for anygiven depth of habitat; hence, such large equili-brium shifts could be explained only by large shiftsin the depth habitat of species (Fig. 8). Further-more, the shifts in depth habitat required to explainseasonal coccolith d18O variations through equili-brium compositional changes are opposite to those
1996 1997 1998
Northern Bay
West Bay
indicated by sea-surface height anomalies for northern Bay of
estern Bay of Bengal (dashed line (Somayajulu et al., 2003).

ARTICLE IN PRESS
NBBT_N8
-4.5
-3.5
-2.5
-1.5
-0.5
Jan-94 Mar-94 May-94 Jul-94 Sep-94 Nov-94 Jan-95 Mar-95
month
δO
F.profunda G.oceanicaHelico+Calcid. equil (0m)equil(50m) equil (100m)
NBBT-N8
-3
-2
-1
0
1
Jan-94 Mar-94 May-94 Jul-94 Sep-94 Nov-94 Jan-95 Mar-95
month
δC
F.profunda G.oceanica Helico.+Calcid.
surface
100 m
NBBT-N
-3.5
-2.5
-1.5
-0.5
-3 -2 -1 01
δ C
δO F. profunda
G. oceanica
Helico/Calcid
NBBT S8
-4.5
-3.5
-2.5
-1.5
-0.5
Jan-
94
Mar-
94
May-
94
Jul-94 Sep-
94
Nov-
94
Jan-
95
Mar-
95
month
δO
F. profunda G. oceanicaHelico.+Calcid. equil (0m)equil (50m) equil (100m)
NBBT S8
-3
-2
-1
0
1
Jan-94 Mar-94 May-
94
Jul-94 Sep-
94
Nov-
94
Jan-95 Mar-95
month
δC
F. profunda G. oceanica Helico+Calcid.
surface
100 m
NBBT-S
-4.5
-4
-3.5
-3
-2.5
-2
-1.5
-1
-0.5
0
-3 -2 -1 01
δ C
δO F. profunda
G. oceanica
Helico/Calcid
(A)
(B)
(C)
(D)
(E)
(F)
Fig. 8. Seasonal changes in d18O (A,C) and d13C (B,D) in coccolith fractions dominated by F. profunda, G. oceanica, and H. carteri (with
minor C. leptoporus) from NBBTN (A,B) and NBBTS (C,D). For d18O, gray lines indicate equilibrium d18O expected given seasonal
changes in water temperature and salinity at different depths, based on data from World Ocean Atlas 2001 and salinity-d18O seawater
calibration (Delaygue et al., 2001). For d13C, boxes denote surface and subsurface measurements of d13C of dissolved inorganic carbon
from the winter WOCE cruise in north central Bay of Bengal (Olson et al., 1995). Shaded interval denotes period of elevated upwelling
indicators. (E,F) d18O vs. d13C in coccolith fractions dominated by F. profunda, G. oceanica, and H. carteri (with minor C. leptoporus) for
NBBTN (E) and NBBTS (F).
H.M. Stoll et al. / Deep-Sea Research II 54 (2007) 558–580 575
that would be required to explain seasonal d13Cshifts. Consequently, changes in equilibrium com-positions are unlikely to explain the seasonal shiftsin coccolith stable isotopic ratios.
Vital effects in coccolith stable isotopic ratiosappear to be good candidates for explaining theoffsets among the different species, and potentiallythe seasonal trends as well. The offsets amongdifferent species, with isotopically lighter values inHelicosphaera and C. leptoporus fraction comparedto the G. oceanica fraction, are consistent with thoseof vital effects observed in culture (Ziveri et al.,
2003). Furthermore, carbon and oxygen isotopicratios show a strong direct correlation, with aslope of 1, both within coccoliths of a givenspecies and among the different species(Fig. 8E,F). The direct relationship between carbonand oxygen isotope ratios is opposite to thatexpected for equilibrium calcite composition atdifferent depths in the water column, since deeperwaters have lower d13C DIC, but their coldertemperatures would lead to higher d18O. The directrelationship is similar to that observed in plankticforaminifera (Spero et al., 1997) attributed to the
ARTICLE IN PRESSH.M. Stoll et al. / Deep-Sea Research II 54 (2007) 558–580576
carbonate ion effect, and a carbonate ion effect hasbeen observed on stable isotopic ratios of C.
leptoporus coccoliths from culture (Ziveri, pers.comm. 2006).
While the sense of d13C and d18O correlation isconsistent with the carbon ion effect (CIE), theslope of 1 is much greater than the 0.3 typicallyobserved for the CIE in other calcifying organisms.However, the typical 0.3 slope derives fromcomparisons of d18O carbonate–d18O seawater andd13C carbonate–d13C DIC. If there were an inversecorrelation of carbonate ion and equilibrium d18Ofrom seawater d18O and temperature effects, or adirect correlation between d13C dissolved inorganiccarbon in seawater, the effective d18O carbonate vs.d13C carbonate slope could be amplified in the Bayof Bengal trap samples. Such relationships areobserved in the available data from WOCE (Olsonet al., 1995) and qualitatively explain the higherd18O vs. of d13C slope in the coccolith fractions.Consequently a large proportion of the mainseasonally covarying trends in d13C and d18O arelikely to reflect changes in the carbonate ionconcentration, although some shifts in d18O notmatched in d13C likely reflect changes in watertemperature and salinity.
In the Bay of Bengal during WOCE cruise, thecarbonate ion was highest in the surface ocean andlowest in the deeper waters. In waters of 40–80mdepth the carbonate ion concentration decreasednorthward towards the river delta. Carbonate ionwas highly inversely correlated with nitrate. If thiscorrelation were representative throughout the year,then stable isotopic compositions of coccolithsmight be indicative of the degree of correspondencebetween their production depth and nitrate levels.The lower degree of stable isotopic variation in theF. profunda fraction may indicate that this speciesalways dwells in a more restricted environment nearthe nutricline with smaller variations in temperatureand carbonate ion. Surprisingly, the isotopic varia-tions in the other species indicate opposite shifts incarbonate ion content in their respective niches in agiven season. G. oceanica indicate higher carbonateion in winter (NEM) and early spring and minimumcarbonate ion during the SWM, whereas the H.
carteri– C. leptoporus fraction indicates highestcarbonate ion during the late SWM and fallintermonsoon period. Either niches of differentspecies are strongly vertically partitioned, or pro-duction of different species is occurring in differentregions of the trap catchment area or at different
times of each trap catchment period characterizedby different transient regimes in nutrient pumpingand carbonate ion. Further study characterizing thecarbonate ion effect and a greater array of seawaterstable isotopic measurements may enhance the useof sediment trap coccolith stable isotope ratios as akey marker for the regime of production ofcoccolithophores and help resolve current uncer-tainties on processes and efficiency of particleexport.
4.5.2. Foraminifera
Compared to coccoliths, the stable isotopicvariations in foraminifera exhibit a closer affinityto equilibrium changes in water temperature andsalinity and more limited expression of vital effects.In NBBTN, both oxygen isotopic compositions andtrends of G. sacculifer and G. ruber track thoseexpected from equilibrium in surface waters, andthose of N. dutertrei broadly track values and trendsin equilibrium composition predicted for waters at50m depth (Fig. 9). G. bulloides exhibits the samed18O trend as other species but with a largeramplitude. In NBBTS, all species except G. ruber
show d18O near equilibrium composition and range,and isotopic compositions of G. ruber broadly trackthose expected from equilibrium in surface waters.
Differences in absolute values of carbon isotopessuggest that coccoliths are produced in deeperwaters than most foraminifera. Individual speciesof foraminifera exhibit comparable 1.5% ranges ind18O and d13C over the course of the 1994–1995 trapperiod, with comparable values of d18O. However,most species of foraminifera exhibit d13C valuesbetween �1% and +2%, higher than coccolithd13C values which ranged from 0 to �3%. Only G.
bulloides exhibits d13C values comparable to thoseof coccoliths. Since G. bulloides typically flourishesin upwelling conditions, it may be sampling deeperwaters with lower d13C values.
Carbon isotopes in NBBTN surface mixed-layerspecies G. sacculifer and G. ruber show less variationthan other species, possibly due to a consistenthabitat restricted to shallow photic zone. In thenorthern trap site, there is a positive correlationamong d18O and d13C for both G. bulloides and N.
dutertrei (Fig. 9C), consistent with carbonate ioneffect rather than depth of habitat changes for theorigin of isotopic variations. Similar covariation isnot observed for other species in NBBTN, or forany species in NBBTS. The large variability in d13Cof N. dutertrei in NBBTS, not matched by
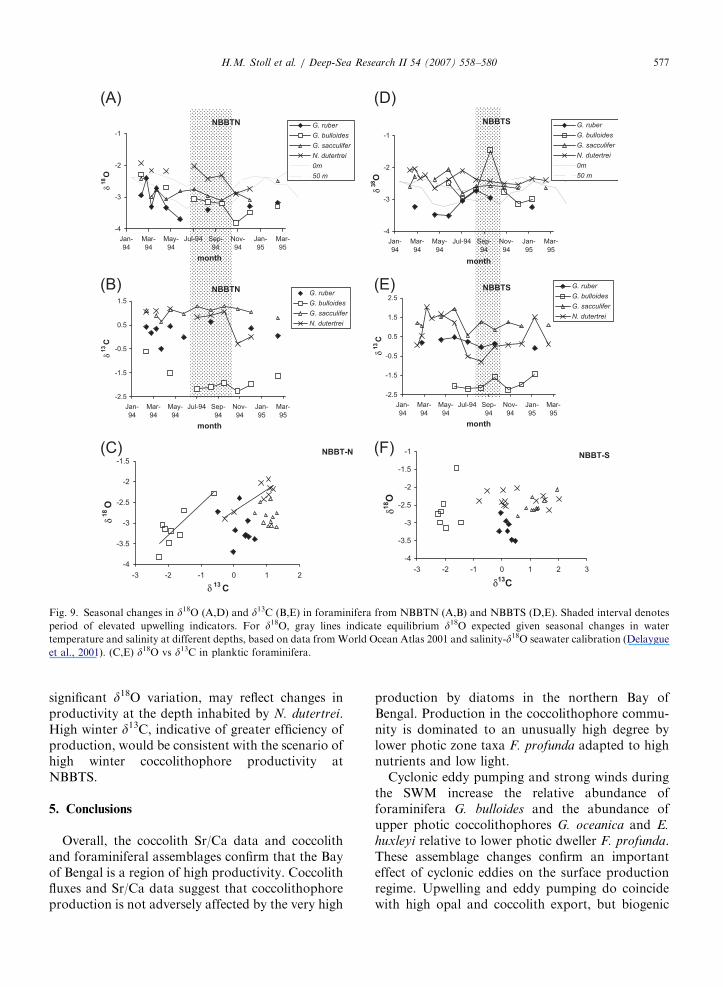
ARTICLE IN PRESS
NBBTS
-4
-3
-2
-1
Jan-
94
Mar-
94
May-
94
Jul-94 Sep-
94
Nov-
94
Jan-
95
Mar-
95
month
δ38O
G. ruber
G. bulloides
G. sacculifer
N. dutertrei
0m
50 m
NBBTN
-4
-3
-2
-1
Jan-
94
Mar-
94
May-
94
Jul-94 Sep-
94
Nov-
94
Jan-
95
Mar-
95
month
δ18O
G. ruber
G. bulloides
G. sacculifer
N. dutertrei
0m
50 m
NBBTS
-2.5
-1.5
-0.5
0.5
1.5
2.5
Jan-
94
Mar-
94
May-
94
Jul-94 Sep-
94
Nov-
94
Jan-
95
Mar-
95
month
δ13C
G. ruber
G. bulloides
G. sacculifer
N. dutertrei
NBBTN
-2.5
-1.5
-0.5
0.5
1.5
Jan-
94
Mar-
94
May-
94
Jul-94 Sep-
94
Nov-
94
Jan-
95
Mar-
95
month
δ13C
G. ruber
G. bulloides
G. sacculifer
N. dutertrei
NBBT-S
-4
-3.5
-3
-2.5
-2
-1.5
-1
-3 -2 -1 0 1 2 3
δ13C
δ18O
NBBT-N
-4
-3.5
-3
-2.5
-2
-1.5
-3 -2 -1 0 1 2
δ 13C
δ18O
(A)
(B)
(C)
(D)
(E)
(F)
Fig. 9. Seasonal changes in d18O (A,D) and d13C (B,E) in foraminifera from NBBTN (A,B) and NBBTS (D,E). Shaded interval denotes
period of elevated upwelling indicators. For d18O, gray lines indicate equilibrium d18O expected given seasonal changes in water
temperature and salinity at different depths, based on data fromWorld Ocean Atlas 2001 and salinity-d18O seawater calibration (Delaygue
et al., 2001). (C,E) d18O vs d13C in planktic foraminifera.
H.M. Stoll et al. / Deep-Sea Research II 54 (2007) 558–580 577
significant d18O variation, may reflect changes inproductivity at the depth inhabited by N. dutertrei.High winter d13C, indicative of greater efficiency ofproduction, would be consistent with the scenario ofhigh winter coccolithophore productivity atNBBTS.
5. Conclusions
Overall, the coccolith Sr/Ca data and coccolithand foraminiferal assemblages confirm that the Bayof Bengal is a region of high productivity. Coccolithfluxes and Sr/Ca data suggest that coccolithophoreproduction is not adversely affected by the very high
production by diatoms in the northern Bay ofBengal. Production in the coccolithophore commu-nity is dominated to an unusually high degree bylower photic zone taxa F. profunda adapted to highnutrients and low light.
Cyclonic eddy pumping and strong winds duringthe SWM increase the relative abundance offoraminifera G. bulloides and the abundance ofupper photic coccolithophores G. oceanica and E.
huxleyi relative to lower photic dweller F. profunda.These assemblage changes confirm an importanteffect of cyclonic eddies on the surface productionregime. Upwelling and eddy pumping do coincidewith high opal and coccolith export, but biogenic
ARTICLE IN PRESSH.M. Stoll et al. / Deep-Sea Research II 54 (2007) 558–580578
export is not uniquely associated with upwellingindicators and eddy pumping. In both traps, peakorganic carbon export precedes the onset of eddypumping. In the northern trap peak opal fluxes alsoprecede eddy pumping, and in the NBBTS trapforaminiferal fluxes and fluxes of deep photicdwelling coccoliths precede eddy pumping. Thesedata suggest an alternate mode of production in theBay of Bengal, which is not driven by upwelling butrather high production deeper in the water column,probably by taxa adapted to lower light levels. It isworth investigating why this mode of deep produc-tion might be characterized by higher f-ratios andexport efficiency (Kumar and Ramesh, 2005)compared to those inferred for the bay from models(Francois et al., 2002).
Major export pulses of organic carbon coincidewith pulses of lithogenic export. However, simplescavenging of suspended organic carbon by litho-genic pulses is not likely to explain the increasedexport. In both traps the pulses of organic carbonexport coincide with elevated fluxes of planktonicforaminifera, which must reflect increased forami-niferal production resulting from increased foodavailability and primary production. Given anincrease of production, the presence of significantlithogenic particles may still enhance export effi-ciency. In the northern trap, coccolith carbonateexport is decoupled from the main pulse of organiccarbon export; hence coccolith carbonate ballastingdoes not have a major role in seasonal cycle oforganic carbon export from the photic zone toshallow (800m) traps.
In the NBBTS traps there is evidence for seasonalchanges in export efficiency which decouple produc-tion of coccoliths from export of coccoliths. Winterpeaks in foraminiferal export and high Sr/Ca ratiosof C. leptoporus and G. oceanica coccoliths suggestepisodes of high winter coccolithophore productionwithout concomitant peaks in coccolith export.Export efficiency appears highest during the SWMwhen opal production is high. Seasonal changes inexport efficiency also have been inferred for othersediment traps in the Arabian Sea and Sargasso Sea(Stoll et al., 2007). The patterns of seasonalsuccession in coccolith assemblages from the north-ern Bay of Bengal suggest that, while exportefficiency of material to traps may vary seasonally,the biogenic sinking material is composed predomi-nantly of new production rather than scavengedmaterial that has been in suspension for a long timein the water column. During seasons with lower
export efficiency, the non-exported material is likelydissolved or regenerated.
Future study of seasonal patterns in livingpopulations of phytoplankton, including the cocco-lithophores taht are easily identifiable in sedimenttraps and sediment material, together with modelingof eddy pumping and effects on carbonate ion andequilibrium stable isotopic profiles, will significantlyenhance our ability to interpret the sediment trapand sediment records of primary production in thisand other settings.
Acknowledgments
We thank Adam Banasiak for technical assistancepicking coccoliths and preparing sediment trapsamples. Research supported by ACS-PRF 40549-B2 (HMS) and NSF OCE-0424474 (HMS) and afellowship to H. Stoll from the Spanish Ministry ofEducation cofunded by the European Social Fund.
References
Babu, M.T., Sarma, V., Murty, V.S.N., Vethamony, P., 2003. On
the circulation in the Bay of Bengal during Northern spring
inter-monsoon (March–April 1987). Deep-Sea Research II 50,
855–865.
Bairbakhish, A.N., Bollmann, J., Sprengel, C., Thierstein, H.R.,
2001. Disintegration of aggregates and coccospheres in
sediment trap samples. Marine Micropaleontology, 219–223.
Beaufort, L., Lancelot, Y., Camberlin, P., Cayre, O., Vincent, E.,
Bassinot, F., Labeyrie, L., 1997. Insolation cycles as a major
control of Equatorial Indian Ocean Primary Production.
Science 278 (5342), 1451–1454.
Broerse, A.T.C., 2000. Earth Sciences. Vrije University, Am-
sterdam, The Netherlands.
Broerse, A.T.C., Brummer, G.J.A., Van Hinte, J.E., 2000a.
Coccolithophore export production in response to monsoonal
upwelling off Somalia (northwestern Indian Ocean). Deep-
Sea Research II 47 (9–11), 2179–2205.
Broerse, A.T.C., Ziveri, P., van Hinte, J.E., Honjo, S., 2000b.
Coccolithophore export production, species composition, and
coccolith-CaCO3 fluxes in the NE Atlantic (341 N 211 W and
481 N 211 W). Deep-Sea Research II 47 (9–11), 1877–1905.
Cayre, O., Beaufort, L., Vincent, E., 1999. Paleoproductivity in
the Equatorial Indian Ocean for the last 260,000 yr: a transfer
function based on planktonic foraminifera. Quaternary
Science Reviews 18 (6), 839–857.
Conan, S.M.H., Brummer, G.J.A., 2000. Fluxes of planktic
foraminifera in response to monsoonal upwelling on the
Somalia Basin margin. Deep-Sea Research II 47, 2207–2227.
Cullen, J.L., 1981. Microfossil evidence for changing salinity
patterns in the Bay of Bengal over the past 20,000 years.
Palaeogeography Palaeoclimatology Palaeoecology 35,
315–356.
Datta, D.K., 1999. Dissolved phosphate in the Ganges-Brahma-
putra-Megna river system in the Bengal Basin, Bangladesh.
ARTICLE IN PRESSH.M. Stoll et al. / Deep-Sea Research II 54 (2007) 558–580 579
Mitteilungen aus dern Geologisch-Palaontologischen Institut
der Universitat Hamburge, SCOPE/UNEP 82, 131–138.
Delaygue, G., Bard, E., Rollion, C., Jouzel, J., Stievenard, M.,
Duplessy, J.C., Ganssen, G., 2001. Oxygen isotope/salinity
relationship in the northern Indian Ocean. Journal of
Geophysical Research 106, 4565–4574.
Dowling, C.B., Poreda, R.J., Basu, A.R., 2003. The ground water
geochemistry of Bengal Basin: weathering, chemosorption,
and trace metal flux to the oceans. Geochimica Et Cosmochi-
mica Acta 67, 2117–2136.
Francois, R., Honjo, S., Krishfield, R., Manganini, S., 2002.
Factors controlling the flux of organic carbon to the
bathypelagic zone of the ocean. Global Biogeochemical
Cycles 16.
Gupta, G.V.M., Curry, W.B., Ittekkot, V., Muralinath, A.S.,
1997. Seasonal variation in the flux of planktonic foramini-
fera: sediment trap results from the Bay of Bengal, Northern
Indian Ocean. Journal of Foraminiferal Research 27, 5–19.
Haidar, A.T., Thierstein, H.R., 2001. Coccolithophore dynamics
off Bermuda (N. Atlantic). Deep-Sea Research II 48,
1925–1956.
Ittekkot, V., Nair, R.R., Honjo, S., Ramaswamy, V., Bartsch,
M., Manganini, S., Desai, B.N., 1991. Enhanced particle
fluxes in Bay of Bengal induced by injection of freshwater.
Nature 351, 385–387.
Klaas, C., Archer, D.E., 2002. Association of sinking organic
matter with various types of mineral ballast in the deep sea:
implications for the rain ratio. Global Biogeochemical Cycles
16.
Kumar, S., Ramesh, R., 2005. Productivity measurements in the
Bay of Bengal using the 15N tracer: implications to the global
carbon cycle. Indian Journal of Marine Sciences 34, 153–162.
Kumar, S., Ramesh, R., Sardesai, S., Sheshshayee, M.S., 2004.
High new production in the Bay of Bengal: possible causes
and implications. Geophysical Research Letters 31.
Langer, G., Nehrke, G., et al., 2006. Coccolith strontium to
calcium ratios in Emiliania huxleyi: the dependence on
seawater strontium and calcium concentrations. Limnology
and Oceanography 51, 310–320.
Madhupratap, M., Gauns, M., et al., 2003. Biogeochemistry of
the Bay of Bengal: physical, chemical and primary productiv-
ity characteristics of the central and western Bay of Bengal
during the summer monsoon 2001. Deep-Sea Research II 50,
881–896.
Minoletti, F., Gardin, S., Nicot, E., Renard, M., Spezzaferri, S.,
2001. Mise au point d’un protocole experimental de separa-
tion granulometrique d’assemblage de nannofossiles calcaires:
applications paleoecologique et geochimiques. Bulletin De La
Societe Geologique De France 172, 437–446.
Olson, D.B., Doney, S.C., Musgrave, D.L., 1995. WOCE 17N
Cruise Report, R/V/ Knorr Cruise 145/10 in the Indian
Ocean, Scripps Institute of Oceanography, 33 pp.
Passow, U., De la Rocha, C.L., 2006. Accumulation of mineral
ballast on organic aggregates. Global Biogeochemical Cycles
20 (1).
Poulton, A.J., Adey, T., Balch, W.M., Holligan, P., 2007.
Relating coccolithophore calcification rates to phyoplankton
community dynamics: regional differences and implications
for carbon export. Deep-Sea Research II, this issue
[doi:10.1016/j.dsr2.2006.12.003].
Prasad, T.G., 2004. A comparison of mixed-layer dynamics
between the Arabian Sea and Bay of Bengal: one-
dimensional model results. Journal of Geophysical Research
109.
Prasanna Kumar, S., Nuncio, M., Narvekar, J., 2004. Are eddies
nature’s trigger to enhance biological productivity in the Bay
of Bengal? Geophysical Research Letters 31.
Ramaswamy, V., Gaye, B., 2006. Regional variations in the
fluxes of foraminifera carbonate, coccolithophorid carbonate,
and biogenic opal in the northern Indian Ocean. Deep-Sea
Research I 53, 271–293.
Rickaby, R.E.M., Bard, E., Sonzogni, C., Rostek, F., Beaufort,
L., Barker, S., Rees, G., Schrag, D.P., 2007. Coccolith
chemistry reveals secular variations in the global ocean
carbon cycle? Earth and Planetary Science Letters 253, 83–95.
Rickaby, R.E.M., Schrag, D.P., Zondervan, I., Riebesell, U.,
2002. Growth rate dependence of Sr incorporation during
calcification of Emiliania huxleyi. Global Biogeochemical
Cycles 16 (1).
Sadhuram, Y., 2004. Record decrease of sea surface temperature
following the passage of a super cyclone over the Bay of
Bengal. Current Science 86, 383–384.
Sarin, M.M., Krishnawswami, S., Dilli, K., Somayajulu, B.L.K.,
Moore, W.S., 1989. Major ion chemistry of the Ganga-
Brahmaputra river system: weathering processes and fluxes to
the Bay of Bengal. Geochimica et Cosmochimica Acta 53,
997–1009.
Shenoi, S.S.C., Shankar, D., Shetye, S.R., 2002. Difference in
heat budgets of the near-surface Arabian Sea and Bay of
Bengal: implications for the summer monsoon. Journal of
Geophysical Research 107.
Shetye, S.R., Shenoi, S.S.C., Gouveia, A.D., Michael, G.S.,
Sundar, D., Namppothiri, G., 1991. Wind-driven coastal
upwelling along the western boundary of the Bay of Bengal
during the southwest monsoon. Continental Shelf Research
11, 1397–1408.
Siegel, D.A., Armstrong, R.A., 2002. Trajectories of sinking
particles in the Sargasso Sea: modeling of statistical funnels
above deep-ocean sediment traps (vol. 44, pp. 1519–1997).
Deep-Sea Research I 49, 1115–1116.
Siegel, D.A., Deuser, W.G., 1997. Trajectories of sinking particles
in the Sargasso Sea: modeling of statistical funnels above
deep-ocean sediment traps. Deep-Sea Research I 44,
1519–1541.
Somayajulu, Y.K., Murty, V.S.N., Sarma, V., 2003. Seasonal and
inter-annual variability of surface circulation in the Bay of
Bengal from TOPEX/Poseidon altimetry. Deep-Sea Research
II 50, 867–880.
Spero, H.J., Bijma, J., Lea, D., Bemis, B.E., 1997. Effect of
seawater carbonate concentration on foraminiferal carbon
and oxygen isotopes. Nature 390, 497–500.
Sprengel, C., Baumann, K.H., Henderiks, J., Henrich, R., Neuer,
S., 2002. Modern coccolithophore and carbonate sedimenta-
tion along a productivity gradient in the Canary
Islands region: seasonal export production and surface
accumulation rates. Deep-Sea Research II 49 (17),
3577–3598.
Stoll, H., Ziveri, P., 2004. Coccolithophorid-based geochemical
proxies. In: Thierstein, H., Young, J. (Eds.), Coccolitho-
phores: From Molecular Processes to Global Impact. Spring-
er, New York, pp. 529–562.
Stoll, H.M., Bains, S., 2003. Coccolith Sr/Ca records of
productivity during the Paleocene-Eocene thermal maximum
from the Weddell Sea. Paleoceanography 18 (2).
ARTICLE IN PRESSH.M. Stoll et al. / Deep-Sea Research II 54 (2007) 558–580580
Stoll, H.M., Ziveri, P., 2002. Separation of monospecific and
restricted coccolith assemblages from sediments using differ-
ential settling velocity. Marine Micropaleontology 46 (1–2),
209–221.
Stoll, H., Ziveri, P., Shimizu, N., Conte, M. H., Theroux, S.,
2007. Relationship between coccolith Sr/Ca ratios and
coccolithophore production and export in the Arabian Sea
and Sargasso Sea. Deep-Sea Research II, this issue
[doi:10.1016/j.dsr2.2007.01.003].
Sweeney, E.N., McGillicuddy, D.J., Buesseler, K.O., 2003.
Biogeochemical impacts due to mesoscale eddy activity in
the Sargasso Sea as measured at the Bermuda Atlantic Time-
series Study (BATS). Deep-Sea Research II 50, 3017–3039.
Unger, D., Ittekkot, V., Schafer, P., Tiemann, J., Rescheke, S.,
2003. Seasonality and interannual variability of particle fluxes
to the deep Bay of Bengal: influence of riverine input and
oceanographic processes. Deep-Sea Research II 50, 897–923.
Unger, D., Ittekkot, V., Schafer, P., Tiemann, J., 2005.
Biogeochemistry of particulate organic matter from the Bay
of Bengal as discernible from hydrolysable neutral carbohy-
drates and amino acids. Marine Chemistry 96, 155–184.
Vinayachandran, P.N., Mathew, S., 2003. Phytoplankton bloom
in the Bay of Bengal during the northeast monsoon and its
intensification by cyclones. Geophysical Research Letters 30.
Vinayachandran, P.N., Saji, H.N., Yamagata, T., 1999. Response
of the Equatorial Indian Ocean to an unusual wind
event during 1994. Geophysical Research Letters 26,
1613–1616.
Young, J., 1994. Functions of Coccoliths. In: Winter, A., Sissler,
W. (Eds.), Coccolithophores. Cambridge University Press,
Cambridge, UK, pp. 63–82.
Young, J., Ziveri, P., 2000. Calculation of coccolith volume and
its use in calibration of carbonate flux estimates. Deep-Sea
Research II 47, 1679–1700.
Ziveri, P., Stoll, H., Probert, I., Klass, C., Geisen, M., Ganssen,
G., Young, J., 2003. Stable isotope ‘vital effects in coccolith
calcite. Earth and Planetary Science Letters 210 (1–2),
137–149.