Warrantless Searches for Article 23 Offences - Centre for ...
Upload
biochange-labCategory
view
0download
0
arX
iv:1
103.
0477
v1 [
astr
o-ph
.HE
] 2
Mar
201
1
Prepared for submission to JCAP
Searches for Dark Matter annihilation
signatures in the Segue 1 satellite
galaxy with the MAGIC-I telescope
MAGIC Collaboration
J. Aleksic1 E. A. Alvarez2 L. A. Antonelli3 P. Antoranz4
M. Asensio2 M. Backes5 J. A. Barrio2 D. Bastieri6 J. BecerraGonzalez7,8 W. Bednarek9 A. Berdyugin10 K. Berger7,8
E. Bernardini11 A. Biland12 O. Blanch1 R. K. Bock13 A. Boller12
G. Bonnoli3 D. Borla Tridon13 I. Braun12 T. Bretz14,26 A. Canellas15
E. Carmona13 A. Carosi3 P. Colin13 E. Colombo7 J. L. Contreras2
J. Cortina1 L. Cossio16 S. Covino3 F. Dazzi16,27 A. De Angelis16
E. De Cea del Pozo17 B. De Lotto16 C. Delgado Mendez7,28
A. Diago Ortega7,8 M. Doert5 A. Domınguez18 D. DominisPrester19 D. Dorner12 M. Doro20 D. Elsaesser14 D. Ferenc19
M. V. Fonseca2 L. Font20 C. Fruck130 R. J. Garcıa Lopez7,8
M. Garczarczyk7 D. Garrido20 G. Giavitto1 N. Godinovic19
D. Hadasch17 D. Hafner13 A. Herrero7,8 D. Hildebrand12
D. Hohne-Monch14 J. Hose13 D. Hrupec19 B. Huber12 T. Jogler13
S. Klepser1 T. Krahenbuhl12 J. Krause13 A. La Barbera3 D. Lelas19
E. Leonardo4 E. Lindfors10 S. Lombardi6 M. Lopez2 E. Lorenz12,13
M. Makariev21 G. Maneva21 N. Mankuzhiyil16 K. Mannheim14
L. Maraschi3 M. Mariotti6 M. Martınez1 D. Mazin1,13 M. Meucci4
J. M. Miranda4 R. Mirzoyan13 H. Miyamoto13 J. Moldon15
A. Moralejo1 P. Munar-Androver15 D. Nieto2 K. Nilsson10,29
R. Orito13 I. Oya2 S. Paiano6 D. Paneque13 R. Paoletti4 S. Pardo2
J. M. Paredes15 S. Partini4 M. Pasanen10 F. Pauss12
M. A. Perez-Torres1 M. Persic16,22 L. Peruzzo6 M. Pilia23
J. Pochon7 F. Prada18 P. G. Prada Moroni24 E. Prandini6
I. Puljak19 I. Reichardt1 R. Reinthal10 W. Rhode5 M. Ribo15
J. Rico25,1 S. Rugamer14 A. Saggion6 K. Saito13 T. Y. Saito13
M. Salvati3 K. Satalecka11 V. Scalzotto6 V. Scapin2 C. Schultz6
T. Schweizer13 M. Shayduk13 S. N. Shore24 A. Sillanpaa10

J. Sitarek9 D. Sobczynska9 F. Spanier14 S. Spiro3 A. Stamerra4
B. Steinke13 J. Storz14 N. Strah5 T. Suric19 L. Takalo10
H. Takami13 F. Tavecchio3 P. Temnikov21 T. Terzic19 D. Tescaro24
M. Teshima13 M. Thom5 O. Tibolla14 D. F. Torres25,17 A. Treves23
H. Vankov21 P. Vogler12 R. M. Wagner13 Q. Weitzel12 V. Zabalza15
F. Zandanel18 R. Zanin1 and M. Fornasa18,30 R. Essig31 N. Sehgal32
L. E. Strigari32
1IFAE, Edifici Cn., Campus UAB, E-08193 Bellaterra, Spain2Universidad Complutense, E-28040 Madrid, Spain3INAF National Institute for Astrophysics, I-00136 Rome, Italy4Universita di Siena, and INFN Pisa, I-53100 Siena, Italy5Technische Universitat Dortmund, D-44221 Dortmund, Germany6Universita di Padova and INFN, I-35131 Padova, Italy7Inst. de Astrofısica de Canarias, E-38200 La Laguna, Tenerife, Spain8Depto. de Astrofısica, Universidad de La Laguna, E-38206 La Laguna, Spain9University of Lodz, PL-90236 Lodz, Poland
10Tuorla Observatory, University of Turku, FI-21500 Piikkio, Finland11Deutsches Elektronen-Synchrotron (DESY), D-15738 Zeuthen, Germany12ETH Zurich, CH-8093 Switzerland13Max-Planck-Institut fur Physik, D-80805 Munchen, Germany14Universitat Wurzburg, D-97074 Wurzburg, Germany15Universitat de Barcelona (ICC/IEEC), E-08028 Barcelona, Spain16Universita di Udine, and INFN Trieste, I-33100 Udine, Italy17Institut de Ciencies de l’Espai (IEEC-CSIC), E-08193 Bellaterra, Spain18Inst. de Astrofısica de Andalucıa (CSIC), E-18080 Granada, Spain19Croatian MAGIC Consortium, Institute R. Boskovic, University of Rijeka and University
of Split, HR-10000 Zagreb, Croatia20Universitat Autonoma de Barcelona, E-08193 Bellaterra, Spain21Inst. for Nucl. Research and Nucl. Energy, BG-1784 Sofia, Bulgaria22INAF/Osservatorio Astronomico and INFN, I-34143 Trieste, Italy23Universita dell’Insubria, Como, I-22100 Como, Italy24Universita di Pisa, and INFN Pisa, I-56126 Pisa, Italy25ICREA, E-08010 Barcelona, Spain26now at: Ecole polytechnique federale de Lausanne (EPFL), Lausanne, Switzerland27supported by INFN Padova28now at: Centro de Investigaciones Energeticas, Medioambientales y Tecnologicas (CIEMAT),
Madrid, Spain29now at: Finnish Centre for Astronomy with ESO (FINCA), Turku, Finland30MultiDark fellow31Stanford Linear Accelerator Center, Stanford, California, 94309, USA32Kavli Institute for Particle Astrophysics and Cosmology, Stanford University, Stanford,
California 94305, USA
E-mail: [email protected], [email protected], [email protected],[email protected]
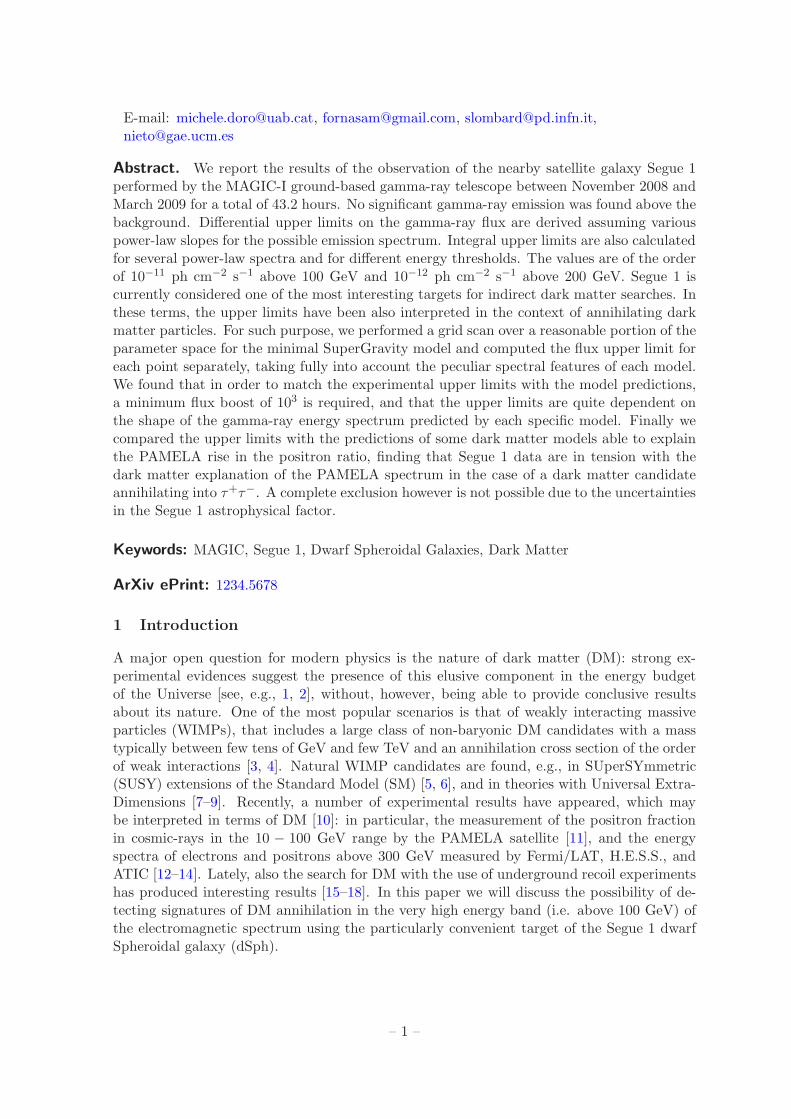
Abstract. We report the results of the observation of the nearby satellite galaxy Segue 1performed by the MAGIC-I ground-based gamma-ray telescope between November 2008 andMarch 2009 for a total of 43.2 hours. No significant gamma-ray emission was found above thebackground. Differential upper limits on the gamma-ray flux are derived assuming variouspower-law slopes for the possible emission spectrum. Integral upper limits are also calculatedfor several power-law spectra and for different energy thresholds. The values are of the orderof 10−11 ph cm−2 s−1 above 100 GeV and 10−12 ph cm−2 s−1 above 200 GeV. Segue 1 iscurrently considered one of the most interesting targets for indirect dark matter searches. Inthese terms, the upper limits have been also interpreted in the context of annihilating darkmatter particles. For such purpose, we performed a grid scan over a reasonable portion of theparameter space for the minimal SuperGravity model and computed the flux upper limit foreach point separately, taking fully into account the peculiar spectral features of each model.We found that in order to match the experimental upper limits with the model predictions,a minimum flux boost of 103 is required, and that the upper limits are quite dependent onthe shape of the gamma-ray energy spectrum predicted by each specific model. Finally wecompared the upper limits with the predictions of some dark matter models able to explainthe PAMELA rise in the positron ratio, finding that Segue 1 data are in tension with thedark matter explanation of the PAMELA spectrum in the case of a dark matter candidateannihilating into τ+τ−. A complete exclusion however is not possible due to the uncertaintiesin the Segue 1 astrophysical factor.
Keywords: MAGIC, Segue 1, Dwarf Spheroidal Galaxies, Dark Matter
ArXiv ePrint: 1234.5678
1 Introduction
A major open question for modern physics is the nature of dark matter (DM): strong ex-perimental evidences suggest the presence of this elusive component in the energy budgetof the Universe [see, e.g., 1, 2], without, however, being able to provide conclusive resultsabout its nature. One of the most popular scenarios is that of weakly interacting massiveparticles (WIMPs), that includes a large class of non-baryonic DM candidates with a masstypically between few tens of GeV and few TeV and an annihilation cross section of the orderof weak interactions [3, 4]. Natural WIMP candidates are found, e.g., in SUperSYmmetric(SUSY) extensions of the Standard Model (SM) [5, 6], and in theories with Universal Extra-Dimensions [7–9]. Recently, a number of experimental results have appeared, which maybe interpreted in terms of DM [10]: in particular, the measurement of the positron fractionin cosmic-rays in the 10 − 100 GeV range by the PAMELA satellite [11], and the energyspectra of electrons and positrons above 300 GeV measured by Fermi/LAT, H.E.S.S., andATIC [12–14]. Lately, also the search for DM with the use of underground recoil experimentshas produced interesting results [15–18]. In this paper we will discuss the possibility of de-tecting signatures of DM annihilation in the very high energy band (i.e. above 100 GeV) ofthe electromagnetic spectrum using the particularly convenient target of the Segue 1 dwarfSpheroidal galaxy (dSph).
– 1 –

Assuming the ΛCDM cosmological model, DM structures form by hierachical collapseof small overdensities and are supposed to extend in mass down to the scale of the Earth oreven below [19–21]. DM structures may also host smaller satellite structures and it has beenproposed that the dSphs in the Milky Way (MW) may have formed within some of thesesubhalos hosted in the larger MW DM halo [22–25]. So far, around two dozen dSphs havebeen identified in the MW. They represent excellent targets for indirect DM searches dueto their very large mass-to-light ratios, low baryonic content (which disfavours gamma-rayemission from conventional astrophysical sources) and their location often at high galacticlatitudes, where contamination by Galactic background is subdominant [26–29].
To this class belongs Segue 1, a satellite galaxy discovered by Belokurov et al. [30] in theSloan Extension for Galactic Understanding and Exploration [SEGUE, 31]. It is located at adistance of 23±2 kpc from the Sun (28 kpc from the Galactic Center) at (RA, Dec) = (10.12h,16.08). Despite the fact that its nature has been debated after discovery [30, 32–34], it hasnow been interpreted more clearly as an ultrafaint MW satellite galaxy in [35] through theidentification of several new member stars (66 instead of the previous 24). This interpretationhas also been confirmed in [36] using a Bayesian analysis of star membership probabilities.Segue 1 was highlighted as a good target for indirect DM detection in [37] and [38]. TheFermi/LAT [39] has observed Segue 1 in its survey observation mode: results from the first 3months of data have been presented in [40] and [41], while results from the first 9 months ofdata have been presented in [42] and [43]. No gamma-ray signal was detected. Implicationsfor DM models have been considered in [44] and [45]. Segue 1 was also observed by the X-raytelescope onboard the SWIFT satellite. Data from this short observation (∼ 5 ks) have beenanalyzed in [46] where no detection is reported either.
We present here the results of the observation of the Segue 1 satellite performed by theMajor Atmospheric Gamma-ray Imaging Cherenkov (MAGIC) telescope. The observationtook place between November 2008 and March 2009, for a total of 43.2 hours (29.4 hours ingood observational conditions after quality cuts). No significant detection above the back-ground was found for energies above 100 GeV. In this paper we describe the data analysisand determine upper limits (ULs) for the gamma-ray emission. We extensively study thedependence of the ULs on a set of parameters like the expected energy spectrum of thesource or on experimental features like the energy threshold and the angular resolution. TheMAGIC-I observation is then used to put constraints on some models of DM. We focus onthe case of annihilating SUSY DM candidates and compute a grid scan over a reasonablerange of the SUSY parameters. Point per point we use the predicted energy spectrum tocompute specific ULs, showing that the dependence on the energy spectrum is even moreprominent than in the case of power-law spectra. ULs are also given for DM models that fitthe PAMELA and Fermi/LAT cosmic-ray spectra.
The paper is organized as follows: in section 2 we describe the observation of Segue 1with MAGIC-I and discuss the analysis. In section 3 the calculation of the ULs on thedifferential and integral flux is outlined and results are reported in the case of power-lawspectra. We focus on a possible DM interpretation in section 4. Conclusions are drawn insection 5 together with a brief summary.
2 Observation of Segue 1 with the MAGIC-I telescope
The MAGIC experiment for ground-based gamma-ray astronomy consists of a system of twotelescopes operating in stereoscopic mode since fall 2009 at the Canary Island of La Palma
– 2 –

(28.8 N, 17.8 W, 2200 m a.s.l.). The first telescope, MAGIC-I, has been operating since late2003, whereas the second one, dubbed MAGIC-II, has started operations at the beginning of2010 [47]. The stereoscopic system allows for improved background rejection specially at lowenergies (and therefore higher sensitivity), improved energy and angular resolutions, and alower energy threshold [48].
The observation of Segue 1 was carried out when only the first telescope was operating.The data were taken during dark nights between November 2008 and March 2009, for a totalexposure time of 43.2 hours. The source was surveyed at zenith angles between 12.7 and33.9, which guarantees a low energy threshold, in false-source tracking (wobble) mode [49],in which the pointing direction alternates every 20 minutes between two positions, offset by±0.4 in RA from the source.
The data analysis was performed using the standard MAGIC-I analysis and reconstruc-tion software. After the calibration and image cleaning [50, 51], the hadronic backgroundrejection is achieved through a multivariate method called Random Forest (RF) [51, 52].The algorithm uses the image Hillas parameters [53] and timing variables to compute agamma-ray/hadron discriminator called hadronness by comparison with Monte Carlo (MC)gamma-ray simulations. Hadronness ranges from 0 (for showers confidently identified as ini-tiated by gamma-rays) to 1 (for those clearly showing the features of a hadronic cosmic-rayinitiated shower). The RF method is also used to estimate the energy of the showers. Thedetector MC simulation was tuned to fit the actual telescope performance at the time of theobservations. After standard quality cuts in trigger rate, atmospheric condition, and a checkof the distribution of basic image parameters, around 30% of the Segue 1 data were rejected,resulting in 29.4 hours of data. The same quality cuts were applied to a sample of CrabNebula data, taken in similar experimental conditions, to cross-check the RF routines andthe analysis cuts.
With respect to the standard MAGIC-I analysis, an additional cut was introduced toaccount for the presence of the star η−Leonis, with apparent magnitude V = 3.5, B − V =0.02 and (RA, Dec) = (10.12h, 16.76), located at 0.68 from the position of Segue 1. Thelight of the star entered the trigger region of the MAGIC-I camera and, as a consequence,produced local inhomogeneities, which are not treated properly by the standard analysis atenergies below 200 GeV. Therefore, all events below this energy and spatially coincidentwith an optimized region around the position of the star in the camera were discarded. Withsuch additional star-cuts, around 20% of the events were rejected. The same star-cuts wereapplied to the Crab Nebula data, and to the MC gamma-ray events for consistency. The finalenergy threshold was at 100 GeV and the star-cuts had the main effect of slightly reducingthe effective area at lower energies.
The number of candidates for gamma-ray events from the direction of the source wasestimated using the distribution of |α| angles1[53], which is related to the orientation of theshower. The best set of cuts for the hadronness and |α| parameters were optimized on theCrab Nebula data sample, separately in logarithmic energy bins, and under the assumptionof a point-like emission. In section 4 we will further discuss this issue. In figure 1, the |α|-plotabove 100 GeV is shown. The number of excess events was computed in a fixed fiducial signalregion with |α| < 14 and is Nexc(> 100 GeV)= −279 ± 329, corresponding to a significanceof −0.85σ, computed using eq. (17) of Li & Ma [54].
1The |α| parameter is defined as the angle between the major axis of an image and the direction from the
image center of gravity to a reference point in the field-of-view, which is the nominal source position for the
ON data, and a control background point for the OFF data.
– 3 –

]° | [α| 0 10 20 30 40 50 60 70 80 90
coun
ts
0
1000
2000
3000
4000
5000
6000
7000
8000
9000
= 29.42 [h]onT = 53928onN
233± = 54207 offN 329± = -279 excN
= -0.85LiMa
σ
MAGIC Coll. (2010)
Figure 1. |α|−plot from 29.4 hours of observation of Segue 1 above 100 GeV with the MAGIC-I telescope. The vertical dashed line represents the fiducial region |α| < 14 where the signal isexpected. Black points represent the background (OFF sample), red points the signal (ON sample),and green points their difference.
In figure 2, we show the significance map for the sky region around Segue 1. For thisplot the source independent DISP method was used [55]. The energy threshold in this casewas raised to 200 GeV to cope with the presence of the star in the trigger region. Thesignificance distribution is consistent with background fluctuations.
3 Upper Limits for Power-Law Spectra
In the previous section we presented the Segue 1 data collected by the MAGIC-I telescope,showing that, above 100 GeV, results are consistent with no signal over the background. Wederive now differential and integral flux ULs for the gamma-ray emission from the source. Inthe computation of the ULs, we will distinguish between “true” energy E (defined for theMC gamma-ray simulated events) and “reconstructed” energy Erec, calculated by means ofthe RF method (see section 2) for the real as well as for the MC gamma-ray data.
3.1 Differential Upper Limits for power-law spectra
In order to calculate the differential flux UL in an energy bin ∆Erec one can estimate theUL in the number of excess events NUL
exc (∆Erec) following the so-called “Rolke method” [56,assuming 30% systematic uncertainty in the signal efficiency and 95% confidence level] fromthe |α|−plot (obtained after the usual analysis cuts and only for reconstructed energies within
– 4 –
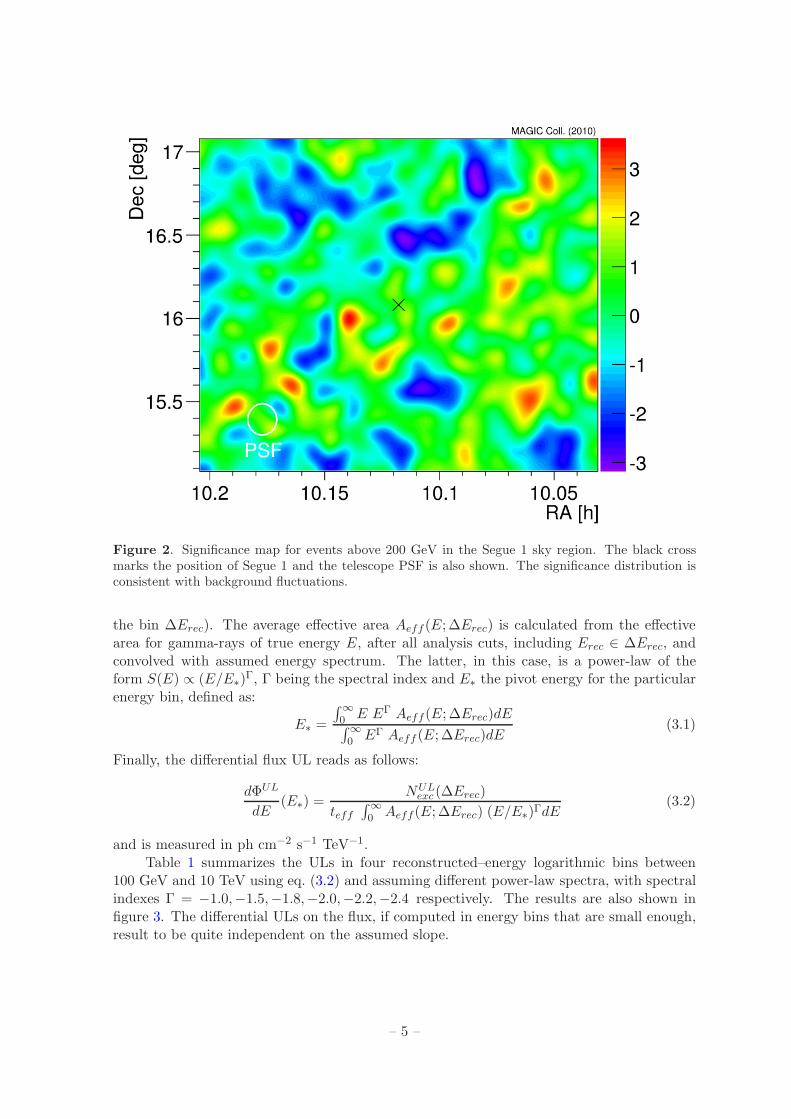
Figure 2. Significance map for events above 200 GeV in the Segue 1 sky region. The black crossmarks the position of Segue 1 and the telescope PSF is also shown. The significance distribution isconsistent with background fluctuations.
the bin ∆Erec). The average effective area Aeff (E; ∆Erec) is calculated from the effectivearea for gamma-rays of true energy E, after all analysis cuts, including Erec ∈ ∆Erec, andconvolved with assumed energy spectrum. The latter, in this case, is a power-law of theform S(E) ∝ (E/E∗)Γ, Γ being the spectral index and E∗ the pivot energy for the particularenergy bin, defined as:
E∗ =
∫∞
0 E EΓ Aeff (E; ∆Erec)dE∫∞
0 EΓ Aeff (E; ∆Erec)dE(3.1)
Finally, the differential flux UL reads as follows:
dΦUL
dE(E∗) =
NULexc (∆Erec)
teff∫∞
0 Aeff (E; ∆Erec) (E/E∗)ΓdE(3.2)
and is measured in ph cm−2 s−1 TeV−1.Table 1 summarizes the ULs in four reconstructed–energy logarithmic bins between
100 GeV and 10 TeV using eq. (3.2) and assuming different power-law spectra, with spectralindexes Γ = −1.0,−1.5,−1.8,−2.0,−2.2,−2.4 respectively. The results are also shown infigure 3. The differential ULs on the flux, if computed in energy bins that are small enough,result to be quite independent on the assumed slope.
– 5 –

Table 1. Differential Segue 1 flux upper limits for several power-law gamma-ray spectra in fourenergy bins
∆E NON/NOFF σLi,Ma dΦUL/dE [TeV−1cm−2s−1][TeV] (NUL
exc ) 95% C.L. (E∗ [GeV])Γ = −1.0 Γ = −1.5 Γ = −1.8 Γ = −2.0 Γ = −2.2 Γ = −2.4
0.1, 0.32 51871/52271 -1.2 4.9 ·10−11 5.2·10−11 5.5·10−11 5.8·10−11 6.1·10−11 6.5·10−11
(399) (228) (211) (200) (183) (187) (180)0.32, 1 696/657 1.1 3.3 ·10−12 3.4·10−12 3.6·10−12 3.8·10−12 4.0·10−12 4.2·10−12
(156) (681) (631) (603) (584) (566) (548)1, 3.2 99/77 1.7 3.5 ·10−13 3.7·10−13 3.9·10−13 4.0·10−13 4.2·10−13 4.5·10−13
(72) (2060) (1917) (1835) (1782) (1730) (1681)3.2, 10 69/57 1.1 5.7 ·10−14 6.0·10−14 6.4·10−14 6.6·10−14 7.0·10−14 7.4·10−14
(48) (6750) (6230) (5937) (5751) (5572) (5402)
[GeV]*E210 310 410
]-1
s-2
cm
-1
/dE
[T
eVU
LΦd
-1610
-1510
-1410
-1310
-1210
-1110
-1010
-910
-810
-710 = -1Γspectral index
= -1.5Γspectral index
= -1.8Γspectral index
= -2Γspectral index
= -2.2Γspectral index
= -2.4Γspectral index
MAGIC Coll. (2010)
Figure 3. Differential flux upper limits from Segue 1 as in table 1. As reference, the Crab Nebuladifferential flux (red dashed line) and its 10% (blue dashed line) and 1% (yellow dashed line) fractionsare also drawn.
3.2 Integral Upper Limits for power-law spectra
Extending the computation of the ULs to energies above a given threshold E0, we end upwith the following expression:
ΦUL(> E0) =NUL
exc (Erec > E0)∫∞
E0S(E)dE
teff∫∞
0 Aeff (E;Erec > E0)S(E)dE(3.3)
where S(E) is again the assumed energy spectrum of the source, NULexc (Erec > E0) is derived,
as mentioned above, from the corresponding |α|−plot for Erec > E0, and the effective area
– 6 –

[GeV]E_thresh210 310
]-1
s-2
[cm
UL
Φ
-1310
-1210
-1110
-1010 = -1Γspectral index
= -1.5Γspectral index
= -1.8Γspectral index
= -2Γspectral index
= -2.2Γspectral index
= -2.4Γspectral index
MAGIC Coll. (2010)
Figure 4. Integral flux upper limits from Segue 1. The arrows indicate the integral flux upper limitsas in table 2 for different power-law spectra and energy thresholds. On the contrary, the dashed linesindicate the corresponding integral upper limits if zero significance σLi,Ma is assumed.
is reweighted for the assumed source spectrum.Table 2 and figure 4 present the integral ULs achieved by the MAGIC-I observation of
Segue 1 for different energy thresholds and different power-law spectra with spectral indexΓ = −1.0,−1.5,−1.8,−2.0,−2.2,−2.4 respectively. The results are comparable with theresults of other IACTs on observations of dSphs [57–62].
Table 2. Integral Segue 1 flux upper limits for several power-law spectra and different energy thresh-olds E0
E0 NON/NOFF NULexc σLi,Ma ΦUL/× 10−12
[GeV] 95% C.L. [cm−2s−1]Γ = −1.0 Γ = −1.5 Γ = −1.8 Γ = −2.0 Γ = −2.2 Γ = −2.4
100 52978/53301 453 -0.99 7.5 8.8 10.5 11.6 12.7 13.7126 18835/19233 174 -2.04 2.8 3.2 3.6 4.0 4.3 4.6158 6122/6374 93 -2.25 1.5 1.6 1.8 1.9 2.0 2.1200 3012/3088 110 -0.97 1.7 1.7 1.9 2.0 2.1 2.2251 1687/1654 194 0.57 3.0 2.9 3.1 3.2 3.4 3.5316 1107/1030 250 1.67 3.8 3.6 3.7 3.9 2.9 4.1398 792/761 147 0.79 2.2 2.0 2.1 2.1 2.2 2.2501 613/580 140 0.96 2.1 1.9 1.9 1.9 2.0 2.0631 536/509 124 0.84 1.8 1.6 1.6 1.6 1.6 1.6794 486/445 146 1.34 2.1 1.8 1.8 1.8 1.8 1.81000 411/373 135 1.36 2.0 1.7 1.6 1.6 1.6 1.6
– 7 –
In the case of integral ULs, we see that the dependence on the different power-lawgamma-ray spectra is slightly stronger than in the differential ULs case, and the UL for theΓ = −1.0 spectrum is a factor of two stronger than for the Γ = −2.4 spectrum.
In addition, we clearly see the effect of the statistical fluctuations (characterized bythe significance of detection σLi,Ma) on the integral ULs value. The significance of detectiondepends on analysis cuts and the level of residual background: this has quite a strong impacton the UL of the number of events NUL
exc , calculated with the Rolke method, and eventuallyon the flux UL (see tables 1 and 2). Quantitatively, a smaller significance corresponds to alower (more stringent) UL: e.g., going from σLi,Ma = −1 to 1, the UL gets worse by a factor of3. This is an intrinsic feature of the stastical methods exploited in the analysis and it shouldbe taken into account when comparing ULs from different analyses.
For this reason, in order to estimate the effect of the spectral slope and of the energythreshold on the value of the integral UL, without being biased by the fluctuation due todifferent values of the significance, we computed again the ULs assuming a null value forσLi,Ma: in particular dashed lines in figure 4 are obtained with a significance equal to zero(i.e. with number of ON events equal to the number of OFF events in the signal region ofthe |α|-plot) for different values of Γ and E0.
4 Constraints on Dark Matter Models
In this section Segue 1 is treated as target for indirect DM searches. Assuming a particularform for Segue 1 DM halo, we translate the ULs calculation described before into constraintson the DM annihilation rate.
The gamma-ray flux due to DM annihilations depends on i) the intrinsic DM densitydistribution in the source, ii) the particle physics characteristics of the DM candidate andiii) the telescope energy resolution ǫ, the field of view ∆Ω within which the putative signalis integrated, and the energy threshold E0. It is usually factorized in two terms:
Φ(> E0,∆Ω) = ΦPPǫ (> E0) J (∆Ω), (4.1)
where ΦPPǫ is the so-called particle physics factor and reads as follows:
ΦPPǫ (> E0) =
1
4π
〈σannv〉
2m2χ
∫ mχ
E0
n∑
i=1
BidN i
γ
dEdE, (4.2)
where 〈σannv〉 is the velocity averaged annihilation cross section, mχ is the DM particle mass,and
∑ni=1B
idN iγ/dE = dNγ/dE is the sum over all the n possible annihilation channels
producing photons (Bi is the particular branching ratio for channel i).The term J(∆Ω) is the astrophysical factor and is given by the line-of-sight integral
over the DM density squared within a solid angle ∆Ω:
J(∆Ω) =
∫
∆Ω
∫
losρ2(r(s,Ω)) ds dΩ. (4.3)
Motivated by results from cosmological simulations, to describe the Segue 1 DM densitydistribution we used the Einasto profile [63]:
ρEIN(r) = ρse−2n [(r/rs)1/n−1], (4.4)
– 8 –

which produced a good fit to the subhalos simulated by the most recent N -body simulations[21]. Eq. (4.4) is defined by three parameters: the scale density ρs, the scale radius rs andthe index n, which typically ranges from −3 to 7. For the computation of the astrophysicalfactor, we have used ρs = 1.1 × 10⁸ M⊙kpc−3, rs = 0.15 kpc and n = 3.3. The extent of theSegue 1 stellar distribution, and thus a conservative mininum extent of its stellar DM halo, is0.25 deg [35, 45]. The astrophysical uncertainty on J(∆Ω) has been estimated to be slightlylarger than one order of magnitude at 2σ level [45].
In figure 5 we show how the gamma-ray flux increases when integrating within largerregions around the center of the source. We see that the source is slightly extended comparedto a representative MAGIC-I angular resolution of 0.1. The energy dependent |α| cutsapplied in the analysis determine the integrating angle which fix the fraction of the totalastrophysical factor that must be considered for the ULs computation. In order to get thisintegrating angle we have produced a toy MC simulation for extended sources starting frompoint-like MC events and spreading the original gamma-ray arrival directions according tothe source DM density distribution of figure 5. Since the source is only slightly extendedand the assumed luminosity is very peaked at the center, this method mimics reasonablywell a dedicated analysis for an extended source. We have found that the applied |α| cutscorrespond to an angular integration of 0.14 from the Segue 1 center (corresponding to asolid angle of 10−5 sr). From figure 5, one can see that such integrating angle encloses 64%of the total astrophysical factor. Therefore, with the values mentioned above for scale radiusand density which leads to a total astrophysical factor of J(∆Ω) = 1.78×10¹⁹ GeV2 cm−5 sr,the effective astrophysical factor within the considered analysis cuts is J(∆Ω) = 1.14 × 10¹⁹
GeV2 cm−5 sr.Focusing now on the particle physics factor, we restrict ourselves for now to the case of
a SUSY model in which the presence of a discrete symmetry (R−parity) guarantees that theLightest Supersymmetric Particle (LSP) is stable over cosmological timescales and, therefore,a good WIMP candidate. We will consider a 5-dimensional subspace of the Minimal Super-symmetric Standard Model (MSSM) called mSUGRA [64, 65], which is defined by universalmasses for the gauginos (m1/2), scalars (m0), and trilinear couplings (A0), as well as by theratio of the vacuum expectation values of the two Higgs fields (tan β) and the sign of theHiggsino mass term sign(µ). In the majority of mSUGRA models, the role of the LSP isplayed by the lightest neutralino χ, a linear combination of the super-partners of the gaugebosons and neutral Higgs bosons.
In order to study the phenomenology of mSUGRA we performed a grid scan over theparameter space. We spanned (with linear steps) the regions indicated in table 3, chosento provide neutralino masses within the range of detection for MAGIC-I. For each directionwe considered 40 steps and in each bin along m0 and m1/2 we randomly selected a pointwithin that bin. The scan has been done once with a positive sign(µ) and then again with anegative sign(µ), for a total of 5 × 10⁶ points. For each mSUGRA model we used DarkSUSY
5.0.4 [66] i) to test if the model is unphysical, ii) to check if it passes the Standard Model(SM) experimental constraints implemented in the code (e.g. LEP bounds on Higgs massmh > 114 GeV, on chargino mass mχ+ > 103.5 GeV and constraints from b → sγ), and iii)to compute the relic density [with Isasugra 7.78 67].
All the models in the scan that correspond to a neutralino with a relic density compatiblewith the value derived by WMAP data within three times its experimental error σWMAP [1]are plotted as crosses in figure 6. The crosses approximatively cover the mass range between100 GeV and 1 TeV, due to the range that we considered for m0 and m1/2 in the scan. On the
– 9 –

[deg]Ψ0 0.1 0.2 0.3 0.4 0.5 0.6 0.7 0.8 0.9 1
Flu
x fr
actio
n [%
]
0
10
20
30
40
50
60
70
80
90
100
Einasto profile
MAGIC Coll. (2010)
Point-like cut
Figure 5. Fraction for squared DM density around Segue 1 integrated within an angular opening Ψwith respect to the total squared DM density, as a function of Ψ itself. The dashed line indicates theangular opening corresponding roughly to the cut in the |α| plot used in the current analysis, whichwas optimized for point-like sources. An Einasto profile, as defined in the text, is assumed to describethe DM density distribution.
Table 3. Parameter space for the scan over mSUGRA. From Komatsu et al. [1] ΩWMAPDM h2 = 0.1123
and σWMAP = 0.0035.Parameter Range Steps
m0 50 ; 5000 GeV 40m1/2 0 ; 5000 GeV 40
tan β 2 ; 62 40A0 −7000 ; 7000 40
sign(µ) +;− 2
Total number of models scanned 5.12 × 10⁶
& passing SM bounds 2.42 × 10⁶
& with ΩDMh2 − ΩWMAP
DM h2 < 3σWMAP 42427& with |ΩDMh
2 − ΩWMAPDM
h2| < 3σWMAP 4180
contrary, the values for the cross section span many orders of magnitude. They are mainlyconcentrated around a value of 10−26 cm3 s−1, but there are models that, due to particularmechanisms, are characterized by lower values for the cross section. One example is theprominent “strip” that crosses the plane from 10−26 cm3 s−1 to around 3×10⁻²⁹ cm3 s−1 for
– 10 –

[GeV]χm0 200 400 600 800 1000 1200
]-1
s3>
[ cm
UL
vσ<
-3010
-2910
-2810
-2710
-2610
-2510
-2410
-2310
-2210
-2110
-2010MAGIC Coll. (2010)
)σ2± (J_astro-τ+τ
bb
mSugra (WMAP)
(>85%)b b→χχ (>70%)-τ+τ →χχ
Figure 6. Annihilation cross section ULs from Segue 1 MAGIC data considering neutralino anni-hilating entirely into bb or into τ+τ−. mSUGRA models with a relic density within 3σWMAP fromthe WMAP value are plotted (black crosses). Among these, neutralinos annihilating mainly in bband τ+τ− are indicated with light brown points and blue points respectively. The dashed brownline indicates ULs for a neutralino annihilating entirely into bb while the solid blue lines the case ofannihilations into τ+τ−. The blue thin line represents the integral UL for the τ+τ− channel as ifthey were calculated (independently of the mass) with a fixed energy threshold of 100 GeV, while forthe thick blue line the energy threshold is optimized for each value of mχ. Finally, for annihilationsinto τ+τ−, the blue band covers the 2σ uncertainty on JΘ(∆Ω).
neutralinos that co-annihilate with stops and staus, or the “tail” at low masses (around 50GeV). Among the models compatible with WMAP bounds, two representative subsets arealso shown using a different color coding according to their main annihilation channel (lightbrown points for branching ratio B(b b) > 0.85, and blue points for B(τ+τ−) > 0.7), whichare representatives of a soft and hard gamma-ray spectrum respectively (see figure 7).
For each DM model in the scan, the integral flux UL ΦUL(> E0) can be computedfollowing eq. (3.3), using the Segue 1 data and the specific gamma-ray spectrum of the
– 11 –

E [GeV]100 200 300 400 500 600 700 800 900 1000
/dE
γdN
-810
-710
-610
-510
-410
-310
-210
-110
1-τ+τ →DMDM
-µ+µ →DMDM
-W+ W→DMDM
b b→DMDM
-e+e-e+ e→ φφ →DMDM
Figure 7. Spectra of different annihilation channels. For the channels bb,W+W−, τ+τ−, µ+µ− weused the fits from Ref. [68]. For φφ → 4e we used the parameterization in [37] with mφ = 1 GeV.
individual DM model. In Sec. 3.2 we noticed that the integral ULs may change as a functionof the energy threshold, with lower (more stringent) ULs if E0 is larger than the experimentalone [see also 69]. While this variation is quite predictable in the case of power-laws, thesituation may be less clear for annihilation spectra that contain features and terminate atthe DM mass. An example of some gamma-ray spectra used in this analysis for a DM mass of1 TeV is shown in figure 7. Therefore, for each model we computed the UL for different valuesof energy thresholds E0 among those listed in table 2. To ensure an unbiased comparison, weconsidered the ideal case of null significance σLi,Ma = 0. For each E0 we used the appropriateaverage effective area above E0, reweighted with the particular gamma-ray spectrum fromDM annihilations. The value of the energy threshold producing the lowest (most stringent)UL was then assigned to the particular DM model. Finally we computed again for each modelthe UL using the optimal E0 and the analysis cuts described in Sec. 2 (thus abandoning theσLi,Ma = 0 hypothesis).
To ensure a more direct comparison with the particle physics predictions, we presentour results in terms of ULs on the averaged cross section 〈σannv〉
UL, following eq. (4.2):
〈σannv〉UL =
8πm2χ ΦUL(> E0)
J(∆Ω)∫mχ
E0
dNγ
dE dE. (4.5)
– 12 –

The effect of the energy threshold optimization can be seen in figure 6: the two solid bluelines indicate the UL on the annihilation cross section in the case of annihilations only into theτ channel (i.e. B(τ+τ−) = 1). The thin solid blue line represents the calculation of 〈σannv〉
UL
for a fixed energy threshold of E0 = 100 GeV, while the thick blue line indicates the sameUL after the optimization of the E0: it appears that for DM candidates with masses around500 GeV a factor of 3 in the UL can be gained if the optimal E0 is considered. In the samefigure, it is also possible to see how the ULs depend on the shape of the energy spectrum: thedashed red line indicates the UL (determined with optimized energy threshold) in the caseof annihilations only into bb. Differences can be larger than one order of magnitude [see also70] and, as expected, hard spectra are more constraining. Finally, in the case of annihilationsinto τ+τ−, we also indicate (by means of the blue band) the uncertainty in the astrophysi-cal factor at the 2σ level, showing how strongly it affects our ULs and prospects for detection.
In figure 8 we plot again the 〈σannv〉 predictions (same as in figure 6) for the pointsin the scan (full circles), together with the corresponding ULs after E0 optimization (fullsquares). In addition, all the models in the scan that correspond to a neutralino with a relicdensity lower than the value derived by WMAP data plus three times its experimental errorσWMAP [1] are also plotted as grey crosses. In this case, since the standard freeze-out predictsa too small relic density, we would require a non-thermal production mechanism for the DMto recover the correct relic density. We are not considering the case of multi-componentDM: if the neutralino is responsible for only a fraction of the total DM density, it wouldbe reasonable to rescale the value of the Segue 1 astrophysical factor (and consequenty theUL) by the same fraction. It can be seen that, for large neutralino masses, ULs concentratearound 10−22 cm3 s−1, while at lower masses, the distribution is wider, because models witha low gamma-ray flux above the threshold are able to produce only loose ULs (as in the caseof squares at low masses with UL of the order of 10−20 − 10−19 cm3 s−1). We stress thateach point in the scan should be compared to its own UL, and hence the apparent overlapin figure 8 between the ULs (plotted as squares) and some models with a relic density belowthe WMAP value (grey crosses) does not imply that any of these models is excluded. Inorder to avoid this possible misunderstanding we decide to compute point per point what wecall enhancement factors (ENFs) defined as the ratio between the UL on the averaged crosssection and the value predicted by mSUGRA:
ENF = 〈σannv〉UL/〈σannv〉. (4.6)
This indicates how much the cross section of the particular model should be increased inorder to make it detectable. In these terms, one can easily understand which points can beexcluded by MAGIC-I data on Segue 1 since they would be associated to an ENF smallerthan one. In figure 8 the color coding is chosen in terms of the ENFs: yellow for points withan ENF smaller than 104, orange for models with 104 <ENF< 105, red if 105 <ENF< 106
and brown if ENF> 106.In figure 9 the ENFs are also plotted as a function of the mass for models compatible
with WMAP value of the relic density (red crosses) and below (black crosses). The panel inthe upper right of the figure indicates the ENF distribution for the two sets of models. Forthose compatible with WMAP (red crosses), the lowest ENF is of the order of 103. Figure 8tells us that the models charactized by the lowest ENF are those with the largest annihilationcross section and a neutralino mass above 200 GeV. On the contrary, the majority of thepoints in the scan have an ENF > 104. Moreover, it can also be seen that the distribution
– 13 –

[GeV]χm0 200 400 600 800 1000 1200
]-1
s3
v> [
cmσ
<
-2910
-2810
-2710
-2610
-2510
-2410
-2310
-2210
-2110
-2010
-1910
-1810MAGIC Coll. (2010)
Upper limitsmSUGRA (<WMAP)mSUGRA (WMAP)
4 ENF<105<ENF<104 106<ENF<105 10
6 ENF>10
Figure 8. Annihilation cross section ULs from Segue 1 MAGIC data computed for individual pointsin the scan. Grey crosses indicate the annihilation cross section value for those points in the scan (seetable 3) that pass the SM constraints and with a relic density lower than WMAP bound. The fullcircles only consider models within 3σWMAP from WMAP. For each of these full circles the UL on thecross section can be computed from the Segue 1 data (after energy threshold optimization) and it isindicated here by a square. Circles and squared are color coded in terms of the enhancement factor(see eq. (4.6)).
of ENFs is quite wide. As commented before, this large spread is due to the very high (lessconstraining) ULs relative to models with small neutralino masses, as already pointed out in[58, 59], and in general to models with a low gamma-ray flux above the energy threshold. Inthe case of models with a relic density below the WMAP value (black crosses), the situationis slightly better: their intrinsic higher cross sections make them closer to their ULs, theENF peaks at values somewhat lower than those for points compatible with WMAP and thedistribution extends to lower values. In particular we have 211 models with an ENF< 40,106 with an ENF< 20, 25 with and ENF< 10 and 4 with ENF< 5.
For the sake of completeness, we point out that the contribution of monochromatic lines
– 14 –

[GeV]χm0 200 400 600 800 1000 1200
Log1
0 (E
NF
)
1
2
3
4
5
6
7
8
9
10
smaller WMAPDMΩ
within WMAPDMΩ
MAGIC Coll. (2010)
Log10 (ENF)1 2 3 4 5 6 7 8 9 10
1
10
210
310
410
Figure 9. Enhancement factors as a function of the DM mass for models in the scan providing arelic density compatible with WMAP value (red crosses) or below (black crosses). The panel in theupper right part indicates the distribution of the ENFs for these two sets of models with the samecolor coding.
to the annihilation spectrum is neglected in this study, due to the fact that their contributionis subdominant with respect to the continuum emission [71].
4.1 Impact on PAMELA preferred region
Despite the fact that several astrophysical explanations have been proposed to describe therise in the energy spectrum of the positron fraction e+/(e+ + e−) measured by PAMELA[11, 72–74], an interpretation in terms of DM is still possible [see, e.g., 75–82]. Typically,the DM particle has to be heavy and annihilate mainly to leptons. One possibility that hasbeen largely studied is that the annihilation to leptons occurs through the production ofan intermediate state φ, mediator of a new, long range, attractive force [76]. However, avery large annihilation cross section is required, about a factor 100 − 1000 larger than thecanonical value derived for thermal production of 〈σannv〉 ∼ 10−26 cm3 s−1. In the following,
– 15 –

[GeV]χm0 200 400 600 800 1000 1200
]-1
s3 v
> [c
mσ<
-2710
-2610
-2510
-2410
-2310
-2210
-2110
-2010
-1910MAGIC Coll. (2010)
-µ+µ-τ+τ
-e+2e→φφ
-µ+µPAMELA -τ+τPAMELA
-e+2e→φφPAMELA
Figure 10. Exclusion lines for a neutralino DM annihilating exclusively into µ+µ− (green lines)or τ+τ− (blue line) and for a DM candidate interacting with a light intermediate state φ decayinginto a pair of electrons (pink line). The same annihilation channels (with the same color coding) areconsidered to draw the regions in the plane that provide a good fit to the PAMELA measurementof the energy spectrum of the positron fraction. The regions are taken from [45], which are adapted
from [81]. We used an astrophysical factor of J(∆Ω) = 1.14 × 10¹⁹ GeV2 cm−5 sr.
we test our ULs against some of the models proposed in the literature that fit the PAMELAdata. The regions in the (mχ, 〈σannv〉) plane that provide a good fit to the PAMELA dataare shown in figure 10 for a DM candidate annihilating into µ+µ−, τ+τ− and for the caseof the intermediate state φ decaying to e+e−, with mφ = 1 GeV. These regions have beenadapted from [81] after rescaling from a local DM density of 0.3 GeV/cm3 to 0.43 GeV/cm3
[83].Using again the specific DM annihilation spectra, we plot in figure 10 the ULs obtained
from the Segue 1 data. We can see that, in this case, the ENFs needed to meet the PAMELA-favoured region are much smaller than for mSUGRA, and in the case of annihilation intoτ+τ− our ULs are probing the relevant regions. However, we recall that the uncertainty
– 16 –

in the astrophysical factor (see figure 6) is large: if future data on Segue 1 point to anastrophysical factor close to the upper end of the currently allowed range, our observationsof Segue 1 might be able to confirm the exclusion of the PAMELA region for DM particlesannihilating in τ+τ−, at least for massive DM candidates. Note that for the annihilation intoφφ → 4e, an additional Sommerfeld enhancement due to the lower DM velocity dispersionin Segue 1 compared to the DM velocity dispersion in the MW halo may effectively shift upthe PAMELA preferred region by an order of magnitude, at least for low enough φ masses(see also [45]).
5 Summary and discussion
In the present paper we presented the observation of the ultra-faint satellite galaxy Segue 1performed by the MAGIC-I telescope (single telescope mode) over 29.4 hours of selecteddata. A description of the data analysis is reported with the result of no detection above thebackground for energies larger than 100 GeV (sections 2).
The result is used to compute ULs on the gamma-ray emission from the source, assumingdifferent power-law energy spectra. The computation is done first in energy bins (table 1 andfigure 3) and then for integral ULs above different energy thresholds (table 2 and figure 4). Inall cases, we averaged the effective area by reweighting with the specific gamma-ray spectrum,which allowed us to determine how much the ULs depend on the specific spectrum. Wealso pointed out the fact that one can get more stringent ULs if computed above energieslarger than the experimental energy threshold, as a result of the interplay between the largersensitivity of the experiment at moderate energies and the assumed spectrum.
We focused then on indirect detection of DM and produced ULs on the annihilation crosssection for a large scan of neutralino models within the mSUGRA scenario (figure 8). TheULs are derived separately for each point in the scan in order to completely account for thedependence on the specific spectral shape. Results indicate that ULs are quite dependent onthe energy spectrum and a general exclusion plot cannot be drawn to constrain the parameterspace (figure 8). For this reason, we find it quite useful to provide the results in terms ofenhancement factors, defined as the intrinsic flux boost needed to meet detection (eq. 4.6).Results are shown in figure 9. A mininum boost is found of the order of 103 (for modelscompatible with WMAP) while “typical” values are at 104−5. However, if we loosen theconstraint and request only that the SUSY models do not overshoot the WMAP value forthe relic density, then the situation improves since we can have ENFs as low as 3.9. In theseterms MAGIC-I data on Segue 1 are not so far from excluding portions of mSUGRA.
We have also discussed how MAGIC-I data on Segue 1 can be used to test the PAMELAresults on cosmic-rays. Current results are probing the PAMELA preferred region for thecase that DM annihilates into τ+τ−. Future improved measurements of the kinematics ofthe stars in Segue 1 may decrease the uncertainty in the line-of-sight integral over the DMdensity squared and rule out this region.
The robustness of our results depends mainly on the assumptions on the astrophysicalfactor, since an uncertainty of two orders of magnitude (at 2σ) remains, as estimated in[45]. Our result can be considered conservative since they do not take into account intrinsiccontributions to the flux from the presence of substructures in the ”smooth” DM halo profileof Segue 1 (which is already “per se” a substructure of the larger MW halo). The effects ofsubstructures most likely increase the flux by a factor of a few at the most [20, 21, 38]. Asecond contribution to the flux, unaccounted for in our calculation, comes from a particle
– 17 –

physics mechanism known as the Sommerfeld effect, which may additionally boost up thepredictions for the gamma-ray emission from DM annihilation. Its effect on the predictedfluxes from halo substructures have been studied in [84] and [45]. The most spectaculareffects are present for some resonant values of the DM mass where the flux can be increasedby a factor of ∼ 104. How these models can be constrained by dSphs observation has beenstudied in [85] and [45].
It is beyond the goal of this paper to discuss constraints on other DM scenarios. Asa brief comment, we simply recall that models with Universal Extra Dimensions predict astable particle whose annihilation signatures are typically harder than the ones in mSUGRA.For these models, one can use the ULs we presented for the τ+τ− channel, which can be takenas reference for hard spectra, and therefore draw conclusions similar to ours. Furthermore,for the case of decaying DM (that can also fit the PAMELA and Fermi/LAT-HESS results),one can rescale our results accounting for a different astrophysical factor (depending on theDM density and not on the DM density squared) and constrain the decay timescale insteadof the annihilation cross section.
Comparing MAGIC-I results on Segue 1 with those of Fermi/LAT, the different energyrange covered by the two experiments implies that the latter is more constraining for lowmass DM candidates, while MAGIC (or Cherenkov telescopes in general) can produce betterULs only for DM heavier than few hundreds of GeV. For low mass neutralinos, it is alreadypossible for Fermi/LAT to exclude some of the mSUGRA models with a relic density smallerthan what was measured by WMAP [70]. With 5 years of data, Fermi/LAT may be able toprobe some of the points of the parameter space considered here. In case of no detection,this will have the effect of excluding most of the models with large ENFs, shown in figure 9,which normally correspond to low-mass neutralinos. On the other hand, Fermi/LAT willprobe the larger DM masses shown in figure 8 and figure 9.
In conclusion, while the observations presented here did not result in a detection, andthe ULs require still quite high (and in some cases unmotivated) flux enhancement factorsto actually match the experiment sensitivity, an analysis like the one presented here is ableto point out details and features that can be important for future deep exposures of this orsimilar objects, using facilities with much improved sensitivity, e.g. the planned CherenkovTelescope Array [86].
Acknowledgments
We would like to thank the Instituto de Astrofısica de Canarias for the excellent workingconditions at the Observatorio del Roque de los Muchachos in La Palma. The support ofthe German BMBF and MPG, the Italian INFN, the Swiss National Fund SNF, and theSpanish MICINN is gratefully acknowledged. This work was also supported by the MarieCurie program, by the CPAN CSD2007-00042 and MultiDark CSD2009-00064 projects ofthe Spanish Consolider-Ingenio 2010 programme, by grant DO02-353 of the Bulgarian NSF,by grant 127740 of the Academy of Finland, by the YIP of the Helmholtz Gemeinschaft, bythe DFG Cluster of Excellence “Origin and Structure of the Universe”, and by the PolishMNiSzW grant 745/N-HESS-MAGIC/2010/0.The authors wish to thank A. de la Cruz Dombriz and J.A.R. Cembranos for useful discussionsand feedbacks.
– 18 –

References
[1] WMAP Collaboration, E. Komatsu et. al., Seven-Year Wilkinson Microwave AnisotropyProbe (WMAP) Observations: Cosmological Interpretation, Astrophys.J.Suppl. 192 (2011) 18,[astro-ph.CO/1001.4538].
[2] D. Clowe, M. Bradac, A. H. Gonzalez, M. Markevitch, S. W. Randall, et. al., A direct empiricalproof of the existence of dark matter, Astrophys.J. 648 (2006) L109–L113, [astro-ph/0608407].
[3] G. Bertone, D. Hooper, and J. Silk, Particle dark matter: Evidence, candidates and constraints,Phys.Rept. 405 (2005) 279–390, [hep-ph/0404175].
[4] G. Bertone, ed., Particle Dark Matter. Cambridge University Press, first published ed., 2010.
[5] G. Jungman, M. Kamionkowski, and K. Griest, Supersymmetric dark matter, Phys.Rept. 267(1996) 195–373, [hep-ph/9506380].
[6] S. P. Martin, A Supersymmetry Primer, in Perspectives on Supersymmetry (G. L. Kane, ed.),1998. hep-ph/9709356.
[7] T. Appelquist, H. Cheng, and B. A. Dobrescu, Bounds on universal extra dimensions,Phys.Rev.D 64 (Aug., 2001) 035002, [hep-ph/0012100].
[8] G. Servant and T. M. P. Tait, Is the lightest Kaluza-Klein particle a viable dark mattercandidate?, Nucl.Phys.B 650 (Feb., 2003) 391–419, [hep-ph/0206071].
[9] H.-C. Cheng, K. T. Matchev, and M. Schmaltz, Bosonic supersymmetry? Getting fooled at theCERN LHC, Phys.Rev. D66 (2002) 056006, [hep-ph/0205314].
[10] S. Colafrancesco, Dark Matter in Modern Cosmology, AIP Conf.Proc. 1206 (2010) 5–26,[astro-ph.CO/1004.3869].
[11] PAMELA Collaboration, O. Adriani et. al., An anomalous positron abundance in cosmic rayswith energies 1.5-100 GeV, Nature 458 (2009) 607–609, [astro-ph/0810.4995].
[12] Fermi-LAT Collaboration, A. A. Abdo et. al., Measurement of the Cosmic Ray e+ plus e-spectrum from 20 GeV to 1 TeV with the Fermi Large Area Telescope, Phys.Rev.Lett. 102(2009) 181101, [astro-ph.HE/0905.0025].
[13] HESS Collaboration, F. Aharonian et. al., Probing the ATIC peak in the cosmic-ray electronspectrum with H.E.S.S, Astron.Astrophys. 508 (2009) 561, [astro-ph.HE/0905.0105].
[14] J. Chang, J. Adams, H. Ahn, G. Bashindzhagyan, M. Christl, et. al., An excess of cosmic rayelectrons at energies of 300-800 GeV, Nature 456 (2008) 362–365.
[15] DAMA Collaboration, R. Bernabei et. al., First results from DAMA/LIBRA and thecombined results with DAMA/NaI, Eur. Phys. J. C56 (2008) 333–355, [arXiv:0804.2741].
[16] CDMS-II Collaboration, Z. Ahmed et. al., Dark Matter Search Results from the CDMS IIExperiment, Science 327 (2010) 1619–1621, [astro-ph.CO/0912.3592].
[17] CoGeNT Collaboration, C. Aalseth et. al., Results from a Search for Light-Mass Dark Matterwith a P-type Point Contact Germanium Detector, ArXiv e-prints (2010)[astro-ph.CO/1002.4703].
[18] XENON100 Collaboration, E. Aprile et. al., First Dark Matter Results from the XENON100Experiment, Phys.Rev.Lett. 105 (2010) 131302, [astro-ph.CO/1005.0380].
[19] A. M. Green, S. Hofmann, and D. J. Schwarz, The power spectrum of SUSY - CDM onsub-galactic scales, Mon.Not.Roy.Astron.Soc. 353 (2004) L23, [astro-ph/0309621].
[20] J. Diemand, M. Kuhlen, P. Madau, M. Zemp, B. Moore, et. al., Clumps and streams in thelocal dark matter distribution, Nature 454 (2008) 735–738, [astro-ph/0805.1244].
[21] V. Springel, J. Wang, M. Vogelsberger, A. Ludlow, A. Jenkins, A. Helmi, J. F. Navarro, C. S.
– 19 –
Frenk, and S. D. M. White, The Aquarius Project: the subhaloes of galactic haloes,Mon.Not.Roy.Astron.Soc. 391 (Dec., 2008) 1685–1711, [astro-ph/0809.0898].
[22] A. A. Klypin, A. V. Kravtsov, O. Valenzuela, and F. Prada, Where are the missing galacticsatellites?, Astrophys. J. 522 (1999) 82–92, [astro-ph/9901240].
[23] B. Moore et. al., Dark Matter Substructure in Galactic Halos, astro-ph/9907411.
[24] A. V. Kravtsov, O. Y. Gnedin, and A. A. Klypin, The tumultuous lives of galactic dwarfs andthe missing satellites problem, Astrophys. J. 609 (2004) 482–497, [astro-ph/0401088].
[25] L. E. Strigari et. al., Redefining the Missing Satellites Problem, Astrophys. J. 669 (2007)676–683, [arXiv:0704.1817].
[26] G. Gilmore, M. I. Wilkinson, R. F. Wyse, J. T. Kleyna, A. Koch, et. al., The Observedproperties of Dark Matter on small spatial scales, Astrophys.J. 663 (2007) 948–959,[astro-ph/0703308].
[27] J. D. Simon and M. Geha, The Kinematics of the Ultra-Faint Milky Way Satellites: Solving theMissing Satellite Problem, Astrophys.J. 670 (2007) 313–331, [astro-ph/0706.0516].
[28] L. E. Strigari, S. M. Koushiappas, J. S. Bullock, and M. Kaplinghat, Precise constraints on thedark matter content of MilkyWay dwarf galaxies for gamma-ray experiments, Phys.Rev.D 75
(Apr., 2007) 083526, [astro-ph/0611925].
[29] M. A. Sanchez-Conde, F. Prada, E. L. Lokas, M. E. Gomez, R. Wojtak, and M. Moles, Darkmatter annihilation in Draco: New considerations of the expected gamma flux, Phys.Rev.D 76
(Dec., 2007) 123509–+, [astro-ph/0701426].
[30] SDSS Collaboration, V. Belokurov et. al., Cats and Dogs, Hair and A Hero: A Quintet of NewMilky Way Companions, Astrophys.J. 654 (2007) 897–906, [astro-ph/0608448].
[31] SDSS-II SEGUE Collaboration, B. Yanny et. al., SEGUE: A Spectroscopic Survey of 240,000Stars with g = 14-20, Astron.J. 137 (May, 2009) 4377–4399, [astro-ph.GA/0902.1781].
[32] M. Niederste-Ostholt, V. Belokurov, N. W. Evans, G. Gilmore, R. F. G. Wyse, and J. E.Norris, The origin of Segue 1, Mon.Not.Roy.Astron.Soc. 398 (Oct., 2009) 1771–1781,[astro-ph.GA/0906.3669].
[33] M. Geha, B. Willman, J. D. Simon, L. E. Strigari, E. N. Kirby, et. al., The Least LuminousGalaxy: Spectroscopy of the Milky Way Satellite Segue 1, Astrophys.J. 692 (2009) 1464–1475,[astro-ph/0809.2781].
[34] M. Xiang-Gruess, Y. Lou, and W. J. Duschl, Dark matter dominated dwarf disc galaxy Segue 1,Mon.Not.Roy.Astron.Soc. 400 (Nov., 2009) L52–L56, [astro-ph.CO/0909.3496].
[35] J. D. Simon, M. Geha, Q. E. Minor, G. D. Martinez, E. N. Kirby, et. al., A CompleteSpectroscopic Survey of the Milky Way Satellite Segue 1: The Darkest Galaxy, Astrophys.J.(submitted) (2010) [astro-ph.GA/1007.4198].
[36] G. D. Martinez, Q. E. Minor, J. Bullock, M. Kaplinghat, J. D. Simon, et. al., A CompleteSpectroscopic Survey of the Milky Way satellite Segue 1: Dark matter content, stellarmembership and binary properties from a Bayesian analysis, ArXiv e-prints (2010)[astro-ph.GA/1008.4585].
[37] R. Essig, N. Sehgal, and L. E. Strigari, Bounds on Cross-sections and Lifetimes for DarkMatter Annihilation and Decay into Charged Leptons from Gamma-ray Observations of DwarfGalaxies, Phys.Rev. D80 (2009) 023506, [hep-ph/0902.4750].
[38] G. D. Martinez, J. S. Bullock, M. Kaplinghat, L. E. Strigari, and R. Trotta, Indirect DarkMatter Detection from Dwarf Satellites: Joint Expectations from Astrophysics andSupersymmetry, JCAP 0906 (2009) 014, [arXiv:0902.4715].
[39] Fermi-LAT Collaboration, W. Atwood et. al., The Large Area Telescope on the Fermi
– 20 –

Gamma-ray Space Telescope Mission, Astrophys.J. 697 (2009) 1071–1102,[astro-ph.IM/0902.1089].
[40] Fermi-LAT Collaboration, P. Wang et. al. Cosmology in Northern California Meeting, 2009.
[41] Fermi-LAT Collaboration, C. Farnier. Roma International Conference in Astro-ParticlePhysics, 2008.
[42] Fermi-LAT Collaboration, S. Murgia. TEV Particle Astrophysics Conference, 2009.
[43] Fermi-LAT Collaboration, T. Jeltema. TEV Particle Astrophysics Conference, 2009.
[44] P. Scott, J. Conrad, J. Edsjo, L. Bergstrom, C. Farnier, and Y. Akrami, Direct constraints onminimal supersymmetry from Fermi-LAT observations of the dwarf galaxy Segue 1, JCAP 1
(Jan., 2010) 31, [arXiv:0909.3300].
[45] R. Essig, N. Sehgal, L. E. Strigari, M. Geha, and J. D. Simon, Indirect Dark Matter DetectionLimits from the Ultra-Faint Milky Way Satellite Segue 1, Phys.Rev. D82 (2010) 123503,[astro-ph.CO/1007.4199].
[46] N. Mirabal, Swift observation of Segue 1: constraints on sterile neutrino parameters in thedarkest galaxy, Mon.Not.Roy.Astron.Soc. 409 (Nov., 2010) L128–L131,[astro-ph.HE/1010.4706].
[47] MAGIC Collaboration, J. Cortina, F. Goebel, T. Schweizer, and f. t. M. Collaboration,Technical Performance of the MAGIC Telescopes, Proceedings of the International Cosmic RayConference (2009) [astro-ph.I/0907.1211].
[48] MAGIC Collaboration, P. Colin et. al., Performance of the MAGIC telescopes in stereoscopicmode, Proceedings of the International Cosmic Ray Conference (2009)[astro-ph.IM/0907.0960].
[49] V. P. Fomin, A. A. Stepanian, R. C. Lamb, D. A. Lewis, P. M., and T. C. Weekes, Newmethods of atmospheric Cherenkov imaging for gamma-ray astronomy. 1: The False sourcemethod, Astropart.Phys. 2 (1994) 137.
[50] MAGIC Collaboration, J. Albert et. al., FADC signal reconstruction for the MAGICTelescope, Nucl.Instrum.Meth. A594 (2008) 407–419, [astro-ph/0612385].
[51] MAGIC Collaboration, J. Albert et. al., Implementation of the Random Forest Method for theImaging Atmospheric Cherenkov Telescope MAGIC, Nucl.Instrum.Meth. A588 (2008) 424–432,[astro-ph/0709.3719].
[52] L. Breiman, Random forests, Machine Learning 45 (2001) 5–32. 10.1023/A:1010933404324.
[53] Hillas, A.M., Cherenkov Images of EAS produced by primary gamma rays and by nuclei,Proceedings of the 19th International Cosmic Ray Conference, La Jolla 3 (1985) 445.
[54] T.-P. Li and Y.-Q. Ma, Analysis methods for results in gamma-ray astronomy, Astrophys.J.272 (1983) 317–324.
[55] MAGIC Collaboration, E. Domingo-Santamaria, J. Flix Molina, V. Scalzotto, W. Wittek, andJ. Rico, The DISP analysis method for point-like or extended gamma source searches / studieswith the MAGIC telescope, Proceedings of the International Cosmic Ray Conference (2005)[astro-ph/0508274].
[56] W. A. Rolke, A. M. Lopez, and J. Conrad, Limits and confidence intervals in the presence ofnuisance parameters, Nucl.Instrum.Meth. A551 (2005) 493–503, [physics/0403059].
[57] HESS Collaboration, F. Aharonian et. al., Observations of the Sagittarius Dwarf galaxy by theH.E.S.S. experiment and search for a Dark Matter signal, Astropart. Phys. 29 (2008) 55–62,[astro-ph/0711.2369].
[58] MAGIC Collaboration, J. Albert et. al., Upper limit for gamma-ray emission above 140-GeV
– 21 –

from the dwarf spheroidal galaxy Draco, Astrophys.J. 679 (2008) 428–431,[astro-ph/0711.2574].
[59] MAGIC Collaboration, E. Aliu et. al., MAGIC upper limits on the VHE gamma-ray emissionfrom the satellite galaxy Willman 1, Astrophys. J. 697 (2009) 1299–1304,[astro-ph/0810.3561].
[60] M. Wood et. al., A Search for Dark Matter Annihilation with the Whipple 10 m Telescope,Astrophys.J. 678 (May, 2008) 594–605, [astro-ph/0801.1708].
[61] HESS Collaboration, F. Aharonian et. al., A Search for a Dark Matter Annihilation SignalToward the Canis Major Overdensity with H.E.S.S., Astrophys.J. 691 (Jan., 2009) 175–181,[astro-ph/0809.3894].
[62] VERITAS Collaboration, V. A. Acciari et. al., VERITAS Search for VHE Gamma-rayEmission from Dwarf Spheroidal Galaxies, Astrophys.J. 720 (2010) 1174–1180,[astro-ph.CO/1006.5955].
[63] J. F. Navarro, A. Ludlow, V. Springel, J. Wang, M. Vogelsberger, S. D. M. White, A. Jenkins,C. S. Frenk, and A. Helmi, The diversity and similarity of simulated cold dark matter haloes,Mon.Not.Roy.Astron.Soc. 402 (Feb., 2010) 21–34, [astro-ph/0810.1522].
[64] A. H. Chamseddine, R. L. Arnowitt, and P. Nath, Locally Supersymmetric Grand Unification,Phys.Rev.Lett. 49 (1982) 970.
[65] H. P. Nilles, Supersymmetry, Supergravity and Particle Physics, Phys. Rep. 110 (1984) 1–162.
[66] P. Gondolo, J. Edsjo, P. Ullio, L. Bergstrom, M. Schelke, et. al., DarkSUSY: Computingsupersymmetric dark matter properties numerically, JCAP 0407 (2004) 008,[astro-ph/0406204].
[67] H. Baer, F. E. Paige, S. D. Protopescu, and X. Tata, ISAJET 7.69: A Monte Carlo EventGenerator for pp, p(bar)p, and e+e- Reactions, ArXiv e-prints (Dec., 2003) [hep-ph/0312045].
[68] J. A. R. Cembranos, A. de la Cruz-Dombriz, A. Dobado, R. A. Lineros, and A. L. Maroto,Photon spectra from WIMP annihilation, ArXiv e-prints (Sept., 2010) [hep-ph/1009.4936].
[69] T. Bringmann, M. Doro, and M. Fornasa, Dark Matter signals from Draco and Willman 1:Prospects for MAGIC II and CTA, JCAP 0901 (2009) 016, [astro-ph/0809.2269].
[70] A. Abdo, M. Ackermann, M. Ajello, W. Atwood, L. Baldini, et. al., Observations of Milky WayDwarf Spheroidal galaxies with the Fermi-LAT detector and constraints on Dark Mattermodels, Astrophys.J. 712 (2010) 147–158, [astro-ph.CO/1001.4531].
[71] L. Bergstrom, P. Ullio, and J. H. Buckley, Observability of gamma-rays from dark matterneutralino annihilations in the Milky Way halo, Astropart.Phys. 9 (1998) 137–162,[astro-ph/9712318].
[72] D. Hooper, P. Blasi, and P. D. Serpico, Pulsars as the Sources of High Energy Cosmic RayPositrons, JCAP 0901 (2009) 025, [arXiv:0810.1527].
[73] H. Yuksel, M. D. Kistler, and T. Stanev, TeV Gamma Rays from Geminga and the Origin ofthe GeV Positron Excess, Phys. Rev. Lett. 103 (2009) 051101, [arXiv:0810.2784].
[74] S. Profumo, Dissecting Pamela (and ATIC) with Occam’s Razor: existing, well-known Pulsarsnaturally account for the ’anomalous’ Cosmic-Ray Electron and Positron Data,arXiv:0812.4457.
[75] M. Cirelli, M. Kadastik, M. Raidal, and A. Strumia, Model-independent implications of thee+-, anti-proton cosmic ray spectra on properties of Dark Matter, Nucl.Phys. B813 (2009)1–21, [hep-ph/0809.2409].
[76] N. Arkani-Hamed, D. P. Finkbeiner, T. R. Slatyer, and N. Weiner, A Theory of Dark Matter,Phys.Rev. D79 (2009) 015014, [hep-ph/0810.0713].
– 22 –

[77] M. Pospelov and A. Ritz, Astrophysical Signatures of Secluded Dark Matter, Phys.Lett. B671
(2009) 391–397, [hep-ph/0810.1502].
[78] I. Cholis, D. P. Finkbeiner, L. Goodenough, and N. Weiner, The PAMELA Positron Excessfrom Annihilations into a Light Boson, JCAP 0912 (2009) 007, [astro-ph/0810.5344].
[79] I. Cholis, G. Dobler, D. P. Finkbeiner, L. Goodenough, and N. Weiner, The Case for a 700+GeV WIMP: Cosmic Ray Spectra from ATIC and PAMELA, Phys.Rev. D80 (2009) 123518,[astro-ph/0811.3641].
[80] L. Bergstrom, J. Edsjo, and G. Zaharijas, Dark matter interpretation of recent electron andpositron data, Phys.Rev.Lett. 103 (2009) 031103, [astro-ph.HE/0905.0333].
[81] P. Meade, M. Papucci, A. Strumia, and T. Volansky, Dark Matter Interpretations of the e+-Excesses after FERMI, Nucl.Phys. B831 (2010) 178–203, [hep-ph/0905.0480].
[82] D. P. Finkbeiner, L. Goodenough, T. R. Slatyer, M. Vogelsberger, and N. Weiner, ConsistentScenarios for Cosmic-Ray Excesses from Sommerfeld-Enhanced Dark Matter Annihilation,ArXiv e-prints (Nov., 2010) [hep-ph/1011.3082].
[83] P. Salucci, F. Nesti, G. Gentile, and C. F. Martins, The dark matter density at the Sun’slocation, Astron. Astrophys. 523 (2010) A83, [arXiv:1003.3101].
[84] M. Lattanzi and J. I. Silk, Can the WIMP annihilation boost factor be boosted by theSommerfeld enhancement?, Phys.Rev. D79 (2009) 083523, [astro-ph/0812.0360].
[85] L. Pieri, M. Lattanzi, and J. Silk, Constraining the dark matter annihilation cross-section withCherenkov telescope observations of dwarf galaxies, Mon.Not.Roy.Astron.Soc. 399 (Nov., 2009)2033–2040, [astro-ph.HE/0902.4330].
[86] CTA Consortium Collaboration, W. Hoffman and M. Martinez, Design Concepts for theCherenkov Telescope Array, ArXiv e-prints (2010) [astro-ph.IM/1008.3703].
– 23 –
Copyright © 2022 FDOKUMEN