Screening Depression and Anxiety via Brief Measures of ...
37
Screening Depression and Anxiety via Brief Measures of Psychological Inflexibility Sean N. Weeks a , Tyler L. Renshaw a , and Anthony J. Roberson b a Department of Psychology, Utah State University. b Department of Clinical, Health, and Applied Sciences, University of Houston-Clear Lake Author Note Correspondence should be addressed to Sean Weeks, Utah State University, Department of Psychology, 2810 Old Main Hill, Logan, UT 84322, USA. Email: [email protected] . We declare no conflicts of interest related to this study.
-
Upload
khangminh22 -
Category
Documents
-
view
1 -
download
0
Transcript of Screening Depression and Anxiety via Brief Measures of ...

Screening Depression and Anxiety via Brief Measures of Psychological Inflexibility
Sean N. Weeksa, Tyler L. Renshawa, and Anthony J. Robersonb
a Department of Psychology, Utah State University.
b Department of Clinical, Health, and Applied Sciences, University of Houston-Clear Lake
Author Note
Correspondence should be addressed to Sean Weeks, Utah State University, Department
of Psychology, 2810 Old Main Hill, Logan, UT 84322, USA. Email: [email protected].
We declare no conflicts of interest related to this study.

Abstract
We evaluated the usefulness of scores from two transdiagnostic scales—the 8-item version of the
Avoidance and Fusion Questionnaire for Youth (AFQ-Y8) and the second edition of the
Avoidance and Action Questionnaire (AAQ-II)—for estimating symptom severity on two
measures of depression and anxiety. Responses from 797 college students, who mostly identified
as White and female, to both measures of psychological inflexibility were analyzed to determine
how well scores estimated anxiety and depression above or below a given severity level and at
specific categories of symptom severity. Findings indicated that scores from both measures were
acceptable to excellent screeners of concurrent ratings of anxiety and depression. Results varied
somewhat depending on the measure used, level of severity targeted, and scope of screening. By
investigating the screening accuracy of these transdiagnostic measures and potential cut scores to
ease in interpreting results, we hope these measures might prove useful for addressing barriers in
public health screening endeavors.
Keywords: psychological inflexibility, mental health, depression, anxiety, screening

Screening Depression and Anxiety via Brief Measures of Psychological Inflexibility
Psychological flexibility is the theorized mechanism of change targeted through
acceptance and commitment therapy (ACT; Hayes et al., 2006). This overarching construct is
derived from six underlying processes: acceptance, defusion, present moment awareness, self-as-
context, values, and committed action. Broadly put, psychological flexibility refers to one’s
ability to adapt or persist in various contexts for the purposes of contacting valued outcomes
(Hayes et al., 2006). Conversely, psychological inflexibility refers to the opposite valence of the
construct. Psychological flexibility was developed out of necessity to be a pragmatic,
overarching construct for guiding the goals of treatment. The aim of improving psychological
flexibility is applicable for all clients, regardless of presentation (Hayes et al., 2006; Levin et al.,
2014). Therefore, the purpose of ACT is to increase psychological flexibility by addressing the
relevant processes implicated in the individual’s presenting inflexibility. This goal can be
generalized across time, place, problem, and pathology—making ACT a truly transdiagnostic
treatment approach (Dindo et al., 2017).
Transdiagnostic treatments, like ACT, have proven to be beneficial by focusing on
changing the mechanism that leads to multiple problems, instead of targeting just one.
Transdiagnostic approaches also help to reduce the burden of highly tailored treatment plans,
such as intensity, cost, resources, and complexity (Martin et al., 2017). In broader
implementations of mental health services, it is difficult to train, finance, and retain professionals
who are knowledgeable in evidence-based practice (EBP; Stewart et al., 2016). Transdiagnostic
mental health treatments offer a potential solution toward this end, as training and
implementation can be streamlined across diverse presenting problems as well as generalized and
scaled for use within a public health framework (Martin et al., 2017).
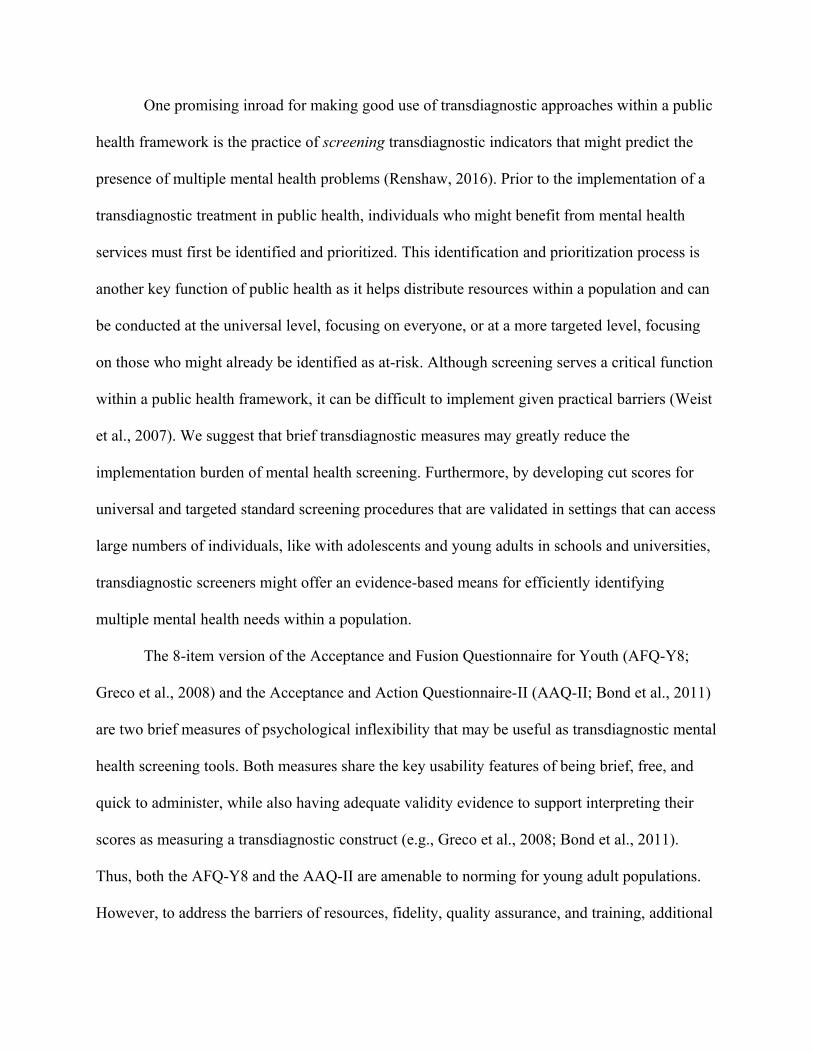
One promising inroad for making good use of transdiagnostic approaches within a public
health framework is the practice of screening transdiagnostic indicators that might predict the
presence of multiple mental health problems (Renshaw, 2016). Prior to the implementation of a
transdiagnostic treatment in public health, individuals who might benefit from mental health
services must first be identified and prioritized. This identification and prioritization process is
another key function of public health as it helps distribute resources within a population and can
be conducted at the universal level, focusing on everyone, or at a more targeted level, focusing
on those who might already be identified as at-risk. Although screening serves a critical function
within a public health framework, it can be difficult to implement given practical barriers (Weist
et al., 2007). We suggest that brief transdiagnostic measures may greatly reduce the
implementation burden of mental health screening. Furthermore, by developing cut scores for
universal and targeted standard screening procedures that are validated in settings that can access
large numbers of individuals, like with adolescents and young adults in schools and universities,
transdiagnostic screeners might offer an evidence-based means for efficiently identifying
multiple mental health needs within a population.
The 8-item version of the Acceptance and Fusion Questionnaire for Youth (AFQ-Y8;
Greco et al., 2008) and the Acceptance and Action Questionnaire-II (AAQ-II; Bond et al., 2011)
are two brief measures of psychological inflexibility that may be useful as transdiagnostic mental
health screening tools. Both measures share the key usability features of being brief, free, and
quick to administer, while also having adequate validity evidence to support interpreting their
scores as measuring a transdiagnostic construct (e.g., Greco et al., 2008; Bond et al., 2011).
Thus, both the AFQ-Y8 and the AAQ-II are amenable to norming for young adult populations.
However, to address the barriers of resources, fidelity, quality assurance, and training, additional
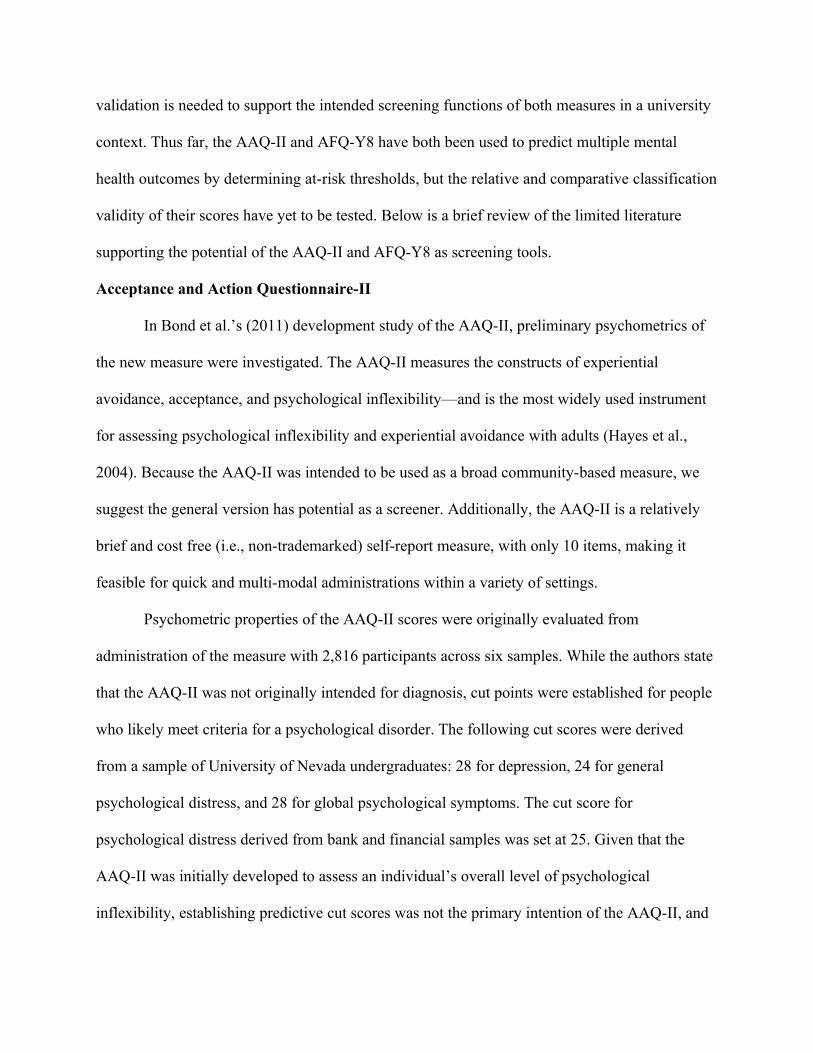
validation is needed to support the intended screening functions of both measures in a university
context. Thus far, the AAQ-II and AFQ-Y8 have both been used to predict multiple mental
health outcomes by determining at-risk thresholds, but the relative and comparative classification
validity of their scores have yet to be tested. Below is a brief review of the limited literature
supporting the potential of the AAQ-II and AFQ-Y8 as screening tools.
Acceptance and Action Questionnaire-II
In Bond et al.’s (2011) development study of the AAQ-II, preliminary psychometrics of
the new measure were investigated. The AAQ-II measures the constructs of experiential
avoidance, acceptance, and psychological inflexibility—and is the most widely used instrument
for assessing psychological inflexibility and experiential avoidance with adults (Hayes et al.,
2004). Because the AAQ-II was intended to be used as a broad community-based measure, we
suggest the general version has potential as a screener. Additionally, the AAQ-II is a relatively
brief and cost free (i.e., non-trademarked) self-report measure, with only 10 items, making it
feasible for quick and multi-modal administrations within a variety of settings.
Psychometric properties of the AAQ-II scores were originally evaluated from
administration of the measure with 2,816 participants across six samples. While the authors state
that the AAQ-II was not originally intended for diagnosis, cut points were established for people
who likely meet criteria for a psychological disorder. The following cut scores were derived
from a sample of University of Nevada undergraduates: 28 for depression, 24 for general
psychological distress, and 28 for global psychological symptoms. The cut score for
psychological distress derived from bank and financial samples was set at 25. Given that the
AAQ-II was initially developed to assess an individual’s overall level of psychological
inflexibility, establishing predictive cut scores was not the primary intention of the AAQ-II, and

therefore detailed statistical results were not provided. Thus, many indicators necessary for
defending the screening functions of a measure are unknown. However, the AAQ-II’s
development as a brief, efficient, and psychometrically sound community-based measure
provided sufficient rationale for researchers to consider evaluating it as a possible instrument for
screening.
In other work investigating possible cut scores for the AAQ-II, Hussey and Barnes-
Holmes (2012) sought to validate the use of an implicit measure based on relational frame theory
(Hayes et al., 2001) and depressive mood states. Scores from the Implicit Relational Assessment
Procedure (IRAP; Barens-Holmes et al., 2010) were tested in relation with psychological
inflexibility scores, measured by the AAQ-II. Results showed a distinction between participants
in the two depression groups based on the AAQ-II, with scores of 41 and below (indicating
participants with “high flexibility”) capturing all participants in the “Normal” range depressive
group. Moreover, using an AAQ-II cut score of 48 and above, 80% of the mild/moderate
depressive group were captured in the “low flexibility” group. Interestingly, Hussey and Barnes-
Holmes (2012) state that these findings are comparable with the cut scores suggested by Bond et
al. (2011) findings; however, roughly a 20-point difference exists between their recommended
cut points on the AAQ-II for depression risk.
Avoidance and Fusion Questionnaire for Youth
The AFQ-Y, developed by Greco et al. (2008), is a direct adaptation of the AAQ-I for
measuring psychological inflexibility in youth. Originally created as both a 17- and 8-item
measure, the AFQ-Y has been shown to have strong convergent and discriminant validity based
on Greco et al.’s (2008) initial validation study using confirmatory factor analysis. Moreover, the

results suggested strong internal consistency of scores with both college ( = .82; Renshaw,
2018) and youth samples ( = .90; Livheim et al., 2016).
Venta et al. (2012) conducted one of the few studies in which AFQ-Y cut scores from the
17-item version were evaluated for classification utility in predicting anxiety diagnoses. This
study used a sample of 111 adolescents in an inpatient psychiatric facility. Using a receiver
operating characteristic (ROC) curve analysis, Venta et al. (2012) found that scores from the
AFQ-Y17 had moderate classification accuracy (AUC = .78) for any anxiety diagnosis
(determined by a priori clinical decision making). The optimal cut score on the AFQ-Y17 for
screening for anxiety disorders was determined to be 26.5, which had both modest sensitivity
(.73) and specificity (.71).
Renshaw (2016) evaluated the classification utility of the short, 8-item version of the
AFQ-Y as a universal screener in schools for clinical-level depression and anxiety. This study
involved 219 adolescents attending an urban public high school, who responded to the AFQ-Y8
along with concurrent measures of depression, anxiety, and academic problems. Results based on
a confirmatory factor analysis showed that the AFQ-Y8 provided a better one-factor model fit
with the data than did the AFQ-Y17, and thus a ROC curve analysis was conducted with the
AFQ-Y8 as opposed to the longer version of the measure. Ultimately, findings indicated that the
scores from the AFQ-Y8 had excellent accuracy in identifying clinical-level depression (AUC
= .91) and anxiety (AUC = .92) based on concurrent gold-standard diagnostic scales. Renshaw
(2016) determined that an AFQ-Y8 cut score of 15 or greater was optimal for identifying a
school-based population of youth as being at-risk for significant internalizing problems, with
good sensitivities (.86 and .92) and specificities (.88 and .87) for depression and anxiety,
respectively.

Additional work to identify cut scores for the AFQ-Y8 with youth was done by Oppo and
colleagues (2019) using the Italian version of the measure (I-AFQ-Y8; Schweiger et al., 2017).
In their study, 1336 Italian secondary students’ scores on measures of psychological inflexibility
and mindfulness were examined using ROC curve analyses to determine who was at risk for
behavioral and emotional problems as well as for social, practical, and academic skill difficulties.
Using an identified cut score of 10.5, scores from the I-AFQ-8 were determined to predict 78%
of internalizing cases based on scores on the Youth Self-Report (Achenbach & Rescorla, 2001),
with modest sensitivity (.73) and specificity (.70). It is noteworthy that the results of this study
found AUC, sensitivity, and specificity values that were nearly identical with those found in the
Venta et al.’s (2012) study. It is also noteworthy that Renshaw (2016) found the AFQ-Y8 to have
stronger classification utility than did other studies, yet this is likely attributable to the
differences in measurement approaches for defining criterion variables.
The Present Study
As the above review highlights, screening cut scores previously developed for the AAQ-
II and AFQ-Y8 have varied as a function of the instrument used, the populations sampled, and
the criterion variables to which scores were compared. All of the studies outlined above have
used measures derived from the original AAQ-I (Hayes et al., 2004) and have shown to have at
least modest sensitivity, specificity, and overall classification utility. These findings are
reasonable, given the expectation within the screening literature that classification accuracy will
vary within sub-populations and across measures (Streiner & Cairney, 2007). They are also
promising, suggesting scores from both measures might be useful for transdiagnostic screening.
However, none of the studies reviewed tested the comparative classification utility of the AAQ-II
and AFQ-Y8 within the same sample; rather, each study administered and tested only one of the

brief psychological inflexibility measures, not both. Additionally, neither measures’ utility has
been tested at different levels of screening (i.e., universal or targeted). Considering scores from
the AAQ-II and AFQ-Y8 have both been deemed defensible for use with young adults (e.g.,
Bond et al., 2011; Fergus et al., 2012; Renshaw, 2018), both are potentially viable screeners for
public health purposes within this population. Young adulthood is a transitional stage that is
characterized by increased agency, new responsibilities, and identity formation, making this time
a pivotal contributor to an individual’s lifelong mental health trajectory (Schulenberg et al.,
2004). It is therefore important to find ways to adequately identify those at-risk for a broad range
of mental health problems during the developmental window of young adulthood. Thus, the
overarching goal of the present study was to directly evaluate the comparative classification
utility of scores from the AAQ-II and AFQ-Y8 within a young adult sample. Based on previous
research in this area, we predicted that scores from both the AAQ-II and AFQ-Y8 would yield at
least modest overall classification accuracy (AUC > .70), and that a potentially optimal cut score
would be characterized by at least modest sensitivity and specificity (> .70).
Ultimately, findings from the present study contribute to science-based practice in two
primary ways. First, the study expands the literature regarding validity evidence supporting the
practice of screening for psychological inflexibility. Second, findings help inform applied use of
psychological inflexibility measures with young, college-age adults within a public health
context, providing mental health professionals with evidence-based guidelines for detecting
internalizing problems via scores derived from the AFQ-Y8 and AAQ-II.
Methods
Participants

The present study was a secondary analysis of the same sample of participants described
in Renshaw (2018), using a narrower set of variables derived from responses to the large survey
of undergraduates described in that study. Participants were 797 college students attending a
large university in the southern region of the United States, who were recruited to participate
through an online system managed by the University’s Department of Psychology. Participants
were predominantly White (76.7%) and female (84.6%), and they were relatively evenly
distributed across educational class (first year = 32.6%, second year = 22.3%, third year = 27%,
fourth year or more = 18.1%). Additional details regarding the sampling method and survey
administration are reported in Renshaw (2018).
Measures
AAQ-II
The AAQ-II (Bond et al., 2011) was originally developed as a 10-item measure; however,
the present study used the reduced, 7-item version of measure recommended following further
psychometric analyses (Hayes, ND). Previous research regarding the psychometrics of the 10-
item AAQ-II was reviewed above (see Introduction), and validity evidence supporting the
defensibility of the 7-item version with the present sample was established by Renshaw (2018).
AFQ-Y8
As described above, the full version of the AFQ-Y (Greco et al., 2008) contains 17 items,
yet the briefer version—intended for population-based assessments—consists of a subset of 8
items. Previous validity evidence supporting both versions of the AFQ-Y was reviewed above
(see Introduction), and the psychometric superiority of the 8-item version compared to the 17-
item version was established with the present sample by Renshaw (2018).
Beck Depression Inventory–2 (BDI-II)

The BDI-II (Beck et al., 1996) is a 21-item measure of depression. Previous research
shows that scores from the BDI-II show strong internal consistency reliability and concurrent
validity with other mental health variables (Beck et al., 1996). Cut scores suggested in the user
manual for the BDI-II allow for the following four classifications of depression-related
symptoms: 13 or below = minimal, 14–19 = mild, 20–28 = moderate, 29 or above = severe.
Beck Anxiety Inventory (BAI)
The BAI (Beck & Steer, 1993) is a 21-item measure of anxiety. Previous research shows
that responses to the BAI have strong internal consistency reliability and concurrent validity with
other mental health indicators (Beck & Steer, 1993). Cut scores provided in the user manual for
the BAI allow for the following four classifications of anxiety-related symptoms: 7 or below =
minimal, 8–15 = mild, 16–25 = moderate, 26 or above = severe.
Data Analyses
Prior to running the primary analyses, descriptive statistics were evaluated to ensure the
useability of the data from each measure for answering the relevant research questions.
Psychometrics reported in Renshaw (2018) were also referenced to support functionality of the
measures.
Next, a series of ROC curve models were run to test the classification accuracy of scores
derived from the AAQ-II and AFQ-Y8 with the several classification options operationalized by
recommended cut scores on the BDI-II and BAI. Area under the curve (AUC) statistics from
these analyses were evaluated to determine the overall risk identification ability of each measure
(AUC values .50–.70 = low, .70–.90 = moderate, .90–1.00 = high; Streiner & Cairney, 2007). All
ROC curve models were evaluated in the R statistical environment (R Development Core Team,
2020) using the pROC package (Robin et al., 2011).

Model series 1 evaluated the ability of AAQ-II and AFQ-Y8 scores to discriminate
between minimal and mild-only classifications for anxiety and depression, respectively. Model
series 2 looked at the ability of AAQ-II and AFQ-Y8 scores to discriminate between minimal
and at-least-mild classifications (including scores in the moderate and severe ranges). Model
series 3 assessed the ability of these scores to discern between minimal and moderate-only
classifications, whereas Model series 4 assessed the ability of the scores in discriminating
between mild-or-below (including the minimal range) and at-least-moderate classifications
(including scores in the severe range). Model series 5 examined the ability of AAQ-II and AFQ-
Y8 scores to discriminate between minimal and severe classifications, whereas Model series 6
evaluated the discrimination ability of these scores for moderate-or-below (including the
minimal and mild ranges) and severe classifications, respectively.
These various classification accuracy models were conducted to help inform differential
use of screeners within a public health service delivery framework. Specifically, results from the
categorical models (i.e., Model series 1, 2, and 3) predicting the difference between minimal
symptoms and a single category or classification of elevated symptoms (i.e., mild versus
moderate versus severe) may inform targeted screening, which is used to better estimate
symptom severity—and therefore prioritize services—for those who have previously been
identified as at-risk by another means (e.g., referral for services from a peer, colleague, or
caregiver). Whereas the threshold models (i.e., Model series 4, 5, and 6) that estimate the
difference between a level of symptoms (i.e., minimal-or-higher, moderate-or-higher, severe)
and any level below that threshold (i.e., minimal, minimal-to-mild, and minimal-to-moderate)
may inform universal screening, which functions to identify a subset of individuals within a
population who meet a certain threshold of risk deemed consequential by the service system. All

iterations of categorical and threshold models were explored in this study given that there were
no priors from other studies to guide a more limited set of analyses. Therefore, it was assumed
plausible that results from ROC curve analyses could have differential classification utility based
on factors of the measure (i.e., AAQ-II vs. AFQ-Y8), outcome of interest (i.e., depression vs.
anxiety), and model type (i.e., categorical vs. threshold).
Following the series of ROC curve analyses, secondary analyses were conducted to
evaluate potential cut scores for the most viable categorical and threshold uses of each measure
based on evaluation of AUC results. Given the large number of potential measure–outcome–
classification combinations that could warrant cut scores based on promising AUC results
(> .70), a more limited set of analyses were run to serve as a proof-of-concept for how AAQ-II
and AFQ-Y8 cuts might be derived for the purposes of targeted or universal screening.
Appropriate cut scores were determined by creating comparison tables of sensitivity, specificity,
and positive and negative predictive values for the range of possible measure scores using the
pROC package (Robin et al., 2011). To minimize false positive and false negative results, we
considered an optimal cut score as one that balances the highest possible levels of both
sensitivity and specificity (.70–.80 = adequate, .80–.90 = good, and .90–1.00 = excellent), while
prioritizing negative and positive predictive values as a secondary consideration.
Results
Preliminary Analyses
Data from all 797 respondents were complete with no missing values. The composite
scores derived from each measure of psychological inflexibility (i.e., AAQ-II and AFQ-Y8),
anxiety (i.e., BAI), and depression (i.e., BDI-II) showed relative normality in their sample
distributions and adequate estimates of internal consistency (see Table 1). Pearson’s bivariate

correlations were conducted between scores derived from each measure and showed a strong
positive correlation between both measures of psychological inflexibility. Additionally,
moderately strong positive associations were found between the predictor and criterion measures
(see Table 2).
Primary Analyses
As described above, six series of ROC curve analyses (Model series 1–6) were evaluated
to investigate the classification accuracy of scores from the AAQ-II on the BDI-II (series A), the
AAQ-II on the BAI (series B), the AFQ-Y8 on the BDI-II (series C), and the AFQ-Y8 on the
BAI (series D). For each of these, we described Model series 1, 2, and 3 as categorical models
given they estimated the difference between minimal symptoms and a single other category of
elevated symptoms (i.e., mild, moderate, or severe), mutually exclusive from the others. We
described Model series 4, 5, and 6 as threshold models given they estimated the difference
between a stated threshold level of symptoms (i.e., mild-or-higher, moderate-or-higher, severe)
and any level below that threshold (i.e., minimal, minimal-to-mild, minimal-to-moderate).
Table 3 shows the AUC results for each series of ROC curve analyses. Based on the
perceived utility of both types of ROC models (i.e., categorical vs. threshold) for informing
differential screening uses (i.e., targeted vs. universal), the most appropriate and effective AUC
for each model type and purpose was selected to determine optimal cut scores based on
consideration of sensitivity, specificity, and positive and negative predictive values. Specifically,
threshold cut scores were determined to be more appropriate at the mild or moderate level in
order to be as inclusive as possible for universal screening purposes, whereas categorical cut
scores were determined to be more appropriate at the level that was deemed empirically superior
for classification. Again, the goal of this demonstration was not to exhaustively probe all cut

score possibilities for all purposes, but rather to illustrate the viability of deriving cut scores from
the ROC models analyzed previously.
AAQ-II Depression Classification Accuracy
The AAQ-II had an excellent AUC of 0.93 for identifying individuals scoring in the
severe versus minimal score range (see Table 3, Categorical Model A3). Table 4 shows that a cut
score of 26 on the AAQ-II accurately identified 84% of the sample with scores in the severe
depression range on the BDI-II and 85% who scored below the severe range. When assessing
whether a participant experienced symptoms of depression between moderate or less (see Table
3, Threshold Model A5), AAQ-II scores resulted in an AUC of .86. Table 5 shows that an AAQ-
II cut score of 26 accurately identified 79% of the sample with scores in the moderate-or-severe
range on the BDI-II and 78% who scored below. Further, 50% of participants with an AAQ-II
score of 26 or more had concurrent scores in the moderate or severe depression range on the
BDI-II while 93% with a score of 25 or less were also below this range of depression scores.
AAQ-II Anxiety Classification Accuracy
As with the other categorical model described above, individuals scoring in the severe
range of anxiety were most effectively identified by the AAQ-II when compared to minimal
symptoms (AUC = .93; see Table 3, Categorical Model B3). Table 6 shows that a cut score of 21
on the AAQ-II accurately identified 89% of the sample with BAI scores in the severe range and
89% who scored below. When assessing whether a participant experienced symptoms of anxiety
between mild or less (see Table 3, Threshold Model B4), AAQ-II scores resulted in an AUC
of .82. Table 7 shows that an AAQ-II cut score of 17 accurately identified 73% of the sample
with scores in the mild-to-severe range on the BAI and 75% that scored below.
AFQ-Y8 Depression Classification Accuracy

Based on results in Table 3, scores from the AFQ-Y8 had the best predictive value for
identifying individuals in the severe versus minimal score range as evidenced by an excellent
AUC of .95 (see Table 3, Categorical Model C3). Values presented in Table 8 indicate that a cut
score of 12 on the AFQ-Y8 accurately identified 89% of the sample with scores in the severe
versus minimal depression range on the BDI-II and 88% that scored below the severe range.
When assessing whether a participant experienced symptoms of depression between moderate or
less (see Table 3, Threshold Model C5), AFQ-Y8 scores resulted in a good AUC of .88. Table 9
shows that an AFQ-Y8 cut score of 11 accurately identified 80% of the sample with scores in the
moderate-or-severe range on the BDI-II and 77% who scored below.
AFQ-Y8 Anxiety Classification Accuracy
Assessing the utility of the AFQ-Y8 scores for identifying relative levels of anxiety, the
severe versus minimal evaluation (see Table 3; Categorical Model D3) was most accurate overall
with an AUC of .90, falling in the excellent range. Results presented in Table 10 indicate that a
cut score of 9 accurately identified 79% of the sample with scores in the severe anxiety range on
the BAI and 84% who scored below that range. When assessing whether a participant
experienced symptoms of anxiety between mild or less (see Table 3, Threshold Model D4),
AFQ-Y8 scores resulted in an acceptable AUC of .77. Table 11 shows that an AFQ-Y8 cut score
of 7 accurately identified 68% of the sample with scores in the mild-to-severe range on the BAI
and 73% who scored below.
Discussion
The current study aimed to improve public health-oriented mental health screening by
evaluating the usefulness of scores from two transdiagnostic rating scales of psychological
inflexibility in estimating concurrent symptom severity on measures of depression and anxiety.
By investigating the screening accuracy of these transdiagnostic measures and potential cut

scores to ease in interpreting results, we hoped the AFQ-Y8 and AAQ-II might be useful for
addressing practical barriers inherent in public health screening endeavors.
Both measures of psychological inflexibility were assessed to determine how their scores
may most effectively be used for estimating anxiety and depression risk above or below a given
severity level (i.e., threshold models), and for estimating the specific category of symptom
severity (i.e., mild, moderate, or severe exclusively) compared to minimal symptoms (i.e.,
categorical models). Overall, findings indicated that scores from both measures were acceptable
to excellent screeners of concurrent ratings of anxiety and depression based on certain metrics
but performed more poorly based on others. Further, results varied depending on the measure
used (AFQ-Y8 vs. AAQ-II), level of severity (i.e., mild vs. moderate vs. severe), and scope of
screening (i.e., categorical models vs. threshold models; see Table 3).
Considering the categorical models, in which psychological inflexibility scores were used
to estimate specific risk categories, as would be used in a targeted screening paradigm, scores
from both AFQ-Y8 and AAQ-II were most effective at identifying anxiety and depression
severity in the severe range, with uniformly strong AUC values. Similarly, considering the
results from the threshold models, where risk was set at a given level and all individuals above
that point were considered at-risk, as would be in a universal screening paradigm, scores from
the screening measures also performed best when risk was set at the severe level for both anxiety
and depression scores. However, AUC values for the severe categorical models were consistently
stronger than AUC for the severe threshold models. Additionally, the range of AUC values for
the threshold models within each series were not substantively different from one another when
considering their confidence intervals. In interest of investigating cuts that capture larger swaths
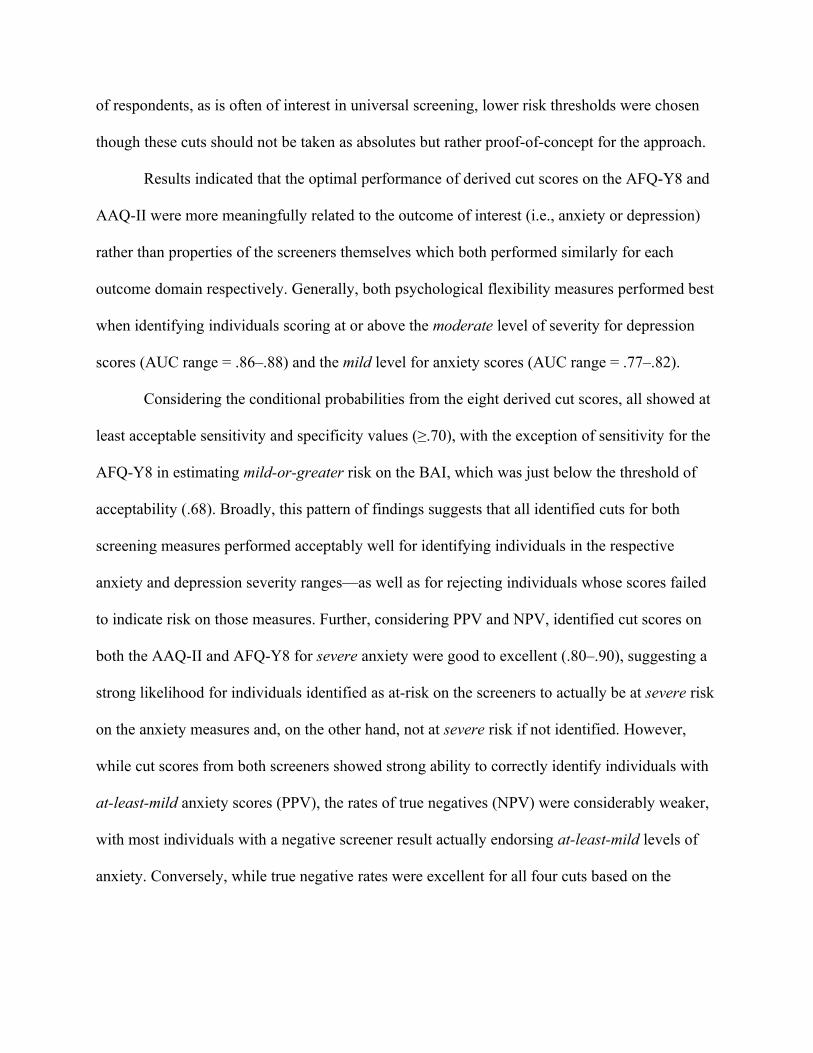
of respondents, as is often of interest in universal screening, lower risk thresholds were chosen
though these cuts should not be taken as absolutes but rather proof-of-concept for the approach.
Results indicated that the optimal performance of derived cut scores on the AFQ-Y8 and
AAQ-II were more meaningfully related to the outcome of interest (i.e., anxiety or depression)
rather than properties of the screeners themselves which both performed similarly for each
outcome domain respectively. Generally, both psychological flexibility measures performed best
when identifying individuals scoring at or above the moderate level of severity for depression
scores (AUC range = .86–.88) and the mild level for anxiety scores (AUC range = .77–.82).
Considering the conditional probabilities from the eight derived cut scores, all showed at
least acceptable sensitivity and specificity values (≥.70), with the exception of sensitivity for the
AFQ-Y8 in estimating mild-or-greater risk on the BAI, which was just below the threshold of
acceptability (.68). Broadly, this pattern of findings suggests that all identified cuts for both
screening measures performed acceptably well for identifying individuals in the respective
anxiety and depression severity ranges—as well as for rejecting individuals whose scores failed
to indicate risk on those measures. Further, considering PPV and NPV, identified cut scores on
both the AAQ-II and AFQ-Y8 for severe anxiety were good to excellent (.80–.90), suggesting a
strong likelihood for individuals identified as at-risk on the screeners to actually be at severe risk
on the anxiety measures and, on the other hand, not at severe risk if not identified. However,
while cut scores from both screeners showed strong ability to correctly identify individuals with
at-least-mild anxiety scores (PPV), the rates of true negatives (NPV) were considerably weaker,
with most individuals with a negative screener result actually endorsing at-least-mild levels of
anxiety. Conversely, while true negative rates were excellent for all four cuts based on the

depression measure, the true positive rates were only at about chance levels for each (PPV range
= .46–.53), suggesting considerable overidentification of depression risk.
We suggest that these results were largely consistent with findings from past research
using similar criterion measures. In Bond et al.’s (2011) development study of the AAQ-II, they
found that scores ranging from 24–28 were useful, depending on the sample and outcome. The
results of the AAQ-II on depression in the current study were also within this range (i.e., 26).
It is noteworthy that the AUC values were similar for predicting threshold levels of
anxiety across the AAQ-II and AFQ-Y8 in this sample (.77–.80) and with results from Venta et
al. and Oppo et al. calculating AUCs in the same range. Compared to Renshaw’s (2016) work
with the AFQ-Y8 using an urban high school student sample, our study found similarly high
AUC values when looking at the severe category of depression. But we determined that both
depression and anxiety risk could be more usefully identified with somewhat lower cut scores of
12 and 9, respectively, compared to Renshaw’s cut score of 15 for both criterions. One plausible
explanation for this discrepancy is that the AFQ-Y8 may be more sensitive when used as a
screener with young adults compared to adolescents. Additionally, the difference in samples
went beyond age, with the majority of Renshaw’s (2016) participants identifying as Black or
African American (96.3%) and roughly equally split between female and male respondents,
whereas the current study was comprised mostly of individuals identifying primarily as White
(76.7%) and female. Thus, these differences could possibly be explained by cultural and gender
identity factors, as these demographic variables have been shown to influence reporting in
response to sensitive mental health questions (Van de Vijer & Leung, 2021). Future studies
should therefore investigate the potential social/contextual mechanisms that impact the
applicability of psychological inflexibility cut scores across demographically diverse samples.

Implications
The current study’s findings indicate that scores from the AFQ-Y8 and the AAQ-II could
determine with reasonable precision if a college student scores in a given range on concurrent
measures of anxiety and depression. We suggest these findings have implications for both
universal and targeted screening endeavors and that brief transdiagnostic measures, including the
AFQ-Y8 and AAQ-II, could aid in reducing barriers to mental health care outlined by Weist et
al. (2007). Additionally, determining cut scores for risk identification can help to further
streamline the screening process by simplifying score interpretation. Findings from the current
study provide preliminary support for the usefulness of these measures toward such ends.
Although the purposes of screening will differ depending on the needs of the provider or
organization, results from this study suggest that taking a threshold approach may be more
broadly useful in situations where entire populations are being monitored. By using the
psychological flexibility measures to determine if an individual is above or below a given
symptom level (or threshold) for transdiagnostic internalizing symptoms, practitioners can
capture all respondents as functioning somewhere along a spectrum of symptom severity. This
screening paradigm can inform further assessment or may justify the need for a transdiagnostic
intervention, such as ACT, which addresses psychological inflexibility as the targeted
mechanism for change.
Moreover, the AFQ-Y8 and AAQ-II may be useful measures in multiple-gating
assessment procedures, where multiple measures and methods are used in sequential order—
often increasing in focus and intensity—to determine diagnoses or identify target problems
(Walker et al., 2014). Traditionally, multiple-gating assessment has been an approach to address
the barriers previously mentioned with public health screening by reducing the numbers of

individuals who would require more intensive assessment. This is done by identifying and
eliminating those who do not qualify as “at-risk” on less intensive measures. For this reason,
multiple-gating is considered best practice for screening in schools and community settings
(Whitcomb & Merrell, 2013). By analyzing the AFQ-Y8 and AAQ-II at the universal and
targeted levels, they could be used at multiple gates in the multiple-gating procedure, but with
different thresholds for identifying those in need. Ideally, this could simplify the identification
process by accounting for both levels of screening and further streamlining the process for those
who need more intensive assessment to access services.
While the current study highlighted the most effective cut scores for the AFQ-Y8 and
AAQ-II based on the criterion domains of interest (i.e., anxiety vs. depression), we suggest that
researchers might use the information provided in this study to evaluate alternative cuts for these
measures at other severity levels and with local samples. Furthermore, considering the much
higher and distributed base rates of anxiety risk compared to the lower prevalence depression
risk, it may be useful for future research or practical applications to set a lower threshold for
identifying depression risk and a higher bar for anxiety risk—recognizing that how scores are
used should always be driven by intent and needs of the organization implementing screening.
Limitations
A major limitation of this study is the generalizability of results based on sample
characteristics. Data for the current study was collected with university undergraduate students
and, when compared to results from a sample of mostly African American high school students
(Renshaw, 2016), the AUC values remained similar; however, identified cut scores were lower.
Considering our findings, the performance of AFQ-Y8 and AAQ-II scores are still likely to have
good predictive ability, though the thresholds for determining risk are likely to shift based on the

particular sample, highlighting the need to evaluate local norms, if possible, in comparison with
those derived from previous research. We therefore recommend that future research continue to
explore the usefulness of brief transdiagnostic screeners across populations with varying
demographic characteristics. It is noteworthy that the current study also employed data collection
procedures that were based on convenience sampling, a method that can often produce biased
results that may mispresent the true population. Thus, future research using purposive,
representative sampling techniques is warranted.
Finally, this study was also limited in its choice of predictor and criterion measures. The
current study used only anxiety and depression as mental health criterions, and measured the
transdiagnostic construct of psychological inflexibility using only the AFQ-Y8 and AAQ-II.
There is a breadth of broadband and narrowband measures that focus on various aspects of
mental health that could be tested in a similar manner. Furthermore, the AFQ-Y8 and AAQ-II
are compared to other screening instruments in this study, but to strengthen confidence in
classification, clinical samples and gold-standard diagnostic instruments/assessment procedures
(e.g., clinical interviews) should be used for comparison in later studies. Future research could
benefit from investigating other mental health criterions, diagnostic tools, more global measures
of mental health, and even different valences of these constructs. Testing the predictive ability of
psychological inflexibility measures with different types of assessment procedures and outcomes
could further aid in the generalizability of evidence supporting the viability of screening mental
health difficulties via brief transdiagnostic measures.

References
Achenbach, T. M., & Rescorla, L. (2001). Manual for the ASEBA school-age forms & profiles:
an integrated system of multi-informant assessment. Burlington, VT: ASEBA.
Barnes-Holmes, D., Barnes-Holmes, Y., Stewart, I., & Boles, S. (2010). A sketch of the Implicit
Relational Assessment Procedure (IRAP) and the Relational Elaboration and Coherence
(REC) model. The Psychological Record, 60(3), 527–542.
https://doi.org/10.1007/BF03395726
Beck, A. T., Steer, R. A., & Brown, G. K. (1996). Manual for the Beck Depression Inventory-2.
Psychological Corporation.
Beck, A. T., & Steer, R. A. (1993). Manual for the Beck Anxiety Inventory. Psychological
Corporation.
Bond, F. W., Hayes, S. C., Baer, R. A., Carpenter, K. M., Guenole, N., Orcutt, H. K., Waltz, T.,
& Zettle, R. D. (2011). Preliminary psychometric properties of the Acceptance and
Action Questionnaire–II: A revised measure of psychological inflexibility and
experiential avoidance. Behavior Therapy, 42(4), 676–688.
https://doi.org/10.1016/j.beth.2011.03.007
Dindo, L., Van Liew, J. R., & Arch, J. J. (2017). Acceptance and commitment therapy: a
transdiagnostic behavioral intervention for mental health and medical
conditions. Neurotherapeutics, 14(3), 546–553.
Fergus, T. A., Valentiner, D. P., Gillen, M. J., Hiraoka, R., Twohig, M. P., Abramowitz, J. S., &
McGrath, P. B. (2012). Assessing psychological inflexibility: The psychometric

properties of the Avoidance and Fusion Questionnaire for Youth in two adult samples.
Psychological Assessment, 24(2), 402–408. https://doi.org/10.1037/a0025776
Greco, L. A., Lambert, W., & Baer, R. A. (2008). Psychological inflexibility in childhood and
adolescence: Development and evaluation of the Avoidance and Fusion Questionnaire for
Youth. Psychological Assessment, 20(2), 93–102. https://doi.org/10.1037/1040-
3590.20.2.93
Hayes, S. C. (ND). The 7-item Acceptance and Action Questionnaire-II. Association for
Contextual Behavioral Science.
https://contextualscience.org/acceptance_action_questionnaire_aaq_and_variations
Hayes, S. C., Luoma, J. B., Bond, F. W., Masuda, A., & Lillis, J. (2006). Acceptance and
commitment therapy: Model, processes and outcomes. Behaviour Research and Therapy,
44(1), 1–25. https://doi.org/10.1016/j.brat.2005.06.006
Hayes, S. C., Barnes-Holmes, D., & Roche, B. (Eds.). (2001). Relational frame theory: A post-
Skinnerian account of human language and cognition. Plenum.
Hayes, S. C., Strosahl, K. D., Wilson, K. G., Bissett, R. T., Pistorello, J., Toarmino, D., Polusny,
M., A., Dykstra, T. A., Batten, S. V., Bergan, J., Stewart, S. H., Zvolensky, M. J., Eifert,
G. H., Bond, F. W., Forsyth J. P., Karekla, M., & McCurry, S. M. (2004). Measuring
experiential avoidance: A preliminary test of a working model. The Psychological
Record, 54(4), 553–578. https://doi.org/10.1007/BF03395492
Hussey, I., & Barnes-Holmes, D. (2012). The implicit relational assessment procedure as a
measure of implicit depression and the role of psychological flexibility. Cognitive and
Behavioral Practice, 19(4), 573–582. https://doi.org/10.1016/j.cbpra.2012.03.002

Levin, M. E., MacLane, C., Daflos, S., Seeley, J. R., Hayes, S. C., Biglan, A., & Pistorello, J.
(2014). Examining psychological inflexibility as a transdiagnostic process across
psychological disorders. Journal of contextual behavioral science, 3(3), 155-163. https://
doi.org/10.1016/j.jcbs.2014.06.003Get
Livheim, F., Tengström, A., Bond, F. W., Andersson, G., Dahl, J., & Rosendahl, I. (2016).
Psychometric properties of the Avoidance and Fusion Questionnaire for Youth: A
psychological measure of psychological inflexibility in youth. Journal of Contextual
Behavioral Science, 5(2), 103–110. https://doi.org/10.1016/j.jcbs.2016.04.001
Martin, P., Murray, L. K., Darnell, D., & Dorsey, S. (2017). Transdiagnostic treatment
approaches for greater public health impact: Implementing principles of evidence based ‐
mental health interventions. Clinical Psychology: Science and Practice, 25(4), e12270.
https://doi.org/10.1111/cpsp.12270
Oppo, A., Schweiger, M., Ristallo, A., Presti, G., Pergolizzi, F., & Moderato, P. (2019).
Mindfulness skills and psychological inflexibility: Two useful tools for a clinical
assessment for adolescents with internalizing behaviors. Journal of Child and Family
Studies, 28(12), 3569–3580. https://doi.org/10.1007/s10826-019-01539-w
R Core Team. (2020). R: A language and environment for statistical computing. Vienna, Austria:
R Foundation for Statistical Computing. https://www.R-project.org/
Renshaw, T. L. (2016). Screening for psychological inflexibility: Initial validation of the
Avoidance and Fusion Questionnaire for Youth as a school mental health
screener. Journal of Psychoeducational Assessment, 35(5), 482–493.
https://doi.org/10.1177/0734282916644096

Renshaw, T. L. (2018). Probing the relative psychometric validity of three measures of
psychological inflexibility. Journal of Contextual Behavioral Science, 7, 47–54.
https://doi.org/10.1016/j.jcbs.2017.12.001
Robin, X., Turck, N., Hainard, A., Tiberti, N., Lisacek, F., Sanchez, J. C., & Müller, M. (2011).
pROC: an open-source package for R and S+ to analyze and compare ROC curves. BMC
bioinformatics, 12(1), 1–8. https://doi.org/10.1186/1471-2105-12-77
Schulenberg, J. E., Sameroff, A. J., & Cicchetti, D. (2004). The transition to adulthood as a
critical juncture in the course of psychopathology and mental health. Development and
psychopathology, 16(4), 799-806. https://doi.org/10.1017/s0954579404040015
Schweiger, M., Ristallo, A., Oppo, A., Pergolizzi, F., Presti, G., & Moderato, P. (2017). Ragazzi
in lotta con emozioni e pensieri: la validazione della versione italiana dell Avoidance andʼ
Fusion Questionnaire for Youth (I-AFQ-Y). Psicoterapia Cognitiva e Comportamentale,
23(2), 141–162.
Stewart, R. E., Adams, D. R., Mandell, D. S., Hadley, T. R., Evans, A. C., Rubin, R., Erney, J.,
Neimark, G., Hurford, M. O., Beidas, R. S., & Beidas, R. S. (2016). The perfect storm:
collision of the business of mental health and the implementation of evidence-based
practices. Psychiatric Services, 67(2), 159–161.
https://doi.org/10.1176/appi.ps.201500392
Streiner, D. L., & Cairney, J. (2007). What's under the ROC? An introduction to receiver
operating characteristics curves. The Canadian Journal of Psychiatry, 52(2), 121–128.
https://doi.org/10.1177/070674370705200210
Van de Vijver, F. J., & Leung, K. (2021). Methods and data analysis for cross-cultural
research (Vol. 116). Cambridge University Press.

Venta, A., Sharp, C., & Hart, J. (2012). The relation between anxiety disorder and experiential
avoidance in inpatient adolescents. Psychological Assessment, 24(1), 240–248.
https://doi.org/10.1037/a0025362
Walker, H. M., Small, J. W., Severson, H. H., Seeley, J. R., & Feil, E. G. (2014). Multiple-
gating approaches in universal screening within school and community settings. In R. J.
Kettler, T. A. Glover, C. A. Albers, & K. A. Feeney-Kettler (Eds.), School psychology
book series. Universal screening in educational settings: Evidence-based decision
making for schools (p. 47–75). American Psychological
Association. https://doi.org/10.1037/14316-003
Weist, M. D., Rubin, M., Moore, E., Adelsheim, S., & Wrobel, G. (2007). Mental health
screening in schools. Journal of School Health, 77(2), 53–58.
https://doi.org/10.1111/j.1746-1561.2007.00167.x
Whitcomb, S., & Merrell, K. W. (2013). Behavioral, social, and emotional assessment of
children and adolescents. Routledge.

Table 1
Descriptive Statistics for All Study Measures
Measure M SD min max skewness kurtosis α ωAFQ-Y8 9.14 5.95 0 30 0.78 0.18 0.80 0.85AAQ-II 21.65 9.65 7 49 0.50 -0.45 0.91 0.93BAI 17.16 11.10 0 57 0.87 0.50 0.92 0.94BDI-II 12.53 10.51 0 52 1.05 0.64 0.93 0.96Note. AFQ-Y8 = 8-item version of the Avoidance and Fusion Questionnaire for Youth; AAQ-II
= second edition of the Acceptance and Action Questionnaire; BAI = Beck Anxiety Inventory;
BDI-II = second edition of the Beck Depression Inventory.
Table 2
Bivariate Correlations Among All Study Measures
Measures
Pearson r [95% CI]AFQ-Y8 AAQ-II BAI BDI-II
AFQ-Y8 ––
AAQ-II .78* [.75, .80] ––
BAI .59* [.54, .64] .63* [.59, .68] ––
BDI-II .68* [.64, .72] .69* [.65, .73] .67* [.62, .71] ––
*p < .001.
Note. AFQ-Y8 = 8-item version Avoidance and Fusion Questionnaire for Youth; AAQ-II =
second edition of the Acceptance and Action Questionnaire; BAI = Beck Anxiety Inventory;
BDI-II = second edition of the Beck Depression Inventory.
Table 3
Area Under the Curve (AUC) for All Classification Accuracy Models
Classification Level
Classification Series/Model Mild Moderate Severe

AUC [95% CI] AUC [95% CI] AUC [95% CI]Series A: AAQ-II on BDI-II
Categorical A1: .80 [.76, .84] A2: .88 [.84, .91] A3: .93 [.90, .96]Threshold A4: .86 [.83, .89] A5: .86 [.83, .89] A6: .87 [.83, .91]
Series B: AAQ-II on BAICategorical B1: .71 [.66, .76] B2: .86 [.82, .90] B3: .93 [.90, .96]Threshold B4: .82 [.78, .85] B5: .81 [.78, .84] B6: .83 [.79, .86]
Series C: AFQ-Y8 on BDI-IICategorical C1: .75 [.70, .79] C2: .87 [.83, .90] C3: .95 [.93, .97]Threshold C4: .84 [.81, .87] C5: .88 [.85, .90] C6: .90 [.87, .93]
Series D: AFQ-Y8 on BAICategorical D1: .67 [.62, .72] D2: .79 [.74, .84] D3: .90 [.87, .93]Threshold D4: .77 [.73, .81] D5: .77 [.73, .80] D6: .80 [.76, .84]
Note. AFQ-Y8 = 8-item version of the Avoidance and Fusion Questionnaire for Youth; AAQ-II
= second edition of the Acceptance and Action Questionnaire; BAI = Beck Anxiety Inventory;
BDI-II = second edition of the Beck Depression Inventory.
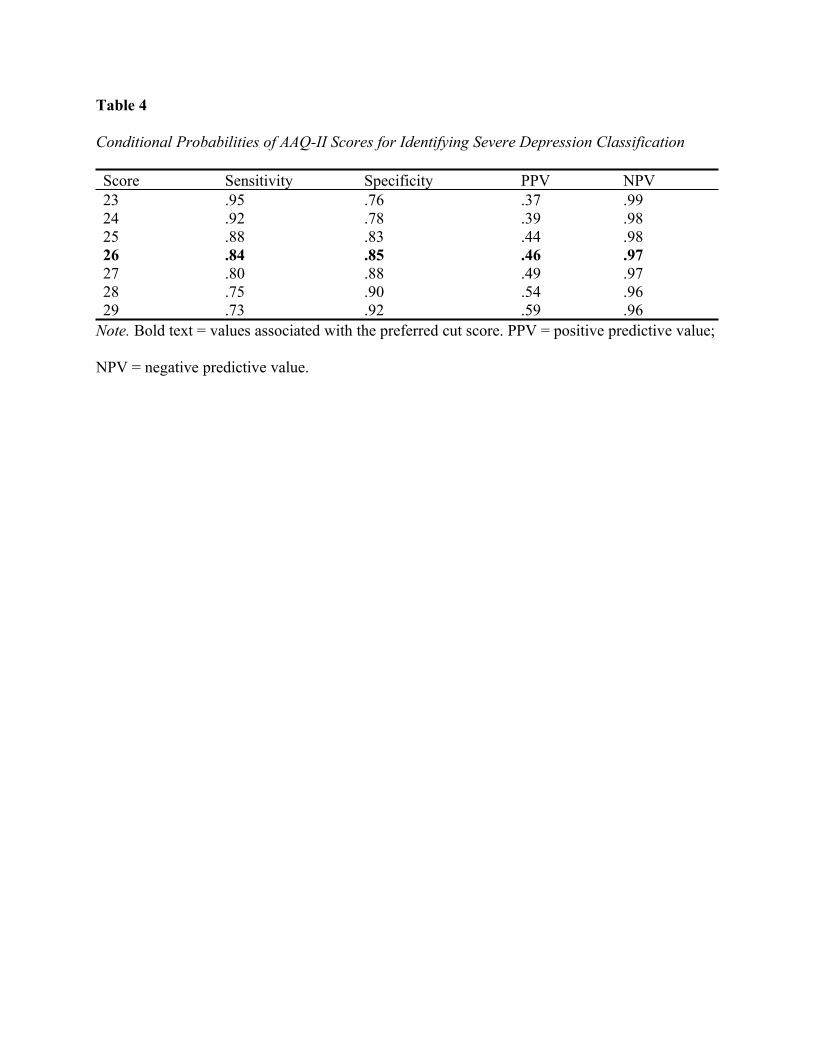
Table 4
Conditional Probabilities of AAQ-II Scores for Identifying Severe Depression Classification
Score Sensitivity Specificity PPV NPV23 .95 .76 .37 .9924 .92 .78 .39 .9825 .88 .83 .44 .9826 .84 .85 .46 .9727 .80 .88 .49 .9728 .75 .90 .54 .9629 .73 .92 .59 .96
Note. Bold text = values associated with the preferred cut score. PPV = positive predictive value;
NPV = negative predictive value.

Table 5
Conditional Probabilities of AAQ-II Scores for Identifying At-Least-Moderate Depression
Classifications
Score Sensitivity Specificity PPV NPV23 .90 .67 .43 .9624 .86 .70 .45 .9525 .84 .75 .48 .9426 .79 .78 .50 .9327 .75 .80 .52 .9228 .68 .84 .54 .9029 .65 .87 .58 .90
Note. Bold text = values associated with the preferred cut score. PPV = positive predictive value;
NPV = negative predictive value.

Table 6
Conditional Probabilities of AAQ-II Scores for Identifying Severe Anxiety Classification
Score Sensitivity Specificity PPV NPV18 .92 .79 .82 .9119 .91 .84 .86 .9020 .91 .87 .88 .9021 .89 .89 .90 .8822 .88 .90 .90 .8723 .85 .91 .91 .8524 .83 .93 .92 .84
Note. Bold text = values associated with the preferred cut score.

Table 7
Conditional Probabilities of AAQ-II Scores for Identifying At-Least-Mild Anxiety Classification
Score Sensitivity Specificity PPV NPV14 .84 .61 .89 .4915 .80 .64 .90 .4516 .76 .70 .91 .4217 .73 .75 .92 .4118 .69 .79 .93 .4019 .66 .84 .94 .3820 .64 .87 .95 .38
Note. Bold text = values associated with the preferred cut score.

Table 8
Conditional Probabilities of AFQ-Y8 Scores for Identifying Severe Depression Classification
Score Sensitivity Specificity PPV NPV9 .96 .73 .35 .9910 .96 .79 .41 .9911 .93 .84 .46 .9912 .89 .88 .53 .9813 .88 .89 .56 .9614 .77 .91 .57 .9615 .75 .94 .66 .96
Note. Bold text = values associated with the preferred cut score.

Table 9
Conditional Probabilities of AFQ-Y8 Scores for Identifying At-Least-Moderate Depression
Classification
Score Sensitivity Specificity PPV NPV8 .90 .57 .37 .959 .88 .66 .42 .9510 .86 .72 .46 .9511 .80 .77 .49 .9312 .73 .82 .54 .9213 .71 .86 .58 .9114 .62 .88 .59 .89
Note. Bold text = values associated with the preferred cut score.

Table 10
Conditional Probabilities of AFQ-Y8 Scores for Identifying Severe Anxiety Classification
Score Sensitivity Specificity PPV NPV6 .94 .65 .74 .917 .89 .73 .78 .878 .84 .75 .78 .829 .79 .84 .84 .8010 .77 .88 .87 .7811 .71 .89 .88 .7512 .67 .94 .92 .73
Note. Bold text = values associated with the preferred cut score.

Table 11
Conditional Probabilities of AFQ-Y8 Scores for Predicting At-Least-Mild Anxiety Classification
Score Sensitivity Specificity PPV NPV4 .89 .37 .85 .465 .83 .52 .87 .446 .76 .65 .89 .417 .68 .73 .91 .378 .60 .75 .91 .329 .53 .84 .93 .3110 .48 .88 .94 .30
Note. Bold text = values associated with the preferred cut score.