SCPRED: Accurate prediction of protein structural class for sequences of twilight-zone similarity...
15
BioMed Central Page 1 of 15 (page number not for citation purposes) BMC Bioinformatics Open Access Methodology article SCPRED: Accurate prediction of protein structural class for sequences of twilight-zone similarity with predicting sequences Lukasz Kurgan* 1 , Krzysztof Cios 2 and Ke Chen 1 Address: 1 Department of Electrical and Computer Engineering, University of Alberta, ECEFR, 9701 116 Street, Edmonton, AB, T6G 2V4, Canada and 2 Department of Computer Science, Virginia Commonwealth University, 601 West Main Street, Room 204, Richmond, Virginia 23284-3068, USA Email: Lukasz Kurgan* - [email protected]; Krzysztof Cios - [email protected]; Ke Chen - [email protected] * Corresponding author Abstract Background: Protein structure prediction methods provide accurate results when a homologous protein is predicted, while poorer predictions are obtained in the absence of homologous templates. However, some protein chains that share twilight-zone pairwise identity can form similar folds and thus determining structural similarity without the sequence similarity would be desirable for the structure prediction. The folding type of a protein or its domain is defined as the structural class. Current structural class prediction methods that predict the four structural classes defined in SCOP provide up to 63% accuracy for the datasets in which sequence identity of any pair of sequences belongs to the twilight-zone. We propose SCPRED method that improves prediction accuracy for sequences that share twilight-zone pairwise similarity with sequences used for the prediction. Results: SCPRED uses a support vector machine classifier that takes several custom-designed features as its input to predict the structural classes. Based on extensive design that considers over 2300 index-, composition- and physicochemical properties-based features along with features based on the predicted secondary structure and content, the classifier's input includes 8 features based on information extracted from the secondary structure predicted with PSI-PRED and one feature computed from the sequence. Tests performed with datasets of 1673 protein chains, in which any pair of sequences shares twilight-zone similarity, show that SCPRED obtains 80.3% accuracy when predicting the four SCOP-defined structural classes, which is superior when compared with over a dozen recent competing methods that are based on support vector machine, logistic regression, and ensemble of classifiers predictors. Conclusion: The SCPRED can accurately find similar structures for sequences that share low identity with sequence used for the prediction. The high predictive accuracy achieved by SCPRED is attributed to the design of the features, which are capable of separating the structural classes in spite of their low dimensionality. We also demonstrate that the SCPRED's predictions can be successfully used as a post-processing filter to improve performance of modern fold classification methods. Published: 1 May 2008 BMC Bioinformatics 2008, 9:226 doi:10.1186/1471-2105-9-226 Received: 31 October 2007 Accepted: 1 May 2008 This article is available from: http://www.biomedcentral.com/1471-2105/9/226 © 2008 Kurgan et al; licensee BioMed Central Ltd. This is an Open Access article distributed under the terms of the Creative Commons Attribution License (http://creativecommons.org/licenses/by/2.0 ), which permits unrestricted use, distribution, and reproduction in any medium, provided the original work is properly cited.
-
Upload
independent -
Category
Documents
-
view
0 -
download
0
Transcript of SCPRED: Accurate prediction of protein structural class for sequences of twilight-zone similarity...
BioMed CentralBMC Bioinformatics
ss
Open AcceMethodology articleSCPRED: Accurate prediction of protein structural class for sequences of twilight-zone similarity with predicting sequencesLukasz Kurgan*1, Krzysztof Cios2 and Ke Chen1Address: 1Department of Electrical and Computer Engineering, University of Alberta, ECEFR, 9701 116 Street, Edmonton, AB, T6G 2V4, Canada and 2Department of Computer Science, Virginia Commonwealth University, 601 West Main Street, Room 204, Richmond, Virginia 23284-3068, USA
Email: Lukasz Kurgan* - [email protected]; Krzysztof Cios - [email protected]; Ke Chen - [email protected]
* Corresponding author
AbstractBackground: Protein structure prediction methods provide accurate results when a homologousprotein is predicted, while poorer predictions are obtained in the absence of homologoustemplates. However, some protein chains that share twilight-zone pairwise identity can formsimilar folds and thus determining structural similarity without the sequence similarity would bedesirable for the structure prediction. The folding type of a protein or its domain is defined as thestructural class. Current structural class prediction methods that predict the four structural classesdefined in SCOP provide up to 63% accuracy for the datasets in which sequence identity of any pairof sequences belongs to the twilight-zone. We propose SCPRED method that improves predictionaccuracy for sequences that share twilight-zone pairwise similarity with sequences used for theprediction.
Results: SCPRED uses a support vector machine classifier that takes several custom-designedfeatures as its input to predict the structural classes. Based on extensive design that considers over2300 index-, composition- and physicochemical properties-based features along with featuresbased on the predicted secondary structure and content, the classifier's input includes 8 featuresbased on information extracted from the secondary structure predicted with PSI-PRED and onefeature computed from the sequence. Tests performed with datasets of 1673 protein chains, inwhich any pair of sequences shares twilight-zone similarity, show that SCPRED obtains 80.3%accuracy when predicting the four SCOP-defined structural classes, which is superior whencompared with over a dozen recent competing methods that are based on support vector machine,logistic regression, and ensemble of classifiers predictors.
Conclusion: The SCPRED can accurately find similar structures for sequences that share lowidentity with sequence used for the prediction. The high predictive accuracy achieved by SCPREDis attributed to the design of the features, which are capable of separating the structural classes inspite of their low dimensionality. We also demonstrate that the SCPRED's predictions can besuccessfully used as a post-processing filter to improve performance of modern fold classificationmethods.
Published: 1 May 2008
BMC Bioinformatics 2008, 9:226 doi:10.1186/1471-2105-9-226
Received: 31 October 2007Accepted: 1 May 2008
This article is available from: http://www.biomedcentral.com/1471-2105/9/226
© 2008 Kurgan et al; licensee BioMed Central Ltd. This is an Open Access article distributed under the terms of the Creative Commons Attribution License (http://creativecommons.org/licenses/by/2.0), which permits unrestricted use, distribution, and reproduction in any medium, provided the original work is properly cited.
Page 1 of 15(page number not for citation purposes)
BMC Bioinformatics 2008, 9:226 http://www.biomedcentral.com/1471-2105/9/226
BackgroundProtein structures are predicted to provide answers to keyquestions related to protein function, regulation, andinteractions [1,2]. The solved structures are increasinglyuseful for structure modeling/prediction for unsolvedprotein sequences that have a closely related (similar)sequence with a known structure [3,4]. Homology mode-ling, one of the most successful paradigms used to predictthe structure, is based on the assumption that similarsequences share similar folding patterns [5,6]. Sequencealignment which allows for finding similar sequencesamong the known structures [7,8] usually does not per-form well when no sequences with high identity are avail-able. At the same time, structurally similar proteins thatshare low sequence identity with the sequences used forprediction can be found based on coarse grained classifi-cations such as those provided in Structural Classificationof Proteins (SCOP) database [9,10]. This database imple-ments a hierarchy of relations between known proteinand protein domain structures, in which the first level isknown as the structural class. Prediction of structuralclasses is based on identifying folding patterns based onthousands of already categorized proteins and using thesepatterns for millions of proteins with unknown structuresbut known amino acid (AA) sequences. There are fourmajor structural classes: all-α, all-β, α/β, and α+β. The all-α and all-β classes represent structures that consist ofmainly α-helices and β-strands, respectively. The α/β andα+β classes contain both α-helices and β-strands whichare mainly interspersed and segregated, respectively [9].SCOP also defines three additional classes, i.e., multi-domain, membrane and cell surface, and small proteins,as well as four supplementary categories, i.e., coiled coil,designed, and low resolution proteins and peptides. Theproposed method targets the four main classes due to twofactors: (1) about 90% of SCOP entries belong to the fourclasses, and most of the existing structural class predictionmethods also target these classes [11]. At the same time,the growing number of proteins that are categorized intothe other classes motivates development of the corre-sponding predictive methodologies. We note that theCATH (Class, Architecture, Topology and Homologoussuperfamily) database [12] defines three main structural
classes: mainly-α, mainly-β, and mixed (the fourth classincludes irregular proteins that are composed mostly ofcoils), which approximately correspond to the all-α, all-β,and combination of the α/β and α+β classes in SCOP. Weaddress the SCOP based classification, as it further subdi-vides the mixed proteins and since most of the existingstructural class prediction methods are also based on thisdefinition of the structural classes. Currently, the struc-tural classes in SCOP are assigned manually based on theknown structures, while in the past several automatedassignment methods were proposed. They include amethod proposed by Chou [13] and another by Eisen-haber and colleagues [14], see Table 1. We note that thefirst assignment method requires knowledge of structure(to distinguish between parallel and antiparallel sheets)and the second one is based purely on the content of thetwo secondary structures and merges α/β and α+β classesinto a mixed class. At the same time, the assignment per-formed in the SCOP database is more complex and gov-erned by different rules for the α/β and α+β classes. Theclassification of protein structures in SCOP is performedmanually by experts and is based on evolutionary rela-tionships and on the principles that govern their three-dimensional structure [9]. The structural classes aredefined based on grouping of the assigned folds, which inturn are categorized based on similarities in spatialarrangement of the protein structure. The folds areassigned to the classes on the basis of the secondary struc-tures, in terms of both their content and spatial arrange-ment, of which they are composed. In case of all-α and all-β classes they include folds composed mostly of α-helicesand β-sheets, respectively. The α+β class includes folds inwhich α-helices and β-strands that are largely inter-spersed, while the in case of α/β class which are segregated[9]. Therefore, the assignment into the latter two classesrequires the knowledge of the spatial arrangement of theα-helices and β-strands. Since this manual procedure can-not be directly traced using the input sequence or even itscorresponding secondary sequence, a variety of methodsthat predict the structural class based on the proteinsequence were developed to facilitate automated, high-throughput assignment. We note that the manual assign-ment of structural classes in SCOP does not use the fea-
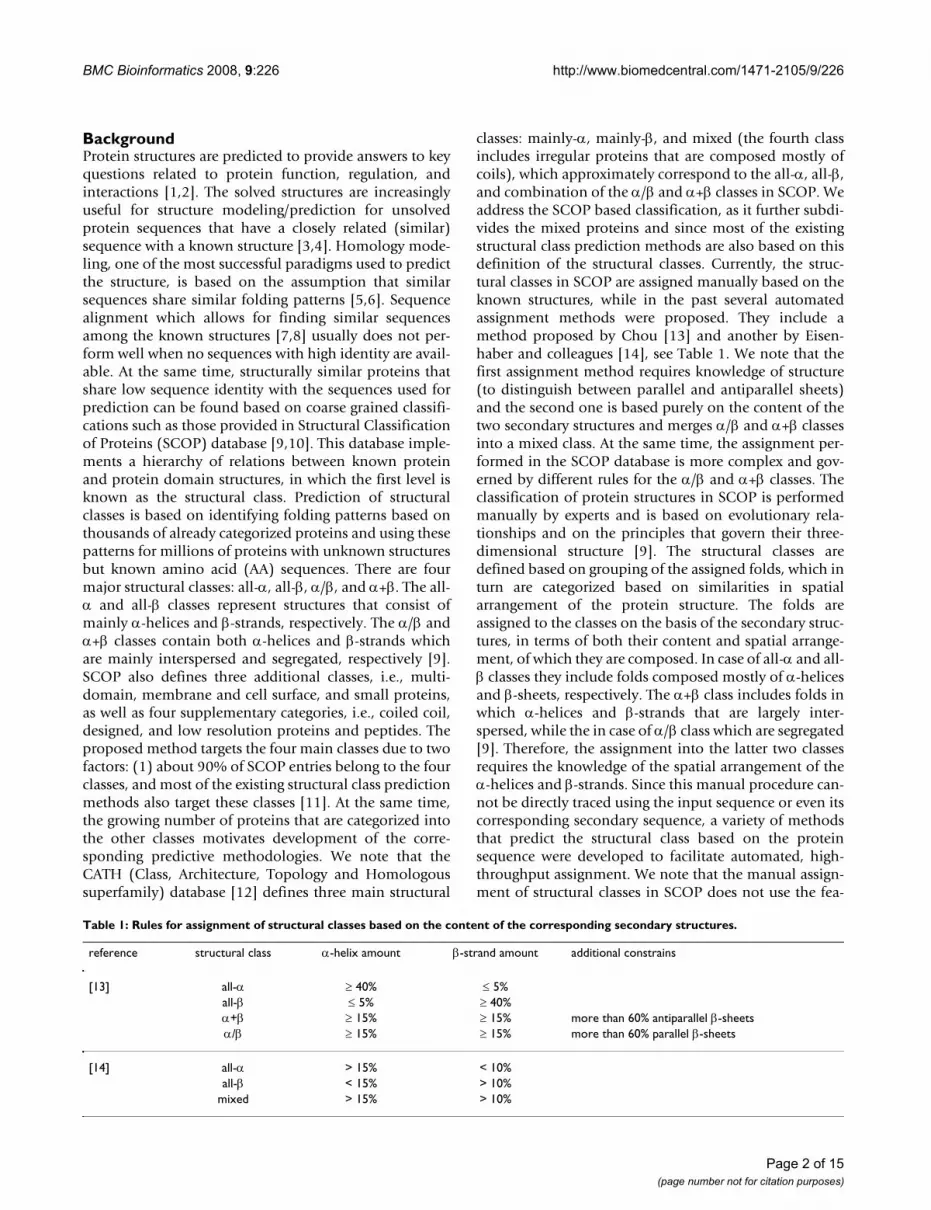
Table 1: Rules for assignment of structural classes based on the content of the corresponding secondary structures.
reference structural class α-helix amount β-strand amount additional constrains
[13] all-α ≥ 40% ≤ 5%all-β ≤ 5% ≥ 40%α+β ≥ 15% ≥ 15% more than 60% antiparallel β-sheetsα/β ≥ 15% ≥ 15% more than 60% parallel β-sheets
[14] all-α > 15% < 10%all-β < 15% > 10%
mixed > 15% > 10%
Page 2 of 15(page number not for citation purposes)
BMC Bioinformatics 2008, 9:226 http://www.biomedcentral.com/1471-2105/9/226
tures or model applied in the proposed method, as theSCOP assignment is based on spatial arrangement of sec-ondary structure segments, while our method is based onthe flat secondary structure sequence.
Prediction of the structural classes is performed in twosteps: 1) the AA sequences are transformed into a fixed-length feature vectors; 2) the feature vectors are fed into aclassification algorithm to generate a prediction outcome.Numerous in-silico structural class prediction methodswere developed. Majority of them use relatively simplefeatures such as composition vector, auto-correlationfunctions based on non-bonded residue energy, polypep-tide composition, pseudo AA composition [15] and com-plexity measure factor [13,16-25]. Several recent methodsuse more advanced feature vectors that either combinephysicochemical properties and sequence composition,or optimize a selected type of the features [26-29]. Predic-tions are performed using a wide range of classificationalgorithms such as fuzzy clustering [30], neural network[31], Bayesian classification [32], rough sets [33], compo-nent-coupled [18-20], information discrepancy [22-24],logistic regression [26-29], decision tree [23,34], and sup-port vector machine [27,34-36]. In recent works complexclassification models such as ensembles [27], bagging[34], and boosting [22,37] were explored. Unfortunately,some of these methods were tested on small datasets,often with relatively high sequence identity, whichresulted in high prediction accuracy [26]. A recent reviewby Chou provides further details and motivation fordevelopment of structural class prediction methods [11].A feasible alternative for above methods is to use the pre-dicted secondary structure, which can be obtained withaccuracy of over 80% for highly similar sequences [38], toassign the corresponding structural classes, e.g., by usingone of the abovementioned assignment methods. Themain drawback is that in this case the prediction wouldconcern only the all-α, all-β and mixed (which combinesα/β and α+β classes) classes.
Development of high quality prediction methods forsequences that are characterized by low identity withsequence used to the prediction continues to be a chal-lenging task. Majority of current secondary structure pre-diction methods use sequence alignment that requires atleast ~30% identity between the query sequence andsequence(s) used to predict its structure [39]. More than95% of protein chains characterized by a lower, 20–25%,pairwise identity, also referred as the twilight-zone simi-larity, have different structures [40], which substantiallyreduces accuracy of the corresponding predictions. Forinstance, recent research shows that the accuracy of thesecondary structure prediction methods trained andtested on protein set in which any pair of sequences sharestwilight-zone similarity drops to 65–68% [41]. Similarly,
although structural class prediction accuracies for datasetsin which training and test sequences share high pairwisesequence identity reach over 90%, they drop to 57–63%when training and testing is performed using datasets inwhich any pair of sequences has twilight-zone similarity[26,29,32]. At the same time, about 40% of sequences forwhich the tertiary structure was deposited to Protein DataBank (PDB) in 2005 share twilight-zone pairwise similar-ity with any sequence deposited in the PDB before 2005[29], which motivates development of the predictionmethods for these challenging sequences. Most impor-tantly, pairs of sequences with low identity can share sim-ilar folding patterns or overall structure [42,43] and canbe used to predict tertiary structure [44]. Research alsoshows that finding similar folding patterns among theproteins characterized by low sequence identity is benefi-cial for reconstruction of the tertiary structure [45,46].
Large number of proteins chains that are of interest to thebiologists (which are being deposited to PDB) and thatshare twilight-zone pairwise identity with the chains forwhich the structure is known, and the potential structuralsimilarities between these protein sequences that can beexploited to build more accurate structure predictionmethods serve as our motivation. One solution toimprove predictions for sequences that share twilight-zone pairwise identity with sequences used to performpredictions is to use a large library of reference functionalsequence motifs to build a feature vector that can providehigher accuracy. Such method that uses 7785 features wasproposed in [47]. Our goal is to introduce a novel in-silicomethod that uses a compact and intuitive feature vector toprovide accurate prediction of the structural classes for thesequences that have twilight-zone pairwise identity withthe sequences used to perform predictions, which in turncould be used to find structurally similar protein thatshare low sequence similarity.
The proposed method, named SCPRED, uses a custom-designed feature vector that includes 9 features and a sup-port vector machine classifier to generate predictions. Ourmethod is based on the fact that the structural classes aredefined based on the secondary structure, although wenote that the assignment in SCOP is based on the spatialarrangement of the secondary structure, while our methoduses only the secondary structure sequence. We use thesecondary structure predicted from the protein sequenceby the PSI-PRED [48,49] to develop a novel set of success-ful features that allow accurately classifying all four struc-tural classes. These features together with acomprehensive set of features used in prior research areused to carefully design, by using feature selection, a com-pact and well performing feature vector. We also demon-strate that SCPRED can be applied to improveperformance of other related prediction methods. Our
Page 3 of 15(page number not for citation purposes)
BMC Bioinformatics 2008, 9:226 http://www.biomedcentral.com/1471-2105/9/226
tests show that coupling of the proposed method as apost-processing filter with state-of-the-art fold classifica-tion methods such as PFP [50] and PFRES [51] improvestheir performance.
Results and discussionThe experimental evaluation was performed using 10-foldcross validation and jackknife tests to avoid overfittingand assure statistical validity of the results [17,26,52]. Thetests were performed on the 25PDB dataset, whichincludes 1673 sequences which share twilight-zone pair-wise similarity, i.e., any pairs of sequence in this set sharestwilight-zone similarity. We also use another low-identitydataset, FC699, to evaluate value added of usingSCPRED's predictions to improve accuracy of protein foldpredictions performed with PFP and PFRES methods. Thereported results include the overall accuracy (the numberof correct predictions divided by the total number of testsequences), accuracy for each structural class (number ofcorrect predictions for a given class divided by the numberof sequences from this class), Matthews's correlation coef-ficient (MCC) for each structural class, and generalizedsquared correlation (GC2). The MCC values rangebetween -1 and 1, where 0 represents random correlation,and bigger positive (negative) values indicate better(lower) prediction quality for a given class. Since MCCworks only for binary classification, we also reported GC2,which is based on χ2 statistics. The GC2 values rangebetween 0 and 1, where 0 corresponds to the worst classi-fication (no correct predictions) and 1 corresponds to per-fect classification. MCC and GC2 are described in [53].
We note that current secondary structure prediction meth-ods achieve the average accuracy close to 80%, e.g., EVAserver reports that PSI-PRED provides the average accuracyof 77.9% for 224 proteins (tested between Apr 2001 andSept 2005) [54]. Since the average accuracy of PSI-PREDpredictions was 77.9% and 77.5% for the 25PDB andFC699 datasets, respectively, we believe that the presentedresults provide a reliable estimate of the future perform-ance of the proposed method.
Comparison with structural class prediction methodsThe SCPRED was comprehensively compared with over adozen of competing structural class methods which usevarious feature vectors and classifiers. The comparisonincludes three groups of modern methods:
- methods that apply optimized feature vectors [26-28],
- advanced multi-classifier methods including boosting[23], ensembles [27], and bagging [34],
- methods that use the best performing SVM [36] andinformation discrepancy based classifiers [22,24].
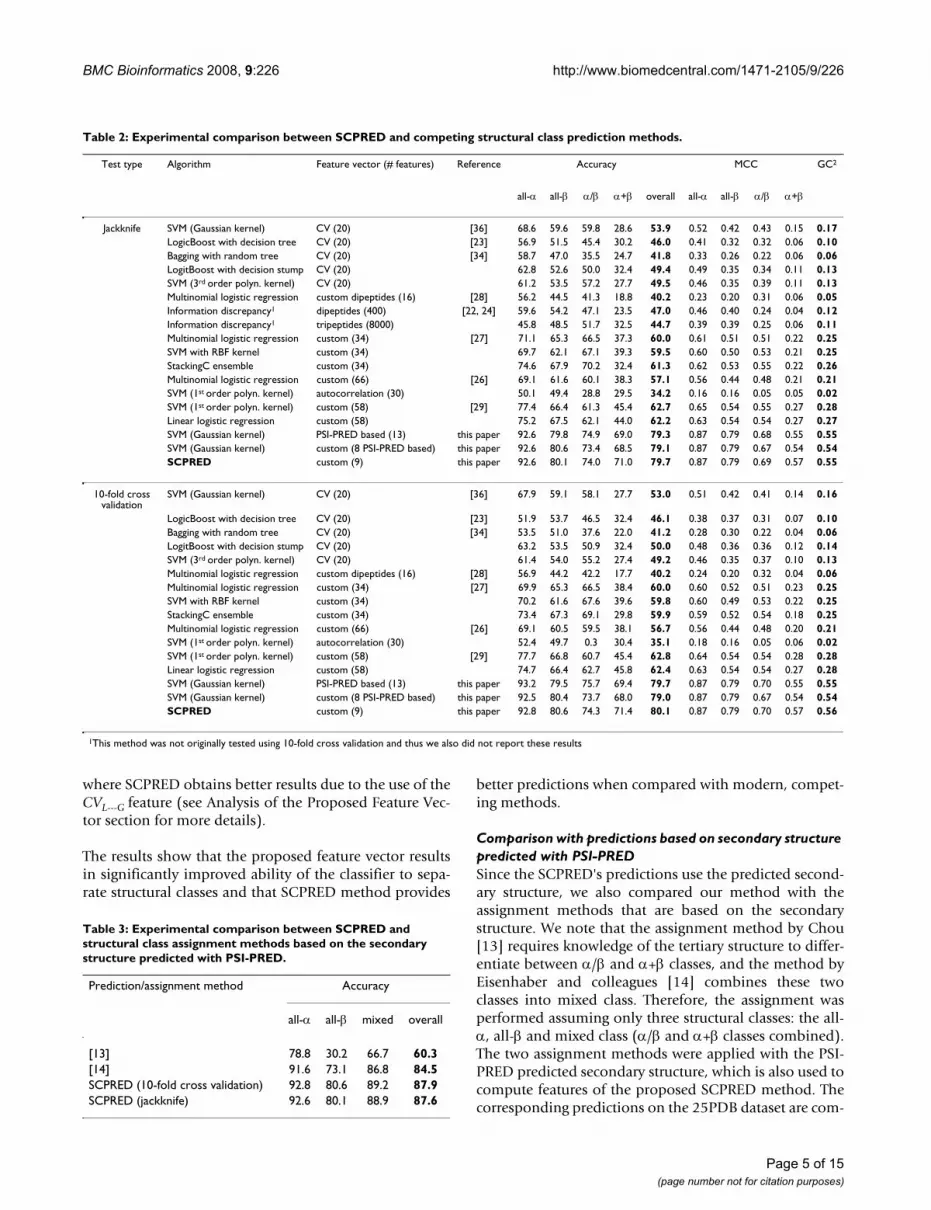
Classification results for the competing methods and theSCPRED are compared in Table 2. The SCPRED, whichuses only 9 features, obtained 80% accuracy for both out-of-sample tests. The second best method, which was alsodesigned using 25PDB dataset (in which training and testsequence share twilight-zone identity) [29], obtained63% accuracy. The remaining, competing methods obtainaccuracies that range between 35% and 60%. The rela-tively low accuracies obtained by the competing methodsare due to using a challenging 25PDB dataset [29]. Wenote that some of these methods [22-24,26,32,34] wereoriginally testes on datasets characterized by highersequence similarity, which resulted in higher reportedaccuracies. The methods that reach 60% accuracy arebased on a custom-designed feature vectors that includessequence composition and physicochemical properties[27]. We observe that the usage of simple, composition-based features results in lower accuracy. The results alsoshow that the SVM and logistic regression classifiers per-form well on this challenging problem.
The most accurate predictions are obtained for the all-αclass (nearly 92% accuracy), while the best results for theall-β and α/β classes are 81% and 75%, respectively. 70%accuracy is obtained for the α+β class. Similar trend isobserved for all tested methods although the correspond-ing accuracies are lower. The main reason for good per-formance for the all-α class is that these sequences are α-helix rich and the helical structures are the easiest to pre-dict, i.e., a helix consists of a single segment and is charac-terized by a repetitive structure.
Table 2 also shows prediction results where the same SVMclassifier as in the proposed SCPRED method is applied,but only using the features based on the secondary struc-ture predicted with PSI-PRED ("SVM (Gaussian kernel);PSI-PRED based (13)" rows in Table 2). In this case, theinput vector for SVM includes 13 features. We observe thatSCPRED that uses features based on sequence and second-ary structure is characterized by a smaller feature set andslightly higher prediction accuracy, i.e., the improvementequals 0.4%. The differences are small, and they clearlyindicate that the primary source of the information thatassures the accurate predictions is the secondary structurepredicted with PSI-PRED.
We also performed an experiment where only the 8 PSI-PRED based features from the sequence representationused by SCPRED were used for the prediction ("SVM(Gaussian kernel); custom (8 PSI-PRED based)" rows inTable 2). In this case, the prediction accuracy deterioratedby less than 1% when compared with SCPRED, whichagain confirms that predicted secondary structure pro-vides the bulk of useful information for the proposed pre-diction method. The main difference concerns α+β class
Page 4 of 15(page number not for citation purposes)
BMC Bioinformatics 2008, 9:226 http://www.biomedcentral.com/1471-2105/9/226
where SCPRED obtains better results due to the use of theCVL---G feature (see Analysis of the Proposed Feature Vec-tor section for more details).
The results show that the proposed feature vector resultsin significantly improved ability of the classifier to sepa-rate structural classes and that SCPRED method provides
better predictions when compared with modern, compet-ing methods.
Comparison with predictions based on secondary structure predicted with PSI-PREDSince the SCPRED's predictions use the predicted second-ary structure, we also compared our method with theassignment methods that are based on the secondarystructure. We note that the assignment method by Chou[13] requires knowledge of the tertiary structure to differ-entiate between α/β and α+β classes, and the method byEisenhaber and colleagues [14] combines these twoclasses into mixed class. Therefore, the assignment wasperformed assuming only three structural classes: the all-α, all-β and mixed class (α/β and α+β classes combined).The two assignment methods were applied with the PSI-PRED predicted secondary structure, which is also used tocompute features of the proposed SCPRED method. Thecorresponding predictions on the 25PDB dataset are com-
Table 2: Experimental comparison between SCPRED and competing structural class prediction methods.
Test type Algorithm Feature vector (# features) Reference Accuracy MCC GC2
all-α all-β α/β α+β overall all-α all-β α/β α+β
Jackknife SVM (Gaussian kernel) CV (20) [36] 68.6 59.6 59.8 28.6 53.9 0.52 0.42 0.43 0.15 0.17LogicBoost with decision tree CV (20) [23] 56.9 51.5 45.4 30.2 46.0 0.41 0.32 0.32 0.06 0.10Bagging with random tree CV (20) [34] 58.7 47.0 35.5 24.7 41.8 0.33 0.26 0.22 0.06 0.06LogitBoost with decision stump CV (20) 62.8 52.6 50.0 32.4 49.4 0.49 0.35 0.34 0.11 0.13SVM (3rd order polyn. kernel) CV (20) 61.2 53.5 57.2 27.7 49.5 0.46 0.35 0.39 0.11 0.13Multinomial logistic regression custom dipeptides (16) [28] 56.2 44.5 41.3 18.8 40.2 0.23 0.20 0.31 0.06 0.05Information discrepancy1 dipeptides (400) [22, 24] 59.6 54.2 47.1 23.5 47.0 0.46 0.40 0.24 0.04 0.12Information discrepancy1 tripeptides (8000) 45.8 48.5 51.7 32.5 44.7 0.39 0.39 0.25 0.06 0.11Multinomial logistic regression custom (34) [27] 71.1 65.3 66.5 37.3 60.0 0.61 0.51 0.51 0.22 0.25SVM with RBF kernel custom (34) 69.7 62.1 67.1 39.3 59.5 0.60 0.50 0.53 0.21 0.25StackingC ensemble custom (34) 74.6 67.9 70.2 32.4 61.3 0.62 0.53 0.55 0.22 0.26Multinomial logistic regression custom (66) [26] 69.1 61.6 60.1 38.3 57.1 0.56 0.44 0.48 0.21 0.21SVM (1st order polyn. kernel) autocorrelation (30) 50.1 49.4 28.8 29.5 34.2 0.16 0.16 0.05 0.05 0.02SVM (1st order polyn. kernel) custom (58) [29] 77.4 66.4 61.3 45.4 62.7 0.65 0.54 0.55 0.27 0.28Linear logistic regression custom (58) 75.2 67.5 62.1 44.0 62.2 0.63 0.54 0.54 0.27 0.27SVM (Gaussian kernel) PSI-PRED based (13) this paper 92.6 79.8 74.9 69.0 79.3 0.87 0.79 0.68 0.55 0.55SVM (Gaussian kernel) custom (8 PSI-PRED based) this paper 92.6 80.6 73.4 68.5 79.1 0.87 0.79 0.67 0.54 0.54SCPRED custom (9) this paper 92.6 80.1 74.0 71.0 79.7 0.87 0.79 0.69 0.57 0.55
10-fold cross validation
SVM (Gaussian kernel) CV (20) [36] 67.9 59.1 58.1 27.7 53.0 0.51 0.42 0.41 0.14 0.16
LogicBoost with decision tree CV (20) [23] 51.9 53.7 46.5 32.4 46.1 0.38 0.37 0.31 0.07 0.10Bagging with random tree CV (20) [34] 53.5 51.0 37.6 22.0 41.2 0.28 0.30 0.22 0.04 0.06LogitBoost with decision stump CV (20) 63.2 53.5 50.9 32.4 50.0 0.48 0.36 0.36 0.12 0.14SVM (3rd order polyn. kernel) CV (20) 61.4 54.0 55.2 27.4 49.2 0.46 0.35 0.37 0.10 0.13Multinomial logistic regression custom dipeptides (16) [28] 56.9 44.2 42.2 17.7 40.2 0.24 0.20 0.32 0.04 0.06Multinomial logistic regression custom (34) [27] 69.9 65.3 66.5 38.4 60.0 0.60 0.52 0.51 0.23 0.25SVM with RBF kernel custom (34) 70.2 61.6 67.6 39.6 59.8 0.60 0.49 0.53 0.22 0.25StackingC ensemble custom (34) 73.4 67.3 69.1 29.8 59.9 0.59 0.52 0.54 0.18 0.25Multinomial logistic regression custom (66) [26] 69.1 60.5 59.5 38.1 56.7 0.56 0.44 0.48 0.20 0.21SVM (1st order polyn. kernel) autocorrelation (30) 52.4 49.7 0.3 30.4 35.1 0.18 0.16 0.05 0.06 0.02SVM (1st order polyn. kernel) custom (58) [29] 77.7 66.8 60.7 45.4 62.8 0.64 0.54 0.54 0.28 0.28Linear logistic regression custom (58) 74.7 66.4 62.7 45.8 62.4 0.63 0.54 0.54 0.27 0.28SVM (Gaussian kernel) PSI-PRED based (13) this paper 93.2 79.5 75.7 69.4 79.7 0.87 0.79 0.70 0.55 0.55SVM (Gaussian kernel) custom (8 PSI-PRED based) this paper 92.5 80.4 73.7 68.0 79.0 0.87 0.79 0.67 0.54 0.54SCPRED custom (9) this paper 92.8 80.6 74.3 71.4 80.1 0.87 0.79 0.70 0.57 0.56
1This method was not originally tested using 10-fold cross validation and thus we also did not report these results
Table 3: Experimental comparison between SCPRED and structural class assignment methods based on the secondary structure predicted with PSI-PRED.
Prediction/assignment method Accuracy
all-α all-β mixed overall
[13] 78.8 30.2 66.7 60.3[14] 91.6 73.1 86.8 84.5SCPRED (10-fold cross validation) 92.8 80.6 89.2 87.9SCPRED (jackknife) 92.6 80.1 88.9 87.6
Page 5 of 15(page number not for citation purposes)
BMC Bioinformatics 2008, 9:226 http://www.biomedcentral.com/1471-2105/9/226
pared in Table 3. Since the assignment methods only usethe predicted secondary structure, i.e., there is no modelto train, they do not require out-of-sample testing.
The results show that the SCPRED provides more accuratepredictions, i.e., 15.5% error rate of the more accurateassignment proposed by Eisenhaber and colleagues wasreduced by 3.4/15.5 = 21% in case of using SCPRED. Thiscorresponds to 260 incorrect predictions for the auto-mated assignment, while SCPRED made only 203 mis-takes. At the same time, SCPRED is capable of predictingα/β and α+β classes while the automated assignmentcombines these two classes together.
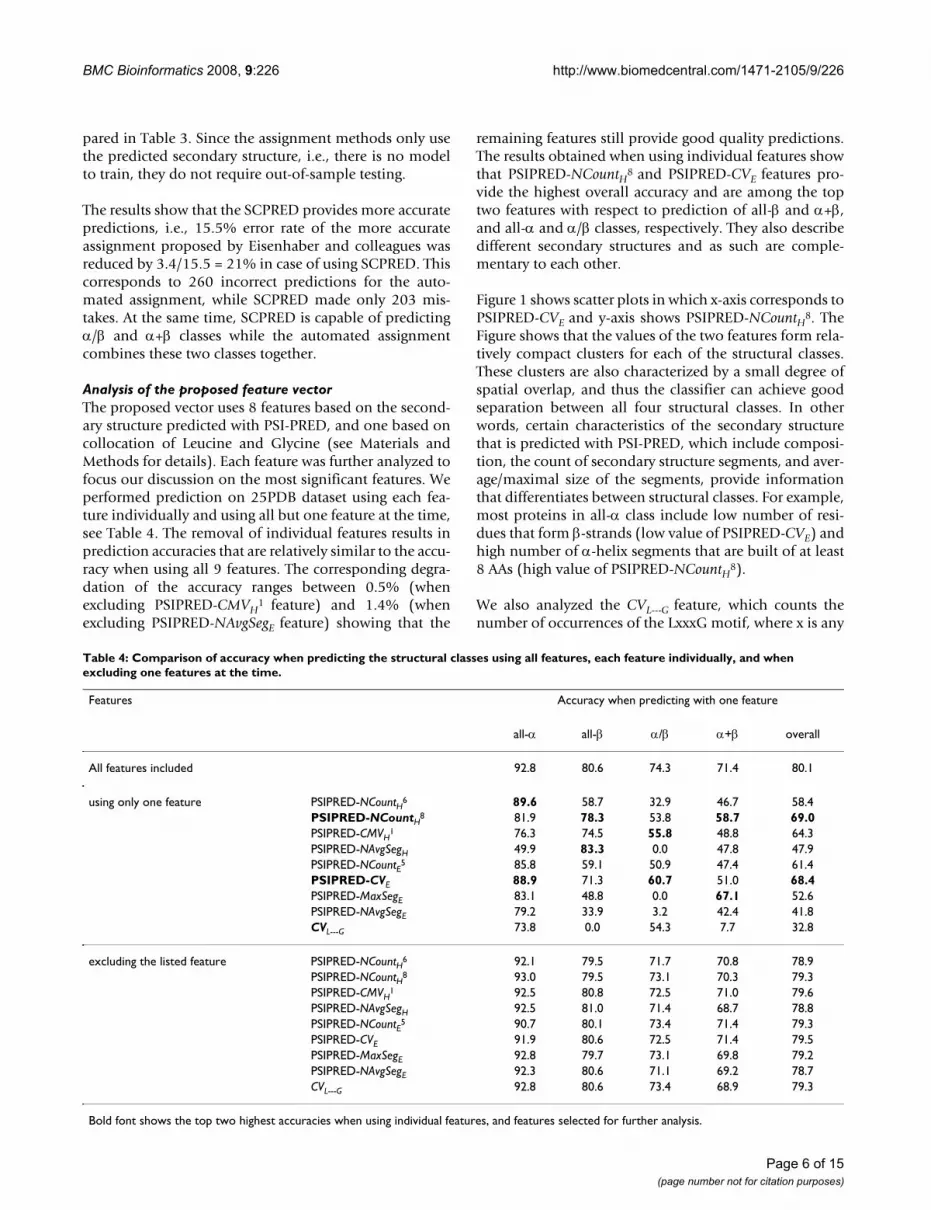
Analysis of the proposed feature vectorThe proposed vector uses 8 features based on the second-ary structure predicted with PSI-PRED, and one based oncollocation of Leucine and Glycine (see Materials andMethods for details). Each feature was further analyzed tofocus our discussion on the most significant features. Weperformed prediction on 25PDB dataset using each fea-ture individually and using all but one feature at the time,see Table 4. The removal of individual features results inprediction accuracies that are relatively similar to the accu-racy when using all 9 features. The corresponding degra-dation of the accuracy ranges between 0.5% (whenexcluding PSIPRED-CMVH
1 feature) and 1.4% (whenexcluding PSIPRED-NAvgSegE feature) showing that the
remaining features still provide good quality predictions.The results obtained when using individual features showthat PSIPRED-NCountH8 and PSIPRED-CVE features pro-vide the highest overall accuracy and are among the toptwo features with respect to prediction of all-β and α+β,and all-α and α/β classes, respectively. They also describedifferent secondary structures and as such are comple-mentary to each other.
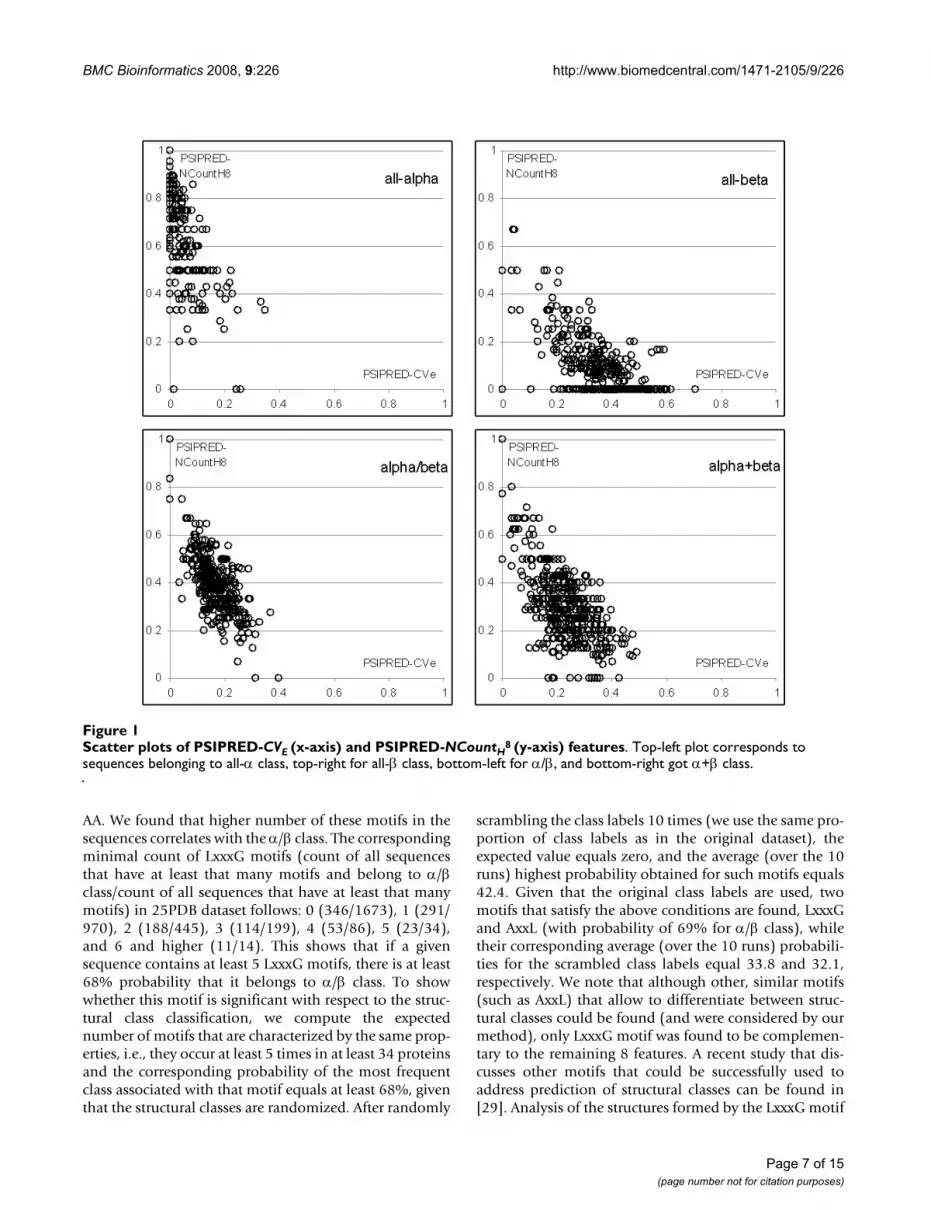
Figure 1 shows scatter plots in which x-axis corresponds toPSIPRED-CVE and y-axis shows PSIPRED-NCountH8. TheFigure shows that the values of the two features form rela-tively compact clusters for each of the structural classes.These clusters are also characterized by a small degree ofspatial overlap, and thus the classifier can achieve goodseparation between all four structural classes. In otherwords, certain characteristics of the secondary structurethat is predicted with PSI-PRED, which include composi-tion, the count of secondary structure segments, and aver-age/maximal size of the segments, provide informationthat differentiates between structural classes. For example,most proteins in all-α class include low number of resi-dues that form β-strands (low value of PSIPRED-CVE) andhigh number of α-helix segments that are built of at least8 AAs (high value of PSIPRED-NCountH8).
We also analyzed the CVL---G feature, which counts thenumber of occurrences of the LxxxG motif, where x is any
Table 4: Comparison of accuracy when predicting the structural classes using all features, each feature individually, and when excluding one features at the time.
Features Accuracy when predicting with one feature
all-α all-β α/β α+β overall
All features included 92.8 80.6 74.3 71.4 80.1
using only one feature PSIPRED-NCountH6 89.6 58.7 32.9 46.7 58.4PSIPRED-NCountH
8 81.9 78.3 53.8 58.7 69.0PSIPRED-CMVH
1 76.3 74.5 55.8 48.8 64.3PSIPRED-NAvgSegH 49.9 83.3 0.0 47.8 47.9PSIPRED-NCountE5 85.8 59.1 50.9 47.4 61.4PSIPRED-CVE 88.9 71.3 60.7 51.0 68.4PSIPRED-MaxSegE 83.1 48.8 0.0 67.1 52.6PSIPRED-NAvgSegE 79.2 33.9 3.2 42.4 41.8CVL---G 73.8 0.0 54.3 7.7 32.8
excluding the listed feature PSIPRED-NCountH6 92.1 79.5 71.7 70.8 78.9PSIPRED-NCountH8 93.0 79.5 73.1 70.3 79.3PSIPRED-CMVH
1 92.5 80.8 72.5 71.0 79.6PSIPRED-NAvgSegH 92.5 81.0 71.4 68.7 78.8PSIPRED-NCountE5 90.7 80.1 73.4 71.4 79.3PSIPRED-CVE 91.9 80.6 72.5 71.4 79.5PSIPRED-MaxSegE 92.8 79.7 73.1 69.8 79.2PSIPRED-NAvgSegE 92.3 80.6 71.1 69.2 78.7CVL---G 92.8 80.6 73.4 68.9 79.3
Bold font shows the top two highest accuracies when using individual features, and features selected for further analysis.
Page 6 of 15(page number not for citation purposes)
BMC Bioinformatics 2008, 9:226 http://www.biomedcentral.com/1471-2105/9/226
AA. We found that higher number of these motifs in thesequences correlates with the α/β class. The correspondingminimal count of LxxxG motifs (count of all sequencesthat have at least that many motifs and belong to α/βclass/count of all sequences that have at least that manymotifs) in 25PDB dataset follows: 0 (346/1673), 1 (291/970), 2 (188/445), 3 (114/199), 4 (53/86), 5 (23/34),and 6 and higher (11/14). This shows that if a givensequence contains at least 5 LxxxG motifs, there is at least68% probability that it belongs to α/β class. To showwhether this motif is significant with respect to the struc-tural class classification, we compute the expectednumber of motifs that are characterized by the same prop-erties, i.e., they occur at least 5 times in at least 34 proteinsand the corresponding probability of the most frequentclass associated with that motif equals at least 68%, giventhat the structural classes are randomized. After randomly
scrambling the class labels 10 times (we use the same pro-portion of class labels as in the original dataset), theexpected value equals zero, and the average (over the 10runs) highest probability obtained for such motifs equals42.4. Given that the original class labels are used, twomotifs that satisfy the above conditions are found, LxxxGand AxxL (with probability of 69% for α/β class), whiletheir corresponding average (over the 10 runs) probabili-ties for the scrambled class labels equal 33.8 and 32.1,respectively. We note that although other, similar motifs(such as AxxL) that allow to differentiate between struc-tural classes could be found (and were considered by ourmethod), only LxxxG motif was found to be complemen-tary to the remaining 8 features. A recent study that dis-cusses other motifs that could be successfully used toaddress prediction of structural classes can be found in[29]. Analysis of the structures formed by the LxxxG motif
Scatter plots of PSIPRED-CVE (x-axis) and PSIPRED-NCountH8 (y-axis) featuresFigure 1Scatter plots of PSIPRED-CVE (x-axis) and PSIPRED-NCountH
8 (y-axis) features. Top-left plot corresponds to sequences belonging to all-α class, top-right for all-β class, bottom-left for α/β, and bottom-right got α+β class.
Page 7 of 15(page number not for citation purposes)
BMC Bioinformatics 2008, 9:226 http://www.biomedcentral.com/1471-2105/9/226
reveals that many of them form either terminal end of anα-helix or a β-strand that folds into a parallel β-sheet. Thetwo proteins that include the highest number of thesemotifs are (1) 1ofda2 domain that includes 9 motifs (6form terminal end of an α-helix, 1 forms a parallel β-sheetand 2 form coils), and (2) 1r66 protein that includes 8motifs (3 form terminal end of an α-helix, 2 form a paral-lel β-sheet and 3 form coils. This motif could serve as a sig-nature for some proteins that belong to the α/β class.
Application to fold classificationThe SCPRED was coupled, as a post-processing filter, withtwo modern fold classification methods: PFP [50] andPFRES [51]. Fold classification aims at prediction of a foldfor a given protein sequence, where multiple fold types aredefined for each structural class. This means that each pre-dicted fold can be automatically assigned to a correspond-ing structural class. Among the 27 folds predicted by PFPand PFRES, 6 (globin-like, cytochrome c, DNA/RNA-binding 3-helical bundle, four-helical up-and-down bun-dle, 4-helical cytokines, and EF Hand-like) belong to theall-α class, 9 (immunoglobulin-like beta-sandwich,cupredoxin-like, viral coat and capsid proteins, concanav-alin A-like lectins/glucanases, SH3-like barrel, OB-fold,beta-Trefoil, trypsin-like serine proteases, and lipocalins)to the all-β class, 9 (TIM beta/alpha-barrel, FAD/NAD (P)-binding domain, flavodoxin-like, NAD (P)-binding Ross-mann-fold domains, P-loop containing nucleoside tri-phosphate hydrolases, thioredoxin fold, ribonuclease H-like motif, alpha/beta-Hydrolases, and periplasmic bind-ing protein-like I) to the α/β class, and 2 (beta-Grasp andFerredoxin-like) to α+β class. The remaining fold con-cerns small proteins and thus was removed from our tests.The post processing was based on removing all predic-tions for which SCPRED and a given fold classificationmethod predicted different structural classes, i.e., the pre-dicted fold belonged to a different structural class than the
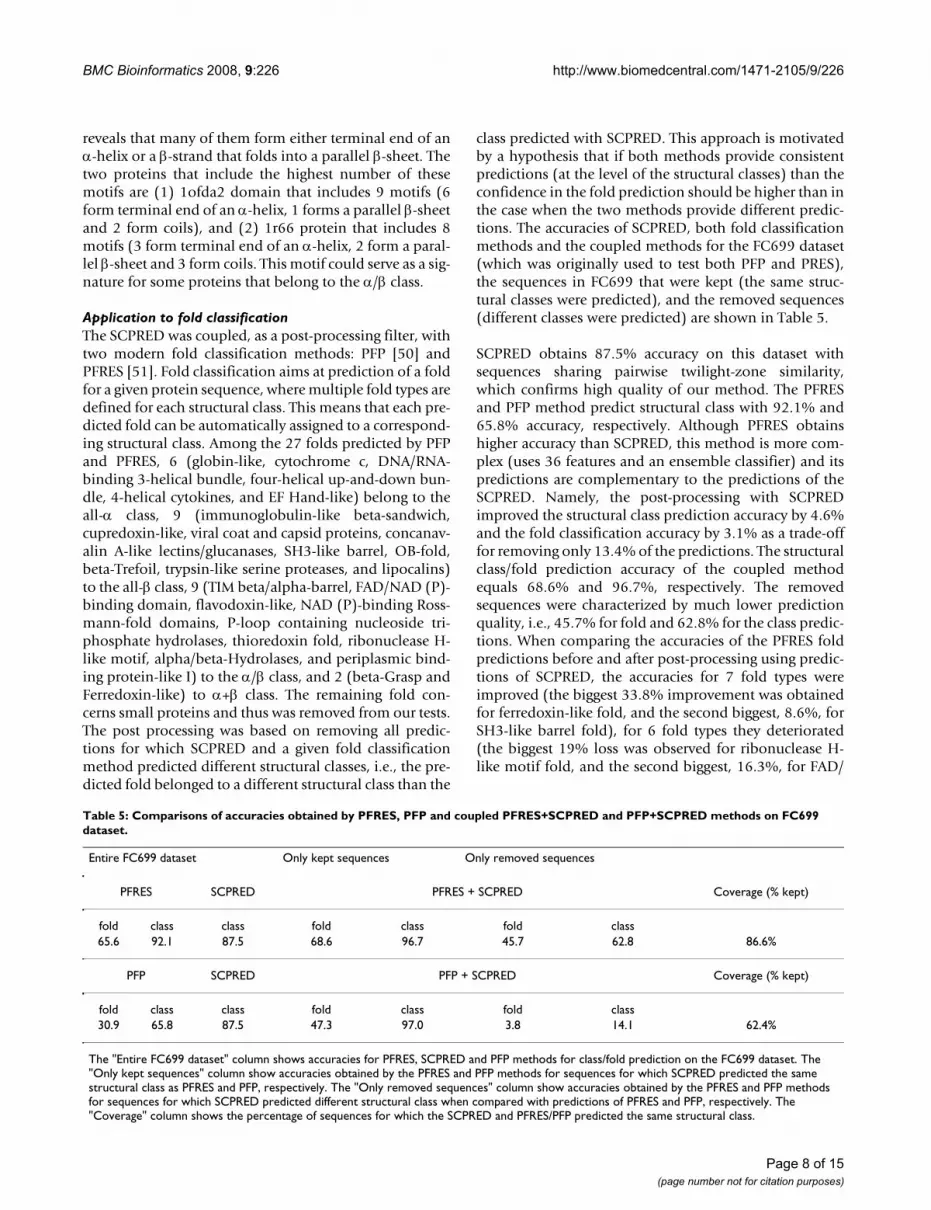
class predicted with SCPRED. This approach is motivatedby a hypothesis that if both methods provide consistentpredictions (at the level of the structural classes) than theconfidence in the fold prediction should be higher than inthe case when the two methods provide different predic-tions. The accuracies of SCPRED, both fold classificationmethods and the coupled methods for the FC699 dataset(which was originally used to test both PFP and PRES),the sequences in FC699 that were kept (the same struc-tural classes were predicted), and the removed sequences(different classes were predicted) are shown in Table 5.
SCPRED obtains 87.5% accuracy on this dataset withsequences sharing pairwise twilight-zone similarity,which confirms high quality of our method. The PFRESand PFP method predict structural class with 92.1% and65.8% accuracy, respectively. Although PFRES obtainshigher accuracy than SCPRED, this method is more com-plex (uses 36 features and an ensemble classifier) and itspredictions are complementary to the predictions of theSCPRED. Namely, the post-processing with SCPREDimproved the structural class prediction accuracy by 4.6%and the fold classification accuracy by 3.1% as a trade-offfor removing only 13.4% of the predictions. The structuralclass/fold prediction accuracy of the coupled methodequals 68.6% and 96.7%, respectively. The removedsequences were characterized by much lower predictionquality, i.e., 45.7% for fold and 62.8% for the class predic-tions. When comparing the accuracies of the PFRES foldpredictions before and after post-processing using predic-tions of SCPRED, the accuracies for 7 fold types wereimproved (the biggest 33.8% improvement was obtainedfor ferredoxin-like fold, and the second biggest, 8.6%, forSH3-like barrel fold), for 6 fold types they deteriorated(the biggest 19% loss was observed for ribonuclease H-like motif fold, and the second biggest, 16.3%, for FAD/
Table 5: Comparisons of accuracies obtained by PFRES, PFP and coupled PFRES+SCPRED and PFP+SCPRED methods on FC699 dataset.
Entire FC699 dataset Only kept sequences Only removed sequences
PFRES SCPRED PFRES + SCPRED Coverage (% kept)
fold class class fold class fold class65.6 92.1 87.5 68.6 96.7 45.7 62.8 86.6%
PFP SCPRED PFP + SCPRED Coverage (% kept)
fold class class fold class fold class30.9 65.8 87.5 47.3 97.0 3.8 14.1 62.4%
The "Entire FC699 dataset" column shows accuracies for PFRES, SCPRED and PFP methods for class/fold prediction on the FC699 dataset. The "Only kept sequences" column show accuracies obtained by the PFRES and PFP methods for sequences for which SCPRED predicted the same structural class as PFRES and PFP, respectively. The "Only removed sequences" column show accuracies obtained by the PFRES and PFP methods for sequences for which SCPRED predicted different structural class when compared with predictions of PFRES and PFP, respectively. The "Coverage" column shows the percentage of sequences for which the SCPRED and PFRES/PFP predicted the same structural class.
Page 8 of 15(page number not for citation purposes)
BMC Bioinformatics 2008, 9:226 http://www.biomedcentral.com/1471-2105/9/226
NAD (P)-binding domain fold), and for the remaining 13fold typed the accuracies did not change.
The improvements for the PFP method were more sub-stantial. Post processing improved the fold predictionaccuracy by 16.4% and the class prediction accuracy by9.5% while removing 37.6% of predictions. The removedsequences were characterized by poorer predictions, i.e.,3.8% and 14.1% accuracies. Coupling of PFP withSCPRED as the post-processor resulted in improvementsfor 17 folds (the largest improvements of 66.6% and 46%were obtained for 4-helical cytokines and ferredoxin-likefolds, respectively), deterioration of prediction accuracyfor 1 fold (the loss of accuracy by 4% was observed forFAD/NAD (P)-binding domain fold), and accuracies for 8folds did not change, when compared with accuraciesobtained with standalone PFP.
The 5 folds for which post-processing with SCPREDimproved accuracies in case of both PFP and PFRESinclude DNA/RNA-binding 3-helical bundle, immu-noglobulin-like beta-sandwich, viral coat and capsid pro-teins, TIM beta/alpha-barrel, and ferredoxin-like, whilethe only fold that suffered consistent looses was FAD/NAD (P)-binding domain. In a nutshell, our tests showthat coupling of the SCPRED with modern fold predictorsprovides improved accuracy and allows for removingpoorer performing predictions.
ConclusionPrediction of structural classes for the "twilight-zonesequences", i.e., sequences that share twilight-zone simi-larity with sequences used for prediction, not only allowslearning the overall folding type for a given proteinsequence, but also helps in finding proteins that formsimilar folds in spite of low sequence similarity. There-fore, a high quality structural class predictor would bebeneficial for in-silico prediction of tertiary structure ofproteins with low sequence identity with respect tosequence used for prediction. To this end, we introducedthe SCPRED method for prediction of structural classesfrom the "twilight-zone sequences". Our method providespredictions using SVM classifier and a compact featurevector to represent the input sequences. The features uti-lize information about secondary structure predicted withPSI-PRED and the protein sequence. Based on a compre-hensive empirical comparison with other predictionmethods on a set of over 1600 domains that share twi-light-zone sequence similarity, the SCPRED is shown toobtain 80% accuracy, while the accuracies of other meth-ods range between 35% and 63%. The main contributionof this paper is the new feature vector which was shown touncover several relations between the predicted secondarystructure and certain sequence motifs, and the structuralclasses. We show that the main source of the information
that allows for successful predictions of structural classesis the secondary structure predicted with PSI-PRED. Wealso demonstrate that the proposed method can be suc-cessfully coupled with state-of-the-art fold classificationmethods to improve their accuracy. The empirical resultsshow that although the proposed methods obtains favo-rable overall accuracy, the predictions for the mixed (α+βand α/β) classes are of lower quality when compared withthe predictions for all-α and all-β classes. Therefore, inves-tigations into improving predictions for the mixed classeswould constitute an interesting subject for future work.One of such attempts could be implemented throughdesigning of a classifier that better balances accuraciesbetween all classes as a trade-of for lower overall accuracy.
MethodsDatasetsThe SCPRED was tested on a large benchmark dataset, inwhich any pair of sequences shares twilight-zone similar-ity. This means that any test sequence shares twilight-zoneidentity with any sequence in the training set used to gen-erate the proposed classification model. The dataset,referred to as 25PDB, was selected using 25% PDBSELECTlist [56], which includes proteins from PDB that werescanned with high resolution, and with low, on averageabout 25%, identity. The dataset was originally publishedin [26] and was used to benchmark two structural classprediction methods [27,29]. It contains 1673 proteinsand domains, which include 443 all-α, 443 all-β, 346 α/β, and 441 α+β sequences.
A second dataset was used to verify whether the predictedstructural classes can be used to perform post-processingof the results generated by two modern fold classificationmethods, PFP and PFRES. This dataset was originallyintroduced in [51] and includes sequences that belong tothe 27 protein folds (as defined in SCOP) and that weredeposited into PDB between 2002 and 2004. Thesesequences were filtered by CD-HIT [57] at 40% sequenceidentity. Next, the remaining sequences were aligned withthe sequences from the 25PDB dataset and the sequencesthat were used to train PFP and PFRES methods usingSmith-Waterman algorithm [58]. Only sequences thathave less than 35% sequence identity with any sequencein 25PDB dataset and the two training sets were selected.We also removed proteins that belong to the "small pro-tein" fold since they do not belong to any particular struc-tural class, and they can be accurately classified based onthe length of the underlying sequence. The final dataset,named FC699, includes 699 sequences that share low40% identity with each other and 35% identity withsequences used to train SCPRED, PFP, and PFRES meth-ods.
Page 9 of 15(page number not for citation purposes)
BMC Bioinformatics 2008, 9:226 http://www.biomedcentral.com/1471-2105/9/226
Feature vectorThe feature vector was derived from a comprehensive listof feature sets that were used for prediction of proteinstructural class, secondary structure content, function,family, structural flexibility, and solvent accessibility[23,26-29,33,59-72].
Sequence length denoted by N.
Index-based features
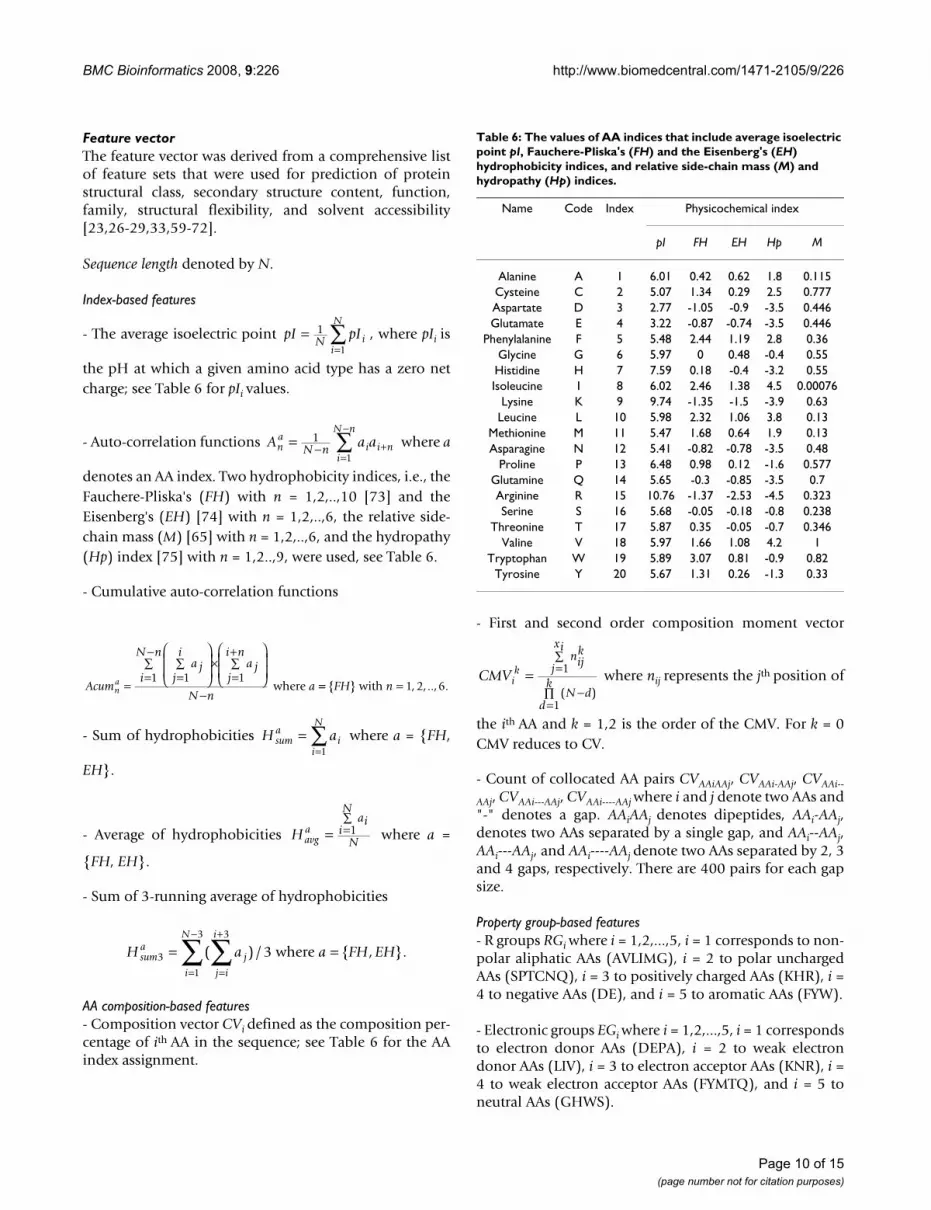
- The average isoelectric point , where pIi is
the pH at which a given amino acid type has a zero netcharge; see Table 6 for pIi values.
- Auto-correlation functions where a
denotes an AA index. Two hydrophobicity indices, i.e., theFauchere-Pliska's (FH) with n = 1,2,..,10 [73] and theEisenberg's (EH) [74] with n = 1,2,..,6, the relative side-chain mass (M) [65] with n = 1,2,..,6, and the hydropathy(Hp) index [75] with n = 1,2..,9, were used, see Table 6.
- Cumulative auto-correlation functions
- Sum of hydrophobicities where a = {FH,
EH}.
- Average of hydrophobicities where a =
{FH, EH}.
- Sum of 3-running average of hydrophobicities
AA composition-based features- Composition vector CVi defined as the composition per-centage of ith AA in the sequence; see Table 6 for the AAindex assignment.
- First and second order composition moment vector
where nij represents the jth position of
the ith AA and k = 1,2 is the order of the CMV. For k = 0CMV reduces to CV.
- Count of collocated AA pairs CVAAiAAj, CVAAi-AAj, CVAAi--
AAj, CVAAi---AAj, CVAAi----AAj where i and j denote two AAs and"-" denotes a gap. AAiAAj denotes dipeptides, AAi-AAj,denotes two AAs separated by a single gap, and AAi--AAj,AAi---AAj, and AAi----AAj denote two AAs separated by 2, 3and 4 gaps, respectively. There are 400 pairs for each gapsize.
Property group-based features- R groups RGi where i = 1,2,...,5, i = 1 corresponds to non-polar aliphatic AAs (AVLIMG), i = 2 to polar unchargedAAs (SPTCNQ), i = 3 to positively charged AAs (KHR), i =4 to negative AAs (DE), and i = 5 to aromatic AAs (FYW).
- Electronic groups EGi where i = 1,2,...,5, i = 1 correspondsto electron donor AAs (DEPA), i = 2 to weak electrondonor AAs (LIV), i = 3 to electron acceptor AAs (KNR), i =4 to weak electron acceptor AAs (FYMTQ), and i = 5 toneutral AAs (GHWS).
pI pIN ii
N=
=∑1
1
A a ana
i i ni
N n
N n= − +=
−
∑1
1
Acum
a jj
ia j
j
i n
i
N n
N nan
a ==∑
⎛
⎝⎜⎜
⎞
⎠⎟⎟×
=
+∑
⎛
⎝⎜⎜
⎞
⎠⎟⎟=
−∑
−1 11
where == ={ } , ,.., .FH n with 1 2 6
H asuma
ii
N=
=∑
1
Havga
aii
N
N= =∑
1
H a a FH EHsuma
j
j i
i
i
N
3
3
1
3
3= ==
+
=
−
∑∑( ) / { , }. where
CMVik
nijk
j
xi
N dd
k= =∑
−=∏
1
1( )
Table 6: The values of AA indices that include average isoelectric point pI, Fauchere-Pliska's (FH) and the Eisenberg's (EH) hydrophobicity indices, and relative side-chain mass (M) and hydropathy (Hp) indices.
Name Code Index Physicochemical index
pI FH EH Hp M
Alanine A 1 6.01 0.42 0.62 1.8 0.115Cysteine C 2 5.07 1.34 0.29 2.5 0.777Aspartate D 3 2.77 -1.05 -0.9 -3.5 0.446Glutamate E 4 3.22 -0.87 -0.74 -3.5 0.446
Phenylalanine F 5 5.48 2.44 1.19 2.8 0.36Glycine G 6 5.97 0 0.48 -0.4 0.55Histidine H 7 7.59 0.18 -0.4 -3.2 0.55Isoleucine I 8 6.02 2.46 1.38 4.5 0.00076
Lysine K 9 9.74 -1.35 -1.5 -3.9 0.63Leucine L 10 5.98 2.32 1.06 3.8 0.13
Methionine M 11 5.47 1.68 0.64 1.9 0.13Asparagine N 12 5.41 -0.82 -0.78 -3.5 0.48
Proline P 13 6.48 0.98 0.12 -1.6 0.577Glutamine Q 14 5.65 -0.3 -0.85 -3.5 0.7Arginine R 15 10.76 -1.37 -2.53 -4.5 0.323Serine S 16 5.68 -0.05 -0.18 -0.8 0.238
Threonine T 17 5.87 0.35 -0.05 -0.7 0.346Valine V 18 5.97 1.66 1.08 4.2 1
Tryptophan W 19 5.89 3.07 0.81 -0.9 0.82Tyrosine Y 20 5.67 1.31 0.26 -1.3 0.33
Page 10 of 15(page number not for citation purposes)
BMC Bioinformatics 2008, 9:226 http://www.biomedcentral.com/1471-2105/9/226
- Chemical groups CGi, which are defined based on com-position of chemical group that constitute the side chainswhere i = 1,2,...,10 corresponds to C, CAROM, CH, CH2,CH2RING, CH3, CHAROM, CO, NH, OH side chaingroups, respectively.
- Exchange groups XGi where i = 1(HRK), 2(DENQ), 3(C),4(STPAG), 5(MILV), 6(FYW), are supported by statisticalstudies and cluster AAs based on point mutation that rep-resent conservative replacements through revolution.
- Hydrophobicity group HGi where i = 1,2 includeshydrophilic AAs (KHRDESTNQ), and hydrophobic AAs(VLIMAFPWYCG).
- Other groups OGi where i = 1,2,...,7 are defined based onmolecular weights, i.e. tiny (AG), small (AGST) and bulky(FHWYR) AAs, and other groupings such as polar(DEKHRNTQSYW), aromatic (FHWY), charged(DEKHRVLI), and polar uncharged AAs (NQ).
- The composition percentage of each group was com-puted.
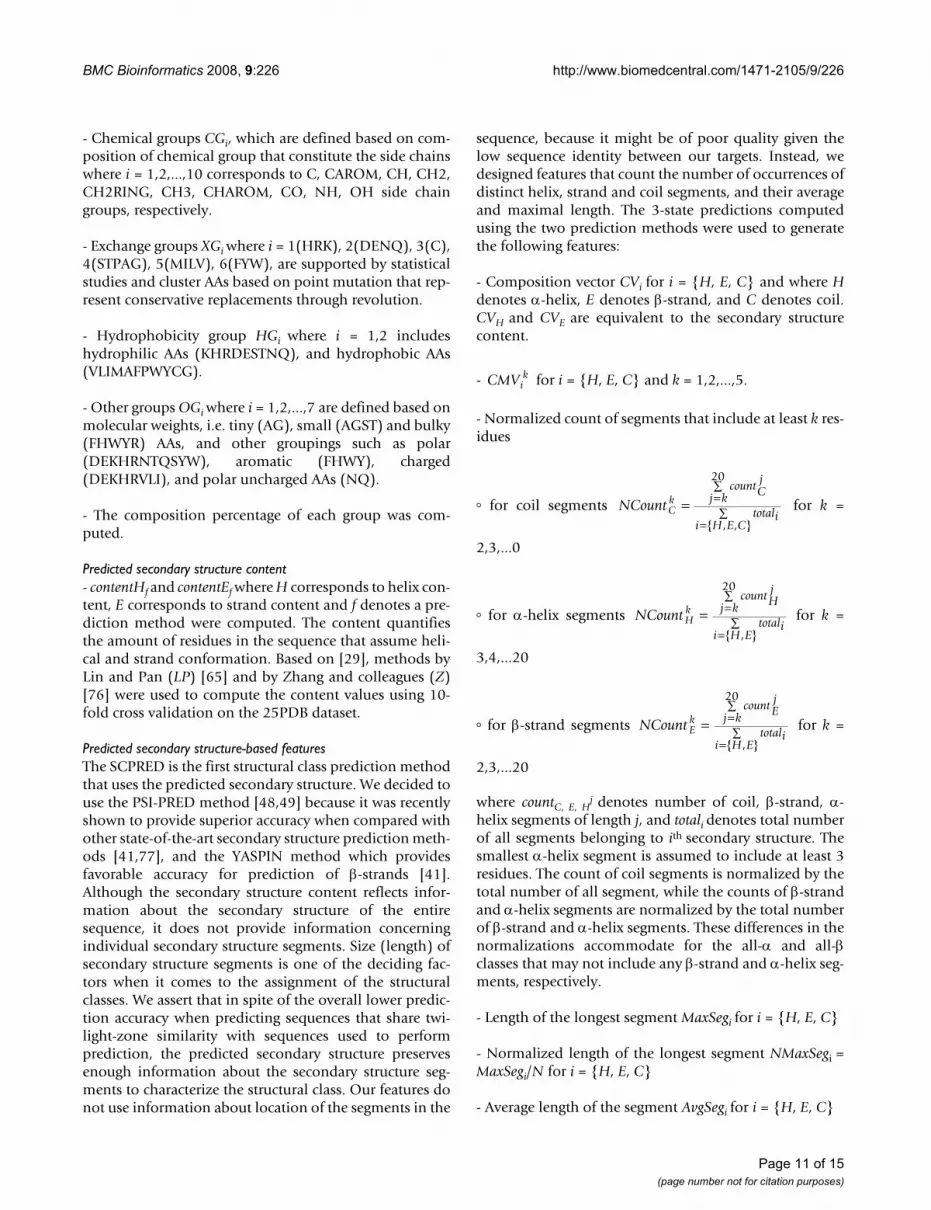
Predicted secondary structure content- contentHf and contentEf where H corresponds to helix con-tent, E corresponds to strand content and f denotes a pre-diction method were computed. The content quantifiesthe amount of residues in the sequence that assume heli-cal and strand conformation. Based on [29], methods byLin and Pan (LP) [65] and by Zhang and colleagues (Z)[76] were used to compute the content values using 10-fold cross validation on the 25PDB dataset.
Predicted secondary structure-based featuresThe SCPRED is the first structural class prediction methodthat uses the predicted secondary structure. We decided touse the PSI-PRED method [48,49] because it was recentlyshown to provide superior accuracy when compared withother state-of-the-art secondary structure prediction meth-ods [41,77], and the YASPIN method which providesfavorable accuracy for prediction of β-strands [41].Although the secondary structure content reflects infor-mation about the secondary structure of the entiresequence, it does not provide information concerningindividual secondary structure segments. Size (length) ofsecondary structure segments is one of the deciding fac-tors when it comes to the assignment of the structuralclasses. We assert that in spite of the overall lower predic-tion accuracy when predicting sequences that share twi-light-zone similarity with sequences used to performprediction, the predicted secondary structure preservesenough information about the secondary structure seg-ments to characterize the structural class. Our features donot use information about location of the segments in the
sequence, because it might be of poor quality given thelow sequence identity between our targets. Instead, wedesigned features that count the number of occurrences ofdistinct helix, strand and coil segments, and their averageand maximal length. The 3-state predictions computedusing the two prediction methods were used to generatethe following features:
- Composition vector CVi for i = {H, E, C} and where Hdenotes α-helix, E denotes β-strand, and C denotes coil.CVH and CVE are equivalent to the secondary structurecontent.
- for i = {H, E, C} and k = 1,2,...,5.
- Normalized count of segments that include at least k res-idues
� for coil segments for k =
2,3,...0
� for α-helix segments for k =
3,4,...20
� for β-strand segments for k =
2,3,...20
where countC, E, Hj denotes number of coil, β-strand, α-
helix segments of length j, and totali denotes total numberof all segments belonging to ith secondary structure. Thesmallest α-helix segment is assumed to include at least 3residues. The count of coil segments is normalized by thetotal number of all segment, while the counts of β-strandand α-helix segments are normalized by the total numberof β-strand and α-helix segments. These differences in thenormalizations accommodate for the all-α and all-βclasses that may not include any β-strand and α-helix seg-ments, respectively.
- Length of the longest segment MaxSegi for i = {H, E, C}
- Normalized length of the longest segment NMaxSegi =MaxSegi/N for i = {H, E, C}
- Average length of the segment AvgSegi for i = {H, E, C}
CMVik
NCountCk
countCj
j ktotali
i H E C
= =∑
=∑
20
{ , , }
NCount Hk
countHj
j ktotali
i H E
= =∑
=∑
20
{ , }
NCount Ek
countEj
j ktotali
i H E
= =∑
=∑
20
{ , }
Page 11 of 15(page number not for citation purposes)
BMC Bioinformatics 2008, 9:226 http://www.biomedcentral.com/1471-2105/9/226
- Normalized average length of the segment NAvgSegi =AvgSegi/N for i = {H, E, C}
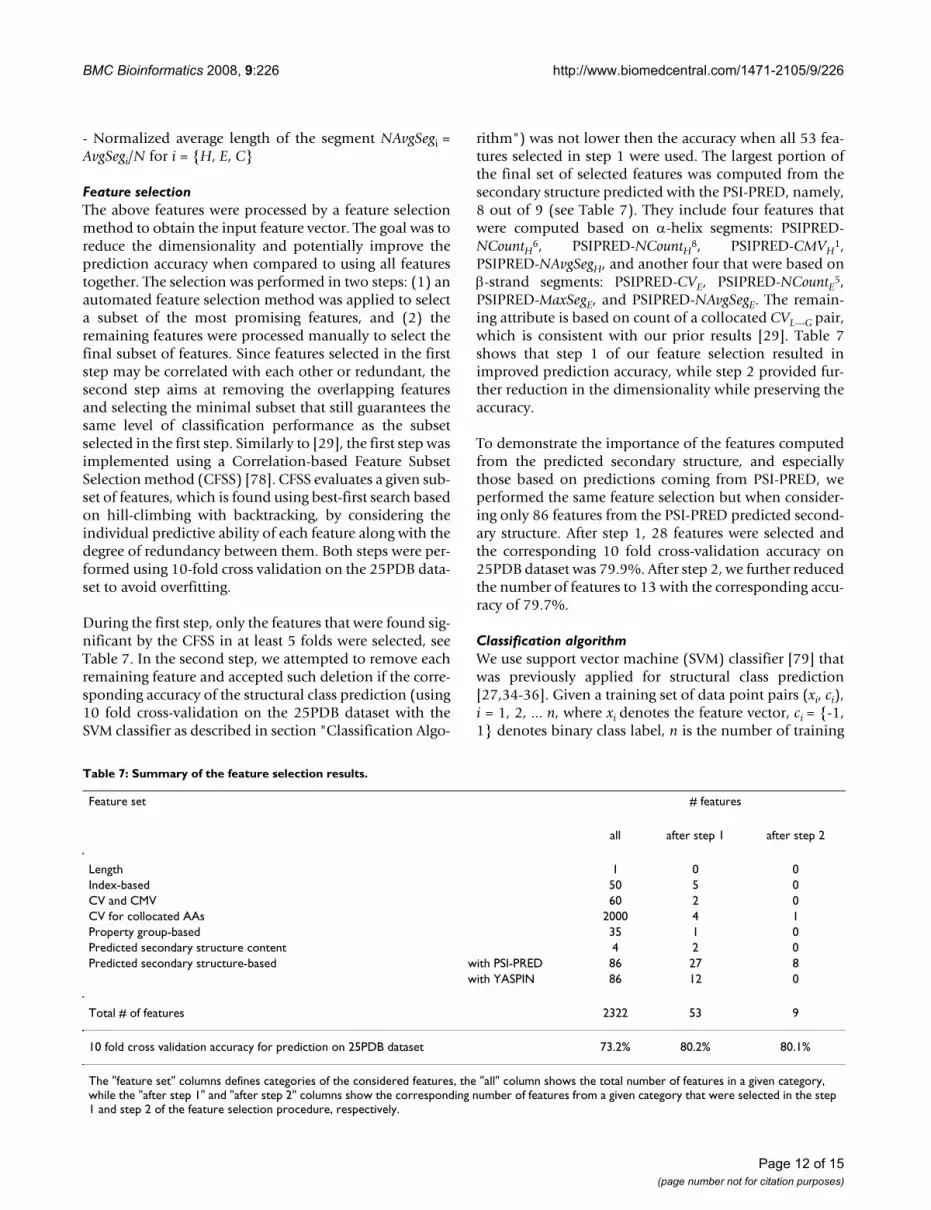
Feature selectionThe above features were processed by a feature selectionmethod to obtain the input feature vector. The goal was toreduce the dimensionality and potentially improve theprediction accuracy when compared to using all featurestogether. The selection was performed in two steps: (1) anautomated feature selection method was applied to selecta subset of the most promising features, and (2) theremaining features were processed manually to select thefinal subset of features. Since features selected in the firststep may be correlated with each other or redundant, thesecond step aims at removing the overlapping featuresand selecting the minimal subset that still guarantees thesame level of classification performance as the subsetselected in the first step. Similarly to [29], the first step wasimplemented using a Correlation-based Feature SubsetSelection method (CFSS) [78]. CFSS evaluates a given sub-set of features, which is found using best-first search basedon hill-climbing with backtracking, by considering theindividual predictive ability of each feature along with thedegree of redundancy between them. Both steps were per-formed using 10-fold cross validation on the 25PDB data-set to avoid overfitting.
During the first step, only the features that were found sig-nificant by the CFSS in at least 5 folds were selected, seeTable 7. In the second step, we attempted to remove eachremaining feature and accepted such deletion if the corre-sponding accuracy of the structural class prediction (using10 fold cross-validation on the 25PDB dataset with theSVM classifier as described in section "Classification Algo-
rithm") was not lower then the accuracy when all 53 fea-tures selected in step 1 were used. The largest portion ofthe final set of selected features was computed from thesecondary structure predicted with the PSI-PRED, namely,8 out of 9 (see Table 7). They include four features thatwere computed based on α-helix segments: PSIPRED-NCountH6, PSIPRED-NCountH8, PSIPRED-CMVH
1,PSIPRED-NAvgSegH, and another four that were based onβ-strand segments: PSIPRED-CVE, PSIPRED-NCountE5,PSIPRED-MaxSegE, and PSIPRED-NAvgSegE. The remain-ing attribute is based on count of a collocated CVL---G pair,which is consistent with our prior results [29]. Table 7shows that step 1 of our feature selection resulted inimproved prediction accuracy, while step 2 provided fur-ther reduction in the dimensionality while preserving theaccuracy.
To demonstrate the importance of the features computedfrom the predicted secondary structure, and especiallythose based on predictions coming from PSI-PRED, weperformed the same feature selection but when consider-ing only 86 features from the PSI-PRED predicted second-ary structure. After step 1, 28 features were selected andthe corresponding 10 fold cross-validation accuracy on25PDB dataset was 79.9%. After step 2, we further reducedthe number of features to 13 with the corresponding accu-racy of 79.7%.
Classification algorithmWe use support vector machine (SVM) classifier [79] thatwas previously applied for structural class prediction[27,34-36]. Given a training set of data point pairs (xi, ci),i = 1, 2, ... n, where xi denotes the feature vector, ci = {-1,1} denotes binary class label, n is the number of training
Table 7: Summary of the feature selection results.
Feature set # features
all after step 1 after step 2
Length 1 0 0Index-based 50 5 0CV and CMV 60 2 0CV for collocated AAs 2000 4 1Property group-based 35 1 0Predicted secondary structure content 4 2 0Predicted secondary structure-based with PSI-PRED 86 27 8
with YASPIN 86 12 0
Total # of features 2322 53 9
10 fold cross validation accuracy for prediction on 25PDB dataset 73.2% 80.2% 80.1%
The "feature set" columns defines categories of the considered features, the "all" column shows the total number of features in a given category, while the "after step 1" and "after step 2" columns show the corresponding number of features from a given category that were selected in the step 1 and step 2 of the feature selection procedure, respectively.
Page 12 of 15(page number not for citation purposes)
BMC Bioinformatics 2008, 9:226 http://www.biomedcentral.com/1471-2105/9/226
data points, finding the optimal SVM is achieved by solv-ing:
where w is a vector perpendicular to wx-b = 0 hyperplanethat separates the two classes, C is a user defined complex-ity constant, ξi are slack variables that measure the degreeof misclassification of xi for a given hyperplane, b is an off-set that defines the size of a margin that separates the twoclasses, and z = φ(x) where k(x, x') = φ(x)·φ(x') is a userdefined kernel function.
The SVM classifier was trained using Platt's sequentialminimal optimization algorithm [80] that was furtheroptimized by Keerthi and colleagues [81]. The structuralclass prediction that includes multiple classes is solvedusing pairwise binary classification, namely, a separateclassifier is build for each pair of classes. Two popularfamilies of kernel functions including polynomials andradial basis functions (RBF) were used. The kernel func-tion selection and parameterization as well as selection ofthe complexity constant value were performed based on10-fold cross validation on the 25PDB dataset using 53features selected in step 1 of the feature selection proce-dure. The final classifier uses C = 2 and the RBF kernel
The classification algorithms used to develop and com-pare the proposed method were implemented in Weka[82]. We note that computation of the SVM model usingthe 25PDB dataset encoded using the selected 9 featurestakes less than 2 seconds on a desktop computer equippedwith Pentium processor at 2.8GHz.
Availability & requirementsThe prediction model and datasets can be freely accessedat http://biomine.ece.ualberta.ca/SCPRED/SCPRED.htm
Authors' contributionsLK contributed to the conception and design of the pre-diction method, prepared the datasets, designed and com-puted the features, performed feature selection andexperimental comparison, and helped with evaluation ofthe results. KC contributed to the conception of the pre-diction method and helped with evaluation of the results.KC prepared the datasets, designed and computed the fea-tures, and helped with experimental comparison. Allauthors have drafted, corrected and approved the manu-script.
AcknowledgementsL. Kurgan acknowledges support from NSERC Canada. K. Chen's research was supported by the Alberta Ingenuity Scholarship.
References1. Chou KC: Structural bioinformatics and its impact to bio-
medical science. Current Medicinal Chemistry 2004, 11:2105-34.2. Chou KC, Wei DQ, Du QS, Sirois S, Zhong WZ: Progress in com-
putational approach to drug development against SARS.Current Medicinal Chemistry 2006, 13:3263-70.
3. Tress M, Ezkurdia I, Grana O, Lopez G, Valencia A: Assessment ofpredictions submitted for the CASP6 comparative modelingcategory. Proteins 2005, 61(S7):27-45.
4. Wang G, Jin Y, Dunbrack RL Jr: Assessment of fold recognitionpredictions in CASP6. Proteins 2005, 61(S7):46-66.
5. Zhang Y, Skolnick J: The protein structure prediction problemcould be solved using the current PDB library. Proc Natl AcadSci USA 2005, 102:1029-34.
6. Ruan J, Chen K, Tuszynski JA, Kurgan L: Quantitative analysis ofthe conservation of the tertiary structure of protein seg-ments. Protein J 2006, 25:301-15.
7. Altschul SF, Madden TL, Schaffer AA, Zhang JH, Zhang Z, Miller W,Lipman DJ: Gapped BLAST and PSI-BLAST: a new generationof protein database search programs. Nucleic Acids Res 1997,17:3389-402.
8. Yu YK, Gertz EM, Agarwala R, Schaffer AA, Altschul SF: Retrievalaccuracy, statistical significance and compositional similarityin protein sequence database searches. Nucleic Acids Res 2006,34:5966-73.
9. Murzin AG, Brenner SE, Hubbard T, Chothia C: SCOP: A struc-tural classification of protein database for the investigationof sequence and structures. J Mol Biol 1995, 247:536-40.
10. Andreeva A, Howorth D, Brenner SE, Hubbard TJ, Chothia C, MurzinAG: SCOP database in 2004: refinements integrate structureand sequence family data. Nucleic Acids Res 2004, 32:D226-9.
11. Chou KC: Progress in protein structural class prediction andits impact to bioinformatics and proteomics. Curr Protein PeptSci 2005, 6(5):423-436.
12. Orengo CA, Michie AD, Jones S, Jones DT, Swindells MB, ThorntonJM: CATH- A Hierarchic Classification of Protein DomainStructures. Structure 1997, 5(8):1093-1108.
13. Chou KC: A Novel Approach to Predicting Protein StructuralClasses in a (20-1)-D Amino Acid Composition Space. Pro-teins 1995, 21:319-344.
14. Eisenhaber F, Frömmel C, Argos P: Prediction of secondary struc-tural content of proteins from their amino acid compositionalone, II The paradox with secondary structural class. Proteins1996, 25:169-179.
15. Chou KC: Prediction of protein cellular attributes usingpseudo amino acid composition. PROTEINS: Structure, Function,and Genetics 2001, 43:246-255.
16. Chou KC, Zhang CT: Predicting protein folding types by dis-tance functions that make allowances for amino acid interac-tions. Journal of Biological Chemistry 1994, 269:22014-20.
17. Chou KC, Zhang CT: Prediction of protein structural classes.Crit Rev Biochem Mol Biol 1995, 30(4):275-349.
18. Chou KC, Liu W, Maggiora GM, Zhang CT: Prediction and classi-fication of domain structural classes. Proteins 1998,31(1):97-103.
19. Chou KC, Maggiora GM: Domain structural class prediction.Protein Engineering 1998, 11:523-538.
20. Zhou GP: An intriguing controversy over protein structuralclass prediction. J Protein Chem 1998, 17:729-38.
21. Bu W-S, Feng Z-P, Zhang Z, Zhang C-T: Prediction of protein(domain) structural classes based on amino-acid index. Eur JBiochem 1999, 266:1043-49.
22. Jin L, Fang W, Tang H: Prediction of protein structural classesby a new measure of information discrepancy. Comput Biol andChem 2003, 27:373-80.
23. Cai YD, Feng KY, Lu WC, Chou KC: Using LogitBoost classifierto predict protein structural classes. J Theor Biol 2006,238:172-6.
24. Kedarisetti KD, Kurgan L, Dick S: A Comment on 'Prediction ofprotein structural classes by a new measure of informationdiscrepancy'. Comput Biol and Chem 2006, 30:393-4.
min
( )
w C
c wz b i n
i
i
i i i
2
1 1
+
− ≥ − ≤ ≤
∑ξ
ξsuch that and
k x x ei ix x, ’ .’( ) = =− −γ γ
2
0 6 where
Page 13 of 15(page number not for citation purposes)
http://www.ncbi.nlm.nih.gov/entrez/query.fcgi?cmd=Retrieve&db=PubMed&dopt=Abstract&list_uids=7723011
http://www.ncbi.nlm.nih.gov/entrez/query.fcgi?cmd=Retrieve&db=PubMed&dopt=Abstract&list_uids=7723011
http://www.ncbi.nlm.nih.gov/entrez/query.fcgi?cmd=Retrieve&db=PubMed&dopt=Abstract&list_uids=7723011
http://www.ncbi.nlm.nih.gov/entrez/query.fcgi?cmd=Retrieve&db=PubMed&dopt=Abstract&list_uids=9309224
http://www.ncbi.nlm.nih.gov/entrez/query.fcgi?cmd=Retrieve&db=PubMed&dopt=Abstract&list_uids=9309224
http://www.ncbi.nlm.nih.gov/entrez/query.fcgi?cmd=Retrieve&db=PubMed&dopt=Abstract&list_uids=7567954
http://www.ncbi.nlm.nih.gov/entrez/query.fcgi?cmd=Retrieve&db=PubMed&dopt=Abstract&list_uids=7567954
http://www.ncbi.nlm.nih.gov/entrez/query.fcgi?cmd=Retrieve&db=PubMed&dopt=Abstract&list_uids=8811733
http://www.ncbi.nlm.nih.gov/entrez/query.fcgi?cmd=Retrieve&db=PubMed&dopt=Abstract&list_uids=8811733
http://www.ncbi.nlm.nih.gov/entrez/query.fcgi?cmd=Retrieve&db=PubMed&dopt=Abstract&list_uids=8811733
http://www.ncbi.nlm.nih.gov/entrez/query.fcgi?cmd=Retrieve&db=PubMed&dopt=Abstract&list_uids=8071322
http://www.ncbi.nlm.nih.gov/entrez/query.fcgi?cmd=Retrieve&db=PubMed&dopt=Abstract&list_uids=8071322
http://www.ncbi.nlm.nih.gov/entrez/query.fcgi?cmd=Retrieve&db=PubMed&dopt=Abstract&list_uids=8071322
http://www.ncbi.nlm.nih.gov/entrez/query.fcgi?cmd=Retrieve&db=PubMed&dopt=Abstract&list_uids=7587280
http://www.ncbi.nlm.nih.gov/entrez/query.fcgi?cmd=Retrieve&db=PubMed&dopt=Abstract&list_uids=9552161
http://www.ncbi.nlm.nih.gov/entrez/query.fcgi?cmd=Retrieve&db=PubMed&dopt=Abstract&list_uids=9552161
http://www.ncbi.nlm.nih.gov/entrez/query.fcgi?cmd=Retrieve&db=PubMed&dopt=Abstract&list_uids=9740370
http://www.ncbi.nlm.nih.gov/entrez/query.fcgi?cmd=Retrieve&db=PubMed&dopt=Abstract&list_uids=9988519
BMC Bioinformatics 2008, 9:226 http://www.biomedcentral.com/1471-2105/9/226
25. Xiao X, Shao S, Huang Z, Chou KC: Using pseudo amino acidcomposition to predict protein structural classes:approached with complexity measure factor. J Comput Chem2006, 27(4):478-82.
26. Kurgan L, Homaeian L: Prediction of structural classes for pro-tein sequences and domains – impact of prediction algo-rithms, sequence representation and homology, and testprocedures on accuracy. Pattern Recognition 2006, 39:2323-43.
27. Kedarisetti KD, Kurgan L, Dick S: Classifier ensembles for pro-tein structural class prediction with varying homology. Bio-chem Biophys Res Commun 2006, 348:981-8.
28. Jahandideh S, Abdolmaleki P, Jahandideh M, Sadat Hayatshahi SH:Novel hybrid method for the evaluation of parameters con-tributing in determination of protein structural classes. JTheor Biol 2007, 244:275-81.
29. Kurgan L, Chen K: Prediction of protein structural class for thetwilight zone sequences. Biochem Biophys Res Commun 2007,357(2):453-60.
30. Shen HB, Yang J, Liu X-J, Chou KC: Using supervised fuzzy clus-tering to predict protein structural classes. Biochem Biophys ResCommun 2005, 334:577-81.
31. Cai YD, Zhou GP: Prediction of protein structural classes byneural network. Biochimie 2000, 82:783-85.
32. Wang Z-X, Yuan Z: How good is the prediction of proteinstructural class by the component-coupled method? Proteins2000, 38:165-75.
33. Cao Y, Liu S, Zhang L, Qin J, Wang J, Tang K: Prediction of proteinstructural class with Rough Sets. BMC Bioinformatics 2006, 7:20.
34. Dong L, Yuan Y, Cai T: Using Bagging classifier to predict pro-tein domain structural class. J Biomol Struct Dyn 2006, 24:239-42.
35. Cai YD, Liu XJ, Xu X, Zhou GP: Support vector machines forpredicting protein structural class. BMC Bioinformatics 2001, 2:3.
36. Cai YD, Liu XJ, Xu XB, Chou KC: Support vector machines forprediction of protein domain structural class. J Theor Biol 2003,221:115-20.
37. Feng KY, Cai YD, Chou KC: Boosting classifier for predictingprotein domain structural class. Biochem Biophys Res Commun2005, 334:213-7.
38. Montgomerie S, Sundararaj S, Gallin WJ, Wishart DS: Improvingthe accuracy of protein secondary structure prediction usingstructural alignment. BMC Bioinformatics 2006, 7:301.
39. Sander C, Schneider R: Database of homology-derived struc-tures and the structural meaning of sequence alignment. Pro-teins 1991, 9:56-68.
40. Rost B: Twilight zone of protein sequence alignments. ProteinEng 1999, 2:85-94.
41. Lin K, Simossis V, Taylor W, Heringa J: A simple and fast second-ary structure prediction method using hidden neural net-works. Bioinformatics 2005, 21:152-9.
42. Chou KC, Watenpaugh KD, Heinrikson RL: A Model of the com-plex between cyclin-dependent kinase 5(Cdk5) and the acti-vation domain of neuronal Cdk5 activator. Biochem Biophys ResCommun 1999, 259:420-428.
43. Paiardini A, Bossa F, Pascarella S: Evolutionarily conservedregions and hydrophobic contacts at the superfamily level:The case of the fold-type I, pyri-doxal-5'-phosphate-depend-ent enzymes. Protein Sci 2004, 13:2992-3005.
44. Bujnicki JM: Protein structure prediction by recombination offragments. ChemBioChem 2006, 7:19-27.
45. Reinhardt A, Eisenberg D: DPANN: improved sequence tostructure alignments following fold recognition. Proteins 2004,56:528-38.
46. Tomii K, Hirokawa T, Motono C: Protein structure predictionusing a variety of profile libraries and 3D verification. Proteins2005, 61(S7):114-21.
47. Chou KC, Cai YD: Predicting protein structural class by func-tional domain composition. Biochem Biophys Res Commun 2004,321:1007-9.
48. Jones DT: Protein secondary structure prediction based onposition-specific scoring matrices. J Mol Biol 1999,292(2):195-202.
49. Bryson K, McGuffin LJ, Marsden RL, Ward JJ, Sodhi JS, Jones DT: Pro-tein structure prediction servers at University College Lon-don. Nucl Acids Res 2005, 33:W36-38.
50. Shen HB, Chou KC: Ensemble classifier for protein fold patternrecognition. Bioinformatics 2006, 22:1717-22.
51. Chen K, Kurgan L: PFRES: protein fold classification by usingevolutionary information and predicted secondary struc-ture. Bioinformatics 2007, 23(21):2843-50.
52. Chou KC, Shen HB: Recent progresses in protein subcellularlocation prediction. Analytical Biochemistry 2007, 370:1-16.
53. Baldi P, Brunak S, Chauvin Y, Andersen CA, Nielsen H: Assessingthe accuracy of prediction algorithms for classification: Anoverview. Bioinformatics 2000, 16:412-24.
54. Eyrich VA, Marti-Renom MA, Przybylski D, Madhusudhan MS, Fiser A,Pazos F, Valencia A, Sali A, Rost B: EVA: continuous automaticevaluation of protein structure prediction servers. Bioinfor-matics 2001, 17:1242-3.
55. Moreland JL, Gramada A, Buzko OV, Zhang Q, Bourne PE: Themolecular biology toolkit (mbt): A modular platform fordeveloping molecular visualization applications. BMC Bioinfor-matics 2005, 6:21.
56. Hobohm U, Sander C: Enlarged representative set of proteinstructures. Protein Science 1994, 3:522.
57. Li W, Godzik A: Cd-hit: a fast program for clustering and com-paring large sets of protein or nucleotide sequences. Bioinfor-matics 2006, 22:1658-9.
58. Smith TF, Waterman MS: Identification of common molecularsubsequences. J Mol Biol 1981, 147:195-7.
59. Muskal SM, Kim S-H: Predicting protein secondary structurecontent: a tandem neural network approach. J Mol Biol 1992,225:713-27.
60. Hobohm U, Sander C: A sequence property approach tosearching protein databases. J Mol Biol 1995, 251:390-9.
61. Eisenhaber F, Imperiale F, Argos P, Frommel C: Pediction of sec-ondary structural contents of proteins from their amino acidcomposition alone, I new analytic vector decompositionmethods. Proteins 1996, 25:157-68.
62. Zhang CT, Zhang Z, He Z: Prediction of the secondary struc-ture contents of globular proteins based on three structuralclasses. J Protein Chem 1998, 17:261-72.
63. Zhang CT, Lin ZS, Zhang Z, Yan M: Prediction of helix/strandcontent of globular proteins based on their primarysequences. Protein Eng 1998, 11:971-9.
64. Li X, Pan X: New method for accurate prediction of solventaccessibility from protein sequence. Proteins 2001, 42:1-5.
65. Lin Z, Pan X: Accurate prediction of protein secondary struc-tural content. J Protein Chem 2001, 20:217-20.
66. Yang X, Wang B: Weave amino acid sequences for protein sec-ondary structure prediction. 8th ACM SIGMOD Workshop onResearch Issues in Data Mining and Knowledge Discovery 2003:80-87.
67. Ganapathiraju M, Klein-Seetharaman J, Balakrishnan N, Reddy R:Characterization of protein secondary structure. IEEE SignalProc Magazine 2004, 15:78-87.
68. Ruan J, Wang K, Yang J, Kurgan L, Cios KJ: Highly accurate andconsistent method for prediction of helix and strand contentfrom primary protein sequences. Artif Intell Med 2005, 35:9-35.
69. Chen K, Kurgan L, Ruan J: Optimization of the sliding windowsize for protein structure prediction. Inter Conf on ComputationalIntelligence in Bioinformatics and Computational Biology 2006:366-72.
70. Homaeian L, Kurgan L, Cios KJ, Ruan J, Chen K: Prediction of pro-tein secondary structure content for the twilight zonesequences. Proteins 2007, 69:486-98.
71. Chen K, Kurgan LA, Ruan J: Prediction of flexible/rigid regionsfrom protein sequences using k-spaced amino acid pairs.BMC Struct Biol 2007, 7:25.
72. Chen K, Kurgan L, Rahbari M: Prediction of protein crystalliza-tion using collocation of amino acid pairs. Biochem Biophys ResCommun 2007, 355:764-9.
73. Fauchere JL, Pliska V: Hydrophobic parameters p of amino-acidside chains from the partitioning of N-acetyl-amino-acidamides. Eur J Med Chem 1983, 18:369-75.
74. Eisenberg D, Weiss RM, Trewilliger TC: The hydrophobicmoment detects periodicity in protein hydrophobicity. Procof Nat Academy of Sci 1984, 81:140-4.
75. Kyte J, Doolitle RF: A simple method for displaying the hydro-pathic character of a protein. J Mol Biol 1982, 157:105-32.
76. Zhang ZD, Sun ZR, Zhang CT: A new approach to predict thehelix/strand content of globular proteins. J Theor Biol 2001,208:65-78.
Page 14 of 15(page number not for citation purposes)
http://www.ncbi.nlm.nih.gov/entrez/query.fcgi?cmd=Retrieve&db=PubMed&dopt=Abstract&list_uids=2017436
http://www.ncbi.nlm.nih.gov/entrez/query.fcgi?cmd=Retrieve&db=PubMed&dopt=Abstract&list_uids=2017436
http://www.ncbi.nlm.nih.gov/entrez/query.fcgi?cmd=Retrieve&db=PubMed&dopt=Abstract&list_uids=8019422
http://www.ncbi.nlm.nih.gov/entrez/query.fcgi?cmd=Retrieve&db=PubMed&dopt=Abstract&list_uids=8019422
http://www.ncbi.nlm.nih.gov/entrez/query.fcgi?cmd=Retrieve&db=PubMed&dopt=Abstract&list_uids=7265238
http://www.ncbi.nlm.nih.gov/entrez/query.fcgi?cmd=Retrieve&db=PubMed&dopt=Abstract&list_uids=7265238
http://www.ncbi.nlm.nih.gov/entrez/query.fcgi?cmd=Retrieve&db=PubMed&dopt=Abstract&list_uids=1602478
http://www.ncbi.nlm.nih.gov/entrez/query.fcgi?cmd=Retrieve&db=PubMed&dopt=Abstract&list_uids=1602478
http://www.ncbi.nlm.nih.gov/entrez/query.fcgi?cmd=Retrieve&db=PubMed&dopt=Abstract&list_uids=7650738
http://www.ncbi.nlm.nih.gov/entrez/query.fcgi?cmd=Retrieve&db=PubMed&dopt=Abstract&list_uids=7650738
http://www.ncbi.nlm.nih.gov/entrez/query.fcgi?cmd=Retrieve&db=PubMed&dopt=Abstract&list_uids=8811732
http://www.ncbi.nlm.nih.gov/entrez/query.fcgi?cmd=Retrieve&db=PubMed&dopt=Abstract&list_uids=8811732
http://www.ncbi.nlm.nih.gov/entrez/query.fcgi?cmd=Retrieve&db=PubMed&dopt=Abstract&list_uids=8811732
http://www.ncbi.nlm.nih.gov/entrez/query.fcgi?cmd=Retrieve&db=PubMed&dopt=Abstract&list_uids=9588950
http://www.ncbi.nlm.nih.gov/entrez/query.fcgi?cmd=Retrieve&db=PubMed&dopt=Abstract&list_uids=9588950
http://www.ncbi.nlm.nih.gov/entrez/query.fcgi?cmd=Retrieve&db=PubMed&dopt=Abstract&list_uids=9588950
http://www.ncbi.nlm.nih.gov/entrez/query.fcgi?cmd=Retrieve&db=PubMed&dopt=Abstract&list_uids=9876917
http://www.ncbi.nlm.nih.gov/entrez/query.fcgi?cmd=Retrieve&db=PubMed&dopt=Abstract&list_uids=9876917
http://www.ncbi.nlm.nih.gov/entrez/query.fcgi?cmd=Retrieve&db=PubMed&dopt=Abstract&list_uids=9876917
http://www.ncbi.nlm.nih.gov/entrez/query.fcgi?cmd=Retrieve&db=PubMed&dopt=Abstract&list_uids=7108955
BMC Bioinformatics 2008, 9:226 http://www.biomedcentral.com/1471-2105/9/226
Publish with BioMed Central and every scientist can read your work free of charge
"BioMed Central will be the most significant development for disseminating the results of biomedical research in our lifetime."
Sir Paul Nurse, Cancer Research UK
Your research papers will be:
available free of charge to the entire biomedical community
peer reviewed and published immediately upon acceptance
cited in PubMed and archived on PubMed Central
yours — you keep the copyright
Submit your manuscript here:http://www.biomedcentral.com/info/publishing_adv.asp
BioMedcentral
77. Birzele F, Kramer S: A new representation for protein second-ary structure prediction based on frequent patterns. Bioinfor-matics 2006, 22:2628-34.
78. Hall M: Correlation based feature selection for machinelearning. Ph.D. dissertation, University of Waikato, Dept of Com-puter Science; 1999.
79. Vapnik V: The Nature of Statistical Learning Theory. Springer-Verlag; 1999.
80. Platt J: Fast training of support vector machines using sequen-tial minimal optimization. Advances in kernel methods – supportvector learning, MIT Press 1998.
81. Keerthi SS, Shevade SK, Bhattacharyya C, Murthy K: Improvementsto Platt's SMO algorithm for SVM classifier design. NeuralComput 2001, 13:637-49.
82. Witten I, Frank E: Data Mining: Practical Machine LearningTools and Techniques. 2nd edition. Morgan Kaufmann, San Fran-cisco; 2005.
Page 15 of 15(page number not for citation purposes)