Scientific, Technical and Economic Committee for Fisheries. Evaluation of multi-annual plans for cod...
84
Scientific, Technical and Economic Committee for Fisheries (STECF) Review of national reports on Member States efforts to achieve balance between fleet capacity and fishing opportunities (STECF-12-18) This report was reviewed by the STECF during its 41 st plenary meeting held from 5 to 9 November 2012 in Brussels, Belgium Edited by HazelCurtis and NatachaCarvalho Report EUR 25600 EN
-
Upload
independent -
Category
Documents
-
view
1 -
download
0
Transcript of Scientific, Technical and Economic Committee for Fisheries. Evaluation of multi-annual plans for cod...
Scientific, Technical and Economic
Committee for Fisheries (STECF)
Review of national reports on Member
States efforts to achieve balance between
fleet capacity and fishing opportunities
(STECF-12-18)
This report was reviewed by the STECF during its 41st
plenary meeting
held from 5 to 9 November 2012 in Brussels, Belgium
Edited by HazelCurtis and NatachaCarvalho
Report EUR 25600 EN
European Commission
Joint Research Centre
Institute for the Protection and Security of the Citizen
Contact information
STECF secretariat
Address: TP 051, 21027 Ispra (VA), Italy
E-mail: [email protected]
Tel.: 0039 0332 789343
Fax: 0039 0332 789658
https://stecf.jrc.ec.europa.eu/home
http://ipsc.jrc.ec.europa.eu/
http://www.jrc.ec.europa.eu/
Legal Notice
Neither the European Commission nor any person acting on behalf of the Commission is responsible for the use which might be made of this
publication.
This report does not necessarily reflect the view of the European Commission and in no way anticipates the Commission’s future policy in
this area.
Europe Direct is a service to help you find answers to your questions about the European Union
Freephone number (*): 00 800 6 7 8 9 10 11
(*) Certain mobile telephone operators do not allow access to 00 800 numbers or these calls may be billed.
A great deal of additional information on the European Union is available on the Internet.It can be accessed through the Europa server
http://europa.eu/
JRC 76704
EUR 25600 EN
ISBN 978-92-79-27459-6
ISSN 1831-9424
doi:10.2788/6727
Luxembourg: Publications Office of the European Union, 2012
© European Union, 2012
Reproduction is authorised provided the source is acknowledged
Printed in Italy
3
TABLE OF CONTENTS
Request to the STECF ............................................................................................................................... 5
Introduction .............................................................................................................................................. 5
STECF observations .................................................................................................................................. 5
STECF conclusions .................................................................................................................................... 7
STECF recommendations .......................................................................................................................... 8
Expert Working Group EWG-12-11 and EWG-12-21 report ..................................................................... 9
1 Executive summary ...........................................................................................................................10
2 Conclusions of the Expert Working Group ........................................................................................11
3 Recommendations of the Expert Working group..............................................................................12
4 Introduction and terms of reference.................................................................................................13
4.1 Introduction ..................................................................................................................................13
4.2 Terms of Reference for EWG-12-11 .............................................................................................13
4.3 Amendments to the EWG 12-11 Terms of Reference ..................................................................14
4.4 Terms of Reference for EWG-12-21 .............................................................................................15
4.5 Participants ...................................................................................................................................15
5 Evaluate MS Annual reports: Compliance with Regulations .............................................................16
5.1 Scoring system for evaluation of MS reports required elements ................................................16
5.2 Evaluation of Member States annual reports for 2011 ................................................................18
5.3 Specific comments on required elements of Member States annual reports .............................26
6 Collation of balance indicators ..........................................................................................................32
6.1 Data availability ............................................................................................................................34
6.2 Selected indicators .......................................................................................................................34
6.3 MS tables of indicator values: ......................................................................................................39
6.4 Evaluation of MS own assessments of balance ............................................................................54
7 Discussion of Results .........................................................................................................................70
7.1 Data issues ....................................................................................................................................70
8 Appendix ............................................................................................................................................71
9 List of Participants .............................................................................................................................78
10 List of Background Documents ..........................................................................................................81

4
LIST OF FIGURES AND TABLES
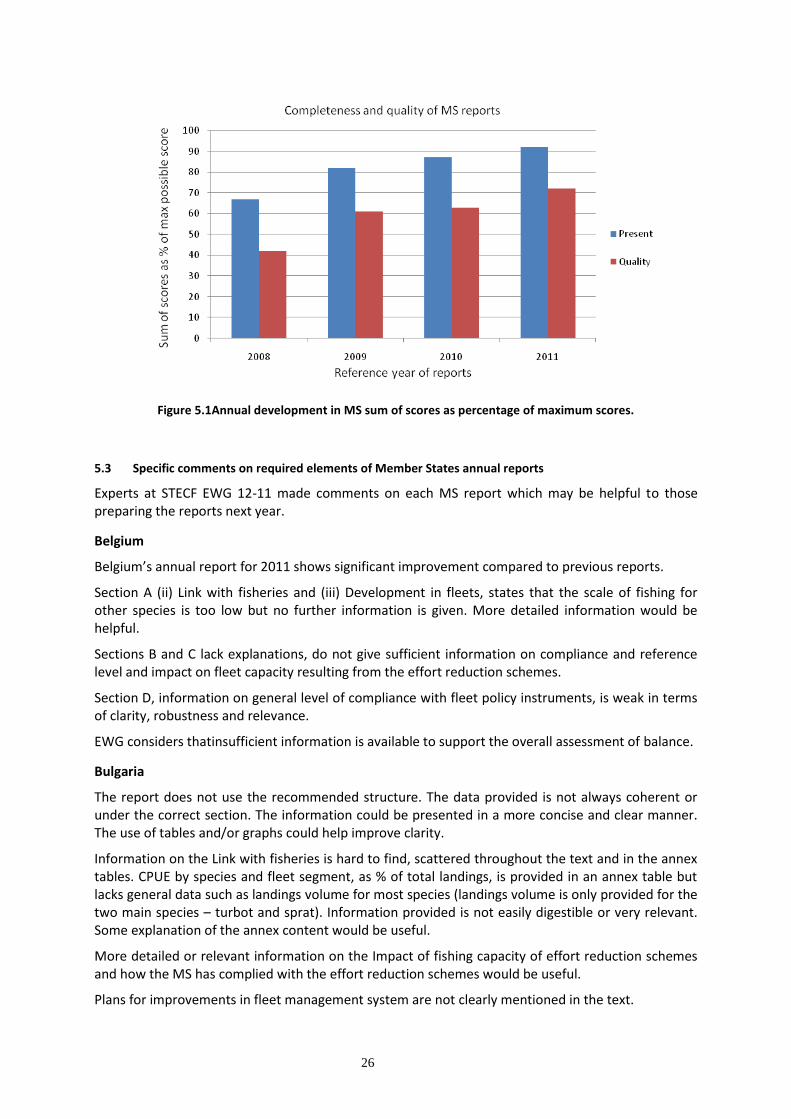
Figure 5.1.Annual development in MS sum of scores as percentage of maximum scores. .................................. 26
Table 5.1 Scoring system for evaluating Member States annual reports ............................................................. 17
Table 5.2 Scores by Member State for inclusion of required elements in annual reports ................................... 19
Table 5.3 Scores by Member State for quality of required elements in annual reports....................................... 20
Table 5.4 Scores by Member State for structure of required elements in annual reports ................................... 21
Table 5.5 Ranked results for inclusion of required elements in MS reports. ........................................................ 22
Table 5.6 Ranked results for quality of included elements in MS reports ............................................................ 23
Table 5.7 Comparison of scores for inclusion of required elements between 2009, 2010 and 2011 MS reports 24
Table 5.8 Comparison of scores for quality of included elements between 2009, 2010 and 2011 MS reports ... 25
Table 6.1 Ranking of Member States by fleet importance in terms of vessel GT, engine KW and total value of landings ................................................................................................................................................................. 33
Table 6.2 Summary of indicators for selected fleet segments in Denmark .......................................................... 40
Table 6.3 Summary of indicators for selected fleet segments in France .............................................................. 41
Table 6.3 Continued. Summary of indicators for selected fleet segments in France ........................................... 42
Table 6.4 Summary of indicators for selected fleet segments in Ireland .............................................................. 43
Table 6.5 Summary of indicators for selected fleet segments in Italy .................................................................. 44
Table 6.6 Summary of indicators for selected fleet segments in the Netherlands .............................................. 45
Table 6.7 Summary of indicators for selected fleet segments in Portugal .......................................................... 46
Table 6.8 Summary of indicators for selected fleet segments in Spain ............................................................... 47
Table 6.9 Summary of indicators for selected fleet segments in the United Kingdom ........................................ 48
Table 6.10 Summary of indicators for selected fleet segments in Sweden .......................................................... 49
Table 6.11 Summary of indicators for selected fleet segments in Latvia............................................................. 50
Table 6.12 Summary of indicators for selected fleet segments in Lithuania ....................................................... 50
Table 6.13 Summary of indicators for selected fleet segments in Estonia .......................................................... 51
Table 6.14 Summary of indicators for selected fleet segments in Germany ....................................................... 52
Table 6.15 Summary of indicators for selected fleet segments in Belgium ......................................................... 53
Table 8.1. Proportion of the landings value, number of stocks assessed and the number of overfished stocks included in the analysis by MS fleet segment. ...................................................................................................... 71
Table 8.2. Inflation and nominal long term (LT) interest rates by EU Member State 2008-2010. ........................ 77
5
SCIENTIFIC, TECHNICAL AND ECONOMIC COMMITTEE FOR FISHERIES (STECF)
Review of national reports on Member States efforts to achieve balance between fleet capacity and fishing opportunities(STECF-12-18)
THIS REPORT WAS REVIEWED DURING THE PLENARY MEETING HELD IN BRUSSELS, BELGIUM, 5-9NOVEMBER 2012
Request to the STECF
STECF is requested to review the report of two groups, the EWG-12-11 held from September 24 – 28 2012 in Edinburgh and the EWG-12-21 held from 23 – 26 October 2012 in Barza di Ispra, evaluate the findings and make any appropriate comments and recommendations.
Introduction
The report of the Expert Working Group on Review of national reports on Member States efforts to achieve balance between fleet capacity and fishing opportunities (EWG -12-11) was reviewed by the STECF during its 41st plenary meeting held from 5 Nov to 9 Nov, 2012 in Brussels, Belgium. The following observations, conclusions and recommendations represent the outcomes of that review.
STECF observations
The report includes the work of two EWGs. The tasks of these EWG were to:
1 Collate technical, economic and biological indicators, based on DCF economic fleet segments, and based on the reports provided by MS and compare EWG opinions to MS own opinions.
2 Evaluate MS annual reports in terms of Compliance with Art. 14 of Council Regulation No. 2371/2002 and Articles 13 and 14 of Regulation 1013/2010.
The EWG assessed balance indicators for the period 2008-2010 (or for some cases, 2009-2011) using the following indicators:
The Return on Fixed Tangible Assets.
The ratio of current revenue to break-even revenue (CR/BER).
The capacity utilisation per fleet segment (average days at sea / maximum observed or maximum theoretical days at sea).
A “sustainable harvest indicator”: average fishing mortality F/Fmsy for all assessed stocks that were landed by the fleet segment, weighted by the segment’s landing value of the included stocks.
6
Regarding task 1, the exercise was done for 92 fleet segments from 14 MS, representing more than 70% of the total EU landings value. In addition, the EWG examined the extent to which registered vessels in the 14 MS were inactive. This was done because inactive vessels cannot be allocated to a fleet segment, so cannot be considered in fleet segment balance indicators, but they do represent additional capacity that is not utilised. The EWG compared the outcomes with balance indicators presented in the MS reports and drew conclusions about inconsistencies. EWG 12-21 was asked not to judge overall balance between fishing fleets and fishing opportunities but rather to simply present the values of the different indicators and comment on values of individual indicators.
The EWG concluded that there is substantial variation in the values of the balance indicators among fleet segments and MS, both in the MS reports and in the independent analysis. From a technical point of view, there is a large number of fleet segments whose capacity is under-utilised. Comparison of the EWG analysis and the MS reports is in many cases, complicated by differences in definitions of fleet segments reported and because of differences in methods used to calculate indicators. In cases where results could be compared, results were not always consistent.
With regard to task 2, the EWG concluded that there was further overall improvement in providing the required elements and the quality of the required elements in MS reports on the balance between capacity and fishing opportunities compared to the 2010 reports. Despite this improvement, there is still considerable scope for further improvements by some MS, e.g. in the report structure. Moreover, some MS failed to present an overall opinion on whether the capacity of their fleet was in balance with its fishing opportunity. In some cases, the MS’ opinion on balance was not based on or supported by the evidence presented in its report.
STECF notes that there were two EWG meetings and an ad hoc contract and that the TOR were not fully addressed. The main reasons for not completely answering the ToR are the request being new, the limited availability of data and the amount of work required, particularly due to the high number of fleet segments. Because of the time limitations and the priority to work on the data and extend the number of fleet segments included in the analysis, the EWG did not have time to thoroughly discuss the outcomes with regard to the approach taken and the utility of the indicators.
STECF notes that not all indicators used by the EWG to assess the balance question were from the Commission guidelines on balance indicators. The biological and the social indicators were not used. Instead, the “sustainable harvest indicator” was provided by one of the experts who had calculated this indicator under the terms of an ad hoc contract with DG Mare before the second EWG. In the EWG report different aspects of the interpretation and limitations of the indicators are discussed. However, no justification for the change in indicators is given. Moreover, the report does not provide an assessment of the suitability of the indicator of “sustainable harvest indicator”, whereas this indicator was only proposed recently in the EWG on ecosystem approach (STECF EWG 11-13) and has not yet been thoroughly considered and approved.
STECF also notes that the “sustainable harvest indicator” integrates information on both the harvest rate of the stocks, the landings composition, and the prices of the various fish species, which makes it complex to draw clear conclusions from the resulting indicator values, and may mask possible unsustainable fishing. E.g. for different fleet segments (Estonia TM24-40, Latvia TM VL24-40, France TM VL40-XX), the indicator score is around one, which means that on average the fleet segments are not relying economically on overexploited stocks, whereas information presented also states that most species landed by these fleet segments are overexploited.
STECF observes that if a particular fleet segment has a high value for the “sustainable harvest indicator”, it does not necessarily mean that the fleet segment in question is over-capacity for its permitted or its sustainable harvest opportunity. Reducing the number of vessels in a fleet segment with a high value for this “sustainable harvest indicator” will not necessarily improve (reduce) the

7
value of the indicator. Although the indicator may flag up a problem within one fleet segment, the solution to the problem does not necessarily lie solely within that particular fleet segment.
STECF observes that, the “sustainable harvest indicator” has only been calculated for a limited number of (mainly North European) fleet segments. This results from the limited availability of stock assessment results and the decision by the EWG to only present values for segments with 40% or more of their landings value coming from assessed stocks. STECF supports the decision of the EWG to set a threshold, in order to present representative results, but observes that this then limits the usefulness of the indicator for broad implementation. STECF notes that in the updated Commission guidelines on balance indicators, alternative biological indicators are proposed in cases where only limited biological information is available, but that these were not used by the EWG.
STECF observes that, as the EWG used the stock information from the STECF review of advice report for 2012, stock status available in October 2011 was used for the “sustainable harvest indicator”, which might be outdated. This is particularly a concern for stocks assessed by GFCM due to the time delay between the stock assessment working group and the final adoption of assessments by the GFCM scientific advisory committee (GFCM-SAC).
STECF observes a difference in some years between the total number of vessels from the DCF and the official fleet register – this was not presented in the EWG report.
STECF notes that the ability of the EWG to calculate the full complement of indicators was compromised by the absence of appropriate data submission from some Member States. The JRC data coverage reports provide overviews of the timeliness and contents of the Member States' data submissions in response to data calls launched by the Commission under the DCF to support STECF. These reports are accessible on: http://datacollection.jrc.ec.europa.eu/index.htm.
STECF conclusions
STECF concludes that while it should be possible for MS to provide indicator values, it is preferable to have independent calculation of balance indicators because independent calculation provides consistent methodology and wider coverage of fleet segments. Furthermore, it would be helpful if MS were required to include such independently-calculated indicators in their National reports and to take them into account when drawing conclusions on balance between their fishing capacity and their fishing opportunities. This would require changes in the timing of the EWG meeting and the deadline for the National reports.
STECF concludes that the usefulness of the indicator summary in future EWG reports would be enhanced if the calculated balance indicators were those contained in the updated Commission guidelines on balance indicators for MS as approved by STECF PLEN 2012-02.
STECF concludes that the “sustainable harvest indicator” if used in conjunction with other indicators (e.g. technical, economic, social) and other information such as number of overfished stocks in the landings of a fleet segment, may provide a first indicator of possible problems relating to fleet capacity within a fleet segment. The use of a suite of different types of indicators for each fleet segment or vessel length category also mitigates the risk that a fleet segment relying on overfished stocks might not be identified using this indicator alone.
STECF concludes that it would be able to give more useful and informed comments on the value of the “sustainable harvest indicator”, if the “sustainable harvest indicator” itself was better understood.
STECF concludes that the approach adopted by the second balance EWG, to provide expert comments on individual indicator values only, was preferable to the approach requested in the ToRof
8
the first EWG, in which experts were asked to draw conclusions on whether and to what extent a fleet segment’s fishing capacity was in balance or out of balance with its fishing opportunity.
The summary tables included in the joint report of EWG-12-11/21 (http://stecf.jrc.ec.europa.eu/reports/balance) can be considered as a useful starting point for discussions on reasons for possible overcapacity and possible management actions.
STECF concludes that in order to streamline the process for the production of future STECF reports on balance indicators, it is desirable that the collation of information, quality checking and the calculation of the indicator values are completed before the EWG meeting, as is done in preparation for the AER.
STECF recommendations
STECF recommends to the Commission that further work is carried out by an EWG to evaluate, explore and understand the sustainable harvest indicator and its implications for issues of overcapacity so that more useful expert comments can be made based on the value of the indicator.
STECF recommends that in order to facilitate the calculation of the balance indicators, the Commission should ensure that the data required in the DC-map includes the maximum observed number of days at sea per vessel per fleet segment. This would enable the technical indicator to be calculated based on DC-Map data.
STECF reiterates its recommendation from STECF PLEN 2012-02 that the Commission adopts the updated “Guidelines for an improved analysis of the balance between fishing capacity and fishing opportunities” and distribute them to MS.
9
EXPERT WORKING GROUP EWG-12-11 AND EWG-12-21 REPORT
REPORT TO THE STECF
EXPERT WORKING GROUP ON REVIEW OF NATIONAL REPORTS ON BALANCE BETWEEN
FISHING CAPACITIES AND FISHING OPPORTUNITIES (EWG-12-11 and EWG 12-21)
Edinburgh, United Kingdom, 24-28September 2012 Barza, Italy, 23-26 October 2012
This report does not necessarily reflect the view of the STECF and the European Commission and in no way anticipates the Commission’s future policy in this area
10
1 EXECUTIVE SUMMARY
Findings of the STECF Expert Working Groups on the Evaluation of Member States Annual Reports for 2011 (EWG 12-11 and EWG 12-21) are summarised below in relation to each of the terms of reference tasks:
ToR 1 and ToR 2a:Collate technical, economic and biological indicators and evaluate MS reports.These tasks relate to carrying out analysis and then reporting findings,so they are combined for the purposes of summarising our findings.
1. This was a new task for an EWG and included: 2. Collate material on balance provided by MS, 3. Collate indicators based on DCF economic fleet segments, 4. Compare EWG opinions to MS own opinions. 5. Although DG Mare provided a large spreadsheet that began the task of collating information
from MS annual reports, there was nevertheless insufficient time available during the EWGs to complete this request in respect of all MS and for every fleet segment. However, the segments for which the analysis was conducted represent the majority (72%) of value of landings made by the EU fleet in 2010.
6. For many MS, the fleet segments presented in their voluntary report on the balance indicators differed from the economic DCF fleet segmentation.This inconsistency made it difficult to evaluate what the MS had presented and concluded.
7. Making evaluations of balance by fleet segments necessarily excludes considerations of inactive vessels in MS fleets, because inactive vessels cannot be allocated to fleet segments.Therefore, by fleet segment, a MS could conclude it is mostly in balance or only somewhat overcapacity.However, when the national fleet is considered,including the inactive vessels on the national fleet register, the overall MS situation could be considerably different if there is a large proportion of inactive vessels.
8. Some MS have poor quality, essentially inaccurate, fleet registers, in that many vessels that no longer physically exist have not been removed from the MS fleet register.If the vessel remains on the register but does not exist in reality then it will show up as an inactive vessel.Therefore for MS whose fleet registers are inaccurate in this respect, their proportion of national fleet vessels that are inactive is likely to be an overstatement of the true number of vessels that do exist but were inactive.
9. Based on MS own conclusions on balance, there is substantial variation between fleet segments and between MS in terms of the degree of balance between fleet capacity and fishing opportunity.
10. From a technical point of view, there is a large number of fleet segments whose capacity is substantially under-utilised.
11. There were many instances where MS calculations of balance indicators were not consistent with EWG estimation of indicators.
12. There were some differences between methods used by MS in estimating indicators and methods used by EWG.
13. General situation of balance indicators is not universally improving or worsening. 14. Presentation of indicator summary tables, with comments, no traffic lights, is useful
approach 15. The lack of stock assessments for a significant number of stocks continues to be a major
inhibitor when it comes to the inclusion of biological considerations when assessing the balance between fishing capacity and fishing opportunities. Increasing the number of stocks
11
for which such information is available should be an urgent priority, in particular for the Mediterranean and Black Sea.
ToR 2.b: Evaluate MS annual reports in terms of Compliance with Art. 14 of Council Regulation No. 2371/2002 and Art.12 of Commission Regulation No. 1438/2003
16. There was further overall improvement in providing the required elements and the quality of the required elements in MS reports compared to their previous year reports (reference year 2010).
17. This is the third consecutive year in which the EWG has observed improvements relative to the previous year.
18. All 21 MS that submitted reports achieved scores over 70% for including required elements. 19. Romania did not submit a report in relation to reference year 2011. 20. The average of scores for including required elements increased again from 20.9 for the 2010
reports to 22.1 for the 2011 reports (reports submitted during 2012) 21. 18 MS were judged to have given an overall opinion on whether their fleet was or was not in
balance with its fishing opportunity. Although MS are required to report on reference year 2011, some of the balance indicators could only be calculated for 2010 due to data time lags, and therefore MS conclusions on balance may have related to 2010.
22. It would be useful if the Commission translators could be provided with the recommended English section headings of the annual reports so that the translators could use standard terms for their translated headings, making it easier for experts to identify relevant sections.
23. It would be very useful if the graphs, tables and figures could also be translated.
2 CONCLUSIONS OF THE EXPERT WORKING GROUP
STECF EWG 12-11 and EWG 12-21 reached the following conclusions:
Assessment of balance between fishing capacity and fishing opportunity 1. There is considerable variation across the EU among MS own assessments of their fleet
segments in terms of whether their capacity is in balance with their opportunity. 2. Some MS national fleets are evidently of much greater capacity or catching capability than
would be necessary to harvest their permitted fishing opportunities or the sustainable fishing opportunities.
3. To get an overview of national fleet degree of balance, it is necessary to consider the overall proportion of inactive vessels in the national fleet.This cannot be done by fleet segmentas vessel must have been active in order to be allocated to a segment. Instead, analysis of inactive vessels has been done by vessel length category.
4. Some MS had many fleet segments for which data was unavailable. Among the MS selected for inclusion in the analysis, Spain was particularly poor in terms of data availability.
5. Some of the data required to estimate the balance indicators is not required to be submitted by MS under the current DCF.
6. Some MS presented balance indicators but then made statements about the degree of balance or imbalance in their fleet segments (which exclude inactive vessels) or their national fleet (which includes inactive vessels) which were not well supported by the data they had presented.
7. There is a wide range of causes of and factors influencing fleet over-capacity, including the effects of natural environment processes, decisions of business owners and policy implementation. Because ofthe dynamic nature of the factors contributing to balance or imbalance, the degree of balance between a fleet segment defined by DCF and its fishing opportunities can change substantially from one year to the next.
12
8. Increasing the number of stocks for which stocks assessments are available should be an urgent priority, in particular for the Mediterranean and Black Sea, to extend coverage of balance indicator calculations.
MS annual reports: compliance with regulations
9. Overall there were further improvements in completeness and quality of MS reports on their efforts to achieve a sustainable balance between the capacity of their fleets and their fishing opportunities.
10. A minority of MS reports do not follow the recommended structure and are incomplete and of poor quality. There is scope for considerable improvement in some cases.
11. Some MS failed to present an overall opinion on whether the capacity of their fleet was in balance with its fishing opportunity.
12. Some MS presented an opinion on balance which was not based on or supported by the data and evidence presented in their report.
13. This year one MS, Romania, did not submit a report for 2011 to the Commission.
3 RECOMMENDATIONS OF THE EXPERT WORKING GROUP
STECF EWG 12-11 and EWG 12-21 make the following recommendations:
1. Independent, objective calculations of balance indicators should be made for all MS fleet
segments and MS national fleets. Ideally this should be done before an STECF EWG and the
results should be available to experts to consider at the EWG.
2. Ideally, all types of balance indicators,including the social indicators, should be estimated in
order to obtain a full picture of balance between capacity and opportunity.
3. A data call should be made specifically for the purpose of allowing an independent group (such
as JRC or STECF or an ad hoc contractor) to estimate balance indicators.The time series of data
should ideally be longer than 3 years.
13
4 INTRODUCTION AND TERMS OF REFERENCE
4.1 Introduction
Two expert working groups were convened under STECF to assess MS reports on balance, the first, EWG 12-11, was held in Edinburgh from the 24 to 28 September 2012 and the second, EWG 12-21, was held in Barza di Ispra, from the 23 to 26 October 2012. Both expert working groups included many experts who have contributed to previous working groups involved in devising the assessment system and assessing MS annual reports.This continuity of expertise improves and speeds up the assessment process. The evaluation process also benefited from the presence of some new experts in the group.
4.2 Terms of Reference for EWG-12-11
The following terms of reference were agreed by DG Maritime Affairs and Fisheries (MARE) and the chair of the expert working group:
Background In the past, the Commission has had difficulty evaluating MS national reports because of the absence of common standards or criteria for assessing possible overcapacity, relative to their fishing opportunity, of fleet segments. The Commission is therefore requesting that an analysis of balance between fleet capacity and fishing opportunity be made using a standard approach across all EU fleet segments and based on DCF information. This analysis could be compared with MS own national analyses, and with the conclusions that MS have drawn relating to balance.
In addition the usual evaluation of MS reports and Commission summaries are requested.
Tasks to be performed:
1. Collate technical, economic and biological indicators for analysis of balance between fleet capacity and fishing opportunity and compare the degree of balance or imbalance across all EU fleet segments for reference years 2010 and 2011, depending on data availability.
DG MARE will provide values for indicators, calculated by its Structural Policy and Economic Analysis Unit. The EWG is requested to use these values where they are considered appropriate, or else to provide alternative values with explanation.
The EWG should evaluate, for all possible fleet segments and based on DCF data:
(i) The first economic balance indicator (RoI), as described in the "Guidelines for an improved analysis of the balance between fishing capacity and fishing opportunities", where possible, or an appropriate proxy in other cases.
(ii) The ratio of current revenue to break-even revenue (CR/BER).
(iii) The number and proportion of inactive vessels in each segment.
(iv) The technical indicator as described in Section 2.1 of the Guidelines.
(v) The first biological indicator as described in the Guidelines, or if the first indicator can not be calculated, or is not available, the second or third indicators.
(vi) For each fleet segment, STECF is asked to state the extent to which the fleet segment is considered to be in balance with its permitted fishing opportunity, for instance using the phrases recommended by STECF in Version 2 of the Guidelines:
a) Capacity is substantially in excess of opportunity – means that the fleet is capable of catching (at reference year catch rates) far in excess of the permitted opportunity, or that
14
the actual level of production could have been achieved with substantially less physical capacity in the fleet.
b) Capacity is somewhat in excess of opportunity – means that the fleet is capable of catching more than the permitted opportunity.
c) Capacity is approximately in balance with the fishing opportunity. There is either little unused fleet capacity or little unused fishing opportunity.
d) Capacity is somewhat below the fishing opportunity – means that there is more than a little unused opportunity due to lack of catching capacity, which is therefore not delivering possible economic and social benefits to the Member State.
e) Capacity is substantially below the fishing opportunity – means that a substantial amount of the fishing opportunity is not taken up due to lack of fleet capacity, and there are substantial social and economic benefits that are not being realised by the Member State.
For fleet segments for which the indicators can be calculated the statements should refer to the indicator values. For fleet segments for which the indicators cannot be calculated, STECF is requested to identify the problem with the data and, if possible, provide a qualitative evaluation.
2. Evaluate Member States’ reports
Evaluate the Member States' reports on their efforts during 2010 to achieve a sustainable balance between fleet (or fishing) capacity and fishing opportunities, structured as follows:
a) For each fleet segment, the EWG should summarise the situation with respect to the indicators calculated under ToR 1 and statements under Tor 1(vi) and record:
i) any statement by the MS concerned as to whether overcapacity is (or is not) believed to exist
ii) any statement made by MS concerning national objectives for the sector concerned (e.g. objectives to increase or decrease capacity).
iii) any statement made by MS concerning means deployed in order to adjust capacity (e.g. decommissioning schemes, national incentives etc.)
iv) any methodological problems associated with the calculation of indicators or the estimation of overcapacity.
v) Member States' evaluation of the effect of fishing effort management measures on fishing capacity
b) Compliance of MS reports with Art. 14 of Council Regulation No. 2371/2002 and Art.12 of Commission Regulation No. 1438/2003
To fulfil ToR 2. please score the Member States' reports according to the system for required elements detailed in sections 7.1 and 7.5, and table 7.1 of the report by SG-BRE10-01.
The results of the scoring exercise should be presented as in tables 7.2 and 7.3 of the report of SG-BRE 10-01. Updated versions of tables 7.4 and 7.5 should also be presented.
Please also provide basic observations on the content of the Member States' reports. See report of SG-BRE 10-01, sections 7.2, 7.3 and 7.4.
4.3 Amendments to the EWG 12-11 Terms of Reference
After the terms of reference for the EWG were agreed, some minor errors in the text were identified and the following adjustments were observed by the EWG:
The EWG did not evaluate Commission summaries of MS annual reports
15
Reference years for economic indicators were 2008, 2009 and 2010, the most recent years available
Inactive vessels were assessed per vessel length category or per national fleet
The reference year of MS reports assessed is 2011, however some of the balance indicators, presented by MS on a voluntary basis, must use data only up to 2010 because of time lags in collecting and analysing the data.
The EWG was asked to evaluate MS reports in terms of their compliance with Article 12 of Commission Regulation 1438/2003. In fact that Regulation has been repealed and the reference should be to Articles 13 and 14 of Regulation 1013/2010. The articles have not changed.
4.4 Terms of Reference for EWG-12-21
1. Complete the terms of reference 1 (i) to 1(iv) and 2(a) as agreed for STECF Meeting 12-11 (i.e. not including ToR 1(vi).
2. In place of the indicator described in the previous term of reference 1(v), evaluate a harvest rate indicator (calculated for each segment as the average ratio of current fishing mortality to Fmsy across stocks exploited by the segment, and weighted by the first-sale value) in the list of parameters to be evaluated.
4.5 Participants
The full lists of participants at EWG 12-11 and EWG 12-21 are presented in Section 9.

16
5 EVALUATE MS ANNUAL REPORTS: COMPLIANCE WITH REGULATIONS
Under Item 2 in the Terms of Reference, EWG 12-11 was asked to evaluate Member States’ reports on their efforts during 2011 to achieve a sustainable balance between fleet capacity and fishing opportunities, structured as follows:
b) Compliance of Member States’ reports with Article 14 of Council Regulation no. 2371/2002 and Articles 13 and 14 of Regulation 1013/2010.
Section 5 of this report reflects work carried out entirely within the first working group, EWG 12-11.
5.1 Scoring system for evaluation of MS reports required elements
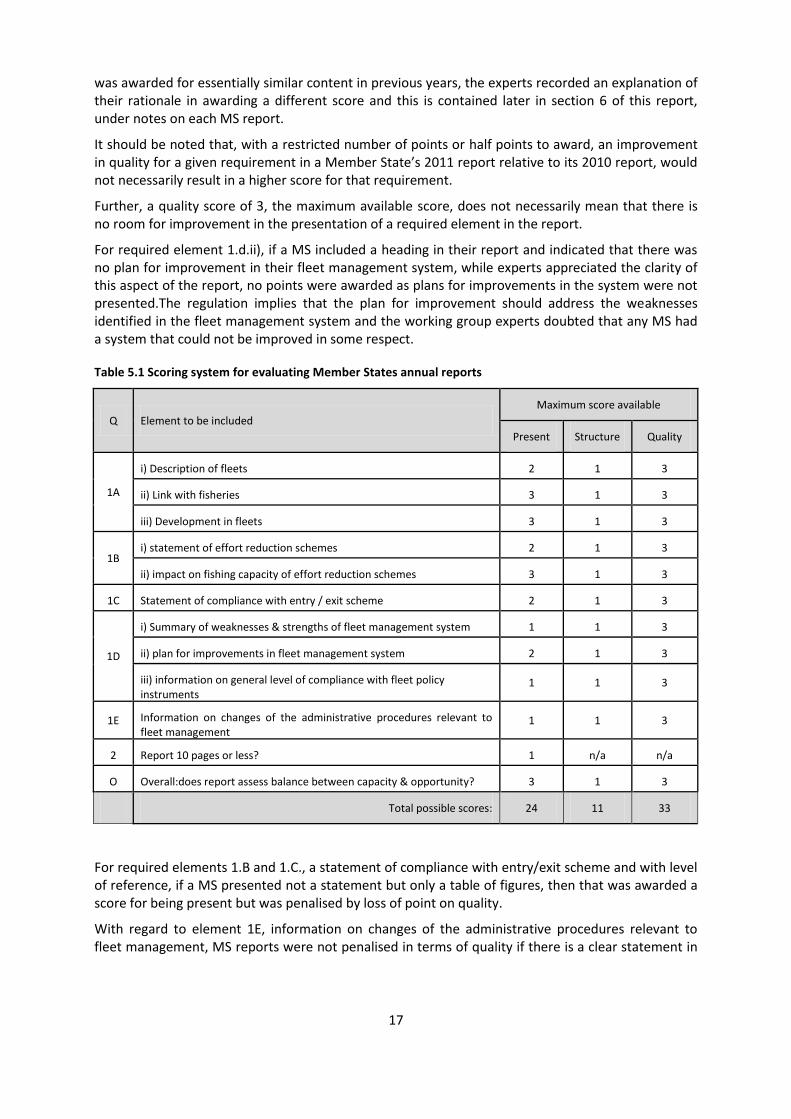
The working group assessed compliance with Articles 13 and 14 of Regulation 1013/2010 by using the scoring system that had been developed during SGBRE 09-01. Table 5.1 shows the scoring system used, which is based on the elements of Article 14 (items 1A to 2 in Table 7.1) and Article 13 (item O in Table 7.1).The scoring system was largely as used in previous years and awards a score for providing the required information and a separate score for the quality of the information.Scores for providing the required information are weighted to reflect the experts’ view of the importance of the elements included (present) in Member States’ reports.The quality score is a reflection of the completeness, robustness and relevance of the information provided.Experts did not assign a score for submitting the report by the required date.
For including the required elements, reports were awarded full marks available for each element.If the element in respect of 2011 was absent, the score was zero.Therefore, if a MS included a required element but only in relation to the wrong year, the report would score zero for including that element.
We awarded specific scores for completeness, robustness and relevance and each of these elements could achieve a score of 0, 0.5 or 1, so that the total quality score could be between 0 and 3 for each required element.
A new feature of the scoring system reflected a recommendation in the report of EWG 11-10 (STECF Report 11-17) in which suggested that in future, MS reports should be evaluated for adherence to the recommended structure, and that any required content that was not under a relevant heading would not be scored as being present.This recommendation reflected the fact that several MS reports included elements of the required content but not under relevant headings, so that it was difficult and time-consuming for experts to assess whether the required content was included at all.On further reflection, experts in EWG 12-11 decided that the content should be marked as being present even if it was included under irrelevant headings at various points within MS reports because the legislation does not require MS to follow a coherent and useful reporting structure, but rather only requires them to include the stated content.However, in order to encourage MS to adopt the previously recommended simple and straightforward report structure, and include content under the correct headings, experts decided to award additional points for Structure for each required element of the report.Thus, for example, if item 1A.iii) Development in fleets, is not given a heading, and the content for this item is included under another heading, elsewhere in the report, that MS report would receive the marks for the item being present, but would score zero for Structure of that required element.
Experts split into groups to evaluate MS reports so it is possible that groups may have applied the scoring system differently.However the system was discussed in plenary so this risk is considered to be small.Last year’s MS reports and scores were also reviewed to try to ensure consistency of evaluation between years.If experts decided to award a different score for the 2011 MS report than
17
was awarded for essentially similar content in previous years, the experts recorded an explanation of their rationale in awarding a different score and this is contained later in section 6 of this report, under notes on each MS report.
It should be noted that, with a restricted number of points or half points to award, an improvement in quality for a given requirement in a Member State’s 2011 report relative to its 2010 report, would not necessarily result in a higher score for that requirement.
Further, a quality score of 3, the maximum available score, does not necessarily mean that there is no room for improvement in the presentation of a required element in the report.
For required element 1.d.ii), if a MS included a heading in their report and indicated that there was no plan for improvement in their fleet management system, while experts appreciated the clarity of this aspect of the report, no points were awarded as plans for improvements in the system were not presented.The regulation implies that the plan for improvement should address the weaknesses identified in the fleet management system and the working group experts doubted that any MS had a system that could not be improved in some respect.
Table 5.1 Scoring system for evaluating Member States annual reports
Q Element to be included
Maximum score available
Present Structure Quality
1A
i) Description of fleets 2 1 3
ii) Link with fisheries 3 1 3
iii) Development in fleets 3 1 3
1B i) statement of effort reduction schemes 2 1 3
ii) impact on fishing capacity of effort reduction schemes 3 1 3
1C Statement of compliance with entry / exit scheme 2 1 3
1D
i) Summary of weaknesses & strengths of fleet management system 1 1 3
ii) plan for improvements in fleet management system 2 1 3
iii) information on general level of compliance with fleet policy instruments
1 1 3
1E Information on changes of the administrative procedures relevant to fleet management
1 1 3
2 Report 10 pages or less? 1 n/a n/a
O Overall:does report assess balance between capacity & opportunity? 3 1 3
Total possible scores: 24 11 33
For required elements 1.B and 1.C., a statement of compliance with entry/exit scheme and with level of reference, if a MS presented not a statement but only a table of figures, then that was awarded a score for being present but was penalised by loss of point on quality.
With regard to element 1E, information on changes of the administrative procedures relevant to fleet management, MS reports were not penalised in terms of quality if there is a clear statement in

18
the report which states that there were no changes in the administrative procedures relevant to the fleet management.
The requirement that reports should be 10 pages or less was interpreted to mean that the annual report covering the legally required elements should be 10 pages or less.If a report exceeded 10 pages only because it included non-required elements such as balance indicators, or an annex of detailed information, then the report was still awarded a point for being 10 pages or less.
Experts looked for MS reports to include a clear overall statement, or statements per fleet segment, on the balance of capacity and opportunity for their fleets.This element was presented by more MS than in previous years.
Timely submission We reviewed report submission dates and note that 11 of the 22 relevant MS submitted their annual reports by the deadline of 30 April 2012, compared to 8 last year.A further 2 MS were less than one week late and the last report was received on 31 July.Romania did not submit a report to the Commission before the working group meeting.UK submitted its report for 2011 and its report for 2010 which had not been submitted last year as required.Only the UK report for 2011 was evaluated.
5.2 Evaluation of Member States annual reports for 2011
All MS reports received by the Commission prior to the working group (21 reports) were evaluated by the STECF EWG 12-11against the requirements of Articles 13 and 14 of Regulation 1013/2010.
Overall there is less variation between MS reports for 2011 in terms of their completeness and quality.There is also a further general improvement in completeness and quality of reports compared to the reports for 2010, making three consecutive years in which reports have improved overall, see Table 5.2.
Completeness Table 5.2 shows the scores by MS for inclusion of required elements in their annual report (the “Present” score).
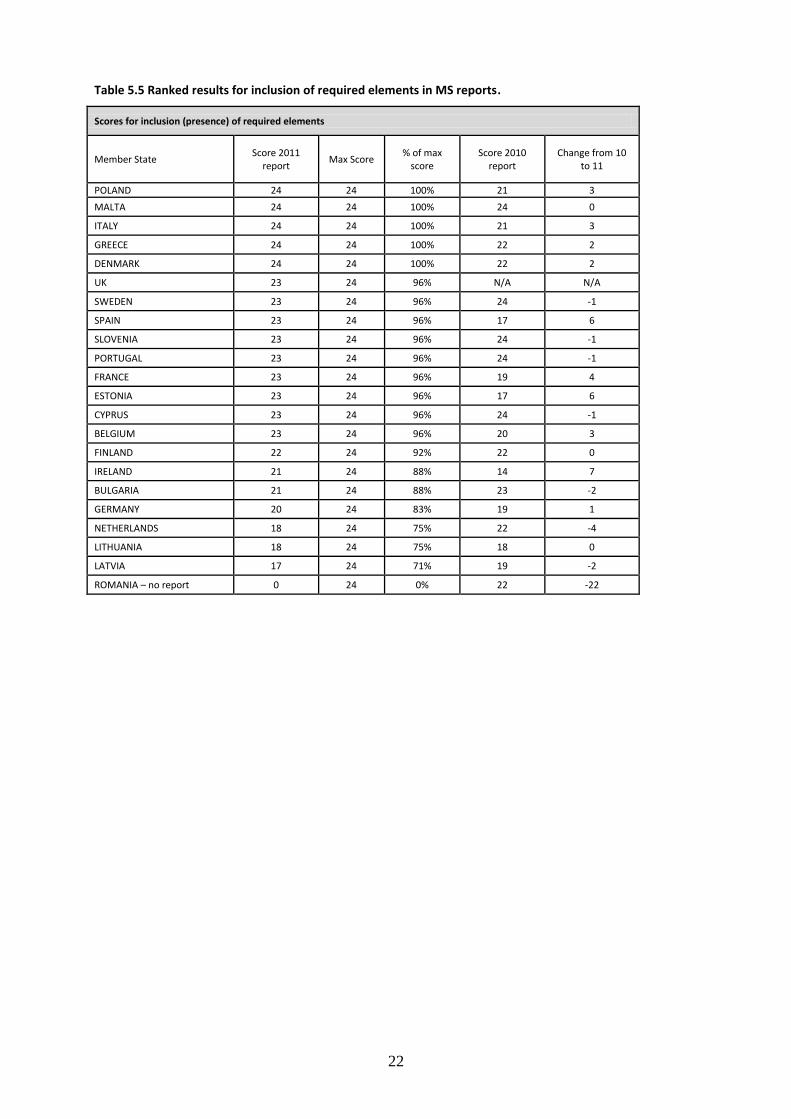
Table 5.5 ranks MS by their score for inclusion of required elements. A maximum of 24 points was available. Poland, Malta, Portugal, Italy, Greece and Denmark achieved the maximum 24 points, while the minimum was 17 points which is 3 points higher than last year’s minimum score. All MS scored above 70% for including the required elements. Annual improvements in completeness of reports are illustrated in Table 5.7 and Fig. 5.1.
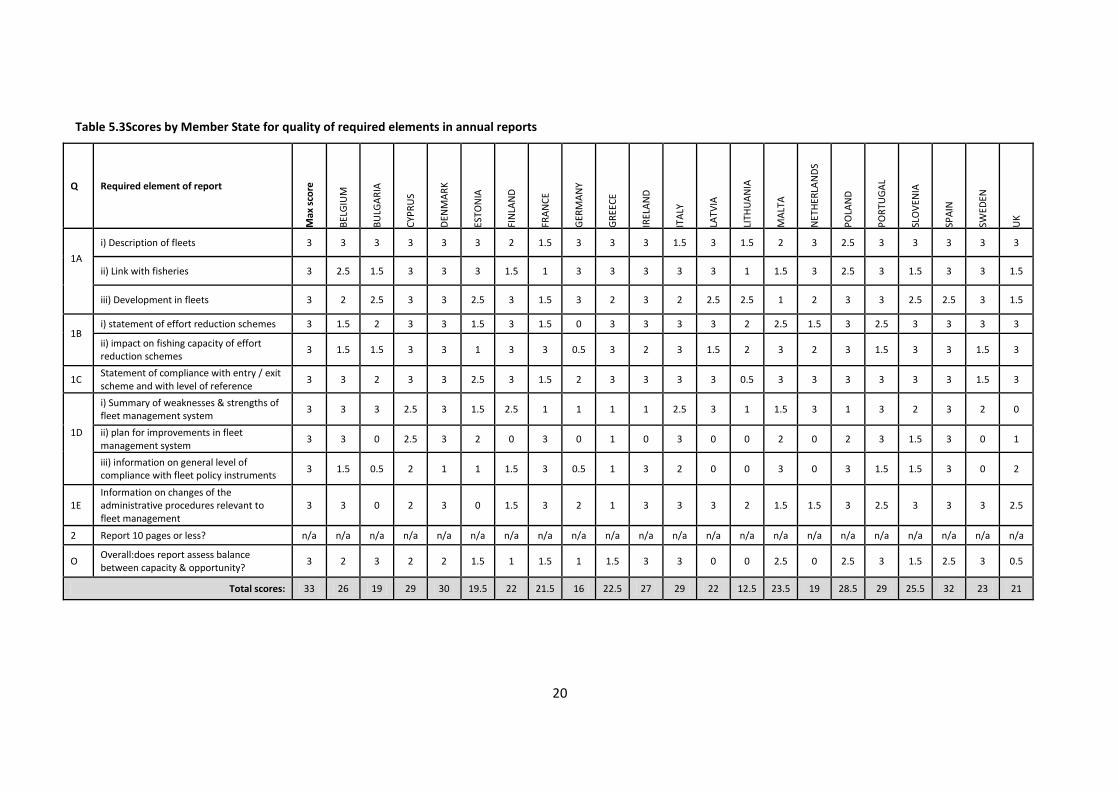
Quality Table 5.3shows the Quality scores by MS for included elements in the annual reports and there is an overall improvement compared to the quality of 2010 reports.Table 5.6 ranks MS by their quality score for the required elements.A maximum of 33 points was available.The report of Spain achieved the highest score with 32 points.Annual improvements in quality of reports are illustrated in Table 5.8 and Fig. 5.1.
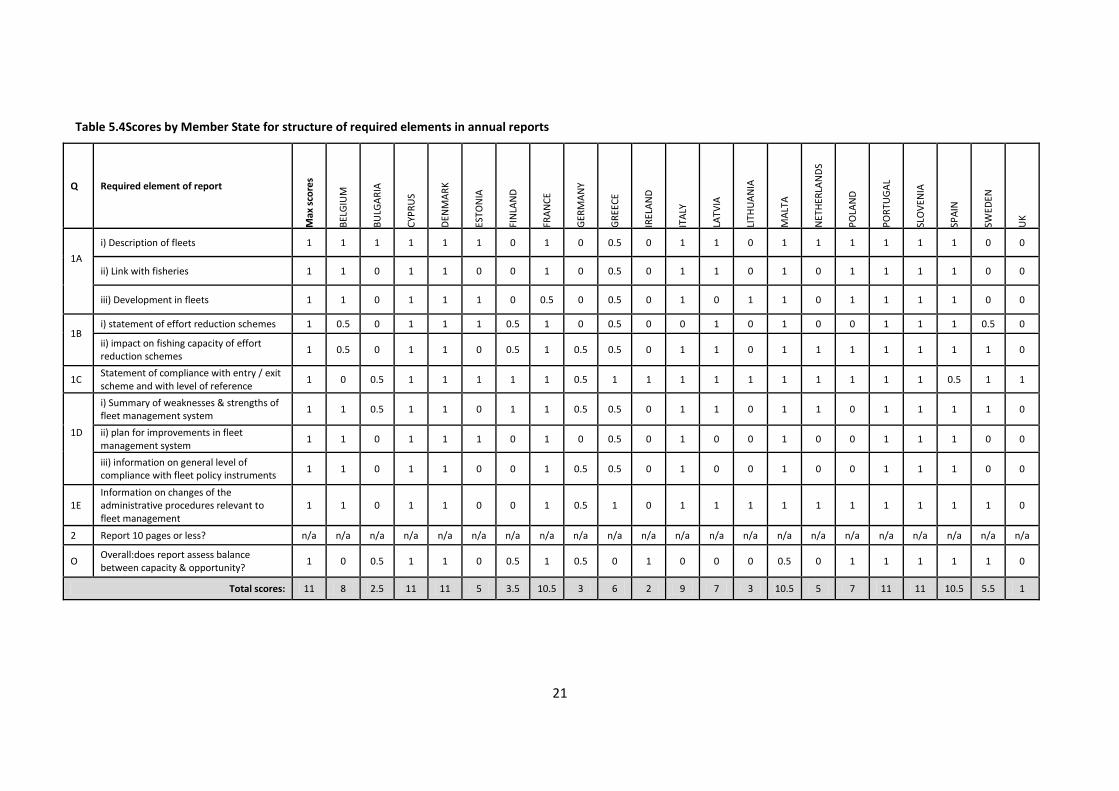
Structure Table 5.4 shows scores awarded by experts to reflect the extent to which MS annual reports followed the report structure that was recommended by STECF in 2010.Most MS reports did follow the recommended structure.
Experts find it very time consuming to identify the required elements in MS annual reports that are not structured with headings reflecting the required elements and reports with headings that do not reflect the material contained in those sections.

19
Table 5.2Scores by Member State for inclusion of required elements in annual reports
Q Required element of report
Max
Sco
re
BEL
GIU
M
BU
LGA
RIA
CYP
RU
S
DEN
MA
RK
ESTO
NIA
FIN
LAN
D
FRA
NC
E
GER
MA
NY
GR
EEC
E
IREL
AN
D
ITA
LY
LATV
IA
LITH
UA
NIA
MA
LTA
NET
HER
LAN
DS
PO
LAN
D
PO
RTU
GA
L
SLO
VEN
IA
SPA
IN
SWED
EN
UK
1A
i) Description of fleets 2 2 2 2 2 2 2 2 2 2 2 2 2 2 2 2 2 2 2 2 2 2
ii) Link with fisheries 3 3 3 3 3 3 3 3 3 3 3 3 3 3 3 3 3 3 3 3 3 3
iii) Development in fleets 3 3 3 3 3 3 3 3 3 3 3 3 3 3 3 3 3 3 3 3 3 3
1B
i) statement of effort reduction schemes 2 2 2 2 2 2 2 2 0 2 2 2 2 2 2 2 2 2 2 2 2 2
ii) impact on fishing capacity of effort reduction schemes
3 3 3 3 3 3 3 3 3 3 3 3 3 3 3 3 3 3 3 3 3 3
1C Statement of compliance with entry / exit scheme and with level of reference
2 2 2 2 2 2 2 2 2 2 2 2 2 2 2 2 2 2 2 2 2 2
1D
i) Summary of weaknesses & strengths of fleet management system
1 1 1 1 1 1 1 1 1 1 1 1 1 1 1 1 1 1 1 1 1 1
ii) plan for improvements in fleet management system
2 2 0 2 2 2 0 2 0 2 0 2 0 0 2 0 2 2 2 2 2 2
iii) information on general level of compliance with fleet policy instruments
1 1 1 1 1 1 1 1 1 1 1 1 0 0 1 0 1 1 1 1 0 1
1E Information on changes of the administrative procedures relevant to fleet management
1 1 0 1 1 0 1 1 1 1 1 1 1 1 1 1 1 1 1 1 1 1
2 Report 10 pages or less? 1 0 1 0 1 1 1 0 1 1 0 1 0 1 1 1 1 0 0 0 1 0
O Overall:does report assess balance between capacity & opportunity?
3 3 3 3 3 3 3 3 3 3 3 3 0 0 3 0 3 3 3 3 3 3
Totalscores: 24 23 21 23 24 23 22 23 20 24 21 24 17 18 24 18 24 23 23 23 23 23
20
Table 5.3Scores by Member State for quality of required elements in annual reports
Q Required element of report
Max
sco
re
BEL
GIU
M
BU
LGA
RIA
CYP
RU
S
DEN
MA
RK
ESTO
NIA
FIN
LAN
D
FRA
NC
E
GER
MA
NY
GR
EEC
E
IREL
AN
D
ITA
LY
LATV
IA
LITH
UA
NIA
MA
LTA
NET
HER
LAN
DS
PO
LAN
D
PO
RTU
GA
L
SLO
VEN
IA
SPA
IN
SWED
EN
UK
1A
i) Description of fleets 3 3 3 3 3 3 2 1.5 3 3 3 1.5 3 1.5 2 3 2.5 3 3 3 3 3
ii) Link with fisheries 3 2.5 1.5 3 3 3 1.5 1 3 3 3 3 3 1 1.5 3 2.5 3 1.5 3 3 1.5
iii) Development in fleets 3 2 2.5 3 3 2.5 3 1.5 3 2 3 2 2.5 2.5 1 2 3 3 2.5 2.5 3 1.5
1B
i) statement of effort reduction schemes 3 1.5 2 3 3 1.5 3 1.5 0 3 3 3 3 2 2.5 1.5 3 2.5 3 3 3 3
ii) impact on fishing capacity of effort reduction schemes
3 1.5 1.5 3 3 1 3 3 0.5 3 2 3 1.5 2 3 2 3 1.5 3 3 1.5 3
1C Statement of compliance with entry / exit scheme and with level of reference
3 3 2 3 3 2.5 3 1.5 2 3 3 3 3 0.5 3 3 3 3 3 3 1.5 3
1D
i) Summary of weaknesses & strengths of fleet management system
3 3 3 2.5 3 1.5 2.5 1 1 1 1 2.5 3 1 1.5 3 1 3 2 3 2 0
ii) plan for improvements in fleet management system
3 3 0 2.5 3 2 0 3 0 1 0 3 0 0 2 0 2 3 1.5 3 0 1
iii) information on general level of compliance with fleet policy instruments
3 1.5 0.5 2 1 1 1.5 3 0.5 1 3 2 0 0 3 0 3 1.5 1.5 3 0 2
1E Information on changes of the administrative procedures relevant to fleet management
3 3 0 2 3 0 1.5 3 2 1 3 3 3 2 1.5 1.5 3 2.5 3 3 3 2.5
2 Report 10 pages or less? n/a n/a n/a n/a n/a n/a n/a n/a n/a n/a n/a n/a n/a n/a n/a n/a n/a n/a n/a n/a n/a n/a
O Overall:does report assess balance between capacity & opportunity?
3 2 3 2 2 1.5 1 1.5 1 1.5 3 3 0 0 2.5 0 2.5 3 1.5 2.5 3 0.5
Total scores: 33 26 19 29 30 19.5 22 21.5 16 22.5 27 29 22 12.5 23.5 19 28.5 29 25.5 32 23 21
21
Table 5.4Scores by Member State for structure of required elements in annual reports
Q Required element of report
Max
sco
res
BEL
GIU
M
BU
LGA
RIA
CYP
RU
S
DEN
MA
RK
ESTO
NIA
FIN
LAN
D
FRA
NC
E
GER
MA
NY
GR
EEC
E
IREL
AN
D
ITA
LY
LATV
IA
LITH
UA
NIA
MA
LTA
NET
HER
LAN
DS
PO
LAN
D
PO
RTU
GA
L
SLO
VEN
IA
SPA
IN
SWED
EN
UK
1A
i) Description of fleets 1 1 1 1 1 1 0 1 0 0.5 0 1 1 0 1 1 1 1 1 1 0 0
ii) Link with fisheries 1 1 0 1 1 0 0 1 0 0.5 0 1 1 0 1 0 1 1 1 1 0 0
iii) Development in fleets 1 1 0 1 1 1 0 0.5 0 0.5 0 1 0 1 1 0 1 1 1 1 0 0
1B
i) statement of effort reduction schemes 1 0.5 0 1 1 1 0.5 1 0 0.5 0 0 1 0 1 0 0 1 1 1 0.5 0
ii) impact on fishing capacity of effort reduction schemes
1 0.5 0 1 1 0 0.5 1 0.5 0.5 0 1 1 0 1 1 1 1 1 1 1 0
1C Statement of compliance with entry / exit scheme and with level of reference
1 0 0.5 1 1 1 1 1 0.5 1 1 1 1 1 1 1 1 1 1 0.5 1 1
1D
i) Summary of weaknesses & strengths of fleet management system
1 1 0.5 1 1 0 1 1 0.5 0.5 0 1 1 0 1 1 0 1 1 1 1 0
ii) plan for improvements in fleet management system
1 1 0 1 1 1 0 1 0 0.5 0 1 0 0 1 0 0 1 1 1 0 0
iii) information on general level of compliance with fleet policy instruments
1 1 0 1 1 0 0 1 0.5 0.5 0 1 0 0 1 0 0 1 1 1 0 0
1E Information on changes of the administrative procedures relevant to fleet management
1 1 0 1 1 0 0 1 0.5 1 0 1 1 1 1 1 1 1 1 1 1 0
2 Report 10 pages or less? n/a n/a n/a n/a n/a n/a n/a n/a n/a n/a n/a n/a n/a n/a n/a n/a n/a n/a n/a n/a n/a n/a
O Overall:does report assess balance between capacity & opportunity?
1 0 0.5 1 1 0 0.5 1 0.5 0 1 0 0 0 0.5 0 1 1 1 1 1 0
Total scores: 11 8 2.5 11 11 5 3.5 10.5 3 6 2 9 7 3 10.5 5 7 11 11 10.5 5.5 1
22
Table 5.5 Ranked results for inclusion of required elements in MS reports.
Scores for inclusion (presence) of required elements
Member State Score 2011
report Max Score
% of max score
Score 2010 report
Change from 10 to 11
POLAND 24 24 100% 21 3
MALTA 24 24 100% 24 0
ITALY 24 24 100% 21 3
GREECE 24 24 100% 22 2
DENMARK 24 24 100% 22 2
UK 23 24 96% N/A N/A
SWEDEN 23 24 96% 24 -1
SPAIN 23 24 96% 17 6
SLOVENIA 23 24 96% 24 -1
PORTUGAL 23 24 96% 24 -1
FRANCE 23 24 96% 19 4
ESTONIA 23 24 96% 17 6
CYPRUS 23 24 96% 24 -1
BELGIUM 23 24 96% 20 3
FINLAND 22 24 92% 22 0
IRELAND 21 24 88% 14 7
BULGARIA 21 24 88% 23 -2
GERMANY 20 24 83% 19 1
NETHERLANDS 18 24 75% 22 -4
LITHUANIA 18 24 75% 18 0
LATVIA 17 24 71% 19 -2
ROMANIA – no report 0 24 0% 22 -22

23
Table 5.6Ranked results for quality of included elements in MS reports
Scores for quality of included elements
Member State 2011 Score Max Score % Score 2010
report Change from 2010
to 11
SPAIN 32.0 33 97% 18.5 13.5
DENMARK 30.0 33 91% 26.5 3.5
CYPRUS 29.0 33 88% 26 3.0
ITALY 29.0 33 88% 17.5 11.5
PORTUGAL 29.0 33 88% 26 3.0
POLAND 28.5 33 86% 28 0.5
IRELAND 27.0 33 82% 12.5 14.5
BELGIUM 26.0 33 79% 16.5 9.5
SLOVENIA 25.5 33 77% 25 0.5
MALTA 23.5 33 71% 23.5 0.0
GREECE 22.5 33 68% 22 0.5
FINLAND 22.0 33 67% 27 -5.0
LATVIA 22.0 33 67% 22.5 -0.5
FRANCE 21.5 33 65% 8 13.5
SWEDEN 21.0 33 64% 30 -9.0
UK 21.0 33 64% N/A N/A
ESTONIA 19.5 33 59% 12.5 7.0
BULGARIA 19.0 33 58% 19.5 -0.5
NETHERLANDS 19.0 33 58% 17.5 1.5
GERMANY 16.0 33 48% 18.5 -2.5
LITHUANIA 12.5 33 38% 17 -4.5
Romania – no report 0.0 33 0% 23 -23.0
24 24
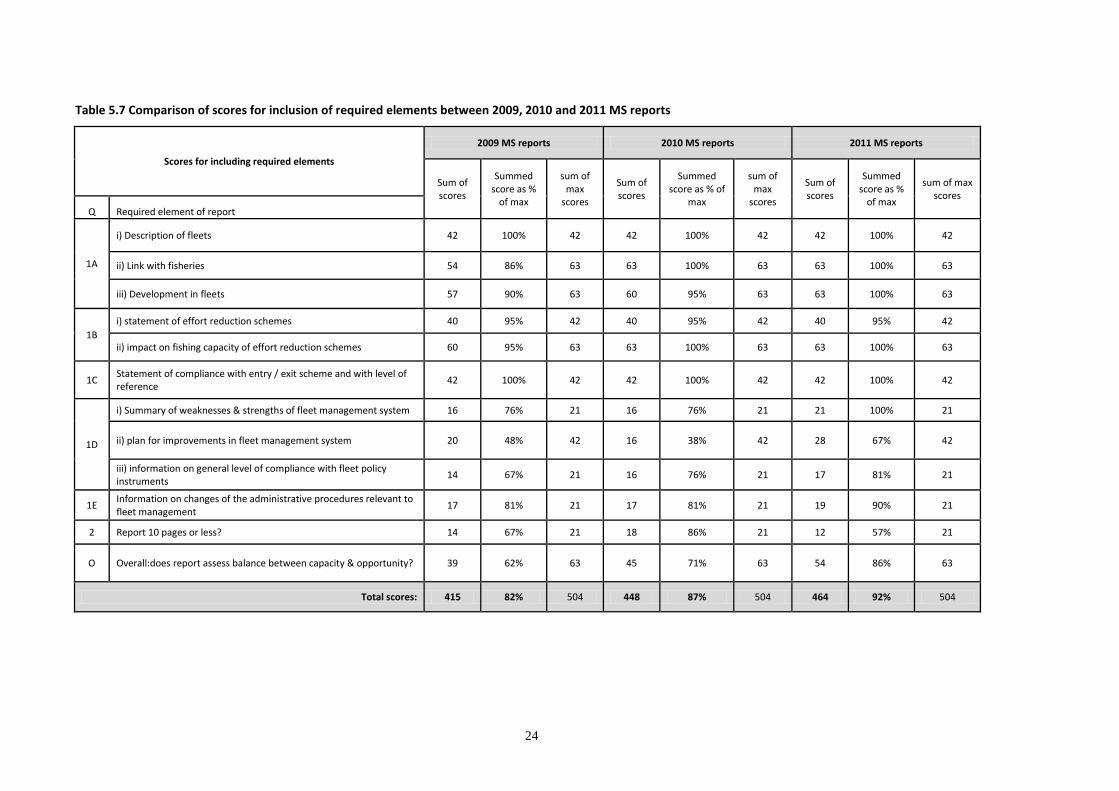
Table 5.7 Comparison of scores for inclusion of required elements between 2009, 2010 and 2011 MS reports
Scores for including required elements
2009 MS reports 2010 MS reports 2011 MS reports
Sum of scores
Summed score as %
of max
sum of max
scores
Sum of scores
Summed score as % of
max
sum of max
scores
Sum of scores
Summed score as %
of max
sum of max scores
Q Required element of report
1A
i) Description of fleets 42 100% 42 42 100% 42 42 100% 42
ii) Link with fisheries 54 86% 63 63 100% 63 63 100% 63
iii) Development in fleets 57 90% 63 60 95% 63 63 100% 63
1B
i) statement of effort reduction schemes 40 95% 42 40 95% 42 40 95% 42
ii) impact on fishing capacity of effort reduction schemes 60 95% 63 63 100% 63 63 100% 63
1C Statement of compliance with entry / exit scheme and with level of reference
42 100% 42 42 100% 42 42 100% 42
1D
i) Summary of weaknesses & strengths of fleet management system 16 76% 21 16 76% 21 21 100% 21
ii) plan for improvements in fleet management system 20 48% 42 16 38% 42 28 67% 42
iii) information on general level of compliance with fleet policy instruments
14 67% 21 16 76% 21 17 81% 21
1E Information on changes of the administrative procedures relevant to fleet management
17 81% 21 17 81% 21 19 90% 21
2 Report 10 pages or less? 14 67% 21 18 86% 21 12 57% 21
O Overall:does report assess balance between capacity & opportunity? 39 62% 63 45 71% 63 54 86% 63
Total scores: 415 82% 504 448 87% 504 464 92% 504
25 25
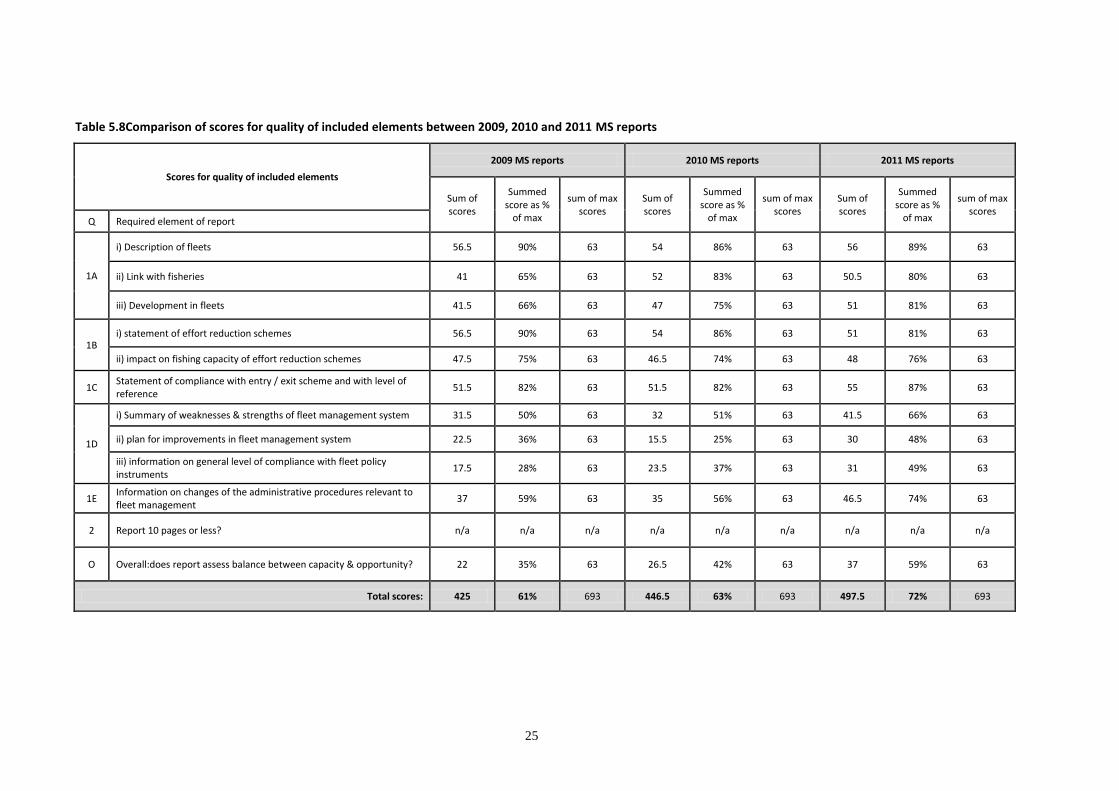
Table 5.8Comparison of scores for quality of included elements between 2009, 2010 and 2011 MS reports
Scores for quality of included elements
2009 MS reports 2010 MS reports 2011 MS reports
Sum of scores
Summed score as %
of max
sum of max scores
Sum of scores
Summed score as %
of max
sum of max scores
Sum of scores
Summed score as %
of max
sum of max scores
Q Required element of report
1A
i) Description of fleets 56.5 90% 63 54 86% 63 56 89% 63
ii) Link with fisheries 41 65% 63 52 83% 63 50.5 80% 63
iii) Development in fleets 41.5 66% 63 47 75% 63 51 81% 63
1B i) statement of effort reduction schemes 56.5 90% 63 54 86% 63 51 81% 63
ii) impact on fishing capacity of effort reduction schemes 47.5 75% 63 46.5 74% 63 48 76% 63
1C Statement of compliance with entry / exit scheme and with level of reference
51.5 82% 63 51.5 82% 63 55 87% 63
1D
i) Summary of weaknesses & strengths of fleet management system 31.5 50% 63 32 51% 63 41.5 66% 63
ii) plan for improvements in fleet management system 22.5 36% 63 15.5 25% 63 30 48% 63
iii) information on general level of compliance with fleet policy instruments
17.5 28% 63 23.5 37% 63 31 49% 63
1E Information on changes of the administrative procedures relevant to fleet management
37 59% 63 35 56% 63 46.5 74% 63
2 Report 10 pages or less? n/a n/a n/a n/a n/a n/a n/a n/a n/a
O Overall:does report assess balance between capacity & opportunity? 22 35% 63 26.5 42% 63 37 59% 63
Total scores: 425 61% 693 446.5 63% 693 497.5 72% 693
26 26
Figure 5.1Annual development in MS sum of scores as percentage of maximum scores.
5.3 Specific comments on required elements of Member States annual reports
Experts at STECF EWG 12-11 made comments on each MS report which may be helpful to those preparing the reports next year.
Belgium
Belgium’s annual report for 2011 shows significant improvement compared to previous reports.
Section A (ii) Link with fisheries and (iii) Development in fleets, states that the scale of fishing for other species is too low but no further information is given. More detailed information would be helpful.
Sections B and C lack explanations, do not give sufficient information on compliance and reference level and impact on fleet capacity resulting from the effort reduction schemes.
Section D, information on general level of compliance with fleet policy instruments, is weak in terms of clarity, robustness and relevance.
EWG considers thatinsufficient information is available to support the overall assessment of balance.
Bulgaria
The report does not use the recommended structure. The data provided is not always coherent or under the correct section. The information could be presented in a more concise and clear manner. The use of tables and/or graphs could help improve clarity.
Information on the Link with fisheries is hard to find, scattered throughout the text and in the annex tables. CPUE by species and fleet segment, as % of total landings, is provided in an annex table but lacks general data such as landings volume for most species (landings volume is only provided for the two main species – turbot and sprat). Information provided is not easily digestible or very relevant. Some explanation of the annex content would be useful.
More detailed or relevant information on the Impact of fishing capacity of effort reduction schemes and how the MS has complied with the effort reduction schemes would be useful.
Plans for improvements in fleet management system are not clearly mentioned in the text.

27 27
Information on changes of the administrative procedures relevant to fleet management is not provided.
Overall assessment of balanced is provided by fleet segments (vessel length) using the traffic light system. However, the relevance or correctness of the biological indicators remain questionable.
Cyprus
Overall the report is clearly presented and follows the recommended structure.
More detailed information on the General level of compliance with fleet policy instruments would improve the overall quality and completeness of the report.
Cyprus improved on last year’s report by providing the technical indicator based on 2011 data (as opposed to providing only for 2009 in last year’s report).
The biological indicator CPUE was provided for the small scale fleet and trawl fleet, as well as for the main target species over an 11 year time series (2000-2011); CPUE also provided for target species of the drifting long line fleet segment for the years 2006-2011. However, CPUE is not ideal as a biological indicator of balance between fleet capacity and fishing opportunity.
Cyprus again incorrectly calculated the social indicator Gross Value Added, by not including fixed costs in the calculation of GVA.
Cyprus appears to have corrected its issue with calculating RoI, which was observed in the 2010 report.
Overall assessment of balanced is provided by main fleet segments but the traffic light system was not used.
Denmark
The report is clear and closely follows the recommended structure.
Compliance with fleet policy instruments should include management measures other than entry-exit rules, for instance, information on infringements and inspections on the main management measures.
Conclusions on overcapacity and balance between fleet capacity and fishing opportunities are provided in the report but do not seem to be consistent with the estimated indicators.
Estonia
The overall report structure improved compared to the previous year’s report, but not all the suggested headings were used.
No clear overall assessment of balance was given and traffic light system was not used for the technical and biological indicators.
Finland
The EWG feels that a somewhat generous overall evaluation of Finland’s report was given last year.
The report does not follow the recommended structure laid out in the previous STECF report.
More relevant qualitative and quantitative information on the Description of fleets; Link with fisheries, Summary of weaknesses & strengths of fleet management system and Information on changes of the administrative procedures relevant to fleet management, would improve the overall quality and completeness of the report.
No balance indicators were provided, only a descriptive analysis in relation to fishing quotas.
Overall assessment of balance between capacity and opportunity was not provided.
28 28
France
The French report is concisely structured and an improvement from the previous year.
In section 3 of the report, the French EU-based fleet is not reported in sufficient detail, which does not allow the EWG to consider the various fleet segments operating in EU waters, or their link with stocks targeted. A higher level of disaggregation would be more informative.
More information on the objectives and results of the various effort reduction schemes is desirable.
Information on compliance with the entry/exit scheme is not complete or robust – more detail on reference levels and calculation methods would be useful. There is also the question of whether France has two separate exit entry regimes i.e. one for the outer regions and whether separate information should be provided.
The summary of weaknesses & strengths of fleet management system is inadequate as only one ‘strength’ and no weaknesses were provided.
EWG feels thatthere is insufficient information to support the assessment on balance, no balance indicators were calculated.Quota uptake and capacity decrease statistics are not appropriate indicators of balance.
Germany
The report did not use the proposed structure.
Description of fleets,Link with fisheries and Development in fleets are combined by fleet segments under the same heading ‘Development of fishing capacity and fishing opportunities’, making it dificult to evaluate completeness.
No clear Statement of effort reduction schemes is mentioned.Description of Plans for improvements in fleet management system and Level of compliance with fleet policy instruments were not provided.
More qualitative and quantitative information on the impacts on fishing capacity of effort reduction schemes, fleet management system, weaknesses & strengths of the fleet management system, and changes to the administrative procedures relevant to fleet management would improve the overall quality and completeness of the report.
None of the balance indicators were provided. Justification for this includes lack of data for the year in question or questionable utility of the indicators.
The report contains some vague statements on the extent of imbalance between fleet and fishing opportunity for some of the fleet segments. However, no clear overall assessment of balance is mentioned.
Greece
Greece provided a clear report with summary and good fleet segment descriptors. Overall, the report is an improvement from last year’s. However, the report structure recommended by STECF EWG 11-17 is not completely followed.
Greece could expand the Table under “general description of the fishing fleet” to include information from previous years.
Some text is provided on the fleet management system, its plan for improvements and information on general level of compliance with fleet policy instruments. However, the section is incomplete and lacks robustness. A more detailed account would be helpful.
29 29
Ireland
The report is significantly improved compared to last year’s report. The proposed guidelines were followed to some extent. Description of fleets, Link with fisheries and Development in fleets were combined into one general section.
More information on the Impacts on fishing capacity of effort reduction schemes and Weaknesses & strengths of fleet management system would improve the overall quality and completeness of the report.
Information on Plans for improvement in fleet management system was not provided in the report.
Italy
Section on weaknesses and strengths of fleet management system only makes reference to management system but does not point out any pertinent issues or weaknesses.
Section on general level of compliance with fleet policy instruments lacks detail.
Latvia
The report does not exactly follow the recommended structure laid out in the previous STECF report.
Latvia provides a good description of the fleet, but development of the fleet should be covered by segments and should have more than one year. The impact on fishing capacity of effort reduction schemes does not state or show the importance of that reduction to the fleet capacity.
The report does not mention implementation of any plans for improvements in the fleet management system.
The report includes a section on the balance between fishing opportunities and fishing capacity and on the technical indicator it provides a short statement about that, using a “traffic light system”, however, there is no statement onoverall balance between capacity and opportunity.
Lithuania
Overall there was no improvement in the 2012 report compared to the report submitted in 2011.
Description of fleet / link with fishery is only presented as a figure in the report annex, no text interpretation of the figure is provided.
The sections on statement of effort reduction scheme and the impact on the fishing capacity of the effort reduction scheme are combined, there is no clear distinction between the two.
The statement of compliance with the entry/exit scheme and with the level of reference presents ‘2010’ data only. However, when comparing with the 2011 report, figures do not match. It is thus not clear if this is a copy and paste error or which year the provided figures refer to.This element received zero points for presence as ostensibly the data related to the wrong year.
Malta
The report follows the recommended structure laid out in the previous STECF report.
The information provided for both the Description of fleets and Development in fleets is incomplete. Data by fleet segment and a table with time series data could have been provided of a more complete picture. A more relevant explanation regarding the replacement of vessels is needed.
Much of the information provided for Link with fisheries is not very relevant for this section while relevant data is missing. Overall, more detailed information is needed for a more precise overview of the fleet, by fleet segment or fleet component (small and large scale).
Information presented under Weaknesses & strengths of the management systems is rather general, i.e. a description of the management systems is given with no clear reference to any weaknesses nor strengths. More relevant information could be provided.

30 30
Netherlands
The overall report structure improved compared to the previous year, however sections were not presented in the correct order.
Some sections continue to be incomplete (section on the information on general level of compliance with fleet policy instruments)or are missing.
Zero points were awarded for the section on overall assessment of balance between capacity and opportunity since only a short conclusion was presented, discussing economic and biological indicators separately.
Poland
The overall report structure improved compared to the previous year, however the suggested heading wording was not always used.
The section on fleet development is only presented as a table, no text interpretation is provided.
This year, a lower score was attributed for the section on the weaknesses and strengths of the fleet management system as no pertinent issues were singled out.
A lower score is given for plan for improvements in fleet management system asessentially details on the IT system are given.
Portugal
The overall report structure is improved compared to the previous year, however the wording of the headings is different from the headings suggested by the EWG.This seems to have been a translation issue; the EWG suggests that the Commission could supply translators with the suggested report sub-headings as a reference point in future. Furthermore, graph legends were in Portuguese, although translation is provided in table format in the report.
The section on impact on fishing capacity of effort reduction schemes does not mention fishing effort in western waters and outermost regions.
Slovenia
The report follows the recommended structure laid out in the previous STECF EWG report.
The overall quality and completeness of the report would be improved by including more qualitative and quantitative information on the Link with fisheries, Development in fleets, Weaknesses & strengths of fleet management system, Plans for improvement in fleet management system and Information on general level of compliance with fleet policy instruments.
The biological indicator (CPUE) presented is not the most relevant and is only calculated for European sardine and anchovy.
Social and economic balance indicators are estimated for 2010 but estimation methods are not clearly stated or presented.
Spain
There is a significant improvement in the report compared to the previous year’s report.
In the section on ‘Development in fleets’, the time series of data provided could be longer for a clearer picture. In addition, it is unclear what the data in the second table consists of: if it is the number of licences or not? There is a lack of qualitative explanation in this section.
In the section ‘Statement of compliance with entry / exit scheme’ – the first tables containing data on GT and kW require further explanation – it is not obvious to the reader what some of the stated GT and kW measures actually mean. Again, a qualitative explanation is lacking.
31 31
In the section ‘Summary of weaknesses & strengths of fleet management system’ – a more ‘in-depth’ qualitative explanation would have been useful to help the reader understand how significant each point raised actually is.
Although the report clearly contains a statement on the extent of imbalance between fleet capacity and fishing opportunity, as no biological indicator was calculated due to a reported lack of time, marks have been deducted from thescore for lack of robustness. Biological indicator results are a vital component in making a qualitative evaluation on the extent of imbalance between fleet and opportunity.
Finally, the graphs relating to decreases in vessel numbers, GT and kW for the years 2009-2011 under the report summary section are slightly misleading as the steep downward trend displayed is due to the incorrect setting of the vertical axes. If these were set to zero, the downward slope would be far less pronounced.
Sweden
The report does not exactly follow the recommended structure laid out in the previous STECF report.
EWG could not find any information on whether the Swedish fleet is in compliance with entry/exit schemes, so we gave it a presence score of zero. The previous EWG 11-10 (STECF report 11-17) gave Sweden a presence score for this element. In order to state if the country has complied with the entry exit scheme, the current GT/kW should be compared with the same indicators as at 1st January 2003. This was not done.
No information was provided on the general level of compliance with fleet policy instruments.
More information on plans for improvements in the fleet management system, strengths and weaknesses of the fleet management system, and impacts on fishing capacity of effort reduction schemes, would improve the overall quality and completeness of the report
United Kingdom
The report submitted was for two years (2010 and 2011).
Detailed information on the state of the UK fleet is included but guidelines on report structure and indicator calculation were not followed.
Link with fisheries is given but not clearly presented: list of stocks and areas where they are targeted is given in an appendix table; while no information or text is presented in the actual report.
32 32
6 COLLATION OF BALANCE INDICATORS
From this point onwards in this report, the material presented is a combination of work started in the first group, EWG 12-11, then developed and completed in the second working group, EWG 12-21.
The EWGs were asked to collate material relating to assessments of balance from MS reports along with balance indicators calculated and provided by DG Mare and information and indicators that the experts calculated during the working group.
To help provide some firm information to inform policy decisions, the EWG understand that the Commission wanted standardised assessments of three elements for EU fleet segments:
economic performance of fleet segments,
activity levels / vessel utilisation rates,
the sustainability of harvest rates of fish stocks on which fleet segments rely.
As this was the first time that experts have carried out this exercise, in the first EWG there was uncertainty about how long the exercise would take, concern about availability of data to provide information on stock health or harvest rates for fleet segments and concern about the possibility of completing the tasks for more than 500 fleet segments in only 3 days.In fact, the task was not completed and that is why an additional EWG was arranged.
For the second EWG, a sustainable harvest indicator was provided to the EWG by one of the experts who had calculated this indicator under the terms of an ad hoc contract with DG Mare before the second EWG.
Even in the second EWG, there was concern that the task could not be completed for all EU fleet segments and so, with guidance from DG Mare, experts decided to initially select a restricted number of fleet segments that would include the majority of fleet capacity and value of landings in the EU. The initial selection process was as follows:
First, using data from the 2012 AER, MS were selected if they were in the top ten MS for national fleet GT, national fleet kW or national fleet value of landings. Second, the seven MS that appeared in all 3 of those top ten lists were selected. In addition, Italy was selected as it appeared at or near the top of two lists. This gave eight MS for the initial tranche. Third, within each MS, the DCF economic data fleet segments at Supra Region level (e.g. DTS VL1218 Area 27) were ranked in order of value of landings (income from landings) and segments that generated 70% or more of national landings value were selected. The selection of fleet segments within MS did not consider vessel GT and engine kW.
This process resulted in the selection of 61 DCF fleet segments, which in 2010 generated €4.3 billion of landings, equating to 65% of total EU value of landings. This selection method did not produce a geographically even distribution of fleet segments, so that, for instance, the Baltic Sea is not well represented within the first selection of 61 fleet segments.
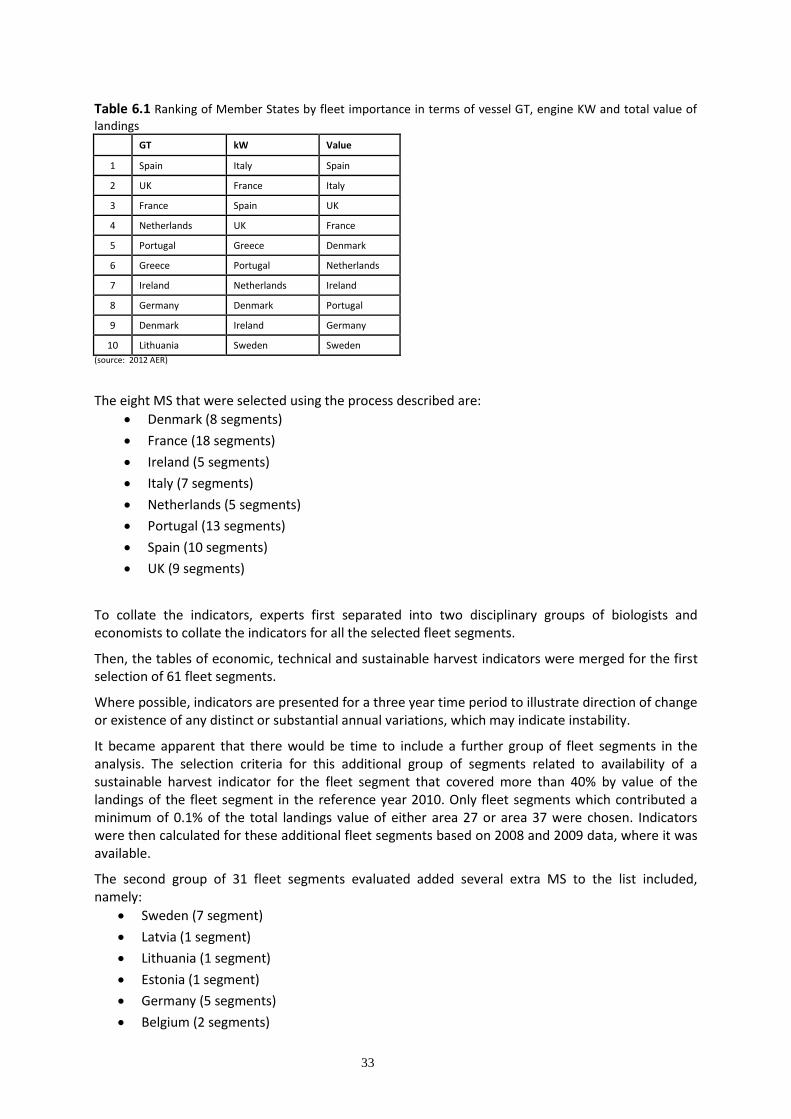
33 33
Table 6.1 Ranking of Member States by fleet importance in terms of vessel GT, engine KW and total value of
landings
GT kW Value
1 Spain Italy Spain
2 UK France Italy
3 France Spain UK
4 Netherlands UK France
5 Portugal Greece Denmark
6 Greece Portugal Netherlands
7 Ireland Netherlands Ireland
8 Germany Denmark Portugal
9 Denmark Ireland Germany
10 Lithuania Sweden Sweden
(source: 2012 AER)
The eight MS that were selected using the process described are:
Denmark (8 segments)
France (18 segments)
Ireland (5 segments)
Italy (7 segments)
Netherlands (5 segments)
Portugal (13 segments)
Spain (10 segments)
UK (9 segments)
To collate the indicators, experts first separated into two disciplinary groups of biologists and economists to collate the indicators for all the selected fleet segments.
Then, the tables of economic, technical and sustainable harvest indicators were merged for the first selection of 61 fleet segments.
Where possible, indicators are presented for a three year time period to illustrate direction of change or existence of any distinct or substantial annual variations, which may indicate instability.
It became apparent that there would be time to include a further group of fleet segments in the analysis. The selection criteria for this additional group of segments related to availability of a sustainable harvest indicator for the fleet segment that covered more than 40% by value of the landings of the fleet segment in the reference year 2010. Only fleet segments which contributed a minimum of 0.1% of the total landings value of either area 27 or area 37 were chosen. Indicators were then calculated for these additional fleet segments based on 2008 and 2009 data, where it was available.
The second group of 31 fleet segments evaluated added several extra MS to the list included, namely:
Sweden (7 segment)
Latvia (1 segment)
Lithuania (1 segment)
Estonia (1 segment)
Germany (5 segments)
Belgium (2 segments)
34 34
Altogether there are 14 MS included in the analysis, representing 72% of the value of landings by EU fleets in 2010.
6.1 Data availability
Although the initially selected fleet segments produced 65% of the EU fleet value of landings in 2010, there are data shortages for many of these fleet segments, so the picture presented is incomplete even for this selection of fleet segments.
Some of the data required to calculate the indicators is not required of MS under the DCF and unless the MS have voluntarily supplied the data in their annual reports, it was not possible to estimate the indicators in these cases. For example, the average and maximum observed days at seas per fleet segment are required for the technical indicator but maximum observed days at sea (or even the maximum theoretical days at sea) are not required under the DCF.
For the sustainable harvest indicator, some of the stocks harvested by fleet segments are not assessed and therefore F and Fmsy are not observed or defined and hence, the F/Fmsy indicator cannot be calculated for those stocks, and the sustainability of the harvested stocks is therefore limited to only a proportion of stocks harvested by the fleet segment.
In some cases, even though data are required under the DCF, some MS have nevertheless not supplied the data and therefore in these cases, the indicators cannot be calculated.
6.2 Selected indicators
The ‘Guidelines for an improved analysis of the balance between fishing capacity and fishing opportunities’ contain the following indicators:
- One technical balance indicator (capacity utilisation per fleet segment(average days at
sea / maximum observed or maximum theoretical days at sea),
- Three biological balance indicators (Ratio between F estimated and F target (F/Tt), Ratio
between current catch weight and stock biomass, and, as a last resort, CPUE)
- Two economic balance indicators (return on investment (ROI) and the current revenue /
break even revenue ratio (CR/BER).
- Two social balance indicators (Crew wages per FTE and Gross value added (GVA) as a
proportion of income.
Technical Indicator
Technical indicator: average days at sea / max number of days at sea per fleet segment As reported in the guidelines, the maximum number of days at sea to be used for calculating the technical indicator “Ratio between days at sea and maximum days at sea” should be established by the vessel in the fleet segment using most days at sea in any of the years in the time series, or by an average of the days at sea of the vessels that were most active in each of the time spans.
The maximum possible days at sea can be estimated based on two approaches. The actual maximum achieved days at sea are based on real data and the theoretical maximum days at sea are based on the maximum theoretical possible amount of days at sea. Based on SGBRE 10-01, it is suggested that the theoretical maximum number of days at sea should be calculated as 365 days minus the days that the MS considers that the fleet will not use for social, technical and/or other reasons. These reasons could be weekends, holidays, days to repair and maintain the vessel and weather conditions that make fishing unprofitable or unsafe to fish. The actual maximum days at sea is based on the vessel or groups of vessels in a segment that has the highest days at sea in a year during a given time period. This is only an appropriate way of estimating the maximum days at sea, if the segment is not restricted by any effort regulations.
Given the definition reported above, the maximum number of days at sea cannot be calculated by using data aggregated at fleet segment level, as collected by DCF, but only using data disaggregated at vessel level or if the single figure for maximum observed days at sea is reported.
35 35
STECF EWG 12-11 was requested to estimate indicators on balance between fishing capacity and opportunities by using all available data, including that collected by DCF. As the maximum number of days at sea was not available in DCF data, the EWG decided to use the values reported in the MS annual reports. Unfortunately, not all MS estimated the technical indicator or reported the values used to estimate this indicator. Furthermore, indicators by MS were generally estimated for fleet segments used for local management purposes. These are generally not consistent with those defined by DCF and used for statistical reasons.
Where possible, STECF EWG 12-11 identified matches between the national fleet segments and the DCF fleet segments and used the maximum days at sea per vessel reported in the MS annual reports or any other information useful to identify a maximum value more useful than the physical maximum of 365 days.
For instance, the maximum number of days at sea for all DCF Netherlands fleet segments was set at 240 as suggested in the MS annual report: “For a better indication of the size of the fleet in relation to the available days at sea it is possible to express the number of days actually used as a percentage of the number of calendar days a vessel would in theory be able to use. This was done on the basis that a vessel would in theory be able to fish for five days a week for 48 weeks a year, i.e. 240 days” [….] “The utilisation rate calculated in this way is around 60%. Only a small number of vessels fished for 240 calendar days or more in 2011.”
Biological Indicators
The recommended biological indicators were not calculated for DCF economic fleet segments before the meetings and therefore could not be used by the EWG.
Sustainable Harvest Indicator1 A sustainable harvest indicator was provided to the second working group (in Barza) by one of the experts who had calculated this indicator under the terms of an ad hoc contract with DG Mare before the second EWG.
The Sustainable Harvest Indicator(SHI) shows whether, on average, stocks on which a fleet segment is economically dependent are harvested with a fishing mortality rate at which the population can produce the maximum sustainable yield (MSY).
Thus, the indicator is based only on stocks for which stock assessments and estimates of current F and Fmsy are available. Stocks for which no assessment is available, or for which only reference points of the biomass level at which the population can produce MSY are available, wereexcludedfrom the indicator. If the stocks included amounted to less than 40% of a fleet segment’s landings value in 2010, then the indicator value was not presented as it was considered not to be representative of the harvested stocks.
The calculation of the F2*fleet Sustainable Harvest Indicatorwas based on the following data sources:
For the most up-to-date current F estimates and stock reference points information was taken from: - Area 27: ICES summary stock database version October 2012
(http://www.ices.dk/datacentre/StdGraphDB.asp);
- Area 37: EWG 11-17, Review of advice for 2012 part 3. Advice on Stocks of Interest to
the European Community in areas under the jurisdiction of CCAMLR, CECAF, WECAF,
1 For further details on the methodology used to calculate indicator F2*fleet refer to ad hoc document by Jerome Guitton.

36 36
ICCAT, IOTC, IAATC, GFCM, NAFO, and stocks in the North East Atlantic assessed by ICES.
11-17 October 2011, Ancona, Italy. JRC 67715. 245 pp.
Data on landing values was taken from 2012 DCF fishing fleet economic data call.
Once the analysis was run, experts decided to present the indicator only for fleet segments with 40%or more of their landings value coming from assessed stocks. This wasbecause experts felt that if less than 40% of landings value was represented in the indicator then it was no longer a useful indicator for decision making. Experts accepted that the choice of threshold was somewhat arbitrary but sought to strike a balance between the usefulness of the indicator (based on how representative it was of segment landings) and being able to present an indicator value for a larger number of fleet segments. Where the indicator was calculated for ≤ 40% of landing values, the indicator was not reported and the cell in the summary table contains the letters LP, standing for Low Proportion.
The EWG however considers that this 40% coverage threshold at the current state of knowledge means that the indicator will rarely be included for Mediterranean fleet segments, since fleet segments in this ecosystem rely on a large number of species and landings compositions vary seasonally. A larger number of stocks need to be assessed for the Mediterranean for the indicator to be of value to managers in relation to Mediterranean fleet segments.
Indicator Constraints:
The indicator used (F2*fleet) takes the mean fishing mortalities F* for all stocks that are harvested by the fleet segment and for which assessments are available, weighted by the value of the landings of the included stocks. Taking a weighted average in such a manner creates a clear risk of masking the situation of individual stocks. This can for instance create a situation where a sustainably harvested stock with a large value could hide problems with several additional stocks harvested by the fleet segment in a very bad state that only contribute a small proportion to the total landings value generated by the fleet segment in question.
No information is given on the number of stocks actually harvested by the individual fleet segments. The number of assessed stocks presented in the table can thus not be put into context. However the proportion of the value of landings to the total value of landings, the total number of stocks assessed and the number of those stocks that are assessed as overfished(F>Fmsy) included in the analysis is reported in an Annex in section 8 of this report.
For the majority of fleet segments the EWG noted that the proportion of landings included in the indicator calculations for the selected fleet segments was low due to lack of stock assessment data. Stock assessments are still lacking for many high value species such as shellfish and high value crustaceans; considering landings by weight may have increased the proportion of coverage with regards to fleet landings included in the calculations. These stocks are often coastal and could be assessed at the national or local level. However, centralised and homogenous parameters (such as FMSY and F) are not readily available.
Discards are not included in the considerations; the data used as input data is landings data, not catch data. There is no consideration of potential value of discarded fraction of the stock and other species since such data is not available.
The indicator by itself does not take into account any considerations on the health of ecosystems and a number of additional indicators would need to be considered in the context of implementing an ‘ecosystem approach’ to fisheries management (EAFM). The indicator is based on economic considerations and for example does not consider vulnerable species, the impact of the fleet segments on habitats in general and the harvest of sensitive habitats in particular, as well as the selectivity (i.e. which part -in term of age classes- of the stock is being exploited) of individual fleet segments.
The EWG discussed the possibility that the indicator gives a more pessimistic picture with regards to the economic dependence of fleet segments on overexploited stocks than is actually the case. The reason is that in the ICES area stock assessments are in many cases
37 37
carried out for important species that are shared between several countries and subject to TACs. The indicator could thus be interpreted as being in line with the application as a precautionary approach.
Data Constraints:
The 2012 DCF fishing fleet economic data call lacked information for: - Fleet segments containing less that 10 vessels due to confidentiality problems.
- Landing values for the Spanish fleet (all years). Data from previous datacalls were not
referred to since the EWG was aware that Spain recently revised all landings data
submitted to ICES for previous years.
- Landing values for French fleet (2008)
- Information for Greece (since 2008)
Since there is no equivalent of the ICES stock summary database for the Mediterranean and long distance fleets from EU MS operating offshore, the STECF review of advice report for 2012 was the source for information on current F estimates and stock reference points for fleets operating in these areas. This report was based on information available in October 2011. As a result estimates of current F and target references point are in some instances out of date. This was in particular a concern for stocks assessed by FAO-GFCM due to the time delay between the stock assessment working group and the final adoption of assessments by the GFCM scientific advisory committee (SAC).
In order to facilitate the calculation of the indicators for the Mediterranean and Black Sea and for the long distance fleets from EU MS operating offshore, a creation of free access databases with the historical results of the assessments carried out is advisable. The ICES database structure could be used to merge both databases.
There were instances where stock assessments and management plans were available but where actual values for the target reference point FMSY were not available. In these cases the indicator could not be calculated. One possible reason for such cases is that for some species reference points based on biomass are more appropriate (e.g. sandeel). In such cases the indicator should be calculated in terms of B* (B* is the weighted average of the normalized B* for the same stocks; B* = 1 if Bcur = SSB = Bpa), however this process was too time consuming to complete during the EWG meeting. This could mean for instance, that some important Danish fleet segments could have no value for this indicator if the value of their landings of all stocks for which an estimate of F* was available was lower than 40% of their total landings value. All fleetsegments landing, for instance, a lot of sandeels,are likely to have no value for this indicator.
Overall the lack of stock assessments for a significant number of stocks, whatever their commercial value, makes it difficult to include biological considerations when assessing balance between fishing capacity and fishing opportunities. Increasing the number of stocks for which stock assessments are available should be an urgent priority.
Economic Indicators
Two economic balance indicators were considered by the EWG: Rate of Return on Fixed Tangible Assets (RoFTA) and Current revenue break-even revenue ration (CR/BER).
Rate of Return on Fixed Tangible Assets (RoFTA)
The Guidelines for an improved analysis of the balance between fishing capacity and fishing opportunities, version 2, June 2012, proposes the use of RoI (Return on Investment), which is defined as the net profit (profit after capital stock depreciation) of the fleet divided by total capital asset value of the fleet, as one of economical indicators of balance and fleet sustainability.
The RoI should be calculated in the following way:
RoI = (Net profit + opportunity cost of capital) / Capital asset value
38 38
The value of capital asset usually defined as sum of tangible and intangible capital. In the case of commercial fishing, intangible assets are fishing rights if they are spread within the sector, attributed to the enterprises and valued.
As data on intangible assets were not available for all MS, the Return on Fixed Tangible Assets (RoFTA) was calculated as an approximation of RoI.
The calculation of RoFTA uses exactly the same calculation method but without including the value of fishing rights. Net profit in the calculation of RoFTA excludes direct subsidies.
RoFTA was compared with the risk free return on investment (usually long terms Government loans). For the analysis, the risk free interest rate (theoretical rate of return of an investment with no risk of financial loss), was used as a target reference point (TRP).
The risk-free rate represents the interest that an investor would expect from an absolutely risk-free investment over a given period of time (in practice, access to the risk free rates are not common). Since the risk free rate can be obtained with no risk, it is implied that any additional financial risk taken by an investor should be rewarded with an interest rate higher than the risk-free rate. In a risky business such as fishing, one would expect the rate of return to be higher than the risk free rate.
When RoFTA is lower than the TRP, investment elsewhere could be more profitable and it would be inefficient from the investor’s perspective to invest in that particular fleet segment (over-capitalisation).
When RoFTA is greater than the TRP, high rates of return reflect the generation of rent by the harvest of the fish stock.
The annual risk-free interest rates used as the target reference point differ for each MS and are based on the monthly average interest rates for long-term government bonds issued by each MS, contained in the European Central Bank data base, see table 8.2.
There are three reference points, important for the analysis, identified as:
RoFTA> interest rate – the fleet is making profits that are higher than risk free investments (in
that MS) indicating that the fleet is economically sustainable:
0 <RoFTA< interest rate – indicates that the sector is profitable; however the opportunity
costs of using the capital (in that MS) are higher than the actual return on investment.
RoFTA<0 – indicating that the fleet is making losses and is not operating in an economically
sustainable manner.
RoFTA greater than zero but lower than the reference point (return received from investing capital value elsewhere i.e. low risk long term government bonds) suggest that normal returns are being generated. Results greater than the reference point suggest that extraordinary profits (that is profits above the opportunity costs) are being generated, also known as resource rent. If access is not restricted to stocks that allow vessels to generate positive resource rent, owners would be attracted to direct additional fishing effort to that stock. RoFTA below zero suggests negative returns and indicatespossible economic over-capitalisation.
Current revenue as a proportion of break-even revenue ratio (CR/BER)
The ratio between the current revenue and the break-even revenue (CR/BER) can indicate either the short term profitability of a fleet segment or can indicate the extent of over or under capitalisation within a fleet segment, depending on the length of time series available and also whether capital costs are included in the calculation. If there is a time series of at least 3 years and capital costs are included in the calculations, then results can provide an indication of the extent of over or under capitalisation.
The Break-even revenue is calculated as follows:

39 39
BER = (Fixed Costs) / (1- [Variable costs / Current Revenue])
where:
Variable costs = Crew costs + Unpaid labour + Energy costs + Repair and Maintenance costs + other variable costs
and, Fixed costs =Non variable costs + depreciation + opportunity cost of capital
The ratio is calculated by dividing the Current revenue by the BER:
Ratio = Current Revenue (CR) / BER
If the ratio is greater than 1, enough revenue is generated to cover fixed and capital costs, indicating that the segment is economically viable.
Conversely, if the ratio is above 0 but less than 1, insufficient income is generated to cover fixed and capital costs, indicating that the segment is economically unviable.
If Variable costs exceed Current Revenue, the Break-even Revenue figure will be calculated as a negative value, which reflects that the business is making an operating loss,generating revenues lower than the operating costs. This is a situation that cannot be sustained beyond the short term and means that the activity of the business is being subsidised from shareholders’ funds. In these cases, we present the letter OL instead of the indicator value to denote that on average the segment made an Operating Loss during that reference year.
6.3 MS tables of indicator values:
This section presents the indicator values for the selected fleet segments, by MS, where data is available. For each indicator there are brief interpretive comments relating to the trend over the 3 year period, the sustainability of the situation and the availability or reliability of data.
Additionally, for most MS the table includesthe number and proportion of inactive vessels in each length category where possible, or by national fleet. For two MS there is no data available to calculate the number and proportion of inactive vessels per length category or for the national fleet.
Comments in tables
For economic indicators, a comment of “sustainable” means that if that level of return or that proportion of revenues continues, then the businesses can continue to operate without subsidy from shareholders or public funds.This assumes that the fishing opportunity remains sustainable.
A business may continue to operate unprofitably for many years if subsidised by the owners or shareholders (by using up the capital invested or retained profits and thus eroding the shareholder value of the business). In the fishing industry this can happen if the owner/operator sees no other good option for household income in the meantime and hopes that the situation will improve soon, so the owner continues to operate unprofitably in the hope that his crew and customers will still be there when the situation is resolved by improvements in externally determined factors e.g. higher fish sales prices, higher quotas or lower fuel prices.
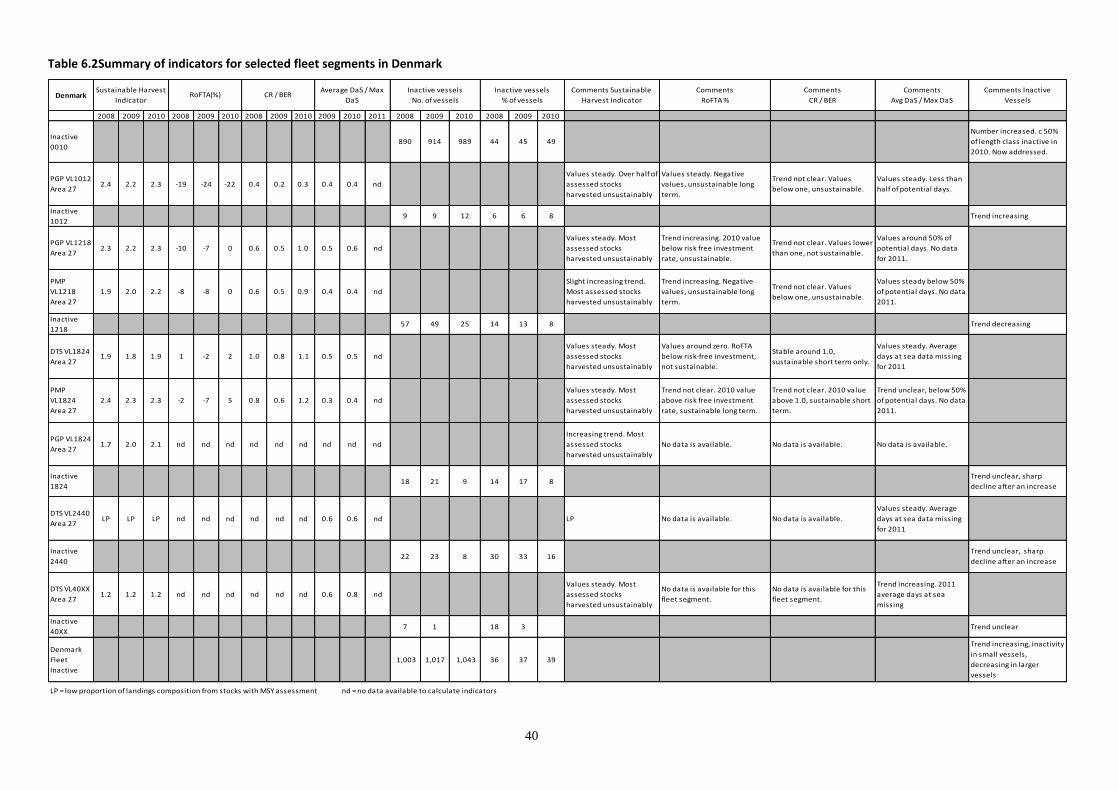
40 40
Table 6.2Summary of indicators for selected fleet segments in Denmark
DenmarkComments Sustainable
Harvest Indicator
Comments
RoFTA %
Comments
CR / BER
Comments
Avg DaS / Max DaS
Comments Inactive
Vessels
2008 2009 2010 2008 2009 2010 2008 2009 2010 2009 2010 2011 2008 2009 2010 2008 2009 2010
Inactive
0010890 914 989 44 45 49
Number increased. c 50%
of length class inactive in
2010. Now addressed.
PGP VL1012
Area 272.4 2.2 2.3 -19 -24 -22 0.4 0.2 0.3 0.4 0.4 nd
Values steady. Over half of
assessed stocks
harvested unsustainably
Values steady. Negative
values, unsustainable long
term.
Trend not clear. Values
below one, unsustainable.
Values steady. Less than
half of potential days.
Inactive
10129 9 12 6 6 8 Trend increasing
PGP VL1218
Area 272.3 2.2 2.3 -10 -7 0 0.6 0.5 1.0 0.5 0.6 nd
Values steady. Most
assessed stocks
harvested unsustainably
Trend increasing. 2010 value
below risk free investment
rate, unsustainable.
Trend not clear. Values lower
than one, not sustainable.
Values around 50% of
potential days. No data
for 2011.
PMP
VL1218
Area 27
1.9 2.0 2.2 -8 -8 0 0.6 0.5 0.9 0.4 0.4 nd
Slight increasing trend.
Most assessed stocks
harvested unsustainably
Trend increasing. Negative
values, unsustainable long
term.
Trend not clear. Values
below one, unsustainable.
Values steady below 50%
of potential days. No data
2011.
Inactive
121857 49 25 14 13 8 Trend decreasing
DTS VL1824
Area 271.9 1.8 1.9 1 -2 2 1.0 0.8 1.1 0.5 0.5 nd
Values steady. Most
assessed stocks
harvested unsustainably
Values around zero. RoFTA
below risk-free investment,
not sustainable.
Stable around 1.0,
sustainable short term only.
Values steady. Average
days at sea data missing
for 2011
PMP
VL1824
Area 27
2.4 2.3 2.3 -2 -7 5 0.8 0.6 1.2 0.3 0.4 nd
Values steady. Most
assessed stocks
harvested unsustainably
Trend not clear. 2010 value
above risk free investment
rate, sustainable long term.
Trend not clear. 2010 value
above 1.0, sustainable short
term.
Trend unclear, below 50%
of potential days. No data
2011.
PGP VL1824
Area 271.7 2.0 2.1 nd nd nd nd nd nd nd nd nd
Increasing trend. Most
assessed stocks
harvested unsustainably
No data is available. No data is available. No data is available.
Inactive
182418 21 9 14 17 8
Trend unclear, sharp
decline after an increase
DTS VL2440
Area 27LP LP LP nd nd nd nd nd nd 0.6 0.6 nd LP No data is available. No data is available.
Values steady. Average
days at sea data missing
for 2011
Inactive
244022 23 8 30 33 16
Trend unclear, sharp
decline after an increase
DTS VL40XX
Area 271.2 1.2 1.2 nd nd nd nd nd nd 0.6 0.8 nd
Values steady. Most
assessed stocks
harvested unsustainably
No data is available for this
fleet segment.
No data is available for this
fleet segment.
Trend increasing. 2011
average days at sea
missing
Inactive
40XX7 1 18 3 Trend unclear
Denmark
Fleet
Inactive
1,003 1,017 1,043 36 37 39
Trend increasing, inactivity
in small vessels,
decreasing in larger
vessels
LP = low proportion of landings composition from stocks with MSY assessment nd = no data available to calculate indicators
Sustainable Harvest
IndicatorRoFTA(%) CR / BER
Inactive vessels
% of vessels
Inactive vessels
No. of vessels
Average DaS / Max
DaS
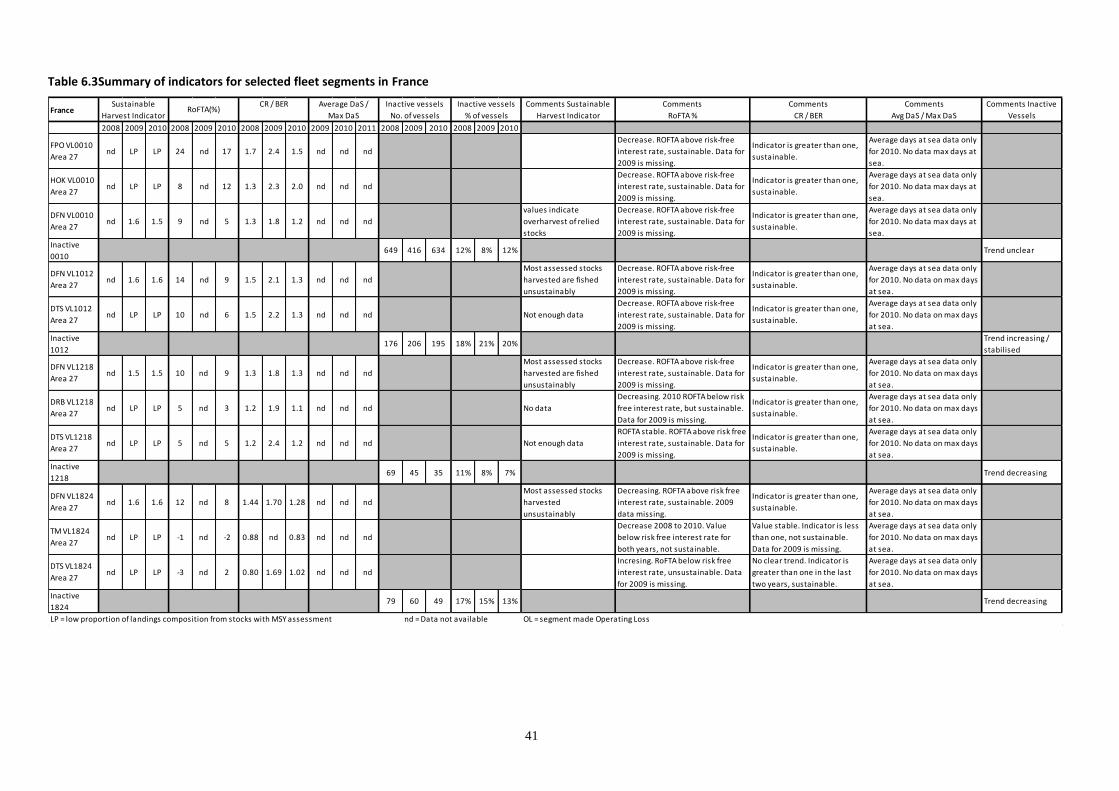
41 41
Table 6.3Summary of indicators for selected fleet segments in France
FranceComments Sustainable
Harvest Indicator
Comments
RoFTA %
Comments
CR / BER
Comments
Avg DaS / Max DaS
Comments Inactive
Vessels
2008 2009 2010 2008 2009 2010 2008 2009 2010 2009 2010 2011 2008 2009 2010 2008 2009 2010
FPO VL0010
Area 27nd LP LP 24 nd 17 1.7 2.4 1.5 nd nd nd
Decrease. ROFTA above risk-free
interest rate, sustainable. Data for
2009 is missing.
Indicator is greater than one,
sustainable.
Average days at sea data only
for 2010. No data max days at
sea.
HOK VL0010
Area 27nd LP LP 8 nd 12 1.3 2.3 2.0 nd nd nd
Decrease. ROFTA above risk-free
interest rate, sustainable. Data for
2009 is missing.
Indicator is greater than one,
sustainable.
Average days at sea data only
for 2010. No data max days at
sea.
DFN VL0010
Area 27nd 1.6 1.5 9 nd 5 1.3 1.8 1.2 nd nd nd
values indicate
overharvest of relied
stocks
Decrease. ROFTA above risk-free
interest rate, sustainable. Data for
2009 is missing.
Indicator is greater than one,
sustainable.
Average days at sea data only
for 2010. No data max days at
sea.
Inactive
0010649 416 634 12% 8% 12% Trend unclear
DFN VL1012
Area 27nd 1.6 1.6 14 nd 9 1.5 2.1 1.3 nd nd nd
Most assessed stocks
harvested are fished
unsustainably
Decrease. ROFTA above risk-free
interest rate, sustainable. Data for
2009 is missing.
Indicator is greater than one,
sustainable.
Average days at sea data only
for 2010. No data on max days
at sea.
DTS VL1012
Area 27nd LP LP 10 nd 6 1.5 2.2 1.3 nd nd nd Not enough data
Decrease. ROFTA above risk-free
interest rate, sustainable. Data for
2009 is missing.
Indicator is greater than one,
sustainable.
Average days at sea data only
for 2010. No data on max days
at sea.
Inactive
1012176 206 195 18% 21% 20%
Trend increasing /
stabilised
DFN VL1218
Area 27nd 1.5 1.5 10 nd 9 1.3 1.8 1.3 nd nd nd
Most assessed stocks
harvested are fished
unsustainably
Decrease. ROFTA above risk-free
interest rate, sustainable. Data for
2009 is missing.
Indicator is greater than one,
sustainable.
Average days at sea data only
for 2010. No data on max days
at sea.
DRB VL1218
Area 27nd LP LP 5 nd 3 1.2 1.9 1.1 nd nd nd No data
Decreasing. 2010 ROFTA below risk
free interest rate, but sustainable.
Data for 2009 is missing.
Indicator is greater than one,
sustainable.
Average days at sea data only
for 2010. No data on max days
at sea.
DTS VL1218
Area 27nd LP LP 5 nd 5 1.2 2.4 1.2 nd nd nd Not enough data
ROFTA stable. ROFTA above risk free
interest rate, sustainable. Data for
2009 is missing.
Indicator is greater than one,
sustainable.
Average days at sea data only
for 2010. No data on max days
at sea.
Inactive
121869 45 35 11% 8% 7% Trend decreasing
DFN VL1824
Area 27nd 1.6 1.6 12 nd 8 1.44 1.70 1.28 nd nd nd
Most assessed stocks
harvested
unsustainably
Decreasing. ROFTA above risk free
interest rate, sustainable. 2009
data missing.
Indicator is greater than one,
sustainable.
Average days at sea data only
for 2010. No data on max days
at sea.
TM VL1824
Area 27nd LP LP -1 nd -2 0.88 nd 0.83 nd nd nd
Decrease 2008 to 2010. Value
below risk free interest rate for
both years, not sustainable.
Value stable. Indicator is less
than one, not sustainable.
Data for 2009 is missing.
Average days at sea data only
for 2010. No data on max days
at sea.
DTS VL1824
Area 27nd LP LP -3 nd 2 0.80 1.69 1.02 nd nd nd
Incresing. RoFTA below risk free
interest rate, unsustainable. Data
for 2009 is missing.
No clear trend. Indicator is
greater than one in the last
two years, sustainable.
Average days at sea data only
for 2010. No data on max days
at sea.
Inactive
182479 60 49 17% 15% 13% Trend decreasing
LP = low proportion of landings composition from stocks with MSY assessment nd = Data not available OL = segment made Operating Loss
Inactive vessels
% of vessels
Sustainable
Harvest IndicatorRoFTA(%)
CR / BER Average DaS /
Max DaS
Inactive vessels
No. of vessels

42 42
Table 6.4 Continued. Summary of indicators for selected fleet segments in France
FranceComments Sustainable
Harvest Indicator
Comments
RoFTA %
Comments
CR / BER
Comments
Avg DaS / Max DaS
Comments Inactive
Vessels
2008 2009 2010 2008 2009 2010 2008 2009 2010 2009 2010 2011 2008 2009 2010 2008 2009 2010
DFN VL2440
Area 27nd 1.6 1.6 36 nd 12 2.0 nd 1.4 nd nd nd
Most assessed stocks
harvested
unsustainably
Decreasing. ROFTA above risk free
interest rate, sustainable. 2009
data missing.
Indicator is greater than one,
sustainable. Data for 2009 is
missing.
Average days at sea available
only for 2010. No data on
maximum days at sea.
DTS VL2440
Area 27nd LP LP -3 nd -4 0.8 1.2 0.8 nd nd nd Not enough data
Decrease. ROFTA below risk free
interest rate, unsustainable. Data
for 2009 missing.
No clear trend. Indicator
below 1.0 on average, not
sustainable.
Average days at sea available
only for 2010. No data on
maximum days at sea.
HOK VL2440
Area 27nd 1.6 1.7 2 nd nd 1.0 nd 20.5 nd 0.7 nd
All assessed stocks
harvested
unsustainably. Missing
data 2008
2008 below risk free investment
rate, unsustainable. 2009, 2010
data missing.
Trend not clear. Values above
1.0, sustainable.
Above 50% of potential days.
Data not available for 2009
and 2011.
MGP VL2440
Area 27nd 1.7 1.8 nd nd -3 nd nd 0.8 nd 1.2 nd
Increasing. Over half
assessed stocks
harvested
unsustainably. Missing
data 2008
2010 negative, unsustainablethe
long term. 2008, 2009 no data
Trend not clear. Value below
1.0, not sustainable.
Inadequate reference level.
Data not available for 2009
and 2011.
Inactive
244017 22 21 8% 11% 12%
Trend: increasing /
stabilised
DTS VL40XX
Area 27nd LP LP -8 nd -6 0.1 0.9 0.2 nd nd nd Not enough data
Decreasing. ROFTA below risk free
interest rate, not sustainable. 2009
data missing.
No clear trend. Indicator is
less than one, not sustainable.
Average days at sea available
only for 2010. No data on
maximum days at sea.
TM VL40XX
Area 27nd 1 0.8 nd nd 1 nd nd 1.0 nd nd nd
Relied on herring
harvested at Fmsy, but
other 4 stocks
overharvested.
Data for 2008 and 2009 missing.
2010 ROFTA below risk free interest
rate, unsustainable.
2010 indicator below one, not
sustainable. Data for 2008 and
2009 missing.
Average days at sea available
only for 2010. No data max
days at sea.
PS VL40XX
OFRnd nd nd nd nd -4 nd OL 0.4 nd nd nd
Not possible to assess
No data for this fleet
segment
Data for 2008 and 2009 missing.
2010 ROFTA below risk free interest
rate, unsustainable.
No clear trend. Indicator is
less than one, not sustainable.
2008 data missing.
Average days at sea available
only for 2010. No data on
maximum days at sea.
Inactive 40XX 2 5 9 4% 10% 18% Trend: increasing
FRA Inactive
fleet998 905 1,174 13% 12% 16%
Trend increasing; no
DCF data, EU fleet
register used to
estimate; big
increase in 40m+
length group
LP = low proportion of landings composition from stocks with MSY assessment nd = Data not available OL = segment made Operating Loss
Inactive vessels
% of vessels
Sustainable
Harvest IndicatorRoFTA(%)
CR / BER Average DaS /
Max DaS
Inactive vessels
No. of vessels
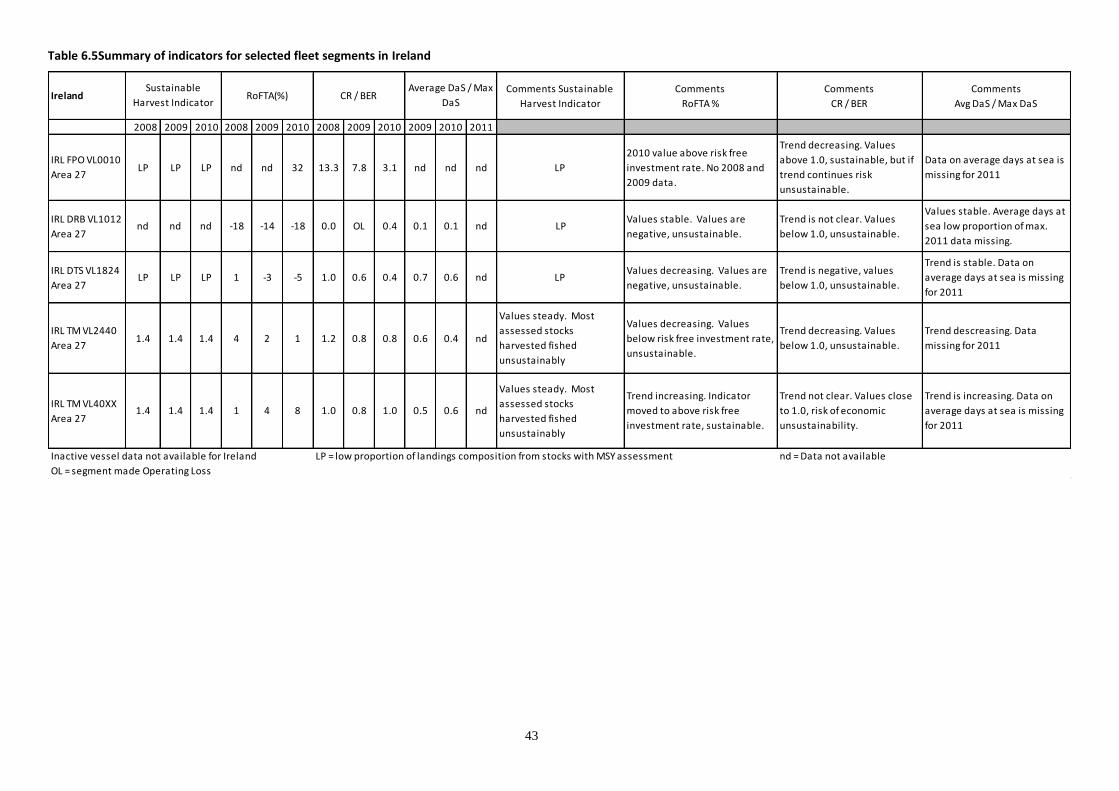
43 43
Table 6.5Summary of indicators for selected fleet segments in Ireland
IrelandComments Sustainable
Harvest Indicator
Comments
RoFTA %
Comments
CR / BER
Comments
Avg DaS / Max DaS
2008 2009 2010 2008 2009 2010 2008 2009 2010 2009 2010 2011
IRL FPO VL0010
Area 27LP LP LP nd nd 32 13.3 7.8 3.1 nd nd nd LP
2010 value above risk free
investment rate. No 2008 and
2009 data.
Trend decreasing. Values
above 1.0, sustainable, but if
trend continues risk
unsustainable.
Data on average days at sea is
missing for 2011
IRL DRB VL1012
Area 27nd nd nd -18 -14 -18 0.0 OL 0.4 0.1 0.1 nd LP
Values stable. Values are
negative, unsustainable.
Trend is not clear. Values
below 1.0, unsustainable.
Values stable. Average days at
sea low proportion of max.
2011 data missing.
IRL DTS VL1824
Area 27LP LP LP 1 -3 -5 1.0 0.6 0.4 0.7 0.6 nd LP
Values decreasing. Values are
negative, unsustainable.
Trend is negative, values
below 1.0, unsustainable.
Trend is stable. Data on
average days at sea is missing
for 2011
IRL TM VL2440
Area 271.4 1.4 1.4 4 2 1 1.2 0.8 0.8 0.6 0.4 nd
Values steady. Most
assessed stocks
harvested fished
unsustainably
Values decreasing. Values
below risk free investment rate,
unsustainable.
Trend decreasing. Values
below 1.0, unsustainable.
Trend descreasing. Data
missing for 2011
IRL TM VL40XX
Area 271.4 1.4 1.4 1 4 8 1.0 0.8 1.0 0.5 0.6 nd
Values steady. Most
assessed stocks
harvested fished
unsustainably
Trend increasing. Indicator
moved to above risk free
investment rate, sustainable.
Trend not clear. Values close
to 1.0, risk of economic
unsustainability.
Trend is increasing. Data on
average days at sea is missing
for 2011
Inactive vessel data not available for Ireland LP = low proportion of landings composition from stocks with MSY assessment nd = Data not available
OL = segment made Operating Loss
Sustainable
Harvest IndicatorRoFTA(%) CR / BER
Average DaS / Max
DaS

44 44
Table 6.6Summary of indicators for selected fleet segments in Italy
ItalyComments Sustainable
Harvest Indicator
Comments
RoFTA %
Comments
CR / BER
Comments
Avg DaS / Max DaS
Comments
Inactive Vessels
2008 2009 2010 2008 2009 2010 2008 2009 2010 2009 2010 2011 2009 2010 2011 2009 2010 2011
Inactive 0006 359 389 273 11 12 9 Decreasing trend
PGP VL0612
Area 37LP LP LP 36 41 26 2.0 2.0 1.7 nd nd nd
Most assessed stocks
fished unsustainably
Trend not clear. Values above risk free
investment rate, sustainable. Small
vessels, low capital value, even low
profit amounts give good RoFTA.
Trend not clear. Values above
1.0 sustainable.
Inactive 0612 862 885 824 12 13 12Stable proportion
inactive
DTS VL1218
Area 37LP LP LP 26 51 40 1.8 2.4 2.2 nd nd nd
Most assessed stocks
fished unsustainably
Trend not clear. Values above risk free
investment rate, sustainable. Small
vessels, low capital value, even low
profit amounts give good RoFTA.
Values stable. Values above
one, sustainable
DRB VL1218
Area 37nd nd nd 34 35 30 2.2 2.0 1.9 nd nd nd
Most assessed stocks
fished unsustainably
Stable, above risk free investment
rate. Sustainable long term.
Indicator decreasing. Values
above one, sustainable.
Inactive 1218 338 330 255 10 10 8 Decreasing trend
DTS VL1824
Area 37LP LP LP 5 14 6 1.1 1.3 1.1 nd nd nd
Most assessed stocks
fished unsustainably
Trend not clear. ROFTA above risk free
rate, sustainable long term.
Stable values. Values above
1.0, sustainable.
TBB VL1824
Area 274.5 4.6 4.6 nd nd nd nd nd nd 0.5 0.4 nd
Values steady. All assessed
stocks harvested
unsustainably
No data available. No data available.
Trend decreasing.
Average was below half
of potential days. No
data 2011.
Inactive 1824 37 45 42 4 5 4 Stable situation
DTS VL2440
Area 37LP LP LP -8 -6 -9 0.6 0.7 0.6 nd nd nd
Most assessed stocks are
fished unsustainably
Stable, ROFTA below risk free interest
rate, not sustainable long term.
Stable. Value below 1.0
unsustainable beyond short
term.
TBB VL2440
Area 374.5 4.6 4.6 -1 17 3 0.9 1.5 1.0 0.4 0.4 nd
Values steady. All
assessed stocks harvested
unsustainably
Trend not clear. Value below risk free
investment rate, unsustainable.
Trend not clear. Values above
1.0, sustainable.
Trend decreasing.
Average was below half
of potential days. No
data 2011.
Inactive 2440 7 12 2 2 3 0 Decreasing trend
Inactive 40XX nd 24 nd nd 60 nd Includes tuna fleet
Italy fleet
inactive1,603 1,685 1,396 11 11 9 Decreasing trend
LP = low proportion of landings composition from stocks with MSY assessment nd = Data not available
Inactive vessels
% of vessels
Sustainable
Harvest IndicatorRoFTA(%) CR / BER
Average DaS / Max
DaS
Inactive vessels
No. of vessels
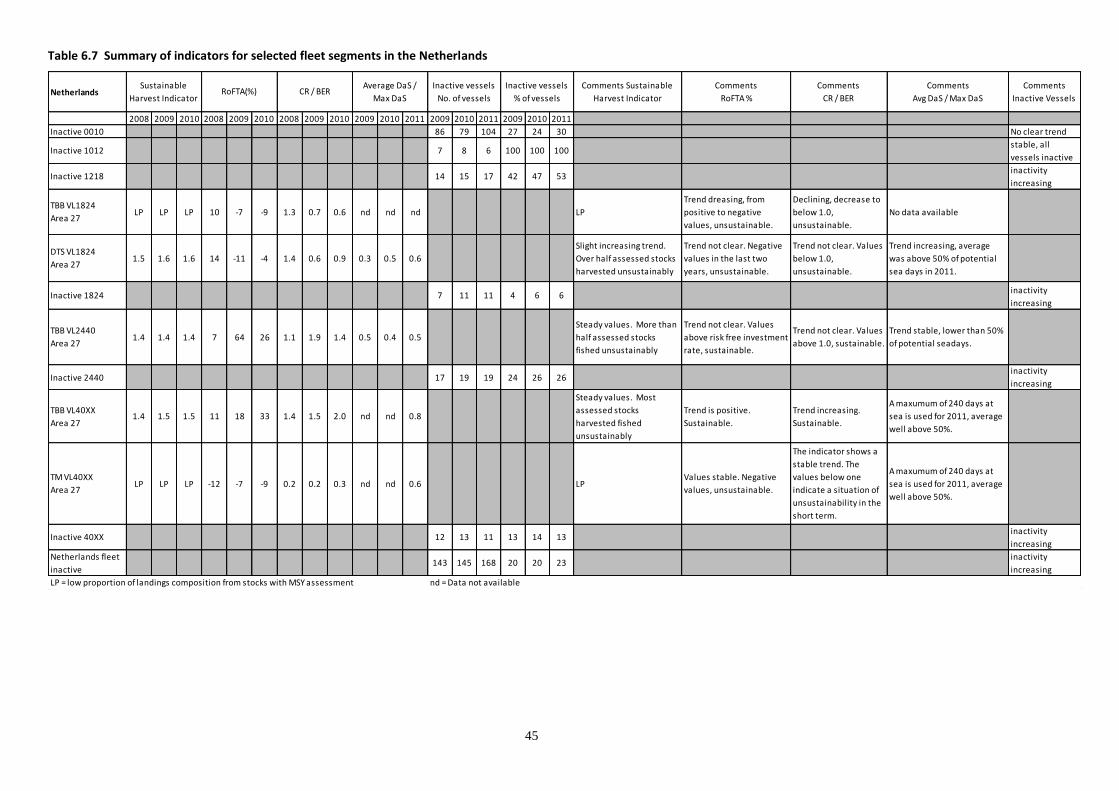
45 45
Table 6.7 Summary of indicators for selected fleet segments in the Netherlands
NetherlandsComments Sustainable
Harvest Indicator
Comments
RoFTA %
Comments
CR / BER
Comments
Avg DaS / Max DaS
Comments
Inactive Vessels
2008 2009 2010 2008 2009 2010 2008 2009 2010 2009 2010 2011 2009 2010 2011 2009 2010 2011
Inactive 0010 86 79 104 27 24 30 No clear trend
Inactive 1012 7 8 6 100 100 100stable, all
vessels inactive
Inactive 1218 14 15 17 42 47 53inactivity
increasing
TBB VL1824
Area 27LP LP LP 10 -7 -9 1.3 0.7 0.6 nd nd nd LP
Trend dreasing, from
positive to negative
values, unsustainable.
Declining, decrease to
below 1.0,
unsustainable.
No data available
DTS VL1824
Area 271.5 1.6 1.6 14 -11 -4 1.4 0.6 0.9 0.3 0.5 0.6
Slight increasing trend.
Over half assessed stocks
harvested unsustainably
Trend not clear. Negative
values in the last two
years, unsustainable.
Trend not clear. Values
below 1.0,
unsustainable.
Trend increasing, average
was above 50% of potential
sea days in 2011.
Inactive 1824 7 11 11 4 6 6inactivity
increasing
TBB VL2440
Area 271.4 1.4 1.4 7 64 26 1.1 1.9 1.4 0.5 0.4 0.5
Steady values. More than
half assessed stocks
fished unsustainably
Trend not clear. Values
above risk free investment
rate, sustainable.
Trend not clear. Values
above 1.0, sustainable.
Trend stable, lower than 50%
of potential seadays.
Inactive 2440 17 19 19 24 26 26inactivity
increasing
TBB VL40XX
Area 271.4 1.5 1.5 11 18 33 1.4 1.5 2.0 nd nd 0.8
Steady values. Most
assessed stocks
harvested fished
unsustainably
Trend is positive.
Sustainable.
Trend increasing.
Sustainable.
A maxumum of 240 days at
sea is used for 2011, average
well above 50%.
TM VL40XX
Area 27LP LP LP -12 -7 -9 0.2 0.2 0.3 nd nd 0.6 LP
Values stable. Negative
values, unsustainable.
The indicator shows a
stable trend. The
values below one
indicate a situation of
unsustainability in the
short term.
A maxumum of 240 days at
sea is used for 2011, average
well above 50%.
Inactive 40XX 12 13 11 13 14 13inactivity
increasing
Netherlands fleet
inactive143 145 168 20 20 23
inactivity
increasing
LP = low proportion of landings composition from stocks with MSY assessment nd = Data not available
Inactive vessels
No. of vessels
Inactive vessels
% of vessels
Sustainable
Harvest IndicatorRoFTA(%) CR / BER
Average DaS /
Max DaS

46 46
Table 6.8 Summary of indicators for selected fleet segments in Portugal
PortugalComments Sustainable
Harvest Indicator
Comments
RoFTA %
Comments
CR / BER
Comments
Avg DaS / Max DaSComments Inactive Vessels
2008 2009 2010 2008 2009 2010 2008 2009 2010 2009 2010 2011 2009 2010 2011 2009 2010 2011
PGP VL0010
Area 27LP LP LP 22 33 34 1.7 1.9 1.9 0.2 0.2 0.2
Most assessed stocks
fished unsustainably
Increasing trend. Values above risk
free investment rate, sustainable.
Increasing trend. Values
above risk free investment
rate, sustainable.
Values stable. Average
vessel use only 25% max
vessel use.
PMP VL0010
Area 27LP LP LP 46 37 -10 2.2 2.0 0.5 0.3 0.5 0.2
Most assessed stocks
fished unsustainably
Trend declining. 2010 has negative
value, unsustainable.
Trend declining. 2010 value
below 1.0, unsustainable.
No clear trend. Average
vessel use less than 50%
maximum use.
Inactive 0010 3,267 3,299 3,390 43% 44% 45%Increasing gradually; almost
half the length class inactive
DFN VL1218
Area 27LP LP LP 28 8 16 1.9 1.1 1.3 0.5 0.5 0.6
Most assessed stocks
fished unsustainably
No clear trend. Values above risk
free investment rate, sustainable.
No clear trend. Values above
1.0, sustainable.
Values stable. Average
vessel use c.50% of max.
FPO VL1218
Area 27LP LP LP 59 nd 32 3.0 nd 1.8 nd 0.5 0.5
Most assessed stocks
fished unsustainably
Declining trend. Values above risk
free investment rate, sustainable.
Declining trend. Values
above 1.0, sustainable.Not enough data
Inactive 1012 46 56 54 15% 18% 17%Stable, less than 20%
inactive
Inactive 1218 69 77 100 16% 28% 23%No clear trend, nearly 1/4
inactive
HOK VL1824
Area 27LP LP LP 37 3 24 2.3 0.9 1.7 nd nd nd
Most assessed stocks
fished unsustainably
Trend not clear. Values above risk
free investment rate, sustainable.
Trend not clear. Value above
1.0, sustainable.
Data not reliable as value
was above 1.0.
PS VL1824
Area 27LP LP LP 31 4 85 2.1 1.0 2.6 0.6 0.6 0.5
Most assessed stocks
fished unsustainably
Trend not clear, variations
believable? Values above risk free
investment rate, sustainable.
Trend not clear, variations
not likely? Values above 1.0,
sustainable.
Values stable. Average
vessel use c.half potential
days.
Inactive 1824 39 36 35 23% 27% 20%Decreasing, low proportion
inactive
PMP VL2440
Area 27nd nd nd 3 16 17 1.0 1.4 1.4 0.3 0.3 nd no data
Trend not clear. Values above risk
free investment rate, sustainable.
Trend not clear. Values
above 1.0, sustainable.
Values stable average
vessel use low.
DTS VL2440
Area 27LP LP LP -6 4 3 0.8 1.0 1.0 0.6 0.9 0.9
Most assessed stocks
fished unsustainably
Trend not clear. Improvement last
2 years, but values below risk free
investment rate. Unsustainable.
Trend positive. Improvement
from < 1.0 to 1.0. Sustainable
short term.
Trend is increasing.
DTS VL2440
OFRnd nd nd -12 nd 22 0.5 nd 1.6 nd nd nd
Not possible to assess.
MS did not provide data
Values increasing. 2010 value
above risk free investment rate,
sustainable.
Trend increasing. Value
above 1.0, sustainable.No data available.
HOK VL2440
Area 27LP LP LP -20 nd 1 0.3 nd 0.9 nd nd nd
Most assessed stocks
fished unsustainably
Trend increasing. Values below
risk free investment rate,
unsustainable.
Trend increasing. Values
below 1.0, unsustainable.No data available.
HOK VL2440
OFRnd nd nd 1 nd 9 1.0 nd 1.2 nd nd nd
Not possible to assess.
MS did not provide data
Values increasing. 2010 above risk
free investment rate, sustainable.
Trend increasing. Value
above 1.0, sustainable.
Data is not reliable as
value is above one.
PS VL2440
Area 27LP LP LP 35 16 153 2.1 1.3 3.8 0.6 0.6 0.6
Most assessed stocks
fished unsustainably
No clear trend. Values above risk
free investment rate, sustainable.
Trend not clear. Values
above 1.0, sustainable. 2010
data questionable.
Values stable. Average
use only half of max use.
Inactive 2440 38 38 33 19% 25% 18% Low inactivity
DTS VL40XX
Area 27nd nd nd -20 1 22 0.3 0.9 1.4 0.8 0.7 0.8 Values increasing. Sustainable.
Trend increasing. Value
above 1.0, sustainable. Values stable.
Inactive 40XX 7 6 10 37% 32% 36%Over one third of the length
class inactive
Portugal fleet
inactive3,466 3,512 3,622 40% 41% 42%
High proportion inactive in
national fleet, more in small
and large length classes
LP = low proportion of landings composition from stocks with MSY assessment nd = Data not available or not reliable
Inactive vessels
% of vessels
Sustainable
Harvest IndicatorRoFTA(%) CR / BER
Average DaS /
Max DaS
Inactive vessels
No. of vessels

47 47
Table 6.9 Summary of indicators for selected fleet segments in Spain
Spain
Comments
Sustainable Harvest
Indicator
Comments
RoFTA %
Comments
CR / BER
Comments
Avg DaS / Max DaS
2008 2009 2010 2008 2009 2010 2008 2009 2010 2009 2010 2011
PMP VL0010
Area 27nd nd nd nd nd nd 0.04 1.10 OL nd nd nd Operating loss, not sustainable
DTS VL1824
Area 37nd nd nd nd nd nd OL 0.6 0.5 nd nd nd well below 1.0, not sustainable
DTS VL2440
Area 27nd nd nd nd nd nd 0.1 0.5 0.9 nd nd nd below 1.0, not sustainable
HOK VL2440
OFRnd nd nd nd nd nd OL 0.6 1.0 nd nd nd below 1.0, not sustainable
DTS VL2440
OFRnd nd nd nd nd nd 0.1 OL OL nd nd nd Operating loss, not sustainable
PS VL2440
Area 27nd nd nd nd nd nd 0.1 0.2 3.1 nd nd nd 2010 value above 1.0, sustainable
DTS VL40XX
Area 27nd nd nd nd nd nd 1.1 0.8 1.7 nd nd nd 2010 value above 1.0, sustainable
PS VL40XX
OFRnd nd nd nd nd nd 1.1 OL 1.2 nd nd nd 2010 value above 1.0, sustainable
DTS VL40XX
OFRnd nd nd nd nd nd 0.2 1.0 1.2 nd nd nd 2010 value above 1.0, sustainable
HOK VL40XX
OFRnd nd nd nd nd nd 0.3 0.8 0.6 nd nd nd below 1.0, not sustainable
Inactive vessel data not available for Spain nd = data for indicator not provided by MS OL = segment made Operating Loss
Sustainable Harvest
IndicatorRoFTA(%)
CR / BER Average DaS / Max DaS
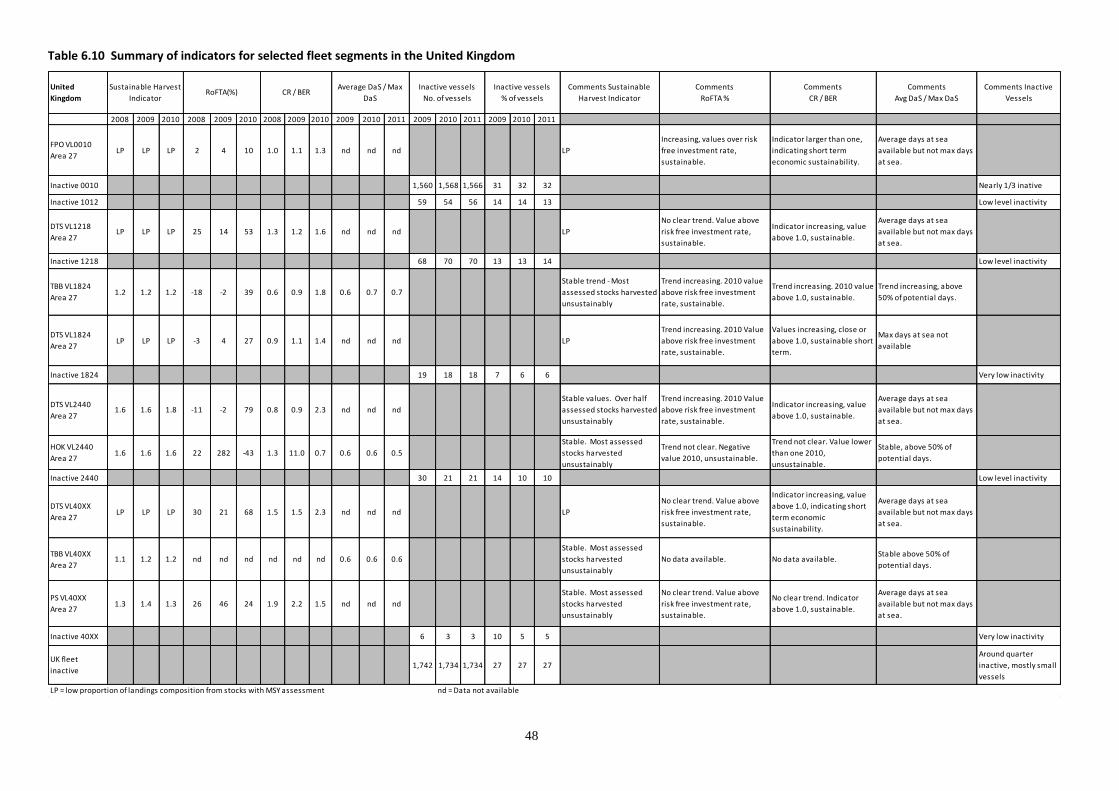
48 48
Table 6.10 Summary of indicators for selected fleet segments in the United Kingdom
United
Kingdom
Comments Sustainable
Harvest Indicator
Comments
RoFTA %
Comments
CR / BER
Comments
Avg DaS / Max DaS
Comments Inactive
Vessels
2008 2009 2010 2008 2009 2010 2008 2009 2010 2009 2010 2011 2009 2010 2011 2009 2010 2011
FPO VL0010
Area 27LP LP LP 2 4 10 1.0 1.1 1.3 nd nd nd LP
Increasing, values over risk
free investment rate,
sustainable.
Indicator larger than one,
indicating short term
economic sustainability.
Average days at sea
available but not max days
at sea.
Inactive 0010 1,560 1,568 1,566 31 32 32 Nearly 1/3 inative
Inactive 1012 59 54 56 14 14 13 Low level inactivity
DTS VL1218
Area 27LP LP LP 25 14 53 1.3 1.2 1.6 nd nd nd LP
No clear trend. Value above
risk free investment rate,
sustainable.
Indicator increasing, value
above 1.0, sustainable.
Average days at sea
available but not max days
at sea.
Inactive 1218 68 70 70 13 13 14 Low level inactivity
TBB VL1824
Area 271.2 1.2 1.2 -18 -2 39 0.6 0.9 1.8 0.6 0.7 0.7
Stable trend - Most
assessed stocks harvested
unsustainably
Trend increasing. 2010 value
above risk free investment
rate, sustainable.
Trend increasing. 2010 value
above 1.0, sustainable.
Trend increasing, above
50% of potential days.
DTS VL1824
Area 27LP LP LP -3 4 27 0.9 1.1 1.4 nd nd nd LP
Trend increasing. 2010 Value
above risk free investment
rate, sustainable.
Values increasing, close or
above 1.0, sustainable short
term.
Max days at sea not
available
Inactive 1824 19 18 18 7 6 6 Very low inactivity
DTS VL2440
Area 271.6 1.6 1.8 -11 -2 79 0.8 0.9 2.3 nd nd nd
Stable values. Over half
assessed stocks harvested
unsustainably
Trend increasing. 2010 Value
above risk free investment
rate, sustainable.
Indicator increasing, value
above 1.0, sustainable.
Average days at sea
available but not max days
at sea.
HOK VL2440
Area 271.6 1.6 1.6 22 282 -43 1.3 11.0 0.7 0.6 0.6 0.5
Stable. Most assessed
stocks harvested
unsustainably
Trend not clear. Negative
value 2010, unsustainable.
Trend not clear. Value lower
than one 2010,
unsustainable.
Stable, above 50% of
potential days.
Inactive 2440 30 21 21 14 10 10 Low level inactivity
DTS VL40XX
Area 27LP LP LP 30 21 68 1.5 1.5 2.3 nd nd nd LP
No clear trend. Value above
risk free investment rate,
sustainable.
Indicator increasing, value
above 1.0, indicating short
term economic
sustainability.
Average days at sea
available but not max days
at sea.
TBB VL40XX
Area 271.1 1.2 1.2 nd nd nd nd nd nd 0.6 0.6 0.6
Stable. Most assessed
stocks harvested
unsustainably
No data available. No data available.Stable above 50% of
potential days.
PS VL40XX
Area 271.3 1.4 1.3 26 46 24 1.9 2.2 1.5 nd nd nd
Stable. Most assessed
stocks harvested
unsustainably
No clear trend. Value above
risk free investment rate,
sustainable.
No clear trend. Indicator
above 1.0, sustainable.
Average days at sea
available but not max days
at sea.
Inactive 40XX 6 3 3 10 5 5 Very low inactivity
UK fleet
inactive1,742 1,734 1,734 27 27 27
Around quarter
inactive, mostly small
vessels
LP = low proportion of landings composition from stocks with MSY assessment nd = Data not available
Inactive vessels
% of vessels
Sustainable Harvest
IndicatorRoFTA(%) CR / BER
Average DaS / Max
DaS
Inactive vessels
No. of vessels
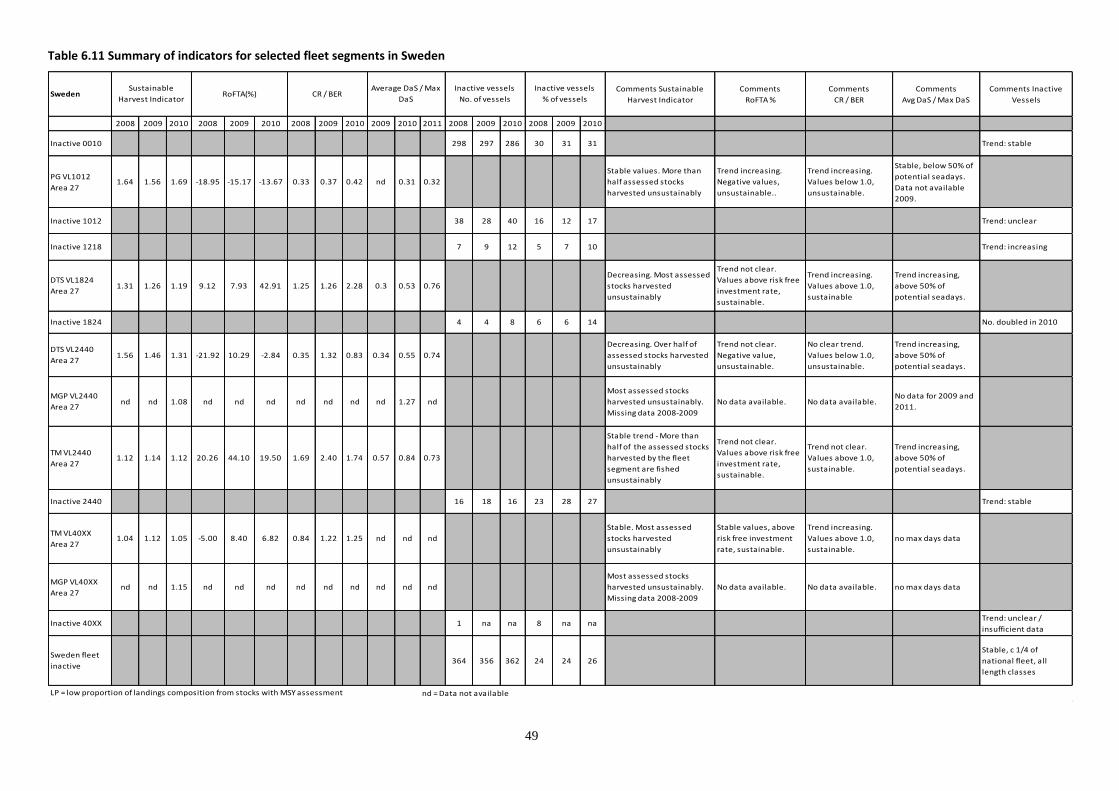
49 49
Table 6.11 Summary of indicators for selected fleet segments in Sweden
SwedenComments Sustainable
Harvest Indicator
Comments
RoFTA %
Comments
CR / BER
Comments
Avg DaS / Max DaS
Comments Inactive
Vessels
2008 2009 2010 2008 2009 2010 2008 2009 2010 2009 2010 2011 2008 2009 2010 2008 2009 2010
Inactive 0010 298 297 286 30 31 31 Trend: stable
PG VL1012
Area 271.64 1.56 1.69 -18.95 -15.17 -13.67 0.33 0.37 0.42 nd 0.31 0.32
Stable values. More than
half assessed stocks
harvested unsustainably
Trend increasing.
Negative values,
unsustainable..
Trend increasing.
Values below 1.0,
unsustainable.
Stable, below 50% of
potential seadays.
Data not available
2009.
Inactive 1012 38 28 40 16 12 17 Trend: unclear
Inactive 1218 7 9 12 5 7 10 Trend: increasing
DTS VL1824
Area 271.31 1.26 1.19 9.12 7.93 42.91 1.25 1.26 2.28 0.3 0.53 0.76
Decreasing. Most assessed
stocks harvested
unsustainably
Trend not clear.
Values above risk free
investment rate,
sustainable.
Trend increasing.
Values above 1.0,
sustainable
Trend increasing,
above 50% of
potential seadays.
Inactive 1824 4 4 8 6 6 14 No. doubled in 2010
DTS VL2440
Area 271.56 1.46 1.31 -21.92 10.29 -2.84 0.35 1.32 0.83 0.34 0.55 0.74
Decreasing. Over half of
assessed stocks harvested
unsustainably
Trend not clear.
Negative value,
unsustainable.
No clear trend.
Values below 1.0,
unsustainable.
Trend increasing,
above 50% of
potential seadays.
MGP VL2440
Area 27nd nd 1.08 nd nd nd nd nd nd nd 1.27 nd
Most assessed stocks
harvested unsustainably.
Missing data 2008-2009
No data available. No data available.No data for 2009 and
2011.
TM VL2440
Area 271.12 1.14 1.12 20.26 44.10 19.50 1.69 2.40 1.74 0.57 0.84 0.73
Stable trend - More than
half of the assessed stocks
harvested by the fleet
segment are fished
unsustainably
Trend not clear.
Values above risk free
investment rate,
sustainable.
Trend not clear.
Values above 1.0,
sustainable.
Trend increasing,
above 50% of
potential seadays.
Inactive 2440 16 18 16 23 28 27 Trend: stable
TM VL40XX
Area 271.04 1.12 1.05 -5.00 8.40 6.82 0.84 1.22 1.25 nd nd nd
Stable. Most assessed
stocks harvested
unsustainably
Stable values, above
risk free investment
rate, sustainable.
Trend increasing.
Values above 1.0,
sustainable.
no max days data
MGP VL40XX
Area 27nd nd 1.15 nd nd nd nd nd nd nd nd nd
Most assessed stocks
harvested unsustainably.
Missing data 2008-2009
No data available. No data available. no max days data
Inactive 40XX 1 na na 8 na naTrend: unclear /
insufficient data
Sweden fleet
inactive364 356 362 24 24 26
Stable, c 1/4 of
national fleet, all
length classes
nd = Data not available LP = low proportion of landings composition from stocks with MSY assessment
Sustainable
Harvest Indicator
Inactive vessels
% of vessels
Inactive vessels
No. of vessels
Average DaS / Max
DaSCR / BER RoFTA(%)
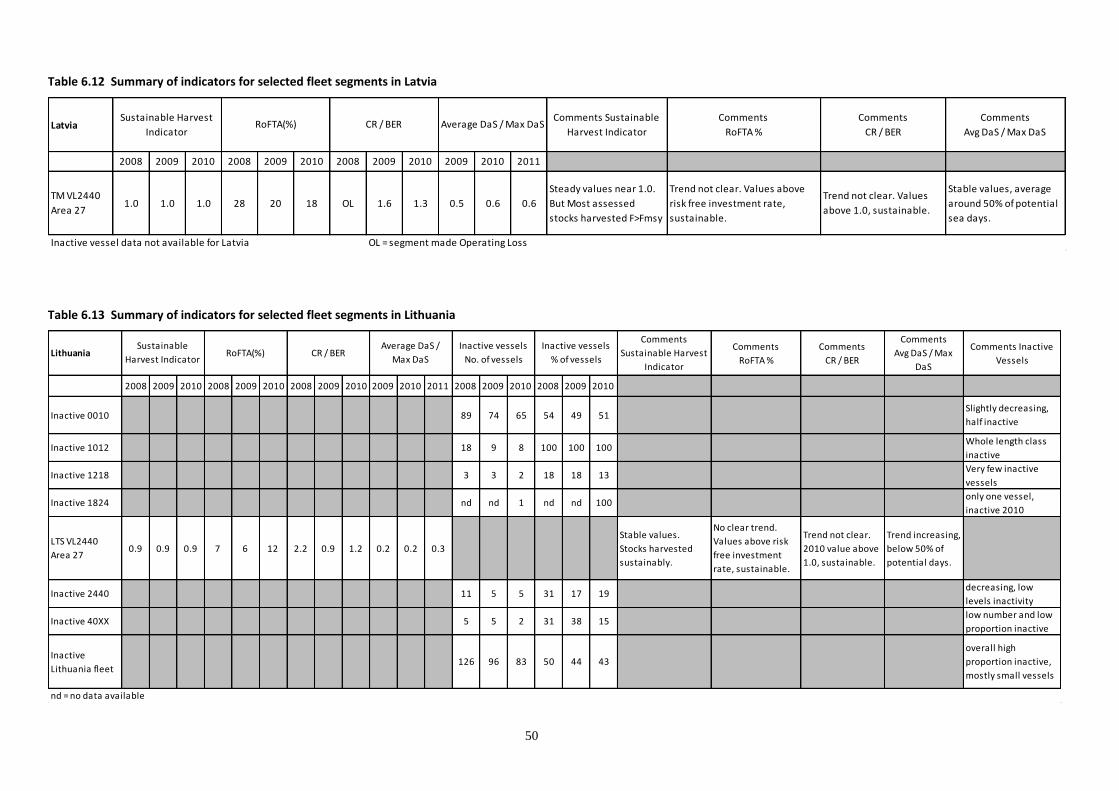
50 50
Table 6.12 Summary of indicators for selected fleet segments in Latvia
LatviaComments Sustainable
Harvest Indicator
Comments
RoFTA %
Comments
CR / BER
Comments
Avg DaS / Max DaS
2008 2009 2010 2008 2009 2010 2008 2009 2010 2009 2010 2011
TM VL2440
Area 271.0 1.0 1.0 28 20 18 OL 1.6 1.3 0.5 0.6 0.6
Steady values near 1.0.
But Most assessed
stocks harvested F>Fmsy
Trend not clear. Values above
risk free investment rate,
sustainable.
Trend not clear. Values
above 1.0, sustainable.
Stable values, average
around 50% of potential
sea days.
Inactive vessel data not available for Latvia OL = segment made Operating Loss
Sustainable Harvest
IndicatorRoFTA(%) CR / BER Average DaS / Max DaS
Table 6.13 Summary of indicators for selected fleet segments in Lithuania
Lithuania
Comments
Sustainable Harvest
Indicator
Comments
RoFTA %
Comments
CR / BER
Comments
Avg DaS / Max
DaS
Comments Inactive
Vessels
2008 2009 2010 2008 2009 2010 2008 2009 2010 2009 2010 2011 2008 2009 2010 2008 2009 2010
Inactive 0010 89 74 65 54 49 51Slightly decreasing,
half inactive
Inactive 1012 18 9 8 100 100 100Whole length class
inactive
Inactive 1218 3 3 2 18 18 13Very few inactive
vessels
Inactive 1824 nd nd 1 nd nd 100only one vessel,
inactive 2010
LTS VL2440
Area 270.9 0.9 0.9 7 6 12 2.2 0.9 1.2 0.2 0.2 0.3
Stable values.
Stocks harvested
sustainably.
No clear trend.
Values above risk
free investment
rate, sustainable.
Trend not clear.
2010 value above
1.0, sustainable.
Trend increasing,
below 50% of
potential days.
Inactive 2440 11 5 5 31 17 19decreasing, low
levels inactivity
Inactive 40XX 5 5 2 31 38 15low number and low
proportion inactive
Inactive
Lithuania fleet126 96 83 50 44 43
overall high
proportion inactive,
mostly small vessels
nd = no data available
CR / BER Average DaS /
Max DaS
Inactive vessels
No. of vessels
Inactive vessels
% of vessels
Sustainable
Harvest IndicatorRoFTA(%)
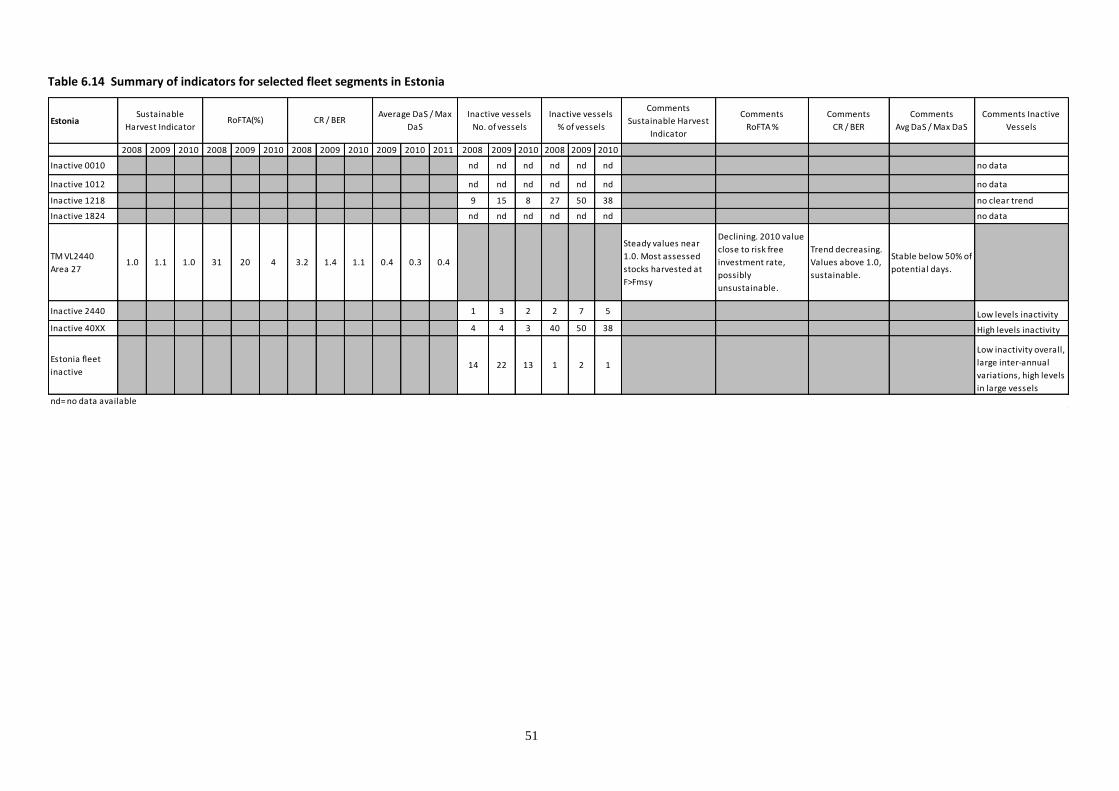
51 51
Table 6.14 Summary of indicators for selected fleet segments in Estonia
Estonia
Comments
Sustainable Harvest
Indicator
Comments
RoFTA %
Comments
CR / BER
Comments
Avg DaS / Max DaS
Comments Inactive
Vessels
2008 2009 2010 2008 2009 2010 2008 2009 2010 2009 2010 2011 2008 2009 2010 2008 2009 2010
Inactive 0010 nd nd nd nd nd nd no data
Inactive 1012 nd nd nd nd nd nd no data
Inactive 1218 9 15 8 27 50 38 no clear trend
Inactive 1824 nd nd nd nd nd nd no data
TM VL2440
Area 271.0 1.1 1.0 31 20 4 3.2 1.4 1.1 0.4 0.3 0.4
Steady values near
1.0. Most assessed
stocks harvested at
F>Fmsy
Declining. 2010 value
close to risk free
investment rate,
possibly
unsustainable.
Trend decreasing.
Values above 1.0,
sustainable.
Stable below 50% of
potential days.
Inactive 2440 1 3 2 2 7 5 Low levels inactivity
Inactive 40XX 4 4 3 40 50 38 High levels inactivity
Estonia fleet
inactive14 22 13 1 2 1
Low inactivity overall,
large inter-annual
variations, high levels
in large vessels
nd= no data available
Inactive vessels
% of vessels
Sustainable
Harvest IndicatorRoFTA(%) CR / BER
Average DaS / Max
DaS
Inactive vessels
No. of vessels

52 52
Table 6.15 Summary of indicators for selected fleet segments in Germany
GermanyComments Sustainable
Harvest Indicator
Comments
RoFTA %
Comments
CR / BER
Comments
Avg DaS / Max DaSComments Inactive Vessels
2008 2009 2010 2008 2009 2010 2008 2009 2010 2009 2010 2011 2008 2009 2010 2008 2009 2010
PG VL0010
Area 272.0 1.8 2.0 32 3 15 2.5 1.0 1.5 0.2 0.2 0.2
Stable values - Most assessed
stocks harvested
unsustainably
Trend not clear. Values above
risk free investment rate,
sustainable.
Trend not clear. Values
above 1.0, sustainable.
Stable values. Average is
below half of potential days.
Inactive 0010 485 468 458 35% 35% 35%Stable values, around 1/3
incative
Inactive 1012 7 8 8 7% 8% 8% Stable, very low inactivity
DTS VL1218
Area 272.2 1.9 2.0 4 -4 14 1.1 0.7 1.4 0.3 0.3 0.3
Stable values.Over half
assessed stocks harvested
unsustainably
Trend not clear. 2010 value
above risk free investment
rate, sustainable.
Trend not clear. 2010 value
above 1.0, sustainable.
Stable values. Average below
half of potential days.
Inactive 1218 11 12 19 5% 6% 9% Trend increasing, low
inactivity
DTS VL1824
Area 271.8 1.6 1.6 28 2 21 2.1 0.9 1.9 0.4 0.4 0.4
Stable values - Most assessed
stocks harvested
unsustainably
Trend not clear. 2010 value
above risk free investment
rate, sustainable.
Trend not clear. 2010 value
above 1.0, sustainable.
Stable values. Average below
half of potential days.
Inactive 1824 4 6 5 4% 6% 5% Stable, very low inactivity
DTS VL2440
Area 271.8 1.9 2.1 -93 11 41 0.1 1.3 2.8 0.5 0.5 0.5
Slight increasing trend - Most
assessed stocks harvested
unsustainably
Trend increasing. Values above
risk free investment rate,
sustainable.
Trend not clear. Values
above 1.0, sustainable.
Stable values. Average below
half of potential days.
TBB VL2440
Area 271.4 1.4 1.4 28 28 16 2.4 2.2 1.6 0.6 0.5 0.4
Stable values - Most assessed
stocks harvested
unsustainably
Trend declining. Values above
risk free investment rate,
sustainable.
Trend decreasing. Values
higher than one, sustainable
short term.
Decreasing values. Average
below half of potential days.
Inactive 2440 5 7 5 13% 16% 12% Unclear trend, low inactivity
Inactive 40XX 1 4 2 5% 22% 11%Unclear trend; low vessel
numbers in total.
Germany fleet
inactive513 505 497 27% 28% 28%
Overall stable, high levels,
mostly small scale group
Sustainable
Harvest IndicatorRoFTA(%) CR / BER
Inactive vessels
% of vessels
Average DaS / Max
DaS
Inactive vessels
No. of vessels
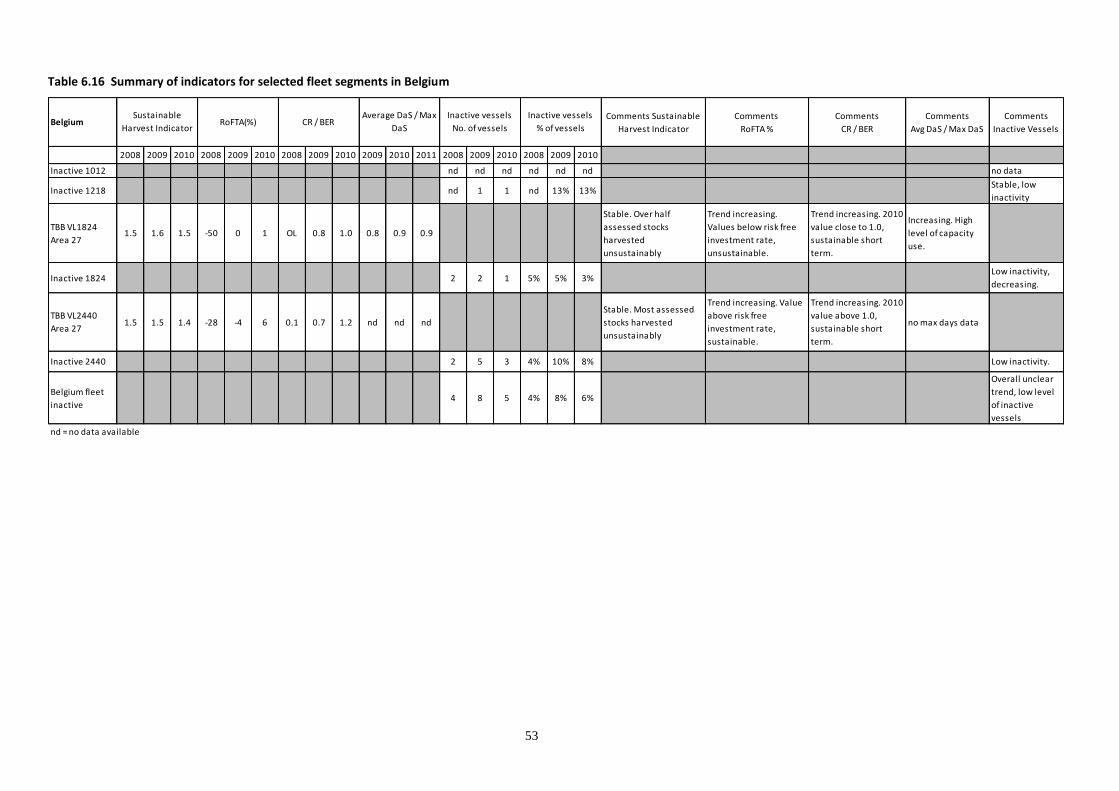
53 53
Table 6.16 Summary of indicators for selected fleet segments in Belgium
BelgiumComments Sustainable
Harvest Indicator
Comments
RoFTA %
Comments
CR / BER
Comments
Avg DaS / Max DaS
Comments
Inactive Vessels
2008 2009 2010 2008 2009 2010 2008 2009 2010 2009 2010 2011 2008 2009 2010 2008 2009 2010
Inactive 1012 nd nd nd nd nd nd no data
Inactive 1218 nd 1 1 nd 13% 13%Stable, low
inactivity
TBB VL1824
Area 271.5 1.6 1.5 -50 0 1 OL 0.8 1.0 0.8 0.9 0.9
Stable. Over half
assessed stocks
harvested
unsustainably
Trend increasing.
Values below risk free
investment rate,
unsustainable.
Trend increasing. 2010
value close to 1.0,
sustainable short
term.
Increasing. High
level of capacity
use.
Inactive 1824 2 2 1 5% 5% 3%Low inactivity,
decreasing.
TBB VL2440
Area 271.5 1.5 1.4 -28 -4 6 0.1 0.7 1.2 nd nd nd
Stable. Most assessed
stocks harvested
unsustainably
Trend increasing. Value
above risk free
investment rate,
sustainable.
Trend increasing. 2010
value above 1.0,
sustainable short
term.
no max days data
Inactive 2440 2 5 3 4% 10% 8% Low inactivity.
Belgium fleet
inactive4 8 5 4% 8% 6%
Overall unclear
trend, low level
of inactive
vessels
nd = no data available
CR / BER Average DaS / Max
DaS
Inactive vessels
No. of vessels
Inactive vessels
% of vessels
Sustainable
Harvest IndicatorRoFTA(%)

54 54
6.4 Evaluation of MS own assessments of balance
For each of the selected MS, we present a summary of their statements about balance in their national fleets, objectives for their fleet in terms of achieving or maintaining balance, means used to adjust fleet capacity and any explanations they have for their chosen strategies or their overall situation. We also highlight the consistency or discrepancy between indicators presented by MS and MS statements regarding balance. Belgium
MS Statements – balance, objectives, capacity adjustments
Belgium provided the following statement about balance: "Given the current stock situation and fleet structure, there seems to be almost balance between the fish stocks and the fleet size".
Additional relevant information from MS report
There is little unused capacity and there are few unused fishing opportunities. The use of the national quota for sole has indeed decreased, but this is not due to an imbalance in capacity but to the impact of the different stocks on management in these mixed fisheries.
Belgium is continuing to make efforts to steadily reduce capacity, inter alia by introducing the 'fishing entitlement factor' (vangstrechtfactor), whereby kWs can be exchanged for increased fishing opportunities.
Biological
The biological indicatorsFestimated/Ftargetare presented by the MS only for key stocks in 2010, not for fleet segments. Key stock AreaVII sole has a value of the indicator over 1.0 which implies the stock is over-exploited. Other stocks reported by the MS have valuesbelow 1.0.
Economic
Economic indicators for 2010 were negative, but are recovering to a more acceptable level.
Technical
The technical indicators are very similar and fairly stable; 2008 was clearly a crisis year after which the technical indicators returned more or less to their normal values.
MS explanations
Although in equilibrium, the balance between fishing opportunities and the Belgian fishing fleet is very fragile. Any sudden drastic changes in fisheries policy or management resulting in reduced fishing opportunities will seriously upset this balance immediately.
Consistency / discrepancy between indicators presented and statements of balance
Belgium’s assessment of balance is not completely supported by the data presented by the MS in the section of the economic and technical indicators.
The conclusions made by Belgium with regards to biological sustainability of their fleet are not robust, as most of the stocks fished by the fleet segments are not considered.
The MS statement on presence of a balance between fleet capacity and fishing opportunities is consistent with indicators presented for the two fleet segments, beam trawling 12-24 and 24-40. Other fleet segments are not included in the analysis.
Comparison between MS presented indicators and EWG calculated using DCF data
According to the indicator presented by the EWG,for all fleet segments assessed, most of the stocks in the landings composition are fished unsustainably, and, the majority of landings value of the Belgian fleet segments are also from stocks that have F>Fmsy.
55 55
The MS presentation of the biological indicator is incorrect as it is done by stock rather than by fleet segment. The overall picture presented by the MS does not look too bad because “only” one stock presented is at F>Fmsy. However, this is a major stock providing a large proportion of the value of landings of the fleet segments. Experts also expect that some other stocks landed by these segments, but not presented in the Belgian report, were also fished at F>Fmsy in 2010.
The fleet segmentation used by the MS does not completely match with DCF fleet segmentation.
Belgian fleet RoI results could not be directly compared with DCF data as the MS used RoI instead of RoFTA and different vessel length classes. DCF data on RoFTA and CR/BER suggests that there may be over-capitalisation for the beam trawl segments
As for the economic indicator, values estimated by EWG on RoFTA and CR/BER are negative for beam trawlers 24-40, TBB 12-18 and TBB 18-24. Similarly, the MS report shows negative values of RoI for beam trawler 12-24 and 24-40.
For the technical indicator, results by the EWG for vessels over 24m are very close to 1, indicating an efficient use of vessels (assuming that the maximum days at sea is an efficient operation). The value for beam trawlers 12-24, estimated as an average of TBB 12-18 and 18-24, is similar to that presented in the MS report (0.78).
Denmark
MS Statements – balance, objectives, capacity adjustments
Denmark provided a statement of balance for each fleet segment, with all segments assessed as either “approximately in balance” or “Capacity is somewhat in excess of opportunity”.
However, Denmark notes that when inactive vessels are included in the analysis there is overcapacity in segments of small vessels.
Denmark has an objective to reduce the number of inactive vessels remaining on the fleet register purely for the purpose of retaining fishing rights for the vessel owner to use on another vessel.
Additional relevant information from MS report
Biological
Denmark calculated only biological indicator 3, CPUE, for plaice, cod and Nephrops for segments with significant catches in the period 2005-2011.
For all areas combined, the general trend is an increase in CPUE for the three species.
Denmark concludes that in general the biological indicators are positive. However this should be treated with caution since data is limited, in particular biological data with clear reference to specific segments.
Economic
In many cases the economic indicators are negative, particularly for vessels under 12m. There appears to be some improvement for medium sized vessels between 12 and 24m.
Technical
Denmark concludes that making strong conclusions about presence of technical overcapacity is difficult because each fleet segment is not very homogeneous.
Based on Commission guidelines, technical overcapacity is present in all fleet segments in 2011.
MS explanations
If the technical indicators had been calculated using only commercial vessels, the ratios would have been higher, because the non-commercial vessels on average have a much lower level of activity.
56 56
The negative economic indicators for small vessels is partly explained by the fact that the segments presented in the economic analysis included passive [inactive] vessels and that it is likely that the active vessels of most segments would show better economic results.
With regards to inactive vessels Denmark explains that at the time of writing (April 2012) the Danish AgriFish Agency had just issued new rules regarding the concentration of transferable fishing rights (ITQs and VQSs). The old rules regarding concentration of transferable Vessel Quota Shares (VQSs) prohibited the concentration of fishing rights for more than 4 vessels, which had the effect that some vessel owners have more than 4 vessels, but only use 1 or 2 of these vessels for actual fishing. Through the fish pool system they can transfer their yearly amount of fish from their inactive vessels to their active vessels. The new rules removes the 4 vessel rule, and this is expected to have the effect of further reducing the size of the fleet, as there is no longer any incentive for the fisherman to have an inactive vessel in a fishing pool. When the new rules are implemented, fishermen can simply transfer the Transferable Vessel Quota Shares from the inactive vessels permanently to their active vessels, and they will no longer have any use for the inactive vessels.
Consistency / discrepancy between indicators presented and statements of balance
The conclusions on the economic indicators provided in the report reflect the data provided in the report for RoI and CR/BER.
Denmark’s assessment of balance is supported by the data presented by the MS in the section of the technical indicator. However the technical indicator was not included in the overall evaluation by the MS.
The proportion of inactive vessels in the national Danish fleet, is not taken into account in their overall assessment of balance.
The conclusions made by Denmark with regards to CPUE trends are supported by the data presented. However, CPUE trends are not presented for all fleet segments or species exploited by the Danish fleet. Moreover CPUE is a biological indicator of last resort and cannot be used to draw reliable conclusions, in particular given the short time series presented. Thus, overall the conclusions made by Denmark with regards to biological sustainability of their feet are not robust.
Comparison between MS presented indicators and EWG calculated using DCF data
The conclusions made by Denmark with regards to indicators trends are not supported by indicators calculated by EWG using DCF data, considering that most of the assessed stocks harvested by the fleet segments are fished unsustainably.
The fleet segmentation used by the MS does not completely match with DCF fleet segmentation.
Even though a different fleet segmentation is used by the MS compared to that of DCF and methodology is different (the MS estimated RoI instead of RoFTA), indicators from the two sources show similar results, indicating a negative economic situation for most of the Danish fleet segments both in terms of RoFTA (or RoI) and CR/BER.
Estonia
MS Statements – balance, objectives, capacity adjustments
Estonia provided the following statement about balance: "There is some overcapacity in the fleet, mainly in the segment: Baltic Sea trawling > 12 m".
Additional relevant information from MS report
Technical
The number of active fishing vessels in segment 4S1 has decreased from 48 in 2010 to 42 in 2011, the number of active vessels in segment 4S3 has not changed compared to 2010. The proportion of inactive vessels is below 20% both in terms of kW and GT.
57 57
Biological
The biological indicator (CPUE), calculated separately for the Baltic Sea trawling vessel segment (4S1) and the high seas fishery segment (4S3), based on data from 2007 to 2011, showed in both cases a decrease from 2010 to 2011.
Economic
Over the three-year period, the RoI has been rather stable in vessel group 10-12 metres of length, but has fluctuated in vessel group 12-18 metres of length.
MS explanations
From an ad-hoc study in 2008, and based on 2007 data for the different segments in the Estonian fishing fleet, on the basis of several indicators, including those suggested by the Commission (biological and technical indicators), the optimum fishing capacity of the segment 4S1 would be ca. 12 500 kW and 5000 GT. However, since this assessment of optimum capacity is based on the assumption that the fleet uses its full fishing capacity, and since this assumption may not be very realistic, the study concludes that the capacity of the 4S1 segment should not fall below ca. 14 400 kW and 5800 GT. According to the fleet register, capacity of the 4S1 segment at the end of 2011 was ca. 11 600 kW and 4 286 GT.
As regards the 4S3 segment, the minimum fishing capacity necessary to make use of all Estonia’s high seas fishing quotas (based on the same previous analysis) would be ca. 16 900 kW and 12 700 GT. At the end of 2011, the total capacity of active 4S3 fishing vessels was ca. 12 700 kW and 8300 GT.
Consistency / discrepancy between indicators presented and statements of balance
The conclusions made by Estonia with regards to CPUE trends are supported by the data presented. However, CPUE trends are not presented for all species exploited by the fleet. Moreover, CPUE is a biological indicator of last resort and cannot be used to draw reliable conclusions, in particular given the short time series presented. Thus overall the conclusions made by Estonia with regards to biological sustainability of their fleets are not robust.
There is insufficient information to evaluate if indicators presented by the MS support the statements on balance.
Comparison between MS presented indicators and EWG calculated using DCF data
The conclusions made by Estonia with regards to indicators trends are not supported by indicators calculated by EWG using DCF data, considering that most of the assessed stocks harvested by the fleet segment are fished unsustainably. Moreover, it was not possible to calculate the EWG indicator for the high seas fishery segment.
The fleet segmentation used by the MS does match with the DCF fleet segmentation. The indicators estimated by the EWG differ from those provided by the MS. This is mainly due to the different methodology adopted (RoI estimated by the MS and RoFTA by the EWG). As for the indicator CR/BER, this was not provided by the MS.
France
MS Statements – balance, objectives, capacity adjustments
France provided the following statement about the balance between fleet capacity and fishing opportunities: "Most French fisheries show a balance. The fleet of the outermost regions has reached its optimum level".
Plans aimed at fisheries categorised as sensitive for four fleets have resulted in limited withdrawal of vessels (one fishing for Bluefin tuna in the Med, 12 trawlers in the Mediterranean, 4 cod-fishing vessels and 42 vessels fishing eel and elver).
Additional relevant information from MS report
France used the Catch/quota ratio as a biological indicator, but STECF considers this an inappropriate indicator as it does not reflect overcapacity issues.

58 58
MS explanations
Medium- and long-term operational prospects are used as argumentsto prepare for changes in fishing opportunities.
France has requested experts to develop alternative indicators to the existing capacity guidelines for assessing the development of its fleet. An intermediate report was presented in December 2010 and is still under discussion at the national level. Pending these discussions, France applied one of these indicators in the report ('fishery activity indicator').
Consistency / discrepancy between indicators presented and statements of balance
Even though the group did not consider the Catch/quota ratio as a suitable biological indicator, there is a clear evidence that overcapacity exists in some of the French fleet segments (e.g. Deep-water shark).
The MS did not provide data for the economic and technical indicator. Therefore, no comment is possible on this point.
Comparison between MS presented indicators and EWG calculated using DCF data
According to the indicator presented by the group all fleet segments assessed,except for one, are relying on stocks fished unsustainably. Thus, there is a general disagreement between the results provided by the MS and the EWG. Moreover, it was not possible to calculate the EWG indicator for the high seas fishery segment.
The MS did not provide data for the economic and technical indicator. Therefore, it is not possible to make a comparison with the economic and technical indicators estimated by the EWG.
Germany
MS Statements – balance, objectives, capacity adjustments
Germany does not provide a clear statement about the overall situation of balance between fishing capacity and fishing opportunities. Germany just stated: "The German fleet has adapted both to the economic conditions and to the availability of resources. This is why, in the reporting period, there was no need for the State to intervene in the development of the fleet".
Additional relevant information from MS report
Germany provides capacity adjustment information for each fleet segment. Overall, the current capacity for three fleet segments out of eight is still appropriate in view of stock conditions.
Biological
Germany questions the utility of determining overcapacity solely on the basis of the current balance between fishing mortality and the scientific target (e.g. FMSY).
Economic
In Germany, the figures required to establish the economic and social indicators are, to a large extent, not accessible to the fisheries authorities of the Federal Government and the Länder for data protection reasons, or at best become available only 12 to 15 months after the end of the reporting period. Therefore such indicators would either not be calculated within the prescribed time limit or would be calculated only in incomplete form, thus providing an outdated description of the situation.
MS explanations
The German fishing fleet must retain sufficient overall capacity to be able to use the quotas allocated to Germany.
The determining factor for a fleet’s utilisation of capacity is not the fishing mortality, but how much it is allowed to catch for a given fishing mortality (TAC). It must be established whether there is general overcapacity if the majority of the stocks are actually being fished at the target level (usually fishing mortality at MSY-level).
59 59
Utility of the indicators required by the guidelines is questionable, and a substantial part of the necessary data, to the extent permissible under data protection rules, would have to be specially collected and processed by the fisheries authorities of the Länder, which is not feasible due to the considerable added administrative burden this would involve.
Data on EU catches (including discards) for each metier are not available when the fleet report for the year in question (in this case 2011) is being drawn up. Calculating indicators for previous years makes little sense, given that stock conditions tend to change rapidly. Germany intends to calculate the biological indicators when a majority of stocks are being fished at target level.
Consistency / discrepancy between indicators presented and statements of balance
Germany did not provide any indicators.
Comparison between MS presented indicators and EWG calculated using DCF data
Germany didnot provide any indicators.
Ireland
MS Statements – balance, objectives, capacity adjustments
Ireland states difficulties in assessing capacity in the report due to proposed fleet segments (DCF) not being able to capture specific diversity of the Irish fleet. Diversity is related to,among other things, relevant differentiated characteristics of smaller spatial divisions, specific targeted species and transboundary character of segments.
Objectives to reduce capacity in a focused way are stated. The statement from the MS does not regard objectives related to fishing opportunities (e.g. overexploited stocks).
The MS describes the beam trawl segment’s improved situation as an example of good results of two decommissioning schemes (2005-2006 and 2008).
Additional relevant information from MS report
Fleet segment definitions contain several metiers. Metiers operate across a broad geographic range (ICES VIa, VIb, VIIa, VIIe-k, IVa, IIa) and across management areas (VIa&VIIa), subject to activity restrictions. Each metier targets a cluster of different species and individual vessels operate across all ICES divisions.
The biological indicator shows overexploitation for several stocks: Cod VIa; Saithe IV & VI and IIIa; CodVIIe-k; HakeVI, VII, VIII; Nephrops (FU15)VIIa; mackerel Northeast Atlantic; Herring in the NE Atlantic I II.
The MS comments that cost efficiency of the decommissioning schemes was reviewed for the Whitefish Decommissioning Schemes. Ireland’s Value for Money Review (VMF) of the schemes was published in 2012.
Ireland may bring forward a further carefully targeted fleet restructuring initiative during the present Operational Programme to address the differences in capacity inside segments.
Ireland states the belief that the option of further future well targeted decommissioning should be retained in the European Maritime and Fisheries Fund.
MS explanations
Irish fleets are transboundary, e.g. between Irish Sea and Celtic Sea this distinction considered relevant and is not present in DCF segmentation, therefore e.g. maximum days at sea have a very wide spread in some segments as demersal trawlers. This is stated as a reason for economic and technical indicators not been calculated.
MS specify difficulties in calculating the biological indicators for segments because of their heterogeneous activity. For biological indicator B1, MS mentioned specifically problems of discards
60 60
estimation. MS required specific guidelines to better define fleet units. For stock lacking analytical assessment, MS mentioned a lake of biomass estimates for using B2, therefore they used B3.
Consistency / discrepancy between indicators presented and statements of balance
The MS makes no claim of balance or imbalance. However, the biological indicator 1, (ratio between estimated F and target F) shows values above 1 for Cod VIa; SaitheIV& VI and IIIa; CodVIIe-k; HakeVI, VII, VIII; Nephrops (FU15) Sole VIIa; NEA mackerel Northeast Atlantic; Herring in the NE Atlantic I II, providing evidence of unbalanced status between fishing capacity and fishing opportunities.
Comparison between MS presented indicators and EWG calculated using DCF data
The segmentation used for the economic indicators includes only three highly aggregated segments (Specific, Polyvalent Beam trawl and Refrigerated Sea Water Pelagic), the EWG indicators based on DCF data give a more detailed picture showing for example a low economic indicator in the long demersal vessels, with high use of capacity (technical indicator) and high economic indicators for pots with low use of capacity.
The MS presented indicators showing a 32% reduction in the number of inactive vessels in the beam trawler segment and 19% reduction in the gross tonnage of inactive vessels in the refrigerated sea water pelagic from 2010 to 2011. These reductions could not be calculated by experts at the EWG due to lack of DCF data.
Italy
MS Statements – balance, objectives, capacity adjustments
MS stated that: “Although the indicators for Italy show extreme variations by fishing segment and geographical area, an analysis has revealed a significant deterioration in the technical, economic and social indicators and a largely unchanged situation for the biological indicator”.
Balance between the fleets and available fishing opportunities deteriorated in 2010, particularly for the purse seiner and large-scale (LOA > 24 m) bottom trawler segments. By contrast, small-scale fishing, longliners and smaller-scale bottom trawlers showed a stable situation or a slight improvement.
The current scheme for reducing fishing effort is helping to achieve a better balance between the fishing effort and the available biological resources.
The further planned reduction in fishing capacity will lead to an additional reduction in fishing pressure. National management plans, which contain fleet decommissioning schemes, provide for annual monitoring to verify the implementation of the objectives identified and quantified for each fishing method and area.
To date effective reduction in the fishing fleet has taken place in line with national adjustment plans supported by permanent withdrawal measures within the scope of structural funds (EFF). Italy has planned to decommission 10% of the Italian fleet, representing 17.921 GT and 93.690 kW to be withdrawn.
Additional relevant information from MS report
Biological indicator
Catch per Unit effort was presented, but the other two proposed indicators, 'F' and 'H', cannot be calculated owing to the specific characteristics of fishing in the Mediterranean.
The Catch Per Unit of Effort recorded in 2010 was slightly lower than in the previous year as a result of a worrying (albeit slight) decrease recorded in bottom trawling, the segment that accounts for around 35% of Italian fish production, and a decrease of the Catch Per Unit of Effort for longliners.

61 61
Economic indicator
Most economic indicators are positive. Italy presents results for both economic balance indicators, however only the purse seine segments are directly comparable with results provided by JRC using DCF segmentation. The economic indicators present negative values for the bigger trawlers and seiners.
Technical indicator
The averages of the technical indicators for every fleet segment for 2009 and 2010 show overcapacity. There is a small decrease in the proportion of inactive vessels from 2010 to 2011.
Italy estimated the technical indicator as described in the guidelines, using average days at sea as a proportion of maximum observed days at sea by a vessel in each segment. Data on average days at sea per fleet segment is not available for 2011.
MS explanations
Indicators for Italy show extreme variations by fishing segment and geographical area. Further analysis has revealed a significant deterioration in the technical, economic and social indicators and a largely unchanged situation for the biological indicator.
The first biological indicators were not calculated because they are based, inter alia, on determining maximum quotas that may be fished for a given stock (total allowable catches (TACs).
The fishing effort of the bottom trawl fleet in North Adriatic was affected by the entry into force in 2010, of many of the restrictions provided for by Regulation (EC) No 1967/2006. In particular, the ban on bottom trawl fishing for sand smelt and cuttlefish within three nautical miles of the coast is having severe repercussions on the small-scale bottom trawl fleet in the northern Adriatic. Similarly, in a sector that is strongly characterised by non-industrial fishing and rather resistant to change, the need to replace nets has led to a reduction in activity both due to the delay entailed by obtaining the new nets and the technical difficulties involved in bringing them into line with the new rules.
High levels of returns on investment for a number of segments are due to low levels of investment.
Consistency / discrepancy between indicators presented and statements of balance
Italy provides biological, economical and technical indicators in its annual report but assessments of balance are not well supported by their own evidence.
The group noted that 2011 all biological indicators were not calculated. Moreover the use of the traffic light approach on year by year basis is completely misleading. For 2011 biological indicators were not calculated. The use of the traffic light approach on year by year basis is misleading. In the table of CPUE indicators, Italy presented trends of averages of CPUE in previous years. This method of multi-annual average CPUE is not appropriate and can present a misleading interpretation.
Italy should have enough information and data to calculate the first and the second biological indicators (e.g. assessments, catch and survey data), even if only a few species are under TAC.
Comparison between MS presented indicators and EWG calculated using DCF data
The 5 fleet segments analysed within the EWG were mostly fishing on stocks assessed to be overfished, the dredge 12-18m selected by the EWG criteria were not possible to evaluate due to the lack of stock assessment for the species targeted (molluscs).
It was not possible to evaluate the technical indicator, because the maximum theoretical days at sea is not provided by the MS.
The EWG consider the Italian national report contains results for both economic balance indicators, however only the purse seine segments are directly comparable with results provided by JRC using DCF segmentation. When compared those results are similar, with differences likely due to subtle changes in methodology.
62 62
The EWG notes Italy comments on high levels of returns for a number of segments due to low investment, and notes that the Italy report authors have colour coded some segments as yellow or red, even though these indicator results would be classed as green when calculated with DCF data.
Latvia
MS Statements – balance, objectives, capacity adjustments
The Latvian report mentions a ‘’small degree of overcapacity…”and concludes that “the existence of excess capacity of Latvian fishing fleet shows that further reduction can be applied in order to reach better balance between fishing capacity and fishing opportunities.”
Latvia did not provide any information on objectives for fleet segments. However, Latvia's efforts to address the identified over capacity in the fleet are reflected in the Latvian fishing capacity reduction scheme. According to this scheme, 216 vessels have been scrapped from the Baltic Sea fishing fleet, 44 without any national or EU financial support. This process should have a positive effect on the balance between the fishing fleet’s capacity and the fish resources allocated to Latvia.
Additional relevant information from MS report
The existence of excess capacity shows that further reduction can be applied in order to reach better balance. Latvia provides a good indicator presentation despite the fact that the technical and biological indicators do not cover all segments (no data for Coastal Fishing Fleet PGP VL 0012).
Technical indicators
The proportion of inactive vessels is only given for the fleet as a whole. The capacity utilisation indicator is given for the national fleet and for an addition three fleet segments.
Capacity utilisation indicators less than 0.7 suggest a small degree of overcapacity.
Biological indicators
Overall, the estimated F/Ft ratio values for different species and fleet segments in 2010, presented mainly “green” traffic light results for the Latvian fleet as a whole. Based on the set of biological indicators calculated for 2006-2010, MS concluded that the balance between fishing capacity and fish resources opportunities is quite sustainable and close to the level of desirable exploitation degree of fish resources for Latvian fishing fleet in the Baltic Sea proper and in the Gulf of Riga.
Economic indicators
According to the Latvian report, the ratio between current revenue and break-even revenue (CR/BER) indicates a profitable fishery in the short term period. For all fleet segments CR/BER indicator was greater than “1” for each analysed year. The current cash flow covers current costs in the short time period and it shows that the economic activity was sustainable for the three main segments.
According to the Latvian report, “Return on investment (RoI) shows investment profitability. The data on investments by fleet segments were received only for 2009 and 2010. RoI greater than or equal to zero shows positive return generated by the investment. Results greater than zero suggest that extraordinary profit are being generated and showing a sign of economic under – capitalisation. Positive values mean that it was profitable to invest the money in fishery.”
MS explanations
Under-utilisation of capacity in the Latvian fleet is mainly due to catch limitations, including historical distribution of catch limits among different fishing companies, which reflects to all the fleet segments. Hence, the low value of capacity utilisation indicator should not be considered as the result of structural imbalance of the Latvian fleet and the applied management scheme is working adequately in all segments.
63 63
Consistency / discrepancy between indicators presented and statements of balance
Overall, the balance indicators presented by Latvia are supported by their own evidence and are consistent with their statements of balance (’small degree of overcapacity”).
- Latvia stated that based on biological indicators the balance between fishing capacity and fish resources opportunities is quite sustainable and close to the level of desirable exploitation degree. These conclusions are based on the biological parameters of assessed stock taken from the Report of WGBFAS, ICES CM 2011\ACOM:10, and in fact most of the biological indicators estimated suggest that these stocks are being exploited sustainably.
- a small degree of technical overcapacity in the Latvian fleet (between 0.6 and 0.8)
- CR/BER > 1 for most of the fleet segments analysed.
However, inactive vessels were not reported or mentioned in the report and the balance indicators were not estimated for all fleet segments.
Comparison between MS presented indicators and EWG calculated using DCF data
The biological indicator estimated by the EWG, based on DCF data, has steady values over the period,with most of the assessed stocks being unsustainably harvested by the fleet segments. The EWG opinion does not coincide with Latvia’s statement on balance (according to TM VL2440).
EWG assessment is that Latvian Fishing fleet capacity is approximately in balance with the fishing opportunity. There is either little unused fishing opportunity despite of the fact that Latvia has reported no inactive vessels.
There appears to be unexplained differences between the economic indicators contained in the Latvian national report and the ones estimated based on DCF data. Latvia suggests that the fleet is performing well, with most of the fleet segments covered presenting positive RoI and CR/BER indicators. However, not only is Latvia misinterpreting the RoI indicator (i.e. greater or equal to zero does not necessarily imply investment profitability) but their results do not concur with the DCF estimated indicators of CR/BER, which suggest potential over-capacity for most of the fleet segments.
Lithuania
MS Statements – balance, objectives, capacity adjustments
To achieve a sustainable balance between fishing capacity and available resources, the Lithuanian fishing fleet must retain sufficient overall capacity to be able to use the quotas allocated to Lithuania.
Additional relevant information from MS report
The number of vessels in the Lithuanian fishing fleet fell by 20 (-11.7%) in 2011, tonnage decreased by 748.4 GT (-1.6%) and engine power increased by 38.4 kW (+0.07%). Most of the reductions took place in the <15m fleet segment. The capacity of the open Baltic Sea-segment, fishing for cod, flounder, herring and sprat, remained at a status quo. The engine power of the deep sea, pelagic fleet conducted in NAFO, NEAFC, SPRFMO, Mauritania, Morocco, Senegal, Guineaincreased by 346 kW. Allocated quotas under the Morocco/EU agreement were almost fully utilised. In Mauritanian waters there were no fixed quotas for Lithuania, fisheries in this zone was conducted on “Olympic principle”. Lithuania did not follow the suggested guidelines; no attempt was made to calculate any of the balance indicators.
MS explanations
Lithuania’s fishing fleet in the Baltic Sea was significantly reduced before the multiannual cod management plan for the Baltic came into force, therefore this plan did not have much impact on fleet reduction. The Lithuanian Fisheries Law is under the revision.
64 64
Consistency / discrepancy between indicators presented and statements of balance
Lithuania did not present any indicators.
Comparison between MS presented indicators and EWG calculated using DCF data
The Lithuanian demersal fleet segment examined by the EWG seemed to be economically dependent on a stock that was exploited sustainably in comparison with the reference points defined by the available stock assessment. However stock assessment data was available only for one of the species fished by the fleet segment.
Netherlands
MS Statements – balance, objectives, capacity adjustments
The Netherlands calculated a fleet utilisation rate of 60% (number of days actually used as a percentage of the number of days vessels are in theory able to use). The pelagic fleet operating in the ‘North’ (ICES areas) is fishing stocks in a reasonably good situation. However the fishing pressure is clearly too high for species being exploited by pelagic trawlers operating in the 'South'; in the Pacific Ocean and off the West coast of Africa in particular. The value of the biological indicator for the demersal sector shows a reliance on overexploited stocks, although in particular plaice stocks have improved in recent years.
Additional relevant information from MS report
The Netherlands report big differences in use of days, which shows that some vessels are only very rarely used; such vessels seem to be used more for 'parking' quota, which is then hired out to the owners of other vessels (this indicates that it would be possible to fish the available quota with fewer vessels). The pelagic fleet segment and the non-beam trawl segment of the demersal fleet had negative economic results and the economic indicators 'break-even revenue' and 'return on investment' both show a negative trend. The biological indicator shows the Netherlands is overfishing for sole, cod and mackerel. Where information was available to calculate an indicator for species fished in the Pacific Ocean and off the West coast of Africa, in particular off the coast of Mauretania, the biological indicator showed a clear situation of overfishing.
MS explanations
Apart from a few minor infringements the Dutch vessels have generally kept to the catch quota well, except for a few minor overruns. For the demersal sector the stock situation is improving, in particular for plaice. The demersal fleet segment had trouble with the high diesel price in 2010; the pelagic fleet had to contend with diminishing quotas, low fish prices and high diesel costs. The entry/exit regime is operating as it should and at no time was the actual capacity of the fleet greater than the permitted capacity.
Consistency / discrepancy between indicators presented and statements of balance
The indicators calculated by the Netherlands are consistent with the conclusions the MS draws. The MS report however lacks an overall assessment of balance taking into account technical, biological, economic (and social) factors; only a short conclusion is presented which discusses economic and biological indicators separately.
Comparison between MS presented indicators and EWG calculated using DCF data
Based on the EWG calculations all except one of the Netherland’s demersalfleet segments assessed were economically dependent on stocks that on average were overexploited in comparison with the reference points defined by stock assessments.
MS report fleet segmentation does not completely match the segmentation used by the DCF.
The MS report provides results for the economic indicator RoI (RoFTA is not calculated) and CR/BER. Results from the two sources are therefore difficult to compare. Results provided by EWG using DCF data show that values of both economic indicators for DTS 1824, TBB 1824 and TM 40XX are in the

65 65
red area of the Traffic Light method, suggesting possible over-capacity. However, the MS report shows positive values for beam trawlers.
Portugal
MS Statements – balance, objectives, capacity adjustments
The analysis of the results relating to the technical, economic, biological and social indicators shows that, with the exception of the social indicator for the trawling segment, there is a concentration of “green” results, indicating that the capacity of the Portuguese fleet, for the segments under review, is in balance with the available fishing opportunities. No specific objective of capacity reduction was provided by the Member State. Portugal however states that depending on the scientific assessments, the policy will continue with any necessary specific adjustments. With regard to the horse mackerel, blue whiting and bonito, Portugal stated that there is no overcapacity and no need for adjustment. In the case of hake and European pilchard, alternative measures for fleet reductions will be taken; measures are implemented to contain fishing effort and limit catches for pilchard. Portugal deems no fleet reduction measures are intended since good recruitment could lead to stock recovery.
Additional relevant information from MS report
The 'unlicensed' (inactive) fleet consists of 3.467 vessels (41.3% of the total fleet) with a total capacity of 16.717 GT (16.5%) and 59.192 kW (15.9%), specified per fleet segment. Significant measures of fleet reduction were carried out in the last years. In particular, in 2011, a reduction of 27% in the number of vessels included in the activity under the plan for recovery of the hake and Norway lobster and a 20% reduction of Portuguese vessels involved in Tuna fisheries were carried out. With the implementation of the various plans, from 2008/2009 (when fleet capacity adjustment plans entered into force) to 2011, a reduction of 4705 GT and 15995 kW was achieved. As a direct result of this reduction, the number of licences issued fell by about 230 sets of gear. In addition a fishing capacity control regime for deep-water species came into force in 2011. The Biological Indicator 1 was estimated by the MS only for trawl 24-40 m and purse seine 12-24 m fleet segments; results showed that for the overall range of species in each of these segments the situation is balanced.
MS explanations
Portugal stated that the large variety of species caught and the fact that the fleet segments which make up the greatest number of vessels catch a very diverse range of species makes it complex and difficult to do any analysis based on biological indicators. In 2011, Portugal plans to survey vessels out of action for a prolonged period to better understand the underlying reasons and thus gain a better understanding of the relationship between the registered fleet capacity and the active fleet.
Consistency / discrepancy between indicators presented and statements of balance
In the section of overall balance between fleet capacity and fishing opportunities in the MS report, the MS shows a 'green light' (using the Traffic Light method) for the technical indicator although the indicator values are 0.67 for the trawling and 0.58 for the purse seine fleet segments. This is inconsistent as values below 0.7 should indicate a situation of overcapacity (‘red light’).
Comparison between MS presented indicators and EWG calculated using DCF data
MS used a fleet segmentation which does not completely match with the fleet segmentation used by DCF. The MS report provides results only for the economic indicator CR/BER (RoI or RoFTA is not calculated), however fleet segments are not directly comparable with results using DCF data and fleet segmentation. Based on the economic indicator, the data shows potential over-capitalisation for 3 of the 13 fleet segments analysed in the report, and potential under-capitalisation for the remaining fleet segments. Dredge 0-12 and 12-24 in the MS report show values below one for this indicator. The analysis made on the DCF fleet segments DRB 00-10, 10-12 and 12-18 shows similar results. As for trawl fleet segments, outputs produced by the MS are not consistent with the values
66 66
estimated on the DCF data for the same indicator. The indicator CR/BER estimated on DCF data show values below one for DTS 00-10 and DTS 12-18 in 2010, while the same indicator estimated by the MS for trawl is above one for all length classes. The negative performance of these fleet segments is confirmed also by the indicator RoFTA estimated by the EWG on DCF data.
The values provided by the MS for the technical indicator are similar to those estimated on DCF data. Both sources show a general underutilisation of fleet capacity for most of the Portuguese fleet segments.
Due to a lack of stock assessment data for the most valuable species being landed by Portugal the EWG was not able to compare the biological indicators presented by Portugal with the harvest sustainability index calculated using DCF data.
Spain
MS Statements – balance, objectives, capacity adjustments
“The Spanish fleet capacity exceeds opportunities somewhat and the fleet is capable of catching more than its allocated quota.”
The fleet shows a positive development towards achieving a balance between structural capacity and current fishing opportunities, helped by EFF aid for the fishing effort adjustment plans (decommissioning).
The restructuring of the fleet through the use of EFF funds will be sufficient to bring capacity into line with fishing effort and fishing opportunities.
"EFF aid for the fishing effort adjustment plans approved since 2007 has helped to bring about a fleet composition that better reflects fishing opportunities. However, although we are more than 90% of the way to achieving the objectives for 31 December 2011 put forward in those plans, we believe that we must continue with this policy in order to bring fleet capacity into line with fishing effort."
"… of the 623 vessels for which aid was approved for their definitive withdrawal, 566 vessels had been withdrawn since the start of the Plan. …. In 2011, 84 vessels with an average catch of 5,450 tonnes were broken up."
Additional relevant information from MS report
Biological indicators
Biological indicators of balance are not provided due lack of data at the time of submission.
Economic indicators
Current revenue / break-even revenue are provided and indicators presented are all positive (above 1.0).
Spain concludes that 100% of Spanish fishing fleets have been, and are, profitable.
“The economic indicators show indeed good economic results for the whole Spanish fishing fleets.”
Technical indicators
Technical indicators presented by Spain for their fleet by main fishing gear and fishing area show mostly low or moderate value, with several higher values, for average vessel use as a proportion of maximum vessel use per year.
Spain concludes that for the majority of its fleet, capacity is in balance with opportunity. However, the Mediterranean fleet appears to be in excess of balance.
MS explanations
Although the Spanish report refers to the Spanish fishing fleet as falling “within group b) of the categories defined by the Commission, in that capacity exceeds opportunities somewhat and the fleet is capable of catching more than its allocated quota”, no reason for retaining overcapacity is
67 67
given but ‘’believes that it should continue with their policy to bring fleet capacity in line with fishing opportunities”.
Consistency / discrepancy between indicators presented and statements of balance
Partial assessments were provided for the technical, social and economic indicators but no biological indicator was estimated.
Spain delivers economic and technical indicators that are consistent with their conclusion that the fleet is somewhat in balance, e.g. technical indicator suggests some overcapacity.
However, as Spain did not provide any biological indicators it therefore should not state that the majority of their fleet is in balance.
Comparison between MS presented indicators and EWG calculated using DCF data
The economic indicators estimated by the EWG using DCF data were not consistent with the indictors provided by Spain, even though both set of indicators were not directly comparable due to the fact that Spain only presented data by fishing gear and not by DCF fleet segments. The DCF economic indicators do not suggest that the entire Spanish fleet is profitable (as claimed in the MS report). Furthermore, EWG was not able to calculate any technical or biological indicatorsbecause no data were available. An overall assessment of balance between fleet capacity and fishing opportunities thus can not be made for the Spanish fishing fleet due to insufficient data.
For the technical indicator, Spain uses its own reference range values for the technical indicator: “red” traffic light is attributed to values <0.6 instead of <0.7. Yet, as Spain did not provide capacity and effort data in the latest DCF call for economic data, it was not possible to validate the MS assessment.
The EWG concludes that Spain did not completely and robustly assess balance and that there is not sufficient evidence to support their conclusions.
Sweden
MS Statements – balance, objectives, capacity adjustments
Indicators presented by the MS reveal overcapacity in several segments of the fleet.
MS stated that the fishing mortality is too high in three segments: passive gear <12 metres, seiners and pelagic trawlers and bottom trawlers.
The economic indicators reveal that vessels <12 meters with passive gear show economic overcapacity (negative returns on Investments) and that all segments with passive gear have income levels that do not cover the costs. The capacity utilization varies widely, between 8 % and 57 %. The number of inactive vessel represents 25 % of the Swedish fleet (351 vessels are inactive).
Various measure to reduce capacity are presented by the MS: diminution of vessel size and/or gear size of small-scale pelagic, ending of eel fishing in 2012, two decommissioning campaigns targeting cod trawlers for a total reduction of 2 466 GT (-26%) and 9 590 kW (-19%), withdrawal requirement system for the pelagic segment and for other types of trawlers and vessels over 12 metres, and a system of transferable fishing rights for pelagic fishing
In addition to that within the EFF 2007–2013 framework; Sweden, in its operational programme, has given priority to scrapping aid and carried out scrapping campaigns in the Baltic Sea and the North Sea, both of which measures have played a significant part in adapting fishing capacity
Additional relevant information from MS report
Biological indicator
Sweden estimates that the fishing mortality exceeds the desirable catch rate for the sustainable
exploitation of the stocks. Fishing mortality is too high in three segments: Passive gear <12m, seiners
and pelagic trawlers and bottom trawlers.

68 68
The result for the pelagic segment (seiners and pelagic trawlers) decreased especially between 2009
and 2010, while the result for bottom trawlers shows a steady downward trend (2008 -2010).
Economic indicator
The second economic indicator ‘current revenue against break-even revenue’ is positive for the majority of the fleet. However all the passive gear segments indicates economic overcapacity.
The gross value added per full-time equivalent (FTE) and vessel for Swedish fleet should be regarded as low
MS explanations
Considering the biological indicators MS mentioned that: ”while the values still indicate that fishing mortality exceeds the desirable catch rate for the sustainable exploitation of the stock, the trend is moving in the right direction”. Regarding economic indicators MS considered that for calculation of Current revenue against break-even revenue andRoI, labour costs do not include owners’ withdrawals in the calculation of from sole proprietorships, meaning that the actual costs of labour are in fact higher and RoI is somewhat underestimated.
Regarding the technical indicator MS explained: “The Commission's guidelines state that values continually below 0.7 must be considered as showing a distinct structural overcapacity. However, the segment must be homogeneous in order to reach this conclusion. There can be a large spread within each segment ». Globally MS pointed out that the indicators and methods of calculation used leave room for further interpretations and discussion, which limits the possibility to make comparisons with other Member States. These indicators give only a rough overview, and there may be a large spread within each segment.
Consistency / discrepancy between indicators presented and statements of balance
Swedish assessment of balance is supported by the data presented by the MS report.
However the coverage of the catches considered in the calculation of the biological indicators by the MS, are expressed by fleet segment and not by species; which did not allow EWG to evaluate them properly.
The economic indicators provided showed economic sustainability supporting the MS statements on balance.
Comparison between MS presented indicators and EWG calculated using DCF data
Sweden provides both economic indicators, however comparison is difficult for some segments, as the MS does not use the DCF segmentation for the whole fleet. Nonetheless, DCF data gives quite different values for most of the indicators. In general the indicators based on DCF data are lower in magnitude. The main difference is that the DCF indicators suggestcontrary conclusions for economic sustainability in terms of RoFTA for trawlers >24m. In terms of the CR/BER, the DCF indicator showsunsustainable values for around half of the fleet segments. EWG notes that the F/Ft trend for seiners and pelagic trawlers is decreasing giving a “right direction trend” mentioned by the MS, however the mortality remains very high (F/Ft = 4,80 in 2010). Within the selection of fleet segment analysed by the EWG indicator used for indicate that most of the assessed stocks harvested by the fleet segments are fished unsustainably (data were missing for 2008 and 2009 for two fleet segments). Indicator for demersal trawlers and seiners 18 to 40 m calculated by the EWG present a decreasing trend and match the MS evaluation, but remain high.
69 69
United Kingdom
MS Statements – balance, objectives, capacity adjustments
The United Kingdom states that for some areas, such as for stocks covered by recovery regimes, there is an imbalance and that within the fleet there is a significant level of potential capacity. The UK also states that within the UK fleet as a whole, it is recognised that there are several significant areas of activity by parts of the UK fleet where there is a balance between capacity and opportunity.
Additional relevant information from MS report
The STECF guidelines were not applied, but some technical, biological and socio-economic data were provided. Over 90% of the capacity of the UK over 10 m fishing fleet is active each year. The UK 10 m and under fleet operates to a lower level of utilisation – around 20% of the fleet capacity is not active during the year. The UK considers that for the country as a whole in 2010 and 2011 76% of the value of fish landed was from sources assessed as sustainable. In the report the UK states that this value was calculated by considering all species for which ICES has not made an assessment of current stock status as being ‘a sustainable source’. For the pelagic segment only 50% of fish stocks and species landed in 2011 were from sustainable sources. ICES assessments for Mackerel (harvested unsustainably in NE Atlantic regions) and for Blue Whiting (all areas) are key drivers for the changes in the indicator.
MS explanations
Reasons for capacity not being used can vary, such as mechanical problems or vessel age. The lack of fishing opportunities has led owners of some of the over 10 m fleet to keep some of their vessels inactive for periods, moving their quotas to other vessels in their fleets, or in some cases leasing the quota out to other vessel owners. The same has occurred under the days at sea limitations: some vessels are inactive and available days at sea are transferred to other vessels to keep them fishing.
Consistency / discrepancy between indicators presented and statements of balance
The EWG considers the indicator of the degree to which UK fishing activity is dependent on sustainable sources of fish is not calculated in an acceptable manner since stocks for which ICES has made an assessment but not set a level for Fpa as well as stocks for which no assessment is available were considered to be sustainably fished by the UK. In addition the UK points out that the methodology behind the biological indicator are under review in light of intended move to FMSY instead of Fpa as well as other relevant factors.
It is difficult to make additional consideration on the consistency between indicators presented and statements of balance since the report does not follow the suggested structure and indicators were not calculated according to the indicator guidelines suggested to MS.
Comparison between MS presented indicators and EWG calculated using DCF data
Based on the EWG calculations all of the UK fleet segment assessed were economically dependent on stocks that on average were overexploited in comparison with the reference points defined by stock assessments. This does not agree with the UK’s statement that 76% of the value of fish landed is from sources assessed as sustainable.
The MS used a fleet segmentation which does not match with the fleet segmentation used by DCF.
The MS report provides results only for the economic indicator RoI (RoFTA is not calculated). Results provided by EWG using DCF data present high variation in values that is therefore not comparable to the indicators provided by the MS.

70 70
7 DISCUSSION OF RESULTS
Current legislation in force (EC 2371/2002; EC 1013/2010) requires MS to report on their efforts to achieve a sustainable balance between fishing capacity and fishing opportunities.It does not, however, specifically require MS to assess and state the degree of balance or identify the existence of fleet over capacity.Many MS have therefore fulfilled the legal obligation to report but have not stated their views on whether their fleet segments are of the appropriate capacity or not.Other MS have estimated balance indicators and then made statements of their views on fleet capacity but their opinions are not supported by the balance indicators they have presented.
In previous years, the Commission has asked STECF to assess and evaluate the compliance of MS reports with the legislation and to assess the accuracy of estimations of STECF’s balance indicators, where these have been voluntarily presented by MS.
This report presents balance indicators estimated by independent experts for MS, where data were available, and gives an overview of balance indicators for the most important fleet segments in the EU. No attempt has been made to draw conclusions about the degree of balance but rather, the indicators have been presented in tables to enable readers to draw their own conclusions. These tables could also represent a baseline situation against which the effects of further policy proposals could be compared.
7.1 Data issues
The exercise highlighted some issues with data availability and compatibility, which arise from inconsistencies between different aspects of the DCF, such as fleet segmentation for biological and economic variables and differences in the timing when biological and economic data become available to MS.The issue of differing fleet segmentations for biological and economic variables is being addressed by STECF with a view to ensuring that an updated DCF will provide data suitable for a number of purposes.
The lack of stock assessments for a significant number of stocks continues to be a major inhibitor when it comes to the inclusion of biological considerations when assessing the balance between fishing capacity and fishing opportunities. Increasing the number of stocks for which such information is available should be an urgent priority, in particular for the Mediterranean and Black Sea.

71 71
8 APPENDIX
Table 8.1. Proportion of the landings value, number of stocks assessed and the number of overfished stocks included in the analysis by MS fleet segment.
Fleet Segment Area
Sustainable Harvest Indicator
Proportion of landing values included in the
indicator
No. stock harvested that have been
assessed
No. stock assessed F>Fmsy
% unsustainable stock/assessed stock
EWG comments
(for segments with >=40% landings value from assessed stocks)
2008 2009 2010 2008 2009 2010 2008 2009 2010 2008 2009 2010 2008 2009 2010 Trend Sustainability Missing data
BEL TBB VL2440 27 1.5 1.5 1.4 61 66 66 18 18 19 13 13 13 72.2 72.2 68.4 Stable Most of the assessed stocks harvested by the fleet segment are fished unsustainably
BEL TBB VL1824 27 1.5 1.6 1.4 54 54 58 15 13 16 10 9 10 66.7 69.2 62.5 Stable More than the half of the assessed stocks harvested by the fleet segment are fished unsustainably
DNK DTS VL1824 27 1.9 1.8 1.9 42 41 40 15 14 14 11 10 10 73.3 71.4 71.4 Stable Most of the assessed stocks harvested by the fleet segment are fished unsustainably
DNK DTS VL2440 27 1.7 1.7 1.7 35 36 38 16 16 16 11 11 11 68.8 68.8 68.8
DNK DTS VL40XX 27 1.2 1.2 1.2 54 40 37 14 14 14 10 10 10 71.4 71.4 71.4 Stable Most of the assessed stocks harvested by the fleet segment are fished unsustainably
DNK PGP VL1012 27 2.4 2.2 2.3 63 51 56 12 13 12 8 9 8 66.7 69.2 66.7 Stable More than the half of the assessed stocks harvested by the fleet segment are fished unsustainably
DNK PGP VL1218 27 2.3 2.2 2.3 62 63 63 12 11 11 8 8 8 66.7 27 72.7 Stable Most of the assessed stocks harvested by the fleet segment are fished unsustainably
DNK PMP VL1218
27 1.9 2.0 2.2 62 68 43 11 10 14 7 7 10 63.6 70.0 71.4 Slight
increasing
Most of the assessed stocks harvested by the fleet segment are fished unsustainably
DNK PMP VL1824
27 2.4 2.3 2.3 56 44 55 14 14 11 10 10 8 71.4 71.4 72.7 Stable Most of the assessed stocks harvested by the fleet segment are fished unsustainably
DNK PGP VL1824 27 1.7 2.0 2.1 52 52 69 10 10 10 7 7 7 70.0 70.0 70.0 Increasing Most of the assessed stocks harvested by the fleet segment are fished unsustainably
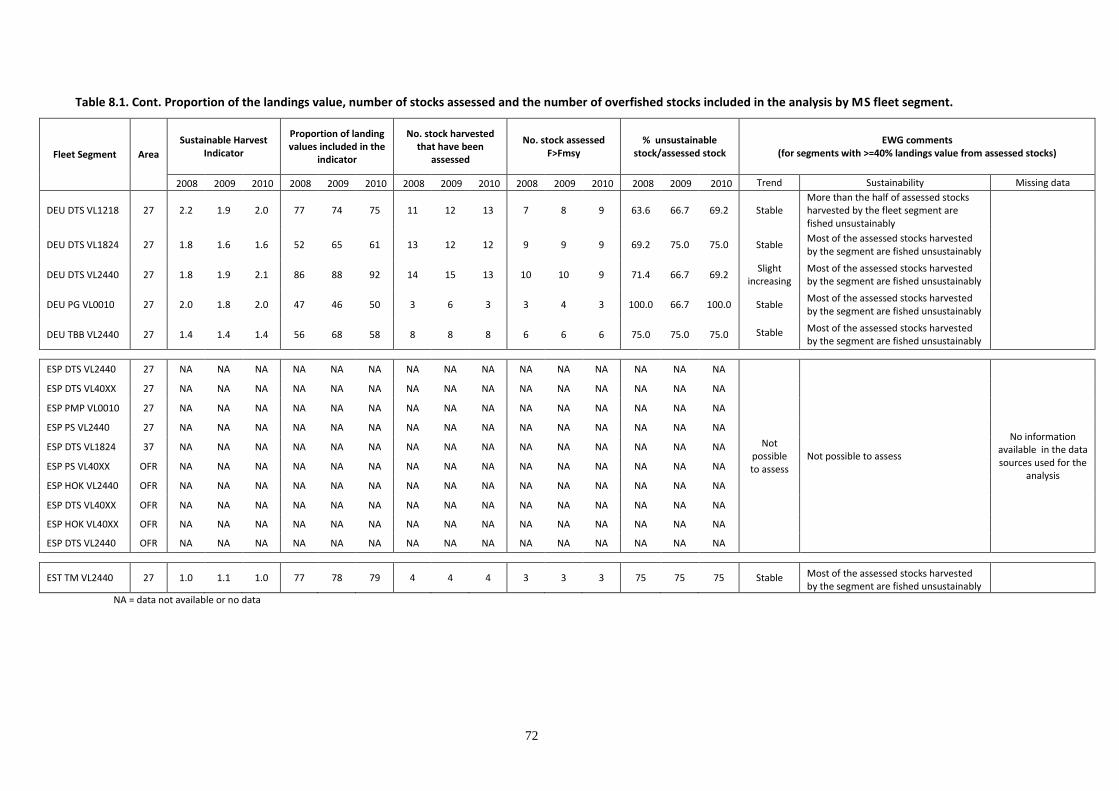
72 72
Table 8.1. Cont. Proportion of the landings value, number of stocks assessed and the number of overfished stocks included in the analysis by MS fleet segment.
Fleet Segment Area
Sustainable Harvest Indicator
Proportion of landing values included in the
indicator
No. stock harvested that have been
assessed
No. stock assessed F>Fmsy
% unsustainable stock/assessed stock
EWG comments (for segments with >=40% landings value from assessed stocks)
2008 2009 2010 2008 2009 2010 2008 2009 2010 2008 2009 2010 2008 2009 2010 Trend Sustainability Missing data
DEU DTS VL1218 27 2.2 1.9 2.0 77 74 75 11 12 13 7 8 9 63.6 66.7 69.2 Stable More than the half of assessed stocks harvested by the fleet segment are fished unsustainably
DEU DTS VL1824 27 1.8 1.6 1.6 52 65 61 13 12 12 9 9 9 69.2 75.0 75.0 Stable Most of the assessed stocks harvested by the segment are fished unsustainably
DEU DTS VL2440 27 1.8 1.9 2.1 86 88 92 14 15 13 10 10 9 71.4 66.7 69.2 Slight
increasing Most of the assessed stocks harvested by the segment are fished unsustainably
DEU PG VL0010 27 2.0 1.8 2.0 47 46 50 3 6 3 3 4 3 100.0 66.7 100.0 Stable Most of the assessed stocks harvested by the segment are fished unsustainably
DEU TBB VL2440 27 1.4 1.4 1.4 56 68 58 8 8 8 6 6 6 75.0 75.0 75.0 Stable Most of the assessed stocks harvested by the segment are fished unsustainably
ESP DTS VL2440 27 NA NA NA NA NA NA NA NA NA NA NA NA NA NA NA
Not possible to assess
Not possible to assess
No information available in the data sources used for the
analysis
ESP DTS VL40XX 27 NA NA NA NA NA NA NA NA NA NA NA NA NA NA NA
ESP PMP VL0010 27 NA NA NA NA NA NA NA NA NA NA NA NA NA NA NA
ESP PS VL2440 27 NA NA NA NA NA NA NA NA NA NA NA NA NA NA NA
ESP DTS VL1824 37 NA NA NA NA NA NA NA NA NA NA NA NA NA NA NA
ESP PS VL40XX OFR NA NA NA NA NA NA NA NA NA NA NA NA NA NA NA
ESP HOK VL2440 OFR NA NA NA NA NA NA NA NA NA NA NA NA NA NA NA
ESP DTS VL40XX OFR NA NA NA NA NA NA NA NA NA NA NA NA NA NA NA
ESP HOK VL40XX OFR NA NA NA NA NA NA NA NA NA NA NA NA NA NA NA
ESP DTS VL2440 OFR NA NA NA NA NA NA NA NA NA NA NA NA NA NA NA
EST TM VL2440 27 1.0 1.1 1.0 77 78 79 4 4 4 3 3 3 75 75 75 Stable Most of the assessed stocks harvested by the segment are fished unsustainably
NA = data not available or no data

73 73
Table 8.1. Cont. Proportion of the landings value, number of stocks assessed and the number of overfished stocks included in the analysis by MS fleet segment.
Fleet Segment Area
Sustainable Harvest Indicator
Proportion of landing values included in the
indicator
No. stock harvested that have been
assessed
No. stock assessed F>Fmsy
% unsustainable stock/assessed stock
EWG comments (for segments with >=40% landings value from assessed stocks)
2008 2009 2010 2008 2009 2010 2008 2009 2010 2008 2009 2010 2008 2009 2010 Trend Sustainability Missing data
FRA DFN VL0010 27 NA NA 1.5 NA NA 33 NA NA 14 NA NA 10 NA NA 71
FRA DFN VL1012 27 NA NA 1.6 NA NA 52 NA NA 15 NA NA 11 NA NA 73 Not possible
to asses
Most of the assessed stocks harvested by the segment are fished unsustainably
Only 2010 data are available for the analysis
FRA DFN VL1218 27 NA NA 1.5 NA NA 55 NA NA 11 NA NA 9 NA NA 82 Not possible
to asses
Most of the assessed stocks harvested by the segment are fished unsustainably
Only 2010 data are available for the analysis
FRA DFN VL1824 27 NA NA 1.6 NA NA 64 NA NA 8 NA NA 7 NA NA 88 Not possible
to asses
Most of the assessed stocks harvested by the segment are fished unsustainably
Only 2010 data are available for the analysis
FRA DFN VL2440 27 NA NA 1.6 NA NA 81 NA NA 5 NA NA 4 NA NA 80 Not possible
to asses
Most of the assessed stocks harvested by the segment are fished unsustainably
Only 2010 data are available for the analysis
FRA DTS VL1012 27 NA NA 1.5 NA NA 20 NA NA 13 NA NA 10 NA NA 77 FRA DTS VL1218 27 NA NA 1.6 NA NA 16 NA NA 13 NA NA 11 NA NA 85 FRA DTS VL1824 27 NA NA 2.0 NA NA 12 NA NA 19 NA NA 13 NA NA 68 FRA DTS VL2440 27 NA NA 2.3 NA NA 15 NA NA 21 NA NA 14 NA NA 67 FRA DTS VL40XX 27 NA NA 1.4 NA NA 36 NA NA 7 NA NA 5 NA NA 71 FRA FPO VL0010 27 NA NA 1.5 NA NA 2 NA NA 10 NA NA 8 NA NA 80 FRA HOK VL0010 27 NA NA 1.7 NA NA 5 NA NA 7 NA NA 7 NA NA 100 FRA TM VL1824 27 NA NA 1.5 NA NA 9 NA NA 10 NA NA 9 NA NA 90
FRA TM VL40XX 27 NA NA 0.8 NA NA 82 NA NA 5 NA NA 4 NA NA 80 Not possible
to asses
Indicator shows that fleet is relying on stocks in good condition as fishery targets herring. However herring is only one of the 5 assessed stocks; remaining 4 are overexploited.
Only 2010 data are available for the analysis
FRA PS VL40XX OFR NA NA NA NA NA NA NA NA NA NA NA NA NA NA NA Not possible
to asses Not possible to assess
No data provided for this segment
FRA HOK VL2440 27 NA NA 1.7 84 NA NA 3 NA NA 3 NA NA 100 Not possible
to asses All the assessed stocks harvested by the segment are fished unsustainably
Only 2010 data are available for
the analysis
FRA MGP VL2440 27 NA 1.7 1.8 68 41 NA 9 6 NA 6 3 NA 67 50 Increasing More than the half of the assessed stocks harvested by the segment are fished unsustainably
Missing data for 2008
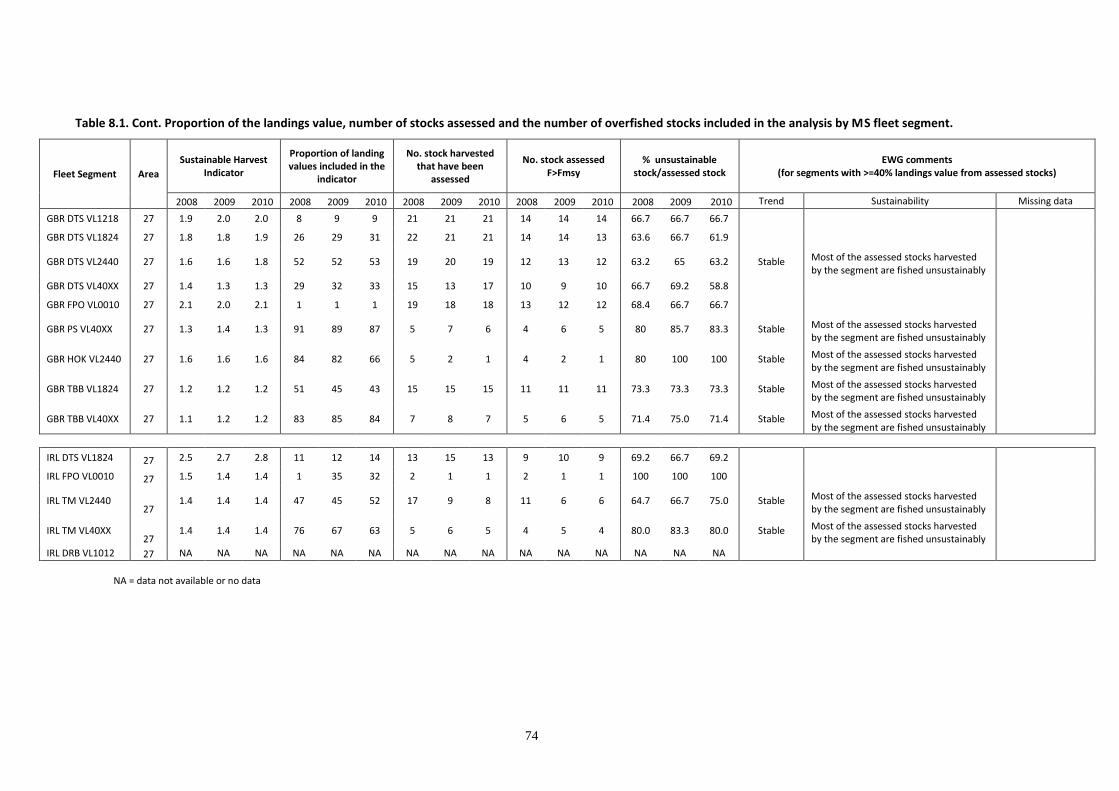
74 74
Table 8.1. Cont. Proportion of the landings value, number of stocks assessed and the number of overfished stocks included in the analysis by MS fleet segment.
Fleet Segment Area
Sustainable Harvest Indicator
Proportion of landing values included in the
indicator
No. stock harvested that have been
assessed
No. stock assessed F>Fmsy
% unsustainable stock/assessed stock
EWG comments (for segments with >=40% landings value from assessed stocks)
2008 2009 2010 2008 2009 2010 2008 2009 2010 2008 2009 2010 2008 2009 2010 Trend Sustainability Missing data
GBR DTS VL1218 27 1.9 2.0 2.0 8 9 9 21 21 21 14 14 14 66.7 66.7 66.7
GBR DTS VL1824 27 1.8 1.8 1.9 26 29 31 22 21 21 14 14 13 63.6 66.7 61.9
GBR DTS VL2440 27 1.6 1.6 1.8 52 52 53 19 20 19 12 13 12 63.2 65 63.2 Stable Most of the assessed stocks harvested by the segment are fished unsustainably
GBR DTS VL40XX 27 1.4 1.3 1.3 29 32 33 15 13 17 10 9 10 66.7 69.2 58.8
GBR FPO VL0010 27 2.1 2.0 2.1 1 1 1 19 18 18 13 12 12 68.4 66.7 66.7
GBR PS VL40XX 27 1.3 1.4 1.3 91 89 87 5 7 6 4 6 5 80 85.7 83.3 Stable Most of the assessed stocks harvested by the segment are fished unsustainably
GBR HOK VL2440 27 1.6 1.6 1.6 84 82 66 5 2 1 4 2 1 80 100 100 Stable Most of the assessed stocks harvested by the segment are fished unsustainably
GBR TBB VL1824 27 1.2 1.2 1.2 51 45 43 15 15 15 11 11 11 73.3 73.3 73.3 Stable Most of the assessed stocks harvested by the segment are fished unsustainably
GBR TBB VL40XX 27 1.1 1.2 1.2 83 85 84 7 8 7 5 6 5 71.4 75.0 71.4 Stable Most of the assessed stocks harvested by the segment are fished unsustainably
IRL DTS VL1824 27 2.5 2.7 2.8 11 12 14 13 15 13 9 10 9 69.2 66.7 69.2
IRL FPO VL0010 27 1.5 1.4 1.4 1 35 32 2 1 1 2 1 1 100 100 100
IRL TM VL2440 27
1.4 1.4 1.4 47 45 52 17 9 8 11 6 6 64.7 66.7 75.0 Stable Most of the assessed stocks harvested by the segment are fished unsustainably
IRL TM VL40XX 27
1.4 1.4 1.4 76 67 63 5 6 5 4 5 4 80.0 83.3 80.0 Stable Most of the assessed stocks harvested by the segment are fished unsustainably
IRL DRB VL1012 27 NA NA NA NA NA NA NA NA NA NA NA NA NA NA NA
NA = data not available or no data

75 75
Table 8.1. Cont. Proportion of the landings value, number of stocks assessed and the number of overfished stocks included in the analysis by MS fleet segment.
Fleet Segment Area
Sustainable Harvest Indicator
Proportion of landing values included in the
indicator
No. stock harvested that have been
assessed
No. stock assessed F>Fmsy
% unsustainable stock/assessed stock
EWG comments (for segments with >=40% landings value from assessed stocks)
2008 2009 2010 2008 2009 2010 2008 2009 2010 2008 2009 2010 2008 2009 2010 Trend Sustainability Missing data
ITA TBB VL1824 37
4.5 4.6 4.6 36 40 44 3 3 3 3 3 3 100 100 100 Stable All the assessed stocks harvested by the segment are fished unsustainably
ITA TBB VL2440 37
4.5 4.6 4.6 42 50 41 3 3 3 3 3 3 100 100 100 Stable All the assessed stocks harvested by the segment are fished unsustainably
ITA DTS VL1218 37 2.2 2.3 2.3 22 22 22 16 16 16 15 15 15 93.8 93.8 93.8
ITA DTS VL1824 37 2.3 2.3 2.3 24 24 23 16 16 16 15 15 15 93.8 93.8 93.8
ITA DTS VL2440 37 2.5 2.5 2.5 32 34 37 16 16 16 15 15 15 93.8 93.8 93.8
ITA PGP VL0612 37 2.5 2.5 2.5 9 10 10 14 14 14 13 13 13 92.9 92.9 92.9
ITA DRB VL1218 37 NA NA NA NA NA NA NA NA NA NA NA NA NA NA NA
LTU DTS VL2440 27 0.9 0.9 0.9 89 100 94 1 1 1 0 0 0 0 0 0 Stable The stock harvested is in a good state
LVA TM VL2440 27 1.0 1.0 1.0 86 81 80.6 3 4 4 2 3 3 66.7 75 75.0 Stable Most of the assessed stocks harvested by the segment are fished unsustainably
NLD TBB VL1824 27 1.6 1.6 1.6 17 21 20 8 7 7 5 5 5 62.5 71.4 71.4
NLD TBB VL40XX 27 1.4 1.5 1.5 78 81 80 9 8 10 6 5 7 66.7 62.5 70.0 Stable Most of the assessed stocks harvested by the segment are fished unsustainably
NLD TM VL40XX 27 1.1 1.1 1.0 37 38 38 7 5 6 5 4 4 71.4 80.0 66.7
NLD TBB VL2440 27 1.4 1.4 1.4 44 73 70 9 8 9 6 6 6 66.7 75 66.7 Stable More than half of the assessed stocks harvested by the segment are fished unsustainably
NLD DTS VL1824 27 1.5 1.6 1.6 66 49 45 9 8 10 7 5 7 77.8 62.5 70.0 Slight
increasing
More than half of the assessed stocks harvested by the segment are fished unsustainably
NA = data not available or no data
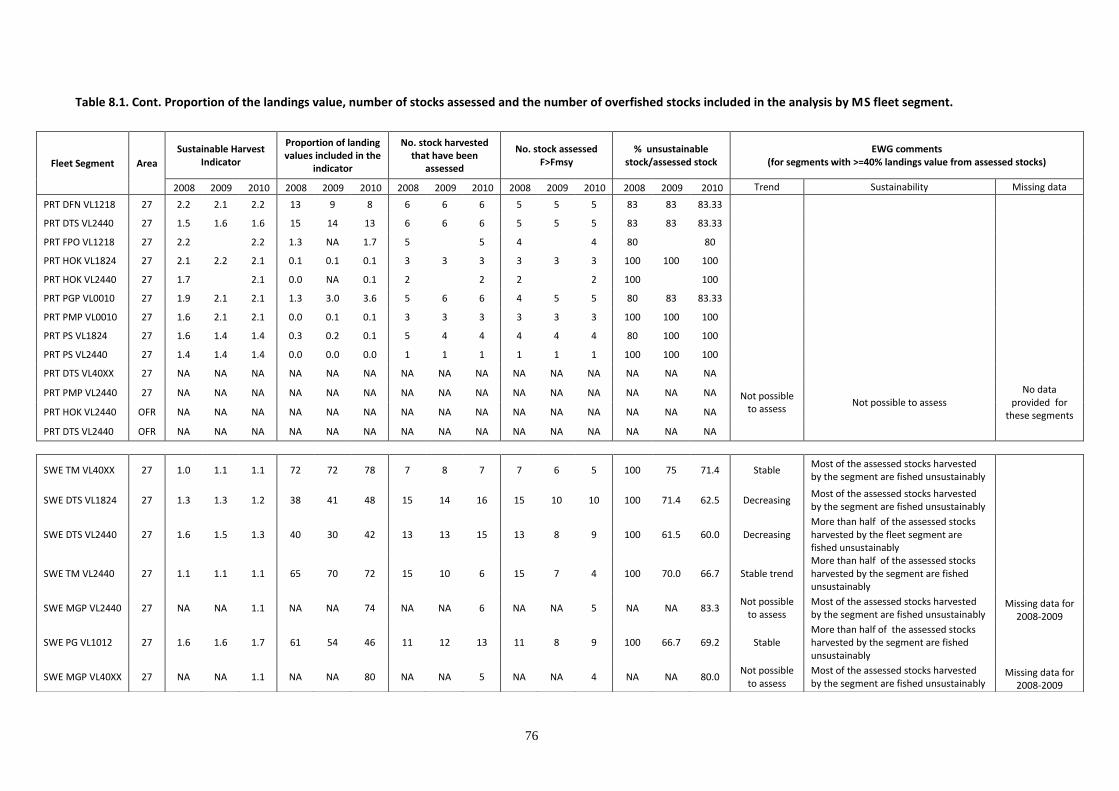
76 76
Table 8.1. Cont. Proportion of the landings value, number of stocks assessed and the number of overfished stocks included in the analysis by MS fleet segment.
Fleet Segment Area
Sustainable Harvest Indicator
Proportion of landing values included in the
indicator
No. stock harvested that have been
assessed
No. stock assessed F>Fmsy
% unsustainable stock/assessed stock
EWG comments (for segments with >=40% landings value from assessed stocks)
2008 2009 2010 2008 2009 2010 2008 2009 2010 2008 2009 2010 2008 2009 2010 Trend Sustainability Missing data
PRT DFN VL1218 27 2.2 2.1 2.2 13 9 8 6 6 6 5 5 5 83 83 83.33
PRT DTS VL2440 27 1.5 1.6 1.6 15 14 13 6 6 6 5 5 5 83 83 83.33
PRT FPO VL1218 27 2.2 2.2 1.3 NA 1.7 5 5 4 4 80 80
PRT HOK VL1824 27 2.1 2.2 2.1 0.1 0.1 0.1 3 3 3 3 3 3 100 100 100
PRT HOK VL2440 27 1.7 2.1 0.0 NA 0.1 2 2 2 2 100 100
PRT PGP VL0010 27 1.9 2.1 2.1 1.3 3.0 3.6 5 6 6 4 5 5 80 83 83.33
PRT PMP VL0010 27 1.6 2.1 2.1 0.0 0.1 0.1 3 3 3 3 3 3 100 100 100
PRT PS VL1824 27 1.6 1.4 1.4 0.3 0.2 0.1 5 4 4 4 4 4 80 100 100
PRT PS VL2440 27 1.4 1.4 1.4 0.0 0.0 0.0 1 1 1 1 1 1 100 100 100
PRT DTS VL40XX 27 NA NA NA NA NA NA NA NA NA NA NA NA NA NA NA
Not possible to assess
Not possible to assess No data
provided for these segments
PRT PMP VL2440 27 NA NA NA NA NA NA NA NA NA NA NA NA NA NA NA
PRT HOK VL2440 OFR NA NA NA NA NA NA NA NA NA NA NA NA NA NA NA
PRT DTS VL2440 OFR NA NA NA NA NA NA NA NA NA NA NA NA NA NA NA
SWE TM VL40XX 27 1.0 1.1 1.1 72 72 78 7 8 7 7 6 5 100 75 71.4 Stable Most of the assessed stocks harvested by the segment are fished unsustainably
SWE DTS VL1824 27 1.3 1.3 1.2 38 41 48 15 14 16 15 10 10 100 71.4 62.5 Decreasing Most of the assessed stocks harvested by the segment are fished unsustainably
SWE DTS VL2440 27 1.6 1.5 1.3 40 30 42 13 13 15 13 8 9 100 61.5 60.0 Decreasing More than half of the assessed stocks harvested by the fleet segment are fished unsustainably
SWE TM VL2440 27 1.1 1.1 1.1 65 70 72 15 10 6 15 7 4 100 70.0 66.7 Stable trend More than half of the assessed stocks harvested by the segment are fished unsustainably
SWE MGP VL2440 27 NA NA 1.1 NA NA 74 NA NA 6 NA NA 5 NA NA 83.3 Not possible
to assess Most of the assessed stocks harvested by the segment are fished unsustainably
Missing data for 2008-2009
SWE PG VL1012 27 1.6 1.6 1.7 61 54 46 11 12 13 11 8 9 100 66.7 69.2 Stable More than half of the assessed stocks harvested by the segment are fished unsustainably
SWE MGP VL40XX 27 NA NA 1.1 NA NA 80 NA NA 5 NA NA 4 NA NA 80.0 Not possible
to assess Most of the assessed stocks harvested by the segment are fished unsustainably
Missing data for 2008-2009

77 77
Table 8.2. Inflation and nominal long term (LT) interest rates by EU Member State 2008-2010.
Inflation
LT (nominal) Interest rate
2008 2009 2010 2008 2009 2010
Belgium 4.5 0 2.3 4.4 3.9 3.5
Bulgaria 12 2.5 3 5.4 7.2 6.0
Cyprus 4.4 0.2 2.6 4.6 4.6 4.6
Denmark 3.6 1.1 2.2 4.3 3.6 2.9
Estonia 10.6 0.2 2.7 8.2 8.0 6.0
Finland 3.9 1.6 1.7 4.3 3.7 3.0
France 3.2 0.1 1.7 4.2 3.7 3.1
Germany 2.8 0.2 1.2 4.0 3.2 2.7
Greece 4.2 1.3 4.7 4.8 5.2 9.1
Ireland 3.1 -1.7 -1.6 4.5 5.2 5.7
Italy 3.5 0.8 1.6 4.7 4.3 4.0
Latvia 15.3 3.3 -1.2 6.4 12.4 10.3
Lithuania 11.1 4.2 1.2 5.6 14.0 5.6
Malta 4.7 1.8 2 4.8 4.5 4.2
Netherlands 2.2 1 0.9 4.2 3.7 3.0
Poland 4.2 4 2.7 6.1 6.1 5.8
Portugal 2.7 -0.9 1.4 4.5 4.2 5.4
Romania 7.9 5.6 6.1 7.7 9.7 7.3
Slovenia 5.5 0.9 2.1 4.6 4.4 3.8
Spain 4.1 -0.2 2 4.4 4.0 4.3
Sweden 3.3 1.9 1.9 3.9 3.3 2.9
United Kingdom 3.6 2.2 3.3 4.5 3.4 3.4
(source: Eurostat/ECB)
Note: In the Eurostat and ECB data bases, the long-term interest rate statistics for MS refer to the monthly average interest rates for long-term government bonds issued by each country. The annual average rate was calculated from the monthly averages by MS.
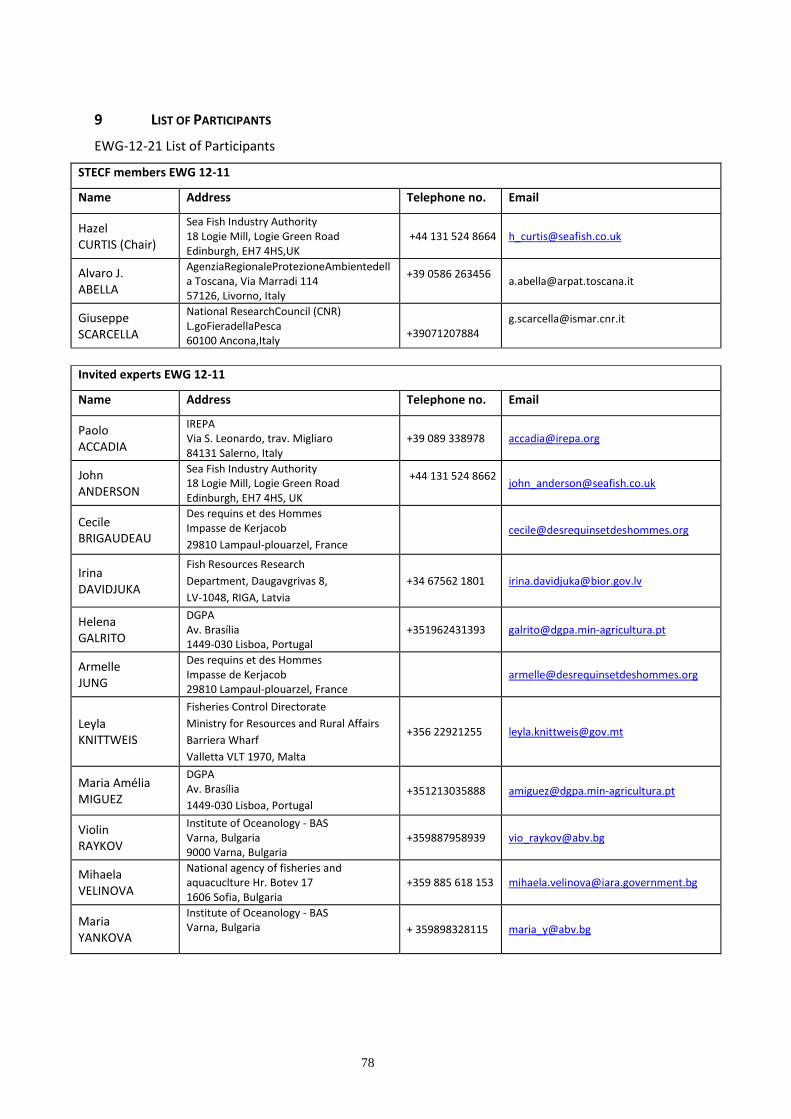
78 78
9 LIST OF PARTICIPANTS
EWG-12-21 List of Participants
STECF members EWG 12-11
Name Address Telephone no. Email
Hazel CURTIS (Chair)
Sea Fish Industry Authority 18 Logie Mill, Logie Green Road Edinburgh, EH7 4HS,UK
+44 131 524 8664 [email protected]
Alvaro J. ABELLA
AgenziaRegionaleProtezioneAmbientedella Toscana, Via Marradi 114 57126, Livorno, Italy
+39 0586 263456
Giuseppe SCARCELLA
National ResearchCouncil (CNR) L.goFieradellaPesca 60100 Ancona,Italy
+39071207884
Invited experts EWG 12-11
Name Address Telephone no. Email
Paolo ACCADIA
IREPA Via S. Leonardo, trav. Migliaro 84131 Salerno, Italy
+39 089 338978 [email protected]
John ANDERSON
Sea Fish Industry Authority 18 Logie Mill, Logie Green Road Edinburgh, EH7 4HS, UK
+44 131 524 8662
Cecile BRIGAUDEAU
Des requins et des Hommes Impasse de Kerjacob
29810 Lampaul-plouarzel, France [email protected]
Irina DAVIDJUKA
Fish Resources Research
Department, Daugavgrivas 8,
LV-1048, RIGA, Latvia
+34 67562 1801 [email protected]
Helena GALRITO
DGPA Av. Brasília 1449-030 Lisboa, Portugal
+351962431393 [email protected]
Armelle JUNG
Des requins et des Hommes Impasse de Kerjacob 29810 Lampaul-plouarzel, France
Leyla KNITTWEIS
Fisheries Control Directorate
Ministry for Resources and Rural Affairs
Barriera Wharf
Valletta VLT 1970, Malta
+356 22921255 [email protected]
Maria Amélia MIGUEZ
DGPA Av. Brasília
1449-030 Lisboa, Portugal +351213035888 [email protected]
Violin RAYKOV
Institute of Oceanology - BAS Varna, Bulgaria 9000 Varna, Bulgaria
+359887958939 [email protected]
Mihaela VELINOVA
National agency of fisheries and aquacuclture Hr. Botev 17 1606 Sofia, Bulgaria
+359 885 618 153 [email protected]
Maria YANKOVA
Institute of Oceanology - BAS Varna, Bulgaria
+ 359898328115 [email protected]
79 79
European Commission EWG 12-11
Name Address Telephone no. Email
Kenneth PATTERSON
DG Mare 99 Rue Joseph, Brussels Belgium
+3222998227 [email protected]
Natacha CARVALHO
Joint Research Centre (IPSC) Maritime Affairs Unit Via E. Fermi, 2749 21027 Ispra (VA), Italy
+390332786713
JRC Experts EWG 12-11
Name Address Telephone no. Email
Natacha CARVALHO
Joint Research Centre (IPSC) Maritime Affairs Unit Via E. Fermi, 2749 21027 Ispra (VA), Italy
+390332786713
EWG-12-21 List of Participants
STECF members EWG 12-21
Name Address Telephone no. Email
Hazel CURTIS (Chair)
Sea Fish Industry Authority 18 Logie Mill, Logie Green Road Edinburgh, EH7 4HS,UK
+44 131 524 8664 [email protected]
Giuseppe SCARCELLA
National ResearchCouncil (CNR) L.goFieradellaPesca 60100 Ancona,Italy
+39071207884 [email protected]
Invited experts EWG 12-21
Name Address Telephone no. Email
Paolo ACCADIA
IREPA Via S. Leonardo, trav. Migliaro 84131 Salerno, Italy
+39 089 338978 [email protected]
Leyre GOTI
Independent expert Palmaille 9 22767HAMBURGGermany
+49 4039405107 [email protected]
Jerome GUITTON
Agrocampus oust
65 rue de saint brieuc
35700RENNESFrance
+33 223 485859 [email protected]
Armelle JUNG
Des requins et des Hommes Impasse de Kerjacob 29810 Lampaul-plouarzel, France
Maria YANKOVA
Institute of Oceanology - BAS Varna, Bulgaria
+ 359898328115 [email protected]
Leyla KNITTWEIS
Malta Centre for Fisheries Science
Fort San Lucjan
BBG 1283 Marsaxlokk, Malta
+3562229331
80 80
European Commission EWG 12-21
Name Address Telephone no. Email
Kenneth PATTERSON
DG Mare 99 Rue Joseph, Brussels Belgium
+3222998227 [email protected]
Natacha CARVALHO
Joint Research Centre (IPSC) Maritime Affairs Unit Via E. Fermi, 2749 21027 Ispra (VA), Italy
+390332786713
JRC Experts EWG 12-21
Name Address Telephone no. Email
Natacha CARVALHO
Joint Research Centre (IPSC) Maritime Affairs Unit Via E. Fermi, 2749 21027 Ispra (VA), Italy
+390332786713
Arina MOTOVA
Joint Research Centre (IPSC) Maritime Affairs Unit Via E. Fermi, 2749 21027 Ispra (VA), Italy
+390332785253 [email protected]
Hajo RÄTZ
Joint Research Centre (IPSC) Maritime Affairs Unit Via E. Fermi, 2749 21027 Ispra (VA), Italy
+390332786073
Jarno VIRTANEN
Joint Research Centre (IPSC) Maritime Affairs Unit Via E. Fermi, 2749 21027 Ispra (VA), Italy
+390332789614
81 81
10 LIST OF BACKGROUND DOCUMENTS
Background documents are published on the meeting’s web site on: http://stecf.jrc.ec.europa.eu/web/stecf/ewg21 List of background documents:
1. EWG-12-11 – Declarations of invited and JRC experts 2. EWG-12-21 –Declarations of invited and JRC experts
3. DG MARE Guidelines for an improved analysis of the balance between fishing capacity and
fishing opportunities version 2, June 2012
4. 11-11_STECF 11-17 - Balance capacity and fishing opportunities_JRC67795.pdf 5. 10-09_SG-BRE 10-01 - Fleet capacity and fishing opportunities _JRC61983.pdf
82
European Commission
EUR 25600 EN – Joint Research Centre – Institute for the Protection and Security of the Citizen
Title: Scientific, Technical and Economic Committee for Fisheries. Review of national reports on Member States efforts to achieve balance
between fleet capacity and fishing opportunities (STECF-12-18).
EWG-12-11members:Curtis, H., Abella, J. A., Accadia, P., Anderson, J. Brigaudeau, C., Carvalho, N., Davidjuka , I., Galrito, H., Jung, A.,
Knittweis, L., Miguez, M.A.,Scarcella, G., Raykov, V., Velinova, M., &Yankova, M.
EWG 12-21 members: Curtis, H., Accadia, P., Carvalho, N., Guitton, J., Jung, A., Knittweis, L., Motova, A., Rätz, H.-J., Scarcella, G.,
Virtanen, J. &Yankova, M.
STECF members: Casey, J., Abella, J. A., Andersen, J., Bailey, N., Bertignac, M., Cardinale, M., Curtis, H., Daskalov, G., Delaney, A.,
Döring, R., Garcia Rodriguez, M., Gascuel, D., Graham, N., Gustavsson, T., Jennings, S., Kenny, A., Kirkegaard, E., Kraak, S., Kuikka, S.,
Malvarosa, L., Martin, P., Murua, H., Nord, J., Nowakowski, P., Prellezo, R., Sala, A., Scarcella, G., Simmonds, J., Somarakis, S., Stransky,
C., Theret, F., Ulrich, C., Vanhee, W. & Van Oostenbrugge, H.
Luxembourg: Publications Office of the European Union
2012 – 81 pp. – 21 x 29.7 cm
EUR – Scientific and Technical Research series – ISSN 1831-9424 (online), ISSN 1018-5593 (print)
ISBN 978-92-79-27459-6
doi:10.2788/6727
Abstract
STECF reviewed the report of the EWG-12-11 held from September 24 – 28 2012 in Edinburgh and EWG-12-21 held from 23 – 26 October
2012 in Barza di Ispra, during its Plenary meeting on November 5-9 in Brussels.

83
How to obtain EU publications Our priced publications are available from EU Bookshop (http://bookshop.europa.eu), where you can place an order with the sales agent of your choice. The Publications Office has a worldwide network of sales agents. You can obtain their contact details bysending a fax to (352) 29 29-42758.

84
LB
-NA
-2560
0-E
N-N
As the Commission’s in-house science service, the Joint Research Centre’s mission is to provide EU
policies with independent, evidence-based scientific and technical support throughout the whole policy
cycle.
Working in close cooperation with policy Directorates-General, the JRC addresses key societal
challenges while stimulating innovation through developing new standards, methods and tools, and
sharing and transferring its know-how to the Member States and international community.
Key policy areas include: environment and climate change; energy and transport; agriculture and food
security; health and consumer protection; information society and digital agenda; safety and security
including nuclear; all supported through a cross-cutting and multi-disciplinary approach.
----------------------------------------------------------------------------------------------------------------------------- --
The Scientific, Technical and Economic Committee for Fisheries (STECF) has been established by the
European Commission. The STECF is being consulted at regular intervals on matters pertaining to the
conservation and management of living aquatic resources, including biological, economic,
environmental, social and technical considerations.