Exit Windows as an alternative selective system for the Barents Sea Demersal Fishery for cod and...
11
Fisheries Research 85 (2007) 309–319 Exit Windows as an alternative selective system for the Barents Sea Demersal Fishery for cod and haddock E. Grimaldo a,∗ , R.B. Larsen a , R. Holst b a Norwegian College of Fishery Science, Breivika N-9037 Tromsø, Norway b DIFRES, Danish Institute for Fisheries Research, North Sea Centre, DK-9850 Hirtshals, Denmark Received 8 June 2006; received in revised form 12 March 2007; accepted 30 March 2007 Abstract During a 4-year research period, trouser trawl experiments were performed to assess the cod and haddock selection capacity of a codend fitted with two 130 mm exit windows. These windows, which were 10 meshes high and 45 meshes long, were inserted in the rearmost part of the codend. The results showed that this codend was very efficient in releasing large amounts of undersized fish and the 50% retention length (l 50 ) was far above the minimum landing size (MLS) for both the analysed species (the MLS for cod is 47 cm, 44 cm for haddock). For cod, the mean l 50 values varied between 53.6 and 57.3 cm and the mean selection range (SR) values from 6.8 to 9.3 cm. Haddock was measured during two trials with the mean l 50 at 50.5 and 50.6 cm; and the mean SR values at 6.3 and 6.0 cm. Total catch weights varied between 0.7 and 6.6 metric tonnes. In some cases an important effect of catch weights upon the l 50 could be detected. © 2007 Elsevier B.V. All rights reserved. Keywords: Exit windows; Selectivity; Codend; Bycatch; Cod; Haddock 1. Introduction The Barents Sea Demersal Fishery targets mainly three species, cod (Gadus morhua), haddock (Melanogrammus aeglefinus) and saithe (Pollachius virens); with cod represent- ing the highest percentage of the total catch. In the early 1980s, the management of this fishery was based on mesh size reg- ulations and controls over the minimum landing size (MLS). Later, new regulations established a surveillance program and during 1983–1984 it was observed that substantial areas should be closed to fishing activities due to the high proportion of under- sized fish in the catches. Diamond-mesh codends were observed to have less effective mesh openings as the catches increased in size; a situation which revealed the need for improving size selection in trawls. In this context, and as an alternative to ordinary diamond- mesh codends, experiments were undertaken using square-mesh codends and rigid sorting grids that were able to maintain more stable openings in the codend through which escape could occur effectively despite changes in speed, catch sizes, etc. Rigid sort- ∗ Corresponding author. Tel.: +47 77 64 6861; fax: +47 77 64 6020. E-mail address: [email protected] (E. Grimaldo). ing grids were developed in the early 1990s, and in 1997 became mandatory in the Barents Sea for all fish trawl fleets (regardless of nationality). Despite the promising results with square-mesh panels obtained by numerous researchers (Cooper and Hickey, 1989; Robertson, 1989; Millar and Walsh, 1992; Walsh et al., 1992), they were found to be unusable in the Barents Sea mainly due to problems associated with red fish (Sebastes spp.). Experiments with the ‘Swedish design’ of exit windows, per- formed in the Baltic Sea, showed that the selectivity of these nets was considerably higher than normal codends (Larsson, 1994; Tschernij et al., 1996). These exit windows were made of stiff yarn and inserted in the side of the codend. Similar results were also obtained by inserting square-mesh panels in the sides of the codend (the ‘Danish design’) (Lowry et al., 1995). As a result, these types of codends were adopted into legislation in June, 1995 by the European Community (EC Council regulation No. 3362/94, 20, December 1994) and for the whole Baltic Sea by the International Baltic Sea Fishery Commission (IBSFC). In regulations adopted in 2002, a single top window (also known as the BACOMA window) replaced the side window codend. The BACOMA codend consists of a large square-mesh window placed in the upper panel of the codend (for further details, see Tschernij and Suuronen, 2002; and Dahm et al., 2003). 0165-7836/$ – see front matter © 2007 Elsevier B.V. All rights reserved. doi:10.1016/j.fishres.2007.03.005
-
Upload
southerndenmark -
Category
Documents
-
view
1 -
download
0
Transcript of Exit Windows as an alternative selective system for the Barents Sea Demersal Fishery for cod and...
A
wTavmc©
K
1
saituLdbstis
mcse
0d
Fisheries Research 85 (2007) 309–319
Exit Windows as an alternative selective system for the BarentsSea Demersal Fishery for cod and haddock
E. Grimaldo a,∗, R.B. Larsen a, R. Holst b
a Norwegian College of Fishery Science, Breivika N-9037 Tromsø, Norwayb DIFRES, Danish Institute for Fisheries Research, North Sea Centre, DK-9850 Hirtshals, Denmark
Received 8 June 2006; received in revised form 12 March 2007; accepted 30 March 2007
bstract
During a 4-year research period, trouser trawl experiments were performed to assess the cod and haddock selection capacity of a codend fittedith two 130 mm exit windows. These windows, which were 10 meshes high and 45 meshes long, were inserted in the rearmost part of the codend.he results showed that this codend was very efficient in releasing large amounts of undersized fish and the 50% retention length (l50) was farbove the minimum landing size (MLS) for both the analysed species (the MLS for cod is 47 cm, 44 cm for haddock). For cod, the mean l values
50aried between 53.6 and 57.3 cm and the mean selection range (SR) values from 6.8 to 9.3 cm. Haddock was measured during two trials with theean l50 at 50.5 and 50.6 cm; and the mean SR values at 6.3 and 6.0 cm. Total catch weights varied between 0.7 and 6.6 metric tonnes. In some
ases an important effect of catch weights upon the l50 could be detected.2007 Elsevier B.V. All rights reserved.
imop11d
fwTyatrJN
eywords: Exit windows; Selectivity; Codend; Bycatch; Cod; Haddock
. Introduction
The Barents Sea Demersal Fishery targets mainly threepecies, cod (Gadus morhua), haddock (Melanogrammuseglefinus) and saithe (Pollachius virens); with cod represent-ng the highest percentage of the total catch. In the early 1980s,he management of this fishery was based on mesh size reg-lations and controls over the minimum landing size (MLS).ater, new regulations established a surveillance program anduring 1983–1984 it was observed that substantial areas shoulde closed to fishing activities due to the high proportion of under-ized fish in the catches. Diamond-mesh codends were observedo have less effective mesh openings as the catches increasedn size; a situation which revealed the need for improving sizeelection in trawls.
In this context, and as an alternative to ordinary diamond-esh codends, experiments were undertaken using square-mesh
odends and rigid sorting grids that were able to maintain moretable openings in the codend through which escape could occurffectively despite changes in speed, catch sizes, etc. Rigid sort-
∗ Corresponding author. Tel.: +47 77 64 6861; fax: +47 77 64 6020.E-mail address: [email protected] (E. Grimaldo).
bIkcwd2
165-7836/$ – see front matter © 2007 Elsevier B.V. All rights reserved.oi:10.1016/j.fishres.2007.03.005
ng grids were developed in the early 1990s, and in 1997 becameandatory in the Barents Sea for all fish trawl fleets (regardless
f nationality). Despite the promising results with square-meshanels obtained by numerous researchers (Cooper and Hickey,989; Robertson, 1989; Millar and Walsh, 1992; Walsh et al.,992), they were found to be unusable in the Barents Sea mainlyue to problems associated with red fish (Sebastes spp.).
Experiments with the ‘Swedish design’ of exit windows, per-ormed in the Baltic Sea, showed that the selectivity of these netsas considerably higher than normal codends (Larsson, 1994;schernij et al., 1996). These exit windows were made of stiffarn and inserted in the side of the codend. Similar results werelso obtained by inserting square-mesh panels in the sides ofhe codend (the ‘Danish design’) (Lowry et al., 1995). As aesult, these types of codends were adopted into legislation inune, 1995 by the European Community (EC Council regulationo. 3362/94, 20, December 1994) and for the whole Baltic Seay the International Baltic Sea Fishery Commission (IBSFC).n regulations adopted in 2002, a single top window (alsonown as the BACOMA window) replaced the side window
odend. The BACOMA codend consists of a large square-meshindow placed in the upper panel of the codend (for furtheretails, see Tschernij and Suuronen, 2002; and Dahm et al.,003).
3 es Re
mhRm(ama8aMnosg
esDsto
2
‘bgo1
afi(bgswTettthcw
msconw
2
cbstItmmprm
2
ddpipcp5tttwnwitaw
TG
C
1234
10 E. Grimaldo et al. / Fisheri
In the North Sea fisheries for whiting, haddock and cod,any experiments with exit-windows and square-mesh codends
ave been performed since the early 1980s (Robertson, 1983;obertson and Stewart, 1988). During the 1990s, the experi-ents carried out by Hillis et al. (1991), Ulmstrand and Larsson
1991), Briggs (1992) Thorsteinsson (1992) and Madsen etl. (1999) led to the use of square-mesh panels becomingandatory in 2000 for Scottish-registered demersal trawlers
nd in 2001 for all other EC trawlers (EC Council regulation50/1998). Further experiments with escape windows (Zuur etl., 2001; Graham and Kynoch, 2001; Graham et al., 2003, 2004;adsen and Staehr, 2005; O’Neill et al., 2006) have focused
ot only on measuring the codend selectivity of these typesf codends, but also on comparing their selectivity with otherelection systems, such as diamond-mesh codends and sortingrids.
The objective of the present study is to use this vast knowl-dge of developing exit windows to search for an alternativeystem to the selection grids exclusively used in the Barents Seaemersal Fishery. Furthermore, this study aims to document the
election properties of codends fitted with exit windows in rela-ion to cod and haddock fishing, and to assess the consistencyf these properties over time.
. Materials and methods
Experiments were performed on board the research trawlerJan Mayen’ (63.80 m LOA, 4080 HP) during four cruisesetween December 2003 and March 2006 (Table 1). The fishingrounds were along the coast of Troms and Finnmark and westf Bear Island (northern Norway) at depths that varied between15 and 407 m.
Two types of trawls were used for the experiments. One wastrouser trawl Alfredo 5, with a 37.70 m headline, 21.30 m
shing line, and a stretched circumference of 53 m per body342 meshes of 155 mm). The wings and the two bellies wereuilt of polyethylene (PE) with a mesh size of 155 mm. Theround gear was composed of 53 cm rubber discs, and 53 cmteel bobbins, and the sweeps were 60 m long. The otter boardsere Thyborøn T2, 10 m2 in area and weighing 3000 kg each.he other trawl was a modified trouser trawl Alfredo 5 builtntirely of 80 mm-sized mesh to prevent the escape of fishhrough the meshes of the trawl belly or extension sections. Thewine diameters were recalculated in order to keep the same
rawl solidity as in the earlier experiments. This modified trawlad a 37.70 m headline, a 21.30 m fishing line, and a stretchedircumference of 52.2 m per body (653 meshes of 80 mm). Theings and the two bellies were built of polyethylene (PE) with a2
h
able 1eneral information about the four cruises
ruise Date Codend Depth (m
December 2003 155 mm exit windows 290–400January–February 2005 130 mm exit windows 170–220November–December 2005 130 mm exit windows 220–380February–March 2006 130 mm exit windows 115–407
search 85 (2007) 309–319
esh size of 80 mm. The ground gear and the otter board wereimilar to those of the trouser trawl Alfredo 5. Similarly, twoodends (experimental and control) were constructed entirelyf double 6.0 mm diameter braided-nylon twine with a 135 mmominal mesh size. They had a circumference of 60 meshes andere 59.5 meshes long (Table 2).
.1. Experiments
Four cruises were performed during the research period: Inruise 1, the exit windows were made of single 4 mm diameterraided-polyethylene (PE) twine, with a 155 mm nominal meshize, 6 meshes high and 45 meshes long, and were mounted withhe maximum opening (with a hanging ratio of 0.70) (Fig. 1).n cruises 2–4, the exit windows were made of 6 mm diame-er single-braided-nylon (PA) twine, with a 130 mm nominal
esh size, 10 meshes high and 45 meshes long. In addition, theireshes were coated with a special plastic bonding in order to
rovide some stiffness and they were mounted with a hangingatio of 0.70. The actual mesh size of these exit windows waseasured using an ICES gauge (Table 2).
.2. Data collection
All data were collected using the trouser trawl methodescribed by Wileman et al. (1996). Assuming no length depen-ency on which of the two codends a fish enters, given it hasassed into the trawl mouth, this method ensures that more sim-lar size distributions enter the two codends. This method is alsoreferred because there is no masking effect as in the coveredodend method, and because of its simple rigging system in com-arison with the more complex arrangements of twin trawls. A5 mm braided-polyethylene-twine inner net was inserted insidehe control codend to obtain information about the length dis-ribution of the fish which entered the trawl. After each tow,he catches of the experimental codend and the control codendere emptied and sorted by species. Fish were measured to theearest cm. Large catches of cod (over 600 fish in each codend)ere sub-sampled. Underwater observations were recorded dur-
ng experiments 1, 2 and 4 to observe the escape behaviour ofhe fish inside the experimental codends. The camera used wasSimrad OE 1324, connected to a self-contained recorder unitith a DV tape and batteries.
.3. Statistical analysis
The statistical analysis of data from selectivity experimentsas, since the early 1990s, commonly been conducted by a two-
) Towing speed (knots) Towing time (hours) Number of hauls
3 2–3 93 2–3 403 2–3 163 2–3 11

E. Grimaldo et al. / Fisheries Research 85 (2007) 309–319 311
Table 2Specification of the gears which were used during the four cruises
Cruise 1 Cruise 2 Cruise 3 Cruise 4
TrawlType Trouser trawl Alfredo 5 Trouser trawl Alfredo 5 Trouser trawl Alfredo 5 Trouser trawl Alfredo 5Circumference 342 meshes per body 342 meshes per body 342 meshes per body 653 meshes per bodyNominal mesh size 155 mm 155 mm 155 mm 80 mmFishing line 21.30 m 21.30 m 21.30 m 21.30 mHead line 37.70 m 37.70 m 37.70 m 37.70 m
CodendMaterial 6 mm double braided
twine PA6 mm double braidedtwine PA
6 mm double braidedtwine PA
6 mm double braidedtwine PA
Nominal mesh size 135 mm 135 mm 135 mm 135 mmLength 59.5 meshes 59.5 meshes 59.5 meshes 59.5 meshesCircumference 60 meshes 60 meshes 60 meshes 60 meshes
Exit windowsMaterial 4 mm single braided
twine PE6 mm single braidedtwine PA
6 mm single braidedtwine PA
6 mm single braidedtwine PA
Nominal mesh size 155 mm 130 mm 130 mm 130 mmActual mesh size (Mean ± S.D.)a 153.03 ± 1.85 131.8 ± 2.8 mm b 128 ± 3.2 mmLength 45 meshes 45 meshes 45 meshes 45 meshesHeight 6 meshes 10 meshes 10 meshes 10 meshesHanging ratio 0.7 0.7 0.7 0.7
= 20
sfimlpcm
hr
Fss
Floats None 4 (0
a Measured with a ICES mesh gauge.b No measurements were performed.
tep approach. The first step reduces the catch-at-length data bytting selectivity curves for individual hauls using the SELECTethod (Millar, 1992). The second step employs a variant of a
inear mixed effects model (Laird and Ware, 1982), in which thearameter estimates are used as observations and the estimatedovariances act as known variances. This is the so-called Fryer’sodel of between-haul variance (Fryer, 1991). Covariates at the
2
i
ig. 1. Diagram showing the experimental codends fitted with (a) two 155 mm exithows the difference in the mesh openings of the exit window panel and the 135 mtretched by 4 tonnes of tension, the exit window mesh remains wide open and free o
.32 cm) 4 (0 = 20.32 cm) 4 (0 = 20.32 cm)
aul level (e.g. catch weight) can be introduced assuming a linearelationship with the parameters.
.4. Individual hauls
The conditional probability ϕ(l) for a length l fish to be caughtn the test codend, given it has been caught in the combined trawl,
window panels and (b) two 130 mm exit windows panels. (c) Photograph thatm diamond mesh codend. Note that despite the fact that the codend is beingf tension (Source: http://www.calsen-net.dk/).
3 es Re
ip
c
(
(
p((
g
Fe(
mgohtefitoae
2
cn
h((pso
ec
ttttottpe
3
Eptiiocbsc
3
uahtilcbewTmnitsHs
12 E. Grimaldo et al. / Fisheri
s described by means of the retention probability r(l) and a splitarameter p.
ϕ(l) = pr(l)
1 − p + pr(l)
The split parameter reflects the fishing intensity of the testodend relative to the control codend.
The most common choice of the selectivity function is theinverse) logit:
r(l; α, β) = exp(α0 + α1l)
1 + exp(α0 + α1l)
Other choices are available including asymmetric curvesMcCullagh and Nelder, 1989).
For the purpose of estimating selectivity it is convenient toarameterise the curve directly by the selectivity parametersl50, SR) rather than using the generic parameterisation aboveMadsen and Holst, 2002):
r(l; α, β) = exp(log(9)((l − l50)/SR))
1 + exp(log(9)((l − l50)/SR))
Model checking is achieved by residual plots and standardoodness-of-fit statistics.
More detailed descriptions of the SELECT method andryer’s model of between-haul-variation are well describedlsewhere in the literature. See, for example Millar and Fryer1999).
The codends considered here are fitted with exit windows,ade of a different material than the codends and with a different
eometry. The effective selection process is therefore composedf two distinct selective devices. O’Neill et al. (2006) describedow the SELECT method could be amended to fit separate selec-ivity estimates for the codend and the panel. It is, however, ourxperience that this is generally not possible, due to lack of suf-cient contrast between the devices and the binomial errors in
he data. Since Fryer’s model of between-haul-variation reliesn estimates from individual hauls, the method of differenti-ting selectivities implies considerable discard of data whenstimating the mean selectivity.
.5. Mean selectivity
The selectivity estimates (l50,i, SRi) from haul i (in any givenruise) are now considered an observation from a bi-variateormal distribution:
(l50,i, SRi)T ∼ N2((l50, SR)T ; Ri + D)
Here Ri and D denote the within haul i and between-aul variation, respectively. The mean selectivity parametersl50,SR) can be estimated by use of the EC Web program
http://www.constat.dk/ecwebsd). The Ri matrix can be appro-riately replaced by the estimated Ri, obtained from the firsttep of the analysis. This describes the essence of Fryer’s modelf between-haul-variation. He also demonstrated how it easilytrSo
search 85 (2007) 309–319
xtends to include covariates. Here, we have considered the totalatch weight (W).
l50 = l50,0 + β1W
SR = SR0 + β2W
The bulk catch affects the geometry of the mesh openings inhe codend during the catch process and consequently is likelyo affect its selective properties. This may not be evident fromhe data if the bulk catch is taken during a short time towardshe end of the haul. A continuous catch of fish over the durationf the haul will, however, likely imply a continuous change ofhe selectivity during the haul. Herrmann et al. (2007) addressedhis issue by using simulations. Models using catch weight havereviously been considered by many other authors, e.g. Madsent al. (1999, 2002).
. Results
A total of 76 hauls were carried out during the research period.ight hauls were not included in the analysis due to technicalroblems with the gear. Out of the remaining hauls, six failedo converge. The problem of non-convergence is a well-knownssue for paired-gear experiments and relates to the non-linearitynduced by the split parameter. The six hauls caught a totalf 5.9 metric tonnes of cod and 0.9 metric tonnes of haddockorresponding to 4.6 and 5.6%, respectively, of the total num-ers caught in all valid hauls. The remaining 62 hauls providedelectivity information for cod and 31 of them for haddock. Theatches of these hauls ranged from 0.7 to 6.6 metric tonnes.
.1. Analysis of individual hauls
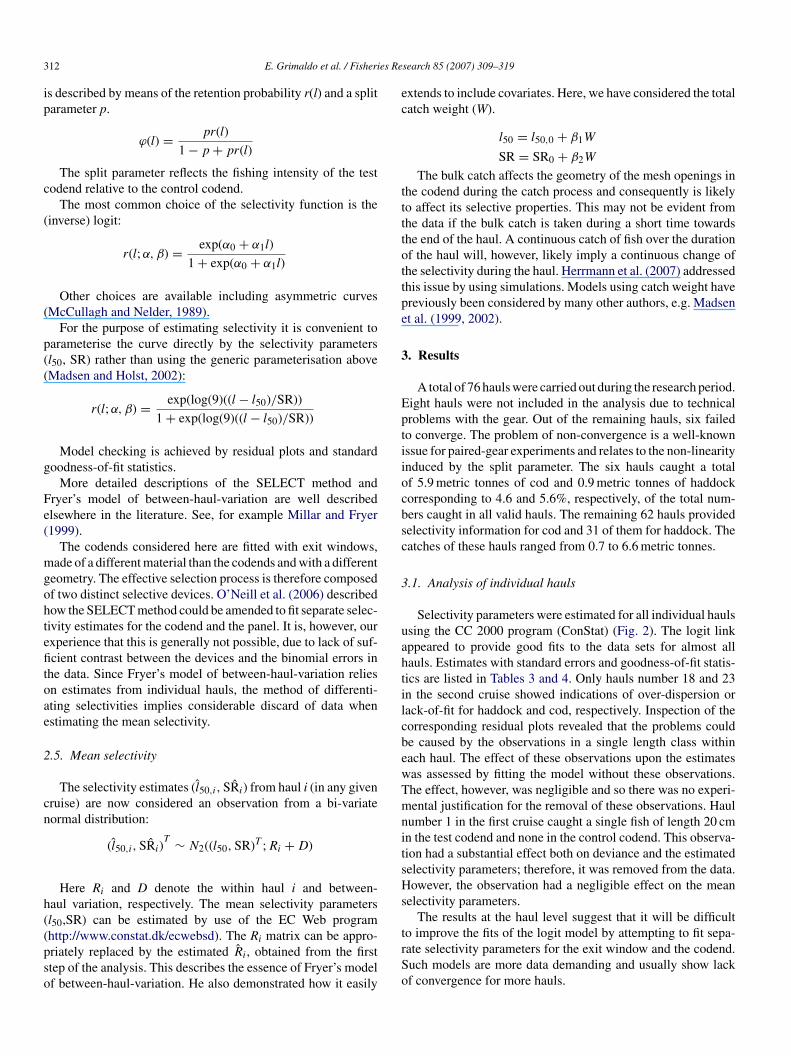
Selectivity parameters were estimated for all individual haulssing the CC 2000 program (ConStat) (Fig. 2). The logit linkppeared to provide good fits to the data sets for almost allauls. Estimates with standard errors and goodness-of-fit statis-ics are listed in Tables 3 and 4. Only hauls number 18 and 23n the second cruise showed indications of over-dispersion orack-of-fit for haddock and cod, respectively. Inspection of theorresponding residual plots revealed that the problems coulde caused by the observations in a single length class withinach haul. The effect of these observations upon the estimatesas assessed by fitting the model without these observations.he effect, however, was negligible and so there was no experi-ental justification for the removal of these observations. Haul
umber 1 in the first cruise caught a single fish of length 20 cmn the test codend and none in the control codend. This observa-ion had a substantial effect both on deviance and the estimatedelectivity parameters; therefore, it was removed from the data.owever, the observation had a negligible effect on the mean
electivity parameters.The results at the haul level suggest that it will be difficult
o improve the fits of the logit model by attempting to fit sepa-ate selectivity parameters for the exit window and the codend.uch models are more data demanding and usually show lackf convergence for more hauls.
E. Grimaldo et al. / Fisheries Research 85 (2007) 309–319 313
tted l
3
stpt
tp
Fig. 2. Individual selection curves for cod and haddock (do
.2. Mean selectivity
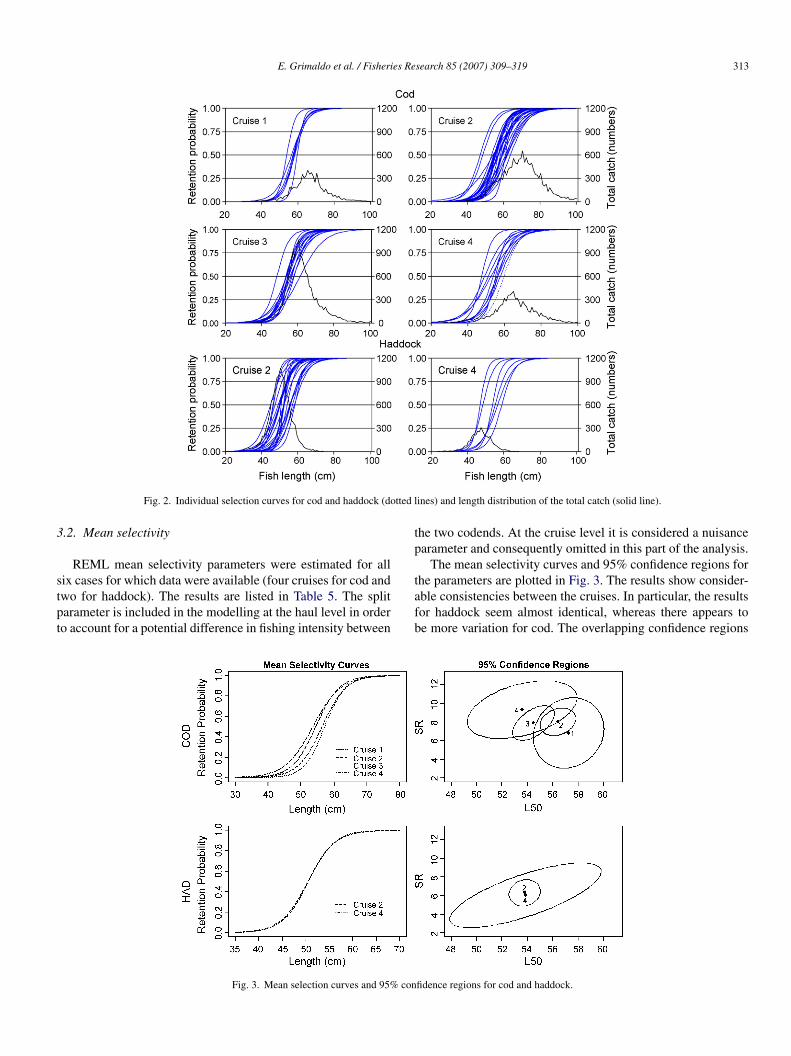
REML mean selectivity parameters were estimated for all
ix cases for which data were available (four cruises for cod andwo for haddock). The results are listed in Table 5. The splitarameter is included in the modelling at the haul level in ordero account for a potential difference in fishing intensity betweentafb
Fig. 3. Mean selection curves and 95% con
ines) and length distribution of the total catch (solid line).
he two codends. At the cruise level it is considered a nuisancearameter and consequently omitted in this part of the analysis.
The mean selectivity curves and 95% confidence regions for
he parameters are plotted in Fig. 3. The results show consider-ble consistencies between the cruises. In particular, the resultsor haddock seem almost identical, whereas there appears toe more variation for cod. The overlapping confidence regionsfidence regions for cod and haddock.

3 es Re
scvis(t
dwtnw
3
bef0uT
123
wuwtcsamam
3
wtoeth(ac
4
s
pdoboitt(
tbbmpiet
(ai2oara
fFs
cd(tohaKc(dTwatcatpls
14 E. Grimaldo et al. / Fisheri
how, however, that no pairwise significant differences (p > 0.05)an be detected. If all confidence regions for cod had the sameolume as the one for cruise 2, several pairs would be disjointed,.e. show significant differences (p < 0.05), though at a relativelymall scale. The number of hauls employed varied between 6haddock, cruises 4) and 29 (cod cruise 2). This largely explainshe differences in the sizes of the confidence regions.
Although no significant difference (p > 0.05) could beetected, it is noted that the estimates of the l50 tend to decreaseith time (cruise index) and similarly that the estimated SRs
end to increase. This may be a consequence of the reduction,early 4 mm, of the actual mesh size of the exit windows thatas observed between cruises 2 and 4 (Table 2).
.3. Mean selectivity depending on catch weight
The effect of catch weight upon the selectivity was assessedy fitting models which included this as a covariate. Significantffects on the l50 could be detected for cod in cruises 3 and 4 andor haddock in cruise 4, with p-values for the weight effect of.03, 0.008 and 0.01, respectively. No effect could be detectedpon the SR. Estimates for these models are listed in Table 6.he l50 estimates are given by:
. Cod, Cruise 3 l50 = 52.5 + 1.42W
. Cod, Cruise 4 l50 = 60.9 − 3.79W
. Haddock, Cruise 4 l50 = 58.9 − 24.1W
here W is the total catch weight in metric tonnes for the partic-lar species. The left column of Fig. 4 plots the regression linesith 95% confidence bands for the effect of catch weight upon
he l50. It is noticeable that the l50 is positively correlated withatch weight for cod in cruise 3 whereas the two other caseshow negative correlation. The direction in the latter two is ingreement with the results found by Madsen et al. (1999). Theiddle and right columns of Fig. 5 plot the selectivity curves
nd corresponding 95% confidence regions for the minimum,edian and maximum observed catch weights.
.4. Underwater observations
Underwater observations showed that the exit-window panelsere slackened and that their mesh remained wide open (during
he whole towing process) while other parts of the codend builtf diamond mesh were fairly closed (Fig. 5). In addition, thexit-window panels were also seen to flutter constantly; a situa-ion that provoked an immediate escape response on undersizedaddock and that did not change even in poor light conditionsFig. 6). Cod however, did not display the same escape behaviours haddock did, and they were observed to line up and swimalmly in the centre of the codend.
. Discussion
The closure of meshes in the diamond-mesh codends as a con-equence of increasing catch size becomes considerably less of a
imIe
search 85 (2007) 309–319
roblem when using the exit-windows codend, because the win-ow meshes remain open even when there is increasing tensionn the codend. The diamond meshes of the lower panel and thoseetween the two exit windows hold all the tension generated, notnly by the accumulation of fish inside the codend but also dur-ng haul back. This is a qualitative advantage when comparedo the Bacoma codend, which was observed to suffer deforma-ions due to the concentration of forces in the longitudinal twinesTschernij and Suuronen, 2002).
The four cruises showed considerably consistent results forhe selectivity parameter estimates. Although it was not possi-le to detect significant differences at a 5% significance level,etween the estimates from any of the trials, the experimentsay suggest that selectivity of codends is not necessarily a static
roperty of a gear but may change with wear and use. For codn particular, we found indications of a trend with decreasing l50stimates and corresponding increases in SR estimates duringhe course of the 4-year period.
This phenomenon was also observed by Tschernij et al.1996) when working with ‘Swedish windows’ and theyttributed the poorer selection to extensive use. In these exper-ments the l50 for cod dropped 3.7 cm and the SR increased.5 cm from 2003 to 2006. It appears that the progressive lossf the panel’s stiff plastic coating causes the twines to get softernd hold more particles; over time this effect causes a gradualeduction in the nominal mesh size of the exit windows, and thusreduction of their selective properties.
Surprisingly, the selectivity estimates for haddock obtainedrom the experiments in February 2005 and the experiments inebruary 2006 are virtually identical. A dynamic change in theelective properties may therefore be species-dependent.
The potential effect of catch size upon the selectivity ofodends has been addressed by many researchers and with veryiverse conclusions. Madsen et al. (1998) and O’Neill et al.2006), who considered selectivity for cod and haddock, respec-ively, found that catch size had a weak effect or no effect at alln the l50 or SR values. However, they had too few hauls withigh catches to make any firm conclusions. In contrast, Madsennd Moth-Poulsen (1994), Erickson et al. (1996), O’Neill andynoch (1996), and Madsen et al. (1999) found an effect of
atch size when using escape panels. Tschernij and Suuronen2002) also observed a considerable catch-size effect with stan-ard diamond-mesh codends but not with the window codends.he findings in the present work are also not consistent. Catcheight had an effect in three out of six cases. One case showedpositive correlation between catch weight and l50, whereas
he last two cases showed a negative correlation. It seems that aatch effect starts to appear when the catch increases to the pointt which the area of the windows is drastically reduced. Whenhe escape windows are fully covered with fish, the selectivityrocess is transferred to the diamond mesh and the codends actike a normal diamond-mesh codend. Models including catch-ize effects are mainly useful in providing conceptual insights
nto the selectivity mechanism. For management purposes suchodels are less applicable, when considered as regressions.t may, however, improve the use of gear selectivity in fish-ries management if the regression models are combined with
E. Grimaldo et al. / Fisheries Research 85 (2007) 309–319 315
Table 3SELECT estimates of l50 and SR with standard errors and goodness-of-fit statistics which were calculated for cod during the four cruises
Species Cruise Haul l50 SR Goodness of fit Weight
Est SE Est SE Deviance DOF p-value
Cod 1 1 53.4 −2.4 5.0 −3.1 40.0 41 0.515 0.541 2 58.2 −1.8 8.4 −2.0 62.3 53 0.180 0.941 3 56.0 −3.2 9.7 −4.4 40.1 47 0.753 1.261 4 57.6 −1.5 6.8 −2.1 66.0 54 0.127 1.801 5 59.0 −1.5 3.8 −1.9 40.0 51 0.868 0.621 7 56.8 −1.4 7.7 −2.2 41.4 54 0.896 2.941 8 57.2 −1.6 7.1 −2.2 50.1 54 0.624 1.152 1 55.1 −1.6 7.2 −2.1 45.5 51 0.692 1.362 2 56.6 −3.4 11.6 −4.5 51.7 47 0.297 0.712 3 58.9 −2.8 8.8 −3.6 56.8 52 0.300 0.922 4 46.5 −4.0 8.5 −5.6 60.4 50 0.150 0.752 5 61.0 −3.0 9.8 −3.2 31.4 49 0.976 0.782 6 55.6 −2.2 7.1 −3.4 40.5 50 0.830 1.002 8 58.4 −1.8 10.1 −2.3 72.4 56 0.069 2.942 9 56.6 −2.5 10.6 −3.7 54.0 58 0.624 1.762 10 55.0 −4.2 9.8 −7.6 58.0 51 0.233 0.902 11 54.2 −3.1 11.1 −4.5 53.3 48 0.278 0.862 12 58.4 −2.4 8.1 −3.3 42.9 51 0.782 1.342 13 54.2 −2.9 8.8 −4.0 40.7 45 0.654 0.692 18 54.3 −3.0 8.9 −4.1 42.2 45 0.593 0.682 19 56.2 −2.8 10.9 −3.6 60.5 53 0.225 1.482 20 54.0 −2.3 9.4 −3.6 33.9 56 0.992 1.912 21 60.5 −3.3 12.0 −4.4 51.3 58 0.720 1.692 22 61.6 −3.5 12.5 −3.8 62.5 58 0.321 2.032 23 61.4 −3.3 11.6 −4.1 81.4 59 0.028 1.692 24 53.7 −4.6 16.2 −9.0 59.6 54 0.280 1.482 25 54.9 −1.6 7.4 −2.2 69.3 57 0.127 1.912 26 52.9 −2.5 9.2 −3.6 55.8 59 0.595 1.362 27 59.0 −2.9 12.1 −3.5 46.3 56 0.820 1.292 28 48.0 −4.9 9.0 −5.4 37.6 46 0.807 1.072 29 63.2 −2.4 10.9 −2.7 39.4 52 0.901 1.682 30 56.5 −1.2 6.3 −1.7 53.0 51 0.397 3.632 32 54.6 −2.6 9.6 −3.8 56.1 51 0.290 1.042 33 55.6 −1.6 7.2 −2.1 59.6 53 0.247 1.592 39 60.4 −1.6 4.7 −1.8 59.8 50 0.162 1.162 40 57.7 −1.3 6.7 −1.9 62.6 53 0.172 3.013 1 54.0 −1.8 8.1 −3.0 66.6 51 0.070 1.353 9 53.2 −2.5 8.3 −4.7 41.8 49 0.759 1.023 3 48.1 −2.6 7.4 −3.2 53.1 51 0.394 1.263 4 57.4 −8.0 10.7 −11.4 38.2 43 0.678 0.883 5 53.3 −3.1 8.5 −7.7 36.7 47 0.861 0.873 6 53.1 −1.6 7.9 −2.6 53.4 51 0.383 1.323 7 53.5 −3.6 11.4 −5.7 41.2 49 0.778 0.853 8 56.6 −1.9 8.6 −3.1 56.8 53 0.337 1.153 9 55.0 −4.0 12.0 −7.7 43.5 42 0.409 1.083 10 54.0 −1.0 5.4 −1.5 39.2 51 0.885 0.853 11 61.0 −3.0 14.5 −2.9 64.8 55 0.172 2.663 12 55.8 −2.2 10.2 −2.8 32.8 53 0.987 1.353 13 54.3 −1.3 7.8 −1.7 41.4 53 0.875 2.183 14 54.6 −1.8 9.5 −2.2 51.1 52 0.508 1.243 15 57.7 −1.3 8.3 −1.6 48.9 53 0.634 2.844 1 47.6 −1.6 6.4 −1.8 80.4 69 0.165 3.234 9 56.5 −2.8 8.7 −3.7 63.4 57 0.260 0.744 3 56.5 −3.8 11.2 −3.7 54.8 66 0.836 0.854 4 51.2 −3.5 12.8 −4.5 47.1 63 0.933 1.854 5 49.2 −2.7 12.0 −3.6 46.7 69 0.982 2.504 6 52.7 −3.3 15.0 −4.1 53.7 70 0.926 3.024 7 55.2 −2.5 6.2 −4.4 43.5 41 0.364 1.404 8 55.8 −2.9 10.3 −4.1 52.6 52 0.450 1.414 9 57.8 −4.1 11.1 −6.6 47.7 52 0.643 2.054 10 59.8 −1.9 9.4 −2.3 54.9 53 0.404 1.854 11 53.9 −2.7 8.8 −3.4 62.2 61 0.433 1.55
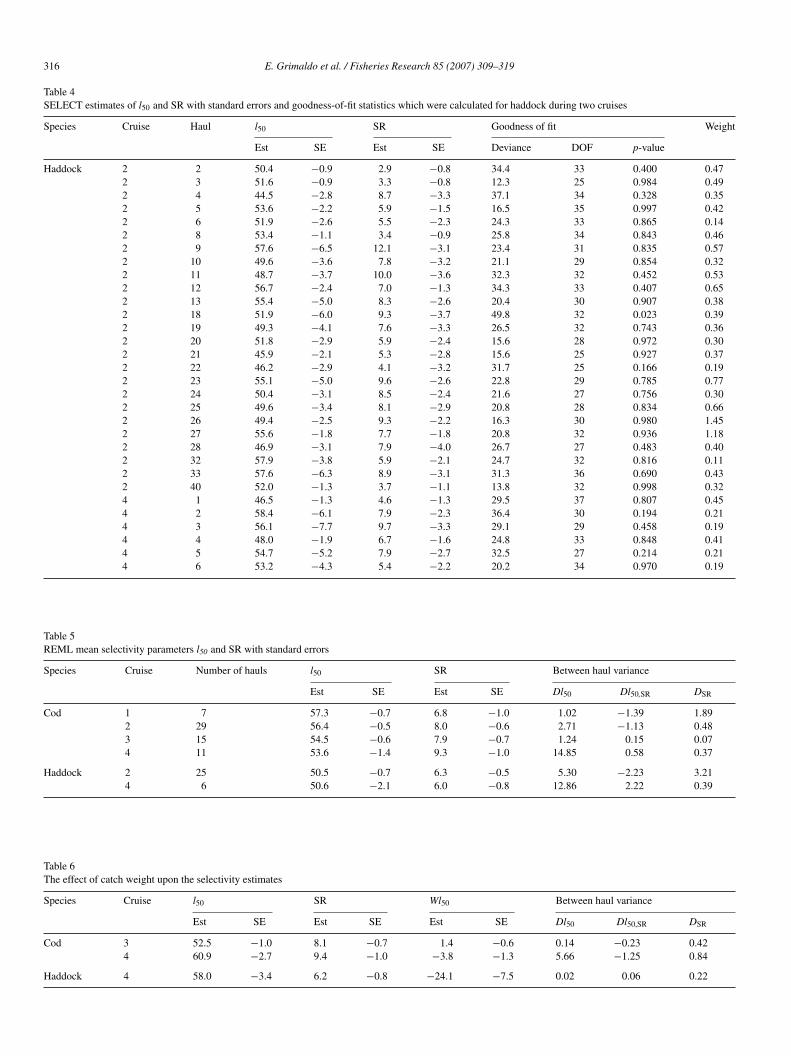
316 E. Grimaldo et al. / Fisheries Research 85 (2007) 309–319
Table 4SELECT estimates of l50 and SR with standard errors and goodness-of-fit statistics which were calculated for haddock during two cruises
Species Cruise Haul l50 SR Goodness of fit Weight
Est SE Est SE Deviance DOF p-value
Haddock 2 2 50.4 −0.9 2.9 −0.8 34.4 33 0.400 0.472 3 51.6 −0.9 3.3 −0.8 12.3 25 0.984 0.492 4 44.5 −2.8 8.7 −3.3 37.1 34 0.328 0.352 5 53.6 −2.2 5.9 −1.5 16.5 35 0.997 0.422 6 51.9 −2.6 5.5 −2.3 24.3 33 0.865 0.142 8 53.4 −1.1 3.4 −0.9 25.8 34 0.843 0.462 9 57.6 −6.5 12.1 −3.1 23.4 31 0.835 0.572 10 49.6 −3.6 7.8 −3.2 21.1 29 0.854 0.322 11 48.7 −3.7 10.0 −3.6 32.3 32 0.452 0.532 12 56.7 −2.4 7.0 −1.3 34.3 33 0.407 0.652 13 55.4 −5.0 8.3 −2.6 20.4 30 0.907 0.382 18 51.9 −6.0 9.3 −3.7 49.8 32 0.023 0.392 19 49.3 −4.1 7.6 −3.3 26.5 32 0.743 0.362 20 51.8 −2.9 5.9 −2.4 15.6 28 0.972 0.302 21 45.9 −2.1 5.3 −2.8 15.6 25 0.927 0.372 22 46.2 −2.9 4.1 −3.2 31.7 25 0.166 0.192 23 55.1 −5.0 9.6 −2.6 22.8 29 0.785 0.772 24 50.4 −3.1 8.5 −2.4 21.6 27 0.756 0.302 25 49.6 −3.4 8.1 −2.9 20.8 28 0.834 0.662 26 49.4 −2.5 9.3 −2.2 16.3 30 0.980 1.452 27 55.6 −1.8 7.7 −1.8 20.8 32 0.936 1.182 28 46.9 −3.1 7.9 −4.0 26.7 27 0.483 0.402 32 57.9 −3.8 5.9 −2.1 24.7 32 0.816 0.112 33 57.6 −6.3 8.9 −3.1 31.3 36 0.690 0.432 40 52.0 −1.3 3.7 −1.1 13.8 32 0.998 0.324 1 46.5 −1.3 4.6 −1.3 29.5 37 0.807 0.454 2 58.4 −6.1 7.9 −2.3 36.4 30 0.194 0.214 3 56.1 −7.7 9.7 −3.3 29.1 29 0.458 0.194 4 48.0 −1.9 6.7 −1.6 24.8 33 0.848 0.414 5 54.7 −5.2 7.9 −2.7 32.5 27 0.214 0.214 6 53.2 −4.3 5.4 −2.2 20.2 34 0.970 0.19
Table 5REML mean selectivity parameters l50 and SR with standard errors
Species Cruise Number of hauls l50 SR Between haul variance
Est SE Est SE Dl50 Dl50,SR DSR
Cod 1 7 57.3 −0.7 6.8 −1.0 1.02 −1.39 1.892 29 56.4 −0.5 8.0 −0.6 2.71 −1.13 0.483 15 54.5 −0.6 7.9 −0.7 1.24 0.15 0.074 11 53.6 −1.4 9.3 −1.0 14.85 0.58 0.37
Haddock 2 25 50.5 −0.7 6.3 −0.5 5.30 −2.23 3.214 6 50.6 −2.1 6.0 −0.8 12.86 2.22 0.39
Table 6The effect of catch weight upon the selectivity estimates
Species Cruise l50 SR Wl50 Between haul variance
Est SE Est SE Est SE Dl50 Dl50,SR DSR
Cod 3 52.5 −1.0 8.1 −0.7 1.4 −0.6 0.14 −0.23 0.424 60.9 −2.7 9.4 −1.0 −3.8 −1.3 5.66 −1.25 0.84
Haddock 4 58.0 −3.4 6.2 −0.8 −24.1 −7.5 0.02 0.06 0.22

E. Grimaldo et al. / Fisheries Research 85 (2007) 309–319 317
F the efc d max
citta
aieo
(mmeod
Fofl
ig. 4. The left column plots the regression lines with 95% confidence bands forurves and corresponding 95% confidence regions for the minimum, median an
atch landing information. A mean selectivity curve integrat-ng out the catch-size effect will have a different interpretationhan the one presented here. Use of such models needs fur-her investigation and was considered outside the scope of thisrticle.
Underwater observations revealed that the exit windows
ppeared to perform better with haddock when they were flutter-ng. The movement of the exit windows seemed to encourage thescape of the fish by offering them a flexible and continuouslypen mesh. However, when the exit-window panel was tightenedtaaa
ig. 5. Photographs (grabbed video frames) from the codend with two 130 mm exit wf the exit window panels causes a very fast escape response from the haddock, whiloated in order to stretch out the exit window panels without dramatically changing t
fect of catch weight upon l50. The middle and right columns plots the selectivityimum observed catch weights.
by means of tying some floats in their upper part, to make theeshes more stable), fish were more reluctant to pass through theeshes and normally spent more time inside the codend before
scaping. When the exit-window panel was slackened, fish werebserved to pass through relatively quickly. Under these con-itions haddock displayed the most active escaping behaviour
hrough the exit windows. Cod, however, made surprisingly fewctive attempts to swim through the wide-open (window) meshnd remained swimming calmly inside the codend. Tschernijnd Suuronen (2002) also observed similar behaviour and sug-indows. (a) The camera is attached inside the codend facing aft. The flutteringe cod line up and swim calmly in the centre of the codend. (b) The top panel ishe escape of haddock after entering the codend.
318 E. Grimaldo et al. / Fisheries Research 85 (2007) 309–319
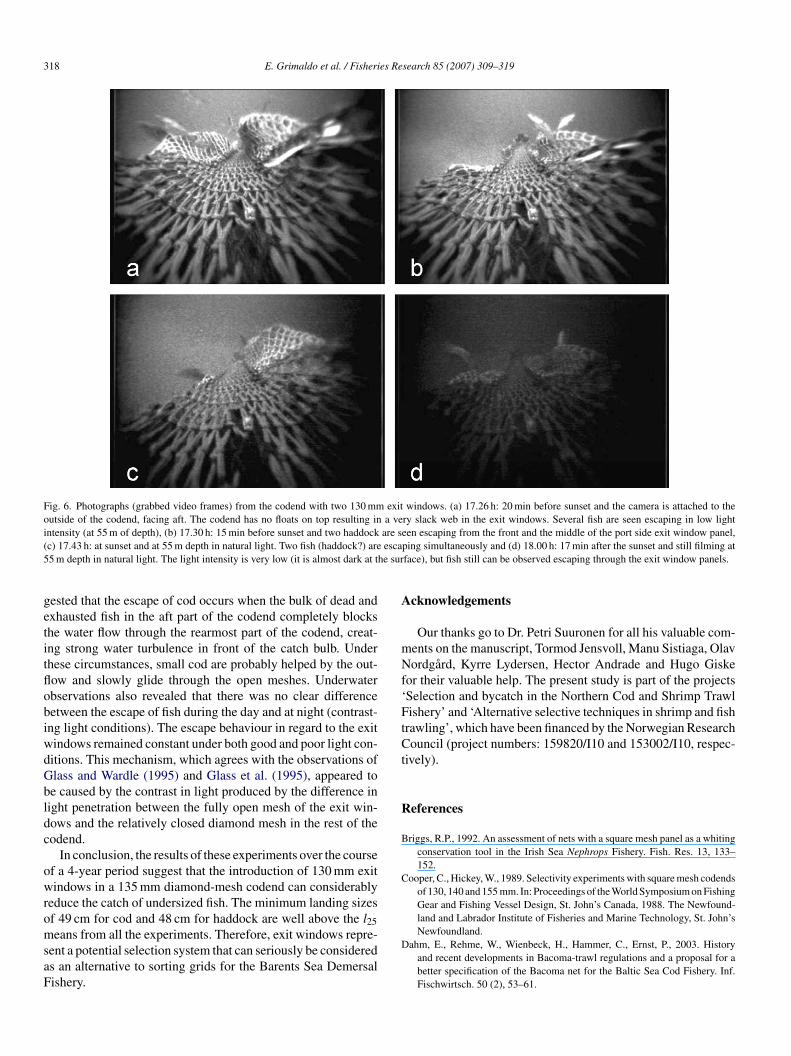
Fig. 6. Photographs (grabbed video frames) from the codend with two 130 mm exit windows. (a) 17.26 h: 20 min before sunset and the camera is attached to theoutside of the codend, facing aft. The codend has no floats on top resulting in a very slack web in the exit windows. Several fish are seen escaping in low lightintensity (at 55 m of depth), (b) 17.30 h: 15 min before sunset and two haddock are seen escaping from the front and the middle of the port side exit window panel,( esca5 he sur
getitflobiwdGbldc
owromsaF
A
mNf‘FtCt
R
B
C
c) 17.43 h: at sunset and at 55 m depth in natural light. Two fish (haddock?) are5 m depth in natural light. The light intensity is very low (it is almost dark at t
ested that the escape of cod occurs when the bulk of dead andxhausted fish in the aft part of the codend completely blockshe water flow through the rearmost part of the codend, creat-ng strong water turbulence in front of the catch bulb. Underhese circumstances, small cod are probably helped by the out-ow and slowly glide through the open meshes. Underwaterbservations also revealed that there was no clear differenceetween the escape of fish during the day and at night (contrast-ng light conditions). The escape behaviour in regard to the exitindows remained constant under both good and poor light con-itions. This mechanism, which agrees with the observations oflass and Wardle (1995) and Glass et al. (1995), appeared toe caused by the contrast in light produced by the difference inight penetration between the fully open mesh of the exit win-ows and the relatively closed diamond mesh in the rest of theodend.
In conclusion, the results of these experiments over the coursef a 4-year period suggest that the introduction of 130 mm exitindows in a 135 mm diamond-mesh codend can considerably
educe the catch of undersized fish. The minimum landing sizesf 49 cm for cod and 48 cm for haddock are well above the l25
eans from all the experiments. Therefore, exit windows repre-ent a potential selection system that can seriously be considereds an alternative to sorting grids for the Barents Sea Demersalishery.
D
ping simultaneously and (d) 18.00 h: 17 min after the sunset and still filming atface), but fish still can be observed escaping through the exit window panels.
cknowledgements
Our thanks go to Dr. Petri Suuronen for all his valuable com-ents on the manuscript, Tormod Jensvoll, Manu Sistiaga, Olavordgard, Kyrre Lydersen, Hector Andrade and Hugo Giske
or their valuable help. The present study is part of the projectsSelection and bycatch in the Northern Cod and Shrimp Trawlishery’ and ‘Alternative selective techniques in shrimp and fish
rawling’, which have been financed by the Norwegian Researchouncil (project numbers: 159820/I10 and 153002/I10, respec-
ively).
eferences
riggs, R.P., 1992. An assessment of nets with a square mesh panel as a whitingconservation tool in the Irish Sea Nephrops Fishery. Fish. Res. 13, 133–152.
ooper, C., Hickey, W., 1989. Selectivity experiments with square mesh codendsof 130, 140 and 155 mm. In: Proceedings of the World Symposium on FishingGear and Fishing Vessel Design, St. John’s Canada, 1988. The Newfound-land and Labrador Institute of Fisheries and Marine Technology, St. John’s
Newfoundland.ahm, E., Rehme, W., Wienbeck, H., Hammer, C., Ernst, P., 2003. Historyand recent developments in Bacoma-trawl regulations and a proposal for abetter specification of the Bacoma net for the Baltic Sea Cod Fishery. Inf.Fischwirtsch. 50 (2), 53–61.
es Re
E
F
G
G
G
G
G
H
H
L
L
L
M
M
M
M
M
M
M
M
M
O
O
R
R
R
T
T
T
U
W
W
E. Grimaldo et al. / Fisheri
rickson, D.L., Perez-Comas, J.A., Pikitch, E.K., Wallace, J.R., 1996. Effects ofcatch size and codend type on the escapement of walleye Pollock (Theragrachalcogramma) from pelagic trawls. Fish. Res. 28, 179–196.
ryer, R.J., 1991. A model of between-haul variation in selectivity. ICESJ. Mar.Sci. 48, 281–290.
lass, C., Wardle, C.S., 1995. Studies on the use of visual stimuli to controlfish escape from codends II. The effect of a black tunnel on the reactionbehaviour of fish in otter trawl codends. Fish. Res. 23, 165–174.
lass, C., Wardle, C.S., Gosden, S.J., Racey, D.N., 1995. Studies on the useof visual stimuli to control fish escape from codends I. Laboratory studieson the effect of a black tunnel on mesh penetration. Fish. Res. 23, 157–164.
raham, N., Kynoch, R.J., 2001. Square mesh panels in demersal trawls: somedata on haddock selectivity in relation to mesh size and position. Fish. Res.49, 207–218.
raham, N., Kynoch, R.J., Fryer, R.J., 2003. Square mesh panels in demersaltrawls: further data relating haddock and whiting selectivity to panel position.Fish. Res. 62, 361–375.
raham, N., O’Neill, F.G., Fryer, R.J., Galbraith, R.D., Myklebust, A., 2004.Selectivity of a 120 mm diamond cod-end and the effect of inserting a rigidor a square mesh panel. Fish. Res. 67, 151–161.
errmann, B., Frandsen, R., Holts, R., O’Neill, F.G., 2007. Simulation-basedinvestigation of the paired-gear method in cod-end selectivity studies. Fish.Res. 83, 175–184.
illis, J.P., McCormick, R., Rihan, D., Geary, M., 1991. Square mesh experi-ments in the Irish Sea. ICES C.M., B58.
aird, N.M., Ware, J.H., 1982. Random-effects models for longitudinal data.Biometrics 38, 963–974.
arsson, P.O., 1994. Selectivity experiments with cod trawls in the Baltic. ICESC.M., B2.
owry, N., Knudsen, L.H., Wileman, D., 1995. Selectivity in Baltic cod trawlswith square mesh windows. ICES C.M., B5.
cCullagh, P., Nelder, J.A., 1989. Generalized Linear Models. Chapman andHall, London.
adsen, N., Holst, R., 2002. Assessment of the cover effect in trawl codendselectivity experiments. Fish. Res. 56, 289–301.
adsen, N., Holst, R., Foldager, L., 2002. Escape windows to improve the sizeselectivity in the Baltic cod trawl fishery. Fish. Res. 57, 223–235.
adsen, N., Moth-Poulsen, T., 1994. Measurements of the selectivity of
Nephrops and demersal roundfish species in conventional and square meshpanels’ codends in the northern North Sea. ICES C.M., B14.adsen, N., Moth-Poulsen, T., Lowry, N., 1998. Selectivity experiments withcodends fished in the Baltic Sea Cod (Gadus morhua) Fishery. Fish. Res.36, 1–14.
Z
search 85 (2007) 309–319 319
adsen, N., Moth-Poulsen, T., Holst, R., Wileman, D., 1999. Selectivityexperiments with escape windows in the North Sea Nephrops (Nephropsnorvegicus) trawl fishery. Fish. Res. 42, 167–181.
adsen, N., Staehr, K.L., 2005. Selectivity experiments to estimate the effect ofescape windows in the Skagerak roundfish fishery. Fish. Res. 71, 241–245.
illar, R.B., 1992. Estimating the size-selectivity of fishing gear by conditioningon the total catch. J. Am. Stat. Assoc. 87, 962–968.
illar, R.B., Fryer, R.J., 1999. Estimating the size-selection curves of towedgears, traps, nets and hooks. Rev. Fish. Biol. Fish. 9, 89–116. Millar, R.B.,Walsh, S.J., 1992. Analysis of trawl selectivity studies with application totrouser trawls. Fish. Res. 13, 205–220.
’Neill, F.G., Kynoch, R.J., 1996. The effect of cover mesh size and codendcatch size on codend selectivity. Fish. Res. 28, 291–303.
’Neill, F.G., Kynoch, R.J., Fryer, R.J., 2006. Square mesh panels in North Seademersal trawls: separate estimates of panel and codend selectivity. Fish.Res. 78, 333–341.
obertson, J.H.B., 1983. Square mesh codend selectivity experiments on whit-ing (Merlangius merlangus (L.)) and haddock (Melanogrammus aeglefinus(L.)). ICES C.M., B25.
obertson, J.H.B., Stewart, P.A.M., 1988. A comparison of size selection ofhaddock and whiting by square and diamond mesh codends. J. Cons. Int.Exp. Mer. 44, 148–161.
obertson, J.H.B., 1989. The effect of trawl codend design on the selectioncharacteristics. In: Proceedings of the World Symposium on Fishing Gearand Fishing Vessel Design, St. John’s Canada, 1988. The Newfoundlandand Labrador Institute of Fisheries and Marine Technology, St. John’s New-foundland.
horsteinsson, G., 1992. The use of square mesh codends in the Icelandic Shrimp(Pandalus borealis) Fishery. Fish. Res. 13, 255–266.
schernij, V., Larsson, P.O., Suuronen, P., Holts, R., 1996. Swedish trials in theBaltic Sea to improve selectivity in demersal trawls. ICES C.M., B25.
schernij, V., Suuronen, P., 2002. Improving trawl selectivity in the Baltic.Nordic Council of Ministers (TemaNord 2002. No. 512).
lmstrand, M., Larsson, P.O., 1991. Experiments with square mesh window inthe top panel of a Nephrops trawl. ICES C.M., B50.
alsh, S.J., Millar, R.B., Cooper, C.G., Hickey, W.M., 1992. Codend selec-tion in American plaice: diamond versus square mesh. Fish. Res. 13, 235–254.
ileman, D.A., Ferro, R.S.T., Fontaine, R., Millar, R.B., 1996. Manual of meth-
ods of measuring the selectivity of towed fishing gears. ICES Coop. Res. Rep.215, 126.uur, G., Fryer, R.J., Ferro, R.S., Tokai, T., 2001. Modelling the size selectivitiesof a trawl codend and an associated square mesh panel. ICES J. Mar. Sci.58, 657–671.