Scientific, Technical and Economic Committee for Fisheries ...
468
Scientific, Technical and Economic Committee for Fisheries (STECF) Report of the SGRST-08-03 Working Group o Fishing Effort Regime Edited by Nick Bailey & Hans-Joachim Rätz EUR 23640 EN - 2008 1 – 5 SEPTEMBER, LYSEKIL, SWEDEN Prepared in draft by SGRST-08-01: 2 -6 JUNE, ISPRA, ITALY
-
Upload
khangminh22 -
Category
Documents
-
view
1 -
download
0
Transcript of Scientific, Technical and Economic Committee for Fisheries ...
Scientific, Technical and Economic
Committee for Fisheries (STECF) Report of the SGRST-08-03 Working Group o
Fishing Effort Regime
Edited by Nick Bailey & Hans-Joachim Rätz
EUR 23640 EN - 2008
1 – 5 SEPTEMBER, LYSEKIL, SWEDEN
Prepared in draft by SGRST-08-01: 2 -6 JUNE, ISPRA, ITALY
-0-
The mission of the Institute for the Protection and Security of the Citizen (IPSC) is to provide research results and to support EU policy-makers in their effort towards global security and towards protection of European citizens from accidents, deliberate attacks, fraud and illegal actions against EU policies European Commission Joint Research Centre Institute for the Protection and Security of the Citizen Contact information Address: TP 051, 21027 Ispra (VA), Italy E-mail: [email protected] Tel.: 0039 0332 789343 Fax: 0039 0332 789658 https://stecf.jrc.ec.europa.eu/home http://ipsc.jrc.ec.europa.eu/ http://www.jrc.ec.europa.eu/ Legal Notice Neither the European Commission nor any person acting on behalf of the Commission is responsible for the use which might be made of this publication. This report does not necessarily reflect the view of the European Commission and in no way anticipates the Commission’s future policy in this area.
Europe Direct is a service to help you find answers to your questions about the European Union
Freephone number (*):
00 800 6 7 8 9 10 11
(*) Certain mobile telephone operators do not allow access to 00 800 numbers or these calls may be billed.
A great deal of additional information on the European Union is available on the Internet. It can be accessed through the Europa server http://europa.eu/ JRC 49085 EUR 23640 EN ISBN 978-92-79-09688-4 ISSN 1018-5593 DOI 10.2788/37579 Luxembourg: Office for Official Publications of the European Communities © European Communities, 2008 Reproduction is authorised provided the source is acknowledged Printed in Italy

-1-
-1-
TABLE OF CONTENTS
1. BACKGROUND: ___________________________________________5
2. TERMS OF REFERENCE: ___________________________________6
3. STECF COMMENTS AND CONCLUSIONS______________________8
4. SUMMARY ______________________________________________11
5. INTRODUCTION __________________________________________14
5.1. Terms of Reference ________________________________________________________14
5.2. Participants_______________________________________________________________17
5.3. Report notations ___________________________________________________________17
5.4. Data call _________________________________________________________________21
5.5. Data policy, formats and availability ___________________________________________22 5.5.1. Data policy _____________________________________________________________22 5.5.2. Nominal fleet specific effort data 2000-2007___________________________________22 5.5.3. Effective fleet specific effort data by rectangle 2003-2007 ________________________30 5.5.4. Fleet specific landing and discard data 2003-2007_______________________________32 5.5.5. Fleet specific landing and effort data 2003-2007 of small boats (<10m) ______________41
5.6. Estimation of fleet specific international landings and discards _____________________44
5.7. Treatment of CPUE data ____________________________________________________48
5.8. Ranking of gears on the basis of contribution to catches ___________________________48
5.9. Summary of effort and landings by ‘unregulated’ gears ___________________________48
5.10. Presentation of under 10m information ________________________________________49
5.11. Presentation of spatial information on effective effort _____________________________49
5.12. Effort management categories and DCR metiers _________________________________50
6. REVIEW OF ANNEX IIA OF REGULATION 40/2008 IN THE CONTEXT OF THE COD RECOVERY PLAN (REGULATION 423/2004 __________________54
6.1. General remarks___________________________________________________________54
6.2. Trends in nominal effort 2000-2007 ___________________________________________59 6.2.1. Trends in nominal effort by derogation and Member State ________________________59 6.2.2. Trend in effort by derogation in management area 2a: Kattegat ____________________81
-2-
6.2.3. Trend in effort by derogation in management area 2b: Skagerrak, North Sea (incl. 2EU), and Eastern Channel 88 6.2.4. Trend in effort by derogation in management area 2c: Irish Sea ___________________104 6.2.5. Trend in effort by derogation in management area 2d: West of Scotland ____________112
6.3. Trend in catch estimates including discards 2003-2007 by derogation and species _____122 6.3.1. Trend in catches by Member State __________________________________________122 6.3.2. Trend in catch estimates in weight and numbers at age by derogation in management area 2a: Kattegat 122 6.3.3. Trend in catch estimates in weight and numbers at age by derogation in management area 2b: Skagerrak, North Sea (incl. 2EU), and Eastern Channel ________________________________138 6.3.4. Trend in catch estimates in weight and numbers at age by derogation in management area 2c: Irish Sea 179 6.3.5. Trend in catch estimates in weight and numbers at age by derogation in management area 2d: West of Scotland 199
6.4. Trends in CPUE of cod, plaice and sole _______________________________________219 6.4.1. General considerations regarding CPUE estimates _____________________________219 6.4.2. Trend in CPUE of cod, sole and plaice by derogation in management area 2a: Kattegat 219 6.4.3. Trend in CPUE of cod, sole and plaice by derogation in management area 2b: Skagerrak, North Sea (incl. 2EU), and Eastern Channel __________________________________________________222 6.4.4. Trend in CPUE of cod, sole and plaice by derogation in management area 2c: Irish Sea 228 6.4.5. Trend in CPUE of cod by derogation in management area 2d: West of Scotland ______232
6.5. Ranked derogations according to relative contributions to cod, sole and plaice catches _235 6.5.1. Ranked derogations according to cod, sole and plaice catches in management area 2a: Kattegat 235 6.5.2. Ranked derogations according to cod, sole and plaice catches in management area 2b: Skagerrak, North Sea (incl. 2EU), and Eastern Channel _________________________________________241 6.5.3. Ranked derogations according to cod, sole and plaice catches in management area 2c: Irish Sea 248 6.5.4. Ranked derogations according to cod catches in management area 2d: West of Scotland 251
6.6. Unregulated gears ________________________________________________________252 6.6.1. Unregulated gears introduction ____________________________________________252 6.6.2. Unregulated gear in management area 2a: Kattegat _____________________________253 6.6.3. Unregulated gear in management area 2b:Skagerrak, North Sea , Eastern Channel ____254 6.6.4. Unregulated gear in management area 2c: Irish Sea_____________________________257 6.6.5. Unregulated gear in management area 2d: West of Scotland______________________259
6.7. Fishing effort and catches (landings and discards) of cod, sole and plaice and associated species of vessels <10m ____________________________________________________________________261
6.7.1. Introduction ___________________________________________________________261 6.7.2. Vessels <10m in management area 2a: Kattegat _______________________________261 6.7.3. Vessels <10m in management area 2b: Skaggerak, North Sea and Eastern Channel____265 6.7.4. Vessels <10m in management area 2c: Irish Sea _______________________________270 6.7.5. Vessels <10m in management area 2d: West of Scotland ________________________272
6.8. Significance of unregulated and under 10m vessel landings in the context of regulated gear landings 275
6.8.1. Significance of Unregulated Gears and Vessels <10m in management area 2a: Kattegat 275 6.8.2. Significance of Unregulated Gears and Vessels <10m in management area 2b: Skaggerak, North Sea and Eastern Channel ____________________________________________________________275 6.8.3. Significance of Unregulated Gears and Vessels <10m in management area 2c: Irish Sea 276 6.8.4. Significance of Unregulated Gears and Vessels <10m in management area 2d: West of Scotland 276
6.9. Spatial distribution patterns of effective fishing effort of trawled gears 2003-2007 _____277 6.9.1. General remarks ________________________________________________________277 6.9.2. Spatial Distribution of Effective Effort in management area 2a: Kattegat ____________277
-3-
6.9.3. Spatial Distribution of Effective Effort in management area 2b:North Sea, Skagerrak & Eastern Channel 283 6.9.4. Spatial distribution patterns of effective fishing effort of trawled gears in management area 2c: Irish Sea 290 6.9.5. Spatial Distribution of Effective Effort in management area 2d: West of Scotland_____298
6.10. Metier versus effort management regime ______________________________________307 6.10.1. Introduction _________________________________________________________307 6.10.2. Irish Sea Metiers _____________________________________________________307 6.10.3. Comparison of Regulated Gears in Annex IIA and Metiers under the Revised DCR in management area 2d: West of Scotland ________________________________________________________316
7. REVIEW OF ANNEX IIB OF REGULATION 40/2008 IN THE CONTEXT OF THE RECOVERY PLAN FOR SOUTHERN HAKE AND NEPHROPS (REGULATION 2166/2005) _________________________________________________324
7.1. General considerations regarding the derogations and special conditions ____________324
7.2. Trend in effort 2000-2007 by derogation and by Member State_____________________325
7.3. Trend in catch estimates 2003-2007 by derogation in management areas 8c and 9a ____329
7.4. Trend in CPUE of hake and Norway lobster____________________________________336
7.5. Ranked derogations according to relative contributions to hake and Nephrops catches _336
7.6. Unregulated gears ________________________________________________________337
7.7. Sampling plans, fishing effort and catches (landings and discards) of hake, Nephrops and associated species of vessels <10m____________________________________________________________337
7.8. Spatial distribution patterns of effective fishing effort of trawled gears 2003-2006 _____338
7.9. References ______________________________________________________________338
8. REVIEW OF ANNEX IIC OF REGULATION 40/2008 IN THE CONTEXT OF THE RECOVERY OF WESTERN CHANNEL SOLE (PROPOSAL COM (2003) 819 FINAL) ____________________________________________________339
8.1. General considerations regarding the derogations and special conditions ____________339
8.2. Trend in effort 2000-2007 by derogation and by Member State_____________________339
8.3. Trend in catch estimates 2003-2007 by derogation in management area 7e ___________345
8.4. Trend in CPUE of sole and plaice ____________________________________________351
8.5. Ranked derogations according to relative contributions to sole catches ______________353
8.6. Unregulated gear in management area 7e _____________________________________354
8.7. Fishing effort and catches (landings and discards) of sole and associated species of vessels <10m 358
8.7.1. General considerations regarding catches of vessels <10m _______________________358 8.7.2. Country specific information of vessels <10m_________________________________358
8.8. Spatial distribution patterns of effective fishing effort of trawled gears 2003-2007 _____361
-4-
9. CELTIC SEA ____________________________________________365
9.1. General _________________________________________________________________365
9.2. Nominal effort ___________________________________________________________372 9.2.1. Gear category and member state ___________________________________________372 9.2.2. Celtic Sea all___________________________________________________________382 9.2.3. VIIfg – part of Celtic Sea _________________________________________________389 9.2.4. Comparison between the two different area designations ________________________393
9.3. Catch estimates in the Celtic Sea area_________________________________________394 9.3.1. Introduction ___________________________________________________________394 9.3.2. Celtic Sea overall area ___________________________________________________405 9.3.3. VIIfg subset of Celtic sea _________________________________________________407
9.4. CPUE __________________________________________________________________410
9.5. Ranked gear categories ____________________________________________________415
9.6. Unregulated/Unallocated gear_______________________________________________416 9.6.1. Celtic Sea all___________________________________________________________416 9.6.2. Unregulated/Unallocated gears in VIIfg______________________________________419
9.7. Under 10m ______________________________________________________________421
9.8. Relative importance of un-regulated and under 10m vessels in overall_______________422
9.9. Spatial presentations ______________________________________________________422
9.10. Conclusion ______________________________________________________________431
Appendix 1: French raw data from DRC Program : Cod landings and discards ______________435
Appendix 2: Analysis of the French métiers ___________________________________________446
Appendix 3: Summary of Spanish effort data (kwdays) in ICES VIa by gear type and mesh size. _459
Appendix 4: SGRST-08-01 AND SGRST-08-03 PARTICIPANTS LIST_____________________460
ANNEX EXPERT DECLARATIONS______________________________462
-5-
SCIENTIFIC, TECHNICAL AND ECONOMIC COMMITTEE FOR FISHERIES (STECF)
STECF COMMENTS ON THE REPORT OF THE SGRST-08-03 WORKING GROUP REPORT
1 – 5 SEPTEMBER, LYSEKIL, SWEDEN
PREPARED IN DRAFT BY SGRST-08-01: 2 -6 JUNE, ISPRA, ITALY
STECF UNDERTOOK THE REVIEW DURING THE PLENARY MEETING
HELD IN BRUSSELS 3-7 NOVEMBER 2008
1. BACKGROUND:
STECF is requested to review the report of the SGRST-08-03 of September 1-5, 2008 (Lysekil) meeting, evaluate the findings and make any appropriate comments and recommendations.
The working group was requested for:
1 – an assessment of fishing effort deployed by fisheries and métiers which are currently affected by fishing effort management schemes defined in Annex II to Regulation (EC) No 40/2008;
2 – an assessment of fishing effort deployed by fisheries and metiers, which will be affected by the extension of the cod recovery plan to the Celtic Sea.

-6-
2. TERMS OF REFERENCE:
1. To provide historical series, as far back in time as possible, according to each of the following fishing areas:
Areas covered by Annex IIA
a. Kattegat (ICES functional unit IIIaS), b. (i) Skagerrak (ICES functional Unit IIIaN), (ii) North Sea (EC waters of ICES
sub-area II and ICES sub-area IV), (iii) Eastern channel (ICES division VIId) c. West of Scotland (ICES division VIa) d. Irish Sea (ICES division VIIa)
Areas covered by Annex IIB
e. Atlantic waters of the Iberian Peninsula (ICES divisions VIIIc and IXa, excluding the Gulf of Cadiz)
Areas covered by Annex IIC
f. Western Channel (ICES division VIIe)
New areas related to the assessment request
g. Celtic Sea (total of ICES divisions VIIb, VIIc, VIIe, VIIf, VIIg, VIIh, VIIj and VIIk and total for the subset of ICES divisions VIIf and VIIg)
The data should also be broken down by
Member State ; regulated gear type and by associated special conditions defined in Annex II
as far as relevant ; unregulated gear types catching
o cod in fishing areas a, b(i), b(ii), b(iii), c, d and g; o sole in fishing areas b(i), b(ii), b(iii) and f; o plaice in fishing areas b(i), b(ii) and b(iii), o hake and Norway lobster in fishing area e
for the following parameters:
a. Fishing effort, measured in kW.days and in GT.days and in number of vessels concerned
b. Catches (landings and discards provided separately) of
-7-
cod, sole and plaice in areas covered by Annex IIA, hake and Norway lobster in areas covered by Annex IIB, sole in areas covered by Annex IIC, cod in the Celtic Sea,
by weight and by numbers at age.
c. Catches (landings and discards provided separately) of
non-cod , non-sole and non-plaice in areas covered by Annex IIA, non-hake and non-Norway lobster in areas covered by Annex IIB, non-sole in areas covered by Annex IIC, non-cod in the Celtic sea catches (landings and discards)
by species, by weight and by numbers at age
d. Catch per unit effort (cpue) of
cod, sole and plaice in areas covered by Annex IIA, hake and Norway lobster in areas covered by Annex IIB, sole in areas covered by Annex IIC, cod in the Celtic Sea.
2. Based on the information compiled under point (1) above, to rank gear types, with and without associated special conditions, on the basis of their contribution to catches expressed both in weight and in number of
cod, sole and plaice in areas covered by Annex IIA, hake and Norway lobster in areas covered by Annex IIB, sole in areas covered by Annex IIC, cod in the Celtic Sea.
3. If relevant data are available, to comment on the quality of estimations on total catches and discards.
4. To assess the fishing effort and catches (landings and discards) of
cod, sole and plaice in areas covered by Annex IIA, hake and Norway lobster in areas covered by Annex IIB, sole in areas covered by Annex IIC, cod in the Celtic sea
and associated species corresponding to vessels of length overall smaller than 10 metres in each fishery, by gear (corresponding to regulated and unregulated gear as defined in Annex II framework) and by Member State according to sampling plans implemented to estimate these parameters.
5. To describe the spatial distribution of the fishing effort deployed both in the Celtic Sea and in the context of Annexes IIA, IIB and IIC to Regulation (EC) No 41/20007, according to data reported in logbooks on the basis of ICES statistical rectangles, with the aim to determine to what extent fishing effort has moved from long distance to

-8-
coastal areas since the implementation of the days-at-sea regime for the first time in 2003 (Annex XVII to Regulation (EC) No 2341/2002).
6. Based on information compiled under point (1), on assessments done under point (2), (3), (4) and (5) and on the definition of métier adopted on level 6 of the matrix developed by the STECF-SGRN and STECF-SGECA Working Groups, to highlight métiers
that are affected by rules defined in fishing effort regimes defined in Annex II for each of the areas a, b(i), b(ii), b(iii), c, d, e and f or
that would be affected by a possible extension of the fishing effort (Annexe IIA) related to the cod recovery plan to the Celtic Sea.
In both cases and for each métier which will have been identified, it is requested to specify economic data which are already available or which should be requested to Member States to allow assessment of any change in fishing effort management schemes related to Annex II.
During this process, it is requested that that STECF-SGRST Working Group attempt
to classify combinations of grouping of fishing gears and special conditions, as currently define in Annex II, according to the typology suggested by the STECF-SGRN.
to notice o when aggregations of combinations may be suggested (e.g. when such
combinations cover a similar métier) o when separation of combinations may be suggested (e.g. when such
combinations cover two different métiers, or more).
3. STECF COMMENTS AND CONCLUSIONS
• STECF endorses the report of SGRST-08-03 and its findings and conclusions.
• STECF-SGRST has during its two meetings updated fleet specific effort and catch (including discard estimates where available) data up to 2007 and provides in this report, results based on an aggregation, which is consistent with the fleet/gear categories defined in Annexes IIA, IIB and IIC to Council Reg. 40/2008. This year data were received from more countries including Spain and preliminary discard rates from France.
• STECF considers that good progress was made by SGRST this year in collating data and preparing advice on the Celtic Sea.
• STECF considers that the overall effect has been an improvement in data quantity and detail provided on a wider range of metrics.
• STECF notes that the assignment of effort and catches according to derogations is based on best expert knowledge, data availability and methods used, and also reflects cooperation with the national control and enforcement
-9-
institutions. In view of the extensive databases created, some data inconsistencies may still exist.
• STECF notes that discard data are still incomplete from some member states and areas. STECF therefore recommends that care is exercised in the use of metrics in the report that involve catch data.
• STECF is unable to comment on the quality of the fleet specific estimates of total catches and discards, mainly due to lack of requested data quality parameters, i.e. numbers of discard samples, fish measured and aged.
• Detailed information on unregulated gears (gears not covered by Annexes IIA, IIB and IIC) was provided by SGRST for the first time. STECF notes that data queries concerning these gears were complex and suggests that if these data are to be used for management purposes in the near future, consultation with the SGRST chair and JRC database support is advised.
• STECF considers that it would be advantageous if closer alignment could be achieved between future effort management regime gear categories and the requirements and rationale of the new Data Collection Regulation. Some progress was made in examining the relationship between metiers and the effort categories as defined in Annexes IIA, B and C of Council Regulation 40/2008 (particularly in the Irish Sea and West of Scotland) and further work is needed.
• STECF supports the view that more permanent future support and maintenance of the STECF database is necessary. Given the repeated experience of late and inconsistent data reports received from Member States, STECF recommends that the task of European fleet-specific data compilations of effort and catch be better institutionalised and conducted on a routine basis. STECF welcomes the Commission’s intent to provide support through JRC. STECF also recommends that the Commission take steps to discuss and agree the future arrangements for access to the database.
-10-
STECF/SGRST-08-03 WORKING GROUP REPORT
ON ASSESSMENT OF FISHING EFFORT REGIME
LYSEKIL, 1-5 SEPTEMBER 2008
PREPARED IN DRAFT BY SGRST-08-01: 2 -6 JUNE, ISPRA, ITALY
This report does not necessarily reflect the view of the European Commission and in no way anticipates the Commission’s future policy in this area
-11-
4. SUMMARY
General remarks
• STECF- SGRST was given an extensive list of TORs to tackle. Good progress was made with most of these although TOR 3 concerning catch data quality was not addressed and preliminary work was conducted on TOR 6.
• STECF-SGRST has during its two meetings updated fleet specific effort and catch (including discard estimates where available) data up to 2007 and provides in this report results based on an aggregation which is consistent with the fleet/gear defined in Annexes IIA, IIB and IIC to Council Reg. 40/2008. This year data were received from more countries including Spain and preliminary discard rates from France. The overall effect was for greater detail and data provided on a wider range of metrics.
• STECF-SGRST was this year asked to collate data and advise on the Celtic Sea and completed a detailed new section in the report.
• STECF-SGRST notes that assignment of derogations is based on best expert knowledge, data availability, and methods used which also reflects cooperation with the national control and enforcement institutions. Specific data errors may exist regarding the extensive data bases and the special knowledge required when dealing with them.
• STECF-SGRST notes that there have been no requests to evaluate national proposals for fleet aggregations.
• STECF-SGRST remains in a poor situation regarding the description of the quality of the fleet specific estimates of total catches and discards, mainly due to lack of requested data quality parameters, i.e. number of discard samples, fish measured and aged.
• STECF-SGRST considers that it would be advantageous if there was closer alignment between the effort management regime and the requirements and rational of the new Data Collection Regulation. Some progress was made in examining the relationship between metiers and the effort categories (particularly in the Irish Sea and West of Scotland) and further work is needed so that appropriate alignment of the schemes can be developed or a basic list of data requirements can be drawn up. Such rationalisations would improve evaluation of fleet effort regulations.
• STECF SGRST had lengthy discussions about future support and maintenance of the STECF database . Given the repeated experience of late and inconsistent data reports received from Member States, STECF-SGRST reiterates its recommendation that the task of European fleet specific data compilations of effort and catch be better institutionalised and conducted on a routine basis. The group favoured an option which retained the responsibility in JRC but with a more transparent and long term sustainable support structure. There was widespread acknowledgemnt of the value of the database and its potential use in other forums is well recognised.
-12-
Review of Annex IIA of Council Reg. 40/2008 in the context of the cod recovery plan (Regulation 423/2004):
• STECF-SGRST notes a high consistency between the updated fleet specific effort and catch data provided in 2008 and the historic information provided in previous years.
• STECF-SGRST notes that the majority of the defined derogations of the management areas remain poorly used. Contrarily, the mixed fishery strategies which lack specific provisions for avoiding cod, plaice or sole catches dominate.
• STECF-SGRST notes that cod avoiding derogations generally contribute low amounts to overall cod catches and are characterised by lower catch rates of cod.
• STECF-SGRST estimated further effort reductions from 2006 to 2007 in most areas regarding most of the cod, plaice and sole sensitive derogations, particularly trawl gears and gill netters. West of Scotland effort appears to have stabilised
• Unregulated gears and under 10m gears make catches of cod, plaice and sole which vary in their significance to overall catches depending on area. For example in the west of Scotland and Irish Sea catches of cod by these groups are small, while in the Kattegat and in the Skagerrak,North Sea, Eastern Channel they are more significant (accounting for up to about 20% ).
• STECF-SGRST continues to observe a high constancy in the catch compositions of the fleets defined in Annex IIA.
• STECF-SGRST notes increased discards of 2 year old cod in 2007 (year class 2005) in the Skagerrak, in the North Sea and to the West of Scotland by the majority of cod sensitive gears.
• STECF-SGRST reiterates its statement that not all areas occupied by the western European cod stocks are covered by the effort regulation in Council Reg. 40/2008 Annex IIA and its recommendation, that all of the areas occupied by the western European cod stocks should be effectively covered by the cod recovery plan and its associated effort measures.
• STECF-SGRST provided much more extensive information on spatial developments in the use of different gears and it is possible to see changes occurring over the time series in a numer of areas and gears. The patterns are often gear specific and variously reflect different member state fisheries, abundance changes of target stocks, economic considerations and effort regulations. In general large scale changes in spatial distribution are not obvious in the time period observed.
Review of Annex IIB of Council Reg. 40/2008 in the context of the recovery plan for Southern hake and Nephrops (Regulation 2166/2005)
• STECF-SGRST notes that there were improvements in fleet specific effort and catch data for Annex IIB with the provision of data from Spain. These data were only provided, however, for trips landing hake. Some inconsistent mesh
-13-
information and data aggregations prevent a precise review of the effects of the defined derogations, nevertheless a more complete picture is emerging.
• Among the regulated gears, bottom trawls contribute the most effort and account for about 57% of hake landings made by regulated gears. Clear trends in the development of effort are not apparent.
• STECF-SGRST notes that the non-regulated gears and gears lacking information have, on average, accounted for over 50% of effort. trammel nets, account for about 5%. The unregulated gears contribute 76% of the overall hake landings but only 4% is taken by trammel nets.
Review of Annex IIC of Council Reg. 40/2008 in the context of the recovery of Western Channel sole (proposal COM (2003) 819 final)
• STECF-SGRST notes that with the exception of discard data there have been significant improvements in the provision of data from member states and the requested fleet specific effort data is now regarded as complete. The lack of discard data continues to impair the estimation of catches and some inconsistent data aggregations prevents a precise review of the effects of the defined derogations.
• STECF-SGRST notes that there are no indications of effort reductions in terms of kW*days, GT*days or number of vessels regarding the sole sensitive derogations.
• STECF-SGRST notes that the non-regulated (effort in days at sea) otter trawl fleet accounts for about 85% of the effort and contributes significantly to the estimates of landings in weight of cod (87%), plaice (24%) and sole (about 34%). In the case of cod, unregulated otter trawl take about 82% of the total
Review of Celtic Sea effort and catches in the context of proposals to extend the cod recovery zone to include cod stocks in this area
• Data were provided by key players in the fisheries operating in the Celtic Sea region. The coverage was considered adequate to make a good start with the process of describing and detailing activities and catches using the framework of the Annex IIA as applied in other areas.
• STECF SGRST was able to provide summaries for two different spatial descriptions. One for the Celtic Sea as a whole and one for ICES areas VIIfg only.
• Trawl effort predominated in both areas and has declined in both areas recently.
• Results suggested that the VIIfg definition of the Celtic Sea accounted for a large part of the cod landings of the area as a whole and that the CPUE of cod in this area is higher than the area as a whole.
• STECF SGRST discussed whether any future extension of the cod recovery plan to apply to the Celtic Sea cod stock should apply to the whole area or would be effective if restricted to the smaller subset area. It was considered that additional information (such information on spawning area or nursery ground) in areas outside VIIfg would be needed to make such a judgement.
-14-
5. INTRODUCTION
The STECF Sub-group on “fishing effort management” held its first annual meeting in ISPRA in Italy, 21-25 May 2007 (SGRST-08-01). As the group was unable to accomplish its tasks due to missing, late and inconsistent data submissions, a follow-up meeting (SGRST 08-03).was called to order in Lysekil, Sweden, 1-5 September 2008. A progress report from the first meeting was presented at the June STECF plenary. This report summarises data presented and the discussions and results of both meetings.
To provide continuing transparency in the scientific advisory process, the meeting was open to observers (sec. 5.2), including stakeholder representatives. One industry representative participated in the first meeting.
5.1. Terms of Reference
By 14 July 2008 the DG Fish of the EU-Commission revised the ToR given to the STECF Subgroup SGRST-08-03. The changes affected the Celtic Sea issues and the revised ToR were disseminated to relevant parties. The overarching request was for: i) an assessment of fishing effort deployed by fisheries and métiers which are currently affected by fishing effort management schemes defined in Annex II to Regulation (EC) No 40/2008; ii)an assessment of fishing effort deployed by fisheries and métiers which will be affected by the extension of the cod recovery plan to the Celtic Sea
1. To provide historical series, as far back in time as possible, according to each of the following fishing areas:
Areas covered by Annex IIA
h. Kattegat (ICES functional unit IIIaS),
i. (i) Skagerrak (ICES functional Unit IIIaN), (ii) North Sea (EC waters of ICES sub-area II and ICES sub-area IV), (iii) Eastern channel (ICES division VIId)
j. West of Scotland (ICES division VIa)
k. Irish Sea (ICES division VIIa)
Areas covered by Annex IIB
l. Atlantic waters of the Iberian Peninsula (ICES divisions VIIIc and IXa, excluding the Gulf of Cadiz)
Areas covered by Annex IIC
m. Western Channel (ICES division VIIe)
New areas related to the assessment request
n. Celtic Sea (total of ICES divisions VIIb, VIIc, VIIe, VIIf, VIIg, VIIh, VIIj and VIIk and total for the subset of ICES divisions VIIf and VIIg)
-15-
The data should also be broken down by
Member State ;
regulated gear type and by associated special conditions defined in Annex II as far as relevant ;
unregulated gear types catching
o cod in fishing areas a, b(i), b(ii), b(iii), c, d and g;
o sole in fishing areas b(i), b(ii), b(iii) and f;
o plaice in fishing areas b(i), b(ii) and b(iii),
o hake and Norway lobster in fishing area e
for the following parameters:
a. Fishing effort, measured in kW.days and in GT.days and in number of vessels concerned
b. Catches (landings and discards provided separately) of
cod, sole and plaice in areas covered by Annex IIA,
hake and Norway lobster in areas covered by Annex IIB,
sole in areas covered by Annex IIC,
cod in the Celtic Sea,
by weight and by numbers at age.
c. Catches (landings and discards provided separately) of
non-cod , non-sole and non-plaice in areas covered by Annex IIA,
non-hake and non-Norway lobster in areas covered by Annex IIB,
non-sole in areas covered by Annex IIC,
non-cod in the Celtic sea catches (landings and discards)
by species, by weight and by numbers at age
d. Catch per unit effort (CPUE) of
cod, sole and plaice in areas covered by Annex IIA,
hake and Norway lobster in areas covered by Annex IIB,
sole in areas covered by Annex IIC,
cod in the Celtic Sea,

-16-
2. Based on the information compiled under point (1) above, to rank gear types, with and without associated special conditions, on the basis of their contribution to catches expressed both in weight and in number of
cod, sole and plaice in areas covered by Annex IIA,
hake and Norway lobster in areas covered by Annex IIB,
sole in areas covered by Annex IIC,
cod in the Celtic Sea.
3. If relevant data are available, to comment on the quality of estimations on total catches and discards.
4. To assess the fishing effort and catches (landings and discards) of
cod, sole and plaice in areas covered by Annex IIA,
hake and Norway lobster in areas covered by Annex IIB,
sole in areas covered by Annex IIC,
cod in the Celtic sea
and associated species corresponding to vessels of length overall smaller than 10 metres in each fishery, by gear (corresponding to regulated and unregulated gear as defined in Annex II framework) and by Member State according to sampling plans implemented to estimate these parameters.
5. To describe the spatial distribution of the fishing effort deployed both in the Celtic Sea and in the context of Annexes IIA, IIB and IIC to Regulation (EC) No 41/20007, according to data reported in logbooks on the basis of ICES statistical rectangles, with the aim to determine to what extent fishing effort has moved from long distance to coastal areas since the implementation of the days-at-sea regime for the first time in 2003 (Annex XVII to Regulation (EC) No 2341/2002).
6. Based on information compiled under point (1), on assessments done under point (2), (3), (4) and (5) and on the definition of métier adopted on level 6 of the matrix developed by the STECF-SGRN and STECF-SGECA Working Groups, to highlight métiers
that are affected by rules defined in fishing effort regimes defined in Annex II for each of the areas a, b(i), b(ii), b(iii), c, d, e and f or
that would be affected by a possible extension of the fishing effort (Annexe IIA) related to the cod recovery plan to the Celtic Sea.
In both cases and for each métier which will have been identified, it is requested to specify economic data which are already available or which should be requested to Member States to allow assessment of any change in fishing effort management schemes related to Annex II.
During this process, it is requested that that STECF-SGRST Working Group attempt
-17-
to classify combinations of grouping of fishing gears and special conditions, as currently define in Annex II, according to the typology suggested by the STECF-SGRN.
to notice
o when aggregations of combinations may be suggested (e.g. when such combinations cover a similar métier)
o when separation of combinations may be suggested (e.g. when such combinations cover two different métiers, or more).
5.2. Participants
In 2007, STECF and its subgroups adopted a new working style with stakeholder involvement as observers to improve transparency in scientific evaluations. Observers were invited to comment on the TORs and related analyses and results. The stakeholder involvement was in accordance with the protocol for STECF meetings observers, Brussels, 20 September 2006.
Experience during the meeting again showed that representatives of stakeholder organisations and interest groups were very interested in the evaluation of the basic information regarding the trends in fleet specific information and specific data deficiencies. Contributions took the form of constructive questions and clarifying comments mainly focussed on recent experience of fishing activity by different fleets.
Participants of the meeting are grouped by STECF members, invited experts, JRC experts, stakeholder, and EU-Commission representatives and are listed in Appendix 4.
5.3. Report notations
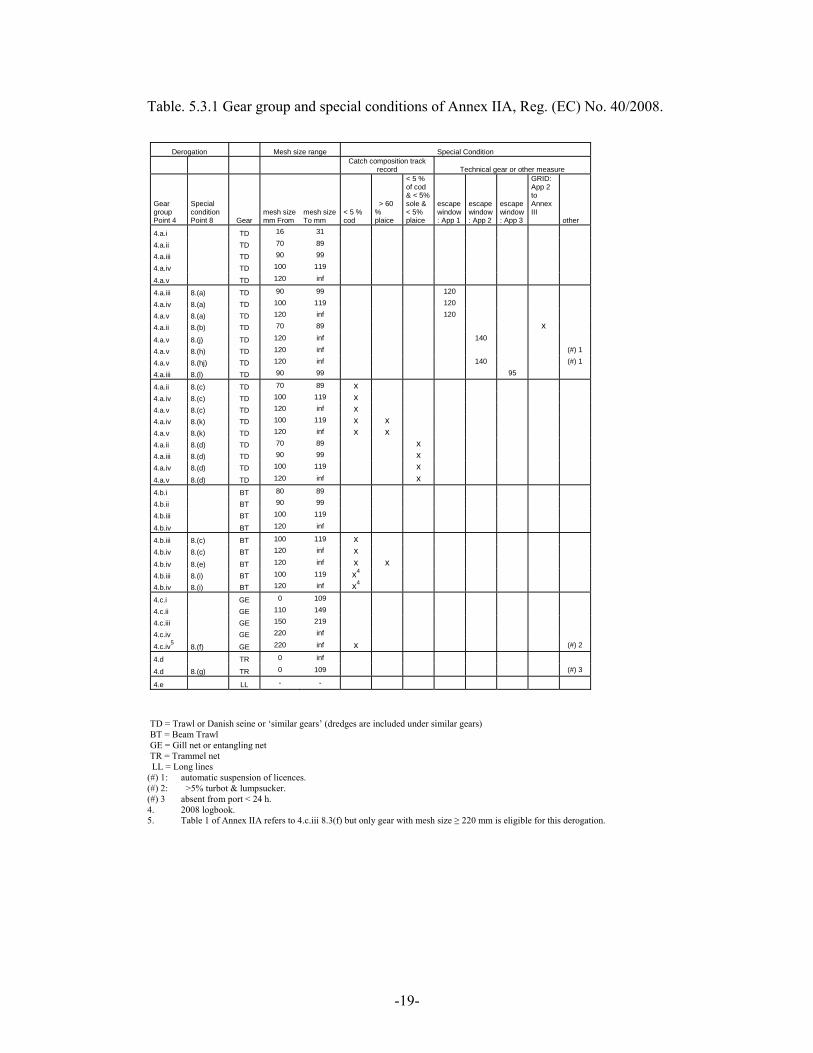
To identify the categories assessed for effort and catch this working group adopts terminology that matches as closely as possible that used in the tables outlining days at sea allowances in Annex II of the fishing opportunities regulation, (Council Reg. (EC) No. 40/2008). We illustrate this using Annex IIA as an example.
Annex IIA categorises fleet effort in terms of a “gear group” (specified in point 4 of the annex) and whether the fleet using a given gear group has qualified for any “special condition”, (specified in point 8.3 of the Annex IIA). The days at sea allowances prescribed for these combinations are presented in “Table 1” of the regulation’s annex. The table specifies effort limits for various fishing areas, the areas being defined in point 2 of the annex.
As convenient shorthand this report uses the term ‘derogation’ to refer to any combination of gear group and special condition. So for example, a vessel using a trawl gear of mesh size between 70 and 89mm but which qualifies for no special condition belongs to derogation “4.a.ii none”, (point 4 (a) sub bullet point (ii) of

-18-
Annex IIA). A vessel using a trawl gear of the same mesh size but where a vessel has a catch composition with less than 5% cod from 2002 would belong to derogation “4.a.ii IIA8c”, (the ‘IIA’ distinguishes a special condition from Annex IIA as opposed to Annex IIB or Annex IIC). The notation for regulated areas can also be added. If a vessel using the gear “4.a.ii IIA8c” fishes in the Kattegat this can be labelled as effort in the category “4.a.ii IIA8c 2a”, (the 2a refers to the area defined under point 2 (a) of Annex IIA). Table 5.3.1 lists notation for all derogations associated with Annex IIA and links it to descriptions of the fishing gears and special conditions as specified in Annex IIA. Table 5.3.2 lists and describes the fishing area definitions.
Similar notation can be devised for effort categories specified under Annexes IIB and IIC of Regulation (EC) No. 40/2008. Under Annex IIB gear groups are defined under point 3 and special conditions under point 7.2. In 2007 gear group definitions were made for bottom trawls, gill nets and bottom long lines. These groupings were merged in the 2008 legislation. The working group considered maintaining the categories as defined in 2007 was important in terms of maximising the clarity of information from results. Therefore gear groupings have been kept consistent with those from the Annex IIB in 2007 (found in regulation (EC) No. 41/2007). Table 5.3.3 links notation with gear group and special conditions. So, for example, a vessel using a gill net of mesh size ≥ 60mm and conforming to the hake catch composition rules would belong to derogation “3.b.i IIB72a”.
Under Annex IIC gear groups are defined under point 3 and special conditions under point 7. Table 5.3.4 links notation with gear group and special conditions. So, for example, a vessel using a static net of mesh size less than 220mm belongs to derogation “3.b”.
-19-
Table. 5.3.1 Gear group and special conditions of Annex IIA, Reg. (EC) No. 40/2008.
Derogation Mesh size range Special Condition
Catch composition track
record Technical gear or other measure
Gear group Point 4
Special condition Point 8 Gear
mesh size mm From
mesh size To mm
< 5 % cod
> 60 % plaice
< 5 % of cod & < 5% sole & < 5% plaice
escape window: App 1
escape window: App 2
escape window: App 3
GRID: App 2 to Annex III
other
4.a.i TD 16 31
4.a.ii TD 70 89
4.a.iii TD 90 99
4.a.iv TD 100 119
4.a.v TD 120 inf
4.a.iii 8.(a) TD 90 99 120
4.a.iv 8.(a) TD 100 119 120
4.a.v 8.(a) TD 120 inf 120
4.a.ii 8.(b) TD 70 89 x
4.a.v 8.(j) TD 120 inf 140
4.a.v 8.(h) TD 120 inf (#) 1
4.a.v 8.(hj) TD 120 inf 140 (#) 1
4.a.iii 8.(l) TD 90 99 95
4.a.ii 8.(c) TD 70 89 x
4.a.iv 8.(c) TD 100 119 x
4.a.v 8.(c) TD 120 inf x
4.a.iv 8.(k) TD 100 119 x x
4.a.v 8.(k) TD 120 inf x x
4.a.ii 8.(d) TD 70 89 x
4.a.iii 8.(d) TD 90 99 x
4.a.iv 8.(d) TD 100 119 x
4.a.v 8.(d) TD 120 inf x
4.b.i BT 80 89
4.b.ii BT 90 99
4.b.iii BT 100 119
4.b.iv BT 120 inf
4.b.iii 8.(c) BT 100 119 x
4.b.iv 8.(c) BT 120 inf x
4.b.iv 8.(e) BT 120 inf x x
4.b.iii 8.(i) BT 100 119 x4
4.b.iv 8.(i) BT 120 inf x4
4.c.i GE 0 109
4.c.ii GE 110 149
4.c.iii GE 150 219
4.c.iv GE 220 inf
4.c.iv5 8.(f) GE 220 inf x (#) 2
4.d TR 0 inf
4.d 8.(g) TR 0 109 (#) 3
4.e LL - -
TD = Trawl or Danish seine or ‘similar gears’ (dredges are included under similar gears) BT = Beam Trawl GE = Gill net or entangling net TR = Trammel net
LL = Long lines (#) 1: automatic suspension of licences. (#) 2: >5% turbot & lumpsucker. (#) 3 absent from port < 24 h. 4. 2008 logbook. 5. Table 1 of Annex IIA refers to 4.c.iii 8.3(f) but only gear with mesh size ≥ 220 mm is eligible for this derogation.
-20-
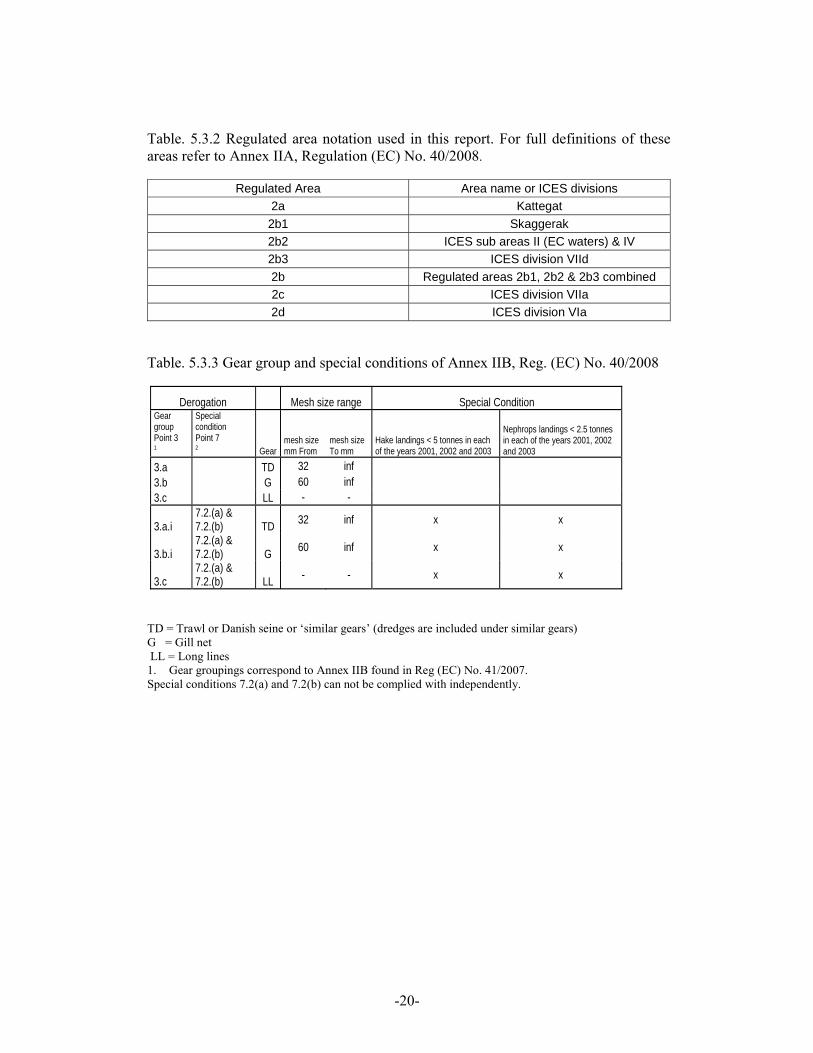
Table. 5.3.2 Regulated area notation used in this report. For full definitions of these areas refer to Annex IIA, Regulation (EC) No. 40/2008.
Regulated Area Area name or ICES divisions 2a Kattegat 2b1 Skaggerak 2b2 ICES sub areas II (EC waters) & IV 2b3 ICES division VIId 2b Regulated areas 2b1, 2b2 & 2b3 combined 2c ICES division VIIa 2d ICES division VIa
Table. 5.3.3 Gear group and special conditions of Annex IIB, Reg. (EC) No. 40/2008
Derogation Mesh size range Special Condition Gear group Point 3 1
Special condition Point 7 2 Gear
mesh size mm From
mesh size To mm
Hake landings < 5 tonnes in each of the years 2001, 2002 and 2003
Nephrops landings < 2.5 tonnes in each of the years 2001, 2002 and 2003
3.a TD 32 inf 3.b G 60 inf 3.c LL - -
3.a.i 7.2.(a) & 7.2.(b) TD 32 inf x x
3.b.i 7.2.(a) & 7.2.(b) G 60 inf x x
3.c 7.2.(a) & 7.2.(b) LL - - x x
TD = Trawl or Danish seine or ‘similar gears’ (dredges are included under similar gears) G = Gill net LL = Long lines 1. Gear groupings correspond to Annex IIB found in Reg (EC) No. 41/2007. Special conditions 7.2(a) and 7.2(b) can not be complied with independently.
-21-
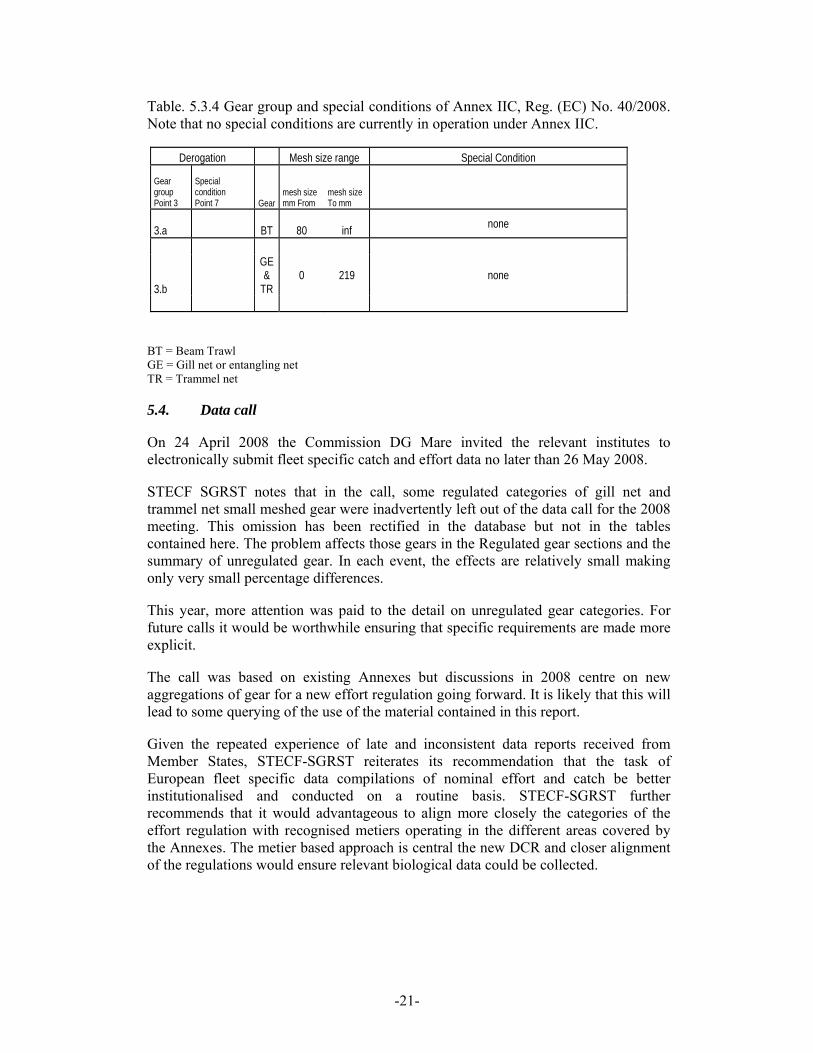
Table. 5.3.4 Gear group and special conditions of Annex IIC, Reg. (EC) No. 40/2008. Note that no special conditions are currently in operation under Annex IIC.
Derogation Mesh size range Special Condition
Gear group Point 3
Special condition Point 7 Gear
mesh size mm From
mesh size To mm
3.a BT 80 inf none
3.b
GE &
TR 0 219 none
BT = Beam Trawl GE = Gill net or entangling net TR = Trammel net
5.4. Data call
On 24 April 2008 the Commission DG Mare invited the relevant institutes to electronically submit fleet specific catch and effort data no later than 26 May 2008.
STECF SGRST notes that in the call, some regulated categories of gill net and trammel net small meshed gear were inadvertently left out of the data call for the 2008 meeting. This omission has been rectified in the database but not in the tables contained here. The problem affects those gears in the Regulated gear sections and the summary of unregulated gear. In each event, the effects are relatively small making only very small percentage differences.
This year, more attention was paid to the detail on unregulated gear categories. For future calls it would be worthwhile ensuring that specific requirements are made more explicit.
The call was based on existing Annexes but discussions in 2008 centre on new aggregations of gear for a new effort regulation going forward. It is likely that this will lead to some querying of the use of the material contained in this report.
Given the repeated experience of late and inconsistent data reports received from Member States, STECF-SGRST reiterates its recommendation that the task of European fleet specific data compilations of nominal effort and catch be better institutionalised and conducted on a routine basis. STECF-SGRST further recommends that it would advantageous to align more closely the categories of the effort regulation with recognised metiers operating in the different areas covered by the Annexes. The metier based approach is central the new DCR and closer alignment of the regulations would ensure relevant biological data could be collected.
-22-
5.5. Data policy, formats and availability
Originally, the catch and effort data base structures used by STECF-SGRST were developed by the ICES Study Group on the Development of Fishery-based Forecasts (ICES CM 2004/ACFM:11, 41 pp.) with few amendments required for the review of fishery regulations. The format of the fleet specific data on catches including discards and effort is given in Annex 1 of this report. The format has been almost unchanged compared to the data bases compiled during the STECF subgroup meetings dealing with cod recovery or mixed fisheries reviews over the past 3 years except for one new data field introduced in 2006 specifying the fleets’ aggregations regarding the special conditions defined in Annexes IIA-C of Council Reg. 41/2007.
5.5.1. Data policy
Experts reported about national data policies of the national fleet specific landings, discards and effort data in support of a continued use of the data by STECF-SGRST but with the required permission for any use by other scientific or non-scientific groups. This implies that national experts need to be contacted for their consent before granting access to the data. However, Denmark and Portugal reserves the right of the deletion of the national data on request.
JRC requests to be informed about applications of data access and their notifications.
5.5.2. Nominal fleet specific effort data 2000-2007
The fleet aggregation according to the derogations (gear group, mesh size and management area) defined in Annexes IIA-C is within the competence of the Member States’ institutes and differ between countries due to availability of essential information, different interpretations and/or different expertise to manage the extensive databases. Inconsistencies in interpretation and fleet aggregations and changes to the basis of deriving effort data (eg VMS compared with logbooks) caused a few data re-submissions following the first meeting of STECF –SGRST. Final analysis was deferred to the second meeting 1-5 September 2008 and finally presented here.
STECF-SGRST notes that assignment of derogations is based on best expert knowledge and data availability, which also reflects cooperation with the national control and enforcement institutions. Specific data errors may exist regarding the huge data bases and the special knowledge required when dealing with them.
STECF-SGRST notes that there have been no requests to evaluate national proposals for fleet aggregations. Thus, the data bases and their evaluations do not include any additional fleet aggregations to those given in the Annexes IIA-C of Council Reg. 40/2008.
The availability of the fleet specific effort data requested by Member State is summarised in the following paragraphs and Table 5.5.2.1. The additional fleet aggregation according to the derogations laid down in the Council Reg. 40/2008

-23-
Annexes A-C resulted in quite consistent effort trends compared with last year’s STECF-SGRST data evaluations. The overall differences of the summed nominal effort by nation, area and year range generally below 10%.
Belgium: Belgium provided effort data for 2000-2007 by quarter, for all relevant areas where the Belgian fleets are operational. For the period 2000-2002 the effort (and landings) is allocated to the rectangle where the most effort occurred. Since 2003 effort (and landings) is split proportionally over the rectangles as effort became available by rectangle from logbook data. As Belgium does not have trip-by-trip information on the true mesh size for its fleets, Belgium (as well as other countries) agreed to assume certain mesh sizes for its beam trawler fleets. Beamers operating in area VIIIa,b were assumed to use a 70-79 mm mesh size as this is the minimum legal mesh size in that area for beamers. For the North Sea, the trips were split according to the rectangles reported in the logbooks, and mesh sizes were allocated in line with Council Regulation (EC) N° 2056/2001. This regulation stipulates that beam trawlers are prohibited to use less than 120 mm in ICES Division IV to the north of 56° 00’ N. Therefore all beam trawl information from this part of ICES Division IV was accounted against an assumed >120mm mesh size. The same regulation also stipulates that within the rectangle with coordinates east coast of the UK between 55° 00’ and 56° 00’ and the points 55° 00’ N – 05° 00’ E and 56° 00’ N – 05° 00’ E, beam trawlers can use 100 to 119 mm mesh size. Here also it was assumed that the mesh size used by the Belgian Beam trawl fleet was 100-119 mm. For the rest of ICES Division IV (the southern part) a mesh size of 80-89 mm was assumed for the beam trawlers. Apart from these assumed mesh size which are based on rectangle information from logbooks, it was also assumed that the shrimp fishery used a mesh size of 16-31 mm. The mesh size of the beam trawl fleets in the other area’s was assumed to be 80-89 mm. The three Belgian gear categories are: beam, otter, and other. For otter and other gear, no assumptions of mesh sizes were made. The effort in kW*days is calculated as engine power times days at sea as requested, where days at sea are calculated as fishing hours divided by 24. The requested GT_DAYS_AT_SEA is not a straight forward extraction from the Belgian database. The procedure used is as follows: Extracting the gross tonnage per trip and area, as well as the fishing hours spent by area. To become the fishing days the following formula was used: Fishing days = (Fishing hours + 9.5)/21.0, which is based on an analytical evaluation of the relationship between fishing days and fishing hours for all vessels trips from the Belgian fleet over one year. Note that this is still a proxy for “Days at Sea” as it is “Fishing days”. The multiplication of the gross tonnage with the fishing days is the best estimate to calculate the requested GT_DAYS_AT_SEA. For the extraction of the number of vessels, the following procedure was used: After allocating each trip to the rectangles where fishing occurred (see above North Sea procedure), the same assumptions were made to allocate the different mesh sizes to the beam trawl fleets in the different quarters. By doing this some vessels occurred several times in the same quarter in the same area. By replacing the values to 1 and hereby counting several appearances of the same vessel in an area and quarter, we derived a sole entry from that vessel by year, quarter, gear type and mesh size and could therefore count the number of vessels.
No special conditions were allocated to any Belgian fleet category until now as no Belgian vessel applied for any special condition in any year since the special conditions have been introduced.
-24-
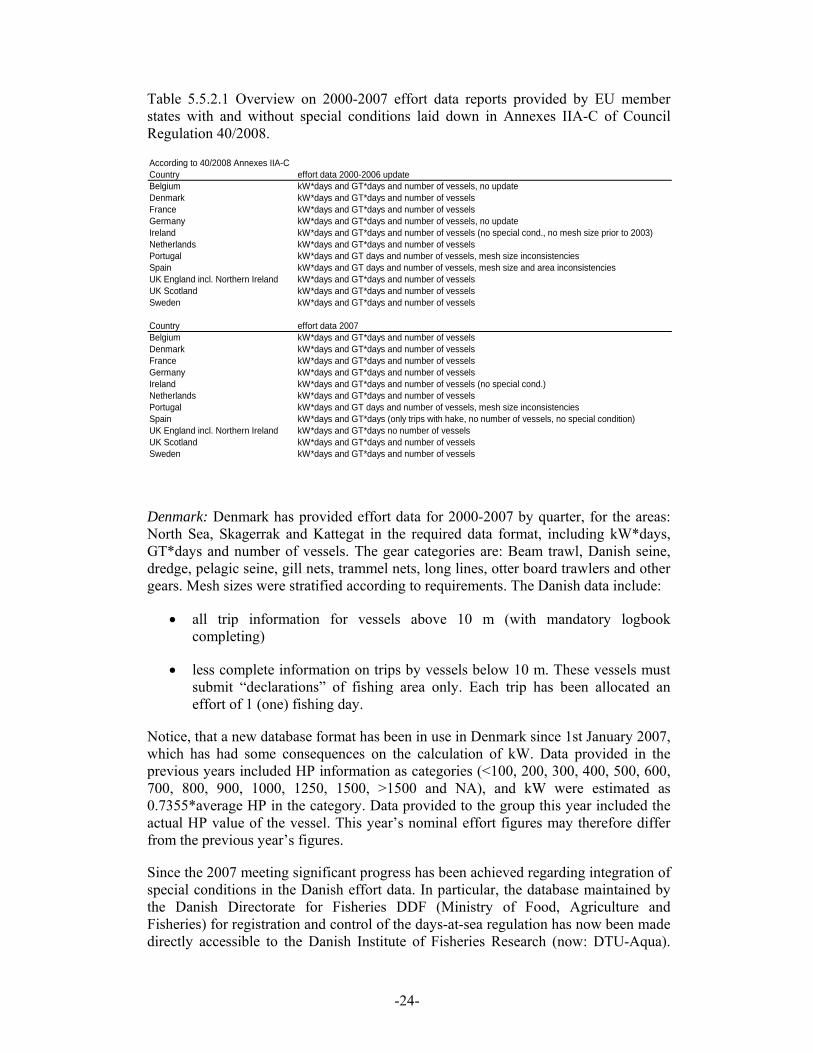
Table 5.5.2.1 Overview on 2000-2007 effort data reports provided by EU member states with and without special conditions laid down in Annexes IIA-C of Council Regulation 40/2008.
According to 40/2008 Annexes IIA-CCountry effort data 2000-2006 updateBelgium kW*days and GT*days and number of vessels, no updateDenmark kW*days and GT*days and number of vesselsFrance kW*days and GT*days and number of vesselsGermany kW*days and GT*days and number of vessels, no updateIreland kW*days and GT*days and number of vessels (no special cond., no mesh size prior to 2003)Netherlands kW*days and GT*days and number of vesselsPortugal kW*days and GT days and number of vessels, mesh size inconsistenciesSpain kW*days and GT days and number of vessels, mesh size and area inconsistenciesUK England incl. Northern Ireland kW*days and GT*days and number of vesselsUK Scotland kW*days and GT*days and number of vesselsSweden kW*days and GT*days and number of vessels
Country effort data 2007Belgium kW*days and GT*days and number of vesselsDenmark kW*days and GT*days and number of vesselsFrance kW*days and GT*days and number of vesselsGermany kW*days and GT*days and number of vesselsIreland kW*days and GT*days and number of vessels (no special cond.)Netherlands kW*days and GT*days and number of vesselsPortugal kW*days and GT days and number of vessels, mesh size inconsistenciesSpain kW*days and GT*days (only trips with hake, no number of vessels, no special condition)UK England incl. Northern Ireland kW*days and GT*days no number of vesselsUK Scotland kW*days and GT*days and number of vesselsSweden kW*days and GT*days and number of vessels
Denmark: Denmark has provided effort data for 2000-2007 by quarter, for the areas: North Sea, Skagerrak and Kattegat in the required data format, including kW*days, GT*days and number of vessels. The gear categories are: Beam trawl, Danish seine, dredge, pelagic seine, gill nets, trammel nets, long lines, otter board trawlers and other gears. Mesh sizes were stratified according to requirements. The Danish data include:
• all trip information for vessels above 10 m (with mandatory logbook completing)
• less complete information on trips by vessels below 10 m. These vessels must submit “declarations” of fishing area only. Each trip has been allocated an effort of 1 (one) fishing day.
Notice, that a new database format has been in use in Denmark since 1st January 2007, which has had some consequences on the calculation of kW. Data provided in the previous years included HP information as categories (<100, 200, 300, 400, 500, 600, 700, 800, 900, 1000, 1250, 1500, >1500 and NA), and kW were estimated as 0.7355*average HP in the category. Data provided to the group this year included the actual HP value of the vessel. This year’s nominal effort figures may therefore differ from the previous year’s figures.
Since the 2007 meeting significant progress has been achieved regarding integration of special conditions in the Danish effort data. In particular, the database maintained by the Danish Directorate for Fisheries DDF (Ministry of Food, Agriculture and Fisheries) for registration and control of the days-at-sea regulation has now been made directly accessible to the Danish Institute of Fisheries Research (now: DTU-Aqua).
-25-
This database contains information on a trip-by-trip basis on gear category and possible derogations (if any) for all fishing trips since 2006, thus reflecting the actual use of derogations by Danish fishermen. The database covers the derogations IIA81a, IIA81c, IIA81e, IIA81h, IIA81j and IIA81l. and was merged with the DIFRES DFAD catch and effort database for 2006. In addition, further potential (or eligible) derogations were calculated for the period 2002-2005, based on post-stratification of 2002 catch records according to annex IIA specifications. These include the derogations IIA81c, IIA81d and IIA81f. These derogations are referred to as “eligible” in the sense that they could potentially be requested by Danish fishermen based on their 2002 catch record. The limited number of overlap between both sources of information indicates that Danish fishermen have in reality made little use of 2002 records-based derogations they were eligible to, but have on the contrary requested gear-based derogations (e.g. by using escape windows). The only overlap between both types of derogations is the derogation IIA81c, which for 2006 could be calculated either as based on 2002 catch record or as coming from the database of the Danish Directorate for Fisheries. The latter option was chosen, and differences in the amount of Danish effort within that derogation between 2002-2005 and 2006 should be interpreted as the difference between “eligible” use of this derogation based on post-stratification of logbooks data and its “true” use by Danish fishermen in 2006.
France: For France effort data from 2000 to 2007 in kW and gross tonnage days at sea were updated in the mixed fishery database after the meeting of June and the data for the area VIII were added. These data give the number of vessels concerned in a defined area for each fishery for all gears with all mesh size ranges. The calculation of days number results from the division of fishing time (as recorded in the log-books) by 24, rounded to the upper number of days by quarter.
Concerning data quality, data have been compiled from logbook recorded in the French national database. Data used are not completely exhaustive but the data quality has been improved since 2000. All data were provided for all area concerned by the cod recovery plan but they did not take into account limits defining waters under the sovereignty or jurisdiction of Member States as laid down in article 2a of the Amendments to Regulation (EC) No 423/2004 about geographical definition.
The special conditions have been calculated thanks to an algorithm taking into account the specific composition for each trip.
A reference table have been used to create the relationship between the mesh size recorded into the logbook and the mesh size range defined into the mixed fisheries database. When this information is missing, the missing value ‘-1’ has been used.
Germany: Germany provided fleet specific effort data for 2000-2007 in the requested formats derived from official logbook data bases covering all vessels ≥10m. In addition to the usual nominal effort data in kW*days at sea, the requested effort data are also presented in the units of GT*days at sea and maximum number of vessels observed active in the defined derogations. The latest data submission covers the areas defined in Annex IIA, i.e. Skagerrak, Kattegat, North Sea including the southern part of Division II in the EU-Zone and ICES Divisions VI and Va and Vb. There were no demersal fisheries (mesh sizes ≥70mm) conducted in the Eastern Channel, the Irish Sea or the southern Divisions. The data consider the aggregation by quarter, area, gear, mesh size, and existing derogations including special conditions of 8.1.a, 8.1.c, 8.1.d,
-26-
8.1.e and 8.1.f. During 2000-2007, the fleets did not apply or have been eligible for other special conditions as confirmed by personal communication with the control and enforcement institute (BLE).
Ireland: Ireland provided fleet specific effort data for 2000-2007 in the requested formats, derived from official logbook databases for vessels ≥10 meters. Data has been provided in nominal effort as kW*days-at-sea, effective effort in kW*hours fishing, GT*days at sea and vessel numbers within each category. Submitted data has been aggregated by year, quarter and gear for all areas detailed in Annex IIA in which the Irish fleet is active. This data is not divided into special conditions, as Irish vessels have not applied for special conditions relating to this data call. Those special conditions applied for by Irish vessels relate to the allocation of additional days at sea for enhanced observer coverage. In the majority of cases, days at sea allocations are not considered limiting within the Irish fleet. Limitations affecting fishers primarily result from restricted quota availability, in which cases additional days at sea are of no advantage. Mesh size information was only available from 2003 onwards. Days-at-sea effort for 2000-2002 is presented as a calculated proxy, obtained from the average ratio of operational fishing days to days at sea by gear. Revisions have been made to the 2003-2006 data provided to STECF-SGRST in 2008. These revisions result from a combination of data availability updates and database improvements carried out in the later part of 2007.
Netherlands: The Netherlands attended the first of the meetings of STECF-SGRST on the assessment of fishing effort regime. The Netherlands initially provided reworked effort data based on VMS information for the years 2000-2007, as requested in Annex 1 part B of the official data call. Following screening it was established that data for 2000 and 2001 were derived from a rather sparse coverage of VMS information and were therefore not representative. It was agreed that these years should be omitted from the database and for the Netherlands, only material from 2002 onwards was included. For the years included in the database, there was good correspondence between the new VMS based material and that provided in previous years. The data did not distinguish between subareas but effort was aggregated over the whole area 2 (2B123) (i.e. Skagerrak, North Sea zone IV, and Eastern English Channel). Hence, it cannot be distinguished whether vessels had fished in the Skagerrak, the North Sea zone IV, or in the Eastern English Channel. No special conditions were indicated.
Portugal: No experts from Portugal attended the meetings but the colleagues provided effort data for 2004-2007 (Kw*days and GT*days) by quarter and year in the required data format for the areas 8c and 9a where the Portuguese fleet operates. Numbers of vessels were not provided. The information refers to all fishing vessels with overall length ≥10 m, licensed for the period 2004-2007. The gear categories and mesh size provided were in agreement with the data call and Annex IIB, gillnet with mesh size >60mm, otter trawl with mesh size >32mm and bottom longlines. However, no mesh size information could be provided for significant parts of the fleets deploying the gears defined. In the case of trawl, the unknown mesh size means that although the mesh size is greater than 32 mm, it is not possible to specify according to the categories defined by this working group, but their effort can be taken into account. The same is not applicable to the gillnets with unknown mesh size. This resulted in a high proportion of gillnet effort which could not be assigned to the defined derogations and therefore were grouped as unknown (none). Special conditions have

-27-
been provided for a mixed passive gear category (“PGP”), which includes vessels operating with more than one gear. Although this group includes unregulated gears (trammel nets, traps, dredges, etc.) and regulated gears (longlines and gillnets) affected by the special conditions, it was not possible to consider the gear specific effort in the evaluation and they were added to “none”. The trawl fleet was further allocated to two fisheries, targeting crustaceans operating in area 9a or targeting demersal fish operating in areas 8c and 9a. Effort was computed differently for those vessels covered by the Southern Hake and Nephrops recovery plan which have effort limitations and other vessels. The former were computed based on logbooks information and the last based on sales notes, assuming each sale represents one fishing day.
Spain: Spain provided nominal effort (kW*days) and GT*days at sea data for 2000-2007 by quarter, ICES divisions and mesh size range for ICES divisions VII e-k, VIIIc and IXa (without Gulf of Cádiz). Data contain only information of the trips that landed hake.The eleven Spanish gear categories are: BEAM (Beam trawl), DEM_SEINE (Danish and Scottish seiners), DREDGE (Dredges), GILL (Drift and fixed Nets except Trammel Nets), LONGLINE (Longlines), OTTER (Bottom trawl), PEL_SEINE (Pelagic seine and purse seine), PEL_TRAWL (Pelagic Trawl), POTS (Pots and traps), TRAMMEL (Trammel Nets) and NONE-N/A (unidentified gears). Effort by rectangle and by special conditions were not available. Allocating the trips to the strata some vessels occurred several times in the same year, quarter, gear type and mesh size in the same area, providing incorrect numbers, therefore number of vessel was not available.
Following the meeting, Spain also provided effort information for ICES VIa. This material arrived some time after the effort data compilations had been completed and after STECF had completed its review of available effort data from Member states. For these reasons, the data are included as a small summary table in Appendix III.
Sweden: Sweden provided fleet specific effort data for 2000-2007 in the requested formats derived from official logbook data bases covering all vessel ≥10m. In addition to the usual nominal effort data in kW*days at sea, the requested effort data are also presented in the units of GT*days at sea and number of vessels. The latest data submission covers the areas defined in Annex IIA, i.e. Skagerrak, Kattegat, North Sea. The data consider the aggregation by quarter, area, gear, mesh size, and existing derogations including special conditions of 8.3.a, 8.3.b.
For vessels <10m Sweden provided total nominal effort usual nominal effort data in kW*days at sea, the requested effort data are also presented in the units of GT*days at sea in areas defined in Annex IIA, i.e. Skagerrak, Kattegat, North Sea. The data consider the aggregation by quarter, area, gear, mesh size, and existing derogations including special conditions of 8.3.a, 8.3.b.
The main problem in using Swedish data analysing the use of technical regulations according to Annex 11a has been the mismatch in the introduction of a new technical measure in annex IIA and the national coding of the gear in the logbook. This has meant that the use of the special condition IIa8.3a has been assessed by other data sources than the logbook. During 2007, gear code for the 8.3 a was introduced which allowed a comparence of the data sources for 2005, and 2006.the result from this comparison showed that the other data source and the loggbok matched satisfactory.
-28-
For special condition IIa8.3b there has been no such mismatch the introduction of the gear and the gear cod was introduced simultaneously.
UK England (England, Wales & Northern Ireland): UK England Wales NI provided effort data for 2000-2007. These data were provided as kW+days, GT+days and number of vessels. The special conditions were allocated according to eligibility of vessels during the relefvant reference periods based on the appropriate use of gear/mech combinations, catch compositions by activity. However, it needs to be borne in mind that experience of running the systems has been that the fishermen do not always take up the options. The derogations bring with them obligations to carry forward a restriction to their activity - e.g. to maintain the low level of cod etc by-catch rates. In many cases fishermen choose not to take up the derogations and fished to the smaller amounts of days at sea so they could be less restricted in their catch patterns. There are also instances when observations of their activity lead to the derogations being repealed - e.g. some vessels ended up losing a derogation because they could not maintain the low level of cod catches required by the derogation. As such, there is a clear difference between what these vessels might have historically done in terms of fishing effort and future patterns of activity - it cannot be simply assumed that if a lot of fishing effort was seen by vessels eligible for a derogation in past years, that this will be seen in the current or future years. There are also many vessels that are eligible for more than one of the possible derogations - e.g. every vessel eligible for 8.1.(d) must defacto be eligible for 8.1.(c). These reasons make the coding of effort against the various derogations not a clear cut exercise – but in order to produce the data for the analysis a decision was made when compiling the data to allocate fishing effort for individual fishing vessels to the different special conditions according the condition that would give them the most days at sea. When looking at the analysis of effort for any one special condition, it thus needs to be borne in mind that the condition itself (and thus its associated effort) could cut across other conditions as well. For new vessels coming into the fishery, a link is made back to the track record of the vessels associated with the licence used to allow entry. Any new boat that wants to enter and start fishing in the recovery zones with regulated gear goes through several checks. These include a review of where its licence cover has come from, in terms of the historic activity of the vessels holding the licences during the reference period. These track records must allow the current new vessel to meet the track record criteria in full or they would not be allowed to fish. For example, a new demersal trawler coming into the North Sea has to buy licences which were on vessels active in the North Sea with the particular type of regulated gear during the reference period for fishing to be permitted. In cases where the new vessel is coming in after aggregating several licences from smaller vessels, all of the donor licences have to meet the track record criteria as well.
UK (Scotland): Scotland provided effort data for the years 2000-2007. Effort is provided in terms of kW*days at sea (kWdays), gross tonnage*days at sea (GTdays) and number of vessels per category. Number of vessels and kWdays data are provided for all years. Effort in terms of Gross Tonnage*days at sea is provided for the years 2003-2007 consistent with the completion of EU wide vessel gross tonnage recalibration. As for catch data, effort data conforms to the aggregation by quarter, area, gear and mesh size as set out in the data request. Fisheries are defined using the combination of gear, mesh size and fishing area as specified in the STECF data requirement. Fisheries were further split according to SGDFF format area definitions
-29-
(4, 7d etc). Special conditions (as per Appendix 5 of the data requirements document) were applied where possible. The databases available to UK (Scotland) do not provide information on whether a vessel has adopted one of the technical measures relevant to some special conditions or on special conditions requiring in-season management. Therefore, special condition designations have only been entered for certain fisheries. These include fisheries that can be built up from vessels active in 2002 and whose track record complied with one of the species composition rules set out in Annex IIA of regulation 40/2008. That is, all records of vessels fishing within waters subject to the effort rules of Annex IIA were grouped according to unique combination of vessel, gear type and mesh size range as used by Scottish government marine directorate (this combines gear groups 4.a.ii and 4.a.iii; also 4.a.iv and 4.a.v). For data for 2002 the annual catch composition of these grouped records were tested for compliance with the special condition requirements and special condition codes assigned to vessels if appropriate. In terms of area, all activity of a given vessel in 2002 was aggregated. For other years vessel, gear and mesh size combinations received the same special condition status as applied in 2002 (assuming the same combination existed in 2002). Also special condition 8.1(i) was applied to vessels using beam trawls with mesh size >= 100mm if they had used beam trawls with mesh < 100mm in 2003, 2004, 2005 or 2006 and special condition 8.1(g) for vessels using trammel nets with mesh size < 110mm and absent from port no more than 24 hours. After assignment of special condition status vessels were grouped into fisheries. If a vessel fished in more than one area or used more than one type of gear or mesh size it is possible for it to contribute to more than one fishery grouping and to have qualified for special condition status in one or more fisheries but not in others. The number of vessels associated with each gear, mesh size, SGDFF area and special condition status has also been provided. Any vessel assigned to more than one fishery grouping will be counted in the number of vessels contributing to each grouping, i.e. there is the possibility of multiple counting of vessels. Existing special conditions were assigned exclusively i.e. there is no repetition of records to accommodate assigning more than one special condition code. So for example if a fishery qualified for both special condition code IIA81c and IIA81d it would be assigned IIA81d on the grounds the latter allows a greater number of days at sea. Catch assigned to statistical squares west of the line defined in section 2.2 of Annex IIA have not been excluded from calculations determining 2002 track record. The special condition defined under Annex IIB was found not to be relevant to Scottish vessels. No recorded landings from the divisions regulated under Annex IIB are present in any of the years 2000-2007. Data is compiled on a basis comparable with the information from the rest of the UK. Effort on voyages using more than one mesh size is allocated according to log book data. This affects the information for effort in the years prior to 2003, when vessels were allowed to use different mesh sizes within the same voyage. Similarly, effort on voyages fishing in more than one rectangle is allocated according to logbook data. Starting with the 2007 STECF meetings Scottish fleet effort for the other gears (dredges, pelagic seines, pots) is provided directly by UK (Scotland) on a comparable basis with that provided previously by UK (England).
-30-
5.5.3. Effective fleet specific effort data by rectangle 2003-2007
In order to accomplish the ToR item 5 dealing with spatial distributions patterns of fishing effort, SGRST continued to use the data base structure agreed last year and as defined under item C of Annex 1 to this report (data formats). As the nominal effort in kW*days or GT*days can not be precisely divided into the requested geographical resolution of ICES statistical rectangles, the group decided to invite data on effective effort in units of trawled hours by statistical rectangle for trawled gears only (BEAM, OTTER and DEM_SEINE). The data have been made available from the national logbooks and aggregated to the regulated gear groups (derogations) defined in Annexes IIA, IIB and IIC of Council Reg. 40/2008.
Belgium: Belgium provided effort data (hours fished) for 2003-2007 by rectangle and by quarter, for all relevant areas where the Belgian fleets are operational. Since 2003 effort (and landings) are split proportionally over the rectangles as effort became available by rectangle from logbook data. As Belgium does not have trip-by-trip information on the true mesh size for its fleets, Belgium (as well as other countries) agreed to assume certain mesh sizes for its beam trawler fleets. Beamers operating in area VIIIa,b were assumed to use a 70-79 mm mesh size as this is the minimum legal mesh size in that area for beamers. For the North Sea, the trips were split according to the rectangles reported in the logbooks, and mesh sizes were allocated in line with Council Regulation (EC) N° 2056/2001. This regulation stipulates that beam trawlers are prohibited to use less than 120 mm in ICES Division IV to the north of 56° 00’ N. Therefore all beam trawl information from this part of ICES Division IV was accounted against an assumed >120mm mesh size. The same regulation also stipulates that within the rectangle with coordinates along the east coast of the UK between 55° 00’ N and 56° 00’ N and the points 55° 00’ N – 05° 00’ E and 56° 00’ N – 05° 00’ E, beam trawlers can use 100 to 119 mm mesh size. Here also it was assumed that the mesh size used by the Belgian Beam trawl fleet was 100-119 mm. For the rest of ICES Division IV (the southern part) a mesh size of 80-89 mm was assumed for the beam trawlers. Apart from these assumed mesh size which are based on rectangle information from logbooks, it was also assumed that the shrimp fishery used a mesh size of 16-31 mm. The mesh size of the beam trawl fleets in the other area’s was assumed to be 80-89 mm. The three Belgian gear categories are: beam, otter, and other. For otter and other gear, no assumptions of mesh sizes were made. No special conditions were allocated to any Belgian fleet category until now as no Belgian vessel applied for any special condition in any year since the special conditions have been introduced.
Denmark: Denmark provided effort data by rectangle for 2003-2007, with the same gear and mesh sizes categories and including the same derogations as for nominal effort data (kW*days, see Sec. 5.5.2). Fishing hours are not registered in Danish logbooks, and could not be provided. Notice, that the unit of effort by rectangle is the number of fishing days. This figure is obtained as the sum (by rectangle) of each registered fishing day divided by the number of ICES rectangles visited during that fishing day.
France: France updated effective effort data in kW*days GT*days and numbers of boats for the period 2000-2007. These data were provided by rectangle and by quarter, for all areas in the request format taking into account derogations defined in Annex 2a
-31-
of the Council Reg. 40/2008. These data are available from logbooks and give the number of hours trawled for each fleet.
Germany: Germany aggregated the effective effort in units of trawled hours deployed by vessels using demersal towed gears, i.e. beam, otter trawls and seines. As requested, this data submission utilised ICES statistical rectangles.
Ireland: Ireland provided effective effort by ICES statistical rectangle in units of hours trawled for the period 2003-2007, derived from the national logbook database for vessels greater than or equal to 10 meters in length. This has been provided in the requested formats for demersal trawled gears, i.e. beam trawls, otter trawls, and demersal seines. Data has been aggregated by year, quarter and gear for all areas detailed in Annex IIA in which the Irish fleet is active.
Netherlands: The Netherlands provided effective effort (in units of fishing hours) by rectangle for the years 2003-2007, as requested in Annex 1 C of the official data call.
Portugal: Portugal provided effective effort data by statistical rectangle in hours fished.
Spain: Spain did not provide effective effort data by statistical rectangle.
Sweden: Sweden provided effort data by rectangle for 2003-2007, with the same gear and mesh sizes categories and including the same derogations as for nominal effort data ( see sec. 5.5.2). The effort data are expressed as hours fishing per trip and vessel /Ices square, based on the set position of the gear. The data could overestimate the hours spent /Ices square since the fishing operation to a large extent could have been performed in neighbouring Ices rectangles.
UK England: England provided effort by ICES statistical rectangle data for the years 2003-2007. It was not possible to provide trawled hours data however. This is because hours trawled is not a mandatory field in the fishers’ logbooks and is therefore not necessarily completed. Instead, the data used to provide nominal effort (see section 5.5.2) is held on a statistical rectangle basis by UK (England). This data was simply multiplied by 24 to get a measure of fishing effort expressed in hours.
UK (Scotland): Scotland provided effort by ICES statistical rectangle data for the years 2003-2007. It was not possible to provide trawled hours data however. This is because hours trawled is not a mandatory field in the fishers’ logbooks and is therefore not necessarily completed. Instead, the data used to provide nominal effort (see section 5.5.2) is held on a statistical rectangle basis by UK (Scotland). This data was simply multiplied by 24 to get a measure of fishing effort expressed in hours.
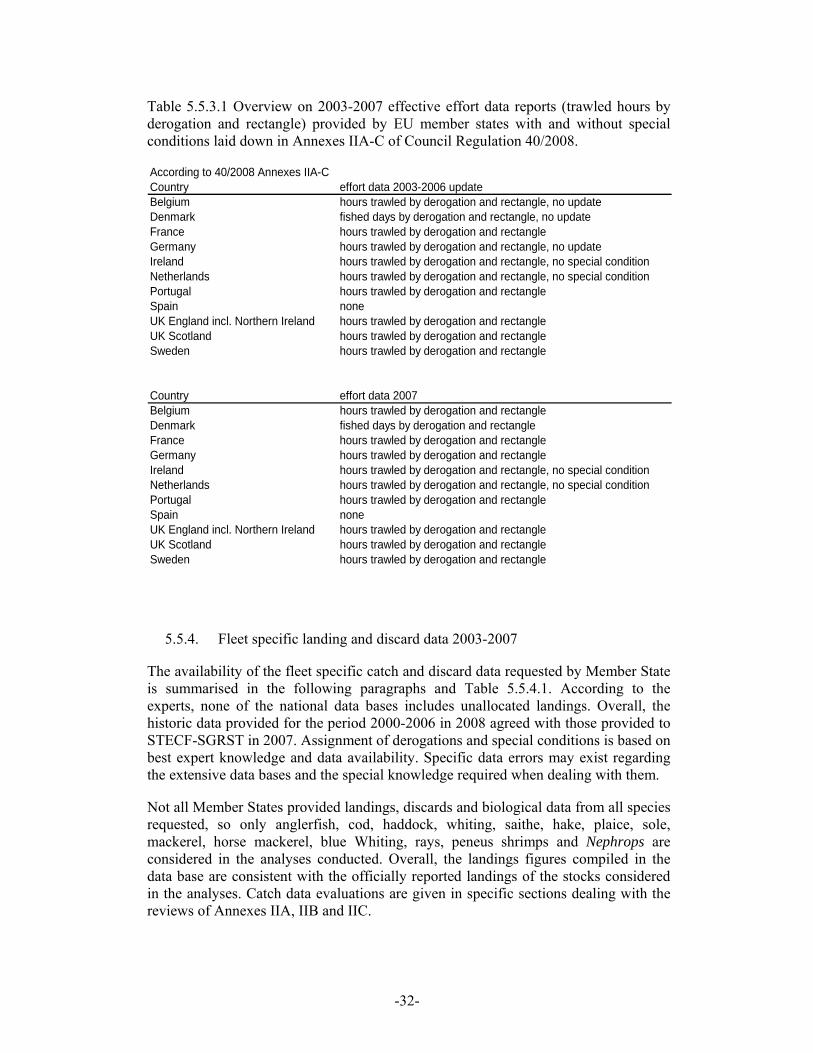
-32-
Table 5.5.3.1 Overview on 2003-2007 effective effort data reports (trawled hours by derogation and rectangle) provided by EU member states with and without special conditions laid down in Annexes IIA-C of Council Regulation 40/2008.
According to 40/2008 Annexes IIA-CCountry effort data 2003-2006 updateBelgium hours trawled by derogation and rectangle, no updateDenmark fished days by derogation and rectangle, no updateFrance hours trawled by derogation and rectangleGermany hours trawled by derogation and rectangle, no updateIreland hours trawled by derogation and rectangle, no special conditionNetherlands hours trawled by derogation and rectangle, no special conditionPortugal hours trawled by derogation and rectangleSpain noneUK England incl. Northern Ireland hours trawled by derogation and rectangleUK Scotland hours trawled by derogation and rectangleSweden hours trawled by derogation and rectangle
Country effort data 2007Belgium hours trawled by derogation and rectangleDenmark fished days by derogation and rectangleFrance hours trawled by derogation and rectangleGermany hours trawled by derogation and rectangleIreland hours trawled by derogation and rectangle, no special conditionNetherlands hours trawled by derogation and rectangle, no special conditionPortugal hours trawled by derogation and rectangleSpain noneUK England incl. Northern Ireland hours trawled by derogation and rectangleUK Scotland hours trawled by derogation and rectangleSweden hours trawled by derogation and rectangle
5.5.4. Fleet specific landing and discard data 2003-2007
The availability of the fleet specific catch and discard data requested by Member State is summarised in the following paragraphs and Table 5.5.4.1. According to the experts, none of the national data bases includes unallocated landings. Overall, the historic data provided for the period 2000-2006 in 2008 agreed with those provided to STECF-SGRST in 2007. Assignment of derogations and special conditions is based on best expert knowledge and data availability. Specific data errors may exist regarding the extensive data bases and the special knowledge required when dealing with them.
Not all Member States provided landings, discards and biological data from all species requested, so only anglerfish, cod, haddock, whiting, saithe, hake, plaice, sole, mackerel, horse mackerel, blue Whiting, rays, peneus shrimps and Nephrops are considered in the analyses conducted. Overall, the landings figures compiled in the data base are consistent with the officially reported landings of the stocks considered in the analyses. Catch data evaluations are given in specific sections dealing with the reviews of Annexes IIA, IIB and IIC.
-33-
Some Member States again did not provide essential quality parameters of the data. Consequently, STECF-SGRST remains in a poor situation regarding the description of the quality of the fleet specific estimates of discards and age disaggregated catches, mainly due to lack of requested information (no. of discard samples, fish measured and aged). Consequently, TOR 3 was not addressed.
Belgium: Belgium provided fleet specific landings data for 2003-2007 derived from official logbook databases for all vessels ≥10 meters. The data covers all areas defined in Annex IIA in which the Belgian fleets are active and conforms to the requested aggregation, by quarter, area, gear and mesh sizes.
The species provided are: anglerfish, brill, cod, dab, haddock, hake, lemon sole, Nephrops, plaice, saithe, pollack, sole, skates and rays, turbot and whiting. The age composition on landings for sole and plaice in ICES subdivisions IVb, IVc, VIId, VIIa, VIIfg and sole in subdivision VIIIab have been provided by quarter for the Belgian beam trawlers. The total number of samples, as well as numbers aged and length measurements by quarter have been apportioned in the same ratio as total quarterly beam trawl fleet landings to annual landings.
Discard data for 2004-2007 were provided from the Belgian Beam trawl fleet for the following species: anglerfish, brill, cod, dab, haddock, hake, lemon sole, plaice, saithe, sole, skates and rays, turbot and whiting. The areas covered are 4, 7a, 7d, 7e, 7f and 7g. Belgian discard data represent all ages without disaggregation by age. Information by area for all observer-trips during the year have been merged together, giving an annual percentage of discards estimate per species. The annual estimates of discard rate have been assumed to apply in each of the 4 quarters.
There is no information on misreporting. The landings in the database are based on combined information of logbook data and sale slips. The actual landed weight is split according the logbook information on hours fished in the respective rectangles. As Belgium does not have trip-by-trip information on the true mesh size for its fleets, Belgium (as well as other countries) agreed to assume certain mesh sizes for its beam trawler fleets. Beamers operating in area VIIIa,b were assumed to use a 70-79 mm mesh size as this is the minimum legal mesh size in that area for beamers. For the North Sea, the trips were split according to the rectangles reported in the logbooks, and mesh sizes were allocated in line with Council Regulation (EC) N° 2056/2001. This regulation stipulates that beam trawlers are prohibited to use less than 120 mm in ICES Division IV to the north of 56° 00’ N. Therefore all beam trawl information from this part of ICES Division IV was accounted against an assumed >120mm mesh size. The same regulation also stipulates that within the rectangle with coordinates east coast of the UK between 55° 00’ and 56° 00’ and the points 55° 00’ N – 05° 00’ E and 56° 00’ N – 05° 00’ E, beam trawlers can use 100 to 119 mm mesh size. Here also we assumed that the mesh size used by the Belgian Beam trawl fleet was 100-119 mm. For the rest of ICES Division IV (the southern part) a mesh size of 80-89 mm was assumed for the beam trawlers. Apart from these assumed mesh size which are based on rectangle information from logbooks, it was also assumed that the shrimp fishery used a mesh size of 16-31 mm. The mesh size of the beam trawl fleets in the other area’s was assumed to be 80-89 mm. The three Belgian gear categories are: beam, otter, and other. For otter and other gear, no assumptions of mesh sizes were made.
-34-
No special conditions were allocated to any Belgian fleet category until now as no Belgian vessel applied for any special condition in any year since the special conditions have been introduced.
Denmark: Denmark provided quarterly landings data for 2002-2007 for the areas North Sea, Skagerrak and Kattegat in the required data format, and covering 39 species. The Danish data include all trip information from vessels both above 10 m (with mandatory logbook submision) and below 10 m (with declarations of fishing area (“farvandseklæring”) and being allocated an effort of 1 (one) fishing day. Landings information comes from the sale slips register. Significant progress has been achieved between both meetings in order to integrate special conditions in the Danish effort data, leading to the inclusion of 6 “true” derogations actually used by Danish fishermen in 2006 and 2007 and 3 “eligible” derogations based on post-stratification of 2002 catch records (see Sect. 5.5.2). Age distribution data were provided for cod, haddock, plaice, sole and saithe 2003-2007. Numbers of samples for landings by species/fishery were provided according to the requirement. Discards data were provided for Kattegat, Skagerrak and North Sea. However, the Danish discards sampling program is structured according to national fisheries definitions, which do not cover the same level of precision as landings data with regards to mesh size (categories available are Danish Seine, Nephrops trawl and Demersal trawl). The number of samples within each stratum is considered too low to be further broken down to the requested mesh sizes categories. Therefore the Danish discards data were not included in the database. There is no quantitative information on misreporting, but there are some indications on potentially significant mis- and underreporting of cod in Kattegat (ICES WGBFAS 2007).
France: Landings data by derogation to the mixed fishery database from 2000 to 2007 were updated for all areas, species and gears. Data by age has been provided for whiting and saithe for the same period.
Discards samples have not been raised to the total French fishery. The level of sampling being rather weak for most of the fishery and the variability high from one trip to another, it has not been possible so far to raise the samples to the total fishery.
Raw data from observed trips (under the DCR program) are provided in Table 1; Appendix 1. Those data are provided by area and main gear. For each of them, Table 1 contains hauls numbers or ‘pieces of net’ number, mean cod landings and discards calculated from sampled trips. Graphs in Appendix 1 show the discards rate relating to the landings.
These results are to be treated with caution at the present time considering the high degree of uncertainty arising from the low sampling level. Furthermore, these results do not take into account the possible differences between metiers. A fuller description of French metiers can be found in Appendix 2.
Some metiers or years show somewhat high discard ratio for cod, but most of them are based on a very small amount of cod.
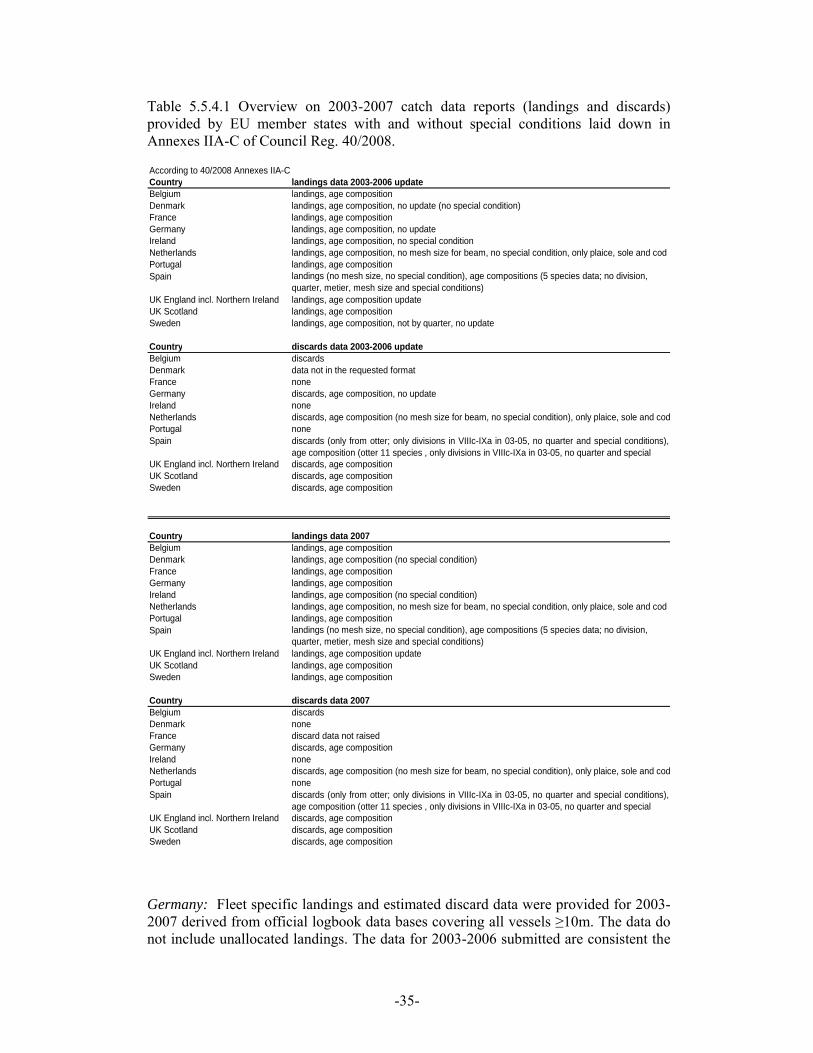
-35-
Table 5.5.4.1 Overview on 2003-2007 catch data reports (landings and discards) provided by EU member states with and without special conditions laid down in Annexes IIA-C of Council Reg. 40/2008.
According to 40/2008 Annexes IIA-CCountry landings data 2003-2006 updateBelgium landings, age compositionDenmark landings, age composition, no update (no special condition)France landings, age compositionGermany landings, age composition, no updateIreland landings, age composition, no special conditionNetherlands landings, age composition, no mesh size for beam, no special condition, only plaice, sole and codPortugal landings, age compositionSpain landings (no mesh size, no special condition), age compositions (5 species data; no division,
quarter, metier, mesh size and special conditions) UK England incl. Northern Ireland landings, age composition updateUK Scotland landings, age compositionSweden landings, age composition, not by quarter, no update
Country discards data 2003-2006 updateBelgium discardsDenmark data not in the requested formatFrance noneGermany discards, age composition, no updateIreland noneNetherlands discards, age composition (no mesh size for beam, no special condition), only plaice, sole and codPortugal noneSpain discards (only from otter; only divisions in VIIIc-IXa in 03-05, no quarter and special conditions),
age composition (otter 11 species , only divisions in VIIIc-IXa in 03-05, no quarter and special UK England incl. Northern Ireland discards, age compositionUK Scotland discards, age compositionSweden discards, age composition
Country landings data 2007Belgium landings, age compositionDenmark landings, age composition (no special condition)France landings, age compositionGermany landings, age compositionIreland landings, age composition (no special condition)Netherlands landings, age composition, no mesh size for beam, no special condition, only plaice, sole and codPortugal landings, age compositionSpain landings (no mesh size, no special condition), age compositions (5 species data; no division,
quarter, metier, mesh size and special conditions) UK England incl. Northern Ireland landings, age composition updateUK Scotland landings, age compositionSweden landings, age composition
Country discards data 2007Belgium discardsDenmark noneFrance discard data not raisedGermany discards, age compositionIreland noneNetherlands discards, age composition (no mesh size for beam, no special condition), only plaice, sole and codPortugal noneSpain discards (only from otter; only divisions in VIIIc-IXa in 03-05, no quarter and special conditions),
age composition (otter 11 species , only divisions in VIIIc-IXa in 03-05, no quarter and special UK England incl. Northern Ireland discards, age compositionUK Scotland discards, age compositionSweden discards, age composition
Germany: Fleet specific landings and estimated discard data were provided for 2003-2007 derived from official logbook data bases covering all vessels ≥10m. The data do not include unallocated landings. The data for 2003-2006 submitted are consistent the

-36-
data provided in 2007. The estimation of discards is based on about 20-30 observer trips per year and the ratio between observed catch and discard weights (sec 5.6). Age compositions of the landed or discarded catches are given where data were available and the sum of products-check (SOP) did not exceed ±25% of the assessed weight of the landings or discards. The data cover the areas defined in Annex IIA, i.e. Skagerrak, Kattegat, North Sea including the southern part of Division II in the EU-Zone and the Division VI to the west of Scotland. There were no demersal fisheries (mesh sizes ≥70mm) conducted in the Eastern Channel, the Irish Sea or the south-western Divisions. The data consider the aggregation by quarter, area, gear, mesh size, and existing derogations including special conditions of 8.1.a, 8.1.c, 8.1.d, 8.1.e and 8.1.f and species requested by the group including dab, anglerfish and lumpsucker. During 2000-2007, the fleets did not apply or have been eligible for other special conditions as confirmed by personal communication with the control and enforcement institute (BLE).
Ireland: Ireland provided fleet specific landings data for 2003-2007 derived from official logbook databases for all vessels ≥10 meters. The data covers all areas defined in Annex IIA in which the Irish fleet is active and conforms to the requested aggregation, of quarter, area, gear, mesh size, and species requested by the group. This data is not divided into special conditions, as Irish vessels have not applied for special conditions relating to this data call. Those special conditions applied for by Irish vessels relate to the allocation of additional days at sea for enhanced observer coverage. There is no quantitative information on misreporting. Revisions have been made to the 2003-2006 data provided to STECF-SGRST in 2008. These revisions result from a combination of data availability updates and database improvements carried out in the later part of 2007.
Irish landings age composition information from port sampling was made available for the time series within VIa, VIIa, VIIg, and VIIj. However, this data was not available with mesh size information. Therefore, their inclusion has been restricted to cases where a single mesh size range could be assumed. Thus maintaining mesh size information in the landings data. Annual information was provided in cases where sampling data was limited. This was then partitioned into quarterly information according to landed weights. This resulted in the inclusion of several beam trawl landing age compositions for cod, haddock, plaice, sole and whiting in VIIa and VIIg. Age compositions for whiting landed by demersal seines in quarter 3 of 2005 were also included. In relation to discards, annual information relating to otter trawls was available for areas VIa, VIIa, VIIg, and VIIj. Ireland’s discard program is fleet based spanning all mesh sizes. As a result, too few samples were available within each of the mesh size groupings outlined within the data call to provide discard information by mesh size. As a result, no Irish discard information has been included by this group.
Netherlands: The Netherlands provided an update of landings and discards data of plaice, sole and cod for the year 2007. These data cover only beam trawls with a mesh size equal to or greater than 80 mm, and some without any mesh size information.
This inability to specify a more detailed mesh size range is due to the logbook data available not including landings per market size classes per trip. This information is needed to enable construction of landings age composition by defined segments of the fleet. Considering that about 80% of the Dutch demersal landings from the North Sea (mainly plaice and sole) are from beam trawls with engine power larger than 300 HP
-37-
fishing with an 80mm mesh size, it is usually assumed that the age composition derived from port sampling is representative of the total landings for this area. This assumption was also made by STECF-SGRST to allow for a comparison with other countries’ data. Therefore, the catch allocated to beam trawls in the North Sea with a mesh size ≥80 mm or without mesh size information were assigned a mesh size range of 80-89mm. Landings were given for sole, plaice and cod.
Dutch discard information was provided for the beam trawl fleet with a mesh size range of 80-89mm in area … for three species: sole, plaice and cod. Discards for sole and plaice were raised to fleet level using the ratio of days at sea*HP sampled to the total days at sea*HP made by the fleet. Cod discards for 2003-2004 were raised using number of trips sampled to total trips made by the fleet. The numbers discarded at age were calculated based on an annual age length key, provided by port sampling and surveys.
In 2006, ten trips were sampled in the framework of the discards sampling programme of the Dutch beam trawl fishery in the North Sea. Nine trips were on board beam trawl vessels larger than 300HP fishing with 80mm cod-end mesh size. One trip was on board a German otter bottom trawl vessel larger than 300HP fishing with 80mm cod-end mesh size. The spatial distribution of fishing effort of the Dutch beam trawl fleet larger than 300HP fishing with 80mm cod-end mesh size was similar to the effort distribution in the discard sampling. Samples of the discards and landings were counted and measured, and raised to catches per hour, per trip, per quarter and per year.
Sampled numbers of fish per haul were raised to numbers at length, and for some species at age, for both discards and landings. Different raising procedures were used for discards and landings because different sources of information were used for these catch components. For the landings the total landed weight per species by trip was available from the auction, while such data was not available for discards. Discards were raised from sampled numbers in a haul to total numbers in a haul with the ratio of estimated haul volume to sampled haul volume. Total numbers per haul were summed over all sampled hauls in a trip and divided by duration of the sampled hauls to obtain total numbers discarded per hour per trip. Numbers were converted to weight using standard length-weight relationships. Landings were raised from sampled numbers per haul to total numbers per trip with the ration of total landings weight in the trip to sampled landings weight. Total numbers landed were calculated by dividing total numbers in the trip by the trip duration. Landed weight per hour was calculated by dividing total landings weight by trip duration. Average numbers landed and discarded at length per trip were then calculated per period (quarter or year) by summing the numbers at length per hour over the number observer trips in this period and dividing this by total number of trips in this period. Numbers at age were calculated from numbers at length using age-length keys, which calculate the proportion of fish at length (l) with age (a). Numbers at age landed and discarded are raised to fleet level by effort-ratio: multiplying total numbers at age in the sampled trips with the ratio of hpeffort (effort in days at sea multiplied by the engine power of the vessel in HP) of the fleet to hpeffort of the sampled trips (Helmond and Overzee 2008).
Cod discard numbers for 2005 were raised by two alternative methods: (1) using the ratio of days at sea*HP sampled to the total days at sea*HP made by the fleet, and (2)
-38-
using the ratio of landings weight sampled to the total landings weight of the fleet. Results with the second method were sometimes lower, but usually much higher (up to 8-fold), than with the first method. The tables and graphs in this report use the data as raised by the first method, which was chosen because these data were more consistent with the data as provided in 2005. Discard data provided by the Netherlands are derived from the IMARES discard sampling program, sampling only very few trips (10) per year. However, in 2004 the industry started its own discard sampling program (sampling plaice discards, and since 2006 also cod discards) with a much higher coverage. These data have been analysed by IMARES for various purposes. Unfortunately, these data were not ready in the right format to be used for the current report. It is important to state that the cod discard data is derived from very few observations (9 fish in 2003, 35 in 2004, and 38 in 2005). As a result the data are highly variable and therefore conclusions drawn on these data should be considered with great care. These data are intended only to provide an approximate indication of fleet catch compositions.
Portugal: No expert of Portuguese fisheries attended the meetings of STECF-SGRST in 2008 . However, Portugal provided landings data for 2004-by quarter and year in the required data format for the areas 8c and 9a where the Portuguese fleet operates. Portugal did not provide discards data due to difficulties with the estimation procedure and the short time period of the discards sampling program. Age disaggregated landings were provided for hake, as well as for horse mackerel, mackerel, Spanisch mackerel and blue whiting. The information refers to all fishing vessels with overall length ≥10 m, licensed for the period 2004-2006. The gear categories and mesh size provided were in agreement with the data call and Annex IIB, gillnet with mesh size >60mm, otter trawl with mesh size >32mm and bottom longlines. However, no mesh size information could be provided for significant parts of the fleets deploying the gears defined and contributing significantly to both hake and Nephrops landings. In the case of trawl, the unknown mesh size means that although the mesh size is greater than 32 mm, it is not possible to specify according to the categories defined by this working group, but their landings can be taken into account. The same is not applicable to the gillnets with unknown mesh size. This resulted in a high proportion of gillnet landings which could not be assigned to the defined derogations and therefore were grouped as unknown (none). Special conditions have been provided for a mixed passive gear category (“PGP”), that includes vessels that operate with more than one gear. Although this group includes unregulated gears (trammel nets, traps, dredges, etc.) and regulated gears (longlines and gillnets) affected by the special conditions, it was not possible to consider the gear specific landings in the evaluation and they were added to “none”. The trawl fleet was further allocated to two fisheries, targeting crustaceans operating in area 9a or targeting demersal fish operating in areas 8c and 9a.
Spain: Fleet specific landings data were provided for 2003-2007 derived from official logbook databases for all vessels ≥10 meters. Data include all trips (with and without landings of hake), species and Spanish landings in other Member States. The data covers ICES Subarea VII and ICES Divisions VIIIc and IXa (without Gulf of Cádiz in 2006 and 2007) conforms to the requested aggregation, by quarter, ICES Division and gear. Mesh sizes ranges and special conditions information was not available. The eleven Spanish gear categories were: BEAM (Beam trawl), DEM_SEINE (Danish and Scottish seiners), DREDGE (Dredges), GILL (Drift and fixed Nets except Trammel
-39-
Nets), LONGLINE (Longlines in VII, Bottom Longlines in VIIIc and IXa), OTTER (Bottom trawl), PEL_SEINE (Pelagic seine and purse seine), PEL_TRAWL (Pelagic Trawl), POTS (Pots and traps), TRAMMEL (Trammel Nets) and NONE-N/A (unidentified gears). 2003-2007 landings age compositions from otter, gillnet and longline hake and from otter megrim of VII, VIIIc and IXa were provided. In VIIIc and IXa, 2003-2007 otter four-spot megrim, 2003-2006 otter blue whiting and IXa 2007 gill and otter pouting ages were available. Ages data were by year (by six months for blue whiting), but not by quarter, mesh size, special condition, metier and Division (only for 2007 VIIIc-IXa hake and pouting ages), therefore data were not incorporated to the database. Discards weights and ages were available for OTTER from 2003-2007 by year, mesh size and metier but not by ICES division (only for VIIIc-IXa in 2003-2005), quarter and special conditions, therefore no discards estimates are included in the database (see below).
Sweden: Sweden provided catch data in the required data format for cod, Nephrops and plaice for the years 2003-2006, by quarter, for the areas: Skagerrak and Kattegat. However, as the by-catch data for other species could not be identified by quarter, all Swedish catches were assigned to be taken during the first quarter. STECF-SGRST notes that this data manipulation prevents any analyses by quarter. Age distribution data were provided for cod, plaice and Nephrops (both for the retained and the discarded part of the catch). Data for special conditions were available only for special condition IIA81b in Skagerrak for 2004, 2005, 2006 . The gear categories used for are otter trawl 90-99mm, split into Nephrops - demersal fish and Nephrops trawl with sorting grid (IIA83b). For 2006 data covered the gear category of gill nets of the mesh size range 110-149mm. Mesh sizes were stratified according to requirements. No catch data were provided for vessels <10m. In Sweden, landings of cod were prohibited during parts of 2003, 2004, 2005 and 2006 which resulted in discard of adult cod. There is no information on misreporting.
In 2007 sweden provided catch data for the special condition aiii AII 83a, (90 mm trawl with 120 mm square mesh panel).
UK (England, Wales and Northern Ireland): The raising procedure used by the UK (England, Wales and Northern Ireland) for 2008 has changed significantly from previous years and data have been reworked for the entire period of 2002-2007.
Landings and effort data were retrieved by The UK Marine Fisheries Agency (MFA) on a year, quarter, species, area, gear, mesh, special condition basis. Length compositions for the landings and discards came from the discard sampling. Comparisons of the length compositions from the market sampling and the discard sampling programmes for the major stocks showed generally good correspondence. There is no guarantee that either the market sampling, or the discard sampling gives the “true” LD.
ALKs for landings were created on a year, quarter, species, area basis from the market sampling data. The same strata were used for discard ALKs but the data came from the discard sampling programme. Annual versions of the ALK (i.e. year, species, area) were created for filling in missing values.
-40-
Missing values in the retained portion of the ALK (i.e. lengths observed for which no age data exist) were filled first using the annual retained ALK, then the quarterly discard ALK then the annual discard ALK. Missing values in the discarded portion of the ALK were filled using the annual discard ALK, then the annual retained ALK. Strata were only considered to have sufficient age data if more than 80% of the fish measured had associated ages. Those strata with less than 80% aged result in the provision of landings and discards biomass only. In those strata considered well aged, lengths for which there was no associated age were ignored. Numbers retained and discarded at age were raised up such that the retained biomass equalled the landings recorded in FAD (the official system for recording landings information in England and Wales. Discard data were also ignored if the retained biomass of a strata was less than 0.02% of the total landings – these strata are presented with landings biomass only. For those stocks with no observed discards (or insufficient data), the final table contains only landing information.
UK (Scotland): Landings data were provided for the years 2003-2007 for all species caught by Scottish vessels specified in the STECF data requirement, including: cod, haddock, whiting, saithe, monkfish, plaice, sole, Nephrops, lumpsucker, turbot and dab. The data does not include landings with no matching effort data for the voyage, though if there is any effort data for the voyage, matching effort records are imputed for all landings. The data conforms to the aggregation by quarter, area, gear and mesh size as set out in the data request. Fisheries are defined using a combination of gear, mesh size and fishing area as set out in the STECF data requirement. Landings and discard numbers at age were derived from market sampling and discard sampling data. This data is stratified by west coast (division VIa) and east coast (sub area IV). If data was from landings from one of these two areas and if the gear category could be matched to FRS specific gear codes catch and discard numbers at age were supplied for cod, haddock, whiting and saithe. For landings from other areas (including all areas in Southern Shelf waters), other types of gear, and in all cases for other species, only landed weight was provided for the given category. Landing numbers at age were calculated from (landed weight in the record * proportion of quarterly landed weight represented by age A)/(mean weight-at-age A). Discard numbers at age were calculated from (landed weight in the record * proportion of quarterly discarded weight represented by age A * ratio of quarterly discards to landings)/(mean weight of discards at age A). The market and discard sampling data files are only produced according to the following categories
• MTR: Motor trawl (bottom trawls, boat length >= 27.432m, targeting demersal species)
• LTR: Light trawl (bottom trawls, boat length < 27.432m, targeting demersal species)
• PTR: Pair trawl (all pair trawls targeting demersal species) • SEN: Seine nets (single and pair) • NTR: Nephrops trawls (all trawls targeting Nephrops)
Therefore, even though landed weights are differentiated according to the data specification of this sub-group no distinction can be made between mesh size categories in terms of proportions at length and proportions at age in the landings and discards, or between mesh size categories in terms of the ratio of discards to landings. In addition, age-length keys are pooled for LTR, NTR and SEN such that the age/length relationship will be common across these gears. Currently Scottish discards
-41-
are raised using a stratified ratio estimator, with the strata being defined by gear type, area (i.e. areas defined in the Scottish market sampling scheme) and quarter (January – March, April – June, …). The auxiliary variable used in the ratio estimator is species landings. Due to the expensive nature of discard sampling many strata are unsampled. This problem is overcome by ad-hoc fill in rules – inshore light trawl data might be used to fill in an empty inshore Nephrops trawl stratum for example. The estimates of discards for each stratum are then summed to give an estimate of total discards, by area and gear if required. There are known problems, however, with bias and imprecision with this method. For comments on incorporation of special conditions see the UK (Scotland) paragraph under section 5.5.2.
5.5.5. Fleet specific landing and effort data 2003-2007 of small boats (<10m)
Belgium: Belgium did not provide any information for vessels under 10m.
Denmark: Landings and effort data for vessels less than 10m were made available by Denmark in the same format as for larger vessels. Vessels of size less than 10 m are included in the general Danish vessel register database together with the vessels > 10 m (for which logbooks are mandatory). Landings from the small vessels are however recorded through a sale slips register as for vessels > 10 m, and information on the effort of vessels < 10 m is provided through declarations of which area the fishing trip took place (“farvandserklæring”). The level of effort is estimated as one fishing day per registered trip, as most vessels engage in day-trip fishery. This is the basis for the data on landings composition and fishing area by these vessels. Gear and mesh size is often missing, and no information is provided on the ICES rectangle level. On a national scale, the number of small vessels registered in the database has been fairly constant around 850 vessels since 2000, while in comparison the number of vessels larger than 10m has decreased regularly from 1100 vessels in 2000 to 760 in 2006.
France:
France provided data for vessels under 10 m for the period 2003 to 2007. All vessels registered in the national Fleet Register have to submit a declaration. Small vessels less than 10 meters are not obliged to complete logbooks but they have to submit a monthly form. These data are stored in the national data base in the same way as for other vessels (> 10 meters).
Effort data are calculated from declarative sources listed above. They were validated by cross-checking with a national sampling for monthly activity calendar. All fishing vessels are sampled directly or indirectly to assess the metiers they have done during the previous year.
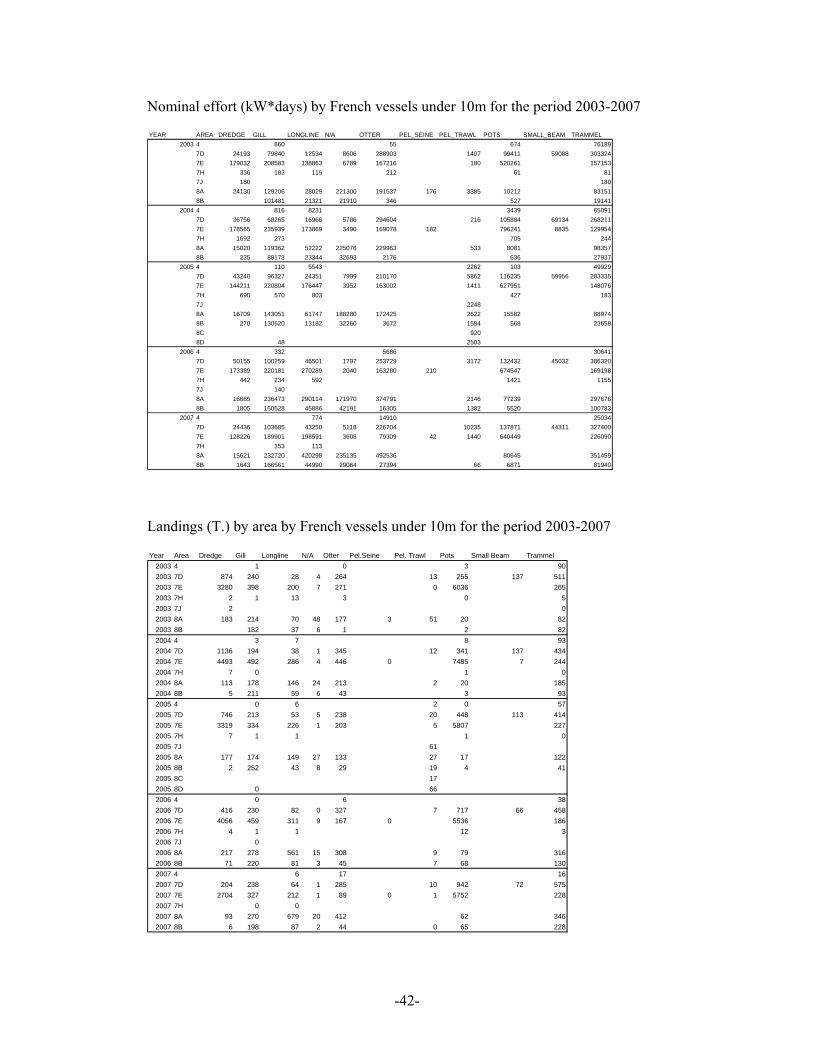
-42-
Nominal effort (kW*days) by French vessels under 10m for the period 2003-2007
YEAR AREA DREDGE GILL LONGLINE N/A OTTER PEL_SEINE PEL_TRAWL POTS SMALL_BEAM TRAMMEL2003 4 660 55 674 76189
7D 24193 79840 12534 8606 288903 1407 99411 59088 3033247E 179032 208583 138863 6789 167216 180 520261 1571537H 336 183 115 212 61 817J 180 1808A 24130 129206 28029 221300 191537 176 3385 10212 831518B 101481 21321 21910 346 527 19141
2004 4 816 8231 3439 650917D 36756 68265 16966 5786 294604 216 105884 69134 2682117E 178565 235939 173869 3490 169078 182 796241 8835 1299547H 1692 273 705 2448A 15020 119362 52222 225076 229963 533 8081 983578B 235 88173 23344 32693 2176 636 27937
2005 4 110 5543 2262 103 499297D 43240 96327 24351 7999 210170 5862 116235 59956 2833357E 144211 220804 176447 3952 163002 1411 627951 1480767H 690 570 803 427 1837J 22488A 16709 143051 61747 188280 172425 2622 15582 889748B 270 130520 13182 32260 3672 1584 568 236588C 9208D 48 2503
2006 4 332 5686 306417D 50155 100259 46501 1797 253729 3172 132432 45032 3863207E 173389 220181 270289 2040 163280 210 674547 1691987H 442 234 592 1421 11557J 1408A 16665 236473 290114 171970 374791 2146 77239 2976768B 1805 150528 45886 42191 16305 1382 5520 100783
2007 4 774 14910 250347D 24436 103685 43250 5118 226704 10235 137871 44311 3274007E 128226 189901 198591 3608 79309 42 1440 640449 2260907H 153 1138A 15621 232720 420298 235135 492536 80645 3514598B 1643 166561 44990 29064 27394 66 6871 81940
Landings (T.) by area by French vessels under 10m for the period 2003-2007
Year Area Dredge Gill Longline N/A Otter Pel.Seine Pel. Trawl Pots Small Beam Trammel2003 4 1 0 3 902003 7D 874 240 28 4 264 13 255 137 5112003 7E 3280 398 200 7 271 0 6036 2652003 7H 2 1 13 3 0 52003 7J 2 02003 8A 183 214 70 48 177 3 51 20 822003 8B 182 37 6 1 2 822004 4 3 7 8 932004 7D 1136 194 38 1 345 12 341 137 4342004 7E 4493 492 286 4 446 0 7485 7 2442004 7H 7 0 1 02004 8A 113 178 146 24 213 2 20 1852004 8B 5 211 59 6 43 3 932005 4 0 6 2 0 572005 7D 746 213 53 5 238 20 448 113 4142005 7E 3319 334 226 1 203 5 5807 2272005 7H 7 1 1 1 02005 7J 612005 8A 177 174 149 27 133 27 17 1222005 8B 2 252 43 8 29 19 4 412005 8C 172005 8D 0 662006 4 0 6 382006 7D 416 230 82 0 327 7 717 66 4582006 7E 4056 459 311 9 167 0 5536 1862006 7H 4 1 1 12 32006 7J 02006 8A 217 278 561 15 308 9 79 3162006 8B 71 220 81 3 45 7 68 1302007 4 6 17 162007 7D 204 238 64 1 285 10 942 72 5752007 7E 2704 327 212 1 89 0 1 5752 2282007 7H 0 02007 8A 93 270 679 20 412 62 3462007 8B 6 198 87 2 44 0 65 228
-43-
Germany: Germany provided aggregated data regarding the fleet of vessels <10m. The data cover landings by area and species and effort in terms of number of vessels. However, no mesh size information is available from the landings declarations given in the years 2004-2007. The data are evaluated in section 6.7.2.
Ireland: Ireland provided data for small vessels of less than 10 meters in length for the period 2003-2007. Attempts are underway to construct an accurate list of these small vessels, which at present stands as approximately 1284 registered vessels, of which around 600 or so hold polyvalent pot licences.
Vessels less than 10 meters are not legally required to complete logbooks, therefore data of limited detail is available. Landings data from Irish vessels under 10 meters are obtained from monthly reports. These reports provide the species live weight by ICES area landed into ports each month. No vessel, gear, or effort information is recorded. There is some doubt as to the accuracy of these monthly reports. However, landings show the main species landed by <10m vessels to be non-TAC, shellfish species. In terms of sampling programs, there are no long-term specific programs like those for over 10 meter vessels. This is partly due to the insignificant landings of TAC species, as well as issues relating to onboard sampling staff safety. However, studies are carried out on specific species or sections of the inshore fleet, including lobster and brown crab, or activity patterns of vessels from certain ports. Landings data are given in aggregated formats within each of the Annex IIA area sections for which landings are recorded for the Irish under 10m vessels.
Monitoring of effort by the small inshore vessels presents difficulties as fishers are not required to record their effort. However, the majority of these small vessels have a daily fishing pattern, leaving at dawn and returning in the afternoon of the same day to land their catch. These are primarily artisanal vessels, not equipped to hold fish on board for long periods. Gear choice of these small vessels is influenced by both home port and local available stocks. The principal methods of the inshore fleet are passive, particularly pots. However, other gears are used including otter trawls and shellfish dredges. The under 10 meter vessels exploit the territorial sea and coastal waters, operating within the ICES areas adjoining the Irish coast (VIa, VIIa, VIIb, VIIg and VIIj).
No information regarding small boats <10m was provided by the Netherlands.
No information regarding small boats <10m was provided by Portugal.
No information regarding small boats <10m was provided by Spain.
Sweden: Effort and landing data for vessels less than 10m were made available by Sweden in the same format as for larger vessels. Vessels <10 m that are using trawl and demersal seines are obliged to use the same logbook as larger vessels. Vessels <10m using other gears are using the “coastal fishing journal” which predominantly follows the same structure as the standard logbook. Sweden reported landings on Nephrops, Cod and Plaice for vessels (<10m) for 2003-2007.
-44-
UK England, Wales and Northern Ireland: Data on catch and effort for under 10 m vessels are made available for UK vessels (including England, Wales and Northern Ireland). However, the effort data in particular are likely to be incomplete as there was no obligation for vessels to report effort before mid-2006.
UK Scotland: Effort data for Scottish vessels <10m were made available to STECF-SGRST. The effort data for 2000-2007 are given in a format consistent with the data submissions for bigger boats. Prior to the introduction of UK legislation known as the Register of Buyers and Sellers (RBS) for shellfish in Scotland in early 2006, some effort catching shellfish using POTS and Shell fishing by hand appears to have been under-recorded but the data for effort by other gears (those regulated for vessels >10m) shows no change in trend consequent on the introduction of RBS and therefore can be assessed as being complete in earlier years. However, the effort data supplied for Scottish registered vessels will exclude voyages landing into ports in England and other non-Scottish areas of the UK. Data on number of vessels per category has been supplied. Scottish under 10m boats are known to use more than one type of gear on individual trips or within a quarter, however and multiple counting of boats is therefore significant. The landings data for 2003-2007 are given in a format consistent with the data submissions for bigger boats.
Although UK(Scotland) carry out a stratified sampling observer programme based on gear, area and quarter, no specific consideration is given to estimating discards for vessels in the category of less than 10 metres in length. Vessels in this category are classed in the same groups as vessels over 10 metres in length based on the fishing method rather than vessel size. For a variety of reasons, including Health and Safety, discard sampling staff tend not to sail on vessels in the under 10 metre category.
In 2003 the Scottish Fisheries Statistics showed landings of the main commercial demersal species from vessels in the <10 metre category operating in Scotland to be below the level where the sampling intensities as defined in Appendix XV (Section H) of regulation (EC) 1639/2001 (Table 2) requires sampling to be carried out. A pilot study conducted in 2004 comparing a <10m vessel and >10m vessel using trawl gear and targeting Nephrops concluded overall weight discarded per hour was very similar between the vessels. As a consequence regular sampling of the <10 metre category in relation to landings and discards of Nephrops are conducted but the estimation of demersal discards for this category is based on the assumption that all vessels targeting Nephrops and operating in the same sampling area have the same catching and discarding characteristics.
5.6. Estimation of fleet specific international landings and discards
The estimation of fleet specific international landings and discards is based on linking the information about fleet specific discards and catch and discards at age among countries and replacing poor or lacking values with aggregated information from other countries.
Reported data by country are aggregated by fleet properties and raised to the officially reported landings or discards in the SGDFF 2004 (ICES 2004) format. Fleet definitions are based on area, year, quarter, gear, mesh size groups, special conditions
-45-
as defined in Council Reg. 41/2007 Annexes 2A-C and national fisheries (metiers) definitions.
The data management and estimation procedures follow the simple raising strategies outlined below :
• Data management:
The fleets are classified to their management areas, years, quarters and effort regulated gear groups disregarding the countries and fisheries (metiers).
• Estimation of discard rates by fleet ( DR ):
Let the following notation be: D=discards, L= landings, snf = sampled national fleet, unf = unsampled or poorly sampled national fleet.
A poorly sampled fleet is defined as such when 0.75snfSOP < or 1.25snfSOP >
The available landings and discards are aggregated (summed) by fleets and mean discard rates are calculated:
( )
snfsnf
snf snfsnf
DDR
L D=
+
∑∑
with 0snfD ≥ and with 0snf snfL D+ >
otherwise 0 (means no catch)
Fleet specific discard amounts are calculated when no discard information is available by
( ).
1unf
unf
L DRD
DR=
− when unfD is null (empty)
Fleets without any discards information remain as such.
• Estimation of landings in numbers and mean weight at age for non or poorly sampled national fleets
Let i be the age reference
Landings in numbers ( ,snf iN ) and mean weight at age ( ,snf iW ) are aggregated by sampled fleets when SOPsnf ≥ 0.75 and SOPsnf ≤ 1.25.
Raising of numbers and mean weights at ages 0-11 to non or poorly sampled fleets by
-46-
,
,
( ).snf i unfsnf
unf isnf
snf
N LN
L=∑∑
, ,( )unf i snf iW mean W=
The mean weights are unweighted and an appropriate weighing procedure, i.e. number of fish measured, should be explored.
Fleets without any landings at age information remain as such.
• Estimation of discards in numbers and mean weight at age for non or poor sampled fleets
Discards in numbers ( ,snf iN ) and mean weight at age ( ,snf iW ) are aggregated by sampled fleets when SOPsnf ≥ 0.75 and SOPsnf ≤ 1.25 along the same procedure as for the landings.
Raising of numbers and mean weights at ages 0-11 to non or poorly sampled fleets by
,
,
( ).snf i unfsnf
unf isnf
snf
N DN
D=∑∑
, ,( )unf i snf iW mean W=
The mean weights are unweighted and an appropriate weighing procedure, i.e. number of fish measured, should be explored.
Fleets without any landings at age information remain as such.
An example of this raising procedure is given in Table 15.2.3.2 under the header "Discards", the values between parenthesis are the estimated values.
• Catch at age estimation including discards
Catches by fleets are estimated as the sum of landings and discards. Missing discards are ignored.
Catches at ages 0-11 in numbers are estimated as the sum of landings at age in numbers and discards at age in numbers. Missing discards are ignored.
Mean weights at ages 0-11 are estimated at weighted means (according to ratios of landings at age and discards at age to catches at age).
-47-
Finally, all fleets’ catches and catches at ages in numbers and mean weights are aggregated finally over management areas, years and effort regulated gear groups.
Fleets without any information on discards or landings at age and discards at age remain unchanged and need to be raised separately on an agreed basis in case that they constitute significant landings.
The STECF-SGRST notes that sampling of catch at sea including discards is expensive and difficult. This means that sampling coverage tends to be rather limited, and estimates of discards are subject to high uncertainty. This is true of all the discard data used here, and in some cases the discard estimates presented represent the first attempt to use the discard data from some fisheries in an advisory context. Where the coverage is considered adequate to estimate the overall catch compositions of specific fleets these are presented, but they are intended only to provide an approximate indication of fleet catch compositions. In cases where there are little data, the estimated discard rates may be biased and imprecise (Stratoudakis et al., 1999). The mean weights are estimated as unweighted means. This results in a biased estimate. An appropriate weighing procedure, i.e. number of fish measured, should be explored.
STECF-SGRST further notes that the approach of discard estimation applied is generally consistent with the method used in the discard estimates published by the FAO (Kelleher, 2004). However, the group also notes that the design of a discard sampling scheme might differ depending on whether the objective was to estimate total discards, or discard for specific fleets. In the current context estimates from sampling schemes designed for the former purpose are being used for the latter purpose which again means the estimates should only be used with caution. Where this is the case, comparisons are made between the estimates of total discards used for assessment purposes, and the fleet-specific estimates used here.
With regard to age composition data, STECF-SGRST notes that the analyses presented here are intended to quantify the catch compositions of the various fleets and gears of interest. For this purpose it is the species compositions and the estimated landings and discards that are of primary importance, with the age compositions being only of secondary importance. Applying the age compositions to the national catches by fleet and gear is a complex process not least because it typically involves considerable filling-in to account for categories which do not correspond to those within national sampling schemes. It would make any future data compilation and analyses much more efficient if age composition data were not required. While there is clearly a trade-off between efficiency on one hand and providing additional information on the other, the group notes that in the current context the age composition data add little information. As a result it proposes that any future data requests and analyses should be restricted to age-aggregated information.

-48-
5.7. Treatment of CPUE data
STECF-SGRST notes that CPUE series are often interpreted and used as stock abundance indicator. However, STECF-SGRST emphasises that the presented trends in CPUE by fleets are subject to selective fishing strategies (area, gear, mesh size etc.) and thus maybe biased. On the other hand, CPUE derived from targeted fisheries may provide very useful information on stock abundance trends. Furthermore, it must be taken into consideration that the majority of the CPUE trends represent only overall weights in the landings (LPUE) without discards or with poorly estimated discards. Ideally, the CPUE should be based on age disaggregated abundance rather than overall weights and reflect technological creep when trends over longer periods are evaluated. Time constraints prevented STECF-SGRST from estimations of CPUE trends by age and full evaluations of these. STECF-SGRST recommends that CPUE in units of numbers at age/(kw*days) be estimated and compared with the recent assessment results provided by ICES.
STECF-SGRST presents CPUE by derogations in units of g/(kW*days) Where discard estimates are not available, the trends in LPUE (landings per unit of effort) are given in the same units. STECF wishes to stress again that great care should be used in the interpretation of these data owing to the incomplete nature of information on discarded fish.
5.8. Ranking of gears on the basis of contribution to catches
STECF-SGRST presented the ranked contributions of the individual derogations pertaining to Annex IIA of Coun. Reg. 40/2008 to cod, plaice and sole catches for the years 2003 to 2007. There was discussion about whether the ranking should be based on a single recent year (possibly reflecting the most up to date importance of the different gear types in contributing to mortality of these species) or an average for a range of years (which allows for any aberrations in the series). A decision was taken to rank according to 2007. The data for other years are available for alternative analysis in the background spreadsheets .
The catch estimates are based on the sums of the landings and discards where available. STECF-SGRST considers the catch estimates as uncertain where derogations lack discard estimates or they are poorly sampled. The ranking according to catch in numbers only considers derogations for which catch in numbers are available. STECF wishes to stress again that great care should be used in the interpretation of these data owing to the incomplete nature of information on discarded fish.
5.9. Summary of effort and landings by ‘unregulated’ gears
In the summary tables of effort (for example in Section 6.2) the ‘none none’ category represents i) unregulated gear types and mesh sizes in addition to ii) unidentified mesh sizes. STECF has attempted to provide a break down of the main gears within this category (for example in Section 6.6 for Annex IIA) in effort (kW*Days at sea), cod catches, plaice catches and sole catches. This analysis should help to identify any gears
-49-
contributing significantly to landings of these species but which are not currently regulated.
This is the first year for which detailed analysis of this type has been attempted and following completion of the tables in the report, some inconsistencies were identified which need to be investigated. For this reason some care is required in interpretation of the data until any required amendments are completed.
It is important in making use of the data in this report, that the ‘none none’ material is not counted more than once. It would be preferable to use data from the sections covering unregulated gears.
5.10. Presentation of under 10m information
This STECF-SGRST reportprovides an overview of landings and effort data provided by the experts regarding their national fisheries of vessels <10m, which are not obliged to report their landings through logbooks but rather do landings declarations.
Previously, information on vessels <10m has been provided in the STECF SGRST reports only as a series of individual country reports describing activities and landings. In this report individual country information is again provided where available – new information is provided from several countries. An attempt is also made to compile available information for each area into overall figures. Since not all countries were able to fulfil this part of the data call, the aggregate estimates for each region of the cod recovery zone must be considered as minimum estimates. Nevertheless, they begin to give an idea of the scale of landings contributed by these smaller classes of vessel.
5.11. Presentation of spatial information on effective effort
STECF-SGRST notes that minimum geographic resolution in the available logbook information on landings and effective effort is by ICES rectangle and considers analyses to only be possible at that resolution at the present time. The effective effort values of certain nations were given in days fished which were then converted to trawled hours by applying a factor of 24. STECF-SGRST notes that only major changes in the geographical distribution patterns should be given attention given the imprecision of the created data set. A full set of figures is availabale electronically but a selection of key gears is included in this report.
Figures use a common scale across years for a given category (e.g. 4.a.ii. none) but scales are unique to each category such that the colours assigned to statistical rectangles for category 4.a.ii. none can not be compared directly to those assigned for category 4.a.ii.IIA8d say. Figures use a percentiles scale, i.e. number of data values found in each colour band is the same. This is after data values across all years have been combined for that category.
-50-
5.12. Effort management categories and DCR metiers
ToR 6 requires a consideration of the relationship between the gear categories as defined in relation to the existing effort management regime, and the metiers defined by STECF SGRN in relation to the revision of the data collection regulation (DCR). At present these represent two rather different systems for classifying fishing activity. Specific requirement in this TOR is to identify situations where one metier adequately describes several effort categories (in other words there is redundancy in the effort management categories) and also cases where one effort category includes more than one metier and in so doing masks important detail.
STECF SGRST spent some time discussing this issue and describes below the different systems for classifying fishing before discussing ways to bridge the gap between them. Given the time available, the group was not able to fully address the TOR but for two of the areas in Annex IIA (Irish Sea and West of Scotland, has made an attempt at a closer examination of the relationship between effort management categories and metiers with a view to identifying where improvements could be made and redundancy reduced.
Vessels subject to effort management regulations are assigned to categories based on the gear type and mesh-size of their gear. The allocation of number of days at sea is then based on gear category, area fished, and on whether the vessel qualifies for any special conditions which allow additional days. For example, vessels fishing with trawls or demersal seines with mesh size of 120mm or above (gear 4av) in the North Sea (area 2b2) in 2008 were allocated 86 days at sea during 2008. If they used a 140mm square mesh panel (special condition 8.3(j)) this allocation was increased to 115 days. While no target species are specified for this gear type in the effort regulations, the basic EU technical measures regulation (850/1998) includes catch composition rules that specify the maximum percentages of different species that may be landed when using each gear/mesh size combination.
As a move towards a fishery-based approach to data collection, STECF SGRN has developed a classification system for fishing activity based on the concept of metiers. Appendix 2 provides an example of this concept in its description of French metiers. The STECF SGRN system, known as the Nantes matrix, involves a number of different levels such that each level provides a more precise description of fishing activity. For example, level 2 is gear class (e.g. trawl); level 3 is gear group (e.g. bottom trawl); level 4 is gear type (e.g. bottom otter trawl); level 5 is target assemblage (e.g. mixed crustaceans and demersal fish), then level 6 describes the mesh size and any other selective devices in use. Under this system, any fishing trip can be allocated to one of these metiers based on the gear used and the species composition of the resulting landings.
From the above descriptions, it is clear that the DCR matrix represents a much more detailed approach to describing fishing activity than the effort management categorisation. In particular, the DCR approach involves more detailed information on gear type (i.e. the ability to distinguish between, e.g. pair trawls and single trawls) and also on catch composition (in relation to the different target assemblages). In contrast, the effort management categories include only information corresponding to DCR level three (gear group) and level six (mesh size & selective devices). As a result, an effort management category may include both multiple gear types and multiple target
-51-
assemblages. The latter information is more critical, given that the intention of effort management is to protect specific components of the target assemblages.
In order to identify the correspondence between effort management categories and DCR métiers, it is necessary to review the effort management categories and identify cases where these may involve multiple gear types (e.g. single and pair trawl within demersal trawl) and/or multiple target assemblages. The review should also identify cases where special conditions associated with a particular grouping involve a difference in gear selectivity characteristics or target assemblage. An additional question relates to the uptake of special conditions. If, in practice, the amount of effort attributed to a particular special condition is negligible, then questions about whether that effort involves multiple gear types or target assemblages are rather academic.
Differences in catch composition when using the same gear, presumably reflect either differences in the area/season where the gear is used, or differences in the selectivity of the gear in practice. The latter can result from additional selectivity devices, such as square mesh panels, that in some cases are specified in special conditions as their use may result in an increase in the allocation of days at sea. It is harder to evaluate differences in the seasonal or spatial use of a gear, as the basic data in use are annual and spatially aggregated. However, to some extent, nation can be used as a proxy for area where the gear is used, as with some exceptions, the grounds fished by the vessels of a given nation, will be similar from year to year, and are typically adjacent to that nation’s coastline.
As a first step to mapping the effort management categories on to the Nantes matrix DCR métiers, the following information could be tabulated:
• Gear category, e.g. 4av • Special condition regulation e.g. 8.1a, including the baseline (i.e. no special
condition) • The conditions associated with that regulation, in this case the use of a 120mm
square mesh panel • Whether or not the conditions imply a difference in selectivity or catch
composition • Recent allocations of days at sea for the condition (to illustrate the extent to
which these imply a separate fishery to the baseline • Some indication of the nations involved, for instance the top three nations in
terms of recent effort, and their percentage of the total • Some indication of the total uptake of that special condition, for instance the
percentage of recent effort by that gear aggregated across all special conditions.
As an illustration an example table for gear 4av in the North Sea, Skagerrak & Eastern Channel is given in Table X.1. A number of points emerge from this example. The large majority of effort by this gear (c. 91%) is not allocated to special conditions. Further, it is reasonably spread across different nations, so may well involve different catch compositions (though not necessarily different target assemblages). The most
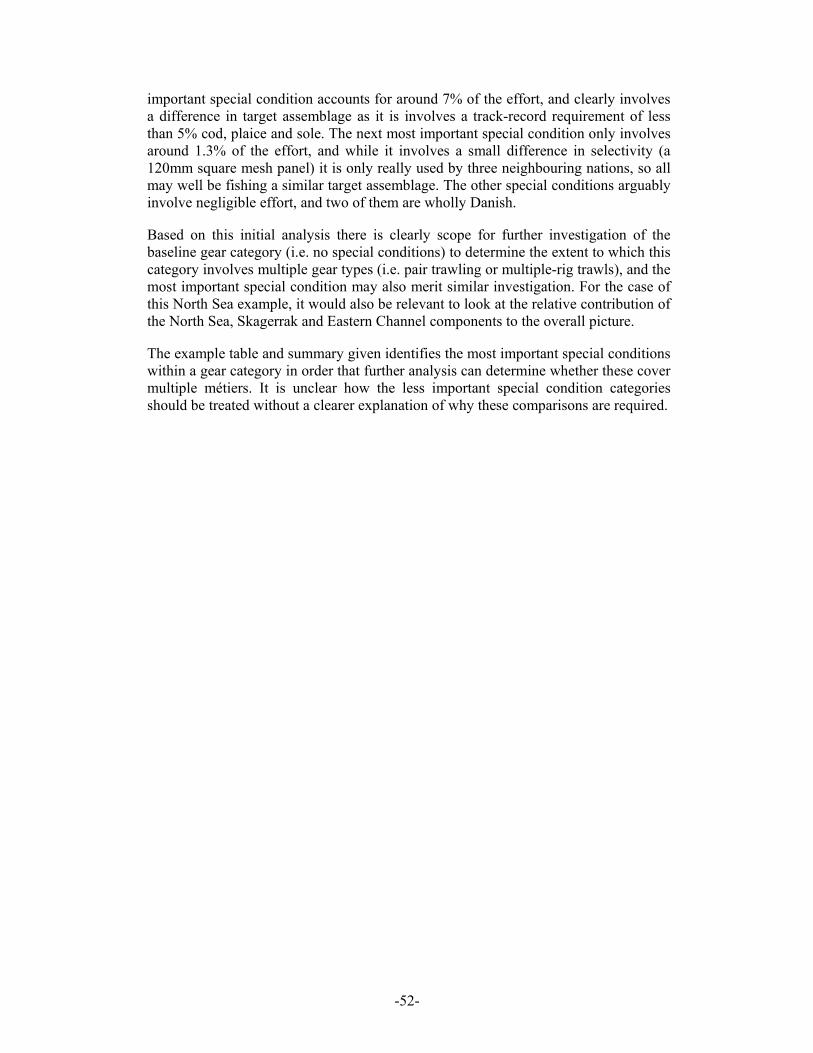
-52-
important special condition accounts for around 7% of the effort, and clearly involves a difference in target assemblage as it is involves a track-record requirement of less than 5% cod, plaice and sole. The next most important special condition only involves around 1.3% of the effort, and while it involves a small difference in selectivity (a 120mm square mesh panel) it is only really used by three neighbouring nations, so all may well be fishing a similar target assemblage. The other special conditions arguably involve negligible effort, and two of them are wholly Danish.
Based on this initial analysis there is clearly scope for further investigation of the baseline gear category (i.e. no special conditions) to determine the extent to which this category involves multiple gear types (i.e. pair trawling or multiple-rig trawls), and the most important special condition may also merit similar investigation. For the case of this North Sea example, it would also be relevant to look at the relative contribution of the North Sea, Skagerrak and Eastern Channel components to the overall picture.
The example table and summary given identifies the most important special conditions within a gear category in order that further analysis can determine whether these cover multiple métiers. It is unclear how the less important special condition categories should be treated without a clearer explanation of why these comparisons are required.
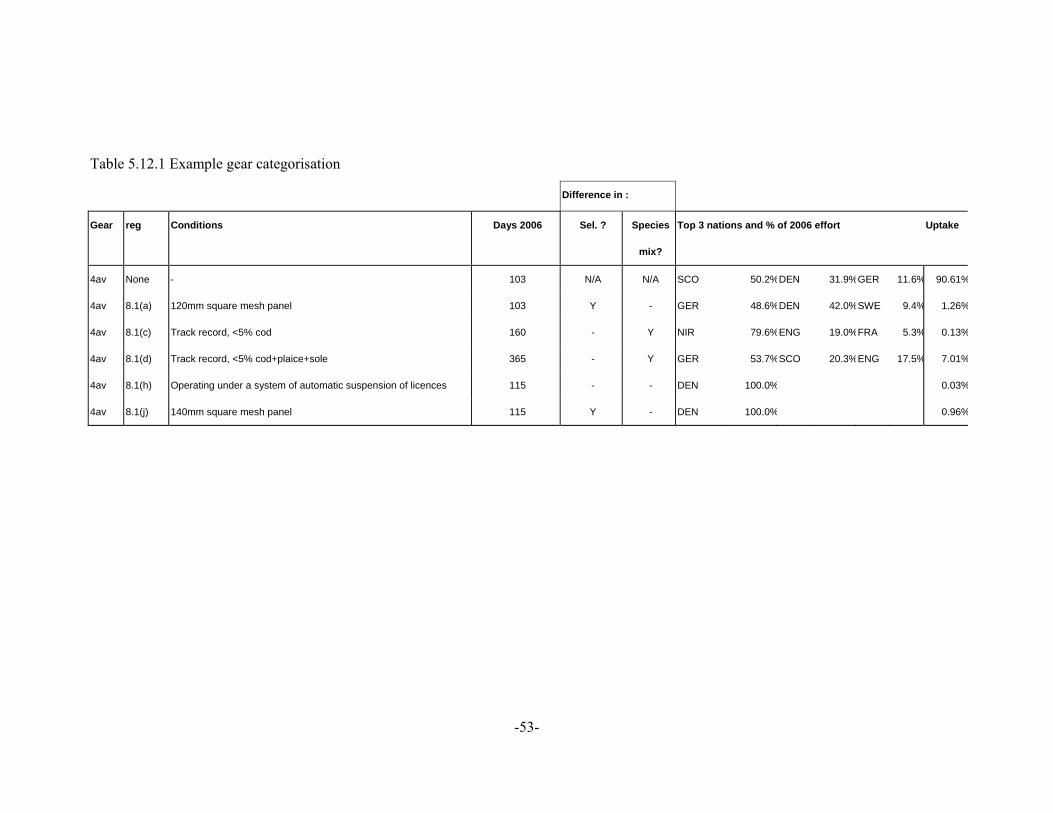
-53-
Table 5.12.1 Example gear categorisation
Difference in :
Gear reg Conditions Days 2006 Sel. ? Species
mix?
Top 3 nations and % of 2006 effort Uptake
4av None - 103 N/A N/A SCO 50.2%DEN 31.9%GER 11.6% 90.61%
4av 8.1(a) 120mm square mesh panel 103 Y - GER 48.6%DEN 42.0%SWE 9.4% 1.26%
4av 8.1(c) Track record, <5% cod 160 - Y NIR 79.6%ENG 19.0%FRA 5.3% 0.13%
4av 8.1(d) Track record, <5% cod+plaice+sole 365 - Y GER 53.7%SCO 20.3%ENG 17.5% 7.01%
4av 8.1(h) Operating under a system of automatic suspension of licences 115 - - DEN 100.0% 0.03%
4av 8.1(j) 140mm square mesh panel 115 Y - DEN 100.0% 0.96%

-54-
6. REVIEW OF ANNEX IIA OF REGULATION 40/2008 IN THE CONTEXT OF THE COD RECOVERY PLAN (REGULATION 423/2004
6.1. General remarks
STECF-SGRST notes that assignment of derogations and special conditions is based on best expert knowledge and data availability. Data errors may exist taking into consideration the very large size of data bases involved, (a known example is allocation of special conditions when no gear group is specified). STECF-SGRST notes that table 1 of Annex IIA refers to special condition 4.c.iii.IIA8f but describes this as a special condition for gillnets and entangling nets with mesh size >= 220mm. Nets with this mesh size are defined under paragraph 4.c.iv.
The group emphasises that the assignment of some derogations and special conditions to the individual vessels (fleet aggregation) is based on its landings compositions in specified reference years but independent of its effort deployed in that fleet segment. Consequently, a vessel may be entitled to derogations including special conditions based on the landing composition of a single haul and thus realise certain flexibility in comparison with vessels with more constant activities.
Specific technical or gear configurations defined in the special conditions of the derogations are often not registered in the logbook databases, i.e. multi rigging, sorting or escapement devices (special conditions 8.1.a, b, j) or in-season management plans (8.1.d, h, i, k). STECF-SGRST notes that in-season information and fleet aggregations imply the direct involvement of the national control and enforcement institutions in the review process. STECF-SGRST recommends that to the fullest extent possible, national logbook data bases be made consistent with both the regulations defined in Annex IIA of the fishing opportunities regulation and the fleet-metier definitions defined under the revised data collection regulation (Council Reg. 199/2008).
STECF-SGRST notes that the West of Scotland management line defined in section 2.2 in Annex IIA of Council Reg. 40/2008 cuts statistical rectangles. This fact prevents precise allocation from logbooks of landings and discards to the cod recovery zone. A link between VMS data and logbook landings information by rectangles could contribute to a precise allocation. In the absence of VMS data assignments of vessels to fleets qualifying for special conditions based on historic landings compositions and evaluation of historic effort and catches west of Scotland must be considered over all statistical rectangles in ICES Division 6a including those beyond the Cod Recovery Zone. Further, the group considers the area placed under a recovery plan should encompass the full range of the stock and that this range includes those rectangles beyond the current Cod Recovery Zone.
STECF-SGRST notes the following changes in Annexes IIA to Council Reg. 40/2008 as compared to the Annex IIA to 41/2007:
• The option of a permanent observer to ensure compliance with the catch composition rules under special condition IIA8d made available in 2007 has been extended to include special conditions IIA8c, IIA8e, IIA8f and IIA8k also (paragraph 8.4). It is now explicitly stated that observers must be independent of the vessel owner and that the observer plan be submitted by the flag member state
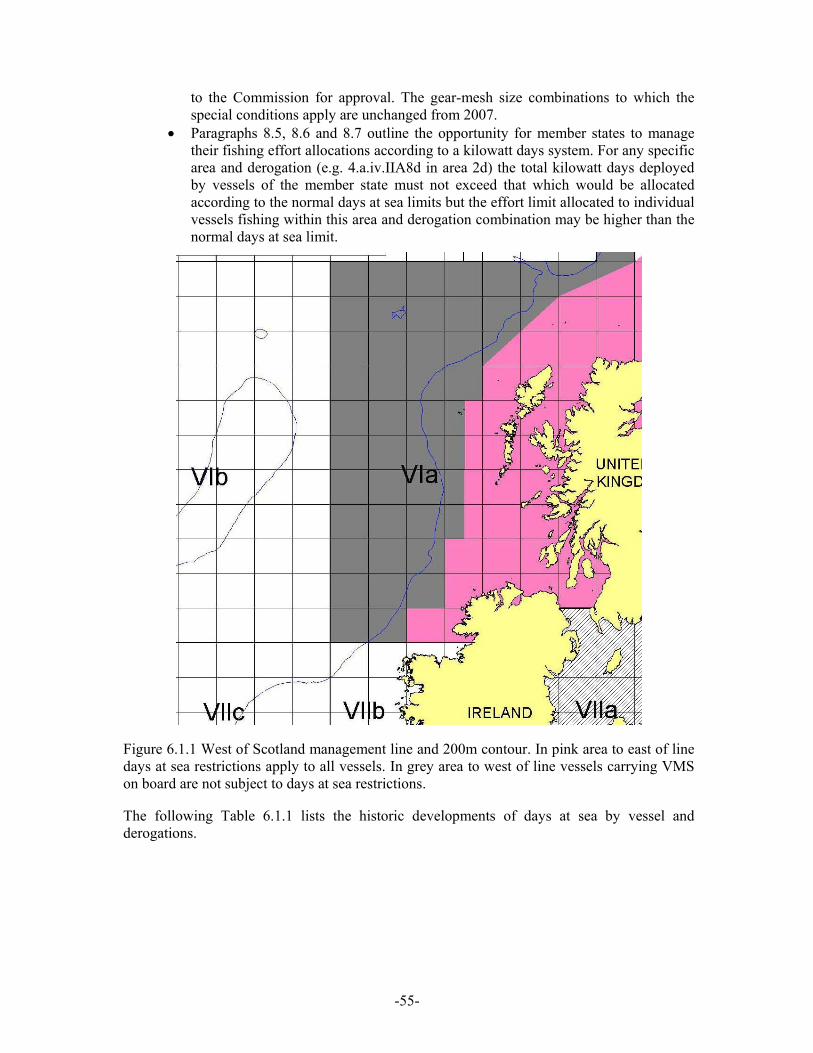
-55-
to the Commission for approval. The gear-mesh size combinations to which the special conditions apply are unchanged from 2007.
• Paragraphs 8.5, 8.6 and 8.7 outline the opportunity for member states to manage their fishing effort allocations according to a kilowatt days system. For any specific area and derogation (e.g. 4.a.iv.IIA8d in area 2d) the total kilowatt days deployed by vessels of the member state must not exceed that which would be allocated according to the normal days at sea limits but the effort limit allocated to individual vessels fishing within this area and derogation combination may be higher than the normal days at sea limit.
Figure 6.1.1 West of Scotland management line and 200m contour. In pink area to east of line days at sea restrictions apply to all vessels. In grey area to west of line vessels carrying VMS on board are not subject to days at sea restrictions.
The following Table 6.1.1 lists the historic developments of days at sea by vessel and derogations.
-56-
Table 6.1.1 Historic trends in days at sea by vessel specified in the Council Regulations since 2003.
Annex AREA REG GEAR SPECON 2003 2004 2005 2006 2007 2008IIA 2a 4ai none 276 240 228 228 228 228IIA 2a 4aii IIA83b 252 365 365 365IIA 2a 4aii IIA83d 365 365 280 280 280IIA 2a 4aii none 300 264IIA 2a 4aiii IIA83a 144 137 126 126IIA 2a 4aiii IIA83d 365 365 365 365 365IIA 2a 4aiii none 300 264 108 103 95 71IIA 2a 4aiii deleted (2007) IIA83b 365IIA 2a 4aiii new (2007) IIA83l 132 132IIA 2a 4aiv IIA83a 144 137 137 137IIA 2a 4aiv IIA83c 168 156 148 148 148IIA 2a 4aiv IIA83d 365 365 365 365 353IIA 2a 4aiv none 108 120 108 103 103 103IIA 2a 4av IIA83a 144 137 137 137IIA 2a 4av IIA83c 180 168 160 160 160IIA 2a 4av IIA83d 365 365 365 365 365IIA 2a 4av IIA83h 120 115 115 115IIA 2a 4av IIA83j 144 149 149 103IIA 2a 4av none 108 120 108 103 103 103IIA 2a 4ci none 192 168 156 140 140 140IIA 2a 4cii new (2007) none 192 168 156 140 140 140IIA 2a 4ciii new (2007) former 4cii none 192 168 156 140 140 140IIA 2a 4civ new (2007) former 4ciii IIA83f 192 180 162 162 162IIA 2a 4civ new (2007) former 4ciii none 192 168 156 140 140 140IIA 2a 4d IIA83g 140 140 140IIA 2a 4d none 192 168 156 140 140 140IIA 2a 4e none 228 204 192 173 173 173IIA 2b 4ai none 276 240 228 228 228 228IIA 2b 4aii IIA83b 365 365 365IIA 2b 4aii IIA83d 365 365 280 280 280IIA 2b 4aiv IIA83c 168 156 148 148 148IIA 2b 4aiv IIA83d 365 365 365 365 365IIA 2b 4aiv none 108 120 108 103 95 86IIA 2b 4av IIA83c 180 168 160 160 160IIA 2b 4av IIA83d 365 365 365 365 365IIA 2b 4av IIA83h 120 115 115 115IIA 2b 4av none 108 120 108 103 96 86IIA 2b 4ci none 168 156 140 140 140IIA 2b 4cii new (2007) none 168 156 140 140 126IIA 2b 4ciii new (2007) former 4cii none 168 156 140 130 117IIA 2b 4civ new (2007) former 4ciii none 168 156 140 140 140IIA 2b 4d none 168 156 140 140 140IIA 2b 4e none 204 192 173 173 173IIA 2b1 4aii IIA83b 252 365 365 365IIA 2b1 4aii none 300 264IIA 2b1 4aiii IIA83a 144 137 126 126IIA 2b1 4aiii IIA83d 365 365 365 365 365IIA 2b1 4aiii none 300 264 108 103 95 86IIA 2b1 4aiii new (2007) IIA83l 132 132
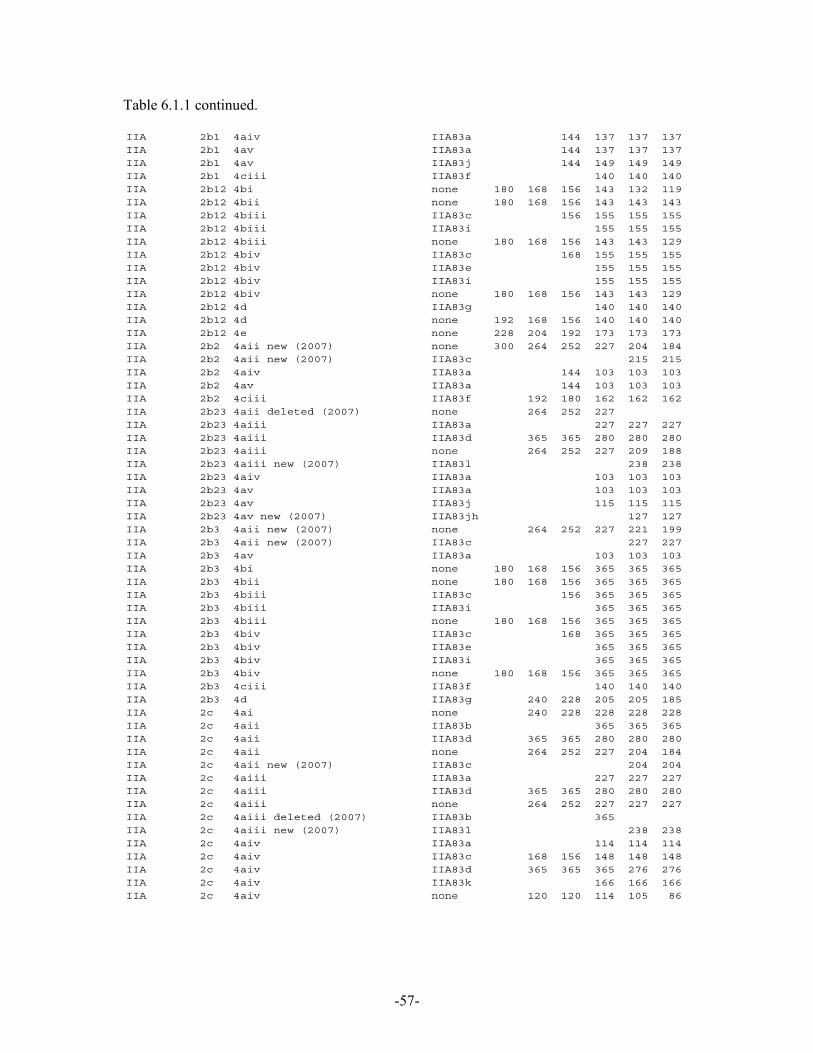
-57-
Table 6.1.1 continued.
IIA 2b1 4aiv IIA83a 144 137 137 137IIA 2b1 4av IIA83a 144 137 137 137IIA 2b1 4av IIA83j 144 149 149 149IIA 2b1 4ciii IIA83f 140 140 140IIA 2b12 4bi none 180 168 156 143 132 119IIA 2b12 4bii none 180 168 156 143 143 143IIA 2b12 4biii IIA83c 156 155 155 155IIA 2b12 4biii IIA83i 155 155 155IIA 2b12 4biii none 180 168 156 143 143 129IIA 2b12 4biv IIA83c 168 155 155 155IIA 2b12 4biv IIA83e 155 155 155IIA 2b12 4biv IIA83i 155 155 155IIA 2b12 4biv none 180 168 156 143 143 129IIA 2b12 4d IIA83g 140 140 140IIA 2b12 4d none 192 168 156 140 140 140IIA 2b12 4e none 228 204 192 173 173 173IIA 2b2 4aii new (2007) none 300 264 252 227 204 184IIA 2b2 4aii new (2007) IIA83c 215 215IIA 2b2 4aiv IIA83a 144 103 103 103IIA 2b2 4av IIA83a 144 103 103 103IIA 2b2 4ciii IIA83f 192 180 162 162 162IIA 2b23 4aii deleted (2007) none 264 252 227IIA 2b23 4aiii IIA83a 227 227 227IIA 2b23 4aiii IIA83d 365 365 280 280 280IIA 2b23 4aiii none 264 252 227 209 188IIA 2b23 4aiii new (2007) IIA83l 238 238IIA 2b23 4aiv IIA83a 103 103 103IIA 2b23 4av IIA83a 103 103 103IIA 2b23 4av IIA83j 115 115 115IIA 2b23 4av new (2007) IIA83jh 127 127IIA 2b3 4aii new (2007) none 264 252 227 221 199IIA 2b3 4aii new (2007) IIA83c 227 227IIA 2b3 4av IIA83a 103 103 103IIA 2b3 4bi none 180 168 156 365 365 365IIA 2b3 4bii none 180 168 156 365 365 365IIA 2b3 4biii IIA83c 156 365 365 365IIA 2b3 4biii IIA83i 365 365 365IIA 2b3 4biii none 180 168 156 365 365 365IIA 2b3 4biv IIA83c 168 365 365 365IIA 2b3 4biv IIA83e 365 365 365IIA 2b3 4biv IIA83i 365 365 365IIA 2b3 4biv none 180 168 156 365 365 365IIA 2b3 4ciii IIA83f 140 140 140IIA 2b3 4d IIA83g 240 228 205 205 185IIA 2c 4ai none 240 228 228 228 228IIA 2c 4aii IIA83b 365 365 365IIA 2c 4aii IIA83d 365 365 280 280 280IIA 2c 4aii none 264 252 227 204 184IIA 2c 4aii new (2007) IIA83c 204 204IIA 2c 4aiii IIA83a 227 227 227IIA 2c 4aiii IIA83d 365 365 280 280 280IIA 2c 4aiii none 264 252 227 227 227IIA 2c 4aiii deleted (2007) IIA83b 365IIA 2c 4aiii new (2007) IIA83l 238 238IIA 2c 4aiv IIA83a 114 114 114IIA 2c 4aiv IIA83c 168 156 148 148 148IIA 2c 4aiv IIA83d 365 365 365 276 276IIA 2c 4aiv IIA83k 166 166 166IIA 2c 4aiv none 120 120 114 105 86
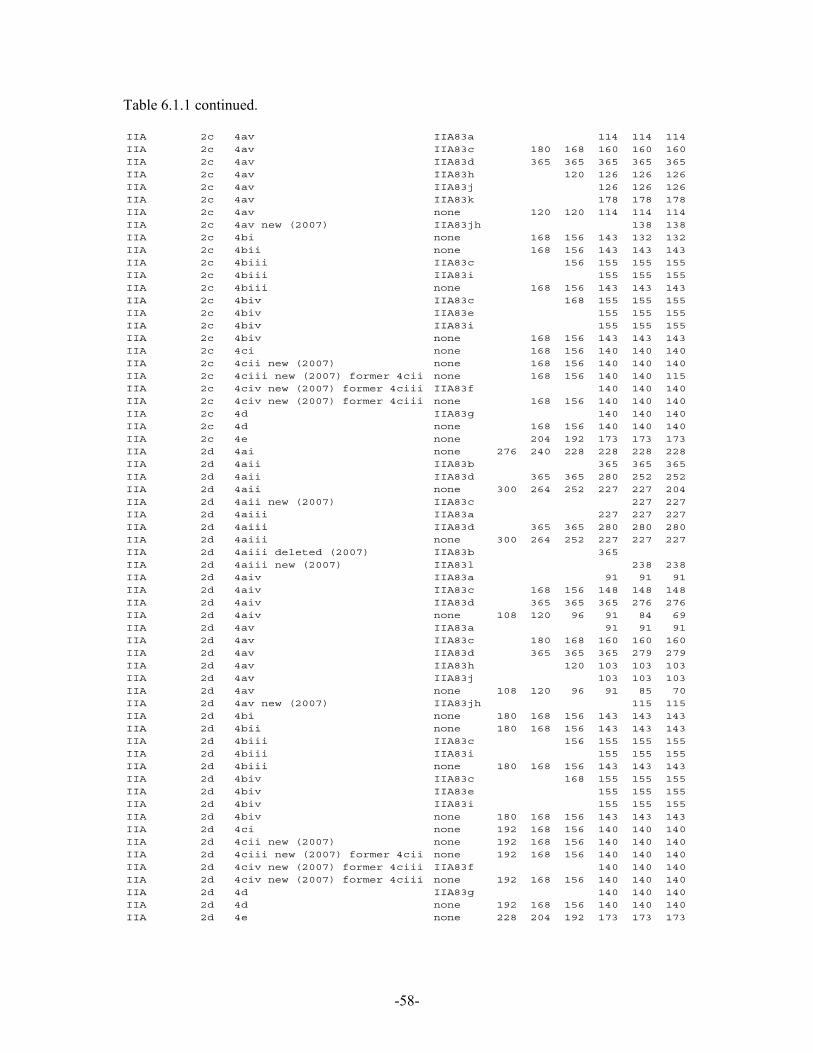
-58-
Table 6.1.1 continued.
IIA 2c 4av IIA83a 114 114 114IIA 2c 4av IIA83c 180 168 160 160 160IIA 2c 4av IIA83d 365 365 365 365 365IIA 2c 4av IIA83h 120 126 126 126IIA 2c 4av IIA83j 126 126 126IIA 2c 4av IIA83k 178 178 178IIA 2c 4av none 120 120 114 114 114IIA 2c 4av new (2007) IIA83jh 138 138IIA 2c 4bi none 168 156 143 132 132IIA 2c 4bii none 168 156 143 143 143IIA 2c 4biii IIA83c 156 155 155 155IIA 2c 4biii IIA83i 155 155 155IIA 2c 4biii none 168 156 143 143 143IIA 2c 4biv IIA83c 168 155 155 155IIA 2c 4biv IIA83e 155 155 155IIA 2c 4biv IIA83i 155 155 155IIA 2c 4biv none 168 156 143 143 143IIA 2c 4ci none 168 156 140 140 140IIA 2c 4cii new (2007) none 168 156 140 140 140IIA 2c 4ciii new (2007) former 4cii none 168 156 140 140 115IIA 2c 4civ new (2007) former 4ciii IIA83f 140 140 140IIA 2c 4civ new (2007) former 4ciii none 168 156 140 140 140IIA 2c 4d IIA83g 140 140 140IIA 2c 4d none 168 156 140 140 140IIA 2c 4e none 204 192 173 173 173IIA 2d 4ai none 276 240 228 228 228 228IIA 2d 4aii IIA83b 365 365 365IIA 2d 4aii IIA83d 365 365 280 252 252IIA 2d 4aii none 300 264 252 227 227 204IIA 2d 4aii new (2007) IIA83c 227 227IIA 2d 4aiii IIA83a 227 227 227IIA 2d 4aiii IIA83d 365 365 280 280 280IIA 2d 4aiii none 300 264 252 227 227 227IIA 2d 4aiii deleted (2007) IIA83b 365IIA 2d 4aiii new (2007) IIA83l 238 238IIA 2d 4aiv IIA83a 91 91 91IIA 2d 4aiv IIA83c 168 156 148 148 148IIA 2d 4aiv IIA83d 365 365 365 276 276IIA 2d 4aiv none 108 120 96 91 84 69IIA 2d 4av IIA83a 91 91 91IIA 2d 4av IIA83c 180 168 160 160 160IIA 2d 4av IIA83d 365 365 365 279 279IIA 2d 4av IIA83h 120 103 103 103IIA 2d 4av IIA83j 103 103 103IIA 2d 4av none 108 120 96 91 85 70IIA 2d 4av new (2007) IIA83jh 115 115IIA 2d 4bi none 180 168 156 143 143 143IIA 2d 4bii none 180 168 156 143 143 143IIA 2d 4biii IIA83c 156 155 155 155IIA 2d 4biii IIA83i 155 155 155IIA 2d 4biii none 180 168 156 143 143 143IIA 2d 4biv IIA83c 168 155 155 155IIA 2d 4biv IIA83e 155 155 155IIA 2d 4biv IIA83i 155 155 155IIA 2d 4biv none 180 168 156 143 143 143IIA 2d 4ci none 192 168 156 140 140 140IIA 2d 4cii new (2007) none 192 168 156 140 140 140IIA 2d 4ciii new (2007) former 4cii none 192 168 156 140 140 140IIA 2d 4civ new (2007) former 4ciii IIA83f 140 140 140IIA 2d 4civ new (2007) former 4ciii none 192 168 156 140 140 140IIA 2d 4d IIA83g 140 140 140IIA 2d 4d none 192 168 156 140 140 140IIA 2d 4e none 228 204 192 173 173 173
-59-
6.2. Trends in nominal effort 2000-2007
6.2.1. Trends in nominal effort by derogation and Member State
Table 6.2.1.1 lists the trends in effort by derogation given in Coun. Reg. 40/2008 (Table 1 of Annex IIA) by country in kW*days. In general there exists a high consistency of the data provided in 2008 in comparison with the historic effort data submissions to the STECF subgroups on cod recovery reviews provided in 2007.
In accordance to the ToR respective trends by derogation in GT*days (gross tonnage) are listed in Table 6.2.1.2. STECF-SGRST notes that the GT of decommissioned vessels before 2003 are not available as Member States only estimated the GT of vessels active during 2003-2007. Unlike Table 6.2.1.1; Table 6.2.1.2 therefore only lists the trend in effort for the years 2003 to 2007.
For the same period 2003 to 2007 the Table 6.2.1.3 lists the number of vessels by Member state and derogations. STECF-SGRST emphasises that the number of vessels need to be interpreted with care and cannot be added across derogations as the individual vessels may have been engaged in more than one of the defined fleets and thus be multi-fold counted. As the effort values are by quarter and some Member Countries provided stratified data by fisheries, the Table 6.2.1.3 represents the maximum number of vessels observed in any of the categories defined under the various derogations in a given year. The annual values therefore present numbers of vessels, which indicate maximum values of vessels observed in any of the individual quarters or nationally defined fisheries which are identified to contribute to the defined derogations given in the Annex IIA.
STECF-SGRST considers the quantitative results and trends of some special conditions difficult to interpret as certain Member States have failed to aggregate their fleets accordingly (see section 5.5.2). The experts expressed improved cooperation with the information provided by the national control and enforcement institutions to aggregate the fleets’ catch and effort data. However, STECF-SGRST again notes that assignment of derogations is based on best expert knowledge and data availability. Specific data errors may exist regarding the huge data bases and the special knowledge required when dealing with them.
Note that in the tables of Section 6.2 the category ‘none none’ contains a combination of the effort information for gears which are not regulated under Annex IIA and effort information for vessels which recorded no gear type or mesh size. This category is explored in more detail in Section 6.6 where a breakdown into the constituent components is included. It is important in making use of the data in this report, that the ‘none none’ material is not included more than once. It would be preferable to use data in Section 6.6
Note also that the summary in Table 6.2.1.1 does not contain Spanish information relating to ICES VIa. This information was provided by Spain after the STECF review and is tabulated in Appendix 3.

-60-
Table 6.2.1.1 Trend in nominal effort (kW*days at sea) by existing derogations given in Table 1 of Annex IIA (Coun. Reg. 40/2008) and Member State, 2000-2007. Derogations are sorted by area, gear, special condition (SPECON), and country. Data qualities are summarised in Section 5.5.2 and Table 5.5.2.1.
ANNEX REG AREA REG GEAR SPECON COUNTRY 2000 2001 2002 2003 2004 2005 2006 2007IIa 2a 4ai none DEN 250303 379963 564151 540187 347357 315261 258982 169095IIa 2a 4ai none GER 1989IIa 2a 4ai none SWE 34860 58078 29714 33717 34056 53585 69015 44959IIa 2a 4aii IIA81b SWE 9912 113990 165426 233076IIa 2a 4aii IIA81d DEN 73062 63027 2532 366 271 128IIa 2a 4aii none DEN 1914299 1819125 1650195 1554406 179125 51707 4424 1059IIa 2a 4aii none GER 32520 1288 19419 35690 3288 13354IIa 2a 4aii none SWE 535167 337257 100391 73294 26046IIa 2a 4aiii IIA81a DEN 471600 418246IIa 2a 4aiii IIA81a SWE 546830 552263 524884IIa 2a 4aiii IIA81d DEN 22056 54029 29423 17703 9745 13259IIa 2a 4aiii IIA81l DEN 109233IIa 2a 4aiii none DEN 1938069 2151896 1777714 2103384 2983961 2606136 1839774 1748383IIa 2a 4aiii none GER 2431 10387 16354 18444 36096 7884 19176 31421IIa 2a 4aiii none SWE 1067772 1237725 1172922 1296340 1007665 385439 510609 517080IIa 2a 4aiv IIA81a DEN 61953 55879IIa 2a 4aiv IIA81a SWE 3325IIa 2a 4aiv IIA81c DEN 141996 44018 80856 98962 6651 5447IIa 2a 4aiv IIA81d DEN 3443 276 5370IIa 2a 4aiv none DEN 716324 771538 350674 80003 80526 78790 108074 100304IIa 2a 4aiv none GER 9757 8320 894 478 2475 5262 2180IIa 2a 4aiv none SWE 218719 169823 72991 32512 15121 11546 5160 4282IIa 2a 4av IIA81a DEN 1817IIa 2a 4av IIA81a SWE 6966IIa 2a 4av IIA81c DEN 13610 12321 93IIa 2a 4av IIA81d DEN 7324 647 324IIa 2a 4av IIA81j DEN 11967 2104IIa 2a 4av none DEN 70846 44037 64793 93620 27328 15797 50324 20134IIa 2a 4av none GER 1760 1305 1434 478 1434 1434IIa 2a 4av none SWE 10273 14460 11858 13324 5225IIa 2a 4biii none DEN 121IIa 2a 4ci none DEN 114507 70691 98136 23694 24870 72896 61485 29662IIa 2a 4ci none GER 11861 12508 13553 27837 38093 38927IIa 2a 4ci none SWE 6827 5290 3202 2084 1237 3308 4592 5793IIa 2a 4cii none DEN 89173 131485 116181 211506 63365 57523 62234 50587IIa 2a 4cii none GER 1932 800 1288 368 636 1350 1800IIa 2a 4cii none SWE 35051 26373 31378 30125 13792 12859 23142 36061IIa 2a 4ciii none DEN 32467 51997 67471 31095 5552 4292 6088 8961IIa 2a 4ciii none GER 525IIa 2a 4ciii none SWE 11313 5662 2044 4441 3689 2920 2384IIa 2a 4civ IIA81f DEN 12157 4111 2663 386IIa 2a 4civ none DEN 12910 31537 26938 60159 22000 4073 4397 8447IIa 2a 4civ none SWE 576 576 2150 9110 9396 2586 3270 4884IIa 2a 4d none DEN 243 1172 380 5181 2205 1256IIa 2a 4e none DEN 118 3791IIa 2a 4e none SWE 749 2079 3651 5682 1376 10684 27478 37856IIa 2a none none DEN 276471 256106 291961 374630 312973 399753 350033 268802IIa 2a none none GER 2877IIa 2a none none SWE 288803 607495 531239 606670 573943 544320 542008 494539IIa 2b 4ai none DEN 3562103 2498562 2289008 2100009 1708310 988434 685775 490934IIa 2b 4ai none ENG 4918 7406 88 51696 1660 201IIa 2b 4ai none FRA 29960 43521 81257 64449 99046 129642 92434 114255IIa 2b 4ai none GER 1967 4940 570 808 10502 884IIa 2b 4ai none IRL -1IIa 2b 4ai none NED *** *** 4374 6466 7241 10992 29425 27953IIa 2b 4ai none NIR 7680IIa 2b 4ai none SCO 92011 6521 6375 5460 2356 116 72821IIa 2b 4ai none SWE 121644 316123 200433 207504 275488 338637 238150 214528IIa 2b 4aii IIA81b SWE 308459 542008 664972 894575IIa 2b 4aii IIA81d DEN 286013 138894 23214 1499 268IIa 2b 4aii IIA81d ENG 331675 313095 317200 387482 446492 463321 371660 376196IIa 2b 4aii IIA81d FRA 2565958 5438154 4926100 7788615 8589718 8642627 9139147 6876991IIa 2b 4aii IIA81d GBJ 25039 25038 17334 19260 7383 12519 1926 7383IIa 2b 4aii IIA81d NIR 3632 14991 68494 44645IIa 2b 4aii IIA81d SCO 2777498 3228538 4104580 4309552 4005036 3482452 2940513 2661754IIa 2b 4aiv IIA81c DEN 1383057 327383 551368 552339 27829 38743IIa 2b 4aiv IIA81c ENG 545789 557964 557536 371239 246316 101516 510548 398456IIa 2b 4aiv IIA81c FRA 1074 179 797 3418IIa 2b 4aiv IIA81c GER 258064 232481 187341 50877 15195 19860 112313 51447IIa 2b 4aiv IIA81c NIR 1926 428 6226IIa 2b 4aiv IIA81c SCO 208075 155563 122684 214722 237665 179725 106816 118238IIa 2b 4aiv IIA81d DEN 45507 861 1692 3398
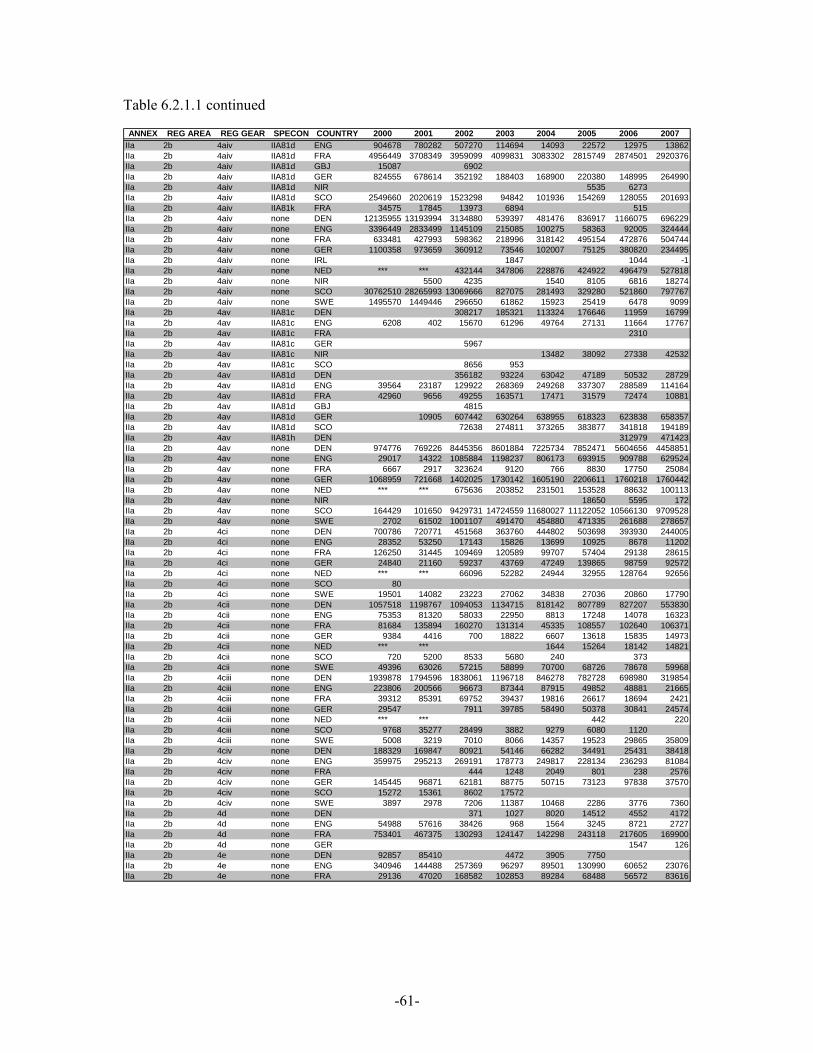
-61-
Table 6.2.1.1 continued
ANNEX REG AREA REG GEAR SPECON COUNTRY 2000 2001 2002 2003 2004 2005 2006 2007IIa 2b 4aiv IIA81d ENG 904678 780282 507270 114694 14093 22572 12975 13862IIa 2b 4aiv IIA81d FRA 4956449 3708349 3959099 4099831 3083302 2815749 2874501 2920376IIa 2b 4aiv IIA81d GBJ 15087 6902IIa 2b 4aiv IIA81d GER 824555 678614 352192 188403 168900 220380 148995 264990IIa 2b 4aiv IIA81d NIR 5535 6273IIa 2b 4aiv IIA81d SCO 2549660 2020619 1523298 94842 101936 154269 128055 201693IIa 2b 4aiv IIA81k FRA 34575 17845 13973 6894 515IIa 2b 4aiv none DEN 12135955 13193994 3134880 539397 481476 836917 1166075 696229IIa 2b 4aiv none ENG 3396449 2833499 1145109 215085 100275 58363 92005 324444IIa 2b 4aiv none FRA 633481 427993 598362 218996 318142 495154 472876 504744IIa 2b 4aiv none GER 1100358 973659 360912 73546 102007 75125 380820 234495IIa 2b 4aiv none IRL 1847 1044 -1IIa 2b 4aiv none NED *** *** 432144 347806 228876 424922 496479 527818IIa 2b 4aiv none NIR 5500 4235 1540 8105 6816 18274IIa 2b 4aiv none SCO 30762510 28265993 13069666 827075 281493 329280 521860 797767IIa 2b 4aiv none SWE 1495570 1449446 296650 61862 15923 25419 6478 9099IIa 2b 4av IIA81c DEN 308217 185321 113324 176646 11959 16799IIa 2b 4av IIA81c ENG 6208 402 15670 61296 49764 27131 11664 17767IIa 2b 4av IIA81c FRA 2310IIa 2b 4av IIA81c GER 5967IIa 2b 4av IIA81c NIR 13482 38092 27338 42532IIa 2b 4av IIA81c SCO 8656 953IIa 2b 4av IIA81d DEN 356182 93224 63042 47189 50532 28729IIa 2b 4av IIA81d ENG 39564 23187 129922 268369 249268 337307 288589 114164IIa 2b 4av IIA81d FRA 42960 9656 49255 163571 17471 31579 72474 10881IIa 2b 4av IIA81d GBJ 4815IIa 2b 4av IIA81d GER 10905 607442 630264 638955 618323 623838 658357IIa 2b 4av IIA81d SCO 72638 274811 373265 383877 341818 194189IIa 2b 4av IIA81h DEN 312979 471423IIa 2b 4av none DEN 974776 769226 8445356 8601884 7225734 7852471 5604656 4458851IIa 2b 4av none ENG 29017 14322 1085884 1198237 806173 693915 909788 629524IIa 2b 4av none FRA 6667 2917 323624 9120 766 8830 17750 25084IIa 2b 4av none GER 1068959 721668 1402025 1730142 1605190 2206611 1760218 1760442IIa 2b 4av none NED *** *** 675636 203852 231501 153528 88632 100113IIa 2b 4av none NIR 18650 5595 172IIa 2b 4av none SCO 164429 101650 9429731 14724559 11680027 11122052 10566130 9709528IIa 2b 4av none SWE 2702 61502 1001107 491470 454880 471335 261688 278657IIa 2b 4ci none DEN 700786 720771 451568 363760 444802 503698 393930 244005IIa 2b 4ci none ENG 28352 53250 17143 15826 13699 10925 8678 11202IIa 2b 4ci none FRA 126250 31445 109469 120589 99707 57404 29138 28615IIa 2b 4ci none GER 24840 21160 59237 43769 47249 139865 98759 92572IIa 2b 4ci none NED *** *** 66096 52282 24944 32955 128764 92656IIa 2b 4ci none SCO 80IIa 2b 4ci none SWE 19501 14082 23223 27062 34838 27036 20860 17790IIa 2b 4cii none DEN 1057518 1198767 1094053 1134715 818142 807789 827207 553830IIa 2b 4cii none ENG 75353 81320 58033 22950 8813 17248 14078 16323IIa 2b 4cii none FRA 81684 135894 160270 131314 45335 108557 102640 106371IIa 2b 4cii none GER 9384 4416 700 18822 6607 13618 15835 14973IIa 2b 4cii none NED *** *** 1644 15264 18142 14821IIa 2b 4cii none SCO 720 5200 8533 5680 240 373IIa 2b 4cii none SWE 49396 63026 57215 58899 70700 68726 78678 59968IIa 2b 4ciii none DEN 1939878 1794596 1838061 1196718 846278 782728 698980 319854IIa 2b 4ciii none ENG 223806 200566 96673 87344 87915 49852 48881 21665IIa 2b 4ciii none FRA 39312 85391 69752 39437 19816 26617 18694 2421IIa 2b 4ciii none GER 29547 7911 39785 58490 50378 30841 24574IIa 2b 4ciii none NED *** *** 442 220IIa 2b 4ciii none SCO 9768 35277 28499 3882 9279 6080 1120IIa 2b 4ciii none SWE 5008 3219 7010 8066 14357 19523 29865 35809IIa 2b 4civ none DEN 188329 169847 80921 54146 66282 34491 25431 38418IIa 2b 4civ none ENG 359975 295213 269191 178773 249817 228134 236293 81084IIa 2b 4civ none FRA 444 1248 2049 801 238 2576IIa 2b 4civ none GER 145445 96871 62181 88775 50715 73123 97838 37570IIa 2b 4civ none SCO 15272 15361 8602 17572IIa 2b 4civ none SWE 3897 2978 7206 11387 10468 2286 3776 7360IIa 2b 4d none DEN 371 1027 8020 14512 4552 4172IIa 2b 4d none ENG 54988 57616 38426 968 1564 3245 8721 2727IIa 2b 4d none FRA 753401 467375 130293 124147 142298 243118 217605 169900IIa 2b 4d none GER 1547 126IIa 2b 4e none DEN 92857 85410 4472 3905 7750IIa 2b 4e none ENG 340946 144488 257369 96297 89501 130990 60652 23076IIa 2b 4e none FRA 29136 47020 168582 102853 89284 68488 56572 83616
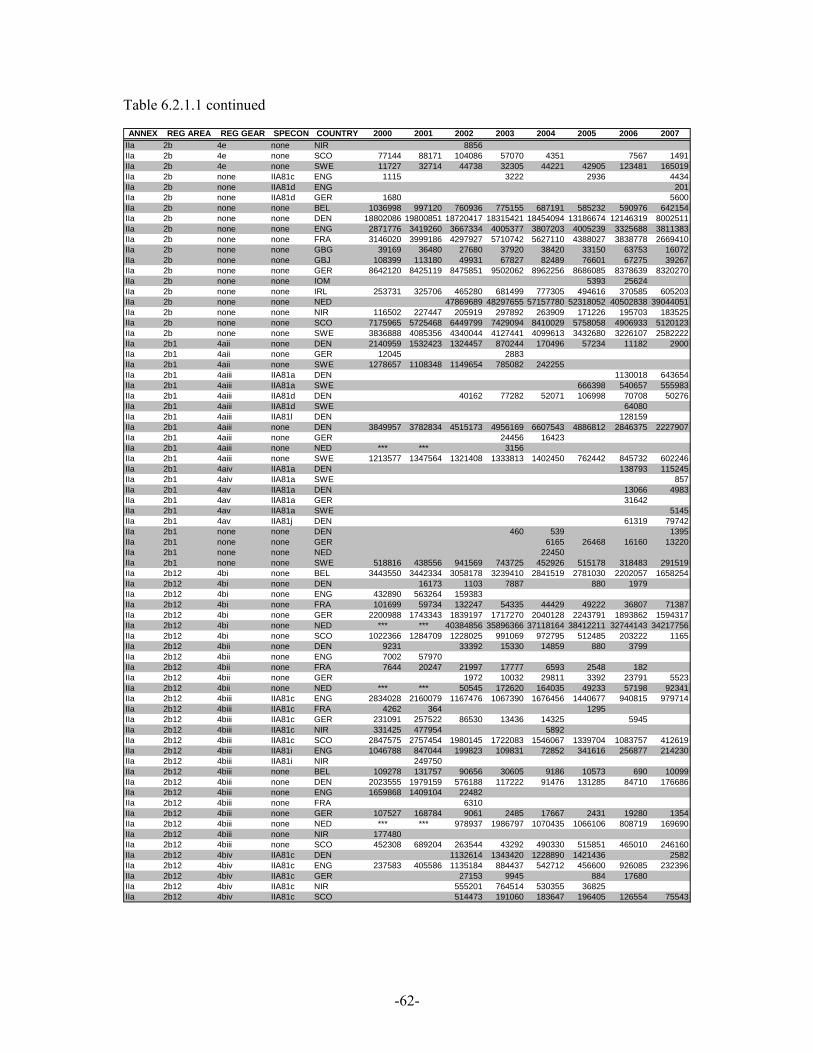
-62-
Table 6.2.1.1 continued
ANNEX REG AREA REG GEAR SPECON COUNTRY 2000 2001 2002 2003 2004 2005 2006 2007IIa 2b 4e none NIR 8856IIa 2b 4e none SCO 77144 88171 104086 57070 4351 7567 1491IIa 2b 4e none SWE 11727 32714 44738 32305 44221 42905 123481 165019IIa 2b none IIA81c ENG 1115 3222 2936 4434IIa 2b none IIA81d ENG 201IIa 2b none IIA81d GER 1680 5600IIa 2b none none BEL 1036998 997120 760936 775155 687191 585232 590976 642154IIa 2b none none DEN 18802086 19800851 18720417 18315421 18454094 13186674 12146319 8002511IIa 2b none none ENG 2871776 3419260 3667334 4005377 3807203 4005239 3325688 3811383IIa 2b none none FRA 3146020 3999186 4297927 5710742 5627110 4388027 3838778 2669410IIa 2b none none GBG 39169 36480 27680 37920 38420 33150 63753 16072IIa 2b none none GBJ 108399 113180 49931 67827 82489 76601 67275 39267IIa 2b none none GER 8642120 8425119 8475851 9502062 8962256 8686085 8378639 8320270IIa 2b none none IOM 5393 25624IIa 2b none none IRL 253731 325706 465280 681499 777305 494616 370585 605203IIa 2b none none NED 47869689 48297655 57157780 52318052 40502838 39044051IIa 2b none none NIR 116502 227447 205919 297892 263909 171226 195703 183525IIa 2b none none SCO 7175965 5725468 6449799 7429094 8410029 5758058 4906933 5120123IIa 2b none none SWE 3836888 4085356 4340044 4127441 4099613 3432680 3226107 2582222IIa 2b1 4aii none DEN 2140959 1532423 1324457 870244 170496 57234 11182 2900IIa 2b1 4aii none GER 12045 2883IIa 2b1 4aii none SWE 1278657 1108348 1149654 785082 242255IIa 2b1 4aiii IIA81a DEN 1130018 643654IIa 2b1 4aiii IIA81a SWE 666398 540657 555983IIa 2b1 4aiii IIA81d DEN 40162 77282 52071 106998 70708 50276IIa 2b1 4aiii IIA81d SWE 64080IIa 2b1 4aiii IIA81l DEN 128159IIa 2b1 4aiii none DEN 3849957 3782834 4515173 4956169 6607543 4886812 2846375 2227907IIa 2b1 4aiii none GER 24456 16423IIa 2b1 4aiii none NED *** *** 3156IIa 2b1 4aiii none SWE 1213577 1347564 1321408 1333813 1402450 762442 845732 602246IIa 2b1 4aiv IIA81a DEN 138793 115245IIa 2b1 4aiv IIA81a SWE 857IIa 2b1 4av IIA81a DEN 13066 4983IIa 2b1 4av IIA81a GER 31642IIa 2b1 4av IIA81a SWE 5145IIa 2b1 4av IIA81j DEN 61319 79742IIa 2b1 none none DEN 460 539 1395IIa 2b1 none none GER 6165 26468 16160 13220IIa 2b1 none none NED 22450IIa 2b1 none none SWE 518816 438556 941569 743725 452926 515178 318483 291519IIa 2b12 4bi none BEL 3443550 3442334 3058178 3239410 2841519 2781030 2202057 1658254IIa 2b12 4bi none DEN 16173 1103 7887 880 1979IIa 2b12 4bi none ENG 432890 563264 159383IIa 2b12 4bi none FRA 101699 59734 132247 54335 44429 49222 36807 71387IIa 2b12 4bi none GER 2200988 1743343 1839197 1717270 2040128 2243791 1893862 1594317IIa 2b12 4bi none NED *** *** 40384856 35896366 37118164 38412211 32744143 34217756IIa 2b12 4bi none SCO 1022366 1284709 1228025 991069 972795 512485 203222 1165IIa 2b12 4bii none DEN 9231 33392 15330 14859 880 3799IIa 2b12 4bii none ENG 7002 57970IIa 2b12 4bii none FRA 7644 20247 21997 17777 6593 2548 182IIa 2b12 4bii none GER 1972 10032 29811 3392 23791 5523IIa 2b12 4bii none NED *** *** 50545 172620 164035 49233 57198 92341IIa 2b12 4biii IIA81c ENG 2834028 2160079 1167476 1067390 1676456 1440677 940815 979714IIa 2b12 4biii IIA81c FRA 4262 364 1295IIa 2b12 4biii IIA81c GER 231091 257522 86530 13436 14325 5945IIa 2b12 4biii IIA81c NIR 331425 477954 5892IIa 2b12 4biii IIA81c SCO 2847575 2757454 1980145 1722083 1546067 1339704 1083757 412619IIa 2b12 4biii IIA81i ENG 1046788 847044 199823 109831 72852 341616 256877 214230IIa 2b12 4biii IIA81i NIR 249750IIa 2b12 4biii none BEL 109278 131757 90656 30605 9186 10573 690 10099IIa 2b12 4biii none DEN 2023555 1979159 576188 117222 91476 131285 84710 176686IIa 2b12 4biii none ENG 1659868 1409104 22482IIa 2b12 4biii none FRA 6310IIa 2b12 4biii none GER 107527 168784 9061 2485 17667 2431 19280 1354IIa 2b12 4biii none NED *** *** 978937 1986797 1070435 1066106 808719 169690IIa 2b12 4biii none NIR 177480IIa 2b12 4biii none SCO 452308 689204 263544 43292 490330 515851 465010 246160IIa 2b12 4biv IIA81c DEN 1132614 1343420 1228890 1421436 2582IIa 2b12 4biv IIA81c ENG 237583 405586 1135184 884437 542712 456600 926085 232396IIa 2b12 4biv IIA81c GER 27153 9945 884 17680IIa 2b12 4biv IIA81c NIR 555201 764514 530355 36825IIa 2b12 4biv IIA81c SCO 514473 191060 183647 196405 126554 75543

-63-
Table 6.2.1.1 continued
ANNEX REG AREA REG GEAR SPECON COUNTRY 2000 2001 2002 2003 2004 2005 2006 2007IIa 2b12 4biv IIA81e DEN 266012IIa 2b12 4biv IIA81e GER 34189 1760 6188IIa 2b12 4biv IIA81i ENG 16412 791355 171000 127076 161559 395155 73442IIa 2b12 4biv IIA81i NIR 195175 200725 12950IIa 2b12 4biv none BEL 1645583 1308188 1312043 656291 878958 795603 796619 730055IIa 2b12 4biv none DEN 101205 71929 53587 215265 260271 52320 720838 931187IIa 2b12 4biv none ENG 8058 102068 275983 5372 1343IIa 2b12 4biv none FRA 728IIa 2b12 4biv none GER 1502 8168 54051 36657 32691 1465 30559 31610IIa 2b12 4biv none NED *** *** 462179 759292 1228530 1222580 1644934 917919IIa 2b12 4biv none SCO 457447 675878 511069 534405 476538 273770IIa 2b12 4d IIA81g ENG 376 376 470 1222 1598 611IIa 2b12 4d IIA81g FRA 295344 355406 639139 378817 365066 415191 784394 761615IIa 2b2 4aii IIA81c DEN 1287080 1216513 958279 734753IIa 2b2 4aii IIA81c ENG 287014 288372 273506 370966 227325 256542 259232 131602IIa 2b2 4aii IIA81c GBJ 106IIa 2b2 4aii IIA81c GER 64542 100149 129922 130082 92199 121990 90884 155893IIa 2b2 4aii IIA81c NIR 4096 6784 3200 3968 6168 7486IIa 2b2 4aii IIA81c SCO 33677 22711 17020 37538 50960 37310IIa 2b2 4aii none DEN 929663 1054377 890903 1324543 1355350 1180252 1287300 604448IIa 2b2 4aii none ENG 420356 411050 412665 641242 469689 476779 458720 308173IIa 2b2 4aii none FRA 766319 1063089 1440441 941338 567878 661073 607578 698640IIa 2b2 4aii none GER 187190 142625 125664 349022 387025 270202 469754 456903IIa 2b2 4aii none IRL 884 75202IIa 2b2 4aii none NED *** *** 533159 1092704 1129488 1172389 1316873 1267964IIa 2b2 4aii none NIR 7480 15565 660 51420 242246 103225IIa 2b2 4aii none SCO 2045119 2070990 4438929 4979045 4369666 4838779 4474364 4282071IIa 2b2 4aii none SWE 180IIa 2b2 4civ IIA81f DEN 81918 59611 52335 25155 29147 32655IIa 2b2 none IIA81c GER 3920 2800IIa 2b2 none none DEN 128 121 125IIa 2b2 none none ENG 437891 850184 1160742 1139504 1075098 1184279 962026 1071386IIa 2b2 none none FRA 454331 468141 372889 362665 411252 567740 623195 355152IIa 2b2 none none GBI 1115IIa 2b2 none none GER 904498 1097945 1155611 1528003 1374810 1276679 1123927 490862IIa 2b2 none none IOM 1115IIa 2b2 none none IRL 470269 532227 391299 185818 374129IIa 2b2 none none NED 6045975 5588739 6377933 6020951 4973436 4824179IIa 2b2 none none NIR 57172 6651 81873 116060 75583 41087 36328 53402IIa 2b2 none none SCO 3533808 2910912 3832177 4484369 4151725 2599448 2011600 2000785IIa 2b2 none none SWE 77984 98496 124025 131915 132204 167035 124395 154017IIa 2b23 4aiii IIA81a DEN 41262IIa 2b23 4aiii IIA81a GER 4862IIa 2b23 4aiii IIA81a SWE 490IIa 2b23 4aiii IIA81d DEN 13834 30728 8135IIa 2b23 4aiii IIA81d ENG 23474 17692 17662 15208 92746 132176 164750 148231IIa 2b23 4aiii IIA81d FRA 224746 422398 541405 613641 761554 390345 127403 103864IIa 2b23 4aiii IIA81d GBJ 16050 2086 8667 12840 13161 13482 12198IIa 2b23 4aiii IIA81d NIR 21160 70447 165009IIa 2b23 4aiii IIA81d SCO 666 2442 7688 3330 1332 444 1942IIa 2b23 4aiii IIA81l DEN 204687IIa 2b23 4aiii none DEN 295265 417316 525095 1184934 1268740 732120 416000 847866IIa 2b23 4aiii none ENG 6714 7121 1145 241253 176891 179936 231846 231818IIa 2b23 4aiii none FRA 396943 376708 579304 329864 308350 142541 100895 124867IIa 2b23 4aiii none GER 24973 51272 544706 424591 319296 203129 74730IIa 2b23 4aiii none IRL 54IIa 2b23 4aiii none NED *** *** 18288 223385 119409 26041 71070 110015IIa 2b23 4aiii none NIR 8580 130137 147942 317276IIa 2b23 4aiii none SCO 13867 18653 2866 741463 1097688 749088 1146477 1736268IIa 2b23 4aiii none SWE 1679 2892 4265 2055 1192 808 2515IIa 2b23 4aiv IIA81a DEN 11716 1871IIa 2b23 4aiv IIA81a GER 8840IIa 2b23 4av IIA81a DEN 387772 126006IIa 2b23 4av IIA81a GER 168918IIa 2b23 4av IIA81a SWE 24354 64083IIa 2b23 4av IIA81j DEN 1354302 677660IIa 2b23 none none DEN 189 559 258 2853 250 22IIa 2b23 none none FRA 66124 110870 182753 212818 730583 2428888 3347656 3159782IIa 2b23 none none SCO 1456IIa 2b3 4aii IIA81c ENG 65021 38433 34198 30199 42735 35214 24084 15282IIa 2b3 4aii IIA81c GBJ 6985 1524 318IIa 2b3 4aii none ENG 59527 26717 16656 34580 8114 44 3634 3843IIa 2b3 4aii none FRA 3523543 3864044 5883796 4464795 4354517 5114257 4962047 5176292IIa 2b3 4aii none GBG 3978IIa 2b3 4aii none NED *** *** 5916 22904 48477 105547 259692 320919

-64-
Table 6.2.1.1 continued
ANNEX REG AREA REG GEAR SPECON COUNTRY 2000 2001 2002 2003 2004 2005 2006 2007IIa 2b3 4aii none SCO 825 11553 115117 204496IIa 2b3 4bi none BEL 1318773 1516593 1847425 1953931 1534549 1357218 1926810 2178441IIa 2b3 4bi none ENG 66773 96292 81391 21481IIa 2b3 4bi none FRA 430204 594232 676110 637688 694987 721017 831204 756975IIa 2b3 4bi none NED *** *** 1471 2204 0 368IIa 2b3 4bii none ENG 1395IIa 2b3 4bii none FRA 18588 105417 132198 45278 18207 38356 43665 16711IIa 2b3 4biii IIA81c ENG 3810 9947 3323 1564 1484 1870IIa 2b3 4biii IIA81c FRA 16169 9737IIa 2b3 4biii IIA81i ENG 6057 2314 3477IIa 2b3 4biii none ENG 1088IIa 2b3 4biii none FRA 1155 6929IIa 2b3 4biv IIA81c ENG 688IIa 2b3 4civ IIA81f FRA 6789 770IIa 2b3 4d IIA81g ENG 2538 2303 6862 7332 6486 6110 4136 4841IIa 2b3 4d IIA81g FRA 31540 682803 1516338 1496916 1602765 1729434 1607043 1773016IIa 2b3 none none FRA 459136 829865 841507 727350 948975 374602 150946 145501IIa 2b3 none none NED *** *** 2205IIa 2c 4ai none ENG 134IIa 2c 4ai none IRL 2643 1562 18418 10520IIa 2c 4ai none NIR 2560 2204IIa 2c 4aii IIA81c ENG 97548 81999 85930 57164 52758 60013 66834 77932IIa 2c 4aii IIA81c GBI 7964 4397 8688 10434 9051 16456 2715 866IIa 2c 4aii IIA81c GBJ 530IIa 2c 4aii IIA81c IOM 7964 4397 8688 10434 9051 16456 2715IIa 2c 4aii IIA81c NIR 702641 752535 627308 779206 519733 523554 427669 340920IIa 2c 4aii IIA81d ENG 116172 83223 68011 55104 68483 55299 76444 69117IIa 2c 4aii IIA81d FRA 4689 588IIa 2c 4aii IIA81d NIR 1060555 1297492 1256489 1486187 1550041 1537372 1445494 1635335IIa 2c 4aii IIA81d SCO 60274 27507 17756 38021 31019 15407 7301 11038IIa 2c 4aii none ENG 247959 156734 82763 85870 152396 130809 77003 84254IIa 2c 4aii none FRA 43768 8681 1767 588 2352 324IIa 2c 4aii none GBI 4 2153 67 435 2039 603 9497IIa 2c 4aii none IOM 4 2153 67 435 2039 603IIa 2c 4aii none IRL 1206196 1363394 1458446 1454518 1540079IIa 2c 4aii none NIR 2091492 1842546 1065358 1129939 1067888 1155502 1102736 1166472IIa 2c 4aii none SCO 3834 6832 4106 62165 19015 134 268IIa 2c 4aiii IIA81d ENG 9843 333 8360 6497 6294 11450 8077 1672IIa 2c 4aiii IIA81d FRA 672IIa 2c 4aiii IIA81d NIR 558 179 179 4205 766IIa 2c 4aiii none ENG 20300 4613 1032 282 56515 27783 19167 11607IIa 2c 4aiii none FRA 316IIa 2c 4aiii none GBI 1196 13 1340 623 459 1301IIa 2c 4aiii none IOM 1196 13 1340 623 459IIa 2c 4aiii none IRL 10567 2081 13298 3989 13576IIa 2c 4aiii none NIR 3033 4650 344 946 3508 10120IIa 2c 4aiii none SCO 2187 586 5502IIa 2c 4aiv IIA81c ENG 4544 31412 24877 30114 2012 3062 1726 1160IIa 2c 4aiv IIA81c FRA 11337 5454 11950IIa 2c 4aiv IIA81c GBI 511 1448 362 172IIa 2c 4aiv IIA81c IOM 511 1448 362 172IIa 2c 4aiv IIA81c NIR 68967 97426 198442 246783 140165 52257 48407 26888IIa 2c 4aiv IIA81d ENG 79769 95722 80933 103095 85048 24446 4662 833IIa 2c 4aiv IIA81d FRA 34418 25468 162527 49165 77326 62571 43118 16070IIa 2c 4aiv IIA81d NIR 383369 535157 586322 608941 485911 361528 351396 209229IIa 2c 4aiv IIA81d SCO 19579 30597 28557 26110 26011 3889 1762IIa 2c 4aiv IIA81k ENG 1780 801IIa 2c 4aiv IIA81k FRA 10602 12968 37081 18338 53303IIa 2c 4aiv none ENG 163507 233258 185210 167828 104860 62735 61890 14535IIa 2c 4aiv none FRA 108769 496480 471305 393683 163742 213195 114601 60039IIa 2c 4aiv none GBI 16057 4494 648IIa 2c 4aiv none IOM 16057 4494IIa 2c 4aiv none IRL 347258 133774 84376 87629 139648IIa 2c 4aiv none NIR 890558 980684 1061636 1194903 535958 457228 376689 100550IIa 2c 4aiv none SCO 91594 88560 55875 62612 4096 1342IIa 2c 4av IIA81c ENG 82 1154 902 2026 264 820 690IIa 2c 4av IIA81c NIR 5564 1712IIa 2c 4av IIA81d ENG 6262 1887 5878 15337 2010 333IIa 2c 4av IIA81d NIR 3150IIa 2c 4av IIA81d SCO 1148IIa 2c 4av none ENG 149 243 80733 3186 3186
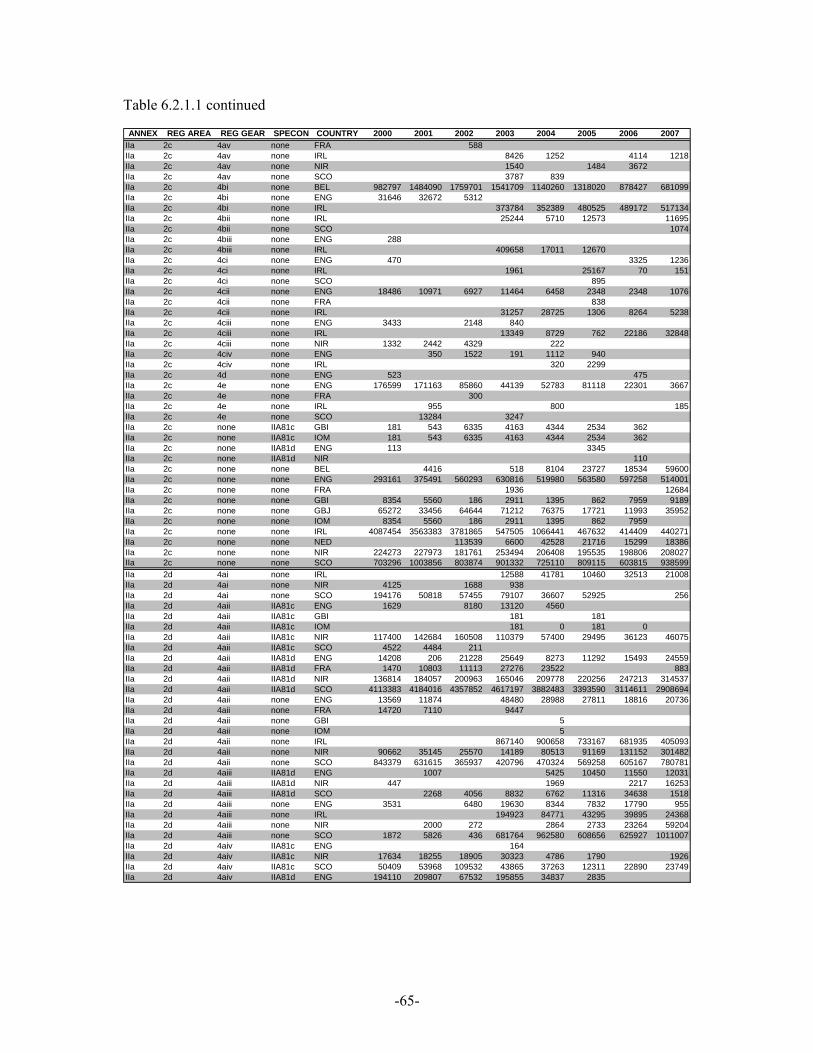
-65-
Table 6.2.1.1 continued
ANNEX REG AREA REG GEAR SPECON COUNTRY 2000 2001 2002 2003 2004 2005 2006 2007IIa 2c 4av none FRA 588IIa 2c 4av none IRL 8426 1252 4114 1218IIa 2c 4av none NIR 1540 1484 3672IIa 2c 4av none SCO 3787 839IIa 2c 4bi none BEL 982797 1484090 1759701 1541709 1140260 1318020 878427 681099IIa 2c 4bi none ENG 31646 32672 5312IIa 2c 4bi none IRL 373784 352389 480525 489172 517134IIa 2c 4bii none IRL 25244 5710 12573 11695IIa 2c 4bii none SCO 1074IIa 2c 4biii none ENG 288IIa 2c 4biii none IRL 409658 17011 12670IIa 2c 4ci none ENG 470 3325 1236IIa 2c 4ci none IRL 1961 25167 70 151IIa 2c 4ci none SCO 895IIa 2c 4cii none ENG 18486 10971 6927 11464 6458 2348 2348 1076IIa 2c 4cii none FRA 838IIa 2c 4cii none IRL 31257 28725 1306 8264 5238IIa 2c 4ciii none ENG 3433 2148 840IIa 2c 4ciii none IRL 13349 8729 762 22186 32848IIa 2c 4ciii none NIR 1332 2442 4329 222IIa 2c 4civ none ENG 350 1522 191 1112 940IIa 2c 4civ none IRL 320 2299IIa 2c 4d none ENG 523 475IIa 2c 4e none ENG 176599 171163 85860 44139 52783 81118 22301 3667IIa 2c 4e none FRA 300IIa 2c 4e none IRL 955 800 185IIa 2c 4e none SCO 13284 3247IIa 2c none IIA81c GBI 181 543 6335 4163 4344 2534 362IIa 2c none IIA81c IOM 181 543 6335 4163 4344 2534 362IIa 2c none IIA81d ENG 113 3345IIa 2c none IIA81d NIR 110IIa 2c none none BEL 4416 518 8104 23727 18534 59600IIa 2c none none ENG 293161 375491 560293 630816 519980 563580 597258 514001IIa 2c none none FRA 1936 12684IIa 2c none none GBI 8354 5560 186 2911 1395 862 7959 9189IIa 2c none none GBJ 65272 33456 64644 71212 76375 17721 11993 35952IIa 2c none none IOM 8354 5560 186 2911 1395 862 7959IIa 2c none none IRL 4087454 3563383 3781865 547505 1066441 467632 414409 440271IIa 2c none none NED 113539 6600 42528 21716 15299 18386IIa 2c none none NIR 224273 227973 181761 253494 206408 195535 198806 208027IIa 2c none none SCO 703296 1003856 803874 901332 725110 809115 603815 938599IIa 2d 4ai none IRL 12588 41781 10460 32513 21008IIa 2d 4ai none NIR 4125 1688 938IIa 2d 4ai none SCO 194176 50818 57455 79107 36607 52925 256IIa 2d 4aii IIA81c ENG 1629 8180 13120 4560IIa 2d 4aii IIA81c GBI 181 181IIa 2d 4aii IIA81c IOM 181 0 181 0IIa 2d 4aii IIA81c NIR 117400 142684 160508 110379 57400 29495 36123 46075IIa 2d 4aii IIA81c SCO 4522 4484 211IIa 2d 4aii IIA81d ENG 14208 206 21228 25649 8273 11292 15493 24559IIa 2d 4aii IIA81d FRA 1470 10803 11113 27276 23522 883IIa 2d 4aii IIA81d NIR 136814 184057 200963 165046 209778 220256 247213 314537IIa 2d 4aii IIA81d SCO 4113383 4184016 4357852 4617197 3882483 3393590 3114611 2908694IIa 2d 4aii none ENG 13569 11874 48480 28988 27811 18816 20736IIa 2d 4aii none FRA 14720 7110 9447IIa 2d 4aii none GBI 5IIa 2d 4aii none IOM 5IIa 2d 4aii none IRL 867140 900658 733167 681935 405093IIa 2d 4aii none NIR 90662 35145 25570 14189 80513 91169 131152 301482IIa 2d 4aii none SCO 843379 631615 365937 420796 470324 569258 605167 780781IIa 2d 4aiii IIA81d ENG 1007 5425 10450 11550 12031IIa 2d 4aiii IIA81d NIR 447 1969 2217 16253IIa 2d 4aiii IIA81d SCO 2268 4056 8832 6762 11316 34638 1518IIa 2d 4aiii none ENG 3531 6480 19630 8344 7832 17790 955IIa 2d 4aiii none IRL 194923 84771 43295 39895 24368IIa 2d 4aiii none NIR 2000 272 2864 2733 23264 59204IIa 2d 4aiii none SCO 1872 5826 436 681764 962580 608656 625927 1011007IIa 2d 4aiv IIA81c ENG 164IIa 2d 4aiv IIA81c NIR 17634 18255 18905 30323 4786 1790 1926IIa 2d 4aiv IIA81c SCO 50409 53968 109532 43865 37263 12311 22890 23749IIa 2d 4aiv IIA81d ENG 194110 209807 67532 195855 34837 2835
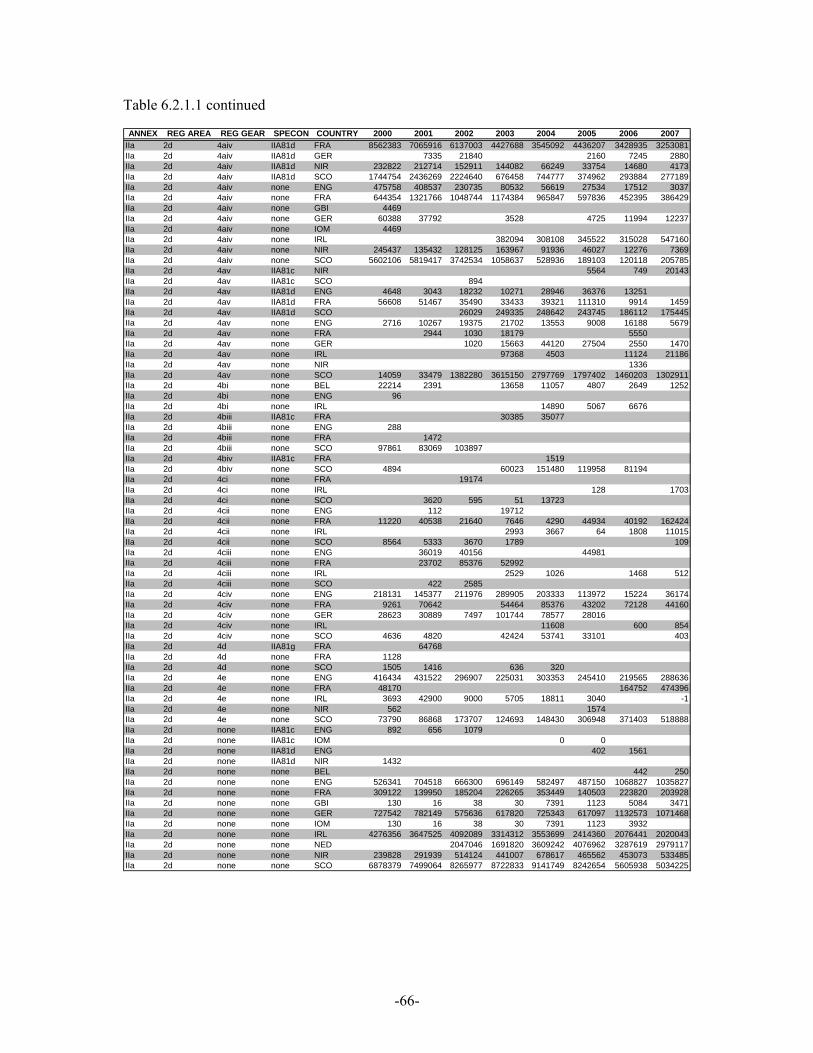
-66-
Table 6.2.1.1 continued
ANNEX REG AREA REG GEAR SPECON COUNTRY 2000 2001 2002 2003 2004 2005 2006 2007IIa 2d 4aiv IIA81d FRA 8562383 7065916 6137003 4427688 3545092 4436207 3428935 3253081IIa 2d 4aiv IIA81d GER 7335 21840 2160 7245 2880IIa 2d 4aiv IIA81d NIR 232822 212714 152911 144082 66249 33754 14680 4173IIa 2d 4aiv IIA81d SCO 1744754 2436269 2224640 676458 744777 374962 293884 277189IIa 2d 4aiv none ENG 475758 408537 230735 80532 56619 27534 17512 3037IIa 2d 4aiv none FRA 644354 1321766 1048744 1174384 965847 597836 452395 386429IIa 2d 4aiv none GBI 4469IIa 2d 4aiv none GER 60388 37792 3528 4725 11994 12237IIa 2d 4aiv none IOM 4469IIa 2d 4aiv none IRL 382094 308108 345522 315028 547160IIa 2d 4aiv none NIR 245437 135432 128125 163967 91936 46027 12276 7369IIa 2d 4aiv none SCO 5602106 5819417 3742534 1058637 528936 189103 120118 205785IIa 2d 4av IIA81c NIR 5564 749 20143IIa 2d 4av IIA81c SCO 894IIa 2d 4av IIA81d ENG 4648 3043 18232 10271 28946 36376 13251IIa 2d 4av IIA81d FRA 56608 51467 35490 33433 39321 111310 9914 1459IIa 2d 4av IIA81d SCO 26029 249335 248642 243745 186112 175445IIa 2d 4av none ENG 2716 10267 19375 21702 13553 9008 16188 5679IIa 2d 4av none FRA 2944 1030 18179 5550IIa 2d 4av none GER 1020 15663 44120 27504 2550 1470IIa 2d 4av none IRL 97368 4503 11124 21186IIa 2d 4av none NIR 1336IIa 2d 4av none SCO 14059 33479 1382280 3615150 2797769 1797402 1460203 1302911IIa 2d 4bi none BEL 22214 2391 13658 11057 4807 2649 1252IIa 2d 4bi none ENG 96IIa 2d 4bi none IRL 14890 5067 6676IIa 2d 4biii IIA81c FRA 30385 35077IIa 2d 4biii none ENG 288IIa 2d 4biii none FRA 1472IIa 2d 4biii none SCO 97861 83069 103897IIa 2d 4biv IIA81c FRA 1519IIa 2d 4biv none SCO 4894 60023 151480 119958 81194IIa 2d 4ci none FRA 19174IIa 2d 4ci none IRL 128 1703IIa 2d 4ci none SCO 3620 595 51 13723IIa 2d 4cii none ENG 112 19712IIa 2d 4cii none FRA 11220 40538 21640 7646 4290 44934 40192 162424IIa 2d 4cii none IRL 2993 3667 64 1808 11015IIa 2d 4cii none SCO 8564 5333 3670 1789 109IIa 2d 4ciii none ENG 36019 40156 44981IIa 2d 4ciii none FRA 23702 85376 52992IIa 2d 4ciii none IRL 2529 1026 1468 512IIa 2d 4ciii none SCO 422 2585IIa 2d 4civ none ENG 218131 145377 211976 289905 203333 113972 15224 36174IIa 2d 4civ none FRA 9261 70642 54464 85376 43202 72128 44160IIa 2d 4civ none GER 28623 30889 7497 101744 78577 28016IIa 2d 4civ none IRL 11608 600 854IIa 2d 4civ none SCO 4636 4820 42424 53741 33101 403IIa 2d 4d IIA81g FRA 64768IIa 2d 4d none FRA 1128IIa 2d 4d none SCO 1505 1416 636 320IIa 2d 4e none ENG 416434 431522 296907 225031 303353 245410 219565 288636IIa 2d 4e none FRA 48170 164752 474396IIa 2d 4e none IRL 3693 42900 9000 5705 18811 3040 -1IIa 2d 4e none NIR 562 1574IIa 2d 4e none SCO 73790 86868 173707 124693 148430 306948 371403 518888IIa 2d none IIA81c ENG 892 656 1079IIa 2d none IIA81c IOM 0 0IIa 2d none IIA81d ENG 402 1561IIa 2d none IIA81d NIR 1432IIa 2d none none BEL 442 250IIa 2d none none ENG 526341 704518 666300 696149 582497 487150 1068827 1035827IIa 2d none none FRA 309122 139950 185204 226265 353449 140503 223820 203928IIa 2d none none GBI 130 16 38 30 7391 1123 5084 3471IIa 2d none none GER 727542 782149 575636 617820 725343 617097 1132573 1071468IIa 2d none none IOM 130 16 38 30 7391 1123 3932IIa 2d none none IRL 4276356 3647525 4092089 3314312 3553699 2414360 2076441 2020043IIa 2d none none NED 2047046 1691820 3609242 4076962 3287619 2979117IIa 2d none none NIR 239828 291939 514124 441007 678617 465562 453073 533485IIa 2d none none SCO 6878379 7499064 8265977 8722833 9141749 8242654 5605938 5034225
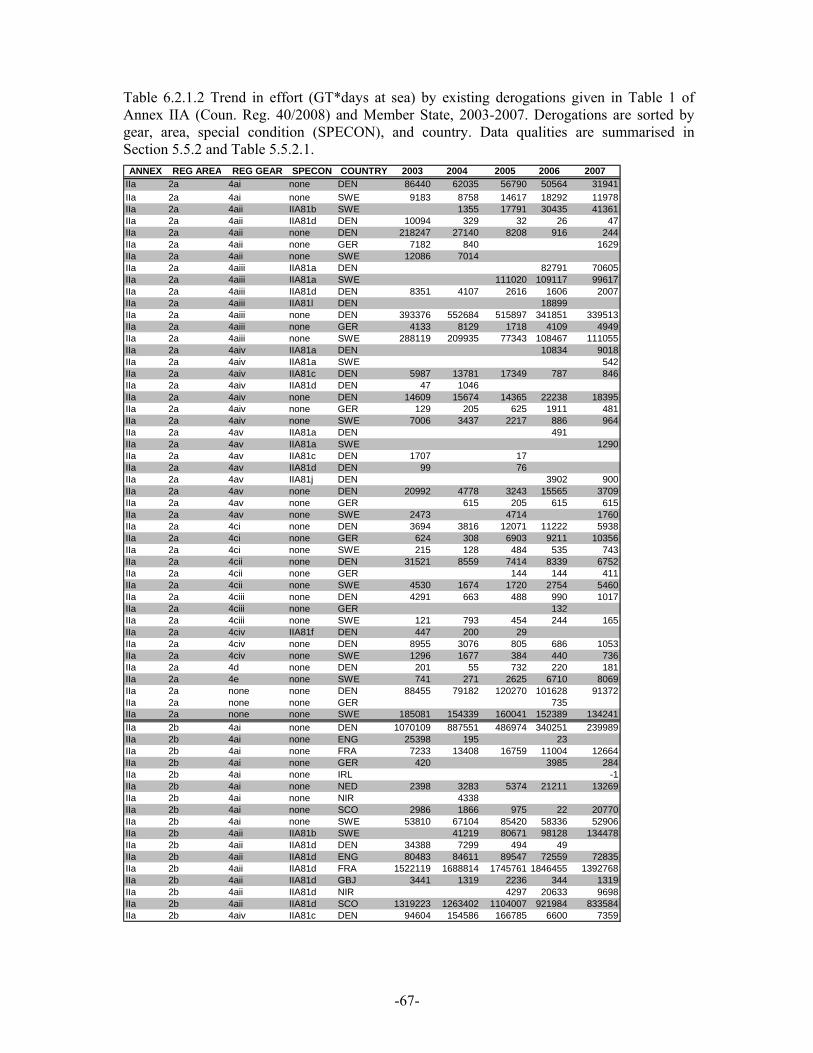
-67-
Table 6.2.1.2 Trend in effort (GT*days at sea) by existing derogations given in Table 1 of Annex IIA (Coun. Reg. 40/2008) and Member State, 2003-2007. Derogations are sorted by gear, area, special condition (SPECON), and country. Data qualities are summarised in Section 5.5.2 and Table 5.5.2.1.
ANNEX REG AREA REG GEAR SPECON COUNTRY 2003 2004 2005 2006 2007IIa 2a 4ai none DEN 86440 62035 56790 50564 31941IIa 2a 4ai none SWE 9183 8758 14617 18292 11978IIa 2a 4aii IIA81b SWE 1355 17791 30435 41361IIa 2a 4aii IIA81d DEN 10094 329 32 26 47IIa 2a 4aii none DEN 218247 27140 8208 916 244IIa 2a 4aii none GER 7182 840 1629IIa 2a 4aii none SWE 12086 7014IIa 2a 4aiii IIA81a DEN 82791 70605IIa 2a 4aiii IIA81a SWE 111020 109117 99617IIa 2a 4aiii IIA81d DEN 8351 4107 2616 1606 2007IIa 2a 4aiii IIA81l DEN 18899IIa 2a 4aiii none DEN 393376 552684 515897 341851 339513IIa 2a 4aiii none GER 4133 8129 1718 4109 4949IIa 2a 4aiii none SWE 288119 209935 77343 108467 111055IIa 2a 4aiv IIA81a DEN 10834 9018IIa 2a 4aiv IIA81a SWE 542IIa 2a 4aiv IIA81c DEN 5987 13781 17349 787 846IIa 2a 4aiv IIA81d DEN 47 1046IIa 2a 4aiv none DEN 14609 15674 14365 22238 18395IIa 2a 4aiv none GER 129 205 625 1911 481IIa 2a 4aiv none SWE 7006 3437 2217 886 964IIa 2a 4av IIA81a DEN 491IIa 2a 4av IIA81a SWE 1290IIa 2a 4av IIA81c DEN 1707 17IIa 2a 4av IIA81d DEN 99 76IIa 2a 4av IIA81j DEN 3902 900IIa 2a 4av none DEN 20992 4778 3243 15565 3709IIa 2a 4av none GER 615 205 615 615IIa 2a 4av none SWE 2473 4714 1760IIa 2a 4ci none DEN 3694 3816 12071 11222 5938IIa 2a 4ci none GER 624 308 6903 9211 10356IIa 2a 4ci none SWE 215 128 484 535 743IIa 2a 4cii none DEN 31521 8559 7414 8339 6752IIa 2a 4cii none GER 144 144 411IIa 2a 4cii none SWE 4530 1674 1720 2754 5460IIa 2a 4ciii none DEN 4291 663 488 990 1017IIa 2a 4ciii none GER 132IIa 2a 4ciii none SWE 121 793 454 244 165IIa 2a 4civ IIA81f DEN 447 200 29IIa 2a 4civ none DEN 8955 3076 805 686 1053IIa 2a 4civ none SWE 1296 1677 384 440 736IIa 2a 4d none DEN 201 55 732 220 181IIa 2a 4e none SWE 741 271 2625 6710 8069IIa 2a none none DEN 88455 79182 120270 101628 91372IIa 2a none none GER 735IIa 2a none none SWE 185081 154339 160041 152389 134241IIa 2b 4ai none DEN 1070109 887551 486974 340251 239989IIa 2b 4ai none ENG 25398 195 23IIa 2b 4ai none FRA 7233 13408 16759 11004 12664IIa 2b 4ai none GER 420 3985 284IIa 2b 4ai none IRL -1IIa 2b 4ai none NED 2398 3283 5374 21211 13269IIa 2b 4ai none NIR 4338IIa 2b 4ai none SCO 2986 1866 975 22 20770IIa 2b 4ai none SWE 53810 67104 85420 58336 52906IIa 2b 4aii IIA81b SWE 41219 80671 98128 134478IIa 2b 4aii IIA81d DEN 34388 7299 494 49IIa 2b 4aii IIA81d ENG 80483 84611 89547 72559 72835IIa 2b 4aii IIA81d FRA 1522119 1688814 1745761 1846455 1392768IIa 2b 4aii IIA81d GBJ 3441 1319 2236 344 1319IIa 2b 4aii IIA81d NIR 4297 20633 9698IIa 2b 4aii IIA81d SCO 1319223 1263402 1104007 921984 833584IIa 2b 4aiv IIA81c DEN 94604 154586 166785 6600 7359

-68-
Table 6.2.1.2 continued
ANNEX REG AREA REG GEAR SPECON COUNTRY 2003 2004 2005 2006 2007IIa 2b 4aiv IIA81c ENG 108059 72052 29159 147891 116800IIa 2b 4aiv IIA81c FRA 119 258IIa 2b 4aiv IIA81c GER 36821 11253 14689 81831 37530IIa 2b 4aiv IIA81c NIR 711 158 1456IIa 2b 4aiv IIA81c SCO 75666 84090 63558 37741 41917IIa 2b 4aiv IIA81d DEN 135 883 1119IIa 2b 4aiv IIA81d ENG 40816 5087 6538 4049 4905IIa 2b 4aiv IIA81d FRA 1589958 1224722 1080465 1119860 1147254IIa 2b 4aiv IIA81d GER 97271 104679 133385 93903 152456IIa 2b 4aiv IIA81d NIR 2430 2754IIa 2b 4aiv IIA81d SCO 32318 38786 49623 42407 63567IIa 2b 4aiv IIA81k FRA 889 113IIa 2b 4aiv none DEN 137655 143922 247982 345262 193923IIa 2b 4aiv none ENG 81257 32595 15017 23687 121492IIa 2b 4aiv none FRA 39905 65324 94665 124445 91688IIa 2b 4aiv none GER 38409 44292 37843 250237 172293IIa 2b 4aiv none IRL 710 386 -1IIa 2b 4aiv none NED 122130 88051 138297 149174 178598IIa 2b 4aiv none NIR 672 3024 2025 5174IIa 2b 4aiv none SCO 303939 96761 107627 182862 301170IIa 2b 4aiv none SWE 15381 4221 7034 2076 2678IIa 2b 4av IIA81c DEN 43196 31197 55817 4141 8585IIa 2b 4av IIA81c ENG 10820 12107 5304 2408 3220IIa 2b 4av IIA81c FRA 189IIa 2b 4av IIA81c NIR 4977 14062 10092 15701IIa 2b 4av IIA81c SCO 316IIa 2b 4av IIA81d DEN 44977 34195 25859 21492 16978IIa 2b 4av IIA81d ENG 92217 96915 145092 117954 31649IIa 2b 4av IIA81d FRA 62360 8492 14140 35556 3251IIa 2b 4av IIA81d GER 301584 346020 361693 361533 371870IIa 2b 4av IIA81d SCO 102476 140793 147476 136390 78197IIa 2b 4av IIA81h DEN 135809 209067IIa 2b 4av none DEN 3269044 2726833 2975439 2092788 1671527IIa 2b 4av none ENG 422501 242077 225655 435144 210451IIa 2b 4av none FRA 2932 206 840 7077 7014IIa 2b 4av none GER 950848 905544 1212842 1006644 960346IIa 2b 4av none NED 82257 79763 49343 25386 32796IIa 2b 4av none NIR 8000 2400 88IIa 2b 4av none SCO 5980276 4796343 4581958 4360871 4024208IIa 2b 4av none SWE 173741 155461 163934 87397 100725IIa 2b 4ci none DEN 77638 123755 137262 110688 78106IIa 2b 4ci none ENG 2080 897 2315 1580 1972IIa 2b 4ci none FRA 15394 9613 6150 2989 2118IIa 2b 4ci none GER 9950 11073 24300 20888 22456IIa 2b 4ci none NED 16546 7704 10572 39953 28700IIa 2b 4ci none SWE 1744 2972 2409 2127 1467IIa 2b 4cii none DEN 199099 146406 143048 150927 104695IIa 2b 4cii none ENG 3857 962 1643 986 1497IIa 2b 4cii none FRA 10789 3612 11814 10291 10391IIa 2b 4cii none GER 1380 1342 3186 3660 3428IIa 2b 4cii none NED 590 11424 10591 7848IIa 2b 4cii none SCO 899 38 147IIa 2b 4cii none SWE 4856 5220 5161 5354 4149IIa 2b 4ciii none DEN 262611 198993 185846 171655 65869IIa 2b 4ciii none ENG 27074 29799 17020 15854 5728IIa 2b 4ciii none FRA 3591 1620 3184 1390 221IIa 2b 4ciii none GER 8074 11561 12535 7724 6096IIa 2b 4ciii none NED 124 53IIa 2b 4ciii none SCO 654 1455 963 177IIa 2b 4ciii none SWE 858 1334 1521 1696 2044
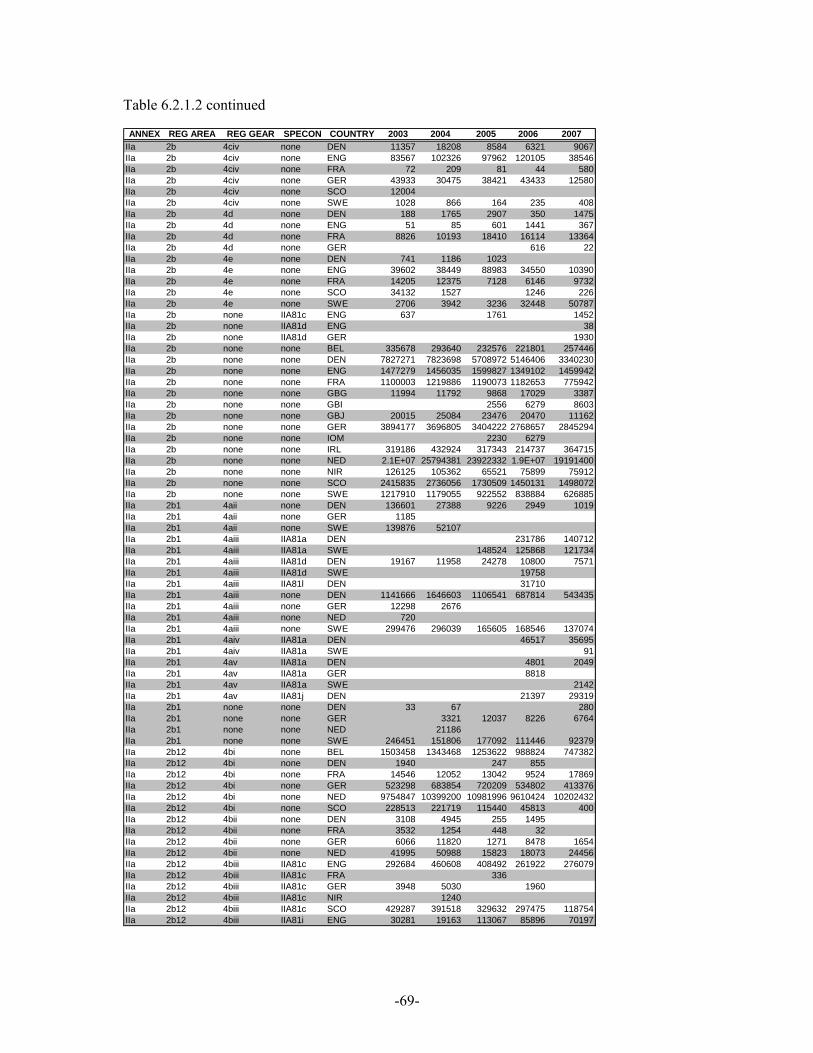
-69-
Table 6.2.1.2 continued
ANNEX REG AREA REG GEAR SPECON COUNTRY 2003 2004 2005 2006 2007IIa 2b 4civ none DEN 11357 18208 8584 6321 9067IIa 2b 4civ none ENG 83567 102326 97962 120105 38546IIa 2b 4civ none FRA 72 209 81 44 580IIa 2b 4civ none GER 43933 30475 38421 43433 12580IIa 2b 4civ none SCO 12004IIa 2b 4civ none SWE 1028 866 164 235 408IIa 2b 4d none DEN 188 1765 2907 350 1475IIa 2b 4d none ENG 51 85 601 1441 367IIa 2b 4d none FRA 8826 10193 18410 16114 13364IIa 2b 4d none GER 616 22IIa 2b 4e none DEN 741 1186 1023IIa 2b 4e none ENG 39602 38449 88983 34550 10390IIa 2b 4e none FRA 14205 12375 7128 6146 9732IIa 2b 4e none SCO 34132 1527 1246 226IIa 2b 4e none SWE 2706 3942 3236 32448 50787IIa 2b none IIA81c ENG 637 1761 1452IIa 2b none IIA81d ENG 38IIa 2b none IIA81d GER 1930IIa 2b none none BEL 335678 293640 232576 221801 257446IIa 2b none none DEN 7827271 7823698 5708972 5146406 3340230IIa 2b none none ENG 1477279 1456035 1599827 1349102 1459942IIa 2b none none FRA 1100003 1219886 1190073 1182653 775942IIa 2b none none GBG 11994 11792 9868 17029 3387IIa 2b none none GBI 2556 6279 8603IIa 2b none none GBJ 20015 25084 23476 20470 11162IIa 2b none none GER 3894177 3696805 3404222 2768657 2845294IIa 2b none none IOM 2230 6279IIa 2b none none IRL 319186 432924 317343 214737 364715IIa 2b none none NED 2.1E+07 25794381 23922332 1.9E+07 19191400IIa 2b none none NIR 126125 105362 65521 75899 75912IIa 2b none none SCO 2415835 2736056 1730509 1450131 1498072IIa 2b none none SWE 1217910 1179055 922552 838884 626885IIa 2b1 4aii none DEN 136601 27388 9226 2949 1019IIa 2b1 4aii none GER 1185IIa 2b1 4aii none SWE 139876 52107IIa 2b1 4aiii IIA81a DEN 231786 140712IIa 2b1 4aiii IIA81a SWE 148524 125868 121734IIa 2b1 4aiii IIA81d DEN 19167 11958 24278 10800 7571IIa 2b1 4aiii IIA81d SWE 19758IIa 2b1 4aiii IIA81l DEN 31710IIa 2b1 4aiii none DEN 1141666 1646603 1106541 687814 543435IIa 2b1 4aiii none GER 12298 2676IIa 2b1 4aiii none NED 720IIa 2b1 4aiii none SWE 299476 296039 165605 168546 137074IIa 2b1 4aiv IIA81a DEN 46517 35695IIa 2b1 4aiv IIA81a SWE 91IIa 2b1 4av IIA81a DEN 4801 2049IIa 2b1 4av IIA81a GER 8818IIa 2b1 4av IIA81a SWE 2142IIa 2b1 4av IIA81j DEN 21397 29319IIa 2b1 none none DEN 33 67 280IIa 2b1 none none GER 3321 12037 8226 6764IIa 2b1 none none NED 21186IIa 2b1 none none SWE 246451 151806 177092 111446 92379IIa 2b12 4bi none BEL 1503458 1343468 1253622 988824 747382IIa 2b12 4bi none DEN 1940 247 855IIa 2b12 4bi none FRA 14546 12052 13042 9524 17869IIa 2b12 4bi none GER 523298 683854 720209 534802 413376IIa 2b12 4bi none NED 9754847 10399200 10981996 9610424 10202432IIa 2b12 4bi none SCO 228513 221719 115440 45813 400IIa 2b12 4bii none DEN 3108 4945 255 1495IIa 2b12 4bii none FRA 3532 1254 448 32IIa 2b12 4bii none GER 6066 11820 1271 8478 1654IIa 2b12 4bii none NED 41995 50988 15823 18073 24456IIa 2b12 4biii IIA81c ENG 292684 460608 408492 261922 276079IIa 2b12 4biii IIA81c FRA 336IIa 2b12 4biii IIA81c GER 3948 5030 1960IIa 2b12 4biii IIA81c NIR 1240IIa 2b12 4biii IIA81c SCO 429287 391518 329632 297475 118754IIa 2b12 4biii IIA81i ENG 30281 19163 113067 85896 70197
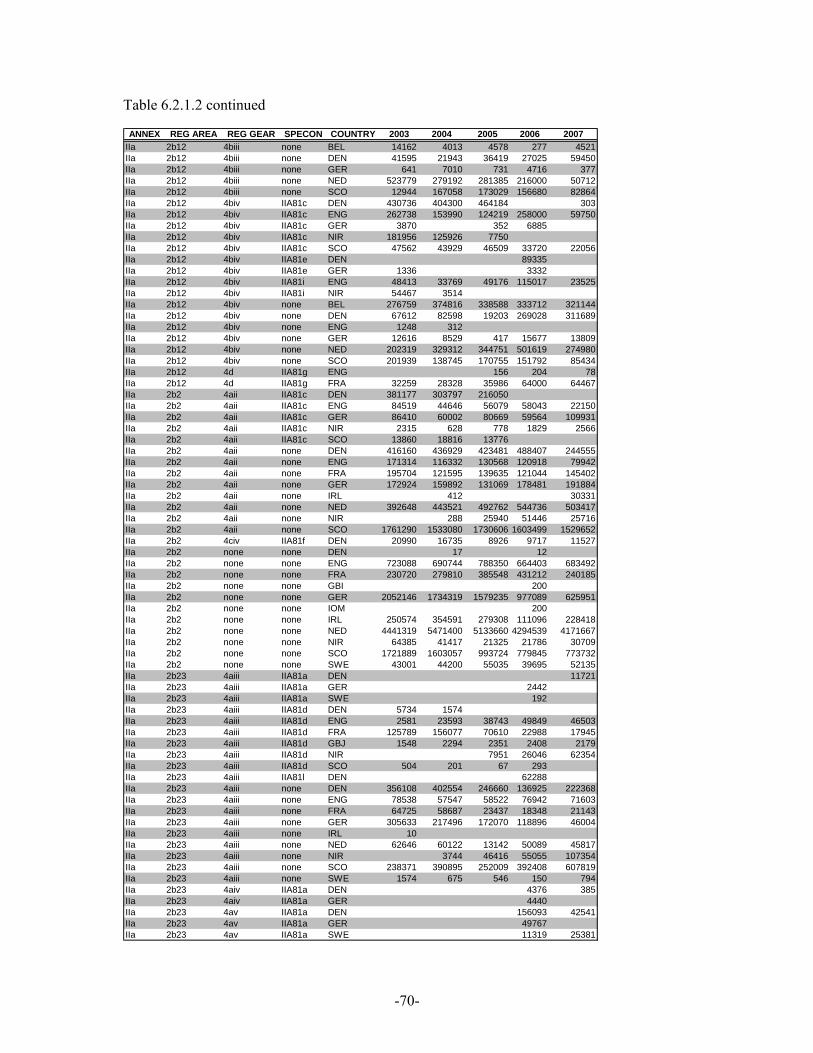
-70-
Table 6.2.1.2 continued
ANNEX REG AREA REG GEAR SPECON COUNTRY 2003 2004 2005 2006 2007IIa 2b12 4biii none BEL 14162 4013 4578 277 4521IIa 2b12 4biii none DEN 41595 21943 36419 27025 59450IIa 2b12 4biii none GER 641 7010 731 4716 377IIa 2b12 4biii none NED 523779 279192 281385 216000 50712IIa 2b12 4biii none SCO 12944 167058 173029 156680 82864IIa 2b12 4biv IIA81c DEN 430736 404300 464184 303IIa 2b12 4biv IIA81c ENG 262738 153990 124219 258000 59750IIa 2b12 4biv IIA81c GER 3870 352 6885IIa 2b12 4biv IIA81c NIR 181956 125926 7750IIa 2b12 4biv IIA81c SCO 47562 43929 46509 33720 22056IIa 2b12 4biv IIA81e DEN 89335IIa 2b12 4biv IIA81e GER 1336 3332IIa 2b12 4biv IIA81i ENG 48413 33769 49176 115017 23525IIa 2b12 4biv IIA81i NIR 54467 3514IIa 2b12 4biv none BEL 276759 374816 338588 333712 321144IIa 2b12 4biv none DEN 67612 82598 19203 269028 311689IIa 2b12 4biv none ENG 1248 312IIa 2b12 4biv none GER 12616 8529 417 15677 13809IIa 2b12 4biv none NED 202319 329312 344751 501619 274980IIa 2b12 4biv none SCO 201939 138745 170755 151792 85434IIa 2b12 4d IIA81g ENG 156 204 78IIa 2b12 4d IIA81g FRA 32259 28328 35986 64000 64467IIa 2b2 4aii IIA81c DEN 381177 303797 216050IIa 2b2 4aii IIA81c ENG 84519 44646 56079 58043 22150IIa 2b2 4aii IIA81c GER 86410 60002 80669 59564 109931IIa 2b2 4aii IIA81c NIR 2315 628 778 1829 2566IIa 2b2 4aii IIA81c SCO 13860 18816 13776IIa 2b2 4aii none DEN 416160 436929 423481 488407 244555IIa 2b2 4aii none ENG 171314 116332 130568 120918 79942IIa 2b2 4aii none FRA 195704 121595 139635 121044 145402IIa 2b2 4aii none GER 172924 159892 131069 178481 191884IIa 2b2 4aii none IRL 412 30331IIa 2b2 4aii none NED 392648 443521 492762 544736 503417IIa 2b2 4aii none NIR 288 25940 51446 25716IIa 2b2 4aii none SCO 1761290 1533080 1730606 1603499 1529652IIa 2b2 4civ IIA81f DEN 20990 16735 8926 9717 11527IIa 2b2 none none DEN 17 12IIa 2b2 none none ENG 723088 690744 788350 664403 683492IIa 2b2 none none FRA 230720 279810 385548 431212 240185IIa 2b2 none none GBI 200IIa 2b2 none none GER 2052146 1734319 1579235 977089 625951IIa 2b2 none none IOM 200IIa 2b2 none none IRL 250574 354591 279308 111096 228418IIa 2b2 none none NED 4441319 5471400 5133660 4294539 4171667IIa 2b2 none none NIR 64385 41417 21325 21786 30709IIa 2b2 none none SCO 1721889 1603057 993724 779845 773732IIa 2b2 none none SWE 43001 44200 55035 39695 52135IIa 2b23 4aiii IIA81a DEN 11721IIa 2b23 4aiii IIA81a GER 2442IIa 2b23 4aiii IIA81a SWE 192IIa 2b23 4aiii IIA81d DEN 5734 1574IIa 2b23 4aiii IIA81d ENG 2581 23593 38743 49849 46503IIa 2b23 4aiii IIA81d FRA 125789 156077 70610 22988 17945IIa 2b23 4aiii IIA81d GBJ 1548 2294 2351 2408 2179IIa 2b23 4aiii IIA81d NIR 7951 26046 62354IIa 2b23 4aiii IIA81d SCO 504 201 67 293IIa 2b23 4aiii IIA81l DEN 62288IIa 2b23 4aiii none DEN 356108 402554 246660 136925 222368IIa 2b23 4aiii none ENG 78538 57547 58522 76942 71603IIa 2b23 4aiii none FRA 64725 58687 23437 18348 21143IIa 2b23 4aiii none GER 305633 217496 172070 118896 46004IIa 2b23 4aiii none IRL 10IIa 2b23 4aiii none NED 62646 60122 13142 50089 45817IIa 2b23 4aiii none NIR 3744 46416 55055 107354IIa 2b23 4aiii none SCO 238371 390895 252009 392408 607819IIa 2b23 4aiii none SWE 1574 675 546 150 794IIa 2b23 4aiv IIA81a DEN 4376 385IIa 2b23 4aiv IIA81a GER 4440IIa 2b23 4av IIA81a DEN 156093 42541IIa 2b23 4av IIA81a GER 49767IIa 2b23 4av IIA81a SWE 11319 25381
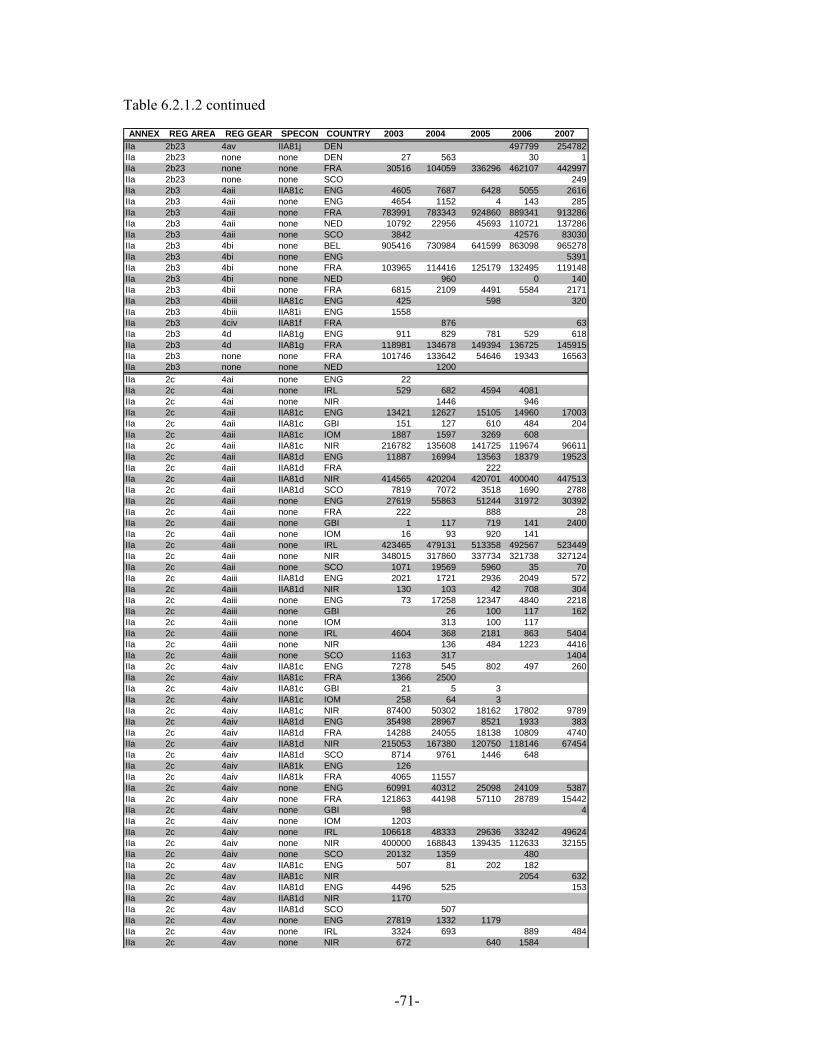
-71-
Table 6.2.1.2 continued
ANNEX REG AREA REG GEAR SPECON COUNTRY 2003 2004 2005 2006 2007IIa 2b23 4av IIA81j DEN 497799 254782IIa 2b23 none none DEN 27 563 30 1IIa 2b23 none none FRA 30516 104059 336296 462107 442997IIa 2b23 none none SCO 249IIa 2b3 4aii IIA81c ENG 4605 7687 6428 5055 2616IIa 2b3 4aii none ENG 4654 1152 4 143 285IIa 2b3 4aii none FRA 783991 783343 924860 889341 913286IIa 2b3 4aii none NED 10792 22956 45693 110721 137286IIa 2b3 4aii none SCO 3842 42576 83030IIa 2b3 4bi none BEL 905416 730984 641599 863098 965278IIa 2b3 4bi none ENG 5391IIa 2b3 4bi none FRA 103965 114416 125179 132495 119148IIa 2b3 4bi none NED 960 0 140IIa 2b3 4bii none FRA 6815 2109 4491 5584 2171IIa 2b3 4biii IIA81c ENG 425 598 320IIa 2b3 4biii IIA81i ENG 1558IIa 2b3 4civ IIA81f FRA 876 63IIa 2b3 4d IIA81g ENG 911 829 781 529 618IIa 2b3 4d IIA81g FRA 118981 134678 149394 136725 145915IIa 2b3 none none FRA 101746 133642 54646 19343 16563IIa 2b3 none none NED 1200IIa 2c 4ai none ENG 22IIa 2c 4ai none IRL 529 682 4594 4081IIa 2c 4ai none NIR 1446 946IIa 2c 4aii IIA81c ENG 13421 12627 15105 14960 17003IIa 2c 4aii IIA81c GBI 151 127 610 484 204IIa 2c 4aii IIA81c IOM 1887 1597 3269 608IIa 2c 4aii IIA81c NIR 216782 135608 141725 119674 96611IIa 2c 4aii IIA81d ENG 11887 16994 13563 18379 19523IIa 2c 4aii IIA81d FRA 222IIa 2c 4aii IIA81d NIR 414565 420204 420701 400040 447513IIa 2c 4aii IIA81d SCO 7819 7072 3518 1690 2788IIa 2c 4aii none ENG 27619 55863 51244 31972 30392IIa 2c 4aii none FRA 222 888 28IIa 2c 4aii none GBI 1 117 719 141 2400IIa 2c 4aii none IOM 16 93 920 141IIa 2c 4aii none IRL 423465 479131 513358 492567 523449IIa 2c 4aii none NIR 348015 317860 337734 321738 327124IIa 2c 4aii none SCO 1071 19569 5960 35 70IIa 2c 4aiii IIA81d ENG 2021 1721 2936 2049 572IIa 2c 4aiii IIA81d NIR 130 103 42 708 304IIa 2c 4aiii none ENG 73 17258 12347 4840 2218IIa 2c 4aiii none GBI 26 100 117 162IIa 2c 4aiii none IOM 313 100 117IIa 2c 4aiii none IRL 4604 368 2181 863 5404IIa 2c 4aiii none NIR 136 484 1223 4416IIa 2c 4aiii none SCO 1163 317 1404IIa 2c 4aiv IIA81c ENG 7278 545 802 497 260IIa 2c 4aiv IIA81c FRA 1366 2500IIa 2c 4aiv IIA81c GBI 21 5 3IIa 2c 4aiv IIA81c IOM 258 64 3IIa 2c 4aiv IIA81c NIR 87400 50302 18162 17802 9789IIa 2c 4aiv IIA81d ENG 35498 28967 8521 1933 383IIa 2c 4aiv IIA81d FRA 14288 24055 18138 10809 4740IIa 2c 4aiv IIA81d NIR 215053 167380 120750 118146 67454IIa 2c 4aiv IIA81d SCO 8714 9761 1446 648IIa 2c 4aiv IIA81k ENG 126IIa 2c 4aiv IIA81k FRA 4065 11557IIa 2c 4aiv none ENG 60991 40312 25098 24109 5387IIa 2c 4aiv none FRA 121863 44198 57110 28789 15442IIa 2c 4aiv none GBI 98 4IIa 2c 4aiv none IOM 1203IIa 2c 4aiv none IRL 106618 48333 29636 33242 49624IIa 2c 4aiv none NIR 400000 168843 139435 112633 32155IIa 2c 4aiv none SCO 20132 1359 480IIa 2c 4av IIA81c ENG 507 81 202 182IIa 2c 4av IIA81c NIR 2054 632IIa 2c 4av IIA81d ENG 4496 525 153IIa 2c 4av IIA81d NIR 1170IIa 2c 4av IIA81d SCO 507IIa 2c 4av none ENG 27819 1332 1179IIa 2c 4av none IRL 3324 693 889 484IIa 2c 4av none NIR 672 640 1584
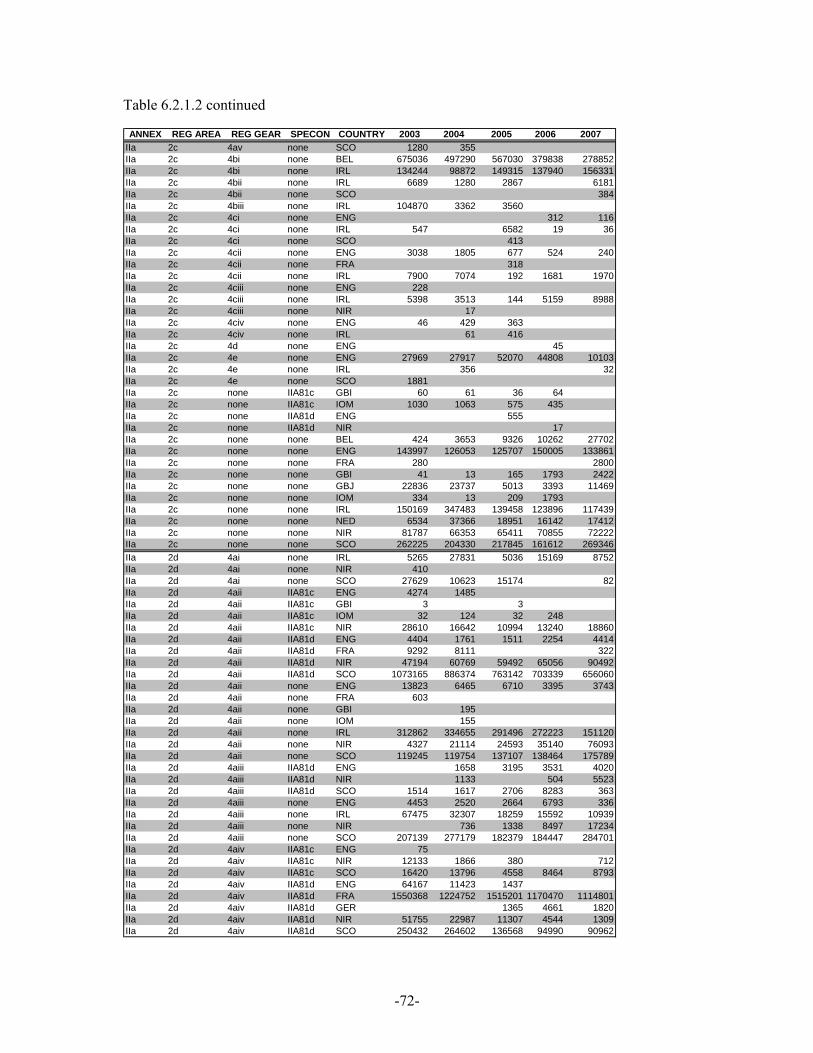
-72-
Table 6.2.1.2 continued
ANNEX REG AREA REG GEAR SPECON COUNTRY 2003 2004 2005 2006 2007IIa 2c 4av none SCO 1280 355IIa 2c 4bi none BEL 675036 497290 567030 379838 278852IIa 2c 4bi none IRL 134244 98872 149315 137940 156331IIa 2c 4bii none IRL 6689 1280 2867 6181IIa 2c 4bii none SCO 384IIa 2c 4biii none IRL 104870 3362 3560IIa 2c 4ci none ENG 312 116IIa 2c 4ci none IRL 547 6582 19 36IIa 2c 4ci none SCO 413IIa 2c 4cii none ENG 3038 1805 677 524 240IIa 2c 4cii none FRA 318IIa 2c 4cii none IRL 7900 7074 192 1681 1970IIa 2c 4ciii none ENG 228IIa 2c 4ciii none IRL 5398 3513 144 5159 8988IIa 2c 4ciii none NIR 17IIa 2c 4civ none ENG 46 429 363IIa 2c 4civ none IRL 61 416IIa 2c 4d none ENG 45IIa 2c 4e none ENG 27969 27917 52070 44808 10103IIa 2c 4e none IRL 356 32IIa 2c 4e none SCO 1881IIa 2c none IIA81c GBI 60 61 36 64IIa 2c none IIA81c IOM 1030 1063 575 435IIa 2c none IIA81d ENG 555IIa 2c none IIA81d NIR 17IIa 2c none none BEL 424 3653 9326 10262 27702IIa 2c none none ENG 143997 126053 125707 150005 133861IIa 2c none none FRA 280 2800IIa 2c none none GBI 41 13 165 1793 2422IIa 2c none none GBJ 22836 23737 5013 3393 11469IIa 2c none none IOM 334 13 209 1793IIa 2c none none IRL 150169 347483 139458 123896 117439IIa 2c none none NED 6534 37366 18951 16142 17412IIa 2c none none NIR 81787 66353 65411 70855 72222IIa 2c none none SCO 262225 204330 217845 161612 269346IIa 2d 4ai none IRL 5265 27831 5036 15169 8752IIa 2d 4ai none NIR 410IIa 2d 4ai none SCO 27629 10623 15174 82IIa 2d 4aii IIA81c ENG 4274 1485IIa 2d 4aii IIA81c GBI 3 3IIa 2d 4aii IIA81c IOM 32 124 32 248IIa 2d 4aii IIA81c NIR 28610 16642 10994 13240 18860IIa 2d 4aii IIA81d ENG 4404 1761 1511 2254 4414IIa 2d 4aii IIA81d FRA 9292 8111 322IIa 2d 4aii IIA81d NIR 47194 60769 59492 65056 90492IIa 2d 4aii IIA81d SCO 1073165 886374 763142 703339 656060IIa 2d 4aii none ENG 13823 6465 6710 3395 3743IIa 2d 4aii none FRA 603IIa 2d 4aii none GBI 195IIa 2d 4aii none IOM 155IIa 2d 4aii none IRL 312862 334655 291496 272223 151120IIa 2d 4aii none NIR 4327 21114 24593 35140 76093IIa 2d 4aii none SCO 119245 119754 137107 138464 175789IIa 2d 4aiii IIA81d ENG 1658 3195 3531 4020IIa 2d 4aiii IIA81d NIR 1133 504 5523IIa 2d 4aiii IIA81d SCO 1514 1617 2706 8283 363IIa 2d 4aiii none ENG 4453 2520 2664 6793 336IIa 2d 4aiii none IRL 67475 32307 18259 15592 10939IIa 2d 4aiii none NIR 736 1338 8497 17234IIa 2d 4aiii none SCO 207139 277179 182379 184447 284701IIa 2d 4aiv IIA81c ENG 75IIa 2d 4aiv IIA81c NIR 12133 1866 380 712IIa 2d 4aiv IIA81c SCO 16420 13796 4558 8464 8793IIa 2d 4aiv IIA81d ENG 64167 11423 1437IIa 2d 4aiv IIA81d FRA 1550368 1224752 1515201 1170470 1114801IIa 2d 4aiv IIA81d GER 1365 4661 1820IIa 2d 4aiv IIA81d NIR 51755 22987 11307 4544 1309IIa 2d 4aiv IIA81d SCO 250432 264602 136568 94990 90962
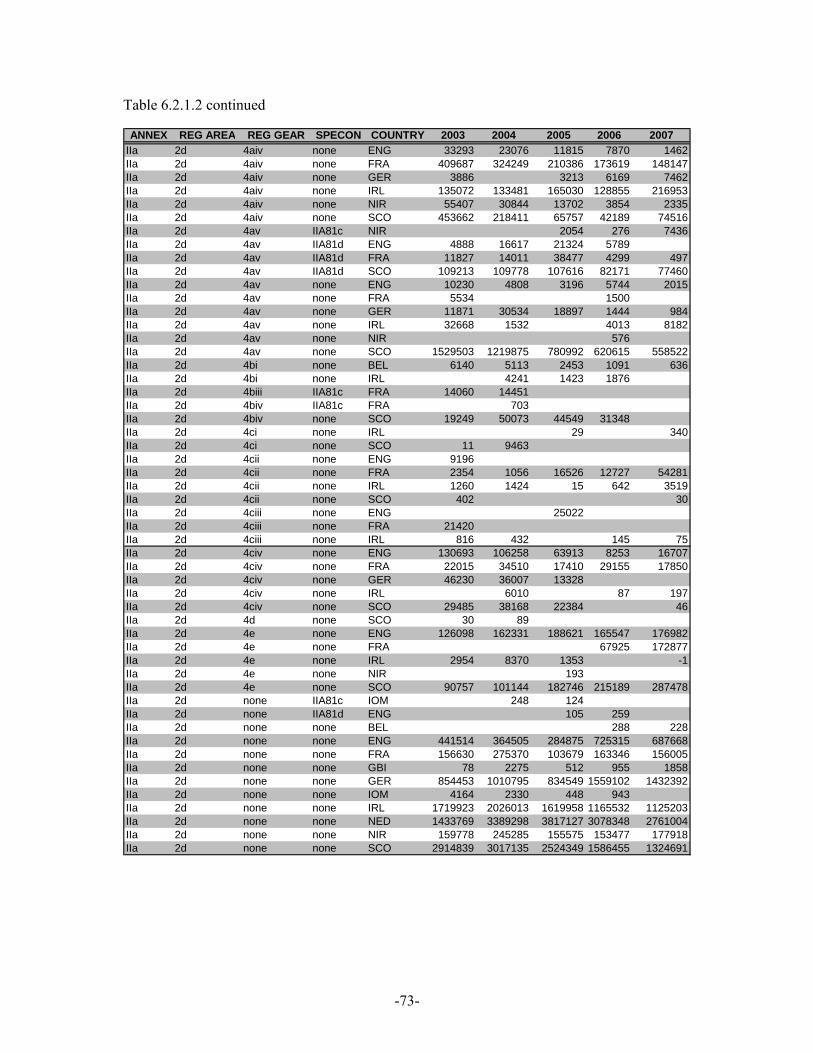
-73-
Table 6.2.1.2 continued
ANNEX REG AREA REG GEAR SPECON COUNTRY 2003 2004 2005 2006 2007IIa 2d 4aiv none ENG 33293 23076 11815 7870 1462IIa 2d 4aiv none FRA 409687 324249 210386 173619 148147IIa 2d 4aiv none GER 3886 3213 6169 7462IIa 2d 4aiv none IRL 135072 133481 165030 128855 216953IIa 2d 4aiv none NIR 55407 30844 13702 3854 2335IIa 2d 4aiv none SCO 453662 218411 65757 42189 74516IIa 2d 4av IIA81c NIR 2054 276 7436IIa 2d 4av IIA81d ENG 4888 16617 21324 5789IIa 2d 4av IIA81d FRA 11827 14011 38477 4299 497IIa 2d 4av IIA81d SCO 109213 109778 107616 82171 77460IIa 2d 4av none ENG 10230 4808 3196 5744 2015IIa 2d 4av none FRA 5534 1500IIa 2d 4av none GER 11871 30534 18897 1444 984IIa 2d 4av none IRL 32668 1532 4013 8182IIa 2d 4av none NIR 576IIa 2d 4av none SCO 1529503 1219875 780992 620615 558522IIa 2d 4bi none BEL 6140 5113 2453 1091 636IIa 2d 4bi none IRL 4241 1423 1876IIa 2d 4biii IIA81c FRA 14060 14451IIa 2d 4biv IIA81c FRA 703IIa 2d 4biv none SCO 19249 50073 44549 31348IIa 2d 4ci none IRL 29 340IIa 2d 4ci none SCO 11 9463IIa 2d 4cii none ENG 9196IIa 2d 4cii none FRA 2354 1056 16526 12727 54281IIa 2d 4cii none IRL 1260 1424 15 642 3519IIa 2d 4cii none SCO 402 30IIa 2d 4ciii none ENG 25022IIa 2d 4ciii none FRA 21420IIa 2d 4ciii none IRL 816 432 145 75IIa 2d 4civ none ENG 130693 106258 63913 8253 16707IIa 2d 4civ none FRA 22015 34510 17410 29155 17850IIa 2d 4civ none GER 46230 36007 13328IIa 2d 4civ none IRL 6010 87 197IIa 2d 4civ none SCO 29485 38168 22384 46IIa 2d 4d none SCO 30 89IIa 2d 4e none ENG 126098 162331 188621 165547 176982IIa 2d 4e none FRA 67925 172877IIa 2d 4e none IRL 2954 8370 1353 -1IIa 2d 4e none NIR 193IIa 2d 4e none SCO 90757 101144 182746 215189 287478IIa 2d none IIA81c IOM 248 124IIa 2d none IIA81d ENG 105 259IIa 2d none none BEL 288 228IIa 2d none none ENG 441514 364505 284875 725315 687668IIa 2d none none FRA 156630 275370 103679 163346 156005IIa 2d none none GBI 78 2275 512 955 1858IIa 2d none none GER 854453 1010795 834549 1559102 1432392IIa 2d none none IOM 4164 2330 448 943IIa 2d none none IRL 1719923 2026013 1619958 1165532 1125203IIa 2d none none NED 1433769 3389298 3817127 3078348 2761004IIa 2d none none NIR 159778 245285 155575 153477 177918IIa 2d none none SCO 2914839 3017135 2524349 1586455 1324691
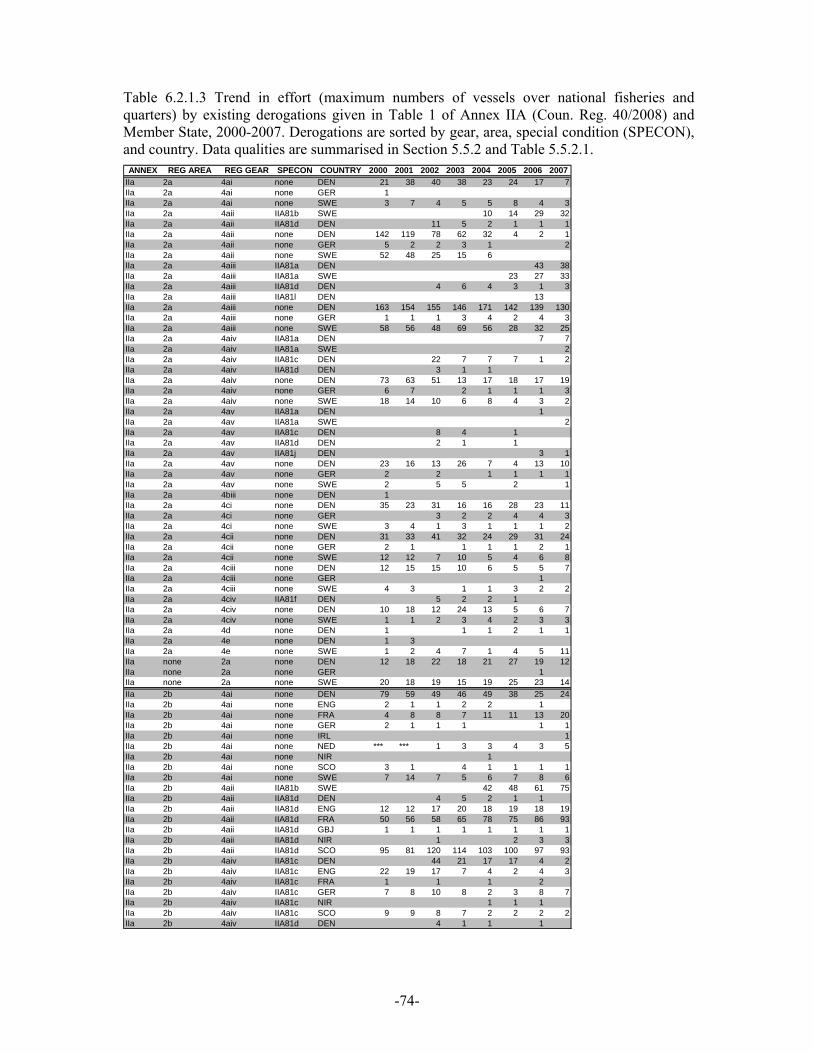
-74-
Table 6.2.1.3 Trend in effort (maximum numbers of vessels over national fisheries and quarters) by existing derogations given in Table 1 of Annex IIA (Coun. Reg. 40/2008) and Member State, 2000-2007. Derogations are sorted by gear, area, special condition (SPECON), and country. Data qualities are summarised in Section 5.5.2 and Table 5.5.2.1.
ANNEX REG AREA REG GEAR SPECON COUNTRY 2000 2001 2002 2003 2004 2005 2006 2007IIa 2a 4ai none DEN 21 38 40 38 23 24 17 7IIa 2a 4ai none GER 1IIa 2a 4ai none SWE 3 7 4 5 5 8 4 3IIa 2a 4aii IIA81b SWE 10 14 29 32IIa 2a 4aii IIA81d DEN 11 5 2 1 1 1IIa 2a 4aii none DEN 142 119 78 62 32 4 2 1IIa 2a 4aii none GER 5 2 2 3 1 2IIa 2a 4aii none SWE 52 48 25 15 6IIa 2a 4aiii IIA81a DEN 43 38IIa 2a 4aiii IIA81a SWE 23 27 33IIa 2a 4aiii IIA81d DEN 4 6 4 3 1 3IIa 2a 4aiii IIA81l DEN 13IIa 2a 4aiii none DEN 163 154 155 146 171 142 139 130IIa 2a 4aiii none GER 1 1 1 3 4 2 4 3IIa 2a 4aiii none SWE 58 56 48 69 56 28 32 25IIa 2a 4aiv IIA81a DEN 7 7IIa 2a 4aiv IIA81a SWE 2IIa 2a 4aiv IIA81c DEN 22 7 7 7 1 2IIa 2a 4aiv IIA81d DEN 3 1 1IIa 2a 4aiv none DEN 73 63 51 13 17 18 17 19IIa 2a 4aiv none GER 6 7 2 1 1 1 3IIa 2a 4aiv none SWE 18 14 10 6 8 4 3 2IIa 2a 4av IIA81a DEN 1IIa 2a 4av IIA81a SWE 2IIa 2a 4av IIA81c DEN 8 4 1IIa 2a 4av IIA81d DEN 2 1 1IIa 2a 4av IIA81j DEN 3 1IIa 2a 4av none DEN 23 16 13 26 7 4 13 10IIa 2a 4av none GER 2 2 1 1 1 1IIa 2a 4av none SWE 2 5 5 2 1IIa 2a 4biii none DEN 1IIa 2a 4ci none DEN 35 23 31 16 16 28 23 11IIa 2a 4ci none GER 3 2 2 4 4 3IIa 2a 4ci none SWE 3 4 1 3 1 1 1 2IIa 2a 4cii none DEN 31 33 41 32 24 29 31 24IIa 2a 4cii none GER 2 1 1 1 1 2 1IIa 2a 4cii none SWE 12 12 7 10 5 4 6 8IIa 2a 4ciii none DEN 12 15 15 10 6 5 5 7IIa 2a 4ciii none GER 1IIa 2a 4ciii none SWE 4 3 1 1 3 2 2IIa 2a 4civ IIA81f DEN 5 2 2 1IIa 2a 4civ none DEN 10 18 12 24 13 5 6 7IIa 2a 4civ none SWE 1 1 2 3 4 2 3 3IIa 2a 4d none DEN 1 1 1 2 1 1IIa 2a 4e none DEN 1 3IIa 2a 4e none SWE 1 2 4 7 1 4 5 11IIa none 2a none DEN 12 18 22 18 21 27 19 12IIa none 2a none GER 1IIa none 2a none SWE 20 18 19 15 19 25 23 14IIa 2b 4ai none DEN 79 59 49 46 49 38 25 24IIa 2b 4ai none ENG 2 1 1 2 2 1IIa 2b 4ai none FRA 4 8 8 7 11 11 13 20IIa 2b 4ai none GER 2 1 1 1 1 1IIa 2b 4ai none IRL 1IIa 2b 4ai none NED *** *** 1 3 3 4 3 5IIa 2b 4ai none NIR 1IIa 2b 4ai none SCO 3 1 4 1 1 1 1IIa 2b 4ai none SWE 7 14 7 5 6 7 8 6IIa 2b 4aii IIA81b SWE 42 48 61 75IIa 2b 4aii IIA81d DEN 4 5 2 1 1IIa 2b 4aii IIA81d ENG 12 12 17 20 18 19 18 19IIa 2b 4aii IIA81d FRA 50 56 58 65 78 75 86 93IIa 2b 4aii IIA81d GBJ 1 1 1 1 1 1 1 1IIa 2b 4aii IIA81d NIR 1 2 3 3IIa 2b 4aii IIA81d SCO 95 81 120 114 103 100 97 93IIa 2b 4aiv IIA81c DEN 44 21 17 17 4 2IIa 2b 4aiv IIA81c ENG 22 19 17 7 4 2 4 3IIa 2b 4aiv IIA81c FRA 1 1 1 2IIa 2b 4aiv IIA81c GER 7 8 10 8 2 3 8 7IIa 2b 4aiv IIA81c NIR 1 1 1IIa 2b 4aiv IIA81c SCO 9 9 8 7 2 2 2 2IIa 2b 4aiv IIA81d DEN 4 1 1 1
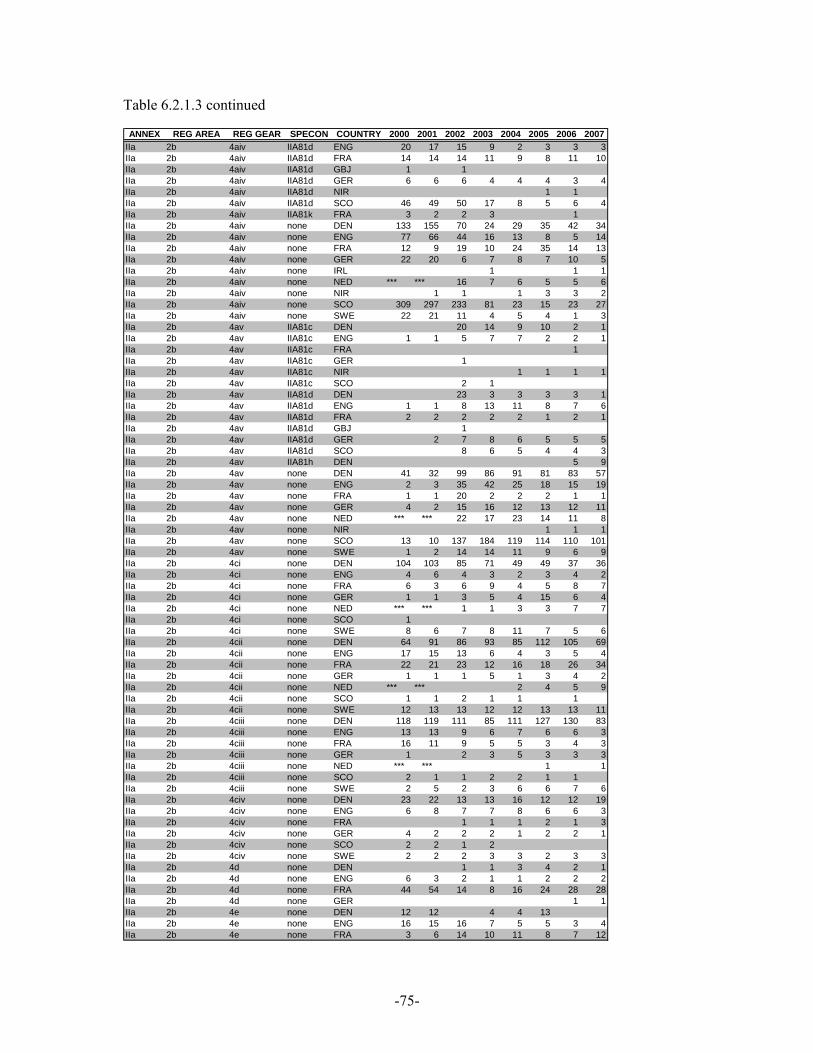
-75-
Table 6.2.1.3 continued
ANNEX REG AREA REG GEAR SPECON COUNTRY 2000 2001 2002 2003 2004 2005 2006 2007IIa 2b 4aiv IIA81d ENG 20 17 15 9 2 3 3 3IIa 2b 4aiv IIA81d FRA 14 14 14 11 9 8 11 10IIa 2b 4aiv IIA81d GBJ 1 1IIa 2b 4aiv IIA81d GER 6 6 6 4 4 4 3 4IIa 2b 4aiv IIA81d NIR 1 1IIa 2b 4aiv IIA81d SCO 46 49 50 17 8 5 6 4IIa 2b 4aiv IIA81k FRA 3 2 2 3 1IIa 2b 4aiv none DEN 133 155 70 24 29 35 42 34IIa 2b 4aiv none ENG 77 66 44 16 13 8 5 14IIa 2b 4aiv none FRA 12 9 19 10 24 35 14 13IIa 2b 4aiv none GER 22 20 6 7 8 7 10 5IIa 2b 4aiv none IRL 1 1 1IIa 2b 4aiv none NED *** *** 16 7 6 5 5 6IIa 2b 4aiv none NIR 1 1 1 3 3 2IIa 2b 4aiv none SCO 309 297 233 81 23 15 23 27IIa 2b 4aiv none SWE 22 21 11 4 5 4 1 3IIa 2b 4av IIA81c DEN 20 14 9 10 2 1IIa 2b 4av IIA81c ENG 1 1 5 7 7 2 2 1IIa 2b 4av IIA81c FRA 1IIa 2b 4av IIA81c GER 1IIa 2b 4av IIA81c NIR 1 1 1 1IIa 2b 4av IIA81c SCO 2 1IIa 2b 4av IIA81d DEN 23 3 3 3 3 1IIa 2b 4av IIA81d ENG 1 1 8 13 11 8 7 6IIa 2b 4av IIA81d FRA 2 2 2 2 2 1 2 1IIa 2b 4av IIA81d GBJ 1IIa 2b 4av IIA81d GER 2 7 8 6 5 5 5IIa 2b 4av IIA81d SCO 8 6 5 4 4 3IIa 2b 4av IIA81h DEN 5 9IIa 2b 4av none DEN 41 32 99 86 91 81 83 57IIa 2b 4av none ENG 2 3 35 42 25 18 15 19IIa 2b 4av none FRA 1 1 20 2 2 2 1 1IIa 2b 4av none GER 4 2 15 16 12 13 12 11IIa 2b 4av none NED *** *** 22 17 23 14 11 8IIa 2b 4av none NIR 1 1 1IIa 2b 4av none SCO 13 10 137 184 119 114 110 101IIa 2b 4av none SWE 1 2 14 14 11 9 6 9IIa 2b 4ci none DEN 104 103 85 71 49 49 37 36IIa 2b 4ci none ENG 4 6 4 3 2 3 4 2IIa 2b 4ci none FRA 6 3 6 9 4 5 8 7IIa 2b 4ci none GER 1 1 3 5 4 15 6 4IIa 2b 4ci none NED *** *** 1 1 3 3 7 7IIa 2b 4ci none SCO 1IIa 2b 4ci none SWE 8 6 7 8 11 7 5 6IIa 2b 4cii none DEN 64 91 86 93 85 112 105 69IIa 2b 4cii none ENG 17 15 13 6 4 3 5 4IIa 2b 4cii none FRA 22 21 23 12 16 18 26 34IIa 2b 4cii none GER 1 1 1 5 1 3 4 2IIa 2b 4cii none NED *** *** 2 4 5 9IIa 2b 4cii none SCO 1 1 2 1 1 1IIa 2b 4cii none SWE 12 13 13 12 12 13 13 11IIa 2b 4ciii none DEN 118 119 111 85 111 127 130 83IIa 2b 4ciii none ENG 13 13 9 6 7 6 6 3IIa 2b 4ciii none FRA 16 11 9 5 5 3 4 3IIa 2b 4ciii none GER 1 2 3 5 3 3 3IIa 2b 4ciii none NED *** *** 1 1IIa 2b 4ciii none SCO 2 1 1 2 2 1 1IIa 2b 4ciii none SWE 2 5 2 3 6 6 7 6IIa 2b 4civ none DEN 23 22 13 13 16 12 12 19IIa 2b 4civ none ENG 6 8 7 7 8 6 6 3IIa 2b 4civ none FRA 1 1 1 2 1 3IIa 2b 4civ none GER 4 2 2 2 1 2 2 1IIa 2b 4civ none SCO 2 2 1 2IIa 2b 4civ none SWE 2 2 2 3 3 2 3 3IIa 2b 4d none DEN 1 1 3 4 2 1IIa 2b 4d none ENG 6 3 2 1 1 2 2 2IIa 2b 4d none FRA 44 54 14 8 16 24 28 28IIa 2b 4d none GER 1 1IIa 2b 4e none DEN 12 12 4 4 13IIa 2b 4e none ENG 16 15 16 7 5 5 3 4IIa 2b 4e none FRA 3 6 14 10 11 8 7 12

-76-
Table 6.2.1.3 continued
ANNEX REG AREA REG GEAR SPECON COUNTRY 2000 2001 2002 2003 2004 2005 2006 2007IIa 2b 4e none NIR 1IIa 2b 4e none SCO 4 4 7 2 4 4 1IIa 2b 4e none SWE 9 14 11 13 13 12 14 21IIa 2b none IIA81c ENG 1 1 2 1IIa 2b none IIA81d ENG 1IIa 2b none IIA81d GER 1 1IIa none 2b none BEL 41 34 29 32 28 28 27 28IIa none 2b none DEN 145 149 166 152 171 85 114 87IIa none 2b none ENG 50 53 53 51 50 50 48 48IIa none 2b none FRA 86 150 157 157 135 127 88 58IIa none 2b none GBG 2 1 1 1 1 1 1 1IIa none 2b none GBI 2 3 2IIa none 2b none GBJ 2 2 2 2 2 2 2 2IIa none 2b none GER 232 232 228 228 227 233 234 238IIa none 2b none IOM 2 3IIa none 2b none IRL 9 16 20 15 20 16 12 27IIa none 2b none NED 152 223 299 341 332 328IIa none 2b none NIR 3 1 4 3 3 3 3 2IIa none 2b none SCO 46 47 42 51 61 56 38 46IIa none 2b none SWE 67 69 55 59 57 54 50 46IIa 2b1 4aii none DEN 157 93 82 50 36 3 3 1IIa 2b1 4aii none GER 1 1IIa 2b1 4aii none SWE 115 102 79 59 45IIa 2b1 4aiii IIA81a DEN 49 31IIa 2b1 4aiii IIA81a SWE 18 19 46IIa 2b1 4aiii IIA81d DEN 6 4 6 5 3 3IIa 2b1 4aiii IIA81d SWE 1IIa 2b1 4aiii IIA81l DEN 12IIa 2b1 4aiii none DEN 167 141 174 147 173 136 122 100IIa 2b1 4aiii none GER 3 2IIa 2b1 4aiii none NED *** *** 1IIa 2b1 4aiii none SWE 70 74 72 61 68 46 43 20IIa 2b1 4aiv IIA81a DEN 11 7IIa 2b1 4aiv IIA81a SWE 1IIa 2b1 4av IIA81a DEN 3 2IIa 2b1 4av IIA81a GER 3IIa 2b1 4av IIA81a SWE 7IIa 2b1 4av IIA81j DEN 4 5IIa none 2b1 none DEN 1 4 1IIa none 2b1 none GER 1 3 2 2IIa none 2b1 none NED 2IIa none 2b1 none SWE 38 40 42 41 43 46 41 25IIa 2b12 4bi none BEL 91 104 105 106 99 92 89 76IIa 2b12 4bi none DEN 1 1 1 1 1IIa 2b12 4bi none ENG 9 9 7IIa 2b12 4bi none FRA 4 3 2 2 3 2 3 3IIa 2b12 4bi none GER 80 56 72 118 95 100 87 75IIa 2b12 4bi none NED *** *** 149 162 183 183 167 154IIa 2b12 4bi none SCO 6 6 6 5 4 3 2 1IIa 2b12 4bii none DEN 1 2 2 2 1 2IIa 2b12 4bii none ENG 1 1IIa 2b12 4bii none FRA 1 2 3 2 2 1 1IIa 2b12 4bii none GER 2 3 5 3 5 3IIa 2b12 4bii none NED *** *** 2 8 7 4 4 9IIa 2b12 4biii IIA81c ENG 22 16 9 9 12 13 9 9IIa 2b12 4biii IIA81c FRA 1 1 1IIa 2b12 4biii IIA81c GER 7 7 9 2 2 1IIa 2b12 4biii IIA81c NIR 1 2 1IIa 2b12 4biii IIA81c SCO 11 11 11 9 10 7 7 6IIa 2b12 4biii IIA81i ENG 7 7 4 5 2 3 3 2IIa 2b12 4biii IIA81i NIR 1IIa 2b12 4biii none BEL 5 6 7 5 2 2 1 3IIa 2b12 4biii none DEN 9 9 6 6 2 4 2 3IIa 2b12 4biii none ENG 10 10 2IIa 2b12 4biii none FRA 2IIa 2b12 4biii none GER 13 14 2 4 5 1 3 1IIa 2b12 4biii none NED *** *** 21 33 23 24 27 10IIa 2b12 4biii none NIR 1IIa 2b12 4biii none SCO 5 6 2 2 3 5 4 4IIa 2b12 4biv IIA81c DEN 7 7 7 8 1IIa 2b12 4biv IIA81c ENG 3 2 10 9 8 7 9 4IIa 2b12 4biv IIA81c GER 4 2 1 2IIa 2b12 4biv IIA81c NIR 2 2 2 1IIa 2b12 4biv IIA81c SCO 7 3 3 2 3 3

-77-
Table 6.2.1.3 continued
ANNEX REG AREA REG GEAR SPECON COUNTRY 2000 2001 2002 2003 2004 2005 2006 2007IIa 2b12 4biv IIA81e DEN 2IIa 2b12 4biv IIA81e GER 3 1 1IIa 2b12 4biv IIA81i ENG 1 5 3 2 2 3 2IIa 2b12 4biv IIA81i NIR 1 1 1IIa 2b12 4biv none BEL 22 27 29 19 30 27 23 27IIa 2b12 4biv none DEN 10 10 3 6 5 5 6 4IIa 2b12 4biv none ENG 1 1 4 1 1IIa 2b12 4biv none FRA 1IIa 2b12 4biv none GER 1 2 2 4 2 1 6 10IIa 2b12 4biv none NED *** *** 9 16 31 27 36 33IIa 2b12 4biv none SCO 2 6 5 6 6 3IIa 2b12 4d IIA81g ENG 1 1 1 1 1 1IIa 2b12 4d IIA81g FRA 9 16 32 31 30 37 42 40IIa 2b2 4aii IIA81c DEN 41 34 25 14IIa 2b2 4aii IIA81c ENG 19 19 29 26 21 21 18 14IIa 2b2 4aii IIA81c GBJ 1IIa 2b2 4aii IIA81c GER 4 6 6 7 6 6 5 5IIa 2b2 4aii IIA81c NIR 1 1 1 1 2 1IIa 2b2 4aii IIA81c SCO 1 1 1 1 1 1IIa 2b2 4aii none DEN 38 36 21 34 28 17 26 16IIa 2b2 4aii none ENG 40 29 37 39 28 28 22 22IIa 2b2 4aii none FRA 27 34 32 22 22 22 20 23IIa 2b2 4aii none GER 8 9 5 17 16 17 16 10IIa 2b2 4aii none IRL 1 1IIa 2b2 4aii none NED *** *** 20 41 44 37 39 38IIa 2b2 4aii none NIR 1 1 1 2 6 5IIa 2b2 4aii none SCO 64 56 73 79 62 68 76 70IIa 2b2 4aii none SWE 1IIa 2b2 4civ IIA81f DEN 18 8 10 6 6 7IIa 2b2 none IIA81c GER 1 1IIa none 2b2 none DEN 1 1 1IIa none 2b2 none ENG 2 4 4 4 4 4 4 4IIa none 2b2 none FRA 3 5 4 3 3 3 3 3IIa none 2b2 none GBI 1IIa none 2b2 none GER 4 4 4 4 6 7 8 6IIa none 2b2 none IOM 1IIa none 2b2 none IRL 15 20 16 12 27IIa none 2b2 none NED 13 12 12 13 10 11IIa none 2b2 none NIR 3 1 4 3 3 3 3 2IIa none 2b2 none SCO 30 35 27 26 24 23 18 17IIa none 2b2 none SWE 10 15 29 27 23 21 22 19IIa 2b23 4aiii IIA81a DEN 1IIa 2b23 4aiii IIA81a GER 1IIa 2b23 4aiii IIA81a SWE 1IIa 2b23 4aiii IIA81d DEN 4 3 2IIa 2b23 4aiii IIA81d ENG 4 3 3 3 3 3 4 5IIa 2b23 4aiii IIA81d FRA 13 8 10 12 13 10 8 12IIa 2b23 4aiii IIA81d GBJ 1 1 1 1 1 1 1IIa 2b23 4aiii IIA81d NIR 2 4 6IIa 2b23 4aiii IIA81d SCO 1 1 2 1 1 1 1IIa 2b23 4aiii IIA81l DEN 6IIa 2b23 4aiii none DEN 28 36 43 52 44 32 21 19IIa 2b23 4aiii none ENG 3 3 1 13 9 7 13 9IIa 2b23 4aiii none FRA 11 8 13 17 15 14 12 14IIa 2b23 4aiii none GER 2 2 20 20 17 13 7IIa 2b23 4aiii none IRL 1IIa 2b23 4aiii none NED *** *** 1 5 8 2 7 5IIa 2b23 4aiii none NIR 1 7 7 13IIa 2b23 4aiii none SCO 1 1 2 25 37 29 58 54IIa 2b23 4aiii none SWE 1 1 2 1 1 1 2IIa 2b23 4aiv IIA81a DEN 3 1IIa 2b23 4aiv IIA81a GER 1IIa 2b23 4av IIA81a DEN 5 2IIa 2b23 4av IIA81a GER 3IIa 2b23 4av IIA81a SWE 1 6IIa 2b23 4av IIA81j DEN 16 9IIa none 2b23 none DEN 2 1 1 3 1 1IIa none 2b23 none FRA 11 12 21 32 89 164 180 179IIa none 2b23 none SCO 2IIa 2b3 4aii IIA81c ENG 10 8 7 5 4 4 3 2IIa 2b3 4aii IIA81c GBJ 1 1 1IIa 2b3 4aii none ENG 8 4 2 3 2 1 1 2IIa 2b3 4aii none FRA 68 74 92 94 96 123 140 138IIa 2b3 4aii none GBG 1IIa 2b3 4aii none NED *** *** 2 3 5 9 8 7
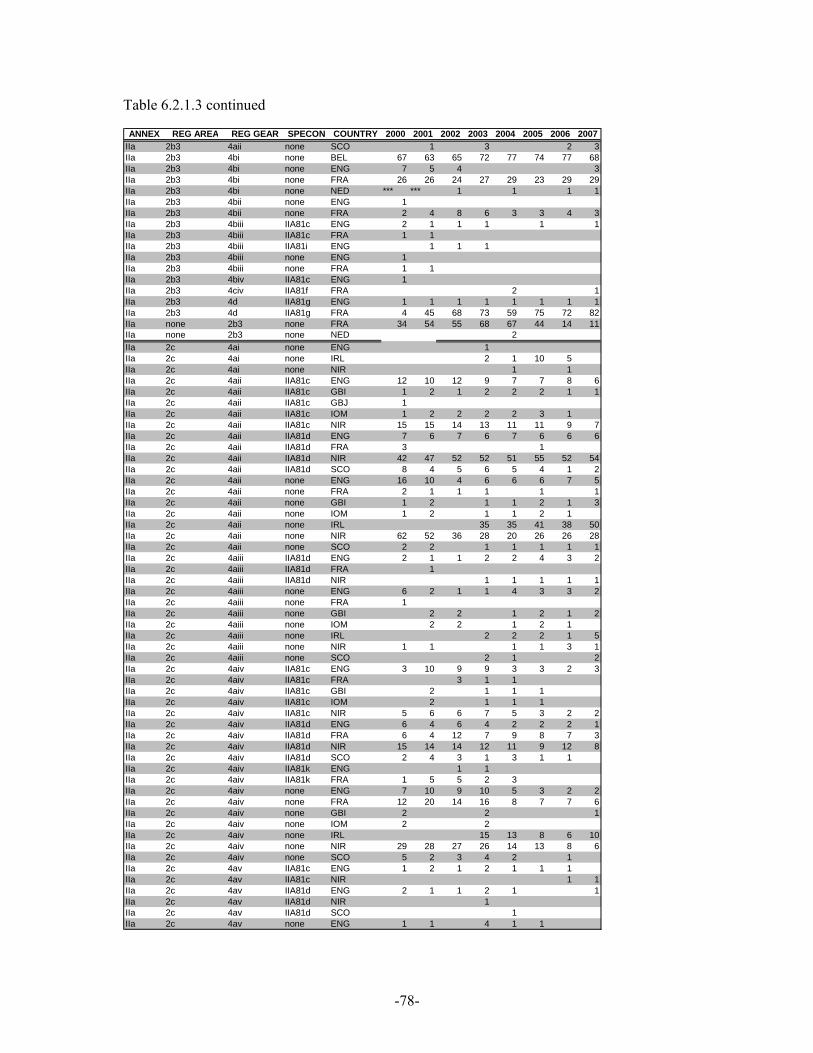
-78-
Table 6.2.1.3 continued
ANNEX REG AREA REG GEAR SPECON COUNTRY 2000 2001 2002 2003 2004 2005 2006 2007IIa 2b3 4aii none SCO 1 3 2 3IIa 2b3 4bi none BEL 67 63 65 72 77 74 77 68IIa 2b3 4bi none ENG 7 5 4 3IIa 2b3 4bi none FRA 26 26 24 27 29 23 29 29IIa 2b3 4bi none NED *** *** 1 1 1 1IIa 2b3 4bii none ENG 1IIa 2b3 4bii none FRA 2 4 8 6 3 3 4 3IIa 2b3 4biii IIA81c ENG 2 1 1 1 1 1IIa 2b3 4biii IIA81c FRA 1 1IIa 2b3 4biii IIA81i ENG 1 1 1IIa 2b3 4biii none ENG 1IIa 2b3 4biii none FRA 1 1IIa 2b3 4biv IIA81c ENG 1IIa 2b3 4civ IIA81f FRA 2 1IIa 2b3 4d IIA81g ENG 1 1 1 1 1 1 1 1IIa 2b3 4d IIA81g FRA 4 45 68 73 59 75 72 82IIa none 2b3 none FRA 34 54 55 68 67 44 14 11IIa none 2b3 none NED 2IIa 2c 4ai none ENG 1IIa 2c 4ai none IRL 2 1 10 5IIa 2c 4ai none NIR 1 1IIa 2c 4aii IIA81c ENG 12 10 12 9 7 7 8 6IIa 2c 4aii IIA81c GBI 1 2 1 2 2 2 1 1IIa 2c 4aii IIA81c GBJ 1IIa 2c 4aii IIA81c IOM 1 2 2 2 2 3 1IIa 2c 4aii IIA81c NIR 15 15 14 13 11 11 9 7IIa 2c 4aii IIA81d ENG 7 6 7 6 7 6 6 6IIa 2c 4aii IIA81d FRA 3 1IIa 2c 4aii IIA81d NIR 42 47 52 52 51 55 52 54IIa 2c 4aii IIA81d SCO 8 4 5 6 5 4 1 2IIa 2c 4aii none ENG 16 10 4 6 6 6 7 5IIa 2c 4aii none FRA 2 1 1 1 1 1IIa 2c 4aii none GBI 1 2 1 1 2 1 3IIa 2c 4aii none IOM 1 2 1 1 2 1IIa 2c 4aii none IRL 35 35 41 38 50IIa 2c 4aii none NIR 62 52 36 28 20 26 26 28IIa 2c 4aii none SCO 2 2 1 1 1 1 1IIa 2c 4aiii IIA81d ENG 2 1 1 2 2 4 3 2IIa 2c 4aiii IIA81d FRA 1IIa 2c 4aiii IIA81d NIR 1 1 1 1 1IIa 2c 4aiii none ENG 6 2 1 1 4 3 3 2IIa 2c 4aiii none FRA 1IIa 2c 4aiii none GBI 2 2 1 2 1 2IIa 2c 4aiii none IOM 2 2 1 2 1IIa 2c 4aiii none IRL 2 2 2 1 5IIa 2c 4aiii none NIR 1 1 1 1 3 1IIa 2c 4aiii none SCO 2 1 2IIa 2c 4aiv IIA81c ENG 3 10 9 9 3 3 2 3IIa 2c 4aiv IIA81c FRA 3 1 1IIa 2c 4aiv IIA81c GBI 2 1 1 1IIa 2c 4aiv IIA81c IOM 2 1 1 1IIa 2c 4aiv IIA81c NIR 5 6 6 7 5 3 2 2IIa 2c 4aiv IIA81d ENG 6 4 6 4 2 2 2 1IIa 2c 4aiv IIA81d FRA 6 4 12 7 9 8 7 3IIa 2c 4aiv IIA81d NIR 15 14 14 12 11 9 12 8IIa 2c 4aiv IIA81d SCO 2 4 3 1 3 1 1IIa 2c 4aiv IIA81k ENG 1 1IIa 2c 4aiv IIA81k FRA 1 5 5 2 3IIa 2c 4aiv none ENG 7 10 9 10 5 3 2 2IIa 2c 4aiv none FRA 12 20 14 16 8 7 7 6IIa 2c 4aiv none GBI 2 2 1IIa 2c 4aiv none IOM 2 2IIa 2c 4aiv none IRL 15 13 8 6 10IIa 2c 4aiv none NIR 29 28 27 26 14 13 8 6IIa 2c 4aiv none SCO 5 2 3 4 2 1IIa 2c 4av IIA81c ENG 1 2 1 2 1 1 1IIa 2c 4av IIA81c NIR 1 1IIa 2c 4av IIA81d ENG 2 1 1 2 1 1IIa 2c 4av IIA81d NIR 1IIa 2c 4av IIA81d SCO 1IIa 2c 4av none ENG 1 1 4 1 1
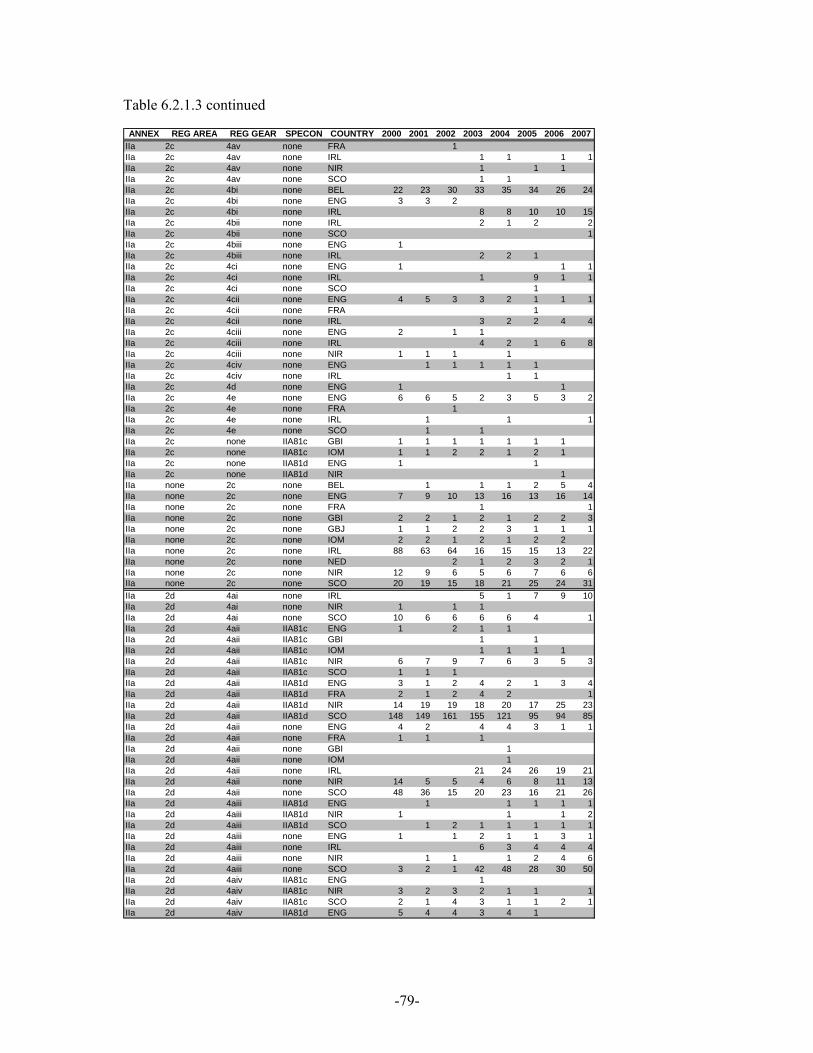
-79-
Table 6.2.1.3 continued
ANNEX REG AREA REG GEAR SPECON COUNTRY 2000 2001 2002 2003 2004 2005 2006 2007IIa 2c 4av none FRA 1IIa 2c 4av none IRL 1 1 1 1IIa 2c 4av none NIR 1 1 1IIa 2c 4av none SCO 1 1IIa 2c 4bi none BEL 22 23 30 33 35 34 26 24IIa 2c 4bi none ENG 3 3 2IIa 2c 4bi none IRL 8 8 10 10 15IIa 2c 4bii none IRL 2 1 2 2IIa 2c 4bii none SCO 1IIa 2c 4biii none ENG 1IIa 2c 4biii none IRL 2 2 1IIa 2c 4ci none ENG 1 1 1IIa 2c 4ci none IRL 1 9 1 1IIa 2c 4ci none SCO 1IIa 2c 4cii none ENG 4 5 3 3 2 1 1 1IIa 2c 4cii none FRA 1IIa 2c 4cii none IRL 3 2 2 4 4IIa 2c 4ciii none ENG 2 1 1IIa 2c 4ciii none IRL 4 2 1 6 8IIa 2c 4ciii none NIR 1 1 1 1IIa 2c 4civ none ENG 1 1 1 1 1IIa 2c 4civ none IRL 1 1IIa 2c 4d none ENG 1 1IIa 2c 4e none ENG 6 6 5 2 3 5 3 2IIa 2c 4e none FRA 1IIa 2c 4e none IRL 1 1 1IIa 2c 4e none SCO 1 1IIa 2c none IIA81c GBI 1 1 1 1 1 1 1IIa 2c none IIA81c IOM 1 1 2 2 1 2 1IIa 2c none IIA81d ENG 1 1IIa 2c none IIA81d NIR 1IIa none 2c none BEL 1 1 1 2 5 4IIa none 2c none ENG 7 9 10 13 16 13 16 14IIa none 2c none FRA 1 1IIa none 2c none GBI 2 2 1 2 1 2 2 3IIa none 2c none GBJ 1 1 2 2 3 1 1 1IIa none 2c none IOM 2 2 1 2 1 2 2IIa none 2c none IRL 88 63 64 16 15 15 13 22IIa none 2c none NED 2 1 2 3 2 1IIa none 2c none NIR 12 9 6 5 6 7 6 6IIa none 2c none SCO 20 19 15 18 21 25 24 31IIa 2d 4ai none IRL 5 1 7 9 10IIa 2d 4ai none NIR 1 1 1IIa 2d 4ai none SCO 10 6 6 6 6 4 1IIa 2d 4aii IIA81c ENG 1 2 1 1IIa 2d 4aii IIA81c GBI 1 1IIa 2d 4aii IIA81c IOM 1 1 1 1IIa 2d 4aii IIA81c NIR 6 7 9 7 6 3 5 3IIa 2d 4aii IIA81c SCO 1 1 1IIa 2d 4aii IIA81d ENG 3 1 2 4 2 1 3 4IIa 2d 4aii IIA81d FRA 2 1 2 4 2 1IIa 2d 4aii IIA81d NIR 14 19 19 18 20 17 25 23IIa 2d 4aii IIA81d SCO 148 149 161 155 121 95 94 85IIa 2d 4aii none ENG 4 2 4 4 3 1 1IIa 2d 4aii none FRA 1 1 1IIa 2d 4aii none GBI 1IIa 2d 4aii none IOM 1IIa 2d 4aii none IRL 21 24 26 19 21IIa 2d 4aii none NIR 14 5 5 4 6 8 11 13IIa 2d 4aii none SCO 48 36 15 20 23 16 21 26IIa 2d 4aiii IIA81d ENG 1 1 1 1 1IIa 2d 4aiii IIA81d NIR 1 1 1 2IIa 2d 4aiii IIA81d SCO 1 2 1 1 1 1 1IIa 2d 4aiii none ENG 1 1 2 1 1 3 1IIa 2d 4aiii none IRL 6 3 4 4 4IIa 2d 4aiii none NIR 1 1 1 2 4 6IIa 2d 4aiii none SCO 3 2 1 42 48 28 30 50IIa 2d 4aiv IIA81c ENG 1IIa 2d 4aiv IIA81c NIR 3 2 3 2 1 1 1IIa 2d 4aiv IIA81c SCO 2 1 4 3 1 1 2 1IIa 2d 4aiv IIA81d ENG 5 4 4 3 4 1
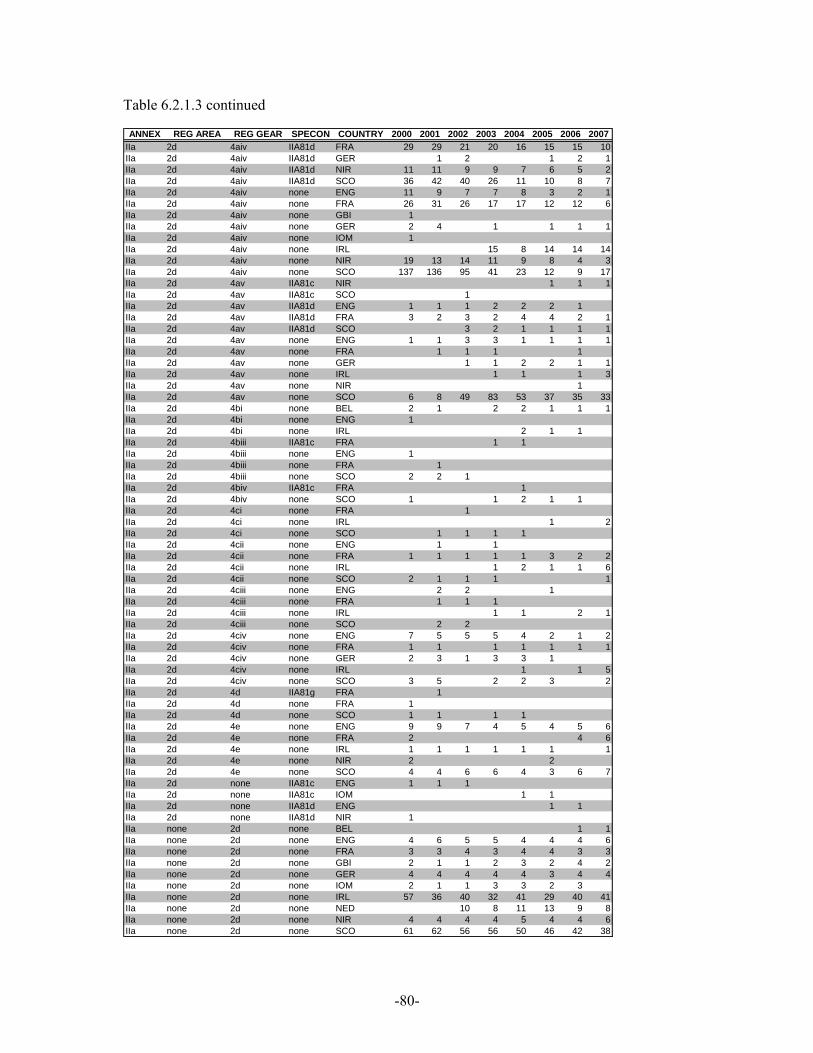
-80-
Table 6.2.1.3 continued
ANNEX REG AREA REG GEAR SPECON COUNTRY 2000 2001 2002 2003 2004 2005 2006 2007IIa 2d 4aiv IIA81d FRA 29 29 21 20 16 15 15 10IIa 2d 4aiv IIA81d GER 1 2 1 2 1IIa 2d 4aiv IIA81d NIR 11 11 9 9 7 6 5 2IIa 2d 4aiv IIA81d SCO 36 42 40 26 11 10 8 7IIa 2d 4aiv none ENG 11 9 7 7 8 3 2 1IIa 2d 4aiv none FRA 26 31 26 17 17 12 12 6IIa 2d 4aiv none GBI 1IIa 2d 4aiv none GER 2 4 1 1 1 1IIa 2d 4aiv none IOM 1IIa 2d 4aiv none IRL 15 8 14 14 14IIa 2d 4aiv none NIR 19 13 14 11 9 8 4 3IIa 2d 4aiv none SCO 137 136 95 41 23 12 9 17IIa 2d 4av IIA81c NIR 1 1 1IIa 2d 4av IIA81c SCO 1IIa 2d 4av IIA81d ENG 1 1 1 2 2 2 1IIa 2d 4av IIA81d FRA 3 2 3 2 4 4 2 1IIa 2d 4av IIA81d SCO 3 2 1 1 1 1IIa 2d 4av none ENG 1 1 3 3 1 1 1 1IIa 2d 4av none FRA 1 1 1 1IIa 2d 4av none GER 1 1 2 2 1 1IIa 2d 4av none IRL 1 1 1 3IIa 2d 4av none NIR 1IIa 2d 4av none SCO 6 8 49 83 53 37 35 33IIa 2d 4bi none BEL 2 1 2 2 1 1 1IIa 2d 4bi none ENG 1IIa 2d 4bi none IRL 2 1 1IIa 2d 4biii IIA81c FRA 1 1IIa 2d 4biii none ENG 1IIa 2d 4biii none FRA 1IIa 2d 4biii none SCO 2 2 1IIa 2d 4biv IIA81c FRA 1IIa 2d 4biv none SCO 1 1 2 1 1IIa 2d 4ci none FRA 1IIa 2d 4ci none IRL 1 2IIa 2d 4ci none SCO 1 1 1 1IIa 2d 4cii none ENG 1 1IIa 2d 4cii none FRA 1 1 1 1 1 3 2 2IIa 2d 4cii none IRL 1 2 1 1 6IIa 2d 4cii none SCO 2 1 1 1 1IIa 2d 4ciii none ENG 2 2 1IIa 2d 4ciii none FRA 1 1 1IIa 2d 4ciii none IRL 1 1 2 1IIa 2d 4ciii none SCO 2 2IIa 2d 4civ none ENG 7 5 5 5 4 2 1 2IIa 2d 4civ none FRA 1 1 1 1 1 1 1IIa 2d 4civ none GER 2 3 1 3 3 1IIa 2d 4civ none IRL 1 1 5IIa 2d 4civ none SCO 3 5 2 2 3 2IIa 2d 4d IIA81g FRA 1IIa 2d 4d none FRA 1IIa 2d 4d none SCO 1 1 1 1IIa 2d 4e none ENG 9 9 7 4 5 4 5 6IIa 2d 4e none FRA 2 4 6IIa 2d 4e none IRL 1 1 1 1 1 1 1IIa 2d 4e none NIR 2 2IIa 2d 4e none SCO 4 4 6 6 4 3 6 7IIa 2d none IIA81c ENG 1 1 1IIa 2d none IIA81c IOM 1 1IIa 2d none IIA81d ENG 1 1IIa 2d none IIA81d NIR 1IIa none 2d none BEL 1 1IIa none 2d none ENG 4 6 5 5 4 4 4 6IIa none 2d none FRA 3 3 4 3 4 4 3 3IIa none 2d none GBI 2 1 1 2 3 2 4 2IIa none 2d none GER 4 4 4 4 4 3 4 4IIa none 2d none IOM 2 1 1 3 3 2 3IIa none 2d none IRL 57 36 40 32 41 29 40 41IIa none 2d none NED 10 8 11 13 9 8IIa none 2d none NIR 4 4 4 4 5 4 4 6IIa none 2d none SCO 61 62 56 56 50 46 42 38
-81-
6.2.2. Trend in effort by derogation in management area 2a: Kattegat
All member states fishing in this area have reported their effort data, including mesh size range category and derogations and the overall confidence in the results are high. The total nominal effort in the Kattegat decreased by 35 % between the years 2002-2007.
The fisheries in Kattegat are dominated by Denmark and Sweden using predominantly trawls (app.93 % of the total effort in 2007), primarily with a mesh size of 90-99 mm (77%). Beam trawls are forbidden and the effort deployed by passive gears (gill-trammel nets and longline ) are relatively small (app 4% of annual effort).The amount of nominal effort which could not be assigned to the existing gear categories was around 2% in 2007, partly constituted by trawls with mesh size of 32-54 and 55-69 mm targeting shrimp or pelagic resources.
The overall decrease in effort by 35 % of the identified gear categories compared to 2002 is mainly due to a decrease in trawls of 70-89 mm mesh size, (87%) and trawls with mesh > 100mm mesh size (69%). A major shift occurred between 2003 and 2004 when the use of 70-89 mm without sorting grid was banned. The ban of the 70-79 mm trawl caused an increase in effort by trawls in 90-99 mm mesh size category during 2004.Effort by this category, however has decreased by 10 during the period of 2005-2007. Overall the overall effort in this fishery has increased by 9 % since 2002. The decrease in the use of the 100m mesh size trawl could probably be an effect of the lower number of days given to this mesh size category in comparison with 90-99 mm gear. A similar major decrease can be seen in the gillnetters, where effort has decreased by 49 % since 2002.
Although there are several special conditions available for Kattegatt there are very few that are used at all or to a low extent in 2007.
The special condition IIA83a (previously: IIA81a) (120mm square mesh panel) was the special condition with the highest uptake , representing 29% of the nominal effort in the gear category 4aiii, 34% of the nominal effort in the gear category 4aiv and 19% of the nominal effort in gear category 4av.
In fact the derogation “4 aii IIA83a” represents 22 % of the total nominal effort deployed in the Kattegat in 2007.
Notice, that the special condition IIA81l (95 mm square mesh window) that represented 3 % of the effort by the 4aiii gear category in 2006 has disappeared in 2007. It was solely used by the Danish fishery in 2006. However, according to the information provided by the Danish fishing industry, this special condition was not used at all in 2007.
The highest uptake of any special condition within a gear group is the sorting grid, IIA83b, in the aii gear category representing 94 % of the effort. This is due to that this gear class is only allowed to be used with this special condition. The IIA83b derogation is only used by one member state, and constitutes only 5 % of the total effort in the Kattegat 2007.
The total maximum number of vessels in Kattegat has steadily decreased between 2000 and 2005, from 614 boats to 419 respectively (Figure 6.2.2.2). This trend is mainly due to a decrease in the gear categories 4.a.ii (trawls 70-89 mm) and 4.a.iv (trawls 100-119 mm) (Figure 6.2.2.4) which corresponds well with the trends in nominal effort for these categories. Between 2005 and 2006 the maximum number of boats increased from 390 to 460 boats, mainly in the category 4.a.iii (trawls 90-99 mm) with the derogation IIA81a (120 mm escape
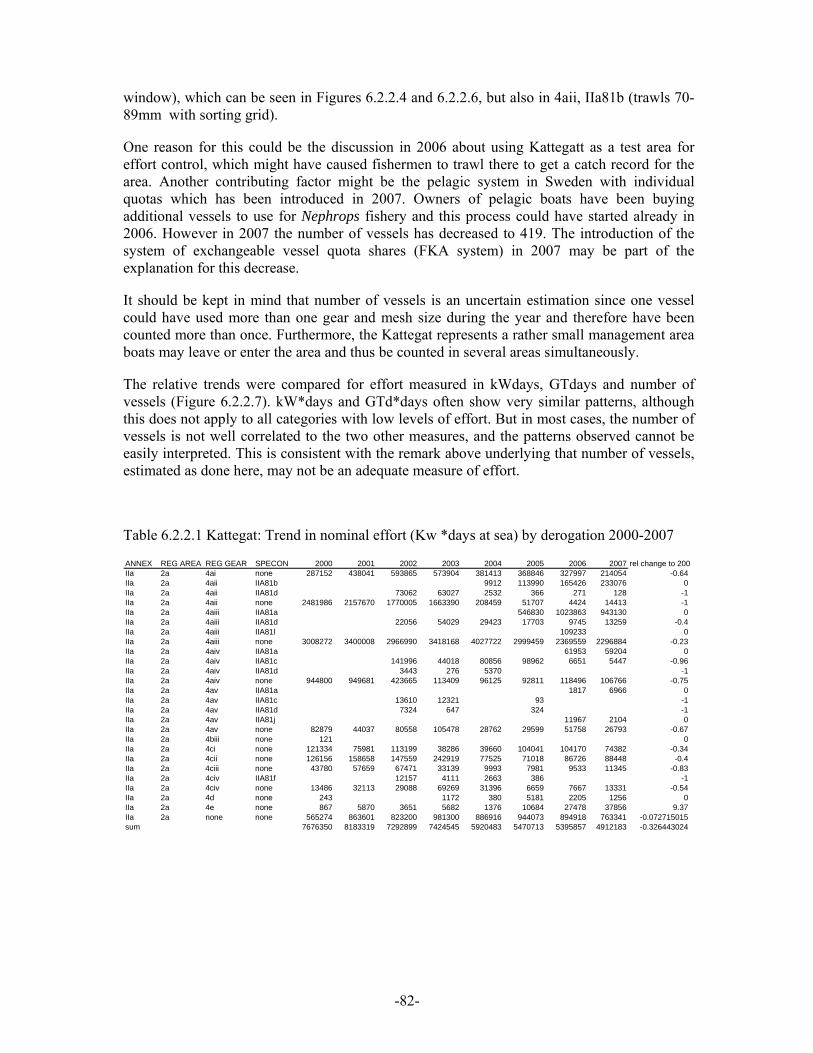
-82-
window), which can be seen in Figures 6.2.2.4 and 6.2.2.6, but also in 4aii, IIa81b (trawls 70-89mm with sorting grid).
One reason for this could be the discussion in 2006 about using Kattegatt as a test area for effort control, which might have caused fishermen to trawl there to get a catch record for the area. Another contributing factor might be the pelagic system in Sweden with individual quotas which has been introduced in 2007. Owners of pelagic boats have been buying additional vessels to use for Nephrops fishery and this process could have started already in 2006. However in 2007 the number of vessels has decreased to 419. The introduction of the system of exchangeable vessel quota shares (FKA system) in 2007 may be part of the explanation for this decrease.
It should be kept in mind that number of vessels is an uncertain estimation since one vessel could have used more than one gear and mesh size during the year and therefore have been counted more than once. Furthermore, the Kattegat represents a rather small management area boats may leave or enter the area and thus be counted in several areas simultaneously.
The relative trends were compared for effort measured in kWdays, GTdays and number of vessels (Figure 6.2.2.7). kW*days and GTd*days often show very similar patterns, although this does not apply to all categories with low levels of effort. But in most cases, the number of vessels is not well correlated to the two other measures, and the patterns observed cannot be easily interpreted. This is consistent with the remark above underlying that number of vessels, estimated as done here, may not be an adequate measure of effort.
Table 6.2.2.1 Kattegat: Trend in nominal effort (Kw *days at sea) by derogation 2000-2007
ANNEX REG AREA REG GEAR SPECON 2000 2001 2002 2003 2004 2005 2006 2007 rel change to 200IIa 2a 4ai none 287152 438041 593865 573904 381413 368846 327997 214054 -0.64IIa 2a 4aii IIA81b 9912 113990 165426 233076 0IIa 2a 4aii IIA81d 73062 63027 2532 366 271 128 -1IIa 2a 4aii none 2481986 2157670 1770005 1663390 208459 51707 4424 14413 -1IIa 2a 4aiii IIA81a 546830 1023863 943130 0IIa 2a 4aiii IIA81d 22056 54029 29423 17703 9745 13259 -0.4IIa 2a 4aiii IIA81l 109233 0IIa 2a 4aiii none 3008272 3400008 2966990 3418168 4027722 2999459 2369559 2296884 -0.23IIa 2a 4aiv IIA81a 61953 59204 0IIa 2a 4aiv IIA81c 141996 44018 80856 98962 6651 5447 -0.96IIa 2a 4aiv IIA81d 3443 276 5370 -1IIa 2a 4aiv none 944800 949681 423665 113409 96125 92811 118496 106766 -0.75IIa 2a 4av IIA81a 1817 6966 0IIa 2a 4av IIA81c 13610 12321 93 -1IIa 2a 4av IIA81d 7324 647 324 -1IIa 2a 4av IIA81j 11967 2104 0IIa 2a 4av none 82879 44037 80558 105478 28762 29599 51758 26793 -0.67IIa 2a 4biii none 121 0IIa 2a 4ci none 121334 75981 113199 38286 39660 104041 104170 74382 -0.34IIa 2a 4cii none 126156 158658 147559 242919 77525 71018 86726 88448 -0.4IIa 2a 4ciii none 43780 57659 67471 33139 9993 7981 9533 11345 -0.83IIa 2a 4civ IIA81f 12157 4111 2663 386 -1IIa 2a 4civ none 13486 32113 29088 69269 31396 6659 7667 13331 -0.54IIa 2a 4d none 243 1172 380 5181 2205 1256 0IIa 2a 4e none 867 5870 3651 5682 1376 10684 27478 37856 9.37IIa 2a none none 565274 863601 823200 981300 886916 944073 894918 763341 -0.072715015sum 7676350 8183319 7292899 7424545 5920483 5470713 5395857 4912183 -0.326443024
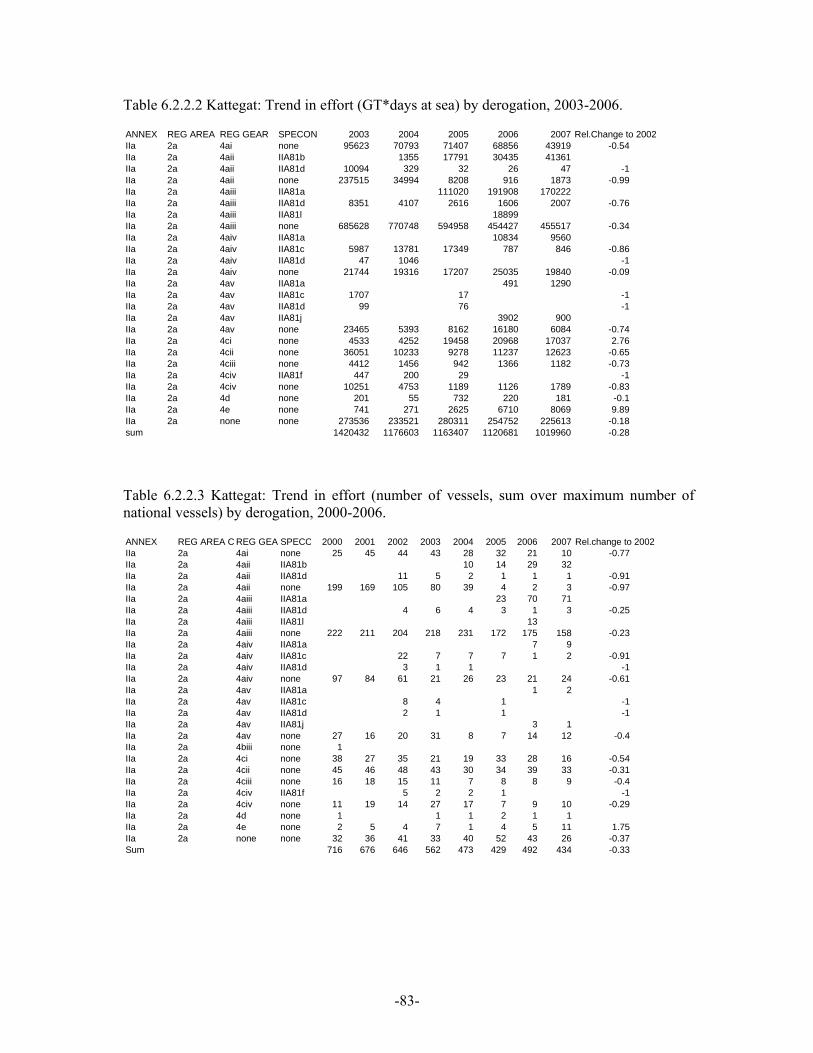
-83-
Table 6.2.2.2 Kattegat: Trend in effort (GT*days at sea) by derogation, 2003-2006.
ANNEX REG AREA REG GEAR SPECON 2003 2004 2005 2006 2007 Rel.Change to 2002IIa 2a 4ai none 95623 70793 71407 68856 43919 -0.54IIa 2a 4aii IIA81b 1355 17791 30435 41361IIa 2a 4aii IIA81d 10094 329 32 26 47 -1IIa 2a 4aii none 237515 34994 8208 916 1873 -0.99IIa 2a 4aiii IIA81a 111020 191908 170222IIa 2a 4aiii IIA81d 8351 4107 2616 1606 2007 -0.76IIa 2a 4aiii IIA81l 18899IIa 2a 4aiii none 685628 770748 594958 454427 455517 -0.34IIa 2a 4aiv IIA81a 10834 9560IIa 2a 4aiv IIA81c 5987 13781 17349 787 846 -0.86IIa 2a 4aiv IIA81d 47 1046 -1IIa 2a 4aiv none 21744 19316 17207 25035 19840 -0.09IIa 2a 4av IIA81a 491 1290IIa 2a 4av IIA81c 1707 17 -1IIa 2a 4av IIA81d 99 76 -1IIa 2a 4av IIA81j 3902 900IIa 2a 4av none 23465 5393 8162 16180 6084 -0.74IIa 2a 4ci none 4533 4252 19458 20968 17037 2.76IIa 2a 4cii none 36051 10233 9278 11237 12623 -0.65IIa 2a 4ciii none 4412 1456 942 1366 1182 -0.73IIa 2a 4civ IIA81f 447 200 29 -1IIa 2a 4civ none 10251 4753 1189 1126 1789 -0.83IIa 2a 4d none 201 55 732 220 181 -0.1IIa 2a 4e none 741 271 2625 6710 8069 9.89IIa 2a none none 273536 233521 280311 254752 225613 -0.18sum 1420432 1176603 1163407 1120681 1019960 -0.28
Table 6.2.2.3 Kattegat: Trend in effort (number of vessels, sum over maximum number of national vessels) by derogation, 2000-2006.
ANNEX REG AREA C REG GEA SPECO 2000 2001 2002 2003 2004 2005 2006 2007 Rel.change to 2002IIa 2a 4ai none 25 45 44 43 28 32 21 10 -0.77IIa 2a 4aii IIA81b 10 14 29 32IIa 2a 4aii IIA81d 11 5 2 1 1 1 -0.91IIa 2a 4aii none 199 169 105 80 39 4 2 3 -0.97IIa 2a 4aiii IIA81a 23 70 71IIa 2a 4aiii IIA81d 4 6 4 3 1 3 -0.25IIa 2a 4aiii IIA81l 13IIa 2a 4aiii none 222 211 204 218 231 172 175 158 -0.23IIa 2a 4aiv IIA81a 7 9IIa 2a 4aiv IIA81c 22 7 7 7 1 2 -0.91IIa 2a 4aiv IIA81d 3 1 1 -1IIa 2a 4aiv none 97 84 61 21 26 23 21 24 -0.61IIa 2a 4av IIA81a 1 2IIa 2a 4av IIA81c 8 4 1 -1IIa 2a 4av IIA81d 2 1 1 -1IIa 2a 4av IIA81j 3 1IIa 2a 4av none 27 16 20 31 8 7 14 12 -0.4IIa 2a 4biii none 1IIa 2a 4ci none 38 27 35 21 19 33 28 16 -0.54IIa 2a 4cii none 45 46 48 43 30 34 39 33 -0.31IIa 2a 4ciii none 16 18 15 11 7 8 8 9 -0.4IIa 2a 4civ IIA81f 5 2 2 1 -1IIa 2a 4civ none 11 19 14 27 17 7 9 10 -0.29IIa 2a 4d none 1 1 1 2 1 1IIa 2a 4e none 2 5 4 7 1 4 5 11 1.75IIa 2a none none 32 36 41 33 40 52 43 26 -0.37Sum 716 676 646 562 473 429 492 434 -0.33
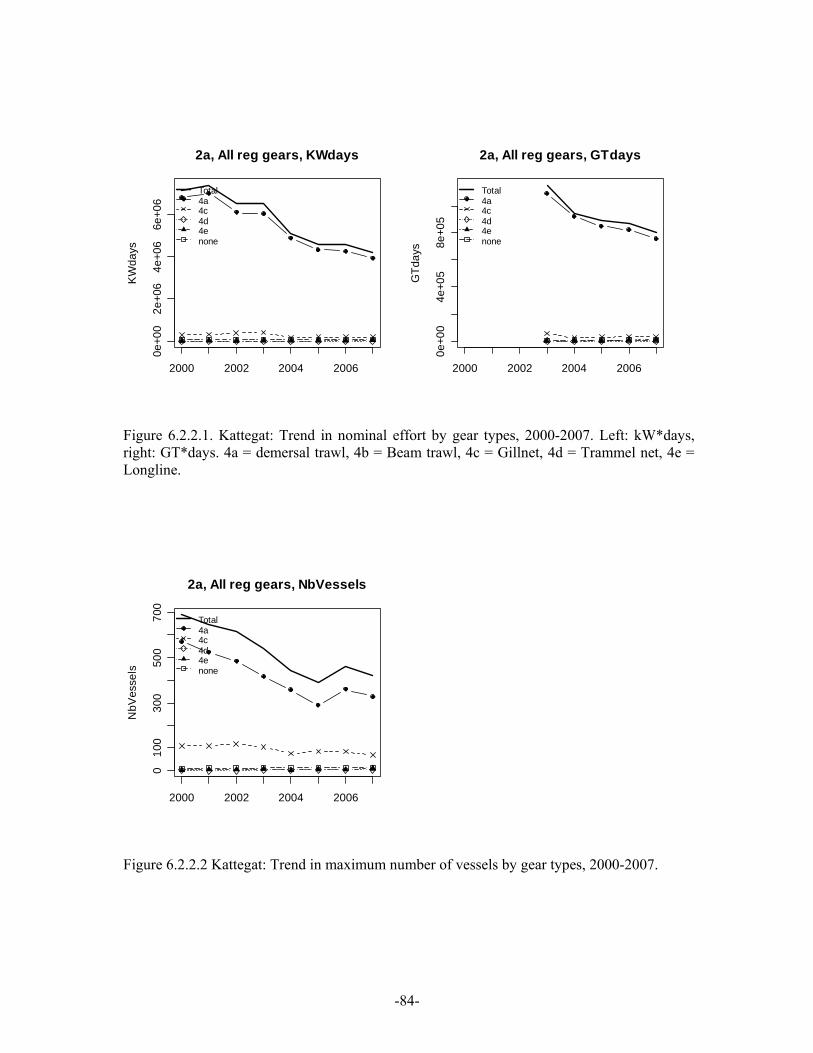
-84-
2000 2002 2004 2006
0e+0
02e
+06
4e+0
66e
+06
2a, All reg gears, KWdays
KW
days
Total4a4c4d4enone
2000 2002 2004 2006
0e+0
04e
+05
8e+0
5
2a, All reg gears, GTdays
GTd
ays
Total4a4c4d4enone
Figure 6.2.2.1. Kattegat: Trend in nominal effort by gear types, 2000-2007. Left: kW*days, right: GT*days. 4a = demersal trawl, 4b = Beam trawl, 4c = Gillnet, 4d = Trammel net, 4e = Longline.
2000 2002 2004 2006
010
030
050
070
0
2a, All reg gears, NbVessels
NbV
esse
ls
Total4a4c4d4enone
Figure 6.2.2.2 Kattegat: Trend in maximum number of vessels by gear types, 2000-2007.
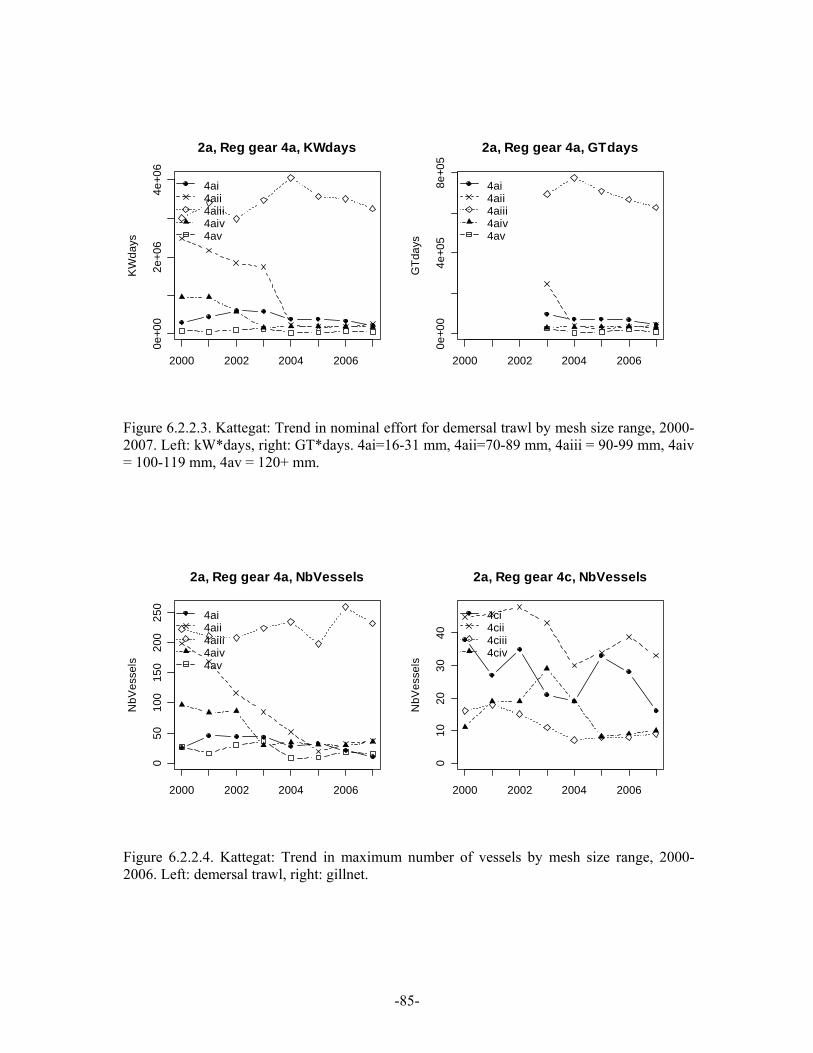
-85-
2000 2002 2004 2006
0e+0
02e
+06
4e+0
62a, Reg gear 4a, KWdays
KW
days
4ai4aii4aiii4aiv4av
2000 2002 2004 2006
0e+0
04e
+05
8e+0
5
2a, Reg gear 4a, GTdays
GTd
ays
4ai4aii4aiii4aiv4av
Figure 6.2.2.3. Kattegat: Trend in nominal effort for demersal trawl by mesh size range, 2000-2007. Left: kW*days, right: GT*days. 4ai=16-31 mm, 4aii=70-89 mm, 4aiii = 90-99 mm, 4aiv = 100-119 mm, 4av = 120+ mm.
2000 2002 2004 2006
050
100
150
200
250
2a, Reg gear 4a, NbVessels
NbV
esse
ls
4ai4aii4aiii4aiv4av
2000 2002 2004 2006
010
2030
40
2a, Reg gear 4c, NbVessels
NbV
esse
ls
4ci4cii4ciii4civ
Figure 6.2.2.4. Kattegat: Trend in maximum number of vessels by mesh size range, 2000-2006. Left: demersal trawl, right: gillnet.
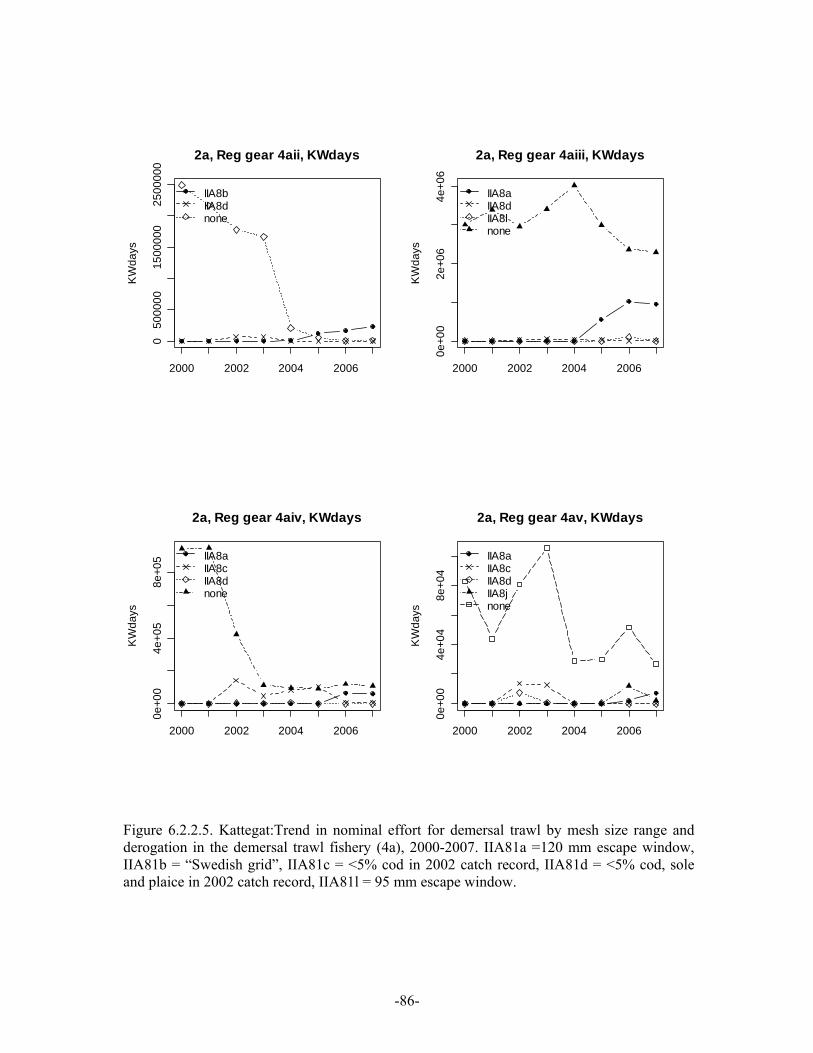
-86-
2000 2002 2004 2006
050
0000
1500
000
2500
000
2a, Reg gear 4aii, KWdays
KW
days
IIA8bIIA8dnone
2000 2002 2004 2006
0e+0
02e
+06
4e+0
6
2a, Reg gear 4aiii, KWdays
KW
days
IIA8aIIA8dIIA8lnone
2000 2002 2004 2006
0e+0
04e
+05
8e+0
5
2a, Reg gear 4aiv, KWdays
KW
days
IIA8aIIA8cIIA8dnone
2000 2002 2004 2006
0e+0
04e
+04
8e+0
4
2a, Reg gear 4av, KWdays
KW
days
IIA8aIIA8cIIA8dIIA8jnone
Figure 6.2.2.5. Kattegat:Trend in nominal effort for demersal trawl by mesh size range and derogation in the demersal trawl fishery (4a), 2000-2007. IIA81a =120 mm escape window, IIA81b = “Swedish grid”, IIA81c = <5% cod in 2002 catch record, IIA81d = <5% cod, sole and plaice in 2002 catch record, IIA81l = 95 mm escape window.
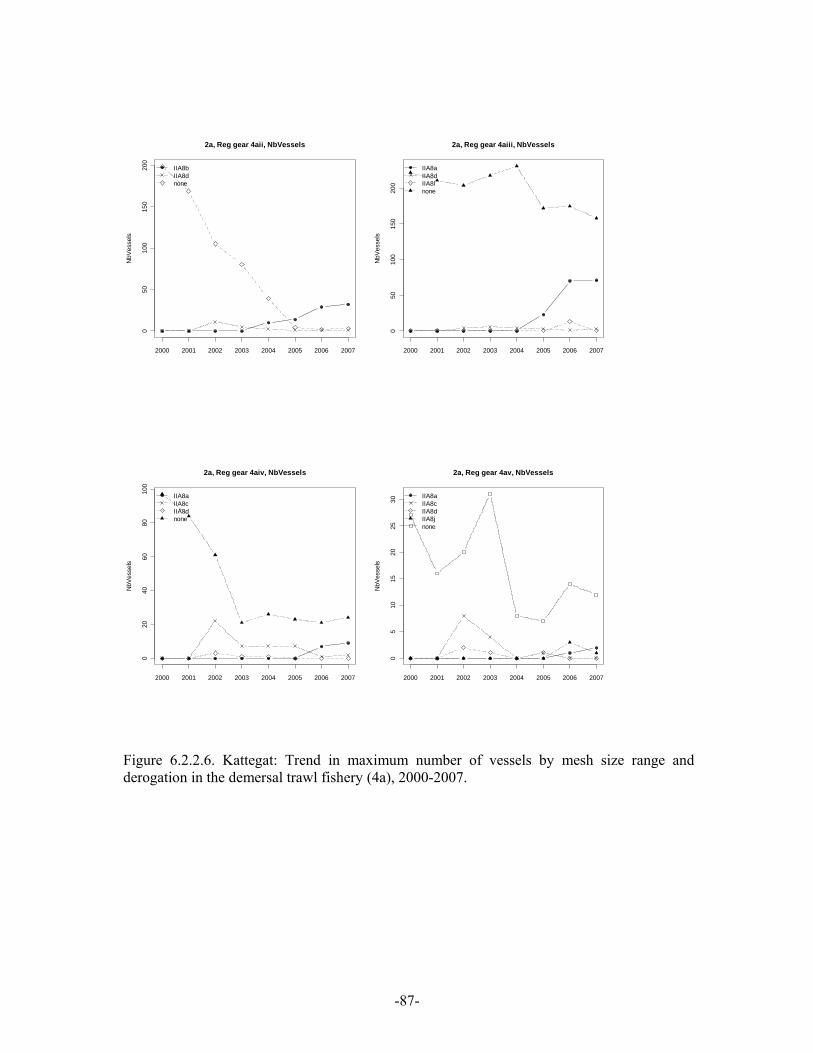
-87-
2000 2001 2002 2003 2004 2005 2006 2007
050
100
150
200
2a, Reg gear 4aii, NbVessels
NbV
esse
ls
IIA8bIIA8dnone
2000 2001 2002 2003 2004 2005 2006 2007
050
100
150
200
2a, Reg gear 4aiii, NbVessels
NbV
esse
ls
IIA8aIIA8dIIA8lnone
2000 2001 2002 2003 2004 2005 2006 2007
020
4060
8010
0
2a, Reg gear 4aiv, NbVessels
NbV
esse
ls
IIA8aIIA8cIIA8dnone
2000 2001 2002 2003 2004 2005 2006 2007
05
1015
2025
30
2a, Reg gear 4av, NbVessels
NbV
esse
ls
IIA8aIIA8cIIA8dIIA8jnone
Figure 6.2.2.6. Kattegat: Trend in maximum number of vessels by mesh size range and derogation in the demersal trawl fishery (4a), 2000-2007.
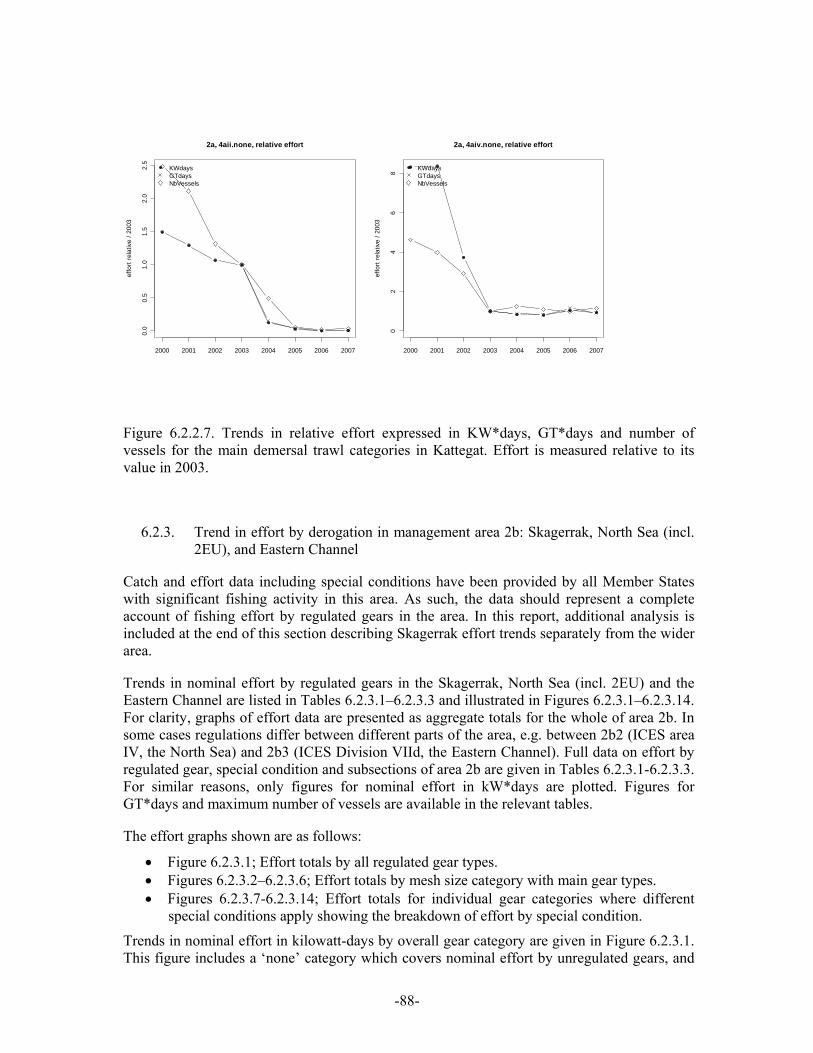
-88-
2000 2001 2002 2003 2004 2005 2006 2007
0.0
0.5
1.0
1.5
2.0
2.5
2a, 4aii.none, relative effort
effo
rt re
lativ
e / 2
003
KWdaysGTdaysNbVessels
2000 2001 2002 2003 2004 2005 2006 2007
02
46
8
2a, 4aiv.none, relative effort
effo
rt re
lativ
e / 2
003
KWdaysGTdaysNbVessels
Figure 6.2.2.7. Trends in relative effort expressed in KW*days, GT*days and number of vessels for the main demersal trawl categories in Kattegat. Effort is measured relative to its value in 2003.
6.2.3. Trend in effort by derogation in management area 2b: Skagerrak, North Sea (incl. 2EU), and Eastern Channel
Catch and effort data including special conditions have been provided by all Member States with significant fishing activity in this area. As such, the data should represent a complete account of fishing effort by regulated gears in the area. In this report, additional analysis is included at the end of this section describing Skagerrak effort trends separately from the wider area.
Trends in nominal effort by regulated gears in the Skagerrak, North Sea (incl. 2EU) and the Eastern Channel are listed in Tables 6.2.3.1–6.2.3.3 and illustrated in Figures 6.2.3.1–6.2.3.14. For clarity, graphs of effort data are presented as aggregate totals for the whole of area 2b. In some cases regulations differ between different parts of the area, e.g. between 2b2 (ICES area IV, the North Sea) and 2b3 (ICES Division VIId, the Eastern Channel). Full data on effort by regulated gear, special condition and subsections of area 2b are given in Tables 6.2.3.1-6.2.3.3. For similar reasons, only figures for nominal effort in kW*days are plotted. Figures for GT*days and maximum number of vessels are available in the relevant tables.
The effort graphs shown are as follows:
• Figure 6.2.3.1; Effort totals by all regulated gear types. • Figures 6.2.3.2–6.2.3.6; Effort totals by mesh size category with main gear types. • Figures 6.2.3.7-6.2.3.14; Effort totals for individual gear categories where different
special conditions apply showing the breakdown of effort by special condition.
Trends in nominal effort in kilowatt-days by overall gear category are given in Figure 6.2.3.1. This figure includes a ‘none’ category which covers nominal effort by unregulated gears, and
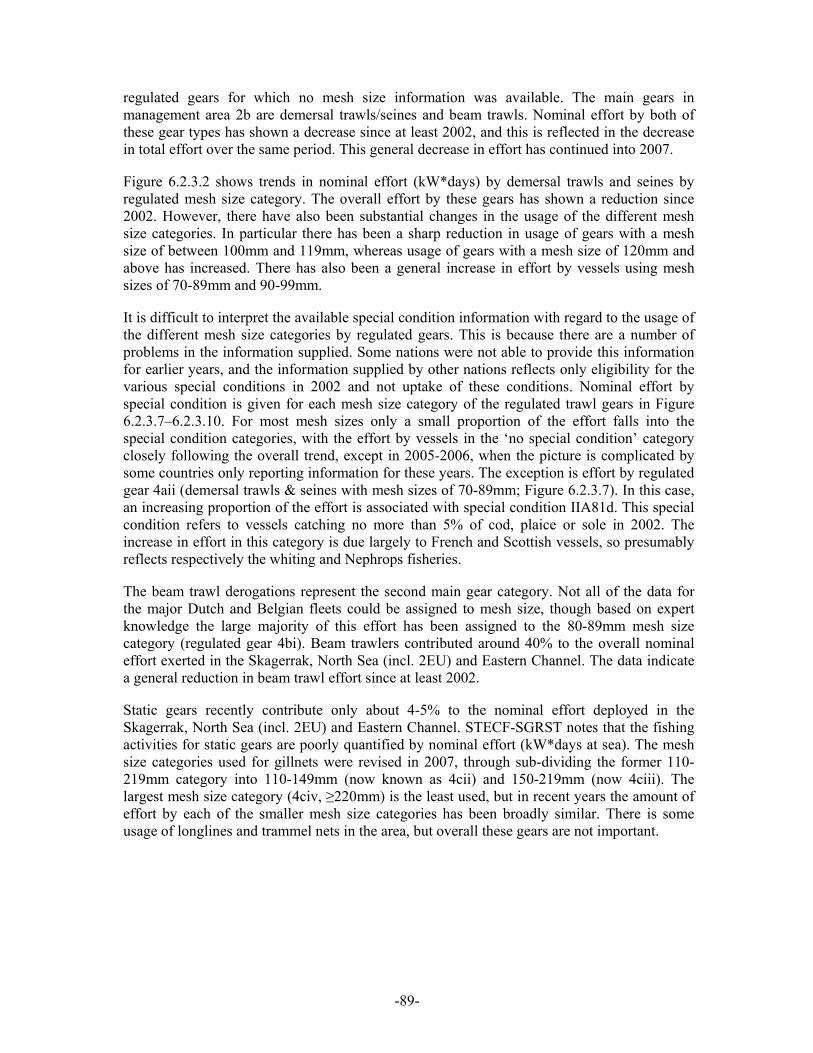
-89-
regulated gears for which no mesh size information was available. The main gears in management area 2b are demersal trawls/seines and beam trawls. Nominal effort by both of these gear types has shown a decrease since at least 2002, and this is reflected in the decrease in total effort over the same period. This general decrease in effort has continued into 2007.
Figure 6.2.3.2 shows trends in nominal effort (kW*days) by demersal trawls and seines by regulated mesh size category. The overall effort by these gears has shown a reduction since 2002. However, there have also been substantial changes in the usage of the different mesh size categories. In particular there has been a sharp reduction in usage of gears with a mesh size of between 100mm and 119mm, whereas usage of gears with a mesh size of 120mm and above has increased. There has also been a general increase in effort by vessels using mesh sizes of 70-89mm and 90-99mm.
It is difficult to interpret the available special condition information with regard to the usage of the different mesh size categories by regulated gears. This is because there are a number of problems in the information supplied. Some nations were not able to provide this information for earlier years, and the information supplied by other nations reflects only eligibility for the various special conditions in 2002 and not uptake of these conditions. Nominal effort by special condition is given for each mesh size category of the regulated trawl gears in Figure 6.2.3.7–6.2.3.10. For most mesh sizes only a small proportion of the effort falls into the special condition categories, with the effort by vessels in the ‘no special condition’ category closely following the overall trend, except in 2005-2006, when the picture is complicated by some countries only reporting information for these years. The exception is effort by regulated gear 4aii (demersal trawls & seines with mesh sizes of 70-89mm; Figure 6.2.3.7). In this case, an increasing proportion of the effort is associated with special condition IIA81d. This special condition refers to vessels catching no more than 5% of cod, plaice or sole in 2002. The increase in effort in this category is due largely to French and Scottish vessels, so presumably reflects respectively the whiting and Nephrops fisheries.
The beam trawl derogations represent the second main gear category. Not all of the data for the major Dutch and Belgian fleets could be assigned to mesh size, though based on expert knowledge the large majority of this effort has been assigned to the 80-89mm mesh size category (regulated gear 4bi). Beam trawlers contributed around 40% to the overall nominal effort exerted in the Skagerrak, North Sea (incl. 2EU) and Eastern Channel. The data indicate a general reduction in beam trawl effort since at least 2002.
Static gears recently contribute only about 4-5% to the nominal effort deployed in the Skagerrak, North Sea (incl. 2EU) and Eastern Channel. STECF-SGRST notes that the fishing activities for static gears are poorly quantified by nominal effort (kW*days at sea). The mesh size categories used for gillnets were revised in 2007, through sub-dividing the former 110-219mm category into 110-149mm (now known as 4cii) and 150-219mm (now 4ciii). The largest mesh size category (4civ, ≥220mm) is the least used, but in recent years the amount of effort by each of the smaller mesh size categories has been broadly similar. There is some usage of longlines and trammel nets in the area, but overall these gears are not important.
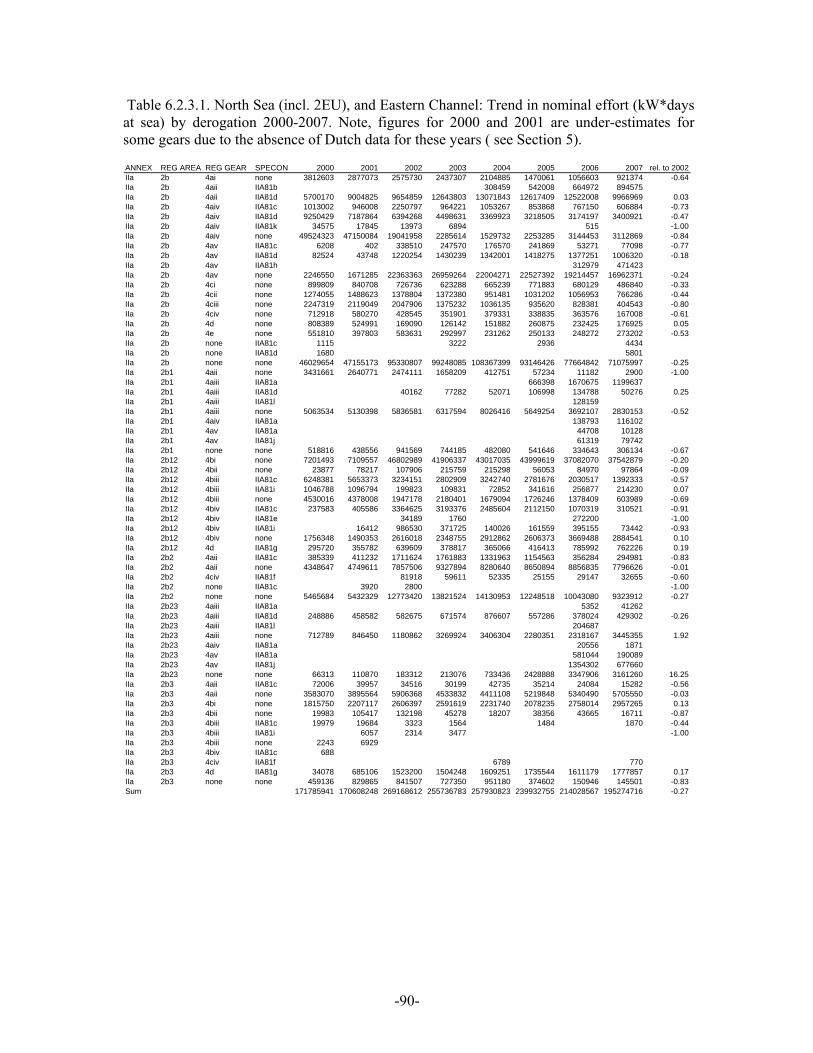
-90-
Table 6.2.3.1. North Sea (incl. 2EU), and Eastern Channel: Trend in nominal effort (kW*days at sea) by derogation 2000-2007. Note, figures for 2000 and 2001 are under-estimates for some gears due to the absence of Dutch data for these years ( see Section 5).
ANNEX REG AREA REG GEAR SPECON 2000 2001 2002 2003 2004 2005 2006 2007 rel. to 2002IIa 2b 4ai none 3812603 2877073 2575730 2437307 2104885 1470061 1056603 921374 -0.64IIa 2b 4aii IIA81b 308459 542008 664972 894575IIa 2b 4aii IIA81d 5700170 9004825 9654859 12643803 13071843 12617409 12522008 9966969 0.03IIa 2b 4aiv IIA81c 1013002 946008 2250797 964221 1053267 853868 767150 606884 -0.73IIa 2b 4aiv IIA81d 9250429 7187864 6394268 4498631 3369923 3218505 3174197 3400921 -0.47IIa 2b 4aiv IIA81k 34575 17845 13973 6894 515 -1.00IIa 2b 4aiv none 49524323 47150084 19041958 2285614 1529732 2253285 3144453 3112869 -0.84IIa 2b 4av IIA81c 6208 402 338510 247570 176570 241869 53271 77098 -0.77IIa 2b 4av IIA81d 82524 43748 1220254 1430239 1342001 1418275 1377251 1006320 -0.18IIa 2b 4av IIA81h 312979 471423IIa 2b 4av none 2246550 1671285 22363363 26959264 22004271 22527392 19214457 16962371 -0.24IIa 2b 4ci none 899809 840708 726736 623288 665239 771883 680129 486840 -0.33IIa 2b 4cii none 1274055 1488623 1378804 1372380 951481 1031202 1056953 766286 -0.44IIa 2b 4ciii none 2247319 2119049 2047906 1375232 1036135 935620 828381 404543 -0.80IIa 2b 4civ none 712918 580270 428545 351901 379331 338835 363576 167008 -0.61IIa 2b 4d none 808389 524991 169090 126142 151882 260875 232425 176925 0.05IIa 2b 4e none 551810 397803 583631 292997 231262 250133 248272 273202 -0.53IIa 2b none IIA81c 1115 3222 2936 4434IIa 2b none IIA81d 1680 5801IIa 2b none none 46029654 47155173 95330807 99248085 108367399 93146426 77664842 71075997 -0.25IIa 2b1 4aii none 3431661 2640771 2474111 1658209 412751 57234 11182 2900 -1.00IIa 2b1 4aiii IIA81a 666398 1670675 1199637IIa 2b1 4aiii IIA81d 40162 77282 52071 106998 134788 50276 0.25IIa 2b1 4aiii IIA81l 128159IIa 2b1 4aiii none 5063534 5130398 5836581 6317594 8026416 5649254 3692107 2830153 -0.52IIa 2b1 4aiv IIA81a 138793 116102IIa 2b1 4av IIA81a 44708 10128IIa 2b1 4av IIA81j 61319 79742IIa 2b1 none none 518816 438556 941569 744185 482080 541646 334643 306134 -0.67IIa 2b12 4bi none 7201493 7109557 46802989 41906337 43017035 43999619 37082070 37542879 -0.20IIa 2b12 4bii none 23877 78217 107906 215759 215298 56053 84970 97864 -0.09IIa 2b12 4biii IIA81c 6248381 5653373 3234151 2802909 3242740 2781676 2030517 1392333 -0.57IIa 2b12 4biii IIA81i 1046788 1096794 199823 109831 72852 341616 256877 214230 0.07IIa 2b12 4biii none 4530016 4378008 1947178 2180401 1679094 1726246 1378409 603989 -0.69IIa 2b12 4biv IIA81c 237583 405586 3364625 3193376 2485604 2112150 1070319 310521 -0.91IIa 2b12 4biv IIA81e 34189 1760 272200 -1.00IIa 2b12 4biv IIA81i 16412 986530 371725 140026 161559 395155 73442 -0.93IIa 2b12 4biv none 1756348 1490353 2616018 2348755 2912862 2606373 3669488 2884541 0.10IIa 2b12 4d IIA81g 295720 355782 639609 378817 365066 416413 785992 762226 0.19IIa 2b2 4aii IIA81c 385339 411232 1711624 1761883 1331963 1154563 356284 294981 -0.83IIa 2b2 4aii none 4348647 4749611 7857506 9327894 8280640 8650894 8856835 7796626 -0.01IIa 2b2 4civ IIA81f 81918 59611 52335 25155 29147 32655 -0.60IIa 2b2 none IIA81c 3920 2800 -1.00IIa 2b2 none none 5465684 5432329 12773420 13821524 14130953 12248518 10043080 9323912 -0.27IIa 2b23 4aiii IIA81a 5352 41262IIa 2b23 4aiii IIA81d 248886 458582 582675 671574 876607 557286 378024 429302 -0.26IIa 2b23 4aiii IIA81l 204687IIa 2b23 4aiii none 712789 846450 1180862 3269924 3406304 2280351 2318167 3445355 1.92IIa 2b23 4aiv IIA81a 20556 1871IIa 2b23 4av IIA81a 581044 190089IIa 2b23 4av IIA81j 1354302 677660IIa 2b23 none none 66313 110870 183312 213076 733436 2428888 3347906 3161260 16.25IIa 2b3 4aii IIA81c 72006 39957 34516 30199 42735 35214 24084 15282 -0.56IIa 2b3 4aii none 3583070 3895564 5906368 4533832 4411108 5219848 5340490 5705550 -0.03IIa 2b3 4bi none 1815750 2207117 2606397 2591619 2231740 2078235 2758014 2957265 0.13IIa 2b3 4bii none 19983 105417 132198 45278 18207 38356 43665 16711 -0.87IIa 2b3 4biii IIA81c 19979 19684 3323 1564 1484 1870 -0.44IIa 2b3 4biii IIA81i 6057 2314 3477 -1.00IIa 2b3 4biii none 2243 6929IIa 2b3 4biv IIA81c 688IIa 2b3 4civ IIA81f 6789 770IIa 2b3 4d IIA81g 34078 685106 1523200 1504248 1609251 1735544 1611179 1777857 0.17IIa 2b3 none none 459136 829865 841507 727350 951180 374602 150946 145501 -0.83Sum 171785941 170608248 269168612 255736783 257930823 239932755 214028567 195274716 -0.27
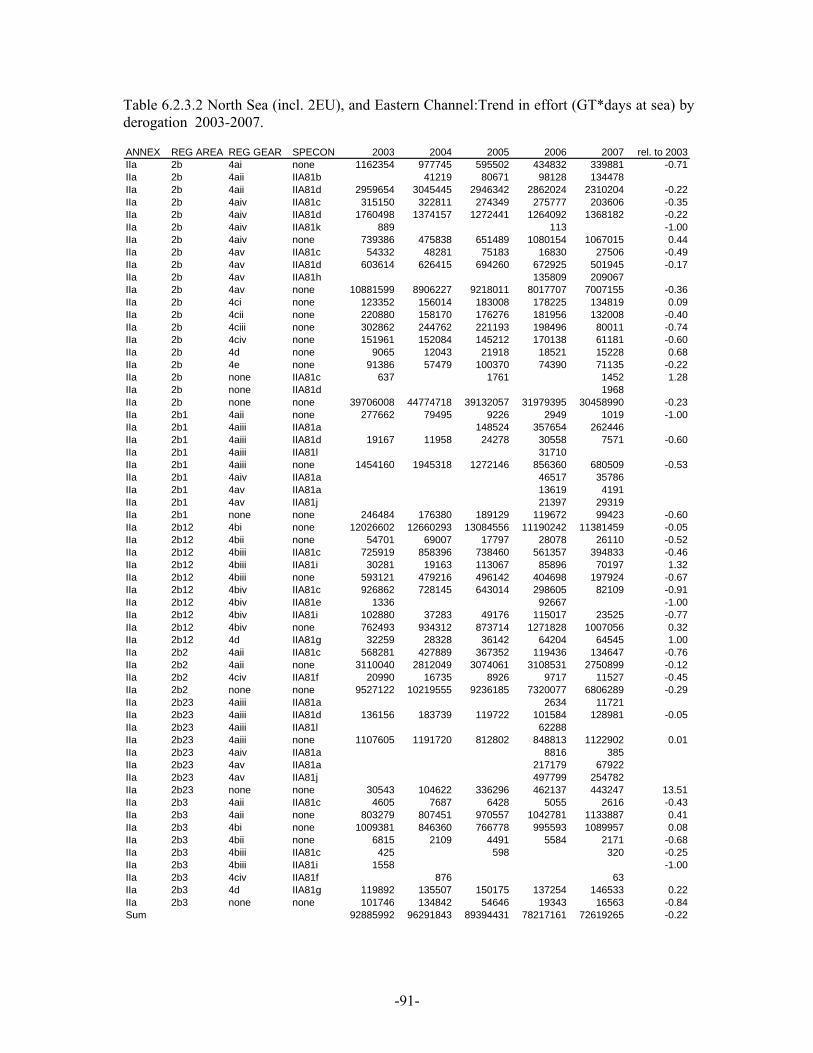
-91-
Table 6.2.3.2 North Sea (incl. 2EU), and Eastern Channel:Trend in effort (GT*days at sea) by derogation 2003-2007.
ANNEX REG AREA REG GEAR SPECON 2003 2004 2005 2006 2007 rel. to 2003IIa 2b 4ai none 1162354 977745 595502 434832 339881 -0.71IIa 2b 4aii IIA81b 41219 80671 98128 134478IIa 2b 4aii IIA81d 2959654 3045445 2946342 2862024 2310204 -0.22IIa 2b 4aiv IIA81c 315150 322811 274349 275777 203606 -0.35IIa 2b 4aiv IIA81d 1760498 1374157 1272441 1264092 1368182 -0.22IIa 2b 4aiv IIA81k 889 113 -1.00IIa 2b 4aiv none 739386 475838 651489 1080154 1067015 0.44IIa 2b 4av IIA81c 54332 48281 75183 16830 27506 -0.49IIa 2b 4av IIA81d 603614 626415 694260 672925 501945 -0.17IIa 2b 4av IIA81h 135809 209067IIa 2b 4av none 10881599 8906227 9218011 8017707 7007155 -0.36IIa 2b 4ci none 123352 156014 183008 178225 134819 0.09IIa 2b 4cii none 220880 158170 176276 181956 132008 -0.40IIa 2b 4ciii none 302862 244762 221193 198496 80011 -0.74IIa 2b 4civ none 151961 152084 145212 170138 61181 -0.60IIa 2b 4d none 9065 12043 21918 18521 15228 0.68IIa 2b 4e none 91386 57479 100370 74390 71135 -0.22IIa 2b none IIA81c 637 1761 1452 1.28IIa 2b none IIA81d 1968IIa 2b none none 39706008 44774718 39132057 31979395 30458990 -0.23IIa 2b1 4aii none 277662 79495 9226 2949 1019 -1.00IIa 2b1 4aiii IIA81a 148524 357654 262446IIa 2b1 4aiii IIA81d 19167 11958 24278 30558 7571 -0.60IIa 2b1 4aiii IIA81l 31710IIa 2b1 4aiii none 1454160 1945318 1272146 856360 680509 -0.53IIa 2b1 4aiv IIA81a 46517 35786IIa 2b1 4av IIA81a 13619 4191IIa 2b1 4av IIA81j 21397 29319IIa 2b1 none none 246484 176380 189129 119672 99423 -0.60IIa 2b12 4bi none 12026602 12660293 13084556 11190242 11381459 -0.05IIa 2b12 4bii none 54701 69007 17797 28078 26110 -0.52IIa 2b12 4biii IIA81c 725919 858396 738460 561357 394833 -0.46IIa 2b12 4biii IIA81i 30281 19163 113067 85896 70197 1.32IIa 2b12 4biii none 593121 479216 496142 404698 197924 -0.67IIa 2b12 4biv IIA81c 926862 728145 643014 298605 82109 -0.91IIa 2b12 4biv IIA81e 1336 92667 -1.00IIa 2b12 4biv IIA81i 102880 37283 49176 115017 23525 -0.77IIa 2b12 4biv none 762493 934312 873714 1271828 1007056 0.32IIa 2b12 4d IIA81g 32259 28328 36142 64204 64545 1.00IIa 2b2 4aii IIA81c 568281 427889 367352 119436 134647 -0.76IIa 2b2 4aii none 3110040 2812049 3074061 3108531 2750899 -0.12IIa 2b2 4civ IIA81f 20990 16735 8926 9717 11527 -0.45IIa 2b2 none none 9527122 10219555 9236185 7320077 6806289 -0.29IIa 2b23 4aiii IIA81a 2634 11721IIa 2b23 4aiii IIA81d 136156 183739 119722 101584 128981 -0.05IIa 2b23 4aiii IIA81l 62288IIa 2b23 4aiii none 1107605 1191720 812802 848813 1122902 0.01IIa 2b23 4aiv IIA81a 8816 385IIa 2b23 4av IIA81a 217179 67922IIa 2b23 4av IIA81j 497799 254782IIa 2b23 none none 30543 104622 336296 462137 443247 13.51IIa 2b3 4aii IIA81c 4605 7687 6428 5055 2616 -0.43IIa 2b3 4aii none 803279 807451 970557 1042781 1133887 0.41IIa 2b3 4bi none 1009381 846360 766778 995593 1089957 0.08IIa 2b3 4bii none 6815 2109 4491 5584 2171 -0.68IIa 2b3 4biii IIA81c 425 598 320 -0.25IIa 2b3 4biii IIA81i 1558 -1.00IIa 2b3 4civ IIA81f 876 63IIa 2b3 4d IIA81g 119892 135507 150175 137254 146533 0.22IIa 2b3 none none 101746 134842 54646 19343 16563 -0.84Sum 92885992 96291843 89394431 78217161 72619265 -0.22

-92-
Table 6.2.3.3 North Sea (incl. 2EU), and Eastern Channel:Trend in effort (number of vessels, sum over maximum number of national vessels) by derogation 2000-2007. Note, figures for 2000 and 2001 are under-estimates for some gears due to the absence of Dutch data for these years (See Section 5).
ANNEX REG AREA REG GEAR SPECON 2000 2001 2002 2003 2004 2005 2006 2007 rel. to 2002IIa 2b 4ai none 97 84 67 68 73 61 52 58 -0.13IIa 2b 4aii IIA81b 42 48 61 75IIa 2b 4aii IIA81d 158 150 201 205 202 198 206 209 0.04IIa 2b 4aiv IIA81c 39 36 80 43 27 25 21 14 -0.83IIa 2b 4aiv IIA81d 87 86 90 42 24 21 25 21 -0.77IIa 2b 4aiv IIA81k 3 2 2 3 1 -1.00IIa 2b 4aiv none 575 569 400 150 109 112 104 105 -0.74IIa 2b 4av IIA81c 1 1 28 22 17 13 6 3 -0.89IIa 2b 4av IIA81d 3 5 49 32 27 21 21 16 -0.67IIa 2b 4av IIA81h 5 9IIa 2b 4av none 62 50 342 361 283 252 239 207 -0.39IIa 2b 4ci none 124 119 106 97 73 82 67 62 -0.42IIa 2b 4cii none 117 142 138 129 121 153 159 129 -0.07IIa 2b 4ciii none 152 149 134 104 136 147 151 99 -0.26IIa 2b 4civ none 37 36 26 28 29 24 24 29 0.12IIa 2b 4d none 50 57 17 10 20 30 33 32 0.88IIa 2b 4e none 44 51 49 36 37 38 28 38 -0.22IIa 2b none IIA81c 1 1 2 1IIa 2b none IIA81d 1 2IIa 2b none none 683 754 909 974 1,054 1,000 955 913 0.00IIa 2b1 4aii none 273 195 161 110 81 3 3 1 -0.99IIa 2b1 4aiii IIA81a 18 68 77IIa 2b1 4aiii IIA81d 6 4 6 5 4 3 -0.50IIa 2b1 4aiii IIA81l 12IIa 2b1 4aiii none 237 215 246 212 243 182 165 120 -0.51IIa 2b1 4aiv IIA81a 11 8IIa 2b1 4av IIA81a 6 9IIa 2b1 4av IIA81j 4 5IIa 2b1 none none 38 40 42 42 50 49 43 28 -0.33IIa 2b12 4bi none 190 179 342 394 384 381 349 309 -0.10IIa 2b12 4bii none 3 3 9 15 16 9 12 12 0.33IIa 2b12 4biii IIA81c 42 37 29 20 25 21 17 15 -0.48IIa 2b12 4biii IIA81i 7 8 4 5 2 3 3 2 -0.50IIa 2b12 4biii none 43 45 42 50 35 36 37 21 -0.50IIa 2b12 4biv IIA81c 3 2 30 23 20 19 14 8 -0.73IIa 2b12 4biv IIA81e 3 1 3 -1.00IIa 2b12 4biv IIA81i 1 6 4 3 2 3 2 -0.67IIa 2b12 4biv none 34 40 50 52 74 66 77 77 0.54IIa 2b12 4d IIA81g 10 17 33 31 30 38 43 41 0.24IIa 2b2 4aii IIA81c 25 26 78 69 54 43 25 20 -0.74IIa 2b2 4aii none 177 165 190 232 202 191 205 185 -0.03IIa 2b2 4civ IIA81f 18 8 10 6 6 7 -0.61IIa 2b2 none IIA81c 1 1 -1.00IIa 2b2 none none 52 64 86 94 96 90 83 89 0.03IIa 2b23 4aiii IIA81a 2 1IIa 2b23 4aiii IIA81d 18 13 20 20 20 17 18 24 0.20IIa 2b23 4aiii IIA81l 6IIa 2b23 4aiii none 43 51 63 135 135 109 132 123 0.95IIa 2b23 4aiv IIA81a 4 1IIa 2b23 4av IIA81a 9 8IIa 2b23 4av IIA81j 16 9IIa 2b23 none none 13 12 22 33 92 164 181 182 7.27IIa 2b3 4aii IIA81c 11 9 8 5 4 4 3 2 -0.75IIa 2b3 4aii none 76 80 96 103 103 133 151 150 0.56IIa 2b3 4bi none 100 94 94 99 107 97 107 101 0.07IIa 2b3 4bii none 3 4 8 6 3 3 4 3 -0.63IIa 2b3 4biii IIA81c 3 2 1 1 1 1 0.00IIa 2b3 4biii IIA81i 1 1 1 -1.00IIa 2b3 4biii none 2 1IIa 2b3 4biv IIA81c 1IIa 2b3 4civ IIA81f 2 1IIa 2b3 4d IIA81g 5 46 69 74 60 76 73 83 0.20IIa 2b3 none none 34 54 55 68 69 44 14 11 -0.80
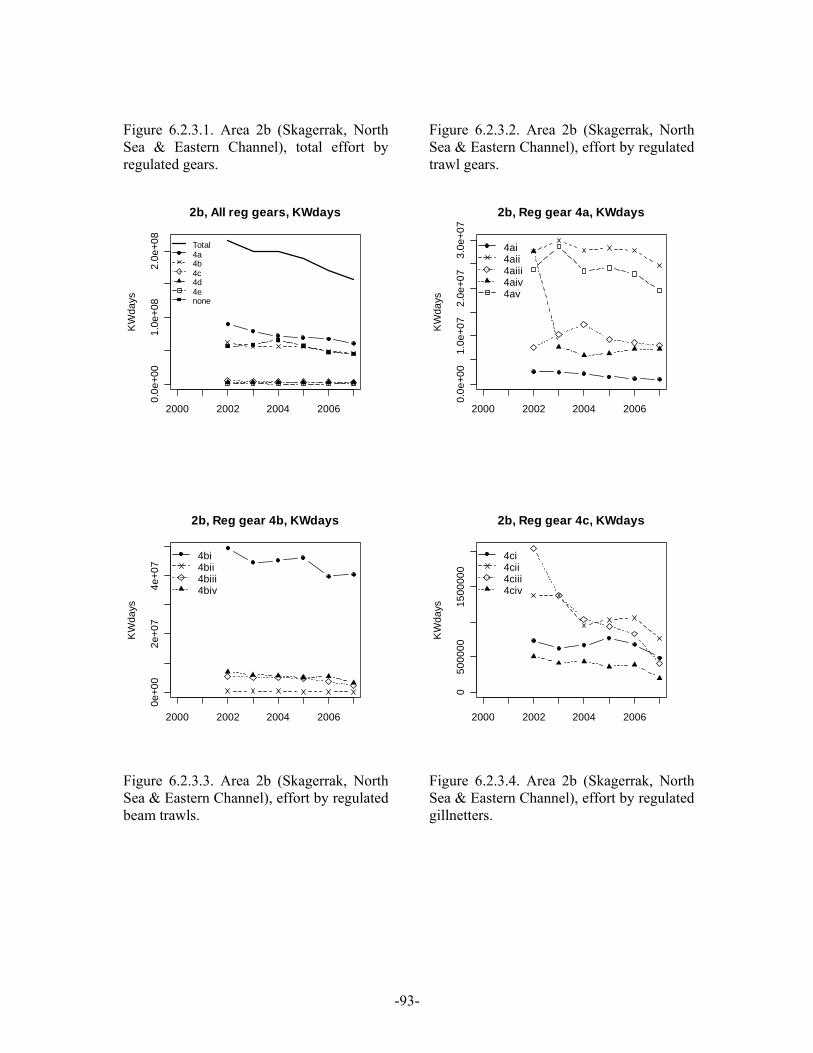
-93-
Figure 6.2.3.1. Area 2b (Skagerrak, North Sea & Eastern Channel), total effort by regulated gears.
2000 2002 2004 2006
0.0e
+00
1.0e
+08
2.0e
+08
2b, All reg gears, KWdays
KW
days
Total4a4b4c4d4enone
Figure 6.2.3.2. Area 2b (Skagerrak, North Sea & Eastern Channel), effort by regulated trawl gears.
2000 2002 2004 2006
0.0e
+00
1.0e
+07
2.0e
+07
3.0e
+07
2b, Reg gear 4a, KWdays
KW
days
4ai4aii4aiii4aiv4av
2000 2002 2004 2006
0e+0
02e
+07
4e+0
7
2b, Reg gear 4b, KWdays
KW
days
4bi4bii4biii4biv
Figure 6.2.3.3. Area 2b (Skagerrak, North Sea & Eastern Channel), effort by regulated beam trawls.
2000 2002 2004 2006
050
0000
1500
000
2b, Reg gear 4c, KWdays
KW
days
4ci4cii4ciii4civ
Figure 6.2.3.4. Area 2b (Skagerrak, North Sea & Eastern Channel), effort by regulated gillnetters.
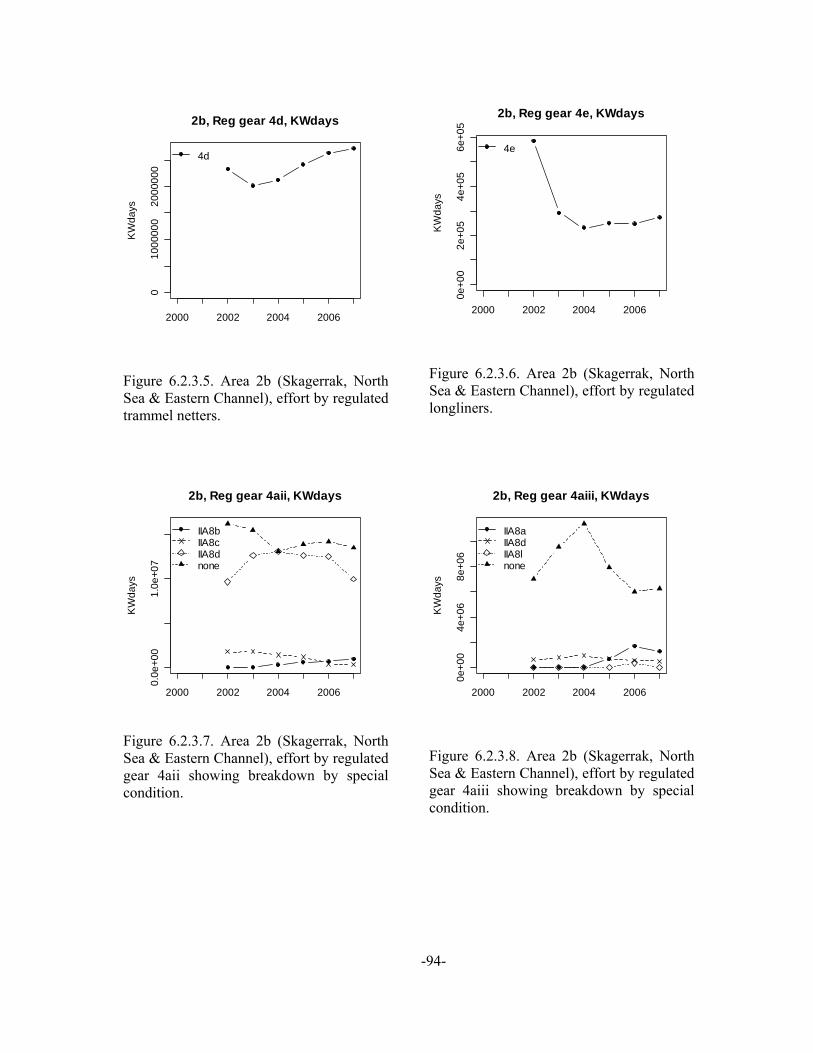
-94-
2000 2002 2004 2006
010
0000
020
0000
0
2b, Reg gear 4d, KWdaysK
Wda
ys
4d
Figure 6.2.3.5. Area 2b (Skagerrak, North Sea & Eastern Channel), effort by regulated trammel netters.
2000 2002 2004 2006
0e+0
02e
+05
4e+0
56e
+05
2b, Reg gear 4e, KWdays
KW
days
4e
Figure 6.2.3.6. Area 2b (Skagerrak, North Sea & Eastern Channel), effort by regulated longliners.
2000 2002 2004 2006
0.0e
+00
1.0e
+07
2b, Reg gear 4aii, KWdays
KW
days
IIA8bIIA8cIIA8dnone
Figure 6.2.3.7. Area 2b (Skagerrak, North Sea & Eastern Channel), effort by regulated gear 4aii showing breakdown by special condition.
2000 2002 2004 2006
0e+0
04e
+06
8e+0
6
2b, Reg gear 4aiii, KWdays
KW
days
IIA8aIIA8dIIA8lnone
Figure 6.2.3.8. Area 2b (Skagerrak, North Sea & Eastern Channel), effort by regulated gear 4aiii showing breakdown by special condition.
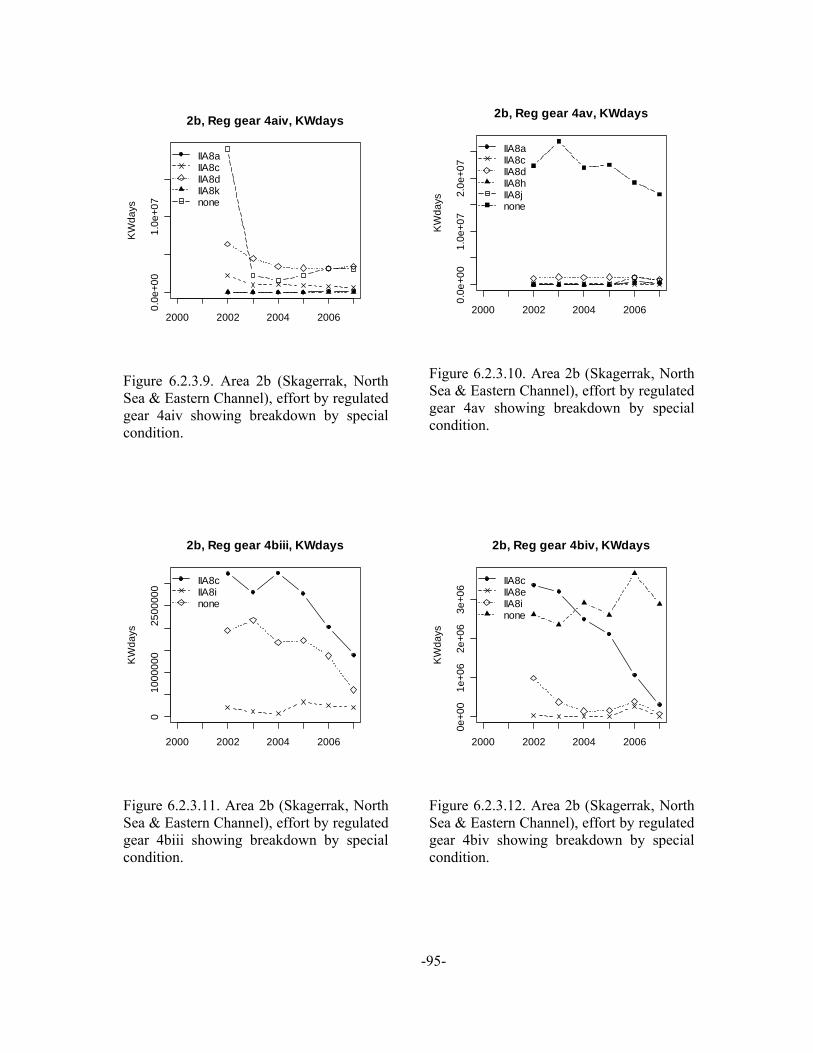
-95-
2000 2002 2004 2006
0.0e
+00
1.0e
+07
2b, Reg gear 4aiv, KWdaysK
Wda
ys
IIA8aIIA8cIIA8dIIA8knone
Figure 6.2.3.9. Area 2b (Skagerrak, North Sea & Eastern Channel), effort by regulated gear 4aiv showing breakdown by special condition.
2000 2002 2004 2006
0.0e
+00
1.0e
+07
2.0e
+07
2b, Reg gear 4av, KWdays
KW
days
IIA8aIIA8cIIA8dIIA8hIIA8jnone
Figure 6.2.3.10. Area 2b (Skagerrak, North Sea & Eastern Channel), effort by regulated gear 4av showing breakdown by special condition.
2000 2002 2004 2006
010
0000
025
0000
0
2b, Reg gear 4biii, KWdays
KW
days
IIA8cIIA8inone
Figure 6.2.3.11. Area 2b (Skagerrak, North Sea & Eastern Channel), effort by regulated gear 4biii showing breakdown by special condition.
2000 2002 2004 2006
0e+0
01e
+06
2e+0
63e
+06
2b, Reg gear 4biv, KWdays
KW
days
IIA8cIIA8eIIA8inone
Figure 6.2.3.12. Area 2b (Skagerrak, North Sea & Eastern Channel), effort by regulated gear 4biv showing breakdown by special condition.

-96-
2000 2002 2004 2006
0e+0
02e
+05
4e+0
5
2b, Reg gear 4civ, KWdaysK
Wda
ys
IIA8fnone
Figure 6.2.3.13. Area 2b (Skagerrak, North Sea & Eastern Channel), effort by regulated gear 4civ showing breakdown by special condition.
2000 2002 2004 2006
010
0000
020
0000
0
2b, Reg gear 4d, KWdays
KW
days
IIA8gnone
Figure 6.2.3.14. Area 2b (Skagerrak, North Sea & Eastern Channel), effort by regulated gear 4d showing breakdown by special condition.
Skagerrak detail
This subsection presents and analyses effort trend data for area 2b1 (Skagerrak) separately. The reasons for analysing the Skagerrak data separate from the larger 2b area are differences in the annex IIa effort regime (see Table 6.1.1), technical regulations (minimum mesh size, catch composition regulations-see council reg. 40/2008), stock boundaries and quotas and in fisheries in general. In addition, evaluation of effort trend data for the small Skagerrak area is difficult when data is pooled with data from the large area comprising also the North Sea and Eastern channel.
Effort data including special conditions have been provided by all Member States with fishing activity in the Skagerrak (BEL, GER, DEN, NED, SCO, SWE). The Skagerrak fisheries are however strongly dominated by Denmark and Sweden. These two countries accounts for over 97% of the total effort. The data should therefore represent a complete account of fishing effort by regulated gears in the area.
Trends in nominal effort by regulated gears in the Skagerrak are listed in Tables 6.2.3.a.1–6.2.3.a.3 and illustrated in Figures 6.2.3.a.1–6.2.3.12. Full data on effort by regulated gear, special condition and subsections of area 2b1 are given in Tables 6.2.3.a.1-6.2.3.a.3.
Trends in nominal effort by overall gear category are given in Figure 6.2.3.a.1-6.2.3.a.3. These graphs include a ‘none’ category which covers nominal effort by unspecified gears for which no mesh size information was available.
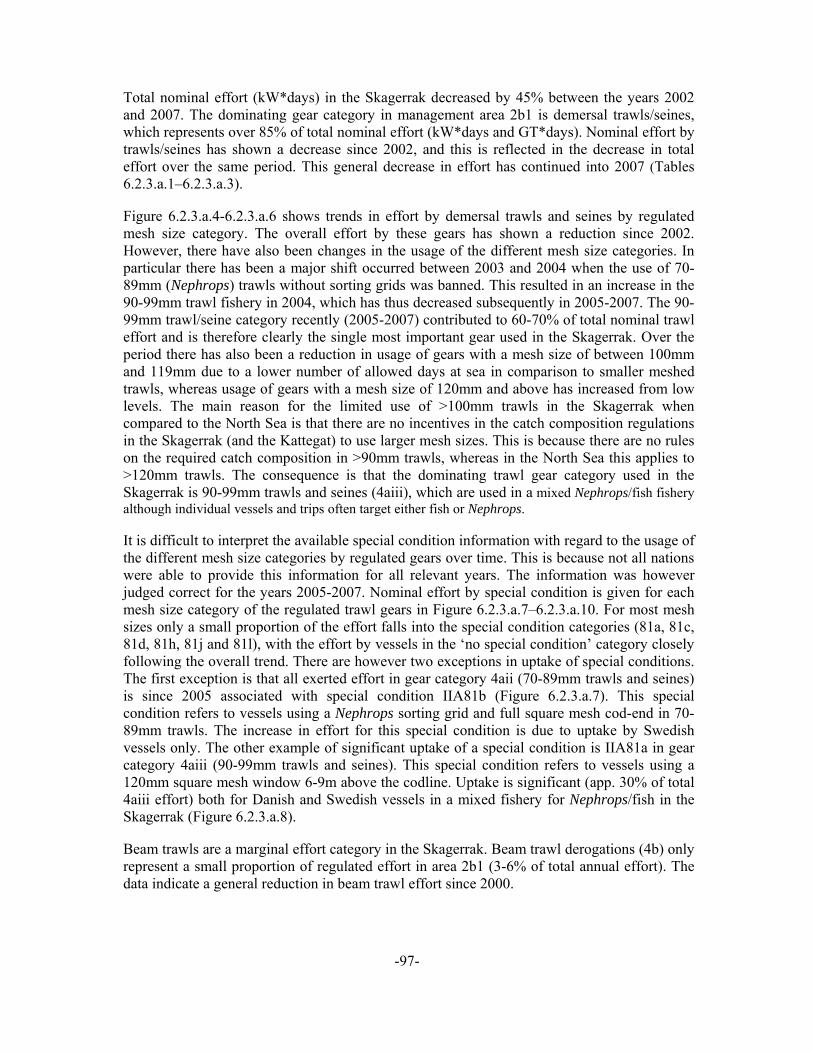
-97-
Total nominal effort (kW*days) in the Skagerrak decreased by 45% between the years 2002 and 2007. The dominating gear category in management area 2b1 is demersal trawls/seines, which represents over 85% of total nominal effort (kW*days and GT*days). Nominal effort by trawls/seines has shown a decrease since 2002, and this is reflected in the decrease in total effort over the same period. This general decrease in effort has continued into 2007 (Tables 6.2.3.a.1–6.2.3.a.3).
Figure 6.2.3.a.4-6.2.3.a.6 shows trends in effort by demersal trawls and seines by regulated mesh size category. The overall effort by these gears has shown a reduction since 2002. However, there have also been changes in the usage of the different mesh size categories. In particular there has been a major shift occurred between 2003 and 2004 when the use of 70-89mm (Nephrops) trawls without sorting grids was banned. This resulted in an increase in the 90-99mm trawl fishery in 2004, which has thus decreased subsequently in 2005-2007. The 90-99mm trawl/seine category recently (2005-2007) contributed to 60-70% of total nominal trawl effort and is therefore clearly the single most important gear used in the Skagerrak. Over the period there has also been a reduction in usage of gears with a mesh size of between 100mm and 119mm due to a lower number of allowed days at sea in comparison to smaller meshed trawls, whereas usage of gears with a mesh size of 120mm and above has increased from low levels. The main reason for the limited use of >100mm trawls in the Skagerrak when compared to the North Sea is that there are no incentives in the catch composition regulations in the Skagerrak (and the Kattegat) to use larger mesh sizes. This is because there are no rules on the required catch composition in >90mm trawls, whereas in the North Sea this applies to >120mm trawls. The consequence is that the dominating trawl gear category used in the Skagerrak is 90-99mm trawls and seines (4aiii), which are used in a mixed Nephrops/fish fishery although individual vessels and trips often target either fish or Nephrops.
It is difficult to interpret the available special condition information with regard to the usage of the different mesh size categories by regulated gears over time. This is because not all nations were able to provide this information for all relevant years. The information was however judged correct for the years 2005-2007. Nominal effort by special condition is given for each mesh size category of the regulated trawl gears in Figure 6.2.3.a.7–6.2.3.a.10. For most mesh sizes only a small proportion of the effort falls into the special condition categories (81a, 81c, 81d, 81h, 81j and 81l), with the effort by vessels in the ‘no special condition’ category closely following the overall trend. There are however two exceptions in uptake of special conditions. The first exception is that all exerted effort in gear category 4aii (70-89mm trawls and seines) is since 2005 associated with special condition IIA81b (Figure 6.2.3.a.7). This special condition refers to vessels using a Nephrops sorting grid and full square mesh cod-end in 70-89mm trawls. The increase in effort for this special condition is due to uptake by Swedish vessels only. The other example of significant uptake of a special condition is IIA81a in gear category 4aiii (90-99mm trawls and seines). This special condition refers to vessels using a 120mm square mesh window 6-9m above the codline. Uptake is significant (app. 30% of total 4aiii effort) both for Danish and Swedish vessels in a mixed fishery for Nephrops/fish in the Skagerrak (Figure 6.2.3.a.8).
Beam trawls are a marginal effort category in the Skagerrak. Beam trawl derogations (4b) only represent a small proportion of regulated effort in area 2b1 (3-6% of total annual effort). The data indicate a general reduction in beam trawl effort since 2000.

-98-
Static gears recently contribute only about 5-8% to the nominal effort deployed in the Skagerrak. STECF-SGRST notes that the fishing activities for static gears are poorly quantified by nominal effort (kW*days at sea). If the number of vessels is used as a proxy for effort, the importance of static vessels is considerably larger (32-34% of total Skagerrak effort for 2005-07). Data on nominal gill net effort indicate a general reduction since 2000 (Figure 6.2.3.a.10-6.2.3.a.12). The effort reduction is more pronounced in terms of kW or GT*days than in the number of vessels, which may indicate a reduced average vessel size. The dominating mesh size category is 4cii (110-150mm). The largest mesh size category (4civ, ≥220mm) is the least used. There is some usage of longlines and trammel nets in the area, but overall these gears are unimportant.
Table 6.2.3.a.1. Trend in nominal effort (kW*days at sea) by derogation in the Skagerrak (area 2b1), 2000-2007.
ANNEX REG AREA GEAR SPECON 2000 2001 2002 2003 2004 2005 2006 2007 Rel change to 2002IIa 2b1 4a none 8952 3000 0 0 0 270 0 0IIa 2b1 4ai none 421389 510961 381158 377919 387803 382823 270204 239157 -0,37IIa 2b1 4aii IIA81a 0 0 0 0 0 0 437 0IIa 2b1 4aii IIa81b 0 0 0 0 308459 542008 664972 894575IIa 2b1 4aii IIA81d 0 0 285013 138894 23214 1499 268 0 -1,00IIa 2b1 4aii none 3431661 2640771 2474111 1658209 412751 57234 11182 2900 -1,00IIa 2b1 4aiii IIA81a 0 0 0 0 0 666398 1670675 1199637IIa 2b1 4aiii IIA81d 0 0 40162 77282 52071 106998 134788 50276 0,25IIa 2b1 4aiii IIA81h 0 0 0 0 0 0 0 880IIa 2b1 4aiii IIA81j 0 0 0 0 0 0 0 2104IIa 2b1 4aiii IIa81l 0 0 0 0 0 0 128159 0IIa 2b1 4aiii none 5063534 5130398 5836581 6314438 8026416 5649254 3692107 2830153 -0,52IIa 2b1 4aiv IIA81a 0 0 0 0 0 0 138793 116102IIa 2b1 4aiv IIA81c 0 0 187053 13494 35488 74498 5952 26314 -0,86IIa 2b1 4aiv IIA81d 0 0 7322 861 10512 0 0 36780 4,02IIa 2b1 4aiv IIA81h 0 0 0 0 0 0 0 2750IIa 2b1 4aiv IIa81l 0 0 0 0 0 0 734 0IIa 2b1 4aiv none 2930989 3572239 2473517 309248 244560 608608 627553 411755 -0,83IIa 2b1 4av IIA81a 0 0 0 0 0 0 44708 10128IIa 2b1 4av IIA81c 0 0 39450 900 13806 11390 0 0 -1,00IIa 2b1 4av IIA81d 0 0 28900 3200 49284 81288 56727 91786 2,18IIa 2b1 4av IIA81h 0 0 0 0 0 0 0 983IIa 2b1 4av IIA81j 0 0 0 0 0 0 61319 79742IIa 2b1 4av IIa81l 0 0 0 0 0 0 1250 0IIa 2b1 4av none 108707 215617 634726 421007 361098 520359 598932 775674 0,22IIa 2b1 4b none 0 2515 0 0 0 0 0 0IIa 2b1 4bi none 0 16173 0 39621 78405 49142 88752 60476IIa 2b1 4bii none 0 0 26331 154081 30826 13448 3757 0 -1,00IIa 2b1 4biii IIA81c 19976 0 2301 0 660 0 0 0 -1,00IIa 2b1 4biii none 461634 1153058 408189 140841 92202 90268 47048 159043 -0,61IIa 2b1 4biv IIA81c 0 0 294 440 0 0 0 0 -1,00IIa 2b1 4biv IIA81e 0 0 0 0 0 0 25766 0IIa 2b1 4biv none 14343 25582 58922 193707 514483 445508 49128 96617 0,64IIa 2b1 4c none 11965 12630 8606 10775 13128 9089 8109 12960 0,51IIa 2b1 4ci none 94364 101594 25296 8297 5723 15930 12185 12576 -0,50IIa 2b1 4cii none 511077 609238 586485 390861 342845 323098 355262 266650 -0,55IIa 2b1 4ciii none 278678 399923 301262 148873 96553 93172 89338 116089 -0,61IIa 2b1 4civ none 38209 27351 15588 17688 14014 7637 6540 14305 -0,08IIa 2b1 4d none 88 15081 574 88 2249 3880 9594 234 -0,59IIa 2b1 4e none 36365 74543 63601 48571 44965 42750 113476 156854 1,47IIa 2b1 none none 460 539 1395Sum 13431931 14510674 13885442 10469755 11162054 9796549 8917715 7668895 -0,45

-99-
Table 6.2.3.a.2. Trend in effort (GT*days at sea) by derogation in the Skagerrak (area 2b1), 2000-2007.
ANNEX REG AREA GEAR SPECON 2000 2001 2002 2003 2004 2005 2006 2007 Rel change to 2002IIa 2b1 4a none 2891 846 0 0 0 36 0 0IIa 2b1 4ai none 100894 114274 86056 82251 92152 96029 65145 58370 -0,32IIa 2b1 4aii IIA81a 0 0 0 0 0 0 73 0IIa 2b1 4aii IIa81b 0 0 0 0 41219 80671 98128 134478IIa 2b1 4aii IIA81d 0 0 90179 34388 7299 494 49 0 -1,00IIa 2b1 4aii none 590811 478955 424748 277662 79495 9226 2949 1019 -1,00IIa 2b1 4aiii IIA81a 0 0 0 0 0 148524 357654 262446IIa 2b1 4aiii IIA81d 0 0 7494 19167 11958 24278 30558 7571 0,01IIa 2b1 4aiii IIA81h 0 0 0 0 0 0 0 228IIa 2b1 4aiii IIA81j 0 0 0 0 0 0 0 900IIa 2b1 4aiii IIa81l 0 0 0 0 0 0 31710 0IIa 2b1 4aiii none 1052927 1055908 1165592 1454160 1945318 1272146 856360 680509 -0,42IIa 2b1 4aiv IIA81a 0 0 0 0 0 0 46517 35786IIa 2b1 4aiv IIA81c 0 0 39249 2990 5621 11313 704 3866 -0,90IIa 2b1 4aiv IIA81d 0 0 1773 135 6787 0 0 20280 10,44IIa 2b1 4aiv IIA81h 0 0 0 0 0 0 0 279IIa 2b1 4aiv IIa81l 0 0 0 0 0 0 202 0IIa 2b1 4aiv none 752218 1047099 633217 77380 67524 179900 175455 104914 -0,83IIa 2b1 4av IIA81a 0 0 0 0 0 0 13619 4191IIa 2b1 4av IIA81c 0 0 7576 183 5760 4390 0 0 -1,00IIa 2b1 4av IIA81d 0 0 7889 1224 21332 33990 23771 44017 4,58IIa 2b1 4av IIA81h 0 0 0 0 0 0 0 770IIa 2b1 4av IIA81j 0 0 0 0 0 0 21397 29319IIa 2b1 4av IIa81l 0 0 0 0 0 0 355 0IIa 2b1 4av none 17734 44952 198694 154086 133836 188916 213578 277800 0,40IIa 2b1 4bi none 0 5357 0 12716 28426 20519 35513 24813IIa 2b1 4bii none 0 0 8534 36623 12759 5113 2567 0 -1,00IIa 2b1 4biii IIA81c 4400 0 551 0 501 0 0 0 -1,00IIa 2b1 4biii none 142181 347358 126945 36721 24786 24427 15584 53507 -0,58IIa 2b1 4biv IIA81c 0 0 55 132 0 0 0 0 -1,00IIa 2b1 4biv IIA81e 0 0 800 0 0 0 8656 0 -1,00IIa 2b1 4biv none 6938 11748 19189 61111 143094 122418 18586 32346 0,69IIa 2b1 4c none 2667 2483 1406 1494 1384 653 801 1400 0,00IIa 2b1 4ci none 11944 16900 3269 728 501 1388 1468 1386 -0,58IIa 2b1 4cii none 70352 88297 81687 50176 41622 38755 41721 31528 -0,61IIa 2b1 4ciii none 34588 57540 47237 18385 11640 10448 9931 12350 -0,74IIa 2b1 4civ none 6178 4460 2102 1684 1287 637 525 1160 -0,45IIa 2b1 4d none 7 2215 63 726 188 439 1003 30 -0,52IIa 2b1 4e none 5043 12789 7753 8945 3971 3085 30845 49463 5,38IIa 2b1 none none 33 67 280Sum 2801773 3291181 2962058 2333100 2688527 2277795 2105424 1875006 -0,37
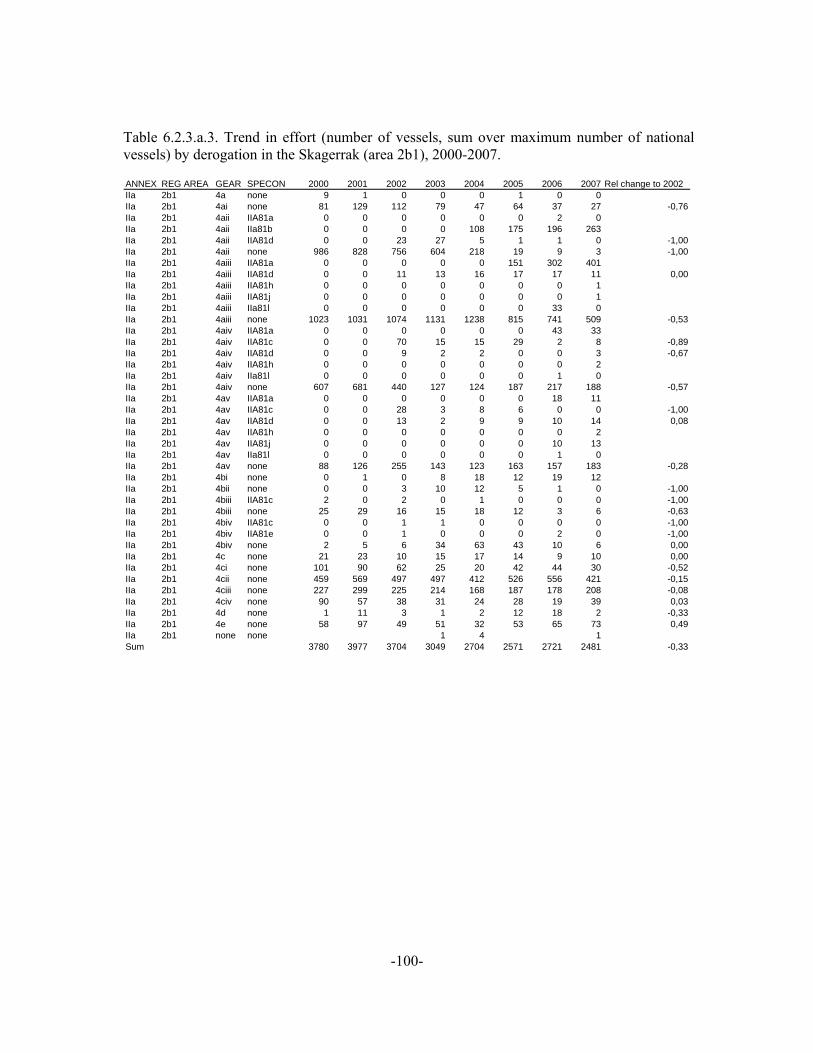
-100-
Table 6.2.3.a.3. Trend in effort (number of vessels, sum over maximum number of national vessels) by derogation in the Skagerrak (area 2b1), 2000-2007.
ANNEX REG AREA GEAR SPECON 2000 2001 2002 2003 2004 2005 2006 2007 Rel change to 2002IIa 2b1 4a none 9 1 0 0 0 1 0 0IIa 2b1 4ai none 81 129 112 79 47 64 37 27 -0,76IIa 2b1 4aii IIA81a 0 0 0 0 0 0 2 0IIa 2b1 4aii IIa81b 0 0 0 0 108 175 196 263IIa 2b1 4aii IIA81d 0 0 23 27 5 1 1 0 -1,00IIa 2b1 4aii none 986 828 756 604 218 19 9 3 -1,00IIa 2b1 4aiii IIA81a 0 0 0 0 0 151 302 401IIa 2b1 4aiii IIA81d 0 0 11 13 16 17 17 11 0,00IIa 2b1 4aiii IIA81h 0 0 0 0 0 0 0 1IIa 2b1 4aiii IIA81j 0 0 0 0 0 0 0 1IIa 2b1 4aiii IIa81l 0 0 0 0 0 0 33 0IIa 2b1 4aiii none 1023 1031 1074 1131 1238 815 741 509 -0,53IIa 2b1 4aiv IIA81a 0 0 0 0 0 0 43 33IIa 2b1 4aiv IIA81c 0 0 70 15 15 29 2 8 -0,89IIa 2b1 4aiv IIA81d 0 0 9 2 2 0 0 3 -0,67IIa 2b1 4aiv IIA81h 0 0 0 0 0 0 0 2IIa 2b1 4aiv IIa81l 0 0 0 0 0 0 1 0IIa 2b1 4aiv none 607 681 440 127 124 187 217 188 -0,57IIa 2b1 4av IIA81a 0 0 0 0 0 0 18 11IIa 2b1 4av IIA81c 0 0 28 3 8 6 0 0 -1,00IIa 2b1 4av IIA81d 0 0 13 2 9 9 10 14 0,08IIa 2b1 4av IIA81h 0 0 0 0 0 0 0 2IIa 2b1 4av IIA81j 0 0 0 0 0 0 10 13IIa 2b1 4av IIa81l 0 0 0 0 0 0 1 0IIa 2b1 4av none 88 126 255 143 123 163 157 183 -0,28IIa 2b1 4bi none 0 1 0 8 18 12 19 12IIa 2b1 4bii none 0 0 3 10 12 5 1 0 -1,00IIa 2b1 4biii IIA81c 2 0 2 0 1 0 0 0 -1,00IIa 2b1 4biii none 25 29 16 15 18 12 3 6 -0,63IIa 2b1 4biv IIA81c 0 0 1 1 0 0 0 0 -1,00IIa 2b1 4biv IIA81e 0 0 1 0 0 0 2 0 -1,00IIa 2b1 4biv none 2 5 6 34 63 43 10 6 0,00IIa 2b1 4c none 21 23 10 15 17 14 9 10 0,00IIa 2b1 4ci none 101 90 62 25 20 42 44 30 -0,52IIa 2b1 4cii none 459 569 497 497 412 526 556 421 -0,15IIa 2b1 4ciii none 227 299 225 214 168 187 178 208 -0,08IIa 2b1 4civ none 90 57 38 31 24 28 19 39 0,03IIa 2b1 4d none 1 11 3 1 2 12 18 2 -0,33IIa 2b1 4e none 58 97 49 51 32 53 65 73 0,49IIa 2b1 none none 1 4 1Sum 3780 3977 3704 3049 2704 2571 2721 2481 -0,33
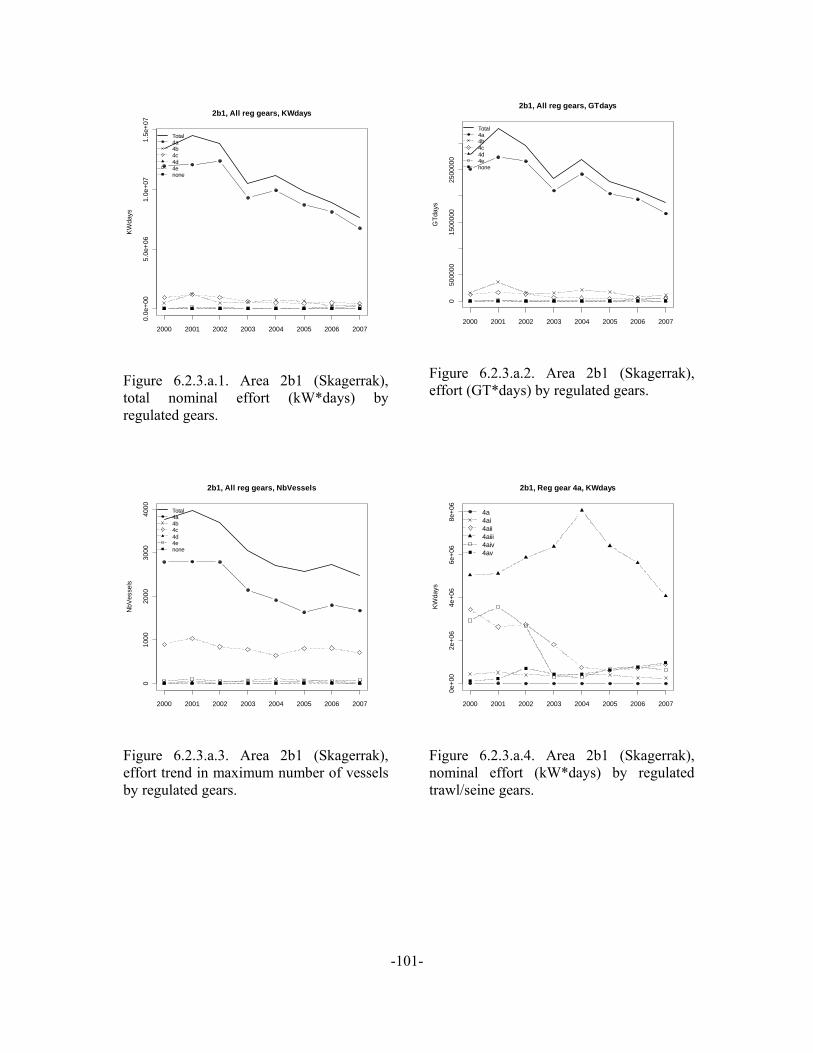
-101-
2000 2001 2002 2003 2004 2005 2006 2007
0.0e
+00
5.0e
+06
1.0e
+07
1.5e
+07
2b1, All reg gears, KWdays
KWda
ysTotal4a4b4c4d4enone
Figure 6.2.3.a.1. Area 2b1 (Skagerrak), total nominal effort (kW*days) by regulated gears.
2000 2001 2002 2003 2004 2005 2006 2007
050
0000
1500
000
2500
000
2b1, All reg gears, GTdays
GTd
ays
Total4a4b4c4d4enone
Figure 6.2.3.a.2. Area 2b1 (Skagerrak), effort (GT*days) by regulated gears.
2000 2001 2002 2003 2004 2005 2006 2007
010
0020
0030
0040
00
2b1, All reg gears, NbVessels
NbV
esse
ls
Total4a4b4c4d4enone
Figure 6.2.3.a.3. Area 2b1 (Skagerrak), effort trend in maximum number of vessels by regulated gears.
2000 2001 2002 2003 2004 2005 2006 2007
0e+0
02e
+06
4e+0
66e
+06
8e+0
6
2b1, Reg gear 4a, KWdays
KWda
ys
4a4ai4aii4aiii4aiv4av
Figure 6.2.3.a.4. Area 2b1 (Skagerrak), nominal effort (kW*days) by regulated trawl/seine gears.
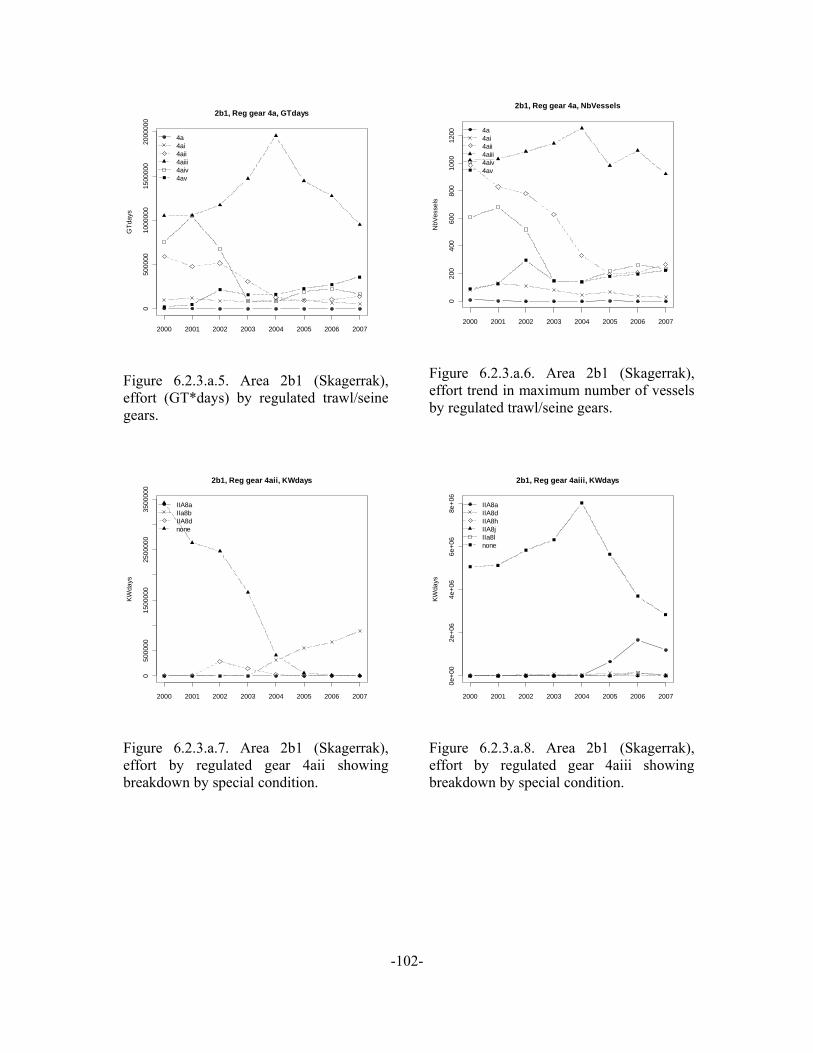
-102-
2000 2001 2002 2003 2004 2005 2006 2007
050
0000
1000
000
1500
000
2000
000
2b1, Reg gear 4a, GTdays
GTd
ays
4a4ai4aii4aiii4aiv4av
Figure 6.2.3.a.5. Area 2b1 (Skagerrak), effort (GT*days) by regulated trawl/seine gears.
2000 2001 2002 2003 2004 2005 2006 2007
020
040
060
080
010
0012
00
2b1, Reg gear 4a, NbVessels
NbV
esse
ls
4a4ai4aii4aiii4aiv4av
Figure 6.2.3.a.6. Area 2b1 (Skagerrak), effort trend in maximum number of vessels by regulated trawl/seine gears.
2000 2001 2002 2003 2004 2005 2006 2007
050
0000
1500
000
2500
000
3500
000
2b1, Reg gear 4aii, KWdays
KWda
ys
IIA8aIIa8bIIA8dnone
Figure 6.2.3.a.7. Area 2b1 (Skagerrak), effort by regulated gear 4aii showing breakdown by special condition.
2000 2001 2002 2003 2004 2005 2006 2007
0e+0
02e
+06
4e+0
66e
+06
8e+0
6
2b1, Reg gear 4aiii, KWdays
KWda
ys
IIA8aIIA8dIIA8hIIA8jIIa8lnone
Figure 6.2.3.a.8. Area 2b1 (Skagerrak), effort by regulated gear 4aiii showing breakdown by special condition.
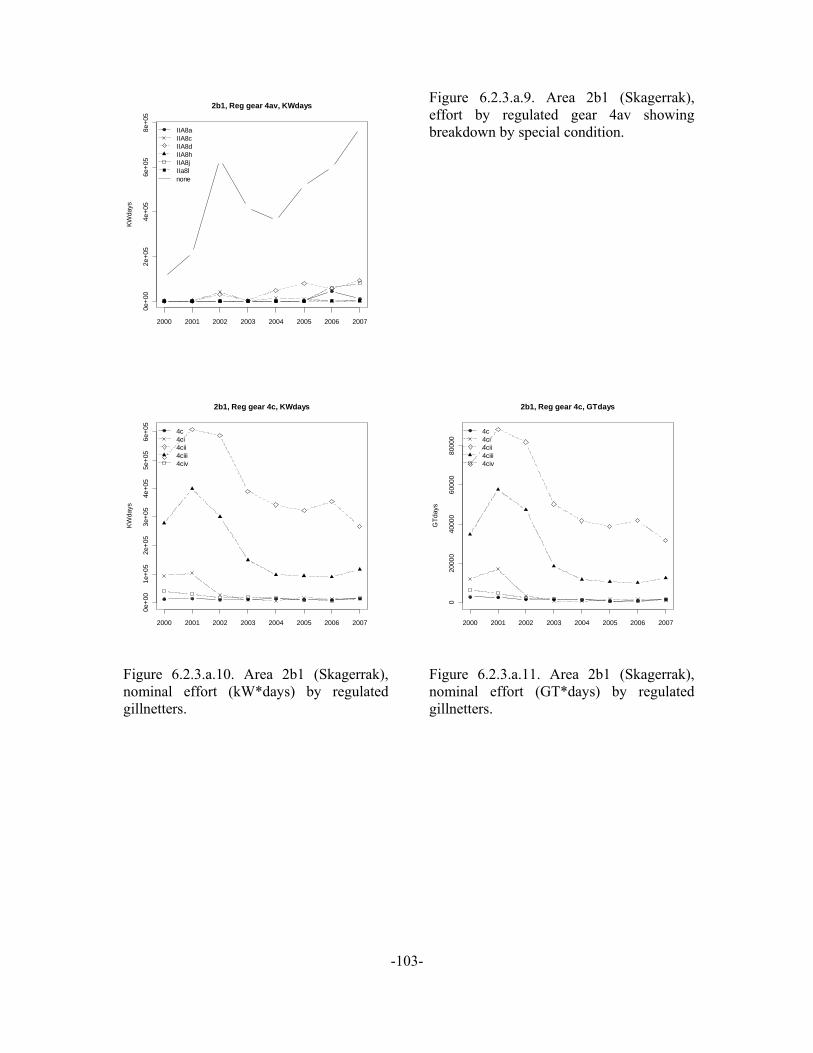
-103-
2000 2001 2002 2003 2004 2005 2006 2007
0e+0
02e
+05
4e+0
56e
+05
8e+0
5
2b1, Reg gear 4av, KWdays
KWda
ysIIA8aIIA8cIIA8dIIA8hIIA8jIIa8lnone
Figure 6.2.3.a.9. Area 2b1 (Skagerrak), effort by regulated gear 4av showing breakdown by special condition.
2000 2001 2002 2003 2004 2005 2006 2007
0e+0
01e
+05
2e+0
53e
+05
4e+0
55e
+05
6e+0
5
2b1, Reg gear 4c, KWdays
KWda
ys
4c4ci4cii4ciii4civ
Figure 6.2.3.a.10. Area 2b1 (Skagerrak), nominal effort (kW*days) by regulated gillnetters.
2000 2001 2002 2003 2004 2005 2006 2007
020
000
4000
060
000
8000
0
2b1, Reg gear 4c, GTdays
GTd
ays
4c4ci4cii4ciii4civ
Figure 6.2.3.a.11. Area 2b1 (Skagerrak), nominal effort (GT*days) by regulated gillnetters.
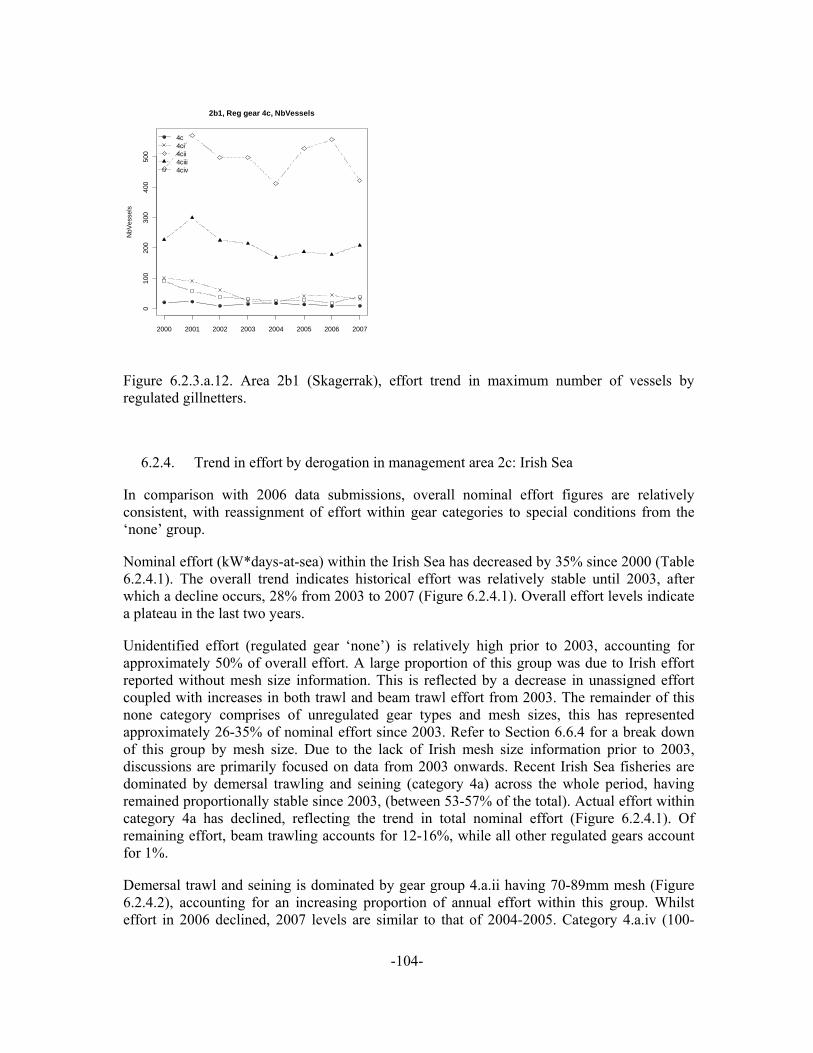
-104-
2000 2001 2002 2003 2004 2005 2006 2007
010
020
030
040
050
0
2b1, Reg gear 4c, NbVessels
NbV
esse
ls4c4ci4cii4ciii4civ
Figure 6.2.3.a.12. Area 2b1 (Skagerrak), effort trend in maximum number of vessels by regulated gillnetters.
6.2.4. Trend in effort by derogation in management area 2c: Irish Sea
In comparison with 2006 data submissions, overall nominal effort figures are relatively consistent, with reassignment of effort within gear categories to special conditions from the ‘none’ group.
Nominal effort (kW*days-at-sea) within the Irish Sea has decreased by 35% since 2000 (Table 6.2.4.1). The overall trend indicates historical effort was relatively stable until 2003, after which a decline occurs, 28% from 2003 to 2007 (Figure 6.2.4.1). Overall effort levels indicate a plateau in the last two years.
Unidentified effort (regulated gear ‘none’) is relatively high prior to 2003, accounting for approximately 50% of overall effort. A large proportion of this group was due to Irish effort reported without mesh size information. This is reflected by a decrease in unassigned effort coupled with increases in both trawl and beam trawl effort from 2003. The remainder of this none category comprises of unregulated gear types and mesh sizes, this has represented approximately 26-35% of nominal effort since 2003. Refer to Section 6.6.4 for a break down of this group by mesh size. Due to the lack of Irish mesh size information prior to 2003, discussions are primarily focused on data from 2003 onwards. Recent Irish Sea fisheries are dominated by demersal trawling and seining (category 4a) across the whole period, having remained proportionally stable since 2003, (between 53-57% of the total). Actual effort within category 4a has declined, reflecting the trend in total nominal effort (Figure 6.2.4.1). Of remaining effort, beam trawling accounts for 12-16%, while all other regulated gears account for 1%.
Demersal trawl and seining is dominated by gear group 4.a.ii having 70-89mm mesh (Figure 6.2.4.2), accounting for an increasing proportion of annual effort within this group. Whilst effort in 2006 declined, 2007 levels are similar to that of 2004-2005. Category 4.a.iv (100-
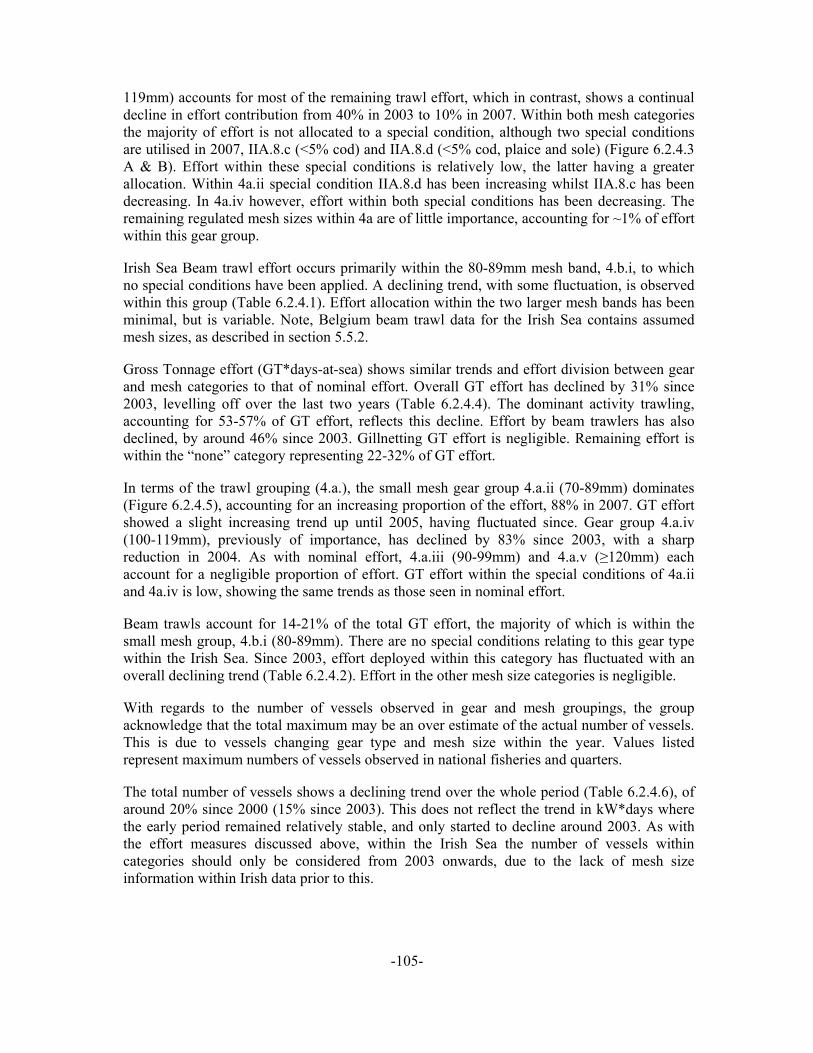
-105-
119mm) accounts for most of the remaining trawl effort, which in contrast, shows a continual decline in effort contribution from 40% in 2003 to 10% in 2007. Within both mesh categories the majority of effort is not allocated to a special condition, although two special conditions are utilised in 2007, IIA.8.c (<5% cod) and IIA.8.d (<5% cod, plaice and sole) (Figure 6.2.4.3 A & B). Effort within these special conditions is relatively low, the latter having a greater allocation. Within 4a.ii special condition IIA.8.d has been increasing whilst IIA.8.c has been decreasing. In 4a.iv however, effort within both special conditions has been decreasing. The remaining regulated mesh sizes within 4a are of little importance, accounting for ~1% of effort within this gear group.
Irish Sea Beam trawl effort occurs primarily within the 80-89mm mesh band, 4.b.i, to which no special conditions have been applied. A declining trend, with some fluctuation, is observed within this group (Table 6.2.4.1). Effort allocation within the two larger mesh bands has been minimal, but is variable. Note, Belgium beam trawl data for the Irish Sea contains assumed mesh sizes, as described in section 5.5.2.
Gross Tonnage effort (GT*days-at-sea) shows similar trends and effort division between gear and mesh categories to that of nominal effort. Overall GT effort has declined by 31% since 2003, levelling off over the last two years (Table 6.2.4.4). The dominant activity trawling, accounting for 53-57% of GT effort, reflects this decline. Effort by beam trawlers has also declined, by around 46% since 2003. Gillnetting GT effort is negligible. Remaining effort is within the “none” category representing 22-32% of GT effort.
In terms of the trawl grouping (4.a.), the small mesh gear group 4.a.ii (70-89mm) dominates (Figure 6.2.4.5), accounting for an increasing proportion of the effort, 88% in 2007. GT effort showed a slight increasing trend up until 2005, having fluctuated since. Gear group 4.a.iv (100-119mm), previously of importance, has declined by 83% since 2003, with a sharp reduction in 2004. As with nominal effort, 4.a.iii (90-99mm) and 4.a.v (≥120mm) each account for a negligible proportion of effort. GT effort within the special conditions of 4a.ii and 4a.iv is low, showing the same trends as those seen in nominal effort.
Beam trawls account for 14-21% of the total GT effort, the majority of which is within the small mesh group, 4.b.i (80-89mm). There are no special conditions relating to this gear type within the Irish Sea. Since 2003, effort deployed within this category has fluctuated with an overall declining trend (Table 6.2.4.2). Effort in the other mesh size categories is negligible.
With regards to the number of vessels observed in gear and mesh groupings, the group acknowledge that the total maximum may be an over estimate of the actual number of vessels. This is due to vessels changing gear type and mesh size within the year. Values listed represent maximum numbers of vessels observed in national fisheries and quarters.
The total number of vessels shows a declining trend over the whole period (Table 6.2.4.6), of around 20% since 2000 (15% since 2003). This does not reflect the trend in kW*days where the early period remained relatively stable, and only started to decline around 2003. As with the effort measures discussed above, within the Irish Sea the number of vessels within categories should only be considered from 2003 onwards, due to the lack of mesh size information within Irish data prior to this.
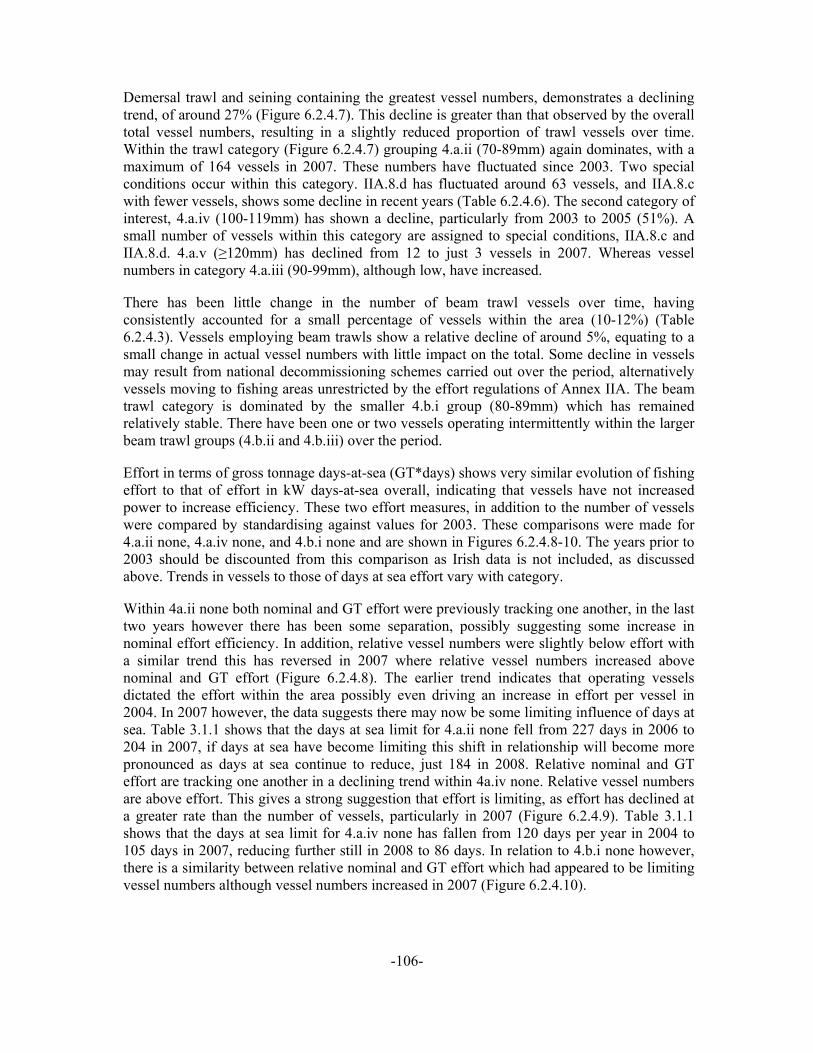
-106-
Demersal trawl and seining containing the greatest vessel numbers, demonstrates a declining trend, of around 27% (Figure 6.2.4.7). This decline is greater than that observed by the overall total vessel numbers, resulting in a slightly reduced proportion of trawl vessels over time. Within the trawl category (Figure 6.2.4.7) grouping 4.a.ii (70-89mm) again dominates, with a maximum of 164 vessels in 2007. These numbers have fluctuated since 2003. Two special conditions occur within this category. IIA.8.d has fluctuated around 63 vessels, and IIA.8.c with fewer vessels, shows some decline in recent years (Table 6.2.4.6). The second category of interest, 4.a.iv (100-119mm) has shown a decline, particularly from 2003 to 2005 (51%). A small number of vessels within this category are assigned to special conditions, IIA.8.c and IIA.8.d. 4.a.v (≥120mm) has declined from 12 to just 3 vessels in 2007. Whereas vessel numbers in category 4.a.iii (90-99mm), although low, have increased.
There has been little change in the number of beam trawl vessels over time, having consistently accounted for a small percentage of vessels within the area (10-12%) (Table 6.2.4.3). Vessels employing beam trawls show a relative decline of around 5%, equating to a small change in actual vessel numbers with little impact on the total. Some decline in vessels may result from national decommissioning schemes carried out over the period, alternatively vessels moving to fishing areas unrestricted by the effort regulations of Annex IIA. The beam trawl category is dominated by the smaller 4.b.i group (80-89mm) which has remained relatively stable. There have been one or two vessels operating intermittently within the larger beam trawl groups (4.b.ii and 4.b.iii) over the period.
Effort in terms of gross tonnage days-at-sea (GT*days) shows very similar evolution of fishing effort to that of effort in kW days-at-sea overall, indicating that vessels have not increased power to increase efficiency. These two effort measures, in addition to the number of vessels were compared by standardising against values for 2003. These comparisons were made for 4.a.ii none, 4.a.iv none, and 4.b.i none and are shown in Figures 6.2.4.8-10. The years prior to 2003 should be discounted from this comparison as Irish data is not included, as discussed above. Trends in vessels to those of days at sea effort vary with category.
Within 4a.ii none both nominal and GT effort were previously tracking one another, in the last two years however there has been some separation, possibly suggesting some increase in nominal effort efficiency. In addition, relative vessel numbers were slightly below effort with a similar trend this has reversed in 2007 where relative vessel numbers increased above nominal and GT effort (Figure 6.2.4.8). The earlier trend indicates that operating vessels dictated the effort within the area possibly even driving an increase in effort per vessel in 2004. In 2007 however, the data suggests there may now be some limiting influence of days at sea. Table 3.1.1 shows that the days at sea limit for 4.a.ii none fell from 227 days in 2006 to 204 in 2007, if days at sea have become limiting this shift in relationship will become more pronounced as days at sea continue to reduce, just 184 in 2008. Relative nominal and GT effort are tracking one another in a declining trend within 4a.iv none. Relative vessel numbers are above effort. This gives a strong suggestion that effort is limiting, as effort has declined at a greater rate than the number of vessels, particularly in 2007 (Figure 6.2.4.9). Table 3.1.1 shows that the days at sea limit for 4.a.iv none has fallen from 120 days per year in 2004 to 105 days in 2007, reducing further still in 2008 to 86 days. In relation to 4.b.i none however, there is a similarity between relative nominal and GT effort which had appeared to be limiting vessel numbers although vessel numbers increased in 2007 (Figure 6.2.4.10).

-107-
Table 6.2.4.1 Irish Sea. Trend in nominal effort (kW*days at sea) by derogation 2000-2007.
ANNEX REG AREA CREG GEAR SPECON 2000 2001 2002 2003 2004 2005 2006 2007Relative to
2003IIa 2c 4ai none 2777 4122 18418 12724 -1.00IIa 2c 4aii IIA81c 816647 843328 730614 857238 590593 616479 499933 419718 -0.51IIa 2c 4aii IIA81d 1241690 1408222 1342256 1579312 1649543 1608666 1529239 1715490 0.09IIa 2c 4aii none 2387061 2019099 1149888 2426833 2646713 2770202 2635597 2800894 0.15IIa 2c 4aiii IIA81d 9843 1005 8360 7055 6473 11629 12282 2438 -0.65IIa 2c 4aiii none 23649 11655 1058 13036 62206 43273 27582 42106 2.23IIa 2c 4aiv IIA81c 73511 129860 234656 285247 154851 55663 50133 28048 -0.90IIa 2c 4aiv IIA81d 517135 686944 858339 787311 674296 452434 400938 226132 -0.71IIa 2c 4aiv IIA81k 10602 12968 38861 19139 53303 -1.00IIa 2c 4aiv none 1286542 1798982 1774026 2175272 942430 817534 642151 315420 -0.85IIa 2c 4av IIA81c 82 1154 902 2026 264 820 6254 1712 -0.15IIa 2c 4av IIA81d 6262 1887 5878 18487 3158 333 -0.98IIa 2c 4av none 149 243 588 94486 5277 4670 7786 1218 -0.99IIa 2c 4bi none 1014443 1516762 1765013 1915493 1492649 1798545 1367599 1198233 -0.37IIa 2c 4bii none 25244 5710 12573 12769 -0.49IIa 2c 4biii none 288 409658 17011 12670 -1.00IIa 2c 4ci none 470 1961 26062 3395 1387 -0.29IIa 2c 4cii none 18486 10971 6927 42721 35183 4492 10612 6314 -0.85IIa 2c 4ciii none 4765 2442 6477 14189 8951 762 22186 32848 1.32IIa 2c 4civ none 350 1522 191 1432 3239 -1.00IIa 2c 4d none 523 475IIa 2c 4e none 176599 185402 86160 47386 53583 81118 22301 3852 -0.92IIa 2c none IIA81c * 362 1086 12670 8326 8688 5068 724 -1.00IIa 2c none IIA81d * 113 3345 110IIa 2c none none 5390164 5219695 5506348 2419235 2647736 2100750 1876032 2236709 -0.08Sum 12979386 13852055 13530543 13152623 11064172 10448412 9128053 9045621 -0.31
* inconsistent data format
Table 6.2.4.2 Irish Sea. Trend in effort (GT*days at sea) by derogation 2003-2007.
ANNEX REG AREA REG GEAR SPECON 2003 2004 2005 2006 2007Relative to
2003IIa 2c 4ai none 551 2128 4594 5027 -1.00IIa 2c 4aii IIA81c 232241 149959 160709 135726 113818 -0.51IIa 2c 4aii IIA81d 434271 444270 438004 420109 469824 0.08IIa 2c 4aii none 800409 872633 910823 846594 883463 0.10IIa 2c 4aiii IIA81d 2151 1824 2978 2757 876 -0.59IIa 2c 4aiii none 5840 18418 15212 7160 13604 1.33IIa 2c 4aiv IIA81c 96323 53416 18970 18299 10049 -0.90IIa 2c 4aiv IIA81d 273553 230163 148855 131536 72577 -0.73IIa 2c 4aiv IIA81k 4191 11557 -1.00IIa 2c 4aiv none 710905 303045 251279 199253 102612 -0.86IIa 2c 4av IIA81c 507 81 202 2236 632 0.25IIa 2c 4av IIA81d 5666 1032 153 -0.97IIa 2c 4av none 33095 2380 1819 2473 484 -0.99IIa 2c 4bi none 809280 596162 716345 517778 435183 -0.46IIa 2c 4bii none 6689 1280 2867 6565 -0.02IIa 2c 4biii none 104870 3362 3560 -1.00IIa 2c 4ci none 547 6995 331 152 -0.72IIa 2c 4cii none 10938 8879 1187 2205 2210 -0.80IIa 2c 4ciii none 5626 3530 144 5159 8988 0.60IIa 2c 4civ none 46 490 779 -1.00IIa 2c 4d none 45IIa 2c 4e none 29850 28273 52070 44808 10135 -0.66IIa 2c none IIA81c * 1090 1124 611 499 -1.00IIa 2c none IIA81d * 555 17IIa 2c none none 668627 809001 582085 539751 654673 -0.02Sum 4237266 3543007 3320643 2881763 2785998 -0.34
* inconsistent data format
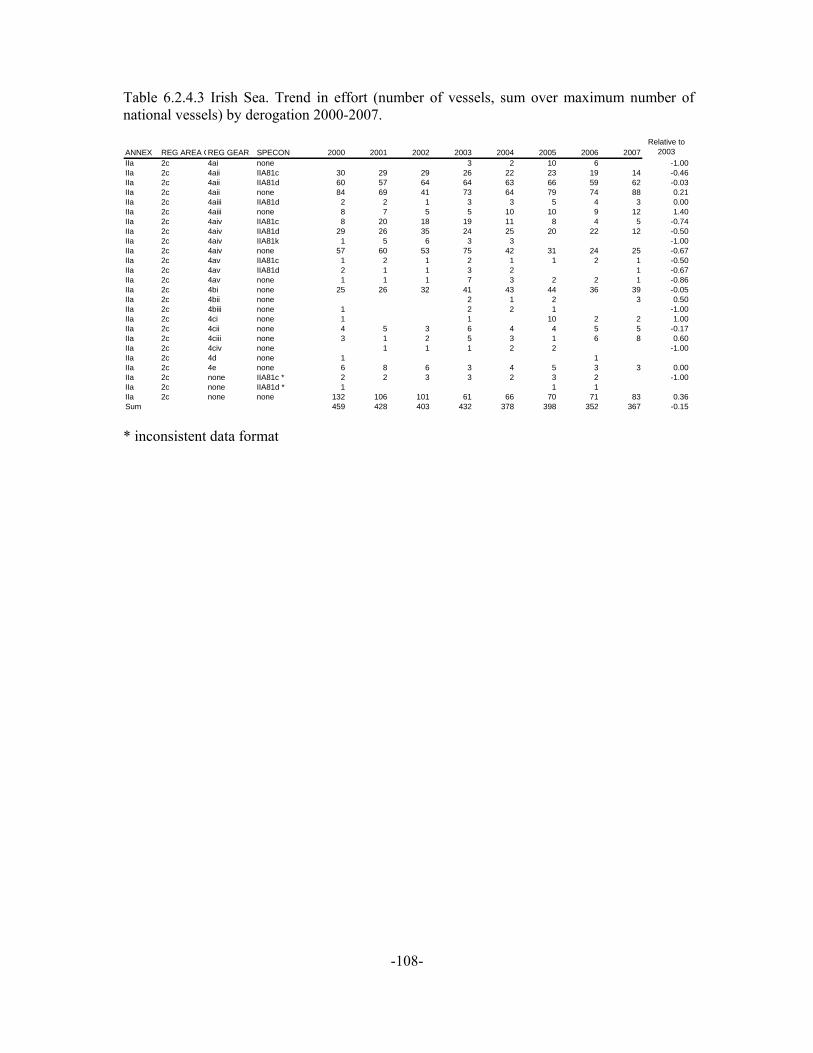
-108-
Table 6.2.4.3 Irish Sea. Trend in effort (number of vessels, sum over maximum number of national vessels) by derogation 2000-2007.
ANNEX REG AREA CREG GEAR SPECON 2000 2001 2002 2003 2004 2005 2006 2007Relative to
2003IIa 2c 4ai none 3 2 10 6 -1.00IIa 2c 4aii IIA81c 30 29 29 26 22 23 19 14 -0.46IIa 2c 4aii IIA81d 60 57 64 64 63 66 59 62 -0.03IIa 2c 4aii none 84 69 41 73 64 79 74 88 0.21IIa 2c 4aiii IIA81d 2 2 1 3 3 5 4 3 0.00IIa 2c 4aiii none 8 7 5 5 10 10 9 12 1.40IIa 2c 4aiv IIA81c 8 20 18 19 11 8 4 5 -0.74IIa 2c 4aiv IIA81d 29 26 35 24 25 20 22 12 -0.50IIa 2c 4aiv IIA81k 1 5 6 3 3 -1.00IIa 2c 4aiv none 57 60 53 75 42 31 24 25 -0.67IIa 2c 4av IIA81c 1 2 1 2 1 1 2 1 -0.50IIa 2c 4av IIA81d 2 1 1 3 2 1 -0.67IIa 2c 4av none 1 1 1 7 3 2 2 1 -0.86IIa 2c 4bi none 25 26 32 41 43 44 36 39 -0.05IIa 2c 4bii none 2 1 2 3 0.50IIa 2c 4biii none 1 2 2 1 -1.00IIa 2c 4ci none 1 1 10 2 2 1.00IIa 2c 4cii none 4 5 3 6 4 4 5 5 -0.17IIa 2c 4ciii none 3 1 2 5 3 1 6 8 0.60IIa 2c 4civ none 1 1 1 2 2 -1.00IIa 2c 4d none 1 1IIa 2c 4e none 6 8 6 3 4 5 3 3 0.00IIa 2c none IIA81c * 2 2 3 3 2 3 2 -1.00IIa 2c none IIA81d * 1 1 1IIa 2c none none 132 106 101 61 66 70 71 83 0.36Sum 459 428 403 432 378 398 352 367 -0.15
* inconsistent data format
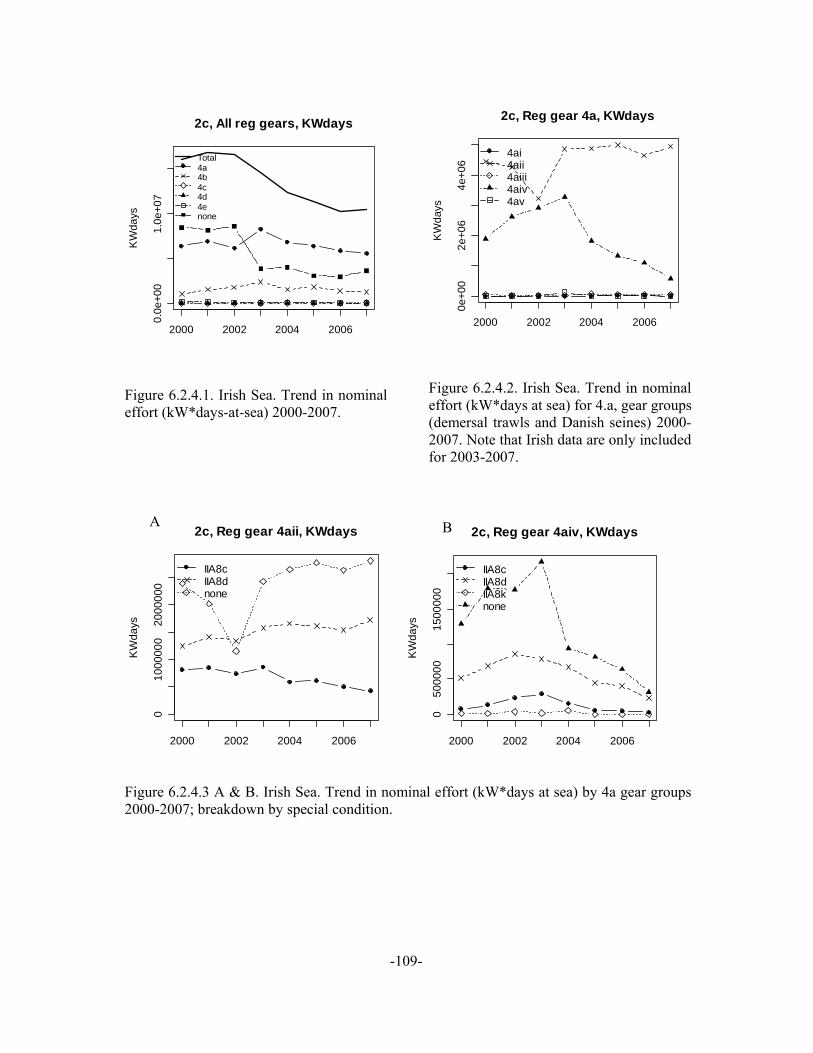
-109-
2000 2002 2004 2006
0.0e
+00
1.0e
+07
2c, All reg gears, KWdaysK
Wda
ys
Total4a4b4c4d4enone
Figure 6.2.4.1. Irish Sea. Trend in nominal effort (kW*days-at-sea) 2000-2007.
2000 2002 2004 2006
0e+0
02e
+06
4e+0
6
2c, Reg gear 4a, KWdays
KW
days
4ai4aii4aiii4aiv4av
Figure 6.2.4.2. Irish Sea. Trend in nominal effort (kW*days at sea) for 4.a, gear groups (demersal trawls and Danish seines) 2000-2007. Note that Irish data are only included for 2003-2007.
2000 2002 2004 2006
010
0000
020
0000
0
2c, Reg gear 4aii, KWdays
KW
days
IIA8cIIA8dnone
2000 2002 2004 2006
050
0000
1500
000
2c, Reg gear 4aiv, KWdays
KW
days
IIA8cIIA8dIIA8knone
Figure 6.2.4.3 A & B. Irish Sea. Trend in nominal effort (kW*days at sea) by 4a gear groups 2000-2007; breakdown by special condition.
A B
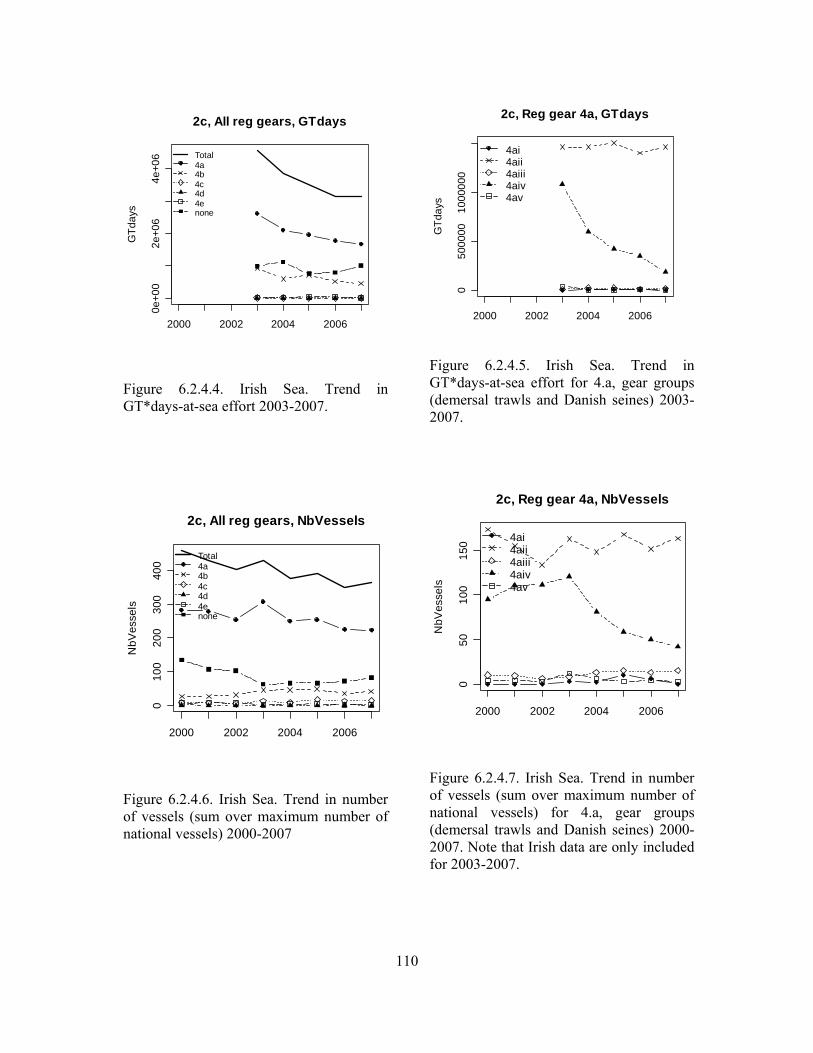
110
2000 2002 2004 2006
0e+0
02e
+06
4e+0
6
2c, All reg gears, GTdaysG
Tday
s
Total4a4b4c4d4enone
Figure 6.2.4.4. Irish Sea. Trend in GT*days-at-sea effort 2003-2007.
2000 2002 2004 2006
010
020
030
040
0
2c, All reg gears, NbVessels
NbV
esse
ls
Total4a4b4c4d4enone
Figure 6.2.4.6. Irish Sea. Trend in number of vessels (sum over maximum number of national vessels) 2000-2007
2000 2002 2004 2006
050
0000
1000
000
2c, Reg gear 4a, GTdays
GTd
ays
4ai4aii4aiii4aiv4av
Figure 6.2.4.5. Irish Sea. Trend in GT*days-at-sea effort for 4.a, gear groups (demersal trawls and Danish seines) 2003-2007.
2000 2002 2004 2006
050
100
150
2c, Reg gear 4a, NbVessels
NbV
esse
ls
4ai4aii4aiii4aiv4av
Figure 6.2.4.7. Irish Sea. Trend in number of vessels (sum over maximum number of national vessels) for 4.a, gear groups (demersal trawls and Danish seines) 2000-2007. Note that Irish data are only included for 2003-2007.
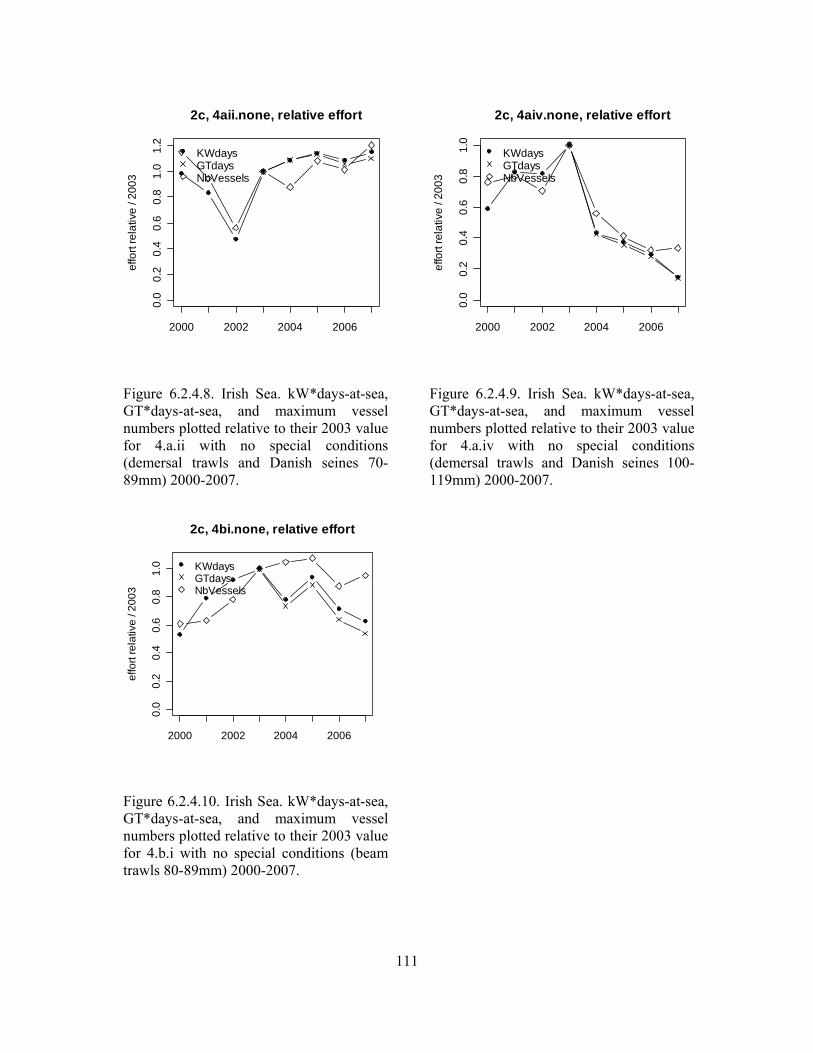
111
2000 2002 2004 2006
0.0
0.2
0.4
0.6
0.8
1.0
1.2
2c, 4aii.none, relative effortef
fort
rela
tive
/ 200
3
KWdaysGTdaysNbVessels
Figure 6.2.4.8. Irish Sea. kW*days-at-sea, GT*days-at-sea, and maximum vessel numbers plotted relative to their 2003 value for 4.a.ii with no special conditions (demersal trawls and Danish seines 70-89mm) 2000-2007.
2000 2002 2004 2006
0.0
0.2
0.4
0.6
0.8
1.0
2c, 4bi.none, relative effort
effo
rt re
lativ
e / 2
003
KWdaysGTdaysNbVessels
Figure 6.2.4.10. Irish Sea. kW*days-at-sea, GT*days-at-sea, and maximum vessel numbers plotted relative to their 2003 value for 4.b.i with no special conditions (beam trawls 80-89mm) 2000-2007.
2000 2002 2004 2006
0.0
0.2
0.4
0.6
0.8
1.0
2c, 4aiv.none, relative effort
effo
rt re
lativ
e / 2
003
KWdaysGTdaysNbVessels
Figure 6.2.4.9. Irish Sea. kW*days-at-sea, GT*days-at-sea, and maximum vessel numbers plotted relative to their 2003 value for 4.a.iv with no special conditions (demersal trawls and Danish seines 100-119mm) 2000-2007.
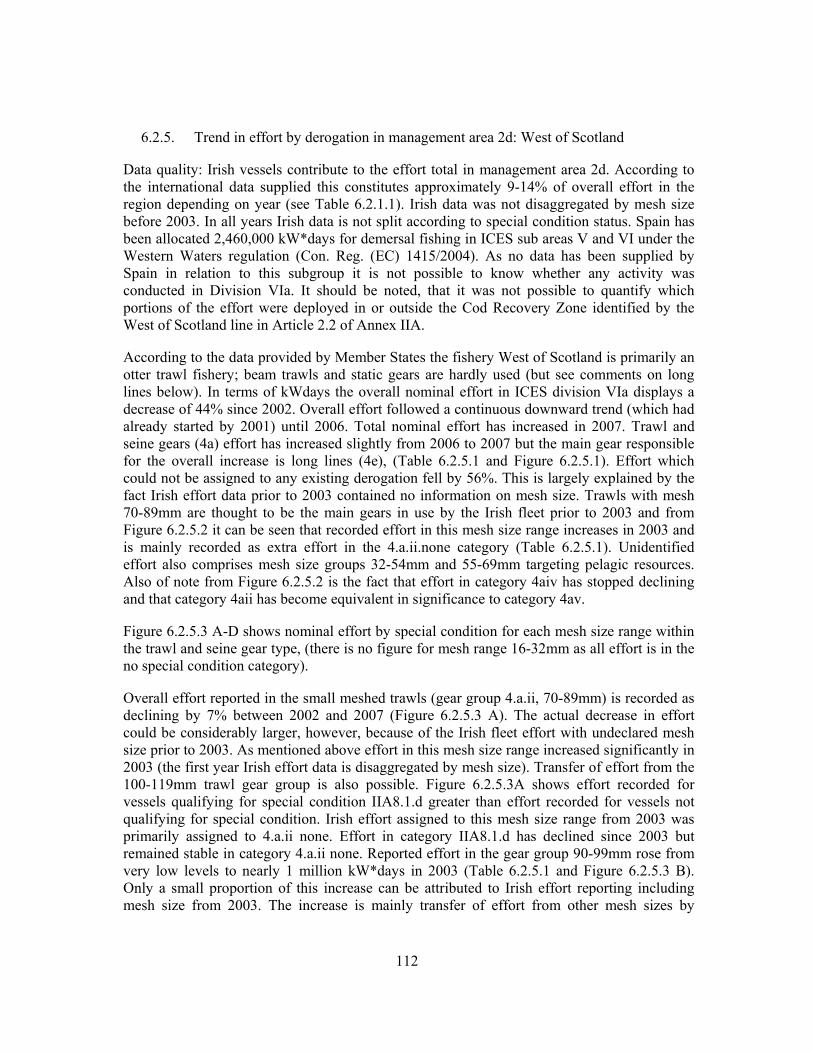
112
6.2.5. Trend in effort by derogation in management area 2d: West of Scotland
Data quality: Irish vessels contribute to the effort total in management area 2d. According to the international data supplied this constitutes approximately 9-14% of overall effort in the region depending on year (see Table 6.2.1.1). Irish data was not disaggregated by mesh size before 2003. In all years Irish data is not split according to special condition status. Spain has been allocated 2,460,000 kW*days for demersal fishing in ICES sub areas V and VI under the Western Waters regulation (Con. Reg. (EC) 1415/2004). As no data has been supplied by Spain in relation to this subgroup it is not possible to know whether any activity was conducted in Division VIa. It should be noted, that it was not possible to quantify which portions of the effort were deployed in or outside the Cod Recovery Zone identified by the West of Scotland line in Article 2.2 of Annex IIA.
According to the data provided by Member States the fishery West of Scotland is primarily an otter trawl fishery; beam trawls and static gears are hardly used (but see comments on long lines below). In terms of kWdays the overall nominal effort in ICES division VIa displays a decrease of 44% since 2002. Overall effort followed a continuous downward trend (which had already started by 2001) until 2006. Total nominal effort has increased in 2007. Trawl and seine gears (4a) effort has increased slightly from 2006 to 2007 but the main gear responsible for the overall increase is long lines (4e), (Table 6.2.5.1 and Figure 6.2.5.1). Effort which could not be assigned to any existing derogation fell by 56%. This is largely explained by the fact Irish effort data prior to 2003 contained no information on mesh size. Trawls with mesh 70-89mm are thought to be the main gears in use by the Irish fleet prior to 2003 and from Figure 6.2.5.2 it can be seen that recorded effort in this mesh size range increases in 2003 and is mainly recorded as extra effort in the 4.a.ii.none category (Table 6.2.5.1). Unidentified effort also comprises mesh size groups 32-54mm and 55-69mm targeting pelagic resources. Also of note from Figure 6.2.5.2 is the fact that effort in category 4aiv has stopped declining and that category 4aii has become equivalent in significance to category 4av.
Figure 6.2.5.3 A-D shows nominal effort by special condition for each mesh size range within the trawl and seine gear type, (there is no figure for mesh range 16-32mm as all effort is in the no special condition category).
Overall effort reported in the small meshed trawls (gear group 4.a.ii, 70-89mm) is recorded as declining by 7% between 2002 and 2007 (Figure 6.2.5.3 A). The actual decrease in effort could be considerably larger, however, because of the Irish fleet effort with undeclared mesh size prior to 2003. As mentioned above effort in this mesh size range increased significantly in 2003 (the first year Irish effort data is disaggregated by mesh size). Transfer of effort from the 100-119mm trawl gear group is also possible. Figure 6.2.5.3A shows effort recorded for vessels qualifying for special condition IIA8.1.d greater than effort recorded for vessels not qualifying for special condition. Irish effort assigned to this mesh size range from 2003 was primarily assigned to 4.a.ii none. Effort in category IIA8.1.d has declined since 2003 but remained stable in category 4.a.ii none. Reported effort in the gear group 90-99mm rose from very low levels to nearly 1 million kW*days in 2003 (Table 6.2.5.1 and Figure 6.2.5.3 B). Only a small proportion of this increase can be attributed to Irish effort reporting including mesh size from 2003. The increase is mainly transfer of effort from other mesh sizes by

113
Scottish vessels. The contribution of this gear group to the overall effort in Division VIa is relatively minor however.
Historically, the highest effort was deployed by otter trawls of 100-119mm (gear group 4.a.iv, Table 6.2.5.1 Figure 6.2.5.2 & Figure 6.2.5.3 C). Effort since 2002 has decreased substantially in the three derogations of this gear group, by 77% for vessels not qualifying for special condition, 59% for vessels with low catch of cod, plaice and sole (special condition IIA8.1.d) and 80% for vessels with low catch of cod only (IIA8.1.c), although Figure 6.2.5.3 C shows that this last derogation is only a minor component of the effort in this mesh size range. Some of the reduction in 4.a.iv effort might be explained by a switch to mesh >120mm, (gear group 4.a.v). The rate of decrease in effort in the derogation 4.a.iv IIA81d appears to be slowing and effort in this derogation still exceeds overall effort in gear group 4.a.v. The pattern for 4.a.iv none is similar to that for 4.a.iv IIA81d and in this category recorded effort has increased slightly from 2006 to 2007.
Effort in the gear group 4.a.v (mesh ≥120mm) is mostly conducted by vessels not qualifying for special conditions and effort in 2007 for this derogation is only 5% less than the effort recorded in 2002 (Table 6.2.5.1 and Figures 6.2.5.2 and 6.2.5.3 D). Figure 6.2.5.3D however shows how effort in this derogation rose sharply between 2001 and 2003 but has since fallen significantly in all subsequent years.
Table 6.2.5.2 shows effort in terms of gross tonnage days at sea (GT*days at sea). This measure of effort by basic gear category is shown in Figure 6.2.5.4. As for kW*days, the effort is dominated by demersal trawl gears. Attention is therefore concentrated on investigating the demersal trawl gears by mesh size category (Figure 6.2.5.5) and then the derogations within each mesh size category (Figure 6.2.5.6 A-D). However, long lines (4e) show a noticeable increase since 2003 and, as for kW*days, seem the primary reason for an overall increase in GT*days at sea recorded in the area between 2006 and 2007. This category is considered further when comparing between effort measures. From Table 6.2.5.2 and Figures 6.2.5.4 to 6.2.5.6 it can be seen the evolution of fishing effort indicated by both effort measures is very similar.
Table 6.2.5.3 records number of vessels by derogation. To record an annual number of vessels the maximum number from any of the four quarters within the year is chosen. Because vessels are not necessarily assigned exclusively to a single derogation, some multiple counting may occur if summing across derogations. The number of vessels by basic gear category is shown in Figure 6.2.5.7. As might be expected from the kW*days and GT*days results the large majority of vessels are recorded as using demersal trawl gear. The increase in this category in 2003 again reflects records from Ireland including mesh size from 2003, (before this the vessels may well have been unclassified, i.e. assigned to ‘none none’).
For the most significant categories of trawl/seine gear and for long line gears the three measures of kW*days, GT*days and number of vessels are compared by standardising against values for 2003. These comparisons are shown in Figures 6.2.5.8 to 6.2.5.13. For category 4.a.ii none there is the indication number of vessels and kWdays have remained relatively constant since 2003 while GT*days has declined which would indicate a greater proportion of effort by smaller boats. For category 4.a.ii IIA81d the trends over time between the three measures are all very consistent. This would suggest changes in the kW*days at sea and GT*days at sea measures reflect changes in the number of vessels operating in the area. For

114
derogation 4.a.iv IIA81d Figure 6.2.5.11 suggests that within an overall picture of declining effort and vessel numbers, effort per vessel fell up to 2003 but has increased again since. For derogation 4.a.iv.none, however, the rate of decrease in number of vessels has slowed since 2003 such that the number looks to have become constant. The kWdays and GTdays measures continued to fall more quickly than number of vessels before recovering in 2007. For derogation 4.a.v.none the number of vessels has remained effectively constant since 2005 but the kWdays and GTdays measures have continued to fall.
Figure 6.2.5.13 shows the effort comparisons for longlines (gear 4e). It clearly indicates an increase in effort per vessel since 2003 as well as an increase in the number of vessels since 2005.
Table 6.2.5.1 West of Scotland. Trend in nominal effort (kW*days at sea) by derogation, 2000-2007.
ANNEX REG AREA CREG GEAR SPECON 2000 2001 2002 2003 2004 2005 2006 2007 Rel.Change to 2002IIa 2d 4ai none 198301 50818 59143 92633 78388 63385 32513 21264 -0.64IIa 2d 4aii IIA81c 123551 147168 168899 123861 61960 29857 36123 46075 -0.73IIa 2d 4aii IIA81d 4265875 4379082 4591156 4835168 4124056 3625138 3377317 3248673 -0.29IIa 2d 4aii none 962330 685744 391507 1360052 1480493 1421405 1437070 1508092 2.85IIa 2d 4aiii IIA81d 447 3275 4056 8832 14156 21766 48405 29802 6.35IIa 2d 4aiii none 5403 7826 7188 896317 1058559 662516 706876 1095534 151.41IIa 2d 4aiv IIA81c 68043 72223 128437 74352 42049 14101 22890 25675 -0.80IIa 2d 4aiv IIA81d 10734069 9932041 8603926 5444083 4390955 4849918 3744744 3537323 -0.59IIa 2d 4aiv none 7036981 7722944 5150138 2863142 1951446 1210747 929323 1162017 -0.77IIa 2d 4av IIA81c 894 5564 749 20143 21.53IIa 2d 4av IIA81d 61256 54510 79751 293039 316909 391431 209277 176904 1.22IIa 2d 4av none 16775 46690 1403705 3768062 2859945 1833914 1496951 1331246 -0.05IIa 2d 4bi none 22310 2391 13658 25947 9874 9325 1252IIa 2d 4biii IIA81c 30385 35077IIa 2d 4biii none 98149 84541 103897 -1.00IIa 2d 4biv IIA81c 1519IIa 2d 4biv none 4894 60023 151480 119958 81194IIa 2d 4ci none 3620 19769 51 13723 128 1703 -0.91IIa 2d 4cii none 19784 45983 25310 32140 7957 44998 42000 173548 5.86IIa 2d 4ciii none 60143 128117 55521 1026 44981 1468 512 -1.00IIa 2d 4civ none 260651 251728 219473 488537 432635 218291 87952 81591 -0.63IIa 2d 4d IIA81g 64768IIa 2d 4d none 2633 1416 636 320IIa 2d 4e none 542649 561290 479614 355429 470594 556972 755720 1281919 1.67IIa 2d none IIA81c 892 656 1079 0 0 -1.00IIa 2d none IIA81d 1432 402 1561IIa 2d none none 12957828 13065177 16346452 15710266 18659378 16446534 13857749 12881814 -0.21Sum 37384253 37244034 37912511 36506187 36178572 31571880 26879207 26625087 -0.30

115
Table 6.2.5.2 West of Scotland. Trend in effort (GT*days at sea) by derogation, 2003-2007.
ANNEX REG AREA REG GEAR SPECON 2003 2004 2005 2006 2007 Rel. Change to 2003IIa 2d 4ai none 33304 38454 20210 15169 8834 -0.73IIa 2d 4aii IIA81c 32919 18251 11029 13488 18860 -0.43IIa 2d 4aii IIA81d 1134055 957015 824145 770649 751288 -0.34IIa 2d 4aii none 450860 482338 459906 449222 406745 -0.10IIa 2d 4aiii IIA81d 1514 4408 5901 12318 9906 5.54IIa 2d 4aiii none 279067 312742 204640 215329 313210 0.12IIa 2d 4aiv IIA81c 28628 15662 4938 8464 9505 -0.67IIa 2d 4aiv IIA81d 1916722 1523764 1665878 1274665 1208892 -0.37IIa 2d 4aiv none 1091007 730061 469903 362556 450875 -0.59IIa 2d 4av IIA81c 2054 276 7436IIa 2d 4av IIA81d 125928 140406 167417 92259 77957 -0.38IIa 2d 4av none 1589806 1256749 803085 633892 569703 -0.64IIa 2d 4bi none 6140 9354 3876 2967 636 -0.90IIa 2d 4biii IIA81c 14060 14451 -1.00IIa 2d 4biv IIA81c 703IIa 2d 4biv none 19249 50073 44549 31348 -1.00IIa 2d 4ci none 11 9463 29 340 29.91IIa 2d 4cii none 13212 2480 16541 13369 57830 3.38IIa 2d 4ciii none 22236 432 25022 145 75 -1.00IIa 2d 4civ none 228423 220953 117035 37495 34800 -0.85IIa 2d 4d none 30 89 -1.00IIa 2d 4e none 219809 271845 372913 448661 637336 1.90IIa 2d none IIA81c 248 124IIa 2d none IIA81d 105 259IIa 2d none none 7685148 10333006 9341072 8433761 7666967 0.00Sum 14892128 16392947 14560372 12816292 12231195 -0.18
Table 6.2.5.3 West of Scotland. Trend in effort (number of vessels, sum over maximum number of national vessels) by derogation, 2000-2007.
ANNEX REG AREA REG GEAR SPECON 2000 2001 2002 2003 2004 2005 2006 2007 Rel. Change to 2002IIa 2d 4ai none 11 6 7 12 7 11 9 11 0.57IIa 2d 4aii IIA81c 8 8 12 10 8 5 6 3 -0.75IIa 2d 4aii IIA81d 167 170 184 181 145 113 122 113 -0.39IIa 2d 4aii none 67 44 20 50 59 53 52 61 2.05IIa 2d 4aiii IIA81d 1 2 2 1 3 2 3 4 1.00IIa 2d 4aiii none 4 3 3 50 53 35 41 61 19.33IIa 2d 4aiv IIA81c 5 3 7 6 2 2 2 2 -0.71IIa 2d 4aiv IIA81d 81 87 76 58 38 33 30 20 -0.74IIa 2d 4aiv none 197 193 142 92 65 50 42 42 -0.70IIa 2d 4av IIA81c 1 1 1 1 0.00IIa 2d 4av IIA81d 4 3 7 6 7 7 4 2 -0.71IIa 2d 4av none 7 10 54 89 57 40 40 38 -0.30IIa 2d 4bi none 3 1 2 4 2 2 1IIa 2d 4biii IIA81c 1 1IIa 2d 4biii none 3 3 1 -1.00IIa 2d 4biv IIA81c 1IIa 2d 4biv none 1 1 2 1 1IIa 2d 4ci none 1 2 1 1 1 2 0.00IIa 2d 4cii none 3 3 2 4 3 4 3 9 3.50IIa 2d 4ciii none 5 5 2 1 1 2 1 -0.80IIa 2d 4civ none 13 14 6 11 11 7 3 10 0.67IIa 2d 4d IIA81g 1IIa 2d 4d none 2 1 1 1IIa 2d 4e none 18 14 14 11 10 10 15 20 0.43IIa 2d none IIA81c 1 1 1 1 1 -1.00IIa 2d none IIA81d 1 1 1IIa 2d none none 137 117 125 117 125 107 114 109 -0.13Sum 734 690 671 706 605 487 493 510 -0.24
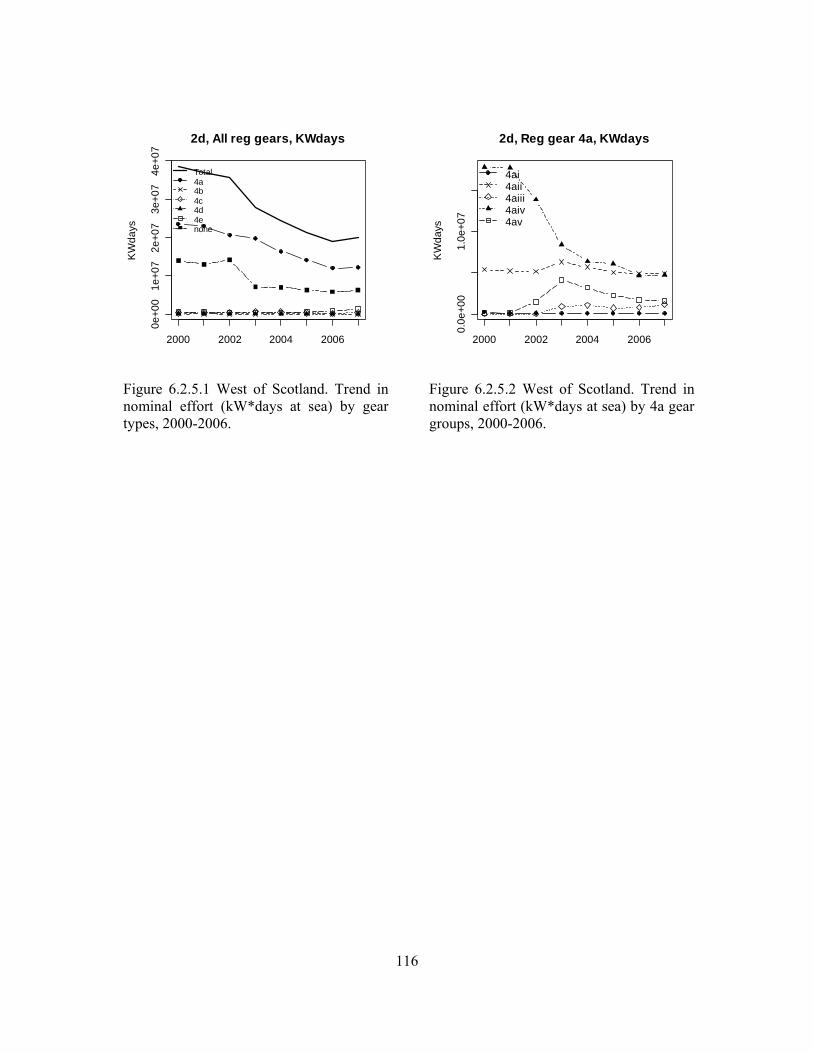
116
2000 2002 2004 2006
0e+0
01e
+07
2e+0
73e
+07
4e+0
72d, All reg gears, KWdays
KW
days
Total4a4b4c4d4enone
Figure 6.2.5.1 West of Scotland. Trend in nominal effort (kW*days at sea) by gear types, 2000-2006.
2000 2002 2004 2006
0.0e
+00
1.0e
+07
2d, Reg gear 4a, KWdays
KW
days
4ai4aii4aiii4aiv4av
Figure 6.2.5.2 West of Scotland. Trend in nominal effort (kW*days at sea) by 4a gear groups, 2000-2006.
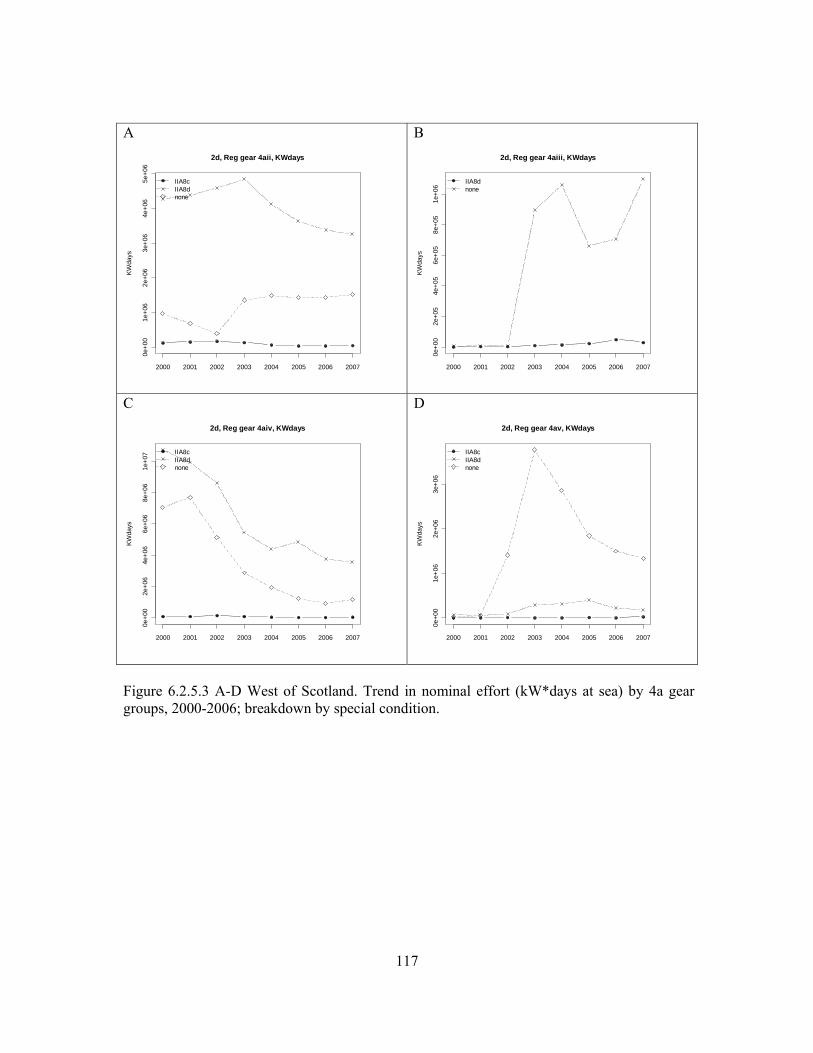
117
A
2000 2001 2002 2003 2004 2005 2006 2007
0e+0
01e
+06
2e+0
63e
+06
4e+0
65e
+06
2d, Reg gear 4aii, KWdays
KWda
ys
IIA8cIIA8dnone
B
2000 2001 2002 2003 2004 2005 2006 2007
0e+0
02e
+05
4e+0
56e
+05
8e+0
51e
+06
2d, Reg gear 4aiii, KWdays
KWda
ys
IIA8dnone
C
2000 2001 2002 2003 2004 2005 2006 2007
0e+0
02e
+06
4e+0
66e
+06
8e+0
61e
+07
2d, Reg gear 4aiv, KWdays
KWda
ys
IIA8cIIA8dnone
D
2000 2001 2002 2003 2004 2005 2006 2007
0e+0
01e
+06
2e+0
63e
+06
2d, Reg gear 4av, KWdaysKW
days
IIA8cIIA8dnone
Figure 6.2.5.3 A-D West of Scotland. Trend in nominal effort (kW*days at sea) by 4a gear groups, 2000-2006; breakdown by special condition.
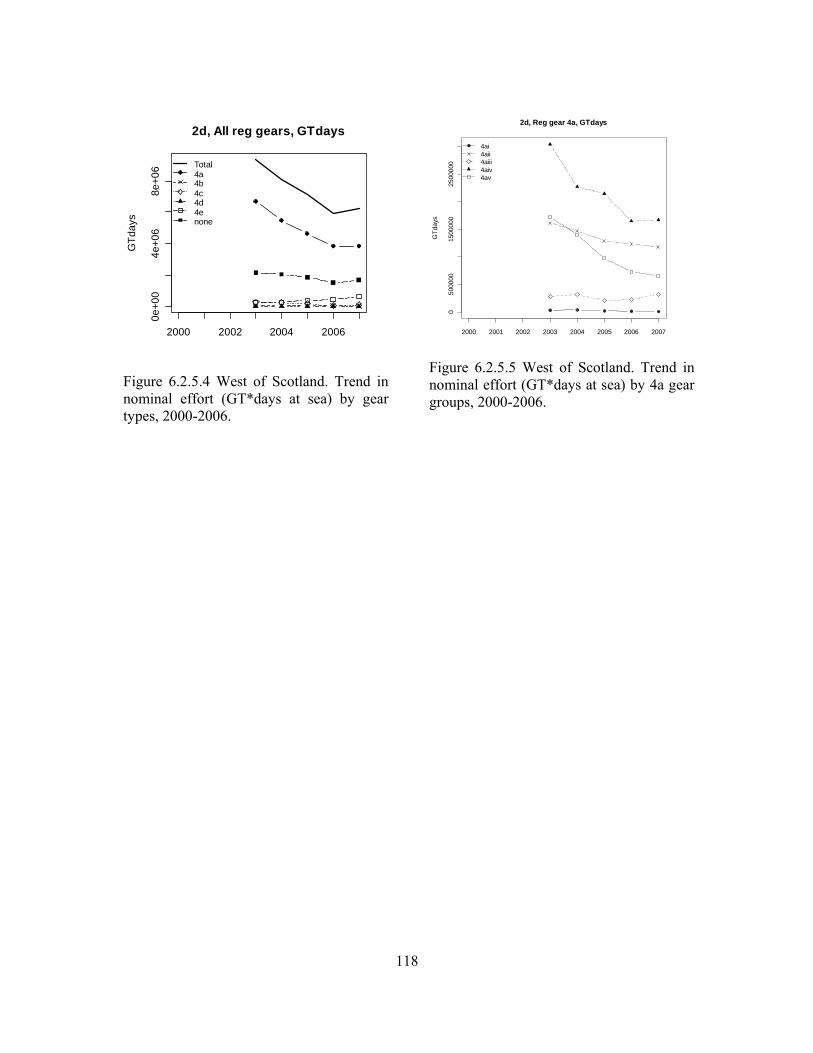
118
2000 2002 2004 2006
0e+0
04e
+06
8e+0
6
2d, All reg gears, GTdaysG
Tday
s
Total4a4b4c4d4enone
Figure 6.2.5.4 West of Scotland. Trend in nominal effort (GT*days at sea) by gear types, 2000-2006.
2000 2001 2002 2003 2004 2005 2006 2007
050
0000
1500
000
2500
000
2d, Reg gear 4a, GTdays
GTd
ays
4ai4aii4aiii4aiv4av
Figure 6.2.5.5 West of Scotland. Trend in nominal effort (GT*days at sea) by 4a gear groups, 2000-2006.
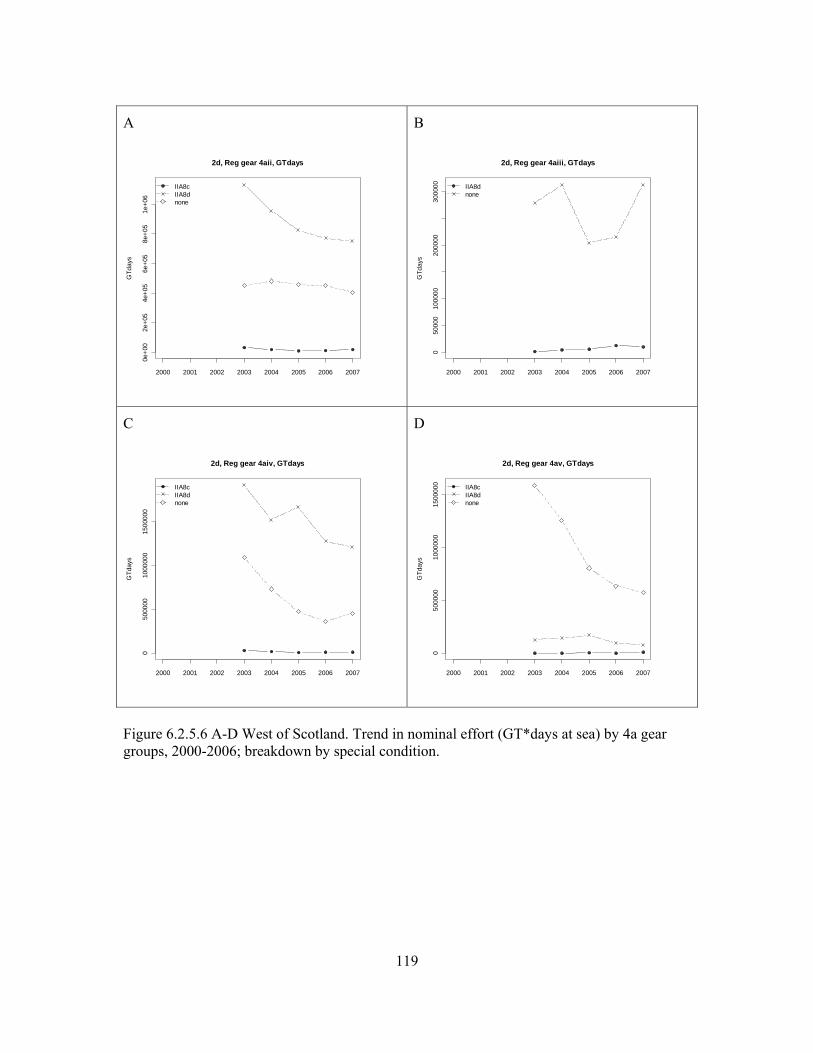
119
A
2000 2001 2002 2003 2004 2005 2006 2007
0e+0
02e
+05
4e+0
56e
+05
8e+0
51e
+06
2d, Reg gear 4aii, GTdays
GTd
ays
IIA8cIIA8dnone
B
2000 2001 2002 2003 2004 2005 2006 2007
050
000
1000
0020
0000
3000
00
2d, Reg gear 4aiii, GTdays
GTd
ays
IIA8dnone
C
2000 2001 2002 2003 2004 2005 2006 2007
050
0000
1000
000
1500
000
2d, Reg gear 4aiv, GTdays
GTd
ays
IIA8cIIA8dnone
D
2000 2001 2002 2003 2004 2005 2006 2007
050
0000
1000
000
1500
000
2d, Reg gear 4av, GTdays
GTd
ays
IIA8cIIA8dnone
Figure 6.2.5.6 A-D West of Scotland. Trend in nominal effort (GT*days at sea) by 4a gear groups, 2000-2006; breakdown by special condition.
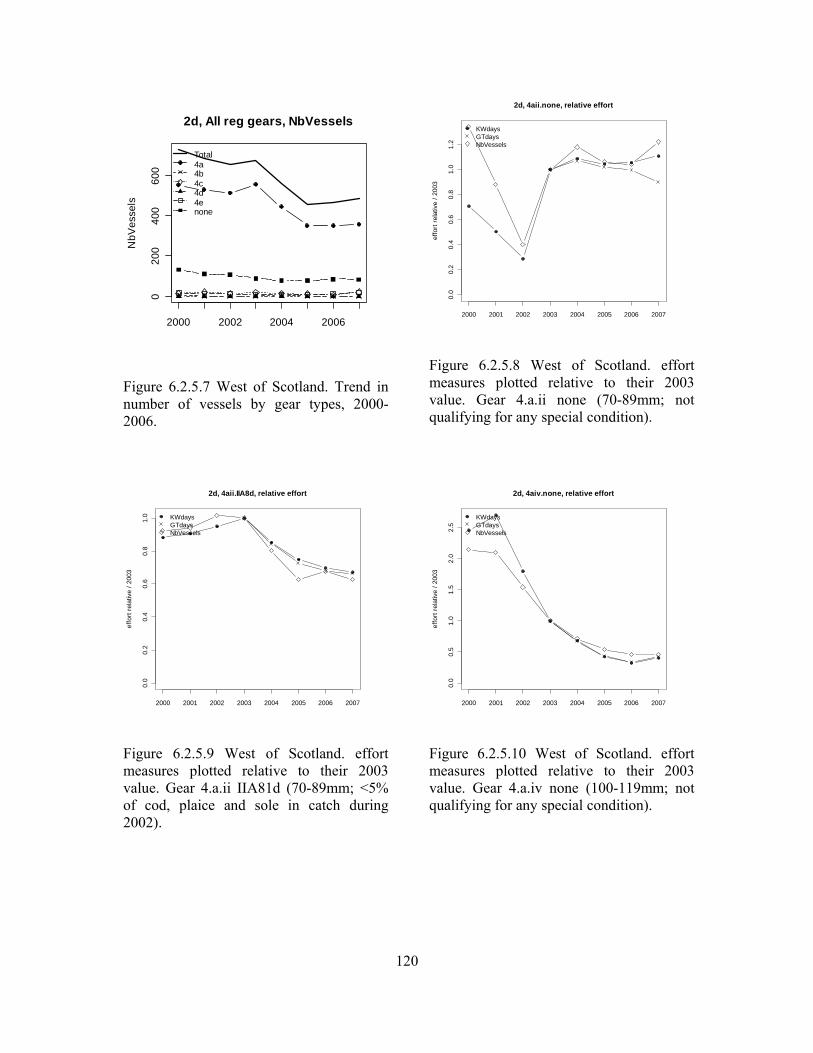
120
2000 2002 2004 2006
020
040
060
0
2d, All reg gears, NbVesselsN
bVes
sels
Total4a4b4c4d4enone
Figure 6.2.5.7 West of Scotland. Trend in number of vessels by gear types, 2000-2006.
2000 2001 2002 2003 2004 2005 2006 2007
0.0
0.2
0.4
0.6
0.8
1.0
1.2
2d, 4aii.none, relative effort
effo
rt re
lativ
e / 2
003
KWdaysGTdaysNbVessels
Figure 6.2.5.8 West of Scotland. effort measures plotted relative to their 2003 value. Gear 4.a.ii none (70-89mm; not qualifying for any special condition).
2000 2001 2002 2003 2004 2005 2006 2007
0.0
0.2
0.4
0.6
0.8
1.0
2d, 4aii.IIA8d, relative effort
effo
rt re
lativ
e / 2
003
KWdaysGTdaysNbVessels
Figure 6.2.5.9 West of Scotland. effort measures plotted relative to their 2003 value. Gear 4.a.ii IIA81d (70-89mm; <5% of cod, plaice and sole in catch during 2002).
2000 2001 2002 2003 2004 2005 2006 2007
0.0
0.5
1.0
1.5
2.0
2.5
2d, 4aiv.none, relative effort
effo
rt re
lativ
e / 2
003
KWdaysGTdaysNbVessels
Figure 6.2.5.10 West of Scotland. effort measures plotted relative to their 2003 value. Gear 4.a.iv none (100-119mm; not qualifying for any special condition).
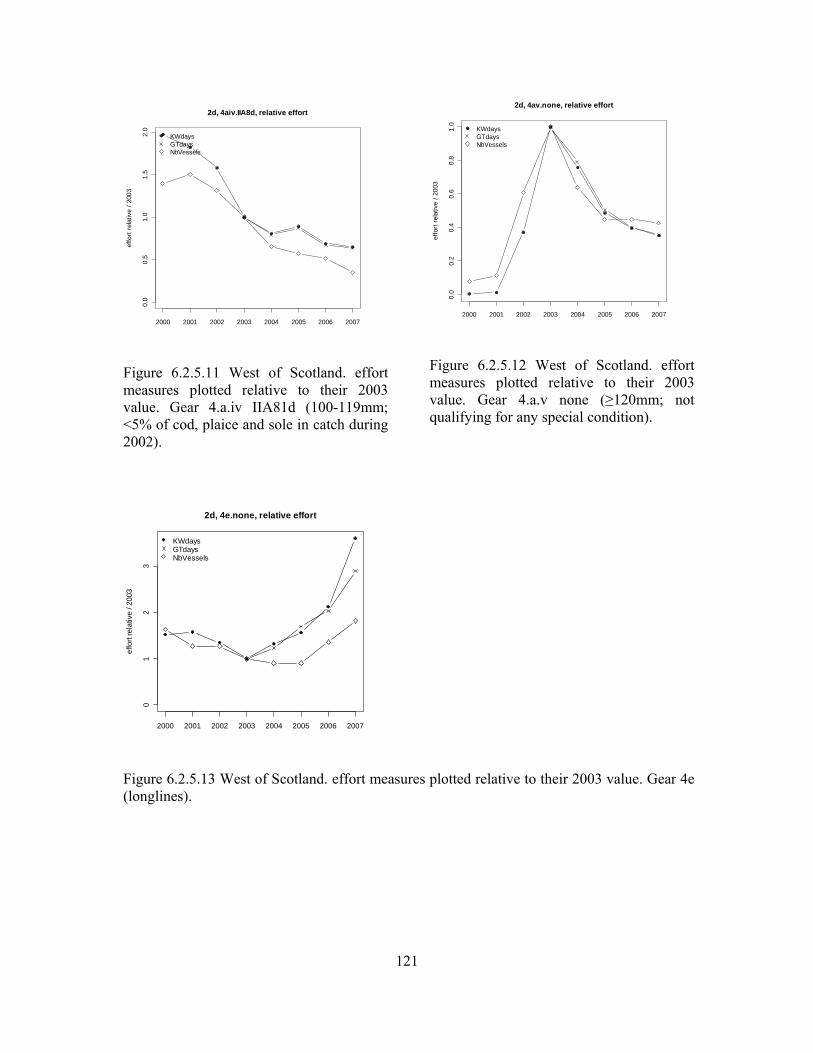
121
2000 2001 2002 2003 2004 2005 2006 2007
0.0
0.5
1.0
1.5
2.0
2d, 4aiv.IIA8d, relative effort
effo
rt re
lativ
e / 2
003
KWdaysGTdaysNbVessels
Figure 6.2.5.11 West of Scotland. effort measures plotted relative to their 2003 value. Gear 4.a.iv IIA81d (100-119mm; <5% of cod, plaice and sole in catch during 2002).
2000 2001 2002 2003 2004 2005 2006 2007
0.0
0.2
0.4
0.6
0.8
1.0
2d, 4av.none, relative effort
effo
rt re
lativ
e / 2
003
KWdaysGTdaysNbVessels
Figure 6.2.5.12 West of Scotland. effort measures plotted relative to their 2003 value. Gear 4.a.v none (≥120mm; not qualifying for any special condition).
2000 2001 2002 2003 2004 2005 2006 2007
01
23
2d, 4e.none, relative effort
effo
rt re
lativ
e / 2
003
KWdaysGTdaysNbVessels
Figure 6.2.5.13 West of Scotland. effort measures plotted relative to their 2003 value. Gear 4e (longlines).
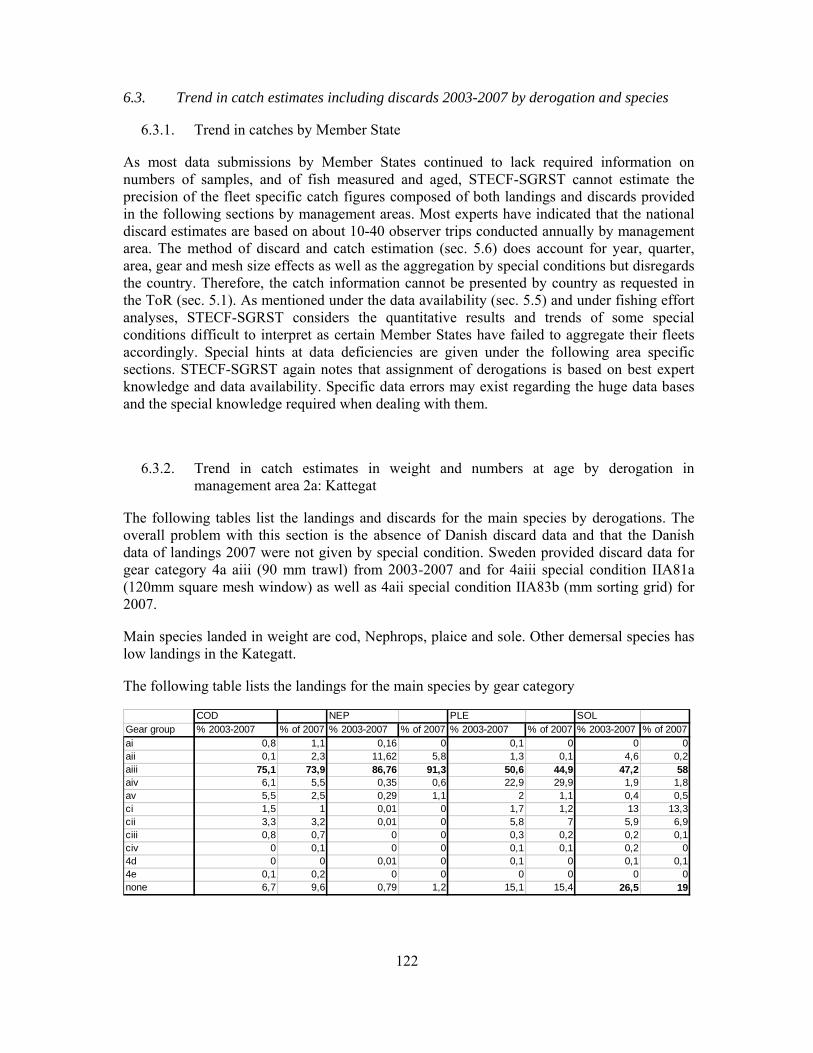
122
6.3. Trend in catch estimates including discards 2003-2007 by derogation and species
6.3.1. Trend in catches by Member State
As most data submissions by Member States continued to lack required information on numbers of samples, and of fish measured and aged, STECF-SGRST cannot estimate the precision of the fleet specific catch figures composed of both landings and discards provided in the following sections by management areas. Most experts have indicated that the national discard estimates are based on about 10-40 observer trips conducted annually by management area. The method of discard and catch estimation (sec. 5.6) does account for year, quarter, area, gear and mesh size effects as well as the aggregation by special conditions but disregards the country. Therefore, the catch information cannot be presented by country as requested in the ToR (sec. 5.1). As mentioned under the data availability (sec. 5.5) and under fishing effort analyses, STECF-SGRST considers the quantitative results and trends of some special conditions difficult to interpret as certain Member States have failed to aggregate their fleets accordingly. Special hints at data deficiencies are given under the following area specific sections. STECF-SGRST again notes that assignment of derogations is based on best expert knowledge and data availability. Specific data errors may exist regarding the huge data bases and the special knowledge required when dealing with them.
6.3.2. Trend in catch estimates in weight and numbers at age by derogation in management area 2a: Kattegat
The following tables list the landings and discards for the main species by derogations. The overall problem with this section is the absence of Danish discard data and that the Danish data of landings 2007 were not given by special condition. Sweden provided discard data for gear category 4a aiii (90 mm trawl) from 2003-2007 and for 4aiii special condition IIA81a (120mm square mesh window) as well as 4aii special condition IIA83b (mm sorting grid) for 2007.
Main species landed in weight are cod, Nephrops, plaice and sole. Other demersal species has low landings in the Kategatt.
The following table lists the landings for the main species by gear category
COD NEP PLE SOLGear group % 2003-2007 % of 2007 % 2003-2007 % of 2007 % 2003-2007 % of 2007 % 2003-2007 % of 2007ai 0,8 1,1 0,16 0 0,1 0 0 0aii 0,1 2,3 11,62 5,8 1,3 0,1 4,6 0,2aiii 75,1 73,9 86,76 91,3 50,6 44,9 47,2 58aiv 6,1 5,5 0,35 0,6 22,9 29,9 1,9 1,8av 5,5 2,5 0,29 1,1 2 1,1 0,4 0,5ci 1,5 1 0,01 0 1,7 1,2 13 13,3cii 3,3 3,2 0,01 0 5,8 7 5,9 6,9ciii 0,8 0,7 0 0 0,3 0,2 0,2 0,1civ 0 0,1 0 0 0,1 0,1 0,2 04d 0 0 0,01 0 0,1 0 0,1 0,14e 0,1 0,2 0 0 0 0 0 0none 6,7 9,6 0,79 1,2 15,1 15,4 26,5 19
123
Landing of Cod, Nephrops, Plaice and sole in Kattegatt by gear category presented as % of total 2007 and % of average landings 2003-2007.
Amongst the gear groups 90 mm trawl (4aii) takes the largest share of the landings 73 % of the cod landings, 91 % of the Nephrops landing, 50 % of the Plaice landings and 58 % of the landings of Sole 2007. The gear group (>100-<120) are responsible for a large share of the landings of Plaice, 30% but a limited amount of the landings of the other species. The unspecified group (none) are responsible for 19 % of the sole landings, The none group is exclusively a fact of the inclusion of vessels less than 10 m in the Danish catch data base.
The absence of discard data from the Danish fisheries makes it impossible to estimate discard - and catch rates from the entire Kattegat fisheries. Due to differences in national management systems as well as differences in fishing patterns it is not possible to consider the Swedish discard data representative for the Danish fishery. In Sweden the fishery is managed by weekly rations while Denmark in 2007 introduced individual vessel quotas. The fisheries in Sweden is also characterised by long periods of prohibition to land different species, particularly cod (for example in 2006 the cod fishery in Kattegatt were closed for 8 months). The different management regimes have implications on the discard patterns of fish, particularly fish discarded for quota reasons which for cod is an important problem in the Kattegat.
Table 6.3.2.1 and 6.3.2.2 show an overview of landed amount, discarded amount and discard rate for different species by special condition. The discard figures in the table should only be considered indicative since Swedish discard ratios, which could not be considered representative for the Danish fisheries, have been used to estimate Danish discards due to absence of Danish discard data in 2007. Further note that the Danish landings data for 2007 only are available by gear categories and not by special condition. Absence of this detailed data makes impact assessment of different special conditions on fishing mortality impossible.
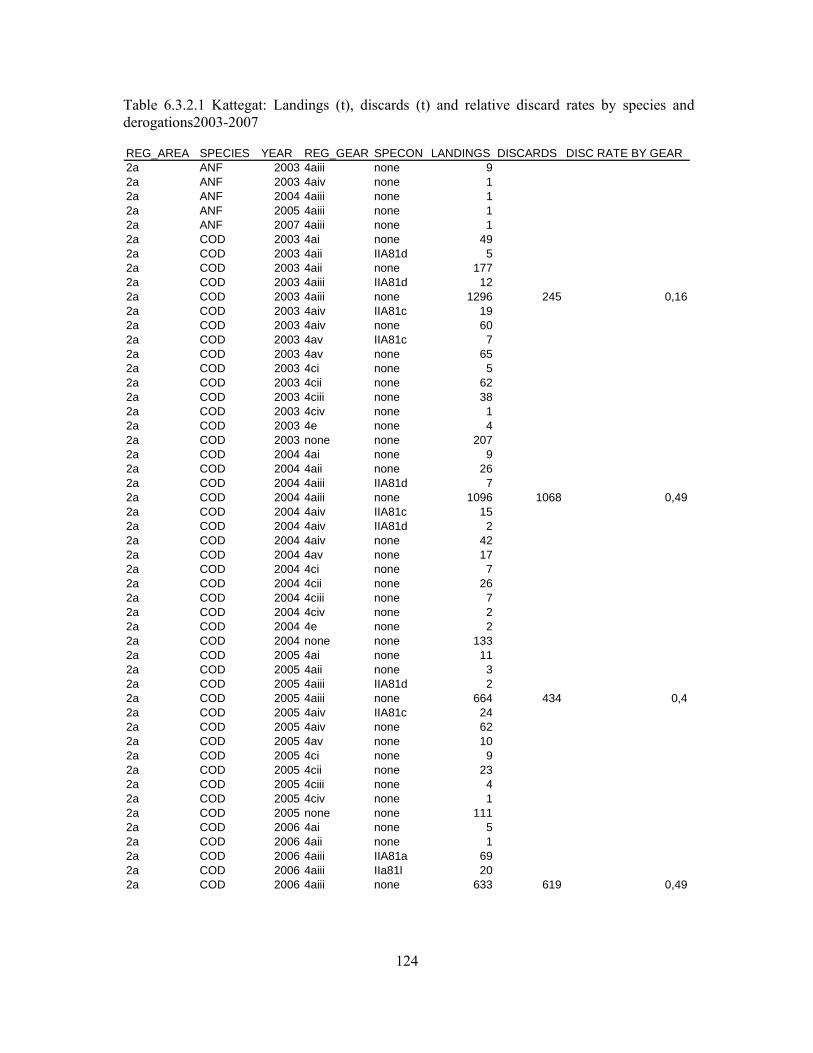
124
Table 6.3.2.1 Kattegat: Landings (t), discards (t) and relative discard rates by species and derogations2003-2007
REG_AREA SPECIES YEAR REG_GEAR SPECON LANDINGS DISCARDS DISC RATE BY GEAR2a ANF 2003 4aiii none 92a ANF 2003 4aiv none 12a ANF 2004 4aiii none 12a ANF 2005 4aiii none 12a ANF 2007 4aiii none 12a COD 2003 4ai none 492a COD 2003 4aii IIA81d 52a COD 2003 4aii none 1772a COD 2003 4aiii IIA81d 122a COD 2003 4aiii none 1296 245 0,162a COD 2003 4aiv IIA81c 192a COD 2003 4aiv none 602a COD 2003 4av IIA81c 72a COD 2003 4av none 652a COD 2003 4ci none 52a COD 2003 4cii none 622a COD 2003 4ciii none 382a COD 2003 4civ none 12a COD 2003 4e none 42a COD 2003 none none 2072a COD 2004 4ai none 92a COD 2004 4aii none 262a COD 2004 4aiii IIA81d 72a COD 2004 4aiii none 1096 1068 0,492a COD 2004 4aiv IIA81c 152a COD 2004 4aiv IIA81d 22a COD 2004 4aiv none 422a COD 2004 4av none 172a COD 2004 4ci none 72a COD 2004 4cii none 262a COD 2004 4ciii none 72a COD 2004 4civ none 22a COD 2004 4e none 22a COD 2004 none none 1332a COD 2005 4ai none 112a COD 2005 4aii none 32a COD 2005 4aiii IIA81d 22a COD 2005 4aiii none 664 434 0,42a COD 2005 4aiv IIA81c 242a COD 2005 4aiv none 622a COD 2005 4av none 102a COD 2005 4ci none 92a COD 2005 4cii none 232a COD 2005 4ciii none 42a COD 2005 4civ none 12a COD 2005 none none 1112a COD 2006 4ai none 52a COD 2006 4aii none 12a COD 2006 4aiii IIA81a 692a COD 2006 4aiii IIa81l 202a COD 2006 4aiii none 633 619 0,49
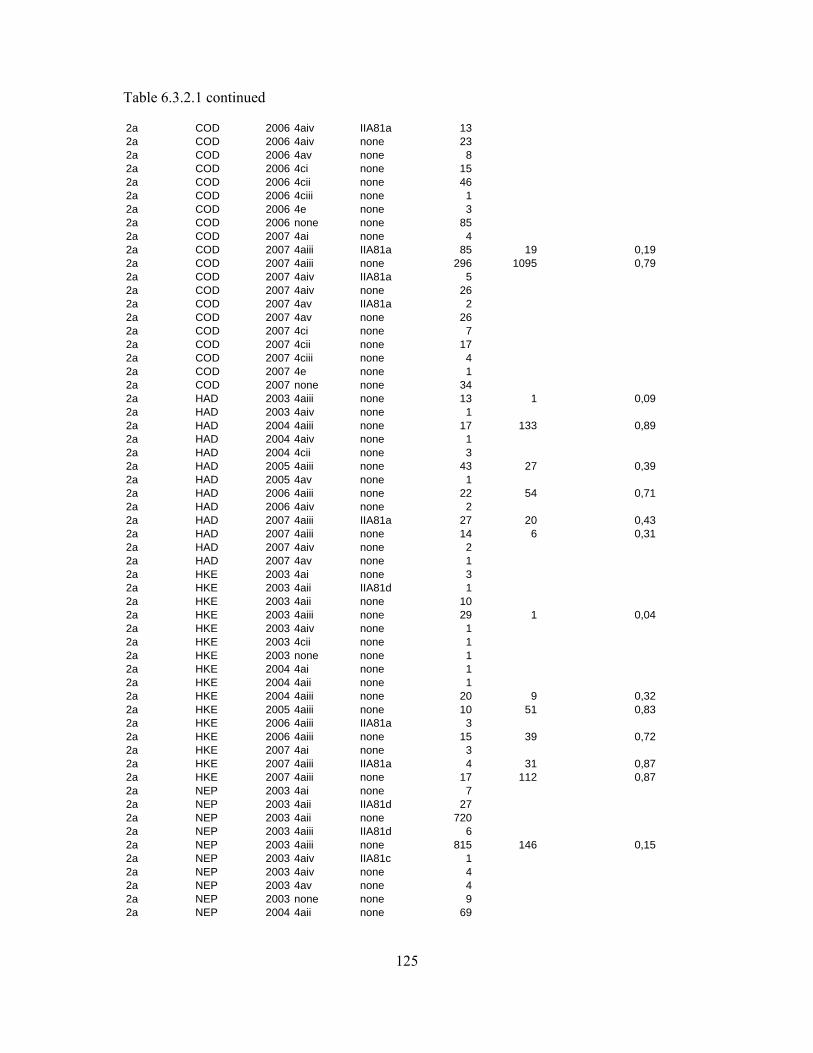
125
Table 6.3.2.1 continued
2a COD 2006 4aiv IIA81a 132a COD 2006 4aiv none 232a COD 2006 4av none 82a COD 2006 4ci none 152a COD 2006 4cii none 462a COD 2006 4ciii none 12a COD 2006 4e none 32a COD 2006 none none 852a COD 2007 4ai none 42a COD 2007 4aiii IIA81a 85 19 0,192a COD 2007 4aiii none 296 1095 0,792a COD 2007 4aiv IIA81a 52a COD 2007 4aiv none 262a COD 2007 4av IIA81a 22a COD 2007 4av none 262a COD 2007 4ci none 72a COD 2007 4cii none 172a COD 2007 4ciii none 42a COD 2007 4e none 12a COD 2007 none none 342a HAD 2003 4aiii none 13 1 0,092a HAD 2003 4aiv none 12a HAD 2004 4aiii none 17 133 0,892a HAD 2004 4aiv none 12a HAD 2004 4cii none 32a HAD 2005 4aiii none 43 27 0,392a HAD 2005 4av none 12a HAD 2006 4aiii none 22 54 0,712a HAD 2006 4aiv none 22a HAD 2007 4aiii IIA81a 27 20 0,432a HAD 2007 4aiii none 14 6 0,312a HAD 2007 4aiv none 22a HAD 2007 4av none 12a HKE 2003 4ai none 32a HKE 2003 4aii IIA81d 12a HKE 2003 4aii none 102a HKE 2003 4aiii none 29 1 0,042a HKE 2003 4aiv none 12a HKE 2003 4cii none 12a HKE 2003 none none 12a HKE 2004 4ai none 12a HKE 2004 4aii none 12a HKE 2004 4aiii none 20 9 0,322a HKE 2005 4aiii none 10 51 0,832a HKE 2006 4aiii IIA81a 32a HKE 2006 4aiii none 15 39 0,722a HKE 2007 4ai none 32a HKE 2007 4aiii IIA81a 4 31 0,872a HKE 2007 4aiii none 17 112 0,872a NEP 2003 4ai none 72a NEP 2003 4aii IIA81d 272a NEP 2003 4aii none 7202a NEP 2003 4aiii IIA81d 62a NEP 2003 4aiii none 815 146 0,152a NEP 2003 4aiv IIA81c 12a NEP 2003 4aiv none 42a NEP 2003 4av none 42a NEP 2003 none none 92a NEP 2004 4aii none 69
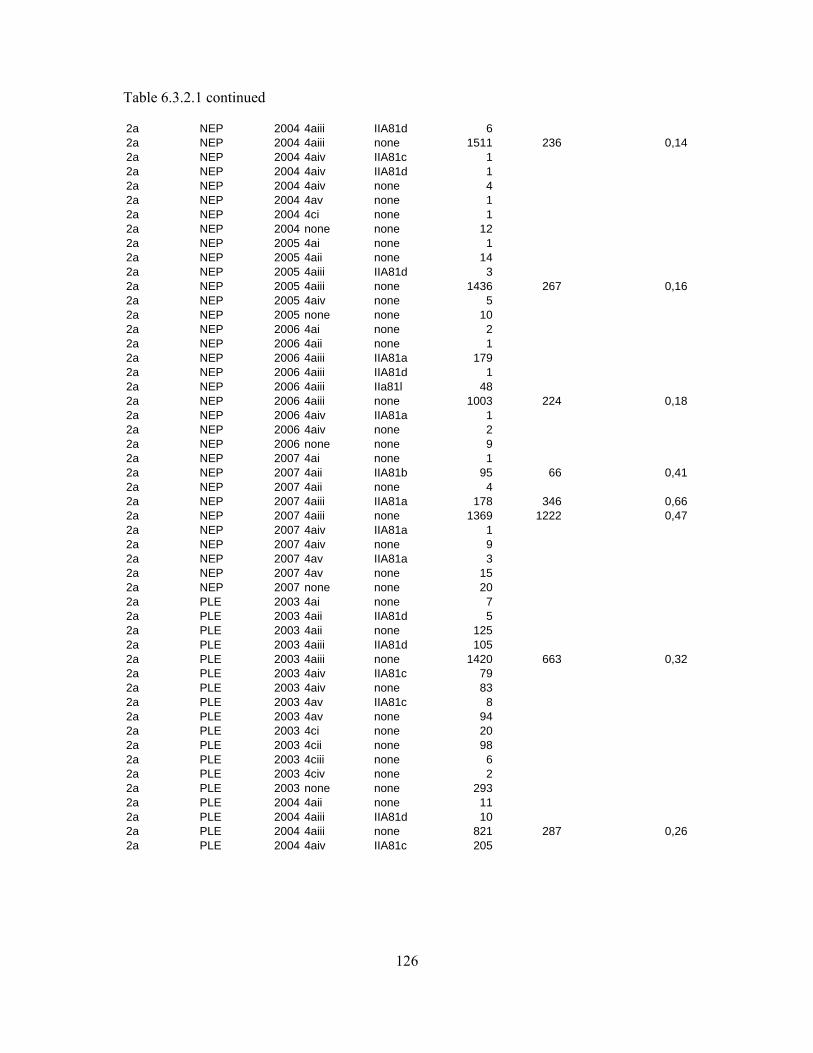
126
Table 6.3.2.1 continued
2a NEP 2004 4aiii IIA81d 62a NEP 2004 4aiii none 1511 236 0,142a NEP 2004 4aiv IIA81c 12a NEP 2004 4aiv IIA81d 12a NEP 2004 4aiv none 42a NEP 2004 4av none 12a NEP 2004 4ci none 12a NEP 2004 none none 122a NEP 2005 4ai none 12a NEP 2005 4aii none 142a NEP 2005 4aiii IIA81d 32a NEP 2005 4aiii none 1436 267 0,162a NEP 2005 4aiv none 52a NEP 2005 none none 102a NEP 2006 4ai none 22a NEP 2006 4aii none 12a NEP 2006 4aiii IIA81a 1792a NEP 2006 4aiii IIA81d 12a NEP 2006 4aiii IIa81l 482a NEP 2006 4aiii none 1003 224 0,182a NEP 2006 4aiv IIA81a 12a NEP 2006 4aiv none 22a NEP 2006 none none 92a NEP 2007 4ai none 12a NEP 2007 4aii IIA81b 95 66 0,412a NEP 2007 4aii none 42a NEP 2007 4aiii IIA81a 178 346 0,662a NEP 2007 4aiii none 1369 1222 0,472a NEP 2007 4aiv IIA81a 12a NEP 2007 4aiv none 92a NEP 2007 4av IIA81a 32a NEP 2007 4av none 152a NEP 2007 none none 202a PLE 2003 4ai none 72a PLE 2003 4aii IIA81d 52a PLE 2003 4aii none 1252a PLE 2003 4aiii IIA81d 1052a PLE 2003 4aiii none 1420 663 0,322a PLE 2003 4aiv IIA81c 792a PLE 2003 4aiv none 832a PLE 2003 4av IIA81c 82a PLE 2003 4av none 942a PLE 2003 4ci none 202a PLE 2003 4cii none 982a PLE 2003 4ciii none 62a PLE 2003 4civ none 22a PLE 2003 none none 2932a PLE 2004 4aii none 112a PLE 2004 4aiii IIA81d 102a PLE 2004 4aiii none 821 287 0,262a PLE 2004 4aiv IIA81c 205
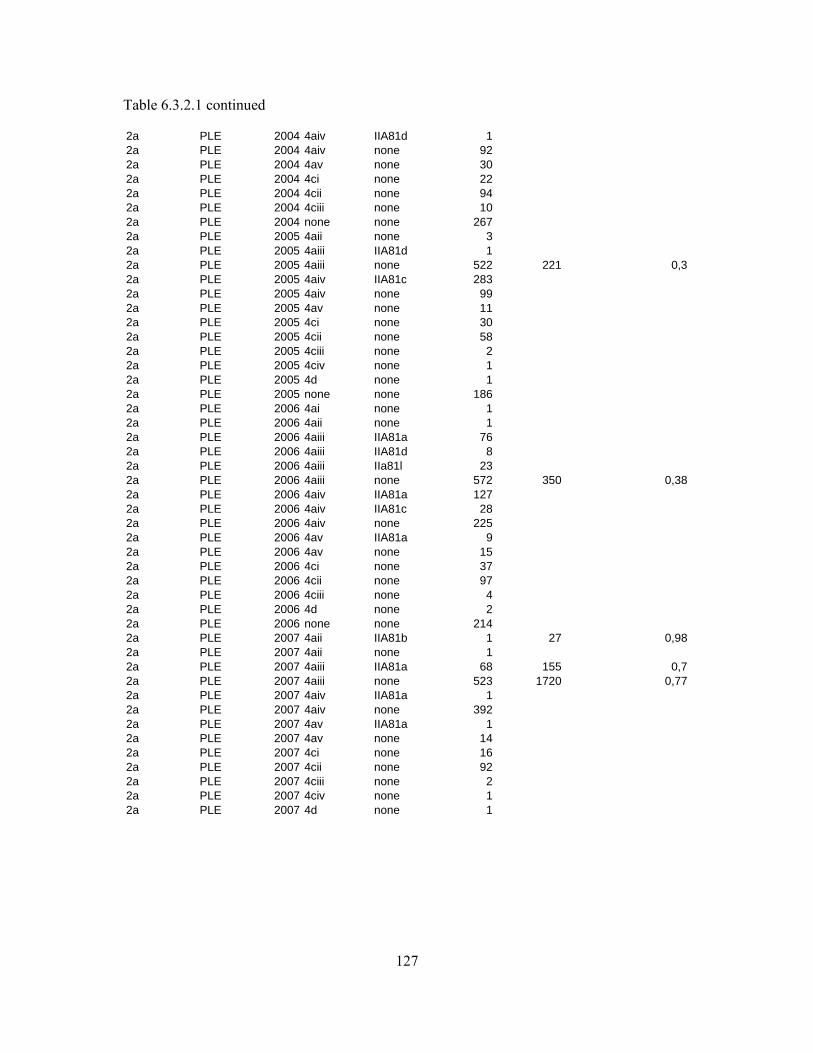
127
Table 6.3.2.1 continued
2a PLE 2004 4aiv IIA81d 12a PLE 2004 4aiv none 922a PLE 2004 4av none 302a PLE 2004 4ci none 222a PLE 2004 4cii none 942a PLE 2004 4ciii none 102a PLE 2004 none none 2672a PLE 2005 4aii none 32a PLE 2005 4aiii IIA81d 12a PLE 2005 4aiii none 522 221 0,32a PLE 2005 4aiv IIA81c 2832a PLE 2005 4aiv none 992a PLE 2005 4av none 112a PLE 2005 4ci none 302a PLE 2005 4cii none 582a PLE 2005 4ciii none 22a PLE 2005 4civ none 12a PLE 2005 4d none 12a PLE 2005 none none 1862a PLE 2006 4ai none 12a PLE 2006 4aii none 12a PLE 2006 4aiii IIA81a 762a PLE 2006 4aiii IIA81d 82a PLE 2006 4aiii IIa81l 232a PLE 2006 4aiii none 572 350 0,382a PLE 2006 4aiv IIA81a 1272a PLE 2006 4aiv IIA81c 282a PLE 2006 4aiv none 2252a PLE 2006 4av IIA81a 92a PLE 2006 4av none 152a PLE 2006 4ci none 372a PLE 2006 4cii none 972a PLE 2006 4ciii none 42a PLE 2006 4d none 22a PLE 2006 none none 2142a PLE 2007 4aii IIA81b 1 27 0,982a PLE 2007 4aii none 12a PLE 2007 4aiii IIA81a 68 155 0,72a PLE 2007 4aiii none 523 1720 0,772a PLE 2007 4aiv IIA81a 12a PLE 2007 4aiv none 3922a PLE 2007 4av IIA81a 12a PLE 2007 4av none 142a PLE 2007 4ci none 162a PLE 2007 4cii none 922a PLE 2007 4ciii none 22a PLE 2007 4civ none 12a PLE 2007 4d none 1
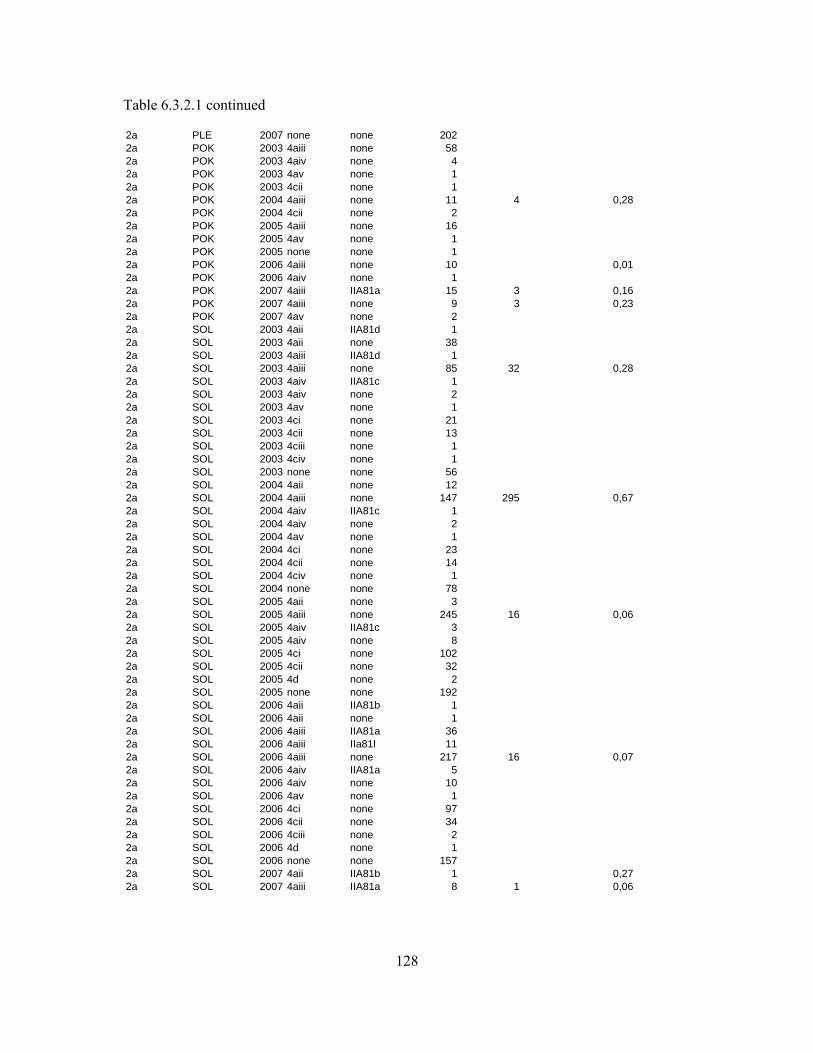
128
Table 6.3.2.1 continued
2a PLE 2007 none none 2022a POK 2003 4aiii none 582a POK 2003 4aiv none 42a POK 2003 4av none 12a POK 2003 4cii none 12a POK 2004 4aiii none 11 4 0,282a POK 2004 4cii none 22a POK 2005 4aiii none 162a POK 2005 4av none 12a POK 2005 none none 12a POK 2006 4aiii none 10 0,012a POK 2006 4aiv none 12a POK 2007 4aiii IIA81a 15 3 0,162a POK 2007 4aiii none 9 3 0,232a POK 2007 4av none 22a SOL 2003 4aii IIA81d 12a SOL 2003 4aii none 382a SOL 2003 4aiii IIA81d 12a SOL 2003 4aiii none 85 32 0,282a SOL 2003 4aiv IIA81c 12a SOL 2003 4aiv none 22a SOL 2003 4av none 12a SOL 2003 4ci none 212a SOL 2003 4cii none 132a SOL 2003 4ciii none 12a SOL 2003 4civ none 12a SOL 2003 none none 562a SOL 2004 4aii none 122a SOL 2004 4aiii none 147 295 0,672a SOL 2004 4aiv IIA81c 12a SOL 2004 4aiv none 22a SOL 2004 4av none 12a SOL 2004 4ci none 232a SOL 2004 4cii none 142a SOL 2004 4civ none 12a SOL 2004 none none 782a SOL 2005 4aii none 32a SOL 2005 4aiii none 245 16 0,062a SOL 2005 4aiv IIA81c 32a SOL 2005 4aiv none 82a SOL 2005 4ci none 1022a SOL 2005 4cii none 322a SOL 2005 4d none 22a SOL 2005 none none 1922a SOL 2006 4aii IIA81b 12a SOL 2006 4aii none 12a SOL 2006 4aiii IIA81a 362a SOL 2006 4aiii IIa81l 112a SOL 2006 4aiii none 217 16 0,072a SOL 2006 4aiv IIA81a 52a SOL 2006 4aiv none 102a SOL 2006 4av none 12a SOL 2006 4ci none 972a SOL 2006 4cii none 342a SOL 2006 4ciii none 22a SOL 2006 4d none 12a SOL 2006 none none 1572a SOL 2007 4aii IIA81b 1 0,272a SOL 2007 4aiii IIA81a 8 1 0,06
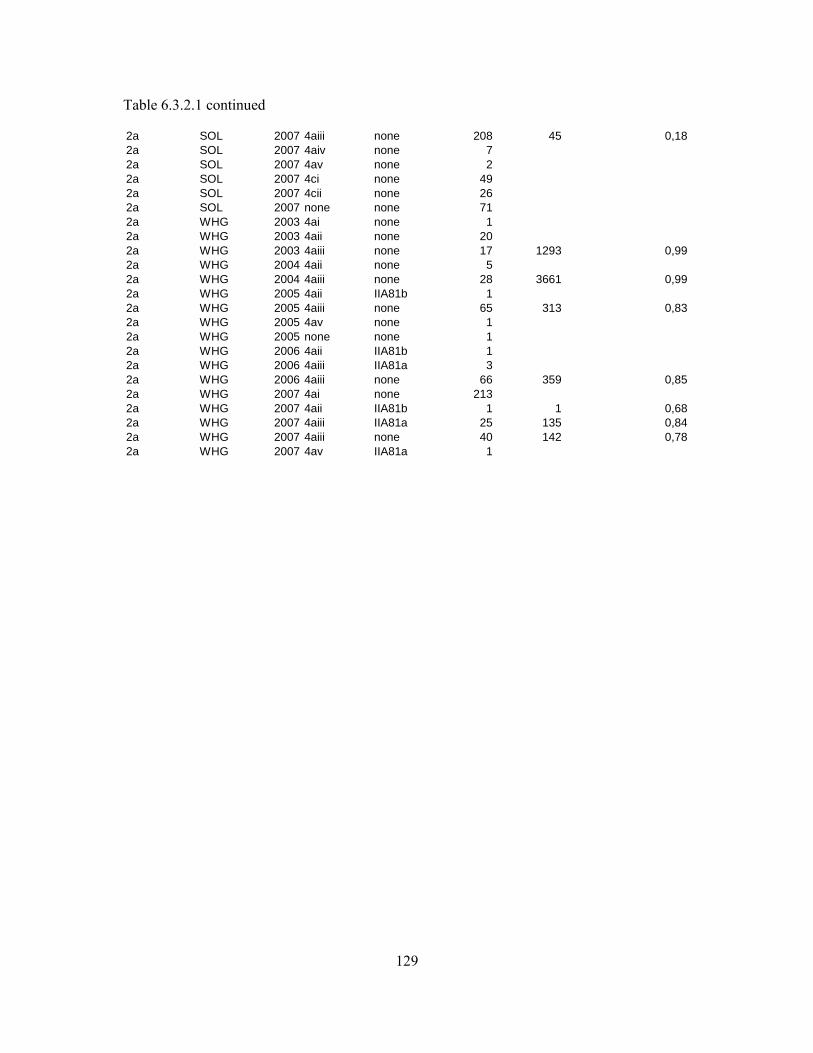
129
Table 6.3.2.1 continued
2a SOL 2007 4aiii none 208 45 0,182a SOL 2007 4aiv none 72a SOL 2007 4av none 22a SOL 2007 4ci none 492a SOL 2007 4cii none 262a SOL 2007 none none 712a WHG 2003 4ai none 12a WHG 2003 4aii none 202a WHG 2003 4aiii none 17 1293 0,992a WHG 2004 4aii none 52a WHG 2004 4aiii none 28 3661 0,992a WHG 2005 4aii IIA81b 12a WHG 2005 4aiii none 65 313 0,832a WHG 2005 4av none 12a WHG 2005 none none 12a WHG 2006 4aii IIA81b 12a WHG 2006 4aiii IIA81a 32a WHG 2006 4aiii none 66 359 0,852a WHG 2007 4ai none 2132a WHG 2007 4aii IIA81b 1 1 0,682a WHG 2007 4aiii IIA81a 25 135 0,842a WHG 2007 4aiii none 40 142 0,782a WHG 2007 4av IIA81a 1
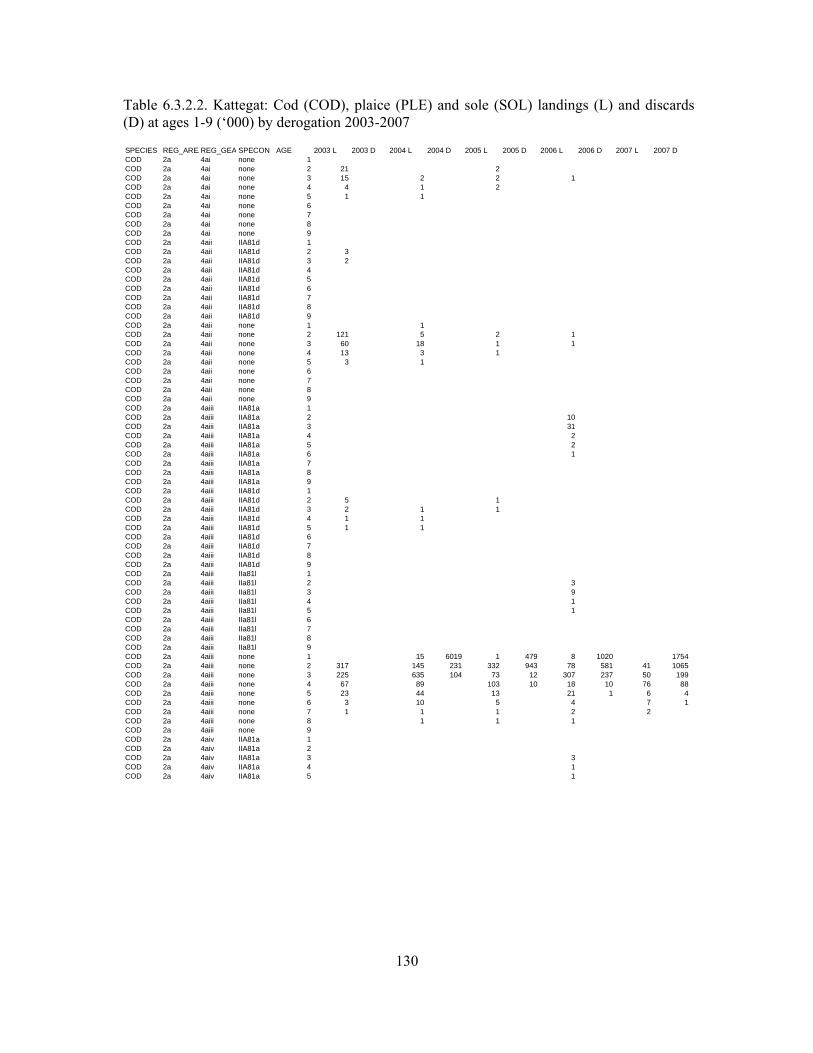
130
Table 6.3.2.2. Kattegat: Cod (COD), plaice (PLE) and sole (SOL) landings (L) and discards (D) at ages 1-9 (‘000) by derogation 2003-2007
SPECIES REG_AREAREG_GEA SPECON AGE 2003 L 2003 D 2004 L 2004 D 2005 L 2005 D 2006 L 2006 D 2007 L 2007 DCOD 2a 4ai none 1COD 2a 4ai none 2 21 2COD 2a 4ai none 3 15 2 2 1COD 2a 4ai none 4 4 1 2COD 2a 4ai none 5 1 1COD 2a 4ai none 6COD 2a 4ai none 7COD 2a 4ai none 8COD 2a 4ai none 9COD 2a 4aii IIA81d 1COD 2a 4aii IIA81d 2 3COD 2a 4aii IIA81d 3 2COD 2a 4aii IIA81d 4COD 2a 4aii IIA81d 5COD 2a 4aii IIA81d 6COD 2a 4aii IIA81d 7COD 2a 4aii IIA81d 8COD 2a 4aii IIA81d 9COD 2a 4aii none 1 1COD 2a 4aii none 2 121 5 2 1COD 2a 4aii none 3 60 18 1 1COD 2a 4aii none 4 13 3 1COD 2a 4aii none 5 3 1COD 2a 4aii none 6COD 2a 4aii none 7COD 2a 4aii none 8COD 2a 4aii none 9COD 2a 4aiii IIA81a 1COD 2a 4aiii IIA81a 2 10COD 2a 4aiii IIA81a 3 31COD 2a 4aiii IIA81a 4 2COD 2a 4aiii IIA81a 5 2COD 2a 4aiii IIA81a 6 1COD 2a 4aiii IIA81a 7COD 2a 4aiii IIA81a 8COD 2a 4aiii IIA81a 9COD 2a 4aiii IIA81d 1COD 2a 4aiii IIA81d 2 5 1COD 2a 4aiii IIA81d 3 2 1 1COD 2a 4aiii IIA81d 4 1 1COD 2a 4aiii IIA81d 5 1 1COD 2a 4aiii IIA81d 6COD 2a 4aiii IIA81d 7COD 2a 4aiii IIA81d 8COD 2a 4aiii IIA81d 9COD 2a 4aiii IIa81l 1COD 2a 4aiii IIa81l 2 3COD 2a 4aiii IIa81l 3 9COD 2a 4aiii IIa81l 4 1COD 2a 4aiii IIa81l 5 1COD 2a 4aiii IIa81l 6COD 2a 4aiii IIa81l 7COD 2a 4aiii IIa81l 8COD 2a 4aiii IIa81l 9COD 2a 4aiii none 1 15 6019 1 479 8 1020 1754COD 2a 4aiii none 2 317 145 231 332 943 78 581 41 1065COD 2a 4aiii none 3 225 635 104 73 12 307 237 50 199COD 2a 4aiii none 4 67 89 103 10 18 10 76 88COD 2a 4aiii none 5 23 44 13 21 1 6 4COD 2a 4aiii none 6 3 10 5 4 7 1COD 2a 4aiii none 7 1 1 1 2 2COD 2a 4aiii none 8 1 1 1COD 2a 4aiii none 9COD 2a 4aiv IIA81a 1COD 2a 4aiv IIA81a 2COD 2a 4aiv IIA81a 3 3COD 2a 4aiv IIA81a 4 1COD 2a 4aiv IIA81a 5 1
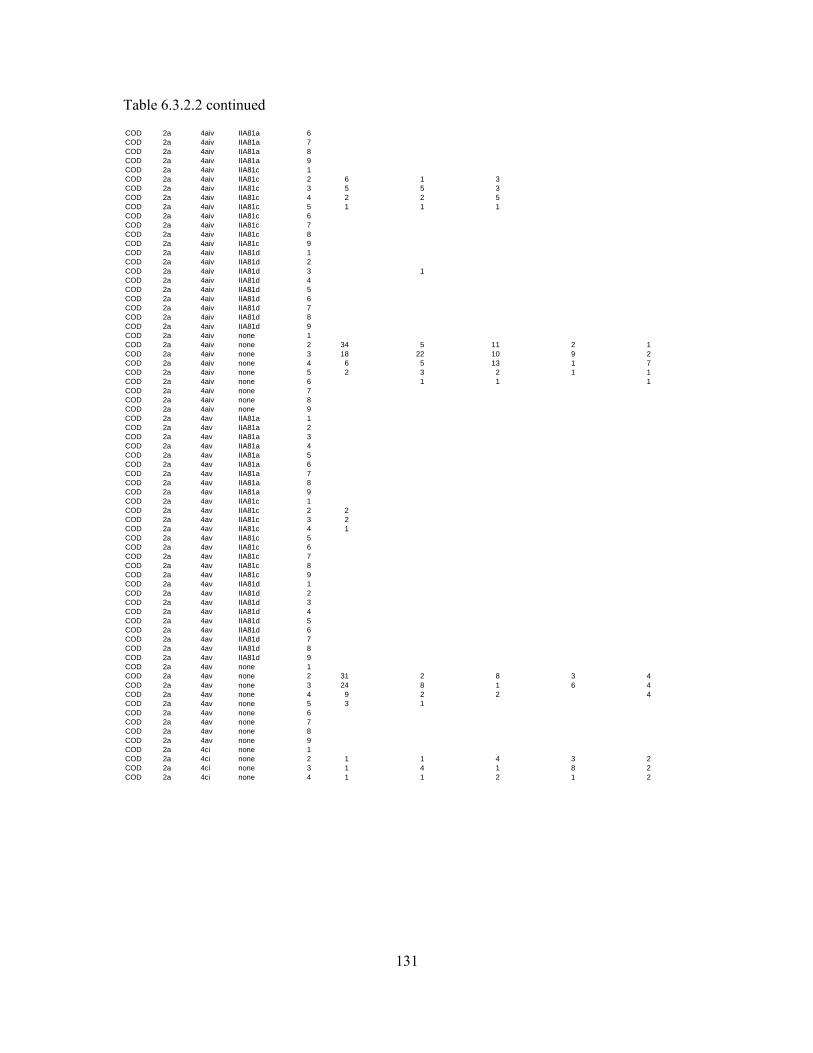
131
Table 6.3.2.2 continued
COD 2a 4aiv IIA81a 6COD 2a 4aiv IIA81a 7COD 2a 4aiv IIA81a 8COD 2a 4aiv IIA81a 9COD 2a 4aiv IIA81c 1COD 2a 4aiv IIA81c 2 6 1 3COD 2a 4aiv IIA81c 3 5 5 3COD 2a 4aiv IIA81c 4 2 2 5COD 2a 4aiv IIA81c 5 1 1 1COD 2a 4aiv IIA81c 6COD 2a 4aiv IIA81c 7COD 2a 4aiv IIA81c 8COD 2a 4aiv IIA81c 9COD 2a 4aiv IIA81d 1COD 2a 4aiv IIA81d 2COD 2a 4aiv IIA81d 3 1COD 2a 4aiv IIA81d 4COD 2a 4aiv IIA81d 5COD 2a 4aiv IIA81d 6COD 2a 4aiv IIA81d 7COD 2a 4aiv IIA81d 8COD 2a 4aiv IIA81d 9COD 2a 4aiv none 1COD 2a 4aiv none 2 34 5 11 2 1COD 2a 4aiv none 3 18 22 10 9 2COD 2a 4aiv none 4 6 5 13 1 7COD 2a 4aiv none 5 2 3 2 1 1COD 2a 4aiv none 6 1 1 1COD 2a 4aiv none 7COD 2a 4aiv none 8COD 2a 4aiv none 9COD 2a 4av IIA81a 1COD 2a 4av IIA81a 2COD 2a 4av IIA81a 3COD 2a 4av IIA81a 4COD 2a 4av IIA81a 5COD 2a 4av IIA81a 6COD 2a 4av IIA81a 7COD 2a 4av IIA81a 8COD 2a 4av IIA81a 9COD 2a 4av IIA81c 1COD 2a 4av IIA81c 2 2COD 2a 4av IIA81c 3 2COD 2a 4av IIA81c 4 1COD 2a 4av IIA81c 5COD 2a 4av IIA81c 6COD 2a 4av IIA81c 7COD 2a 4av IIA81c 8COD 2a 4av IIA81c 9COD 2a 4av IIA81d 1COD 2a 4av IIA81d 2COD 2a 4av IIA81d 3COD 2a 4av IIA81d 4COD 2a 4av IIA81d 5COD 2a 4av IIA81d 6COD 2a 4av IIA81d 7COD 2a 4av IIA81d 8COD 2a 4av IIA81d 9COD 2a 4av none 1COD 2a 4av none 2 31 2 8 3 4COD 2a 4av none 3 24 8 1 6 4COD 2a 4av none 4 9 2 2 4COD 2a 4av none 5 3 1COD 2a 4av none 6COD 2a 4av none 7COD 2a 4av none 8COD 2a 4av none 9COD 2a 4ci none 1COD 2a 4ci none 2 1 1 4 3 2COD 2a 4ci none 3 1 4 1 8 2COD 2a 4ci none 4 1 1 2 1 2
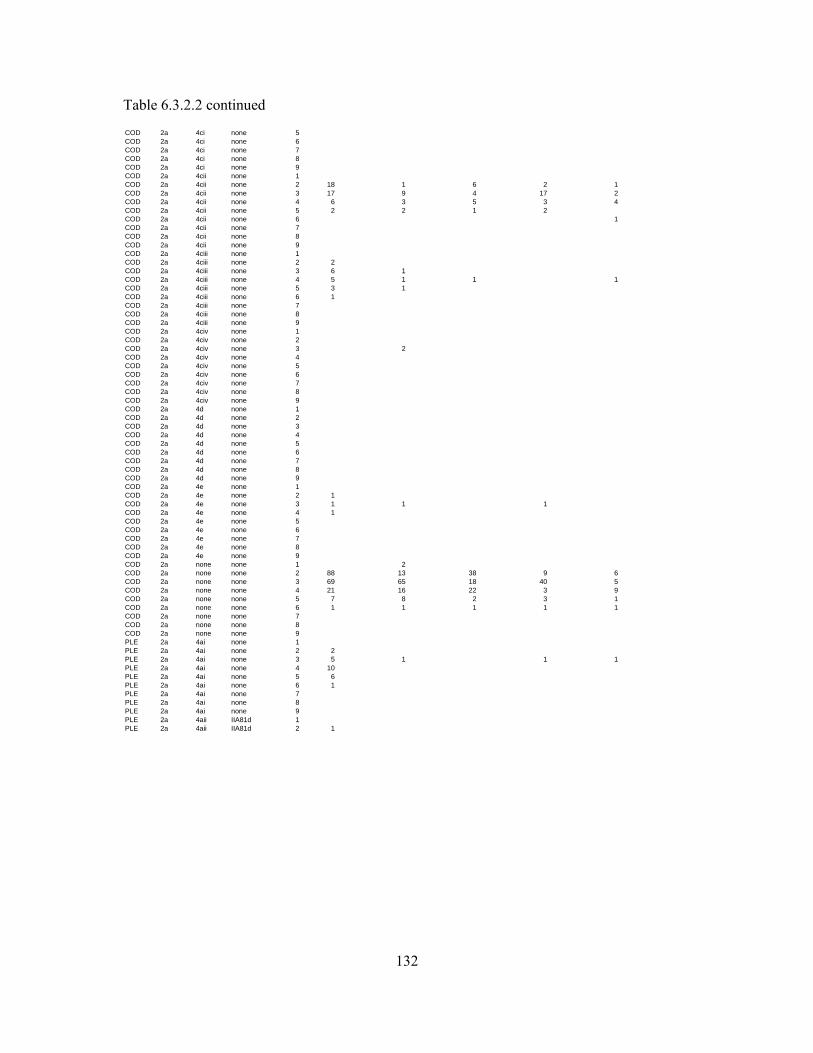
132
Table 6.3.2.2 continued
COD 2a 4ci none 5COD 2a 4ci none 6COD 2a 4ci none 7COD 2a 4ci none 8COD 2a 4ci none 9COD 2a 4cii none 1COD 2a 4cii none 2 18 1 6 2 1COD 2a 4cii none 3 17 9 4 17 2COD 2a 4cii none 4 6 3 5 3 4COD 2a 4cii none 5 2 2 1 2COD 2a 4cii none 6 1COD 2a 4cii none 7COD 2a 4cii none 8COD 2a 4cii none 9COD 2a 4ciii none 1COD 2a 4ciii none 2 2COD 2a 4ciii none 3 6 1COD 2a 4ciii none 4 5 1 1 1COD 2a 4ciii none 5 3 1COD 2a 4ciii none 6 1COD 2a 4ciii none 7COD 2a 4ciii none 8COD 2a 4ciii none 9COD 2a 4civ none 1COD 2a 4civ none 2COD 2a 4civ none 3 2COD 2a 4civ none 4COD 2a 4civ none 5COD 2a 4civ none 6COD 2a 4civ none 7COD 2a 4civ none 8COD 2a 4civ none 9COD 2a 4d none 1COD 2a 4d none 2COD 2a 4d none 3COD 2a 4d none 4COD 2a 4d none 5COD 2a 4d none 6COD 2a 4d none 7COD 2a 4d none 8COD 2a 4d none 9COD 2a 4e none 1COD 2a 4e none 2 1COD 2a 4e none 3 1 1 1COD 2a 4e none 4 1COD 2a 4e none 5COD 2a 4e none 6COD 2a 4e none 7COD 2a 4e none 8COD 2a 4e none 9COD 2a none none 1 2COD 2a none none 2 88 13 38 9 6COD 2a none none 3 69 65 18 40 5COD 2a none none 4 21 16 22 3 9COD 2a none none 5 7 8 2 3 1COD 2a none none 6 1 1 1 1 1COD 2a none none 7COD 2a none none 8COD 2a none none 9PLE 2a 4ai none 1PLE 2a 4ai none 2 2PLE 2a 4ai none 3 5 1 1 1PLE 2a 4ai none 4 10PLE 2a 4ai none 5 6PLE 2a 4ai none 6 1PLE 2a 4ai none 7PLE 2a 4ai none 8PLE 2a 4ai none 9PLE 2a 4aii IIA81d 1PLE 2a 4aii IIA81d 2 1
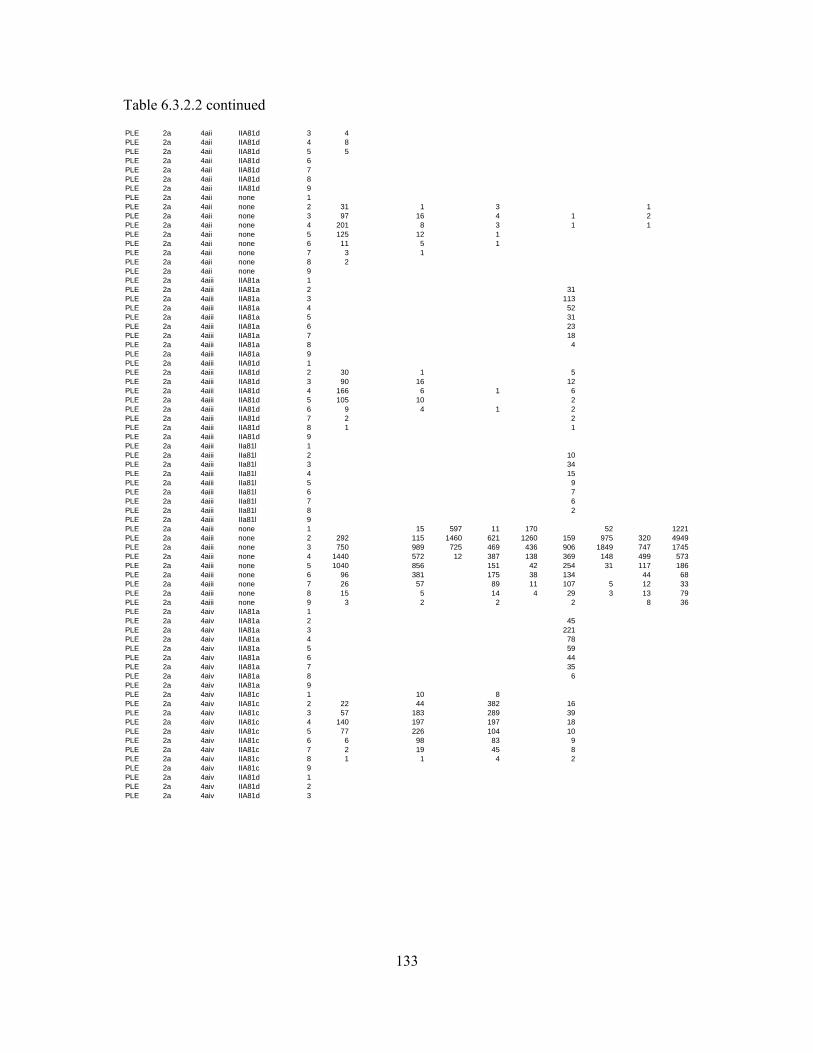
133
Table 6.3.2.2 continued
PLE 2a 4aii IIA81d 3 4PLE 2a 4aii IIA81d 4 8PLE 2a 4aii IIA81d 5 5PLE 2a 4aii IIA81d 6PLE 2a 4aii IIA81d 7PLE 2a 4aii IIA81d 8PLE 2a 4aii IIA81d 9PLE 2a 4aii none 1PLE 2a 4aii none 2 31 1 3 1PLE 2a 4aii none 3 97 16 4 1 2PLE 2a 4aii none 4 201 8 3 1 1PLE 2a 4aii none 5 125 12 1PLE 2a 4aii none 6 11 5 1PLE 2a 4aii none 7 3 1PLE 2a 4aii none 8 2PLE 2a 4aii none 9PLE 2a 4aiii IIA81a 1PLE 2a 4aiii IIA81a 2 31PLE 2a 4aiii IIA81a 3 113PLE 2a 4aiii IIA81a 4 52PLE 2a 4aiii IIA81a 5 31PLE 2a 4aiii IIA81a 6 23PLE 2a 4aiii IIA81a 7 18PLE 2a 4aiii IIA81a 8 4PLE 2a 4aiii IIA81a 9PLE 2a 4aiii IIA81d 1PLE 2a 4aiii IIA81d 2 30 1 5PLE 2a 4aiii IIA81d 3 90 16 12PLE 2a 4aiii IIA81d 4 166 6 1 6PLE 2a 4aiii IIA81d 5 105 10 2PLE 2a 4aiii IIA81d 6 9 4 1 2PLE 2a 4aiii IIA81d 7 2 2PLE 2a 4aiii IIA81d 8 1 1PLE 2a 4aiii IIA81d 9PLE 2a 4aiii IIa81l 1PLE 2a 4aiii IIa81l 2 10PLE 2a 4aiii IIa81l 3 34PLE 2a 4aiii IIa81l 4 15PLE 2a 4aiii IIa81l 5 9PLE 2a 4aiii IIa81l 6 7PLE 2a 4aiii IIa81l 7 6PLE 2a 4aiii IIa81l 8 2PLE 2a 4aiii IIa81l 9PLE 2a 4aiii none 1 15 597 11 170 52 1221PLE 2a 4aiii none 2 292 115 1460 621 1260 159 975 320 4949PLE 2a 4aiii none 3 750 989 725 469 436 906 1849 747 1745PLE 2a 4aiii none 4 1440 572 12 387 138 369 148 499 573PLE 2a 4aiii none 5 1040 856 151 42 254 31 117 186PLE 2a 4aiii none 6 96 381 175 38 134 44 68PLE 2a 4aiii none 7 26 57 89 11 107 5 12 33PLE 2a 4aiii none 8 15 5 14 4 29 3 13 79PLE 2a 4aiii none 9 3 2 2 2 8 36PLE 2a 4aiv IIA81a 1PLE 2a 4aiv IIA81a 2 45PLE 2a 4aiv IIA81a 3 221PLE 2a 4aiv IIA81a 4 78PLE 2a 4aiv IIA81a 5 59PLE 2a 4aiv IIA81a 6 44PLE 2a 4aiv IIA81a 7 35PLE 2a 4aiv IIA81a 8 6PLE 2a 4aiv IIA81a 9PLE 2a 4aiv IIA81c 1 10 8PLE 2a 4aiv IIA81c 2 22 44 382 16PLE 2a 4aiv IIA81c 3 57 183 289 39PLE 2a 4aiv IIA81c 4 140 197 197 18PLE 2a 4aiv IIA81c 5 77 226 104 10PLE 2a 4aiv IIA81c 6 6 98 83 9PLE 2a 4aiv IIA81c 7 2 19 45 8PLE 2a 4aiv IIA81c 8 1 1 4 2PLE 2a 4aiv IIA81c 9PLE 2a 4aiv IIA81d 1PLE 2a 4aiv IIA81d 2PLE 2a 4aiv IIA81d 3

134
Table 6.3.2.2 continued
PLE 2a 4aiv IIA81d 4 1PLE 2a 4aiv IIA81d 5PLE 2a 4aiv IIA81d 6PLE 2a 4aiv IIA81d 7PLE 2a 4aiv IIA81d 8PLE 2a 4aiv IIA81d 9PLE 2a 4aiv none 1 3 2PLE 2a 4aiv none 2 22 16 92 90 254PLE 2a 4aiv none 3 64 105 97 345 648PLE 2a 4aiv none 4 164 88 90 151 392PLE 2a 4aiv none 5 66 100 50 97 80PLE 2a 4aiv none 6 4 40 44 68 19PLE 2a 4aiv none 7 2 7 23 54 5PLE 2a 4aiv none 8 1 2 13 3PLE 2a 4aiv none 9 2PLE 2a 4av IIA81a 1PLE 2a 4av IIA81a 2 7PLE 2a 4av IIA81a 3 14PLE 2a 4av IIA81a 4 7PLE 2a 4av IIA81a 5 3PLE 2a 4av IIA81a 6 3PLE 2a 4av IIA81a 7 2PLE 2a 4av IIA81a 8PLE 2a 4av IIA81a 9PLE 2a 4av IIA81c 1PLE 2a 4av IIA81c 2 2PLE 2a 4av IIA81c 3 5PLE 2a 4av IIA81c 4 17PLE 2a 4av IIA81c 5 4PLE 2a 4av IIA81c 6PLE 2a 4av IIA81c 7PLE 2a 4av IIA81c 8PLE 2a 4av IIA81c 9PLE 2a 4av IIA81d 1PLE 2a 4av IIA81d 2PLE 2a 4av IIA81d 3PLE 2a 4av IIA81d 4PLE 2a 4av IIA81d 5PLE 2a 4av IIA81d 6PLE 2a 4av IIA81d 7PLE 2a 4av IIA81d 8PLE 2a 4av IIA81d 9PLE 2a 4av none 1 1PLE 2a 4av none 2 30 6 3 7 12PLE 2a 4av none 3 72 28 8 21 22PLE 2a 4av none 4 149 27 12 9 11PLE 2a 4av none 5 99 35 8 5 2PLE 2a 4av none 6 7 14 7 4PLE 2a 4av none 7 2 3 4 4PLE 2a 4av none 8 1 1 1PLE 2a 4av none 9PLE 2a 4ci none 1 1 1PLE 2a 4ci none 2 5 3 44 14 10PLE 2a 4ci none 3 13 28 35 59 24PLE 2a 4ci none 4 28 23 17 23 15PLE 2a 4ci none 5 23 20 8 18 5PLE 2a 4ci none 6 2 8 6 13 1PLE 2a 4ci none 7 1 1 4 10PLE 2a 4ci none 8 2PLE 2a 4ci none 9PLE 2a 4cii none 1 5 1PLE 2a 4cii none 2 18 16 55 16 57PLE 2a 4cii none 3 62 84 54 146 141PLE 2a 4cii none 4 136 91 51 77 90PLE 2a 4cii none 5 100 82 24 61 18PLE 2a 4cii none 6 12 39 24 27 6PLE 2a 4cii none 7 3 8 12 19 2PLE 2a 4cii none 8 3 1 2 3 1PLE 2a 4cii none 9 1 1PLE 2a 4ciii none 1PLE 2a 4ciii none 2 2 1
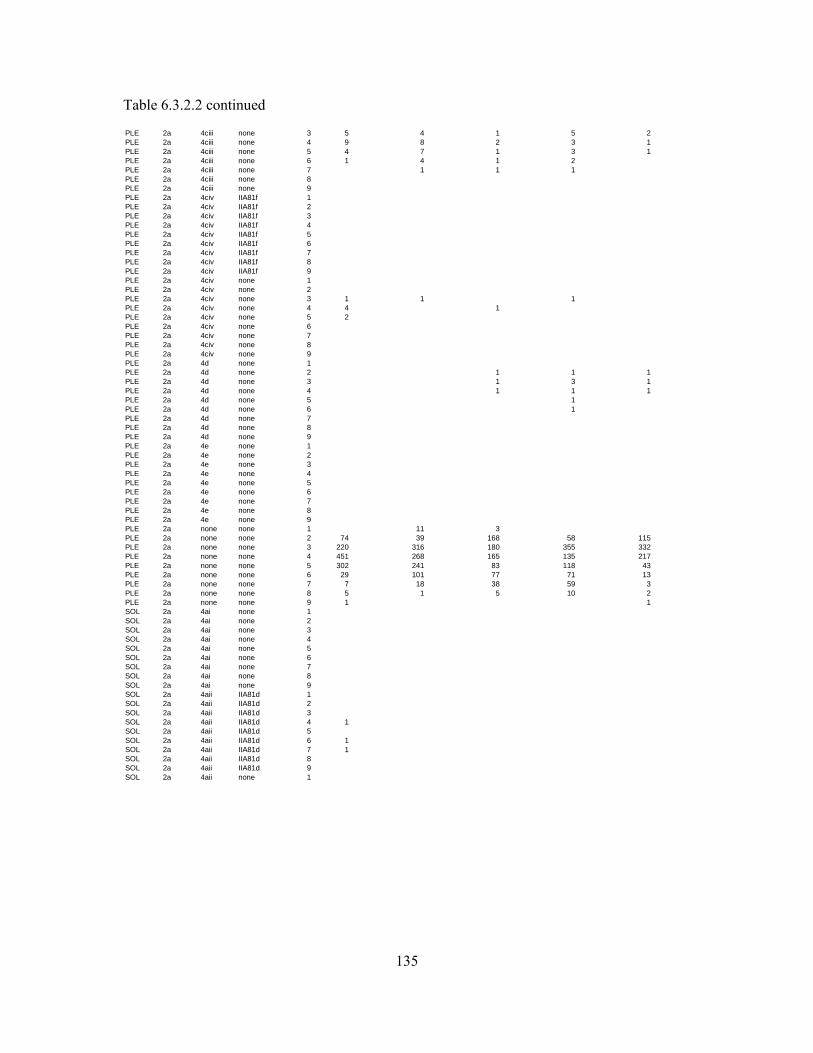
135
Table 6.3.2.2 continued
PLE 2a 4ciii none 3 5 4 1 5 2PLE 2a 4ciii none 4 9 8 2 3 1PLE 2a 4ciii none 5 4 7 1 3 1PLE 2a 4ciii none 6 1 4 1 2PLE 2a 4ciii none 7 1 1 1PLE 2a 4ciii none 8PLE 2a 4ciii none 9PLE 2a 4civ IIA81f 1PLE 2a 4civ IIA81f 2PLE 2a 4civ IIA81f 3PLE 2a 4civ IIA81f 4PLE 2a 4civ IIA81f 5PLE 2a 4civ IIA81f 6PLE 2a 4civ IIA81f 7PLE 2a 4civ IIA81f 8PLE 2a 4civ IIA81f 9PLE 2a 4civ none 1PLE 2a 4civ none 2PLE 2a 4civ none 3 1 1 1PLE 2a 4civ none 4 4 1PLE 2a 4civ none 5 2PLE 2a 4civ none 6PLE 2a 4civ none 7PLE 2a 4civ none 8PLE 2a 4civ none 9PLE 2a 4d none 1PLE 2a 4d none 2 1 1 1PLE 2a 4d none 3 1 3 1PLE 2a 4d none 4 1 1 1PLE 2a 4d none 5 1PLE 2a 4d none 6 1PLE 2a 4d none 7PLE 2a 4d none 8PLE 2a 4d none 9PLE 2a 4e none 1PLE 2a 4e none 2PLE 2a 4e none 3PLE 2a 4e none 4PLE 2a 4e none 5PLE 2a 4e none 6PLE 2a 4e none 7PLE 2a 4e none 8PLE 2a 4e none 9PLE 2a none none 1 11 3PLE 2a none none 2 74 39 168 58 115PLE 2a none none 3 220 316 180 355 332PLE 2a none none 4 451 268 165 135 217PLE 2a none none 5 302 241 83 118 43PLE 2a none none 6 29 101 77 71 13PLE 2a none none 7 7 18 38 59 3PLE 2a none none 8 5 1 5 10 2PLE 2a none none 9 1 1SOL 2a 4ai none 1SOL 2a 4ai none 2SOL 2a 4ai none 3SOL 2a 4ai none 4SOL 2a 4ai none 5SOL 2a 4ai none 6SOL 2a 4ai none 7SOL 2a 4ai none 8SOL 2a 4ai none 9SOL 2a 4aii IIA81d 1SOL 2a 4aii IIA81d 2SOL 2a 4aii IIA81d 3SOL 2a 4aii IIA81d 4 1SOL 2a 4aii IIA81d 5SOL 2a 4aii IIA81d 6 1SOL 2a 4aii IIA81d 7 1SOL 2a 4aii IIA81d 8SOL 2a 4aii IIA81d 9SOL 2a 4aii none 1

136
Table 6.3.2.2 continued
SOL 2a 4aii none 2 4 1SOL 2a 4aii none 3 29 5 3 1SOL 2a 4aii none 4 29 10 3 1SOL 2a 4aii none 5 17 8 2 1SOL 2a 4aii none 6 18 4 1SOL 2a 4aii none 7 13 3SOL 2a 4aii none 8 2 2SOL 2a 4aii none 9 3 1SOL 2a 4aiii IIA81a 1SOL 2a 4aiii IIA81a 2 9SOL 2a 4aiii IIA81a 3 18SOL 2a 4aiii IIA81a 4 37SOL 2a 4aiii IIA81a 5 29SOL 2a 4aiii IIA81a 6 21SOL 2a 4aiii IIA81a 7 8SOL 2a 4aiii IIA81a 8 2SOL 2a 4aiii IIA81a 9 1SOL 2a 4aiii IIA81d 1SOL 2a 4aiii IIA81d 2SOL 2a 4aiii IIA81d 3 1SOL 2a 4aiii IIA81d 4 1SOL 2a 4aiii IIA81d 5SOL 2a 4aiii IIA81d 6SOL 2a 4aiii IIA81d 7SOL 2a 4aiii IIA81d 8SOL 2a 4aiii IIA81d 9SOL 2a 4aiii IIa81l 1SOL 2a 4aiii IIa81l 2 4SOL 2a 4aiii IIa81l 3 6SOL 2a 4aiii IIa81l 4 11SOL 2a 4aiii IIa81l 5 9SOL 2a 4aiii IIa81l 6 6SOL 2a 4aiii IIa81l 7 2SOL 2a 4aiii IIa81l 8SOL 2a 4aiii IIa81l 9SOL 2a 4aiii none 1 1 22SOL 2a 4aiii none 2 7 30 51 44 153SOL 2a 4aiii none 3 38 78 277 104 161SOL 2a 4aiii none 4 35 96 261 227 107SOL 2a 4aiii none 5 16 40 152 173 187SOL 2a 4aiii none 6 15 21 81 123 63SOL 2a 4aiii none 7 8 15 25 48 27SOL 2a 4aiii none 8 1 7 16 15 18SOL 2a 4aiii none 9 2 4 11 7 14SOL 2a 4aiv IIA81a 1SOL 2a 4aiv IIA81a 2 1SOL 2a 4aiv IIA81a 3 4SOL 2a 4aiv IIA81a 4 6SOL 2a 4aiv IIA81a 5 5SOL 2a 4aiv IIA81a 6 3SOL 2a 4aiv IIA81a 7 1SOL 2a 4aiv IIA81a 8 1SOL 2a 4aiv IIA81a 9SOL 2a 4aiv IIA81c 1SOL 2a 4aiv IIA81c 2 1SOL 2a 4aiv IIA81c 3 1 1 3SOL 2a 4aiv IIA81c 4 1 1 4SOL 2a 4aiv IIA81c 5 1 1 2SOL 2a 4aiv IIA81c 6 1 1SOL 2a 4aiv IIA81c 7 1SOL 2a 4aiv IIA81c 8SOL 2a 4aiv IIA81c 9SOL 2a 4aiv none 1SOL 2a 4aiv none 2 2 2 3SOL 2a 4aiv none 3 2 2 9 5 4SOL 2a 4aiv none 4 2 3 9 11 4SOL 2a 4aiv none 5 1 2 5 9 7SOL 2a 4aiv none 6 1 1 3 6 3SOL 2a 4aiv none 7 1 1 2 1SOL 2a 4aiv none 8 1 1 1SOL 2a 4aiv none 9
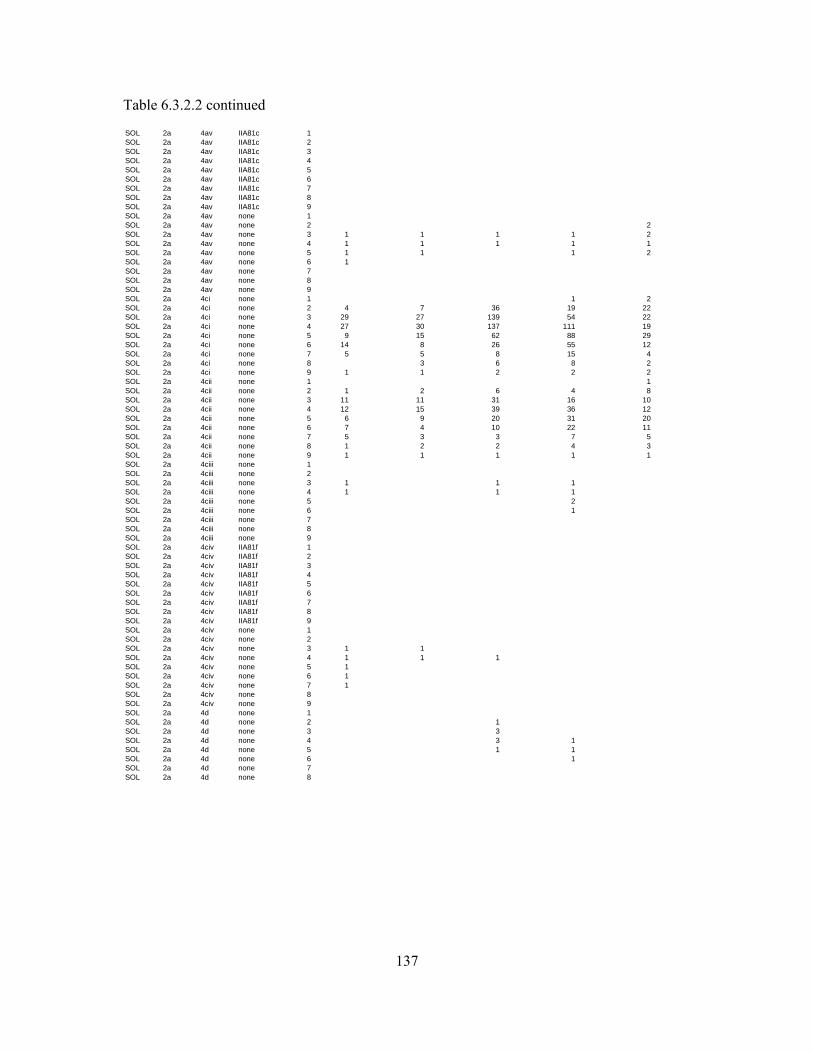
137
Table 6.3.2.2 continued
SOL 2a 4av IIA81c 1SOL 2a 4av IIA81c 2SOL 2a 4av IIA81c 3SOL 2a 4av IIA81c 4SOL 2a 4av IIA81c 5SOL 2a 4av IIA81c 6SOL 2a 4av IIA81c 7SOL 2a 4av IIA81c 8SOL 2a 4av IIA81c 9SOL 2a 4av none 1SOL 2a 4av none 2 2SOL 2a 4av none 3 1 1 1 1 2SOL 2a 4av none 4 1 1 1 1 1SOL 2a 4av none 5 1 1 1 2SOL 2a 4av none 6 1SOL 2a 4av none 7SOL 2a 4av none 8SOL 2a 4av none 9SOL 2a 4ci none 1 1 2SOL 2a 4ci none 2 4 7 36 19 22SOL 2a 4ci none 3 29 27 139 54 22SOL 2a 4ci none 4 27 30 137 111 19SOL 2a 4ci none 5 9 15 62 88 29SOL 2a 4ci none 6 14 8 26 55 12SOL 2a 4ci none 7 5 5 8 15 4SOL 2a 4ci none 8 3 6 8 2SOL 2a 4ci none 9 1 1 2 2 2SOL 2a 4cii none 1 1SOL 2a 4cii none 2 1 2 6 4 8SOL 2a 4cii none 3 11 11 31 16 10SOL 2a 4cii none 4 12 15 39 36 12SOL 2a 4cii none 5 6 9 20 31 20SOL 2a 4cii none 6 7 4 10 22 11SOL 2a 4cii none 7 5 3 3 7 5SOL 2a 4cii none 8 1 2 2 4 3SOL 2a 4cii none 9 1 1 1 1 1SOL 2a 4ciii none 1SOL 2a 4ciii none 2SOL 2a 4ciii none 3 1 1 1SOL 2a 4ciii none 4 1 1 1SOL 2a 4ciii none 5 2SOL 2a 4ciii none 6 1SOL 2a 4ciii none 7SOL 2a 4ciii none 8SOL 2a 4ciii none 9SOL 2a 4civ IIA81f 1SOL 2a 4civ IIA81f 2SOL 2a 4civ IIA81f 3SOL 2a 4civ IIA81f 4SOL 2a 4civ IIA81f 5SOL 2a 4civ IIA81f 6SOL 2a 4civ IIA81f 7SOL 2a 4civ IIA81f 8SOL 2a 4civ IIA81f 9SOL 2a 4civ none 1SOL 2a 4civ none 2SOL 2a 4civ none 3 1 1SOL 2a 4civ none 4 1 1 1SOL 2a 4civ none 5 1SOL 2a 4civ none 6 1SOL 2a 4civ none 7 1SOL 2a 4civ none 8SOL 2a 4civ none 9SOL 2a 4d none 1SOL 2a 4d none 2 1SOL 2a 4d none 3 3SOL 2a 4d none 4 3 1SOL 2a 4d none 5 1 1SOL 2a 4d none 6 1SOL 2a 4d none 7SOL 2a 4d none 8
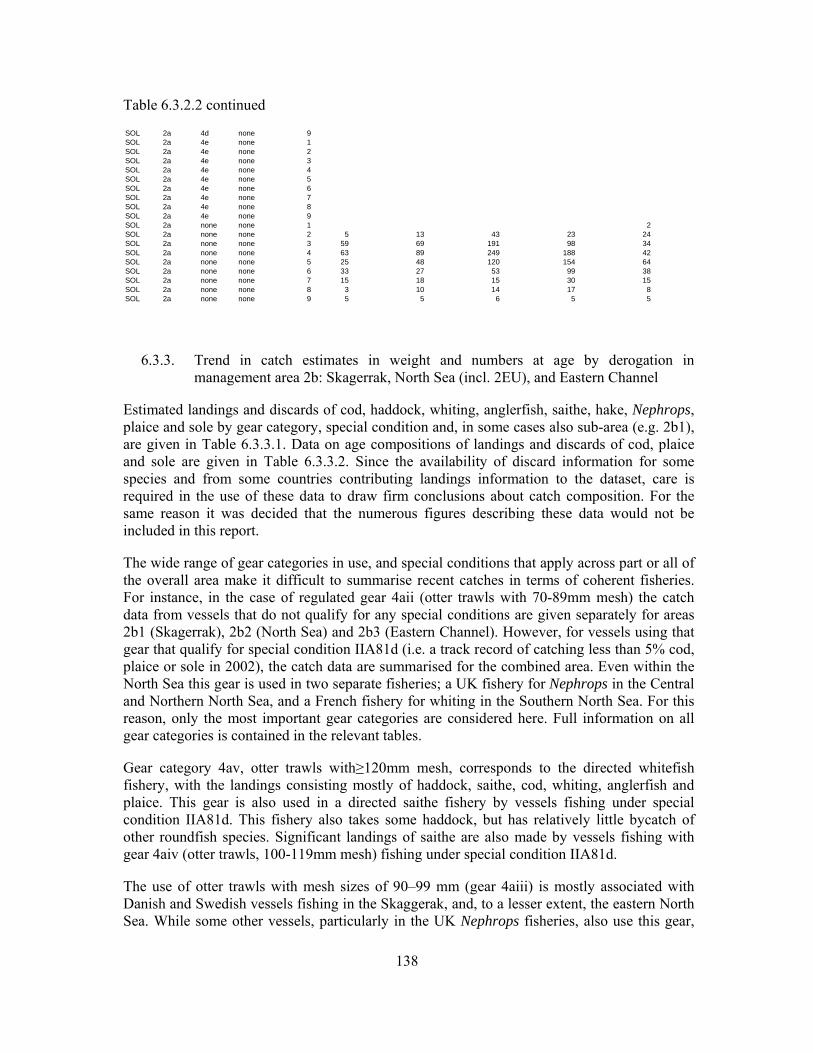
138
Table 6.3.2.2 continued
SOL 2a 4d none 9SOL 2a 4e none 1SOL 2a 4e none 2SOL 2a 4e none 3SOL 2a 4e none 4SOL 2a 4e none 5SOL 2a 4e none 6SOL 2a 4e none 7SOL 2a 4e none 8SOL 2a 4e none 9SOL 2a none none 1 2SOL 2a none none 2 5 13 43 23 24SOL 2a none none 3 59 69 191 98 34SOL 2a none none 4 63 89 249 188 42SOL 2a none none 5 25 48 120 154 64SOL 2a none none 6 33 27 53 99 38SOL 2a none none 7 15 18 15 30 15SOL 2a none none 8 3 10 14 17 8SOL 2a none none 9 5 5 6 5 5
6.3.3. Trend in catch estimates in weight and numbers at age by derogation in management area 2b: Skagerrak, North Sea (incl. 2EU), and Eastern Channel
Estimated landings and discards of cod, haddock, whiting, anglerfish, saithe, hake, Nephrops, plaice and sole by gear category, special condition and, in some cases also sub-area (e.g. 2b1), are given in Table 6.3.3.1. Data on age compositions of landings and discards of cod, plaice and sole are given in Table 6.3.3.2. Since the availability of discard information for some species and from some countries contributing landings information to the dataset, care is required in the use of these data to draw firm conclusions about catch composition. For the same reason it was decided that the numerous figures describing these data would not be included in this report.
The wide range of gear categories in use, and special conditions that apply across part or all of the overall area make it difficult to summarise recent catches in terms of coherent fisheries. For instance, in the case of regulated gear 4aii (otter trawls with 70-89mm mesh) the catch data from vessels that do not qualify for any special conditions are given separately for areas 2b1 (Skagerrak), 2b2 (North Sea) and 2b3 (Eastern Channel). However, for vessels using that gear that qualify for special condition IIA81d (i.e. a track record of catching less than 5% cod, plaice or sole in 2002), the catch data are summarised for the combined area. Even within the North Sea this gear is used in two separate fisheries; a UK fishery for Nephrops in the Central and Northern North Sea, and a French fishery for whiting in the Southern North Sea. For this reason, only the most important gear categories are considered here. Full information on all gear categories is contained in the relevant tables.
Gear category 4av, otter trawls with≥120mm mesh, corresponds to the directed whitefish fishery, with the landings consisting mostly of haddock, saithe, cod, whiting, anglerfish and plaice. This gear is also used in a directed saithe fishery by vessels fishing under special condition IIA81d. This fishery also takes some haddock, but has relatively little bycatch of other roundfish species. Significant landings of saithe are also made by vessels fishing with gear 4aiv (otter trawls, 100-119mm mesh) fishing under special condition IIA81d.
The use of otter trawls with mesh sizes of 90–99 mm (gear 4aiii) is mostly associated with Danish and Swedish vessels fishing in the Skaggerak, and, to a lesser extent, the eastern North Sea. While some other vessels, particularly in the UK Nephrops fisheries, also use this gear,
139
Danish and Swedish vessels in the Skagerrak account for most cod landings taken by this gear, which also takes most other demersal species in a mixed fishery.
The fishery using otter trawl mesh sizes of 70-89mm can be broadly categorised as a whiting fishery in the southern North Sea and Eastern Channel and a Nephrops fishery in the central and northern North Sea.
Beam trawlers using mesh sizes of 80-89mm (gear 4bi) take the large majority of the catches of plaice and sole. These vessels also land some cod and discard substantial quantities of plaice and whiting.
Gillnetters can use a variety of mesh sizes to target different species. Based on the information summarised here, mesh sizes of 109mm or less (4ci) are used to target sole, whereas mesh sizes of 110-149mm (4cii) and 150-219mm (4ciii) catch mostly cod and plaice. The gillnet fisheries for cod and plaice are rather distinct from each other, so the classification by mesh size is a little artificial in this case. The larger gillnet mesh sizes (4civ) are used to target Turbot & Lumpsucker, though of the species considered here, anglerfish are the main species caught. There are some catches of sole by trammel nets in the North Sea and eastern channel. Most of these catches are made by vessels fishing under special condition IIA81g which requires vessels to be absent from port for no more than 24 hours at a time.
A common feature of cod sensitive mobile gears is the indication of increased discards of 1 year old cod in 2006 and 2 year old cod n 2007 (year class 2005) in the management area 2b.
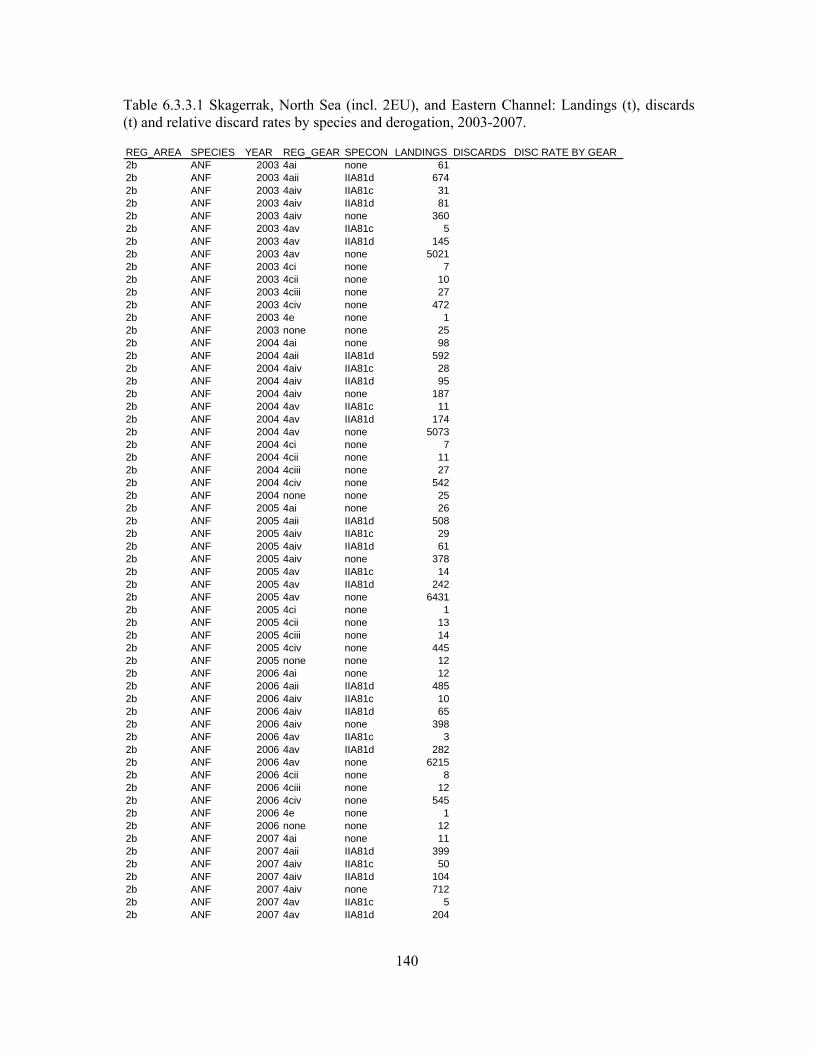
140
Table 6.3.3.1 Skagerrak, North Sea (incl. 2EU), and Eastern Channel: Landings (t), discards (t) and relative discard rates by species and derogation, 2003-2007.
REG_AREA SPECIES YEAR REG_GEAR SPECON LANDINGS DISCARDS DISC RATE BY GEAR2b ANF 2003 4ai none 612b ANF 2003 4aii IIA81d 6742b ANF 2003 4aiv IIA81c 312b ANF 2003 4aiv IIA81d 812b ANF 2003 4aiv none 3602b ANF 2003 4av IIA81c 52b ANF 2003 4av IIA81d 1452b ANF 2003 4av none 50212b ANF 2003 4ci none 72b ANF 2003 4cii none 102b ANF 2003 4ciii none 272b ANF 2003 4civ none 4722b ANF 2003 4e none 12b ANF 2003 none none 252b ANF 2004 4ai none 982b ANF 2004 4aii IIA81d 5922b ANF 2004 4aiv IIA81c 282b ANF 2004 4aiv IIA81d 952b ANF 2004 4aiv none 1872b ANF 2004 4av IIA81c 112b ANF 2004 4av IIA81d 1742b ANF 2004 4av none 50732b ANF 2004 4ci none 72b ANF 2004 4cii none 112b ANF 2004 4ciii none 272b ANF 2004 4civ none 5422b ANF 2004 none none 252b ANF 2005 4ai none 262b ANF 2005 4aii IIA81d 5082b ANF 2005 4aiv IIA81c 292b ANF 2005 4aiv IIA81d 612b ANF 2005 4aiv none 3782b ANF 2005 4av IIA81c 142b ANF 2005 4av IIA81d 2422b ANF 2005 4av none 64312b ANF 2005 4ci none 12b ANF 2005 4cii none 132b ANF 2005 4ciii none 142b ANF 2005 4civ none 4452b ANF 2005 none none 122b ANF 2006 4ai none 122b ANF 2006 4aii IIA81d 4852b ANF 2006 4aiv IIA81c 102b ANF 2006 4aiv IIA81d 652b ANF 2006 4aiv none 3982b ANF 2006 4av IIA81c 32b ANF 2006 4av IIA81d 2822b ANF 2006 4av none 62152b ANF 2006 4cii none 82b ANF 2006 4ciii none 122b ANF 2006 4civ none 5452b ANF 2006 4e none 12b ANF 2006 none none 122b ANF 2007 4ai none 112b ANF 2007 4aii IIA81d 3992b ANF 2007 4aiv IIA81c 502b ANF 2007 4aiv IIA81d 1042b ANF 2007 4aiv none 7122b ANF 2007 4av IIA81c 52b ANF 2007 4av IIA81d 204

141
Table 6.3.3.1 continued
2b ANF 2007 4av none 64212b ANF 2007 4cii none 122b ANF 2007 4ciii none 52b ANF 2007 4civ none 3562b ANF 2007 4d none 12b ANF 2007 none none 1422b COD 2003 4ai none 362b COD 2003 4aii IIA81d 565 469 0.452b COD 2003 4aiv IIA81c 61 2 0.032b COD 2003 4aiv IIA81d 86 6 0.062b COD 2003 4aiv none 368 21 0.052b COD 2003 4av IIA81c 52 7 0.122b COD 2003 4av IIA81d 363 33 0.082b COD 2003 4av none 10985 962 0.082b COD 2003 4ci none 1502b COD 2003 4cii none 12772b COD 2003 4ciii none 2101 42b COD 2003 4civ none 182b COD 2003 4d none 622b COD 2003 4e none 2262b COD 2003 none none 12212b COD 2004 4ai none 18 0.012b COD 2004 4aii IIA81d 396 165 0.292b COD 2004 4aiv IIA81c 58 3 0.052b COD 2004 4aiv IIA81d 46 3 0.062b COD 2004 4aiv none 382 59 0.132b COD 2004 4av IIA81c 62 1 0.022b COD 2004 4av IIA81d 348 20 0.052b COD 2004 4av none 9857 1048 0.12b COD 2004 4ci none 1372b COD 2004 4cii none 1511 12b COD 2004 4ciii none 26352b COD 2004 4civ none 382b COD 2004 4d none 282b COD 2004 4e none 1262b COD 2004 none none 14122b COD 2005 4ai none 192b COD 2005 4aii IIA81d 333 207 0.382b COD 2005 4aiv IIA81c 101 13 0.112b COD 2005 4aiv IIA81d 60 5 0.082b COD 2005 4aiv none 827 114 0.122b COD 2005 4av IIA81c 792b COD 2005 4av IIA81d 438 18 0.042b COD 2005 4av none 10787 1221 0.12b COD 2005 4ci none 1352b COD 2005 4cii none 1656 32b COD 2005 4ciii none 24752b COD 2005 4civ none 442b COD 2005 4d none 832b COD 2005 4e none 1352b COD 2005 none none 1089 129 0.112b COD 2006 4ai none 82b COD 2006 4aii IIA81d 335 372 0.532b COD 2006 4aiv IIA81c 40 10 0.192b COD 2006 4aiv IIA81d 66 15 0.192b COD 2006 4aiv none 558 70 0.112b COD 2006 4av IIA81c 6 0.012b COD 2006 4av IIA81d 455 26 0.052b COD 2006 4av none 10210 1668 0.142b COD 2006 4ci none 1182b COD 2006 4cii none 1702
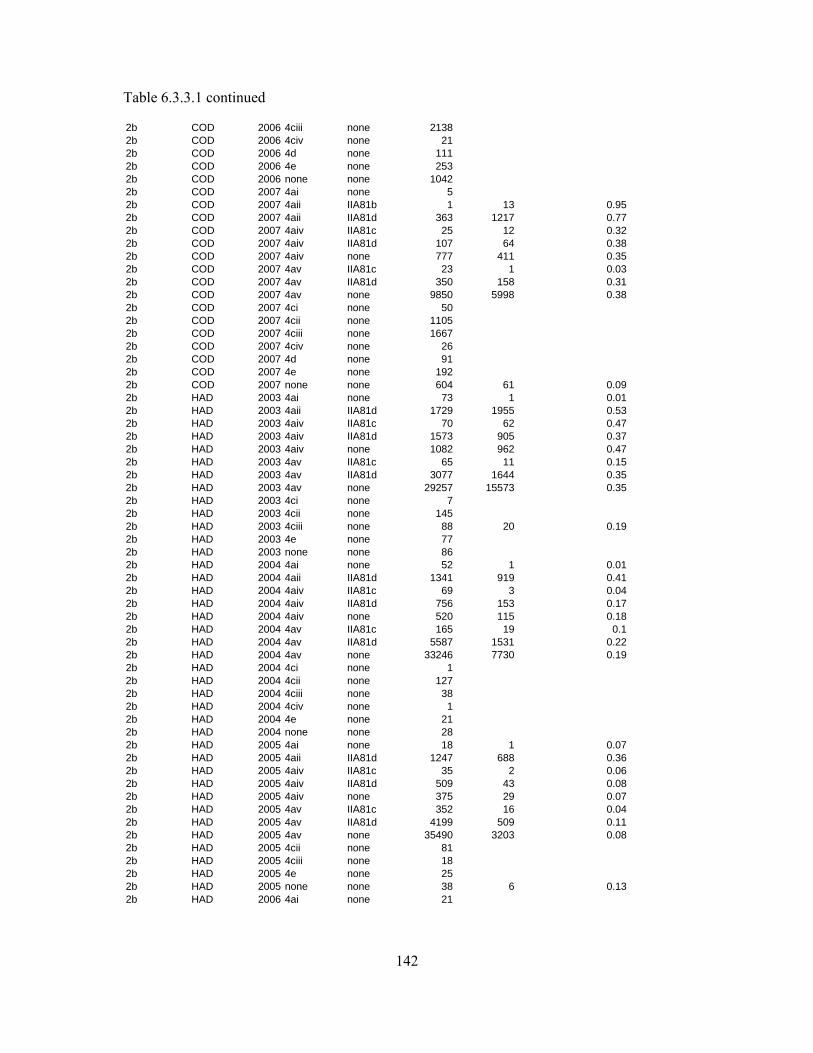
142
Table 6.3.3.1 continued
2b COD 2006 4ciii none 21382b COD 2006 4civ none 212b COD 2006 4d none 1112b COD 2006 4e none 2532b COD 2006 none none 10422b COD 2007 4ai none 52b COD 2007 4aii IIA81b 1 13 0.952b COD 2007 4aii IIA81d 363 1217 0.772b COD 2007 4aiv IIA81c 25 12 0.322b COD 2007 4aiv IIA81d 107 64 0.382b COD 2007 4aiv none 777 411 0.352b COD 2007 4av IIA81c 23 1 0.032b COD 2007 4av IIA81d 350 158 0.312b COD 2007 4av none 9850 5998 0.382b COD 2007 4ci none 502b COD 2007 4cii none 11052b COD 2007 4ciii none 16672b COD 2007 4civ none 262b COD 2007 4d none 912b COD 2007 4e none 1922b COD 2007 none none 604 61 0.092b HAD 2003 4ai none 73 1 0.012b HAD 2003 4aii IIA81d 1729 1955 0.532b HAD 2003 4aiv IIA81c 70 62 0.472b HAD 2003 4aiv IIA81d 1573 905 0.372b HAD 2003 4aiv none 1082 962 0.472b HAD 2003 4av IIA81c 65 11 0.152b HAD 2003 4av IIA81d 3077 1644 0.352b HAD 2003 4av none 29257 15573 0.352b HAD 2003 4ci none 72b HAD 2003 4cii none 1452b HAD 2003 4ciii none 88 20 0.192b HAD 2003 4e none 772b HAD 2003 none none 862b HAD 2004 4ai none 52 1 0.012b HAD 2004 4aii IIA81d 1341 919 0.412b HAD 2004 4aiv IIA81c 69 3 0.042b HAD 2004 4aiv IIA81d 756 153 0.172b HAD 2004 4aiv none 520 115 0.182b HAD 2004 4av IIA81c 165 19 0.12b HAD 2004 4av IIA81d 5587 1531 0.222b HAD 2004 4av none 33246 7730 0.192b HAD 2004 4ci none 12b HAD 2004 4cii none 1272b HAD 2004 4ciii none 382b HAD 2004 4civ none 12b HAD 2004 4e none 212b HAD 2004 none none 282b HAD 2005 4ai none 18 1 0.072b HAD 2005 4aii IIA81d 1247 688 0.362b HAD 2005 4aiv IIA81c 35 2 0.062b HAD 2005 4aiv IIA81d 509 43 0.082b HAD 2005 4aiv none 375 29 0.072b HAD 2005 4av IIA81c 352 16 0.042b HAD 2005 4av IIA81d 4199 509 0.112b HAD 2005 4av none 35490 3203 0.082b HAD 2005 4cii none 812b HAD 2005 4ciii none 182b HAD 2005 4e none 252b HAD 2005 none none 38 6 0.132b HAD 2006 4ai none 21
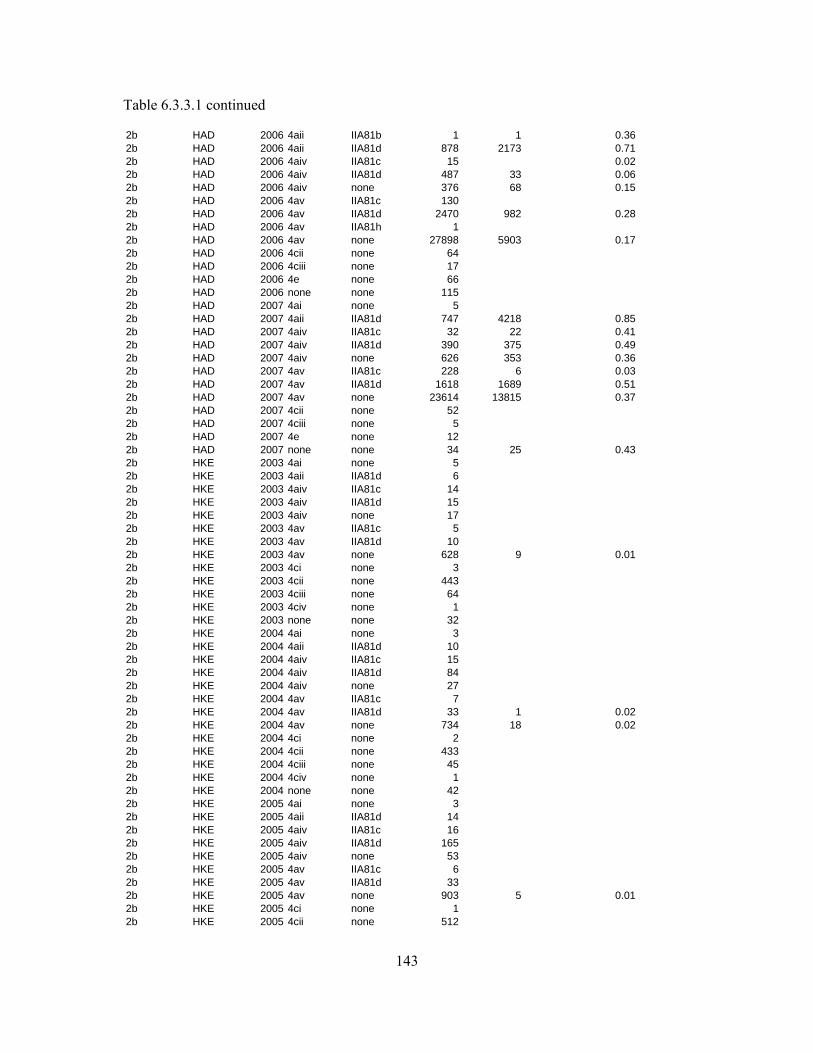
143
Table 6.3.3.1 continued
2b HAD 2006 4aii IIA81b 1 1 0.362b HAD 2006 4aii IIA81d 878 2173 0.712b HAD 2006 4aiv IIA81c 15 0.022b HAD 2006 4aiv IIA81d 487 33 0.062b HAD 2006 4aiv none 376 68 0.152b HAD 2006 4av IIA81c 1302b HAD 2006 4av IIA81d 2470 982 0.282b HAD 2006 4av IIA81h 12b HAD 2006 4av none 27898 5903 0.172b HAD 2006 4cii none 642b HAD 2006 4ciii none 172b HAD 2006 4e none 662b HAD 2006 none none 1152b HAD 2007 4ai none 52b HAD 2007 4aii IIA81d 747 4218 0.852b HAD 2007 4aiv IIA81c 32 22 0.412b HAD 2007 4aiv IIA81d 390 375 0.492b HAD 2007 4aiv none 626 353 0.362b HAD 2007 4av IIA81c 228 6 0.032b HAD 2007 4av IIA81d 1618 1689 0.512b HAD 2007 4av none 23614 13815 0.372b HAD 2007 4cii none 522b HAD 2007 4ciii none 52b HAD 2007 4e none 122b HAD 2007 none none 34 25 0.432b HKE 2003 4ai none 52b HKE 2003 4aii IIA81d 62b HKE 2003 4aiv IIA81c 142b HKE 2003 4aiv IIA81d 152b HKE 2003 4aiv none 172b HKE 2003 4av IIA81c 52b HKE 2003 4av IIA81d 102b HKE 2003 4av none 628 9 0.012b HKE 2003 4ci none 32b HKE 2003 4cii none 4432b HKE 2003 4ciii none 642b HKE 2003 4civ none 12b HKE 2003 none none 322b HKE 2004 4ai none 32b HKE 2004 4aii IIA81d 102b HKE 2004 4aiv IIA81c 152b HKE 2004 4aiv IIA81d 842b HKE 2004 4aiv none 272b HKE 2004 4av IIA81c 72b HKE 2004 4av IIA81d 33 1 0.022b HKE 2004 4av none 734 18 0.022b HKE 2004 4ci none 22b HKE 2004 4cii none 4332b HKE 2004 4ciii none 452b HKE 2004 4civ none 12b HKE 2004 none none 422b HKE 2005 4ai none 32b HKE 2005 4aii IIA81d 142b HKE 2005 4aiv IIA81c 162b HKE 2005 4aiv IIA81d 1652b HKE 2005 4aiv none 532b HKE 2005 4av IIA81c 62b HKE 2005 4av IIA81d 332b HKE 2005 4av none 903 5 0.012b HKE 2005 4ci none 12b HKE 2005 4cii none 512
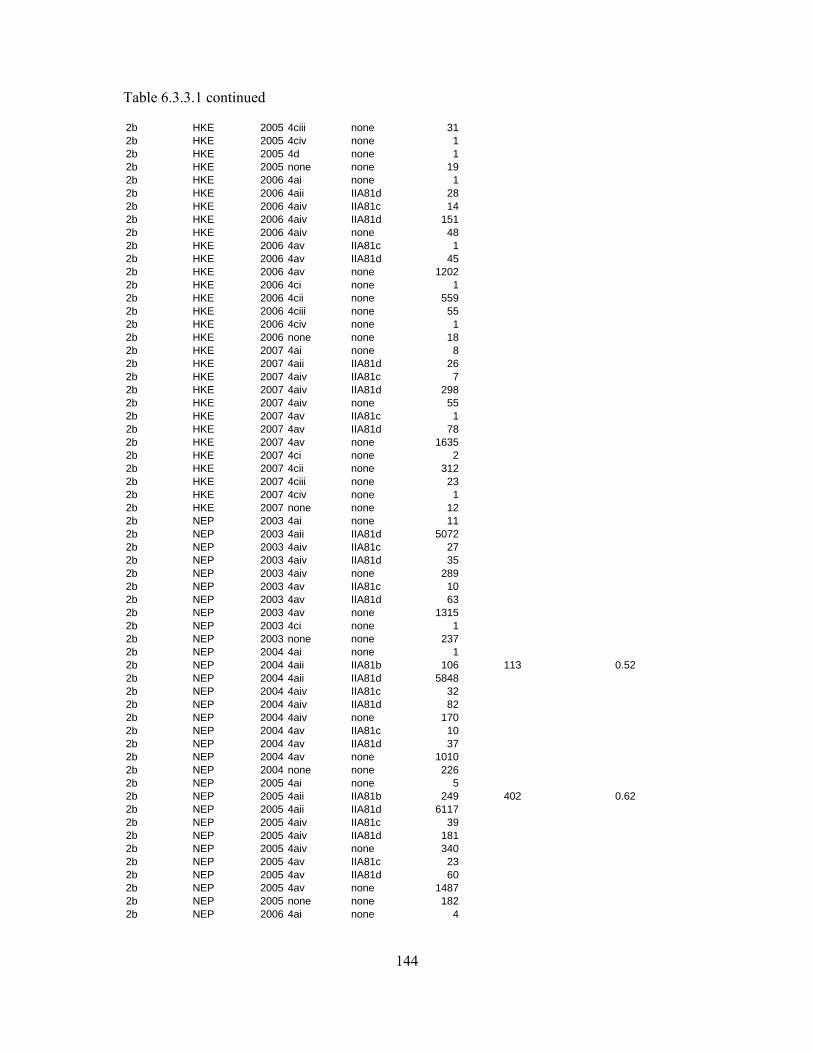
144
Table 6.3.3.1 continued
2b HKE 2005 4ciii none 312b HKE 2005 4civ none 12b HKE 2005 4d none 12b HKE 2005 none none 192b HKE 2006 4ai none 12b HKE 2006 4aii IIA81d 282b HKE 2006 4aiv IIA81c 142b HKE 2006 4aiv IIA81d 1512b HKE 2006 4aiv none 482b HKE 2006 4av IIA81c 12b HKE 2006 4av IIA81d 452b HKE 2006 4av none 12022b HKE 2006 4ci none 12b HKE 2006 4cii none 5592b HKE 2006 4ciii none 552b HKE 2006 4civ none 12b HKE 2006 none none 182b HKE 2007 4ai none 82b HKE 2007 4aii IIA81d 262b HKE 2007 4aiv IIA81c 72b HKE 2007 4aiv IIA81d 2982b HKE 2007 4aiv none 552b HKE 2007 4av IIA81c 12b HKE 2007 4av IIA81d 782b HKE 2007 4av none 16352b HKE 2007 4ci none 22b HKE 2007 4cii none 3122b HKE 2007 4ciii none 232b HKE 2007 4civ none 12b HKE 2007 none none 122b NEP 2003 4ai none 112b NEP 2003 4aii IIA81d 50722b NEP 2003 4aiv IIA81c 272b NEP 2003 4aiv IIA81d 352b NEP 2003 4aiv none 2892b NEP 2003 4av IIA81c 102b NEP 2003 4av IIA81d 632b NEP 2003 4av none 13152b NEP 2003 4ci none 12b NEP 2003 none none 2372b NEP 2004 4ai none 12b NEP 2004 4aii IIA81b 106 113 0.522b NEP 2004 4aii IIA81d 58482b NEP 2004 4aiv IIA81c 322b NEP 2004 4aiv IIA81d 822b NEP 2004 4aiv none 1702b NEP 2004 4av IIA81c 102b NEP 2004 4av IIA81d 372b NEP 2004 4av none 10102b NEP 2004 none none 2262b NEP 2005 4ai none 52b NEP 2005 4aii IIA81b 249 402 0.622b NEP 2005 4aii IIA81d 61172b NEP 2005 4aiv IIA81c 392b NEP 2005 4aiv IIA81d 1812b NEP 2005 4aiv none 3402b NEP 2005 4av IIA81c 232b NEP 2005 4av IIA81d 602b NEP 2005 4av none 14872b NEP 2005 none none 1822b NEP 2006 4ai none 4
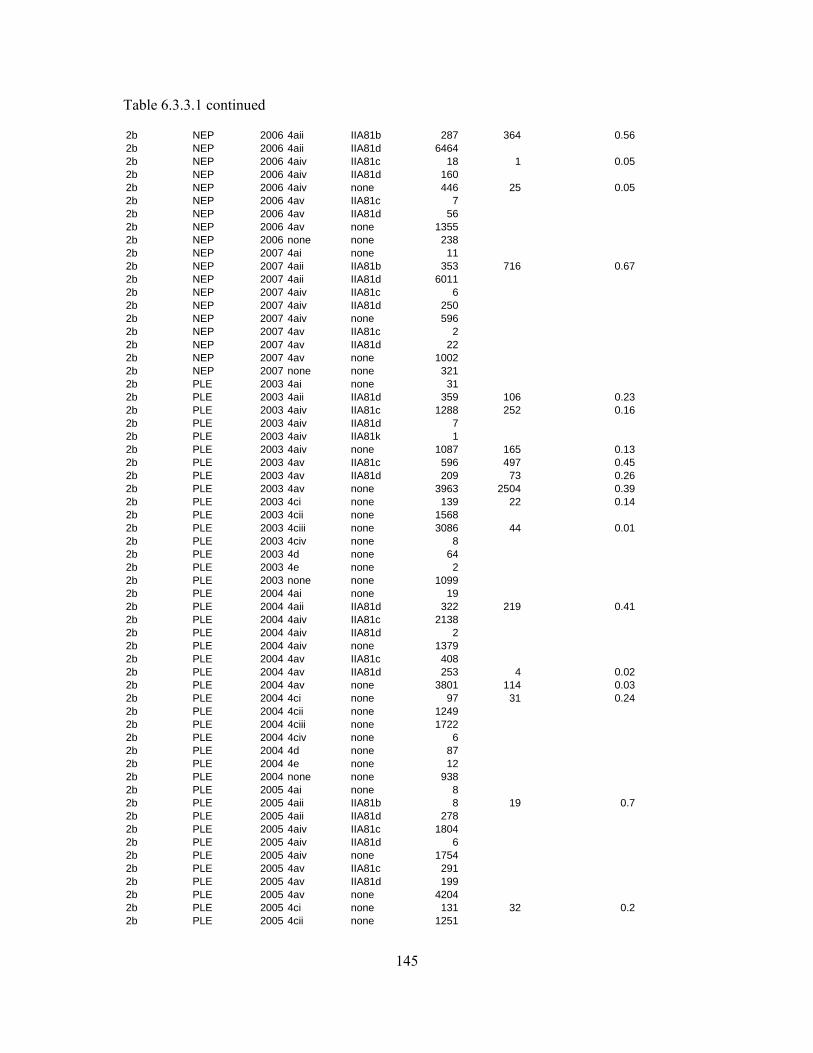
145
Table 6.3.3.1 continued
2b NEP 2006 4aii IIA81b 287 364 0.562b NEP 2006 4aii IIA81d 64642b NEP 2006 4aiv IIA81c 18 1 0.052b NEP 2006 4aiv IIA81d 1602b NEP 2006 4aiv none 446 25 0.052b NEP 2006 4av IIA81c 72b NEP 2006 4av IIA81d 562b NEP 2006 4av none 13552b NEP 2006 none none 2382b NEP 2007 4ai none 112b NEP 2007 4aii IIA81b 353 716 0.672b NEP 2007 4aii IIA81d 60112b NEP 2007 4aiv IIA81c 62b NEP 2007 4aiv IIA81d 2502b NEP 2007 4aiv none 5962b NEP 2007 4av IIA81c 22b NEP 2007 4av IIA81d 222b NEP 2007 4av none 10022b NEP 2007 none none 3212b PLE 2003 4ai none 312b PLE 2003 4aii IIA81d 359 106 0.232b PLE 2003 4aiv IIA81c 1288 252 0.162b PLE 2003 4aiv IIA81d 72b PLE 2003 4aiv IIA81k 12b PLE 2003 4aiv none 1087 165 0.132b PLE 2003 4av IIA81c 596 497 0.452b PLE 2003 4av IIA81d 209 73 0.262b PLE 2003 4av none 3963 2504 0.392b PLE 2003 4ci none 139 22 0.142b PLE 2003 4cii none 15682b PLE 2003 4ciii none 3086 44 0.012b PLE 2003 4civ none 82b PLE 2003 4d none 642b PLE 2003 4e none 22b PLE 2003 none none 10992b PLE 2004 4ai none 192b PLE 2004 4aii IIA81d 322 219 0.412b PLE 2004 4aiv IIA81c 21382b PLE 2004 4aiv IIA81d 22b PLE 2004 4aiv none 13792b PLE 2004 4av IIA81c 4082b PLE 2004 4av IIA81d 253 4 0.022b PLE 2004 4av none 3801 114 0.032b PLE 2004 4ci none 97 31 0.242b PLE 2004 4cii none 12492b PLE 2004 4ciii none 17222b PLE 2004 4civ none 62b PLE 2004 4d none 872b PLE 2004 4e none 122b PLE 2004 none none 9382b PLE 2005 4ai none 82b PLE 2005 4aii IIA81b 8 19 0.72b PLE 2005 4aii IIA81d 2782b PLE 2005 4aiv IIA81c 18042b PLE 2005 4aiv IIA81d 62b PLE 2005 4aiv none 17542b PLE 2005 4av IIA81c 2912b PLE 2005 4av IIA81d 1992b PLE 2005 4av none 42042b PLE 2005 4ci none 131 32 0.22b PLE 2005 4cii none 1251
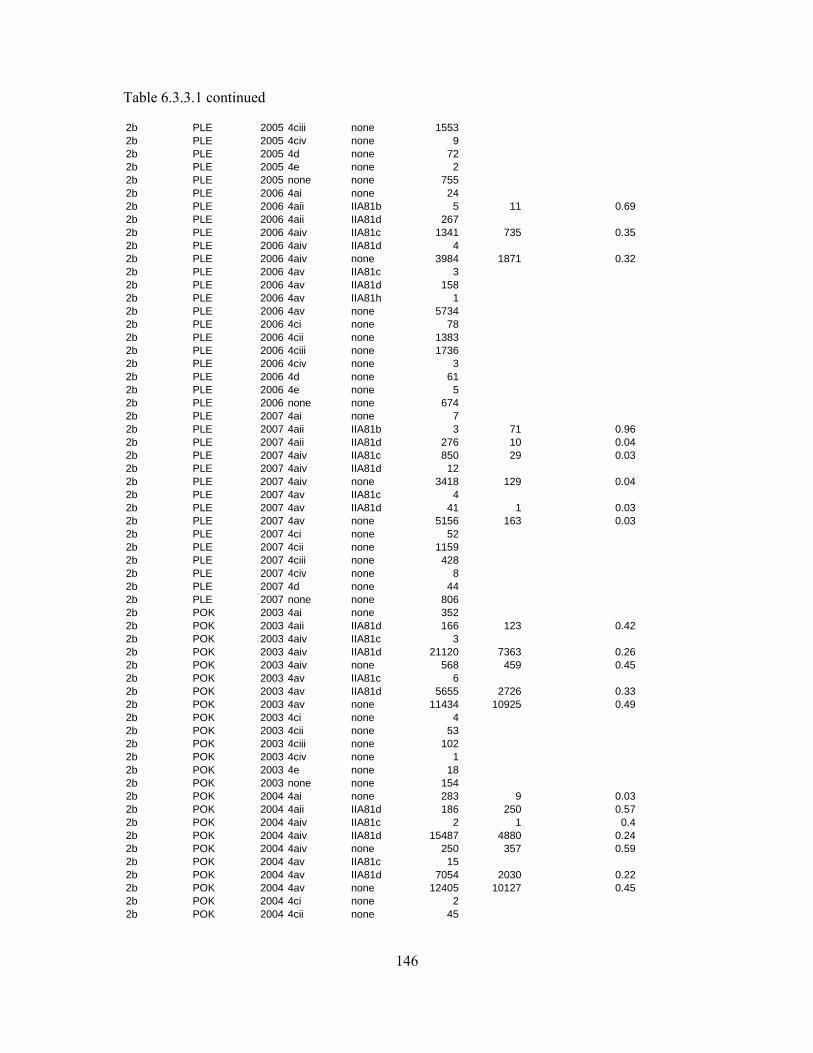
146
Table 6.3.3.1 continued
2b PLE 2005 4ciii none 15532b PLE 2005 4civ none 92b PLE 2005 4d none 722b PLE 2005 4e none 22b PLE 2005 none none 7552b PLE 2006 4ai none 242b PLE 2006 4aii IIA81b 5 11 0.692b PLE 2006 4aii IIA81d 2672b PLE 2006 4aiv IIA81c 1341 735 0.352b PLE 2006 4aiv IIA81d 42b PLE 2006 4aiv none 3984 1871 0.322b PLE 2006 4av IIA81c 32b PLE 2006 4av IIA81d 1582b PLE 2006 4av IIA81h 12b PLE 2006 4av none 57342b PLE 2006 4ci none 782b PLE 2006 4cii none 13832b PLE 2006 4ciii none 17362b PLE 2006 4civ none 32b PLE 2006 4d none 612b PLE 2006 4e none 52b PLE 2006 none none 6742b PLE 2007 4ai none 72b PLE 2007 4aii IIA81b 3 71 0.962b PLE 2007 4aii IIA81d 276 10 0.042b PLE 2007 4aiv IIA81c 850 29 0.032b PLE 2007 4aiv IIA81d 122b PLE 2007 4aiv none 3418 129 0.042b PLE 2007 4av IIA81c 42b PLE 2007 4av IIA81d 41 1 0.032b PLE 2007 4av none 5156 163 0.032b PLE 2007 4ci none 522b PLE 2007 4cii none 11592b PLE 2007 4ciii none 4282b PLE 2007 4civ none 82b PLE 2007 4d none 442b PLE 2007 none none 8062b POK 2003 4ai none 3522b POK 2003 4aii IIA81d 166 123 0.422b POK 2003 4aiv IIA81c 32b POK 2003 4aiv IIA81d 21120 7363 0.262b POK 2003 4aiv none 568 459 0.452b POK 2003 4av IIA81c 62b POK 2003 4av IIA81d 5655 2726 0.332b POK 2003 4av none 11434 10925 0.492b POK 2003 4ci none 42b POK 2003 4cii none 532b POK 2003 4ciii none 1022b POK 2003 4civ none 12b POK 2003 4e none 182b POK 2003 none none 1542b POK 2004 4ai none 283 9 0.032b POK 2004 4aii IIA81d 186 250 0.572b POK 2004 4aiv IIA81c 2 1 0.42b POK 2004 4aiv IIA81d 15487 4880 0.242b POK 2004 4aiv none 250 357 0.592b POK 2004 4av IIA81c 152b POK 2004 4av IIA81d 7054 2030 0.222b POK 2004 4av none 12405 10127 0.452b POK 2004 4ci none 22b POK 2004 4cii none 45
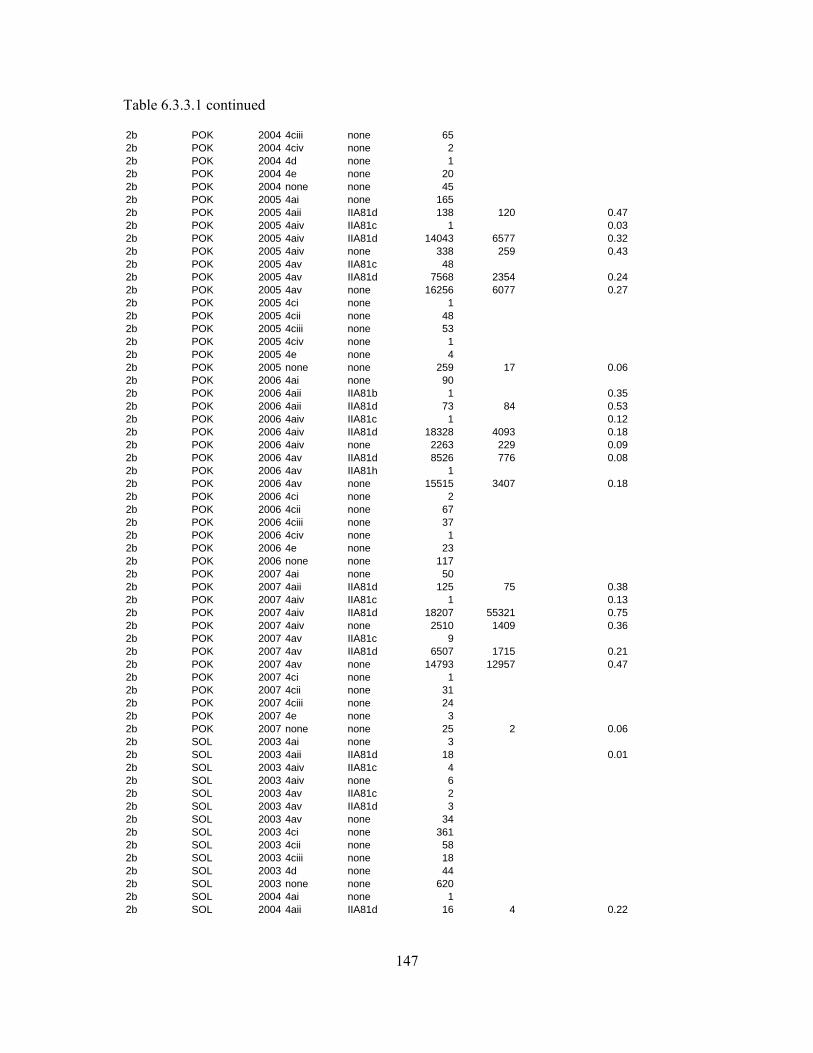
147
Table 6.3.3.1 continued
2b POK 2004 4ciii none 652b POK 2004 4civ none 22b POK 2004 4d none 12b POK 2004 4e none 202b POK 2004 none none 452b POK 2005 4ai none 1652b POK 2005 4aii IIA81d 138 120 0.472b POK 2005 4aiv IIA81c 1 0.032b POK 2005 4aiv IIA81d 14043 6577 0.322b POK 2005 4aiv none 338 259 0.432b POK 2005 4av IIA81c 482b POK 2005 4av IIA81d 7568 2354 0.242b POK 2005 4av none 16256 6077 0.272b POK 2005 4ci none 12b POK 2005 4cii none 482b POK 2005 4ciii none 532b POK 2005 4civ none 12b POK 2005 4e none 42b POK 2005 none none 259 17 0.062b POK 2006 4ai none 902b POK 2006 4aii IIA81b 1 0.352b POK 2006 4aii IIA81d 73 84 0.532b POK 2006 4aiv IIA81c 1 0.122b POK 2006 4aiv IIA81d 18328 4093 0.182b POK 2006 4aiv none 2263 229 0.092b POK 2006 4av IIA81d 8526 776 0.082b POK 2006 4av IIA81h 12b POK 2006 4av none 15515 3407 0.182b POK 2006 4ci none 22b POK 2006 4cii none 672b POK 2006 4ciii none 372b POK 2006 4civ none 12b POK 2006 4e none 232b POK 2006 none none 1172b POK 2007 4ai none 502b POK 2007 4aii IIA81d 125 75 0.382b POK 2007 4aiv IIA81c 1 0.132b POK 2007 4aiv IIA81d 18207 55321 0.752b POK 2007 4aiv none 2510 1409 0.362b POK 2007 4av IIA81c 92b POK 2007 4av IIA81d 6507 1715 0.212b POK 2007 4av none 14793 12957 0.472b POK 2007 4ci none 12b POK 2007 4cii none 312b POK 2007 4ciii none 242b POK 2007 4e none 32b POK 2007 none none 25 2 0.062b SOL 2003 4ai none 32b SOL 2003 4aii IIA81d 18 0.012b SOL 2003 4aiv IIA81c 42b SOL 2003 4aiv none 62b SOL 2003 4av IIA81c 22b SOL 2003 4av IIA81d 32b SOL 2003 4av none 342b SOL 2003 4ci none 3612b SOL 2003 4cii none 582b SOL 2003 4ciii none 182b SOL 2003 4d none 442b SOL 2003 none none 6202b SOL 2004 4ai none 12b SOL 2004 4aii IIA81d 16 4 0.22

148
Table 6.3.3.1 continued
2b SOL 2004 4aiv IIA81c 102b SOL 2004 4aiv none 142b SOL 2004 4av IIA81c 32b SOL 2004 4av IIA81d 32b SOL 2004 4av none 212b SOL 2004 4ci none 322 8 0.022b SOL 2004 4cii none 602b SOL 2004 4ciii none 282b SOL 2004 4d none 252b SOL 2004 none none 4872b SOL 2005 4ai none 32b SOL 2005 4aii IIA81b 1 0.142b SOL 2005 4aii IIA81d 212b SOL 2005 4aiv IIA81c 22b SOL 2005 4aiv none 152b SOL 2005 4av IIA81c 12b SOL 2005 4av IIA81d 12b SOL 2005 4av none 102b SOL 2005 4ci none 414 5 0.012b SOL 2005 4cii none 1682b SOL 2005 4ciii none 702b SOL 2005 4d none 642b SOL 2005 none none 2122b SOL 2006 4ai none 12b SOL 2006 4aii IIA81b 1 0.112b SOL 2006 4aii IIA81d 322b SOL 2006 4aiv IIA81c 12b SOL 2006 4aiv none 242b SOL 2006 4av IIA81c 22b SOL 2006 4av IIA81d 12b SOL 2006 4av none 412b SOL 2006 4ci none 4502b SOL 2006 4cii none 632b SOL 2006 4ciii none 202b SOL 2006 4d none 362b SOL 2006 none none 1442b SOL 2007 4ai none 12b SOL 2007 4aii IIA81b 2 2 0.472b SOL 2007 4aii IIA81d 33 25 0.422b SOL 2007 4aiv IIA81d 12b SOL 2007 4aiv none 42b SOL 2007 4av IIA81d 12b SOL 2007 4av none 72b SOL 2007 4ci none 372 32 0.082b SOL 2007 4cii none 962b SOL 2007 4ciii none 142b SOL 2007 4d none 24 1 0.042b SOL 2007 none none 2532b WHG 2003 4ai none 102b WHG 2003 4aii IIA81d 5694 21940 0.792b WHG 2003 4aiv IIA81c 15 10 0.42b WHG 2003 4aiv IIA81d 340 182 0.352b WHG 2003 4aiv none 286 206 0.422b WHG 2003 4av IIA81c 12 24 0.672b WHG 2003 4av IIA81d 254 256 0.52b WHG 2003 4av none 4216 3058 0.422b WHG 2003 4ci none 12b WHG 2003 4cii none 42b WHG 2003 4ciii none 12b WHG 2003 4d none 82b WHG 2003 none none 127
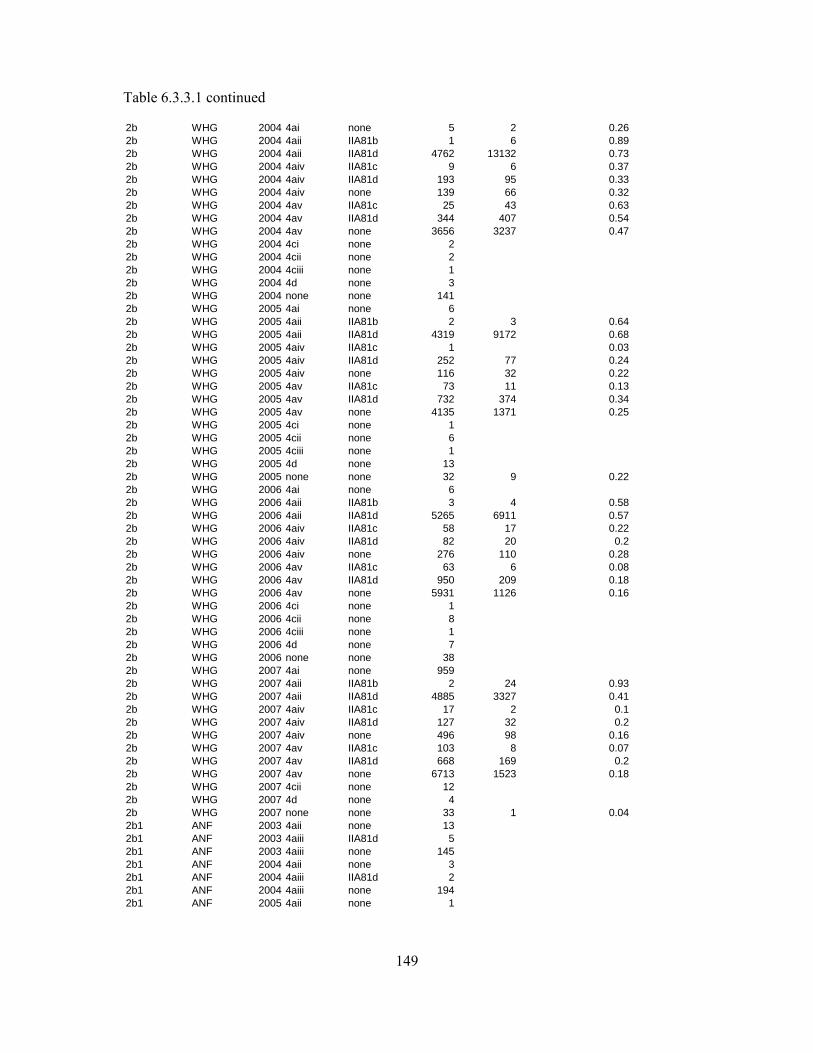
149
Table 6.3.3.1 continued
2b WHG 2004 4ai none 5 2 0.262b WHG 2004 4aii IIA81b 1 6 0.892b WHG 2004 4aii IIA81d 4762 13132 0.732b WHG 2004 4aiv IIA81c 9 6 0.372b WHG 2004 4aiv IIA81d 193 95 0.332b WHG 2004 4aiv none 139 66 0.322b WHG 2004 4av IIA81c 25 43 0.632b WHG 2004 4av IIA81d 344 407 0.542b WHG 2004 4av none 3656 3237 0.472b WHG 2004 4ci none 22b WHG 2004 4cii none 22b WHG 2004 4ciii none 12b WHG 2004 4d none 32b WHG 2004 none none 1412b WHG 2005 4ai none 62b WHG 2005 4aii IIA81b 2 3 0.642b WHG 2005 4aii IIA81d 4319 9172 0.682b WHG 2005 4aiv IIA81c 1 0.032b WHG 2005 4aiv IIA81d 252 77 0.242b WHG 2005 4aiv none 116 32 0.222b WHG 2005 4av IIA81c 73 11 0.132b WHG 2005 4av IIA81d 732 374 0.342b WHG 2005 4av none 4135 1371 0.252b WHG 2005 4ci none 12b WHG 2005 4cii none 62b WHG 2005 4ciii none 12b WHG 2005 4d none 132b WHG 2005 none none 32 9 0.222b WHG 2006 4ai none 62b WHG 2006 4aii IIA81b 3 4 0.582b WHG 2006 4aii IIA81d 5265 6911 0.572b WHG 2006 4aiv IIA81c 58 17 0.222b WHG 2006 4aiv IIA81d 82 20 0.22b WHG 2006 4aiv none 276 110 0.282b WHG 2006 4av IIA81c 63 6 0.082b WHG 2006 4av IIA81d 950 209 0.182b WHG 2006 4av none 5931 1126 0.162b WHG 2006 4ci none 12b WHG 2006 4cii none 82b WHG 2006 4ciii none 12b WHG 2006 4d none 72b WHG 2006 none none 382b WHG 2007 4ai none 9592b WHG 2007 4aii IIA81b 2 24 0.932b WHG 2007 4aii IIA81d 4885 3327 0.412b WHG 2007 4aiv IIA81c 17 2 0.12b WHG 2007 4aiv IIA81d 127 32 0.22b WHG 2007 4aiv none 496 98 0.162b WHG 2007 4av IIA81c 103 8 0.072b WHG 2007 4av IIA81d 668 169 0.22b WHG 2007 4av none 6713 1523 0.182b WHG 2007 4cii none 122b WHG 2007 4d none 42b WHG 2007 none none 33 1 0.042b1 ANF 2003 4aii none 132b1 ANF 2003 4aiii IIA81d 52b1 ANF 2003 4aiii none 1452b1 ANF 2004 4aii none 32b1 ANF 2004 4aiii IIA81d 22b1 ANF 2004 4aiii none 1942b1 ANF 2005 4aii none 1
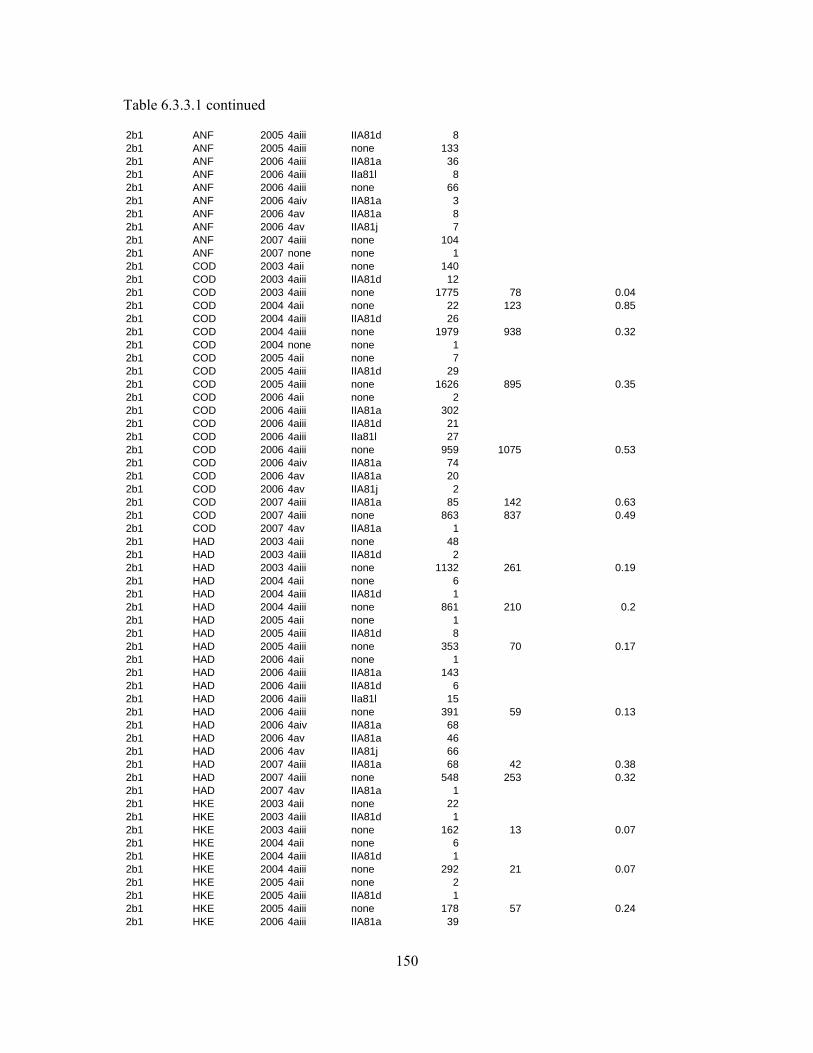
150
Table 6.3.3.1 continued
2b1 ANF 2005 4aiii IIA81d 82b1 ANF 2005 4aiii none 1332b1 ANF 2006 4aiii IIA81a 362b1 ANF 2006 4aiii IIa81l 82b1 ANF 2006 4aiii none 662b1 ANF 2006 4aiv IIA81a 32b1 ANF 2006 4av IIA81a 82b1 ANF 2006 4av IIA81j 72b1 ANF 2007 4aiii none 1042b1 ANF 2007 none none 12b1 COD 2003 4aii none 1402b1 COD 2003 4aiii IIA81d 122b1 COD 2003 4aiii none 1775 78 0.042b1 COD 2004 4aii none 22 123 0.852b1 COD 2004 4aiii IIA81d 262b1 COD 2004 4aiii none 1979 938 0.322b1 COD 2004 none none 12b1 COD 2005 4aii none 72b1 COD 2005 4aiii IIA81d 292b1 COD 2005 4aiii none 1626 895 0.352b1 COD 2006 4aii none 22b1 COD 2006 4aiii IIA81a 3022b1 COD 2006 4aiii IIA81d 212b1 COD 2006 4aiii IIa81l 272b1 COD 2006 4aiii none 959 1075 0.532b1 COD 2006 4aiv IIA81a 742b1 COD 2006 4av IIA81a 202b1 COD 2006 4av IIA81j 22b1 COD 2007 4aiii IIA81a 85 142 0.632b1 COD 2007 4aiii none 863 837 0.492b1 COD 2007 4av IIA81a 12b1 HAD 2003 4aii none 482b1 HAD 2003 4aiii IIA81d 22b1 HAD 2003 4aiii none 1132 261 0.192b1 HAD 2004 4aii none 62b1 HAD 2004 4aiii IIA81d 12b1 HAD 2004 4aiii none 861 210 0.22b1 HAD 2005 4aii none 12b1 HAD 2005 4aiii IIA81d 82b1 HAD 2005 4aiii none 353 70 0.172b1 HAD 2006 4aii none 12b1 HAD 2006 4aiii IIA81a 1432b1 HAD 2006 4aiii IIA81d 62b1 HAD 2006 4aiii IIa81l 152b1 HAD 2006 4aiii none 391 59 0.132b1 HAD 2006 4aiv IIA81a 682b1 HAD 2006 4av IIA81a 462b1 HAD 2006 4av IIA81j 662b1 HAD 2007 4aiii IIA81a 68 42 0.382b1 HAD 2007 4aiii none 548 253 0.322b1 HAD 2007 4av IIA81a 12b1 HKE 2003 4aii none 222b1 HKE 2003 4aiii IIA81d 12b1 HKE 2003 4aiii none 162 13 0.072b1 HKE 2004 4aii none 62b1 HKE 2004 4aiii IIA81d 12b1 HKE 2004 4aiii none 292 21 0.072b1 HKE 2005 4aii none 22b1 HKE 2005 4aiii IIA81d 12b1 HKE 2005 4aiii none 178 57 0.242b1 HKE 2006 4aiii IIA81a 39
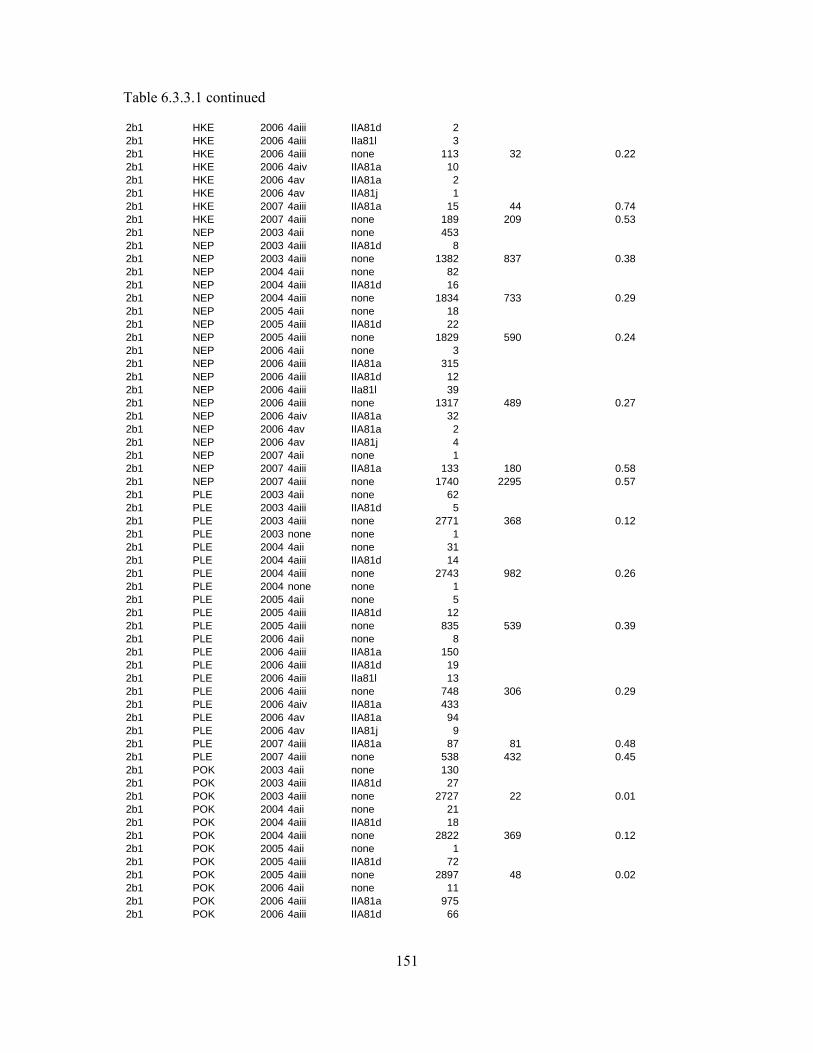
151
Table 6.3.3.1 continued
2b1 HKE 2006 4aiii IIA81d 22b1 HKE 2006 4aiii IIa81l 32b1 HKE 2006 4aiii none 113 32 0.222b1 HKE 2006 4aiv IIA81a 102b1 HKE 2006 4av IIA81a 22b1 HKE 2006 4av IIA81j 12b1 HKE 2007 4aiii IIA81a 15 44 0.742b1 HKE 2007 4aiii none 189 209 0.532b1 NEP 2003 4aii none 4532b1 NEP 2003 4aiii IIA81d 82b1 NEP 2003 4aiii none 1382 837 0.382b1 NEP 2004 4aii none 822b1 NEP 2004 4aiii IIA81d 162b1 NEP 2004 4aiii none 1834 733 0.292b1 NEP 2005 4aii none 182b1 NEP 2005 4aiii IIA81d 222b1 NEP 2005 4aiii none 1829 590 0.242b1 NEP 2006 4aii none 32b1 NEP 2006 4aiii IIA81a 3152b1 NEP 2006 4aiii IIA81d 122b1 NEP 2006 4aiii IIa81l 392b1 NEP 2006 4aiii none 1317 489 0.272b1 NEP 2006 4aiv IIA81a 322b1 NEP 2006 4av IIA81a 22b1 NEP 2006 4av IIA81j 42b1 NEP 2007 4aii none 12b1 NEP 2007 4aiii IIA81a 133 180 0.582b1 NEP 2007 4aiii none 1740 2295 0.572b1 PLE 2003 4aii none 622b1 PLE 2003 4aiii IIA81d 52b1 PLE 2003 4aiii none 2771 368 0.122b1 PLE 2003 none none 12b1 PLE 2004 4aii none 312b1 PLE 2004 4aiii IIA81d 142b1 PLE 2004 4aiii none 2743 982 0.262b1 PLE 2004 none none 12b1 PLE 2005 4aii none 52b1 PLE 2005 4aiii IIA81d 122b1 PLE 2005 4aiii none 835 539 0.392b1 PLE 2006 4aii none 82b1 PLE 2006 4aiii IIA81a 1502b1 PLE 2006 4aiii IIA81d 192b1 PLE 2006 4aiii IIa81l 132b1 PLE 2006 4aiii none 748 306 0.292b1 PLE 2006 4aiv IIA81a 4332b1 PLE 2006 4av IIA81a 942b1 PLE 2006 4av IIA81j 92b1 PLE 2007 4aiii IIA81a 87 81 0.482b1 PLE 2007 4aiii none 538 432 0.452b1 POK 2003 4aii none 1302b1 POK 2003 4aiii IIA81d 272b1 POK 2003 4aiii none 2727 22 0.012b1 POK 2004 4aii none 212b1 POK 2004 4aiii IIA81d 182b1 POK 2004 4aiii none 2822 369 0.122b1 POK 2005 4aii none 12b1 POK 2005 4aiii IIA81d 722b1 POK 2005 4aiii none 2897 48 0.022b1 POK 2006 4aii none 112b1 POK 2006 4aiii IIA81a 9752b1 POK 2006 4aiii IIA81d 66
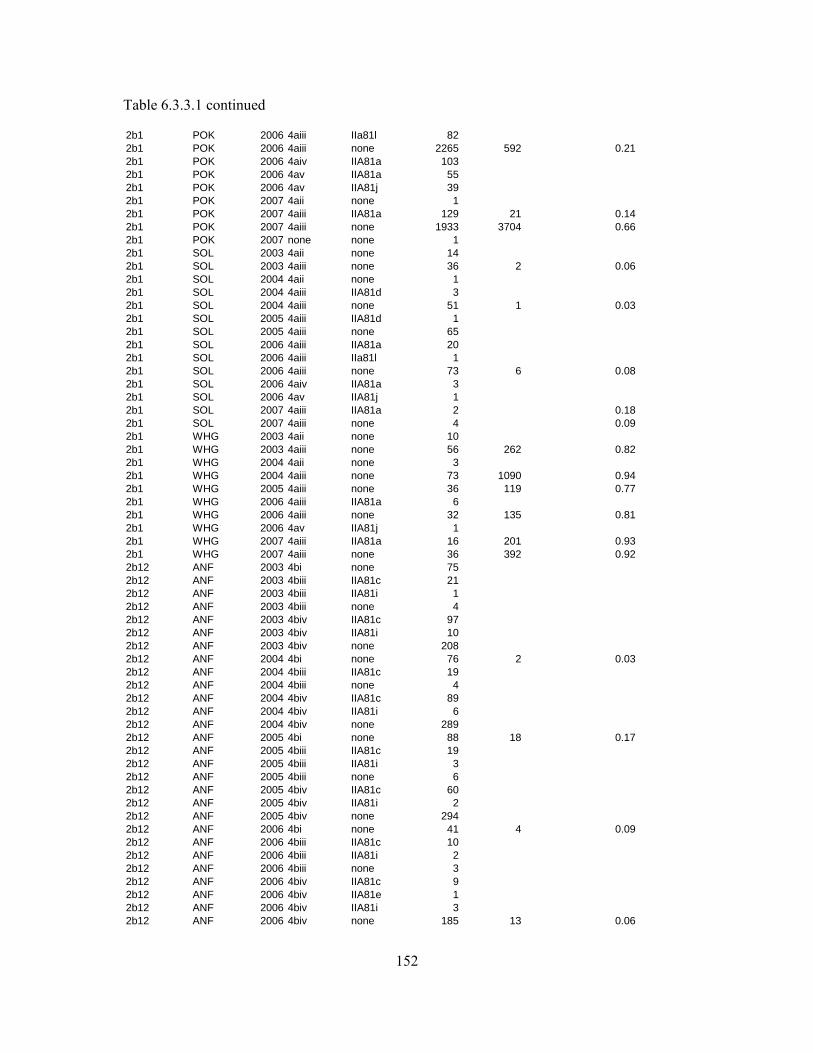
152
Table 6.3.3.1 continued
2b1 POK 2006 4aiii IIa81l 822b1 POK 2006 4aiii none 2265 592 0.212b1 POK 2006 4aiv IIA81a 1032b1 POK 2006 4av IIA81a 552b1 POK 2006 4av IIA81j 392b1 POK 2007 4aii none 12b1 POK 2007 4aiii IIA81a 129 21 0.142b1 POK 2007 4aiii none 1933 3704 0.662b1 POK 2007 none none 12b1 SOL 2003 4aii none 142b1 SOL 2003 4aiii none 36 2 0.062b1 SOL 2004 4aii none 12b1 SOL 2004 4aiii IIA81d 32b1 SOL 2004 4aiii none 51 1 0.032b1 SOL 2005 4aiii IIA81d 12b1 SOL 2005 4aiii none 652b1 SOL 2006 4aiii IIA81a 202b1 SOL 2006 4aiii IIa81l 12b1 SOL 2006 4aiii none 73 6 0.082b1 SOL 2006 4aiv IIA81a 32b1 SOL 2006 4av IIA81j 12b1 SOL 2007 4aiii IIA81a 2 0.182b1 SOL 2007 4aiii none 4 0.092b1 WHG 2003 4aii none 102b1 WHG 2003 4aiii none 56 262 0.822b1 WHG 2004 4aii none 32b1 WHG 2004 4aiii none 73 1090 0.942b1 WHG 2005 4aiii none 36 119 0.772b1 WHG 2006 4aiii IIA81a 62b1 WHG 2006 4aiii none 32 135 0.812b1 WHG 2006 4av IIA81j 12b1 WHG 2007 4aiii IIA81a 16 201 0.932b1 WHG 2007 4aiii none 36 392 0.922b12 ANF 2003 4bi none 752b12 ANF 2003 4biii IIA81c 212b12 ANF 2003 4biii IIA81i 12b12 ANF 2003 4biii none 42b12 ANF 2003 4biv IIA81c 972b12 ANF 2003 4biv IIA81i 102b12 ANF 2003 4biv none 2082b12 ANF 2004 4bi none 76 2 0.032b12 ANF 2004 4biii IIA81c 192b12 ANF 2004 4biii none 42b12 ANF 2004 4biv IIA81c 892b12 ANF 2004 4biv IIA81i 62b12 ANF 2004 4biv none 2892b12 ANF 2005 4bi none 88 18 0.172b12 ANF 2005 4biii IIA81c 192b12 ANF 2005 4biii IIA81i 32b12 ANF 2005 4biii none 62b12 ANF 2005 4biv IIA81c 602b12 ANF 2005 4biv IIA81i 22b12 ANF 2005 4biv none 2942b12 ANF 2006 4bi none 41 4 0.092b12 ANF 2006 4biii IIA81c 102b12 ANF 2006 4biii IIA81i 22b12 ANF 2006 4biii none 32b12 ANF 2006 4biv IIA81c 92b12 ANF 2006 4biv IIA81e 12b12 ANF 2006 4biv IIA81i 32b12 ANF 2006 4biv none 185 13 0.06
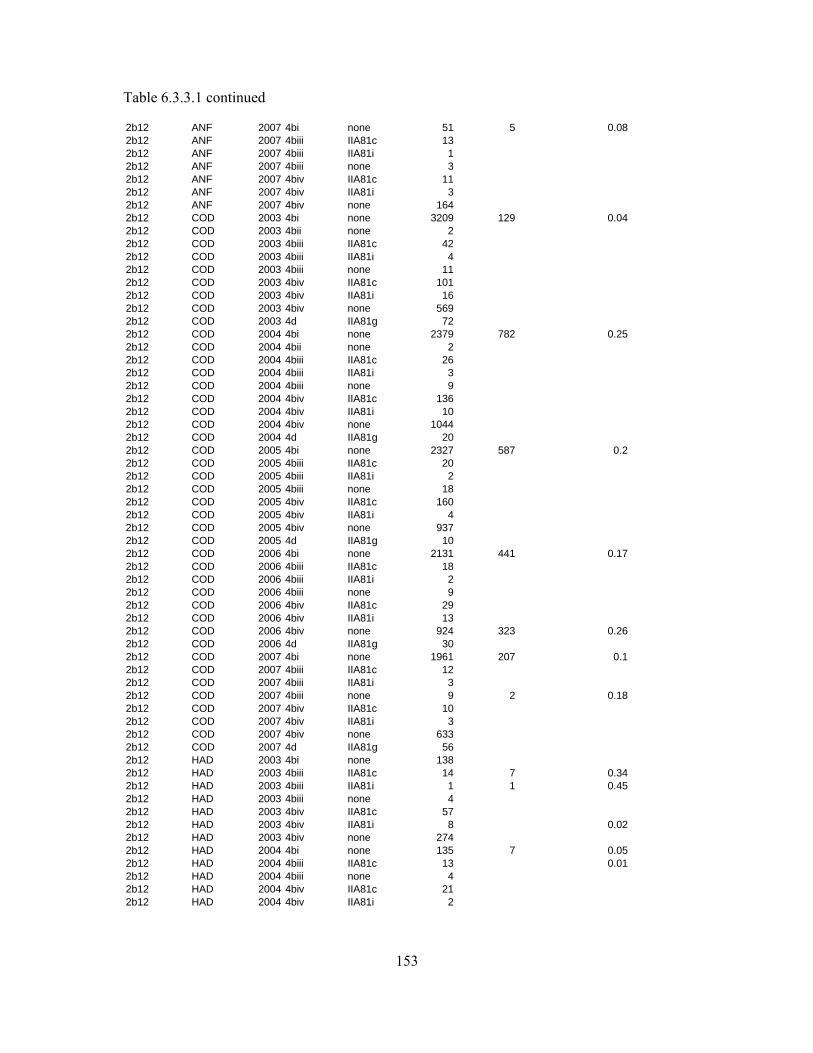
153
Table 6.3.3.1 continued
2b12 ANF 2007 4bi none 51 5 0.082b12 ANF 2007 4biii IIA81c 132b12 ANF 2007 4biii IIA81i 12b12 ANF 2007 4biii none 32b12 ANF 2007 4biv IIA81c 112b12 ANF 2007 4biv IIA81i 32b12 ANF 2007 4biv none 1642b12 COD 2003 4bi none 3209 129 0.042b12 COD 2003 4bii none 22b12 COD 2003 4biii IIA81c 422b12 COD 2003 4biii IIA81i 42b12 COD 2003 4biii none 112b12 COD 2003 4biv IIA81c 1012b12 COD 2003 4biv IIA81i 162b12 COD 2003 4biv none 5692b12 COD 2003 4d IIA81g 722b12 COD 2004 4bi none 2379 782 0.252b12 COD 2004 4bii none 22b12 COD 2004 4biii IIA81c 262b12 COD 2004 4biii IIA81i 32b12 COD 2004 4biii none 92b12 COD 2004 4biv IIA81c 1362b12 COD 2004 4biv IIA81i 102b12 COD 2004 4biv none 10442b12 COD 2004 4d IIA81g 202b12 COD 2005 4bi none 2327 587 0.22b12 COD 2005 4biii IIA81c 202b12 COD 2005 4biii IIA81i 22b12 COD 2005 4biii none 182b12 COD 2005 4biv IIA81c 1602b12 COD 2005 4biv IIA81i 42b12 COD 2005 4biv none 9372b12 COD 2005 4d IIA81g 102b12 COD 2006 4bi none 2131 441 0.172b12 COD 2006 4biii IIA81c 182b12 COD 2006 4biii IIA81i 22b12 COD 2006 4biii none 92b12 COD 2006 4biv IIA81c 292b12 COD 2006 4biv IIA81i 132b12 COD 2006 4biv none 924 323 0.262b12 COD 2006 4d IIA81g 302b12 COD 2007 4bi none 1961 207 0.12b12 COD 2007 4biii IIA81c 122b12 COD 2007 4biii IIA81i 32b12 COD 2007 4biii none 9 2 0.182b12 COD 2007 4biv IIA81c 102b12 COD 2007 4biv IIA81i 32b12 COD 2007 4biv none 6332b12 COD 2007 4d IIA81g 562b12 HAD 2003 4bi none 1382b12 HAD 2003 4biii IIA81c 14 7 0.342b12 HAD 2003 4biii IIA81i 1 1 0.452b12 HAD 2003 4biii none 42b12 HAD 2003 4biv IIA81c 572b12 HAD 2003 4biv IIA81i 8 0.022b12 HAD 2003 4biv none 2742b12 HAD 2004 4bi none 135 7 0.052b12 HAD 2004 4biii IIA81c 13 0.012b12 HAD 2004 4biii none 42b12 HAD 2004 4biv IIA81c 212b12 HAD 2004 4biv IIA81i 2
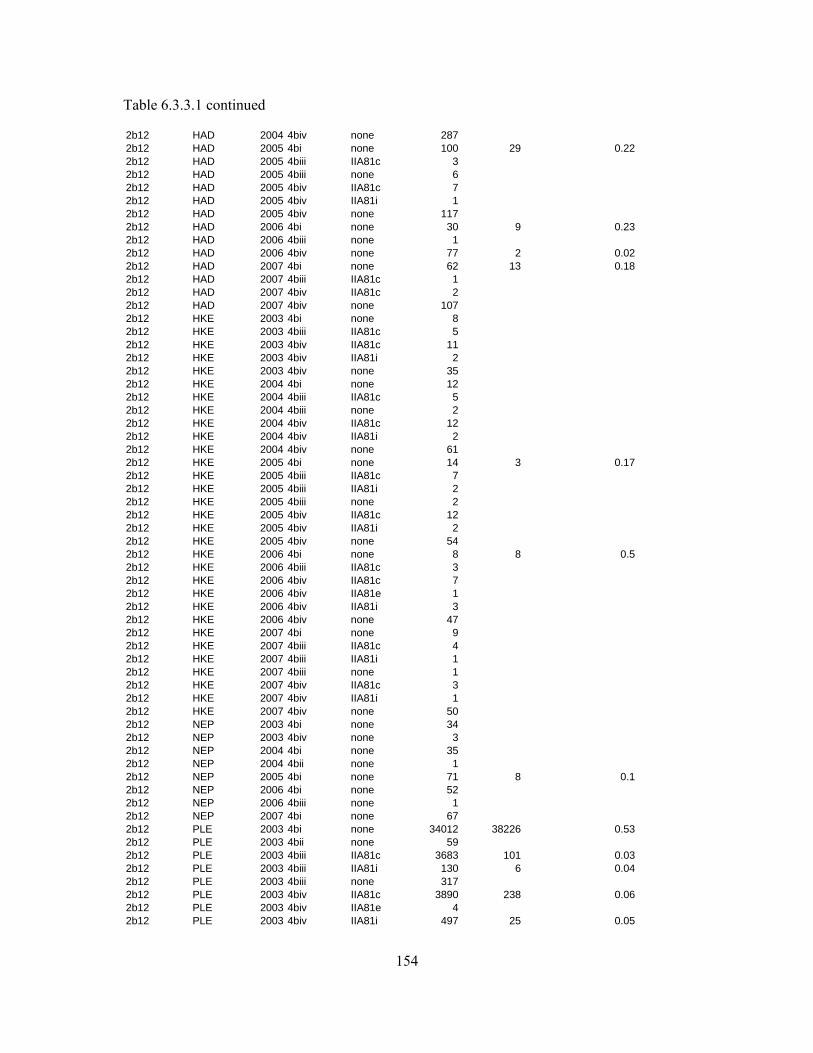
154
Table 6.3.3.1 continued
2b12 HAD 2004 4biv none 2872b12 HAD 2005 4bi none 100 29 0.222b12 HAD 2005 4biii IIA81c 32b12 HAD 2005 4biii none 62b12 HAD 2005 4biv IIA81c 72b12 HAD 2005 4biv IIA81i 12b12 HAD 2005 4biv none 1172b12 HAD 2006 4bi none 30 9 0.232b12 HAD 2006 4biii none 12b12 HAD 2006 4biv none 77 2 0.022b12 HAD 2007 4bi none 62 13 0.182b12 HAD 2007 4biii IIA81c 12b12 HAD 2007 4biv IIA81c 22b12 HAD 2007 4biv none 1072b12 HKE 2003 4bi none 82b12 HKE 2003 4biii IIA81c 52b12 HKE 2003 4biv IIA81c 112b12 HKE 2003 4biv IIA81i 22b12 HKE 2003 4biv none 352b12 HKE 2004 4bi none 122b12 HKE 2004 4biii IIA81c 52b12 HKE 2004 4biii none 22b12 HKE 2004 4biv IIA81c 122b12 HKE 2004 4biv IIA81i 22b12 HKE 2004 4biv none 612b12 HKE 2005 4bi none 14 3 0.172b12 HKE 2005 4biii IIA81c 72b12 HKE 2005 4biii IIA81i 22b12 HKE 2005 4biii none 22b12 HKE 2005 4biv IIA81c 122b12 HKE 2005 4biv IIA81i 22b12 HKE 2005 4biv none 542b12 HKE 2006 4bi none 8 8 0.52b12 HKE 2006 4biii IIA81c 32b12 HKE 2006 4biv IIA81c 72b12 HKE 2006 4biv IIA81e 12b12 HKE 2006 4biv IIA81i 32b12 HKE 2006 4biv none 472b12 HKE 2007 4bi none 92b12 HKE 2007 4biii IIA81c 42b12 HKE 2007 4biii IIA81i 12b12 HKE 2007 4biii none 12b12 HKE 2007 4biv IIA81c 32b12 HKE 2007 4biv IIA81i 12b12 HKE 2007 4biv none 502b12 NEP 2003 4bi none 342b12 NEP 2003 4biv none 32b12 NEP 2004 4bi none 352b12 NEP 2004 4bii none 12b12 NEP 2005 4bi none 71 8 0.12b12 NEP 2006 4bi none 522b12 NEP 2006 4biii none 12b12 NEP 2007 4bi none 672b12 PLE 2003 4bi none 34012 38226 0.532b12 PLE 2003 4bii none 592b12 PLE 2003 4biii IIA81c 3683 101 0.032b12 PLE 2003 4biii IIA81i 130 6 0.042b12 PLE 2003 4biii none 3172b12 PLE 2003 4biv IIA81c 3890 238 0.062b12 PLE 2003 4biv IIA81e 42b12 PLE 2003 4biv IIA81i 497 25 0.05

155
Table 6.3.3.1 continued
2b12 PLE 2003 4biv none 29032b12 PLE 2003 4d IIA81g 812b12 PLE 2004 4bi none 30059 28406 0.492b12 PLE 2004 4bii none 882b12 PLE 2004 4biii IIA81c 46902b12 PLE 2004 4biii IIA81i 1002b12 PLE 2004 4biii none 9532b12 PLE 2004 4biv IIA81c 30072b12 PLE 2004 4biv IIA81i 2132b12 PLE 2004 4biv none 30532b12 PLE 2004 4d IIA81g 592b12 ple 2005 4bi none 27491 23093 0.462b12 PLE 2005 4bii none 52b12 PLE 2005 4biii IIA81c 33862b12 PLE 2005 4biii IIA81i 4672b12 PLE 2005 4biii none 9912b12 PLE 2005 4biv IIA81c 27092b12 PLE 2005 4biv IIA81i 2442b12 PLE 2005 4biv none 22472b12 PLE 2005 4d IIA81g 642b12 PLE 2006 4bi none 27614 24716 0.472b12 PLE 2006 4bii none 372b12 PLE 2006 4biii IIA81c 26542b12 PLE 2006 4biii IIA81i 3742b12 PLE 2006 4biii none 11112b12 PLE 2006 4biv IIA81c 17022b12 PLE 2006 4biv IIA81e 4652b12 PLE 2006 4biv IIA81i 6302b12 PLE 2006 4biv none 4938 106 0.022b12 PLE 2006 4d IIA81g 732b12 PLE 2007 4bi none 24890 20245 0.452b12 PLE 2007 4bii none 62b12 PLE 2007 4biii IIA81c 22752b12 PLE 2007 4biii IIA81i 3972b12 PLE 2007 4biii none 970 15 0.022b12 PLE 2007 4biv IIA81c 6332b12 PLE 2007 4biv IIA81i 1452b12 PLE 2007 4biv none 42862b12 PLE 2007 4d IIA81g 632b12 POK 2003 4bi none 92b12 POK 2003 4biv IIA81c 22b12 POK 2003 4biv IIA81i 22b12 POK 2003 4biv none 272b12 POK 2004 4bi none 122b12 POK 2004 4biii IIA81c 12b12 POK 2004 4biii IIA81i 52b12 POK 2004 4biv IIA81c 22b12 POK 2004 4biv none 132b12 POK 2005 4bi none 202b12 POK 2005 4biii IIA81c 12b12 POK 2005 4biv IIA81c 12b12 POK 2005 4biv none 82b12 POK 2006 4bi none 62b12 POK 2006 4biv none 92b12 POK 2007 4bi none 102b12 POK 2007 4biv IIA81c 12b12 POK 2007 4biv none 92b12 SOL 2003 4bi none 15724 1700 0.12b12 SOL 2003 4bii none 252b12 SOL 2003 4biii IIA81c 512b12 SOL 2003 4biii IIA81i 4
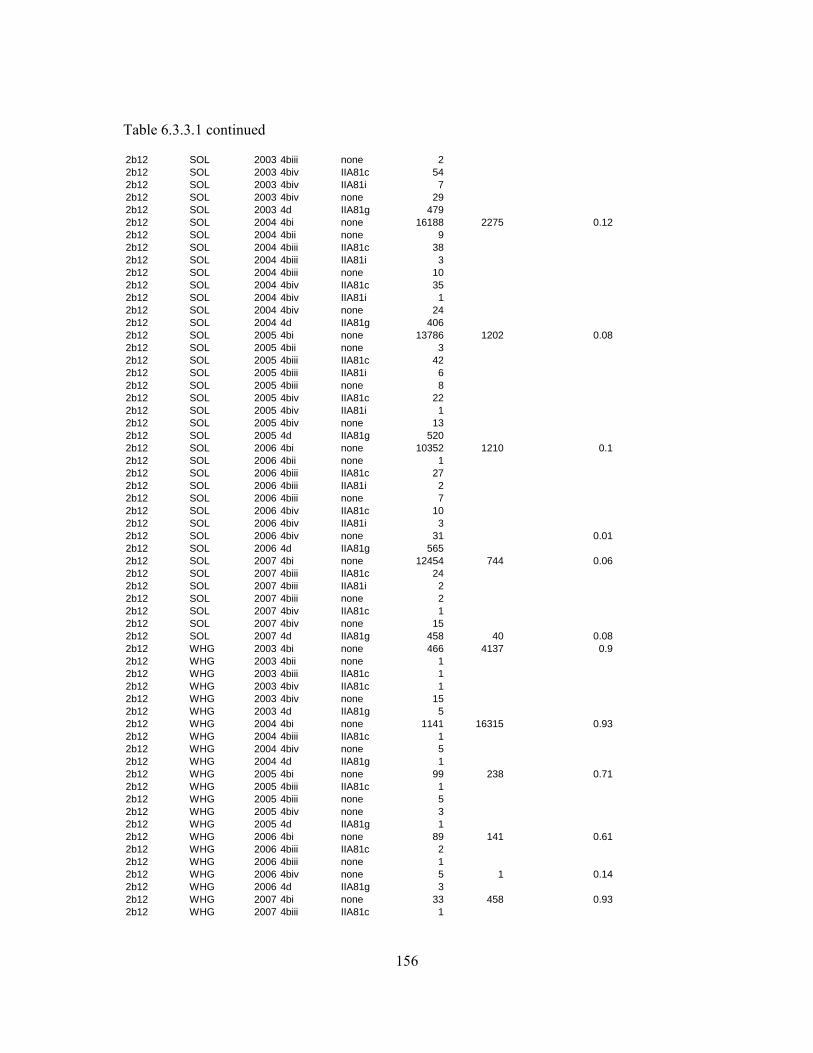
156
Table 6.3.3.1 continued
2b12 SOL 2003 4biii none 22b12 SOL 2003 4biv IIA81c 542b12 SOL 2003 4biv IIA81i 72b12 SOL 2003 4biv none 292b12 SOL 2003 4d IIA81g 4792b12 SOL 2004 4bi none 16188 2275 0.122b12 SOL 2004 4bii none 92b12 SOL 2004 4biii IIA81c 382b12 SOL 2004 4biii IIA81i 32b12 SOL 2004 4biii none 102b12 SOL 2004 4biv IIA81c 352b12 SOL 2004 4biv IIA81i 12b12 SOL 2004 4biv none 242b12 SOL 2004 4d IIA81g 4062b12 SOL 2005 4bi none 13786 1202 0.082b12 SOL 2005 4bii none 32b12 SOL 2005 4biii IIA81c 422b12 SOL 2005 4biii IIA81i 62b12 SOL 2005 4biii none 82b12 SOL 2005 4biv IIA81c 222b12 SOL 2005 4biv IIA81i 12b12 SOL 2005 4biv none 132b12 SOL 2005 4d IIA81g 5202b12 SOL 2006 4bi none 10352 1210 0.12b12 SOL 2006 4bii none 12b12 SOL 2006 4biii IIA81c 272b12 SOL 2006 4biii IIA81i 22b12 SOL 2006 4biii none 72b12 SOL 2006 4biv IIA81c 102b12 SOL 2006 4biv IIA81i 32b12 SOL 2006 4biv none 31 0.012b12 SOL 2006 4d IIA81g 5652b12 SOL 2007 4bi none 12454 744 0.062b12 SOL 2007 4biii IIA81c 242b12 SOL 2007 4biii IIA81i 22b12 SOL 2007 4biii none 22b12 SOL 2007 4biv IIA81c 12b12 SOL 2007 4biv none 152b12 SOL 2007 4d IIA81g 458 40 0.082b12 WHG 2003 4bi none 466 4137 0.92b12 WHG 2003 4bii none 12b12 WHG 2003 4biii IIA81c 12b12 WHG 2003 4biv IIA81c 12b12 WHG 2003 4biv none 152b12 WHG 2003 4d IIA81g 52b12 WHG 2004 4bi none 1141 16315 0.932b12 WHG 2004 4biii IIA81c 12b12 WHG 2004 4biv none 52b12 WHG 2004 4d IIA81g 12b12 WHG 2005 4bi none 99 238 0.712b12 WHG 2005 4biii IIA81c 12b12 WHG 2005 4biii none 52b12 WHG 2005 4biv none 32b12 WHG 2005 4d IIA81g 12b12 WHG 2006 4bi none 89 141 0.612b12 WHG 2006 4biii IIA81c 22b12 WHG 2006 4biii none 12b12 WHG 2006 4biv none 5 1 0.142b12 WHG 2006 4d IIA81g 32b12 WHG 2007 4bi none 33 458 0.932b12 WHG 2007 4biii IIA81c 1
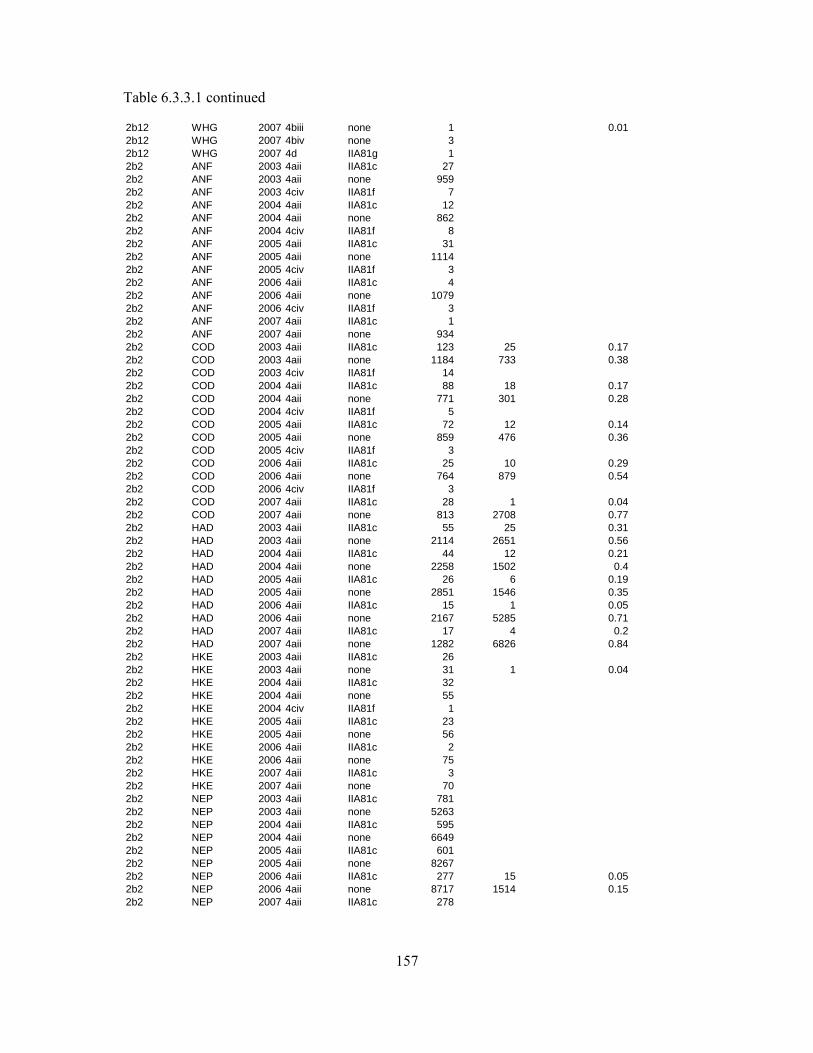
157
Table 6.3.3.1 continued
2b12 WHG 2007 4biii none 1 0.012b12 WHG 2007 4biv none 32b12 WHG 2007 4d IIA81g 12b2 ANF 2003 4aii IIA81c 272b2 ANF 2003 4aii none 9592b2 ANF 2003 4civ IIA81f 72b2 ANF 2004 4aii IIA81c 122b2 ANF 2004 4aii none 8622b2 ANF 2004 4civ IIA81f 82b2 ANF 2005 4aii IIA81c 312b2 ANF 2005 4aii none 11142b2 ANF 2005 4civ IIA81f 32b2 ANF 2006 4aii IIA81c 42b2 ANF 2006 4aii none 10792b2 ANF 2006 4civ IIA81f 32b2 ANF 2007 4aii IIA81c 12b2 ANF 2007 4aii none 9342b2 COD 2003 4aii IIA81c 123 25 0.172b2 COD 2003 4aii none 1184 733 0.382b2 COD 2003 4civ IIA81f 142b2 COD 2004 4aii IIA81c 88 18 0.172b2 COD 2004 4aii none 771 301 0.282b2 COD 2004 4civ IIA81f 52b2 COD 2005 4aii IIA81c 72 12 0.142b2 COD 2005 4aii none 859 476 0.362b2 COD 2005 4civ IIA81f 32b2 COD 2006 4aii IIA81c 25 10 0.292b2 COD 2006 4aii none 764 879 0.542b2 COD 2006 4civ IIA81f 32b2 COD 2007 4aii IIA81c 28 1 0.042b2 COD 2007 4aii none 813 2708 0.772b2 HAD 2003 4aii IIA81c 55 25 0.312b2 HAD 2003 4aii none 2114 2651 0.562b2 HAD 2004 4aii IIA81c 44 12 0.212b2 HAD 2004 4aii none 2258 1502 0.42b2 HAD 2005 4aii IIA81c 26 6 0.192b2 HAD 2005 4aii none 2851 1546 0.352b2 HAD 2006 4aii IIA81c 15 1 0.052b2 HAD 2006 4aii none 2167 5285 0.712b2 HAD 2007 4aii IIA81c 17 4 0.22b2 HAD 2007 4aii none 1282 6826 0.842b2 HKE 2003 4aii IIA81c 262b2 HKE 2003 4aii none 31 1 0.042b2 HKE 2004 4aii IIA81c 322b2 HKE 2004 4aii none 552b2 HKE 2004 4civ IIA81f 12b2 HKE 2005 4aii IIA81c 232b2 HKE 2005 4aii none 562b2 HKE 2006 4aii IIA81c 22b2 HKE 2006 4aii none 752b2 HKE 2007 4aii IIA81c 32b2 HKE 2007 4aii none 702b2 NEP 2003 4aii IIA81c 7812b2 NEP 2003 4aii none 52632b2 NEP 2004 4aii IIA81c 5952b2 NEP 2004 4aii none 66492b2 NEP 2005 4aii IIA81c 6012b2 NEP 2005 4aii none 82672b2 NEP 2006 4aii IIA81c 277 15 0.052b2 NEP 2006 4aii none 8717 1514 0.152b2 NEP 2007 4aii IIA81c 278
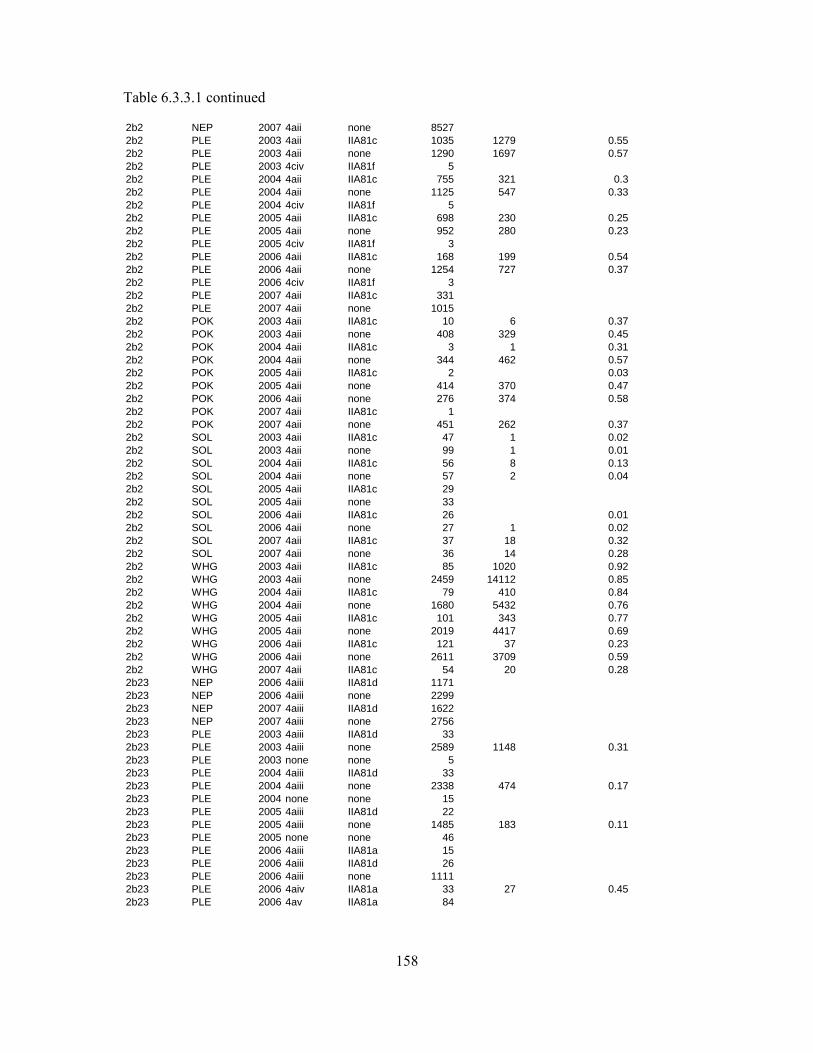
158
Table 6.3.3.1 continued
2b2 NEP 2007 4aii none 85272b2 PLE 2003 4aii IIA81c 1035 1279 0.552b2 PLE 2003 4aii none 1290 1697 0.572b2 PLE 2003 4civ IIA81f 52b2 PLE 2004 4aii IIA81c 755 321 0.32b2 PLE 2004 4aii none 1125 547 0.332b2 PLE 2004 4civ IIA81f 52b2 PLE 2005 4aii IIA81c 698 230 0.252b2 PLE 2005 4aii none 952 280 0.232b2 PLE 2005 4civ IIA81f 32b2 PLE 2006 4aii IIA81c 168 199 0.542b2 PLE 2006 4aii none 1254 727 0.372b2 PLE 2006 4civ IIA81f 32b2 PLE 2007 4aii IIA81c 3312b2 PLE 2007 4aii none 10152b2 POK 2003 4aii IIA81c 10 6 0.372b2 POK 2003 4aii none 408 329 0.452b2 POK 2004 4aii IIA81c 3 1 0.312b2 POK 2004 4aii none 344 462 0.572b2 POK 2005 4aii IIA81c 2 0.032b2 POK 2005 4aii none 414 370 0.472b2 POK 2006 4aii none 276 374 0.582b2 POK 2007 4aii IIA81c 12b2 POK 2007 4aii none 451 262 0.372b2 SOL 2003 4aii IIA81c 47 1 0.022b2 SOL 2003 4aii none 99 1 0.012b2 SOL 2004 4aii IIA81c 56 8 0.132b2 SOL 2004 4aii none 57 2 0.042b2 SOL 2005 4aii IIA81c 292b2 SOL 2005 4aii none 332b2 SOL 2006 4aii IIA81c 26 0.012b2 SOL 2006 4aii none 27 1 0.022b2 SOL 2007 4aii IIA81c 37 18 0.322b2 SOL 2007 4aii none 36 14 0.282b2 WHG 2003 4aii IIA81c 85 1020 0.922b2 WHG 2003 4aii none 2459 14112 0.852b2 WHG 2004 4aii IIA81c 79 410 0.842b2 WHG 2004 4aii none 1680 5432 0.762b2 WHG 2005 4aii IIA81c 101 343 0.772b2 WHG 2005 4aii none 2019 4417 0.692b2 WHG 2006 4aii IIA81c 121 37 0.232b2 WHG 2006 4aii none 2611 3709 0.592b2 WHG 2007 4aii IIA81c 54 20 0.282b23 NEP 2006 4aiii IIA81d 11712b23 NEP 2006 4aiii none 22992b23 NEP 2007 4aiii IIA81d 16222b23 NEP 2007 4aiii none 27562b23 PLE 2003 4aiii IIA81d 332b23 PLE 2003 4aiii none 2589 1148 0.312b23 PLE 2003 none none 52b23 PLE 2004 4aiii IIA81d 332b23 PLE 2004 4aiii none 2338 474 0.172b23 PLE 2004 none none 152b23 PLE 2005 4aiii IIA81d 222b23 PLE 2005 4aiii none 1485 183 0.112b23 PLE 2005 none none 462b23 PLE 2006 4aiii IIA81a 152b23 PLE 2006 4aiii IIA81d 262b23 PLE 2006 4aiii none 11112b23 PLE 2006 4aiv IIA81a 33 27 0.452b23 PLE 2006 4av IIA81a 84
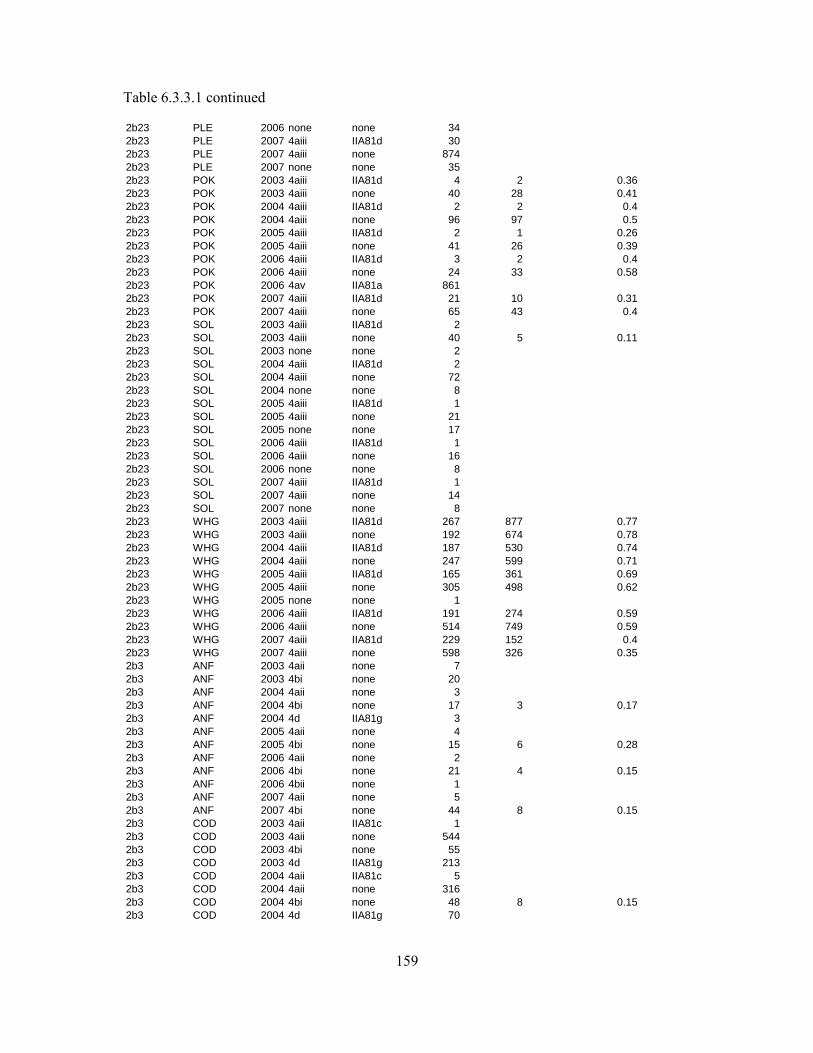
159
Table 6.3.3.1 continued
2b23 PLE 2006 none none 342b23 PLE 2007 4aiii IIA81d 302b23 PLE 2007 4aiii none 8742b23 PLE 2007 none none 352b23 POK 2003 4aiii IIA81d 4 2 0.362b23 POK 2003 4aiii none 40 28 0.412b23 POK 2004 4aiii IIA81d 2 2 0.42b23 POK 2004 4aiii none 96 97 0.52b23 POK 2005 4aiii IIA81d 2 1 0.262b23 POK 2005 4aiii none 41 26 0.392b23 POK 2006 4aiii IIA81d 3 2 0.42b23 POK 2006 4aiii none 24 33 0.582b23 POK 2006 4av IIA81a 8612b23 POK 2007 4aiii IIA81d 21 10 0.312b23 POK 2007 4aiii none 65 43 0.42b23 SOL 2003 4aiii IIA81d 22b23 SOL 2003 4aiii none 40 5 0.112b23 SOL 2003 none none 22b23 SOL 2004 4aiii IIA81d 22b23 SOL 2004 4aiii none 722b23 SOL 2004 none none 82b23 SOL 2005 4aiii IIA81d 12b23 SOL 2005 4aiii none 212b23 SOL 2005 none none 172b23 SOL 2006 4aiii IIA81d 12b23 SOL 2006 4aiii none 162b23 SOL 2006 none none 82b23 SOL 2007 4aiii IIA81d 12b23 SOL 2007 4aiii none 142b23 SOL 2007 none none 82b23 WHG 2003 4aiii IIA81d 267 877 0.772b23 WHG 2003 4aiii none 192 674 0.782b23 WHG 2004 4aiii IIA81d 187 530 0.742b23 WHG 2004 4aiii none 247 599 0.712b23 WHG 2005 4aiii IIA81d 165 361 0.692b23 WHG 2005 4aiii none 305 498 0.622b23 WHG 2005 none none 12b23 WHG 2006 4aiii IIA81d 191 274 0.592b23 WHG 2006 4aiii none 514 749 0.592b23 WHG 2007 4aiii IIA81d 229 152 0.42b23 WHG 2007 4aiii none 598 326 0.352b3 ANF 2003 4aii none 72b3 ANF 2003 4bi none 202b3 ANF 2004 4aii none 32b3 ANF 2004 4bi none 17 3 0.172b3 ANF 2004 4d IIA81g 32b3 ANF 2005 4aii none 42b3 ANF 2005 4bi none 15 6 0.282b3 ANF 2006 4aii none 22b3 ANF 2006 4bi none 21 4 0.152b3 ANF 2006 4bii none 12b3 ANF 2007 4aii none 52b3 ANF 2007 4bi none 44 8 0.152b3 COD 2003 4aii IIA81c 12b3 COD 2003 4aii none 5442b3 COD 2003 4bi none 552b3 COD 2003 4d IIA81g 2132b3 COD 2004 4aii IIA81c 52b3 COD 2004 4aii none 3162b3 COD 2004 4bi none 48 8 0.152b3 COD 2004 4d IIA81g 70

160
Table 6.3.3.1 continued
2b3 COD 2005 4aii IIA81c 22b3 COD 2005 4aii none 4442b3 COD 2005 4bi none 51 2 0.032b3 COD 2005 4d IIA81g 532b3 COD 2006 4aii none 466 147 0.242b3 COD 2006 4bi none 83 19 0.182b3 COD 2006 4d IIA81g 762b3 COD 2007 4aii IIA81c 22b3 COD 2007 4aii none 735 266 0.272b3 COD 2007 4bi none 89 28 0.242b3 COD 2007 4bii none 12b3 COD 2007 4d IIA81g 1352b3 HAD 2003 4bi none 12b3 HAD 2004 4bi none 12b3 HAD 2005 4aii none 42b3 HAD 2006 4bi none 12b3 HAD 2007 4aii none 42b3 HAD 2007 4bi none 12b3 HKE 2005 4aii none 22b3 PLE 2003 4aii IIA81c 11 4 0.272b3 PLE 2003 4aii none 915 434 0.322b3 PLE 2003 4bi none 14092b3 PLE 2003 4bii none 432b3 PLE 2003 4d IIA81g 2602b3 PLE 2003 none none 252b3 PLE 2004 4aii IIA81c 7 2 0.252b3 PLE 2004 4aii none 817 851 0.512b3 PLE 2004 4bi none 1319 161 0.112b3 PLE 2004 4bii none 282b3 PLE 2004 4d IIA81g 3162b3 PLE 2004 none none 402b3 PLE 2005 4aii IIA81c 72b3 PLE 2005 4aii none 8122b3 PLE 2005 4bi none 1208 61 0.052b3 PLE 2005 4bii none 292b3 PLE 2005 4d IIA81g 2042b3 PLE 2005 none none 622b3 PLE 2006 4aii IIA81c 82b3 PLE 2006 4aii none 6522b3 PLE 2006 4bi none 1325 179 0.122b3 PLE 2006 4bii none 242b3 PLE 2006 4d IIA81g 1942b3 PLE 2006 none none 282b3 PLE 2007 4aii IIA81c 6 0.062b3 PLE 2007 4aii none 571 36 0.062b3 PLE 2007 4bi none 1744 142 0.082b3 PLE 2007 4biii IIA81c 12b3 PLE 2007 4d IIA81g 303 9 0.032b3 PLE 2007 none none 92b3 POK 2003 4bi none 12b3 POK 2005 4aii none 12b3 SOL 2003 4aii IIA81c 62b3 SOL 2003 4aii none 3802b3 SOL 2003 4bi none 19722b3 SOL 2003 4bii none 562b3 SOL 2003 4biii IIA81i 12b3 SOL 2003 4d IIA81g 13292b3 SOL 2003 none none 162b3 SOL 2004 4aii IIA81c 32b3 SOL 2004 4aii none 3012b3 SOL 2004 4bi none 1835 65 0.03
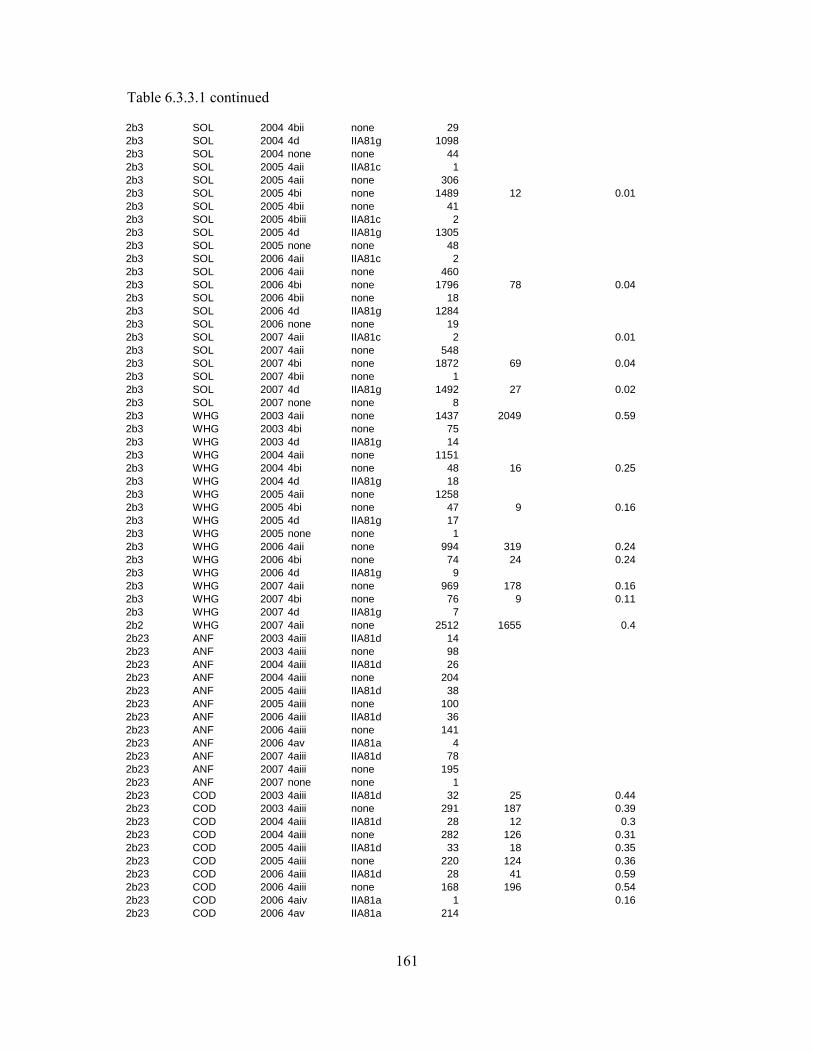
161
Table 6.3.3.1 continued
2b3 SOL 2004 4bii none 292b3 SOL 2004 4d IIA81g 10982b3 SOL 2004 none none 442b3 SOL 2005 4aii IIA81c 12b3 SOL 2005 4aii none 3062b3 SOL 2005 4bi none 1489 12 0.012b3 SOL 2005 4bii none 412b3 SOL 2005 4biii IIA81c 22b3 SOL 2005 4d IIA81g 13052b3 SOL 2005 none none 482b3 SOL 2006 4aii IIA81c 22b3 SOL 2006 4aii none 4602b3 SOL 2006 4bi none 1796 78 0.042b3 SOL 2006 4bii none 182b3 SOL 2006 4d IIA81g 12842b3 SOL 2006 none none 192b3 SOL 2007 4aii IIA81c 2 0.012b3 SOL 2007 4aii none 5482b3 SOL 2007 4bi none 1872 69 0.042b3 SOL 2007 4bii none 12b3 SOL 2007 4d IIA81g 1492 27 0.022b3 SOL 2007 none none 82b3 WHG 2003 4aii none 1437 2049 0.592b3 WHG 2003 4bi none 752b3 WHG 2003 4d IIA81g 142b3 WHG 2004 4aii none 11512b3 WHG 2004 4bi none 48 16 0.252b3 WHG 2004 4d IIA81g 182b3 WHG 2005 4aii none 12582b3 WHG 2005 4bi none 47 9 0.162b3 WHG 2005 4d IIA81g 172b3 WHG 2005 none none 12b3 WHG 2006 4aii none 994 319 0.242b3 WHG 2006 4bi none 74 24 0.242b3 WHG 2006 4d IIA81g 92b3 WHG 2007 4aii none 969 178 0.162b3 WHG 2007 4bi none 76 9 0.112b3 WHG 2007 4d IIA81g 72b2 WHG 2007 4aii none 2512 1655 0.42b23 ANF 2003 4aiii IIA81d 142b23 ANF 2003 4aiii none 982b23 ANF 2004 4aiii IIA81d 262b23 ANF 2004 4aiii none 2042b23 ANF 2005 4aiii IIA81d 382b23 ANF 2005 4aiii none 1002b23 ANF 2006 4aiii IIA81d 362b23 ANF 2006 4aiii none 1412b23 ANF 2006 4av IIA81a 42b23 ANF 2007 4aiii IIA81d 782b23 ANF 2007 4aiii none 1952b23 ANF 2007 none none 12b23 COD 2003 4aiii IIA81d 32 25 0.442b23 COD 2003 4aiii none 291 187 0.392b23 COD 2004 4aiii IIA81d 28 12 0.32b23 COD 2004 4aiii none 282 126 0.312b23 COD 2005 4aiii IIA81d 33 18 0.352b23 COD 2005 4aiii none 220 124 0.362b23 COD 2006 4aiii IIA81d 28 41 0.592b23 COD 2006 4aiii none 168 196 0.542b23 COD 2006 4aiv IIA81a 1 0.162b23 COD 2006 4av IIA81a 214
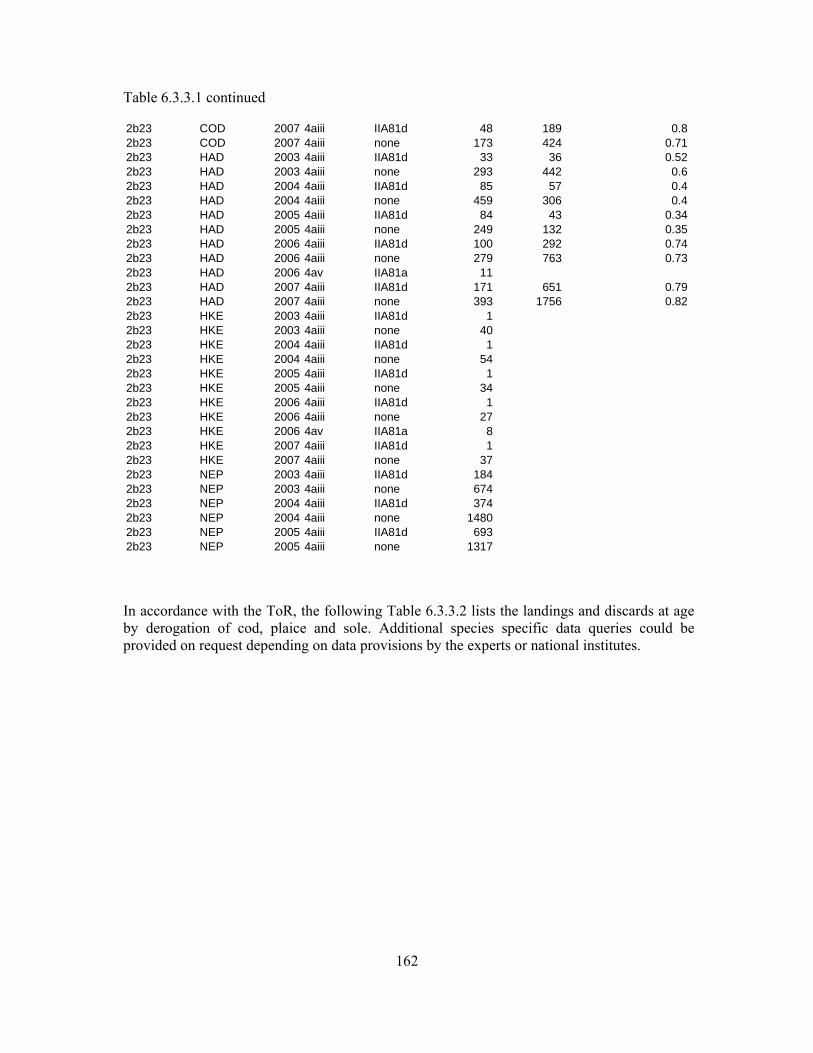
162
Table 6.3.3.1 continued
2b23 COD 2007 4aiii IIA81d 48 189 0.82b23 COD 2007 4aiii none 173 424 0.712b23 HAD 2003 4aiii IIA81d 33 36 0.522b23 HAD 2003 4aiii none 293 442 0.62b23 HAD 2004 4aiii IIA81d 85 57 0.42b23 HAD 2004 4aiii none 459 306 0.42b23 HAD 2005 4aiii IIA81d 84 43 0.342b23 HAD 2005 4aiii none 249 132 0.352b23 HAD 2006 4aiii IIA81d 100 292 0.742b23 HAD 2006 4aiii none 279 763 0.732b23 HAD 2006 4av IIA81a 112b23 HAD 2007 4aiii IIA81d 171 651 0.792b23 HAD 2007 4aiii none 393 1756 0.822b23 HKE 2003 4aiii IIA81d 12b23 HKE 2003 4aiii none 402b23 HKE 2004 4aiii IIA81d 12b23 HKE 2004 4aiii none 542b23 HKE 2005 4aiii IIA81d 12b23 HKE 2005 4aiii none 342b23 HKE 2006 4aiii IIA81d 12b23 HKE 2006 4aiii none 272b23 HKE 2006 4av IIA81a 82b23 HKE 2007 4aiii IIA81d 12b23 HKE 2007 4aiii none 372b23 NEP 2003 4aiii IIA81d 1842b23 NEP 2003 4aiii none 6742b23 NEP 2004 4aiii IIA81d 3742b23 NEP 2004 4aiii none 14802b23 NEP 2005 4aiii IIA81d 6932b23 NEP 2005 4aiii none 1317
In accordance with the ToR, the following Table 6.3.3.2 lists the landings and discards at age by derogation of cod, plaice and sole. Additional species specific data queries could be provided on request depending on data provisions by the experts or national institutes.
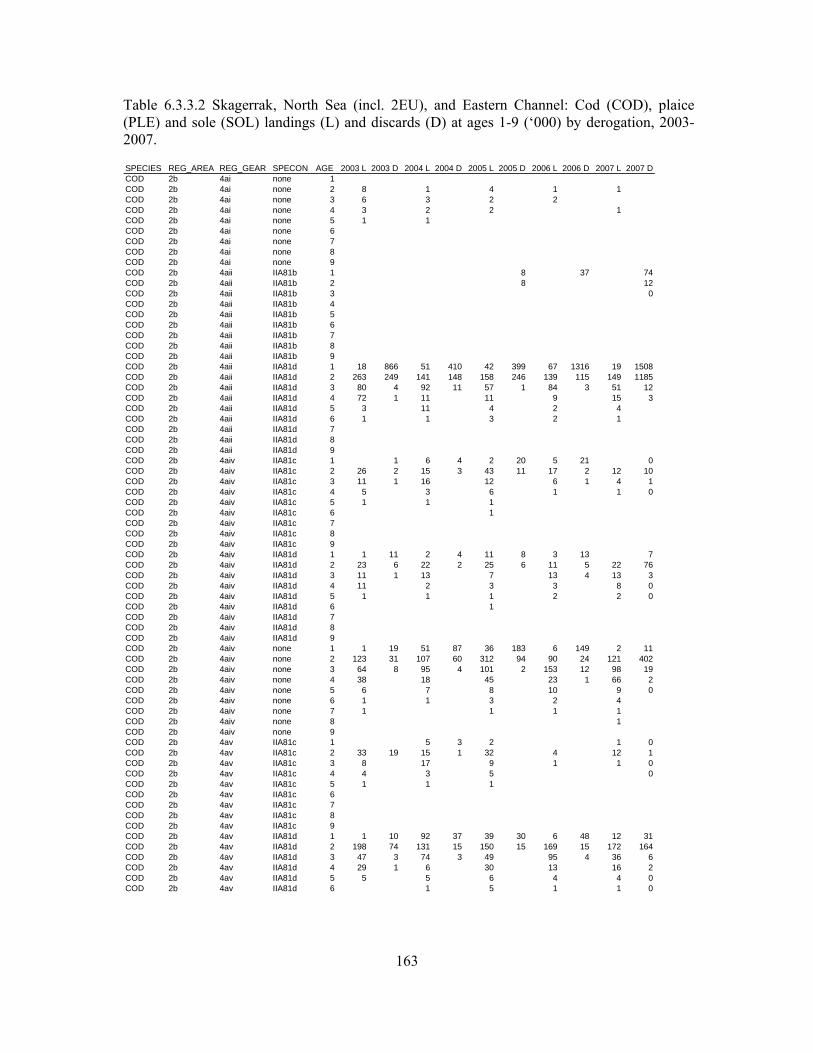
163
Table 6.3.3.2 Skagerrak, North Sea (incl. 2EU), and Eastern Channel: Cod (COD), plaice (PLE) and sole (SOL) landings (L) and discards (D) at ages 1-9 (‘000) by derogation, 2003-2007.
SPECIES REG_AREA REG_GEAR SPECON AGE 2003 L 2003 D 2004 L 2004 D 2005 L 2005 D 2006 L 2006 D 2007 L 2007 DCOD 2b 4ai none 1COD 2b 4ai none 2 8 1 4 1 1COD 2b 4ai none 3 6 3 2 2COD 2b 4ai none 4 3 2 2 1COD 2b 4ai none 5 1 1COD 2b 4ai none 6COD 2b 4ai none 7COD 2b 4ai none 8COD 2b 4ai none 9COD 2b 4aii IIA81b 1 8 37 74COD 2b 4aii IIA81b 2 8 12COD 2b 4aii IIA81b 3 0COD 2b 4aii IIA81b 4COD 2b 4aii IIA81b 5COD 2b 4aii IIA81b 6COD 2b 4aii IIA81b 7COD 2b 4aii IIA81b 8COD 2b 4aii IIA81b 9COD 2b 4aii IIA81d 1 18 866 51 410 42 399 67 1316 19 1508COD 2b 4aii IIA81d 2 263 249 141 148 158 246 139 115 149 1185COD 2b 4aii IIA81d 3 80 4 92 11 57 1 84 3 51 12COD 2b 4aii IIA81d 4 72 1 11 11 9 15 3COD 2b 4aii IIA81d 5 3 11 4 2 4COD 2b 4aii IIA81d 6 1 1 3 2 1COD 2b 4aii IIA81d 7COD 2b 4aii IIA81d 8COD 2b 4aii IIA81d 9COD 2b 4aiv IIA81c 1 1 6 4 2 20 5 21 0COD 2b 4aiv IIA81c 2 26 2 15 3 43 11 17 2 12 10COD 2b 4aiv IIA81c 3 11 1 16 12 6 1 4 1COD 2b 4aiv IIA81c 4 5 3 6 1 1 0COD 2b 4aiv IIA81c 5 1 1 1COD 2b 4aiv IIA81c 6 1COD 2b 4aiv IIA81c 7COD 2b 4aiv IIA81c 8COD 2b 4aiv IIA81c 9COD 2b 4aiv IIA81d 1 1 11 2 4 11 8 3 13 7COD 2b 4aiv IIA81d 2 23 6 22 2 25 6 11 5 22 76COD 2b 4aiv IIA81d 3 11 1 13 7 13 4 13 3COD 2b 4aiv IIA81d 4 11 2 3 3 8 0COD 2b 4aiv IIA81d 5 1 1 1 2 2 0COD 2b 4aiv IIA81d 6 1COD 2b 4aiv IIA81d 7COD 2b 4aiv IIA81d 8COD 2b 4aiv IIA81d 9COD 2b 4aiv none 1 1 19 51 87 36 183 6 149 2 11COD 2b 4aiv none 2 123 31 107 60 312 94 90 24 121 402COD 2b 4aiv none 3 64 8 95 4 101 2 153 12 98 19COD 2b 4aiv none 4 38 18 45 23 1 66 2COD 2b 4aiv none 5 6 7 8 10 9 0COD 2b 4aiv none 6 1 1 3 2 4COD 2b 4aiv none 7 1 1 1 1COD 2b 4aiv none 8 1COD 2b 4aiv none 9COD 2b 4av IIA81c 1 5 3 2 1 0COD 2b 4av IIA81c 2 33 19 15 1 32 4 12 1COD 2b 4av IIA81c 3 8 17 9 1 1 0COD 2b 4av IIA81c 4 4 3 5 0COD 2b 4av IIA81c 5 1 1 1COD 2b 4av IIA81c 6COD 2b 4av IIA81c 7COD 2b 4av IIA81c 8COD 2b 4av IIA81c 9COD 2b 4av IIA81d 1 1 10 92 37 39 30 6 48 12 31COD 2b 4av IIA81d 2 198 74 131 15 150 15 169 15 172 164COD 2b 4av IIA81d 3 47 3 74 3 49 95 4 36 6COD 2b 4av IIA81d 4 29 1 6 30 13 16 2COD 2b 4av IIA81d 5 5 5 6 4 4 0COD 2b 4av IIA81d 6 1 5 1 1 0

164
Table 6.3.3.2 continued
COD 2b 4av IIA81d 7 1 1 1COD 2b 4av IIA81d 8 1COD 2b 4av IIA81d 9COD 2b 4av none 1 74 1264 504 1675 164 1593 103 3863 81 1245COD 2b 4av none 2 3464 1545 2079 1271 3601 1665 1823 796 2142 5790COD 2b 4av none 3 1751 136 2011 285 1358 35 2279 333 1031 244COD 2b 4av none 4 1270 23 520 689 447 23 780 55COD 2b 4av none 5 142 493 203 245 2 189 3COD 2b 4av none 6 14 63 185 50 53 3COD 2b 4av none 7 22 10 25 50 1 27COD 2b 4av none 8 5 10 7 4 24COD 2b 4av none 9 5 5 1 1 1COD 2b 4ci none 1 2COD 2b 4ci none 2 28 9 29 13 8COD 2b 4ci none 3 28 30 18 33 8COD 2b 4ci none 4 13 12 16 6 6COD 2b 4ci none 5 4 4 3 3 1COD 2b 4ci none 6 1 1 1COD 2b 4ci none 7COD 2b 4ci none 8COD 2b 4ci none 9COD 2b 4cii none 1 4 22 9 6 2COD 2b 4cii none 2 326 159 431 6 195 144COD 2b 4cii none 3 281 415 240 486 170COD 2b 4cii none 4 92 138 155 83 129COD 2b 4cii none 5 19 30 27 35 14COD 2b 4cii none 6 4 6 7 5 4COD 2b 4cii none 7 1 1 1 1 1COD 2b 4cii none 8 1COD 2b 4cii none 9COD 2b 4ciii none 1 2 19 5 4 1COD 2b 4ciii none 2 220 2 138 266 122 84COD 2b 4ciii none 3 261 522 268 450 181COD 2b 4ciii none 4 221 240 288 117 222COD 2b 4ciii none 5 70 80 72 72 35COD 2b 4ciii none 6 9 19 27 10 11COD 2b 4ciii none 7 8 3 4 6 3COD 2b 4ciii none 8 2 2 1 3 1COD 2b 4ciii none 9COD 2b 4civ none 1COD 2b 4civ none 2 2 1 3 1 1COD 2b 4civ none 3 3 6 3 5 2COD 2b 4civ none 4 2 4 4 1 4COD 2b 4civ none 5 1 2 1 1 1COD 2b 4civ none 6 1COD 2b 4civ none 7COD 2b 4civ none 8COD 2b 4civ none 9COD 2b 4d none 1 1COD 2b 4d none 2 4 3 3 4COD 2b 4d none 3 2 5 3 7COD 2b 4d none 4 1 1 3 1 1COD 2b 4d none 5 1COD 2b 4d none 6COD 2b 4d none 7COD 2b 4d none 8COD 2b 4d none 9COD 2b 4e none 1 1 1 1 1 1COD 2b 4e none 2 65 13 34 24 47COD 2b 4e none 3 50 32 18 60 36COD 2b 4e none 4 20 13 13 14 18COD 2b 4e none 5 3 4 2 8 2COD 2b 4e none 6 1 1 1 1COD 2b 4e none 7 1COD 2b 4e none 8COD 2b 4e none 9COD 2b none none 1 9 44 9 331 4 1 0COD 2b none none 2 506 168 347 13 147 109 198COD 2b none none 3 246 403 158 335 98COD 2b none none 4 68 115 100 46 70

165
Table 6.3.3.2 continued
COD 2b none none 5 14 25 20 18 6COD 2b none none 6 3 5 5 2 1COD 2b none none 7 1 1 1 1COD 2b none none 8COD 2b none none 9COD 2b1 4aii none 1 4 1 633COD 2b1 4aii none 2 81 2 12 4COD 2b1 4aii none 3 24 9 1 1COD 2b1 4aii none 4 3 2COD 2b1 4aii none 5 1COD 2b1 4aii none 6 1COD 2b1 4aii none 7COD 2b1 4aii none 8COD 2b1 4aii none 9COD 2b1 4aiii IIA81a 1 2COD 2b1 4aiii IIA81a 2 31COD 2b1 4aiii IIA81a 3 82COD 2b1 4aiii IIA81a 4 12COD 2b1 4aiii IIA81a 5 5COD 2b1 4aiii IIA81a 6 1COD 2b1 4aiii IIA81a 7COD 2b1 4aiii IIA81a 8COD 2b1 4aiii IIA81a 9COD 2b1 4aiii IIA81d 1 3 1COD 2b1 4aiii IIA81d 2 7 5 11 4COD 2b1 4aiii IIA81d 3 2 9 3 6COD 2b1 4aiii IIA81d 4 1 2 1COD 2b1 4aiii IIA81d 5 1COD 2b1 4aiii IIA81d 6COD 2b1 4aiii IIA81d 7COD 2b1 4aiii IIA81d 8COD 2b1 4aiii IIA81d 9COD 2b1 4aiii IIa81l 1 1COD 2b1 4aiii IIa81l 2 4COD 2b1 4aiii IIa81l 3 7COD 2b1 4aiii IIa81l 4 1COD 2b1 4aiii IIa81l 5COD 2b1 4aiii IIa81l 6COD 2b1 4aiii IIa81l 7COD 2b1 4aiii IIa81l 8COD 2b1 4aiii IIa81l 9COD 2b1 4aiii none 1 18 111 1682 25 1007 15 2071 5 1902COD 2b1 4aiii none 2 621 229 264 744 807 130 515 170 629COD 2b1 4aiii none 3 211 577 166 183 49 261 170 114 56COD 2b1 4aiii none 4 35 108 102 14 39 24 71 13COD 2b1 4aiii none 5 14 29 25 2 16 10 8 1COD 2b1 4aiii none 6 5 12 9 2 5 2 4COD 2b1 4aiii none 7 2 1 3 1 1COD 2b1 4aiii none 8 1 1 1COD 2b1 4aiii none 9 1 1COD 2b1 4aiv IIA81a 1COD 2b1 4aiv IIA81a 2 5COD 2b1 4aiv IIA81a 3 20COD 2b1 4aiv IIA81a 4 3COD 2b1 4aiv IIA81a 5 1COD 2b1 4aiv IIA81a 6COD 2b1 4aiv IIA81a 7COD 2b1 4aiv IIA81a 8COD 2b1 4aiv IIA81a 9COD 2b1 4av IIA81a 1COD 2b1 4av IIA81a 2 4COD 2b1 4av IIA81a 3 5COD 2b1 4av IIA81a 4 1COD 2b1 4av IIA81a 5COD 2b1 4av IIA81a 6COD 2b1 4av IIA81a 7COD 2b1 4av IIA81a 8COD 2b1 4av IIA81a 9COD 2b1 4av IIA81j 1COD 2b1 4av IIA81j 2
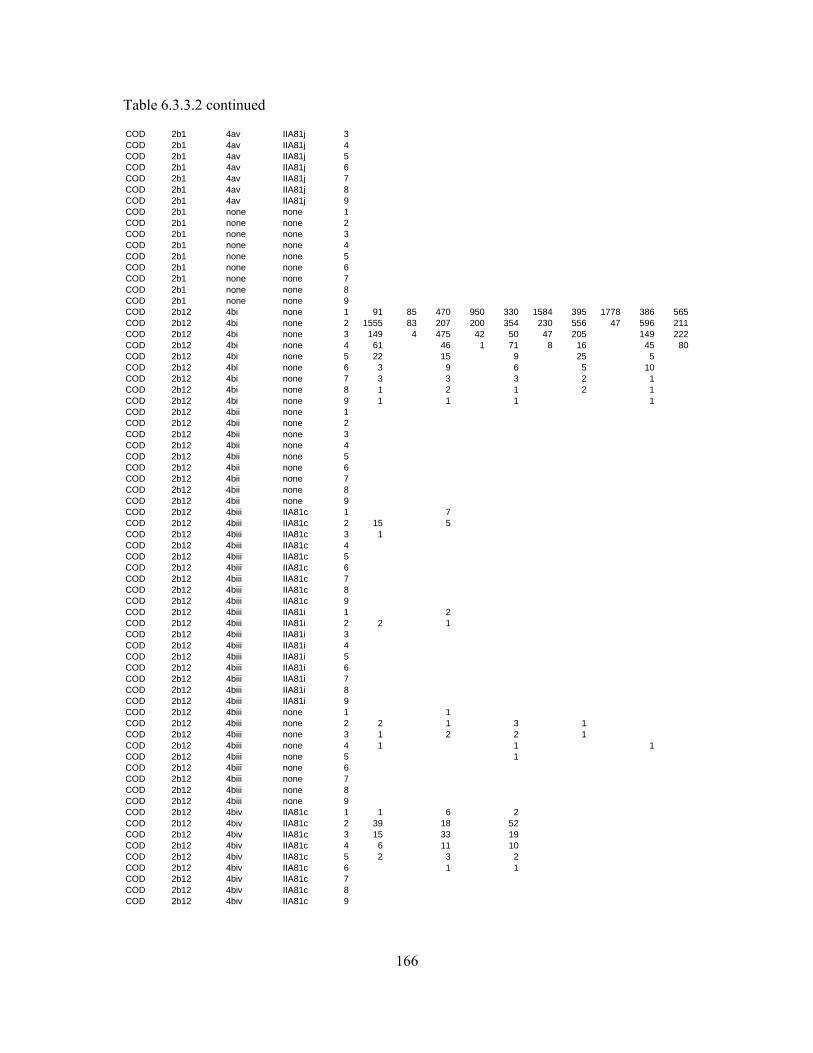
166
Table 6.3.3.2 continued
COD 2b1 4av IIA81j 3COD 2b1 4av IIA81j 4COD 2b1 4av IIA81j 5COD 2b1 4av IIA81j 6COD 2b1 4av IIA81j 7COD 2b1 4av IIA81j 8COD 2b1 4av IIA81j 9COD 2b1 none none 1COD 2b1 none none 2COD 2b1 none none 3COD 2b1 none none 4COD 2b1 none none 5COD 2b1 none none 6COD 2b1 none none 7COD 2b1 none none 8COD 2b1 none none 9COD 2b12 4bi none 1 91 85 470 950 330 1584 395 1778 386 565COD 2b12 4bi none 2 1555 83 207 200 354 230 556 47 596 211COD 2b12 4bi none 3 149 4 475 42 50 47 205 149 222COD 2b12 4bi none 4 61 46 1 71 8 16 45 80COD 2b12 4bi none 5 22 15 9 25 5COD 2b12 4bi none 6 3 9 6 5 10COD 2b12 4bi none 7 3 3 3 2 1COD 2b12 4bi none 8 1 2 1 2 1COD 2b12 4bi none 9 1 1 1 1COD 2b12 4bii none 1COD 2b12 4bii none 2COD 2b12 4bii none 3COD 2b12 4bii none 4COD 2b12 4bii none 5COD 2b12 4bii none 6COD 2b12 4bii none 7COD 2b12 4bii none 8COD 2b12 4bii none 9COD 2b12 4biii IIA81c 1 7COD 2b12 4biii IIA81c 2 15 5COD 2b12 4biii IIA81c 3 1COD 2b12 4biii IIA81c 4COD 2b12 4biii IIA81c 5COD 2b12 4biii IIA81c 6COD 2b12 4biii IIA81c 7COD 2b12 4biii IIA81c 8COD 2b12 4biii IIA81c 9COD 2b12 4biii IIA81i 1 2COD 2b12 4biii IIA81i 2 2 1COD 2b12 4biii IIA81i 3COD 2b12 4biii IIA81i 4COD 2b12 4biii IIA81i 5COD 2b12 4biii IIA81i 6COD 2b12 4biii IIA81i 7COD 2b12 4biii IIA81i 8COD 2b12 4biii IIA81i 9COD 2b12 4biii none 1 1COD 2b12 4biii none 2 2 1 3 1COD 2b12 4biii none 3 1 2 2 1COD 2b12 4biii none 4 1 1 1COD 2b12 4biii none 5 1COD 2b12 4biii none 6COD 2b12 4biii none 7COD 2b12 4biii none 8COD 2b12 4biii none 9COD 2b12 4biv IIA81c 1 1 6 2COD 2b12 4biv IIA81c 2 39 18 52COD 2b12 4biv IIA81c 3 15 33 19COD 2b12 4biv IIA81c 4 6 11 10COD 2b12 4biv IIA81c 5 2 3 2COD 2b12 4biv IIA81c 6 1 1COD 2b12 4biv IIA81c 7COD 2b12 4biv IIA81c 8COD 2b12 4biv IIA81c 9
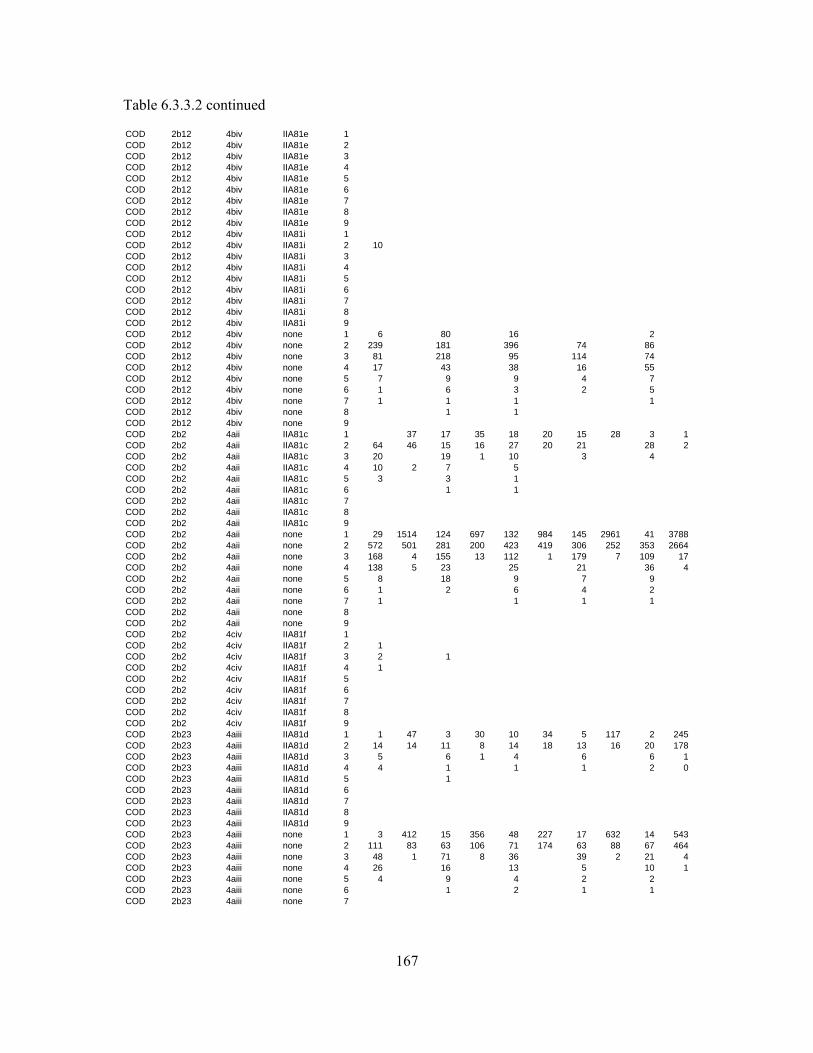
167
Table 6.3.3.2 continued
COD 2b12 4biv IIA81e 1COD 2b12 4biv IIA81e 2COD 2b12 4biv IIA81e 3COD 2b12 4biv IIA81e 4COD 2b12 4biv IIA81e 5COD 2b12 4biv IIA81e 6COD 2b12 4biv IIA81e 7COD 2b12 4biv IIA81e 8COD 2b12 4biv IIA81e 9COD 2b12 4biv IIA81i 1COD 2b12 4biv IIA81i 2 10COD 2b12 4biv IIA81i 3COD 2b12 4biv IIA81i 4COD 2b12 4biv IIA81i 5COD 2b12 4biv IIA81i 6COD 2b12 4biv IIA81i 7COD 2b12 4biv IIA81i 8COD 2b12 4biv IIA81i 9COD 2b12 4biv none 1 6 80 16 2COD 2b12 4biv none 2 239 181 396 74 86COD 2b12 4biv none 3 81 218 95 114 74COD 2b12 4biv none 4 17 43 38 16 55COD 2b12 4biv none 5 7 9 9 4 7COD 2b12 4biv none 6 1 6 3 2 5COD 2b12 4biv none 7 1 1 1 1COD 2b12 4biv none 8 1 1COD 2b12 4biv none 9COD 2b2 4aii IIA81c 1 37 17 35 18 20 15 28 3 1COD 2b2 4aii IIA81c 2 64 46 15 16 27 20 21 28 2COD 2b2 4aii IIA81c 3 20 19 1 10 3 4COD 2b2 4aii IIA81c 4 10 2 7 5COD 2b2 4aii IIA81c 5 3 3 1COD 2b2 4aii IIA81c 6 1 1COD 2b2 4aii IIA81c 7COD 2b2 4aii IIA81c 8COD 2b2 4aii IIA81c 9COD 2b2 4aii none 1 29 1514 124 697 132 984 145 2961 41 3788COD 2b2 4aii none 2 572 501 281 200 423 419 306 252 353 2664COD 2b2 4aii none 3 168 4 155 13 112 1 179 7 109 17COD 2b2 4aii none 4 138 5 23 25 21 36 4COD 2b2 4aii none 5 8 18 9 7 9COD 2b2 4aii none 6 1 2 6 4 2COD 2b2 4aii none 7 1 1 1 1COD 2b2 4aii none 8COD 2b2 4aii none 9COD 2b2 4civ IIA81f 1COD 2b2 4civ IIA81f 2 1COD 2b2 4civ IIA81f 3 2 1COD 2b2 4civ IIA81f 4 1COD 2b2 4civ IIA81f 5COD 2b2 4civ IIA81f 6COD 2b2 4civ IIA81f 7COD 2b2 4civ IIA81f 8COD 2b2 4civ IIA81f 9COD 2b23 4aiii IIA81d 1 1 47 3 30 10 34 5 117 2 245COD 2b23 4aiii IIA81d 2 14 14 11 8 14 18 13 16 20 178COD 2b23 4aiii IIA81d 3 5 6 1 4 6 6 1COD 2b23 4aiii IIA81d 4 4 1 1 1 2 0COD 2b23 4aiii IIA81d 5 1COD 2b23 4aiii IIA81d 6COD 2b23 4aiii IIA81d 7COD 2b23 4aiii IIA81d 8COD 2b23 4aiii IIA81d 9COD 2b23 4aiii none 1 3 412 15 356 48 227 17 632 14 543COD 2b23 4aiii none 2 111 83 63 106 71 174 63 88 67 464COD 2b23 4aiii none 3 48 1 71 8 36 39 2 21 4COD 2b23 4aiii none 4 26 16 13 5 10 1COD 2b23 4aiii none 5 4 9 4 2 2COD 2b23 4aiii none 6 1 2 1 1COD 2b23 4aiii none 7
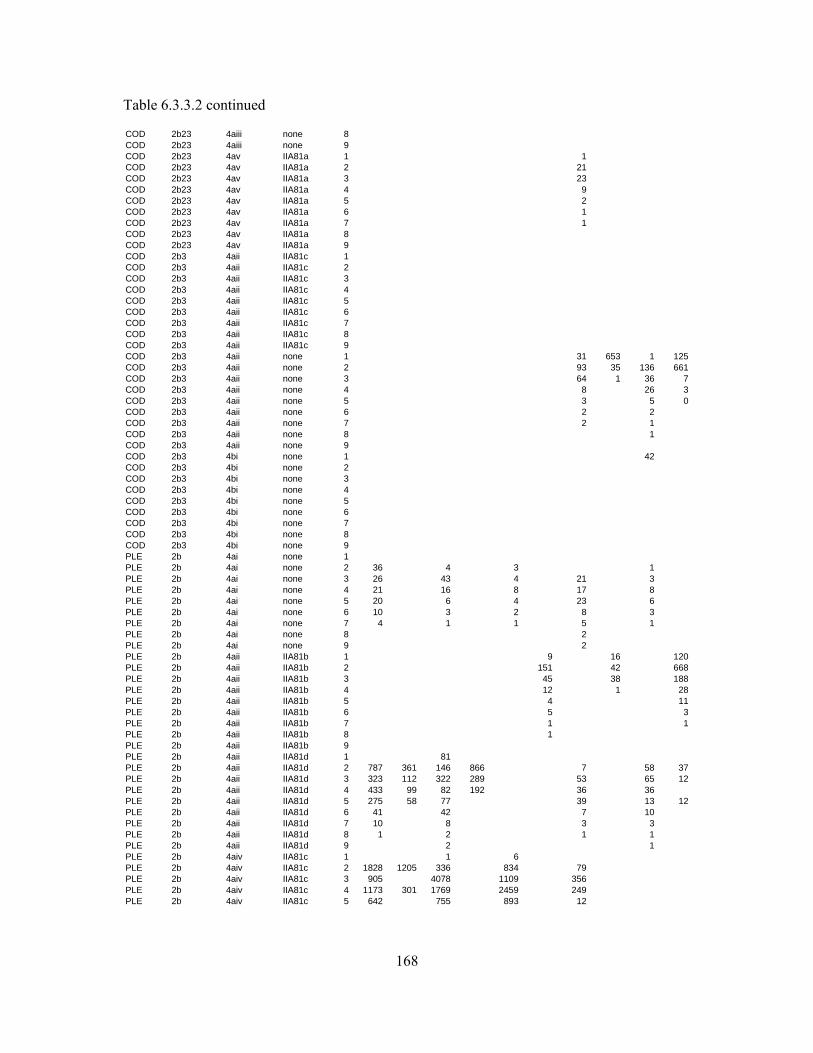
168
Table 6.3.3.2 continued
COD 2b23 4aiii none 8COD 2b23 4aiii none 9COD 2b23 4av IIA81a 1 1COD 2b23 4av IIA81a 2 21COD 2b23 4av IIA81a 3 23COD 2b23 4av IIA81a 4 9COD 2b23 4av IIA81a 5 2COD 2b23 4av IIA81a 6 1COD 2b23 4av IIA81a 7 1COD 2b23 4av IIA81a 8COD 2b23 4av IIA81a 9COD 2b3 4aii IIA81c 1COD 2b3 4aii IIA81c 2COD 2b3 4aii IIA81c 3COD 2b3 4aii IIA81c 4COD 2b3 4aii IIA81c 5COD 2b3 4aii IIA81c 6COD 2b3 4aii IIA81c 7COD 2b3 4aii IIA81c 8COD 2b3 4aii IIA81c 9COD 2b3 4aii none 1 31 653 1 125COD 2b3 4aii none 2 93 35 136 661COD 2b3 4aii none 3 64 1 36 7COD 2b3 4aii none 4 8 26 3COD 2b3 4aii none 5 3 5 0COD 2b3 4aii none 6 2 2COD 2b3 4aii none 7 2 1COD 2b3 4aii none 8 1COD 2b3 4aii none 9COD 2b3 4bi none 1 42COD 2b3 4bi none 2COD 2b3 4bi none 3COD 2b3 4bi none 4COD 2b3 4bi none 5COD 2b3 4bi none 6COD 2b3 4bi none 7COD 2b3 4bi none 8COD 2b3 4bi none 9PLE 2b 4ai none 1PLE 2b 4ai none 2 36 4 3 1PLE 2b 4ai none 3 26 43 4 21 3PLE 2b 4ai none 4 21 16 8 17 8PLE 2b 4ai none 5 20 6 4 23 6PLE 2b 4ai none 6 10 3 2 8 3PLE 2b 4ai none 7 4 1 1 5 1PLE 2b 4ai none 8 2PLE 2b 4ai none 9 2PLE 2b 4aii IIA81b 1 9 16 120PLE 2b 4aii IIA81b 2 151 42 668PLE 2b 4aii IIA81b 3 45 38 188PLE 2b 4aii IIA81b 4 12 1 28PLE 2b 4aii IIA81b 5 4 11PLE 2b 4aii IIA81b 6 5 3PLE 2b 4aii IIA81b 7 1 1PLE 2b 4aii IIA81b 8 1PLE 2b 4aii IIA81b 9PLE 2b 4aii IIA81d 1 81PLE 2b 4aii IIA81d 2 787 361 146 866 7 58 37PLE 2b 4aii IIA81d 3 323 112 322 289 53 65 12PLE 2b 4aii IIA81d 4 433 99 82 192 36 36PLE 2b 4aii IIA81d 5 275 58 77 39 13 12PLE 2b 4aii IIA81d 6 41 42 7 10PLE 2b 4aii IIA81d 7 10 8 3 3PLE 2b 4aii IIA81d 8 1 2 1 1PLE 2b 4aii IIA81d 9 2 1PLE 2b 4aiv IIA81c 1 1 6PLE 2b 4aiv IIA81c 2 1828 1205 336 834 79PLE 2b 4aiv IIA81c 3 905 4078 1109 356PLE 2b 4aiv IIA81c 4 1173 301 1769 2459 249PLE 2b 4aiv IIA81c 5 642 755 893 12
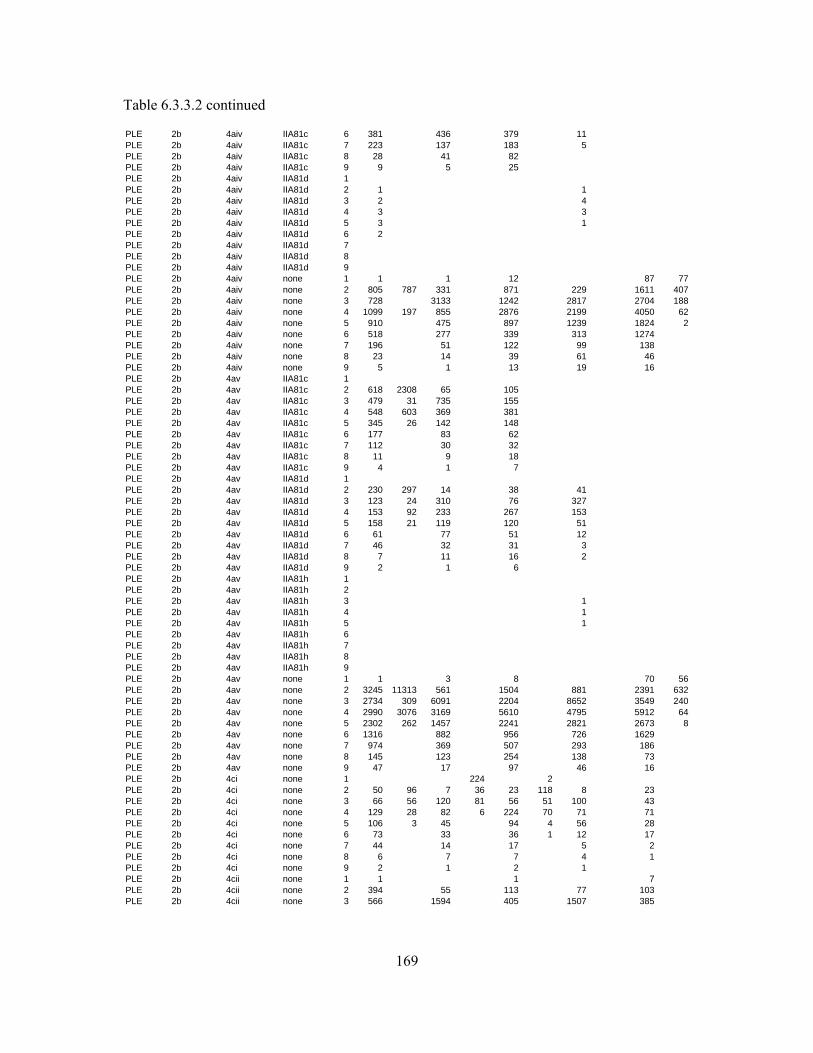
169
Table 6.3.3.2 continued
PLE 2b 4aiv IIA81c 6 381 436 379 11PLE 2b 4aiv IIA81c 7 223 137 183 5PLE 2b 4aiv IIA81c 8 28 41 82PLE 2b 4aiv IIA81c 9 9 5 25PLE 2b 4aiv IIA81d 1PLE 2b 4aiv IIA81d 2 1 1PLE 2b 4aiv IIA81d 3 2 4PLE 2b 4aiv IIA81d 4 3 3PLE 2b 4aiv IIA81d 5 3 1PLE 2b 4aiv IIA81d 6 2PLE 2b 4aiv IIA81d 7PLE 2b 4aiv IIA81d 8PLE 2b 4aiv IIA81d 9PLE 2b 4aiv none 1 1 1 12 87 77PLE 2b 4aiv none 2 805 787 331 871 229 1611 407PLE 2b 4aiv none 3 728 3133 1242 2817 2704 188PLE 2b 4aiv none 4 1099 197 855 2876 2199 4050 62PLE 2b 4aiv none 5 910 475 897 1239 1824 2PLE 2b 4aiv none 6 518 277 339 313 1274PLE 2b 4aiv none 7 196 51 122 99 138PLE 2b 4aiv none 8 23 14 39 61 46PLE 2b 4aiv none 9 5 1 13 19 16PLE 2b 4av IIA81c 1PLE 2b 4av IIA81c 2 618 2308 65 105PLE 2b 4av IIA81c 3 479 31 735 155PLE 2b 4av IIA81c 4 548 603 369 381PLE 2b 4av IIA81c 5 345 26 142 148PLE 2b 4av IIA81c 6 177 83 62PLE 2b 4av IIA81c 7 112 30 32PLE 2b 4av IIA81c 8 11 9 18PLE 2b 4av IIA81c 9 4 1 7PLE 2b 4av IIA81d 1PLE 2b 4av IIA81d 2 230 297 14 38 41PLE 2b 4av IIA81d 3 123 24 310 76 327PLE 2b 4av IIA81d 4 153 92 233 267 153PLE 2b 4av IIA81d 5 158 21 119 120 51PLE 2b 4av IIA81d 6 61 77 51 12PLE 2b 4av IIA81d 7 46 32 31 3PLE 2b 4av IIA81d 8 7 11 16 2PLE 2b 4av IIA81d 9 2 1 6PLE 2b 4av IIA81h 1PLE 2b 4av IIA81h 2PLE 2b 4av IIA81h 3 1PLE 2b 4av IIA81h 4 1PLE 2b 4av IIA81h 5 1PLE 2b 4av IIA81h 6PLE 2b 4av IIA81h 7PLE 2b 4av IIA81h 8PLE 2b 4av IIA81h 9PLE 2b 4av none 1 1 3 8 70 56PLE 2b 4av none 2 3245 11313 561 1504 881 2391 632PLE 2b 4av none 3 2734 309 6091 2204 8652 3549 240PLE 2b 4av none 4 2990 3076 3169 5610 4795 5912 64PLE 2b 4av none 5 2302 262 1457 2241 2821 2673 8PLE 2b 4av none 6 1316 882 956 726 1629PLE 2b 4av none 7 974 369 507 293 186PLE 2b 4av none 8 145 123 254 138 73PLE 2b 4av none 9 47 17 97 46 16PLE 2b 4ci none 1 224 2PLE 2b 4ci none 2 50 96 7 36 23 118 8 23PLE 2b 4ci none 3 66 56 120 81 56 51 100 43PLE 2b 4ci none 4 129 28 82 6 224 70 71 71PLE 2b 4ci none 5 106 3 45 94 4 56 28PLE 2b 4ci none 6 73 33 36 1 12 17PLE 2b 4ci none 7 44 14 17 5 2PLE 2b 4ci none 8 6 7 7 4 1PLE 2b 4ci none 9 2 1 2 1PLE 2b 4cii none 1 1 1 7PLE 2b 4cii none 2 394 55 113 77 103PLE 2b 4cii none 3 566 1594 405 1507 385

170
Table 6.3.3.2 continued
PLE 2b 4cii none 4 1347 1098 1874 1263 1168PLE 2b 4cii none 5 1300 689 853 1143 972PLE 2b 4cii none 6 835 475 377 295 638PLE 2b 4cii none 7 588 158 194 140 134PLE 2b 4cii none 8 74 72 87 70 43PLE 2b 4cii none 9 26 9 35 38 10PLE 2b 4ciii none 1 1PLE 2b 4ciii none 2 110 16 35 26 19PLE 2b 4ciii none 3 332 657 241 819 89PLE 2b 4ciii none 4 1379 721 1428 723 365PLE 2b 4ciii none 5 2009 1025 1007 1619 375PLE 2b 4ciii none 6 1422 879 630 652 244PLE 2b 4ciii none 7 2085 423 378 475 64PLE 2b 4ciii none 8 249 320 217 207 22PLE 2b 4ciii none 9 122 59 93 189 5PLE 2b 4civ none 1PLE 2b 4civ none 2 2 1PLE 2b 4civ none 3 2 2 2 3 1PLE 2b 4civ none 4 3 2 10 2 4PLE 2b 4civ none 5 3 2 5 1 4PLE 2b 4civ none 6 2 2 3 1 4PLE 2b 4civ none 7 3 2 2 1PLE 2b 4civ none 8 1 1 1PLE 2b 4civ none 9 1PLE 2b 4d none 1PLE 2b 4d none 2 18 8 1PLE 2b 4d none 3 14 144 21 19 4PLE 2b 4d none 4 46 82 81 24 19PLE 2b 4d none 5 24 23 32 42 10PLE 2b 4d none 6 16 14 11 9 6PLE 2b 4d none 7 8 5 5 9 1PLE 2b 4d none 8 1 1 3 12PLE 2b 4d none 9 1 6PLE 2b 4e none 1PLE 2b 4e none 2 1PLE 2b 4e none 3 6 7PLE 2b 4e none 4 1 4 2 5PLE 2b 4e none 5 1 6 1 4PLE 2b 4e none 6 1 5 1PLE 2b 4e none 7 1 3PLE 2b 4e none 8 2PLE 2b 4e none 9PLE 2b none none 1 1 1 13PLE 2b none none 2 374 83 87 66 264PLE 2b none none 3 435 1445 292 880 496PLE 2b none none 4 973 695 1181 684 906PLE 2b none none 5 979 483 516 503 478PLE 2b none none 6 649 321 219 104 345PLE 2b none none 7 326 98 103 43 46PLE 2b none none 8 45 46 43 21 15PLE 2b none none 9 11 6 17 9 4PLE 2b1 4aii none 1PLE 2b1 4aii none 2 26 9 2PLE 2b1 4aii none 3 29 60 3 8PLE 2b1 4aii none 4 56 15 9 8PLE 2b1 4aii none 5 69 12 3 6PLE 2b1 4aii none 6 39 7 1 1PLE 2b1 4aii none 7 9 1 1PLE 2b1 4aii none 8 1 1PLE 2b1 4aii none 9PLE 2b1 4aiii IIA81a 1PLE 2b1 4aiii IIA81a 2 16PLE 2b1 4aiii IIA81a 3 185PLE 2b1 4aiii IIA81a 4 158PLE 2b1 4aiii IIA81a 5 117PLE 2b1 4aiii IIA81a 6 18PLE 2b1 4aiii IIA81a 7 8PLE 2b1 4aiii IIA81a 8 5PLE 2b1 4aiii IIA81a 9 2PLE 2b1 4aiii IIA81d 1
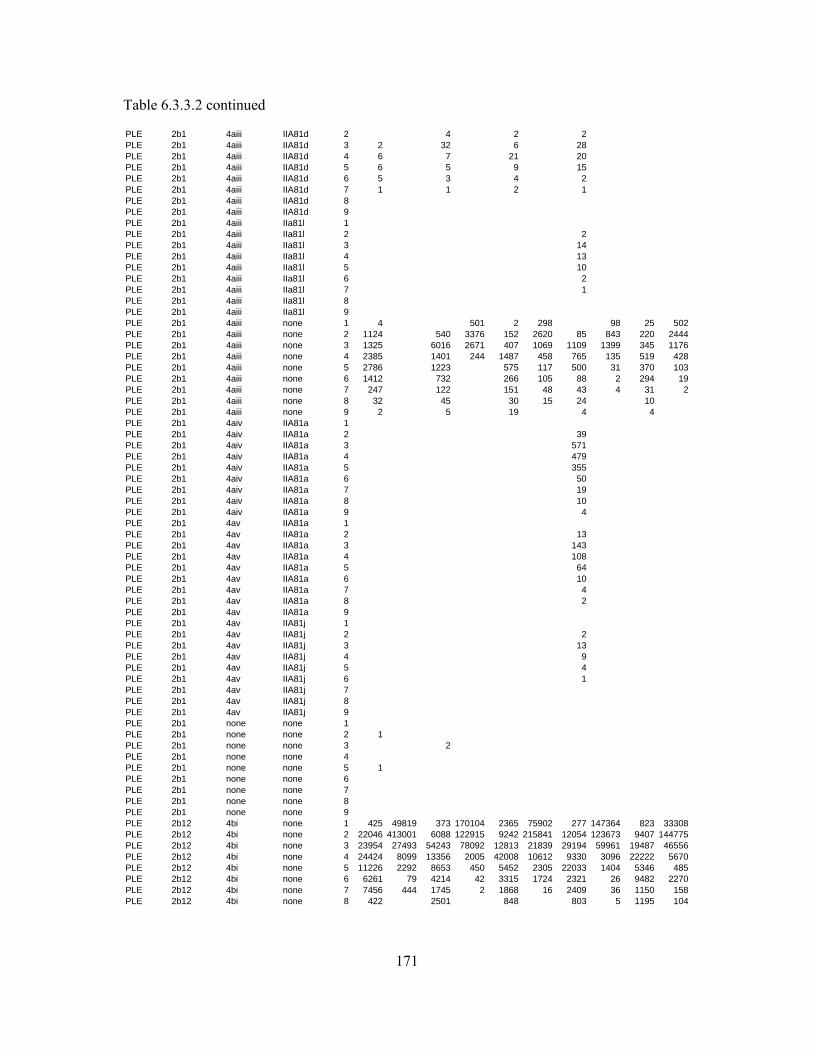
171
Table 6.3.3.2 continued
PLE 2b1 4aiii IIA81d 2 4 2 2PLE 2b1 4aiii IIA81d 3 2 32 6 28PLE 2b1 4aiii IIA81d 4 6 7 21 20PLE 2b1 4aiii IIA81d 5 6 5 9 15PLE 2b1 4aiii IIA81d 6 5 3 4 2PLE 2b1 4aiii IIA81d 7 1 1 2 1PLE 2b1 4aiii IIA81d 8PLE 2b1 4aiii IIA81d 9PLE 2b1 4aiii IIa81l 1PLE 2b1 4aiii IIa81l 2 2PLE 2b1 4aiii IIa81l 3 14PLE 2b1 4aiii IIa81l 4 13PLE 2b1 4aiii IIa81l 5 10PLE 2b1 4aiii IIa81l 6 2PLE 2b1 4aiii IIa81l 7 1PLE 2b1 4aiii IIa81l 8PLE 2b1 4aiii IIa81l 9PLE 2b1 4aiii none 1 4 501 2 298 98 25 502PLE 2b1 4aiii none 2 1124 540 3376 152 2620 85 843 220 2444PLE 2b1 4aiii none 3 1325 6016 2671 407 1069 1109 1399 345 1176PLE 2b1 4aiii none 4 2385 1401 244 1487 458 765 135 519 428PLE 2b1 4aiii none 5 2786 1223 575 117 500 31 370 103PLE 2b1 4aiii none 6 1412 732 266 105 88 2 294 19PLE 2b1 4aiii none 7 247 122 151 48 43 4 31 2PLE 2b1 4aiii none 8 32 45 30 15 24 10PLE 2b1 4aiii none 9 2 5 19 4 4PLE 2b1 4aiv IIA81a 1PLE 2b1 4aiv IIA81a 2 39PLE 2b1 4aiv IIA81a 3 571PLE 2b1 4aiv IIA81a 4 479PLE 2b1 4aiv IIA81a 5 355PLE 2b1 4aiv IIA81a 6 50PLE 2b1 4aiv IIA81a 7 19PLE 2b1 4aiv IIA81a 8 10PLE 2b1 4aiv IIA81a 9 4PLE 2b1 4av IIA81a 1PLE 2b1 4av IIA81a 2 13PLE 2b1 4av IIA81a 3 143PLE 2b1 4av IIA81a 4 108PLE 2b1 4av IIA81a 5 64PLE 2b1 4av IIA81a 6 10PLE 2b1 4av IIA81a 7 4PLE 2b1 4av IIA81a 8 2PLE 2b1 4av IIA81a 9PLE 2b1 4av IIA81j 1PLE 2b1 4av IIA81j 2 2PLE 2b1 4av IIA81j 3 13PLE 2b1 4av IIA81j 4 9PLE 2b1 4av IIA81j 5 4PLE 2b1 4av IIA81j 6 1PLE 2b1 4av IIA81j 7PLE 2b1 4av IIA81j 8PLE 2b1 4av IIA81j 9PLE 2b1 none none 1PLE 2b1 none none 2 1PLE 2b1 none none 3 2PLE 2b1 none none 4PLE 2b1 none none 5 1PLE 2b1 none none 6PLE 2b1 none none 7PLE 2b1 none none 8PLE 2b1 none none 9PLE 2b12 4bi none 1 425 49819 373 170104 2365 75902 277 147364 823 33308PLE 2b12 4bi none 2 22046 413001 6088 122915 9242 215841 12054 123673 9407 144775PLE 2b12 4bi none 3 23954 27493 54243 78092 12813 21839 29194 59961 19487 46556PLE 2b12 4bi none 4 24424 8099 13356 2005 42008 10612 9330 3096 22222 5670PLE 2b12 4bi none 5 11226 2292 8653 450 5452 2305 22033 1404 5346 485PLE 2b12 4bi none 6 6261 79 4214 42 3315 1724 2321 26 9482 2270PLE 2b12 4bi none 7 7456 444 1745 2 1868 16 2409 36 1150 158PLE 2b12 4bi none 8 422 2501 848 803 5 1195 104
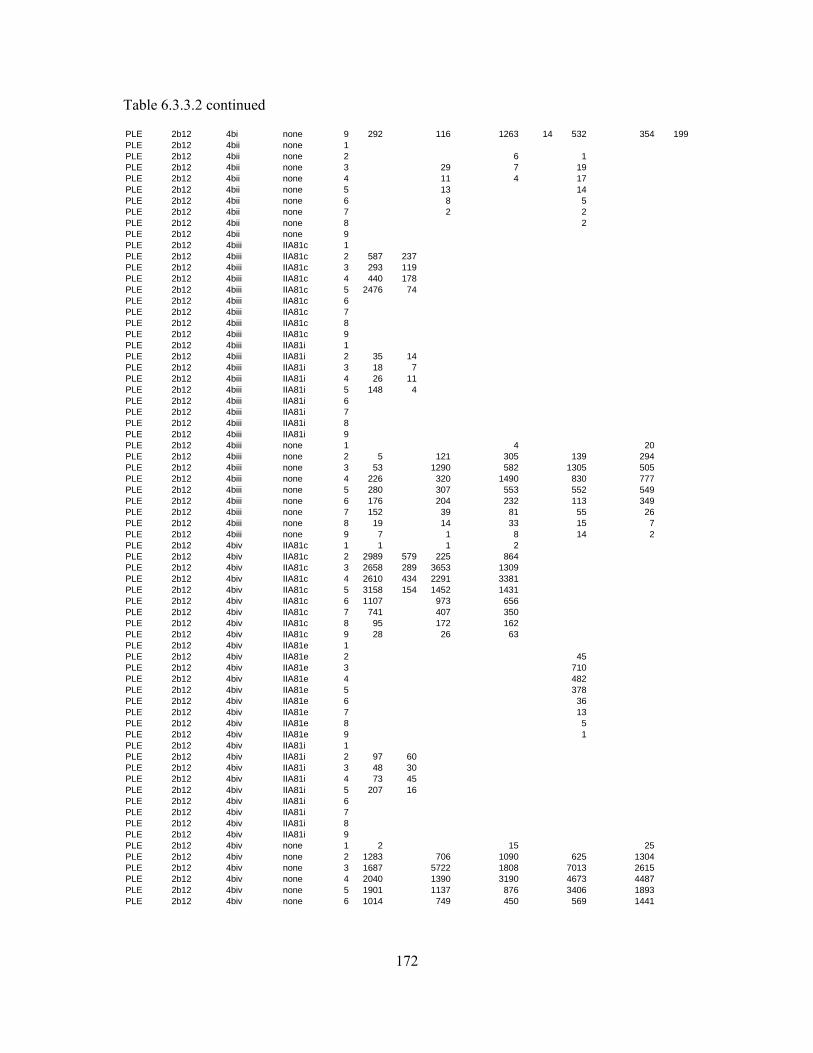
172
Table 6.3.3.2 continued
PLE 2b12 4bi none 9 292 116 1263 14 532 354 199PLE 2b12 4bii none 1PLE 2b12 4bii none 2 6 1PLE 2b12 4bii none 3 29 7 19PLE 2b12 4bii none 4 11 4 17PLE 2b12 4bii none 5 13 14PLE 2b12 4bii none 6 8 5PLE 2b12 4bii none 7 2 2PLE 2b12 4bii none 8 2PLE 2b12 4bii none 9PLE 2b12 4biii IIA81c 1PLE 2b12 4biii IIA81c 2 587 237PLE 2b12 4biii IIA81c 3 293 119PLE 2b12 4biii IIA81c 4 440 178PLE 2b12 4biii IIA81c 5 2476 74PLE 2b12 4biii IIA81c 6PLE 2b12 4biii IIA81c 7PLE 2b12 4biii IIA81c 8PLE 2b12 4biii IIA81c 9PLE 2b12 4biii IIA81i 1PLE 2b12 4biii IIA81i 2 35 14PLE 2b12 4biii IIA81i 3 18 7PLE 2b12 4biii IIA81i 4 26 11PLE 2b12 4biii IIA81i 5 148 4PLE 2b12 4biii IIA81i 6PLE 2b12 4biii IIA81i 7PLE 2b12 4biii IIA81i 8PLE 2b12 4biii IIA81i 9PLE 2b12 4biii none 1 4 20PLE 2b12 4biii none 2 5 121 305 139 294PLE 2b12 4biii none 3 53 1290 582 1305 505PLE 2b12 4biii none 4 226 320 1490 830 777PLE 2b12 4biii none 5 280 307 553 552 549PLE 2b12 4biii none 6 176 204 232 113 349PLE 2b12 4biii none 7 152 39 81 55 26PLE 2b12 4biii none 8 19 14 33 15 7PLE 2b12 4biii none 9 7 1 8 14 2PLE 2b12 4biv IIA81c 1 1 1 2PLE 2b12 4biv IIA81c 2 2989 579 225 864PLE 2b12 4biv IIA81c 3 2658 289 3653 1309PLE 2b12 4biv IIA81c 4 2610 434 2291 3381PLE 2b12 4biv IIA81c 5 3158 154 1452 1431PLE 2b12 4biv IIA81c 6 1107 973 656PLE 2b12 4biv IIA81c 7 741 407 350PLE 2b12 4biv IIA81c 8 95 172 162PLE 2b12 4biv IIA81c 9 28 26 63PLE 2b12 4biv IIA81e 1PLE 2b12 4biv IIA81e 2 45PLE 2b12 4biv IIA81e 3 710PLE 2b12 4biv IIA81e 4 482PLE 2b12 4biv IIA81e 5 378PLE 2b12 4biv IIA81e 6 36PLE 2b12 4biv IIA81e 7 13PLE 2b12 4biv IIA81e 8 5PLE 2b12 4biv IIA81e 9 1PLE 2b12 4biv IIA81i 1PLE 2b12 4biv IIA81i 2 97 60PLE 2b12 4biv IIA81i 3 48 30PLE 2b12 4biv IIA81i 4 73 45PLE 2b12 4biv IIA81i 5 207 16PLE 2b12 4biv IIA81i 6PLE 2b12 4biv IIA81i 7PLE 2b12 4biv IIA81i 8PLE 2b12 4biv IIA81i 9PLE 2b12 4biv none 1 2 15 25PLE 2b12 4biv none 2 1283 706 1090 625 1304PLE 2b12 4biv none 3 1687 5722 1808 7013 2615PLE 2b12 4biv none 4 2040 1390 3190 4673 4487PLE 2b12 4biv none 5 1901 1137 876 3406 1893PLE 2b12 4biv none 6 1014 749 450 569 1441
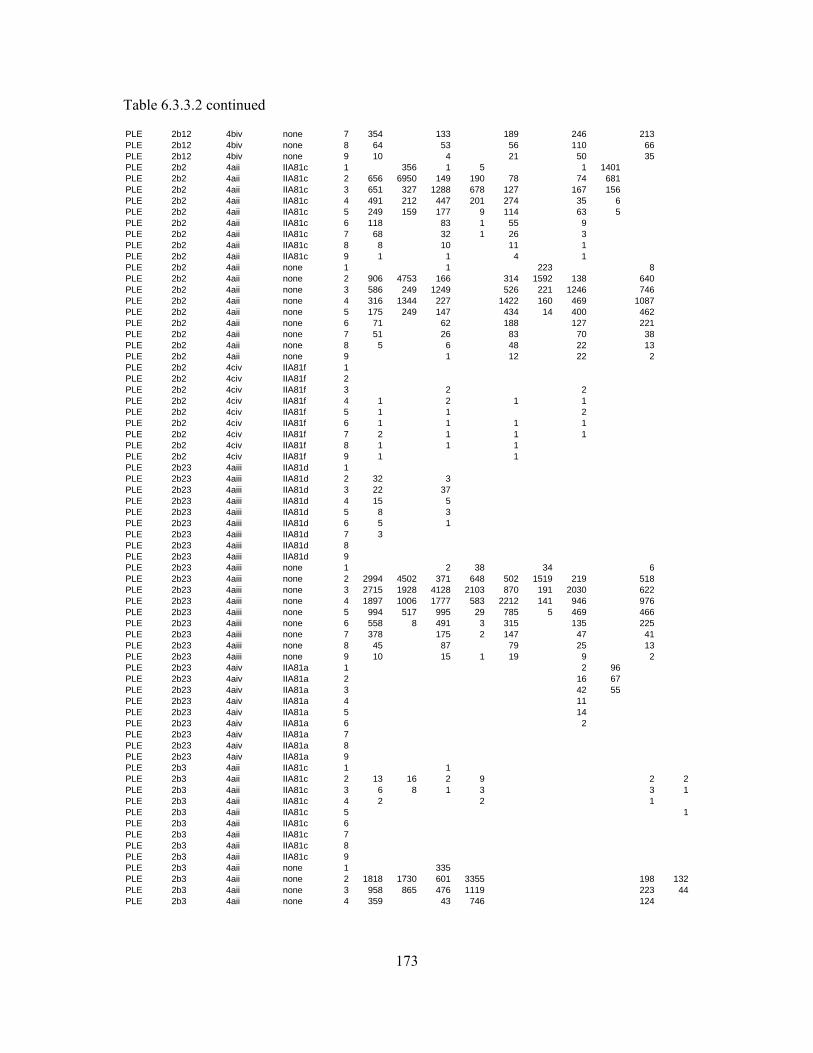
173
Table 6.3.3.2 continued
PLE 2b12 4biv none 7 354 133 189 246 213PLE 2b12 4biv none 8 64 53 56 110 66PLE 2b12 4biv none 9 10 4 21 50 35PLE 2b2 4aii IIA81c 1 356 1 5 1 1401PLE 2b2 4aii IIA81c 2 656 6950 149 190 78 74 681PLE 2b2 4aii IIA81c 3 651 327 1288 678 127 167 156PLE 2b2 4aii IIA81c 4 491 212 447 201 274 35 6PLE 2b2 4aii IIA81c 5 249 159 177 9 114 63 5PLE 2b2 4aii IIA81c 6 118 83 1 55 9PLE 2b2 4aii IIA81c 7 68 32 1 26 3PLE 2b2 4aii IIA81c 8 8 10 11 1PLE 2b2 4aii IIA81c 9 1 1 4 1PLE 2b2 4aii none 1 1 223 8PLE 2b2 4aii none 2 906 4753 166 314 1592 138 640PLE 2b2 4aii none 3 586 249 1249 526 221 1246 746PLE 2b2 4aii none 4 316 1344 227 1422 160 469 1087PLE 2b2 4aii none 5 175 249 147 434 14 400 462PLE 2b2 4aii none 6 71 62 188 127 221PLE 2b2 4aii none 7 51 26 83 70 38PLE 2b2 4aii none 8 5 6 48 22 13PLE 2b2 4aii none 9 1 12 22 2PLE 2b2 4civ IIA81f 1PLE 2b2 4civ IIA81f 2PLE 2b2 4civ IIA81f 3 2 2PLE 2b2 4civ IIA81f 4 1 2 1 1PLE 2b2 4civ IIA81f 5 1 1 2PLE 2b2 4civ IIA81f 6 1 1 1 1PLE 2b2 4civ IIA81f 7 2 1 1 1PLE 2b2 4civ IIA81f 8 1 1 1PLE 2b2 4civ IIA81f 9 1 1PLE 2b23 4aiii IIA81d 1PLE 2b23 4aiii IIA81d 2 32 3PLE 2b23 4aiii IIA81d 3 22 37PLE 2b23 4aiii IIA81d 4 15 5PLE 2b23 4aiii IIA81d 5 8 3PLE 2b23 4aiii IIA81d 6 5 1PLE 2b23 4aiii IIA81d 7 3PLE 2b23 4aiii IIA81d 8PLE 2b23 4aiii IIA81d 9PLE 2b23 4aiii none 1 2 38 34 6PLE 2b23 4aiii none 2 2994 4502 371 648 502 1519 219 518PLE 2b23 4aiii none 3 2715 1928 4128 2103 870 191 2030 622PLE 2b23 4aiii none 4 1897 1006 1777 583 2212 141 946 976PLE 2b23 4aiii none 5 994 517 995 29 785 5 469 466PLE 2b23 4aiii none 6 558 8 491 3 315 135 225PLE 2b23 4aiii none 7 378 175 2 147 47 41PLE 2b23 4aiii none 8 45 87 79 25 13PLE 2b23 4aiii none 9 10 15 1 19 9 2PLE 2b23 4aiv IIA81a 1 2 96PLE 2b23 4aiv IIA81a 2 16 67PLE 2b23 4aiv IIA81a 3 42 55PLE 2b23 4aiv IIA81a 4 11PLE 2b23 4aiv IIA81a 5 14PLE 2b23 4aiv IIA81a 6 2PLE 2b23 4aiv IIA81a 7PLE 2b23 4aiv IIA81a 8PLE 2b23 4aiv IIA81a 9PLE 2b3 4aii IIA81c 1 1PLE 2b3 4aii IIA81c 2 13 16 2 9 2 2PLE 2b3 4aii IIA81c 3 6 8 1 3 3 1PLE 2b3 4aii IIA81c 4 2 2 1PLE 2b3 4aii IIA81c 5 1PLE 2b3 4aii IIA81c 6PLE 2b3 4aii IIA81c 7PLE 2b3 4aii IIA81c 8PLE 2b3 4aii IIA81c 9PLE 2b3 4aii none 1 335PLE 2b3 4aii none 2 1818 1730 601 3355 198 132PLE 2b3 4aii none 3 958 865 476 1119 223 44PLE 2b3 4aii none 4 359 43 746 124
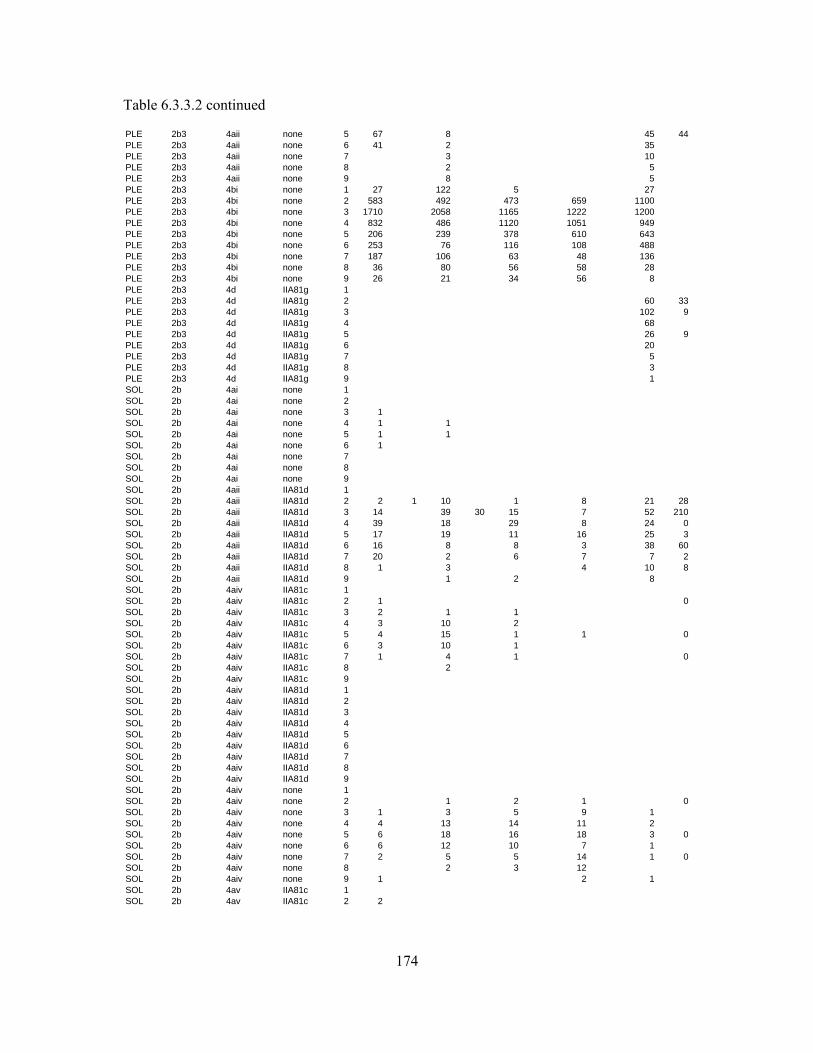
174
Table 6.3.3.2 continued
PLE 2b3 4aii none 5 67 8 45 44PLE 2b3 4aii none 6 41 2 35PLE 2b3 4aii none 7 3 10PLE 2b3 4aii none 8 2 5PLE 2b3 4aii none 9 8 5PLE 2b3 4bi none 1 27 122 5 27PLE 2b3 4bi none 2 583 492 473 659 1100PLE 2b3 4bi none 3 1710 2058 1165 1222 1200PLE 2b3 4bi none 4 832 486 1120 1051 949PLE 2b3 4bi none 5 206 239 378 610 643PLE 2b3 4bi none 6 253 76 116 108 488PLE 2b3 4bi none 7 187 106 63 48 136PLE 2b3 4bi none 8 36 80 56 58 28PLE 2b3 4bi none 9 26 21 34 56 8PLE 2b3 4d IIA81g 1PLE 2b3 4d IIA81g 2 60 33PLE 2b3 4d IIA81g 3 102 9PLE 2b3 4d IIA81g 4 68PLE 2b3 4d IIA81g 5 26 9PLE 2b3 4d IIA81g 6 20PLE 2b3 4d IIA81g 7 5PLE 2b3 4d IIA81g 8 3PLE 2b3 4d IIA81g 9 1SOL 2b 4ai none 1SOL 2b 4ai none 2SOL 2b 4ai none 3 1SOL 2b 4ai none 4 1 1SOL 2b 4ai none 5 1 1SOL 2b 4ai none 6 1SOL 2b 4ai none 7SOL 2b 4ai none 8SOL 2b 4ai none 9SOL 2b 4aii IIA81d 1SOL 2b 4aii IIA81d 2 2 1 10 1 8 21 28SOL 2b 4aii IIA81d 3 14 39 30 15 7 52 210SOL 2b 4aii IIA81d 4 39 18 29 8 24 0SOL 2b 4aii IIA81d 5 17 19 11 16 25 3SOL 2b 4aii IIA81d 6 16 8 8 3 38 60SOL 2b 4aii IIA81d 7 20 2 6 7 7 2SOL 2b 4aii IIA81d 8 1 3 4 10 8SOL 2b 4aii IIA81d 9 1 2 8SOL 2b 4aiv IIA81c 1SOL 2b 4aiv IIA81c 2 1 0SOL 2b 4aiv IIA81c 3 2 1 1SOL 2b 4aiv IIA81c 4 3 10 2SOL 2b 4aiv IIA81c 5 4 15 1 1 0SOL 2b 4aiv IIA81c 6 3 10 1SOL 2b 4aiv IIA81c 7 1 4 1 0SOL 2b 4aiv IIA81c 8 2SOL 2b 4aiv IIA81c 9SOL 2b 4aiv IIA81d 1SOL 2b 4aiv IIA81d 2SOL 2b 4aiv IIA81d 3SOL 2b 4aiv IIA81d 4SOL 2b 4aiv IIA81d 5SOL 2b 4aiv IIA81d 6SOL 2b 4aiv IIA81d 7SOL 2b 4aiv IIA81d 8SOL 2b 4aiv IIA81d 9SOL 2b 4aiv none 1SOL 2b 4aiv none 2 1 2 1 0SOL 2b 4aiv none 3 1 3 5 9 1SOL 2b 4aiv none 4 4 13 14 11 2SOL 2b 4aiv none 5 6 18 16 18 3 0SOL 2b 4aiv none 6 6 12 10 7 1SOL 2b 4aiv none 7 2 5 5 14 1 0SOL 2b 4aiv none 8 2 3 12SOL 2b 4aiv none 9 1 2 1SOL 2b 4av IIA81c 1SOL 2b 4av IIA81c 2 2
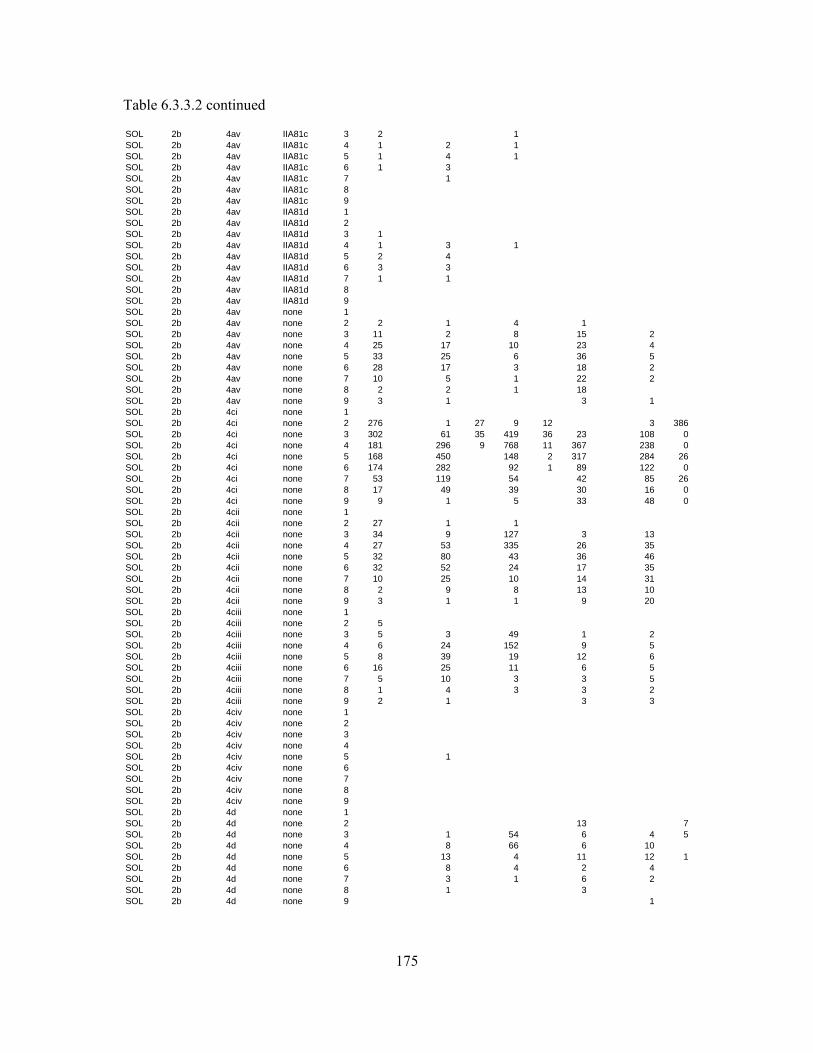
175
Table 6.3.3.2 continued
SOL 2b 4av IIA81c 3 2 1SOL 2b 4av IIA81c 4 1 2 1SOL 2b 4av IIA81c 5 1 4 1SOL 2b 4av IIA81c 6 1 3SOL 2b 4av IIA81c 7 1SOL 2b 4av IIA81c 8SOL 2b 4av IIA81c 9SOL 2b 4av IIA81d 1SOL 2b 4av IIA81d 2SOL 2b 4av IIA81d 3 1SOL 2b 4av IIA81d 4 1 3 1SOL 2b 4av IIA81d 5 2 4SOL 2b 4av IIA81d 6 3 3SOL 2b 4av IIA81d 7 1 1SOL 2b 4av IIA81d 8SOL 2b 4av IIA81d 9SOL 2b 4av none 1SOL 2b 4av none 2 2 1 4 1SOL 2b 4av none 3 11 2 8 15 2SOL 2b 4av none 4 25 17 10 23 4SOL 2b 4av none 5 33 25 6 36 5SOL 2b 4av none 6 28 17 3 18 2SOL 2b 4av none 7 10 5 1 22 2SOL 2b 4av none 8 2 2 1 18SOL 2b 4av none 9 3 1 3 1SOL 2b 4ci none 1SOL 2b 4ci none 2 276 1 27 9 12 3 386SOL 2b 4ci none 3 302 61 35 419 36 23 108 0SOL 2b 4ci none 4 181 296 9 768 11 367 238 0SOL 2b 4ci none 5 168 450 148 2 317 284 26SOL 2b 4ci none 6 174 282 92 1 89 122 0SOL 2b 4ci none 7 53 119 54 42 85 26SOL 2b 4ci none 8 17 49 39 30 16 0SOL 2b 4ci none 9 9 1 5 33 48 0SOL 2b 4cii none 1SOL 2b 4cii none 2 27 1 1SOL 2b 4cii none 3 34 9 127 3 13SOL 2b 4cii none 4 27 53 335 26 35SOL 2b 4cii none 5 32 80 43 36 46SOL 2b 4cii none 6 32 52 24 17 35SOL 2b 4cii none 7 10 25 10 14 31SOL 2b 4cii none 8 2 9 8 13 10SOL 2b 4cii none 9 3 1 1 9 20SOL 2b 4ciii none 1SOL 2b 4ciii none 2 5SOL 2b 4ciii none 3 5 3 49 1 2SOL 2b 4ciii none 4 6 24 152 9 5SOL 2b 4ciii none 5 8 39 19 12 6SOL 2b 4ciii none 6 16 25 11 6 5SOL 2b 4ciii none 7 5 10 3 3 5SOL 2b 4ciii none 8 1 4 3 3 2SOL 2b 4ciii none 9 2 1 3 3SOL 2b 4civ none 1SOL 2b 4civ none 2SOL 2b 4civ none 3SOL 2b 4civ none 4SOL 2b 4civ none 5 1SOL 2b 4civ none 6SOL 2b 4civ none 7SOL 2b 4civ none 8SOL 2b 4civ none 9SOL 2b 4d none 1SOL 2b 4d none 2 13 7SOL 2b 4d none 3 1 54 6 4 5SOL 2b 4d none 4 8 66 6 10SOL 2b 4d none 5 13 4 11 12 1SOL 2b 4d none 6 8 4 2 4SOL 2b 4d none 7 3 1 6 2SOL 2b 4d none 8 1 3SOL 2b 4d none 9 1
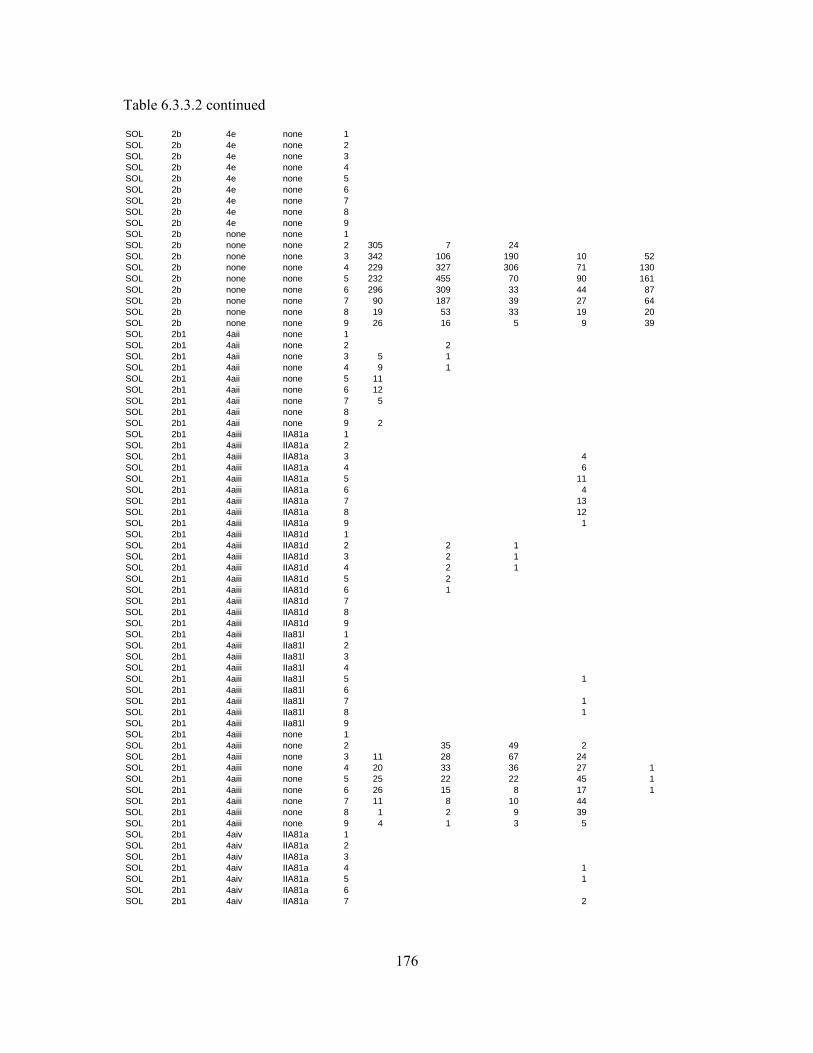
176
Table 6.3.3.2 continued
SOL 2b 4e none 1SOL 2b 4e none 2SOL 2b 4e none 3SOL 2b 4e none 4SOL 2b 4e none 5SOL 2b 4e none 6SOL 2b 4e none 7SOL 2b 4e none 8SOL 2b 4e none 9SOL 2b none none 1SOL 2b none none 2 305 7 24SOL 2b none none 3 342 106 190 10 52SOL 2b none none 4 229 327 306 71 130SOL 2b none none 5 232 455 70 90 161SOL 2b none none 6 296 309 33 44 87SOL 2b none none 7 90 187 39 27 64SOL 2b none none 8 19 53 33 19 20SOL 2b none none 9 26 16 5 9 39SOL 2b1 4aii none 1SOL 2b1 4aii none 2 2SOL 2b1 4aii none 3 5 1SOL 2b1 4aii none 4 9 1SOL 2b1 4aii none 5 11SOL 2b1 4aii none 6 12SOL 2b1 4aii none 7 5SOL 2b1 4aii none 8SOL 2b1 4aii none 9 2SOL 2b1 4aiii IIA81a 1SOL 2b1 4aiii IIA81a 2SOL 2b1 4aiii IIA81a 3 4SOL 2b1 4aiii IIA81a 4 6SOL 2b1 4aiii IIA81a 5 11SOL 2b1 4aiii IIA81a 6 4SOL 2b1 4aiii IIA81a 7 13SOL 2b1 4aiii IIA81a 8 12SOL 2b1 4aiii IIA81a 9 1SOL 2b1 4aiii IIA81d 1SOL 2b1 4aiii IIA81d 2 2 1SOL 2b1 4aiii IIA81d 3 2 1SOL 2b1 4aiii IIA81d 4 2 1SOL 2b1 4aiii IIA81d 5 2SOL 2b1 4aiii IIA81d 6 1SOL 2b1 4aiii IIA81d 7SOL 2b1 4aiii IIA81d 8SOL 2b1 4aiii IIA81d 9SOL 2b1 4aiii IIa81l 1SOL 2b1 4aiii IIa81l 2SOL 2b1 4aiii IIa81l 3SOL 2b1 4aiii IIa81l 4SOL 2b1 4aiii IIa81l 5 1SOL 2b1 4aiii IIa81l 6SOL 2b1 4aiii IIa81l 7 1SOL 2b1 4aiii IIa81l 8 1SOL 2b1 4aiii IIa81l 9SOL 2b1 4aiii none 1SOL 2b1 4aiii none 2 35 49 2SOL 2b1 4aiii none 3 11 28 67 24SOL 2b1 4aiii none 4 20 33 36 27 1SOL 2b1 4aiii none 5 25 22 22 45 1SOL 2b1 4aiii none 6 26 15 8 17 1SOL 2b1 4aiii none 7 11 8 10 44SOL 2b1 4aiii none 8 1 2 9 39SOL 2b1 4aiii none 9 4 1 3 5SOL 2b1 4aiv IIA81a 1SOL 2b1 4aiv IIA81a 2SOL 2b1 4aiv IIA81a 3SOL 2b1 4aiv IIA81a 4 1SOL 2b1 4aiv IIA81a 5 1SOL 2b1 4aiv IIA81a 6SOL 2b1 4aiv IIA81a 7 2
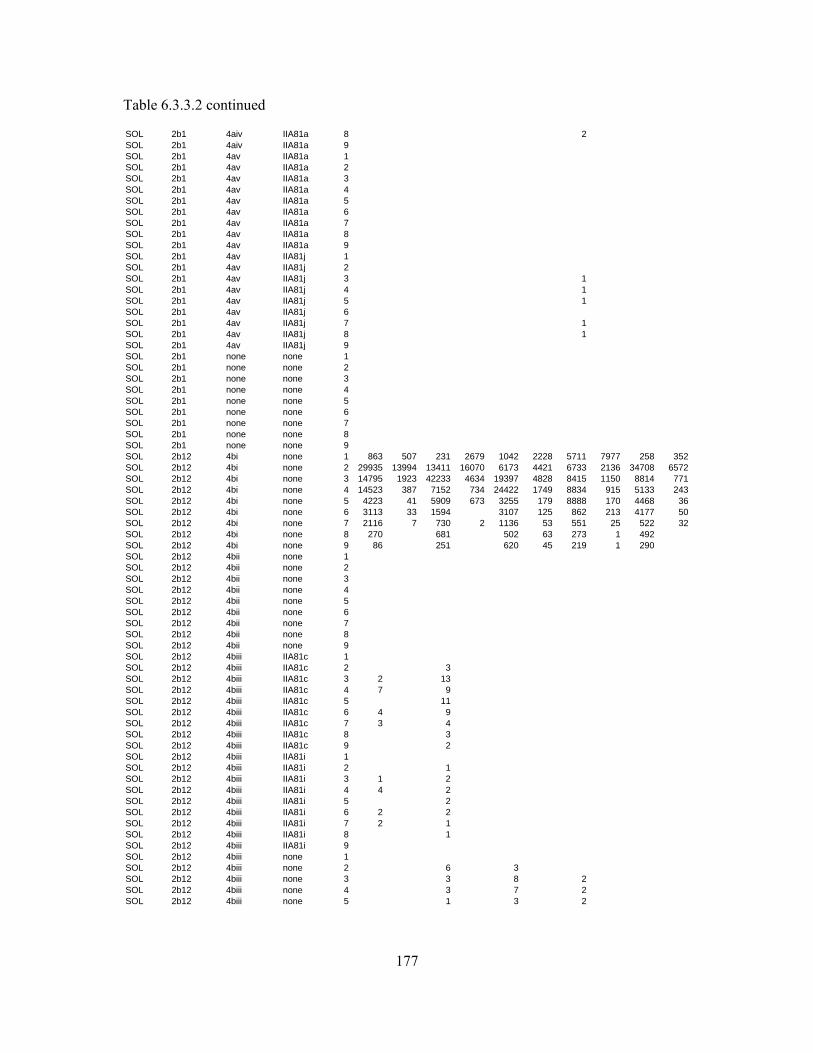
177
Table 6.3.3.2 continued
SOL 2b1 4aiv IIA81a 8 2SOL 2b1 4aiv IIA81a 9SOL 2b1 4av IIA81a 1SOL 2b1 4av IIA81a 2SOL 2b1 4av IIA81a 3SOL 2b1 4av IIA81a 4SOL 2b1 4av IIA81a 5SOL 2b1 4av IIA81a 6SOL 2b1 4av IIA81a 7SOL 2b1 4av IIA81a 8SOL 2b1 4av IIA81a 9SOL 2b1 4av IIA81j 1SOL 2b1 4av IIA81j 2SOL 2b1 4av IIA81j 3 1SOL 2b1 4av IIA81j 4 1SOL 2b1 4av IIA81j 5 1SOL 2b1 4av IIA81j 6SOL 2b1 4av IIA81j 7 1SOL 2b1 4av IIA81j 8 1SOL 2b1 4av IIA81j 9SOL 2b1 none none 1SOL 2b1 none none 2SOL 2b1 none none 3SOL 2b1 none none 4SOL 2b1 none none 5SOL 2b1 none none 6SOL 2b1 none none 7SOL 2b1 none none 8SOL 2b1 none none 9SOL 2b12 4bi none 1 863 507 231 2679 1042 2228 5711 7977 258 352SOL 2b12 4bi none 2 29935 13994 13411 16070 6173 4421 6733 2136 34708 6572SOL 2b12 4bi none 3 14795 1923 42233 4634 19397 4828 8415 1150 8814 771SOL 2b12 4bi none 4 14523 387 7152 734 24422 1749 8834 915 5133 243SOL 2b12 4bi none 5 4223 41 5909 673 3255 179 8888 170 4468 36SOL 2b12 4bi none 6 3113 33 1594 3107 125 862 213 4177 50SOL 2b12 4bi none 7 2116 7 730 2 1136 53 551 25 522 32SOL 2b12 4bi none 8 270 681 502 63 273 1 492SOL 2b12 4bi none 9 86 251 620 45 219 1 290SOL 2b12 4bii none 1SOL 2b12 4bii none 2SOL 2b12 4bii none 3SOL 2b12 4bii none 4SOL 2b12 4bii none 5SOL 2b12 4bii none 6SOL 2b12 4bii none 7SOL 2b12 4bii none 8SOL 2b12 4bii none 9SOL 2b12 4biii IIA81c 1SOL 2b12 4biii IIA81c 2 3SOL 2b12 4biii IIA81c 3 2 13SOL 2b12 4biii IIA81c 4 7 9SOL 2b12 4biii IIA81c 5 11SOL 2b12 4biii IIA81c 6 4 9SOL 2b12 4biii IIA81c 7 3 4SOL 2b12 4biii IIA81c 8 3SOL 2b12 4biii IIA81c 9 2SOL 2b12 4biii IIA81i 1SOL 2b12 4biii IIA81i 2 1SOL 2b12 4biii IIA81i 3 1 2SOL 2b12 4biii IIA81i 4 4 2SOL 2b12 4biii IIA81i 5 2SOL 2b12 4biii IIA81i 6 2 2SOL 2b12 4biii IIA81i 7 2 1SOL 2b12 4biii IIA81i 8 1SOL 2b12 4biii IIA81i 9SOL 2b12 4biii none 1SOL 2b12 4biii none 2 6 3SOL 2b12 4biii none 3 3 8 2SOL 2b12 4biii none 4 3 7 2SOL 2b12 4biii none 5 1 3 2
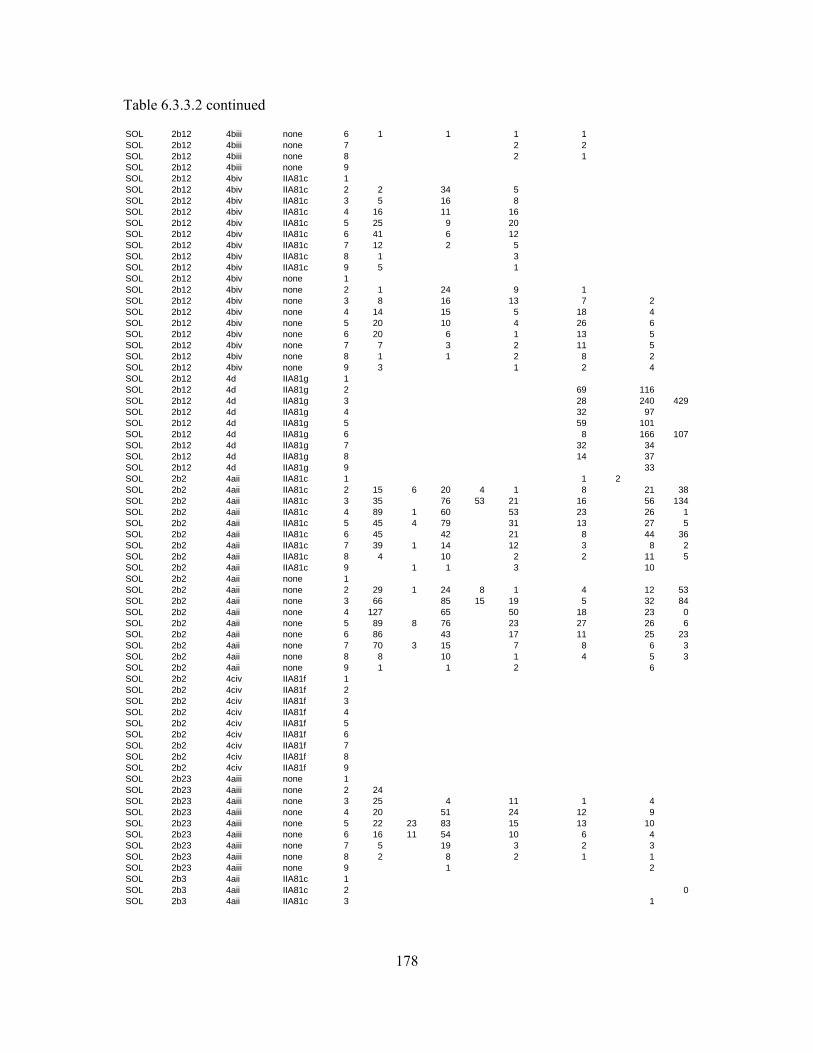
178
Table 6.3.3.2 continued
SOL 2b12 4biii none 6 1 1 1 1SOL 2b12 4biii none 7 2 2SOL 2b12 4biii none 8 2 1SOL 2b12 4biii none 9SOL 2b12 4biv IIA81c 1SOL 2b12 4biv IIA81c 2 2 34 5SOL 2b12 4biv IIA81c 3 5 16 8SOL 2b12 4biv IIA81c 4 16 11 16SOL 2b12 4biv IIA81c 5 25 9 20SOL 2b12 4biv IIA81c 6 41 6 12SOL 2b12 4biv IIA81c 7 12 2 5SOL 2b12 4biv IIA81c 8 1 3SOL 2b12 4biv IIA81c 9 5 1SOL 2b12 4biv none 1SOL 2b12 4biv none 2 1 24 9 1SOL 2b12 4biv none 3 8 16 13 7 2SOL 2b12 4biv none 4 14 15 5 18 4SOL 2b12 4biv none 5 20 10 4 26 6SOL 2b12 4biv none 6 20 6 1 13 5SOL 2b12 4biv none 7 7 3 2 11 5SOL 2b12 4biv none 8 1 1 2 8 2SOL 2b12 4biv none 9 3 1 2 4SOL 2b12 4d IIA81g 1SOL 2b12 4d IIA81g 2 69 116SOL 2b12 4d IIA81g 3 28 240 429SOL 2b12 4d IIA81g 4 32 97SOL 2b12 4d IIA81g 5 59 101SOL 2b12 4d IIA81g 6 8 166 107SOL 2b12 4d IIA81g 7 32 34SOL 2b12 4d IIA81g 8 14 37SOL 2b12 4d IIA81g 9 33SOL 2b2 4aii IIA81c 1 1 2SOL 2b2 4aii IIA81c 2 15 6 20 4 1 8 21 38SOL 2b2 4aii IIA81c 3 35 76 53 21 16 56 134SOL 2b2 4aii IIA81c 4 89 1 60 53 23 26 1SOL 2b2 4aii IIA81c 5 45 4 79 31 13 27 5SOL 2b2 4aii IIA81c 6 45 42 21 8 44 36SOL 2b2 4aii IIA81c 7 39 1 14 12 3 8 2SOL 2b2 4aii IIA81c 8 4 10 2 2 11 5SOL 2b2 4aii IIA81c 9 1 1 3 10SOL 2b2 4aii none 1SOL 2b2 4aii none 2 29 1 24 8 1 4 12 53SOL 2b2 4aii none 3 66 85 15 19 5 32 84SOL 2b2 4aii none 4 127 65 50 18 23 0SOL 2b2 4aii none 5 89 8 76 23 27 26 6SOL 2b2 4aii none 6 86 43 17 11 25 23SOL 2b2 4aii none 7 70 3 15 7 8 6 3SOL 2b2 4aii none 8 8 10 1 4 5 3SOL 2b2 4aii none 9 1 1 2 6SOL 2b2 4civ IIA81f 1SOL 2b2 4civ IIA81f 2SOL 2b2 4civ IIA81f 3SOL 2b2 4civ IIA81f 4SOL 2b2 4civ IIA81f 5SOL 2b2 4civ IIA81f 6SOL 2b2 4civ IIA81f 7SOL 2b2 4civ IIA81f 8SOL 2b2 4civ IIA81f 9SOL 2b23 4aiii none 1SOL 2b23 4aiii none 2 24SOL 2b23 4aiii none 3 25 4 11 1 4SOL 2b23 4aiii none 4 20 51 24 12 9SOL 2b23 4aiii none 5 22 23 83 15 13 10SOL 2b23 4aiii none 6 16 11 54 10 6 4SOL 2b23 4aiii none 7 5 19 3 2 3SOL 2b23 4aiii none 8 2 8 2 1 1SOL 2b23 4aiii none 9 1 2SOL 2b3 4aii IIA81c 1SOL 2b3 4aii IIA81c 2 0SOL 2b3 4aii IIA81c 3 1
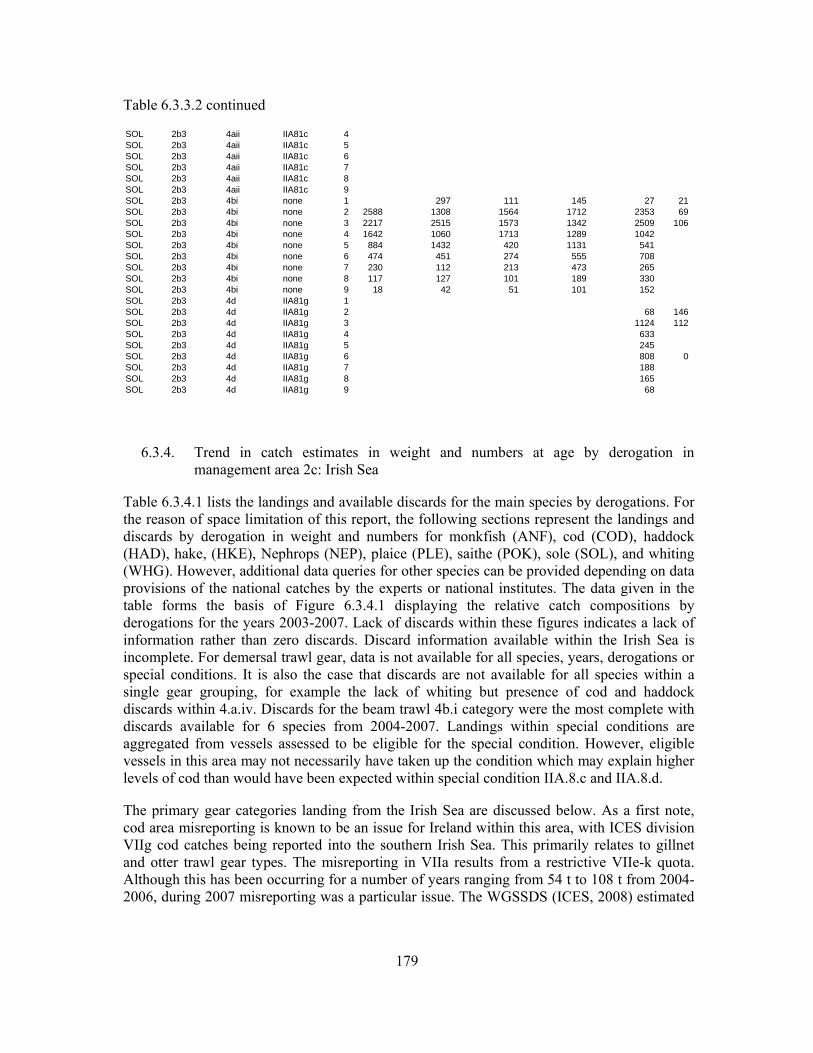
179
Table 6.3.3.2 continued
SOL 2b3 4aii IIA81c 4SOL 2b3 4aii IIA81c 5SOL 2b3 4aii IIA81c 6SOL 2b3 4aii IIA81c 7SOL 2b3 4aii IIA81c 8SOL 2b3 4aii IIA81c 9SOL 2b3 4bi none 1 297 111 145 27 21SOL 2b3 4bi none 2 2588 1308 1564 1712 2353 69SOL 2b3 4bi none 3 2217 2515 1573 1342 2509 106SOL 2b3 4bi none 4 1642 1060 1713 1289 1042SOL 2b3 4bi none 5 884 1432 420 1131 541SOL 2b3 4bi none 6 474 451 274 555 708SOL 2b3 4bi none 7 230 112 213 473 265SOL 2b3 4bi none 8 117 127 101 189 330SOL 2b3 4bi none 9 18 42 51 101 152SOL 2b3 4d IIA81g 1SOL 2b3 4d IIA81g 2 68 146SOL 2b3 4d IIA81g 3 1124 112SOL 2b3 4d IIA81g 4 633SOL 2b3 4d IIA81g 5 245SOL 2b3 4d IIA81g 6 808 0SOL 2b3 4d IIA81g 7 188SOL 2b3 4d IIA81g 8 165SOL 2b3 4d IIA81g 9 68
6.3.4. Trend in catch estimates in weight and numbers at age by derogation in management area 2c: Irish Sea
Table 6.3.4.1 lists the landings and available discards for the main species by derogations. For the reason of space limitation of this report, the following sections represent the landings and discards by derogation in weight and numbers for monkfish (ANF), cod (COD), haddock (HAD), hake, (HKE), Nephrops (NEP), plaice (PLE), saithe (POK), sole (SOL), and whiting (WHG). However, additional data queries for other species can be provided depending on data provisions of the national catches by the experts or national institutes. The data given in the table forms the basis of Figure 6.3.4.1 displaying the relative catch compositions by derogations for the years 2003-2007. Lack of discards within these figures indicates a lack of information rather than zero discards. Discard information available within the Irish Sea is incomplete. For demersal trawl gear, data is not available for all species, years, derogations or special conditions. It is also the case that discards are not available for all species within a single gear grouping, for example the lack of whiting but presence of cod and haddock discards within 4.a.iv. Discards for the beam trawl 4b.i category were the most complete with discards available for 6 species from 2004-2007. Landings within special conditions are aggregated from vessels assessed to be eligible for the special condition. However, eligible vessels in this area may not necessarily have taken up the condition which may explain higher levels of cod than would have been expected within special condition IIA.8.c and IIA.8.d.
The primary gear categories landing from the Irish Sea are discussed below. As a first note, cod area misreporting is known to be an issue for Ireland within this area, with ICES division VIIg cod catches being reported into the southern Irish Sea. This primarily relates to gillnet and otter trawl gear types. The misreporting in VIIa results from a restrictive VIIe-k quota. Although this has been occurring for a number of years ranging from 54 t to 108 t from 2004-2006, during 2007 misreporting was a particular issue. The WGSSDS (ICES, 2008) estimated
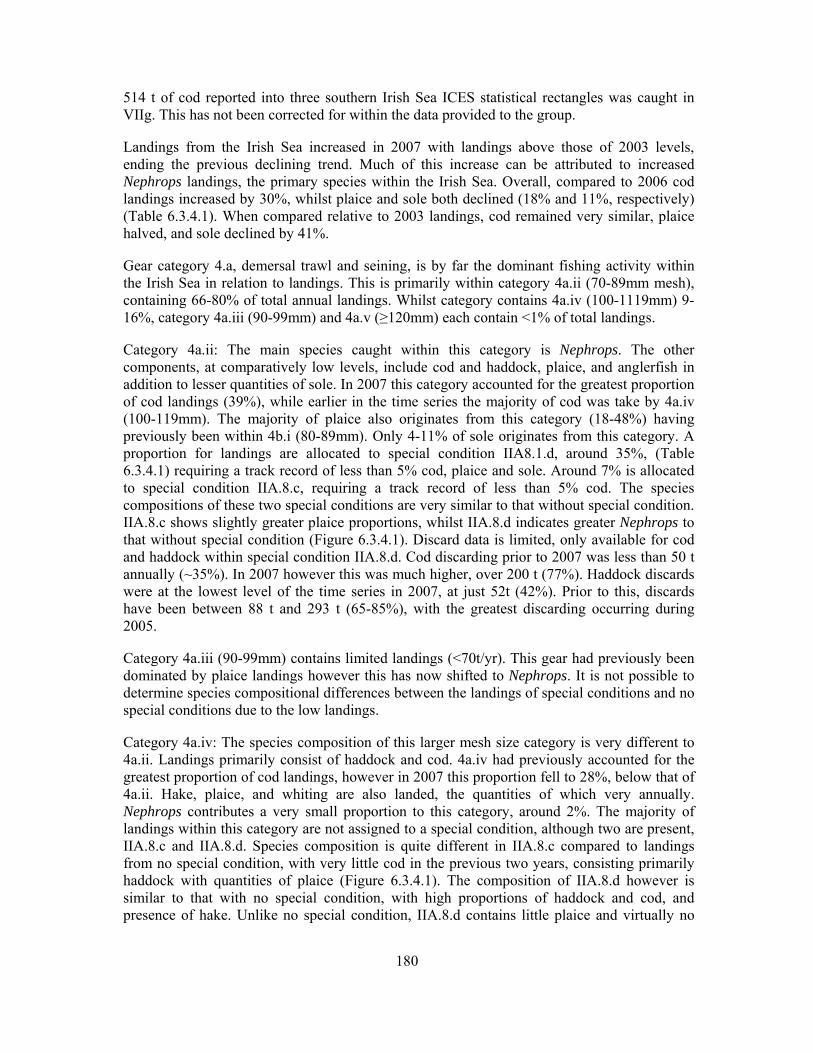
180
514 t of cod reported into three southern Irish Sea ICES statistical rectangles was caught in VIIg. This has not been corrected for within the data provided to the group.
Landings from the Irish Sea increased in 2007 with landings above those of 2003 levels, ending the previous declining trend. Much of this increase can be attributed to increased Nephrops landings, the primary species within the Irish Sea. Overall, compared to 2006 cod landings increased by 30%, whilst plaice and sole both declined (18% and 11%, respectively) (Table 6.3.4.1). When compared relative to 2003 landings, cod remained very similar, plaice halved, and sole declined by 41%.
Gear category 4.a, demersal trawl and seining, is by far the dominant fishing activity within the Irish Sea in relation to landings. This is primarily within category 4a.ii (70-89mm mesh), containing 66-80% of total annual landings. Whilst category contains 4a.iv (100-1119mm) 9-16%, category 4a.iii (90-99mm) and 4a.v (≥120mm) each contain <1% of total landings.
Category 4a.ii: The main species caught within this category is Nephrops. The other components, at comparatively low levels, include cod and haddock, plaice, and anglerfish in addition to lesser quantities of sole. In 2007 this category accounted for the greatest proportion of cod landings (39%), while earlier in the time series the majority of cod was take by 4a.iv (100-119mm). The majority of plaice also originates from this category (18-48%) having previously been within 4b.i (80-89mm). Only 4-11% of sole originates from this category. A proportion for landings are allocated to special condition IIA8.1.d, around 35%, (Table 6.3.4.1) requiring a track record of less than 5% cod, plaice and sole. Around 7% is allocated to special condition IIA.8.c, requiring a track record of less than 5% cod. The species compositions of these two special conditions are very similar to that without special condition. IIA.8.c shows slightly greater plaice proportions, whilst IIA.8.d indicates greater Nephrops to that without special condition (Figure 6.3.4.1). Discard data is limited, only available for cod and haddock within special condition IIA.8.d. Cod discarding prior to 2007 was less than 50 t annually (~35%). In 2007 however this was much higher, over 200 t (77%). Haddock discards were at the lowest level of the time series in 2007, at just 52t (42%). Prior to this, discards have been between 88 t and 293 t (65-85%), with the greatest discarding occurring during 2005.
Category 4a.iii (90-99mm) contains limited landings (<70t/yr). This gear had previously been dominated by plaice landings however this has now shifted to Nephrops. It is not possible to determine species compositional differences between the landings of special conditions and no special conditions due to the low landings.
Category 4a.iv: The species composition of this larger mesh size category is very different to 4a.ii. Landings primarily consist of haddock and cod. 4a.iv had previously accounted for the greatest proportion of cod landings, however in 2007 this proportion fell to 28%, below that of 4a.ii. Hake, plaice, and whiting are also landed, the quantities of which very annually. Nephrops contributes a very small proportion to this category, around 2%. The majority of landings within this category are not assigned to a special condition, although two are present, IIA.8.c and IIA.8.d. Species composition is quite different in IIA.8.c compared to landings from no special condition, with very little cod in the previous two years, consisting primarily haddock with quantities of plaice (Figure 6.3.4.1). The composition of IIA.8.d however is similar to that with no special condition, with high proportions of haddock and cod, and presence of hake. Unlike no special condition, IIA.8.d contains little plaice and virtually no
181
whiting in recent years. It is likely many vessels qualifying for this special condition have not taken it up, given the high proportion of cod. Discard information is limited within this category. Cod and haddock discards are available for special condition IIAa.8.d for 2003 to 2006. There is very little discarding of cod within this special condition, <5 t annually (≤4%), although higher in 2004 at around 45 t (22%). A similar higher level of discarding was observed for haddock in 2004 (81%). Haddock discards appear to remain around, or less than 100 t (<55%).
Category 4a.v: There is a deal of variability within the species composition of this category, likely to result from the low annual landings.
In addition to demersal trawl and seine gear within the Irish Sea, beam trawls are also employed, almost solely 4b.i the 80-89mm mesh category. Belgium (and the Netherlands) beam trawls are assumed to have used the minimum mesh size group 80-89mm 4.b.i (sec. 5.5.2), no assumptions are made for the remaining nations. There are no special conditions relating to this category. The overall species composition of this category is stable, dominated by plaice (29-38%) and sole (38-43%), with relatively consistent annual proportions (Figure6.3.4.1). In addition, lower and more variable proportions of anglerfish, cod, and haddock occur annually. This category contributes 8-16% of cod, 36-57% of plaice, and 76-93% of sole to the total annual landings for each respective species. Discard information available for this category is greater than for any other category within the Irish Sea, covering cod, haddock, plaice, sole, anglerfish and whiting from 2004 to 2007. Plaice discarding occurs at a rate of between 24-32%, constituting the greatest quantities of the data available. The quantity has been declining in recent years, with little impact on the discard rate. Sole has a low discard rate, of ≤5%, peaking at 37 t in 2005, and just 13 t in 2007. Anglerfish discarding is similar, at a very low rate, just 1-2%. Cod discarding occurs at a rate of 11-17% and indicates a grater rate in 2007 to that of 2006. Haddock indicates relatively consistent discarding rates of between 30% and 37%, as does whiting 46-47%), however, neither of this species is caught well by this gear category with low landings and discards.
Species composition within the ‘none none’ category, has varied, previously dominated by Nephrops, shifting to plaice and sole in 2005. Proportions of cod and haddock have remained consistent throughout the period. The proportion of anglerfish increased in 2007, from 7% and 9% to 20%. Landings totalled ~200 t in 2007, constituting a very small proportion of total Irish Sea landings.
One further note, although gillnet landings are low within the Irish Sea, largely attributed to category 4c.iii (150-219mm), these are primarily of cod. Landings have increased in the last two years from <50t/yr previously to over 300 t in 2007 (Figure 6.3.4.1), equating to 26% of total cod landings. No discard data available for the gillnet groupings.
The ToR request landings and discards at age by derogation of cod, plaice and sole. The data is presented in Table 6.3.4.2 and the values are illustrated in Figure 6.3.4.2-4. Additional species specific data queries could be provided on request depending on data provisions by the experts or national institutes.
182
Cod aged information shows within 4a.ii with special condition IIA.8.d landings are recorded from age 1 to 5, however the majority landed are age 2 (Figure 6.3.4.2). Indicating exploitation in the Irish Sea primarily occurs at age 2. Although there is some annual variation in numbers, the numbers are fairly consistent for all but age 2 where there is greater variability. In relation to discards, the majority occurs at age 1, with vast numbers being discarded annually. This is much reduced once cod are age 2, with the exception of vast discarding at this age in 2007. The same pattern is seen in 4a.ii none and 4a.iv IIA.8.d, although no landing or discard at age data was available for 2007. Limited information is available for the remaining gear types.
Plaice within 4a.ii are landed from age 1, at low levels, up to and beyond age 9, also at low levels (Figure 6.3.4.3). The majority of plaice of which are aged 3-6 and in some instances age 2. There does not appear to be differences in the age structure of landings between special conditions and no special condition. There is a slight difference in the age structure for the larger mesh 4a.iv category, with no plaice recorded at age 1. There also appears to be fewer numbers of plaice within 4a.iv, particularly within recent years. No discard information was available for this species within this gear.
Beam trawl category 4b.i is the only gear category with annual age data available for sole landings (Figure 6.3.4.4). No discard age data is available. In most years the minimum landing age for sole is 2, although this was age 1 in 2006. Ages extend up to and likely beyond age 9 with the majority occurring coming from ages 2-6, particularly age 3. In the last two years numbers of ages 2-6 are below those of the previous period.
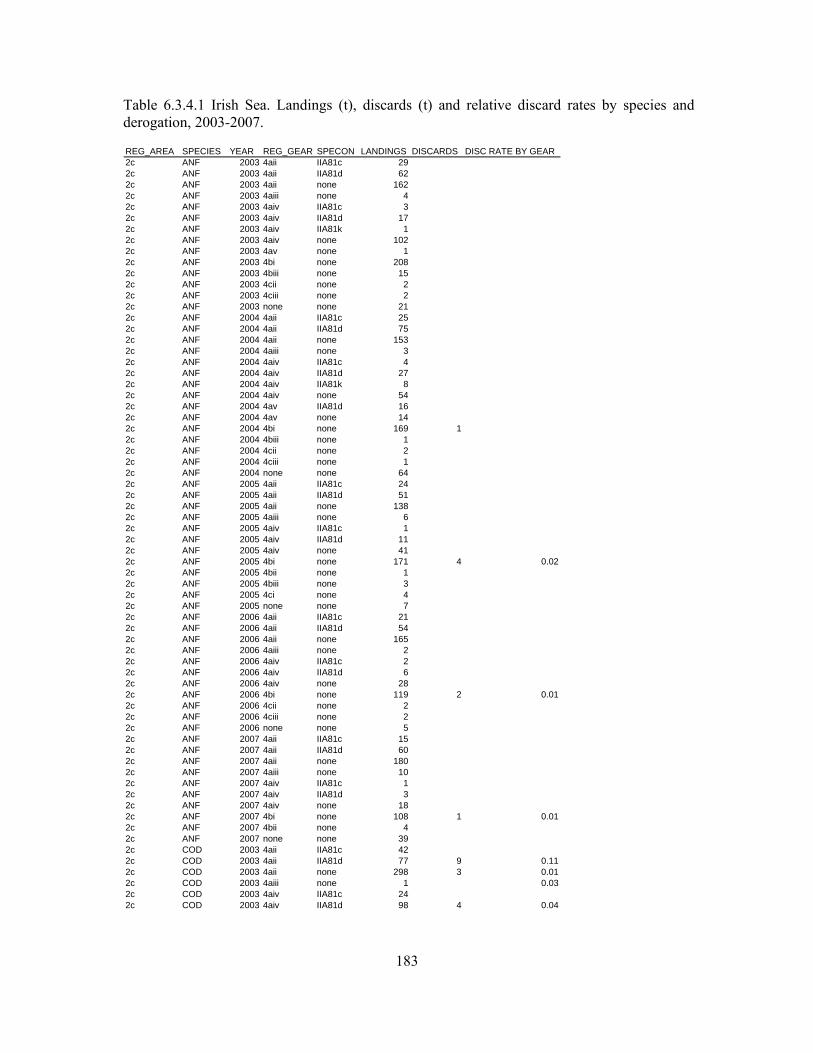
183
Table 6.3.4.1 Irish Sea. Landings (t), discards (t) and relative discard rates by species and derogation, 2003-2007.
REG_AREA SPECIES YEAR REG_GEAR SPECON LANDINGS DISCARDS DISC RATE BY GEAR2c ANF 2003 4aii IIA81c 292c ANF 2003 4aii IIA81d 622c ANF 2003 4aii none 1622c ANF 2003 4aiii none 42c ANF 2003 4aiv IIA81c 32c ANF 2003 4aiv IIA81d 172c ANF 2003 4aiv IIA81k 12c ANF 2003 4aiv none 1022c ANF 2003 4av none 12c ANF 2003 4bi none 2082c ANF 2003 4biii none 152c ANF 2003 4cii none 22c ANF 2003 4ciii none 22c ANF 2003 none none 212c ANF 2004 4aii IIA81c 252c ANF 2004 4aii IIA81d 752c ANF 2004 4aii none 1532c ANF 2004 4aiii none 32c ANF 2004 4aiv IIA81c 42c ANF 2004 4aiv IIA81d 272c ANF 2004 4aiv IIA81k 82c ANF 2004 4aiv none 542c ANF 2004 4av IIA81d 162c ANF 2004 4av none 142c ANF 2004 4bi none 169 12c ANF 2004 4biii none 12c ANF 2004 4cii none 22c ANF 2004 4ciii none 12c ANF 2004 none none 642c ANF 2005 4aii IIA81c 242c ANF 2005 4aii IIA81d 512c ANF 2005 4aii none 1382c ANF 2005 4aiii none 62c ANF 2005 4aiv IIA81c 12c ANF 2005 4aiv IIA81d 112c ANF 2005 4aiv none 412c ANF 2005 4bi none 171 4 0.022c ANF 2005 4bii none 12c ANF 2005 4biii none 32c ANF 2005 4ci none 42c ANF 2005 none none 72c ANF 2006 4aii IIA81c 212c ANF 2006 4aii IIA81d 542c ANF 2006 4aii none 1652c ANF 2006 4aiii none 22c ANF 2006 4aiv IIA81c 22c ANF 2006 4aiv IIA81d 62c ANF 2006 4aiv none 282c ANF 2006 4bi none 119 2 0.012c ANF 2006 4cii none 22c ANF 2006 4ciii none 22c ANF 2006 none none 52c ANF 2007 4aii IIA81c 152c ANF 2007 4aii IIA81d 602c ANF 2007 4aii none 1802c ANF 2007 4aiii none 102c ANF 2007 4aiv IIA81c 12c ANF 2007 4aiv IIA81d 32c ANF 2007 4aiv none 182c ANF 2007 4bi none 108 1 0.012c ANF 2007 4bii none 42c ANF 2007 none none 392c COD 2003 4aii IIA81c 422c COD 2003 4aii IIA81d 77 9 0.112c COD 2003 4aii none 298 3 0.012c COD 2003 4aiii none 1 0.032c COD 2003 4aiv IIA81c 242c COD 2003 4aiv IIA81d 98 4 0.04
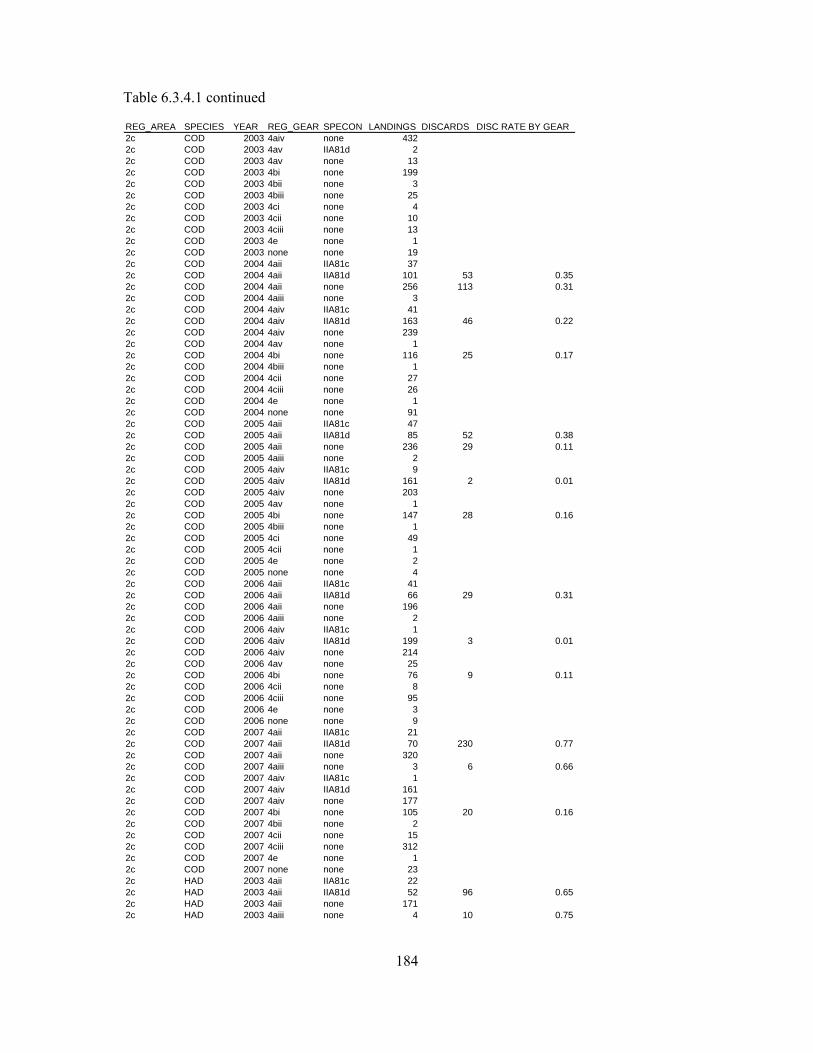
184
Table 6.3.4.1 continued
REG_AREA SPECIES YEAR REG_GEAR SPECON LANDINGS DISCARDS DISC RATE BY GEAR2c COD 2003 4aiv none 4322c COD 2003 4av IIA81d 22c COD 2003 4av none 132c COD 2003 4bi none 1992c COD 2003 4bii none 32c COD 2003 4biii none 252c COD 2003 4ci none 42c COD 2003 4cii none 102c COD 2003 4ciii none 132c COD 2003 4e none 12c COD 2003 none none 192c COD 2004 4aii IIA81c 372c COD 2004 4aii IIA81d 101 53 0.352c COD 2004 4aii none 256 113 0.312c COD 2004 4aiii none 32c COD 2004 4aiv IIA81c 412c COD 2004 4aiv IIA81d 163 46 0.222c COD 2004 4aiv none 2392c COD 2004 4av none 12c COD 2004 4bi none 116 25 0.172c COD 2004 4biii none 12c COD 2004 4cii none 272c COD 2004 4ciii none 262c COD 2004 4e none 12c COD 2004 none none 912c COD 2005 4aii IIA81c 472c COD 2005 4aii IIA81d 85 52 0.382c COD 2005 4aii none 236 29 0.112c COD 2005 4aiii none 22c COD 2005 4aiv IIA81c 92c COD 2005 4aiv IIA81d 161 2 0.012c COD 2005 4aiv none 2032c COD 2005 4av none 12c COD 2005 4bi none 147 28 0.162c COD 2005 4biii none 12c COD 2005 4ci none 492c COD 2005 4cii none 12c COD 2005 4e none 22c COD 2005 none none 42c COD 2006 4aii IIA81c 412c COD 2006 4aii IIA81d 66 29 0.312c COD 2006 4aii none 1962c COD 2006 4aiii none 22c COD 2006 4aiv IIA81c 12c COD 2006 4aiv IIA81d 199 3 0.012c COD 2006 4aiv none 2142c COD 2006 4av none 252c COD 2006 4bi none 76 9 0.112c COD 2006 4cii none 82c COD 2006 4ciii none 952c COD 2006 4e none 32c COD 2006 none none 92c COD 2007 4aii IIA81c 212c COD 2007 4aii IIA81d 70 230 0.772c COD 2007 4aii none 3202c COD 2007 4aiii none 3 6 0.662c COD 2007 4aiv IIA81c 12c COD 2007 4aiv IIA81d 1612c COD 2007 4aiv none 1772c COD 2007 4bi none 105 20 0.162c COD 2007 4bii none 22c COD 2007 4cii none 152c COD 2007 4ciii none 3122c COD 2007 4e none 12c COD 2007 none none 232c HAD 2003 4aii IIA81c 222c HAD 2003 4aii IIA81d 52 96 0.652c HAD 2003 4aii none 1712c HAD 2003 4aiii none 4 10 0.75
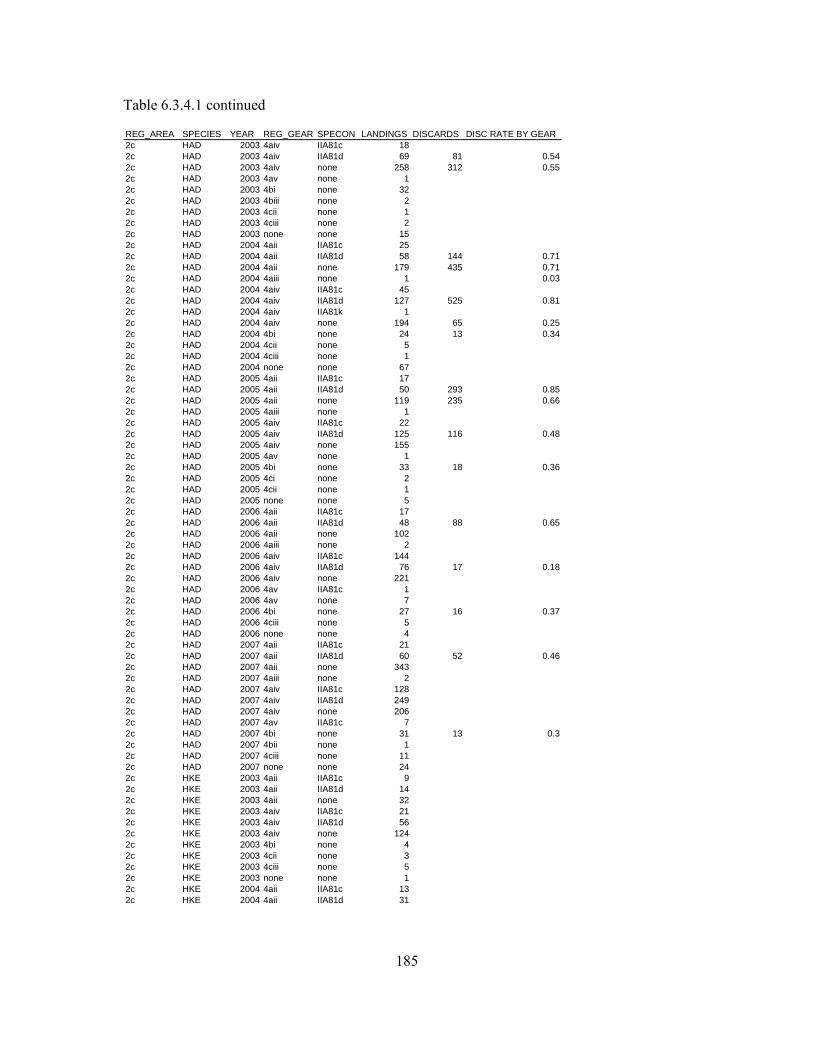
185
Table 6.3.4.1 continued
REG_AREA SPECIES YEAR REG_GEAR SPECON LANDINGS DISCARDS DISC RATE BY GEAR2c HAD 2003 4aiv IIA81c 182c HAD 2003 4aiv IIA81d 69 81 0.542c HAD 2003 4aiv none 258 312 0.552c HAD 2003 4av none 12c HAD 2003 4bi none 322c HAD 2003 4biii none 22c HAD 2003 4cii none 12c HAD 2003 4ciii none 22c HAD 2003 none none 152c HAD 2004 4aii IIA81c 252c HAD 2004 4aii IIA81d 58 144 0.712c HAD 2004 4aii none 179 435 0.712c HAD 2004 4aiii none 1 0.032c HAD 2004 4aiv IIA81c 452c HAD 2004 4aiv IIA81d 127 525 0.812c HAD 2004 4aiv IIA81k 12c HAD 2004 4aiv none 194 65 0.252c HAD 2004 4bi none 24 13 0.342c HAD 2004 4cii none 52c HAD 2004 4ciii none 12c HAD 2004 none none 672c HAD 2005 4aii IIA81c 172c HAD 2005 4aii IIA81d 50 293 0.852c HAD 2005 4aii none 119 235 0.662c HAD 2005 4aiii none 12c HAD 2005 4aiv IIA81c 222c HAD 2005 4aiv IIA81d 125 116 0.482c HAD 2005 4aiv none 1552c HAD 2005 4av none 12c HAD 2005 4bi none 33 18 0.362c HAD 2005 4ci none 22c HAD 2005 4cii none 12c HAD 2005 none none 52c HAD 2006 4aii IIA81c 172c HAD 2006 4aii IIA81d 48 88 0.652c HAD 2006 4aii none 1022c HAD 2006 4aiii none 22c HAD 2006 4aiv IIA81c 1442c HAD 2006 4aiv IIA81d 76 17 0.182c HAD 2006 4aiv none 2212c HAD 2006 4av IIA81c 12c HAD 2006 4av none 72c HAD 2006 4bi none 27 16 0.372c HAD 2006 4ciii none 52c HAD 2006 none none 42c HAD 2007 4aii IIA81c 212c HAD 2007 4aii IIA81d 60 52 0.462c HAD 2007 4aii none 3432c HAD 2007 4aiii none 22c HAD 2007 4aiv IIA81c 1282c HAD 2007 4aiv IIA81d 2492c HAD 2007 4aiv none 2062c HAD 2007 4av IIA81c 72c HAD 2007 4bi none 31 13 0.32c HAD 2007 4bii none 12c HAD 2007 4ciii none 112c HAD 2007 none none 242c HKE 2003 4aii IIA81c 92c HKE 2003 4aii IIA81d 142c HKE 2003 4aii none 322c HKE 2003 4aiv IIA81c 212c HKE 2003 4aiv IIA81d 562c HKE 2003 4aiv none 1242c HKE 2003 4bi none 42c HKE 2003 4cii none 32c HKE 2003 4ciii none 52c HKE 2003 none none 12c HKE 2004 4aii IIA81c 132c HKE 2004 4aii IIA81d 31
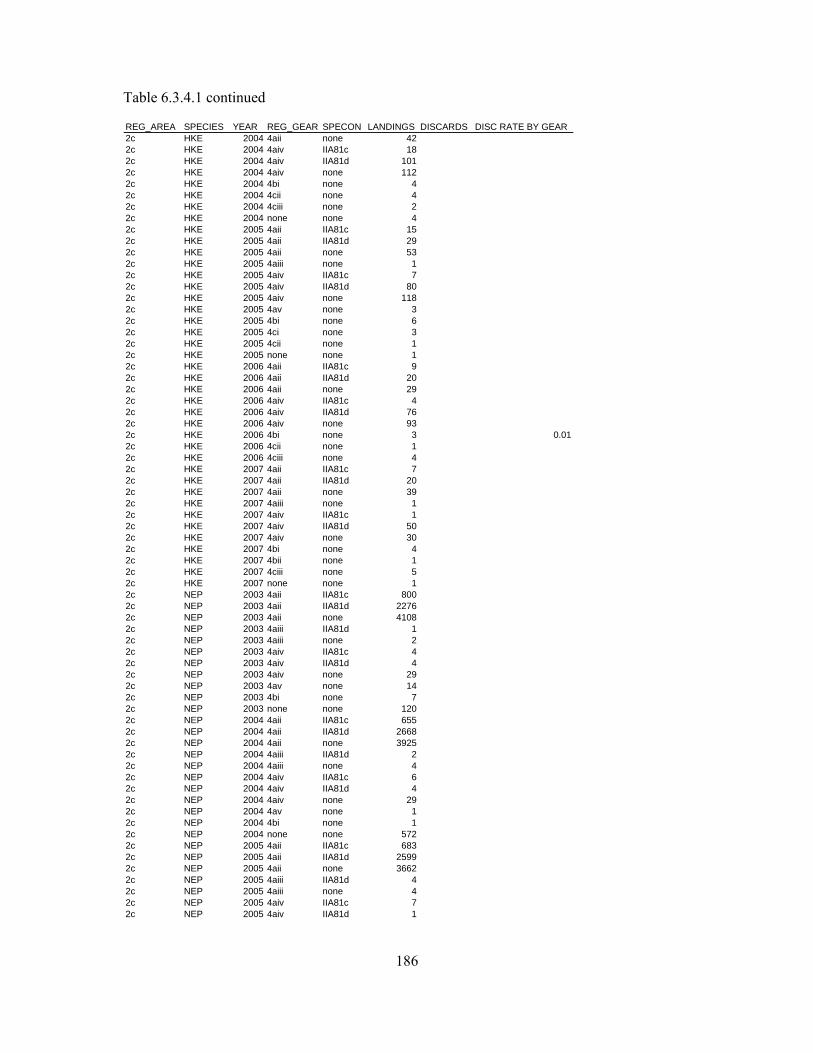
186
Table 6.3.4.1 continued
REG_AREA SPECIES YEAR REG_GEAR SPECON LANDINGS DISCARDS DISC RATE BY GEAR2c HKE 2004 4aii none 422c HKE 2004 4aiv IIA81c 182c HKE 2004 4aiv IIA81d 1012c HKE 2004 4aiv none 1122c HKE 2004 4bi none 42c HKE 2004 4cii none 42c HKE 2004 4ciii none 22c HKE 2004 none none 42c HKE 2005 4aii IIA81c 152c HKE 2005 4aii IIA81d 292c HKE 2005 4aii none 532c HKE 2005 4aiii none 12c HKE 2005 4aiv IIA81c 72c HKE 2005 4aiv IIA81d 802c HKE 2005 4aiv none 1182c HKE 2005 4av none 32c HKE 2005 4bi none 62c HKE 2005 4ci none 32c HKE 2005 4cii none 12c HKE 2005 none none 12c HKE 2006 4aii IIA81c 92c HKE 2006 4aii IIA81d 202c HKE 2006 4aii none 292c HKE 2006 4aiv IIA81c 42c HKE 2006 4aiv IIA81d 762c HKE 2006 4aiv none 932c HKE 2006 4bi none 3 0.012c HKE 2006 4cii none 12c HKE 2006 4ciii none 42c HKE 2007 4aii IIA81c 72c HKE 2007 4aii IIA81d 202c HKE 2007 4aii none 392c HKE 2007 4aiii none 12c HKE 2007 4aiv IIA81c 12c HKE 2007 4aiv IIA81d 502c HKE 2007 4aiv none 302c HKE 2007 4bi none 42c HKE 2007 4bii none 12c HKE 2007 4ciii none 52c HKE 2007 none none 12c NEP 2003 4aii IIA81c 8002c NEP 2003 4aii IIA81d 22762c NEP 2003 4aii none 41082c NEP 2003 4aiii IIA81d 12c NEP 2003 4aiii none 22c NEP 2003 4aiv IIA81c 42c NEP 2003 4aiv IIA81d 42c NEP 2003 4aiv none 292c NEP 2003 4av none 142c NEP 2003 4bi none 72c NEP 2003 none none 1202c NEP 2004 4aii IIA81c 6552c NEP 2004 4aii IIA81d 26682c NEP 2004 4aii none 39252c NEP 2004 4aiii IIA81d 22c NEP 2004 4aiii none 42c NEP 2004 4aiv IIA81c 62c NEP 2004 4aiv IIA81d 42c NEP 2004 4aiv none 292c NEP 2004 4av none 12c NEP 2004 4bi none 12c NEP 2004 none none 5722c NEP 2005 4aii IIA81c 6832c NEP 2005 4aii IIA81d 25992c NEP 2005 4aii none 36622c NEP 2005 4aiii IIA81d 42c NEP 2005 4aiii none 42c NEP 2005 4aiv IIA81c 72c NEP 2005 4aiv IIA81d 1
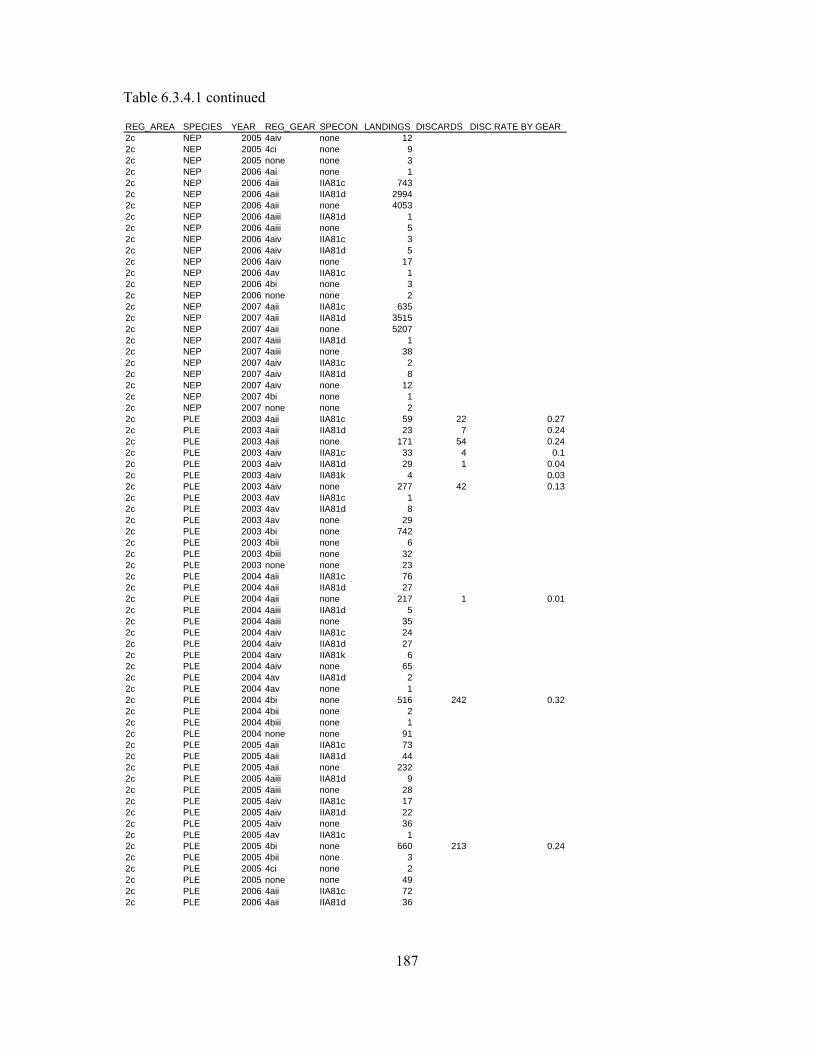
187
Table 6.3.4.1 continued
REG_AREA SPECIES YEAR REG_GEAR SPECON LANDINGS DISCARDS DISC RATE BY GEAR2c NEP 2005 4aiv none 122c NEP 2005 4ci none 92c NEP 2005 none none 32c NEP 2006 4ai none 12c NEP 2006 4aii IIA81c 7432c NEP 2006 4aii IIA81d 29942c NEP 2006 4aii none 40532c NEP 2006 4aiii IIA81d 12c NEP 2006 4aiii none 52c NEP 2006 4aiv IIA81c 32c NEP 2006 4aiv IIA81d 52c NEP 2006 4aiv none 172c NEP 2006 4av IIA81c 12c NEP 2006 4bi none 32c NEP 2006 none none 22c NEP 2007 4aii IIA81c 6352c NEP 2007 4aii IIA81d 35152c NEP 2007 4aii none 52072c NEP 2007 4aiii IIA81d 12c NEP 2007 4aiii none 382c NEP 2007 4aiv IIA81c 22c NEP 2007 4aiv IIA81d 82c NEP 2007 4aiv none 122c NEP 2007 4bi none 12c NEP 2007 none none 22c PLE 2003 4aii IIA81c 59 22 0.272c PLE 2003 4aii IIA81d 23 7 0.242c PLE 2003 4aii none 171 54 0.242c PLE 2003 4aiv IIA81c 33 4 0.12c PLE 2003 4aiv IIA81d 29 1 0.042c PLE 2003 4aiv IIA81k 4 0.032c PLE 2003 4aiv none 277 42 0.132c PLE 2003 4av IIA81c 12c PLE 2003 4av IIA81d 82c PLE 2003 4av none 292c PLE 2003 4bi none 7422c PLE 2003 4bii none 62c PLE 2003 4biii none 322c PLE 2003 none none 232c PLE 2004 4aii IIA81c 762c PLE 2004 4aii IIA81d 272c PLE 2004 4aii none 217 1 0.012c PLE 2004 4aiii IIA81d 52c PLE 2004 4aiii none 352c PLE 2004 4aiv IIA81c 242c PLE 2004 4aiv IIA81d 272c PLE 2004 4aiv IIA81k 62c PLE 2004 4aiv none 652c PLE 2004 4av IIA81d 22c PLE 2004 4av none 12c PLE 2004 4bi none 516 242 0.322c PLE 2004 4bii none 22c PLE 2004 4biii none 12c PLE 2004 none none 912c PLE 2005 4aii IIA81c 732c PLE 2005 4aii IIA81d 442c PLE 2005 4aii none 2322c PLE 2005 4aiii IIA81d 92c PLE 2005 4aiii none 282c PLE 2005 4aiv IIA81c 172c PLE 2005 4aiv IIA81d 222c PLE 2005 4aiv none 362c PLE 2005 4av IIA81c 12c PLE 2005 4bi none 660 213 0.242c PLE 2005 4bii none 32c PLE 2005 4ci none 22c PLE 2005 none none 492c PLE 2006 4aii IIA81c 722c PLE 2006 4aii IIA81d 36
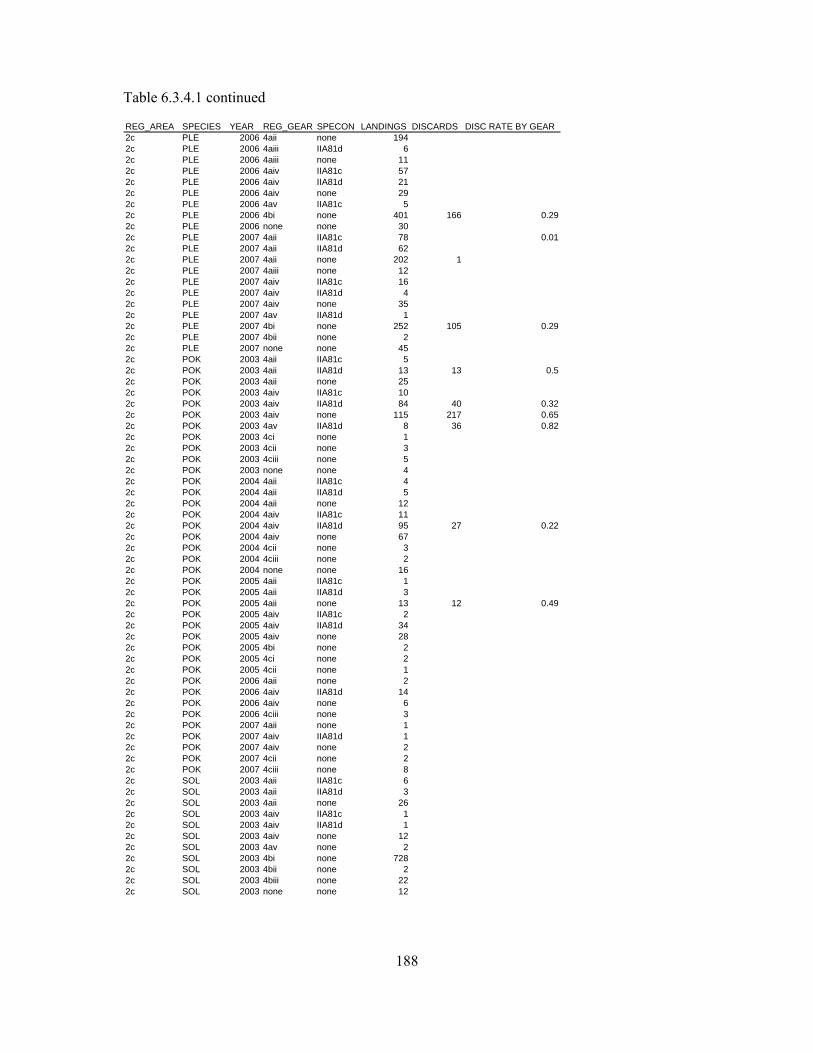
188
Table 6.3.4.1 continued
REG_AREA SPECIES YEAR REG_GEAR SPECON LANDINGS DISCARDS DISC RATE BY GEAR2c PLE 2006 4aii none 1942c PLE 2006 4aiii IIA81d 62c PLE 2006 4aiii none 112c PLE 2006 4aiv IIA81c 572c PLE 2006 4aiv IIA81d 212c PLE 2006 4aiv none 292c PLE 2006 4av IIA81c 52c PLE 2006 4bi none 401 166 0.292c PLE 2006 none none 302c PLE 2007 4aii IIA81c 78 0.012c PLE 2007 4aii IIA81d 622c PLE 2007 4aii none 202 12c PLE 2007 4aiii none 122c PLE 2007 4aiv IIA81c 162c PLE 2007 4aiv IIA81d 42c PLE 2007 4aiv none 352c PLE 2007 4av IIA81d 12c PLE 2007 4bi none 252 105 0.292c PLE 2007 4bii none 22c PLE 2007 none none 452c POK 2003 4aii IIA81c 52c POK 2003 4aii IIA81d 13 13 0.52c POK 2003 4aii none 252c POK 2003 4aiv IIA81c 102c POK 2003 4aiv IIA81d 84 40 0.322c POK 2003 4aiv none 115 217 0.652c POK 2003 4av IIA81d 8 36 0.822c POK 2003 4ci none 12c POK 2003 4cii none 32c POK 2003 4ciii none 52c POK 2003 none none 42c POK 2004 4aii IIA81c 42c POK 2004 4aii IIA81d 52c POK 2004 4aii none 122c POK 2004 4aiv IIA81c 112c POK 2004 4aiv IIA81d 95 27 0.222c POK 2004 4aiv none 672c POK 2004 4cii none 32c POK 2004 4ciii none 22c POK 2004 none none 162c POK 2005 4aii IIA81c 12c POK 2005 4aii IIA81d 32c POK 2005 4aii none 13 12 0.492c POK 2005 4aiv IIA81c 22c POK 2005 4aiv IIA81d 342c POK 2005 4aiv none 282c POK 2005 4bi none 22c POK 2005 4ci none 22c POK 2005 4cii none 12c POK 2006 4aii none 22c POK 2006 4aiv IIA81d 142c POK 2006 4aiv none 62c POK 2006 4ciii none 32c POK 2007 4aii none 12c POK 2007 4aiv IIA81d 12c POK 2007 4aiv none 22c POK 2007 4cii none 22c POK 2007 4ciii none 82c SOL 2003 4aii IIA81c 62c SOL 2003 4aii IIA81d 32c SOL 2003 4aii none 262c SOL 2003 4aiv IIA81c 12c SOL 2003 4aiv IIA81d 12c SOL 2003 4aiv none 122c SOL 2003 4av none 22c SOL 2003 4bi none 7282c SOL 2003 4bii none 22c SOL 2003 4biii none 222c SOL 2003 none none 12

189
Table 6.3.4.1 continued
REG_AREA SPECIES YEAR REG_GEAR SPECON LANDINGS DISCARDS DISC RATE BY GEAR2c SOL 2004 4aii IIA81c 42c SOL 2004 4aii IIA81d 42c SOL 2004 4aii none 182c SOL 2004 4aiii none 12c SOL 2004 4aiv IIA81c 12c SOL 2004 4aiv IIA81d 12c SOL 2004 4aiv IIA81k 12c SOL 2004 4aiv none 42c SOL 2004 4bi none 570 7 0.012c SOL 2004 4biii none 12c SOL 2004 none none 252c SOL 2005 4aii IIA81c 62c SOL 2005 4aii IIA81d 52c SOL 2005 4aii none 202c SOL 2005 4aiii none 12c SOL 2005 4aiv none 62c SOL 2005 4bi none 725 37 0.052c SOL 2005 4bii none 12c SOL 2005 4biii none 12c SOL 2005 none none 182c SOL 2006 4aii IIA81c 72c SOL 2006 4aii IIA81d 52c SOL 2006 4aii none 202c SOL 2006 4aiv none 22c SOL 2006 4bi none 479 22 0.042c SOL 2006 none none 262c SOL 2007 4aii IIA81c 62c SOL 2007 4aii IIA81d 72c SOL 2007 4aii none 392c SOL 2007 4aiv none 32c SOL 2007 4bi none 365 13 0.042c SOL 2007 4bii none 12c SOL 2007 none none 572c WHG 2003 4aii IIA81c 72c WHG 2003 4aii IIA81d 11 104 0.92c WHG 2003 4aii none 1642c WHG 2003 4aiii none 1 6 0.912c WHG 2003 4aiv IIA81c 52c WHG 2003 4aiv IIA81d 58 99 0.632c WHG 2003 4aiv none 151 35 0.192c WHG 2003 4av none 12c WHG 2003 4bi none 162c WHG 2003 4cii none 12c WHG 2003 4ciii none 22c WHG 2003 none none 92c WHG 2004 4aii IIA81c 62c WHG 2004 4aii IIA81d 10 21 0.682c WHG 2004 4aii none 63 401 0.862c WHG 2004 4aiii none 1 7 0.862c WHG 2004 4aiv IIA81c 62c WHG 2004 4aiv IIA81d 16 77 0.832c WHG 2004 4aiv IIA81k 12c WHG 2004 4aiv none 38 69 0.642c WHG 2004 4bi none 12 11 0.472c WHG 2004 4biii none 12c WHG 2004 4cii none 22c WHG 2004 4ciii none 12c WHG 2004 none none 342c WHG 2005 4aii IIA81c 52c WHG 2005 4aii IIA81d 72c WHG 2005 4aii none 90 138 0.62c WHG 2005 4aiii none 12c WHG 2005 4aiv IIA81c 12c WHG 2005 4aiv IIA81d 62c WHG 2005 4aiv none 292c WHG 2005 4bi none 11 10 0.472c WHG 2005 4ci none 12c WHG 2006 4aii IIA81d 22c WHG 2006 4aii none 59
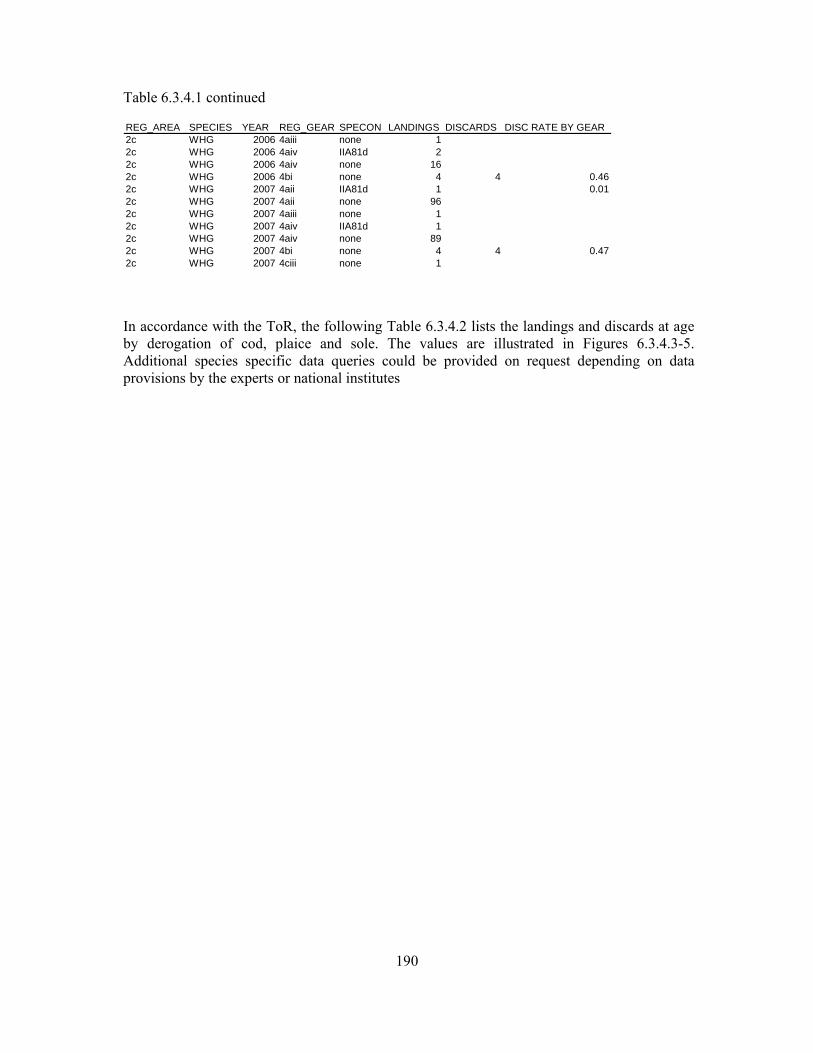
190
Table 6.3.4.1 continued
REG_AREA SPECIES YEAR REG_GEAR SPECON LANDINGS DISCARDS DISC RATE BY GEAR2c WHG 2006 4aiii none 12c WHG 2006 4aiv IIA81d 22c WHG 2006 4aiv none 162c WHG 2006 4bi none 4 4 0.462c WHG 2007 4aii IIA81d 1 0.012c WHG 2007 4aii none 962c WHG 2007 4aiii none 12c WHG 2007 4aiv IIA81d 12c WHG 2007 4aiv none 892c WHG 2007 4bi none 4 4 0.472c WHG 2007 4ciii none 1
In accordance with the ToR, the following Table 6.3.4.2 lists the landings and discards at age by derogation of cod, plaice and sole. The values are illustrated in Figures 6.3.4.3-5. Additional species specific data queries could be provided on request depending on data provisions by the experts or national institutes
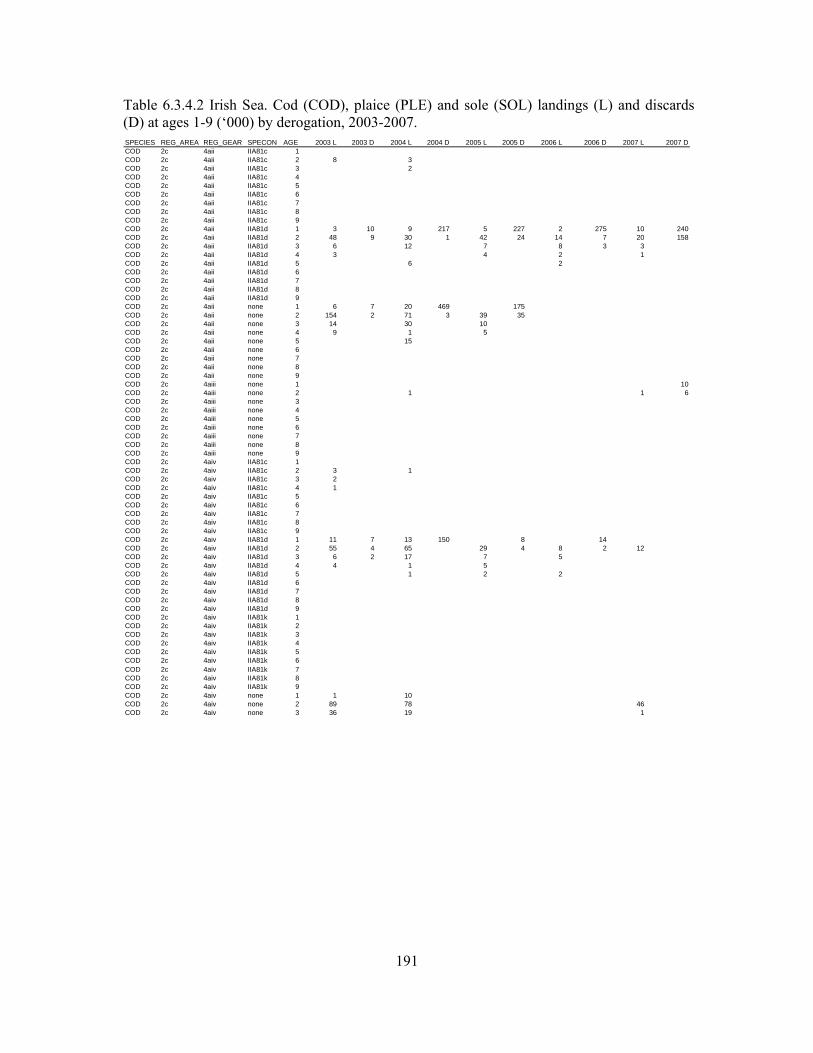
191
Table 6.3.4.2 Irish Sea. Cod (COD), plaice (PLE) and sole (SOL) landings (L) and discards (D) at ages 1-9 (‘000) by derogation, 2003-2007. SPECIES REG_AREA REG_GEAR SPECON AGE 2003 L 2003 D 2004 L 2004 D 2005 L 2005 D 2006 L 2006 D 2007 L 2007 DCOD 2c 4aii IIA81c 1COD 2c 4aii IIA81c 2 8 3COD 2c 4aii IIA81c 3 2COD 2c 4aii IIA81c 4COD 2c 4aii IIA81c 5COD 2c 4aii IIA81c 6COD 2c 4aii IIA81c 7COD 2c 4aii IIA81c 8COD 2c 4aii IIA81c 9COD 2c 4aii IIA81d 1 3 10 9 217 5 227 2 275 10 240COD 2c 4aii IIA81d 2 48 9 30 1 42 24 14 7 20 158COD 2c 4aii IIA81d 3 6 12 7 8 3 3COD 2c 4aii IIA81d 4 3 4 2 1COD 2c 4aii IIA81d 5 6 2COD 2c 4aii IIA81d 6COD 2c 4aii IIA81d 7COD 2c 4aii IIA81d 8COD 2c 4aii IIA81d 9COD 2c 4aii none 1 6 7 20 469 175COD 2c 4aii none 2 154 2 71 3 39 35COD 2c 4aii none 3 14 30 10COD 2c 4aii none 4 9 1 5COD 2c 4aii none 5 15COD 2c 4aii none 6COD 2c 4aii none 7COD 2c 4aii none 8COD 2c 4aii none 9COD 2c 4aiii none 1 10COD 2c 4aiii none 2 1 1 6COD 2c 4aiii none 3COD 2c 4aiii none 4COD 2c 4aiii none 5COD 2c 4aiii none 6COD 2c 4aiii none 7COD 2c 4aiii none 8COD 2c 4aiii none 9COD 2c 4aiv IIA81c 1COD 2c 4aiv IIA81c 2 3 1COD 2c 4aiv IIA81c 3 2COD 2c 4aiv IIA81c 4 1COD 2c 4aiv IIA81c 5COD 2c 4aiv IIA81c 6COD 2c 4aiv IIA81c 7COD 2c 4aiv IIA81c 8COD 2c 4aiv IIA81c 9COD 2c 4aiv IIA81d 1 11 7 13 150 8 14COD 2c 4aiv IIA81d 2 55 4 65 29 4 8 2 12COD 2c 4aiv IIA81d 3 6 2 17 7 5COD 2c 4aiv IIA81d 4 4 1 5COD 2c 4aiv IIA81d 5 1 2 2COD 2c 4aiv IIA81d 6COD 2c 4aiv IIA81d 7COD 2c 4aiv IIA81d 8COD 2c 4aiv IIA81d 9COD 2c 4aiv IIA81k 1COD 2c 4aiv IIA81k 2COD 2c 4aiv IIA81k 3COD 2c 4aiv IIA81k 4COD 2c 4aiv IIA81k 5COD 2c 4aiv IIA81k 6COD 2c 4aiv IIA81k 7COD 2c 4aiv IIA81k 8COD 2c 4aiv IIA81k 9COD 2c 4aiv none 1 1 10COD 2c 4aiv none 2 89 78 46COD 2c 4aiv none 3 36 19 1
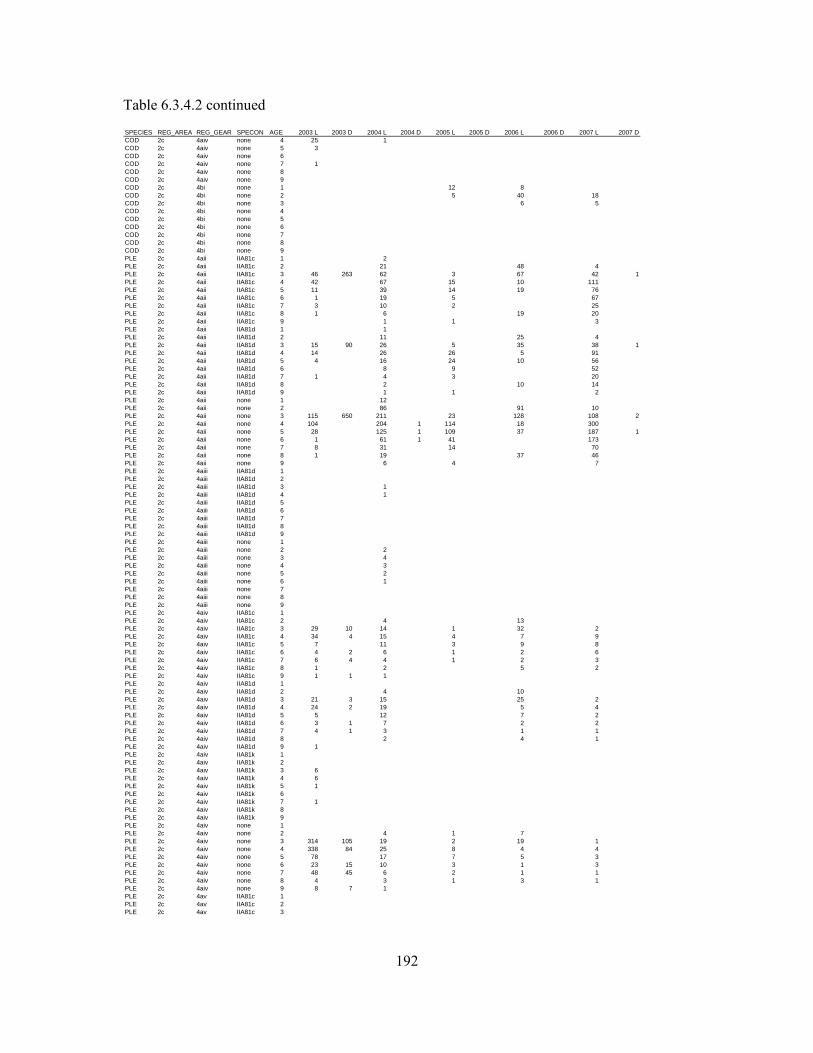
192
Table 6.3.4.2 continued
SPECIES REG_AREA REG_GEAR SPECON AGE 2003 L 2003 D 2004 L 2004 D 2005 L 2005 D 2006 L 2006 D 2007 L 2007 DCOD 2c 4aiv none 4 25 1COD 2c 4aiv none 5 3COD 2c 4aiv none 6COD 2c 4aiv none 7 1COD 2c 4aiv none 8COD 2c 4aiv none 9COD 2c 4bi none 1 12 8COD 2c 4bi none 2 5 40 18COD 2c 4bi none 3 6 5COD 2c 4bi none 4COD 2c 4bi none 5COD 2c 4bi none 6COD 2c 4bi none 7COD 2c 4bi none 8COD 2c 4bi none 9PLE 2c 4aii IIA81c 1 2PLE 2c 4aii IIA81c 2 21 48 4PLE 2c 4aii IIA81c 3 46 263 62 3 67 42 1PLE 2c 4aii IIA81c 4 42 67 15 10 111PLE 2c 4aii IIA81c 5 11 39 14 19 76PLE 2c 4aii IIA81c 6 1 19 5 67PLE 2c 4aii IIA81c 7 3 10 2 25PLE 2c 4aii IIA81c 8 1 6 19 20PLE 2c 4aii IIA81c 9 1 1 3PLE 2c 4aii IIA81d 1 1PLE 2c 4aii IIA81d 2 11 25 4PLE 2c 4aii IIA81d 3 15 90 26 5 35 38 1PLE 2c 4aii IIA81d 4 14 26 26 5 91PLE 2c 4aii IIA81d 5 4 16 24 10 56PLE 2c 4aii IIA81d 6 8 9 52PLE 2c 4aii IIA81d 7 1 4 3 20PLE 2c 4aii IIA81d 8 2 10 14PLE 2c 4aii IIA81d 9 1 1 2PLE 2c 4aii none 1 12PLE 2c 4aii none 2 86 91 10PLE 2c 4aii none 3 115 650 211 23 128 108 2PLE 2c 4aii none 4 104 204 1 114 18 300PLE 2c 4aii none 5 28 125 1 109 37 187 1PLE 2c 4aii none 6 1 61 1 41 173PLE 2c 4aii none 7 8 31 14 70PLE 2c 4aii none 8 1 19 37 46PLE 2c 4aii none 9 6 4 7PLE 2c 4aiii IIA81d 1PLE 2c 4aiii IIA81d 2PLE 2c 4aiii IIA81d 3 1PLE 2c 4aiii IIA81d 4 1PLE 2c 4aiii IIA81d 5PLE 2c 4aiii IIA81d 6PLE 2c 4aiii IIA81d 7PLE 2c 4aiii IIA81d 8PLE 2c 4aiii IIA81d 9PLE 2c 4aiii none 1PLE 2c 4aiii none 2 2PLE 2c 4aiii none 3 4PLE 2c 4aiii none 4 3PLE 2c 4aiii none 5 2PLE 2c 4aiii none 6 1PLE 2c 4aiii none 7PLE 2c 4aiii none 8PLE 2c 4aiii none 9PLE 2c 4aiv IIA81c 1PLE 2c 4aiv IIA81c 2 4 13PLE 2c 4aiv IIA81c 3 29 10 14 1 32 2PLE 2c 4aiv IIA81c 4 34 4 15 4 7 9PLE 2c 4aiv IIA81c 5 7 11 3 9 8PLE 2c 4aiv IIA81c 6 4 2 6 1 2 6PLE 2c 4aiv IIA81c 7 6 4 4 1 2 3PLE 2c 4aiv IIA81c 8 1 2 5 2PLE 2c 4aiv IIA81c 9 1 1 1PLE 2c 4aiv IIA81d 1PLE 2c 4aiv IIA81d 2 4 10PLE 2c 4aiv IIA81d 3 21 3 15 25 2PLE 2c 4aiv IIA81d 4 24 2 19 5 4PLE 2c 4aiv IIA81d 5 5 12 7 2PLE 2c 4aiv IIA81d 6 3 1 7 2 2PLE 2c 4aiv IIA81d 7 4 1 3 1 1PLE 2c 4aiv IIA81d 8 2 4 1PLE 2c 4aiv IIA81d 9 1PLE 2c 4aiv IIA81k 1PLE 2c 4aiv IIA81k 2PLE 2c 4aiv IIA81k 3 6PLE 2c 4aiv IIA81k 4 6PLE 2c 4aiv IIA81k 5 1PLE 2c 4aiv IIA81k 6PLE 2c 4aiv IIA81k 7 1PLE 2c 4aiv IIA81k 8PLE 2c 4aiv IIA81k 9PLE 2c 4aiv none 1PLE 2c 4aiv none 2 4 1 7PLE 2c 4aiv none 3 314 105 19 2 19 1PLE 2c 4aiv none 4 338 84 25 8 4 4PLE 2c 4aiv none 5 78 17 7 5 3PLE 2c 4aiv none 6 23 15 10 3 1 3PLE 2c 4aiv none 7 48 45 6 2 1 1PLE 2c 4aiv none 8 4 3 1 3 1PLE 2c 4aiv none 9 8 7 1PLE 2c 4av IIA81c 1PLE 2c 4av IIA81c 2PLE 2c 4av IIA81c 3
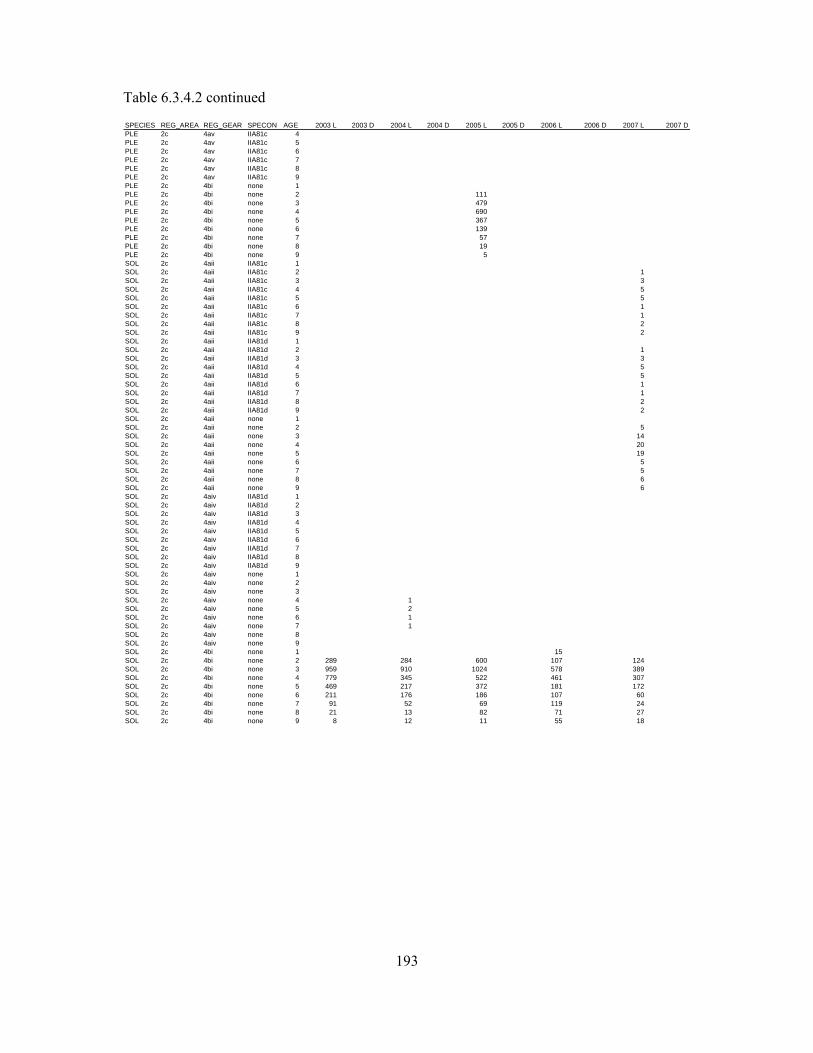
193
Table 6.3.4.2 continued
SPECIES REG_AREA REG_GEAR SPECON AGE 2003 L 2003 D 2004 L 2004 D 2005 L 2005 D 2006 L 2006 D 2007 L 2007 DPLE 2c 4av IIA81c 4PLE 2c 4av IIA81c 5PLE 2c 4av IIA81c 6PLE 2c 4av IIA81c 7PLE 2c 4av IIA81c 8PLE 2c 4av IIA81c 9PLE 2c 4bi none 1PLE 2c 4bi none 2 111PLE 2c 4bi none 3 479PLE 2c 4bi none 4 690PLE 2c 4bi none 5 367PLE 2c 4bi none 6 139PLE 2c 4bi none 7 57PLE 2c 4bi none 8 19PLE 2c 4bi none 9 5SOL 2c 4aii IIA81c 1SOL 2c 4aii IIA81c 2 1SOL 2c 4aii IIA81c 3 3SOL 2c 4aii IIA81c 4 5SOL 2c 4aii IIA81c 5 5SOL 2c 4aii IIA81c 6 1SOL 2c 4aii IIA81c 7 1SOL 2c 4aii IIA81c 8 2SOL 2c 4aii IIA81c 9 2SOL 2c 4aii IIA81d 1SOL 2c 4aii IIA81d 2 1SOL 2c 4aii IIA81d 3 3SOL 2c 4aii IIA81d 4 5SOL 2c 4aii IIA81d 5 5SOL 2c 4aii IIA81d 6 1SOL 2c 4aii IIA81d 7 1SOL 2c 4aii IIA81d 8 2SOL 2c 4aii IIA81d 9 2SOL 2c 4aii none 1SOL 2c 4aii none 2 5SOL 2c 4aii none 3 14SOL 2c 4aii none 4 20SOL 2c 4aii none 5 19SOL 2c 4aii none 6 5SOL 2c 4aii none 7 5SOL 2c 4aii none 8 6SOL 2c 4aii none 9 6SOL 2c 4aiv IIA81d 1SOL 2c 4aiv IIA81d 2SOL 2c 4aiv IIA81d 3SOL 2c 4aiv IIA81d 4SOL 2c 4aiv IIA81d 5SOL 2c 4aiv IIA81d 6SOL 2c 4aiv IIA81d 7SOL 2c 4aiv IIA81d 8SOL 2c 4aiv IIA81d 9SOL 2c 4aiv none 1SOL 2c 4aiv none 2SOL 2c 4aiv none 3SOL 2c 4aiv none 4 1SOL 2c 4aiv none 5 2SOL 2c 4aiv none 6 1SOL 2c 4aiv none 7 1SOL 2c 4aiv none 8SOL 2c 4aiv none 9SOL 2c 4bi none 1 15SOL 2c 4bi none 2 289 284 600 107 124SOL 2c 4bi none 3 959 910 1024 578 389SOL 2c 4bi none 4 779 345 522 461 307SOL 2c 4bi none 5 469 217 372 181 172SOL 2c 4bi none 6 211 176 186 107 60SOL 2c 4bi none 7 91 52 69 119 24SOL 2c 4bi none 8 21 13 82 71 27SOL 2c 4bi none 9 8 12 11 55 18
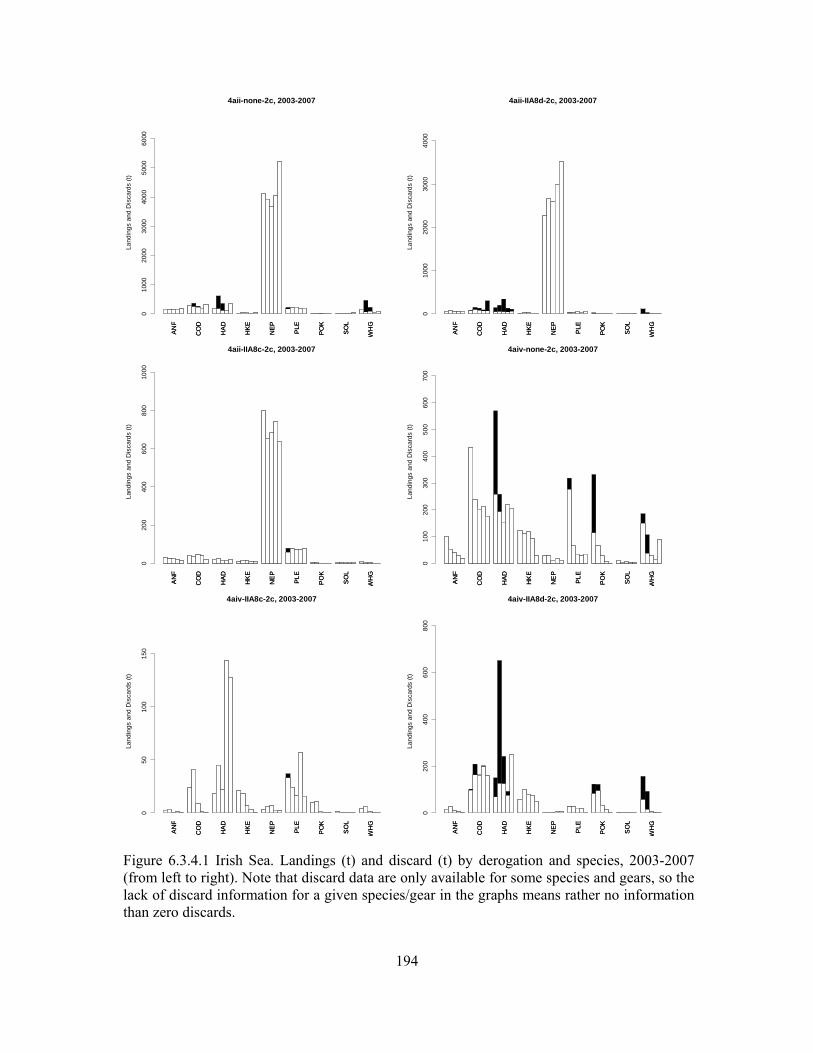
194
AN
F
CO
D
HA
D
HK
E
NE
P
PLE
PO
K
SO
L
WH
G
4aii-none-2c, 2003-2007
Land
ings
and
Dis
card
s (t)
010
0020
0030
0040
0050
0060
00
AN
F
CO
D
HA
D
HK
E
NE
P
PLE
PO
K
SO
L
WH
G
AN
F
CO
D
HA
D
HK
E
NE
P
PLE
PO
K
SO
L
WH
G
4aii-IIA8d-2c, 2003-2007
Land
ings
and
Dis
card
s (t)
010
0020
0030
0040
00
AN
F
CO
D
HA
D
HK
E
NE
P
PLE
PO
K
SO
L
WH
G
AN
F
CO
D
HA
D
HK
E
NE
P
PLE
PO
K
SO
L
WH
G
4aii-IIA8c-2c, 2003-2007
Land
ings
and
Dis
card
s (t)
020
040
060
080
010
00
AN
F
CO
D
HA
D
HK
E
NE
P
PLE
PO
K
SO
L
WH
G
AN
F
CO
D
HA
D
HK
E
NE
P
PLE
PO
K
SO
L
WH
G
4aiv-none-2c, 2003-2007
Land
ings
and
Dis
card
s (t)
010
020
030
040
050
060
070
0
AN
F
CO
D
HA
D
HK
E
NE
P
PLE
PO
K
SO
L
WH
G
AN
F
CO
D
HA
D
HK
E
NE
P
PLE
PO
K
SO
L
WH
G
4aiv-IIA8c-2c, 2003-2007
Land
ings
and
Dis
card
s (t)
050
100
150
AN
F
CO
D
HA
D
HK
E
NE
P
PLE
PO
K
SO
L
WH
G
AN
F
CO
D
HA
D
HK
E
NE
P
PLE
PO
K
SO
L
WH
G
4aiv-IIA8d-2c, 2003-2007
Land
ings
and
Dis
card
s (t)
020
040
060
080
0
AN
F
CO
D
HA
D
HK
E
NE
P
PLE
PO
K
SO
L
WH
G
Figure 6.3.4.1 Irish Sea. Landings (t) and discard (t) by derogation and species, 2003-2007 (from left to right). Note that discard data are only available for some species and gears, so the lack of discard information for a given species/gear in the graphs means rather no information than zero discards.

195
AN
F
CO
D
HA
D
HK
E
NE
P
PLE
PO
K
SO
L
WH
G
4bi-none-2c, 2003-2007
Land
ings
and
Dis
card
s (t)
020
040
060
080
010
00
AN
F
CO
D
HA
D
HK
E
NE
P
PLE
PO
K
SO
L
WH
G
AN
F
CO
D
HA
D
HK
E
NE
P
PLE
PO
K
SO
L
WH
G
none-none-2c, 2003-2007
Land
ings
and
Dis
card
s (t)
010
020
030
040
050
060
070
0
AN
F
CO
D
HA
D
HK
E
NE
P
PLE
PO
K
SO
L
WH
G
AN
F
CO
D
HA
D
HK
E
NE
P
PLE
PO
K
SO
L
WH
G
4ciii-none-2c, 2003-2007
Land
ings
and
Dis
card
s (t)
010
020
030
040
0
AN
F
CO
D
HA
D
HK
E
NE
P
PLE
PO
K
SO
L
WH
G
Figure 6.3.4.1 Continued. Note that discard data are only available for some species and gears, so the lack of discard information for a given species/gear in the graphs means rather no information than zero discards.
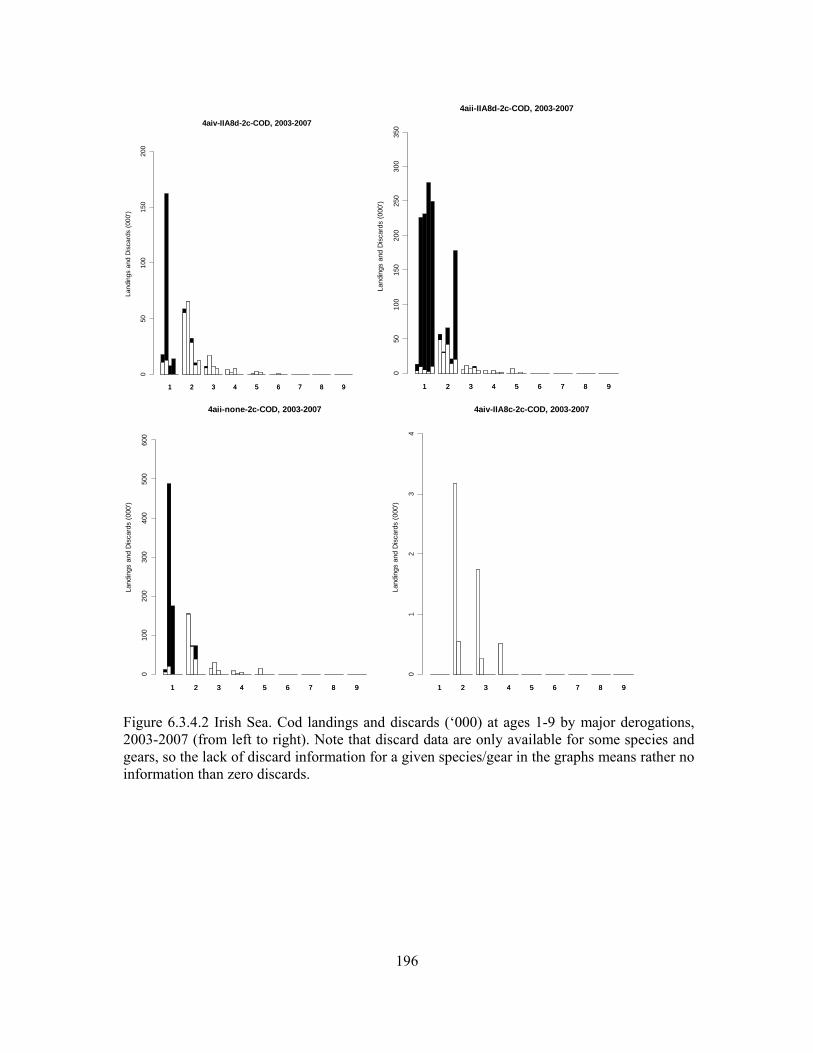
196
1 2 3 4 5 6 7 8 9
4aiv-IIA8d-2c-COD, 2003-2007La
ndin
gs a
nd D
isca
rds
(000
')
050
100
150
200
1 2 3 4 5 6 7 8 9 1 2 3 4 5 6 7 8 9
4aii-IIA8d-2c-COD, 2003-2007
Land
ings
and
Dis
card
s (0
00')
050
100
150
200
250
300
350
1 2 3 4 5 6 7 8 9
1 2 3 4 5 6 7 8 9
4aii-none-2c-COD, 2003-2007
Land
ings
and
Dis
card
s (0
00')
010
020
030
040
050
060
0
1 2 3 4 5 6 7 8 9 1 2 3 4 5 6 7 8 9
4aiv-IIA8c-2c-COD, 2003-2007
Land
ings
and
Dis
card
s (0
00')
01
23
4
1 2 3 4 5 6 7 8 9
Figure 6.3.4.2 Irish Sea. Cod landings and discards (‘000) at ages 1-9 by major derogations, 2003-2007 (from left to right). Note that discard data are only available for some species and gears, so the lack of discard information for a given species/gear in the graphs means rather no information than zero discards.
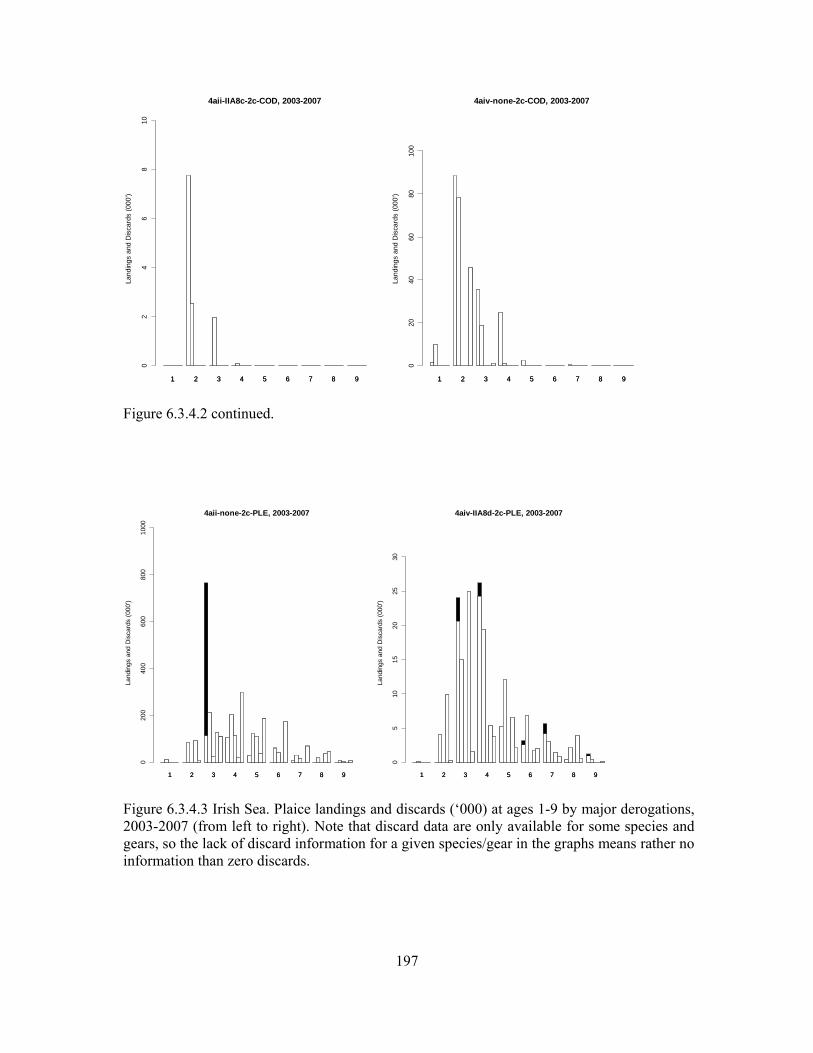
197
1 2 3 4 5 6 7 8 9
4aii-IIA8c-2c-COD, 2003-2007
Land
ings
and
Dis
card
s (0
00')
02
46
810
1 2 3 4 5 6 7 8 9 1 2 3 4 5 6 7 8 9
4aiv-none-2c-COD, 2003-2007
Land
ings
and
Dis
card
s (0
00')
020
4060
8010
0
1 2 3 4 5 6 7 8 9
Figure 6.3.4.2 continued.
1 2 3 4 5 6 7 8 9
4aii-none-2c-PLE, 2003-2007
Land
ings
and
Dis
card
s (0
00')
020
040
060
080
010
00
1 2 3 4 5 6 7 8 9 1 2 3 4 5 6 7 8 9
4aiv-IIA8d-2c-PLE, 2003-2007
Land
ings
and
Dis
card
s (0
00')
05
1015
2025
30
1 2 3 4 5 6 7 8 9
Figure 6.3.4.3 Irish Sea. Plaice landings and discards (‘000) at ages 1-9 by major derogations, 2003-2007 (from left to right). Note that discard data are only available for some species and gears, so the lack of discard information for a given species/gear in the graphs means rather no information than zero discards.
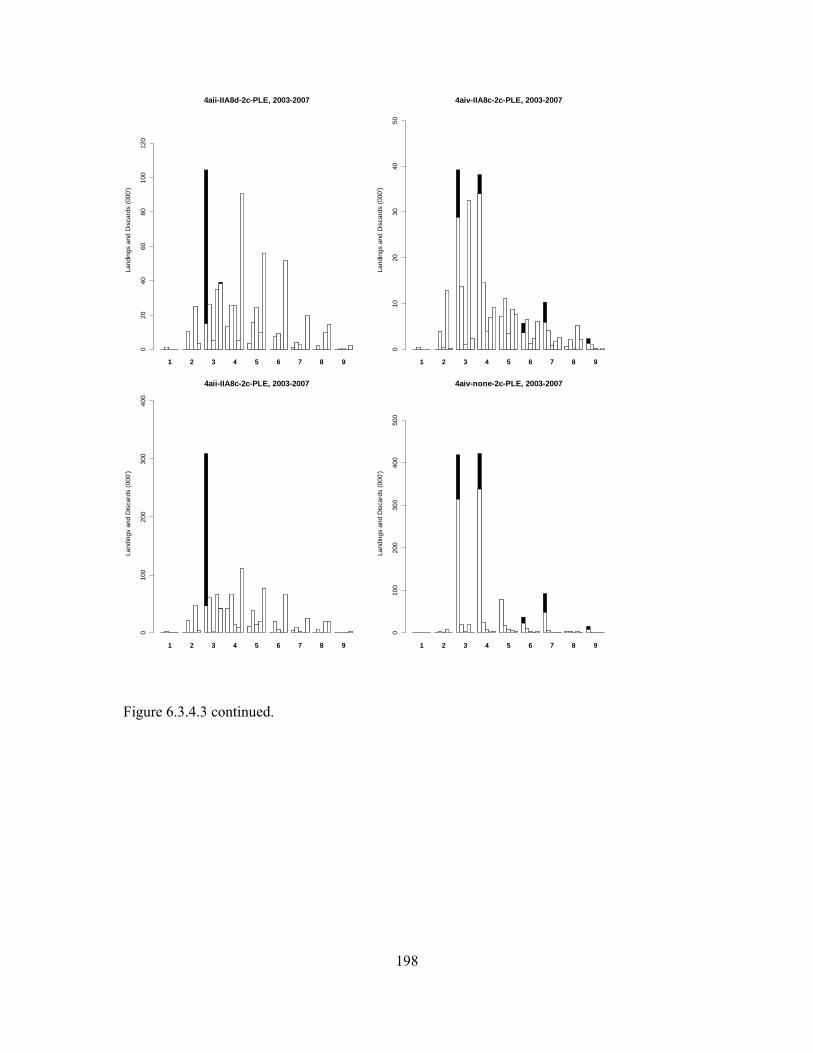
198
1 2 3 4 5 6 7 8 9
4aii-IIA8d-2c-PLE, 2003-2007
Land
ings
and
Dis
card
s (0
00')
020
4060
8010
012
0
1 2 3 4 5 6 7 8 9 1 2 3 4 5 6 7 8 9
4aiv-IIA8c-2c-PLE, 2003-2007
Land
ings
and
Dis
card
s (0
00')
010
2030
4050
1 2 3 4 5 6 7 8 9
1 2 3 4 5 6 7 8 9
4aii-IIA8c-2c-PLE, 2003-2007
Land
ings
and
Dis
card
s (0
00')
010
020
030
040
0
1 2 3 4 5 6 7 8 9 1 2 3 4 5 6 7 8 9
4aiv-none-2c-PLE, 2003-2007La
ndin
gs a
nd D
isca
rds
(000
')
010
020
030
040
050
0
1 2 3 4 5 6 7 8 9
Figure 6.3.4.3 continued.

199
1 2 3 4 5 6 7 8 9
4bi-none-2c-SOL, 2003-2007
Land
ings
and
Dis
card
s (0
00')
020
040
060
080
010
0012
00
1 2 3 4 5 6 7 8 9
Figure 6.3.4.4 Irish Sea. Sole landings and discards (‘000) at ages 1-9 by major derogations, 2003-2007 (from left to right). Note that discard data are only available for some species and gears, so the lack of discard information for a given species/gear in the graphs means rather no information than zero discards.
6.3.5. Trend in catch estimates in weight and numbers at age by derogation in management area 2d: West of Scotland
The following Table 6.3.5.1 lists the landings and discards for the main species by derogation. For the reason of space limitation of this report, the following sections represent the landings and discards by derogation in weight and numbers not for all species caught but only for anglerfish (ANF), cod (COD), haddock (HAD), hake, (HKE), Nephrops (NEP), plaice (PLE), saithe (POK), sole (SOL), and whiting (WHG). However, additional data queries for other species can be provided depending on data provisions of the national catches by the experts or national institutes. The data given in Table 6.3.5.1 forms the basis of Figures 6.3.5.1 and 6.3.5.2 displaying the relative catch compositions by derogations for the years 2003-2007. Discard information on anglerfish, hake, Nephrops, plaice and sole was not available for this report. The lack of the dark bars representing discards in these figures for those species indicates a lack of observations.
A description of the catch compositions of the derogations relevant to the area follows:-
4.a.ii (no special condition & IIA81d): The main species caught by this gear category is Nephrops. The other significant components of the catch are whiting and haddock. The high rates of discarding of whiting and haddock illustrated in Figure 6.3.5.1 suggest that vessels using this size of mesh belong to a targeted Nephrops fishery. Landings of whiting and haddock are higher for vessels not qualifying for special condition while the difference in discards is greater still. With respect to 4.a.ii none landings of anglerfish are now at a comparable level to landings of haddock. Catch of whiting are also reported as falling to a
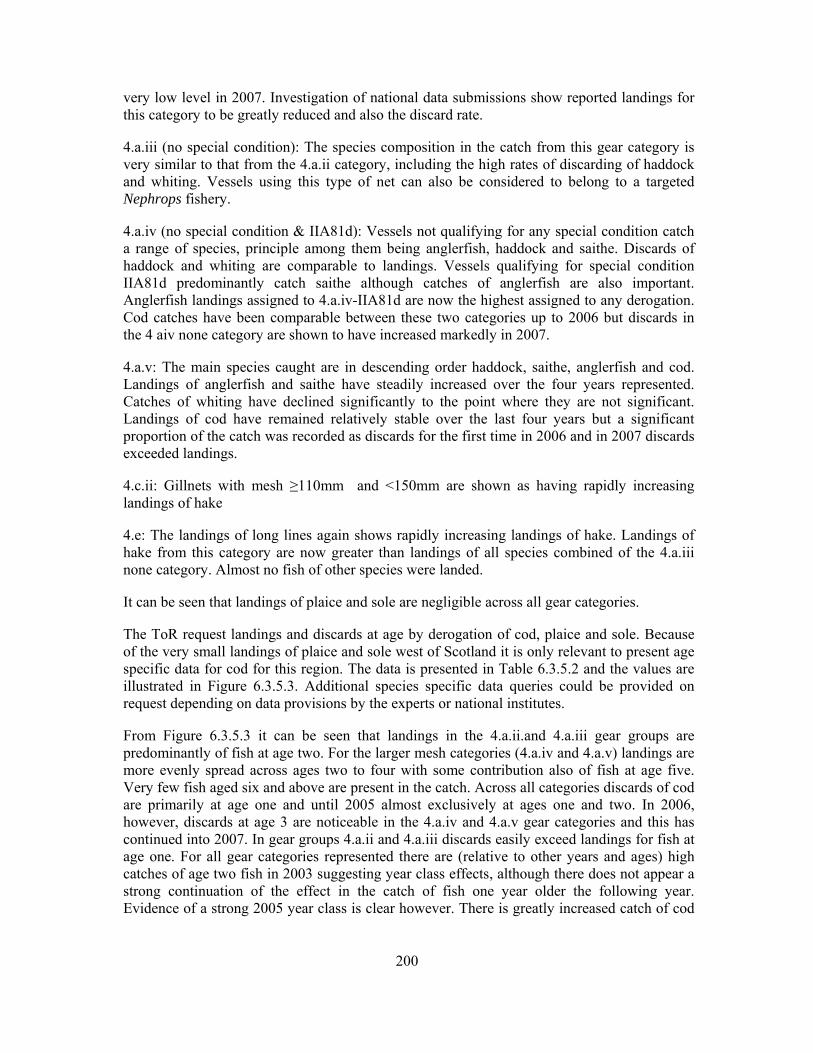
200
very low level in 2007. Investigation of national data submissions show reported landings for this category to be greatly reduced and also the discard rate.
4.a.iii (no special condition): The species composition in the catch from this gear category is very similar to that from the 4.a.ii category, including the high rates of discarding of haddock and whiting. Vessels using this type of net can also be considered to belong to a targeted Nephrops fishery.
4.a.iv (no special condition & IIA81d): Vessels not qualifying for any special condition catch a range of species, principle among them being anglerfish, haddock and saithe. Discards of haddock and whiting are comparable to landings. Vessels qualifying for special condition IIA81d predominantly catch saithe although catches of anglerfish are also important. Anglerfish landings assigned to 4.a.iv-IIA81d are now the highest assigned to any derogation. Cod catches have been comparable between these two categories up to 2006 but discards in the 4 aiv none category are shown to have increased markedly in 2007.
4.a.v: The main species caught are in descending order haddock, saithe, anglerfish and cod. Landings of anglerfish and saithe have steadily increased over the four years represented. Catches of whiting have declined significantly to the point where they are not significant. Landings of cod have remained relatively stable over the last four years but a significant proportion of the catch was recorded as discards for the first time in 2006 and in 2007 discards exceeded landings.
4.c.ii: Gillnets with mesh ≥110mm and <150mm are shown as having rapidly increasing landings of hake
4.e: The landings of long lines again shows rapidly increasing landings of hake. Landings of hake from this category are now greater than landings of all species combined of the 4.a.iii none category. Almost no fish of other species were landed.
It can be seen that landings of plaice and sole are negligible across all gear categories.
The ToR request landings and discards at age by derogation of cod, plaice and sole. Because of the very small landings of plaice and sole west of Scotland it is only relevant to present age specific data for cod for this region. The data is presented in Table 6.3.5.2 and the values are illustrated in Figure 6.3.5.3. Additional species specific data queries could be provided on request depending on data provisions by the experts or national institutes.
From Figure 6.3.5.3 it can be seen that landings in the 4.a.ii.and 4.a.iii gear groups are predominantly of fish at age two. For the larger mesh categories (4.a.iv and 4.a.v) landings are more evenly spread across ages two to four with some contribution also of fish at age five. Very few fish aged six and above are present in the catch. Across all categories discards of cod are primarily at age one and until 2005 almost exclusively at ages one and two. In 2006, however, discards at age 3 are noticeable in the 4.a.iv and 4.a.v gear categories and this has continued into 2007. In gear groups 4.a.ii and 4.a.iii discards easily exceed landings for fish at age one. For all gear categories represented there are (relative to other years and ages) high catches of age two fish in 2003 suggesting year class effects, although there does not appear a strong continuation of the effect in the catch of fish one year older the following year. Evidence of a strong 2005 year class is clear however. There is greatly increased catch of cod
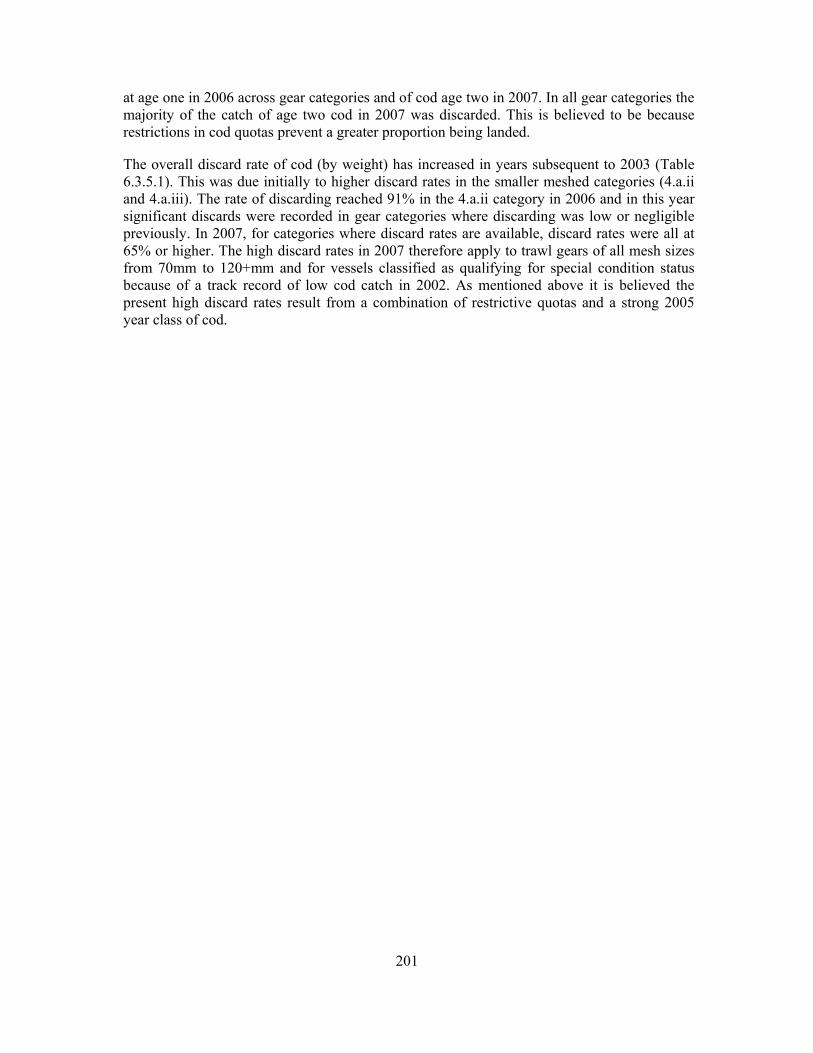
201
at age one in 2006 across gear categories and of cod age two in 2007. In all gear categories the majority of the catch of age two cod in 2007 was discarded. This is believed to be because restrictions in cod quotas prevent a greater proportion being landed.
The overall discard rate of cod (by weight) has increased in years subsequent to 2003 (Table 6.3.5.1). This was due initially to higher discard rates in the smaller meshed categories (4.a.ii and 4.a.iii). The rate of discarding reached 91% in the 4.a.ii category in 2006 and in this year significant discards were recorded in gear categories where discarding was low or negligible previously. In 2007, for categories where discard rates are available, discard rates were all at 65% or higher. The high discard rates in 2007 therefore apply to trawl gears of all mesh sizes from 70mm to 120+mm and for vessels classified as qualifying for special condition status because of a track record of low cod catch in 2002. As mentioned above it is believed the present high discard rates result from a combination of restrictive quotas and a strong 2005 year class of cod.
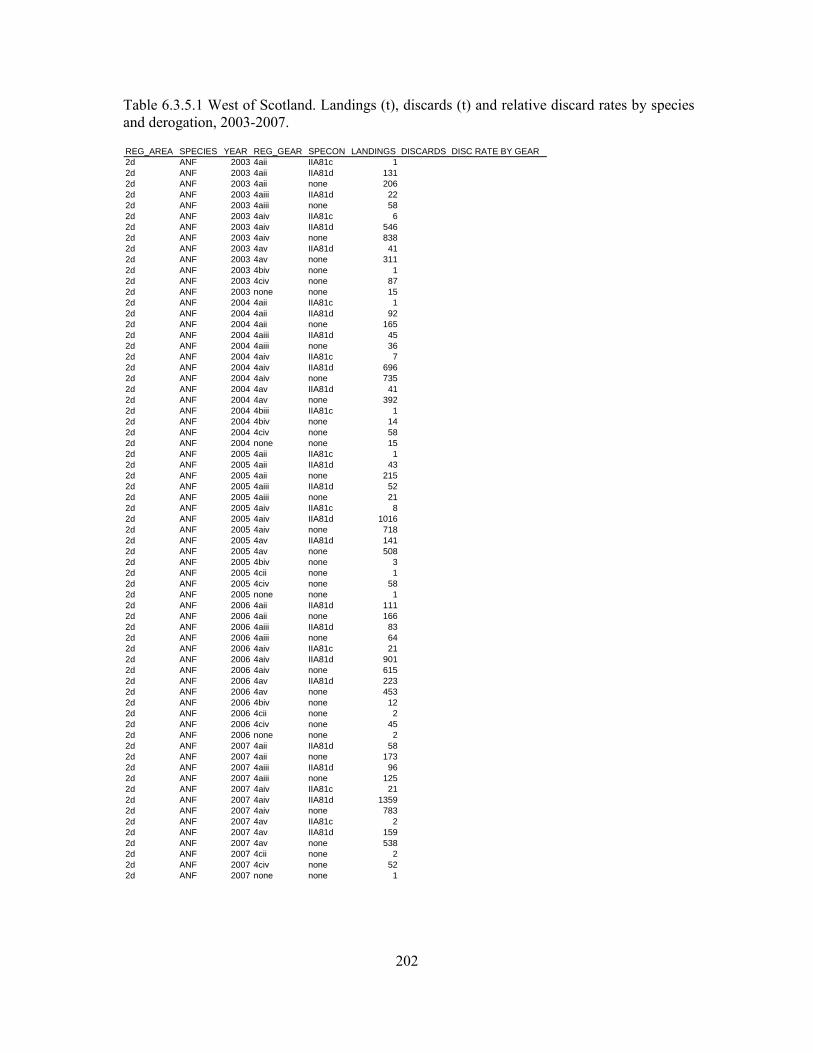
202
Table 6.3.5.1 West of Scotland. Landings (t), discards (t) and relative discard rates by species and derogation, 2003-2007.
REG_AREA SPECIES YEAR REG_GEAR SPECON LANDINGS DISCARDS DISC RATE BY GEAR2d ANF 2003 4aii IIA81c 12d ANF 2003 4aii IIA81d 1312d ANF 2003 4aii none 2062d ANF 2003 4aiii IIA81d 222d ANF 2003 4aiii none 582d ANF 2003 4aiv IIA81c 62d ANF 2003 4aiv IIA81d 5462d ANF 2003 4aiv none 8382d ANF 2003 4av IIA81d 412d ANF 2003 4av none 3112d ANF 2003 4biv none 12d ANF 2003 4civ none 872d ANF 2003 none none 152d ANF 2004 4aii IIA81c 12d ANF 2004 4aii IIA81d 922d ANF 2004 4aii none 1652d ANF 2004 4aiii IIA81d 452d ANF 2004 4aiii none 362d ANF 2004 4aiv IIA81c 72d ANF 2004 4aiv IIA81d 6962d ANF 2004 4aiv none 7352d ANF 2004 4av IIA81d 412d ANF 2004 4av none 3922d ANF 2004 4biii IIA81c 12d ANF 2004 4biv none 142d ANF 2004 4civ none 582d ANF 2004 none none 152d ANF 2005 4aii IIA81c 12d ANF 2005 4aii IIA81d 432d ANF 2005 4aii none 2152d ANF 2005 4aiii IIA81d 522d ANF 2005 4aiii none 212d ANF 2005 4aiv IIA81c 82d ANF 2005 4aiv IIA81d 10162d ANF 2005 4aiv none 7182d ANF 2005 4av IIA81d 1412d ANF 2005 4av none 5082d ANF 2005 4biv none 32d ANF 2005 4cii none 12d ANF 2005 4civ none 582d ANF 2005 none none 12d ANF 2006 4aii IIA81d 1112d ANF 2006 4aii none 1662d ANF 2006 4aiii IIA81d 832d ANF 2006 4aiii none 642d ANF 2006 4aiv IIA81c 212d ANF 2006 4aiv IIA81d 9012d ANF 2006 4aiv none 6152d ANF 2006 4av IIA81d 2232d ANF 2006 4av none 4532d ANF 2006 4biv none 122d ANF 2006 4cii none 22d ANF 2006 4civ none 452d ANF 2006 none none 22d ANF 2007 4aii IIA81d 582d ANF 2007 4aii none 1732d ANF 2007 4aiii IIA81d 962d ANF 2007 4aiii none 1252d ANF 2007 4aiv IIA81c 212d ANF 2007 4aiv IIA81d 13592d ANF 2007 4aiv none 7832d ANF 2007 4av IIA81c 22d ANF 2007 4av IIA81d 1592d ANF 2007 4av none 5382d ANF 2007 4cii none 22d ANF 2007 4civ none 522d ANF 2007 none none 1
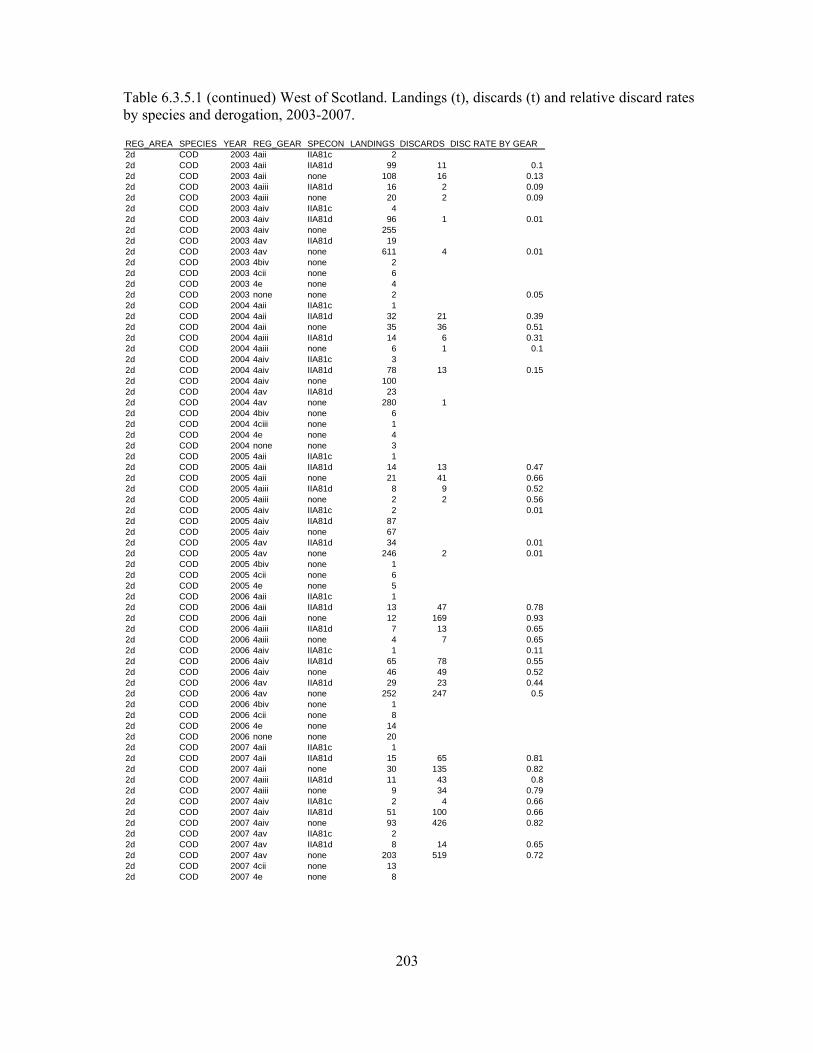
203
Table 6.3.5.1 (continued) West of Scotland. Landings (t), discards (t) and relative discard rates by species and derogation, 2003-2007.
REG_AREA SPECIES YEAR REG_GEAR SPECON LANDINGS DISCARDS DISC RATE BY GEAR2d COD 2003 4aii IIA81c 22d COD 2003 4aii IIA81d 99 11 0.12d COD 2003 4aii none 108 16 0.132d COD 2003 4aiii IIA81d 16 2 0.092d COD 2003 4aiii none 20 2 0.092d COD 2003 4aiv IIA81c 42d COD 2003 4aiv IIA81d 96 1 0.012d COD 2003 4aiv none 2552d COD 2003 4av IIA81d 192d COD 2003 4av none 611 4 0.012d COD 2003 4biv none 22d COD 2003 4cii none 62d COD 2003 4e none 42d COD 2003 none none 2 0.052d COD 2004 4aii IIA81c 12d COD 2004 4aii IIA81d 32 21 0.392d COD 2004 4aii none 35 36 0.512d COD 2004 4aiii IIA81d 14 6 0.312d COD 2004 4aiii none 6 1 0.12d COD 2004 4aiv IIA81c 32d COD 2004 4aiv IIA81d 78 13 0.152d COD 2004 4aiv none 1002d COD 2004 4av IIA81d 232d COD 2004 4av none 280 12d COD 2004 4biv none 62d COD 2004 4ciii none 12d COD 2004 4e none 42d COD 2004 none none 32d COD 2005 4aii IIA81c 12d COD 2005 4aii IIA81d 14 13 0.472d COD 2005 4aii none 21 41 0.662d COD 2005 4aiii IIA81d 8 9 0.522d COD 2005 4aiii none 2 2 0.562d COD 2005 4aiv IIA81c 2 0.012d COD 2005 4aiv IIA81d 872d COD 2005 4aiv none 672d COD 2005 4av IIA81d 34 0.012d COD 2005 4av none 246 2 0.012d COD 2005 4biv none 12d COD 2005 4cii none 62d COD 2005 4e none 52d COD 2006 4aii IIA81c 12d COD 2006 4aii IIA81d 13 47 0.782d COD 2006 4aii none 12 169 0.932d COD 2006 4aiii IIA81d 7 13 0.652d COD 2006 4aiii none 4 7 0.652d COD 2006 4aiv IIA81c 1 0.112d COD 2006 4aiv IIA81d 65 78 0.552d COD 2006 4aiv none 46 49 0.522d COD 2006 4av IIA81d 29 23 0.442d COD 2006 4av none 252 247 0.52d COD 2006 4biv none 12d COD 2006 4cii none 82d COD 2006 4e none 142d COD 2006 none none 202d COD 2007 4aii IIA81c 12d COD 2007 4aii IIA81d 15 65 0.812d COD 2007 4aii none 30 135 0.822d COD 2007 4aiii IIA81d 11 43 0.82d COD 2007 4aiii none 9 34 0.792d COD 2007 4aiv IIA81c 2 4 0.662d COD 2007 4aiv IIA81d 51 100 0.662d COD 2007 4aiv none 93 426 0.822d COD 2007 4av IIA81c 22d COD 2007 4av IIA81d 8 14 0.652d COD 2007 4av none 203 519 0.722d COD 2007 4cii none 132d COD 2007 4e none 8
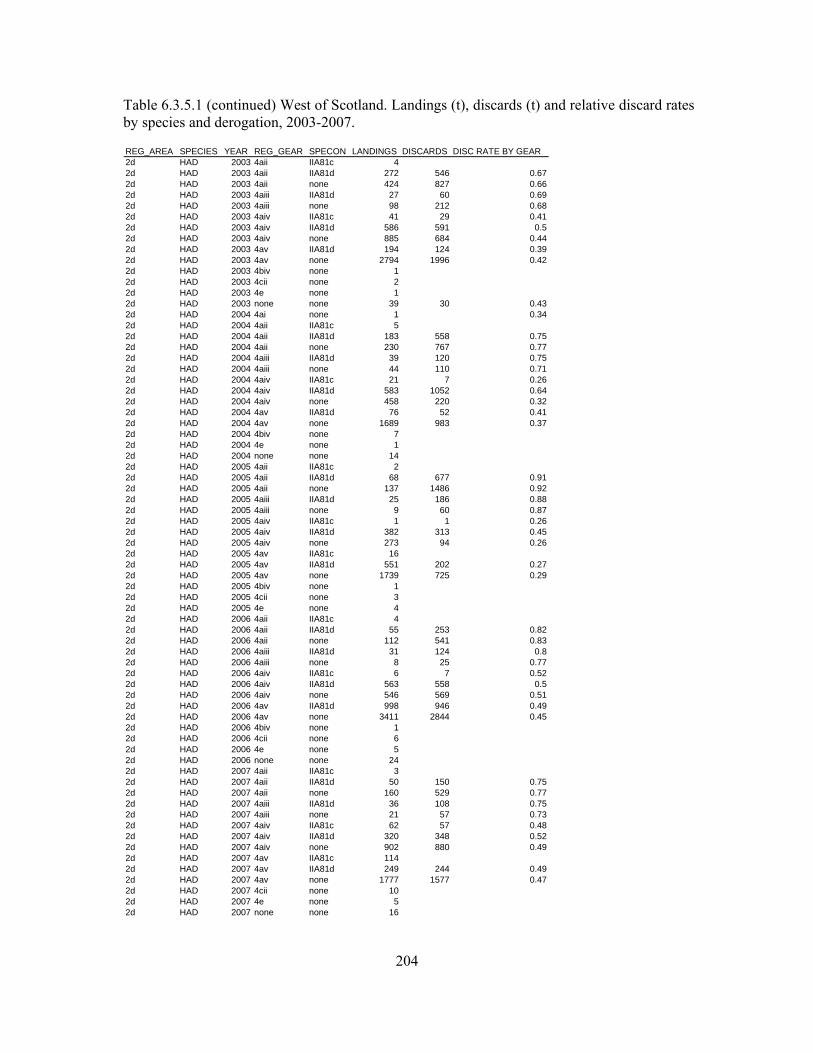
204
Table 6.3.5.1 (continued) West of Scotland. Landings (t), discards (t) and relative discard rates by species and derogation, 2003-2007.
REG_AREA SPECIES YEAR REG_GEAR SPECON LANDINGS DISCARDS DISC RATE BY GEAR2d HAD 2003 4aii IIA81c 42d HAD 2003 4aii IIA81d 272 546 0.672d HAD 2003 4aii none 424 827 0.662d HAD 2003 4aiii IIA81d 27 60 0.692d HAD 2003 4aiii none 98 212 0.682d HAD 2003 4aiv IIA81c 41 29 0.412d HAD 2003 4aiv IIA81d 586 591 0.52d HAD 2003 4aiv none 885 684 0.442d HAD 2003 4av IIA81d 194 124 0.392d HAD 2003 4av none 2794 1996 0.422d HAD 2003 4biv none 12d HAD 2003 4cii none 22d HAD 2003 4e none 12d HAD 2003 none none 39 30 0.432d HAD 2004 4ai none 1 0.342d HAD 2004 4aii IIA81c 52d HAD 2004 4aii IIA81d 183 558 0.752d HAD 2004 4aii none 230 767 0.772d HAD 2004 4aiii IIA81d 39 120 0.752d HAD 2004 4aiii none 44 110 0.712d HAD 2004 4aiv IIA81c 21 7 0.262d HAD 2004 4aiv IIA81d 583 1052 0.642d HAD 2004 4aiv none 458 220 0.322d HAD 2004 4av IIA81d 76 52 0.412d HAD 2004 4av none 1689 983 0.372d HAD 2004 4biv none 72d HAD 2004 4e none 12d HAD 2004 none none 142d HAD 2005 4aii IIA81c 22d HAD 2005 4aii IIA81d 68 677 0.912d HAD 2005 4aii none 137 1486 0.922d HAD 2005 4aiii IIA81d 25 186 0.882d HAD 2005 4aiii none 9 60 0.872d HAD 2005 4aiv IIA81c 1 1 0.262d HAD 2005 4aiv IIA81d 382 313 0.452d HAD 2005 4aiv none 273 94 0.262d HAD 2005 4av IIA81c 162d HAD 2005 4av IIA81d 551 202 0.272d HAD 2005 4av none 1739 725 0.292d HAD 2005 4biv none 12d HAD 2005 4cii none 32d HAD 2005 4e none 42d HAD 2006 4aii IIA81c 42d HAD 2006 4aii IIA81d 55 253 0.822d HAD 2006 4aii none 112 541 0.832d HAD 2006 4aiii IIA81d 31 124 0.82d HAD 2006 4aiii none 8 25 0.772d HAD 2006 4aiv IIA81c 6 7 0.522d HAD 2006 4aiv IIA81d 563 558 0.52d HAD 2006 4aiv none 546 569 0.512d HAD 2006 4av IIA81d 998 946 0.492d HAD 2006 4av none 3411 2844 0.452d HAD 2006 4biv none 12d HAD 2006 4cii none 62d HAD 2006 4e none 52d HAD 2006 none none 242d HAD 2007 4aii IIA81c 32d HAD 2007 4aii IIA81d 50 150 0.752d HAD 2007 4aii none 160 529 0.772d HAD 2007 4aiii IIA81d 36 108 0.752d HAD 2007 4aiii none 21 57 0.732d HAD 2007 4aiv IIA81c 62 57 0.482d HAD 2007 4aiv IIA81d 320 348 0.522d HAD 2007 4aiv none 902 880 0.492d HAD 2007 4av IIA81c 1142d HAD 2007 4av IIA81d 249 244 0.492d HAD 2007 4av none 1777 1577 0.472d HAD 2007 4cii none 102d HAD 2007 4e none 52d HAD 2007 none none 16
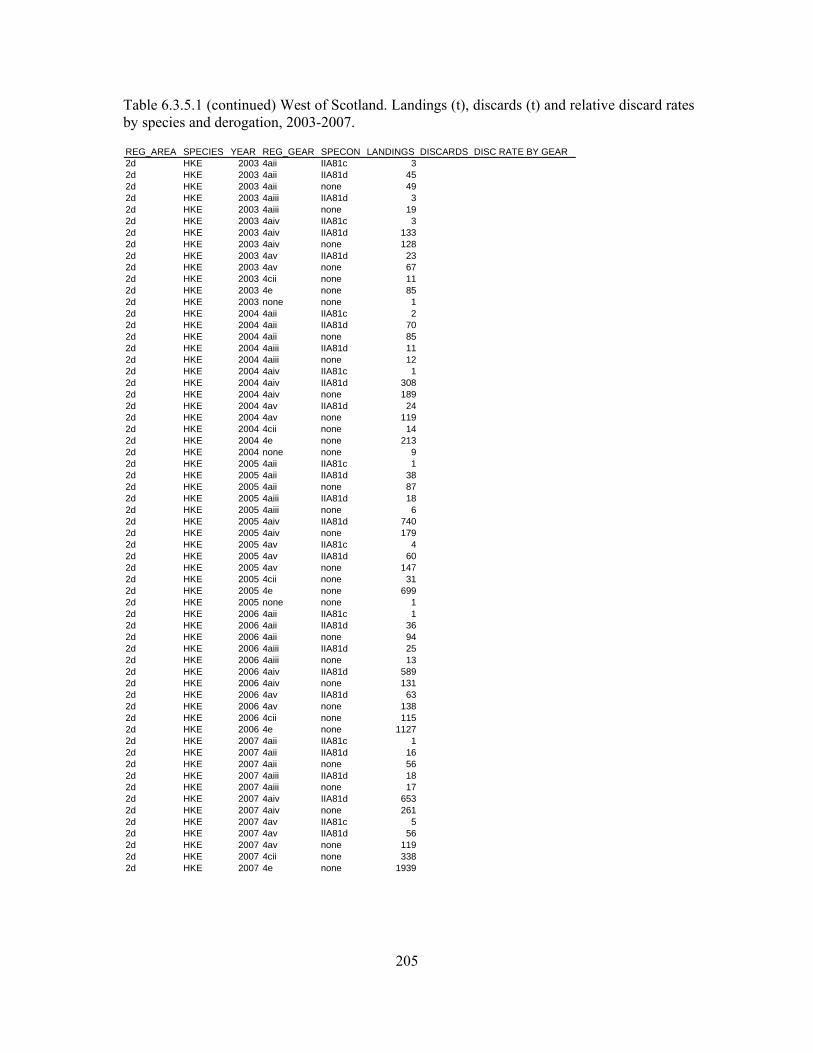
205
Table 6.3.5.1 (continued) West of Scotland. Landings (t), discards (t) and relative discard rates by species and derogation, 2003-2007.
REG_AREA SPECIES YEAR REG_GEAR SPECON LANDINGS DISCARDS DISC RATE BY GEAR2d HKE 2003 4aii IIA81c 32d HKE 2003 4aii IIA81d 452d HKE 2003 4aii none 492d HKE 2003 4aiii IIA81d 32d HKE 2003 4aiii none 192d HKE 2003 4aiv IIA81c 32d HKE 2003 4aiv IIA81d 1332d HKE 2003 4aiv none 1282d HKE 2003 4av IIA81d 232d HKE 2003 4av none 672d HKE 2003 4cii none 112d HKE 2003 4e none 852d HKE 2003 none none 12d HKE 2004 4aii IIA81c 22d HKE 2004 4aii IIA81d 702d HKE 2004 4aii none 852d HKE 2004 4aiii IIA81d 112d HKE 2004 4aiii none 122d HKE 2004 4aiv IIA81c 12d HKE 2004 4aiv IIA81d 3082d HKE 2004 4aiv none 1892d HKE 2004 4av IIA81d 242d HKE 2004 4av none 1192d HKE 2004 4cii none 142d HKE 2004 4e none 2132d HKE 2004 none none 92d HKE 2005 4aii IIA81c 12d HKE 2005 4aii IIA81d 382d HKE 2005 4aii none 872d HKE 2005 4aiii IIA81d 182d HKE 2005 4aiii none 62d HKE 2005 4aiv IIA81d 7402d HKE 2005 4aiv none 1792d HKE 2005 4av IIA81c 42d HKE 2005 4av IIA81d 602d HKE 2005 4av none 1472d HKE 2005 4cii none 312d HKE 2005 4e none 6992d HKE 2005 none none 12d HKE 2006 4aii IIA81c 12d HKE 2006 4aii IIA81d 362d HKE 2006 4aii none 942d HKE 2006 4aiii IIA81d 252d HKE 2006 4aiii none 132d HKE 2006 4aiv IIA81d 5892d HKE 2006 4aiv none 1312d HKE 2006 4av IIA81d 632d HKE 2006 4av none 1382d HKE 2006 4cii none 1152d HKE 2006 4e none 11272d HKE 2007 4aii IIA81c 12d HKE 2007 4aii IIA81d 162d HKE 2007 4aii none 562d HKE 2007 4aiii IIA81d 182d HKE 2007 4aiii none 172d HKE 2007 4aiv IIA81d 6532d HKE 2007 4aiv none 2612d HKE 2007 4av IIA81c 52d HKE 2007 4av IIA81d 562d HKE 2007 4av none 1192d HKE 2007 4cii none 3382d HKE 2007 4e none 1939
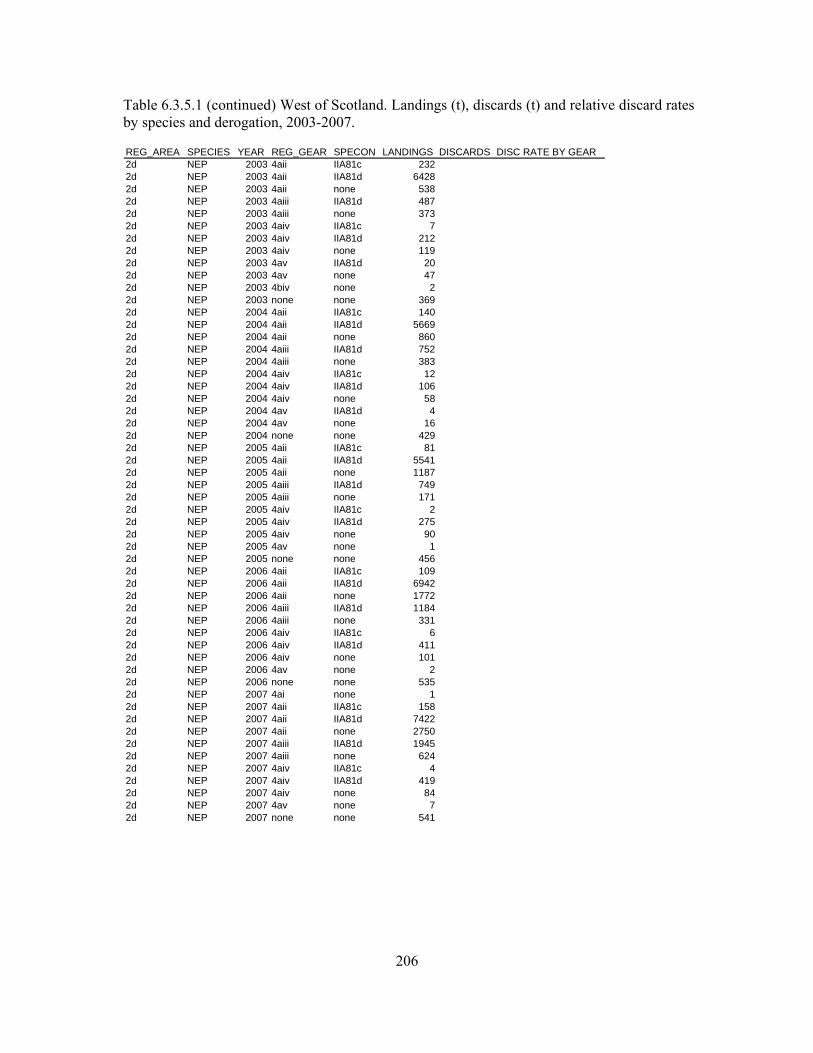
206
Table 6.3.5.1 (continued) West of Scotland. Landings (t), discards (t) and relative discard rates by species and derogation, 2003-2007.
REG_AREA SPECIES YEAR REG_GEAR SPECON LANDINGS DISCARDS DISC RATE BY GEAR2d NEP 2003 4aii IIA81c 2322d NEP 2003 4aii IIA81d 64282d NEP 2003 4aii none 5382d NEP 2003 4aiii IIA81d 4872d NEP 2003 4aiii none 3732d NEP 2003 4aiv IIA81c 72d NEP 2003 4aiv IIA81d 2122d NEP 2003 4aiv none 1192d NEP 2003 4av IIA81d 202d NEP 2003 4av none 472d NEP 2003 4biv none 22d NEP 2003 none none 3692d NEP 2004 4aii IIA81c 1402d NEP 2004 4aii IIA81d 56692d NEP 2004 4aii none 8602d NEP 2004 4aiii IIA81d 7522d NEP 2004 4aiii none 3832d NEP 2004 4aiv IIA81c 122d NEP 2004 4aiv IIA81d 1062d NEP 2004 4aiv none 582d NEP 2004 4av IIA81d 42d NEP 2004 4av none 162d NEP 2004 none none 4292d NEP 2005 4aii IIA81c 812d NEP 2005 4aii IIA81d 55412d NEP 2005 4aii none 11872d NEP 2005 4aiii IIA81d 7492d NEP 2005 4aiii none 1712d NEP 2005 4aiv IIA81c 22d NEP 2005 4aiv IIA81d 2752d NEP 2005 4aiv none 902d NEP 2005 4av none 12d NEP 2005 none none 4562d NEP 2006 4aii IIA81c 1092d NEP 2006 4aii IIA81d 69422d NEP 2006 4aii none 17722d NEP 2006 4aiii IIA81d 11842d NEP 2006 4aiii none 3312d NEP 2006 4aiv IIA81c 62d NEP 2006 4aiv IIA81d 4112d NEP 2006 4aiv none 1012d NEP 2006 4av none 22d NEP 2006 none none 5352d NEP 2007 4ai none 12d NEP 2007 4aii IIA81c 1582d NEP 2007 4aii IIA81d 74222d NEP 2007 4aii none 27502d NEP 2007 4aiii IIA81d 19452d NEP 2007 4aiii none 6242d NEP 2007 4aiv IIA81c 42d NEP 2007 4aiv IIA81d 4192d NEP 2007 4aiv none 842d NEP 2007 4av none 72d NEP 2007 none none 541
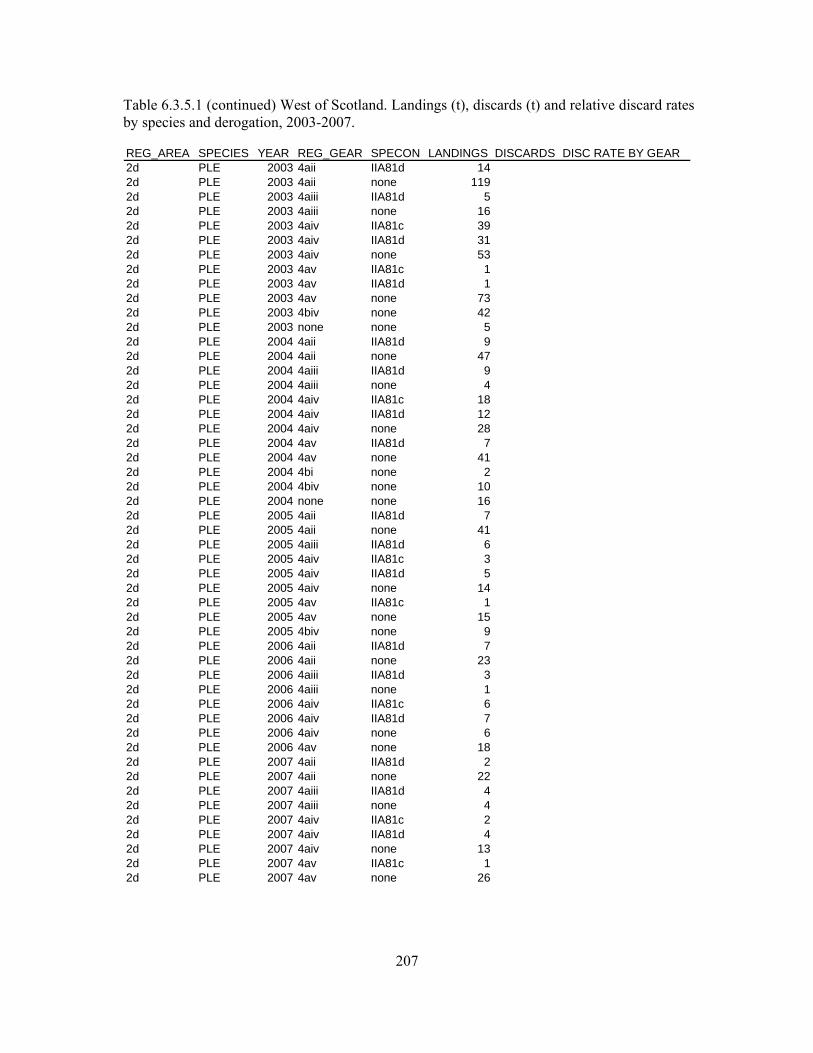
207
Table 6.3.5.1 (continued) West of Scotland. Landings (t), discards (t) and relative discard rates by species and derogation, 2003-2007.
REG_AREA SPECIES YEAR REG_GEAR SPECON LANDINGS DISCARDS DISC RATE BY GEAR2d PLE 2003 4aii IIA81d 142d PLE 2003 4aii none 1192d PLE 2003 4aiii IIA81d 52d PLE 2003 4aiii none 162d PLE 2003 4aiv IIA81c 392d PLE 2003 4aiv IIA81d 312d PLE 2003 4aiv none 532d PLE 2003 4av IIA81c 12d PLE 2003 4av IIA81d 12d PLE 2003 4av none 732d PLE 2003 4biv none 422d PLE 2003 none none 52d PLE 2004 4aii IIA81d 92d PLE 2004 4aii none 472d PLE 2004 4aiii IIA81d 92d PLE 2004 4aiii none 42d PLE 2004 4aiv IIA81c 182d PLE 2004 4aiv IIA81d 122d PLE 2004 4aiv none 282d PLE 2004 4av IIA81d 72d PLE 2004 4av none 412d PLE 2004 4bi none 22d PLE 2004 4biv none 102d PLE 2004 none none 162d PLE 2005 4aii IIA81d 72d PLE 2005 4aii none 412d PLE 2005 4aiii IIA81d 62d PLE 2005 4aiv IIA81c 32d PLE 2005 4aiv IIA81d 52d PLE 2005 4aiv none 142d PLE 2005 4av IIA81c 12d PLE 2005 4av none 152d PLE 2005 4biv none 92d PLE 2006 4aii IIA81d 72d PLE 2006 4aii none 232d PLE 2006 4aiii IIA81d 32d PLE 2006 4aiii none 12d PLE 2006 4aiv IIA81c 62d PLE 2006 4aiv IIA81d 72d PLE 2006 4aiv none 62d PLE 2006 4av none 182d PLE 2007 4aii IIA81d 22d PLE 2007 4aii none 222d PLE 2007 4aiii IIA81d 42d PLE 2007 4aiii none 42d PLE 2007 4aiv IIA81c 22d PLE 2007 4aiv IIA81d 42d PLE 2007 4aiv none 132d PLE 2007 4av IIA81c 12d PLE 2007 4av none 26
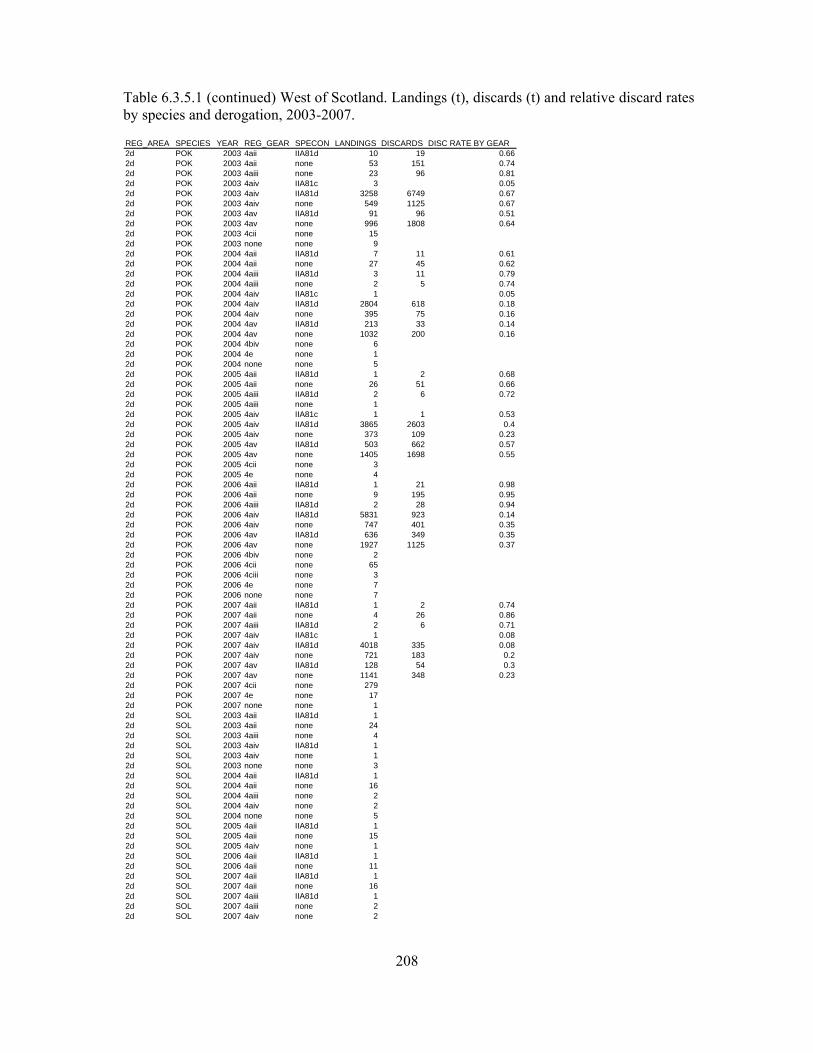
208
Table 6.3.5.1 (continued) West of Scotland. Landings (t), discards (t) and relative discard rates by species and derogation, 2003-2007.
REG_AREA SPECIES YEAR REG_GEAR SPECON LANDINGS DISCARDS DISC RATE BY GEAR2d POK 2003 4aii IIA81d 10 19 0.662d POK 2003 4aii none 53 151 0.742d POK 2003 4aiii none 23 96 0.812d POK 2003 4aiv IIA81c 3 0.052d POK 2003 4aiv IIA81d 3258 6749 0.672d POK 2003 4aiv none 549 1125 0.672d POK 2003 4av IIA81d 91 96 0.512d POK 2003 4av none 996 1808 0.642d POK 2003 4cii none 152d POK 2003 none none 92d POK 2004 4aii IIA81d 7 11 0.612d POK 2004 4aii none 27 45 0.622d POK 2004 4aiii IIA81d 3 11 0.792d POK 2004 4aiii none 2 5 0.742d POK 2004 4aiv IIA81c 1 0.052d POK 2004 4aiv IIA81d 2804 618 0.182d POK 2004 4aiv none 395 75 0.162d POK 2004 4av IIA81d 213 33 0.142d POK 2004 4av none 1032 200 0.162d POK 2004 4biv none 62d POK 2004 4e none 12d POK 2004 none none 52d POK 2005 4aii IIA81d 1 2 0.682d POK 2005 4aii none 26 51 0.662d POK 2005 4aiii IIA81d 2 6 0.722d POK 2005 4aiii none 12d POK 2005 4aiv IIA81c 1 1 0.532d POK 2005 4aiv IIA81d 3865 2603 0.42d POK 2005 4aiv none 373 109 0.232d POK 2005 4av IIA81d 503 662 0.572d POK 2005 4av none 1405 1698 0.552d POK 2005 4cii none 32d POK 2005 4e none 42d POK 2006 4aii IIA81d 1 21 0.982d POK 2006 4aii none 9 195 0.952d POK 2006 4aiii IIA81d 2 28 0.942d POK 2006 4aiv IIA81d 5831 923 0.142d POK 2006 4aiv none 747 401 0.352d POK 2006 4av IIA81d 636 349 0.352d POK 2006 4av none 1927 1125 0.372d POK 2006 4biv none 22d POK 2006 4cii none 652d POK 2006 4ciii none 32d POK 2006 4e none 72d POK 2006 none none 72d POK 2007 4aii IIA81d 1 2 0.742d POK 2007 4aii none 4 26 0.862d POK 2007 4aiii IIA81d 2 6 0.712d POK 2007 4aiv IIA81c 1 0.082d POK 2007 4aiv IIA81d 4018 335 0.082d POK 2007 4aiv none 721 183 0.22d POK 2007 4av IIA81d 128 54 0.32d POK 2007 4av none 1141 348 0.232d POK 2007 4cii none 2792d POK 2007 4e none 172d POK 2007 none none 12d SOL 2003 4aii IIA81d 12d SOL 2003 4aii none 242d SOL 2003 4aiii none 42d SOL 2003 4aiv IIA81d 12d SOL 2003 4aiv none 12d SOL 2003 none none 32d SOL 2004 4aii IIA81d 12d SOL 2004 4aii none 162d SOL 2004 4aiii none 22d SOL 2004 4aiv none 22d SOL 2004 none none 52d SOL 2005 4aii IIA81d 12d SOL 2005 4aii none 152d SOL 2005 4aiv none 12d SOL 2006 4aii IIA81d 12d SOL 2006 4aii none 112d SOL 2007 4aii IIA81d 12d SOL 2007 4aii none 162d SOL 2007 4aiii IIA81d 12d SOL 2007 4aiii none 22d SOL 2007 4aiv none 2
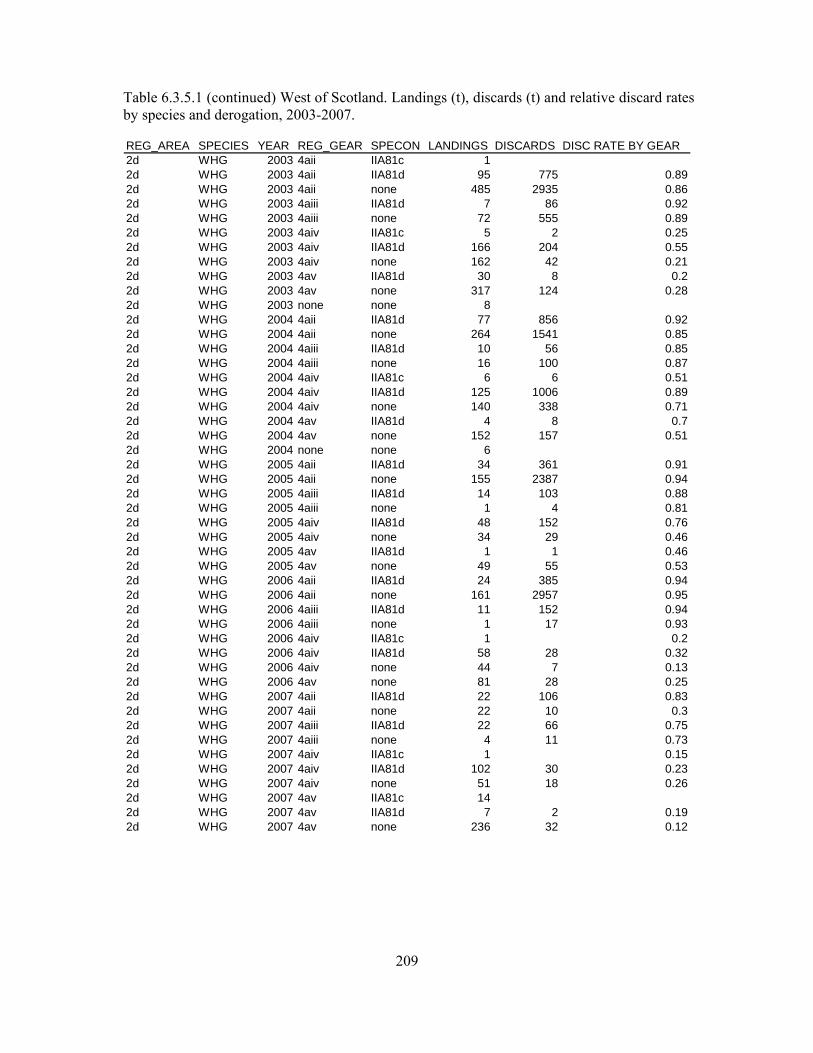
209
Table 6.3.5.1 (continued) West of Scotland. Landings (t), discards (t) and relative discard rates by species and derogation, 2003-2007.
REG_AREA SPECIES YEAR REG_GEAR SPECON LANDINGS DISCARDS DISC RATE BY GEAR2d WHG 2003 4aii IIA81c 12d WHG 2003 4aii IIA81d 95 775 0.892d WHG 2003 4aii none 485 2935 0.862d WHG 2003 4aiii IIA81d 7 86 0.922d WHG 2003 4aiii none 72 555 0.892d WHG 2003 4aiv IIA81c 5 2 0.252d WHG 2003 4aiv IIA81d 166 204 0.552d WHG 2003 4aiv none 162 42 0.212d WHG 2003 4av IIA81d 30 8 0.22d WHG 2003 4av none 317 124 0.282d WHG 2003 none none 82d WHG 2004 4aii IIA81d 77 856 0.922d WHG 2004 4aii none 264 1541 0.852d WHG 2004 4aiii IIA81d 10 56 0.852d WHG 2004 4aiii none 16 100 0.872d WHG 2004 4aiv IIA81c 6 6 0.512d WHG 2004 4aiv IIA81d 125 1006 0.892d WHG 2004 4aiv none 140 338 0.712d WHG 2004 4av IIA81d 4 8 0.72d WHG 2004 4av none 152 157 0.512d WHG 2004 none none 62d WHG 2005 4aii IIA81d 34 361 0.912d WHG 2005 4aii none 155 2387 0.942d WHG 2005 4aiii IIA81d 14 103 0.882d WHG 2005 4aiii none 1 4 0.812d WHG 2005 4aiv IIA81d 48 152 0.762d WHG 2005 4aiv none 34 29 0.462d WHG 2005 4av IIA81d 1 1 0.462d WHG 2005 4av none 49 55 0.532d WHG 2006 4aii IIA81d 24 385 0.942d WHG 2006 4aii none 161 2957 0.952d WHG 2006 4aiii IIA81d 11 152 0.942d WHG 2006 4aiii none 1 17 0.932d WHG 2006 4aiv IIA81c 1 0.22d WHG 2006 4aiv IIA81d 58 28 0.322d WHG 2006 4aiv none 44 7 0.132d WHG 2006 4av none 81 28 0.252d WHG 2007 4aii IIA81d 22 106 0.832d WHG 2007 4aii none 22 10 0.32d WHG 2007 4aiii IIA81d 22 66 0.752d WHG 2007 4aiii none 4 11 0.732d WHG 2007 4aiv IIA81c 1 0.152d WHG 2007 4aiv IIA81d 102 30 0.232d WHG 2007 4aiv none 51 18 0.262d WHG 2007 4av IIA81c 142d WHG 2007 4av IIA81d 7 2 0.192d WHG 2007 4av none 236 32 0.12
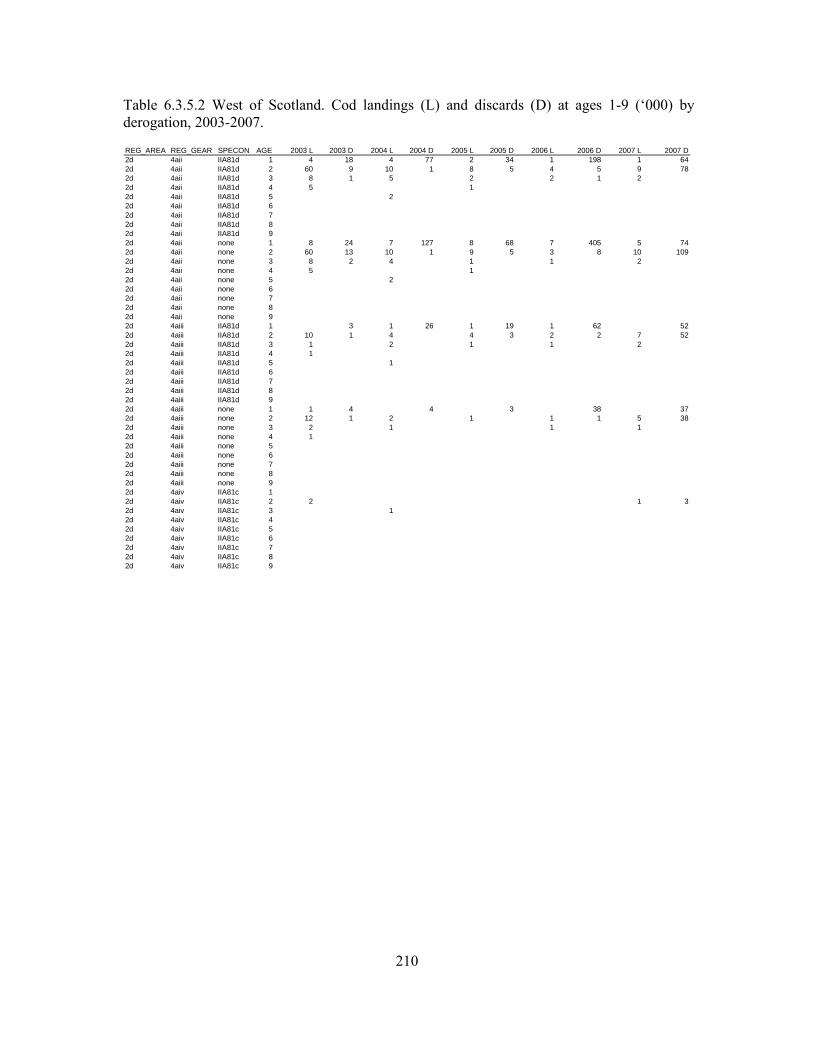
210
Table 6.3.5.2 West of Scotland. Cod landings (L) and discards (D) at ages 1-9 (‘000) by derogation, 2003-2007.
REG_AREA REG_GEAR SPECON AGE 2003 L 2003 D 2004 L 2004 D 2005 L 2005 D 2006 L 2006 D 2007 L 2007 D2d 4aii IIA81d 1 4 18 4 77 2 34 1 198 1 642d 4aii IIA81d 2 60 9 10 1 8 5 4 5 9 782d 4aii IIA81d 3 8 1 5 2 2 1 22d 4aii IIA81d 4 5 12d 4aii IIA81d 5 22d 4aii IIA81d 62d 4aii IIA81d 72d 4aii IIA81d 82d 4aii IIA81d 92d 4aii none 1 8 24 7 127 8 68 7 405 5 742d 4aii none 2 60 13 10 1 9 5 3 8 10 1092d 4aii none 3 8 2 4 1 1 22d 4aii none 4 5 12d 4aii none 5 22d 4aii none 62d 4aii none 72d 4aii none 82d 4aii none 92d 4aiii IIA81d 1 3 1 26 1 19 1 62 522d 4aiii IIA81d 2 10 1 4 4 3 2 2 7 522d 4aiii IIA81d 3 1 2 1 1 22d 4aiii IIA81d 4 12d 4aiii IIA81d 5 12d 4aiii IIA81d 62d 4aiii IIA81d 72d 4aiii IIA81d 82d 4aiii IIA81d 92d 4aiii none 1 1 4 4 3 38 372d 4aiii none 2 12 1 2 1 1 1 5 382d 4aiii none 3 2 1 1 12d 4aiii none 4 12d 4aiii none 52d 4aiii none 62d 4aiii none 72d 4aiii none 82d 4aiii none 92d 4aiv IIA81c 12d 4aiv IIA81c 2 2 1 32d 4aiv IIA81c 3 12d 4aiv IIA81c 42d 4aiv IIA81c 52d 4aiv IIA81c 62d 4aiv IIA81c 72d 4aiv IIA81c 82d 4aiv IIA81c 9
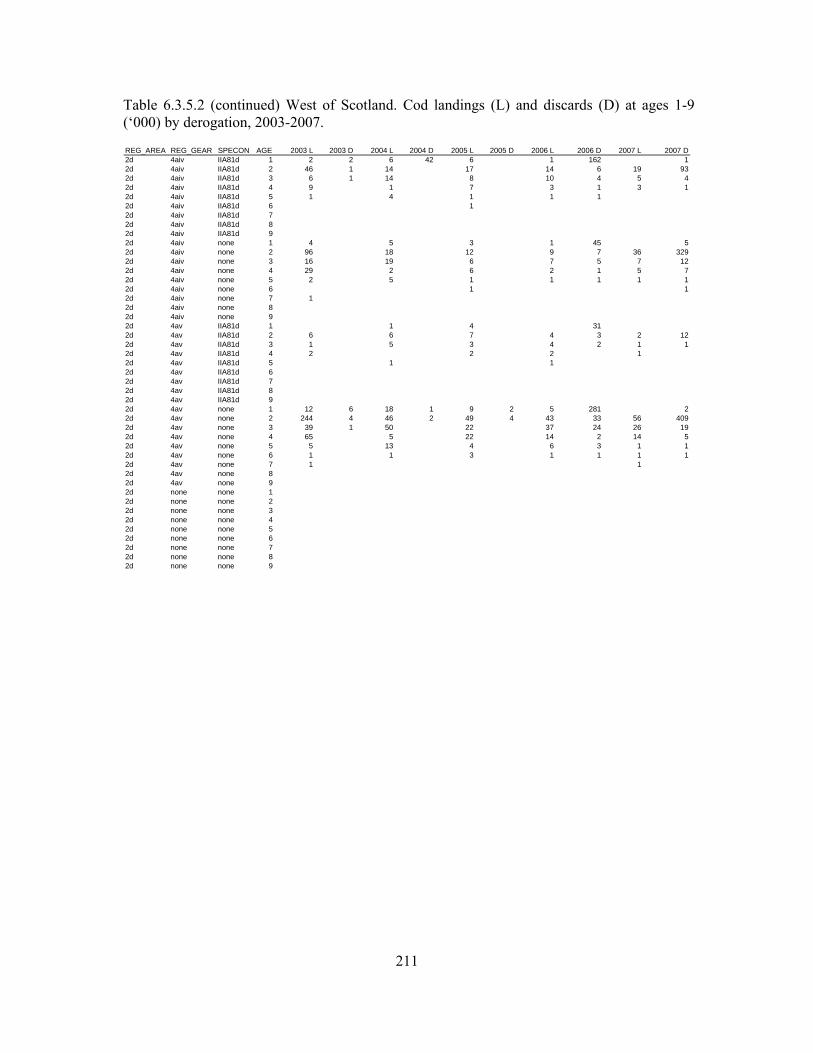
211
Table 6.3.5.2 (continued) West of Scotland. Cod landings (L) and discards (D) at ages 1-9 (‘000) by derogation, 2003-2007.
REG_AREA REG_GEAR SPECON AGE 2003 L 2003 D 2004 L 2004 D 2005 L 2005 D 2006 L 2006 D 2007 L 2007 D2d 4aiv IIA81d 1 2 2 6 42 6 1 162 12d 4aiv IIA81d 2 46 1 14 17 14 6 19 932d 4aiv IIA81d 3 6 1 14 8 10 4 5 42d 4aiv IIA81d 4 9 1 7 3 1 3 12d 4aiv IIA81d 5 1 4 1 1 12d 4aiv IIA81d 6 12d 4aiv IIA81d 72d 4aiv IIA81d 82d 4aiv IIA81d 92d 4aiv none 1 4 5 3 1 45 52d 4aiv none 2 96 18 12 9 7 36 3292d 4aiv none 3 16 19 6 7 5 7 122d 4aiv none 4 29 2 6 2 1 5 72d 4aiv none 5 2 5 1 1 1 1 12d 4aiv none 6 1 12d 4aiv none 7 12d 4aiv none 82d 4aiv none 92d 4av IIA81d 1 1 4 312d 4av IIA81d 2 6 6 7 4 3 2 122d 4av IIA81d 3 1 5 3 4 2 1 12d 4av IIA81d 4 2 2 2 12d 4av IIA81d 5 1 12d 4av IIA81d 62d 4av IIA81d 72d 4av IIA81d 82d 4av IIA81d 92d 4av none 1 12 6 18 1 9 2 5 281 22d 4av none 2 244 4 46 2 49 4 43 33 56 4092d 4av none 3 39 1 50 22 37 24 26 192d 4av none 4 65 5 22 14 2 14 52d 4av none 5 5 13 4 6 3 1 12d 4av none 6 1 1 3 1 1 1 12d 4av none 7 1 12d 4av none 82d 4av none 92d none none 12d none none 22d none none 32d none none 42d none none 52d none none 62d none none 72d none none 82d none none 9
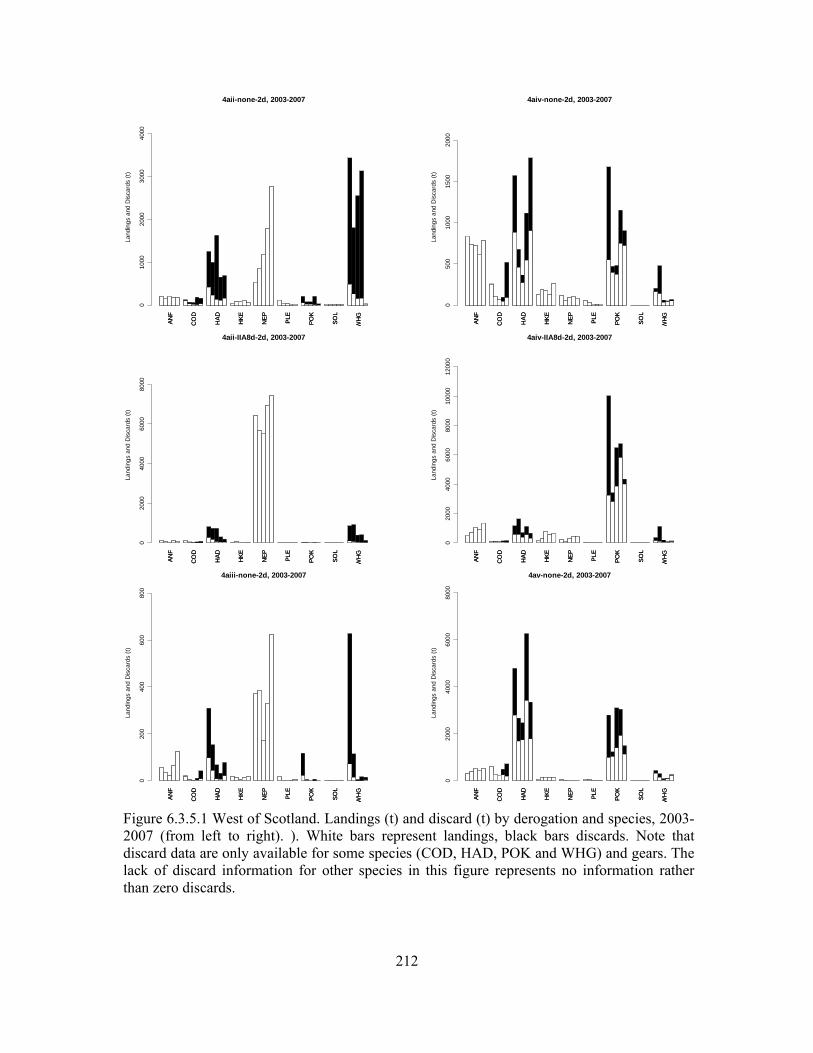
212
ANF
CO
D
HAD HKE
NEP PL
E
POK
SOL
WH
G
4aii-none-2d, 2003-2007
Land
ings
and
Dis
card
s (t)
010
0020
0030
0040
00
ANF
CO
D
HAD HKE
NEP PL
E
POK
SOL
WH
G
ANF
CO
D
HAD HKE
NEP PL
E
POK
SOL
WH
G
4aii-IIA8d-2d, 2003-2007
Land
ings
and
Dis
card
s (t)
020
0040
0060
0080
00
ANF
CO
D
HAD HKE
NEP PL
E
POK
SOL
WH
G
ANF
CO
D
HAD HKE
NEP PL
E
POK
SOL
WH
G
4aiii-none-2d, 2003-2007
Land
ings
and
Dis
card
s (t)
020
040
060
080
0
ANF
CO
D
HAD HKE
NEP PL
E
POK
SOL
WH
G
ANF
CO
D
HAD HKE
NEP PL
E
POK
SOL
WH
G
4aiv-none-2d, 2003-2007
Land
ings
and
Dis
card
s (t)
050
010
0015
0020
00
ANF
CO
D
HAD HKE
NEP PL
E
POK
SOL
WH
G
ANF
CO
D
HAD HKE
NEP PL
E
POK
SOL
WH
G
4aiv-IIA8d-2d, 2003-2007
Land
ings
and
Dis
card
s (t)
020
0040
0060
0080
0010
000
1200
0
ANF
CO
D
HAD HKE
NEP PL
E
POK
SOL
WH
G
ANF
CO
D
HAD HKE
NEP PL
E
POK
SOL
WH
G
4av-none-2d, 2003-2007
Land
ings
and
Dis
card
s (t)
020
0040
0060
0080
00
ANF
CO
D
HAD HKE
NEP PL
E
POK
SOL
WH
G
Figure 6.3.5.1 West of Scotland. Landings (t) and discard (t) by derogation and species, 2003-2007 (from left to right). ). White bars represent landings, black bars discards. Note that discard data are only available for some species (COD, HAD, POK and WHG) and gears. The lack of discard information for other species in this figure represents no information rather than zero discards.

213
ANF
CO
D
HAD HKE
NEP PL
E
POK
SOL
WH
G
4ciii-none-2d, 2003-2007La
ndin
gs a
nd D
isca
rds
(t)
0.0
0.5
1.0
1.5
2.0
2.5
3.0
ANF
CO
D
HAD HKE
NEP PL
E
POK
SOL
WH
G
ANF
CO
D
HAD HKE
NEP PL
E
POK
SOL
WH
G
4e-none-2d, 2003-2007
Land
ings
and
Dis
card
s (t)
050
010
0015
0020
0025
00
ANF
CO
D
HAD HKE
NEP PL
E
POK
SOL
WH
G
AN
F
CO
D
HA
D
HK
E
NE
P
PLE
PO
K
SO
L
WH
G
none-none-2d, 2003-2007
Land
ings
and
Dis
card
s (t)
010
020
030
040
050
060
070
0
AN
F
CO
D
HA
D
HK
E
NE
P
PLE
PO
K
SO
L
WH
G
Figure 6.3.5.2 West of Scotland. Landings (t) and discard (t) by derogation and species, 2003-2007 (from left to right). ). White bars represent landings, black bars discards. Note that discard data are only available for some species (COD, HAD, POK and WHG) and gears. The lack of discard information for a given species/gear in this figure represents no information rather than zero discards.
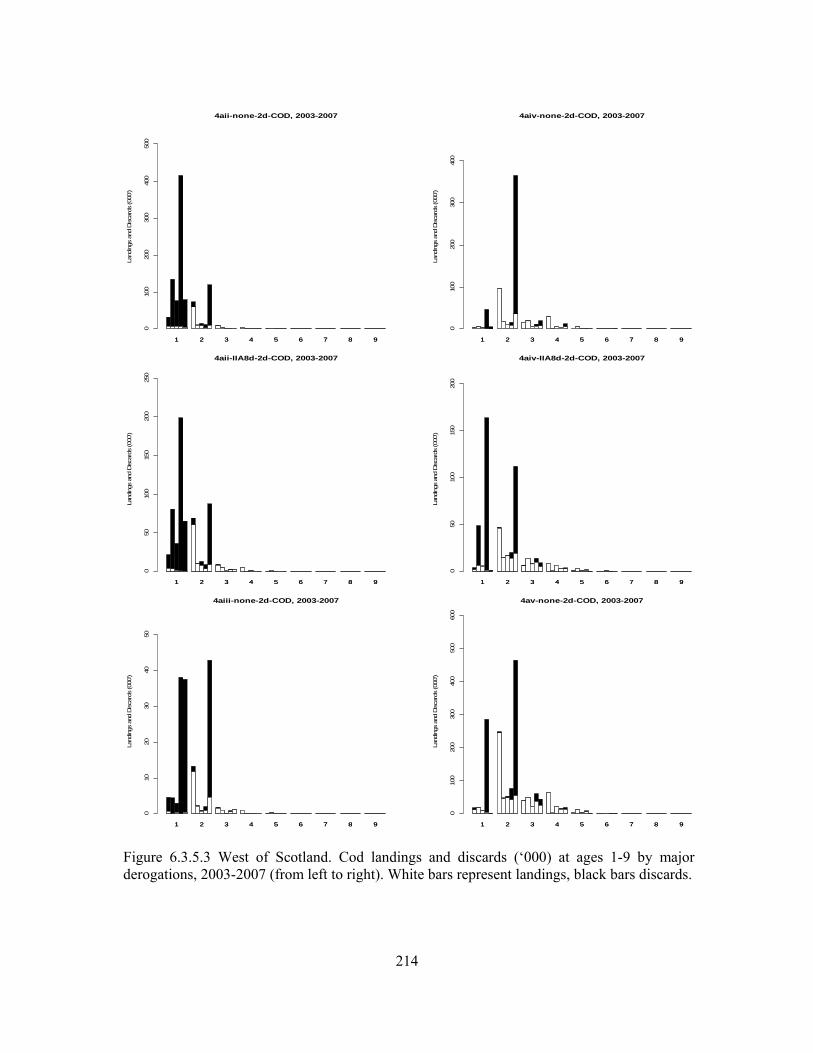
214
1 2 3 4 5 6 7 8 9
4aii-none-2d-COD, 2003-2007
Land
ings
and
Disca
rds
(000
')
010
020
030
040
050
0
1 2 3 4 5 6 7 8 9
1 2 3 4 5 6 7 8 9
4aii-IIA8d-2d-COD, 2003-2007
Land
ings
and
Disca
rds
(000
')
050
100
150
200
250
1 2 3 4 5 6 7 8 9
1 2 3 4 5 6 7 8 9
4aiii-none-2d-COD, 2003-2007
Land
ings
and
Disca
rds
(000
')
010
2030
4050
1 2 3 4 5 6 7 8 9
1 2 3 4 5 6 7 8 9
4aiv-none-2d-COD, 2003-2007
Land
ings
and
Disca
rds
(000
')
010
020
030
040
0
1 2 3 4 5 6 7 8 9
1 2 3 4 5 6 7 8 9
4aiv-IIA8d-2d-COD, 2003-2007
Land
ings
and
Disca
rds
(000
')
050
100
150
200
1 2 3 4 5 6 7 8 9
1 2 3 4 5 6 7 8 9
4av-none-2d-COD, 2003-2007
Land
ings
and
Disca
rds
(000
')
010
020
030
040
050
060
0
1 2 3 4 5 6 7 8 9
Figure 6.3.5.3 West of Scotland. Cod landings and discards (‘000) at ages 1-9 by major derogations, 2003-2007 (from left to right). White bars represent landings, black bars discards.
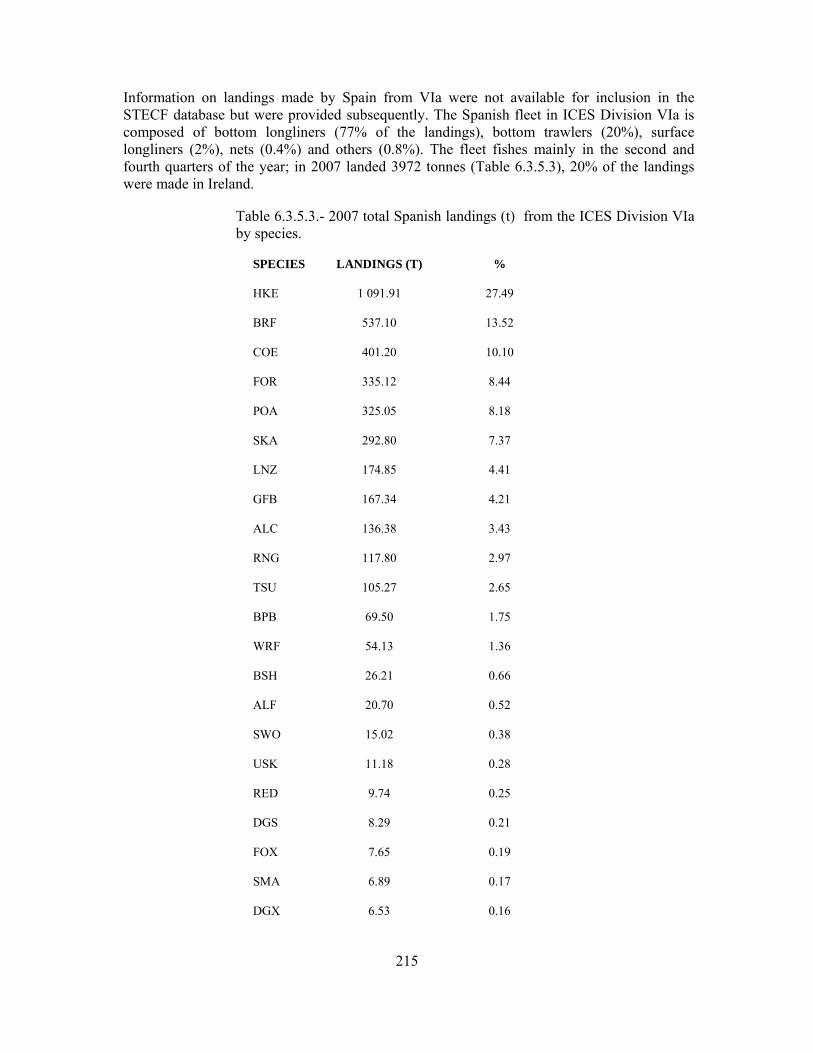
215
Information on landings made by Spain from VIa were not available for inclusion in the STECF database but were provided subsequently. The Spanish fleet in ICES Division VIa is composed of bottom longliners (77% of the landings), bottom trawlers (20%), surface longliners (2%), nets (0.4%) and others (0.8%). The fleet fishes mainly in the second and fourth quarters of the year; in 2007 landed 3972 tonnes (Table 6.3.5.3), 20% of the landings were made in Ireland.
Table 6.3.5.3.- 2007 total Spanish landings (t) from the ICES Division VIa by species.
SPECIES LANDINGS (T) %
HKE 1 091.91 27.49
BRF 537.10 13.52
COE 401.20 10.10
FOR 335.12 8.44
POA 325.05 8.18
SKA 292.80 7.37
LNZ 174.85 4.41
GFB 167.34 4.21
ALC 136.38 3.43
RNG 117.80 2.97
TSU 105.27 2.65
BPB 69.50 1.75
WRF 54.13 1.36
BSH 26.21 0.66
ALF 20.70 0.52
SWO 15.02 0.38
USK 11.18 0.28
RED 9.74 0.25
DGS 8.29 0.21
FOX 7.65 0.19
SMA 6.89 0.17
DGX 6.53 0.16
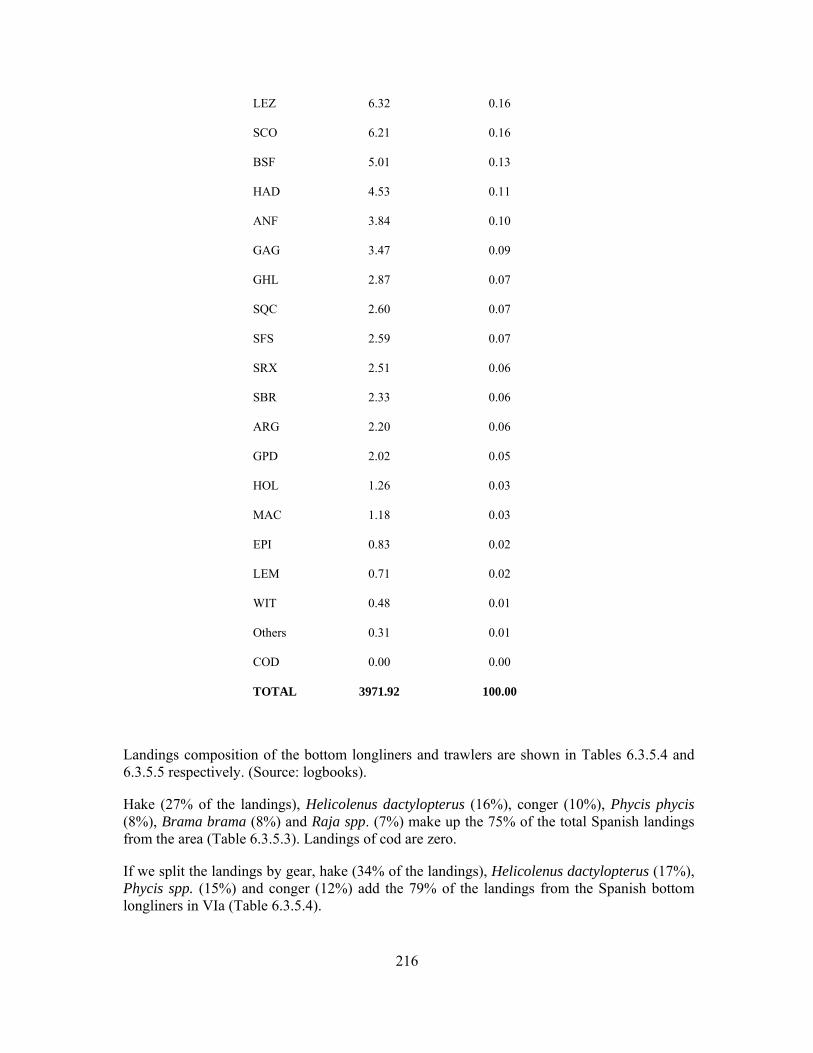
216
LEZ 6.32 0.16
SCO 6.21 0.16
BSF 5.01 0.13
HAD 4.53 0.11
ANF 3.84 0.10
GAG 3.47 0.09
GHL 2.87 0.07
SQC 2.60 0.07
SFS 2.59 0.07
SRX 2.51 0.06
SBR 2.33 0.06
ARG 2.20 0.06
GPD 2.02 0.05
HOL 1.26 0.03
MAC 1.18 0.03
EPI 0.83 0.02
LEM 0.71 0.02
WIT 0.48 0.01
Others 0.31 0.01
COD 0.00 0.00
TOTAL 3971.92 100.00
Landings composition of the bottom longliners and trawlers are shown in Tables 6.3.5.4 and 6.3.5.5 respectively. (Source: logbooks).
Hake (27% of the landings), Helicolenus dactylopterus (16%), conger (10%), Phycis phycis (8%), Brama brama (8%) and Raja spp. (7%) make up the 75% of the total Spanish landings from the area (Table 6.3.5.3). Landings of cod are zero.
If we split the landings by gear, hake (34% of the landings), Helicolenus dactylopterus (17%), Phycis spp. (15%) and conger (12%) add the 79% of the landings from the Spanish bottom longliners in VIa (Table 6.3.5.4).
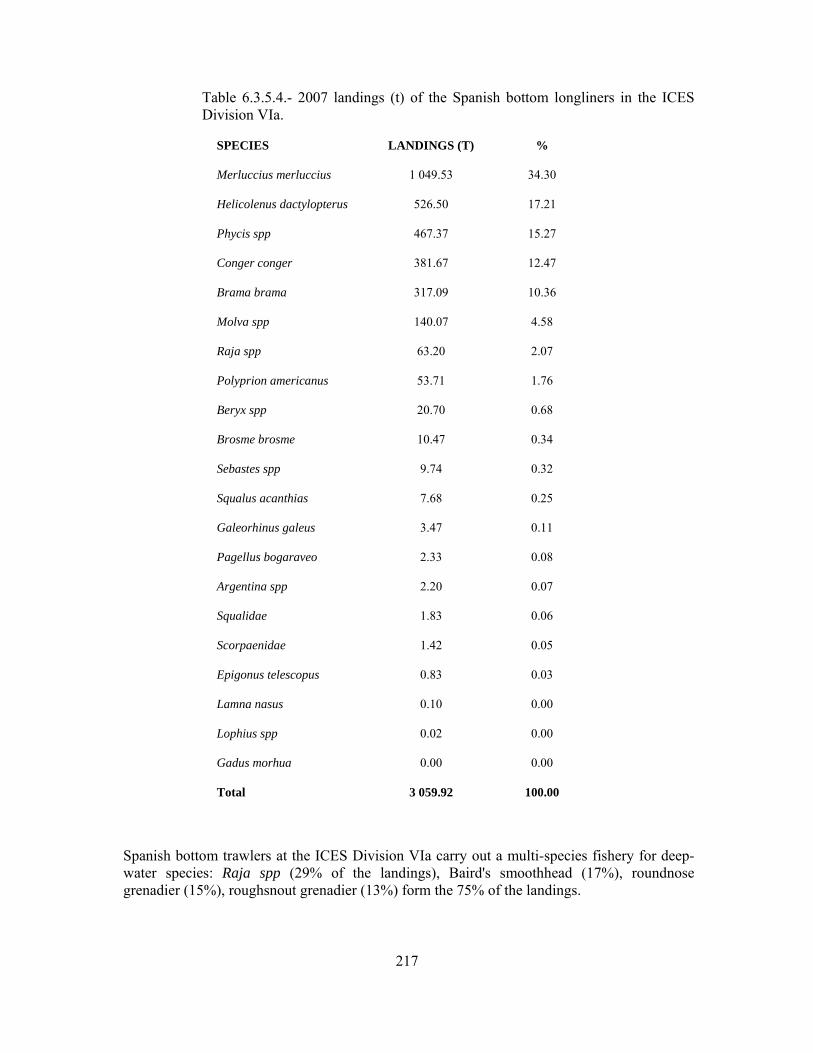
217
Table 6.3.5.4.- 2007 landings (t) of the Spanish bottom longliners in the ICES Division VIa.
SPECIES LANDINGS (T) %
Merluccius merluccius 1 049.53 34.30
Helicolenus dactylopterus 526.50 17.21
Phycis spp 467.37 15.27
Conger conger 381.67 12.47
Brama brama 317.09 10.36
Molva spp 140.07 4.58
Raja spp 63.20 2.07
Polyprion americanus 53.71 1.76
Beryx spp 20.70 0.68
Brosme brosme 10.47 0.34
Sebastes spp 9.74 0.32
Squalus acanthias 7.68 0.25
Galeorhinus galeus 3.47 0.11
Pagellus bogaraveo 2.33 0.08
Argentina spp 2.20 0.07
Squalidae 1.83 0.06
Scorpaenidae 1.42 0.05
Epigonus telescopus 0.83 0.03
Lamna nasus 0.10 0.00
Lophius spp 0.02 0.00
Gadus morhua 0.00 0.00
Total 3 059.92 100.00
Spanish bottom trawlers at the ICES Division VIa carry out a multi-species fishery for deep-water species: Raja spp (29% of the landings), Baird's smoothhead (17%), roundnose grenadier (15%), roughsnout grenadier (13%) form the 75% of the landings.

218
The only discard data for the Spanish fleet in ICES Division VIa come from the Basque fleet collected by AZTI (Basque Country). The Basque fleet in this area prosecutes a bottom trawl fishery with hake and Lophius piscatorius as target species and Macrourus spp. as bycatch species. Discards are mainly composed of Argentina spp. (54% of the discards) and Chimaera monstruosa (13%), species with no commercial value. Small sizes of Helicolenus dactilopterus are also discarded. Other species that are occasionally discarded are Brosme brosme, Macrourus spp., invertebrates, Pollachius virens, Scyliorhinus canicula, Micromesistius poutassou, Chaceon affinis, Alepocephalus bairdii, Galeus melastomus, Etmopterus spinax or Trichiurus lepturus.
Table 6.3.5.5.- 2007 landings (t) of the Spanish bottom trawlers in the ICES Division VIa.
SPECIES LANDINGS (T) %
Raja spp 232.11 29.49
Alepocephalus bairdii 136.38 17.33
Coryphaenoides rupestris 117.80 14.97
Trachyrincus scabrus 105.27 13.37
Pterycombus brama 67.80 8.61
Phycis spp 42.74 5.43
Molva spp 34.78 4.42
Lepidorhombus spp 6.30 0.80
Aphanopus carbo 5.01 0.64
Scorpaenidae 4.79 0.61
Squalidae 4.70 0.60
Melanogrammus aeglefinus 4.53 0.58
Conger conger 3.84 0.49
Lophius spp 3.79 0.48
Merluccius merluccius 3.42 0.43
Reinhardtius hippoglossoides 2.87 0.36
Loligo spp 2.60 0.33
Lepidopus caudatus 2.59 0.33
Epinephelus marginatus 2.02 0.26
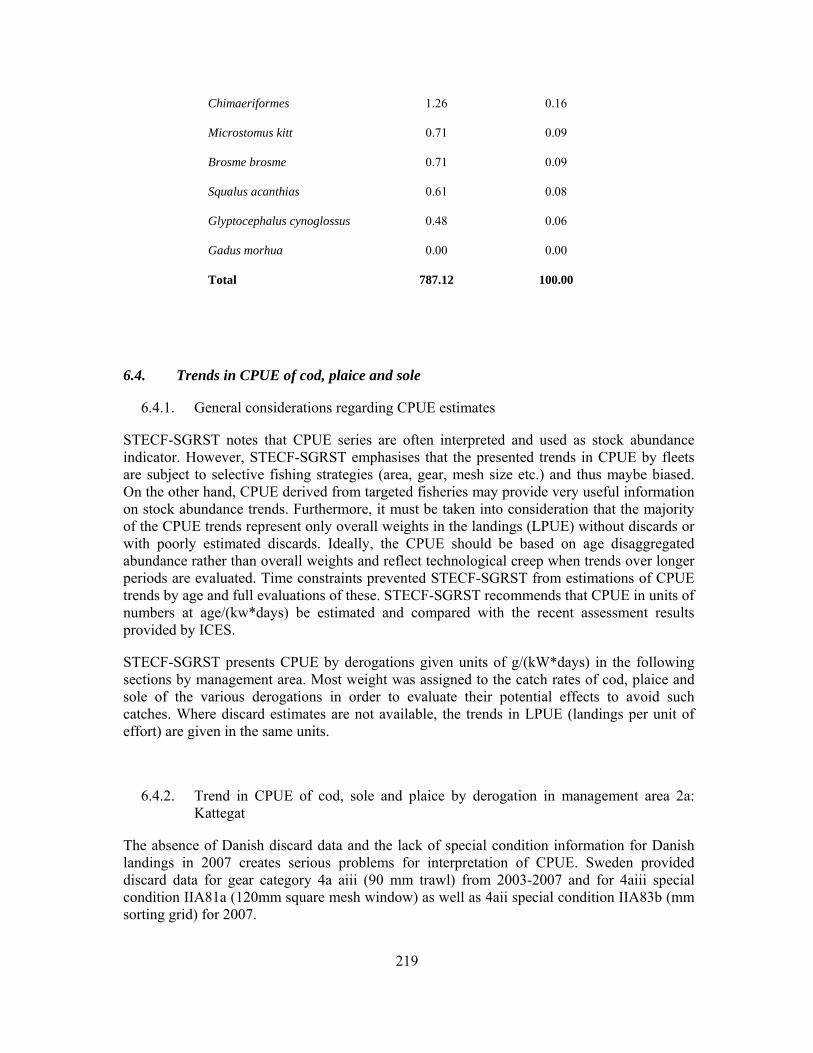
219
Chimaeriformes 1.26 0.16
Microstomus kitt 0.71 0.09
Brosme brosme 0.71 0.09
Squalus acanthias 0.61 0.08
Glyptocephalus cynoglossus 0.48 0.06
Gadus morhua 0.00 0.00
Total 787.12 100.00
6.4. Trends in CPUE of cod, plaice and sole
6.4.1. General considerations regarding CPUE estimates
STECF-SGRST notes that CPUE series are often interpreted and used as stock abundance indicator. However, STECF-SGRST emphasises that the presented trends in CPUE by fleets are subject to selective fishing strategies (area, gear, mesh size etc.) and thus maybe biased. On the other hand, CPUE derived from targeted fisheries may provide very useful information on stock abundance trends. Furthermore, it must be taken into consideration that the majority of the CPUE trends represent only overall weights in the landings (LPUE) without discards or with poorly estimated discards. Ideally, the CPUE should be based on age disaggregated abundance rather than overall weights and reflect technological creep when trends over longer periods are evaluated. Time constraints prevented STECF-SGRST from estimations of CPUE trends by age and full evaluations of these. STECF-SGRST recommends that CPUE in units of numbers at age/(kw*days) be estimated and compared with the recent assessment results provided by ICES.
STECF-SGRST presents CPUE by derogations given units of g/(kW*days) in the following sections by management area. Most weight was assigned to the catch rates of cod, plaice and sole of the various derogations in order to evaluate their potential effects to avoid such catches. Where discard estimates are not available, the trends in LPUE (landings per unit of effort) are given in the same units.
6.4.2. Trend in CPUE of cod, sole and plaice by derogation in management area 2a: Kattegat
The absence of Danish discard data and the lack of special condition information for Danish landings in 2007 creates serious problems for interpretation of CPUE. Sweden provided discard data for gear category 4a aiii (90 mm trawl) from 2003-2007 and for 4aiii special condition IIA81a (120mm square mesh window) as well as 4aii special condition IIA83b (mm sorting grid) for 2007.
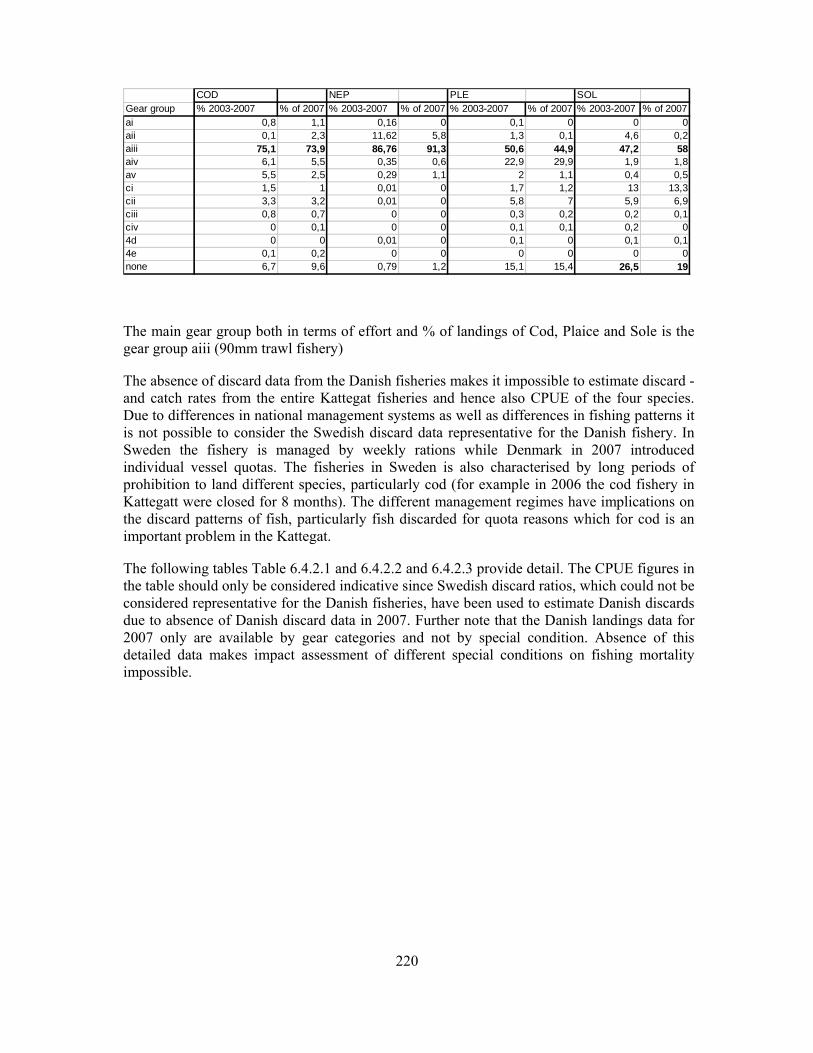
220
COD NEP PLE SOLGear group % 2003-2007 % of 2007 % 2003-2007 % of 2007 % 2003-2007 % of 2007 % 2003-2007 % of 2007ai 0,8 1,1 0,16 0 0,1 0 0 0aii 0,1 2,3 11,62 5,8 1,3 0,1 4,6 0,2aiii 75,1 73,9 86,76 91,3 50,6 44,9 47,2 58aiv 6,1 5,5 0,35 0,6 22,9 29,9 1,9 1,8av 5,5 2,5 0,29 1,1 2 1,1 0,4 0,5ci 1,5 1 0,01 0 1,7 1,2 13 13,3cii 3,3 3,2 0,01 0 5,8 7 5,9 6,9ciii 0,8 0,7 0 0 0,3 0,2 0,2 0,1civ 0 0,1 0 0 0,1 0,1 0,2 04d 0 0 0,01 0 0,1 0 0,1 0,14e 0,1 0,2 0 0 0 0 0 0none 6,7 9,6 0,79 1,2 15,1 15,4 26,5 19
The main gear group both in terms of effort and % of landings of Cod, Plaice and Sole is the gear group aiii (90mm trawl fishery)
The absence of discard data from the Danish fisheries makes it impossible to estimate discard - and catch rates from the entire Kattegat fisheries and hence also CPUE of the four species. Due to differences in national management systems as well as differences in fishing patterns it is not possible to consider the Swedish discard data representative for the Danish fishery. In Sweden the fishery is managed by weekly rations while Denmark in 2007 introduced individual vessel quotas. The fisheries in Sweden is also characterised by long periods of prohibition to land different species, particularly cod (for example in 2006 the cod fishery in Kattegatt were closed for 8 months). The different management regimes have implications on the discard patterns of fish, particularly fish discarded for quota reasons which for cod is an important problem in the Kattegat.
The following tables Table 6.4.2.1 and 6.4.2.2 and 6.4.2.3 provide detail. The CPUE figures in the table should only be considered indicative since Swedish discard ratios, which could not be considered representative for the Danish fisheries, have been used to estimate Danish discards due to absence of Danish discard data in 2007. Further note that the Danish landings data for 2007 only are available by gear categories and not by special condition. Absence of this detailed data makes impact assessment of different special conditions on fishing mortality impossible.
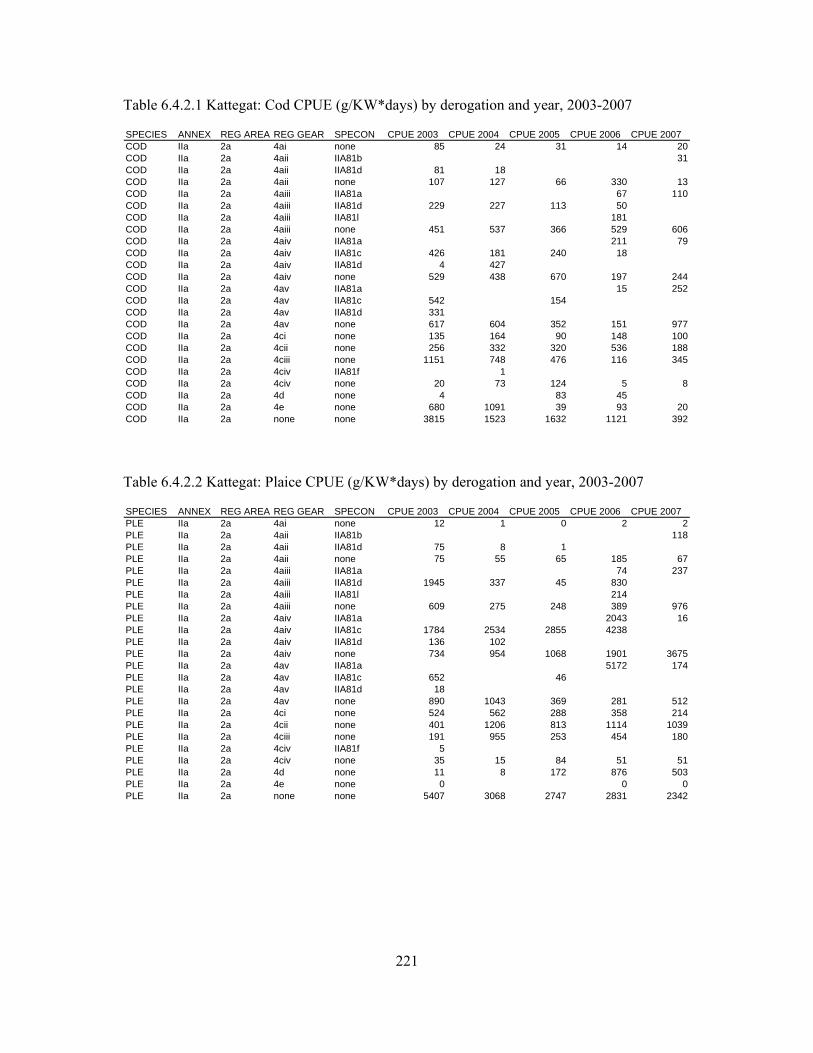
221
Table 6.4.2.1 Kattegat: Cod CPUE (g/KW*days) by derogation and year, 2003-2007
SPECIES ANNEX REG AREA REG GEAR SPECON CPUE 2003 CPUE 2004 CPUE 2005 CPUE 2006 CPUE 2007COD IIa 2a 4ai none 85 24 31 14 20COD IIa 2a 4aii IIA81b 31COD IIa 2a 4aii IIA81d 81 18COD IIa 2a 4aii none 107 127 66 330 13COD IIa 2a 4aiii IIA81a 67 110COD IIa 2a 4aiii IIA81d 229 227 113 50COD IIa 2a 4aiii IIA81l 181COD IIa 2a 4aiii none 451 537 366 529 606COD IIa 2a 4aiv IIA81a 211 79COD IIa 2a 4aiv IIA81c 426 181 240 18COD IIa 2a 4aiv IIA81d 4 427COD IIa 2a 4aiv none 529 438 670 197 244COD IIa 2a 4av IIA81a 15 252COD IIa 2a 4av IIA81c 542 154COD IIa 2a 4av IIA81d 331COD IIa 2a 4av none 617 604 352 151 977COD IIa 2a 4ci none 135 164 90 148 100COD IIa 2a 4cii none 256 332 320 536 188COD IIa 2a 4ciii none 1151 748 476 116 345COD IIa 2a 4civ IIA81f 1COD IIa 2a 4civ none 20 73 124 5 8COD IIa 2a 4d none 4 83 45COD IIa 2a 4e none 680 1091 39 93 20COD IIa 2a none none 3815 1523 1632 1121 392
Table 6.4.2.2 Kattegat: Plaice CPUE (g/KW*days) by derogation and year, 2003-2007
SPECIES ANNEX REG AREA REG GEAR SPECON CPUE 2003 CPUE 2004 CPUE 2005 CPUE 2006 CPUE 2007PLE IIa 2a 4ai none 12 1 0 2 2PLE IIa 2a 4aii IIA81b 118PLE IIa 2a 4aii IIA81d 75 8 1PLE IIa 2a 4aii none 75 55 65 185 67PLE IIa 2a 4aiii IIA81a 74 237PLE IIa 2a 4aiii IIA81d 1945 337 45 830PLE IIa 2a 4aiii IIA81l 214PLE IIa 2a 4aiii none 609 275 248 389 976PLE IIa 2a 4aiv IIA81a 2043 16PLE IIa 2a 4aiv IIA81c 1784 2534 2855 4238PLE IIa 2a 4aiv IIA81d 136 102PLE IIa 2a 4aiv none 734 954 1068 1901 3675PLE IIa 2a 4av IIA81a 5172 174PLE IIa 2a 4av IIA81c 652 46PLE IIa 2a 4av IIA81d 18PLE IIa 2a 4av none 890 1043 369 281 512PLE IIa 2a 4ci none 524 562 288 358 214PLE IIa 2a 4cii none 401 1206 813 1114 1039PLE IIa 2a 4ciii none 191 955 253 454 180PLE IIa 2a 4civ IIA81f 5PLE IIa 2a 4civ none 35 15 84 51 51PLE IIa 2a 4d none 11 8 172 876 503PLE IIa 2a 4e none 0 0 0PLE IIa 2a none none 5407 3068 2747 2831 2342
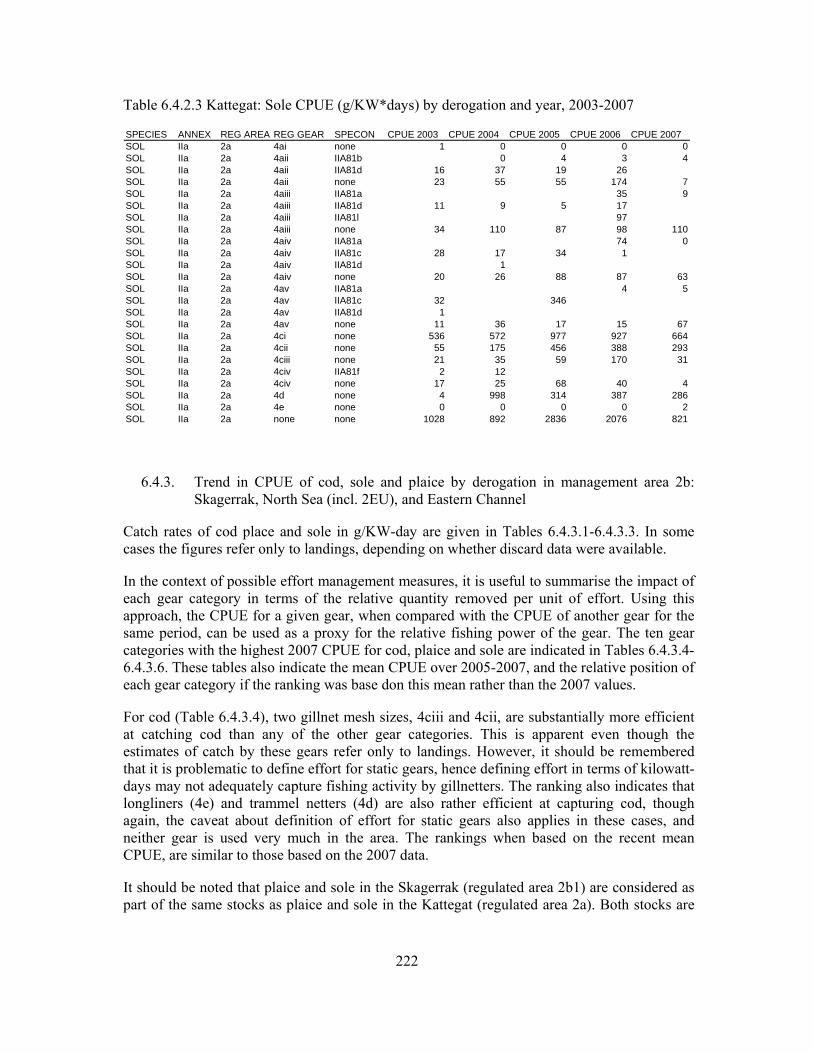
222
Table 6.4.2.3 Kattegat: Sole CPUE (g/KW*days) by derogation and year, 2003-2007
SPECIES ANNEX REG AREA REG GEAR SPECON CPUE 2003 CPUE 2004 CPUE 2005 CPUE 2006 CPUE 2007SOL IIa 2a 4ai none 1 0 0 0 0SOL IIa 2a 4aii IIA81b 0 4 3 4SOL IIa 2a 4aii IIA81d 16 37 19 26SOL IIa 2a 4aii none 23 55 55 174 7SOL IIa 2a 4aiii IIA81a 35 9SOL IIa 2a 4aiii IIA81d 11 9 5 17SOL IIa 2a 4aiii IIA81l 97SOL IIa 2a 4aiii none 34 110 87 98 110SOL IIa 2a 4aiv IIA81a 74 0SOL IIa 2a 4aiv IIA81c 28 17 34 1SOL IIa 2a 4aiv IIA81d 1SOL IIa 2a 4aiv none 20 26 88 87 63SOL IIa 2a 4av IIA81a 4 5SOL IIa 2a 4av IIA81c 32 346SOL IIa 2a 4av IIA81d 1SOL IIa 2a 4av none 11 36 17 15 67SOL IIa 2a 4ci none 536 572 977 927 664SOL IIa 2a 4cii none 55 175 456 388 293SOL IIa 2a 4ciii none 21 35 59 170 31SOL IIa 2a 4civ IIA81f 2 12SOL IIa 2a 4civ none 17 25 68 40 4SOL IIa 2a 4d none 4 998 314 387 286SOL IIa 2a 4e none 0 0 0 0 2SOL IIa 2a none none 1028 892 2836 2076 821
6.4.3. Trend in CPUE of cod, sole and plaice by derogation in management area 2b: Skagerrak, North Sea (incl. 2EU), and Eastern Channel
Catch rates of cod place and sole in g/KW-day are given in Tables 6.4.3.1-6.4.3.3. In some cases the figures refer only to landings, depending on whether discard data were available.
In the context of possible effort management measures, it is useful to summarise the impact of each gear category in terms of the relative quantity removed per unit of effort. Using this approach, the CPUE for a given gear, when compared with the CPUE of another gear for the same period, can be used as a proxy for the relative fishing power of the gear. The ten gear categories with the highest 2007 CPUE for cod, plaice and sole are indicated in Tables 6.4.3.4-6.4.3.6. These tables also indicate the mean CPUE over 2005-2007, and the relative position of each gear category if the ranking was base don this mean rather than the 2007 values.
For cod (Table 6.4.3.4), two gillnet mesh sizes, 4ciii and 4cii, are substantially more efficient at catching cod than any of the other gear categories. This is apparent even though the estimates of catch by these gears refer only to landings. However, it should be remembered that it is problematic to define effort for static gears, hence defining effort in terms of kilowatt-days may not adequately capture fishing activity by gillnetters. The ranking also indicates that longliners (4e) and trammel netters (4d) are also rather efficient at capturing cod, though again, the caveat about definition of effort for static gears also applies in these cases, and neither gear is used very much in the area. The rankings when based on the recent mean CPUE, are similar to those based on the 2007 data.
It should be noted that plaice and sole in the Skagerrak (regulated area 2b1) are considered as part of the same stocks as plaice and sole in the Kattegat (regulated area 2a). Both stocks are
223
considered as being distinct from the North Sea stock, as are plaice and sole in the Eastern Channel (2b3). As a result, the CPUE data for these species need to be interpreted with care.
Compared to the data in the 2007 report of this group, there are some quite substantial differences in plaice CPUE in the data presented here. These have not been investigated in detail, but are though to result from the extensive revision of Dutch data since last year.
The most efficient gear for the capture of plaice (Table 6.4.3.5) is indicated to be large mesh beam trawlers (4biv and 4biii), closely followed by the gillnet category 4ciii, although otter trawl 4aiv fishing under specon IIA81C comes out as the most effective gear if the recent mean value is considered. In general however, the differences in mean catch rates between these different gear types are relatively small.
As with plaice, there are some quite substantial revisions in the CPUE data for sole compared to the data given in the 2007 report. Once again, this is thought to be due to the revision of Dutch data. The figures in Table 6.4.3.6 indicate that the most efficient gears for the capture of sole are generally beam trawls and trammel nets, followed by small mesh gillnets.
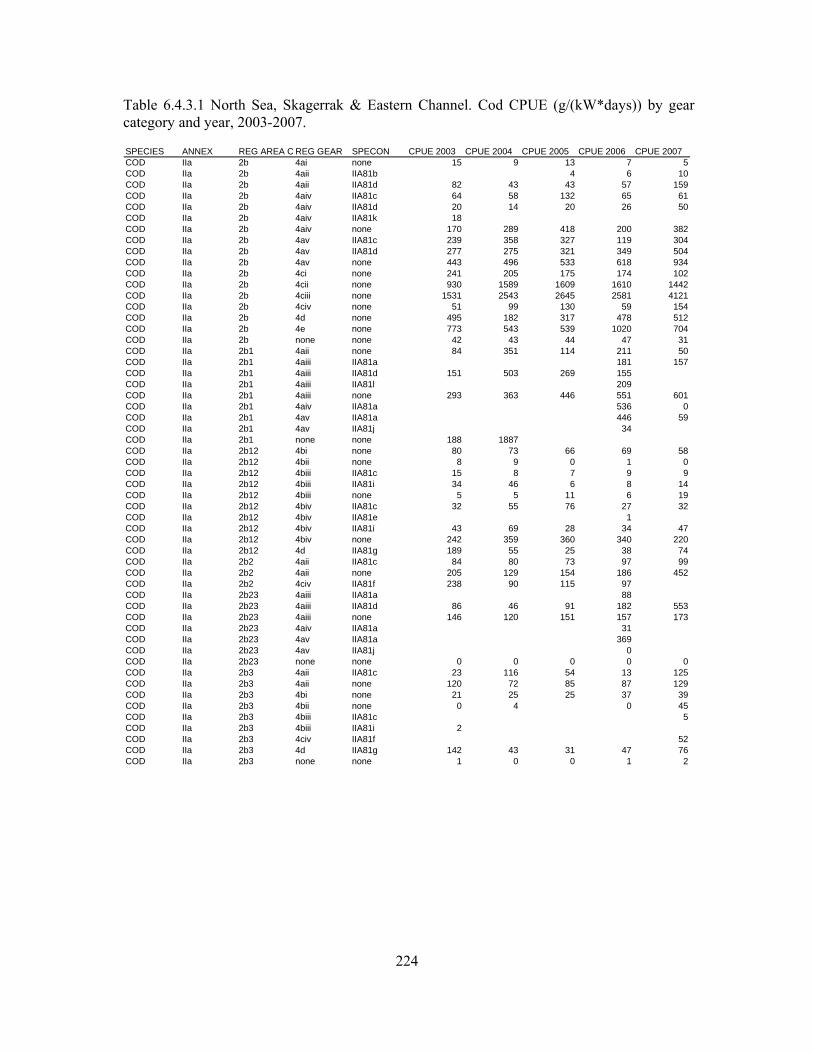
224
Table 6.4.3.1 North Sea, Skagerrak & Eastern Channel. Cod CPUE (g/(kW*days)) by gear category and year, 2003-2007.
SPECIES ANNEX REG AREA C REG GEAR SPECON CPUE 2003 CPUE 2004 CPUE 2005 CPUE 2006 CPUE 2007COD IIa 2b 4ai none 15 9 13 7 5COD IIa 2b 4aii IIA81b 4 6 10COD IIa 2b 4aii IIA81d 82 43 43 57 159COD IIa 2b 4aiv IIA81c 64 58 132 65 61COD IIa 2b 4aiv IIA81d 20 14 20 26 50COD IIa 2b 4aiv IIA81k 18COD IIa 2b 4aiv none 170 289 418 200 382COD IIa 2b 4av IIA81c 239 358 327 119 304COD IIa 2b 4av IIA81d 277 275 321 349 504COD IIa 2b 4av none 443 496 533 618 934COD IIa 2b 4ci none 241 205 175 174 102COD IIa 2b 4cii none 930 1589 1609 1610 1442COD IIa 2b 4ciii none 1531 2543 2645 2581 4121COD IIa 2b 4civ none 51 99 130 59 154COD IIa 2b 4d none 495 182 317 478 512COD IIa 2b 4e none 773 543 539 1020 704COD IIa 2b none none 42 43 44 47 31COD IIa 2b1 4aii none 84 351 114 211 50COD IIa 2b1 4aiii IIA81a 181 157COD IIa 2b1 4aiii IIA81d 151 503 269 155COD IIa 2b1 4aiii IIA81l 209COD IIa 2b1 4aiii none 293 363 446 551 601COD IIa 2b1 4aiv IIA81a 536 0COD IIa 2b1 4av IIA81a 446 59COD IIa 2b1 4av IIA81j 34COD IIa 2b1 none none 188 1887COD IIa 2b12 4bi none 80 73 66 69 58COD IIa 2b12 4bii none 8 9 0 1 0COD IIa 2b12 4biii IIA81c 15 8 7 9 9COD IIa 2b12 4biii IIA81i 34 46 6 8 14COD IIa 2b12 4biii none 5 5 11 6 19COD IIa 2b12 4biv IIA81c 32 55 76 27 32COD IIa 2b12 4biv IIA81e 1COD IIa 2b12 4biv IIA81i 43 69 28 34 47COD IIa 2b12 4biv none 242 359 360 340 220COD IIa 2b12 4d IIA81g 189 55 25 38 74COD IIa 2b2 4aii IIA81c 84 80 73 97 99COD IIa 2b2 4aii none 205 129 154 186 452COD IIa 2b2 4civ IIA81f 238 90 115 97COD IIa 2b23 4aiii IIA81a 88COD IIa 2b23 4aiii IIA81d 86 46 91 182 553COD IIa 2b23 4aiii none 146 120 151 157 173COD IIa 2b23 4aiv IIA81a 31COD IIa 2b23 4av IIA81a 369COD IIa 2b23 4av IIA81j 0COD IIa 2b23 none none 0 0 0 0 0COD IIa 2b3 4aii IIA81c 23 116 54 13 125COD IIa 2b3 4aii none 120 72 85 87 129COD IIa 2b3 4bi none 21 25 25 37 39COD IIa 2b3 4bii none 0 4 0 45COD IIa 2b3 4biii IIA81c 5COD IIa 2b3 4biii IIA81i 2COD IIa 2b3 4civ IIA81f 52COD IIa 2b3 4d IIA81g 142 43 31 47 76COD IIa 2b3 none none 1 0 0 1 2

225
Table 6.4.3.2 North Sea, Skagerrak & Eastern Channel. Plaice CPUE (g/(kW*days)) by gear category and year, 2003-2007
ANNEX REG AREA REG GEAR SPECON CPUE 2003 CPUE 2004 CPUE 2005 CPUE 2006 CPUE 2007IIa 2b 4ai none 13 9 5 23 8IIa 2b 4aii IIA81b 50 24 82IIa 2b 4aii IIA81d 37 41 22 21 29IIa 2b 4aiv IIA81c 1597 2030 2113 2705 1448IIa 2b 4aiv IIA81d 2 1 2 1 4IIa 2b 4aiv IIA81k 77 427IIa 2b 4aiv none 548 902 779 1862 1139IIa 2b 4av IIA81c 4415 2311 1202 53 54IIa 2b 4av IIA81d 197 191 140 115 42IIa 2b 4av IIA81h 5IIa 2b 4av none 240 178 187 298 314IIa 2b 4ci none 258 193 211 115 107IIa 2b 4cii none 1143 1313 1213 1308 1512IIa 2b 4ciii none 2276 1662 1660 2096 1059IIa 2b 4civ none 23 16 27 8 49IIa 2b 4d none 511 576 275 263 249IIa 2b 4e none 7 50 7 21 1IIa 2b none none 38 29 27 30 38IIa 2b1 4aii none 37 75 93 687 63IIa 2b1 4aiii IIA81a 90 140IIa 2b1 4aiii IIA81d 68 277 116 141IIa 2b1 4aiii IIA81l 104IIa 2b1 4aiii none 497 464 243 285 343IIa 2b1 4aiv IIA81a 3118 0IIa 2b1 4av IIA81a 2101 7IIa 2b1 4av IIA81j 142IIa 2b1 none none 1519 1218 80IIa 2b12 4bi none 1724 1359 1150 1411 1202IIa 2b12 4bii none 273 409 83 435 65IIa 2b12 4biii IIA81c 1350 1446 1217 1307 1634IIa 2b12 4biii IIA81i 1241 1367 1366 1456 1853IIa 2b12 4biii none 145 568 574 806 1631IIa 2b12 4biv IIA81c 1293 1210 1282 1590 2038IIa 2b12 4biv IIA81e 2528 1707IIa 2b12 4biv IIA81i 1404 1524 1509 1595 1968IIa 2b12 4biv none 1236 1048 862 1375 1486IIa 2b12 4d IIA81g 215 161 154 93 83IIa 2b2 4aii IIA81c 1314 808 804 1029 1121IIa 2b2 4aii none 320 202 142 224 130IIa 2b2 4civ IIA81f 82 92 114 113IIa 2b2 none none 1 4IIa 2b23 4aiii IIA81a 2800IIa 2b23 4aiii IIA81d 49 37 39 68 71IIa 2b23 4aiii none 1143 825 731 479 254IIa 2b23 4aiv IIA81a 2899IIa 2b23 4av IIA81a 144IIa 2b23 none none 23 21 19 10 11IIa 2b3 4aii IIA81c 489 224 185 333 436IIa 2b3 4aii none 298 378 155 122 106IIa 2b3 4bi none 544 663 611 545 638IIa 2b3 4bii none 957 1531 754 560 22IIa 2b3 4biii IIA81c 107 425IIa 2b3 4biii IIA81i 41IIa 2b3 4civ IIA81f 12 52IIa 2b3 4d IIA81g 173 196 118 120 175IIa 2b3 none none 34 42 165 183 62

226
Table 6.4.3.3 North Sea, Skagerrak & Eastern Channel. Sole CPUE (g/(kW*days)) by gear category and year, 2003-2007
SPECIES ANNEX REG AREA C REG GEAR SPECON CPUE 2003 CPUE 2004 CPUE 2005 CPUE 2006 CPUE 2007SOL IIa 2b 4ai none 1 1 2 1 1SOL IIa 2b 4aii IIA81b 2 3 2 5SOL IIa 2b 4aii IIA81d 1 2 2 3 6SOL IIa 2b 4aiv IIA81c 4 10 2 2 1SOL IIa 2b 4aiv IIA81d 0 0 0 0 0SOL IIa 2b 4aiv IIA81k 6SOL IIa 2b 4aiv none 3 9 6 8 1SOL IIa 2b 4av IIA81c 10 17 3 33 0SOL IIa 2b 4av IIA81d 2 2 1 0 1SOL IIa 2b 4av none 1 1 0 2 0SOL IIa 2b 4ci none 579 496 542 661 830SOL IIa 2b 4cii none 42 63 163 60 125SOL IIa 2b 4ciii none 13 27 75 24 35SOL IIa 2b 4civ none 0 1 1 1 3SOL IIa 2b 4d none 349 164 247 153 142SOL IIa 2b 4e none 0 0 0 0 0SOL IIa 2b none none 21 15 8 6 12SOL IIa 2b1 4aii none 8 4 2 10SOL IIa 2b1 4aiii IIA81a 12 2SOL IIa 2b1 4aiii IIA81d 1 59 8 3SOL IIa 2b1 4aiii IIA81l 7SOL IIa 2b1 4aiii none 6 7 11 21 2SOL IIa 2b1 4aiv IIA81a 24 0SOL IIa 2b1 4av IIA81a 1 0SOL IIa 2b1 4av IIA81j 18SOL IIa 2b1 none none 130SOL IIa 2b12 4bi none 416 429 341 312 352SOL IIa 2b12 4bii none 115 42 59 7 2SOL IIa 2b12 4biii IIA81c 18 12 15 13 18SOL IIa 2b12 4biii IIA81i 38 38 17 8 9SOL IIa 2b12 4biii none 1 6 5 5 4SOL IIa 2b12 4biv IIA81c 17 14 11 9 3SOL IIa 2b12 4biv IIA81e 9 1SOL IIa 2b12 4biv IIA81i 19 4 6 7 4SOL IIa 2b12 4biv none 12 8 5 8 5SOL IIa 2b12 4d IIA81g 1265 1112 1248 719 654SOL IIa 2b2 4aii IIA81c 28 48 25 74 185SOL IIa 2b2 4aii none 11 7 4 3 6SOL IIa 2b2 4civ IIA81f 0 0 2 1SOL IIa 2b23 4aiii IIA81a 4SOL IIa 2b23 4aiii IIA81d 3 3 2 3 2SOL IIa 2b23 4aiii none 14 21 9 7 4SOL IIa 2b23 none none 9 11 7 2 2SOL IIa 2b3 4aii IIA81c 192 59 38 90 118SOL IIa 2b3 4aii none 84 68 59 86 96SOL IIa 2b3 4bi none 761 851 722 680 656SOL IIa 2b3 4bii none 1244 1598 1077 423 40SOL IIa 2b3 4biii IIA81c 1129 142SOL IIa 2b3 4biii IIA81i 332SOL IIa 2b3 4d IIA81g 884 683 752 797 854SOL IIa 2b3 none none 22 46 127 126 53
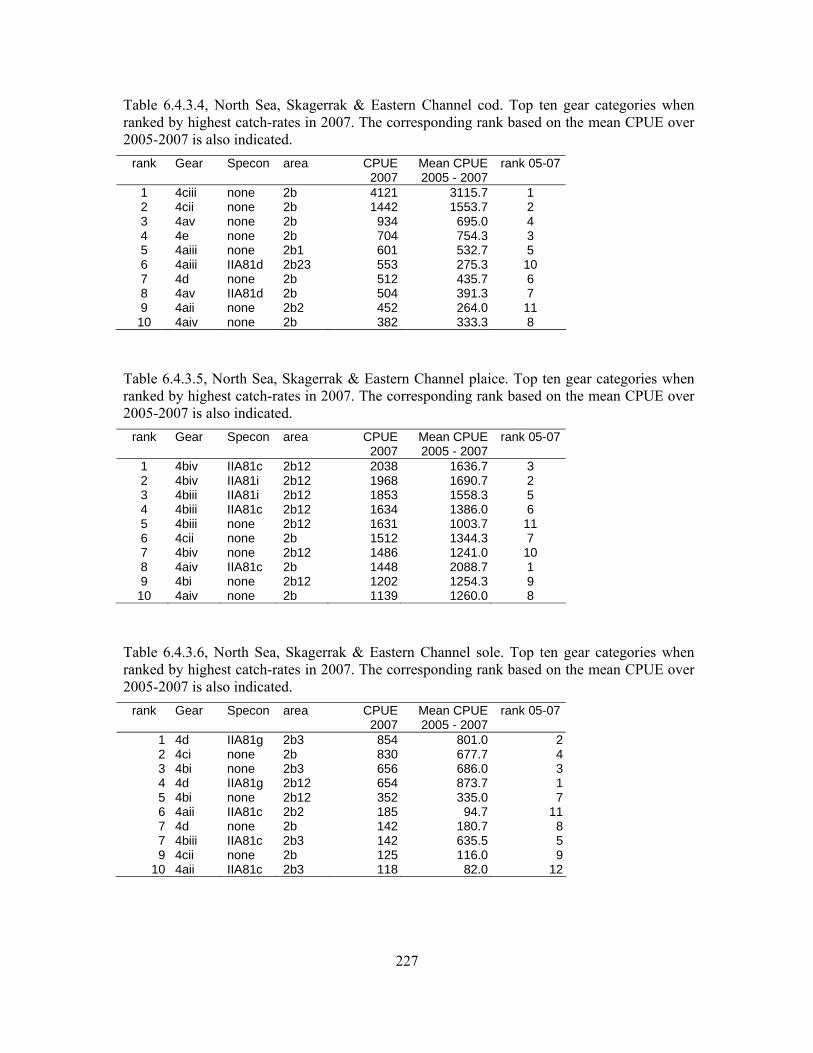
227
Table 6.4.3.4, North Sea, Skagerrak & Eastern Channel cod. Top ten gear categories when ranked by highest catch-rates in 2007. The corresponding rank based on the mean CPUE over 2005-2007 is also indicated.
rank Gear Specon area CPUE 2007
Mean CPUE 2005 - 2007
rank 05-07
1 4ciii none 2b 4121 3115.7 1 2 4cii none 2b 1442 1553.7 2 3 4av none 2b 934 695.0 4 4 4e none 2b 704 754.3 3 5 4aiii none 2b1 601 532.7 5 6 4aiii IIA81d 2b23 553 275.3 10 7 4d none 2b 512 435.7 6 8 4av IIA81d 2b 504 391.3 7 9 4aii none 2b2 452 264.0 11 10 4aiv none 2b 382 333.3 8
Table 6.4.3.5, North Sea, Skagerrak & Eastern Channel plaice. Top ten gear categories when ranked by highest catch-rates in 2007. The corresponding rank based on the mean CPUE over 2005-2007 is also indicated.
rank Gear Specon area CPUE 2007
Mean CPUE 2005 - 2007
rank 05-07
1 4biv IIA81c 2b12 2038 1636.7 3 2 4biv IIA81i 2b12 1968 1690.7 2 3 4biii IIA81i 2b12 1853 1558.3 5 4 4biii IIA81c 2b12 1634 1386.0 6 5 4biii none 2b12 1631 1003.7 11 6 4cii none 2b 1512 1344.3 7 7 4biv none 2b12 1486 1241.0 10 8 4aiv IIA81c 2b 1448 2088.7 1 9 4bi none 2b12 1202 1254.3 9 10 4aiv none 2b 1139 1260.0 8
Table 6.4.3.6, North Sea, Skagerrak & Eastern Channel sole. Top ten gear categories when ranked by highest catch-rates in 2007. The corresponding rank based on the mean CPUE over 2005-2007 is also indicated.
rank Gear Specon area CPUE 2007
Mean CPUE 2005 - 2007
rank 05-07
1 4d IIA81g 2b3 854 801.0 22 4ci none 2b 830 677.7 43 4bi none 2b3 656 686.0 34 4d IIA81g 2b12 654 873.7 15 4bi none 2b12 352 335.0 76 4aii IIA81c 2b2 185 94.7 117 4d none 2b 142 180.7 87 4biii IIA81c 2b3 142 635.5 59 4cii none 2b 125 116.0 9
10 4aii IIA81c 2b3 118 82.0 12
228
6.4.4. Trend in CPUE of cod, sole and plaice by derogation in management area 2c: Irish Sea
Time series of discard data is available for a limited number of gear-special condition combinations. Cod discard data is available primarily for 4a.ii IIA.8.d, 4a.iv IIA.8.d and 4b.i. Plaice discard data for 4a.ii IIA.8.c, 4a.ii IIA.8.d, 4a.ii none and 4b.i. Sole discard data is limited to 4b.i. Thus only these categories can be considered as CPUE where both landings and discards are available, the remainder must be considered as LPUE (landings per unit effort). The units used are grams per kW days-at-sea (g/kW*days)
Only the gears with relatively high effort and/or landings in the Irish Sea will be discussed here, as these are able to provide the most representative figures. Gear mesh combinations with little effort, and static gears where the use of kW*days-at-sea as an appropriate indication of effort is debatable, may have unrepresentative values and are not discussed. Values for cod, plaice, and sole are detailed below (table 6.4.4.1, 6.4.4.2, and 6.4.4.3 respectively)
The most important cod landings and effort allocations are within demersal trawl and seine categories, in addition to the beam trawl category 4b.i in relation to effort. Overall, there appears to be higher CPUE and LPUE values in 2007 than those during 2007 (Table 6.4.4.1 and Figure 6.4.4.1). 4a.iv IIA.8.d which represents CPUE have the highest weights of those gear categories with important effort allocation and cod landings. Cod values are higher for the larger mesh trawl and seine categories than smaller meshes, likely related to decreased Nephrops targeting within these larger mesh categories. This is demonstrated by the lower CPUE values (both landings and discards available 2003-2007) of the smaller mesh equivalent 4a.ii IIA.8.d. CPUE is also available for the beam trawl category 4b.i, this category contains lower weights than those of the two trawl categories containing both landings and discards. As a note, values for cod are highest within the gillnet gear categories, however these categories should not be considered as certain given the low level of landings, and the uncertainty of effort.
In relation to plaice, there are a number of different gear categories with similar weights obtained. Several of the higher rates occur within demersal trawl and seine special condition IIA.8.c higher within 4a.iv. This however represents LPUE, whilst 4a.ii shows CPUE (excl. 2003). For important gears in relation to landings, 4a.ii categories have relatively low CPUEs (discards available excl. 2003). Relative consistency is seen in special condition IIA.8.d and none where the majority of landings occur (Figure 6.4.4.2). The beam trawl category 4b.i however has high CPUE (excl. 2003) (Table 6.4.4.2). This group has been in continual decline since 2004, where in 2007 obtainable values (~300g/kW Days) are 41% lower than those in 2004 (~500g/kW Days) (Figure 6.4.4.2).
Only one gear category has high values for sole, this is in terms of CPUE. This is the beam trawl category 4.b.i (80-89mm). CPUE of sole was highest in 2005, since when CPUE has declined to lowest levels (Figure6.4.4.3). With the exception of other beam trawl mesh categories, currently unused or only at very low levels, all other gear categories with/without special conditions demonstrate far lower LPUEs, <25 g/kW Days (Table 6.4.4.3).
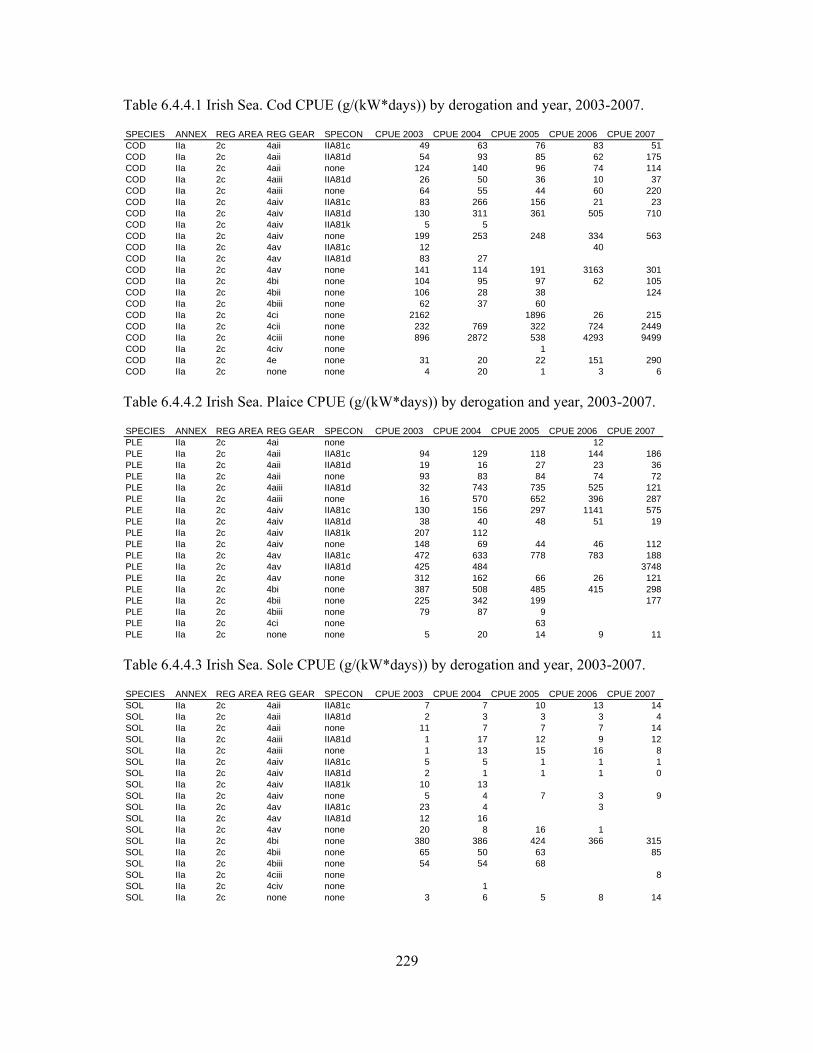
229
Table 6.4.4.1 Irish Sea. Cod CPUE (g/(kW*days)) by derogation and year, 2003-2007.
SPECIES ANNEX REG AREA REG GEAR SPECON CPUE 2003 CPUE 2004 CPUE 2005 CPUE 2006 CPUE 2007COD IIa 2c 4aii IIA81c 49 63 76 83 51COD IIa 2c 4aii IIA81d 54 93 85 62 175COD IIa 2c 4aii none 124 140 96 74 114COD IIa 2c 4aiii IIA81d 26 50 36 10 37COD IIa 2c 4aiii none 64 55 44 60 220COD IIa 2c 4aiv IIA81c 83 266 156 21 23COD IIa 2c 4aiv IIA81d 130 311 361 505 710COD IIa 2c 4aiv IIA81k 5 5COD IIa 2c 4aiv none 199 253 248 334 563COD IIa 2c 4av IIA81c 12 40COD IIa 2c 4av IIA81d 83 27COD IIa 2c 4av none 141 114 191 3163 301COD IIa 2c 4bi none 104 95 97 62 105COD IIa 2c 4bii none 106 28 38 124COD IIa 2c 4biii none 62 37 60COD IIa 2c 4ci none 2162 1896 26 215COD IIa 2c 4cii none 232 769 322 724 2449COD IIa 2c 4ciii none 896 2872 538 4293 9499COD IIa 2c 4civ none 1COD IIa 2c 4e none 31 20 22 151 290COD IIa 2c none none 4 20 1 3 6
Table 6.4.4.2 Irish Sea. Plaice CPUE (g/(kW*days)) by derogation and year, 2003-2007.
SPECIES ANNEX REG AREA REG GEAR SPECON CPUE 2003 CPUE 2004 CPUE 2005 CPUE 2006 CPUE 2007PLE IIa 2c 4ai none 12PLE IIa 2c 4aii IIA81c 94 129 118 144 186PLE IIa 2c 4aii IIA81d 19 16 27 23 36PLE IIa 2c 4aii none 93 83 84 74 72PLE IIa 2c 4aiii IIA81d 32 743 735 525 121PLE IIa 2c 4aiii none 16 570 652 396 287PLE IIa 2c 4aiv IIA81c 130 156 297 1141 575PLE IIa 2c 4aiv IIA81d 38 40 48 51 19PLE IIa 2c 4aiv IIA81k 207 112PLE IIa 2c 4aiv none 148 69 44 46 112PLE IIa 2c 4av IIA81c 472 633 778 783 188PLE IIa 2c 4av IIA81d 425 484 3748PLE IIa 2c 4av none 312 162 66 26 121PLE IIa 2c 4bi none 387 508 485 415 298PLE IIa 2c 4bii none 225 342 199 177PLE IIa 2c 4biii none 79 87 9PLE IIa 2c 4ci none 63PLE IIa 2c none none 5 20 14 9 11
Table 6.4.4.3 Irish Sea. Sole CPUE (g/(kW*days)) by derogation and year, 2003-2007.
SPECIES ANNEX REG AREA REG GEAR SPECON CPUE 2003 CPUE 2004 CPUE 2005 CPUE 2006 CPUE 2007SOL IIa 2c 4aii IIA81c 7 7 10 13 14SOL IIa 2c 4aii IIA81d 2 3 3 3 4SOL IIa 2c 4aii none 11 7 7 7 14SOL IIa 2c 4aiii IIA81d 1 17 12 9 12SOL IIa 2c 4aiii none 1 13 15 16 8SOL IIa 2c 4aiv IIA81c 5 5 1 1 1SOL IIa 2c 4aiv IIA81d 2 1 1 1 0SOL IIa 2c 4aiv IIA81k 10 13SOL IIa 2c 4aiv none 5 4 7 3 9SOL IIa 2c 4av IIA81c 23 4 3SOL IIa 2c 4av IIA81d 12 16SOL IIa 2c 4av none 20 8 16 1SOL IIa 2c 4bi none 380 386 424 366 315SOL IIa 2c 4bii none 65 50 63 85SOL IIa 2c 4biii none 54 54 68SOL IIa 2c 4ciii none 8SOL IIa 2c 4civ none 1SOL IIa 2c none none 3 6 5 8 14
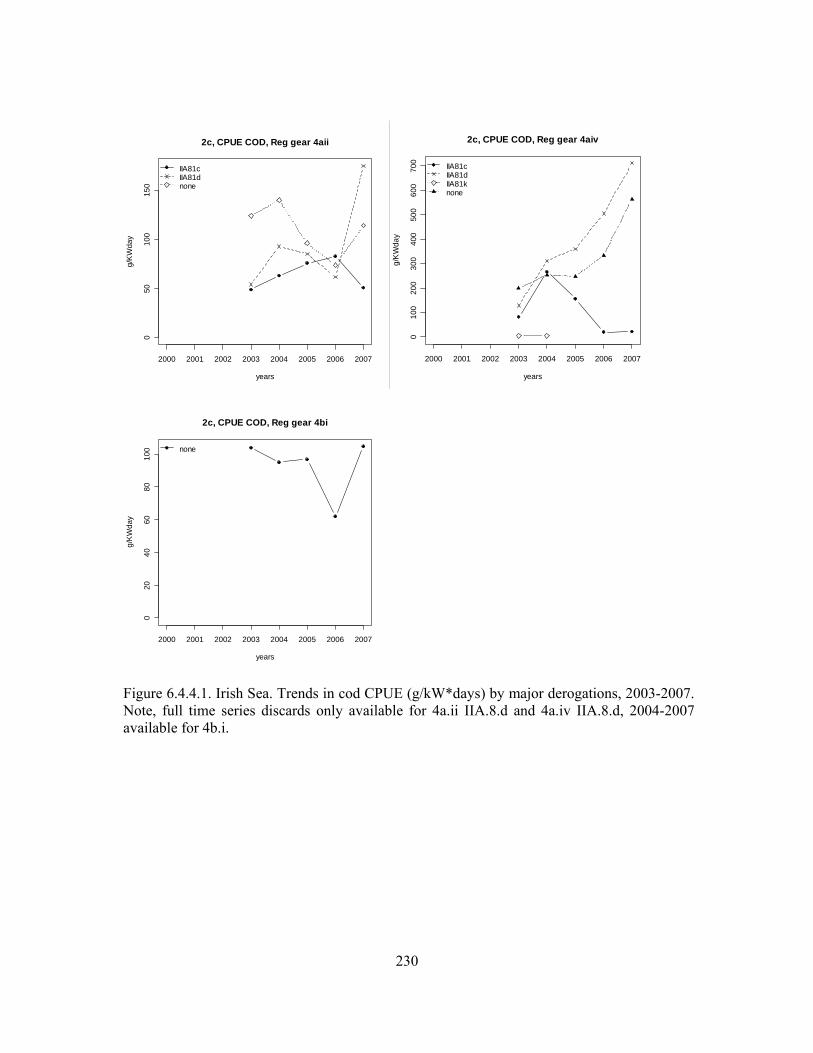
230
2000 2001 2002 2003 2004 2005 2006 2007
050
100
150
2c, CPUE COD, Reg gear 4aii
years
g/K
Wda
y
IIA81cIIA81dnone
2000 2001 2002 2003 2004 2005 2006 2007
010
020
030
040
050
060
070
0
2c, CPUE COD, Reg gear 4aiv
years
g/K
Wda
y
IIA81cIIA81dIIA81knone
2000 2001 2002 2003 2004 2005 2006 2007
020
4060
8010
0
2c, CPUE COD, Reg gear 4bi
years
g/K
Wda
y
none
Figure 6.4.4.1. Irish Sea. Trends in cod CPUE (g/kW*days) by major derogations, 2003-2007. Note, full time series discards only available for 4a.ii IIA.8.d and 4a.iv IIA.8.d, 2004-2007 available for 4b.i.

231
2000 2001 2002 2003 2004 2005 2006 2007
050
100
150
2c, CPUE PLE, Reg gear 4aii
years
g/K
Wda
yIIA81cIIA81dnone
2000 2001 2002 2003 2004 2005 2006 2007
010
020
030
040
050
0
2c, CPUE PLE, Reg gear 4bi
years
g/K
Wda
y
none
Figure 6.4.4.2. Irish Sea. Trends in plaice CPUE (g/kW*days) by major derogations, 2003-2007. Note, 2003-2006 discards only available for 4a.ii IIA8.c, 4a.ii IIA.8.d, 4a.ii none and 4b.i.
2000 2001 2002 2003 2004 2005 2006 2007
010
020
030
040
0
2c, CPUE SOL, Reg gear 4bi
years
g/K
Wda
y
none
Figure 6.4.4.3. Irish Sea. Trends in sole CPUE (g/kW*days) by the major derogation, 2003-2007. Note, discards only available 2003-2006.

232
6.4.5. Trend in CPUE of cod by derogation in management area 2d: West of Scotland
Section 6.3.5 shows how catch of plaice and sole are negligible in the west of Scotland waters and therefore this section only considers CPUE of cod. Table 6.4.5.1 shows cod catch per unit effort (CPUE), recorded in g/kWdays for all derogations. Furthermore, this section concentrates on the demersal trawl and seine gears (gear 4a) as sections 6.2.5 and 6.3.5 demonstrate the negligible importance of beam, static and longline gears in the west of Scotland waters in terms of both effort and catch of cod.
Figures 6.4.5.1 to 6.4.5.4 show the CPUE for each derogation within a given mesh size category of the 4a gear. For all mesh sizes, it can be seen that vessels entitled to a derogation based on a low percentage of cod catch in 2002 have a CPUE of cod consistently below that of vessels not entitled to the derogation. The high CPUE for 4.a.iv IIA81c in 2005 is considered an artefact of division using small numbers. Effort for this derogation is small (approximately 1% of the effort recorded for 4.a.iv IIA81d and 4.a.iv none) and from Table 6.3.5.1 cod landings for this derogation are 1 tonne or less.
Figure 6.4.5.5 compares the cod CPUE for 4.a gear (demersal trawl and seine) of all mesh size ranges where vessels are not qualified for special condition status. As would be expected the cod CPUE is higher for the 4.a.v (≥120mm) gear. Between 2003 and 2006 the temporal pattern of CPUE is consistent across mesh size ranges. In 2007 CPUE has increased significantly for the two largest mesh sizes. This is consistent with the VIa cod assessment conducted by ICES that indicates a strong 2005 year class of cod.
Figure 6.4.5.6 shows the CPUE for long lines (section 6.2.5 shows effort for this category to be increasing in area 2d). There is no discernable trend in cod CPUE for this gear type.
Table 6.4.5.1 West of Scotland. Cod CPUE (g/(kW*days)) by derogation and year, 2003-2007.
SPECIES ANNEX REG AREA REG GEAR SPECON CPUE 2003 CPUE 2004 CPUE 2005 CPUE 2006 CPUE 2007COD IIa 2d 4aii IIA81c 17 20 19 15 15COD IIa 2d 4aii IIA81d 23 13 7 18 25COD IIa 2d 4aii none 91 47 44 127 109COD IIa 2d 4aiii IIA81d 2008 1425 803 428 1804COD IIa 2d 4aiii none 24 7 5 15 39COD IIa 2d 4aiv IIA81c 59 65 155 34 239COD IIa 2d 4aiv IIA81d 18 21 18 38 43COD IIa 2d 4aiv none 89 51 55 103 446COD IIa 2d 4av IIA81c 97COD IIa 2d 4av IIA81d 64 72 87 250 125COD IIa 2d 4av none 163 98 135 333 542COD IIa 2d 4biv none 26 42 5 8COD IIa 2d 4ci none 11COD IIa 2d 4cii none 178 41 137 202 78COD IIa 2d 4ciii none 1 524COD IIa 2d 4civ none 1COD IIa 2d 4e none 12 8 9 18 6COD IIa 2d none none 3
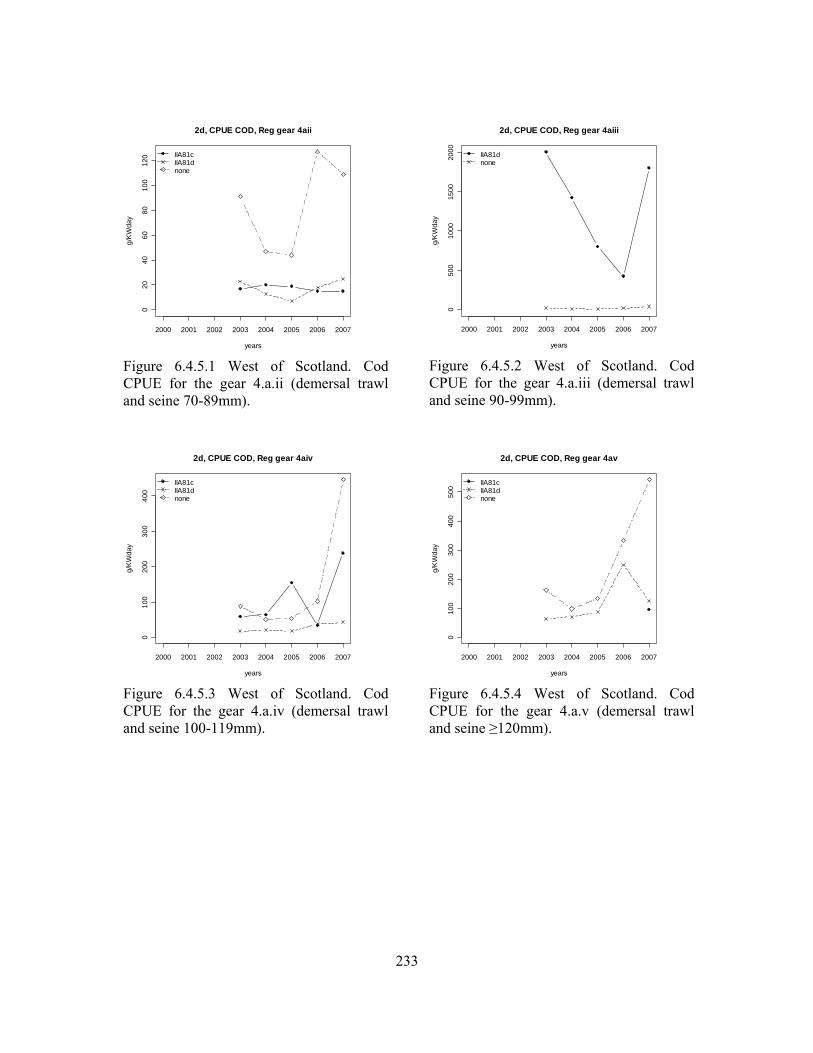
233
2000 2001 2002 2003 2004 2005 2006 2007
020
4060
8010
012
0
2d, CPUE COD, Reg gear 4aii
years
g/K
Wda
y
IIA81cIIA81dnone
Figure 6.4.5.1 West of Scotland. Cod CPUE for the gear 4.a.ii (demersal trawl and seine 70-89mm).
2000 2001 2002 2003 2004 2005 2006 2007
050
010
0015
0020
00
2d, CPUE COD, Reg gear 4aiii
years
g/K
Wda
y
IIA81dnone
Figure 6.4.5.2 West of Scotland. Cod CPUE for the gear 4.a.iii (demersal trawl and seine 90-99mm).
2000 2001 2002 2003 2004 2005 2006 2007
010
020
030
040
0
2d, CPUE COD, Reg gear 4aiv
years
g/K
Wda
y
IIA81cIIA81dnone
Figure 6.4.5.3 West of Scotland. Cod CPUE for the gear 4.a.iv (demersal trawl and seine 100-119mm).
2000 2001 2002 2003 2004 2005 2006 2007
010
020
030
040
050
02d, CPUE COD, Reg gear 4av
years
g/K
Wda
y
IIA81cIIA81dnone
Figure 6.4.5.4 West of Scotland. Cod CPUE for the gear 4.a.v (demersal trawl and seine ≥120mm).
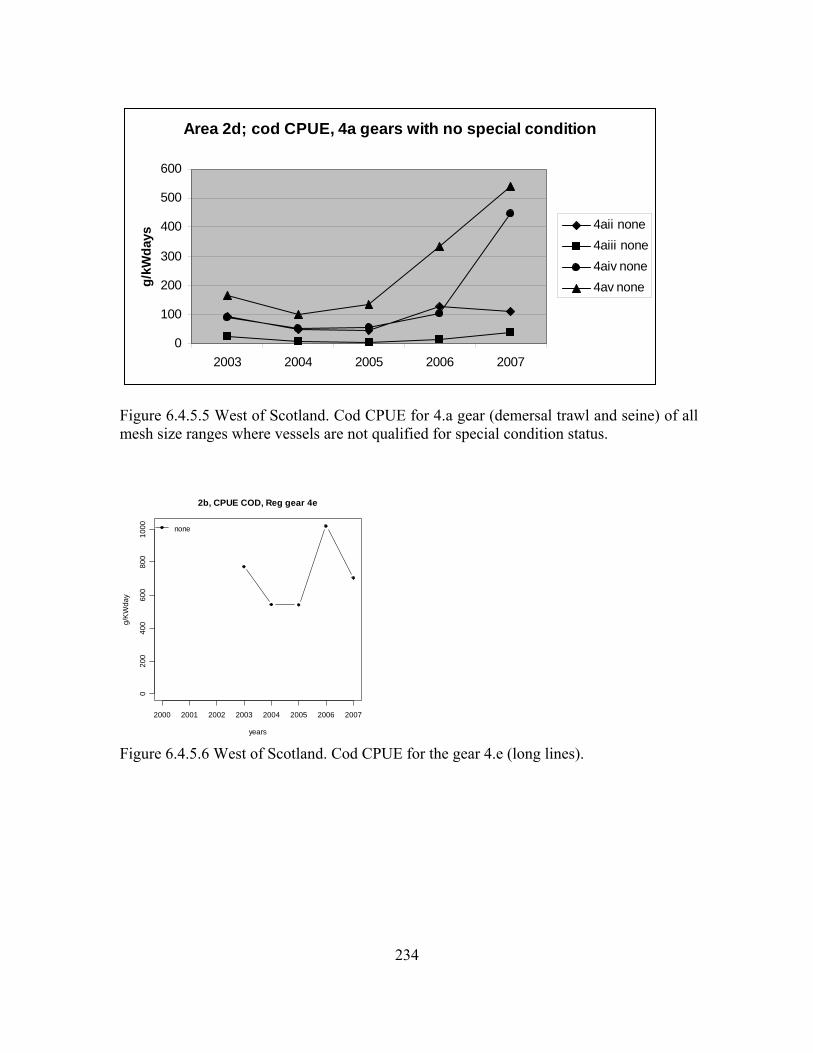
234
Area 2d; cod CPUE, 4a gears with no special condition
0
100
200
300
400
500
600
2003 2004 2005 2006 2007
g/kW
days
4aii none4aiii none4aiv none4av none
Figure 6.4.5.5 West of Scotland. Cod CPUE for 4.a gear (demersal trawl and seine) of all mesh size ranges where vessels are not qualified for special condition status.
2000 2001 2002 2003 2004 2005 2006 2007
020
040
060
080
010
00
2b, CPUE COD, Reg gear 4e
years
g/K
Wda
y
none
Figure 6.4.5.6 West of Scotland. Cod CPUE for the gear 4.e (long lines).

235
6.5. Ranked derogations according to relative contributions to cod, sole and plaice catches
STECF-SGRST presents the ranked contributions of the individual derogations pertaining to Annex IIA of Coun. Reg. 40/2008 to cod, plaice and sole catches for the years 2003 to 2007 in order to allow the evaluation of annual variation.
The catch estimates are based on the sums of the landings and discards where available. STECF-SGRST considers the catch estimates as uncertain where derogations lack discard estimates or they are poorly sampled. The ranking according to catch in numbers only considers derogations for which catch in numbers are available!
6.5.1. Ranked derogations according to cod, sole and plaice catches in management area 2a: Kattegat
This section presents information which lacks Danish discard data and furthermore Danish data of landings in 2007 were not given by special condition. Sweden provided discard data for gear category 4a.iii (90 mm trawl) from 2003-2007 and for 4a.iii special condition IIA81a (120mm square mesh window) as well as 4a.ii special condition IIA83b (sorting grid) for 2007.
The following table lists the landings for the main species by gear category
Table 6.5.1.1: Landing of Cod, Nephrops, Plaice and sole in Kattegatt by gear category presented as % of total 2007 and % of average landings 2003-2007.
COD NEP PLE SOLGear group % 2003-2007 % of 2007 % 2003-2007 % of 2007 % 2003-2007 % of 2007 % 2003-2007 % of 2007ai 0,8 1,1 0,16 0 0,1 0 0 0aii 0,1 2,3 11,62 5,8 1,3 0,1 4,6 0,2aiii 75,1 73,9 86,76 91,3 50,6 44,9 47,2 58aiv 6,1 5,5 0,35 0,6 22,9 29,9 1,9 1,8av 5,5 2,5 0,29 1,1 2 1,1 0,4 0,5ci 1,5 1 0,01 0 1,7 1,2 13 13,3cii 3,3 3,2 0,01 0 5,8 7 5,9 6,9ciii 0,8 0,7 0 0 0,3 0,2 0,2 0,1civ 0 0,1 0 0 0,1 0,1 0,2 04d 0 0 0,01 0 0,1 0 0,1 0,14e 0,1 0,2 0 0 0 0 0 0none 6,7 9,6 0,79 1,2 15,1 15,4 26,5 19
Amongst the gear groups 90 mm trawl (4a.iii) takes the largest share of the landings 73 % of the cod landings, 91 % of the Nephrops landing, 50 % of the Plaice landings and 58 %
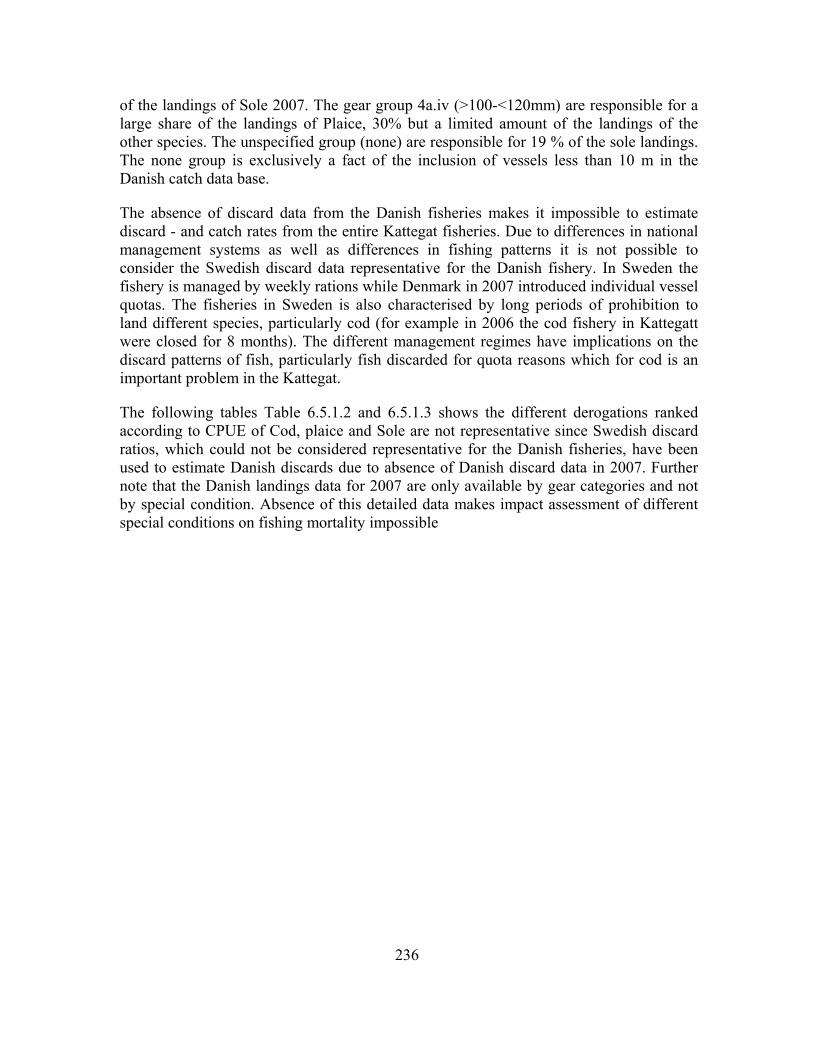
236
of the landings of Sole 2007. The gear group 4a.iv (>100-<120mm) are responsible for a large share of the landings of Plaice, 30% but a limited amount of the landings of the other species. The unspecified group (none) are responsible for 19 % of the sole landings. The none group is exclusively a fact of the inclusion of vessels less than 10 m in the Danish catch data base.
The absence of discard data from the Danish fisheries makes it impossible to estimate discard - and catch rates from the entire Kattegat fisheries. Due to differences in national management systems as well as differences in fishing patterns it is not possible to consider the Swedish discard data representative for the Danish fishery. In Sweden the fishery is managed by weekly rations while Denmark in 2007 introduced individual vessel quotas. The fisheries in Sweden is also characterised by long periods of prohibition to land different species, particularly cod (for example in 2006 the cod fishery in Kattegatt were closed for 8 months). The different management regimes have implications on the discard patterns of fish, particularly fish discarded for quota reasons which for cod is an important problem in the Kattegat.
The following tables Table 6.5.1.2 and 6.5.1.3 shows the different derogations ranked according to CPUE of Cod, plaice and Sole are not representative since Swedish discard ratios, which could not be considered representative for the Danish fisheries, have been used to estimate Danish discards due to absence of Danish discard data in 2007. Further note that the Danish landings data for 2007 are only available by gear categories and not by special condition. Absence of this detailed data makes impact assessment of different special conditions on fishing mortality impossible
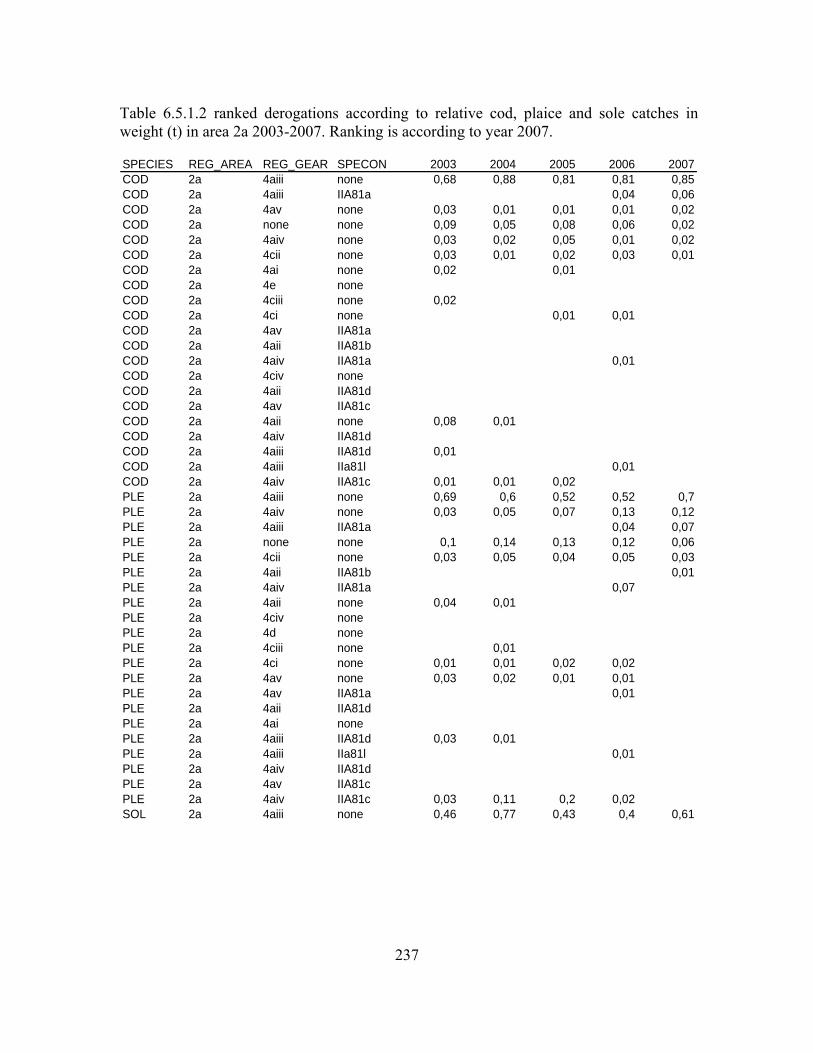
237
Table 6.5.1.2 ranked derogations according to relative cod, plaice and sole catches in weight (t) in area 2a 2003-2007. Ranking is according to year 2007.
SPECIES REG_AREA REG_GEAR SPECON 2003 2004 2005 2006 2007COD 2a 4aiii none 0,68 0,88 0,81 0,81 0,85COD 2a 4aiii IIA81a 0,04 0,06COD 2a 4av none 0,03 0,01 0,01 0,01 0,02COD 2a none none 0,09 0,05 0,08 0,06 0,02COD 2a 4aiv none 0,03 0,02 0,05 0,01 0,02COD 2a 4cii none 0,03 0,01 0,02 0,03 0,01COD 2a 4ai none 0,02 0,01COD 2a 4e noneCOD 2a 4ciii none 0,02COD 2a 4ci none 0,01 0,01COD 2a 4av IIA81aCOD 2a 4aii IIA81bCOD 2a 4aiv IIA81a 0,01COD 2a 4civ noneCOD 2a 4aii IIA81dCOD 2a 4av IIA81cCOD 2a 4aii none 0,08 0,01COD 2a 4aiv IIA81dCOD 2a 4aiii IIA81d 0,01COD 2a 4aiii IIa81l 0,01COD 2a 4aiv IIA81c 0,01 0,01 0,02PLE 2a 4aiii none 0,69 0,6 0,52 0,52 0,7PLE 2a 4aiv none 0,03 0,05 0,07 0,13 0,12PLE 2a 4aiii IIA81a 0,04 0,07PLE 2a none none 0,1 0,14 0,13 0,12 0,06PLE 2a 4cii none 0,03 0,05 0,04 0,05 0,03PLE 2a 4aii IIA81b 0,01PLE 2a 4aiv IIA81a 0,07PLE 2a 4aii none 0,04 0,01PLE 2a 4civ nonePLE 2a 4d nonePLE 2a 4ciii none 0,01PLE 2a 4ci none 0,01 0,01 0,02 0,02PLE 2a 4av none 0,03 0,02 0,01 0,01PLE 2a 4av IIA81a 0,01PLE 2a 4aii IIA81dPLE 2a 4ai nonePLE 2a 4aiii IIA81d 0,03 0,01PLE 2a 4aiii IIa81l 0,01PLE 2a 4aiv IIA81dPLE 2a 4av IIA81cPLE 2a 4aiv IIA81c 0,03 0,11 0,2 0,02SOL 2a 4aiii none 0,46 0,77 0,43 0,4 0,61
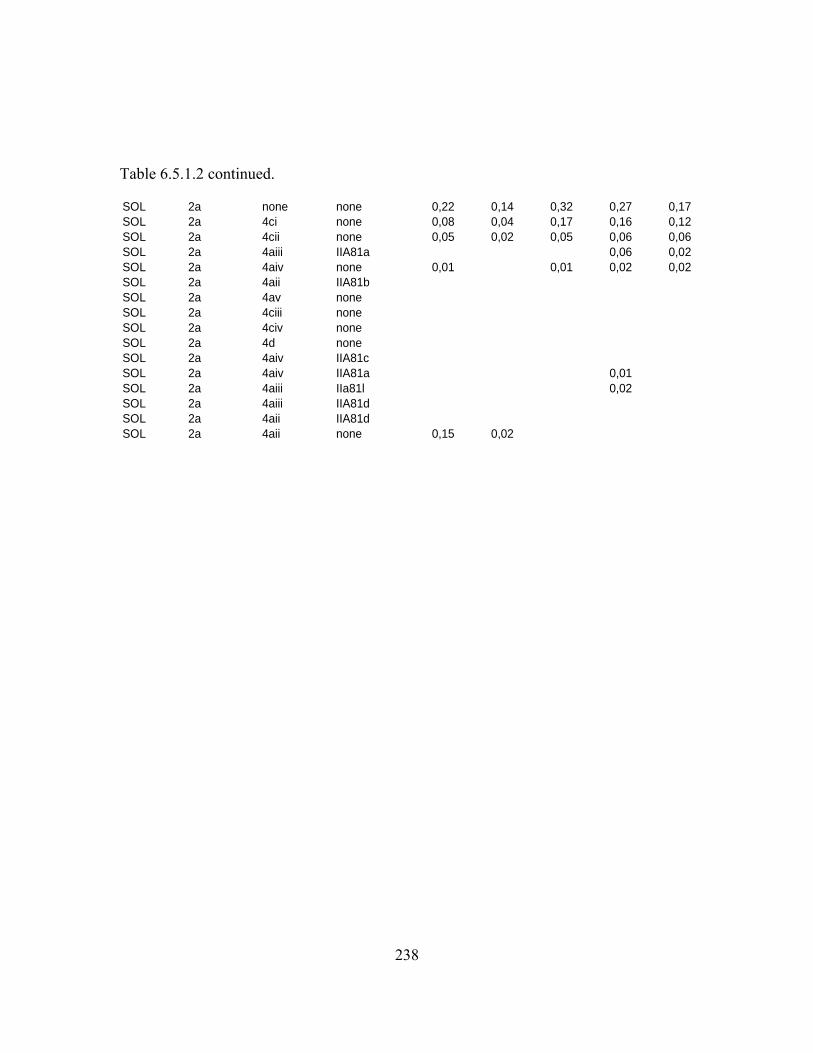
238
Table 6.5.1.2 continued.
SOL 2a none none 0,22 0,14 0,32 0,27 0,17SOL 2a 4ci none 0,08 0,04 0,17 0,16 0,12SOL 2a 4cii none 0,05 0,02 0,05 0,06 0,06SOL 2a 4aiii IIA81a 0,06 0,02SOL 2a 4aiv none 0,01 0,01 0,02 0,02SOL 2a 4aii IIA81bSOL 2a 4av noneSOL 2a 4ciii noneSOL 2a 4civ noneSOL 2a 4d noneSOL 2a 4aiv IIA81cSOL 2a 4aiv IIA81a 0,01SOL 2a 4aiii IIa81l 0,02SOL 2a 4aiii IIA81dSOL 2a 4aii IIA81dSOL 2a 4aii none 0,15 0,02

239
Table 6.5.1.3 ranked derogations according to relative cod, plaice and sole catches in numbers (‘000) (t) in area 2a 2003-2007. Ranking is according to year 2007.
SPECIES REG_AREA REG_GEAR SPECON 2003 2004 2005 2006 2007COD 2b 4av none 0,44 0,39 0,4 0,36 0,36COD 2b2 4aii none 0,13 0,07 0,09 0,14 0,21COD 2b 4aii IIA81d 0,07 0,04 0,04 0,06 0,09COD 2b1 4aiii none 0,04 0,14 0,12 0,12 0,09COD 2b12 4bi none 0,09 0,11 0,11 0,11 0,07COD 2b3 4aii none 0,03 0,03COD 2b23 4aiii none 0,03 0,03 0,02 0,03 0,03COD 2b 4aiv none 0,01 0,02 0,03 0,02 0,02COD 2b 4ciii none 0,04 0,05 0,04 0,03 0,02COD 2b23 4aiii IIA81d 0,01 0,01COD 2b12 4biv none 0,02 0,02 0,02 0,01 0,01COD 2b none none 0,04 0,03 0,04 0,02 0,01COD 2b 4cii none 0,03 0,03 0,04 0,03 0,01COD 2b 4av IIA81d 0,02 0,02 0,01 0,01 0,01COD 2b2 4aii IIA81c 0,01COD 2b 4ai noneCOD 2b3 4bi noneCOD 2b 4civ noneCOD 2b 4aiv IIA81cCOD 2b 4aiv IIA81dCOD 2b 4av IIA81cCOD 2b12 4biii noneCOD 2b 4e none 0,01COD 2b 4ci noneCOD 2b1 4aii none 0,01 0,03COD 2b 4d noneCOD 2b12 4biv IIA81eCOD 2b2 4civ IIA81fCOD 2b3 4aii IIA81cCOD 2b1 4av IIA81aCOD 2b1 4aiii IIA81aCOD 2b 4aii IIA81bCOD 2b23 4av IIA81aCOD 2b12 4biv IIA81iCOD 2b1 4aiii IIA81dCOD 2b12 4biv IIA81cCOD 2b12 4biii IIA81iCOD 2b12 4biii IIA81cCOD 2b12 4bii noneCOD 2b1 4aiv IIA81aCOD 2b1 none noneCOD 2b1 4av IIA81jCOD 2b1 4aiii IIa81lPLE 2b12 4bi none 0,8 0,81 0,83 0,84 0,81PLE 2b 4av none 0,04 0,02 0,03 0,04 0,05PLE 2b 4aiv none 0,01 0,01 0,01 0,01 0,03PLE 2b12 4biv none 0,01 0,02 0,02 0,03 0,03PLE 2b1 4aiii none 0,01 0,03 0,02 0,01 0,02PLE 2b12 4biii none 0,01 0,01 0,01PLE 2b 4cii none 0,01 0,01 0,01 0,01 0,01PLE 2b none none 0,01 0,01 0,01 0,01PLE 2b2 4aii none 0,01 0,01 0,01 0,01PLE 2b23 4aiii none 0,02 0,02 0,01 0,01 0,01PLE 2b3 4bi none 0,01 0,01 0,01 0,01 0,01
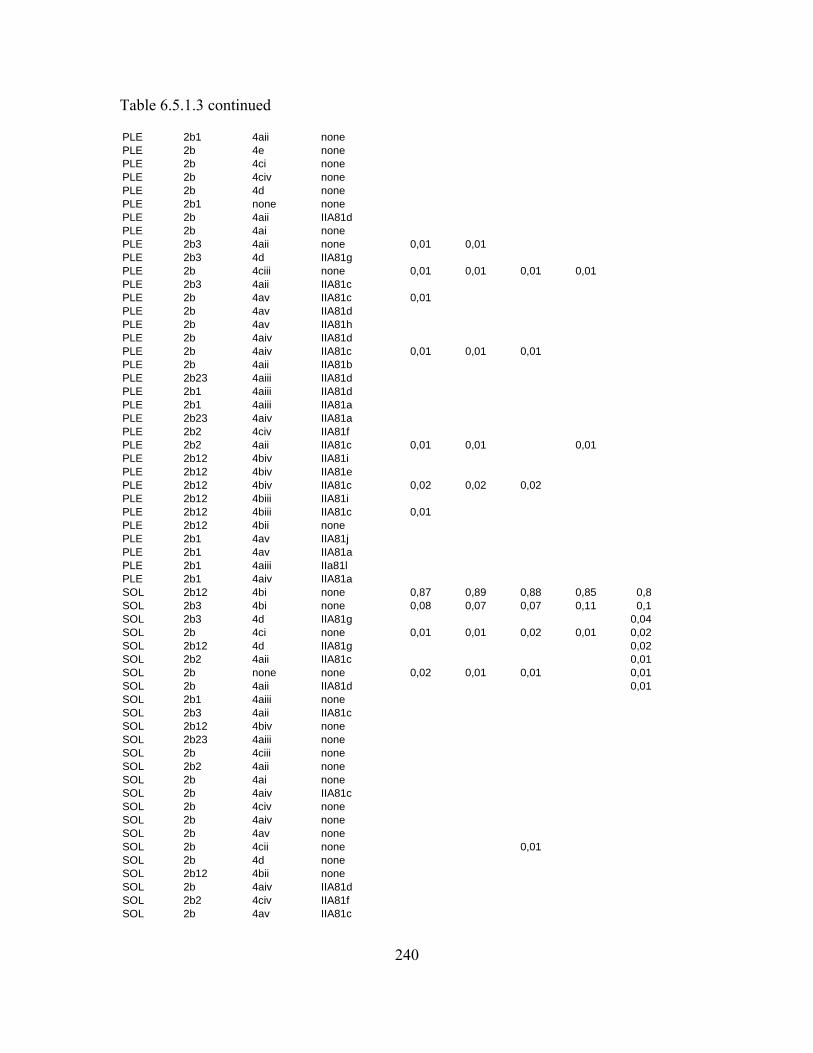
240
Table 6.5.1.3 continued
PLE 2b1 4aii nonePLE 2b 4e nonePLE 2b 4ci nonePLE 2b 4civ nonePLE 2b 4d nonePLE 2b1 none nonePLE 2b 4aii IIA81dPLE 2b 4ai nonePLE 2b3 4aii none 0,01 0,01PLE 2b3 4d IIA81gPLE 2b 4ciii none 0,01 0,01 0,01 0,01PLE 2b3 4aii IIA81cPLE 2b 4av IIA81c 0,01PLE 2b 4av IIA81dPLE 2b 4av IIA81hPLE 2b 4aiv IIA81dPLE 2b 4aiv IIA81c 0,01 0,01 0,01PLE 2b 4aii IIA81bPLE 2b23 4aiii IIA81dPLE 2b1 4aiii IIA81dPLE 2b1 4aiii IIA81aPLE 2b23 4aiv IIA81aPLE 2b2 4civ IIA81fPLE 2b2 4aii IIA81c 0,01 0,01 0,01PLE 2b12 4biv IIA81iPLE 2b12 4biv IIA81ePLE 2b12 4biv IIA81c 0,02 0,02 0,02PLE 2b12 4biii IIA81iPLE 2b12 4biii IIA81c 0,01PLE 2b12 4bii nonePLE 2b1 4av IIA81jPLE 2b1 4av IIA81aPLE 2b1 4aiii IIa81lPLE 2b1 4aiv IIA81aSOL 2b12 4bi none 0,87 0,89 0,88 0,85 0,8SOL 2b3 4bi none 0,08 0,07 0,07 0,11 0,1SOL 2b3 4d IIA81g 0,04SOL 2b 4ci none 0,01 0,01 0,02 0,01 0,02SOL 2b12 4d IIA81g 0,02SOL 2b2 4aii IIA81c 0,01SOL 2b none none 0,02 0,01 0,01 0,01SOL 2b 4aii IIA81d 0,01SOL 2b1 4aiii noneSOL 2b3 4aii IIA81cSOL 2b12 4biv noneSOL 2b23 4aiii noneSOL 2b 4ciii noneSOL 2b2 4aii noneSOL 2b 4ai noneSOL 2b 4aiv IIA81cSOL 2b 4civ noneSOL 2b 4aiv noneSOL 2b 4av noneSOL 2b 4cii none 0,01SOL 2b 4d noneSOL 2b12 4bii noneSOL 2b 4aiv IIA81dSOL 2b2 4civ IIA81fSOL 2b 4av IIA81c
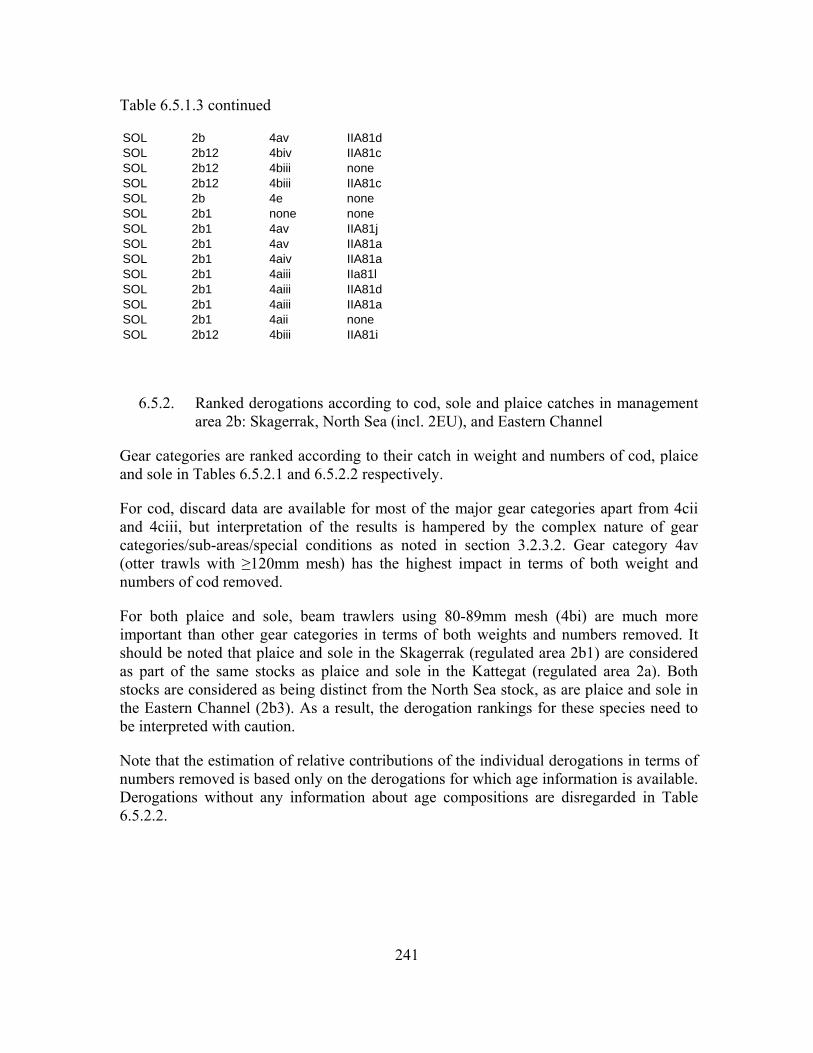
241
Table 6.5.1.3 continued
SOL 2b 4av IIA81dSOL 2b12 4biv IIA81cSOL 2b12 4biii noneSOL 2b12 4biii IIA81cSOL 2b 4e noneSOL 2b1 none noneSOL 2b1 4av IIA81jSOL 2b1 4av IIA81aSOL 2b1 4aiv IIA81aSOL 2b1 4aiii IIa81lSOL 2b1 4aiii IIA81dSOL 2b1 4aiii IIA81aSOL 2b1 4aii noneSOL 2b12 4biii IIA81i
6.5.2. Ranked derogations according to cod, sole and plaice catches in management area 2b: Skagerrak, North Sea (incl. 2EU), and Eastern Channel
Gear categories are ranked according to their catch in weight and numbers of cod, plaice and sole in Tables 6.5.2.1 and 6.5.2.2 respectively.
For cod, discard data are available for most of the major gear categories apart from 4cii and 4ciii, but interpretation of the results is hampered by the complex nature of gear categories/sub-areas/special conditions as noted in section 3.2.3.2. Gear category 4av (otter trawls with ≥120mm mesh) has the highest impact in terms of both weight and numbers of cod removed.
For both plaice and sole, beam trawlers using 80-89mm mesh (4bi) are much more important than other gear categories in terms of both weights and numbers removed. It should be noted that plaice and sole in the Skagerrak (regulated area 2b1) are considered as part of the same stocks as plaice and sole in the Kattegat (regulated area 2a). Both stocks are considered as being distinct from the North Sea stock, as are plaice and sole in the Eastern Channel (2b3). As a result, the derogation rankings for these species need to be interpreted with caution.
Note that the estimation of relative contributions of the individual derogations in terms of numbers removed is based only on the derogations for which age information is available. Derogations without any information about age compositions are disregarded in Table 6.5.2.2.
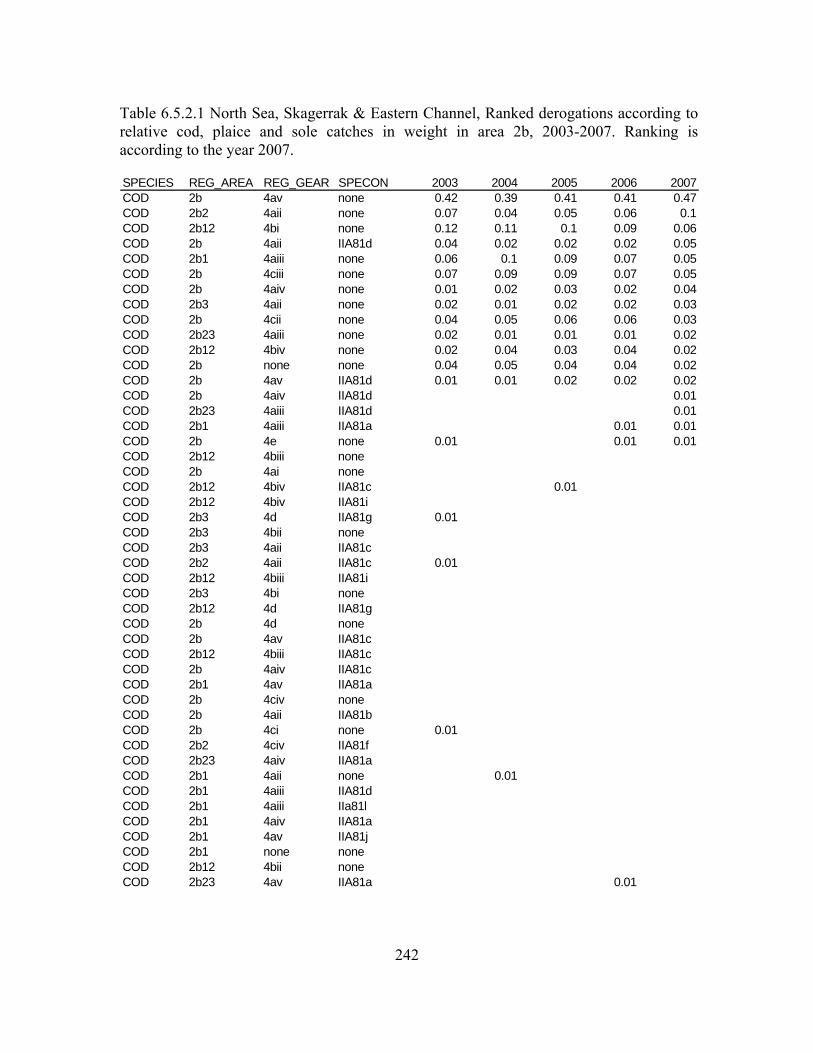
242
Table 6.5.2.1 North Sea, Skagerrak & Eastern Channel, Ranked derogations according to relative cod, plaice and sole catches in weight in area 2b, 2003-2007. Ranking is according to the year 2007.
SPECIES REG_AREA REG_GEAR SPECON 2003 2004 2005 2006 2007COD 2b 4av none 0.42 0.39 0.41 0.41 0.47COD 2b2 4aii none 0.07 0.04 0.05 0.06 0.1COD 2b12 4bi none 0.12 0.11 0.1 0.09 0.06COD 2b 4aii IIA81d 0.04 0.02 0.02 0.02 0.05COD 2b1 4aiii none 0.06 0.1 0.09 0.07 0.05COD 2b 4ciii none 0.07 0.09 0.09 0.07 0.05COD 2b 4aiv none 0.01 0.02 0.03 0.02 0.04COD 2b3 4aii none 0.02 0.01 0.02 0.02 0.03COD 2b 4cii none 0.04 0.05 0.06 0.06 0.03COD 2b23 4aiii none 0.02 0.01 0.01 0.01 0.02COD 2b12 4biv none 0.02 0.04 0.03 0.04 0.02COD 2b none none 0.04 0.05 0.04 0.04 0.02COD 2b 4av IIA81d 0.01 0.01 0.02 0.02 0.02COD 2b 4aiv IIA81d 0.01COD 2b23 4aiii IIA81d 0.01COD 2b1 4aiii IIA81a 0.01 0.01COD 2b 4e none 0.01 0.01 0.01COD 2b12 4biii noneCOD 2b 4ai noneCOD 2b12 4biv IIA81c 0.01COD 2b12 4biv IIA81iCOD 2b3 4d IIA81g 0.01COD 2b3 4bii noneCOD 2b3 4aii IIA81cCOD 2b2 4aii IIA81c 0.01COD 2b12 4biii IIA81iCOD 2b3 4bi noneCOD 2b12 4d IIA81gCOD 2b 4d noneCOD 2b 4av IIA81cCOD 2b12 4biii IIA81cCOD 2b 4aiv IIA81cCOD 2b1 4av IIA81aCOD 2b 4civ noneCOD 2b 4aii IIA81bCOD 2b 4ci none 0.01COD 2b2 4civ IIA81fCOD 2b23 4aiv IIA81aCOD 2b1 4aii none 0.01COD 2b1 4aiii IIA81dCOD 2b1 4aiii IIa81lCOD 2b1 4aiv IIA81aCOD 2b1 4av IIA81jCOD 2b1 none noneCOD 2b12 4bii noneCOD 2b23 4av IIA81a 0.01
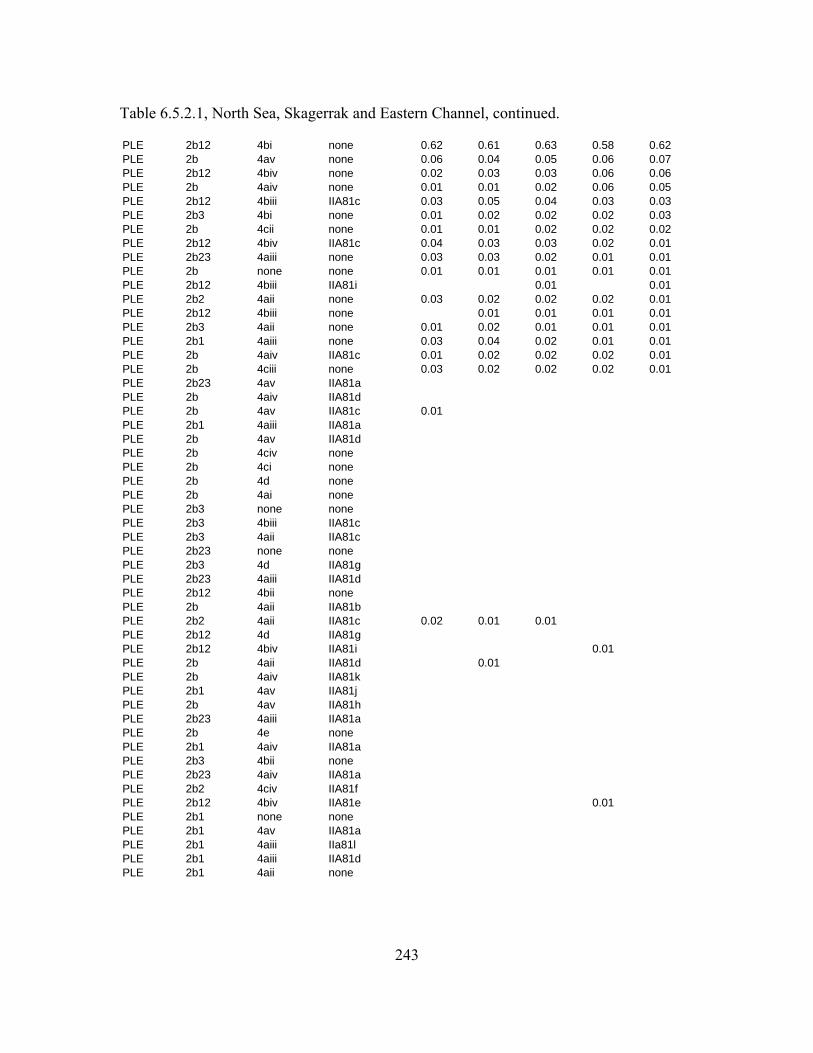
243
Table 6.5.2.1, North Sea, Skagerrak and Eastern Channel, continued.
PLE 2b12 4bi none 0.62 0.61 0.63 0.58 0.62PLE 2b 4av none 0.06 0.04 0.05 0.06 0.07PLE 2b12 4biv none 0.02 0.03 0.03 0.06 0.06PLE 2b 4aiv none 0.01 0.01 0.02 0.06 0.05PLE 2b12 4biii IIA81c 0.03 0.05 0.04 0.03 0.03PLE 2b3 4bi none 0.01 0.02 0.02 0.02 0.03PLE 2b 4cii none 0.01 0.01 0.02 0.02 0.02PLE 2b12 4biv IIA81c 0.04 0.03 0.03 0.02 0.01PLE 2b23 4aiii none 0.03 0.03 0.02 0.01 0.01PLE 2b none none 0.01 0.01 0.01 0.01 0.01PLE 2b12 4biii IIA81i 0.01 0.01PLE 2b2 4aii none 0.03 0.02 0.02 0.02 0.01PLE 2b12 4biii none 0.01 0.01 0.01 0.01PLE 2b3 4aii none 0.01 0.02 0.01 0.01 0.01PLE 2b1 4aiii none 0.03 0.04 0.02 0.01 0.01PLE 2b 4aiv IIA81c 0.01 0.02 0.02 0.02 0.01PLE 2b 4ciii none 0.03 0.02 0.02 0.02 0.01PLE 2b23 4av IIA81aPLE 2b 4aiv IIA81dPLE 2b 4av IIA81c 0.01PLE 2b1 4aiii IIA81aPLE 2b 4av IIA81dPLE 2b 4civ nonePLE 2b 4ci nonePLE 2b 4d nonePLE 2b 4ai nonePLE 2b3 none nonePLE 2b3 4biii IIA81cPLE 2b3 4aii IIA81cPLE 2b23 none nonePLE 2b3 4d IIA81gPLE 2b23 4aiii IIA81dPLE 2b12 4bii nonePLE 2b 4aii IIA81bPLE 2b2 4aii IIA81c 0.02 0.01 0.01PLE 2b12 4d IIA81gPLE 2b12 4biv IIA81i 0.01PLE 2b 4aii IIA81d 0.01PLE 2b 4aiv IIA81kPLE 2b1 4av IIA81jPLE 2b 4av IIA81hPLE 2b23 4aiii IIA81aPLE 2b 4e nonePLE 2b1 4aiv IIA81aPLE 2b3 4bii nonePLE 2b23 4aiv IIA81aPLE 2b2 4civ IIA81fPLE 2b12 4biv IIA81e 0.01PLE 2b1 none nonePLE 2b1 4av IIA81aPLE 2b1 4aiii IIa81lPLE 2b1 4aiii IIA81dPLE 2b1 4aii none
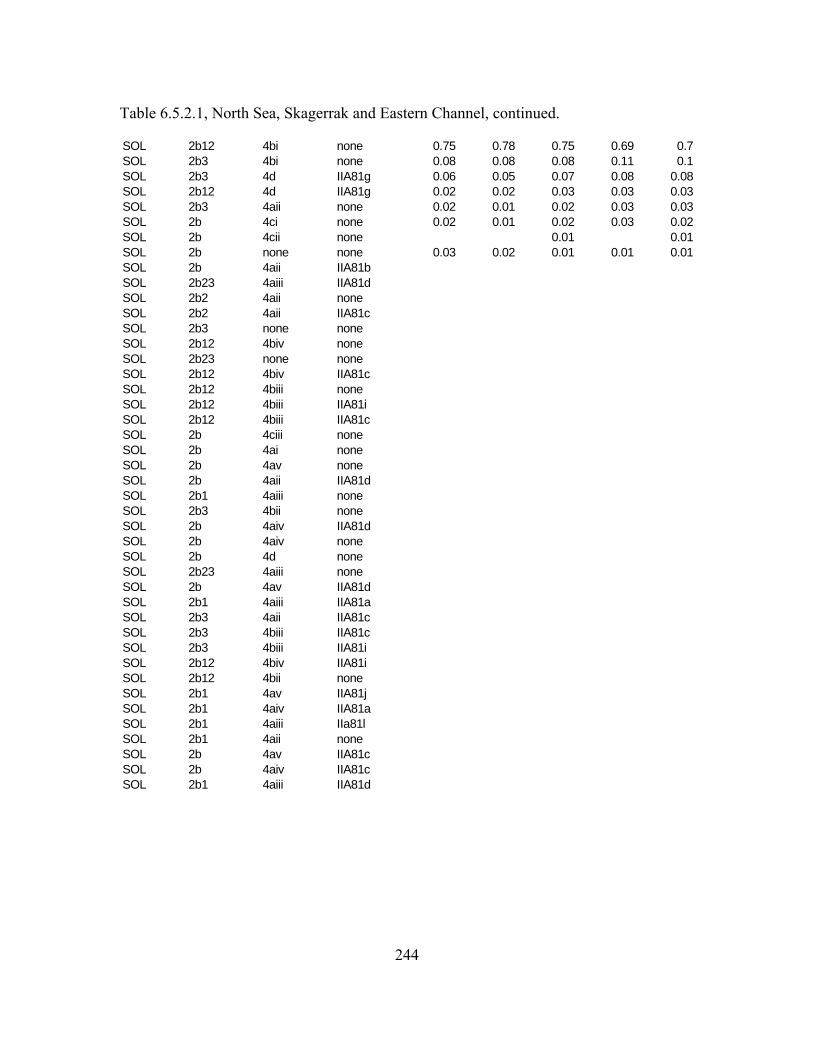
244
Table 6.5.2.1, North Sea, Skagerrak and Eastern Channel, continued.
SOL 2b12 4bi none 0.75 0.78 0.75 0.69 0.7SOL 2b3 4bi none 0.08 0.08 0.08 0.11 0.1SOL 2b3 4d IIA81g 0.06 0.05 0.07 0.08 0.08SOL 2b12 4d IIA81g 0.02 0.02 0.03 0.03 0.03SOL 2b3 4aii none 0.02 0.01 0.02 0.03 0.03SOL 2b 4ci none 0.02 0.01 0.02 0.03 0.02SOL 2b 4cii none 0.01 0.01SOL 2b none none 0.03 0.02 0.01 0.01 0.01SOL 2b 4aii IIA81bSOL 2b23 4aiii IIA81dSOL 2b2 4aii noneSOL 2b2 4aii IIA81cSOL 2b3 none noneSOL 2b12 4biv noneSOL 2b23 none noneSOL 2b12 4biv IIA81cSOL 2b12 4biii noneSOL 2b12 4biii IIA81iSOL 2b12 4biii IIA81cSOL 2b 4ciii noneSOL 2b 4ai noneSOL 2b 4av noneSOL 2b 4aii IIA81dSOL 2b1 4aiii noneSOL 2b3 4bii noneSOL 2b 4aiv IIA81dSOL 2b 4aiv noneSOL 2b 4d noneSOL 2b23 4aiii noneSOL 2b 4av IIA81dSOL 2b1 4aiii IIA81aSOL 2b3 4aii IIA81cSOL 2b3 4biii IIA81cSOL 2b3 4biii IIA81iSOL 2b12 4biv IIA81iSOL 2b12 4bii noneSOL 2b1 4av IIA81jSOL 2b1 4aiv IIA81aSOL 2b1 4aiii IIa81lSOL 2b1 4aii noneSOL 2b 4av IIA81cSOL 2b 4aiv IIA81cSOL 2b1 4aiii IIA81d
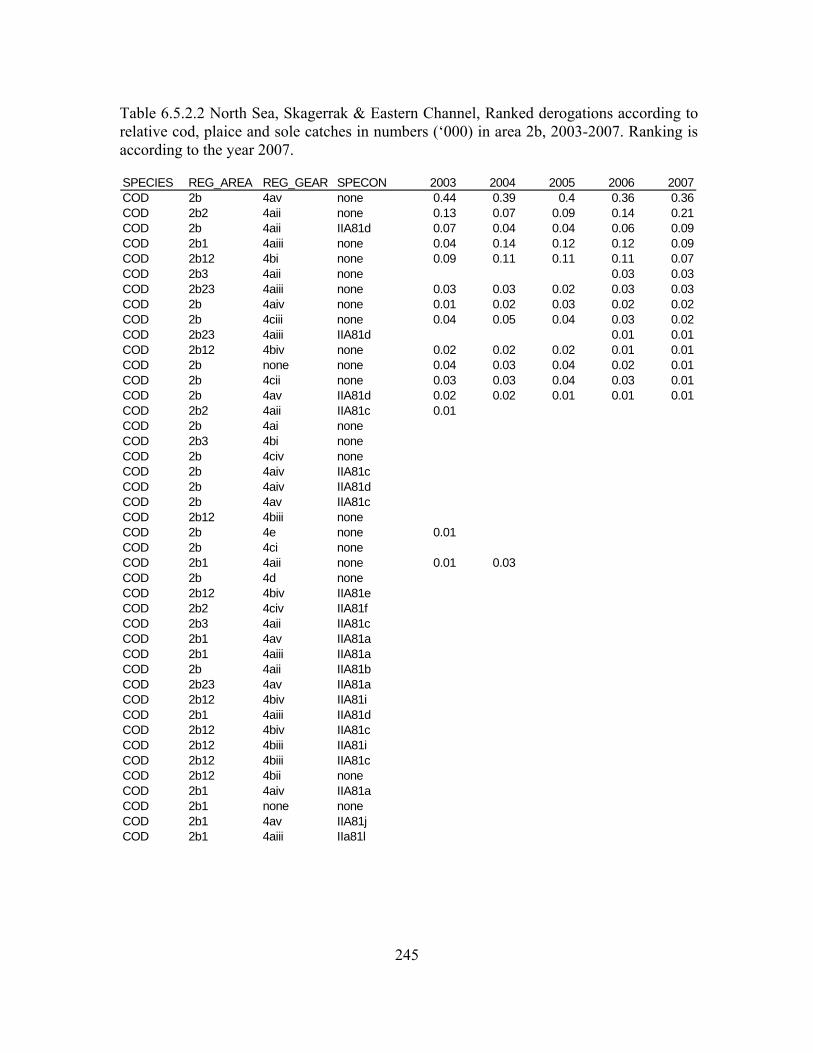
245
Table 6.5.2.2 North Sea, Skagerrak & Eastern Channel, Ranked derogations according to relative cod, plaice and sole catches in numbers (‘000) in area 2b, 2003-2007. Ranking is according to the year 2007.
SPECIES REG_AREA REG_GEAR SPECON 2003 2004 2005 2006 2007COD 2b 4av none 0.44 0.39 0.4 0.36 0.36COD 2b2 4aii none 0.13 0.07 0.09 0.14 0.21COD 2b 4aii IIA81d 0.07 0.04 0.04 0.06 0.09COD 2b1 4aiii none 0.04 0.14 0.12 0.12 0.09COD 2b12 4bi none 0.09 0.11 0.11 0.11 0.07COD 2b3 4aii none 0.03 0.03COD 2b23 4aiii none 0.03 0.03 0.02 0.03 0.03COD 2b 4aiv none 0.01 0.02 0.03 0.02 0.02COD 2b 4ciii none 0.04 0.05 0.04 0.03 0.02COD 2b23 4aiii IIA81d 0.01 0.01COD 2b12 4biv none 0.02 0.02 0.02 0.01 0.01COD 2b none none 0.04 0.03 0.04 0.02 0.01COD 2b 4cii none 0.03 0.03 0.04 0.03 0.01COD 2b 4av IIA81d 0.02 0.02 0.01 0.01 0.01COD 2b2 4aii IIA81c 0.01COD 2b 4ai noneCOD 2b3 4bi noneCOD 2b 4civ noneCOD 2b 4aiv IIA81cCOD 2b 4aiv IIA81dCOD 2b 4av IIA81cCOD 2b12 4biii noneCOD 2b 4e none 0.01COD 2b 4ci noneCOD 2b1 4aii none 0.01 0.03COD 2b 4d noneCOD 2b12 4biv IIA81eCOD 2b2 4civ IIA81fCOD 2b3 4aii IIA81cCOD 2b1 4av IIA81aCOD 2b1 4aiii IIA81aCOD 2b 4aii IIA81bCOD 2b23 4av IIA81aCOD 2b12 4biv IIA81iCOD 2b1 4aiii IIA81dCOD 2b12 4biv IIA81cCOD 2b12 4biii IIA81iCOD 2b12 4biii IIA81cCOD 2b12 4bii noneCOD 2b1 4aiv IIA81aCOD 2b1 none noneCOD 2b1 4av IIA81jCOD 2b1 4aiii IIa81l
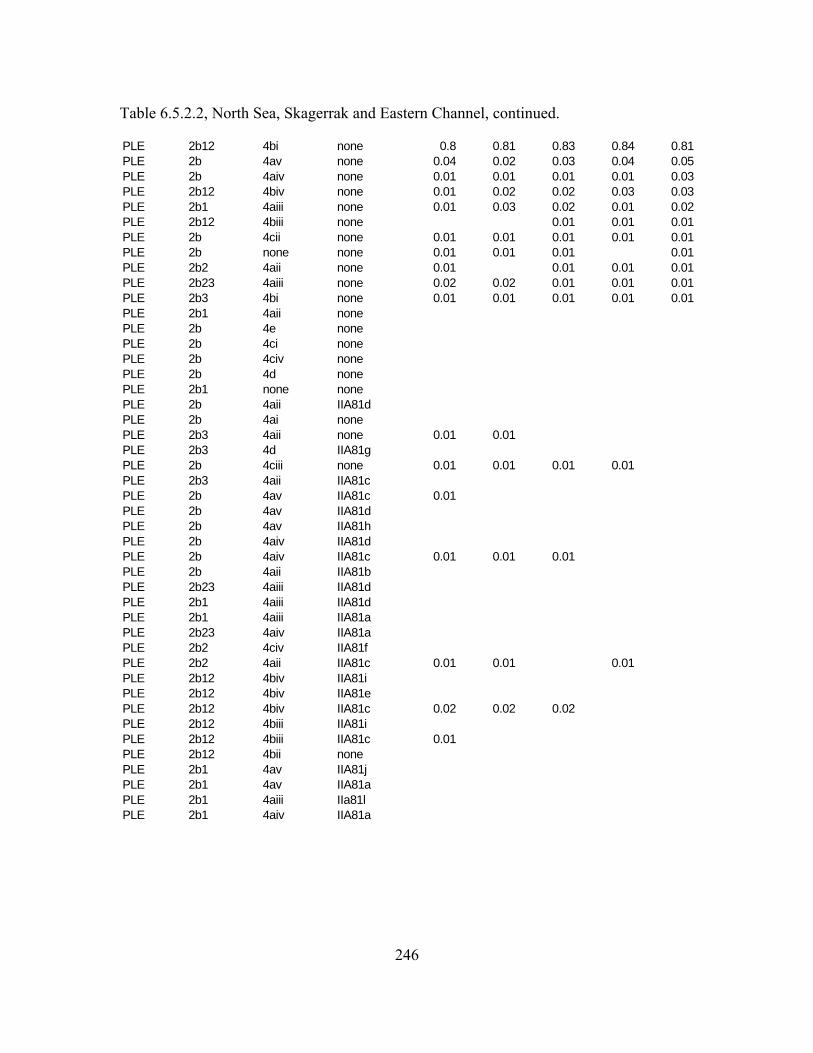
246
Table 6.5.2.2, North Sea, Skagerrak and Eastern Channel, continued.
PLE 2b12 4bi none 0.8 0.81 0.83 0.84 0.81PLE 2b 4av none 0.04 0.02 0.03 0.04 0.05PLE 2b 4aiv none 0.01 0.01 0.01 0.01 0.03PLE 2b12 4biv none 0.01 0.02 0.02 0.03 0.03PLE 2b1 4aiii none 0.01 0.03 0.02 0.01 0.02PLE 2b12 4biii none 0.01 0.01 0.01PLE 2b 4cii none 0.01 0.01 0.01 0.01 0.01PLE 2b none none 0.01 0.01 0.01 0.01PLE 2b2 4aii none 0.01 0.01 0.01 0.01PLE 2b23 4aiii none 0.02 0.02 0.01 0.01 0.01PLE 2b3 4bi none 0.01 0.01 0.01 0.01 0.01PLE 2b1 4aii nonePLE 2b 4e nonePLE 2b 4ci nonePLE 2b 4civ nonePLE 2b 4d nonePLE 2b1 none nonePLE 2b 4aii IIA81dPLE 2b 4ai nonePLE 2b3 4aii none 0.01 0.01PLE 2b3 4d IIA81gPLE 2b 4ciii none 0.01 0.01 0.01 0.01PLE 2b3 4aii IIA81cPLE 2b 4av IIA81c 0.01PLE 2b 4av IIA81dPLE 2b 4av IIA81hPLE 2b 4aiv IIA81dPLE 2b 4aiv IIA81c 0.01 0.01 0.01PLE 2b 4aii IIA81bPLE 2b23 4aiii IIA81dPLE 2b1 4aiii IIA81dPLE 2b1 4aiii IIA81aPLE 2b23 4aiv IIA81aPLE 2b2 4civ IIA81fPLE 2b2 4aii IIA81c 0.01 0.01 0.01PLE 2b12 4biv IIA81iPLE 2b12 4biv IIA81ePLE 2b12 4biv IIA81c 0.02 0.02 0.02PLE 2b12 4biii IIA81iPLE 2b12 4biii IIA81c 0.01PLE 2b12 4bii nonePLE 2b1 4av IIA81jPLE 2b1 4av IIA81aPLE 2b1 4aiii IIa81lPLE 2b1 4aiv IIA81a
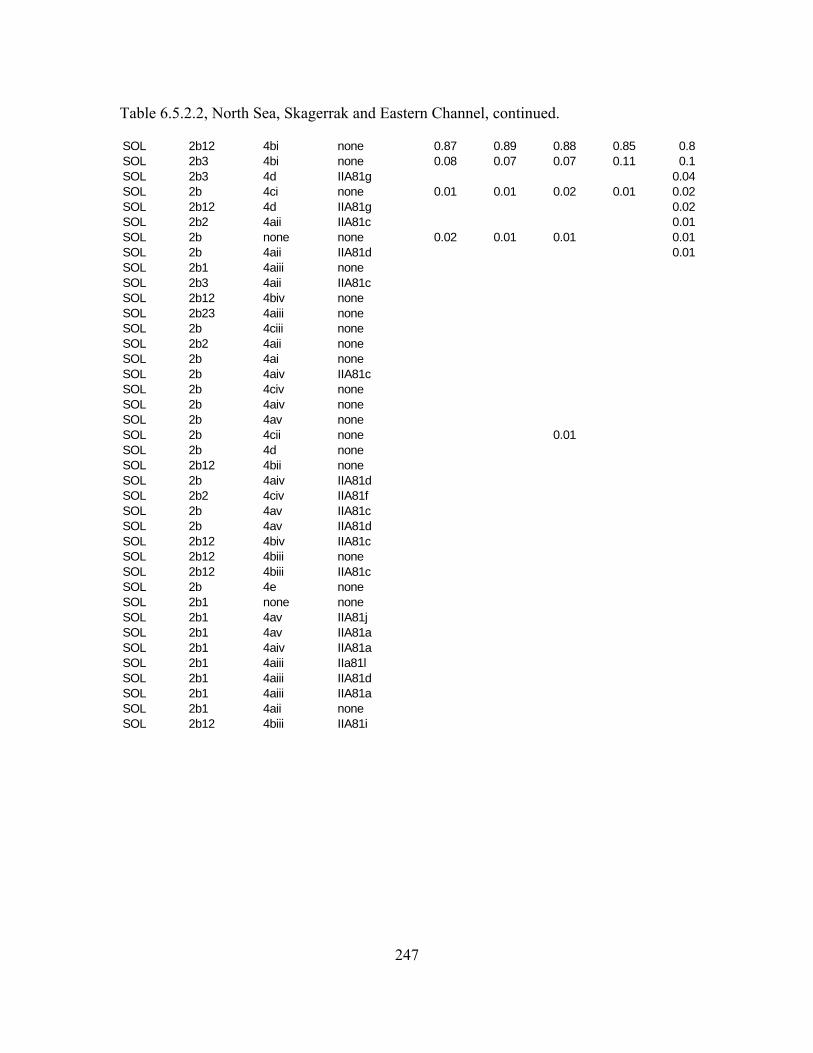
247
Table 6.5.2.2, North Sea, Skagerrak and Eastern Channel, continued.
SOL 2b12 4bi none 0.87 0.89 0.88 0.85 0.8SOL 2b3 4bi none 0.08 0.07 0.07 0.11 0.1SOL 2b3 4d IIA81g 0.04SOL 2b 4ci none 0.01 0.01 0.02 0.01 0.02SOL 2b12 4d IIA81g 0.02SOL 2b2 4aii IIA81c 0.01SOL 2b none none 0.02 0.01 0.01 0.01SOL 2b 4aii IIA81d 0.01SOL 2b1 4aiii noneSOL 2b3 4aii IIA81cSOL 2b12 4biv noneSOL 2b23 4aiii noneSOL 2b 4ciii noneSOL 2b2 4aii noneSOL 2b 4ai noneSOL 2b 4aiv IIA81cSOL 2b 4civ noneSOL 2b 4aiv noneSOL 2b 4av noneSOL 2b 4cii none 0.01SOL 2b 4d noneSOL 2b12 4bii noneSOL 2b 4aiv IIA81dSOL 2b2 4civ IIA81fSOL 2b 4av IIA81cSOL 2b 4av IIA81dSOL 2b12 4biv IIA81cSOL 2b12 4biii noneSOL 2b12 4biii IIA81cSOL 2b 4e noneSOL 2b1 none noneSOL 2b1 4av IIA81jSOL 2b1 4av IIA81aSOL 2b1 4aiv IIA81aSOL 2b1 4aiii IIa81lSOL 2b1 4aiii IIA81dSOL 2b1 4aiii IIA81aSOL 2b1 4aii noneSOL 2b12 4biii IIA81i
248
6.5.3. Ranked derogations according to cod, sole and plaice catches in management area 2c: Irish Sea
Ranked catch are provided in weight (Table 6.5.3.1) and numbers (Table 6.5.3.2) for cod, plaice and sole. These ranks should not be taken as absolute, as discard data is not consistently available for all years or all categories introducing bias into the ranking. STECF-SGRST also notes that in relation to catch numbers, the estimation of relative contributions of the individual derogations is based only on the derogations for which age information is available. Derogations without any information about age compositions are disregarded in Table 6.5.3.2.
Cod ranked by catch weights indicated several important categories. There have been several changes to the ranking of cod to previous years. Category 4a.ii none and 4a.iv none have previously ranked interchangeably between first and second position. In 2007 4a.ii none ranks first. This is followed by 4c.iii and 4a.ii IIA.8.d (which includes discard information for all years), previously having low rankings of little importance (1-2% and 1-13% respectively). The importance of 4a.iv none is much reduced in 2007 to its lowest across the period (just 12%). 4a.iv IIA.8.d has also declined in importance, towards levels observed in 2003. Beam trawl category 4b.i (containing discards 2004-2007) shows importance of 9% in the last two years, lower than the previous three years. All other gear categories with/without special condition are of little importance to the ranking of cod in 2007 (≤1%), or in previous years (≤5%). In relation to catch numbers, 4.a.ii IIA.8.d is ranked first, in 2007 contributing 81%. Percentage numbers have been constantly increasing for this gear category over the period, from 15% in 2003. However, no numbers information was available for the important 4a.ii none category beyond 2005. When available this category contributed 36-41%. Remaining categories have low cod numbers, including several of the larger 4a.iv categories.
Two gears dominate ranking of plaice catch weight, 4b.i beam trawl category (including discards 2004-2007) ranking first with 44-63%. The second is 4a.ii none (including discards 2003-2007, excluding 2006), this category has ranked second throughout the period. In addition this category has been consistently increasing in importance from 14% to 25% in 2007. 4a.ii IIA.8.c (including discards 2003-2007, excluding 2006) ranks third with 10% of plaice in weight, this category has also been increasing, even with low levels of effort. In 2007 4a.ii IIA.8.d (including discards 2003-2007, excluding 2006) accounted for 8% of plaice, having previously contributing ≤4%. Also worthy of note is 4a.iv none which in 2003 accounted for 20%, since which importance fell to around 4% annually. All other gear categories, with/without special condition show little importance. Plaice catch numbers for the top catch weight ranking gear category, 4b.i, were only available in 2005, where it accounted for 81% of the numbers. Of the remaining catch numbers, 13% occurred within 4a.ii none during 2005. It is likely this would be the case had information been available for the whole period. Given the lack of data from the main gear, it would not be possible to make further conclusions from the available data.
249
Catch weight of sole occurs primarily within the first ranking, beam trawl 4b.i (includes discards 2004-2007), prior to 2007 the percentage of sole catch weight within this category was consistently 89% or more. In 2007 however, this fell to 77%. Two other categories increased in sole percentage catch weight in 2007, the none-none category and 4a.ii none. The contribution of these categories however, remains low (12% and 8% respectively). There is little availability of catch numbers for sole in gears other than the main gear 4b.i. In 2007 numbers were available for 4a.ii none, IIA.8.c and IIA.8.d, each of which contributing only a small percentage to sole catch numbers (6%, 2%, and 2% respectively). Thus it is reasonable to assume 4b.i would likely contribute the greatest numbers regardless of increased information availability.
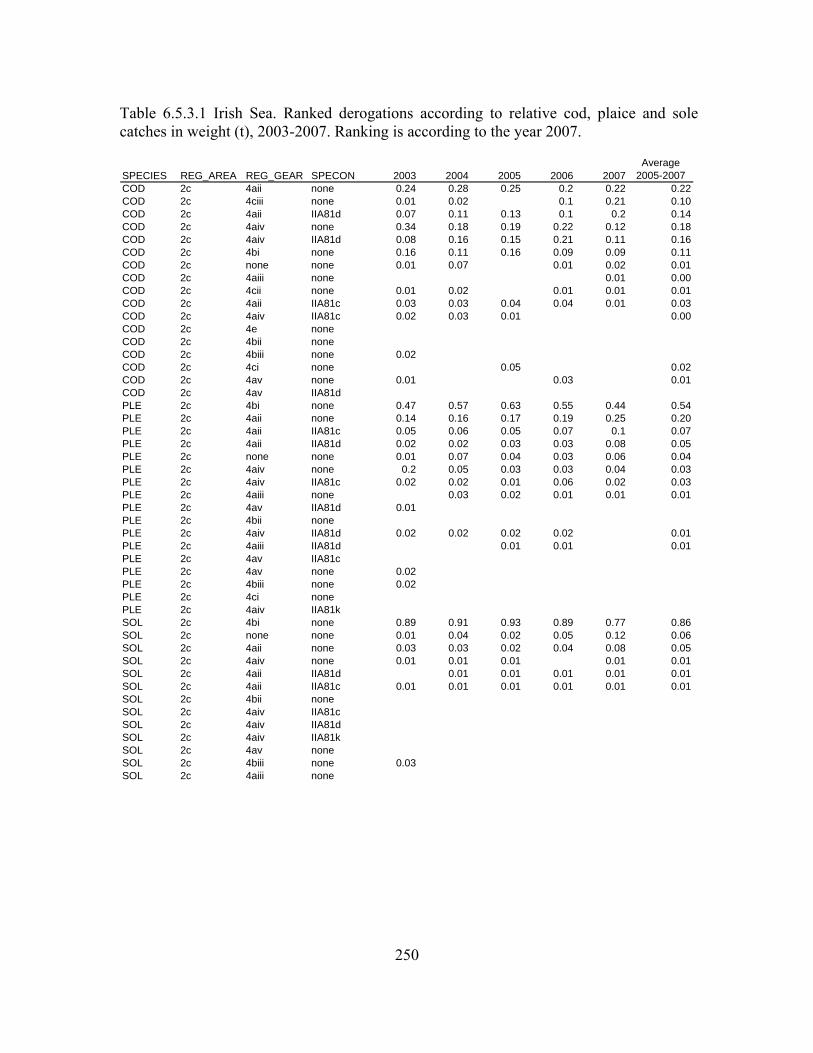
250
Table 6.5.3.1 Irish Sea. Ranked derogations according to relative cod, plaice and sole catches in weight (t), 2003-2007. Ranking is according to the year 2007.
SPECIES REG_AREA REG_GEAR SPECON 2003 2004 2005 2006 2007Average
2005-2007COD 2c 4aii none 0.24 0.28 0.25 0.2 0.22 0.22COD 2c 4ciii none 0.01 0.02 0.1 0.21 0.10COD 2c 4aii IIA81d 0.07 0.11 0.13 0.1 0.2 0.14COD 2c 4aiv none 0.34 0.18 0.19 0.22 0.12 0.18COD 2c 4aiv IIA81d 0.08 0.16 0.15 0.21 0.11 0.16COD 2c 4bi none 0.16 0.11 0.16 0.09 0.09 0.11COD 2c none none 0.01 0.07 0.01 0.02 0.01COD 2c 4aiii none 0.01 0.00COD 2c 4cii none 0.01 0.02 0.01 0.01 0.01COD 2c 4aii IIA81c 0.03 0.03 0.04 0.04 0.01 0.03COD 2c 4aiv IIA81c 0.02 0.03 0.01 0.00COD 2c 4e noneCOD 2c 4bii noneCOD 2c 4biii none 0.02COD 2c 4ci none 0.05 0.02COD 2c 4av none 0.01 0.03 0.01COD 2c 4av IIA81dPLE 2c 4bi none 0.47 0.57 0.63 0.55 0.44 0.54PLE 2c 4aii none 0.14 0.16 0.17 0.19 0.25 0.20PLE 2c 4aii IIA81c 0.05 0.06 0.05 0.07 0.1 0.07PLE 2c 4aii IIA81d 0.02 0.02 0.03 0.03 0.08 0.05PLE 2c none none 0.01 0.07 0.04 0.03 0.06 0.04PLE 2c 4aiv none 0.2 0.05 0.03 0.03 0.04 0.03PLE 2c 4aiv IIA81c 0.02 0.02 0.01 0.06 0.02 0.03PLE 2c 4aiii none 0.03 0.02 0.01 0.01 0.01PLE 2c 4av IIA81d 0.01PLE 2c 4bii nonePLE 2c 4aiv IIA81d 0.02 0.02 0.02 0.02 0.01PLE 2c 4aiii IIA81d 0.01 0.01 0.01PLE 2c 4av IIA81cPLE 2c 4av none 0.02PLE 2c 4biii none 0.02PLE 2c 4ci nonePLE 2c 4aiv IIA81kSOL 2c 4bi none 0.89 0.91 0.93 0.89 0.77 0.86SOL 2c none none 0.01 0.04 0.02 0.05 0.12 0.06SOL 2c 4aii none 0.03 0.03 0.02 0.04 0.08 0.05SOL 2c 4aiv none 0.01 0.01 0.01 0.01 0.01SOL 2c 4aii IIA81d 0.01 0.01 0.01 0.01 0.01SOL 2c 4aii IIA81c 0.01 0.01 0.01 0.01 0.01 0.01SOL 2c 4bii noneSOL 2c 4aiv IIA81cSOL 2c 4aiv IIA81dSOL 2c 4aiv IIA81kSOL 2c 4av noneSOL 2c 4biii none 0.03SOL 2c 4aiii none
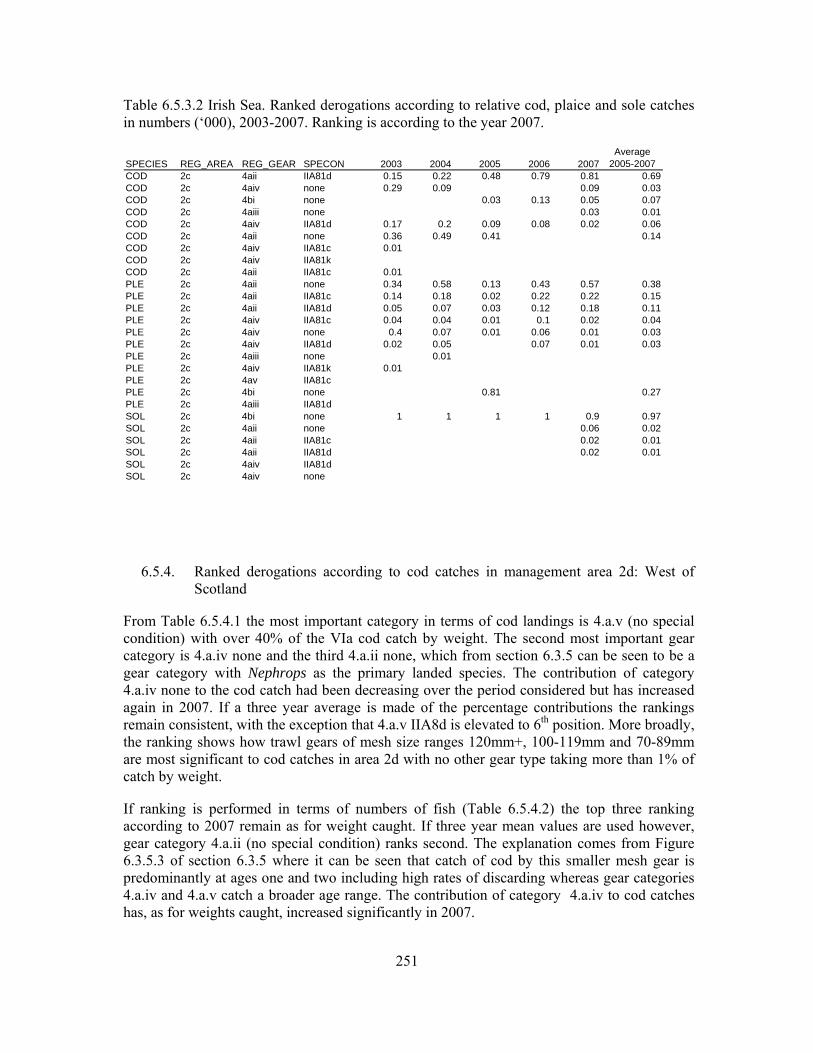
251
Table 6.5.3.2 Irish Sea. Ranked derogations according to relative cod, plaice and sole catches in numbers (‘000), 2003-2007. Ranking is according to the year 2007.
SPECIES REG_AREA REG_GEAR SPECON 2003 2004 2005 2006 2007Average
2005-2007COD 2c 4aii IIA81d 0.15 0.22 0.48 0.79 0.81 0.69COD 2c 4aiv none 0.29 0.09 0.09 0.03COD 2c 4bi none 0.03 0.13 0.05 0.07COD 2c 4aiii none 0.03 0.01COD 2c 4aiv IIA81d 0.17 0.2 0.09 0.08 0.02 0.06COD 2c 4aii none 0.36 0.49 0.41 0.14COD 2c 4aiv IIA81c 0.01COD 2c 4aiv IIA81kCOD 2c 4aii IIA81c 0.01PLE 2c 4aii none 0.34 0.58 0.13 0.43 0.57 0.38PLE 2c 4aii IIA81c 0.14 0.18 0.02 0.22 0.22 0.15PLE 2c 4aii IIA81d 0.05 0.07 0.03 0.12 0.18 0.11PLE 2c 4aiv IIA81c 0.04 0.04 0.01 0.1 0.02 0.04PLE 2c 4aiv none 0.4 0.07 0.01 0.06 0.01 0.03PLE 2c 4aiv IIA81d 0.02 0.05 0.07 0.01 0.03PLE 2c 4aiii none 0.01PLE 2c 4aiv IIA81k 0.01PLE 2c 4av IIA81cPLE 2c 4bi none 0.81 0.27PLE 2c 4aiii IIA81dSOL 2c 4bi none 1 1 1 1 0.9 0.97SOL 2c 4aii none 0.06 0.02SOL 2c 4aii IIA81c 0.02 0.01SOL 2c 4aii IIA81d 0.02 0.01SOL 2c 4aiv IIA81dSOL 2c 4aiv none
6.5.4. Ranked derogations according to cod catches in management area 2d: West of Scotland
From Table 6.5.4.1 the most important category in terms of cod landings is 4.a.v (no special condition) with over 40% of the VIa cod catch by weight. The second most important gear category is 4.a.iv none and the third 4.a.ii none, which from section 6.3.5 can be seen to be a gear category with Nephrops as the primary landed species. The contribution of category 4.a.iv none to the cod catch had been decreasing over the period considered but has increased again in 2007. If a three year average is made of the percentage contributions the rankings remain consistent, with the exception that 4.a.v IIA8d is elevated to 6th position. More broadly, the ranking shows how trawl gears of mesh size ranges 120mm+, 100-119mm and 70-89mm are most significant to cod catches in area 2d with no other gear type taking more than 1% of catch by weight.
If ranking is performed in terms of numbers of fish (Table 6.5.4.2) the top three ranking according to 2007 remain as for weight caught. If three year mean values are used however, gear category 4.a.ii (no special condition) ranks second. The explanation comes from Figure 6.3.5.3 of section 6.3.5 where it can be seen that catch of cod by this smaller mesh gear is predominantly at ages one and two including high rates of discarding whereas gear categories 4.a.iv and 4.a.v catch a broader age range. The contribution of category 4.a.iv to cod catches has, as for weights caught, increased significantly in 2007.

252
STECF-SGRST notes that the estimation of relative contributions to Table 6.5.4.2 uses only categories for which age information is available. Categories without any information about age compositions are disregarded in Table 6.5.4.2.
Table 6.5.4.1 West of Scotland. Ranked derogations according to relative cod catch in tonnes( in area 2d, 2003-2007. Ranking is according to the year 2007.
SPECIES REG_AREA REG_GEAR SPECON 2003 2004 2005 2006 2007 Mean 05-07COD 2d 4av none 0.48 0.42 0.44 0.45 0.4 0.43COD 2d 4aiv none 0.2 0.15 0.12 0.09 0.29 0.17COD 2d 4aii none 0.1 0.11 0.11 0.16 0.09 0.12COD 2d 4aiv IIA81d 0.08 0.14 0.16 0.13 0.08 0.12COD 2d 4aii IIA81d 0.09 0.08 0.05 0.06 0.04 0.05COD 2d 4aiii IIA81d 0.01 0.03 0.03 0.02 0.03 0.03COD 2d 4aiii none 0.02 0.01 0.01 0.01 0.02 0.01COD 2d 4cii none 0.01 0.01 0.01 0.01COD 2d 4av IIA81d 0.01 0.03 0.06 0.05 0.01 0.04COD 2d 4aii IIA81cCOD 2d 4aiv IIA81cCOD 2d 4e none 0.01 0.01 0.01 0.01COD 2d 4av IIA81cCOD 2d 4biv none 0.01COD 2d none none 0.02 0.02COD 2d 4ciii none
Table 6.5.4.2 West of Scotland. Ranked derogations according to relative cod catches in numbers (‘000) in area 2d, 2003-2007. Ranking is according to the year 2007.
SPECIES REG_AREA REG_GEAR SPECON 2003 2004 2005 2006 2007 Mean 05-07COD 2d 4av none 0.43 0.24 0.31 0.3 0.33 0.31COD 2d 4aiv none 0.17 0.09 0.08 0.05 0.25 0.13COD 2d 4aii none 0.14 0.26 0.25 0.28 0.12 0.22COD 2d 4aii IIA81d 0.12 0.17 0.14 0.14 0.09 0.12COD 2d 4aiv IIA81d 0.08 0.14 0.1 0.13 0.08 0.10COD 2d 4aiii IIA81d 0.02 0.06 0.08 0.04 0.07 0.06COD 2d 4aiii none 0.02 0.01 0.01 0.03 0.05 0.03COD 2d 4av IIA81d 0.01 0.02 0.04 0.03 0.01 0.03COD 2d 4aiv IIA81cCOD 2d none none
6.6. Unregulated gears
6.6.1. Unregulated gears introduction
In the summary tables above of effort and catches, the ‘none none’ category represents i) unregulated gear types and mesh sizes in addition to ii) unidentified mesh sizes. STECF has attempted to provide a break down of the main gears within this category in effort (kW*Days at sea), cod catches, plaice catches and sole catches. This analysis should help to identify any gears contributing significantly to landings of these species but which are not currently regulated.
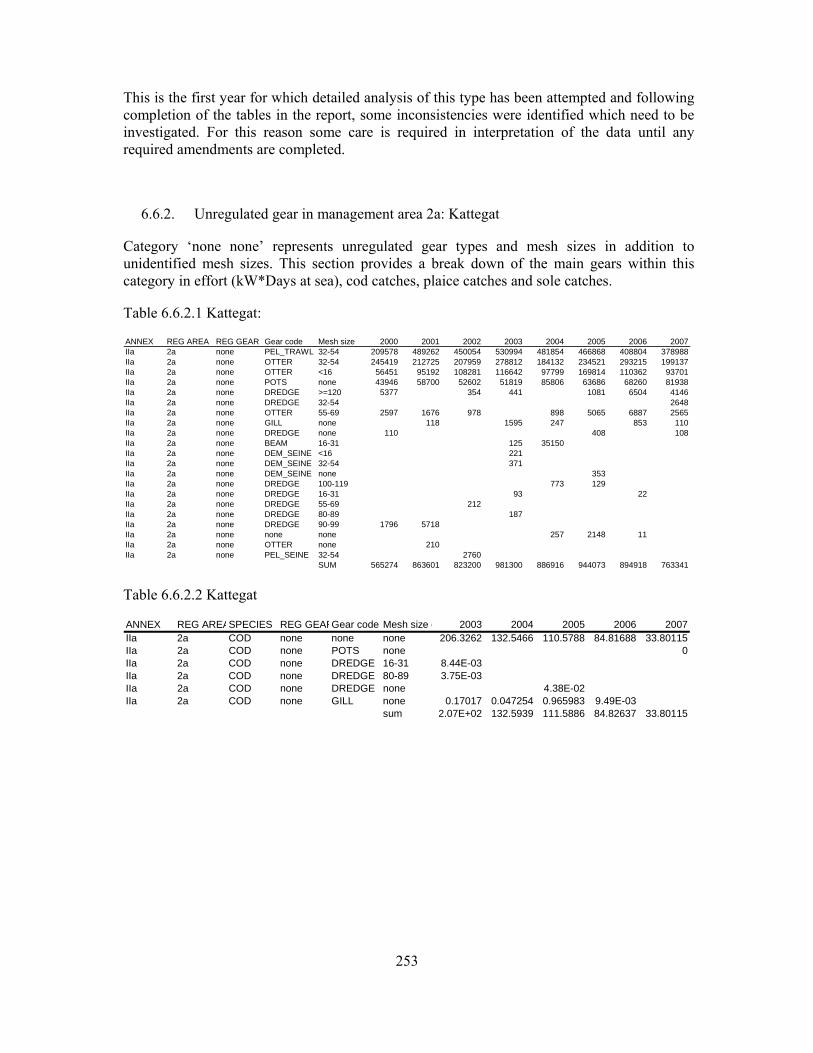
253
This is the first year for which detailed analysis of this type has been attempted and following completion of the tables in the report, some inconsistencies were identified which need to be investigated. For this reason some care is required in interpretation of the data until any required amendments are completed.
6.6.2. Unregulated gear in management area 2a: Kattegat
Category ‘none none’ represents unregulated gear types and mesh sizes in addition to unidentified mesh sizes. This section provides a break down of the main gears within this category in effort (kW*Days at sea), cod catches, plaice catches and sole catches.
Table 6.6.2.1 Kattegat:
ANNEX REG AREA REG GEAR Gear code Mesh size c 2000 2001 2002 2003 2004 2005 2006 2007IIa 2a none PEL_TRAWL 32-54 209578 489262 450054 530994 481854 466868 408804 378988IIa 2a none OTTER 32-54 245419 212725 207959 278812 184132 234521 293215 199137IIa 2a none OTTER <16 56451 95192 108281 116642 97799 169814 110362 93701IIa 2a none POTS none 43946 58700 52602 51819 85806 63686 68260 81938IIa 2a none DREDGE >=120 5377 354 441 1081 6504 4146IIa 2a none DREDGE 32-54 2648IIa 2a none OTTER 55-69 2597 1676 978 898 5065 6887 2565IIa 2a none GILL none 118 1595 247 853 110IIa 2a none DREDGE none 110 408 108IIa 2a none BEAM 16-31 125 35150IIa 2a none DEM_SEINE <16 221IIa 2a none DEM_SEINE 32-54 371IIa 2a none DEM_SEINE none 353IIa 2a none DREDGE 100-119 773 129IIa 2a none DREDGE 16-31 93 22IIa 2a none DREDGE 55-69 212IIa 2a none DREDGE 80-89 187IIa 2a none DREDGE 90-99 1796 5718IIa 2a none none none 257 2148 11IIa 2a none OTTER none 210IIa 2a none PEL_SEINE 32-54 2760
SUM 565274 863601 823200 981300 886916 944073 894918 763341
Table 6.6.2.2 Kattegat
ANNEX REG AREASPECIES REG GEARGear code Mesh size c 2003 2004 2005 2006 2007IIa 2a COD none none none 206.3262 132.5466 110.5788 84.81688 33.80115IIa 2a COD none POTS none 0IIa 2a COD none DREDGE 16-31 8.44E-03IIa 2a COD none DREDGE 80-89 3.75E-03IIa 2a COD none DREDGE none 4.38E-02IIa 2a COD none GILL none 0.17017 0.047254 0.965983 9.49E-03
sum 2.07E+02 132.5939 111.5886 84.82637 33.80115
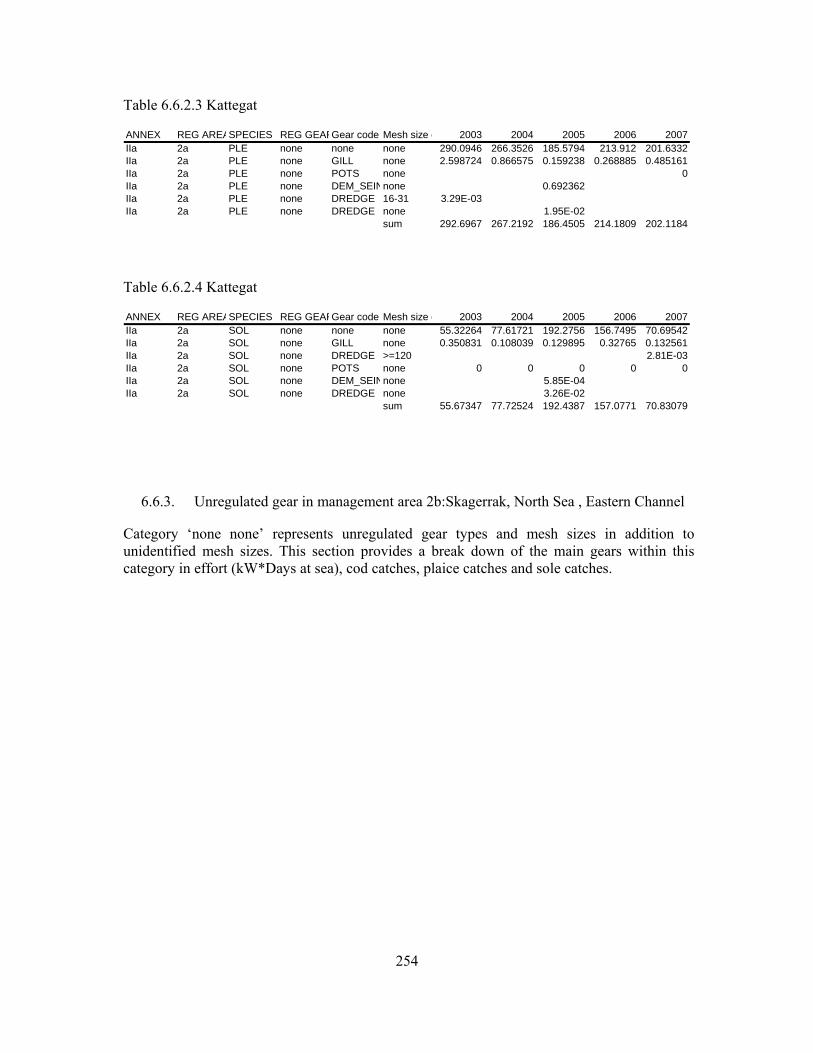
254
Table 6.6.2.3 Kattegat
ANNEX REG AREASPECIES REG GEARGear code Mesh size c 2003 2004 2005 2006 2007IIa 2a PLE none none none 290.0946 266.3526 185.5794 213.912 201.6332IIa 2a PLE none GILL none 2.598724 0.866575 0.159238 0.268885 0.485161IIa 2a PLE none POTS none 0IIa 2a PLE none DEM_SEINnone 0.692362IIa 2a PLE none DREDGE 16-31 3.29E-03IIa 2a PLE none DREDGE none 1.95E-02
sum 292.6967 267.2192 186.4505 214.1809 202.1184
Table 6.6.2.4 Kattegat
ANNEX REG AREASPECIES REG GEARGear code Mesh size c 2003 2004 2005 2006 2007IIa 2a SOL none none none 55.32264 77.61721 192.2756 156.7495 70.69542IIa 2a SOL none GILL none 0.350831 0.108039 0.129895 0.32765 0.132561IIa 2a SOL none DREDGE >=120 2.81E-03IIa 2a SOL none POTS none 0 0 0 0 0IIa 2a SOL none DEM_SEINnone 5.85E-04IIa 2a SOL none DREDGE none 3.26E-02
sum 55.67347 77.72524 192.4387 157.0771 70.83079
6.6.3. Unregulated gear in management area 2b:Skagerrak, North Sea , Eastern Channel
Category ‘none none’ represents unregulated gear types and mesh sizes in addition to unidentified mesh sizes. This section provides a break down of the main gears within this category in effort (kW*Days at sea), cod catches, plaice catches and sole catches.
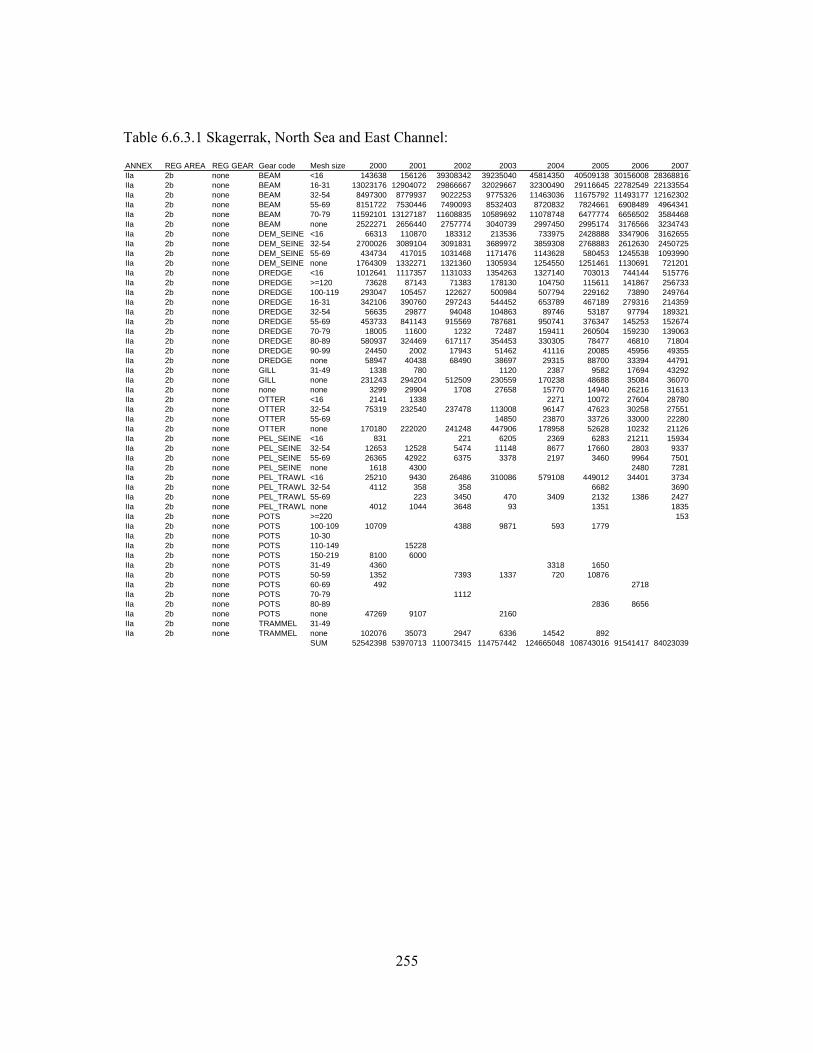
255
Table 6.6.3.1 Skagerrak, North Sea and East Channel:
ANNEX REG AREA REG GEAR Gear code Mesh size c 2000 2001 2002 2003 2004 2005 2006 2007IIa 2b none BEAM <16 143638 156126 39308342 39235040 45814350 40509138 30156008 28368816IIa 2b none BEAM 16-31 13023176 12904072 29866667 32029667 32300490 29116645 22782549 22133554IIa 2b none BEAM 32-54 8497300 8779937 9022253 9775326 11463036 11675792 11493177 12162302IIa 2b none BEAM 55-69 8151722 7530446 7490093 8532403 8720832 7824661 6908489 4964341IIa 2b none BEAM 70-79 11592101 13127187 11608835 10589692 11078748 6477774 6656502 3584468IIa 2b none BEAM none 2522271 2656440 2757774 3040739 2997450 2995174 3176566 3234743IIa 2b none DEM_SEINE <16 66313 110870 183312 213536 733975 2428888 3347906 3162655IIa 2b none DEM_SEINE 32-54 2700026 3089104 3091831 3689972 3859308 2768883 2612630 2450725IIa 2b none DEM_SEINE 55-69 434734 417015 1031468 1171476 1143628 580453 1245538 1093990IIa 2b none DEM_SEINE none 1764309 1332271 1321360 1305934 1254550 1251461 1130691 721201IIa 2b none DREDGE <16 1012641 1117357 1131033 1354263 1327140 703013 744144 515776IIa 2b none DREDGE >=120 73628 87143 71383 178130 104750 115611 141867 256733IIa 2b none DREDGE 100-119 293047 105457 122627 500984 507794 229162 73890 249764IIa 2b none DREDGE 16-31 342106 390760 297243 544452 653789 467189 279316 214359IIa 2b none DREDGE 32-54 56635 29877 94048 104863 89746 53187 97794 189321IIa 2b none DREDGE 55-69 453733 841143 915569 787681 950741 376347 145253 152674IIa 2b none DREDGE 70-79 18005 11600 1232 72487 159411 260504 159230 139063IIa 2b none DREDGE 80-89 580937 324469 617117 354453 330305 78477 46810 71804IIa 2b none DREDGE 90-99 24450 2002 17943 51462 41116 20085 45956 49355IIa 2b none DREDGE none 58947 40438 68490 38697 29315 88700 33394 44791IIa 2b none GILL 31-49 1338 780 1120 2387 9582 17694 43292IIa 2b none GILL none 231243 294204 512509 230559 170238 48688 35084 36070IIa 2b none none none 3299 29904 1708 27658 15770 14940 26216 31613IIa 2b none OTTER <16 2141 1338 2271 10072 27604 28780IIa 2b none OTTER 32-54 75319 232540 237478 113008 96147 47623 30258 27551IIa 2b none OTTER 55-69 14850 23870 33726 33000 22280IIa 2b none OTTER none 170180 222020 241248 447906 178958 52628 10232 21126IIa 2b none PEL_SEINE <16 831 221 6205 2369 6283 21211 15934IIa 2b none PEL_SEINE 32-54 12653 12528 5474 11148 8677 17660 2803 9337IIa 2b none PEL_SEINE 55-69 26365 42922 6375 3378 2197 3460 9964 7501IIa 2b none PEL_SEINE none 1618 4300 2480 7281IIa 2b none PEL_TRAWL <16 25210 9430 26486 310086 579108 449012 34401 3734IIa 2b none PEL_TRAWL 32-54 4112 358 358 6682 3690IIa 2b none PEL_TRAWL 55-69 223 3450 470 3409 2132 1386 2427IIa 2b none PEL_TRAWL none 4012 1044 3648 93 1351 1835IIa 2b none POTS >=220 153IIa 2b none POTS 100-109 10709 4388 9871 593 1779IIa 2b none POTS 10-30IIa 2b none POTS 110-149 15228IIa 2b none POTS 150-219 8100 6000IIa 2b none POTS 31-49 4360 3318 1650IIa 2b none POTS 50-59 1352 7393 1337 720 10876IIa 2b none POTS 60-69 492 2718IIa 2b none POTS 70-79 1112IIa 2b none POTS 80-89 2836 8656IIa 2b none POTS none 47269 9107 2160IIa 2b none TRAMMEL 31-49IIa 2b none TRAMMEL none 102076 35073 2947 6336 14542 892
SUM 52542398 53970713 110073415 114757442 124665048 108743016 91541417 84023039

256
Table 6.6.3.2 Skagerrak, North Sea and East Channel:
ANNEX REG AREASPECIES REG GEARGear code Mesh size c 2003 2004 2005 2006 2007IIa 2b COD none none none 2077.345 2650.199 2063.084 1351.853 932.6268IIa 2b COD none OTTER none 289.146 126.1776 76.35012 682.4461 160.6736IIa 2b COD none GILL none 53.08479 17.3288 5.659155 15.57015 77.68761IIa 2b COD none POTS none 25.3136 32.23136 34.216 30.748 22.804IIa 2b COD none DREDGE >=120 2.874497 4.883991 8.985096 11.22706IIa 2b COD none DREDGE none 1.4111 0.074 0.478 2.29794 9.13115IIa 2b COD none TRAMMEL none 43.09 12.94 4.621143 10.5 3.77IIa 2b COD none DREDGE 80-89 1.648 1.24 0.056 0.308 1.32IIa 2b COD none DEM_SEINnone 3.59658 1.10916IIa 2b COD none DREDGE 16-31 2.35E-02 0.003 0.53IIa 2b COD none PEL_TRAWnone 3.24 1.14 0.04 0.28IIa 2b COD none BEAM none 1.56 0.64 0.7471 0.14IIa 2b COD none DREDGE 90-99 0.585881 4.908381 0.36 0.468 0.092IIa 2b COD none DREDGE 100-119 0.25
sum 2496.448 2849.753 2194.305 2103.216 1221.391
Table 6.6.3.3 Skagerrak, North Sea and East Channel:
ANNEX REG AREASPECIES REG GEARGear code Mesh size c 2003 2004 2005 2006 2007IIa 2b PLE none none none 1590.691 1434.722 1304.847 1255.209 868.91IIa 2b PLE none OTTER none 264.3 268.898 115.5743 67.46736 664.5068IIa 2b PLE none DREDGE 90-99 22.43488 64.46631 184.832 137.744 138.5091IIa 2b PLE none GILL none 38.14674 26.65071 2.570127 2.923173 60.48225IIa 2b PLE none DREDGE 80-89 99.568 160.836 247.44 110.36 36.36IIa 2b PLE none DREDGE none 77.8184 40.64432 37.7438 19.49103 11.32486IIa 2b PLE none DREDGE >=120 2.24 0.701118 11.03325 0.631879 6.474514IIa 2b PLE none TRAMMEL none 69.4 72 36.70471 25.2 6.07IIa 2b PLE none DREDGE 100-119 2.2 0.25 2.5 0.3 2.95IIa 2b PLE none BEAM none 211.9 89.44 70.40922 2.3 1.56IIa 2b PLE none PEL_TRAWnone 12.36 1.28E+01 2.58 2.08E+00 1.12IIa 2b PLE none POTS none 0.676 1.018 0.682 1.444 1.0628IIa 2b PLE none DREDGE 16-31 1.33E-02 0.13 0.16 0.09IIa 2b PLE none POTS 80-89 0.01IIa 2b PLE none DEM_SEINnone 0.3424IIa 2b PLE none DREDGE 70-79 0.12
sum 2391.868 2172.387 2017.389 1625.31 1799.43
Table 6.6.3.4 Skagerrak, North Sea and East Channel:
ANNEX REG AREASPECIES REG GEARGear code Mesh size c 2003 2004 2005 2006 2007IIa 2b SOL none none none 181.7491 308.194 186.3474 119.5757 211.0371IIa 2b SOL none OTTER none 573.792 419.71 148.654 120.788 163.832IIa 2b SOL none GILL none 175.52 74.5362 9.646273 10.77034 118.8389IIa 2b SOL none TRAMMEL none 264.4 258.78 74.46 106.1 60.28IIa 2b SOL none DREDGE 80-89 62.88 175.56 190.92 76.04 31.12IIa 2b SOL none DREDGE 90-99 8.27929 32.4 66.644 31.876 30.56IIa 2b SOL none DREDGE none 42.46615 25.14406 52.74014 28.6204 10.2076IIa 2b SOL none DREDGE >=120 1.44 1.36 2.24 1.246152 4.158354IIa 2b SOL none POTS none 0.014 0.548 0.044 0.728 3.226IIa 2b SOL none BEAM none 224.22 124.56 20.6969 3.4 2.32IIa 2b SOL none PEL_TRAWnone 28.578 10.82 8.08 5.92 1.14IIa 2b SOL none DREDGE 100-119 0.4 0.45 1.165 0.005 0.2IIa 2b SOL none POTS 80-89 0.08IIa 2b SOL none DREDGE 16-31 1.000975 0.004 0.02 0.05IIa 2b SOL none DREDGE 70-79 1.20E-02
sum 1564.74 1432.074 761.6417 505.0896 637.0499
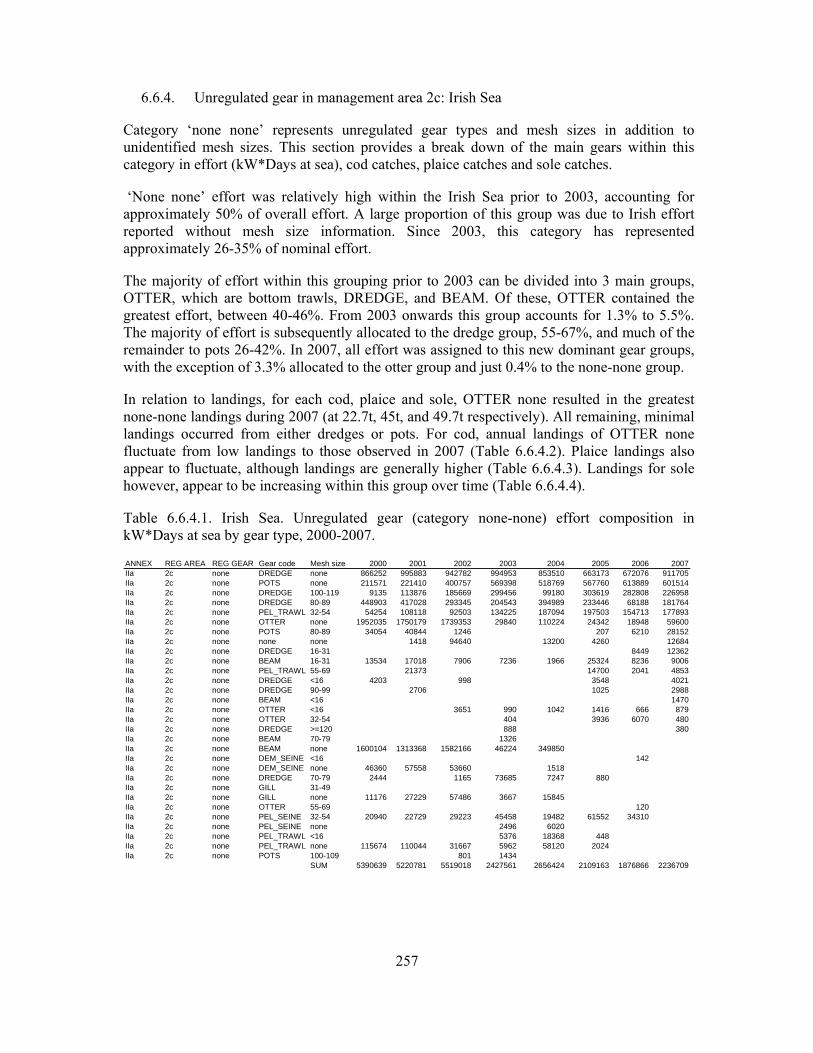
257
6.6.4. Unregulated gear in management area 2c: Irish Sea
Category ‘none none’ represents unregulated gear types and mesh sizes in addition to unidentified mesh sizes. This section provides a break down of the main gears within this category in effort (kW*Days at sea), cod catches, plaice catches and sole catches.
‘None none’ effort was relatively high within the Irish Sea prior to 2003, accounting for approximately 50% of overall effort. A large proportion of this group was due to Irish effort reported without mesh size information. Since 2003, this category has represented approximately 26-35% of nominal effort.
The majority of effort within this grouping prior to 2003 can be divided into 3 main groups, OTTER, which are bottom trawls, DREDGE, and BEAM. Of these, OTTER contained the greatest effort, between 40-46%. From 2003 onwards this group accounts for 1.3% to 5.5%. The majority of effort is subsequently allocated to the dredge group, 55-67%, and much of the remainder to pots 26-42%. In 2007, all effort was assigned to this new dominant gear groups, with the exception of 3.3% allocated to the otter group and just 0.4% to the none-none group.
In relation to landings, for each cod, plaice and sole, OTTER none resulted in the greatest none-none landings during 2007 (at 22.7t, 45t, and 49.7t respectively). All remaining, minimal landings occurred from either dredges or pots. For cod, annual landings of OTTER none fluctuate from low landings to those observed in 2007 (Table 6.6.4.2). Plaice landings also appear to fluctuate, although landings are generally higher (Table 6.6.4.3). Landings for sole however, appear to be increasing within this group over time (Table 6.6.4.4).
Table 6.6.4.1. Irish Sea. Unregulated gear (category none-none) effort composition in kW*Days at sea by gear type, 2000-2007.
ANNEX REG AREA REG GEAR Gear code Mesh size c 2000 2001 2002 2003 2004 2005 2006 2007IIa 2c none DREDGE none 866252 995883 942782 994953 853510 663173 672076 911705IIa 2c none POTS none 211571 221410 400757 569398 518769 567760 613889 601514IIa 2c none DREDGE 100-119 9135 113876 185669 299456 99180 303619 282808 226958IIa 2c none DREDGE 80-89 448903 417028 293345 204543 394989 233446 68188 181764IIa 2c none PEL_TRAWL 32-54 54254 108118 92503 134225 187094 197503 154713 177893IIa 2c none OTTER none 1952035 1750179 1739353 29840 110224 24342 18948 59600IIa 2c none POTS 80-89 34054 40844 1246 207 6210 28152IIa 2c none none none 1418 94640 13200 4260 12684IIa 2c none DREDGE 16-31 8449 12362IIa 2c none BEAM 16-31 13534 17018 7906 7236 1966 25324 8236 9006IIa 2c none PEL_TRAWL 55-69 21373 14700 2041 4853IIa 2c none DREDGE <16 4203 998 3548 4021IIa 2c none DREDGE 90-99 2706 1025 2988IIa 2c none BEAM <16 1470IIa 2c none OTTER <16 3651 990 1042 1416 666 879IIa 2c none OTTER 32-54 404 3936 6070 480IIa 2c none DREDGE >=120 888 380IIa 2c none BEAM 70-79 1326IIa 2c none BEAM none 1600104 1313368 1582166 46224 349850IIa 2c none DEM_SEINE <16 142IIa 2c none DEM_SEINE none 46360 57558 53660 1518IIa 2c none DREDGE 70-79 2444 1165 73685 7247 880IIa 2c none GILL 31-49IIa 2c none GILL none 11176 27229 57486 3667 15845IIa 2c none OTTER 55-69 120IIa 2c none PEL_SEINE 32-54 20940 22729 29223 45458 19482 61552 34310IIa 2c none PEL_SEINE none 2496 6020IIa 2c none PEL_TRAWL <16 5376 18368 448IIa 2c none PEL_TRAWL none 115674 110044 31667 5962 58120 2024IIa 2c none POTS 100-109 801 1434
SUM 5390639 5220781 5519018 2427561 2656424 2109163 1876866 2236709
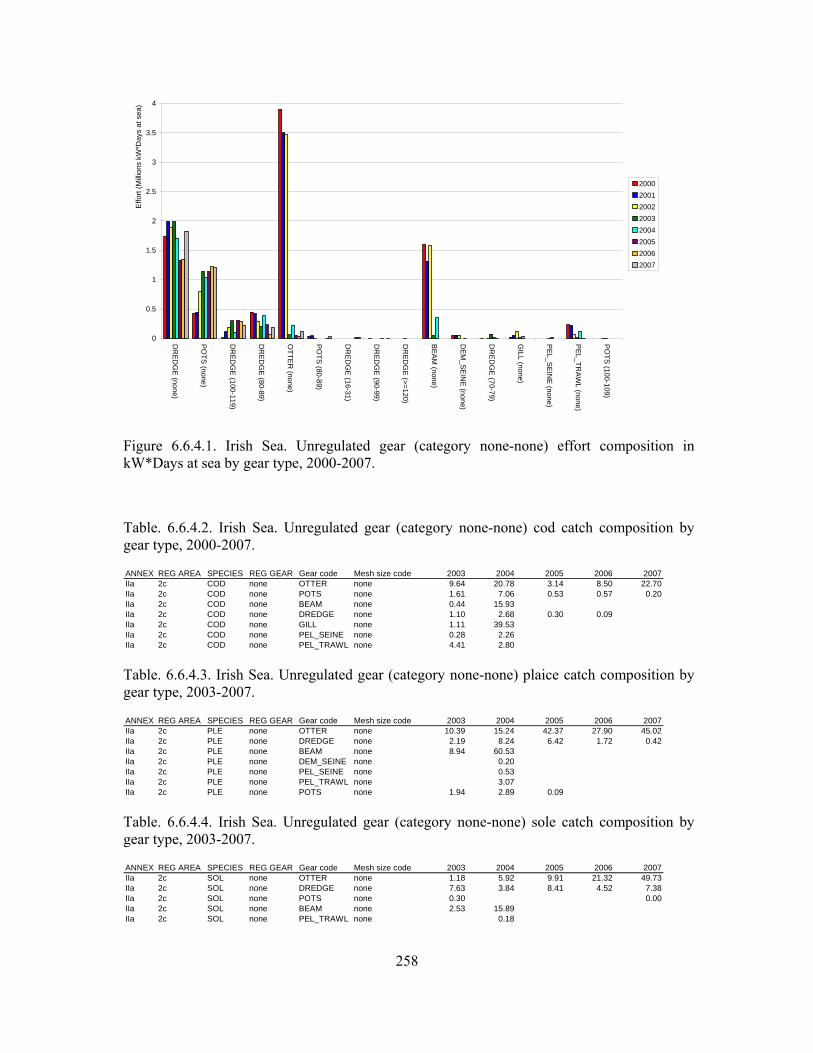
258
0
0.5
1
1.5
2
2.5
3
3.5
4
DR
EDG
E (none)
POTS (none)
DR
EDG
E (100-119)
DR
EDG
E (80-89)
OTTE
R (none)
POTS (80-89)
DR
EDG
E (16-31)
DR
EDG
E (90-99)
DR
EDG
E (>=120)
BEAM (none)
DE
M_SEIN
E (none)
DR
EDG
E (70-79)
GILL (none)
PEL_SEIN
E (none)
PEL_TRAW
L (none)
POTS (100-109)
Effo
rt (M
illion
s kW
*Day
s at
sea
)
20002001200220032004200520062007
Figure 6.6.4.1. Irish Sea. Unregulated gear (category none-none) effort composition in kW*Days at sea by gear type, 2000-2007.
Table. 6.6.4.2. Irish Sea. Unregulated gear (category none-none) cod catch composition by gear type, 2000-2007.
ANNEX REG AREA SPECIES REG GEAR Gear code Mesh size code 2003 2004 2005 2006 2007IIa 2c COD none OTTER none 9.64 20.78 3.14 8.50 22.70IIa 2c COD none POTS none 1.61 7.06 0.53 0.57 0.20IIa 2c COD none BEAM none 0.44 15.93IIa 2c COD none DREDGE none 1.10 2.68 0.30 0.09IIa 2c COD none GILL none 1.11 39.53IIa 2c COD none PEL_SEINE none 0.28 2.26IIa 2c COD none PEL_TRAWL none 4.41 2.80
Table. 6.6.4.3. Irish Sea. Unregulated gear (category none-none) plaice catch composition by gear type, 2003-2007.
ANNEX REG AREA SPECIES REG GEAR Gear code Mesh size code 2003 2004 2005 2006 2007IIa 2c PLE none OTTER none 10.39 15.24 42.37 27.90 45.02IIa 2c PLE none DREDGE none 2.19 8.24 6.42 1.72 0.42IIa 2c PLE none BEAM none 8.94 60.53IIa 2c PLE none DEM_SEINE none 0.20IIa 2c PLE none PEL_SEINE none 0.53IIa 2c PLE none PEL_TRAWL none 3.07IIa 2c PLE none POTS none 1.94 2.89 0.09
Table. 6.6.4.4. Irish Sea. Unregulated gear (category none-none) sole catch composition by gear type, 2003-2007.
ANNEX REG AREA SPECIES REG GEAR Gear code Mesh size code 2003 2004 2005 2006 2007IIa 2c SOL none OTTER none 1.18 5.92 9.91 21.32 49.73IIa 2c SOL none DREDGE none 7.63 3.84 8.41 4.52 7.38IIa 2c SOL none POTS none 0.30 0.00IIa 2c SOL none BEAM none 2.53 15.89IIa 2c SOL none PEL_TRAWL none 0.18
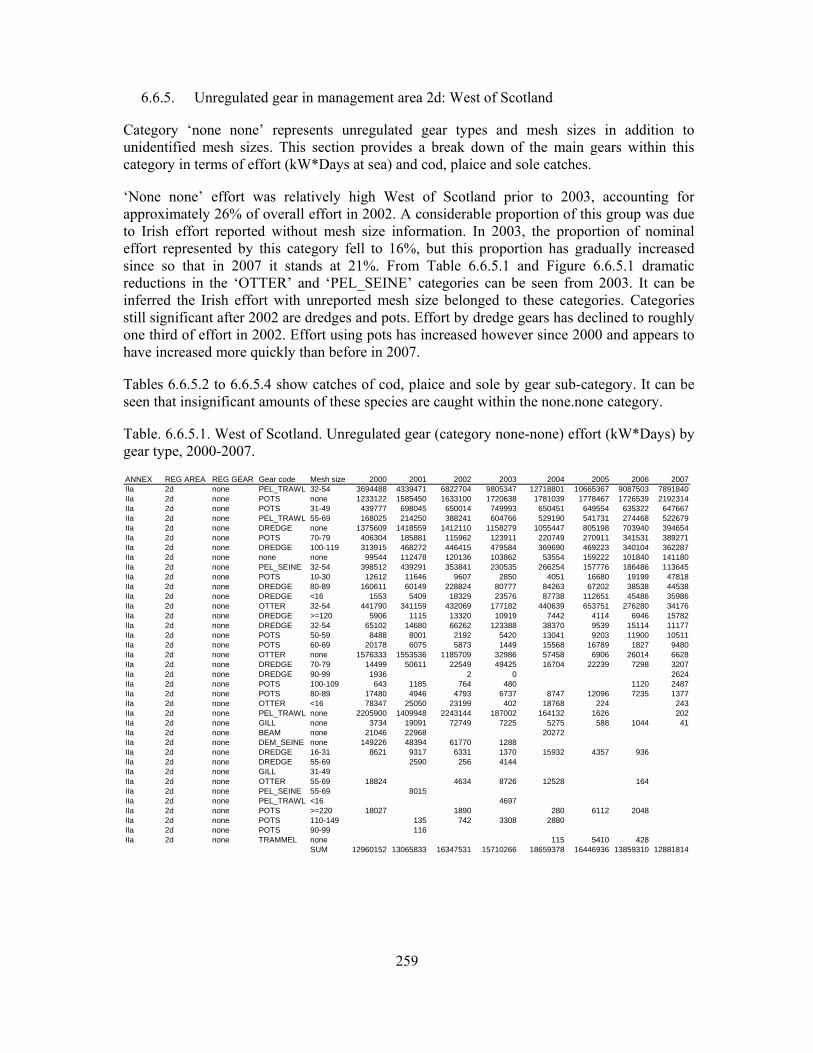
259
6.6.5. Unregulated gear in management area 2d: West of Scotland
Category ‘none none’ represents unregulated gear types and mesh sizes in addition to unidentified mesh sizes. This section provides a break down of the main gears within this category in terms of effort (kW*Days at sea) and cod, plaice and sole catches.
‘None none’ effort was relatively high West of Scotland prior to 2003, accounting for approximately 26% of overall effort in 2002. A considerable proportion of this group was due to Irish effort reported without mesh size information. In 2003, the proportion of nominal effort represented by this category fell to 16%, but this proportion has gradually increased since so that in 2007 it stands at 21%. From Table 6.6.5.1 and Figure 6.6.5.1 dramatic reductions in the ‘OTTER’ and ‘PEL_SEINE’ categories can be seen from 2003. It can be inferred the Irish effort with unreported mesh size belonged to these categories. Categories still significant after 2002 are dredges and pots. Effort by dredge gears has declined to roughly one third of effort in 2002. Effort using pots has increased however since 2000 and appears to have increased more quickly than before in 2007.
Tables 6.6.5.2 to 6.6.5.4 show catches of cod, plaice and sole by gear sub-category. It can be seen that insignificant amounts of these species are caught within the none.none category.
Table. 6.6.5.1. West of Scotland. Unregulated gear (category none-none) effort (kW*Days) by gear type, 2000-2007.
ANNEX REG AREA REG GEAR Gear code Mesh size c 2000 2001 2002 2003 2004 2005 2006 2007IIa 2d none PEL_TRAWL 32-54 3694488 4339471 6822704 9805347 12718801 10665367 9087503 7891840IIa 2d none POTS none 1233122 1585450 1633100 1720638 1781039 1778467 1726539 2192314IIa 2d none POTS 31-49 439777 698045 650014 749993 650451 649554 635322 647667IIa 2d none PEL_TRAWL 55-69 168025 214250 388241 604766 529190 541731 274468 522679IIa 2d none DREDGE none 1375609 1418559 1412110 1158279 1055447 805198 703940 394654IIa 2d none POTS 70-79 406304 185881 115962 123911 220749 270911 341531 389271IIa 2d none DREDGE 100-119 313915 468272 446415 479584 369690 469223 340104 362287IIa 2d none none none 99544 112478 120136 103862 53554 159222 101840 141180IIa 2d none PEL_SEINE 32-54 398512 439291 353841 230535 266254 157776 186486 113645IIa 2d none POTS 10-30 12612 11646 9607 2850 4051 16680 19199 47818IIa 2d none DREDGE 80-89 160611 60149 228824 80777 84263 67202 38538 44538IIa 2d none DREDGE <16 1553 5409 18329 23576 87738 112651 45486 35986IIa 2d none OTTER 32-54 441790 341159 432069 177182 440639 653751 276280 34176IIa 2d none DREDGE >=120 5906 1115 13320 10919 7442 4114 6946 15782IIa 2d none DREDGE 32-54 65102 14680 66262 123388 38370 9539 15114 11177IIa 2d none POTS 50-59 8488 8001 2192 5420 13041 9203 11900 10511IIa 2d none POTS 60-69 20178 6075 5873 1449 15568 16789 1827 9480IIa 2d none OTTER none 1576333 1553536 1185709 32986 57458 6906 26014 6628IIa 2d none DREDGE 70-79 14499 50611 22549 49425 16704 22239 7298 3207IIa 2d none DREDGE 90-99 1936 2 0 2624IIa 2d none POTS 100-109 643 1185 764 480 1120 2487IIa 2d none POTS 80-89 17480 4946 4793 6737 8747 12096 7235 1377IIa 2d none OTTER <16 78347 25050 23199 402 18768 224 243IIa 2d none PEL_TRAWL none 2205900 1409948 2243144 187002 164132 1626 202IIa 2d none GILL none 3734 19091 72749 7225 5275 588 1044 41IIa 2d none BEAM none 21046 22968 20272IIa 2d none DEM_SEINE none 149226 48394 61770 1288IIa 2d none DREDGE 16-31 8621 9317 6331 1370 15932 4357 936IIa 2d none DREDGE 55-69 2590 256 4144IIa 2d none GILL 31-49IIa 2d none OTTER 55-69 18824 4634 8726 12528 164IIa 2d none PEL_SEINE 55-69 8015IIa 2d none PEL_TRAWL <16 4697IIa 2d none POTS >=220 18027 1890 280 6112 2048IIa 2d none POTS 110-149 135 742 3308 2880IIa 2d none POTS 90-99 116IIa 2d none TRAMMEL none 115 5410 428
SUM 12960152 13065833 16347531 15710266 18659378 16446936 13859310 12881814
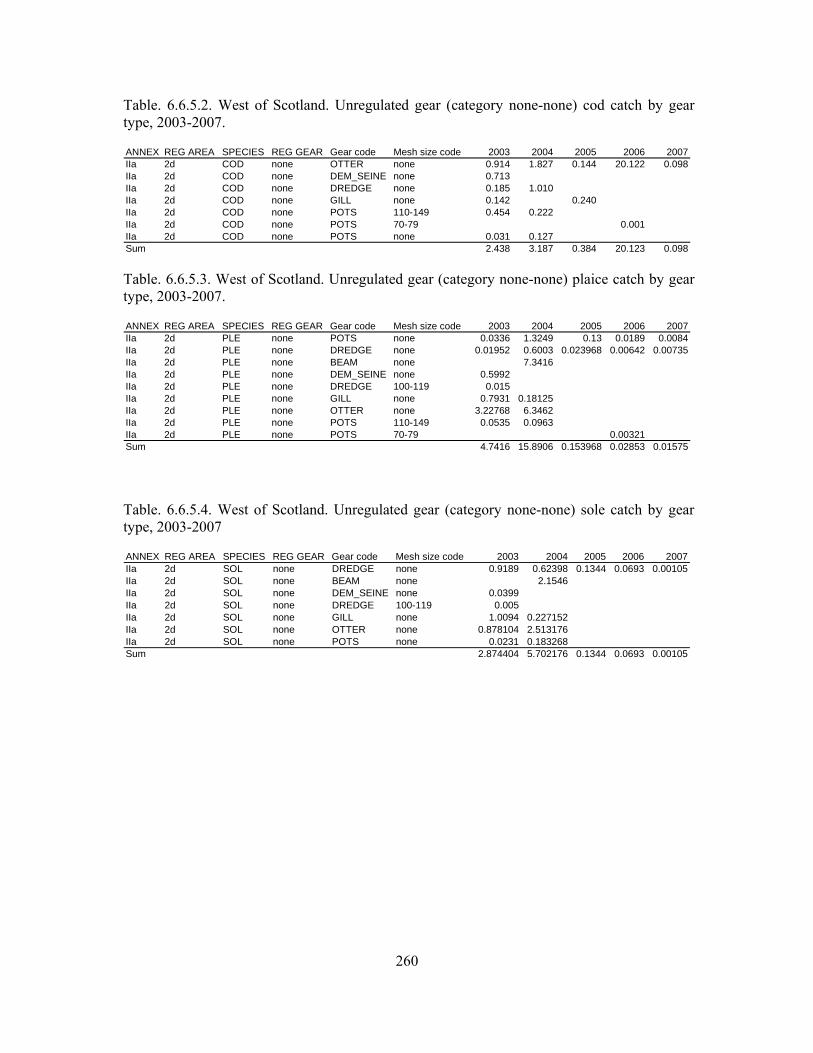
260
Table. 6.6.5.2. West of Scotland. Unregulated gear (category none-none) cod catch by gear type, 2003-2007.
ANNEX REG AREA SPECIES REG GEAR Gear code Mesh size code 2003 2004 2005 2006 2007IIa 2d COD none OTTER none 0.914 1.827 0.144 20.122 0.098IIa 2d COD none DEM_SEINE none 0.713IIa 2d COD none DREDGE none 0.185 1.010IIa 2d COD none GILL none 0.142 0.240IIa 2d COD none POTS 110-149 0.454 0.222IIa 2d COD none POTS 70-79 0.001IIa 2d COD none POTS none 0.031 0.127Sum 2.438 3.187 0.384 20.123 0.098
Table. 6.6.5.3. West of Scotland. Unregulated gear (category none-none) plaice catch by gear type, 2003-2007.
ANNEX REG AREA SPECIES REG GEAR Gear code Mesh size code 2003 2004 2005 2006 2007IIa 2d PLE none POTS none 0.0336 1.3249 0.13 0.0189 0.0084IIa 2d PLE none DREDGE none 0.01952 0.6003 0.023968 0.00642 0.00735IIa 2d PLE none BEAM none 7.3416IIa 2d PLE none DEM_SEINE none 0.5992IIa 2d PLE none DREDGE 100-119 0.015IIa 2d PLE none GILL none 0.7931 0.18125IIa 2d PLE none OTTER none 3.22768 6.3462IIa 2d PLE none POTS 110-149 0.0535 0.0963IIa 2d PLE none POTS 70-79 0.00321Sum 4.7416 15.8906 0.153968 0.02853 0.01575
Table. 6.6.5.4. West of Scotland. Unregulated gear (category none-none) sole catch by gear type, 2003-2007
ANNEX REG AREA SPECIES REG GEAR Gear code Mesh size code 2003 2004 2005 2006 2007IIa 2d SOL none DREDGE none 0.9189 0.62398 0.1344 0.0693 0.00105IIa 2d SOL none BEAM none 2.1546IIa 2d SOL none DEM_SEINE none 0.0399IIa 2d SOL none DREDGE 100-119 0.005IIa 2d SOL none GILL none 1.0094 0.227152IIa 2d SOL none OTTER none 0.878104 2.513176IIa 2d SOL none POTS none 0.0231 0.183268Sum 2.874404 5.702176 0.1344 0.0693 0.00105
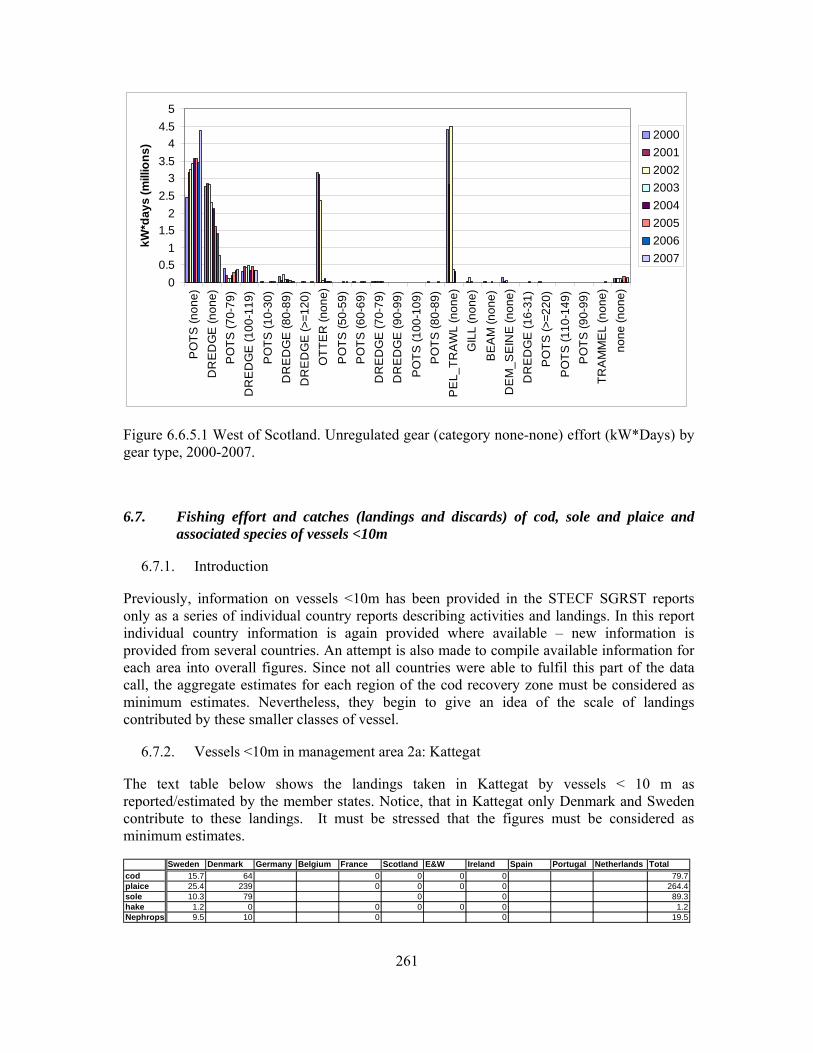
261
00.5
11.5
22.5
33.5
44.5
5
PO
TS (n
one)
DR
ED
GE
(non
e)P
OTS
(70-
79)
DR
ED
GE
(100
-119
)P
OTS
(10-
30)
DR
ED
GE
(80-
89)
DR
ED
GE
(>=1
20)
OTT
ER
(non
e)P
OTS
(50-
59)
PO
TS (6
0-69
)D
RE
DG
E (7
0-79
)D
RE
DG
E (9
0-99
)P
OTS
(100
-109
)P
OTS
(80-
89)
PE
L_TR
AW
L (n
one)
GIL
L (n
one)
BE
AM
(non
e)D
EM
_SE
INE
(non
e)D
RE
DG
E (1
6-31
)P
OTS
(>=2
20)
PO
TS (1
10-1
49)
PO
TS (9
0-99
)TR
AM
ME
L (n
one)
none
(non
e)
kW*d
ays
(mill
ions
)20002001200220032004200520062007
Figure 6.6.5.1 West of Scotland. Unregulated gear (category none-none) effort (kW*Days) by gear type, 2000-2007.
6.7. Fishing effort and catches (landings and discards) of cod, sole and plaice and associated species of vessels <10m
6.7.1. Introduction
Previously, information on vessels <10m has been provided in the STECF SGRST reports only as a series of individual country reports describing activities and landings. In this report individual country information is again provided where available – new information is provided from several countries. An attempt is also made to compile available information for each area into overall figures. Since not all countries were able to fulfil this part of the data call, the aggregate estimates for each region of the cod recovery zone must be considered as minimum estimates. Nevertheless, they begin to give an idea of the scale of landings contributed by these smaller classes of vessel.
6.7.2. Vessels <10m in management area 2a: Kattegat
The text table below shows the landings taken in Kattegat by vessels < 10 m as reported/estimated by the member states. Notice, that in Kattegat only Denmark and Sweden contribute to these landings. It must be stressed that the figures must be considered as minimum estimates.
Sweden Denmark Germany Belgium France Scotland E&W Ireland Spain Portugal Netherlands Totalcod 15.7 64 0 0 0 0 79.7plaice 25.4 239 0 0 0 0 264.4sole 10.3 79 0 0 89.3hake 1.2 0 0 0 0 0 1.2Nephrops 9.5 10 0 0 19.5
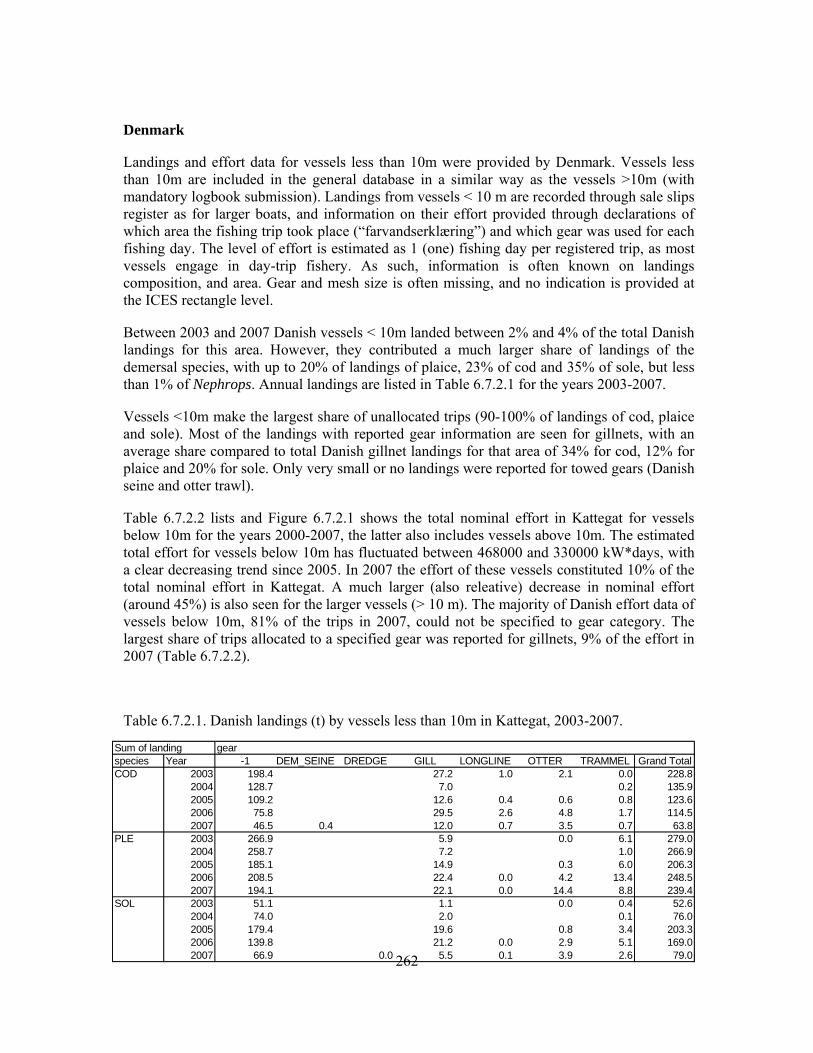
262
Denmark
Landings and effort data for vessels less than 10m were provided by Denmark. Vessels less than 10m are included in the general database in a similar way as the vessels >10m (with mandatory logbook submission). Landings from vessels < 10 m are recorded through sale slips register as for larger boats, and information on their effort provided through declarations of which area the fishing trip took place (“farvandserklæring”) and which gear was used for each fishing day. The level of effort is estimated as 1 (one) fishing day per registered trip, as most vessels engage in day-trip fishery. As such, information is often known on landings composition, and area. Gear and mesh size is often missing, and no indication is provided at the ICES rectangle level.
Between 2003 and 2007 Danish vessels < 10m landed between 2% and 4% of the total Danish landings for this area. However, they contributed a much larger share of landings of the demersal species, with up to 20% of landings of plaice, 23% of cod and 35% of sole, but less than 1% of Nephrops. Annual landings are listed in Table 6.7.2.1 for the years 2003-2007.
Vessels <10m make the largest share of unallocated trips (90-100% of landings of cod, plaice and sole). Most of the landings with reported gear information are seen for gillnets, with an average share compared to total Danish gillnet landings for that area of 34% for cod, 12% for plaice and 20% for sole. Only very small or no landings were reported for towed gears (Danish seine and otter trawl).
Table 6.7.2.2 lists and Figure 6.7.2.1 shows the total nominal effort in Kattegat for vessels below 10m for the years 2000-2007, the latter also includes vessels above 10m. The estimated total effort for vessels below 10m has fluctuated between 468000 and 330000 kW*days, with a clear decreasing trend since 2005. In 2007 the effort of these vessels constituted 10% of the total nominal effort in Kattegat. A much larger (also releative) decrease in nominal effort (around 45%) is also seen for the larger vessels (> 10 m). The majority of Danish effort data of vessels below 10m, 81% of the trips in 2007, could not be specified to gear category. The largest share of trips allocated to a specified gear was reported for gillnets, 9% of the effort in 2007 (Table 6.7.2.2).
Table 6.7.2.1. Danish landings (t) by vessels less than 10m in Kattegat, 2003-2007.
Sum of landing gearspecies Year -1 DEM_SEINE DREDGE GILL LONGLINE OTTER TRAMMEL Grand TotalCOD 2003 198.4 27.2 1.0 2.1 0.0 228.8
2004 128.7 7.0 0.2 135.92005 109.2 12.6 0.4 0.6 0.8 123.62006 75.8 29.5 2.6 4.8 1.7 114.52007 46.5 0.4 12.0 0.7 3.5 0.7 63.8
PLE 2003 266.9 5.9 0.0 6.1 279.02004 258.7 7.2 1.0 266.92005 185.1 14.9 0.3 6.0 206.32006 208.5 22.4 0.0 4.2 13.4 248.52007 194.1 22.1 0.0 14.4 8.8 239.4
SOL 2003 51.1 1.1 0.0 0.4 52.62004 74.0 2.0 0.1 76.02005 179.4 19.6 0.8 3.4 203.32006 139.8 21.2 0.0 2.9 5.1 169.02007 66.9 0.0 5.5 0.1 3.9 2.6 79.0
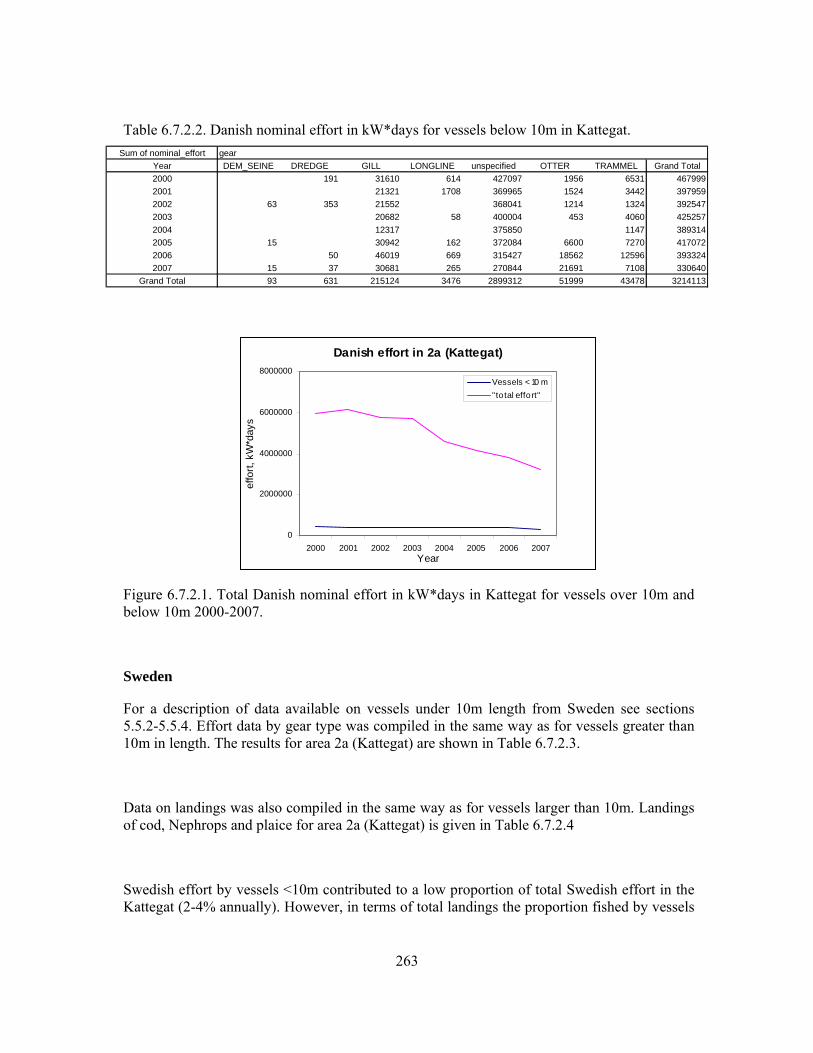
263
Table 6.7.2.2. Danish nominal effort in kW*days for vessels below 10m in Kattegat.
Figure 6.7.2.1. Total Danish nominal effort in kW*days in Kattegat for vessels over 10m and below 10m 2000-2007.
Sweden
For a description of data available on vessels under 10m length from Sweden see sections 5.5.2-5.5.4. Effort data by gear type was compiled in the same way as for vessels greater than 10m in length. The results for area 2a (Kattegat) are shown in Table 6.7.2.3.
Data on landings was also compiled in the same way as for vessels larger than 10m. Landings of cod, Nephrops and plaice for area 2a (Kattegat) is given in Table 6.7.2.4
Swedish effort by vessels <10m contributed to a low proportion of total Swedish effort in the Kattegat (2-4% annually). However, in terms of total landings the proportion fished by vessels
Danish effort in 2a (Kattegat)
0
2000000
4000000
6000000
8000000
2000 2001 2002 2003 2004 2005 2006 2007Year
effo
rt, k
W*d
ays
Vessels < 10 m"total effort"
Sum of nominal_effort gearYear DEM_SEINE DREDGE GILL LONGLINE unspecified OTTER TRAMMEL Grand Total2000 191 31610 614 427097 1956 6531 4679992001 21321 1708 369965 1524 3442 3979592002 63 353 21552 368041 1214 1324 3925472003 20682 58 400004 453 4060 4252572004 12317 375850 1147 3893142005 15 30942 162 372084 6600 7270 4170722006 50 46019 669 315427 18562 12596 3933242007 15 37 30681 265 270844 21691 7108 330640
Grand Total 93 631 215124 3476 2899312 51999 43478 3214113
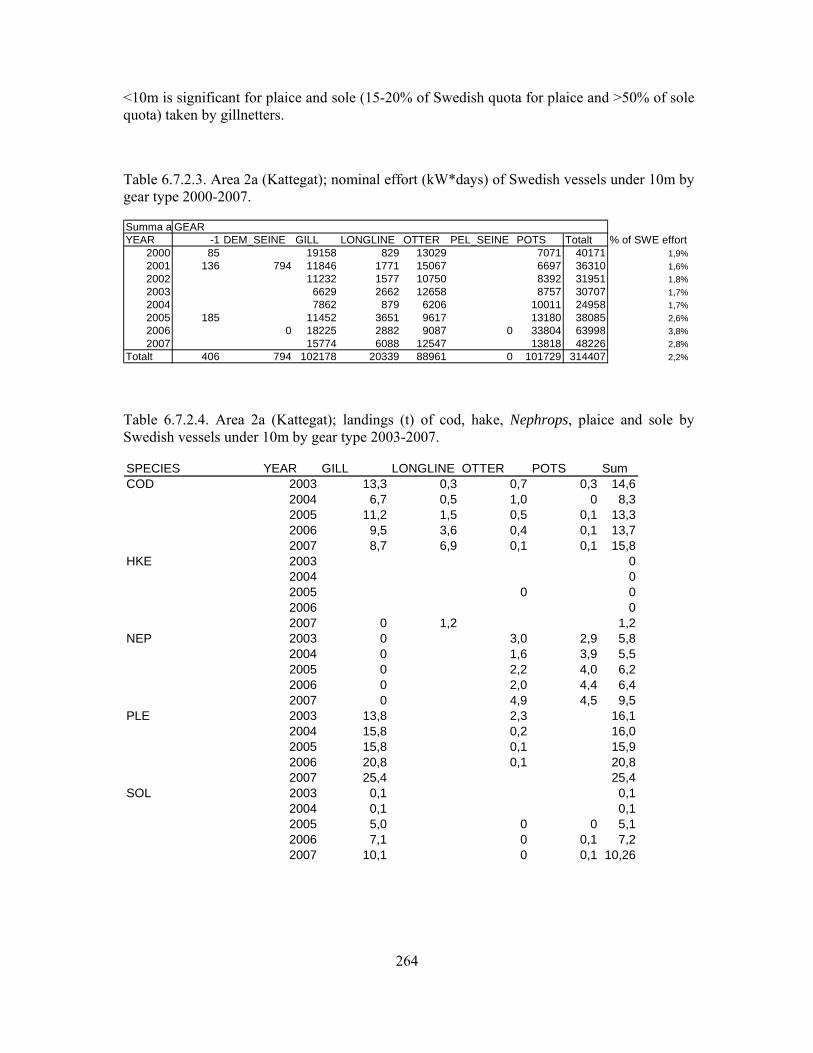
264
<10m is significant for plaice and sole (15-20% of Swedish quota for plaice and >50% of sole quota) taken by gillnetters.
Table 6.7.2.3. Area 2a (Kattegat); nominal effort (kW*days) of Swedish vessels under 10m by gear type 2000-2007.
Summa a GEAR YEAR -1 DEM_SEINE GILL LONGLINE OTTER PEL_SEINE POTS Totalt % of SWE effort
2000 85 19158 829 13029 7071 40171 1,9%2001 136 794 11846 1771 15067 6697 36310 1,6%2002 11232 1577 10750 8392 31951 1,8%2003 6629 2662 12658 8757 30707 1,7%2004 7862 879 6206 10011 24958 1,7%2005 185 11452 3651 9617 13180 38085 2,6%2006 0 18225 2882 9087 0 33804 63998 3,8%2007 15774 6088 12547 13818 48226 2,8%
Totalt 406 794 102178 20339 88961 0 101729 314407 2,2%
Table 6.7.2.4. Area 2a (Kattegat); landings (t) of cod, hake, Nephrops, plaice and sole by Swedish vessels under 10m by gear type 2003-2007.
SPECIES YEAR GILL LONGLINE OTTER POTS SumCOD 2003 13,3 0,3 0,7 0,3 14,6
2004 6,7 0,5 1,0 0 8,32005 11,2 1,5 0,5 0,1 13,32006 9,5 3,6 0,4 0,1 13,72007 8,7 6,9 0,1 0,1 15,8
HKE 2003 02004 02005 0 02006 02007 0 1,2 1,2
NEP 2003 0 3,0 2,9 5,82004 0 1,6 3,9 5,52005 0 2,2 4,0 6,22006 0 2,0 4,4 6,42007 0 4,9 4,5 9,5
PLE 2003 13,8 2,3 16,12004 15,8 0,2 16,02005 15,8 0,1 15,92006 20,8 0,1 20,82007 25,4 25,4
SOL 2003 0,1 0,12004 0,1 0,12005 5,0 0 0 5,12006 7,1 0 0,1 7,22007 10,1 0 0,1 10,26
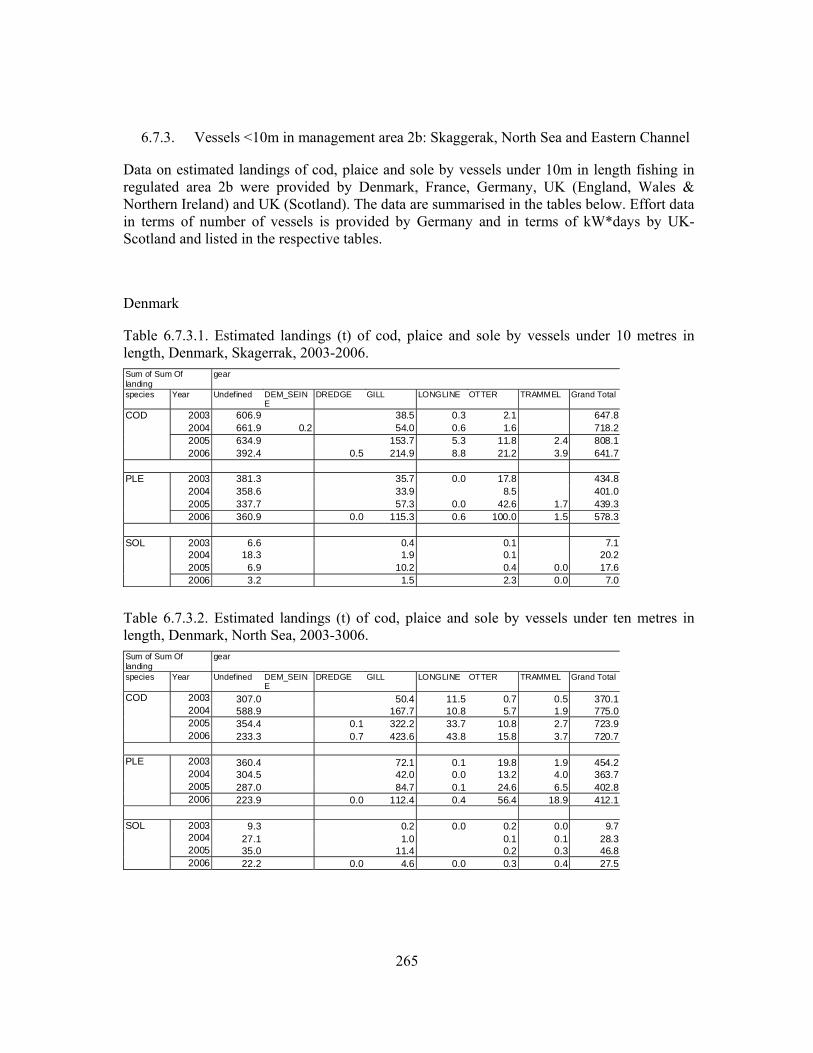
265
6.7.3. Vessels <10m in management area 2b: Skaggerak, North Sea and Eastern Channel
Data on estimated landings of cod, plaice and sole by vessels under 10m in length fishing in regulated area 2b were provided by Denmark, France, Germany, UK (England, Wales & Northern Ireland) and UK (Scotland). The data are summarised in the tables below. Effort data in terms of number of vessels is provided by Germany and in terms of kW*days by UK-Scotland and listed in the respective tables.
Denmark
Table 6.7.3.1. Estimated landings (t) of cod, plaice and sole by vessels under 10 metres in length, Denmark, Skagerrak, 2003-2006. Sum of Sum Of landing
gear
species Year Undefined DEM_SEINE
DREDGE GILL LONGLINE OTTER TRAMMEL Grand Total
COD 2003 606.9 38.5 0.3 2.1 647.8 2004 661.9 0.2 54.0 0.6 1.6 718.2 2005 634.9 153.7 5.3 11.8 2.4 808.1 2006 392.4 0.5 214.9 8.8 21.2 3.9 641.7
PLE 2003 381.3 35.7 0.0 17.8 434.8
2004 358.6 33.9 8.5 401.0 2005 337.7 57.3 0.0 42.6 1.7 439.3 2006 360.9 0.0 115.3 0.6 100.0 1.5 578.3
SOL 2003 6.6 0.4 0.1 7.1
2004 18.3 1.9 0.1 20.2 2005 6.9 10.2 0.4 0.0 17.6 2006 3.2 1.5 2.3 0.0 7.0
Table 6.7.3.2. Estimated landings (t) of cod, plaice and sole by vessels under ten metres in length, Denmark, North Sea, 2003-3006. Sum of Sum Of landing
gear
species Year Undefined DEM_SEINE
DREDGE GILL LONGLINE OTTER TRAMMEL Grand Total
COD 2003 307.0 50.4 11.5 0.7 0.5 370.1 2004 588.9 167.7 10.8 5.7 1.9 775.0 2005 354.4 0.1 322.2 33.7 10.8 2.7 723.9 2006 233.3 0.7 423.6 43.8 15.8 3.7 720.7
PLE 2003 360.4 72.1 0.1 19.8 1.9 454.2
2004 304.5 42.0 0.0 13.2 4.0 363.7 2005 287.0 84.7 0.1 24.6 6.5 402.8 2006 223.9 0.0 112.4 0.4 56.4 18.9 412.1
SOL 2003 9.3 0.2 0.0 0.2 0.0 9.7
2004 27.1 1.0 0.1 0.1 28.3 2005 35.0 11.4 0.2 0.3 46.8 2006 22.2 0.0 4.6 0.0 0.3 0.4 27.5
266
Germany
Access of the German boats <10m to the resources is granted by the fishing licensing. Licenses are granted by the national German control and enforcement institute (Bundesamt für Landwirtschaft und Ernährung, www.ble.de) through the fisheries offices of the federal states of Germany, i.e. Mecklenburg-Vorpommern and Schleswig-Holstein for the Baltic Sea and Schleswig-Holstein, Hamburg and Niedersachsen for the North Sea (German Bight). The licenses are granted for certain periods. Quotas of all boats <10m are based on a constant proportion of the national quota (about 9% of Baltic cod). Individual and joint quotas of the artisanal fisheries are distributed based on historical fishing activities.
Effort: The small boats are not obliged to report logbooks but to do landings declarations, which quantify landed quantities by species in kg. In addition, these landing declarations do provide information of landing ports, dates, gear types but not mesh sizes used. No precise effort measures are available as the recorded cruise information of vessels <10m often cover monthly periods rather than exact departure and return dates. The fishing effort is deployed depending on various factors, including weather conditions. Table 6.9.2.3 lists the number of vessels engaged in the German small-scale fisheries in the Baltic and the German Bight of the North Sea by gear types. The great majority (95%) of the boats are fishing in the Baltic. The number of small vessels fishing in the German Bight of the North Sea decreased from 53 in 2004 to 41 in 2006. In the Baltic, the boats almost exclusively use gillnets. Gillnets also represent the dominant gear type used by the few small boats in the North Sea (50%), but one third of the these small boats deploy beam trawls. However, the exact number of boats given in Table 1 should be interpreted with care as individual boats may have used more than one gear type during a given year and thus be multiple counted. This may concern especially static gear types.
Table 6.7.3.3 Number of German vessels with landing declarations by area and gear type, 2003-2006.
Area Gear 2004 2005 2006Baltic Creel 3 2 3Baltic Gill 786 828 879Baltic Long line 2 3 4Baltic unknown 26 23 19Baltic Other static 4 3 3Baltic Otter 3 3 2Baltic Beam 2North Sea 4B Dredge 1 1 1North Sea 4B Creel 4 3 2North Sea 4B Gill 24 25 18North Sea 4B unknown 7 6 6North Sea 4B Beam 17 15 14Sum Baltic 824 864 910Sum North Sea 4B 53 50 41Sum 877 914 951
267
Landings: Table 6.7.3.4 lists the landings of the small boats by area, year, gear and species. The low cod, plaice and sole landings in 2004-2006 taken by the listed gears in the German Bight appear negligible. Brown shrimp (Crangon crangon) caught by beam trawls and dredges is the main target species. The reported landings of brown shrimp varied among 27 and 57 t. The few boats also land about 4 t of eels per year. Contrarily, the much higher effort deployed in the Baltic results in significant landings of cod, eel, flounder, perch, herring, plaice and whiting (Table 6.7.3.4.)
Table 6.7.3.4 Average landings (kg) of German vessels <10m by area, year, gear type and species, 2004-2006.
Area Year Gear Cod Crangon Eel Flounder Perch Herring Plaice Saithe Sole Whiting Other TotalBaltic 2004 Creel 64 1075 760 1750 4594 8243Baltic 2004 Gill 968835 2523 84516 248807 162954 3620927 8274 11 8 12130 869582 5978567Baltic 2004 Long line 2881 40 10 60 1920 809 5720Baltic 2004 unknown 1199 3025 2828 6008 625601 44 21952 660657Baltic 2004 Other static 463 20 456 4955 2386 8280Baltic 2004 Otter 17466 647 230 487 102 2165 21097Baltic 2005 Creel 118 825 400 4060 2208 7611Baltic 2005 Gill 1292713 192 74629 165236 228270 3925163 10670 36 39 9875 1225340 6932163Baltic 2005 Long line 3798 98 10985 200 15081Baltic 2005 unknown 5230 3089 6718 578587 18 22693 616335Baltic 2005 Other static 585 651 2889 11345 9273 24743Baltic 2005 Otter 18592 22 105 276 1 152 1829 20977Baltic 2005 Beam 11 652 15 10 308 996Baltic 2006 Creel 139 944 605 50 455 3900 6093Baltic 2006 Gill 1277560 444 89493 181912 160488 3387738 9582 125 682 5073 1280330 6393427Baltic 2006 Long line 4494 203 6 90842 26 15 1500 97086Baltic 2006 unknown 5352 974 1499 900 565654 12032 586411Baltic 2006 Other static 19 159 17 1889 2084Baltic 2006 Otter 16193 169 2 63 1644 18071North Sea 4B 2004 Dredges 4114 38 33 4185North Sea 4B 2004 Creel 489 1268 1757North Sea 4B 2004 Gill 7403 1781 13 38 918 10153North Sea 4B 2004 unknown 2873 52 831 3756North Sea 4B 2004 Beam 5 21104 183 40 20 1993 23345North Sea 4B 2005 Dredges 3996 14 1 4011North Sea 4B 2005 Creel 84 630 714North Sea 4B 2005 Gill 224 10453 1644 17 10 1293 13641North Sea 4B 2005 unknown 2250 63 457 2770North Sea 4B 2005 Beam 12889 35 20 10 5 681 13640North Sea 4B 2006 Dredges 10424 27 10451North Sea 4B 2006 Creel 23 701 5714 6438North Sea 4B 2006 Gill 16 14379 1344 34 1348 4 480 17605North Sea 4B 2006 unknown 1980 66 366 2412North Sea 4B 2006 Beam 32370 19 756 33145Sum Baltic 2004 990445 2523 89119 252312 170238 4255383 8761 11 8 12276 901488 6682564Sum Baltic 2005 1320929 962 79292 165258 238277 4530245 10961 37 49 10045 1261851 7617906Sum Baltic 2006 1303757 1388 91434 183417 161438 4044706 9777 125 684 5151 1301295 7103172Sum North Sea 4B 2004 5 32621 5364 40 65 0 0 0 58 0 5043 43196Sum North Sea 4B 2005 224 27338 4027 0 100 0 10 0 15 0 3062 34776Sum North Sea 4B 2006 16 57196 4044 0 100 0 1348 0 4 0 7343 70051
Sampling plan: Given the relatively low landings of regulated species/stocks and the limited effort in terms of boats fishing in the German bight in the North Sea (Division 4B), no specific sampling plans to monitor the discards and biological parameters have been developed or implemented.

268
UK (England, Wales and Northern Ireland)
Table 6.7.3.5. Estimated landings (t) of cod, plaice and sole by vessels under ten metres in length, UK (England, Wales and Northern Ireland), North Sea, 2003-2006.
Sum of LANDINGS
GEAR
SPECIES YEAR BEAM DREDGE GILL LONGLINE OTTER POTS TRAMMEL Grand Total
COD 2003 1.0 182.8 285.9 19.4 16.8 24.2 530.2 2004 61.7 165.0 19.9 14.9 13.5 275.0 2005 23.1 74.7 28.6 10.4 24.1 160.9 2006 56.6 61.5 89.4 10.4 35.8 253.7
PLE 2003 0.0 14.9 0.0 27.0 9.3 51.2
2004 0.0 9.2 0.0 29.3 1.0 39.6 2005 0.0 5.1 0.0 27.1 0.0 2.3 34.5 2006 0.0 7.9 51.9 0.1 0.9 60.9
SOL 2003 4.1 0.0 53.0 0.5 73.2 9.7 55.7 196.3
2004 0.0 45.6 0.1 95.3 0.0 53.6 194.6 2005 0.0 26.7 0.6 95.1 0.0 93.5 216.0 2006 74.1 0.5 121.1 0.0 43.1 238.8
Table 6.7.3.6. Estimated landings (t) of cod, plaice and sole by vessels under ten metres in length, UK (England, Wales and Northern Ireland), Eastern Channel. 2003-2006:
Sum of LAND GEARSPECIES YEAR BEAM DREDGE GILL LONGLINE OTTER POTS TRAMMEL Grand TotalCOD 2003 0.1 0 67.7 0.1 12.2 0.2 11.6 91.9
2004 0.4 52.5 0.2 12.5 0.1 11.2 76.82005 0 0 105.4 0.1 25.7 0 12 143.32006 0 0 210.1 0.5 24.4 0 0 235.2
PLE 2003 2.3 0 172.2 138.1 1.2 30.6 344.42004 3.4 0.1 152 119.8 0 9.7 284.92005 12.1 0.1 129.3 0 66.7 0 8.3 216.62006 11.6 0.7 121.5 0.2 194 0.3 0 328.3
SOL 2003 2.9 0.1 217 0 86.3 2.2 70.1 378.52004 7.7 0 270.2 0 84.4 0.2 29.3 391.82005 11.8 0.1 181.8 0 42.9 0.3 12 248.92006 7.4 0.7 318.9 0.5 99.6 0.4 0.1 427.6
UK Scotland
For a description of data available on vessels under 10m length from UK (Scotland) see section 5.5.5. Effort data in kWdays could be compiled in the same way as for vessels greater than 10m in length. The results for area 2b2 (North Sea) are shown in Table 6.7.3.7.
Landings data was also compiled in the same way as for vessels greater than 10m in length. Landings for cod, plaice and sole as compiled for area 2b2 (North Sea) is given in Table 6.7.3.8. Effort is significant for the OTTER gear but seems to have peaked in 2002 before falling to its lowest value in the series by 2006. Greatest effort has been by vessels using POTS with effort in this category fairly constant over time. Landings of cod are recorded at 23
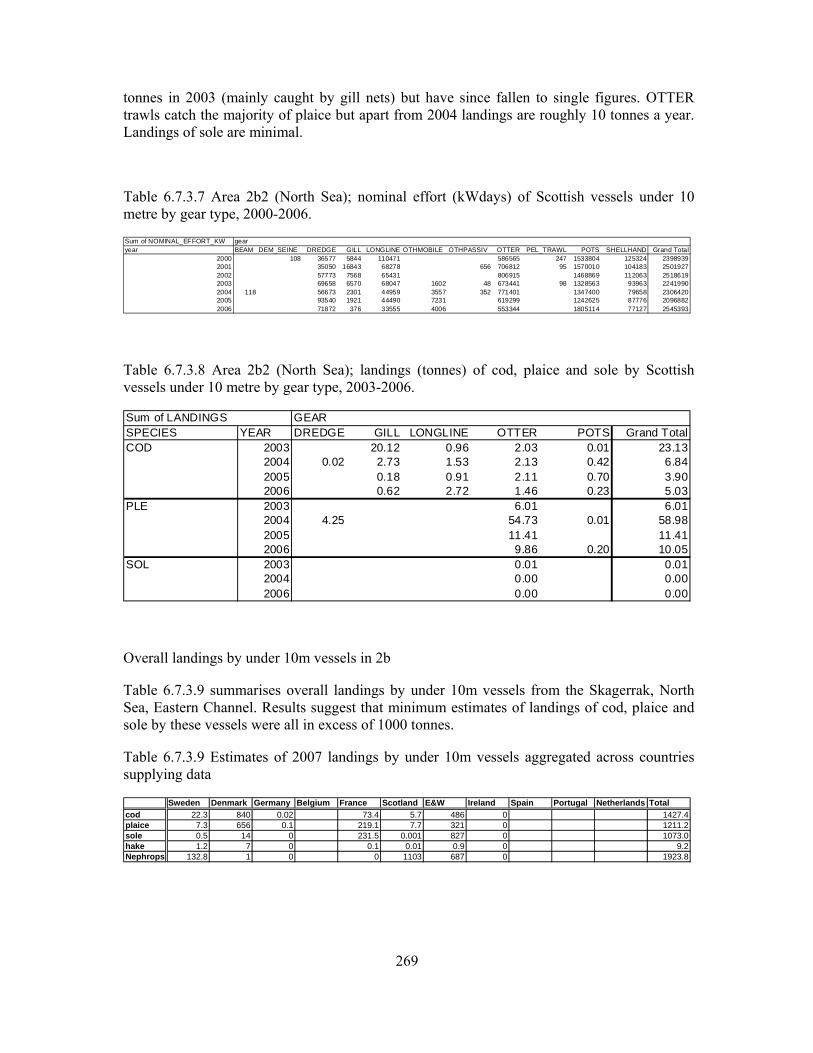
269
tonnes in 2003 (mainly caught by gill nets) but have since fallen to single figures. OTTER trawls catch the majority of plaice but apart from 2004 landings are roughly 10 tonnes a year. Landings of sole are minimal.
Table 6.7.3.7 Area 2b2 (North Sea); nominal effort (kWdays) of Scottish vessels under 10 metre by gear type, 2000-2006.
Sum of NOMINAL_EFFORT_KW gearyear BEAM DEM_SEINE DREDGE GILL LONGLINE OTHMOBILE OTHPASSIV OTTER PEL_TRAWL POTS SHELLHAND Grand Total
2000 108 36577 5844 110471 586565 247 1533804 125324 23989392001 35050 16843 68278 656 706812 95 1570010 104183 25019272002 57773 7568 65431 806915 1468869 112063 25186192003 69658 6570 68047 1602 48 673441 98 1328563 93963 22419902004 118 56673 2301 44959 3557 352 771401 1347400 79658 23064202005 93540 1921 44490 7231 619299 1242625 87776 20968822006 71872 376 33555 4006 553344 1805114 77127 2545393
Table 6.7.3.8 Area 2b2 (North Sea); landings (tonnes) of cod, plaice and sole by Scottish vessels under 10 metre by gear type, 2003-2006.
Sum of LANDINGS GEARSPECIES YEAR DREDGE GILL LONGLINE OTTER POTS Grand TotalCOD 2003 20.12 0.96 2.03 0.01 23.13
2004 0.02 2.73 1.53 2.13 0.42 6.842005 0.18 0.91 2.11 0.70 3.902006 0.62 2.72 1.46 0.23 5.03
PLE 2003 6.01 6.012004 4.25 54.73 0.01 58.982005 11.41 11.412006 9.86 0.20 10.05
SOL 2003 0.01 0.012004 0.00 0.002006 0.00 0.00
Overall landings by under 10m vessels in 2b
Table 6.7.3.9 summarises overall landings by under 10m vessels from the Skagerrak, North Sea, Eastern Channel. Results suggest that minimum estimates of landings of cod, plaice and sole by these vessels were all in excess of 1000 tonnes.
Table 6.7.3.9 Estimates of 2007 landings by under 10m vessels aggregated across countries supplying data
Sweden Denmark Germany Belgium France Scotland E&W Ireland Spain Portugal Netherlands Totalcod 22.3 840 0.02 73.4 5.7 486 0 1427.4plaice 7.3 656 0.1 219.1 7.7 321 0 1211.2sole 0.5 14 0 231.5 0.001 827 0 1073.0hake 1.2 7 0 0.1 0.01 0.9 0 9.2Nephrops 132.8 1 0 0 1103 687 0 1923.8
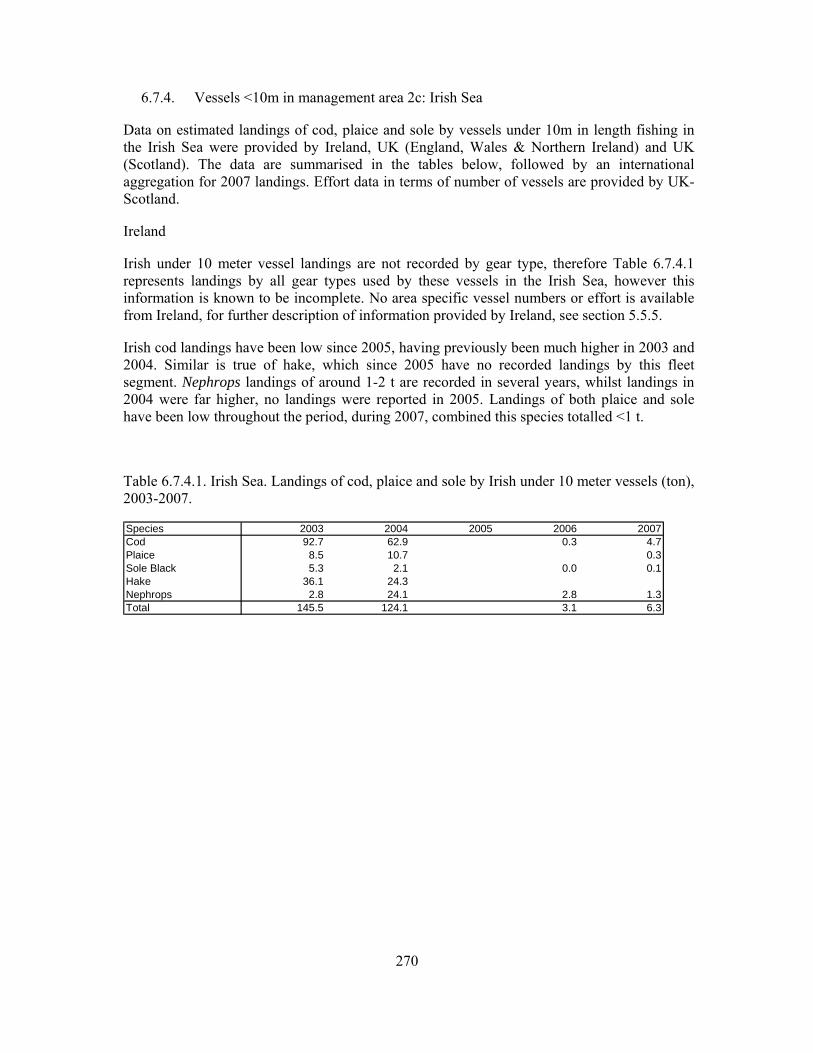
270
6.7.4. Vessels <10m in management area 2c: Irish Sea
Data on estimated landings of cod, plaice and sole by vessels under 10m in length fishing in the Irish Sea were provided by Ireland, UK (England, Wales & Northern Ireland) and UK (Scotland). The data are summarised in the tables below, followed by an international aggregation for 2007 landings. Effort data in terms of number of vessels are provided by UK-Scotland.
Ireland
Irish under 10 meter vessel landings are not recorded by gear type, therefore Table 6.7.4.1 represents landings by all gear types used by these vessels in the Irish Sea, however this information is known to be incomplete. No area specific vessel numbers or effort is available from Ireland, for further description of information provided by Ireland, see section 5.5.5.
Irish cod landings have been low since 2005, having previously been much higher in 2003 and 2004. Similar is true of hake, which since 2005 have no recorded landings by this fleet segment. Nephrops landings of around 1-2 t are recorded in several years, whilst landings in 2004 were far higher, no landings were reported in 2005. Landings of both plaice and sole have been low throughout the period, during 2007, combined this species totalled <1 t.
Table 6.7.4.1. Irish Sea. Landings of cod, plaice and sole by Irish under 10 meter vessels (ton), 2003-2007.
Species 2003 2004 2005 2006 2007Cod 92.7 62.9 0.3 4.7Plaice 8.5 10.7 0.3Sole Black 5.3 2.1 0.0 0.1Hake 36.1 24.3Nephrops 2.8 24.1 2.8 1.3Total 145.5 124.1 3.1 6.3
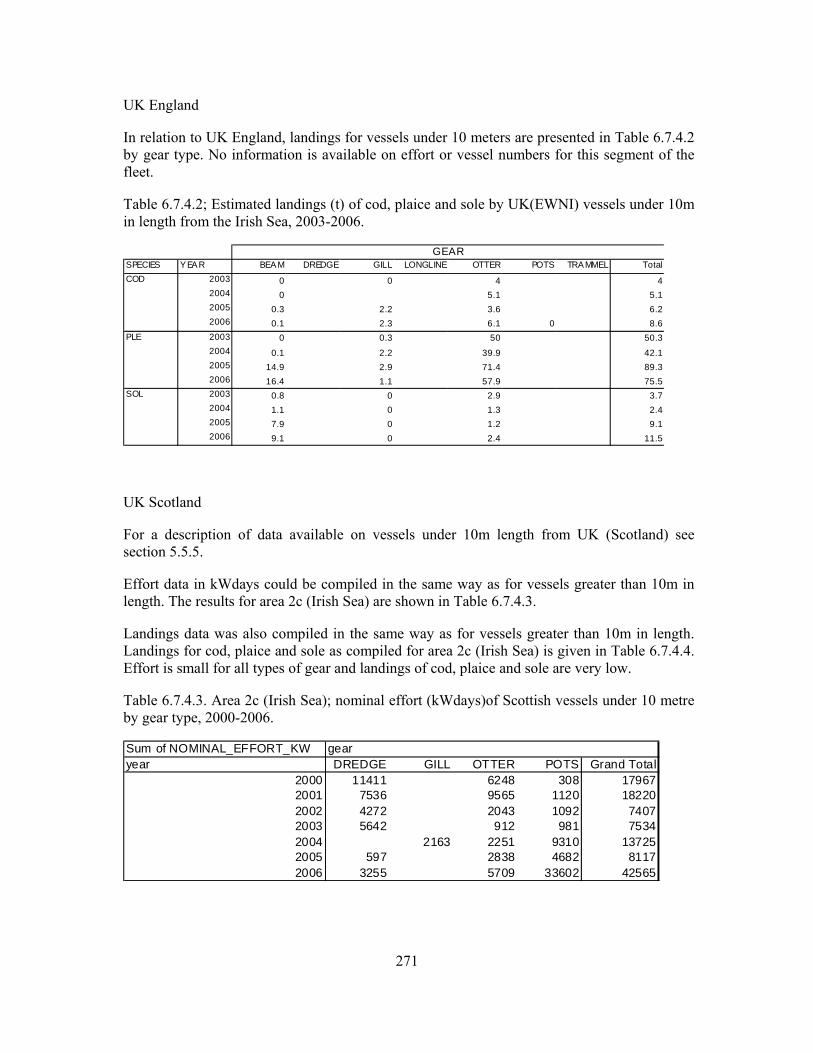
271
UK England
In relation to UK England, landings for vessels under 10 meters are presented in Table 6.7.4.2 by gear type. No information is available on effort or vessel numbers for this segment of the fleet.
Table 6.7.4.2; Estimated landings (t) of cod, plaice and sole by UK(EWNI) vessels under 10m in length from the Irish Sea, 2003-2006.
SPECIES YEAR BEAM DREDGE GILL LONGLINE OTTER POTS TRAMMEL TotalCOD 2003 0 0 4 4
2004 0 5.1 5.12005 0.3 2.2 3.6 6.22006 0.1 2.3 6.1 0 8.6
PLE 2003 0 0.3 50 50.32004 0.1 2.2 39.9 42.12005 14.9 2.9 71.4 89.32006 16.4 1.1 57.9 75.5
SOL 2003 0.8 0 2.9 3.72004 1.1 0 1.3 2.42005 7.9 0 1.2 9.12006 9.1 0 2.4 11.5
GEAR
UK Scotland
For a description of data available on vessels under 10m length from UK (Scotland) see section 5.5.5.
Effort data in kWdays could be compiled in the same way as for vessels greater than 10m in length. The results for area 2c (Irish Sea) are shown in Table 6.7.4.3.
Landings data was also compiled in the same way as for vessels greater than 10m in length. Landings for cod, plaice and sole as compiled for area 2c (Irish Sea) is given in Table 6.7.4.4. Effort is small for all types of gear and landings of cod, plaice and sole are very low.
Table 6.7.4.3. Area 2c (Irish Sea); nominal effort (kWdays)of Scottish vessels under 10 metre by gear type, 2000-2006.
Sum of NOMINAL_EFFORT_KW gearyear DREDGE GILL OTTER POTS Grand Total
2000 11411 6248 308 179672001 7536 9565 1120 182202002 4272 2043 1092 74072003 5642 912 981 75342004 2163 2251 9310 137252005 597 2838 4682 81172006 3255 5709 33602 42565
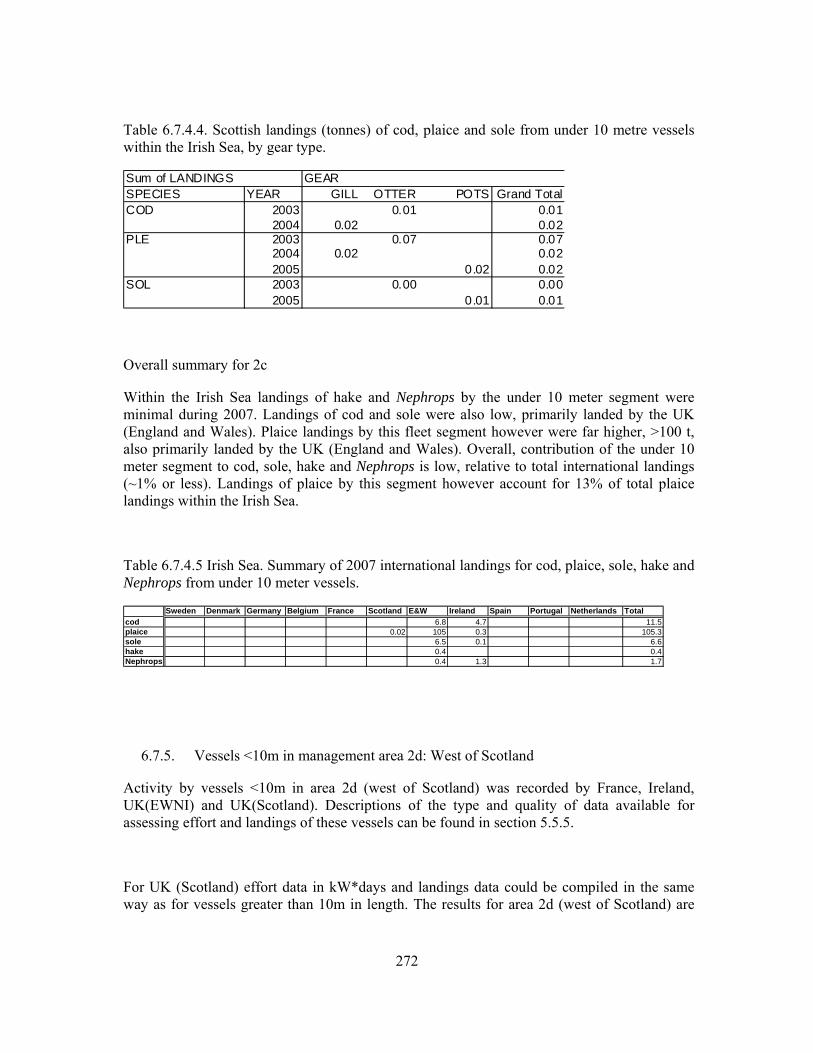
272
Table 6.7.4.4. Scottish landings (tonnes) of cod, plaice and sole from under 10 metre vessels within the Irish Sea, by gear type.
Sum of LANDINGS GEARSPECIES YEAR GILL OTTER POTS Grand TotalCOD 2003 0.01 0.01
2004 0.02 0.02PLE 2003 0.07 0.07
2004 0.02 0.022005 0.02 0.02
SOL 2003 0.00 0.002005 0.01 0.01
Overall summary for 2c
Within the Irish Sea landings of hake and Nephrops by the under 10 meter segment were minimal during 2007. Landings of cod and sole were also low, primarily landed by the UK (England and Wales). Plaice landings by this fleet segment however were far higher, >100 t, also primarily landed by the UK (England and Wales). Overall, contribution of the under 10 meter segment to cod, sole, hake and Nephrops is low, relative to total international landings (~1% or less). Landings of plaice by this segment however account for 13% of total plaice landings within the Irish Sea.
Table 6.7.4.5 Irish Sea. Summary of 2007 international landings for cod, plaice, sole, hake and Nephrops from under 10 meter vessels.
Sweden Denmark Germany Belgium France Scotland E&W Ireland Spain Portugal Netherlands Totalcod 6.8 4.7 11.5plaice 0.02 105 0.3 105.3sole 6.5 0.1 6.6hake 0.4 0.4Nephrops 0.4 1.3 1.7
6.7.5. Vessels <10m in management area 2d: West of Scotland
Activity by vessels <10m in area 2d (west of Scotland) was recorded by France, Ireland, UK(EWNI) and UK(Scotland). Descriptions of the type and quality of data available for assessing effort and landings of these vessels can be found in section 5.5.5.
For UK (Scotland) effort data in kW*days and landings data could be compiled in the same way as for vessels greater than 10m in length. The results for area 2d (west of Scotland) are
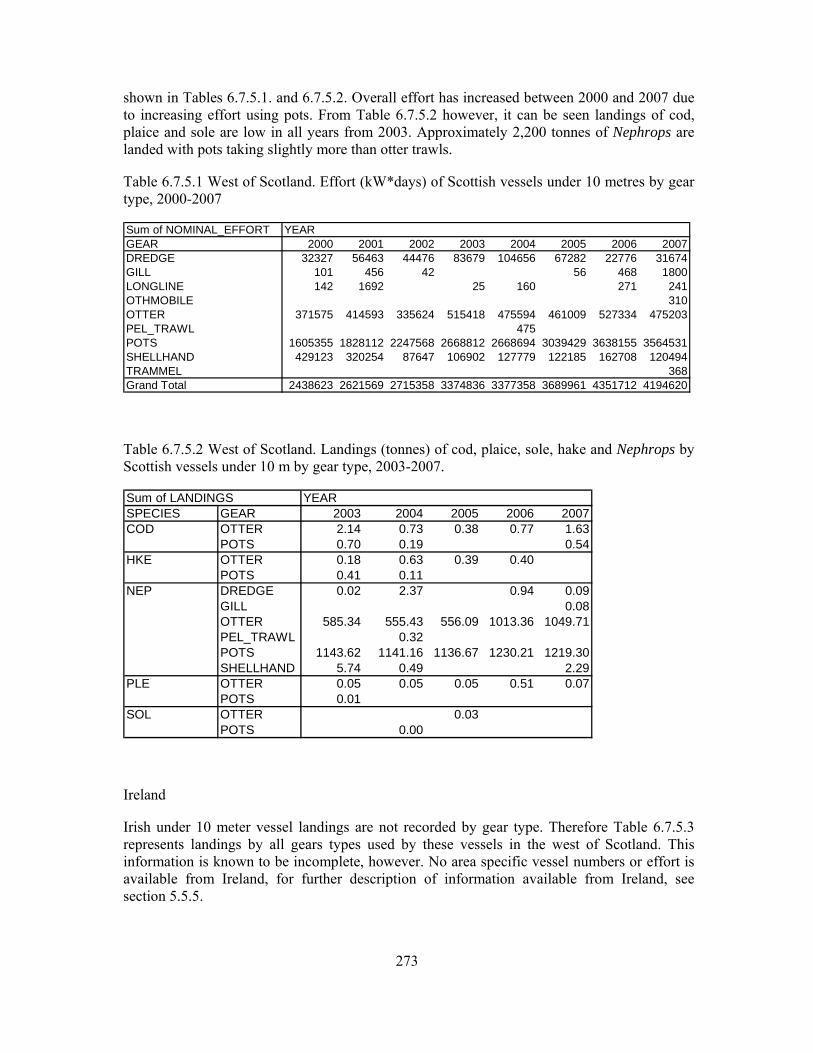
273
shown in Tables 6.7.5.1. and 6.7.5.2. Overall effort has increased between 2000 and 2007 due to increasing effort using pots. From Table 6.7.5.2 however, it can be seen landings of cod, plaice and sole are low in all years from 2003. Approximately 2,200 tonnes of Nephrops are landed with pots taking slightly more than otter trawls.
Table 6.7.5.1 West of Scotland. Effort (kW*days) of Scottish vessels under 10 metres by gear type, 2000-2007
Sum of NOMINAL_EFFORT YEARGEAR 2000 2001 2002 2003 2004 2005 2006 2007DREDGE 32327 56463 44476 83679 104656 67282 22776 31674GILL 101 456 42 56 468 1800LONGLINE 142 1692 25 160 271 241OTHMOBILE 310OTTER 371575 414593 335624 515418 475594 461009 527334 475203PEL_TRAWL 475POTS 1605355 1828112 2247568 2668812 2668694 3039429 3638155 3564531SHELLHAND 429123 320254 87647 106902 127779 122185 162708 120494TRAMMEL 368Grand Total 2438623 2621569 2715358 3374836 3377358 3689961 4351712 4194620
Table 6.7.5.2 West of Scotland. Landings (tonnes) of cod, plaice, sole, hake and Nephrops by Scottish vessels under 10 m by gear type, 2003-2007.
Sum of LANDINGS YEARSPECIES GEAR 2003 2004 2005 2006 2007COD OTTER 2.14 0.73 0.38 0.77 1.63
POTS 0.70 0.19 0.54HKE OTTER 0.18 0.63 0.39 0.40
POTS 0.41 0.11NEP DREDGE 0.02 2.37 0.94 0.09
GILL 0.08OTTER 585.34 555.43 556.09 1013.36 1049.71PEL_TRAWL 0.32POTS 1143.62 1141.16 1136.67 1230.21 1219.30SHELLHAND 5.74 0.49 2.29
PLE OTTER 0.05 0.05 0.05 0.51 0.07POTS 0.01
SOL OTTER 0.03POTS 0.00
Ireland
Irish under 10 meter vessel landings are not recorded by gear type. Therefore Table 6.7.5.3 represents landings by all gears types used by these vessels in the west of Scotland. This information is known to be incomplete, however. No area specific vessel numbers or effort is available from Ireland, for further description of information available from Ireland, see section 5.5.5.
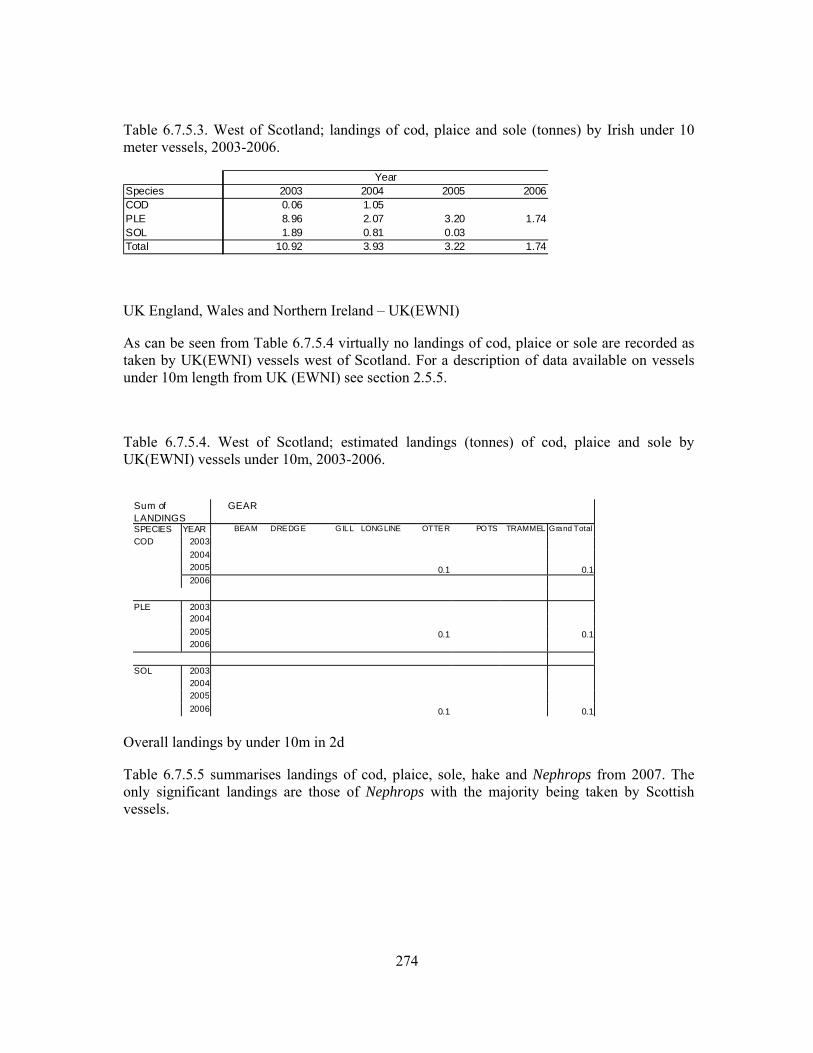
274
Table 6.7.5.3. West of Scotland; landings of cod, plaice and sole (tonnes) by Irish under 10 meter vessels, 2003-2006.
Species 2003 2004 2005 2006COD 0.06 1.05PLE 8.96 2.07 3.20 1.74SOL 1.89 0.81 0.03Total 10.92 3.93 3.22 1.74
Year
UK England, Wales and Northern Ireland – UK(EWNI)
As can be seen from Table 6.7.5.4 virtually no landings of cod, plaice or sole are recorded as taken by UK(EWNI) vessels west of Scotland. For a description of data available on vessels under 10m length from UK (EWNI) see section 2.5.5.
Table 6.7.5.4. West of Scotland; estimated landings (tonnes) of cod, plaice and sole by UK(EWNI) vessels under 10m, 2003-2006.
Sum of LANDINGS
GEAR
SPECIES YEAR BEAM DREDGE GILL LONGLINE OTTER POTS TRAMMEL Grand Total
COD 2003 2004 2005 0.1 0.1 2006
PLE 2003
2004 2005 0.1 0.1 2006
SOL 2003
2004 2005 2006 0.1 0.1
Overall landings by under 10m in 2d
Table 6.7.5.5 summarises landings of cod, plaice, sole, hake and Nephrops from 2007. The only significant landings are those of Nephrops with the majority being taken by Scottish vessels.
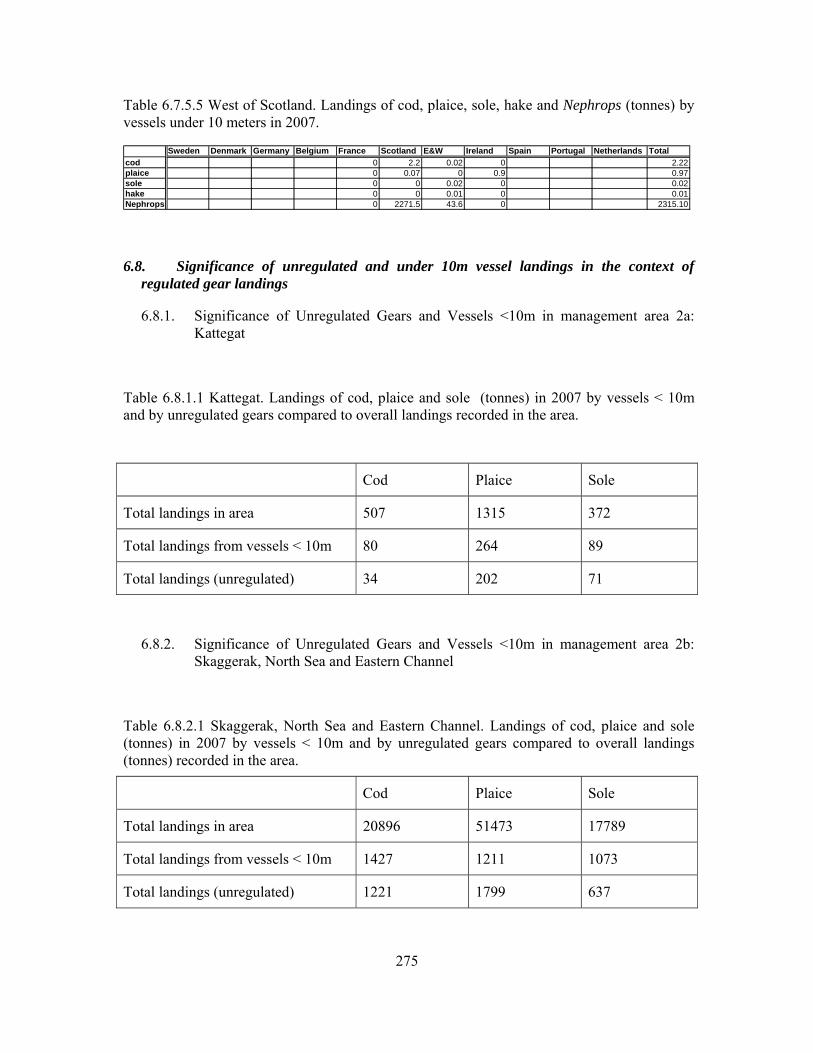
275
Table 6.7.5.5 West of Scotland. Landings of cod, plaice, sole, hake and Nephrops (tonnes) by vessels under 10 meters in 2007.
Sweden Denmark Germany Belgium France Scotland E&W Ireland Spain Portugal Netherlands Totalcod 0 2.2 0.02 0 2.22plaice 0 0.07 0 0.9 0.97sole 0 0 0.02 0 0.02hake 0 0 0.01 0 0.01Nephrops 0 2271.5 43.6 0 2315.10
6.8. Significance of unregulated and under 10m vessel landings in the context of regulated gear landings
6.8.1. Significance of Unregulated Gears and Vessels <10m in management area 2a: Kattegat
Table 6.8.1.1 Kattegat. Landings of cod, plaice and sole (tonnes) in 2007 by vessels < 10m and by unregulated gears compared to overall landings recorded in the area.
Cod Plaice Sole
Total landings in area 507 1315 372
Total landings from vessels < 10m 80 264 89
Total landings (unregulated) 34 202 71
6.8.2. Significance of Unregulated Gears and Vessels <10m in management area 2b: Skaggerak, North Sea and Eastern Channel
Table 6.8.2.1 Skaggerak, North Sea and Eastern Channel. Landings of cod, plaice and sole (tonnes) in 2007 by vessels < 10m and by unregulated gears compared to overall landings (tonnes) recorded in the area.
Cod Plaice Sole
Total landings in area 20896 51473 17789
Total landings from vessels < 10m 1427 1211 1073
Total landings (unregulated) 1221 1799 637
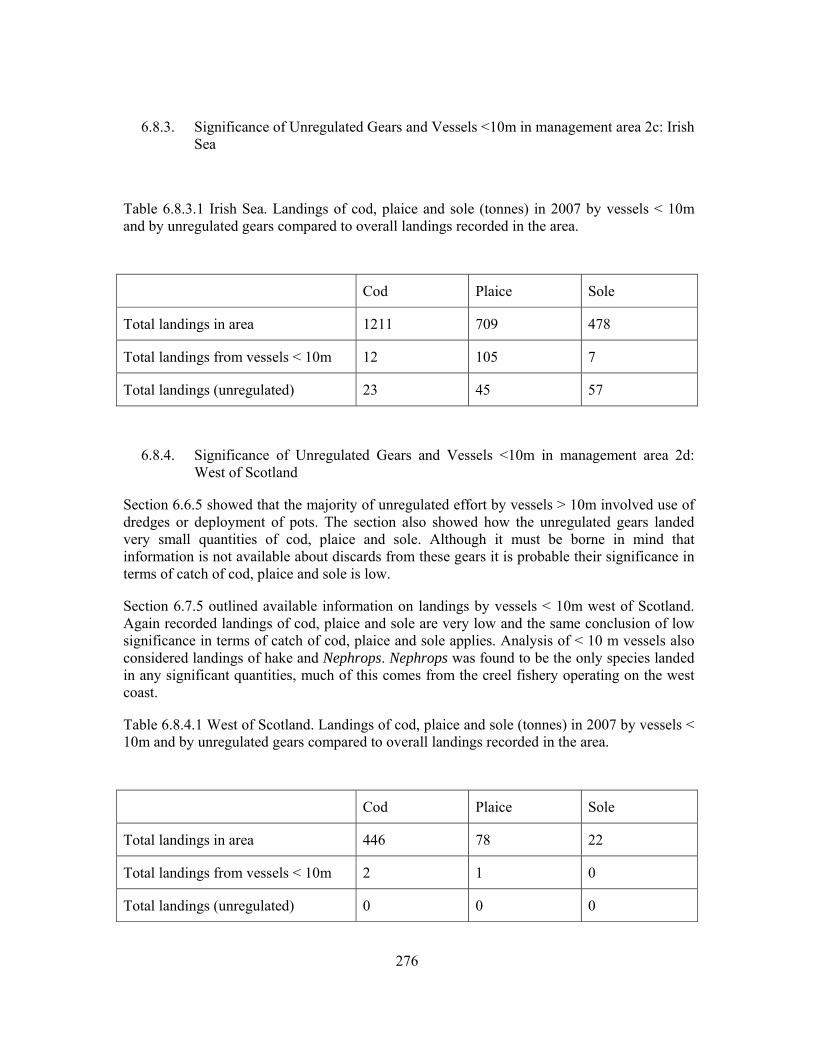
276
6.8.3. Significance of Unregulated Gears and Vessels <10m in management area 2c: Irish Sea
Table 6.8.3.1 Irish Sea. Landings of cod, plaice and sole (tonnes) in 2007 by vessels < 10m and by unregulated gears compared to overall landings recorded in the area.
Cod Plaice Sole
Total landings in area 1211 709 478
Total landings from vessels < 10m 12 105 7
Total landings (unregulated) 23 45 57
6.8.4. Significance of Unregulated Gears and Vessels <10m in management area 2d: West of Scotland
Section 6.6.5 showed that the majority of unregulated effort by vessels > 10m involved use of dredges or deployment of pots. The section also showed how the unregulated gears landed very small quantities of cod, plaice and sole. Although it must be borne in mind that information is not available about discards from these gears it is probable their significance in terms of catch of cod, plaice and sole is low.
Section 6.7.5 outlined available information on landings by vessels < 10m west of Scotland. Again recorded landings of cod, plaice and sole are very low and the same conclusion of low significance in terms of catch of cod, plaice and sole applies. Analysis of < 10 m vessels also considered landings of hake and Nephrops. Nephrops was found to be the only species landed in any significant quantities, much of this comes from the creel fishery operating on the west coast.
Table 6.8.4.1 West of Scotland. Landings of cod, plaice and sole (tonnes) in 2007 by vessels < 10m and by unregulated gears compared to overall landings recorded in the area.
Cod Plaice Sole
Total landings in area 446 78 22
Total landings from vessels < 10m 2 1 0
Total landings (unregulated) 0 0 0
277
6.9. Spatial distribution patterns of effective fishing effort of trawled gears 2003-2007
6.9.1. General remarks
STECF-SGRST notes that minimum geographic resolution in the available logbook information on landings and effective effort is by ICES rectangle and considers analyses to only be possible at that resolution. However, in order to evaluate the geographical distribution patterns of various fleets using specific gears on a larger scale, STECF-SGRST defined an additional data base for effective effort of the various trawled gears (beam and otter trawls, demersal seines) defined as derogations in Annex IIA and called for the data in advance of its follow-up meeting. The data base C on effective effort is defined in Annex 1 to this report and an overview on data provisions is given in section 5.5.3 in this report. The effective effort values of certain nations were given in days fished which were then converted to trawled hours by applying a factor of 24. STECF-SGRST notes that only major changes in the geographical distribution patterns should be given attention given the imprecision of the created data set. Furthermore, only few examples of derogations are presented because of the time and space limits given to STECF-SGRST. A full set of figures is availabale electronically
STECF-SGRST notes a general trend to deploy the available effort closer to the landing ports can only be detected for the beam trawl fleet. In general, it remains unclear whether the observed patterns are due to abundance changes of target stocks, economic considerations or effort regulations.
Figures use a common scale across years for a given category (e.g. 4.a.ii. none) but scales are unique to each category such that the colours assigned to statistical rectangles for category 4.a.ii. none can not be compared directly to those assigned for category 4.a.ii.IIA8d say. Figures use a percentiles scale, i.e. the same number of data values found in each colour band is the same. This is after data values across all years have been combined for that category.
6.9.2. Spatial Distribution of Effective Effort in management area 2a: Kattegat
Maps of effort for area 2a concentrate on those categories identified as significant in terms of recorded effort (see section 6.2.2) and in terms of landings of cod (see section 6.3.2). The spatial graphs are however not limited to the few rectangles in area 2a alone. Instead, a broader approach was chosen in which effort data for important gear in the Kattegat (and Skagerrak) are shown over the whole area (North Sea, Skagerrak, eastern channel and the Kattegat). This approach was chosen in order put the Kattegat (and Skagerrak) spatial trends in a broader perspective and to visualise differences and similarities in fishing patterns over a larger area.
4.a.ii none- Maps shows the sudden disappearance of 70-89mm trawls in Kattegat and Skagerrak in 2005. This moved effort to grid trawls (4.a.ii.IIA81b) and to 4.a.iii. trawls.
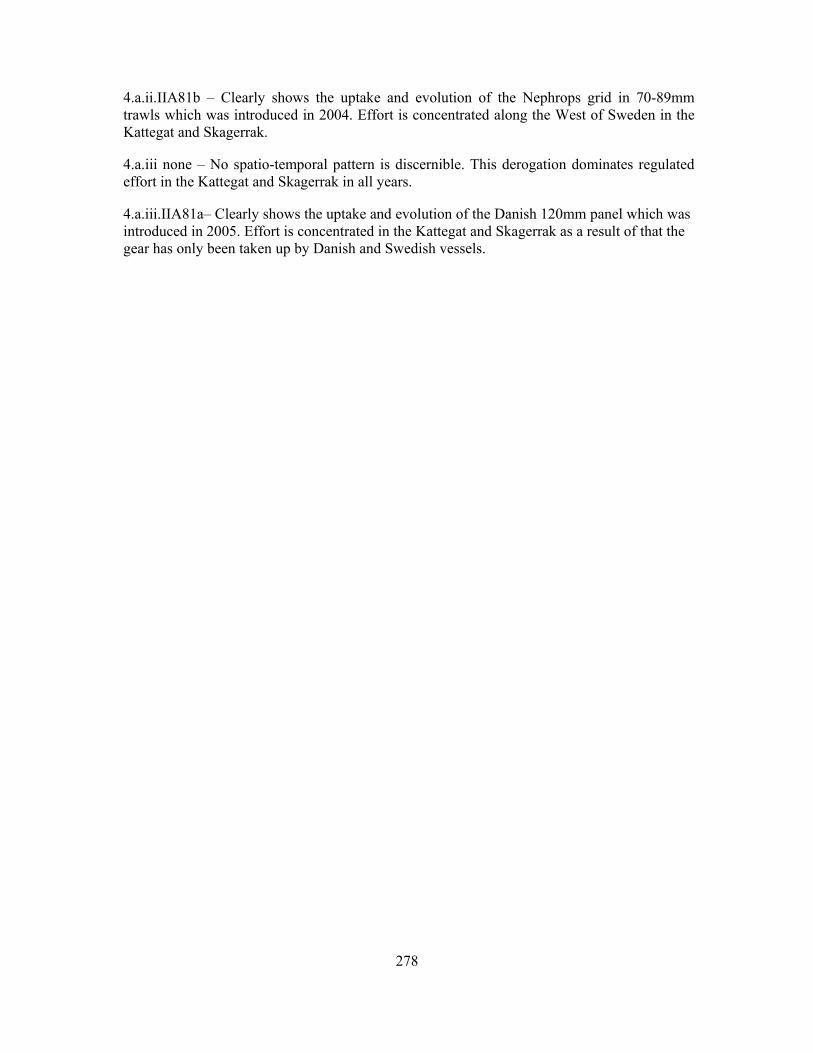
278
4.a.ii.IIA81b – Clearly shows the uptake and evolution of the Nephrops grid in 70-89mm trawls which was introduced in 2004. Effort is concentrated along the West of Sweden in the Kattegat and Skagerrak.
4.a.iii none – No spatio-temporal pattern is discernible. This derogation dominates regulated effort in the Kattegat and Skagerrak in all years.
4.a.iii.IIA81a– Clearly shows the uptake and evolution of the Danish 120mm panel which was introduced in 2005. Effort is concentrated in the Kattegat and Skagerrak as a result of that the gear has only been taken up by Danish and Swedish vessels.
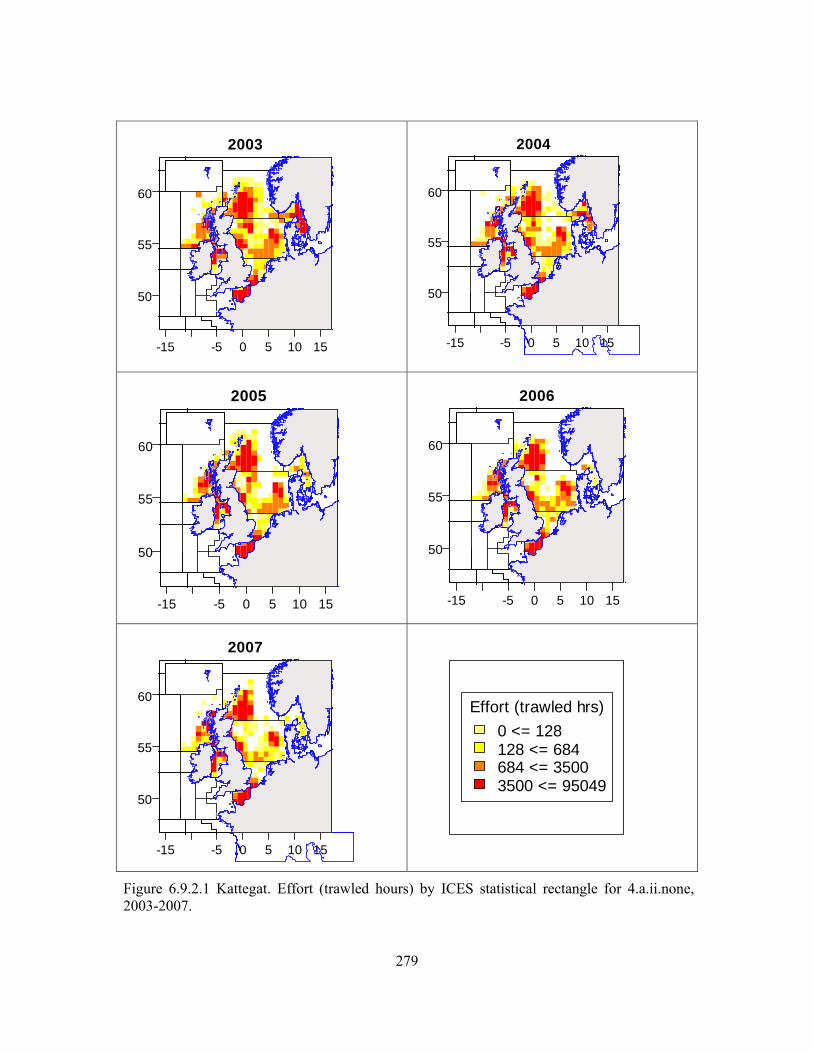
279
-15 -5 0 5 10 15
50
55
60
2003
-15 -5 0 5 10 15
50
55
60
2004
-15 -5 0 5 10 15
50
55
60
2005
-15 -5 0 5 10 15
50
55
60
2006
-15 -5 0 5 10 15
50
55
60
2007
Effort (trawled hrs)0 <= 128128 <= 684684 <= 35003500 <= 95049
Figure 6.9.2.1 Kattegat. Effort (trawled hours) by ICES statistical rectangle for 4.a.ii.none, 2003-2007.
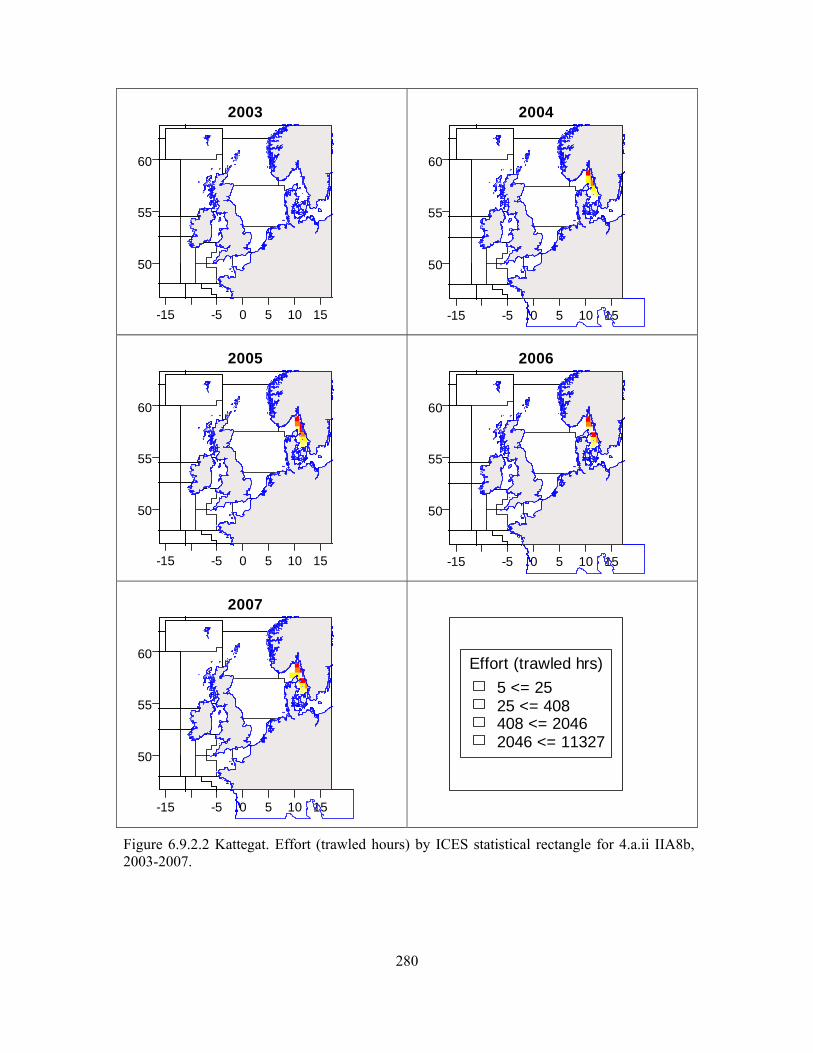
280
-15 -5 0 5 10 15
50
55
60
2003
-15 -5 0 5 10 15
50
55
60
2004
-15 -5 0 5 10 15
50
55
60
2005
-15 -5 0 5 10 15
50
55
60
2006
-15 -5 0 5 10 15
50
55
60
2007
Effort (trawled hrs)5 <= 2525 <= 408408 <= 20462046 <= 11327
Figure 6.9.2.2 Kattegat. Effort (trawled hours) by ICES statistical rectangle for 4.a.ii IIA8b, 2003-2007.
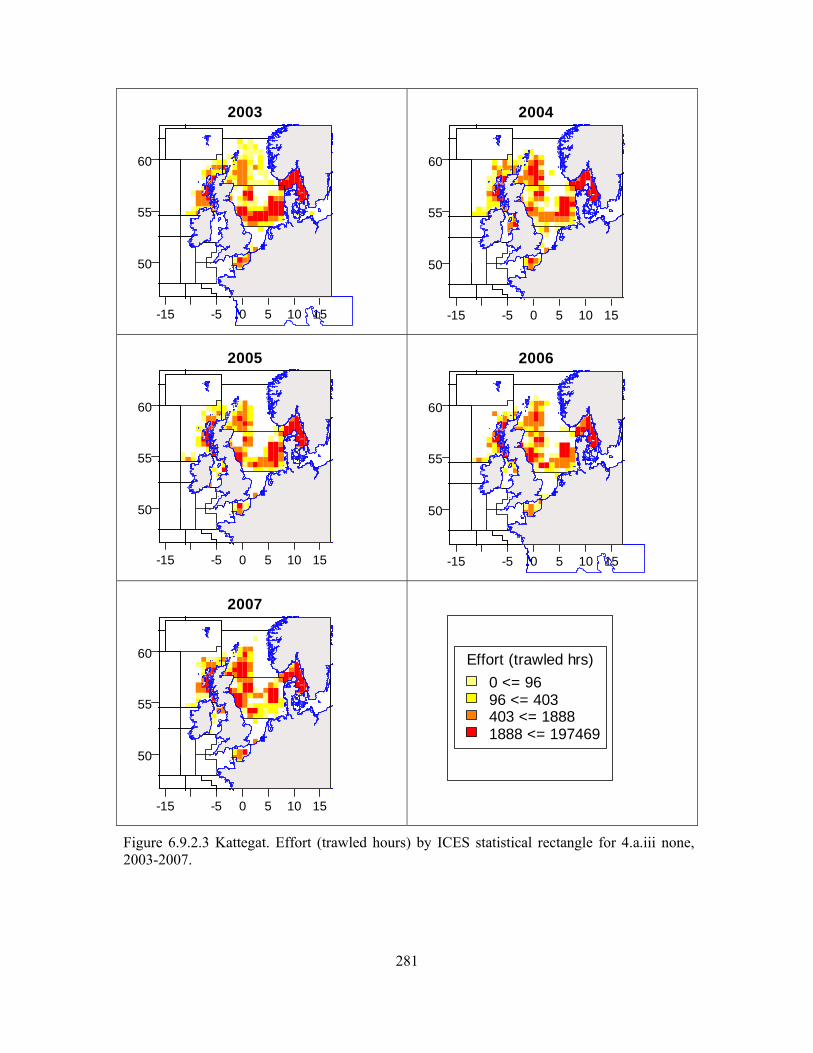
281
-15 -5 0 5 10 15
50
55
60
2003
-15 -5 0 5 10 15
50
55
60
2004
-15 -5 0 5 10 15
50
55
60
2005
-15 -5 0 5 10 15
50
55
60
2006
-15 -5 0 5 10 15
50
55
60
2007
Effort (trawled hrs)0 <= 9696 <= 403403 <= 18881888 <= 197469
Figure 6.9.2.3 Kattegat. Effort (trawled hours) by ICES statistical rectangle for 4.a.iii none, 2003-2007.
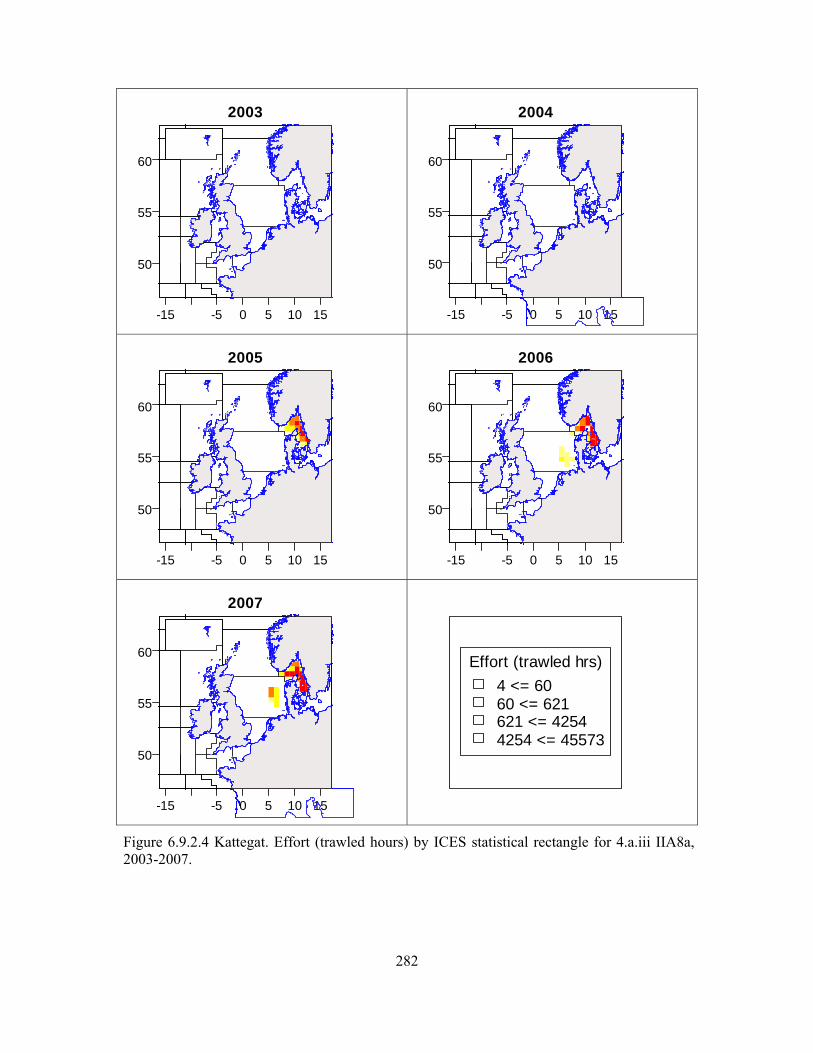
282
-15 -5 0 5 10 15
50
55
60
2003
-15 -5 0 5 10 15
50
55
60
2004
-15 -5 0 5 10 15
50
55
60
2005
-15 -5 0 5 10 15
50
55
60
2006
-15 -5 0 5 10 15
50
55
60
2007
Effort (trawled hrs)4 <= 6060 <= 621621 <= 42544254 <= 45573
Figure 6.9.2.4 Kattegat. Effort (trawled hours) by ICES statistical rectangle for 4.a.iii IIA8a, 2003-2007.
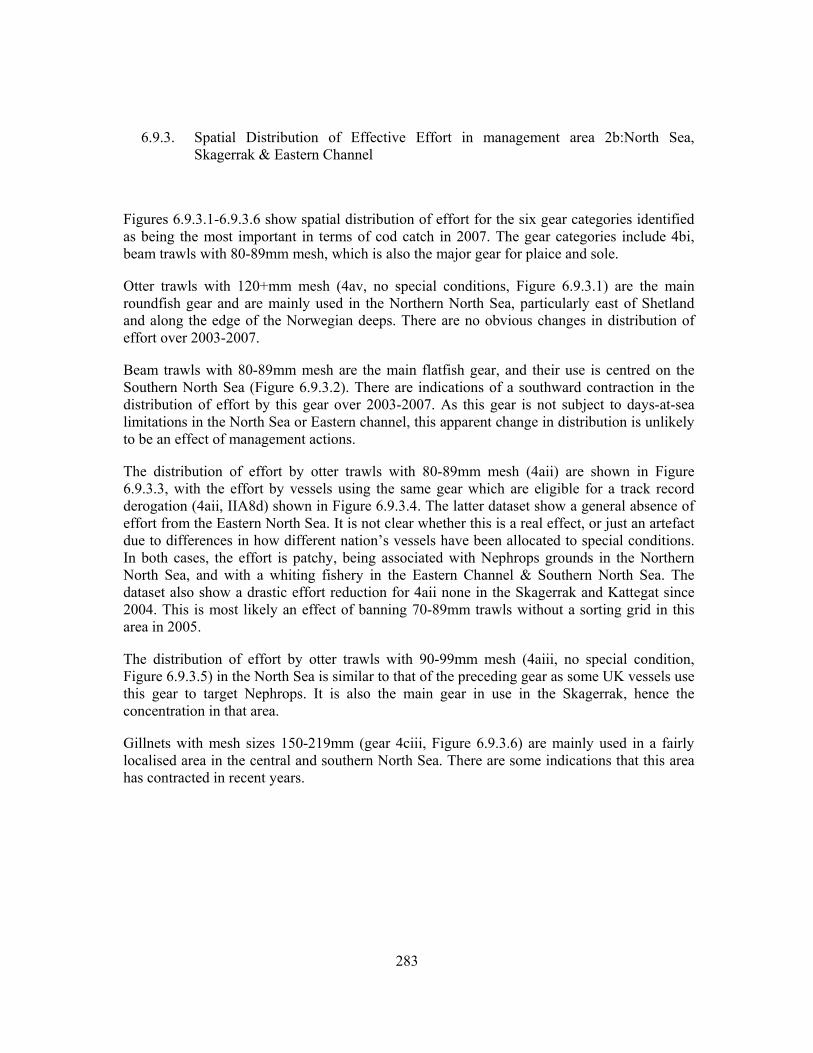
283
6.9.3. Spatial Distribution of Effective Effort in management area 2b:North Sea, Skagerrak & Eastern Channel
Figures 6.9.3.1-6.9.3.6 show spatial distribution of effort for the six gear categories identified as being the most important in terms of cod catch in 2007. The gear categories include 4bi, beam trawls with 80-89mm mesh, which is also the major gear for plaice and sole.
Otter trawls with 120+mm mesh (4av, no special conditions, Figure 6.9.3.1) are the main roundfish gear and are mainly used in the Northern North Sea, particularly east of Shetland and along the edge of the Norwegian deeps. There are no obvious changes in distribution of effort over 2003-2007.
Beam trawls with 80-89mm mesh are the main flatfish gear, and their use is centred on the Southern North Sea (Figure 6.9.3.2). There are indications of a southward contraction in the distribution of effort by this gear over 2003-2007. As this gear is not subject to days-at-sea limitations in the North Sea or Eastern channel, this apparent change in distribution is unlikely to be an effect of management actions.
The distribution of effort by otter trawls with 80-89mm mesh (4aii) are shown in Figure 6.9.3.3, with the effort by vessels using the same gear which are eligible for a track record derogation (4aii, IIA8d) shown in Figure 6.9.3.4. The latter dataset show a general absence of effort from the Eastern North Sea. It is not clear whether this is a real effect, or just an artefact due to differences in how different nation’s vessels have been allocated to special conditions. In both cases, the effort is patchy, being associated with Nephrops grounds in the Northern North Sea, and with a whiting fishery in the Eastern Channel & Southern North Sea. The dataset also show a drastic effort reduction for 4aii none in the Skagerrak and Kattegat since 2004. This is most likely an effect of banning 70-89mm trawls without a sorting grid in this area in 2005.
The distribution of effort by otter trawls with 90-99mm mesh (4aiii, no special condition, Figure 6.9.3.5) in the North Sea is similar to that of the preceding gear as some UK vessels use this gear to target Nephrops. It is also the main gear in use in the Skagerrak, hence the concentration in that area.
Gillnets with mesh sizes 150-219mm (gear 4ciii, Figure 6.9.3.6) are mainly used in a fairly localised area in the central and southern North Sea. There are some indications that this area has contracted in recent years.
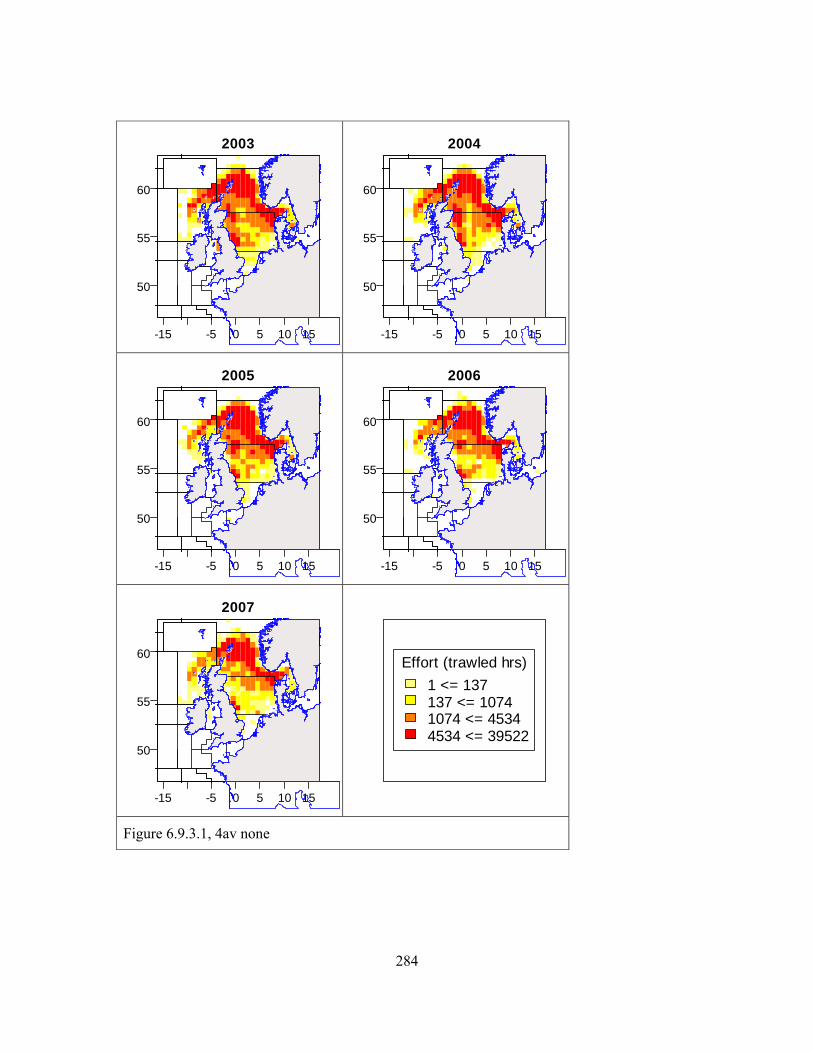
284
-15 -5 0 5 10 15
50
55
60
2003
-15 -5 0 5 10 15
50
55
60
2004
-15 -5 0 5 10 15
50
55
60
2005
-15 -5 0 5 10 15
50
55
60
2006
-15 -5 0 5 10 15
50
55
60
2007
Effort (trawled hrs)1 <= 137137 <= 10741074 <= 45344534 <= 39522
Figure 6.9.3.1, 4av none
285
-15 -5 0 5 10 15
50
55
60
2003
-15 -5 0 5 10 15
50
55
60
2004
-15 -5 0 5 10 15
50
55
60
2005
-15 -5 0 5 10 15
50
55
60
2006
-15 -5 0 5 10 15
50
55
60
2007
Effort (trawled hrs)1 <= 309309 <= 12591259 <= 41584158 <= 46647
Figure 6.9.3.2, 4bi none
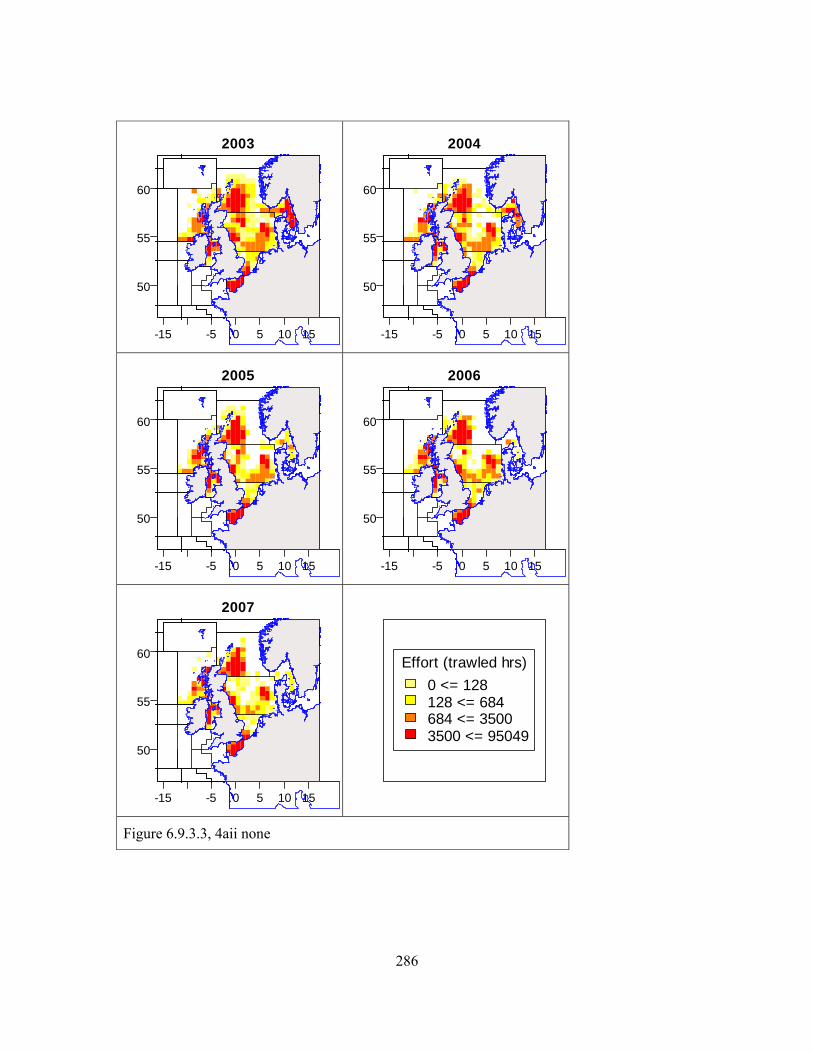
286
-15 -5 0 5 10 15
50
55
60
2003
-15 -5 0 5 10 15
50
55
60
2004
-15 -5 0 5 10 15
50
55
60
2005
-15 -5 0 5 10 15
50
55
60
2006
-15 -5 0 5 10 15
50
55
60
2007
Effort (trawled hrs)0 <= 128128 <= 684684 <= 35003500 <= 95049
Figure 6.9.3.3, 4aii none
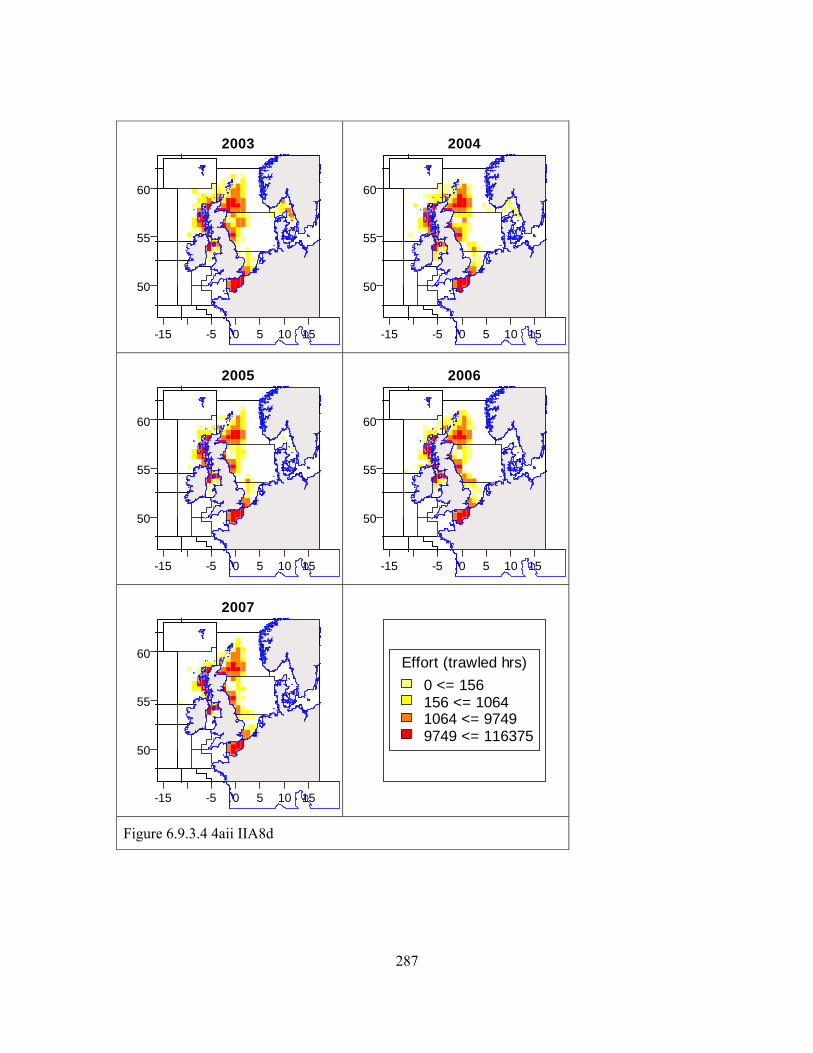
287
-15 -5 0 5 10 15
50
55
60
2003
-15 -5 0 5 10 15
50
55
60
2004
-15 -5 0 5 10 15
50
55
60
2005
-15 -5 0 5 10 15
50
55
60
2006
-15 -5 0 5 10 15
50
55
60
2007
Effort (trawled hrs)0 <= 156156 <= 10641064 <= 97499749 <= 116375
Figure 6.9.3.4 4aii IIA8d
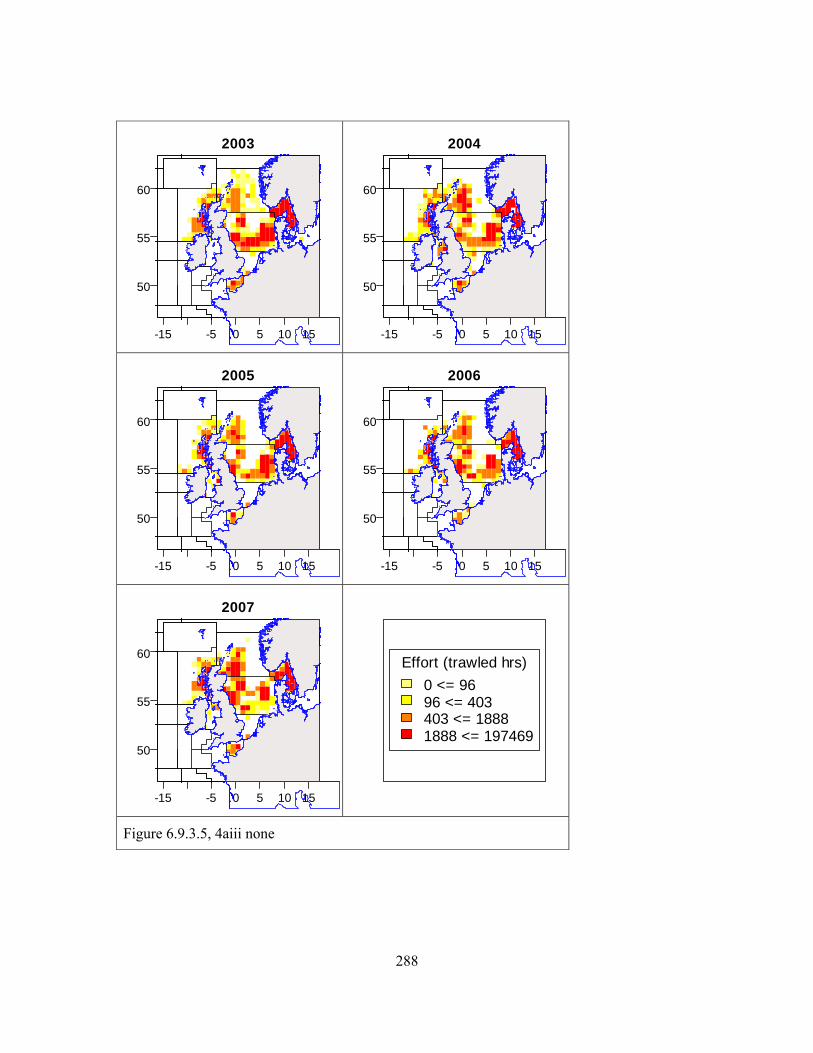
288
-15 -5 0 5 10 15
50
55
60
2003
-15 -5 0 5 10 15
50
55
60
2004
-15 -5 0 5 10 15
50
55
60
2005
-15 -5 0 5 10 15
50
55
60
2006
-15 -5 0 5 10 15
50
55
60
2007
Effort (trawled hrs)0 <= 9696 <= 403403 <= 18881888 <= 197469
Figure 6.9.3.5, 4aiii none
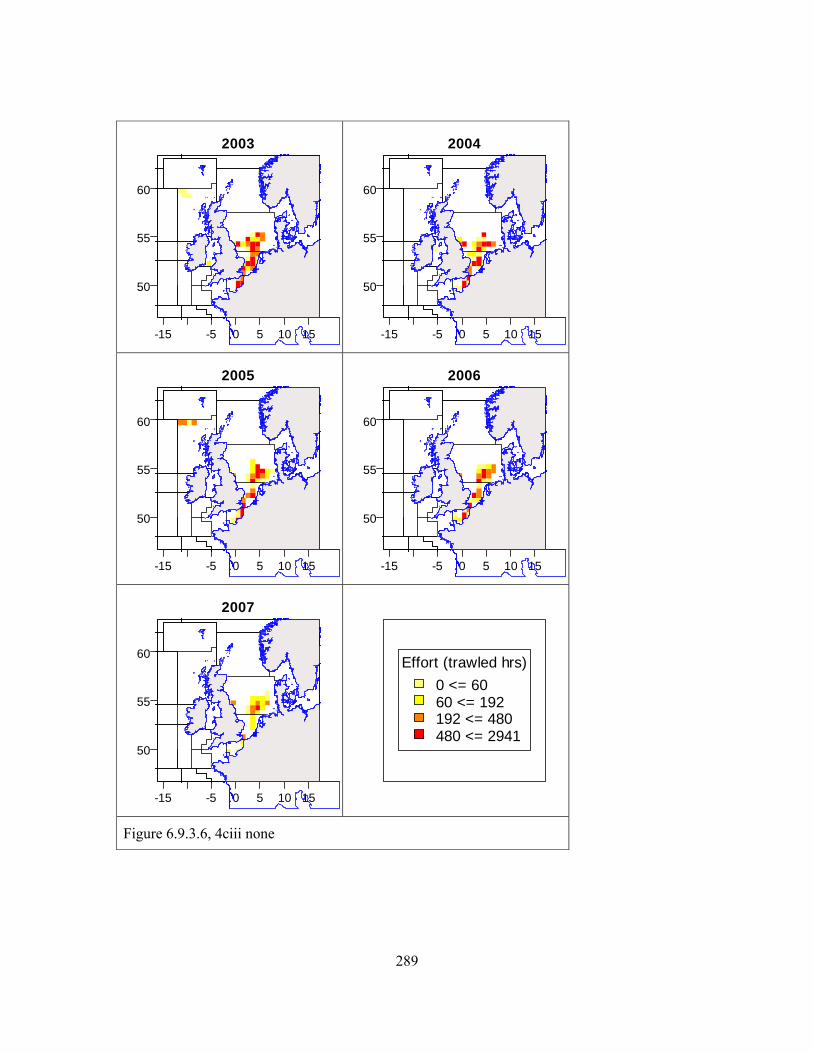
289
-15 -5 0 5 10 15
50
55
60
2003
-15 -5 0 5 10 15
50
55
60
2004
-15 -5 0 5 10 15
50
55
60
2005
-15 -5 0 5 10 15
50
55
60
2006
-15 -5 0 5 10 15
50
55
60
2007
Effort (trawled hrs)0 <= 6060 <= 192192 <= 480480 <= 2941
Figure 6.9.3.6, 4ciii none
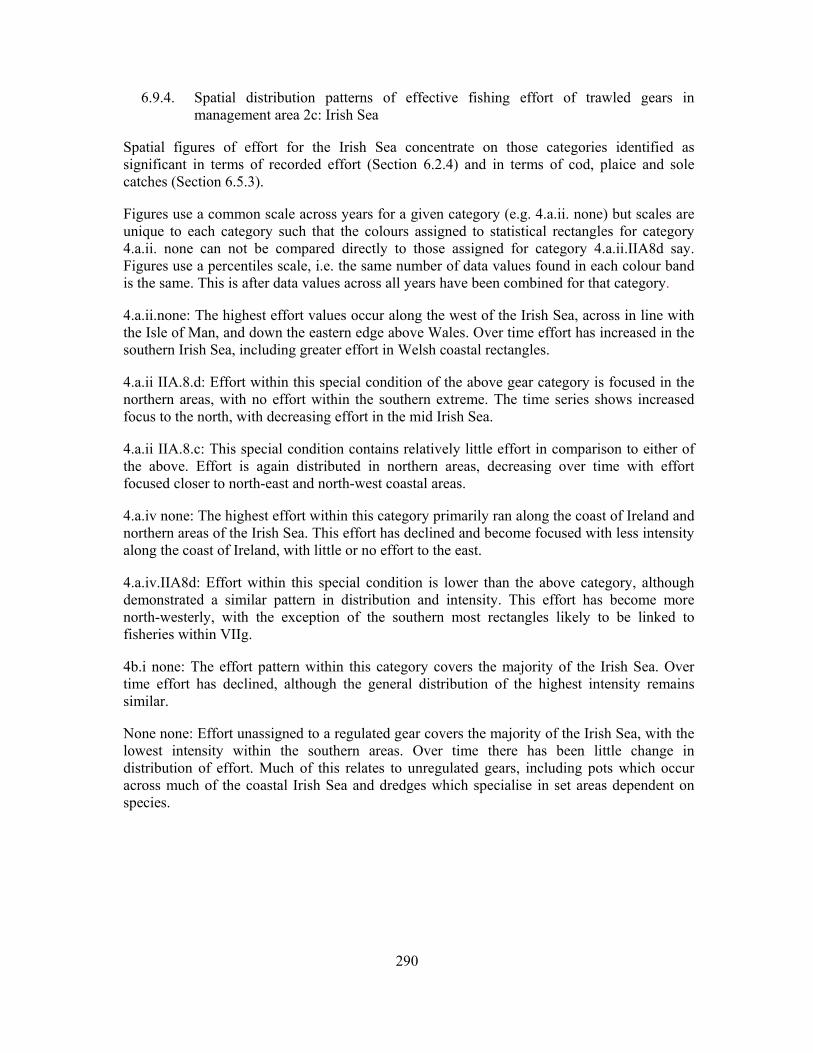
290
6.9.4. Spatial distribution patterns of effective fishing effort of trawled gears in management area 2c: Irish Sea
Spatial figures of effort for the Irish Sea concentrate on those categories identified as significant in terms of recorded effort (Section 6.2.4) and in terms of cod, plaice and sole catches (Section 6.5.3).
Figures use a common scale across years for a given category (e.g. 4.a.ii. none) but scales are unique to each category such that the colours assigned to statistical rectangles for category 4.a.ii. none can not be compared directly to those assigned for category 4.a.ii.IIA8d say. Figures use a percentiles scale, i.e. the same number of data values found in each colour band is the same. This is after data values across all years have been combined for that category.
4.a.ii.none: The highest effort values occur along the west of the Irish Sea, across in line with the Isle of Man, and down the eastern edge above Wales. Over time effort has increased in the southern Irish Sea, including greater effort in Welsh coastal rectangles.
4.a.ii IIA.8.d: Effort within this special condition of the above gear category is focused in the northern areas, with no effort within the southern extreme. The time series shows increased focus to the north, with decreasing effort in the mid Irish Sea.
4.a.ii IIA.8.c: This special condition contains relatively little effort in comparison to either of the above. Effort is again distributed in northern areas, decreasing over time with effort focused closer to north-east and north-west coastal areas.
4.a.iv none: The highest effort within this category primarily ran along the coast of Ireland and northern areas of the Irish Sea. This effort has declined and become focused with less intensity along the coast of Ireland, with little or no effort to the east.
4.a.iv.IIA8d: Effort within this special condition is lower than the above category, although demonstrated a similar pattern in distribution and intensity. This effort has become more north-westerly, with the exception of the southern most rectangles likely to be linked to fisheries within VIIg.
4b.i none: The effort pattern within this category covers the majority of the Irish Sea. Over time effort has declined, although the general distribution of the highest intensity remains similar.
None none: Effort unassigned to a regulated gear covers the majority of the Irish Sea, with the lowest intensity within the southern areas. Over time there has been little change in distribution of effort. Much of this relates to unregulated gears, including pots which occur across much of the coastal Irish Sea and dredges which specialise in set areas dependent on species.
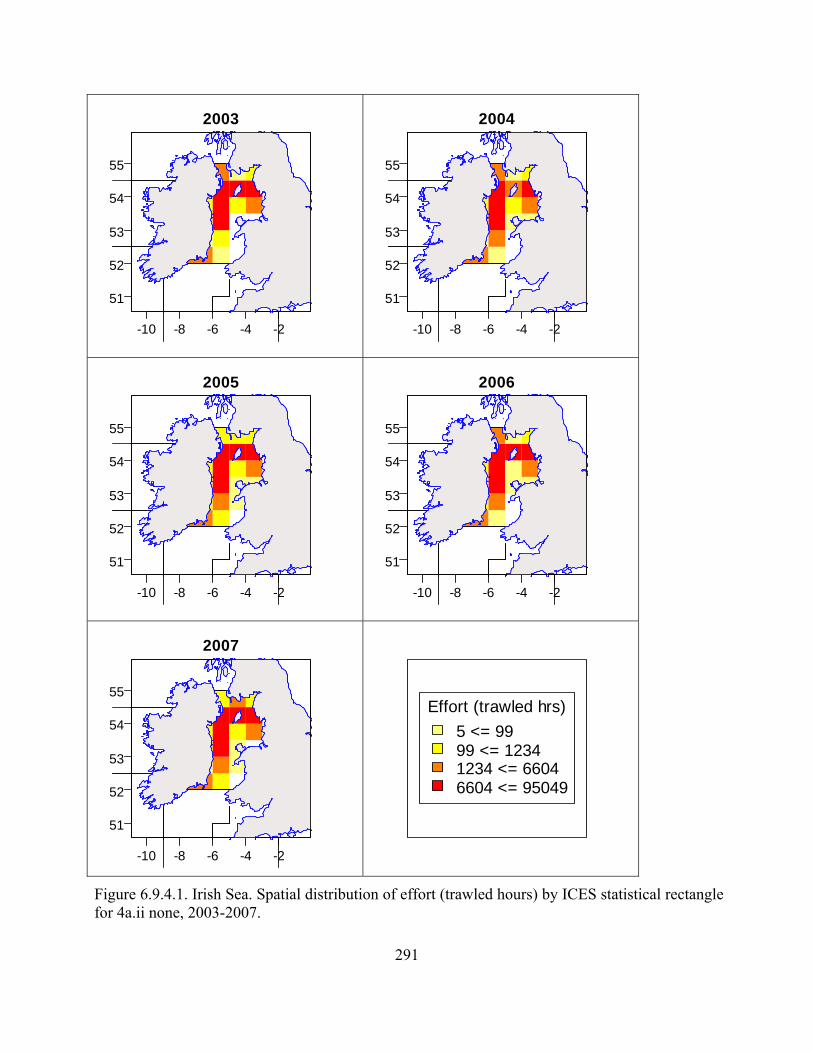
291
-10 -8 -6 -4 -2
51
52
53
54
55
2003
-10 -8 -6 -4 -2
51
52
53
54
55
2004
-10 -8 -6 -4 -2
51
52
53
54
55
2005
-10 -8 -6 -4 -2
51
52
53
54
55
2006
-10 -8 -6 -4 -2
51
52
53
54
55
2007
Effort (trawled hrs)5 <= 9999 <= 12341234 <= 66046604 <= 95049
Figure 6.9.4.1. Irish Sea. Spatial distribution of effort (trawled hours) by ICES statistical rectangle for 4a.ii none, 2003-2007.
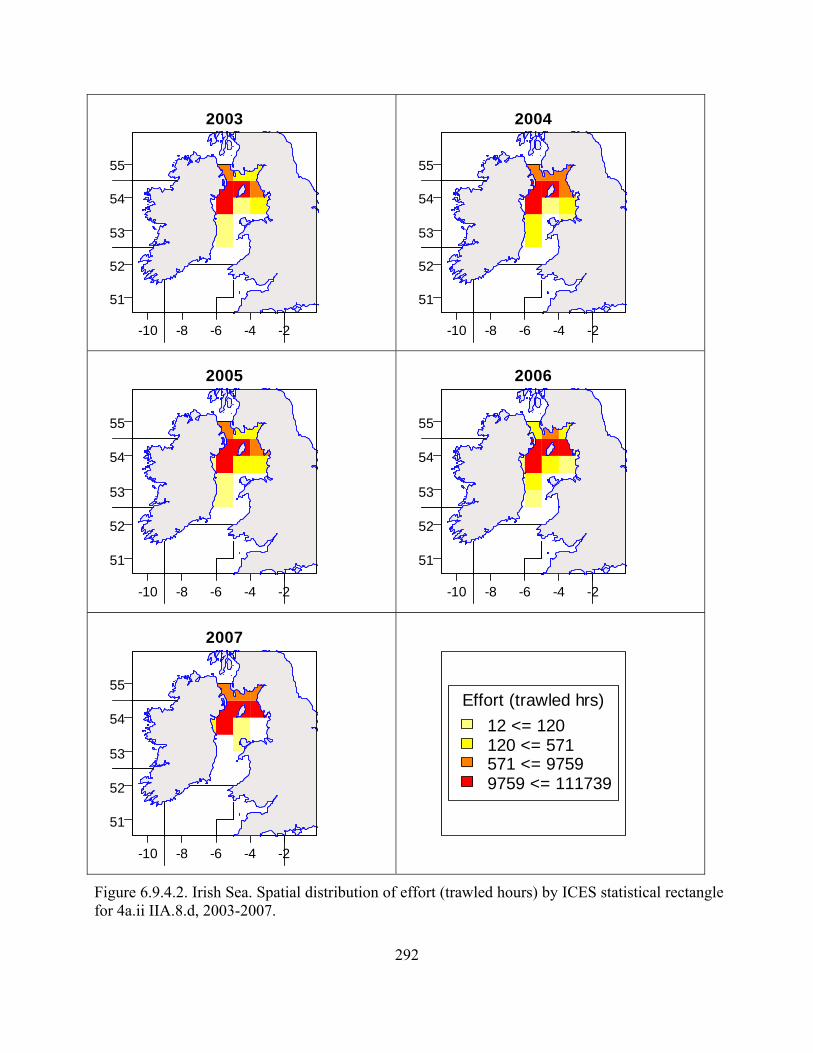
292
-10 -8 -6 -4 -2
51
52
53
54
55
2003
-10 -8 -6 -4 -2
51
52
53
54
55
2004
-10 -8 -6 -4 -2
51
52
53
54
55
2005
-10 -8 -6 -4 -2
51
52
53
54
55
2006
-10 -8 -6 -4 -2
51
52
53
54
55
2007
Effort (trawled hrs)12 <= 120120 <= 571571 <= 97599759 <= 111739
Figure 6.9.4.2. Irish Sea. Spatial distribution of effort (trawled hours) by ICES statistical rectangle for 4a.ii IIA.8.d, 2003-2007.
293
-10 -8 -6 -4 -2
51
52
53
54
55
2003
-10 -8 -6 -4 -2
51
52
53
54
55
2004
-10 -8 -6 -4 -2
51
52
53
54
55
2005
-10 -8 -6 -4 -2
51
52
53
54
55
2006
-10 -8 -6 -4 -2
51
52
53
54
55
2007
Effort (trawled hrs)24 <= 528528 <= 38003800 <= 97289728 <= 29485
Figure 6.9.4.3. Irish Sea. Spatial distribution of effort (trawled hours) by ICES statistical rectangle for 4a.ii IIA.8.c, 2003-2007.
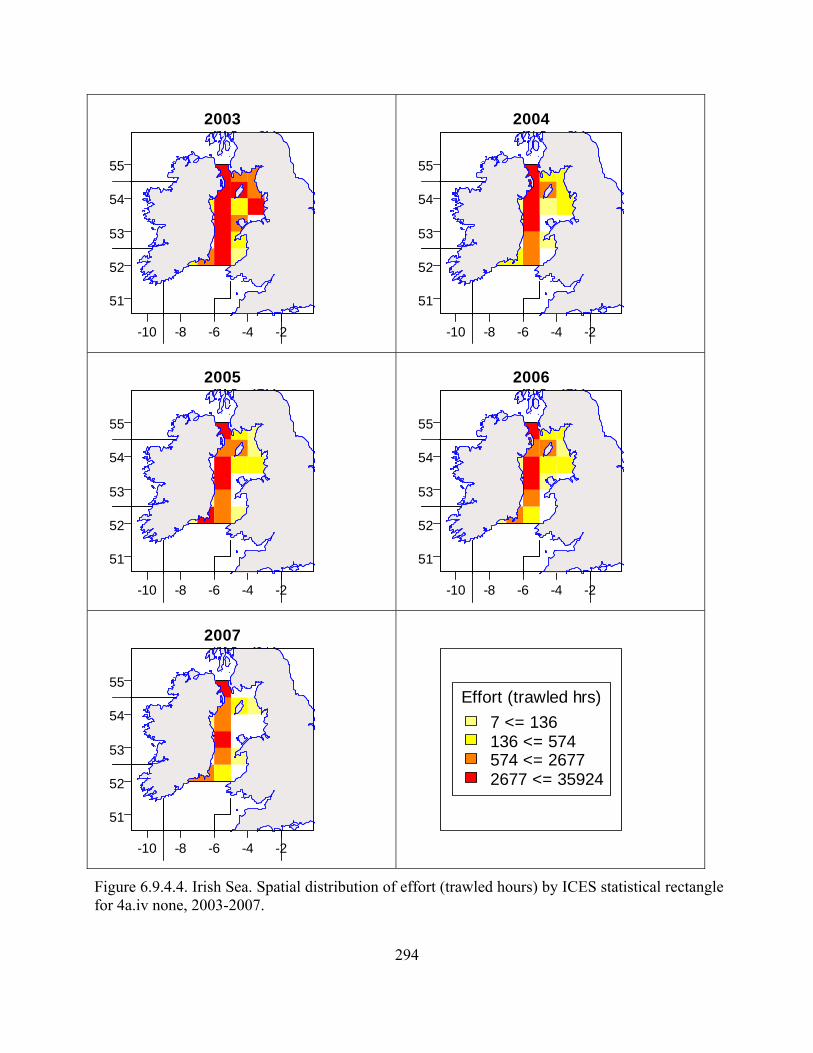
294
-10 -8 -6 -4 -2
51
52
53
54
55
2003
-10 -8 -6 -4 -2
51
52
53
54
55
2004
-10 -8 -6 -4 -2
51
52
53
54
55
2005
-10 -8 -6 -4 -2
51
52
53
54
55
2006
-10 -8 -6 -4 -2
51
52
53
54
55
2007
Effort (trawled hrs)7 <= 136136 <= 574574 <= 26772677 <= 35924
Figure 6.9.4.4. Irish Sea. Spatial distribution of effort (trawled hours) by ICES statistical rectangle for 4a.iv none, 2003-2007.
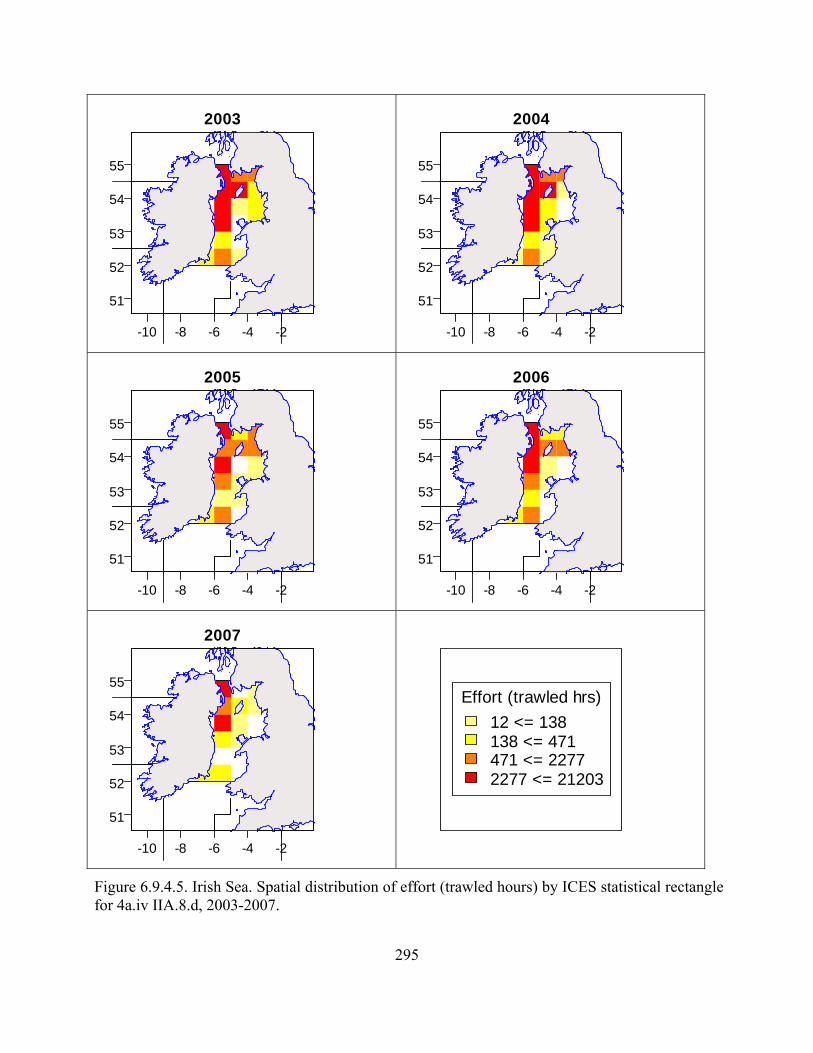
295
-10 -8 -6 -4 -2
51
52
53
54
55
2003
-10 -8 -6 -4 -2
51
52
53
54
55
2004
-10 -8 -6 -4 -2
51
52
53
54
55
2005
-10 -8 -6 -4 -2
51
52
53
54
55
2006
-10 -8 -6 -4 -2
51
52
53
54
55
2007
Effort (trawled hrs)12 <= 138138 <= 471471 <= 22772277 <= 21203
Figure 6.9.4.5. Irish Sea. Spatial distribution of effort (trawled hours) by ICES statistical rectangle for 4a.iv IIA.8.d, 2003-2007.
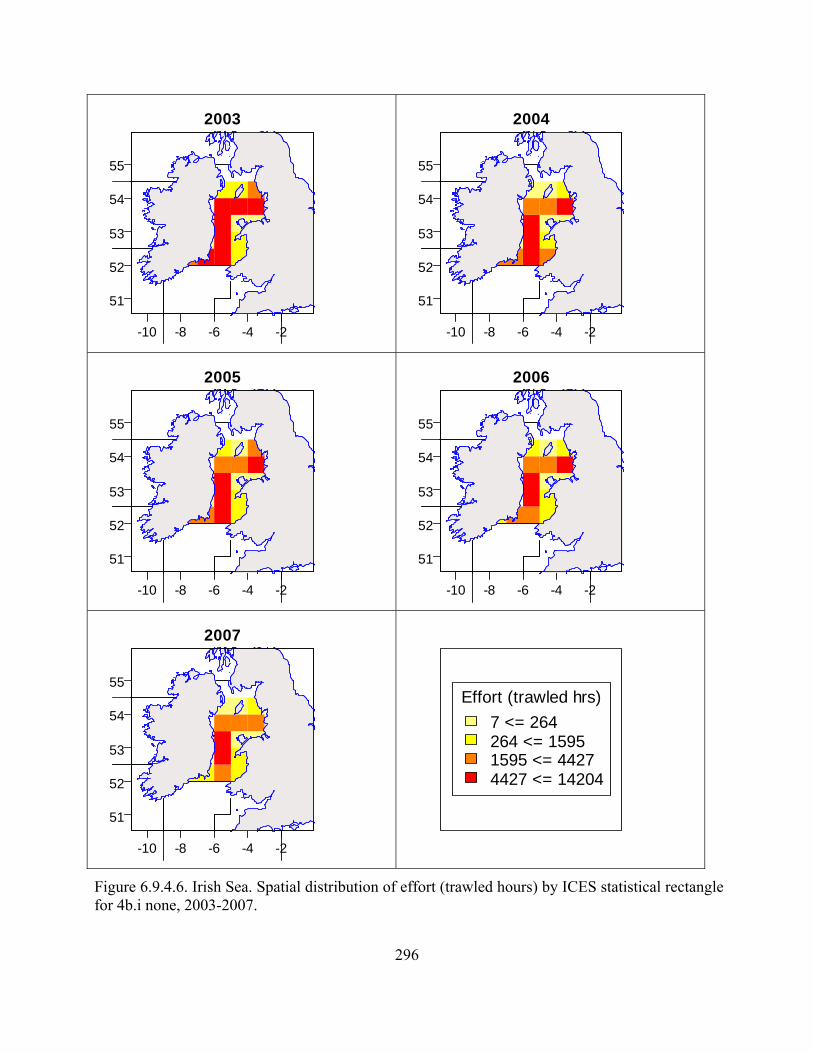
296
-10 -8 -6 -4 -2
51
52
53
54
55
2003
-10 -8 -6 -4 -2
51
52
53
54
55
2004
-10 -8 -6 -4 -2
51
52
53
54
55
2005
-10 -8 -6 -4 -2
51
52
53
54
55
2006
-10 -8 -6 -4 -2
51
52
53
54
55
2007
Effort (trawled hrs)7 <= 264264 <= 15951595 <= 44274427 <= 14204
Figure 6.9.4.6. Irish Sea. Spatial distribution of effort (trawled hours) by ICES statistical rectangle for 4b.i none, 2003-2007.

297
-10 -8 -6 -4 -2
51
52
53
54
55
2003
-10 -8 -6 -4 -2
51
52
53
54
55
2004
-10 -8 -6 -4 -2
51
52
53
54
55
2005
-10 -8 -6 -4 -2
51
52
53
54
55
2006
-10 -8 -6 -4 -2
51
52
53
54
55
2007
Effort (trawled hrs)2 <= 502502 <= 24252425 <= 64686468 <= 28775
Figure 6.9.4.7. Irish Sea. Spatial distribution of effort (trawled hours) by ICES statistical rectangle for none-none, 2003-2007.
298
6.9.5. Spatial Distribution of Effective Effort in management area 2d: West of Scotland
Spatial figures of effort for area 2d concentrate on those categories identified as significant in terms of recorded effort (see section 6.2.5) and in terms of catches of cod (see section 6.5.4). From section 6.3.5 catches of plaice and sole are shown to be small for all categories in area 2d and these species were not considered when deciding on categories to present here.
Figures use a common scale across years for a given category (e.g. 4.a.ii. none) but scales are unique to each category such that the colours assigned to statistical rectangles for category 4.a.ii. none can not be compared directly to those assigned for category 4.a.ii.IIA8d say. Figures use a percentiles scale, i.e. the same number of data values found in each colour band is the same. This is after data values across all years have been combined for that category.
4.a.ii.IIA8d – Highest values of effort in the area between the Scottish mainland and the Outer Hebrides (known as the north and south Minches) and also in the area outside the Clyde estuary just to the north of the boundary between areas 2d and 2c. The time series shows a contraction of effort in towards these areas of greatest activity.
4.a.ii none – Shows the same areas of high effort as for category 4.a.ii.IIA8d but also effort on the continental shelf south of 57 degrees north. Activity in this last area has decreased in the period 2003-2007 and effort north of 58.5 degrees north has effectively ceased.
4.a.iv.IIA8d – Effort is concentrated along the West of Scotland management line with some rectangles of higher activity close to the Scottish coast, either in the Minch area and/or just north of the 2d, 2c area border. There is evidence for an overall decrease in effort but the spatial pattern has remained consistent over the period considered.
4.a.iv none – The effort pattern is similar to that for 4.a.iv.IIA8d but with less activity in the Minch area. There is a reduction of effort in the more northern waters (north of 58 degrees north). This trend is not so evident for category 4.a.iv.IIA8d.
4.a.v none – Effort is found in the northern half of management area 2d with little or no effort south of 57 degrees north. North of this line rectangles in the far north east corner of the area are consistently recorded as belonging to the highest effort category and there is evidence of some concentration of effort along the shelf edge/West of Scotland management line. There is little effort, however, in the Minch area or adjacent to the outer Hebrides.
4.e none – There is a concentration of effort along the continental shelf edge consistent with time. There are also rectangles of high effort in the south Minch area and rectangles outside the Clyde estuary to the north of the 2d, 2c area border in some years. Section 6.2.5 showed increased effort recorded in area 2d for this gear category but there is no obvious expansion of areas being fished using long lines.
None.none – Effort unassigned to a regulated gear is mostly contained within two distinct blocks. The first is just to the north of the Scottish mainland and west of the 2d and 2b management area boundaries (4-7 degrees west and 58.5-59.5 degrees north). The second is bounded by the Scottish
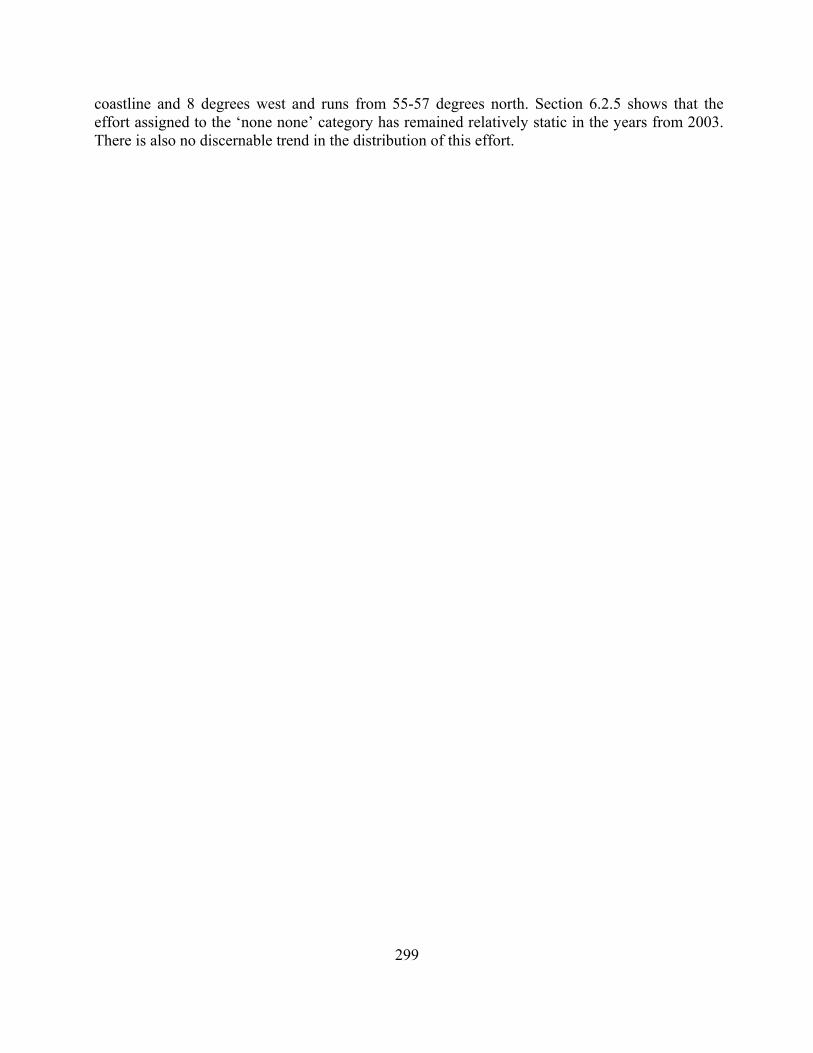
299
coastline and 8 degrees west and runs from 55-57 degrees north. Section 6.2.5 shows that the effort assigned to the ‘none none’ category has remained relatively static in the years from 2003. There is also no discernable trend in the distribution of this effort.
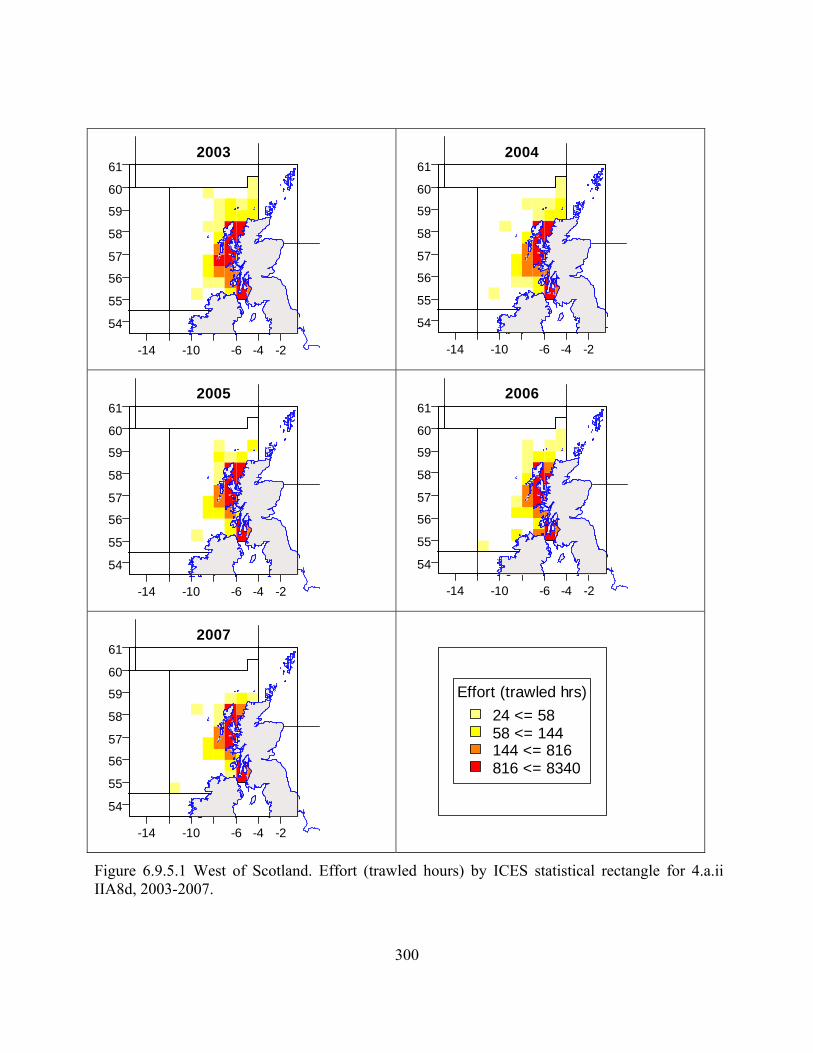
300
-14 -10 -6 -4 -2
54
55
56
57
58
59
60
612003
-14 -10 -6 -4 -2
54
55
56
57
58
59
60
612004
-14 -10 -6 -4 -2
54
55
56
57
58
59
60
612005
-14 -10 -6 -4 -2
54
55
56
57
58
59
60
612006
-14 -10 -6 -4 -2
54
55
56
57
58
59
60
612007
Effort (trawled hrs)24 <= 5858 <= 144144 <= 816816 <= 8340
Figure 6.9.5.1 West of Scotland. Effort (trawled hours) by ICES statistical rectangle for 4.a.ii IIA8d, 2003-2007.
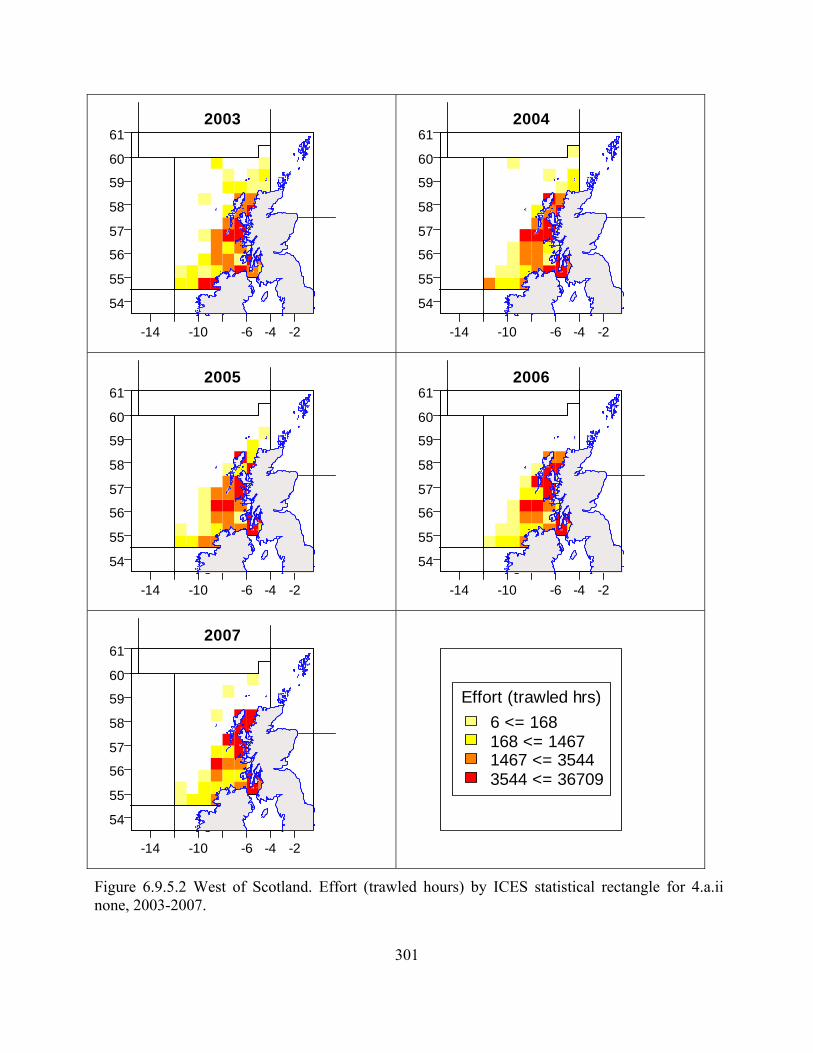
301
-14 -10 -6 -4 -2
54
55
56
57
58
59
60
612003
-14 -10 -6 -4 -2
54
55
56
57
58
59
60
612004
-14 -10 -6 -4 -2
54
55
56
57
58
59
60
612005
-14 -10 -6 -4 -2
54
55
56
57
58
59
60
612006
-14 -10 -6 -4 -2
54
55
56
57
58
59
60
612007
Effort (trawled hrs)6 <= 168168 <= 14671467 <= 35443544 <= 36709
Figure 6.9.5.2 West of Scotland. Effort (trawled hours) by ICES statistical rectangle for 4.a.ii none, 2003-2007.
302
-14 -10 -6 -4 -2
54
55
56
57
58
59
60
612003
-14 -10 -6 -4 -2
54
55
56
57
58
59
60
612004
-14 -10 -6 -4 -2
54
55
56
57
58
59
60
612005
-14 -10 -6 -4 -2
54
55
56
57
58
59
60
612006
-14 -10 -6 -4 -2
54
55
56
57
58
59
60
612007
Effort (trawled hrs)0 <= 130130 <= 551551 <= 30353035 <= 18864
Figure 6.9.5.3 West of Scotland. Effort (trawled hours) by ICES statistical rectangle for 4.a.iv IIA8d, 2003-2007.
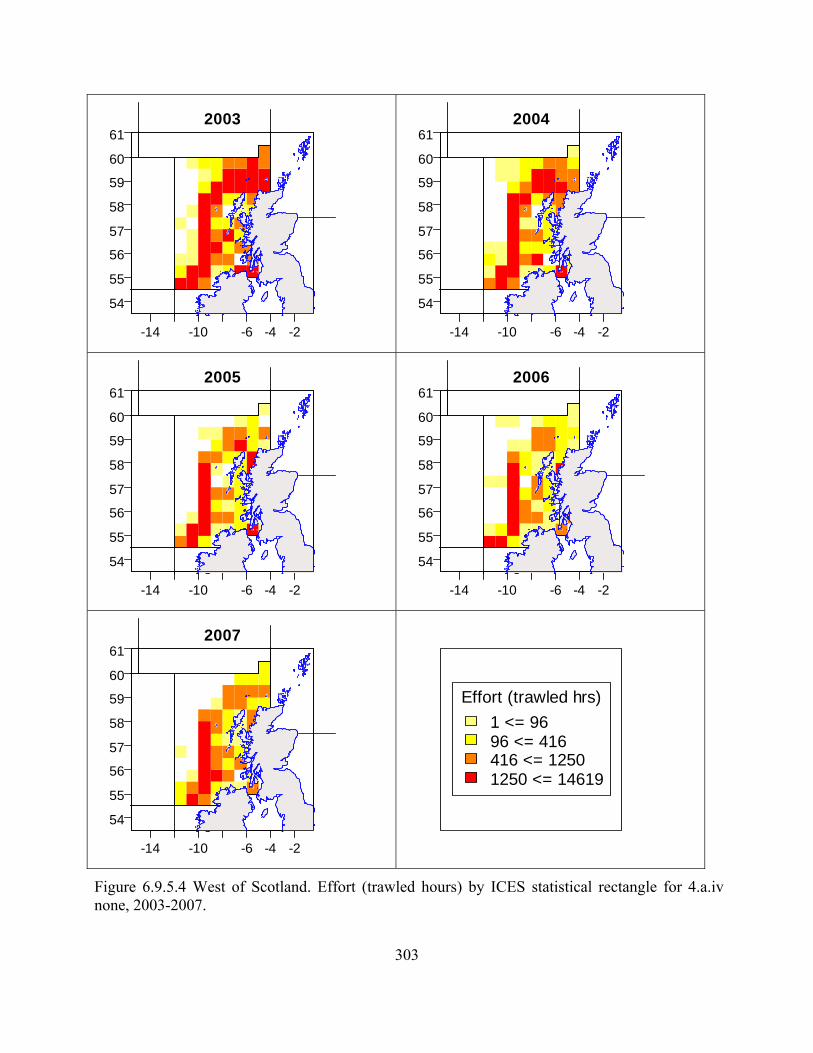
303
-14 -10 -6 -4 -2
54
55
56
57
58
59
60
612003
-14 -10 -6 -4 -2
54
55
56
57
58
59
60
612004
-14 -10 -6 -4 -2
54
55
56
57
58
59
60
612005
-14 -10 -6 -4 -2
54
55
56
57
58
59
60
612006
-14 -10 -6 -4 -2
54
55
56
57
58
59
60
612007
Effort (trawled hrs)1 <= 9696 <= 416416 <= 12501250 <= 14619
Figure 6.9.5.4 West of Scotland. Effort (trawled hours) by ICES statistical rectangle for 4.a.iv none, 2003-2007.

304
-14 -10 -6 -4 -2
54
55
56
57
58
59
60
612003
-14 -10 -6 -4 -2
54
55
56
57
58
59
60
612004
-14 -10 -6 -4 -2
54
55
56
57
58
59
60
612005
-14 -10 -6 -4 -2
54
55
56
57
58
59
60
612006
-14 -10 -6 -4 -2
54
55
56
57
58
59
60
612007
Effort (trawled hrs)1 <= 5555 <= 383383 <= 22672267 <= 14781
Figure 6.9.5.5 West of Scotland. Effort (trawled hours) by ICES statistical rectangle for 4.a.v none, 2003-2007.
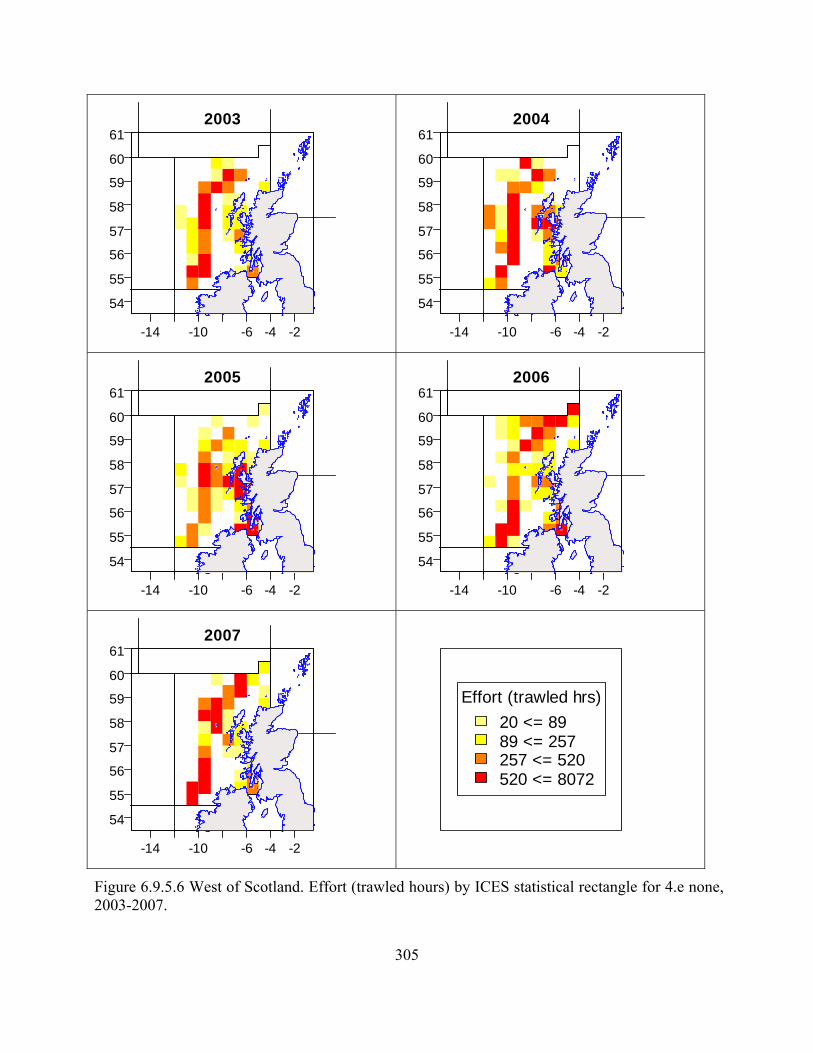
305
-14 -10 -6 -4 -2
54
55
56
57
58
59
60
612003
-14 -10 -6 -4 -2
54
55
56
57
58
59
60
612004
-14 -10 -6 -4 -2
54
55
56
57
58
59
60
612005
-14 -10 -6 -4 -2
54
55
56
57
58
59
60
612006
-14 -10 -6 -4 -2
54
55
56
57
58
59
60
612007
Effort (trawled hrs)20 <= 8989 <= 257257 <= 520520 <= 8072
Figure 6.9.5.6 West of Scotland. Effort (trawled hours) by ICES statistical rectangle for 4.e none, 2003-2007.
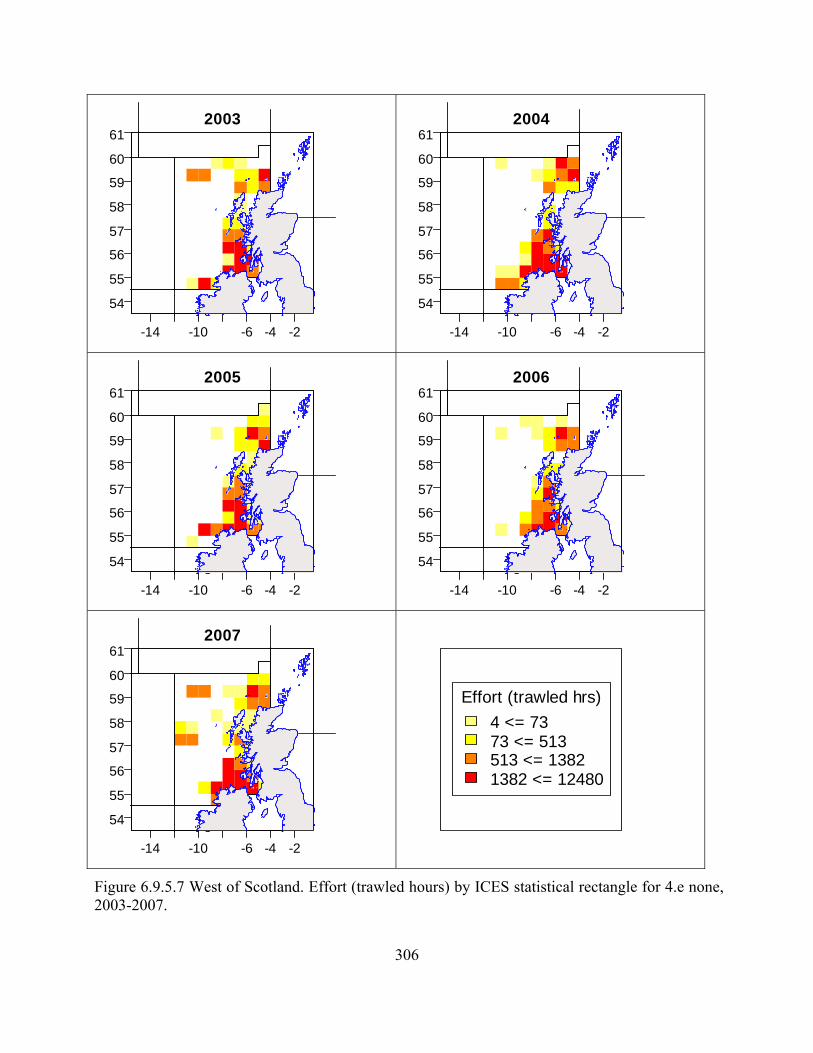
306
-14 -10 -6 -4 -2
54
55
56
57
58
59
60
612003
-14 -10 -6 -4 -2
54
55
56
57
58
59
60
612004
-14 -10 -6 -4 -2
54
55
56
57
58
59
60
612005
-14 -10 -6 -4 -2
54
55
56
57
58
59
60
612006
-14 -10 -6 -4 -2
54
55
56
57
58
59
60
612007
Effort (trawled hrs)4 <= 7373 <= 513513 <= 13821382 <= 12480
Figure 6.9.5.7 West of Scotland. Effort (trawled hours) by ICES statistical rectangle for 4.e none, 2003-2007.
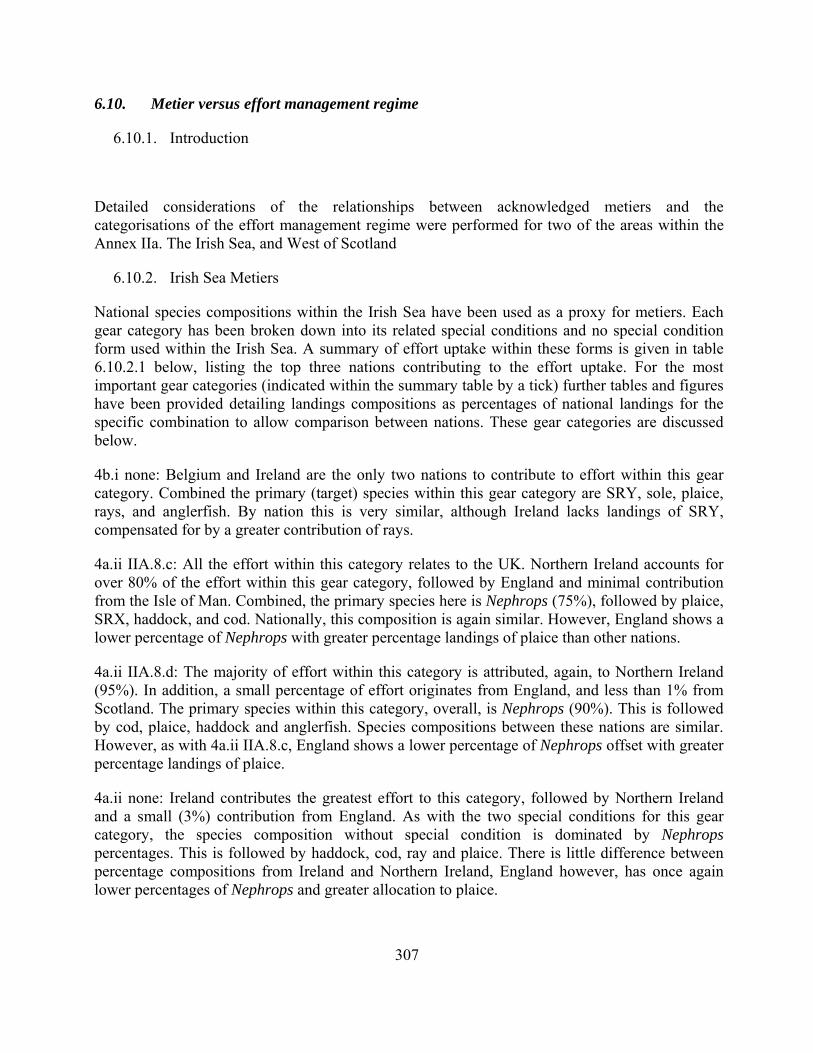
307
6.10. Metier versus effort management regime
6.10.1. Introduction
Detailed considerations of the relationships between acknowledged metiers and the categorisations of the effort management regime were performed for two of the areas within the Annex IIa. The Irish Sea, and West of Scotland
6.10.2. Irish Sea Metiers
National species compositions within the Irish Sea have been used as a proxy for metiers. Each gear category has been broken down into its related special conditions and no special condition form used within the Irish Sea. A summary of effort uptake within these forms is given in table 6.10.2.1 below, listing the top three nations contributing to the effort uptake. For the most important gear categories (indicated within the summary table by a tick) further tables and figures have been provided detailing landings compositions as percentages of national landings for the specific combination to allow comparison between nations. These gear categories are discussed below.
4b.i none: Belgium and Ireland are the only two nations to contribute to effort within this gear category. Combined the primary (target) species within this gear category are SRY, sole, plaice, rays, and anglerfish. By nation this is very similar, although Ireland lacks landings of SRY, compensated for by a greater contribution of rays.
4a.ii IIA.8.c: All the effort within this category relates to the UK. Northern Ireland accounts for over 80% of the effort within this gear category, followed by England and minimal contribution from the Isle of Man. Combined, the primary species here is Nephrops (75%), followed by plaice, SRX, haddock, and cod. Nationally, this composition is again similar. However, England shows a lower percentage of Nephrops with greater percentage landings of plaice than other nations.
4a.ii IIA.8.d: The majority of effort within this category is attributed, again, to Northern Ireland (95%). In addition, a small percentage of effort originates from England, and less than 1% from Scotland. The primary species within this category, overall, is Nephrops (90%). This is followed by cod, plaice, haddock and anglerfish. Species compositions between these nations are similar. However, as with 4a.ii IIA.8.c, England shows a lower percentage of Nephrops offset with greater percentage landings of plaice.
4a.ii none: Ireland contributes the greatest effort to this category, followed by Northern Ireland and a small (3%) contribution from England. As with the two special conditions for this gear category, the species composition without special condition is dominated by Nephrops percentages. This is followed by haddock, cod, ray and plaice. There is little difference between percentage compositions from Ireland and Northern Ireland, England however, has once again lower percentages of Nephrops and greater allocation to plaice.
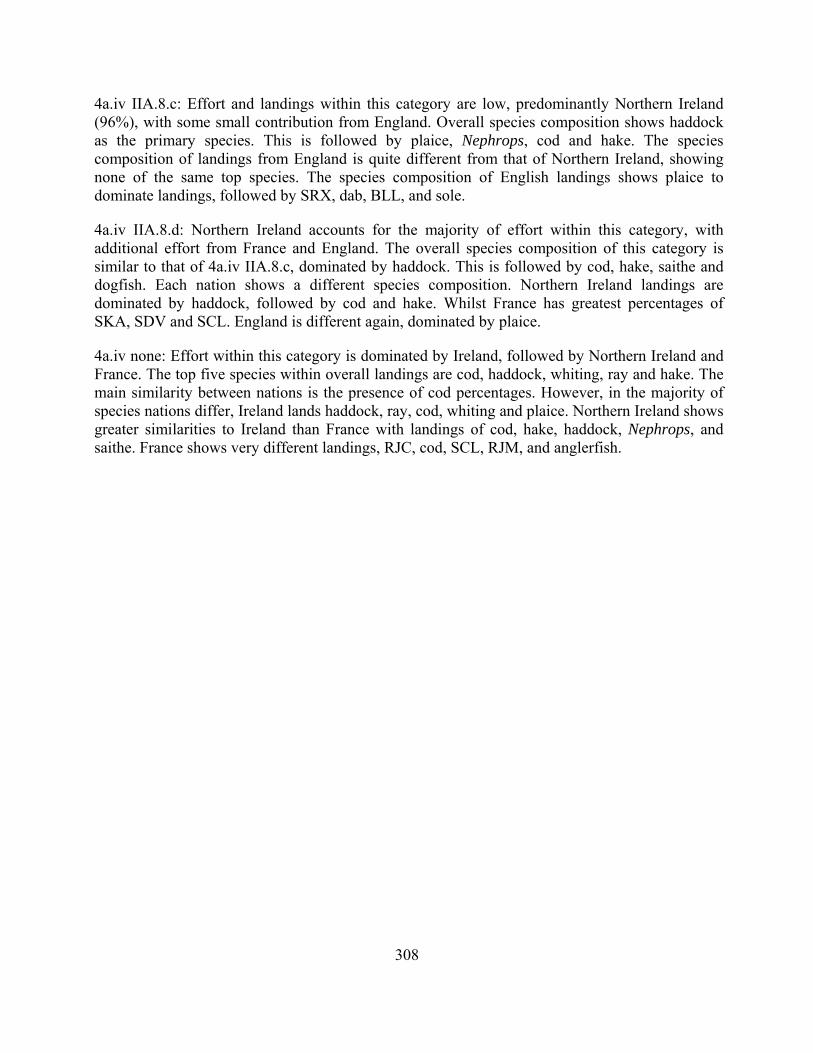
308
4a.iv IIA.8.c: Effort and landings within this category are low, predominantly Northern Ireland (96%), with some small contribution from England. Overall species composition shows haddock as the primary species. This is followed by plaice, Nephrops, cod and hake. The species composition of landings from England is quite different from that of Northern Ireland, showing none of the same top species. The species composition of English landings shows plaice to dominate landings, followed by SRX, dab, BLL, and sole.
4a.iv IIA.8.d: Northern Ireland accounts for the majority of effort within this category, with additional effort from France and England. The overall species composition of this category is similar to that of 4a.iv IIA.8.c, dominated by haddock. This is followed by cod, hake, saithe and dogfish. Each nation shows a different species composition. Northern Ireland landings are dominated by haddock, followed by cod and hake. Whilst France has greatest percentages of SKA, SDV and SCL. England is different again, dominated by plaice.
4a.iv none: Effort within this category is dominated by Ireland, followed by Northern Ireland and France. The top five species within overall landings are cod, haddock, whiting, ray and hake. The main similarity between nations is the presence of cod percentages. However, in the majority of species nations differ, Ireland lands haddock, ray, cod, whiting and plaice. Northern Ireland shows greater similarities to Ireland than France with landings of cod, hake, haddock, Nephrops, and saithe. France shows very different landings, RJC, cod, SCL, RJM, and anglerfish.

309
Table 6.10.2.1. Irish Sea. regulated gear category forms showing percentage effort uptake, and the top three nations involved, 2007.
Area Type Detailed Discription MeshSpecial
Condition DetailDays
allowanceEffort 2007
Uptake (%) 1 % Effort 2 % Effort 3 % Effort
Species detail
2c 4a 4aii Trawl 70-89mm IIA81c track record <5%cod 204 419,718 8.50 NIR 81.23 ENG 18.57 GBI 0.212c 4a 4aii Trawl 70-89mm IIA81d track record <5%cod+sol+pla 280 1,715,490 34.75 NIR 95.33 ENG 4.03 SCO 0.642c 4a 4aii Trawl 70-89mm none 184 2,800,894 56.74 IRL 54.99 NIR 41.65 ENG 3.01
2c 4a 4aiii Trawl 90-99mm IIA81d track record <5%cod+sol+pla 280 2,438 5.47 ENG 68.58 NIR 31.422c 4a 4aiii Trawl 90-99mm none 227 42,106 94.53 IRL 32.24 ENG 27.57 NIR 24.03
2c 4a 4aiv Trawl 100-119mm IIA81c track record <5%cod 148 28,048 4.92 NIR 95.86 ENG 4.142c 4a 4aiv Trawl 100-119mm IIA81d track record <5%cod+sol+pla 276 226,132 39.70 NIR 92.53 FRA 7.11 ENG 0.372c 4a 4aiv Trawl 100-119mm none 86 315,420 55.38 IRL 44.27 NIR 31.88 FRA 19.03
2c 4a 4av Trawl >=120mm IIA81c track record <5%cod 160 1,712 52.47 NIR 1002c 4a 4av Trawl >=120mm IIA81d track record <5%cod+sol+pla Unl. 333 10.21 ENG 1002c 4a 4av Trawl >=120mm none 114 1,218 37.33 IRL 100
2c 4b 4bi Beam Trawl 80-89mm none 132 1,198,233 100.00
2c 4b 4bii Beam Trawl 90-99mm none 143 12,769 100.00 IRL 91.59 SCO 8.41
2c 4c 4ci Gillnet <110mm none 140 1,387 100.00 ENG 89.11 IRL 10.89
2c 4c 4cii Gillnet 110-149mm none 140 6,314 100.00 IRL 82.96 ENG 17.04
2c 4c 4ciii Gillnet 150-219mm none 115 32,848 100.00 IRL 100
2c 4e 4e Longline NA none 173 3,852 100.00 ENG 95.2 IRL 4.8
2c none none No info No info none 3,610,926 100.00 SCO 40.21 ENG 27.22 IRL 22.83
Top 3 nationsGear

310
Table 6.10.2.2. Irish Sea. Top five species ranked by percentage landings for the primary nations contributing to effort within gear category 4b.i none (without special condition), 2007.
Category Nation% Effort in category
2007 Landings 1 2 3 4 5
All Nations 1922.0 SRY (30.5) SOL (30.5) RAJ (17.4) PLE (13.1) ANF (5.6)BEL 56.84 1258.0 SRY (46.6) SOL (22.3) PLE (13.6) ANF (5.2) COD (4.4)IRL 43.16 664.0 RAJ (50.5) SOL (12.7) PLE (12) COD (7.5) ANF (6.5)
Ranked species by landings (ton)
4bi none
0.0
10.0
20.0
30.0
40.0
50.0
60.0
ANF BLL COD DAB DGS FLX HAD HKE LEM LEZ LIN MEG NEP PAI PLE POK POL RAJ SOL SOX SQI SRY TUR WHG WIT
Perc
enta
ge la
ndin
gs (%
)
Total BEL IRL
Figure 6.10.2.1. Irish Sea. Percentage species composition of national landings for gear category 4b.i none (without special condition), 2007.
Table 6.10.2.3. Irish Sea. Top five species ranked by percentage landings for the primary nations contributing to effort within gear category 4a.ii IIA.8.c (<5% cod), 2007.
Category Nation% Effort in category
2007 Landings 1 2 3 4 5
All Nations 849.8 NEP (74.8) PLE (9.1) SRX (3.6) HAD (2.5) COD (2.5)NIR 81.23 697.7 NEP (84.5) HAD (3.1) COD (2.9) PLE (2.2) ANF (2.1)ENG 18.57 150.8 PLE (41.3) NEP (29.3) SRX (12.8) FLX (8.8) DAB (2.7)GBI 0.21 1.3 NEP (93.1) COD (3.8) HKE (1.9) ANF (0.6) TUR (0.5)
Ranked species by landings (ton)
4a.ii IIA.8.c
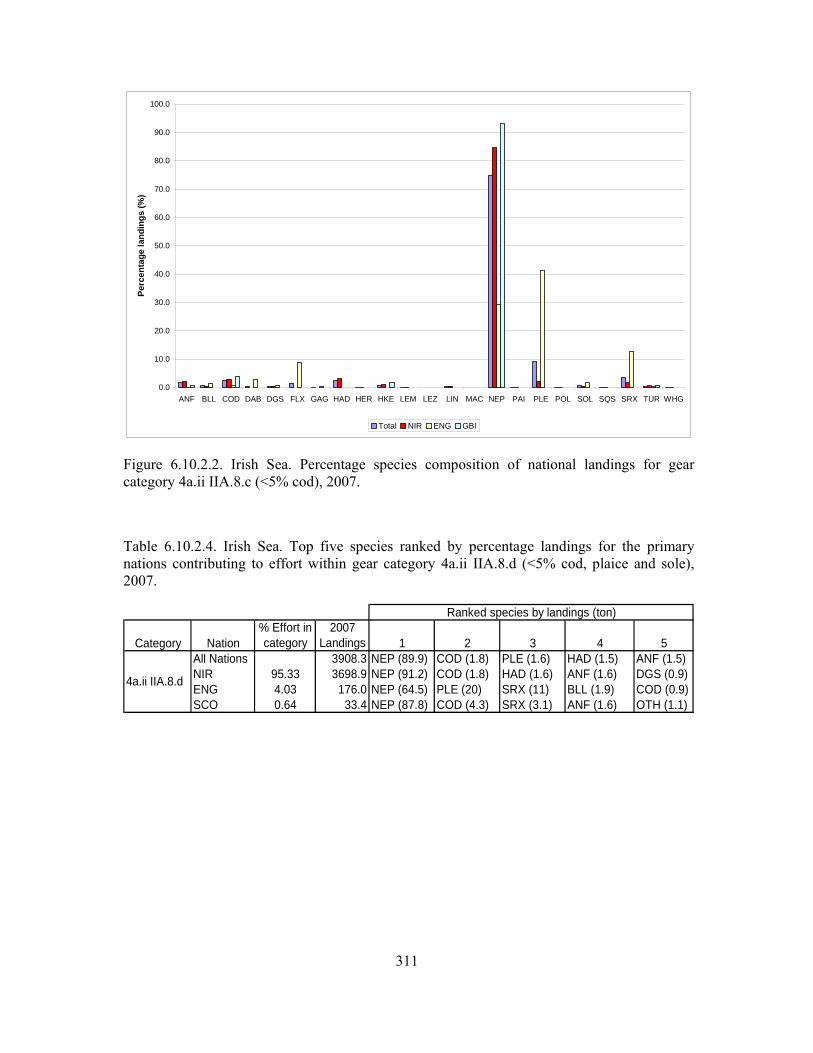
311
0.0
10.0
20.0
30.0
40.0
50.0
60.0
70.0
80.0
90.0
100.0
ANF BLL COD DAB DGS FLX GAG HAD HER HKE LEM LEZ LIN MAC NEP PAI PLE POL SOL SQS SRX TUR WHG
Perc
enta
ge la
ndin
gs (%
)
Total NIR ENG GBI
Figure 6.10.2.2. Irish Sea. Percentage species composition of national landings for gear category 4a.ii IIA.8.c (<5% cod), 2007.
Table 6.10.2.4. Irish Sea. Top five species ranked by percentage landings for the primary nations contributing to effort within gear category 4a.ii IIA.8.d (<5% cod, plaice and sole), 2007.
Category Nation% Effort in category
2007 Landings 1 2 3 4 5
All Nations 3908.3 NEP (89.9) COD (1.8) PLE (1.6) HAD (1.5) ANF (1.5)NIR 95.33 3698.9 NEP (91.2) COD (1.8) HAD (1.6) ANF (1.6) DGS (0.9)ENG 4.03 176.0 NEP (64.5) PLE (20) SRX (11) BLL (1.9) COD (0.9)SCO 0.64 33.4 NEP (87.8) COD (4.3) SRX (3.1) ANF (1.6) OTH (1.1)
Ranked species by landings (ton)
4a.ii IIA.8.d
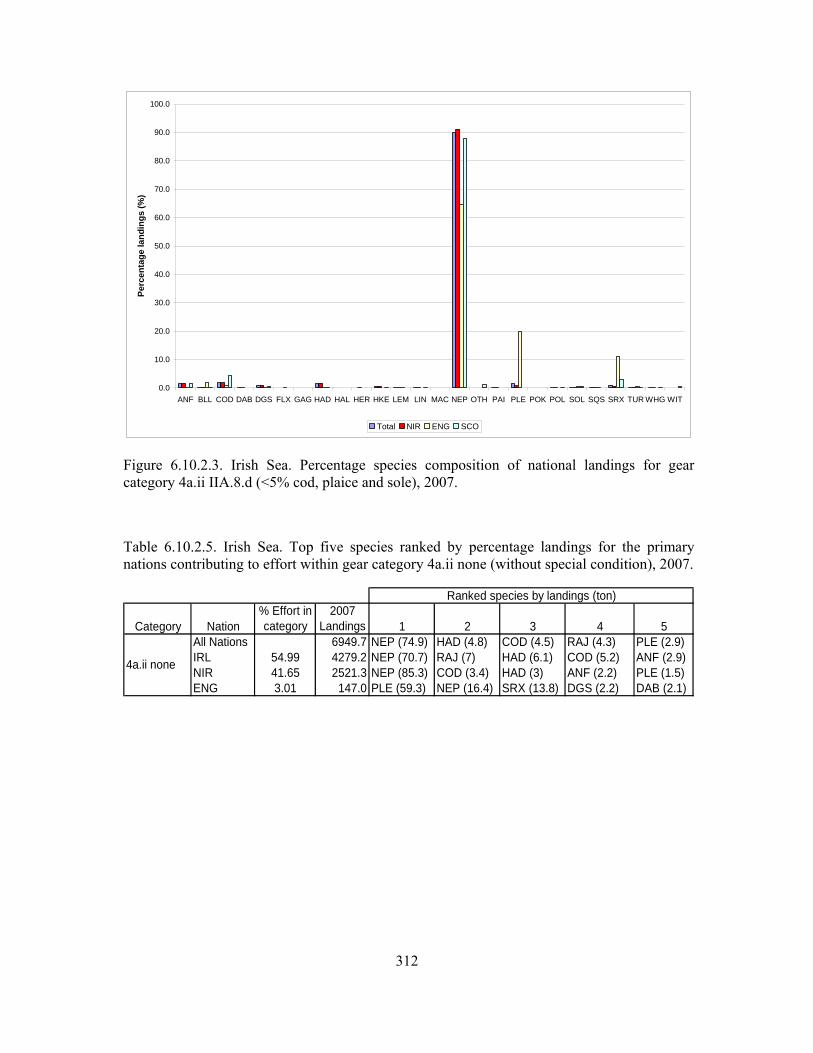
312
0.0
10.0
20.0
30.0
40.0
50.0
60.0
70.0
80.0
90.0
100.0
ANF BLL COD DAB DGS FLX GAG HAD HAL HER HKE LEM LIN MAC NEP OTH PAI PLE POK POL SOL SQS SRX TUR WHG WIT
Perc
enta
ge la
ndin
gs (%
)
Total NIR ENG SCO
Figure 6.10.2.3. Irish Sea. Percentage species composition of national landings for gear category 4a.ii IIA.8.d (<5% cod, plaice and sole), 2007.
Table 6.10.2.5. Irish Sea. Top five species ranked by percentage landings for the primary nations contributing to effort within gear category 4a.ii none (without special condition), 2007.
Category Nation% Effort in category
2007 Landings 1 2 3 4 5
All Nations 6949.7 NEP (74.9) HAD (4.8) COD (4.5) RAJ (4.3) PLE (2.9)IRL 54.99 4279.2 NEP (70.7) RAJ (7) HAD (6.1) COD (5.2) ANF (2.9)NIR 41.65 2521.3 NEP (85.3) COD (3.4) HAD (3) ANF (2.2) PLE (1.5)ENG 3.01 147.0 PLE (59.3) NEP (16.4) SRX (13.8) DGS (2.2) DAB (2.1)
Ranked species by landings (ton)
4a.ii none

313
0.0
10.0
20.0
30.0
40.0
50.0
60.0
70.0
80.0
90.0
ANF BLL CODCTCDABDGS FLX GAGHADHALHERHKELEM LEZ LIN MACNEP PAI PLE POKPOL RAJ REDSOLSOXSQSSRXTURWHGWIT
Perc
enta
ge la
ndin
gs (%
)
Total IRL NIR ENG
Figure 6.10.2.4. Irish Sea. Percentage species composition of national landings for gear category 4a.ii none (without special condition), 2007.
Table 6.10.2.6. Irish Sea. Top five species ranked by percentage landings for the primary nations contributing to effort within gear category 4a.iv IIA.8.c (<5% cod), 2007.
Category Nation% Effort in category
2007 Landings 1 2 3 4 5
All Nations 69.1 HAD (87) PLE (7.1) NEP (3.4) COD (0.7) HKE (0.6)NIR 95.86 65.4 HAD (92) NEP (3.6) PLE (2.1) COD (0.7) HKE (0.7)ENG 4.14 3.8 PLE (94.2) SRX (2.6) DAB (1.4) BLL (1.1) SOL (0.5)
Ranked species by landings (ton)
4a.iv IIA.8.c
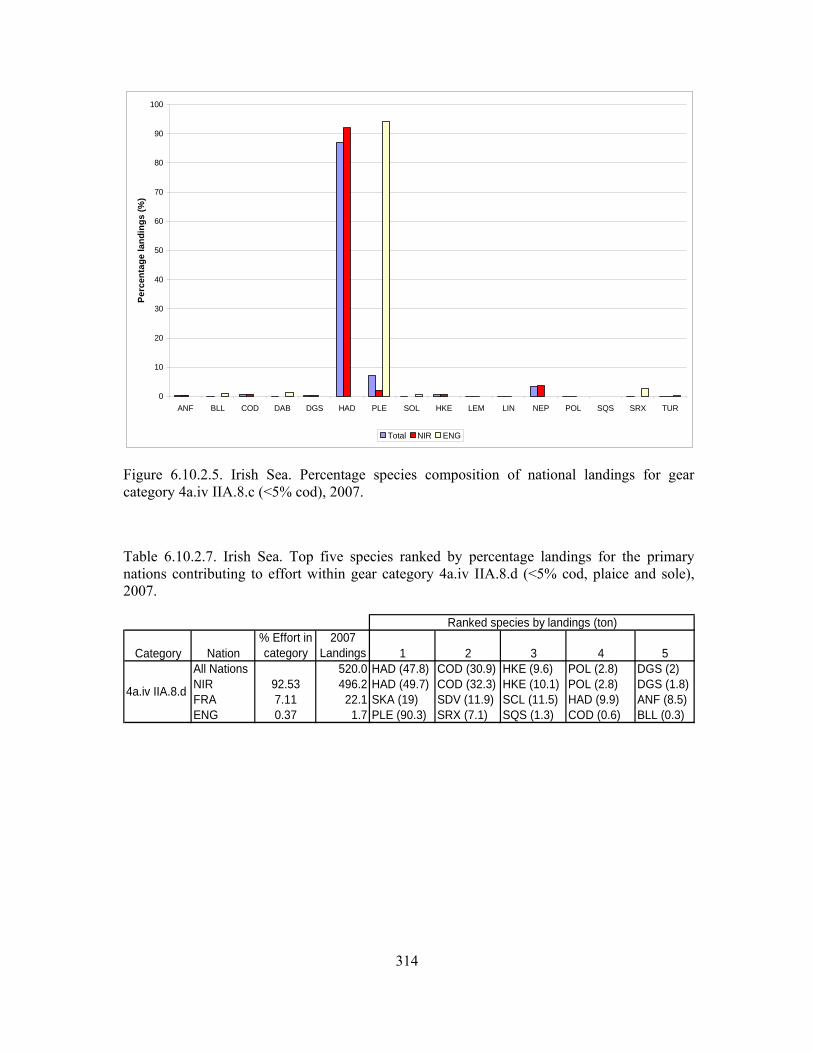
314
0
10
20
30
40
50
60
70
80
90
100
ANF BLL COD DAB DGS HAD PLE SOL HKE LEM LIN NEP POL SQS SRX TUR
Perc
enta
ge la
ndin
gs (%
)
Total NIR ENG
Figure 6.10.2.5. Irish Sea. Percentage species composition of national landings for gear category 4a.iv IIA.8.c (<5% cod), 2007.
Table 6.10.2.7. Irish Sea. Top five species ranked by percentage landings for the primary nations contributing to effort within gear category 4a.iv IIA.8.d (<5% cod, plaice and sole), 2007.
Category Nation% Effort in category
2007 Landings 1 2 3 4 5
All Nations 520.0 HAD (47.8) COD (30.9) HKE (9.6) POL (2.8) DGS (2)NIR 92.53 496.2 HAD (49.7) COD (32.3) HKE (10.1) POL (2.8) DGS (1.8)FRA 7.11 22.1 SKA (19) SDV (11.9) SCL (11.5) HAD (9.9) ANF (8.5)ENG 0.37 1.7 PLE (90.3) SRX (7.1) SQS (1.3) COD (0.6) BLL (0.3)
Ranked species by landings (ton)
4a.iv IIA.8.d

315
0.0
10.0
20.0
30.0
40.0
50.0
60.0
70.0
80.0
90.0
100.0
ANF BIB BLL BSH BSSCOD COECTC DGSGAGGUGGURGUX HADHKE JOD LEM LIN LSK MEGMUX MZZ NEP PLE POK POL RJB RJC RJM RJN RJO SCL SDV SKA SOLSQCSQS SRX TURWHGWITWSX
Perc
enta
ge la
ndin
gs (%
)
Total NIR FRA ENG
Figure 6.10.2.6. Irish Sea. Percentage species composition of national landings for gear category 4a.iv IIA.8.d (<5% cod, plaice and sole), 2007.
Table 6.10.2.8. Irish Sea. Top five species ranked by percentage landings for the primary nations contributing to effort within gear category 4a.iv none (without special condition), 2007.
Category Nation% Effort in category
2007 Landings 1 2 3 4 5
All Nations 600.6 COD (26.3) HAD (17.7) RAJ (11) WHG (10.7) HKE (4.5)IRL 44.27 320.7 HAD (25.3) RAJ (20.6) COD (20.6) WHG (19.4) PLE (4)NIR 31.88 134.8 COD (53) HKE (17.6) HAD (14.9) NEP (3.7) POL (3.1)FRA 19.03 121.7 RJC (21.2) COD (14.3) SCL (11.7) RJM (9.5) ANF (8.1)
Ranked species by landings (ton)
4a.iv none
0.0
10.0
20.0
30.0
40.0
50.0
60.0
AGNANF BIB BLL BSHBSSCAACODCOECTCDGS ELF FLEGAGGUGGURGUXHADHERHKEJODLBELEM LEZ LIN LSKMACMEGMORMUXMZZ NEP PAI PLE POKPOLPORRAJ RJB RJC RJF RJM RJNRJOSCL SCRSDVSKA SOLSOXSQC SQISQSSRXTURWHGWIT
Perc
enta
ge la
ndin
gs (%
)
Total IRL NIR FRA
Figure 6.10.2.7. Irish Sea. Percentage species composition of national landings for gear category 4a.iv none without special condition), 2007.
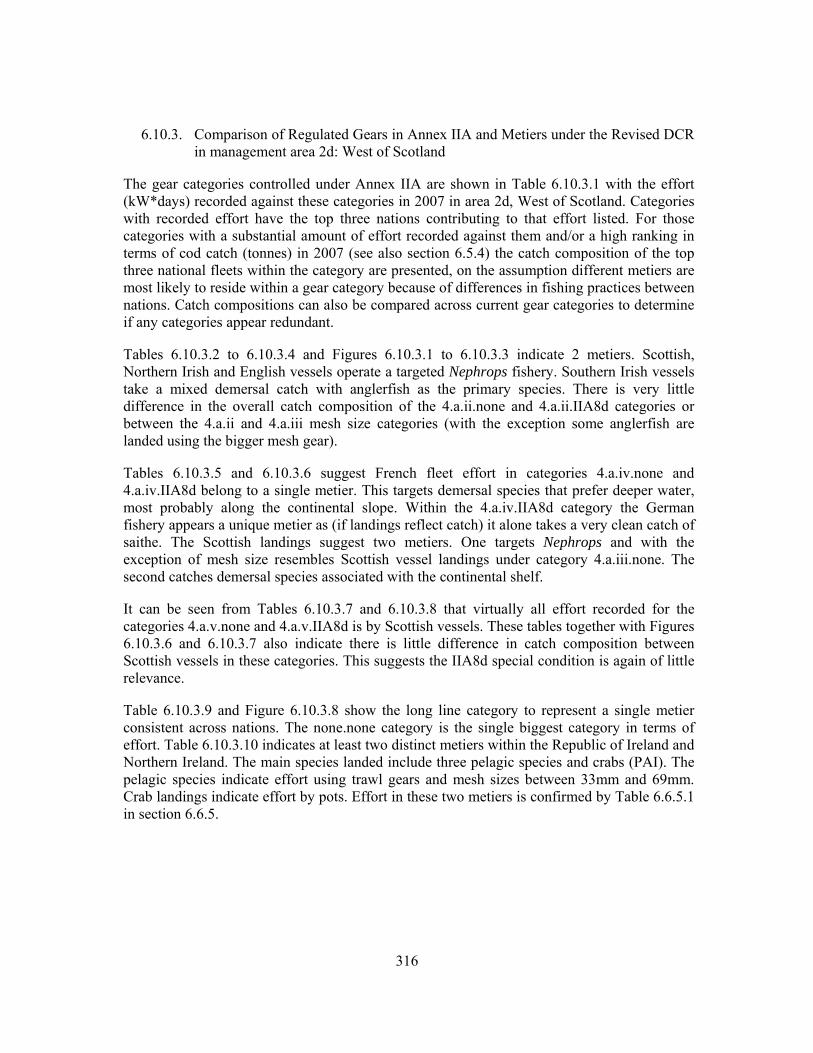
316
6.10.3. Comparison of Regulated Gears in Annex IIA and Metiers under the Revised DCR in management area 2d: West of Scotland
The gear categories controlled under Annex IIA are shown in Table 6.10.3.1 with the effort (kW*days) recorded against these categories in 2007 in area 2d, West of Scotland. Categories with recorded effort have the top three nations contributing to that effort listed. For those categories with a substantial amount of effort recorded against them and/or a high ranking in terms of cod catch (tonnes) in 2007 (see also section 6.5.4) the catch composition of the top three national fleets within the category are presented, on the assumption different metiers are most likely to reside within a gear category because of differences in fishing practices between nations. Catch compositions can also be compared across current gear categories to determine if any categories appear redundant.
Tables 6.10.3.2 to 6.10.3.4 and Figures 6.10.3.1 to 6.10.3.3 indicate 2 metiers. Scottish, Northern Irish and English vessels operate a targeted Nephrops fishery. Southern Irish vessels take a mixed demersal catch with anglerfish as the primary species. There is very little difference in the overall catch composition of the 4.a.ii.none and 4.a.ii.IIA8d categories or between the 4.a.ii and 4.a.iii mesh size categories (with the exception some anglerfish are landed using the bigger mesh gear).
Tables 6.10.3.5 and 6.10.3.6 suggest French fleet effort in categories 4.a.iv.none and 4.a.iv.IIA8d belong to a single metier. This targets demersal species that prefer deeper water, most probably along the continental slope. Within the 4.a.iv.IIA8d category the German fishery appears a unique metier as (if landings reflect catch) it alone takes a very clean catch of saithe. The Scottish landings suggest two metiers. One targets Nephrops and with the exception of mesh size resembles Scottish vessel landings under category 4.a.iii.none. The second catches demersal species associated with the continental shelf.
It can be seen from Tables 6.10.3.7 and 6.10.3.8 that virtually all effort recorded for the categories 4.a.v.none and 4.a.v.IIA8d is by Scottish vessels. These tables together with Figures 6.10.3.6 and 6.10.3.7 also indicate there is little difference in catch composition between Scottish vessels in these categories. This suggests the IIA8d special condition is again of little relevance.
Table 6.10.3.9 and Figure 6.10.3.8 show the long line category to represent a single metier consistent across nations. The none.none category is the single biggest category in terms of effort. Table 6.10.3.10 indicates at least two distinct metiers within the Republic of Ireland and Northern Ireland. The main species landed include three pelagic species and crabs (PAI). The pelagic species indicate effort using trawl gears and mesh sizes between 33mm and 69mm. Crab landings indicate effort by pots. Effort in these two metiers is confirmed by Table 6.6.5.1 in section 6.6.5.
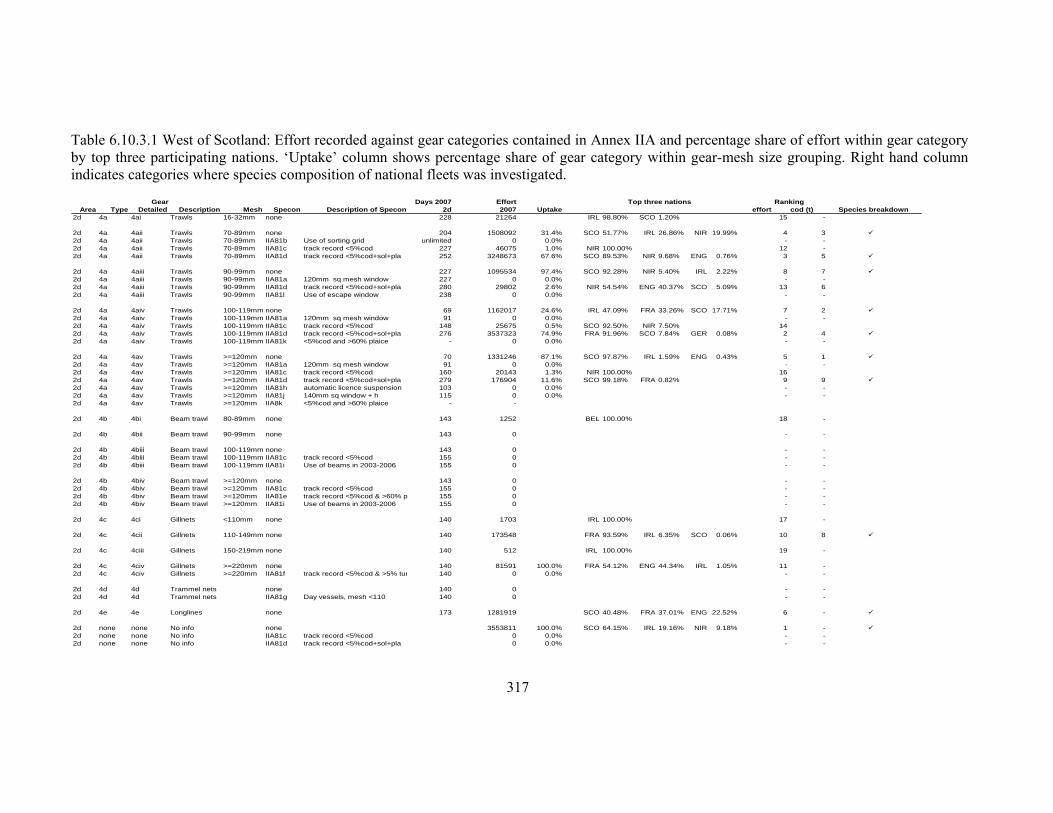
317
Table 6.10.3.1 West of Scotland: Effort recorded against gear categories contained in Annex IIA and percentage share of effort within gear category by top three participating nations. ‘Uptake’ column shows percentage share of gear category within gear-mesh size grouping. Right hand column indicates categories where species composition of national fleets was investigated.
Days 2007 EffortArea Type Detailed Description Mesh Specon Description of Specon 2d 2007 Uptake effort cod (t) Species breakdown
2d 4a 4ai Trawls 16-32mm none 228 21264 IRL 98.80% SCO 1.20% 15 -
2d 4a 4aii Trawls 70-89mm none 204 1508092 31.4% SCO 51.77% IRL 26.86% NIR 19.99% 4 32d 4a 4aii Trawls 70-89mm IIA81b Use of sorting grid unlimited 0 0.0% - -2d 4a 4aii Trawls 70-89mm IIA81c track record <5%cod 227 46075 1.0% NIR 100.00% 12 -2d 4a 4aii Trawls 70-89mm IIA81d track record <5%cod+sol+pla 252 3248673 67.6% SCO 89.53% NIR 9.68% ENG 0.76% 3 5
2d 4a 4aiii Trawls 90-99mm none 227 1095534 97.4% SCO 92.28% NIR 5.40% IRL 2.22% 8 72d 4a 4aiii Trawls 90-99mm IIA81a 120mm sq mesh window 227 0 0.0% - -2d 4a 4aiii Trawls 90-99mm IIA81d track record <5%cod+sol+pla 280 29802 2.6% NIR 54.54% ENG 40.37% SCO 5.09% 13 62d 4a 4aiii Trawls 90-99mm IIA81l Use of escape window 238 0 0.0% - -
2d 4a 4aiv Trawls 100-119mm none 69 1162017 24.6% IRL 47.09% FRA 33.26% SCO 17.71% 7 22d 4a 4aiv Trawls 100-119mm IIA81a 120mm sq mesh window 91 0 0.0% - -2d 4a 4aiv Trawls 100-119mm IIA81c track record <5%cod 148 25675 0.5% SCO 92.50% NIR 7.50% 142d 4a 4aiv Trawls 100-119mm IIA81d track record <5%cod+sol+pla 276 3537323 74.9% FRA 91.96% SCO 7.84% GER 0.08% 2 42d 4a 4aiv Trawls 100-119mm IIA81k <5%cod and >60% plaice - 0 0.0% - -
2d 4a 4av Trawls >=120mm none 70 1331246 87.1% SCO 97.87% IRL 1.59% ENG 0.43% 5 12d 4a 4av Trawls >=120mm IIA81a 120mm sq mesh window 91 0 0.0% - -2d 4a 4av Trawls >=120mm IIA81c track record <5%cod 160 20143 1.3% NIR 100.00% 162d 4a 4av Trawls >=120mm IIA81d track record <5%cod+sol+pla 279 176904 11.6% SCO 99.18% FRA 0.82% 9 92d 4a 4av Trawls >=120mm IIA81h automatic licence suspension 103 0 0.0% - -2d 4a 4av Trawls >=120mm IIA81j 140mm sq window + h 115 0 0.0% - -2d 4a 4av Trawls >=120mm IIA8k <5%cod and >60% plaice - -
2d 4b 4bi Beam trawl 80-89mm none 143 1252 BEL 100.00% 18 -
2d 4b 4bii Beam trawl 90-99mm none 143 0 - -
2d 4b 4biii Beam trawl 100-119mm none 143 0 - -2d 4b 4biii Beam trawl 100-119mm IIA81c track record <5%cod 155 0 - -2d 4b 4biii Beam trawl 100-119mm IIA81i Use of beams in 2003-2006 155 0 - -
2d 4b 4biv Beam trawl >=120mm none 143 0 - -2d 4b 4biv Beam trawl >=120mm IIA81c track record <5%cod 155 0 - -2d 4b 4biv Beam trawl >=120mm IIA81e track record <5%cod & >60% p 155 0 - -2d 4b 4biv Beam trawl >=120mm IIA81i Use of beams in 2003-2006 155 0 - -
2d 4c 4ci Gillnets <110mm none 140 1703 IRL 100.00% 17 -
2d 4c 4cii Gillnets 110-149mm none 140 173548 FRA 93.59% IRL 6.35% SCO 0.06% 10 8
2d 4c 4ciii Gillnets 150-219mm none 140 512 IRL 100.00% 19 -
2d 4c 4civ Gillnets >=220mm none 140 81591 100.0% FRA 54.12% ENG 44.34% IRL 1.05% 11 -2d 4c 4civ Gillnets >=220mm IIA81f track record <5%cod & >5% tur 140 0 0.0% - -
2d 4d 4d Trammel nets none 140 0 - -2d 4d 4d Trammel nets IIA81g Day vessels, mesh <110 140 0 - -
2d 4e 4e Longlines none 173 1281919 SCO 40.48% FRA 37.01% ENG 22.52% 6 -
2d none none No info none 3553811 100.0% SCO 64.15% IRL 19.16% NIR 9.18% 1 -2d none none No info IIA81c track record <5%cod 0 0.0% - -2d none none No info IIA81d track record <5%cod+sol+pla 0 0.0% - -
Gear Top three nations Ranking
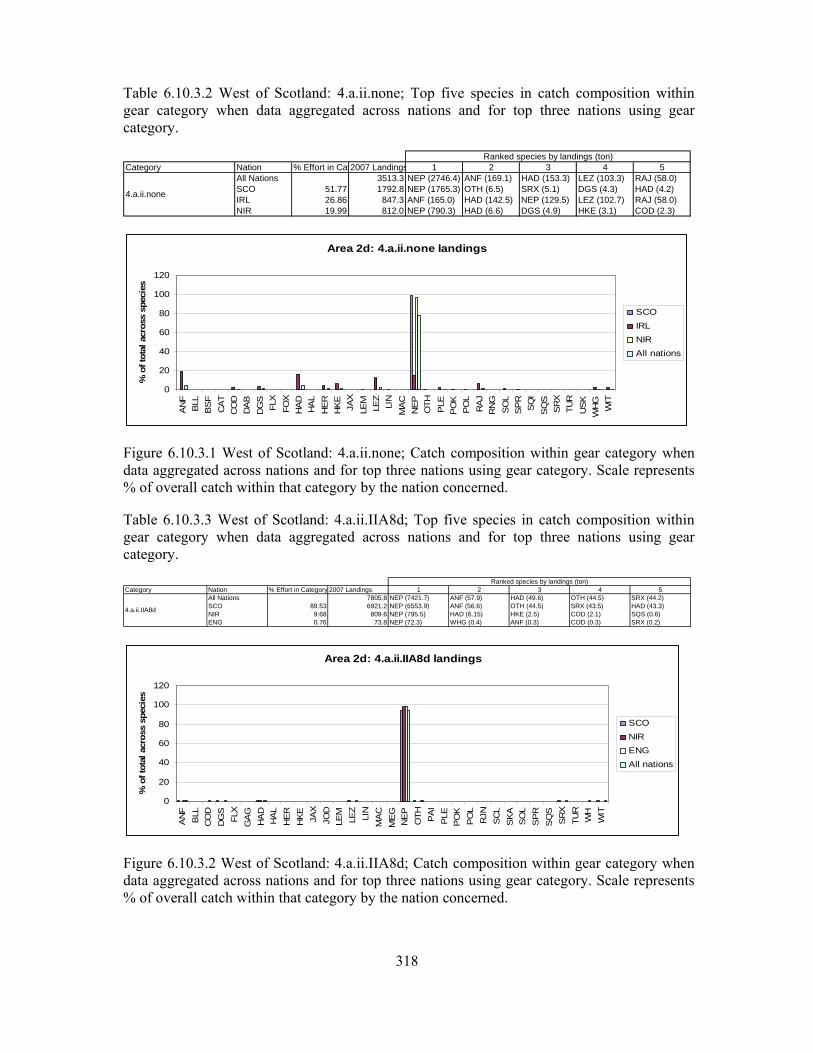
318
Table 6.10.3.2 West of Scotland: 4.a.ii.none; Top five species in catch composition within gear category when data aggregated across nations and for top three nations using gear category.
Category Nation % Effort in Cat2007 Landings 1 2 3 4 5All Nations 3513.3 NEP (2746.4) ANF (169.1) HAD (153.3) LEZ (103.3) RAJ (58.0)SCO 51.77 1792.8 NEP (1765.3) OTH (6.5) SRX (5.1) DGS (4.3) HAD (4.2)IRL 26.86 847.3 ANF (165.0) HAD (142.5) NEP (129.5) LEZ (102.7) RAJ (58.0)NIR 19.99 812.0 NEP (790.3) HAD (6.6) DGS (4.9) HKE (3.1) COD (2.3)
Ranked species by landings (ton)
4.a.ii.none
Area 2d: 4.a.ii.none landings
0
20
40
60
80
100
120
AN
FB
LLB
SF
CA
TC
OD
DA
BD
GS
FLX
FOX
HA
DH
AL
HE
RH
KE
JAX
LEM
LEZ
LIN
MA
CN
EP
OTH
PLE
PO
KP
OL
RA
JR
NG
SO
LS
PR
SQ
IS
QS
SR
XTU
RU
SK
WH
GW
IT
% o
f tot
al a
cros
s sp
ecie
s
SCOIRLNIRAll nations
Figure 6.10.3.1 West of Scotland: 4.a.ii.none; Catch composition within gear category when data aggregated across nations and for top three nations using gear category. Scale represents % of overall catch within that category by the nation concerned.
Table 6.10.3.3 West of Scotland: 4.a.ii.IIA8d; Top five species in catch composition within gear category when data aggregated across nations and for top three nations using gear category.
Category Nation % Effort in Category 2007 Landings 1 2 3 4 5All Nations 7805.8 NEP (7421.7) ANF (57.9) HAD (49.6) OTH (44.5) SRX (44.2)SCO 89.53 6921.2 NEP (6553.9) ANF (56.6) OTH (44.5) SRX (43.5) HAD (43.3)NIR 9.68 809.6 NEP (795.5) HAD (6.15) HKE (2.5) COD (2.1) SQS (0.6)ENG 0.76 73.8 NEP (72.3) WHG (0.4) ANF (0.3) COD (0.3) SRX (0.2)
Ranked species by landings (ton)
4.a.ii.IIA8d
Area 2d: 4.a.ii.IIA8d landings
0
20
40
60
80
100
120
AN
FB
LLC
OD
DG
SFL
XG
AG
HA
DH
AL
HE
RH
KE
JAX
JOD
LEM
LEZ
LIN
MA
CM
EG
NE
PO
TH PA
IP
LEP
OK
PO
LR
JNS
CL
SK
AS
OL
SP
RS
QS
SR
XTU
RW
HW
IT
% o
f tot
al a
cros
s sp
ecie
s
SCONIRENGAll nations
Figure 6.10.3.2 West of Scotland: 4.a.ii.IIA8d; Catch composition within gear category when data aggregated across nations and for top three nations using gear category. Scale represents % of overall catch within that category by the nation concerned.
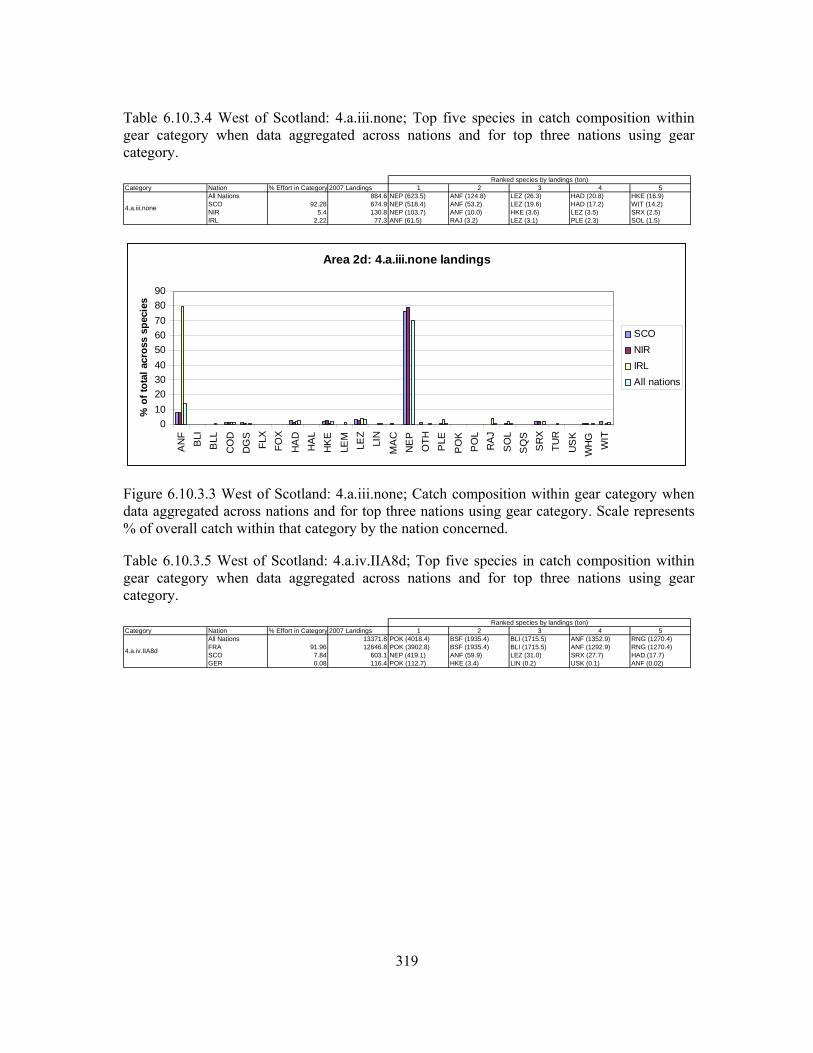
319
Table 6.10.3.4 West of Scotland: 4.a.iii.none; Top five species in catch composition within gear category when data aggregated across nations and for top three nations using gear category.
Category Nation % Effort in Category 2007 Landings 1 2 3 4 5All Nations 884.6 NEP (623.5) ANF (124.8) LEZ (26.3) HAD (20.8) HKE (16.9)SCO 92.28 674.9 NEP (518.4) ANF (53.2) LEZ (19.6) HAD (17.2) WIT (14.2)NIR 5.4 130.8 NEP (103.7) ANF (10.0) HKE (3.6) LEZ (3.5) SRX (2.5)IRL 2.22 77.3 ANF (61.5) RAJ (3.2) LEZ (3.1) PLE (2.3) SOL (1.5)
Ranked species by landings (ton)
4.a.iii.none
Area 2d: 4.a.iii.none landings
0102030405060708090
AN
FB
LIB
LL
CO
DD
GS
FLX
FOX
HA
DH
AL
HK
E
LEM
LEZ
LIN
MA
CN
EP
OTH
PLE
PO
KP
OL
RA
J
SO
LS
QS
SR
XTU
R
US
KW
HG
WIT
% o
f tot
al a
cros
s sp
ecie
s
SCONIRIRLAll nations
Figure 6.10.3.3 West of Scotland: 4.a.iii.none; Catch composition within gear category when data aggregated across nations and for top three nations using gear category. Scale represents % of overall catch within that category by the nation concerned.
Table 6.10.3.5 West of Scotland: 4.a.iv.IIA8d; Top five species in catch composition within gear category when data aggregated across nations and for top three nations using gear category.
Category Nation % Effort in Category 2007 Landings 1 2 3 4 5All Nations 13371.8 POK (4018.4) BSF (1935.4) BLI (1715.5) ANF (1352.9) RNG (1270.4)FRA 91.96 12646.8 POK (3902.8) BSF (1935.4) BLI (1715.5) ANF (1292.9) RNG (1270.4)SCO 7.84 603.1 NEP (419.1) ANF (59.9) LEZ (31.0) SRX (27.7) HAD (17.7)GER 0.08 116.4 POK (112.7) HKE (3.4) LIN (0.2) USK (0.1) ANF (0.02)
Ranked species by landings (ton)
4.a.iv.IIA8d
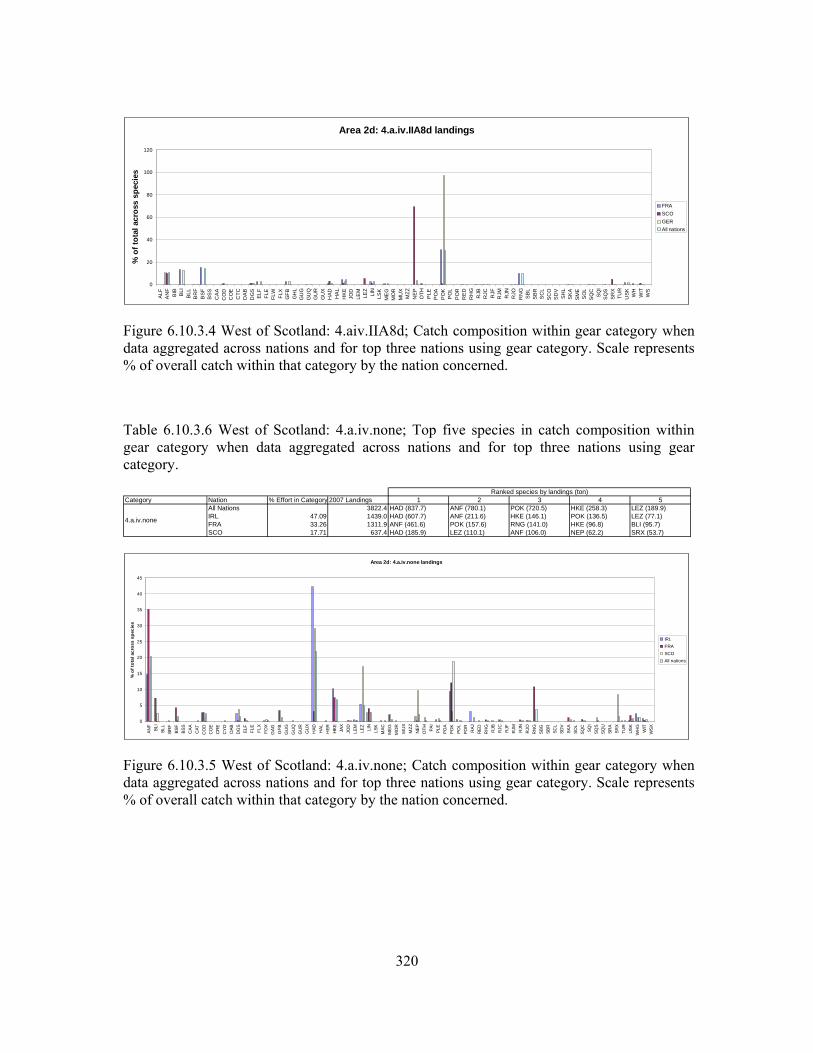
320
Area 2d: 4.a.iv.IIA8d landings
0
20
40
60
80
100
120
ALF
AN
FB
IB BLI
BLL
BR
FB
SF
BS
SC
AA
CO
DC
OE
CTC
DA
BD
GS
ELF
FLE
FLW
FLX
GFB
GH
LG
UG
GU
QG
UR
GU
XH
AD
HA
LH
KE
JOD
LEM
LEZ
LIN
LSK
ME
GM
OR
MU
XM
ZZN
EP
OTH
PLE
PO
AP
OK
PO
LP
OR
RE
DR
HG
RJB
RJC RJF
RJM RJN
RJO
RN
GS
BL
SB
RS
CL
SC
OS
DV
SH
LS
KA
SM
ES
OL
SQ
CS
QI
SQ
SS
RX
TUR
US
KW
HW
ITW
S
% o
f tot
al a
cros
s sp
ecie
s
FRASCOGERAll nations
Figure 6.10.3.4 West of Scotland: 4.aiv.IIA8d; Catch composition within gear category when data aggregated across nations and for top three nations using gear category. Scale represents % of overall catch within that category by the nation concerned.
Table 6.10.3.6 West of Scotland: 4.a.iv.none; Top five species in catch composition within gear category when data aggregated across nations and for top three nations using gear category.
Category Nation % Effort in Category 2007 Landings 1 2 3 4 5All Nations 3822.4 HAD (837.7) ANF (780.1) POK (720.5) HKE (258.3) LEZ (189.9)IRL 47.09 1439.0 HAD (607.7) ANF (211.6) HKE (146.1) POK (136.5) LEZ (77.1)FRA 33.26 1311.9 ANF (461.6) POK (157.6) RNG (141.0) HKE (96.8) BLI (95.7)SCO 17.71 637.4 HAD (185.9) LEZ (110.1) ANF (106.0) NEP (62.2) SRX (53.7)
Ranked species by landings (ton)
4.a.iv.none
Area 2d: 4.a.iv.none landings
0
5
10
15
20
25
30
35
40
45
ANF
BLI
BLL
BRF
BSF
BSS
CAA
CAT
CO
DC
OE
CR
EC
YO DAB
DG
SEL
FFL
EFL
XFO
XG
AG GFB
GU
GG
UQ
GU
RG
UX
HAD HAL
HER HKE JA
XJO
DLE
MLE
ZLI
NLS
KM
ACM
EGM
OR
MU
XM
ZZN
EPO
TH PAI
PLE
POA
POK
POL
POR
RAJ
RED
RH
GR
JBR
JC RJF
RJM RJN
RJO
RN
GSB
GSB
RSC
LSD
VSK
ASO
LSQ
CSQ
ISQ
SSQ
USR
ASR
XTU
RU
SKW
HG
WIT
WSX
% o
f tot
al a
cros
s sp
ecie
s
IRLFRASCOAll nations
Figure 6.10.3.5 West of Scotland: 4.a.iv.none; Catch composition within gear category when data aggregated across nations and for top three nations using gear category. Scale represents % of overall catch within that category by the nation concerned.
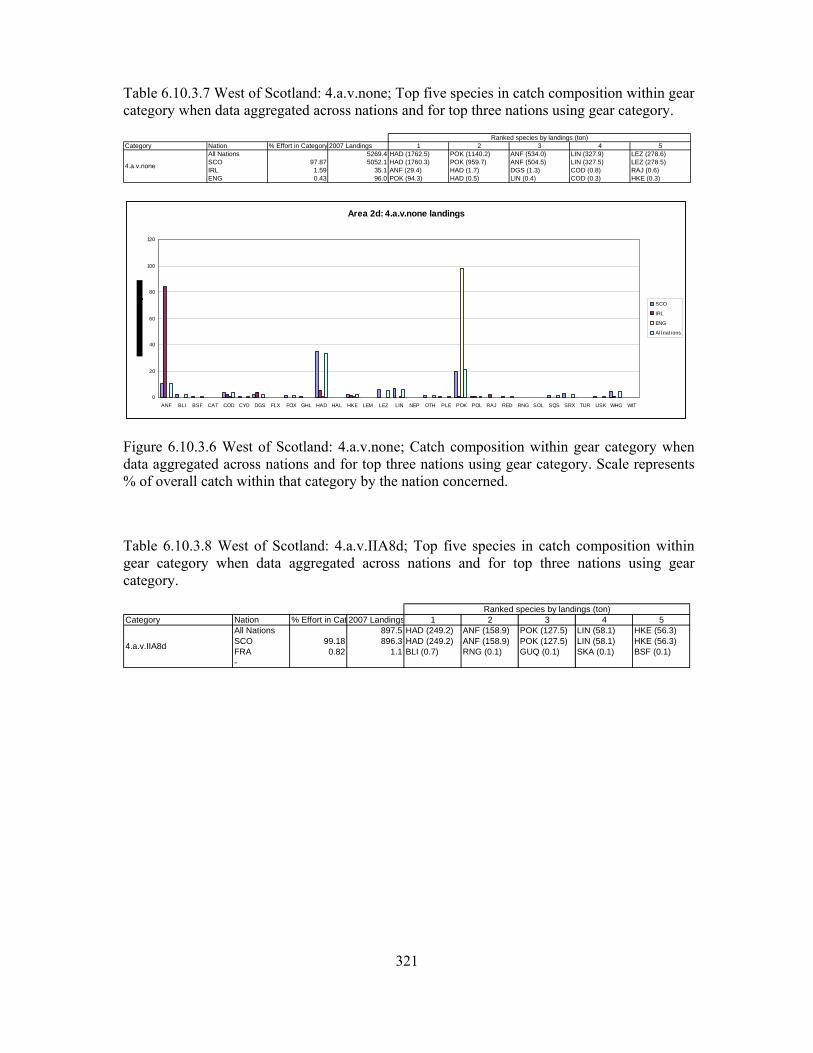
321
Table 6.10.3.7 West of Scotland: 4.a.v.none; Top five species in catch composition within gear category when data aggregated across nations and for top three nations using gear category.
Category Nation % Effort in Category 2007 Landings 1 2 3 4 5All Nations 5269.4 HAD (1762.5) POK (1140.2) ANF (534.0) LIN (327.9) LEZ (278.6)SCO 97.87 5052.1 HAD (1760.3) POK (959.7) ANF (504.5) LIN (327.5) LEZ (278.5)IRL 1.59 35.1 ANF (29.4) HAD (1.7) DGS (1.3) COD (0.8) RAJ (0.6)ENG 0.43 96.0 POK (94.3) HAD (0.5) LIN (0.4) COD (0.3) HKE (0.3)
Ranked species by landings (ton)
4.a.v.none
Area 2d: 4.a.v.none landings
0
20
40
60
80
100
120
ANF BLI BSF CAT COD CYO DGS FLX FOX GHL HAD HAL HKE LEM LEZ LIN NEP OTH PLE POK POL RAJ RED RNG SOL SQS SRX TUR USK WHG WIT
SCO
IRL
ENG
All nat ions
Figure 6.10.3.6 West of Scotland: 4.a.v.none; Catch composition within gear category when data aggregated across nations and for top three nations using gear category. Scale represents % of overall catch within that category by the nation concerned.
Table 6.10.3.8 West of Scotland: 4.a.v.IIA8d; Top five species in catch composition within gear category when data aggregated across nations and for top three nations using gear category.
Category Nation % Effort in Cat 2007 Landings 1 2 3 4 5All Nations 897.5 HAD (249.2) ANF (158.9) POK (127.5) LIN (58.1) HKE (56.3)SCO 99.18 896.3 HAD (249.2) ANF (158.9) POK (127.5) LIN (58.1) HKE (56.3)FRA 0.82 1.1 BLI (0.7) RNG (0.1) GUQ (0.1) SKA (0.1) BSF (0.1)-
Ranked species by landings (ton)
4.a.v.IIA8d

322
Area 2d: 4.a.v.IIA8d landings
0
10
20
30
40
50
60
70
ANF BLI BSF CAT COD CYO DGS FOX GUQ HAD HAL HKE LEM LEZ LIN OTH PLE POK POL RED RNG SHL SKA SQS SRX TUR USK WHG WIT
SCO
FRA
All nat ions
Figure 6.10.3.7 West of Scotland: 4.a.v.IIA8d; Catch composition within gear category when data aggregated across nations and for top three nations using gear category. Scale represents % of overall catch within that category by the nation concerned.
Table 6.10.3.9 West of Scotland: 4.e.none; Top five species in catch composition within gear category when data aggregated across nations and for top three nations using gear category.
Category Nation % Effort in Category 2007 Landings 1 2 3 4 5All Nations 3128.6 HKE (1938.9) LIN (704.7) OTH (216.7) DGS (94.9) SRX (41.3)SCO 40.48 1722.6 HKE (950.1) LIN (448.5) OTH (216.7) FOX (36.4) DGS (31.5)FRA 37.01 855.7 HKE (674.5) LIN (160.2) POA (4.8) POK (4.4) POL (3.2)ENG 22.52 550.3 HKE (314.3) LIN (96.0) DGS (63.3) SRX (38.5) USK (28.7)
Ranked species by landings (ton)
4.e.none
Area 2d: 4.e.none landings
0
10
20
30
40
50
60
70
80
90
ALF
ANF
BLI
BRF
CO
D
CO
E
CYO DG
S
FOX
GAG GFB
GU
Q
HAD HKE LIN
OTH
POA
POK
POL
RED
SBR
SCK
SRX
USK
% o
f tot
al a
cros
s sp
ecie
s
SCO
FRA
ENG
All nations
Figure 6.10.3.8 West of Scotland: 4.e.none; Catch composition within gear category when data aggregated across nations and for top three nations using gear category. Scale represents % of overall catch within that category by the nation concerned.
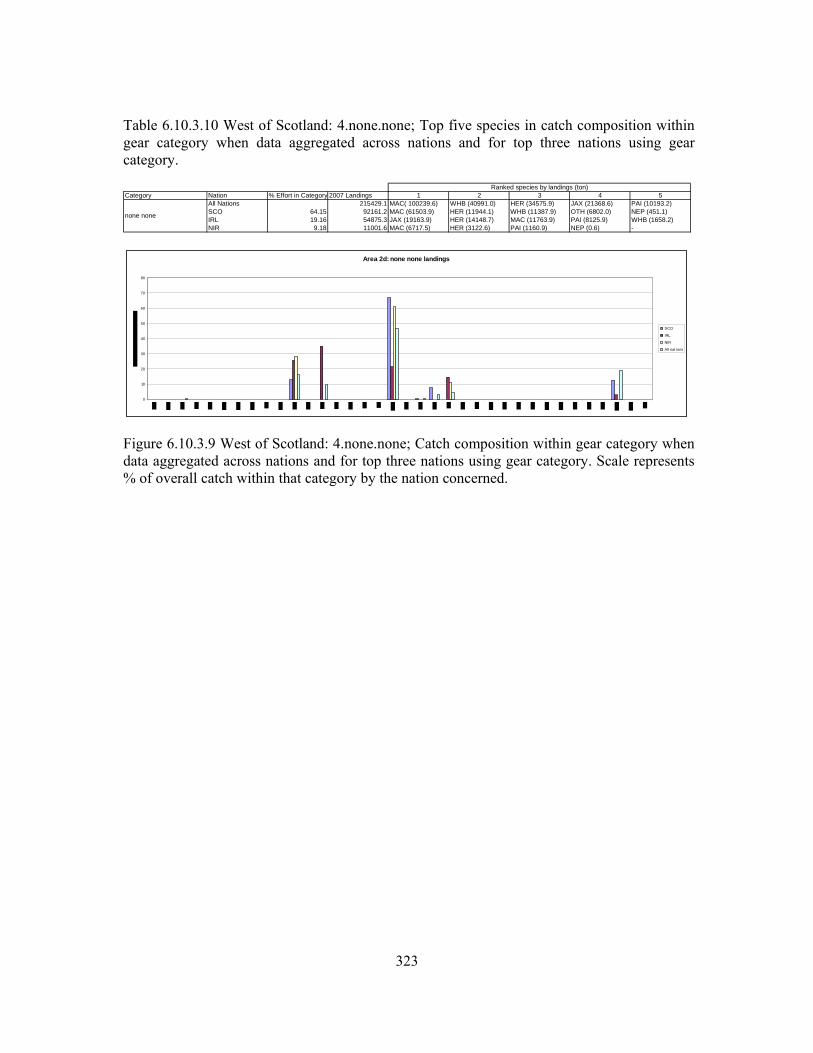
323
Table 6.10.3.10 West of Scotland: 4.none.none; Top five species in catch composition within gear category when data aggregated across nations and for top three nations using gear category.
Category Nation % Effort in Category 2007 Landings 1 2 3 4 5All Nations 215429.1 MAC( 100239.6) WHB (40991.0) HER (34575.9) JAX (21368.6) PAI (10193.2)SCO 64.15 92161.2 MAC (61503.9) HER (11944.1) WHB (11387.9) OTH (6802.0) NEP (451.1)IRL 19.16 54875.3 JAX (19163.9) HER (14148.7) MAC (11763.9) PAI (8125.9) WHB (1658.2)NIR 9.18 11001.6 MAC (6717.5) HER (3122.6) PAI (1160.9) NEP (0.6) -
Ranked species by landings (ton)
none none
Area 2d: none none landings
0
10
20
30
40
50
60
70
80
SCO
IRL
NIR
All nat ions
Figure 6.10.3.9 West of Scotland: 4.none.none; Catch composition within gear category when data aggregated across nations and for top three nations using gear category. Scale represents % of overall catch within that category by the nation concerned.
324
7. REVIEW OF ANNEX IIB OF REGULATION 40/2008 IN THE CONTEXT OF THE RECOVERY PLAN FOR SOUTHERN HAKE AND NEPHROPS (REGULATION 2166/2005)
7.1. General considerations regarding the derogations and special conditions
STECF-SGRST considers that Annex IIB of Council Reg. 40/2008 represents a fleet specific effort management regime which supports the southern hake and Nephrops recovery plan (Council Reg. 2166/2005). Annex IIB excludes the Gulf of Cádiz although this area is included as part of the definition of the stock area of southern hake and Iberian Nephrops.
STECF-SGRST notes that the classification of the trawl mesh size ≥32mm in Annex IIB mixes two clearly defined Portuguese fisheries. One fishery targets demersal fish species with mesh size 65-69mm, and the other targets crustaceans using two different mesh sizes (shrimps with mesh size 55-59mm and Nephrops with mesh size ≥70mm) with different licenses, operating in different fishing grounds and depth ranges. A clear identification of these mesh sizes in the effort regulation may provide more focused and efficient effort management.
STECF-SGRST notes that under the gears group indicated in point 3 of the Annex IIB there is a mixture of 10 different Spanish metiers: “baca”, “jurelera”, pair bottom trawl (PTB), “volanta”, “rasco”, “LLS-COE”, “LLS-HKE”, “LLS-POL”, (“LLS-BSS”) and “LLS-MIX”.
Otter bottom trawl, with cod end mesh size of 65 mm, a vertical opening of 1.2-1.5 m and a wingspread of 22-25 m (metier “baca”) targets demersal species while the same gear with a vertical opening of 5-5.5 m and wingspread of 18-20 m (metier “jurelera”) targets horse mackerel and other pelagics (Fonseca et al., 2000).
PTB, with cod end mesh size between 45-55 mm (Fonseca et al., 2000), vertical opening of 25 m and a wingspread of 65 m, targets blue whiting (69% of the total catches) and hake (IBERMIX, 2007).
The gillnet fleet is divided in metier “volanta”, with mesh size of 90 mm operating in depths between 100 and 400 and targeting hake and metier “rasco”, with mesh size of 280 mm operating in depths between 100-800 m and catching anglerfish.
The longline fleet is divided by targets species: conger (metier “LLS-COE”), hake (“LLS-HKE”), pollack (“LLS-POL”), seabass (“LLS-BSS”), mixed fishery (“LLS-MIX”). The metier “LLS-HKE” represents only the 15% of the longline effort and is the only fishery targeting large hake of breeding size (IBERMIX, 2007).
STECF-SGRST considers that the use of fishing days (or kW*days) to manage effort of static gears such as gillnets and longlines is a very poor approximation of the effective effort and thus may put at risk the management goals. A possible way to improve the impact of the effort management towards an effective reduction in fishing mortality of static gears could be to enforce continuous closed periods so that fishermen will have to bring their gear ashore and stop fishing during certain periods.
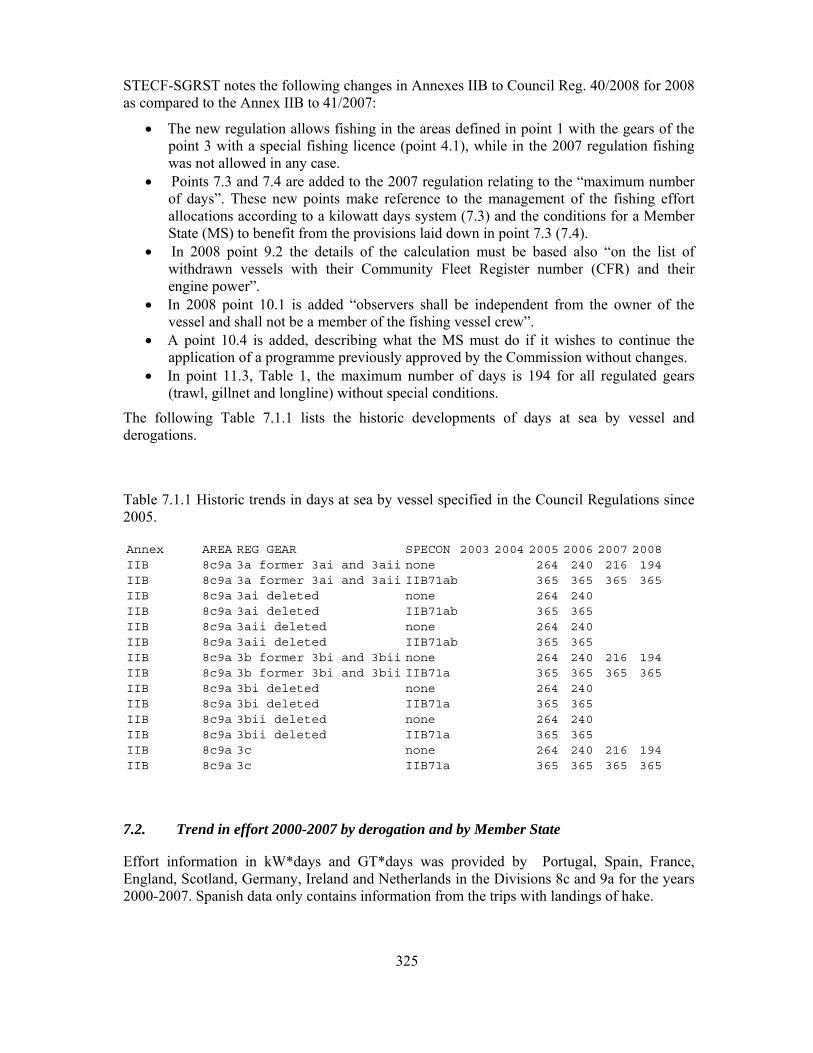
325
STECF-SGRST notes the following changes in Annexes IIB to Council Reg. 40/2008 for 2008 as compared to the Annex IIB to 41/2007:
• The new regulation allows fishing in the areas defined in point 1 with the gears of the point 3 with a special fishing licence (point 4.1), while in the 2007 regulation fishing was not allowed in any case.
• Points 7.3 and 7.4 are added to the 2007 regulation relating to the “maximum number of days”. These new points make reference to the management of the fishing effort allocations according to a kilowatt days system (7.3) and the conditions for a Member State (MS) to benefit from the provisions laid down in point 7.3 (7.4).
• In 2008 point 9.2 the details of the calculation must be based also “on the list of withdrawn vessels with their Community Fleet Register number (CFR) and their engine power”.
• In 2008 point 10.1 is added “observers shall be independent from the owner of the vessel and shall not be a member of the fishing vessel crew”.
• A point 10.4 is added, describing what the MS must do if it wishes to continue the application of a programme previously approved by the Commission without changes.
• In point 11.3, Table 1, the maximum number of days is 194 for all regulated gears (trawl, gillnet and longline) without special conditions.
The following Table 7.1.1 lists the historic developments of days at sea by vessel and derogations.
Table 7.1.1 Historic trends in days at sea by vessel specified in the Council Regulations since 2005.
Annex AREA REG GEAR SPECON 2003 2004 2005 2006 2007 2008IIB 8c9a 3a former 3ai and 3aii none 264 240 216 194IIB 8c9a 3a former 3ai and 3aii IIB71ab 365 365 365 365IIB 8c9a 3ai deleted none 264 240IIB 8c9a 3ai deleted IIB71ab 365 365IIB 8c9a 3aii deleted none 264 240IIB 8c9a 3aii deleted IIB71ab 365 365IIB 8c9a 3b former 3bi and 3bii none 264 240 216 194IIB 8c9a 3b former 3bi and 3bii IIB71a 365 365 365 365IIB 8c9a 3bi deleted none 264 240IIB 8c9a 3bi deleted IIB71a 365 365IIB 8c9a 3bii deleted none 264 240IIB 8c9a 3bii deleted IIB71a 365 365IIB 8c9a 3c none 264 240 216 194IIB 8c9a 3c IIB71a 365 365 365 365
7.2. Trend in effort 2000-2007 by derogation and by Member State
Effort information in kW*days and GT*days was provided by Portugal, Spain, France, England, Scotland, Germany, Ireland and Netherlands in the Divisions 8c and 9a for the years 2000-2007. Spanish data only contains information from the trips with landings of hake.
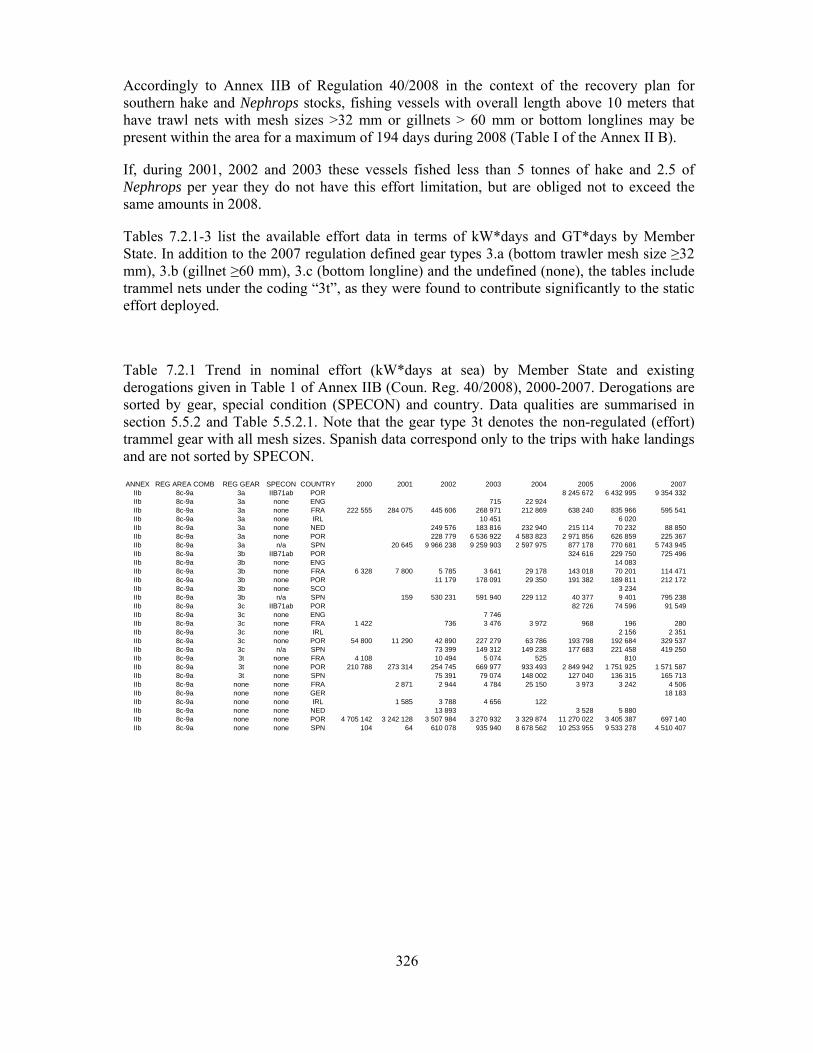
326
Accordingly to Annex IIB of Regulation 40/2008 in the context of the recovery plan for southern hake and Nephrops stocks, fishing vessels with overall length above 10 meters that have trawl nets with mesh sizes >32 mm or gillnets > 60 mm or bottom longlines may be present within the area for a maximum of 194 days during 2008 (Table I of the Annex II B).
If, during 2001, 2002 and 2003 these vessels fished less than 5 tonnes of hake and 2.5 of Nephrops per year they do not have this effort limitation, but are obliged not to exceed the same amounts in 2008.
Tables 7.2.1-3 list the available effort data in terms of kW*days and GT*days by Member State. In addition to the 2007 regulation defined gear types 3.a (bottom trawler mesh size ≥32 mm), 3.b (gillnet ≥60 mm), 3.c (bottom longline) and the undefined (none), the tables include trammel nets under the coding “3t”, as they were found to contribute significantly to the static effort deployed.
Table 7.2.1 Trend in nominal effort (kW*days at sea) by Member State and existing derogations given in Table 1 of Annex IIB (Coun. Reg. 40/2008), 2000-2007. Derogations are sorted by gear, special condition (SPECON) and country. Data qualities are summarised in section 5.5.2 and Table 5.5.2.1. Note that the gear type 3t denotes the non-regulated (effort) trammel gear with all mesh sizes. Spanish data correspond only to the trips with hake landings and are not sorted by SPECON.
ANNEX REG AREA COMB REG GEAR SPECON COUNTRY 2000 2001 2002 2003 2004 2005 2006 2007IIb 8c-9a 3a IIB71ab POR 8 245 672 6 432 995 9 354 332 IIb 8c-9a 3a none ENG 715 22 924 IIb 8c-9a 3a none FRA 222 555 284 075 445 606 268 971 212 869 638 240 835 966 595 541 IIb 8c-9a 3a none IRL 10 451 6 020 IIb 8c-9a 3a none NED 249 576 183 816 232 940 215 114 70 232 88 850 IIb 8c-9a 3a none POR 228 779 6 536 922 4 583 823 2 971 856 626 859 225 367 IIb 8c-9a 3a n/a SPN 20 645 9 966 238 9 259 903 2 597 975 877 178 770 681 5 743 945 IIb 8c-9a 3b IIB71ab POR 324 616 229 750 725 496 IIb 8c-9a 3b none ENG 14 083 IIb 8c-9a 3b none FRA 6 328 7 800 5 785 3 641 29 178 143 018 70 201 114 471 IIb 8c-9a 3b none POR 11 179 178 091 29 350 191 382 189 811 212 172 IIb 8c-9a 3b none SCO 3 234 IIb 8c-9a 3b n/a SPN 159 530 231 591 940 229 112 40 377 9 401 795 238 IIb 8c-9a 3c IIB71ab POR 82 726 74 596 91 549 IIb 8c-9a 3c none ENG 7 746 IIb 8c-9a 3c none FRA 1 422 736 3 476 3 972 968 196 280 IIb 8c-9a 3c none IRL 2 156 2 351 IIb 8c-9a 3c none POR 54 800 11 290 42 890 227 279 63 786 193 798 192 684 329 537 IIb 8c-9a 3c n/a SPN 73 399 149 312 149 238 177 683 221 458 419 250 IIb 8c-9a 3t none FRA 4 108 10 494 5 074 525 810 IIb 8c-9a 3t none POR 210 788 273 314 254 745 669 977 933 493 2 849 942 1 751 925 1 571 587 IIb 8c-9a 3t none SPN 75 391 79 074 148 002 127 040 136 315 165 713 IIb 8c-9a none none FRA 2 871 2 944 4 784 25 150 3 973 3 242 4 506 IIb 8c-9a none none GER 18 183 IIb 8c-9a none none IRL 1 585 3 788 4 656 122 IIb 8c-9a none none NED 13 893 3 528 5 880 IIb 8c-9a none none POR 4 705 142 3 242 128 3 507 984 3 270 932 3 329 874 11 270 022 3 405 387 697 140 IIb 8c-9a none none SPN 104 64 610 078 935 940 8 678 562 10 253 955 9 533 278 4 510 407
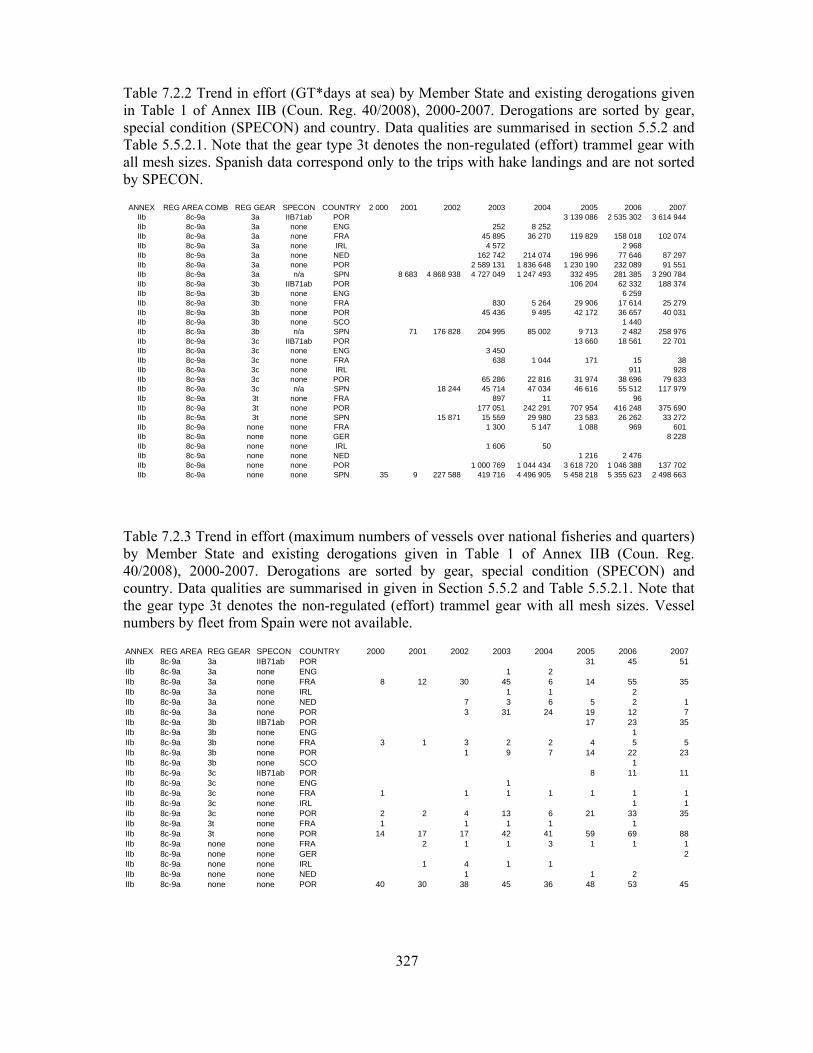
327
Table 7.2.2 Trend in effort (GT*days at sea) by Member State and existing derogations given in Table 1 of Annex IIB (Coun. Reg. 40/2008), 2000-2007. Derogations are sorted by gear, special condition (SPECON) and country. Data qualities are summarised in section 5.5.2 and Table 5.5.2.1. Note that the gear type 3t denotes the non-regulated (effort) trammel gear with all mesh sizes. Spanish data correspond only to the trips with hake landings and are not sorted by SPECON.
ANNEX REG AREA COMB REG GEAR SPECON COUNTRY 2 000 2001 2002 2003 2004 2005 2006 2007IIb 8c-9a 3a IIB71ab POR 3 139 086 2 535 302 3 614 944 IIb 8c-9a 3a none ENG 252 8 252 IIb 8c-9a 3a none FRA 45 895 36 270 119 829 158 018 102 074 IIb 8c-9a 3a none IRL 4 572 2 968 IIb 8c-9a 3a none NED 162 742 214 074 196 996 77 646 87 297 IIb 8c-9a 3a none POR 2 589 131 1 836 648 1 230 190 232 089 91 551 IIb 8c-9a 3a n/a SPN 8 683 4 868 938 4 727 049 1 247 493 332 495 281 385 3 290 784 IIb 8c-9a 3b IIB71ab POR 106 204 62 332 188 374 IIb 8c-9a 3b none ENG 6 259 IIb 8c-9a 3b none FRA 830 5 264 29 906 17 614 25 279 IIb 8c-9a 3b none POR 45 436 9 495 42 172 36 657 40 031 IIb 8c-9a 3b none SCO 1 440 IIb 8c-9a 3b n/a SPN 71 176 828 204 995 85 002 9 713 2 482 258 976 IIb 8c-9a 3c IIB71ab POR 13 660 18 561 22 701 IIb 8c-9a 3c none ENG 3 450 IIb 8c-9a 3c none FRA 638 1 044 171 15 38 IIb 8c-9a 3c none IRL 911 928 IIb 8c-9a 3c none POR 65 286 22 816 31 974 38 696 79 633 IIb 8c-9a 3c n/a SPN 18 244 45 714 47 034 46 616 55 512 117 979 IIb 8c-9a 3t none FRA 897 11 96 IIb 8c-9a 3t none POR 177 051 242 291 707 954 416 248 375 690 IIb 8c-9a 3t none SPN 15 871 15 559 29 980 23 583 26 262 33 272 IIb 8c-9a none none FRA 1 300 5 147 1 088 969 601 IIb 8c-9a none none GER 8 228 IIb 8c-9a none none IRL 1 606 50 IIb 8c-9a none none NED 1 216 2 476 IIb 8c-9a none none POR 1 000 769 1 044 434 3 618 720 1 046 388 137 702 IIb 8c-9a none none SPN 35 9 227 588 419 716 4 496 905 5 458 218 5 355 623 2 498 663
Table 7.2.3 Trend in effort (maximum numbers of vessels over national fisheries and quarters) by Member State and existing derogations given in Table 1 of Annex IIB (Coun. Reg. 40/2008), 2000-2007. Derogations are sorted by gear, special condition (SPECON) and country. Data qualities are summarised in given in Section 5.5.2 and Table 5.5.2.1. Note that the gear type 3t denotes the non-regulated (effort) trammel gear with all mesh sizes. Vessel numbers by fleet from Spain were not available.
ANNEX REG AREA CREG GEAR SPECON COUNTRY 2000 2001 2002 2003 2004 2005 2006 2007IIb 8c-9a 3a IIB71ab POR 31 45 51IIb 8c-9a 3a none ENG 1 2IIb 8c-9a 3a none FRA 8 12 30 45 6 14 55 35IIb 8c-9a 3a none IRL 1 1 2IIb 8c-9a 3a none NED 7 3 6 5 2 1IIb 8c-9a 3a none POR 3 31 24 19 12 7IIb 8c-9a 3b IIB71ab POR 17 23 35IIb 8c-9a 3b none ENG 1IIb 8c-9a 3b none FRA 3 1 3 2 2 4 5 5IIb 8c-9a 3b none POR 1 9 7 14 22 23IIb 8c-9a 3b none SCO 1IIb 8c-9a 3c IIB71ab POR 8 11 11IIb 8c-9a 3c none ENG 1IIb 8c-9a 3c none FRA 1 1 1 1 1 1 1IIb 8c-9a 3c none IRL 1 1IIb 8c-9a 3c none POR 2 2 4 13 6 21 33 35IIb 8c-9a 3t none FRA 1 1 1 1 1IIb 8c-9a 3t none POR 14 17 17 42 41 59 69 88IIb 8c-9a none none FRA 2 1 1 3 1 1 1IIb 8c-9a none none GER 2IIb 8c-9a none none IRL 1 4 1 1IIb 8c-9a none none NED 1 1 2IIb 8c-9a none none POR 40 30 38 45 36 48 53 45
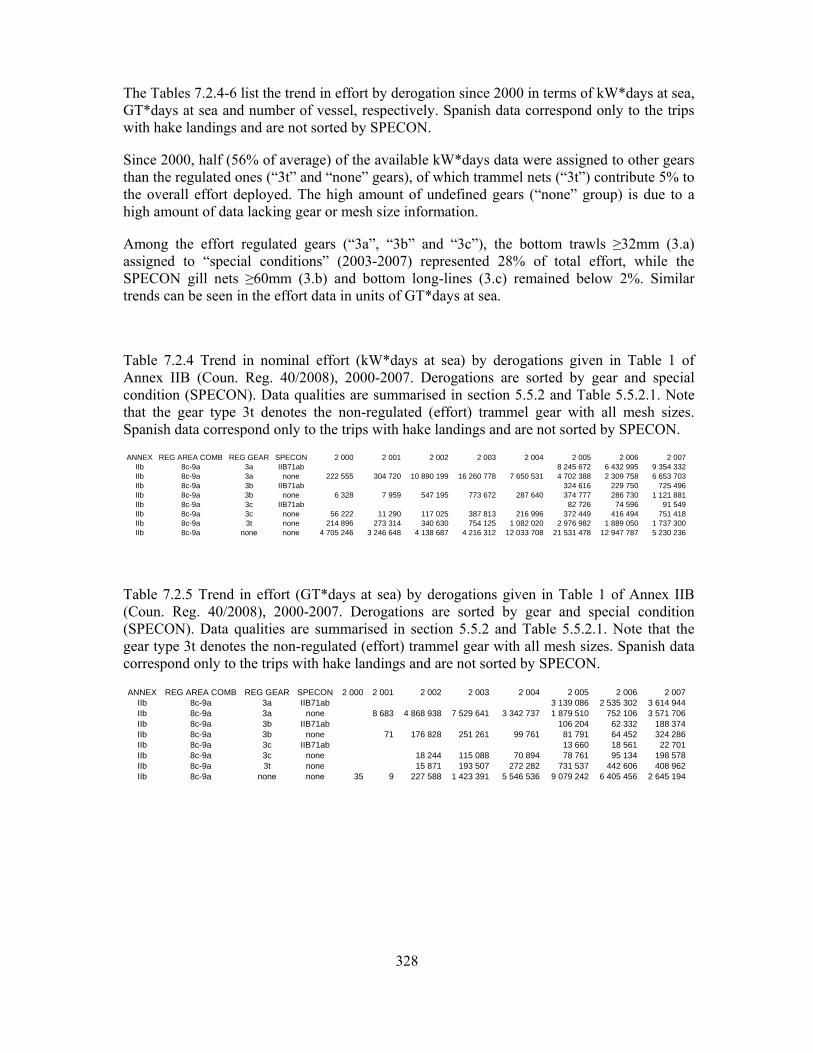
328
The Tables 7.2.4-6 list the trend in effort by derogation since 2000 in terms of kW*days at sea, GT*days at sea and number of vessel, respectively. Spanish data correspond only to the trips with hake landings and are not sorted by SPECON.
Since 2000, half (56% of average) of the available kW*days data were assigned to other gears than the regulated ones (“3t” and “none” gears), of which trammel nets (“3t”) contribute 5% to the overall effort deployed. The high amount of undefined gears (“none” group) is due to a high amount of data lacking gear or mesh size information.
Among the effort regulated gears (“3a”, “3b” and “3c”), the bottom trawls ≥32mm (3.a) assigned to “special conditions” (2003-2007) represented 28% of total effort, while the SPECON gill nets ≥60mm (3.b) and bottom long-lines (3.c) remained below 2%. Similar trends can be seen in the effort data in units of GT*days at sea.
Table 7.2.4 Trend in nominal effort (kW*days at sea) by derogations given in Table 1 of Annex IIB (Coun. Reg. 40/2008), 2000-2007. Derogations are sorted by gear and special condition (SPECON). Data qualities are summarised in section 5.5.2 and Table 5.5.2.1. Note that the gear type 3t denotes the non-regulated (effort) trammel gear with all mesh sizes. Spanish data correspond only to the trips with hake landings and are not sorted by SPECON.
ANNEX REG AREA COMB REG GEAR SPECON 2 000 2 001 2 002 2 003 2 004 2 005 2 006 2 007 IIb 8c-9a 3a IIB71ab 8 245 672 6 432 995 9 354 332 IIb 8c-9a 3a none 222 555 304 720 10 890 199 16 260 778 7 650 531 4 702 388 2 309 758 6 653 703 IIb 8c-9a 3b IIB71ab 324 616 229 750 725 496 IIb 8c-9a 3b none 6 328 7 959 547 195 773 672 287 640 374 777 286 730 1 121 881 IIb 8c-9a 3c IIB71ab 82 726 74 596 91 549 IIb 8c-9a 3c none 56 222 11 290 117 025 387 813 216 996 372 449 416 494 751 418 IIb 8c-9a 3t none 214 896 273 314 340 630 754 125 1 082 020 2 976 982 1 889 050 1 737 300 IIb 8c-9a none none 4 705 246 3 246 648 4 138 687 4 216 312 12 033 708 21 531 478 12 947 787 5 230 236
Table 7.2.5 Trend in effort (GT*days at sea) by derogations given in Table 1 of Annex IIB (Coun. Reg. 40/2008), 2000-2007. Derogations are sorted by gear and special condition (SPECON). Data qualities are summarised in section 5.5.2 and Table 5.5.2.1. Note that the gear type 3t denotes the non-regulated (effort) trammel gear with all mesh sizes. Spanish data correspond only to the trips with hake landings and are not sorted by SPECON.
ANNEX REG AREA COMB REG GEAR SPECON 2 000 2 001 2 002 2 003 2 004 2 005 2 006 2 007 IIb 8c-9a 3a IIB71ab 3 139 086 2 535 302 3 614 944 IIb 8c-9a 3a none 8 683 4 868 938 7 529 641 3 342 737 1 879 510 752 106 3 571 706 IIb 8c-9a 3b IIB71ab 106 204 62 332 188 374 IIb 8c-9a 3b none 71 176 828 251 261 99 761 81 791 64 452 324 286 IIb 8c-9a 3c IIB71ab 13 660 18 561 22 701 IIb 8c-9a 3c none 18 244 115 088 70 894 78 761 95 134 198 578 IIb 8c-9a 3t none 15 871 193 507 272 282 731 537 442 606 408 962 IIb 8c-9a none none 35 9 227 588 1 423 391 5 546 536 9 079 242 6 405 456 2 645 194
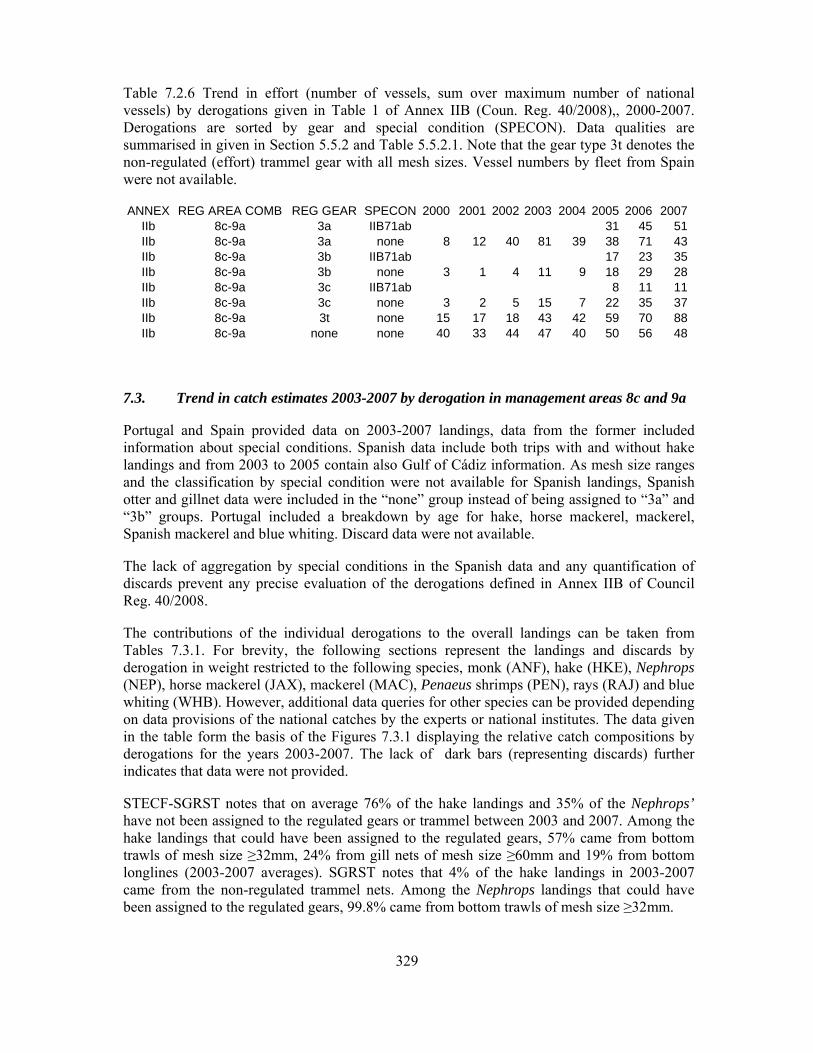
329
Table 7.2.6 Trend in effort (number of vessels, sum over maximum number of national vessels) by derogations given in Table 1 of Annex IIB (Coun. Reg. 40/2008),, 2000-2007. Derogations are sorted by gear and special condition (SPECON). Data qualities are summarised in given in Section 5.5.2 and Table 5.5.2.1. Note that the gear type 3t denotes the non-regulated (effort) trammel gear with all mesh sizes. Vessel numbers by fleet from Spain were not available.
ANNEX REG AREA COMB REG GEAR SPECON 2000 2001 2002 2003 2004 2005 2006 2007IIb 8c-9a 3a IIB71ab 31 45 51IIb 8c-9a 3a none 8 12 40 81 39 38 71 43IIb 8c-9a 3b IIB71ab 17 23 35IIb 8c-9a 3b none 3 1 4 11 9 18 29 28IIb 8c-9a 3c IIB71ab 8 11 11IIb 8c-9a 3c none 3 2 5 15 7 22 35 37IIb 8c-9a 3t none 15 17 18 43 42 59 70 88IIb 8c-9a none none 40 33 44 47 40 50 56 48
7.3. Trend in catch estimates 2003-2007 by derogation in management areas 8c and 9a
Portugal and Spain provided data on 2003-2007 landings, data from the former included information about special conditions. Spanish data include both trips with and without hake landings and from 2003 to 2005 contain also Gulf of Cádiz information. As mesh size ranges and the classification by special condition were not available for Spanish landings, Spanish otter and gillnet data were included in the “none” group instead of being assigned to “3a” and “3b” groups. Portugal included a breakdown by age for hake, horse mackerel, mackerel, Spanish mackerel and blue whiting. Discard data were not available.
The lack of aggregation by special conditions in the Spanish data and any quantification of discards prevent any precise evaluation of the derogations defined in Annex IIB of Council Reg. 40/2008.
The contributions of the individual derogations to the overall landings can be taken from Tables 7.3.1. For brevity, the following sections represent the landings and discards by derogation in weight restricted to the following species, monk (ANF), hake (HKE), Nephrops (NEP), horse mackerel (JAX), mackerel (MAC), Penaeus shrimps (PEN), rays (RAJ) and blue whiting (WHB). However, additional data queries for other species can be provided depending on data provisions of the national catches by the experts or national institutes. The data given in the table form the basis of the Figures 7.3.1 displaying the relative catch compositions by derogations for the years 2003-2007. The lack of dark bars (representing discards) further indicates that data were not provided.
STECF-SGRST notes that on average 76% of the hake landings and 35% of the Nephrops’ have not been assigned to the regulated gears or trammel between 2003 and 2007. Among the hake landings that could have been assigned to the regulated gears, 57% came from bottom trawls of mesh size ≥32mm, 24% from gill nets of mesh size ≥60mm and 19% from bottom longlines (2003-2007 averages). SGRST notes that 4% of the hake landings in 2003-2007 came from the non-regulated trammel nets. Among the Nephrops landings that could have been assigned to the regulated gears, 99.8% came from bottom trawls of mesh size ≥32mm.
330
Bottom trawls >32 mm (3.a) catch mainly blue whiting (51% of the landings of the selected species between 2003 and 2007) and mackerel (23%); hake represents 14% of the landings and Nephrops 7%. The gill nets (3.b) and the longlines (3.c) are more species selective towards hake (76% and 56% of the landings respectively). Also the unregulated trammel nets are distinguished by a clear species selectivity towards targeting monk (44%) and hake (32%). Other unregulated gears fish mainly horse mackerel (34%), mackerel (33%) and blue whiting (26%); and 6% and 0% of hake and Nephrops, respectively.
Considering only 2006 and 2007 data (data without the Gulf of Cádiz) the percentage of hake in the landings is slightly higher in the regulated gears.
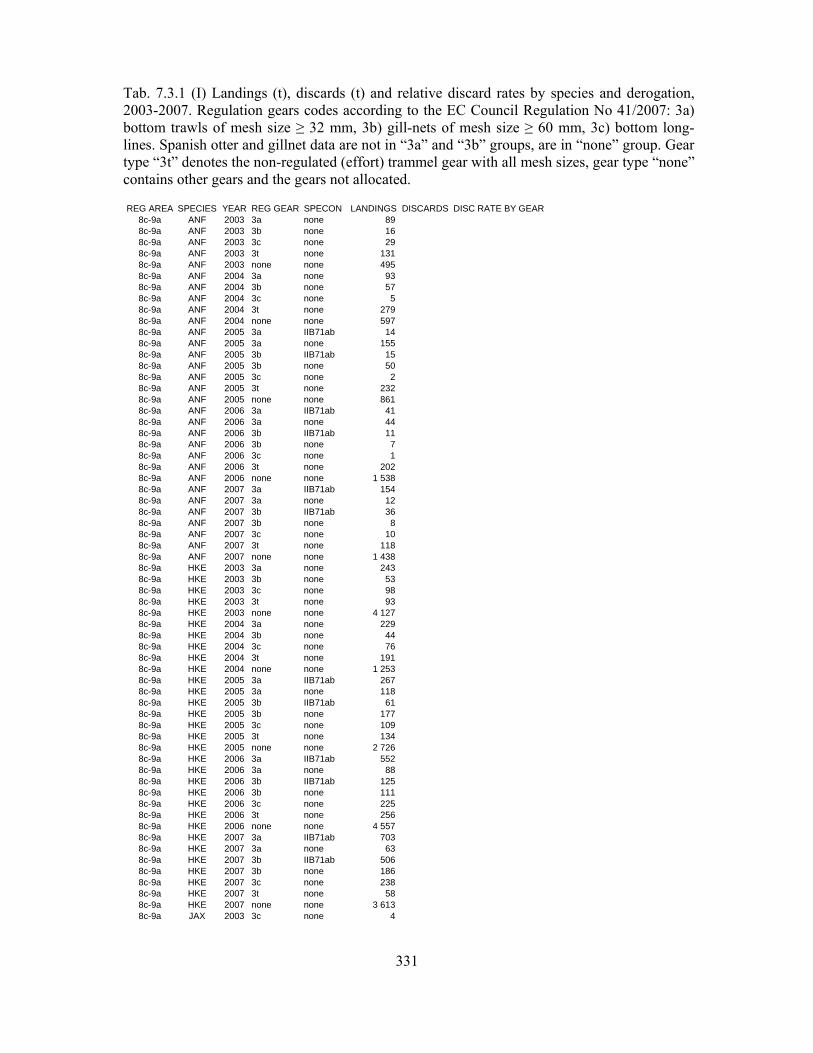
331
Tab. 7.3.1 (I) Landings (t), discards (t) and relative discard rates by species and derogation, 2003-2007. Regulation gears codes according to the EC Council Regulation No 41/2007: 3a) bottom trawls of mesh size ≥ 32 mm, 3b) gill-nets of mesh size ≥ 60 mm, 3c) bottom long-lines. Spanish otter and gillnet data are not in “3a” and “3b” groups, are in “none” group. Gear type “3t” denotes the non-regulated (effort) trammel gear with all mesh sizes, gear type “none” contains other gears and the gears not allocated.
REG AREA SPECIES YEAR REG GEAR SPECON LANDINGS DISCARDS DISC RATE BY GEAR8c-9a ANF 2003 3a none 89 8c-9a ANF 2003 3b none 16 8c-9a ANF 2003 3c none 29 8c-9a ANF 2003 3t none 131 8c-9a ANF 2003 none none 495 8c-9a ANF 2004 3a none 93 8c-9a ANF 2004 3b none 57 8c-9a ANF 2004 3c none 5 8c-9a ANF 2004 3t none 279 8c-9a ANF 2004 none none 597 8c-9a ANF 2005 3a IIB71ab 14 8c-9a ANF 2005 3a none 155 8c-9a ANF 2005 3b IIB71ab 15 8c-9a ANF 2005 3b none 50 8c-9a ANF 2005 3c none 2 8c-9a ANF 2005 3t none 232 8c-9a ANF 2005 none none 861 8c-9a ANF 2006 3a IIB71ab 41 8c-9a ANF 2006 3a none 44 8c-9a ANF 2006 3b IIB71ab 11 8c-9a ANF 2006 3b none 7 8c-9a ANF 2006 3c none 1 8c-9a ANF 2006 3t none 202 8c-9a ANF 2006 none none 1 538 8c-9a ANF 2007 3a IIB71ab 154 8c-9a ANF 2007 3a none 12 8c-9a ANF 2007 3b IIB71ab 36 8c-9a ANF 2007 3b none 8 8c-9a ANF 2007 3c none 10 8c-9a ANF 2007 3t none 118 8c-9a ANF 2007 none none 1 438 8c-9a HKE 2003 3a none 243 8c-9a HKE 2003 3b none 53 8c-9a HKE 2003 3c none 98 8c-9a HKE 2003 3t none 93 8c-9a HKE 2003 none none 4 127 8c-9a HKE 2004 3a none 229 8c-9a HKE 2004 3b none 44 8c-9a HKE 2004 3c none 76 8c-9a HKE 2004 3t none 191 8c-9a HKE 2004 none none 1 253 8c-9a HKE 2005 3a IIB71ab 267 8c-9a HKE 2005 3a none 118 8c-9a HKE 2005 3b IIB71ab 61 8c-9a HKE 2005 3b none 177 8c-9a HKE 2005 3c none 109 8c-9a HKE 2005 3t none 134 8c-9a HKE 2005 none none 2 726 8c-9a HKE 2006 3a IIB71ab 552 8c-9a HKE 2006 3a none 88 8c-9a HKE 2006 3b IIB71ab 125 8c-9a HKE 2006 3b none 111 8c-9a HKE 2006 3c none 225 8c-9a HKE 2006 3t none 256 8c-9a HKE 2006 none none 4 557 8c-9a HKE 2007 3a IIB71ab 703 8c-9a HKE 2007 3a none 63 8c-9a HKE 2007 3b IIB71ab 506 8c-9a HKE 2007 3b none 186 8c-9a HKE 2007 3c none 238 8c-9a HKE 2007 3t none 58 8c-9a HKE 2007 none none 3 613 8c-9a JAX 2003 3c none 4

332
Tab. 7.3.1 (continued)
REG AREA SPECIES YEAR REG GEAR SPECON LANDINGS DISCARDS DISC RATE BY GEAR8c-9a JAX 2003 3t none 2 8c-9a JAX 2003 none none 12 828 8c-9a JAX 2004 3a none 1 8c-9a JAX 2004 3c none 5 8c-9a JAX 2004 3t none 8 8c-9a JAX 2004 none none 15 360 8c-9a JAX 2005 3c none 4 8c-9a JAX 2005 3t none 7 8c-9a JAX 2005 none none 12 555 8c-9a JAX 2006 3c none 14 8c-9a JAX 2006 3t none 10 8c-9a JAX 2006 none none 31 141 8c-9a JAX 2007 3c none 7 8c-9a JAX 2007 3t none 21 8c-9a JAX 2007 none none 31 408 8c-9a MAC 2003 3a none 708 8c-9a MAC 2003 3b none 1 8c-9a MAC 2003 3c none 6 8c-9a MAC 2003 3t none 33 8c-9a MAC 2003 none none 8 974 8c-9a MAC 2004 3a none 632 8c-9a MAC 2004 3b none 0 8c-9a MAC 2004 3c none 62 8c-9a MAC 2004 3t none 31 8c-9a MAC 2004 none none 10 743 8c-9a MAC 2005 3a IIB71ab 485 8c-9a MAC 2005 3a none 165 8c-9a MAC 2005 3b IIB71ab 0 8c-9a MAC 2005 3b none 0 8c-9a MAC 2005 3c none 92 8c-9a MAC 2005 3t none 33 8c-9a MAC 2005 none none 16 499 8c-9a MAC 2006 3a IIB71ab 354 8c-9a MAC 2006 3a none 86 8c-9a MAC 2006 3b IIB71ab 5 8c-9a MAC 2006 3b none 1 8c-9a MAC 2006 3c none 45 8c-9a MAC 2006 3t none 24 8c-9a MAC 2006 none none 35 391 8c-9a MAC 2007 3a IIB71ab 732 8c-9a MAC 2007 3a none 75 8c-9a MAC 2007 3b IIB71ab 8 8c-9a MAC 2007 3b none 4 8c-9a MAC 2007 3c none 140 8c-9a MAC 2007 3t none 29 8c-9a MAC 2007 none none 37 538 8c-9a NEP 2003 3a none 198 8c-9a NEP 2003 3c none 0 8c-9a NEP 2003 3t none 0 8c-9a NEP 2003 none none 84 8c-9a NEP 2004 3a none 163 8c-9a NEP 2004 3c none 0 8c-9a NEP 2004 3t none 0 8c-9a NEP 2004 none none 46 8c-9a NEP 2005 3a IIB71ab 67 8c-9a NEP 2005 3a none 143 8c-9a NEP 2005 3b IIB71ab 1 8c-9a NEP 2005 3b none 0 8c-9a NEP 2005 3c none 0 8c-9a NEP 2005 3t none 1 8c-9a NEP 2005 none none 160 8c-9a NEP 2006 3a IIB71ab 212 8c-9a NEP 2006 3a none 35
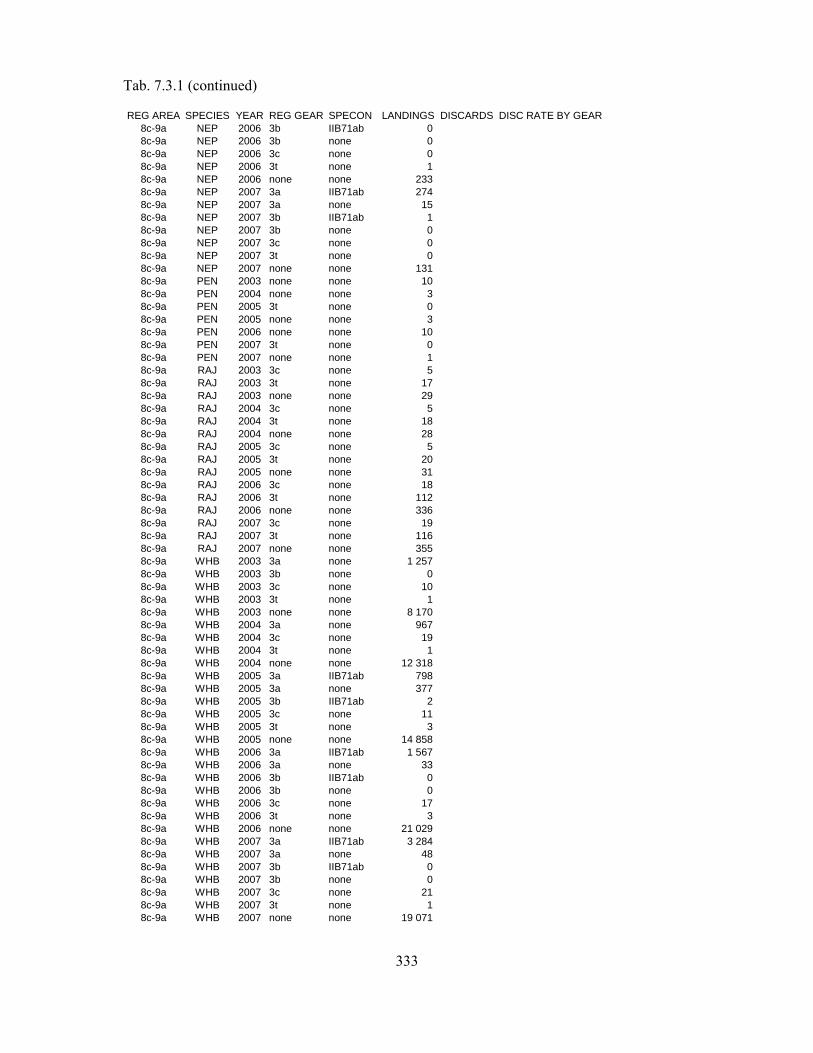
333
Tab. 7.3.1 (continued)
REG AREA SPECIES YEAR REG GEAR SPECON LANDINGS DISCARDS DISC RATE BY GEAR8c-9a NEP 2006 3b IIB71ab 0 8c-9a NEP 2006 3b none 0 8c-9a NEP 2006 3c none 0 8c-9a NEP 2006 3t none 1 8c-9a NEP 2006 none none 233 8c-9a NEP 2007 3a IIB71ab 274 8c-9a NEP 2007 3a none 15 8c-9a NEP 2007 3b IIB71ab 1 8c-9a NEP 2007 3b none 0 8c-9a NEP 2007 3c none 0 8c-9a NEP 2007 3t none 0 8c-9a NEP 2007 none none 131 8c-9a PEN 2003 none none 10 8c-9a PEN 2004 none none 3 8c-9a PEN 2005 3t none 0 8c-9a PEN 2005 none none 3 8c-9a PEN 2006 none none 10 8c-9a PEN 2007 3t none 0 8c-9a PEN 2007 none none 1 8c-9a RAJ 2003 3c none 5 8c-9a RAJ 2003 3t none 17 8c-9a RAJ 2003 none none 29 8c-9a RAJ 2004 3c none 5 8c-9a RAJ 2004 3t none 18 8c-9a RAJ 2004 none none 28 8c-9a RAJ 2005 3c none 5 8c-9a RAJ 2005 3t none 20 8c-9a RAJ 2005 none none 31 8c-9a RAJ 2006 3c none 18 8c-9a RAJ 2006 3t none 112 8c-9a RAJ 2006 none none 336 8c-9a RAJ 2007 3c none 19 8c-9a RAJ 2007 3t none 116 8c-9a RAJ 2007 none none 355 8c-9a WHB 2003 3a none 1 257 8c-9a WHB 2003 3b none 0 8c-9a WHB 2003 3c none 10 8c-9a WHB 2003 3t none 1 8c-9a WHB 2003 none none 8 170 8c-9a WHB 2004 3a none 967 8c-9a WHB 2004 3c none 19 8c-9a WHB 2004 3t none 1 8c-9a WHB 2004 none none 12 318 8c-9a WHB 2005 3a IIB71ab 798 8c-9a WHB 2005 3a none 377 8c-9a WHB 2005 3b IIB71ab 2 8c-9a WHB 2005 3c none 11 8c-9a WHB 2005 3t none 3 8c-9a WHB 2005 none none 14 858 8c-9a WHB 2006 3a IIB71ab 1 567 8c-9a WHB 2006 3a none 33 8c-9a WHB 2006 3b IIB71ab 0 8c-9a WHB 2006 3b none 0 8c-9a WHB 2006 3c none 17 8c-9a WHB 2006 3t none 3 8c-9a WHB 2006 none none 21 029 8c-9a WHB 2007 3a IIB71ab 3 284 8c-9a WHB 2007 3a none 48 8c-9a WHB 2007 3b IIB71ab 0 8c-9a WHB 2007 3b none 0 8c-9a WHB 2007 3c none 21 8c-9a WHB 2007 3t none 1 8c-9a WHB 2007 none none 19 071

334

335
AN
F
CO
D
HA
D
HK
E
NE
P
PLE
PO
K
SO
L
WH
G
3a-IIB7ab-8c-9a, 2003-2007
Land
ings
and
Dis
card
s (t)
020
040
060
080
0
AN
F
CO
D
HA
D
HK
E
NE
P
PLE
PO
K
SO
L
WH
G
AN
F
CO
D
HA
D
HK
E
NE
P
PLE
PO
K
SO
L
WH
G
3a-none-8c-9a, 2003-2007
Land
ings
and
Dis
card
s (t)
050
100
150
200
250
300
AN
F
CO
D
HA
D
HK
E
NE
P
PLE
PO
K
SO
L
WH
G
AN
F
CO
D
HA
D
HK
E
NE
P
PLE
PO
K
SO
L
WH
G
3b-IIB7ab-8c-9a, 2003-2007
Land
ings
and
Dis
card
s (t)
010
020
030
040
050
060
0
AN
F
CO
D
HA
D
HK
E
NE
P
PLE
PO
K
SO
L
WH
G
AN
F
CO
D
HA
D
HK
E
NE
P
PLE
PO
K
SO
L
WH
G
3b-none-8c-9a, 2003-2007
Land
ings
and
Dis
card
s (t)
050
100
150
200
AN
F
CO
D
HA
D
HK
E
NE
P
PLE
PO
K
SO
L
WH
G
AN
F
CO
D
HA
D
HK
E
NE
P
PLE
PO
K
SO
L
WH
G
3c-none-8c-9a, 2003-2007
Land
ings
and
Dis
card
s (t)
050
100
150
200
250
300
AN
F
CO
D
HA
D
HK
E
NE
P
PLE
PO
K
SO
L
WH
G
AN
F
CO
D
HA
D
HK
E
NE
P
PLE
PO
K
SO
L
WH
G
3t-none-8c-9a, 2003-2007
Land
ings
and
Dis
card
s (t)
050
100
150
200
250
300
350
AN
F
CO
D
HA
D
HK
E
NE
P
PLE
PO
K
SO
L
WH
G
Fig. 7.3.1 Landings (t) and discard (t) by derogation and species, 2003-2007 (from left to right). Spanish otter and gillnet data are not in “3a” and “3b” groups, are in “none” group. The lack of discard information in the graphs means rather no information than zero discards. Note that the gear type 3t denotes the non-regulated (effort) trammel gear with all mesh sizes
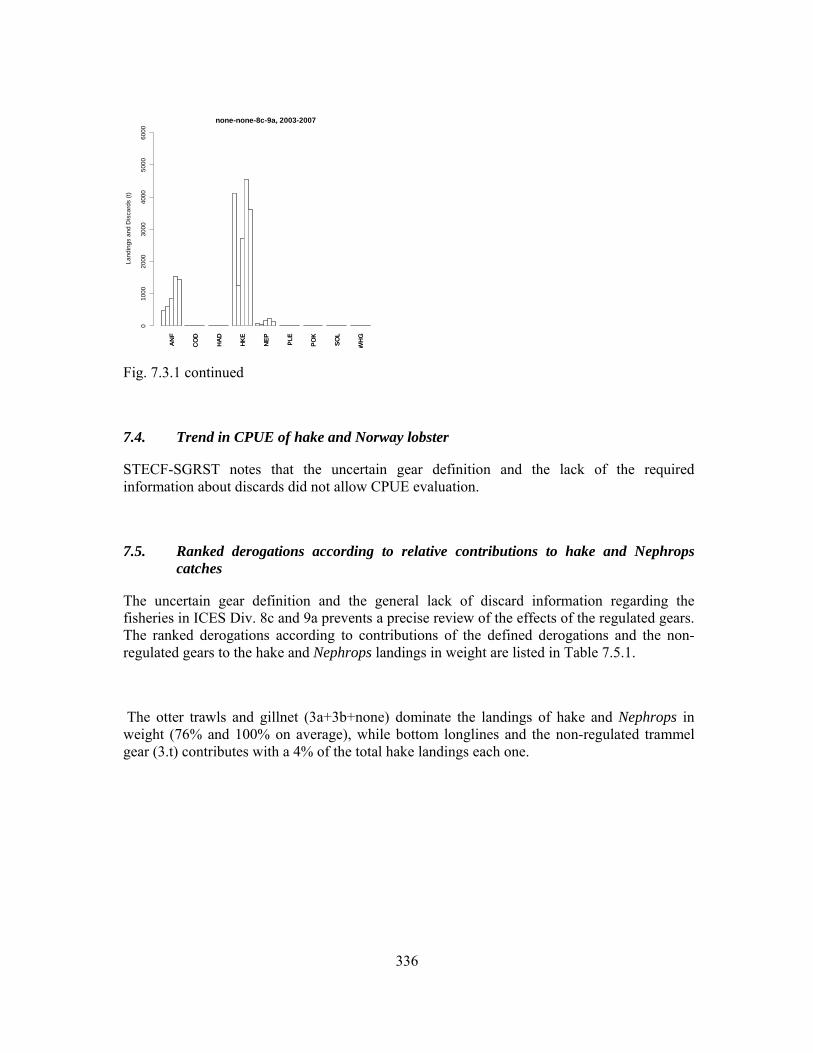
336
AN
F
CO
D
HA
D
HK
E
NE
P
PLE
PO
K
SO
L
WH
G
none-none-8c-9a, 2003-2007La
ndin
gs a
nd D
isca
rds
(t)
010
0020
0030
0040
0050
0060
00
AN
F
CO
D
HA
D
HK
E
NE
P
PLE
PO
K
SO
L
WH
G
Fig. 7.3.1 continued
7.4. Trend in CPUE of hake and Norway lobster
STECF-SGRST notes that the uncertain gear definition and the lack of the required information about discards did not allow CPUE evaluation.
7.5. Ranked derogations according to relative contributions to hake and Nephrops catches
The uncertain gear definition and the general lack of discard information regarding the fisheries in ICES Div. 8c and 9a prevents a precise review of the effects of the regulated gears. The ranked derogations according to contributions of the defined derogations and the non-regulated gears to the hake and Nephrops landings in weight are listed in Table 7.5.1.
The otter trawls and gillnet (3a+3b+none) dominate the landings of hake and Nephrops in weight (76% and 100% on average), while bottom longlines and the non-regulated trammel gear (3.t) contributes with a 4% of the total hake landings each one.
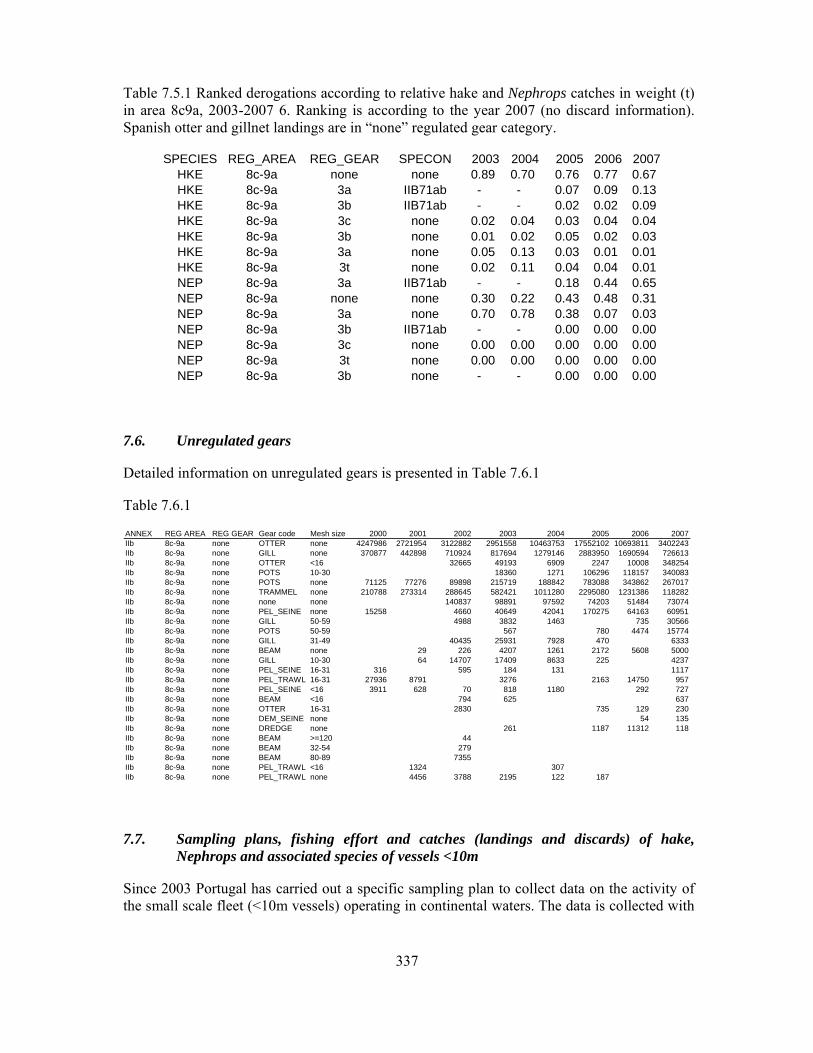
337
Table 7.5.1 Ranked derogations according to relative hake and Nephrops catches in weight (t) in area 8c9a, 2003-2007 6. Ranking is according to the year 2007 (no discard information). Spanish otter and gillnet landings are in “none” regulated gear category.
SPECIES REG_AREA REG_GEAR SPECON 2003 2004 2005 2006 2007HKE 8c-9a none none 0.89 0.70 0.76 0.77 0.67 HKE 8c-9a 3a IIB71ab - - 0.07 0.09 0.13 HKE 8c-9a 3b IIB71ab - - 0.02 0.02 0.09 HKE 8c-9a 3c none 0.02 0.04 0.03 0.04 0.04 HKE 8c-9a 3b none 0.01 0.02 0.05 0.02 0.03 HKE 8c-9a 3a none 0.05 0.13 0.03 0.01 0.01 HKE 8c-9a 3t none 0.02 0.11 0.04 0.04 0.01 NEP 8c-9a 3a IIB71ab - - 0.18 0.44 0.65 NEP 8c-9a none none 0.30 0.22 0.43 0.48 0.31 NEP 8c-9a 3a none 0.70 0.78 0.38 0.07 0.03 NEP 8c-9a 3b IIB71ab - - 0.00 0.00 0.00 NEP 8c-9a 3c none 0.00 0.00 0.00 0.00 0.00 NEP 8c-9a 3t none 0.00 0.00 0.00 0.00 0.00 NEP 8c-9a 3b none - - 0.00 0.00 0.00
7.6. Unregulated gears
Detailed information on unregulated gears is presented in Table 7.6.1
Table 7.6.1
ANNEX REG AREA REG GEAR Gear code Mesh size c 2000 2001 2002 2003 2004 2005 2006 2007IIb 8c-9a none OTTER none 4247986 2721954 3122882 2951558 10463753 17552102 10693811 3402243IIb 8c-9a none GILL none 370877 442898 710924 817694 1279146 2883950 1690594 726613IIb 8c-9a none OTTER <16 32665 49193 6909 2247 10008 348254IIb 8c-9a none POTS 10-30 18360 1271 106296 118157 340083IIb 8c-9a none POTS none 71125 77276 89898 215719 188842 783088 343862 267017IIb 8c-9a none TRAMMEL none 210788 273314 288645 582421 1011280 2295080 1231386 118282IIb 8c-9a none none none 140837 98891 97592 74203 51484 73074IIb 8c-9a none PEL_SEINE none 15258 4660 40649 42041 170275 64163 60951IIb 8c-9a none GILL 50-59 4988 3832 1463 735 30566IIb 8c-9a none POTS 50-59 567 780 4474 15774IIb 8c-9a none GILL 31-49 40435 25931 7928 470 6333IIb 8c-9a none BEAM none 29 226 4207 1261 2172 5608 5000IIb 8c-9a none GILL 10-30 64 14707 17409 8633 225 4237IIb 8c-9a none PEL_SEINE 16-31 316 595 184 131 1117IIb 8c-9a none PEL_TRAWL 16-31 27936 8791 3276 2163 14750 957IIb 8c-9a none PEL_SEINE <16 3911 628 70 818 1180 292 727IIb 8c-9a none BEAM <16 794 625 637IIb 8c-9a none OTTER 16-31 2830 735 129 230IIb 8c-9a none DEM_SEINE none 54 135IIb 8c-9a none DREDGE none 261 1187 11312 118IIb 8c-9a none BEAM >=120 44IIb 8c-9a none BEAM 32-54 279IIb 8c-9a none BEAM 80-89 7355IIb 8c-9a none PEL_TRAWL <16 1324 307IIb 8c-9a none PEL_TRAWL none 4456 3788 2195 122 187
7.7. Sampling plans, fishing effort and catches (landings and discards) of hake, Nephrops and associated species of vessels <10m
Since 2003 Portugal has carried out a specific sampling plan to collect data on the activity of the small scale fleet (<10m vessels) operating in continental waters. The data is collected with

338
a stratified random strategy by skippers' interviews, and provides information about catches by species and effort. This sampling plan is under the scope of Reg.(EC) 1639/2001 and the results were presented on the annual reports requested by the DGFish. There were, however, no data provided to STECF-SGRST.
7.8. Spatial distribution patterns of effective fishing effort of trawled gears 2003-2006
No information was available from national case studies or from data provided to STECF-SGRST for a review of spatial information.
7.9. References
Fonseca P., Campos A., Garcia A., Cardador F., Meixide M., Padín A., Theret F., Mellita M., and Morandeau, F. 2000. Trawl Selectivity Studies in Region 3. Study Contract Nº 96/61; Final Report.
Abad, E; I. Artetxe; F. Cardador; J. Castro (coordinator); D. García; M. Marín; A. Murta; A. Punzón; I. Quincoces; M. Santurtún; C. Silva; L. Silva. 2007. Identification and segmentation of mixed‐ species fisheries operating in the atlantic iberian peninsula
waters. IBERMIX project (Contract Ref.: FISH/2004/03‐ 33).
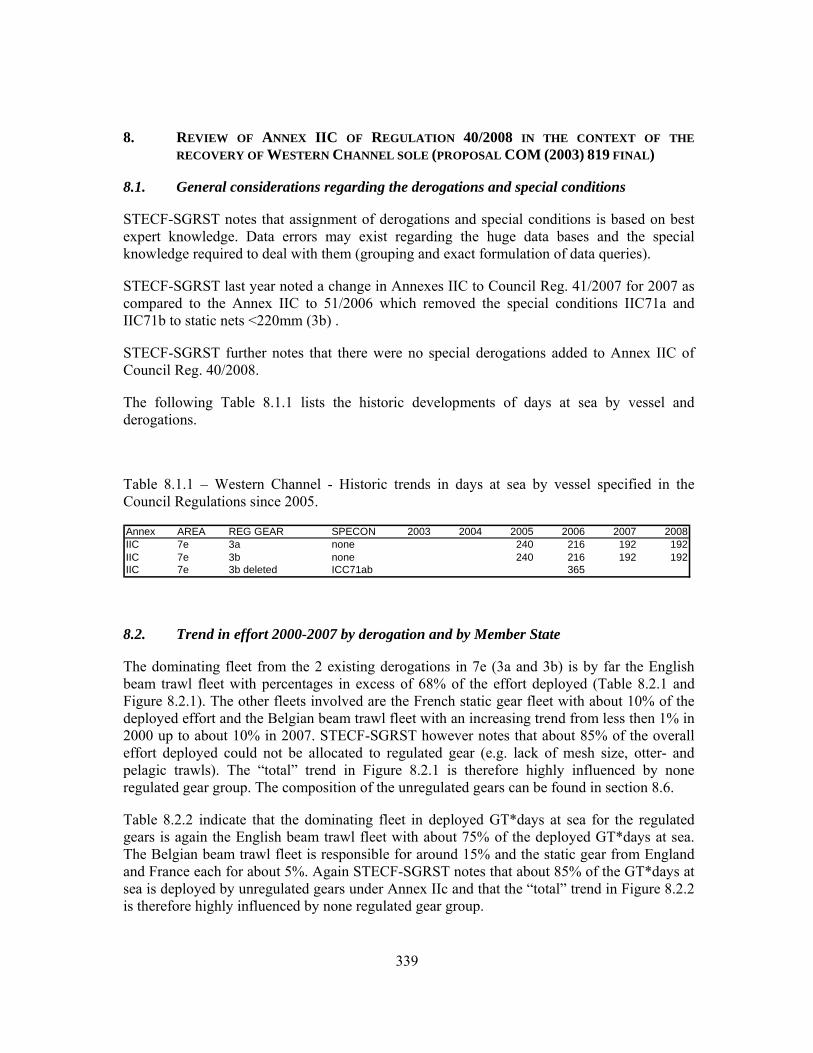
339
8. REVIEW OF ANNEX IIC OF REGULATION 40/2008 IN THE CONTEXT OF THE RECOVERY OF WESTERN CHANNEL SOLE (PROPOSAL COM (2003) 819 FINAL)
8.1. General considerations regarding the derogations and special conditions
STECF-SGRST notes that assignment of derogations and special conditions is based on best expert knowledge. Data errors may exist regarding the huge data bases and the special knowledge required to deal with them (grouping and exact formulation of data queries).
STECF-SGRST last year noted a change in Annexes IIC to Council Reg. 41/2007 for 2007 as compared to the Annex IIC to 51/2006 which removed the special conditions IIC71a and IIC71b to static nets <220mm (3b) .
STECF-SGRST further notes that there were no special derogations added to Annex IIC of Council Reg. 40/2008.
The following Table 8.1.1 lists the historic developments of days at sea by vessel and derogations.
Table 8.1.1 – Western Channel - Historic trends in days at sea by vessel specified in the Council Regulations since 2005.
Annex AREA REG GEAR SPECON 2003 2004 2005 2006 2007 2008IIC 7e 3a none 240 216 192 192IIC 7e 3b none 240 216 192 192IIC 7e 3b deleted ICC71ab 365
8.2. Trend in effort 2000-2007 by derogation and by Member State
The dominating fleet from the 2 existing derogations in 7e (3a and 3b) is by far the English beam trawl fleet with percentages in excess of 68% of the effort deployed (Table 8.2.1 and Figure 8.2.1). The other fleets involved are the French static gear fleet with about 10% of the deployed effort and the Belgian beam trawl fleet with an increasing trend from less then 1% in 2000 up to about 10% in 2007. STECF-SGRST however notes that about 85% of the overall effort deployed could not be allocated to regulated gear (e.g. lack of mesh size, otter- and pelagic trawls). The “total” trend in Figure 8.2.1 is therefore highly influenced by none regulated gear group. The composition of the unregulated gears can be found in section 8.6.
Table 8.2.2 indicate that the dominating fleet in deployed GT*days at sea for the regulated gears is again the English beam trawl fleet with about 75% of the deployed GT*days at sea. The Belgian beam trawl fleet is responsible for around 15% and the static gear from England and France each for about 5%. Again STECF-SGRST notes that about 85% of the GT*days at sea is deployed by unregulated gears under Annex IIc and that the “total” trend in Figure 8.2.2 is therefore highly influenced by none regulated gear group.

340
Table 8.2.3 and Figure 8.2.3 show the number of vessels active in area 7e (maximum number of national vessels over national fisheries). About 70% of the vessels are allocated to non- regulated derogations, partly due to the absence of mesh sizes. Therefore, it was decided that the number of vessels in the regulated fisheries are not representing the correct number of the active vessels in the regulated fisheries but rather underestimated.
The trends in the nominal effort of the 2 derogations (3a and 3b) are illustrated in Table 8.2.4. The beam trawl fleets increased to about 20% above the 2002 level since 2004. In 2007 it dropped to 16% above the 2002 level. The static nets increased steadily over the time series to about 15% above the 2002 level in the years 2003-2005. Since then this category dropped sharply to 32% under the 2002 level in 2007.
Table 8.2.5 shows the trend in GT*days at sea for the 2 derogations from 2003 onwards. The beam trawl fleet increased by about 5%. The static gear dropped 12% and 40% below the 2003 level in 2006 and 2007 respectively.
STECF-SGRST notes that the ratio of nominal effort (kW*days at sea) to GT*days at sea is about 3 for the beam trawl fleet and about 7 for the static gear.
Table 8.2.6 and Figure 8.2.3 show the trend in the number of vessels active in both derogations over the time series 2003-2007. Although it is assumed that the absolute numbers do not reflect the true picture of the regulated fisheries (see above), relative trends may give some indication of the evolution of these fisheries. The beam trawl fleet fluctuated around the same level since 2003. The static nets have decreased in 2007 to 19% below the 2003 level.
Figures 8.2.4 and 8.2.5 show the effort measures (kW*days, GT*days and NbVessels) plotted relative to their 2003 value for the two derogations 3a and 3b. For both derogations the trends in relative effort are very similar. The divergence in trends from the number of vessels could be explained partly by the lack of mesh size information for certain fisheries (see also above).
Table 8.2.1 – Western Channel - Trend in nominal effort (kW*days at sea) by existing derogations given in Table 1 of Annex IIC (Coun. Reg. 40/2008) and Member State, 2000-2007. Derogations are sorted by gear, special condition (SPECON), and country. Data qualities are summarised in section 5.5.2 and Table 5.5.2.1.

341
ANNEX REG AREA CREG GEAR SPECON COUNTRY 2000 2001 2002 2003 2004 2005 2006 2007IIc 7e 3a none BEL 12964 31058 92967 135704 272963 299317 326630 436714IIc 7e 3a none ENG 2575833 3030491 2907963 3374612 3206879 3227189 3283912 3026197IIc 7e 3a none FRA 29328 19981 123685 140305 142268 191766IIc 7e 3a none GBJ 90184 171795 151338 122867 209969 121552IIc 7e 3a none IRL 23419 35184 3267 5083 13610IIc 7e 3a none NED 1470IIc 7e 3a none SCO 3666IIc 7e 3b none ENG 261670 341896 251527 311964 201590 174766 150848 93281IIc 7e 3b none FRA 68319 160625 495910 536959 655572 694684 584155 411312IIc 7e 3b none SCO 3240IIc 7e 3b none SPN 176 650IIc 7e none none BEL 1565 111 1005 1933IIc 7e none none ENG 4773718 4259728 4107795 3894553 4249485 4365470 4253191 4321458IIc 7e none none FRA 13170118 15265720 21021793 17677024 20399128 24186777 21269562 20243551IIc 7e none none GBG 124978 149820 43963 75936 57178 45814 57732IIc 7e none none GBI 13000 21138 16978 19902 1116IIc 7e none none GBJ 186428 148493 106436 57886 8667 28248 42051IIc 7e none none GER 269612 197006 118202 94385 98335 92680 42091IIc 7e none none IOM 13000 21138 16978 19902IIc 7e none none IRL 505785 151307 155094 179642 341388 151660 3880 21768IIc 7e none none NED 1242548 1781536 1259464 1514797 1841683 1391150IIc 7e none none NIR 1302IIc 7e none none SCO 864566 752426 775389 705191 607932 691449 585772 593926IIc 7e none none SPN 9543 109750 80639 71840 48387 54915
Table 8.2.2 – Western Channel - Trend in effort (GT*days at sea) by existing derogations given in Table 1 of Annex IIC (Coun. Reg. 40/2008) and Member State, 2003-2007. Derogations are sorted by gear, special condition (SPECON), and country. Data qualities are summarised in section 5.5.2 and Table 5.5.2.1.
ANNEX REG AREA CREG GEAR SPECON COUNTRY 2003 2004 2005 2006 2007IIc 7e 3a none BEL 63250 130435 135727 147606 194781IIc 7e 3a none ENG 970035 931814 932209 957036 923426IIc 7e 3a none FRA 3200 21098 22767 19941 25479IIc 7e 3a none GBJ 35244 63209 36080IIc 7e 3a none IRL 5022 7984 1055 1707 2904IIc 7e 3a none NED 560IIc 7e 3a none SCO 1296IIc 7e 3b none ENG 61144 47631 44936 42162 23145IIc 7e 3b none FRA 60295 73199 80431 64739 48667IIc 7e 3b none SCO 1024IIc 7e 3b none SPN 146 320IIc 7e none none BEL 307 769 940IIc 7e none none ENG 925101 1020408 1039082 1017913 972460IIc 7e none none FRA 3462508 3939991 4773740 4089621 3753685IIc 7e none none GBG 14231 10689 8384 12267IIc 7e none none GBI 4548 255IIc 7e none none GBJ 12154 1548 5046 7512IIc 7e none none GER 115397 132799 106385 59489IIc 7e none none IOM 4548IIc 7e none none IRL 62837 105670 41874 1240 9512IIc 7e none none NED 1418452 1017028 1146429 1480057 1054021IIc 7e none none NIR 301IIc 7e none none SCO 229531 198595 218716 194240 207963IIc 7e none none SPN 52711 38488 52088 43021 47311
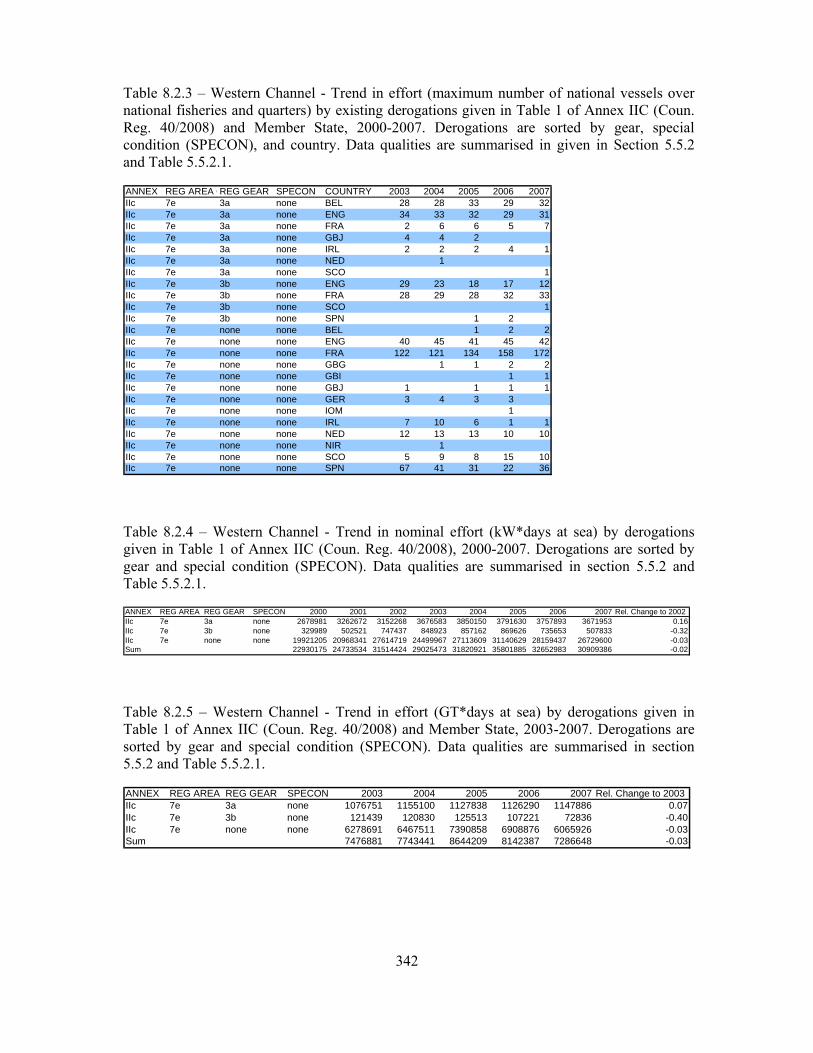
342
Table 8.2.3 – Western Channel - Trend in effort (maximum number of national vessels over national fisheries and quarters) by existing derogations given in Table 1 of Annex IIC (Coun. Reg. 40/2008) and Member State, 2000-2007. Derogations are sorted by gear, special condition (SPECON), and country. Data qualities are summarised in given in Section 5.5.2 and Table 5.5.2.1.
ANNEX REG AREA CREG GEAR SPECON COUNTRY 2003 2004 2005 2006 2007IIc 7e 3a none BEL 28 28 33 29 32IIc 7e 3a none ENG 34 33 32 29 31IIc 7e 3a none FRA 2 6 6 5 7IIc 7e 3a none GBJ 4 4 2IIc 7e 3a none IRL 2 2 2 4 1IIc 7e 3a none NED 1IIc 7e 3a none SCO 1IIc 7e 3b none ENG 29 23 18 17 12IIc 7e 3b none FRA 28 29 28 32 33IIc 7e 3b none SCO 1IIc 7e 3b none SPN 1 2IIc 7e none none BEL 1 2 2IIc 7e none none ENG 40 45 41 45 42IIc 7e none none FRA 122 121 134 158 172IIc 7e none none GBG 1 1 2 2IIc 7e none none GBI 1 1IIc 7e none none GBJ 1 1 1 1IIc 7e none none GER 3 4 3 3IIc 7e none none IOM 1IIc 7e none none IRL 7 10 6 1 1IIc 7e none none NED 12 13 13 10 10IIc 7e none none NIR 1IIc 7e none none SCO 5 9 8 15 10IIc 7e none none SPN 67 41 31 22 36
Table 8.2.4 – Western Channel - Trend in nominal effort (kW*days at sea) by derogations given in Table 1 of Annex IIC (Coun. Reg. 40/2008), 2000-2007. Derogations are sorted by gear and special condition (SPECON). Data qualities are summarised in section 5.5.2 and Table 5.5.2.1.
ANNEX REG AREA REG GEAR SPECON 2000 2001 2002 2003 2004 2005 2006 2007 Rel. Change to 2002IIc 7e 3a none 2678981 3262672 3152268 3676583 3850150 3791630 3757893 3671953 0.16IIc 7e 3b none 329989 502521 747437 848923 857162 869626 735653 507833 -0.32IIc 7e none none 19921205 20968341 27614719 24499967 27113609 31140629 28159437 26729600 -0.03Sum 22930175 24733534 31514424 29025473 31820921 35801885 32652983 30909386 -0.02
Table 8.2.5 – Western Channel - Trend in effort (GT*days at sea) by derogations given in Table 1 of Annex IIC (Coun. Reg. 40/2008) and Member State, 2003-2007. Derogations are sorted by gear and special condition (SPECON). Data qualities are summarised in section 5.5.2 and Table 5.5.2.1.
ANNEX REG AREA REG GEAR SPECON 2003 2004 2005 2006 2007 Rel. Change to 2003IIc 7e 3a none 1076751 1155100 1127838 1126290 1147886 0.07IIc 7e 3b none 121439 120830 125513 107221 72836 -0.40IIc 7e none none 6278691 6467511 7390858 6908876 6065926 -0.03Sum 7476881 7743441 8644209 8142387 7286648 -0.03
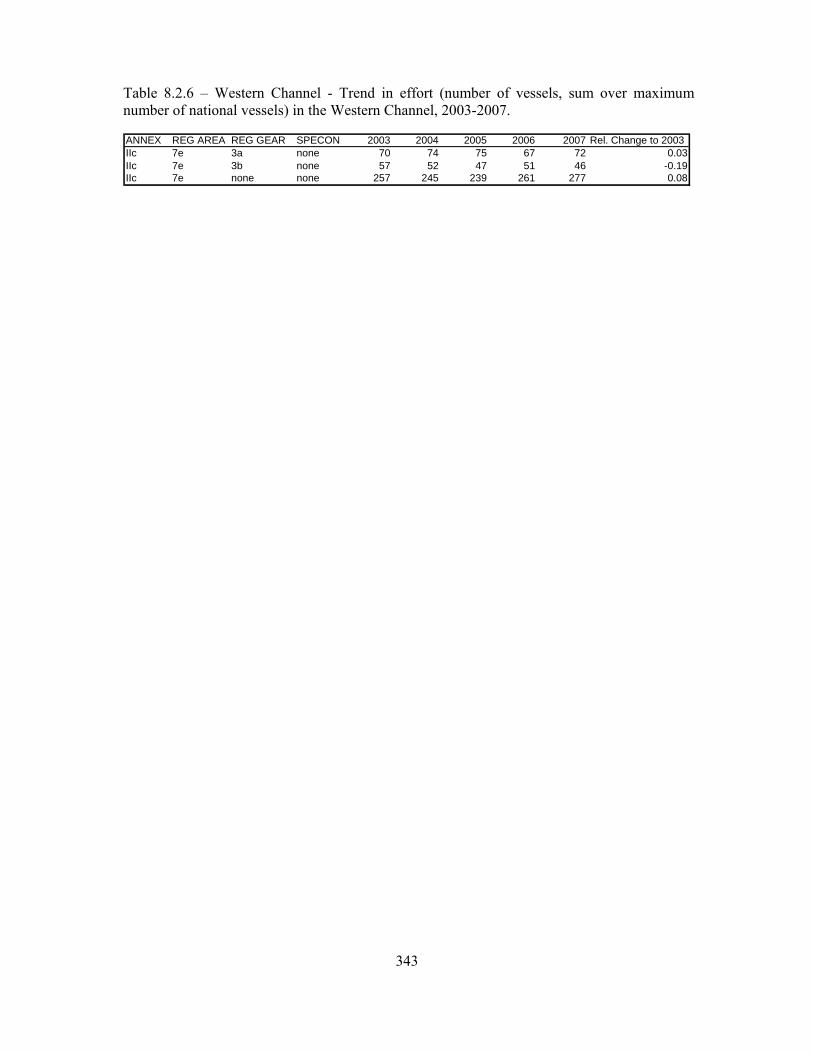
343
Table 8.2.6 – Western Channel - Trend in effort (number of vessels, sum over maximum number of national vessels) in the Western Channel, 2003-2007.
ANNEX REG AREA REG GEAR SPECON 2003 2004 2005 2006 2007 Rel. Change to 2003IIc 7e 3a none 70 74 75 67 72 0.03IIc 7e 3b none 57 52 47 51 46 -0.19IIc 7e none none 257 245 239 261 277 0.08
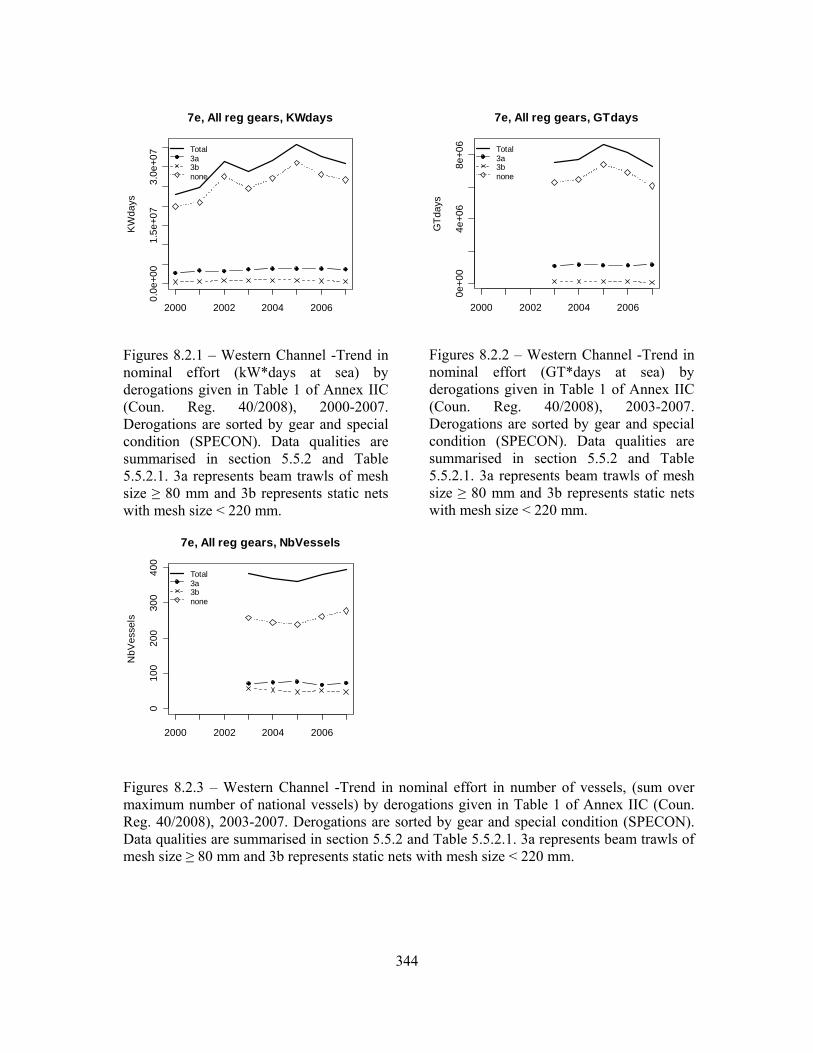
344
2000 2002 2004 2006
0.0e
+00
1.5e
+07
3.0e
+07
7e, All reg gears, KWdaysK
Wda
ys
Total3a3bnone
Figures 8.2.1 – Western Channel -Trend in nominal effort (kW*days at sea) by derogations given in Table 1 of Annex IIC (Coun. Reg. 40/2008), 2000-2007. Derogations are sorted by gear and special condition (SPECON). Data qualities are summarised in section 5.5.2 and Table 5.5.2.1. 3a represents beam trawls of mesh size ≥ 80 mm and 3b represents static nets with mesh size < 220 mm.
2000 2002 2004 2006
0e+0
04e
+06
8e+0
6
7e, All reg gears, GTdays
GTd
ays
Total3a3bnone
Figures 8.2.2 – Western Channel -Trend in nominal effort (GT*days at sea) by derogations given in Table 1 of Annex IIC (Coun. Reg. 40/2008), 2003-2007. Derogations are sorted by gear and special condition (SPECON). Data qualities are summarised in section 5.5.2 and Table 5.5.2.1. 3a represents beam trawls of mesh size ≥ 80 mm and 3b represents static nets with mesh size < 220 mm.
2000 2002 2004 2006
010
020
030
040
0
7e, All reg gears, NbVessels
NbV
esse
ls
Total3a3bnone
Figures 8.2.3 – Western Channel -Trend in nominal effort in number of vessels, (sum over maximum number of national vessels) by derogations given in Table 1 of Annex IIC (Coun. Reg. 40/2008), 2003-2007. Derogations are sorted by gear and special condition (SPECON). Data qualities are summarised in section 5.5.2 and Table 5.5.2.1. 3a represents beam trawls of mesh size ≥ 80 mm and 3b represents static nets with mesh size < 220 mm.
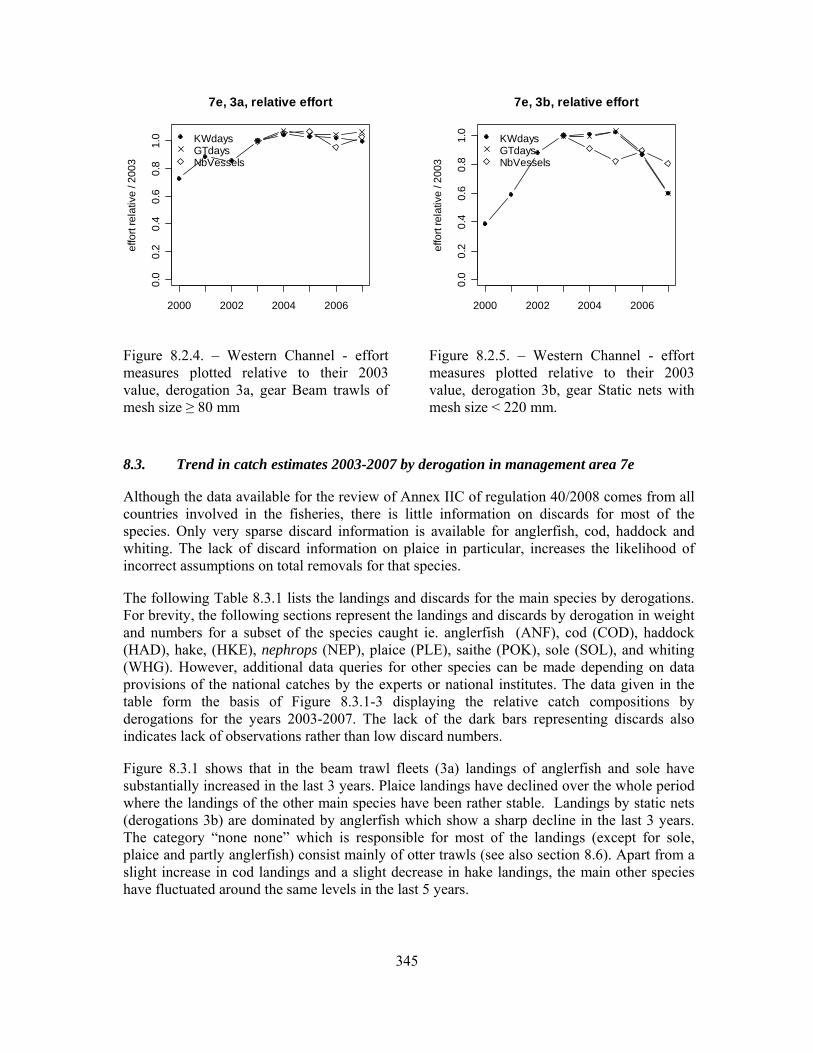
345
2000 2002 2004 2006
0.0
0.2
0.4
0.6
0.8
1.0
7e, 3a, relative effort
effo
rt re
lativ
e / 2
003
KWdaysGTdaysNbVessels
Figure 8.2.4. – Western Channel - effort measures plotted relative to their 2003 value, derogation 3a, gear Beam trawls of mesh size ≥ 80 mm
2000 2002 2004 2006
0.0
0.2
0.4
0.6
0.8
1.0
7e, 3b, relative effort
effo
rt re
lativ
e / 2
003
KWdaysGTdaysNbVessels
Figure 8.2.5. – Western Channel - effort measures plotted relative to their 2003 value, derogation 3b, gear Static nets with mesh size < 220 mm.
8.3. Trend in catch estimates 2003-2007 by derogation in management area 7e
Although the data available for the review of Annex IIC of regulation 40/2008 comes from all countries involved in the fisheries, there is little information on discards for most of the species. Only very sparse discard information is available for anglerfish, cod, haddock and whiting. The lack of discard information on plaice in particular, increases the likelihood of incorrect assumptions on total removals for that species.
The following Table 8.3.1 lists the landings and discards for the main species by derogations. For brevity, the following sections represent the landings and discards by derogation in weight and numbers for a subset of the species caught ie. anglerfish (ANF), cod (COD), haddock (HAD), hake, (HKE), nephrops (NEP), plaice (PLE), saithe (POK), sole (SOL), and whiting (WHG). However, additional data queries for other species can be made depending on data provisions of the national catches by the experts or national institutes. The data given in the table form the basis of Figure 8.3.1-3 displaying the relative catch compositions by derogations for the years 2003-2007. The lack of the dark bars representing discards also indicates lack of observations rather than low discard numbers.
Figure 8.3.1 shows that in the beam trawl fleets (3a) landings of anglerfish and sole have substantially increased in the last 3 years. Plaice landings have declined over the whole period where the landings of the other main species have been rather stable. Landings by static nets (derogations 3b) are dominated by anglerfish which show a sharp decline in the last 3 years. The category “none none” which is responsible for most of the landings (except for sole, plaice and partly anglerfish) consist mainly of otter trawls (see also section 8.6). Apart from a slight increase in cod landings and a slight decrease in hake landings, the main other species have fluctuated around the same levels in the last 5 years.
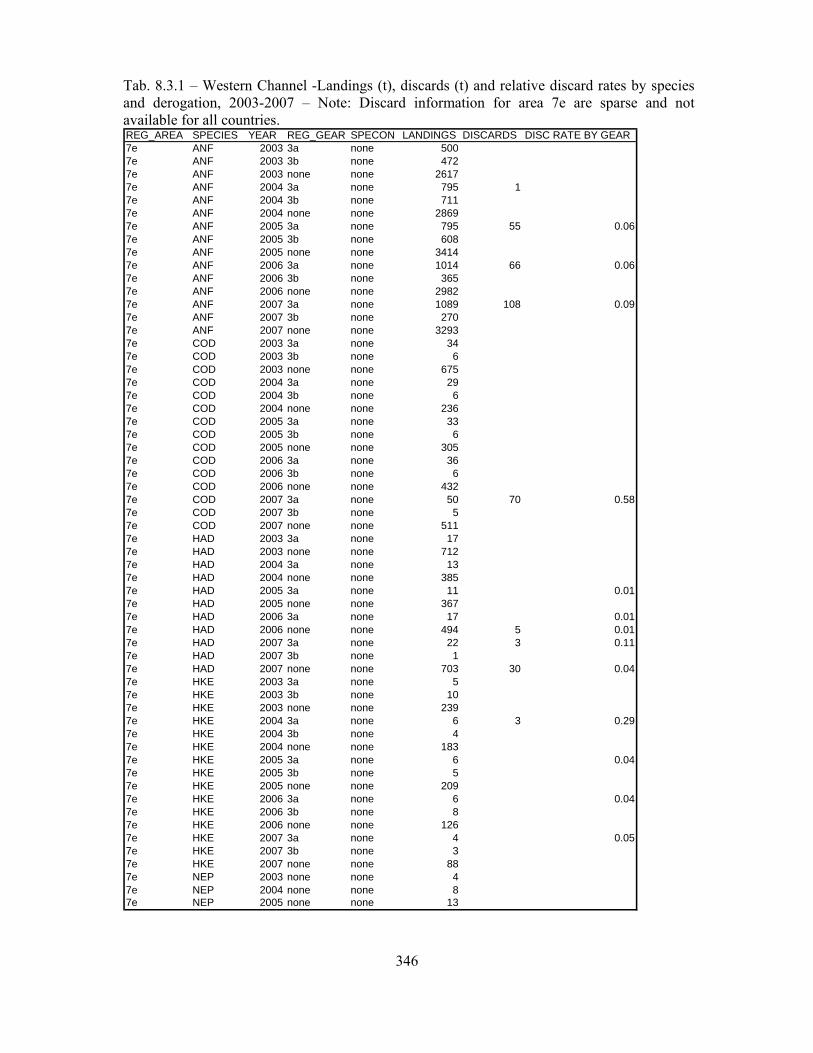
346
Tab. 8.3.1 – Western Channel -Landings (t), discards (t) and relative discard rates by species and derogation, 2003-2007 – Note: Discard information for area 7e are sparse and not available for all countries. REG_AREA SPECIES YEAR REG_GEAR SPECON LANDINGS DISCARDS DISC RATE BY GEAR7e ANF 2003 3a none 5007e ANF 2003 3b none 4727e ANF 2003 none none 26177e ANF 2004 3a none 795 17e ANF 2004 3b none 7117e ANF 2004 none none 28697e ANF 2005 3a none 795 55 0.067e ANF 2005 3b none 6087e ANF 2005 none none 34147e ANF 2006 3a none 1014 66 0.067e ANF 2006 3b none 3657e ANF 2006 none none 29827e ANF 2007 3a none 1089 108 0.097e ANF 2007 3b none 2707e ANF 2007 none none 32937e COD 2003 3a none 347e COD 2003 3b none 67e COD 2003 none none 6757e COD 2004 3a none 297e COD 2004 3b none 67e COD 2004 none none 2367e COD 2005 3a none 337e COD 2005 3b none 67e COD 2005 none none 3057e COD 2006 3a none 367e COD 2006 3b none 67e COD 2006 none none 4327e COD 2007 3a none 50 70 0.587e COD 2007 3b none 57e COD 2007 none none 5117e HAD 2003 3a none 177e HAD 2003 none none 7127e HAD 2004 3a none 137e HAD 2004 none none 3857e HAD 2005 3a none 11 0.017e HAD 2005 none none 3677e HAD 2006 3a none 17 0.017e HAD 2006 none none 494 5 0.017e HAD 2007 3a none 22 3 0.117e HAD 2007 3b none 17e HAD 2007 none none 703 30 0.047e HKE 2003 3a none 57e HKE 2003 3b none 107e HKE 2003 none none 2397e HKE 2004 3a none 6 3 0.297e HKE 2004 3b none 47e HKE 2004 none none 1837e HKE 2005 3a none 6 0.047e HKE 2005 3b none 57e HKE 2005 none none 2097e HKE 2006 3a none 6 0.047e HKE 2006 3b none 87e HKE 2006 none none 1267e HKE 2007 3a none 4 0.057e HKE 2007 3b none 37e HKE 2007 none none 887e NEP 2003 none none 47e NEP 2004 none none 87e NEP 2005 none none 13
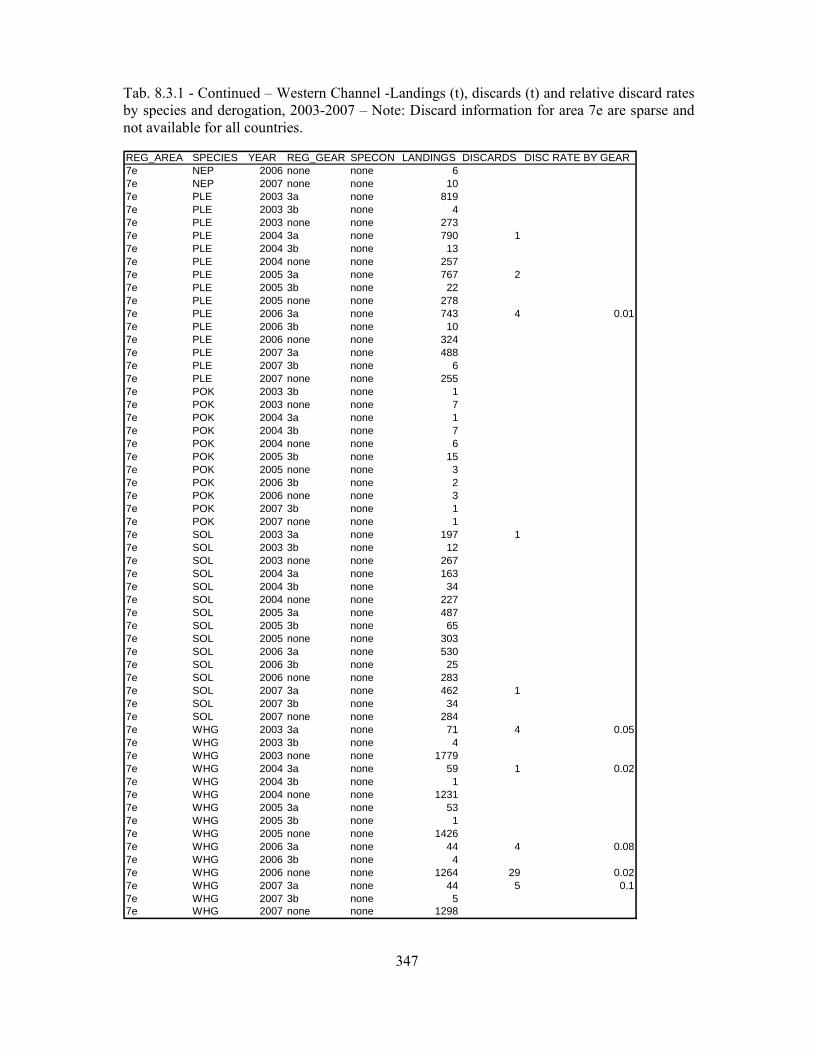
347
Tab. 8.3.1 - Continued – Western Channel -Landings (t), discards (t) and relative discard rates by species and derogation, 2003-2007 – Note: Discard information for area 7e are sparse and not available for all countries.
REG_AREA SPECIES YEAR REG_GEAR SPECON LANDINGS DISCARDS DISC RATE BY GEAR7e NEP 2006 none none 67e NEP 2007 none none 107e PLE 2003 3a none 8197e PLE 2003 3b none 47e PLE 2003 none none 2737e PLE 2004 3a none 790 17e PLE 2004 3b none 137e PLE 2004 none none 2577e PLE 2005 3a none 767 27e PLE 2005 3b none 227e PLE 2005 none none 2787e PLE 2006 3a none 743 4 0.017e PLE 2006 3b none 107e PLE 2006 none none 3247e PLE 2007 3a none 4887e PLE 2007 3b none 67e PLE 2007 none none 2557e POK 2003 3b none 17e POK 2003 none none 77e POK 2004 3a none 17e POK 2004 3b none 77e POK 2004 none none 67e POK 2005 3b none 157e POK 2005 none none 37e POK 2006 3b none 27e POK 2006 none none 37e POK 2007 3b none 17e POK 2007 none none 17e SOL 2003 3a none 197 17e SOL 2003 3b none 127e SOL 2003 none none 2677e SOL 2004 3a none 1637e SOL 2004 3b none 347e SOL 2004 none none 2277e SOL 2005 3a none 4877e SOL 2005 3b none 657e SOL 2005 none none 3037e SOL 2006 3a none 5307e SOL 2006 3b none 257e SOL 2006 none none 2837e SOL 2007 3a none 462 17e SOL 2007 3b none 347e SOL 2007 none none 2847e WHG 2003 3a none 71 4 0.057e WHG 2003 3b none 47e WHG 2003 none none 17797e WHG 2004 3a none 59 1 0.027e WHG 2004 3b none 17e WHG 2004 none none 12317e WHG 2005 3a none 537e WHG 2005 3b none 17e WHG 2005 none none 14267e WHG 2006 3a none 44 4 0.087e WHG 2006 3b none 47e WHG 2006 none none 1264 29 0.027e WHG 2007 3a none 44 5 0.17e WHG 2007 3b none 57e WHG 2007 none none 1298

348
In accordance with the ToR, Table 8.3.2 lists the landings and discards at age by derogation of cod, plaice and sole. The values are illustrated in Figures 8.3.2 and 8.3.3. Additional species specific data queries could be provided on request depending on data provisions by the experts or national institutes.
Although provided in Table 8.3.2, the cod age distribution is not graphically illustrated as cod is of minor importance in area 7e. However, STECF-SGRST notes that for plaice especially, very limited discard information is available which is unfortunate and therefore not showing the true picture of total removals. The age distribution of plaice and sole landings for the two derogations (3a and none-none) are very similar.
Table 8.3.2 – Western Channel - Cod (COD), plaice (PLE) and sole (SOL) landings (L) and discards (D) at ages 1-9 (‘000) by derogation, 2003-2007. – Note: Discard information for area 7e are sparse and not available for all countries.
SPECIES REG_AREA REG_ SPECON AGE 2003 L 2003 D 2004 L 2004 D 2005 L 2005 D 2006 L 2006 D 2007 L 2007 DCOD 7e 3a none 1 12 71COD 7e 3a none 2 6COD 7e 3a none 3COD 7e 3a none 4COD 7e 3a none 5COD 7e 3a none 6COD 7e 3a none 7COD 7e 3a none 8COD 7e 3a none 9COD 7e none none 1 8 304 801COD 7e none none 2 84 27 48 55COD 7e none none 3 12 4 33 4COD 7e none none 4 8 2 1COD 7e none none 5 1 6COD 7e none none 6 1COD 7e none none 7 1COD 7e none none 8COD 7e none none 9PLE 7e 3a none 1 19 17 1 13 1PLE 7e 3a none 2 359 369 1 494 9 475 16 130PLE 7e 3a none 3 592 833 485 1 685 420PLE 7e 3a none 4 420 446 389 2 285 307PLE 7e 3a none 5 197 228 158 1 291 150PLE 7e 3a none 6 199 110 85 102 106PLE 7e 3a none 7 210 66 31 60 41PLE 7e 3a none 8 49 89 32 24 19PLE 7e 3a none 9 38 19 30 15 7PLE 7e none none 1 3 1 6 1PLE 7e none none 2 132 232 276 321 1 148PLE 7e none none 3 187 383 322 1 493 434PLE 7e none none 4 108 174 247 171 225PLE 7e none none 5 38 46 76 109 61PLE 7e none none 6 31 23 29 34 37PLE 7e none none 7 25 8 8 16 13PLE 7e none none 8 4 6 8 5 4PLE 7e none none 9 2 2 7 2 3SOL 7e 3a none 1 5 1SOL 7e 3a none 2 32 3 74 1 107 165 103SOL 7e 3a none 3 195 4 251 1 207 349 502 1SOL 7e 3a none 4 280 4 94 314 192 338SOL 7e 3a none 5 166 64 153 281 143SOL 7e 3a none 6 45 85 185 118 159SOL 7e 3a none 7 39 14 161 162 86SOL 7e 3a none 8 23 21 31 170 90SOL 7e 3a none 9 14 10 41 65 82SOL 7e none none 1SOL 7e none none 2 4 2 34 44SOL 7e none none 3 18 14 71 196SOL 7e none none 4 10 28 49 122SOL 7e none none 5 9 25 84 44SOL 7e none none 6 12 36 34 28SOL 7e none none 7 2 26 44 16SOL 7e none none 8 3 5 37 12SOL 7e none none 9 1 8 12 11
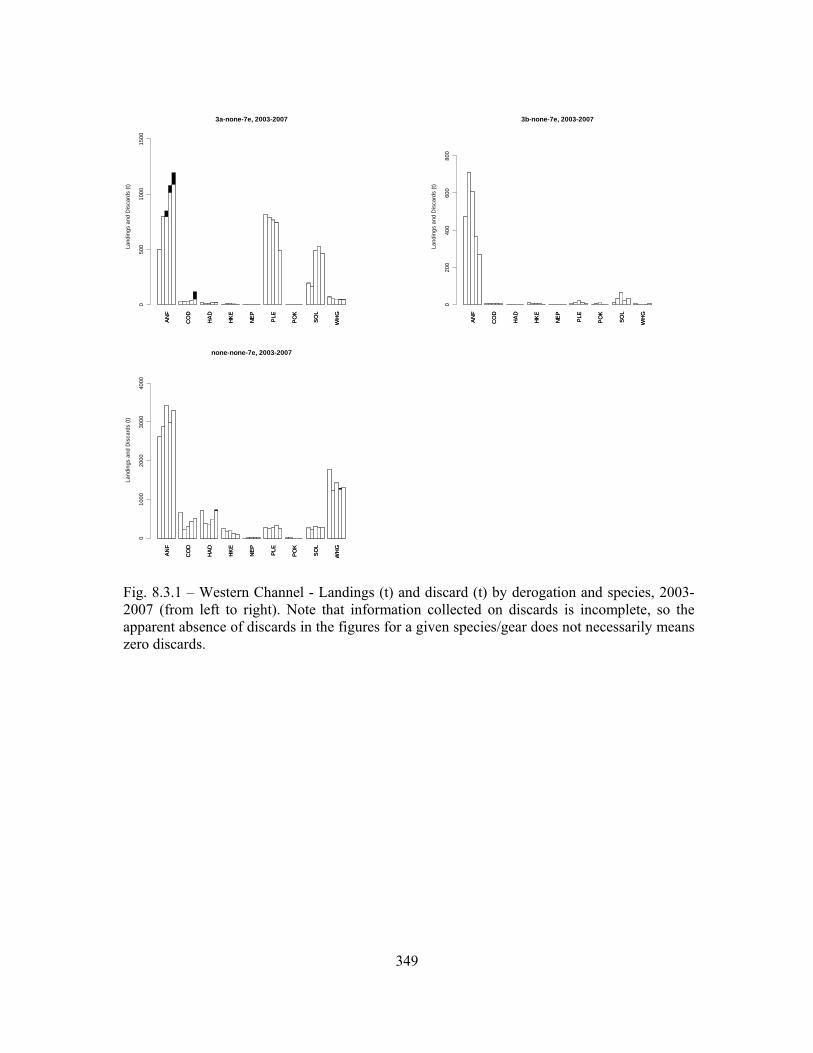
349
AN
F
CO
D
HA
D
HK
E
NE
P
PLE
PO
K
SO
L
WH
G
3a-none-7e, 2003-2007La
ndin
gs a
nd D
isca
rds
(t)
050
010
0015
00
AN
F
CO
D
HA
D
HK
E
NE
P
PLE
PO
K
SO
L
WH
G
AN
F
CO
D
HA
D
HK
E
NE
P
PLE
PO
K
SO
L
WH
G
none-none-7e, 2003-2007
Land
ings
and
Dis
card
s (t)
010
0020
0030
0040
00
AN
F
CO
D
HA
D
HK
E
NE
P
PLE
PO
K
SO
L
WH
G
AN
F
CO
D
HA
D
HK
E
NE
P
PLE
PO
K
SO
L
WH
G
3b-none-7e, 2003-2007
Land
ings
and
Dis
card
s (t)
020
040
060
080
0
AN
F
CO
D
HA
D
HK
E
NE
P
PLE
PO
K
SO
L
WH
G
Fig. 8.3.1 – Western Channel - Landings (t) and discard (t) by derogation and species, 2003-2007 (from left to right). Note that information collected on discards is incomplete, so the apparent absence of discards in the figures for a given species/gear does not necessarily means zero discards.
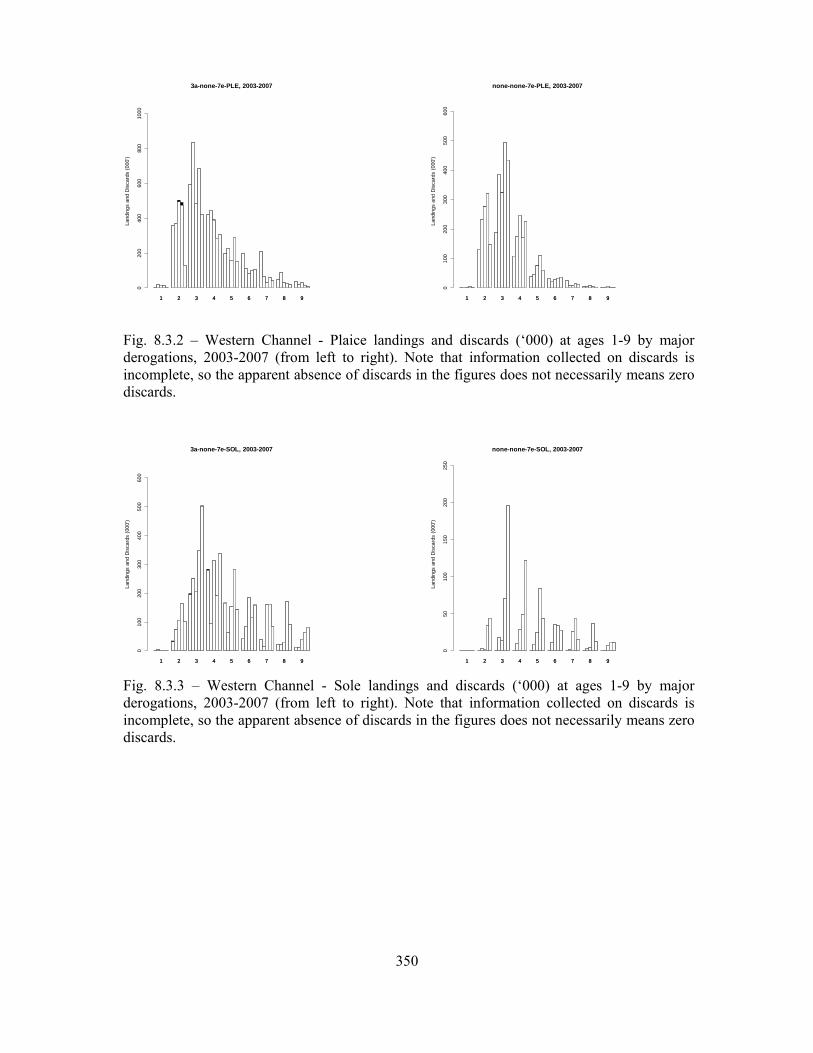
350
1 2 3 4 5 6 7 8 9
3a-none-7e-PLE, 2003-2007
Land
ings
and
Dis
card
s (0
00')
020
040
060
080
010
00
1 2 3 4 5 6 7 8 9
1 2 3 4 5 6 7 8 9
none-none-7e-PLE, 2003-2007
Land
ings
and
Dis
card
s (0
00')
010
020
030
040
050
060
0
1 2 3 4 5 6 7 8 9
Fig. 8.3.2 – Western Channel - Plaice landings and discards (‘000) at ages 1-9 by major derogations, 2003-2007 (from left to right). Note that information collected on discards is incomplete, so the apparent absence of discards in the figures does not necessarily means zero discards.
1 2 3 4 5 6 7 8 9
3a-none-7e-SOL, 2003-2007
Land
ings
and
Dis
card
s (0
00')
010
020
030
040
050
060
0
1 2 3 4 5 6 7 8 9 1 2 3 4 5 6 7 8 9
none-none-7e-SOL, 2003-2007
Land
ings
and
Dis
card
s (0
00')
050
100
150
200
250
1 2 3 4 5 6 7 8 9 Fig. 8.3.3 – Western Channel - Sole landings and discards (‘000) at ages 1-9 by major derogations, 2003-2007 (from left to right). Note that information collected on discards is incomplete, so the apparent absence of discards in the figures does not necessarily means zero discards.
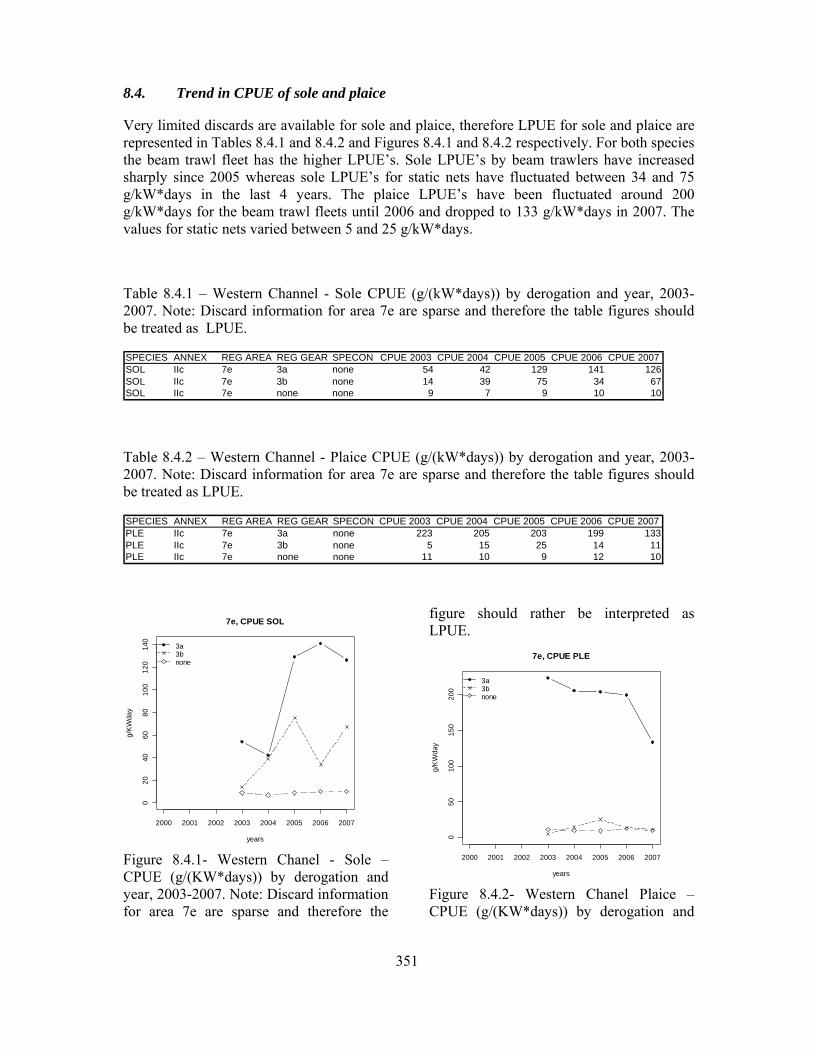
351
8.4. Trend in CPUE of sole and plaice
Very limited discards are available for sole and plaice, therefore LPUE for sole and plaice are represented in Tables 8.4.1 and 8.4.2 and Figures 8.4.1 and 8.4.2 respectively. For both species the beam trawl fleet has the higher LPUE’s. Sole LPUE’s by beam trawlers have increased sharply since 2005 whereas sole LPUE’s for static nets have fluctuated between 34 and 75 g/kW*days in the last 4 years. The plaice LPUE’s have been fluctuated around 200 g/kW*days for the beam trawl fleets until 2006 and dropped to 133 g/kW*days in 2007. The values for static nets varied between 5 and 25 g/kW*days.
Table 8.4.1 – Western Channel - Sole CPUE (g/(kW*days)) by derogation and year, 2003-2007. Note: Discard information for area 7e are sparse and therefore the table figures should be treated as LPUE.
SPECIES ANNEX REG AREA REG GEAR SPECON CPUE 2003 CPUE 2004 CPUE 2005 CPUE 2006 CPUE 2007SOL IIc 7e 3a none 54 42 129 141 126SOL IIc 7e 3b none 14 39 75 34 67SOL IIc 7e none none 9 7 9 10 10
Table 8.4.2 – Western Channel - Plaice CPUE (g/(kW*days)) by derogation and year, 2003-2007. Note: Discard information for area 7e are sparse and therefore the table figures should be treated as LPUE.
SPECIES ANNEX REG AREA REG GEAR SPECON CPUE 2003 CPUE 2004 CPUE 2005 CPUE 2006 CPUE 2007PLE IIc 7e 3a none 223 205 203 199 133PLE IIc 7e 3b none 5 15 25 14 11PLE IIc 7e none none 11 10 9 12 10
2000 2001 2002 2003 2004 2005 2006 2007
020
4060
8010
012
014
0
7e, CPUE SOL
years
g/K
Wda
y
3a3bnone
Figure 8.4.1- Western Chanel - Sole – CPUE (g/(KW*days)) by derogation and year, 2003-2007. Note: Discard information for area 7e are sparse and therefore the
figure should rather be interpreted as LPUE.
2000 2001 2002 2003 2004 2005 2006 2007
050
100
150
200
7e, CPUE PLE
years
g/K
Wda
y
3a3bnone
Figure 8.4.2- Western Chanel Plaice – CPUE (g/(KW*days)) by derogation and
352
year, 2003-2007. Note: Discard information for area 7e are sparse and therefore the figure should rather be interpreted as LPUE.
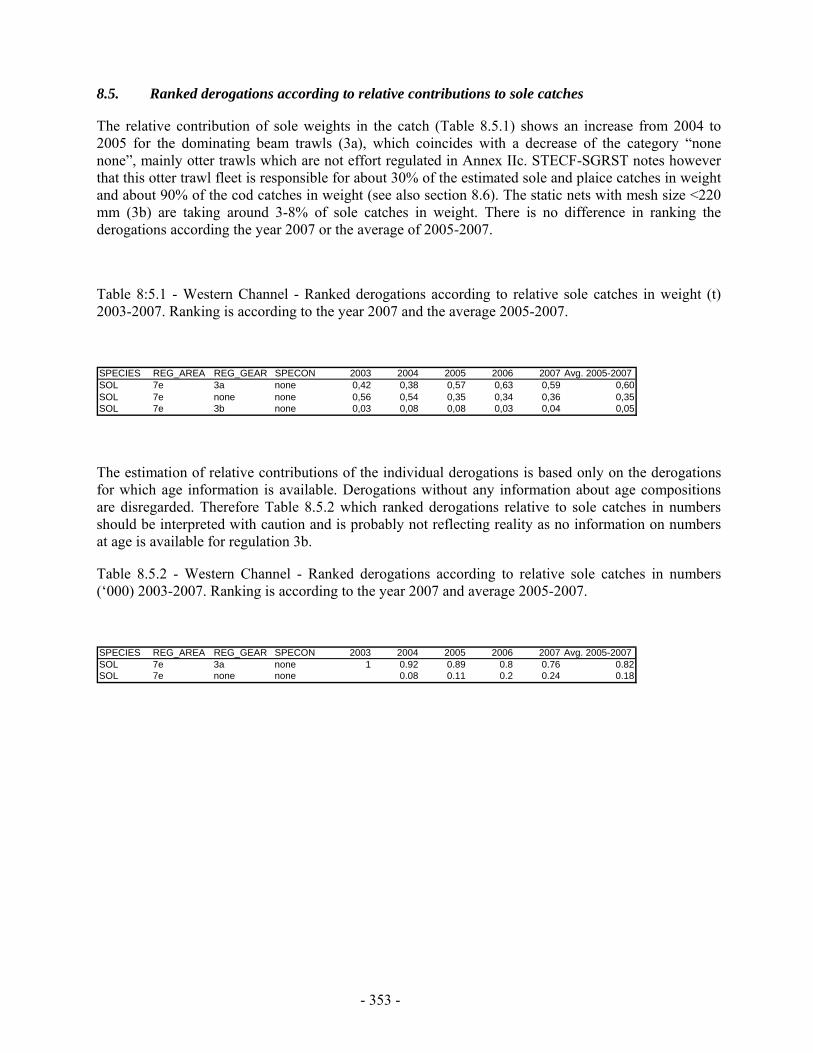
- 353 -
8.5. Ranked derogations according to relative contributions to sole catches
The relative contribution of sole weights in the catch (Table 8.5.1) shows an increase from 2004 to 2005 for the dominating beam trawls (3a), which coincides with a decrease of the category “none none”, mainly otter trawls which are not effort regulated in Annex IIc. STECF-SGRST notes however that this otter trawl fleet is responsible for about 30% of the estimated sole and plaice catches in weight and about 90% of the cod catches in weight (see also section 8.6). The static nets with mesh size <220 mm (3b) are taking around 3-8% of sole catches in weight. There is no difference in ranking the derogations according the year 2007 or the average of 2005-2007.
Table 8:5.1 - Western Channel - Ranked derogations according to relative sole catches in weight (t) 2003-2007. Ranking is according to the year 2007 and the average 2005-2007.
SPECIES REG_AREA REG_GEAR SPECON 2003 2004 2005 2006 2007 Avg. 2005-2007SOL 7e 3a none 0,42 0,38 0,57 0,63 0,59 0,60SOL 7e none none 0,56 0,54 0,35 0,34 0,36 0,35SOL 7e 3b none 0,03 0,08 0,08 0,03 0,04 0,05
The estimation of relative contributions of the individual derogations is based only on the derogations for which age information is available. Derogations without any information about age compositions are disregarded. Therefore Table 8.5.2 which ranked derogations relative to sole catches in numbers should be interpreted with caution and is probably not reflecting reality as no information on numbers at age is available for regulation 3b.
Table 8.5.2 - Western Channel - Ranked derogations according to relative sole catches in numbers (‘000) 2003-2007. Ranking is according to the year 2007 and average 2005-2007.
SPECIES REG_AREA REG_GEAR SPECON 2003 2004 2005 2006 2007 Avg. 2005-2007SOL 7e 3a none 1 0.92 0.89 0.8 0.76 0.82SOL 7e none none 0.08 0.11 0.2 0.24 0.18

- 354 -
8.6. Unregulated gear in management area 7e
Category ‘none none’ represents unregulated gear types and mesh sizes in addition to unidentified mesh sizes. This section provides a break down of the main gears within this category in terms of effort (kW*Days at sea) and cod, sole and plaice catches.
The effort of the unregulated gear group ‘None none’ has been around 85% of the overall nominal effort for the whole time series.
Table 8.6.1 shows the disaggregation of the ‘none none’ category into the different gears and mesh sizes. Effort by otter trawl with mesh size 80-89 mm is by far the dominant gear category with percentages in excess of 47% for all years. Dredge gears, otter trawl (mesh size 100-119), pots, pelagic trawl (mesh 32-54) and longline, each contribute about 5% of the overall effort of the non regulated gear. The rest of the gears account for less then 3% .
Table 8.6.2 provides the cod catches of the unregulated gear types. The cod catches of the unregulated gear are in excess of 87% of the overall cod catches in area 7e for each year of the data series (2003-2007). The otter trawl fleet is taking the bulk of these catches with percentages in excess of 82%. For 2007 the unregulated gears account for 90% of the overall cod catches where the otter trawl fleet is responsible for 89% of these catches.
Table 8.6.3 provides the sole catches of the unregulated gear types. The sole catches of the unregulated gear are in excess of 34% of the overall sole catches in area 7e for each year of the data series (2003-2007). The otter trawl fleet is the main fleet involved with percentages in excess of 24%. For 2007 the unregulated gears account for 36% of the overall sole catches where the otter trawl fleet is responsible for 29% of these catches.
Table 8.6.4 provides the plaice catches of the unregulated gear types. The plaice catches of the unregulated gear are in excess of 24% of the overall plaice catches in area 7e for each year of the data series (2003-2007). The otter trawl fleet is the main fleet involved with percentages in excess of 21%. For 2007 the unregulated gears account for 34% of the overall plaice catches where the otter trawl fleet is responsible for 32% of these catches.
Again STECF-SGRST would like to mention that there is little information on discards for area 7e and therefore that the above percentages are more likely to be representative for landings than for total catches.
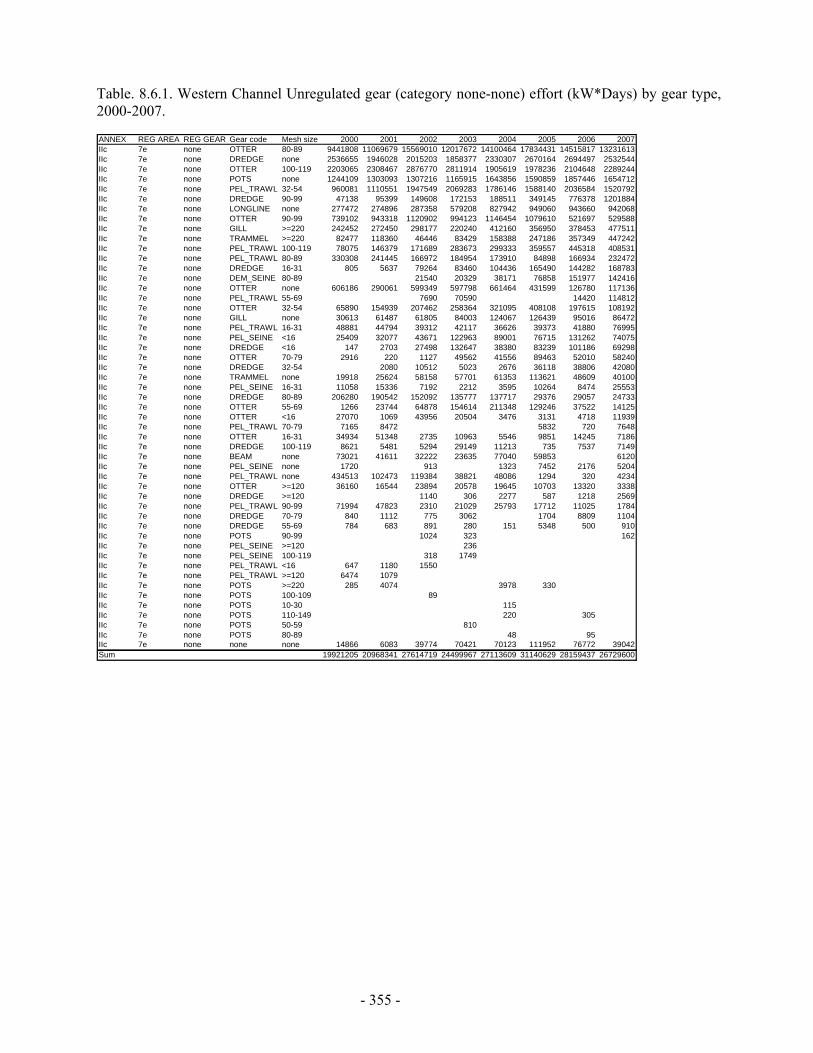
- 355 -
Table. 8.6.1. Western Channel Unregulated gear (category none-none) effort (kW*Days) by gear type, 2000-2007.
ANNEX REG AREA REG GEAR Gear code Mesh size 2000 2001 2002 2003 2004 2005 2006 2007IIc 7e none OTTER 80-89 9441808 11069679 15569010 12017672 14100464 17834431 14515817 13231613IIc 7e none DREDGE none 2536655 1946028 2015203 1858377 2330307 2670164 2694497 2532544IIc 7e none OTTER 100-119 2203065 2308467 2876770 2811914 1905619 1978236 2104648 2289244IIc 7e none POTS none 1244109 1303093 1307216 1165915 1643856 1590859 1857446 1654712IIc 7e none PEL_TRAWL 32-54 960081 1110551 1947549 2069283 1786146 1588140 2036584 1520792IIc 7e none DREDGE 90-99 47138 95399 149608 172153 188511 349145 776378 1201884IIc 7e none LONGLINE none 277472 274896 287358 579208 827942 949060 943660 942068IIc 7e none OTTER 90-99 739102 943318 1120902 994123 1146454 1079610 521697 529588IIc 7e none GILL >=220 242452 272450 298177 220240 412160 356950 378453 477511IIc 7e none TRAMMEL >=220 82477 118360 46446 83429 158388 247186 357349 447242IIc 7e none PEL_TRAWL 100-119 78075 146379 171689 283673 299333 359557 445318 408531IIc 7e none PEL_TRAWL 80-89 330308 241445 166972 184954 173910 84898 166934 232472IIc 7e none DREDGE 16-31 805 5637 79264 83460 104436 165490 144282 168783IIc 7e none DEM_SEINE 80-89 21540 20329 38171 76858 151977 142416IIc 7e none OTTER none 606186 290061 599349 597798 661464 431599 126780 117136IIc 7e none PEL_TRAWL 55-69 7690 70590 14420 114812IIc 7e none OTTER 32-54 65890 154939 207462 258364 321095 408108 197615 108192IIc 7e none GILL none 30613 61487 61805 84003 124067 126439 95016 86472IIc 7e none PEL_TRAWL 16-31 48881 44794 39312 42117 36626 39373 41880 76995IIc 7e none PEL_SEINE <16 25409 32077 43671 122963 89001 76715 131262 74075IIc 7e none DREDGE <16 147 2703 27498 132647 38380 83239 101186 69298IIc 7e none OTTER 70-79 2916 220 1127 49562 41556 89463 52010 58240IIc 7e none DREDGE 32-54 2080 10512 5023 2676 36118 38806 42080IIc 7e none TRAMMEL none 19918 25624 58158 57701 61353 113621 48609 40100IIc 7e none PEL_SEINE 16-31 11058 15336 7192 2212 3595 10264 8474 25553IIc 7e none DREDGE 80-89 206280 190542 152092 135777 137717 29376 29057 24733IIc 7e none OTTER 55-69 1266 23744 64878 154614 211348 129246 37522 14125IIc 7e none OTTER <16 27070 1069 43956 20504 3476 3131 4718 11939IIc 7e none PEL_TRAWL 70-79 7165 8472 5832 720 7648IIc 7e none OTTER 16-31 34934 51348 2735 10963 5546 9851 14245 7186IIc 7e none DREDGE 100-119 8621 5481 5294 29149 11213 735 7537 7149IIc 7e none BEAM none 73021 41611 32222 23635 77040 59853 6120IIc 7e none PEL_SEINE none 1720 913 1323 7452 2176 5204IIc 7e none PEL_TRAWL none 434513 102473 119384 38821 48086 1294 320 4234IIc 7e none OTTER >=120 36160 16544 23894 20578 19645 10703 13320 3338IIc 7e none DREDGE >=120 1140 306 2277 587 1218 2569IIc 7e none PEL_TRAWL 90-99 71994 47823 2310 21029 25793 17712 11025 1784IIc 7e none DREDGE 70-79 840 1112 775 3062 1704 8809 1104IIc 7e none DREDGE 55-69 784 683 891 280 151 5348 500 910IIc 7e none POTS 90-99 1024 323 162IIc 7e none PEL_SEINE >=120 236IIc 7e none PEL_SEINE 100-119 318 1749IIc 7e none PEL_TRAWL <16 647 1180 1550IIc 7e none PEL_TRAWL >=120 6474 1079IIc 7e none POTS >=220 285 4074 3978 330IIc 7e none POTS 100-109 89IIc 7e none POTS 10-30 115IIc 7e none POTS 110-149 220 305IIc 7e none POTS 50-59 810IIc 7e none POTS 80-89 48 95IIc 7e none none none 14866 6083 39774 70421 70123 111952 76772 39042Sum 19921205 20968341 27614719 24499967 27113609 31140629 28159437 26729600
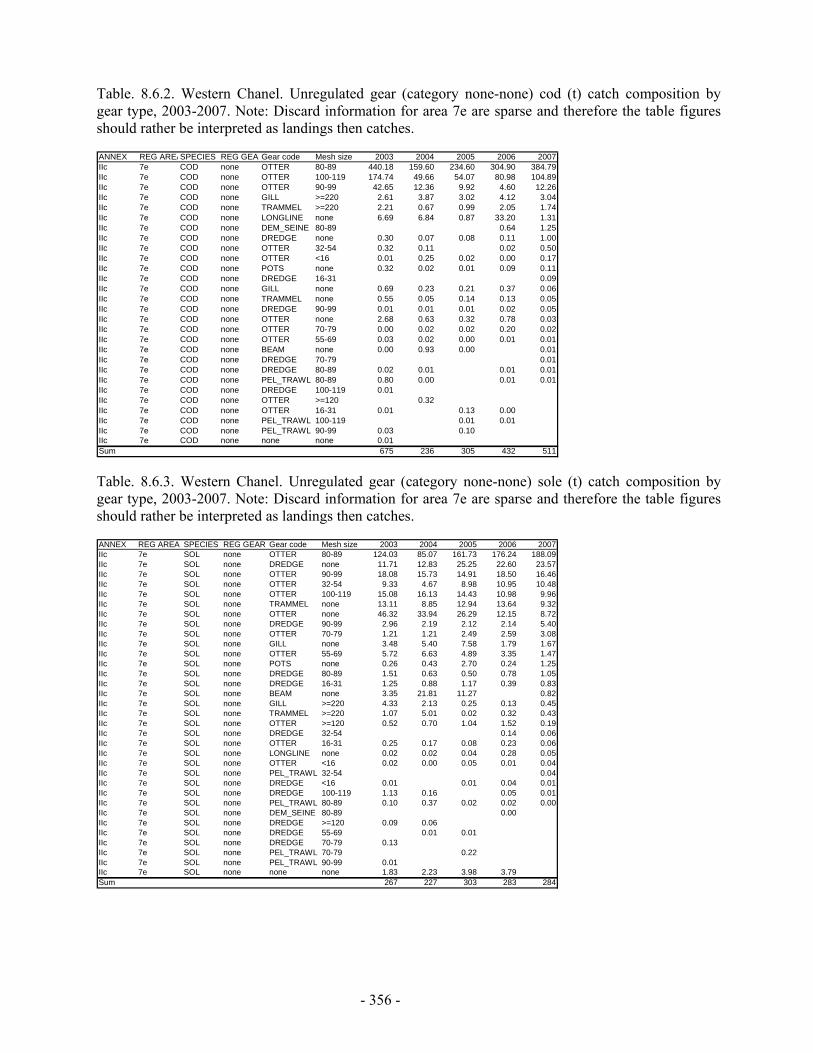
- 356 -
Table. 8.6.2. Western Chanel. Unregulated gear (category none-none) cod (t) catch composition by gear type, 2003-2007. Note: Discard information for area 7e are sparse and therefore the table figures should rather be interpreted as landings then catches.
ANNEX REG AREASPECIES REG GEARGear code Mesh size 2003 2004 2005 2006 2007IIc 7e COD none OTTER 80-89 440.18 159.60 234.60 304.90 384.79IIc 7e COD none OTTER 100-119 174.74 49.66 54.07 80.98 104.89IIc 7e COD none OTTER 90-99 42.65 12.36 9.92 4.60 12.26IIc 7e COD none GILL >=220 2.61 3.87 3.02 4.12 3.04IIc 7e COD none TRAMMEL >=220 2.21 0.67 0.99 2.05 1.74IIc 7e COD none LONGLINE none 6.69 6.84 0.87 33.20 1.31IIc 7e COD none DEM_SEINE 80-89 0.64 1.25IIc 7e COD none DREDGE none 0.30 0.07 0.08 0.11 1.00IIc 7e COD none OTTER 32-54 0.32 0.11 0.02 0.50IIc 7e COD none OTTER <16 0.01 0.25 0.02 0.00 0.17IIc 7e COD none POTS none 0.32 0.02 0.01 0.09 0.11IIc 7e COD none DREDGE 16-31 0.09IIc 7e COD none GILL none 0.69 0.23 0.21 0.37 0.06IIc 7e COD none TRAMMEL none 0.55 0.05 0.14 0.13 0.05IIc 7e COD none DREDGE 90-99 0.01 0.01 0.01 0.02 0.05IIc 7e COD none OTTER none 2.68 0.63 0.32 0.78 0.03IIc 7e COD none OTTER 70-79 0.00 0.02 0.02 0.20 0.02IIc 7e COD none OTTER 55-69 0.03 0.02 0.00 0.01 0.01IIc 7e COD none BEAM none 0.00 0.93 0.00 0.01IIc 7e COD none DREDGE 70-79 0.01IIc 7e COD none DREDGE 80-89 0.02 0.01 0.01 0.01IIc 7e COD none PEL_TRAWL 80-89 0.80 0.00 0.01 0.01IIc 7e COD none DREDGE 100-119 0.01IIc 7e COD none OTTER >=120 0.32IIc 7e COD none OTTER 16-31 0.01 0.13 0.00IIc 7e COD none PEL_TRAWL 100-119 0.01 0.01IIc 7e COD none PEL_TRAWL 90-99 0.03 0.10IIc 7e COD none none none 0.01Sum 675 236 305 432 511
Table. 8.6.3. Western Chanel. Unregulated gear (category none-none) sole (t) catch composition by gear type, 2003-2007. Note: Discard information for area 7e are sparse and therefore the table figures should rather be interpreted as landings then catches.
ANNEX REG AREA SPECIES REG GEAR Gear code Mesh size 2003 2004 2005 2006 2007IIc 7e SOL none OTTER 80-89 124.03 85.07 161.73 176.24 188.09IIc 7e SOL none DREDGE none 11.71 12.83 25.25 22.60 23.57IIc 7e SOL none OTTER 90-99 18.08 15.73 14.91 18.50 16.46IIc 7e SOL none OTTER 32-54 9.33 4.67 8.98 10.95 10.48IIc 7e SOL none OTTER 100-119 15.08 16.13 14.43 10.98 9.96IIc 7e SOL none TRAMMEL none 13.11 8.85 12.94 13.64 9.32IIc 7e SOL none OTTER none 46.32 33.94 26.29 12.15 8.72IIc 7e SOL none DREDGE 90-99 2.96 2.19 2.12 2.14 5.40IIc 7e SOL none OTTER 70-79 1.21 1.21 2.49 2.59 3.08IIc 7e SOL none GILL none 3.48 5.40 7.58 1.79 1.67IIc 7e SOL none OTTER 55-69 5.72 6.63 4.89 3.35 1.47IIc 7e SOL none POTS none 0.26 0.43 2.70 0.24 1.25IIc 7e SOL none DREDGE 80-89 1.51 0.63 0.50 0.78 1.05IIc 7e SOL none DREDGE 16-31 1.25 0.88 1.17 0.39 0.83IIc 7e SOL none BEAM none 3.35 21.81 11.27 0.82IIc 7e SOL none GILL >=220 4.33 2.13 0.25 0.13 0.45IIc 7e SOL none TRAMMEL >=220 1.07 5.01 0.02 0.32 0.43IIc 7e SOL none OTTER >=120 0.52 0.70 1.04 1.52 0.19IIc 7e SOL none DREDGE 32-54 0.14 0.06IIc 7e SOL none OTTER 16-31 0.25 0.17 0.08 0.23 0.06IIc 7e SOL none LONGLINE none 0.02 0.02 0.04 0.28 0.05IIc 7e SOL none OTTER <16 0.02 0.00 0.05 0.01 0.04IIc 7e SOL none PEL_TRAWL 32-54 0.04IIc 7e SOL none DREDGE <16 0.01 0.01 0.04 0.01IIc 7e SOL none DREDGE 100-119 1.13 0.16 0.05 0.01IIc 7e SOL none PEL_TRAWL 80-89 0.10 0.37 0.02 0.02 0.00IIc 7e SOL none DEM_SEINE 80-89 0.00IIc 7e SOL none DREDGE >=120 0.09 0.06IIc 7e SOL none DREDGE 55-69 0.01 0.01IIc 7e SOL none DREDGE 70-79 0.13IIc 7e SOL none PEL_TRAWL 70-79 0.22IIc 7e SOL none PEL_TRAWL 90-99 0.01IIc 7e SOL none none none 1.83 2.23 3.98 3.79Sum 267 227 303 283 284
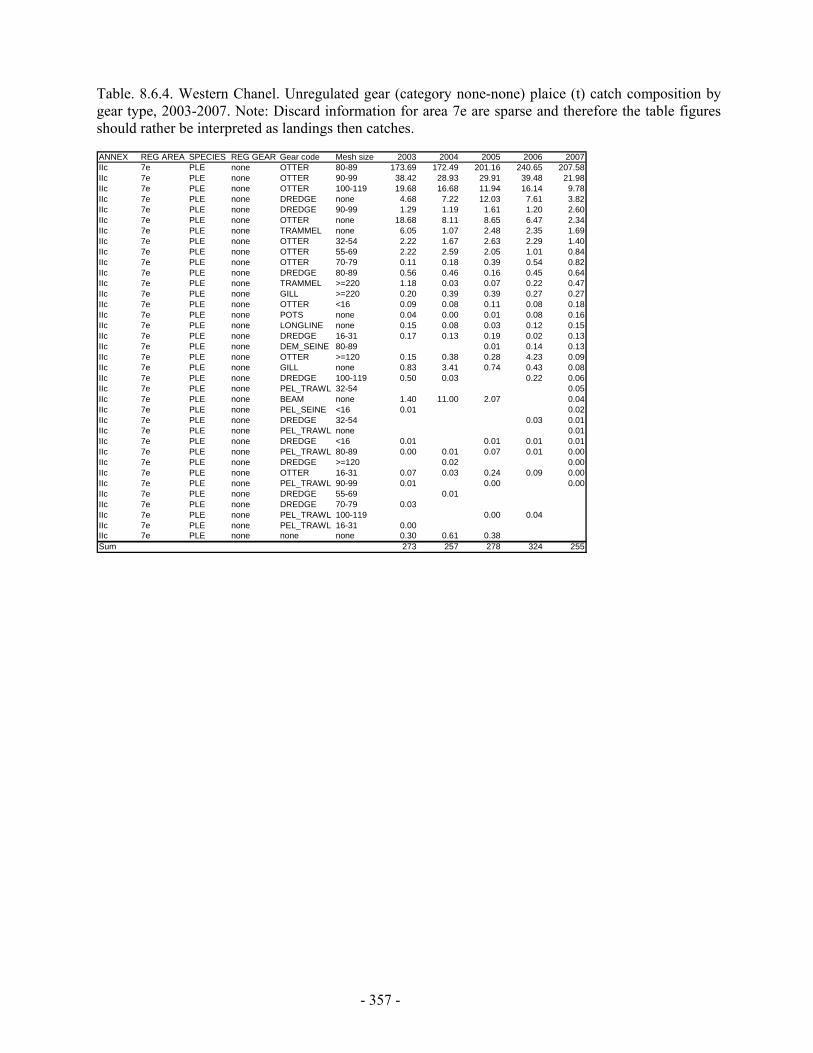
- 357 -
Table. 8.6.4. Western Chanel. Unregulated gear (category none-none) plaice (t) catch composition by gear type, 2003-2007. Note: Discard information for area 7e are sparse and therefore the table figures should rather be interpreted as landings then catches.
ANNEX REG AREA SPECIES REG GEAR Gear code Mesh size 2003 2004 2005 2006 2007IIc 7e PLE none OTTER 80-89 173.69 172.49 201.16 240.65 207.58IIc 7e PLE none OTTER 90-99 38.42 28.93 29.91 39.48 21.98IIc 7e PLE none OTTER 100-119 19.68 16.68 11.94 16.14 9.78IIc 7e PLE none DREDGE none 4.68 7.22 12.03 7.61 3.82IIc 7e PLE none DREDGE 90-99 1.29 1.19 1.61 1.20 2.60IIc 7e PLE none OTTER none 18.68 8.11 8.65 6.47 2.34IIc 7e PLE none TRAMMEL none 6.05 1.07 2.48 2.35 1.69IIc 7e PLE none OTTER 32-54 2.22 1.67 2.63 2.29 1.40IIc 7e PLE none OTTER 55-69 2.22 2.59 2.05 1.01 0.84IIc 7e PLE none OTTER 70-79 0.11 0.18 0.39 0.54 0.82IIc 7e PLE none DREDGE 80-89 0.56 0.46 0.16 0.45 0.64IIc 7e PLE none TRAMMEL >=220 1.18 0.03 0.07 0.22 0.47IIc 7e PLE none GILL >=220 0.20 0.39 0.39 0.27 0.27IIc 7e PLE none OTTER <16 0.09 0.08 0.11 0.08 0.18IIc 7e PLE none POTS none 0.04 0.00 0.01 0.08 0.16IIc 7e PLE none LONGLINE none 0.15 0.08 0.03 0.12 0.15IIc 7e PLE none DREDGE 16-31 0.17 0.13 0.19 0.02 0.13IIc 7e PLE none DEM_SEINE 80-89 0.01 0.14 0.13IIc 7e PLE none OTTER >=120 0.15 0.38 0.28 4.23 0.09IIc 7e PLE none GILL none 0.83 3.41 0.74 0.43 0.08IIc 7e PLE none DREDGE 100-119 0.50 0.03 0.22 0.06IIc 7e PLE none PEL_TRAWL 32-54 0.05IIc 7e PLE none BEAM none 1.40 11.00 2.07 0.04IIc 7e PLE none PEL_SEINE <16 0.01 0.02IIc 7e PLE none DREDGE 32-54 0.03 0.01IIc 7e PLE none PEL_TRAWL none 0.01IIc 7e PLE none DREDGE <16 0.01 0.01 0.01 0.01IIc 7e PLE none PEL_TRAWL 80-89 0.00 0.01 0.07 0.01 0.00IIc 7e PLE none DREDGE >=120 0.02 0.00IIc 7e PLE none OTTER 16-31 0.07 0.03 0.24 0.09 0.00IIc 7e PLE none PEL_TRAWL 90-99 0.01 0.00 0.00IIc 7e PLE none DREDGE 55-69 0.01IIc 7e PLE none DREDGE 70-79 0.03IIc 7e PLE none PEL_TRAWL 100-119 0.00 0.04IIc 7e PLE none PEL_TRAWL 16-31 0.00IIc 7e PLE none none none 0.30 0.61 0.38Sum 273 257 278 324 255
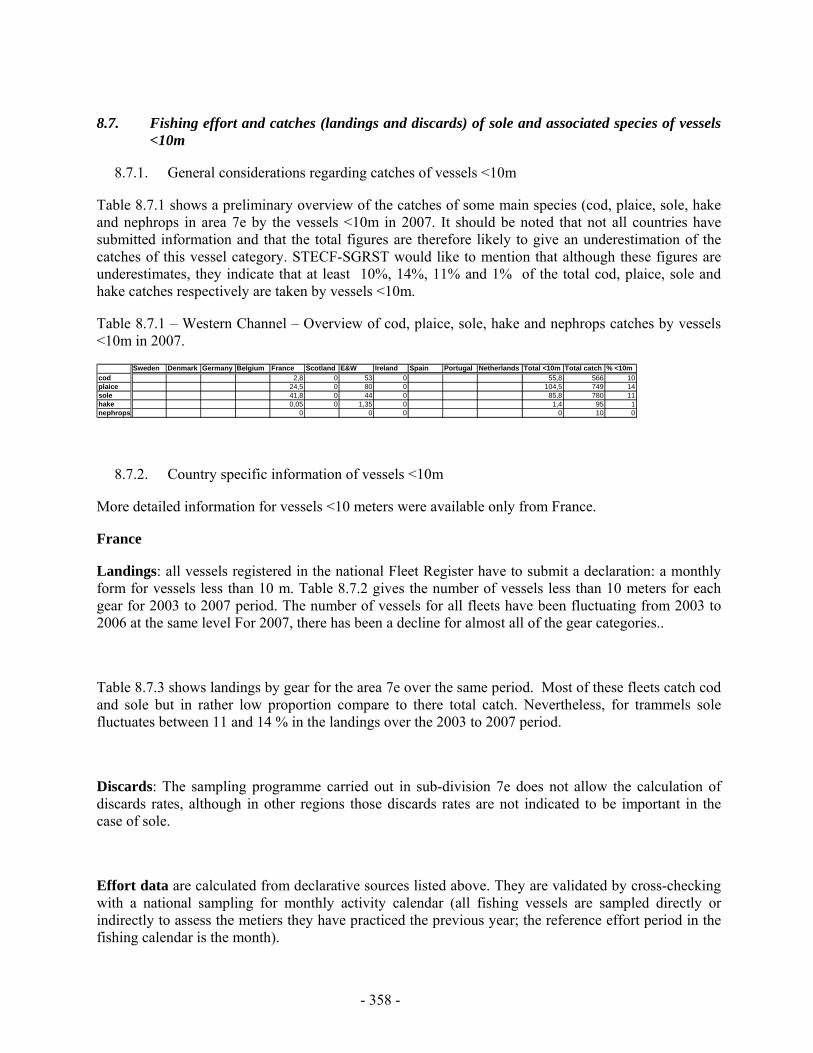
- 358 -
8.7. Fishing effort and catches (landings and discards) of sole and associated species of vessels <10m
8.7.1. General considerations regarding catches of vessels <10m
Table 8.7.1 shows a preliminary overview of the catches of some main species (cod, plaice, sole, hake and nephrops in area 7e by the vessels <10m in 2007. It should be noted that not all countries have submitted information and that the total figures are therefore likely to give an underestimation of the catches of this vessel category. STECF-SGRST would like to mention that although these figures are underestimates, they indicate that at least 10%, 14%, 11% and 1% of the total cod, plaice, sole and hake catches respectively are taken by vessels <10m.
Table 8.7.1 – Western Channel – Overview of cod, plaice, sole, hake and nephrops catches by vessels <10m in 2007.
Sweden Denmark Germany Belgium France Scotland E&W Ireland Spain Portugal Netherlands Total <10m Total catch % <10mcod 2,8 0 53 0 55,8 566 10plaice 24,5 0 80 0 104,5 749 14sole 41,8 0 44 0 85,8 780 11hake 0,05 0 1,35 0 1,4 95 1nephrops 0 0 0 0 10 0
8.7.2. Country specific information of vessels <10m
More detailed information for vessels <10 meters were available only from France.
France
Landings: all vessels registered in the national Fleet Register have to submit a declaration: a monthly form for vessels less than 10 m. Table 8.7.2 gives the number of vessels less than 10 meters for each gear for 2003 to 2007 period. The number of vessels for all fleets have been fluctuating from 2003 to 2006 at the same level For 2007, there has been a decline for almost all of the gear categories..
Table 8.7.3 shows landings by gear for the area 7e over the same period. Most of these fleets catch cod and sole but in rather low proportion compare to there total catch. Nevertheless, for trammels sole fluctuates between 11 and 14 % in the landings over the 2003 to 2007 period.
Discards: The sampling programme carried out in sub-division 7e does not allow the calculation of discards rates, although in other regions those discards rates are not indicated to be important in the case of sole.
Effort data are calculated from declarative sources listed above. They are validated by cross-checking with a national sampling for monthly activity calendar (all fishing vessels are sampled directly or indirectly to assess the metiers they have practiced the previous year; the reference effort period in the fishing calendar is the month).
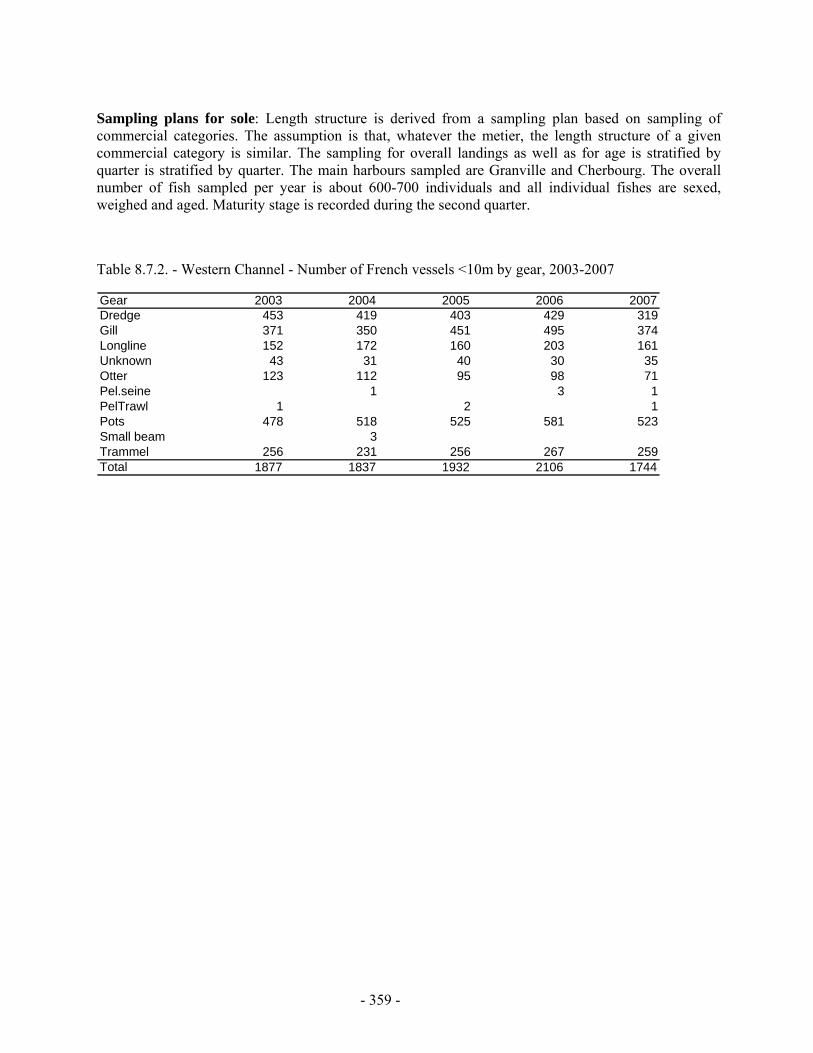
- 359 -
Sampling plans for sole: Length structure is derived from a sampling plan based on sampling of commercial categories. The assumption is that, whatever the metier, the length structure of a given commercial category is similar. The sampling for overall landings as well as for age is stratified by quarter is stratified by quarter. The main harbours sampled are Granville and Cherbourg. The overall number of fish sampled per year is about 600-700 individuals and all individual fishes are sexed, weighed and aged. Maturity stage is recorded during the second quarter.
Table 8.7.2. - Western Channel - Number of French vessels <10m by gear, 2003-2007
Gear 2003 2004 2005 2006 2007Dredge 453 419 403 429 319Gill 371 350 451 495 374Longline 152 172 160 203 161Unknown 43 31 40 30 35Otter 123 112 95 98 71Pel.seine 1 3 1PelTrawl 1 2 1Pots 478 518 525 581 523Small beam 3Trammel 256 231 256 267 259Total 1877 1837 1932 2106 1744

- 360 -
Table 8.7.3. - Western Channel - Landings (Kilos) of French vessels <10m by gear type and species, 2003-2007
Gear Sole Seabass Cod Dab Plaice Anglerfish Whiting Other Total2003 Dredge 685 694 15 4 157 45 35 3 278 352 3 279 987
Gill 10 377 11 766 1 021 4 400 34 785 8 750 326 964 398 063Longline 229 66 290 128 51 30 565 133 080 200 373Unknown 30 19 22 53 80 7 201 7 405Otter 16 933 2 675 345 715 11 836 1 347 436 236 231 270 518Pel.Trawl 60 60Pots 660 840 9 270 1 380 6 032 474 6 035 633Trammel 22 511 5 760 2 341 150 7 005 69 856 3 150 153 998 264 771
2004 Dredge 355 629 52 80 290 4 491 696 4 493 102Gill 8 802 18 314 1 682 40 5 051 76 831 5 720 375 159 491 599Longline 70 101 400 60 240 55 1 570 182 328 285 723Unknown 50 3 530 3 580Otter 10 471 2 061 285 276 5 460 12 562 819 414 160 446 094Pots 3 410 870 1 2 400 7 478 317 7 484 998Small beam 2 960 110 2 040 1 605 6 715Trammel 17 964 4 949 91 20 8 348 75 725 1 570 134 886 243 553
2005 Dredge 63 230 11 1 035 260 3 317 603 3 319 202Gill 10 059 17 515 346 23 4 017 61 178 4 616 236 347 334 101Longline 51 100 680 33 75 30 1 190 124 395 226 454Unknown 880 880Otter 12 740 1 003 358 4 170 14 614 1 332 824 167 665 202 706Pel.Trawl 1 130 2 3 816 4 948Pots 216 167 21 18 5 806 303 5 806 725Trammel 25 356 7 108 876 429 10 171 64 250 1 761 116 852 226 803
2006 Dredge 64 54 60 77 20 4 055 261 4 055 536Gill 6 158 14 115 753 9 3 883 80 219 6 354 347 728 459 219Longline 333 147 320 42 58 14 2 396 160 889 311 052Unknown 9 430 9 430Otter 8 139 475 65 830 6 033 1 650 1 161 148 764 167 117Pots 220 302 27 73 5 535 633 5 536 255Trammel 22 682 7 718 513 2 085 15 815 19 411 4 071 113 230 185 525
2007 Dredge 28 70 46 2 703 717 2 703 861Gill 4 338 13 000 475 2 881 39 675 5 003 261 559 326 931Longline 230 111 750 28 70 37 1 100 98 633 211 848Unknown 1 029 1 029Otter 4 364 928 58 180 5 399 2 215 1 670 74 324 89 138Pel.Trawl 50 7 810 867Pots 240 196 10 5 5 751 257 5 751 708Trammel 32 542 11 381 2 308 42 16 182 22 742 135 142 866 228 198
- 361 -
8.8. Spatial distribution patterns of effective fishing effort of trawled gears 2003-2007
Figure 8.8.1 shows the spatial distribution of the effective fishing effort for beam trawl fleets (3a) during the period 2003 to 2007. The pattern seems similar for the whole period. Although there might be indications of a slight increase of the effort along French coasts in 2007, it is questionable if this increase is significant.
Figure 8.8.2 shows the spatial distribution of the effective fishing effort for static nets with mesh size <220mm (3b) during the period 2003 to 2007. Until 2005, the fishing effort was more important along French coasts but it seems to have moved to the middle of the area 7e and along English coasts. In 2007, the fishing effort seems to have decreased slightly and has been concentrated more in the middle of the area.
Figure 8.8.3 shows the spatial distribution of the effective fishing effort for the unallocated gears ("none-none") during the period 2003 to 2007. Apart from 2005, the activity of the unallocated gears was most prevalent in the coastal areas in 7e.
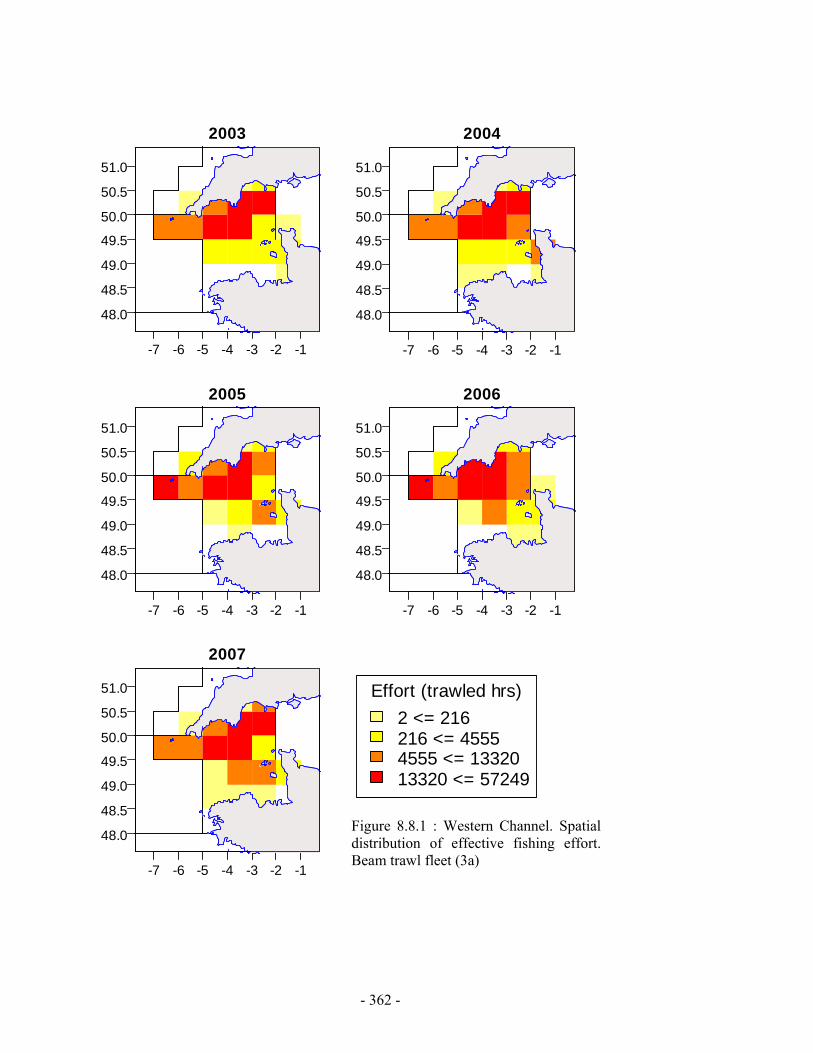
- 362 -
-7 -6 -5 -4 -3 -2 -1
48.0
48.5
49.0
49.5
50.0
50.5
51.0
2003
-7 -6 -5 -4 -3 -2 -1
48.0
48.5
49.0
49.5
50.0
50.5
51.0
2004
-7 -6 -5 -4 -3 -2 -1
48.0
48.5
49.0
49.5
50.0
50.5
51.0
2005
-7 -6 -5 -4 -3 -2 -1
48.0
48.5
49.0
49.5
50.0
50.5
51.0
2006
-7 -6 -5 -4 -3 -2 -1
48.0
48.5
49.0
49.5
50.0
50.5
51.0
2007
Effort (trawled hrs)2 <= 216216 <= 45554555 <= 1332013320 <= 57249
Figure 8.8.1 : Western Channel. Spatial distribution of effective fishing effort. Beam trawl fleet (3a)
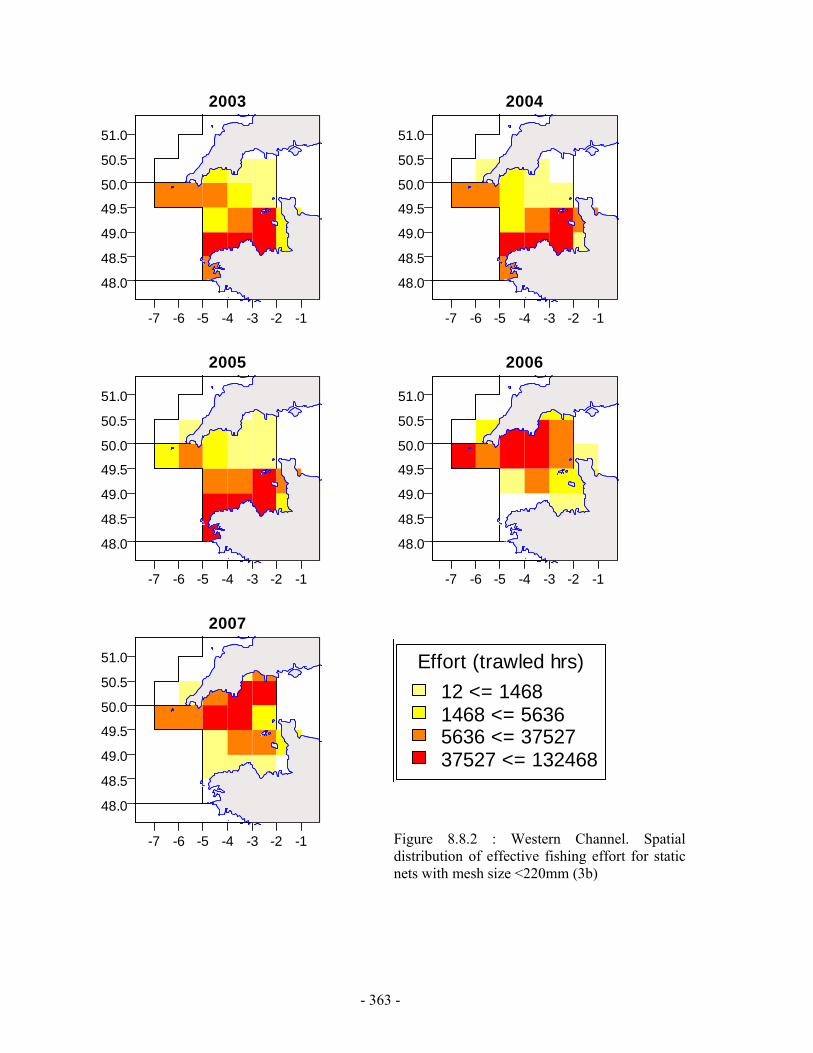
- 363 -
-7 -6 -5 -4 -3 -2 -1
48.0
48.5
49.0
49.5
50.0
50.5
51.0
2003
-7 -6 -5 -4 -3 -2 -1
48.0
48.5
49.0
49.5
50.0
50.5
51.0
2004
-7 -6 -5 -4 -3 -2 -1
48.0
48.5
49.0
49.5
50.0
50.5
51.0
2005
-7 -6 -5 -4 -3 -2 -1
48.0
48.5
49.0
49.5
50.0
50.5
51.0
2006
-7 -6 -5 -4 -3 -2 -1
48.0
48.5
49.0
49.5
50.0
50.5
51.0
2007
Effort (trawled hrs)12 <= 14681468 <= 56365636 <= 3752737527 <= 132468
Figure 8.8.2 : Western Channel. Spatial distribution of effective fishing effort for static nets with mesh size <220mm (3b)
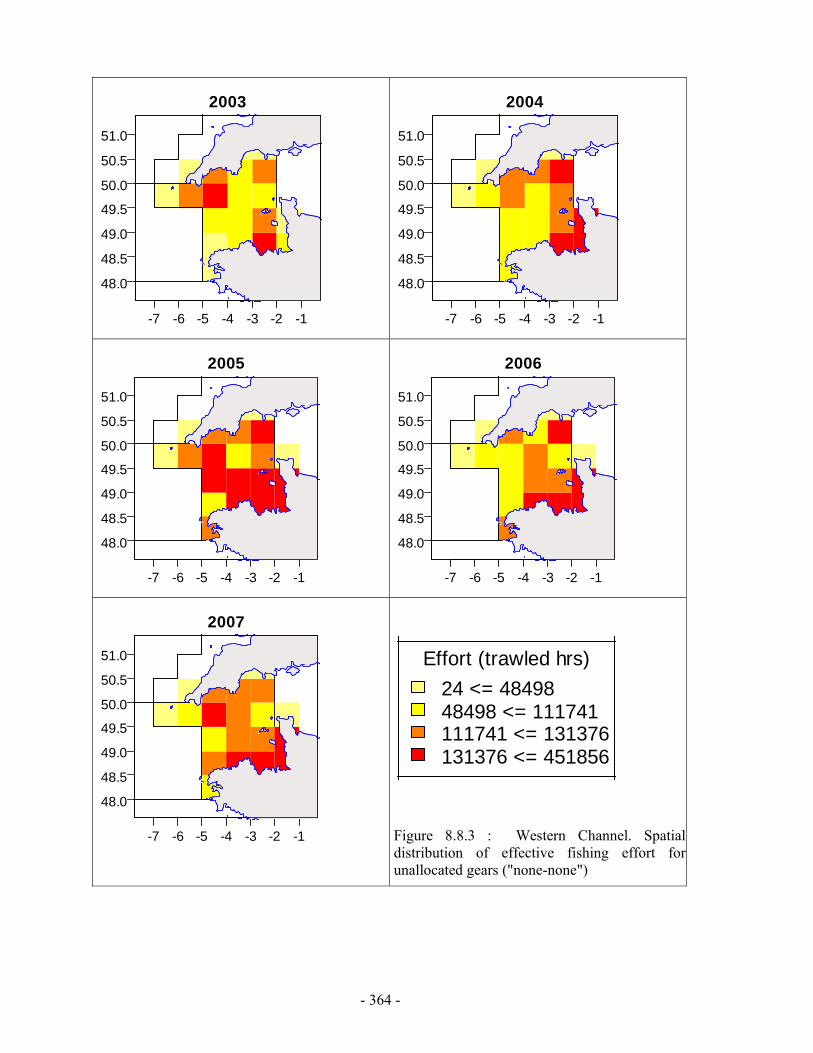
- 364 -
-7 -6 -5 -4 -3 -2 -1
48.0
48.5
49.0
49.5
50.0
50.5
51.0
2003
-7 -6 -5 -4 -3 -2 -1
48.0
48.5
49.0
49.5
50.0
50.5
51.0
2004
-7 -6 -5 -4 -3 -2 -1
48.0
48.5
49.0
49.5
50.0
50.5
51.0
2005
-7 -6 -5 -4 -3 -2 -1
48.0
48.5
49.0
49.5
50.0
50.5
51.0
2006
-7 -6 -5 -4 -3 -2 -1
48.0
48.5
49.0
49.5
50.0
50.5
51.0
2007
Effort (trawled hrs)24 <= 4849848498 <= 111741111741 <= 131376131376 <= 451856
Figure 8.8.3 : Western Channel. Spatial distribution of effective fishing effort for unallocated gears ("none-none")

- 365 -
9. CELTIC SEA
9.1. General
The Celtic Sea (ICES Divisions VIIbc,e-k) is not currently covered by the effort management scheme described under Annex II. However, the recent Commission proposals for the recovery of cod stocks within a revised recovery plan, also includes the Celtic Sea cod and puts forward ideas for an effort management regime to be applied in that area too.
It should be noted that the Celtic Sea cod stock definition covers ICES Divisions VIIe-k, while the cod in the ICES Divisions VIIb-c is considered to be the West Ireland stock.
Landings of cod from the ICES Divisions VIIb-c are very low: 27 tonnes in 2007 are reported (ICES-WGSSDS-2008). However, the overall fishing effort in that area, not dedicated to cod, may be large. This has to be kept in mind while looking at the results for the whole area.
Some relevant information on Division VIIe is presented in Section 8 of the report as part of the Annex IIc regulation covering sole. Since cod in Division VIIe is included in the Celtic Sea definition, fishing effort and catches for that area are also considered in this section.
Data available for the Celtic Sea
Catch and effort data have been provided by all Member States. Spanish data are only available since 2002, and in the case of the effort do not covered ICES Divisions VIIbc. Spanish effort data has been provided by mesh-size, but catch data are only disaggregated by gear.
Irish data are not disaggregated by mesh size before 2003. For this reason, only the period 2003-2007 should be taken as a true representation of trends, not the whole period (2000-2007) shown in the graphs.
The information on discards available to the Group is very partial and with the exception of the Belgian beam-trawlers (for which reliable estimates of discards have been provided), there is only some country-gear categories available for some years. In view of the small numbers of samples, the Group decided to consider landings only. However it should be kept in mind that discards reported to ICES have been substantial for some species and efforts to incorporate discards should be made in future. Métiers in the Celtic Sea It should be kept in mind that, as for the areas covered by Annex IIa, the correspondence between gear-mesh size category and métier in the Celtic Sea may be not straightforward. For instance, the Nephrops métier in the Celtic Sea may be part of mesh-size category 4aii for Irish vessels, while for France this metier is contributed to by mesh-size category 4aiv. Furthermore, even within a same gear and mesh-size category, the impact of fishing on cod may be very different. The following shows a description of the French metiers in the Celtic Sea and the impact of each on cod. Further details of the methodology can be found in Appendix 2. Figure 9.1.1 shows how the total fishing effort (as reported in the log-books) is allocated within each
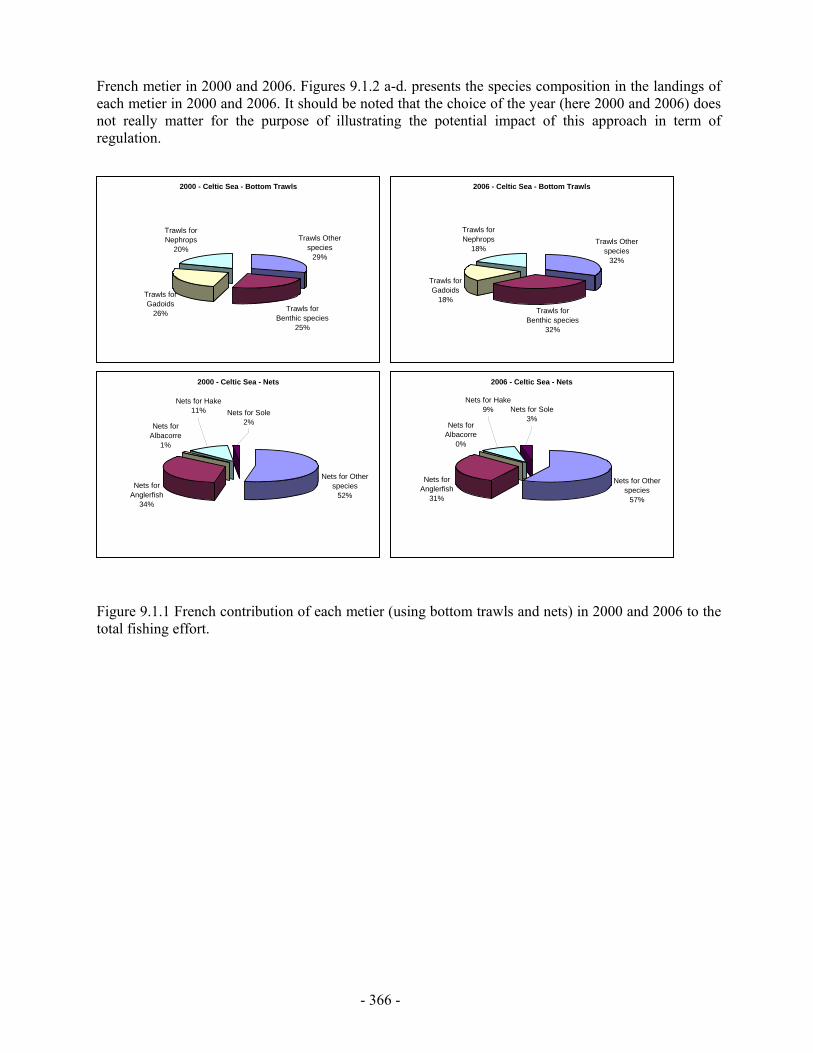
- 366 -
French metier in 2000 and 2006. Figures 9.1.2 a-d. presents the species composition in the landings of each metier in 2000 and 2006. It should be noted that the choice of the year (here 2000 and 2006) does not really matter for the purpose of illustrating the potential impact of this approach in term of regulation.
Figure 9.1.1 French contribution of each metier (using bottom trawls and nets) in 2000 and 2006 to the total fishing effort.
2000 - Celtic Sea - Bottom Trawls
Trawls Other species
29%
Trawls for Benthic species
25%
Trawls for Gadoids
26%
Trawls for Nephrops
20%
2006 - Celtic Sea - Bottom Trawls
Trawls Other species
32%
Trawls for Benthic species
32%
Trawls for Gadoids
18%
Trawls for Nephrops
18%
2000 - Celtic Sea - Nets
Nets for Other species
52%Nets for
Anglerfish34%
Nets for Albacorre
1%
Nets for Hake11% Nets for Sole
2%
2006 - Celtic Sea - Nets
Nets for Other species
57%
Nets for Anglerfish
31%
Nets for Albacorre
0%
Nets for Sole3%
Nets for Hake9%
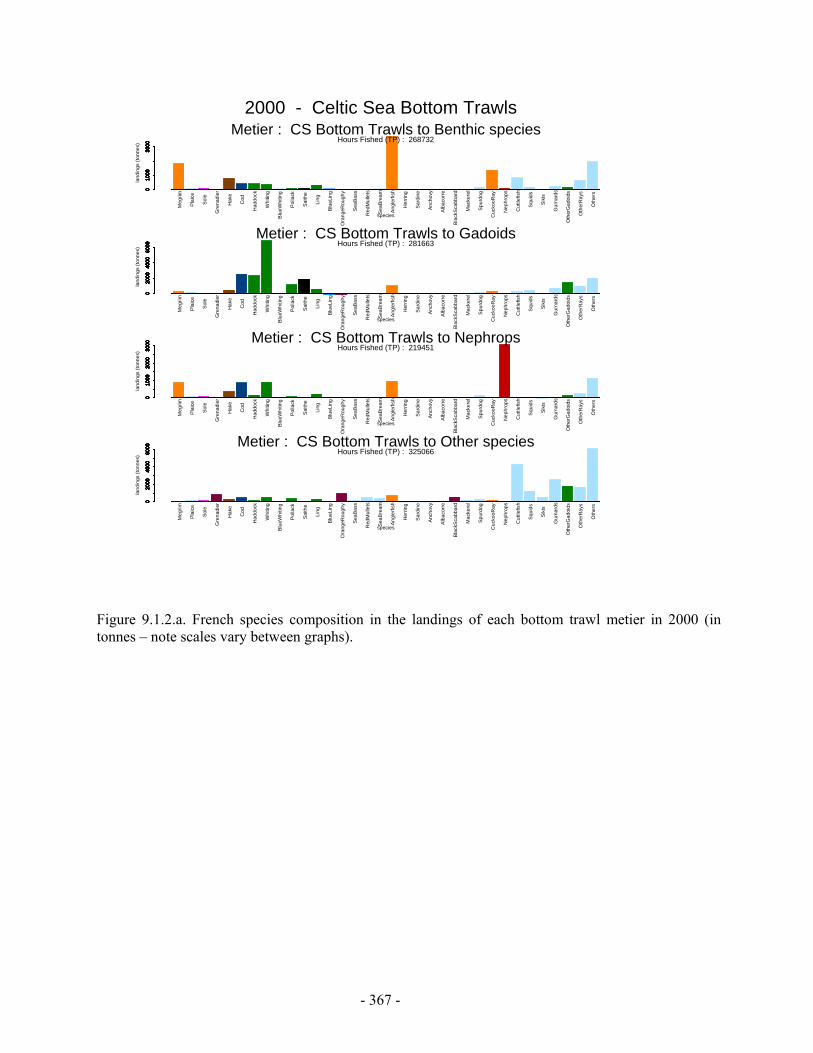
- 367 -
Meg
rim
Pla
ice
Sol
e
Gre
nadi
er
Hak
e
Cod
Had
dock
Whi
ting
Blu
eWhi
ting
Pol
lack
Sai
the
Ling
Blu
eLin
g
Ora
ngeR
ough
y
Sea
Bas
s
Red
Mul
lets
Sea
Bre
am
Ang
lerfi
sh
Her
ring
Sar
dine
Anc
hovy
Alb
acor
re
Bla
ckS
cabb
ard
Mac
kere
l
Spu
rdog
Cuc
kooR
ay
Nep
hrop
s
Cut
tlefis
h
Squ
ids
Sik
is
Gur
nard
s
Oth
erG
adoi
ds
Oth
erR
ays
Oth
ers
010
0030
00
species
010
0030
00
land
ings
(ton
nes)
010
0030
000
1000
3000
010
0030
000
1000
3000
010
0030
000
1000
3000
010
0030
000
1000
3000
Metier : CS Bottom Trawls to Benthic speciesHours Fished (TP) : 268732
Meg
rim
Pla
ice
Sol
e
Gre
nadi
er
Hak
e
Cod
Had
dock
Whi
ting
Blu
eWhi
ting
Pol
lack
Sai
the
Ling
Blu
eLin
g
Ora
ngeR
ough
y
Sea
Bas
s
Red
Mul
lets
Sea
Bre
am
Ang
lerfi
sh
Her
ring
Sar
dine
Anc
hovy
Alb
acor
re
Bla
ckS
cabb
ard
Mac
kere
l
Spu
rdog
Cuc
kooR
ay
Nep
hrop
s
Cut
tlefis
h
Squ
ids
Sik
is
Gur
nard
s
Oth
erG
adoi
ds
Oth
erR
ays
Oth
ers
020
0040
0060
00
species
020
0040
0060
00
land
ings
(ton
nes)
020
0040
0060
000
2000
4000
6000
020
0040
0060
000
2000
4000
6000
020
0040
0060
000
2000
4000
6000
020
0040
0060
000
2000
4000
6000
Metier : CS Bottom Trawls to GadoidsHours Fished (TP) : 281663
Meg
rim
Pla
ice
Sol
e
Gre
nadi
er
Hak
e
Cod
Had
dock
Whi
ting
Blu
eWhi
ting
Pol
lack
Sai
the
Ling
Blu
eLin
g
Ora
ngeR
ough
y
Sea
Bas
s
Red
Mul
lets
Sea
Bre
am
Ang
lerfi
sh
Her
ring
Sar
dine
Anc
hovy
Alb
acor
re
Bla
ckS
cabb
ard
Mac
kere
l
Spu
rdog
Cuc
kooR
ay
Nep
hrop
s
Cut
tlefis
h
Squ
ids
Sik
is
Gur
nard
s
Oth
erG
adoi
ds
Oth
erR
ays
Oth
ers
010
0020
0030
00
species
010
0020
0030
00
land
ings
(ton
nes)
010
0020
0030
000
1000
2000
3000
010
0020
0030
000
1000
2000
3000
010
0020
0030
000
1000
2000
3000
010
0020
0030
000
1000
2000
3000 Metier : CS Bottom Trawls to Nephrops
Hours Fished (TP) : 219451
Meg
rim
Pla
ice
Sol
e
Gre
nadi
er
Hak
e
Cod
Had
dock
Whi
ting
Blu
eWhi
ting
Pol
lack
Sai
the
Ling
Blu
eLin
g
Ora
ngeR
ough
y
Sea
Bas
s
Red
Mul
lets
Sea
Bre
am
Ang
lerfi
sh
Her
ring
Sar
dine
Anc
hovy
Alb
acor
re
Bla
ckS
cabb
ard
Mac
kere
l
Spu
rdog
Cuc
kooR
ay
Nep
hrop
s
Cut
tlefis
h
Squ
ids
Sik
is
Gur
nard
s
Oth
erG
adoi
ds
Oth
erR
ays
Oth
ers
020
0040
0060
00
species
020
0040
0060
00
land
ings
(ton
nes)
020
0040
0060
000
2000
4000
6000
020
0040
0060
000
2000
4000
6000
020
0040
0060
000
2000
4000
6000
020
0040
0060
000
2000
4000
6000 Metier : CS Bottom Trawls to Other species
Hours Fished (TP) : 325066
2000 - Celtic Sea Bottom Trawls
Figure 9.1.2.a. French species composition in the landings of each bottom trawl metier in 2000 (in tonnes – note scales vary between graphs).

- 368 -
Meg
rim
Pla
ice
Sol
e
Gre
nadi
er
Hak
e
Cod
Had
dock
Whi
ting
Blu
eWhi
ting
Pol
lack
Sai
the
Ling
Blu
eLin
g
Ora
ngeR
ough
y
Sea
Bas
s
Red
Mul
lets
Sea
Bre
am
Ang
lerfi
sh
Her
ring
Sar
dine
Anc
hovy
Alb
acor
re
Bla
ckS
cabb
ard
Mac
kere
l
Spu
rdog
Cuc
kooR
ay
Nep
hrop
s
Cut
tlefis
h
Squ
ids
Sik
is
Gur
nard
s
Oth
erG
adoi
ds
Oth
erR
ays
Oth
ers
020
0040
0060
00
species
020
0040
0060
00
land
ings
(ton
nes)
020
0040
0060
000
2000
4000
6000
020
0040
0060
000
2000
4000
6000
020
0040
0060
000
2000
4000
6000
020
0040
0060
000
2000
4000
6000
Metier : CS Bottom Trawls to Benthic speciesHours Fished (TP) : 284610
Meg
rim
Pla
ice
Sol
e
Gre
nadi
er
Hak
e
Cod
Had
dock
Whi
ting
Blu
eWhi
ting
Pol
lack
Sai
the
Ling
Blu
eLin
g
Ora
ngeR
ough
y
Sea
Bas
s
Red
Mul
lets
Sea
Bre
am
Ang
lerfi
sh
Her
ring
Sar
dine
Anc
hovy
Alb
acor
re
Bla
ckS
cabb
ard
Mac
kere
l
Spu
rdog
Cuc
kooR
ay
Nep
hrop
s
Cut
tlefis
h
Squ
ids
Sik
is
Gur
nard
s
Oth
erG
adoi
ds
Oth
erR
ays
Oth
ers
010
0030
00
species
010
0030
00
land
ings
(ton
nes)
010
0030
000
1000
3000
010
0030
000
1000
3000
010
0030
000
1000
3000
010
0030
000
1000
3000
Metier : CS Bottom Trawls to GadoidsHours Fished (TP) : 166136
Meg
rim
Pla
ice
Sol
e
Gre
nadi
er
Hak
e
Cod
Had
dock
Whi
ting
Blu
eWhi
ting
Pol
lack
Sai
the
Ling
Blu
eLin
g
Ora
ngeR
ough
y
Sea
Bas
s
Red
Mul
lets
Sea
Bre
am
Ang
lerfi
sh
Her
ring
Sar
dine
Anc
hovy
Alb
acor
re
Bla
ckS
cabb
ard
Mac
kere
l
Spu
rdog
Cuc
kooR
ay
Nep
hrop
s
Cut
tlefis
h
Squ
ids
Sik
is
Gur
nard
s
Oth
erG
adoi
ds
Oth
erR
ays
Oth
ers
050
015
0025
00
species
050
015
0025
00
land
ings
(ton
nes)
050
015
0025
000
500
1500
2500
050
015
0025
000
500
1500
2500
050
015
0025
000
500
1500
2500
050
015
0025
000
500
1500
2500
Metier : CS Bottom Trawls to NephropsHours Fished (TP) : 159236
Meg
rim
Pla
ice
Sol
e
Gre
nadi
er
Hak
e
Cod
Had
dock
Whi
ting
Blu
eWhi
ting
Pol
lack
Sai
the
Ling
Blu
eLin
g
Ora
ngeR
ough
y
Sea
Bas
s
Red
Mul
lets
Sea
Bre
am
Ang
lerfi
sh
Her
ring
Sar
dine
Anc
hovy
Alb
acor
re
Bla
ckS
cabb
ard
Mac
kere
l
Spu
rdog
Cuc
kooR
ay
Nep
hrop
s
Cut
tlefis
h
Squ
ids
Sik
is
Gur
nard
s
Oth
erG
adoi
ds
Oth
erR
ays
Oth
ers
020
0060
00
species
020
0060
00
land
ings
(ton
nes)
020
0060
000
2000
6000
020
0060
000
2000
6000
020
0060
000
2000
6000
020
0060
000
2000
6000
Metier : CS Bottom Trawls to Other speciesHours Fished (TP) : 292745
2006 - Celtic Sea Bottom Trawls
Figure 9.1.2.b. French species composition in the landings of each bottom trawl metier in 2006 (in tonnes – note scales vary between graphs).
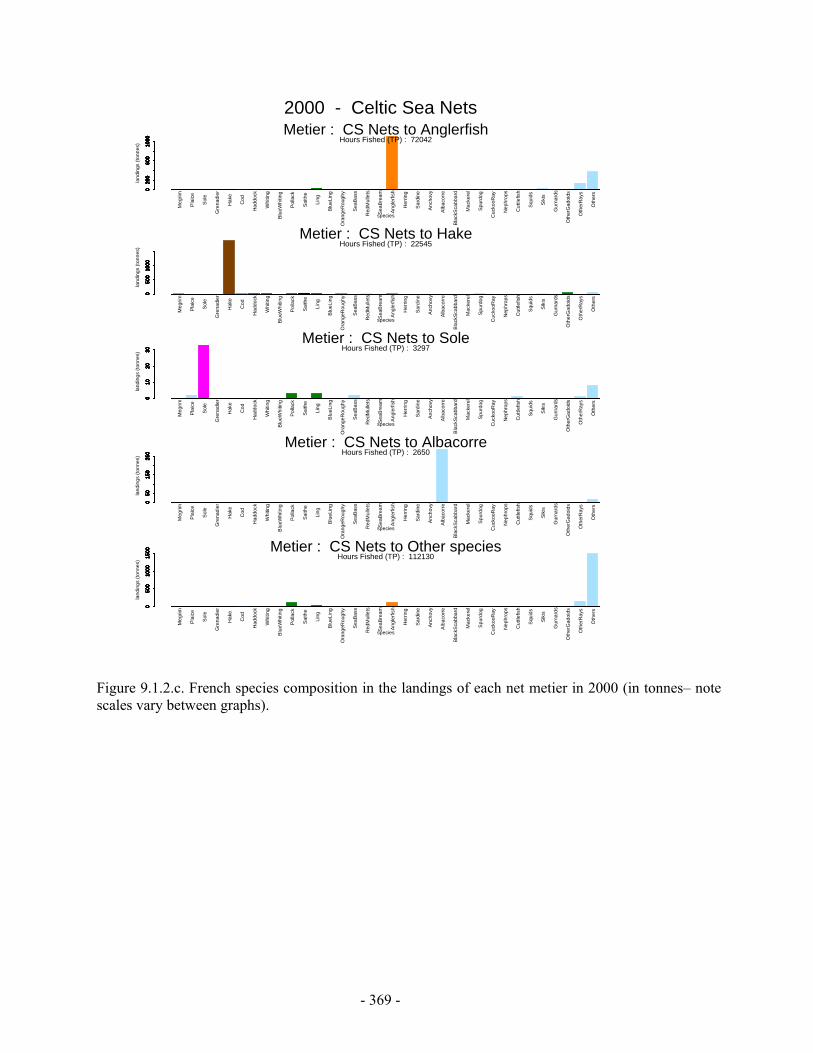
- 369 -
Meg
rim
Pla
ice
Sol
e
Gre
nadi
er
Hak
e
Cod
Had
dock
Whi
ting
Blu
eWhi
ting
Pol
lack
Sai
the
Ling
Blu
eLin
g
Ora
ngeR
ough
y
Sea
Bas
s
Red
Mul
lets
Sea
Bre
am
Ang
lerfi
sh
Her
ring
Sar
dine
Anc
hovy
Alb
acor
re
Bla
ckS
cabb
ard
Mac
kere
l
Spu
rdog
Cuc
kooR
ay
Nep
hrop
s
Cut
tlefis
h
Squ
ids
Sik
is
Gur
nard
s
Oth
erG
adoi
ds
Oth
erR
ays
Oth
ers
020
060
010
00
species
020
060
010
00
land
ings
(ton
nes)
020
060
010
000
200
600
1000
020
060
010
000
200
600
1000
020
060
010
000
200
600
1000
020
060
010
000
200
600
1000
Metier : CS Nets to AnglerfishHours Fished (TP) : 72042
Meg
rim
Pla
ice
Sol
e
Gre
nadi
er
Hak
e
Cod
Had
dock
Whi
ting
Blu
eWhi
ting
Pol
lack
Sai
the
Ling
Blu
eLin
g
Ora
ngeR
ough
y
Sea
Bas
s
Red
Mul
lets
Sea
Bre
am
Ang
lerfi
sh
Her
ring
Sar
dine
Anc
hovy
Alb
acor
re
Bla
ckS
cabb
ard
Mac
kere
l
Spu
rdog
Cuc
kooR
ay
Nep
hrop
s
Cut
tlefis
h
Squ
ids
Sik
is
Gur
nard
s
Oth
erG
adoi
ds
Oth
erR
ays
Oth
ers
050
010
00
species
050
010
00
land
ings
(ton
nes)
050
010
000
500
1000
050
010
000
500
1000
050
010
000
500
1000
050
010
000
500
1000
Metier : CS Nets to HakeHours Fished (TP) : 22545
Meg
rim
Pla
ice
Sol
e
Gre
nadi
er
Hak
e
Cod
Had
dock
Whi
ting
Blu
eWhi
ting
Pol
lack
Sai
the
Ling
Blu
eLin
g
Ora
ngeR
ough
y
Sea
Bas
s
Red
Mul
lets
Sea
Bre
am
Ang
lerfi
sh
Her
ring
Sar
dine
Anc
hovy
Alb
acor
re
Bla
ckS
cabb
ard
Mac
kere
l
Spu
rdog
Cuc
kooR
ay
Nep
hrop
s
Cut
tlefis
h
Squ
ids
Sik
is
Gur
nard
s
Oth
erG
adoi
ds
Oth
erR
ays
Oth
ers
010
2030
species
010
2030
land
ings
(ton
nes)
010
2030
010
2030
010
2030
010
2030
010
2030
010
2030
010
2030
010
2030
Metier : CS Nets to SoleHours Fished (TP) : 3297
Meg
rim
Pla
ice
Sol
e
Gre
nadi
er
Hak
e
Cod
Had
dock
Whi
ting
Blu
eWhi
ting
Pol
lack
Sai
the
Ling
Blu
eLin
g
Ora
ngeR
ough
y
Sea
Bas
s
Red
Mul
lets
Sea
Bre
am
Ang
lerfi
sh
Her
ring
Sar
dine
Anc
hovy
Alb
acor
re
Bla
ckS
cabb
ard
Mac
kere
l
Spu
rdog
Cuc
kooR
ay
Nep
hrop
s
Cut
tlefis
h
Squ
ids
Sik
is
Gur
nard
s
Oth
erG
adoi
ds
Oth
erR
ays
Oth
ers
050
150
250
species
050
150
250
land
ings
(ton
nes)
050
150
250
050
150
250
050
150
250
050
150
250
050
150
250
050
150
250
050
150
250
050
150
250
Metier : CS Nets to AlbacorreHours Fished (TP) : 2650
Meg
rim
Pla
ice
Sol
e
Gre
nadi
er
Hak
e
Cod
Had
dock
Whi
ting
Blu
eWhi
ting
Pol
lack
Sai
the
Ling
Blu
eLin
g
Ora
ngeR
ough
y
Sea
Bas
s
Red
Mul
lets
Sea
Bre
am
Ang
lerfi
sh
Her
ring
Sar
dine
Anc
hovy
Alb
acor
re
Bla
ckS
cabb
ard
Mac
kere
l
Spu
rdog
Cuc
kooR
ay
Nep
hrop
s
Cut
tlefis
h
Squ
ids
Sik
is
Gur
nard
s
Oth
erG
adoi
ds
Oth
erR
ays
Oth
ers
050
010
0015
00
species
050
010
0015
00
land
ings
(ton
nes)
050
010
0015
000
500
1000
1500
050
010
0015
000
500
1000
1500
050
010
0015
000
500
1000
1500
050
010
0015
000
500
1000
1500 Metier : CS Nets to Other species
Hours Fished (TP) : 112130
2000 - Celtic Sea Nets
Figure 9.1.2.c. French species composition in the landings of each net metier in 2000 (in tonnes– note scales vary between graphs).
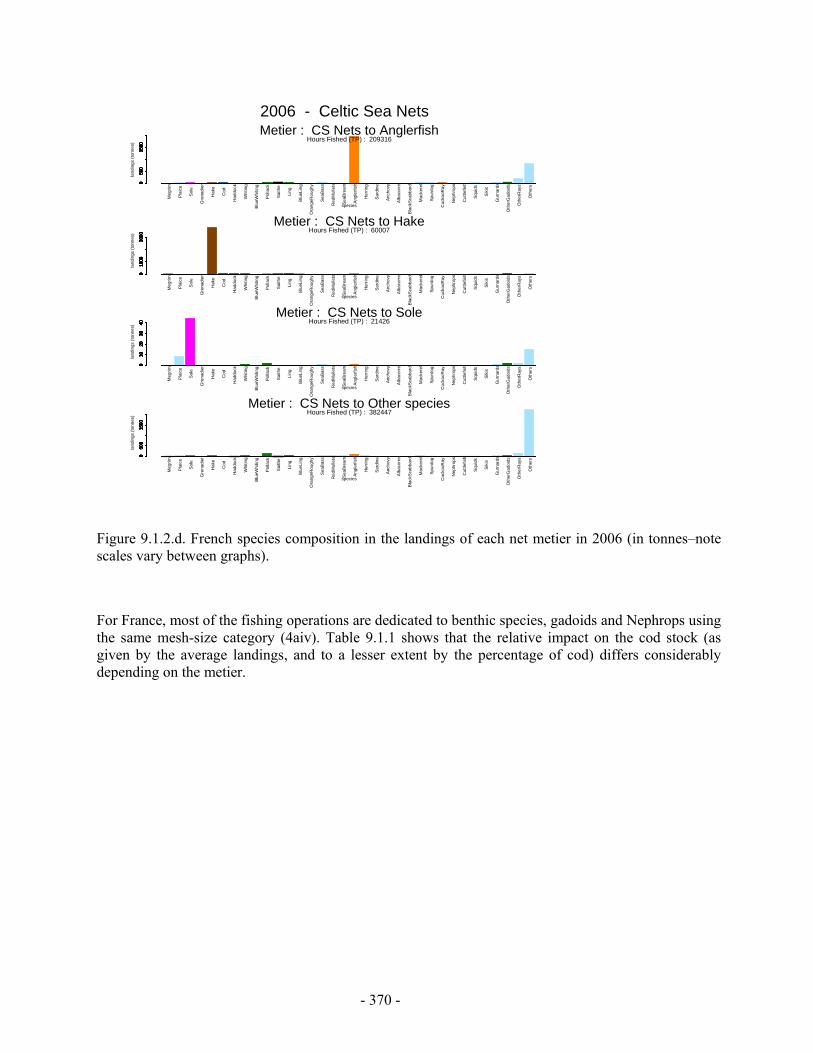
- 370 -
Meg
rim
Plai
ce
Sole
Gre
nadi
er
Hak
e
Cod
Had
dock
Whi
ting
Blue
Whi
ting
Polla
ck
Saith
e
Ling
Blue
Ling
Ora
ngeR
ough
y
SeaB
ass
Red
Mul
lets
SeaB
ream
Angl
erfis
h
Her
ring
Sard
ine
Anch
ovy
Alba
corr
e
Blac
kSca
bbar
d
Mac
kere
l
Spur
dog
Cuc
kooR
ay
Nep
hrop
s
Cut
tlefis
h
Squi
ds
Siki
s
Gur
nard
s
Oth
erG
adoi
ds
Oth
erR
ays
Oth
ers0
500
1500
species
050
015
00
land
ings
(ton
nes)
050
015
000
500
1500
050
015
000
500
1500
050
015
000
500
1500
050
015
000
500
1500
Metier : CS Nets to AnglerfishHours Fished (TP) : 209316
Meg
rim
Plai
ce
Sole
Gre
nadi
er
Hak
e
Cod
Had
dock
Whi
ting
Blue
Whi
ting
Polla
ck
Saith
e
Ling
Blue
Ling
Ora
ngeR
ough
y
SeaB
ass
Red
Mul
lets
SeaB
ream
Angl
erfis
h
Her
ring
Sard
ine
Anch
ovy
Alba
corr
e
Blac
kSca
bbar
d
Mac
kere
l
Spur
dog
Cuc
kooR
ay
Nep
hrop
s
Cut
tlefis
h
Squi
ds
Siki
s
Gur
nard
s
Oth
erG
adoi
ds
Oth
erR
ays
Oth
ers
010
0030
00
species
010
0030
00
land
ings
(ton
nes)
010
0030
000
1000
3000
010
0030
000
1000
3000
010
0030
000
1000
3000
010
0030
000
1000
3000
Metier : CS Nets to HakeHours Fished (TP) : 60007
Meg
rim
Plai
ce
Sole
Gre
nadi
er
Hak
e
Cod
Had
dock
Whi
ting
Blue
Whi
ting
Polla
ck
Saith
e
Ling
Blue
Ling
Ora
ngeR
ough
y
SeaB
ass
Red
Mul
lets
SeaB
ream
Angl
erfis
h
Her
ring
Sard
ine
Anch
ovy
Alba
corr
e
Blac
kSca
bbar
d
Mac
kere
l
Spur
dog
Cuc
kooR
ay
Nep
hrop
s
Cut
tlefis
h
Squi
ds
Siki
s
Gur
nard
s
Oth
erG
adoi
ds
Oth
erR
ays
Oth
ers
010
2030
40
species
010
2030
40
land
ings
(ton
nes)
010
2030
400
1020
3040
010
2030
400
1020
3040
010
2030
400
1020
3040
010
2030
400
1020
3040
Metier : CS Nets to SoleHours Fished (TP) : 21426
Meg
rim
Plai
ce
Sole
Gre
nadi
er
Hak
e
Cod
Had
dock
Whi
ting
Blue
Whi
ting
Polla
ck
Saith
e
Ling
Blue
Ling
Ora
ngeR
ough
y
SeaB
ass
Red
Mul
lets
SeaB
ream
Angl
erfis
h
Her
ring
Sard
ine
Anch
ovy
Alba
corr
e
Blac
kSca
bbar
d
Mac
kere
l
Spur
dog
Cuc
kooR
ay
Nep
hrop
s
Cut
tlefis
h
Squi
ds
Siki
s
Gur
nard
s
Oth
erG
adoi
ds
Oth
erR
ays
Oth
ers
050
015
00
species
050
015
00
land
ings
(ton
nes)
050
015
000
500
1500
050
015
000
500
1500
050
015
000
500
1500
050
015
000
500
1500
Metier : CS Nets to Other speciesHours Fished (TP) : 382447
2006 - Celtic Sea Nets
Figure 9.1.2.d. French species composition in the landings of each net metier in 2006 (in tonnes–note scales vary between graphs).
For France, most of the fishing operations are dedicated to benthic species, gadoids and Nephrops using the same mesh-size category (4aiv). Table 9.1.1 shows that the relative impact on the cod stock (as given by the average landings, and to a lesser extent by the percentage of cod) differs considerably depending on the metier.
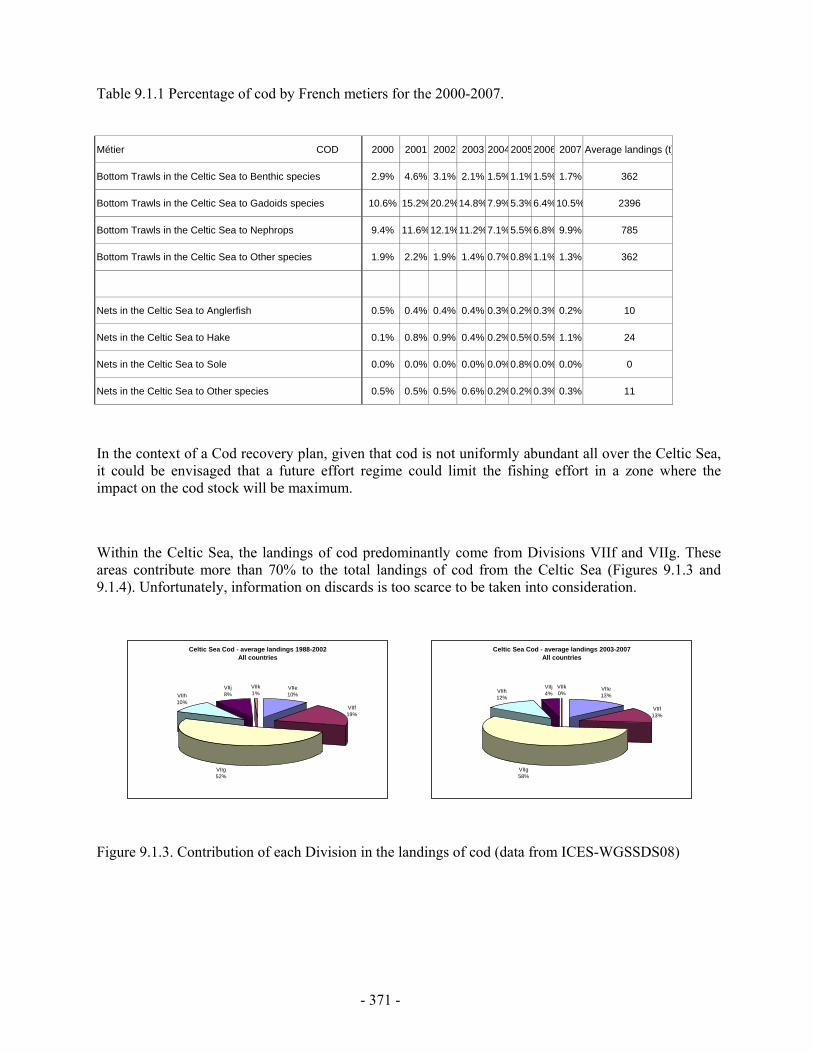
- 371 -
Table 9.1.1 Percentage of cod by French metiers for the 2000-2007.
Métier COD 2000 2001 2002 2003 200420052006 2007 Average landings (t)
Bottom Trawls in the Celtic Sea to Benthic species 2.9% 4.6% 3.1% 2.1% 1.5%1.1%1.5% 1.7% 362
Bottom Trawls in the Celtic Sea to Gadoids species 10.6% 15.2%20.2%14.8%7.9%5.3%6.4%10.5% 2396
Bottom Trawls in the Celtic Sea to Nephrops 9.4% 11.6%12.1%11.2%7.1%5.5%6.8% 9.9% 785
Bottom Trawls in the Celtic Sea to Other species 1.9% 2.2% 1.9% 1.4% 0.7%0.8%1.1% 1.3% 362
Nets in the Celtic Sea to Anglerfish 0.5% 0.4% 0.4% 0.4% 0.3%0.2%0.3% 0.2% 10
Nets in the Celtic Sea to Hake 0.1% 0.8% 0.9% 0.4% 0.2%0.5%0.5% 1.1% 24
Nets in the Celtic Sea to Sole 0.0% 0.0% 0.0% 0.0% 0.0%0.8%0.0% 0.0% 0
Nets in the Celtic Sea to Other species 0.5% 0.5% 0.5% 0.6% 0.2%0.2%0.3% 0.3% 11
In the context of a Cod recovery plan, given that cod is not uniformly abundant all over the Celtic Sea, it could be envisaged that a future effort regime could limit the fishing effort in a zone where the impact on the cod stock will be maximum.
Within the Celtic Sea, the landings of cod predominantly come from Divisions VIIf and VIIg. These areas contribute more than 70% to the total landings of cod from the Celtic Sea (Figures 9.1.3 and 9.1.4). Unfortunately, information on discards is too scarce to be taken into consideration.
Figure 9.1.3. Contribution of each Division in the landings of cod (data from ICES-WGSSDS08)
Celtic Sea Cod - average landings 2003-2007All countries
VIIe13%
VIIf13%
VIIg58%
VIIh12%
VIIj4%
VIIk0%
Celtic Sea Cod - average landings 1988-2002All countries
VIIe10%
VIIf19%
VIIg52%
VIIh10%
VIIj8%
VIIk1%

- 372 -
Figure 9.1.4.: Cod: Contribution of the landings from ICES Divisions VIIfg to the total landings from the Celtic Sea (ICES Divisions VIIbc,e-k) over 2003-2007
The average contribution of the Divisions VIIfg to the Celtic Sea landings of cod is about 70%. This contribution has been slightly decreasing in recent years (from 73% in 2004 to 67% in 2007); this decrease is probably due to the implementation of the closure of the Trevose box since 2005.
In view of the observation that VIIfg area could be considered as the target area for a cod recovery plan, the European Commission specifically requested that STECF-SGRST provide information for this. In each section the VIIfg area is considered in addition to the whole Celtic Sea (VIIbc,e-k) to highlight the contribution of this area to the total effort and to the cod landings, with a presentation of the gear categories and metiers.
9.2. Nominal effort
9.2.1. Gear category and member state
Even though there is at present no effort regulation in the Celtic Sea, the analysis below considered the same gear and mesh categories as used in other areas, as set in the cod recovery plan proposal. Table 9.2.1. lists the trends in effort by gear and mesh categories by country in kW*days, and Table 9.2.2. shows the same thing in GT*days.
For the same period (2000 to 2007), Table 9.2.3 lists the number of vessels by Member state and gear and mesh categories. STECF-SGRST emphasises that the number of vessels need to be interpreted with care and cannot be added across derogations as the individual vessels may have been engaged in more than one of the defined fleets, and thus counted more than once. As the effort values are by quarter and some Member Countries provided stratified data by fisheries, Table 9.2.3 represents the maximum number of vessels observed in any of the categories defined under the various categories in a given year. The annual values therefore present numbers of vessels, which indicate maximum values of vessels observed in any of the individual quarters or nationally defined fisheries which are identified to contribute to the defined categories.
Cod Landings : VIIfg contribution
0%
10%
20%
30%
40%
50%
60%
70%
80%
90%
100%
2003 2004 2005 2006 2007

- 373 -
Table 9.2.1. Trend in effort (kW*days at sea) by gear and mesh categories as given in Table 1 of Annex IIA for other areas (Coun. Reg. 40/2008) and Member State, 2000-2007. Note, data for Celtic Sea 7bcefghjk are shown first, followed by subset 7fg
ANNEX REG AREA COMB REG GEAR SPECON COUNTRY 2000 2001 2002 2003 2004 2005 2006 2007IIx 7bcefghjk 4ai none ENG 54887 45180 39513 47439 30185 41448 43088 82178IIx 7bcefghjk 4ai none FRA 102478 97521 10754 20580 11362 14719 22016 27913IIx 7bcefghjk 4ai none GBG 201IIx 7bcefghjk 4ai none IRL 11443 37751 55716 74458 125459IIx 7bcefghjk 4ai none SCO 1490 745 4917 5364 298 20048IIx 7bcefghjk 4ai none SPN 544 2977 2187IIx 7bcefghjk 4aii none ENG 6954280 4715883 1790184 1771404 1816166 1767888 1615611 1676260IIx 7bcefghjk 4aii none FRA 18610968 19900660 21311559 19157085 20342080 24181807 18660941 17228067IIx 7bcefghjk 4aii none GBG 15120 42228 27234 730 6377 10241IIx 7bcefghjk 4aii none GBJ 69302 27445 34753 3559 8667 28248 42051IIx 7bcefghjk 4aii none IRL 4573273 4438698 5787969 5091059 5466724IIx 7bcefghjk 4aii none NED 24848 29513 46033 91626 109301 222006IIx 7bcefghjk 4aii none NIR 28717 2620 2184 53672 72433 42938 20658IIx 7bcefghjk 4aii none SCO 1236583 837294 396879 451909 332168 352870 383222 345952IIx 7bcefghjk 4aii none SPN 1965303 2169000 379021 47771 1657476IIx 7bcefghjk 4aiii none ENG 408543 345696 345937 411244 437814 414160 414646 423300IIx 7bcefghjk 4aiii none FRA 1520937 1591091 1273476 786373 795810 830186 309272 320556IIx 7bcefghjk 4aiii none GBG 820IIx 7bcefghjk 4aiii none GBJ 4920 1926IIx 7bcefghjk 4aiii none IRL 483323 604119 783549 814975 728061IIx 7bcefghjk 4aiii none SCO 191790 108352 25842 38925 113196 67050 5066 17582IIx 7bcefghjk 4aiii none SPN 20652 2152IIx 7bcefghjk 4aiv none ENG 407027 1514441 3471891 2435882 2258268 1797728 2227810 2304225IIx 7bcefghjk 4aiv none FRA 19528397 25227698 32564449 31909274 27678094 26820778 27641806 25485529IIx 7bcefghjk 4aiv none GBG 5814 328IIx 7bcefghjk 4aiv none GBI 11984IIx 7bcefghjk 4aiv none GBJ 6396 2296IIx 7bcefghjk 4aiv none IOM 11984IIx 7bcefghjk 4aiv none IRL 5251612 4443230 4810573 3804668 3814683IIx 7bcefghjk 4aiv none NIR 7896 20675 12016 7641 716 5176IIx 7bcefghjk 4aiv none SCO 168933 349633 790985 791373 875483 1084678 779451 679941IIx 7bcefghjk 4aiv none SPN 4107671 4170683 1629243 819031 654132 3293510IIx 7bcefghjk 4av none ENG 1119 3354 6493IIx 7bcefghjk 4av none FRA 58023 207552 45807 113041 62711 73073 16590 72907IIx 7bcefghjk 4av none IRL 372092 292860 15983 144323 299810IIx 7bcefghjk 4av none NED 367IIx 7bcefghjk 4av none SCO 1701 11397 2513IIx 7bcefghjk 4av none SPN 8784 17408 4447IIx 7bcefghjk 4bi none BEL 1716560 1703662 1737026 2243305 2909322 2484038 2113073 2039098IIx 7bcefghjk 4bi none ENG 5319656 5717056 5346241 6030498 5693805 5656783 5218550 4951234IIx 7bcefghjk 4bi none FRA 29328 20717 124057 146269 136307 191911IIx 7bcefghjk 4bi none GBJ 168393 276796 275554 284450 365302 202641IIx 7bcefghjk 4bi none IRL 1828886 1474347 1922502 1792998 1697610IIx 7bcefghjk 4bi none NED 1471 1470IIx 7bcefghjk 4bi none SCO 3666IIx 7bcefghjk 4bii none ENG 138457 1920 33936 7302 2032 60385 68251IIx 7bcefghjk 4bii none FRA 1956 308IIx 7bcefghjk 4bii none GBJ 5040 530 3024IIx 7bcefghjk 4bii none IRL 1504824 517623 936635 284383 92108IIx 7bcefghjk 4biii none ENG 6456 21128 12359 2445 1082 27492IIx 7bcefghjk 4biii none FRA 38625IIx 7bcefghjk 4biii none IRL 346621 349348 195322 66595 38606IIx 7bcefghjk 4biv none ENG 52079IIx 7bcefghjk 4biv none IRL 14427IIx 7bcefghjk 4ci none ENG 18110 20674 68373 23765 92930 34827 50880 44609IIx 7bcefghjk 4ci none FRA 56288 95430 61261 133903 26841 148075 69631 44063IIx 7bcefghjk 4ci none IRL 28500 12143 488544 16228 15017IIx 7bcefghjk 4ci none SCO 25313 34086 10592IIx 7bcefghjk 4ci none SPN 3228 9702 2161 10661 290
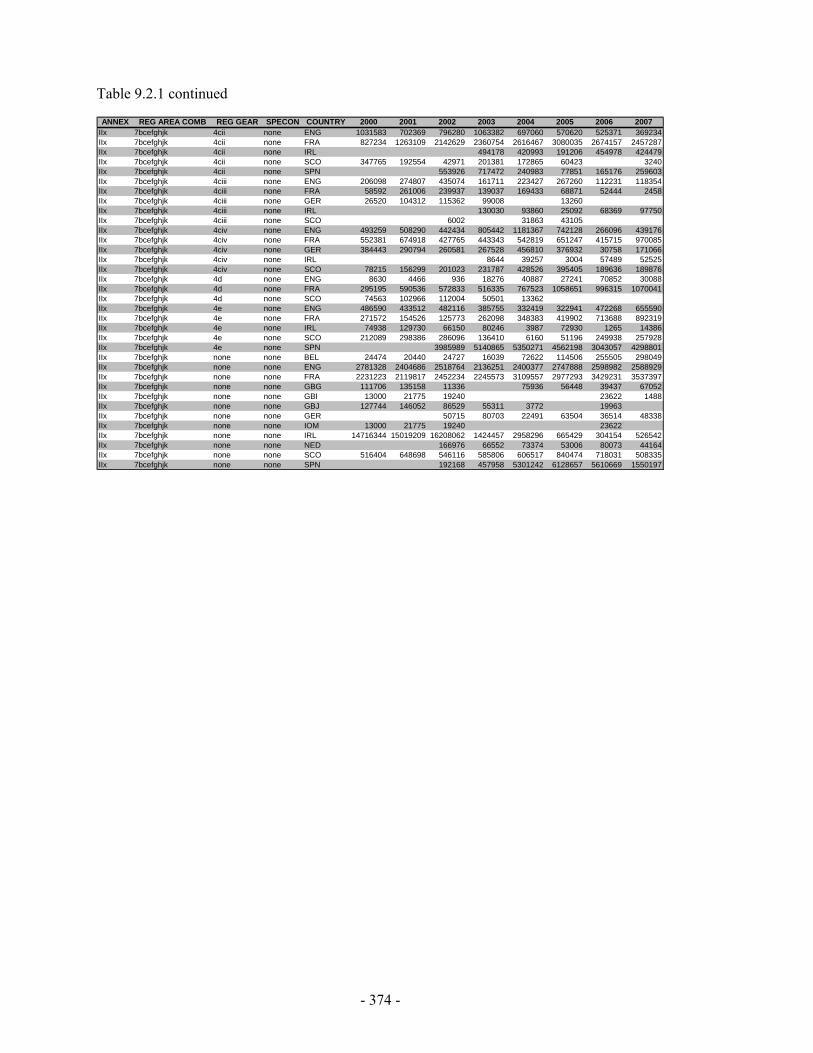
- 374 -
Table 9.2.1 continued
ANNEX REG AREA COMB REG GEAR SPECON COUNTRY 2000 2001 2002 2003 2004 2005 2006 2007IIx 7bcefghjk 4cii none ENG 1031583 702369 796280 1063382 697060 570620 525371 369234IIx 7bcefghjk 4cii none FRA 827234 1263109 2142629 2360754 2616467 3080035 2674157 2457287IIx 7bcefghjk 4cii none IRL 494178 420993 191206 454978 424479IIx 7bcefghjk 4cii none SCO 347765 192554 42971 201381 172865 60423 3240IIx 7bcefghjk 4cii none SPN 553926 717472 240983 77851 165176 259603IIx 7bcefghjk 4ciii none ENG 206098 274807 435074 161711 223427 267260 112231 118354IIx 7bcefghjk 4ciii none FRA 58592 261006 239937 139037 169433 68871 52444 2458IIx 7bcefghjk 4ciii none GER 26520 104312 115362 99008 13260IIx 7bcefghjk 4ciii none IRL 130030 93860 25092 68369 97750IIx 7bcefghjk 4ciii none SCO 6002 31863 43105IIx 7bcefghjk 4civ none ENG 493259 508290 442434 805442 1181367 742128 266096 439176IIx 7bcefghjk 4civ none FRA 552381 674918 427765 443343 542819 651247 415715 970085IIx 7bcefghjk 4civ none GER 384443 290794 260581 267528 456810 376932 30758 171066IIx 7bcefghjk 4civ none IRL 8644 39257 3004 57489 52525IIx 7bcefghjk 4civ none SCO 78215 156299 201023 231787 428526 395405 189636 189876IIx 7bcefghjk 4d none ENG 8630 4466 936 18276 40887 27241 70852 30088IIx 7bcefghjk 4d none FRA 295195 590536 572833 516335 767523 1058651 996315 1070041IIx 7bcefghjk 4d none SCO 74563 102966 112004 50501 13362IIx 7bcefghjk 4e none ENG 486590 433512 482116 385755 332419 322941 472268 655590IIx 7bcefghjk 4e none FRA 271572 154526 125773 262098 348383 419902 713688 892319IIx 7bcefghjk 4e none IRL 74938 129730 66150 80246 3987 72930 1265 14386IIx 7bcefghjk 4e none SCO 212089 298386 286096 136410 6160 51196 249938 257928IIx 7bcefghjk 4e none SPN 3985989 5140865 5350271 4562198 3043057 4298801IIx 7bcefghjk none none BEL 24474 20440 24727 16039 72622 114506 255505 298049IIx 7bcefghjk none none ENG 2781328 2404686 2518764 2136251 2400377 2747888 2598982 2588929IIx 7bcefghjk none none FRA 2231223 2119817 2452234 2245573 3109557 2977293 3429231 3537397IIx 7bcefghjk none none GBG 111706 135158 11336 75936 56448 39437 67052IIx 7bcefghjk none none GBI 13000 21775 19240 23622 1488IIx 7bcefghjk none none GBJ 127744 146052 86529 55311 3772 19963IIx 7bcefghjk none none GER 50715 80703 22491 63504 36514 48338IIx 7bcefghjk none none IOM 13000 21775 19240 23622IIx 7bcefghjk none none IRL 14716344 15019209 16208062 1424457 2958296 665429 304154 526542IIx 7bcefghjk none none NED 166976 66552 73374 53006 80073 44164IIx 7bcefghjk none none SCO 516404 648698 546116 585806 606517 840474 718031 508335IIx 7bcefghjk none none SPN 192168 457958 5301242 6128657 5610669 1550197
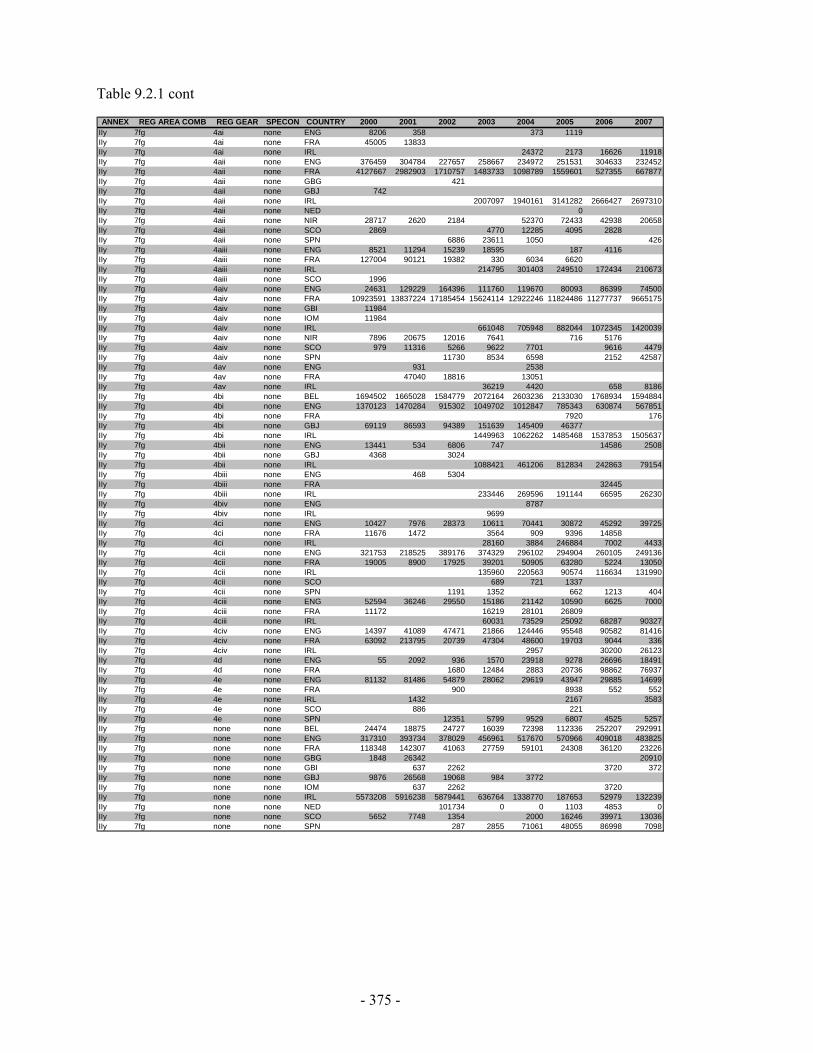
- 375 -
Table 9.2.1 cont
ANNEX REG AREA COMB REG GEAR SPECON COUNTRY 2000 2001 2002 2003 2004 2005 2006 2007IIy 7fg 4ai none ENG 8206 358 373 1119IIy 7fg 4ai none FRA 45005 13833IIy 7fg 4ai none IRL 24372 2173 16626 11918IIy 7fg 4aii none ENG 376459 304784 227657 258667 234972 251531 304633 232452IIy 7fg 4aii none FRA 4127667 2982903 1710757 1483733 1098789 1559601 527355 667877IIy 7fg 4aii none GBG 421IIy 7fg 4aii none GBJ 742IIy 7fg 4aii none IRL 2007097 1940161 3141282 2666427 2697310IIy 7fg 4aii none NED 0IIy 7fg 4aii none NIR 28717 2620 2184 52370 72433 42938 20658IIy 7fg 4aii none SCO 2869 4770 12285 4095 2828IIy 7fg 4aii none SPN 6886 23611 1050 426IIy 7fg 4aiii none ENG 8521 11294 15239 18595 187 4116IIy 7fg 4aiii none FRA 127004 90121 19382 330 6034 6620IIy 7fg 4aiii none IRL 214795 301403 249510 172434 210673IIy 7fg 4aiii none SCO 1996IIy 7fg 4aiv none ENG 24631 129229 164396 111760 119670 80093 86399 74500IIy 7fg 4aiv none FRA 10923591 13837224 17185454 15624114 12922246 11824486 11277737 9665175IIy 7fg 4aiv none GBI 11984IIy 7fg 4aiv none IOM 11984IIy 7fg 4aiv none IRL 661048 705948 882044 1072345 1420039IIy 7fg 4aiv none NIR 7896 20675 12016 7641 716 5176IIy 7fg 4aiv none SCO 979 11316 5266 9622 7701 9616 4479IIy 7fg 4aiv none SPN 11730 8534 6598 2152 42587IIy 7fg 4av none ENG 931 2538IIy 7fg 4av none FRA 47040 18816 13051IIy 7fg 4av none IRL 36219 4420 658 8186IIy 7fg 4bi none BEL 1694502 1665028 1584779 2072164 2603236 2133030 1768934 1594884IIy 7fg 4bi none ENG 1370123 1470284 915302 1049702 1012847 785343 630874 567851IIy 7fg 4bi none FRA 7920 176IIy 7fg 4bi none GBJ 69119 86593 94389 151639 145409 46377IIy 7fg 4bi none IRL 1449963 1062262 1485468 1537853 1505637IIy 7fg 4bii none ENG 13441 534 6806 747 14586 2508IIy 7fg 4bii none GBJ 4368 3024IIy 7fg 4bii none IRL 1088421 461206 812834 242863 79154IIy 7fg 4biii none ENG 468 5304IIy 7fg 4biii none FRA 32445IIy 7fg 4biii none IRL 233446 269596 191144 66595 26230IIy 7fg 4biv none ENG 8787IIy 7fg 4biv none IRL 9699IIy 7fg 4ci none ENG 10427 7976 28373 10611 70441 30872 45292 39725IIy 7fg 4ci none FRA 11676 1472 3564 909 9396 14858IIy 7fg 4ci none IRL 28160 3884 246884 7002 4433IIy 7fg 4cii none ENG 321753 218525 389176 374329 296102 294904 260105 249136IIy 7fg 4cii none FRA 19005 8900 17925 39201 50905 63280 5224 13050IIy 7fg 4cii none IRL 135960 220563 90574 116634 131990IIy 7fg 4cii none SCO 689 721 1337IIy 7fg 4cii none SPN 1191 1352 662 1213 404IIy 7fg 4ciii none ENG 52594 36246 29550 15186 21142 10590 6625 7000IIy 7fg 4ciii none FRA 11172 16219 28101 26809IIy 7fg 4ciii none IRL 60031 73529 25092 68287 90327IIy 7fg 4civ none ENG 14397 41089 47471 21866 124446 95548 90582 81416IIy 7fg 4civ none FRA 63092 213795 20739 47304 48600 19703 9044 336IIy 7fg 4civ none IRL 2957 30200 26123IIy 7fg 4d none ENG 55 2092 936 1570 23918 9278 26696 18491IIy 7fg 4d none FRA 1680 12484 2883 20736 98862 76937IIy 7fg 4e none ENG 81132 81486 54879 28062 29619 43947 29885 14699IIy 7fg 4e none FRA 900 8938 552 552IIy 7fg 4e none IRL 1432 2167 3583IIy 7fg 4e none SCO 886 221IIy 7fg 4e none SPN 12351 5799 9529 6807 4525 5257IIy 7fg none none BEL 24474 18875 24727 16039 72398 112336 252207 292991IIy 7fg none none ENG 317310 393734 378029 456961 517670 570966 409018 483825IIy 7fg none none FRA 118348 142307 41063 27759 59101 24308 36120 23226IIy 7fg none none GBG 1848 26342 20910IIy 7fg none none GBI 637 2262 3720 372IIy 7fg none none GBJ 9876 26568 19068 984 3772IIy 7fg none none IOM 637 2262 3720IIy 7fg none none IRL 5573208 5916238 5879441 636764 1338770 187653 52979 132239IIy 7fg none none NED 101734 0 0 1103 4853 0IIy 7fg none none SCO 5652 7748 1354 2000 16246 39971 13036IIy 7fg none none SPN 287 2855 71061 48055 86998 7098
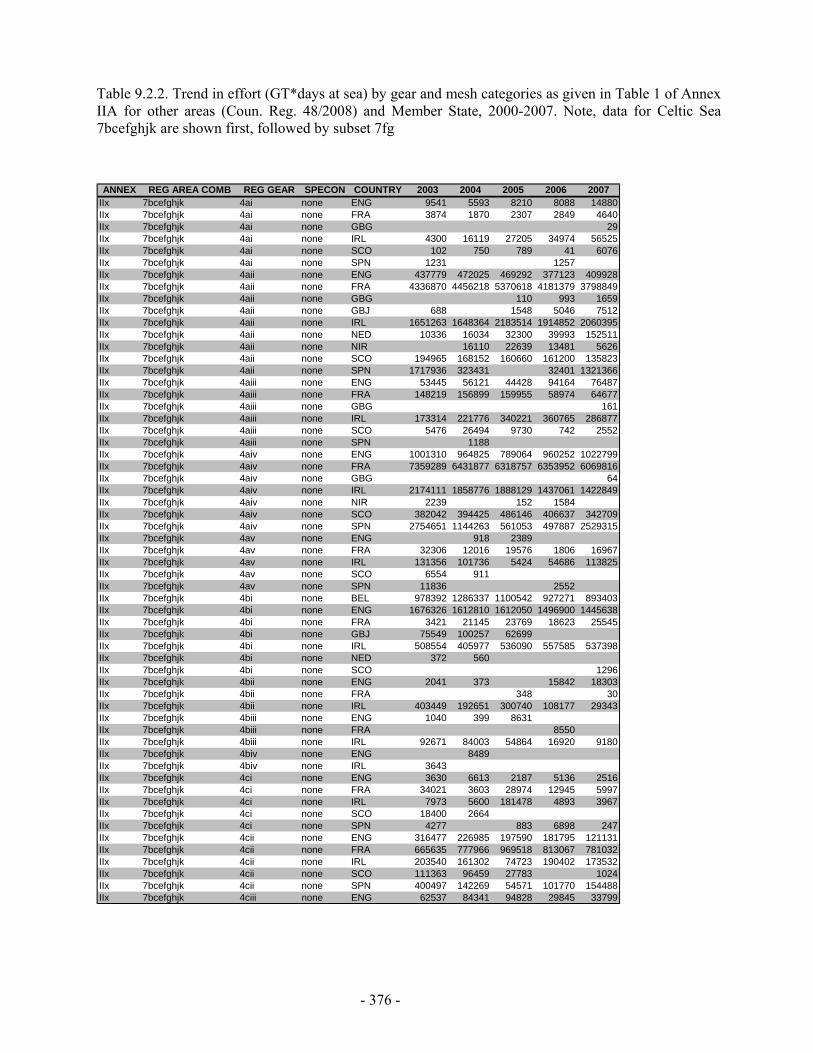
- 376 -
Table 9.2.2. Trend in effort (GT*days at sea) by gear and mesh categories as given in Table 1 of Annex IIA for other areas (Coun. Reg. 48/2008) and Member State, 2000-2007. Note, data for Celtic Sea 7bcefghjk are shown first, followed by subset 7fg
ANNEX REG AREA COMB REG GEAR SPECON COUNTRY 2003 2004 2005 2006 2007IIx 7bcefghjk 4ai none ENG 9541 5593 8210 8088 14880IIx 7bcefghjk 4ai none FRA 3874 1870 2307 2849 4640IIx 7bcefghjk 4ai none GBG 29IIx 7bcefghjk 4ai none IRL 4300 16119 27205 34974 56525IIx 7bcefghjk 4ai none SCO 102 750 789 41 6076IIx 7bcefghjk 4ai none SPN 1231 1257IIx 7bcefghjk 4aii none ENG 437779 472025 469292 377123 409928IIx 7bcefghjk 4aii none FRA 4336870 4456218 5370618 4181379 3798849IIx 7bcefghjk 4aii none GBG 110 993 1659IIx 7bcefghjk 4aii none GBJ 688 1548 5046 7512IIx 7bcefghjk 4aii none IRL 1651263 1648364 2183514 1914852 2060395IIx 7bcefghjk 4aii none NED 10336 16034 32300 39993 152511IIx 7bcefghjk 4aii none NIR 16110 22639 13481 5626IIx 7bcefghjk 4aii none SCO 194965 168152 160660 161200 135823IIx 7bcefghjk 4aii none SPN 1717936 323431 32401 1321366IIx 7bcefghjk 4aiii none ENG 53445 56121 44428 94164 76487IIx 7bcefghjk 4aiii none FRA 148219 156899 159955 58974 64677IIx 7bcefghjk 4aiii none GBG 161IIx 7bcefghjk 4aiii none IRL 173314 221776 340221 360765 286877IIx 7bcefghjk 4aiii none SCO 5476 26494 9730 742 2552IIx 7bcefghjk 4aiii none SPN 1188IIx 7bcefghjk 4aiv none ENG 1001310 964825 789064 960252 1022799IIx 7bcefghjk 4aiv none FRA 7359289 6431877 6318757 6353952 6069816IIx 7bcefghjk 4aiv none GBG 64IIx 7bcefghjk 4aiv none IRL 2174111 1858776 1888129 1437061 1422849IIx 7bcefghjk 4aiv none NIR 2239 152 1584IIx 7bcefghjk 4aiv none SCO 382042 394425 486146 406637 342709IIx 7bcefghjk 4aiv none SPN 2754651 1144263 561053 497887 2529315IIx 7bcefghjk 4av none ENG 918 2389IIx 7bcefghjk 4av none FRA 32306 12016 19576 1806 16967IIx 7bcefghjk 4av none IRL 131356 101736 5424 54686 113825IIx 7bcefghjk 4av none SCO 6554 911IIx 7bcefghjk 4av none SPN 11836 2552IIx 7bcefghjk 4bi none BEL 978392 1286337 1100542 927271 893403IIx 7bcefghjk 4bi none ENG 1676326 1612810 1612050 1496900 1445638IIx 7bcefghjk 4bi none FRA 3421 21145 23769 18623 25545IIx 7bcefghjk 4bi none GBJ 75549 100257 62699IIx 7bcefghjk 4bi none IRL 508554 405977 536090 557585 537398IIx 7bcefghjk 4bi none NED 372 560IIx 7bcefghjk 4bi none SCO 1296IIx 7bcefghjk 4bii none ENG 2041 373 15842 18303IIx 7bcefghjk 4bii none FRA 348 30IIx 7bcefghjk 4bii none IRL 403449 192651 300740 108177 29343IIx 7bcefghjk 4biii none ENG 1040 399 8631IIx 7bcefghjk 4biii none FRA 8550IIx 7bcefghjk 4biii none IRL 92671 84003 54864 16920 9180IIx 7bcefghjk 4biv none ENG 8489IIx 7bcefghjk 4biv none IRL 3643IIx 7bcefghjk 4ci none ENG 3630 6613 2187 5136 2516IIx 7bcefghjk 4ci none FRA 34021 3603 28974 12945 5997IIx 7bcefghjk 4ci none IRL 7973 5600 181478 4893 3967IIx 7bcefghjk 4ci none SCO 18400 2664IIx 7bcefghjk 4ci none SPN 4277 883 6898 247IIx 7bcefghjk 4cii none ENG 316477 226985 197590 181795 121131IIx 7bcefghjk 4cii none FRA 665635 777966 969518 813067 781032IIx 7bcefghjk 4cii none IRL 203540 161302 74723 190402 173532IIx 7bcefghjk 4cii none SCO 111363 96459 27783 1024IIx 7bcefghjk 4cii none SPN 400497 142269 54571 101770 154488IIx 7bcefghjk 4ciii none ENG 62537 84341 94828 29845 33799

- 377 -
Table 9.2.2 cont
ANNEX REG AREA COMB REG GEAR SPECON COUNTRY 2003 2004 2005 2006 2007IIx 7bcefghjk 4ciii none FRA 21134 30320 13004 7223 277IIx 7bcefghjk 4ciii none GER 33152 4440IIx 7bcefghjk 4ciii none IRL 52201 32692 7723 16807 35511IIx 7bcefghjk 4ciii none SCO 15867 23084IIx 7bcefghjk 4civ none ENG 404731 517114 308312 90666 171032IIx 7bcefghjk 4civ none FRA 96563 106963 141190 76542 233985IIx 7bcefghjk 4civ none GER 126150 199196 163240 14123 75117IIx 7bcefghjk 4civ none IRL 3184 17010 964 10701 7949IIx 7bcefghjk 4civ none SCO 139718 239542 220208 108818 92423IIx 7bcefghjk 4d none ENG 9403 15625 8306 27231 8636IIx 7bcefghjk 4d none FRA 67483 103693 151524 146613 158378IIx 7bcefghjk 4d none SCO 29041 7684IIx 7bcefghjk 4e none ENG 136730 120760 113934 184929 251755IIx 7bcefghjk 4e none FRA 49558 75687 83770 209689 277339IIx 7bcefghjk 4e none IRL 40885 1774 28959 281 2944IIx 7bcefghjk 4e none SCO 73341 4374 25555 118666 125637IIx 7bcefghjk 4e none SPN 2745399 2874471 2542036 1829921 2557237IIx 7bcefghjk none none BEL 11838 49338 70882 125751 148393IIx 7bcefghjk none none ENG 476640 547711 619600 596197 582566IIx 7bcefghjk none none FRA 270422 401165 369502 397880 394887IIx 7bcefghjk none none GBG 14231 10579 7391 16579IIx 7bcefghjk none none GBI 5398 340IIx 7bcefghjk none none GBJ 11782 1212 6369IIx 7bcefghjk none none GER 36417 10149 28656 16520 21882IIx 7bcefghjk none none IOM 5398IIx 7bcefghjk none none IRL 434514 970978 174925 70563 96804IIx 7bcefghjk none none NED 17495 18548 14059 31963 16637IIx 7bcefghjk none none SCO 207912 212688 292588 243365 184297IIx 7bcefghjk none none SPN 302149 3826254 4613274 4231749 1118052
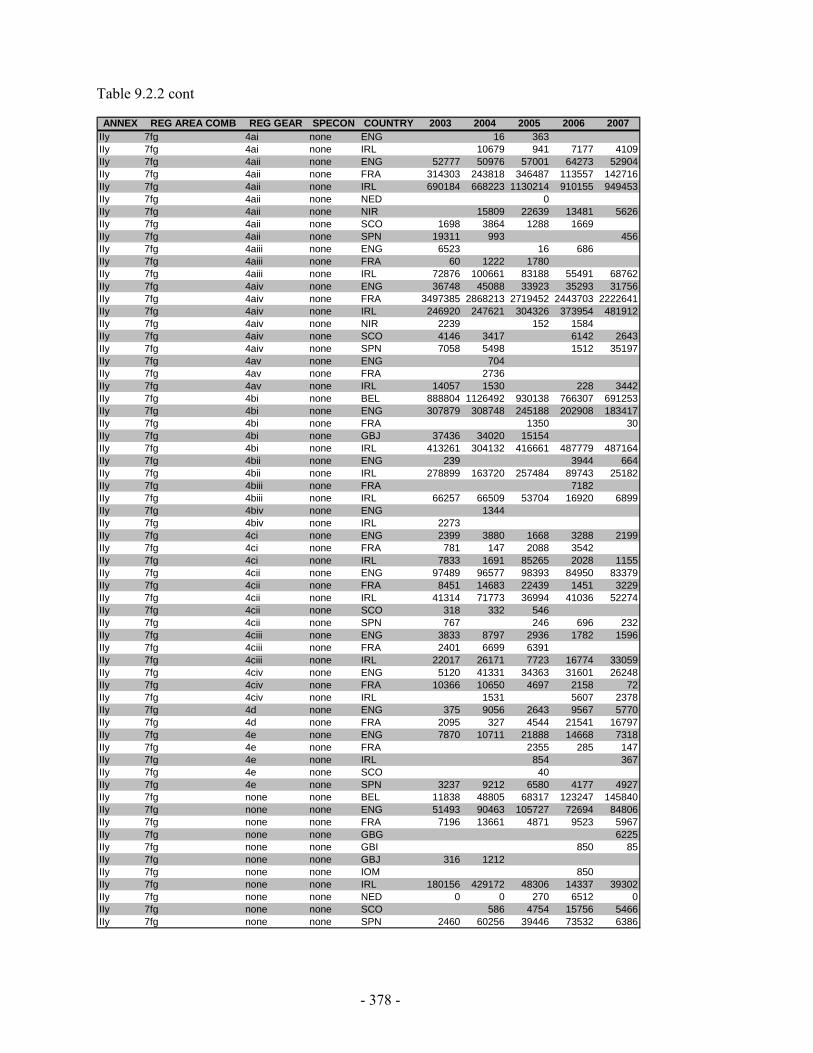
- 378 -
Table 9.2.2 cont
ANNEX REG AREA COMB REG GEAR SPECON COUNTRY 2003 2004 2005 2006 2007IIy 7fg 4ai none ENG 16 363IIy 7fg 4ai none IRL 10679 941 7177 4109IIy 7fg 4aii none ENG 52777 50976 57001 64273 52904IIy 7fg 4aii none FRA 314303 243818 346487 113557 142716IIy 7fg 4aii none IRL 690184 668223 1130214 910155 949453IIy 7fg 4aii none NED 0IIy 7fg 4aii none NIR 15809 22639 13481 5626IIy 7fg 4aii none SCO 1698 3864 1288 1669IIy 7fg 4aii none SPN 19311 993 456IIy 7fg 4aiii none ENG 6523 16 686IIy 7fg 4aiii none FRA 60 1222 1780IIy 7fg 4aiii none IRL 72876 100661 83188 55491 68762IIy 7fg 4aiv none ENG 36748 45088 33923 35293 31756IIy 7fg 4aiv none FRA 3497385 2868213 2719452 2443703 2222641IIy 7fg 4aiv none IRL 246920 247621 304326 373954 481912IIy 7fg 4aiv none NIR 2239 152 1584IIy 7fg 4aiv none SCO 4146 3417 6142 2643IIy 7fg 4aiv none SPN 7058 5498 1512 35197IIy 7fg 4av none ENG 704IIy 7fg 4av none FRA 2736IIy 7fg 4av none IRL 14057 1530 228 3442IIy 7fg 4bi none BEL 888804 1126492 930138 766307 691253IIy 7fg 4bi none ENG 307879 308748 245188 202908 183417IIy 7fg 4bi none FRA 1350 30IIy 7fg 4bi none GBJ 37436 34020 15154IIy 7fg 4bi none IRL 413261 304132 416661 487779 487164IIy 7fg 4bii none ENG 239 3944 664IIy 7fg 4bii none IRL 278899 163720 257484 89743 25182IIy 7fg 4biii none FRA 7182IIy 7fg 4biii none IRL 66257 66509 53704 16920 6899IIy 7fg 4biv none ENG 1344IIy 7fg 4biv none IRL 2273IIy 7fg 4ci none ENG 2399 3880 1668 3288 2199IIy 7fg 4ci none FRA 781 147 2088 3542IIy 7fg 4ci none IRL 7833 1691 85265 2028 1155IIy 7fg 4cii none ENG 97489 96577 98393 84950 83379IIy 7fg 4cii none FRA 8451 14683 22439 1451 3229IIy 7fg 4cii none IRL 41314 71773 36994 41036 52274IIy 7fg 4cii none SCO 318 332 546IIy 7fg 4cii none SPN 767 246 696 232IIy 7fg 4ciii none ENG 3833 8797 2936 1782 1596IIy 7fg 4ciii none FRA 2401 6699 6391IIy 7fg 4ciii none IRL 22017 26171 7723 16774 33059IIy 7fg 4civ none ENG 5120 41331 34363 31601 26248IIy 7fg 4civ none FRA 10366 10650 4697 2158 72IIy 7fg 4civ none IRL 1531 5607 2378IIy 7fg 4d none ENG 375 9056 2643 9567 5770IIy 7fg 4d none FRA 2095 327 4544 21541 16797IIy 7fg 4e none ENG 7870 10711 21888 14668 7318IIy 7fg 4e none FRA 2355 285 147IIy 7fg 4e none IRL 854 367IIy 7fg 4e none SCO 40IIy 7fg 4e none SPN 3237 9212 6580 4177 4927IIy 7fg none none BEL 11838 48805 68317 123247 145840IIy 7fg none none ENG 51493 90463 105727 72694 84806IIy 7fg none none FRA 7196 13661 4871 9523 5967IIy 7fg none none GBG 6225IIy 7fg none none GBI 850 85IIy 7fg none none GBJ 316 1212IIy 7fg none none IOM 850IIy 7fg none none IRL 180156 429172 48306 14337 39302IIy 7fg none none NED 0 0 270 6512 0IIy 7fg none none SCO 586 4754 15756 5466IIy 7fg none none SPN 2460 60256 39446 73532 6386
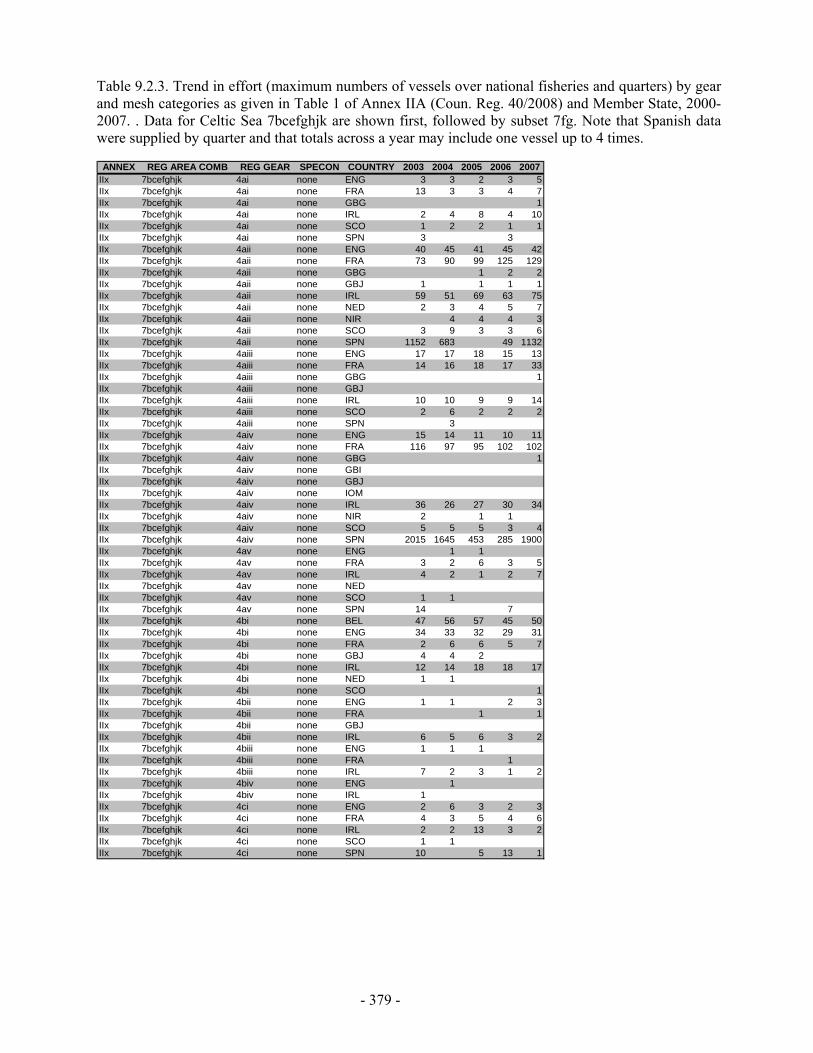
- 379 -
Table 9.2.3. Trend in effort (maximum numbers of vessels over national fisheries and quarters) by gear and mesh categories as given in Table 1 of Annex IIA (Coun. Reg. 40/2008) and Member State, 2000-2007. . Data for Celtic Sea 7bcefghjk are shown first, followed by subset 7fg. Note that Spanish data were supplied by quarter and that totals across a year may include one vessel up to 4 times.
ANNEX REG AREA COMB REG GEAR SPECON COUNTRY 2003 2004 2005 2006 2007IIx 7bcefghjk 4ai none ENG 3 3 2 3 5IIx 7bcefghjk 4ai none FRA 13 3 3 4 7IIx 7bcefghjk 4ai none GBG 1IIx 7bcefghjk 4ai none IRL 2 4 8 4 10IIx 7bcefghjk 4ai none SCO 1 2 2 1 1IIx 7bcefghjk 4ai none SPN 3 3IIx 7bcefghjk 4aii none ENG 40 45 41 45 42IIx 7bcefghjk 4aii none FRA 73 90 99 125 129IIx 7bcefghjk 4aii none GBG 1 2 2IIx 7bcefghjk 4aii none GBJ 1 1 1 1IIx 7bcefghjk 4aii none IRL 59 51 69 63 75IIx 7bcefghjk 4aii none NED 2 3 4 5 7IIx 7bcefghjk 4aii none NIR 4 4 4 3IIx 7bcefghjk 4aii none SCO 3 9 3 3 6IIx 7bcefghjk 4aii none SPN 1152 683 49 1132IIx 7bcefghjk 4aiii none ENG 17 17 18 15 13IIx 7bcefghjk 4aiii none FRA 14 16 18 17 33IIx 7bcefghjk 4aiii none GBG 1IIx 7bcefghjk 4aiii none GBJIIx 7bcefghjk 4aiii none IRL 10 10 9 9 14IIx 7bcefghjk 4aiii none SCO 2 6 2 2 2IIx 7bcefghjk 4aiii none SPN 3IIx 7bcefghjk 4aiv none ENG 15 14 11 10 11IIx 7bcefghjk 4aiv none FRA 116 97 95 102 102IIx 7bcefghjk 4aiv none GBG 1IIx 7bcefghjk 4aiv none GBIIIx 7bcefghjk 4aiv none GBJIIx 7bcefghjk 4aiv none IOMIIx 7bcefghjk 4aiv none IRL 36 26 27 30 34IIx 7bcefghjk 4aiv none NIR 2 1 1IIx 7bcefghjk 4aiv none SCO 5 5 5 3 4IIx 7bcefghjk 4aiv none SPN 2015 1645 453 285 1900IIx 7bcefghjk 4av none ENG 1 1IIx 7bcefghjk 4av none FRA 3 2 6 3 5IIx 7bcefghjk 4av none IRL 4 2 1 2 7IIx 7bcefghjk 4av none NEDIIx 7bcefghjk 4av none SCO 1 1IIx 7bcefghjk 4av none SPN 14 7IIx 7bcefghjk 4bi none BEL 47 56 57 45 50IIx 7bcefghjk 4bi none ENG 34 33 32 29 31IIx 7bcefghjk 4bi none FRA 2 6 6 5 7IIx 7bcefghjk 4bi none GBJ 4 4 2IIx 7bcefghjk 4bi none IRL 12 14 18 18 17IIx 7bcefghjk 4bi none NED 1 1IIx 7bcefghjk 4bi none SCO 1IIx 7bcefghjk 4bii none ENG 1 1 2 3IIx 7bcefghjk 4bii none FRA 1 1IIx 7bcefghjk 4bii none GBJIIx 7bcefghjk 4bii none IRL 6 5 6 3 2IIx 7bcefghjk 4biii none ENG 1 1 1IIx 7bcefghjk 4biii none FRA 1IIx 7bcefghjk 4biii none IRL 7 2 3 1 2IIx 7bcefghjk 4biv none ENG 1IIx 7bcefghjk 4biv none IRL 1IIx 7bcefghjk 4ci none ENG 2 6 3 2 3IIx 7bcefghjk 4ci none FRA 4 3 5 4 6IIx 7bcefghjk 4ci none IRL 2 2 13 3 2IIx 7bcefghjk 4ci none SCO 1 1IIx 7bcefghjk 4ci none SPN 10 5 13 1
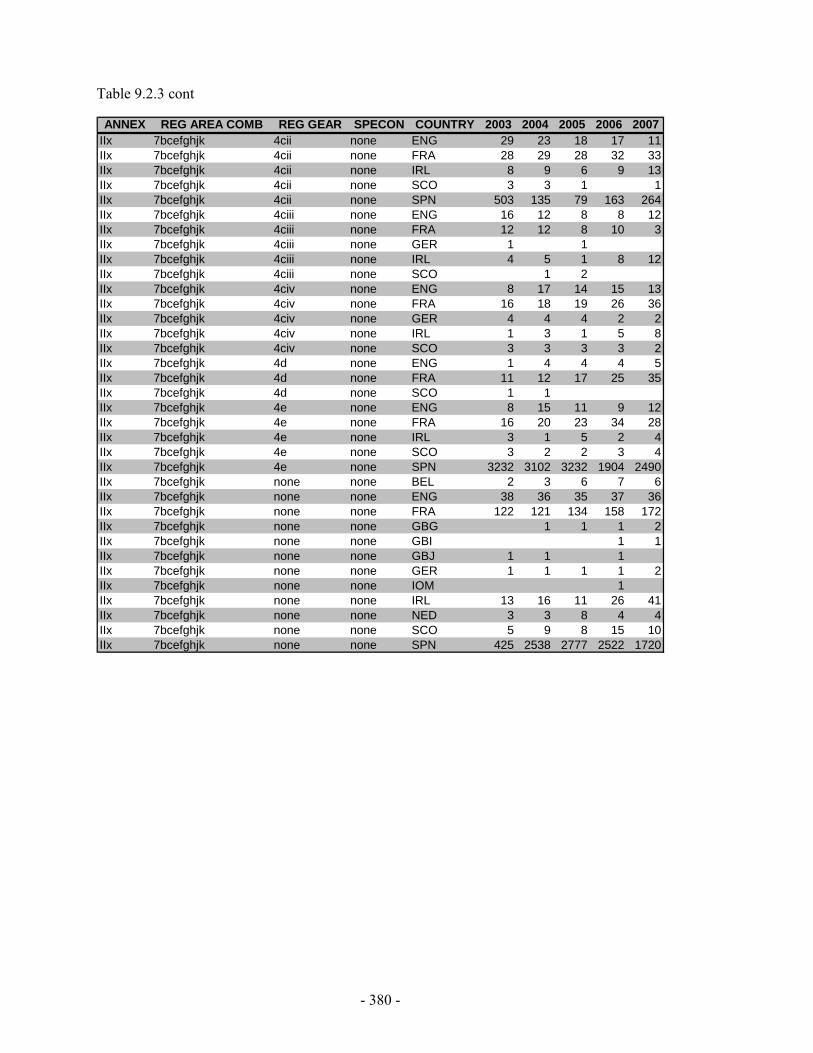
- 380 -
Table 9.2.3 cont
ANNEX REG AREA COMB REG GEAR SPECON COUNTRY 2003 2004 2005 2006 2007IIx 7bcefghjk 4cii none ENG 29 23 18 17 11IIx 7bcefghjk 4cii none FRA 28 29 28 32 33IIx 7bcefghjk 4cii none IRL 8 9 6 9 13IIx 7bcefghjk 4cii none SCO 3 3 1 1IIx 7bcefghjk 4cii none SPN 503 135 79 163 264IIx 7bcefghjk 4ciii none ENG 16 12 8 8 12IIx 7bcefghjk 4ciii none FRA 12 12 8 10 3IIx 7bcefghjk 4ciii none GER 1 1IIx 7bcefghjk 4ciii none IRL 4 5 1 8 12IIx 7bcefghjk 4ciii none SCO 1 2IIx 7bcefghjk 4civ none ENG 8 17 14 15 13IIx 7bcefghjk 4civ none FRA 16 18 19 26 36IIx 7bcefghjk 4civ none GER 4 4 4 2 2IIx 7bcefghjk 4civ none IRL 1 3 1 5 8IIx 7bcefghjk 4civ none SCO 3 3 3 3 2IIx 7bcefghjk 4d none ENG 1 4 4 4 5IIx 7bcefghjk 4d none FRA 11 12 17 25 35IIx 7bcefghjk 4d none SCO 1 1IIx 7bcefghjk 4e none ENG 8 15 11 9 12IIx 7bcefghjk 4e none FRA 16 20 23 34 28IIx 7bcefghjk 4e none IRL 3 1 5 2 4IIx 7bcefghjk 4e none SCO 3 2 2 3 4IIx 7bcefghjk 4e none SPN 3232 3102 3232 1904 2490IIx 7bcefghjk none none BEL 2 3 6 7 6IIx 7bcefghjk none none ENG 38 36 35 37 36IIx 7bcefghjk none none FRA 122 121 134 158 172IIx 7bcefghjk none none GBG 1 1 1 2IIx 7bcefghjk none none GBI 1 1IIx 7bcefghjk none none GBJ 1 1 1IIx 7bcefghjk none none GER 1 1 1 1 2IIx 7bcefghjk none none IOM 1IIx 7bcefghjk none none IRL 13 16 11 26 41IIx 7bcefghjk none none NED 3 3 8 4 4IIx 7bcefghjk none none SCO 5 9 8 15 10IIx 7bcefghjk none none SPN 425 2538 2777 2522 1720
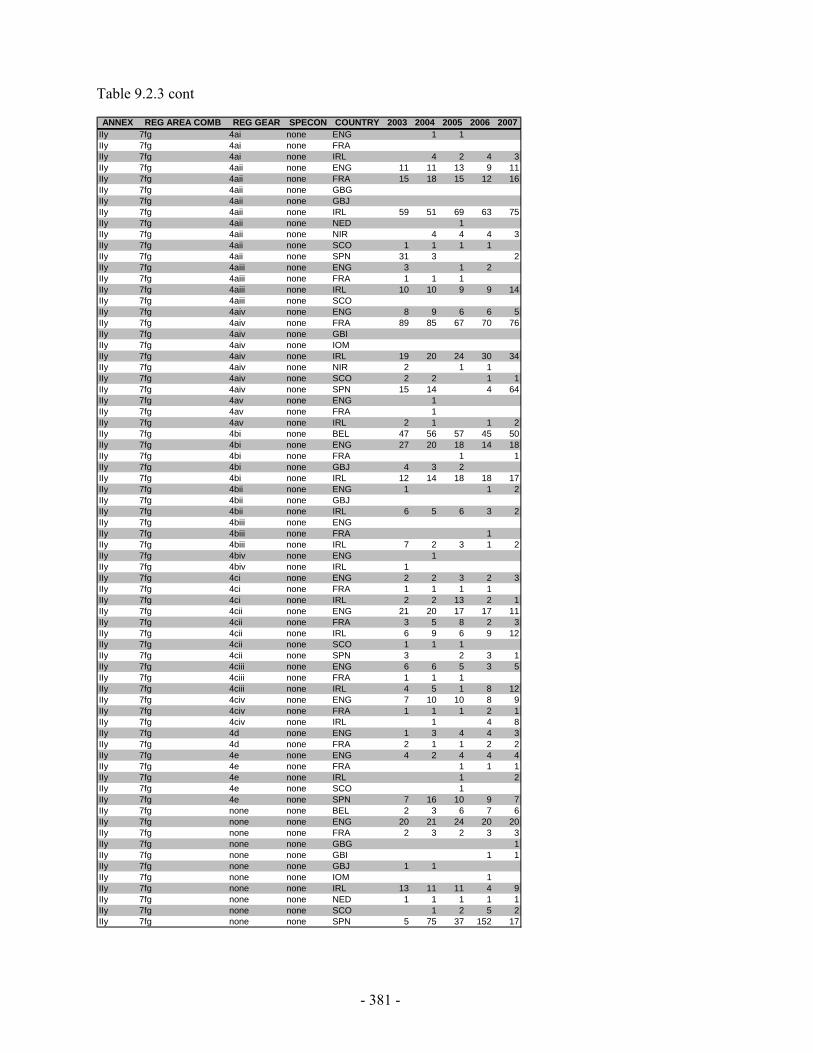
- 381 -
Table 9.2.3 cont
ANNEX REG AREA COMB REG GEAR SPECON COUNTRY 2003 2004 2005 2006 2007IIy 7fg 4ai none ENG 1 1IIy 7fg 4ai none FRAIIy 7fg 4ai none IRL 4 2 4 3IIy 7fg 4aii none ENG 11 11 13 9 11IIy 7fg 4aii none FRA 15 18 15 12 16IIy 7fg 4aii none GBGIIy 7fg 4aii none GBJIIy 7fg 4aii none IRL 59 51 69 63 75IIy 7fg 4aii none NED 1IIy 7fg 4aii none NIR 4 4 4 3IIy 7fg 4aii none SCO 1 1 1 1IIy 7fg 4aii none SPN 31 3 2IIy 7fg 4aiii none ENG 3 1 2IIy 7fg 4aiii none FRA 1 1 1IIy 7fg 4aiii none IRL 10 10 9 9 14IIy 7fg 4aiii none SCOIIy 7fg 4aiv none ENG 8 9 6 6 5IIy 7fg 4aiv none FRA 89 85 67 70 76IIy 7fg 4aiv none GBIIIy 7fg 4aiv none IOMIIy 7fg 4aiv none IRL 19 20 24 30 34IIy 7fg 4aiv none NIR 2 1 1IIy 7fg 4aiv none SCO 2 2 1 1IIy 7fg 4aiv none SPN 15 14 4 64IIy 7fg 4av none ENG 1IIy 7fg 4av none FRA 1IIy 7fg 4av none IRL 2 1 1 2IIy 7fg 4bi none BEL 47 56 57 45 50IIy 7fg 4bi none ENG 27 20 18 14 18IIy 7fg 4bi none FRA 1 1IIy 7fg 4bi none GBJ 4 3 2IIy 7fg 4bi none IRL 12 14 18 18 17IIy 7fg 4bii none ENG 1 1 2IIy 7fg 4bii none GBJIIy 7fg 4bii none IRL 6 5 6 3 2IIy 7fg 4biii none ENGIIy 7fg 4biii none FRA 1IIy 7fg 4biii none IRL 7 2 3 1 2IIy 7fg 4biv none ENG 1IIy 7fg 4biv none IRL 1IIy 7fg 4ci none ENG 2 2 3 2 3IIy 7fg 4ci none FRA 1 1 1 1IIy 7fg 4ci none IRL 2 2 13 2 1IIy 7fg 4cii none ENG 21 20 17 17 11IIy 7fg 4cii none FRA 3 5 8 2 3IIy 7fg 4cii none IRL 6 9 6 9 12IIy 7fg 4cii none SCO 1 1 1IIy 7fg 4cii none SPN 3 2 3 1IIy 7fg 4ciii none ENG 6 6 5 3 5IIy 7fg 4ciii none FRA 1 1 1IIy 7fg 4ciii none IRL 4 5 1 8 12IIy 7fg 4civ none ENG 7 10 10 8 9IIy 7fg 4civ none FRA 1 1 1 2 1IIy 7fg 4civ none IRL 1 4 8IIy 7fg 4d none ENG 1 3 4 4 3IIy 7fg 4d none FRA 2 1 1 2 2IIy 7fg 4e none ENG 4 2 4 4 4IIy 7fg 4e none FRA 1 1 1IIy 7fg 4e none IRL 1 2IIy 7fg 4e none SCO 1IIy 7fg 4e none SPN 7 16 10 9 7IIy 7fg none none BEL 2 3 6 7 6IIy 7fg none none ENG 20 21 24 20 20IIy 7fg none none FRA 2 3 2 3 3IIy 7fg none none GBG 1IIy 7fg none none GBI 1 1IIy 7fg none none GBJ 1 1IIy 7fg none none IOM 1IIy 7fg none none IRL 13 11 11 4 9IIy 7fg none none NED 1 1 1 1 1IIy 7fg none none SCO 1 2 5 2IIy 7fg none none SPN 5 75 37 152 17
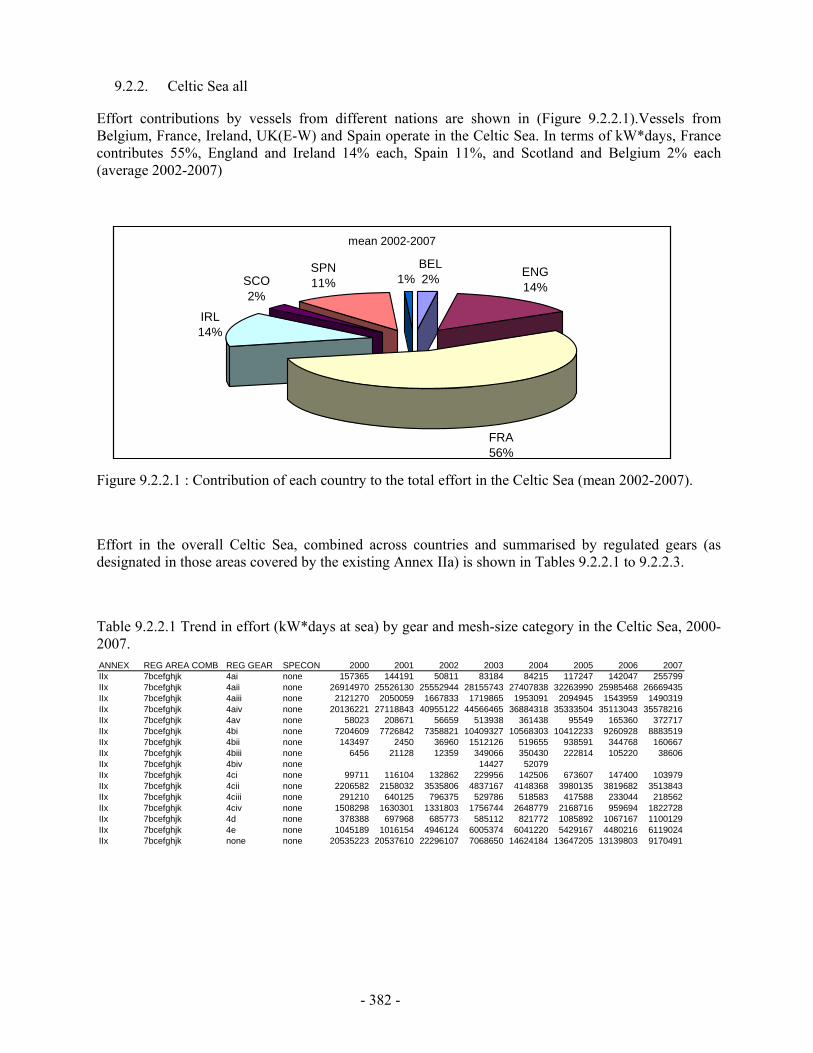
- 382 -
9.2.2. Celtic Sea all
Effort contributions by vessels from different nations are shown in (Figure 9.2.2.1).Vessels from Belgium, France, Ireland, UK(E-W) and Spain operate in the Celtic Sea. In terms of kW*days, France contributes 55%, England and Ireland 14% each, Spain 11%, and Scotland and Belgium 2% each (average 2002-2007)
Figure 9.2.2.1 : Contribution of each country to the total effort in the Celtic Sea (mean 2002-2007).
Effort in the overall Celtic Sea, combined across countries and summarised by regulated gears (as designated in those areas covered by the existing Annex IIa) is shown in Tables 9.2.2.1 to 9.2.2.3.
Table 9.2.2.1 Trend in effort (kW*days at sea) by gear and mesh-size category in the Celtic Sea, 2000-2007.
ANNEX REG AREA COMB REG GEAR SPECON 2000 2001 2002 2003 2004 2005 2006 2007IIx 7bcefghjk 4ai none 157365 144191 50811 83184 84215 117247 142047 255799IIx 7bcefghjk 4aii none 26914970 25526130 25552944 28155743 27407838 32263990 25985468 26669435IIx 7bcefghjk 4aiii none 2121270 2050059 1667833 1719865 1953091 2094945 1543959 1490319IIx 7bcefghjk 4aiv none 20136221 27118843 40955122 44566465 36884318 35333504 35113043 35578216IIx 7bcefghjk 4av none 58023 208671 56659 513938 361438 95549 165360 372717IIx 7bcefghjk 4bi none 7204609 7726842 7358821 10409327 10568303 10412233 9260928 8883519IIx 7bcefghjk 4bii none 143497 2450 36960 1512126 519655 938591 344768 160667IIx 7bcefghjk 4biii none 6456 21128 12359 349066 350430 222814 105220 38606IIx 7bcefghjk 4biv none 14427 52079IIx 7bcefghjk 4ci none 99711 116104 132862 229956 142506 673607 147400 103979IIx 7bcefghjk 4cii none 2206582 2158032 3535806 4837167 4148368 3980135 3819682 3513843IIx 7bcefghjk 4ciii none 291210 640125 796375 529786 518583 417588 233044 218562IIx 7bcefghjk 4civ none 1508298 1630301 1331803 1756744 2648779 2168716 959694 1822728IIx 7bcefghjk 4d none 378388 697968 685773 585112 821772 1085892 1067167 1100129IIx 7bcefghjk 4e none 1045189 1016154 4946124 6005374 6041220 5429167 4480216 6119024IIx 7bcefghjk none none 20535223 20537610 22296107 7068650 14624184 13647205 13139803 9170491
mean 2002-2007
BEL2% ENG
14%
FRA56%
IRL14%
SCO2%
SPN11% 1%
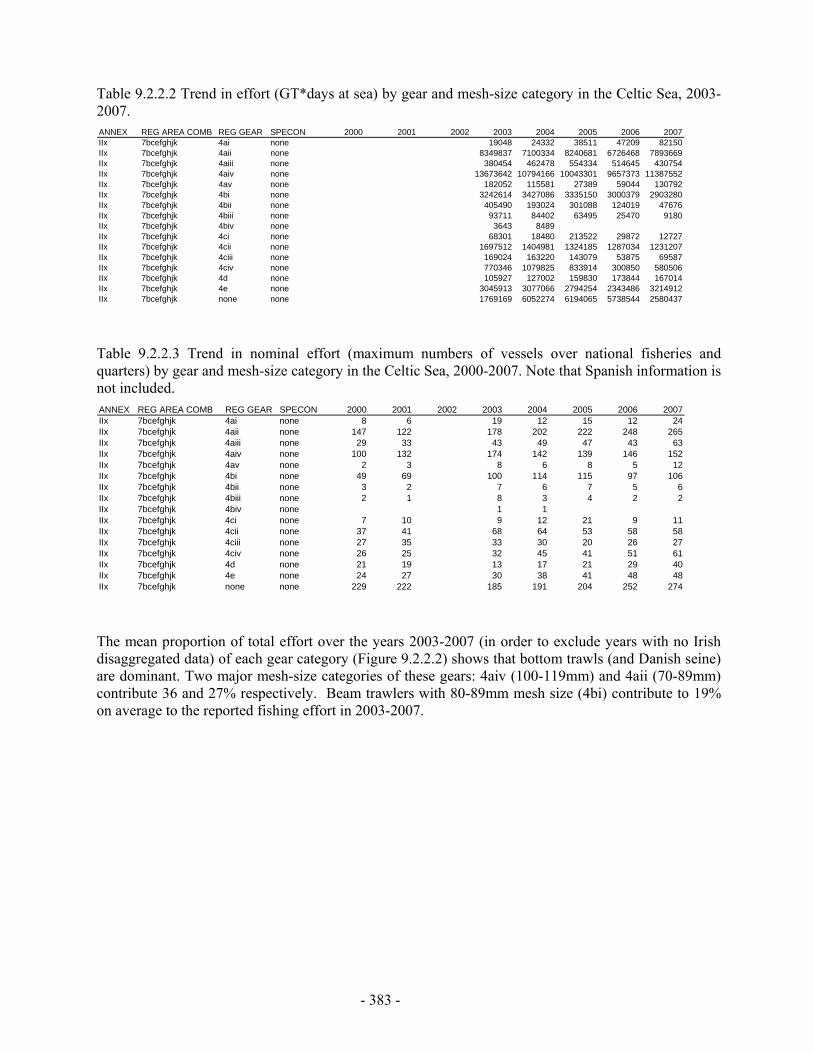
- 383 -
Table 9.2.2.2 Trend in effort (GT*days at sea) by gear and mesh-size category in the Celtic Sea, 2003-2007.
Table 9.2.2.3 Trend in nominal effort (maximum numbers of vessels over national fisheries and quarters) by gear and mesh-size category in the Celtic Sea, 2000-2007. Note that Spanish information is not included.
The mean proportion of total effort over the years 2003-2007 (in order to exclude years with no Irish disaggregated data) of each gear category (Figure 9.2.2.2) shows that bottom trawls (and Danish seine) are dominant. Two major mesh-size categories of these gears: 4aiv (100-119mm) and 4aii (70-89mm) contribute 36 and 27% respectively. Beam trawlers with 80-89mm mesh size (4bi) contribute to 19% on average to the reported fishing effort in 2003-2007.
ANNEX REG AREA COMB REG GEAR SPECON 2000 2001 2002 2003 2004 2005 2006 2007IIx 7bcefghjk 4ai none 19048 24332 38511 47209 82150IIx 7bcefghjk 4aii none 8349837 7100334 8240681 6726468 7893669IIx 7bcefghjk 4aiii none 380454 462478 554334 514645 430754IIx 7bcefghjk 4aiv none 13673642 10794166 10043301 9657373 11387552IIx 7bcefghjk 4av none 182052 115581 27389 59044 130792IIx 7bcefghjk 4bi none 3242614 3427086 3335150 3000379 2903280IIx 7bcefghjk 4bii none 405490 193024 301088 124019 47676IIx 7bcefghjk 4biii none 93711 84402 63495 25470 9180IIx 7bcefghjk 4biv none 3643 8489IIx 7bcefghjk 4ci none 68301 18480 213522 29872 12727IIx 7bcefghjk 4cii none 1697512 1404981 1324185 1287034 1231207IIx 7bcefghjk 4ciii none 169024 163220 143079 53875 69587IIx 7bcefghjk 4civ none 770346 1079825 833914 300850 580506IIx 7bcefghjk 4d none 105927 127002 159830 173844 167014IIx 7bcefghjk 4e none 3045913 3077066 2794254 2343486 3214912IIx 7bcefghjk none none 1769169 6052274 6194065 5738544 2580437
ANNEX REG AREA COMB REG GEAR SPECON 2000 2001 2002 2003 2004 2005 2006 2007IIx 7bcefghjk 4ai none 8 6 19 12 15 12 24IIx 7bcefghjk 4aii none 147 122 178 202 222 248 265IIx 7bcefghjk 4aiii none 29 33 43 49 47 43 63IIx 7bcefghjk 4aiv none 100 132 174 142 139 146 152IIx 7bcefghjk 4av none 2 3 8 6 8 5 12IIx 7bcefghjk 4bi none 49 69 100 114 115 97 106IIx 7bcefghjk 4bii none 3 2 7 6 7 5 6IIx 7bcefghjk 4biii none 2 1 8 3 4 2 2IIx 7bcefghjk 4biv none 1 1IIx 7bcefghjk 4ci none 7 10 9 12 21 9 11IIx 7bcefghjk 4cii none 37 41 68 64 53 58 58IIx 7bcefghjk 4ciii none 27 35 33 30 20 26 27IIx 7bcefghjk 4civ none 26 25 32 45 41 51 61IIx 7bcefghjk 4d none 21 19 13 17 21 29 40IIx 7bcefghjk 4e none 24 27 30 38 41 48 48IIx 7bcefghjk none none 229 222 185 191 204 252 274
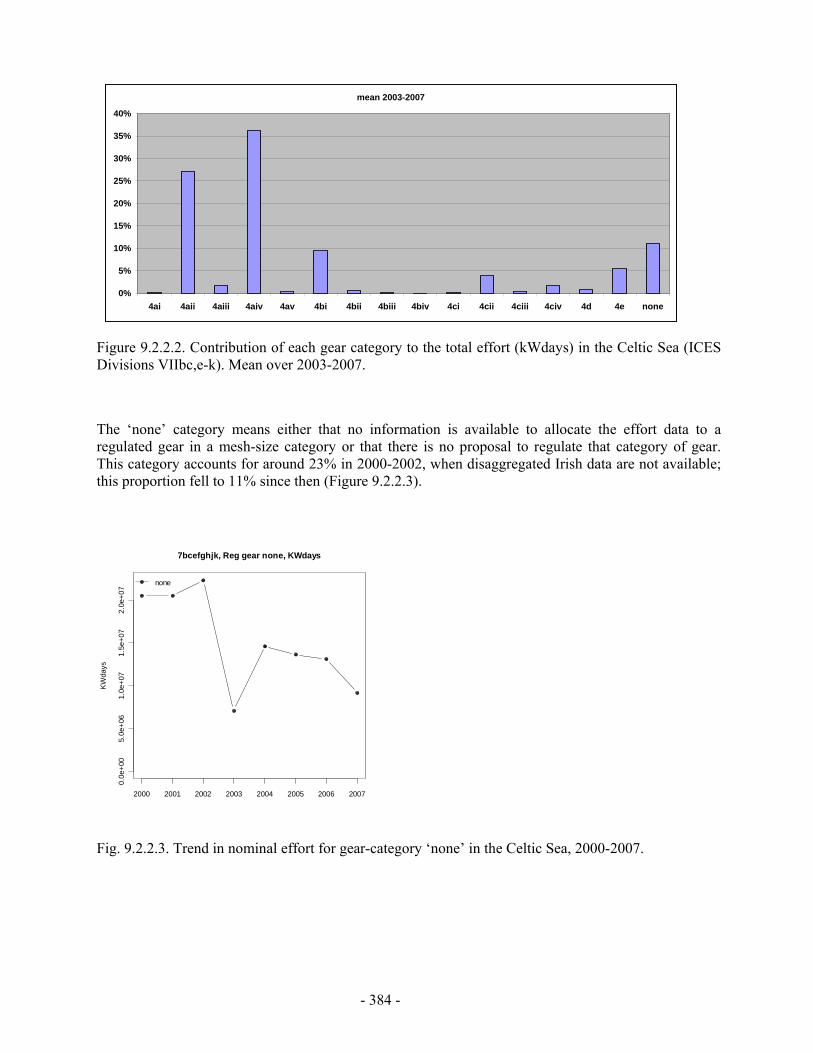
- 384 -
Figure 9.2.2.2. Contribution of each gear category to the total effort (kWdays) in the Celtic Sea (ICES Divisions VIIbc,e-k). Mean over 2003-2007.
The ‘none’ category means either that no information is available to allocate the effort data to a regulated gear in a mesh-size category or that there is no proposal to regulate that category of gear. This category accounts for around 23% in 2000-2002, when disaggregated Irish data are not available; this proportion fell to 11% since then (Figure 9.2.2.3).
2000 2001 2002 2003 2004 2005 2006 2007
0.0e
+00
5.0e
+06
1.0e
+07
1.5e
+07
2.0e
+07
7bcefghjk, Reg gear none, KWdays
KWda
ys
none
Fig. 9.2.2.3. Trend in nominal effort for gear-category ‘none’ in the Celtic Sea, 2000-2007.
mean 2003-2007
0%
5%
10%
15%
20%
25%
30%
35%
40%
4ai 4aii 4aiii 4aiv 4av 4bi 4bii 4biii 4biv 4ci 4cii 4ciii 4civ 4d 4e none

- 385 -
Figures 9.2.2.4 to 9.2.2.9 show the recent trends in nominal effort for the various gear categories and mesh size in the Celtic Sea. Tables 9.2.2.1 to 9.2.2.3 provide details.
As the Spanish data are only available since 2002 and the rather large amount of ‘none category’ effort for some countries or some years, it is difficult to make any comments on the effort trends for any particular gear-category over the whole period 2000-2007, and comparison could only be made over the period 2003-2007.
Total effort as shown in Figure 9.2.2.4 shows an artificial increase between 2000 and 2002 due to the inclusion of the Spanish data since 2002. Total effort has been decreasing since 2002 (a reduction of 13% between 2002 and 2007). Most of the decrease in effort occurred in 2006.
Uncertainties in the numbers of vessels provided by Spain means these data have not been considered. Therefore the graphs showing the trend in number of vessels refer to all countries except Spain. Figure 9.2.2.5 shows a continuous increase in the sum of the maximum number of vessels over the period (an increase of 62% from 2000 to 2007). Since a vessel is counted every time it uses a particular gear category, the sum may not reflect the total amount of vessels involved in this area, but a possible change between gear, or gear-category, within the year. It is not possible to check for a possible increase in the total number of vessels operating in the area.
Figures 9.2.2.6 and 9.2.2.7 show the fishing effort for the bottom trawl (and Danish seine) for each mesh size category and the maximum number of vessels using (at least once) each gear category. As for the total, the fishing effort of these gears (in kW*days or in GT*days) shows a decrease in recent years, while the maximum number of vessels increases, especially for mesh-size category aii (70-89mm). Figures 9.2.2.8 and 9.2.2.9 give the same information for the beam trawls.
The relative trends were compared for effort measured in kW*days, GT*days and number of vessels (Figure 9.2.2.10.). kW*days and GT*days often show very similar patterns, although this does not apply to all categories with low levels of effort. In most cases, however, the number of vessels is not well correlated to the two other measures, and the patterns observed cannot be easily interpreted. This is consistent with the remark above underlying that number of vessels, using the method of estimation here, may not be an adequate measure of effort.
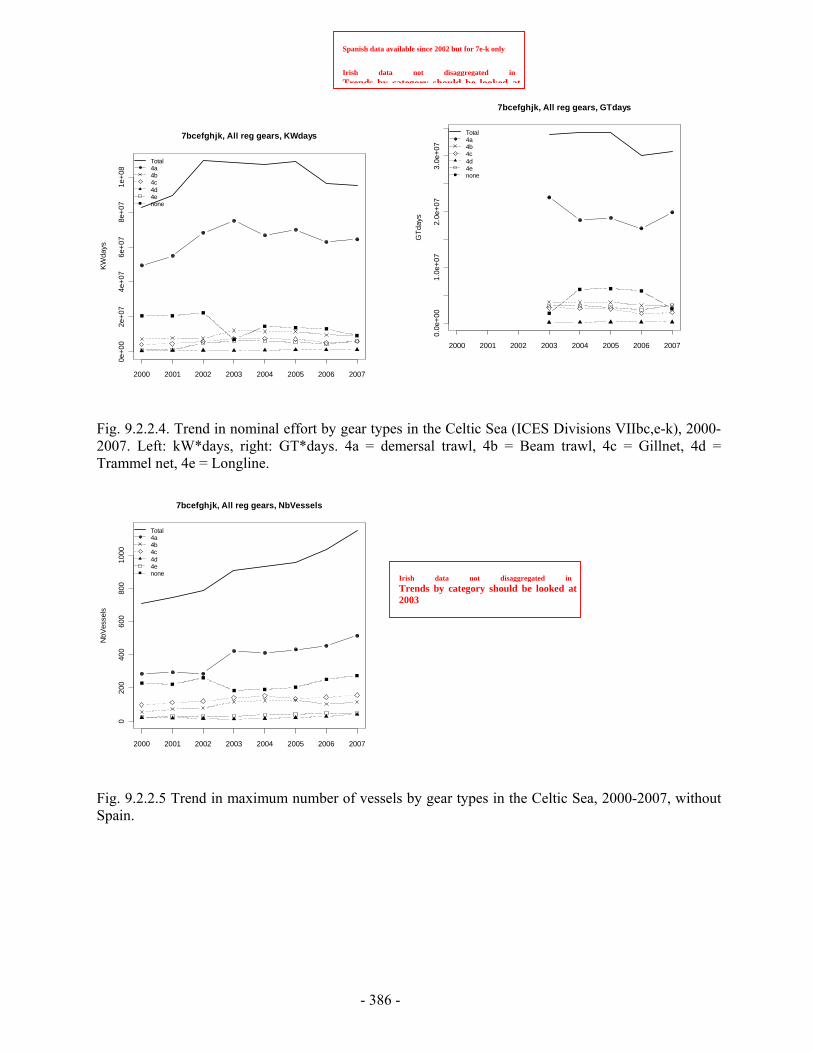
- 386 -
2000 2001 2002 2003 2004 2005 2006 2007
0e+0
02e
+07
4e+0
76e
+07
8e+0
71e
+08
7bcefghjk, All reg gears, KWdays
KWda
ys
Total4a4b4c4d4enone
Fig. 9.2.2.4. Trend in nominal effort by gear types in the Celtic Sea (ICES Divisions VIIbc,e-k), 2000-2007. Left: kW*days, right: GT*days. 4a = demersal trawl, 4b = Beam trawl, 4c = Gillnet, 4d = Trammel net, 4e = Longline.
2000 2001 2002 2003 2004 2005 2006 2007
020
040
060
080
010
00
7bcefghjk, All reg gears, NbVessels
NbV
esse
ls
Total4a4b4c4d4enone
Fig. 9.2.2.5 Trend in maximum number of vessels by gear types in the Celtic Sea, 2000-2007, without Spain.
Spanish data available since 2002 but for 7e-k only
Irish data not disaggregated in Trends by category should be looked at
2000 2001 2002 2003 2004 2005 2006 2007
0.0e
+00
1.0e
+07
2.0e
+07
3.0e
+07
7bcefghjk, All reg gears, GTdays
GTd
ays
Total4a4b4c4d4enone
Irish data not disaggregated in Trends by category should be looked at 2003

- 387 -
2000 2001 2002 2003 2004 2005 2006 2007
0e+0
01e
+07
2e+0
73e
+07
4e+0
7
7bcefghjk, Reg gear 4a, KWdaysKW
days
4ai4aii4aiii4aiv4av
Fig. 9.2.2.6. Trend in nominal effort for demersal trawl by mesh size range in the Celtic Sea (ICES Divisions VIIbc,e-k), 2000-2007. Left: kW*days, right: GT*days. 4ai=16-31 mm, 4aii=70-89 mm, 4aiii = 90-99 mm, 4aiv = 100-119 mm, 4av = 120+ mm.
2000 2001 2002 2003 2004 2005 2006 2007
050
100
150
200
250
7bcefghjk, Reg gear 4a, NbVessels
NbV
esse
ls
4ai4aii4aiii4aiv4av
Fig. 9.2.2.7. Trend in maximum number of vessels by mesh size range in the Celtic Sea, 2000-2007, without Spain. Left: demersal trawl, right: gillnet.
2000 2001 2002 2003 2004 2005 2006 2007
0.0e
+00
4.0e
+06
8.0e
+06
1.2e
+07
7bcefghjk, Reg gear 4a, GTdays
GTd
ays
4ai4aii4aiii4aiv4av
2000 2001 2002 2003 2004 2005 2006 2007
010
2030
4050
6070
7bcefghjk, Reg gear 4c, NbVessels
NbV
esse
ls
4ci4cii4ciii4civ
Irish data not disaggregated in Trends by category should be looked at 2003
Spanish data available since 2002 but for 7e-k only
Irish data not disaggregated in Trends by category should be looked at
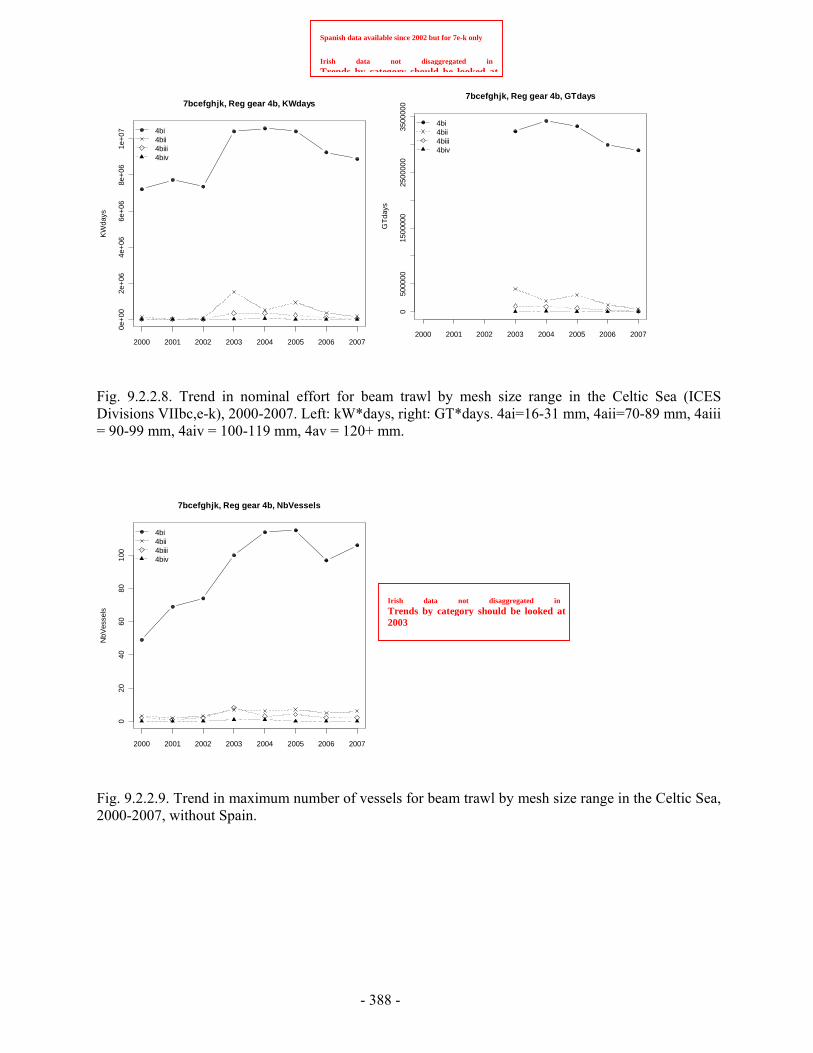
- 388 -
2000 2001 2002 2003 2004 2005 2006 2007
0e+0
02e
+06
4e+0
66e
+06
8e+0
61e
+07
7bcefghjk, Reg gear 4b, KWdaysKW
days
4bi4bii4biii4biv
Fig. 9.2.2.8. Trend in nominal effort for beam trawl by mesh size range in the Celtic Sea (ICES Divisions VIIbc,e-k), 2000-2007. Left: kW*days, right: GT*days. 4ai=16-31 mm, 4aii=70-89 mm, 4aiii = 90-99 mm, 4aiv = 100-119 mm, 4av = 120+ mm.
2000 2001 2002 2003 2004 2005 2006 2007
020
4060
8010
0
7bcefghjk, Reg gear 4b, NbVessels
NbV
esse
ls
4bi4bii4biii4biv
Fig. 9.2.2.9. Trend in maximum number of vessels for beam trawl by mesh size range in the Celtic Sea, 2000-2007, without Spain.
2000 2001 2002 2003 2004 2005 2006 2007
050
0000
1500
000
2500
000
3500
000
7bcefghjk, Reg gear 4b, GTdays
GTd
ays
4bi4bii4biii4biv
Spanish data available since 2002 but for 7e-k only
Irish data not disaggregated in Trends by category should be looked at
Irish data not disaggregated in Trends by category should be looked at 2003
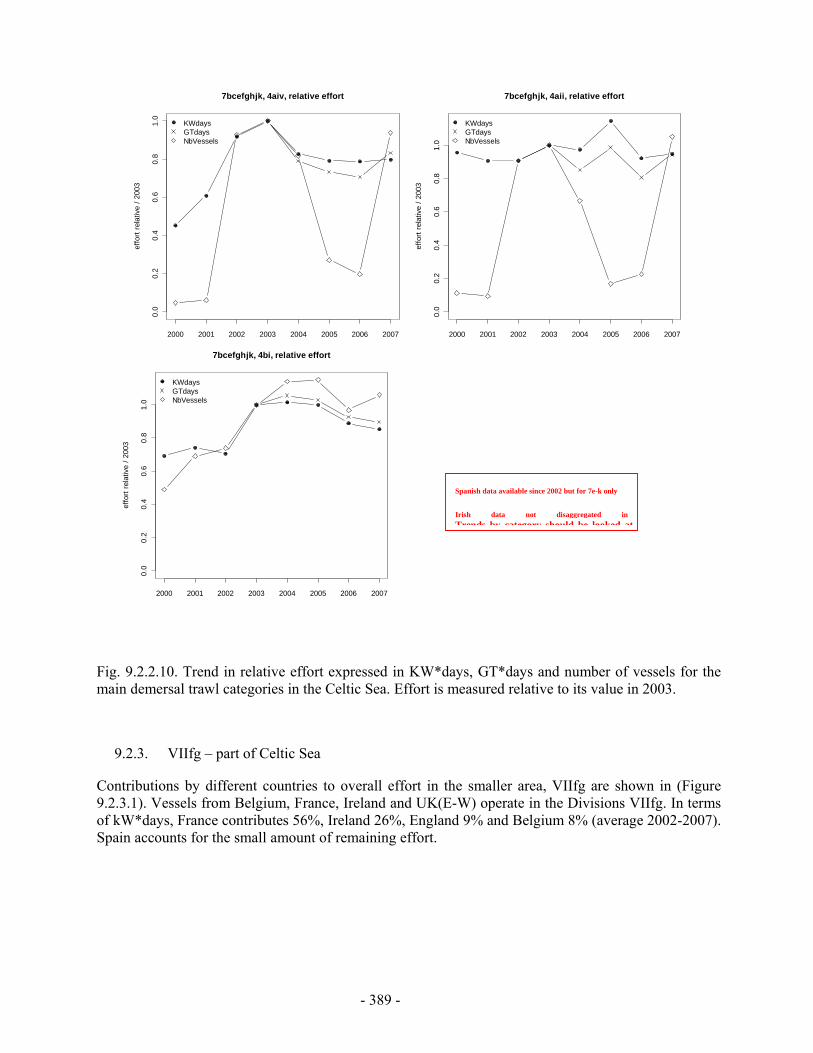
- 389 -
Fig. 9.2.2.10. Trend in relative effort expressed in KW*days, GT*days and number of vessels for the main demersal trawl categories in the Celtic Sea. Effort is measured relative to its value in 2003.
9.2.3. VIIfg – part of Celtic Sea
Contributions by different countries to overall effort in the smaller area, VIIfg are shown in (Figure 9.2.3.1). Vessels from Belgium, France, Ireland and UK(E-W) operate in the Divisions VIIfg. In terms of kW*days, France contributes 56%, Ireland 26%, England 9% and Belgium 8% (average 2002-2007). Spain accounts for the small amount of remaining effort.
2000 2001 2002 2003 2004 2005 2006 2007
0.0
0.2
0.4
0.6
0.8
1.0
7bcefghjk, 4aii, relative effort
effo
rt re
lativ
e / 2
003
KWdaysGTdaysNbVessels
Spanish data available since 2002 but for 7e-k only
Irish data not disaggregated in Trends by category should be looked at
2000 2001 2002 2003 2004 2005 2006 2007
0.0
0.2
0.4
0.6
0.8
1.0
7bcefghjk, 4bi, relative effort
effo
rt re
lativ
e / 2
003
KWdaysGTdaysNbVessels
2000 2001 2002 2003 2004 2005 2006 2007
0.0
0.2
0.4
0.6
0.8
1.0
7bcefghjk, 4aiv, relative effort
effo
rt re
lativ
e / 2
003
KWdaysGTdaysNbVessels
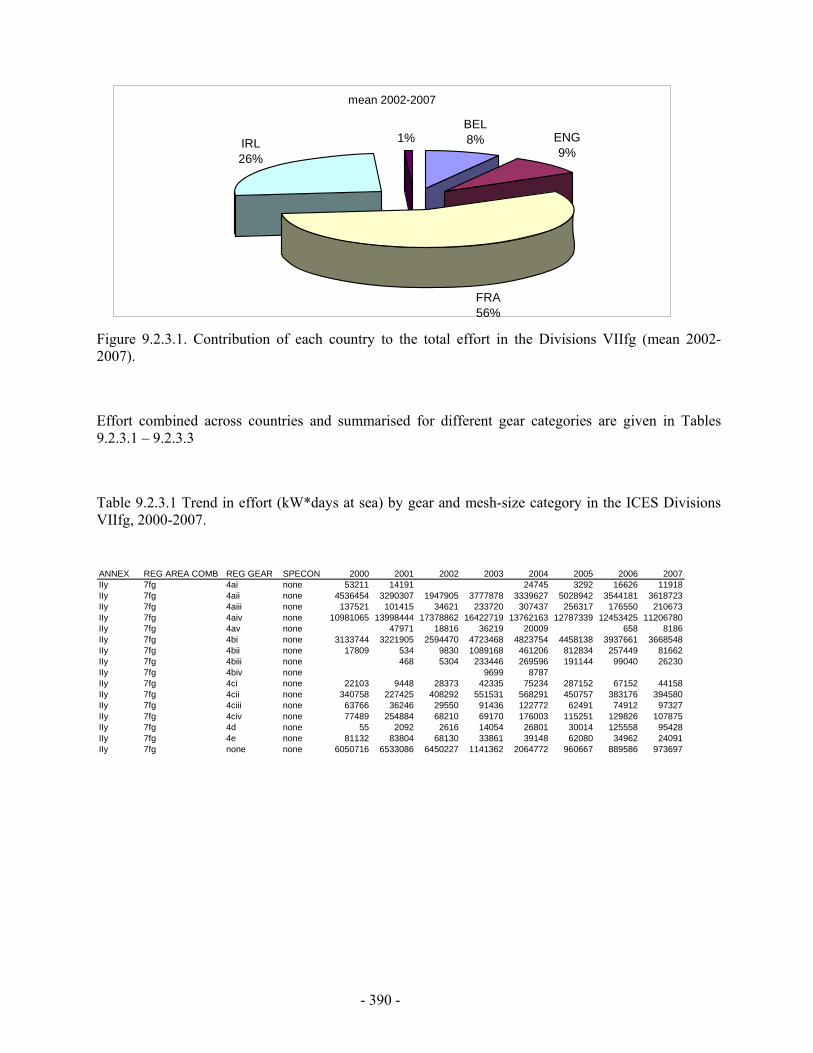
- 390 -
Figure 9.2.3.1. Contribution of each country to the total effort in the Divisions VIIfg (mean 2002-2007).
Effort combined across countries and summarised for different gear categories are given in Tables 9.2.3.1 – 9.2.3.3
Table 9.2.3.1 Trend in effort (kW*days at sea) by gear and mesh-size category in the ICES Divisions VIIfg, 2000-2007.
ANNEX REG AREA COMB REG GEAR SPECON 2000 2001 2002 2003 2004 2005 2006 2007IIy 7fg 4ai none 53211 14191 24745 3292 16626 11918IIy 7fg 4aii none 4536454 3290307 1947905 3777878 3339627 5028942 3544181 3618723IIy 7fg 4aiii none 137521 101415 34621 233720 307437 256317 176550 210673IIy 7fg 4aiv none 10981065 13998444 17378862 16422719 13762163 12787339 12453425 11206780IIy 7fg 4av none 47971 18816 36219 20009 658 8186IIy 7fg 4bi none 3133744 3221905 2594470 4723468 4823754 4458138 3937661 3668548IIy 7fg 4bii none 17809 534 9830 1089168 461206 812834 257449 81662IIy 7fg 4biii none 468 5304 233446 269596 191144 99040 26230IIy 7fg 4biv none 9699 8787IIy 7fg 4ci none 22103 9448 28373 42335 75234 287152 67152 44158IIy 7fg 4cii none 340758 227425 408292 551531 568291 450757 383176 394580IIy 7fg 4ciii none 63766 36246 29550 91436 122772 62491 74912 97327IIy 7fg 4civ none 77489 254884 68210 69170 176003 115251 129826 107875IIy 7fg 4d none 55 2092 2616 14054 26801 30014 125558 95428IIy 7fg 4e none 81132 83804 68130 33861 39148 62080 34962 24091IIy 7fg none none 6050716 6533086 6450227 1141362 2064772 960667 889586 973697
mean 2002-2007
BEL8% ENG
9%
FRA56%
IRL26%
1%
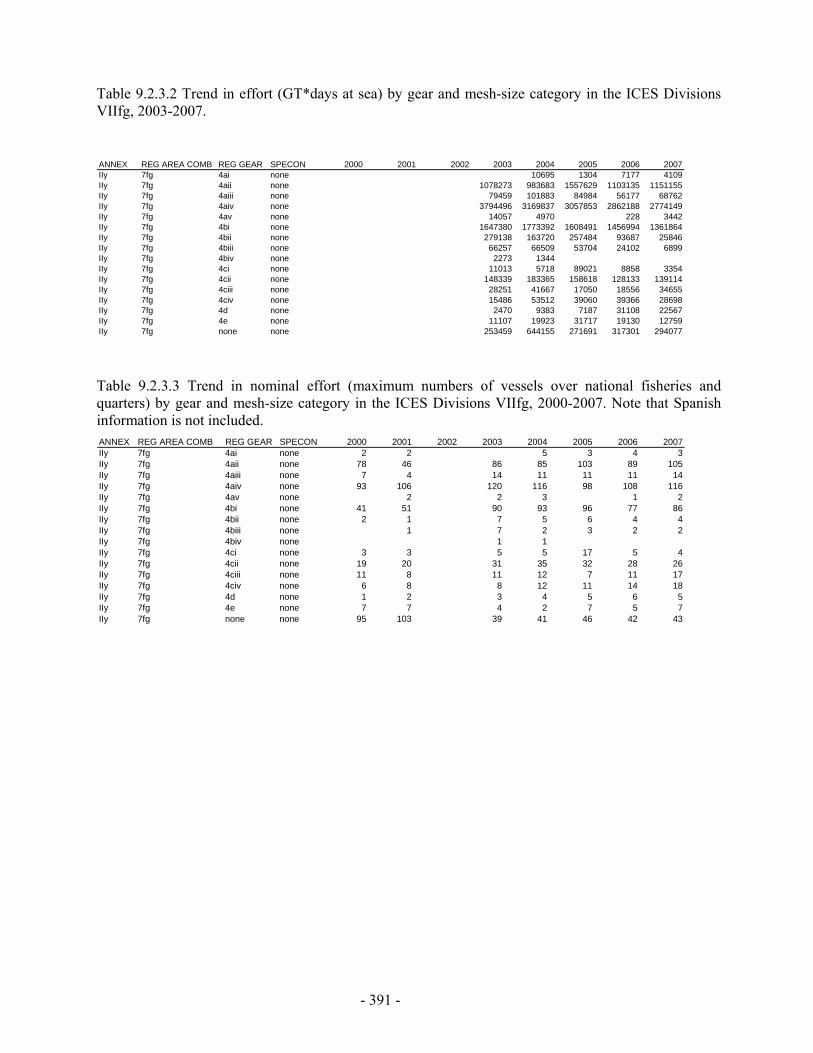
- 391 -
Table 9.2.3.2 Trend in effort (GT*days at sea) by gear and mesh-size category in the ICES Divisions VIIfg, 2003-2007.
Table 9.2.3.3 Trend in nominal effort (maximum numbers of vessels over national fisheries and quarters) by gear and mesh-size category in the ICES Divisions VIIfg, 2000-2007. Note that Spanish information is not included.
ANNEX REG AREA COMB REG GEAR SPECON 2000 2001 2002 2003 2004 2005 2006 2007IIy 7fg 4ai none 2 2 5 3 4 3IIy 7fg 4aii none 78 46 86 85 103 89 105IIy 7fg 4aiii none 7 4 14 11 11 11 14IIy 7fg 4aiv none 93 106 120 116 98 108 116IIy 7fg 4av none 2 2 3 1 2IIy 7fg 4bi none 41 51 90 93 96 77 86IIy 7fg 4bii none 2 1 7 5 6 4 4IIy 7fg 4biii none 1 7 2 3 2 2IIy 7fg 4biv none 1 1IIy 7fg 4ci none 3 3 5 5 17 5 4IIy 7fg 4cii none 19 20 31 35 32 28 26IIy 7fg 4ciii none 11 8 11 12 7 11 17IIy 7fg 4civ none 6 8 8 12 11 14 18IIy 7fg 4d none 1 2 3 4 5 6 5IIy 7fg 4e none 7 7 4 2 7 5 7IIy 7fg none none 95 103 39 41 46 42 43
ANNEX REG AREA COMB REG GEAR SPECON 2000 2001 2002 2003 2004 2005 2006 2007IIy 7fg 4ai none 10695 1304 7177 4109IIy 7fg 4aii none 1078273 983683 1557629 1103135 1151155IIy 7fg 4aiii none 79459 101883 84984 56177 68762IIy 7fg 4aiv none 3794496 3169837 3057853 2862188 2774149IIy 7fg 4av none 14057 4970 228 3442IIy 7fg 4bi none 1647380 1773392 1608491 1456994 1361864IIy 7fg 4bii none 279138 163720 257484 93687 25846IIy 7fg 4biii none 66257 66509 53704 24102 6899IIy 7fg 4biv none 2273 1344IIy 7fg 4ci none 11013 5718 89021 8858 3354IIy 7fg 4cii none 148339 183365 158618 128133 139114IIy 7fg 4ciii none 28251 41667 17050 18556 34655IIy 7fg 4civ none 15486 53512 39060 39366 28698IIy 7fg 4d none 2470 9383 7187 31108 22567IIy 7fg 4e none 11107 19923 31717 19130 12759IIy 7fg none none 253459 644155 271691 317301 294077
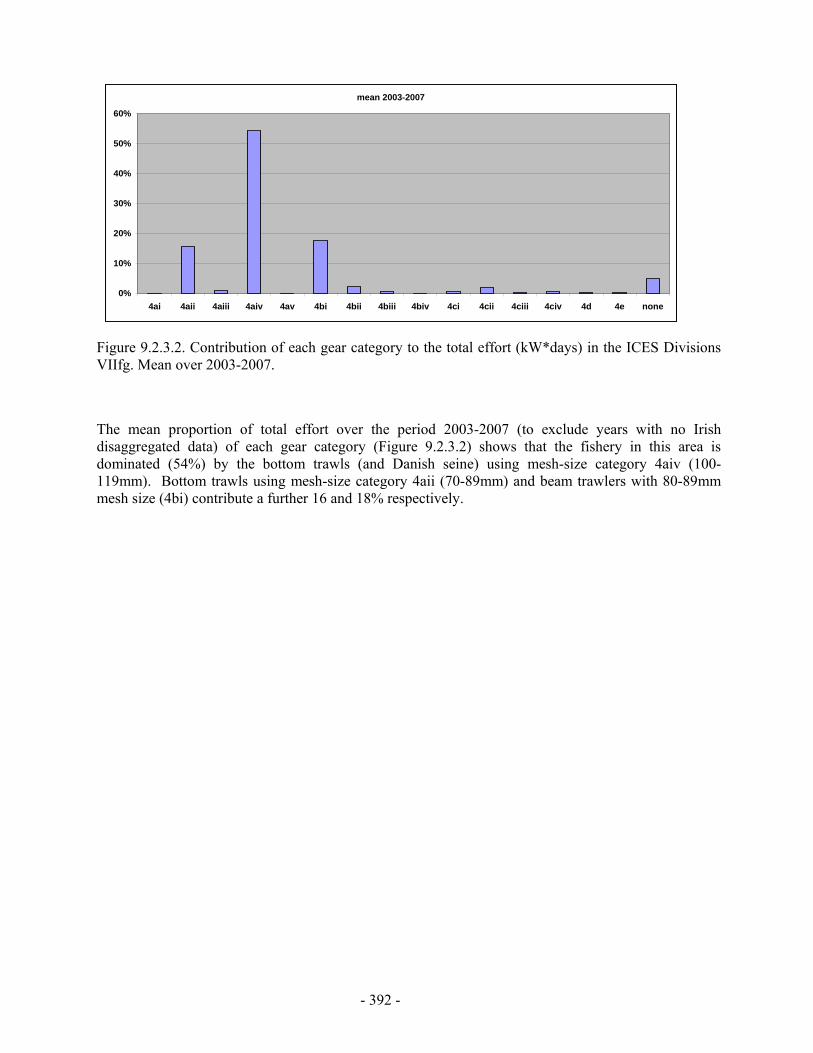
- 392 -
Figure 9.2.3.2. Contribution of each gear category to the total effort (kW*days) in the ICES Divisions VIIfg. Mean over 2003-2007.
The mean proportion of total effort over the period 2003-2007 (to exclude years with no Irish disaggregated data) of each gear category (Figure 9.2.3.2) shows that the fishery in this area is dominated (54%) by the bottom trawls (and Danish seine) using mesh-size category 4aiv (100-119mm). Bottom trawls using mesh-size category 4aii (70-89mm) and beam trawlers with 80-89mm mesh size (4bi) contribute a further 16 and 18% respectively.
mean 2003-2007
0%
10%
20%
30%
40%
50%
60%
4ai 4aii 4aiii 4aiv 4av 4bi 4bii 4biii 4biv 4ci 4cii 4ciii 4civ 4d 4e none
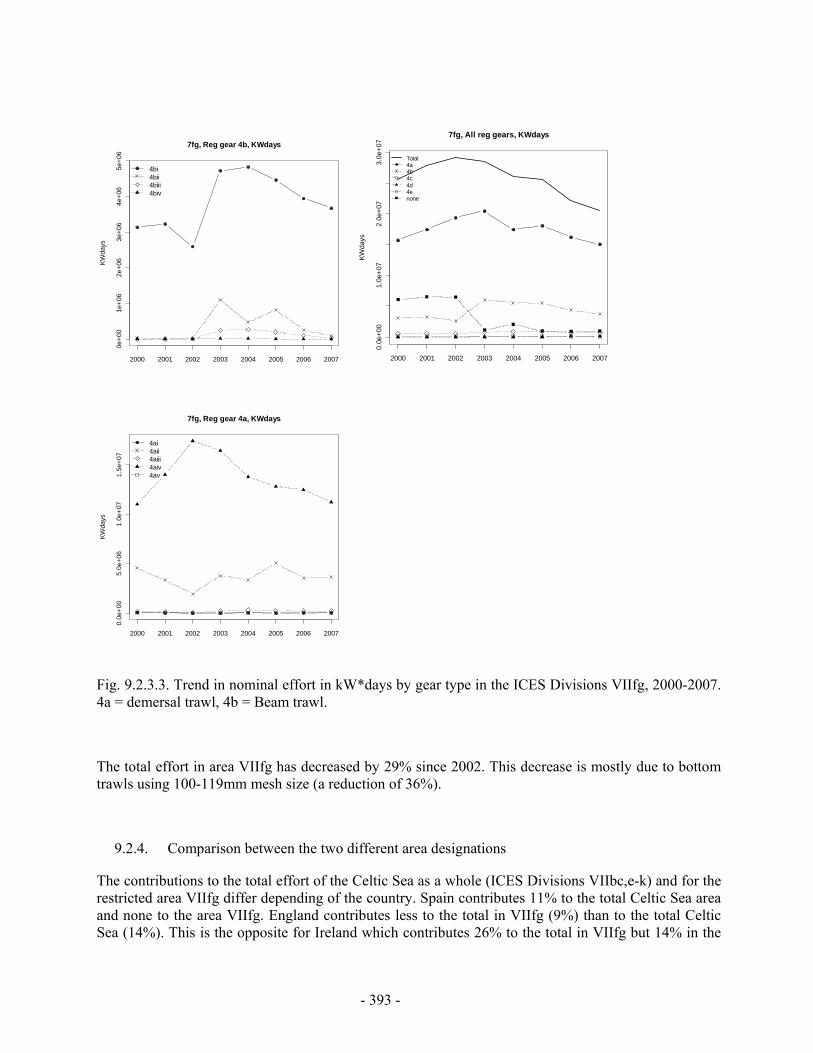
- 393 -
2000 2001 2002 2003 2004 2005 2006 2007
0e+0
01e
+06
2e+0
63e
+06
4e+0
65e
+06
7fg, Reg gear 4b, KWdays
KWda
ys
4bi4bii4biii4biv
2000 2001 2002 2003 2004 2005 2006 2007
0.0e
+00
1.0e
+07
2.0e
+07
3.0e
+07
7fg, All reg gears, KWdays
KWda
ys
Total4a4b4c4d4enone
2000 2001 2002 2003 2004 2005 2006 2007
0.0e
+00
5.0e
+06
1.0e
+07
1.5e
+07
7fg, Reg gear 4a, KWdays
KWda
ys
4ai4aii4aiii4aiv4av
Fig. 9.2.3.3. Trend in nominal effort in kW*days by gear type in the ICES Divisions VIIfg, 2000-2007. 4a = demersal trawl, 4b = Beam trawl.
The total effort in area VIIfg has decreased by 29% since 2002. This decrease is mostly due to bottom trawls using 100-119mm mesh size (a reduction of 36%).
9.2.4. Comparison between the two different area designations
The contributions to the total effort of the Celtic Sea as a whole (ICES Divisions VIIbc,e-k) and for the restricted area VIIfg differ depending of the country. Spain contributes 11% to the total Celtic Sea area and none to the area VIIfg. England contributes less to the total in VIIfg (9%) than to the total Celtic Sea (14%). This is the opposite for Ireland which contributes 26% to the total in VIIfg but 14% in the

- 394 -
whole Celtic Sea, and to a lesser extent Belgium (8% and 2% respectively). The contribution of France in both area is around 55%.
The contribution of the bottom trawls using 100-119 mm mesh size is higher in the Divisions VIIfg than for the Celtic Sea as a whole. Nets and longlines are not used significantly in this area.
9.3. Catch estimates in the Celtic Sea area
9.3.1. Introduction
As already indicated in the general section, only landings data are considered. However it should be kept in mind that discards for some species have been reported to ICES and appear to be rather high. This is particularly the case for cod in recent years because of high-grading practices as a response to prevent quota overshot.
Given the absence of full and reliable discards and scarce ageing information available, the Group considers that catch at age information should not be presented until it has been completed by all countries/years/gears. Table 9.3.1.1a-i presents the landings by species and category for 2003-2007.
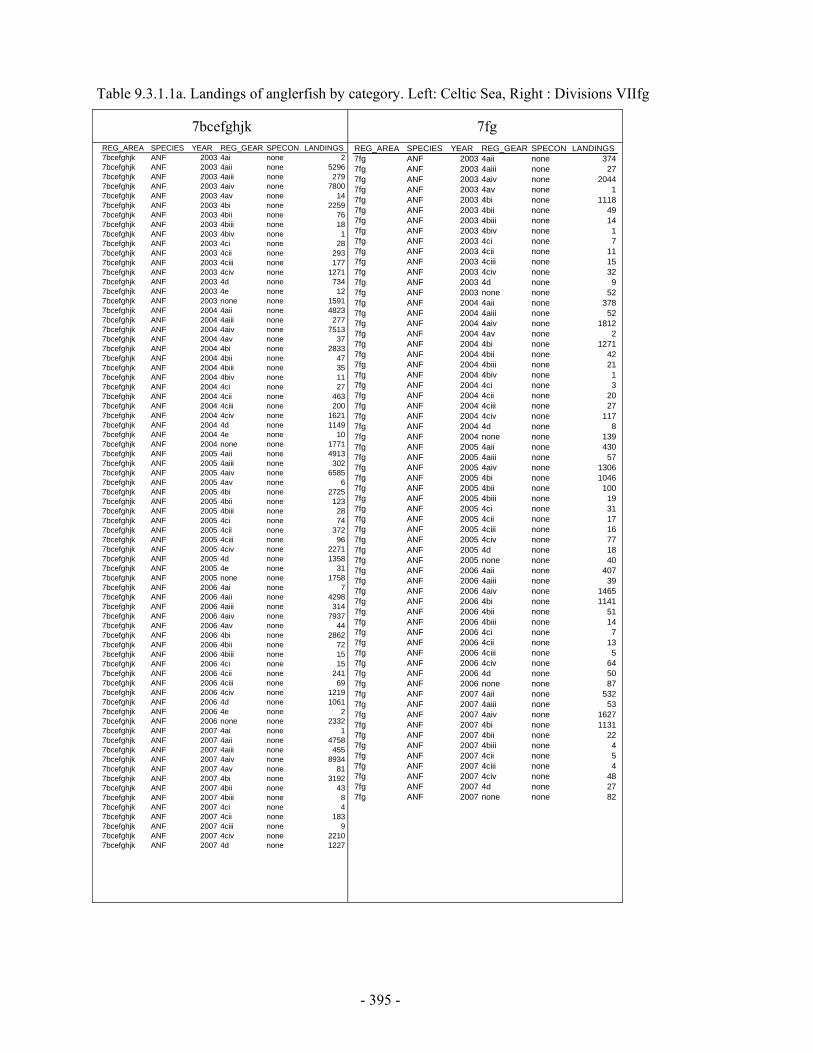
- 395 -
Table 9.3.1.1a. Landings of anglerfish by category. Left: Celtic Sea, Right : Divisions VIIfg
7bcefghjk 7fg
REG_AREA SPECIES YEAR REG_GEAR SPECON LANDINGS7bcefghjk ANF 2003 4ai none 27bcefghjk ANF 2003 4aii none 52967bcefghjk ANF 2003 4aiii none 2797bcefghjk ANF 2003 4aiv none 78007bcefghjk ANF 2003 4av none 147bcefghjk ANF 2003 4bi none 22597bcefghjk ANF 2003 4bii none 767bcefghjk ANF 2003 4biii none 187bcefghjk ANF 2003 4biv none 17bcefghjk ANF 2003 4ci none 287bcefghjk ANF 2003 4cii none 2937bcefghjk ANF 2003 4ciii none 1777bcefghjk ANF 2003 4civ none 12717bcefghjk ANF 2003 4d none 7347bcefghjk ANF 2003 4e none 127bcefghjk ANF 2003 none none 15917bcefghjk ANF 2004 4aii none 48237bcefghjk ANF 2004 4aiii none 2777bcefghjk ANF 2004 4aiv none 75137bcefghjk ANF 2004 4av none 377bcefghjk ANF 2004 4bi none 28337bcefghjk ANF 2004 4bii none 477bcefghjk ANF 2004 4biii none 357bcefghjk ANF 2004 4biv none 117bcefghjk ANF 2004 4ci none 277bcefghjk ANF 2004 4cii none 4637bcefghjk ANF 2004 4ciii none 2007bcefghjk ANF 2004 4civ none 16217bcefghjk ANF 2004 4d none 11497bcefghjk ANF 2004 4e none 107bcefghjk ANF 2004 none none 17717bcefghjk ANF 2005 4aii none 49137bcefghjk ANF 2005 4aiii none 3027bcefghjk ANF 2005 4aiv none 65857bcefghjk ANF 2005 4av none 67bcefghjk ANF 2005 4bi none 27257bcefghjk ANF 2005 4bii none 1237bcefghjk ANF 2005 4biii none 287bcefghjk ANF 2005 4ci none 747bcefghjk ANF 2005 4cii none 3727bcefghjk ANF 2005 4ciii none 967bcefghjk ANF 2005 4civ none 22717bcefghjk ANF 2005 4d none 13587bcefghjk ANF 2005 4e none 317bcefghjk ANF 2005 none none 17587bcefghjk ANF 2006 4ai none 77bcefghjk ANF 2006 4aii none 42987bcefghjk ANF 2006 4aiii none 3147bcefghjk ANF 2006 4aiv none 79377bcefghjk ANF 2006 4av none 447bcefghjk ANF 2006 4bi none 28627bcefghjk ANF 2006 4bii none 727bcefghjk ANF 2006 4biii none 157bcefghjk ANF 2006 4ci none 157bcefghjk ANF 2006 4cii none 2417bcefghjk ANF 2006 4ciii none 697bcefghjk ANF 2006 4civ none 12197bcefghjk ANF 2006 4d none 10617bcefghjk ANF 2006 4e none 27bcefghjk ANF 2006 none none 23327bcefghjk ANF 2007 4ai none 17bcefghjk ANF 2007 4aii none 47587bcefghjk ANF 2007 4aiii none 4557bcefghjk ANF 2007 4aiv none 89347bcefghjk ANF 2007 4av none 817bcefghjk ANF 2007 4bi none 31927bcefghjk ANF 2007 4bii none 437bcefghjk ANF 2007 4biii none 87bcefghjk ANF 2007 4ci none 47bcefghjk ANF 2007 4cii none 1837bcefghjk ANF 2007 4ciii none 97bcefghjk ANF 2007 4civ none 22107bcefghjk ANF 2007 4d none 1227
REG_AREA SPECIES YEAR REG_GEAR SPECON LANDINGS7fg ANF 2003 4aii none 3747fg ANF 2003 4aiii none 277fg ANF 2003 4aiv none 20447fg ANF 2003 4av none 17fg ANF 2003 4bi none 11187fg ANF 2003 4bii none 497fg ANF 2003 4biii none 147fg ANF 2003 4biv none 17fg ANF 2003 4ci none 77fg ANF 2003 4cii none 117fg ANF 2003 4ciii none 157fg ANF 2003 4civ none 327fg ANF 2003 4d none 97fg ANF 2003 none none 527fg ANF 2004 4aii none 3787fg ANF 2004 4aiii none 527fg ANF 2004 4aiv none 18127fg ANF 2004 4av none 27fg ANF 2004 4bi none 12717fg ANF 2004 4bii none 427fg ANF 2004 4biii none 217fg ANF 2004 4biv none 17fg ANF 2004 4ci none 37fg ANF 2004 4cii none 207fg ANF 2004 4ciii none 277fg ANF 2004 4civ none 1177fg ANF 2004 4d none 87fg ANF 2004 none none 1397fg ANF 2005 4aii none 4307fg ANF 2005 4aiii none 577fg ANF 2005 4aiv none 13067fg ANF 2005 4bi none 10467fg ANF 2005 4bii none 1007fg ANF 2005 4biii none 197fg ANF 2005 4ci none 317fg ANF 2005 4cii none 177fg ANF 2005 4ciii none 167fg ANF 2005 4civ none 777fg ANF 2005 4d none 187fg ANF 2005 none none 407fg ANF 2006 4aii none 4077fg ANF 2006 4aiii none 397fg ANF 2006 4aiv none 14657fg ANF 2006 4bi none 11417fg ANF 2006 4bii none 517fg ANF 2006 4biii none 147fg ANF 2006 4ci none 77fg ANF 2006 4cii none 137fg ANF 2006 4ciii none 57fg ANF 2006 4civ none 647fg ANF 2006 4d none 507fg ANF 2006 none none 877fg ANF 2007 4aii none 5327fg ANF 2007 4aiii none 537fg ANF 2007 4aiv none 16277fg ANF 2007 4bi none 11317fg ANF 2007 4bii none 227fg ANF 2007 4biii none 47fg ANF 2007 4cii none 57fg ANF 2007 4ciii none 47fg ANF 2007 4civ none 487fg ANF 2007 4d none 277fg ANF 2007 none none 82
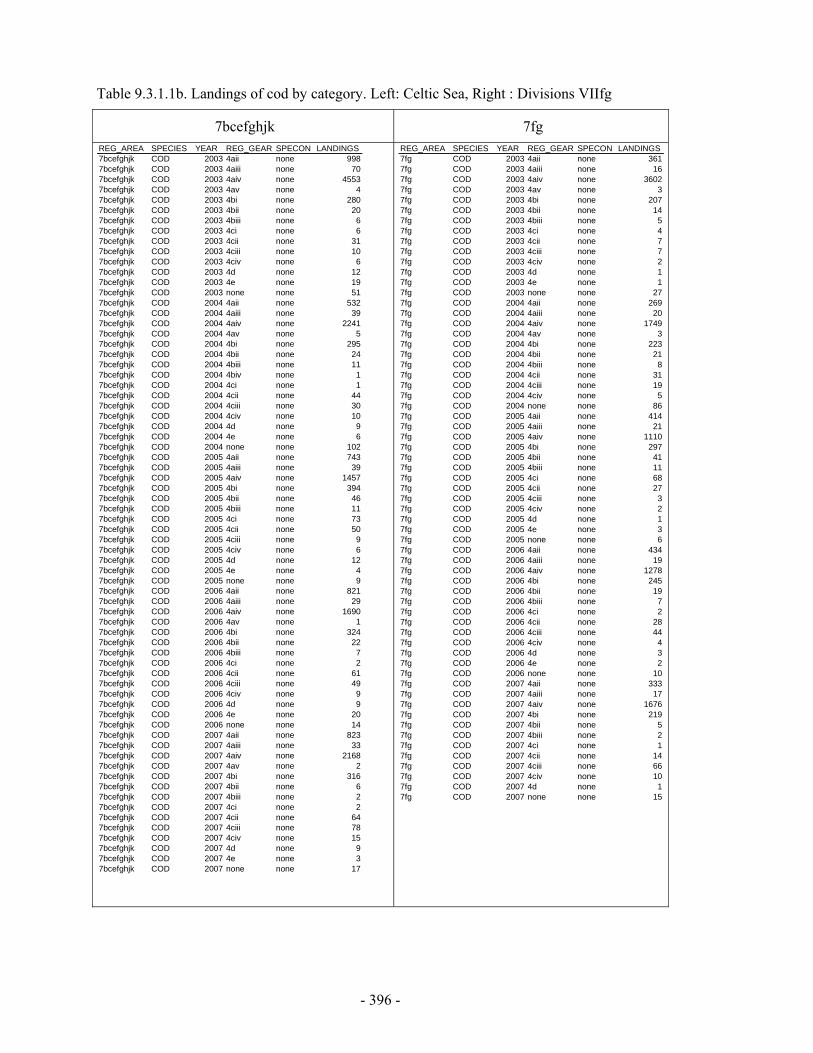
- 396 -
Table 9.3.1.1b. Landings of cod by category. Left: Celtic Sea, Right : Divisions VIIfg
7bcefghjk 7fg
REG_AREA SPECIES YEAR REG_GEAR SPECON LANDINGS7bcefghjk COD 2003 4aii none 9987bcefghjk COD 2003 4aiii none 707bcefghjk COD 2003 4aiv none 45537bcefghjk COD 2003 4av none 47bcefghjk COD 2003 4bi none 2807bcefghjk COD 2003 4bii none 207bcefghjk COD 2003 4biii none 67bcefghjk COD 2003 4ci none 67bcefghjk COD 2003 4cii none 317bcefghjk COD 2003 4ciii none 107bcefghjk COD 2003 4civ none 67bcefghjk COD 2003 4d none 127bcefghjk COD 2003 4e none 197bcefghjk COD 2003 none none 517bcefghjk COD 2004 4aii none 5327bcefghjk COD 2004 4aiii none 397bcefghjk COD 2004 4aiv none 22417bcefghjk COD 2004 4av none 57bcefghjk COD 2004 4bi none 2957bcefghjk COD 2004 4bii none 247bcefghjk COD 2004 4biii none 117bcefghjk COD 2004 4biv none 17bcefghjk COD 2004 4ci none 17bcefghjk COD 2004 4cii none 447bcefghjk COD 2004 4ciii none 307bcefghjk COD 2004 4civ none 107bcefghjk COD 2004 4d none 97bcefghjk COD 2004 4e none 67bcefghjk COD 2004 none none 1027bcefghjk COD 2005 4aii none 7437bcefghjk COD 2005 4aiii none 397bcefghjk COD 2005 4aiv none 14577bcefghjk COD 2005 4bi none 3947bcefghjk COD 2005 4bii none 467bcefghjk COD 2005 4biii none 117bcefghjk COD 2005 4ci none 737bcefghjk COD 2005 4cii none 507bcefghjk COD 2005 4ciii none 97bcefghjk COD 2005 4civ none 67bcefghjk COD 2005 4d none 127bcefghjk COD 2005 4e none 47bcefghjk COD 2005 none none 97bcefghjk COD 2006 4aii none 8217bcefghjk COD 2006 4aiii none 297bcefghjk COD 2006 4aiv none 16907bcefghjk COD 2006 4av none 17bcefghjk COD 2006 4bi none 3247bcefghjk COD 2006 4bii none 227bcefghjk COD 2006 4biii none 77bcefghjk COD 2006 4ci none 27bcefghjk COD 2006 4cii none 617bcefghjk COD 2006 4ciii none 497bcefghjk COD 2006 4civ none 97bcefghjk COD 2006 4d none 97bcefghjk COD 2006 4e none 207bcefghjk COD 2006 none none 147bcefghjk COD 2007 4aii none 8237bcefghjk COD 2007 4aiii none 337bcefghjk COD 2007 4aiv none 21687bcefghjk COD 2007 4av none 27bcefghjk COD 2007 4bi none 3167bcefghjk COD 2007 4bii none 67bcefghjk COD 2007 4biii none 27bcefghjk COD 2007 4ci none 27bcefghjk COD 2007 4cii none 647bcefghjk COD 2007 4ciii none 787bcefghjk COD 2007 4civ none 157bcefghjk COD 2007 4d none 97bcefghjk COD 2007 4e none 37bcefghjk COD 2007 none none 17
REG_AREA SPECIES YEAR REG_GEAR SPECON LANDINGS7fg COD 2003 4aii none 3617fg COD 2003 4aiii none 167fg COD 2003 4aiv none 36027fg COD 2003 4av none 37fg COD 2003 4bi none 2077fg COD 2003 4bii none 147fg COD 2003 4biii none 57fg COD 2003 4ci none 47fg COD 2003 4cii none 77fg COD 2003 4ciii none 77fg COD 2003 4civ none 27fg COD 2003 4d none 17fg COD 2003 4e none 17fg COD 2003 none none 277fg COD 2004 4aii none 2697fg COD 2004 4aiii none 207fg COD 2004 4aiv none 17497fg COD 2004 4av none 37fg COD 2004 4bi none 2237fg COD 2004 4bii none 217fg COD 2004 4biii none 87fg COD 2004 4cii none 317fg COD 2004 4ciii none 197fg COD 2004 4civ none 57fg COD 2004 none none 867fg COD 2005 4aii none 4147fg COD 2005 4aiii none 217fg COD 2005 4aiv none 11107fg COD 2005 4bi none 2977fg COD 2005 4bii none 417fg COD 2005 4biii none 117fg COD 2005 4ci none 687fg COD 2005 4cii none 277fg COD 2005 4ciii none 37fg COD 2005 4civ none 27fg COD 2005 4d none 17fg COD 2005 4e none 37fg COD 2005 none none 67fg COD 2006 4aii none 4347fg COD 2006 4aiii none 197fg COD 2006 4aiv none 12787fg COD 2006 4bi none 2457fg COD 2006 4bii none 197fg COD 2006 4biii none 77fg COD 2006 4ci none 27fg COD 2006 4cii none 287fg COD 2006 4ciii none 447fg COD 2006 4civ none 47fg COD 2006 4d none 37fg COD 2006 4e none 27fg COD 2006 none none 107fg COD 2007 4aii none 3337fg COD 2007 4aiii none 177fg COD 2007 4aiv none 16767fg COD 2007 4bi none 2197fg COD 2007 4bii none 57fg COD 2007 4biii none 27fg COD 2007 4ci none 17fg COD 2007 4cii none 147fg COD 2007 4ciii none 667fg COD 2007 4civ none 107fg COD 2007 4d none 17fg COD 2007 none none 15

- 397 -
Table 9.3.1.1c. Landings of haddock by category. Left: Celtic Sea, Right : Divisions VIIfg
7bcefghjk 7fg
REG_AREA SPECIES YEAR REG_GEAR SPECON LANDINGS7bcefghjk HAD 2003 4ai none 37bcefghjk HAD 2003 4aii none 16937bcefghjk HAD 2003 4aiii none 1237bcefghjk HAD 2003 4aiv none 56017bcefghjk HAD 2003 4av none 87bcefghjk HAD 2003 4bi none 3217bcefghjk HAD 2003 4bii none 377bcefghjk HAD 2003 4biii none 117bcefghjk HAD 2003 4ci none 247bcefghjk HAD 2003 4cii none 877bcefghjk HAD 2003 4ciii none 137bcefghjk HAD 2003 4e none 167bcefghjk HAD 2003 none none 1207bcefghjk HAD 2004 4ai none 17bcefghjk HAD 2004 4aii none 14237bcefghjk HAD 2004 4aiii none 1357bcefghjk HAD 2004 4aiv none 60117bcefghjk HAD 2004 4av none 137bcefghjk HAD 2004 4bi none 3567bcefghjk HAD 2004 4bii none 347bcefghjk HAD 2004 4biii none 247bcefghjk HAD 2004 4biv none 17bcefghjk HAD 2004 4cii none 617bcefghjk HAD 2004 4ciii none 97bcefghjk HAD 2004 4civ none 17bcefghjk HAD 2004 4e none 267bcefghjk HAD 2004 none none 3387bcefghjk HAD 2005 4ai none 17bcefghjk HAD 2005 4aii none 15667bcefghjk HAD 2005 4aiii none 1317bcefghjk HAD 2005 4aiv none 41967bcefghjk HAD 2005 4bi none 4137bcefghjk HAD 2005 4bii none 537bcefghjk HAD 2005 4biii none 177bcefghjk HAD 2005 4ci none 447bcefghjk HAD 2005 4cii none 527bcefghjk HAD 2005 4ciii none 17bcefghjk HAD 2005 4e none 427bcefghjk HAD 2005 none none 1317bcefghjk HAD 2006 4ai none 37bcefghjk HAD 2006 4aii none 13167bcefghjk HAD 2006 4aiii none 1117bcefghjk HAD 2006 4aiv none 33577bcefghjk HAD 2006 4av none 137bcefghjk HAD 2006 4bi none 3237bcefghjk HAD 2006 4bii none 157bcefghjk HAD 2006 4biii none 77bcefghjk HAD 2006 4ci none 27bcefghjk HAD 2006 4cii none 657bcefghjk HAD 2006 4ciii none 57bcefghjk HAD 2006 4civ none 17bcefghjk HAD 2006 4e none 507bcefghjk HAD 2006 none none 1537bcefghjk HAD 2007 4ai none 37bcefghjk HAD 2007 4aii none 14657bcefghjk HAD 2007 4aiii none 1247bcefghjk HAD 2007 4aiv none 42967bcefghjk HAD 2007 4av none 117bcefghjk HAD 2007 4bi none 3357bcefghjk HAD 2007 4bii none 77bcefghjk HAD 2007 4biii none 17bcefghjk HAD 2007 4ci none 27bcefghjk HAD 2007 4cii none 687bcefghjk HAD 2007 4ciii none 357bcefghjk HAD 2007 4civ none 27bcefghjk HAD 2007 4d none 17bcefghjk HAD 2007 4e none 157bcefghjk HAD 2007 none none 198
REG_AREA SPECIES YEAR REG_GEAR SPECON LANDINGS7fg HAD 2003 4aii none 5157fg HAD 2003 4aiii none 477fg HAD 2003 4aiv none 34267fg HAD 2003 4av none 47fg HAD 2003 4bi none 2357fg HAD 2003 4bii none 257fg HAD 2003 4biii none 87fg HAD 2003 4ci none 47fg HAD 2003 4cii none 27fg HAD 2003 4ciii none 117fg HAD 2003 none none 357fg HAD 2004 4aii none 6387fg HAD 2004 4aiii none 687fg HAD 2004 4aiv none 43067fg HAD 2004 4av none 67fg HAD 2004 4bi none 2807fg HAD 2004 4bii none 307fg HAD 2004 4biii none 197fg HAD 2004 4cii none 247fg HAD 2004 4ciii none 87fg HAD 2004 4civ none 17fg HAD 2004 4e none 17fg HAD 2004 none none 1627fg HAD 2005 4aii none 8467fg HAD 2005 4aiii none 637fg HAD 2005 4aiv none 28407fg HAD 2005 4bi none 3357fg HAD 2005 4bii none 447fg HAD 2005 4biii none 167fg HAD 2005 4ci none 227fg HAD 2005 4cii none 137fg HAD 2005 4e none 17fg HAD 2005 none none 127fg HAD 2006 4aii none 6517fg HAD 2006 4aiii none 667fg HAD 2006 4aiv none 20447fg HAD 2006 4bi none 2807fg HAD 2006 4bii none 127fg HAD 2006 4biii none 67fg HAD 2006 4ci none 17fg HAD 2006 4cii none 67fg HAD 2006 4ciii none 57fg HAD 2006 4e none 17fg HAD 2006 none none 97fg HAD 2007 4aii none 5957fg HAD 2007 4aiii none 677fg HAD 2007 4aiv none 27427fg HAD 2007 4bi none 2767fg HAD 2007 4bii none 67fg HAD 2007 4biii none 17fg HAD 2007 4ci none 27fg HAD 2007 4cii none 57fg HAD 2007 4ciii none 347fg HAD 2007 4civ none 27fg HAD 2007 none none 18
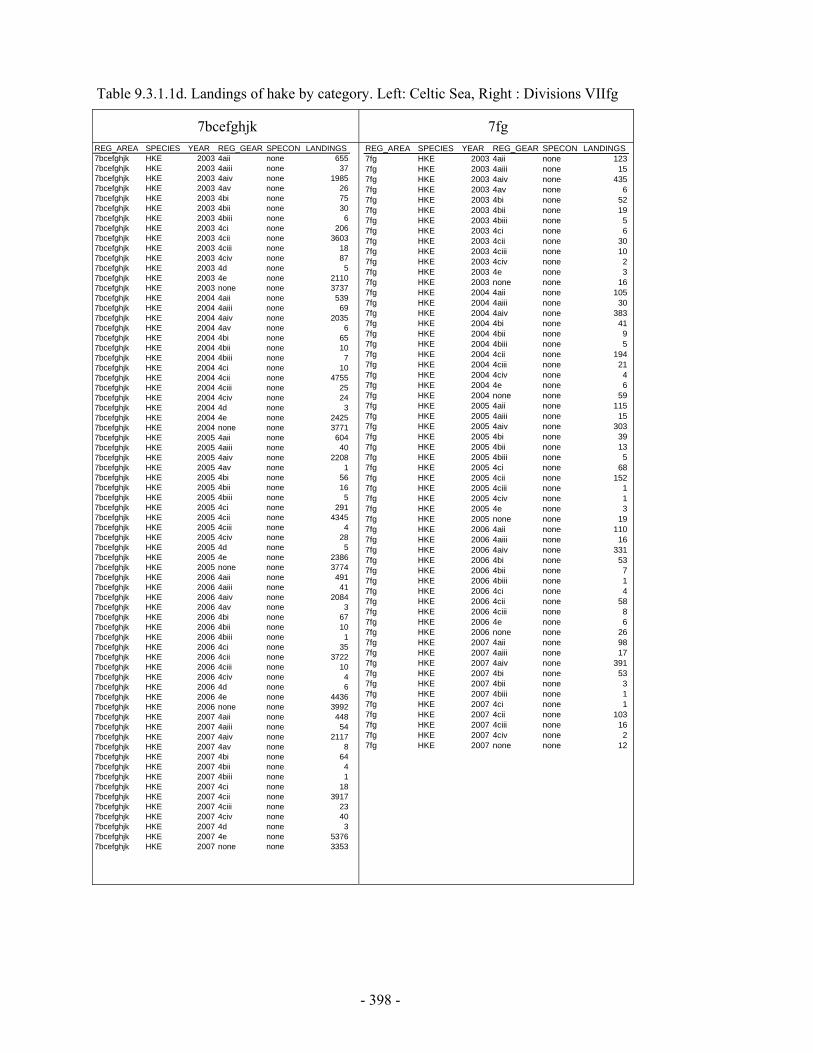
- 398 -
Table 9.3.1.1d. Landings of hake by category. Left: Celtic Sea, Right : Divisions VIIfg
7bcefghjk 7fg
REG_AREA SPECIES YEAR REG_GEAR SPECON LANDINGS7bcefghjk HKE 2003 4aii none 6557bcefghjk HKE 2003 4aiii none 377bcefghjk HKE 2003 4aiv none 19857bcefghjk HKE 2003 4av none 267bcefghjk HKE 2003 4bi none 757bcefghjk HKE 2003 4bii none 307bcefghjk HKE 2003 4biii none 67bcefghjk HKE 2003 4ci none 2067bcefghjk HKE 2003 4cii none 36037bcefghjk HKE 2003 4ciii none 187bcefghjk HKE 2003 4civ none 877bcefghjk HKE 2003 4d none 57bcefghjk HKE 2003 4e none 21107bcefghjk HKE 2003 none none 37377bcefghjk HKE 2004 4aii none 5397bcefghjk HKE 2004 4aiii none 697bcefghjk HKE 2004 4aiv none 20357bcefghjk HKE 2004 4av none 67bcefghjk HKE 2004 4bi none 657bcefghjk HKE 2004 4bii none 107bcefghjk HKE 2004 4biii none 77bcefghjk HKE 2004 4ci none 107bcefghjk HKE 2004 4cii none 47557bcefghjk HKE 2004 4ciii none 257bcefghjk HKE 2004 4civ none 247bcefghjk HKE 2004 4d none 37bcefghjk HKE 2004 4e none 24257bcefghjk HKE 2004 none none 37717bcefghjk HKE 2005 4aii none 6047bcefghjk HKE 2005 4aiii none 407bcefghjk HKE 2005 4aiv none 22087bcefghjk HKE 2005 4av none 17bcefghjk HKE 2005 4bi none 567bcefghjk HKE 2005 4bii none 167bcefghjk HKE 2005 4biii none 57bcefghjk HKE 2005 4ci none 2917bcefghjk HKE 2005 4cii none 43457bcefghjk HKE 2005 4ciii none 47bcefghjk HKE 2005 4civ none 287bcefghjk HKE 2005 4d none 57bcefghjk HKE 2005 4e none 23867bcefghjk HKE 2005 none none 37747bcefghjk HKE 2006 4aii none 4917bcefghjk HKE 2006 4aiii none 417bcefghjk HKE 2006 4aiv none 20847bcefghjk HKE 2006 4av none 37bcefghjk HKE 2006 4bi none 677bcefghjk HKE 2006 4bii none 107bcefghjk HKE 2006 4biii none 17bcefghjk HKE 2006 4ci none 357bcefghjk HKE 2006 4cii none 37227bcefghjk HKE 2006 4ciii none 107bcefghjk HKE 2006 4civ none 47bcefghjk HKE 2006 4d none 67bcefghjk HKE 2006 4e none 44367bcefghjk HKE 2006 none none 39927bcefghjk HKE 2007 4aii none 4487bcefghjk HKE 2007 4aiii none 547bcefghjk HKE 2007 4aiv none 21177bcefghjk HKE 2007 4av none 87bcefghjk HKE 2007 4bi none 647bcefghjk HKE 2007 4bii none 47bcefghjk HKE 2007 4biii none 17bcefghjk HKE 2007 4ci none 187bcefghjk HKE 2007 4cii none 39177bcefghjk HKE 2007 4ciii none 237bcefghjk HKE 2007 4civ none 407bcefghjk HKE 2007 4d none 37bcefghjk HKE 2007 4e none 53767bcefghjk HKE 2007 none none 3353
REG_AREA SPECIES YEAR REG_GEAR SPECON LANDINGS7fg HKE 2003 4aii none 1237fg HKE 2003 4aiii none 157fg HKE 2003 4aiv none 4357fg HKE 2003 4av none 67fg HKE 2003 4bi none 527fg HKE 2003 4bii none 197fg HKE 2003 4biii none 57fg HKE 2003 4ci none 67fg HKE 2003 4cii none 307fg HKE 2003 4ciii none 107fg HKE 2003 4civ none 27fg HKE 2003 4e none 37fg HKE 2003 none none 167fg HKE 2004 4aii none 1057fg HKE 2004 4aiii none 307fg HKE 2004 4aiv none 3837fg HKE 2004 4bi none 417fg HKE 2004 4bii none 97fg HKE 2004 4biii none 57fg HKE 2004 4cii none 1947fg HKE 2004 4ciii none 217fg HKE 2004 4civ none 47fg HKE 2004 4e none 67fg HKE 2004 none none 597fg HKE 2005 4aii none 1157fg HKE 2005 4aiii none 157fg HKE 2005 4aiv none 3037fg HKE 2005 4bi none 397fg HKE 2005 4bii none 137fg HKE 2005 4biii none 57fg HKE 2005 4ci none 687fg HKE 2005 4cii none 1527fg HKE 2005 4ciii none 17fg HKE 2005 4civ none 17fg HKE 2005 4e none 37fg HKE 2005 none none 197fg HKE 2006 4aii none 1107fg HKE 2006 4aiii none 167fg HKE 2006 4aiv none 3317fg HKE 2006 4bi none 537fg HKE 2006 4bii none 77fg HKE 2006 4biii none 17fg HKE 2006 4ci none 47fg HKE 2006 4cii none 587fg HKE 2006 4ciii none 87fg HKE 2006 4e none 67fg HKE 2006 none none 267fg HKE 2007 4aii none 987fg HKE 2007 4aiii none 177fg HKE 2007 4aiv none 3917fg HKE 2007 4bi none 537fg HKE 2007 4bii none 37fg HKE 2007 4biii none 17fg HKE 2007 4ci none 17fg HKE 2007 4cii none 1037fg HKE 2007 4ciii none 167fg HKE 2007 4civ none 27fg HKE 2007 none none 12
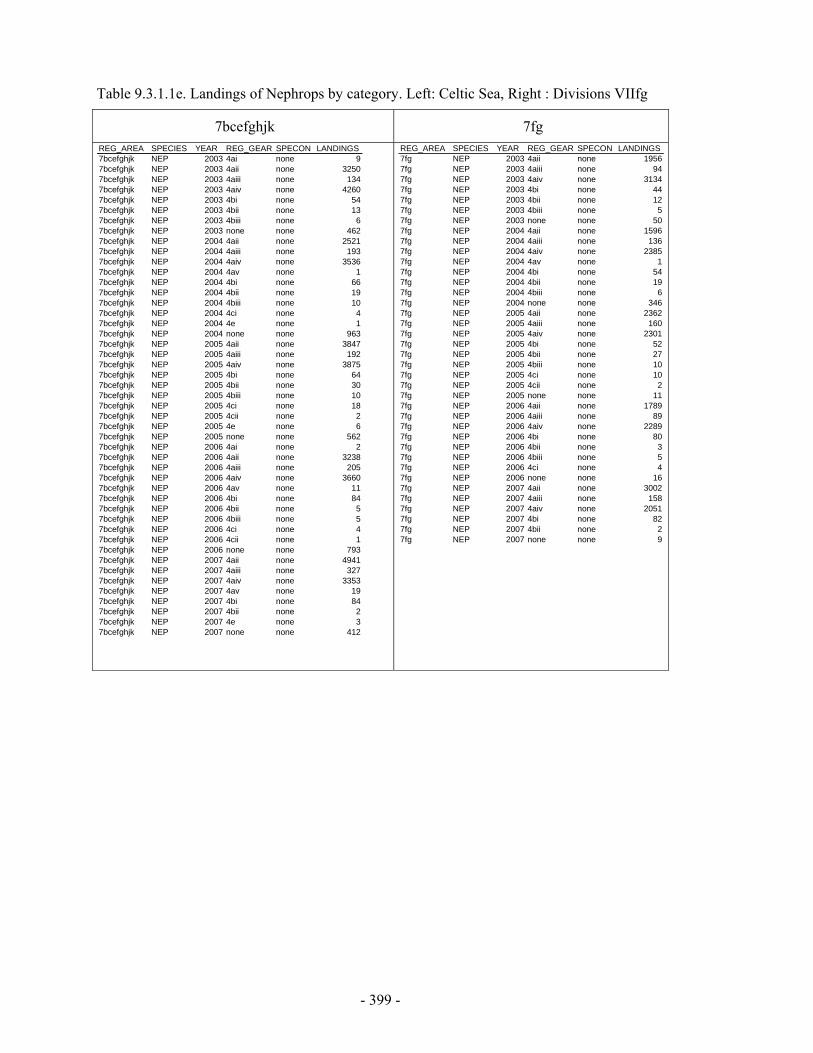
- 399 -
Table 9.3.1.1e. Landings of Nephrops by category. Left: Celtic Sea, Right : Divisions VIIfg
7bcefghjk 7fg
REG_AREA SPECIES YEAR REG_GEAR SPECON LANDINGS7bcefghjk NEP 2003 4ai none 97bcefghjk NEP 2003 4aii none 32507bcefghjk NEP 2003 4aiii none 1347bcefghjk NEP 2003 4aiv none 42607bcefghjk NEP 2003 4bi none 547bcefghjk NEP 2003 4bii none 137bcefghjk NEP 2003 4biii none 67bcefghjk NEP 2003 none none 4627bcefghjk NEP 2004 4aii none 25217bcefghjk NEP 2004 4aiii none 1937bcefghjk NEP 2004 4aiv none 35367bcefghjk NEP 2004 4av none 17bcefghjk NEP 2004 4bi none 667bcefghjk NEP 2004 4bii none 197bcefghjk NEP 2004 4biii none 107bcefghjk NEP 2004 4ci none 47bcefghjk NEP 2004 4e none 17bcefghjk NEP 2004 none none 9637bcefghjk NEP 2005 4aii none 38477bcefghjk NEP 2005 4aiii none 1927bcefghjk NEP 2005 4aiv none 38757bcefghjk NEP 2005 4bi none 647bcefghjk NEP 2005 4bii none 307bcefghjk NEP 2005 4biii none 107bcefghjk NEP 2005 4ci none 187bcefghjk NEP 2005 4cii none 27bcefghjk NEP 2005 4e none 67bcefghjk NEP 2005 none none 5627bcefghjk NEP 2006 4ai none 27bcefghjk NEP 2006 4aii none 32387bcefghjk NEP 2006 4aiii none 2057bcefghjk NEP 2006 4aiv none 36607bcefghjk NEP 2006 4av none 117bcefghjk NEP 2006 4bi none 847bcefghjk NEP 2006 4bii none 57bcefghjk NEP 2006 4biii none 57bcefghjk NEP 2006 4ci none 47bcefghjk NEP 2006 4cii none 17bcefghjk NEP 2006 none none 7937bcefghjk NEP 2007 4aii none 49417bcefghjk NEP 2007 4aiii none 3277bcefghjk NEP 2007 4aiv none 33537bcefghjk NEP 2007 4av none 197bcefghjk NEP 2007 4bi none 847bcefghjk NEP 2007 4bii none 27bcefghjk NEP 2007 4e none 37bcefghjk NEP 2007 none none 412
REG_AREA SPECIES YEAR REG_GEAR SPECON LANDINGS7fg NEP 2003 4aii none 19567fg NEP 2003 4aiii none 947fg NEP 2003 4aiv none 31347fg NEP 2003 4bi none 447fg NEP 2003 4bii none 127fg NEP 2003 4biii none 57fg NEP 2003 none none 507fg NEP 2004 4aii none 15967fg NEP 2004 4aiii none 1367fg NEP 2004 4aiv none 23857fg NEP 2004 4av none 17fg NEP 2004 4bi none 547fg NEP 2004 4bii none 197fg NEP 2004 4biii none 67fg NEP 2004 none none 3467fg NEP 2005 4aii none 23627fg NEP 2005 4aiii none 1607fg NEP 2005 4aiv none 23017fg NEP 2005 4bi none 527fg NEP 2005 4bii none 277fg NEP 2005 4biii none 107fg NEP 2005 4ci none 107fg NEP 2005 4cii none 27fg NEP 2005 none none 117fg NEP 2006 4aii none 17897fg NEP 2006 4aiii none 897fg NEP 2006 4aiv none 22897fg NEP 2006 4bi none 807fg NEP 2006 4bii none 37fg NEP 2006 4biii none 57fg NEP 2006 4ci none 47fg NEP 2006 none none 167fg NEP 2007 4aii none 30027fg NEP 2007 4aiii none 1587fg NEP 2007 4aiv none 20517fg NEP 2007 4bi none 827fg NEP 2007 4bii none 27fg NEP 2007 none none 9

- 400 -
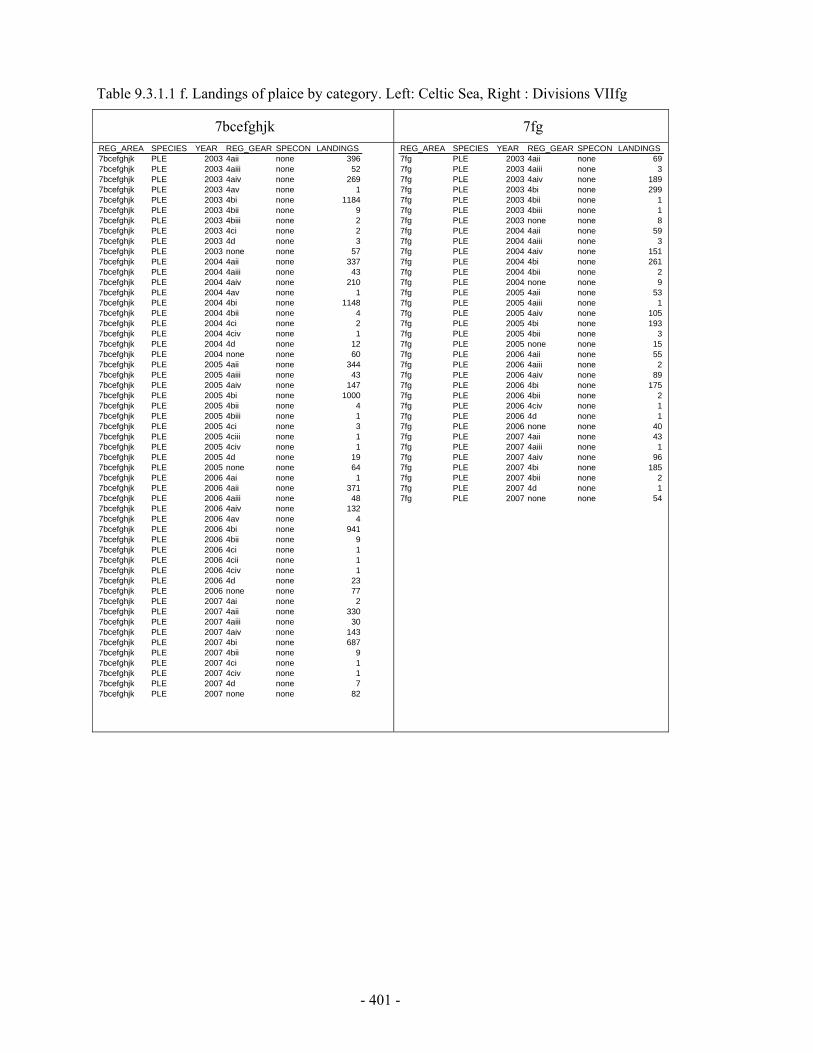
- 401 -
Table 9.3.1.1 f. Landings of plaice by category. Left: Celtic Sea, Right : Divisions VIIfg
7bcefghjk 7fg
REG_AREA SPECIES YEAR REG_GEAR SPECON LANDINGS7bcefghjk PLE 2003 4aii none 3967bcefghjk PLE 2003 4aiii none 527bcefghjk PLE 2003 4aiv none 2697bcefghjk PLE 2003 4av none 17bcefghjk PLE 2003 4bi none 11847bcefghjk PLE 2003 4bii none 97bcefghjk PLE 2003 4biii none 27bcefghjk PLE 2003 4ci none 27bcefghjk PLE 2003 4d none 37bcefghjk PLE 2003 none none 577bcefghjk PLE 2004 4aii none 3377bcefghjk PLE 2004 4aiii none 437bcefghjk PLE 2004 4aiv none 2107bcefghjk PLE 2004 4av none 17bcefghjk PLE 2004 4bi none 11487bcefghjk PLE 2004 4bii none 47bcefghjk PLE 2004 4ci none 27bcefghjk PLE 2004 4civ none 17bcefghjk PLE 2004 4d none 127bcefghjk PLE 2004 none none 607bcefghjk PLE 2005 4aii none 3447bcefghjk PLE 2005 4aiii none 437bcefghjk PLE 2005 4aiv none 1477bcefghjk PLE 2005 4bi none 10007bcefghjk PLE 2005 4bii none 47bcefghjk PLE 2005 4biii none 17bcefghjk PLE 2005 4ci none 37bcefghjk PLE 2005 4ciii none 17bcefghjk PLE 2005 4civ none 17bcefghjk PLE 2005 4d none 197bcefghjk PLE 2005 none none 647bcefghjk PLE 2006 4ai none 17bcefghjk PLE 2006 4aii none 3717bcefghjk PLE 2006 4aiii none 487bcefghjk PLE 2006 4aiv none 1327bcefghjk PLE 2006 4av none 47bcefghjk PLE 2006 4bi none 9417bcefghjk PLE 2006 4bii none 97bcefghjk PLE 2006 4ci none 17bcefghjk PLE 2006 4cii none 17bcefghjk PLE 2006 4civ none 17bcefghjk PLE 2006 4d none 237bcefghjk PLE 2006 none none 777bcefghjk PLE 2007 4ai none 27bcefghjk PLE 2007 4aii none 3307bcefghjk PLE 2007 4aiii none 307bcefghjk PLE 2007 4aiv none 1437bcefghjk PLE 2007 4bi none 6877bcefghjk PLE 2007 4bii none 97bcefghjk PLE 2007 4ci none 17bcefghjk PLE 2007 4civ none 17bcefghjk PLE 2007 4d none 77bcefghjk PLE 2007 none none 82
REG_AREA SPECIES YEAR REG_GEAR SPECON LANDINGS7fg PLE 2003 4aii none 697fg PLE 2003 4aiii none 37fg PLE 2003 4aiv none 1897fg PLE 2003 4bi none 2997fg PLE 2003 4bii none 17fg PLE 2003 4biii none 17fg PLE 2003 none none 87fg PLE 2004 4aii none 597fg PLE 2004 4aiii none 37fg PLE 2004 4aiv none 1517fg PLE 2004 4bi none 2617fg PLE 2004 4bii none 27fg PLE 2004 none none 97fg PLE 2005 4aii none 537fg PLE 2005 4aiii none 17fg PLE 2005 4aiv none 1057fg PLE 2005 4bi none 1937fg PLE 2005 4bii none 37fg PLE 2005 none none 157fg PLE 2006 4aii none 557fg PLE 2006 4aiii none 27fg PLE 2006 4aiv none 897fg PLE 2006 4bi none 1757fg PLE 2006 4bii none 27fg PLE 2006 4civ none 17fg PLE 2006 4d none 17fg PLE 2006 none none 407fg PLE 2007 4aii none 437fg PLE 2007 4aiii none 17fg PLE 2007 4aiv none 967fg PLE 2007 4bi none 1857fg PLE 2007 4bii none 27fg PLE 2007 4d none 17fg PLE 2007 none none 54
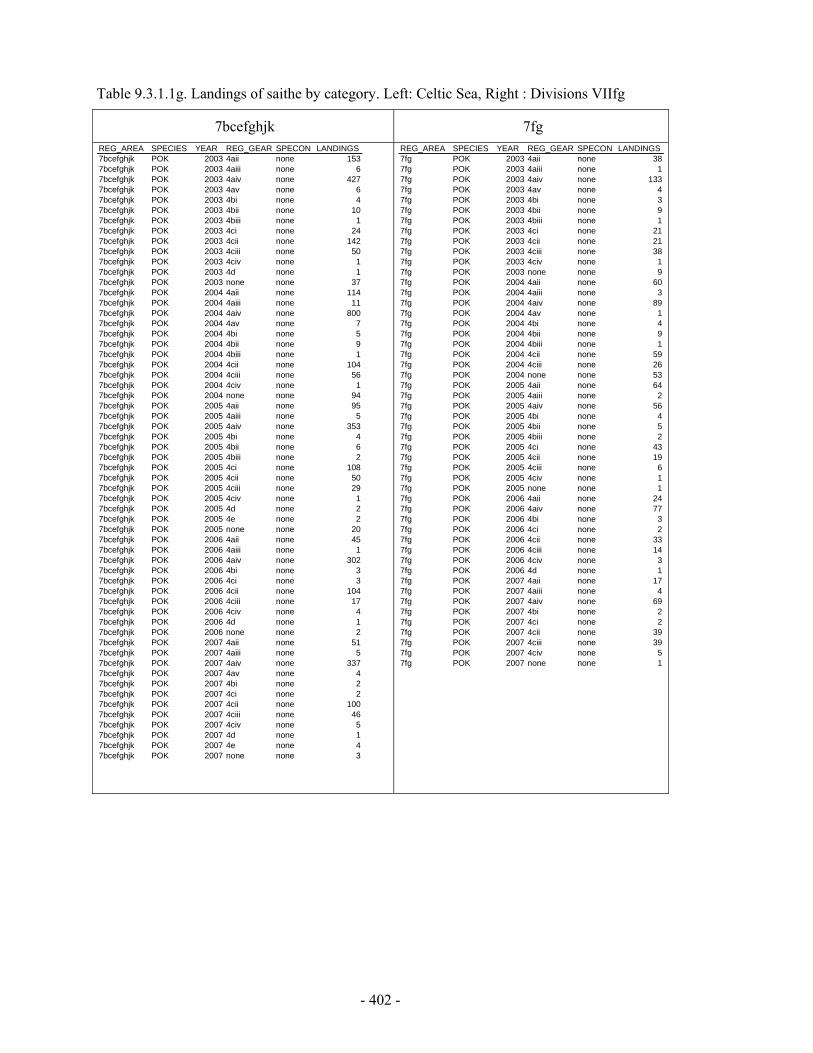
- 402 -
Table 9.3.1.1g. Landings of saithe by category. Left: Celtic Sea, Right : Divisions VIIfg
7bcefghjk 7fg
REG_AREA SPECIES YEAR REG_GEAR SPECON LANDINGS7bcefghjk POK 2003 4aii none 1537bcefghjk POK 2003 4aiii none 67bcefghjk POK 2003 4aiv none 4277bcefghjk POK 2003 4av none 67bcefghjk POK 2003 4bi none 47bcefghjk POK 2003 4bii none 107bcefghjk POK 2003 4biii none 17bcefghjk POK 2003 4ci none 247bcefghjk POK 2003 4cii none 1427bcefghjk POK 2003 4ciii none 507bcefghjk POK 2003 4civ none 17bcefghjk POK 2003 4d none 17bcefghjk POK 2003 none none 377bcefghjk POK 2004 4aii none 1147bcefghjk POK 2004 4aiii none 117bcefghjk POK 2004 4aiv none 8007bcefghjk POK 2004 4av none 77bcefghjk POK 2004 4bi none 57bcefghjk POK 2004 4bii none 97bcefghjk POK 2004 4biii none 17bcefghjk POK 2004 4cii none 1047bcefghjk POK 2004 4ciii none 567bcefghjk POK 2004 4civ none 17bcefghjk POK 2004 none none 947bcefghjk POK 2005 4aii none 957bcefghjk POK 2005 4aiii none 57bcefghjk POK 2005 4aiv none 3537bcefghjk POK 2005 4bi none 47bcefghjk POK 2005 4bii none 67bcefghjk POK 2005 4biii none 27bcefghjk POK 2005 4ci none 1087bcefghjk POK 2005 4cii none 507bcefghjk POK 2005 4ciii none 297bcefghjk POK 2005 4civ none 17bcefghjk POK 2005 4d none 27bcefghjk POK 2005 4e none 27bcefghjk POK 2005 none none 207bcefghjk POK 2006 4aii none 457bcefghjk POK 2006 4aiii none 17bcefghjk POK 2006 4aiv none 3027bcefghjk POK 2006 4bi none 37bcefghjk POK 2006 4ci none 37bcefghjk POK 2006 4cii none 1047bcefghjk POK 2006 4ciii none 177bcefghjk POK 2006 4civ none 47bcefghjk POK 2006 4d none 17bcefghjk POK 2006 none none 27bcefghjk POK 2007 4aii none 517bcefghjk POK 2007 4aiii none 57bcefghjk POK 2007 4aiv none 3377bcefghjk POK 2007 4av none 47bcefghjk POK 2007 4bi none 27bcefghjk POK 2007 4ci none 27bcefghjk POK 2007 4cii none 1007bcefghjk POK 2007 4ciii none 467bcefghjk POK 2007 4civ none 57bcefghjk POK 2007 4d none 17bcefghjk POK 2007 4e none 47bcefghjk POK 2007 none none 3
REG_AREA SPECIES YEAR REG_GEAR SPECON LANDINGS7fg POK 2003 4aii none 387fg POK 2003 4aiii none 17fg POK 2003 4aiv none 1337fg POK 2003 4av none 47fg POK 2003 4bi none 37fg POK 2003 4bii none 97fg POK 2003 4biii none 17fg POK 2003 4ci none 217fg POK 2003 4cii none 217fg POK 2003 4ciii none 387fg POK 2003 4civ none 17fg POK 2003 none none 97fg POK 2004 4aii none 607fg POK 2004 4aiii none 37fg POK 2004 4aiv none 897fg POK 2004 4av none 17fg POK 2004 4bi none 47fg POK 2004 4bii none 97fg POK 2004 4biii none 17fg POK 2004 4cii none 597fg POK 2004 4ciii none 267fg POK 2004 none none 537fg POK 2005 4aii none 647fg POK 2005 4aiii none 27fg POK 2005 4aiv none 567fg POK 2005 4bi none 47fg POK 2005 4bii none 57fg POK 2005 4biii none 27fg POK 2005 4ci none 437fg POK 2005 4cii none 197fg POK 2005 4ciii none 67fg POK 2005 4civ none 17fg POK 2005 none none 17fg POK 2006 4aii none 247fg POK 2006 4aiv none 777fg POK 2006 4bi none 37fg POK 2006 4ci none 27fg POK 2006 4cii none 337fg POK 2006 4ciii none 147fg POK 2006 4civ none 37fg POK 2006 4d none 17fg POK 2007 4aii none 177fg POK 2007 4aiii none 47fg POK 2007 4aiv none 697fg POK 2007 4bi none 27fg POK 2007 4ci none 27fg POK 2007 4cii none 397fg POK 2007 4ciii none 397fg POK 2007 4civ none 57fg POK 2007 none none 1
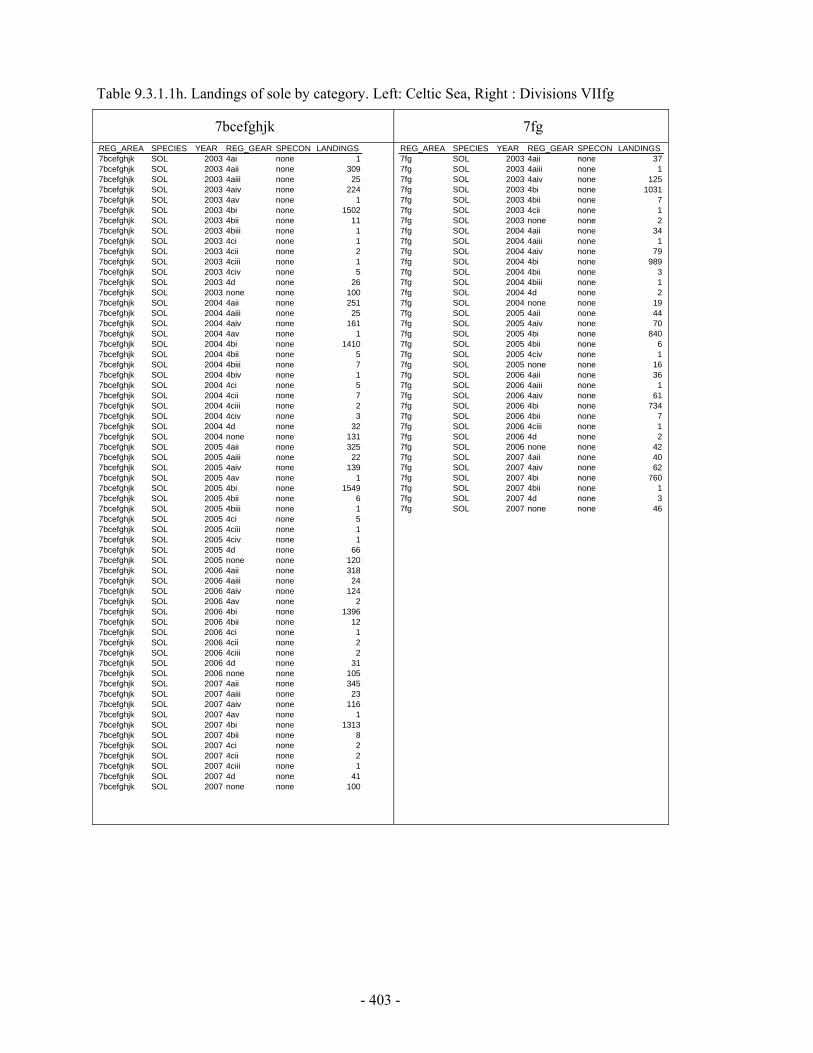
- 403 -
Table 9.3.1.1h. Landings of sole by category. Left: Celtic Sea, Right : Divisions VIIfg
7bcefghjk 7fg
REG_AREA SPECIES YEAR REG_GEAR SPECON LANDINGS7bcefghjk SOL 2003 4ai none 17bcefghjk SOL 2003 4aii none 3097bcefghjk SOL 2003 4aiii none 257bcefghjk SOL 2003 4aiv none 2247bcefghjk SOL 2003 4av none 17bcefghjk SOL 2003 4bi none 15027bcefghjk SOL 2003 4bii none 117bcefghjk SOL 2003 4biii none 17bcefghjk SOL 2003 4ci none 17bcefghjk SOL 2003 4cii none 27bcefghjk SOL 2003 4ciii none 17bcefghjk SOL 2003 4civ none 57bcefghjk SOL 2003 4d none 267bcefghjk SOL 2003 none none 1007bcefghjk SOL 2004 4aii none 2517bcefghjk SOL 2004 4aiii none 257bcefghjk SOL 2004 4aiv none 1617bcefghjk SOL 2004 4av none 17bcefghjk SOL 2004 4bi none 14107bcefghjk SOL 2004 4bii none 57bcefghjk SOL 2004 4biii none 77bcefghjk SOL 2004 4biv none 17bcefghjk SOL 2004 4ci none 57bcefghjk SOL 2004 4cii none 77bcefghjk SOL 2004 4ciii none 27bcefghjk SOL 2004 4civ none 37bcefghjk SOL 2004 4d none 327bcefghjk SOL 2004 none none 1317bcefghjk SOL 2005 4aii none 3257bcefghjk SOL 2005 4aiii none 227bcefghjk SOL 2005 4aiv none 1397bcefghjk SOL 2005 4av none 17bcefghjk SOL 2005 4bi none 15497bcefghjk SOL 2005 4bii none 67bcefghjk SOL 2005 4biii none 17bcefghjk SOL 2005 4ci none 57bcefghjk SOL 2005 4ciii none 17bcefghjk SOL 2005 4civ none 17bcefghjk SOL 2005 4d none 667bcefghjk SOL 2005 none none 1207bcefghjk SOL 2006 4aii none 3187bcefghjk SOL 2006 4aiii none 247bcefghjk SOL 2006 4aiv none 1247bcefghjk SOL 2006 4av none 27bcefghjk SOL 2006 4bi none 13967bcefghjk SOL 2006 4bii none 127bcefghjk SOL 2006 4ci none 17bcefghjk SOL 2006 4cii none 27bcefghjk SOL 2006 4ciii none 27bcefghjk SOL 2006 4d none 317bcefghjk SOL 2006 none none 1057bcefghjk SOL 2007 4aii none 3457bcefghjk SOL 2007 4aiii none 237bcefghjk SOL 2007 4aiv none 1167bcefghjk SOL 2007 4av none 17bcefghjk SOL 2007 4bi none 13137bcefghjk SOL 2007 4bii none 87bcefghjk SOL 2007 4ci none 27bcefghjk SOL 2007 4cii none 27bcefghjk SOL 2007 4ciii none 17bcefghjk SOL 2007 4d none 417bcefghjk SOL 2007 none none 100
REG_AREA SPECIES YEAR REG_GEAR SPECON LANDINGS7fg SOL 2003 4aii none 377fg SOL 2003 4aiii none 17fg SOL 2003 4aiv none 1257fg SOL 2003 4bi none 10317fg SOL 2003 4bii none 77fg SOL 2003 4cii none 17fg SOL 2003 none none 27fg SOL 2004 4aii none 347fg SOL 2004 4aiii none 17fg SOL 2004 4aiv none 797fg SOL 2004 4bi none 9897fg SOL 2004 4bii none 37fg SOL 2004 4biii none 17fg SOL 2004 4d none 27fg SOL 2004 none none 197fg SOL 2005 4aii none 447fg SOL 2005 4aiv none 707fg SOL 2005 4bi none 8407fg SOL 2005 4bii none 67fg SOL 2005 4civ none 17fg SOL 2005 none none 167fg SOL 2006 4aii none 367fg SOL 2006 4aiii none 17fg SOL 2006 4aiv none 617fg SOL 2006 4bi none 7347fg SOL 2006 4bii none 77fg SOL 2006 4ciii none 17fg SOL 2006 4d none 27fg SOL 2006 none none 427fg SOL 2007 4aii none 407fg SOL 2007 4aiv none 627fg SOL 2007 4bi none 7607fg SOL 2007 4bii none 17fg SOL 2007 4d none 37fg SOL 2007 none none 46
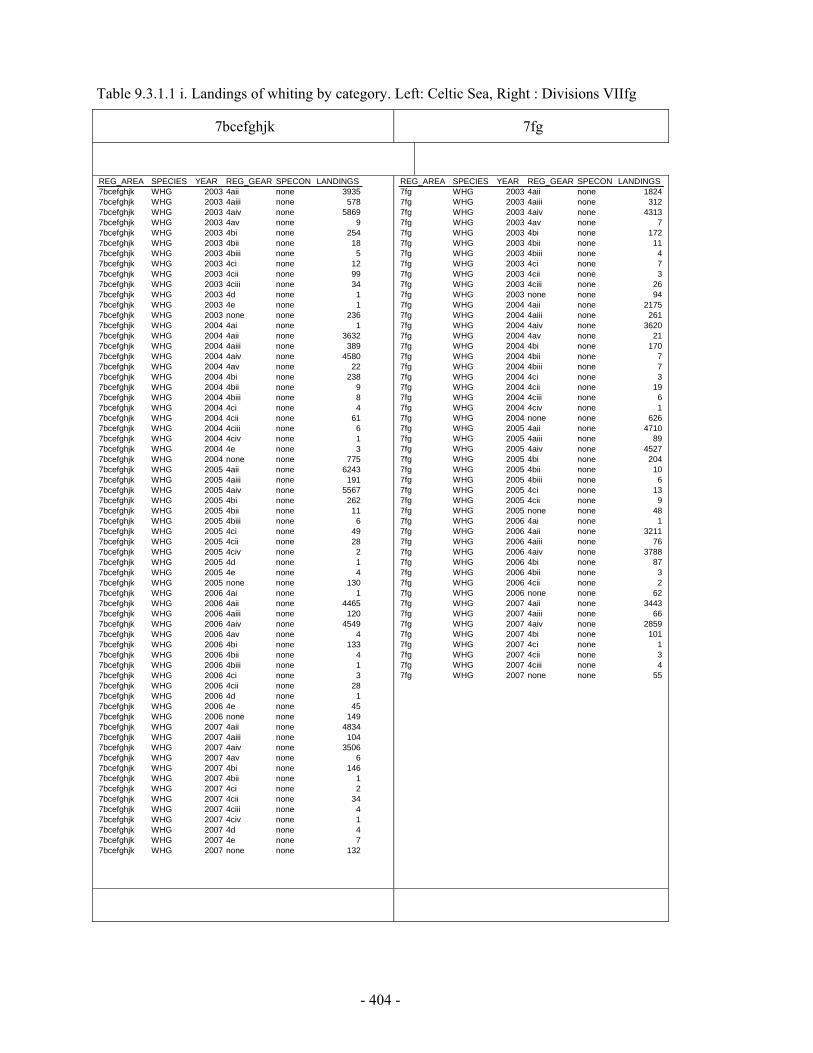
- 404 -
Table 9.3.1.1 i. Landings of whiting by category. Left: Celtic Sea, Right : Divisions VIIfg
7bcefghjk 7fg
REG_AREA SPECIES YEAR REG_GEAR SPECON LANDINGS7bcefghjk WHG 2003 4aii none 39357bcefghjk WHG 2003 4aiii none 5787bcefghjk WHG 2003 4aiv none 58697bcefghjk WHG 2003 4av none 97bcefghjk WHG 2003 4bi none 2547bcefghjk WHG 2003 4bii none 187bcefghjk WHG 2003 4biii none 57bcefghjk WHG 2003 4ci none 127bcefghjk WHG 2003 4cii none 997bcefghjk WHG 2003 4ciii none 347bcefghjk WHG 2003 4d none 17bcefghjk WHG 2003 4e none 17bcefghjk WHG 2003 none none 2367bcefghjk WHG 2004 4ai none 17bcefghjk WHG 2004 4aii none 36327bcefghjk WHG 2004 4aiii none 3897bcefghjk WHG 2004 4aiv none 45807bcefghjk WHG 2004 4av none 227bcefghjk WHG 2004 4bi none 2387bcefghjk WHG 2004 4bii none 97bcefghjk WHG 2004 4biii none 87bcefghjk WHG 2004 4ci none 47bcefghjk WHG 2004 4cii none 617bcefghjk WHG 2004 4ciii none 67bcefghjk WHG 2004 4civ none 17bcefghjk WHG 2004 4e none 37bcefghjk WHG 2004 none none 7757bcefghjk WHG 2005 4aii none 62437bcefghjk WHG 2005 4aiii none 1917bcefghjk WHG 2005 4aiv none 55677bcefghjk WHG 2005 4bi none 2627bcefghjk WHG 2005 4bii none 117bcefghjk WHG 2005 4biii none 67bcefghjk WHG 2005 4ci none 497bcefghjk WHG 2005 4cii none 287bcefghjk WHG 2005 4civ none 27bcefghjk WHG 2005 4d none 17bcefghjk WHG 2005 4e none 47bcefghjk WHG 2005 none none 1307bcefghjk WHG 2006 4ai none 17bcefghjk WHG 2006 4aii none 44657bcefghjk WHG 2006 4aiii none 1207bcefghjk WHG 2006 4aiv none 45497bcefghjk WHG 2006 4av none 47bcefghjk WHG 2006 4bi none 1337bcefghjk WHG 2006 4bii none 47bcefghjk WHG 2006 4biii none 17bcefghjk WHG 2006 4ci none 37bcefghjk WHG 2006 4cii none 287bcefghjk WHG 2006 4d none 17bcefghjk WHG 2006 4e none 457bcefghjk WHG 2006 none none 1497bcefghjk WHG 2007 4aii none 48347bcefghjk WHG 2007 4aiii none 1047bcefghjk WHG 2007 4aiv none 35067bcefghjk WHG 2007 4av none 67bcefghjk WHG 2007 4bi none 1467bcefghjk WHG 2007 4bii none 17bcefghjk WHG 2007 4ci none 27bcefghjk WHG 2007 4cii none 347bcefghjk WHG 2007 4ciii none 47bcefghjk WHG 2007 4civ none 17bcefghjk WHG 2007 4d none 47bcefghjk WHG 2007 4e none 77bcefghjk WHG 2007 none none 132
REG_AREA SPECIES YEAR REG_GEAR SPECON LANDINGS7fg WHG 2003 4aii none 18247fg WHG 2003 4aiii none 3127fg WHG 2003 4aiv none 43137fg WHG 2003 4av none 77fg WHG 2003 4bi none 1727fg WHG 2003 4bii none 117fg WHG 2003 4biii none 47fg WHG 2003 4ci none 77fg WHG 2003 4cii none 37fg WHG 2003 4ciii none 267fg WHG 2003 none none 947fg WHG 2004 4aii none 21757fg WHG 2004 4aiii none 2617fg WHG 2004 4aiv none 36207fg WHG 2004 4av none 217fg WHG 2004 4bi none 1707fg WHG 2004 4bii none 77fg WHG 2004 4biii none 77fg WHG 2004 4ci none 37fg WHG 2004 4cii none 197fg WHG 2004 4ciii none 67fg WHG 2004 4civ none 17fg WHG 2004 none none 6267fg WHG 2005 4aii none 47107fg WHG 2005 4aiii none 897fg WHG 2005 4aiv none 45277fg WHG 2005 4bi none 2047fg WHG 2005 4bii none 107fg WHG 2005 4biii none 67fg WHG 2005 4ci none 137fg WHG 2005 4cii none 97fg WHG 2005 none none 487fg WHG 2006 4ai none 17fg WHG 2006 4aii none 32117fg WHG 2006 4aiii none 767fg WHG 2006 4aiv none 37887fg WHG 2006 4bi none 877fg WHG 2006 4bii none 37fg WHG 2006 4cii none 27fg WHG 2006 none none 627fg WHG 2007 4aii none 34437fg WHG 2007 4aiii none 667fg WHG 2007 4aiv none 28597fg WHG 2007 4bi none 1017fg WHG 2007 4ci none 17fg WHG 2007 4cii none 37fg WHG 2007 4ciii none 47fg WHG 2007 none none 55
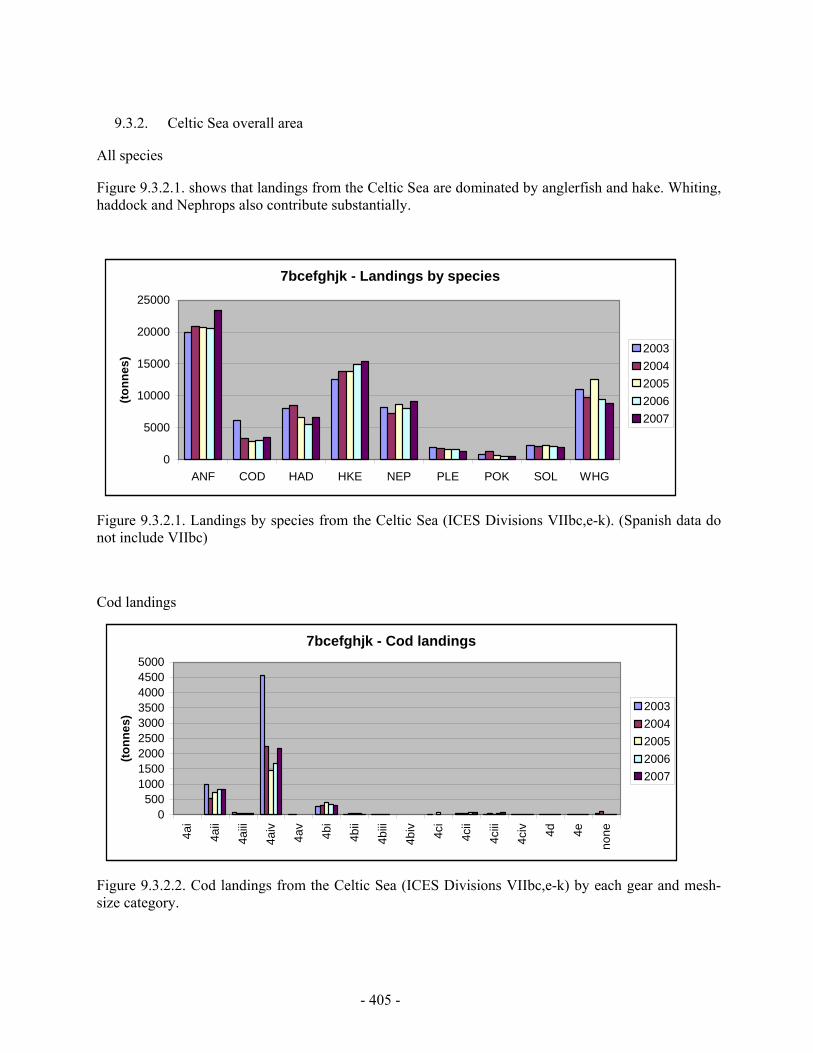
- 405 -
9.3.2. Celtic Sea overall area
All species
Figure 9.3.2.1. shows that landings from the Celtic Sea are dominated by anglerfish and hake. Whiting, haddock and Nephrops also contribute substantially.
Figure 9.3.2.1. Landings by species from the Celtic Sea (ICES Divisions VIIbc,e-k). (Spanish data do not include VIIbc)
Cod landings
Figure 9.3.2.2. Cod landings from the Celtic Sea (ICES Divisions VIIbc,e-k) by each gear and mesh-size category.
7bcefghjk - Cod landings
0500
100015002000250030003500400045005000
4ai
4aii
4aiii
4aiv
4av
4bi
4bii
4biii
4biv 4ci
4cii
4ciii
4civ 4d 4e
none
(tonn
es)
20032004200520062007
7bcefghjk - Landings by species
0
5000
10000
15000
20000
25000
ANF COD HAD HKE NEP PLE POK SOL WHG
(tonn
es) 2003
2004200520062007

- 406 -
AN
F
CO
D
HA
D
HK
E
NE
P
PLE
PO
K
SO
L
WH
G
4aiv-none-7bcefghjk, 2003-2007
Land
ings
and
Dis
card
s (t)
020
0040
0060
0080
0010
000
AN
F
CO
D
HA
D
HK
E
NE
P
PLE
PO
K
SO
L
WH
G AN
F
CO
D
HA
D
HK
E
NE
P
PLE
PO
K
SO
L
WH
G
4aii-none-7bcefghjk, 2003-2007
Land
ings
and
Dis
card
s (t)
020
0040
0060
0080
00
AN
F
CO
D
HA
D
HK
E
NE
P
PLE
PO
K
SO
L
WH
G
AN
F
CO
D
HA
D
HK
E
NE
P
PLE
PO
K
SO
L
WH
G
4aiii-none-7bcefghjk, 2003-2007
Land
ings
and
Dis
card
s (t)
010
020
030
040
050
060
070
0
AN
F
CO
D
HA
D
HK
E
NE
P
PLE
PO
K
SO
L
WH
G AN
F
CO
D
HA
D
HK
E
NE
P
PLE
PO
K
SO
L
WH
G
4bi-none-7bcefghjk, 2003-2007
Land
ings
and
Dis
card
s (t)
010
0020
0030
0040
00
AN
F
CO
D
HA
D
HK
E
NE
P
PLE
PO
K
SO
L
WH
G
AN
F
CO
D
HA
D
HK
E
NE
P
PLE
PO
K
SO
L
WH
G
4cii-none-7bcefghjk, 2003-2007
Land
ings
and
Dis
card
s (t)
010
0020
0030
0040
0050
0060
00
AN
F
CO
D
HA
D
HK
E
NE
P
PLE
PO
K
SO
L
WH
G
AN
F
CO
D
HA
D
HK
E
NE
P
PLE
PO
K
SO
L
WH
G
4civ-none-7bcefghjk, 2003-2007
Land
ings
and
Dis
card
s (t)
050
010
0015
0020
0025
0030
00
AN
F
CO
D
HA
D
HK
E
NE
P
PLE
PO
K
SO
L
WH
G
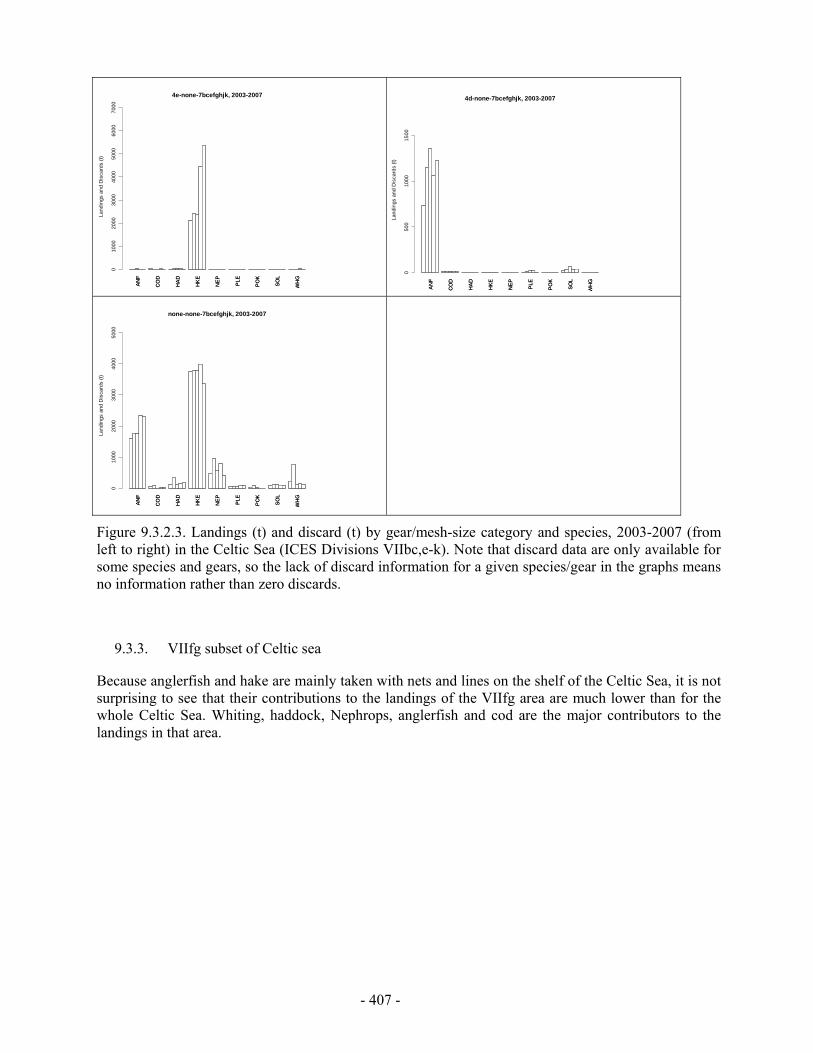
- 407 -
AN
F
CO
D
HA
D
HK
E
NE
P
PLE
PO
K
SO
L
WH
G
4e-none-7bcefghjk, 2003-2007La
ndin
gs a
nd D
isca
rds
(t)
010
0020
0030
0040
0050
0060
0070
00
AN
F
CO
D
HA
D
HK
E
NE
P
PLE
PO
K
SO
L
WH
G
AN
F
CO
D
HA
D
HK
E
NE
P
PLE
PO
K
SO
L
WH
G
none-none-7bcefghjk, 2003-2007
Land
ings
and
Dis
card
s (t)
010
0020
0030
0040
0050
00
AN
F
CO
D
HA
D
HK
E
NE
P
PLE
PO
K
SO
L
WH
G
Figure 9.3.2.3. Landings (t) and discard (t) by gear/mesh-size category and species, 2003-2007 (from left to right) in the Celtic Sea (ICES Divisions VIIbc,e-k). Note that discard data are only available for some species and gears, so the lack of discard information for a given species/gear in the graphs means no information rather than zero discards.
9.3.3. VIIfg subset of Celtic sea
Because anglerfish and hake are mainly taken with nets and lines on the shelf of the Celtic Sea, it is not surprising to see that their contributions to the landings of the VIIfg area are much lower than for the whole Celtic Sea. Whiting, haddock, Nephrops, anglerfish and cod are the major contributors to the landings in that area.
AN
F
CO
D
HA
D
HK
E
NE
P
PLE
PO
K
SO
L
WH
G
4d-none-7bcefghjk, 2003-2007
Land
ings
and
Dis
card
s (t)
050
010
0015
00
AN
F
CO
D
HA
D
HK
E
NE
P
PLE
PO
K
SO
L
WH
G
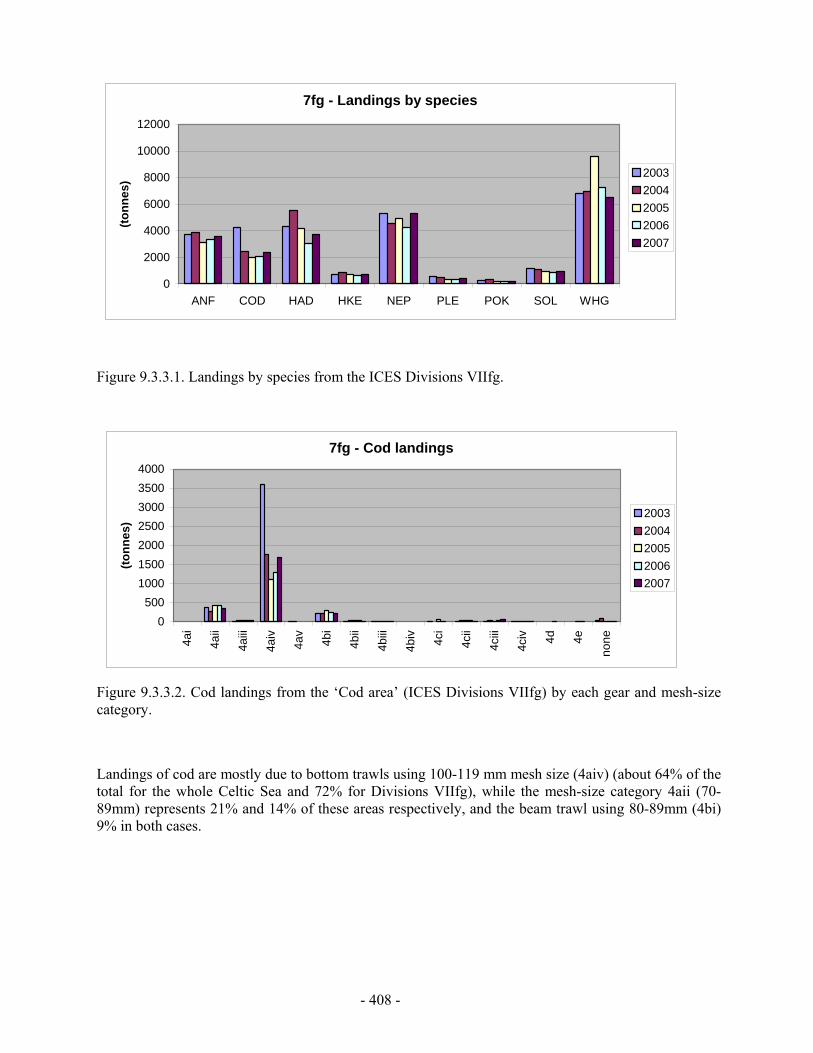
- 408 -
Figure 9.3.3.1. Landings by species from the ICES Divisions VIIfg.
Figure 9.3.3.2. Cod landings from the ‘Cod area’ (ICES Divisions VIIfg) by each gear and mesh-size category.
Landings of cod are mostly due to bottom trawls using 100-119 mm mesh size (4aiv) (about 64% of the total for the whole Celtic Sea and 72% for Divisions VIIfg), while the mesh-size category 4aii (70-89mm) represents 21% and 14% of these areas respectively, and the beam trawl using 80-89mm (4bi) 9% in both cases.
7fg - Landings by species
0
2000
4000
6000
8000
10000
12000
ANF COD HAD HKE NEP PLE POK SOL WHG
(tonn
es) 2003
2004200520062007
7fg - Cod landings
0500
1000150020002500300035004000
4ai
4aii
4aiii
4aiv
4av
4bi
4bii
4biii
4biv 4ci
4cii
4ciii
4civ 4d 4e
none
(tonn
es)
20032004200520062007

- 409 -
AN
F
CO
D
HA
D
HK
E
NE
P
PLE
PO
K
SO
L
WH
G
4aiv-none-7fg, 2003-2007La
ndin
gs a
nd D
isca
rds
(t)
010
0020
0030
0040
0050
0060
00
AN
F
CO
D
HA
D
HK
E
NE
P
PLE
PO
K
SO
L
WH
G AN
F
CO
D
HA
D
HK
E
NE
P
PLE
PO
K
SO
L
WH
G
4aii-none-7fg, 2003-2007
Land
ings
and
Dis
card
s (t)
010
0020
0030
0040
0050
0060
00
AN
F
CO
D
HA
D
HK
E
NE
P
PLE
PO
K
SO
L
WH
G
AN
F
CO
D
HA
D
HK
E
NE
P
PLE
PO
K
SO
L
WH
G
4aii-none-7fg, 2003-2007
Land
ings
and
Dis
card
s (t)
010
0020
0030
0040
0050
0060
00
AN
F
CO
D
HA
D
HK
E
NE
P
PLE
PO
K
SO
L
WH
G AN
F
CO
D
HA
D
HK
E
NE
P
PLE
PO
K
SO
L
WH
G
4bi-none-7fg, 2003-2007
Land
ings
and
Dis
card
s (t)
050
010
0015
00
AN
F
CO
D
HA
D
HK
E
NE
P
PLE
PO
K
SO
L
WH
G
AN
F
CO
D
HA
D
HK
E
NE
P
PLE
PO
K
SO
L
WH
G
4cii-none-7fg, 2003-2007
Land
ings
and
Dis
card
s (t)
050
100
150
200
250
AN
F
CO
D
HA
D
HK
E
NE
P
PLE
PO
K
SO
L
WH
G AN
F
CO
D
HA
D
HK
E
NE
P
PLE
PO
K
SO
L
WH
G
4civ-none-7fg, 2003-2007
Land
ings
and
Dis
card
s (t)
050
100
150
AN
F
CO
D
HA
D
HK
E
NE
P
PLE
PO
K
SO
L
WH
G
AN
F
CO
D
HA
D
HK
E
NE
P
PLE
PO
K
SO
L
WH
G
none-none-7fg, 2003-2007
Land
ings
and
Dis
card
s (t)
020
040
060
080
0
AN
F
CO
D
HA
D
HK
E
NE
P
PLE
PO
K
SO
L
WH
G
Figure 9.3.3.3. Landings (t) and discard (t) by gear/mesh-size category and species, 2003-2007 (from left to right) in the ICES Divisions VIIfg. Note that discard data are only available for some species and gears, so the lack of discard information for a given species/gear in the graphs means no information rather than zero discards.
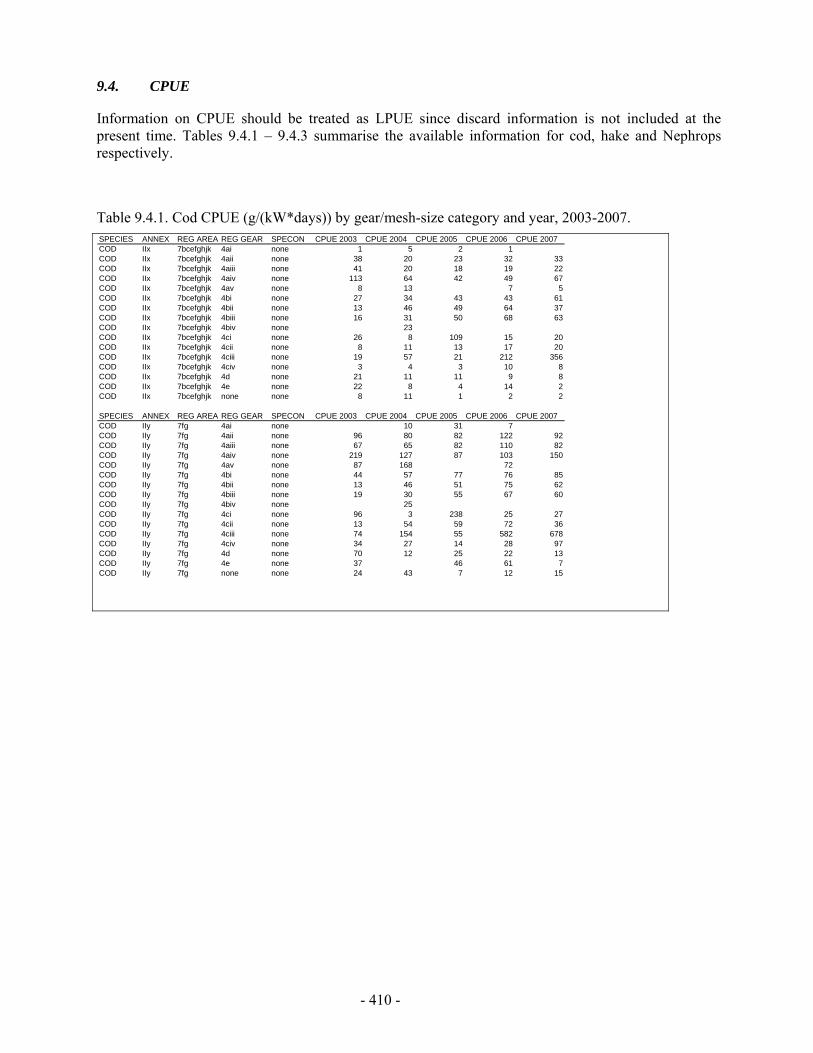
- 410 -
9.4. CPUE
Information on CPUE should be treated as LPUE since discard information is not included at the present time. Tables 9.4.1 – 9.4.3 summarise the available information for cod, hake and Nephrops respectively.
Table 9.4.1. Cod CPUE (g/(kW*days)) by gear/mesh-size category and year, 2003-2007.
SPECIES ANNEX REG AREA REG GEAR SPECON CPUE 2003 CPUE 2004 CPUE 2005 CPUE 2006 CPUE 2007COD IIx 7bcefghjk 4ai none 1 5 2 1COD IIx 7bcefghjk 4aii none 38 20 23 32 33COD IIx 7bcefghjk 4aiii none 41 20 18 19 22COD IIx 7bcefghjk 4aiv none 113 64 42 49 67COD IIx 7bcefghjk 4av none 8 13 7 5COD IIx 7bcefghjk 4bi none 27 34 43 43 61COD IIx 7bcefghjk 4bii none 13 46 49 64 37COD IIx 7bcefghjk 4biii none 16 31 50 68 63COD IIx 7bcefghjk 4biv none 23COD IIx 7bcefghjk 4ci none 26 8 109 15 20COD IIx 7bcefghjk 4cii none 8 11 13 17 20COD IIx 7bcefghjk 4ciii none 19 57 21 212 356COD IIx 7bcefghjk 4civ none 3 4 3 10 8COD IIx 7bcefghjk 4d none 21 11 11 9 8COD IIx 7bcefghjk 4e none 22 8 4 14 2COD IIx 7bcefghjk none none 8 11 1 2 2
SPECIES ANNEX REG AREA REG GEAR SPECON CPUE 2003 CPUE 2004 CPUE 2005 CPUE 2006 CPUE 2007COD IIy 7fg 4ai none 10 31 7COD IIy 7fg 4aii none 96 80 82 122 92COD IIy 7fg 4aiii none 67 65 82 110 82COD IIy 7fg 4aiv none 219 127 87 103 150COD IIy 7fg 4av none 87 168 72COD IIy 7fg 4bi none 44 57 77 76 85COD IIy 7fg 4bii none 13 46 51 75 62COD IIy 7fg 4biii none 19 30 55 67 60COD IIy 7fg 4biv none 25COD IIy 7fg 4ci none 96 3 238 25 27COD IIy 7fg 4cii none 13 54 59 72 36COD IIy 7fg 4ciii none 74 154 55 582 678COD IIy 7fg 4civ none 34 27 14 28 97COD IIy 7fg 4d none 70 12 25 22 13COD IIy 7fg 4e none 37 46 61 7COD IIy 7fg none none 24 43 7 12 15

- 411 -
Table 9.4.2. Hake CPUE (g/(kW*days)) by gear/mesh-size category and year, 2003-2007.
Table 9.4.3. Nephrops CPUE (g/(kW*days)) by gear/mesh-size category and year, 2003-2007.
SPECIES ANNEX REG AREA REG GEAR SPECON CPUE 2003 CPUE 2004 CPUE 2005 CPUE 2006 CPUE 2007NEP IIx 7bcefghjk 4ai none 115 15NEP IIx 7bcefghjk 4aii none 125 93 119 125 198NEP IIx 7bcefghjk 4aiii none 78 99 92 133 219NEP IIx 7bcefghjk 4aiv none 105 100 112 106 104NEP IIx 7bcefghjk 4av none 0 4 66 50NEP IIx 7bcefghjk 4bi none 5 6 6 9 10NEP IIx 7bcefghjk 4bii none 9 37 32 15 15NEP IIx 7bcefghjk 4biii none 16 30 44 50 9NEP IIx 7bcefghjk 4biv none 14NEP IIx 7bcefghjk 4ci none 26 27 28NEP IIx 7bcefghjk 4cii none 0 0 0NEP IIx 7bcefghjk 4ciii none 1NEP IIx 7bcefghjk 4civ none 0 0NEP IIx 7bcefghjk 4d none 0 0 0 0NEP IIx 7bcefghjk 4e none 1 7 1NEP IIx 7bcefghjk none none 70 103 75 105 54
SPECIES ANNEX REG AREA REG GEAR SPECON CPUE 2003 CPUE 2004 CPUE 2005 CPUE 2006 CPUE 2007NEP IIy 7fg 4ai none 18NEP IIy 7fg 4aii none 521 478 470 505 830NEP IIy 7fg 4aiii none 403 443 625 505 751NEP IIy 7fg 4aiv none 191 173 180 184 184NEP IIy 7fg 4av none 2 56 152NEP IIy 7fg 4bi none 9 11 12 20 22NEP IIy 7fg 4bii none 11 41 33 10 30NEP IIy 7fg 4biii none 21 22 50 53 13NEP IIy 7fg 4biv none 20NEP IIy 7fg 4ci none 36 58NEP IIy 7fg 4cii none 0 4NEP IIy 7fg 4civ none 0NEP IIy 7fg none none 44 174 12 20 9
SPECIES ANNEX REG AREA REG GEAR SPECON CPUE 2003 CPUE 2004 CPUE 2005 CPUE 2006 CPUE 2007HKE IIx 7bcefghjk 4ai none 0 3 0 3HKE IIx 7bcefghjk 4aii none 25 20 19 19 18HKE IIx 7bcefghjk 4aiii none 21 35 19 26 36HKE IIx 7bcefghjk 4aiv none 49 58 64 60 66HKE IIx 7bcefghjk 4av none 52 16 15 21 21HKE IIx 7bcefghjk 4bi none 7 10 8 9 10HKE IIx 7bcefghjk 4bii none 20 18 17 28 23HKE IIx 7bcefghjk 4biii none 17 19 22 12 33HKE IIx 7bcefghjk 4biv none 7 2HKE IIx 7bcefghjk 4ci none 937 67 433 254 171HKE IIx 7bcefghjk 4cii none 875 1217 1113 1018 1204HKE IIx 7bcefghjk 4ciii none 35 49 10 41 103HKE IIx 7bcefghjk 4civ none 49 9 13 4 22HKE IIx 7bcefghjk 4d none 8 3 5 6 3HKE IIx 7bcefghjk 4e none 2440 3510 2752 3086 2954HKE IIx 7bcefghjk none none 565 404 502 530 440
SPECIES ANNEX REG AREA REG GEAR SPECON CPUE 2003 CPUE 2004 CPUE 2005 CPUE 2006 CPUE 2007HKE IIy 7fg 4ai none 3 7HKE IIy 7fg 4aii none 33 32 23 31 27HKE IIy 7fg 4aiii none 64 99 60 90 82HKE IIy 7fg 4aiv none 27 28 24 27 35HKE IIy 7fg 4av none 175 21 37HKE IIy 7fg 4bi none 11 13 13 17 21HKE IIy 7fg 4bii none 18 19 16 28 41HKE IIy 7fg 4biii none 21 20 24 12 37HKE IIy 7fg 4biv none 7 1HKE IIy 7fg 4ci none 140 1 236 64 12HKE IIy 7fg 4cii none 54 342 337 152 261HKE IIy 7fg 4ciii none 110 174 9 110 163HKE IIy 7fg 4civ none 30 25 6 2 19HKE IIy 7fg 4d none 3 0 3 1 1HKE IIy 7fg 4e none 94 200 58 208 4HKE IIy 7fg none none 14 30 21 32 13
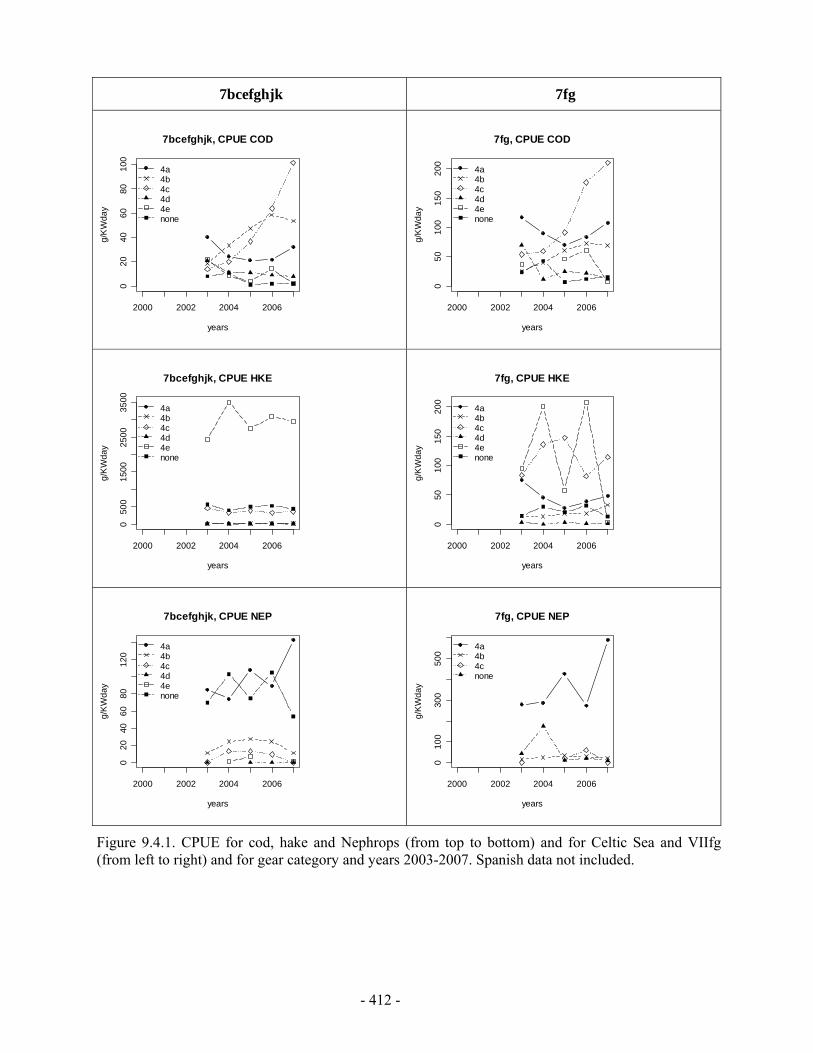
- 412 -
7bcefghjk 7fg
2000 2002 2004 2006
020
4060
8010
0
7bcefghjk, CPUE COD
years
g/K
Wda
y
4a4b4c4d4enone
2000 2002 2004 2006
050
100
150
200
7fg, CPUE COD
years
g/K
Wda
y
4a4b4c4d4enone
2000 2002 2004 2006
050
015
0025
0035
00
7bcefghjk, CPUE HKE
years
g/K
Wda
y
4a4b4c4d4enone
2000 2002 2004 2006
050
100
150
200
7fg, CPUE HKE
years
g/K
Wda
y4a4b4c4d4enone
2000 2002 2004 2006
020
4060
8012
0
7bcefghjk, CPUE NEP
years
g/K
Wda
y
4a4b4c4d4enone
2000 2002 2004 2006
010
030
050
0
7fg, CPUE NEP
years
g/K
Wda
y
4a4b4cnone
Figure 9.4.1. CPUE for cod, hake and Nephrops (from top to bottom) and for Celtic Sea and VIIfg (from left to right) and for gear category and years 2003-2007. Spanish data not included.
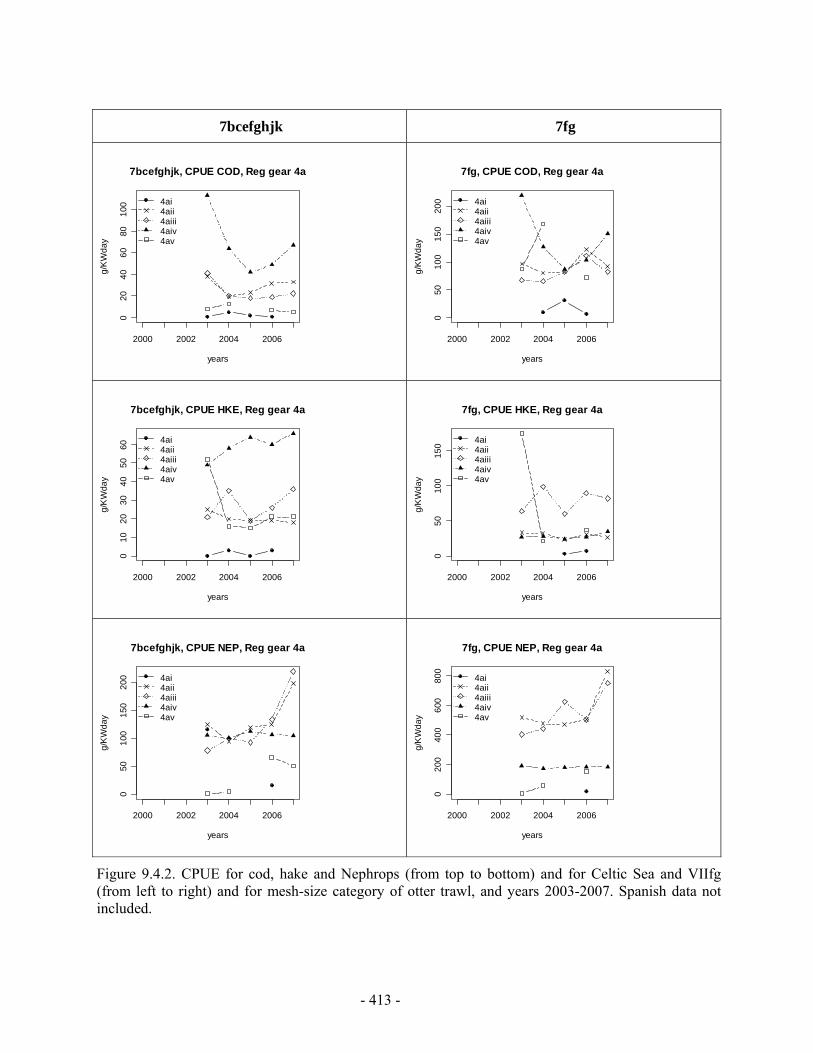
- 413 -
7bcefghjk 7fg
2000 2002 2004 2006
020
4060
8010
0
7bcefghjk, CPUE COD, Reg gear 4a
years
g/K
Wda
y
4ai4aii4aiii4aiv4av
2000 2002 2004 2006
050
100
150
200
7fg, CPUE COD, Reg gear 4a
years
g/K
Wda
y
4ai4aii4aiii4aiv4av
2000 2002 2004 2006
010
2030
4050
60
7bcefghjk, CPUE HKE, Reg gear 4a
years
g/K
Wda
y
4ai4aii4aiii4aiv4av
2000 2002 2004 2006
050
100
150
7fg, CPUE HKE, Reg gear 4a
years
g/K
Wda
y
4ai4aii4aiii4aiv4av
2000 2002 2004 2006
050
100
150
200
7bcefghjk, CPUE NEP, Reg gear 4a
years
g/K
Wda
y
4ai4aii4aiii4aiv4av
2000 2002 2004 2006
020
040
060
080
0
7fg, CPUE NEP, Reg gear 4a
years
g/K
Wda
y
4ai4aii4aiii4aiv4av
Figure 9.4.2. CPUE for cod, hake and Nephrops (from top to bottom) and for Celtic Sea and VIIfg (from left to right) and for mesh-size category of otter trawl, and years 2003-2007. Spanish data not included.
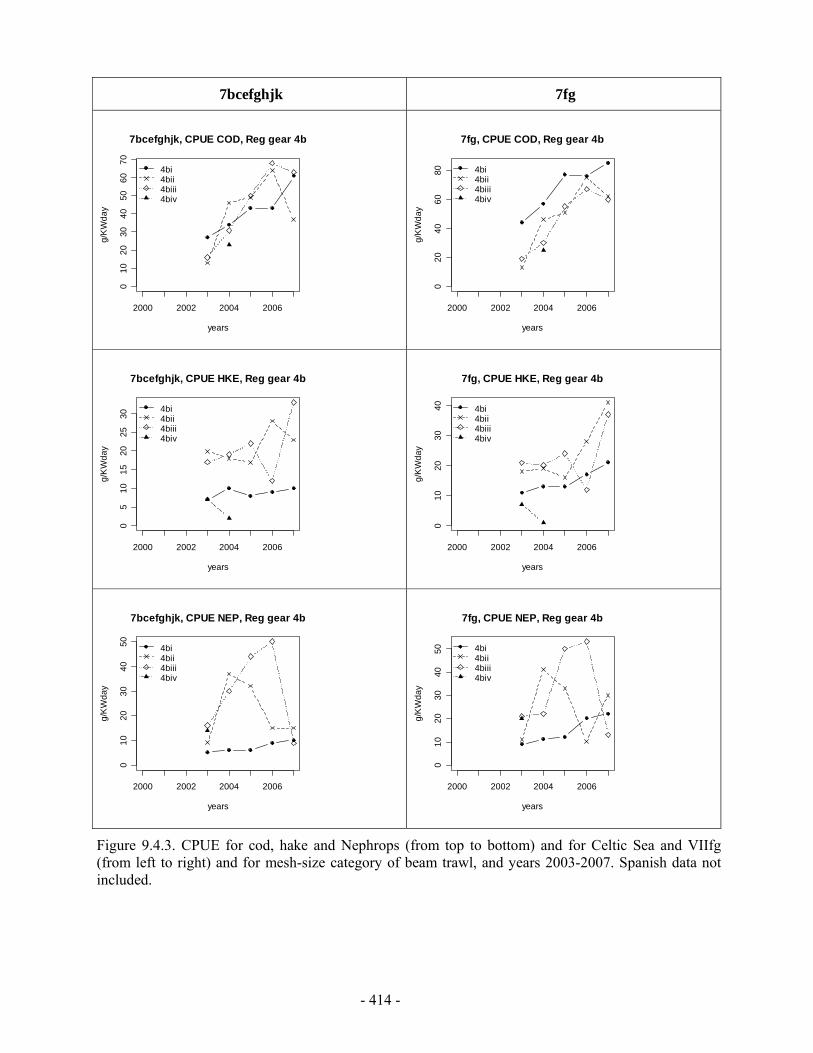
- 414 -
7bcefghjk 7fg
2000 2002 2004 2006
010
2030
4050
6070
7bcefghjk, CPUE COD, Reg gear 4b
years
g/K
Wda
y
4bi4bii4biii4biv
2000 2002 2004 2006
020
4060
80
7fg, CPUE COD, Reg gear 4b
years
g/K
Wda
y
4bi4bii4biii4biv
2000 2002 2004 2006
05
1015
2025
30
7bcefghjk, CPUE HKE, Reg gear 4b
years
g/K
Wda
y
4bi4bii4biii4biv
2000 2002 2004 2006
010
2030
40
7fg, CPUE HKE, Reg gear 4b
years
g/K
Wda
y4bi4bii4biii4biv
2000 2002 2004 2006
010
2030
4050
7bcefghjk, CPUE NEP, Reg gear 4b
years
g/K
Wda
y
4bi4bii4biii4biv
2000 2002 2004 2006
010
2030
4050
7fg, CPUE NEP, Reg gear 4b
years
g/K
Wda
y
4bi4bii4biii4biv
Figure 9.4.3. CPUE for cod, hake and Nephrops (from top to bottom) and for Celtic Sea and VIIfg (from left to right) and for mesh-size category of beam trawl, and years 2003-2007. Spanish data not included.
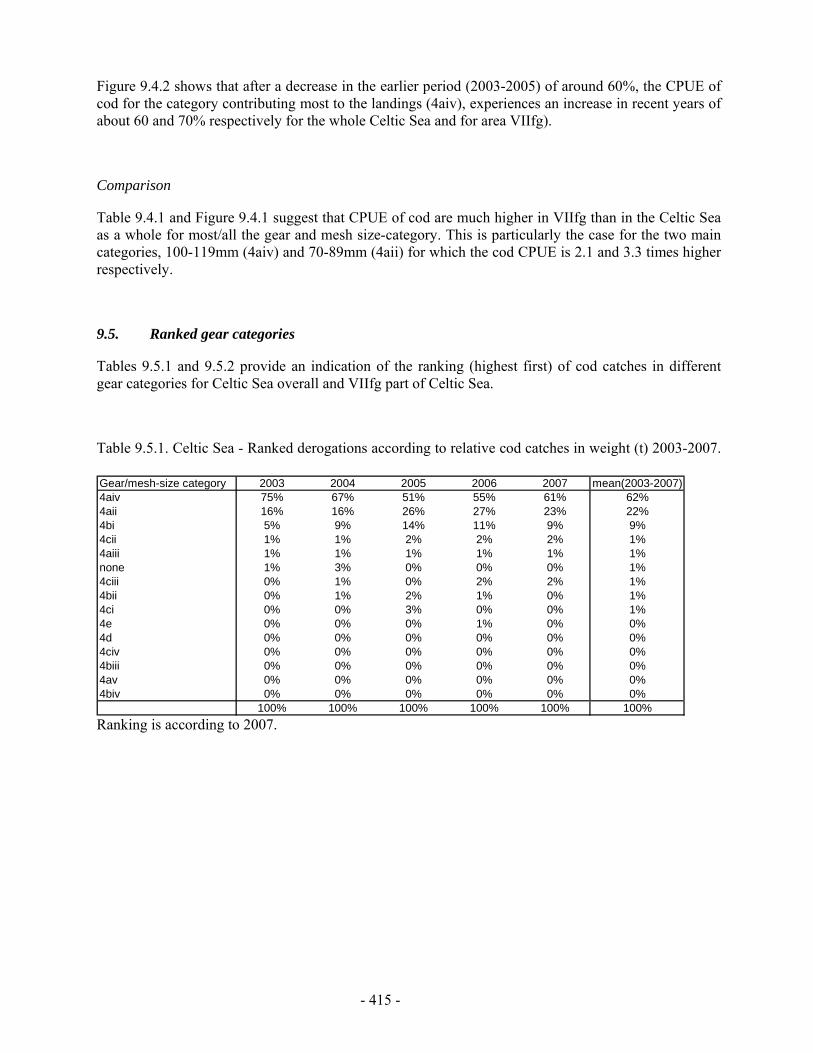
- 415 -
Figure 9.4.2 shows that after a decrease in the earlier period (2003-2005) of around 60%, the CPUE of cod for the category contributing most to the landings (4aiv), experiences an increase in recent years of about 60 and 70% respectively for the whole Celtic Sea and for area VIIfg).
Comparison
Table 9.4.1 and Figure 9.4.1 suggest that CPUE of cod are much higher in VIIfg than in the Celtic Sea as a whole for most/all the gear and mesh size-category. This is particularly the case for the two main categories, 100-119mm (4aiv) and 70-89mm (4aii) for which the cod CPUE is 2.1 and 3.3 times higher respectively.
9.5. Ranked gear categories
Tables 9.5.1 and 9.5.2 provide an indication of the ranking (highest first) of cod catches in different gear categories for Celtic Sea overall and VIIfg part of Celtic Sea.
Table 9.5.1. Celtic Sea - Ranked derogations according to relative cod catches in weight (t) 2003-2007.
Ranking is according to 2007.
Gear/mesh-size category 2003 2004 2005 2006 2007 mean(2003-2007)4aiv 75% 67% 51% 55% 61% 62%4aii 16% 16% 26% 27% 23% 22%4bi 5% 9% 14% 11% 9% 9%4cii 1% 1% 2% 2% 2% 1%4aiii 1% 1% 1% 1% 1% 1%none 1% 3% 0% 0% 0% 1%4ciii 0% 1% 0% 2% 2% 1%4bii 0% 1% 2% 1% 0% 1%4ci 0% 0% 3% 0% 0% 1%4e 0% 0% 0% 1% 0% 0%4d 0% 0% 0% 0% 0% 0%4civ 0% 0% 0% 0% 0% 0%4biii 0% 0% 0% 0% 0% 0%4av 0% 0% 0% 0% 0% 0%4biv 0% 0% 0% 0% 0% 0%
100% 100% 100% 100% 100% 100%
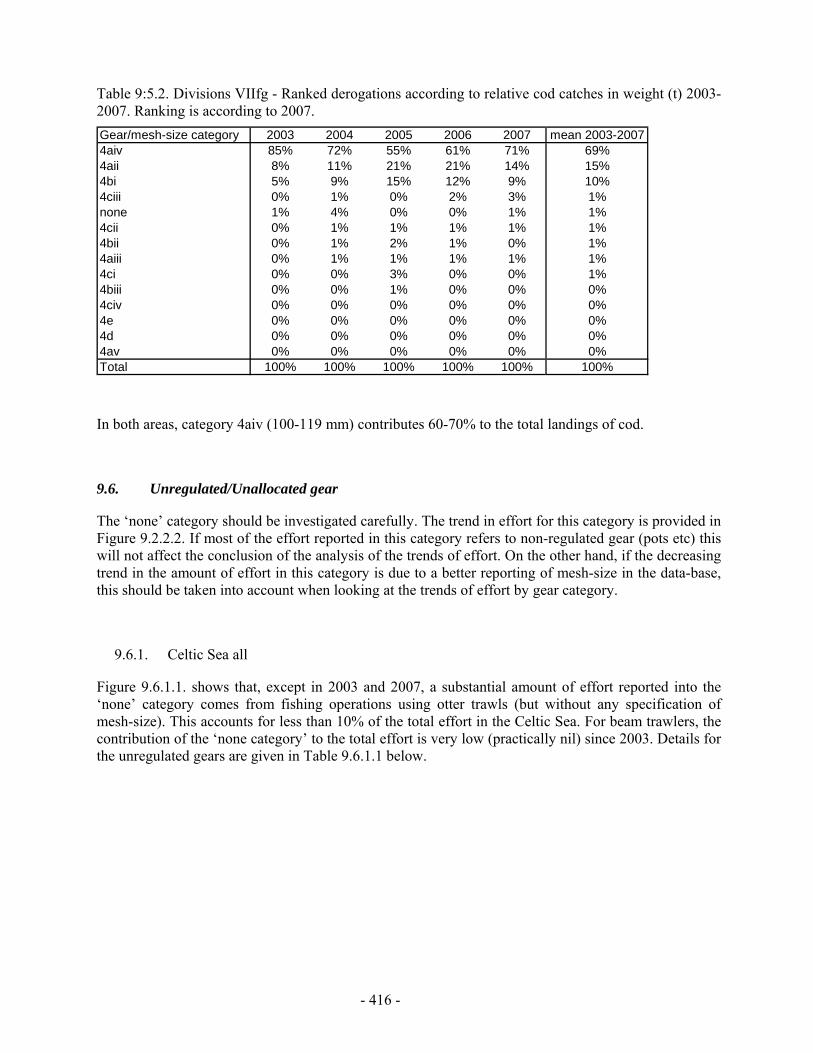
- 416 -
Table 9:5.2. Divisions VIIfg - Ranked derogations according to relative cod catches in weight (t) 2003-2007. Ranking is according to 2007.
In both areas, category 4aiv (100-119 mm) contributes 60-70% to the total landings of cod.
9.6. Unregulated/Unallocated gear
The ‘none’ category should be investigated carefully. The trend in effort for this category is provided in Figure 9.2.2.2. If most of the effort reported in this category refers to non-regulated gear (pots etc) this will not affect the conclusion of the analysis of the trends of effort. On the other hand, if the decreasing trend in the amount of effort in this category is due to a better reporting of mesh-size in the data-base, this should be taken into account when looking at the trends of effort by gear category.
9.6.1. Celtic Sea all
Figure 9.6.1.1. shows that, except in 2003 and 2007, a substantial amount of effort reported into the ‘none’ category comes from fishing operations using otter trawls (but without any specification of mesh-size). This accounts for less than 10% of the total effort in the Celtic Sea. For beam trawlers, the contribution of the ‘none category’ to the total effort is very low (practically nil) since 2003. Details for the unregulated gears are given in Table 9.6.1.1 below.
Gear/mesh-size category 2003 2004 2005 2006 2007 mean 2003-20074aiv 85% 72% 55% 61% 71% 69%4aii 8% 11% 21% 21% 14% 15%4bi 5% 9% 15% 12% 9% 10%4ciii 0% 1% 0% 2% 3% 1%none 1% 4% 0% 0% 1% 1%4cii 0% 1% 1% 1% 1% 1%4bii 0% 1% 2% 1% 0% 1%4aiii 0% 1% 1% 1% 1% 1%4ci 0% 0% 3% 0% 0% 1%4biii 0% 0% 1% 0% 0% 0%4civ 0% 0% 0% 0% 0% 0%4e 0% 0% 0% 0% 0% 0%4d 0% 0% 0% 0% 0% 0%4av 0% 0% 0% 0% 0% 0%Total 100% 100% 100% 100% 100% 100%
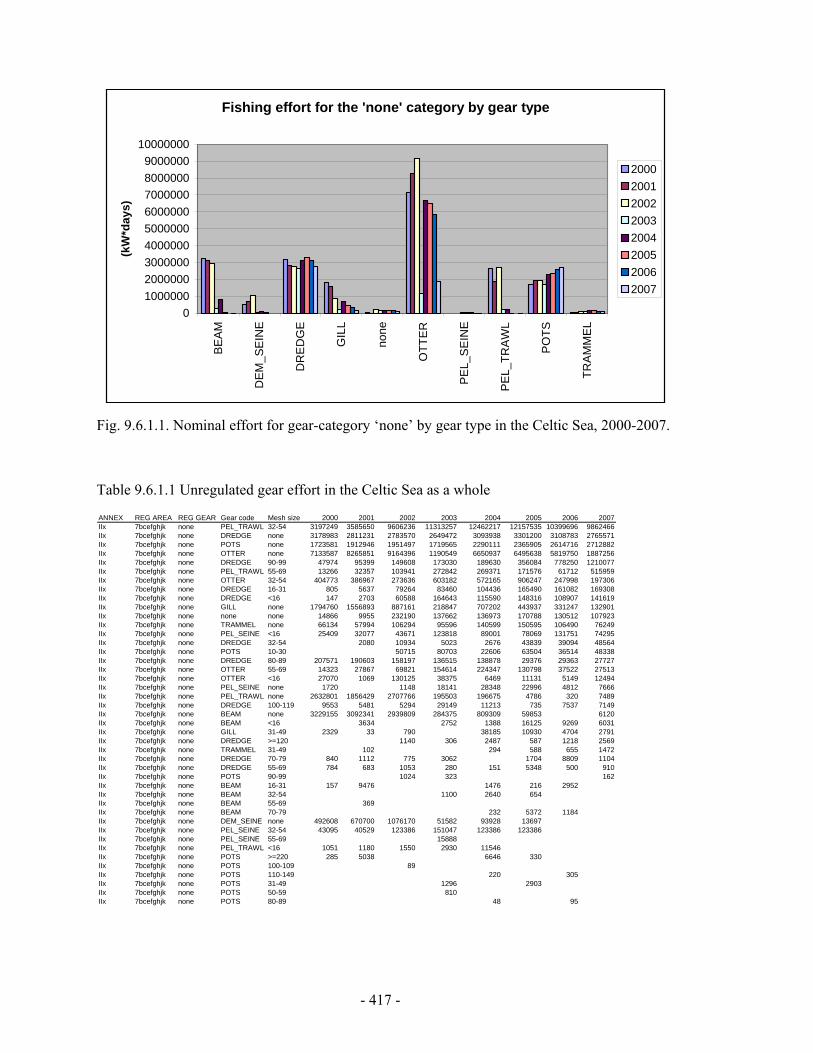
- 417 -
Fig. 9.6.1.1. Nominal effort for gear-category ‘none’ by gear type in the Celtic Sea, 2000-2007.
Table 9.6.1.1 Unregulated gear effort in the Celtic Sea as a whole
ANNEX REG AREA REG GEAR Gear code Mesh size c 2000 2001 2002 2003 2004 2005 2006 2007IIx 7bcefghjk none PEL_TRAWL 32-54 3197249 3585650 9606236 11313257 12462217 12157535 10399696 9862466IIx 7bcefghjk none DREDGE none 3178983 2811231 2783570 2649472 3093938 3301200 3108783 2765571IIx 7bcefghjk none POTS none 1723581 1912946 1951497 1719565 2290111 2365905 2614716 2712882IIx 7bcefghjk none OTTER none 7133587 8265851 9164396 1190549 6650937 6495638 5819750 1887256IIx 7bcefghjk none DREDGE 90-99 47974 95399 149608 173030 189630 356084 778250 1210077IIx 7bcefghjk none PEL_TRAWL 55-69 13266 32357 103941 272842 269371 171576 61712 515959IIx 7bcefghjk none OTTER 32-54 404773 386967 273636 603182 572165 906247 247998 197306IIx 7bcefghjk none DREDGE 16-31 805 5637 79264 83460 104436 165490 161082 169308IIx 7bcefghjk none DREDGE <16 147 2703 60588 164643 115590 148316 108907 141619IIx 7bcefghjk none GILL none 1794760 1556893 887161 218847 707202 443937 331247 132901IIx 7bcefghjk none none none 14866 9955 232190 137662 136973 170788 130512 107923IIx 7bcefghjk none TRAMMEL none 66134 57994 106294 95596 140599 150595 106490 76249IIx 7bcefghjk none PEL_SEINE <16 25409 32077 43671 123818 89001 78069 131751 74295IIx 7bcefghjk none DREDGE 32-54 2080 10934 5023 2676 43839 39094 48564IIx 7bcefghjk none POTS 10-30 50715 80703 22606 63504 36514 48338IIx 7bcefghjk none DREDGE 80-89 207571 190603 158197 136515 138878 29376 29363 27727IIx 7bcefghjk none OTTER 55-69 14323 27867 69821 154614 224347 130798 37522 27513IIx 7bcefghjk none OTTER <16 27070 1069 130125 38375 6469 11131 5149 12494IIx 7bcefghjk none PEL_SEINE none 1720 1148 18141 28348 22996 4812 7666IIx 7bcefghjk none PEL_TRAWL none 2632801 1856429 2707766 195503 196675 4786 320 7489IIx 7bcefghjk none DREDGE 100-119 9553 5481 5294 29149 11213 735 7537 7149IIx 7bcefghjk none BEAM none 3229155 3092341 2939809 284375 809309 59853 6120IIx 7bcefghjk none BEAM <16 3634 2752 1388 16125 9269 6031IIx 7bcefghjk none GILL 31-49 2329 33 790 38185 10930 4704 2791IIx 7bcefghjk none DREDGE >=120 1140 306 2487 587 1218 2569IIx 7bcefghjk none TRAMMEL 31-49 102 294 588 655 1472IIx 7bcefghjk none DREDGE 70-79 840 1112 775 3062 1704 8809 1104IIx 7bcefghjk none DREDGE 55-69 784 683 1053 280 151 5348 500 910IIx 7bcefghjk none POTS 90-99 1024 323 162IIx 7bcefghjk none BEAM 16-31 157 9476 1476 216 2952IIx 7bcefghjk none BEAM 32-54 1100 2640 654IIx 7bcefghjk none BEAM 55-69 369IIx 7bcefghjk none BEAM 70-79 232 5372 1184IIx 7bcefghjk none DEM_SEINE none 492608 670700 1076170 51582 93928 13697IIx 7bcefghjk none PEL_SEINE 32-54 43095 40529 123386 151047 123386 123386IIx 7bcefghjk none PEL_SEINE 55-69 15888IIx 7bcefghjk none PEL_TRAWL <16 1051 1180 1550 2930 11546IIx 7bcefghjk none POTS >=220 285 5038 6646 330IIx 7bcefghjk none POTS 100-109 89IIx 7bcefghjk none POTS 110-149 220 305IIx 7bcefghjk none POTS 31-49 1296 2903IIx 7bcefghjk none POTS 50-59 810IIx 7bcefghjk none POTS 80-89 48 95
Fishing effort for the 'none' category by gear type
0100000020000003000000400000050000006000000700000080000009000000
10000000
BE
AM
DE
M_S
EIN
E
DR
ED
GE
GIL
L
none
OTT
ER
PE
L_S
EIN
E
PE
L_TR
AW
L
PO
TS
TRA
MM
EL
(kW
*day
s)
20002001200220032004200520062007
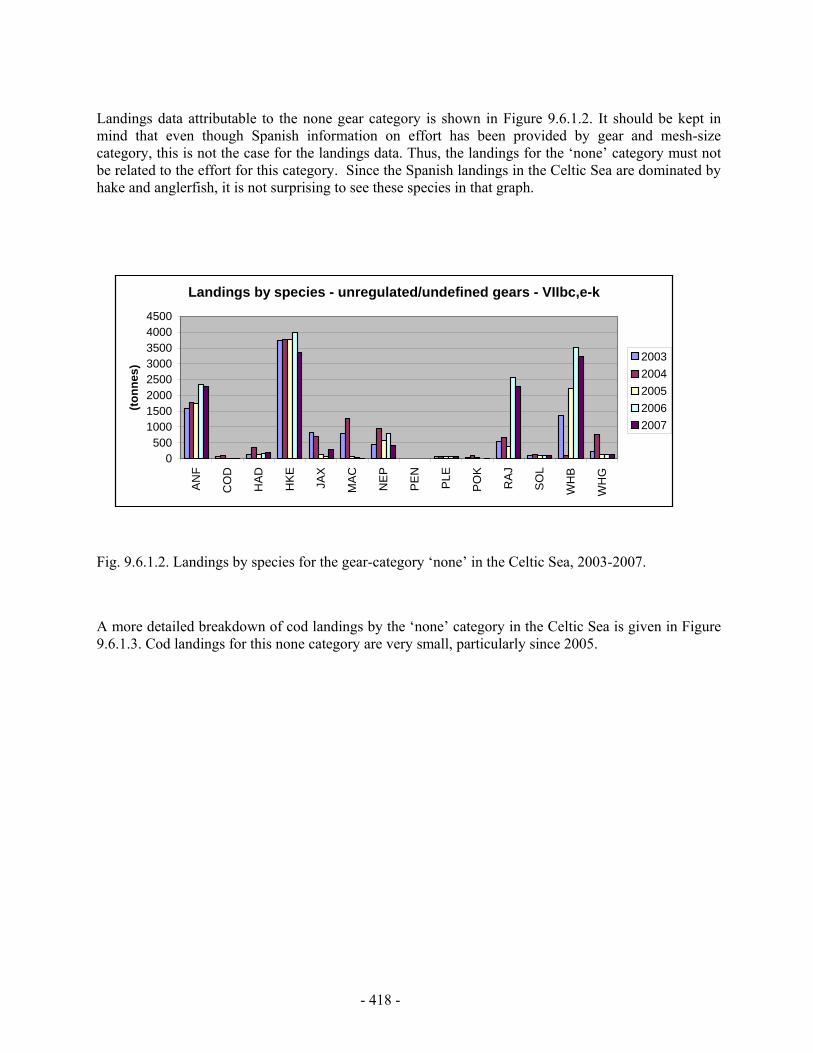
- 418 -
Landings data attributable to the none gear category is shown in Figure 9.6.1.2. It should be kept in mind that even though Spanish information on effort has been provided by gear and mesh-size category, this is not the case for the landings data. Thus, the landings for the ‘none’ category must not be related to the effort for this category. Since the Spanish landings in the Celtic Sea are dominated by hake and anglerfish, it is not surprising to see these species in that graph.
Fig. 9.6.1.2. Landings by species for the gear-category ‘none’ in the Celtic Sea, 2003-2007.
A more detailed breakdown of cod landings by the ‘none’ category in the Celtic Sea is given in Figure 9.6.1.3. Cod landings for this none category are very small, particularly since 2005.
Landings by species - unregulated/undefined gears - VIIbc,e-k
0500
10001500200025003000350040004500
AN
F
CO
D
HA
D
HK
E
JAX
MA
C
NE
P
PE
N
PLE
PO
K
RA
J
SO
L
WH
B
WH
G
(tonn
es)
20032004200520062007
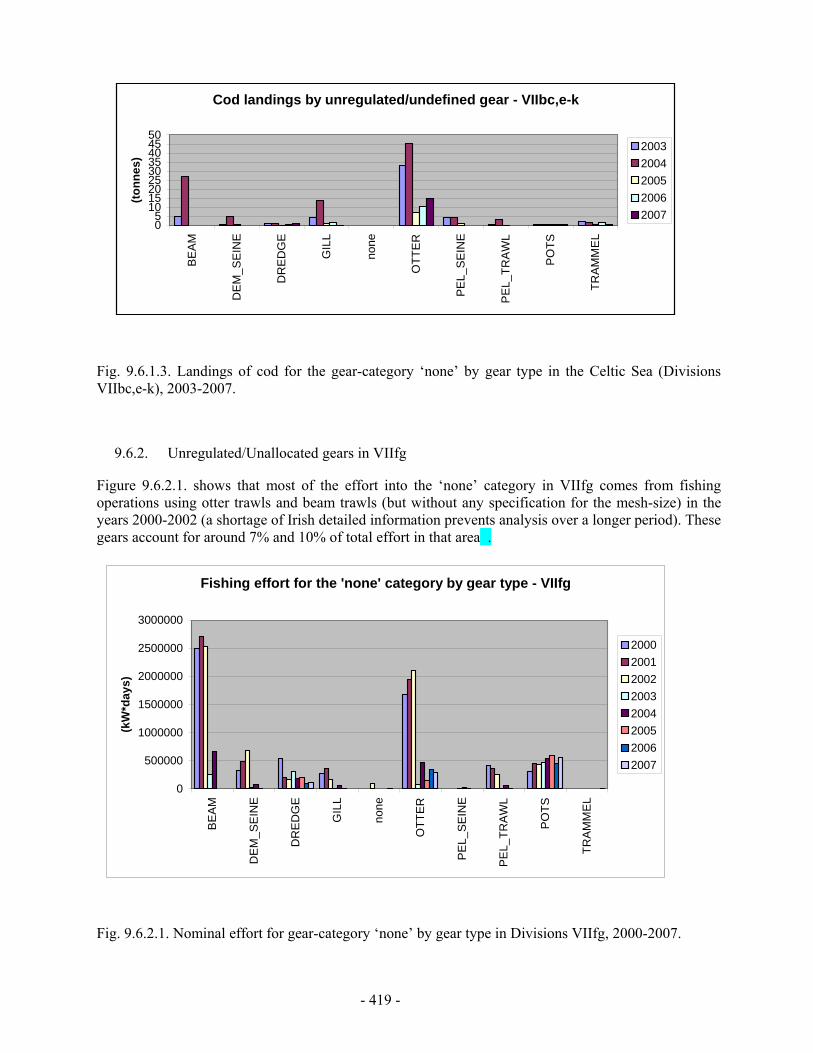
- 419 -
Fig. 9.6.1.3. Landings of cod for the gear-category ‘none’ by gear type in the Celtic Sea (Divisions VIIbc,e-k), 2003-2007.
9.6.2. Unregulated/Unallocated gears in VIIfg
Figure 9.6.2.1. shows that most of the effort into the ‘none’ category in VIIfg comes from fishing operations using otter trawls and beam trawls (but without any specification for the mesh-size) in the years 2000-2002 (a shortage of Irish detailed information prevents analysis over a longer period). These gears account for around 7% and 10% of total effort in that area .
Fig. 9.6.2.1. Nominal effort for gear-category ‘none’ by gear type in Divisions VIIfg, 2000-2007.
Fishing effort for the 'none' category by gear type - VIIfg
0
500000
1000000
1500000
2000000
2500000
3000000
BE
AM
DE
M_S
EIN
E
DR
ED
GE
GIL
L
none
OTT
ER
PE
L_S
EIN
E
PE
L_TR
AW
L
PO
TS
TRA
MM
EL
(kW
*day
s)
20002001200220032004200520062007
Cod landings by unregulated/undefined gear - VIIbc,e-k
05
101520253035404550
BE
AM
DE
M_S
EIN
E
DR
ED
GE
GIL
L
none
OTT
ER
PE
L_S
EIN
E
PE
L_TR
AW
L
PO
TS
TRA
MM
EL
(tonn
es)
20032004200520062007

- 420 -
Species composition of the landings by unregulated/undefined gears is given in Figure 9.6.2.2
Fig. 9.6.2.2. Landings by species for the gear-category ‘none’ in Divisions VIIfg, 2003-2007.
A more detailed breakdown of cod landings by the ‘none’ category in VIIfg is given in Figure 9.6.2.3. The conclusion for this VIIfg area is very similar to the one for the Celtic Sea as a whole: i.e. landings of cod from the ‘none’ category are very small particularly in recent years.
Fig. 9.6.2.3. Landings of cod for the gear-category ‘none’ by gear type in Divisions VIIfg, 2003-2007.
Landings by species - unregulated/undefined gears - VIIfg
0
100
200
300
400
500
600
700
AN
F
CO
D
HA
D
HK
E
JAX
MA
C
NE
P
PLE
PO
K
RA
J
SO
L
WH
B
WH
G
(tonn
es)
20032004200520062007
Cod landings by unregulated/undefined gear - VIIfg
05
10152025303540
BE
AM
DE
M_S
EIN
E
DR
ED
GE
GIL
L
OTT
ER
PE
L_S
EIN
E
PE
L_TR
AW
L
PO
TS
TRA
MM
EL
(tonn
es)
20032004200520062007
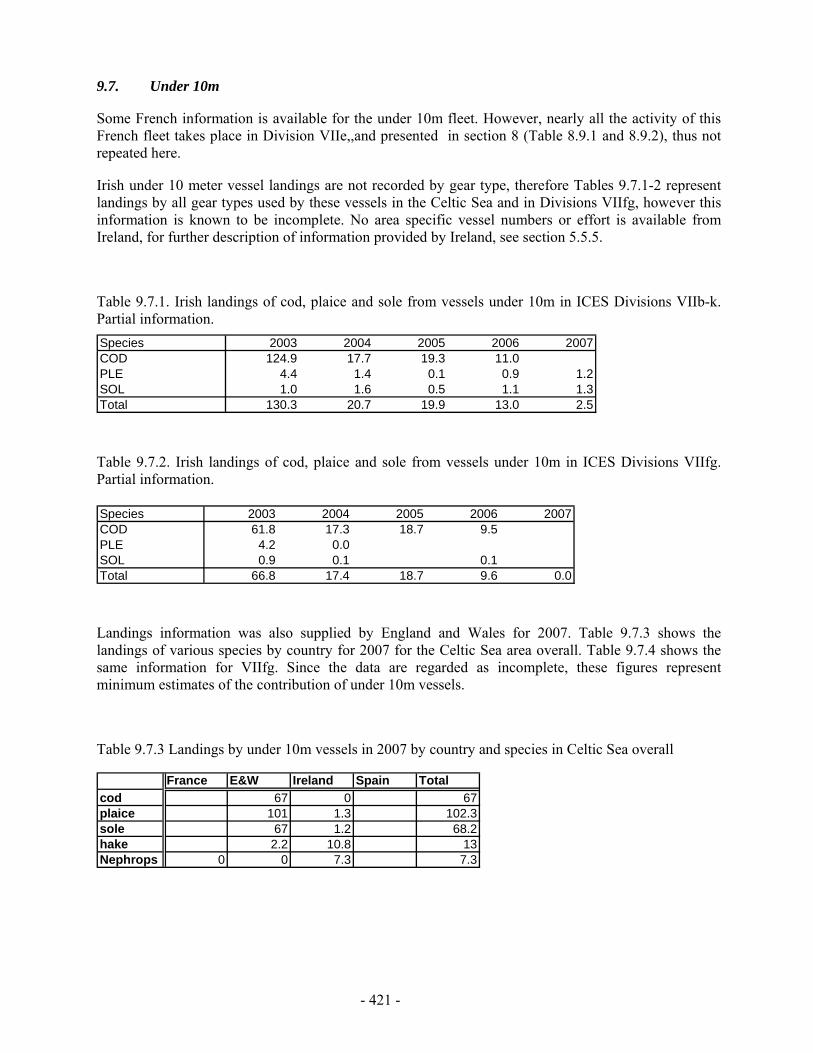
- 421 -
9.7. Under 10m
Some French information is available for the under 10m fleet. However, nearly all the activity of this French fleet takes place in Division VIIe,,and presented in section 8 (Table 8.9.1 and 8.9.2), thus not repeated here.
Irish under 10 meter vessel landings are not recorded by gear type, therefore Tables 9.7.1-2 represent landings by all gear types used by these vessels in the Celtic Sea and in Divisions VIIfg, however this information is known to be incomplete. No area specific vessel numbers or effort is available from Ireland, for further description of information provided by Ireland, see section 5.5.5.
Table 9.7.1. Irish landings of cod, plaice and sole from vessels under 10m in ICES Divisions VIIb-k. Partial information.
Table 9.7.2. Irish landings of cod, plaice and sole from vessels under 10m in ICES Divisions VIIfg. Partial information.
Landings information was also supplied by England and Wales for 2007. Table 9.7.3 shows the landings of various species by country for 2007 for the Celtic Sea area overall. Table 9.7.4 shows the same information for VIIfg. Since the data are regarded as incomplete, these figures represent minimum estimates of the contribution of under 10m vessels.
Table 9.7.3 Landings by under 10m vessels in 2007 by country and species in Celtic Sea overall
France E&W Ireland Spain Totalcod 67 0 67plaice 101 1.3 102.3sole 67 1.2 68.2hake 2.2 10.8 13Nephrops 0 0 7.3 7.3
Species 2003 2004 2005 2006 2007COD 61.8 17.3 18.7 9.5PLE 4.2 0.0SOL 0.9 0.1 0.1Total 66.8 17.4 18.7 9.6 0.0
Species 2003 2004 2005 2006 2007COD 124.9 17.7 19.3 11.0PLE 4.4 1.4 0.1 0.9 1.2SOL 1.0 1.6 0.5 1.1 1.3Total 130.3 20.7 19.9 13.0 2.5
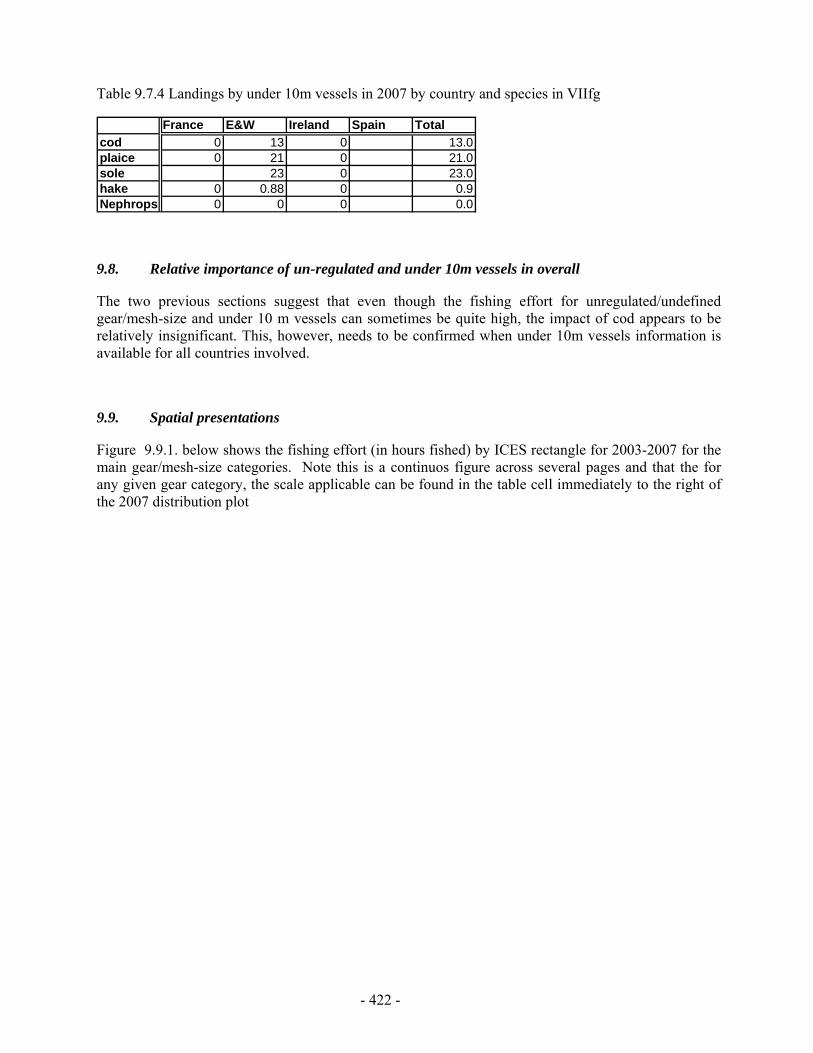
- 422 -
Table 9.7.4 Landings by under 10m vessels in 2007 by country and species in VIIfg
France E&W Ireland Spain Totalcod 0 13 0 13.0plaice 0 21 0 21.0sole 23 0 23.0hake 0 0.88 0 0.9Nephrops 0 0 0 0.0
9.8. Relative importance of un-regulated and under 10m vessels in overall
The two previous sections suggest that even though the fishing effort for unregulated/undefined gear/mesh-size and under 10 m vessels can sometimes be quite high, the impact of cod appears to be relatively insignificant. This, however, needs to be confirmed when under 10m vessels information is available for all countries involved.
9.9. Spatial presentations
Figure 9.9.1. below shows the fishing effort (in hours fished) by ICES rectangle for 2003-2007 for the main gear/mesh-size categories. Note this is a continuos figure across several pages and that the for any given gear category, the scale applicable can be found in the table cell immediately to the right of the 2007 distribution plot
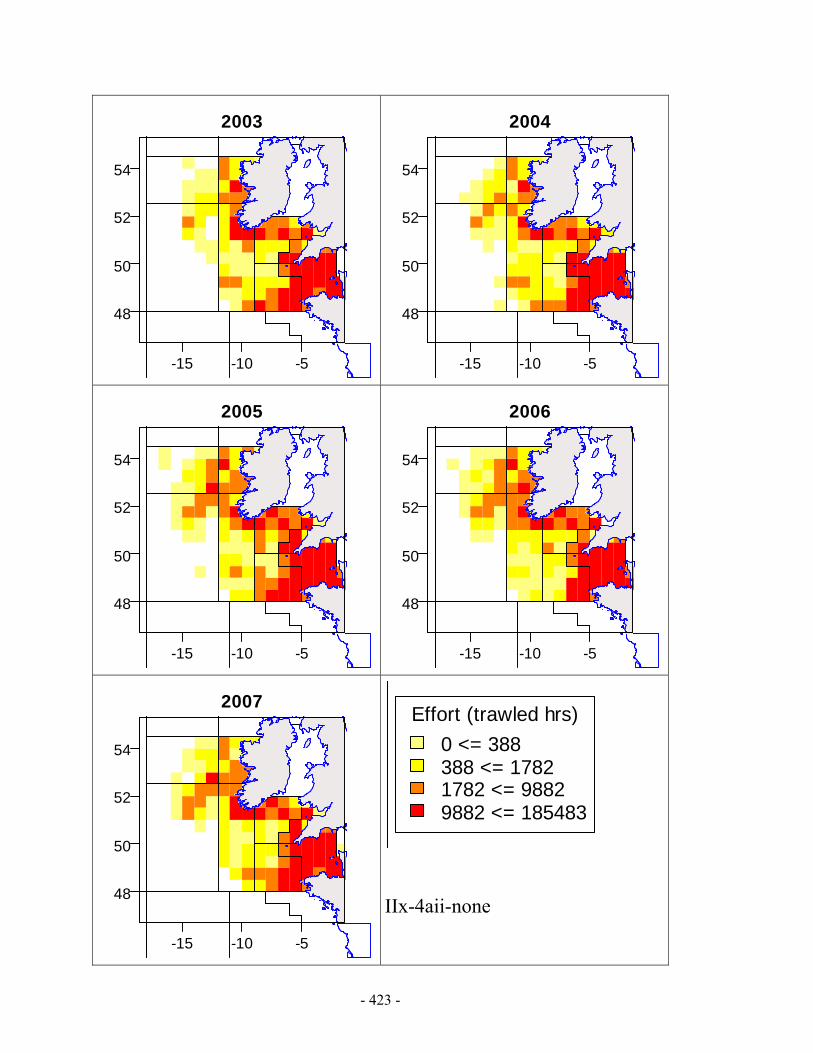
- 423 -
-15 -10 -5
48
50
52
54
2003
-15 -10 -5
48
50
52
54
2004
-15 -10 -5
48
50
52
54
2005
-15 -10 -5
48
50
52
54
2006
-15 -10 -5
48
50
52
54
2007
Effort (trawled hrs)0 <= 388388 <= 17821782 <= 98829882 <= 185483
IIx-4aii-none
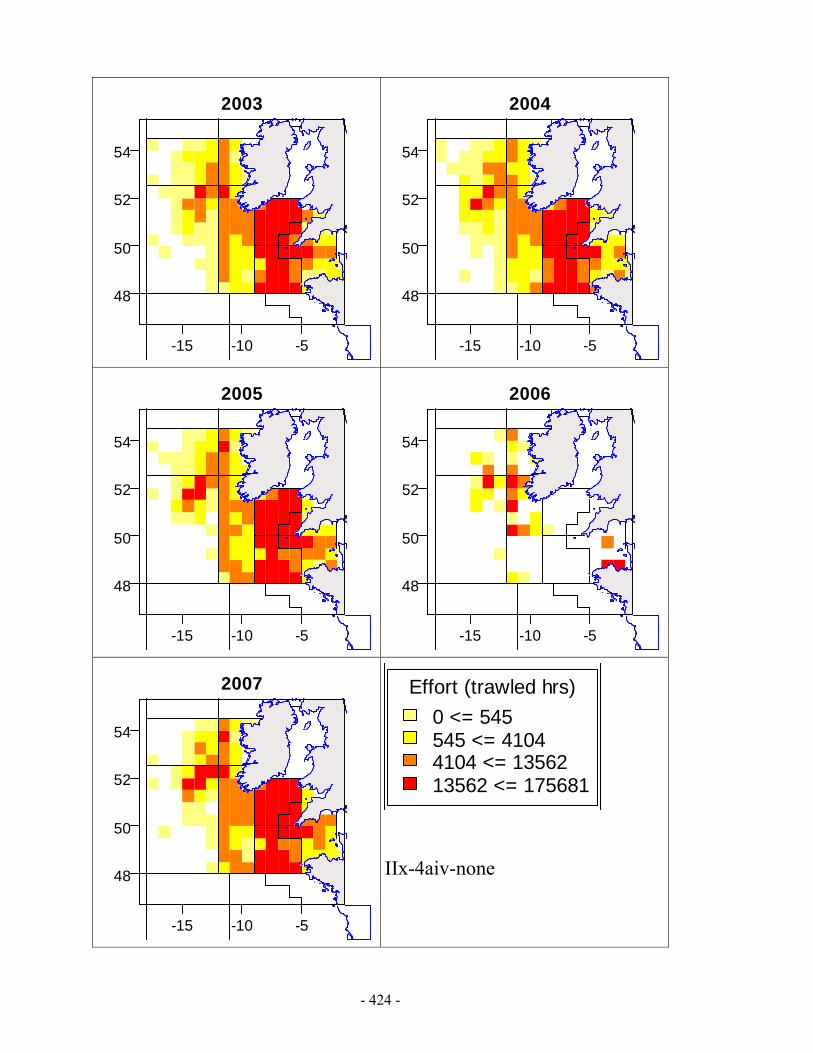
- 424 -
-15 -10 -5
48
50
52
54
2003
-15 -10 -5
48
50
52
54
2004
-15 -10 -5
48
50
52
54
2005
-15 -10 -5
48
50
52
54
2006
-15 -10 -5
48
50
52
54
2007
Effort (trawled hrs)0 <= 545545 <= 41044104 <= 1356213562 <= 175681
IIx-4aiv-none

- 425 -
-15 -10 -5
48
50
52
54
2003
-15 -10 -5
48
50
52
54
2004
-15 -10 -5
48
50
52
54
2005
-15 -10 -5
48
50
52
54
2006
-15 -10 -5
48
50
52
54
2007
Effort (trawled hrs)0 <= 469469 <= 38293829 <= 1133611336 <= 57177
IIx-4bi-none

- 426 -
-15 -10 -5
48
50
52
54
2003
-15 -10 -5
48
50
52
54
2004
-15 -10 -5
48
50
52
54
2005
-15 -10 -5
48
50
52
54
2006
-15 -10 -5
48
50
52
54
2007
Effort (trawled hrs)0 <= 108108 <= 656656 <= 28502850 <= 122708
IIx-4cii-none
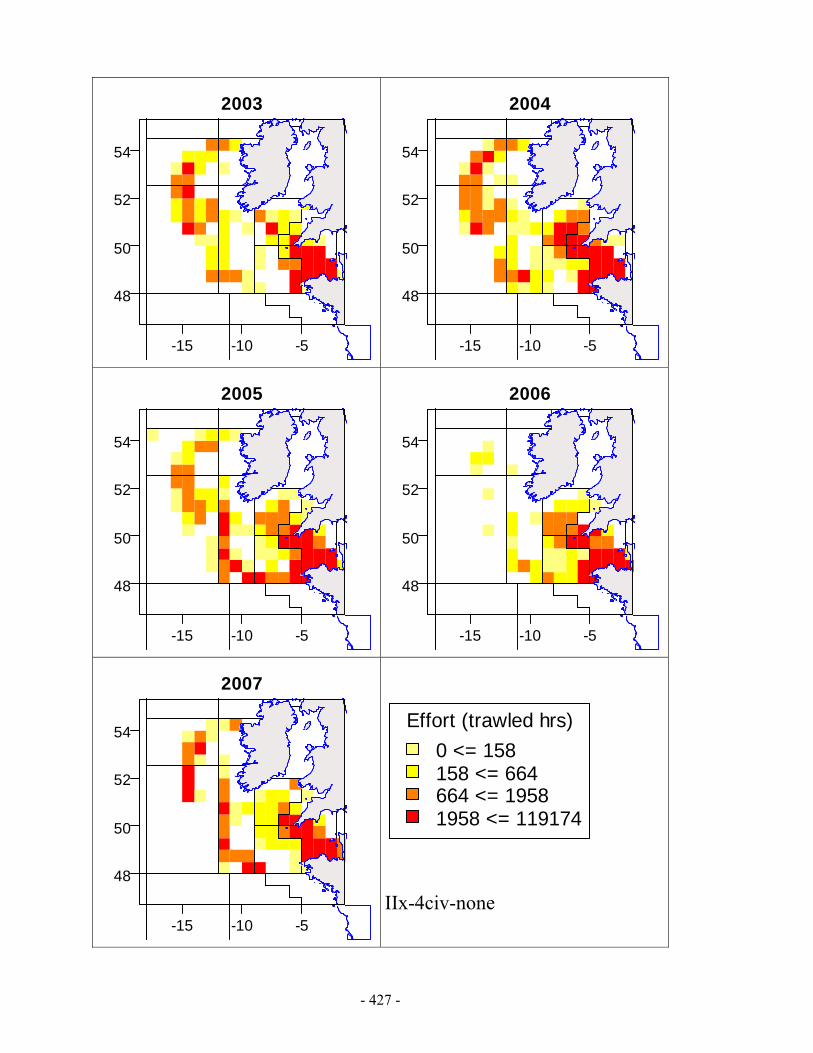
- 427 -
-15 -10 -5
48
50
52
54
2003
-15 -10 -5
48
50
52
54
2004
-15 -10 -5
48
50
52
54
2005
-15 -10 -5
48
50
52
54
2006
-15 -10 -5
48
50
52
54
2007
Effort (trawled hrs)0 <= 158158 <= 664664 <= 19581958 <= 119174
IIx-4civ-none
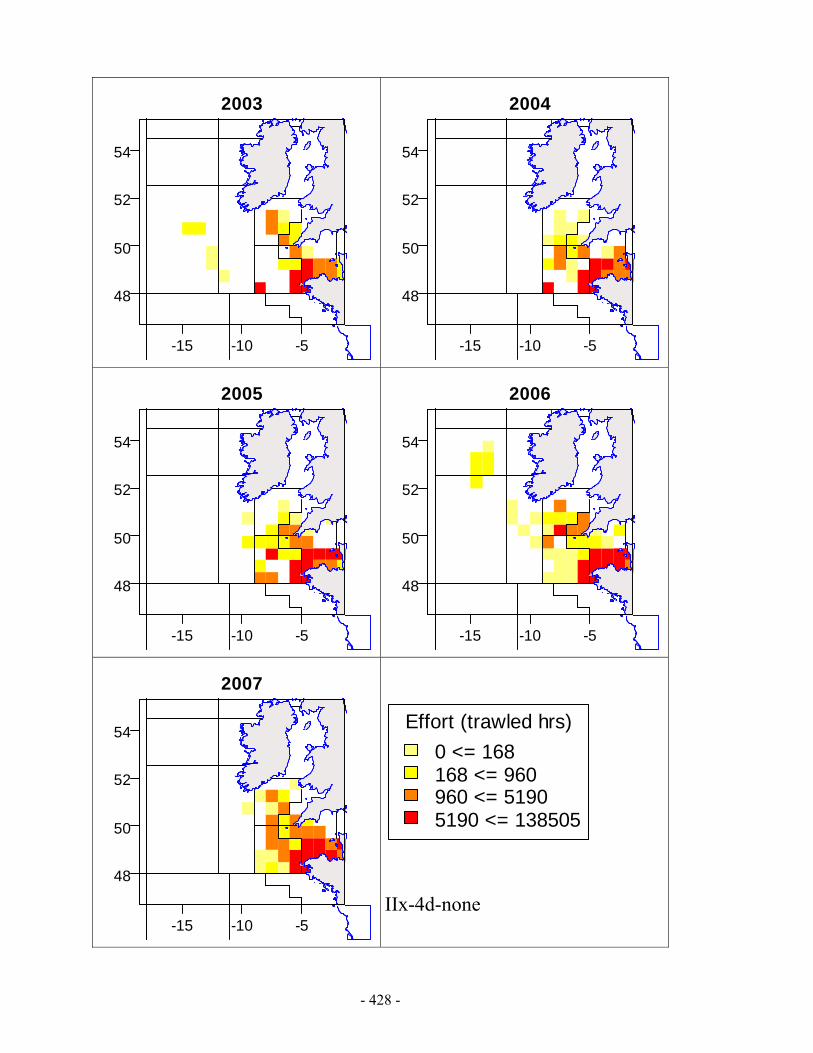
- 428 -
-15 -10 -5
48
50
52
54
2003
-15 -10 -5
48
50
52
54
2004
-15 -10 -5
48
50
52
54
2005
-15 -10 -5
48
50
52
54
2006
-15 -10 -5
48
50
52
54
2007
Effort (trawled hrs)0 <= 168168 <= 960960 <= 51905190 <= 138505
IIx-4d-none

- 429 -
-15 -10 -5
48
50
52
54
2003
-15 -10 -5
48
50
52
54
2004
-15 -10 -5
48
50
52
54
2005
-15 -10 -5
48
50
52
54
2006
-15 -10 -5
48
50
52
54
2007
Effort (trawled hrs)12 <= 7575 <= 324324 <= 984984 <= 27443
IIx-4e-none
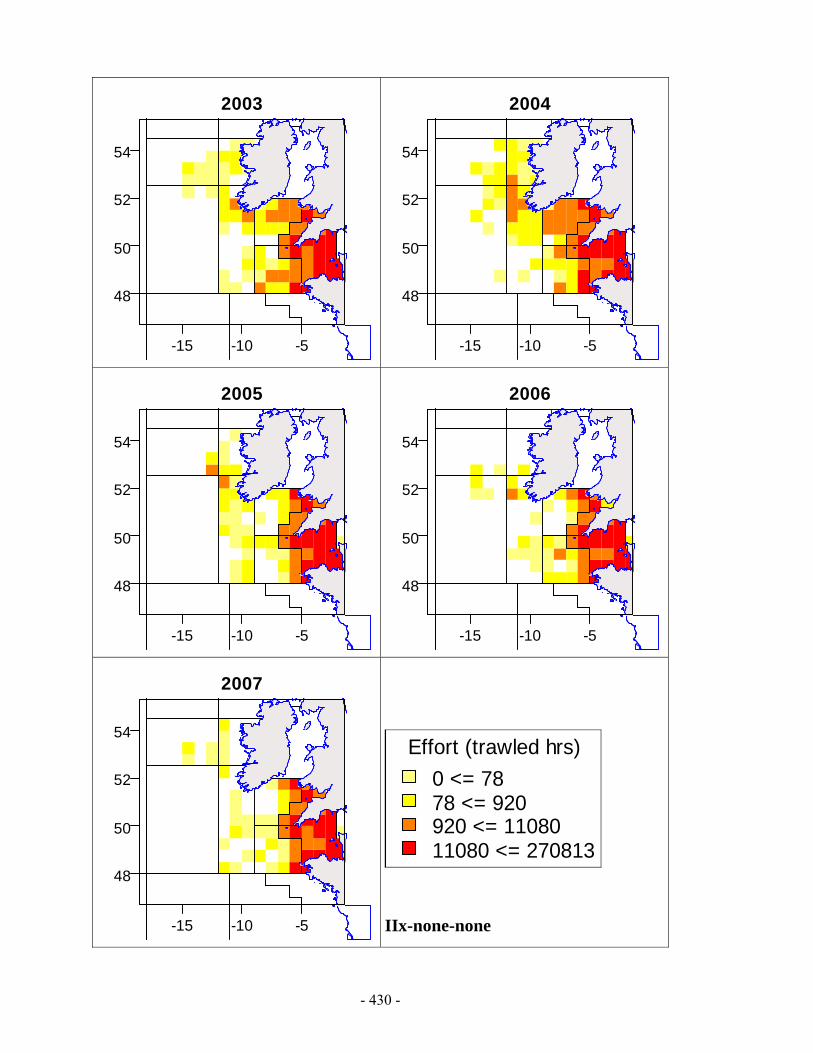
- 430 -
-15 -10 -5
48
50
52
54
2003
-15 -10 -5
48
50
52
54
2004
-15 -10 -5
48
50
52
54
2005
-15 -10 -5
48
50
52
54
2006
-15 -10 -5
48
50
52
54
2007
Effort (trawled hrs)0 <= 7878 <= 920920 <= 1108011080 <= 270813
IIx-none-none
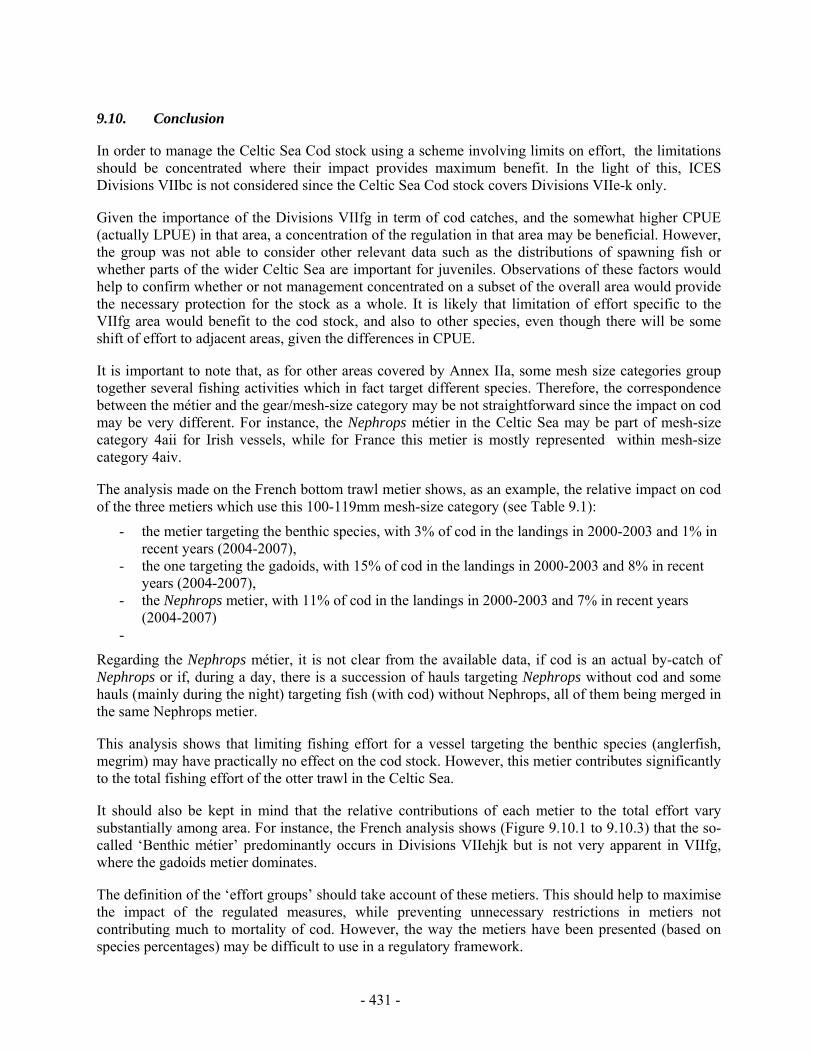
- 431 -
9.10. Conclusion
In order to manage the Celtic Sea Cod stock using a scheme involving limits on effort, the limitations should be concentrated where their impact provides maximum benefit. In the light of this, ICES Divisions VIIbc is not considered since the Celtic Sea Cod stock covers Divisions VIIe-k only.
Given the importance of the Divisions VIIfg in term of cod catches, and the somewhat higher CPUE (actually LPUE) in that area, a concentration of the regulation in that area may be beneficial. However, the group was not able to consider other relevant data such as the distributions of spawning fish or whether parts of the wider Celtic Sea are important for juveniles. Observations of these factors would help to confirm whether or not management concentrated on a subset of the overall area would provide the necessary protection for the stock as a whole. It is likely that limitation of effort specific to the VIIfg area would benefit to the cod stock, and also to other species, even though there will be some shift of effort to adjacent areas, given the differences in CPUE.
It is important to note that, as for other areas covered by Annex IIa, some mesh size categories group together several fishing activities which in fact target different species. Therefore, the correspondence between the métier and the gear/mesh-size category may be not straightforward since the impact on cod may be very different. For instance, the Nephrops métier in the Celtic Sea may be part of mesh-size category 4aii for Irish vessels, while for France this metier is mostly represented within mesh-size category 4aiv.
The analysis made on the French bottom trawl metier shows, as an example, the relative impact on cod of the three metiers which use this 100-119mm mesh-size category (see Table 9.1):
- the metier targeting the benthic species, with 3% of cod in the landings in 2000-2003 and 1% in recent years (2004-2007),
- the one targeting the gadoids, with 15% of cod in the landings in 2000-2003 and 8% in recent years (2004-2007),
- the Nephrops metier, with 11% of cod in the landings in 2000-2003 and 7% in recent years (2004-2007)
-
Regarding the Nephrops métier, it is not clear from the available data, if cod is an actual by-catch of Nephrops or if, during a day, there is a succession of hauls targeting Nephrops without cod and some hauls (mainly during the night) targeting fish (with cod) without Nephrops, all of them being merged in the same Nephrops metier.
This analysis shows that limiting fishing effort for a vessel targeting the benthic species (anglerfish, megrim) may have practically no effect on the cod stock. However, this metier contributes significantly to the total fishing effort of the otter trawl in the Celtic Sea.
It should also be kept in mind that the relative contributions of each metier to the total effort vary substantially among area. For instance, the French analysis shows (Figure 9.10.1 to 9.10.3) that the so-called ‘Benthic métier’ predominantly occurs in Divisions VIIehjk but is not very apparent in VIIfg, where the gadoids metier dominates.
The definition of the ‘effort groups’ should take account of these metiers. This should help to maximise the impact of the regulated measures, while preventing unnecessary restrictions in metiers not contributing much to mortality of cod. However, the way the metiers have been presented (based on species percentages) may be difficult to use in a regulatory framework.
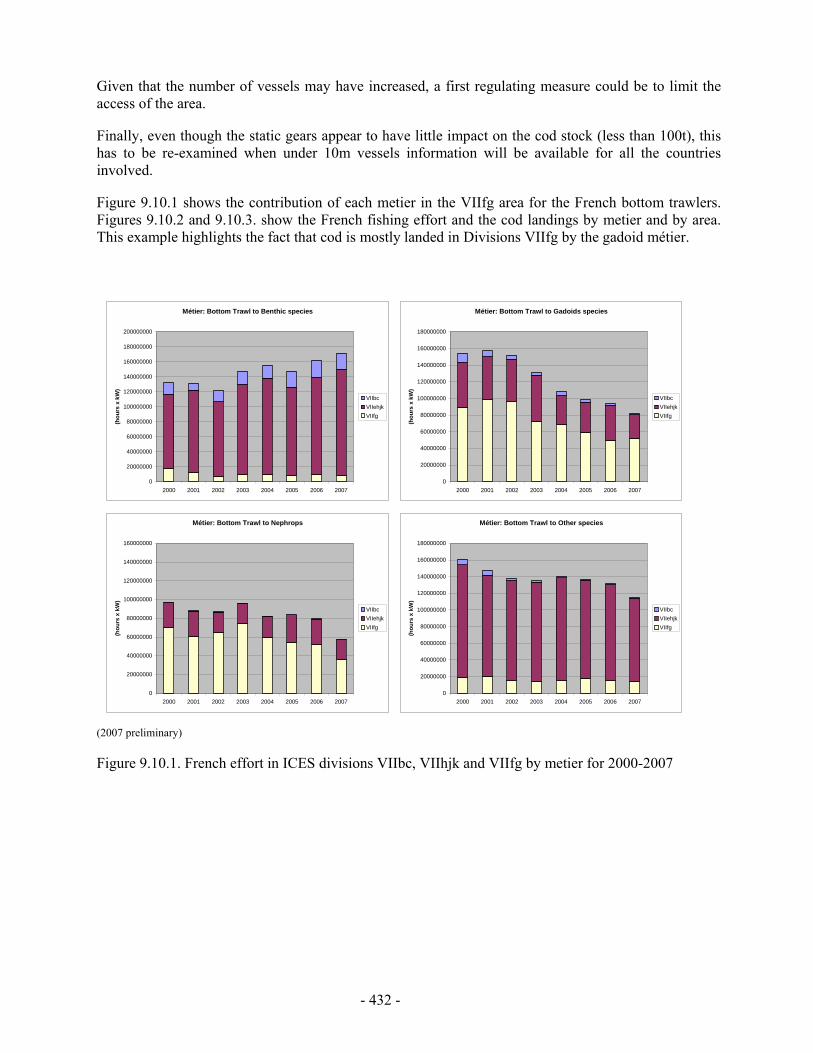
- 432 -
Given that the number of vessels may have increased, a first regulating measure could be to limit the access of the area.
Finally, even though the static gears appear to have little impact on the cod stock (less than 100t), this has to be re-examined when under 10m vessels information will be available for all the countries involved.
Figure 9.10.1 shows the contribution of each metier in the VIIfg area for the French bottom trawlers. Figures 9.10.2 and 9.10.3. show the French fishing effort and the cod landings by metier and by area. This example highlights the fact that cod is mostly landed in Divisions VIIfg by the gadoid métier.
(2007 preliminary)
Figure 9.10.1. French effort in ICES divisions VIIbc, VIIhjk and VIIfg by metier for 2000-2007
Métier: Bottom Trawl to Benthic species
0
20000000
40000000
60000000
80000000
100000000
120000000
140000000
160000000
180000000
200000000
2000 2001 2002 2003 2004 2005 2006 2007
(hou
rs x
kW
)
VIIbcVIIehjkVIIfg
Métier: Bottom Trawl to Gadoids species
0
20000000
40000000
60000000
80000000
100000000
120000000
140000000
160000000
180000000
2000 2001 2002 2003 2004 2005 2006 2007
(hou
rs x
kW
)
VIIbcVIIehjkVIIfg
Métier: Bottom Trawl to Nephrops
0
20000000
40000000
60000000
80000000
100000000
120000000
140000000
160000000
2000 2001 2002 2003 2004 2005 2006 2007
(hou
rs x
kW
)
VIIbcVIIehjkVIIfg
Métier: Bottom Trawl to Other species
0
20000000
40000000
60000000
80000000
100000000
120000000
140000000
160000000
180000000
2000 2001 2002 2003 2004 2005 2006 2007
(hou
rs x
kW
)
VIIbcVIIehjkVIIfg
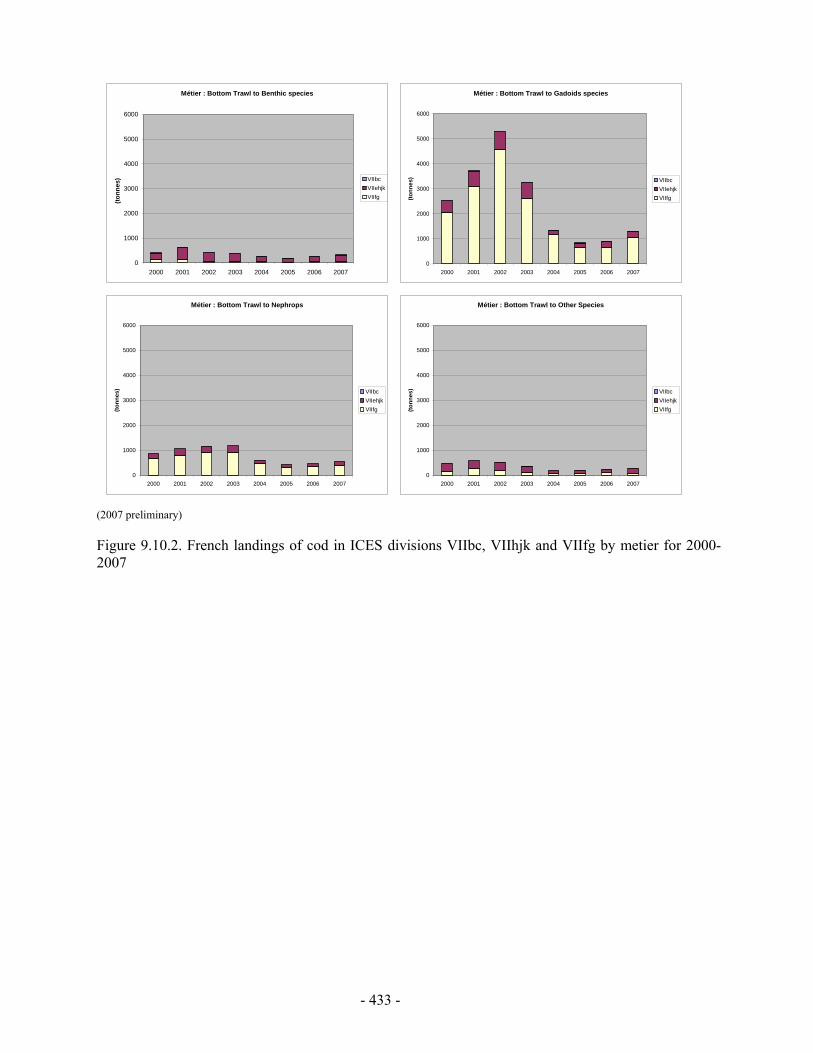
- 433 -
(2007 preliminary)
Figure 9.10.2. French landings of cod in ICES divisions VIIbc, VIIhjk and VIIfg by metier for 2000-2007
Métier : Bottom Trawl to Benthic species
0
1000
2000
3000
4000
5000
6000
2000 2001 2002 2003 2004 2005 2006 2007
(tonn
es) VIIbc
VIIehjkVIIfg
Métier : Bottom Trawl to Gadoids species
0
1000
2000
3000
4000
5000
6000
2000 2001 2002 2003 2004 2005 2006 2007
(tonn
es) VIIbc
VIIehjkVIIfg
Métier : Bottom Trawl to Nephrops
0
1000
2000
3000
4000
5000
6000
2000 2001 2002 2003 2004 2005 2006 2007
(tonn
es) VIIbc
VIIehjkVIIfg
Métier : Bottom Trawl to Other Species
0
1000
2000
3000
4000
5000
6000
2000 2001 2002 2003 2004 2005 2006 2007
(tonn
es) VIIbc
VIIehjkVIIfg
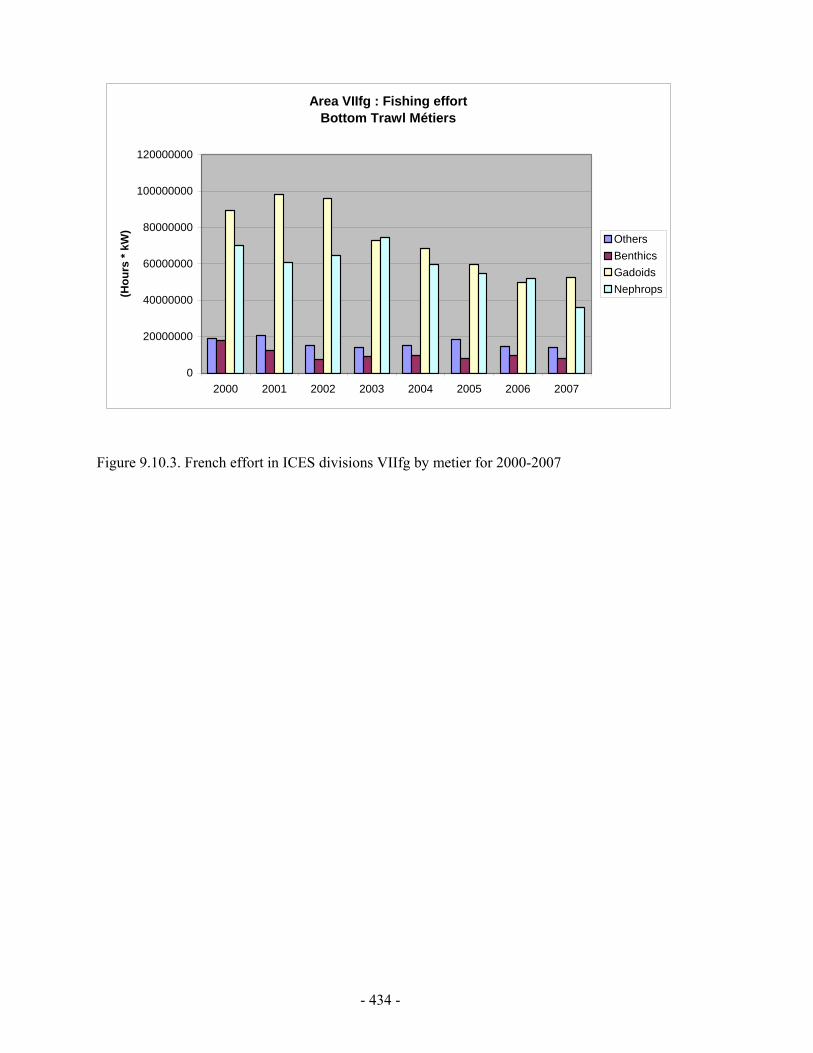
- 434 -
Figure 9.10.3. French effort in ICES divisions VIIfg by metier for 2000-2007
Area VIIfg : Fishing effortBottom Trawl Métiers
0
20000000
40000000
60000000
80000000
100000000
120000000
2000 2001 2002 2003 2004 2005 2006 2007
(Hou
rs *
kW)
OthersBenthicsGadoidsNephrops
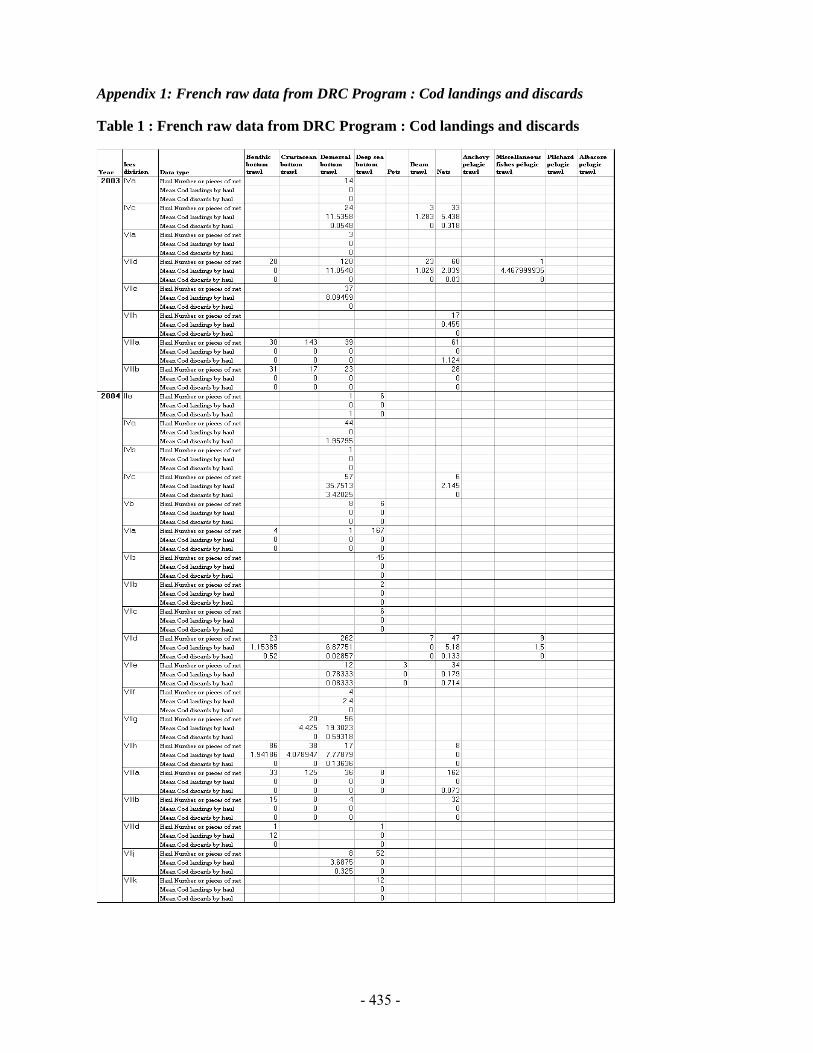
- 435 -
Appendix 1: French raw data from DRC Program : Cod landings and discards
Table 1 : French raw data from DRC Program : Cod landings and discards

- 436 -
Table 1 : French raw data from DRC Program : Cod landings and discards (continued)
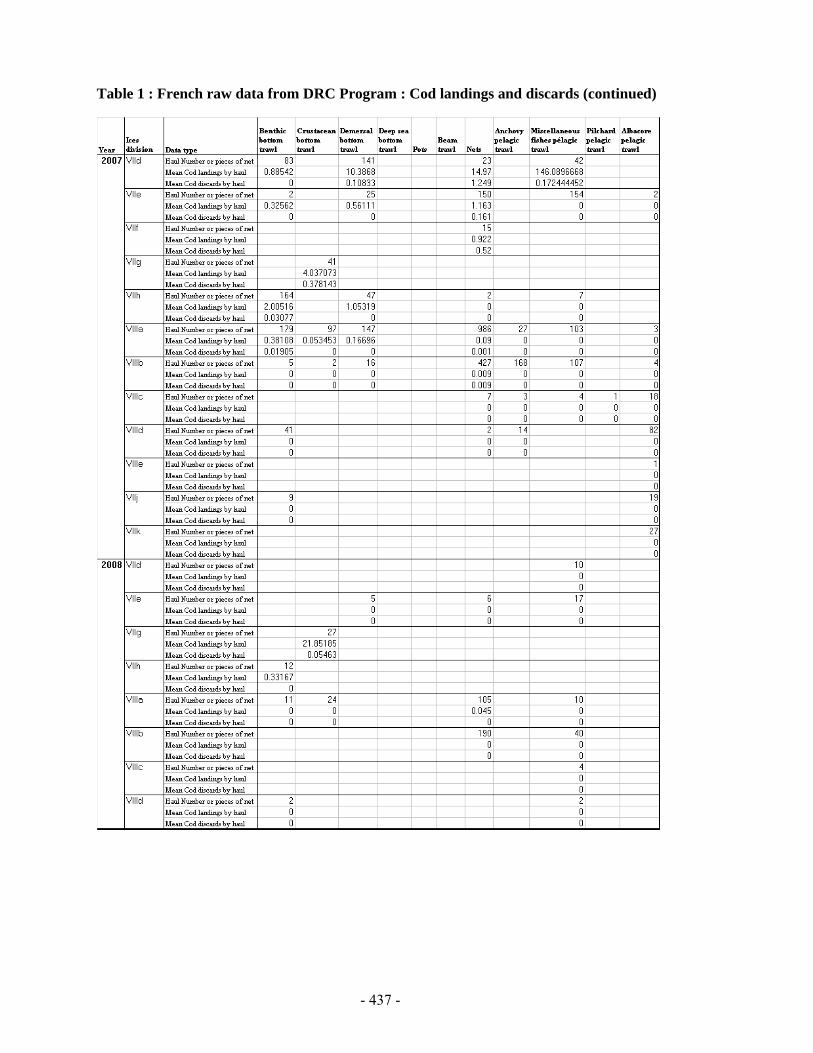
- 437 -
Table 1 : French raw data from DRC Program : Cod landings and discards (continued)

- 438 -
Figure 1 French raw data from DRC Program
Cod landings and discards

- 439 -
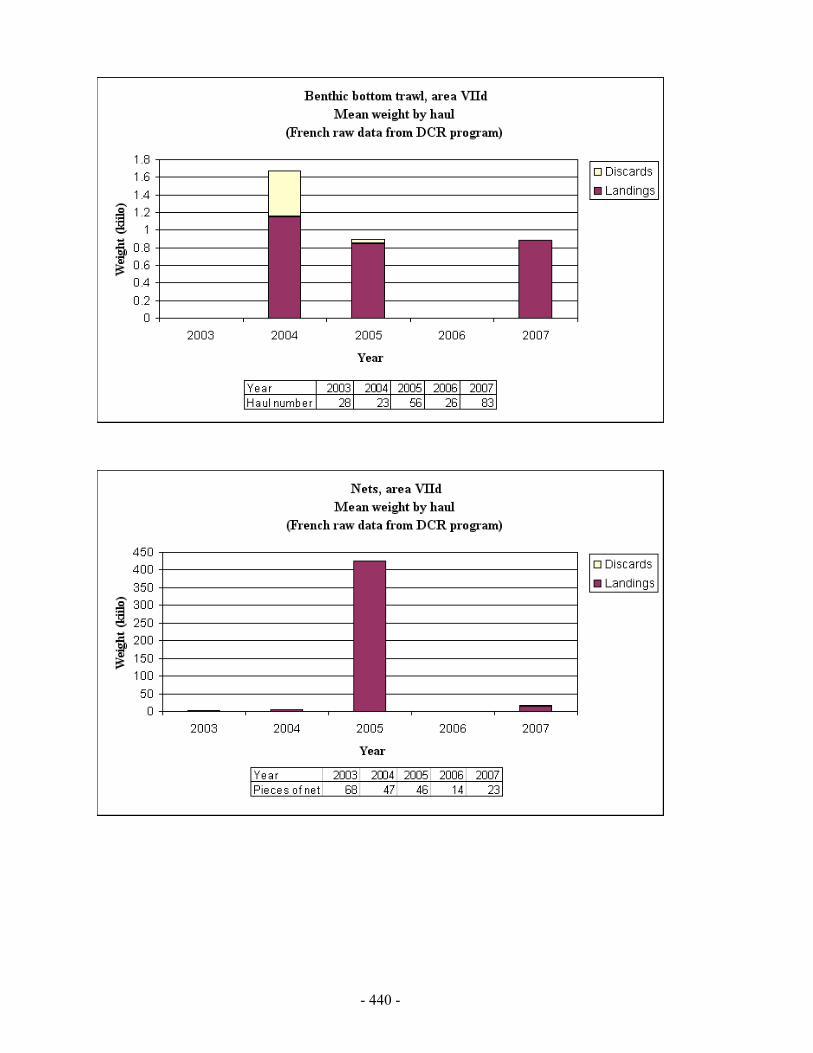
- 440 -
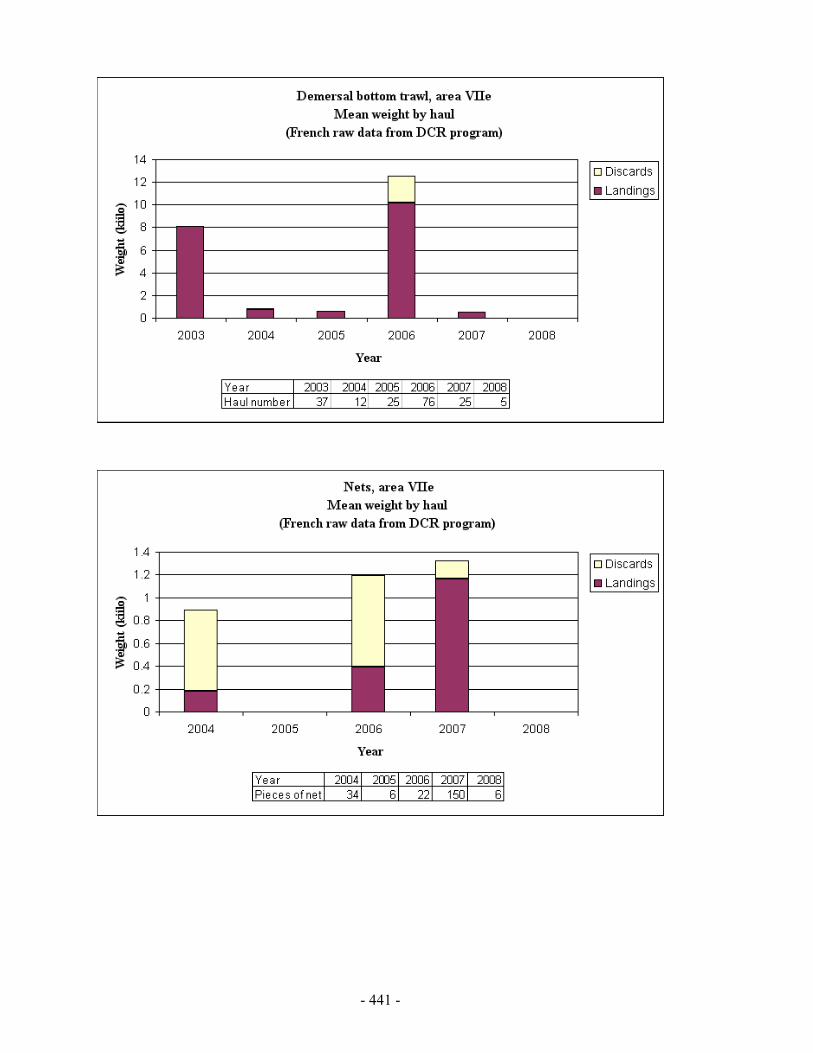
- 441 -
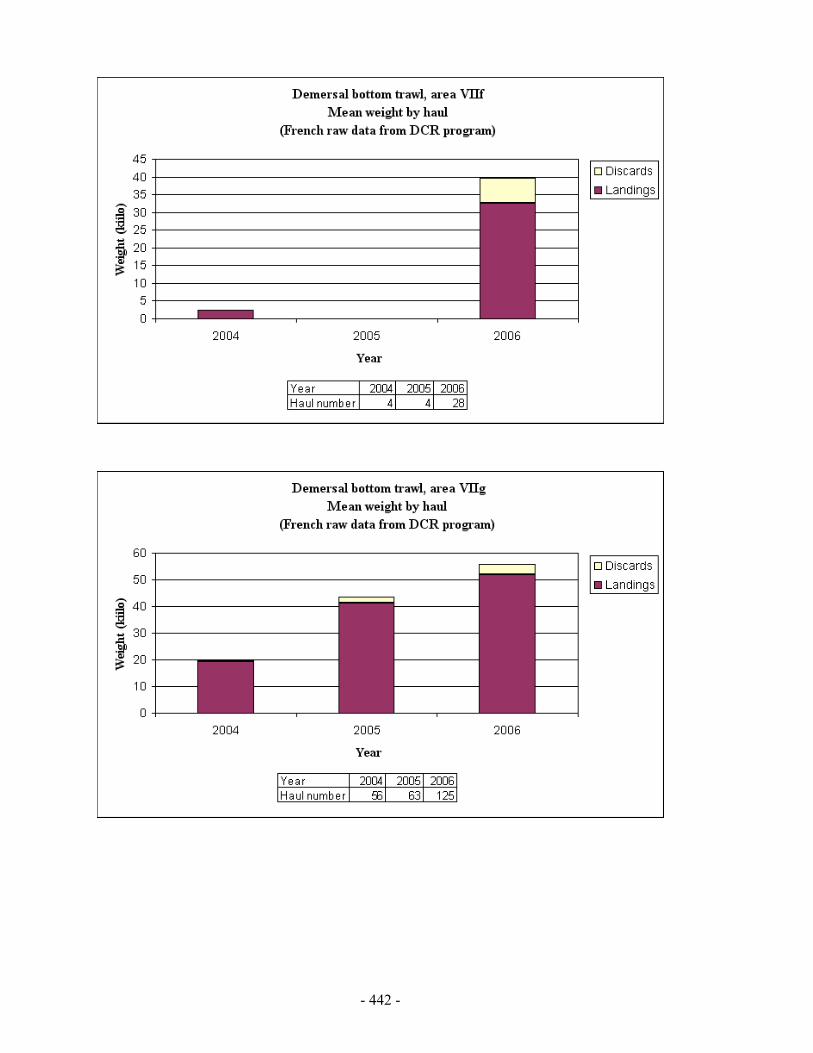
- 442 -
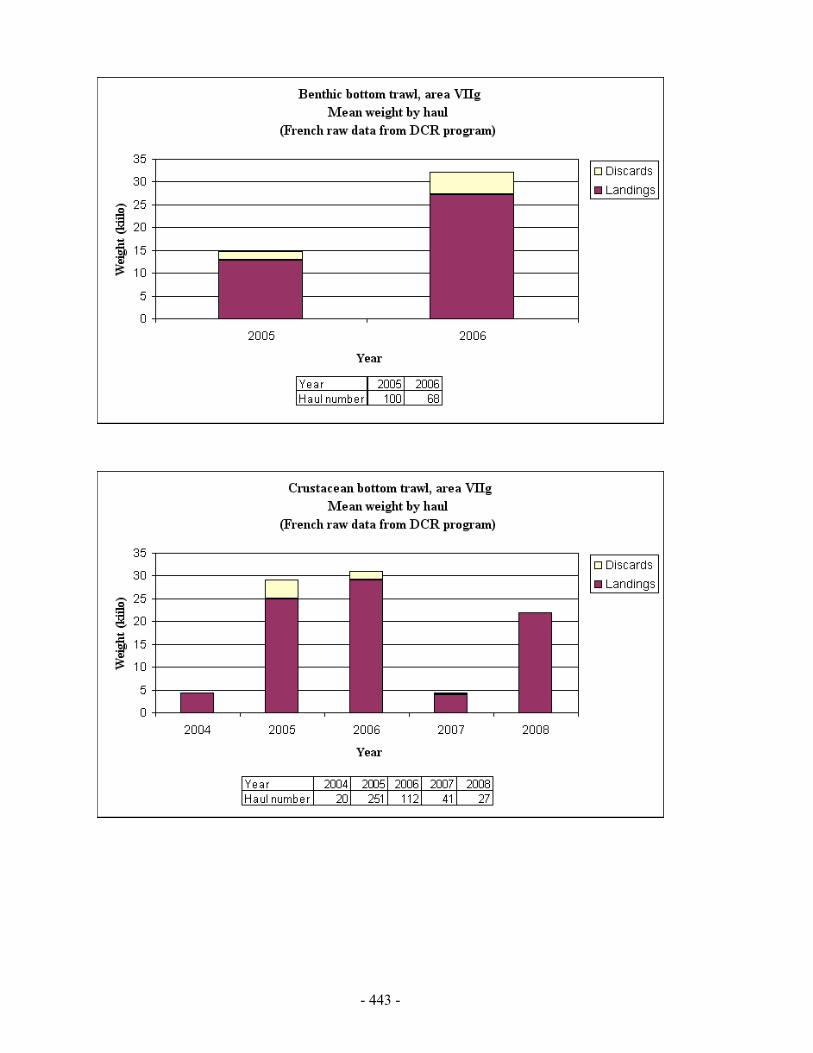
- 443 -

- 444 -
Demersal bottom trawl, area VIIhMean weight by haul
(French raw data from DCR program)
0123456789
2004 2006 2007
Year
Wei
ght (
kiilo
)
DiscardsLandings
Year 2004 2006 2007Haul number 17 3 47
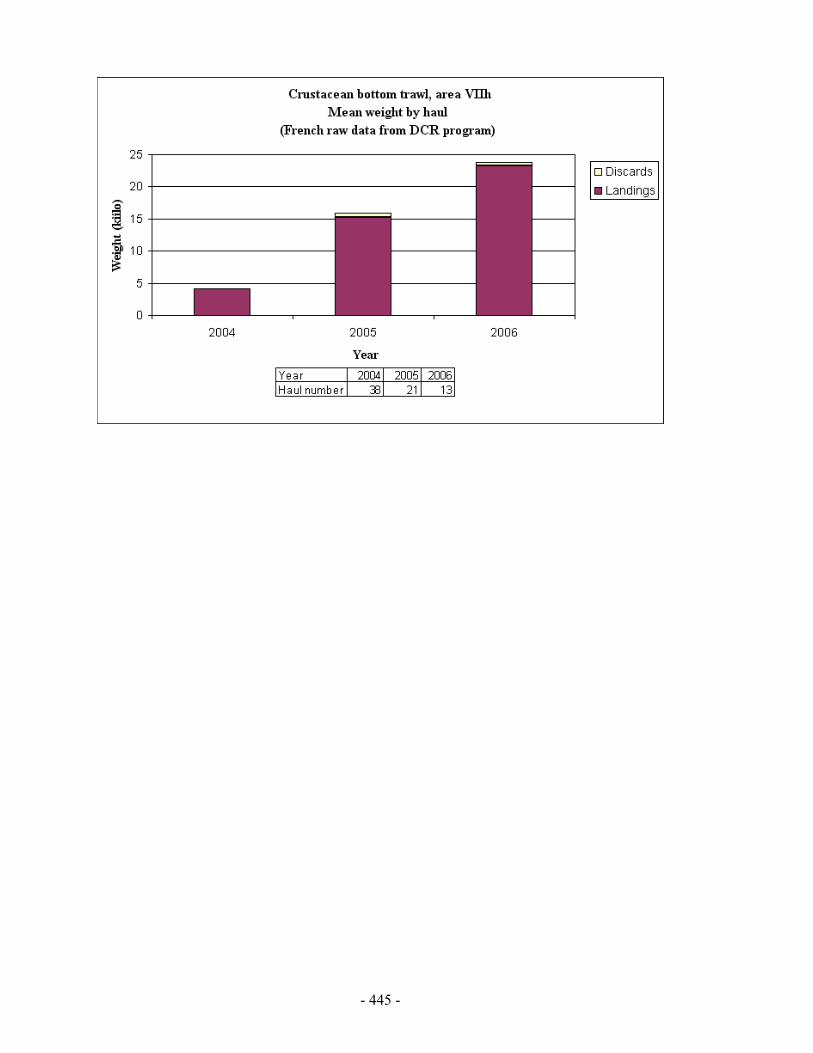
- 445 -
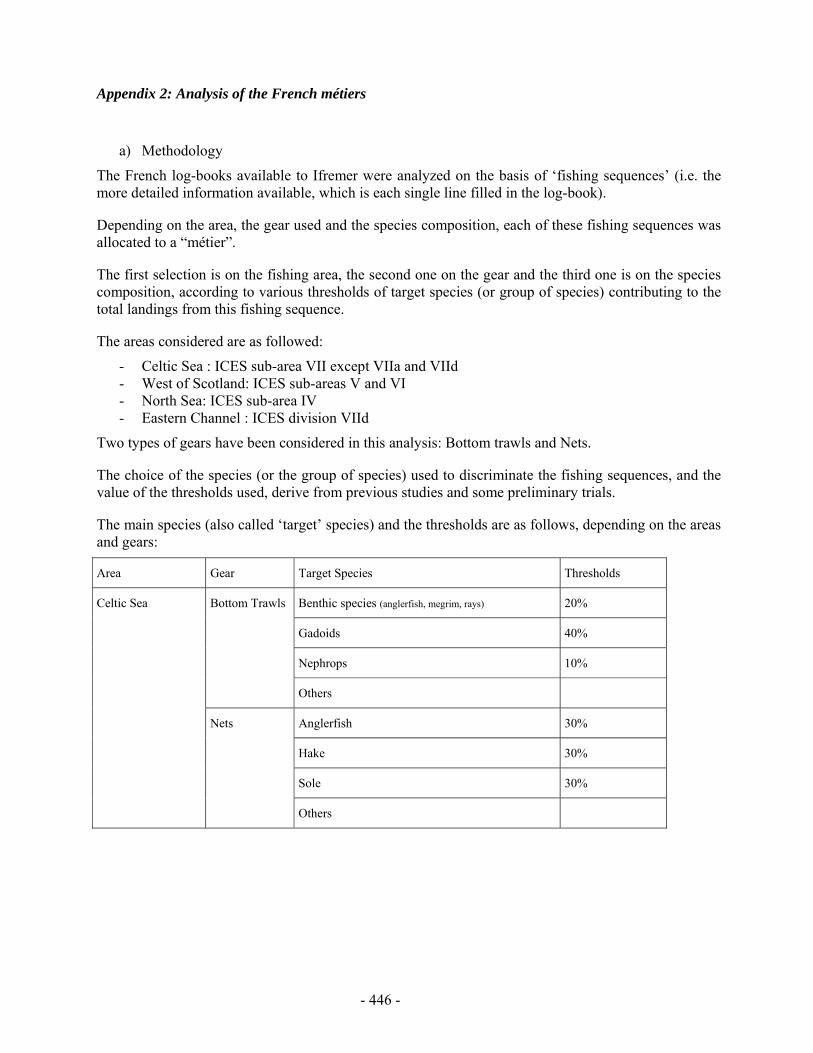
- 446 -
Appendix 2: Analysis of the French métiers
a) Methodology
The French log-books available to Ifremer were analyzed on the basis of ‘fishing sequences’ (i.e. the more detailed information available, which is each single line filled in the log-book).
Depending on the area, the gear used and the species composition, each of these fishing sequences was allocated to a “métier”.
The first selection is on the fishing area, the second one on the gear and the third one is on the species composition, according to various thresholds of target species (or group of species) contributing to the total landings from this fishing sequence.
The areas considered are as followed:
- Celtic Sea : ICES sub-area VII except VIIa and VIId - West of Scotland: ICES sub-areas V and VI - North Sea: ICES sub-area IV - Eastern Channel : ICES division VIId
Two types of gears have been considered in this analysis: Bottom trawls and Nets.
The choice of the species (or the group of species) used to discriminate the fishing sequences, and the value of the thresholds used, derive from previous studies and some preliminary trials.
The main species (also called ‘target’ species) and the thresholds are as follows, depending on the areas and gears:
Area Gear Target Species Thresholds
Celtic Sea Bottom Trawls Benthic species (anglerfish, megrim, rays) 20%
Gadoids 40%
Nephrops 10%
Others
Nets Anglerfish 30%
Hake 30%
Sole 30%
Others
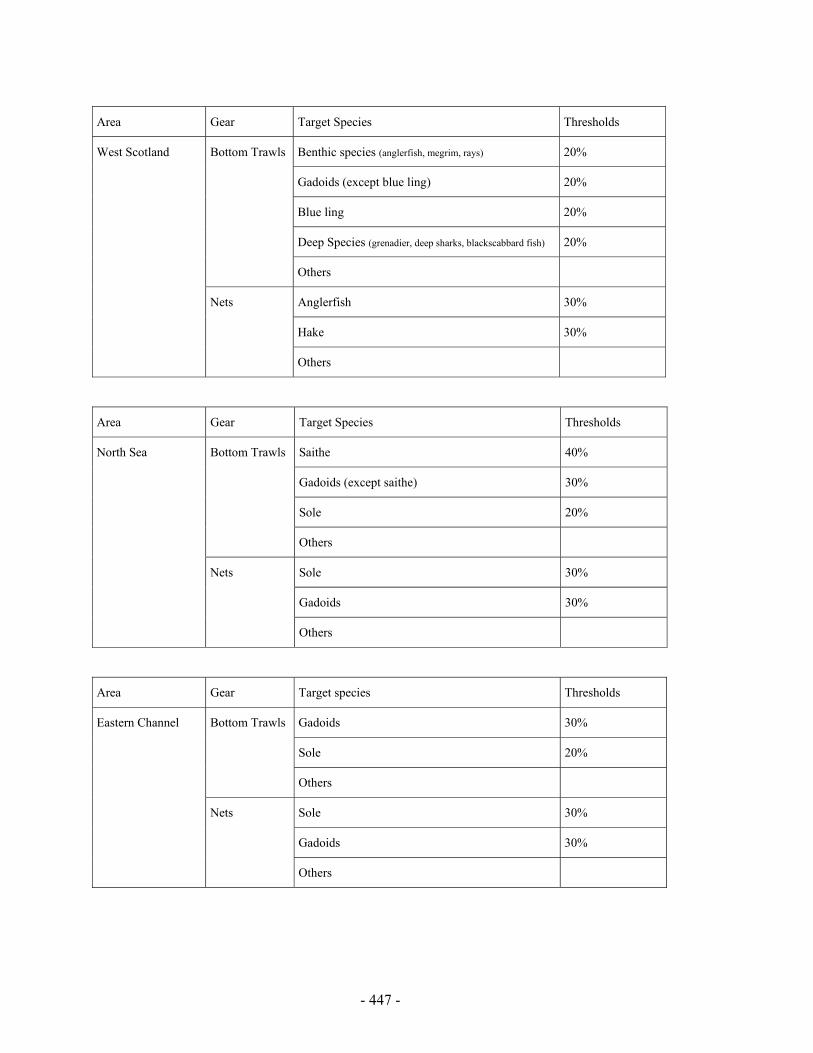
- 447 -
Area Gear Target Species Thresholds
West Scotland Bottom Trawls Benthic species (anglerfish, megrim, rays) 20%
Gadoids (except blue ling) 20%
Blue ling 20%
Deep Species (grenadier, deep sharks, blackscabbard fish) 20%
Others
Nets Anglerfish 30%
Hake 30%
Others
Area Gear Target Species Thresholds
North Sea Bottom Trawls Saithe 40%
Gadoids (except saithe) 30%
Sole 20%
Others
Nets Sole 30%
Gadoids 30%
Others
Area Gear Target species Thresholds
Eastern Channel Bottom Trawls Gadoids 30%
Sole 20%
Others
Nets Sole 30%
Gadoids 30%
Others
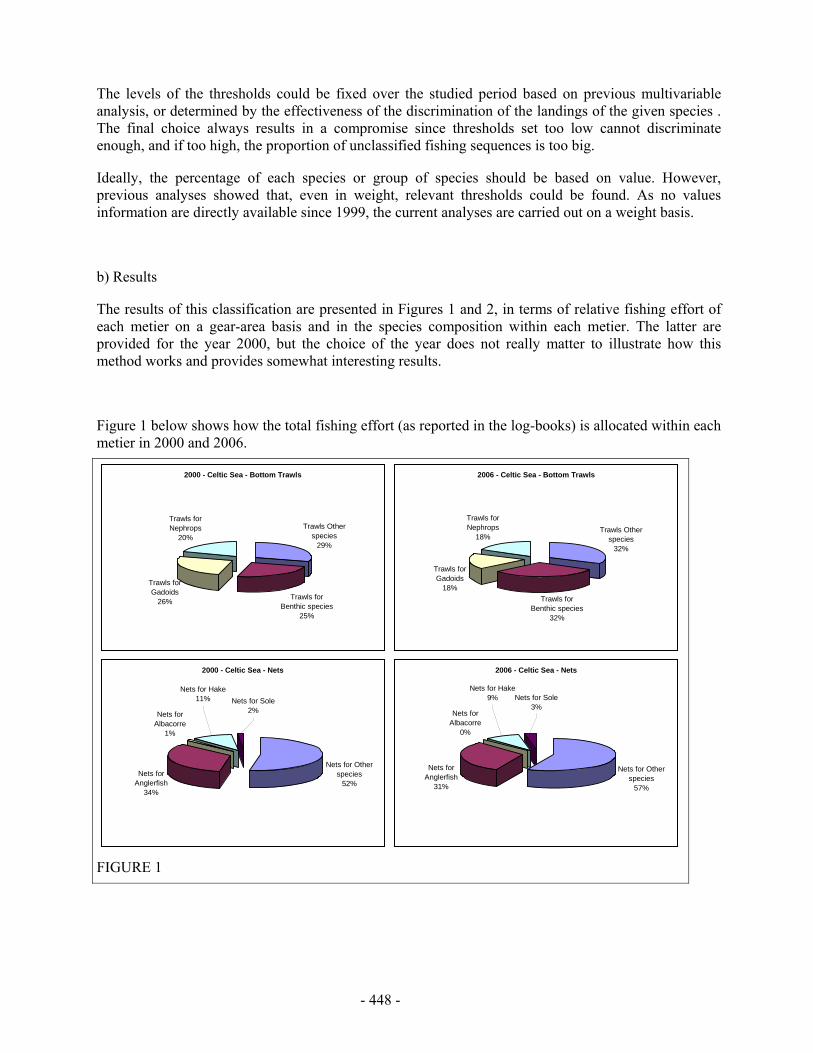
- 448 -
The levels of the thresholds could be fixed over the studied period based on previous multivariable analysis, or determined by the effectiveness of the discrimination of the landings of the given species . The final choice always results in a compromise since thresholds set too low cannot discriminate enough, and if too high, the proportion of unclassified fishing sequences is too big.
Ideally, the percentage of each species or group of species should be based on value. However, previous analyses showed that, even in weight, relevant thresholds could be found. As no values information are directly available since 1999, the current analyses are carried out on a weight basis.
b) Results
The results of this classification are presented in Figures 1 and 2, in terms of relative fishing effort of each metier on a gear-area basis and in the species composition within each metier. The latter are provided for the year 2000, but the choice of the year does not really matter to illustrate how this method works and provides somewhat interesting results.
Figure 1 below shows how the total fishing effort (as reported in the log-books) is allocated within each metier in 2000 and 2006.
FIGURE 1
2000 - Celtic Sea - Bottom Trawls
Trawls Other species
29%
Trawls for Benthic species
25%
Trawls for Gadoids
26%
Trawls for Nephrops
20%
2006 - Celtic Sea - Bottom Trawls
Trawls Other species
32%
Trawls for Benthic species
32%
Trawls for Gadoids
18%
Trawls for Nephrops
18%
2000 - Celtic Sea - Nets
Nets for Other species
52%Nets for
Anglerfish34%
Nets for Albacorre
1%
Nets for Hake11% Nets for Sole
2%
2006 - Celtic Sea - Nets
Nets for Other species
57%
Nets for Anglerfish
31%
Nets for Albacorre
0%
Nets for Sole3%
Nets for Hake9%
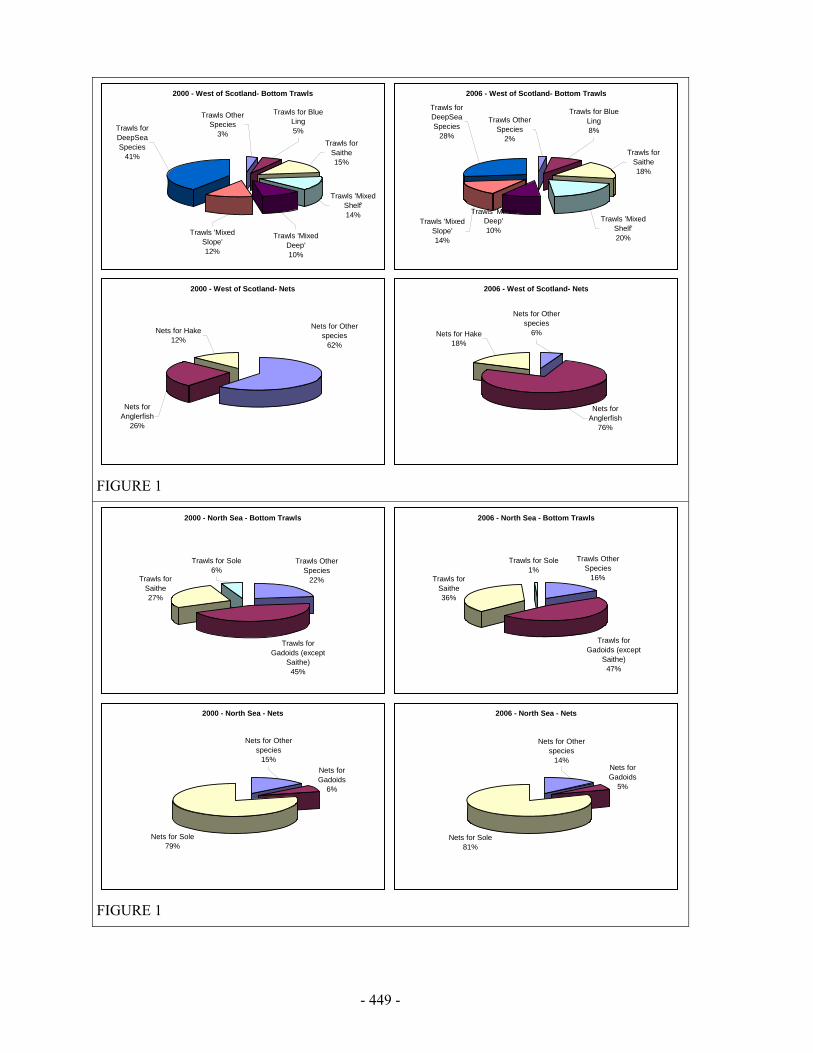
- 449 -
FIGURE 1
FIGURE 1
2000 - West of Scotland- Bottom Trawls
Trawls 'Mixed Slope'12%
Trawls 'Mixed Shelf'14%
Trawls for Saithe15%
Trawls 'Mixed Deep'10%
Trawls for Blue Ling5%
Trawls Other Species
3%Trawls for DeepSea Species
41%
2006 - West of Scotland- Bottom Trawls
Trawls for DeepSea Species
28%
Trawls Other Species
2%
Trawls for Blue Ling8%
Trawls 'Mixed Deep'10%
Trawls for Saithe18%
Trawls 'Mixed Shelf'20%
Trawls 'Mixed Slope'14%
2000 - West of Scotland- Nets
Nets for Other species
62%
Nets for Anglerfish
26%
Nets for Hake12%
2006 - West of Scotland- Nets
Nets for Hake18%
Nets for Anglerfish
76%
Nets for Other species
6%
2000 - North Sea - Bottom Trawls
Trawls Other Species
22%
Trawls for Gadoids (except
Saithe)45%
Trawls for Saithe27%
Trawls for Sole6%
2006 - North Sea - Bottom Trawls
Trawls Other Species
16%
Trawls for Gadoids (except
Saithe)47%
Trawls for Saithe36%
Trawls for Sole1%
2000 - North Sea - Nets
Nets for Gadoids
6%
Nets for Sole79%
Nets for Other species
15%
2006 - North Sea - Nets
Nets for Gadoids
5%
Nets for Sole81%
Nets for Other species
14%
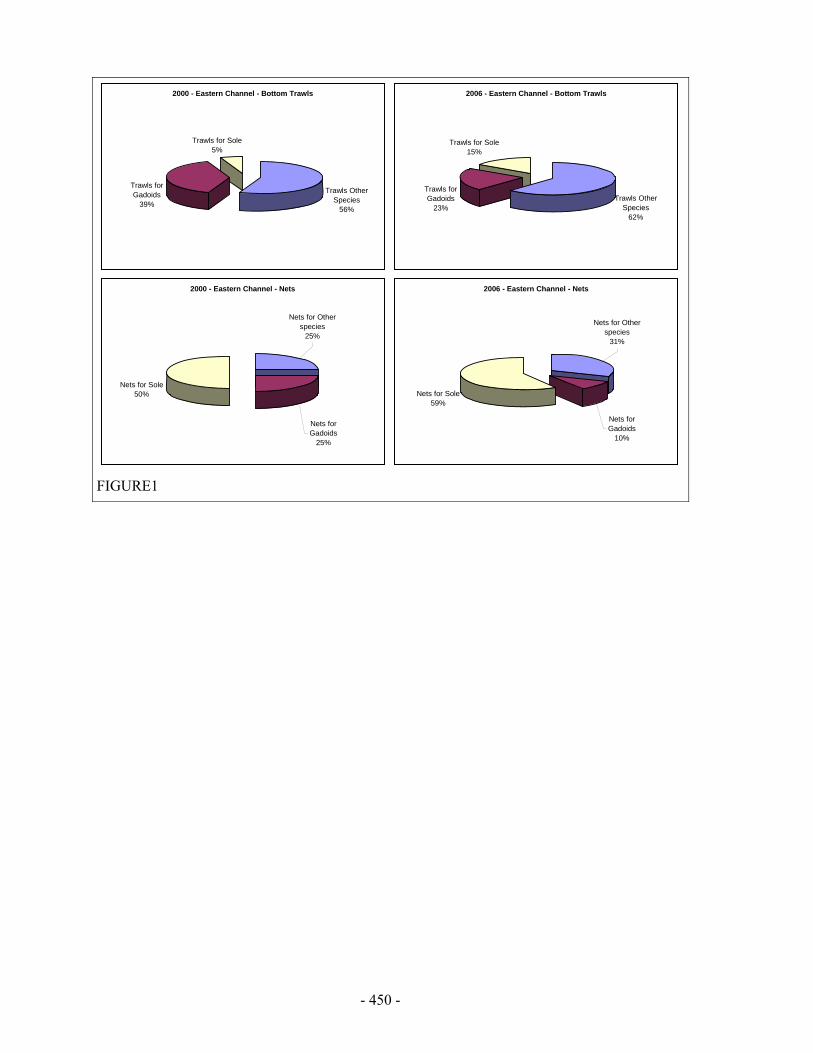
- 450 -
FIGURE1
2000 - Eastern Channel - Bottom Trawls
Trawls Other Species
56%
Trawls for Gadoids
39%
Trawls for Sole5%
2006 - Eastern Channel - Bottom Trawls
Trawls Other Species
62%
Trawls for Gadoids
23%
Trawls for Sole15%
2000 - Eastern Channel - Nets
Nets for Sole50%
Nets for Gadoids
25%
Nets for Other species
25%
2006 - Eastern Channel - Nets
Nets for Sole59%
Nets for Other species
31%
Nets for Gadoids
10%
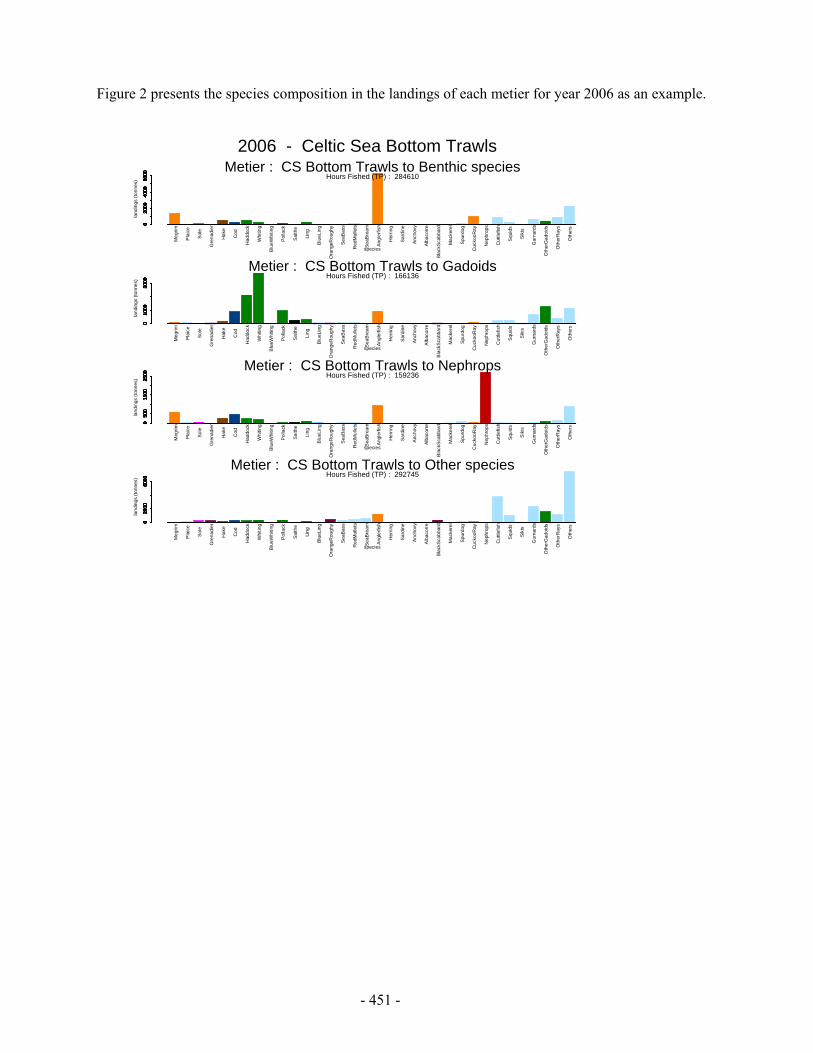
- 451 -
Figure 2 presents the species composition in the landings of each metier for year 2006 as an example.
Meg
rim
Pla
ice
Sol
e
Gre
nadi
er
Hak
e
Cod
Had
dock
Whi
ting
Blu
eWhi
ting
Pol
lack
Sai
the
Ling
Blu
eLin
g
Ora
ngeR
ough
y
Sea
Bas
s
Red
Mul
lets
Sea
Bre
am
Ang
lerfi
sh
Her
ring
Sar
dine
Anc
hovy
Alb
acor
re
Bla
ckS
cabb
ard
Mac
kere
l
Spu
rdog
Cuc
kooR
ay
Nep
hrop
s
Cut
tlefis
h
Squ
ids
Sik
is
Gur
nard
s
Oth
erG
adoi
ds
Oth
erR
ays
Oth
ers
020
0040
0060
00
species
020
0040
0060
00
land
ings
(ton
nes)
020
0040
0060
000
2000
4000
6000
020
0040
0060
000
2000
4000
6000
020
0040
0060
000
2000
4000
6000
020
0040
0060
000
2000
4000
6000
Metier : CS Bottom Trawls to Benthic speciesHours Fished (TP) : 284610
Meg
rim
Pla
ice
Sol
e
Gre
nadi
er
Hak
e
Cod
Had
dock
Whi
ting
Blu
eWhi
ting
Pol
lack
Sai
the
Ling
Blu
eLin
g
Ora
ngeR
ough
y
Sea
Bas
s
Red
Mul
lets
Sea
Bre
am
Ang
lerfi
sh
Her
ring
Sar
dine
Anc
hovy
Alb
acor
re
Bla
ckS
cabb
ard
Mac
kere
l
Spu
rdog
Cuc
kooR
ay
Nep
hrop
s
Cut
tlefis
h
Squ
ids
Sik
is
Gur
nard
s
Oth
erG
adoi
ds
Oth
erR
ays
Oth
ers
010
0030
00
species
010
0030
00
land
ings
(ton
nes)
010
0030
000
1000
3000
010
0030
000
1000
3000
010
0030
000
1000
3000
010
0030
000
1000
3000
Metier : CS Bottom Trawls to GadoidsHours Fished (TP) : 166136
Meg
rim
Pla
ice
Sol
e
Gre
nadi
er
Hak
e
Cod
Had
dock
Whi
ting
Blu
eWhi
ting
Pol
lack
Sai
the
Ling
Blu
eLin
g
Ora
ngeR
ough
y
Sea
Bas
s
Red
Mul
lets
Sea
Bre
am
Ang
lerfi
sh
Her
ring
Sar
dine
Anc
hovy
Alb
acor
re
Bla
ckS
cabb
ard
Mac
kere
l
Spu
rdog
Cuc
kooR
ay
Nep
hrop
s
Cut
tlefis
h
Squ
ids
Sik
is
Gur
nard
s
Oth
erG
adoi
ds
Oth
erR
ays
Oth
ers
050
015
0025
00
species
050
015
0025
00
land
ings
(ton
nes)
050
015
0025
000
500
1500
2500
050
015
0025
000
500
1500
2500
050
015
0025
000
500
1500
2500
050
015
0025
000
500
1500
2500
Metier : CS Bottom Trawls to NephropsHours Fished (TP) : 159236
Meg
rim
Pla
ice
Sol
e
Gre
nadi
er
Hak
e
Cod
Had
dock
Whi
ting
Blu
eWhi
ting
Pol
lack
Sai
the
Ling
Blu
eLin
g
Ora
ngeR
ough
y
Sea
Bas
s
Red
Mul
lets
Sea
Bre
am
Ang
lerfi
sh
Her
ring
Sar
dine
Anc
hovy
Alb
acor
re
Bla
ckS
cabb
ard
Mac
kere
l
Spu
rdog
Cuc
kooR
ay
Nep
hrop
s
Cut
tlefis
h
Squ
ids
Sik
is
Gur
nard
s
Oth
erG
adoi
ds
Oth
erR
ays
Oth
ers
020
0060
00
species
020
0060
00
land
ings
(ton
nes)
020
0060
000
2000
6000
020
0060
000
2000
6000
020
0060
000
2000
6000
020
0060
000
2000
6000
Metier : CS Bottom Trawls to Other speciesHours Fished (TP) : 292745
2006 - Celtic Sea Bottom Trawls
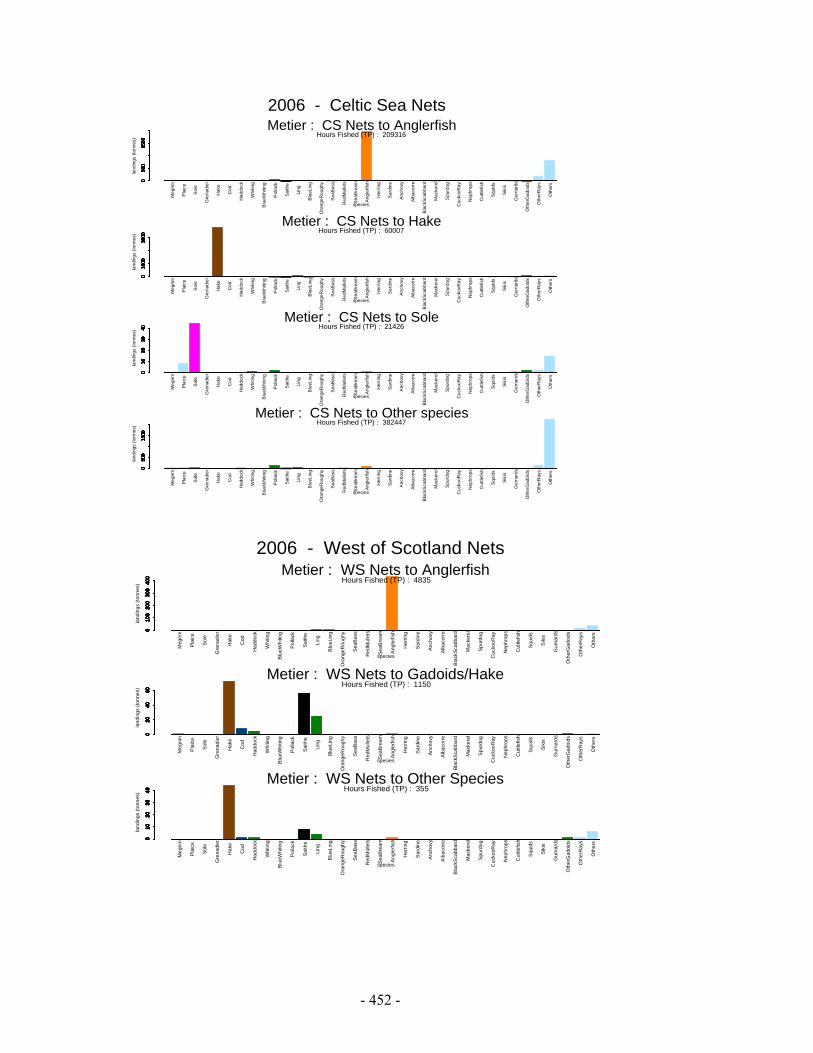
- 452 -
Meg
rim
Pla
ice
Sol
e
Gre
nadi
er
Hak
e
Cod
Had
dock
Whi
ting
Blu
eWhi
ting
Pol
lack
Sai
the
Ling
Blu
eLin
g
Ora
ngeR
ough
y
Sea
Bas
s
Red
Mul
lets
Sea
Bre
am
Ang
lerfi
sh
Her
ring
Sar
dine
Anc
hovy
Alb
acor
re
Bla
ckS
cabb
ard
Mac
kere
l
Spu
rdog
Cuc
kooR
ay
Nep
hrop
s
Cut
tlefis
h
Squ
ids
Sik
is
Gur
nard
s
Oth
erG
adoi
ds
Oth
erR
ays
Oth
ers
050
015
00
species
050
015
00
land
ings
(ton
nes)
050
015
000
500
1500
050
015
000
500
1500
050
015
000
500
1500
050
015
000
500
1500
Metier : CS Nets to AnglerfishHours Fished (TP) : 209316
Meg
rim
Pla
ice
Sol
e
Gre
nadi
er
Hak
e
Cod
Had
dock
Whi
ting
Blu
eWhi
ting
Pol
lack
Sai
the
Ling
Blu
eLin
g
Ora
ngeR
ough
y
Sea
Bas
s
Red
Mul
lets
Sea
Bre
am
Ang
lerfi
sh
Her
ring
Sar
dine
Anc
hovy
Alb
acor
re
Bla
ckS
cabb
ard
Mac
kere
l
Spu
rdog
Cuc
kooR
ay
Nep
hrop
s
Cut
tlefis
h
Squ
ids
Sik
is
Gur
nard
s
Oth
erG
adoi
ds
Oth
erR
ays
Oth
ers
010
0030
00
species
010
0030
00
land
ings
(ton
nes)
010
0030
000
1000
3000
010
0030
000
1000
3000
010
0030
000
1000
3000
010
0030
000
1000
3000
Metier : CS Nets to HakeHours Fished (TP) : 60007
Meg
rim
Pla
ice
Sol
e
Gre
nadi
er
Hak
e
Cod
Had
dock
Whi
ting
Blu
eWhi
ting
Pol
lack
Sai
the
Ling
Blu
eLin
g
Ora
ngeR
ough
y
Sea
Bas
s
Red
Mul
lets
Sea
Bre
am
Ang
lerfi
sh
Her
ring
Sar
dine
Anc
hovy
Alb
acor
re
Bla
ckS
cabb
ard
Mac
kere
l
Spu
rdog
Cuc
kooR
ay
Nep
hrop
s
Cut
tlefis
h
Squ
ids
Sik
is
Gur
nard
s
Oth
erG
adoi
ds
Oth
erR
ays
Oth
ers
010
2030
40
species
010
2030
40
land
ings
(ton
nes)
010
2030
400
1020
3040
010
2030
400
1020
3040
010
2030
400
1020
3040
010
2030
400
1020
3040
Metier : CS Nets to SoleHours Fished (TP) : 21426
Meg
rim
Pla
ice
Sol
e
Gre
nadi
er
Hak
e
Cod
Had
dock
Whi
ting
Blu
eWhi
ting
Pol
lack
Sai
the
Ling
Blu
eLin
g
Ora
ngeR
ough
y
Sea
Bas
s
Red
Mul
lets
Sea
Bre
am
Ang
lerfi
sh
Her
ring
Sar
dine
Anc
hovy
Alb
acor
re
Bla
ckS
cabb
ard
Mac
kere
l
Spu
rdog
Cuc
kooR
ay
Nep
hrop
s
Cut
tlefis
h
Squ
ids
Sik
is
Gur
nard
s
Oth
erG
adoi
ds
Oth
erR
ays
Oth
ers
050
015
00
species
050
015
00
land
ings
(ton
nes)
050
015
000
500
1500
050
015
000
500
1500
050
015
000
500
1500
050
015
000
500
1500
Metier : CS Nets to Other speciesHours Fished (TP) : 382447
2006 - Celtic Sea Nets
Meg
rim
Pla
ice
Sol
e
Gre
nadi
er
Hak
e
Cod
Had
dock
Whi
ting
Blu
eWhi
ting
Pol
lack
Sai
the
Ling
Blu
eLin
g
Ora
ngeR
ough
y
Sea
Bas
s
Red
Mul
lets
Sea
Bre
am
Ang
lerfi
sh
Her
ring
Sar
dine
Anch
ovy
Alb
acor
re
Bla
ckS
cabb
ard
Mac
kere
l
Spu
rdog
Cuc
kooR
ay
Nep
hrop
s
Cut
tlefis
h
Squ
ids
Sik
is
Gur
nard
s
Oth
erG
adoi
ds
Oth
erR
ays
Oth
ers
010
020
030
040
0
species
010
020
030
040
0
land
ings
(ton
nes)
010
020
030
040
00
100
200
300
400
010
020
030
040
00
100
200
300
400
010
020
030
040
00
100
200
300
400
010
020
030
040
00
100
200
300
400
Metier : WS Nets to AnglerfishHours Fished (TP) : 4835
Meg
rim
Pla
ice
Sol
e
Gre
nadi
er
Hak
e
Cod
Had
dock
Whi
ting
Blu
eWhi
ting
Pol
lack
Sai
the
Ling
Blu
eLin
g
Ora
ngeR
ough
y
Sea
Bas
s
Red
Mul
lets
Sea
Bre
am
Ang
lerfi
sh
Her
ring
Sar
dine
Anch
ovy
Alb
acor
re
Bla
ckS
cabb
ard
Mac
kere
l
Spu
rdog
Cuc
kooR
ay
Nep
hrop
s
Cut
tlefis
h
Squ
ids
Sik
is
Gur
nard
s
Oth
erG
adoi
ds
Oth
erR
ays
Oth
ers
020
4060
species
020
4060
land
ings
(ton
nes)
020
4060
020
4060
020
4060
020
4060
020
4060
020
4060
020
4060
020
4060
Metier : WS Nets to Gadoids/HakeHours Fished (TP) : 1150
Meg
rim
Pla
ice
Sol
e
Gre
nadi
er
Hak
e
Cod
Had
dock
Whi
ting
Blu
eWhi
ting
Pol
lack
Sai
the
Ling
Blu
eLin
g
Ora
ngeR
ough
y
Sea
Bas
s
Red
Mul
lets
Sea
Bre
am
Ang
lerfi
sh
Her
ring
Sar
dine
Anch
ovy
Alb
acor
re
Bla
ckS
cabb
ard
Mac
kere
l
Spu
rdog
Cuc
kooR
ay
Nep
hrop
s
Cut
tlefis
h
Squ
ids
Sik
is
Gur
nard
s
Oth
erG
adoi
ds
Oth
erR
ays
Oth
ers
010
2030
40
species
010
2030
40
land
ings
(ton
nes)
010
2030
400
1020
3040
010
2030
400
1020
3040
010
2030
400
1020
3040
010
2030
400
1020
3040
Metier : WS Nets to Other SpeciesHours Fished (TP) : 355
2006 - West of Scotland Nets
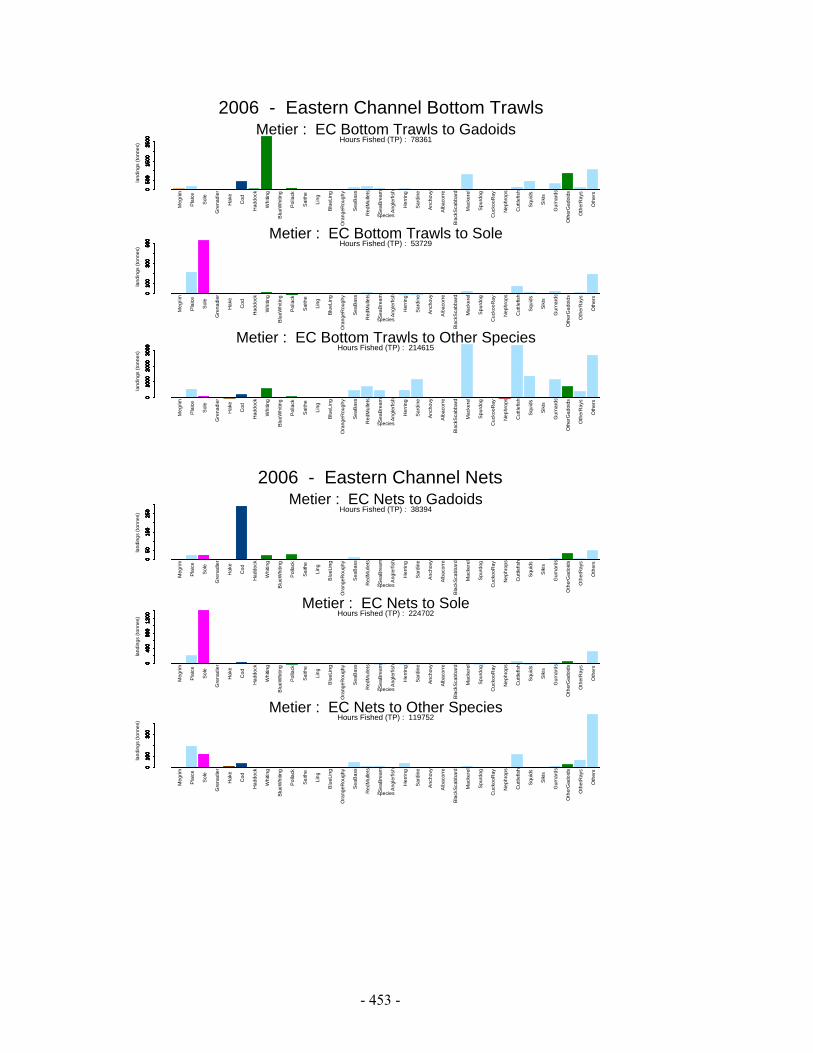
- 453 -
Meg
rim
Pla
ice
Sol
e
Gre
nadi
er
Hak
e
Cod
Had
dock
Whi
ting
Blu
eWhi
ting
Pol
lack
Sai
the
Ling
Blu
eLin
g
Ora
ngeR
ough
y
Sea
Bas
s
Red
Mul
lets
Sea
Bre
am
Ang
lerfi
sh
Her
ring
Sar
dine
Anc
hovy
Alb
acor
re
Bla
ckS
cabb
ard
Mac
kere
l
Spu
rdog
Cuc
kooR
ay
Nep
hrop
s
Cut
tlefis
h
Squ
ids
Sik
is
Gur
nard
s
Oth
erG
adoi
ds
Oth
erR
ays
Oth
ers
050
015
0025
00
species
050
015
0025
00
land
ings
(ton
nes)
050
015
0025
000
500
1500
2500
050
015
0025
000
500
1500
2500
050
015
0025
000
500
1500
2500
050
015
0025
000
500
1500
2500
Metier : EC Bottom Trawls to GadoidsHours Fished (TP) : 78361
Meg
rim
Pla
ice
Sol
e
Gre
nadi
er
Hak
e
Cod
Had
dock
Whi
ting
Blu
eWhi
ting
Pol
lack
Sai
the
Ling
Blu
eLin
g
Ora
ngeR
ough
y
Sea
Bas
s
Red
Mul
lets
Sea
Bre
am
Ang
lerfi
sh
Her
ring
Sar
dine
Anc
hovy
Alb
acor
re
Bla
ckS
cabb
ard
Mac
kere
l
Spu
rdog
Cuc
kooR
ay
Nep
hrop
s
Cut
tlefis
h
Squ
ids
Sik
is
Gur
nard
s
Oth
erG
adoi
ds
Oth
erR
ays
Oth
ers
010
030
050
0
species
010
030
050
0
land
ings
(ton
nes)
010
030
050
00
100
300
500
010
030
050
00
100
300
500
010
030
050
00
100
300
500
010
030
050
00
100
300
500 Metier : EC Bottom Trawls to Sole
Hours Fished (TP) : 53729
Meg
rim
Pla
ice
Sol
e
Gre
nadi
er
Hak
e
Cod
Had
dock
Whi
ting
Blu
eWhi
ting
Pol
lack
Sai
the
Ling
Blu
eLin
g
Ora
ngeR
ough
y
Sea
Bas
s
Red
Mul
lets
Sea
Bre
am
Ang
lerfi
sh
Her
ring
Sar
dine
Anc
hovy
Alb
acor
re
Bla
ckS
cabb
ard
Mac
kere
l
Spu
rdog
Cuc
kooR
ay
Nep
hrop
s
Cut
tlefis
h
Squ
ids
Sik
is
Gur
nard
s
Oth
erG
adoi
ds
Oth
erR
ays
Oth
ers
010
0020
0030
00
species
010
0020
0030
00
land
ings
(ton
nes)
010
0020
0030
000
1000
2000
3000
010
0020
0030
000
1000
2000
3000
010
0020
0030
000
1000
2000
3000
010
0020
0030
000
1000
2000
3000
Metier : EC Bottom Trawls to Other SpeciesHours Fished (TP) : 214615
2006 - Eastern Channel Bottom Trawls
Meg
rim
Pla
ice
Sol
e
Gre
nadi
er
Hak
e
Cod
Had
dock
Whi
ting
Blu
eWhi
ting
Pol
lack
Sai
the
Ling
Blu
eLin
g
Ora
ngeR
ough
y
Sea
Bas
s
Red
Mul
lets
Sea
Bre
am
Ang
lerfi
sh
Her
ring
Sar
dine
Anc
hovy
Alb
acor
re
Bla
ckS
cabb
ard
Mac
kere
l
Spu
rdog
Cuc
kooR
ay
Nep
hrop
s
Cut
tlefis
h
Squ
ids
Sik
is
Gur
nard
s
Oth
erG
adoi
ds
Oth
erR
ays
Oth
ers
050
150
250
species
050
150
250
land
ings
(ton
nes)
050
150
250
050
150
250
050
150
250
050
150
250
050
150
250
050
150
250
050
150
250
050
150
250
Metier : EC Nets to GadoidsHours Fished (TP) : 38394
Meg
rim
Pla
ice
Sol
e
Gre
nadi
er
Hak
e
Cod
Had
dock
Whi
ting
Blu
eWhi
ting
Pol
lack
Sai
the
Ling
Blu
eLin
g
Ora
ngeR
ough
y
Sea
Bas
s
Red
Mul
lets
Sea
Bre
am
Ang
lerfi
sh
Her
ring
Sar
dine
Anc
hovy
Alb
acor
re
Bla
ckS
cabb
ard
Mac
kere
l
Spu
rdog
Cuc
kooR
ay
Nep
hrop
s
Cut
tlefis
h
Squ
ids
Sik
is
Gur
nard
s
Oth
erG
adoi
ds
Oth
erR
ays
Oth
ers
040
080
012
00
species
040
080
012
00
land
ings
(ton
nes)
040
080
012
000
400
800
1200
040
080
012
000
400
800
1200
040
080
012
000
400
800
1200
040
080
012
000
400
800
1200
Metier : EC Nets to SoleHours Fished (TP) : 224702
Meg
rim
Pla
ice
Sol
e
Gre
nadi
er
Hak
e
Cod
Had
dock
Whi
ting
Blu
eWhi
ting
Pol
lack
Sai
the
Ling
Blu
eLin
g
Ora
ngeR
ough
y
Sea
Bas
s
Red
Mul
lets
Sea
Bre
am
Ang
lerfi
sh
Her
ring
Sar
dine
Anc
hovy
Alb
acor
re
Bla
ckS
cabb
ard
Mac
kere
l
Spu
rdog
Cuc
kooR
ay
Nep
hrop
s
Cut
tlefis
h
Squ
ids
Sik
is
Gur
nard
s
Oth
erG
adoi
ds
Oth
erR
ays
Oth
ers
010
030
0
species
010
030
0
land
ings
(ton
nes)
010
030
00
100
300
010
030
00
100
300
010
030
00
100
300
010
030
00
100
300
Metier : EC Nets to Other SpeciesHours Fished (TP) : 119752
2006 - Eastern Channel Nets
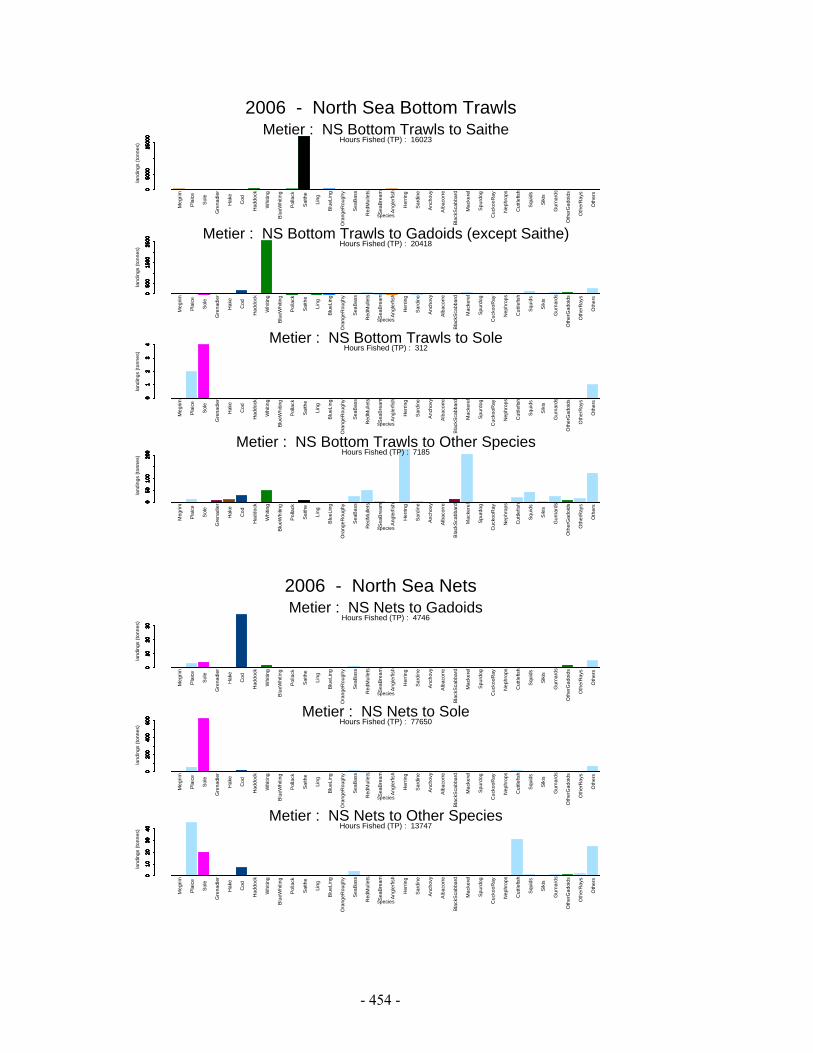
- 454 -
Meg
rim
Pla
ice
Sol
e
Gre
nadi
er
Hak
e
Cod
Had
dock
Whi
ting
Blu
eWhi
ting
Pol
lack
Sai
the
Ling
Blu
eLin
g
Ora
ngeR
ough
y
Sea
Bas
s
Red
Mul
lets
Sea
Bre
am
Ang
lerfi
sh
Her
ring
Sar
dine
Anc
hovy
Alb
acor
re
Bla
ckS
cabb
ard
Mac
kere
l
Spu
rdog
Cuc
kooR
ay
Nep
hrop
s
Cut
tlefis
h
Squ
ids
Sik
is
Gur
nard
s
Oth
erG
adoi
ds
Oth
erR
ays
Oth
ers
050
0015
000
species
050
0015
000
land
ings
(ton
nes)
050
0015
000
050
0015
000
050
0015
000
050
0015
000
050
0015
000
050
0015
000
050
0015
000
050
0015
000
Metier : NS Bottom Trawls to SaitheHours Fished (TP) : 16023
Meg
rim
Pla
ice
Sol
e
Gre
nadi
er
Hak
e
Cod
Had
dock
Whi
ting
Blu
eWhi
ting
Pol
lack
Sai
the
Ling
Blu
eLin
g
Ora
ngeR
ough
y
Sea
Bas
s
Red
Mul
lets
Sea
Bre
am
Ang
lerfi
sh
Her
ring
Sar
dine
Anc
hovy
Alb
acor
re
Bla
ckS
cabb
ard
Mac
kere
l
Spu
rdog
Cuc
kooR
ay
Nep
hrop
s
Cut
tlefis
h
Squ
ids
Sik
is
Gur
nard
s
Oth
erG
adoi
ds
Oth
erR
ays
Oth
ers
050
015
0025
00
species
050
015
0025
00
land
ings
(ton
nes)
050
015
0025
000
500
1500
2500
050
015
0025
000
500
1500
2500
050
015
0025
000
500
1500
2500
050
015
0025
000
500
1500
2500 Metier : NS Bottom Trawls to Gadoids (except Saithe)
Hours Fished (TP) : 20418
Meg
rim
Pla
ice
Sol
e
Gre
nadi
er
Hak
e
Cod
Had
dock
Whi
ting
Blu
eWhi
ting
Pol
lack
Sai
the
Ling
Blu
eLin
g
Ora
ngeR
ough
y
Sea
Bas
s
Red
Mul
lets
Sea
Bre
am
Ang
lerfi
sh
Her
ring
Sar
dine
Anc
hovy
Alb
acor
re
Bla
ckS
cabb
ard
Mac
kere
l
Spu
rdog
Cuc
kooR
ay
Nep
hrop
s
Cut
tlefis
h
Squ
ids
Sik
is
Gur
nard
s
Oth
erG
adoi
ds
Oth
erR
ays
Oth
ers
01
23
4
species
01
23
4
land
ings
(ton
nes)
01
23
40
12
34
01
23
40
12
34
01
23
40
12
34
01
23
40
12
34 Metier : NS Bottom Trawls to Sole
Hours Fished (TP) : 312
Meg
rim
Pla
ice
Sol
e
Gre
nadi
er
Hak
e
Cod
Had
dock
Whi
ting
Blu
eWhi
ting
Pol
lack
Sai
the
Ling
Blu
eLin
g
Ora
ngeR
ough
y
Sea
Bas
s
Red
Mul
lets
Sea
Bre
am
Ang
lerfi
sh
Her
ring
Sar
dine
Anc
hovy
Alb
acor
re
Bla
ckS
cabb
ard
Mac
kere
l
Spu
rdog
Cuc
kooR
ay
Nep
hrop
s
Cut
tlefis
h
Squ
ids
Sik
is
Gur
nard
s
Oth
erG
adoi
ds
Oth
erR
ays
Oth
ers
050
100
200
species
050
100
200
land
ings
(ton
nes)
050
100
200
050
100
200
050
100
200
050
100
200
050
100
200
050
100
200
050
100
200
050
100
200
Metier : NS Bottom Trawls to Other SpeciesHours Fished (TP) : 7185
2006 - North Sea Bottom Trawls
Meg
rim
Pla
ice
Sol
e
Gre
nadi
er
Hak
e
Cod
Had
dock
Whi
ting
Blu
eWhi
ting
Pol
lack
Sai
the
Ling
Blu
eLin
g
Ora
ngeR
ough
y
Sea
Bas
s
Red
Mul
lets
Sea
Bre
am
Ang
lerfi
sh
Her
ring
Sar
dine
Anc
hovy
Alb
acor
re
Bla
ckS
cabb
ard
Mac
kere
l
Spu
rdog
Cuc
kooR
ay
Nep
hrop
s
Cut
tlefis
h
Squ
ids
Sik
is
Gur
nard
s
Oth
erG
adoi
ds
Oth
erR
ays
Oth
ers
010
2030
species
010
2030
land
ings
(ton
nes)
010
2030
010
2030
010
2030
010
2030
010
2030
010
2030
010
2030
010
2030
Metier : NS Nets to GadoidsHours Fished (TP) : 4746
Meg
rim
Pla
ice
Sol
e
Gre
nadi
er
Hak
e
Cod
Had
dock
Whi
ting
Blu
eWhi
ting
Pol
lack
Sai
the
Ling
Blu
eLin
g
Ora
ngeR
ough
y
Sea
Bas
s
Red
Mul
lets
Sea
Bre
am
Ang
lerfi
sh
Her
ring
Sar
dine
Anc
hovy
Alb
acor
re
Bla
ckS
cabb
ard
Mac
kere
l
Spu
rdog
Cuc
kooR
ay
Nep
hrop
s
Cut
tlefis
h
Squ
ids
Sik
is
Gur
nard
s
Oth
erG
adoi
ds
Oth
erR
ays
Oth
ers
020
040
060
0
species
020
040
060
0
land
ings
(ton
nes)
020
040
060
00
200
400
600
020
040
060
00
200
400
600
020
040
060
00
200
400
600
020
040
060
00
200
400
600 Metier : NS Nets to Sole
Hours Fished (TP) : 77650
Meg
rim
Pla
ice
Sol
e
Gre
nadi
er
Hak
e
Cod
Had
dock
Whi
ting
Blu
eWhi
ting
Pol
lack
Sai
the
Ling
Blu
eLin
g
Ora
ngeR
ough
y
Sea
Bas
s
Red
Mul
lets
Sea
Bre
am
Ang
lerfi
sh
Her
ring
Sar
dine
Anc
hovy
Alb
acor
re
Bla
ckS
cabb
ard
Mac
kere
l
Spu
rdog
Cuc
kooR
ay
Nep
hrop
s
Cut
tlefis
h
Squ
ids
Sik
is
Gur
nard
s
Oth
erG
adoi
ds
Oth
erR
ays
Oth
ers
010
2030
40
species
010
2030
40
land
ings
(ton
nes)
010
2030
400
1020
3040
010
2030
400
1020
3040
010
2030
400
1020
3040
010
2030
400
1020
3040
Metier : NS Nets to Other SpeciesHours Fished (TP) : 13747
2006 - North Sea Nets
- 455 -
It is clear that the relevant target species usually dominate the landings of ‘their’ métier, and that other target species contribute very little to the landings of the given metier. This is the case for cod for which several metiers do not catch any (or very few) cod.
Some mixed metiers still occur, but it is not clear if this mix reflects the actual mixture of species for each haul or if the data resolution could not allow separation of several different hauls during the same day (differences between days and nights in the Nephrops fishery; or between depth within the same rectangle in the deep fishery).
The fishing activity in the North Sea and Eastern Channel that has been classified in the metier ‘Others’ is quite substantial. This is probably due to the rather high thresholds used for the target species. This has to be investigated before drawing firm conclusion from this analysis.
It has to be noted that this classification does not take into account the mesh size. It is assumed that all the bottom trawls operated in the Celtic Sea and in the west of Scotland have mesh greater or equal to 100mm (including Nephrops trawlers). Bottom trawls used in the saithe metier in the North Sea have also mesh greater to 100mm. Trawls in the Eastern Channel and in the North Sea (except in the saithe fishery) are assumed to have mesh size in the range 70-100mm.
Given that a vessel could have several métiers in a same year, it is not possible to provide a precise fleet description (number of vessels and characteristics) in each of the defined métier. Furthermore, the computation was based on the available log-books only. For the fishery in area VI and VII, the available information can be considered as a representative sample of the whole fishery. This is probably not the case in the coastal areas and the information given by the available log-books should be considered as a biased sample (since available information is rather scarce for the smallest boats).
This approach should be considered as a preliminary classification of the French fishing activity. This could be refined in terms of target species and thresholds. However, this analysis shows that a same type of gear in the same area can be used to target different types of species. Therefore, constraints on the activity towards one species should be applied to the relevant metier(s). The definition of the ‘effort groups’ should account for that.
The difficulty in this approach is that this classification is based on a posteriori which needs to have accurate information of landings (preferably catches) of each species for each trip.
c) Correspondence between metiers and gear groups + special conditions
Table 1 provides the mean contribution of cod to the total landings of each metier for the years 2000-2007, and the average amount of cod landings. It shows that metiers with significant amount of cod landings are relatively well determined and that some metiers within the same area and using the same gear can be operated without catching (or few) cod.
Table 2 is an attempt to draw correspondence between these metiers and the current gear groups and special conditions as defined in Annex IIa.
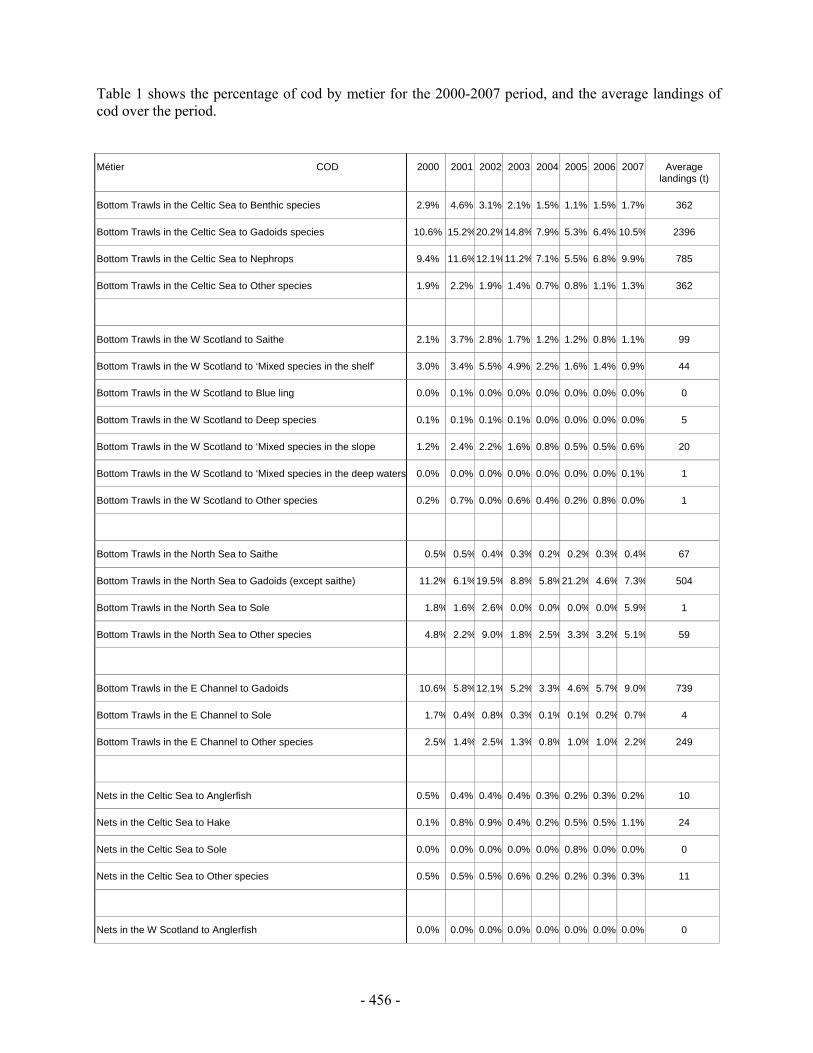
- 456 -
Table 1 shows the percentage of cod by metier for the 2000-2007 period, and the average landings of cod over the period.
Métier COD 2000 2001 2002 2003 2004 2005 2006 2007 Average landings (t)
Bottom Trawls in the Celtic Sea to Benthic species 2.9% 4.6% 3.1% 2.1% 1.5% 1.1% 1.5% 1.7% 362
Bottom Trawls in the Celtic Sea to Gadoids species 10.6% 15.2%20.2%14.8% 7.9% 5.3% 6.4% 10.5% 2396
Bottom Trawls in the Celtic Sea to Nephrops 9.4% 11.6%12.1%11.2% 7.1% 5.5% 6.8% 9.9% 785
Bottom Trawls in the Celtic Sea to Other species 1.9% 2.2% 1.9% 1.4% 0.7% 0.8% 1.1% 1.3% 362
Bottom Trawls in the W Scotland to Saithe 2.1% 3.7% 2.8% 1.7% 1.2% 1.2% 0.8% 1.1% 99
Bottom Trawls in the W Scotland to ‘Mixed species in the shelf’ 3.0% 3.4% 5.5% 4.9% 2.2% 1.6% 1.4% 0.9% 44
Bottom Trawls in the W Scotland to Blue ling 0.0% 0.1% 0.0% 0.0% 0.0% 0.0% 0.0% 0.0% 0
Bottom Trawls in the W Scotland to Deep species 0.1% 0.1% 0.1% 0.1% 0.0% 0.0% 0.0% 0.0% 5
Bottom Trawls in the W Scotland to ‘Mixed species in the slope 1.2% 2.4% 2.2% 1.6% 0.8% 0.5% 0.5% 0.6% 20
Bottom Trawls in the W Scotland to ‘Mixed species in the deep waters 0.0% 0.0% 0.0% 0.0% 0.0% 0.0% 0.0% 0.1% 1
Bottom Trawls in the W Scotland to Other species 0.2% 0.7% 0.0% 0.6% 0.4% 0.2% 0.8% 0.0% 1
Bottom Trawls in the North Sea to Saithe 0.5% 0.5% 0.4% 0.3% 0.2% 0.2% 0.3% 0.4% 67
Bottom Trawls in the North Sea to Gadoids (except saithe) 11.2% 6.1%19.5% 8.8% 5.8%21.2% 4.6% 7.3% 504
Bottom Trawls in the North Sea to Sole 1.8% 1.6% 2.6% 0.0% 0.0% 0.0% 0.0% 5.9% 1
Bottom Trawls in the North Sea to Other species 4.8% 2.2% 9.0% 1.8% 2.5% 3.3% 3.2% 5.1% 59
Bottom Trawls in the E Channel to Gadoids 10.6% 5.8%12.1% 5.2% 3.3% 4.6% 5.7% 9.0% 739
Bottom Trawls in the E Channel to Sole 1.7% 0.4% 0.8% 0.3% 0.1% 0.1% 0.2% 0.7% 4
Bottom Trawls in the E Channel to Other species 2.5% 1.4% 2.5% 1.3% 0.8% 1.0% 1.0% 2.2% 249
Nets in the Celtic Sea to Anglerfish 0.5% 0.4% 0.4% 0.4% 0.3% 0.2% 0.3% 0.2% 10
Nets in the Celtic Sea to Hake 0.1% 0.8% 0.9% 0.4% 0.2% 0.5% 0.5% 1.1% 24
Nets in the Celtic Sea to Sole 0.0% 0.0% 0.0% 0.0% 0.0% 0.8% 0.0% 0.0% 0
Nets in the Celtic Sea to Other species 0.5% 0.5% 0.5% 0.6% 0.2% 0.2% 0.3% 0.3% 11
Nets in the W Scotland to Anglerfish 0.0% 0.0% 0.0% 0.0% 0.0% 0.0% 0.0% 0.0% 0
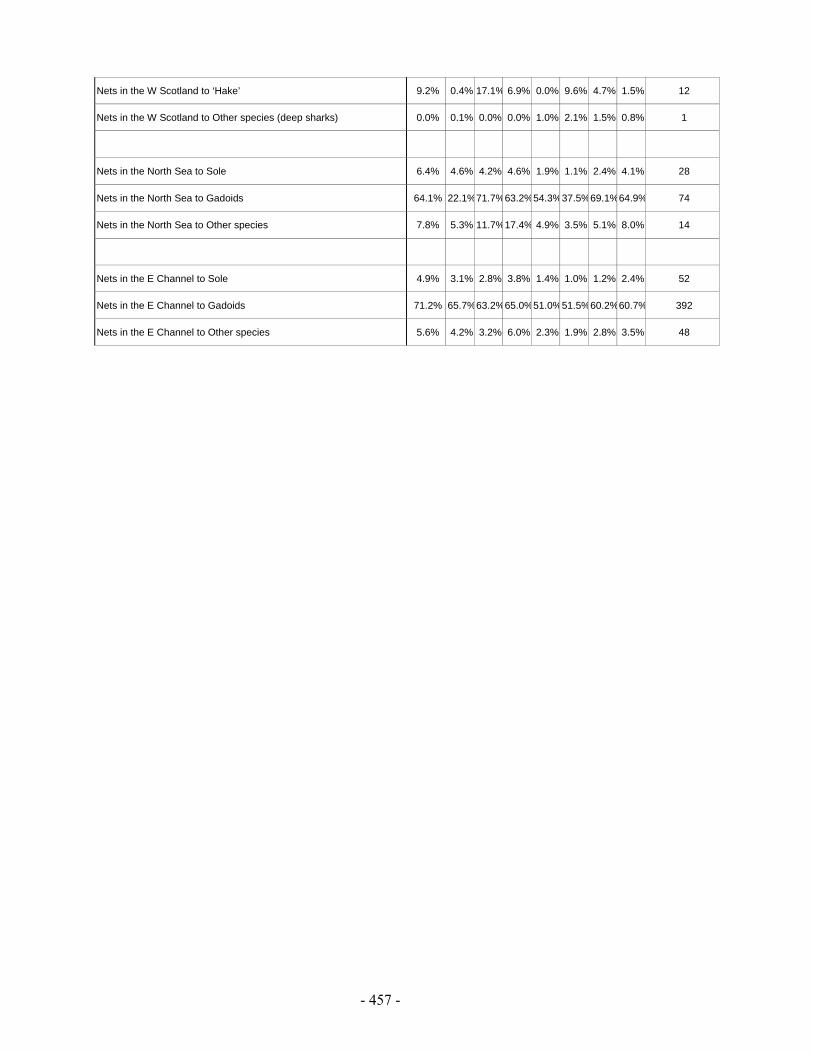
- 457 -
Nets in the W Scotland to ‘Hake’ 9.2% 0.4% 17.1% 6.9% 0.0% 9.6% 4.7% 1.5% 12
Nets in the W Scotland to Other species (deep sharks) 0.0% 0.1% 0.0% 0.0% 1.0% 2.1% 1.5% 0.8% 1
Nets in the North Sea to Sole 6.4% 4.6% 4.2% 4.6% 1.9% 1.1% 2.4% 4.1% 28
Nets in the North Sea to Gadoids 64.1% 22.1%71.7%63.2%54.3%37.5%69.1%64.9% 74
Nets in the North Sea to Other species 7.8% 5.3% 11.7%17.4% 4.9% 3.5% 5.1% 8.0% 14
Nets in the E Channel to Sole 4.9% 3.1% 2.8% 3.8% 1.4% 1.0% 1.2% 2.4% 52
Nets in the E Channel to Gadoids 71.2% 65.7%63.2%65.0%51.0%51.5%60.2%60.7% 392
Nets in the E Channel to Other species 5.6% 4.2% 3.2% 6.0% 2.3% 1.9% 2.8% 3.5% 48
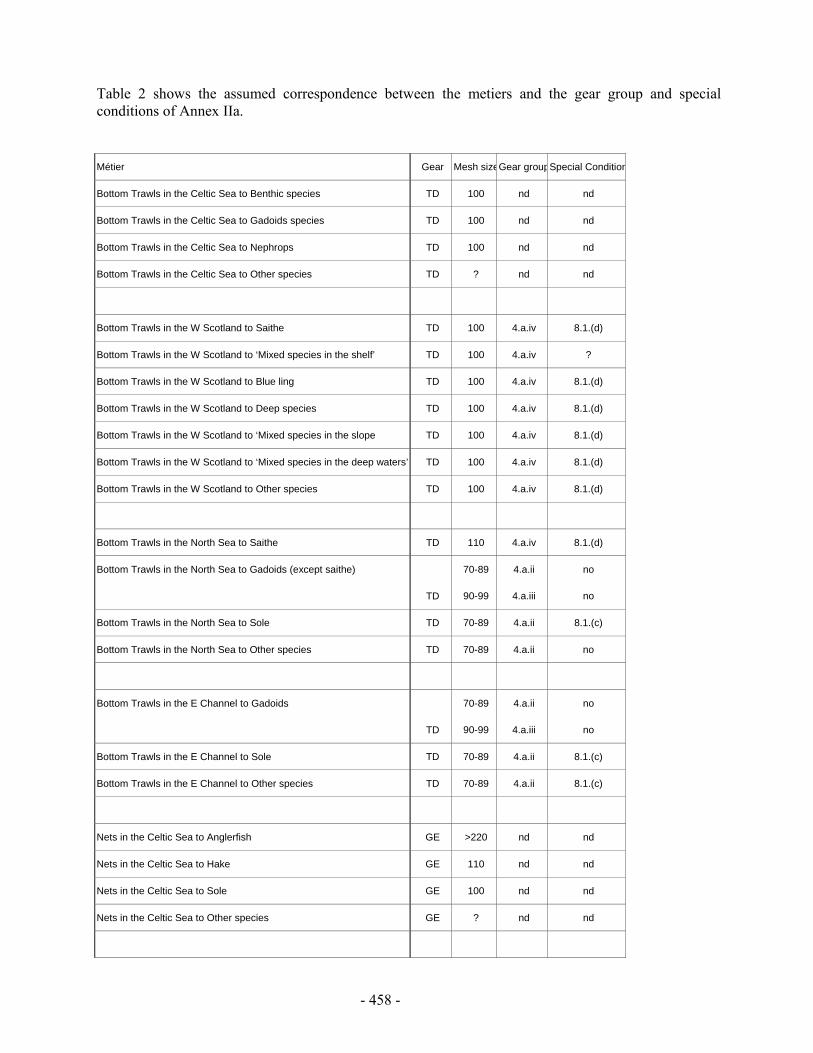
- 458 -
Table 2 shows the assumed correspondence between the metiers and the gear group and special conditions of Annex IIa.
Métier Gear Mesh sizeGear groupSpecial Condition
Bottom Trawls in the Celtic Sea to Benthic species TD 100 nd nd
Bottom Trawls in the Celtic Sea to Gadoids species TD 100 nd nd
Bottom Trawls in the Celtic Sea to Nephrops TD 100 nd nd
Bottom Trawls in the Celtic Sea to Other species TD ? nd nd
Bottom Trawls in the W Scotland to Saithe TD 100 4.a.iv 8.1.(d)
Bottom Trawls in the W Scotland to ‘Mixed species in the shelf’ TD 100 4.a.iv ?
Bottom Trawls in the W Scotland to Blue ling TD 100 4.a.iv 8.1.(d)
Bottom Trawls in the W Scotland to Deep species TD 100 4.a.iv 8.1.(d)
Bottom Trawls in the W Scotland to ‘Mixed species in the slope TD 100 4.a.iv 8.1.(d)
Bottom Trawls in the W Scotland to ‘Mixed species in the deep waters’ TD 100 4.a.iv 8.1.(d)
Bottom Trawls in the W Scotland to Other species TD 100 4.a.iv 8.1.(d)
Bottom Trawls in the North Sea to Saithe TD 110 4.a.iv 8.1.(d)
Bottom Trawls in the North Sea to Gadoids (except saithe)
TD
70-89
90-99
4.a.ii
4.a.iii
no
no
Bottom Trawls in the North Sea to Sole TD 70-89 4.a.ii 8.1.(c)
Bottom Trawls in the North Sea to Other species TD 70-89 4.a.ii no
Bottom Trawls in the E Channel to Gadoids
TD
70-89
90-99
4.a.ii
4.a.iii
no
no
Bottom Trawls in the E Channel to Sole TD 70-89 4.a.ii 8.1.(c)
Bottom Trawls in the E Channel to Other species TD 70-89 4.a.ii 8.1.(c)
Nets in the Celtic Sea to Anglerfish GE >220 nd nd
Nets in the Celtic Sea to Hake GE 110 nd nd
Nets in the Celtic Sea to Sole GE 100 nd nd
Nets in the Celtic Sea to Other species GE ? nd nd

- 459 -
Nets in the W Scotland to Anglerfish GE >220 4.c.iv 8.1.(f)
Nets in the W Scotland to ‘Hake’ GE 110 4.c.ii no
Nets in the W Scotland to Other species (deep sharks) GE 160 4.c.iii no
Nets in the North Sea to Sole TR 90 4.d no / 8.1.(g)
Nets in the North Sea to Gadoids GE 120 4.c.ii no
Nets in the North Sea to Other species GE
TR 100
4.c.i
4d
no / 8.1.(g)
no / 8.1.(g)
Nets in the E Channel to Sole TR 90 4.d no / 8.1.(g)
Nets in the E Channel to Gadoids GE 120 4.c.ii no
Nets in the E Channel to Other species GE
TR 100
4.c.i
4d
no / 8.1.(g)
no / 8.1.(g)
Appendix 3: Summary of Spanish effort data (kwdays) in ICES VIa by gear type and mesh size.
Nominal Effort YearDIVISION GEAR MESH SIZE 2003 2004 2005 2006 2007VIa GILL 110-149 38253.075
none 29.4 3226.65Total GILL 29.4 41479.725LONGLINE none 520520.385 542586.555 1020727.58 1611938.06 1072215.8Total LONGLINE 520520.385 542586.555 1020727.58 1611938.06 1072215.8OTTER 100-119 337769.25 149205 109772.25 61409.25 245431.2
32-54 156.55570-79 58880-89 459.375none 28642.95 103411.56 105250.53 259562.31 60000.99
Total OTTER 367616.13 252616.56 215022.78 320971.56 305432.19none none 7567.56 4602.57 4042.5 5350.8Total none 7567.56 4602.57 4042.5 5350.8
Total VIa 895704.075 799805.685 1239822.26 1932909.62 1424478.51
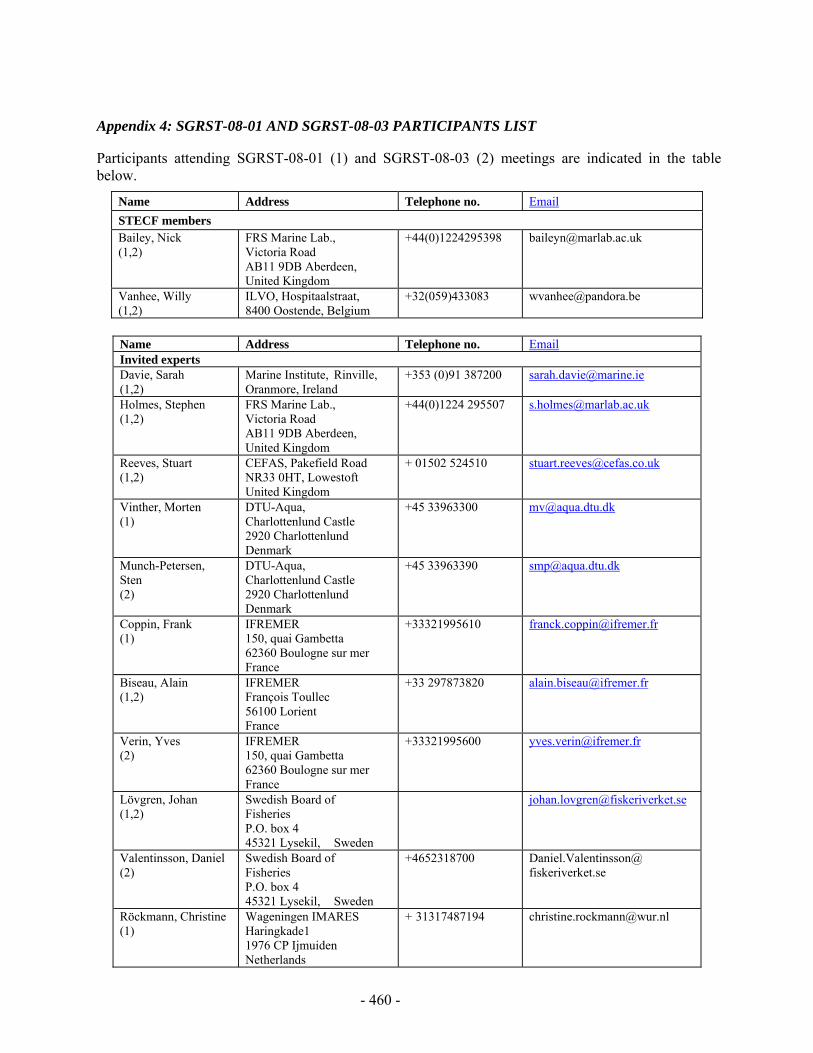
- 460 -
Appendix 4: SGRST-08-01 AND SGRST-08-03 PARTICIPANTS LIST
Participants attending SGRST-08-01 (1) and SGRST-08-03 (2) meetings are indicated in the table below.
Name Address Telephone no. Email STECF members Bailey, Nick (1,2)
FRS Marine Lab., Victoria Road AB11 9DB Aberdeen, United Kingdom
+44(0)1224295398
Vanhee, Willy (1,2)
ILVO, Hospitaalstraat, 8400 Oostende, Belgium
+32(059)433083
Name Address Telephone no. Email Invited experts Davie, Sarah (1,2)
Marine Institute, Rinville, Oranmore, Ireland
+353 (0)91 387200 [email protected]
Holmes, Stephen (1,2)
FRS Marine Lab., Victoria Road AB11 9DB Aberdeen, United Kingdom
+44(0)1224 295507 [email protected]
Reeves, Stuart (1,2)
CEFAS, Pakefield Road NR33 0HT, Lowestoft United Kingdom
+ 01502 524510 [email protected]
Vinther, Morten (1)
DTU-Aqua, Charlottenlund Castle 2920 Charlottenlund Denmark
+45 33963300 [email protected]
Munch-Petersen, Sten (2)
DTU-Aqua, Charlottenlund Castle 2920 Charlottenlund Denmark
+45 33963390 [email protected]
Coppin, Frank (1)
IFREMER 150, quai Gambetta 62360 Boulogne sur mer France
+33321995610 [email protected]
Biseau, Alain (1,2)
IFREMER François Toullec 56100 Lorient France
+33 297873820 [email protected]
Verin, Yves (2)
IFREMER 150, quai Gambetta 62360 Boulogne sur mer France
+33321995600 [email protected]
Lövgren, Johan (1,2)
Swedish Board of Fisheries P.O. box 4 45321 Lysekil, Sweden
Valentinsson, Daniel (2)
Swedish Board of Fisheries P.O. box 4 45321 Lysekil, Sweden
+4652318700 Daniel.Valentinsson@ fiskeriverket.se
Röckmann, Christine (1)
Wageningen IMARES Haringkade1 1976 CP Ijmuiden Netherlands
+ 31317487194 [email protected]
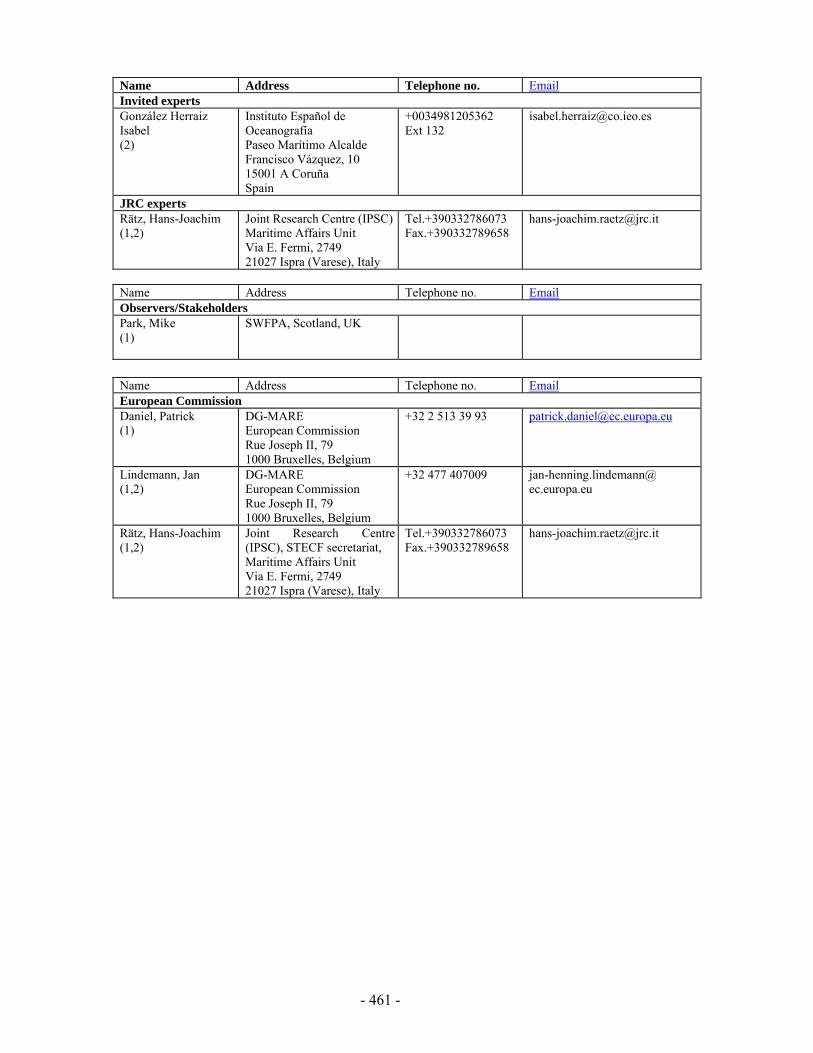
- 461 -
Name Address Telephone no. Email Invited experts González Herraiz Isabel (2)
Instituto Español de Oceanografía Paseo Marítimo Alcalde Francisco Vázquez, 10 15001 A Coruña Spain
+0034981205362 Ext 132
JRC experts Rätz, Hans-Joachim (1,2)
Joint Research Centre (IPSC)Maritime Affairs Unit Via E. Fermi, 2749 21027 Ispra (Varese), Italy
Tel.+390332786073 Fax.+390332789658
Name Address Telephone no. Email Observers/Stakeholders Park, Mike (1)
SWFPA, Scotland, UK
Name Address Telephone no. Email European Commission Daniel, Patrick (1)
DG-MARE European Commission Rue Joseph II, 79 1000 Bruxelles, Belgium
+32 2 513 39 93 [email protected]
Lindemann, Jan (1,2)
DG-MARE European Commission Rue Joseph II, 79 1000 Bruxelles, Belgium
+32 477 407009 jan-henning.lindemann@ ec.europa.eu
Rätz, Hans-Joachim (1,2)
Joint Research Centre (IPSC), STECF secretariat, Maritime Affairs Unit Via E. Fermi, 2749 21027 Ispra (Varese), Italy
Tel.+390332786073 Fax.+390332789658
- 462 -
ANNEX EXPERT DECLARATIONS
Declarations of invited experts are published on the STECF web site on https://stecf.jrc.ec.europa.eu/home together with the final report.
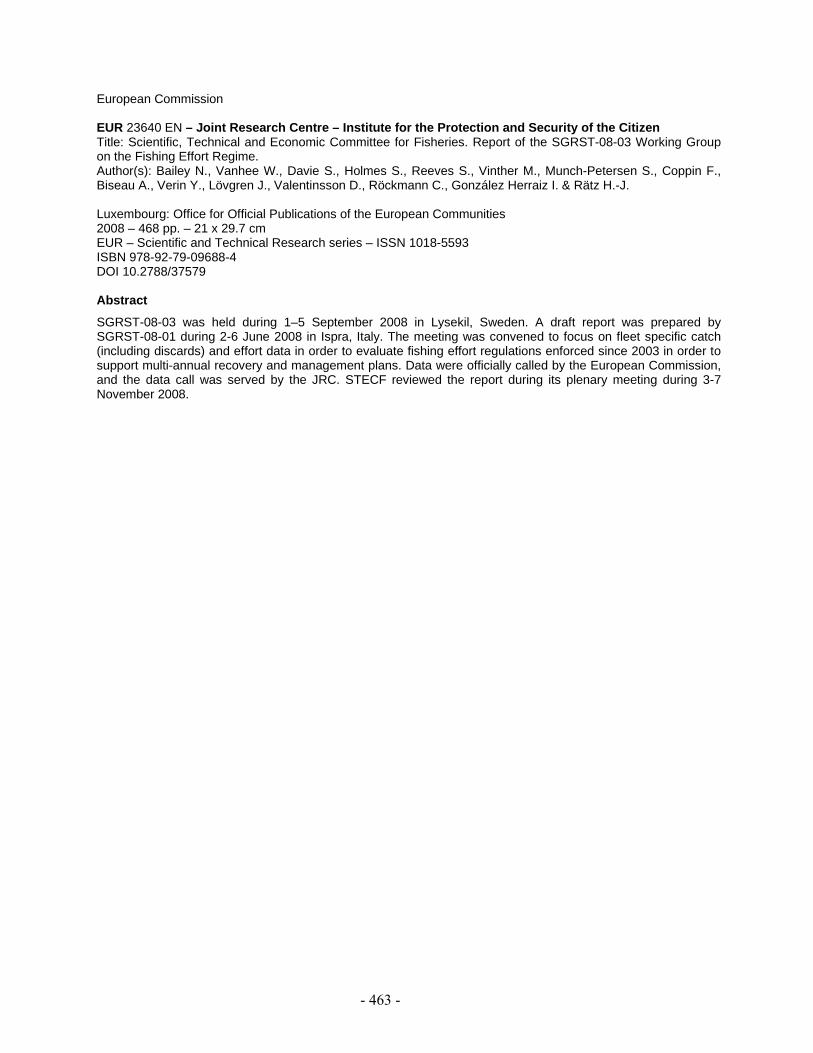
- 463 -
European Commission EUR 23640 EN – Joint Research Centre – Institute for the Protection and Security of the Citizen Title: Scientific, Technical and Economic Committee for Fisheries. Report of the SGRST-08-03 Working Group on the Fishing Effort Regime. Author(s): Bailey N., Vanhee W., Davie S., Holmes S., Reeves S., Vinther M., Munch-Petersen S., Coppin F., Biseau A., Verin Y., Lövgren J., Valentinsson D., Röckmann C., González Herraiz I. & Rätz H.-J. Luxembourg: Office for Official Publications of the European Communities 2008 – 468 pp. – 21 x 29.7 cm EUR – Scientific and Technical Research series – ISSN 1018-5593 ISBN 978-92-79-09688-4 DOI 10.2788/37579 Abstract
SGRST-08-03 was held during 1–5 September 2008 in Lysekil, Sweden. A draft report was prepared by SGRST-08-01 during 2-6 June 2008 in Ispra, Italy. The meeting was convened to focus on fleet specific catch (including discards) and effort data in order to evaluate fishing effort regulations enforced since 2003 in order to support multi-annual recovery and management plans. Data were officially called by the European Commission, and the data call was served by the JRC. STECF reviewed the report during its plenary meeting during 3-7 November 2008.
- 464 -
How to obtain EU publications
Our priced publications are available from EU Bookshop (http://bookshop.europa.eu), where you can place an order with the sales agent of your choice.
The Publications Office has a worldwide network of sales agents. You can obtain their contact details by sending a fax to (352) 29 29-42758.
The mission of the JRC is to provide customer-driven scientific and technical supportfor the conception, development, implementation and monitoring of EU policies. As aservice of the European Commission, the JRC functions as a reference centre ofscience and technology for the Union. Close to the policy-making process, it servesthe common interest of the Member States, while being independent of speciainterests, whether private or national.
LB-N
A-23640-EN-C