SCIENTIFIC QUARTERLY No. 4(48)
150
SILESIAN UNIVERSITY OF TECHNOLOGY GLIWICE 2019 ORGANIZATION & MANAGEMENT SCIENTIFIC QUARTERLY No. 4(48)
-
Upload
khangminh22 -
Category
Documents
-
view
5 -
download
0
Transcript of SCIENTIFIC QUARTERLY No. 4(48)
SILESIAN UNIVERSITY OF TECHNOLOGY GLIWICE 2019
ORGANIZATION & MANAGEMENT
SCIENTIFIC QUARTERLY
No. 4(48)

Rada Naukowa
Przewodnicząca Rady Naukowej
Prof. dr hab. Agata STACHOWICZ-STANUSCH, Politechnika Śląska
Honorowi członkowie
Mary C. GENTILE, USA
Prof. James A.F. STONER, USA
Prof. Andrzej KARBOWNIK, Polska
Prof. Charles WANKEL, USA
Członkowie
Prof. Wolfgang AMANN, USA
Prof. dr hab. Mariusz BRATNICKI, Polska
Prof. Manuela BRUSONI, Włochy
Prof. Jan BRZÓSKA, Polska
Prof. Sergey D. BUSHUYEV, Ukraina
Prof. Helena DESIVILYASYNA, Izrael
Prof. Hans Krause HANSEN, Dania
Dr hab. Izabela JONEK-KOWALSKA, Polska
Prof. Matthias KLEINHAMPEL, Argentyna
Prof. Gianluigi MANGIA, Włochy
Prof. Adela McMURRAY, Australia
Prof. Kenneth MØLBJERG-JØRGENSEN, Dania
Prof. dr hab. Maria NOWICKA-SKOWRON, Polska
Prof. Nikos PASSAS, USA
Prof. Stanislav POLOUČEK, Republika Czeska
Prof. Pedro RIESGO, Hiszpania
Dr hab. Agnieszka SITKO-LUTEK, Polska
Prof. Marco TAVANTI, USA
Prof. Marian TUREK, Polska
Prof. Radha RANI SHARMA, Indie
Dr hab. inż. Radosław WOLNIAK, Polska
Dr hab. Krzysztof ZAMASZ, Polska
Komitet Redakcyjny
Redaktor Naczelny – dr hab. inż. Krzysztof WODARSKI
Zastępca Redaktora Naczelnego – prof. dr hab. Agata STACHOWICZ-STANUSCH
Sekretarz Redakcji – dr inż. Aneta ALEKSANDER, mgr Anna HORZELA, mgr Monika STĘPIEŃ, mgr Alina BROL
Sekretarz ds. promocji – dr hab. inż. Jolanta BIJAŃSKA
Redaktor wydawniczy – mgr Andrzej SMOGULSKI
Redaktor statystyczny – dr Anna MĘCZYŃSKA
Redakcja językowa – GROY TRANSLATIONS
Redaktorzy tematyczni
Prof. dr hab. inż. Józef BENDKOWSKI
Prof. dr hab. inż. Małgorzata GABLETA
Dr hab. inż. Izabela JONEK-KOWALSKA
Prof. dr hab. inż. Andrzej KARBOWNIK
Prof. dr hab. inż. Jerzy LEWANDOWSKI
Prof. dr hab. Krystyna LISIECKA
Dr hab. inż. Magdalena PICHLAK
Prof. dr hab. inż. Jan STACHOWICZ
http://oamquarterly.polsl.pl/
http://www.polsl.pl/Wydzialy/ROZ/Strony/Kwartalnik_Naukowy.aspx
email: [email protected]
ISSN 1899-6116
DOI: 10.29119/1899-6116.2019.48
Wersją pierwotną Kwartalnika Naukowego „Organizacja i Zarządzanie” jest wersja papierowa
CONTENTS
1. Justyna CHMIEL, Karolina KOZIOŁ, Rafał PITERA – Verification of early
warning models on enterprises from the SEZS Europark Mielec ……………………. 5
2. Mariola DŹWIGOŁ-BAROSZ – The career of a female manager ………………… 17
3. Marzena KRAMARZ, Edyta PRZYBYLSKA – Identification of sources
of knowledge about disruptions in intermodal transport ……………………………... 27
4. Anna KWIOTKOWSKA – The impact of organizational characteristics
on R&D projects performance in high-tech company ………………………………... 45
5. Filip LIEBERT, Mateusz ZACZYK – The three aspects model – a new point
of view on virtual project teams in the IT industry …………………………………… 59
6. Anna MUSIOŁ-URBAŃCZYK, Barbara SORYCHTA-WOJSCZYK –
Assumptions for the construction of a project management system
in the Górnośląsko-Zagłębiowska Metropolis ………………………………………... 77
7. Oksana SEROKA-STOLKA – Strategic environmental types and obstacles
to the absorption of clean technologies – the case of Poland ………………………… 87
8. Dariusz SIUDAK – The probabilities of the transitions between the interlocking
directorates’ states based on Markov Chains …………………………………………. 103
9. Paweł WÓJCIK, Piotr KRZESIŃSKI – Human capital of tertiary graduates
in the context of their employability in the labour market of Lubelskie province …… 127
10. Agnieszka ZIELIŃSKA – Management and leadership in technology teams –
empirical research …………………………………………………………………….. 143


Scientific Quarterly “Organization and Management”, 2019, Vol. 4, No. 48; DOI: 10.29119/1899-6116.2019.48.1 www.oamquarterly.polsl.pl
VERIFICATION OF EARLY WARNING MODELS ON ENTERPRISES
FROM THE SEZS EUROPARK MIELEC
Justyna CHMIEL1, Karolina KOZIOŁ2*, Rafał PITERA3
1 Faculty of Economics, Department of Finance and Accounting, University of Rzeszow; [email protected],
ORCID: 0000-0002-3890-2785 2 Faculty of Economics, Department of Economics and Management, University of Rzeszow;
[email protected], ORCID: 0000-0002-2195-6373 3 Faculty of Economics, Department of Finance and Accounting, University of Rzeszow; [email protected],
ORCID: 0000-0001-9598-1240
* Correspondence author
Abstract: In this article the authors focus on the verification of models for forecasting
bankruptcy of enterprises. 30 enterprises located in the Mielec zone were surveyed. Early
warning models were used in the study, including 6 discrimination models and 4 logit models.
The purpose of the article is to verify the effectiveness of selected models for forecasting the
bankruptcy of enterprises that operate in the Mielec special economic zone. The financial data
came from the period 1999-2017. It should be noted that "healthy" enterprises, i.e. those in good
financial condition, operate in the zone to date. The conducted research shows that the selected
models correctly reflected the financial situation of the surveyed enterprises (Institute of
Economic Sciences of the Polish Academy of Sciences model of F. Mączyńska and M. Zawadzki 80% accurate forecasts, and the model of J. Gajdka and D. Stos 73.3%).
The authors point out the need to use many analysis models to reliably assess the financial
situation of enterprises. If only one model is used, the results may lead to erroneous conclusions.
Keywords: financial situation of an enterprise, early warning models, company bankruptcy
forecast, special economic zone.
Introduction
Mielec SEZ belongs to the group of leading industrial zones in Poland. It is located in
a town of 61 thousand, located in the south-eastern part of Poland, in Podkarpackie Province.
The zone creates favourable conditions for new investments, both domestic and foreign.
In addition to aviation, the dynamically developing sectors in the zone include automotive,
metalworking and plastics processing. The largest foreign investors are companies from the
USA, Germany, Austria and Italy.
The areas covered by the status of special economic zones, at the end of December 2004,
covered an area of approx. 6526.3 hectares (i.e. 0.02% of the country), they occupied the
6 J. Chmiel, K. Kozioł, R. Pitera
territory of 79 cities and 55 rural municipalities. According to the legal status, as at December
31, 2017, the total area of areas covered by Special Economic Zones could not exceed
25,000. ha (i.e. 250 km2), and the period of their existence was determined by the end of 2026
(PARP, 2018).
It is worth mentioning that the Polish Investment Zone replacing the previous SEZ is an
instrument that is designed to support the sustainable development of the Polish economy.
In accordance with the Act of May 10, 2018 on supporting new investments, the existing
permits to conduct business activities in Special Economic Zones (SEZ) remain in force until
the end of 2026 (Waćkowska-Kabaczyńska, 2019). The newly created tool stimulates areas that
have been defined in the Strategy for Responsible Development (among others: stimulation of
entrepreneurship, innovation of companies, or foreign expansion of Polish enterprises).
The reason for researching the enterprises of the Mielec zone, created as one of the first in
1995, are the authors' scientific interests in the activities of zone companies that efficiently
attract foreign capital, and more often implement new technical and technological solutions,
thus affecting the competitiveness of the manufactured products and services rendered.
The process of continuous adaptation to changing environmental conditions (including
legal, fiscal or administrative regulations) and increasingly demanding customers are the
requirements that 21st century enterprises must meet.
At a time when a different political system prevailed in Poland (centrally planned economy)
the phenomenon of bankruptcy did not occur.
The turn of the1990s in Poland brought about important political changes in the country.
The fact is that the transition from a centrally planned economy to a market economy gave
Poland a chance to modernize the country. One of the tasks was to reduce the distance in relation
to the highest and most developed EU countries.
In 1997, the social market economy was recognized as the constitutional basis of the Polish
economic system, and the inspiration was the experience of Germany, which, drawing on the
doctrine of ordoliberalism, built a social market economy and achieved spectacular success
after World War II (Przybyciński, 2009, p.192).
Immediately after 1990 there was widespread enthusiasm for starting new private
companies; this enthusiasm is measured at an economical level through entrepreneurial
indicators – in the short term, the number of private companies increased, but, as enthusiasm
was not always a good substitute for managerial skills and experience, many newly-founded
companies faced bankruptcy (Pirtea, 2003).
The phenomenon intensified with the appearance of periods of recession in the country,
when the financial policy was upset, which could have resulted in the company's insolvency.
Taking into account the above changes and phenomena, the article attempts to assess the
effectiveness of selected models for forecasting the bankruptcy of enterprises, companies from
Special Economic Zones of Europark Mielec, using 6 discriminative models (as the most
popular tools) and 4 logit models.

Effectiveness of selected database models… 7
Literature review
Many different models have been formulated in the theory and practice of predicting
business bankruptcy (in economic terms of bankruptcy). McKee (T.E. McKee, 2000) presented
an exhaustive classification listing the following types of procedures and models:
- one-dimensional indicator models,
- multidimensional discriminatory analysis,
- linear probability models,
- logit and probit models,
- decision trees,
- gambling models,
- expert systems,
- mathematical programming,
- neural networks,
- application of the theory of fuzzy sets and rough sets.
The first Polish discriminatory model whose task was bankruptcy forecast was
E. Mączyńska's model. The author used a multiplication model of simplified discriminant analysis to predict the bankruptcy of Polish companies (Mączyńska, 1994). The creation of the
model was associated with the adaptation of E. Altman's western model (or Z-score model) to
Polish conditions. Thanks to E. Altman, a precursor in forecasting threats to the functioning of
enterprises, we can talk about the dynamic development of early warning models.
A developed application of Fisher's linear discriminant function is the bankruptcy prediction
model for Polish companies presented in the work of Gajdka and Stos (1996), where the sample
of industrial enterprises surveyed was equal to 40 entities, half of which were bankrupt, and the
other half – "healthy", listed on Warsaw Stock Exchange.
Discriminant analysis methods are free from one major drawback to indicator analysis,
namely the difficulty of clearly and accurately assessing a company's financial position.
According to T. Korol, the most effective method in forecasting the bankruptcy of companies
among all statistical methods is multidimensional discrimination analysis (Korol, 2010, p. 158).
At the same time, current research allows the conclusion that there is not actually one correct
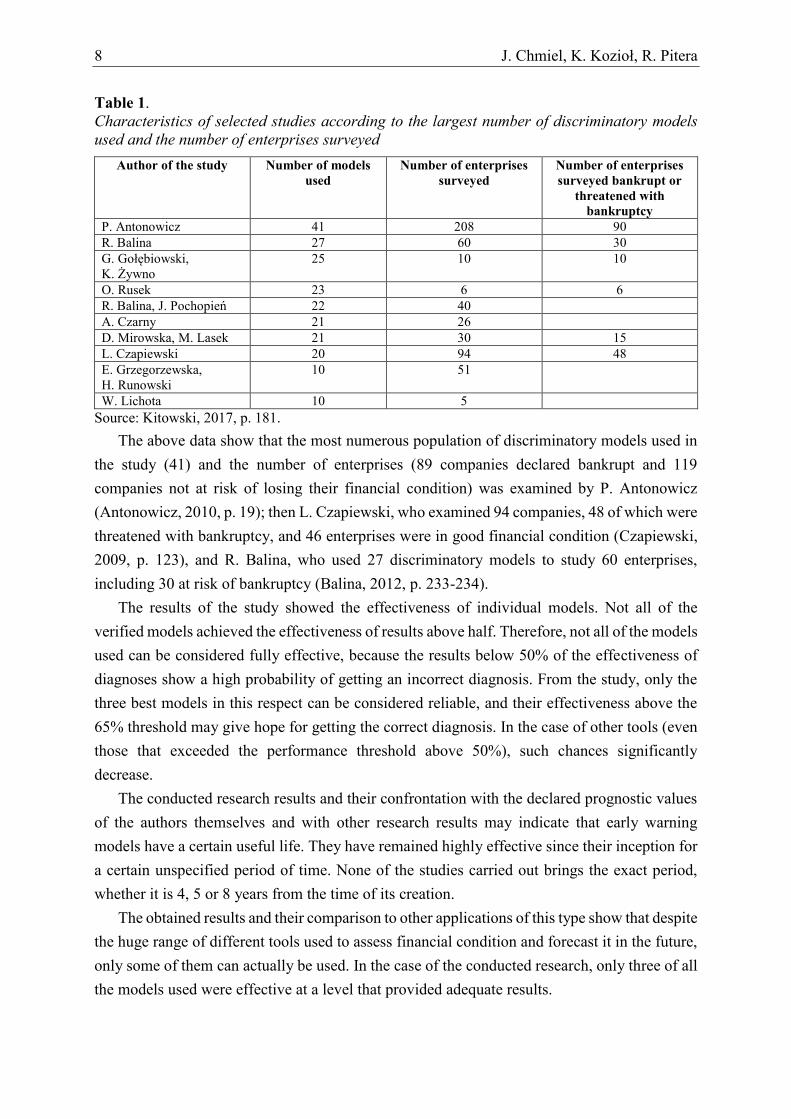
model for assessing the threat of bankruptcy of an enterprise (Mączyńska, Zawadzki 2006, p. 228). The table below is presented, detailing the research of selected authors with the largest
number of discriminatory models used, as well as the number of enterprises surveyed.
8 J. Chmiel, K. Kozioł, R. Pitera
Table 1.
Characteristics of selected studies according to the largest number of discriminatory models
used and the number of enterprises surveyed
Author of the study Number of models
used
Number of enterprises
surveyed
Number of enterprises
surveyed bankrupt or
threatened with
bankruptcy
P. Antonowicz 41 208 90
R. Balina 27 60 30
G. Gołębiowski, K. Żywno
25 10 10
O. Rusek 23 6 6
R. Balina, J. Pochopień 22 40
A. Czarny 21 26
D. Mirowska, M. Lasek 21 30 15
L. Czapiewski 20 94 48
E. Grzegorzewska,
H. Runowski
10 51
W. Lichota 10 5
Source: Kitowski, 2017, p. 181.
The above data show that the most numerous population of discriminatory models used in
the study (41) and the number of enterprises (89 companies declared bankrupt and 119
companies not at risk of losing their financial condition) was examined by P. Antonowicz
(Antonowicz, 2010, p. 19); then L. Czapiewski, who examined 94 companies, 48 of which were
threatened with bankruptcy, and 46 enterprises were in good financial condition (Czapiewski,
2009, p. 123), and R. Balina, who used 27 discriminatory models to study 60 enterprises,
including 30 at risk of bankruptcy (Balina, 2012, p. 233-234).
The results of the study showed the effectiveness of individual models. Not all of the
verified models achieved the effectiveness of results above half. Therefore, not all of the models
used can be considered fully effective, because the results below 50% of the effectiveness of
diagnoses show a high probability of getting an incorrect diagnosis. From the study, only the
three best models in this respect can be considered reliable, and their effectiveness above the
65% threshold may give hope for getting the correct diagnosis. In the case of other tools (even
those that exceeded the performance threshold above 50%), such chances significantly
decrease.
The conducted research results and their confrontation with the declared prognostic values
of the authors themselves and with other research results may indicate that early warning
models have a certain useful life. They have remained highly effective since their inception for
a certain unspecified period of time. None of the studies carried out brings the exact period,
whether it is 4, 5 or 8 years from the time of its creation.
The obtained results and their comparison to other applications of this type show that despite
the huge range of different tools used to assess financial condition and forecast it in the future,
only some of them can actually be used. In the case of the conducted research, only three of all
the models used were effective at a level that provided adequate results.
Effectiveness of selected database models… 9
Research sample and research methodology
The basis for all the methods used in the article was the analysis of existing data.
The analysis includes: a systematic review of the literature, analysis of public data, including
data of the Ministry of Economy, and financial data on enterprises (primarily income statement,
balance sheet).
Based on the collected financial data, 30 enterprises located in the Europark Mielec SEZ –
i.e. 15 bankrupt and 15 termed "healthy"; 10 early warning models were verified
(6 discriminative models and 4 logit models).
The selection of enterprises, apart from operations in the same zone, also concerned
a similar business profile, the number of employees, and the size of assets. All enterprises
operated (operate) in the broadly understood industrial sector. The financial data came from the
period 1999 - 2017. It is also worth adding that healthy enterprises still operate in the zone.
The model of R. Jagiełło was selected for discriminatory models. The author, while creating the model, took into account the specifics of the industry in which a given company operated.
The following models were evaluated:
Discriminatory models:
- model of M. Pogodzińska and S. Sojak
ZPS = 0.644741W1 + 0.912304W2
W1 = (Current assets - Inventories) / (Short-term liabilities)
W2 = (Gross result) / (Sales revenues)
ZPS > 0 good financial condition
ZPS < 0 bankruptcy threat (Pogodzińska, Sojak, 1995);
- model of S. Sojak and J. Stawicki
ZSS bad = -11.6499 - 0.1144W1 + 0.5178W2 - 20.4475W3 - 0.0661W4
ZSS average = -2.3333 - 0.0586W1 - 3.3608W2 + 10.7088W3 + 0.1455W4 - 0.066W5 +
4.5837W6 + 2.4329W7
ZSS good = -5.992 - 0.0153W1 + 2.0482W2 + 9.637W3 + 0.1714W4 - 0.0091W5 -
15.78W6 - 0.0018W7
W1 = (Net profit) / Current assets average) * 100
W2 = (Current Assets - Inventories - Short-term prepayments) / (Short-term liabilities)
W3 = (Average annual working capital) / Average annual assets)
W4 = (Net profit) / (Equity average) * 100
W5 = (Net profit) / Non-current assets average) * 100
W6 = (Net result + Interest on foreign capital - income tax) / (Average assets)
W7 = (Current assets) / (Short-term liabilities)
ZSS > 0 good financial condition
ZSS < 0 bankruptcy threat (Sojak, Stawicki, 2001);
10 J. Chmiel, K. Kozioł, R. Pitera
- model of J. Gajdka and D. Stos
ZJG2 = -0.0005W1 + 2.0552W2 + 1.7260W3 + 0.1155W4 - 0.3342
W1 = (Short-term average annual liabilities - 360) / (Production costs)
W2 = (Net profit) / (Annual assets)
W3 = (Gross profit) / (Sales)
W4 = Assets / Liabilities
ZJG2 > 0 good financial condition,
ZJG2 < 0 bankruptcy
-0.49 <= ZBP =< 0.49 – uncertainty area, no definition of the financial situation (Stos,
Gajdka, 2003).
- B. Prusak's model
ZBP = -1.5685 + 6.5245W1 + 0.148W2 + 0.4061W3 + 2.1754W4
W1 = (EBIT) / (Assets)
W2 = (Operating costs) / (Short-term liabilities)
W3 = (Current assets) / (Short-term liabilities)
W4 = (EBIT) / (Total revenues)
ZBP >= -0.13 good financial condition,
ZBP < -0.13 bankruptcy
-0.13 =< ZBP = < 0.65 "area of uncertainty", no determination of the financial situation
(Prusak, 2005);
- Model "F" of the Institute of Economic Sciences of the Polish Academy of Sciences
E. Mączyńska and M. Zawadzki
ZEM2 = -2.478 + 9.478W1 + 3.613W2 + 3.246W3 +0.455W4 + 0.802W5
W1 = EBIT / (Assets)
W2 = (Equity) / (Assets)
W3 = (Net profit + Depreciation) / (Liabilities)
W4 = (Current Assets) / (Short-term liabilities)
W5 = (Total revenues) / (Assets)
ZEM2 > 0 good financial condition,
ZEM2 < 0 bankruptcy (Mączyńska, 2006); - R. Jagiełło model for the 'Industry' sector
W = -1.8603 + 12.296W1 + 0.1675W2 + 1.399W3
W1 = Profit (loss) on gross sales / Operating expenses
W2 = Total revenues / Assets
W3 = Equity / Assets
With < 0 there is a high probability that this company will be classified as at risk over the
next year
Z > 0 company not in danger of bankruptcy (Jagiełło, 2013).
Effectiveness of selected database models… 11
Logit models:
- T. Korol model
ZTK = 2.0 - 10.19W1 - 4.58W2 - 0.57W3
W1 = Profit on sales / Assets
W2 = (Net profit + Depreciation) / Liabilities
W3 = Operating costs / Short-term liabilities
ZTK <= 0.5 good financial condition,
ZTK > 0.5 bankruptcy.
This is a conventional limit value, because the author himself did not specify such a level.
The value of 0.5 was due to the fact that the learning sample roughly contained a 50%/50%
bankrupt/non-bankrupt ratio. Hence the limit value adopted in this way (Korol, 2010).
- model of D. Wędzki ZDW = -4.0 - 6.0W1 + 9.387W2 - 2.088W3 + 1.317W4 + 0.04W5 - 4.217W6
W1 = (Current assets + Prepayments) / (Short-term liabilities and Special funds +
Prepayments and deferred income)
W2 = (Provisions + Long-term liabilities + Short-term liabilities and Special funds +
Accruals and deferred income) / Assets
W3 = Interest payable / (Profit (loss) on business activities + Interest payable)
W4 = [Net profit (loss) / Equity] / [(Net profit (loss) + Interest payable * (1- Obligatory
encumbrances on the financial result / Gross profit (loss))) / Assets]
W5 = Short-term receivables * Number of days in the period / Net revenues from sales
W6 = Profit (loss) on sales / Net revenues from sales
ZDW =< 0.5 good financial condition,
ZDW > 0.5 bankruptcy (Wędzki, 2005). - M. Gruszczyński model, on the form of the function: ZMG = 4.3515 + 22.8748W1 - 5.5926W2 - 26.1083W3,
W1 = Gross profit/Total revenues
W2 = Liabilities/Assets
W3 = Inventory/Total revenues
where: ZMG > 0, the audited entity is in good financial standing (Gruszczyński, 2003) - P. Stępnia and T. Strąk model, on the form of the function: ZSS = −19 - 11W1 + 6W2 + 40W3 + 19W4,
W1 = Foreign capital/Total capital
W2 = (Current assets - Inventories)/Short-term liabilities
W3 = Net profit/Total capital
W4 = Sales revenues/Operating expenses
where: ZSS > 0, the examined entity is in good financial standing (Stępień, 2004).
12 J. Chmiel, K. Kozioł, R. Pitera
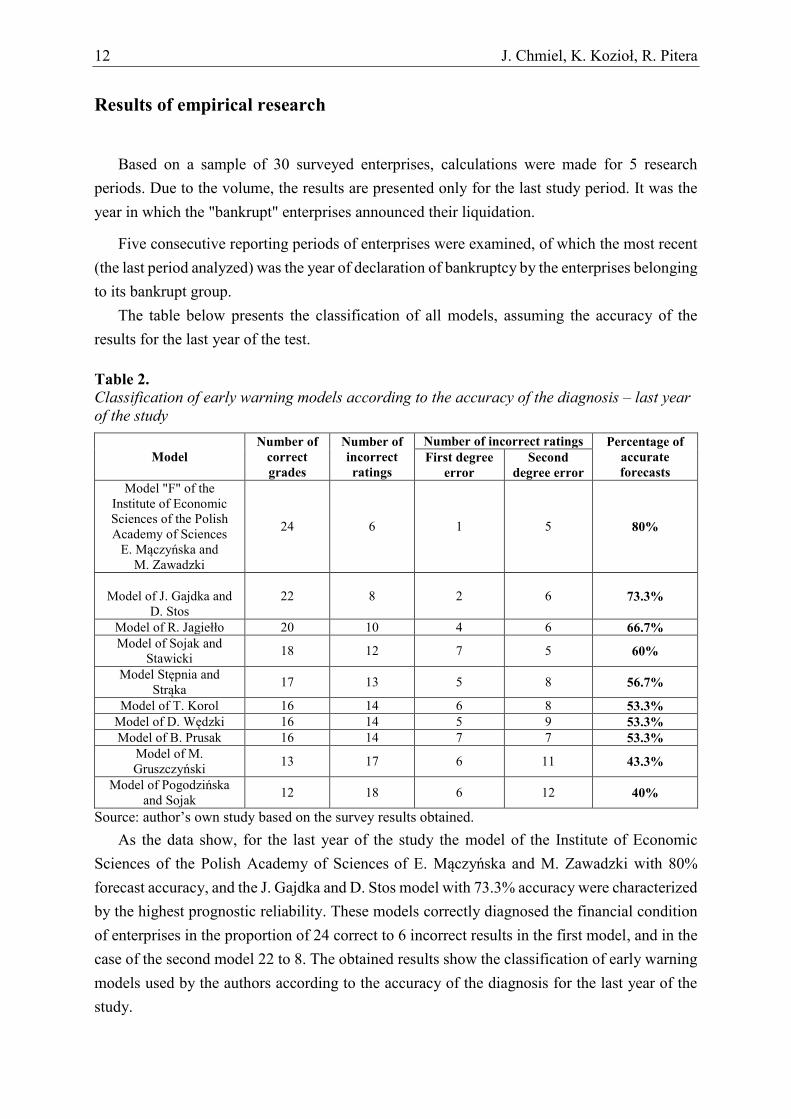
Results of empirical research
Based on a sample of 30 surveyed enterprises, calculations were made for 5 research
periods. Due to the volume, the results are presented only for the last study period. It was the
year in which the "bankrupt" enterprises announced their liquidation.
Five consecutive reporting periods of enterprises were examined, of which the most recent
(the last period analyzed) was the year of declaration of bankruptcy by the enterprises belonging
to its bankrupt group.
The table below presents the classification of all models, assuming the accuracy of the
results for the last year of the test.
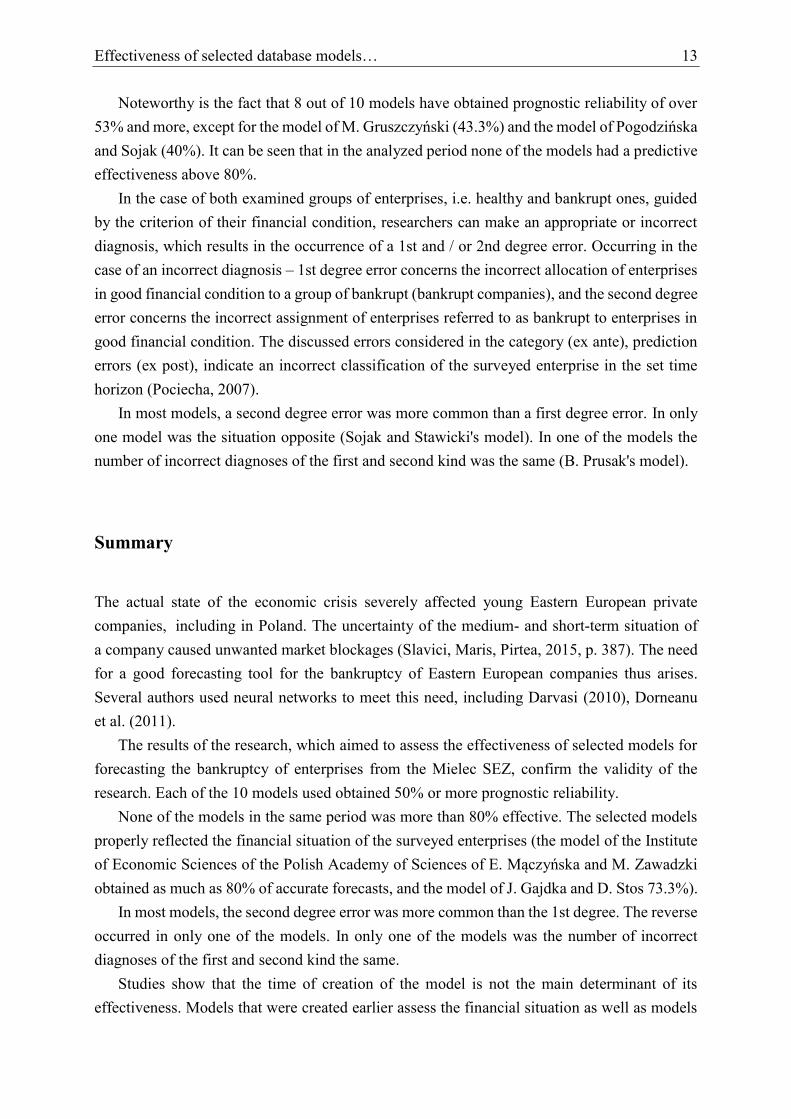
Table 2. Classification of early warning models according to the accuracy of the diagnosis – last year
of the study
Model
Number of
correct
grades
Number of
incorrect
ratings
Number of incorrect ratings Percentage of
accurate
forecasts
First degree
error
Second
degree error
Model "F" of the
Institute of Economic
Sciences of the Polish
Academy of Sciences
E. Mączyńska and M. Zawadzki
24 6 1 5 80%
Model of J. Gajdka and
D. Stos
22 8 2 6 73.3%
Model of R. Jagiełło 20 10 4 6 66.7%
Model of Sojak and
Stawicki 18 12 7 5 60%
Model Stępnia and
Strąka 17 13 5 8 56.7%
Model of T. Korol 16 14 6 8 53.3%
Model of D. Wędzki 16 14 5 9 53.3%
Model of B. Prusak 16 14 7 7 53.3%
Model of M.
Gruszczyński 13 17 6 11 43.3%
Model of Pogodzińska and Sojak
12 18 6 12 40%
Source: author’s own study based on the survey results obtained.
As the data show, for the last year of the study the model of the Institute of Economic
Sciences of the Polish Academy of Sciences of E. Mączyńska and M. Zawadzki with 80% forecast accuracy, and the J. Gajdka and D. Stos model with 73.3% accuracy were characterized
by the highest prognostic reliability. These models correctly diagnosed the financial condition
of enterprises in the proportion of 24 correct to 6 incorrect results in the first model, and in the
case of the second model 22 to 8. The obtained results show the classification of early warning
models used by the authors according to the accuracy of the diagnosis for the last year of the
study.
Effectiveness of selected database models… 13
Noteworthy is the fact that 8 out of 10 models have obtained prognostic reliability of over
53% and more, except for the model of M. Gruszczyński (43.3%) and the model of Pogodzińska and Sojak (40%). It can be seen that in the analyzed period none of the models had a predictive
effectiveness above 80%.
In the case of both examined groups of enterprises, i.e. healthy and bankrupt ones, guided
by the criterion of their financial condition, researchers can make an appropriate or incorrect
diagnosis, which results in the occurrence of a 1st and / or 2nd degree error. Occurring in the
case of an incorrect diagnosis – 1st degree error concerns the incorrect allocation of enterprises
in good financial condition to a group of bankrupt (bankrupt companies), and the second degree
error concerns the incorrect assignment of enterprises referred to as bankrupt to enterprises in
good financial condition. The discussed errors considered in the category (ex ante), prediction
errors (ex post), indicate an incorrect classification of the surveyed enterprise in the set time
horizon (Pociecha, 2007).
In most models, a second degree error was more common than a first degree error. In only
one model was the situation opposite (Sojak and Stawicki's model). In one of the models the
number of incorrect diagnoses of the first and second kind was the same (B. Prusak's model).
Summary
The actual state of the economic crisis severely affected young Eastern European private
companies, including in Poland. The uncertainty of the medium- and short-term situation of
a company caused unwanted market blockages (Slavici, Maris, Pirtea, 2015, p. 387). The need
for a good forecasting tool for the bankruptcy of Eastern European companies thus arises.
Several authors used neural networks to meet this need, including Darvasi (2010), Dorneanu
et al. (2011).
The results of the research, which aimed to assess the effectiveness of selected models for
forecasting the bankruptcy of enterprises from the Mielec SEZ, confirm the validity of the
research. Each of the 10 models used obtained 50% or more prognostic reliability.
None of the models in the same period was more than 80% effective. The selected models
properly reflected the financial situation of the surveyed enterprises (the model of the Institute
of Economic Sciences of the Polish Academy of Sciences of E. Mączyńska and M. Zawadzki obtained as much as 80% of accurate forecasts, and the model of J. Gajdka and D. Stos 73.3%).
In most models, the second degree error was more common than the 1st degree. The reverse
occurred in only one of the models. In only one of the models was the number of incorrect
diagnoses of the first and second kind the same.
Studies show that the time of creation of the model is not the main determinant of its
effectiveness. Models that were created earlier assess the financial situation as well as models
14 J. Chmiel, K. Kozioł, R. Pitera
that were created later. Therefore, it is difficult to determine the useful life of a given model.
However, one should not forget about the choice of methods to assess the financial condition
of enterprises, which is dictated naturally by industry matching. Its task is to reduce the risk of
incorrect model mapping.
References
1. Antonowicz, P. (2010). Zastosowanie macierzy klasyfikacji przedsiębiorstw do oceny zdolności predykcyjnych 52 modeli z-score. Zeszyty Naukowe Politechniki Rzeszowskiej,
272.
2. Balina, R. (2012). Skuteczność wybranych modeli dyskryminacyjnych na przykładzie branży robót budowlanych. Zeszyty Naukowe Uniwersytetu Szczecińskiego, 689.
3. Czapiewski, L. (2009). Efektywność wybranych modeli dyskryminacyjnych
w przewidywaniu trudności finansowych polskich spółek giełdowych. Prace Naukowe
Uniwersytetu Ekonomicznego we Wrocławiu, 48.
4. Darvasi, D. (2010). Foundation and association accounting using traditional and classical
methods and artificial intelligence systems. Timisoara: “Ioan Slavici” Foundation for culture and education Publishing House.
5. Dorneanu, L., Untaru, M., Darvasi, D., Rotarescu, V., Cernescu, L. (2011). Using Artificial
Neural Networks in Financial Optimization. Proceedings of the Fifth Wseas International
Conference on Business Administration (ICBA ’11), WSEAS University Press, Puerto
Morelos, Mexico, 93-96.
6. Gruszczyński, M. (2003). Modele mikroekonometrii w analizie i prognozowaniu zagrożenia finansowego przedsiębiorstw. Warszawa: Instytut Nauk Ekonomicznych Polskiej Akademii
Nauk, 34.
7. Jagiełło, R. (2013). Analiza dyskryminacyjna i regresja logistyczna w procesie oceny
zdolności kredytowej przedsiębiorstw. Materiały i Studia – Narodowy Bank Polski, 286.
8. Kitowski, J. (2017). Stan badań nad wiarygodnością diagnostyczną modeli dyskryminacyjnych. Annales Universitatis Mariae Curie-Skłodowska Lublin –Polonia,
LI, 5, H.
9. Korol, T. (2010). Systemy wczesnego ostrzegania przedsiębiorstw przed ryzykiem upadłości. Warszawa: Oficyna Wydawnicza Wolters Kluwer.
10. Mączyńska, E., Zawadzki M. (2006). Dyskryminacyjne modele predykcji upadłości przedsiębiorstw. Ekonomista, 2.
11. McKee, T.E. (2000). Developing a Bankruptcy Prediction Model via Rough Sets Theory.
International Journal of Intelligent Systems in Accounting, Finance and Management, 9, 3.

Effectiveness of selected database models… 15
12. Pirtea, M. (2003). Treasury Management for Companies. Timisoara: Mirton Publishing
House.
13. Pogodzińska, M., Sojak, S. (1995). Wykorzystanie analizy dyskryminacyjnej w przewidy-
waniu bankructwa przedsiębiorstw. Acta Universitatis Nicolai Copernici – Ekonomia XXV
– Nauki Humanistyczno-Społeczne, 299. Toruń: Wyd. Uniwersytetu Mikołaja Kopernika.
14. Pociecha, J. (2007). Problemy prognozowania bankructwa firmy metodą analizy dyskryminacyjnej, 205. Unifikacja programów nauczania przedmiotów ilościowych. Acta
Universitatis Lodziensis. Folia Oeconomica.
15. Polska strefa inwestycji Zmiany prawne i organizacyjne (2018). Colliers International.
Warszawa: Polska Agencja Inwestycji i Handlu.
16. Prusak, B. (2005). Nowoczesne metody prognozowania zagrożenia finansowego przedsiębiorstw. Warszawa: Difin.
17. Przybyciński, T. (2009). Kształtowanie ładu gospodarczego w Polsce w kontekście integracji z UE. Prace i Materiały Instytutu Rozwoju Gospodarczego SGH, 82. Polityka
gospodarcza w warunkach integracji z Unią Europejską. Warszawa: Szkoła Główna Handlowa.
18. Sojak, S., Stawicki, J. (2001). Wykorzystanie metod taksonomicznych do oceny kondycji
ekonomicznej przedsiębiorstw. Zeszyty Teoretyczne Rachunkowości, 3(59). Warszawa.
19. Slavici, T., Maris, S., Pirtea, M. (2015). Usage of artificial neural networks for optimal
bankruptcy forecasting. Case study: Eastern European small manufacturing enterprises.
Dordrecht: Springer Science + Business Media.
20. Stępień, P., Strąk, T. (2004). Wielowymiarowe modele logitowe oceny zagrożenia bankructwem polskich przedsiębiorstw. In D. Zarzecki (ed.), Zarządzanie finansami: Finansowanie przedsiębiorstw w Unii Europejskiej. Szczecin: Wydawnictwo Uniwersytetu
Szczecińskiego.
21. Stos, D., Gajdka, J. (2003). Ocena kondycji finansowej polskich spółek publicznych w okresie 1998-2001. In D. Zarzecki (ed.), Czas na pieniądz. Zarządzanie finansami. Mierzenie wyników i wycena przedsiębiorstw. Szczecin: Wydawnictwo Uniwersytetu
Szczecińskiego.
22. Waćkowska-Kabaczyńska, M. (2019). Specjalne Strefy Ekonomiczne. Retrieved from:
https://www.gov.pl/web/przedsiebiorczosc-technologia/specjalne-strefy-ekonomiczne,
10.08.2019.
23. Wędzki, D. (2005). Zastosowanie logitowego modelu upadłości przedsiębiorstw.
Ekonomista, 5.


Scientific Quarterly “Organization and Management”, 2019, Vol. 4, No. 48; DOI: 10.29119/1899-6116.2019.48.2 www.oamquarterly.polsl.pl
THE CAREER OF A FEMALE MANAGER
Mariola DŹWIGOŁ-BAROSZ
Silesian University of Technology, Faculty of Organisation and Management, Institute of Management and
Logistics; [email protected], ORCID: 0000-0002-5306-3836
Abstract: The article discusses issues related to the contemporary approach to the professional
career of a female manager. A special focus has been placed on the conditions influencing the
shaping of women's careers. The findings of own research on the perception of women's careers
at managerial positions in modern companies are presented. The considerations are
complemented by an attempt to interpret the reasons for the approach to women's careers.
Keywords: career, manager, woman.
1. Introduction
Women who decide to pursue their careers are obliged to accept both the benefits and the
costs of entering employment. This is reflected in their private lives. For some, a career is
a chance for self-development and to increase their own abilities and skills on professional
grounds. For others, participation in social reality is the essence of gainful employment.
By achieving successes in the professional sector, they gain a higher social status. Many
arguments that encourage women to participate in the multi-sectoral market expansion appeal
to defend their gainful employment. The motives and reasons that encourage women to become
active in the labour market outline a broad spectrum of topics, as well as problems, related to
career and its implementation. It seems that in today's world, it is essential to earn a living by
working, but in this case, it is essential to treat work properly. According to the research
conducted by the Central Economic Information Centre (Centralny Ośrodek Informacji
Gospodarczej, 15.04.2011), 37% of companies are owned by women. Psychologists emphasise
women's greater resilience to stress, ability to act under pressure from multiple tasks, along
with better work organisation and teamwork skills. It seems, therefore, that entrepreneurship is
not lower than in the case of men, although it does not result in promotions. Women are most
often owners of small businesses (they run two-thirds of them) (http://www.gk24.pl/,
31.01.2012), which shows that they feel better in flat organisational structures and that there
are barriers to their promotion to positions in large organisations. This phenomenon has been
18 M. Dźwigoł-Barosz
called the 'the glass ceiling effect' — an invisible, but significant, barrier prohibiting women
from occupying higher positions. Women's careers resemble a pyramid or a glass mountain,
which is impossible to climb, and the prospects indicated by the trends of recent years do not
seem optimistic. Although in Poland women become managers more often than the average in
EU countries (there are six percentage points more of them in these positions), we are slowly
reaching the low EU average level. Over the last five years, the number of female managers has
decreased by 3% (Centralny Ośrodek Informacji Gospodarczej, 08.03.2012).
The aim of the article is to draw attention to the conditions influencing the shaping of
professional careers of women and to examine the perception of professional careers of female
managers in modern companies.
2. Modern approach to career development
Career is a priority value in the life of most of society today and has an impact on
an individual's life (Wiatrowski, 2005). A career is a way of treating work as an opportunity for
self-development and, as D. Gizicka (Gizicka, 2009, p. 325) highlights, is a value that is a vital
source of life satisfaction. On the other hand, M. Suchar (Suchar, 2003, p. 38) defines work as
an autotelic value when it is a source of joy and satisfaction for a human being and, at the same
time, creates a chance for the self-fulfilment of an individual. It is often said that work gives
self-esteem and an opportunity to demonstrate oneself. Many people identify a sense of work
with a sense of life. However, on the contrary, professional activity can be treated by a human
being in an instrumental way and can only be a means to achieve other goals.
The transition to the era of capitalism resulted in profound changes in the performance of
work, where the most important features have been flexibility of time and place, an employee's
contacts with the employer, remuneration system and employee skills. The flexibility of work
has resulted in millions of people becoming 'temporary' workers who have been forced to take
on unsecured working methods that are not favourable to forming a professional identity.
As a result of increased capitalism, relational employment contracts are now transitioning
towards transaction contracts. Its very nature is to exchange the short-term involvement of the
employee in the achievement of the organisation's objectives for the possibility of pursuing an
individual career in that organisation. However, it should be pointed out that an employee's
career development still depends to a large extent on the organisation where he or she works.
The employee is, however, forced to create their own sense of security, usually independently
and through their own responsibility, building up their identity as the bearer of a specific capital
(Tomaszewska-Lipiec, 2016, p. 146).
According to P. Bohdziewicz, an employee functions in the social space in its broad sense
and should create a personal reputation as a professional in a given field. The three major
The career of a female manager 19
directions of change describing the process of transition from a traditional to contemporary
career, which are based on entrepreneurial individuality, include (Bohdziewicz, 2010,
pp. 41-42):
the development of loyalty, referred to as a professional type, instead of organisational
loyalty,
the person's focus on achieving internal rather than external awards,
reliance on oneself during the process of career progression, not on the hiring
organisation.
New trends in career development theory seem to be based on constructivism and social
constructionism. These theories relate to the subjectivity, the agency of the individual,
the attribution of meanings, the mutual relations between the individual and the environment
(McMahon, 2014).
In light of discussions on globalisation, internationalisation and indigenisation, which also
apply to career theory, a criticism of the current most leading career development theories is
being made, pointing to their limitations. They include (Leung, Yuen, 2012):
focusing on personal variables, without taking into account contextual and cultural
variables,
considering self-fulfilment and job satisfaction as objectives of professional choices,
highlighting the significance of free choice and opportunities in decision-making,
development of culturally ingrained practices and measures that are difficult to adapt in
other contexts.
As M. McMahon points out, one of the dominant trends in career psychology is that it takes
little account of the values of "social justice" (McMahon, 2014, p. 15). This approach means
that the careers of women and ethnic minorities, for example, are not sufficiently taken into
account and that this trend in psychology cannot therefore be widely adopted in other cultural
contexts. Critics of such approaches to career psychology stress the underestimation in theories
of the influence of factors such as gender, social status, environmental context, family
conditions or cultural characteristics on the course of individual careers (Blustein, 2011, p. 19).
3. Professional career and gender
The gender of an employee has an impact on the development of a career. Most careers are
gender specific. This group includes stable, conventional, unstable and multi-faceted careers.
There is, however, a set of careers that are specific only to women, where one can distinguish
between home, dual and interrupted work careers. They are largely dependent on biological
aspects, i.e., starting a family, giving birth to children, as well as social aspects, such as
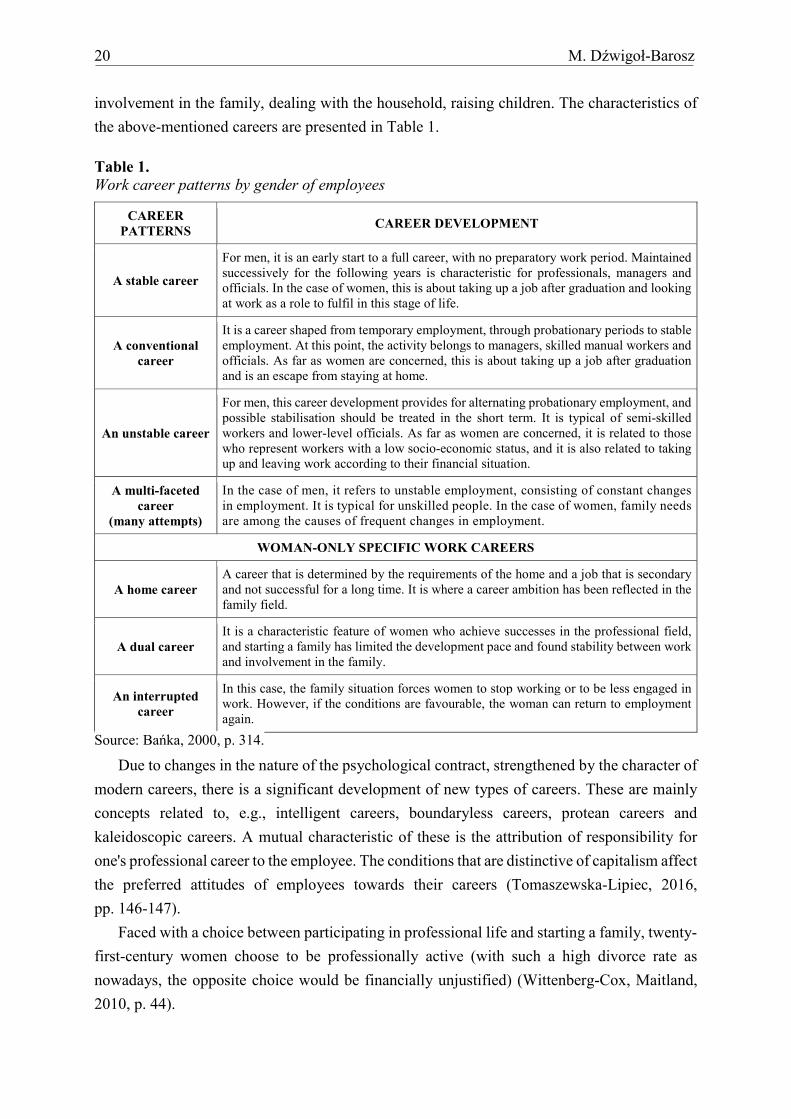
20 M. Dźwigoł-Barosz
involvement in the family, dealing with the household, raising children. The characteristics of
the above-mentioned careers are presented in Table 1.
Table 1.
Work career patterns by gender of employees
CAREER
PATTERNS CAREER DEVELOPMENT
A stable career
For men, it is an early start to a full career, with no preparatory work period. Maintained
successively for the following years is characteristic for professionals, managers and
officials. In the case of women, this is about taking up a job after graduation and looking
at work as a role to fulfil in this stage of life.
A conventional
career
It is a career shaped from temporary employment, through probationary periods to stable
employment. At this point, the activity belongs to managers, skilled manual workers and
officials. As far as women are concerned, this is about taking up a job after graduation
and is an escape from staying at home.
An unstable career
For men, this career development provides for alternating probationary employment, and
possible stabilisation should be treated in the short term. It is typical of semi-skilled
workers and lower-level officials. As far as women are concerned, it is related to those
who represent workers with a low socio-economic status, and it is also related to taking
up and leaving work according to their financial situation.
A multi-faceted
career
(many attempts)
In the case of men, it refers to unstable employment, consisting of constant changes
in employment. It is typical for unskilled people. In the case of women, family needs
are among the causes of frequent changes in employment.
WOMAN-ONLY SPECIFIC WORK CAREERS
A home career
A career that is determined by the requirements of the home and a job that is secondary
and not successful for a long time. It is where a career ambition has been reflected in the
family field.
A dual career
It is a characteristic feature of women who achieve successes in the professional field,
and starting a family has limited the development pace and found stability between work
and involvement in the family.
An interrupted
career
In this case, the family situation forces women to stop working or to be less engaged in
work. However, if the conditions are favourable, the woman can return to employment
again.
Source: Bańka, 2000, p. 314.
Due to changes in the nature of the psychological contract, strengthened by the character of
modern careers, there is a significant development of new types of careers. These are mainly
concepts related to, e.g., intelligent careers, boundaryless careers, protean careers and
kaleidoscopic careers. A mutual characteristic of these is the attribution of responsibility for
one's professional career to the employee. The conditions that are distinctive of capitalism affect
the preferred attitudes of employees towards their careers (Tomaszewska-Lipiec, 2016,
pp. 146-147).
Faced with a choice between participating in professional life and starting a family, twenty-
first-century women choose to be professionally active (with such a high divorce rate as
nowadays, the opposite choice would be financially unjustified) (Wittenberg-Cox, Maitland,
2010, p. 44).
The career of a female manager 21
Additionally, these studies (Hewlett, Buck, 2006, p. 13) have shown that women feel unwell
when they are financially dependent on their spouses. Whether or not their relationship is
successful, most of them do not like asking for money. Nearly half of the surveyed women
(46%) admit that having one's own independent source of income is an important factor
encouraging them to work.
4. The career perception of female managers
E. Lisowska (Lisowska, 2009) claims that a woman has a limited life choice, which is
already culturally determined. In Poland, values such as home and family are respected, but this
is a key reason why Polish women are still overshadowed by men, despite increasingly better
education.
When analysing the reasons for combining a career and motherhood, it is worth drawing
attention to opinions concerning women's work. According to the figures, more than two-fifths
(44%) of those surveyed believe that working women have greater social respect than
housewives who are only involved in housekeeping and childcare. The opposite opinion is
expressed only by 5% of respondents. It is also worth noting, though, that despite quite frequent
beliefs about the greater social role of economically active women than those who take care of
children and work in the household, almost three quarters of respondents (74%) do not
differentiate respect for women depending on their professional status (CBOS, 28.09.2016).
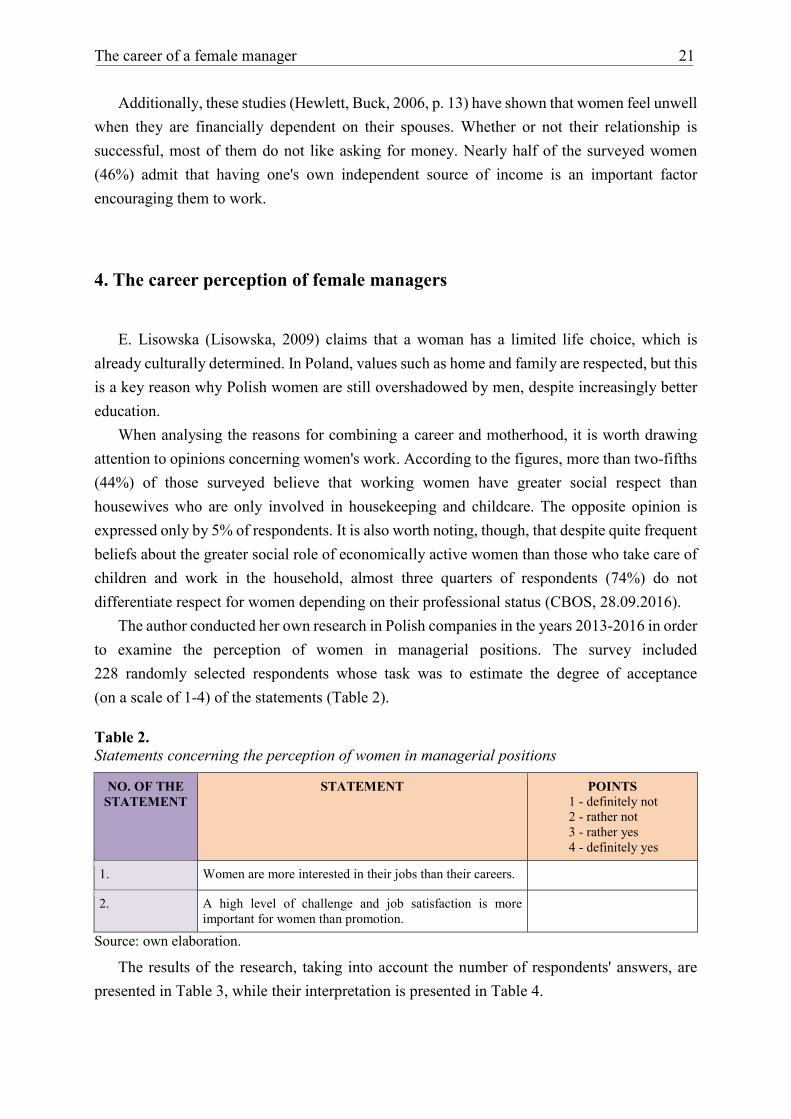
The author conducted her own research in Polish companies in the years 2013-2016 in order
to examine the perception of women in managerial positions. The survey included
228 randomly selected respondents whose task was to estimate the degree of acceptance
(on a scale of 1-4) of the statements (Table 2).
Table 2.
Statements concerning the perception of women in managerial positions
NO. OF THE
STATEMENT STATEMENT POINTS
1 - definitely not
2 - rather not
3 - rather yes
4 - definitely yes
1. Women are more interested in their jobs than their careers.
2. A high level of challenge and job satisfaction is more
important for women than promotion.
Source: own elaboration.
The results of the research, taking into account the number of respondents' answers, are
presented in Table 3, while their interpretation is presented in Table 4.
22 M. Dźwigoł-Barosz
Table 3.
The number of respondents' answers
NO. OF THE
STATEMENT
RESPONDENTS' ANSWERS
definitely not rather not rather yes definitely yes
Statement 1 29 71 86 42
Statement 2 18 51 104 55
Source: own elaboration.
Table 4.
The interpretation of research results
THE PERCEPTION OF WOMEN
IN MANAGERIAL POSITIONS ACCEPTANCE OF
THE STATEMENT INTERPRETATION WITH
PERCENTAGE OF RESPONSES
1. Women are more interested in
their jobs than in their careers. DEFINITELY NOT
and RATHER NOT Women are not more interested in work
than in careers according to 44% of
respondents.
DEFINITELY YES
and RATHER YES Women are more interested in the job itself
than in the career according to 56% of
respondents.
2. More attention paid to high level
of challenges and job satisfaction
than to promotion.
DEFINITELY NOT
and RATHER NOT According to 30% of the respondents,
women do not attach more importance to
high level of challenges and job satisfaction
than to promotion itself.
DEFINITELY YES
and RATHER YES According to 70% of the respondents,
women are more attached to high level of
challenges and job satisfaction than to
promotion.
Source: own elaboration.
The research conducted by the author shapes the image of a woman as more interested in
her work than in her career. This opinion is confirmed by 56% of respondents. In addition,
according to 70% of respondents, managers pay more attention to high level of challenges and
job satisfaction than promotion itself.
Seeking the reasons for such an approach to a woman's professional career, the question
arises: what is the reason for perceiving women as those who attach more importance to work,
high level of challenges and job satisfaction than to career and promotion?
The answers to this question can be found in the results of research conducted by
B. Budrowska, D. Duch and A. Titkow (Budrowska, Duch, Titkow, 2003, pp. 88-91), who, in
their report, published the barriers and limitations related to the development of careers of
Polish women. These are:
the omnipresent assignment of women to traditional roles — women and men,
representatives of business and politics, share the view that motherhood is the cause of
women's reduced availability;

The career of a female manager 23
stereotypical views on women's nature — men emphasise and uphold the cultural
pattern of femininity as delicate, gentle and sensitive and treat their rapid decision-
making as impatience;
men's attitude towards women in the context of mutual cooperation — different
assessment of their own and men's work. The assessment of women consists of two
assessments: the assessment of the cultural shaping of femininity and the assessment of
substantive work. Women also feel protectionism from men, disrespect, envy and
jealousy about achievements;
beliefs about women and men as bosses — a female boss is more concerned about work
organisation and teamwork. Some women cannot imagine 'managing a man'. Women
also often use non-substantive arguments and psychological games, which makes some
women prefer male bosses;
the status of male and female solidarity — there is often strong male solidarity and
a lack of female solidarity, which may be due to the lack of women in positions
dominated by men. And if there is already a group of women, rivalry begins instead of
building solidarity.
From another perspective, perhaps it is the women themselves who are to blame?
Observation shows that the key barriers to women's job promotion are a lack of self-confidence
and self-esteem, as well as submission to opinions and prejudices of the environment.
Well-known surveys show that almost half of men consider themselves to be exceptionally or
very ambitious, with only one-third of women thinking so, although this percentage is growing
consistently, especially among those working in business, where 43% of respondents admit to
having a high level of ambition. In the race to the top, they therefore lose out to men, even
though they are well educated and have the knowledge and skills to hold key positions in
companies.
5. Conclusion
In the recruitment process, and later when applying for promotion, a woman will hear that
it is not a role for her, that women are not good leaders, directors, etc., or that such a role will
make it worse for her to function as a mother, there is a great risk of launching a negative
autostereotype. Indeed, women will be worse off in competitions or assessments, because there
is stress that they will confirm this stereotype, and they will not be good enough as managers,
and at the same time, they will become worse mothers. It may also be a desire to prove to men
that in a managerial role, they are as good as men are. This willingness to prove their
competence, as well as additional pressure, results in less concentration and attention to the
task. In such cases, women do in fact perform worse, because additional thinking about the

24 M. Dźwigoł-Barosz
difficulties arising from their role reduces their ability to process data. It is, to some extent,
women's own responsibility not to let themselves and others run a stereotypical pattern of their
gender in an emotionally difficult situation, but to concentrate on their achievements and
successes — trying not to think of themselves as simply a woman but as a person who has
experience and will cope with the task ahead of her (Raport…, p. 14).
Due to the above, there is a lack of consistency and ambiguity in the approach to
a professional career pursued by women in managerial positions.
The results of research conducted by Deloitte, supported by numerous analyses, indicate
that stereotypes and lack of understanding of the benefits of their participation in management
have a significant impact on the poor position of women in company management. However,
the research also shows that men are better promoted as those in power — due to the extortion
strategy they use to build their careers in companies. Even in top managerial positions, men do
not stop applying pressure, fighting and breaking resistance. On the other hand, in relations
with subordinates and co-workers, chairwomen and female board members behave differently
— they use consultations to inspire the team and use methods of rational justification.
They apply them much more often than men in similar positions (Frańczak, Georgijew, 2012,
p. 17 & next).
In recent years, a new phenomenon has been observed with regard to those women who
have already taken up top positions in a company. However, these successful managers often
leave the company despite being at the top and start their own businesses. This escape from the
highest levels to their own business is called a careerpreneur, corporate incubator or corporate
climber (Terjesen, pp. 246-259). The most common reasons for women leaving a company are
wage inequality, frustration with organisational restrictions and the need for greater flexibility
(Vinnicombe, Bank, 2003).
When considering the professional career of women, it is worth noting that they are often
assigned to support functions jobs and are rarely in positions directly linked to executive
decision making. Women are assessed on the basis of professional skills, not managerial skills,
and this is the direction in which their careers are most often shaped from the very beginning.
At present, a number of measures are being undertaken in order to equalise the rules of
functioning of women and men in business. The evolution of the management approach will
make it possible to achieve an effective balance in managerial positions, which will save a lot
of frustration for ambitious and successful women not wishing to lose their femininity.
The career of a female manager 25
References
1. Bańka, A. (2000). Działalność zawodowa i publiczna. In J. Strelau (ed.), Psychologia
(p. 314). Gdańsk: GWP.
2. Blustein, D.L. (2011). Vocational Psychology at the fork in the Road: Staying the course or
taking the road less traveled. Journal of Career Assessment, 19.
3. Bohdziewicz, P. (2010). Współczesne kariery zawodowe: od modelu biurokratycznego do
przedsiębiorczego. Zarządzanie Zasobami Ludzkimi, 3-4.
4. Budrowska, B., Duch, D., Titkow, A. (2003). Szklany sufit: bariery i ograniczenia karier
polskich kobiet. Raport z badań jakościowych. Warszawa: Instytut Spraw Publicznych.
5. Centralny Ośrodek Informacji Gospodarczej (15.04.2011), http://biznes.gazetaprawna.pl/
artykuly/505499,kobiety_bryluja_w_biznesie_przybywa_tez_pan_ktore_przynosza_do_d
omu_wiecej_pieniedzy_niz_ich_mezowie.html, 14.12.2018.
6. Centralny Ośrodek Informacji Gospodarczej. In Puls Biznesu, 08.03.2012.
7. CBOS. Kobieta pracująca. Komunikat z badań, www.cbos.pl/SPISKOM.POL/2013/
K_028_13. PDF, 28.09.2016.
8. Filipowicz, G. (2004). Zarządzanie kompetencjami zawodowymi. Warszawa: PWE.
9. Frańczak, H., Georgijew, I. (2012). Kobiety i władza w biznesie. Thinktank, zima.
10. Gizicka, D. (2009). Praca zawodowa kobiety a jej miejsce w rodzinie. In M. Szyszka (ed.),
Społeczeństwo, przestrzeń, rodzina. Księga jubileuszowa dedykowana Profesorowi
Piotrowi Kryczce. Lublin.
11. Hewlett, S.A., Buck, L.C. (2006). Odejścia i powroty. Czyli jak zatrzymać utalentowane
kobiety na ścieżce zawodowej. In Kobiety i biznes. Gliwice: Helion.
12. http://www.gk24.pl/, 31.01.2012.
13. Leung, Yuen (2012). Context – Resonant Systems. Perspectives in Career Theory.
In M. McMahon, M. Watson, W. Patton (eds), Handbook of Career Development.
14. Lisowska, E. (2009). Kobiecy styl zarządzania. Gliwice: Helion.
15. McMahon, M. (2014). New Trends in Theory Development in Career Psychology.
New York.
16. Raport z badania mechanizmów budowania pozycji w organizacji oraz sposobów
wywierania wpływu przez osoby zajmujące wyższe stanowiska menedżerskie w Polsce:
Kobiety i władza w biznesie. Czy płeć ma znaczenie dla budowania pozycji i wpływu
w organizacji? Deloitte, październik 2012.
17. Suchar, M. (2003). Kariera i rozwój zawodowy. Gdańsk.
18. Terjesen, S. Senior Women managers: Leveraging Embedded Career Capital in New
Ventures. Career Development International, 10(3).
19. Tomaszewska-Lipiec, R. (2016). Eksternalizacja odpowiedzialności w obszarze kariery
zawodowej. Ruch Pedagogiczny, 1.

26 M. Dźwigoł-Barosz
20. Wiatrowski, Z. (2005). Podstawy pedagogiki pracy. Bydgoszcz.
21. Wittenberg-Cox, A., Maitland, A. (2010). Kobiety i ich wpływ na biznes. Nowa rewolucja
gospodarcza. Warszawa: Oficyna a Wolters Kluwer business.
22. Vinnicombe, S., Bank, J. (2003). Women with Attitude. London: Routledge.

Scientific Quarterly “Organization and Management”, 2019, Vol. 4, No. 48; DOI: 10.29119/1899-6116.2019.48.3 www.oamquarterly.polsl.pl
IDENTIFICATION OF SOURCES OF KNOWLEDGE ABOUT
DISRUPTIONS IN INTERMODAL TRANSPORT
Marzena KRAMARZ1*, Edyta PRZYBYLSKA2
1 Silesian University of Technology, Zabrze, [email protected], ORCID: 0000-0003-0619-5809 2
Silesian University of Technology, Zabrze, [email protected], ORCID: 0000-0002-9475-5927
* Correspondence author
Abstract: Intermodal transport networks, as examples of business networks created in supply
chains, are differentiated not only due to types of key resources in the organization, but also
due to such things as network structure, the nature of the organizations involved, the types of
relations they have, and the roles of individual actors in the network. The business network is
understood as a dynamic system whose configuration depends on the fulfilment of particular
tasks and the competencies of the organizations which form them. Such networks are inherently
temporary, because a new task can initiate the creation of completely new inter-organizational
bonds or change the type of pre-existing relations between network nodes. The cooperation of
enterprises in a freight transport network compels one to look at the problem of knowledge
management in a wider context. The paper focuses on the first stage of knowledge management,
which is knowledge acquisition in an organization and its environment. The paper presents the
idea of gathering knowledge, and identification of the sources of disruptions in an intermodal
network.
Keywords: intermodal transport, disruptions, logistic network.
1. Introduction
Contemporary European transport policy definitely stresses the necessity to develop inter-
branch and balanced transport systems. These guidelines include intermodal transport, which
involves transporting loads in one invariable loading unit on the entire transport route, using
mainly those branches of transport which generate smaller external costs. However, achieving
intermodal transport requires commitment from many entities and the creation of an
interorganizational transport network. Such interrelations may consist of not only competition,
but also collaboration between entities to determine the success and realization of planned
activities and assumed aims. However, the considerable complexity of intermodal transport
networks makes them susceptible to disruptions at different stages of material flows.
These disruptions can vary in nature, impact and origin, and can be generated by every
participant in the network. Due to the significant influence on the reliability of realized flows,
28 M. Kramarz, E. Przybylska
it is essential to gain knowledge about disruptions in order to allow networks to establish
a resilience to them. In connection with the above, this paper aims to design a model of
managing knowledge about disruptions in intermodal transport networks. In order to achieve
such a goal, three detailed exploratory questions were assumed:
• What disruptions are characteristic for intermodal transport networks?
• What are the sources of disruptions in intermodal transport networks?
• Which actors of the network should be included in a disruption monitoring system?
Obtaining answers to the above research questions and fulfilling the assumed objective will
allow further research into the resilience of intermodal transport networks.
2. Interorganizational networks in intermodal transport
For decades management sciences have been leading investigations into the nature of
interorganizational networks. They are defined as networks of enterprises, economic networks
or business networks (Kawa, 2013, p. 77). The literature broadly described the reasons for, and
potential advantages obtained from functioning within networks. However, a consensus
emerged that an organization’s results are no longer able to be based only on the internal
resources and possibilities of an enterprise, but they have to be widely based on resource flows
and relations to other entities in the market (Centenaro, Guedes Laimer, 2017, p. 66).
Consequently, the network approach changes the field of exploration by shifting the source of
the competitive advantage from the inside of an organization to the outside of it, and there it
focuses on single network links, their relations, and adopted methods of cooperation or
organization (Czakon, 2015, p. 11). Referring to the above statements, according to W. Czakon
(2015, p. 11), the expression of attained superiority due to its functioning in the network could
be called a network pension, and treated as a definite distinguishing characteristic trait of the
network.
"Network” is a key notion in the network approach, and it means a number of units
connected within a system of many different connections (Guzdek, 2016, p. 193); it is a set of
actors connected by a set of bonds (Czakon, 2012, p. 15); it is a specific form of connections
among entities, based on correlations, cooperation and confidence (Antonowicz, 2016, p. 76).
According to the IMP Group (The Industrial Marketing and Purchasing Group), a network is
a set of long-term formal and informal (direct and indirect) connections (relations) which appear
between two or more entities (Kawa, 2013, p. 77). In another study, A. Kawa and B. Pierański (2015, pp. 24-25) stress that an interorganizational network is formed by at least three
independent entities and the bonds appearing among them. However, A. Buttery and E. Buttery
(1994, p. 17) indicate two or more organizations connected with relations which influence all
participants of the network. Supply networks are a type of network where material flows play
a key role. They are defined as: “a system built from nodes cooperating with one another in

Identification of sources of knowledge… 29
order to increase the geographical range of influence, market penetration, activity
diversification, and an increase in the innovativeness of the offered products and services” (Kramarz, Kramarz, 2015, p. 61).
In connection with the fact that the functioning of interorganizational networks has become
a characteristic trait of any contemporary economy, it must be stressed that network activity is
performed by enterprises representing different kinds of business activity in the market.
An example is a transport business represented by different branches, concerning both
passenger and freight transport. In connection with the above, it is essential to define the notion
of a "transport network". The literature most frequently presents this it through the prism of
connections in the form of roads, railway lines, or air links within a punctual infrastructure
(Kawa, 2013, p. 333). Also, D. Bernacki (2012, p. 674) identifies transport networks with sets
of transport units and transport connections appearing among them in the form of transport
routes. However, in the presented depiction, a transport network is not understood as compatible
with the network approach known from management sciences.
In this paper, transport networks will be identified as groups of entities connected to one
another by formal and informal relations. These can have vertical and horizontal connections.
The former concern enterprises interrelated in the "supplier-recipient" relation. Flows occurring
between them mainly concern objects and information, thus creating a supply chain. The latter
concern entities which represent the same business activity, offer the same or similar products on
the market, but participate in different supply chains (Kawa, 2013, p. 335). D. Ford and S. Mouzas
(2013, p. 436) stress the significance of relations in established interorganizational networks.
Firstly, they indicate that they cause a decrease in the separation of entities in the network.
Moreover, they treat relations as primary assets, such as financial or physical ones, which are also
valuable to the economic entity. Additional relations have a considerable influence on the
activation and development of performed activities and possessed resources. J. Rześny-
Cieplińska (2010, pp. 226-227) treat transport business enterprises building networks as a form
of adopted strategy for creating competitiveness in the market. Moreover, in her opinion,
networks within which transport enterprises perform activity should be classified according to
several criteria, for instance: property, participation conditions, the scope of activity, and the type
of activity. In the context of the last criterion attention should be paid to the significant number
of different networks to be formed. They are, for example, networks built within a given transport
branch or their combination. Consequently, there appears an idea of intermodal transport
networks as part of contemporary transport policy, which stresses the necessity to build an
integrated and balanced multi-branch transport system. Again, attention should be paid to
defining an intermodal transport network not concurrent with the approach in management
sciences. M. Janic (2007, pp. 33-34) defines an intermodal transport network as a set of nodes of
intermodal character together with flows of consolidated loads appearing among them, such as
containers, exchangeable semitrailers or bodywork, involving the utilization of at least two
branches of transport. The main participants of such a network are supposed to be: senders and
recipients of loads, operators of trans-shipping terminals, and transport enterprises which
30 M. Kramarz, E. Przybylska
physically realize transport as part of different branches of transport. However, similarly to
transport networks, this paper looks at intermodal transport networks of a different nature, taking
into account the building of interorganizational networks based on horizontal relations between
units. In such a depiction, an intermodal transport network will be defined as a set of entities
representing a widely understood branch of intermodal transport together with the relations
appearing among them. These entities will in practice be connected with different branches of
transport used in freight traffic (road, railway, inland navigation, sea, air freight). In such
a network the leading actors will be: forwarding agencies (in individual branches of transport),
transport forwarders, including intermodal transport (within different transport relations,
e.g. road-railway), logistics operators offering full service of loads, also taking into account
transport tasks, operators of intermodal terminals (railway, sea, air and inland waterway
terminals), and administrators of linear infrastructure or customs agencies.
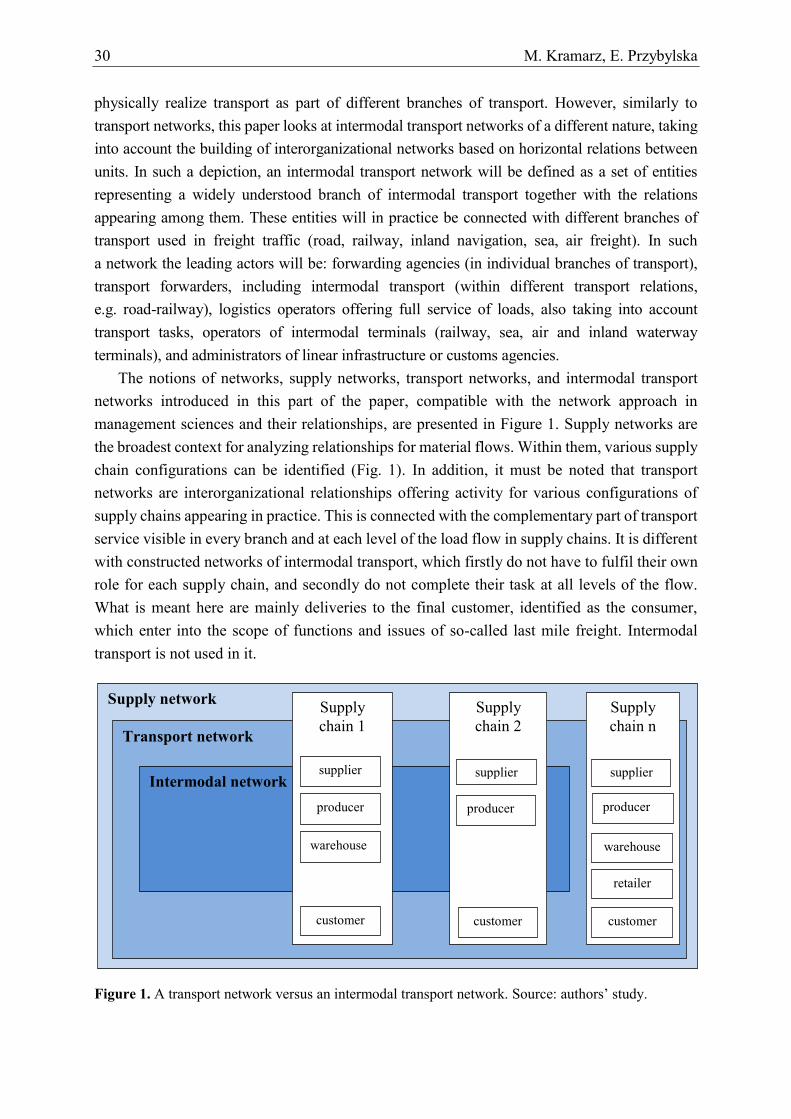
The notions of networks, supply networks, transport networks, and intermodal transport
networks introduced in this part of the paper, compatible with the network approach in
management sciences and their relationships, are presented in Figure 1. Supply networks are
the broadest context for analyzing relationships for material flows. Within them, various supply
chain configurations can be identified (Fig. 1). In addition, it must be noted that transport
networks are interorganizational relationships offering activity for various configurations of
supply chains appearing in practice. This is connected with the complementary part of transport
service visible in every branch and at each level of the load flow in supply chains. It is different
with constructed networks of intermodal transport, which firstly do not have to fulfil their own
role for each supply chain, and secondly do not complete their task at all levels of the flow.
What is meant here are mainly deliveries to the final customer, identified as the consumer,
which enter into the scope of functions and issues of so-called last mile freight. Intermodal
transport is not used in it.
Fig. 1. A transport network versus an intermodal transport network
Source: the authors' study
Figure 1. A transport network versus an intermodal transport network. Source: authors’ study.
Supply network
Transport network
Intermodal network
Supply
chain n
Supply
chain 2
Supply
chain 1
supplier
producer
warehouse
customer
supplier
customer
supplier
producer
warehouse
producer
customer
retailer
Identification of sources of knowledge… 31
The activity of contemporary transport markets, including especially of the intermodal
character, requires close co-operation and partnership among haulage operators, and with other
entities participating in the process of transport and logistics service. The necessity to provide
customers with complex services at high quality level involves building transport networks
which consist of various entities. Their mutual collaboration allows full co-ordination and the
improvement of material and informational flows (Antonowicz, 2011, p. 14). The contemporary
transport market is global in nature, represented by enterprises with different capital whose
range is international. It is a challenge for building collaborative networks due to the
considerable complexity of managing such an international network. This is associated with
cultural differences and business practices in individual countries where network participants
come from (Guzdek, 2016, p. 196). Also, W. Downar (2010, p. 103) stresses the enormous
complexity, multi-agent approach, organizational variety and strong external and internal
connections in transport activity. Consequently, it requires interactions between organizations
which are directly or indirectly connected with offering transport services. The complexity of
the process of providing the customer with value demands a new approach to transport
management. One of its guidelines is to build permanent, formal or informal relations based on
collaboration and confidence. Especially small and average enterprises, representing the same
segment, build collaborative networks in order to increase their own competitiveness in the
market. This is associated with access to external partners' resources (Centenaro, Guedes
Laimer, 2017, pp. 66, 69-70), and replacing or supplementing competitive relations with those
based on collaboration.
M. Antonowicz (2016, p. 77) defines intermodal transport as a service system and
characterized as the collaboration, cooperation and partnership of all entities participating in
the service regardless of the number of chain links involved. These entities have a various
character. They are inter-related by long-term relations, add values to the transport as part of
their activity, and often take the role of suppliers and recipients in relation to one another.
The network approach towards intermodal transport assumes that the organizational results are
no longer based only on the internal resources and possibilities of an enterprise, but largely on
the relations and flows of resources which the enterprise has with other entities in the market.
C. Theys, W. Dullaert and T. Notteboom (2008, pp. 1-37) indicate that the success of the
development and realization of intermodal transport is strictly connected to the ability to
combine loads and coordinate different activities, branches and entities within the intermodal
chain. They stress that a multi-branch and multi-agent approach of intermodal transport calls
for building collaborative networks of the involved parties. Simultaneously, in their opinion,
it is essential to motivate entities to start collaboration within their networks. They refer to costs,
which require that the participation of individual entities in collaboration will not cost more
than their individual work. They propose using the potential of cooperative game theory for
collaborative network analysis within intermodal transport with regard to fair cost sharing
among the involved parties. The necessity to collaborate instead of compete in intermodal

32 M. Kramarz, E. Przybylska
transport is also stressed by A. Febrarro (2016, pp. 84-85), who indicates the possibility to
exchange real-time information with the use of intelligent transport systems as an advantage of
collaborative networks, and notes that the possible supplementary cost resulting from the
collaboration of entities can be compensated for by the reduction of storage and waiting time
for loading/unloading, or the loading/unloading operation itself.
Also, the literature indicates building intermodal transport networks as a way to reduce
external transport costs referring to the negative impact on the natural environment. It is hoped
that an efficiently built network will be a chance for the fulfilment of the idea of balanced cities,
regions or countries (Yamada, et al., 2009, p. 129). A. Centenaro and C. Guedes Laimer (2017,
pp. 66, 69-70) ascribe a special advantage functioning in a network to the possibility of
increasing their own competitiveness in the market, which mainly concerns small and average
enterprises. Apart from the environmental aspects, they include, for instance: the possibility to
reduce transport costs, to improve the quality of transport, an increase in market share, or
reduction of the risk connected with performed activities (Serrano-Hernández, at al., 2017,
p. 398).
The key role in an intermodal transport network is played by enterprises representing nodes
in the form of intermodal terminals; their location, served branches of transport and connections
appearing among them are indicated (Munima, Haralambides, p. 89). A similar opinion in
relation to the significance of operators of terminals in networks was introduced by R. Šakalys and N. Batarlienė (2017, p. 282). They especially focused on the necessity to synchronize the
activities of terminals with respect to place and time. Moreover, they stress the necessity of
close coordination of operations among all the involved entities, especially including of the
linear and point infrastructure and transport operators. M. Antonowicz (2011, p. 14) also
focuses on the part of the infrastructure (mainly including terminals, logistic centres, ports)
which is an instrument for creating conditions for concentrating entities interested in offering
transport services and providing patency and efficiency of realized flows in the network.
Bearing in mind the indicated conditions of intermodal transport networks, this paper
focuses on the issue of disruptions appearing in material flows in such a network.
3. Disruptions and managing knowledge about disruptions in supply chain
and transport networks
Disruptions in supply chains are defined as unexpected events which slow down or stop
material flows between organizations participating in manufacturing and delivering goods and
services (Schmitt, Singh, 2012, pp. 22-32). Y. Sheffi (2005) notes that every type of disruption
requires other activities, so, depending on key risk factors, prevention can vary. Sheffi (2005),

Identification of sources of knowledge… 33
while investigating ways in which enterprises can respond to strong disruptions and conduct
activities reducing threats connected with disruptions, claimed that:
Reduction of bottlenecks connected with disruptions occurs through monitoring, early-
warning systems (an increase in the sensitivity of a supply chain), and quick reaction to
the change of needs, collaboration and redundance;
operating flexibility is increased through standardization of parts, facilitating their
replaceability (product modularity, product designing from the logistics perspective),
the postponed production strategy or mass customization of products (multi-variant
approach) in response to changes of needs which are difficult to forecast, management
of relations with customers and suppliers.
These approaches are an answer to identified disruptions, including their type, frequency
and effects, and aim to increase the resilience of the entire system. The effects of disruptions in
intermodal transport is a deterioration of the reliability indicators, i.e. certainty, completeness
and punctuality of fulfilled transport processes. Gaining and gathering information about
disruptions and then processing this information into knowledge which is distributed among
the network participants is becoming an essential element of managing the entire intermodal
transport network. Gaining, gathering, processing and making knowledge available are
elements of knowledge management systems (Chung-Jeng, Jing-Veins, 2007, pp. 104-118).
Regardless of the scope of the knowledge gathered in the network, it is essential to make
a distinction between data, information, and knowledge. The idea of imperfect knowledge takes
into account inaccuracies, ambiguities, incompleteness, contradictions and untruths from each
of the elements of the knowledge pyramid (Krause, Clark, 1993, pp. 3-9; Ackoff, 1989, pp. 3-9).
As stressed by Bukowski (2016), data consisting of signs and symbols, recorded, processed and
sent, have themselves neither particular meaning nor utility. Only their interpretation decides
their value. The information which is a set of sorted, processed, well-ordered data, presented in
a form which can be useful for the recipient, has a subjective character because it depends not
only on data, but also on the process of their interpretation (Bukowski, 2016; Skyttner, 2008).
Knowledge comes into being by integrating new information with the existing knowledge
concerning a given area of interest, and requires an ability to assess the available information
and understand the reality in light of the available information (Janiszewski, Labroo, Rucker,
2016, pp. 200-208). The skill of effective utilization of the possessed knowledge and experience
is defined as wisdom. In this understanding, Table 1 presents an interpretation of individual
elements of the knowledge pyramid for disruptions in material flows.
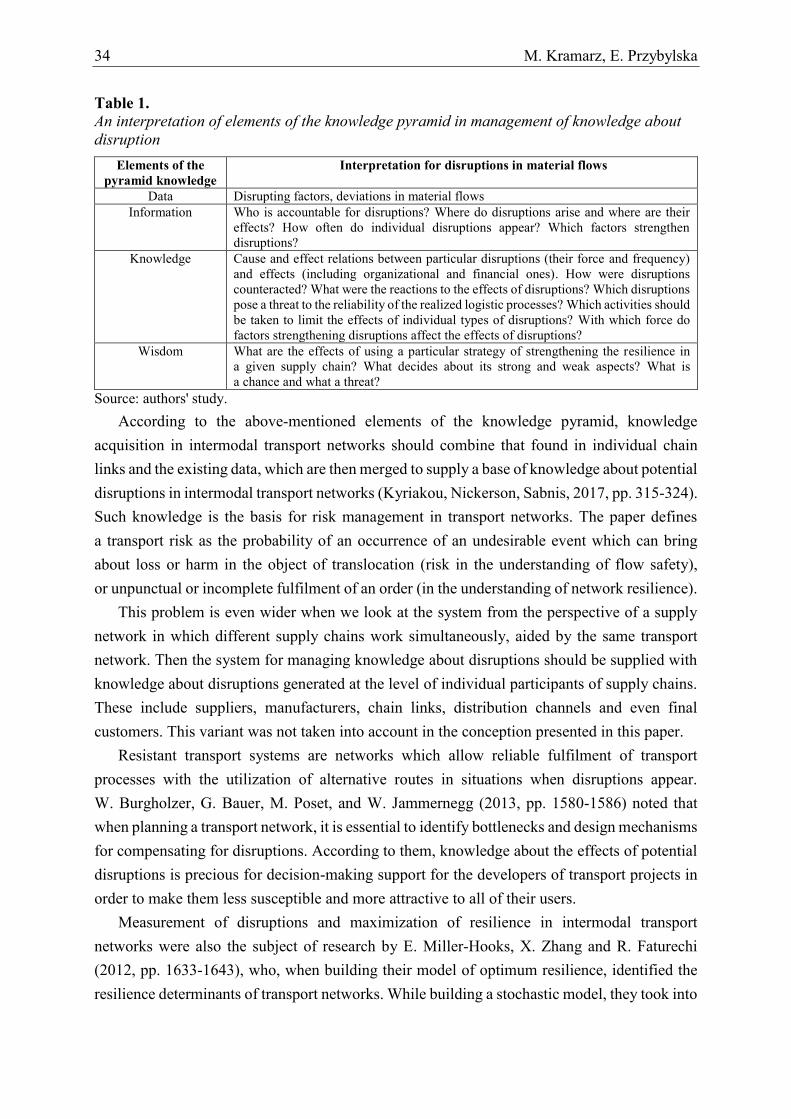
34 M. Kramarz, E. Przybylska
Table 1.
An interpretation of elements of the knowledge pyramid in management of knowledge about
disruption
Elements of the
pyramid knowledge
Interpretation for disruptions in material flows
Data Disrupting factors, deviations in material flows
Information Who is accountable for disruptions? Where do disruptions arise and where are their
effects? How often do individual disruptions appear? Which factors strengthen
disruptions?
Knowledge Cause and effect relations between particular disruptions (their force and frequency)
and effects (including organizational and financial ones). How were disruptions
counteracted? What were the reactions to the effects of disruptions? Which disruptions
pose a threat to the reliability of the realized logistic processes? Which activities should
be taken to limit the effects of individual types of disruptions? With which force do
factors strengthening disruptions affect the effects of disruptions?
Wisdom What are the effects of using a particular strategy of strengthening the resilience in
a given supply chain? What decides about its strong and weak aspects? What is
a chance and what a threat?
Source: authors' study.
According to the above-mentioned elements of the knowledge pyramid, knowledge
acquisition in intermodal transport networks should combine that found in individual chain
links and the existing data, which are then merged to supply a base of knowledge about potential
disruptions in intermodal transport networks (Kyriakou, Nickerson, Sabnis, 2017, pp. 315-324).
Such knowledge is the basis for risk management in transport networks. The paper defines
a transport risk as the probability of an occurrence of an undesirable event which can bring
about loss or harm in the object of translocation (risk in the understanding of flow safety),
or unpunctual or incomplete fulfilment of an order (in the understanding of network resilience).
This problem is even wider when we look at the system from the perspective of a supply
network in which different supply chains work simultaneously, aided by the same transport
network. Then the system for managing knowledge about disruptions should be supplied with
knowledge about disruptions generated at the level of individual participants of supply chains.
These include suppliers, manufacturers, chain links, distribution channels and even final
customers. This variant was not taken into account in the conception presented in this paper.
Resistant transport systems are networks which allow reliable fulfilment of transport
processes with the utilization of alternative routes in situations when disruptions appear.
W. Burgholzer, G. Bauer, M. Poset, and W. Jammernegg (2013, pp. 1580-1586) noted that
when planning a transport network, it is essential to identify bottlenecks and design mechanisms
for compensating for disruptions. According to them, knowledge about the effects of potential
disruptions is precious for decision-making support for the developers of transport projects in
order to make them less susceptible and more attractive to all of their users.
Measurement of disruptions and maximization of resilience in intermodal transport
networks were also the subject of research by E. Miller-Hooks, X. Zhang and R. Faturechi
(2012, pp. 1633-1643), who, when building their model of optimum resilience, identified the
resilience determinants of transport networks. While building a stochastic model, they took into
Identification of sources of knowledge… 35
account the location of container terminals. A similar direction of research into intermodal
transport networks was chosen by M. Francesco, M. Lai, and P. Zuddas, (2013, pp. 827-837)
when also designing a stochastic model. However, they focused their attention on other nodes
of the intermodal transport network: ports. Based on the designed model, they created scenarios
of material flows in intermodal transport networks.
In the above-mentioned publications researchers identify sources of interference, or sources
of risk, in intermodal transport networks. Their analysis allows for a separation of potential
disruptions in intermodal transport networks. Therefore, risk in transport processes can be
associated with:
wrong decisions caused by false, unreliable, insufficient and irregular information;
negligence, ignorance or non-observance of regulations and appointed procedures
connected with required documents, binding duties of a haulage operator, the human
factor;
technical factors;
random factors.
Freight transport is particularly connected with the possibility of threat to goods, damage or
loss, which in practice causes a decrease in the safety of material flows. This threat frequently
results from the incompetence of the transport enterprise, and more precisely an incompetent,
irresponsible worker who allows such threats during the transportation of a commodity. Threats
affecting a decrease in safety during the transportation of an entrusted commodity arise through
endogenous factors and the influence of the external environment on the transported
commodity. Particularly, attention must be paid to such elements as (Romanov, Stajniak,
Konecka, 2017, pp. 620-624):
the technical state of a vehicle;
the suitable protection of shipment;
the technical state of roads;
the driver's skills.
Increasing the security level in transport is influenced by legal regulations. They especially
concern the maximum period a vehicle can be driven non-stop, and the frequency and length of
pauses in driving. Safety is also directly influenced by: observance of traffic rules, a high culture
of driving, maintaining a good physical condition, i.e. eating properly and regularly, valuable
rest during pauses in driving.
Potential sources of disruptions, identified in this part of the paper, were described in detail
in pilot research, which concerned two subnets of intermodal transport in Poland. The notion
of a "subnet” was adopted here in consideration of their fragmentary character in relation to the entire intermodal transport network of working in Poland.
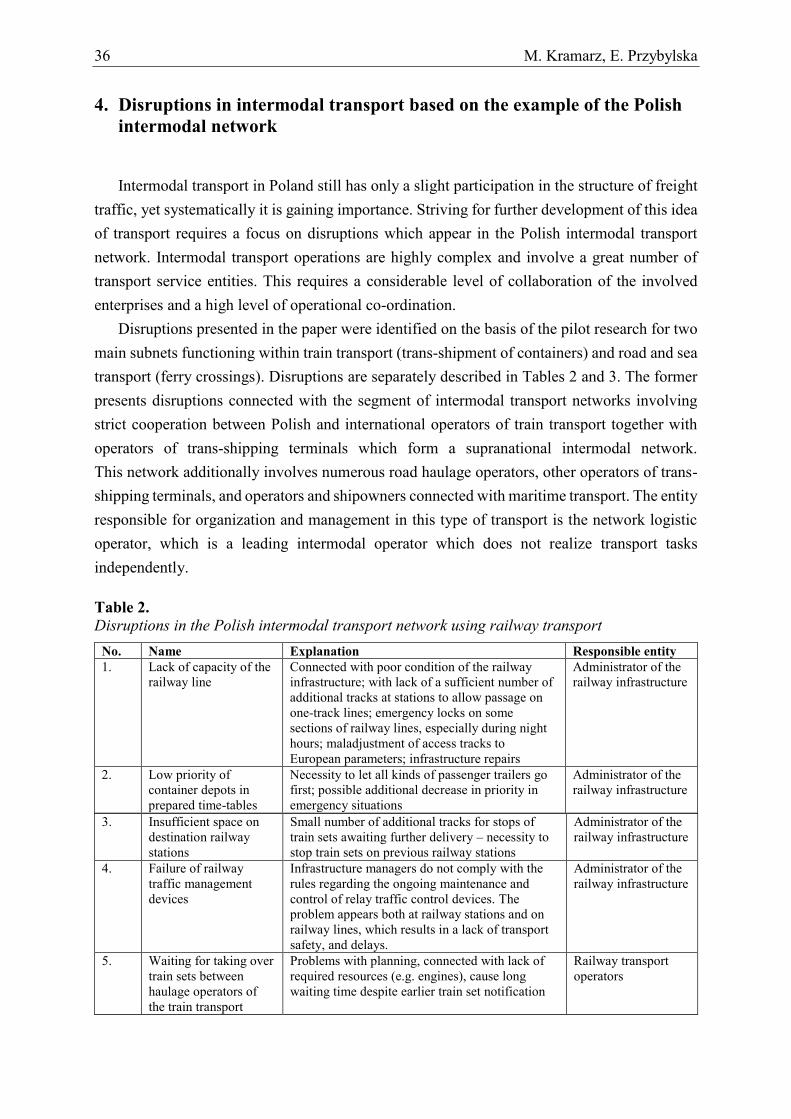
36 M. Kramarz, E. Przybylska
4. Disruptions in intermodal transport based on the example of the Polish
intermodal network
Intermodal transport in Poland still has only a slight participation in the structure of freight
traffic, yet systematically it is gaining importance. Striving for further development of this idea
of transport requires a focus on disruptions which appear in the Polish intermodal transport
network. Intermodal transport operations are highly complex and involve a great number of
transport service entities. This requires a considerable level of collaboration of the involved
enterprises and a high level of operational co-ordination.
Disruptions presented in the paper were identified on the basis of the pilot research for two
main subnets functioning within train transport (trans-shipment of containers) and road and sea
transport (ferry crossings). Disruptions are separately described in Tables 2 and 3. The former
presents disruptions connected with the segment of intermodal transport networks involving
strict cooperation between Polish and international operators of train transport together with
operators of trans-shipping terminals which form a supranational intermodal network.
This network additionally involves numerous road haulage operators, other operators of trans-
shipping terminals, and operators and shipowners connected with maritime transport. The entity
responsible for organization and management in this type of transport is the network logistic
operator, which is a leading intermodal operator which does not realize transport tasks
independently.
Table 2.
Disruptions in the Polish intermodal transport network using railway transport
No. Name Explanation Responsible entity 1. Lack of capacity of the
railway line
Connected with poor condition of the railway
infrastructure; with lack of a sufficient number of
additional tracks at stations to allow passage on
one-track lines; emergency locks on some
sections of railway lines, especially during night
hours; maladjustment of access tracks to
European parameters; infrastructure repairs
Administrator of the
railway infrastructure
2. Low priority of
container depots in
prepared time-tables
Necessity to let all kinds of passenger trailers go
first; possible additional decrease in priority in
emergency situations
Administrator of the
railway infrastructure
3. Insufficient space on
destination railway
stations
Small number of additional tracks for stops of
train sets awaiting further delivery – necessity to
stop train sets on previous railway stations
Administrator of the
railway infrastructure
4. Failure of railway
traffic management
devices
Infrastructure managers do not comply with the
rules regarding the ongoing maintenance and
control of relay traffic control devices. The
problem appears both at railway stations and on
railway lines, which results in a lack of transport
safety, and delays.
Administrator of the
railway infrastructure
5. Waiting for taking over
train sets between
haulage operators of
the train transport
Problems with planning, connected with lack of
required resources (e.g. engines), cause long
waiting time despite earlier train set notification
Railway transport
operators

Identification of sources of knowledge… 37
Cont. table 2. 6. Extended time of shunting
works connected with
changing engines
Waiting for another engine causes prolonged
stoppages at the change station, and the priority
falls on the entire train set at further sections of
the route
Railway transport
operators
7. Lack of engines at the
transfer station
Results from errors in planning and delays Railway transport
operators
8. Delayed train set from
abroad
Caused by many reasons, e.g. lack of engines,
lack of staff, loading delays, etc.
Railway transport
operators
9. Waiting for cars Waiting for groups of cars coming from other
terminals to be coupled to the main set
Railway transport
operators
10. Staff problems Lack of traction team (e.g. no engine driver);
lack of authorization on a particular type of
engine; lack of knowledge about the route
Railway transport
operators
11. Failures of cars Regular inspection for incorrectness in the used
means of transport
Railway transport
operators
12. Failures of engines Regular inspection for incorrectness in the used
means of transport
Railway transport
operators
13. Lack of an auditor Lack of a person responsible for technical
inspection, inspection of the train set to check its
conformity with documentation
Railway transport
operators
14. Lack of the planned train
in the SEPE system
The train will not start because it is not visible to
the traffic controller and other staff members
Railway transport
operators
15. Damage to containers The terminal can refuse to accept the train set for
trans-shipment and further transport in
connection with defects
Operator of trans-
shipping terminal/
road haulage
operators/railway
transport operators
16. Long and delayed train
loading
Despite notification the haulage operator must
wait for completion of loading/unloading
Operator of trans-
shipping terminal
17 Delays in preparing
documentation
Necessity to wait for the delivery of required
documentation
Operator of trans-
shipping terminal
18. Weather conditions Climatic influence is unpredictable, independent
from network participants
None
Source: authors' study.
The disruptions indicated in the table do not exhaust the list of all possible disruptions.
However, they are key events which appear in the analysed segment of the intermodal transport
network. Additionally, disruptions appearing at other levels of the network should also be
indicated, e.g. collaboration of road transport entities with operators of trans-shipping terminals
and with operators of train transport and with maritime transport operators, etc. Nevertheless,
this is not the subject of analysis in this study.
Another example of an intermodal transport subnet analysed from the perspective of
disruptions is the collaboration of entities in road and ferry deliveries. This type of activity
involves the transportation of loads via road transport to the seaport, followed by trans-shipment
of the road conveyance by ferry and, at the last stage, road transport to the recipient.
This network consists of: road transport enterprises (forwarding and transport), logistics
operators, customs agencies, operators of seaports, and maritime transport shipowners.
The identified disruptions are presented in Table 3.
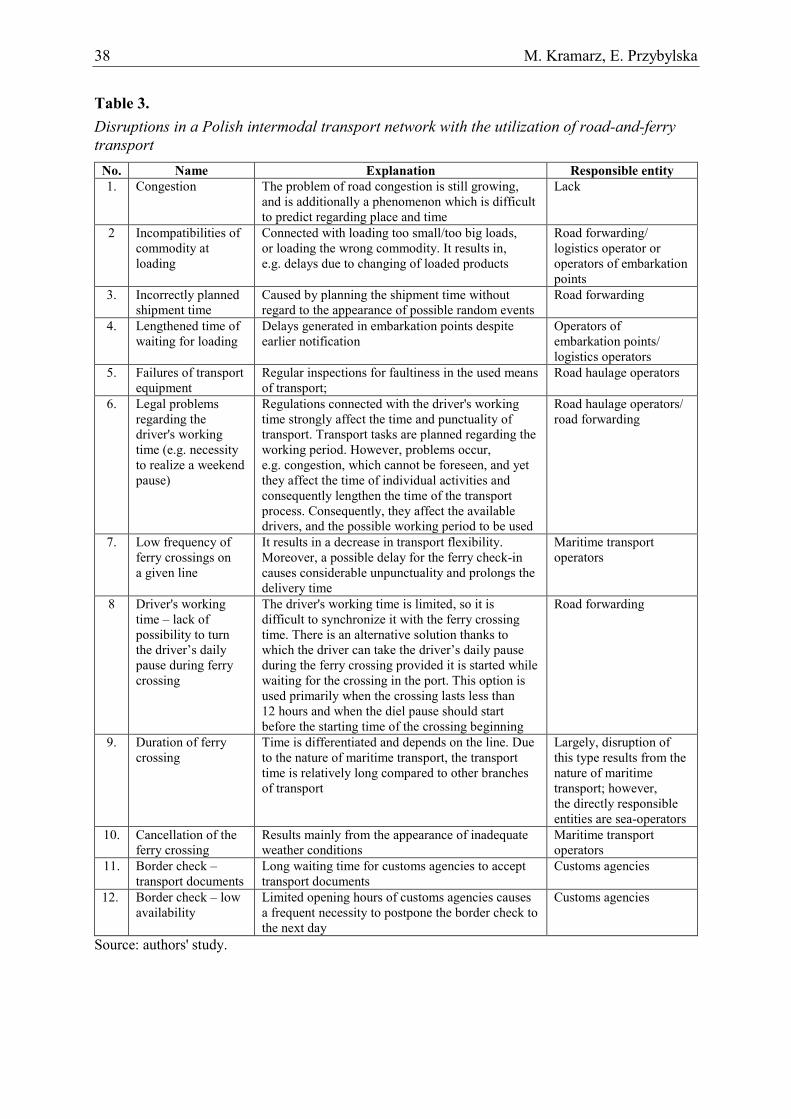
38 M. Kramarz, E. Przybylska
Table 3.
Disruptions in a Polish intermodal transport network with the utilization of road-and-ferry
transport
No. Name Explanation Responsible entity
1. Congestion The problem of road congestion is still growing,
and is additionally a phenomenon which is difficult
to predict regarding place and time
Lack
2 Incompatibilities of
commodity at
loading
Connected with loading too small/too big loads,
or loading the wrong commodity. It results in,
e.g. delays due to changing of loaded products
Road forwarding/
logistics operator or
operators of embarkation
points
3. Incorrectly planned
shipment time
Caused by planning the shipment time without
regard to the appearance of possible random events
Road forwarding
4. Lengthened time of
waiting for loading
Delays generated in embarkation points despite
earlier notification
Operators of
embarkation points/
logistics operators
5. Failures of transport
equipment
Regular inspections for faultiness in the used means
of transport;
Road haulage operators
6. Legal problems
regarding the
driver's working
time (e.g. necessity
to realize a weekend
pause)
Regulations connected with the driver's working
time strongly affect the time and punctuality of
transport. Transport tasks are planned regarding the
working period. However, problems occur,
e.g. congestion, which cannot be foreseen, and yet
they affect the time of individual activities and
consequently lengthen the time of the transport
process. Consequently, they affect the available
drivers, and the possible working period to be used
Road haulage operators/
road forwarding
7. Low frequency of
ferry crossings on
a given line
It results in a decrease in transport flexibility.
Moreover, a possible delay for the ferry check-in
causes considerable unpunctuality and prolongs the
delivery time
Maritime transport
operators
8 Driver's working
time – lack of
possibility to turn
the driver’s daily pause during ferry
crossing
The driver's working time is limited, so it is
difficult to synchronize it with the ferry crossing
time. There is an alternative solution thanks to
which the driver can take the driver’s daily pause
during the ferry crossing provided it is started while
waiting for the crossing in the port. This option is
used primarily when the crossing lasts less than
12 hours and when the diel pause should start
before the starting time of the crossing beginning
Road forwarding
9. Duration of ferry
crossing
Time is differentiated and depends on the line. Due
to the nature of maritime transport, the transport
time is relatively long compared to other branches
of transport
Largely, disruption of
this type results from the
nature of maritime
transport; however,
the directly responsible
entities are sea-operators
10. Cancellation of the
ferry crossing
Results mainly from the appearance of inadequate
weather conditions
Maritime transport
operators
11. Border check –
transport documents
Long waiting time for customs agencies to accept
transport documents
Customs agencies
12. Border check – low
availability
Limited opening hours of customs agencies causes
a frequent necessity to postpone the border check to
the next day
Customs agencies
Source: authors' study.

Identification of sources of knowledge… 39
Similar to the case of Table 2, the list of disruptions indicated in Table 3 is not complete.
Further analyses and enlargement of research will allow the supplementation of the list of
disruptions both for the presented intermodal transport subnets and other networks not taken
into account in the paper.
5. The model of managing knowledge about disruptions in intermodal
transport
Consequence plays a very crucial role in the identification of disruptions. It allows for the
categorization of all the essential disruptions and threats, and for defining the classes of risks
resulting from them. Therefore, it is advised to use different methods which supplement and
verify one another. Compelling organizations in a collaborative transport network to share their
knowledge is definitely the most difficult obstacle to building a system for managing disruptions
in intermodal networks. It requires formalized methods to gain knowledge from commercial and
logistic partners, as well as qualitative methods activating the acquisition of secret knowledge.
The organization coordinating material flows must possess tools adequate for methods of gaining
both open and secret knowledge. Moreover, it is essential to design a methodology of acquiring
data, and then converted it into knowledge about disruptions in individual nodes of the supply
chain. Organizations usually accumulate data exclusively about deviations in material flows
which result from disruptions. Only a certain number of organizations convert those data into
information about where and why deviations occur. Both this information and the unprocessed
data should be accumulated in one network node.
Disruption studies that take into account disruption management problems, resilience and
recovery of freight transport networks, focus on long-term strategic assessments that concern
responsiveness to bombs, terrorist attacks, floods, earthquakes and terminal attacks (Serrano-
Hernández, Juan, Faulin, Perez-Bernabeu, 2017; Sheffi, 2005). Only a limited number of studies
consider the operational level, such as (Skyttner, 2008) who provides a disruption management
method while considering road disruptions and their estimated duration (Ambra, Caris, Macharis,
2019, p. 3). Identification of disruptions should occur in real time, so it is necessary to supplement
the measurement performed by a computer science system with diary research. The data obtained
as a result of the diary research in the chain link where they were recorded should be converted
into information on disruptions available for other network nodes. As shown by investigations,
computer science systems sometimes tend to record deviations in material flows, ineffectively
classifying them to particular sources of disruptions. However, such a connection is necessary in
the knowledge base. Disruptions should be recorded in all cooperating links. However,
the information transferred to the material decoupling point should be information exclusively
about those events whose effects failed to be levelled in the chain link in which they occur.
Those disruptions which resulted in deviations from fulfilled processes, which were levelled in
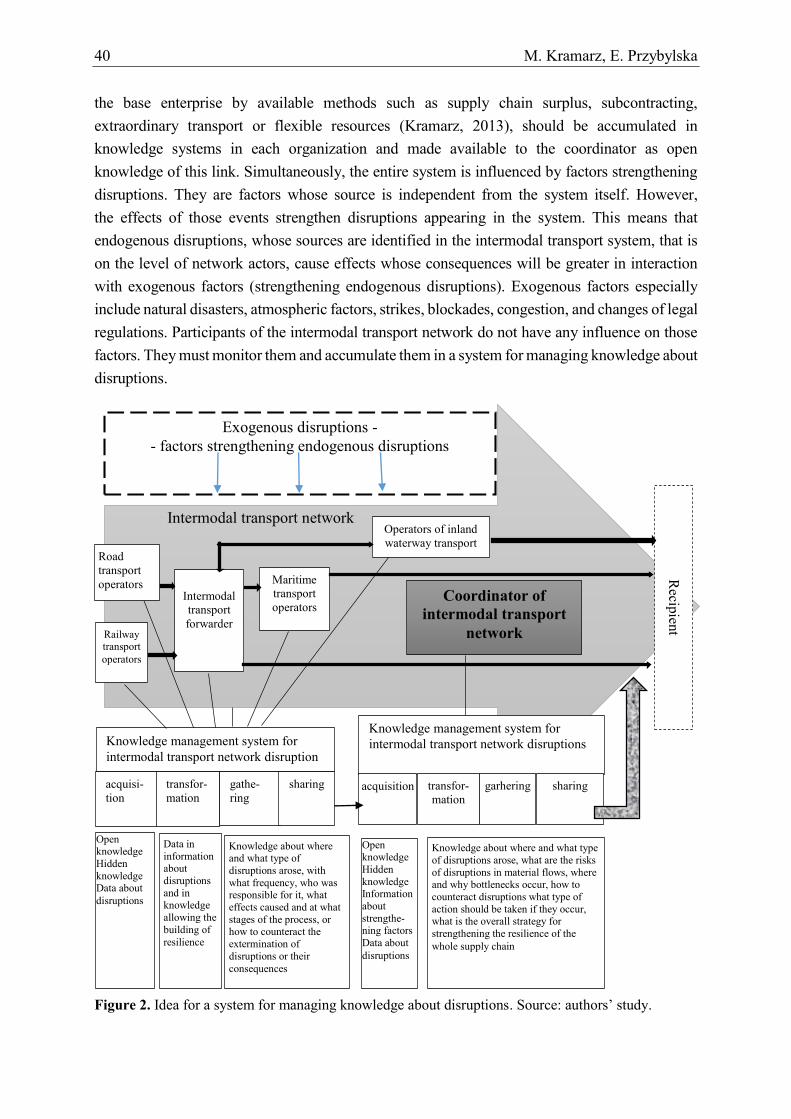
40 M. Kramarz, E. Przybylska
the base enterprise by available methods such as supply chain surplus, subcontracting,
extraordinary transport or flexible resources (Kramarz, 2013), should be accumulated in
knowledge systems in each organization and made available to the coordinator as open
knowledge of this link. Simultaneously, the entire system is influenced by factors strengthening
disruptions. They are factors whose source is independent from the system itself. However,
the effects of those events strengthen disruptions appearing in the system. This means that
endogenous disruptions, whose sources are identified in the intermodal transport system, that is
on the level of network actors, cause effects whose consequences will be greater in interaction
with exogenous factors (strengthening endogenous disruptions). Exogenous factors especially
include natural disasters, atmospheric factors, strikes, blockades, congestion, and changes of legal
regulations. Participants of the intermodal transport network do not have any influence on those
factors. They must monitor them and accumulate them in a system for managing knowledge about
disruptions.
Figure 2. Idea for a system for managing knowledge about disruptions. Source: authors’ study.
Maritime
transport
operators
Intermodal
transport
forwarder Railway transport
operators
Recip
ient
Operators of inland
waterway transport Road
transport
operators
Knowledge management system for
intermodal transport network disruption
Knowledge management system for
intermodal transport network disruptions
acquisi-
tion
transfor-
mation
gathe-
ring
sharing
acquisition transfor-
mation
garhering
sharing
Intermodal transport network
Open knowledge
Hidden
knowledge Data about
disruptions
Data in
information about
disruptions
and in knowledge
allowing the
building of
resilience
Knowledge about where and what type of
disruptions arose, with
what frequency, who was responsible for it, what
effects caused and at what
stages of the process, or how to counteract the
extermination of
disruptions or their
consequences
Knowledge about where and what type
of disruptions arose, what are the risks
of disruptions in material flows, where and why bottlenecks occur, how to
counteract disruptions what type of
action should be taken if they occur, what is the overall strategy for
strengthening the resilience of the
whole supply chain
Open knowledge
Hidden
knowledge Information
about
strengthe-ning factors
Data about
disruptions
Coordinator of
intermodal transport
network
Exogenous disruptions -
- factors strengthening endogenous disruptions

Identification of sources of knowledge… 41
The presented idea of a system for managing knowledge about disruptions assumes that the
knowledge base should be located in the node which has a central position in the network,
i.e. one which is a bond of the network. Figure 2 assumed the hypothesis that the coordinator
of such a network was the operator of an intermodal transport network. However, the indicating
attributes of the coordinator of an intermodal transport network is an object of parallel research
into intermodal transport networks, and consequently verification of this hypothesis will be
continued in further stages of the research. The introduced idea of a system for managing
knowledge about disruptions in intermodal transport networks requires commitment from all
partners and knowledge sharing, as well as the unification of measurement of the disruptions in
all network nodes.
6. Conclusions
Intermodal transport networks, similar to supply chains and other systems, including single
organizations or distribution channels, and due to the key meaning of material flows, they must
analyse the susceptibility of the system to disruptions and also build resilience. Building
resilience requires on one hand access to data and information on disruptions in all chain links
of the system, and on the other hand, possession of knowledge about ways to cope with
particular disruptions in order to consequently limit their effects and realize orders efficiently.
It is also essential to possess knowledge about intensifiers of disruptions in the network.
They are exogenous factors whose sources lie in natural disasters, congestion, weather
conditions, blockades, strikes, etc. This paper aimed to design a model for managing knowledge
about disruptions which, based on the literature research and pilot studies in two intermodal
transport subnets in Poland, is presented in Figure 2. The study indicated the key actors of this
network and characterized the stages of gaining, processing, accumulating and making
available knowledge separately for individual actors of the network and for the coordinator of
the network.
Pilot studies allowed for arranging participants of the intermodal transport network and
indicating those entities where it is necessary to monitor disruptions. Simultaneously, they
provide more detail for the set of potential disruptions developed at the stage of the literature
research. As was noted, it is not a closed set. However, it includes the most common disruptions
as well as disruptions causing the most serious effects. The designed system for managing
knowledge about disruptions assumes compensating for disruptions in subsequent individual
chain links of the intermodal transport network. And those events supply the knowledge base
on ways to solve particular problems in material flows. The main information which is
combined in the base with knowledge about disruptions are those events, together with their
frequency and effects, which spread to other nodes in the intermodal transport network.
42 M. Kramarz, E. Przybylska
The presented results provide a basis for proper research aiming to develop a computer
science tool to aid managing knowledge about disruptions in intermodal transport networks.
The research led as part of the structure of the system for managing knowledge about
disruptions in intermodal transport networks is accompanied by investigations regarding the
potential attributes of the coordinator of such a network.
References
1. Ackoff, R. (1989). From Data to Wisdom. Journal of Applies Systems Analysis, 16.
2. Ambra, T., Caris, A., Macharis, C. (2019). Should I stay or should I go? Assessing intermodal
and synchromodal resilience from a decentralized perspective. Sustainability, 11.
3. Antonowicz, M. (2016). Usługa intermodalna w ujęciu systemowym. Studia Ekonomiczne.
Zeszyty Naukowe UE w Katowicach, 261.
4. Antonowicz, M. (2011). Praktyka partnerstwa ogniw intermodalnego łańcucha transportowego kolej-port na przykładzie Holandii. International Journal of Management
and Economics, 31.
5. Bernacki, D. (2012). Sieciowe aspekty działalności transportowej. Logistyka, 6.
6. Bukowski, L. (2016). Zapewnienie ciągłości dostaw w zmiennym i niepewnym otoczeniu.
Dąbrowa Górnicza: Wyższa Szkoła Biznesu. 7. Buttery, A., Buttery, E. (1994). Business Networks. Reaching new markets with low cost
strategies. Melbourne: Longman Business & Professional.
8. Burgholzer, W., Bauer, G., Poset, M., Jammernegg, W. (2013). Analysing the impact of
disruptions in intermodal transport networks: A micro simulation – based model. Decision
Support Systems, 54(4).
9. Centenaro, A., Guedes Laimer, C. (2017). Cooperative relationships and competitiveness
in supermarket sector. Review of Business Management, 63.
10. Chung-Jeng, C., Jing-Wen, H. (2007). How organizational climate and structure affect
knowledge management – The social interaction perspective. International Journal of
Information Management, 27.
11. Czakon, W. (2015). Sieci międzyorganizacyjne w naukach o zarządzaniu – w kierunku
sieciowych modeli biznesu. Studia Ekonomiczne. Zeszyty Naukowe UE w Katowicach, 217.
12. Czakon, W. (2012). Sieci w zarządzaniu strategicznym. Warszawa: Oficyna Wolters
Kluwer Business.
13. Di Febbraro, A., Sacco, N., Saeednia, M. (2016). An agent-based framework for
cooperative planning of intermodal freight transport chains. Transportation Research,
Part C, 64.
Identification of sources of knowledge… 43
14. Downar, W. (2010). Budowanie sieci relacji a innowacyjność transportu. In E. Załoga,
B. Liberadzki (Eds.), Innowacje w transporcie. Korzyści dla użytkownika. Szczecin:
Uniwersytet Szczeciński. 15. Ford, D., Mouzasa, S., Ford, D., Mouzasa, S. (2013). The theory and practice of business
networking. Industrial Marketing Management, 42.
16. Francesco, M., Lai, M., Zuddas, P. (2013). Maritime repositioning of empty containers
under uncertain port disruption. Computers & Industrial Engineering, 64.
17. Guzdek, S. (2016). Kooperacja jako główna forma współpracy przedsiębiorstw w międzynarodowych sieciach biznesowych. Prace Naukowe UE we Wrocławiu, 450.
18. Janic, M. (2017). Modelling the full costs of an intermodal and road freight transport
network. Transportation Research, Part D, 12.
19. Janiszewski, C., Labroo, A., Rucker, D. (2016). A tutorial in consumer research: knowledge
creation and knowledge appreciation in deductive – conceptual consumer research. Journal
of Consumer Research, 43.
20. Kawa, A. (2013). Analiza sieci przedsiębiorstw z wykorzystaniem metody SNA. In Ł. Sułkowski (Eds.), Przedsiębiorczość i Zarządzanie, XIV/13/1, Łódź: Społeczna Akademia Nauk.
21. Kawa, A. (2013). Sieci pionowe i poziome w gospodarce. Prace Naukowe Uniwersytetu
Ekonomicznego we Wrocławiu, 277.
22. Kawa, A., Pierański, B. (2015). Współpraca sieciowa przedsiębiorstw w Polsce – wyniki
badań. Zeszyty Naukowe WSB w Poznaniu, 64/7.
23. Kramarz, M., Kramarz, W. (2015). Gathering knowledge about disruptions in material
flows in network supply chains. Logforum, 11(1).
24. Kramarz, M., Kramarz ,W. (2015). Configuration of a supply chain of metallurgical
products in the context of the cooperation climate. International Journal of Contemporary
Management, 14, 3.
25. Krause, P., Clark, D. (1989). Representing Uncertain Knowledge: An Al Approach Intellect,
Oxford.
26. Kyriakou, H., Nickerson, J., Sabnis, G. (2017). Knowledge reuse for customization:
metamodels in an open design community for 3D printing. MIS Quarterly. Special Issue:
IT and Innovation, 41(1).
27. Miller-Hooks, E., Zhang, X., Faturechi, R. (2012). Measuring and maximizing resilience of
freight transportation networks. Computers & Operations Research, 39(7).
28. Munim, Z.H., Haralambides, H. (2018). Competition and cooperation for intermodal
container transhipment: A network optimization approach. Research in Transportation
Business & Management, 26.
29. Romanov, P., Stajniak, M., Konecka, S. (2017). Wybrane aspekty zagrożeń i ryzyka w transporcie. Autobusy, 12.
44 M. Kramarz, E. Przybylska
30. Rześny-Cieplińska, J. (2010). Klastry sieciowe w transporcie jako strategia budowania
konkurencyjności przewoźników drogowych. In P. Niedzielski, and R. Tomanek (Eds.),
Innowacje w transporcie. Organizacja i zarządzanie. Szczecin: Uniwersytet Szczeciński. 31. Šakalys, R., Batarlienė, N. (2017). Research on Intermodal Terminal Interaction in
International Transport Corridors. Procedia Engineering, 187.
32. Schmit, A., Singh, M. (2012). A quantitative analysis of disruption risk in a multi – echelon
supply chain. International Journal of Production Economics,139.
33. Serrano-Hernández, A., Juan, A.A., Faulin, J., Perez-Bernabeu, E. (2017). Horizontal
collaboration in freight transport concepts, benefits and environmental challenges. SORT –
Statistics and Operations Research Transactions, 41(2).
34. Sheffi, Y. (2005). Resilient Enterprise Overcoming Vulnerability for Competitive
Adventage. Massachusetts: MIT Press.
35. Skyttner, L. (2008). General Systems Theory: Problems, Perspectives, Practice. Singapore:
Words Scientific.
36. Theys, C., Dullaert, W., Notteboom, T. (2008). Analyzing cooperative networks in
intermodal transportation: a game-theoretic approach. Nectar Logistics and Freight Cluster
Meeting. Delft.
37. Yamada, T.B., Russ, B.F., Castro, J., Taniguchi, E. (2009). Designing multimodal freight
Transport Networks: A heuristic approach and applications. Transportation Science, 43(2).

Scientific Quarterly “Organization and Management”, 2019, Vol. 4, No. 48; DOI: 10.29119/1899-6116.2019.48.4 www.oamquarterly.polsl.pl
THE IMPACT OF ORGANIZATIONAL CHARACTERISTICS
ON R&D PROJECTS PERFORMANCE IN HIGH-TECH COMPANY
Anna KWIOTKOWSKA
Silesian University of Technology, Gliwice; [email protected], ORCID: 0000-0001-5204-1259
Abstract: In this study the impact of selected organizational characteristics on R&D projects
performance were analyzed. The data for the empirical analysis come from a survey of 131
R&D projects across 53 high-tech business units. This study employs a configurational
approach, using fuzzy set Qualitative Comparative Analysis (fs/QCA), to analyze the
combination of structural differentiation, innovation strategy, cooperation with stakeholders,
and project team autonomy with the performance of R&D projects. The results suggest that no
single organizational characteristic is crucial to ensure the success of R&D projects but three
causality paths lead to that outcome. Because of significant interdependencies, the main
organizational characteristic contributing to the success of R&D projects in the high-tech
company concern innovation strategy in connection with either cooperation with stakeholders
or project team autonomy or structural differentiation.
Keywords: organizational characteristics, R&D projects, fuzzy-set Qualitative Comparative
Analysis (fsQCA), high-tech organizations.
1. Introduction
The Project Management Body of Knowledge Guide (2013) defines a project as a temporary
group endeavor that generates a unique product, service or result. The success of project
management is the achievement of objectives dependent on budget, quality and methods for the
scheduling and control of the project. Furthermore, there is still a debate among scientists and
practitioners about the importance of studying the success factors of project (e.g. Ika et al. 2012;
Mavi, and Standing, 2018). As project management success is measured using an array of
different criteria, a multi-criteria decision making approach is appropriate as a method of
evaluation. In reality, there are so many project management success factors it is difficult to
identify the dependence relations between them.
The high-tech industries are characterized by a sustained rhythm of innovation, which is
determined by dynamic and highly competitive markets and requires continuous increase of
performance at the same or even reduced price. High-tech organizations often face challenges
46 A. Kwiotkowska
as part of managing various types of R&D projects (Beckman, and Sinha, 2005). In R&D
projects within high-tech industries, new products are designed, using not only established
technologies, but also a substantial amount of new technologies. In fact, projects can include
radical innovations that have revolutionary changes in technology and clear deviations from
existing practices. According to several authors (e.g. Belso Martínez et al. 2013), a greater
number of successful R&D projects leads to higher incomes for shareholders and higher
learning for their employees. Linking innovation with project-based organizations in high-tech
industries, this study demonstrates the effect of certain organizational characteristics on the
success of the high-tech R&D projects.
This study uses fuzzy set Qualitative Comparative Analysis (fs/QCA), a set-theoretic
approach with the ability to handle high degrees of complexity in how different causal
conditions combine to bring about an outcome (Ragin, 2000, 2008). In the current research, this
approach enables the study of organizational characteristics interdependently. Rather than
estimating the average net effect of particular characteristics, the study assesses how multiple,
alternative configurations of them explain R&D projects performance. These findings help
complement some results in previous studies on R&D projects performance and shed light on
the project’s performance effects of selected organizational characteristics such as structural
differentiation, innovation strategy, cooperation with stakeholders, project team autonomy.
The motivation for this study is twofold. First, prior literature tends to investigate the effect
of the different organizational characteristics on the R&D projects performance in an isolated
fashion, largely ignoring the fit between the characteristics and performance. One of the few
studies on configurations of factors in relation to projects performance that could be identified
through a literature review was research conducted by Dahlgren and Söderlund (2010) or Martínez, Molina-Morales, and Mas-Verdu (2013). Dahlgren and Söderlund (2010), by way of
a multiple case study on four Scandinavian organizations, identified what type of projects
performance is likely to be adopted under a combination of high vs. low project dependence
and high vs. low project uncertainty. In turn linking innovation with project-based
organizations, the study conducted by Belso Martínez, Molina-Morales, and Mas-Verdu
(2013), demonstrates the effect of certain organizational characteristics in the success of
innovation projects that a firm develops. The current paper builds on that research by examining
how configurations of multiple organizational characteristics are related to the B&R projects
performance. This constitutes the first contribution of the current paper. Secondly, studies of
projects-based organizations in high-tech industries so far focus predominantly on performance
management of projects or portfolios of projects but give little attention to performance
management at the organization level. This study complements the earlier studies by applying
organization theory to the study of project-based organizations in high-tech industries as called
for recently by Miterev et al. (2017). In sum, the research question this paper answers is:
What combinations of organizational characteristics are associated with the different R&D
projects performance in high-tech organizations?

The impact of organizational characteristics… 47
Following this introduction, Part 2 of this paper presents the theoretical framework,
Part 3 describes the research method, Part 4 presents research findings and Part 5 contains the
conclusions and discussion.
2. Theoretical background
The literature reveals a rich tradition of studies on contingency factors affecting projects
performance in traditional, non projects-based organizations. The prior reviews conducted by
Chenhall (2007) and Otley (2016) identify in essence the same contingency factors and include
technology, strategy, organizational structure and size, and cooperation with partners,
customers, and suppliers. The literature shows that there exists a lack of analysis about the
impact of organizational characteristics on the performance of R&D projects. To maintain
connectivity and consistency with previously derived evidence, the author of this research
worked upon the studies of Chandrasekaran et al. (2015), Langfield-Smith (2006) and Ganter
and Hecker (2014), Fiss (2011) regarding selection and definitions of organizational
characteristics influencing the performance of R&D projects. On the basis of these
considerations, the following Hypothesis was made: structural differentiation, innovation
strategy, degree of cooperation with stakeholders and project team autonomy effect
performance of R&D projects in a high-tech company. The section below elaborates on each
of the characteristics and their association with projects performance as found in prior research.
In R&D settings, structural differentiation and ability to maintain separate reporting
structures, metrics, and processes for different types of R&D projects are among the most
important organizational characteristics (Chandrasekaran et al. 2012). Structural differentiation
helps create the so-called pragmatic boundaries between R&D projects, helping them to coexist
in the same environment (Gilbert, 2005). As indicated by research conducted by
Chandrasekaran et al. (2015), project team members from innovative projects confirm that
structural diversification within their business units helped them progress better in their
projects. They proved that using structural differentiation based on the extent of change can be
effective in managing innovation R&D projects in high-tech organizations.
The second organizational characteristic in this study captures the organizational attitude
and behavior towards innovation and differentiates between explorative and exploitative
innovation strategies of projects-based organizations. Explorative strategy is characterized by
risk taking, search, variation, testing, discovery, flexibility and innovation in order to pursue
innovations for new clients or markets (Jansen et al. 2006). On the other hand, exploitative
strategy includes refinement, efficiency, selection, production, execution and implementation
building on existing knowledge and needs of existing clients (Jansen et al. 2006). March (1991)
argued for a fundamental trade-off between the exploration and exploitation strategies.
48 A. Kwiotkowska
Distinguishing between exploration versus exploitation can have important implications for the
ease of learning and, hence, the degree to which firms can build and leverage external
experience for greater performance in subsequent R&D projects. Exploitation relies on making
current processes and outputs more efficient though establishing routine, formalization,
centralized authority, and standardized responses to environmental issues (Jansen et al., 2006).
In contrast, Simons (1987) finds that high performing prospectors represent explorative strategy
with radical innovations and are designed to meet the needs of emerging customers or markets.
This ambiguity is in line with Langfield-Smith's (2006) literature review results. Literature
strongly links exploitative and explorative innovation orientation to projects performance
(Hoand, and Rothaermel, 2010; Jansen et al., 2006).
Another significant research variable under study is the cooperation with different
stakeholders participating in a project as partners, customers, suppliers, etc. Stakeholders can
be defined as an individual or a group of individuals, who are influenced by or able to influence
a project. The strong cooperation with stakeholders is necessary for project success, since
a project can be considered a temporary organization of stakeholders pursuing an aim together
(Jepsen, Eskerod, 2009). In this regard, Belderbos et al. (2004) examined and demonstrated the
significant impact of various types of cooperation shared in research and development for an
increase in the value added per employee and the increase in sales of new products on the
market. Their results show that cooperation with suppliers and partners has a significant impact
on the increase of added value per employee and projects performance.
R&D projects can also benefit from different levels of team autonomy (Stewart 2006).
As shown by the results of research carried out by Hoegl et al. (2004) and Lewis et al. (2002),
team autonomy can benefit radical innovation projects that have higher uncertainties.
According to Lewis et al. (2002), the high level of team autonomy gives teams the freedom to
challenge existing ideas and solve complex problems related to product design. Increased
autonomy increases the freedom of project teams to develop their own methods to achieve
project objectives because they can design and implement solutions without authorization from
senior management. By building trust and mutual understanding among project team members,
the structure of tasks becomes more effective at higher levels of uncertainty. Consequently,
high innovation projects can benefit from higher levels of team autonomy (Hoegl, et al. 2004).
According to Burton and Obel (2004, p. 18), “the fit among the patterns of relevant contextual, structural and strategic factors will yield better performance.” From this perspective, the fit of organizational characteristics namely structural differentiation,
innovation strategy, explorative and exploitative strategy, degree of cooperation with
stakeholders and project team autonomy can impact the R&D project performance.

The impact of organizational characteristics… 49
3. Methods and data
To investigate the connection between combinations of contextual conditions,
organizational characteristics and R&D projects performance, this paper applies fuzzy set
Qualitative Comparative Analysis (fs/QSA), which is particularly suitable for comparing
a small number of cases (10-40) regarding many variables (conditions) (4-7) (Rihoux,
and Ragin, 2009). Fs/QCA aims to find subsets of cases within the data set that have the same
causal conditions (organizational characteristics), leading to the same outcome (R&D projects
performance). Fs/QCA is considered to be the most appropriate method for this study, because:
(1) it enables exploration of configurations of conditions (pathways) that in conjunction lead to
a particular outcome (e.g. R&D projects performance); (2) it allows for equi-finality,
i.e., multiple causal pathways that lead to the same outcome of interest; (3) it differentiates
between sufficient conditions (a single condition sufficient to predict an outcome), necessary
conditions (a condition that must be included in every potential pathway to a given outcome);
and INUS conditions (conditions that are part of one of the possible pathways to an outcome).
Respectively, fs/QCA offers the unique opportunity to identify configurations of conditions,
which are difficult to identify by means of other methods.
The data came from a survey of 131 R&D projects across 53 high-tech business units in
Poland. Data collection took place between January 2018 and January 2019 and formed a part
of a larger study investigating innovation and international issues goals in high-tech
organizations. The author conducted in-house surveys in firms and face-to-face interviews with
Senior Manager, Project Leader, and Project Team Members. If an interviewee could not
understand or was not willing to answer certain questions during the in-house survey,
the investigator gave explanations to avoid incomplete answers. The survey included questions
such as decision-making styles, business unit performance, structural differentiation, strategy,
and other demographics (size, R&D investments etc.). The survey instruments were pretested
at the four business units and involved all 15 R&D projects described in the qualitative study.
The pretest assessed three main characteristics of the survey: timing (average time for
a respondent to complete the survey), clarity (are there any ambiguous measurement items and
concepts in the survey?), and content validity (does each question makes sense and is it
appropriate?). Precise understanding of the cases in relation to the results of the survey is crucial
in fs/QCA (Rihoux, and Ragin, 2009), because it enables the researcher to develop comparative
expertise, checking each case and interpreting the outcomes of the analysis. Given between-
case comparison rather than within-case analysis was the aim of this research, conducting few
interviews per case complemented with additional secondary data, is a common data collection
strategy for QCA-studies.
50 A. Kwiotkowska
All measures stem from established scales in the projects management literature. Drawing
on established measurement scales is necessary as improper measurement may result in
questionable findings and potentially unwarranted conclusions. R&D projects can have
objectives and need to take a holistic assessment of performance (Gerwin, and Barrowman,
2002). B&R projects performance is measured using a seven-point Likert scale, which captures
the success of a project relative to its objectives across the following two dimensions: adherence
to schedule and adherence to budget (Chandrasekaran, et al. 2015). This performance was
computed by averaging the score on these items. The project leaders were the informants to
these measures. The strategy was measured using a scale that considered the degree of
explorative and exploitative strategic orientation of the organization. The questionnaire used
was developed by Jansen et al. (2006) and included three items on a seven-point Likert scale.
The degree of cooperation with stakeholders, variable reflecting the company cooperation with
other firms, partners, suppliers, and clients – stakeholders was based on the four items on
a seven-point Likert scale adopted by Bourne (2005). The team autonomy measures the extent
to which project teams were given control over project planning, project objectives, personnel
selection, performance evaluations of the team, and task assignments. High scores indicate
a high degree of team autonomy. The five items for this scale are adapted from Chandrasekaran
et al. (2015).
It is important to emphasize that the final scores of cases on contingency factors and
organizational characteristics, are not based only on the above items, but also significantly on
in-depth interview and analysis of secondary data that have occurred and enabled validation
and motivation of case scores. The case score motivations enabled relative comparison of scores
between R&D projects performance, which revealed a few small inconsistencies between initial
scores and motivations, e.g., same motivations for slightly distinct scores. Corresponding to the
fs/QCA approach for case score validation by means of qualitative data (Rihoux and Ragin,
2009), these inconsistencies were adjusted.
The fs/QCA approach uses Boolean logic to analyze the relationships between cases
(viewed as multiple combinations of different contingency factors) and the result. Therefore,
fs/QCA is especially well suited for identifying different configurations leading to better
performance, because the method identifies how membership of cases is applicable in causal
conditions (i.e., selected organizational characteristics) is linked to membership in the outcome
variable (i.e., success in R&D projects performance). Fs/QCA is conducted in several stages
(Ganter, and Hecker, 2014). In the first stage, a Truth Table is developed. Secondly, the number
of rows in the Truth Table is reduced. Determining the necessary conditions enables one to
distinguish the cases that lead to the outcome. In opposition, cases where the outcome is not
present are irrelevant, and are thus absent when testing propositions. Thirdly, after a review of
the Truth Table, an algorithm that simplifies combinations and minimizes solutions is used.
The cutoff value was set to 0.8, both in line with the theory (Rihoux, and Ragin, 2009), and
with the distribution of consistency scores as observed in the Truth Table. This enabled
The impact of organizational characteristics… 51
simplification of all the combinations of conditions into shorter and more parsimonious
combinations of conditions (Rihoux, and Ragin, 2009). As shown in the Results section,
no single condition was found to be sufficient on its own to predict an outcome, only INUS
conditions that are part of sufficient pathways to a result. The next step is to analyze whether
causal conditions belong to the core or to the peripheral configurations (parsimonious and
intermediate solutions). The parsimonious solution involves all simplifying assumptions,
regardless of whether they include easy or difficult counterfactuals. The intermediate solution
involves simplifying assumptions by including easy counterfactuals. Core conditions are part
of both parsimonious and intermediate solutions. Parsimonious solutions exclude peripheral
conditions, which only appear in the intermediate solution.
For use of fs/QCA, the original scales first must be calibrated into set membership values
(indicating the degree of membership in a set) in the range from 0 to 1. To arrive at continuous
set membership values (in the range between 0 and 1), the log odds method described
by Ragin (2008) is applied. As indicated in the literature (Ragin, 2008; Woodside, 2013),
three anchor points were used to perform this calibration: the 5%-percentile, the median,
and the 95%-percentile of a variable. The extreme points define full non-membership/full
membership in a set, while the median is the crossover point indicating that a case is neither in
nor out of a set (Ragin, 2008). All analyses used the fs/QCA 2.5 software package.
4. Research findings
This section presents the results from the analysis, explaining which conditions lead firms
to the result (i.e., success in R&D project performance). The first step is to examine the
conditions necessary for the result. A necessity test was executed to examine whether there is
a single condition in all configurations to success in R&D projects performance. A condition is
necessary when its consistency is above 0.9 (Ragin, 2008), which indicates the degree to which
a condition is present in all cases with the same outcome. In this study no necessary conditions
were found. The Fs/QCA method enables analyzing combinations of conditions (causal
configurations) between structural differentiation, innovation strategy, cooperation with
stakeholders and project team autonomy. By using the calibrated values (indicating degree of
set membership) for organizational characteristics and for R&D projects performance,
the consistency of all configurations of the organizational characteristics with a membership in
the success in projects performance set was estimated. Table 1 shows each configuration's
consistency and the resulting test against the consistency threshold of 0.74 (Woodside, 2013).
Filled circles indicate above-threshold levels of the respective condition. Empty circles indicate
below-threshold levels. Blank cells indicate ‘don't care’ conditions.
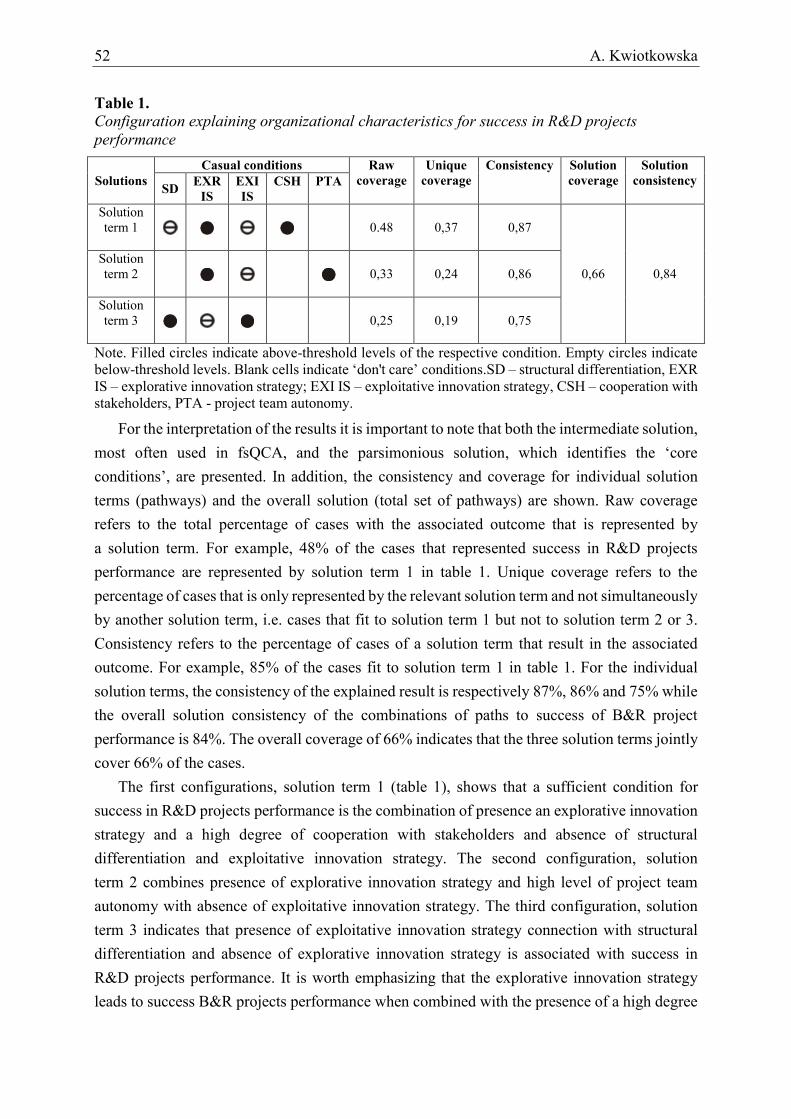
52 A. Kwiotkowska
Table 1.
Configuration explaining organizational characteristics for success in R&D projects
performance
Solutions
Casual conditions Raw
coverage
Unique
coverage
Consistency Solution
coverage
Solution
consistency SD
EXR
IS
EXI
IS
CSH PTA
Solution
term 1
0.48 0,37 0,87
0,66 0,84
Solution
term 2
0,33 0,24 0,86
Solution
term 3
0,25 0,19 0,75
Note. Filled circles indicate above-threshold levels of the respective condition. Empty circles indicate
below-threshold levels. Blank cells indicate ‘don't care’ conditions.SD – structural differentiation, EXR
IS – explorative innovation strategy; EXI IS – exploitative innovation strategy, CSH – cooperation with
stakeholders, PTA - project team autonomy.
For the interpretation of the results it is important to note that both the intermediate solution,
most often used in fsQCA, and the parsimonious solution, which identifies the ‘core conditions’, are presented. In addition, the consistency and coverage for individual solution
terms (pathways) and the overall solution (total set of pathways) are shown. Raw coverage
refers to the total percentage of cases with the associated outcome that is represented by
a solution term. For example, 48% of the cases that represented success in R&D projects
performance are represented by solution term 1 in table 1. Unique coverage refers to the
percentage of cases that is only represented by the relevant solution term and not simultaneously
by another solution term, i.e. cases that fit to solution term 1 but not to solution term 2 or 3.
Consistency refers to the percentage of cases of a solution term that result in the associated
outcome. For example, 85% of the cases fit to solution term 1 in table 1. For the individual
solution terms, the consistency of the explained result is respectively 87%, 86% and 75% while
the overall solution consistency of the combinations of paths to success of B&R project
performance is 84%. The overall coverage of 66% indicates that the three solution terms jointly
cover 66% of the cases.
The first configurations, solution term 1 (table 1), shows that a sufficient condition for
success in R&D projects performance is the combination of presence an explorative innovation
strategy and a high degree of cooperation with stakeholders and absence of structural
differentiation and exploitative innovation strategy. The second configuration, solution
term 2 combines presence of explorative innovation strategy and high level of project team
autonomy with absence of exploitative innovation strategy. The third configuration, solution
term 3 indicates that presence of exploitative innovation strategy connection with structural
differentiation and absence of explorative innovation strategy is associated with success in
R&D projects performance. It is worth emphasizing that the explorative innovation strategy
leads to success B&R projects performance when combined with the presence of a high degree
The impact of organizational characteristics… 53
of cooperation with stakeholders (solution term 1) or with the presence of project team
autonomy (solution term 2). Summarizing, all analyzed conditions to be INUS conditions for
success in R&D projects performance. In other words, rather than having an individual effect,
these conditions are part of sufficient configurations leading to the success in R&D projects
performance.
5. Conclusions and discussion
This study aimed to answer the question what combinations of organizational characteristics
contingency factors are associated with success in R&D projects performance in high-tech
organizations. Results of Qualitative Comparative Analysis on 131 R&D projects across
53 high-tech business units revealed three configurations of conditions. Two configurations,
namely solution term 1 and solution term 2 contained explorative innovation strategy.
Organizations with explorative strategies flexibly take advantage of opportunities in the
environment; have high exploration objectives of introducing new products and processes,
which benefits from high levels of autonomy (Dent, 1990). Such organizations, as indicated
and confirmed by research, are supported either through a high degree of cooperation with
stakeholders (solution term 1) or a high level of project team autonomy (solution term 2).
Both of these combinations are sufficient to achieve success in R&D projects performance.
This study confirms that investing in collaboration with stakeholders can ensure the success of
a project. Cooperative relationships with stakeholders have a significant effect on the growth
of added value (Belderbos et al., 2004), but this cooperation should appear together with other
variables such as presence an explorative innovation strategy and absence of structural
differentiation. This configuration can improve firm performance through the optimal
performance of firms' R&D projects, and can guide the management board towards the
establishment of strategic relationships with stakeholders that meet certain criteria to ensure the
operational and strategic objectives of the firm.
Moreover a high exploration objective in projects creates a complex task environment
characterized by technological uncertainties and scheduling pressures (Sethi et al. 2012).
Under these conditions earlier research shows that tensions can be overwhelming if the team
members do not have an explicit control over task assignments, team member roles,
and day-to-day objectives (Chandrasekaran et al. 2012). In these situations, higher levels of
autonomy within the team help them to better navigate the development efforts and manage
trade-offs between creativity and efficiency. This argument is also supported by studies on agile
software development that argue for higher levels of team autonomy when managing
the trade-offs between dual objectives of changing customer requirements and shorter
time-to-delivery (Vidgen, and Wang, 2009).
54 A. Kwiotkowska
Configuration three, solution term 3 (table 1), indicates that structural differentiation and
exploitative innovation strategy to maintain their market position albeit through controlled
innovation are sufficient conditions for success in R&D projects performance. This structural
differentiation in combination with an exploitative strategy implies that the management does
not need to be very proactive in developing radically new products, but does need to excel in
delivering the products with superior customer service. These results confirm that using
structural differentiation can be effective in managing innovation, R&D projects in high-tech
organizations. For example, project team members working on R&D projects often enjoy the
“required freedom and flexibility” when working on complex tasks as there is minimal pressure to speed up their development activities (Jansen et al. 2009a). Lack of structural differentiation
in these settings may shift preference toward incremental innovation, since these projects have
fast and predictable results when compared to radical innovation projects (Girotra et al. 2007).
As a result, structural differentiation can have an enabling positive effect on R&D project
performance conditional if properly understood.
This study examines organizational characteristics that affect R&D projects' performance.
The analysis uses fs/QCA to identify combinations of causes that lead to success in R&D
projects’ performance for high-tech organizations in Poland. An explorative innovation strategy
supported either through a high degree of cooperation with stakeholders or high levels of project
team autonomy have an important effect on the success of R&D projects. Furthermore,
this study also demonstrates the effect of an exploitative innovation strategy together with
structural differentiation in the ultimate success of the R&D projects. The main effect of this
study for practitioners is that practitioners can clearly identify the key aspects to success in
launching, planning, and development of an R&D project. In the early stages of the R&D
project, such a skill can help organizations choose a strategy, structure, identify partners, and
determine the degree of cooperation with them and adopt the appropriate level of autonomy of
project teams.
This research has certain limitations, which may create opportunities for future
investigations. The analysis conducted in this paper was based on a relatively small number of
cases, and the knowledge of cases was more limited than in some other case study methods.
Therefore, conducting more interviews in one case can contribute to a better understanding of
the success of R&D projects. The conducted research concerns only the performance of R&D
projects in high-tech organizations. Research can be extended for various types of projects
(consulting, engineering) for various business sectors, and even comparing the same
organizations in different European regions. Furthermore cases in the research setting of this
study did not vary in terms of national culture, structure or different types of business
organizations. Future research is needed to investigate whether these factors (in configurations)
play a role in the R&D projects performance.

The impact of organizational characteristics… 55
While the results of this study are based on 53 cases and replication research is probably
needed, it is important to emphasize the unique potential of fs/QCA as a research method.
This method enables testing configurations of conditions in relation to a specific outcome
(e.g. success of projects performance), in a way that is not possible by means of a linear additive
approach. In cases where the interaction of the variables included in the study is mutually
significant fs/QCA offers more accurate predictions of the outcome relative to the linear
additive approach.
References
1. Beckman, S., and Sinha, K.K. (2005). Conducting academic research with an industry
focus: Production and operations management in the high tech industry. Production and
Operations Management, 14(2), 115-124.
2. Belderbos, R., Carree, M., and Lokshin, B. (2004). Cooperative R&D and firm
performance. Research Policy, 33, 1477-1492.
3. Belso Martínez, J.A., Molina-Morales, F.X., and Mas-Verdu, F. (2013). Perceived
usefulness of innovation programs for high-tech and low-tech firms. Management Decision,
51(6), 1190-1206.
4. Bourne, L. (2005). Project relationship management and the stakeholder circleTM, RMIT
University.
5. Burton, R., Obel, B. (2004). Strategic organizational diagnosis and design: the dynamics
of fit. Norwell, MA: Kluwer Academic Press.
6. Chandrasekaran, A., Linderman, K., and Schroeder, R.G. (2012). Antecedents to
ambidexterity competency in high-technology organizations. Journal of Operations
Management, 30(1-2), 134-151.
7. Chandrasekaran, A., Linderman, K., and Schroeder, R. (2015). The Role of Project and
Organizational Context in Managing High-tech R&D Projects. Production and Operations
Management, 24(4), 560-586.
8. Dahlgren, J., Söderlund, J. (2010). Modes and mechanisms of control in multiproject
organizations: the R&D case. International Journal of Technology Management, 50, 1-22.
9. Dent, J.F. (1990). Strategy, organization and control: some possibilities for accounting
research. Accounting, Organization and Society, 15(1-2), 3-25.
10. Fiss, P.C. (2011). Building better causal theories: A fuzzy set approach to typologies in
organizational research. Academy of Management Journal, 54(2), 393-420.
11. Ganter, A., and Hecker, A. (2014). Configurational paths to organizational innovation:
Qualitative comparative analyses of antecedents and contingencies. Journal of Business
Research, 67, 1285-1292.
56 A. Kwiotkowska
12. Gerwin, D., and Barrowman, N. J. (2002). An evaluation of research on integrated product
development. Management Science, 48(7), 938-953.
13. Gilbert, C. 2005. Unbundling the structure of inertia: Resources versus routine rigidity.
Academy of Management Journal, 48(5), 741-763.
14. Hoand, H., and Rothaermel, F. (2010). Leveraging internal and external experience:
exploration, exploitation, and R&D project performance. Strategic management Journal,
31, 734-758.
15. Hoegl, M., Weinkauf, K., and Gemuenden, H.G. (2004). Interteam coordination, project
commitment, and teamwork in mutliteam R&D projects: A longitudinal study.
Organization Science, 15(1), 38-55.
16. Ika, L., Diallo, A., and Thuillier, D. (2012). Critical success factors for world bank projects:
An empirical investigation. International Journal of Project Management, 30(1), 105-116.
17. Jansen, J.P., Van den Bosch, F.A.J., and Volberda, H.W. (2006). Exploratory innovation,
exploitative innovation, and performance: effects of organizational antecedents and
environmental moderators. Management Science, 52(11), 1661-1674.
18. Jepsen, A.L., and Eskerod, P. (2009). Stakeholder analysis in projects: Challenges in using
current guidelines in the real world. International Journal of Projects Management, 27(4),
335-343.
19. Langfield-Smith, K. (2006). A review of quantitative research in management control
systems and strategy. In C.S. Chapman, A.G. Hopwood, M.D. Shield (Eds.), Handbooks of
Management Accounting Research, 2, 753-783.
20. Lewis, M.W., Welsh, M.A., Dehler, G.E., and Green, S.G. (2002). Product development
tensions: Exploring contrasting styles of project management. Academy of Management
Journal, 45(3), 546-564.
21. March, J.G. (1991). Exploration and exploitation in organizational learning. Organization
Science, 2 (special issue: Organizational learning), 71-87.
22. Mavi, R.K., and Standing, C. (2018). Critical success factors of sustainable project
management in construction: A fuzzy DEMATEL-ANP approach. Journal of Cleaner
Production, 194, 751-765.
23. Miterev, M., Turner, J.R., and Mancini, M. (2017). The organization design perspective on
the project-based organization: a structured review. International Journal of Managing
Projects in Business, 10(3), 527-549.
24. Project Management Institute, PMI, (2013). A Guide to the Project Management Body of
Knowledge (PMBOK Guide). United States, PA.
25. Ragin, C.C. (2000). Fuzzy set social science. Chicago: University of Chicago Press.
26. Ragin, C.C. (2006). Set relations in social research: Evaluating their consistency and
coverage. Political Analysis, 14(3), 291-310.
27. Ragin, C.C. (2008). Redesigning social inquiry: Fuzzy sets and beyond. Chicago:
University of Chicago Press.
The impact of organizational characteristics… 57
28. Rihoux, B., Ragin, C.C. (2009). Configurational comparitive methods: qualitative
comparative analysis (QCA) and related techniques. Thousand Oaks, CA: SAGE
Publications, Inc.
29. Sethi, R., Iqbal, Z., Sethi, A. (2012). Developing new-to-the firm products: The role of
micropolitical strategies. Journal of Marketing, 76(2), 99-115.
30. Simons, R. (1987). Accounting control systems and business strategy: an empirical analysis.
Accounting, Organizations and Society, 12(4), 357-374.
31. Stewart, G.L. (2006). A meta-analytic review of relationships between team design features
and team performance. Journal of Management, 32(1), 29-54.
32. Vidgen, R., Wang, X. (2009). Coevolving systems and the organization of agile software
development. Information Systems Research, 20(3), 329-354.
33. Woodside, A.G. (2013). Moving beyond multiple regression analysis to algorithms: Calling
for adoption of a paradigm shift from symmetric to asymmetric thinking in data analysis
and crafting theory, Journal of Business Research, 66(4), 463-472.

Scientific Quarterly “Organization and Management”, 2019, Vol. 4, No. 48; DOI: 10.29119/1899-6116.2019.48.5 www.oamquarterly.polsl.pl
THE THREE ASPECTS MODEL – A NEW POINT OF VIEW
ON VIRTUAL PROJECT TEAMS IN THE IT INDUSTRY
Filip LIEBERT1*, Mateusz ZACZYK2
1 Silesian University of Technology, Faculty of Organisation and Management, [email protected] ORCID: 0000-0001-8700-2604
2 Silesian University of Technology, Faculty of Organisation and Management, [email protected] ORCID: 0000-0002-3206-4784)
* Correspondence author
Abstract: Information technology companies often have to setup a specific virtual environment in order to develop innovative software products. Software development requires a variety of IT tools to ensure a smooth flow of information and proper organisation of tasks within the project team. The evolution of information and communication technologies has allowed virtual teams to share knowledge online, which became more preferable than traditional meetings of developers. The main objective of this article is to determine how virtual project teams are being formed and what are the key attributes of a virtual team – a conceptual Three Aspects Model of a virtual team was presented that may be used in further research. An overview of supportive project management software solutions for virtual teams has also been conducted. The research results presented in the paper indicate that various IT tools lack support in some aspects of virtual project teams.
Keywords: project management software, IT projects, Virtual Project Team, IT project management tools.
1. Introduction
The Information Technology (IT) industry has evolved from offline development methods
to online work spaces. Modern IT companies develop a plethora of new products, including
operating systems or individual software in form of sophisticated programs, mobile apps, video
games, websites and other types of user-related services. As a result of this productive
expansion, many project management methodologies and methods have been invented or
adapted to meet the requirements of new development styles. Jim Highsmith indicates that
Agile Project Development has revolutionised the current state of the IT industry as a result of
adaptation to user requirements, variable project scopes and iterative production cycles
(Highsmith, 2004). Enterprises struggle with the high increase of information flow and dynamic
changes occurring on the IT market. Efficient and incremental development of software
60 F. Liebert, M. Zaczyk
products with the customer’s involvement have become a standard technique in most cases
(Papadopoulos, 2015). New product development models were updated and combined with
Agile methods and techniques (Cooper, 2014). The evolution of IT networks and technological
progress of hardware allowed companies to swiftly and effectively exchange knowledge within
whole organisational structures, especially in the case of project teams which are responsible
for new software development. Fast communication by such means as Internet or intranets and
high availability of virtual supportive tools have encouraged some enterprises to launch new
product development (NPD) projects in virtual environments – often referred to as online
environments or online (cloud) workspaces. Such virtual environments (or workspaces) require
a professional virtual team of developers (Ford, 2017) in order to successfully complete all tasks
of the current project.
Reports of Standish Group indicate that only 30% of projects end successfully. Such results
concern the IT industry, where projects are often cancelled as a result of insufficient funds or
due to lack of human and technological resources, as well as a result of bad management and
lack of knowledge about the market (Standish Group: Chaos Reports, 2004 & 2006).
Other researchers suggest that the main issue of IT development lies within a lack of proper
knowledge transfer in projects’ team structures (Reed, Knight, 2010). Similar problems are
associated with proper understanding of different cultural aspects in multi-cultural workgroups
(Adenfelt, 2010). The Version One Agile report determined that the main barriers which cause
IT projects to fail are the following: improper organisational culture and philosophy of
development, lack of management support, lack of experience and problems with cultural
transitions (13th Annual State of Agile Report, 2019). Such impediments may often derive from
lack of knowledge during the selection of a proper IT tool for setting the virtual project
workspace. These issues indicate that certain procedures and preparations must be carefully
undertaken while creating a Virtual Project Team (VPT). Therefore, the technological layer is
not the only important aspect of Virtual Project Teams.
The main objective of this article is to determine how Virtual Project Teams are being
formed and to present a general overview of IT tools that may be used to support their workflow
– a conceptual Three Aspects Model was presented to characterise all important attributes of an
effective and skilled VPT. Empirical research was also conducted to determine whether the
aforementioned popular IT tools have the capabilities and features that can support the various
aspects of Virtual Project Teams. In this article, these tools are considered as pieces of virtual
environment framework software. The latter can be defined as standalone tools or applications
which support project management and collaboration among members of VPT.

Virtual Project Teams in the IT Industry… 61
2. Virtual Project Management, Virtual Project and Virtual Project Team
Virtual Project Management (VPM) can be defined as the ability (of a Virtual Project
Team or of an enterprise or organisation) to create and configure a proper virtual collaborative
workspace, including its operating principles, and the application of ICT tools, knowledge and
techniques to successfully complete virtual project activities in a fixed amount of time.
The term VPM is often considered as a system (Aslam, 2010) which enables virtual teams to
complete a project’s duties. In other scientific papers, it is defined as an effective virtual team
which has appropriate competencies to execute a virtual project (Duarte, Snyder, 2001).
McMahon (2001) emphasises that virtual collaboration of multiple remote locations and units
may grant better productivity than traditional single location endeavours. He also introduced an
eight-step plan that can be used as a roadmap to properly set up and execute a virtual project:
High Level Virtual Project Organisation (Virtual Culture and Virtual Leadership).
Architecture, Work Split, Tasking.
Planning.
Project Rules.
Lower Level Virtual Project Organisation (Integrated Product's Teams).
Detailed Planning.
Test the Operation Concept of the Virtual Organisation.
Execute.
Other scientists indicate that Virtual Project Management consists of three major areas,
namely – virtual leadership, virtual communication and cyberculture (Nozari et al., 2016).
A clear definition of objectives, continuous feedback, shared vision, trust, motivation,
development of collaboration and knowledge sharing – all these factors have a significant
impact on a virtual project’s outcome (Nozari et al., 2016). Some virtually-driven projects still
require traditional face-to-face meetings during selected phases of its schedule (Lebedieva,
2011). Enterprises often conduct specific stages of the project by using VPM as a result of
a product’s complexity. Some project tasks may also require additional computing power and
distinctive software features, which are only achievable through virtual environment
collaboration. Therefore, a Virtual Project is a collaborative effort undertaken by a virtual
team which uses a specific online environment and IT technologies to perform all project
activities remotely or even in the cloud without the need of any traditional meetings (Krill, Juell,
1997). Virtual projects have various benefits in comparison to the traditional approach,
as virtual teams may improve decision-making activities, reduce overhead costs and reduce
project scheduling (Tastoglou, Milious, 2005).
Numerous scientific papers define a Virtual Project Team (VPT) as a group of people who
interactively cooperate to achieve a project’s goal, where at least one of the team members
works in a different geographical location, time zone or organisation, and as a result,
all communication and decision making is performed by the use of digital means, such as online

62 F. Liebert, M. Zaczyk
software, e-mails, phones, video conferences, live streams and other available means (Hertel,
2015; Gibson, Cohen, 2003; Kirkman, Mathieu, 2004; Dulebohn, Hoch, 2017). There are a few
conditions which have to be meet in order to form a virtual team (Cantu, 1997):
Telecommunication or online network connections are being established between team
members located in distant geographical locations.
Collaboration is being formed by members of different organisations or various
members of one organisation in order to complete specific project activities, and their
headquarters are situated in remote places.
The time involvement of a specific member in a particular project is very dynamic and
differentiates according to the project’s scope, goals and unique characteristics.
Proper IT tools and virtual collaboration software are being used for project
management support (Jones, et. al., 2005).
The above-mentioned elements are crucial for setting up an effective Virtual Project Team.
Building potent and well-organised virtual teams is a very difficult and challenging process.
Scientists have proven that different time zones, business practices and unknown cultural habits
may hinder knowledge sharing and often have a negative impact on the creation of virtual teams
(Dube, Pare, 2001; Kelley-Lee, Sankey, 2008). Some articles also point out that a trustworthy
leadership style plays a crucial role in building successful Virtual Project Teams (Lee, 2009;
Iorio, Taylor, 2015). A more detailed overview of all attributes, aspects and characteristics of
Virtual Project Teams has been prepared in the next subchapter of this paper.
3. Main attributes of Virtual Project Teams – The Three Aspects Model
The stages of a virtual project’s life cycle have some similarities to a traditional project’s life
cycle. A virtual project may be divided into the following stages (Schumacher, 2011):
1. Project initiation – definition of main goal, virtual workspace and final effect.
2. Planning – searching for experts and resources, defining all task of the project.
3. Estimation – appointment of team members and their role assessment in the virtual
environment.
4. Scheduling – defining time limitations for all tasks.
5. Organising – division of responsibility and resources for all tasks.
6. Virtual Project Team Management – role of the Virtual Project Manager.
7. Controlling and monitoring of the project – checking the progress of the project in its full
time scale.
8. Finalisation of the project including creation of a knowledge sharing model for future
undertakings.
Each stage or phase presented above may vary in practice, as most companies use diverse
approaches to virtual project management. The role of a virtual project manager is crucial to
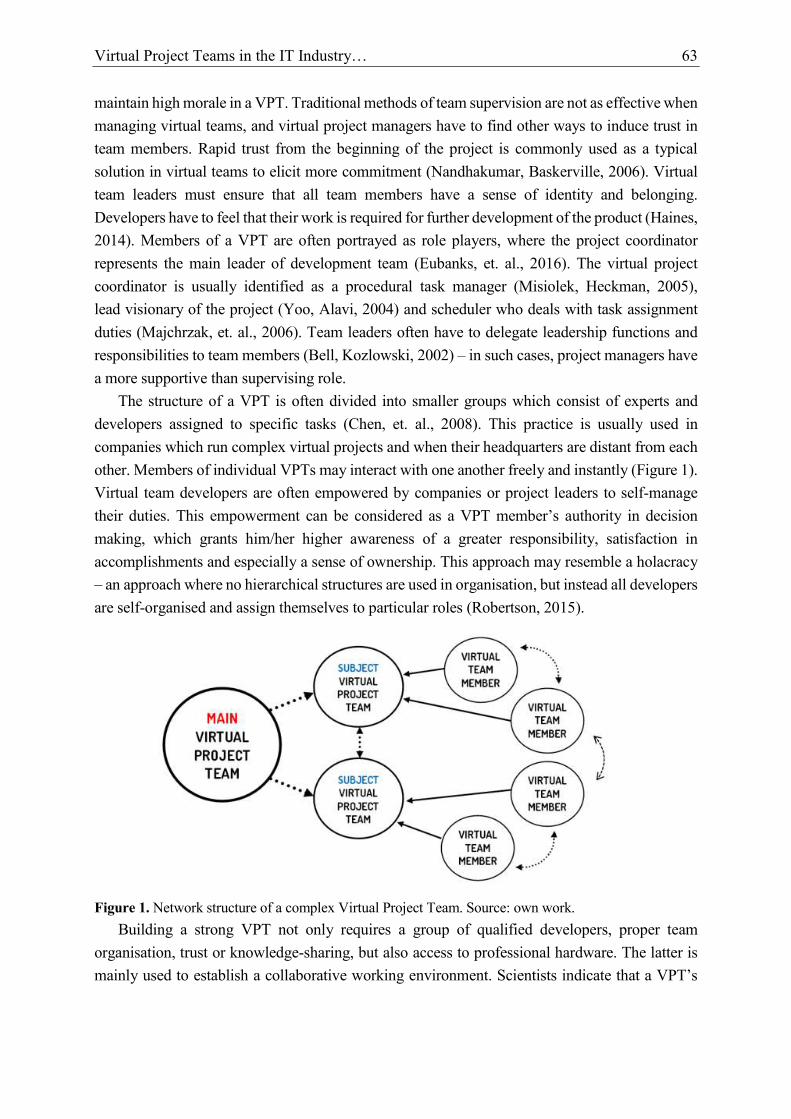
Virtual Project Teams in the IT Industry… 63
maintain high morale in a VPT. Traditional methods of team supervision are not as effective when
managing virtual teams, and virtual project managers have to find other ways to induce trust in
team members. Rapid trust from the beginning of the project is commonly used as a typical
solution in virtual teams to elicit more commitment (Nandhakumar, Baskerville, 2006). Virtual
team leaders must ensure that all team members have a sense of identity and belonging.
Developers have to feel that their work is required for further development of the product (Haines,
2014). Members of a VPT are often portrayed as role players, where the project coordinator
represents the main leader of development team (Eubanks, et. al., 2016). The virtual project
coordinator is usually identified as a procedural task manager (Misiolek, Heckman, 2005),
lead visionary of the project (Yoo, Alavi, 2004) and scheduler who deals with task assignment
duties (Majchrzak, et. al., 2006). Team leaders often have to delegate leadership functions and
responsibilities to team members (Bell, Kozlowski, 2002) – in such cases, project managers have
a more supportive than supervising role.
The structure of a VPT is often divided into smaller groups which consist of experts and
developers assigned to specific tasks (Chen, et. al., 2008). This practice is usually used in
companies which run complex virtual projects and when their headquarters are distant from each
other. Members of individual VPTs may interact with one another freely and instantly (Figure 1).
Virtual team developers are often empowered by companies or project leaders to self-manage
their duties. This empowerment can be considered as a VPT member’s authority in decision
making, which grants him/her higher awareness of a greater responsibility, satisfaction in
accomplishments and especially a sense of ownership. This approach may resemble a holacracy
– an approach where no hierarchical structures are used in organisation, but instead all developers
are self-organised and assign themselves to particular roles (Robertson, 2015).
Figure 1. Network structure of a complex Virtual Project Team. Source: own work.
Building a strong VPT not only requires a group of qualified developers, proper team
organisation, trust or knowledge-sharing, but also access to professional hardware. The latter is
mainly used to establish a collaborative working environment. Scientists indicate that a VPT’s
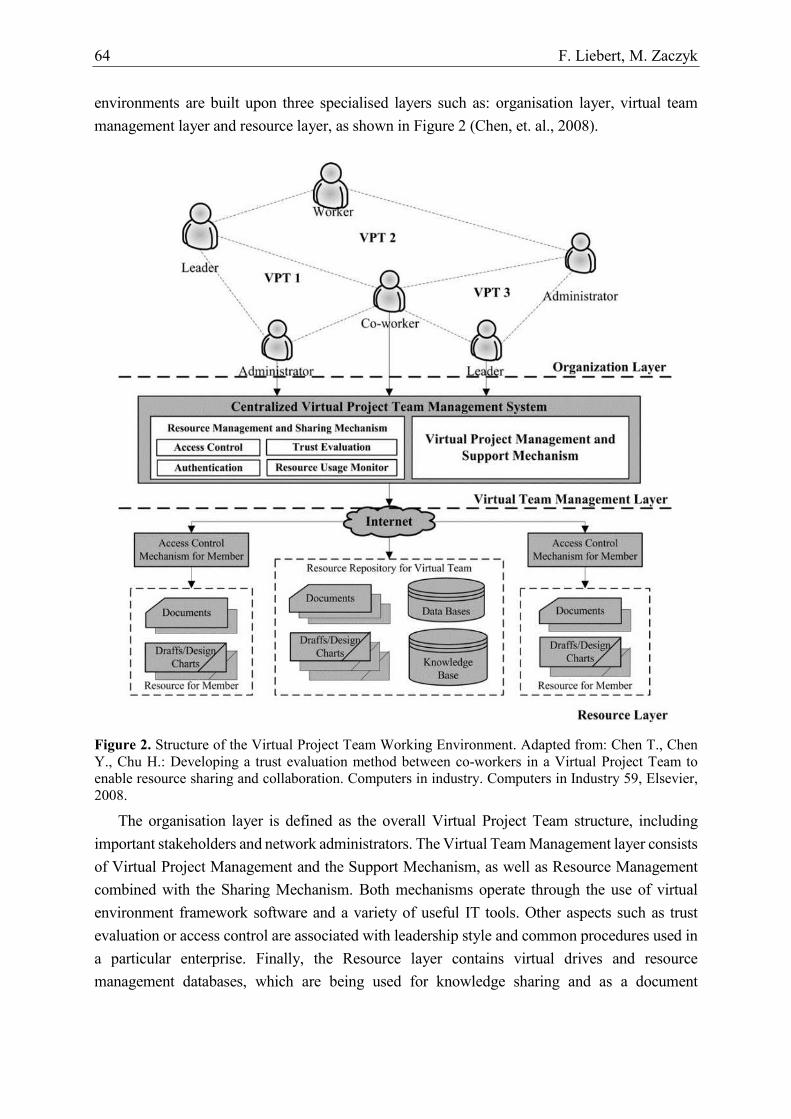
64 F. Liebert, M. Zaczyk
environments are built upon three specialised layers such as: organisation layer, virtual team
management layer and resource layer, as shown in Figure 2 (Chen, et. al., 2008).
Figure 2. Structure of the Virtual Project Team Working Environment. Adapted from: Chen T., Chen Y., Chu H.: Developing a trust evaluation method between co-workers in a Virtual Project Team to enable resource sharing and collaboration. Computers in industry. Computers in Industry 59, Elsevier, 2008.
The organisation layer is defined as the overall Virtual Project Team structure, including
important stakeholders and network administrators. The Virtual Team Management layer consists
of Virtual Project Management and the Support Mechanism, as well as Resource Management
combined with the Sharing Mechanism. Both mechanisms operate through the use of virtual
environment framework software and a variety of useful IT tools. Other aspects such as trust
evaluation or access control are associated with leadership style and common procedures used in
a particular enterprise. Finally, the Resource layer contains virtual drives and resource
management databases, which are being used for knowledge sharing and as a document
Virtual Project Teams in the IT Industry… 65
repository. Proper configuration of the resource layer may have a significant impact on the
workflow of a virtual team.
People, processes and technology are considered as components of Virtual Project Teams
(Conill, 2013; Olaisen, Revang, 2017). People are the key element of every VPT, and such factors
like task-related communication behaviours, team integration and a set of soft skills have an
important impact on the level of trust among virtual team members (Rico et al., 2009). Properly
established processes organise the general workflow of the team and allow them to manage
resources in a more efficient way. Technology is considered as ICT hardware, IT systems and
software solutions which are mainly used to manage new product development projects, support
team collaboration and store valuable knowledge in data repositories. The project management
features of the aforementioned software solutions help virtual teams track various dependencies
associated with projects, such as product backlog, deadlines and milestones. They also provide
better control over project resources. Team collaboration features are mainly used to aid team
members in establishing fast communication, asset creation and to support decision making. Such
software solutions like Wrike or Monday offer special dashboards where every user can check
the current status of the project, manage tasks and get an overview of all project objectives.
By combining all the aforementioned features and characteristics of a VPT, a new approach
may be considered, where Virtual Project Teams can be formed on the basis of three aspects:
Transparency Aspect, Technological Aspect and Social Aspect (also identified as Soft Skills
Aspect). On the basis of these assumptions, a conceptual model of a VPT has been constructed –
we have decided to call it the Three Aspects Model (Figure 3). The model presented below has
been based on a literature review which indicated the most important factors and features of
Virtual Project Teams. The essential literature that laid the groundwork for the Three Aspects
Model consisted of scientific papers in which three key attributes and elements of virtual teams
were identified (these attributes are often referred to as three dimensions of virtual collaboration):
- People, links, purpose (Lipnack, Stamps, 1999);
- Time, space, culture (Fisher, Fisher, 2001);
- Time, place, organisation (Kimble et al., 2000).
The above factors and characteristics were extended by the common issues and challenges of
virtual teams, such as:
- Proper team organisation and setup of technologies (Munkvold, Zigurs, 2007);
- Multicultural communication and collaboration (Duran, Popescu, 2014);
- Soft skills and trust within virtual team development (Greenberg et al., 2007);
- Leadership issues (Liao, 2017);
- Problems associated with knowledge sharing (Pinjani, Palvia, 2013);
- Problems associated with communication in virtual teams (Marlow et al., 2017);
- Issues associated with optimal selection of ICT tools and IT systems (Dávideková, 2017);
- Problems associated with diversity among virtual team members (Taras et al., 2019).
All three aspects of the proposed model can be considered as maturity states pursued by
evolving virtual teams. In other words, virtual team members put a lot of effort into achieving
66 F. Liebert, M. Zaczyk
a high level of transparency in knowledge sharing, enhance self-organisation, optimise
technological tools to maximum capability and obtain a superior level of cooperation and
feedback. There are other types of approaches which describe the proper establishment of virtual
teams from the perspective of project management (like the one presented by Rolfes, M., 2001),
but they mainly focus on certain project phases. Apart from project management, the Three
Aspects Model puts more emphasis on social aspects and the collaboration level among VPT
members, including technology combined with knowledge-sharing, and proposes a slightly
different point of view in this matter. This model mainly concentrates on a Virtual Project Team
and its attributes as a unique construct instead of focusing mainly on a Virtual Project or Virtual
Project Management.
Figure 3. Conceptual Three Aspects Model of a Virtual Project Team. Source: own work.
The Transparency Aspect integrates features of knowledge sharing and access to all important
enterprise data. It also includes a knowledge management system, which determines the flow of
all valuable information and knowledge throughout the environment of a Virtual Project Team.
Collaborative and integrated knowledge sharing is a fundamental factor for creating a successful
virtual team (Olaisen, Revang, 2017; Zahedi, et. al., 2016). Interpersonal trust, knowledge
transfer, efficient communication and understanding of informal knowledge sharing all have
a positive impact on a virtual team’s performance and on a project’s progress (Navimipour,
Charband, 2016). Knowledge management helps to develope collaborative activities and
maintain the overall development endurance of the group (Alsharo, et. al., 2016). The SECI model
of knowledge sharing plays an important role here, as ICT systems, IT software solutions and
Virtual Project Teams in the IT Industry… 67
cloud computing solutions may enhance the four modes of knowledge conversion – socialisation,
externalisation, combination and internalisation (Nonaka, et. al., 2000).
The Technological Aspect consists of all IT project management supporting software
solutions, team-work collaboration software solutions, video and communication software
solutions, databases and file repositories, additional applications, management control systems
and, most importantly, technical compatibility and network accessibility for all Virtual Project
Team members (Conill, 2013; Majchrzak, et. al., 2000; Conforto, Amaral, 2016). Software
solutions and IT tools may vary depending on the type of the project. Some tools offer additional
features like cloud computing or social media services (Conill, 2013). Proper arrangement of an
evolving virtual workspace is a critical factor required for achieving Virtual Project Team synergy
(Marlow, et. al., 2016). Supporting software can help in building virtual team structures, and most
importantly, it provides features that allow the team to check the current status of the project.
A proper management control system is required to set order in a team’s workflow. Such a system
should contain a governance system which regulates all duties and rules of cooperation
(Bisbe, Sivabalan, 2017). Databases and file sharing systems also have an important influence on
tasks performed by VPT members.
The Social Aspect (also known as Soft Skills Aspect) combines the need for a charismatic
team leader and project manager with a proper motivation system, leadership style,
multicultural cooperation, key values and a variety of soft skills for the virtual team (Jarvenpaa,
Leidner, 1999; Warkentin, et. al., 1997). Team feedback turns out to be effective only when
team trust is high (Pennaroja, et. al., 2015). Thus, trust is one of the main key values in virtual
teams (Ford, 2017). The motivation system is the most challenging aspect of virtual
environments (Conill, 2013). Team leaders and project managers must understand how to
motivate their co-workers in online networks and which ways of encouragement are the best to
increase the commitment of VPT members. Comprehension of content and forbearance are
crucial in achieving a communication balance in a virtual environment (Jarvenpaa, et. al., 2004).
Soft skills also have an important role in maintaining appropriate relations with stakeholders
during the realisation of a project (Pokharel, 2011).
4. Overview of Virtual Project Team collaboration software and IT tools
in the perspective of the Three Aspects Model
4.1. Description of research methods
In this study, we have assessed and rated 10 different types of project management software
solutions which provide support in establishing a comprehensive workspace for virtual teams.
These tools were selected on the basis of top 10 virtual project management software solutions
rankings made by various tech and software-related websites. The analysis presented by the
G2.com site seems most interesting, as it includes hundreds of user reviews of as many as 770
68 F. Liebert, M. Zaczyk
pieces of software and applications supporting project management and virtual teams.
The 10 most popular project management and virtual team collaboration tools were selected,
recommended by many software and business services websites (available in December 2019)1.
In order to rate all features of selected software solutions in the perspective of the Three Aspects
Model, we analysed 150 reviews (available on G2.com) of every software solution. Additionally,
we conducted individual tests of every project management solution and assessed the quality of
its features. The main objective of the research was to rate every unique piece of software and
determine whether it is able to provide additional support within particular aspects of virtual
project teams, namely:
Project management support (technological aspect) – considered as utilities and features
crucial for project-related activities, like project objective management, task and backlog
management, schedule management, quality management, risk management, budget
management and resource management;
Database & cloud services support (technological aspect) – considered as availability of
advanced features and functions which can be used in the virtual cloud, like simultaneous
work on a certain case in a virtual workspace or the possibility to temporarily use (or pay
a periodic subscription fee) additional tools available in the cloud, which also concerns
compatibility with various types of databases;
Technical compatibility support (technological aspect) – considered as the possibility to
use certain piece of software on every type of mobile and standalone device, which also
concerns the level of integrity and compatibility with other types of software;
Swift communication support (transparency aspect) – considered as utilities in the form
of messengers, information boards and online chat systems and their integrity with other
popular communication workspaces like Slack;
Knowledge sharing support (transparency aspect) – considered as features which enhance
knowledge and data sharing, e.g. in the form of solution repositories such as general
guides, practical FAQ sections and other types of advice which may provide answers to
unique problems;
Feedback & soft skills support (social aspect) – considered as functions and features
which may enhance the integrity of the whole team, provide easier access to send
feedback or have a positive impact on conversations;
Motivation system support (social aspect) – considered as an employee gratuity system,
e.g. where every team member can be rewarded with special badges or score points for
successfully completing a specific task.
The level of support of every aspect has been rated on a scale from 1 to 5, where 1 was the
lowest rating (very low support) and 5 the highest possible score (very high support).
1 There are many websites and web portals which offer an overview of virtual team collaboration tools or project
management software solutions, such as: project-management.com; capterra.com; pcmag.com; proofhub.com; techradar.com; scoro.com; thedigitalprojectmanager.com; mopinion.com; g2.com. Most of these recommend similar solutions among the top 10 project management supportive software.
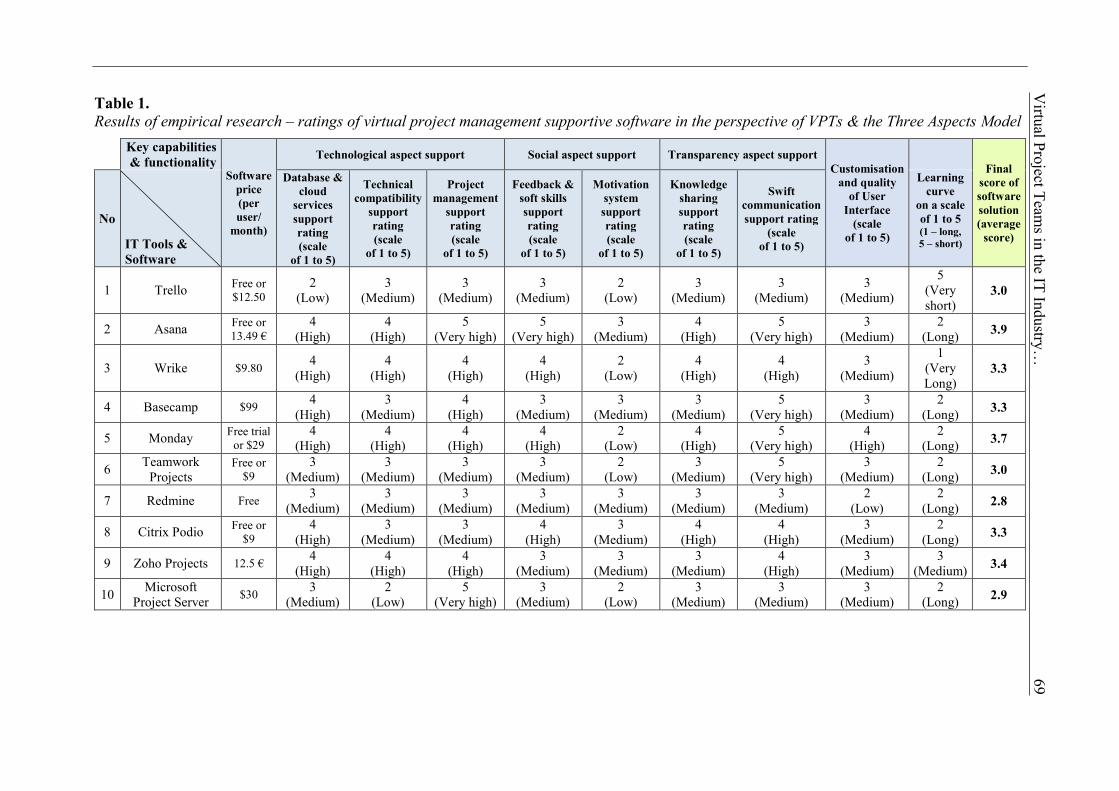
Table 1.
Results of empirical research – ratings of virtual project management supportive software in the perspective of VPTs & the Three Aspects Model
Key capabilities
& functionality Software
price
(per
user/
month)
Technological aspect support Social aspect support Transparency aspect support
Customisation
and quality
of User
Interface
(scale
of 1 to 5)
Final
score of
software
solution
(average
score)
No
IT Tools &
Software
Database &
cloud
services
support
rating
(scale
of 1 to 5)
Technical
compatibility
support
rating
(scale
of 1 to 5)
Project
management
support
rating
(scale
of 1 to 5)
Feedback &
soft skills
support
rating
(scale
of 1 to 5)
Motivation
system
support
rating
(scale
of 1 to 5)
Knowledge
sharing
support
rating
(scale
of 1 to 5)
Swift
communication
support rating
(scale
of 1 to 5)
Learning
curve
on a scale
of 1 to 5 (1 – long,
5 – short)
1 Trello Free or $12.50
2 (Low)
3 (Medium)
3 (Medium)
3 (Medium)
2 (Low)
3 (Medium)
3 (Medium)
3 (Medium)
5 (Very short)
3.0
2 Asana Free or 13.49 €
4 (High)
4 (High)
5 (Very high)
5 (Very high)
3 (Medium)
4 (High)
5 (Very high)
3 (Medium)
2 (Long)
3.9
3 Wrike $9.80 4
(High) 4
(High) 4
(High) 4
(High) 2
(Low) 4
(High) 4
(High) 3
(Medium)
1 (Very Long)
3.3
4 Basecamp $99 4
(High) 3
(Medium) 4
(High) 3
(Medium) 3
(Medium) 3
(Medium) 5
(Very high) 3
(Medium) 2
(Long) 3.3
5 Monday Free trial
or $29
4 (High)
4 (High)
4 (High)
4 (High)
2 (Low)
4 (High)
5 (Very high)
4 (High)
2 (Long)
3.7
6 Teamwork
Projects Free or
$9
3 (Medium)
3 (Medium)
3 (Medium)
3 (Medium)
2 (Low)
3 (Medium)
5 (Very high)
3 (Medium)
2 (Long)
3.0
7 Redmine Free 3
(Medium) 3
(Medium) 3
(Medium) 3
(Medium) 3
(Medium) 3
(Medium) 3
(Medium) 2
(Low) 2
(Long) 2.8
8 Citrix Podio Free or
$9
4 (High)
3 (Medium)
3 (Medium)
4 (High)
3 (Medium)
4 (High)
4 (High)
3 (Medium)
2 (Long)
3.3
9 Zoho Projects 12.5 € 4
(High) 4
(High) 4
(High) 3
(Medium) 3
(Medium) 3
(Medium) 4
(High) 3
(Medium) 3
(Medium) 3.4
10 Microsoft
Project Server $30
3 (Medium)
2 (Low)
5 (Very high)
3 (Medium)
2 (Low)
3 (Medium)
3 (Medium)
3 (Medium)
2 (Long)
2.9
Virtual Project Team
s in the IT Industry…
69
70 F. Liebert, M. Zaczyk
4.2. Research results
The analysis of available project management software solution reviews was conducted in the
period of November – December 2019. The research results are presented in Table 1.
All reviewers were software users (not managers or supervisors) that work at small, medium and
large enterprises associated with new product development activities. The level of customisation
of the user interface and learning curve were also included in the overall assessment of software
features, as they were indicated as important issues among user reviews. The level of learning
curve was rated on a 5-level scale of 1 to 5, where a level of 1 indicates a very long learning
curve, and a level of 5 depicts a very short learning curve. Important note – the software prices
presented in Table 1 were available on 16.12.2019, and they are most probably subject to change.
5. Discussion
The results indicate that most types of analysed software solutions offer a comprehensive
set of features which have a positive impact on Virtual Project Management and on Virtual
Project Team collaboration. Each project management software solution provides support for
VPT activities, at least to some extent. Despite this, there are a few aspects and areas where
they fail to do so due to lack of functionality or a high level of complexity. As shown in Table
1, Monday and Asana are the most advanced, refined and polished solutions designed for virtual
teams. On the other hand, Microsoft Project Server and Redmine seem to be less suited for
VPTs.
In the aspect of technological support, most tools successfully provide VPTs with a decent
level of integrity and project management components. Technological compatibility allows
virtual team members to use various additional tools and apps (accessories like software version
tracking systems, communication workspaces or resource managers). Mobile devices and
tablets are supported by almost every software solution, which enables project members to track
all ongoing tasks and get feedback about current issues whenever and wherever the project
member is located. Only Microsoft Project Server stands out from the rest of the solutions as it
does not have sophisticated applications and functions compatible with mobile devices.
However, this may be due to the specific nature of the software itself. Each solution offers
a wide range of project management features, including task management, Gantt charts with
detailed schedules, assignments, resources management, budged management, calendars,
Kanban boards, to-do lists, workflow management, project team management and some basic
components for risk management and issue tracking. The latter feature is rather limited and may
still require more development by software providers, as risk analysis and risk management are
quite difficult to manage in a virtual environment. Some tools like Trello or Redmine offer

Virtual Project Teams in the IT Industry… 71
a bit lesser set of project management features. Database and cloud services support is at
a satisfactory level in most cases. The only exception is Trello, which is a simple Kanban-style
task management tool that doesn’t provide any additional functions of data transferring or
cloud-related services.
Social aspect support turns out to be the most problematic area, where the majority of the
assessed software solutions perform poorly or at least sufficiently. In other words, almost every
software solution lacks a proper motivation system. For example, a user panel with badges,
experience, abilities and description of individual skillsets would be an extraordinary feature
for every virtual project member. Such individual virtual project user charters could also include
developer’s achievements, rewards and completed challenges from the past few months or
years. Moreover, this could allow for a faster exchange of human resources among various
projects that require a particular set of professional skills. Zoho, Basecamp, Citrix Podio and
Asana have some of the team member motivation features, but only to a small degree or with
minor functionality (usually in the form of a simple list of skills, which includes the proficiency
level of every skill). In the case of feedback and soft skills, there are just a few project
management software solutions that can been highlighted for having more advanced feedback-
related functions or attributes, such as 1 on 1 virtual meetings or built-in virtual discussion
sections, namely Asana, Wrike, Monday and Citrix Podio.
Knowledge sharing and swift communication support are the most praised and
well-developed aspects of every project management software solution for VPTs. Virtually
every tool offers an excellent package of communication and collaboration features, such as
messengers, chats, discussion boards and panels, or even audio-video call systems.
Communication is swift, effective and on demand due to mobile apps and fully-fledged desktop
solutions. Only Trello, Redmine and Microsoft Project Server have limited communication
capabilities. Trello lacks a decent built-in chat system among users. Redmine is an open source
tool which requires complicated configuration in order to achieve a transparent environment
for project’s team. Lastly, Microsoft Project Server lacks advanced mobile device support and
collaborative features. Knowledge sharing is rather well-developed in most cases, but some
reviewers pointed out that many software solutions have limited file sharing functionality.
For example, sometimes users are unable to send photos or project-related graphs including
important data (these issue concerns solutions with a ‘Medium’ rating).
Customisation and user interface are one of the main issues of every software solution.
Many users complained about the confusing design of various features, buttons or panels. Some
elements of dashboards and task panels are strangely resized on different platforms and a bit
puzzling to beginners. Lack of personalisation and customisation is a major problem of almost
every software solution. The only exception is Monday, which has some positive reviews
concerning this aspect. On the other hand, the most outdated and criticised tool is Redmine,
which uses an older type of visual design. All tools have an extremely high learning curve,
which means that their adaptation and proper configuration is a very difficult and demanding
72 F. Liebert, M. Zaczyk
challenge for VPTs. Some reviewers stated that it took them weeks to fully implement
a particular solution in their company (Wrike is the hardest to learn project management
software solution). The only exception is Trello, which is very easy to learn. This is mainly
a result of its low complexity, as it is a simple tool for managing tasks in smaller teams.
In order to summarise the results of our project management software solution overview,
on the basis of the analysed data collected from 1,500 reviews (150 reviews for every software
solution) and our individual tests, we have identified 10 of the most common disadvantages
that applied to almost every project management tool for VPTs – these are the following:
Lack of features associated with motivation;
Limited feedback functionality;
Steep learning curve and high level of complexity;
Low or limited customisation of features;
Low customisation of User Interface;
Serious performance problems;
Lack of proper integration with other applications or software types;
Limited mobile device support;
Limited knowledge sharing (e.g. limited file repositories);
Unpolished project management features (Gantt chart issues or limited resources
management).
6. Conclusion
In the era of agile scrum frameworks and iterative product development, a need for better
organisation of workflow has emerged, especially in software development teams. Project
management software solutions allow virtual NPD teams to effectively organise their product
backlog and properly manage all tasks of an IT project. These tools are also becoming the main
channel of communication for a project team. This article provides a general overview of
supportive project management software solutions and assesses their value in the perspective
of VPTs. The Three Aspects Model of a Virtual Project Team, which consists of the
Transparency Aspect, Social Aspect and Technological Aspect, was used to evaluate the
supportive potential of every software solution.
Research results indicate that most software solutions provide VPTs with a vast and wide
range of useful features that have a positive impact on team collaboration and project
management. Unfortunately, each tool has some disadvantages and lacks functionality in
particular aspects of VPTs. Most software solutions are unable to properly support motivation
aspects in virtual teams. Maybe a system of gratification in the form of an individual charter

Virtual Project Teams in the IT Industry… 73
with project member’s achievements, rewards, badges or individual skillsets could be an
interesting solution here. However, this should not be confused with an employee evaluation
card - the key aspect in this case is to motivate and satisfy the team member. Another problem
is the steep learning curve of every software. Complex or highly priced software solutions are
difficult and discouraging to many users. Some project management features of software
solutions also seem to be limited or unpolished. Finally, the lack of demanded customisation
and confusing user interface are the major issues of every project management software
solution.
The study presented in this article has some limitations. First of all, this research was of
a qualitative nature and took into account the subjective opinions from user reviews. Secondly,
company size and the experience of the user may have a significant impact on the final
assessment of a particular software solution. Another limitation was the number of selected
tools which support VPTs. There are literally hundreds of tools that support virtual project
management, and dozens of tools could be assessed, but a detailed evaluation of all their
features could be an extremely complex research process. The results presented in this paper
can be considered as a pilot study that will serve as a starting point for further research on the
Three Aspects Model for VPTs.
In conclusion, more research is required in this area, especially since VPTs and IT projects
are a crucial part of a very dynamic and evolving industry. Future studies should verify even
higher numbers of software solutions and identify more factors which may have a significant
impact on VPT collaboration. The presented Three Aspects Model is also a concept – it may be
modified or extended with new elements, attributes or additional factors.
References
1. Adenfelt, M. (2010). Exploring the performance of transnational projects: Shared
knowledge, coordination and communication. International Journal of Project
Management, 28, Elsevier.
2. Alsharo, M., et. al. (2016). Virtual team effectiveness: The role of knowledge sharing and
trust. Information and Management. Elsevier.
3. Aslam, S. (2010). Study of Effective Virtual Project Management through Emotional
Intelligence, Empowerment and Leadership Style in Partly and Truly Global Projects.
Taxila: University of Engineering and Technology.
4. Bisbe, J., Sivabalan, P. (2017). Management control and trust in virtual settings: A case
study of a virtual new product development team. Management Accounting Research.
5. Cantu, C. (1997). Virtual Teams. CSWT Papers – Center for the Study of Work Teams.
University of North Texas.

74 F. Liebert, M. Zaczyk
6. Chen, T., Chen, Y., Chu, H. (2008). Developing a trust evaluation method between co-
workers in Virtual Project Team for enabling resource sharing and collaboration. Computers
in industry. Computers in Industry, 59, Elsevier.
7. Conforto, E., Amaral, D. (2016). Agile project management and stage-gate model –
A hybrid framework for technology-based companies. Journal of Engineering and
Technology Management, 40, Elsevier.
8. Conill, R.F. (2013). Motivation in Virtual Project Management. Karlstad Business School.
9. Cooper, G.R. (2014). What’s Next?: After Stage ‐ Gate. Product Innovation Best Practice
Series. Research-Technology Management.
10. Dávideková, M. & Hvorecký, J. (2017). ICT Collaboration Tools for Virtual Teams in
Terms of the SECI Model. International Journal of Engineering Pedagogy.
11. Duarte L.D., Snyder T.N. (2001). Mastering Virtual Teams. Strategies, Tools, and
Techniques That Succeed. San Francisco: Jossey-Bass. A Wiley Company.
12. Dube, L., Pare, G. (2001). Global Virtual Teams. Communications of the ACM, 44(12).
13. Dulebohn, J.H., Hoch, J.E. (2017). Virtual teams in organizations. Human Resource
Management Review.
14. Duran, V., Popescu, A.-D. (2014). The Challenge of Multicultural Communication in
Virtual Teams. Procedia – Social and Behavioral Sciences, 109.
15. Eubanks, D., Palanski, M., Olabisi, J., Joinson, A., Dove, J. (2016). Team dynamics in
virtual, partially distributed teams: Optimal role fulfilment. Computers in Human
Behaviour, 61. Elsevier.
16. Fisher, K., Fisher, M. (2001). The Distance Manger: A Hands-On Guide to Managing Off-
Site Employees and Virtual Teams. New York: McGraw-Hill.
17. Ford, C., et al. (2017). Strategies for building effective virtual teams: Trust is key. Business
Horizons, 60, Elsevier.
18. Gibson, C., Cohen, S. (2003). Virtual Teams That Work: Creating Conditions for Virtual
Team Effectiveness. San Francisco: Jossey-Bass.
19. Greenberg, P., Greenberg, R., Antonucci, Y. (2007). Creating and sustaining trust in virtual
teams. Business Horizons, Vol. 50, Issue 4.
20. Haines, R. (2014): Group development in virtual teams: An experimental reexamination.
Computers in Human Behavior, 39, Elsevier.
21. Hertel, G., et al. (2015): Managing virtual teams: A review of current empirical research.
Human Resource Management Review, 15.
22. Highsmith, J. (2004). APM: Agile Project Management. Creating Innovative Products.
Pearson Education.
23. Iorio, J., Taylor, J. (2015). Precursors to engaged leaders in Virtual Project Teams.
International Journal of Project Management, 33, Elsevier.
24. Jarvenpaa, S.L., Leidner, D.E. (1999). Communication and trust in global virtual teams.
Organization Science, 10(6).

Virtual Project Teams in the IT Industry… 75
25. Jarvenpaa, S.L., Shaw, T.R., Staples, D.S. (2004). Toward contextualized theories of trust:
The role of trust in global virtual teams. Information Systems Research, 15(3).
26. Jones, R., Oyung, R., Pace, L. (2005). Working Virtually: Challenges of Virtual Teams. Idea
Group Inc.
27. Kelley-Lee, L., Sankey, T. (2008). Global virtual teams for value creation and project
success: A case study. International Journal of Project Management, 26, Elsevier.
28. Kimble, C., Barlow, A., Li, F. (2000). Effective Virtual Teams Through Communities of
Practice. Strathclyde Business School Management Science Working Paper, 9.
29. Kirkman, B.L., Mathieu, J.E. (2005). The dimensions and antecedents of team virtuality.
Journal of Management, 31(5).
30. Krill, T., Juell, P. (1997). Virtual Project Management. Proceedings of the Small College
Computing Symposium (SCCS’97). North Dakota State University, March 1997
31. Lebedieva, O., et al. (2011). Virtual Project Management. CADSM’2011, 23-25.02.2011.
32. Lee, M. (2009). E-ethical leadership for Virtual Project Teams. International Journal of
Project Management, 27, Elsevier.
33. Liao, Ch. (2017). Leadership in virtual teams: A multilevel perspective. Human Resource
Management Review, 27, 4.
34. Lipnack, J., Stamps J. (1999). Virtual Teams: The New Way to Work. Strategy &
Leadership, January/February.
35. Majchrzak, A., et. al. (2000). Technology Adaptation: The Case of a Computer-supported
Inter-organizational Virtual Team. MIS Quarterly, 24.
36. Majchrzak, A., Wagner, C., Yates, D. (2006). Corporate wiki users: results of a survey.
WikiSym’06. 37. Marlow, S.L., et al. (2016). Communication in virtual teams: a conceptual framework and
research agenda, Human Resource Management Review.
38. McMahon, P.E. (2001): Virtual Project Management: Software Solutions for Today and the
Future. CRC Press LLC.
39. Misiolek, N.L., Heckman, R. (2005). Patterns of emergent leadership in virtual teams.
Hawaii International Conference on System Sciences (HICSS-38), Waikoloa, HI.
40. Munkvold, B., Zigurs, I. (2007). Process and technology challenges in swift-starting virtual
teams. Information & Management, 44, 3.
41. Nandhakumar, J., Baskerville, R. (2006). Durability of online team-working: Patterns of
trust. Information Technology & People, 19(4), 371-389.
42. Navimipour, N., Charband, Y. (2016). Knowledge sharing mechanisms and techniques in
project teams: Literature review, classification, and current trends. Computers in Human
Behaviour, 62. Elsevier.
43. Nonaka, I., Toyama, R., Konno, N. (2000). SECI, Ba and Leadership: a unified model of
dynamic knowledge creation. Long Range Planning, 33(1).
44. Nozari, H., Najafi, S.E., Jafari-Eskandari, M., & Aliahmadi, A. (2016). Providing a Model
for Virtual Project Management with an Emphasis on IT Projects.
76 F. Liebert, M. Zaczyk
45. Olaisen, J., Revang, O. (2017). Working smarter and greener: Collaborative knowledge
sharing in virtual global project team. International Journal of Information Management,
37, Elsevier.
46. Papadopoulos, G. (2015). Moving from traditional to agile software development
methodologies also on large, distributed projects. Procedia – Social and Behavioural
Sciences, 175, Elsevier.
47. Pennaroja, V., Orengo, V., Zornoza, A., Sanchez, J., Ripoll, P. (2015). How team feedback
and team trust influence information processing and learning in virtual teams: A moderated
mediation model. Computers in Human Behaviour, 48. Elsevier.
48. Pinjani, P., Palvia, P. (2013). Trust and knowledge sharing in diverse global virtual teams.
Information & Management, 50, 4.
49. Pokharel, S. (2011). Stakeholders’ roles in virtual project environment: A case study.
Journal of Engineering and Technology Management, 28, Elsevier.
50. Reed, A., Knight, L. (2010). Effect of a Virtual Project Team environment on
communication-related project risk. International Journal of Project Management,
28, Elsevier.
51. Report Data: 13th Annual State of Agile Report, Version One, 2019.
52. Rico, Ramón, & Alcover, Carlos-Maria, & Manzanares, Miriam, & Gil, Francisco (2009).
The joint relationships of communication behaviors and task interdependence on trust
building and change in virtual project teams. Social Science Information, 48.
53. Robertson, B.J. (2015). Holacracy: The New Management System for a Rapidly Changing
World. Henry Holt and Company.
54. Rolfes, M. (2001). Virtual Project Management. A term paper for MSIS 489.
55. Schumacher, M. (2011). Proposition of a Tool to Build Virtual Teams: Virtual Team
Building Support System: Considerations of Virtual Project Management, Competence
Management and Virtual Team Interaction. Other. Ecole Centrale Paris.
56. Standish Group: Chaos Reports. 1999, 2001, 2004, 2006.
57. Taras, V. et al. (2019). Diverse effects of diversity: Disaggregating effects of diversity in
global virtual teams. Journal of International Management, 25, 4.
58. Tastoglou, E., Milious, E. (2005): Virtual culture: Work and play on the internet. Social
Computer Review.
59. Warkentin, M.E., Sayeed, L., and Hightower, R. (1997). Virtual Teams versus Face-to-face
Teams: An Exploratory Study of a Web-based Conference System. Decision Sciences,
28, 4.
60. Yoo, Y., Alavi, M. (2004). Emergent leadership in virtual teams: what do emergent leaders
do? Information and Organization, 14.
61. Zahedi, M., Mojtaba, S., Muhammad, A. (2016). A systematic review of knowledge sharing
challenges and practices in global software development. International Journal of
Information Management, 36, Elsevier.
Scientific Quarterly “Organization and Management”, 2019, Vol. 4, No. 48; DOI: 10.29119/1899-6116.2019.48.6 www.oamquarterly.polsl.pl
ASSUMPTIONS FOR THE CONSTRUCTION
OF A PROJECT MANAGEMENT SYSTEM
IN THE GÓRNOŚLĄSKO-ZAGŁĘBIOWSKA METROPOLIS
Anna MUSIOŁ-URBAŃCZYK1*, Barbara SORYCHTA-WOJSCZYK2
1 Silesian University of Technology, Faculty of Organization and Management, Zabrze;
[email protected]; ORCID: 0000-0002-4109-1063 2 Silesian University of Technology, Faculty of Organization and Management, Zabrze;
[email protected].; ORCID: 0000-0002-5237-8908
* Correspondence author
Abstract: The article presents the assumptions for the construction of a project management
system in the GZM Metropolis, which will contribute to raising the effectiveness of functioning
of the Metropolitan Office. The proposed project management system will be adapted to reflect
the specific character, the needs and the conditions for the functioning of the newly created
organization, i.e. the GZM Metropolis.
Keywords: project management, organization efficiency, metropolis.
1. Introduction
The metropolitan union in the Silesian voivodeship was established on 1 July 2017 pursuant
to an Agreement of 9 March 2017 on the Metropolitan Union in the Silesian Voivodeship.
The main goal of the GZM Metropolis is to make use of the potential of member municipalities,
stimulate the creativity of residents and inspire changes that will accelerate social and economic
processes. This goal will be achieved, among others, through the implementation of projects
and tasks with particular emphasis on the needs and problems of member municipalities,
rational spatial planning, comprehensive management of sustainable development (Statute of
the "Górnośląsko-Zagłębiowska Metropolis" Metropolitan Union). The tasks which are planned and implemented by the GZM requires a systematized approach taking into account
the correct allocation of resources and the rational spending of funds.
The operation of the metropolis would benefit from a project management concept adapted
to the needs and conditions for the functioning of the GZM. This approach will allow to
correctly plan projects, implement them, and ensure their adequate monitoring and control.

78 A. Musioł-Urbańczyk, B. Sorychta-Wojsczyk
In the context of these objectives, it is necessary to develop and implement a project
management system. The purpose of this article is to present the assumptions for the
construction of a project management system in GZM, which will contribute to raising the
effectiveness of functioning of the Metropolitan Office.
A study of literature has therefore been conducted to elaborate on public management,
strategic management and project management in public administration. Furthermore, based on
interviews, observations and desk research carried out in the Metropolitan Office, the main
factors which affect the implementation of projects were identified.
2. Establishment and functioning of the GZM
Górnośląsko-Zagłębiowska Metropolis is a metropolitan union in the Silesian Voivodeship,
established on the basis of the Upper Silesian Conurbation pursuant to the provisions of the
Act of 9 March 2017 on the Metropolitan Union in the Silesian Voivodeship. The Metropolis
was officially launched on 1 January 2018 as a union of 41 municipalities and communes
(fig. 1) comprising:
26 municipalities, i.e.: Bytom, Będzin, Bieruń, Chorzów, Czeladź, Dąbrowa Górnicza, Gliwice, Imielin, Katowice, Knurów, Lędziny, Łaziska Górne, Mikołów, Mysłowice, Piekary Śląskie, Pyskowice, Radzionków, Ruda Śląska, Siemianowice Śląskie, Sławków, Sosnowiec, Świętochłowice, Tarnowskie Góry, Tychy, Wojkowice, Zabrze;
13 rural communes, i.e.: Bobrowniki, Bojszowy, Chełm Śląski, Gierałtowice, Kobiór, Mierzęcice Ożarowice, Pilchowice, Psary, Rudziniec, Świerklaniec, Wyry, Zbrosławice;
2 rural municipalities: i.e. Sośniowice and Siewierz. A metropolitan union performs the following tasks: shaping the spatial order, stimulating
social and economic development within the metropolitan union, planning, coordinating,
integrative abd developing public mass transit, including road, railway and other, rail transport,
as well as promoting urban mobility, overseeing tasks in metropolitan passenger transit,
cooperating in the routing of national and regional roads within the metropolitan union,
promoting the metropolitan union and its area. Apart from these, the metropolitan union is
competent in the implementation of public tasks pertaining to the scope of the municipality,
poviat or voivodeship self-government, or in coordinating the implementation of these tasks
pursuant to a memorandum of understanding entered into with a self-government unit or an
association of self-government units (the Act of 9 March 2017 on the Metropolitan Union in
the Silesian Voivodeship).
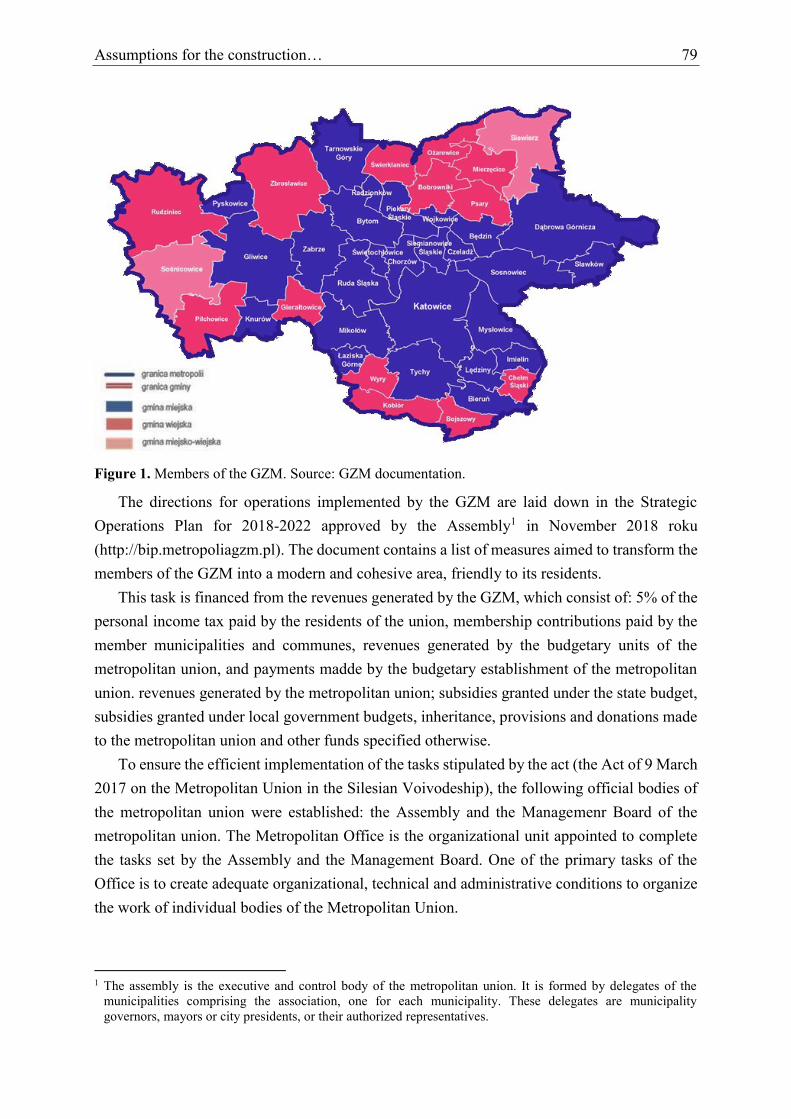
Assumptions for the construction… 79
Figure 1. Members of the GZM. Source: GZM documentation.
The directions for operations implemented by the GZM are laid down in the Strategic
Operations Plan for 2018-2022 approved by the Assembly1 in November 2018 roku
(http://bip.metropoliagzm.pl). The document contains a list of measures aimed to transform the
members of the GZM into a modern and cohesive area, friendly to its residents.
This task is financed from the revenues generated by the GZM, which consist of: 5% of the
personal income tax paid by the residents of the union, membership contributions paid by the
member municipalities and communes, revenues generated by the budgetary units of the
metropolitan union, and payments madde by the budgetary establishment of the metropolitan
union. revenues generated by the metropolitan union; subsidies granted under the state budget,
subsidies granted under local government budgets, inheritance, provisions and donations made
to the metropolitan union and other funds specified otherwise.
To ensure the efficient implementation of the tasks stipulated by the act (the Act of 9 March
2017 on the Metropolitan Union in the Silesian Voivodeship), the following official bodies of
the metropolitan union were established: the Assembly and the Managemenr Board of the
metropolitan union. The Metropolitan Office is the organizational unit appointed to complete
the tasks set by the Assembly and the Management Board. One of the primary tasks of the
Office is to create adequate organizational, technical and administrative conditions to organize
the work of individual bodies of the Metropolitan Union.
1 The assembly is the executive and control body of the metropolitan union. It is formed by delegates of the
municipalities comprising the association, one for each municipality. These delegates are municipality
governors, mayors or city presidents, or their authorized representatives.

80 A. Musioł-Urbańczyk, B. Sorychta-Wojsczyk
3. Formulation of a research problem
The goal of GZM is to make use of the potential of member municipalities, stimulate the
creativity of residents and inspire changes that will accelerate social and economic processes.
Thus formulated, the objective will be accomplished, among others, through the
implementation of projects and tasks. The current environment of contemporary public
organizations is characterized by a high level of uncertainty, complex and multi-aspect
problems related to the management of relations with stakeholders. Despite this, public
organizations from all over the world are expected to increase their effectiveness while
providing higher-quality services for the community. This forces them to search for new
methods of public management, ones that will facilitate the effective implementation of tasks
in a turbulent environment. Public organizations are often judged for their effectiveness and
efficiency. Efficiency is an ambiguous notion. For the purpose of this study, efficiency is
understood as the institutional efficiency of the metropolitan office. This assumes efficiently
working and substantively prepared clerks, correct organizational structures, correctly selected
methods, procedures and operational standards, the application of effective management
instruments, expected accessibility and quality of public services (Przywojska, Podgórniak-
Krzykacz, 2017). The pursuit of effectiveness in public organizations is manifested by public
management concepts, i.e. the concept of traditional public administration, New Public
Management (NPM), New Public Governance (NPG), Neo-Weberian State (NWS).
Furthermore, the efficiency of operation of public organizations can be improved by applying
instruments of strategic management and a project approach.
Since the beginning of its activity, the GZM has completed many projects, among others:
free commute for children and adolescents up to the age of 16, free commute for drivers on
days with elevated air pollution levels, Metropolitan Transport, Metropolitan Bicycle,
and others. These enterprises required significant financing and the coordination of activities
from many people and institutions. Numerous interviews, extensive observations and desk
research carried out at the Metropolitan Office to examine the factors which have negative
impact on the effective and efficient completion of these projects have pointed to:
The absence of procedures for the opening, planning, implementation and monitoring
of projects.
The absence of a formally appointed project manager.
Difficulties in the integration of project participants due to their different professional
experiences (experiences gained during their work in public and business
organizations).
Difficulties in communication among project participants due to the fact that individual
participants use different terminologies and different elements of project management
methodologies, standards and tools.

Assumptions for the construction… 81
The absence of unified project management tools.
The absence of toole for gathering and storing knowledge knowledge derived from
projects.
Lack of access to current knowledge on the progress of individual projects.
It is therefore necessary to create an adequate approach to project management in the
Metropolitan Office, in order to combine a vision of the future with the past experiences,
while limiting uncertainty and risk in project implementation.
However, the efficiency of project management requires the synchronization and
coordination of measures. This approach requires an ordered and homogeneous approach to
project management, which is attained, among others, by implementing standards pertaining to
the methodology and technique of project management.
A review of available literature has pointed to the absence of a holistic approach to the
management of a public organization consisting in a metropolitan union. A study of literature
(Prawelska-Skrzypek, Jałocha, 2014; Jałocha, 2014; Dolata, 2013, 2014; Jaskanis,
Marczewska, Darecki, 2015) has indicated that the main problem associated with project
management in public organizations in Poland is the tension between the officious, rigid
structure of work in functional teams and the work of project teams. Another notable feature is
the absence of units which coordinate the implementation of individual projects.
Therefore, in order to ensure the efficient operation of a management system of a public
organization, the Metropolitan Office, it is necessary to develop a project management system.
A project management system should ensure the effective and efficient implementation of
individual projects, and therefore to ensure the efficient functioning of the organization as
a whole. Some of the measurable benefits of the project-centered approach in the metropolitan
office include:
ensuring the cohesion of project objectives with the objectives of the organization,
applying uniform project management standards and tools,
selecting the right employees and seeing that they perfect their competences
(in connection with a personal strategy),
exchanging knowledge and experiences by applying standardized project management
tools, standardized software, common training programs, etc.
4. Conditions for the construction of a project management system in GZM
In order to ensure the efficient implementation of projects, a project management system
was proposed for the Metropolitan Office, one that would take into account the specific
character of this organization. The documents proposed must comply with the following
documents:
82 A. Musioł-Urbańczyk, B. Sorychta-Wojsczyk
Organizational Regulations of the Metropolitan Office of the Górnośląsko-
Zagłębiowska Metropolis (GZM). Appendix 2 to resolution No. 127/2018 of the Management Board of Górnośląsko-Zagłębiowska Metropolis dated 28 June 2018.
Statute of the "Górnośląsko-Zagłębiowska Metropolis" Metropolitan Union. Appendix to resolution No. V/1/2018 of the Assembly of the Górnośląsko-Zagłębiowska Metropolis of 16.02.2018.
Act of 9 March 2017 on the Metropolitan Union in the Silesian Voivodeship, Journal of
Laws of 2017, item 730.
The Public Procurement Act of 29 January 2004, Journal of Laws of 2004, No. 19, item
177, Journal of Laws of 2017, item 1579, 2018.
Disposition no. 43/2018 of the President of the Management Board of the Górnośląsko-
Zagłębiowska Metropolis of 23 July 2018 on the adoption of regulations for the grant of public procurement, to which the provisions of the Public Procurement Act, including
any annexes thereto, shall not apply.
Other acts and regulations regulating the functioning of local government units.
In order to develop a project management system, it is therefore necessary to review any
applicable good practices and methodologies in the scope of project management.
Project management methodologies can be classified into two groups of methodologies and
standards: classic methodologies and standards and agile methodologies and approaches.
The first group of methodologies and standards includes, among others PMBoK (Project
Management Body of Knowledge), PRINCE2 (Projects in Controlled Environments),
PCM (Project Cycle Management) and IPMA (International Project Management
Association), (Wirkus, 2013, pp. 183-208). Agile methodologies and approaches include:
SCRUM, Prince2 Agile etc. Furthermore, there are industry and company methodologies
developed by expert associations from specific industries, and major business organizations.
Methodologies, standards and approaches to project management and good practices
facilitate project management, pointing to correct procedures, i.e. correct methods of preparing
a plan for a project and correct methods of implementing it.
In an organization like the Metropolitan Office, it would be difficult to apply a different
project management methodology or standard. Any project management system developed
should be adapted to the specific character, condition and needs of the Metropolitan Office.
The project management system should support the planning and implementation of
projects in the Metropolitan Office. The system is assumed to include:
1. A project management model.
2. The roles of individual project management participants.
3. Project management procedures.

Assumptions for the construction… 83
For the GZM Metropolitan Office, the project management model should include four
stages:
1. Project initiation and definition.
2. Project planning.
3. Project implementation, monitoring and control.
4. Project closure.
For each of the stages of the model, a procedure should be developed, specifying the roles
and obligations of individual participants of the project management process in the
Metropolitan Office. The following entities should be the primary participants of the project
management process in the Metropolitan Office:
The Management Board of GZM, which will be in charge of securing the finances for
the implementation of the project.
A Steering Committee which will be responsible for achieving the objectives of the
project.
A Project Manager, who will be authorized and obligated to conduct ongoing project
management.
A Project Team which will be in charge of implementing individual tasks as part of the
project.
A Project Office which will offer substantive-administrative services, including
providing advice, tips, assistance in project management tools.
Project Reviewt Committee, the main purpose of which will be to assess any project
initiatives reported.
A procedure for initiating and defining the project should be developed as part of stage one.
Initiating and defining a project assumes the search, formulation and notification of ideas in the
form of project initiatives. The possibility of submitting project initiatives in the metropolitan
office should be offered to a wide group of people and institutions, not only the employees of
the office, but also the residents, member municipalities and other institutions and organizations
based within the GZM. Any project initiatives submitted should be reviewed by an appointed
body – the Project Review Committee, based on predetermined project review criteria. Based
on the review of project initiatives, the Management Board of the GZM should make a decision
to open selected projects, and should appoint a Project Team and a Project Manager.
At the second stage, the project planning procedure should be supplemented with two
procedures which are particularly important from the point of view of the metropolitan office,
i.e. project stakeholder management and project risk management. The purpose of project
planning is to create a plan of all tasks to be completed, their deadlines and costs. A plan is
a document which is used to run a project, measure its actual progress relative to its
expectations, and is updated in progress, as successive pieces of information about the progress
of project works are received. A project plan should include the following elements:
84 A. Musioł-Urbańczyk, B. Sorychta-Wojsczyk
1. Justification for the implementation of the project.
2. Main and detailed objectives of the project.
3. Stakeholder management plan.
4. Communication plan.
5. Scope of the project.
6. Project schedule, including a specification of the milestones.
7. Responsibility matrix for individual tasks.
8. Project budget.
9. Risk management plan.
10. Economic analysis of the project.
At stage three, the project implementation, monitoring and control procedure should
consider the possibility of introducing changes into the project. The project implementation and
controlling stage cover implementation of tasks arising from the plan, and controlling of
compliance with the plan to accomplish the project objectives. This stage should particularly
include the following tasks:
coordination and control of the work of the team and any subcontractors,
acceptance of completed works,
ongoing reporting of the progress of the project,
ongoing coordination of the project, due to changes taking place in its implementation.
A change may appear during the control and monitoring of the project, which may be
reported by any participant or stakeholder of the project (both internal and external project
stakeholders).
At the last stage, the project should be closed. This stage aims at completing any tasks
related to the formal closure of all measures in all areas of the project. This stage should
particularly include:
formal closure and settlement of the project,
review of the project (financial, technical, qualitative, etc.),
accumulation and distribution of knowledge and experiences obtained in the course of
the project, particularly by drawing up a final report from the project.
In order to depict the proposed project management system for the Metropolitan Office,
a process map should be developed for each stage of the project management model.
They describe the temporal progress of tasks in reference to individual participants of the
project management process. Due to the sheer size of the process maps, i.e. a large number of
task elements and a large number of participants, it is not possible to present them in this study.

Assumptions for the construction… 85
5. Summary
The development and implementation of a project management system should contribute to
improving the functionality of the Metropolitan Office.
In order to improve the efficiency of this system, organizational and material changes
should be introduced. As regarding organizational changes, an organizational unit, i.e. a Project
Office, should be created in the Metropolitan Office. As regarding material changes, a dedicated
IT tool facilitating the process of project management should be implemented.
The project management system implemented in the Metropolitan Office must be adapted
to its specific nature, its needs and its operating conditions. In order to develop this system,
an analysis of methodologies, standards and approaches to project management should be
conducted. This will allow to select these elements from individual approaches, which will
contribute the most to ensuring the efficiency of the organization.
The proposed project management system should include: the model, the roles and
procedures of project management. The implementation and application of such a system in the
Metropolitan Office should contribute to the effective management of each project, and to
achieving its objectives in a timely manner.
References
1. Act of 9 March 2017 on the Metropolitan Union in the Silesian Voivodeship. Journal of
Laws of 2017, item 730.
2. Disposition no. 3/2018 of the President of the Management Board of the Górnośląsko-
Zagłębiowska Metropolis of 9 January 2018 on the adoption of regulations for the grant of public procurement, to which the provisions of the Public Procurement Act, including any
annexes thereto, shall not apply.
3. Dolata, M. (2013). Dojrzałość projektowa podstawowych jednostek samorządu terytorialnego w Polsce Dojrzałość projektowa jako mechanizm identyfikacji przyczyn sukcesów i porażek w zarządzaniu projektami. Organizacja i Kierowanie, 5(158).
Warszawa: Komitet Nauk Organizacji i Zarządzania PAN, SGH. 4. Dolata, M. (2014). Identyfikacja i kształtowanie kluczowych czynników sukcesu w
zarządzaniu projektami jako mechanizm zapewnienia doskonałości w podstawowych jednostkach samorządu terytorialnego w Polsce. Prace Naukowe, 356. Wrocław:
Uniwersytet Ekonomiczny.
5. http://bip.metropoliagzm.pl/artykul/30624/124488/uchwala-nr-xii-73-2018-zgromadzenia-
gornoslasko-zaglebiowskiej-metropolii, 12.03.2019.
86 A. Musioł-Urbańczyk, B. Sorychta-Wojsczyk
6. ISO 21500: 2012 – Guidance on project management.
7. Jałocha, B. (2014). Zarządzanie portfelem projektów. Koncepcje biznesowe, a praktyka organizacji publicznych. Kraków: Wydawnictwo Uniwersytetu Jagiellońskiego.
8. Jaskanis, A., Marczewska, M., Darecki, M. (2015). Zarządzanie projektami w administracji pulicznej. Warszawa: PRESSCOM Sp. z o.o.
9. Kompendium wiedzy o zarządzaniu projektami. PMBOK Guide, 2000 Edition (2003).
Warszawa: Wyd. MT & DC.
10. Organizational Regulations of the Metropolitan Office of the Górnośląsko-Zagłębiowska Metropolis (GZM). Appendix 2 to resolution no. 37/2017 of the Management Board of the
Górnośląsko-Zagłębiowska Metropolis of 18 December 2017.
11. Prawelska-Skrzypek, G., Jałocha, B. (2014). Projektyzacja sektora publicznego w Polsce
— implikacje dla organizacji samorządu terytorialnego. Zarządzanie Publiczne, 3(27).
12. PRINCE2 – Skuteczne Zarządzanie Projektem. 13. Przywojska, J., Podgórniak-Krzykacz, A. (2017). Zarządzanie publiczne w świetle strategii
wojewódzkich. Łodź: Instytut Diagnoz i Analiz Społecznych. 14. Statute of the "Górnośląsko-Zagłębiowska Metropolis" Metropolitan Union. Appendix to
resolution No. V/1/2018 of the Assembly of the Górnośląsko-Zagłębiowska Metropolis of 16.02.2018.
15. The Public Procurement Act of 29 January 2004 Journal of Laws of 2004, No. 19, item 177,
Journal of Laws of 2017, item 1579, 2018.
16. Wirkus, M. (2013). Metodyki zarządzania projektami – przegląd. In: Wirkus, M.,
Roszkowski, H., Dostatni, E., Gierulski, W. (eds.), Collective study edited by Zarządzanie projektem. Warszawa: PWE.
Scientific Quarterly “Organization and Management”, 2019, Vol. 4, No. 48; DOI: 10.29119/1899-6116.2019.48.7 www.oamquarterly.polsl.pl
STRATEGIC ENVIRONMENTAL TYPES AND OBSTACLES
TO THE ABSORPTION OF CLEAN TECHNOLOGIES – THE CASE OF POLAND
Oksana SEROKA-STOLKA
Technical University of Częstochowa, Częstochowa; [email protected], ORCID: 0000-0003-2044-4875
Abstract: The adoption of a cleaner production approach to environmental protection has
generated the need to identify obstacles affecting the absorption of clean technologies by
enterprises with different strategic environmental types in Poland. This research analysis
focuses on a sample of industrial firms representing the following industries: food, fuel and
energy and chemical. Findings indicate that there are statistical differences between the types
of environmental strategies related to the influence of financial and legal obstacles to the
absorption of clean technologies. The study also shows that the influence of obstacles on
proactive environmental strategies was found to be smaller than on strategies with a lower level
of adaptation.
Keywords: strategic management, clean technologies, absorption, obstacles.
1. Introduction
Since the early 90s, evolution of firms’ environmentalism from end-of-pipe technologies
towards clean technologies in controlling and reducing fossil fuel emissions and potentially
limiting climate change has been observed (Acemoglu et al., 2016). Many solutions that
determine enterprise response to the environmental protection regulatory changes are of
a technological nature. The attitude of securing enterprise compliance with the law (reactivity)
is extended with an interest in expensive “clean” environmental technologies, as a sign of
anticipation of changes, which leads to predicting the environmental harmfulness risk. The risk
anticipation is an antecedent of results of the negative enterprise effect on the natural
environment. By extending the range of voluntary activities the enterprise responses to the
requirements of market and non-market stakeholders, emphasising the role of new
environmental technologies that prevent the pollution generation “at source” and activating
internal resources in order to meet the surrounding requirements.
88 O. Seroka-Stolka
Many forms of environmentally friendly behaviours of firms are viewed as innovations,
and, therefore, they should be interpreted from an absorption and diffusion perspective (Darley
and Beniger, 1981). An absorption is an efficient absorption (acquisition) or acceptance by the
enterprise, industry and economy of an innovation emerging on the market (Kaźmierczak-
Piwko and Graczyk, 2012). A diffusion is the dissemination of an innovation within a social
system. The diffusion theory focuses on how quickly and to what degree a social system accepts
an innovation (Driessen, and Hillebrand, 2002). The absorption of clean technologies by an
enterprise is associated with numerous conditions; therefore, it is justified to identify them and
their influence on strategic environmental types of Polish companies. The aim of the article is
to identify and assess obstacles to the absorption of clean technologies by enterprises in groups
of enterprises with different types of environmental strategies.
2. Clean technologies and corporate strategic responses to environmental
issues
Technologies are a strategic resource, co-deciding the market advantage of a company.
Environmental technologies are divided into two groups: integrated and additive environmental
technologies (end-of-pipe technologies). Integrated environmental technologies can be
subdivided into product and process integrated measures, and these require reorganisation of
the whole production process in companies (Figure 1). Searching for solutions preventing the
emission of pollutants (dust, gas, sewage, waste, etc.) and the implementation of integrated
environmental technologies seems to be a more beneficial solution than removing the effects
of generated pollution through obsolete "end-of-pipe" technologies (Rennings, 2000;
Baumgartner and Zielowski, 2007). The cost of developing a company's own technology is
a much more capital-intensive undertaking than the absorption of environmental technology
from outside an enterprise (Teece, 1977). The absorption of new technologies means acceptance
of innovations that emerge as a result of the innovations' diffusion (Leszczyńska, 2011). Lanoie
et al. (2011) argue that technology-based standards often impose the best available technology
that already exists, providing little incentives for investment in R&D (Lanoie et al., 2011).
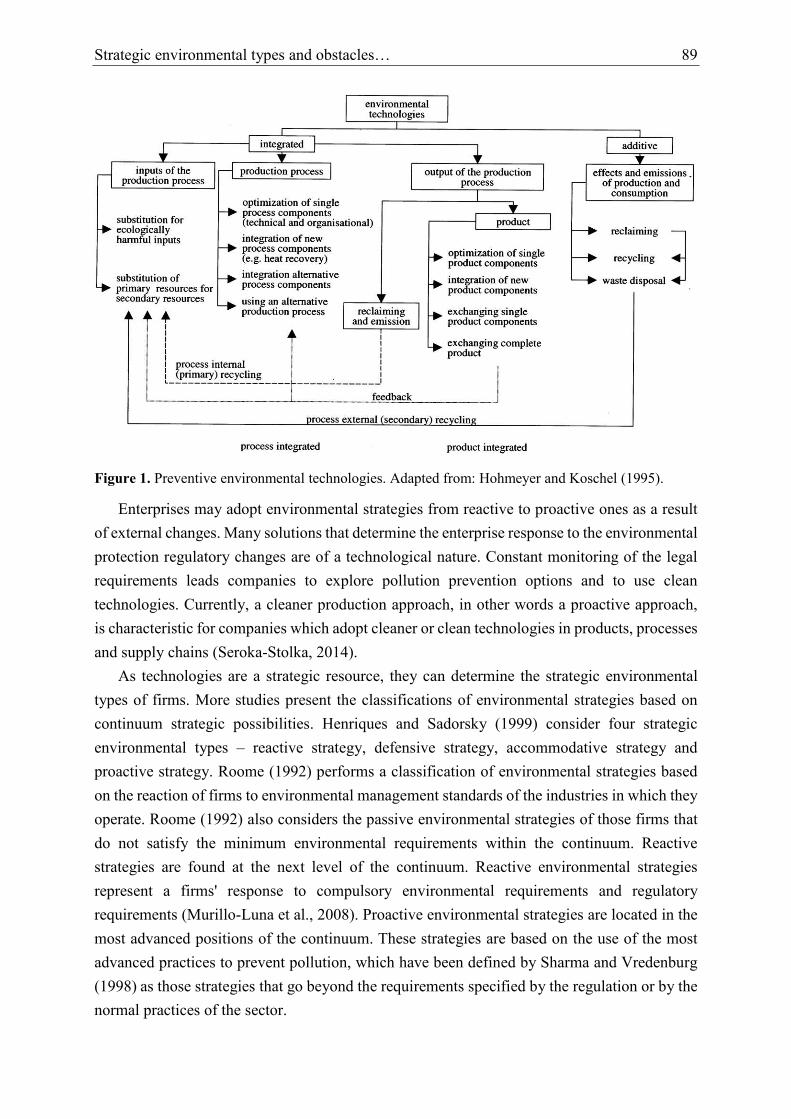
Strategic environmental types and obstacles… 89
Figure 1. Preventive environmental technologies. Adapted from: Hohmeyer and Koschel (1995).
Enterprises may adopt environmental strategies from reactive to proactive ones as a result
of external changes. Many solutions that determine the enterprise response to the environmental
protection regulatory changes are of a technological nature. Constant monitoring of the legal
requirements leads companies to explore pollution prevention options and to use clean
technologies. Currently, a cleaner production approach, in other words a proactive approach,
is characteristic for companies which adopt cleaner or clean technologies in products, processes
and supply chains (Seroka-Stolka, 2014).
As technologies are a strategic resource, they can determine the strategic environmental
types of firms. More studies present the classifications of environmental strategies based on
continuum strategic possibilities. Henriques and Sadorsky (1999) consider four strategic
environmental types – reactive strategy, defensive strategy, accommodative strategy and
proactive strategy. Roome (1992) performs a classification of environmental strategies based
on the reaction of firms to environmental management standards of the industries in which they
operate. Roome (1992) also considers the passive environmental strategies of those firms that
do not satisfy the minimum environmental requirements within the continuum. Reactive
strategies are found at the next level of the continuum. Reactive environmental strategies
represent a firms' response to compulsory environmental requirements and regulatory
requirements (Murillo-Luna et al., 2008). Proactive environmental strategies are located in the
most advanced positions of the continuum. These strategies are based on the use of the most
advanced practices to prevent pollution, which have been defined by Sharma and Vredenburg
(1998) as those strategies that go beyond the requirements specified by the regulation or by the
normal practices of the sector.
90 O. Seroka-Stolka
In other words, when an enterprise only meets the regulatory requirements, then it is called
a reactive environmental strategy, and when it voluntarily (“beyond regulation”) extends them,
it is recognised as a proactive environmental strategy (Dongwon, 2003; Darnall, J. Carmin,
2005; Aragón-Correa, 2007).
Garcés-Ayerbe et al. (2016) present the evolutionary model of strategies – from laggard
positions with low intensity of environmental practices, to eco-innovative strategic positions
characterised by high intensity of the adoption of environmental practices in different areas:
production process, product, management and supply chains (Garcés-Ayerbe et al., 2016).
Enterprises with proactive strategies are environmentally friendly and more eco-innovative than
companies with less advanced strategies which adopt “end-of-pipe technologies”. Enterprises
with proactive environmental strategies voluntarily prevent pollution “at source” and use clean
technologies, which goes beyond the legal requirements and environmental standards achieved
by anticipating the most likely changes in the law. Anticipating the law requires early
implementation, improvement or replacement of existing technology with new technology by
enterprises.
Seroka-Stolka (2017) presents four different types of environmental strategies as follows:
passive environmental strategy, reactive environmental strategy, attention to stakeholders
strategy, proactive environmental strategy (Seroka-Stolka, 2017, pp. 236-237). This typology
of environmental strategies is developed incrementally in an evolutionary process. It presents
an evolutionary way to develop eco-innovations and was adopted in a research process.
The initially dominant strategic attitude of securing compliance with the law is gradually
extended with voluntary “beyond regulation” activities to develop clean technologies
applicable in a given industry, business sector, region or country as a sign of legal regulation
anticipation and meeting regulatory requirements. In summary, reactive and proactive
environmental strategies of enterprises differ in the degree of minimisation of pollution and
adoption of technologies “at source” to protect the natural environment.
3. Obstacles to absorption of clean technologies by enterprises
Clean technologies are regarded as the essential resource of ecological competitiveness
(Buhl, 2016). Many research studies have confirmed that the adoption of clean technologies
helps to protect the environment and contributes to a corporate green image or brand, as well
as better performance and competitiveness of the firm (Ar, 2012). Companies that have decided
to adopt or are in the process of implementing clean technologies should understand what
existing obstacles and conditions may affect implementation of clean technologies.
Nevertheless, there is no doubt that companies can develop their own environmental
technologies that will be suitable for their production needs. However, external sources of

Strategic environmental types and obstacles… 91
environmental technologies' absorption are considered as cheaper and requiring a shorter cycle
of implementation, as well as lower business risk, for companies (Teece, 2003).
A general model of environmental technologies absorption presented by R. Kemp (1997)
introduces technological and economic factors, as well as the environment conditions, that
affect the effective acquisition and later implementation of environmental technologies by
enterprises as follows:
information channels,
the scope and frequency of the information obtained,
motivations for searching for information about environmental technologies.
The model also highlights the role of internal capabilities as learning capabilities. The level
of the absorption of environmental technologies deepens on the information transfer system,
the economic and technological nature of the technology and characteristics of the external
environment (Kemp, 1997).
Scholars identify different conditions and obstacles relevant to eco-innovations as follows:
environmental regulations, environmental standards (ISO 14001, EMAS), environmental R&D,
environmental policy pressure, networking activities, quality/nature of industrial relations and
process and induced costs, green culture, green information system (IS), infrastructure
regulatory costs, absorptive capacity, stakeholders and culture, green organisational identity,
corporate environmental ethics, green intellectual capital (Post, and Altman, 1994; Gluch et al.,
2009; Qi et al., 2013; Chang and Chen, 2013; Chang, 2011; Chen, 2007).
However, some of the studies identify barriers and obstacles that prevent acquisition of
clean technologies by enterprises with different types of environmental strategies. The first
proposition of the classification of barriers, based on the strategic environmental adaptation of
the firm, is the one proposed by Post and Altman. They distinguish between industry and
organisational barriers. The industry barriers are as follows:
high costs of the environmental investment,
competitive pressures,
regulatory constraints,
information and technical knowledge.
High costs of the environmental investment are related to the acquisition of clean
technologies to prevent pollution and implementation of Environmental Management Systems
and often force firms to place priority on other types of investments in a situation when they
are under high competitive pressure (Post and Altman, 1994). Post and Altman (1994) also
indicate regulation restrictions and scarce flexibility in regulation compliance as barriers for
changing the technological process and strategies towards cleaner production. Most of the
authors emphasise that some characteristics of the command-and-control regulations promote
the adoption of correction strategies rather than the prevention of pollution strategies by

92 O. Seroka-Stolka
implementation of clean technologies. Important obstacles are the lack of information about the
potential results of absorption of clean technologies and access to technical knowledge.
The second proposition of the obstacles are organisational barriers as follows:
employee attitudes,
inadequate top management leadership,
poor communication,
past practices (Murillo-Luna et al., 2011; Shi et al., 2008).
Researchers often indicate the important barriers of clean technologies adoption as follows:
organisational barriers such as employees’ and top management’s lack of commitment with the
environment, limited training of employees, lack of organisational skills and qualification
(Murillo-Luna et al., 2007; Zilahy, 2004). Moors et al. (2005) and Sandberg & Aarikka-
Stenroos (2014) classified barriers of radical innovations as follows:
economic barriers,
systematic characteristics,
knowledge infrastructure,
legislative context,
organisation and culture of the firm,
stage of technology development (Moors et al., 2005, p. 663; Sandberg, Aarikka,
Stenroos, 2014).
Moors et al. (2005) highlight that the organisational culture of the firm influences its
environmental effects and preventive measurements and determines short-term thinking in
production technologies (Moors et al., 2005). Furthermore, bureaucratic complexity related to
legislation also represents a barrier that prevents environmental actions (Zilahy, 2004).
Moors et al. (2005) point out that the availability of an extended firm-internal technology
network including technical specialists is essential. Moreover, knowledge networks are
necessary for the development and exchange of scientific and technical know-how about
cleaner production methods. Therefore, it is justified to assess the influence of obstacles on
absorption of clean technologies by enterprises with different types of environmental strategies.
Hence the following hypotheses:
Hypothesis 1. The effect of the influence related to the absorption of clean technologies by
enterprises with a proactive environmental strategy is weaker in comparison to the
environmental strategies of enterprises with a lower level of adaptation to the environment.
Hypothesis 2. There are statistical differences between types of environmental strategies
related to the influence of obstacles on the absorption of clean technologies by enterprises.
Strategic environmental types and obstacles… 93
4. Research method and materials
The research was made on a total sample of 750 randomly chosen enterprises, based on the
stratification criterion, from the following industries: food (40%), fuel and energy (36%),
chemical (24%). Stratified sampling significantly increases the sample representativeness and
reduces its error. A final sample consist of 180 firms, and the response rate is 24%.
A questionnaire survey was completed by management staff responsible for environmental
management or production management. The four descriptions of environmental strategies
(passive, reactive, attention to stakeholders, proactive environmental strategies) proposed by
Murillo-Luna et al. (2008) and Seroka-Stolka (2017) were combined and used as an instrument
to identify the types of environmental strategies. The respondents were asked to choose the
most appropriate description of the environmental strategy if at least four of seven aspects listed
in the questionnaire were suitable for their firms. According to literature, nine obstacles were
chosen as independent variables and were measured through five-point Likert scales. The types
of environmental strategies represented a dependent variable. Firms were asked to assess the
obstacles, where the value 1 meant – “not at all important”, and value 5 – “the most important”
obstacle. To assess the influence of each of the obstacles influencing the absorption of clean
technologies between the types of environmental strategies, the Kruskal-Wallis test and median
test were performed. To indicate which groups of environmental strategies differ statistically,
a post-hoc analysis was performed. The statistical verification of hypotheses was performed at
three levels of significance: α = 0.05, α = 0.01, α = 0.1. However, the maximum acceptable
probability of making a type I error during the statistical verification of hypotheses was
determined at α = 0.05.
5. Results
The results of the self-classification indicate that 37% of companies chose a reactive
environmental strategy, 35% of companies chose a strategy of “attention to the stakeholders”,
and 28% of the firms recognised a proactive environmental strategy. No company declaring the
passive environmental strategy was identified. As a result, the sample consisted of three groups
of firms with different environmental strategies (Figure 2).
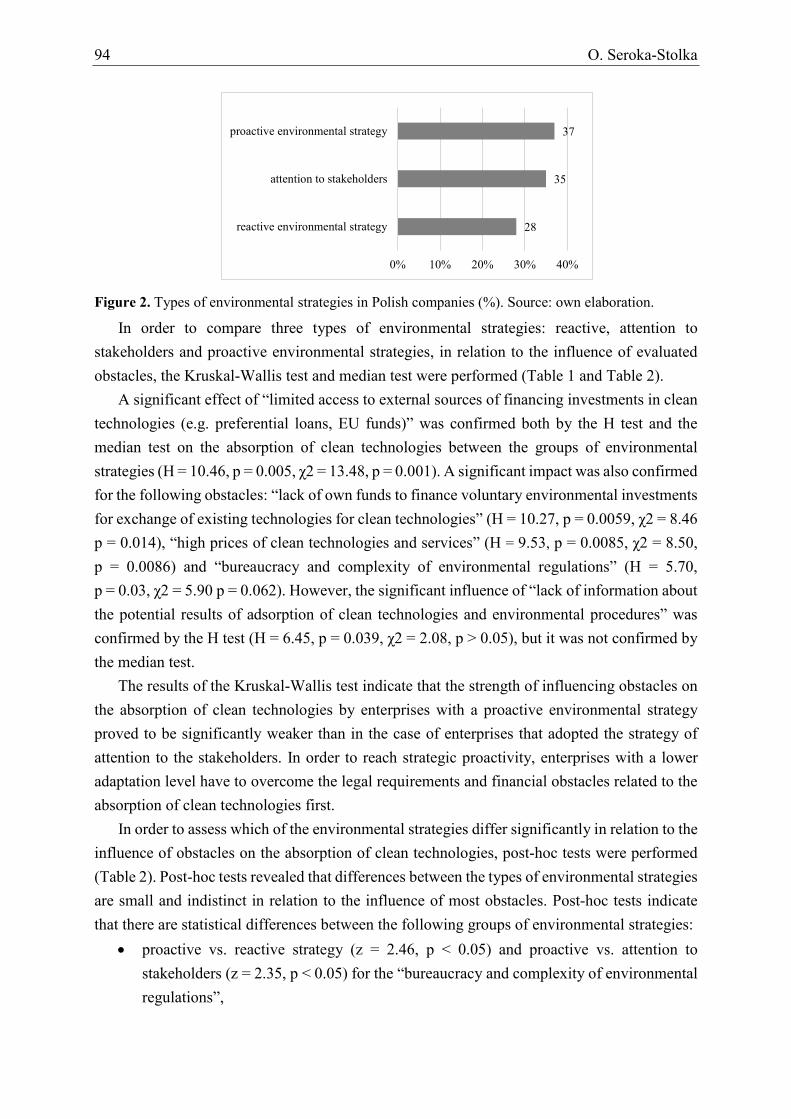
94 O. Seroka-Stolka
Figure 2. Types of environmental strategies in Polish companies (%). Source: own elaboration.
In order to compare three types of environmental strategies: reactive, attention to
stakeholders and proactive environmental strategies, in relation to the influence of evaluated
obstacles, the Kruskal-Wallis test and median test were performed (Table 1 and Table 2).
A significant effect of “limited access to external sources of financing investments in clean
technologies (e.g. preferential loans, EU funds)” was confirmed both by the H test and the
median test on the absorption of clean technologies between the groups of environmental
strategies (H = 10.46, p = 0.005, χ2 = 13.48, p = 0.001). A significant impact was also confirmed
for the following obstacles: “lack of own funds to finance voluntary environmental investments
for exchange of existing technologies for clean technologies” (H = 10.27, p = 0.0059, χ2 = 8.46
p = 0.014), “high prices of clean technologies and services” (H = 9.53, p = 0.0085, χ2 = 8.50,
p = 0.0086) and “bureaucracy and complexity of environmental regulations” (H = 5.70,
p = 0.03, χ2 = 5.90 p = 0.062). However, the significant influence of “lack of information about
the potential results of adsorption of clean technologies and environmental procedures” was
confirmed by the H test (H = 6.45, p = 0.039, χ2 = 2.08, p > 0.05), but it was not confirmed by
the median test.
The results of the Kruskal-Wallis test indicate that the strength of influencing obstacles on
the absorption of clean technologies by enterprises with a proactive environmental strategy
proved to be significantly weaker than in the case of enterprises that adopted the strategy of
attention to the stakeholders. In order to reach strategic proactivity, enterprises with a lower
adaptation level have to overcome the legal requirements and financial obstacles related to the
absorption of clean technologies first.
In order to assess which of the environmental strategies differ significantly in relation to the
influence of obstacles on the absorption of clean technologies, post-hoc tests were performed
(Table 2). Post-hoc tests revealed that differences between the types of environmental strategies
are small and indistinct in relation to the influence of most obstacles. Post-hoc tests indicate
that there are statistical differences between the following groups of environmental strategies:
proactive vs. reactive strategy (z = 2.46, p < 0.05) and proactive vs. attention to
stakeholders (z = 2.35, p < 0.05) for the “bureaucracy and complexity of environmental
regulations”,
28
35
37
0% 10% 20% 30% 40%
reactive environmental strategy
attention to stakeholders
proactive environmental strategy
Strategic environmental types and obstacles… 95
proactive vs. attention to stakeholders for “lack of information about the absorption of
clean technologies and environmental procedures” (z = 2.41, p < 0.05),
proactive vs. attention to stakeholders for “limited access to external sources of
financing investments in clean technologies (e.g. preferential loans, EU funds)”
(z = 3.04, p < 0.05),
attention to stakeholders vs. reactive strategy for “high prices of clean technologies and
services” (z = 2.90, p < 0.05),
proactive vs. attention to stakeholders (z = 2.580134, p < 0.05) and attention to
stakeholders vs. reactive strategy (z = 2.77, p < 0.05) for “lack of own funds to finance
voluntary environmental investments (e.g. exchange of economically viable
technologies for clean technologies)”. To sum up, the post-hoc analysis shows that there are some statistical differences between
the types of environmental strategies for the influence of finical and bureaucracy and
complexity of environmental regulations obstacles. The conducted research allows us to accept
hypothesis 1 fully and hypothesis 2 in part.
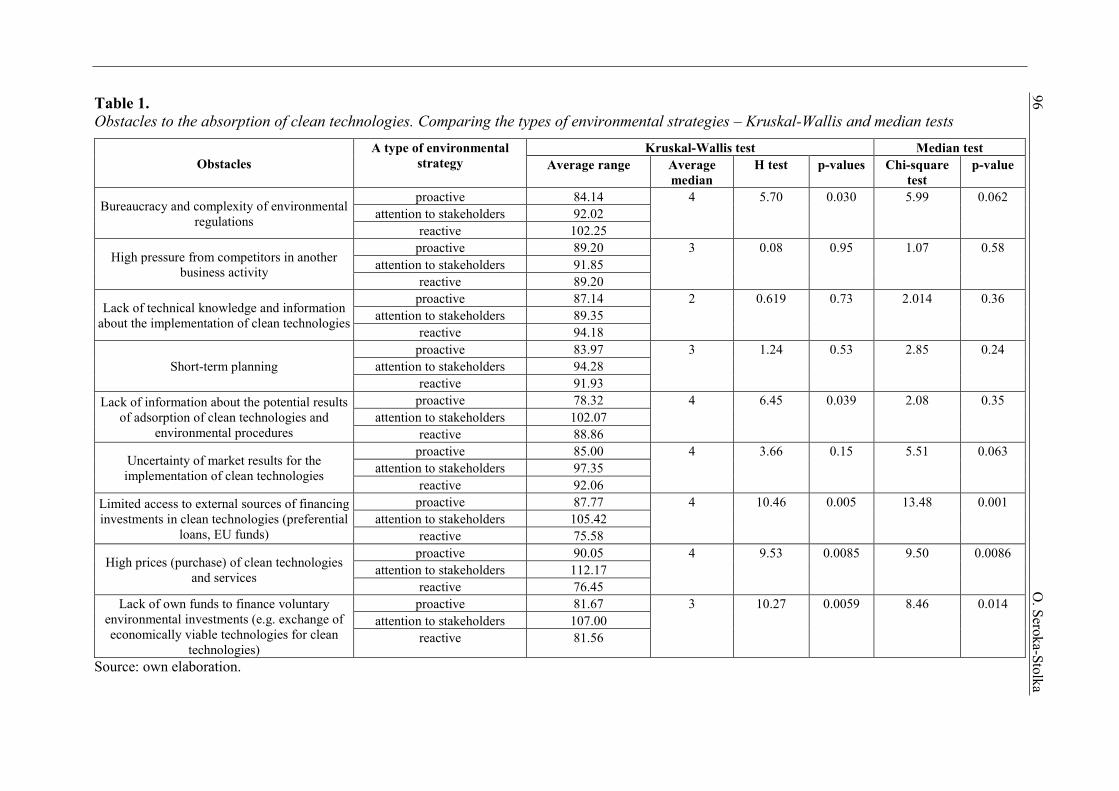
Table 1.
Obstacles to the absorption of clean technologies. Comparing the types of environmental strategies – Kruskal-Wallis and median tests
Obstacles
A type of environmental
strategy
Kruskal-Wallis test Median test
Average range Average
median
H test p-values Chi-square
test
p-value
Bureaucracy and complexity of environmental
regulations
proactive 84.14 4 5.70 0.030 5.99 0.062
attention to stakeholders 92.02
reactive 102.25
High pressure from competitors in another
business activity
proactive 89.20 3 0.08 0.95 1.07 0.58
attention to stakeholders 91.85
reactive 89.20
Lack of technical knowledge and information
about the implementation of clean technologies
proactive 87.14 2 0.619 0.73 2.014 0.36
attention to stakeholders 89.35
reactive 94.18
Short-term planning
proactive 83.97 3 1.24 0.53 2.85 0.24
attention to stakeholders 94.28
reactive 91.93
Lack of information about the potential results
of adsorption of clean technologies and
environmental procedures
proactive 78.32 4 6.45 0.039 2.08 0.35
attention to stakeholders 102.07
reactive 88.86
Uncertainty of market results for the
implementation of clean technologies
proactive 85.00 4 3.66 0.15 5.51 0.063
attention to stakeholders 97.35
reactive 92.06
Limited access to external sources of financing
investments in clean technologies (preferential
loans, EU funds)
proactive 87.77 4 10.46 0.005 13.48 0.001
attention to stakeholders 105.42
reactive 75.58
High prices (purchase) of clean technologies
and services
proactive 90.05 4 9.53 0.0085 9.50 0.0086
attention to stakeholders 112.17
reactive 76.45
Lack of own funds to finance voluntary
environmental investments (e.g. exchange of
economically viable technologies for clean
technologies)
proactive 81.67 3 10.27 0.0059 8.46 0.014
attention to stakeholders 107.00
reactive 81.56
Source: own elaboration.
96
O. S
eroka-S
tolk
a

Strategic environmental types and obstacles… 97
Table 2.
Obstacles to the absorption of clean technologies. Differences between the types of
environmental strategies – post-hoc tests
Obstacles Differences between the types of
environmental strategies Z test P value
Bureaucracy and complexity of
environmental regulations
proactive vs. reactive strategy 2.466855 p<0.05
proactive vs. attention to stakeholders 2.358780 p<0.05
attention to stakeholders vs. reactive strategy 0.629729 p>0.05
High pressure from competitors in
another business activity
proactive vs. reactive strategy 0.133352 p>0.05
proactive vs. attention to stakeholders 0.138274 p>0.05
attention to stakeholders vs. reactive strategy 0.289023 p>0.05
Lack of technical knowledge and
information about
proactive vs. reactive strategy 0.225178 p>0.05
proactive vs. attention to stakeholders 0.525691 p>0.05
attention to stakeholders vs. reactive strategy 0.724149 p>0.05
Short-term planning proactive vs. reactive strategy 0.819519 p>0.05
proactive vs. attention to stakeholders 1.050975 p>0.05
attention to stakeholders vs. reactive strategy 0.256477 p>0.05
Lack of information about the
absorption of clean technologies
and environmental procedures
proactive vs. reactive strategy 1.084986 p>0.05
proactive vs. attention to stakeholders 2.419598 p<0.05
attention to stakeholders vs. reactive strategy 1.439105 p>0.05
Uncertainty of market results for
the implementation of clean
technologies
proactive vs. reactive strategy 1.242284 p>0.05
proactive vs. attention to stakeholders 1.768464 p>0.05
attention to stakeholders vs. reactive strategy 0.576279 p>0.05
Limited access to external sources
of financing investments in clean
technologies (preferential loans,
EU funds)
proactive vs. reactive strategy 1.254257 p>0.05
proactive vs. attention to stakeholders 3.040337 p<0.05
attention to stakeholders vs. reactive strategy 1.923760 p>0.05
High prices (purchase) of clean
technologies and services
proactive vs. reactive strategy 1.709224 p>0.05
proactive vs. attention to stakeholders 1.027430 p>0.05
attention to stakeholders vs. reactive strategy 2.907927 p<0.05
Lack of own funds to finance
voluntary environmental
investments (e.g. exchange of
economically viable technologies
for clean technologies)
proactive vs. reactive strategy 0.011147 p>0.05
proactive vs. attention to stakeholders 2.580134 p<0.05
attention to stakeholders vs. reactive strategy 2.771021 p<0.05
Source: own elaboration.
6. Discussion
The research revealed the differences between the types of environmental strategies with
respect to the influence of most analysing obstacles on the absorption of clean technologies, but
financial and regulatory constraints proved to be statistically significant. Moors et al. (2005)
also confirmed that the most important barriers of cleaner production technologies appear to be
the cost of investment and the high risk involved in committing capital to unproven technology.
The impact of bureaucracy and complexity of environmental regulations on the absorption of
clean technologies significantly differs between two types of environmental strategies:
proactive vs. reactive strategy and proactive vs. attention to stakeholders. Regulatory conditions
have been identified as an important determinant of adopting clean technologies in several
98 O. Seroka-Stolka
empirical studies (Del Rio Gonzalez, 2005; Frondel et al., 2007; Long et al., 2016).
Del Rio Gonzalez (2005) identified regulation pressure as one of the main drivers of adopting
cleaner technologies in a survey in the Spanish pulp and paper industry (Del Rio Gonzalez,
2005). Frondel et al. (2007) highlight that the effects of environmental regulation may differ
with regard to different environmental technology fields (Frondel et al., 2007). The core barrier
which is identified by these studies is the financial cost of the technology or innovation placed
upon the adopter. However, Frondel et al. (2004) argue that regulatory measures are not
significant for the introduction of cleaner production technologies (Frondel et al. (2004).
They explain that this results from the fact that cleaner production measures have been less
subject to environmental regulations so far. Nevertheless, it is worth emphasising that
regulatory barriers in some countries play a crucial role, because they place greater emphasis
on climate mitigation. Long et al. (2016) confirm that high costs and long pay-back periods are
important barriers to adoption of clean technologies. Moreover, they confirm that the diffusion
process of clean technologies is still low, and the costs of the adoption of cleaner production
technologies are still high (Long et al., 2016).
As a result of the study, it can also be concluded that there is a common tendency of the
impact of the obstacles: the intensification of the impact of the obstacles was the largest among
enterprises with strategies of attention to stakeholders and then decreased in the group of
enterprises with pro-active environmental strategies. This may mean that enterprises with
a strategy of attention to stakeholders first have to overcome the economic and financial
constraints associated with the absorption of clean technologies to achieve strategic pro-
activity. Similar research results were gained by Murillo-Luna et al. (2007) and Valero-Gil
et al. (2017). They concluded that the greater the strategic proactivity level, the less influence
of the barriers. Furthermore, they confirmed that major external barriers arise mainly from the
high opportunity cost of environmental investment and from the bureaucratic complexity of the
legislation, and these are related to their lack of financial capability (Murillo-Luna et al., 2011;
Valero-Gil et al., 2017).
Access to financial resources is an important factor in the absorption of clean technologies.
Limited capital leads to the creation of investment barriers. Capital remaining at the disposal of
an enterprise is often shifted to priority investments. If environmental activities do not belong
to them, it may be difficult or impossible to achieve more advanced environmental strategies.

Strategic environmental types and obstacles… 99
7. Summary
This research study investigates the influence of obstacles related to absorption of clean
technologies by enterprises with different types of environmental strategies – reactive, attention
to stakeholders and proactive. The research study confirmed that financial and legal obstacles
play an important role in the process of absorption of clean technologies by enterprises with
different types of environmental strategies. However, further research is needed. The major
limitation of the study is that the observations were collected from a single country sample.
Moreover, the sample consisted mostly of big companies with proactive environmental
strategies that usually have greater financial resources.
References
1. Acemoglu, D., Akcigit, U., Hanley, D., & Kerr, W. (2016). Transition to clean technology.
Journal of Political Economy,124(1), 52-104.
2. Ar, I.M. (2012). The impact of green product innovation on firm performance and
competitive capability: the moderating role of managerial environmental concern.
Procedia-Social and Behavioral Sciences, 62, 854-864. doi: 10.1016/j.sbspro.2012.09.144.
3. Aragón-Correa, J.A., & Rubio-Lopez, E.A. (2007). Proactive corporate environmental
strategies: myths and misunderstandings. Long Range Planning, 40(3), 357-381. doi:
10.1016/j.lrp.2007.02.008.
4. Baumgartner, R.J., & Zielowski, C. (2007). Analyzing zero emission strategies regarding
impact on organizational culture and contribution to sustainable development. Journal of
Cleaner Production, 15(13-14), 1321-1327. doi:10.1016/j.jclepro.2006.07.016.
5. Buhl, A., Blazejewski, S., & Dittmer, F. (2016). The more, the merrier: Why and how
employee-driven eco-innovation enhances environmental and competitive advantage.
Sustainability, 8(9), 946. doi:10.3390/su8090946.
6. Chang, C.H. (2011). The influence of corporate environmental ethics on competitive
advantage: The mediation role of green innovation. Journal of Business Ethics, 104(3),
361-370.
7. Chang, C.H., & Chen, Y.S. (2013). Green organizational identity and green innovation.
Management Decision, 51(5), 1056-1070.
8. Chen, Y.S. (2008). The positive effect of green intellectual capital on competitive
advantages of firms. Journal of Business Ethics, 77(3), 271-286.
9. Darley, J.M. & Beniger, J.R. (1981). Diffusion of energy-conserving innovations. Journal
of Social Issues, 37(2), 150-171. Retrieved from https://www.nber.org/papers/w20743.pdf.
100 O. Seroka-Stolka
10. Darnall, N., Carmin, J. (2005). Greener and Cleaner? The Signaling Accuracy of U.S.
Voluntary Environmental Programs. Policy Sciences, 38(2/3), 71-90.
11. Del Rio Gonzalez, P. (2005). Analysing the factors influencing clean technology adoption:
a study of the Spanish pulp and paper industry. Business Strategy and the Environment,
14(1), 20-37. doi.org/10.1016/j.jclepro.2006.07.016.
12. Dongwon, L. (2003). A Typology of Corporate Environmental Strategy and Its Driving
Factors in Multinational Corporation. Los Angeles: University of Southern California.
13. Driessen, P.H., & Hillebrand, B. (2002). Adoption and diffusion of green innovations.
Marketing for sustainability: towards transactional policy-making. In G.C. Bartels, and
W.J.A. Nelissen (Eds.), Marketing for Sustainability: Towards Transactional Policy-
Making (pp. 343-55). Amsterdam: IOS Press.
14. Frondel, M., Horbach, J., Rennings, K. (2004). End-of-Pipe or Cleaner Production?
An Empirical Comparison of Environmental Innovation Decisions Across OECD
Countries. ZEW Discussion Papers, 04-82. Mannheim: Zentrum für Europäische Wirtschaftsforschung (ZEW).
15. Frondel, M., Horbach, J., Rennings, K. (2007). End-of-Pipe or Cleaner Production?
An Empirical Comparison of Environmental Innovation Decisions Across OECD
Countries. Business Strategy and the Environment, 16, 8, 571-584.
16. Garcés-Ayerbe, C., Scarpellini, S., Valero-Gil, J., & Rivera-Torres, P. (2016). Proactive
environmental strategy development: from laggard to eco-innovative firms. Journal of
Organizational Change Management, 29(7), 1118-1134. doi.org/10.1108/JOCM-05-2016-
0081.
17. Gluch, P., Gustafsson, M., & Thuvander, L. (2009). An absorptive capacity model for green
innovation and performance in the construction industry. Construction Management and
Economics, 27(5), pp. 451-464. doi: 10.1080/01446190902896645.
18. Hohmeyer, O., and Koschel, H., (1995). Umweltpolitische Instrumente zur Fo¨rderung des Einsatzes integrierter Umwelttechnik. Final Report of a Study of ZEW commissioned by
the Bu¨rofu¨r Technikfolgenabscha¨tzung beim Deutschen Bundestag (TAB). Mannheim, copied manuscript.
19. Kaźmierczak-Piwko, L., & Graczyk, M. (2012). Rola ekoinnowacji w procesie
zrównoważonego rozwoju regionu. Prace Naukowe Uniwersytetu Ekonomicznego we
Wrocławiu, 244, 147-157.
20. Kemp, R. (1997). Environmental Policy and Technical Change. Cheltenham-Brookfield:
Edward Elgar.
21. Lanoie, P., Laurent‐Lucchetti, J., Johnstone, N., & Ambec, S. (2011). Environmental policy,
innovation and performance: new insights on the Porter hypothesis. Journal of Economics
& Management Strategy, 20(3), 803-842.
22. Leszczyńska, A. (2011). Absorpcja innowacji ekologicznych w przedsiębiorstwie. Lublin:
Wydawnictwo Uniwersytetu Marii Curie-Skłodowskiej, 21.
Strategic environmental types and obstacles… 101
23. Long, T.B., Blok, V., & Coninx, I. (2016). Barriers to the adoption and diffusion of
technological innovations for climate-smart agriculture in Europe: evidence from the
Netherlands, France, Switzerland and Italy. Journal of Cleaner Production, 112, 9-21.
24. Moors, E.H., Mulder, K.F., & Vergragt, P.J. (2005). Towards cleaner production: barriers
and strategies in the base metals producing industry. Journal of Cleaner Production,
13(7), 657-668.
25. Murillo-Luna, J.L., Garce´s-Ayerbe, C., & Rivera-Torres, P. (2008), Why do patterns of
environmental response differ? A stakeholders pressure approach. Strategic Management
Journal, 29(11), 1225-1240, https://doi.org/10.1002/smj.711.
26. Murillo-Luna, J.L., Garcés-Ayerbe, C., & Rivera-Torres, P. (2007). What prevents firms
from advancing in their environmental strategy? International Advances in Economic
Research, 13(1), 35-46. doi: 10.1007/s11294-006-9059-6.
27. Murillo-Luna, J.L., Garcés-Ayerbe, C., & Rivera-Torres, P. (2011). Barriers to the adoption
of proactive environmental strategies. Journal of Cleaner Production, 19(13), 1417-1425.
doi:10.1016/j.jclepro.2011.05.005
28. Post, J.E., & Altman, B.W. (1994). Managing the environmental change process: Barriers
and opportunities. Journal of Organizational Change Management, 7(4), 64-81.
29. Qi, G., Zeng, S., Tam, C., Yin, H., Zou, H. (2013). Stakeholders’ influences on corporate green innovation strategy: A case study of manufacturing firms in China. CSR.
Environmental Management, 20, 1-14. doi.org/10.1002/csr.283.
30. Rennings, K. (2000). Redefining innovation-eco-innovation research and the contribution
from ecological economics. Ecological Economics, 32(2), 319-332.
31. Roome, N. (1992). Developing environmental management strategies. Business Strategy
and the Environment, 1,11-24. doi: 10.1002/bse.3280010104.
32. Sandberg, B., & Aarikka-Stenroos, L. (2014). What makes it so difficult? A systematic
review on barriers to radical innovation. Industrial Marketing Management, 43(8), 1293-
1305. doi.org/10.1016/j.indmarman.2014.08.003.
33. Seroka-Stolka, O. (2014). The development of green logistics for implementation
sustainable development strategy in companies. Procedia-Social and Behavioral Sciences,
151, 302-309. doi: 10.1016/j.sbspro.2014.10.028.
34. Seroka-Stolka, O. (2017). Uwarunkowania proaktywnego podejścia do proekologicznego rozwoju przedsiębiorstwa [Determinants of a proactive approach to pro-environmental
enterprise development]. Częstochowa: Wydawnictwo Wydziału Zarządzania Politechniki Częstochowskiej [Faculty of Management of the Czestochowa University of Technology Press], 236-237.
35. Shi, H., Peng, S.Z., Liu, Y., & Zhong, P. (2008). Barriers to the implementation of cleaner
production in Chinese SMEs: government, industry and expert stakeholders' perspectives.
Journal of Cleaner Production, 16(7), 842-852.

102 O. Seroka-Stolka
36. Teece, D.J. (1977). Technology transfer by multinational firms: The resource cost of
transferring technological know-how. The Economic Journal, 87(346), 242-261.
37. Teece, D.J. (2003). Technology Transfer by Multinational Firms: The Resource Cost of
Transferring Technological Know-How. Essays in Technology Management and Policy:
Selected Papers of David J. Teece, no. 262.
38. Valero-Gil, J., Rivera-Torres, P., & Garcés-Ayerbe, C. (2017). How is environmental
proactivity accomplished? Drivers and barriers in firms’ pro-environmental change process.
Sustainability, 9(8), 1327. doi:10.3390/su9081327.
39. Zilahy, G. (2004). Organisational factors determining the implementation of cleaner
production measures in the corporate sector. Journal of Cleaner Production, 12(4),
311-319.

Scientific Quarterly “Organization and Management”, 2019, Vol. 4, No. 48; DOI: 10.29119/1899-6116.2019.48.8 www.oamquarterly.polsl.pl
THE PROBABILITIES OF THE TRANSITIONS
BETWEEN THE INTERLOCKING DIRECTORATES’ STATES BASED ON MARKOV CHAINS
Dariusz SIUDAK
Lodz University of Technology, Faculty of Management and Production Engineering; [email protected],
ORCID: 0000-0003-0872-6204
Abstract: The article analyzes the process of changes in the interlocking directorates network
using Markov chains. The probabilities of company transitions between three specific states of
networking, i.e. isolation, networking outside the largest component, and networking inside the
largest component, were estimated. In addition, the average probabilities of transitions between
states in the next 6 quarter periods, constant probabilities of transitions independent of the initial
state of the process, and the expected time of return of the chain to individual states were
estimated. Regardless of the initial state of networking of the enterprise, the highest probability
was obtained for the process to be found in the state of connection with the largest component.
Keywords: interlocking directorates, network strategy, Markov Chain, probability of transition,
estimated return time for Markov Chain.
1. Introduction
Relationships between companies may arise as a result of interlocking directorates, which
Pfeffer and Salancik (2003/1978) describe as a form of interorganizational linkage that
facilitates interaction between the organizations over time. This is a situation in which an inter-
organizational network connection emerges. The subject of the work is related to a network of
connections created through interlocking directorates, where the connection between
companies is formed in a situation where at least one person is a member of the board of two
companies (Mizruchi, 1996). Interlocking directorates are an important topic in organizational
and management studies (Lamb, 2017). Interlocking board networks are thought to compromise
the effectiveness of corporate governance (Wong, et al., 2015). Fich and Shivdasani (2006)
found that corporations that have ties with other firms in interlocking board networks are
associated with weak governance. Interlocking board linkages have important economic
consequences for corporations and shareholders (Martin, et al., 2015; Withers, et al., 2018;
Zona, et al., 2017).

104 D. Siudak
The literature on the subject includes several theoretical constructions explaining the
existence of interlocking directorates. They can be divided into two trends, where the subject
of interlocking arises as a result of relations between directors due to personal benefits or bonds
between organizations. Relationships between individuals are models of career advancement
(Stokman, et al., 1988; Zajac, 1988; Perry, and Peyer, 2005), class hegemony (social cohesion)
(Zeitlin, 1974; Useem, 1979, 1984; Burt, 1980; Palmer, 1983), or management control (Koenig,
et al., 1979). Interorganizational relations include collusion models (Pennings, 1980;
Burt, 1983), resource dependence (Pfeffer, 1972; Pennings, 1980; Pfeffer, 1987; Pfeffer,
and Salancik, 2003/1978), legitimacy (Mizruchi, 1996), financial control (Dooley, 1969;
Mariolis, 1975; Richardson, 1987; Mizruchi, and Stearns, 1988, 1994; Lang, and Lockhart,
1990), or reciprocity (Allen, 1974; Schoorman, et al., 1981). Each of these models can be
a separate cause of interlocking at a specific time, or as a combination of several models at the
same time. The strategy of establishing business connections using the board of directors is
described as the most flexible and the most easily implemented (Pfeffer, and Salancik,
2003/1978), and the most widely used strategy in the area of the external environment of the
company (Bazerman, and Schoorman, 1983; Yang, and Cai, 2011). This is due to a number of
benefits that the interlocking directorates can bring to the enterprise (Siudak, 2018).
The enterprise at a given moment in time may be in one of three states of networking:
1) isolation, i.e. no demonstrated connections in the network (degree = 0), where the degree is
the number of ties; 2) networking beyond the largest component (degree > 0 but no connection
to the largest component); 3) networking within the largest component.
The aim of the article is to estimate the probability of changes between 3 specified
networking states. The achievement of such a goal can contribute to the development of the
theory of forming and functioning strategies based on the participation of organizations in the
network. In particular, an attempt was made to answer two research questions. Firstly, is the
process of the transition of enterprises between listed board interlocks stable or variable?
Secondly, to which interlocking state is the organization most likely to migrate in the board
interlocks network forming process? These questions identify a research gap in the literature on
interlocking directorates. The aim of this paper was to fill this gap. This research is the first to
show the measurement of the probabilities of the transitions between the interlocking
directorates' states.
Two research methods were used in this paper. Social network analysis was employed to
classify enterprises into one of the three states of networking. TheMarkov chain was used to
estimate the probability of organizational transitions between the states of networking.
The combination of both quantitative methods is an innovative approach in the research process.
We find that the interlocking network at the level of individual enterprises is characterized
by relative variability in terms of the achieved networking state. In addition, regardless of the
initial state, the company is most likely to be in a networked state within the largest component
The probabilities of the transitions… 105
of the interlocking network, and least likely in the state of networking outside the largest
component.
The paper is organized as follows. Part 2 presents the literature review. Part 3 presents the
applied research method. Part 4 describes the data underlying the study. Part 5 is devoted to the
results of the study, and the work is closed with final conclusions.
2. Literature review
The theory of resource dependency (Pfeffer, and Salancik, 2003/1978) assumes that the
benefits of maintaining relationships with enterprises (through joint members of the board of
directors) result from the coordination of inter-organizational exchange of resources, such as
capital, information, legitimization, skills and market access. The need for companies to
establish relationships with other organizations arises from the desire to have access to
resources controlled by those organizations (Mintz, and Schwartz, 1985). Interlocking
directorates is a tool for reducing uncertainty resulting from resource dependency and
information asymmetry as a consequence of obtaining low cost benefits from access to
information and coordination of activities. The aim is to obtain a number of benefits for the
organization in the form of increasing market information, controlling the environment,
reducing dependencies, reducing transaction costs related to the relationship between the
company and external entities, as an instrument to protect against the negative effects of
uncertainty arising from the external environment of enterprise (Pennings, 1980; Burt, 1983;
Williamson, 1984; Pearce II, and Zahra, 1992; Pfeffer, and Salancik, 2003/1978).
The demand for resources controlled by external organizations creates a dependency
between the enterprise and organizations in its environment. The number of relations with
external entities determines the level of resource dependency of the enterprise (Boyd, 1990,
p. 419). Managing the dependency of an organization consists in acquiring and controlling key
resources necessary in the activity of the organization taken to reduce dependency on other
organizations and increase dependency on other undertakings (Barringer, and Harrison, 2000,
p. 372). At the same time, dependence on resources may also lead to negative aspects of the
organization’s participation in the network in the perspective of the problem of strategic dependence on the network (Lichtarski, et al., 2017). In this context, the dependence of
enterprises on resources controlled by external organizations in the enterprise environment
results in a complex structure of inter-organizational relations (Kaczmarek, et al., 2014, p. 350).
Empirical confirmation of the theory of resource dependence is presented in the works of: Allen
(1974); Pennings (1980); Provan (1980); Boyd (1990); Dalton, et al., (1999); Chin-Huat, et al.,
(2003), and Sankowska and Siudak (2015).
106 D. Siudak
Creating a corporate linking structure through the board of directors enables the low cost of
developing a reliable information flow channel, which is an important element in the adaptation
of the strategy and the process of diffusion of practices between enterprises (Mizruchi, 1992;
Galaskiewicz, and Wasserman, 1989; Hallock, 1997; Wong, et al., 2015; Davis, 1991; Davis,
and Greve, 1997; Chuluun, et al., 2017; Mazzola, et al., 2016; Srinivasan, et al., 2018; Rao,
and Sivakumar, 1999; Chen, et al., 2009; Ortiz-de-Mandojana, et al., 2012; Yang, and Cai,
2011; Connelly, et al., 2011; Shipilov, et al., 2010; Sharopshire, 2010; Perry, and Peyer, 2005).
The benefits of interlocking networking of the corporation also concern the increase in the
reputation of the board of directors (Schoorman, et al., 1981), reduction of information
asymmetry (Lacker, et al., 2011), transfer of tacit knowledge between enterprises (Burt, 1980;
Boyd, 1990; O'Hagan, and Green 2002, 2004; Uddin, 2012; Simoni, and Caiazza, 2013),
and providing access to a source of critical resources for the organization (Mizruchi, and
Stearns, 1988), including the possibility of raising debt capital (Mizruchi, and Stearns, 1994).
Enterprises, depending on the sources of uncertainty, may look for different benefits of
interlocking. In general, the flow of information that reduces its asymmetry and the absorption
and protection of external resources reducing the inter-organizational resource dependency and
the associated uncertainty are recognized as the main benefits of networking companies through
the members of the board of directors.
There are also disadvantages associated with networking through interlocking. Interlocking
with the use of a board of directors who sit on too many other boards may lead to an excess of
their duties, which is referred to as "business directors" (Harris, and Shimizu, 2004).
Then, limited time possibilities result in a decrease in the efficiency of the executive monitoring
function in affiliated business boards (Core, et al., 1999; Shivdasani, and Yermack 1999;
Fich, and Shivdasani, 2006). The costs of networking include the loss of partial autonomy and
control over the company and flexibility in making decisions (Schoorman, et al., 1981),
the possibility of a conflict of interests between related companies that compete with each other
for the same resources, talents of social capital, co-operators or clients (Loderer, and Peyer,
2002), diffusion of harmful management practices, costs related to remuneration and costs of
the representational fund of an additionally employed board member only due to the desire of
interlocking with companies on whose boards the affiliate person sits. The decision to use the
strategy of interlocking should be based on the relation of the possible benefits to the costs of
interlocking, where their difference is determined by the economic result from interlocking,
which can be both positive and negative. Participation in the largest component of the network
enables the achievement of the indicated benefits from interlocking in a much wider scope.
This particularly concerns the reduction of uncertainty in the company's environment through
access to more and diverse resources, and participation in the flow of information in a wider
scope. The use of the interlocking strategy with the lack of connection with the largest
component may be associated with the reduction of benefits while incurring similar networking
costs when combined with the largest component. Then a situation may arise where the costs
The probabilities of the transitions… 107
of networking outweigh the benefits of interlocking. As a result, this leads to a decrease in the
economic efficiency of networking. In particular, in order to create the enterprise value, the
effect of acquiring resources and information from the interlocking network must be sufficiently
strong, which may ensure participation in the largest component as a network of considerable
size and potential benefits obtained (Siudak, 2018).
Participation in the board interlock network may have a positive impact on the financial
results of the company. A positive influence of established relations in the interlock network
on the return on assets (ROA) (Pombo, and Gutiérez, 2011; Lacker, et al., 2013; Horton, et al.,
2012), return on equity (ROE) (Phan, et al., 2003; Pombo, and Gutiérez, 2011; Drago, et al.,
2015; George, et al., 2001) and on profit has been demonstrated (O'Hagan, and Rice, 2015;
Keister, 1998). At the same time, the positive impact of board interlocks on the value of the
company has also been reported (Ferris, et al., 2003; Durbach, et al., 2013; Yeo, et al., 2003;
Hallock, 1997). However, the effect of the created relationships in the interlocking directorates
network on the value of the enterprise ignores the aspect of whether the enterprise is part of the
largest component of the network or whether these relationships do not provide a link with the
largest component of the network. This effect has been taken into account in the works (Siudak,
2017, 2018). Based on the analysis of variance (ANOVA), enterprises belonging to the largest
network component have a significantly higher statistical market value than organizations that
are outside the largest network component, but are not isolated in the network (Siudak, 2017).
At the same time, it was shown on the basis of regression analysis that networking within the
largest network component results in a higher market value of the enterprise (Siudak, 2018).
In other words, in order to achieve a surplus of benefits over the costs of networking an
undertaking, it is necessary to participate in the network within its largest component.
Connection to the largest network component enables a wider range of participation in the flow
of information, the possibility of acquiring resources from the organization's environment, and
thus the effective reduction of uncertainty. Then, the benefits of established connections in the
board interlock network will exceed the costs. Otherwise, if the company has relations in the
network but is not part of its largest component, it means narrowed participation in the board
interlock network and limits the possibilities of reducing uncertainty, and thus increasing the
value of the company. The important issue is where the organization is in the state of
networking; isolation; networking beyond the largest component; or networking within the
largest component. In this context, the research questions posed in the introduction take on
a significant dimension.
108 D. Siudak
3. Method
The study of the interlocking directorates network can be implemented using a social
network analysis. Whenever two companies share a director in the affiliation network
(two-mode network), there is a link between them in the one-mode network. The board
interlocking network derived from the two-mode network can be analyzed with the standard
techniques of a social network analysis. The degree of a vertex is equal to the number of edges
connected to it if the network is undirected, unweighted and without self-loops. Freeman (1979)
indicate that degree is simple and measured by the number of direct ties involving a node in
a network. In undirected and social networks there is a large component that contains more than
a half of the network. The rest of network is divided into a large number of small components
and isolated nodes. A component is a subset of the nodes of a network such that there exists at
least one path between each vertex of that subset (Newman, 2010). Based on information about
the degree and composition of the largest component, we can assign each firm to one of three
states: 1) isolation; 2) outside the largest component; 3) inside the largest component.
In order to carry out the research, Markov chains were used, which are defined as processes
with discrete time space. Initially, the application of Markov processes took place in physical
sciences, and over time useful applications were found for economic sciences. The basic
properties of Markov's processes are (Lawrence, and Pasternack, 2002, pp. CD-73):
1) The process under consideration consists of a countable number of stages.
2) At each stage the process may be in a countable number of possible states.
3) The probability of the process passing from state i in step t to state j in stage t + 1 is
independent of the way in which the process was in state i.
Consideration will be given to the process for which we accept the process of the networking
of enterprises, where, in accordance with the adopted model, may in moments t = 0, 1, 2, …, N,
occur in one of three states S = {1, 2, s = 3}. The course of the process is stochastic (Xt, tN)
and is a Markov process if variables Xt are dependent, i.e. they meet the Markov condition if
the following equation is fulfilled 𝑃(𝑋𝑡 = 𝑗|𝑋0 = 𝑖0, 𝑋1 = 𝑖1, . . . , 𝑋𝑡−1 = 𝑖) = 𝑃(𝑋𝑡 = 𝑗|𝑋𝑡−1 = 𝑖) for i, jS, tN (1)
For particular moments tN and for particular states i,jS, probability that the process will
be in state j at moment t, provided that in moment t-1 the process was in state i, it is independent
of the states in which the process was in the moments preceding moment t-1. This means that
the future state of the process is independent of the state in the past. Markov processes are
characterized by the lack of process memory property. Thus, the influence of the past on the
future evolution of the process depends only on the observed state of the process at the last
moment. The way a process is found in a certain state does not affect its future evolution
(Iosifescu, et al., 2010). The estimation of the matrix of probabilities of Markov chain passages
was carried out on the basis of macrodata, which is the most common in practice.
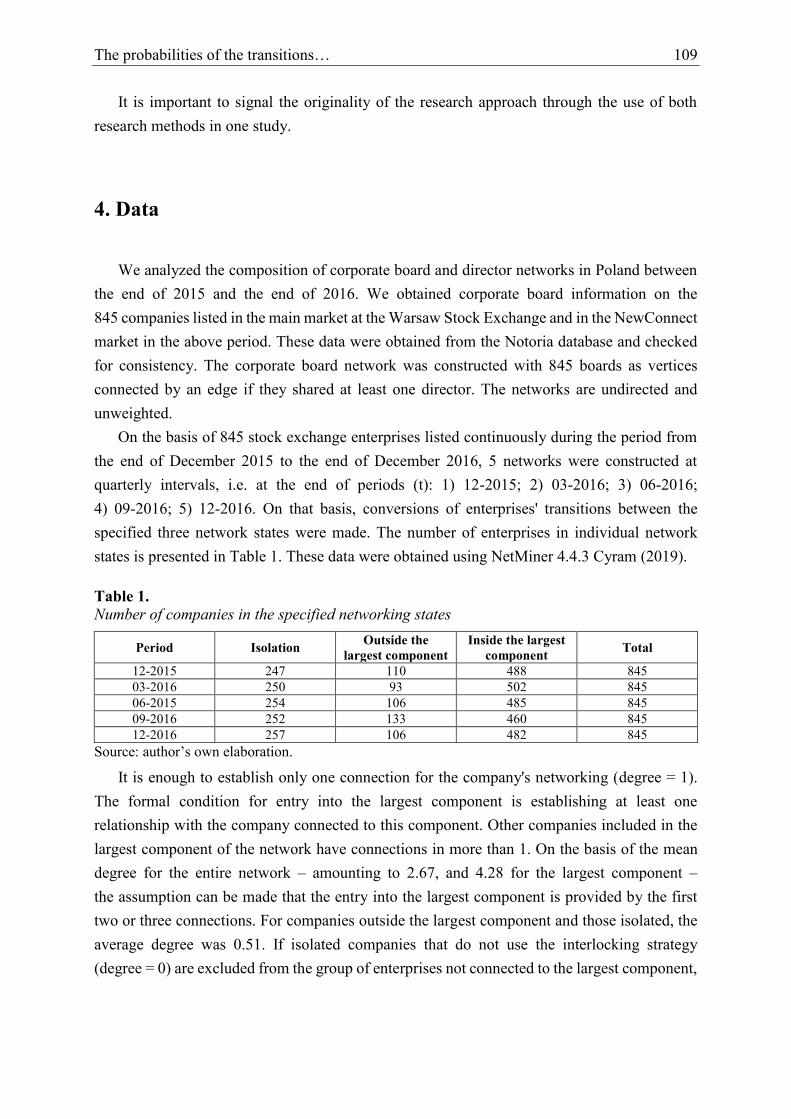
The probabilities of the transitions… 109
It is important to signal the originality of the research approach through the use of both
research methods in one study.
4. Data
We analyzed the composition of corporate board and director networks in Poland between
the end of 2015 and the end of 2016. We obtained corporate board information on the
845 companies listed in the main market at the Warsaw Stock Exchange and in the NewConnect
market in the above period. These data were obtained from the Notoria database and checked
for consistency. The corporate board network was constructed with 845 boards as vertices
connected by an edge if they shared at least one director. The networks are undirected and
unweighted.
On the basis of 845 stock exchange enterprises listed continuously during the period from
the end of December 2015 to the end of December 2016, 5 networks were constructed at
quarterly intervals, i.e. at the end of periods (t): 1) 12-2015; 2) 03-2016; 3) 06-2016;
4) 09-2016; 5) 12-2016. On that basis, conversions of enterprises' transitions between the
specified three network states were made. The number of enterprises in individual network
states is presented in Table 1. These data were obtained using NetMiner 4.4.3 Cyram (2019).
Table 1.
Number of companies in the specified networking states
Period Isolation Outside the
largest component
Inside the largest
component Total
12-2015 247 110 488 845
03-2016 250 93 502 845
06-2015 254 106 485 845
09-2016 252 133 460 845
12-2016 257 106 482 845
Source: author’s own elaboration.
It is enough to establish only one connection for the company's networking (degree = 1).
The formal condition for entry into the largest component is establishing at least one
relationship with the company connected to this component. Other companies included in the
largest component of the network have connections in more than 1. On the basis of the mean
degree for the entire network – amounting to 2.67, and 4.28 for the largest component –
the assumption can be made that the entry into the largest component is provided by the first
two or three connections. For companies outside the largest component and those isolated, the
average degree was 0.51. If isolated companies that do not use the interlocking strategy
(degree = 0) are excluded from the group of enterprises not connected to the largest component,

110 D. Siudak
then the mean degree is 1.69. On the other hand, only an average of 78 companies were
connected to the largest component by concluding only one relationship.
5. Results
Changes in the state of the analyzed process of enterprise networking in subsequent stages
tN are shown in table 2.
Table 2.
Number of company transitions between specified networking states
03-2016
Networking states Isolation
Outside the largest
component
Inside the largest
component Total
12-
2015
Isolation 232 6 9 247
Outside the largest component 5 82 23 110
Inside the largest component 13 5 470 488
Total 250 93 502 845
06-2016
Networking states Isolation
Outside the largest
component
Inside the largest
component Total
03-
2016
Isolation 225 3 22 250
Outside the largest component 8 78 7 93
Inside the largest component 21 25 456 502
Total 254 106 485 845
09-2016
Networking states Isolation
Outside the largest
component
Inside the largest
component Total
06-
2016
Isolation 231 10 13 254
Outside the largest component 5 91 10 106
Inside the largest component 16 32 437 485
Total 252 133 460 845
12-2016
Networking states Isolation
Outside the largest
component
Inside the largest
component Total
09-
2016
Isolation 230 7 16 253
Outside the largest component 5 90 38 133
Inside the largest component 22 9 428 459
Total 257 106 482 845
Source: author’s own elaboration.
The sum of elements of individual lines means the number of enterprises in the respective
process states at the beginning of a given period, and at the same time at the end of the previous
period, while the sum of elements of individual columns indicates the number of companies in
individual groups at the end of the analyzed period. The probabilities of transitions between
individual networking states, being elements of the probability matrix (P) of chain transitions,
are presented in Table 3.

The probabilities of the transitions… 111
Table 3.
Probabilities of company transitions between networking states
Networking states Isolation Outside the largest
component
Inside the largest
component Total
Isolation 0.000 0.478 0.522 1
Outside the largest component 0.706 0.000 0.294 1
Inside the largest component 0.393 0.000 0.607 1
Source: own elaboration.
The estimated probabilities of transitions concern only the first period, and the question of
determining probabilities of transitions in subsequent steps (periods) will be the subject of
consideration later. Table 4 presents the mean probabilities of changes in the state of networking
in the next 6 quarter periods.
Table 4.
Mean probabilities of transition between networking states for the next 6 stages
Period Isolation Outside the largest component Inside the largest component
t = 1 0.366 0.159 0.474
t = 2 0.299 0.175 0.526
t = 3 0.331 0.143 0.527
t = 4 0.308 0.158 0.534
t = 5 0.322 0.147 0.531
t = 6 0.313 0.153 0.533
Source: author’s own elaboration.
For each subsequent period ahead from 2016, when the latest empirical data were collected,
the mean probability of an enterprise getting into one of the three networking states after
a certain number of steps was estimated. For example, after 6 steps, the probability of getting
into the largest component was 53.3%, and in the state of isolation it was 31.3%, regardless of
the state the network was initially. For all 6 stages, the probability of getting into the largest
component is greater than the likelihood of isolation. The figures below show graphically the
changes in the probabilities of the process transition according to the state of isolation
(Figure 1); networking outside the largest component (Figure 2); networking inside the largest
component (Figure 3).
The likelihood of reaching the state of the enterprise networking state in the largest
component is increased in relation to the passing of time, especially in the period of one year
(Figure 5). The reason for this may lie in the possibility of achieving surplus benefits over the
costs of networking as a result of the relational strategy.
Isolation of the enterprise from the interlocking directorates results in the lack of receiving
the expected benefits from networking, and the costs of networking are not incurred.
The economic result of interlocking, which is defined as the difference between the benefits
and the costs of networking, is 0. On the other hand, reaching the state of networking outside
the largest component can lead to excess costs over benefits from networking. This may explain
the reason for the decrease in the probability of reaching the state of isolation and networking
beyond the largest component over a period of 7-8 quarters.
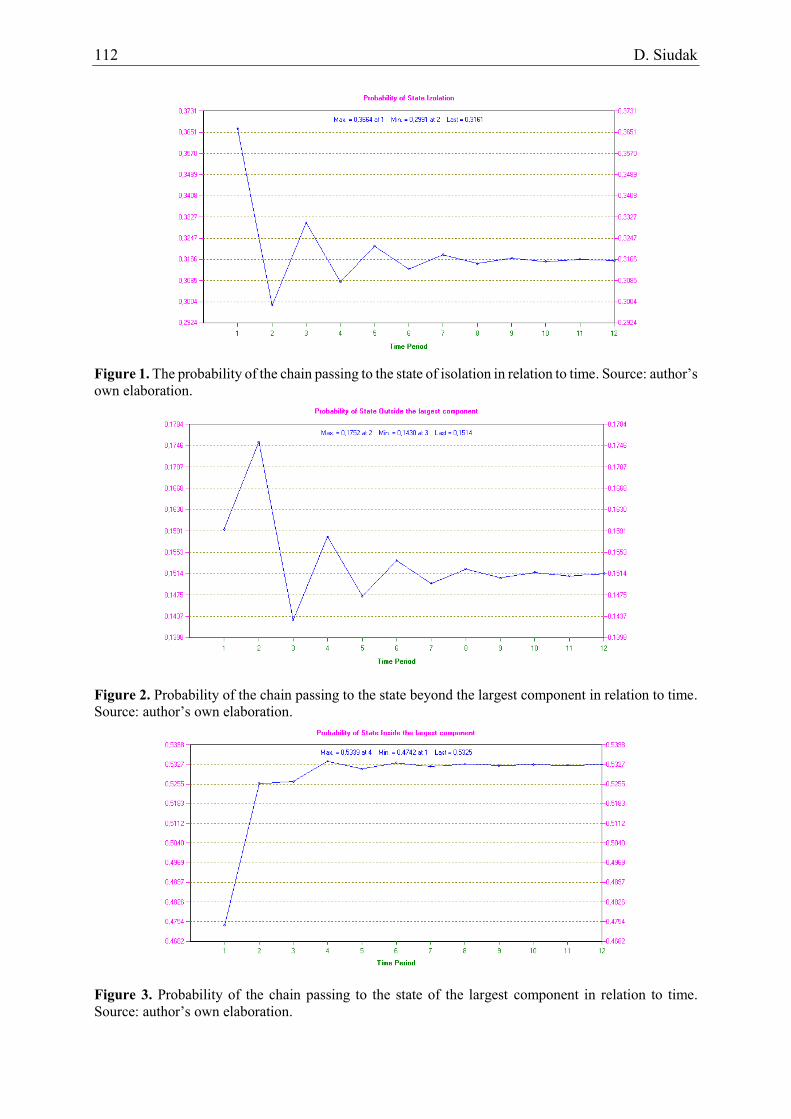
112 D. Siudak
Figure 1. The probability of the chain passing to the state of isolation in relation to time. Source: author’s own elaboration.
Figure 2. Probability of the chain passing to the state beyond the largest component in relation to time.
Source: author’s own elaboration.
Figure 3. Probability of the chain passing to the state of the largest component in relation to time.
Source: author’s own elaboration.
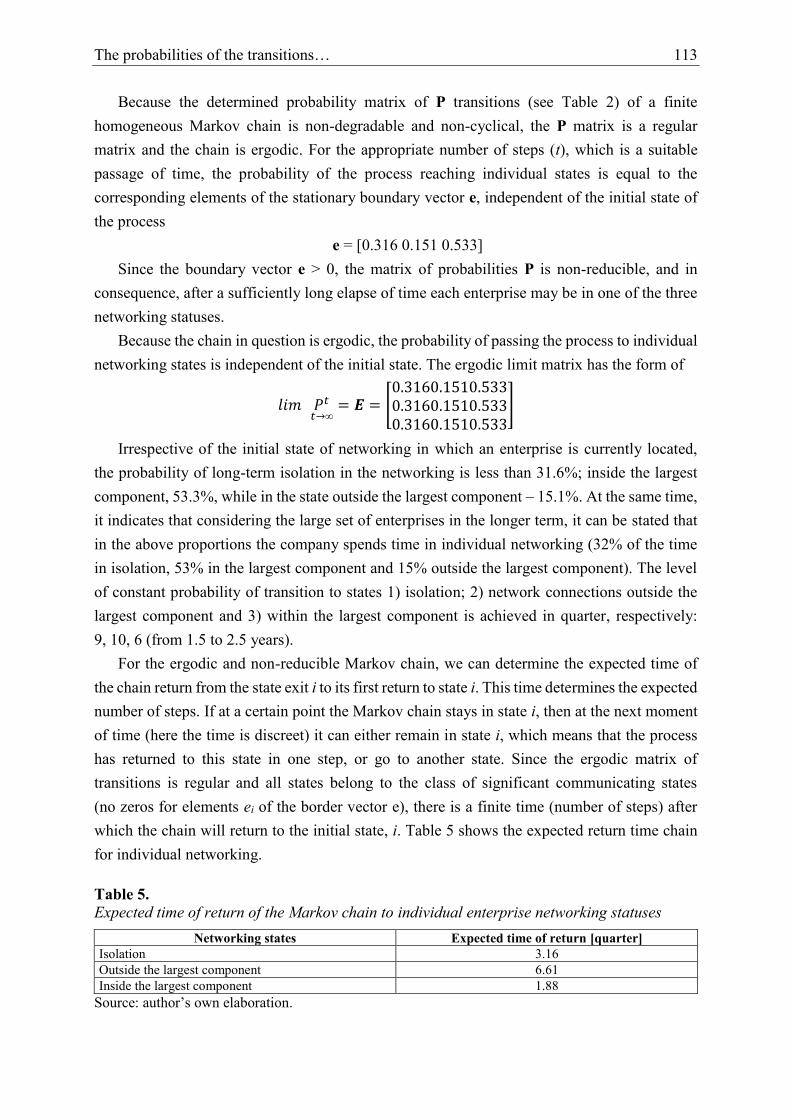
The probabilities of the transitions… 113
Because the determined probability matrix of P transitions (see Table 2) of a finite
homogeneous Markov chain is non-degradable and non-cyclical, the P matrix is a regular
matrix and the chain is ergodic. For the appropriate number of steps (t), which is a suitable
passage of time, the probability of the process reaching individual states is equal to the
corresponding elements of the stationary boundary vector e, independent of the initial state of
the process
e = [0.316 0.151 0.533]
Since the boundary vector e > 0, the matrix of probabilities P is non-reducible, and in
consequence, after a sufficiently long elapse of time each enterprise may be in one of the three
networking statuses.
Because the chain in question is ergodic, the probability of passing the process to individual
networking states is independent of the initial state. The ergodic limit matrix has the form of 𝑙𝑖𝑚 𝑃𝑡𝑡→∞= 𝑬 = [0.3160.1510.5330.3160.1510.5330.3160.1510.533]
Irrespective of the initial state of networking in which an enterprise is currently located,
the probability of long-term isolation in the networking is less than 31.6%; inside the largest
component, 53.3%, while in the state outside the largest component – 15.1%. At the same time,
it indicates that considering the large set of enterprises in the longer term, it can be stated that
in the above proportions the company spends time in individual networking (32% of the time
in isolation, 53% in the largest component and 15% outside the largest component). The level
of constant probability of transition to states 1) isolation; 2) network connections outside the
largest component and 3) within the largest component is achieved in quarter, respectively:
9, 10, 6 (from 1.5 to 2.5 years).
For the ergodic and non-reducible Markov chain, we can determine the expected time of
the chain return from the state exit i to its first return to state i. This time determines the expected
number of steps. If at a certain point the Markov chain stays in state i, then at the next moment
of time (here the time is discreet) it can either remain in state i, which means that the process
has returned to this state in one step, or go to another state. Since the ergodic matrix of
transitions is regular and all states belong to the class of significant communicating states
(no zeros for elements ei of the border vector e), there is a finite time (number of steps) after
which the chain will return to the initial state, i. Table 5 shows the expected return time chain
for individual networking.
Table 5.
Expected time of return of the Markov chain to individual enterprise networking statuses
Networking states Expected time of return [quarter]
Isolation 3.16
Outside the largest component 6.61
Inside the largest component 1.88
Source: author’s own elaboration.

114 D. Siudak
The expected times of returning of a process to a specific networking state concern the
period that elapses from the exit of an enterprise from a given state until it returns to the same
state. The expected time of returning the company to the state of networking in the largest
component is 1.88 quarters (approximately 24.5 weeks). If the company loses the link
guaranteeing connection with the largest component, the expected return to the largest
component is less than 25 weeks. However, the return to the state of networking outside the
largest component is 6.6 quarters. In other words, the state of networking beyond the largest
component is a kind of transitional state. If the company makes a link allowing for connection
with the largest component or goes into a state of isolation, it will take over 1.5 years to return
to the networking beyond the component. On the other hand, the expected time of returning of
the process to the isolation condition occurs after 3.2 quarters. This may prove relatively
difficult to maintain in the long-term connection in the interlocking network.
6. Conclusions
In this study we estimate the probability of changes between 3 specified networking states.
The probability of passing the process to specified networking states is independent of the initial
state. With regard to the first research question, it should be stated that the interlocking network
at the level of individual enterprises is characterized by relative volatility in terms of the
achieved state of networking. Isolation of the enterprise is to some extent the result of the
enterprise's decision. However, a networked company may lose its connection with the largest
component as a result of breaking the direct link (it concerns the so-called pendant nodes)
or following the break of the indirect connection. In the first case, as a result, the company most
often changes the state of networking connection from the connection to the largest component
of the network to the state of isolation. In the second case, the company remains networked but
located outside the largest component. The mechanism of changing the networking process
works similarly in the opposite direction. On the other hand, the change in the state of
networking between isolation and networking beyond the largest component results from
a change in purely direct relationships. The protection against changing the state of networking
with the connection to the largest component of the network to the other two is the pursuit of
an appropriate networking strategy consisting in maintaining one relationship with a strongly
networked company, the so-called hub, or maintaining more connections with the less centrally
compliant companies included in the largest network component. Then, the loss of one link
does not change the state of networking. The structure of the network in terms of the number
of companies in isolation and networking in the largest network component is relatively stable,
especially for two opposing states – isolation and networking within the largest component.
However, at the level of individual network actors, the dynamics of the networking process in
The probabilities of the transitions… 115
time is relatively high. In the long-term, each company, irrespective of the current state of the
process, may be in one of the three networking states.
In relation to the second research question, the research conducted allows us to conclude
that the organization has the highest probability of transition to a state of networking within the
largest component of the network. The growing probability of being in a networked state within
the largest network component (see Figure 3), the highest constant probability of being in this
state regardless of the initial state and the shortest time of chain return to this state
(see Table 4) shows the possibility of achieving a surplus of benefits over the costs of
networking and, consequently, obtaining economic benefits from the use of a networking
strategy.
This study contributes to the social network literature. The high constant probability of
transition to the state of networking in the structure of the largest network component indicates
the importance of conducting the organization’s relational strategy. The organization’s relational strategy displaces the atomic form of perception of the enterprise's activity.
Participation in the board interlock network may be associated with receiving benefits in excess
of the costs of maintaining relations in the network. As a result, an enterprise, by participating
in the network exchange of information and potential exchange of resources with other
organizations, may improve financial results and increase market value. On the other hand,
competition in the demand for external resources may lead to changes in the state of the
company's networking in the interlocking network.
Acknowledgements
This research was supported by a grant financed by the National Science Centre based on
decision no. DEC-2013/11/B/HS4/00466.
References
1. Allen, M. (1974). The Structure of Interorganizational Elite Cooptation: Interlocking
Corporate Directorates. American Sociological Review, 39, 3, 393-406.
2. Barringer, B., and Harrison, J. (2000). Walking a Tightrope: Creating Value Through
Interorganizational Relationships. Journal of Management, 26(3), 367-403.
3. Bazerman, M., and Schoorman, F. (1983). A Limited Rationality Model of Interlocking
Directorates. Academy of Management Review, 8, 206-217.
116 D. Siudak
4. Boyd, B. (1990). Corporate Linkages and organizational Environment: A Test of the
Resource Dependence Model. Strategic Management Journal, 11, 419-430.
5. Burt, R. (1980). Cooptive Corporate Actor Networks: A Reconsideration of Interlocking
Directorates Involving American Manufacturing. Administrative Science Quarterly, 25,
557-581.
6. Burt, R. (1983). Corporate Profits and Cooptation. Networks of Market Constrains and
Directorate Ties in the American Economy. New York: Academic Press.
7. Chen, R., Dyball, M., and Wright, S. (2009). The Link Between Board Composition and
Corporate Diversification in Australian Corporations. Corporate Governance: An Inter-
national Review, 17, 208-223.
8. Chin-Huat, O., Wan, D., and Kee-Sing, O. (2003). An Exploratory Study on Interlocking
Directorates in Listed Firms in Singapore. Corporate Governance: An International
Review, 11, 322-334.
9. Chuluun, T., Prevost, A., and Upadhyay, A. (2017). Firm Network Structure and
Innovation. Journal of Corporate Finance, 44, 193-214.
10. Connelly, B., Johnson, J., Tihanyi, L., and Ellstrand, A. (2011). More Than Adopters:
Competing Influences in the Interlocking Directorate, Organization Science, 22(3),
688-703.
11. Core, J., Shivdasani, A., and Yermack, D. (1999). CEO Involvement in the Selection of
New Board Members: An Empirical Analysis. Journal of Finance, 54, 1829-1853.
12. Cyram, 2019, NetMiner 4.4.3, Cyram Inc., Seoul.
13. Dalton, D., Daily, C., Johnson, J., and Ellstrand, A. (1999). Number of Directors and
Financial Performances: A Meta-analysis. Academy of Management Journal, 42, 674-686.
14. Davis, G. (1991). Agents without Principles? The Spread of the Poison Pill Through the
Intercorporate Network. Administrative Science Quarterly, 36, 583-613.
15. Davis, G., and Greve, H. (1997). Corporate Elite Networks and Governance Changes in the
1980s. American Journal of Sociology, 103, 1-37.
16. Dooley, P. (1969), The Interlocking Directorate. The American Economic Review,
59, 314-323.
17. Drago, C., Millo, F., Ricciuti, R., and Santella, P. (2015). Corporate Governance Reforms,
Interlocking Directorship and Company Performance in Italy. International Review of Law
and Economics, 41, 38-49.
18. Durbach, I., Katshunga, D., and Parker, H. (2013). Community Structure and Centrality
Effects in the South African Company Network. South African Journal of Business
Management, 44, 35-43.
19. Ferris, S., Jagannathan, M., and Pritchard, A. (2003). Too Busy to Mind the Business?
Monitoring by Directors with Multiple Board Appointments. The Journal of Finance,
58, 1087-1111.
The probabilities of the transitions… 117
20. Fich, E., and Shivdasani, A. (2006). Are Busy Boards Effective Monitors? The Journal of
Finance, 61, 689-724.
21. Freeman, L. (1979). Centrality in Social Networks Conceptual Clarification. Social
Networks, 1(3), 215-239.
22. Galaskiewicz, J., and Wasserman, S. (1989). Mimetic and Normative Processes within an
Interorganizational Field: An Empirical Test. Administrative Science Quarterly,
34, 454-479.
23. George, G., Wood, D., and Khan, R. (2001). Networking Strategy of Boards: Implications
for Small and Medium-sized Enterprise. Entrepreneurship & Regional Development,
13, 269-285.
24. Hallock, K. (1997). Reciprocally Interlocking Boards of Directors and Executive
Compensation. Journal of Financial and Quantitative Analysis, 32, 332-344.
25. Harris, I., and Shimizu, K. (2004). Too Busy To Serve? An Examination of the Influence
of Overboarded Directors. Journal of Management Science, 41, 775-798.
26. Horton, J., Millo, Y., and Serafeim, G. (2012). Resources or Power? Implications of Social
Networks on Compensation and Firm Performance. Journal of Business Finance &
Accounting, 39, 399-426.
27. Iosifescu, M., Limnios, N., and Oprisan, G. (2010). Introduction to Stochastic Models.
London: John Wiley & Sons.
28. Kaczmarek, S., Kimino, S., and Pye, A. (2014). Interlocking Directorship and Firm
Performance in Highly Regulated Sectors: the Moderating Impact of Board Diversity.
Journal of Management & Governance, 18, 347-372.
29. Keister, L. (1998). Engineering Growth: Business Group Structure and Firm Performance
in China’s Transition Economy. The American Journal of Sociology, 104, 404-440.
30. Koenig, T., Gogel, R., and Sonquist, J. (1979). Models of the Significance of Interlocking
Corporate Directorates. American Journal of Economics and Sociology, 38, 173-186.
31. Lacker, D., So, E., and Wang, C. (2011). Boardroom Centrality and Firm Performance.
Working Paper, 84, Rock Center for Corporate Governance at Stanford University.
32. Lamb, N. (2017). Does the Number of Interlocking Directorates Influence a Firm’s Financial Performance? An Exploratory Meta-Analysis. American Journal of Management,
17(2), 47-57.
33. Lang, J., and Lockhart, D. (1990). Increased Environmental Uncertainty and Changes in
Board Linkage Patterns. Academy of Management Journal, 33, 129-128.
34. Lawrence, J., and Pasternack, B. (2002). Applied Management Science. Modeling,
Spreadsheet Analysis, and Communication for Decision Making. John Wiley & Sons.
35. Lichtarski, J.M., Piórkowska, K., and Ćwik, K. (2017). Uzależnienie strategiczne: Perspektywa sieci międzyorganizacyjnych [Strategic Addiction: Inter-organizational
Networks Perspective]. Organizacja i Kierowanie, 2(176), 65-77.
118 D. Siudak
36. Loderer, C., and Peyer, U. (2002). Board Overlap, Seat Sccumulation and Share Pices.
European Financial Management, 8(2), 165-192.
37. Mariolis, P. (1975). Interlocking Directorates and Control of Corporations: The Theory of
Bank Control. Social Science Quarterly, 56, 425-439.
38. Martin, G., Gözübüyük, R., and Becerra, M. (2013). Interlocks and Firm Performance:
The Role of Uncertainty in the Directorate Interlock-Performance Relationship. Strategic
Management Journal, 36, 235-253.
39. Mazzola, E., Perrone, G., and Kamuriwo, D. (2016). The Interaction Between Inter-firm
and Interlocking Directorate Networks on Firm’s New Product Development Outcomes. Journal of Business Research, 69, 672-682.
40. Mintz, B., and Schwartz, M. (1985). The Power Structure of American Business. Chicago:
University of Chicago Press.
41. Mizruchi, M. (1992). The Structure of Corporate Political Action. Cambridge: Harvard
University Press.
42. Mizruchi, M. (1996). What do Interlocks do? An Analysis, Critique, and Assessment of
Research on Interlocking Directorates. Annual Review of Sociology, 22, 271-298.
43. Mizruchi, M., and Stearns, L. (1988). A Longitudinal Study of the Formation of
Interlocking Directorates. Administrative Science Quarterly, 33, 194-210.
44. Mizruchi, M., and Stearns, L. (1994). A Longitudinal Study of Borrowing by Large
American Corporations. Administrative Science Quarterly, 39, 118-140.
45. Newman, M. (2010). Networks. An Introduction, Oxford University Press.
46. O’Hagan, S., and Green, M. (2002). Tacit Knowledge Transfer via Interlocking
Directorates: A Comparison of Canada and the United States. Geografiska Annaler,
84, 49-63.
47. O’Hagan, S., and Green, M. (2004). Corporate Knowledge Transfer via Interlocking
Directorates: A Network Analysis Approach. Geoforum, 35, 127-139.
48. O’Hagan, S., and Rice, M. (2015). The Geography of Canadian Interlocking Directorates:
How do they Relate to Brain Circulation? Urban Geography, 36, 823-843.
49. Ortiz-de-Mandojana, N., Aragón-Correa, J., Delgado-Ceballos, J., and Ferrón-Vílchez, V.
(2012). The Effect of Director Interlocks on Firms’ Adoption of proactive Environmental Strategies. Corporate Governance: An International Review, 20(2), 164-178.
50. Palmer, D. (1983). Broken Ties: Interlocking Directorates and Intercorporate Coordinating.
Administrative Science Quarterly, 28, 40-55.
51. Pearce, J., and Zahra, S. (1992). Board composition form strategic contingency perspective.
Journal of Management Studies, 29, 411-438.
52. Pennings, J. M., (1980). Interlocking Directorates. San Francisco: Jossey-Bass Limited.
53. Perry, T., and Peyer, U. (2005). Board Seats Accumulation by Executives: A Shareholder
Perspective. The Journal of Finance, 60, 2083-2123.
The probabilities of the transitions… 119
54. Pfeffer, J. (1972). Size and Composition of Corporate Boards of Directors:
The Organization and its Environment. Administrative Science Quarterly, 17, 218-228.
55. Pfeffer, J. (1987). A Resource Dependence Perspective on Intercorporate Relations.
In M. Mizruchi, and M. Schwartz (Eds.), Intercorporate Relations: The Structural Analysis
of Business. Cambridge: Cambridge University Press.
56. Pfeffer, J., and Salancik G. (2003/1978). The External Control of Organizations:
A Resources Dependence Perspective. Stanford: Stanford University Press.
57. Phan, P., Lee, S., and Lau, S. (2003). The Performance Impact of Interlocking Directorates:
The Case of Singapore. Journal of Managerial Issues, 15(3), 338-352.
58. Pombo, C., and Gutiérrez, L. (2011). Outside Directors, Board Interlocks and Firm
Performance: Empirical Evidence form Columbian Business Groups. Journal Economics
and Business, 63, 251-277.
59. Provan, K. (1980). Board Power and Organizational Effectiveness among Human Service
Agencies. Academy of Management Journal, 23, 221-236.
60. Rao, H., and Sivakumar, K. (1999). Institutional Sources of Boundary-spanning Structures:
The Establishment of Investor Relations Departments in the Fortune 500 Industrials.
Organizations Science, 10, 27-42.
61. Richardson, R. (1987). Directorship Interlocks and Corporate Profitability. Administrative
Science Quarterly, 32, 367-386.
62. Sankowska, A., and Siudak, D. (2015). Empiryczna weryfikacja teorii uzależnienia zasobowego w kontekście usieciowienia rady dyrektorów (interlocking directorates) [An Empirical Test of the Resources Dependence Theory in Regard to Interlocking
Directorates]. Finanse, Rynki Finansowe, Ubezpieczenia, 74, 1, 661-673.
63. Schoorman, F., Bazerman, M., and Atkin, R. (1981). Interlocking Directorates: A Strategy
for Reducing Environmental Uncertainty. Academy of Management Review, 6, 243-251.
64. Sharopshire, C. (2010). The Role of the Interlocking Director and Board Receptivity in the
Diffusion of Practices. Academy of Management Journal, 35(2), 246-264.
65. Shipilov, A., Greve, H., and Rowley, T. (2010). When do Interlocks Matter? Institutional
Logics and the Diffusion of Multiple Corporate Practices. Academy of Management
Journal, 53, 846-864.
66. Shivdasani, A., and Yermack, D. (1999). CEO Involvement in the Selection of New Board
Members: An Empirical Analysis. Journal of Finance, 54, 1829-1853.
67. Simoni, M., and Caiazza, R. (2013). Interlocking Directorates’ Effects on Economic System’s Competitiveness. Business Strategy Series, 14(1), 30-35.
68. Siudak, D. (2017). Strategia interlocking directorates a wartość przedsiębiorstwa [Interlocking Directorates Strategy vs. Corporate Value]. Nauki o Finansach, 1(30), 76-85.
69. Siudak, D. (2018). Analiza dynamiczna wpływu usieciowienia na wartość przedsiębiorstwa [Dynamic Analysis of the Impact of Network Relationships on the Company Value]. PWN.
120 D. Siudak
70. Srinivasan, R., Wuyts, S., and Mallapragada, G. (2018). Corporate Board Interlocks and
New Product Introductions. Journal of Marketing, 82, 132-148.
71. Stokman, F., Van der Knoop, J., and Wasseur, F. (1988). Interlocks in the Netherlands:
Stability and Careers in the Period 1960-1980. Social Networks, 10, 183-208.
72. Uddin, M. (2012). Interfirm Cooperation and Information Sharing through Interlocking
Directorates. Management & Marketing, 10, 205-214.
73. Useem, M. (1979). The Social Organization of the American Business Elite and
Participation of Corporation Directors in the Government of America Institutions. American
Sociological Review, 44, 553-571.
74. Useem, M. (1984). The Inner Cycle: Large Corporations and the Rise of Business Political
Activity in the US and UK. Oxford: Oxford University Press.
75. Williamson, O. (1984). Corporate Governance. Yale Law Journal, 93, 1197-1229.
76. Withers, M., Kim, J., and Howard, M. (2018). The Evolution of the Board Interlock
Network Following Sarbanes-Oxley. Social Networks, 52, 56-67.
77. Wong, L., Gygax, A., and Wang, P. (2015). Board interlocking network and the design of
executive compensation packages. Social Networks, 41, 85-100.
78. Yang, Y., and Cai, N. (2011). Interlocking Directorate and Firm’s Diversification Strategy: Perfective of Strategy Learning. In M. Dali (Ed.), Innovative Computing and Information.
Berlin: Springer-Verlag, 87-94.
79. Yeo, H., Pochet, C., and Alcouffe, A. (2003). CEO Reciprocal Interlocks in French
Corporations. Journal of Management and Governance, 7, 87-108.
80. Zajac, E. (1988). Interlocking Directorates as an Interorganizational Strategy. Academy of
Management Journal, 31, 428-438.
81. Zeitlin, M. (1974). Corporate Ownership and Control: The Large Corporation and the
Capitalist Class. American Journal of Sociology, 79, 1073-1119.
82. Zona, F. Gomez-Mejia, L., and Withers, M. (2017). Board Interlocks and Firm
Performance: Toward a Combined Agency-Resource Dependence Perspective. Journal of
Management, 44(2), 589-618.

Scientific Quarterly “Organization and Management”, 2019, Vol. 4, No. 48; DOI: 10.29119/1899-6116.2019.48.9 www.oamquarterly.polsl.pl
HUMAN CAPITAL OF TERTIARY GRADUATES
IN THE CONTEXT OF THEIR EMPLOYABILITY
IN THE LABOUR MARKET OF LUBELSKIE PROVINCE
Paweł WÓJCIK1*, Piotr KRZESIŃSKI2
1 Faculty of Economics, Maria Curie Skłodowska University in Lublin; [email protected],
ORCID: 0000-0001-7376-1853 2 Provincial Labour Office in Lublin; [email protected], ORCID: 0000-0003-1979-4895
* Corresponding author
Abstract: When enrolling at university, student candidates assume that by the time they
graduate, they will have acquired competencies that significantly improve their future
employability. It is therefore worth verifying whether the human capital developed by students
in the course of their studies really does facilitate better employment. The aim of the article is
to identify the key elements of the human capital of tertiary graduates in the context of their
employability. The analysis will utilise data collected in the course of a study conducted in 2017
by the provincial Labour Office in Lublin and covering 1,375 cases of Lublin university
graduates residing and employed within Lubelskie province. The respondents indicated human
capital elements such as education, experience, skills, and personal attributes as those that
significantly influenced their employability. The study revealed that the greatest barrier to good
employment is the lack or insufficiency of professional experience. In turn, the greatest
advantages, significant in terms of professional activity, include the following personal and
practical skills: diligence and accuracy, self-reliance, work organisation, communication skills,
resilience to stress, and engagement. The respondents also mentioned the importance of
availability and readiness to improve the already possessed qualifications.
Keywords: human capital, employability, labour market, tertiary education.
1. Introduction
The significance of competencies possessed in the context of labour market success has
been on a steady increase in recent years (Marszałek, 2012). This is evidenced by the fact that
an individual’s human capital now determines the competitive edge they may or may not enjoy
when seeking employment. Furthermore, human capital is recognized as the greatest source of
value for companies (Sienkiewicz, 2013; Ciekanowski, 2014). Hence, it can be concluded that
both individual professional careers and organisational success are to a considerable extent
dependent on the attributes and abilities of people.
122 P. Wójcik, P. Krzesiński
People enrolling at universities do so in the hope of developing their human capital by
gaining knowledge, skills and experience that will later facilitate their employability.
The process of developing employability is contributed to by three types of agents: universities,
employers, and students – the soon-to-be graduates. One can observe certain structural
inconsistencies in this context that are natural for developing economies undergoing structural
reforms (Rutkowki, 2008). One should point out two key factors limiting the employability of
university graduates. Firstly, there is a discrepancy between the supply of graduates and the job
market demand (Balcerowicz-Szkutnik, et al., 2017). The Polish market is characterised by an
over-representation of tertiary graduates relative to the available compatible employment
opportunities in the market (Wronowska, 2015). Secondly, there is a discrepancy between the
expectations regarding the qualifications and competencies of university graduates as reported
by employers, relative to those actually gained in the course of tertiary education (Macioł, 2012).
Employability is dependent on a variety of factors, chief among which is human capital.
A question therefore arises as to the degree to which university education actually improves the
graduates’ human capital vis-à-vis the demands of the labour market. The aim of this article is
to identify elements of tertiary graduates’ human capital important in the context of their
employability, on the basis of which recommendations for universities can be proposed with
regard to those human capital elements that ought to be developed in the course of tertiary
education in order to improve the employability of future university graduates.
2. Human capital
The interest in human capital has continued to grow since the 1960s, when G.B. Becker,
J. Mincera, and T.W. Schultz first introduced the concept into economic deliberations as a factor
affecting production (Wieczorek-Szymańska, 2010; Potelienė, and Tamašauskienė, 2014).
Human capital theory was focused on the role of education and training in the labour market.
The main idea was to assume that individuals make investments in education and training in
order to gain a set of skills that may be valuable for employers. That means education and
training improve productivity and finally individuals’ earnings. The authors of human capital
theory indicated the need for investment in all types and levels of education, including
university (Suleman, 2017). The idea that investment in education has extended economic and
social profits for the individual and society was known much earlier. Adam Smith (2007) was
the first to ascertain individual skills, abilities, and personal knowledge as valuable qualities of
people in relation to their economic activities (Potelienė, and Tamašauskienė, 2014).
Human capital of tertiary graduates… 123
In Poland, similarly to other eastern and central European countries, the concept of human
capital was first introduced only after the collapse of communism, i.e. at the turn of the 1990s.
(Szopik-Depczyńska, and Korzeniewicz, 2011).
The literature provides numerous definitions attempting to specify the exact nature of
human capital. They focus primarily on the attributes and qualities displayed by an individual.
Additionally, the age and sex of the employee are also considered as factors (Rakowska et. al.,
2018).
Becker (1964) defined human capital as the stock of knowledge, skills and abilities
contained in an individual from natural endowment and subsequent investment in education,
training and experience. Potelienė and Tamašauskienė (2014, p. 43) considered that human
capital is “the ability of an individual to generate income by having a certain skillset or
knowledge, or as the knowledge, skills, and experience of people that make them economically
productive”. Pocztowski (2008, p. 41) understands human capital as “the overall set of attributes and
characteristics embodied by people (knowledge, skills, abilities, health, motivation, values) that
have an intrinsic value and constitute a potential source of income for both the employee-owner
of the human capital, and the organisation taking advantage of the same under certain
circumstances”. Król (2006, p. 97) offers a similar definition of human capital, namely as
“the sum total of particular attributes and qualities embodied by an employee which possess
a certain value and constitute the source of future income for both the employee – owner of the
human capital and the organisation that takes advantage of the same under certain
circumstances”. Both authors emphasise the fact that an individual is the owner of the human
capital, which possesses a specific value and can be beneficial to both the owner and the
organisation.
In turn, Blaug (1995) emphasises the dynamic character of human capital, meaning that it
is not constant, its value can fluctuate, and therefore it needs to be constantly developed.
The author understands human capital as “a resource of knowledge and skills with a certain
inherent value that provides the basis for future income or satisfaction, a fully renewable and
continuously developed human potential” (Blaug, 1995, p. 303).
Higher education is a basic form of investment in the development of human capital. Higher
education can be considered as a high level or a specialized form of human capital, above and
beyond the contribution to economic development, which is extremely important. Education
brings very important benefits for individuals as well as society. It has a crucial impact on
earnings and labour market outcomes. Investment in education also provides non-monetary
profits, for example, it improves the quality of life (Potelienė, and Tamašauskienė, 2014).
The private return from education is a fundamental incentive for individuals to invest in
their higher education. This indicator expresses revenues as a percentage return on the
investment. The private return from education pertains only to individual investments in post
124 P. Wójcik, P. Krzesiński
compulsory education; the indicator ignores government expenditure (Potelienė, and
Tamašauskienė, 2014).
It turns out that the level of the private return from education is different for individual
countries. Potelienė, and Tamašauskienė (2014), based on OECD data from 2009, calculated
that of 22 European countries, the highest indicators of the returns on investment in human
capital are in Poland, Hungary, Estonia and the Slovak Republic. This means that investment
in education is very effective in these countries. Additionally, based on data from Eurostat from
2010, researchers showed that the average indicated wage for people with higher education in
Poland is 66.2% higher than that of individuals who have acquired only secondary education.
3. Employability
The problem of employability has been discussed since the early 20th c., and the concept
has evolved considerably over that period. Currently, employability tends to be approached
holistically by taking into consideration various internal and external factors related to the given
person, as well as any relationships occurring between said factors (Wojdyło-Preisner, 2012;
Wiśniewska, 2015). Additionally, employability could be considered from three perspectives:
as the national workforce level, the human resource management level, and the individual level
(Rothwell et. al., 2009; Pouratashi, 2019). Consequently, the literature fails to provide a single,
universally accepted definition of employability (McQuaid, and Lindsay, 2005; Harvey, 2001).
One concise definition was proposed by Pool and Swell (2007, p. 279), who understand
employability as “Having a set of skills, knowledge and personal attributes that make a person
more likely to secure, and be successful in their chosen occupation”. Therefore, the authors
emphasise the ability to display the specific human capital in the context of working in a given
profession. In turn, Hillage and Pollard (1998, p. 2) posit that “For the individual, employability
depends on the knowledge, skills and attitudes they possess, the way they use those assets and
present them to employers and the context (e.g. personal circumstances and labour market
environment) within which they seek work”. They therefore observe that the value of given
human capital depends on the ability to evidence the same as well as a variety of external
factors.
In terms of tertiary graduates, one should also consider the definition proposed by Yorke
and Knight (2006, p. 3), according to which employability refers to “a set of achievements –
skills, understandings and personal attributes – that make graduates more likely to gain
employment and be successful in their chosen occupations, which benefits themselves,
the workforce, the community and the economy”. An even broader definition was provided in
the Council conclusions of 11 May 2012 on the employability of graduates from education and
training, which state that “employability — that is, the combination of factors which enable

Human capital of tertiary graduates… 125
individuals to progress towards or enter employment, to stay in employment and to progress
during their career — is a complex concept, involving not only each individual's characteristics,
skills, attitudes and motivation, but also other external factors which lie beyond the scope of
education and training policy, such as labour market regulations, demography, the structure of
the economy and the overall economic situation”. The term “perceived employability”, which is conceptualized as “individuals’ evaluations
of their employment chances in both the internal (i.e. within the current organization) and
external labour market (i.e. beyond the boundaries of the current organization)” should be noted
(Houben et. al., 2019, p. 2).
To recapitulate the afore-mentioned definitions of employability, it can be observed that its
key element is constituted by human capital, whose level determines one’s ability to find and
maintain employment in the context of given external factors.
4. Research into the employability of tertiary graduates
In recent years the policy debate which refers to the relationships between higher education
and the labour market has focused on the need to foster graduates’ employability. Pressures are
put on higher education to equip future employees with the right skills for economic and labour
market imperatives. According to Suleman (2017), the employability of graduates for this
reason is becoming a new institutional mission of higher education.
The number of tertiary graduates is increasing in the European Union. Speaking of the
employability of graduates, it should be noted that the Europe 2020 strategy (2010) assumed
the growth of the population aged 30-34 having completed tertiary education from 31% to at
least 40%. Based on data from Eurostat from 2018, it can be concluded that the average quantity
of graduates in the European Union was 40.7%, and 18 of the Member States had figures above
this average. It should be noted that the highest average of tertiary graduates aged between 30-
34 were in Lithuania, Cyprus, Ireland and Luxemburg (Figure 1).

126 P. Wójcik, P. Krzesiński
Figure 1. Tertiary educational attainment in the age group 30-34 (data in %). Source: based on the data
of Eurostat, https://ec.europa.eu/eurostat/tgm/table.do?tab=table&init=1&language=en&pcode=tesem
030&plugin=1, November 26, 2019.
Studies pertaining to the career paths of tertiary graduates in Poland have been developed
primarily due to the statutory requirement imposed on universities with respect to monitoring
the professional progress of graduates, which came into force on 1 October 2011 (Act of
18 March 2011). Prior to the introduction of this obligation, only 33.3% of Polish universities
conducted studies of this kind (Dziewulak, et al., 2014). As the studies were carried out
independently by each individual university, they varied significantly in terms of the
methodologies employed, which greatly hindered any comparative analyses (Pacuska, 2014).
The statutory change introduced in 1 October 2014 (Act of 11 July 2014) entrusted the
minister responsible for higher education with monitoring the professional careers of graduates
based on information provided by universities (currently via The Integrated System of
Information on Science and Higher Education – POL-on) and the Social Insurance Institution
(ZUS). The data gathered by the Minister have been published since 2016 via the national
system of monitoring the economic vicissitudes of graduates (ELA), available at
https://ela.nauka.gov.pl.
Although the ELA system is currently the largest available source of information on the
post-university careers of tertiary graduates in Poland, it is not without certain limitations.
Firstly, the data processed by the system are limited mainly to the scope of economics.
Secondly, the data utilised by the system are gathered as part of the administrative tasks of the
institutions managing the same data, and are therefore not adapted to research purposes.
0
10
20
30
40
50
60
70
Rom
ania
Ital
y
Po
rtu
gal
Bulg
aria
Cze
ch R
epu
bli
c
Hu
ngar
y
Cro
atia
Mal
ta
Ger
man
y
Slo
vak
Rep
ub
lic
EU
(28
co
un
trie
s)
Au
stri
a
Sp
ain
Lat
via
Slo
ven
ia
Fin
lan
d
Gre
ece
Po
lan
d
Fra
nce
Est
on
ia
Bel
giu
m
Un
ited
Kin
gd
om
Den
mar
k
Net
her
lan
ds
Sw
eden
Lu
xem
bou
rg
Irel
and
Cyp
rus
Lit
hu
ania
Human capital of tertiary graduates… 127
Thirdly, information obtained from administrative registers does not include feedback from the
graduates themselves or their employers (Information materials on…). The problems,
limitations and advantages inherent in studies based on administrative registers have been
broadly discussed by Jasiński et al. (2015).
The limitations of the ELA system necessitate additional research to be conducted on the
career paths of tertiary graduates. Furthermore, the changes observed in the labour market and
the related evolution of requirements applicable to potential future employees mean that such
research should be carried out on a continuous basis. Despite the introduction of the ELA
system, many universities elect to conduct independent studies into these issues, mainly through
collaboration with careers offices. The professional advancement of university graduates is also
monitored by Provincial Labour Offices, as well as the Central Statistical Office.
When analysing the results of Polish studies focusing on the career paths of tertiary
graduates one can observe that they are conducted relatively rarely given the context of
managing the human capital of graduates.
5. Human capital of tertiary graduates relative to employability
In order to identify the key elements of human capital that influence the employability of
graduates, we used the data gathered in the study on “Professional Careers of Tertiary Graduates
in Lublin Province” (Gach, and Krzesiński, 2017) conducted in 2017 by the Provincial Labour
Office in Lublin. The study utilised the technique of CAWI (Computer Assisted Web-based
Interview).
For the purposes of the article, a targeted selection was performed by choosing 1,375 cases
out of 1,865 entries available in the database, based on the following criteria: graduation from
a university in Lublin, residence in Lublin Province, and being employed. The most numerous
group was composed of graduates from social studies faculties (53.8%), followed by natural
sciences (15.6%), humanities and arts (9.5%), engineering and technical sciences (8.8%),
medical and health sciences (6.5%), and agricultural sciences (5.8%). A vast majority of the
respondents were graduates from second-cycle programmes or full-time master’s level
programmes (88.8%), with nearly one in ten having graduated from first cycle programmes
(11.2%).
For the purposes of this article, the following elements of human capital were taken into
consideration: education, experience, skills, and personal attributes. Three research questions
were posed. Firstly, whether graduates are or have been employed in positions consistent with
the direction of their university education. Secondly, how many of the students gained actual
professional experience during their studies, and in what form. And finally, what skills and
personal attributes of the graduates had an influence on their employability.

128 P. Wójcik, P. Krzesiński
Graduation from a higher education institution is, but general assumption, an important
factor determining future employability. One in three of the respondents never practiced or do
not currently practice their acquired profession (Table 1). Nonetheless, graduates from the
following fields of study were the most likely to practice or have practiced their acquired
profession: medicine and dentistry (88.6%); architecture and construction (86.1%); biology and
chemistry (82.1%); nursing, physiotherapy and pharmacy (80.8%). Naturally, one has to
remember that the ability to find employment in ones acquired profession may depend on the
specificity of the field of study, one’s personal attributes and skills, as well as the current market
demand.
Table 1.
Practising the profession acquired in the course of studies
Practising the acquired profession
Field of studies No Yes
Medicine and Dentistry 11.4% 88.6%
Architecture and Construction 13.9% 86.1%
Biology and Chemistry 17.9% 82.1%
Nursing, Physiotherapy and Pharmacy 19.2% 80.8%
Transport and Logistics 20.8% 79.2%
Veterinary and Zootechnics 21.6% 78.4%
Psychology 21.7% 78.3%
Economics and Finance 25.0% 75.0%
Sports and Beauty 25.0% 75.0%
Law 26.1% 73.9%
Information Technology 29.4% 70.6%
Administration and Management 31.2% 68.8%
Technology and Mechanics 35.3% 64.7%
Journalism and Information 36.4% 63.6%
Mathematics and Physics 39.3% 60.7%
Education and Social Services 39.4% 60.6%
Humanities 40.5% 59.5%
Geography and Tourism 41.3% 58.7%
Agriculture, Horticulture, Forestry, and Fishery 41.9% 58.1%
Social Sciences 44.5% 55.5%
Production and Processing 47.1% 52.9%
Environmental protection 64.1% 35.9%
Total 445 930
Source: authors’ own elaboration.
As evidenced in the studies on the expectations of employers towards tertiary graduates,
the most common requirement is that of having certain professional experience acquired in the
course of the studies (Halik, 2013). Furthermore, research conducted in a group of nearly
17 thousand unemployed persons aged between 18 and 25 years revealed that the extent of such
professional experience has a significant bearing on the level of unemployment. The lower the
experience, the greater the threat of long-term unemployment (Wojdyło-Preisner and
Zawadzki, 2015).

Human capital of tertiary graduates… 129
In the present study, the respondents were asked whether they had taken any steps towards
gaining professional experience prior to graduation. Nearly 2/3 of the graduates turned out to
have had gained some experience in the course of their studies (66.3%). The same was most
commonly accomplished in the form of mandatory internships (20.8%), and commission or
task-based employment (17.7%). Other forms of placement (11.9%), employment contracts
(11.4%), voluntary work (10.7%), voluntary internships (10.3%), unregistered or non-
contractual employment (9.9%), work at companies or farmsteads belonging to one’s family
(3.9%), and running one’s own business (3.6%). Respondents were also asked to identify the
greatest barriers experienced when seeking employment. The results clearly suggest that the
most significant obstacle in finding desirable employment was the lack of sufficient
professional experience (30.2%). These findings mean that universities do not fully support
students in gaining future employment because 1/3 of students do not gain any professional
experience while studying (33.7%), and almost 1/3 of students go to mandatory internships with
the help of their university (31.1%).
The respondents were further asked to identify the key competencies needed in their
presently occupied position. When choosing from among 24 provided answers, they most
commonly indicated: diligence and meticulousness (7.1%), self-reliance (6.8%), work
organisation (6.8%), communication skills (6.6%), resilience to stress (6.6%), and engagement
(6.1%). (Table 2). This suggests that the curricula of tertiary education courses ought to more
strongly emphasise the development of these particular competencies.
Table 2.
Key competencies in the currently occupied position
Competence Number Percent of responses Percent of cases
Diligence and meticulousness 933 7.1% 67.9%
Self-reliance 896 6.8% 65.2%
Work organisation 903 6.8% 65.7%
Communication skills 874 6.6% 63.6%
Resilience to stress 876 6.6% 63.7%
Engagement 805 6.1% 58.5%
Note. Respondents could choose more than one answer. Source: authors’ own elaboration.
In the subsequent part of the questionnaire, the respondents were asked to choose from
among 12 strengths important in the context of professional activity. The most common
selections were personality traits (18.9%), having specific qualifications and competencies
(16.7%), industry-specific knowledge (12.3%), and only in fourth place the completed course
of study (11.3%) (Table 3). However, when the analysis was narrowed down to only those
graduates who work or used to work in their acquired profession, the field of university study
was the most commonly selected attribute.
130 P. Wójcik, P. Krzesiński
Table 3.
Key attributes of respondents in the context of professional activity
Attribute Number Percent of replies Percent of cases
Personality traits 882 18.9% 64.1%
Specific qualifications or competencies 782 16.7% 56.9%
Industry-specific knowledge 572 12.3% 41.6%
Field of study 527 11.3% 38.3%
Adequate professional experience 477 10.2% 34.7%
Readiness to retrain 473 10.1% 34.4%
Mobility 300 6.4% 21.8%
Professional experience gained in prestigious institutions 249 5.3% 18.1%
Note. Respondents could select more than one attribute. Source: authors’ own elaboration.
Respondents were also asked to consider the question of requirements they had to satisfy in
order to secure their present employment (Table 4). When evaluating 12 of the provided
possible options, they most often selected the need to develop one’s already possessed
qualifications (18.2%). The need to improve one’s qualifications may stem, at least to some
extent, from the general character of the university curriculum, as well as the increasing level
of professional specialisation. At the same time, however, one of the main requirements
imposed by employers relates to various aspects of employee availability, in particular: general
full availability (12.6%), readiness to accept flexible working hours (10.9%), regular commute
to locations distant from one’s place of residence (10.3%), mobile work and business travel
(5.6%). Those requirements stem from modern organisations’ need for flexible management
which allows human capital to be adjusted to environmental requirements (Juchnowicz, 2016).
Table 4.
Key requirements related to the currently held position
Requirements related to the currently held position Number Percent of
replies
Percent of
cases
Development of already possessed qualifications 514 18.2% 37.4%
Full availability 354 12.6% 25.7%
None of the above 315 11.2% 22.9%
Readiness to accept flexible working hours, e.g. work at night, on
bank holidays 307 10.9% 22.3%
Regular commute to locations distant from one’s place of residence 289 10.3% 21.0%
Complete retraining relative to the previously acquired/practiced
profession 253 9.0% 18.4%
Starting one’s own business 175 6.2% 12.7%
Mobile work/business travel 158 5.6% 11.5%
Purchase of a work tool, e.g. a car, specialist machine, computer 155 5.5% 11.3%
Note. Respondents could select more than one requirement. Source: authors’ own elaboration.
Furthermore, it is also worth noting the degree to which the respondents’ knowledge and
skills acquired during university studies are utilised in their work, as assessed by graduates
actually working in their acquired profession. It turns out that 7.1% never use the knowledge
and skills acquired during their studies, 15.6% do so sporadically, 29.1% from time to time,
21.8% often, and 24.3% on a daily basis. The results clearly indicate that the knowledge and
skills gained during university studies are largely insufficient to effectively practice
a profession, which may suggest a certain incompatibility between university curricula and the
Human capital of tertiary graduates… 131
actual needs of employers, which necessitates further development of one’s human capital
outside the academic environment.
6. Summary
The presented results of studies conducted in a group of tertiary graduates revealed that
roughly one in three respondents do not practice their acquired profession, hence the human
capital of those university graduates is utterly wasted.
The results confirmed the importance of professional experience in the context of
employability. It was observed that nearly 2/3 of the graduates made efforts aimed at gaining
experience during their studies. This was most commonly accomplished by partaking in
mandatory practical training and employment under commission or task-based contracts.
The respondents also indicated lack or insufficiency of professional experience as the most
important barrier when seeking employment. Universities do not fully support students in
gaining future employment because 1/3 of students do not gain any professional experience
while studying, and almost 1/3 of students go to mandatory internships with the help of their
university. It is therefore of paramount importance that universities take steps aimed at
activating students in acquiring greater experience, e.g. through practical training, internships,
or employment during university studies.
The article also presents data regarding the key competencies applicable in the currently
held position, strengths of graduates in the context of their professional activity, and the
requirements of their current employers. When drawing up course curricula, universities ought
to consider the development of such competencies as: diligence and conscientiousness,
self-reliance, work organisation, communication skills, resilience to stress, engagement,
and broadly understood availability.
The respondents indicated that the most common requirement in their present place of
employment related to the development of already possessed qualifications. Respondents
practising their acquired profession also reported considerable discrepancies between the scope
of knowledge and skills acquired at university and the scope actually used in their work.
This signifies that human capital must also be developed after completing university studies.
It is noteworthy that in response to the expectations of both employers and students, tertiary
schools increasingly commonly introduce dual studies into their academic offers. The aim of
such courses is to allow students to simultaneously gain academic knowledge as well as
professional experience. The curricula of dual studies combine traditional academic classes
with periods of employment in real-world enterprises. Students are therefore provided with the
opportunity to gain actual professional experience consistent with their area of study, which
will most definitely improve their future employability.
132 P. Wójcik, P. Krzesiński
Analysing the career paths of tertiary graduates is a significant element of the efforts aimed
at improving the overall quality of tertiary education and adapting it to the demands of the
labour market. It should also be remembered, however, that employability is dependent on
a whole range of factors. In future studies, it would also be worth analysing the specificity of
the labour market. The analysis discussed in the present article is limited only to the labour
market in the Lublin region, which is not without a certain specificity (Maleszyk, 2013).
A comparative analysis could therefore be considered to include the perspective of other
provinces, as well as the country as a whole. It also seems interesting to use a scale by Gunwan
et. al. (2018) to measure young adults’ perceptions of their future employability.
References
1. Act of 11 July 2014 amending the Act on higher education and other selected Acts, Dz.U.
[Journal of Laws] 2014, item 1198.
2. Act of 18 March 2011 amending the Act on higher education, Act on academic degrees and
academic title and degrees and title in art, and other selected Acts, Dz.U. [Journal of Laws]
2011, no. 84, item 455.
3. Balcerowicz-Szkutnik, M., Skórska, A., and Wąsowicz, J. (2017). Perspektywy
zatrudnienia absolwentów na polskim rynku pracy [Perspectives of graduate employment
in the Polish job market]. Studia Ekonomiczne. Zeszyty Naukowe Uniwersytetu
Ekonomicznego w Katowicach, 316, 7-17.
4. Becker, G.S. (1964). Human capital: A theoretical and empirical analysis, with special
reference to education. New York: National Bureau of Economic Research.
5. Blaug, M. (1995). Metodologia ekonomii. Warszawa: PWN.
6. Ciekanowski, Z. (2014). Kapitał ludzki najistotniejszym elementem w organizacji [Human
capital as the key element in an organisation]. Zeszyty Naukowe Uniwersytetu Przyrodniczo-
Humanistycznego w Siedlcach. Seria: Administracja i Zarządzanie, 101, 135-148.
7. Council conclusions of 11 May 2012 on the employability of graduates from education and
training (2012/C, 169/04). Official Journal of the European Union, C169/11.
8. Dziewulak, D., Grycuk, A., Russel, P., and Wołodkiewicz-Donimirski, Z. (2014).
Monitorowanie karier zawodowych absolwentów przez polskie uczelnie wyższe w świetle
wyników badania Biura Analiz Sejmowych [Monitoring the professional careers of
graduates by Polish universities in light of the study by the Parliamentary Analyses Office].
Analizy BAS, 5(109), 1-7.
9. Europe 2020 – A strategy for smart, sustainable and inclusive growth. Communication from
the Commission, Brussels, 3.3.2010, COM (2010) 2020.
Human capital of tertiary graduates… 133
10. Gach, G., and Krzesiński, P. (2017). Losy absolwentów szkół wyższych województwa
lubelskiego. Raport z badań ilościowych [Further careers of tertiary graduates in the Lublin
Voivodeship. A report from quantitative studies.], Lublin: Voivodeship Labour Office in
Lublin.
11. Gunawan, W., Creed, P.A., and Glendon, A.I. (2018). Development and Initial Validation
of a Perceived Future Employability Scale for Young Adults. Journal of Career Assessment,
106907271878864. doi:10.1177/1069072718788645.
12. Halik, J. (2013). Sytuacja absolwentów szkół wyższych na rynku pracy w opiniach
pracodawców oraz przedstawicieli środowisk naukowych i akademickich [Situation of
tertiary graduates on the labour market as perceived by employers, researchers and members
of the academia]. Nierówności Społeczne a Wzrost Gospodarczy, 33, 69-97.
13. Harvey, L. (2001). Defning and Measuring Employability, Quality in Higher Education,
7(2), 97-109, doi: 10.1080/1353832012005999 0.
14. Hillage, J., and Pollard, E. (1998). Employability: Developing a Framework for Policy
Analysis, Research report, 85. Suffolk: Department for Education and Employment.
15. Houben, E., De Cuyper, N., Kyndt, E., and Forrier, A. (2019). Learning to Be Employable
or Being Employable to Learn: The Reciprocal Relation Between Perceived Employability
and Work-Related Learning. Journal of Career Development, 089484531986743,
doi:10.1177/0894845319867431.
16. Jasiński, M., Bożykowski, M., Zając, T., Styczeń, M. and Izdebski, A. (2015). Dokładniej, rzetelniej, taniej. Badania oparte na rejestrach publicznych jako szansa dla badań
społecznych w Polsce. [More precise, reliable, and affordable. Studies based on public
register data as an opportunity for social researchers in Poland]. Studia Socjologiczne,
216(1), 45-72.
17. Juchnowicz, M. (2016). Istota elastycznego zarządzania kapitałem ludzkim [Nature of
flexible human capital management]. In M. Juchnowicz (Ed.), Elastyczne zarządzanie
kapitałem ludzkim z perspektywy interesariuszy. Warszawa: PWN.
18. Król, H. (2006). Kapitał ludzki organizacji [Human capital in an organisation]. In H. Król, and A. Ludwiczyński (Eds.), Zarządzanie zasobami ludzkimi. Warszawa: PWN.
19. Macioł, S. (2012). Kwalifikacje i kompetencje absolwentów szkół wyższych – perspektywa
pracodawców [Qualifications and competences of tertiary graduates – employers’ perspective]. Nauka i Szkolnictwo Wyższe, 1(39), 34-54.
20. Maleszyk, P. (2013). Specyfika lubelskiego rynku pracy [Specificity of the Lublin labour
market]. Prace Naukowe Uniwersytetu Ekonomicznego we Wrocławiu, 320, 80-90.
21. Marszałek, A. (2012). “Zatrudnialność” – nowa i poszukiwana cecha pracownika
[“Employability” – the new and desirable trait of an employee]. Polityka Społeczna, 11-12,
20-23.
22. Materiały informacyjne na temat zasobów udostępnianych w ramach czwartej edycji
ogólnopolskiego systemu monitorowania Ekonomicznych Losów Absolwentów szkół

134 P. Wójcik, P. Krzesiński
wyższych (ELA) [Reference material on resources available under the fourth edition of the
national system for monitoring the economic vicissitudes of tertiary graduates (ELA)].
Retrieved from https://ela.nauka.gov.pl/assets/pdf/opis_badania.pdf, 02.07.2019.
23. McQuaid, R.W., Lindsay, C. (2005). The concept of employability. Urban Studies, 42(2),
197-219, doi: 10.1080/0042098042000316100.
24. Ogólnopolski system monitorowania Ekonomicznych Losów Absolwentów szkół wyższych
[National system for monitoring the economic vicissitudes of tertiary graduates]. Retrieved
from https://ela.nauka.gov.pl., 12.07.2019.
25. Pacuska, M. (2014). Zatrudnialność absolwentów szkół wyższych – przegląd wyników
badań losów absolwentów pod kątem zastosowanych wskaźników [Employability of
tertiary graduates – review of results from studies on the careers of graduates relative to the
adopted factors]. E-mentor, 1(53), 4-11.
26. Pocztowski, A. (2008). Zarządzanie zasobami ludzkimi. Strategie – procesy – metody
[Human Resources Management. Strategies – processes – methods]. Warszawa: PWE.
27. Pool, L.D., and Sewell, P. (2007). The key to employability: developing a practical model
of graduate employability. Education + Training, 49(4), 277-289, doi: 10.1108/
00400910710754435.
28. Potelienė, S., Tamašauskienė, Z. (2014). The Rate of Return to Investment in Educaton:
A Case Study of Lithuania. Wroclaw Review of Law, Administration & Economics, 014,
4(2), 41-55, doi: 10.1515/wrlae-2015-0014.
29. Pouratashi, M. (2019). Higher education and activities to improve students’ employability
skills. Journal of Education for Business, 1-7, doi:10.1080/08832323.2018.1548421.
30. Rakowska, A., Sitko-Lutek, A., Mendryk, I., Jakubiak, M., and Cichorzewska, M. (2018).
Diverse Competence Potential of Employees in Innovative Enterprises: Research Results.
In A. Rakowska (Ed.), Unlocking the Potential of Employees in the Context of
Organizational Diversity. Bangkok, Celje, Lublin: To Know Press.
31. Rothwell, A., Jewell, S., and Hardie, M. (2009). Self-perceived employability: Investigating
the responses of post-graduate students. Journal of Vocational Behavior, 75, 152-161.
doi:10.1016/j.jvb.2009.05.002.
32. Rutkowski, J. (2008). Priorytety reformy rynku pracy. Synteza [Priorities of the labour
market reform. A synthesis]. Warszawa: Ministry of Labour and Social Policy.
33. Sienkiewicz, Ł. (2013). System zarządzania zasobami ludzkimi w oparciu o kompetencje
w świetle badań ilościowych [Competence-based system of human resources management
in light of quantitative studies]. In Ł. Sienkiewicz, K. Trawińska-Konador, K. Podwójcic
(Eds.), Polityka zarządzania kompetencjami pracowników. Warszawa: Instytut Badań
Edukacyjnych.
34. Smith, A. (2007). An Inquiry into the Nature and Causes of the Wealth of Nations. Edited
by S.M. Soares. MetaLibri Digital Library, https://www.ibiblio.org/ml/libri/s/
SmithA_WealthNations_p.pdf, November 28, 2019.
Human capital of tertiary graduates… 135
35. Suleman, F. (2017). The employability skills of higher education graduates: insights into
conceptual frameworks and methodological options. Higher Education, 76(2), 263-278,
doi:10.1007/s10734-017-0207-0. 36. Szopik-Depczyńska, K., and Korzeniewicz W. (2011). Kapitał ludzki w modelu wartości
przedsiębiorstwa [Human capital in the corporate value model]. Zeszyty Naukowe
Uniwersytetu Szczecińskiego. Studia i Prace Wydziału Nauk Ekonomicznych i Zarządzania,
24, 177-204.
37. Wieczorek-Szymańska, A. (2010). Koncepcja kapitału ludzkiego w teorii ekonomii –
przegląd wybranych podejść [The concept of human capital in the theory of economics –
a review of selected approaches]. Studia i Prace Wydziału Nauk Ekonomicznych i Zarzą-
dzania, 17, 157-170.
38. Wiśniewska, S. (2015). Zatrudnialność – pojęcie, wymiary, determinant [Employability –
definitions, dimensions, determinant]. Edukacja Ekonomistów i Menedżerów, 1(35), 11-24,
doi: 10.5604/01.3001.0009.4583.
39. Wojdyło-Preisner, M. (2012). Zatrudnialność – definicje, ewolucja koncepcji i ramy do
analiz [Employability – definitions, evolution of the concept, and analytic framework].
Studia Ekonomiczne. Zeszyty Naukowe Uniwersytetu Ekonomicznego w Katowicach, 110,
141-148.
40. Wojdyło-Preisner, M., and Zawadzki K. (2015). Bariery zatrudnialności osób młodych
w Polsce [Barriers to the employability of young people in Pland]. Edukacja Ekonomistów
i Menedżerów, 1(35), 55-73, doi: 10.5604/01.3001.0009.4585.
41. Wronowska, G. (2015). Oczekiwania na rynku pracy. Pracodawcy a absolwenci szkół wyższych w Polsce [Labour market expectations. Employers vs. tertiary graduates]. Studia
Ekonomiczne. Zeszyty Naukowe Uniwersytetu Ekonomicznego w Katowicach, 214,
115-127.
42. Yorke, M., and Knight, P.T. (2004). Embedding Employability into the Curriculum:
Learning & Employabilit. Series III. York: Learning and Teaching Support Network.

Scientific Quarterly “Organization and Management”, 2019, Vol. 4, No. 48; DOI: 10.29119/1899-6116.2019.48.10 www.oamquarterly.polsl.pl
MANAGEMENT AND LEADERSHIP IN TECHNOLOGY TEAMS – EMPIRICAL RESEARCH
Agnieszka ZIELIŃSKA
University of Bielsko-Biala, Bielsko-Biala; [email protected], ORCID: 0000-0003-4266-5177
Abstract: The research goal was to analyse an employee’s position from the top management’s point of view, defined in two dimensions: employees’ potential and their effectiveness. The article uses a brief literature review and qualitative research based on interviews with
management. The interviews were conducted in two time intervals – the first part in 2018 and
the second part in 2019. In the research, top management consisted of a Chief Executive Officer,
an Agile Coach and a Human Resources Business Partner. The people in the above positions
were responsible for retaining employees, creating possible development paths, and the
utilization of human potential. Additional research purposes were to find out how the
employee’s position has changed over the years, and how much the leader’s position in the team has influenced the changes. The study covered the situation of 34 programmers and IT analysts
who worked in 8 technology teams. The assessment of the situation before and after twelve
months showed real consequences of the management’s decision-making process and provided
recommendations for future research.
Keywords: career management, leadership, effectiveness, technology.
1. Introduction
In spite of a better understanding of leadership and effective people management, the issue
is still a common goal of leadership and human resources management studies, two independent
fields of study. Therefore, researchers (Leroy, et al., 2018) have recommended to integrate them
to demonstrate how human resources management and leadership co-determine employees’ motivation and performance. Also, employee retention is currently a huge challenge for
management, especially in IT companies (Pflügler, et al., 2018). Given the importance of IT
professionals in today’s high-technology-driven business environment, it is essential to retain
and fully utilize employees’ performance potential, simultaneously empowering their
engagement and increasing their effectiveness (Erturk, and Vurgun, 2015).
Organizational management practices have been recognized as crucial variables for
employees’ effectiveness and success. According to Bagdadli and Gianecchini (2019), the relationship between organizational investments and career development remains
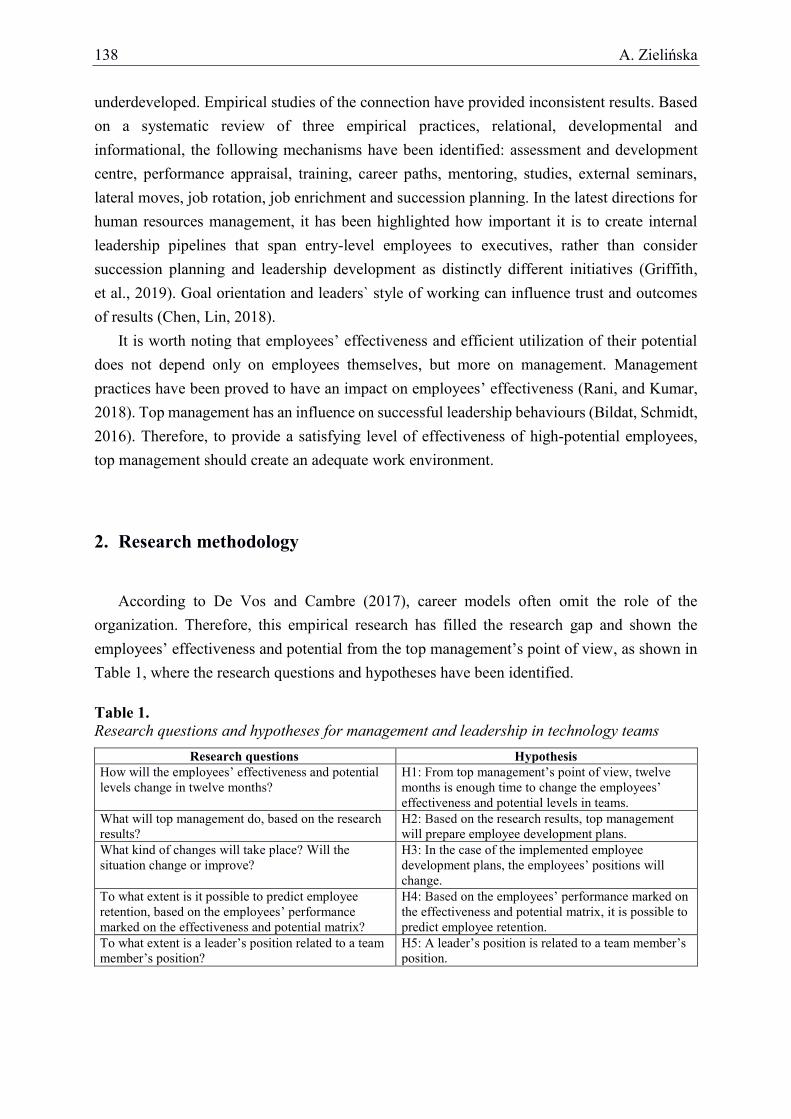
138 A. Zielińska
underdeveloped. Empirical studies of the connection have provided inconsistent results. Based
on a systematic review of three empirical practices, relational, developmental and
informational, the following mechanisms have been identified: assessment and development
centre, performance appraisal, training, career paths, mentoring, studies, external seminars,
lateral moves, job rotation, job enrichment and succession planning. In the latest directions for
human resources management, it has been highlighted how important it is to create internal
leadership pipelines that span entry-level employees to executives, rather than consider
succession planning and leadership development as distinctly different initiatives (Griffith,
et al., 2019). Goal orientation and leaders` style of working can influence trust and outcomes
of results (Chen, Lin, 2018).
It is worth noting that employees’ effectiveness and efficient utilization of their potential does not depend only on employees themselves, but more on management. Management
practices have been proved to have an impact on employees’ effectiveness (Rani, and Kumar,
2018). Top management has an influence on successful leadership behaviours (Bildat, Schmidt,
2016). Therefore, to provide a satisfying level of effectiveness of high-potential employees,
top management should create an adequate work environment.
2. Research methodology
According to De Vos and Cambre (2017), career models often omit the role of the
organization. Therefore, this empirical research has filled the research gap and shown the
employees’ effectiveness and potential from the top management’s point of view, as shown in
Table 1, where the research questions and hypotheses have been identified.
Table 1.
Research questions and hypotheses for management and leadership in technology teams
Research questions Hypothesis
How will the employees’ effectiveness and potential
levels change in twelve months? H1: From top management’s point of view, twelve months is enough time to change the employees’ effectiveness and potential levels in teams.
What will top management do, based on the research
results? H2: Based on the research results, top management
will prepare employee development plans. What kind of changes will take place? Will the
situation change or improve? H3: In the case of the implemented employee
development plans, the employees’ positions will
change. To what extent is it possible to predict employee
retention, based on the employees’ performance
marked on the effectiveness and potential matrix?
H4: Based on the employees’ performance marked on
the effectiveness and potential matrix, it is possible to
predict employee retention. To what extent is a leader’s position related to a team member’s position?
H5: A leader’s position is related to a team member’s position.
Management and leadership in technology… 139
An essential part of the research was related to team leaders and top management’s perception of their positions in the group. Moreover, the assessment of the situation, before and
after twelve months, has highlighted the consequences of the management’s decision-making
processes.
All the management activities should lead to an increase in employees’ engagement, motivation and utilization of their potential, where employees’ potential, defined as knowledge, skills, and competencies, is a stem of human capital (Spurk, et al., 2019). Leveraging human
capital and management team development issues, according to O`Neill and Salas (2018),
are pathways for achieving the full potential of teams and creating high-performance
organizations.
Job performance has been defined as the extent to which employees meet their job
requirements according to their manager’s instructions (Groen, at al., 2017). The performance
can be measured at individual, team and organizational levels (Zorinsky, 2014). Researchers
(Salas, et al., 2015) have demonstrated how essential understanding and improving teamwork
is. Therefore, this empirical research was conducted in two ways: for every worker individually
and from the team’s perspective. The research was conducted as group interviews with the biaxial matrix as an auxiliary tool.
The interviews were divided into a few stages. In every stage, groups of the same three people
were directly involved: Chief Executive Officer, Agile Coach and Human Resources Business
Partner. The aim was to reflect the real environmental conditions. For the purpose of the
research, only top managements having daily contact with team members were selected.
Thanks to that criterion, the top management teams were able to observe samples of the
employees’ behaviours during the interviews.
Indirect research groups consisted of employees who worked in technology teams.
The study covered 34 workers in 8 teams (marked A-H), which meant 3 to 7 members per
group. The team members consisted of 32 males and 2 females employed as programmers or
IT analysts, responsible for the creation, development and implementation of IT software.
The workers did not participate in the interviews because the research goal was to analyze the
employees’ status from top management’s point of view. During the interviews the Chief
Executive Officer, Agile Coach and Human Resources Business Partner used the employees’ names. After completing the results matrix, the data were anonymized.
The research procedure and schedule were followed. Quality researches were conducted in
two parts. The first part was implemented in 2018 and the second one in 2019, after twelve
months. Each time, the same procedure was implemented with the same people in the posts:
Chief Executive Officer, Agile Coach and Human Resources Business Partner. The research
procedure was as follows:
Chief Executive Officer, Agile Coach and Human Resources Business Partner worked
with the biaxial matrix (horizontal axis – the level of potential, vertical axis – the level
of performance). Each of them had their own matrix.
140 A. Zielińska
Together they constructed and agreed on the definition of variables to achieve
a common reference which included: timely task completion, quality of work, problem-
solving. The employee’s potential was defined as the individual’s knowledge, skills and competencies (including education, general mental ability, and the ability to cooperate).
Each of them independently placed the names of team members on the matrix, in places
which fit best according to them. This part was done in silence, without any
consultation.
When everyone had finished completing the matrix, they showed the results and the
interview started.
Every team member’s position was analyzed on three matrices. The Chief Executive
Officer, Agile Coach and Human Resources Business Partner exchanged opinions, gave
examples of behaviours and made decisions. At this stage, the fourth matrix was made.
The analysis of the particular employee’s position was conducted until the moment management agreed on the position. After management came to a joint decision,
the employee’s name was placed on the fourth matrix.
The procedure was conducted for every team member to complete the fourth agreed
matrix of the team.
For every employee, possible development paths and management activities to boost
their potential were defined.
The above research procedure was repeated by the Chief Executive Officer, Agile
Coach and Human Resources Business Partner for every technology team.
The interviews, carried out in 2018, focused on the employees’ development plans. The interviews in 2019 also included questions about the changes which had taken place
over the past twelve months.
Every organization has employees with potential, but matching them to the right post is
a huge challenge. This potential should be used at team and organization levels. From the
business point of view, performance and results are crucial. Therefore, those two perspectives
were taken into account in these researches. Moreover, repeating research after twenty months
enabled us to enclose time perspective and long-term outcomes.
3. Results
The results are illustrated in Figure 1. The information about Team A to Team H is shown
together in order to compare the trends. Formal team leaders are marked with filled circles.
Black circles present the employee’s current position (2019), and grey circles demonstrate the
employee’s former position (2018).

Management and leadership in technology… 141
Lev
el o
f P
erfo
rman
ce
Lev
el o
f P
erfo
rman
ce
A Level of Potential B Level of Potential
Lev
el o
f P
erfo
rman
ce
Lev
el o
f P
erfo
rman
ce
C Level of Potential D Level of Potential
Lev
el o
f P
erfo
rman
ce
Lev
el o
f P
erfo
rman
ce
E Level of Potential F Level of Potential
Lev
el o
f P
erfo
rman
ce
Lev
el o
f P
erfo
rman
ce
G Level of Potential H Level of Potential
- current leader`s position - former leader`s position
- current team member’s position - former team member’s position
- new worker’s position - worker who has left work
* - member indicated as a leader successor ? - worker who is considering leaving work
Figure 1. The employee’s position from top management’s point of view (before and after 12 months).
Based on the discussions conducted during the respondents completing the matrix,
and according to the information presented in Figure 1. The employee’s position from top
management’s point of view. Five hypotheses have been found:

142 A. Zielińska
H1 – partly supported
The research confirmed that twelve months was enough time for management to change
employees’ effectiveness and potential levels, which was clearly visible in A-H teams.
However, it is surprising that without looking at the first matrix, the respondents indicated
quite similar employees’ positions. Only a few workers were placed differently than was done earlier. The reasons for this situation, identified during the interviews in 2019,
were the following: the teams focusing on the products, not projects, tasks requiring
substantive knowledge; team members taking part in the training activities; a relatively
stable situation according to top management; small staff changes initiated by management.
H2 – partly supported
Based on the conclusions made from the employees’ effectiveness and potential matrix, top management designed employees’ development plans for a few leaders, high-potential
employees and workers with the lowest level of effectiveness. They last ones were also
provided with additional support of one-on-one meetings and training.
H3 – supported
The third hypothesis, i.e. in the case of the implemented employee development plans,
and the employees’ positions change, has been supported. The development plan included
the following activities: providing mentoring, changing tasks and duties, giving more
autonomy, and cooperation with younger employees to share knowledge. Additional
activities were accelerated through internal and external training. The positions of the
employees with the implemented development plans have apparently changed.
Management recognized those activities as very positive. New development plans have
been constructed on the basis of the matrix done in 2019.
H4 – supported
Based on the employees’ positions on the effectiveness and potential matrix, the hypothesis that it is possible to predict employee retention has been supported. In Team B, people with
lower effectiveness levels felt uncomfortable in their teams. They did not have any
reinforcement from their leader. The conclusion is that workers with lower effectiveness
levels should take on additional activities.
H5 – strongly supported
The strongest evidence has confirmed that the leader’s position is related to a team member’s position. In teams where low-potential employees were recognized, different
kinds of difficulties appeared. In Team B, the workers left the team. In Team D, the most
valuable high-performing programmer was considering leaving the organization. The team
members have not only followed the high-potential leaders, but also increased their
performance under effective guidance.
Management and leadership in technology… 143
4. Discussion
The research results have led to particular and general conclusions. It is possible to highlight
challenges in the management of technology teams. In Team A, the members have followed
their leader, the person with the best performance and high potential. Every team member has
been positively recognized by the management. Moreover, the member who presented high
potential levels during the interviews has been indicated as a possible successor for the leader’s role in the future. Over a period of twelve months this person got additional development tasks,
e.g. decision making, mentoring junior team members, and guidance of students during their
training. The most difficult challenge for management in Team A was to provide the current
leader, who was considering changing organization, with new tasks and development paths to
ensure positive changes in his professional development. This has been seen as vital because
leaders’ high effectiveness levels can bring them greater professional freedom and ensure them greater mobility in the labour market. This can be both a challenge and a risk, as high team
performance cannot be built without a good leader. During top management’s discussions, it turned out that the leader had soft skills, technological knowledge, and strong social influence
on other team members, which meant a great potential to be used at higher organizational levels.
A different situation was observed in Team B, where the leader had a lower potential level.
Moreover, two team members decided to leave the team between the first and the second parts
of the research. They made a joint decision to leave at the same time. The management decided
to rebuild the team temporarily and hired two new programmers. The fact of two employees
quitting their jobs induced a higher demand for increased team monitoring. Perhaps, a formal
leader in this case should be more of an independent consultant rather than a team leader.
Top management considered a consultant post for the current leader, expanded the team,
and a new leader emerged from the team members and supported the current and future leader
with coaching and other development tools, also recommended in the research literature
(Ladegard, and Gjerde, 2014).
In Team C, the leader accelerated the employees’ results. Management decided to introduce
a new employee to the team. The team member, recognized as not efficient enough, was given
new tasks and duties, which meant more autonomy and independence in the new position as
a consultant. As a result of the change, after twelve months significant changes had been noticed
in the perception of this person, which resulted in his career advancement.
A difficult situation was observed in Team D, where the leader did not present enough
potential. The high-potential programmer with a promising effectiveness level informed
management about their intention to leave the organization, which would be a total loss to the
team. The person had all the necessary advanced technical and soft skills. To avoid conflict in
the team, the management decided to create new opportunities for this programmer to lead
144 A. Zielińska
a new project, planned to be run in the following two months. According to management,
it was the only way to prevent the worker from leaving the organization.
In Team E, the leader had a stable potential level and high effectiveness. The leader has
strongly accelerated his successor’s development, more than had originally been planned.
In Teams F, G and H a similar situation has been observed. The leaders, who had satisfactory
potential and effectiveness levels, were sharing their responsibilities and duties with other team
members who were more eager to follow them. This is an important observation which should
be developed in the future. Large-scale researches are related to leaders, but it has also been
recommended to do research devoted to team members who can be the most valuable followers
to leaders (Epitropaki, et al., 2017). It has also been proved that they can influence one another’s behaviours, which can result in the increased effectiveness of both groups (Oc, and Bashshur,
2013).
In the research the leader had a significant role. The research investing leadership
development suggests it is necessary to relate to the leaders’ performance and their social capital (Subramony, et al., 2018). However, management should also create development paths for
other team members, especially for successors, to prepare them for team leading roles. In many
literature reviews, it is emphasized that team members can become informal or formal leaders
when the organizational structure changes or when a shared leadership style is introduced
(Qiong, and Cormican, 2016). Also, putting Implicit Leadership Theories or Leader-Member
Exchange into practice can help to predict job performance (Khorakian, and Sharifirad, 2019).
At the time of the interviews in 2019, additional arguments were raised which focused on
the question why a particular person is chosen for the leadership role. It turned out that earlier,
the employee’s potential had not been included in the criterion of promotion. Knowledge,
experience and technical skills were essential. Moreover, seniority was one of the main
advantages that can bring higher status, rank and precedence in the promotion process.
Admittedly, knowledge about the organization is valuable, but it is definitely not enough to lead
a team successfully. Also, talent management and career development paths can be different in
different countries (Latukha, and Selivanovskikh, 2016), e.g. because of cultural dimensions
(Feitosa, at al., 2018).
As a major conclusion, it is essential to highlight that leaders’ positions are crucial to provide development opportunities for team members. A low potential leader may cause
decreasing satisfaction, low morale, and eventually make employees’ leave the organization. On the other hand, a leader with high potential and effectiveness levels accounts for team
members’ personal growth and professional development. Based on the results, the following general conclusions have been formulated:
Accelerated performance and development of team members is evident in teams where
a leader is viewed as the most valuable person (teams: A, C, F, G, H). In that situation
team members follow their leader.
Management and leadership in technology… 145
A person without a high potential level should not be a leader as it increases the risk of
employees’ leaving the team. A team member with higher potential and effectiveness levels than a leader increases
the risk of conflict.
Successors have been revealed – the insight discovered during the research.
This research has many limitations. The first and the most obvious limitation is the size of
the sample research group. Secondly, it is necessary to state that effectiveness and potential
cannot be objectively measured, but examined on the basis of the respondents’ own perceptions. Eventually, leadership styles might have a mediating effect on the results. As has been
emphasized (Fischer, et al., 2017), leadership might be analyzed at individual, team,
organizational or even external levels. Communicating shared vision and implementing
leadership styles might enhance performance at a completely different level (Adnan,
and Valliappan, 2019).
Furthermore, the effectiveness and utilization of human potential are related to job
engagement, intention to change the team, or even leave the organization. It is recommended
to conduct additional research on the issues. As researchers (Yu, and Wu, 2017) have claimed,
the reality is more complex, and this research has deepened our knowledge only in some of the
aspects of the work environment.
5. Summary
Substantiation of using the qualitative research has had both scientific and business
objectives. The major value of this research has been the exposition of the employees’ performance and potential from the management’s point of view, especially that top management usually have the power to decide about staff transfers and promotions. The major
purpose of the interviews was not to assess the employees. Top management have also not
intended to rate workers. The most significant value has been to discover and analyse
employees’ predispositions based on specific situations. As a result, top management have been
able to create possible development paths, notice changes, and become more aware of the
consequences of the decisions they have made.

146 A. Zielińska
References
1. Adnan, Snsm, & Valliappan, R. (2019). Communicating shared vision and leadership styles
towards enhancing performance. International Journal of Productivity and Performance
Management, 68(6), 1042-1056.
2. Bagdadli, S., & Gianecchini, M. (2019). Organizational career management practices and
objective career success: A systematic review and framework. Human Resource
Management Review, 29(3), 353-370.
3. Bildat, L., & Schmidt, M. (2016). Management is not Leadership: What it Takes to Lead
People Successfully in the 21th Century. Management 2016: International Business and
Management, Domestic Particularities and Emerging Markets in the Light of Research,
27-36
4. Chen, H.L., & Lin, Y.L. (2018). Goal orientations, leader-leader exchange, trust, and the
outcomes of project performance. International Journal of Project Management, 36(5),
716-729.
5. De Vos, A., & Cambre, B. (2017). Career Management in High-Performing Organizations:
ASet-Theoretic Approach. Human Resource Management, 56(3), 501-518.
6. Epitropaki, O., Kark, R., Mainemelis, C., & Lord, R.G. (2017). Leadership and followership
identity processes: A multilevel review. Leadership Quarterly, 28(1), 104-129.
7. Erturk, A., & Vurgun, L. (2015). Retention of IT professionals: Examining the influence of
empowerment, social exchange, and trust. Journal of Business Research, 68(1), 34-46.
8. Feitosa, J., Grossman, R., & Salazar, M. (2018). Debunking Key Assumptions About
Teams: The Role of Culture. American Psychologist, 73(4), 376-389.
9. Fischer, T., Dietz, J., & Antonakis, J. (2017). Leadership Process Models: A Review and
Synthesis. Journal of Management, 43(6), 1726-1753.
10. Griffith, J.A., Baur, J.E., & Buckley, M.R. (2019). Creating comprehensive leadership
pipelines: Applying the real options approach to organizational leadership development.
Human Resource Management Review, 29(3), 305-315.
11. Groen, B.A.C., Wilderom, C.P.M., & Wouters, M.J.F. (2017). High job performance
through co-developing performance measures with employees. Human Resource
Management, 56(1), 111-132.
12. Khorakian, A., & Sharifirad, M.S. (2019). Integrating Implicit Leadership Theories,
Leader–Member Exchange, Self-Efficacy, and Attachment Theory to Predict Job
Performance. Psychological Reports, 122(3), 1117-1144.
13. Ladegard, G., & Gjerde, S. (2014). Leadership coaching, leader role-efficacy, and trust in
subordinates. A mixed methods study assessing leadership coaching as a leadership
development tool. Leadership Quarterly, 25(4), 631-646.
Management and leadership in technology… 147
14. Latukha, M., & Selivanovskikh, L. (2016). Talent Management Practices in IT Companies
from Emerging Markets: A Comparative Analysis of Russia, India, and China. Journal of
East-West Business, 22(3), 168-197.
15. Leroy, H., Segers, J., van Dierendonck, D., & den Hartog, D. (2018). Managing people in
organizations: Integrating the study of HRM and leadership. Human Resource Management
Review, 28(3), 249-257.
16. Oc, B., & Bashshur, M.R. (2013). Followership, leadership and social influence. Leadership
Quarterly, 24(6), 919-934.
17. O'Neill, T.A., & Salas, E. (2018). Creating high performance teamwork in organizations.
Human Resource Management Review, 28(4), 325-331
18. Pflügler, C., Wiesche, M., Becker, N., & Krcmar, H. (2018). Strategies for Retaining Key
IT Professionals. MIS Quarterly Executive, 17(4), 297-314.
19. Rani, K., & Kumar, S. (2018). Impact of Talent Management Practices on Employee
Effectiveness. Pacific Business Review International, 11(4), 7-16.
20. Salas, E., Shuffler, M.L., Thayer, A.L., Bedwell, W.L., & Lazzara, E.H. (2015).
Understanding and Improving Teamwork in Organizations: A Scientifically Based Practical
Guide. Human Resource Management, 54(4), 599-622.
21. Spurk, D., Hirschi, A., & Dries, N. (2019). Antecedents and Outcomes of Objective Versus
Subjective Career Success: Competing Perspectives and Future Directions. Journal of
Management, 45(1), 35-69.
22. Subramony, M., Segers, J., Chadwick, C., & Shyamsunder, A. (2018). Leadership
development practice bundles and organizational performance: The mediating role of
human capital and social capital. Journal of Business Research, 83, 120-129.
23. Qiong, W., & Cormican, K. (2016). Shared Leadership and Team Creativity: A Social
Network Analysis in Engineering Design Teams. Journal of Technology Management &
Innovation, 11(2), 2-12.
24. Yu, Y., & Wu, J. (2017). Advanced human resource management model based on complex
system and agent-based modeling. Proceedings of the Second International Conference on
Economic and Business Management (Feb. 2017), 33, 333-338.
25. Zorinsky, E.J. (2014). Positive Leadership in Project Management – A Practical Guide to
Enhancing Individual, Team and Organizational Performance. PM World Journal, 3(7), 1-5.

Reviewers of 2019
Prof Wolfgang AMANN
Prof Lucia BEDNAROVA
Prof Manuela BRUSONI
Prof Tymoteusz DOLIGALSKI
Prof Józef FRĄŚ
Prof Grażyna GIERSZEWSKA
Prof Dorota JELONEK
PhD Claudia KAWALLA
Prof Hamid KAZEROONY
Prof Matthias KLEINHEMPEL
Prof Helena KOŚCIELNIAK
Prof Aleksander LOTKO
Prof Igor LIBERKO
Prof Adela McMURRAY
Prof Lorenzo MERCURIO
Prof Agata MESJASZ-LECH
Prof Joanna NOWAKOWSKA-GRUNT
Prof Maria NOWICKA-SKOWRON
Prof Andrzej PACANA
Prof Nikos PASSAS
Prof Zbigniew PASTUSZAK
Prof Anna RAKOWSKA
Prof Pedro RIESGO
Prof Francisco Javier RODRIGEZ
PhD Ana Suarez SANCHEZ
Prof Radha SHARMA
Prof Agnieszka SITKO-LUTEK
Prof Agata STACHOWICZ-STANUSCH
Prof Jacek SZOŁTYSEK
PhD Andrea TOMO
Prof Shiv TRIPATHI
Prof Gregorio Fidalgo VALVERDE
Prof Wiesław URBAN
Prof Charles WANKEL
Prof Anna ZARĘBSKA
Kwartalnik Naukowy „Organizacja i Zarządzanie” (Organization & Management Scientific Quarterly) wydawany przez Wydział Organizacji i Zarządzania Politechniki Śląskiej został objęty programem Ministerstwa Nauki i Szkolnictwa Wyższego „Wsparcie dla czasopism
naukowych” w latach 2019-2020, otrzymując dofinansowanie na: 1. Wdrożenie procedur zabezpieczających oryginalność publikacji naukowych (pozyskanie
numerów DOI (Digital Object Identifier)). 2. Korektę tłumaczenia artykułów na język angielski. 3. Zakup oprogramowania do zarządzania pracami edytorskimi. 4. Stworzenie anglojęzycznych wersji wydawanych publikacji.
Wydano za zgodą
Rektora Politechniki Śląskiej
WYDAWNICTWO POLITECHNIKI ŚLĄSKIEJ
ul. Akademicka 5, 44-100 Gliwice
tel. (32) 237-13-81, faks (32) 237-15-02
www.wydawnictwopolitechniki.pl
Sprzedaż i Marketing
tel. (32) 237-18-48 [email protected]
Nakł. 50 + 44 Ark. wyd. 13 Ark. druk. 9,75 Papier offset 70x100, 80g
zam.