SCIENTIFIC POSTERS CREATING AND PRESENTING
78
A guide for undergraduate students SCIENTIFIC POSTERS CREATING AND PRESENTING A Learner’s Guide Ella M. Weaver Kylienne A. Shaul Brian H. Lower
-
Upload
khangminh22 -
Category
Documents
-
view
0 -
download
0
Transcript of SCIENTIFIC POSTERS CREATING AND PRESENTING

A guide for undergraduate students SCIENTIFIC POSTERSCREATING AND PRESENTING
A Learner’s Guide
Ella M. Weaver Kylienne A. Shaul
Brian H. Lower

1 Posters are used by scientists and engineers to communicate their research to the public. A scientific poster focuses on one defined research topic, question, or issue. It consists of the poster itself and a scientist who stands beside the poster and verbally presents their research to an audience of 1-5 people. A typical poster presentation lasts 5-10 minutes.
Scientific Posters

Scientific Posters
Characteristics Of A Scientific Poster
1. Organized, clean, simple design.
2. Focused on one specific research topic that can be explained in 5-10 minutes.
3. Contains an Abstract, Introduction, Materials & Methods, Results, Discussion and References.
4. Has four to ten high-resolution figures and/or tables that describe the research in detail.
5. Contains minimal text, with figures and tables being the main focus.
Scientific PosterA scientific poster (Fig.1) is an illustrated summary of research that scientists and engineers use to present their scientific dis-coveries to larger audiences. A typical poster is printed on pa-per with dimensions of 36-inches (height) by 48-inches (width).
Posters are displayed at events such as symposiums, confer-ences and meetings to show new discoveries, new results and new information to scientists and engineers from different fields. A large event can have hundreds of posters on display at one time with scientists and engineers standing beside their individ-ual posters to showcase their research.
Poster events are lively, loud and energetic. Attendees will walk around the event and stop at individual posters to interact with the poster presenter. The presenter and attendee will typi-cally engage each other in 5-10 minutes of conversation as the presenter describes the research contained in the poster.
Poster events will typically last a few hours so that attendees have enough time to visit and interact with many posters and poster presenters. This is a good time for scientists to learn from one another and start new research collaborations that could one day lead to new discoveries.
Scientific posters are organized systematically into the following sections: Title, Authors, Abstract, Introduction, Materials and
2
Chapter 1

Methods, Results, Discussion, Acknowledgments and Refer-ences (Fig. 1). Organizing a poster in this manner allows the reader to quickly comprehend the major points of the research and to understand the significance of the work.
The most important parts of a scientific poster will likely be its figures and/or tables because these are what an audience will naturally focus their attention upon. The phrase “a picture is worth a thousand words” is certainly true for scientific posters, and so it is very important for the poster’s author(s) to create in-formative figures that a reader can understand. The “ideal” fig-ure can be challenging to create. Providing too much informa-tion in a figure will only serve to confuse the reader (or audi-ence). Provide too little information and the reader will be left with an incomplete understanding of the research. Both situa-tions should be avoided because they prevent a scientist from effectively communicating with their audience.
Authors use different fonts sizes for their poster text. The larg-est font sizes (e.g., 50-80 point font) will be used for the title, author list and institutions. Section headings will use 30-40 point font. Section text, table captions, figure captions and refer-ences will typically use 20-30 point font. Font sizes smaller than about 20-points should be avoided because it can be diffi-cult to read.
3
Figure 1. Example of a scientific poster focused on human-wildlife inter-actions in Utah. The poster is organized into rows and columns. When printed on paper, the poster will be 36-inches (height) by 48-inches (width). Title, author names and institution are listed at the very top of the poster in large font. Abstract (top left), introduction (bottom left), ma-terials and methods (second column), results (third column), discussion (forth column), references (bottom right). Notice that your eyes are natu-rally drawn to the poster’s figures and title. Note that the total word count (not including references) is approximately 1,000 words.
Figure 1. Scientific Poster

2 Posters contain several important parts including: Title, Author Names, Institutions, Abstract, Introduction, Materials & Methods, Results, Discussion, References, Figures, Tables and Acknowledgements.
Parts of a Poster

Characteristics Of A Title
1. Informs the reader about what is contained within the poster.
2. Summarizes the most important research results and findings.
3. Simple and focused on the research.
4. Straight forward and matter of fact.
5. Clear and concise (e.g., less than 15 words).
6. Avoid words or phrases that sensationalize findings and results, convey bias or provoke human emotion.
5
The poster title should appear at the very top of the poster (Fig. 1). The title should be brief (e.g., less than 15 words), descrip-tive and summarize the most important results and findings. Words, adjectives and phrases that covey bias or human feel-ings should be avoided. Scientists strive to let the data speak for itself and allow the reader the chance to make up their own mind about an issue based on the data that is presented.
For example, a poor title for a scientific poster would be some-thing along the lines of: “Evil coal-fired power plants linked to dangerous mercury levels ruthlessly harm thousands of poor and defenseless children”. A much better title would be: “Mer-cury emissions from coal-fired power plants have been linked to decreased cognitive function in children”. The first title certainly catches your eye, but it presents the research in a biased man-ner before the reader even has a chance to examine the poster. The latter title tells the reader exactly what the poster is about while still allowing the reader the chance to read the poster and make up their own mind about the issue based on the data pre-sented in the poster.
Chapter 2
Title

People And Places
1. Authors’ names are typically listed in order of prominence.
2. Contact information for all authors (e.g., email, physical address, phone number) is provided.
3. This information tells the reader who conducted the research and where it was done.
6
Authors are typically listed in order of prominence, with the per-son who completed most of the research appearing first in the author list and referred to as “first author”. The “second author” would be the person who appears second in the author list and so on. The corresponding author is also often indicated on the poster and may appear as the last name in the author list. The corresponding author is the senior scientist who designed the research, supervised the work and obtained the funding to con-duct the research.
The name of the college, university or institution where the re-search was conducted is also provided with the authors’ names. For example: School of Environment and Natural Re-sources, The Ohio State University, 210 Kottman Hall, 2021 Cof-fey Road, Columbus, Ohio 43210. The email addresses and phone number of the corresponding author is also provided.
Chapter 2
Authors & Institutions

Characteristics Of An Abstract
1. One paragraph.
2. Typically 200-400 words long.
3. A summary of the entire poster.
4. Organized into four distinct sections that appear in order: Introduction, Materials & Methods, Results, Discussion.
5. Each section typically consists of 2-4 sentences.
6. No tables, no figures.
7
The abstract is a paragraph of text that appears at the top-left side of the poster (Fig. 1). It is a summary of the entire poster. It should stand alone such that a person can read the abstract and understand all the research described in the poster. An ab-stract (Fig. 2) contains four parts that should be written in the following order: Introduction, Materials & Methods, Results and Discussion. Each part typically consists of 2-4 sentences and the entire abstract will contain 200-400 words. An abstract con-sists strictly of text, it contains no figures, no tables, and typi-cally it does not contain citations.
Chapter 2
Abstract

8
Figure 2. Example of an abstract and its four parts: Introduction (blue), Materials & Methods (yellow), Results (green), Discussion (red) and optional Conclusion (purple). This abstract is provided merely as an example and is not factual nor is it based on actual research.
Figure 2. Abstract

Characteristics Of An Introduction
1. Tells the reader why the research is important.
2. Provides background about the issue or topic that is being studied.
3. Sets the stage for the rest of the poster.
4. Informs the reader of the goals and objectives of the research.
9
The Introduction section of the poster appears immediately af-ter the Abstract (Fig. 3). It is used to introduce the reader to the topic and provide all the necessary information needed to under-stand the topic or issue. It describes the importance of the re-search, especially in context to previous work that has been conducted in this area. It helps to set the stage for the research described in the poster and provides clear objectives for why the work was conducted. If the work is being conducted in the environment, the introduction often provides information (e.g., biological and physical properties) about the ecosystem, its loca-tion on Earth (e.g., map) and other pertinent history about the field site (Fig. 4). If the work is being conducted in a laboratory setting, the introduction can provide information about the insti-tution (e.g., name, location, mission, funding agency). The Intro-duction section (Figs. 1 & 3) frequently contains photographs of the organism and ecosystem that are being studied, a detailed map of the study site, diagrams or equations describing the topic or issue, and tables that help to organize especially com-plex data for the reader to better understand.
Most posters are divided into four columns with the Introduction section typically taking up 20% of the total area on the poster. You’ll likely want to use 22-point to 26-point font in the Introduc-tion section so that your audience can comfortably read the text. The total number of words contained in the Introduction
Chapter 2
Introduction
10
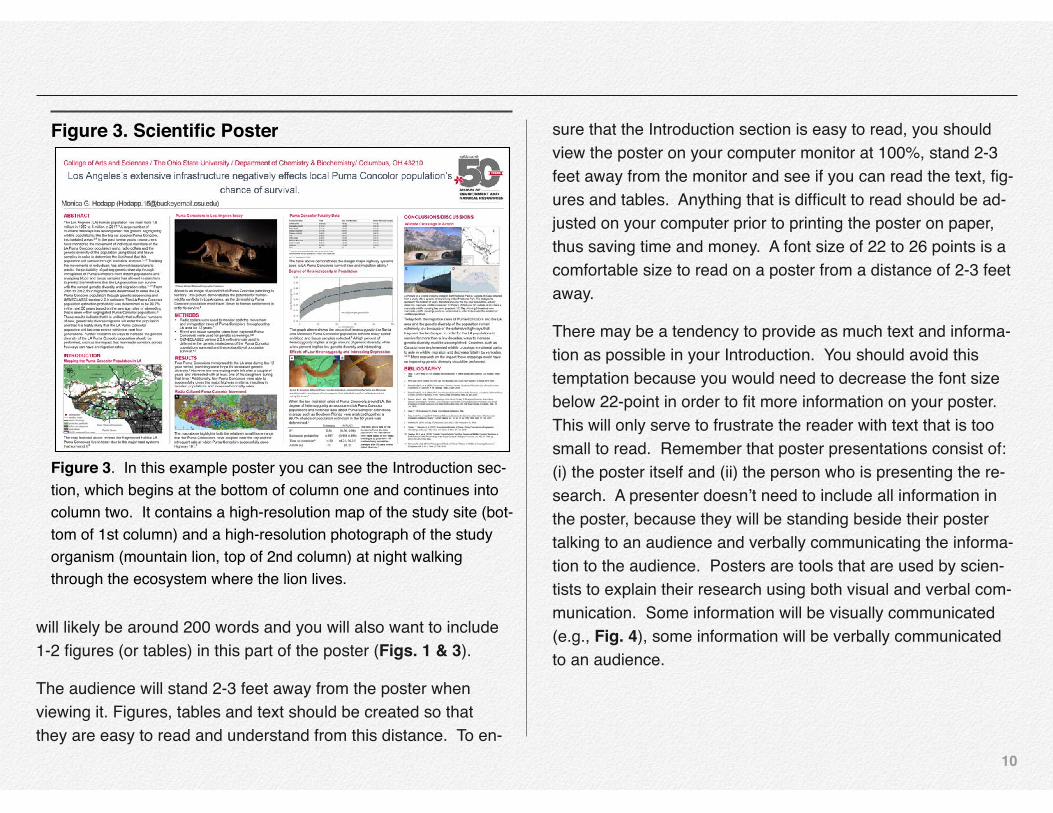
will likely be around 200 words and you will also want to include 1-2 figures (or tables) in this part of the poster (Figs. 1 & 3).
The audience will stand 2-3 feet away from the poster when viewing it. Figures, tables and text should be created so that they are easy to read and understand from this distance. To en-
sure that the Introduction section is easy to read, you should view the poster on your computer monitor at 100%, stand 2-3 feet away from the monitor and see if you can read the text, fig-ures and tables. Anything that is difficult to read should be ad-justed on your computer prior to printing the poster on paper, thus saving time and money. A font size of 22 to 26 points is a comfortable size to read on a poster from a distance of 2-3 feet away.
There may be a tendency to provide as much text and informa-tion as possible in your Introduction. You should avoid this temptation because you would need to decrease the font size below 22-point in order to fit more information on your poster. This will only serve to frustrate the reader with text that is too small to read. Remember that poster presentations consist of: (i) the poster itself and (ii) the person who is presenting the re-search. A presenter doesn’t need to include all information in the poster, because they will be standing beside their poster talking to an audience and verbally communicating the informa-tion to the audience. Posters are tools that are used by scien-tists to explain their research using both visual and verbal com-munication. Some information will be visually communicated (e.g., Fig. 4), some information will be verbally communicated to an audience.
Figure 3. In this example poster you can see the Introduction sec-tion, which begins at the bottom of column one and continues into column two. It contains a high-resolution map of the study site (bot-tom of 1st column) and a high-resolution photograph of the study organism (mountain lion, top of 2nd column) at night walking through the ecosystem where the lion lives.
Figure 3. Scientific Poster

11
Figure 4. Example of an Introduction, which provides the reader with the necessary information to understand the topic or issue and understand the importance of the research that is being described in the poster. References are also provided in this example.
Figure 4. Introduction

Characteristics Of Materials & Methods
1. Tells the reader how the research was conducted.
2. This section is used by other scientists as a guide to reproduce and critically evaluate the research.
3. Provides detailed information about the techniques, methods, instruments and equipment used in the research.
4. Tells the reader who conducted the research, how data was collected, when and where work was completed.
5. Gives information about the materials that were used in the experiments.
12
The Materials and Methods section appears in the poster imme-diately after the Introduction section. It contains all the informa-tion needed to understand how data was collected, which instru-ment or equipment was used to collect data, what method or technique was used to conduct the research, when the work was conducted, who conducted the research, where the re-search was conducted, what material (e.g., chemical com-pound, organism, molecule, mineral) was used in the experi-ments and how or where the material was obtained. This infor-mation is important so that (1) the audience can understand how the research was conducted and (2) so that another scien-tist can attempt to reproduce the results. Reproducibility is a key component of the scientific process and a way that scien-tists can create new knowledge and understanding in their field.
The Materials and Methods section is matter-of-fact and simply states the facts of the research. For example, an author might explain how samples were collected from a field site: “One week after the August 2018 forest fire, 165 soil samples were collected from a depth of 0-5 cm at the White Wolf Campsite in Yosemite National Park. The samples were packed in ice, trans-ported to the laboratory and then stored at -20oC until process-ing. Samples were separated by size using a Wildco 78-700 Sieve Set (63 micron to 4000 micro, Cole-Parmer) and Meinzer II Sieve Shaker (Fisher Scientific).”
Chapter 2
Materials & Methods
13
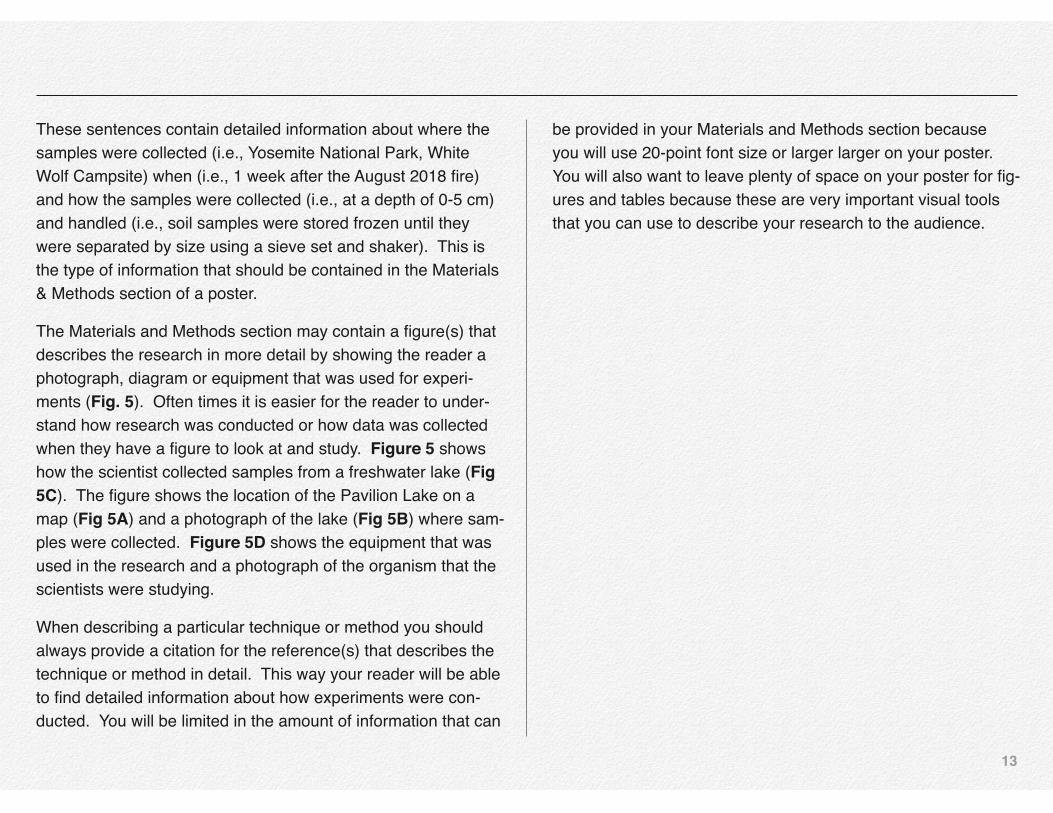
These sentences contain detailed information about where the samples were collected (i.e., Yosemite National Park, White Wolf Campsite) when (i.e., 1 week after the August 2018 fire) and how the samples were collected (i.e., at a depth of 0-5 cm) and handled (i.e., soil samples were stored frozen until they were separated by size using a sieve set and shaker). This is the type of information that should be contained in the Materials & Methods section of a poster.
The Materials and Methods section may contain a figure(s) that describes the research in more detail by showing the reader a photograph, diagram or equipment that was used for experi-ments (Fig. 5). Often times it is easier for the reader to under-stand how research was conducted or how data was collected when they have a figure to look at and study. Figure 5 shows how the scientist collected samples from a freshwater lake (Fig 5C). The figure shows the location of the Pavilion Lake on a map (Fig 5A) and a photograph of the lake (Fig 5B) where sam-ples were collected. Figure 5D shows the equipment that was used in the research and a photograph of the organism that the scientists were studying.
When describing a particular technique or method you should always provide a citation for the reference(s) that describes the technique or method in detail. This way your reader will be able to find detailed information about how experiments were con-ducted. You will be limited in the amount of information that can
be provided in your Materials and Methods section because you will use 20-point font size or larger larger on your poster. You will also want to leave plenty of space on your poster for fig-ures and tables because these are very important visual tools that you can use to describe your research to the audience.

14
Figure 5. Collection and isolation of magnetotactic bacteria from Pavilion Lake. (A) Map showing the location of Pavilion Lake in British Columbia, Can-ada at 50.87o North, 121.74o West. Map obtained using Google Maps. The maximum lake depth is 70 meters, length is 5.75 km, maximum width is 0.8 km, and surface elevation is 820 meters. (B) Photograph of Pavilion Lake ob-tained from Google Maps and taken by S. Davies in August, 2016 near the location where water samples were collected. (C) Photograph of scientist col-lecting magnetotactic bacteria from Pavilion Lake. (D) Collection of magneto-tactic bacteria from the lake, isolation of magnetotactic bacteria using mag-nets, and a transmission electron microscope image of a single bacterium. Images obtained from Oestreicher et al., 2013, Frontiers in Microbiology, Vol. 4, article 406, pages 1-6.
Figure 5. Example of a Materials & Methods Figure

Characteristics Of A Results & Discussion
1. Results section contains data collected by scientists from experiments that they conducted.
2. Data can be measurements, numbers, descriptions and observations.
3. Scientific data is typically described to the audience using graphs, tables, figures, diagrams, maps, charts, photographs and equations.
4. Discussion section provides an interpretation of the data, especially in context to previously published research.
15
The Results and Discussion sections are often combined in a poster in order to (1) save precious space on a poster for the many pieces of information that a scientist would like to tell their audience and (2) by combining the two sections, it becomes easier for the audience to understand the significance of the re-search. Combining the Results section and Discussion section in a poster is different for what is typically done for a scientific journal article. In most journal articles, the Results section is separated from the Discussion section. Journal articles are dif-ferent from posters in that a scientist is not standing next to their journal article explaining it to a reader. Therefore, in a jour-nal article, an author needs to provide more detailed informa-tion so that the reader can understand the research. Separat-ing the Results section and Discussion section allows an author the space necessary to write a lengthier description of the re-search. Journal articles typically contain more text and more content (e.g., figures, tables) than posters.
The Results and Discussion section should contain data, typi-cally in the form of a graph, histogram, chart, image, color-coded map or table (Figs. 1 & 3). Very often data means num-bers that scientists collect from making measurements. These data are typically presented to an audience in the form of graphs and charts to show a reader how these numbers change over time, space or experimental conditions (Fig. 6). Numbers can increase, decrease or stay the same and a graph,
Chapter 2
Results & Discussion

16
or another type of figure, can be effectively used to convey this information to a reader in a visual format (Fig. 6).
An audience will be attracted to a poster because of its figures and so it is very important for the author to pay particular atten-tion to the creation, design and placement of the figures in a poster (Figs. 1 & 3). A good figure is one that is informative, easy to comprehend and allows the reader to understand the significance of the data and experiment. Very often an author will use color to draw attention to a figure.
The Discussion section should state the importance of the re-search that is presented in the poster. It should provide an inter-pretation of the results, especially in context to previously pub-lished research. It may propose future experiments that need to be conducted as a result of the research presented in the poster. It should clearly illustrate the significance of the re-search with regards to new knowledge, understanding and/or discoveries that were made as part of the research.
Figure 6. Graph showing how the population of different decidu-ous trees have changed from 2009 to 2018 in Highbanks Metro Park. Notice that the graph has a label for its x-axis (Year), a label for the y-axis (Deciduous Tree Population, N) and a key that shows, which color corresponds to which tree species (e.g., dark brown is American Sycamore).
Figure 6. Example of a Graph

Characteristics Of References Section
1. Provide the reader with information about who conducted the research, when it was published and the journal that published the work.
2. Provides detailed information about author names, article title, journal name, volume, issue and page numbers so that readers can easily find the source of the information.
3. Acknowledge the scientist(s) who conducted the research and/or the journal article where the research was originally published.
17
The References (or Bibliography) section should list all the sources of information that were used in the poster. This sec-tion appears at the end of the poster. The References section (Fig. 7) typically contains all journal articles (i.e., primary sources) but it can also contain secondary sources (e.g., news-papers, documentaries, government reports). References tell the reader where the original data, information, technique, and/or method can be obtained, who conducted the work and when the paper was published.
In posters, in-text citations are used to tell the reader where in-formation was obtained. An in-text citation should appear after every sentence in the poster that describes the work of others. This includes all sentences that describe discoveries, findings, data, information, experiments, results, techniques, methods, dates, locations, etc.
In-text citations can be done using either (1) superscript num-bers or (2) authors last name, followed by year published.
For example:
1. Polar bear cubs were 25% larger when fed a high-protein diet compared to high-sugar diet.1
2. Polar bear cubs were 25% larger when fed a high-protein diet compared to high-sugar diet (Jones and Smith, 2018).
Chapter 2
References

18
The “1” and “Jones and Smith, 2018” both refer to the same journal article: E.J. Jones and W. A. Smith (2018), Journal of Natural Science, Vol. 53, Issue 12, pages 36-45. Both types of in-text citations are acceptable for use in posters. Authors typi-cally choosing superscript numbers to save space.
Formatting ReferencesYou have likely been taught about MLA (Modern Language As-sociation of America) or APA (American Psychological Associa-tion) formatting and style guide in middle or high school. Many of you are likely proficient in these styles. For most posters you likely will not follow the MLA nor APA styles when citing your sources. There is a practical explanation for why these two styles often are not used in a poster. It is because there are thousands of different professional scientific societies around the world and each society has its own preferred formatting style that they use in publications for their journals and confer-ences. Therefore, citation styles will vary depending on where a poster is presented. In fact, many scientists use software, that, with a click of a button, will transform all of their citations into the proper style and format for any journal or conference.
Nonetheless, we provide 15 examples below of how one could cite primary sources (examples 1-5) and secondary sources (ex-amples 6-15) of information in a scientific poster.
Citing Primary Sources
Peer-reviewed journal articles are considered primary sources. Patents and Published Technical Reports from Government
Figure 7. References section of a poster that uses numbers 1-10 to indicate the source. Each reference contains the authors names, year published, name of the journal, volume number and page num-bers. Reference 1 appears in the poster first, references 2 appears sec-ond and so on.
Figure 7. References Section of Poster.

19
Agencies and Universities are also considered primary sources of information. Five examples of how to cite primary sources are numbered below 1-5.
1. Journal Article in Print (primary source): Most journals are printed on paper others are entirely available online. Authors Names. (Year Published in parenthesis). Article Title. Journal Name, Volume Number (Issue Number in parenthesis): Page Numbers.
1A. Journal Article with one or two authors:McMurran, M. and Christopher, G. (2009). Bayes factors increases criminal sentence recommendations. Legal & Criminological Psychology, 14(1):101-107.
1B. Journal Article with more than two authors: Post, E., et al. (2009). Genome studies of quorum sensing organisms. Science, 325(5946):1355-1358.
2. Online Journal Article (primary source): These journals are electronic and not printed on paper. Authors Names. (Year Published in parenthesis). Title of article. Journal name. Volume number and or page numbers. Include complete URL link in full or DOI if known.
Dionne, M.S. and Schneider, D.S. (2002). Adaptive muta-bility in targeted microRNA infections. Genome Biol.
3:10.3559. http://genomebiology.com/2002/3/4/reviews/1010
3. Government Technical Report in Print (primary source): Author names or name of organization. (Year Published in pa-renthesis). Report title. Report Number. Name of government agency that published report, Place of publication.
Smith, G.I. and Chen Y.P. (2018). Growth stages and toler-able fire intervals for Georgia’s native vegetation data sets. Report no. 247. U.S. Department of Interior. New York, NY, USA.
4. Government Technical Report Published Online (primary source): Author names or name of organization. (Year Pub-lished in parenthesis). Report title. Report Number. Name of government agency that published report. Place of publication. Date retrieved followed by complete URL link in full or DOI if known.
Spandone, H.K. et al. (2017). Energy futures for Midwest-ern wind farms. Report no. C2.4715.12. U.S. Department of Energy. Washington D.C., USA. Retrieved on February 15, 2017 from https://pdfs.semanticscholar.org/3e93/e8551981c644de300.pdf
20
5. Patent (primary source): Author names. Date in parenthe-sis. Title of patented item, technique, method or process. Patent number.
Odell, J.C. (1970, April). Process for batch culturing. U.S. patent 484,363,770.
Citing Secondary Sources
Secondary sources report on and interpret results that have been presented in primary sources. Secondary sources include books, documentaries, magazines, newspapers, podcasts, web-pages from government agencies and universities. Ten exam-ples of how to cite secondary sources are numbered below 6-15.
6. Book Chapter (secondary source): Authors names. (Date of publication in parenthesis). Chapter title, page numbers. Edi-tors of book, Book Title, Place of publication. Name of pub-lisher.
Forman, M.S., and Valsamakis, A. (2003). Specimen col-lection, transport, and processing: virology, p. 1227-1241. Murray, P.R., et al. (Eds.), Manual of clinical microbiology, 8th ed, Washington, D.C. Penguin Press.
7. Book (secondary source):
Anderegg, D. (2007). Nerds: Who they are and why we need more of them. New York, NY. Jeremy P. Tarcher, Pen-guin Press.
8. Magazine Article in Print (secondary source):
Road map to a great deal. (2009, October). Consumer Re-ports, 74(10), 44-47.
9. Magazine Article Published Online (secondary source):
Taibbi, M. (2009, September 3). Sick and wrong. Rolling Stone, 1086, 58-65. Retrieved on February 22, 2020 from http://www.rollingstone.com
10. Newspaper Article in Print (secondary source):
Lucchetti, A. & Craig, S. (2009, September 11). Morgan Stanley taps new boss. The Wall Street Journal, pp. A1, A16.
11. Newspaper Article Published Online (secondary source):
Moran, S. (2009, September 7). If you don't snooze, you lose: Most Americans aren't getting enough sleep. And for both adults and students, there are health consequences.

21
Star Tribune. Retrieved on August 6, 2019 from http://www.startribune.com/
12. Podcast (secondary source):
Nature (Producer). (2009, July 16). Moon gazing in the Southern hemisphere, Audio podcast. Retrieved on No-vember 5,2009, from http://www.nature.com/nature/podcast/index-2009-07-16.html
13. Documentary, Video or Movie (secondary source):
Donner, R. & Lee, S. (Producers), & Hood, G. (Director). (2009). X-Men Origins: Wolverine [DVD]. USA: Twentieth Century-Fox Film Corporation.
14. Personal Web Page (secondary source): In most in-stances a web page is not used as a reference in a poster.
Roszak, T. (1996, September). Why ecology needs psy-chology, why psychology needs ecology. Ecopsychology Online, 1. Retrieved on July 12, 2009 from http://ecopsychology.athabascau.ca/0996/ecowelcome.htm
15. Web Page of Organization or Group of Authors (secon-dary source): In most instances, a webpage is not used as a reference in a poster.
National Museum of American History. (2006, July 7). National museum of American history displays recent hip-hop acquisi-tions. Retrieved fromhttp://www.americanhistory.si.edu/news/pressrelease.cfm?key=29&newskey=383
Characteristics Of Acknowledgements
1. List names of scientists who contributed to the research, but did not provide substantial contribution that would justify authorship.
2. List the funding sources (e.g., grant number, U.S. Government Agency) that made the research possible.
3. List names of research centers, institutions and organizations where research was conducted.
22
One of the hallmarks of good science is to be open about the research and provide as much information as possible. This is also true when acknowledging the funding source for the re-search and names of scientists who contributed to the re-search. The Acknowledgements section typically appears last in a poster and is where an author will list the people who con-tributed to the research, but did not provide substantial contribu-tion to the work that they should appear as a co-author on the poster. The Acknowledgments is also the section of the poster where the authors list the financial support for their research. These can include grants, contracts, fellowships or scholar-ships. The name of funding agencies who provided support for the research should be listed in this section. For example, an author may write: “Financial support was provided by the U.S. National Science Foundation, grant number EAR-012345”.
Chapter 2
Acknowledgements

Characteristics Of A Poster
1. The poster itself should be written so that an audience can understand every part of the poster without needing the author to explain it.
2. Simple and clean design, organized, easy to read for a person standing 3-feet (1 meter) away from the poster.
3. Contains title, author list and contact information, abstract, introduction, materials & methods, results & discussion, figures & tables, references and acknowledgements.
23
A complete poster should contains all the necessary parts and looks similar to Figure 8. Notice the order that each section ap-pears in the poster with the Title, Authors and Abstract appear-ing first, followed by Introduction, Materials & Methods, Results & Discussion, Conclusion, References and Acknowledgements. A poster should also contain 4-8 figures (e.g., graph, histogram, chart, image, color-coded map) and/or tables. In Figure 8, five yellow boxes show the placement of each figure or table. A Fig-ure Title is provided at the top of each yellow box and Figure Caption is typed below each yellow box (Fig. 8). When printed on paper, the poster shown in Figure 8 will be 36-inches (height) by 48-inches (width). Most scientific conferences re-quire posters match these dimensions.
Posters of this size must be printed on paper using large format poster printers, which are available at university bookstores, li-braries, FedEx, UPS, retail stores (e.g. Staples, Walmart, Wal-greens) and online services. Printing cost depends on a num-ber of things (e.g., type of paper, type of ink, turnaround time) but is usually between $75-$150 (USD). Because of the high cost associated with printing a poster on paper, extra time should be spent checking over every detail of a poster before the author decides to send it for printing.
Chapter 2
Complete Poster

24
Figure 8. Complete poster that contains all the essential parts. Title, Authors, Institution, Address, Abstract, Introduction, Materials & Meth-ods, Results & Discussion, Conclusion (optional), References and Acknowledgements. Placeholders for Figures and/or Tables are shown with yellow boxes. Figure Captions are shown under each yellow box. Figures and Tables can be placed anywhere in the poster (except within the Abstract).
Figure 8. Example of a Complete Poster

3 Primary sources are journal articles that describe the research of scientists and engineers. Journal articles go through a rigorous peer-review process before they can be published.
Secondary sources provide descriptions and analysis of journal articles and are typically reviewed by an editor prior to publication.
Scientific Literature
Primary Sources & Secondary Sources
1. Journal articles contains original research and data that must pass a rigorous peer review process before the article will be published for the public to read.
2. Scientists and engineers consider journal articles the primary source of information for scientific research.
3. Newspapers, magazines and documentaries are considered secondary sources of scientific information because they summarize the results and findings of journal articles.
26
Finding Primary SourcesPrimary sources are journal articles written by scientists and en-gineers and published in a journal. Journal articles are a full de-scription of scientists’ original research and contain an abstract, introduction, materials & methods, results and discussion. Jour-nal articles are only published after they have successfully passed through a peer-review process prior to being accepted for publication. Rejected articles are not published and there-fore the public never reads the article. High-impact journals are very selective and have high rejection rates. For example, a journal may accept less than 25% of all the articles that they re-ceive. The remaining 75% are rejected during the peer-review process and never published.
There are two ways to find and read primary source journal arti-cles. (1) The “old-fashioned method” of going to a library and physically finding and reading the journal article inside the li-brary. (2) The “Internet method”, which is the method that most people use today. This entails using a computer, connecting to the internet and remotely searching databases for an electronic copy of the journal article. The person is then able to download and read the article.
Some articles will be free to download and some articles will re-quire a fee or subscription to the journal before you will be able to download an article. The good news for university students
Chapter 3
Finding Sources
27
is that they can freely access and download articles from hun-dreds to thousands of journals through their university library. This service is often included as part of a student’s tuition and fees. Check with your library to see which journals you can ac-cessed for free.
There are dozens of databases and search engines that can be used to find published journal articles. Five such services are:
1. PubMed (https://www.ncbi.nlm.nih.gov/pubmed/)
2. ScienceDirect (https://www.sciencedirect.com)
3. HighWire Press (http://highwire.stanford.edu)
4. Scopus (https://www.scopus.com)
5. Web of Science (www.webofknowledge.com)
The web-based search engine, Google Scholar (https://scholar.google.com) is also gaining favor due to its large capacity and ease of use. Because each search engine has its own limitations, it is always best to use multiple search engines to find journal articles. This will allow you to find more articles published by a wider variety of journals.
Finding Secondary SourcesSecondary sources are books, newspapers, magazines, video documentaries and podcasts that focus on the research con-tained within primary source journal articles. Secondary
sources provide summaries, interpretations and evaluations of primary source journal articles. They are reviewed by editors or producers prior to publication (e.g., book, magazine, newspa-per) or release (e.g., documentary film, podcast). The primary purpose of a secondary source is to inform and educate the public about new discoveries, findings and observations that sci-entists make during the course of their research. Secondary sources are typically published second, after the primary source is published. Secondary sources are easier to read and under-stand (compared to primary source journal articles) because much of the scientific jargon that was contained in the original journal article has been removed. This is done to appeal to a wider audience and make scientific discoveries and finding more accessible to the general public.
Finding secondary sources is easier than finding primary source journal articles because secondary sources are so widely available. These can be found on the internet, televi-sion, newspaper stands, libraries, coffee shops, trains, planes and basically anywhere where you find people. Secondary sources that have an established reputation of reporting facts in an unbiased and straightforward manner, checking these facts and correcting any errors are viewed as credible sources and typically have a large circulation and high readership. Some ex-amples of well-respected secondary sources include:
28
6. BBC (https://www.bbc.com)
7. Chicago Tribune (https://www.chicagotribune.com)
8. Los Angles Times (https://www.latimes.com)
9. National Geographic (https://www.nationalgeographic.com)
10.National Public Radio (https://www.npr.org)
11.The New York Times (https://www.nytimes.com)
12.PBS Nature (https://www.pbs.org/wnet/nature/)
13.PBS NOVA (https://www.pbs.org/wgbh/nova/)
14.Reuters (http://www.reuters.com)
15.Scientific American (https://www.scientificamerican.com)
16.The Seattle Times (https://www.seattletimes.com)
17.Smithsonian (https://www.smithsonianmag.com)
18.USA Today (https://www.usatoday.com)
19.The Wall Street Journal (https://www.wsj.com; despite its name, the WSJ is indeed a newspaper and not a journal)
20.Washington Post (https://www.washingtonpost.com)

Peer-Reviewed Journal Articles
1. Primary Sources are peer-reviewed journal articles.
2. Journal articles go through a rigorous peer review process prior to publication.
3. Seen as the most trusted and well-respected sources of scientific information.
4. Provide a first-hand account of the research.
5. Primary sources can also be patents and technical reports published by government agencies.
29
Primary SourcesMost sources used in a scientific poster come from primary sources (Fig. 9). Primary sources are peer-reviewed journal arti-cles that have successfully passed through a rigorous review process prior to publication. Only after a manuscript (it’s not re-ferred to as an article until it is published) has successfully passed through this process will it be published.
Many high-impact journals are very selective in determining whether to publish a manuscript. Some journals are so selec-tive that they reject greater than 90% of all manuscripts they re-ceive. If a manuscript is rejected, the public will never see or read about the research. Because journal articles have gone through a rigorous peer-review process, they are seen as the most trusted and well respected sources of scientific data and information.
Primary sources are journal articles that have been written by professors, scientists and engineers then submitted to a journal for publication. These professionals are the original source of information discussed in the article. A scientist will (1) conduct research, (2) write a manuscript describing their research and its findings and then (3) send the manuscript to a journal re-questing that it be considered for peer review and potential pub-lication. A journal editor reviews the manuscript to determine whether to send it out for a full peer review. If it meets their
Chapter 3
Primary Sources

30
standards then the manuscript is sent to 2-5 experts in that par-ticular field of research. These experts take a few weeks to re-view the article and make a recommendation to the editor about whether the manuscript is acceptable for publication. Experts are often critical of a manuscript and the research that is pre-sented in the manuscript. It is common, especially for high-impact journals, that peer reviewers advise the editor to reject the manuscript outright. If this happens, the manuscript is sent back to the authors and the public never reads about the re-search. The authors must conduct additional experiments, re-write their manuscript and then submit a revised manuscript back to the same journal, or often another journal. Then the en-tire peer review process starts all over again.
High impact journals (e.g., Science, Nature and Proceedings of the National Academies of Science, PNAS) set high standards for success and will reject the vast majority (e.g., greater than 75%) of all manuscripts that they receive due to unfavorable re-views. Typically, the higher a journal’s impact factor, the higher its rejection rate.
Examples of Primary Sources
1. Science http://www.sciencemag.org
2. Nature http://www.nature.com (Fig. 9)
3. PNAS http://www.pnas.org
There are thou-sands of profes-sional journals that publish hundreds of in-dividual articles each year. Sci-entists have been publish-ing articles in journals for hun-dreds of years. This works out to millions of published arti-cles contained within all these journals. There-fore, the best way to find jour-nal articles that are of interest to you is to use a computer and a search engine.
Figure 9. Nature, which is a journal and a pri-mary source. Shown is the cover for Volume 508, Issue 7495, publication date 10 April 2014. Link: https://www.nature.com/nature/volumes/508/issues/7495 .
Figure 9. The Journal Nature.
31
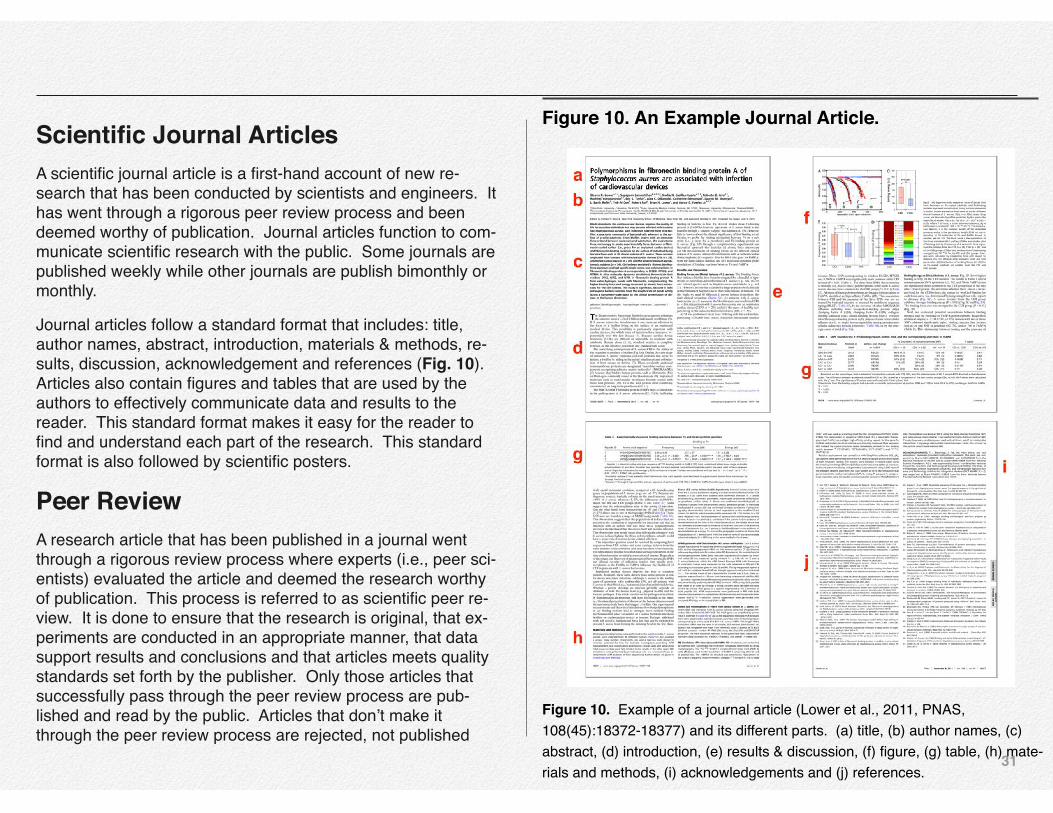
Scientific Journal ArticlesA scientific journal article is a first-hand account of new re-search that has been conducted by scientists and engineers. It has went through a rigorous peer review process and been deemed worthy of publication. Journal articles function to com-municate scientific research with the public. Some journals are published weekly while other journals are publish bimonthly or monthly.
Journal articles follow a standard format that includes: title, author names, abstract, introduction, materials & methods, re-sults, discussion, acknowledgement and references (Fig. 10). Articles also contain figures and tables that are used by the authors to effectively communicate data and results to the reader. This standard format makes it easy for the reader to find and understand each part of the research. This standard format is also followed by scientific posters.
Peer ReviewA research article that has been published in a journal went through a rigorous review process where experts (i.e., peer sci-entists) evaluated the article and deemed the research worthy of publication. This process is referred to as scientific peer re-view. It is done to ensure that the research is original, that ex-periments are conducted in an appropriate manner, that data support results and conclusions and that articles meets quality standards set forth by the publisher. Only those articles that successfully pass through the peer review process are pub-lished and read by the public. Articles that don’t make it through the peer review process are rejected, not published
Figure 10. Example of a journal article (Lower et al., 2011, PNAS, 108(45):18372-18377) and its different parts. (a) title, (b) author names, (c) abstract, (d) introduction, (e) results & discussion, (f) figure, (g) table, (h) mate-rials and methods, (i) acknowledgements and (j) references.
Figure 10. An Example Journal Article.

32
and therefore are never read by the public.
The basic steps of the peer review process are shown in Fig-ures 11. (Step 1) Dr. Brutus Buckeye is a professor at Ohio State University (OSU) who has completed his research, wrote a paper about his findings and wants to publish his paper in the Journal of Natural Systems. (Step 2) Dr. Buckeye sends his pa-per to Dr. Tina Traveler who is a professor at the University of Southern California (USC) and an editor for the Journal of Natu-ral Systems. Dr. Traveler reads the paper to determine if the re-search is original, significant and appropriate for publication in the Journal of Natural Systems. Dr. Traveler will either reject the paper outright or send the paper to several experts to evalu-ate. A paper is typically reviewed by 3-5 experts. (Step 3) In this example (Fig. 11), Dr. Olivia Oxley (professor at University of Oxford), Dr. Dan Bulldog (professor at Yale University) and Dr. Roberto Floresta (professor at Universidade de Sao Paulo) agree to review the paper. The three professors read the paper and write a thorough and detailed review of the paper. They send their reviews to the editor (Dr. Traveler) and recommend that the paper be accepted or rejected. (Step 4) The editor (Dr. Traveler) reads all three reviews, their recommendations and then makes an overall decision to accept or reject the paper for publication in the Journal of Natural Systems (Fig. 12).
Figure 11. Peer Review Process.
Figure 11 shows how the peer review process works for a sci-entific paper. Each reviewer provides a detailed evaluation of the paper that includes a recommendation to accept (thumbs up) or reject (thumbs down) the paper. An editor will read these reviews and make an overall decision to accept the paper for publication in the journal, request a revised paper from the author that will go through the peer review process again, or re-ject the paper. The public will only be able to read those papers that have been accepted for publication.

33
Figure 12. Decision to accept or reject a paper for publication in a journal.
Figure 12. Peer Review Outcomes

Newspapers, Magazines, Public Media, Textbooks
1. While secondray sources do not go through a peer review process, they are reviewed by authors, editors and producers prior to publication to ensure high quality.
2. Secondary sources report on and interpret results that are presented in primary sources.
3. These are typically easier to read and understand when compared to primary source journal articles.
4. Secondary sources typically do not provide the level of detail that is reported in a primary source.
34
Secondary SourcesOther sources that may be used for a scientific poster are sec-ondary sources, which generally refer to newspapers (Fig. 13), radio programs, news programs, documentaries, videos, maga-zines and some government sources. Secondary sources re-port on and interpret results that have been presented in pri-mary sources. Secondary sources generally have not been peer reviewed, however, they have been reviewed by editors, writers and producers prior to publication because the publisher wants to maintain a high degree of integrity with their work and publications.
Just because a secondary source has not been peer reviewed does not mean that it is an inferior source of information com-pared to peer-reviewed journal article. Many secondary sources are very well respected and excellent sources of infor-mation. These publications (e.g., newspaper, magazine, docu-mentary) are used to provide information that has originally been presented elsewhere (e.g., in a journal article, or during a talk at a professional conference). These articles are often re-viewed by an editor(s) prior to publication to ensure that the in-formation is credible and the story is accurate. Just as is the case for journals, a strong reputation for accurately reporting facts and information is one of the main goals that publishers strive to achieve. Those that have developed a trust with the general public because they have a strong reputation for unbi-
Chapter 3
Secondary Sources

35
ased reporting are generally well respected as sources of trust-worthy information. Secondary sources are usually easier to read and easier to understand when compared to primary sources.
Highly respected newspapers (secondary sources) like the New York Times, the Wall Street Journal and the Washington Post have an extensive editorial staff and professional writers to en-sure high quality articles. In addition to newspapers, textbooks, magazines (e.g., National Geographic, Scientific American, Smithsonian), public broadcasters (e.g., NPR, PBS), broadcast television networks (e.g., ABC, CBS, NBC, Fox) are all excel-lent secondary sources.
Examples of Secondary Sources
1. New York Times http://www.nytimes.com (Fig. 13)
2. National Geographic http://www.nationalgeographic.com
3. Mainstream science textbooks
4. National Public Radio http://npr.org
5. PBS Nature http://www.pbs.org/wnet/nature/
6. PBS NOVA http://www.pbs.org/wgbh/nova/
7. PBS FRONTLINE http://www.pbs.org/wgbh/frontline/
8. Scientific American http://www.scientificamerican.com
Figure 13. The New York Times, which is a newspaper and a secon-dary source. This issue was published on October 24, 2015.
Figure 13. Secondary Source Newspaper
THIS WEEKEND
Democrats said they would remain on aHouse committee investigating the Ben-ghazi attack even as they demandedthat it be shut down. PAGE A17
NATIONAL A13-18
A Benghazi Panel Protest
A soldier who helped free hostages inIraq showed an instinct to protect dur-ing his life, and in his death. PAGE A15
He Ran to the Sound of Guns
Police divers are searching the HarlemRiver floor for the weapon used to killan officer. Crime Scene. PAGE A19
NEW YORK A19-21
A Gun Search, Underwater
After 50 years of one-party rule, the Afri-can nation is holding a heavily contestedpresidential election on Sunday. PAGE A4
INTERNATIONAL A4-12
A Political Test for TanzaniaSaving early for your children’s collegetuition won’t adversely affect aid eligi-bility, Ron Lieber writes. PAGE B1
BUSINESS DAY B1-6
The Benefits of a College Fund
Shares of the music streaming servicesank, as investors feared that a crowdedmarket is eating into revenue. PAGE B1
Pandora Takes a Tumble
Gail Collins PAGE A23
EDITORIAL, OP-ED A22-23
The comedians Redd Foxx (died 1991)and Andy Kaufman (died 1984) are be-ing turned into holograms to performand tour again. PAGE C1
ARTS C1-7
Joking Past the Graveyard
Kansas City eliminated the Toronto BlueJays in the American League Champion-ship Series and will meet the Mets in theWorld Series. PAGE D3
SPORTSSATURDAY D1-6
A Mets-Royals World Series
MAURICIO LIMA FOR THE NEW YORK TIMES
A member of the Majid family, Roujin Sheikho, center, rested with her daughter and other kin in a Serbian field in late August.
bloody gashes in his right shin.He stays silent.Zain was born in Syria as the
fighting there was beginning.Ever since, he and his extendedfamily have been living in theshadow of conflict, surroundedby a chaotic mix of fear, threats,extortion and kidnapping.
This summer, Zain, his father,Ahmad Majid, and a band of de-termined relatives — eightadults, including Zain’s pregnantmother, and five other children, ababy and a toddler among them— became part of a remarkablechapter in human migration.
Over nearly two months, thefamily journeyed from Syriathrough Turkey and eight Euro-
By ANEMONA HARTOCOLLIS
Zain al-Abideen Majid’s fatherlifts him over a coil of glitteringrazor wire in the moonlit dark-ness of a Serbian farm, stretchingto hand the boy to a relative onthe other side.
Though Zain is only 4, this is byno means his first surreptitiousborder crossing, and he remem-bers his father’s admonition atthe very start of their journey,when they slipped from theirhomeland of Syria into Turkey:Don’t make a sound, or theguards will beat us.
On this night, as Zain is passedover the wire from Serbia intoHungary, the barbs rip two
pean countries, through much ofthe trip not even sure of a desti-nation. The group was cheeredand cursed, encountering thebest of Europe, and the worst.They endured exhaustion and de-spair, stranded for five days in atrain station in Budapest and im-prisoned in Denmark with seem-ingly no hope of moving forward.And they had moments of tri-umph, outwitting border guards
and benefiting from the camara-derie of fellow travelers.
“It’s better than dying,” saysAhmad.
The sheer number of peopletrudging alongside them hasoften led to impersonal descrip-tions: a wave, a mass, a crisis.But up close they were verymuch individuals living throughan unsettling and sometimes ter-rifying journey. For the Majids,that journey took them from theolive groves of the village in Syr-ia that had nurtured their familyfor generations toward an uncer-tain future in an alien culture.
For much of the trip, I traveledwith them, along with a team ofother journalists from The NewYork Times, documenting theirjoys and sorrows, and sometimesbecoming part of their experi-ence.
The Majids are a tight-knitfamily, resourceful and relativelywell off. For years, Ahmad cau-tiously plotted how best to sur-vive in Syria, even as it was de-teriorating and splintering intofiefs run by rival warlords andmilitias. Prosperous and with
A Syrian Family Swept Up in a Migrant Tide to EuropeMany Obstacles Await
on Perilous Questfor Safe Haven
Continued on Page A8
By MICHAEL S. SCHMIDTand MATT APUZZO
CHICAGO — The F.B.I. direc-tor, James B. Comey, said on Fri-day that the additional scrutinyand criticism of police officers inthe wake of highly publicized epi-sodes of police brutality mayhave led to an increase in violentcrime in some cities as officershave become less aggressive.
With his remarks, Mr. Comeylent the prestige of the F.B.I., thenation’s most prominent law en-forcement agency, to a theorythat is far from settled: that theincreased attention on the policehas made officers less aggressiveand emboldened criminals. Buthe acknowledged that there is sofar no data to back up his as-sertion and that it may be justone of many factors that are con-tributing to the rise in crime, likecheaper drugs and an increase incriminals who are being releasedfrom prison.
“I don’t know whether that ex-plains it entirely, but I do have astrong sense that some part ofthe explanation is a chill windthat has blown through Americanlaw enforcement over the lastyear,” Mr. Comey said in a speechat the University of Chicago LawSchool.
Mr. Comey’s remarks caughtofficials by surprise at the JusticeDepartment, where his views arenot shared at the top levels. Hold-ing the police accountable for civ-il rights violations has been a toppriority at the department in re-cent years, and some senior offi-cials do not believe that scrutinyof police officers has led to an in-crease in crime. While the de-partment had no immediate com-ment on Friday, several officialsprivately fumed at Mr. Comey’ssuggestion.
Among the nation’s law en-forcement officials, there is sharpdisagreement over whether thereis any credence to the so-calledFerguson effect, which refers to
F.B.I. CHIEF LINKS EYES ON POLICE
TO RISE IN CRIME
AN UNSETTLED THEORY
Sharp Dispute OverAny Credence to the
‘Ferguson Effect’
Continued on Page A3
By PATRICK HEALY and TRIP GABRIELA beleaguered Jeb Bush
slashed his campaign spending.Donald J. Trump lost his lead inIowa. And a surging Ben Carsongalvanized his support among so-cial conservatives.
With Hillary Rodham Clintonemerging as the unrivaled leaderin the Democratic contest, theunruly Republican presidentialfield suddenly seemed to lack acenter of political gravity on Fri-day, leaving party strategists andvoters to fear a long nominationfight that could end with a dam-aged standard-bearer facing amore unified left.
Mr. Bush cut salaries, firedconsultants and laid off or re-assigned many campaign work-ers. It was the latest sign that contenders vying for supportfrom moderates and the party’sestablishment are all but runningon fumes — exhausting theircash, or the patience of their sup-porters, but barely moving in thepolls.
Mr. Trump, for months a lead-ing candidate, has now fallen be-hind in Iowa to Mr. Carson, a re-tired neurosurgeon, raising ques-tions about how aggressively he
will act to reverse his saggingpoll numbers. And Mr. Carson,whose fund-raising has roughlykept pace with his climb in thepolls, is moving to run television
commercialsin Iowa, NewHampshireand SouthCarolina, posi-tioning him-self to influ-ence the out-comes inthose statesand others ifhe manages tocontinue lock-ing downevangelicalChristian vot-ers.
Yet amidthe tumult onthe right, thecontours ofthe state-by-
state fight for the Republicannomination have also becomemore apparent.
In Iowa, where Republicans
Bush Cuts Costs, Carson EclipsesTrump in Iowa and G.O.P. Frets
Continued on Page A16
Ben Carson
Jeb BushBy ERIC LIPTON
and JENNIFER STEINHAUER
WASHINGTON — The peti-tions that started surfacingonline over a year ago were as in-cendiary as they were urgent,begging recipients to sign up to“Boot Boehner,” “Dump McCon-nell,” “Drop a Truth-Bomb onKevin McCarthy” and “Fire PaulRyan.”
The calls to oust Republicanleaders in Congress did not comefrom Democrats. They camefrom conservative websites andbloggers who have helped stoke agrass-roots rebellion to make
Congress more conservative, afevered continuation of the six-year Tea Party movement.
But these politically chargedappeals to conservatives aroundthe country were often accompa-nied by a solicitation for money,and the ultimate beneficiaries,records suggest, are the consult-ants who created the campaignsrather than the causes they arepromoting.
It is a practice that has acceler-ated with the explosion of socialmedia. The latest example cameon Wednesday with a new attackon Representative Paul D. Ryan,Republican of Wisconsin, just a
day after he said he was willingto serve as House speaker.
Even some members of Con-gress who might benefit from thepetitions are highly critical of theapproach. “A lot of people arewearing their hearts on theirsleeves trying to help, and onlylater may find out that thismoney is not going where theythought it was,” said Representa-tive David Schweikert, Republi-can of Arizona and a member ofthe Freedom Caucus, the groupof conservative lawmakers whohelped force out RepresentativeJohn A. Boehner of Ohio as
Continued on Page A17
Right-Wing PACs Vilify G.O.P. Elite, and It Pays
By JACK EWINGand JAD MOUAWAD
At least three members ofVolkswagen’s board said theywere left in the dark about thecompany’s emissions cheatingfor two weeks after top execu-tives admitted the deception toAmerican environmental offi-cials.
During that period, the boardwas completing the terms of acontract extension for the auto-maker’s chief executive, MartinWinterkorn. He was pushed outfive days after the use of thecheating device became public,though he insisted he had knownnothing about it.
The board members’ state-ments shed new light on flaws inthe management structure andlines of communication at Volks-wagen, the world’s largest auto-maker. Volkswagen’s stock haslost about a third of its valuesince Sept. 18, when the cheatingwas made public by the UnitedStates Environmental ProtectionAgency.
Volkswagen has admitted thatsome cars were programmed todisable their pollution controlsunless the software detected thatemission tests were being con-ducted. With the controls off, thevehicles had better accelerationand fuel economy, but emitted farhigher levels of nitrogen oxide, apollutant linked to lung ailments.
If Mr. Winterkorn did not knowabout the communication with
Continued on Page B3
RICHARD PERRY/THE NEW YORK TIMES
The auction house is feverishly promoting its sale of the art of its ex-chairman, A. Alfred Taubman,who was jailed for price-fixing. One lot to be sold is Modigliani’s “Paulette Jourdain.” Page C1.
Sotheby’s Pulls Out All the Stops
VOL. CLXV . . . No. 57,029 + © 2015 The New York Times NEW YORK, SATURDAY, OCTOBER 24, 2015
Late EditionToday, clouds and sunshine, high58. Tonight, cloudy, a brief showerlate, low 53. Tomorrow, morningclouds, some afternoon sun, high64. Weather map is on Page C8.
$2.50
3 Directors SayVW Hid DeceitFrom the Board
This article is by ElisabethMalkin, Azam Ahmed andFrances Robles.
MEXICO CITY — The strong-est hurricane ever known to as-sault the Western Hemisphereslammed into Mexico’s south-west Pacific Coast on Friday,transforming hotels into make-shift shelters, shuttering schools,closing airports and sending in-habitants racing to bus stationsto flee inland.
The storm, named HurricanePatricia, packed winds of about165 miles per hour as it struckland, having slowed considerablyfrom earlier speeds of about 200miles per hour as it spun towarda coastline dotted with tiny fish-ing villages and five-star resortsin cities like Puerto Vallarta.
As the outer wall of the hurri-cane swept over the coast in theafternoon, trees were quicklyflattened, landslides tumbledalong a major road, light poleswere toppled and roofs flew off.
“You had to feel how the airtrembled,” said Yael Barragan, atrucking service coordinator inthe port city of Manzanillo, hud-dled in his home with five chil-dren and four other adults. Whenthe wind started blowing, it wasnot long before a neighbor’s roofwas in his backyard. “I saw it fly,and I saw it land in my patio,” hesaid.
Less than an hour after land-fall, the National Hurricane Cen-ter said the storm was barreling
HURRICANE SLAMSCOAST OF MEXICOWITH HIGH FORCE
BRINGS 165-M.P.H. WINDS
Storm Barrels Inland —Extensive Damage
and Flooding
Continued on Page A11
U(D54G1D)y+[!%!]!#!,A truck collided with a bus carrying eld-erly sightseers in southwestern France,killing at least 43 people. PAGE A4
Dozens Die in French Collision
Secretary of State John Kerry and hisRussian counterpart met to explore apolitical solution to the war in Syria andthe future of Bashar al-Assad. PAGE A12
INTERNATIONAL
U.S. and Russia Discuss Syria
C M Y K Nxxx,2015-10-24,A,001,Bs-BK,E2_+

36
9. Washington Post https://www.washingtonpost.com
10.ABC News https://abcnews.go.com
U.S. Government SourcesU.S. government agencies and departments can also be excel-lent sources of scientific data and information. These agencies publish both primary sources and secondary sources of informa-tion. Several examples that are useful to science and technol-ogy are listed below. Each agency or department focuses on a particular field. For example, the USDA focuses on agriculture and NOAA focuses on weather and climate.
1. Centers for Disease Control and Prevention (CDC) http://www.cdc.gov
2. National Aeronautics and Space Administration (NASA) https://www.nasa.gov
3. National Institutes of Health (NIH) http://www.nih.gov
4. National Oceanic and Atmospheric Administration (NOAA) http://www.noaa.gov
5. National Park Service (NPS) http://www.nps.gov
6. Department of Agriculture (USDA) http://www.usda.gov
7. Department of Energy (DOE) http://www.energy.gov
8. Department of Interior (DOI) https://www.doi.gov
9. Environmental Protection Agency (EPA) http://www.epa.gov
10.Fish and Wildlife Service (FWS) http://www.fws.gov
11.Food and Drug Administration (FDA) http://www.fda.gov
12.Geological Survey (USGS) http://www.usgs.gov
13.National Science Foundation (NSF) http://www.nsf.gov
These agencies and departments employ thousands of scien-tists and engineers who conduct research and then report their finding back to the general public. They communicate their dis-coveries and results with the general public through technical reports, guidelines, recommendations, podcasts, seminars, presentations and primary source peer-reviewed journal arti-cles.
For example, Figure 14 shows how the U.S. Environmental Pro-tection Agency (EPA) informs the public about the dangers of polychlorinated biphenyls (PCBs) and their efforts to cleanup PCB waste in the USA. This webpage, shown in Figure 14 (https://www.epa.gov/pcbs/epa-regional-polychlorinated-biphenyl-pcb-programs), is constantly updated with the EPA’s most re-cent data, results and discoveries so that people can stay in-formed and make informed decisions in their daily lives. This webpage would be considered a secondary source. Links to pri-mary source journal articles, secondary source guidelines and fact sheets and regional PCB clean up programs are all pro-vided on the website (Fig. 14).

37
Figure 14. The U.S. Environmental Protection Agency’s PCB Programs webpage. This webpage contains links to both secondary and primary sources of information for the public. Link: https://www.epa.gov/pcbs/epa-regional-polychlorinated-biphenyl-pcb-programs
Figure 14. EPA Website

4 Figures and tables are used by scientists and engineers to communicate large amounts of data to an audience. They serve as efficient and effective ways to show findings, results and trends in a visual format.
A figure can be a chart, diagram, data plot, graph, image, map, photograph or schematic.
Figures & Tables

Characteristics Of Figures & Tables
1. High quality (typically a resolution of at least 300 dpi) figures should be included in a poster so that the audience can easily read and understand the importance of the research.
2. An audience will focus most of their attention on a poster’s figures and tables, therefore it is important to provide high-quality and informative figures and tables.
3. Figures can be illustrations, images, diagrams, photographs, graphs, charts, plots and maps.
4. Tables are used to communicate large amounts of data in a concise and effective manner.
39
Poster FiguresFigures are visual representations of data and information that allows an audience to better understand the research contained in a poster. A figure should always be accompanied by a cap-tion that describes the information contained in the figure (Fig. 15). Figures are important elements of all scientific posters and assist scientists in conveying research results and describing important details about their research topics. Figures can be il-lustrations, charts, graphs, maps, plots, diagrams and photo-graphs. A scientific poster contains multiple figures (typically 4-8) used to describe the research data. However, there should not be so many figures that they take up the entire poster. Be-tween 4-8 figures (or tables) is a reasonable number of figures (or tables) to include in a poster. The exact number will depend on the overall poster design and research objectives, which will be different for each presenter and each poster.
Poster Figure Considerations1. Figures should be high quality and high-resolution images. A resolution of 300 dpi is typically recommended.
2. You should include a variety of figures in your poster, such as photographs, images, graphs, maps, diagrams, charts, etc.
Chapter 4
Figures & Tables

40
3. It is encouraged that you include original figures that you de-signed, created or photographed.
4. Each figure needs to be accompanied by a figure caption that describes the figure. Figure captions should be short (that is, typically less than 100 words) and descriptive.
5. Each figure should contain a citation(s), which references the original source of data/information presented in the figure.
6. Figures are used to engage an audience and capture their attention. This can be done through the use of color (as op-posed to black and white), high-resolution images and photo-graphs, visually stimulating presentations, or graphs and illustra-tions that explain complex information in a clean and simple manner.
Poster TablesTables are use to organize large amounts of data (e.g., num-bers, information, observations) into rows and columns so that an audience can more easily understand the research (Table I). Like a figure, a table is an important part of a scientific poster. It serves to communicate the importance of a particular data set or results to an audience. When viewing a poster, most people will be drawn to figures and tables first and they may not read the text contained in the body of a poster but rather focus all their attention presented in a poster’s figures and tables. There-
fore, it is important that a table be designed and presented in a way that effectively communicates important data and results to the audience.
Poster Table Considerations1. Tables should be clear, concise with data divided into well de-fined categories.
2. Columns and rows should be spaced so that data contained within the table is easy to read.
3. Units of measurement (e.g., kg, meters/second) should be included.
4. A caption should accompany each table to explain the data and information contained within the table.
5. Each table should contain a citation(s) that references the source of the information presented in the table.
6. A minimum of 20-point font should be used in the table so that an audience can read from a distance of 2-3 feet (1 meter).

41
Figure 15. Post-ers use different types of figures to communicate results to an audi-ence. Figures help the audi-ence visualize the information and data con-tained within the text. Figures can be images (A), maps (B), flow charts (C), line and bar graphs (D), photographs (E) and diagrams (F). A figure cap-tion should ac-company each figure to provide a complementary explanation of the data and in-formation con-tained within the figure.
Figure 15. Different Types of Fig-ures.

42
Table I. Tables are used to organize data and information into columns and rows. Tables are typically used to communicate large amounts of data to a reader in a systematic manner. Table font size should be easy for an audience to read when viewing from a distance of 2-3 feet (1 me-ter). Therefore, it is recommended that a minimum of 20-point font be used in tables.
Table I. Individual bird banding in Glacier National Park from 2015-19.
5 A poster presentation consists of (1) the poster and (2) a person who presents the research to (3) an audience.
A presentation lasts 5-10 minutes.
The audience is typically 1-5 people at a time.
It is acceptable for the audience to ask the presenter questions during their presentation.
Poster Presentation

Characteristics Of A Poster Presentation
1. Dress professionally and understand all parts of your poster.
2. Most poster presentations take place in a large room with dozens to hundreds of individual poster presentations occurring simultaneously.
3. A typical presentation lasts 5-10 minutes.
4. Typical audience size for an individual poster presentation will be 1-5 people.
5. It is acceptable for the audience to ask questions during a presentation.
6. The presenter should use figures and tables to communicate with the audience.
44
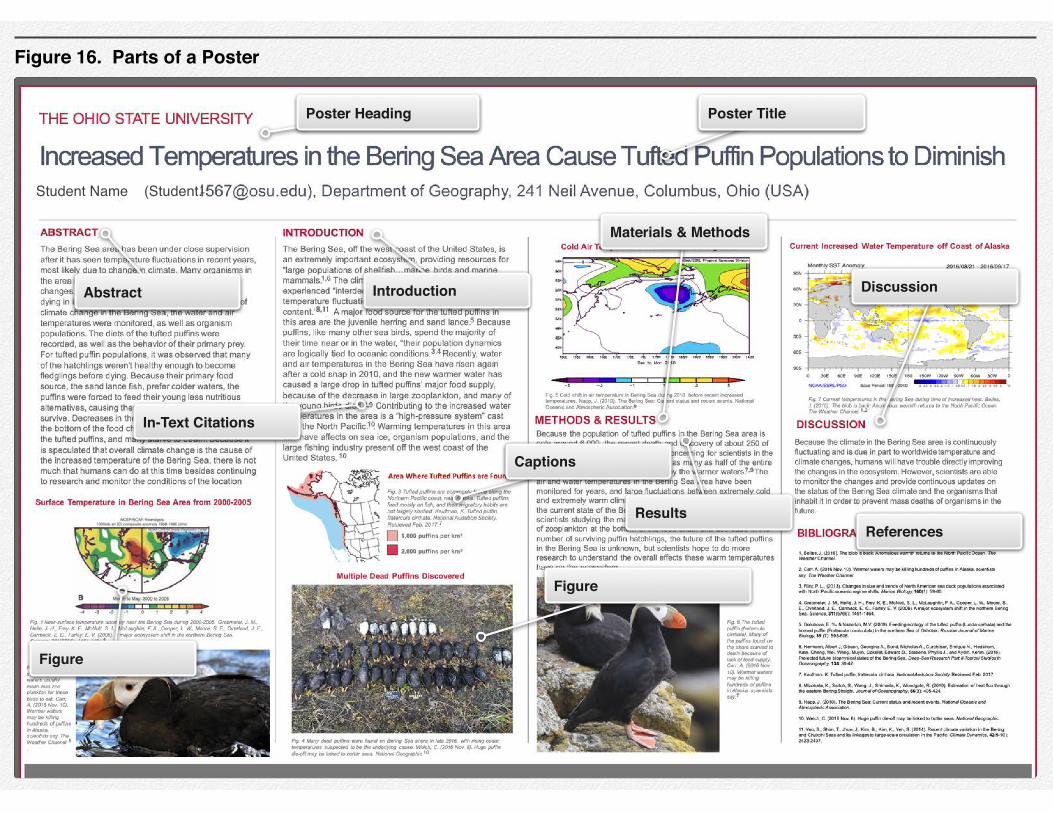
Excellent Poster Presentations are SimpleThe presenter is the scientist or engineer who conducted the re-search. The presenter is an expert in that particular field and should be confident (but not arrogant) when presenting the re-search to their audience. The presenter should understand eve-rything that is in their poster (e.g., issue, topic, figures, tables, references). The presenter should relax, speak clearly, start with the introduction, move through the methods, results and end with the discussion section. The presenter should engage in conservation with the audience and answer their questions during the poster presentation. The presenter should not read word-for-word from a script, but rather they should follow a gen-eral progression through their poster (Fig. 16) that allows for ac-tive and organic discussion between them and the audience.
Tips for Giving a Poster Presentation1. Practice your presentation several times before the poster
event. Dress professionally. Your audience will be focused on your poster for 5-10 minutes so you don't have much time to capture their attention and tell your story. Engaging figures, maps, graphs will help capture their attention.
2. Focus most of your presentation on your figures and tables. Your audience will focus on figures, graphs, tables, maps. They rarely read the poster text. If they read any text at all, it
Chapter 5
Poster Presentation
45
Figure
Poster Title
In-Text Citations
Figure
Materials & Methods
Captions
Results
Discussion
References
IntroductionAbstract
Poster Heading
Figure 16. Parts of a Poster
Lorem ipsum dolor sit amet, consectetur adipisicing elit, sed do tempor incididunt ut labore et dolore magna aliqua.
Student Name (Student.

46
will likely be the abstract and figure captions so a presenter really focus on figures and tables when they prepare for their poster presentation.
3. Speak clearly and know your topic. Remember you are the expert so you need to understand all parts of your poster.
4. Presenters should start their presentation (Fig. 17) by intro-ducing themself and moving onto the Title and Introduction sections. Describe the issue and use figures to help explain the story. Use maps to show the study area, use photo-graphs of the organism or pollutant or issue, use graphs and tables to show patterns (e.g., population increased over past 5 years) focus on important points. Flow from one figure to the next, ending with the discussion and conclusion sections. The presenter should point to the poster when they are talk-ing about a specific figure, and use words and their hands to help explain each part of the poster.
5. Allow your audience to participate, allow them to ask ques-tions throughout your presentation (Fig. 18). Always be re-spectful of your audience. Always try to answer their ques-tions. If you don’t know the answer, the best thing to say is “I don’t know the answer but I can point to another study here in my references section where other scientists are working on this very question.” Engage your audience and show them where to find additional work (e.g., journal articles, names of scientists) about the topic.
6. Avoid saying things like “stuff” and “things” and other general phrases like “this work was great”. Give specifics because this demonstrates to the audience that you understand your topic. Use the vocabulary words that you learned and ex-plain these to the audience. For example, rather than say “This work was great for orangutans.” You could say: “This work was great because it was the first time that we ob-served orangutan feeding behavior in the wild and it allowed us to determine that female orangutans need 5,500 calories per day during their breeding season. Those females that ob-
Figure 17. The poster presenter (left) is communicating with his audience (right) in an oral and visual manner.
Figure 17. Poster Presentation.

47
tained 5,500 calories per day were twice as likely to give birth.”
7. Be prepared for a lively and dynamic event (Fig. 19). Poster events typically consist of dozens or hundreds of in-dividual poster presentations occurring simultaneously in the same room. These events are typically very loud and energetic. Food and beverages are typically provided at the event.
8. Be flexible. The audience will walk around to view as many posters as possible, stopping occasionally to view a poster and talk to a poster presenter about their research. Some people may talk with the presenter for a few seconds, oth-ers may spend 15-20 minutes talking with a poster pre-senter. Presenter-audience interactions will be rather infor-mal and dynamic.
9. Read the poster guide and map prior to attending the poster event. A poster program guide and poster map will be published ahead of the event so that the audience knows where to find each poster and so that the presenter knows where to set up their poster.
10.Wear comfortable shoes. Posters are typically displayed on an easel and the presenter stands by their poster during
Figure 18. Two-Way Communication is Key to a Successful Poster Event.
Figure 18. The presenter (left) and audience (right) are talk-ing with one another.

48
Figure 19. This event consisted of approximately 150 individual posters, presenters and audience. Posters are numbered and presentations are occurring simultaneously.
Figure 19. Poster Event at The Ohio State University.
49
the entire event, which can last up to 2 hours.

AbstractA single paragraph, typically 200-400 words in length, that appears at the very begin-ning of a poster. It is a summary of the research presented in the poster and consists of four parts: Introduction, Materials & Methods, Results and Discussion. Each part is typically 2-4 sentences long. An abstract is strictly text, it contains no figures and no tables.
Related Glossary Terms
Index
Discussion, Introduction, Materials & Methods, Results
Find Term
AcknowledgementsThe section of a poster that typically appears at the very end of a poster. The name of funding agencies who provided financial support for the research will be listed in this section. Authors also use this section to thank people who contributed to the research but did not provide substantial contribution to the work that they should appear as a co-author on the poster.
Related Glossary Terms
Index
Drag related terms here
Find Term

AuthorsScientist(s) who designed, planned and conducted the research and wrote the poster. The scientist who made the most significant contribution to the research is listed first in the author list, the scientist who contributed the 2nd most is listed second in the author list and so on.
Related Glossary Terms
Index
Drag related terms here
Find Term

BibliographyAlso know as References section of a poster. The section of a poster where scholarly publications (i.e., sources of information), which are referred to in the poster are listed. By citing other peoples’ work, the author is (1) giving proper credit to the work of other scientists, (2) justifying why the research is being conducted, (3) providing context for the research, (4) demonstrating the significance of the work and (5) providing addi-tional knowledge and understanding for the research. The Bibliography section typi-cally include information that helps the reader find important information such as; author names, year published, title of article, name of journal, volume number and page numbers.
Related Glossary Terms
Index
References
Find Term

CitationA formal reference to a published work or source of information. A citation is included at the end of a sentence to indicates the source of the information. Citations are listed by number or author name, year published.
For example:
1. Polar bear cubs were 25% larger when fed a high-protein diet compared to high-sugar diet.1
2. Polar bear cubs were 25% larger when fed a high-protein diet compared to high-sugar diet (Jones and Smith, 2018).
The “1” and “Jones and Smith, 2018” both refer to the same journal article: E.J. Jones and W. A. Smith (2018), Journal of Natural Science, Vol. 53, Issue 12, pages 36-45. Both types of in-text citations are acceptable for use in posters, with people typically choosing superscript numbers to save space.
Related Glossary Terms
Index
Primary Source, References, Secondary Source
Find Term

DataInformation, measurements, numbers, observations collected as part of an experi-ment. The experiment can be conducted in a laboratory setting or in the field. Specific instruments, methods and techniques are used to collect data. Data is typically pre-sented to an audience in the form of a graph or table.
Related Glossary Terms
Index
Figure, Graph, Results, Table
Find Term

DiagramType of figures that uses a schematic drawing to show how something functions, flows or is structured.
Related Glossary Terms
Index
Figure, Map
Find Term

DiscussionThe section of a poster that is dedicated to interpreting the results of the research. The Results section and Discussion sections are often combined in a poster to save space and make it easier for the reader to understand the research. The Discussion section is used to (1) describe what the results mean, (2) compare results to other stud-ies, (3) characterize the significance of the results, (4) report the limitations of the re-search and (5) suggest future research.
Related Glossary Terms
Index
Abstract
Find Term

FigureAn image, chart, data plot, graph, map, diagram, schematic, photograph that is used to communicate information and data. Many readers will only look at poster figures rather than reading the main text. Therefore, it is very important that figures are engag-ing and easy to read and understand. A figure should be used in a poster to communi-cate the most significant results of the research. A descriptive caption that explains the data should also accompany each figure.
Related Glossary Terms
Index
Data, Diagram, Graph, Map, Results
Find Term

GraphA type of figure that shows the relationship between two varying quantities. Graphs can be bar charts, line plots or scatter plots.
Related Glossary Terms
Index
Data, Figure, Results
Find Term

IntroductionThe section of a poster that appears directly after the Abstract and is used to introduce the reader to the topic. It provide all the necessary information needed to understand the research, topic or issue. It describes the importance of the research, especially in context to previous work that has been conducted in this area. It helps to set the stage for the research described in the poster and provides clear objectives for why the work was conducted.
Related Glossary Terms
Index
Abstract
Find Term

JournalA periodical publication containing many articles that describe original research con-ducted by scientists and engineers. Journals publish several issues throughout the year that contain the most recent research, data and information about a topic. Jour-nals are used by scientists and engineers as the primary means to disseminate re-search findings. Science journals are typically published by professional societies that specialize in particular disciplines. There are thousands of different scientific journals.
Articles are evaluated using a peer review process prior to publication. Only those arti-cles that successfully make it through the peer-review process are published. Re-jected articles are not published and therefore not seen or read by the public. High-impact journals typically accept a small fraction (e.g., 10-25%) of all articles for publica-tion. The remaining articles do not make it through the peer-review process and are rejected.
Related Glossary Terms
Index
Journal Article, Peer Review, Primary Source
Find Term

Journal ArticleA piece of writing that is published in a journal, describes original research and is authored by the scientists and engineers who performed the work and conducted the experiments. Because of this, journal articles are referred to as primary sources of in-formation. and published by professional journals. Journal articles have gone through a rigorous peer-review process prior to being published. Only those articles that suc-cessfully make it through the peer-review process are published. Rejected articles are not published and therefore not seen or read by the public.
Journals publish several issues throughout the year that contain the most recent re-search, data and information about a topic. High-impact journals typically accept a small fraction (e.g., 10-25%) of all articles for publication. The remaining articles (e.g., 75-90%) do not make it through the peer-review process and are rejected.
Related Glossary Terms
Index
Chapter 3 - Primary Sources
Journal, Peer Review, Primary Source
Find Term

KeynoteA software program developed by Apple to create presentations as well as slides, fig-ures, graphs, diagrams, flow charts, images, maps, etc.
Related Glossary Terms
Index
PowerPoint
Find Term

MapType of figure that shows an area of land, water, cites, forests, physical characteristics, etc. A map typically contains scale bars and cardinal directions (i.e., north, south, east, west) to help orient the reader.
Related Glossary Terms
Index
Diagram, Figure
Find Term

Materials & MethodsThe section of a poster that provides details about how the research was conducted. Authors use this section to describe methods, techniques, equipment and instrumenta-tion that was used for the research. Materials, chemicals, compounds, organisms, molecules, minerals, and samples that were used in the work are also described here. If the research was conducted at a specific location (e.g., institution, field site) or time of year then these details are provided here as well. The information provided in the Materials and Methods sections allows other scientists to reproduce the work pre-sented in the poster.
Related Glossary Terms
Index
Abstract
Find Term
NewspaperA publication that is printed daily or weekly and contains stories about current events, features, opinions and advertisements. Newspapers analyze and interpret the re-search that was presented in a primary source. Newspapers are considered secon-dary sources of information because they are published after a journal article has been published. Compared to journal articles, newspapers are typically easier for an audi-ence to read and understand because much of the scientific jargon has been replaced or removed. Newspapers are reviewed by editors prior to publication. Newspaper arti-cles do not go through a peer review process prior to publication.
Related Glossary Terms
Index
Secondary Source
Find Term
PatentDocument of intellectual property granted by a government that describes a discovery, invention, process, machine, instrument, manufacture, matter or material,
Related Glossary Terms
Index
Primary Source
Find Term

Peer ReviewA research article that has been published in a journal went through a rigorous review process where experts (i.e., peer scientists) evaluated the article and deemed the re-search worthy of publication. This process is referred to as scientific peer review. It is done to ensure that the research is original, that experiments are conducted in an ap-propriate manner, that data support results and conclusions and that articles meets quality standards set forth by the publisher. Only those articles that successfully pass through the peer review process are published and read by the public. Articles that don’t make it through the peer review process are rejected, not published and there-fore are never read by the public.
Many journals, such as high-impact journals, follow a rigorous peer review process that results in rejection rates greater than 75%. Those articles that successfully navi-gate the peer review process (e.g., the remaining 25%) are published by the journal, read by the public and are referred to as primary sources.
Related Glossary Terms
Index
Journal, Journal Article, Primary Source
Find Term

Poster PrintingPosters are very large (e.g., 48-inches x 36-inches) and need to be printed at a print shop using a specialized type of printer such as a plotter or wide-format conventional printer. Universities, libraries, FedEx, UPS all have printing services that, for a price, can be used to print a large-format poster. Prices vary from $50-$150 and turnaround times vary from 1 hour to 24 hours.
Ohio State University has several locations where students can print a large-format poster: https://u.osu.edu/chow.57/2013/11/08/osuposter/
Related Glossary Terms
Index
PowerPoint
Find Term

PowerPointA software program developed by Microsoft to create presentations. Many people use Microsoft PowerPoint to create and print a large-format poster. PowerPoint can also be used to create figures, graphs, diagrams, flow charts, images, maps, etc.
Related Glossary Terms
Index
Keynote, Poster Printing
Find Term

Primary SourceA journal article written by scientists and engineers and published in a journal. Journal articles are a full description of original experiments and research. Journal articles are written by the scientists and engineers who conducted the work. Journal articles con-tain an abstract, introduction, materials & methods, results, discussion and references. Journal articles are only published after they have successfully passed through a peer-review process. Rejected articles are not published and therefore the public never reads the article.
Patents and technical reports published by government agencies are also considered primary sources.
Related Glossary Terms
Index
Citation, Journal, Journal Article, Patent, Peer Review, References, Technical Report
Find Term
ReferencesThe section of a poster where scholarly publications (i.e., sources of information), which are referred to in the poster are listed. Also known as bibliography. By citing other peoples’ work, the author is (1) giving proper credit to the work of other scien-tists, (2) justifying why the research is being conducted, (3) providing context for the re-search, (4) demonstrating the significance of the work and (5) providing additional knowledge and understanding for the research. The References section typically in-clude information that helps the reader find important information such as; author names, year published, title of article, name of journal, volume number and page num-bers.
Related Glossary Terms
Index
Bibliography, Citation, Primary Source, Secondary Source
Find Term

ResultsThe part of the poster where data, findings and information that was discovered as part of the research is provided. Figures and tables are often used in the results sec-tion to communicate these data, findings and information to the reader.
Related Glossary Terms
Index
Abstract, Data, Figure, Graph, Table
Find Term

Secondary SourceArticle or video written or produced by someone who did not participate in the re-search. Examples are books, documentaries, films, government websites, interviews, magazines, newspapers, news programs, podcasts and videos. Secondary sources report on and interpret results that have been presented in primary sources. Secon-dary sources generally have not been peer reviewed, however, they have been re-viewed by editors, writers and producers prior to publication because they want to maintain a high degree of integrity with their work and publication
Related Glossary Terms
Index
Citation, Newspaper, References
Find Term

TableA way to organize data into columns and rows to effectively present large amounts of data to an audience. Many readers will only look at poster tables rather than reading the main text. Therefore, a table should be clear, easy to read, contain legible font type and sizes (e.g., 20-point font size are larger), have sufficient space between rows and columns, contain units of measurement, and have a legend or caption that ex-plains the data.
Related Glossary Terms
Index
Data, Results
Find Term

Technical ReportDocument that describes scientific findings, progress of projects and the results of sci-entific research. It is an official document that provides a summary of research con-ducted over an extended period of time. Technical reports are published by govern-ment agencies, universities and corporations.
Technical reports do not necessarily go through a peer-review process prior to publica-tion. If the report was written by the scientists who conducted the research, then it can be considered a primary source of information.
Related Glossary Terms
Index
Primary Source
Find Term

TitleA brief headline (typically 5-15 words) that appears at the very top of a poster and func-tions to provide a descriptive overview of the poster. It is used to inform the reader what the poster is about.
Related Glossary Terms
Index
Drag related terms here
Find Term