
Science 30 Unit B 1.4.indd - Fort Saskatchewan High
20
41. A group of environmental scientists collected the following data to assess the effects of acid deposition in a specific area: • spots present on surfaces of leaves • concentration of Al 3+ (aq) in soil and water • population sizes of organisms within the ecosystem • population of young fish • information from hunters and inhabitants within the area • observations of fish health • number of plants demonstrating chlorosis • list of insect populations within the area • soil pH • list of plant species within the area Using a table, classify the information collected as being either qualitative data or quantitative data. 1.4 Quantifying Acid Deposition and Monitoring Its Effects In Lesson 1.2 you made observations that led to developing empirical definitions of acids and bases and used indicators to estimate the pH of a solution. In Lesson 1.3 you discovered the value of using information from chemical tests as well as information about the organisms within the environment to investigate the effects of acid deposition. Earlier, you made observations that led to developing empirical definitions of acids and bases and used indicators to estimate the pH of a solution. Information about acids and acid deposition can be categorized in two ways: as qualitative data or quantitative data. You have seen how important the ability to resist the effects of acid deposition can be. In this lesson you will examine a process that is used to determine the concentration of an acid or base in a sample. You have seen how important the ability to resist the effects of acid deposition can be. Now, you will develop a plan to measure buffering capacity. Figure B1.36: Titration is one method used to determine the amount of acid in a sample. qualitative data: a description of a substance by identifying its properties, characteristics, or attributes quantitative data: a description of a substance that involves a measurement and a numerical magnitude Practice Science 30 © 2007 Alberta Education (www.education.gov.ab.ca). Third-party copyright credits are listed on the attached copyright credit page. Chapter 1: Acid Deposition 203
-
Upload
khangminh22 -
Category
Documents
-
view
8 -
download
0
Transcript of Science 30 Unit B 1.4.indd - Fort Saskatchewan High
41. A group of environmental scientists collected the following data to assess the effects of acid deposition in a specific area:
• spots present on surfaces of leaves • concentration of Al3+(aq) in soil and water • population sizes of organisms within the ecosystem • population of young fish • information from hunters and inhabitants within the area • observations of fish health • number of plants demonstrating chlorosis • list of insect populations within the area • soil pH • list of plant species within the area
Using a table, classify the information collected as being either qualitative data or quantitative data.
1.4 Quantifying Acid Deposition and Monitoring Its Effects
In Lesson 1.2 you made observations that led to developing empirical definitions of acids and bases and used indicators to estimate the pH of a solution. In Lesson 1.3 you discovered the value of using information from chemical tests as well as information about the organisms within the environment to investigate the effects of acid deposition. Earlier, you made observations that led to developing empirical definitions of acids and bases and used indicators to estimate the pH of a solution. Information about acids and acid deposition can be categorized in two ways: as qualitative data or quantitative data. You have seen how important the ability to resist the effects of acid deposition can be. In this lesson you will examine a process that is used to determine the concentration of an acid or base in a sample. You have seen how important the ability to resist the effects of acid deposition can be. Now, you will develop a plan to measure buffering capacity.
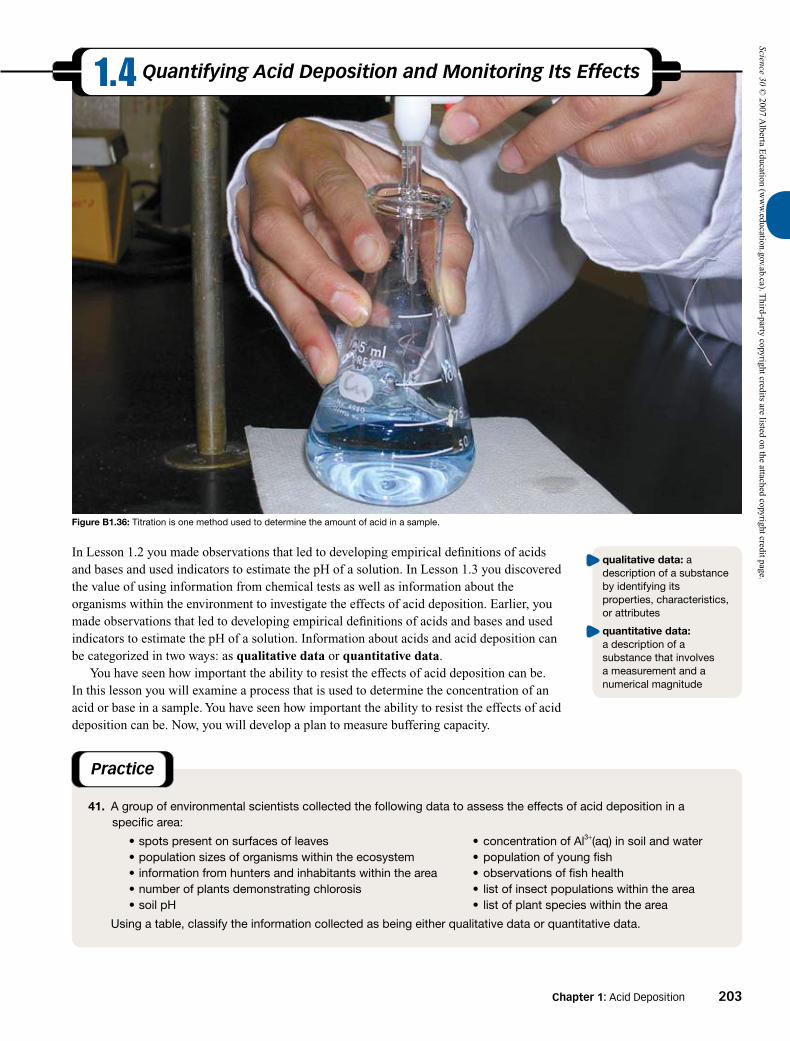
FigureB1.36: Titration is one method used to determine the amount of acid in a sample.
qualitativedata: a description of a substance by identifying its properties, characteristics, or attributes
quantitativedata: a description of a substance that involves a measurement and a numerical magnitude
Practice
Science 30 © 2007 A
lberta Education (w
ww
.education.gov.ab.ca). Third-party copyright credits are listed on the attached copyright credit page.
Chapter 1: Acid Deposition 203

PurposeYou will perform an experiment and use the data to determine which of two solutions contains the most acid.
Science SkillsPerforming and RecordingAnalyzing and Interpreting
��
BackgroundInformationpH is one way to measure the acidity of a solution. One of the empirical properties of an acid is its ability to be neutralized by a base. In this activity you will use a basic solution to test the two acidic solutions you are comparing.
Materials• commercial lemon juice• vinegar• 0.100-mol/L NaOH(aq)• 3, 50-mL beakers• 3 plastic (berol) pipettes (or medicine droppers)• multiwell dish (or 2 watch glasses)• phenolphthalein• grease pencil (or waterproof marker)• “Identifying the More Acidic Solution” handout
from the Science 30 Textbook CD
ProcedureNote: When performing this procedure, make sure all the drops are as similar in size as possible. To deliver similar-sized drops, hold the pipette vertically and maintain the same pressure on the bulb.
step1:Pour approximately 10 mL of the commercial lemon juice and vinegar into separate 50-mL beakers. Label each beaker appropriately.
step2:Pour approximately 20 mL of the NaOH(aq) solution into the third 50-mL beaker. Label this beaker appropriately.
step3:Depress the bulb of the first pipette, and draw some of the lemon juice solution into the pipette.
step4:Gently squeeze the bulb of the pipette and carefully deliver 3 drops of the lemon juice into the first well of the multiwell dish (or to the first watch glass).
step5:Add 1 drop of phenolphthalein to the commercial lemon juice in the multiwell dish (or watch glass). Record the colour of the indicator as the initial colour in “Identifying the More Acidic Solution” handout.
step6:Depress the bulb of the second pipette, and draw some of the NaOH(aq) solution into the pipette.
step7:Hold the pipette containing the NaOH(aq) over the well (or watch glass) containing the lemon juice.
step8:Gently squeeze the bulb and carefully deliver drops of NaOH(aq) solution into the well until the indicator changes colour. Record the number of drops required and the final indicator colour in your table.
step9:Repeat steps 3 to 8 using the third pipette to deliver the vinegar solution to the second well (or watch glass).
AnalysisUse the data collected to identify which of the two solutions tested—the commercial lemon juice or the vinegar—contains more acid.
Traditional Ecological KnowledgeIn Lesson 1.3 you analyzed changes to the environment that scientists and others who depend on the land might observe. You also noted that these observations might be interpreted as being related to the effects of acid deposition, but they are often best considered within a larger context. When studying acid deposition, scientists recognize the intricate connections within ecosystems and have come to recognize the value of traditional ecological knowledge possessed by some members of Canada’s First Nations, Métis, and Inuit. Traditional ecological knowledge provides a holistic or “big-picture” view. This is not only about an intimate knowledge of plants, animals, and natural phenomena, it also involves an understanding of how technologies used by First Nations, Métis, and Inuit groups have impacted the environment. When investigating environmental issues, the holistic data provided through traditional ecological knowledge often complements the methods used by scientists. This combination of perspectives provides for a fuller understanding of the complex web of interactions and relationships within an ecosystem.
traditionalecologicalknowledge: the accumulated observations and understanding of the people living within an area, acquired over many hundreds of years through direct contact with the environment
Identifying the More Acidic Solution
Try This Activity
Science 30 © 2007 A
lberta Education (w
ww
.education.gov.ab.ca). Third-party copyright credits are listed on the attached copyright credit page.
Unit B: Chemistry and the Environment204
How is it possible to determine which solution contains more acid using such simple equipment? What is the significance of using NaOH(aq) and an indicator? Perhaps measuring the volume and proportions of each reactant involved is a key to using your observations from a titration. From your observations, were you able to identify which solution was more concentrated in the previous activity, “Identifying the More Acidic Solution”? In fact, you counted and compared the number of drops required to bring about a colour change to the indicator. There is always a need for quantitative data (in this case, number of drops) along with qualitative data (the colour change signifying the completion of the reaction) to find an answer. Now that you have completed your first titration, it is time for you to see how this method can be used to provide precise numerical data.
Titration—Quantifying Acid in a SolutionPreviously, you examined rainfall data to further examine the factors related to acid deposition. While analyzing the graphs, you may have noted that higher values for total acidity for the rainfall occurred at times when higher concentrations of sulfate ions were present. This pattern contrasts with the inverse variation that occurs when comparing the total acidity and pH. Although pH is a measure of the concentration of hydronium ions in a solution, other methods often have to be used to determine the amount of acid present. Titration is a method of determining the quantity of acid or base present in a sample. As you know, acids can be neutralized by a reaction with a base. Also, the colour change for some indicators can be used to signify when the pH of a solution changes from acidic to basic.
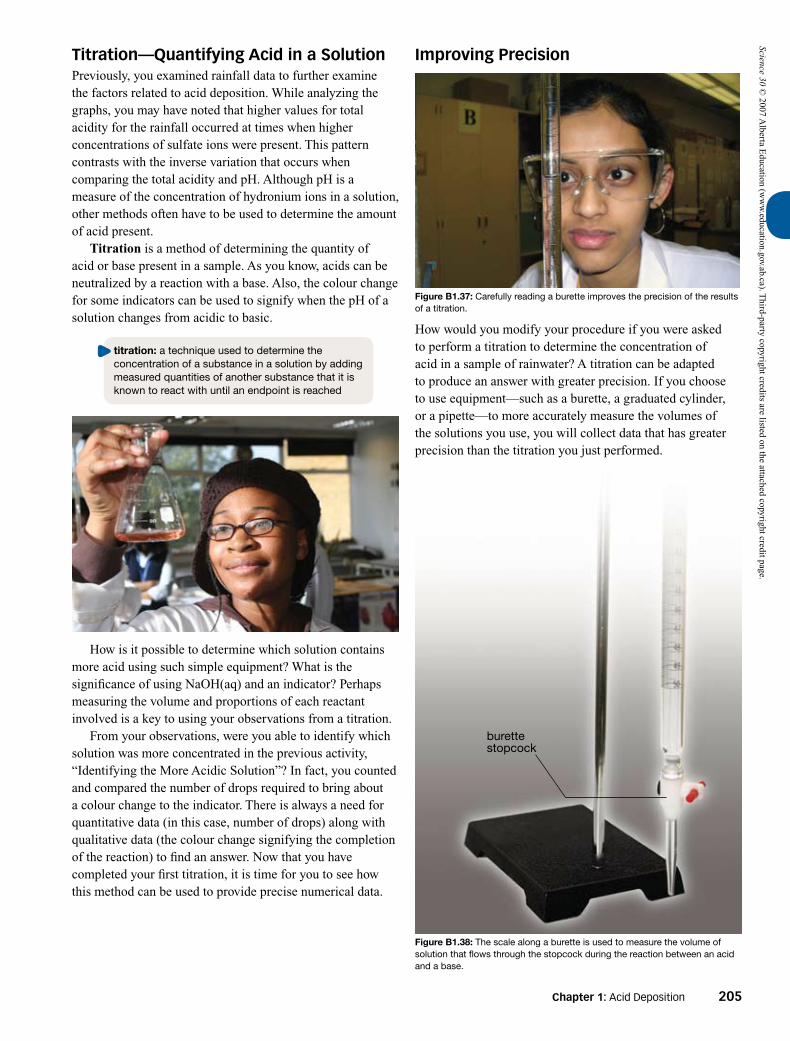
burettestopcock
Improving Precision
How would you modify your procedure if you were asked to perform a titration to determine the concentration of acid in a sample of rainwater? A titration can be adapted to produce an answer with greater precision. If you choose to use equipment—such as a burette, a graduated cylinder, or a pipette—to more accurately measure the volumes of the solutions you use, you will collect data that has greater precision than the titration you just performed.
FigureB1.38: The scale along a burette is used to measure the volume of solution that flows through the stopcock during the reaction between an acid and a base.
FigureB1.37: Carefully reading a burette improves the precision of the results of a titration.
Science 30 © 2007 A
lberta Education (w
ww
.education.gov.ab.ca). Third-party copyright credits are listed on the attached copyright credit page.
titration: a technique used to determine the concentration of a substance in a solution by adding measured quantities of another substance that it is known to react with until an endpoint is reached
Chapter 1: Acid Deposition 205

Titration of an Acid with a Base—Demonstration
Investigation
Science SkillsAnalyzing and Interpreting�
BackgroundInformationYour teacher will demonstrate the procedure for performing a titration. As you watch the demonstration, refer to the instructions given. You will be asked to perform titrations later in this lesson, so paying careful attention to the values you need to measure and record is essential to your ability to adapt this process. Titrations can be performed in microscale or macroscale. This activity uses the macroscale method; however, if you wish to view the instructions describing the microscale method, they are located on the Science 30 Textbook CD.
Use gloves, safety glasses, and a lab apron for this activity.
Materials• bromothymol blue (or phenolphthalein)
• acid solution, containing an unknown concentration of H3O
+(aq)
• 0.100-mol/L NaOH(aq)
• de-ionized or distilled water in a wash bottle
• 250-mL beaker
• 2, 50-mL beakers
• 125-mL Erlenmeyer flask
• 10-mL graduated cylinder (or 10-mL pipette and pipette bulb)
• small liquid funnel
• 50-mL burette
• burette clamp
• ring stand
• grease pencil (or waterproof marker)
MacroscaleMethodstep1: Use the grease pencil to label a 50-mL beaker
“Acid.” Transfer approximately 40 mL of the acid solution (of unknown concentration) to this beaker.
step2: Use the grease pencil to label another 50-mL beaker “Base Sodium Hydroxide.” Transfer approximately 45 mL of the NaOH(aq) to this beaker.
step3: Attach and secure the burette clamp half-way along the ring stand.
step4: Carefully wash the burette. Close the stopcock; then fill it one-third full with water from the wash bottle. Tilt the burette sideways to wash the inside walls with the water; then tilt the burette vertically and hold it over the 250 mL beaker, which will serve as the waste beaker. Open the stopcock and transfer the wash water from the burette into the waste beaker. Repeat this step one more time.
step5: Place the burette into the burette clamp attached to the ring stand.
step6: Close the stopcock; place the funnel into the upper end of the burette; and add approximately 15–20 mL of NaOH(aq) to the burette. Remove the funnel from the top of the burette.
step7: Carefully remove the burette from the clamp; then tilt and wash the inside walls with the sodium hydroxide solution. Return the burette to the clamp. Position the waste beaker under the burette. Open the stopcock to drain the burette.
step8: Close the stopcock and replace the funnel in the upper end of the burette. Add NaOH(aq) to fill the burette so that the liquid level is within the range of 0 and 5 mL.
step9: Position the burette so that the level of the NaOH(aq) is at eye level, and measure the position of the lower surface of the meniscus. (You should be able to measure this to at least one decimal place; however, two decimal places is preferred. You might find that using a card with a dark line on it improves the visibility of the bottom of the meniscus.) Record this level in your table.
33.13.23.243.33.43.5
4
Science 30 © 2007 A
lberta Education (w
ww
.education.gov.ab.ca). Third-party copyright credits are listed on the attached copyright credit page.
Unit B: Chemistry and the Environment206

Using Titration DataWhen a base is added to an acid, a neutralization reaction occurs.
47
48
49
50
Burette Containing NaOH(aq)– source of OH–(aq)– concentration known
Flask ContainingHCI(aq) andBromothymol Blue– source of H3O+(aq)– concentration unknown
At Endpoint– excess OH–(aq)– base conditions– indicator in base colour
OH–
OH–
OH–
OH–
H3O+
H3O+
H3O+
H3O+
H3O+
H3O+
H3O+
H3O+
H3O+
H3O+(aq) + OH–(aq) Æ H2O(l) + H2O(l)
Start of Titration– excess H3O+(aq)– acidic conditions– indicator in acid colour
OH–
OH–
OH–
H3O+
H3O+
Near Endpoint– slight excess H3O+(aq)– near neutral conditions– indicator in intermediate colour
OH–
FigureB1.39: Events of titration
step10: Using either a graduated cylinder or a pipette, transfer 10.0 mL of the acid solution to the 125-mL Erlenmeyer flask. Record the volume of acid sample transferred in your table.
step11: Add 3 to 4 drops of bromothymol blue (or phenolphthalein). Record the colour of the indicator in the acid sample in your table.
step12: Position the Erlenmeyer flask containing the acid and indicator under the burette and then open the stopcock. Add a small amount of the solution from the burette to the contents of the flask. As you add solution from the burette, swirl the contents of the flask to ensure mixing. Repeat adding small amounts of solution from the burette to the flask until the indicator changes colour. Record this colour in your table.
step13: Once a permanent colour change has been reached, position the burette so that the level of the NaOH(aq) is at eye level. Measure the position of the lower surface of the meniscus. Record this level in your table.
step14: Transfer the contents of the Erlenmeyer flask to the waste beaker. Rinse the flask with some water from the wash bottle. Repeat steps 8 to 13 to obtain data from two more trials.
step15: Disassemble, wash, and return equipment to its proper location. Repeat step 4 to wash the burette.
Note: Save your data from this investigation. You will analyze it later in this lesson.
Science 30 © 2007 A
lberta Education (w
ww
.education.gov.ab.ca). Third-party copyright credits are listed on the attached copyright credit page.
Chapter 1: Acid Deposition 207

A balanced chemical equation is like a recipe describing how to carry out a reaction. The chemical formulas you write tell you what to use, and the coefficients that appear in front of the chemical formulas describe how much of each component to use. If you read the reaction between hydronium and hydroxide aloud, it would sound like, “One hydronium ion reacts with one hydroxide ion to produce two molecules of water.” The pattern can then be expanded to any number of particles, including the number of moles. You may recall from previous science courses that the amount of particles within a chemical system is measured as moles. A mole refers to a set number of molecules or particles. One mole refers to the same number of particles for any substance. Using moles, you can read the statement as, “One mole of hydronium reacts with one mole of hydroxide to produce two moles of water molecules.” If you were to focus on the relationship between the relative amounts of hydronium and hydroxide involved in the reaction, the same equation could be stated as, “For each mole of hydronium that reacts, one mole of hydroxide is required.”
In Figure B1.39 on page 207, hydroxide ions within the sodium hydroxide solution were added to neutralize the hydronium ions present in the acid solution being tested. As sodium hydroxide from the burette is added, hydroxide ions enter the acid solution in the flask. A reaction between hydronium ions and hydroxide ions occurs until an excess of hydronium ions no longer exists. The decrease in the quantity of hydronium ions causes the pH of the solution in the flask to increase. The increase in pH is noticeable because of the colour change of the indicator. Once the indicator changes colour to indicate a basic condition, the endpoint of the titration has been reached and the addition of more hydroxide ions causes no further chemical change. As demonstrated in Figure B1.39, it is critical to note the proportion of hydroxide ions required to neutralize the hydronium ions in the solution. Previously, you studied reactions between an acid and a base that did not require coefficients larger than 1 in order to be balanced. You might like the simplicity of not having to use larger coefficients, but the ratio of one particle of acid reacting with one particle of base has even greater significance.
ChemicalReactionBetweenHydroniumandHydroxide
H O aq OH aq H O l H O l
acid conjugatebase
base conjuga23 2
+ -( ) + ( ) Æ ( ) + ( )tte
acid
transfers one H+ to become
accepts one H+ to become
StatementofProportions
1H O aq OH aq H O l H O l1
acid conjugatebase
base conju23 2
+ -( ) + ( ) Æ ( ) + ( )ggate
acid
transfers one H+ to become
accepts one H+ to become
1 particle ofH3O
+(aq)
1 mol ofH3O
+(aq)particles
reactswith
OR
reactswith
1 particle ofOH -(aq)
1 mol ofOH -(aq)particles
THEREFOREnacid reacted = nbase reacted
Science 30 © 2007 A
lberta Education (w
ww
.education.gov.ab.ca). Third-party copyright credits are listed on the attached copyright credit page.
208 Unit B: Chemistry and the Environment
The statement of proportions demonstrated by the balanced chemical equation is what makes it possible to determine the concentration of the unknown solution titrated in the “Titration of an Acid with a Base” demonstration. During the demonstration, moles of hydroxide were added until the acid was neutralized. If you can determine the number of moles of hydroxide that were added, the statement of proportions for this equation indicates that an equal number of moles of hydronium had to be neutralized by the reaction. The molar concentration of a solution is the number of moles of dissolved solute per litre of solution.
The concentration formula can be rearranged to determine the number of moles.
C nV
C V nV
V
n CV
=
¥ = ¥
=
When working with solutions, it is common to know the concentration and volume of the solution you used during the process. In the case of a titration, you tend to use a standard solution in the burette and the graduations along the burette to determine the volume delivered during the titration. The values for the concentration of the standard solution (in the burette) and the volume of solution used to reach the endpoint are substituted into the formula to calculate the number of moles of reactant in the standard solution used to complete the reaction.
standard solution C nV
=
number of moles of dissolved substance (mol)
molar concentration(mol/L) total volume of solution (L)
standardsolution: a solution that has a known concentration
C nV
=
reactant in standard solution standard solution used in each titration
If the acid and the base react in a 1:1 proportion, then
nacid reacted
= nbase reacted
This statement of proportions for an acid-base reaction, where there is a transfer of a single hydrogen ion, can be interpreted as the number of moles of reactant in the standard solution is equal to the number of moles of reactant in the test solution. Recall that the problem identified at the start of the titration demonstration was to determine the molar concentration of the hydronium ions in the acidic solution. Up to this point, you have been able to determine the number of moles of reactant in the standard solution—hydroxide—and, thus, the number of moles of reactant in the test solution—the acid. Now, using the concentration formula, you can determine the molar concentration of the test solution. This time, use the number of moles of reactant and the volume of the test solution.
test solution C nV
=
The data recorded in the titration demonstration can be used to calculate the concentration of the acid in the solution tested. Work through the calculations performed in Example Problem 1.9 on pages 210 and 211. Use the data you recorded from the demonstration to determine the concentration of hydronium ions in the hydrochloric acid tested.
reactant in test solution test solution used in each titration
Science 30 © 2007 A
lberta Education (w
ww
.education.gov.ab.ca). Third-party copyright credits are listed on the attached copyright credit page.
Chapter 1: Acid Deposition 209

The table given shows data from the titration of four 10.0-mL samples of a solution containing hydronium ions and phenolphthalein using 0.130-mol/L sodium hydroxide solution (the standard solution).
Trial
VolumeofStandardSolution(mL)EndpointColourFinal Initial Added
1 13.44 1.22 dark pink
2 25.35 13.44 light pink
3 37.33 25.35 light pink
4 49.22 37.33 light pink
Calculate the concentration of the hydronium ions in the acid solution.
Solutionstep 1: Complete the table.
Trial
VolumeofStandardSolution(mL)EndpointColourFinal Initial Added
1 13.44 1.22 12.22 dark pink
2 25.35 13.44 11.91 light pink
3 37.33 25.35 11.98 light pink
4 49.22 37.33 11.89 light pink
step 2: Select the most consistent trials, and calculate the average volume of standard solution added.
Trials 2 to 4 are the most consistent. This is shown by the similar endpoint colour and the similar volume of standard solution required (within 0.09 mL of each other). Therefore,
Vstandard solution
mL
mL
=+ +( )
==
11 91 11 98 11 893
11 926 666 67
. . .
.
111 93. mL
step 3: Confirm proportions by writing the balanced chemical equation for the titration process.
H3O+(aq) + OH -(aq) Æ H
2O(l) + H
2O(l)
Therefore, for every mole of base, OH -(aq), that reacts, one mole of acid, H3O+(aq), reacts. This means
n nbase reacted acid reacted
= .
Example Problem 1.9
continued
Science 30 © 2007 A
lberta Education (w
ww
.education.gov.ab.ca). Third-party copyright credits are listed on the attached copyright credit page.
Unit B: Chemistry and the Environment210 Chapter 1: Acidic Deposition—Causes, Effects, and Its Applications 210
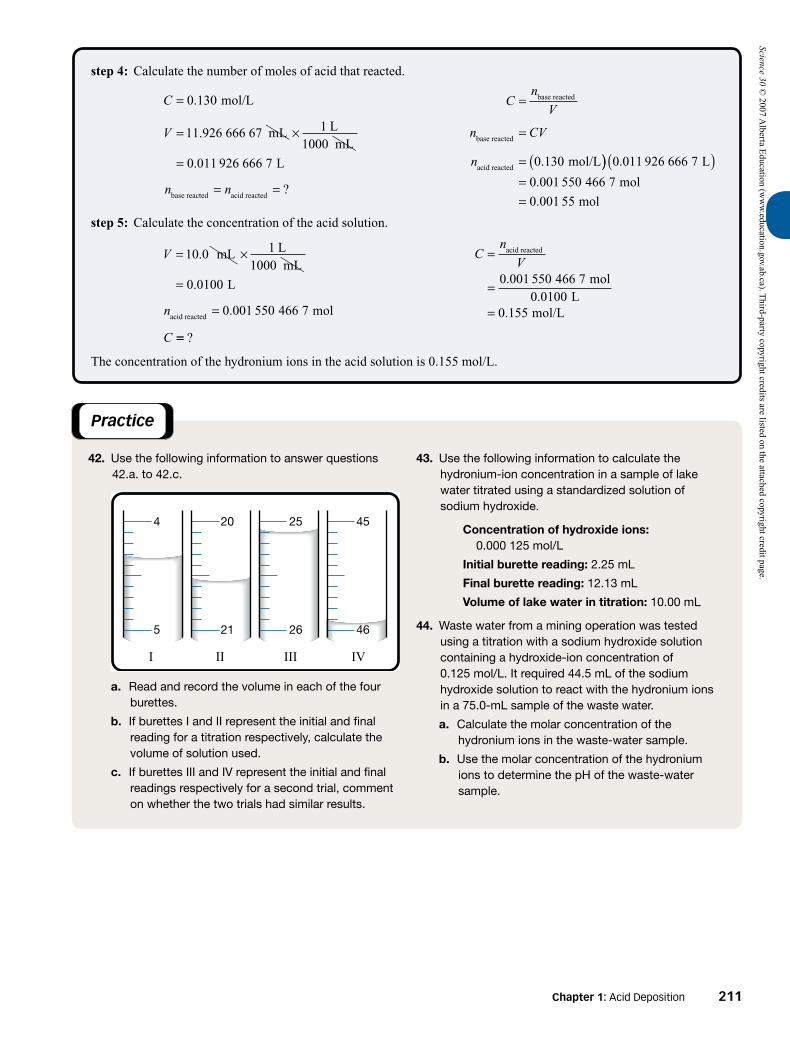
42. Use the following information to answer questions 42.a. to 42.c.
4
5
I
20
21
II
25
26
III
45
46
IV
a. Read and record the volume in each of the four burettes.
b. If burettes I and II represent the initial and final reading for a titration respectively, calculate the volume of solution used.
c. If burettes III and IV represent the initial and final readings respectively for a second trial, comment on whether the two trials had similar results.
43. Use the following information to calculate the hydronium-ion concentration in a sample of lake water titrated using a standardized solution of sodium hydroxide.
Concentrationofhydroxideions: 0.000 125 mol/L
Initialburettereading: 2.25 mL
Finalburettereading: 12.13 mL
Volumeoflakewaterintitration: 10.00 mL
44. Waste water from a mining operation was tested using a titration with a sodium hydroxide solution containing a hydroxide-ion concentration of 0.125 mol/L. It required 44.5 mL of the sodium hydroxide solution to react with the hydronium ions in a 75.0-mL sample of the waste water.
a. Calculate the molar concentration of the hydronium ions in the waste-water sample.
b. Use the molar concentration of the hydronium ions to determine the pH of the waste-water sample.
step 4: Calculate the number of moles of acid that reacted.
C
V
n
=
= ¥
=
0 130
11 926 666 67 11000
0 011 926 666 7
.
.
.
mol/L
mL LmL
L
base reacted acid reacted= =n ?
Cn
V
n CV
n
=
=
= (
base reacted
base reacted
acid reacted mol/L0 130. )) ( )
==
0 011 926 666 7
0 001 550 466 7
0 001 55
.
.
.
L
mol
mol
step 5: Calculate the concentration of the acid solution.
V
n
C
= ¥
=
=
10 0 11000
0 0100
0 001 550 466 7
.
.
.
mL LmL
L
molacid reacted
== ?
Cn
V=
=
=
acid reacted
mol L
mol/L
0 001 550 466 70 0100
0 155
..
.
The concentration of the hydronium ions in the acid solution is 0.155 mol/L.
Practice
Science 30 © 2007 A
lberta Education (w
ww
.education.gov.ab.ca). Third-party copyright credits are listed on the attached copyright credit page.
Chapter 1: Acid Deposition 211

Why Use a Titration?For situations where the amount of substance in a solution is required, titration is the preferred method. Titrations can be performed quickly and with relatively inexpensive equipment. Because many trials are done on samples of the test solution, the results can be used to demonstrate consistent results. Consistent results improve confidence in the data and emphasize the reliability of the titration process.
PurposeYou will determine the concentration of acid or base in a test sample.
BackgroundInformationThe process of titration can be adapted to a variety of situations. Consult with your teacher for further instructions as to which solutions or substances you will be using in this investigation. You may wish to refer to the detailed procedure shown in the titration demonstration earlier in this lesson (pages 206 and 207) and, if necessary, adapt the procedure.
PerformingandRecordingPrepare a data table to record qualitative and quantitative observations from each of the trials performed. Ensure that your data is recorded in a logical and understandable manner.
Analysis1. Use the data you collected to complete the calculations as instructed by your teacher.
CommunicationandTeamworkObtain a copy of a data table from another group of students. Use the data to perform the calculations as instructed by your teacher. Then meet with other students to review the results of the calculations performed on your data and the data of other students.
2. Identify similarities and differences between the sets of data.
3. Comment on whether consistency is observed within the data analyzed. Identify how consistency is evident or not evident within a set of data and between the sets of data.
4. How does the consistency (or lack thereof) in the data affect your confidence in being able to state the concentration of the solution tested? Identify which aspect—reliability or validity—is addressed by consistency within and between the sets of data.
Performing a Titration
Investigation
Science SkillsPerforming and RecordingAnalyzing and InterpretingCommunication and Teamwork
���
Science 30 © 2007 A
lberta Education (w
ww
.education.gov.ab.ca). Third-party copyright credits are listed on the attached copyright credit page.
Unit B: Chemistry and the Environment212

PurposeDo all acids behave similarly? You will compare two acids that appear at different positions on the “Table of Acids and Bases.”
Materials• 1.00-mol/L ethanoic acid• 1.00-mol/L hydrochloric acid• 2, 10-mL graduated cylinders• 2 eyedroppers• 2, 5-cm lengths of magnesium ribbon• 2, 50-mL beakers• 2 test tubes (capacity around 5 mL)• pH paper (or pH meter)• test tube rack• scissors• grease pencil (or waterproof marker)• stopwatch (or clock)• conductivity meter• forceps or tweezers
Use gloves, safety glasses, and a lab apron for this activity.
Procedurestep1:Prepare a data table with two columns. Use the names of the two acid solutions listed in the materials as the
headings for your table.
step2:Use the grease pencil to label one of the test tubes “Ethanoic Acid.” Place the test tube into the test tube rack.
step3:Transfer exactly 5.00 mL of ethanoic acid to one of the graduated cylinders. Use an eyedropper to ensure the meniscus is at the 5.00-mL mark on the cylinder.
step4:Transfer the ethanoic acid in the graduated cylinder to the “Ethanoic Acid” test tube.
step5:Transfer enough of the ethanoic acid from the test tube to cover the bottom of one of the 50-mL beakers. Use the conductivity meter to test the solution. Record your observations in your data table. Use the acid in the beaker to measure the pH. Place one of the strips of pH paper into the remaining solution, and record the pH of the solution in a data table. (If you are using a pH meter, you may have to use a larger volume of acid in the beaker to cover the electrode at the bottom of the meter. Ensure that you rinse the electrode before testing the pH of the second solution.)
step6:Repeat steps 2 to 5 using the hydrochloric acid solution.
step7:Place a strip of magnesium into each of the test tubes. Record the initial response of the magnesium to the acid and the length of time until a reaction no longer occurs in each of the test tubes. Estimate the amount of magnesium remaining in each test tube.
AnalysisUse the data collected to prepare a list of similarities and differences between ethanoic acid and hydrochloric acid.
Comparing Two Acids
Try This Activity
Science 30 © 2007 A
lberta Education (w
ww
.education.gov.ab.ca). Third-party copyright credits are listed on the attached copyright credit page.
Science SkillsPerforming and RecordingAnalyzing and Interpreting
��
Chapter 1: Acid Deposition 213

Acids and bases can be categorized into two groups: strong and weak. The members of each group appear in the “Table of Acids and Bases.”
You might then interpret the lower conductivity and the higher pH of the ethanoic acid solution to mean that ethanoic acid produced fewer hydronium ions when it reacted with water.
ReactionofHydrochloricAcidandWater
HCl aq H O l H O aq Cl aq( ) + ( ) Æ ( ) + ( )+ -
acid conjugateacid
base conjug2 3
aatebase
ReactionofEthanoicAcidandWater
CH COOH aq H O l H O aq CH COO aq
acid conjugateacid
base3 2 3 3( ) + ( ) Æ ( ) ++ - (( )
conjugatebase
AcidName AcidFormula ConjugateBaseFormula
hydrochloric acid HCl(aq) Cl-(aq)
sulfuric acid H2SO4(aq) HSO4-(aq)
nitric acid HNO3(aq) NO3-(aq)
hydronium ion H3O+(aq) H2O(l)
oxalic acid HOOCCOOH(aq) HOOCCOO-(aq)
sulfurous acid H2SO3(aq) HSO3-(aq)
hydrogen sulfate ion HSO4-(aq) SO4
2-(aq)
phosphoric acid H3PO4(aq) H2PO4-(aq)
orange IV HOr(aq) Or-(aq)
nitrous acid HNO2(aq) NO2-(aq)
hydrofluoric acid HF(aq) F-(aq)
methanoic acid HCOOH(aq) HCOO-(aq)
methyl orange HMo(aq) Mo-(aq)
benzoic acid C6H5COOH(aq) C6H5COO-(aq)
ethanoic (acetic) acid CH3COOH(aq) CH3COO-(aq)
carbonic acid, CO2(g) + H2O(l) H2CO3(aq) HCO3-(aq)
bromothymol blue HBb(aq) Bb-(aq)
hydrosulfuric acid H2S(aq) HS-(aq)
phenolphthalein HPh(aq) Ph-(aq)
boric acid H3BO3(aq) H2BO3-(aq)
ammonium ion NH4+(aq) NH3(aq)
hydrogen carbonate ion HCO3-(aq) CO3
2-(aq)
indigo carmine HIc(aq) Ic-(aq)
water (55.5 mol/L) H2O(l) OH-(aq)
TABLEOFACIdSANdBASES
STRONGACIdS
WEAKBASES
STRONGBASE
WEAKACIdS
Strong and Weak AcidsThe differences in the behaviour of ethanoic acid and hydrochloric acid are representative of two groupings used to classify acids. In the “Comparing Two Acids” activity, you tested two acid solutions with identical molar concentrations. Despite this similarity, can you explain why the hydrochloric acid solution had a lower pH and higher conductivity than the ethanoic acid solution? Earlier in this lesson you discovered that solutions with lower pH values, like hydrochloric acid, contain higher concentrations of hydronium ions. The higher conductivity of the hydrochloric acid solution confirmed that it contained more ions. The results from these two tests suggest that hydrochloric acid behaves differently than ethanoic acid in an aqueous solution.
Science 30 © 2007 A
lberta Education (w
ww
.education.gov.ab.ca). Third-party copyright credits are listed on the attached copyright credit page.
Unit B: Chemistry and the Environment214

45. List the acids produced from sulfur oxide and nitrogen oxide emissions. Use the “Table of Acids and Bases” to classify these acids as being either strong or weak.
46. Use the pH values you measured in the “Comparing Two Acids” activity to further support the notion that the two acids tested produce different concentrations of hydronium ions.
47. “Strong acids react almost completely with water to produce hydronium ions.” Is this statement supported by the data you collected in the “Comparing Two Acids” activity? Support your answer.
48. Write the balanced chemical equation for the reaction between nitrous acid, HNO2(aq), and hydroxide, OH -(aq). Identify the acid, the base, the conjugate acid, and the conjugate base.
The reaction between sulfurous acid and carbonate ions demonstrates that the deposition of a weak acid could react with carbonate ions—a substance found in many types of soil. From the “Comparing Two Acids” activity, you saw that a weak acid solution and a strong acid solution of identical concentration and volume produces the same overall effect. Now, recall that many acids are produced from emissions. Whether strong or weak, acids can still lower the pH of water and react with components in the soil. Can you predict the effect on chemical components of soil, like carbonate ions, when subject to long-term acid deposition?
ReactionofaWeakAcidandaBase
H SO aq CO aq
sulfurous acidweak acid
carbonate ionb
2 3 32( ) + ( )
( )
-
aaseconjugate
acidconjugate
base
HSO aq HCO aq
( )
Æ ( ) + ( )- -3 3
transfers one H+ to become
accepts one H+ to become
Practice
As indicated earlier, the substances in the “Table of Acids and Bases” are arranged according to strength. It is important to note that strength refers only to the extent that an acid or base will react with water to produce hydronium ions or hydroxide ions, respectively. As you saw, both the ethanoic acid and the hydrochloric acid tested had equal molar concentrations and both consumed the same amount of magnesium ribbon. It is important to remember that weak acids will transfer a hydrogen ion to a base similar to the way a strong acid will.
Titrations Involving Strong or Weak Acids and BasesWhen you completed the “Comparing Two Acids” investigation, you may have been surprised to find that acids can vary in the extent to which they react with water. Earlier in this chapter you used pH measurements to measure acidity; but the results of the last investigation showed that pH is not the best way to determine the concentration of acid in a solution. When acid particles react directly with base particles, titration is the preferred method of determining the concentration of acid in a solution. When designing a titration, you need to ensure that the acid will react with the base; so, when possible, a solution containing hydroxide ions (a strong base) is used. For a similar reason, solutions containing strong acids are most often used to titrate basic solutions. When selecting solutions for titration, you may want to refer to the “Table of Acids and Bases.” Regardless of the acid being titrated, the quantity (number of moles) involved in the reaction, not its strength, will determine the volume of base required. Example Problems 1.10 and 1.11, on pages 216 and 217, demonstrate calculations using data obtained from the titration of weak acids and bases. As you work through these problems, identify similarities in how these problems and the examples you completed earlier were solved.
Science 30 © 2007 A
lberta Education (w
ww
.education.gov.ab.ca). Third-party copyright credits are listed on the attached copyright credit page.
Chapter 1: Acid Deposition 215

A 25.00-mL sample of methanoic acid, HCOOH(aq), was titrated with a standard solution of 0.250-mol/L sodium hydroxide, NaOH(aq). If 17.5 mL of sodium hydroxide was required to react with the methanoic acid, calculate the initial concentration of the acid solution.
Solutionstep 1: Write the balanced chemical equation of the reaction between the acid and the base.
Note: Only OH -(aq) is written because that is how this base appears on the “Table of Acids and Bases.” Since Na+(aq) is neither an acid nor a base, it is not involved in this reaction and does not need to appear in the equation.
step 2: Confirm that the acid and base react in equal proportions using the coefficients from the balanced chemical equation.
Because the acid and base react in equal proportions,
n nOH HCOOH- =
step 3: Use the data to determine the initial concentration of the methanoic acid.
C
V
V
OH
OH
HCOOH
mol/L
mL LmL
L
-
-
=
= ¥
=
=
0 250
17 5 11000
0 0175
25 00
.
.
.
. mmL LmL
L
HCOOH
¥
=
=
11000
0 025 00.
?C
n n
C V C V
CC V
V
OH HCOOH
OH OH HCOOH HCOOH
HCOOHOH OH
HCOOH
-
- -
- -
=
=
=
=0 25. 00 0 0175
0 025 00
0 175
mol/L L
L
mol/L
( ) ( )( )
=
.
.
.
The initial concentration of the methanoic acid was 0.175 mol/L.
Example Problem 1.10
transfers one H+ to become
transfers one H+ to become
HCOOH aq OH aq HCOO aq H O l( ) + ( ) Æ ( ) + ( )- -
acid conjugatebase
base con
2
jjugateacid
Science 30 © 2007 A
lberta Education (w
ww
.education.gov.ab.ca). Third-party copyright credits are listed on the attached copyright credit page.
Unit B: Chemistry and the Environment216

49. In a titration, 27.3 mL of a 0.0130-mol/L potassium hydroxide solution was required to neutralize 50.0 mL of a nitric acid solution. Calculate the concentration of the nitric acid solution.
50. A student titrates a solution containing an unknown concentration of sodium hydroxide with a standard solution of hydrochloric acid. If 33.6 mL of 0.0200-mol/L hydrochloric acid is required to neutralize a 25.0-mL sample of the basic solution, calculate the concentration of the sodium hydroxide in the basic solution.
51. A technician wants to predict the volume of a 0.150-mol/L sodium hydroxide solution required to neutralize 2.00 L of a 0.100-mol/L acidic solution. Calculate the volume of sodium hydroxide solution required.
Calculate the volume of a 0.150-mol/L solution containing hydrogen carbonate ions required to react with the hydronium ions present in 75.5 mL of a 0.200-mol/L hydrobromic acid solution.
SolutionWrite the balanced chemical equation for this reaction, and determine the proportion of base reacted to acid reacted.
H3O+(aq) + HCO
3-(aq) Æ H
2CO
3(aq) + H
2O(l)
Therefore, n nHCO H O3
- +=3
.
Determine the volume of carbonate ions needed to react with the hydrobromic acid.
C
V
C
H O
H O
HCO
mol/L
mL L mL
L
3
3
3
0 200
75 5 11000
0 0755
0
+
+
+
=
= ¥
=
=
.
.
.
..
?
150 mol/L
HCO3
V - =
n n
C V C V
VC V
C
HCO H O
HCO HCO H O H O
HCO
H O H O
HCO
3 3
3 3
3 3
3
- +
- - + +
-
+ +
-
=
=
=
3 3
3
==( ) ( )
( )=
0 200 0 0755
0 150
0 101 101
. .
.
.
mol/L L
mol/L
L or mL
To neutralize the hydrobromic acid, 101 mL of the hydrogen carbonate ion solution is required.
Example Problem 1.11 Practice
Determining Buffering CapacityComponents in the soil or water can neutralize acid added as either wet or dry deposition. As you know, soils and lake water in different parts of Canada have different chemical components and, thus, vary in their ability to neutralize acids. As a result, measuring the buffering capacity of soil or lake water provides a great deal of insight into the ability of an area to withstand the effects of acid deposition. Buffering, as the term suggests, refers to a sample’s ability to be exposed to acid or base and not change in pH. The chemical components in soil can act as buffers because substances that can act as bases or as acids are present. You have examined the importance of the carbonate ion, CO
32-(aq), as a buffer in soil. Because a carbonate ion has the
ability to accept a hydrogen ion from an acid, the carbonate ion reacts with the acid, keeping the pH of the soil (or of the water) constant.
Science 30 © 2007 A
lberta Education (w
ww
.education.gov.ab.ca). Third-party copyright credits are listed on the attached copyright credit page.
Chapter 1: Acid Deposition 217

H2CO3(aq) HCO3–(aq)+ base Æ
Blood Buffering
+
HCO3–(aq) H2CO3(aq)+ acid Æ
conjugate acid
+ conjugate acid
red blood cells
blood vessel
Buffers exist in other biological systems. Blood contains two dissolved chemical substances: carbonic acid, H2CO
3(aq),
and hydrogen carbonate, HCO3-(aq). Each of these substances has the ability to react with and counteract the presence of
either excess base or excess acid, respectively, that may be present in blood. Because a change in blood pH of over 0.5 can be fatal, this buffering mechanism is important to survival. Even when you are exercising and producing lots of CO
2 and lactic
acid, the hydrogen carbonate ion in the blood counteracts the effects of CO2 and lactic acid to maintain a constant pH.
source of mineralsthat can act asbuffers for soil
source of mineralsthat can act as
buffers for water
Science 30 © 2007 A
lberta Education (w
ww
.education.gov.ab.ca). Third-party copyright credits are listed on the attached copyright credit page.
SourcesofBuffering
FigureB1.40: The chemical composition of rock underlying soil and bodies of water influences buffering capacity.
Unit B: Chemistry and the Environment218

BackgroundInformationSo far in this unit you have learned about acid-base reactions, indicators, pH, titrations, and calculations involving chemical quantities of substances when dissolved in solution. You are encouraged to use your accumulated knowledge and skills to develop an experiment that could achieve the purpose of this investigation.
Science Skills Initiating and Planning�
PurposeYou will develop a procedure to determine the amount (number of moles) of acid that can be buffered by a sample of lake water or by a sample of soil.
Designing an Experiment to Determine Buffering Capacity
Investigation
Other Ways of Monitoring Acid DepositionIn Lesson 1.1 you discovered that Alberta’s Ministry of the Environment collects information about the condition of the atmosphere from a variety of monitoring stations throughout the province. In addition, a mobile monitoring station is available to travel to locations where additional testing is required. Recall that scientists examine biodiversity and changes to populations within an ecosystem as another source of information about the effects of acid deposition. You also looked at the traditional ecological knowledge of people within Canada’s First Nations, Métis, and Inuit communities regarding changes that have been occurring within the environment. All of these sources provide valuable information and contribute to a better understanding of the impact human activity has on the environment.
Fort McMurray
Fort VermilionFort Chipewyan
Beaverlodge Cold Lake
Lethbridge
KananaskisSuffield
Red Deer
Calgary
Edmonton
Calgary
Edmonton
East
Central
Alberta EnvironmentAir QualityMonitoring Stations
Alberta EnvironmentPrecipitation QualityMonitoring Stations
South
East
Central
Northwest
FigureB1.42: Monitoring stations throughout Alberta collect data to provide information about air quality.
Volume of Substance Added
buffering capacity
buffering
bufferingends
bufferdepletedp
H
pH Graph for a Buffer
substance added is an acidsubstance added is a base
FigureB1.41: Buffers minimize the pH change for a system (e.g., soil or lake water). A sharp change to the pH of a sample being tested indicates that the acid or base being added is no longer being neutralized—the buffering capacity has been exceeded.
The net effect of a buffer is to maintain the pH at a relatively constant level despite the addition of an acid or base. Can buffering last forever? From earlier studies, it appears that regions of eastern Canada have low natural buffering capacity; many areas have become overwhelmed by acid deposition. Is it possible to apply what you have learned about performing a titration and using the data collected to determine a value for the buffering capacity of a sample? In the next investigation you will develop an experimental procedure to address this question.
FigureB1.43: This is one of many air monitoring stations around Alberta.
Science 30 © 2007 A
lberta Education (w
ww
.education.gov.ab.ca). Third-party copyright credits are listed on the attached copyright credit page.
Chapter 1: Acid Deposition 219

PurposeYou will evaluate the experimental design of a study developed to monitor the effects of acid deposition and the recovery of an area affected by acid deposition.
BackgroundInformationThe effects of acid rain were first noticed in the Great Lakes region of eastern Canada in the 1970s. Since that time, a great deal of study has been undertaken to identify factors and patterns of emissions and how they have affected the environment. Current studies involve the long-term collection of chemical and biological data to monitor a number of lakes in the region for signs of change. You should note that many of these lakes have been affected by acidification and are being monitored for changes to determine whether water quality and ecosystems are demonstrating improvement over time.
Procedurestep1:Prepare a table with two columns. Add the heading “Positive Aspects” to the first column and the
heading “Negative Aspects” to the second column.
step2:Obtain the document “Acid Rain Biomonitoring in Ontario’s Lakes” from the Science 30 Textbook CD.
step3:Read the plan described in the document. Then use the Internet to conduct additional research on this plan.
step4:Consider each aspect of the plan described in the document and those identified in the additional information you collected. Determine if the aspect is positive or negative. For each entry in the table, provide a justification.
step5: Identify any aspects that are not being investigated in the plan, and place them in the appropriate column along with your justification.
step6:Compare your table with those of other students. Identify any similarities and differences among the aspects and any similarities and differences among the justifications.
step7:Develop a consensus within the group, and prepare a brief visual presentation identifying important strengths and weaknesses of the approach used to monitor the effects of acid deposition.
step8:To use reliable methods and improve the validity of research, scientists often choose to use approaches developed by previous studies when planning a new study. Make a recommendation as to whether the plan you reviewed should be used as a framework for studies to monitor the effects of acid deposition in Alberta. If possible, indicate parts of the study that need to be modified or identify any additional tests that should be performed. Explain your reasoning.
In this lesson you analyzed and performed titrations to solve problems involving quantifying acids or bases. You also learned about the importance of buffering capacity to a biological system. Titration can be used to determine a value for buffering capacity. You also determined that acids and bases can be classified as being strong or weak, based on the extent to which they react with water.
1.4 Summary
Assessing an Approach to Monitor the Effects of Acid Deposition
Utilizing Technology
Science 30 © 2007 A
lberta Education (w
ww
.education.gov.ab.ca). Third-party copyright credits are listed on the attached copyright credit page.
Science SkillsAnalyzing and InterpretingCommunication and Teamwork
��
Unit B: Chemistry and the Environment220

Knowledge1. Define the following terms.
a. indicator b. titration
c. burette d. Erlenmeyer flask
e. endpoint f. pH meter
2. Explain why a solution’s pH cannot always be used to estimate the concentration of acid within a solution.
3. Write a list of the strong acids that appear on the “Table of Acids and Bases.” Explain why strong acids are often used as standard solutions for titrations.
Applying Concepts4. It takes 16.7 mL of 0.100-mol/L hydroxide ions to neutralize 10.0 mL of an acidic solution of unknown concentration.
a. Calculate the hydronium-ion concentration of the acid.
b. Determine the pH of the acid.
5. 60.0 mL of nitric acid with a molar concentration of 2.50 mol/L is accidentally spilled. The base, HCO3-(aq), from an
acid-spill kit has a concentration of 0.145 mol/L. Determine the volume of base, HCO3-(aq), needed to treat the spill.
6. In a titration experiment, a 10.0-mL sample of vinegar, CH3COOH(aq), is titrated with 0.108-mol/L sodium hydroxide,
NaOH(aq). After three trials, it is determined that an average of 7.55 mL of NaOH(aq) is required to neutralize the solution. Determine the molar concentration of ethanoic acid in the vinegar solution.
7. Three 10.0-mL samples of hydrochloric acid with phenolphthalein were titrated with a 0.0567-mol/L solution of sodium hydroxide, NaOH(aq). The results obtained are summarized in the table.
Trial
VolumeofStandardSolution(mL)EndpointColourFinal Initial Added
1 13.61 1.72 light pink
2 25.68 13.67 light pink
3 37.55 25.64 light pink
InitialReading(mL)
FinalReading(mL)
difference(mL)
10.13 20.73 10.60
20.73 31.34 10.61
31.34 41.93 10.59
TITRATION1
InitialReading(mL)
FinalReading(mL)
difference(mL)
10.15 19.96 9.81
19.96 30.68 10.72
30.68 41.87 11.19
TITRATION2
Which set of data would you be more confident with? Explain your reasons.
9. Explain at least two ways in which you can improve your titration technique to obtain more consistent results.
1.4 Questions
a. Calculate the average volume of NaOH(aq) used.
b. Calculate the molar concentration of the hydrochloric acid tested.
8. Mikhail performed two series of titrations on 15.0-mL test samples. Here are his results.
Science 30 © 2007 A
lberta Education (w
ww
.education.gov.ab.ca). Third-party copyright credits are listed on the attached copyright credit page.
Chapter 1: Acid Deposition 221

Photo Credits and AcknowledgementsAll photographs, illustrations, and text contained in this book have been created by or for Alberta Education, unless noted herein or elsewhere in this Science 30 textbook. Alberta Education wishes to thank the following rights holders for granting permission to incorporate their works into this textbook. Every effort has been made to identify and acknowledge the appropriate rights holder for each third-party work. Please notify Alberta Education of any errors or omissions so that corrective action may be taken.
Legend: t = top, m = middle, b = bottom, l = left, r = right
205 (l) © Laurence Gough/iStockphoto 208–209 © Mark Yuill/shutterstock 212 © Mrloz/CanStockPhoto 213 © Olivier/CanStockPhoto 215 (br) © Razvan Photography /CanStockPhoto 216–217 © Trout55/shutterstock 219 (br) © Alberta Environment 220 © Alexander Iotzov/shutterstock